

Compact Muon Solenoid
LHC, CERN
| CMS-HIG-22-003 ; CERN-EP-2023-223 | ||
| Search for an exotic decay of the Higgs boson into a Z boson and a pseudoscalar particle in proton-proton collisions at $ \sqrt{s} = $ 13 TeV | ||
| CMS Collaboration | ||
| 31 October 2023 | ||
| Phys. Lett. B 852 (2024) 138582 | ||
| Abstract: A search for an exotic decay of the Higgs boson to a Z boson and a light pseudoscalar particle (a), decaying to a pair of leptons and a pair of photons, respectively, is presented. The search is based on proton-proton collision data at a center-of-mass energy of $ \sqrt{s} = $ 13 TeV, collected with the CMS detector and corresponding to an integrated luminosity of 138 fb$ ^{-1} $. The analysis probes pseudoscalar masses $ m_{\mathrm{a}} $ between 1 and 30 GeV, leading to two pairs of well-isolated leptons and photons. Upper limits at 95% confidence level are set on the Higgs boson production cross section times its branching fraction to two leptons and two photons. The observed (expected) limits are in the range of 1.1-17.8 (1.7-17.9) fb within the probed $ m_{\mathrm{a}} $ interval. An excess of data above the expected standard model background with a local (global) significance of 2.6 (1.3) standard deviations is observed for a mass hypothesis of $ m_{\mathrm{a}}= $ 3 GeV. Limits on models involving axion-like particles, formulated as an effective field theory, are also reported. | ||
| Links: e-print arXiv:2311.00130 [hep-ex] (PDF) ; CDS record ; inSPIRE record ; HepData record ; Physics Briefing ; CADI line (restricted) ; | ||
| Figures & Tables | Summary | Additional Figures | References | CMS Publications |
|---|
| Figures | |

png pdf |
Figure 1:
Feynman diagram for a BSM decay of the H boson into a Z boson and a light pseudoscalar boson, subsequently decaying to two leptons ($ \ell = $ e, $ \mu $) and two photons, respectively. |
png pdf |
Figure 2:
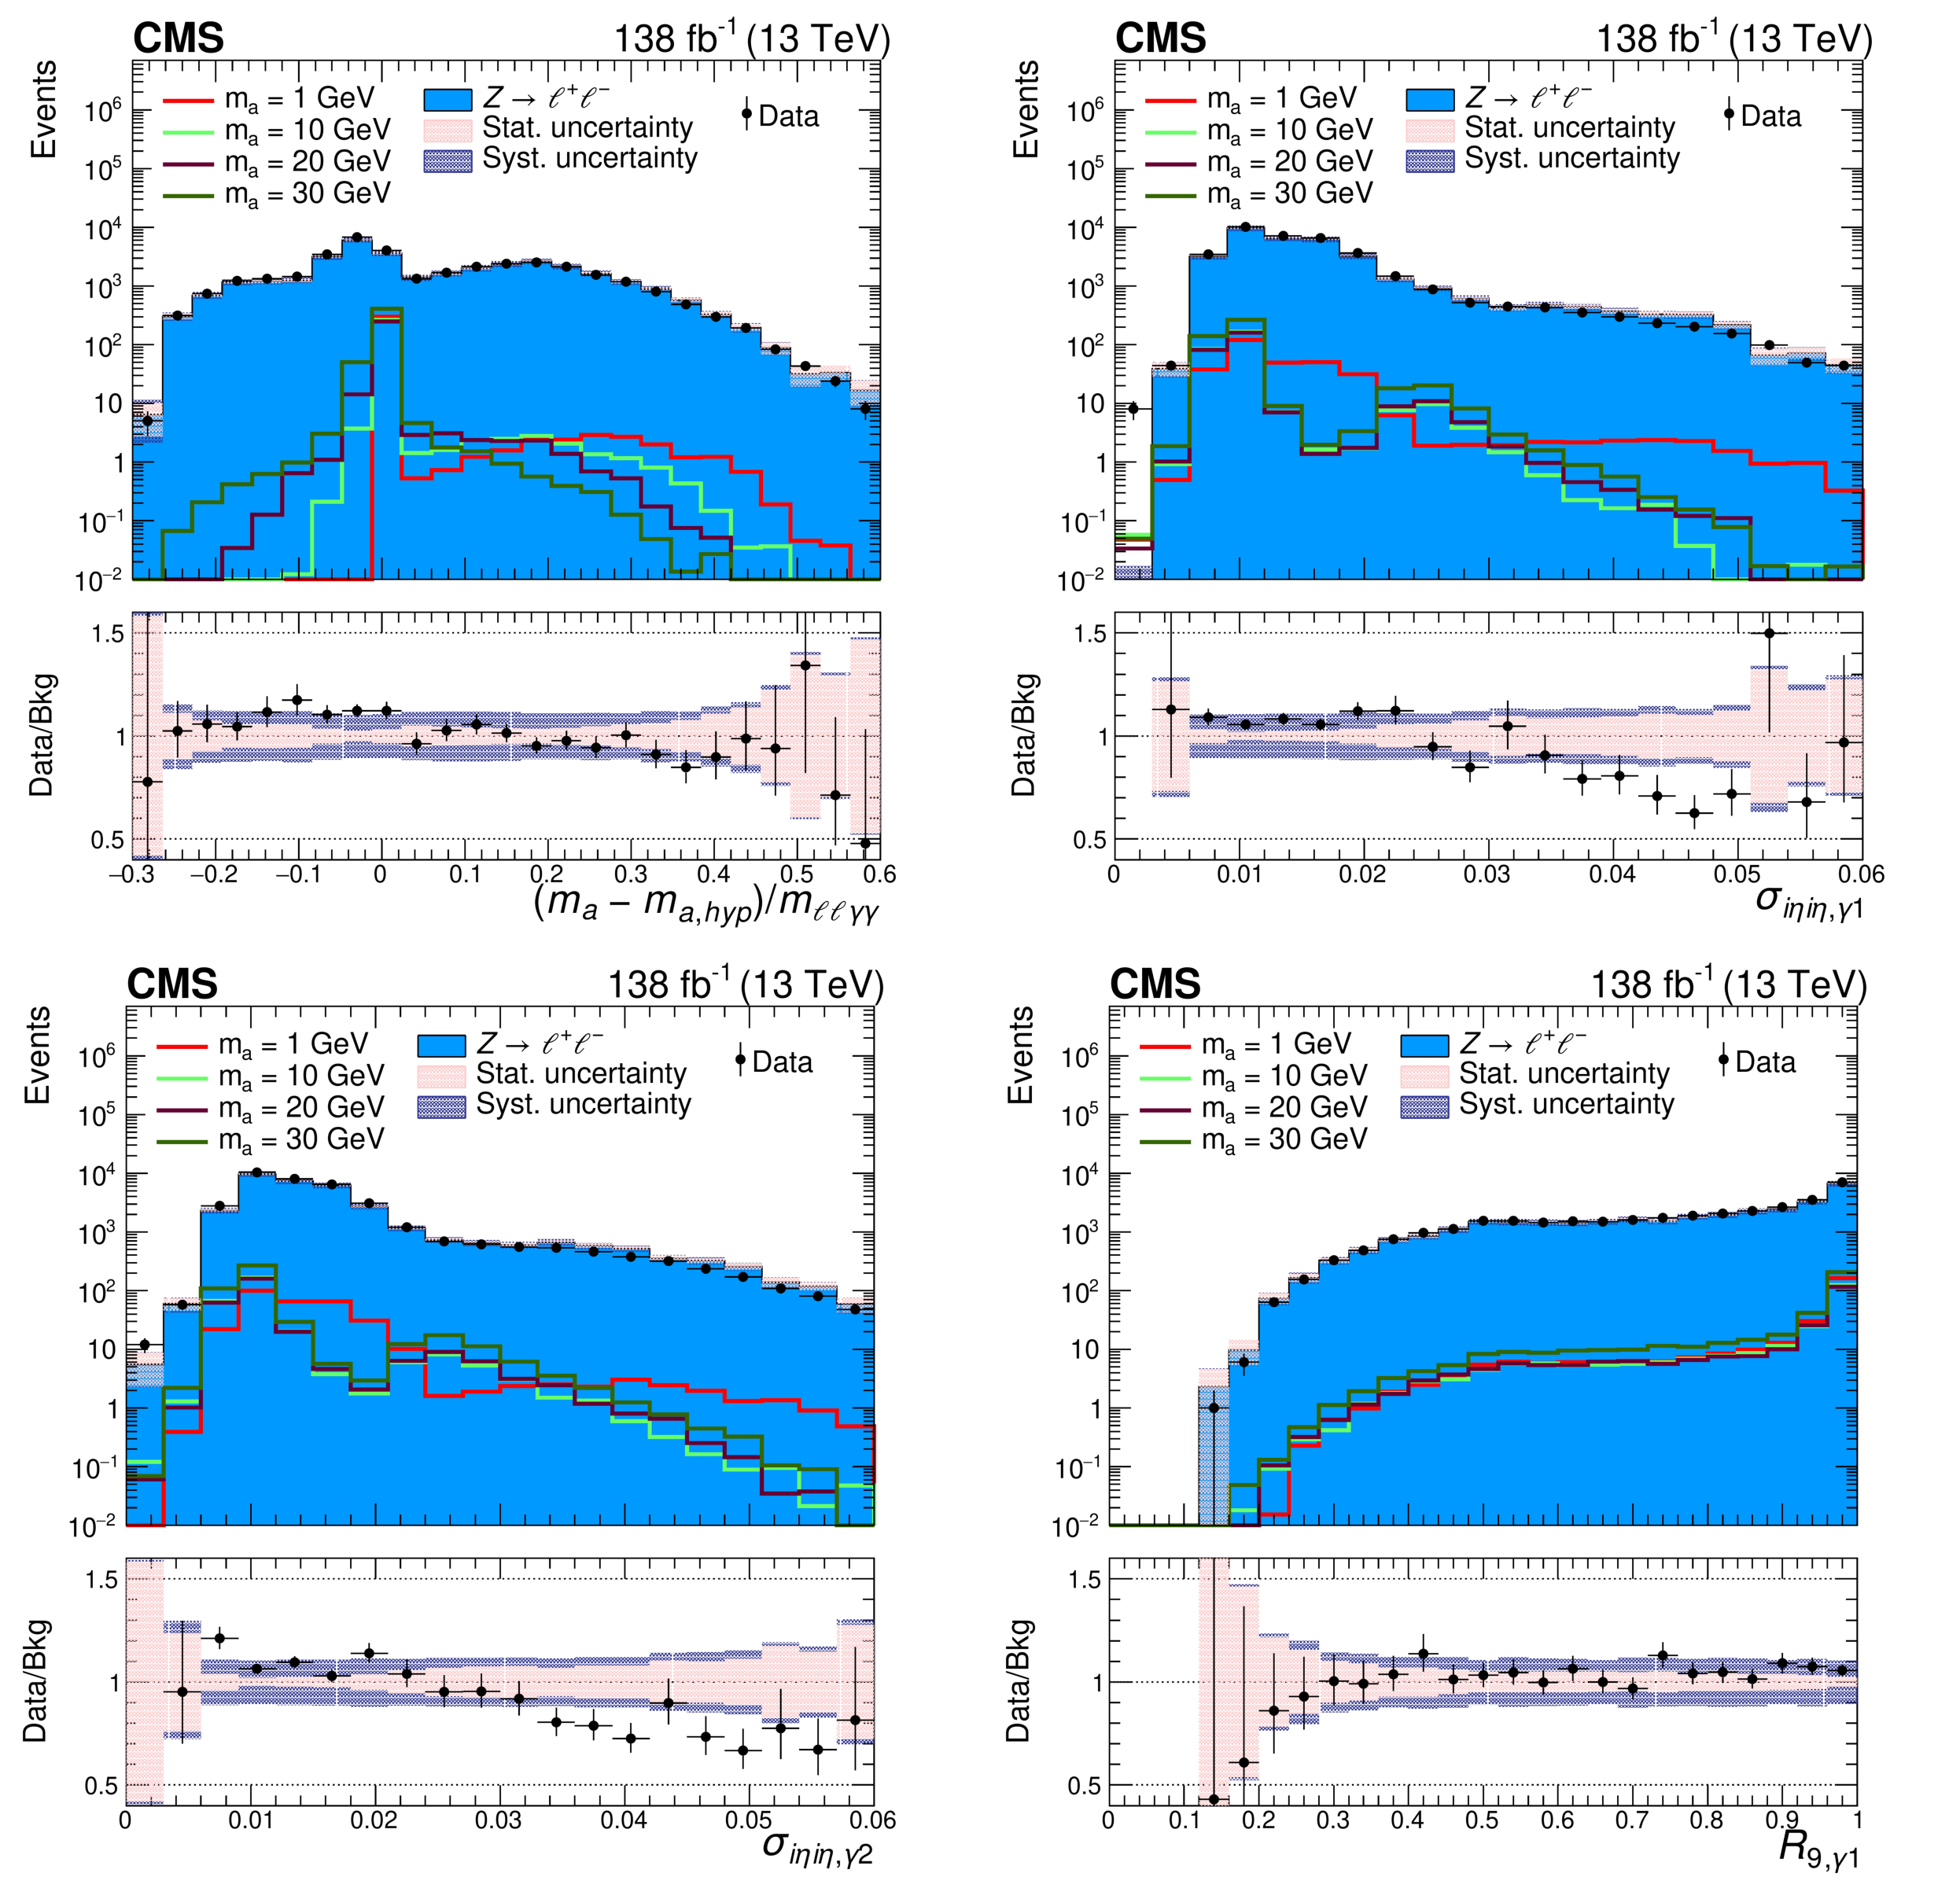
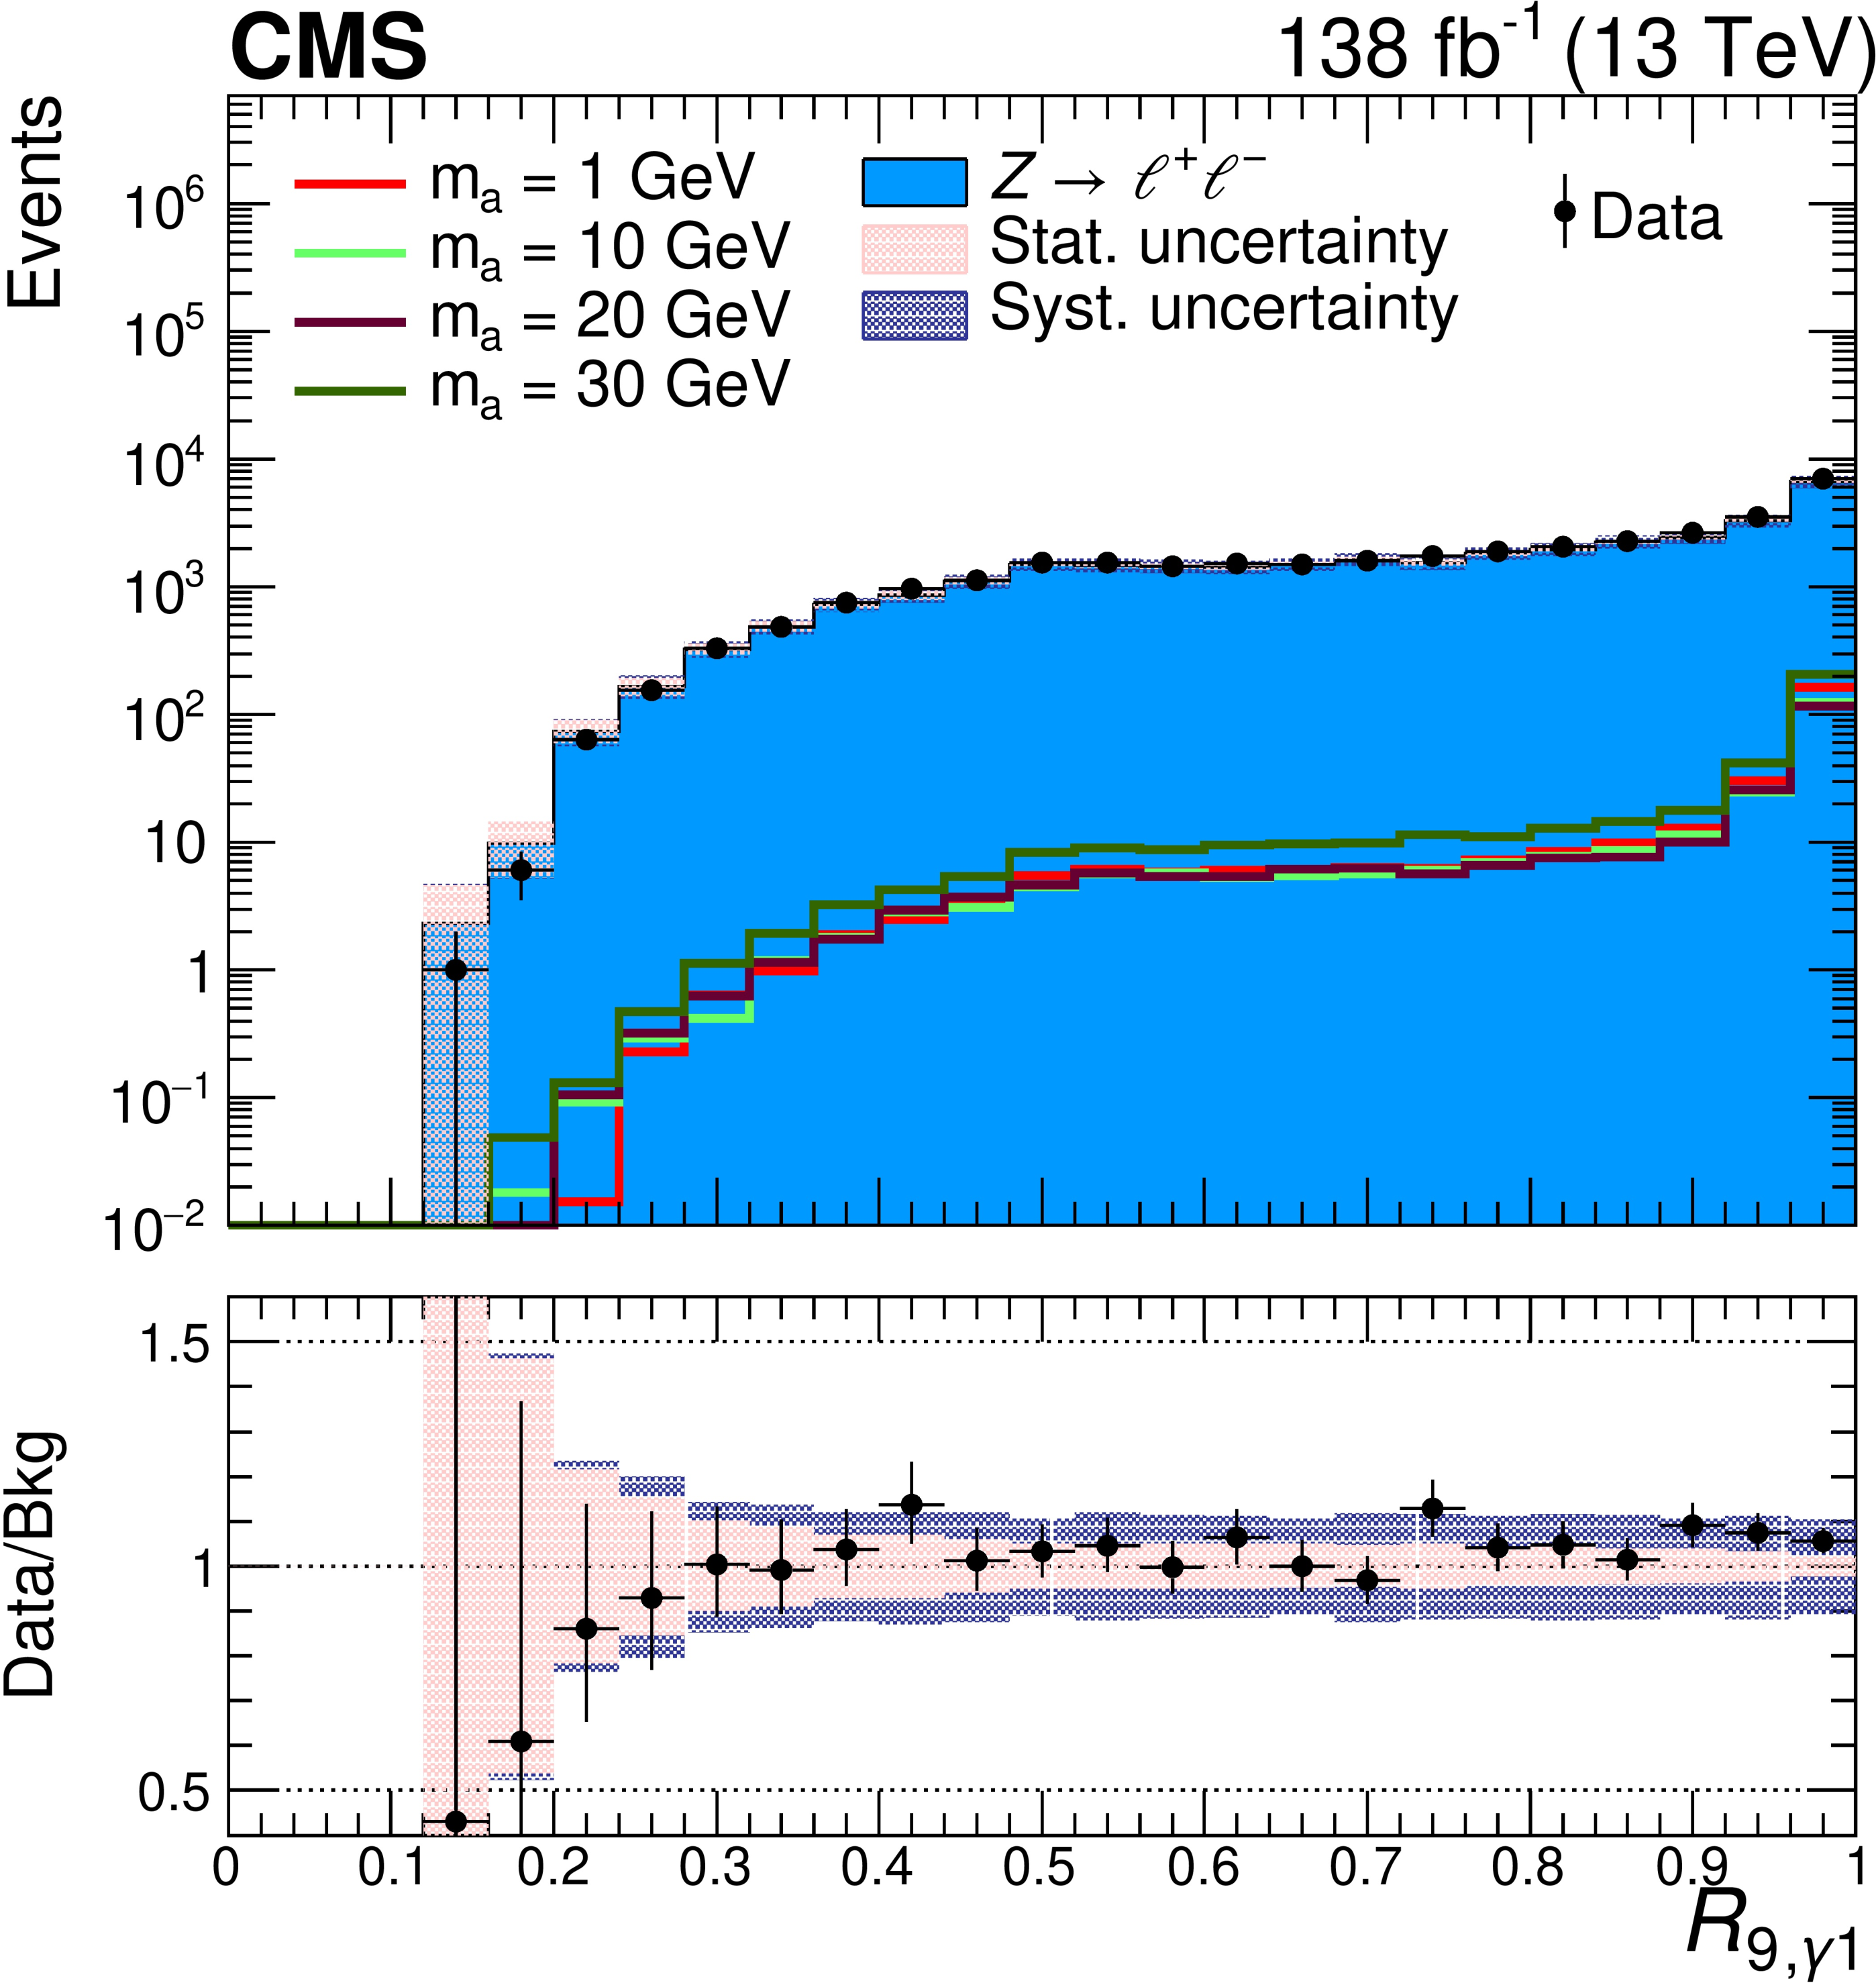
Distributions of the four most discriminating variables used as input to the BDT: $ (m_{\mathrm{a}}-m_{\mathrm{a},\text{hyp}})/m_{\ell\ell\gamma\gamma} $ (upper left), leading photon's $ \sigma_{i\eta i\eta} $ (upper right), subleading photon's $ \sigma_{i\eta i\eta} $ (lower left), and leading photon's $ R_9 $ (lower right). The events pass the selection criteria described in Section 5. The signal is scaled to a cross section of 0.1 pb and the background sample is normalized to an integrated luminosity of 138 fb$ ^{-1} $. The systematic uncertainties included in the shaded band are related to the photon efficiency, lepton efficiency, and pileup modeling. The impact of the remaining disagreement between data and simulation is negligible. |
png pdf |
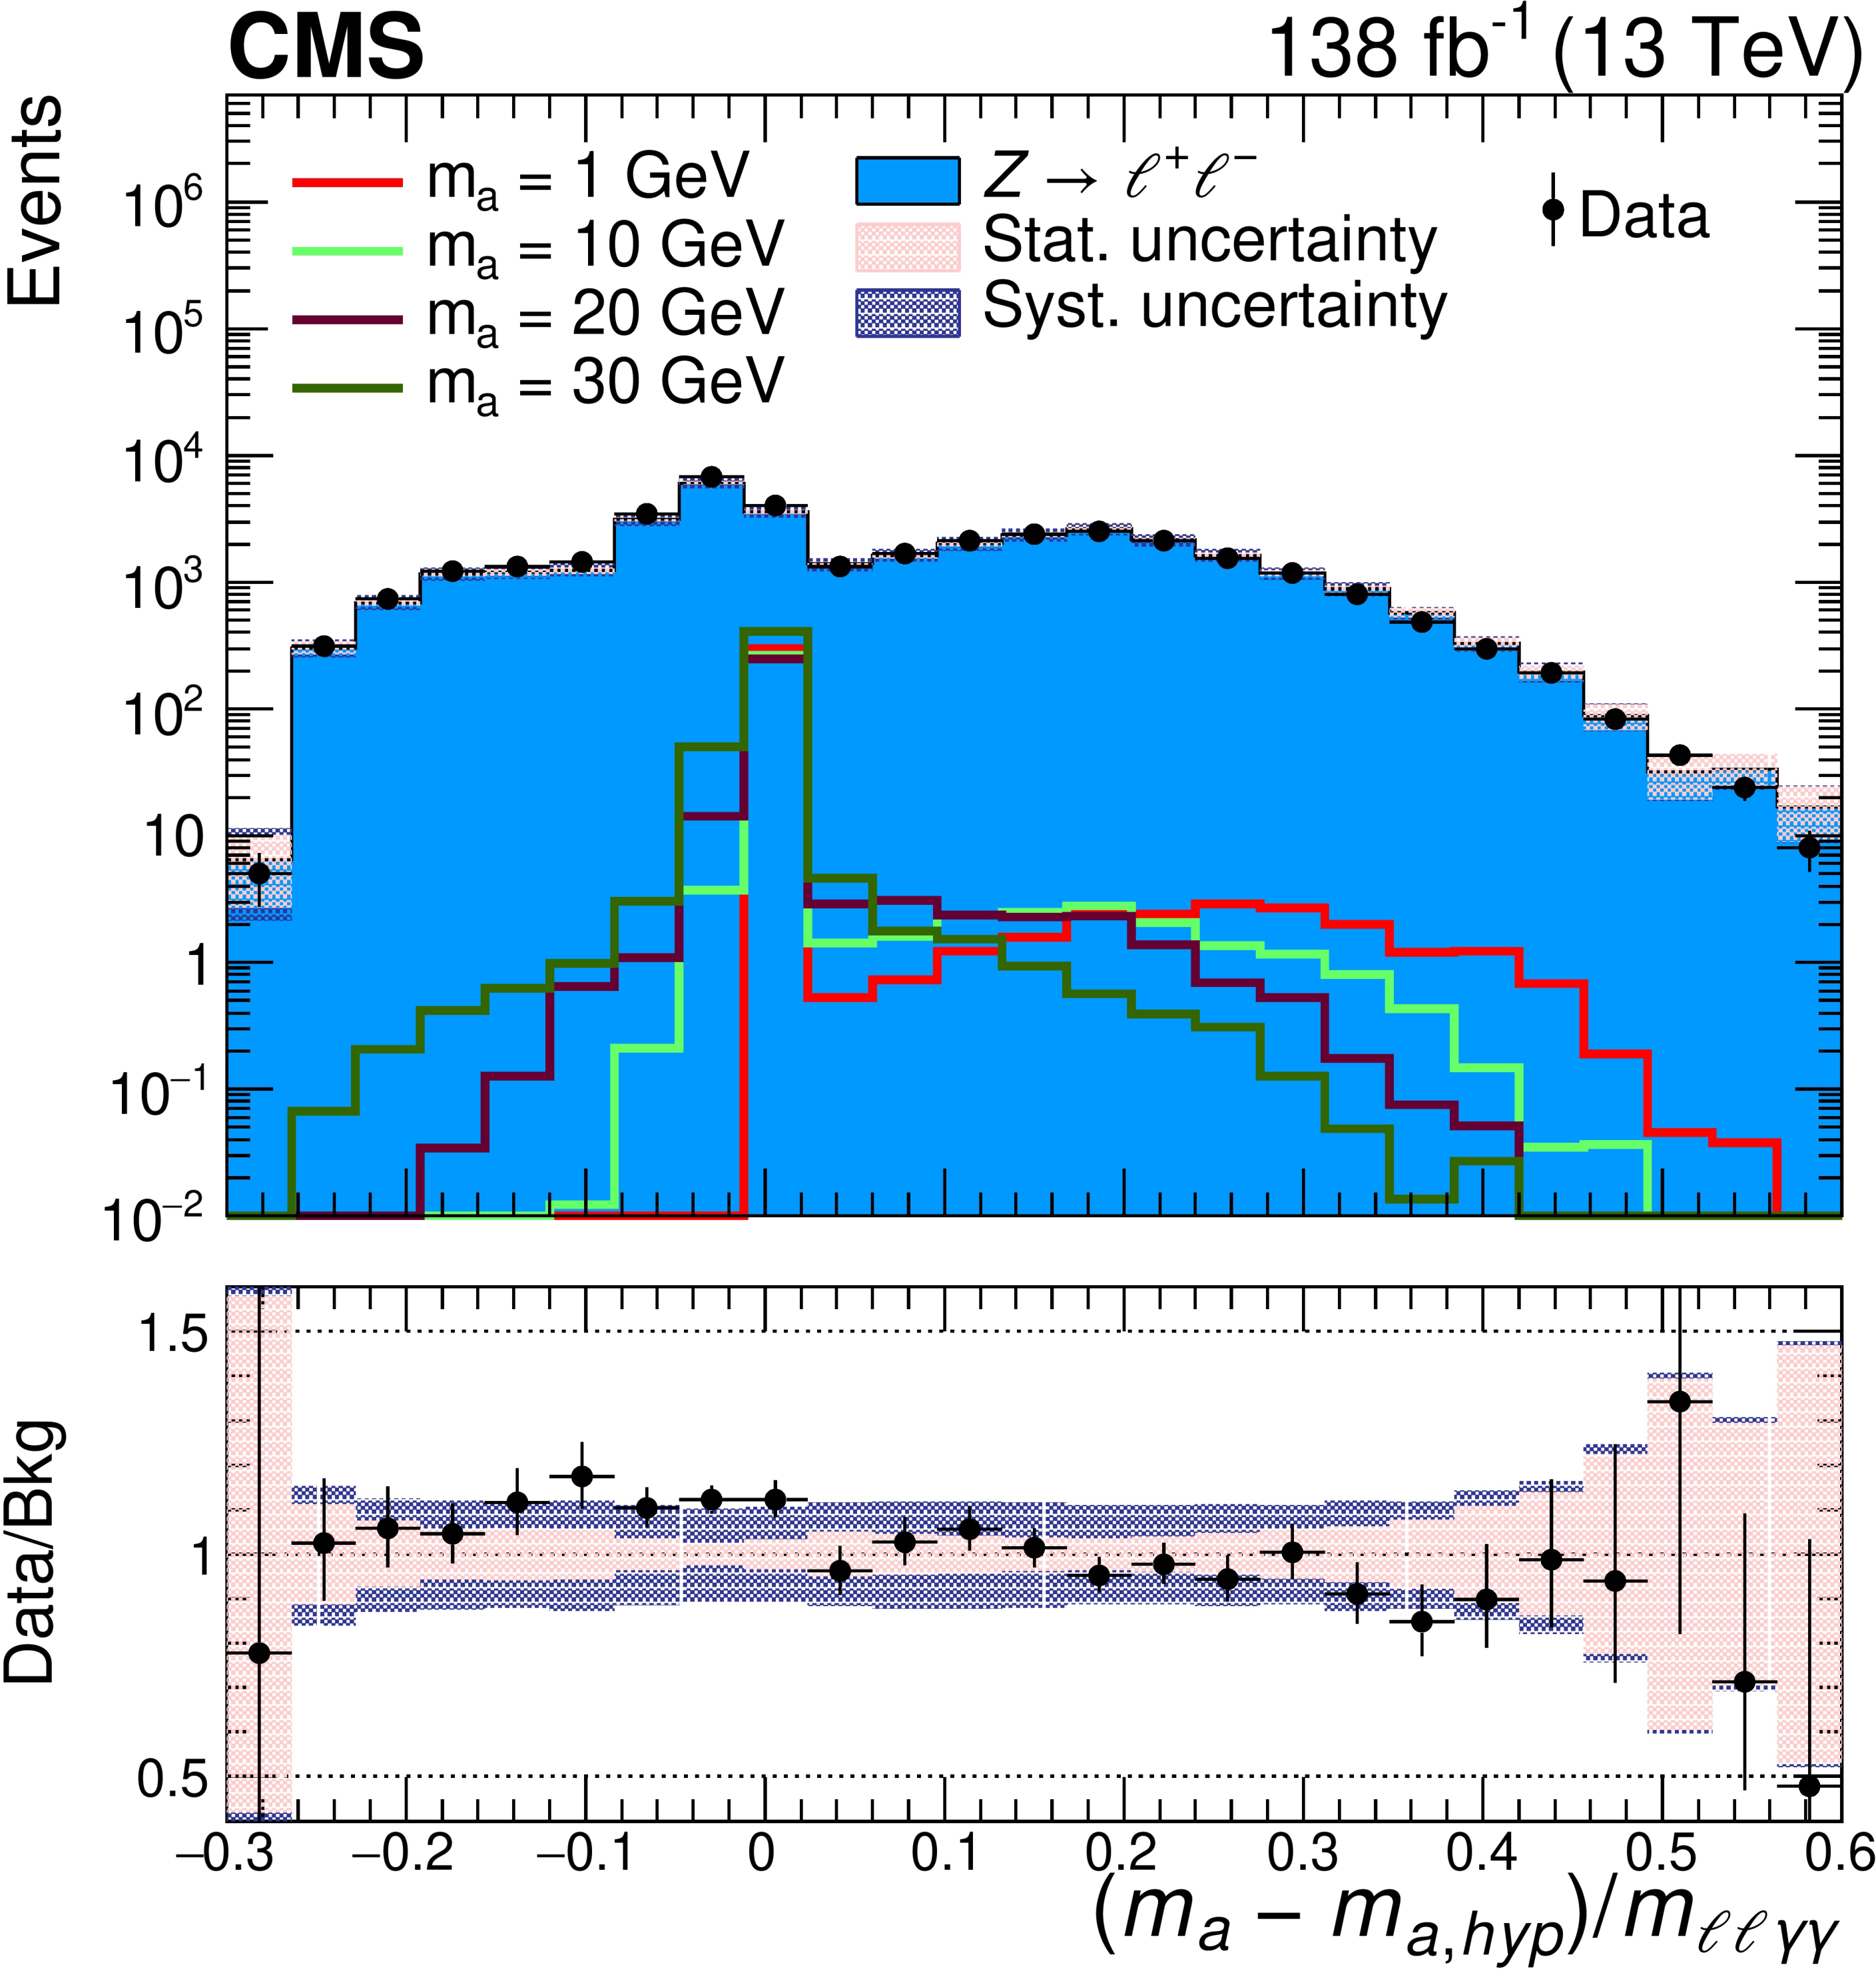
Figure 2-a:
Distribution of $ (m_{\mathrm{a}}-m_{\mathrm{a},\text{hyp}})/m_{\ell\ell\gamma\gamma} $. The events pass the selection criteria described in Section 5. The signal is scaled to a cross section of 0.1 pb and the background sample is normalized to an integrated luminosity of 138 fb$ ^{-1} $. The systematic uncertainties included in the shaded band are related to the photon efficiency, lepton efficiency, and pileup modeling. The impact of the remaining disagreement between data and simulation is negligible. |
png pdf |
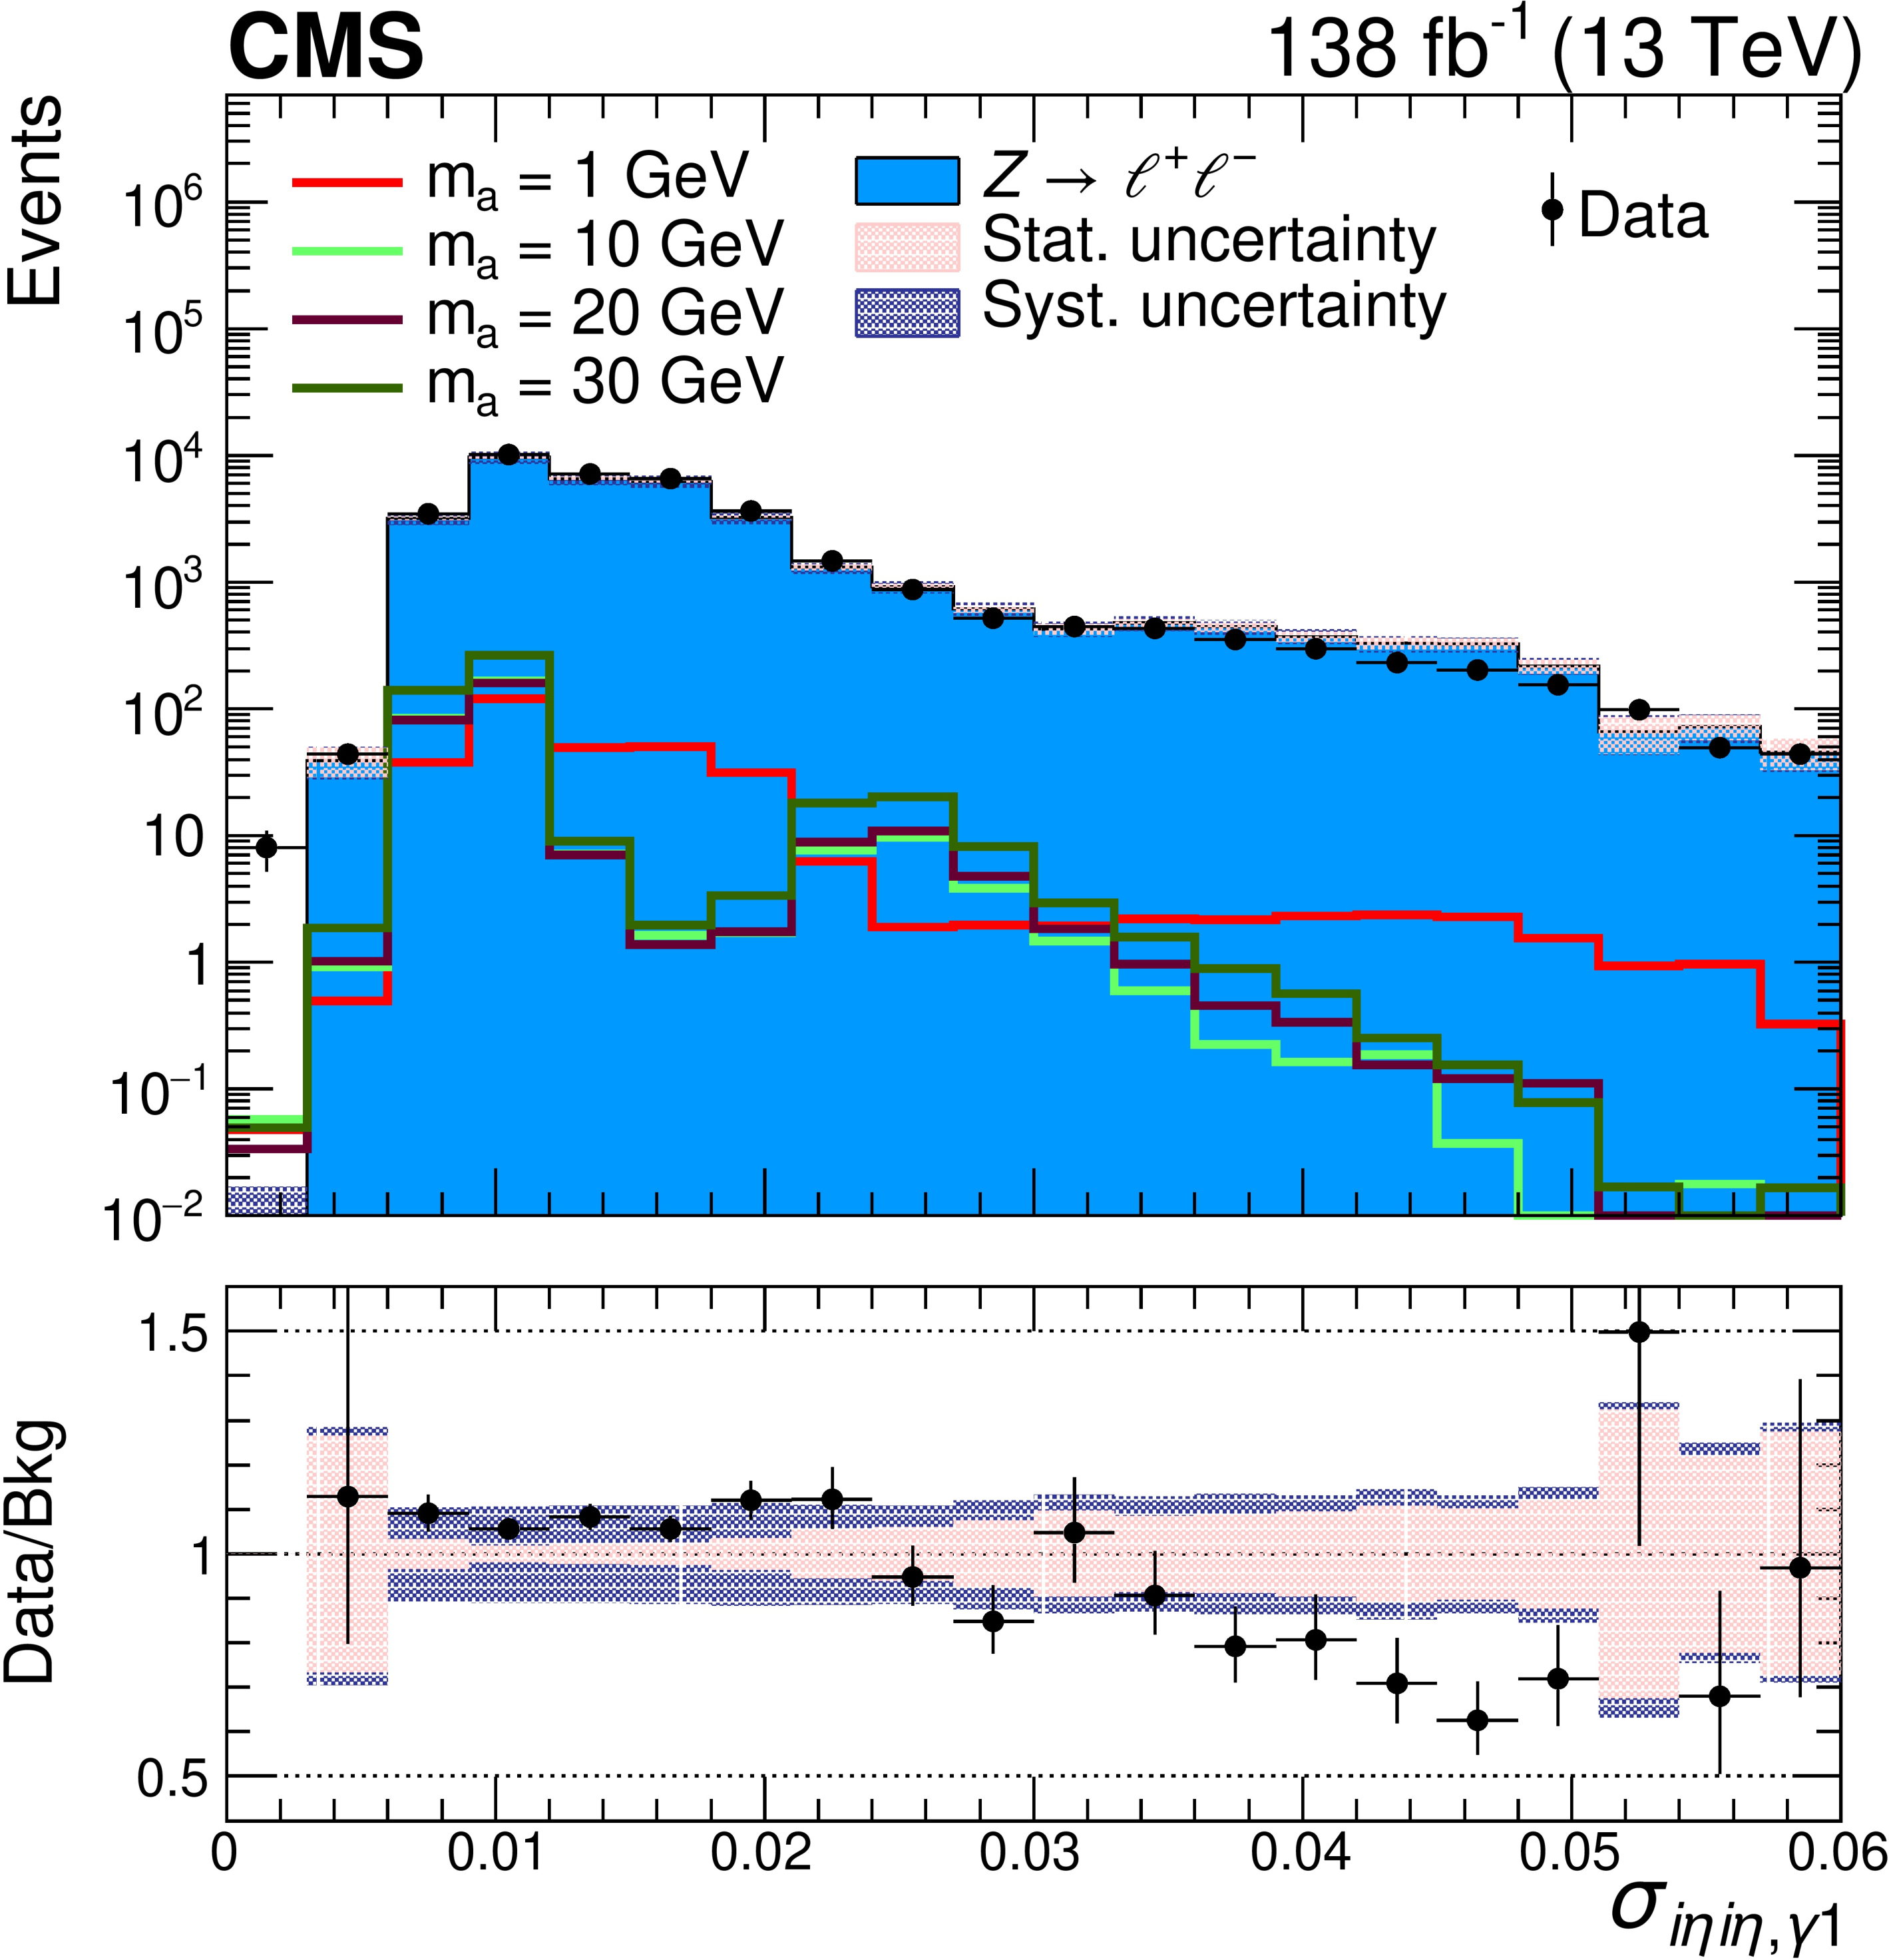
Figure 2-b:
Distribution of leading photon's $ \sigma_{i\eta i\eta} $. The events pass the selection criteria described in Section 5. The signal is scaled to a cross section of 0.1 pb and the background sample is normalized to an integrated luminosity of 138 fb$ ^{-1} $. The systematic uncertainties included in the shaded band are related to the photon efficiency, lepton efficiency, and pileup modeling. The impact of the remaining disagreement between data and simulation is negligible. |
png pdf |
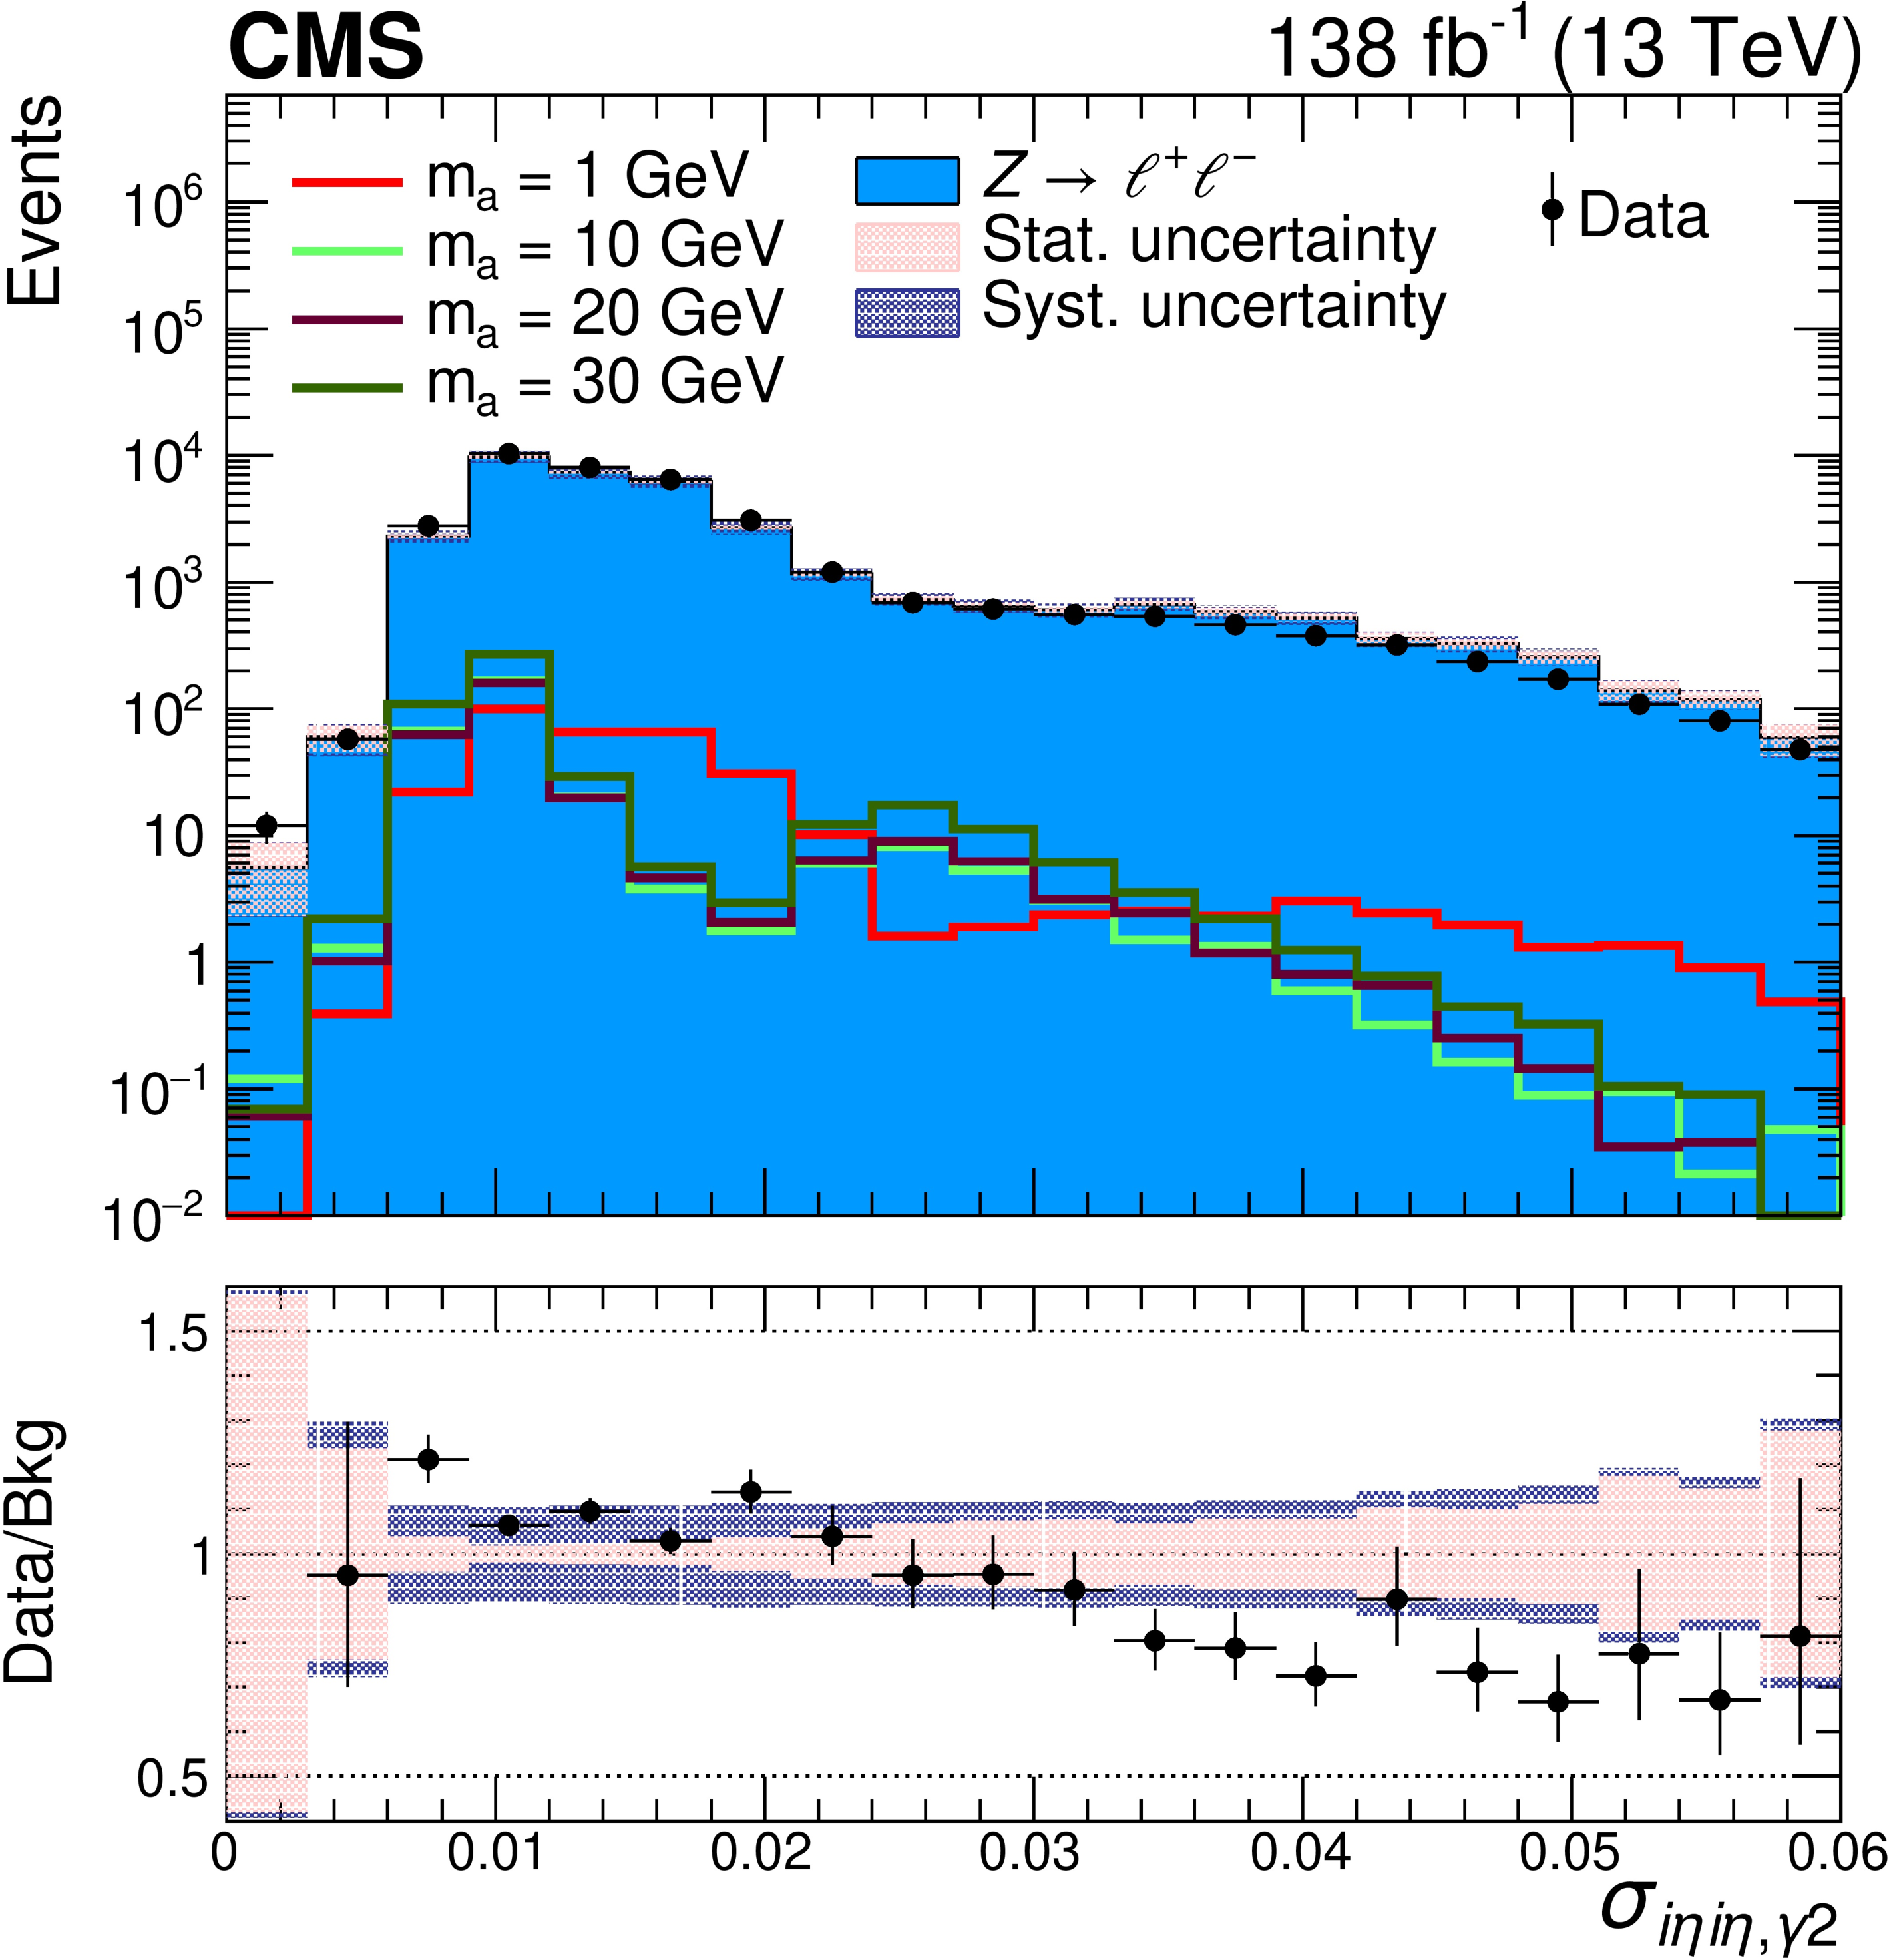
Figure 2-c:
Distribution of subleading photon's $ \sigma_{i\eta i\eta} $. The events pass the selection criteria described in Section 5. The signal is scaled to a cross section of 0.1 pb and the background sample is normalized to an integrated luminosity of 138 fb$ ^{-1} $. The systematic uncertainties included in the shaded band are related to the photon efficiency, lepton efficiency, and pileup modeling. The impact of the remaining disagreement between data and simulation is negligible. |
png pdf |
Figure 2-d:
Distribution of leading photon's $ R_9 $. The events pass the selection criteria described in Section 5. The signal is scaled to a cross section of 0.1 pb and the background sample is normalized to an integrated luminosity of 138 fb$ ^{-1} $. The systematic uncertainties included in the shaded band are related to the photon efficiency, lepton efficiency, and pileup modeling. The impact of the remaining disagreement between data and simulation is negligible. |
png pdf |
Figure 3:
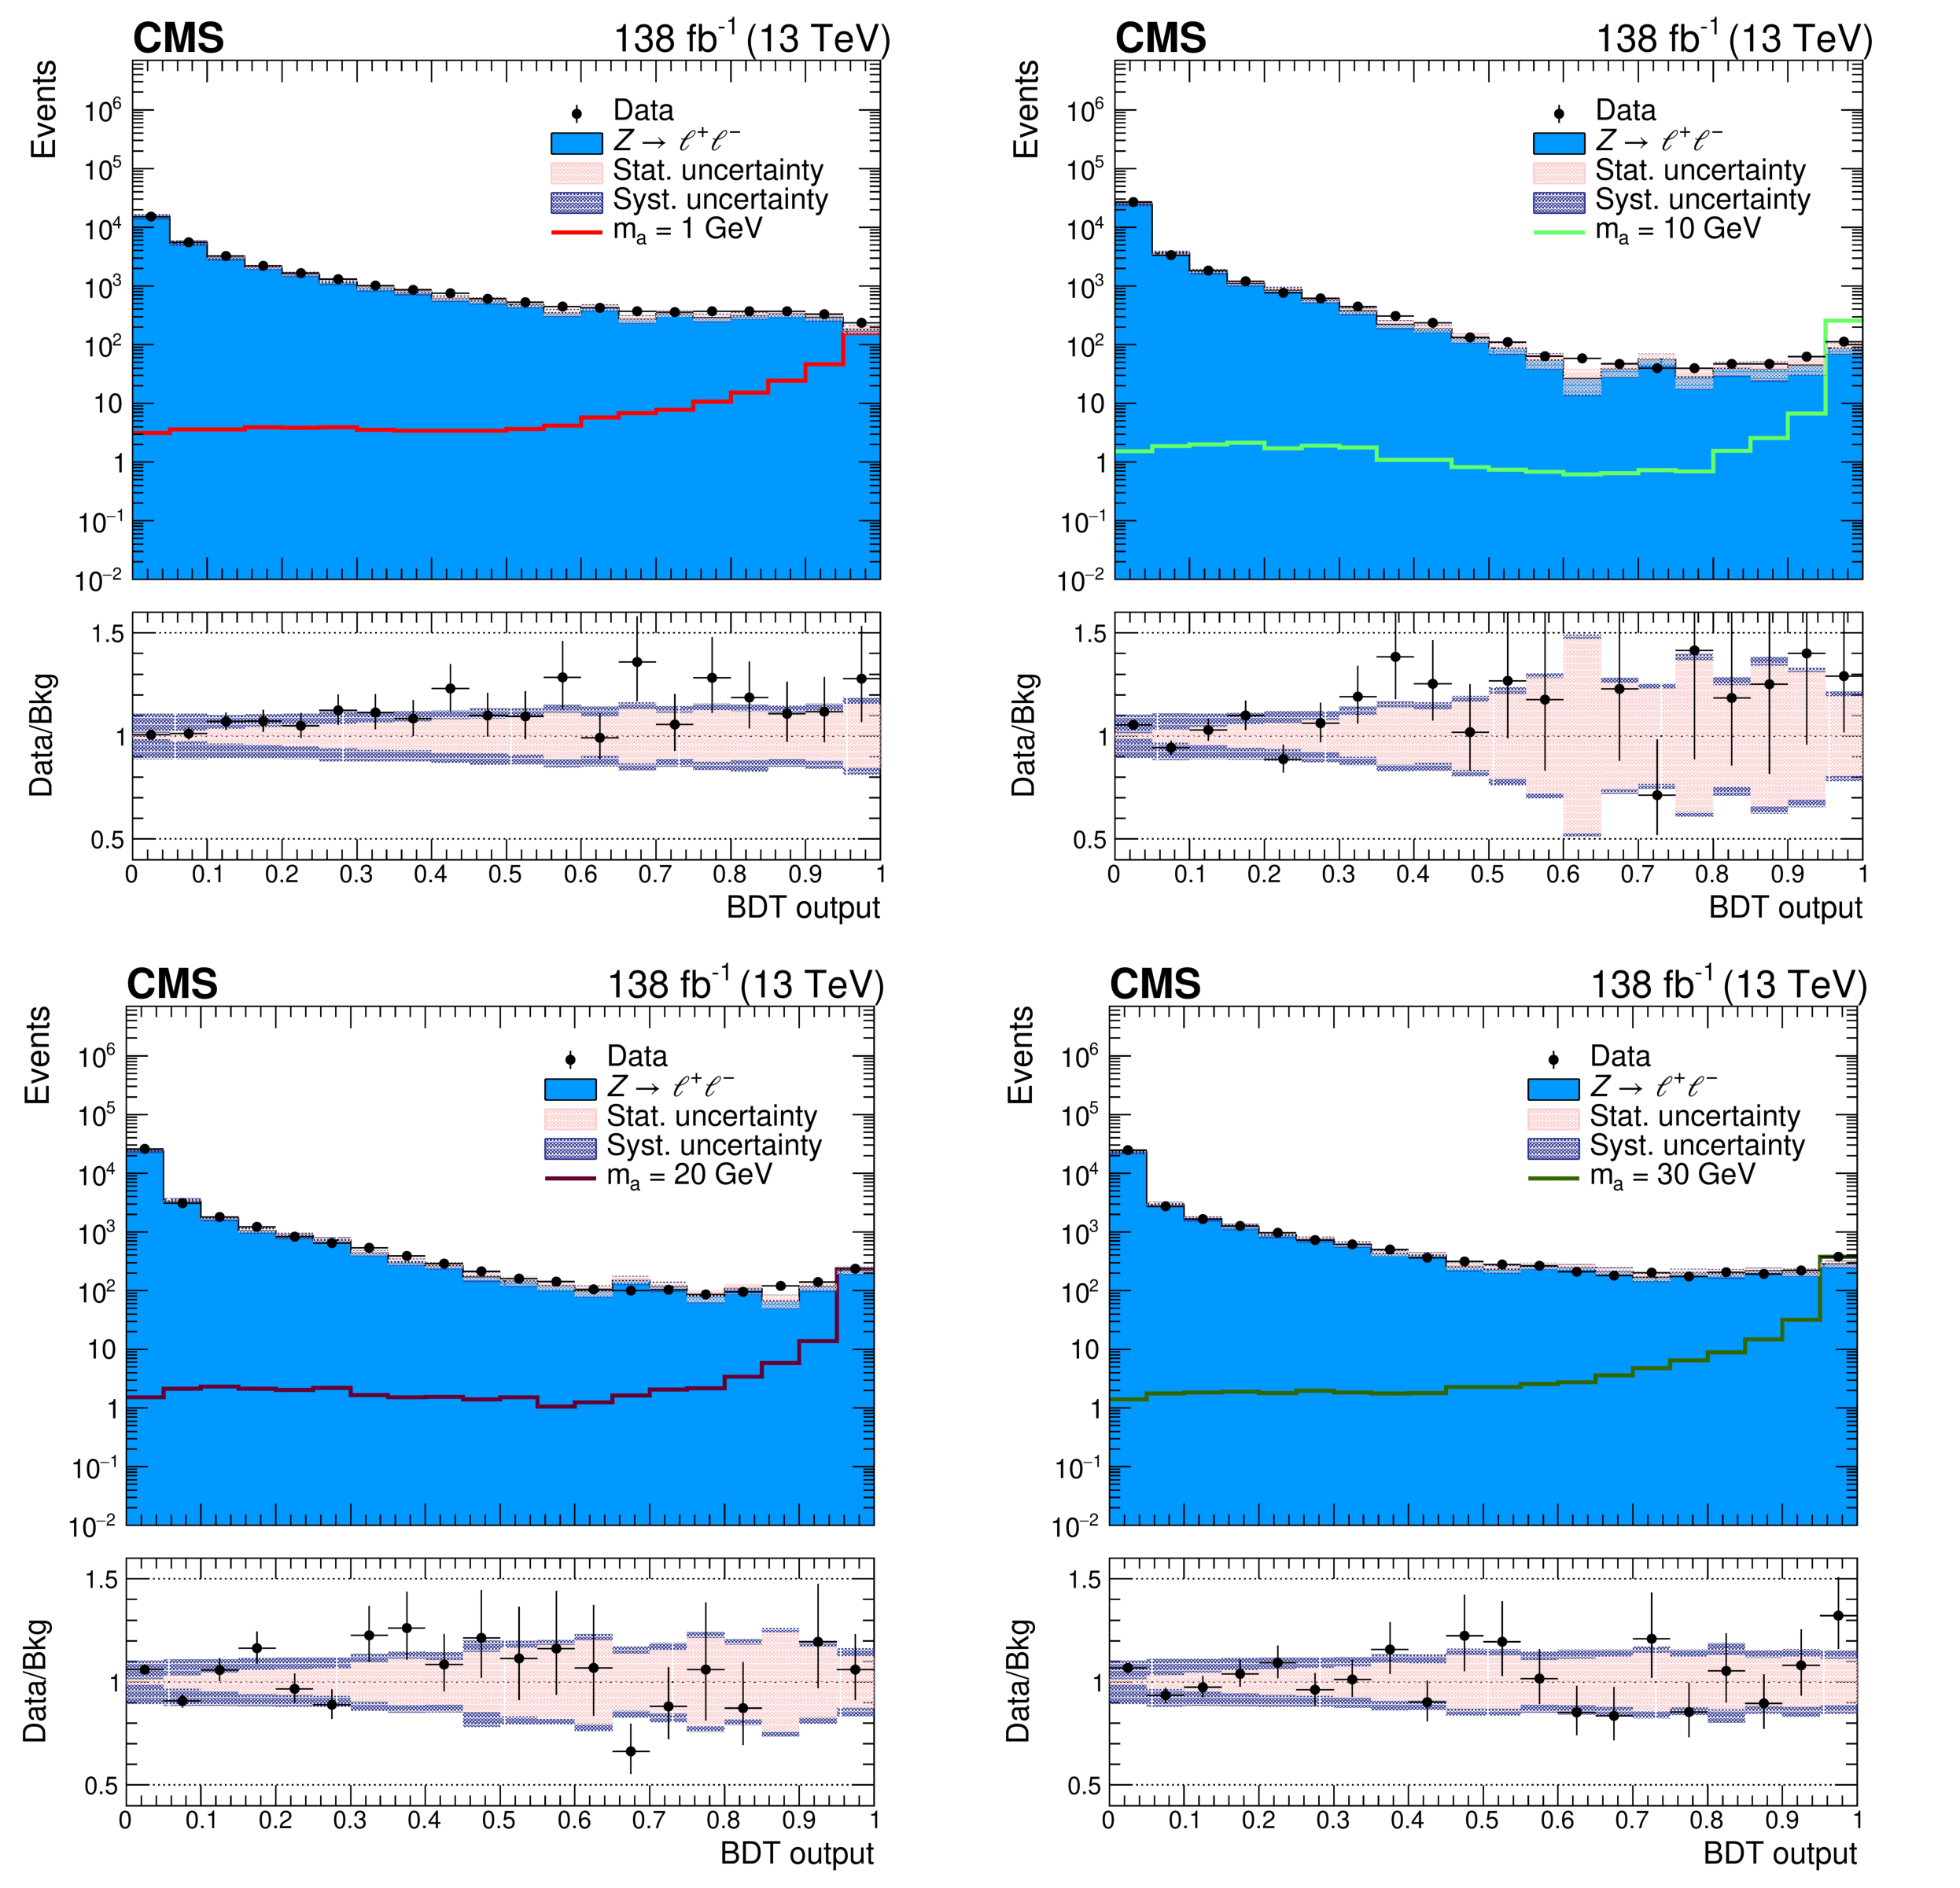
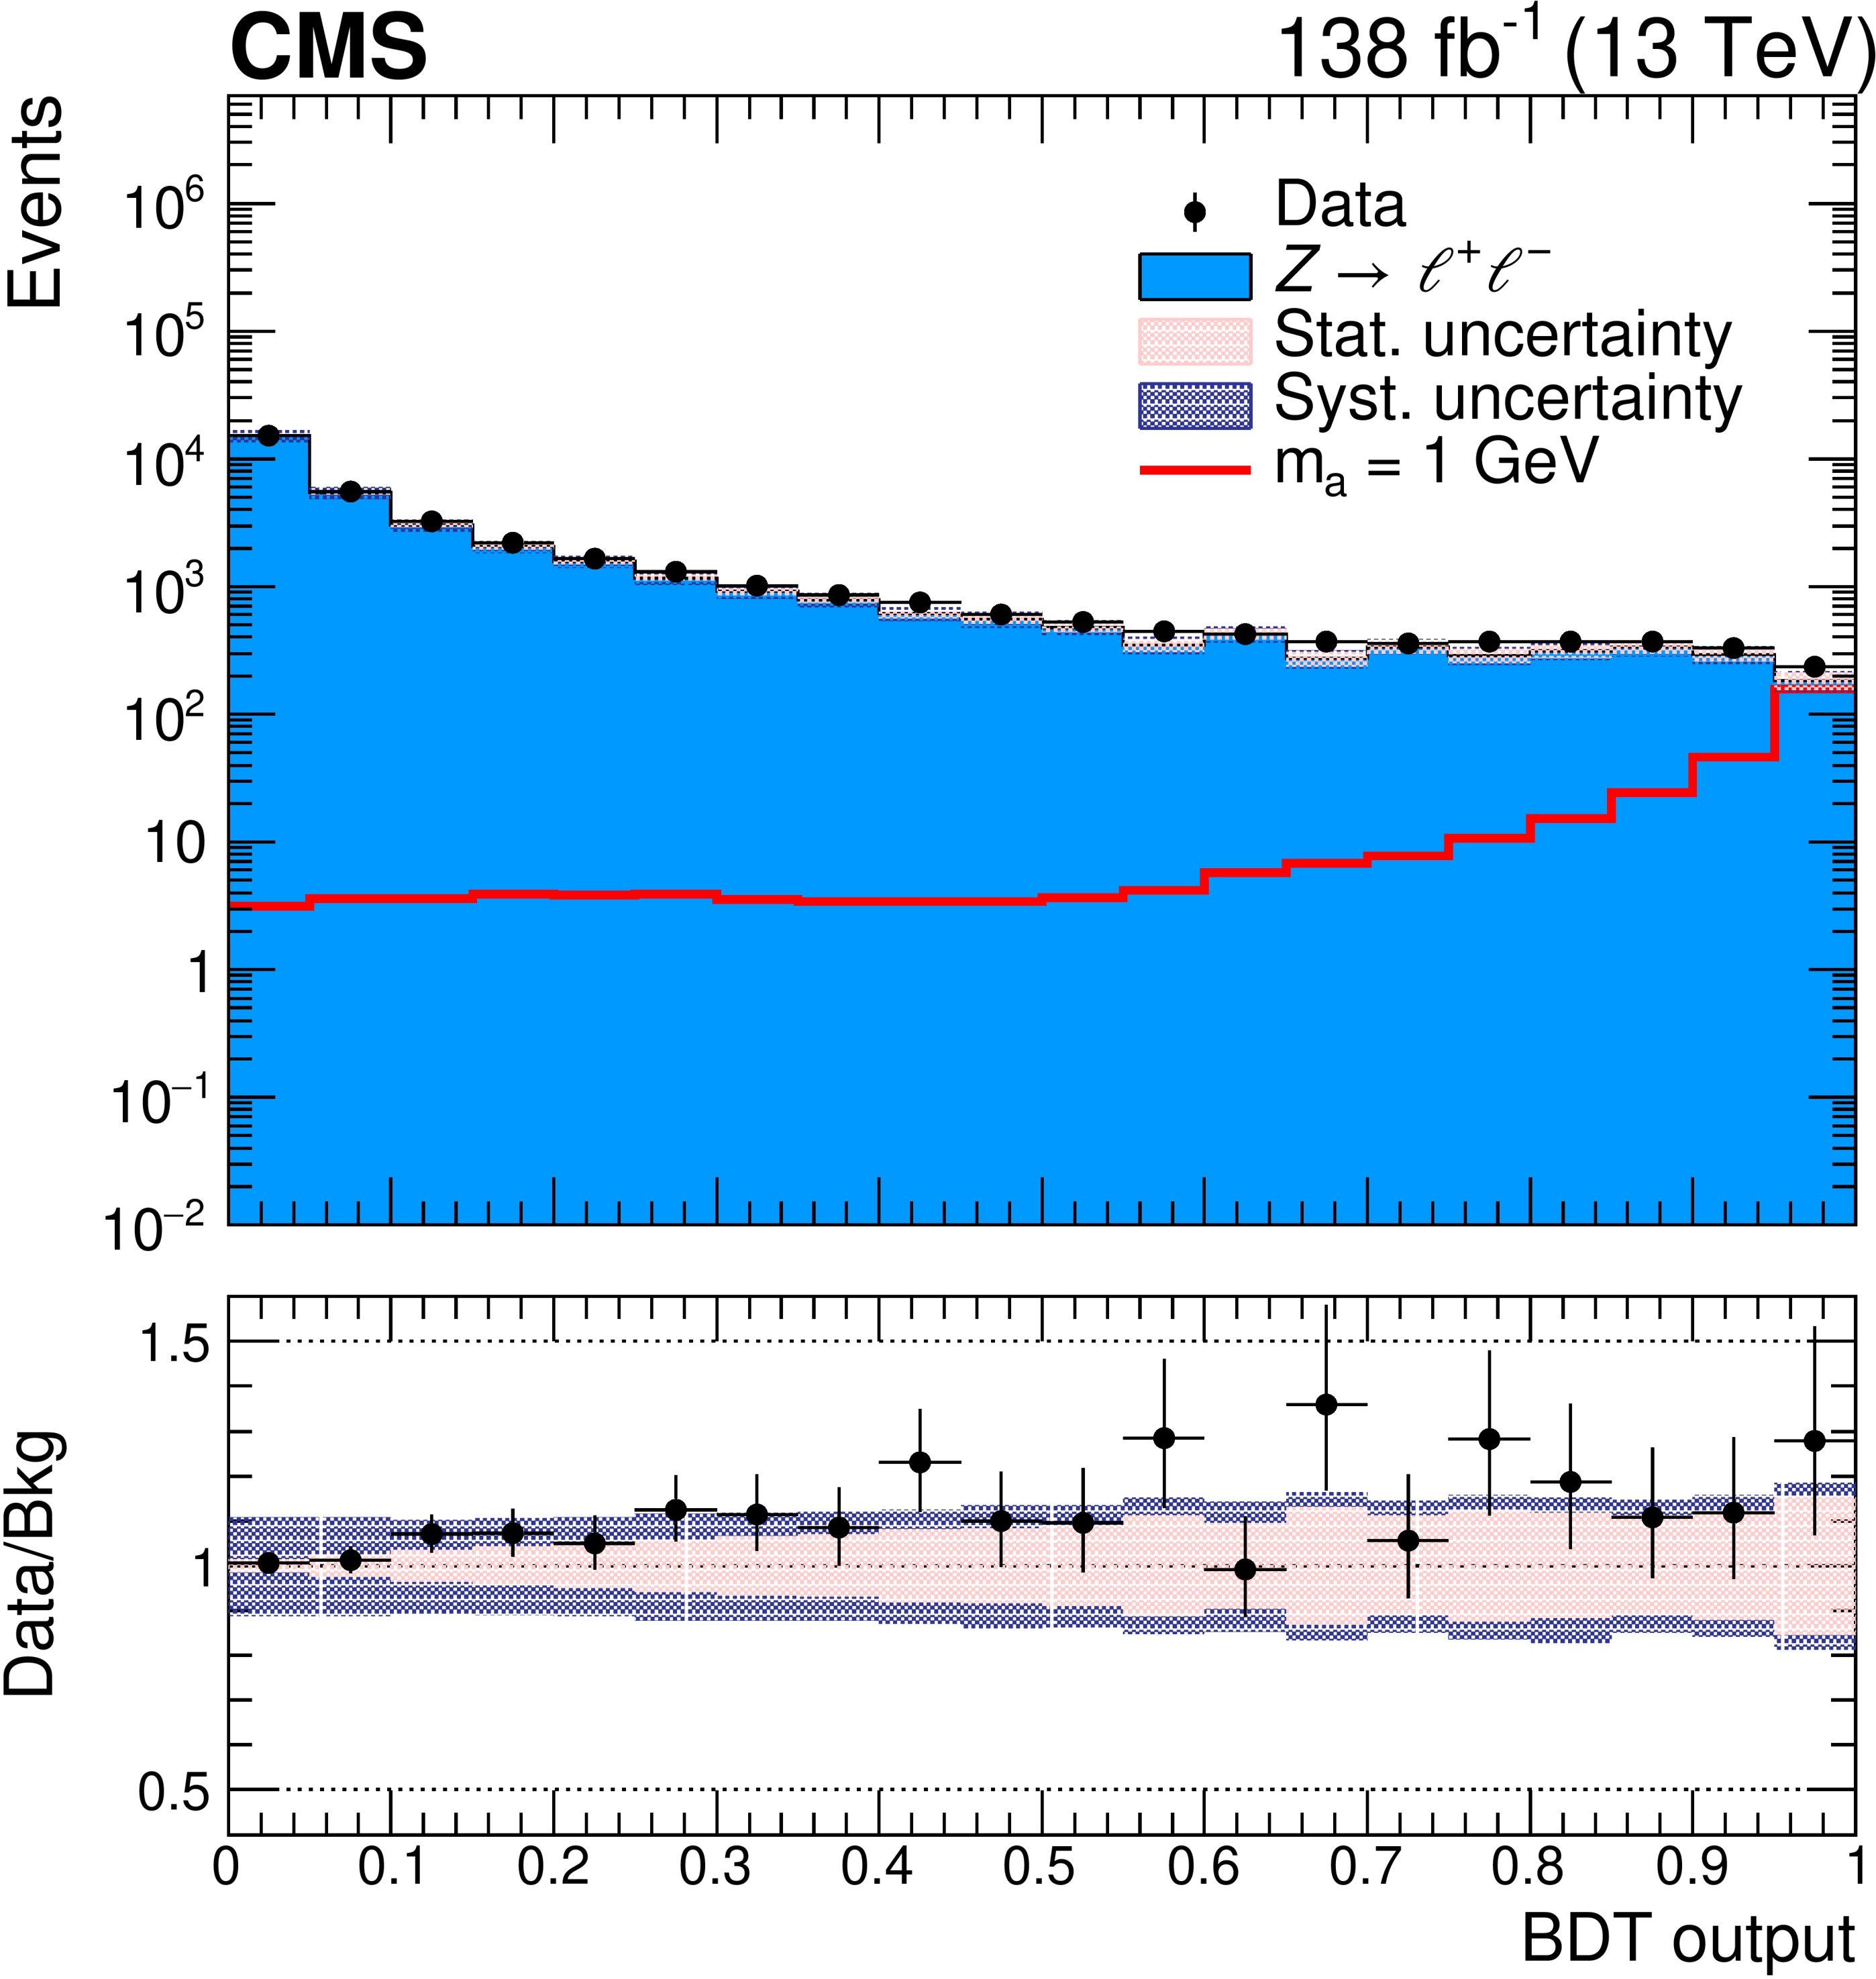
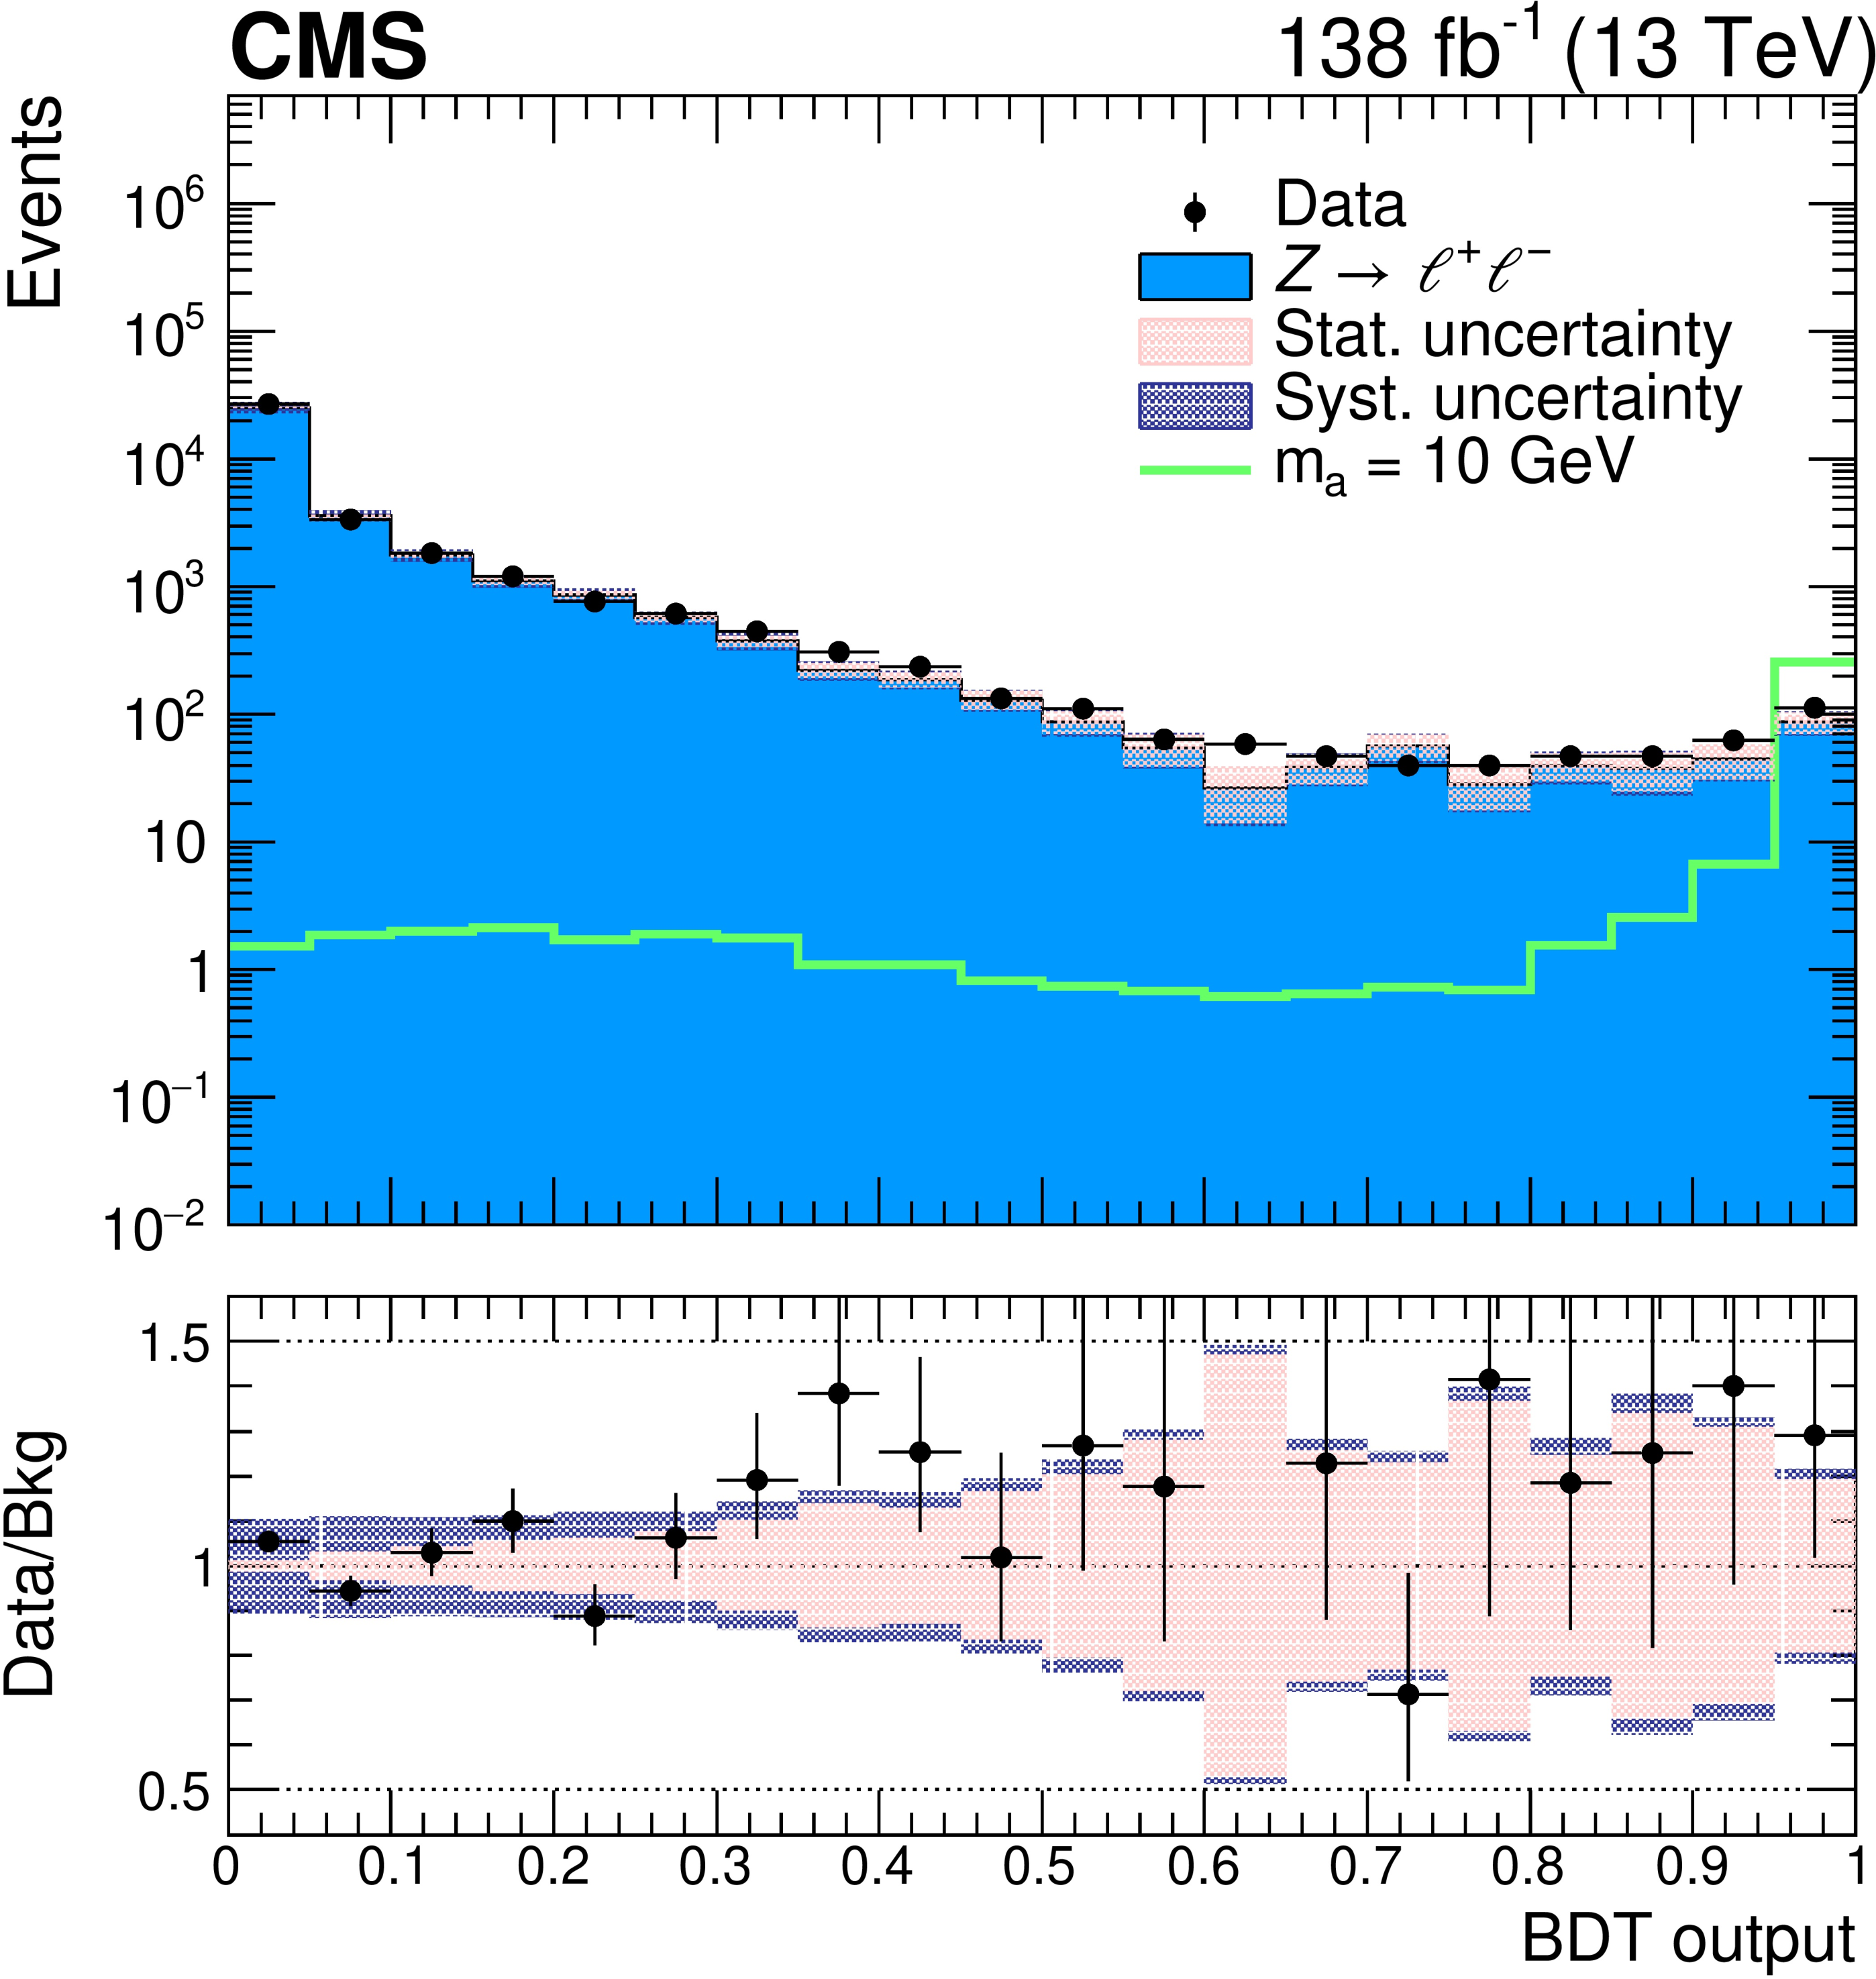
Distributions of the BDT output for $ m_{\mathrm{a}} = $ 1 GeV (upper left), 10 GeV (upper right), 20 GeV (lower left), and 30 GeV (lower right). The events pass the selection criteria described in Section 5. The signal is scaled to a cross section of 0.1 pb and the background sample is normalized to an integrated luminosity of 138 fb$ ^{-1} $. The systematic uncertainties included in the shaded band are related to the photon efficiency, lepton efficiency, and pileup modeling. |
png pdf |
Figure 3-a:
Distributions of the BDT output for $ m_{\mathrm{a}} = $ 1 GeV. The events pass the selection criteria described in Section 5. The signal is scaled to a cross section of 0.1 pb and the background sample is normalized to an integrated luminosity of 138 fb$ ^{-1} $. The systematic uncertainties included in the shaded band are related to the photon efficiency, lepton efficiency, and pileup modeling. |
png pdf |
Figure 3-b:
Distributions of the BDT output for $ m_{\mathrm{a}} = $ 10 GeV. The events pass the selection criteria described in Section 5. The signal is scaled to a cross section of 0.1 pb and the background sample is normalized to an integrated luminosity of 138 fb$ ^{-1} $. The systematic uncertainties included in the shaded band are related to the photon efficiency, lepton efficiency, and pileup modeling. |

png pdf |
Figure 3-c:
Distributions of the BDT output for $ m_{\mathrm{a}} = $ 20 GeV. The events pass the selection criteria described in Section 5. The signal is scaled to a cross section of 0.1 pb and the background sample is normalized to an integrated luminosity of 138 fb$ ^{-1} $. The systematic uncertainties included in the shaded band are related to the photon efficiency, lepton efficiency, and pileup modeling. |

png pdf |
Figure 3-d:
Distributions of the BDT output for $ m_{\mathrm{a}} = $ 30 GeV. The events pass the selection criteria described in Section 5. The signal is scaled to a cross section of 0.1 pb and the background sample is normalized to an integrated luminosity of 138 fb$ ^{-1} $. The systematic uncertainties included in the shaded band are related to the photon efficiency, lepton efficiency, and pileup modeling. |
png pdf |
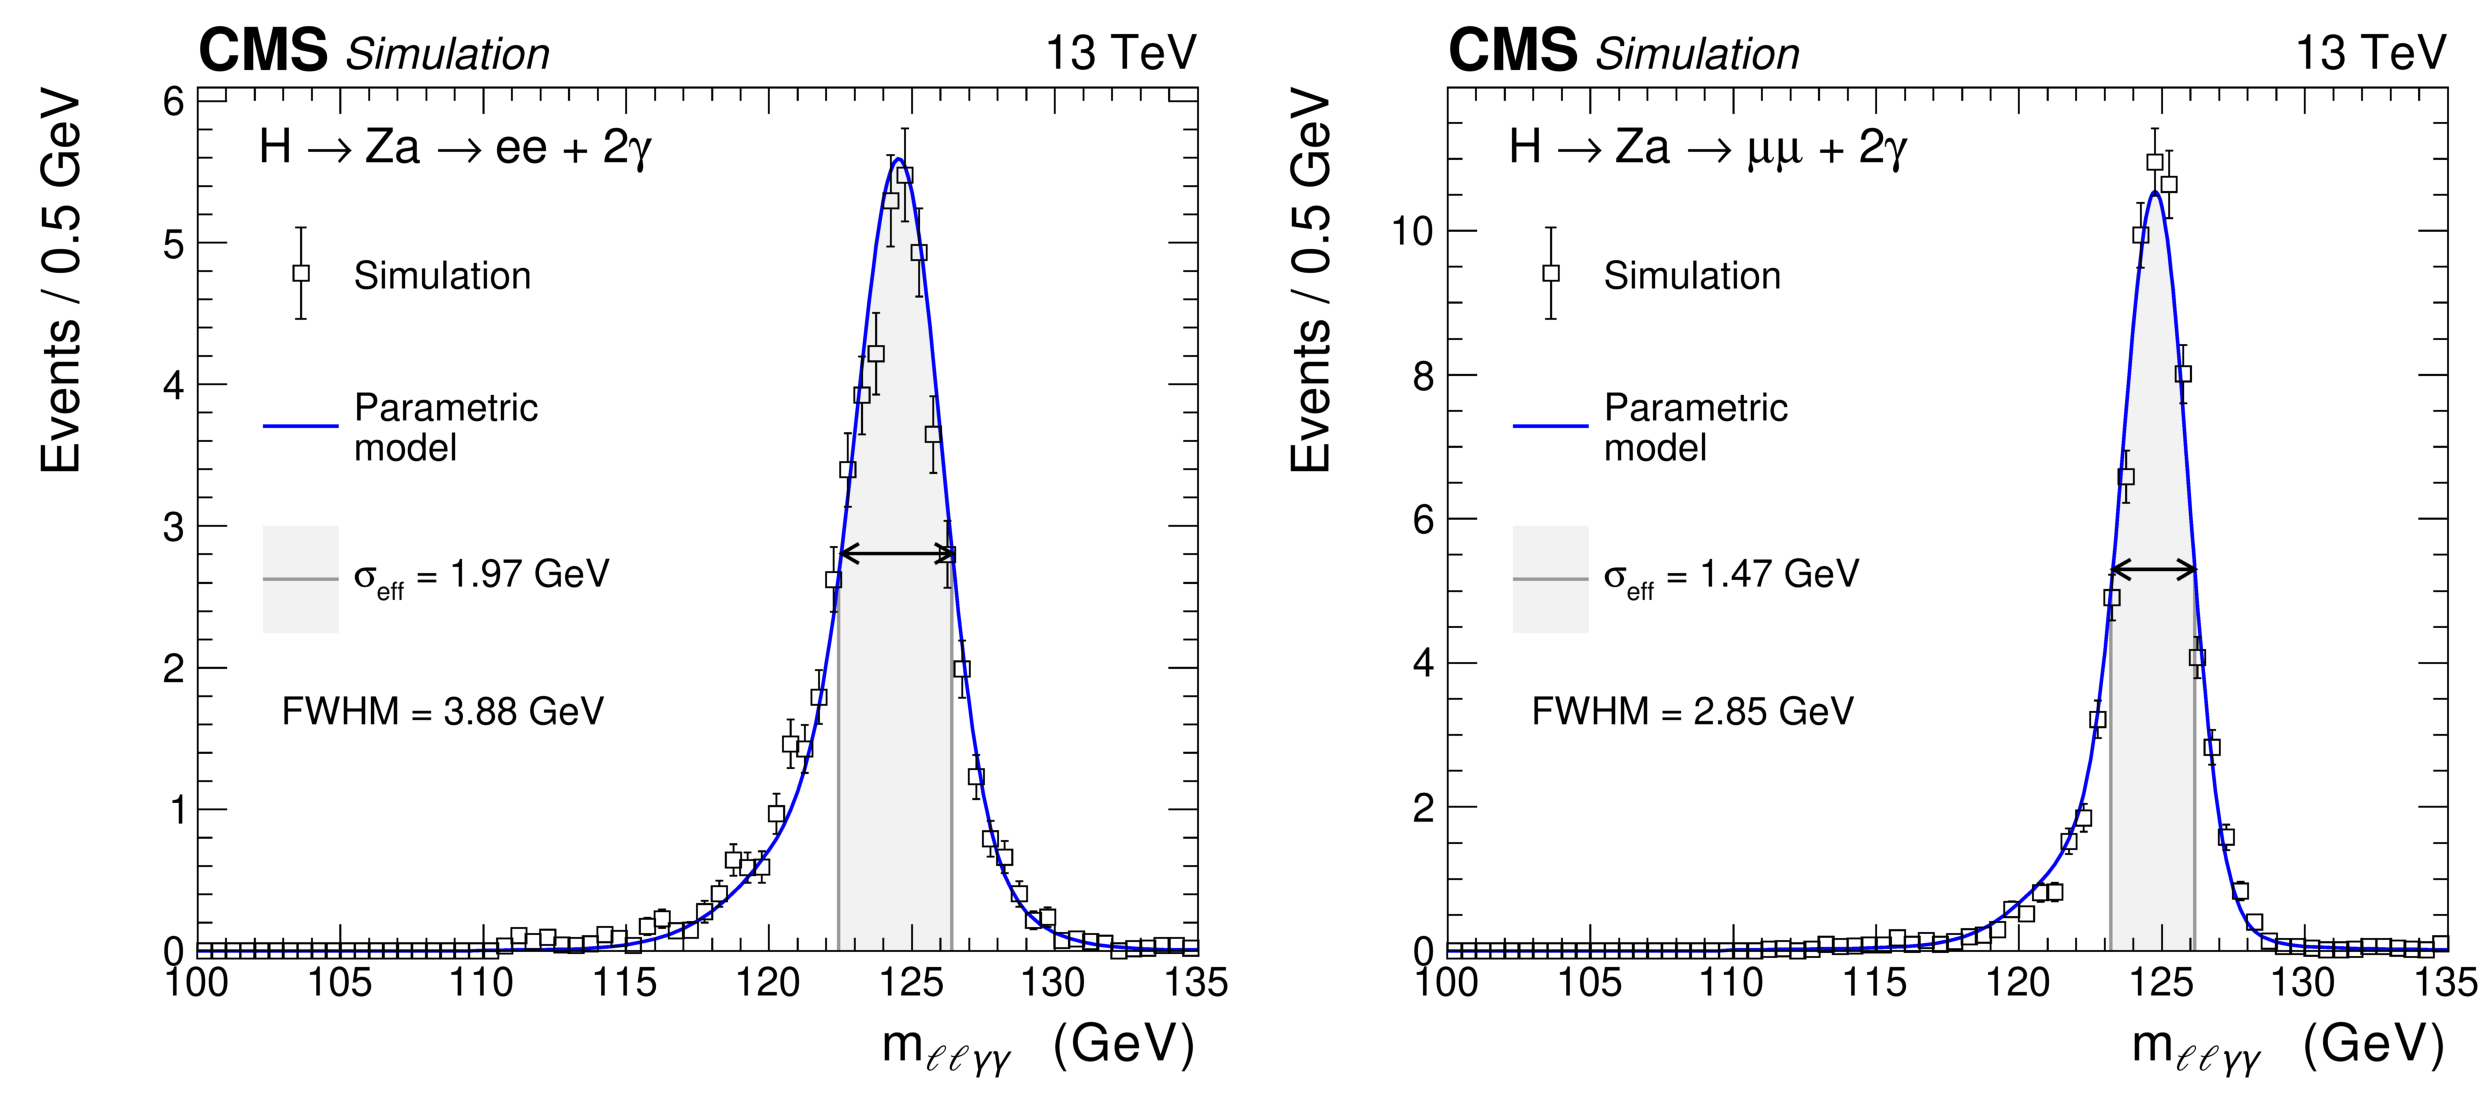
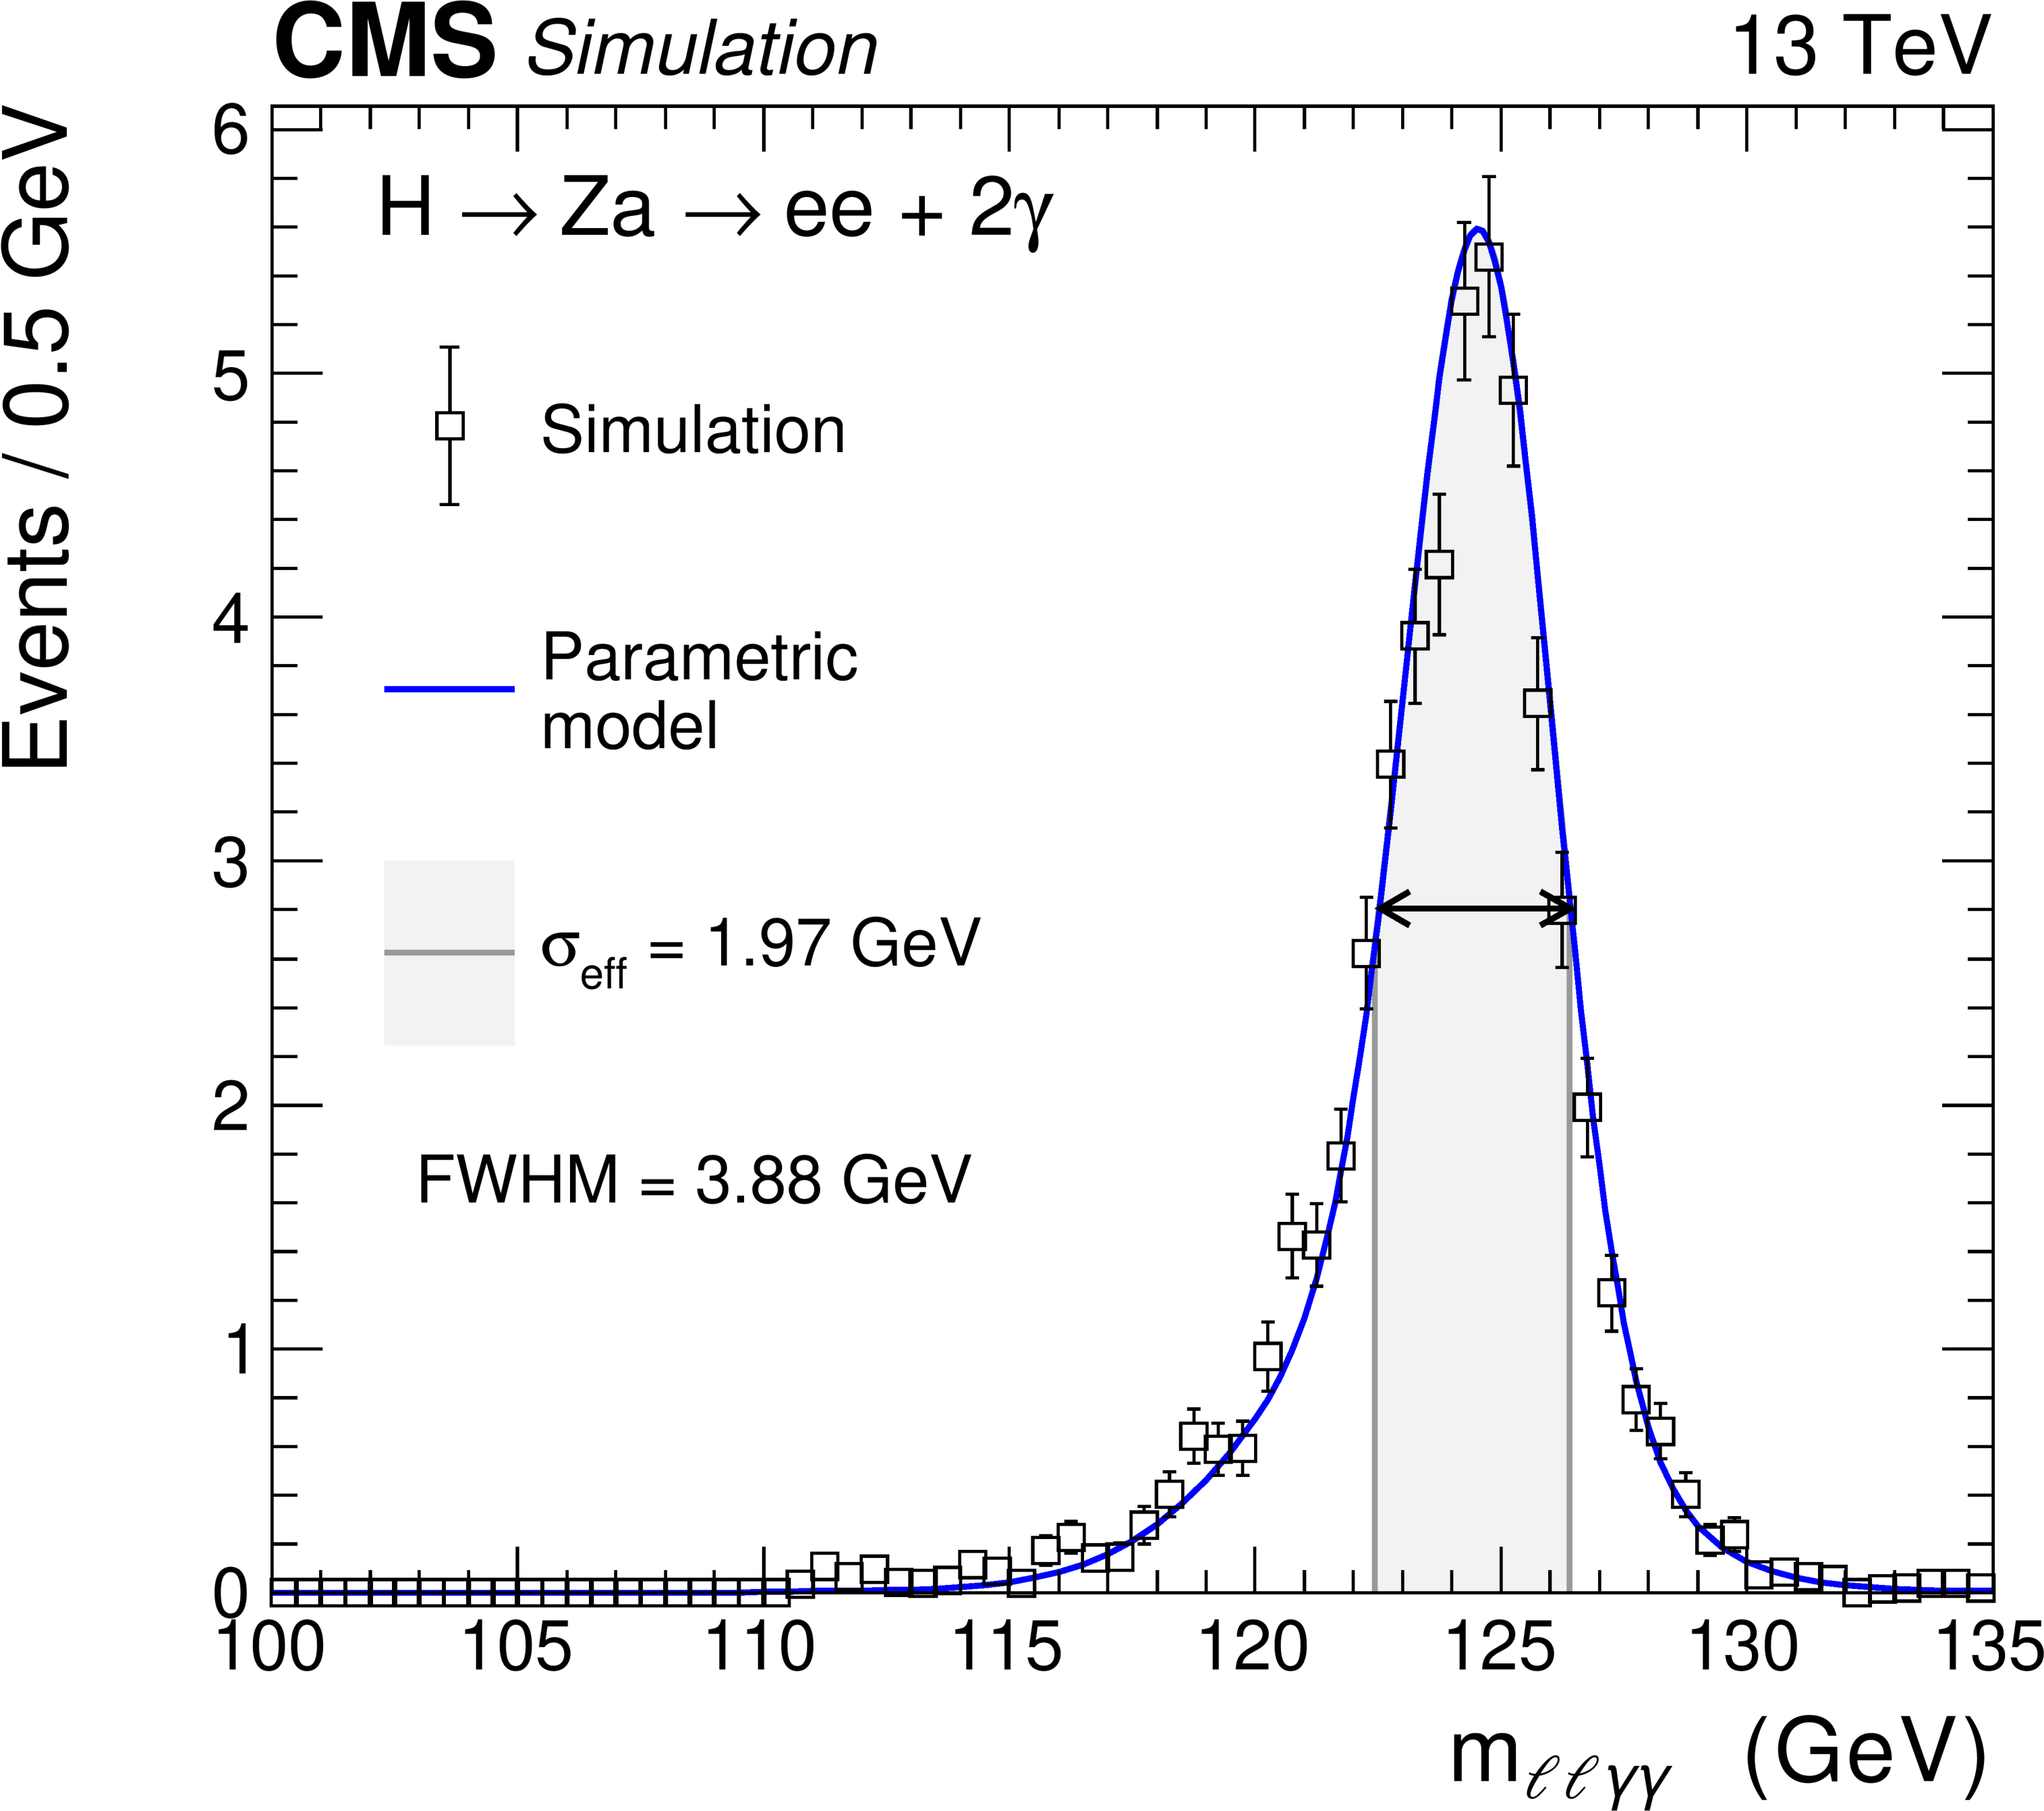
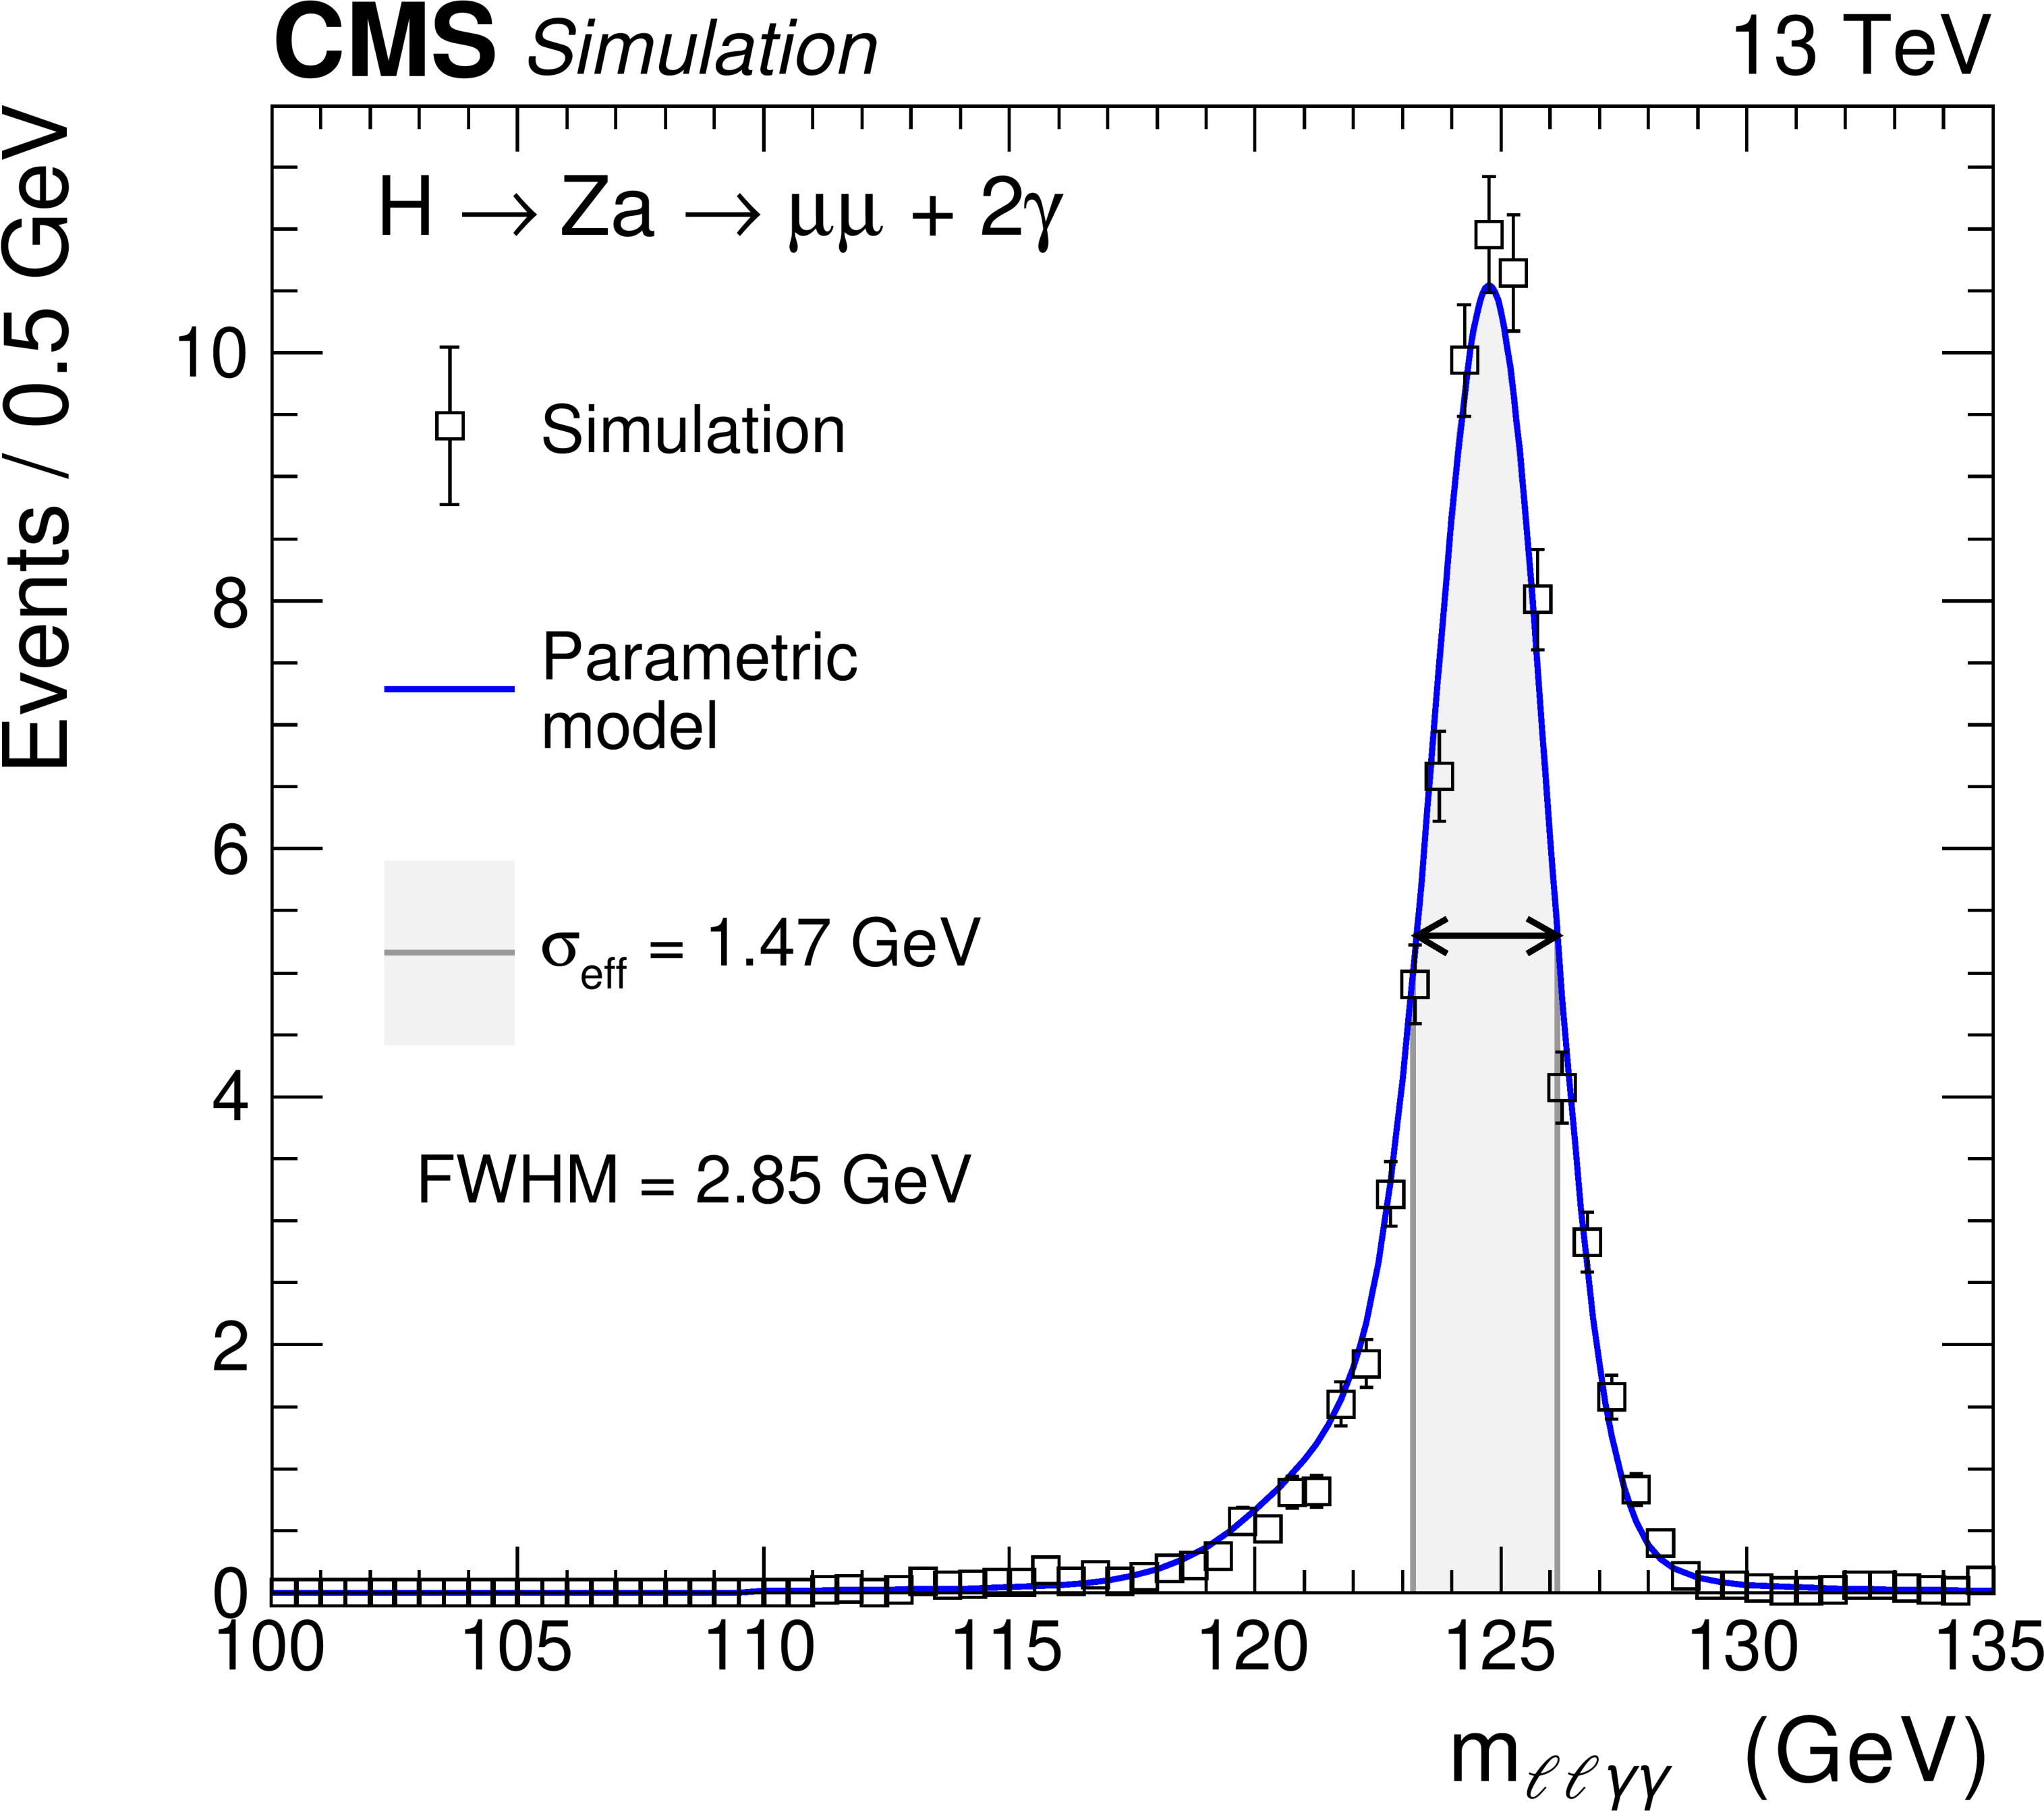
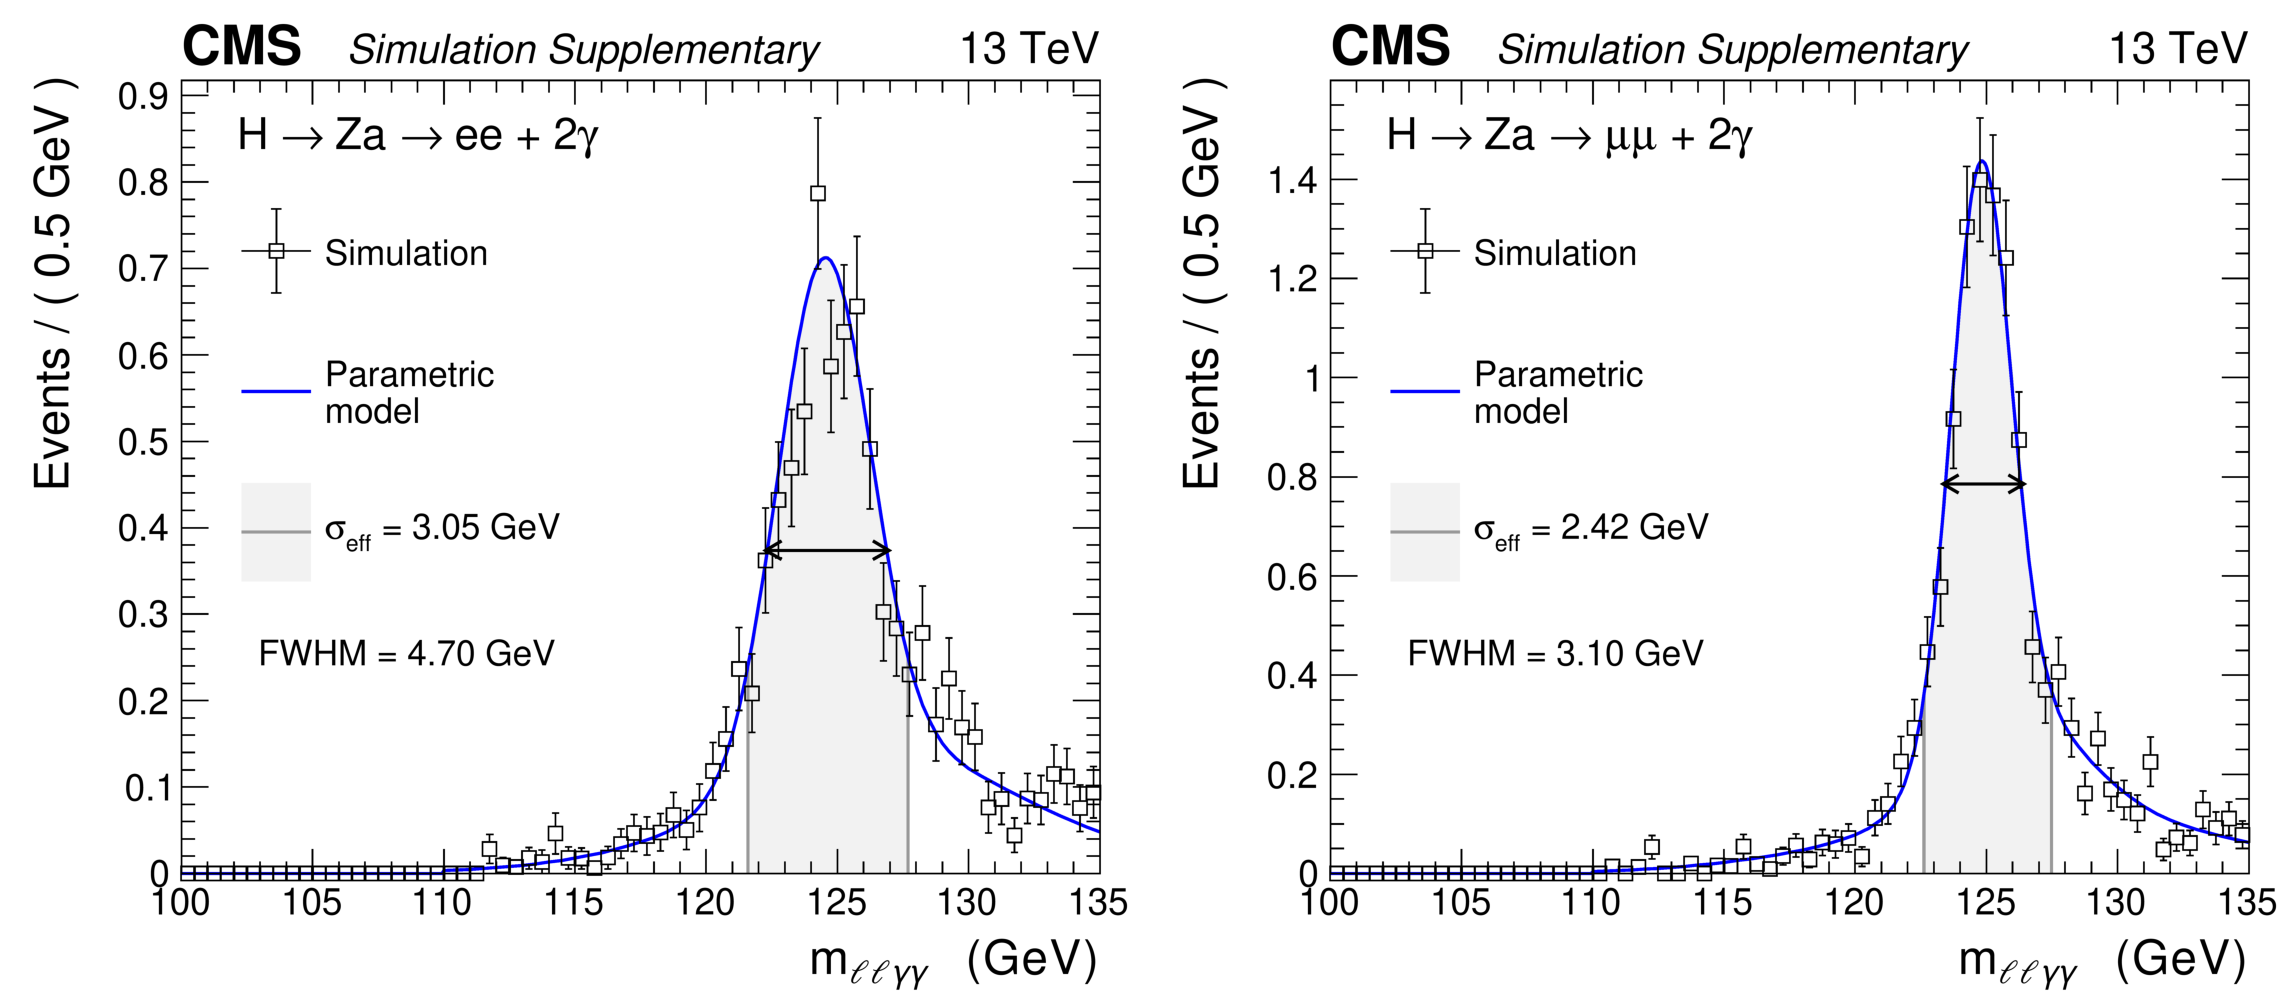
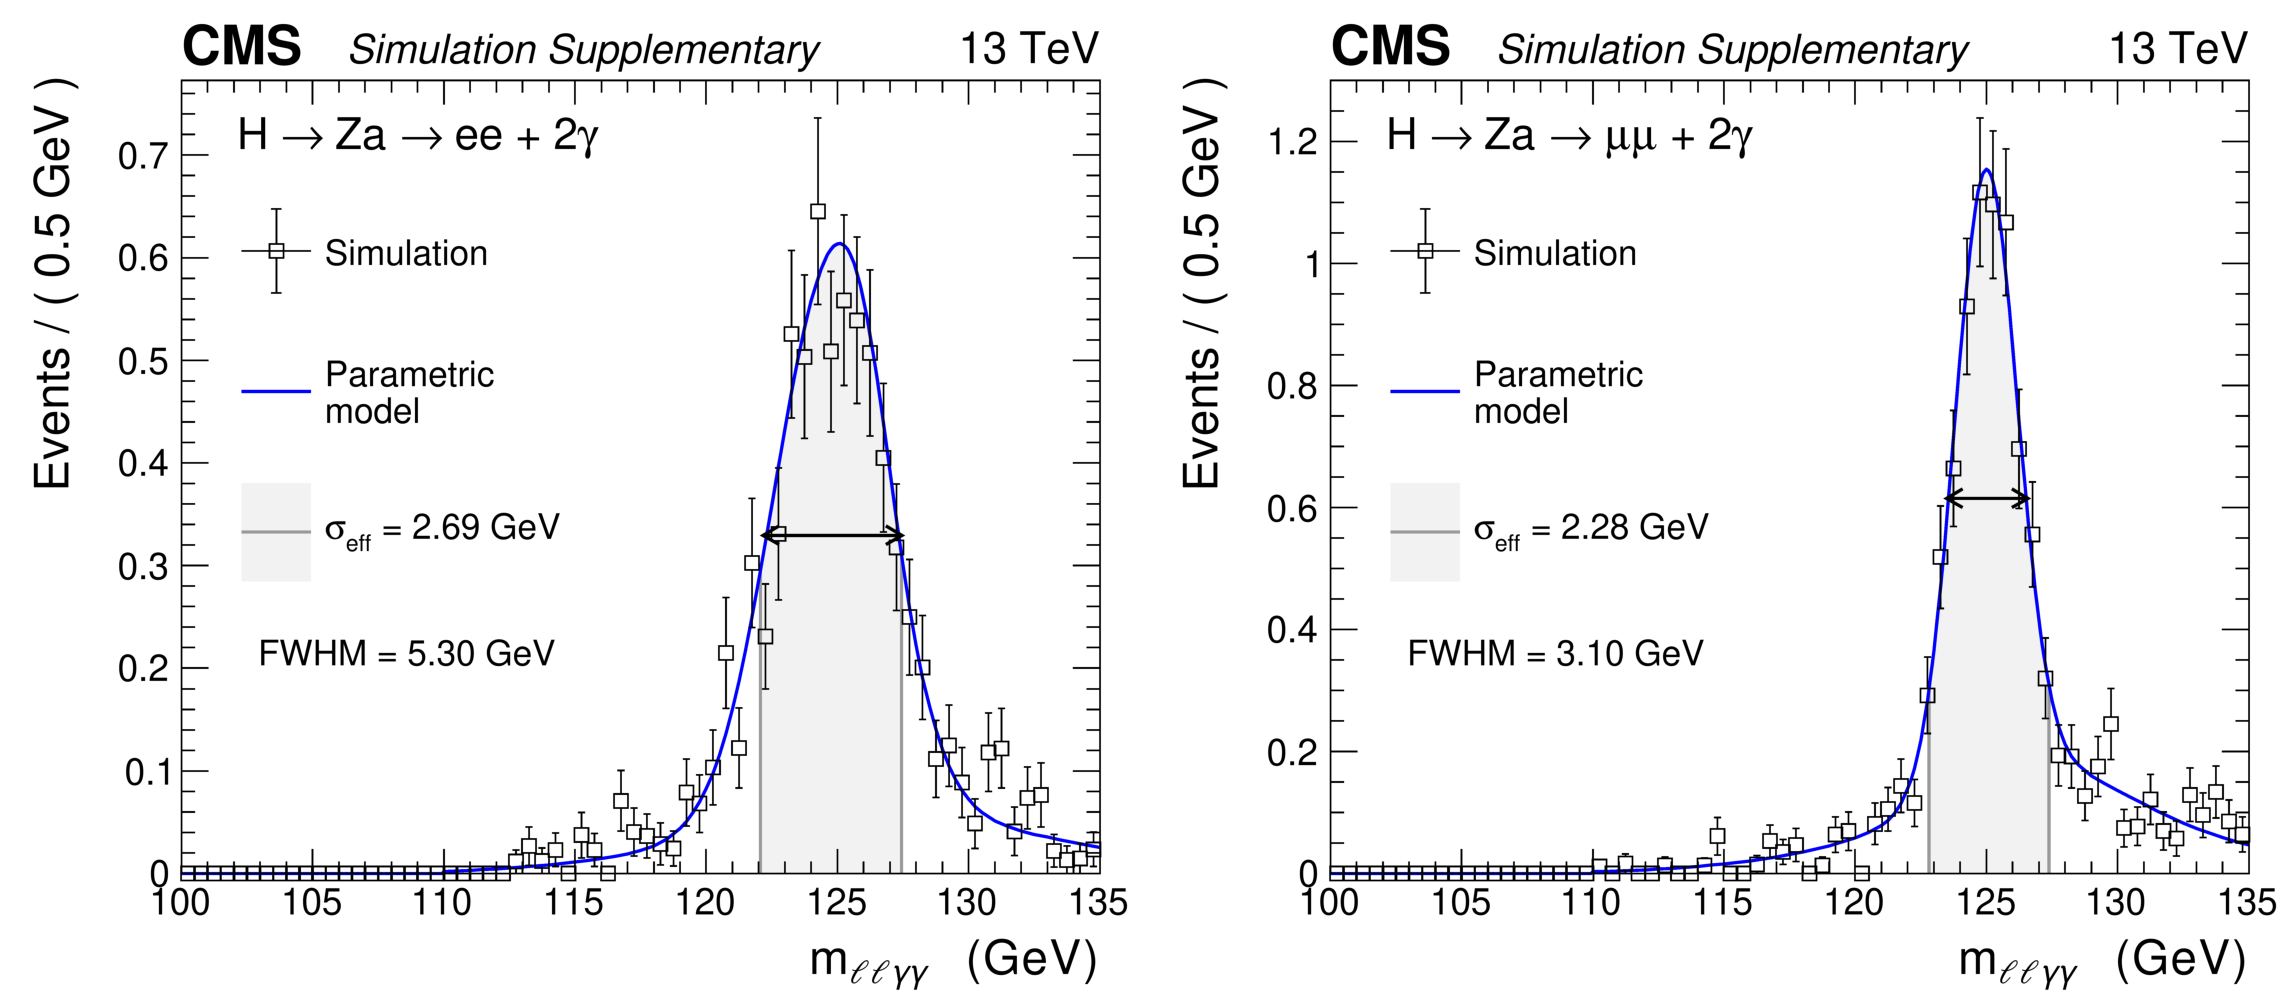
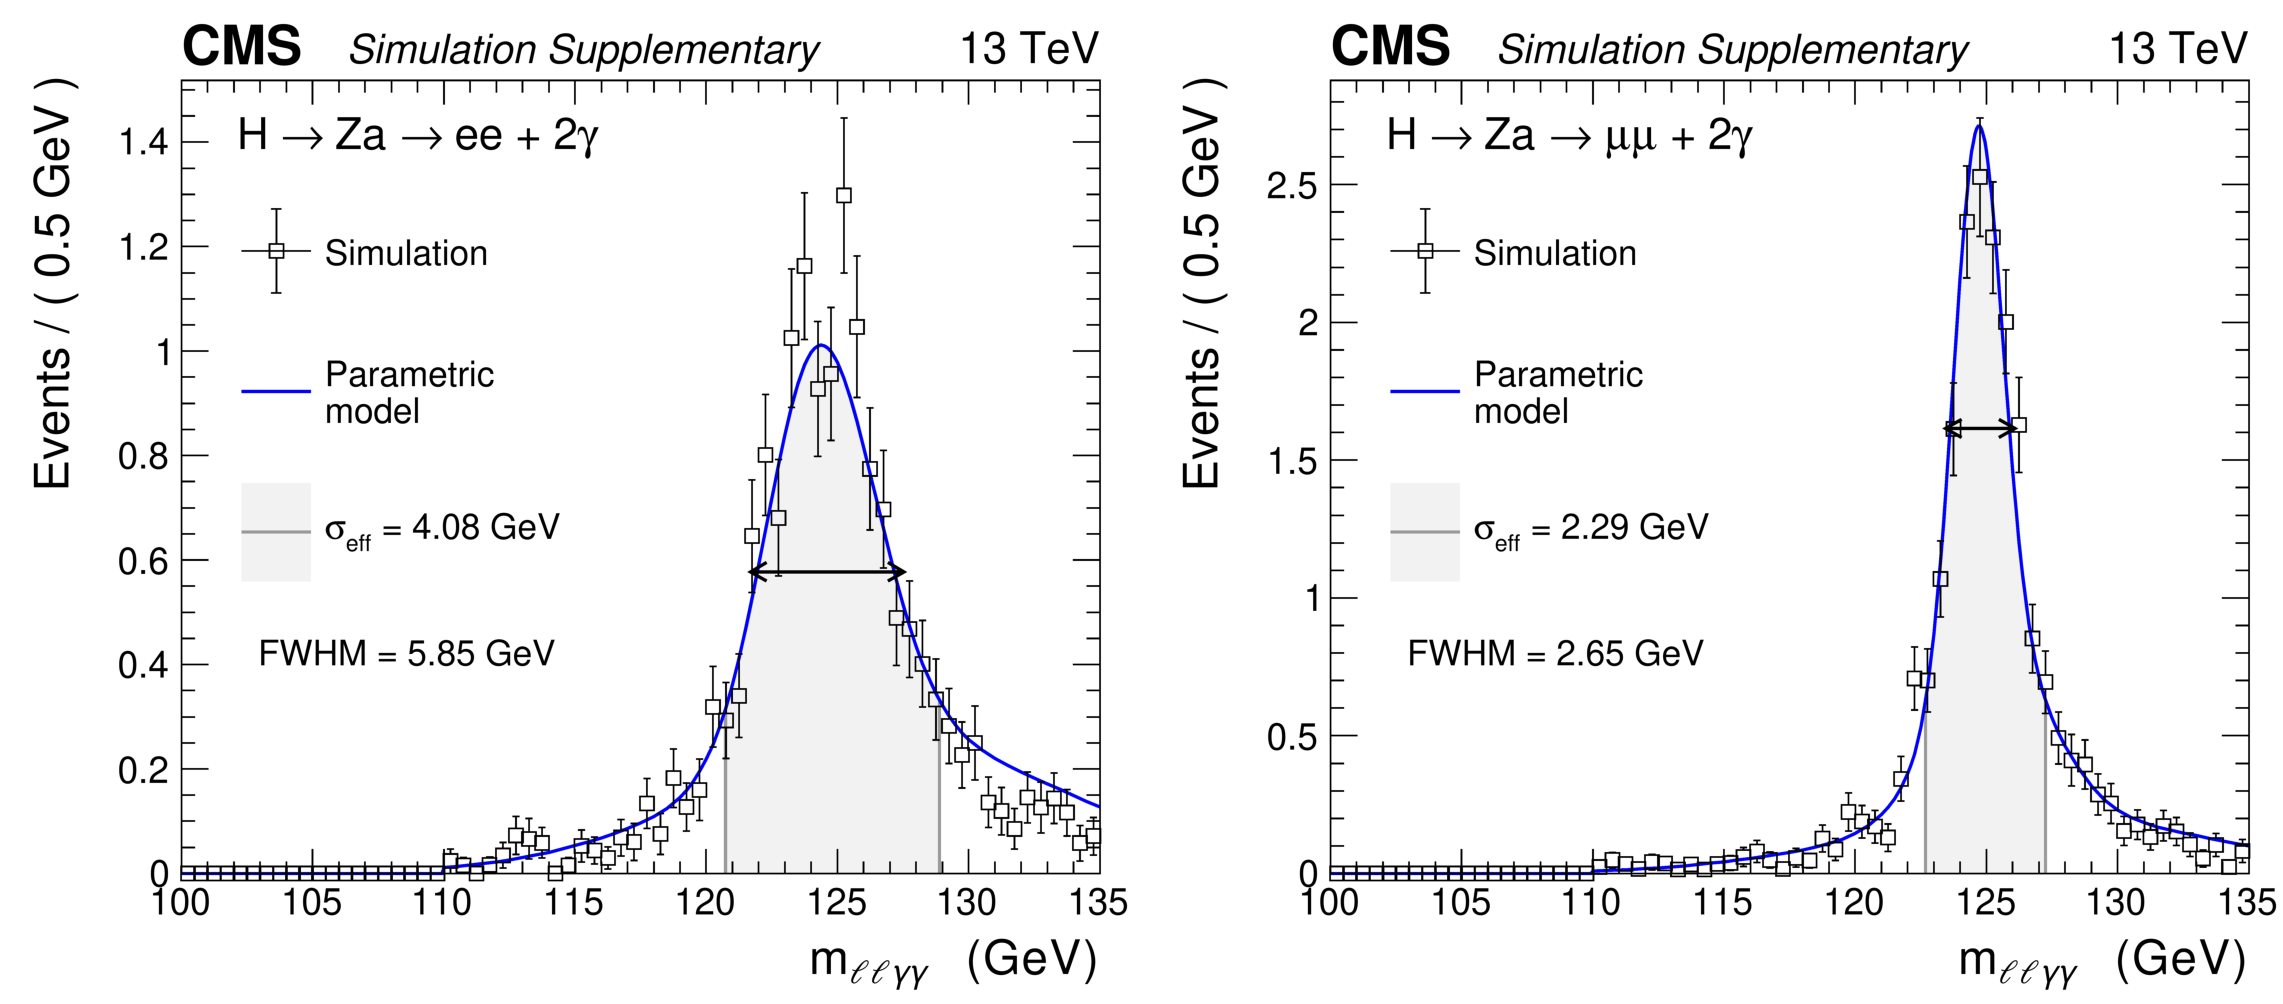
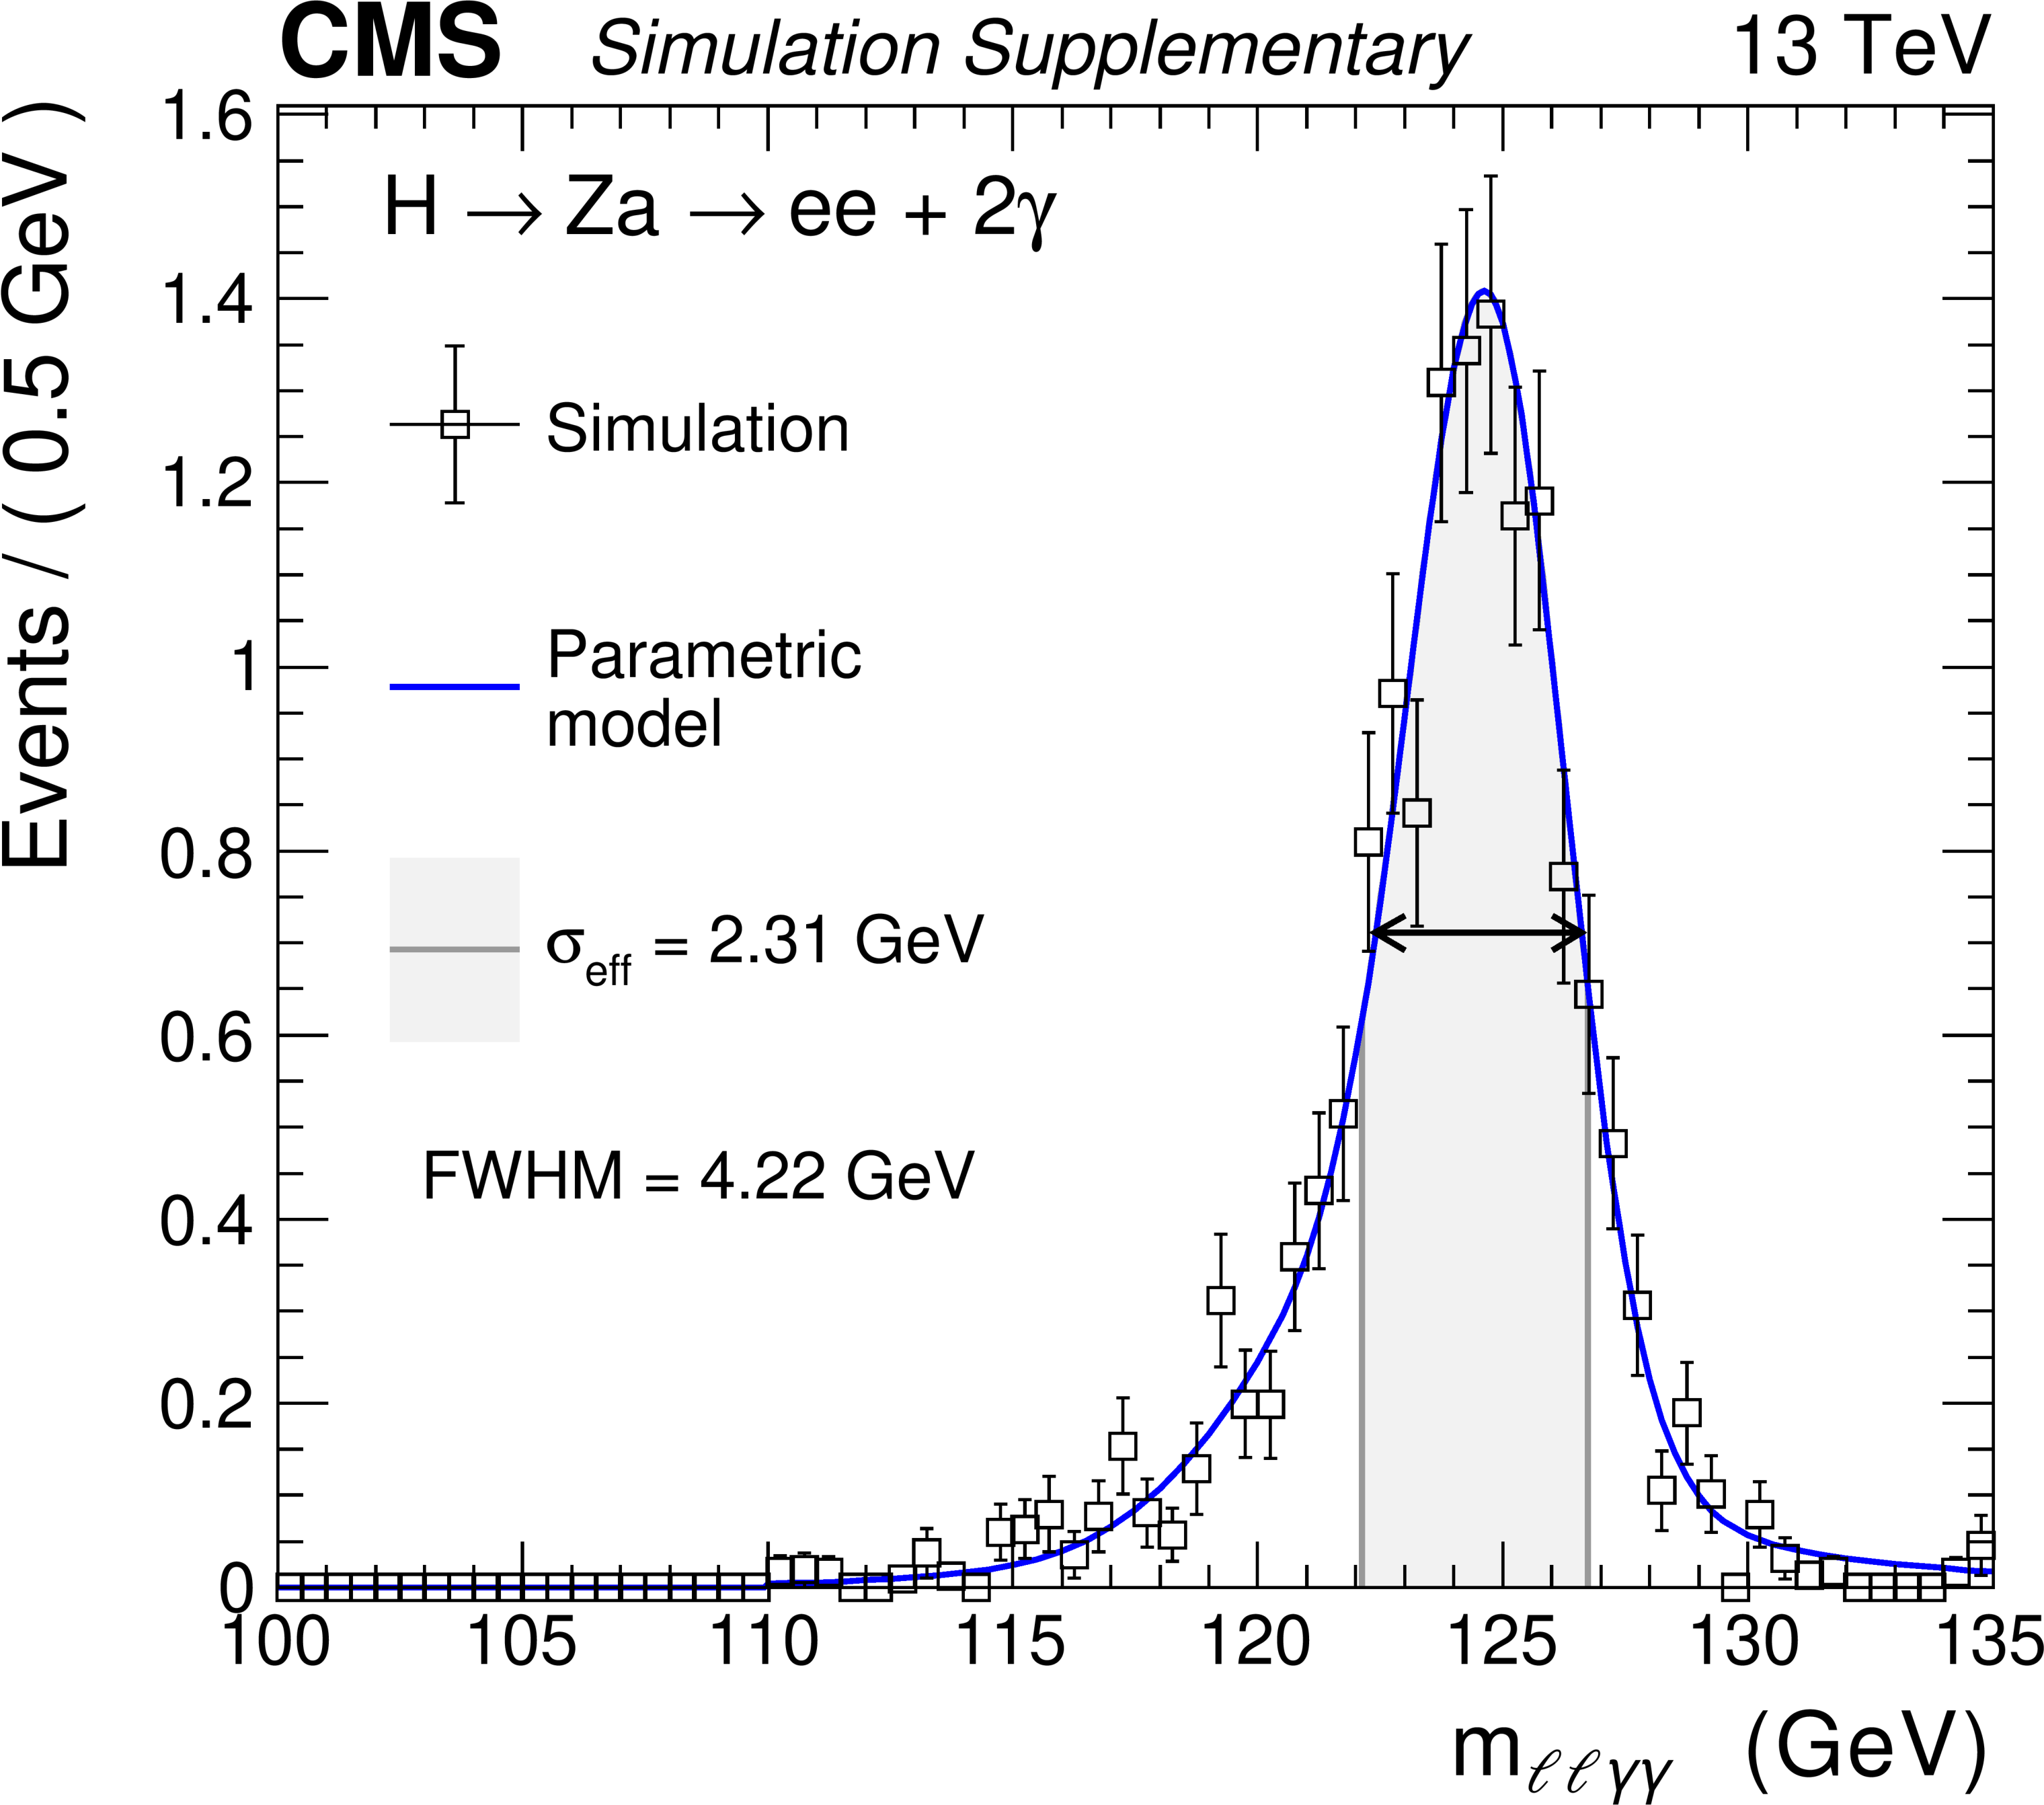
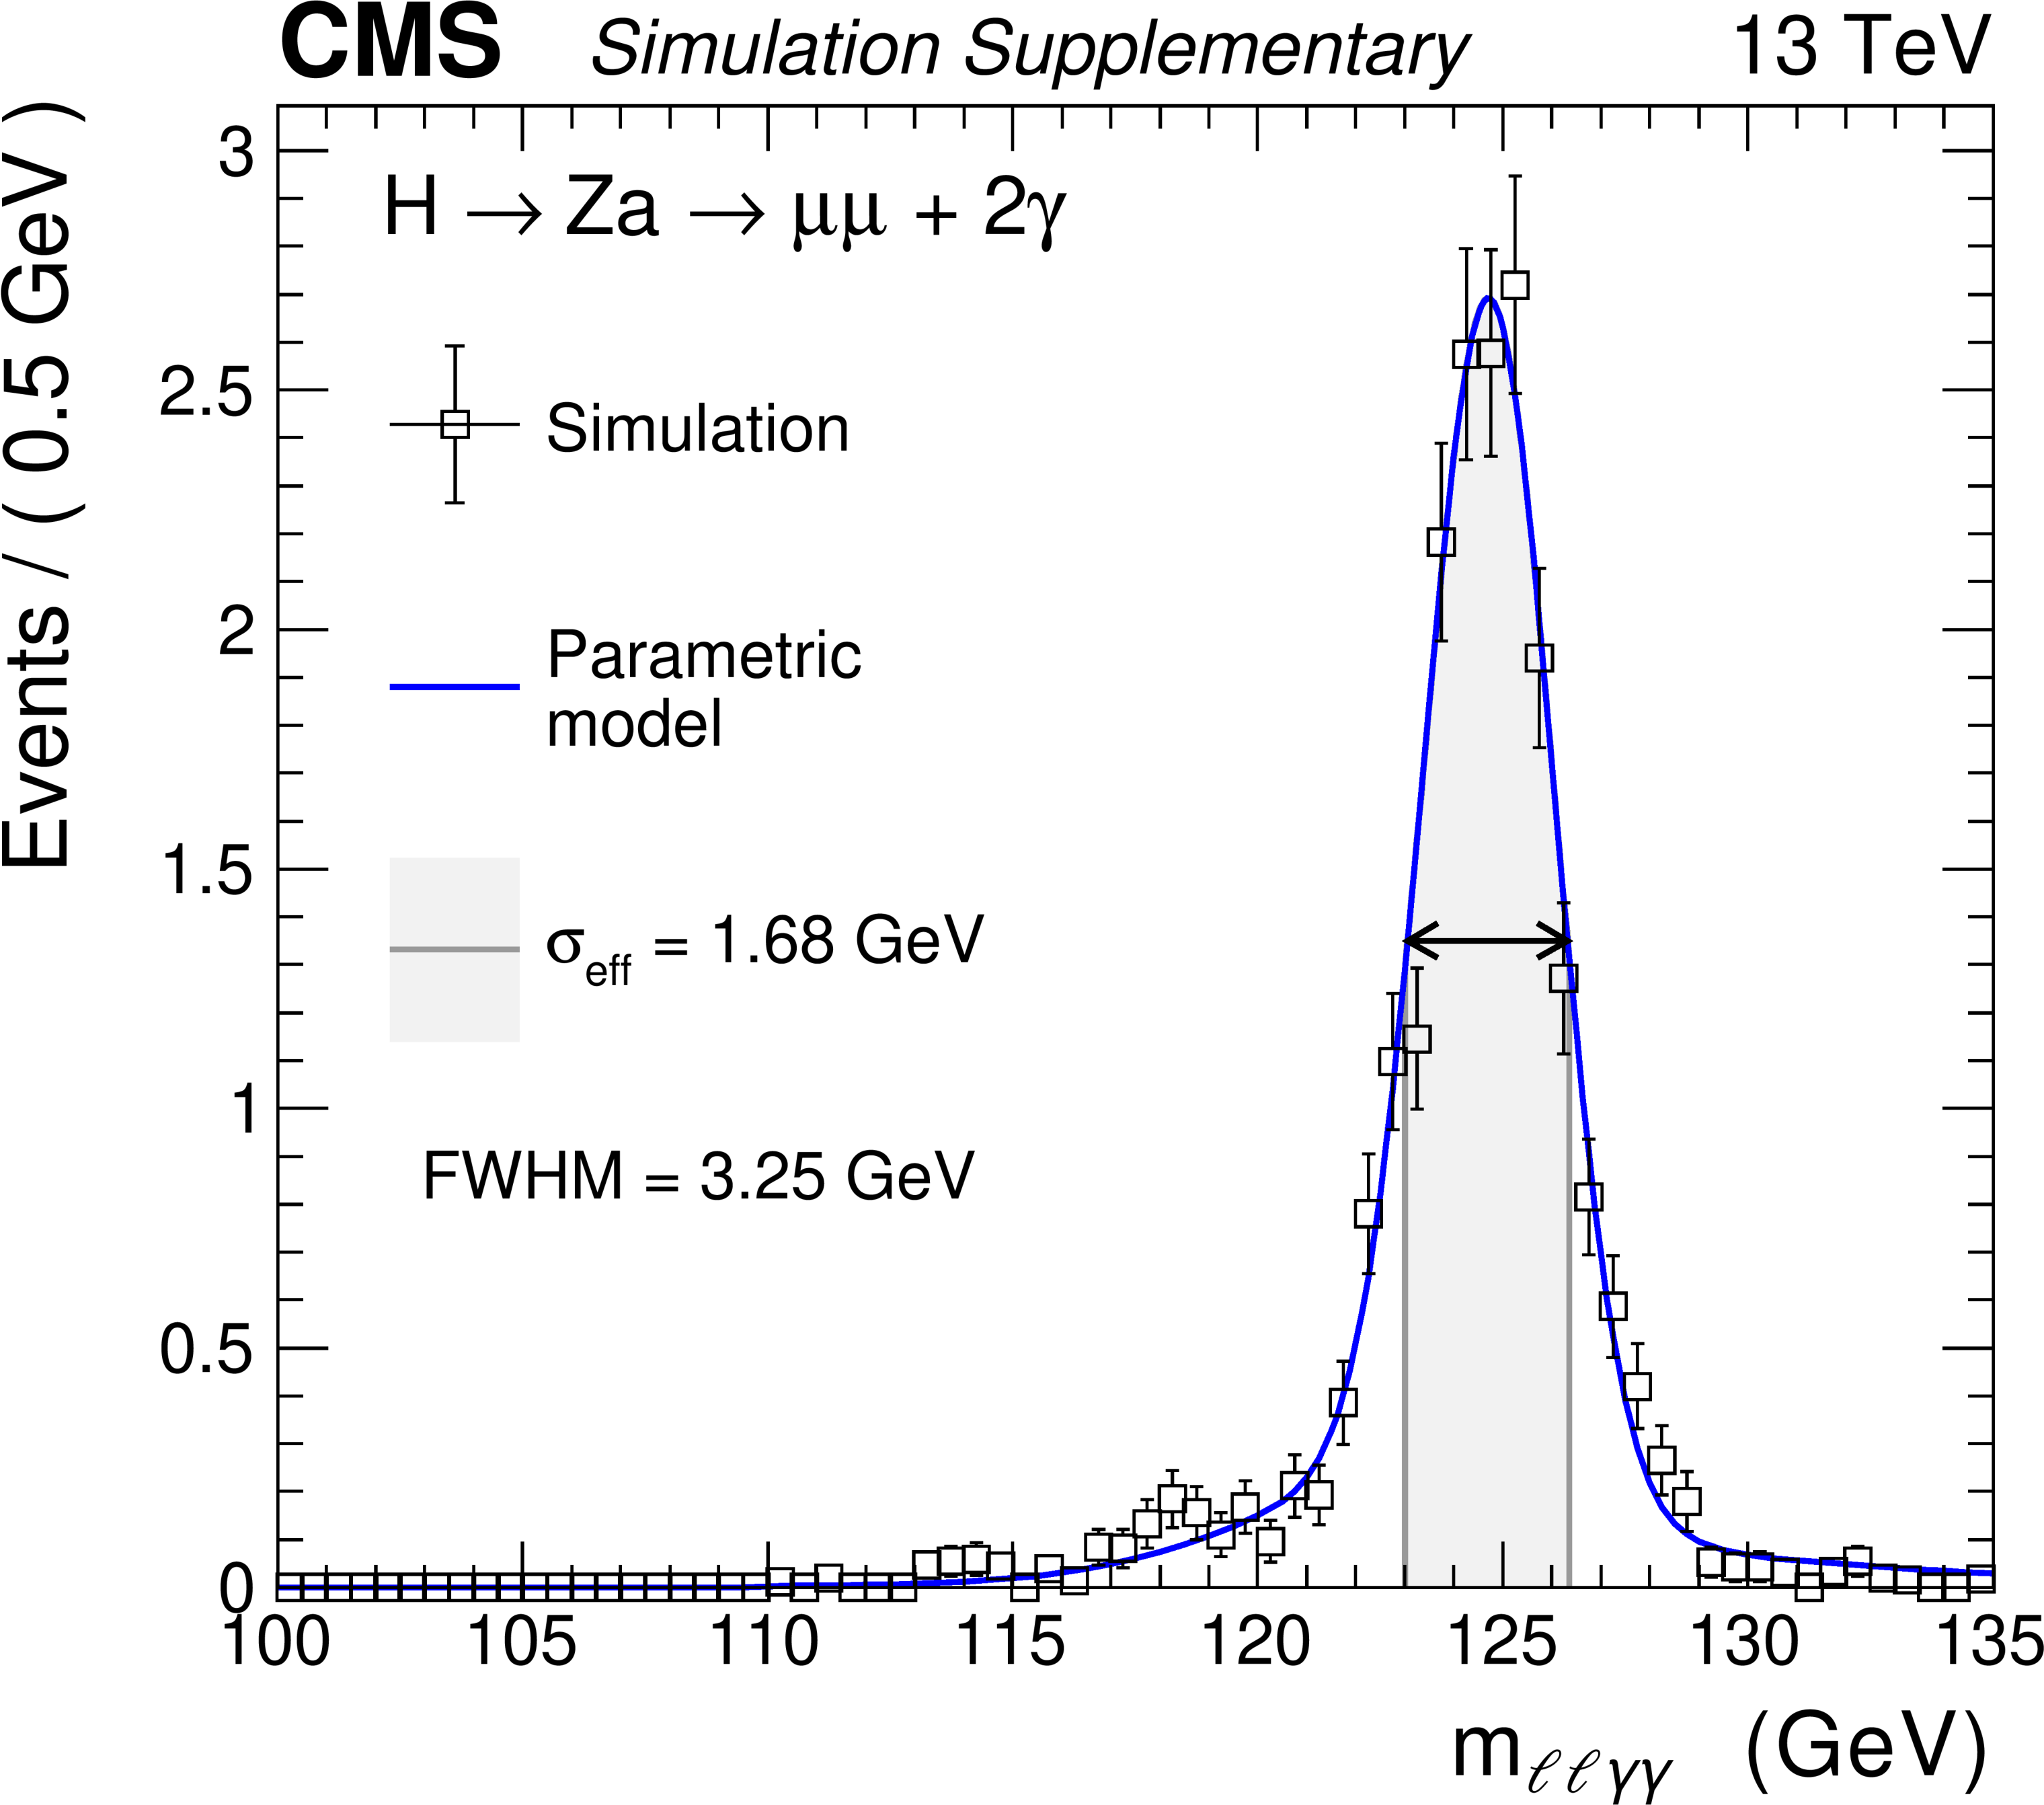
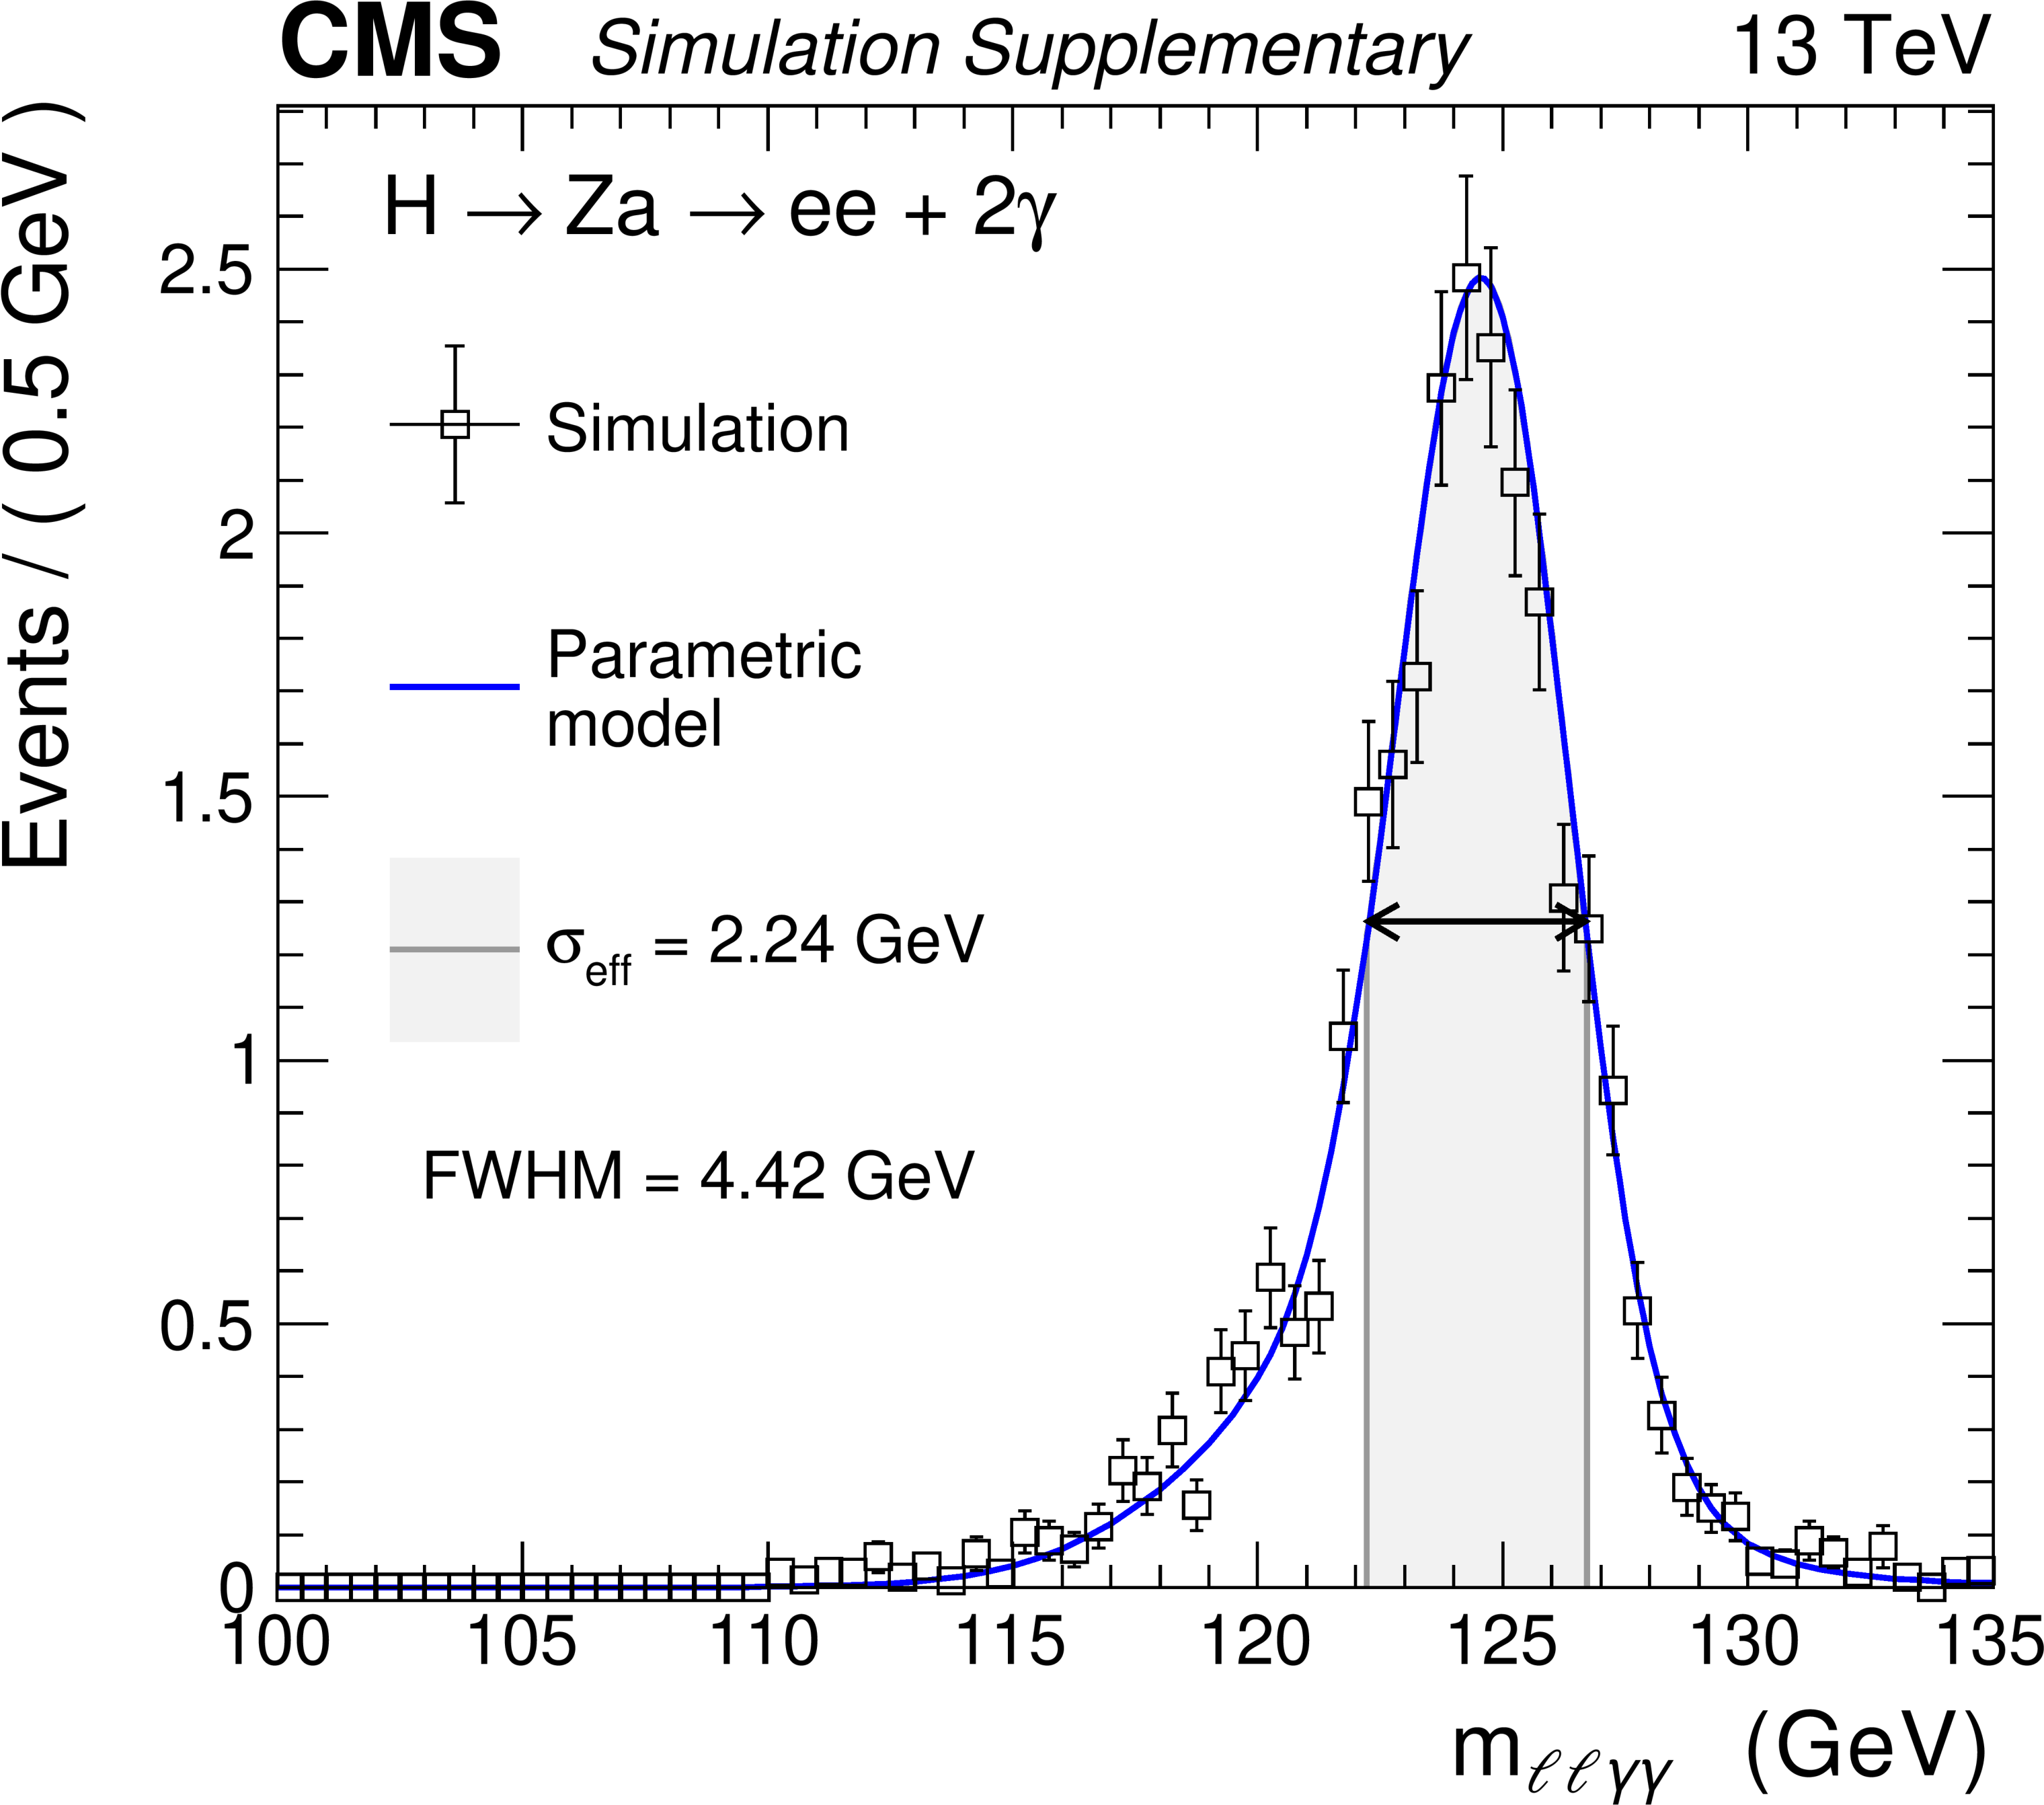
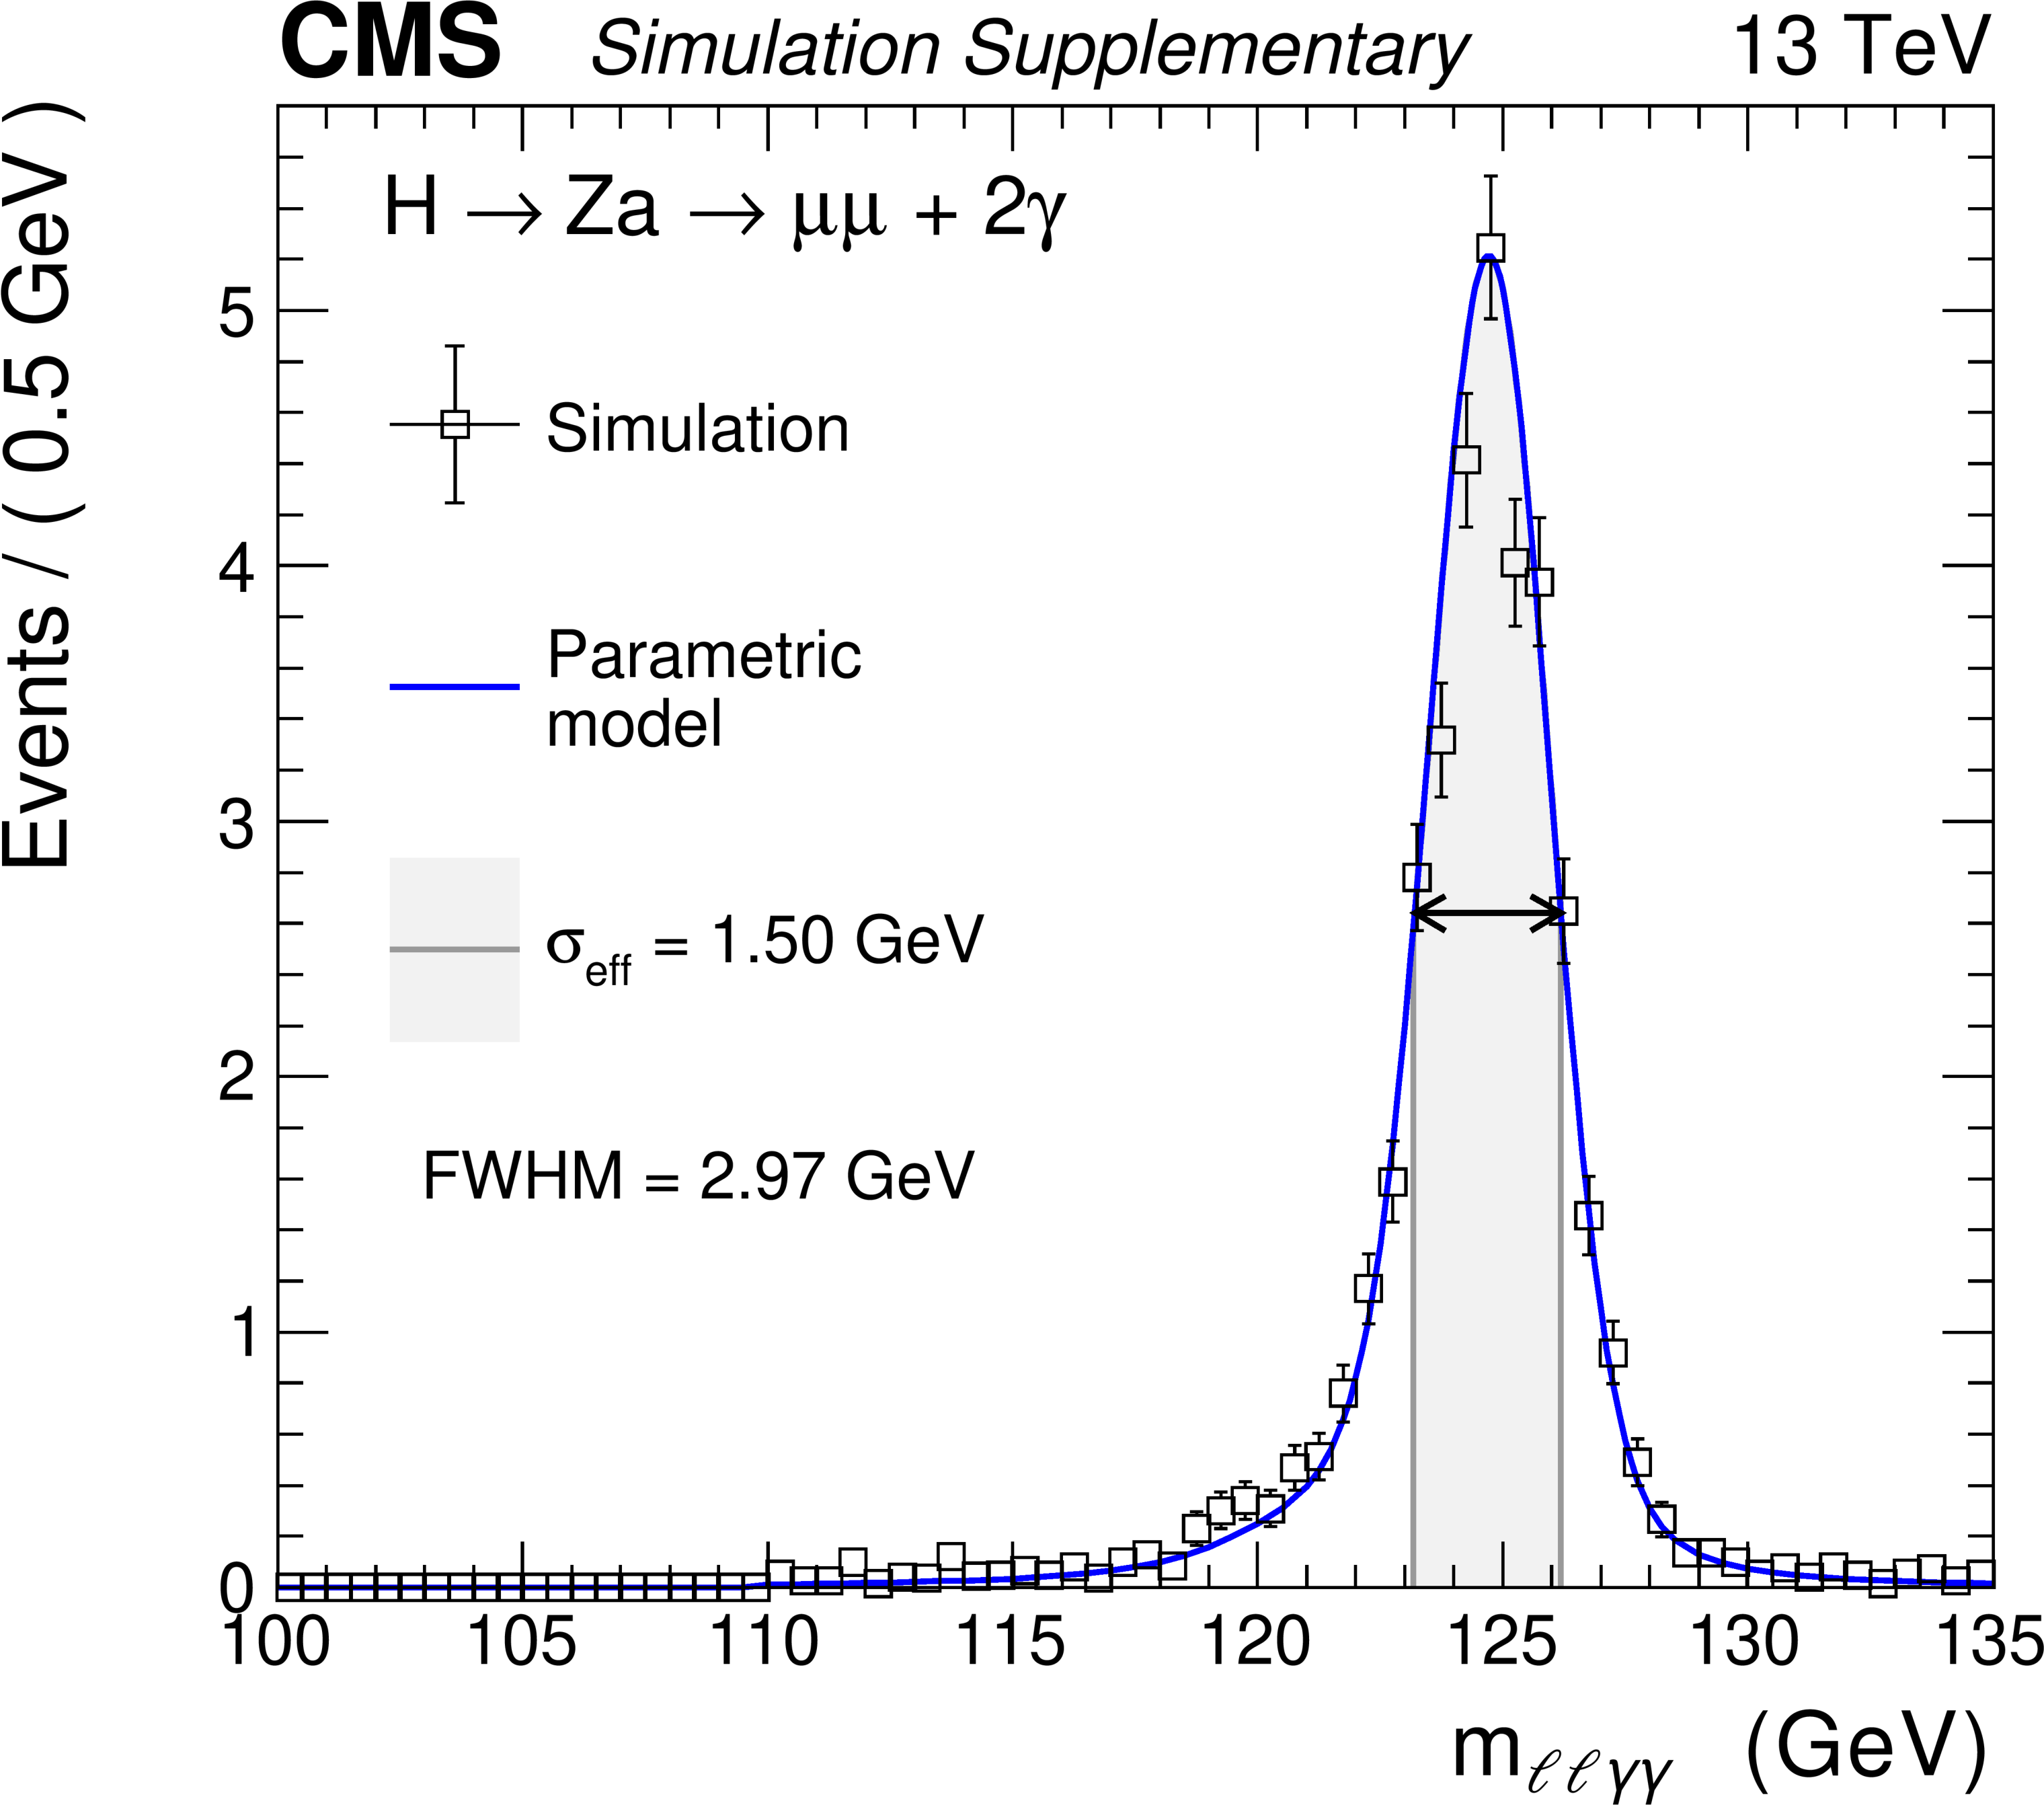
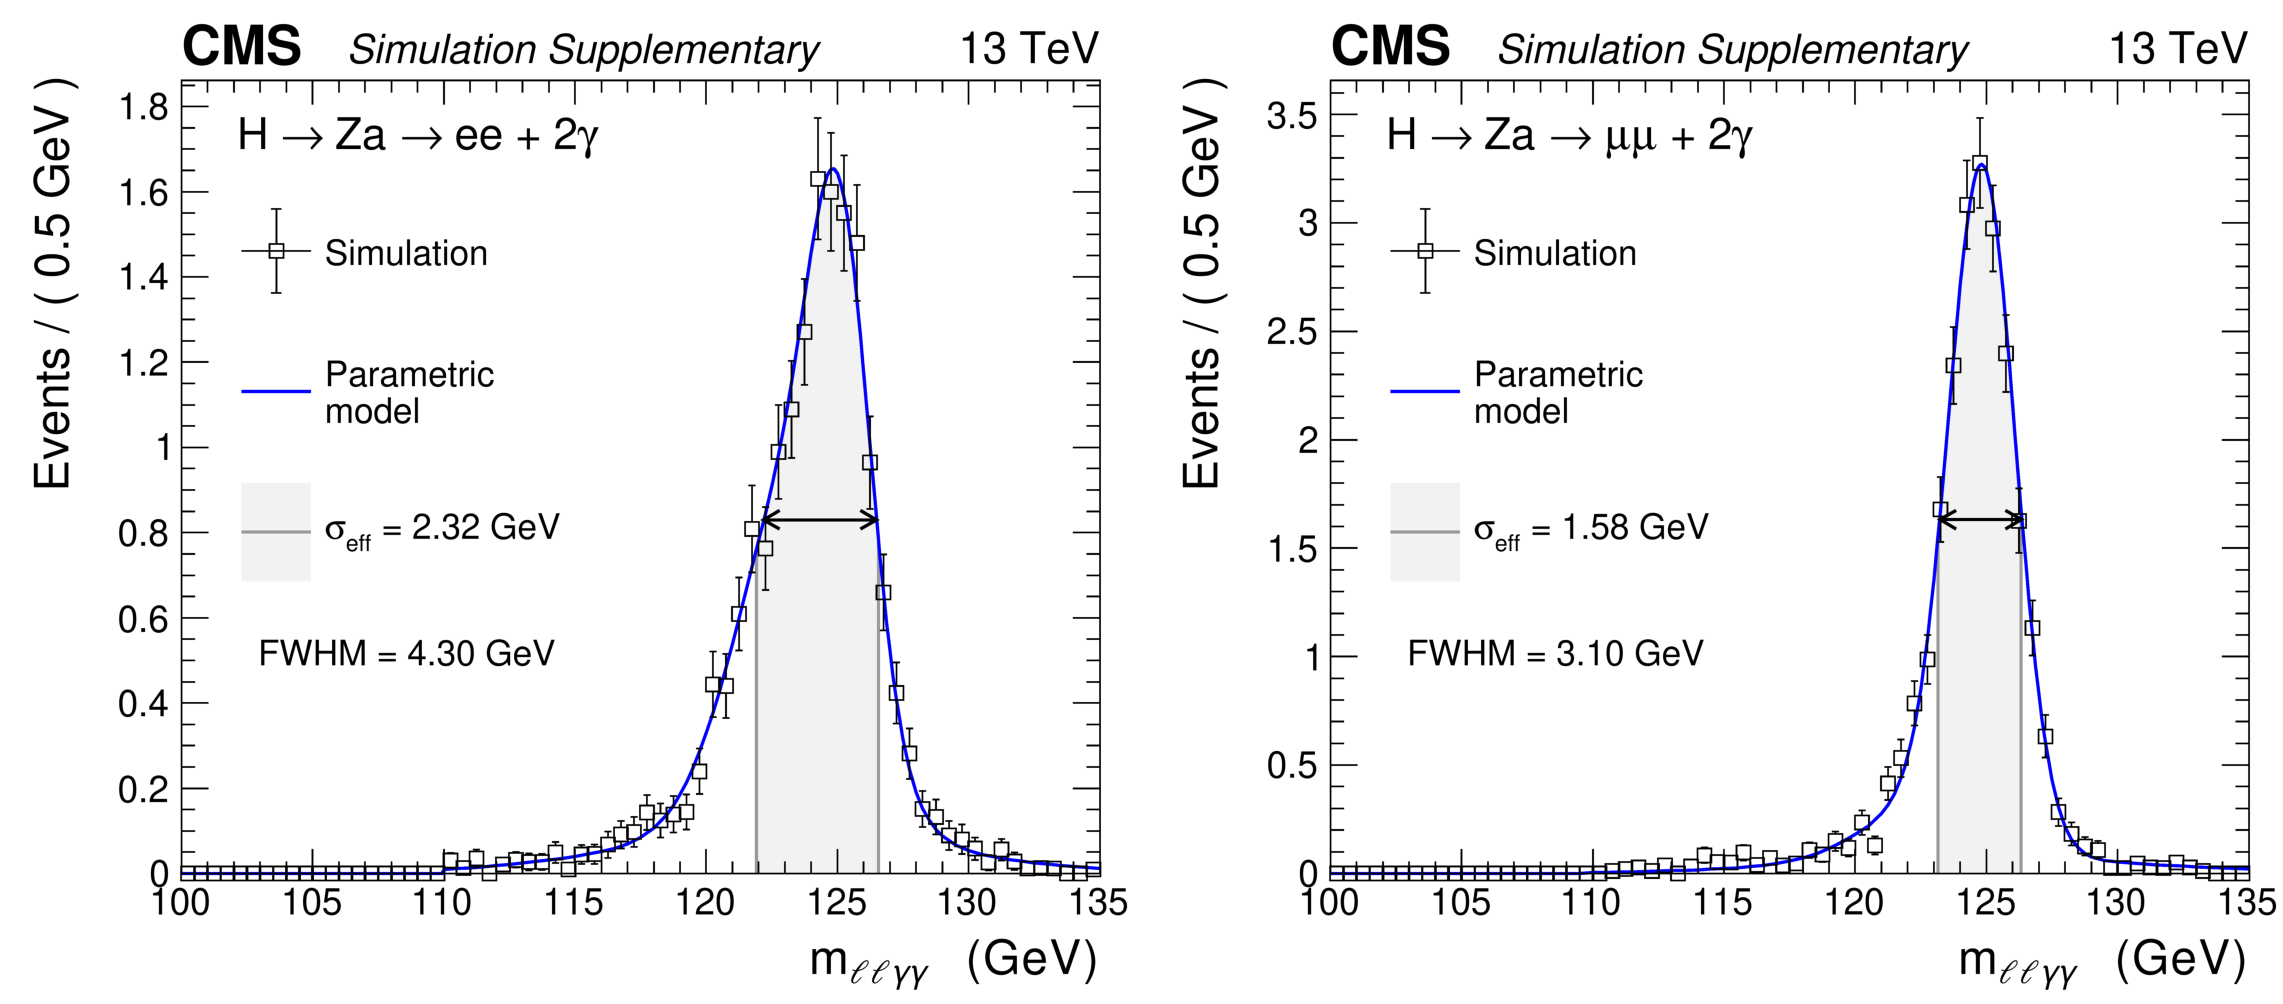
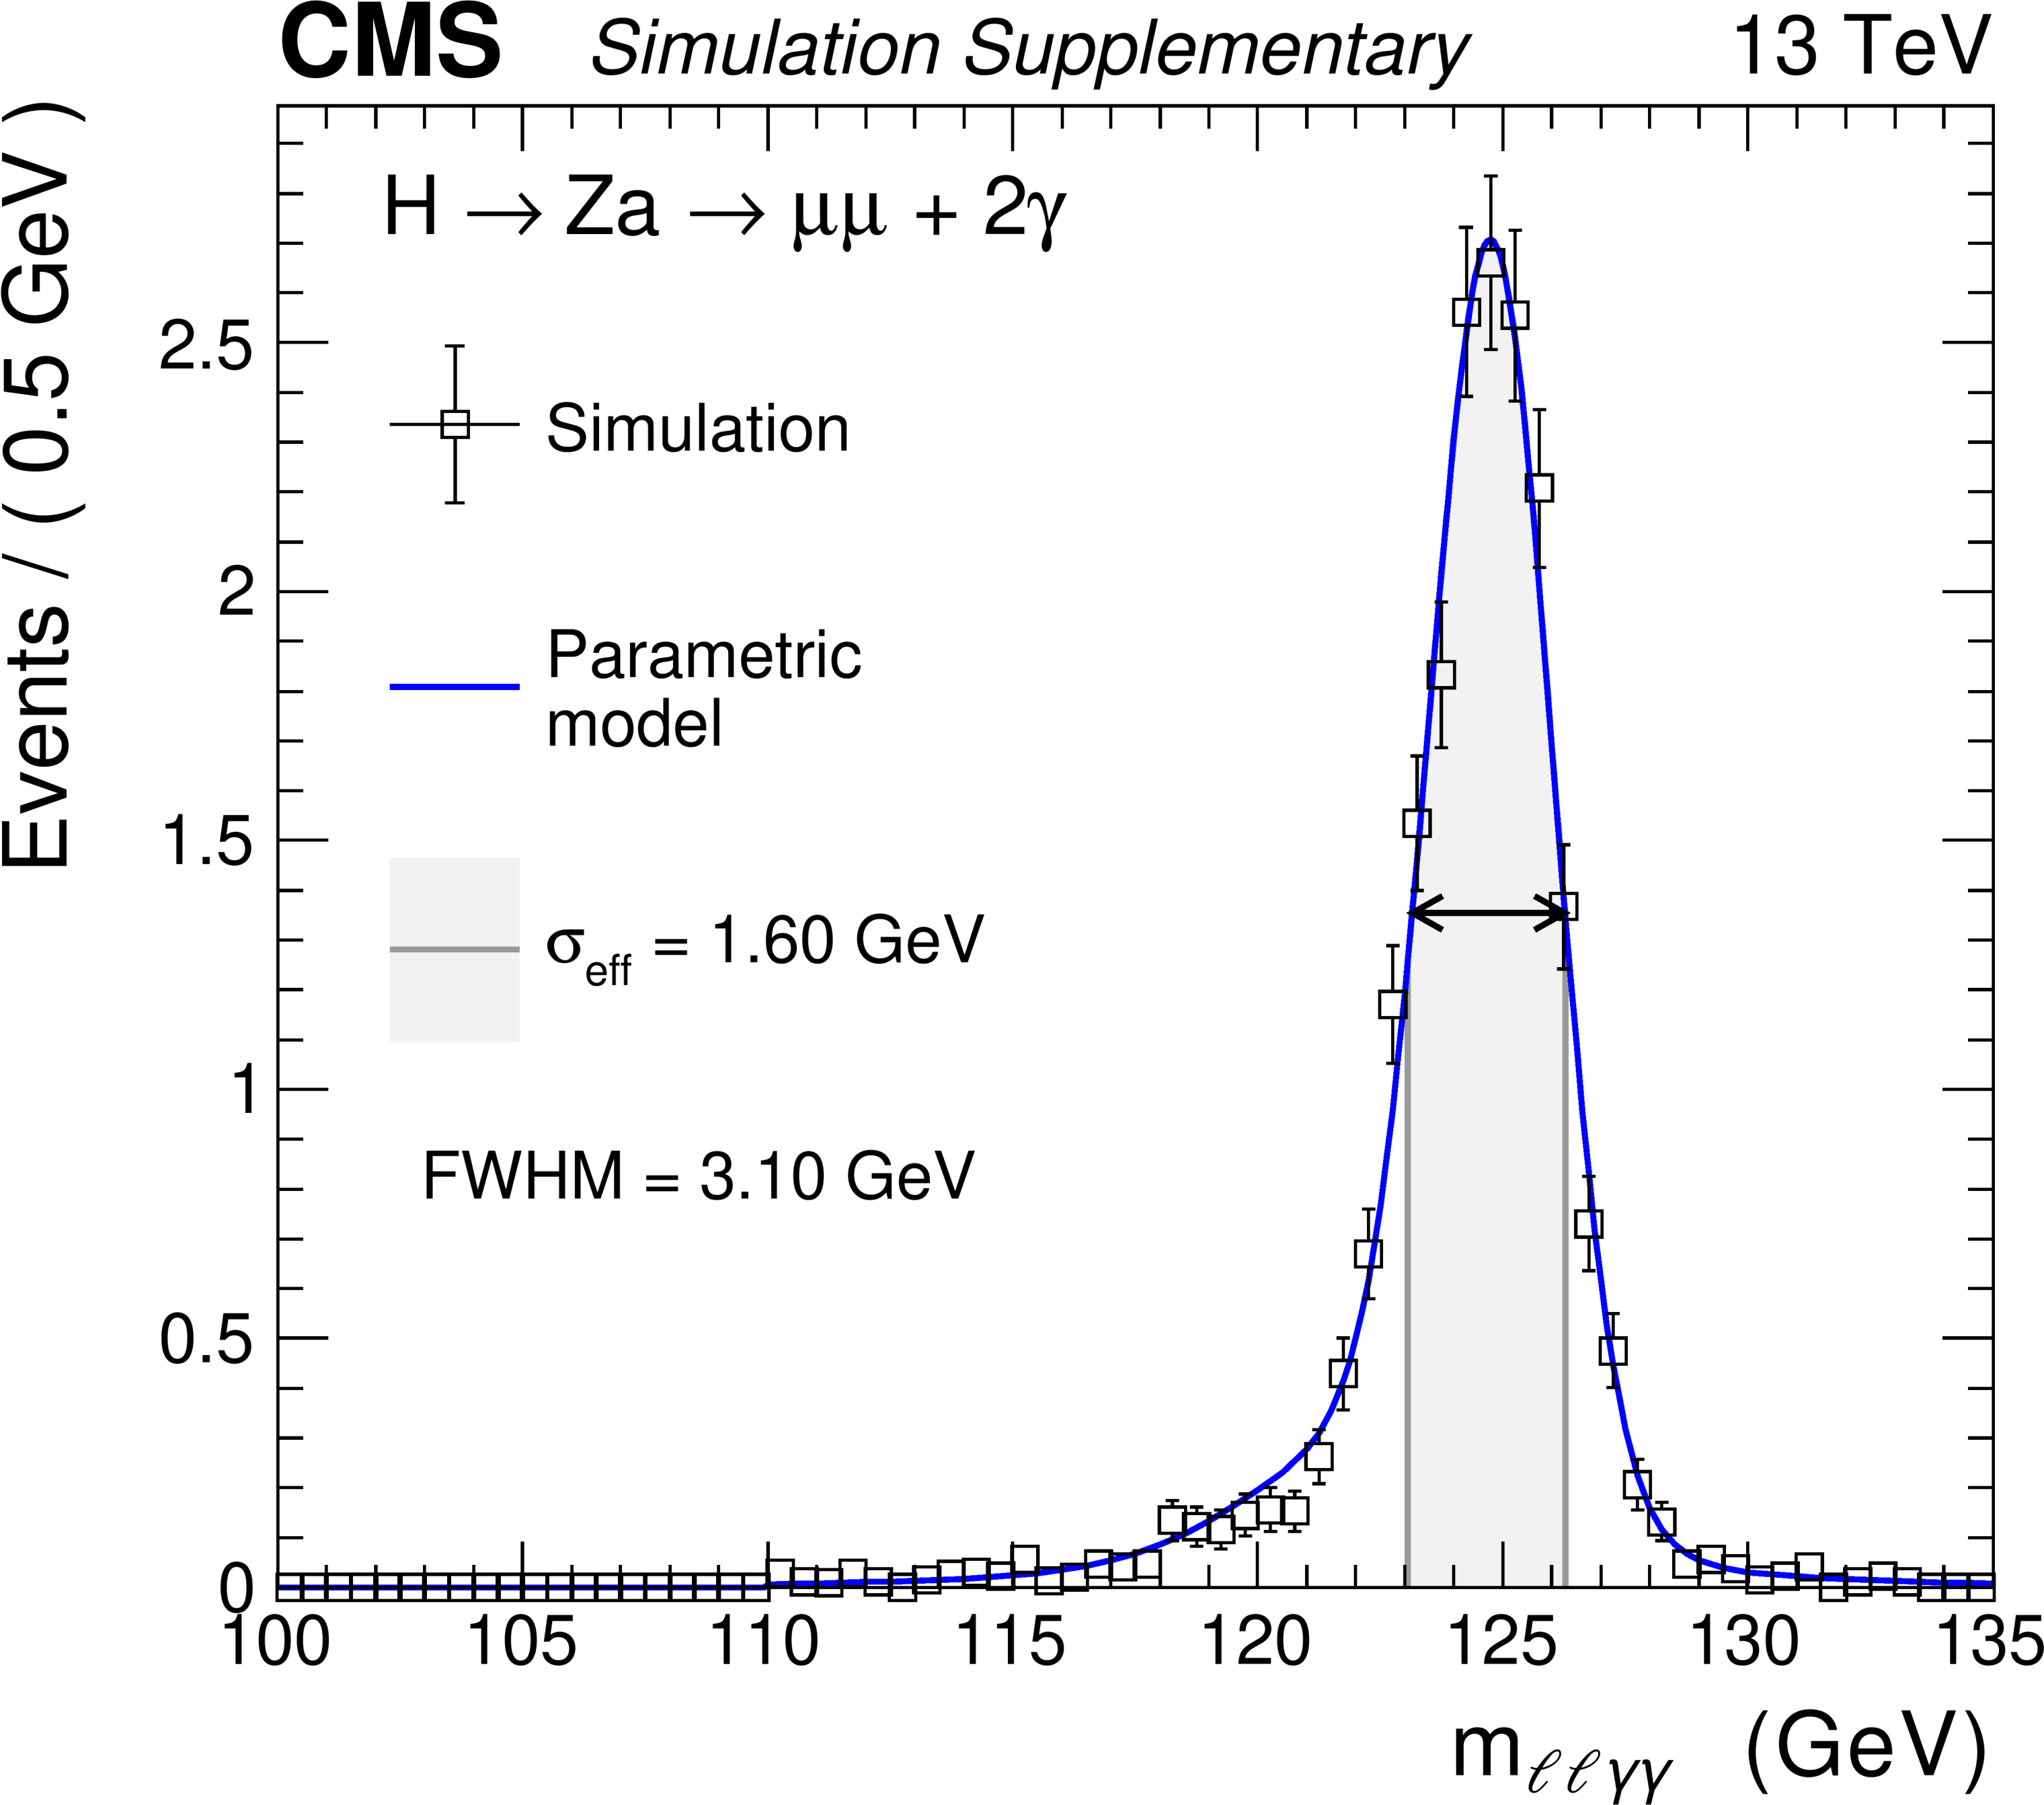
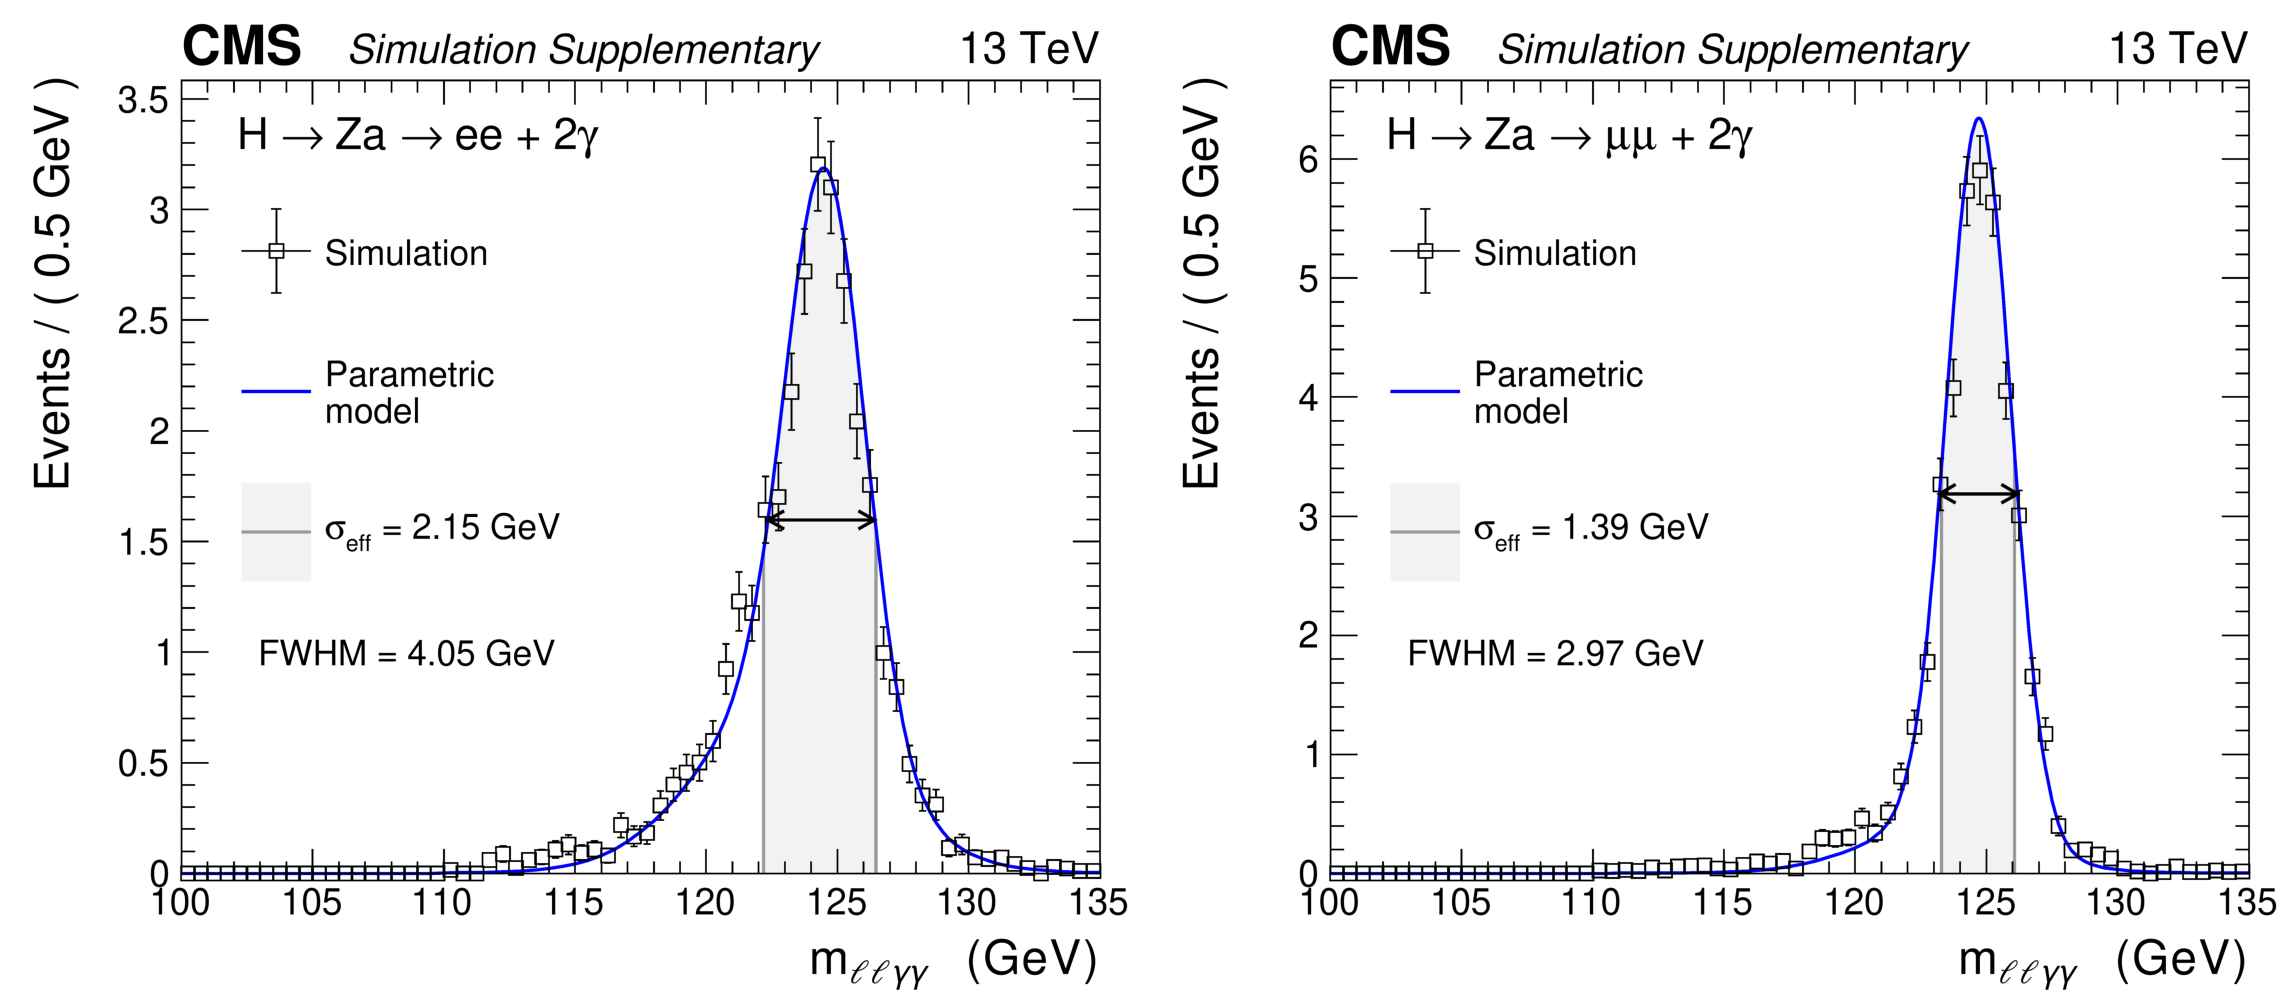
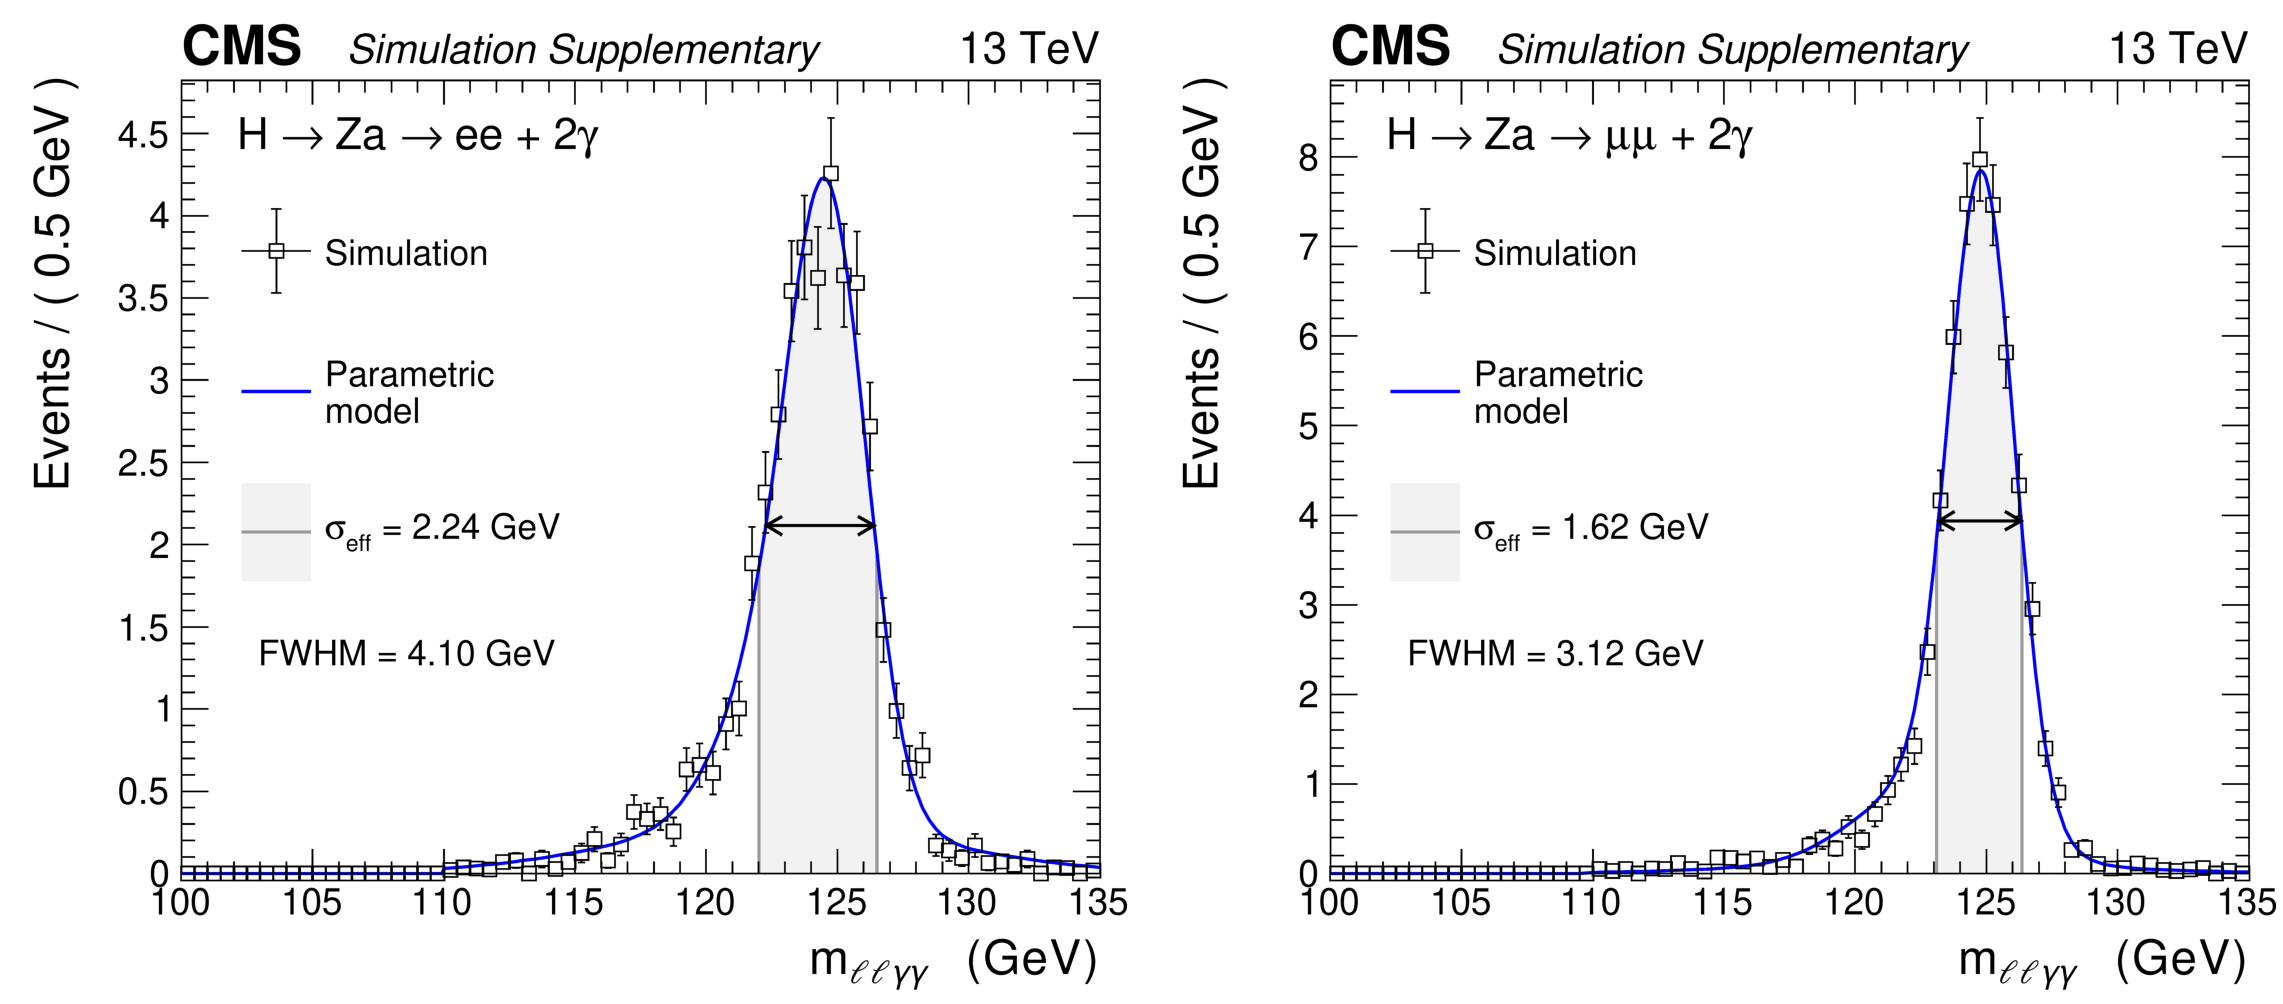
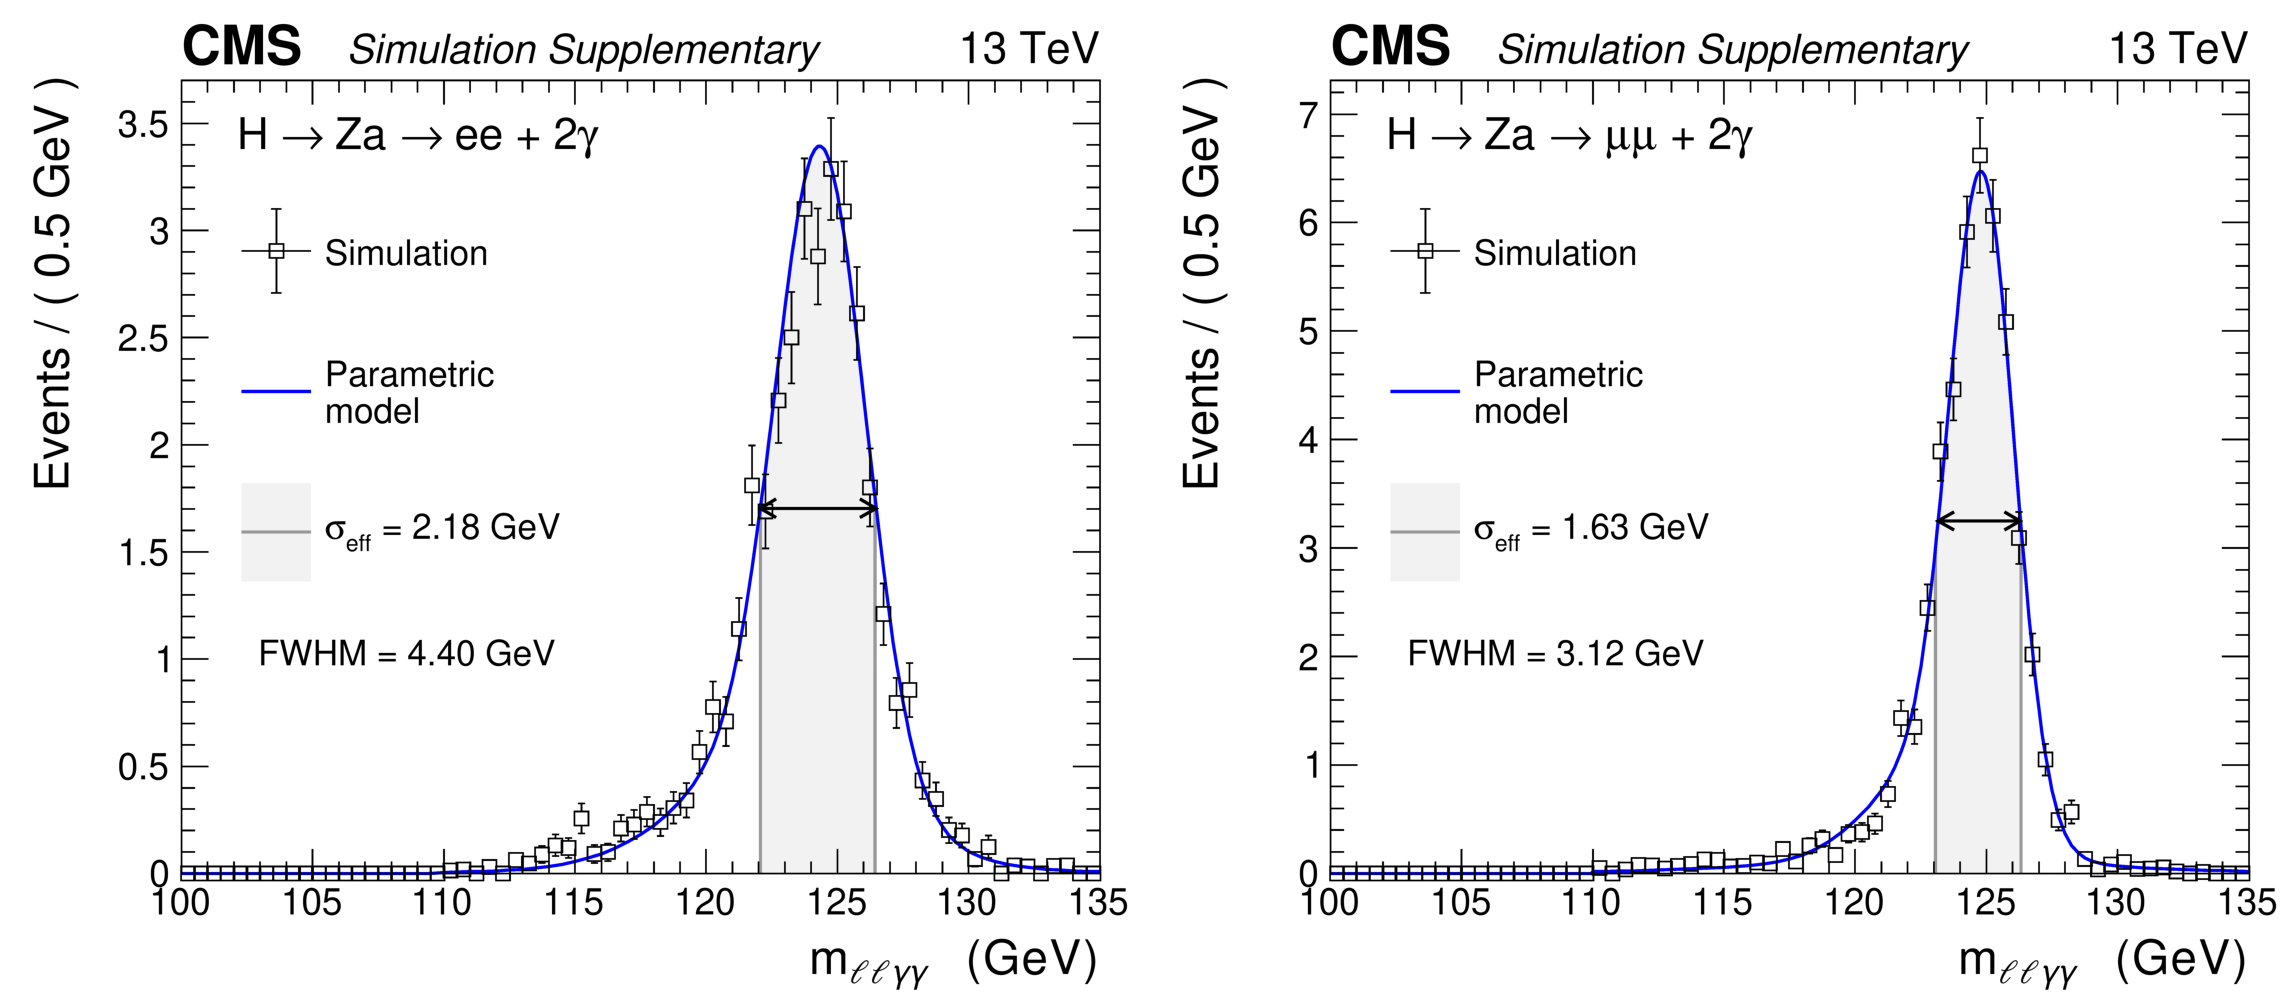
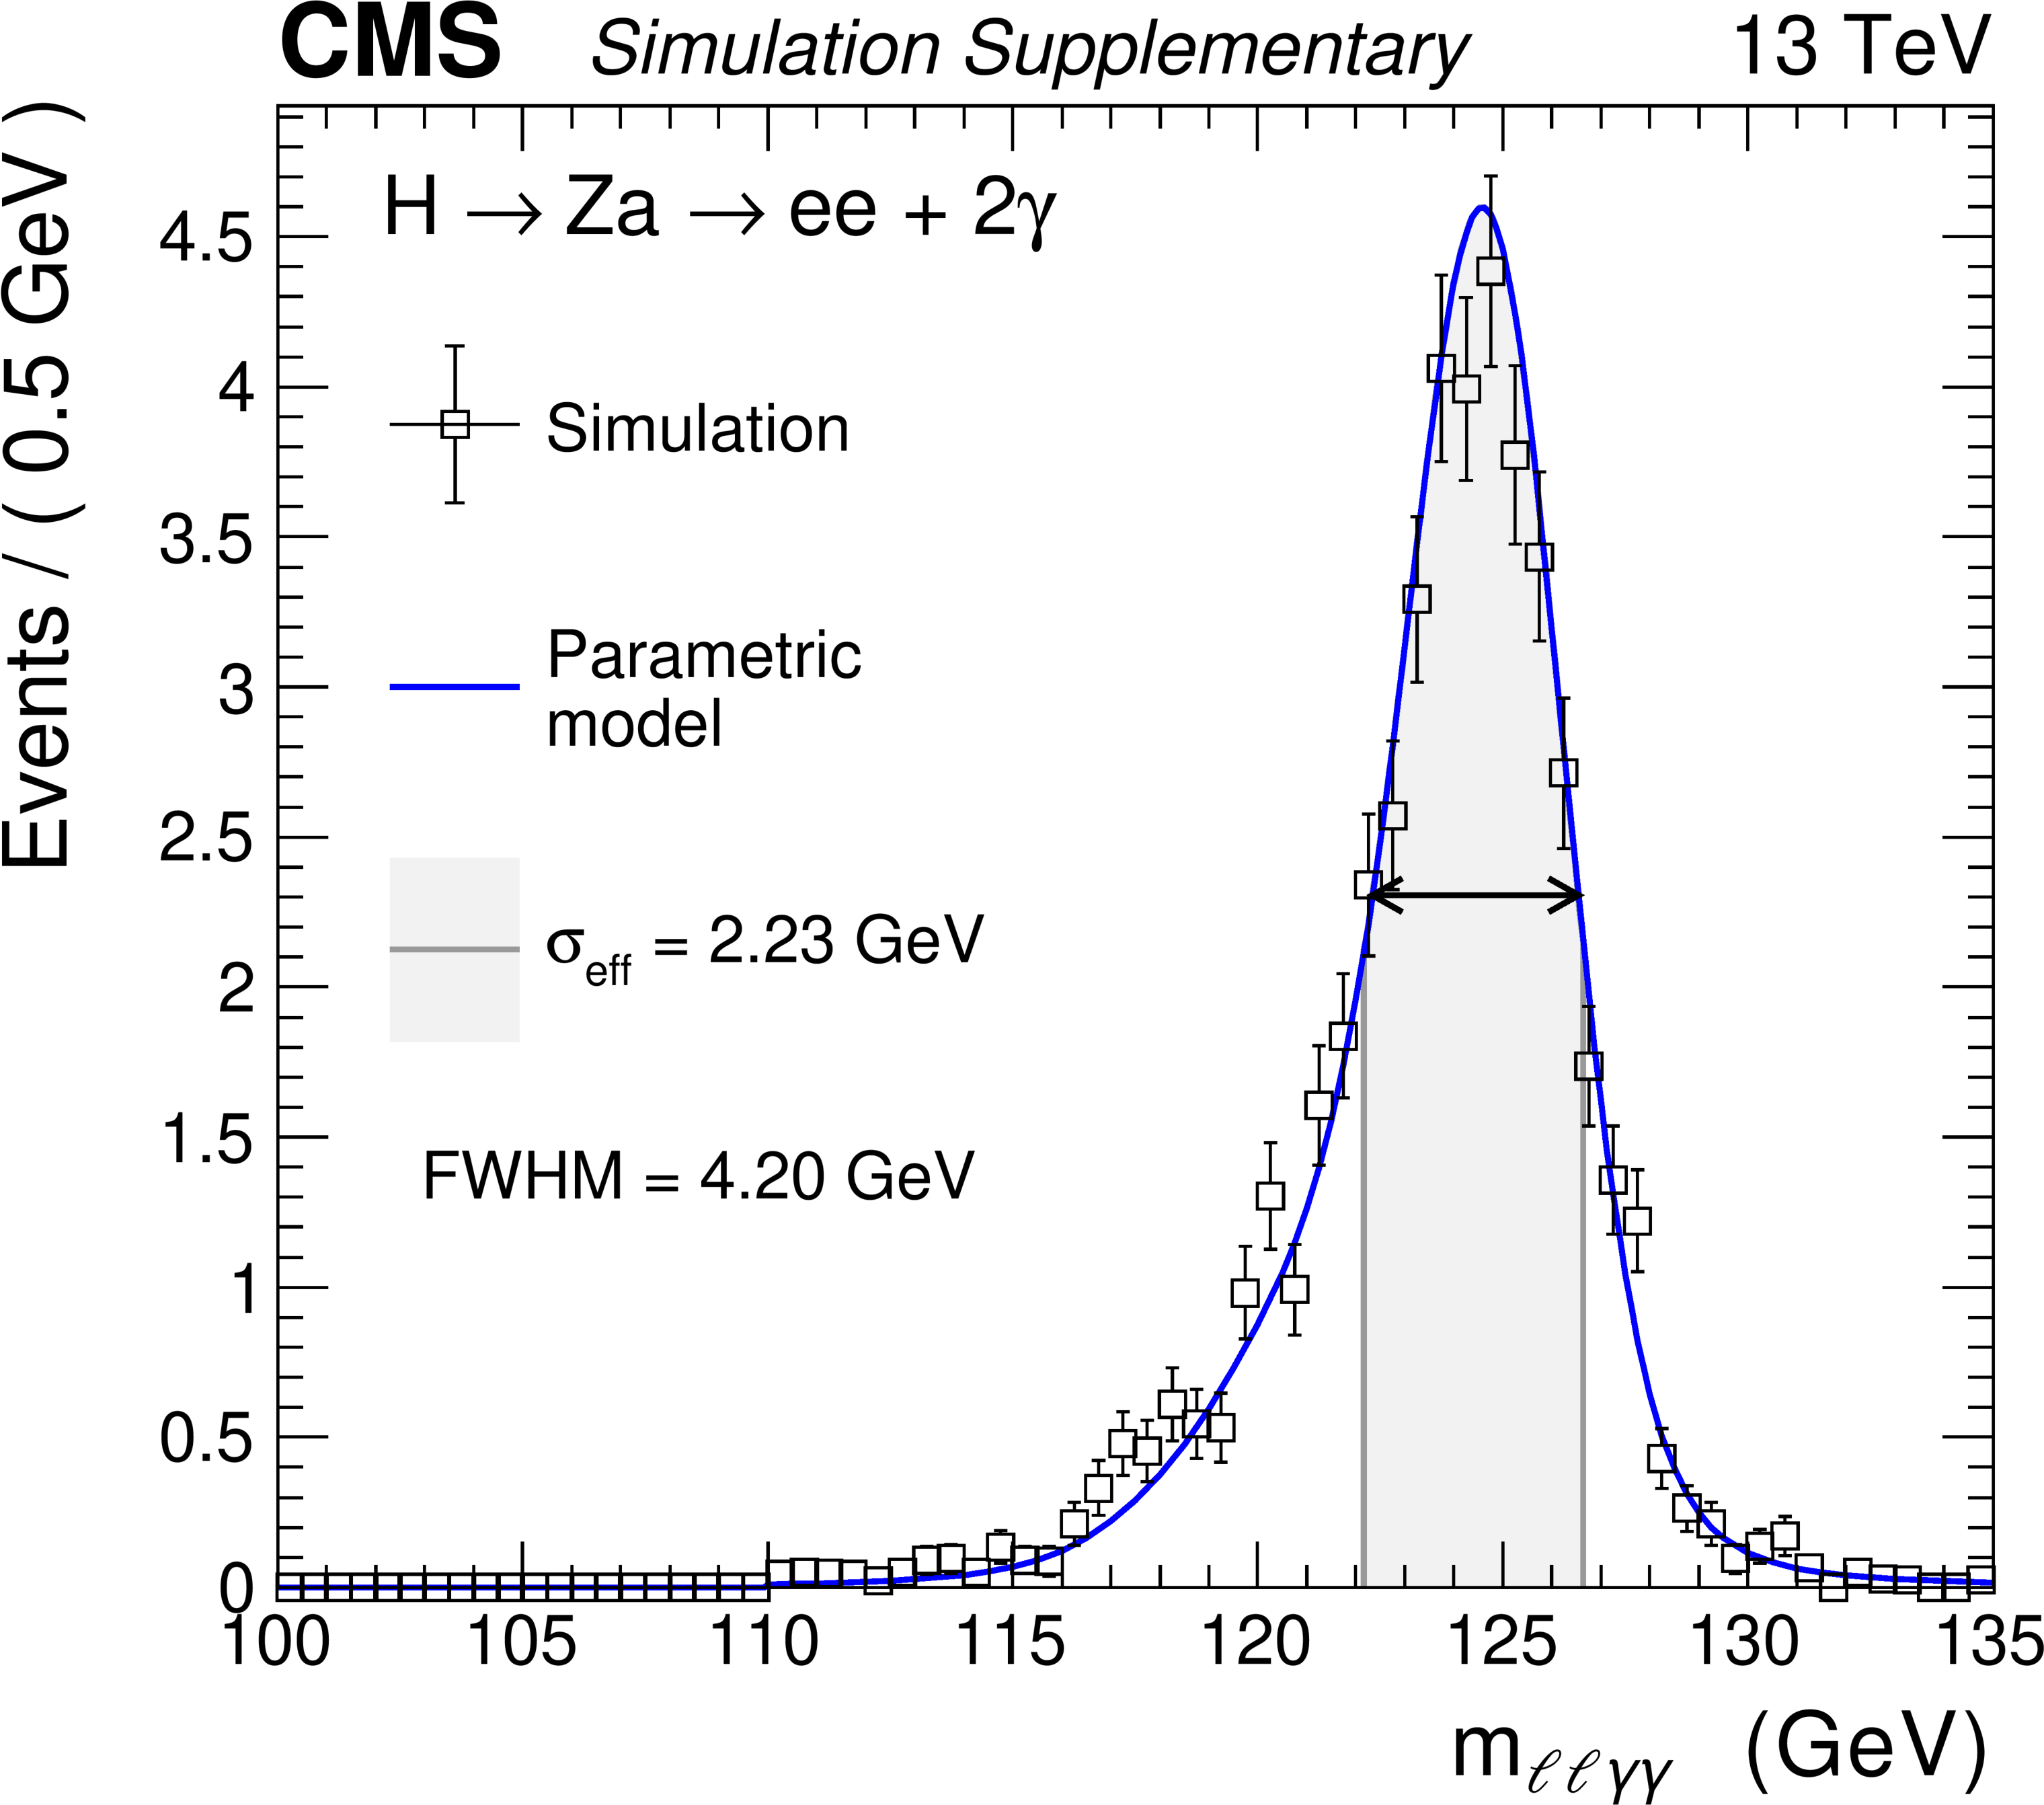
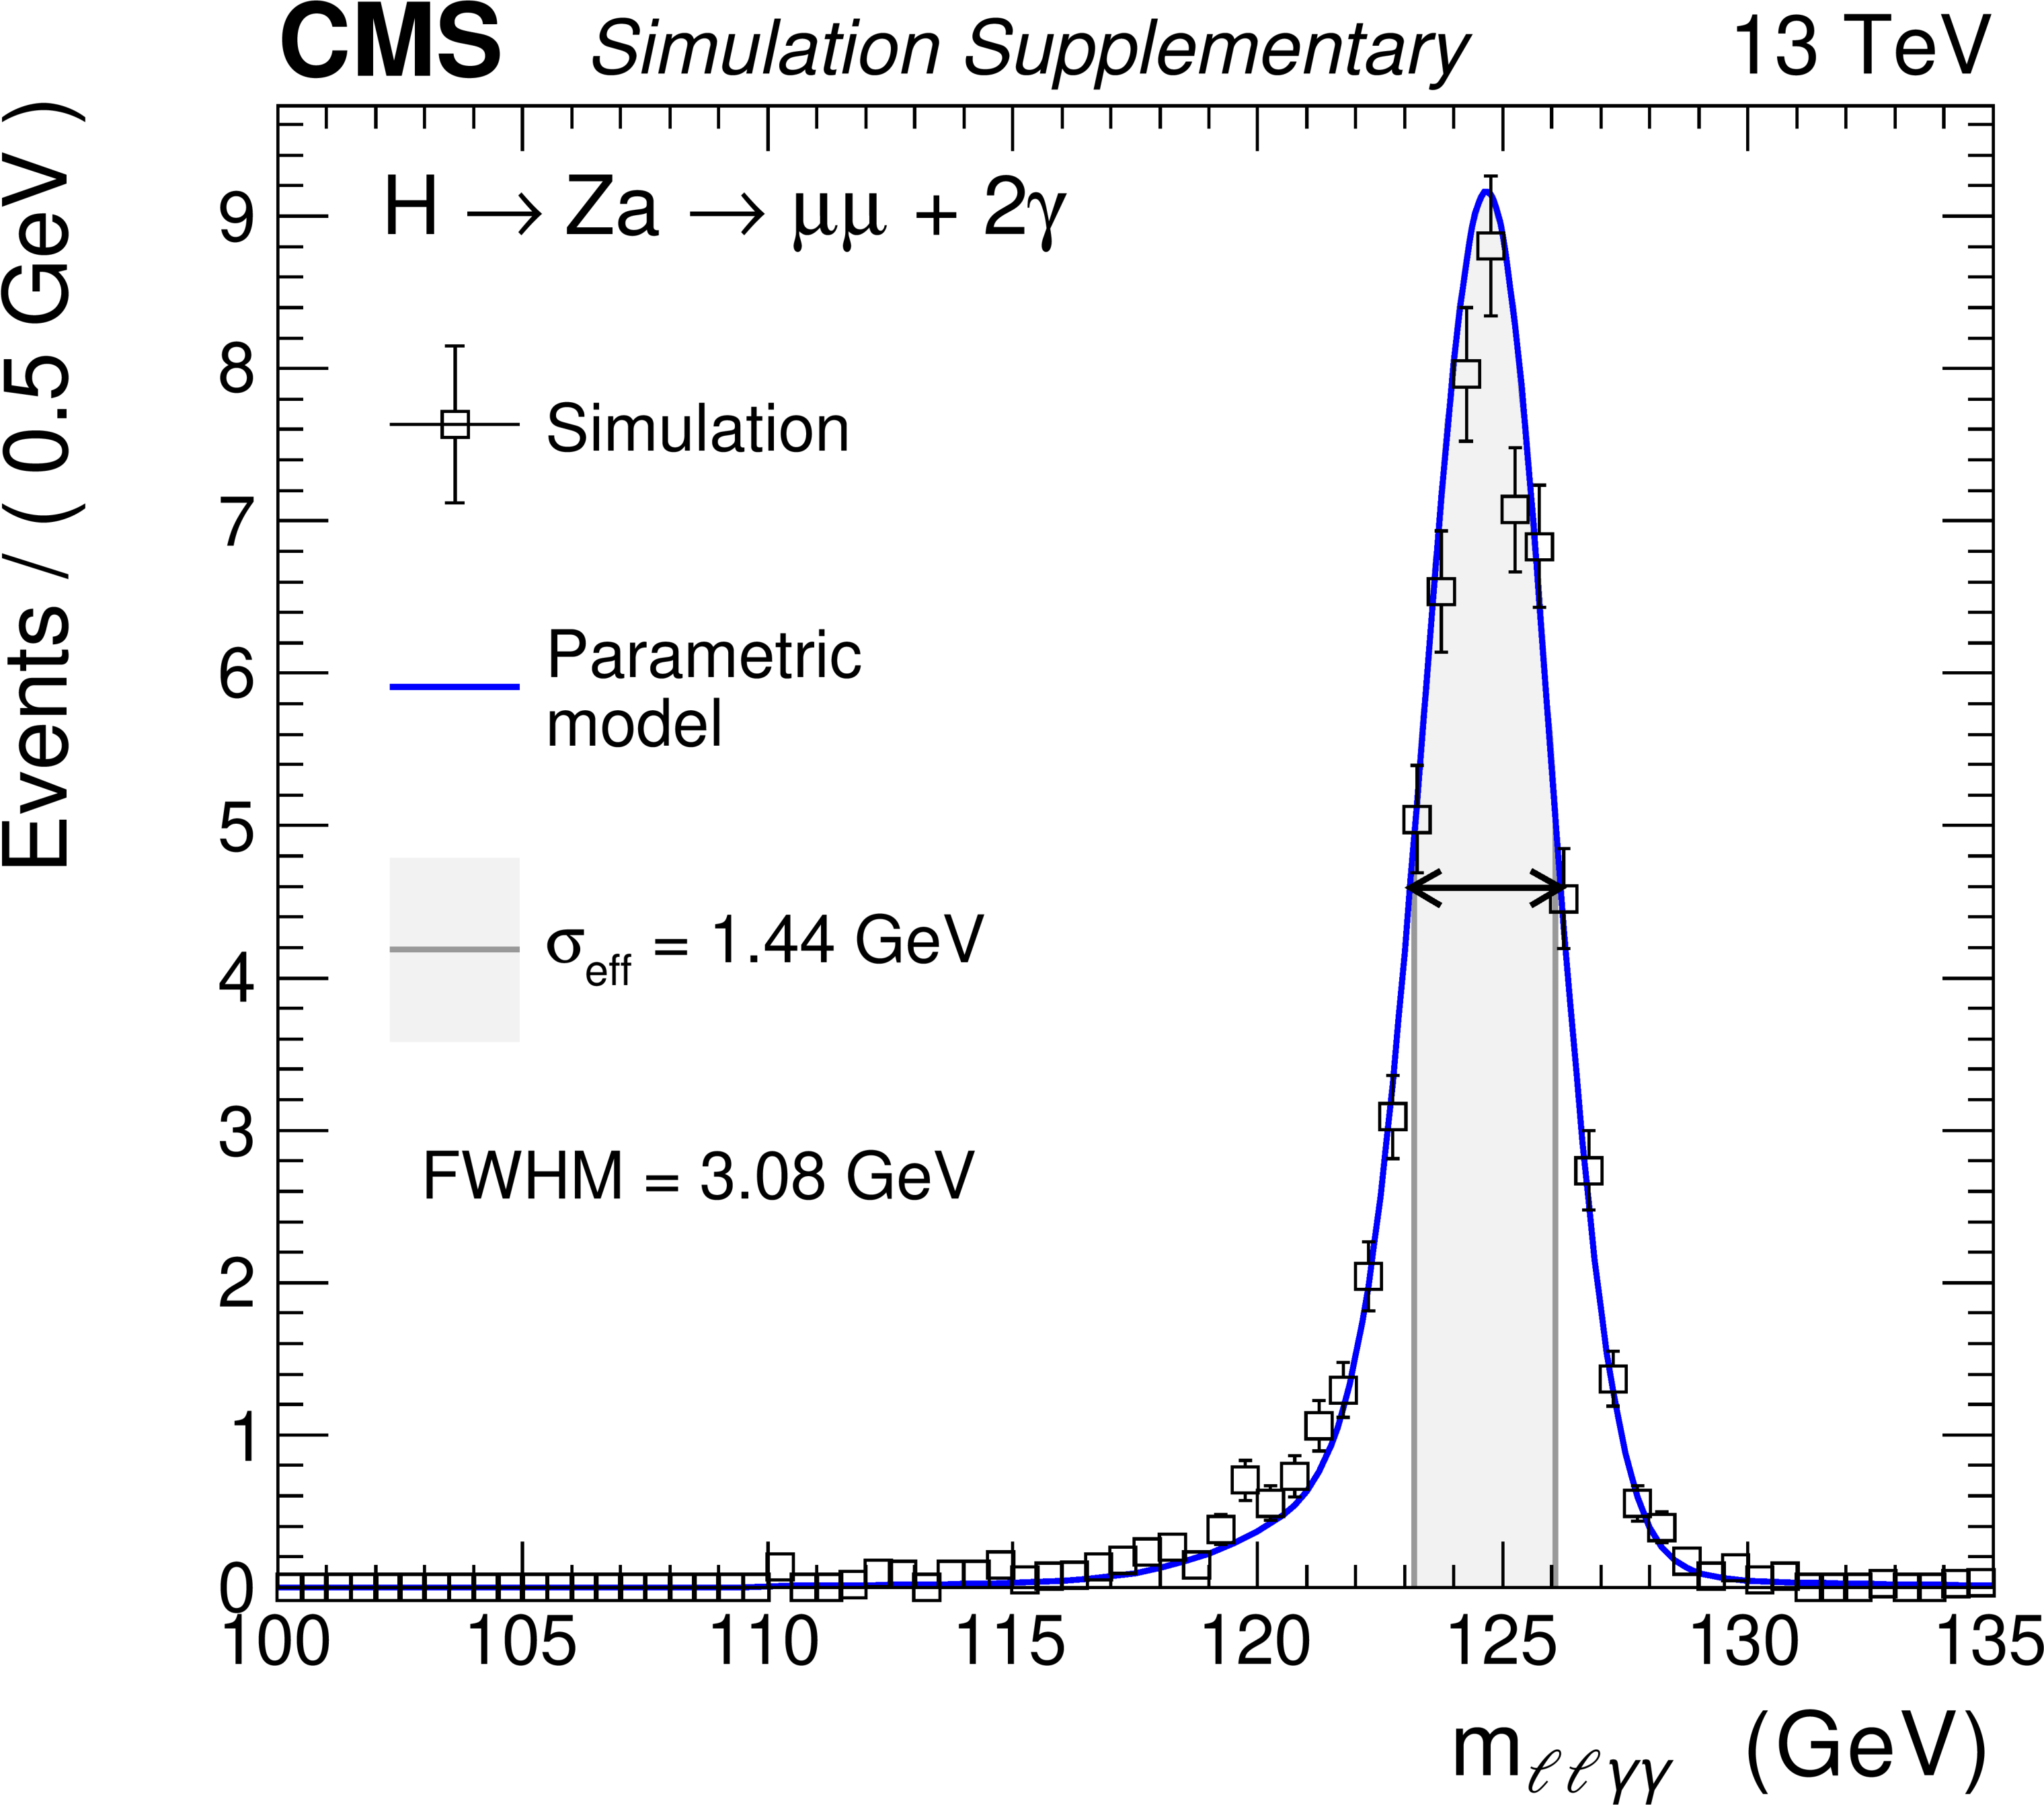
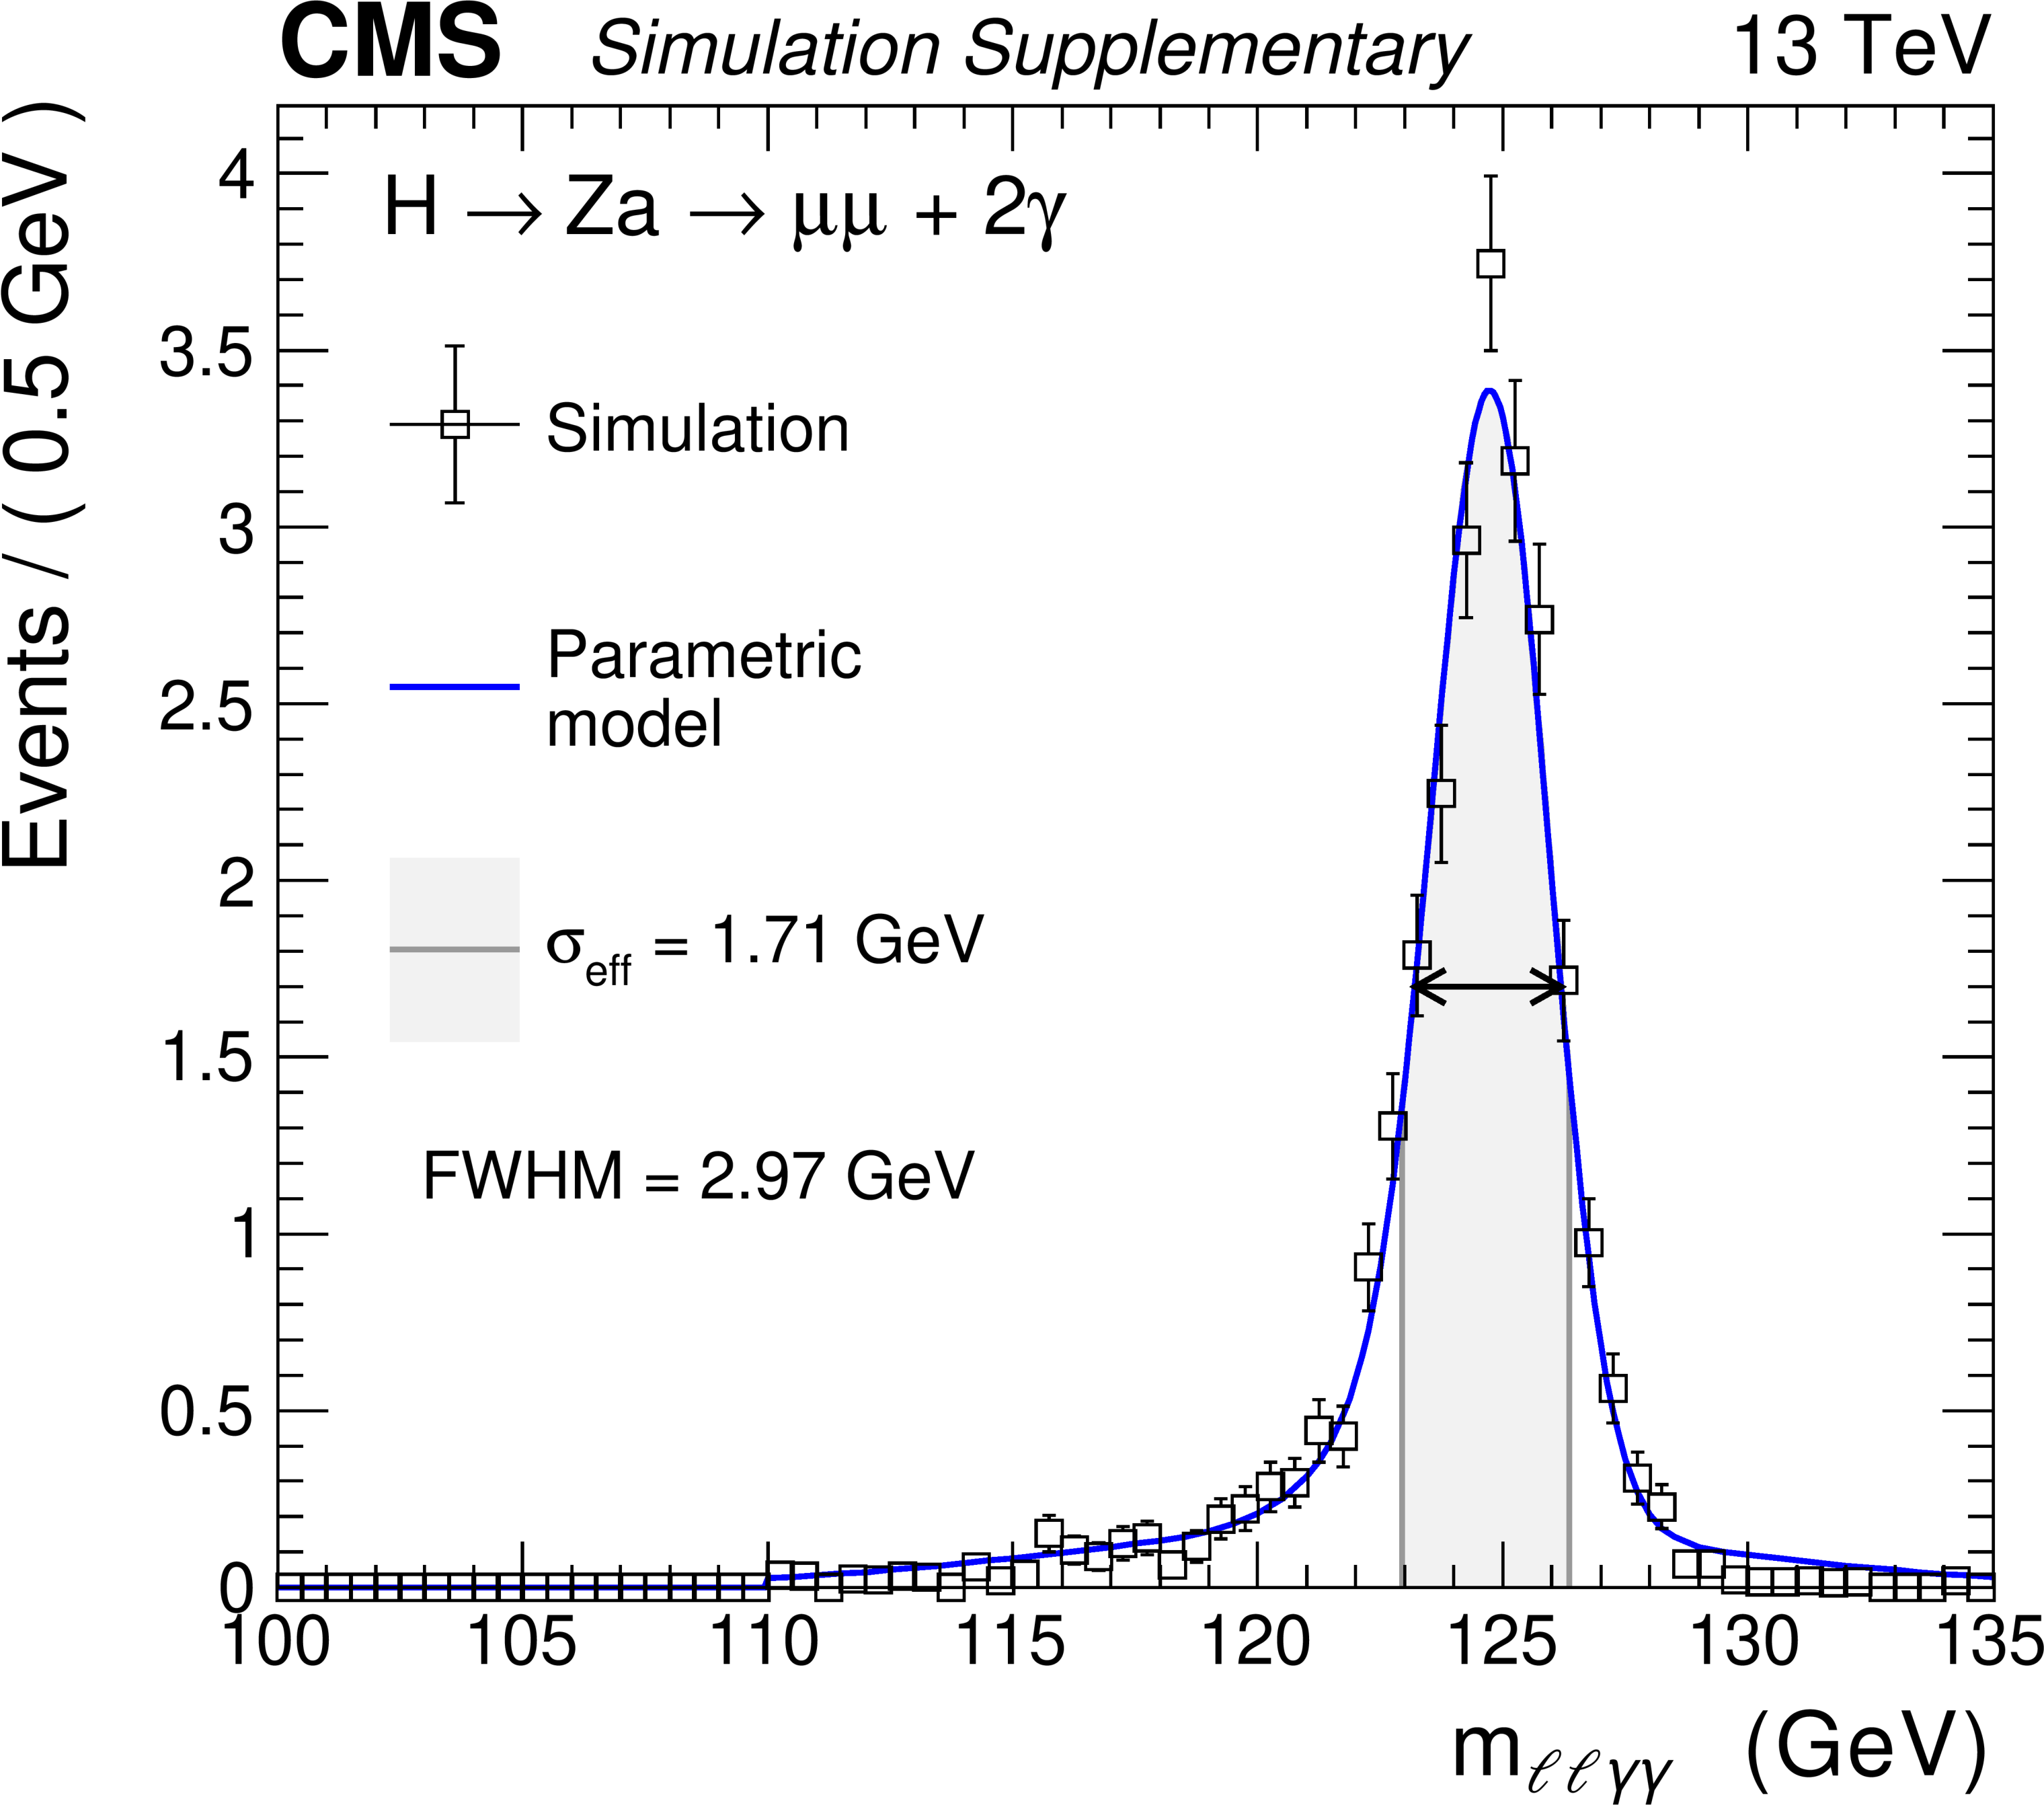
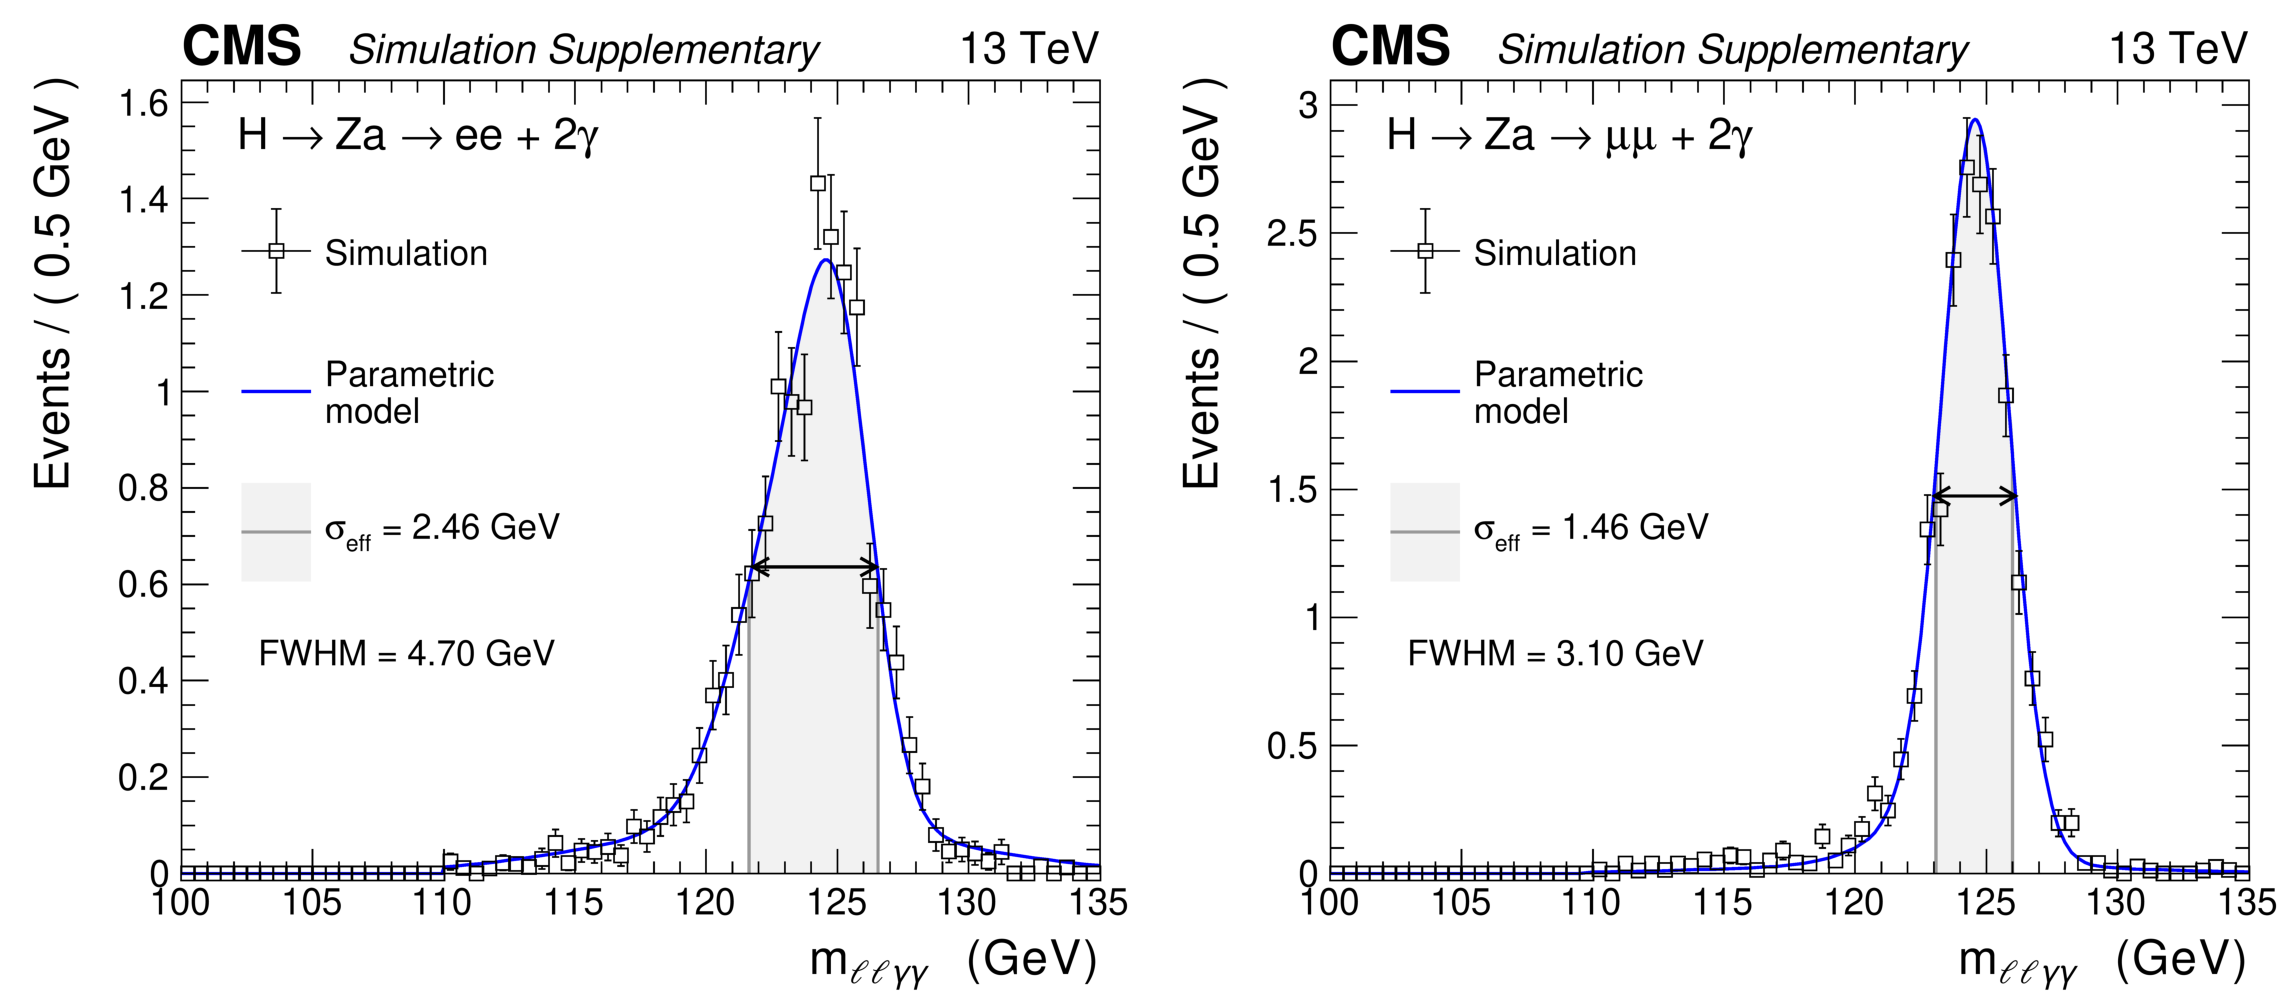
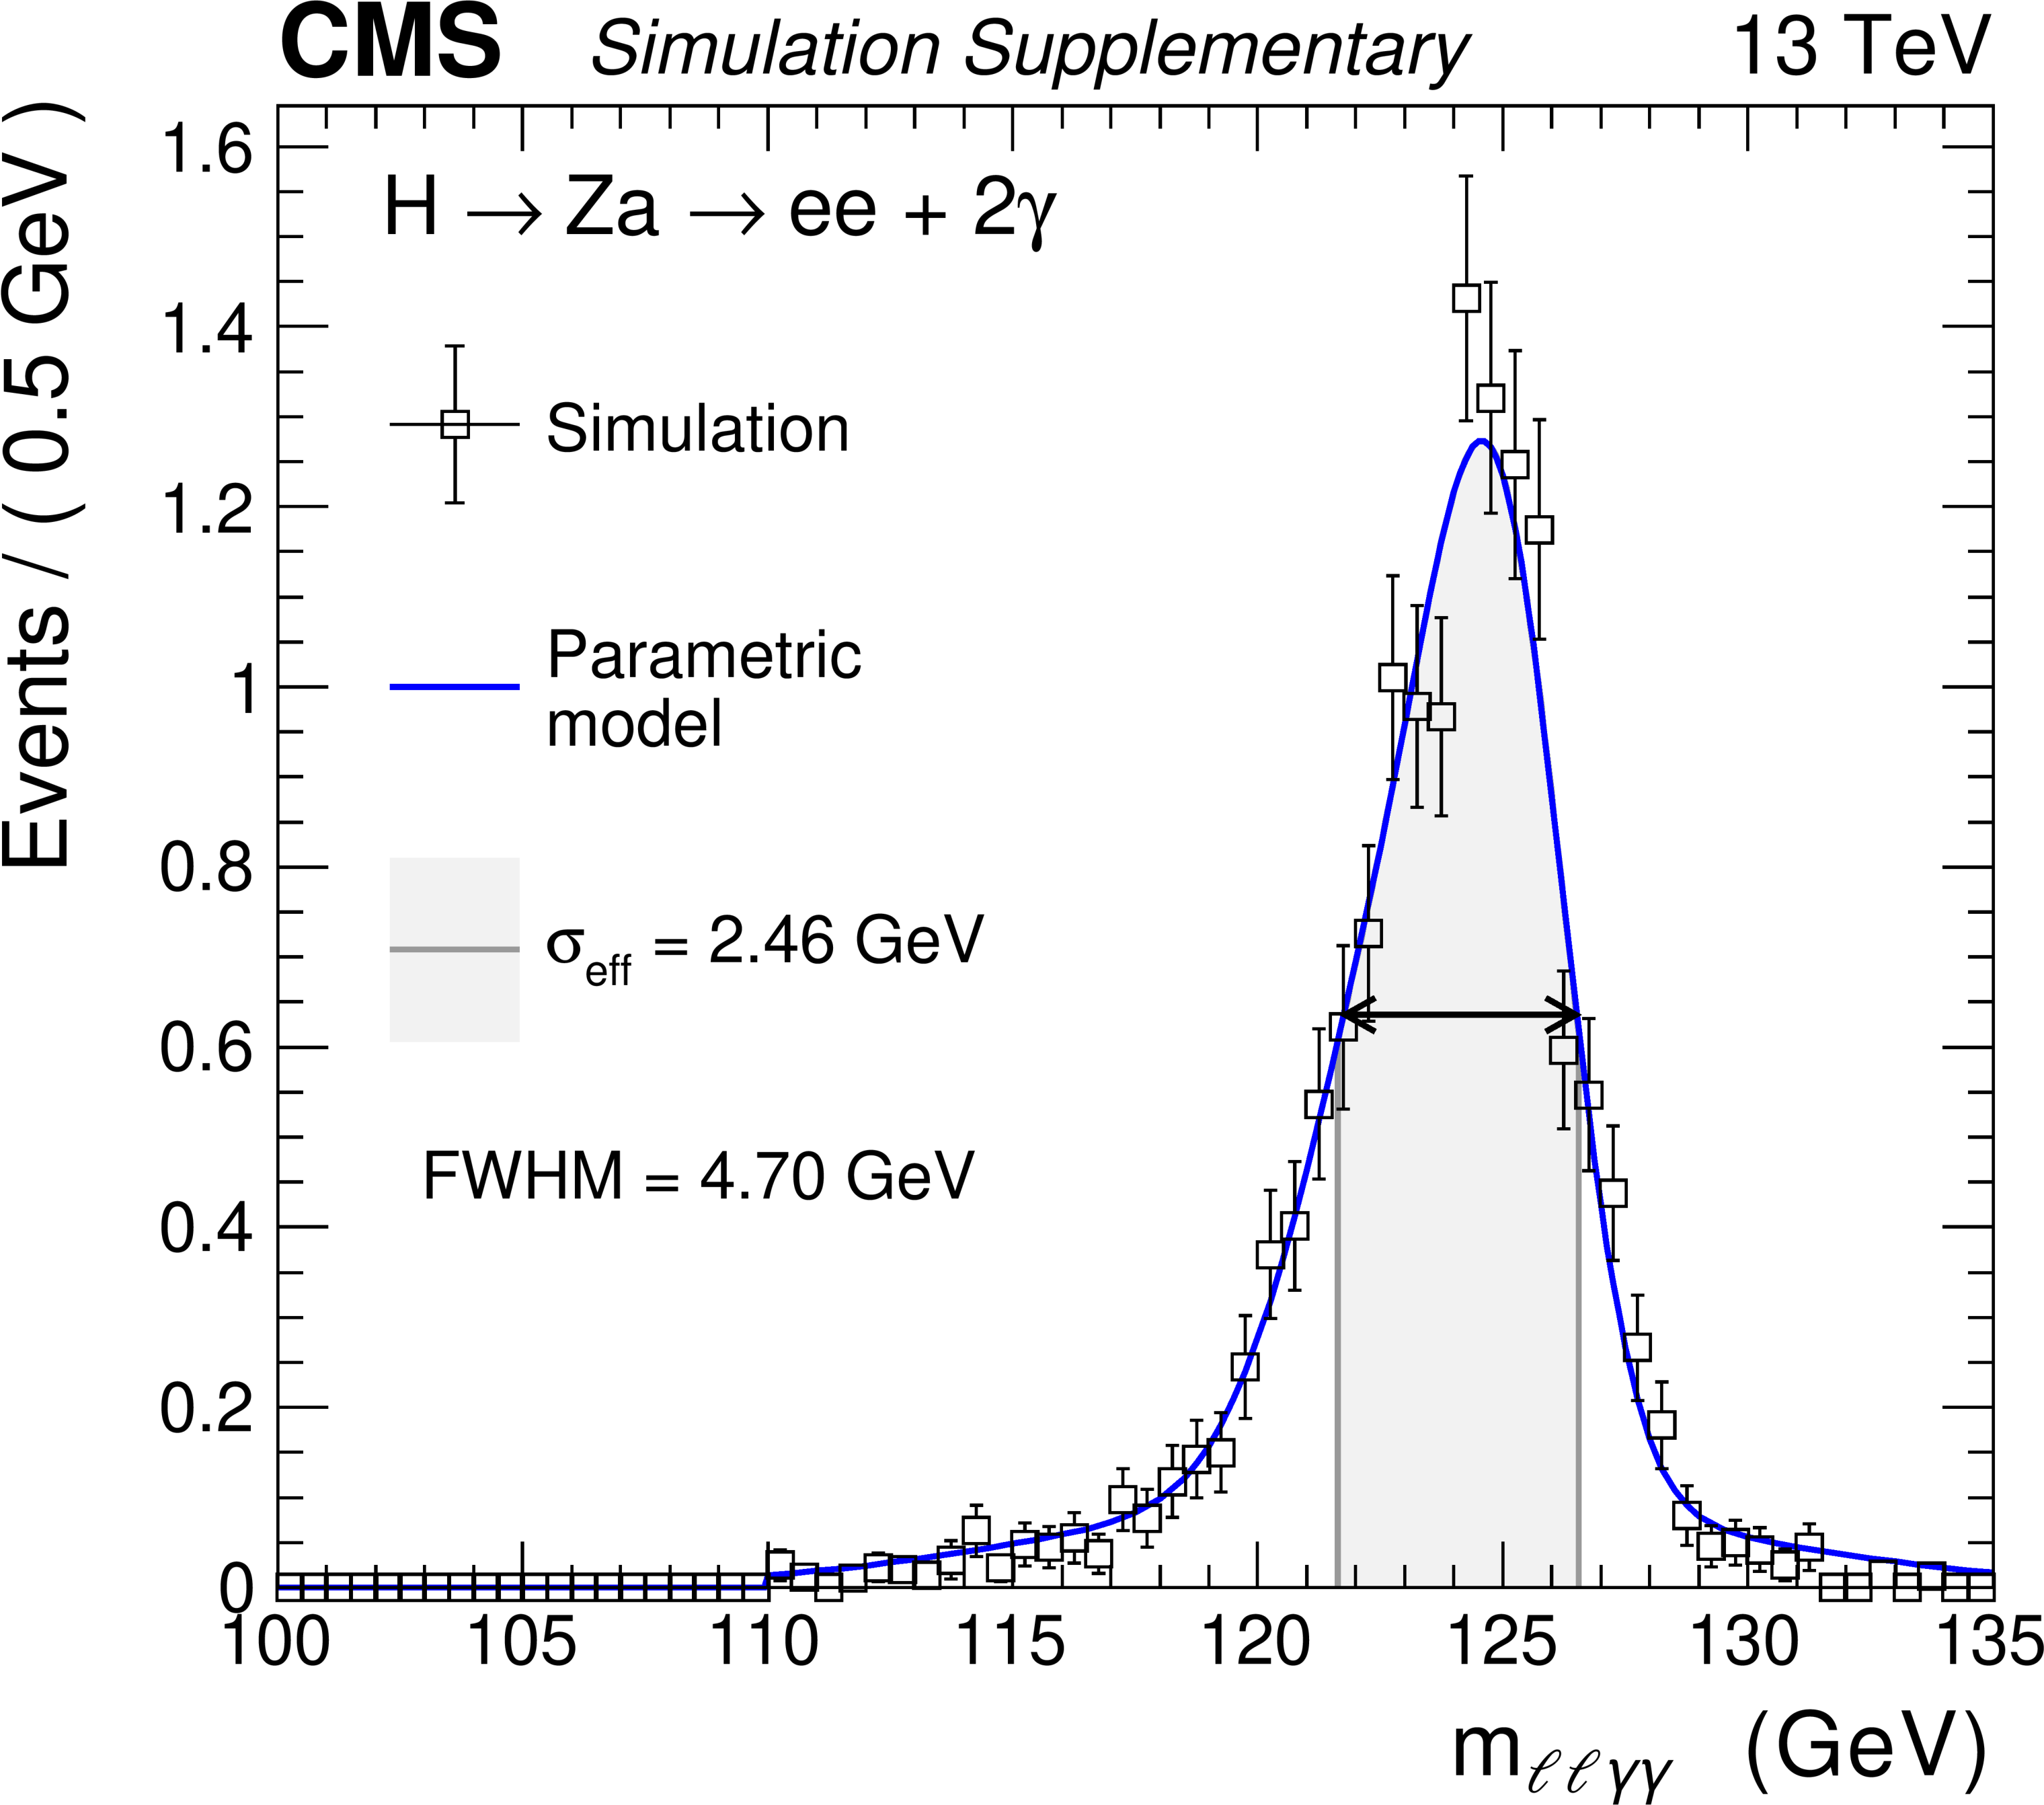
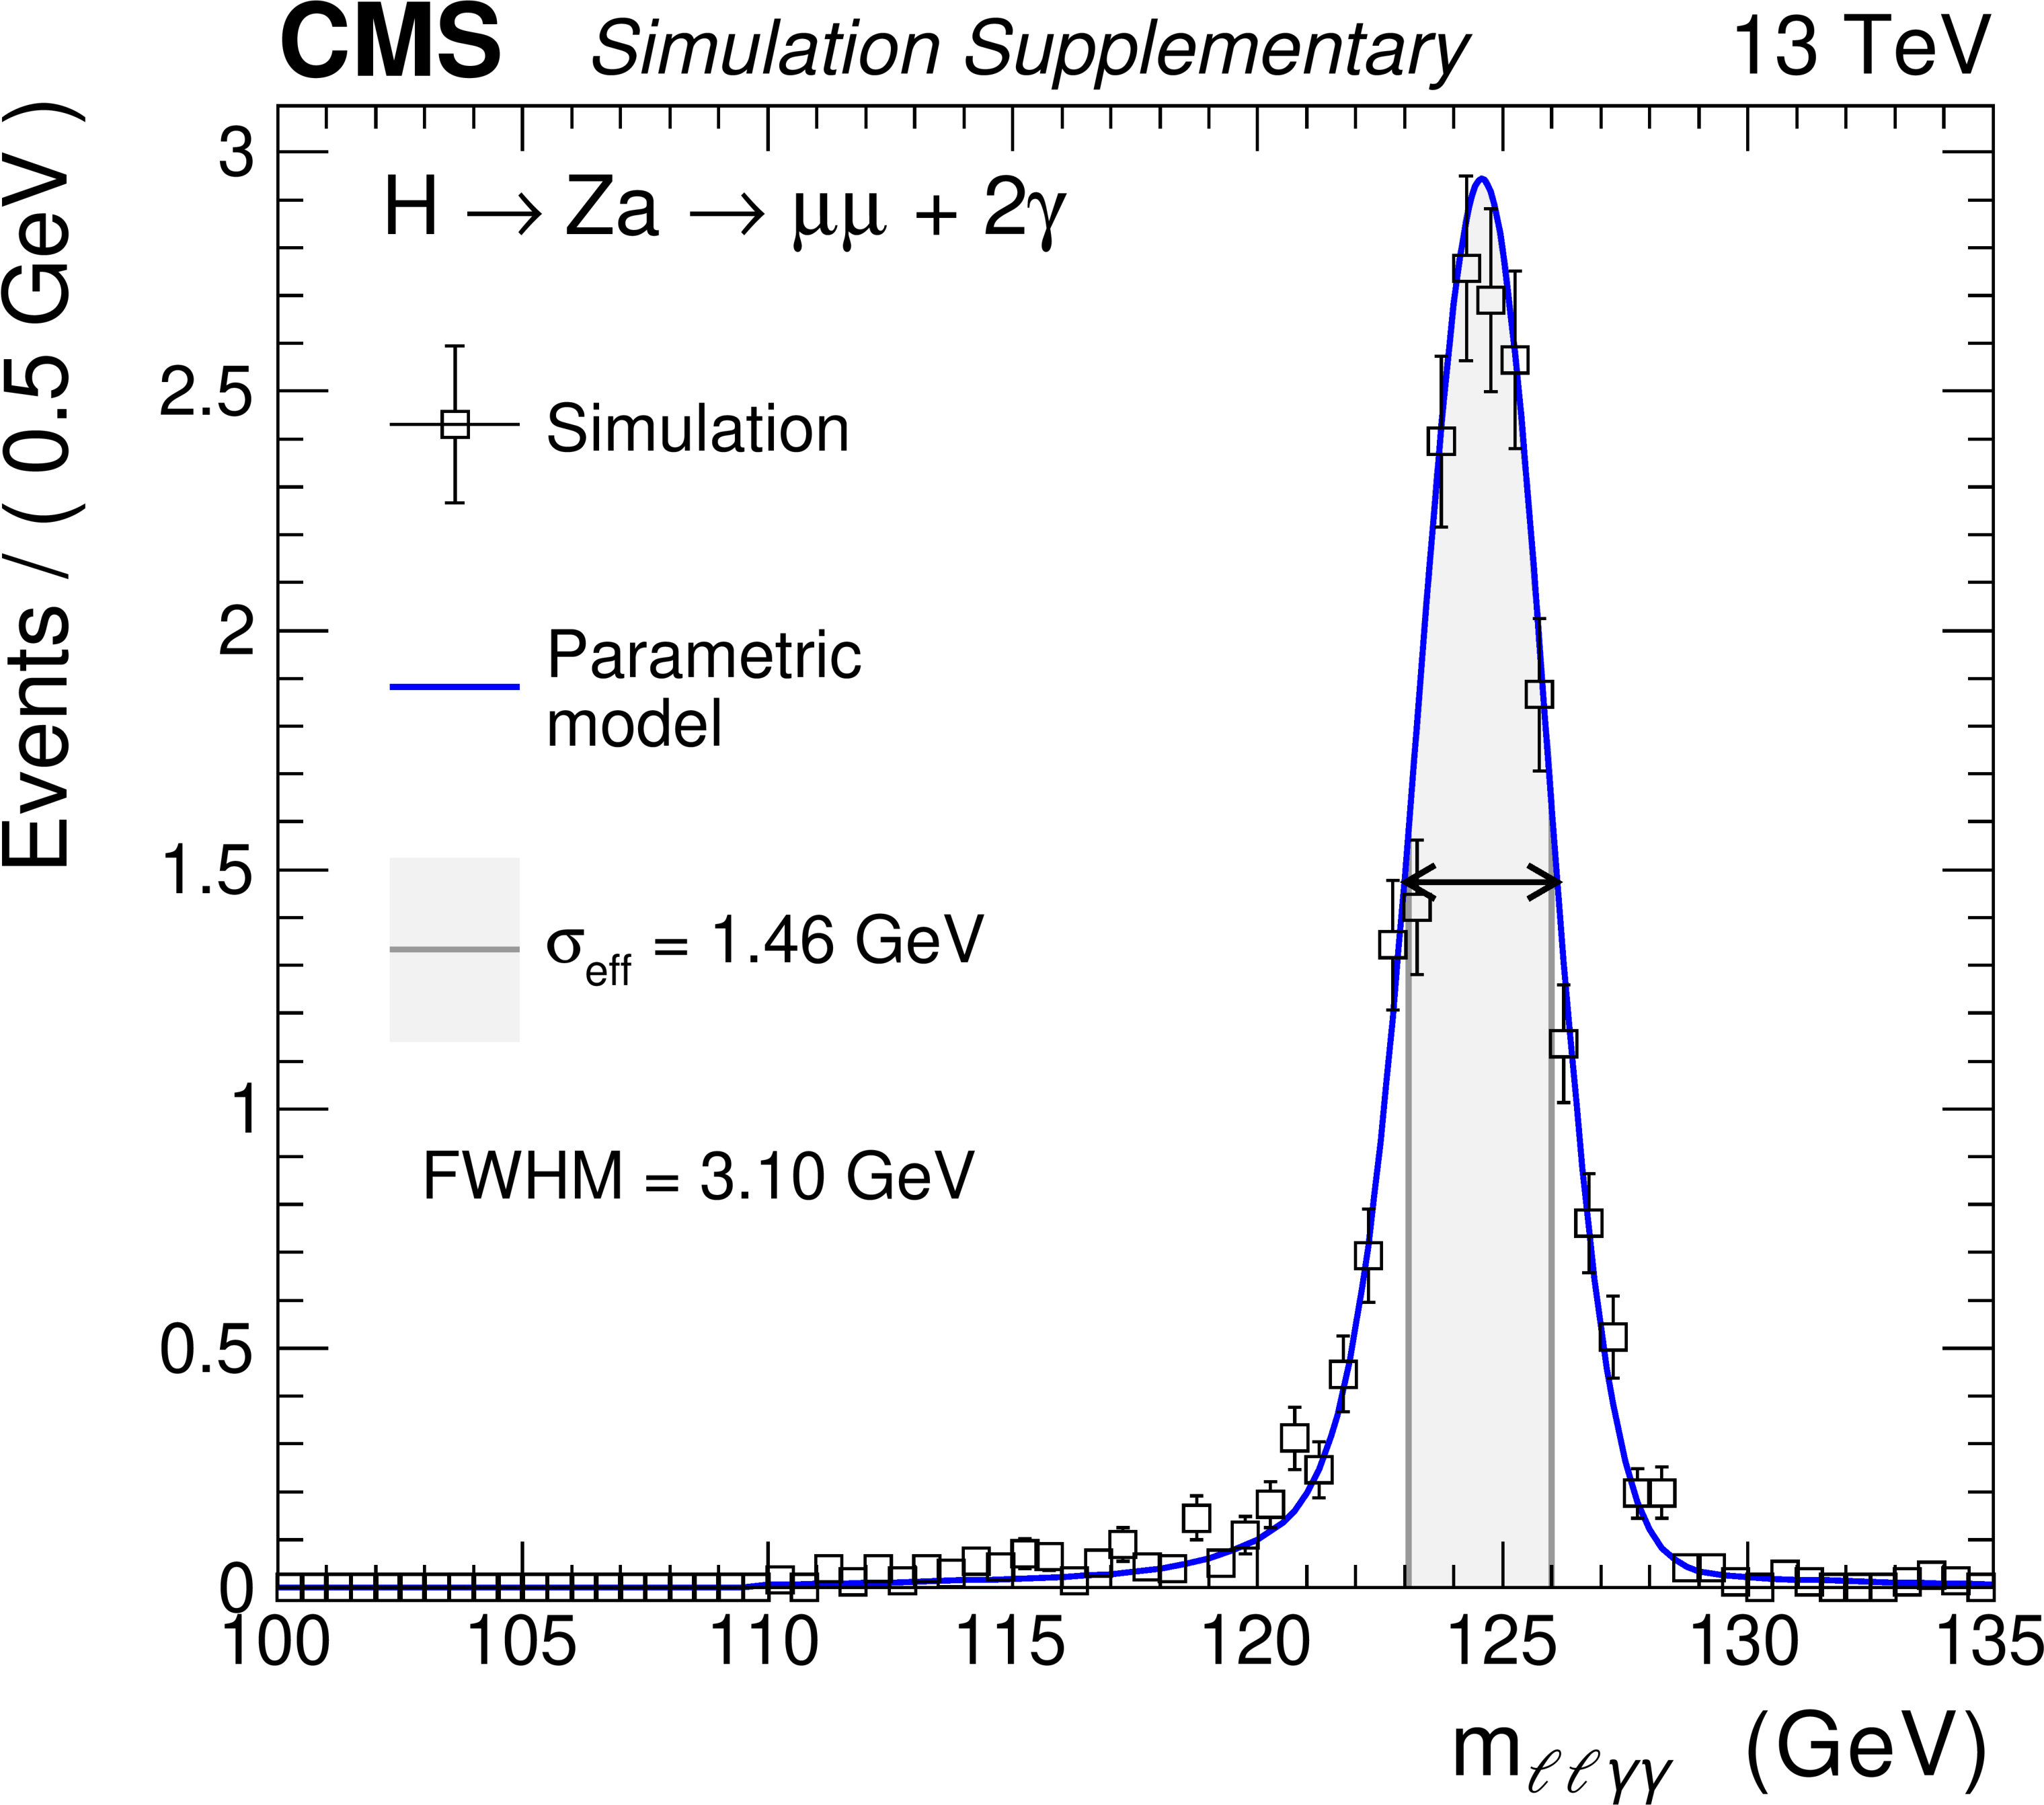
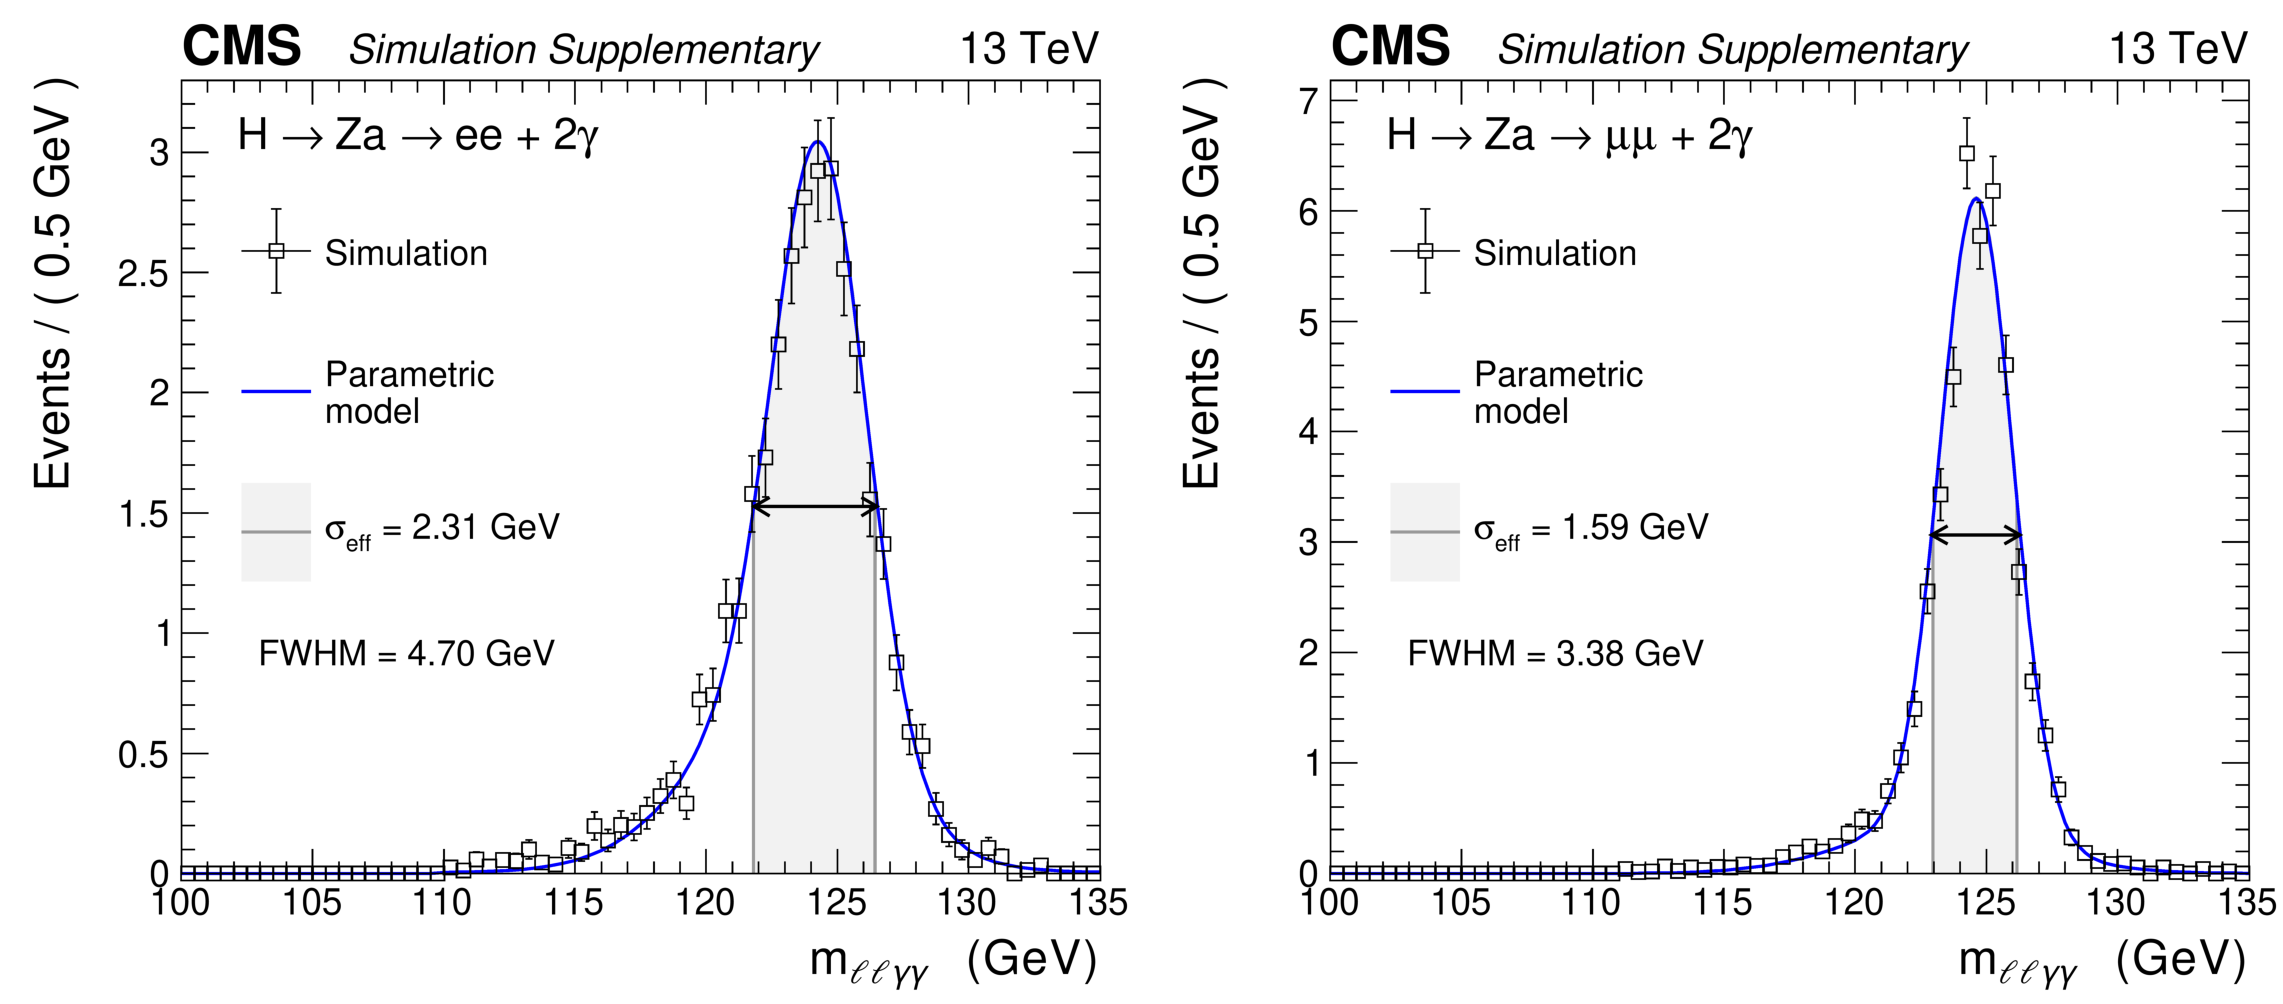
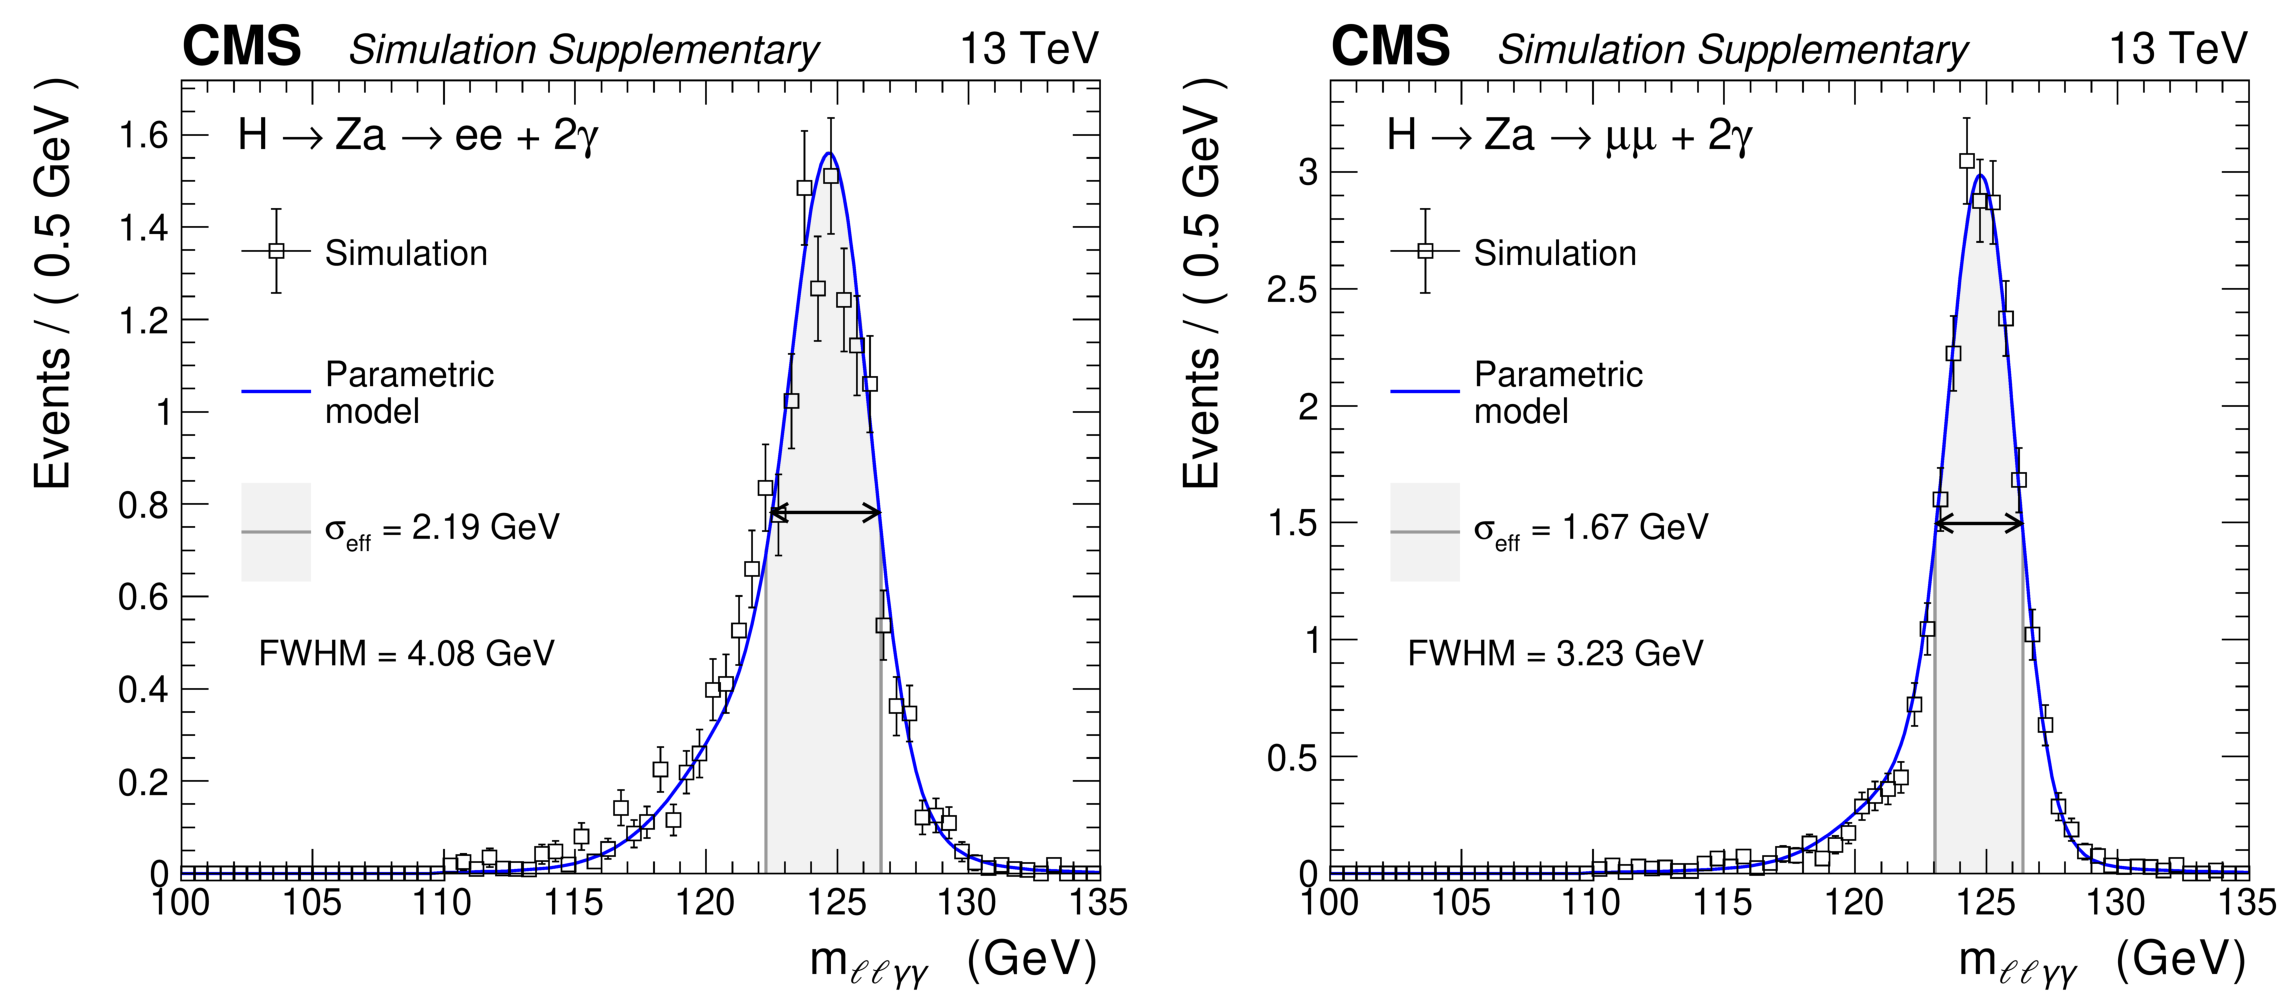
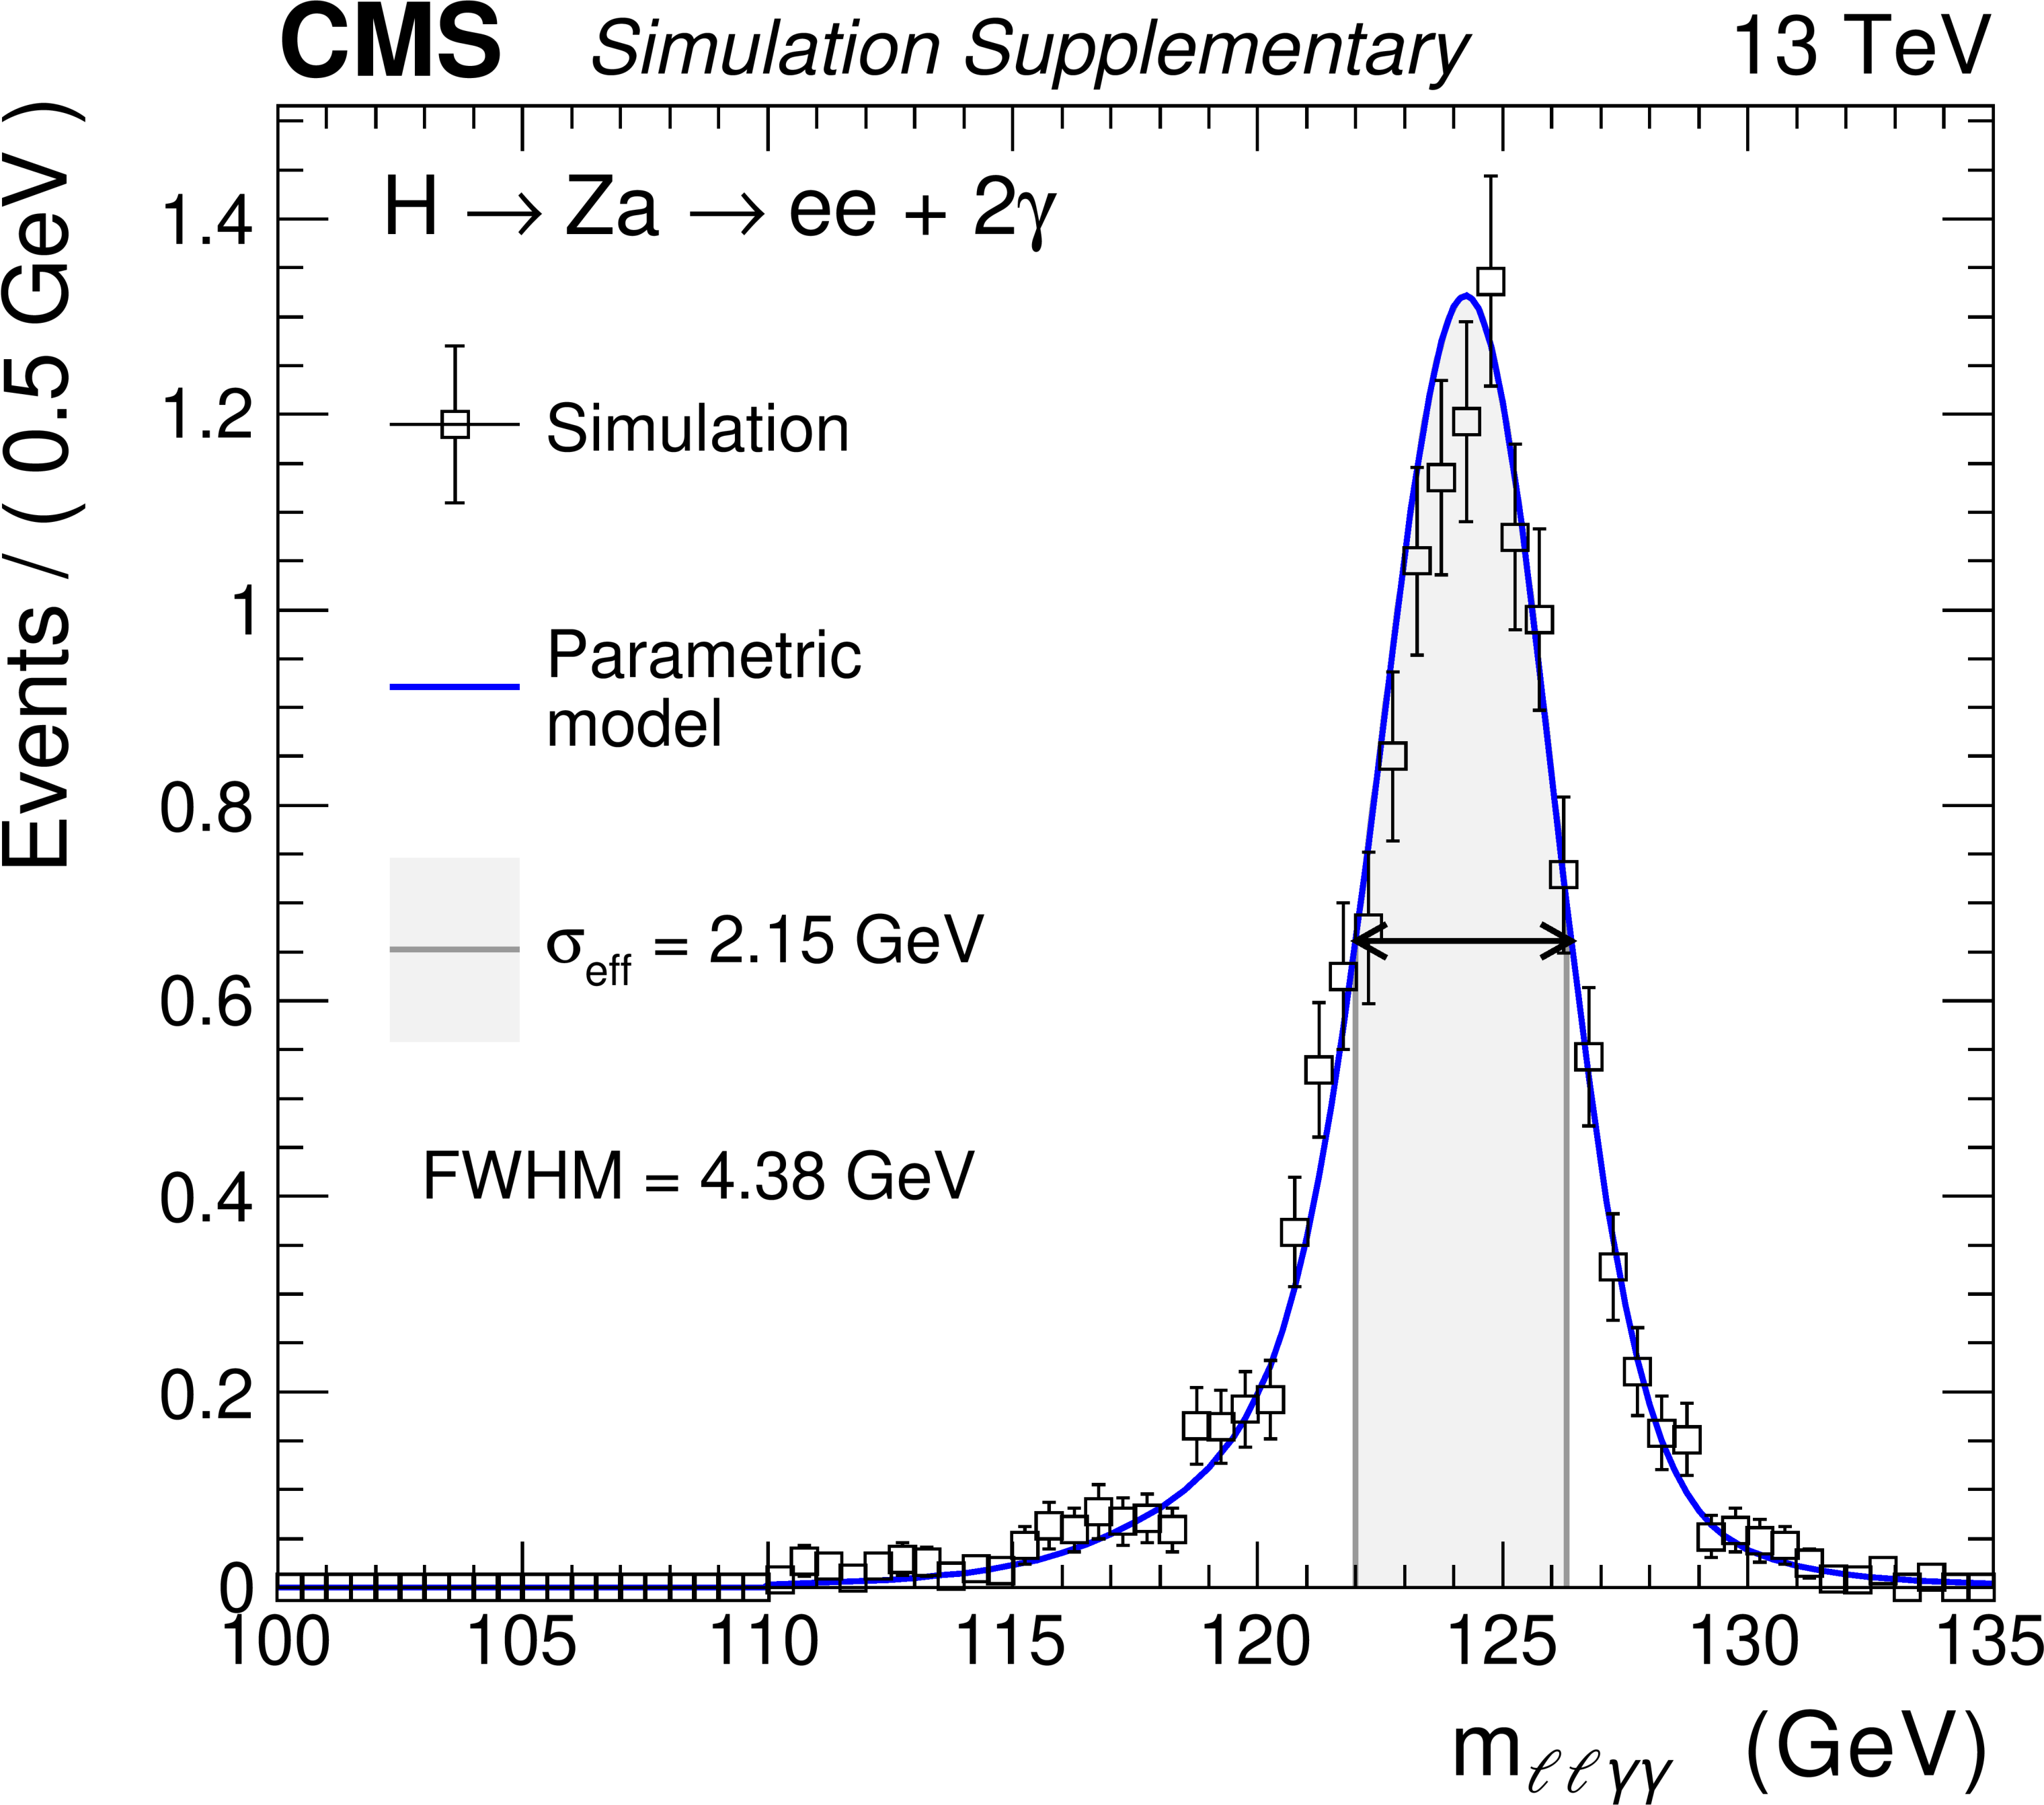
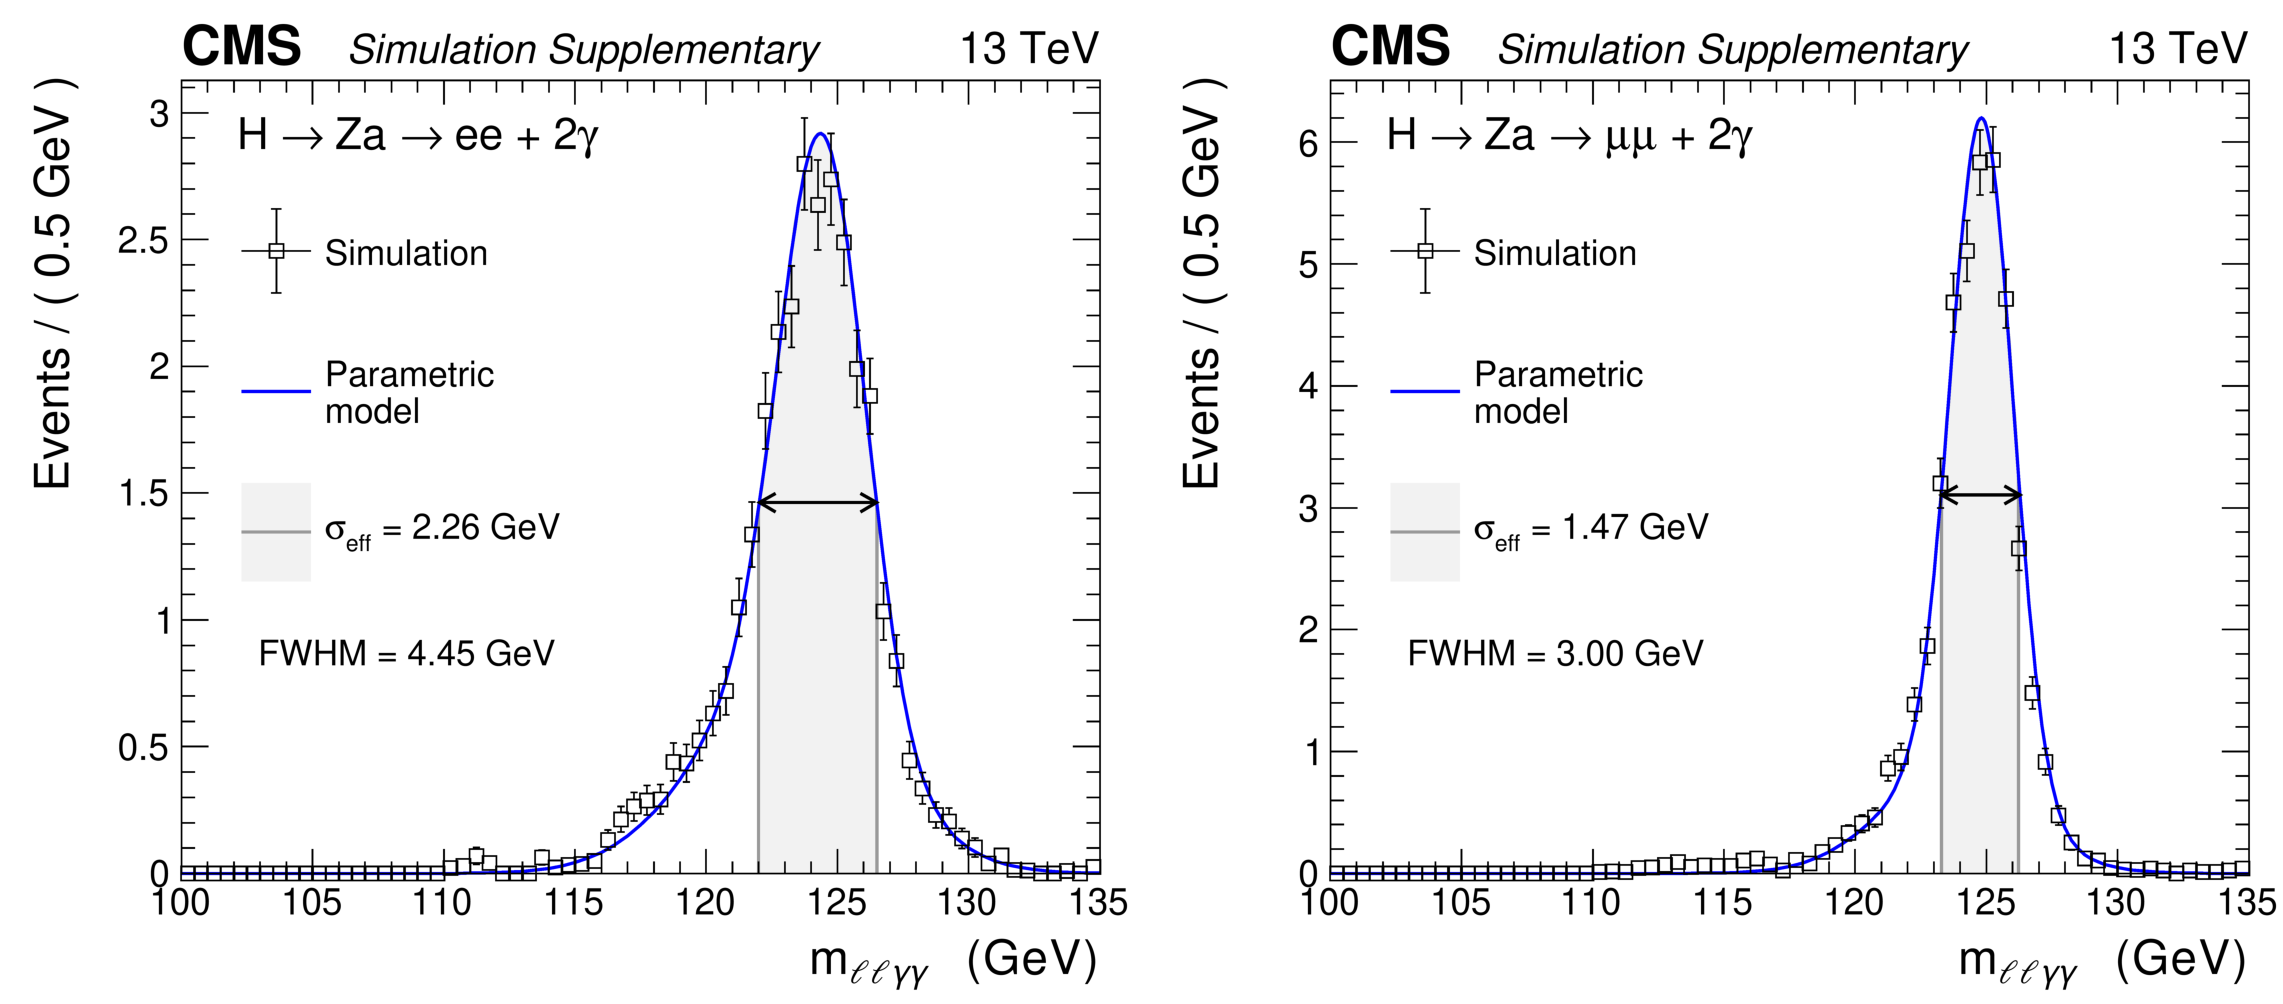
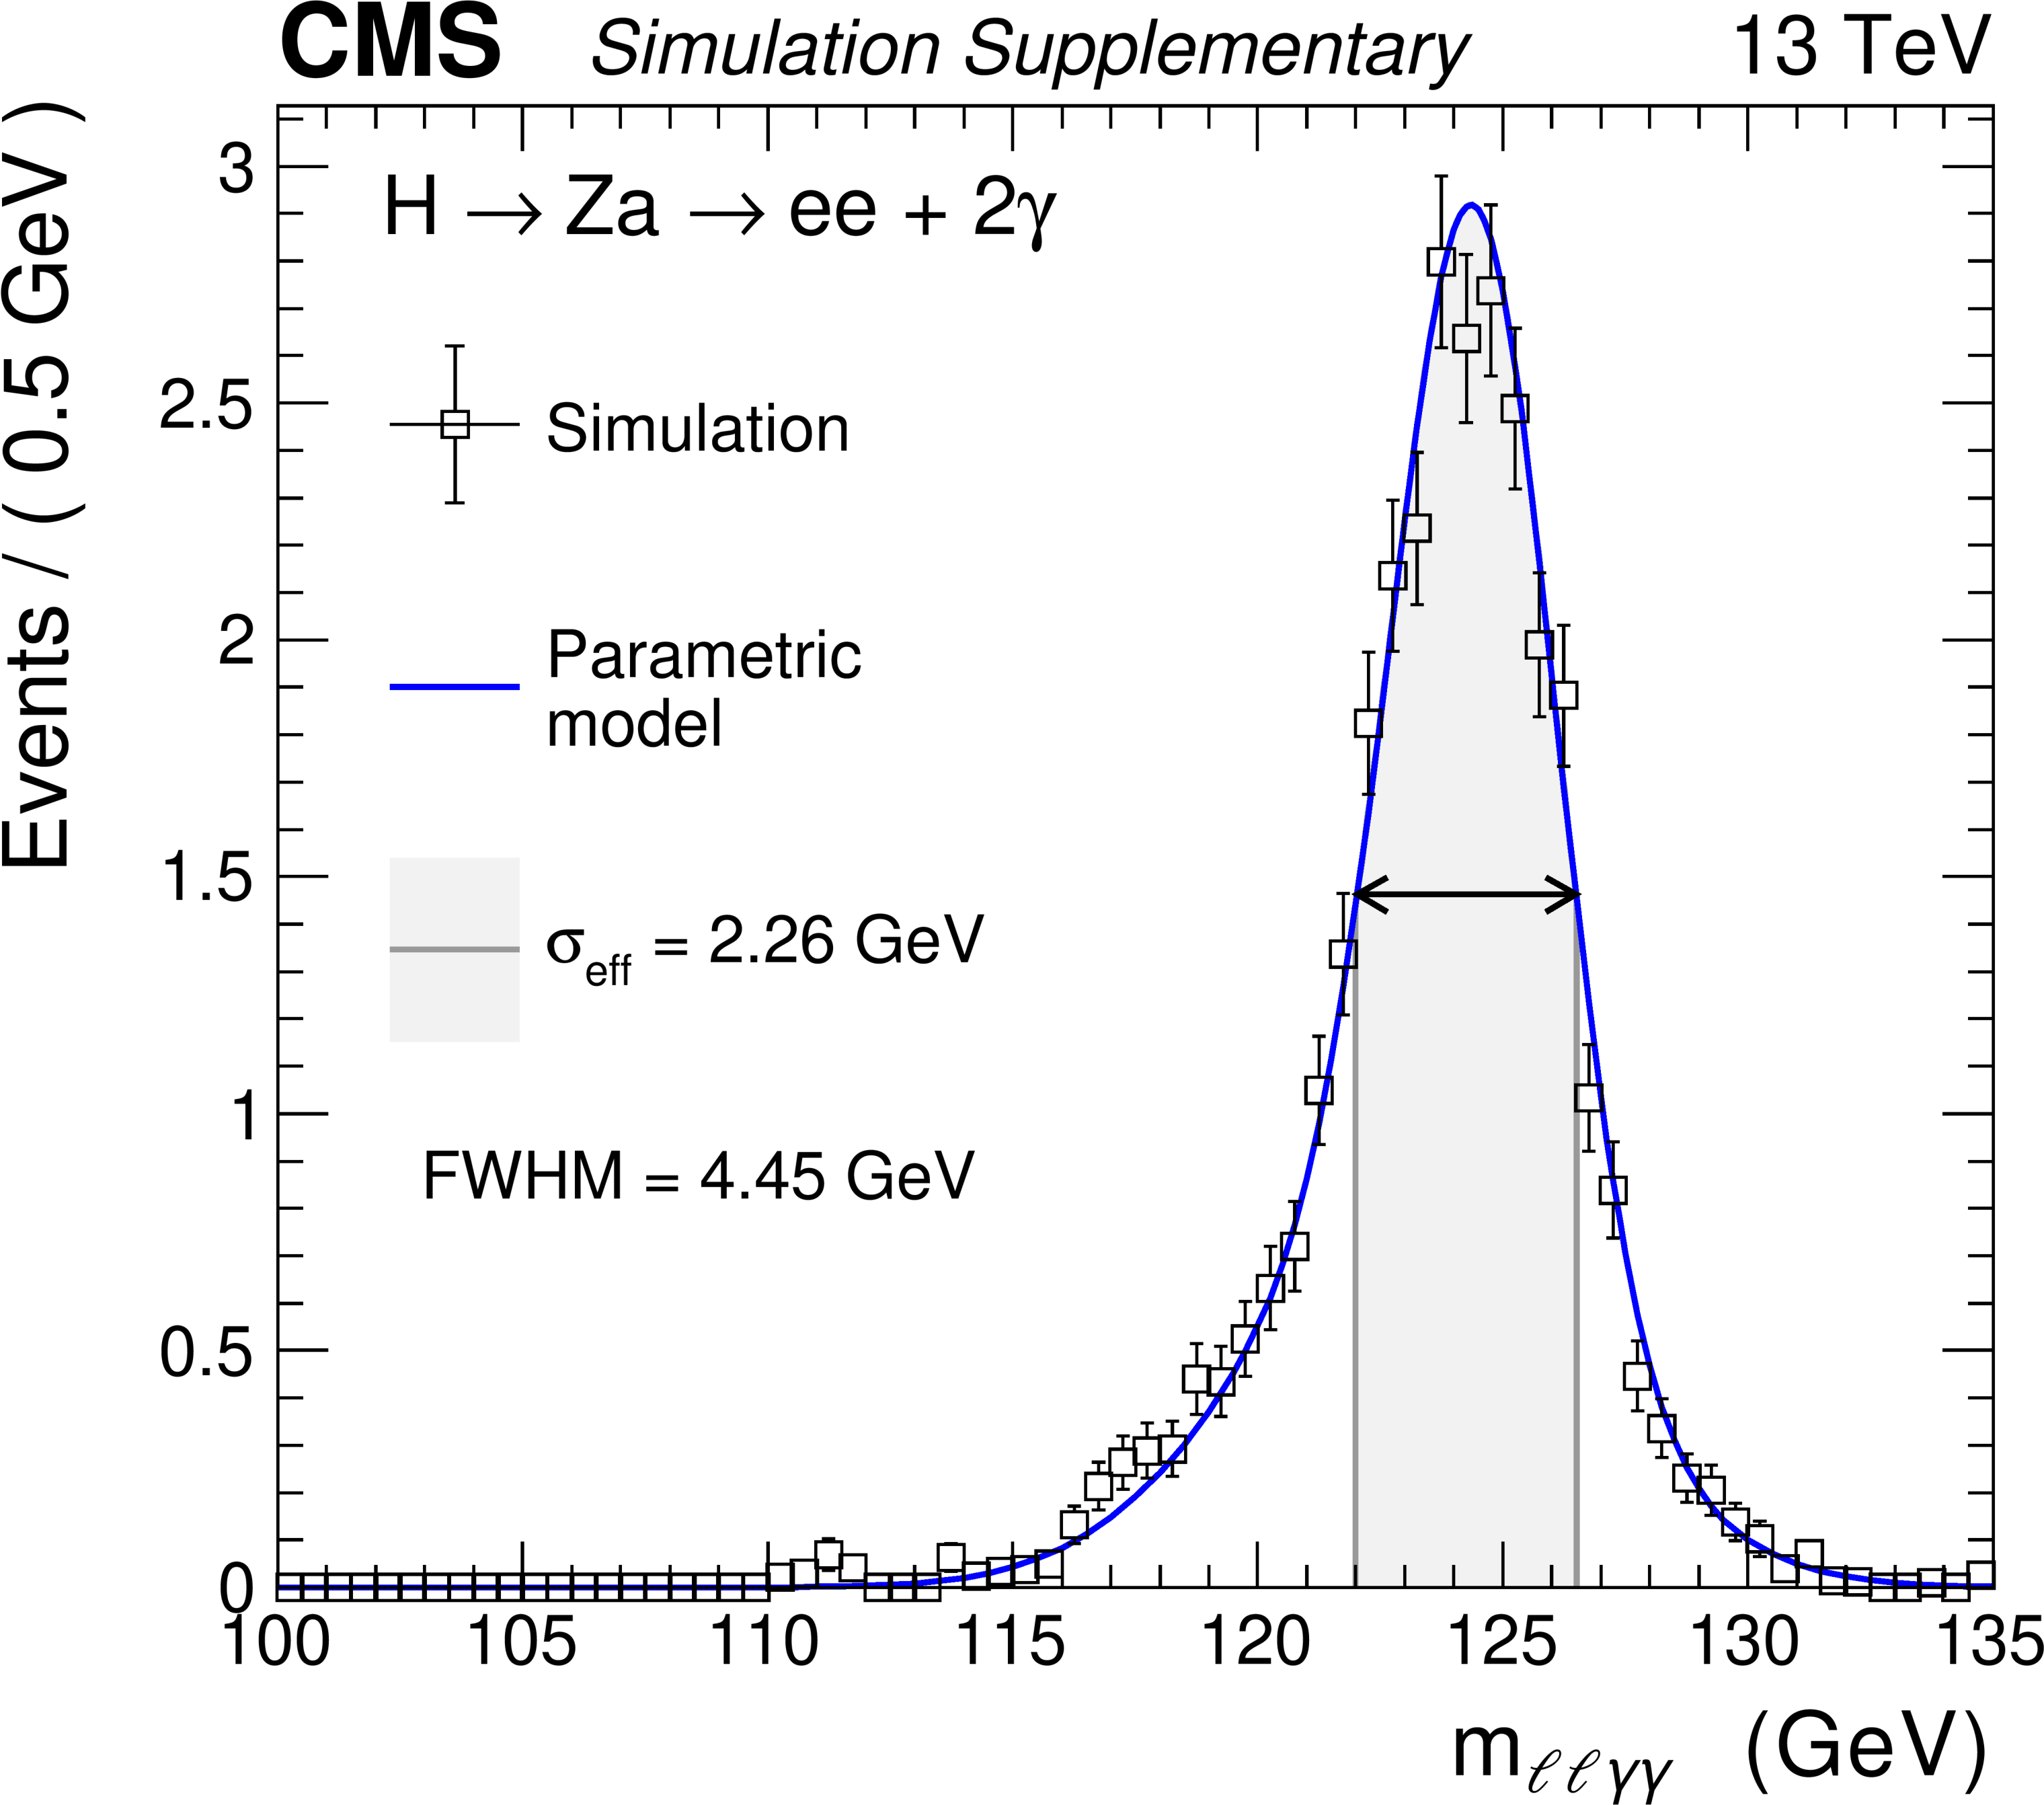
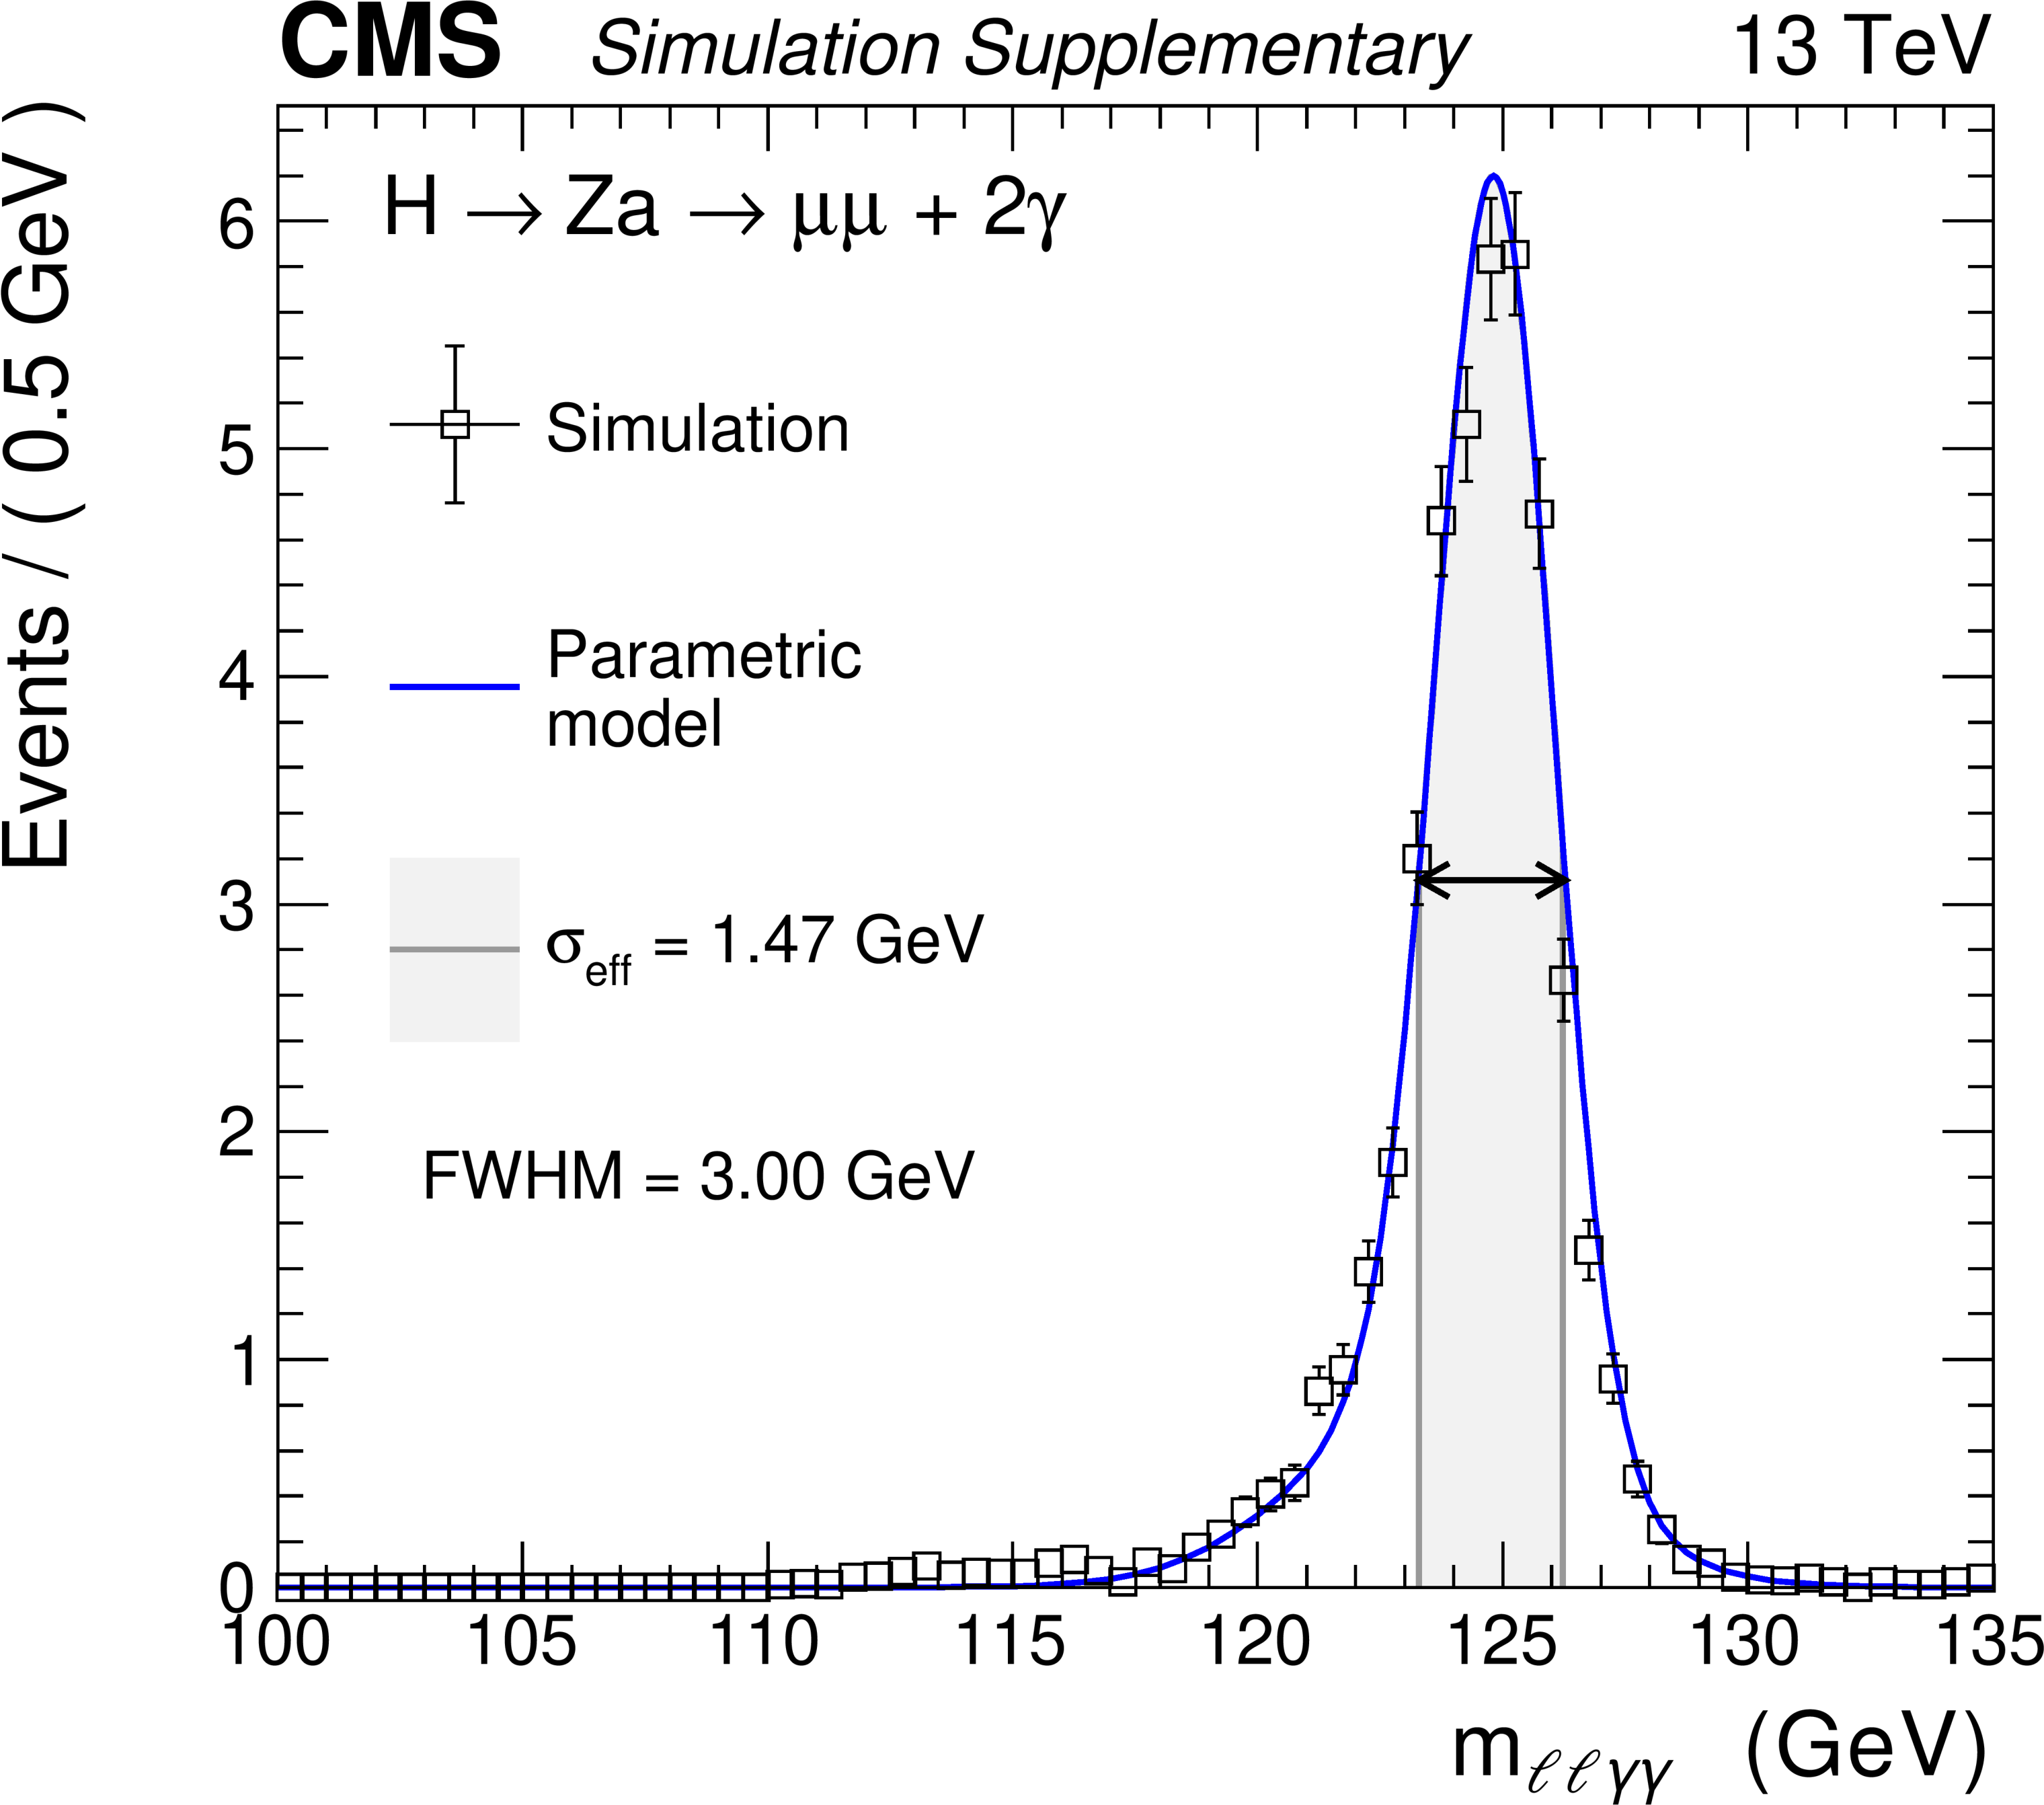
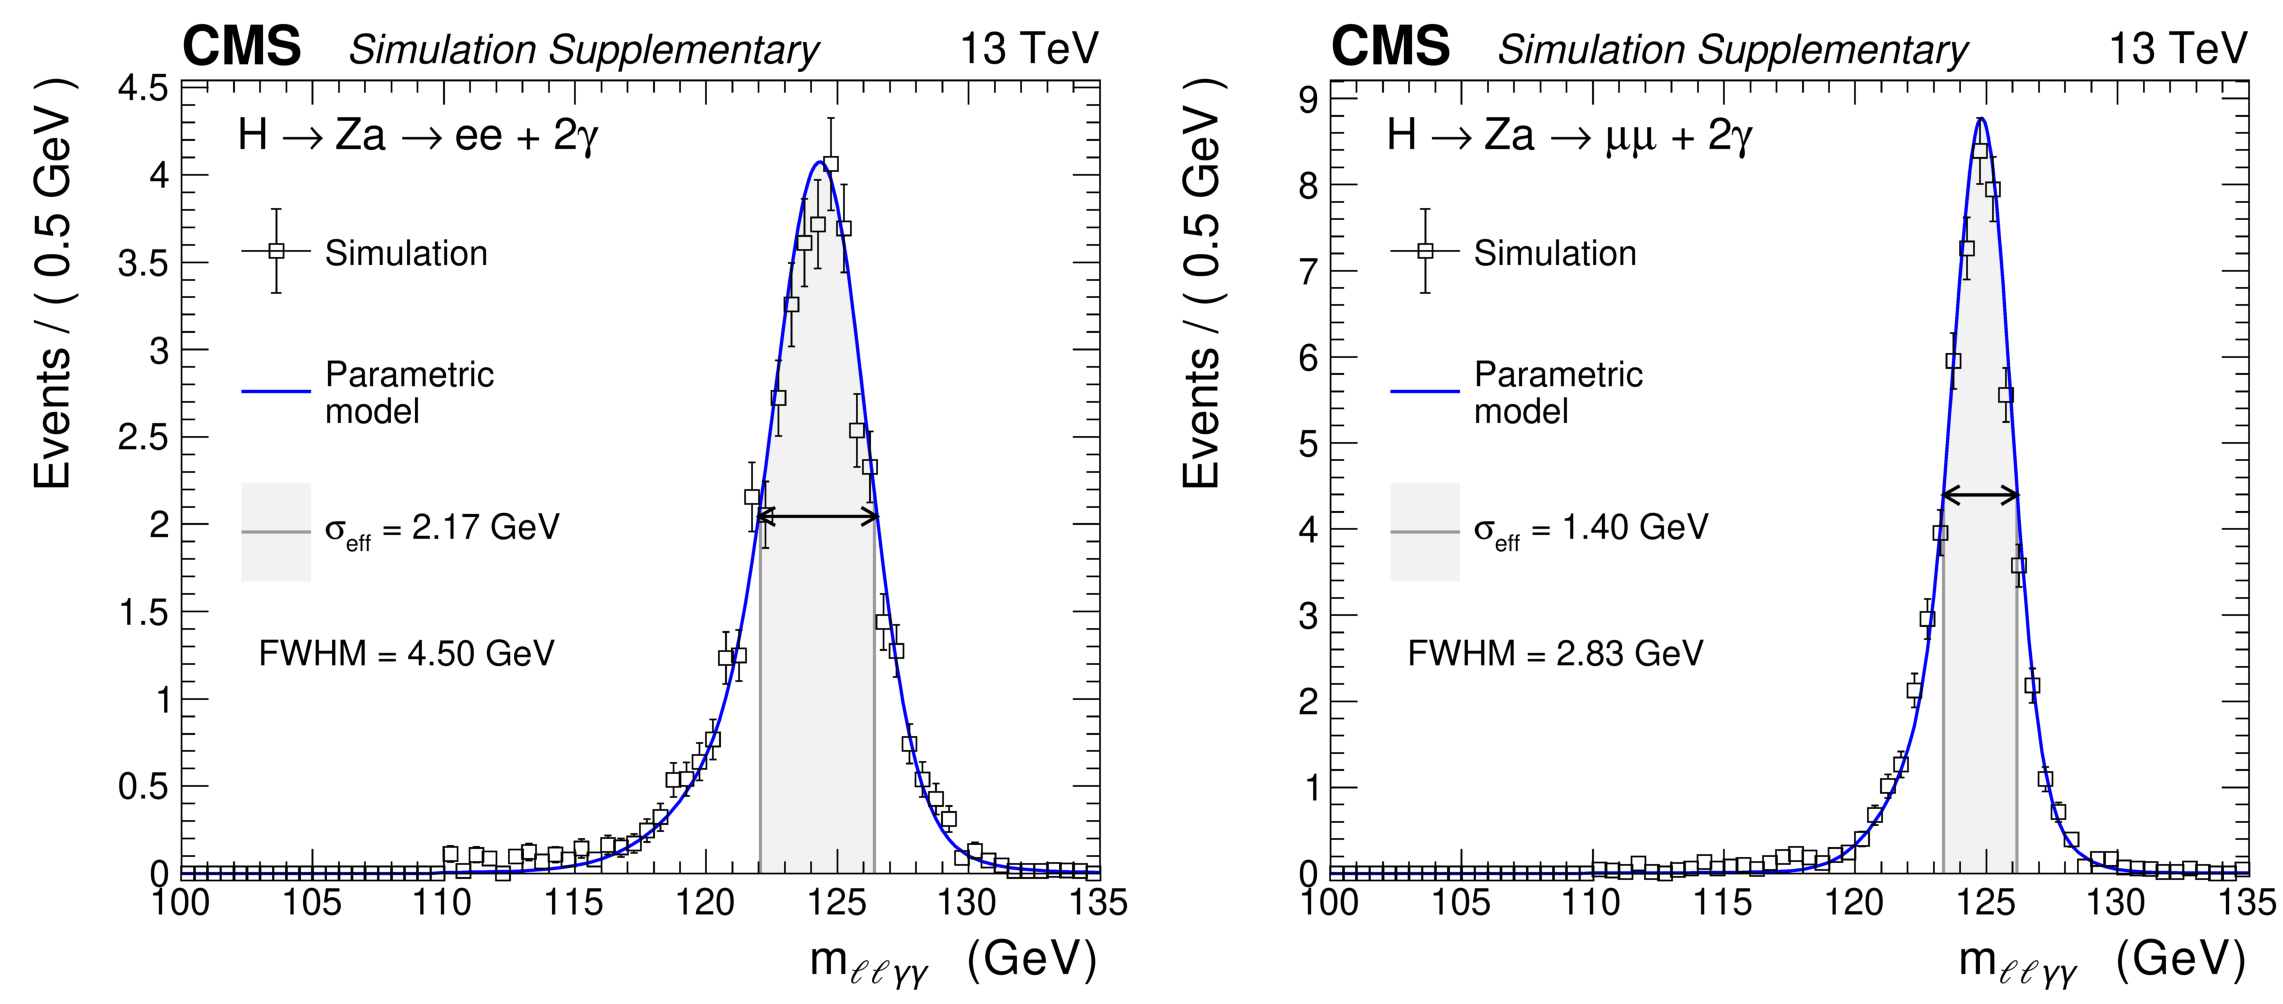
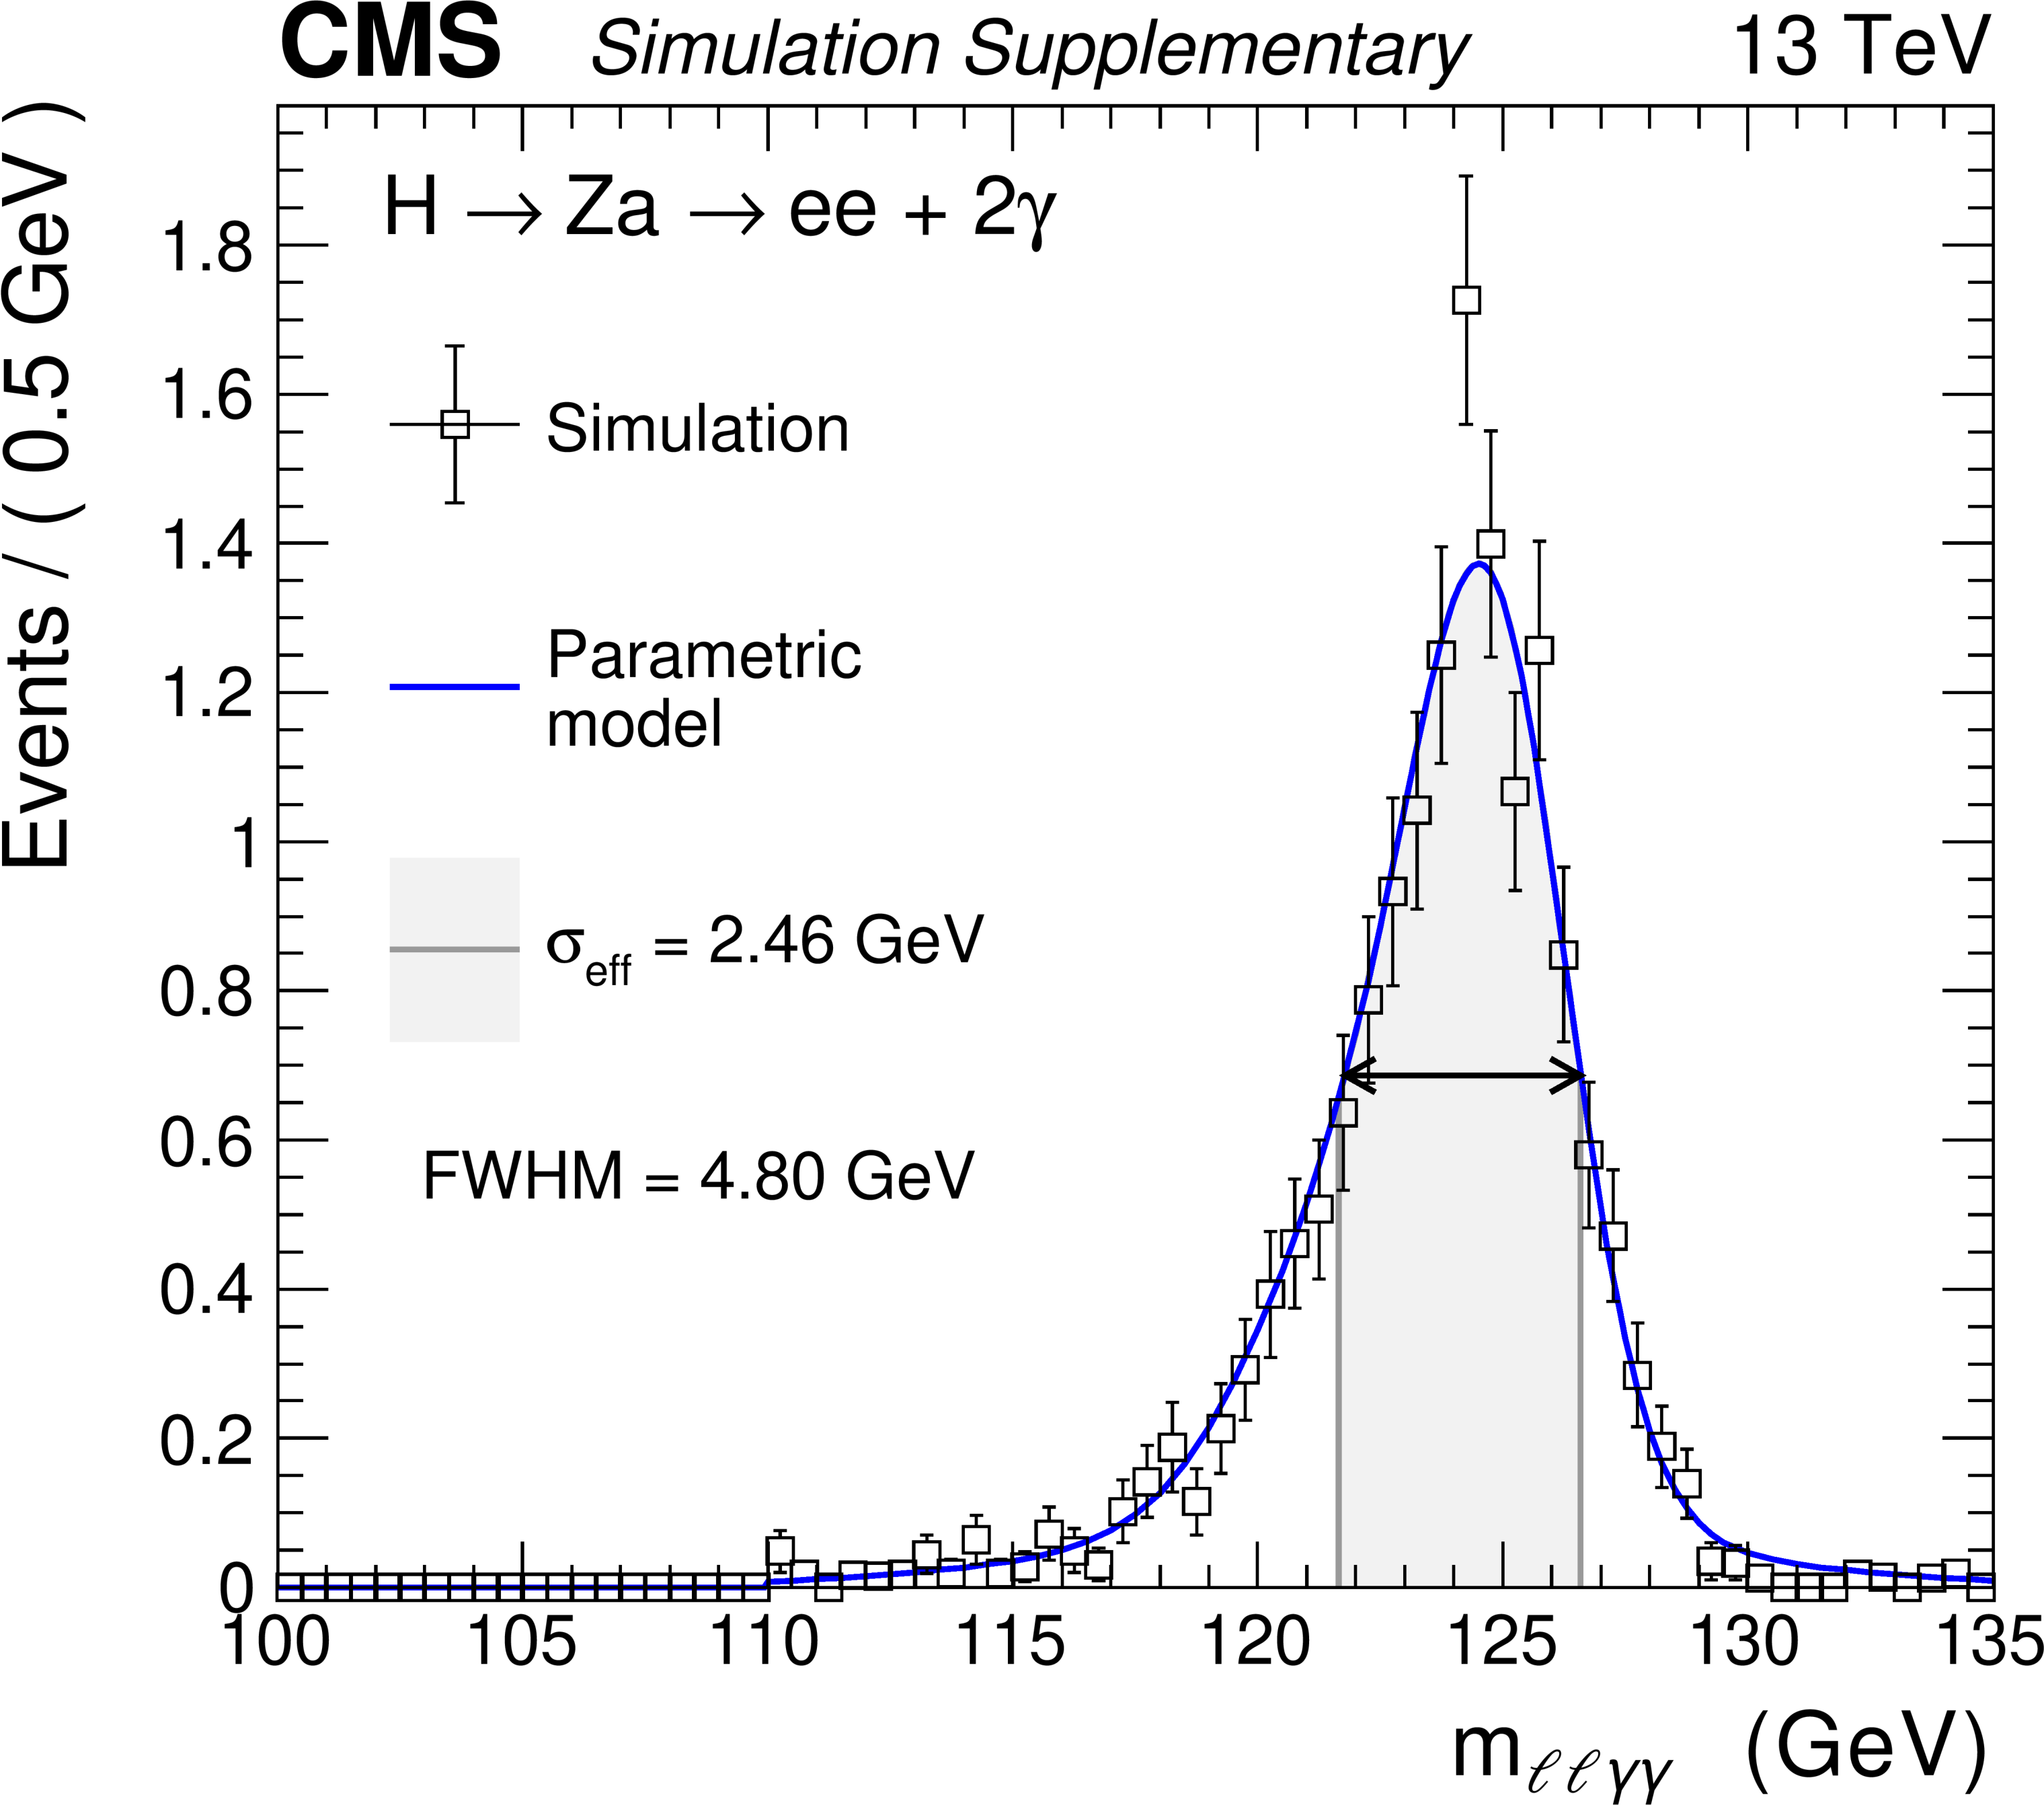
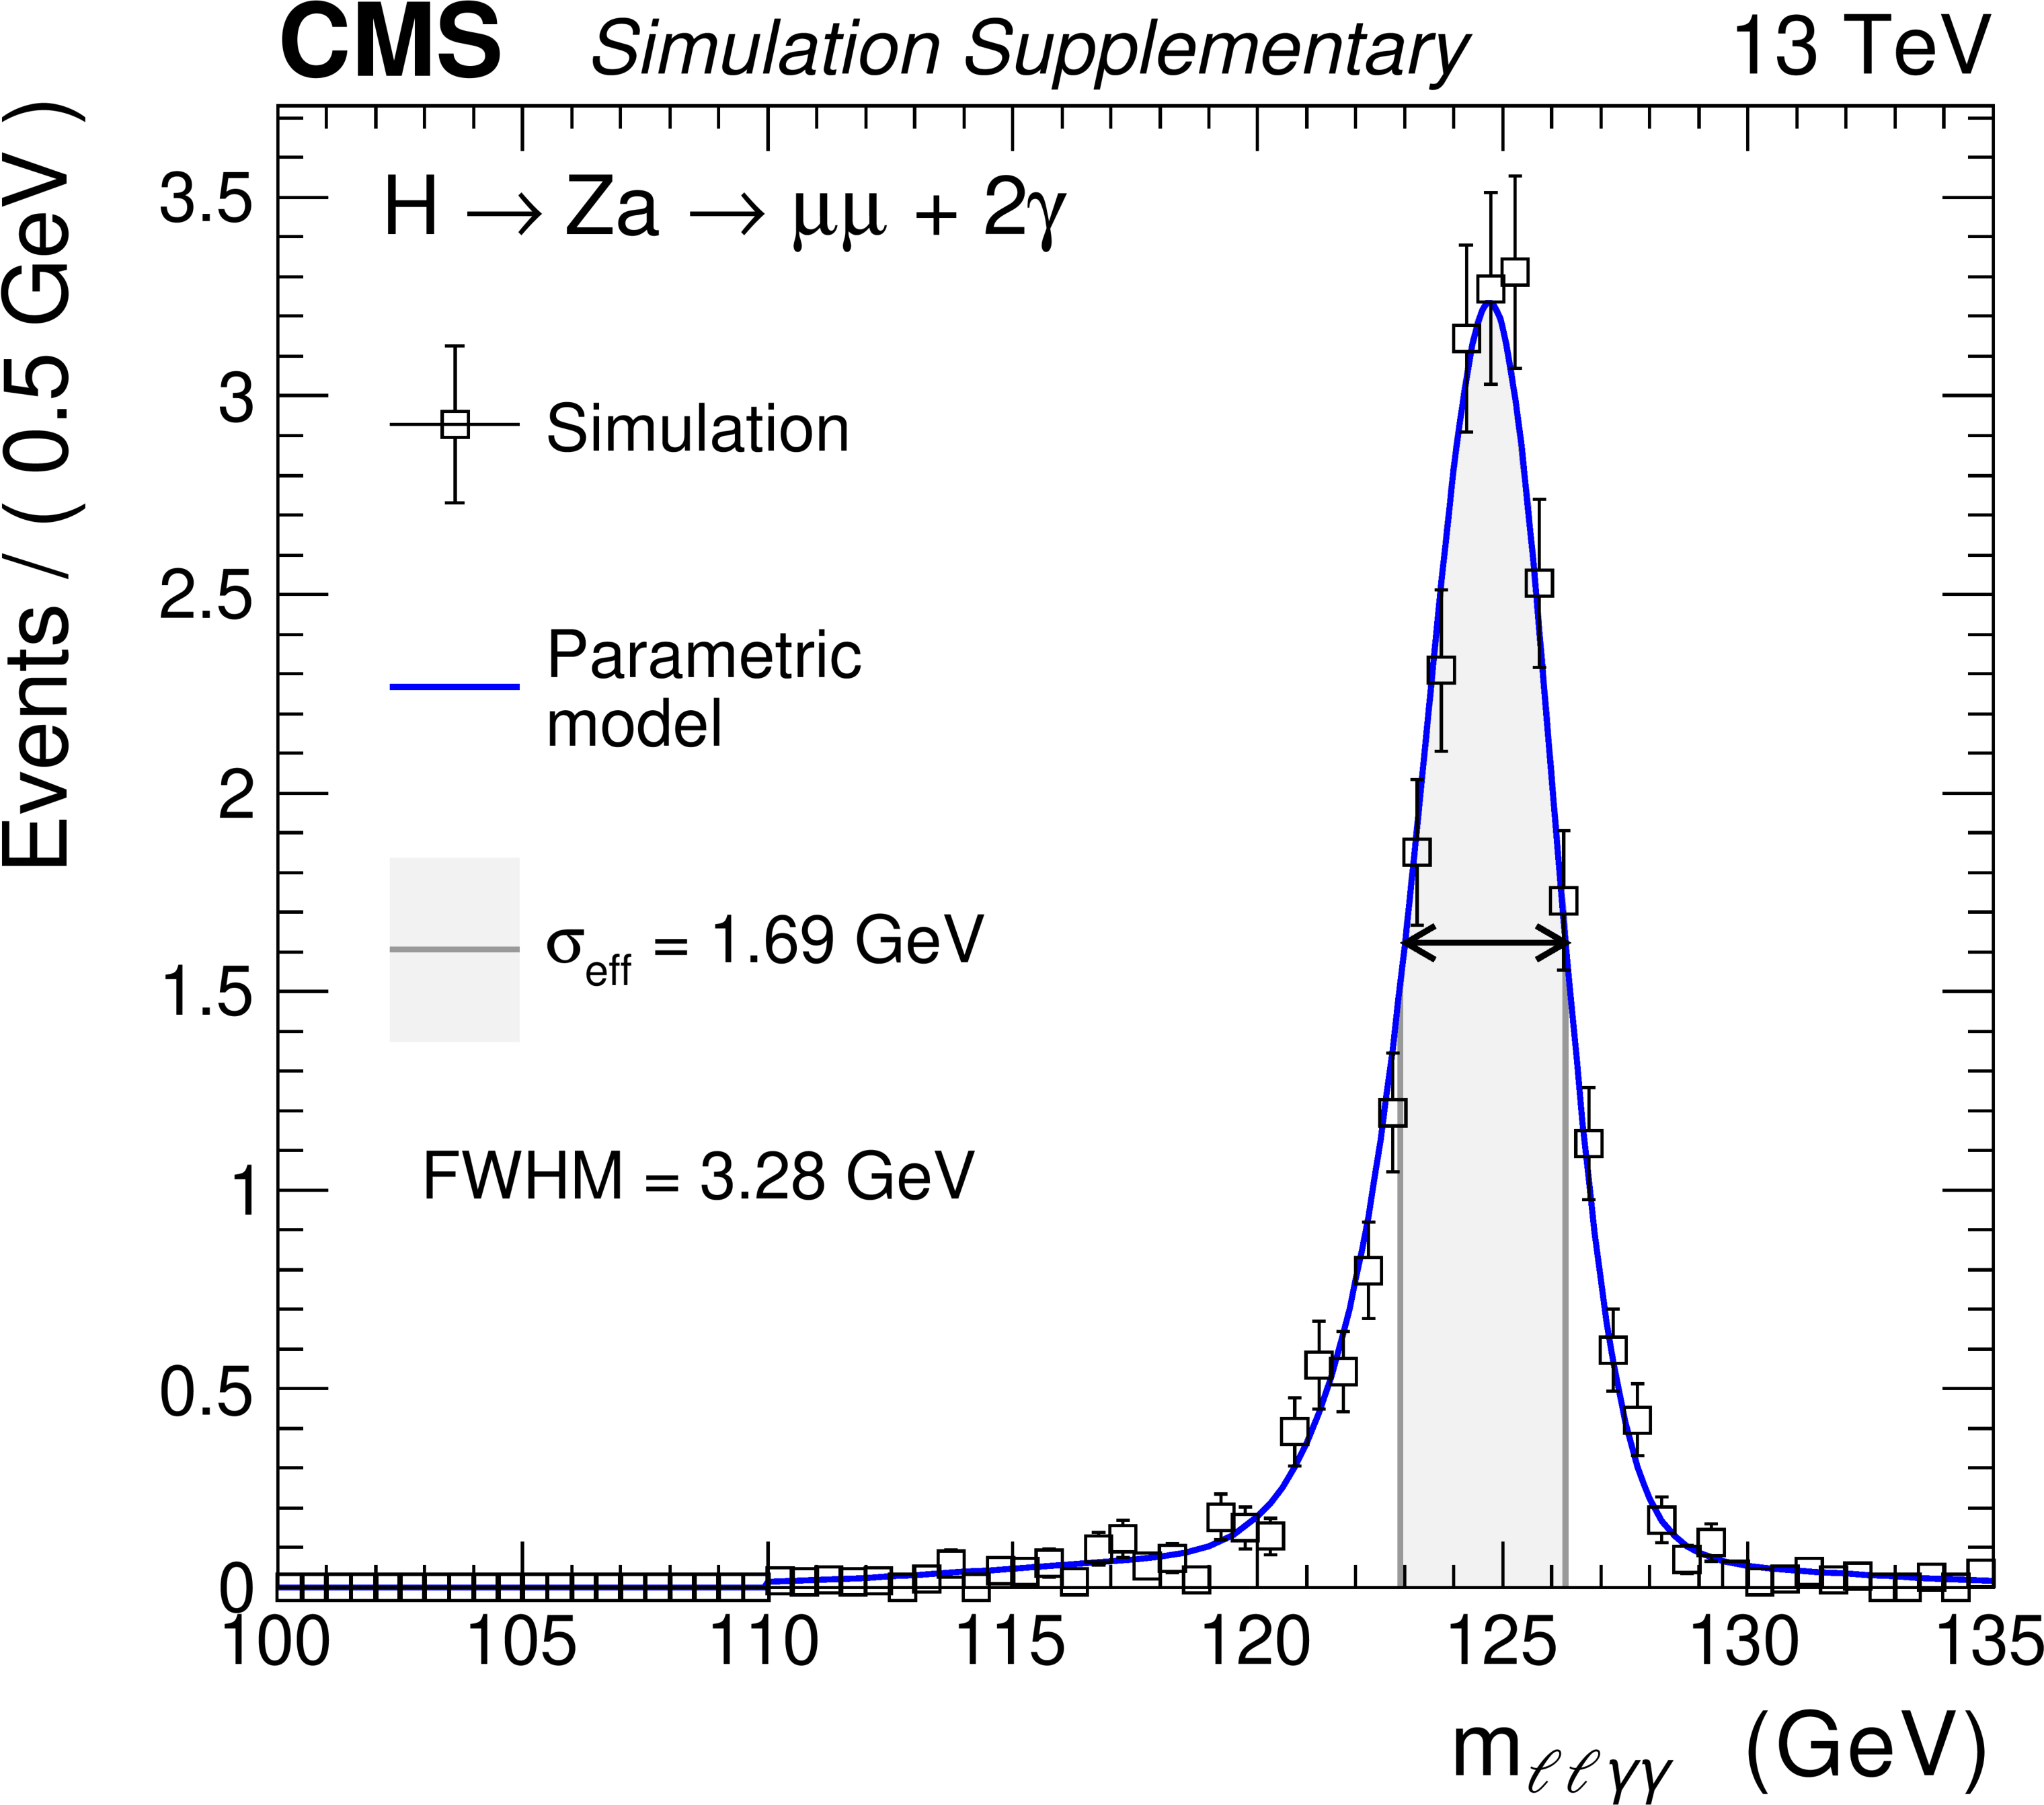
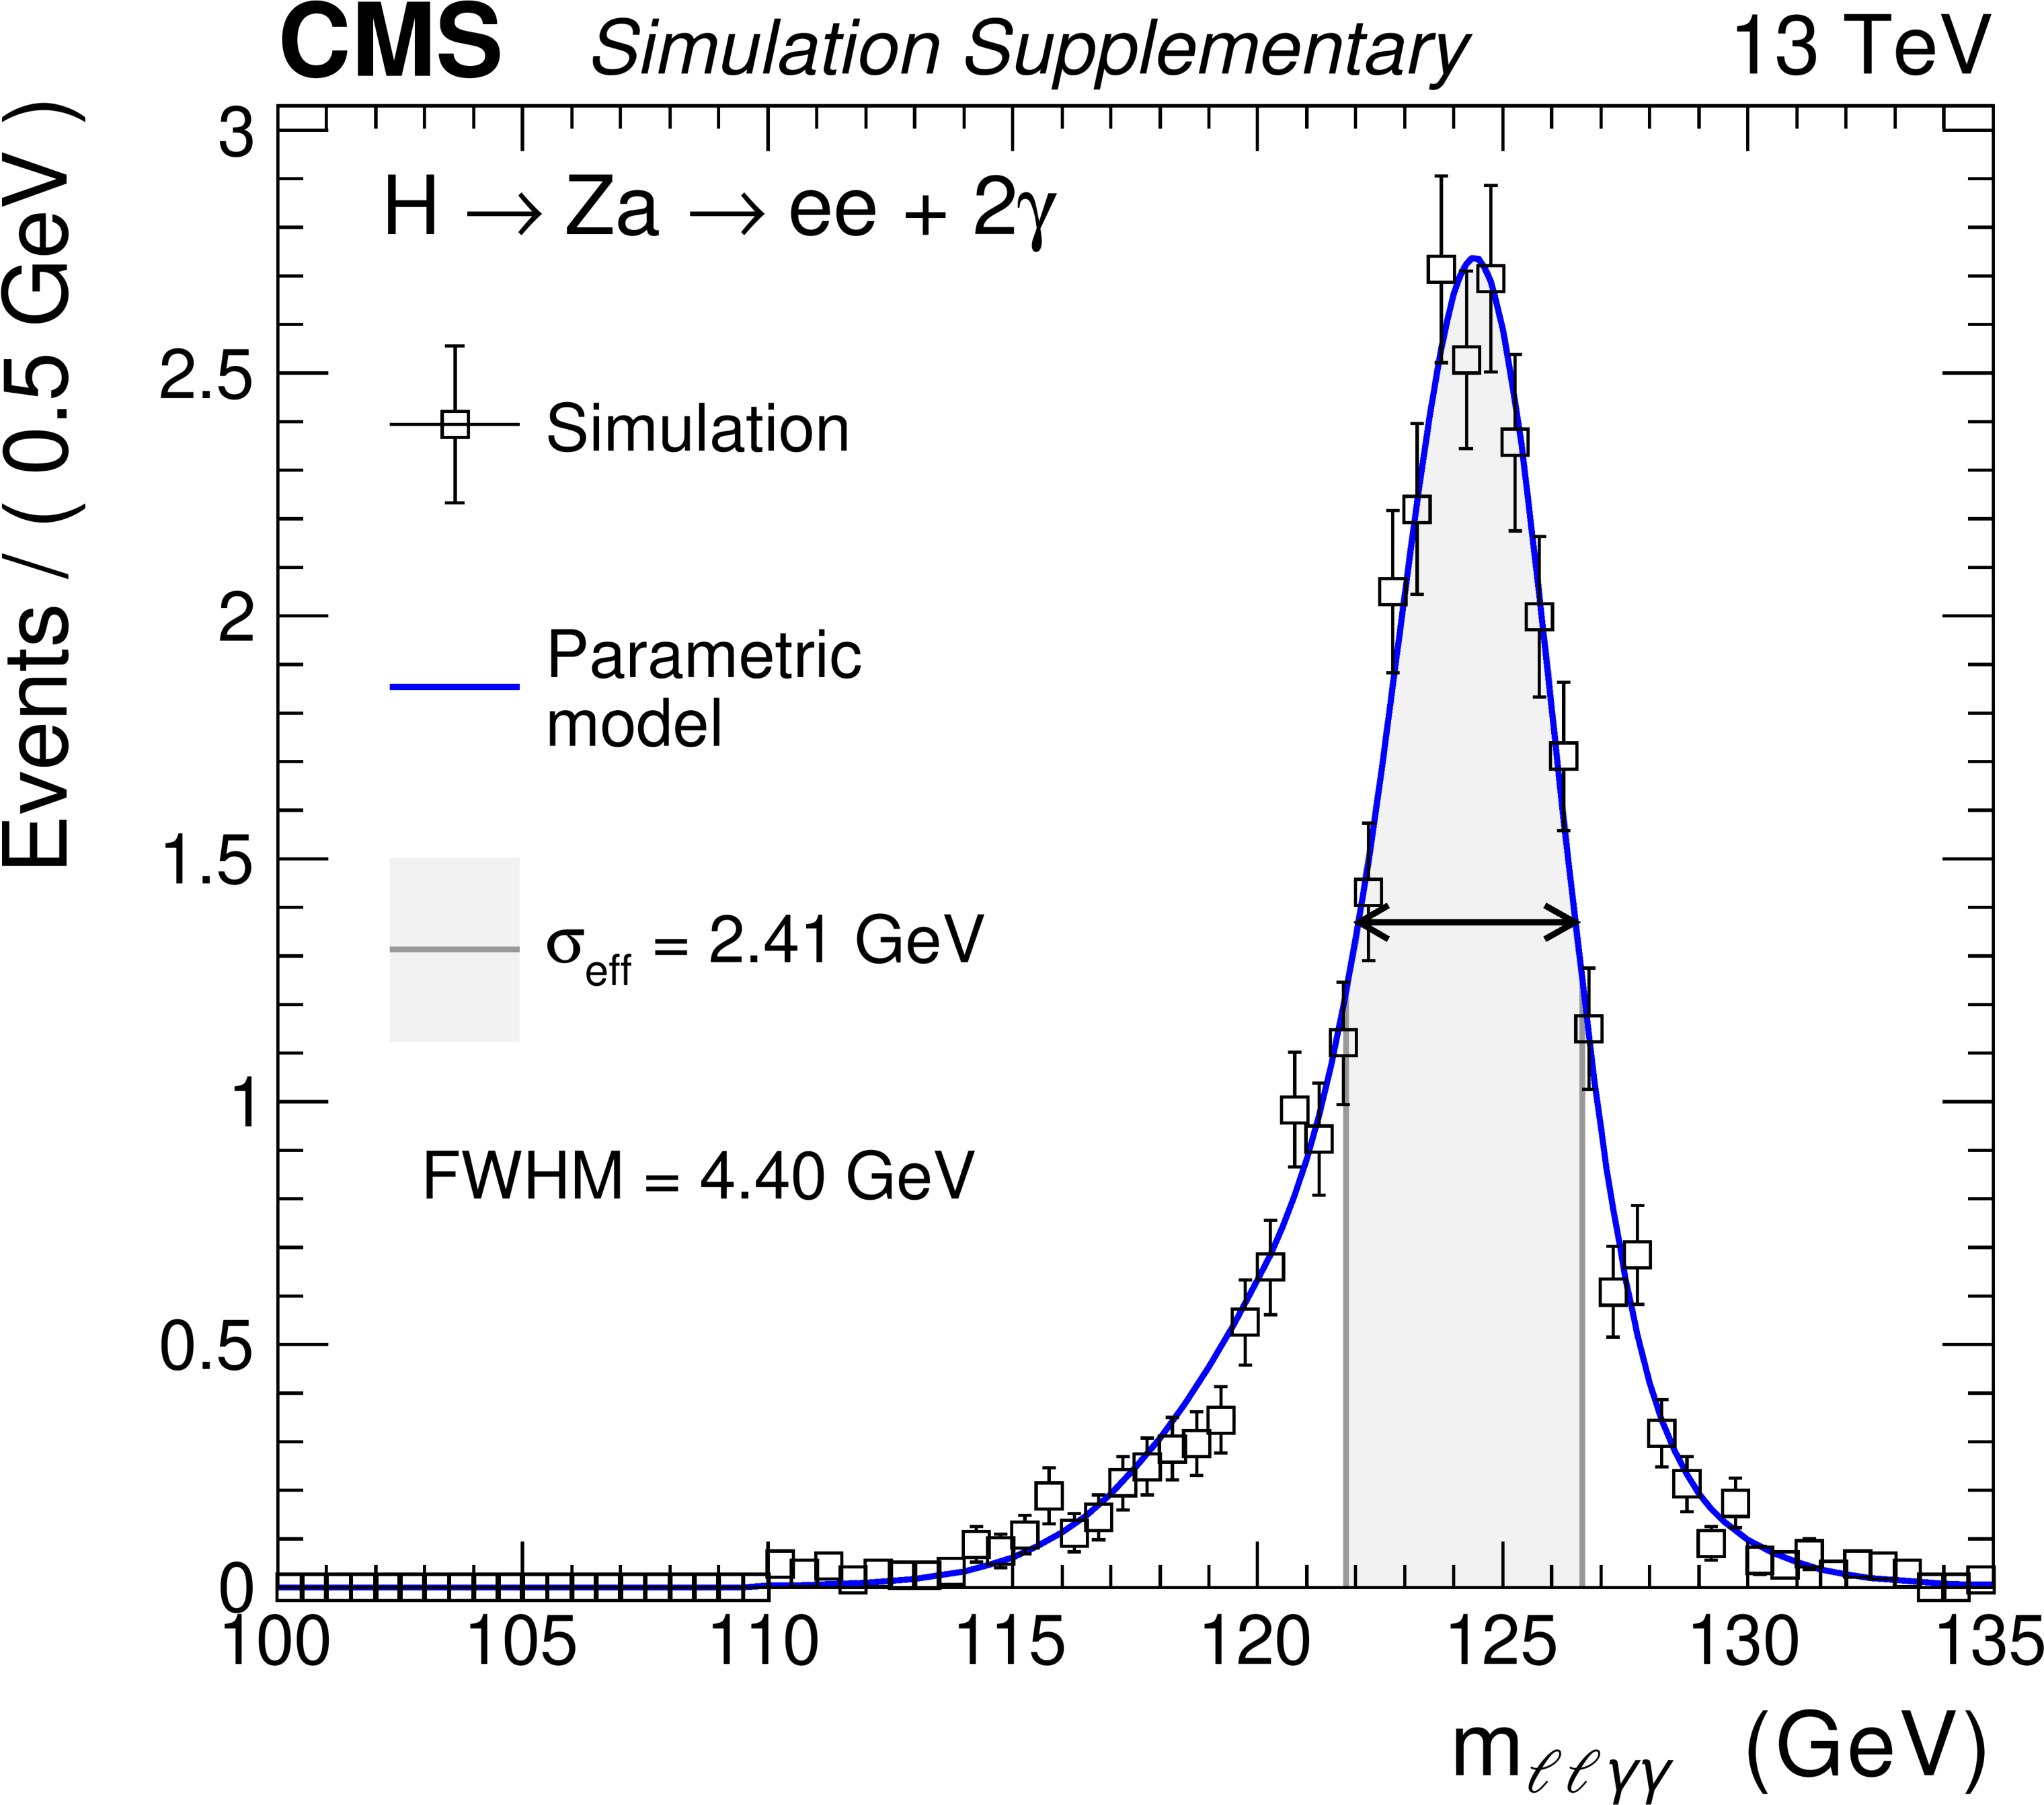
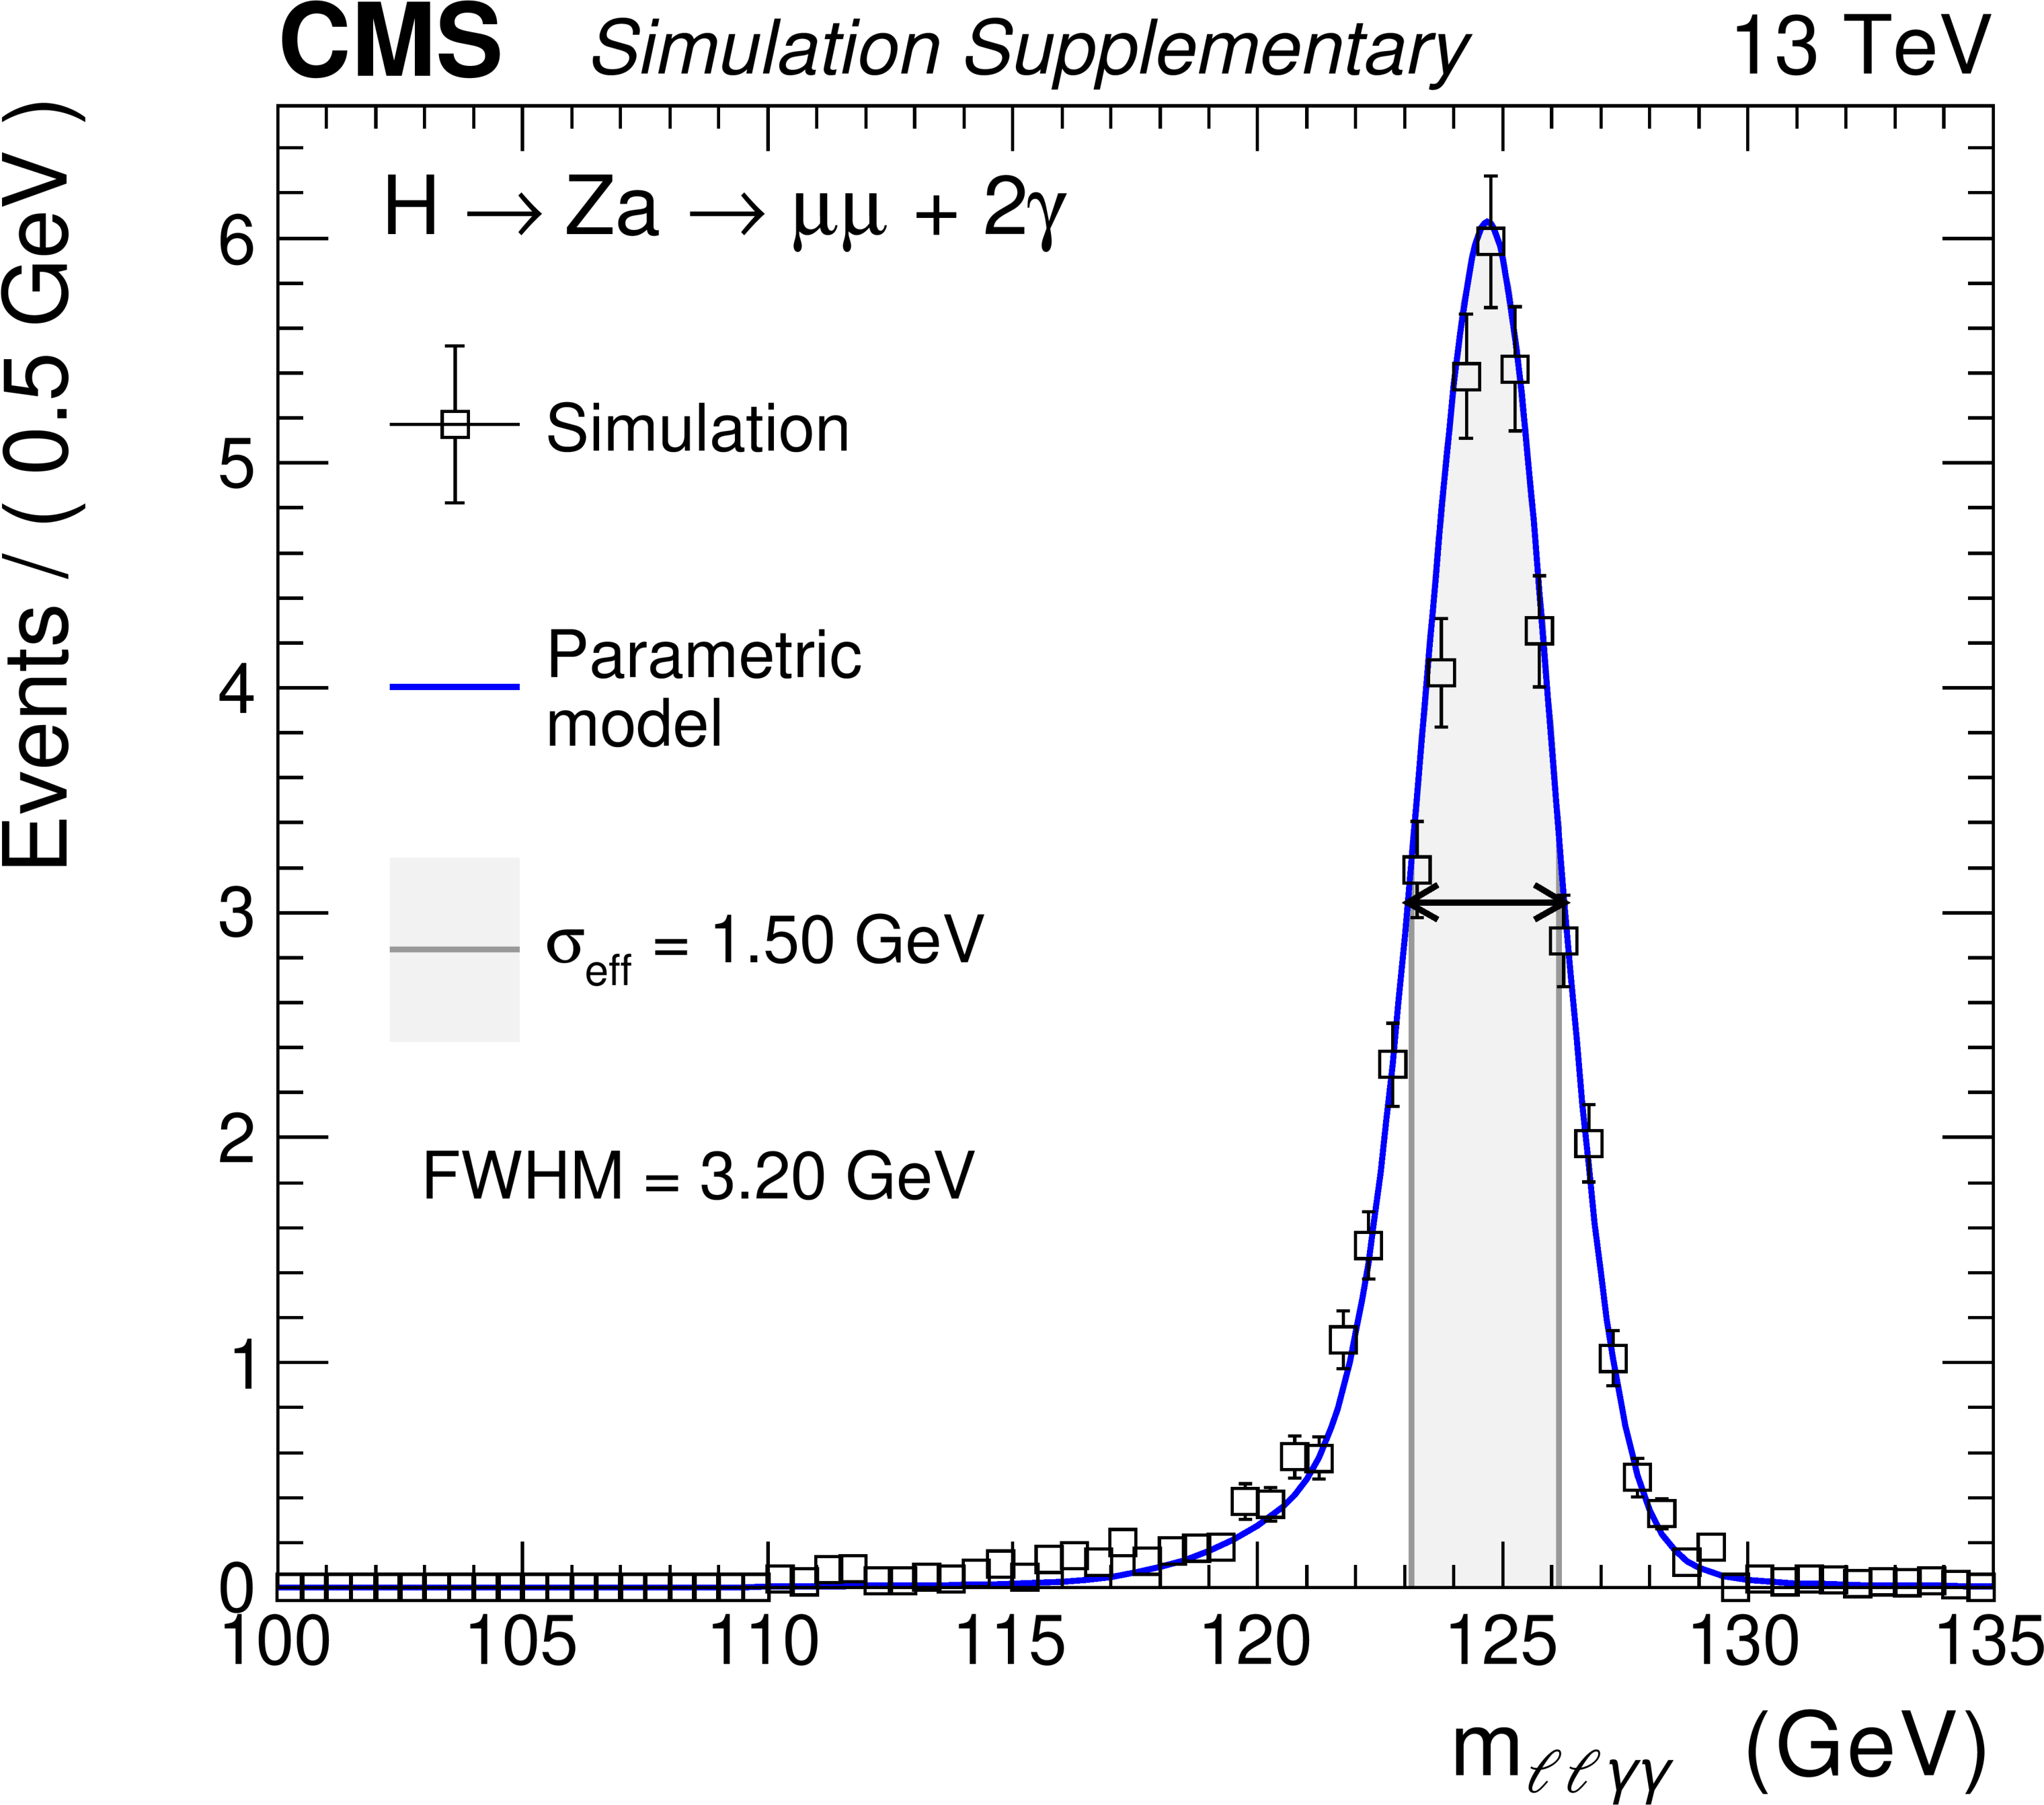
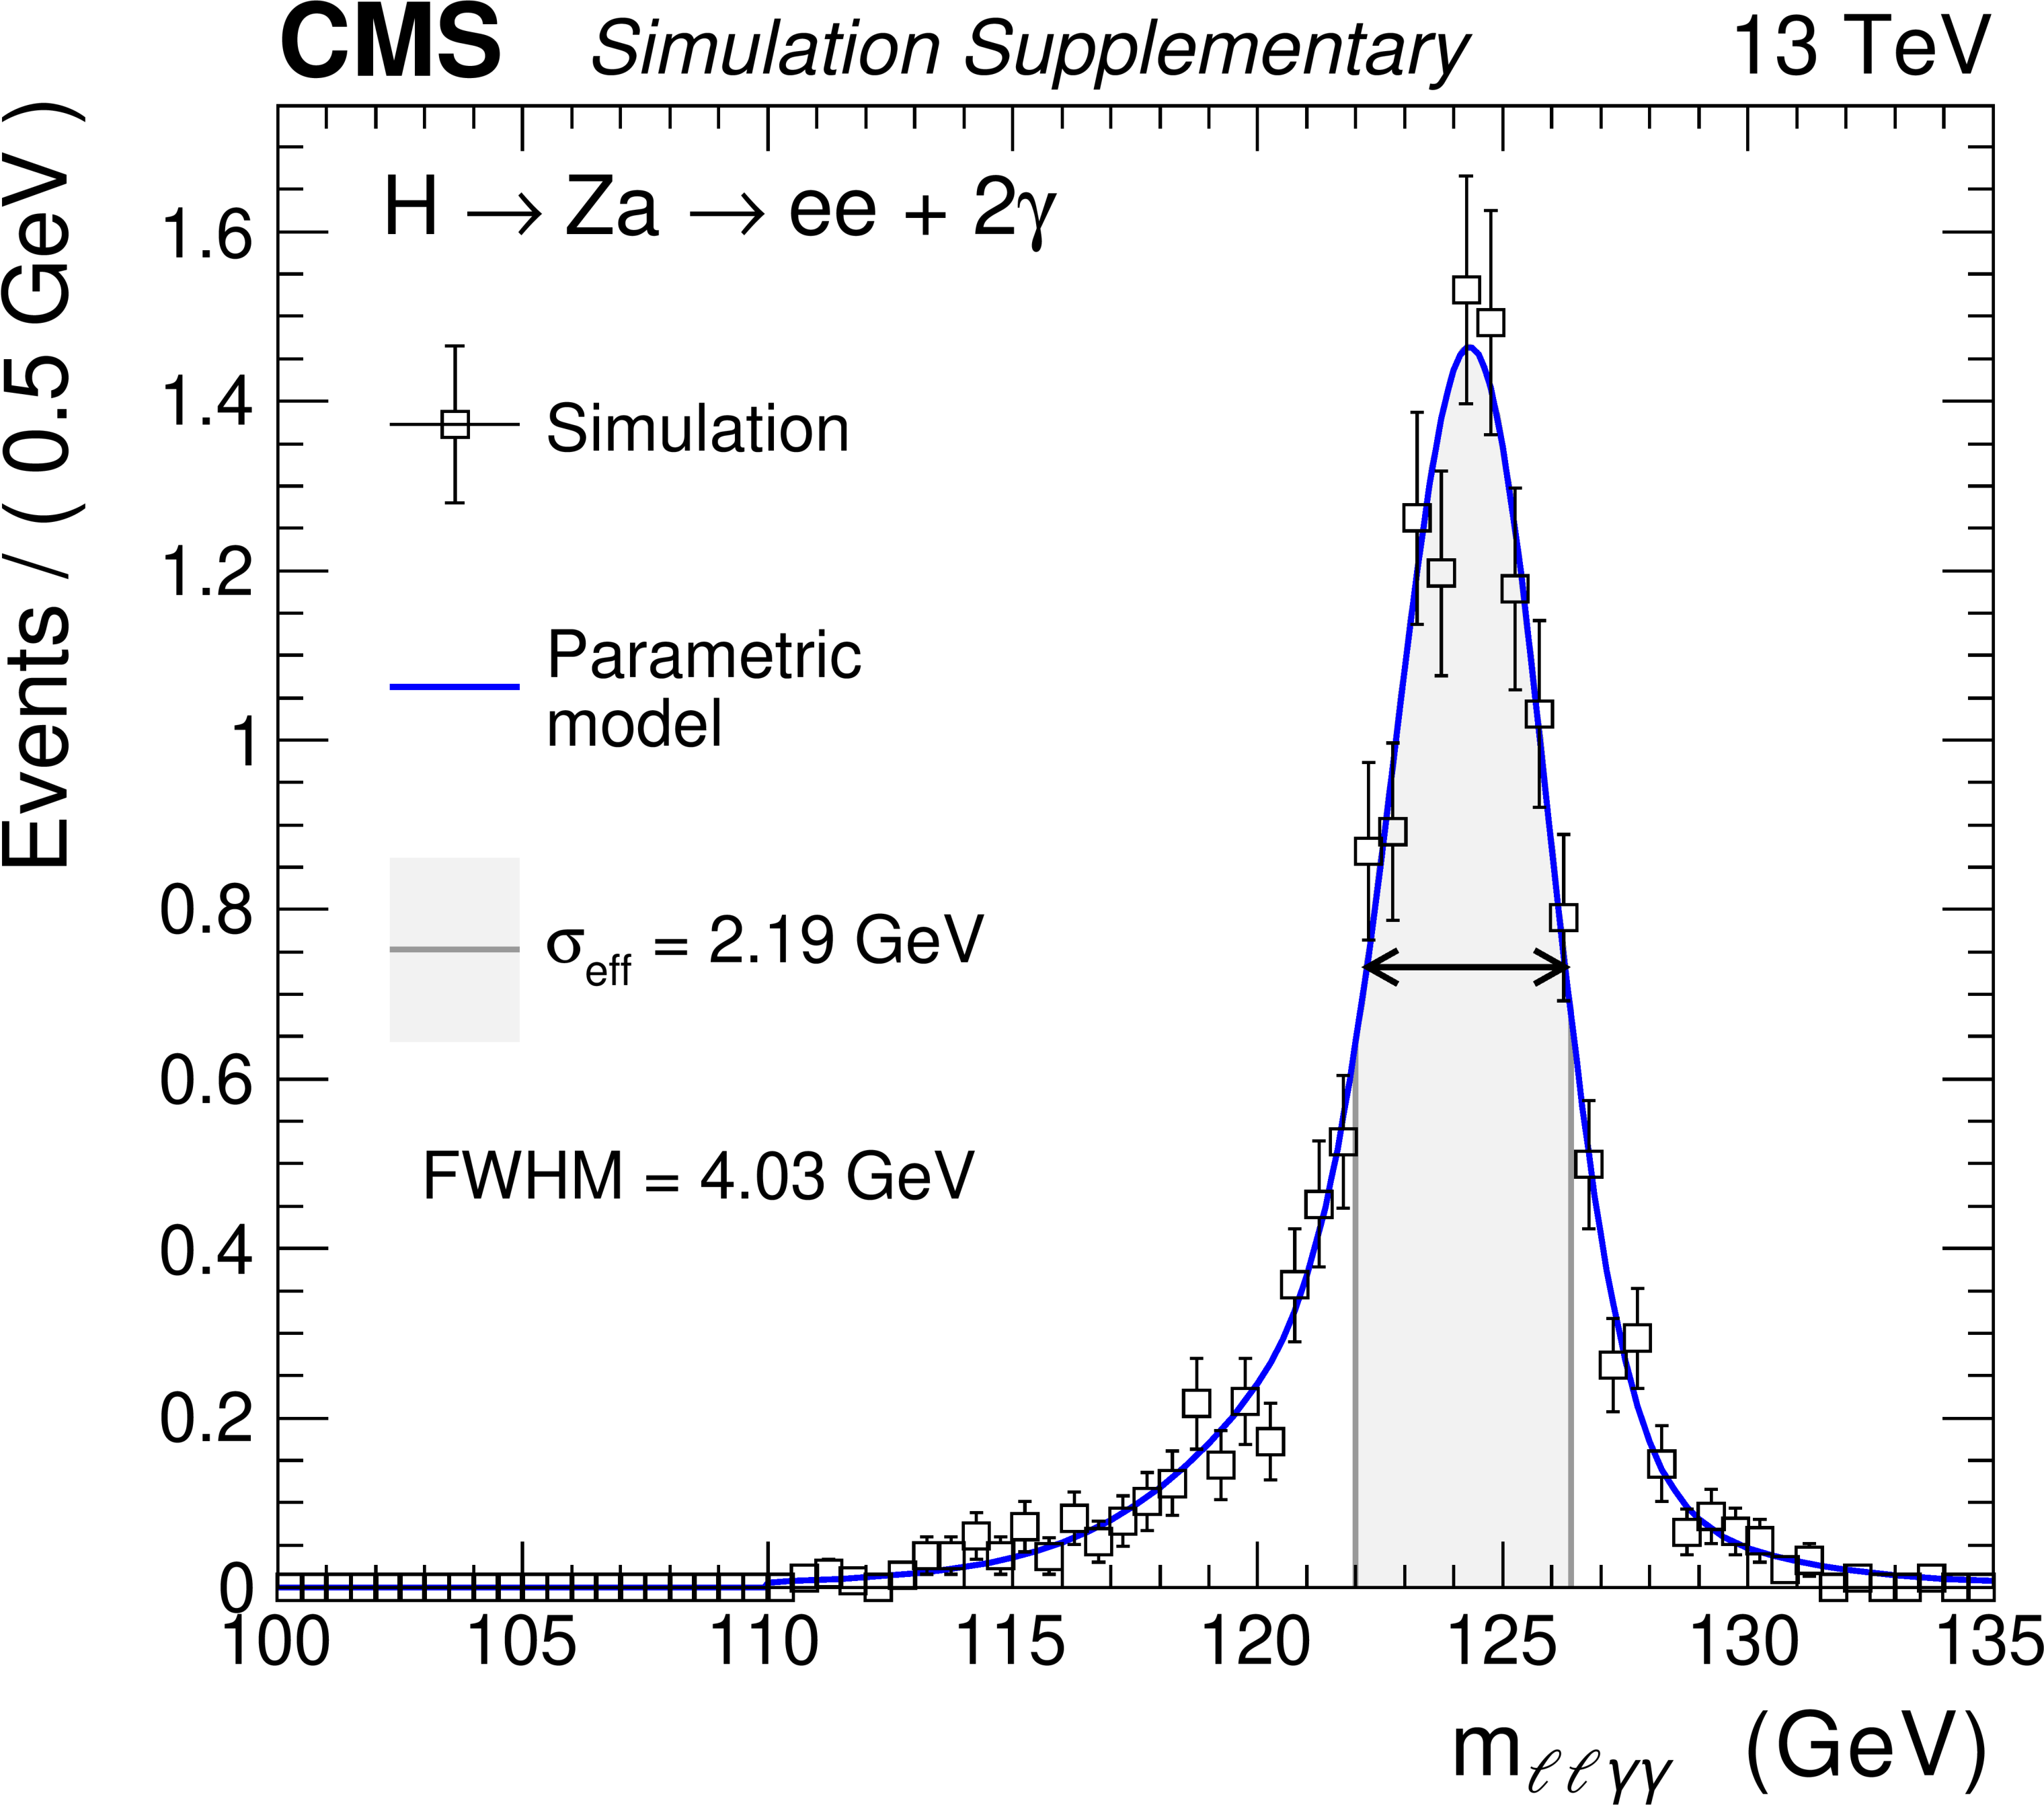
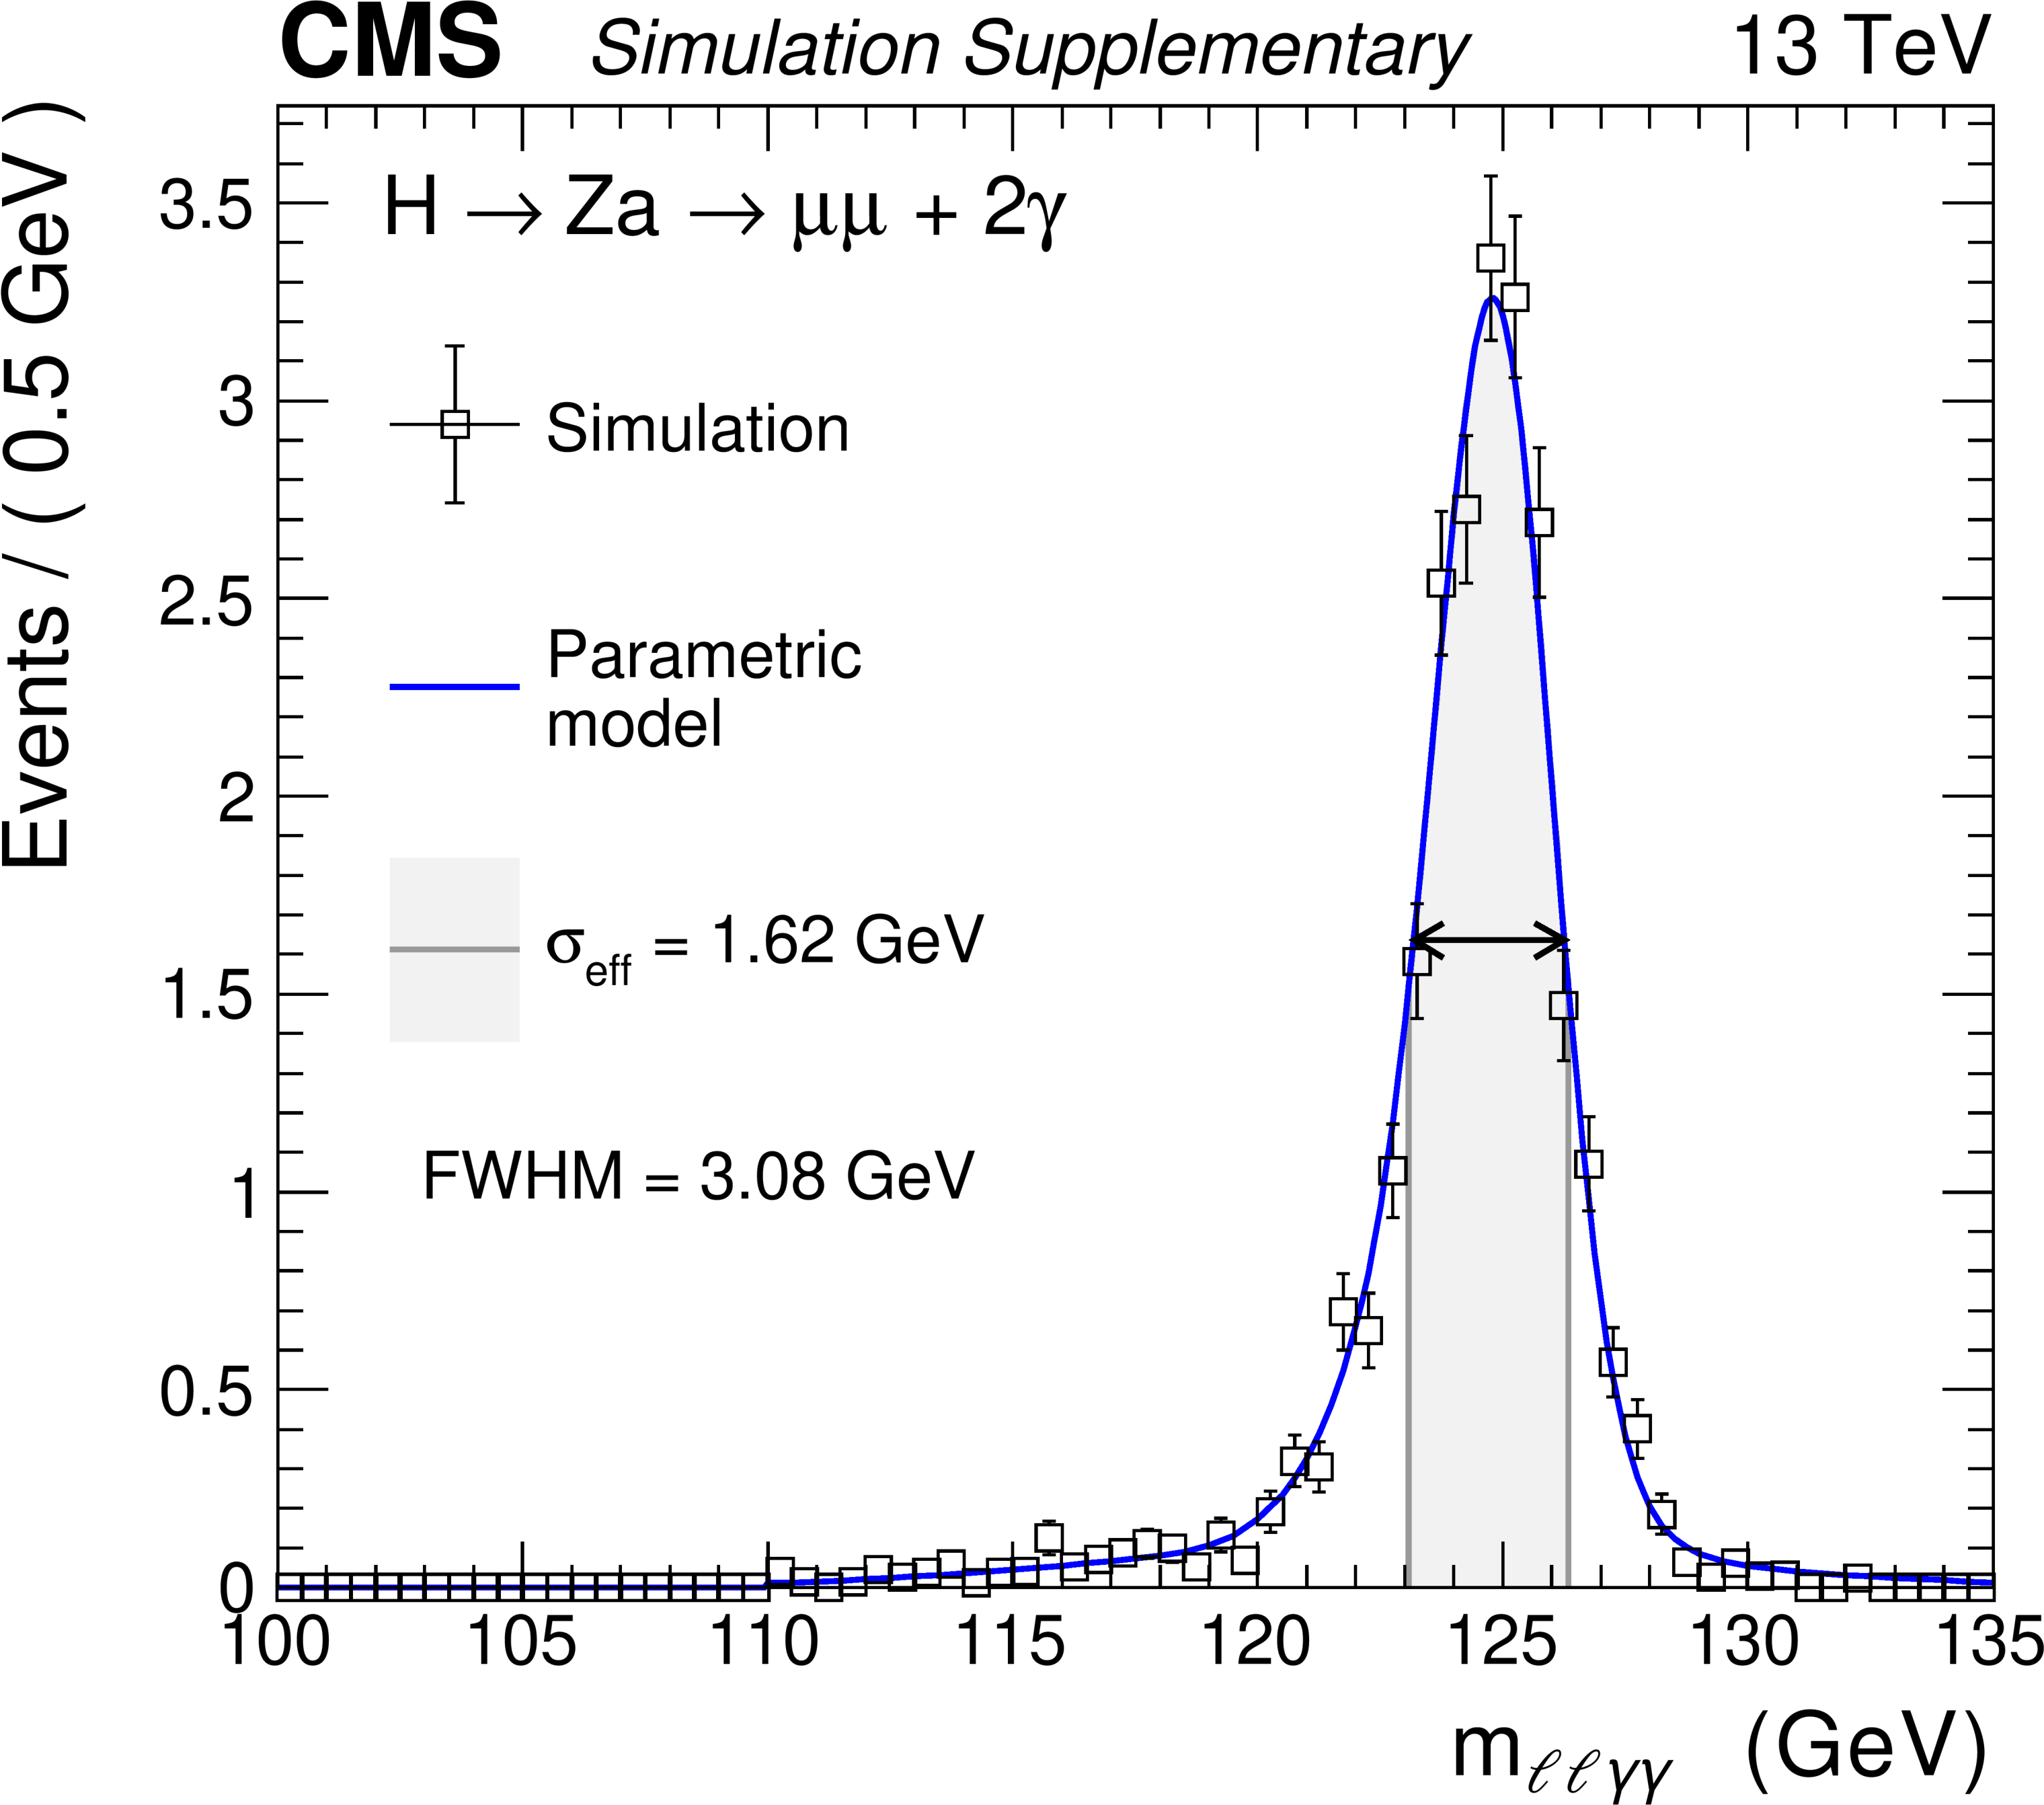
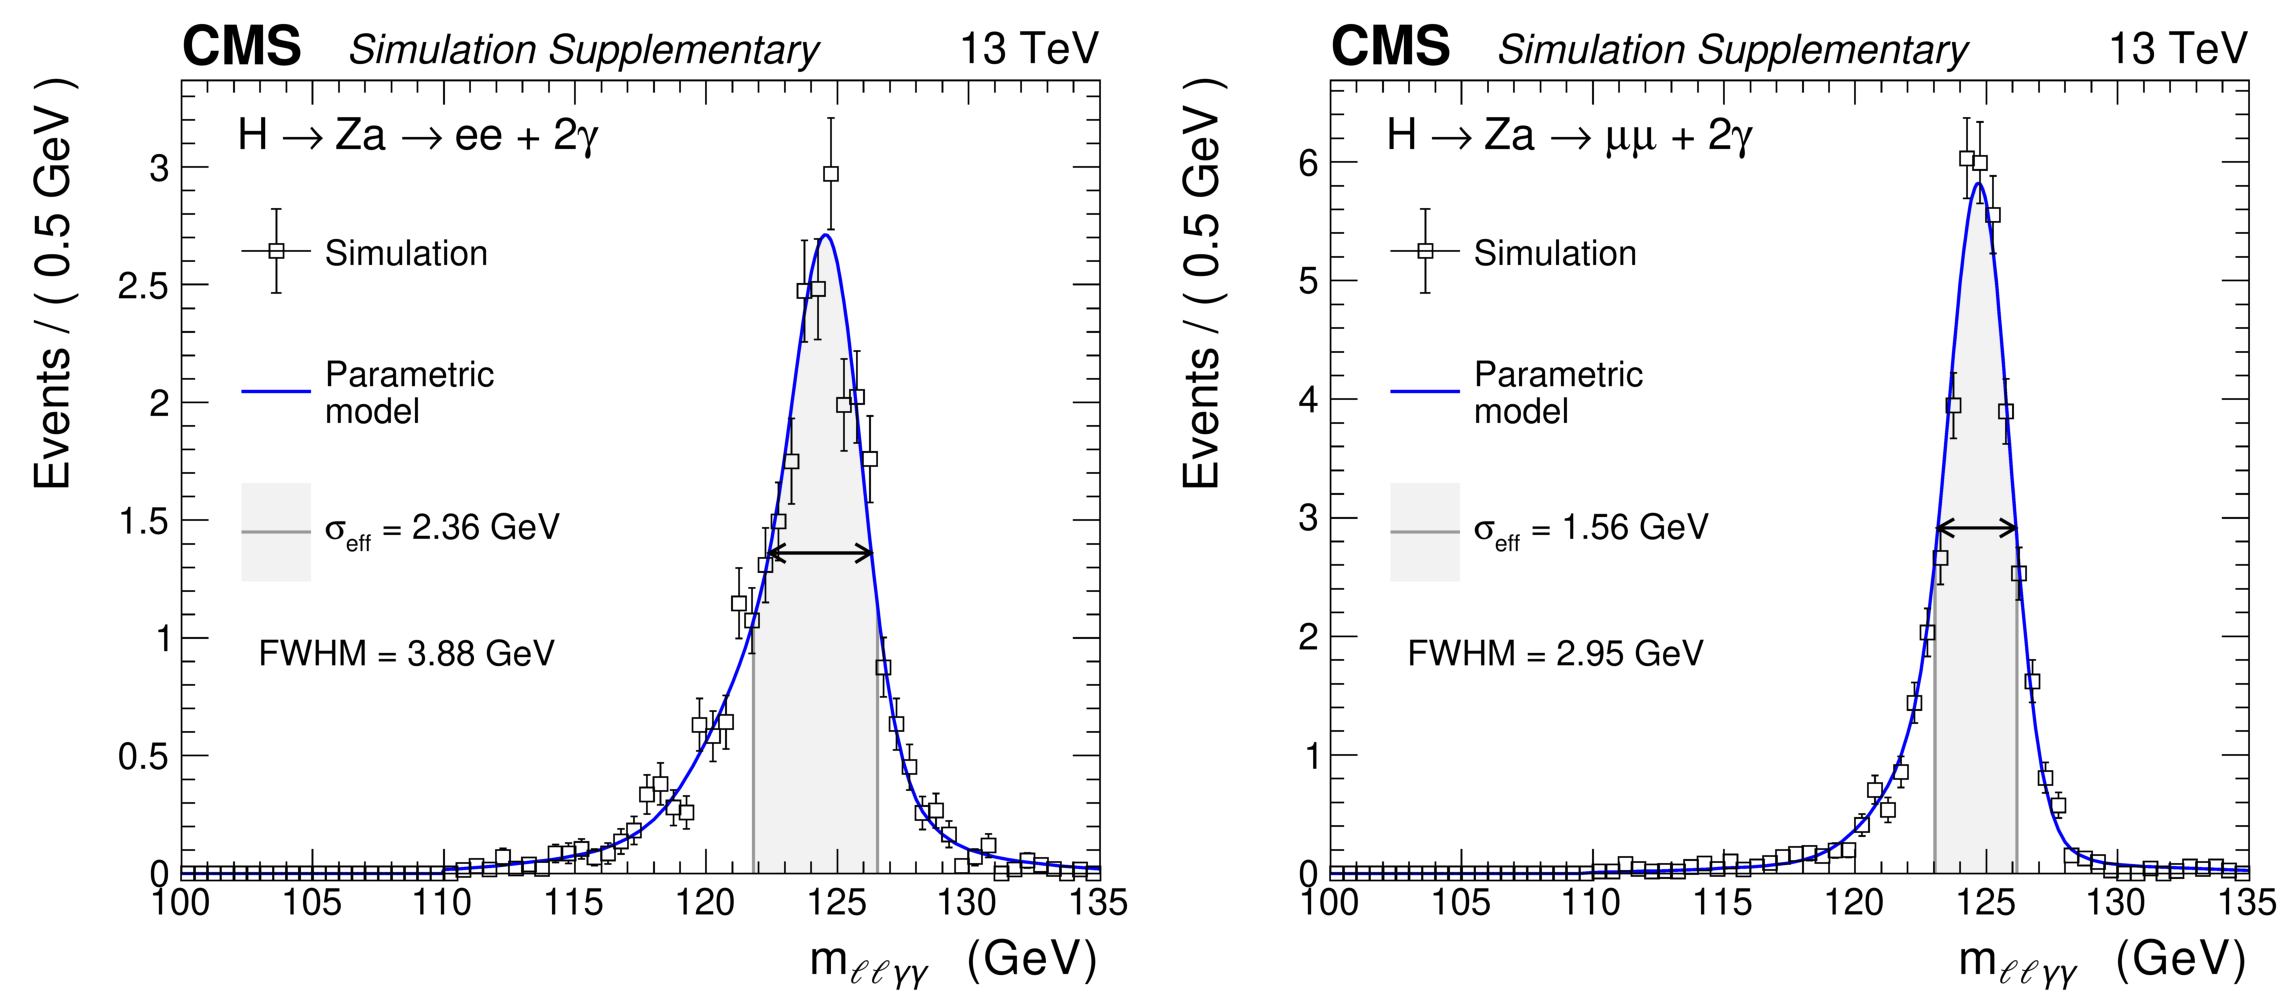
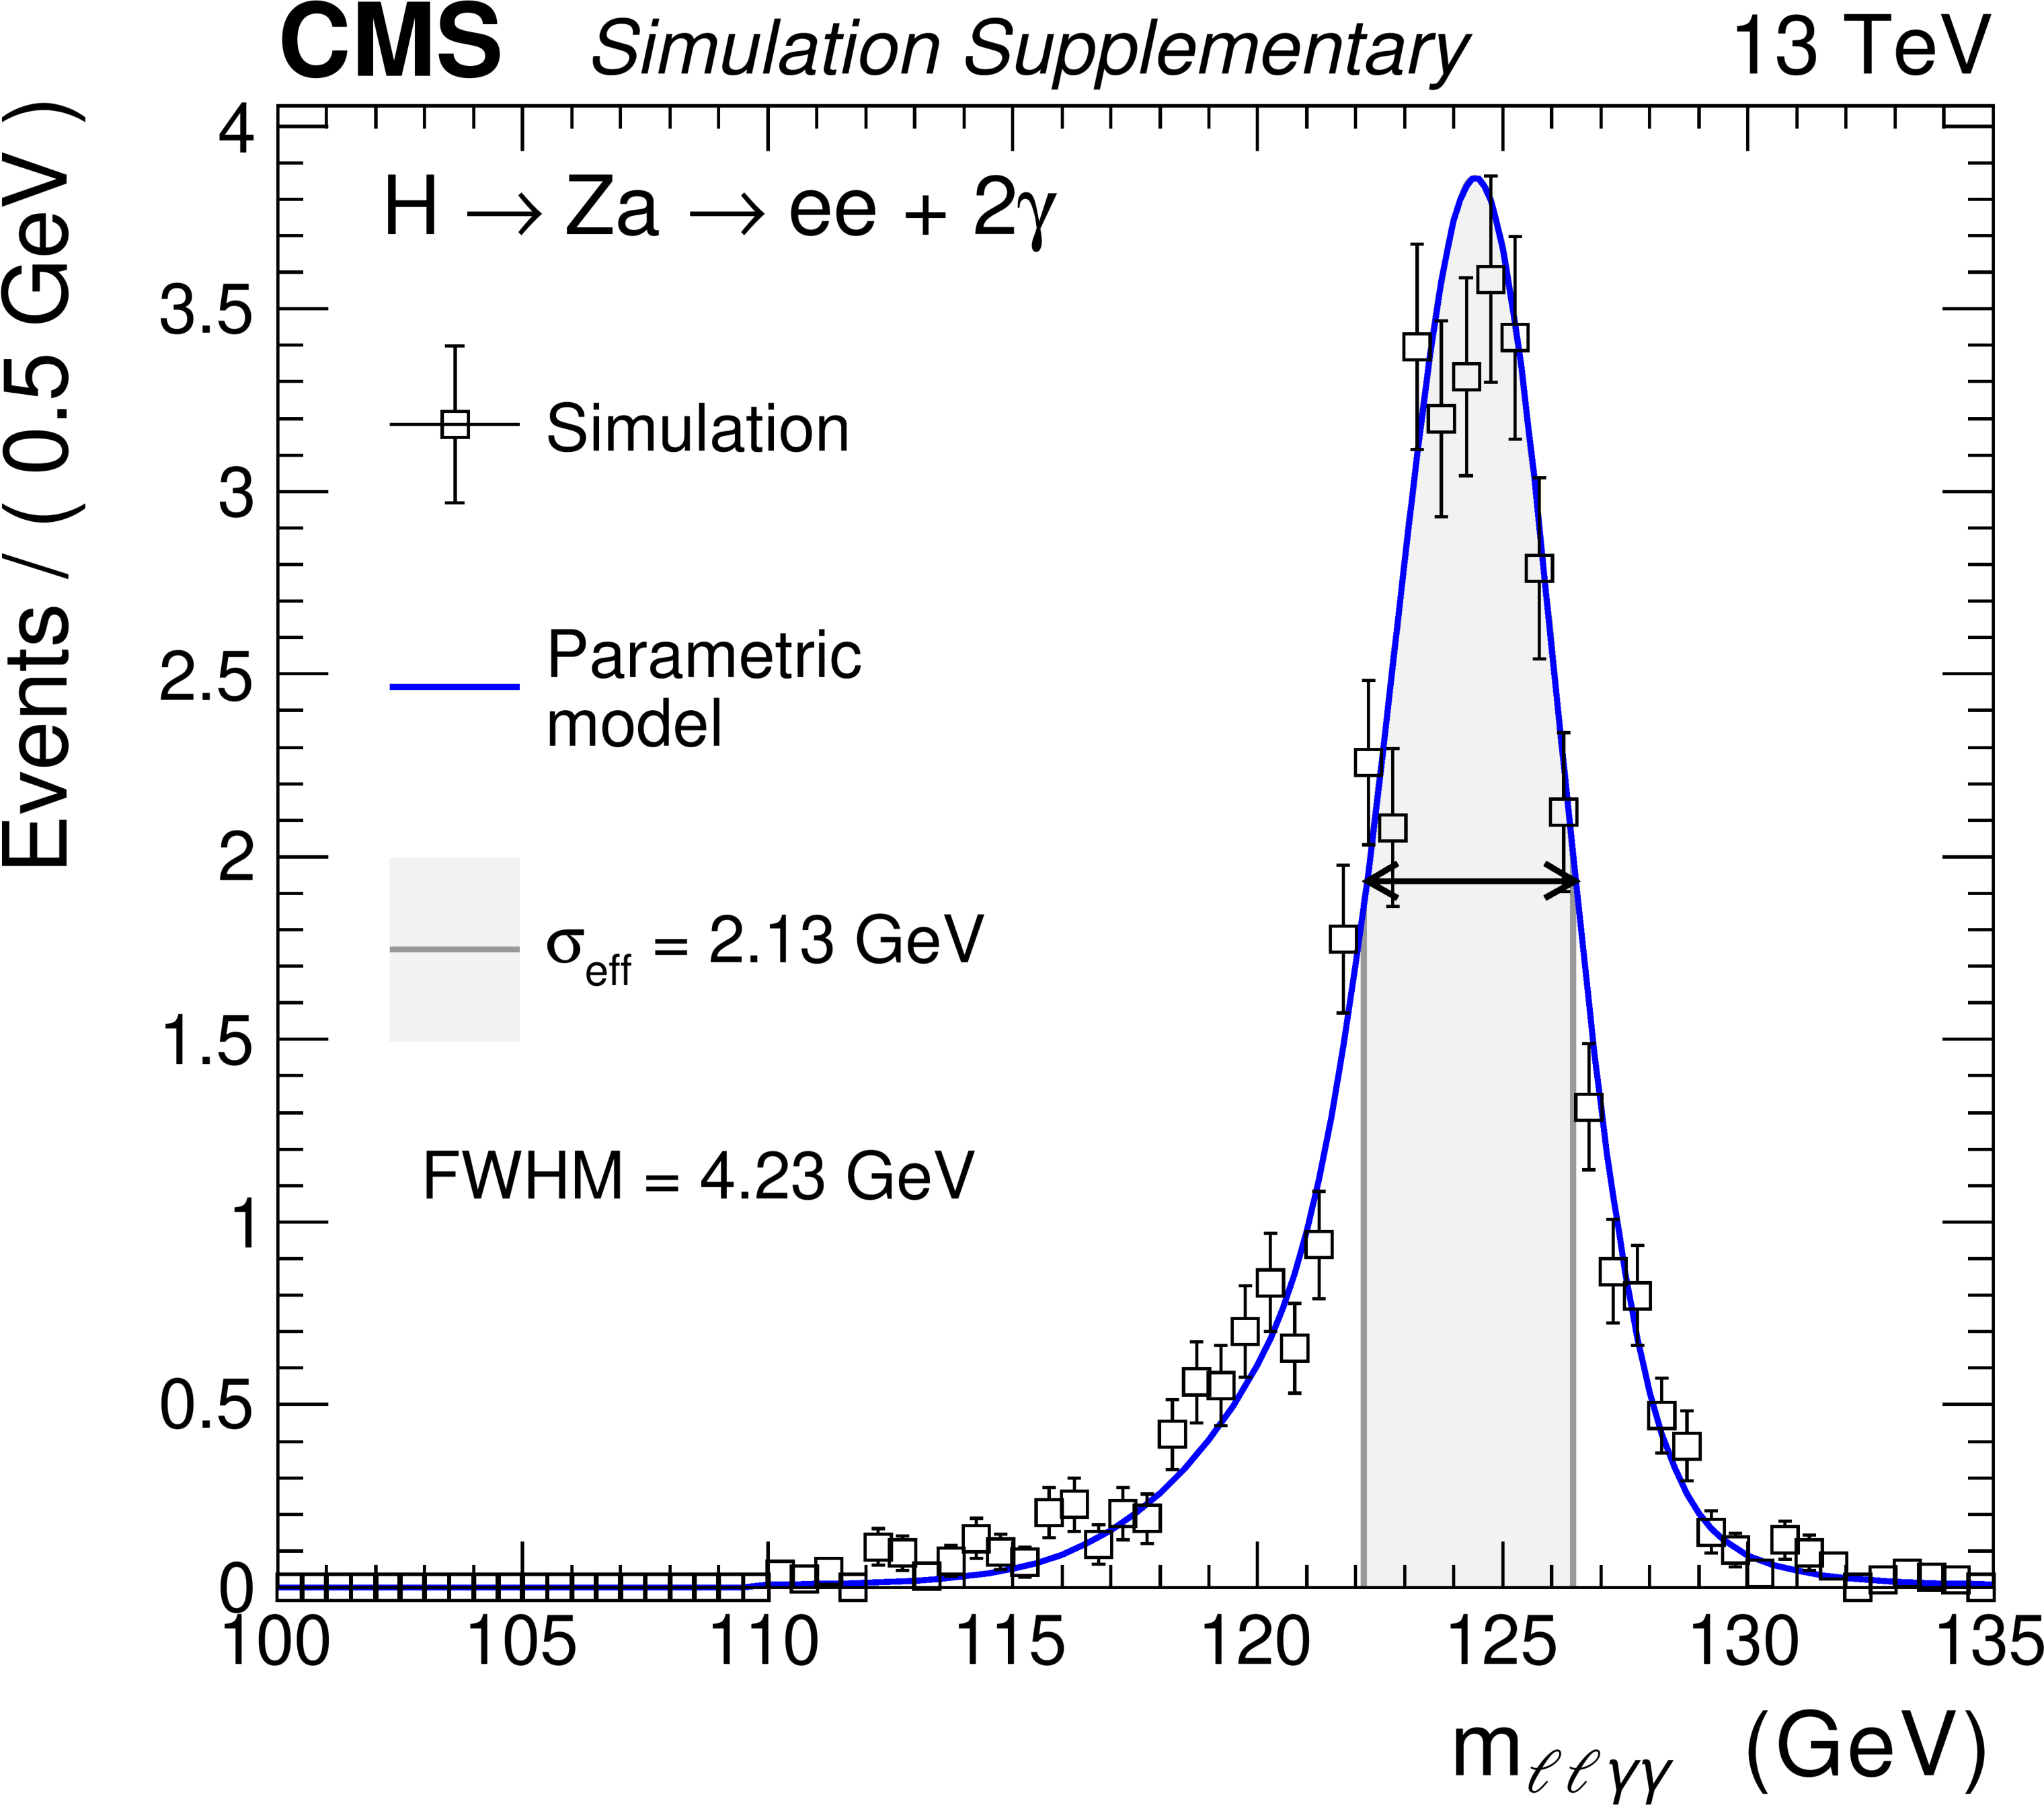
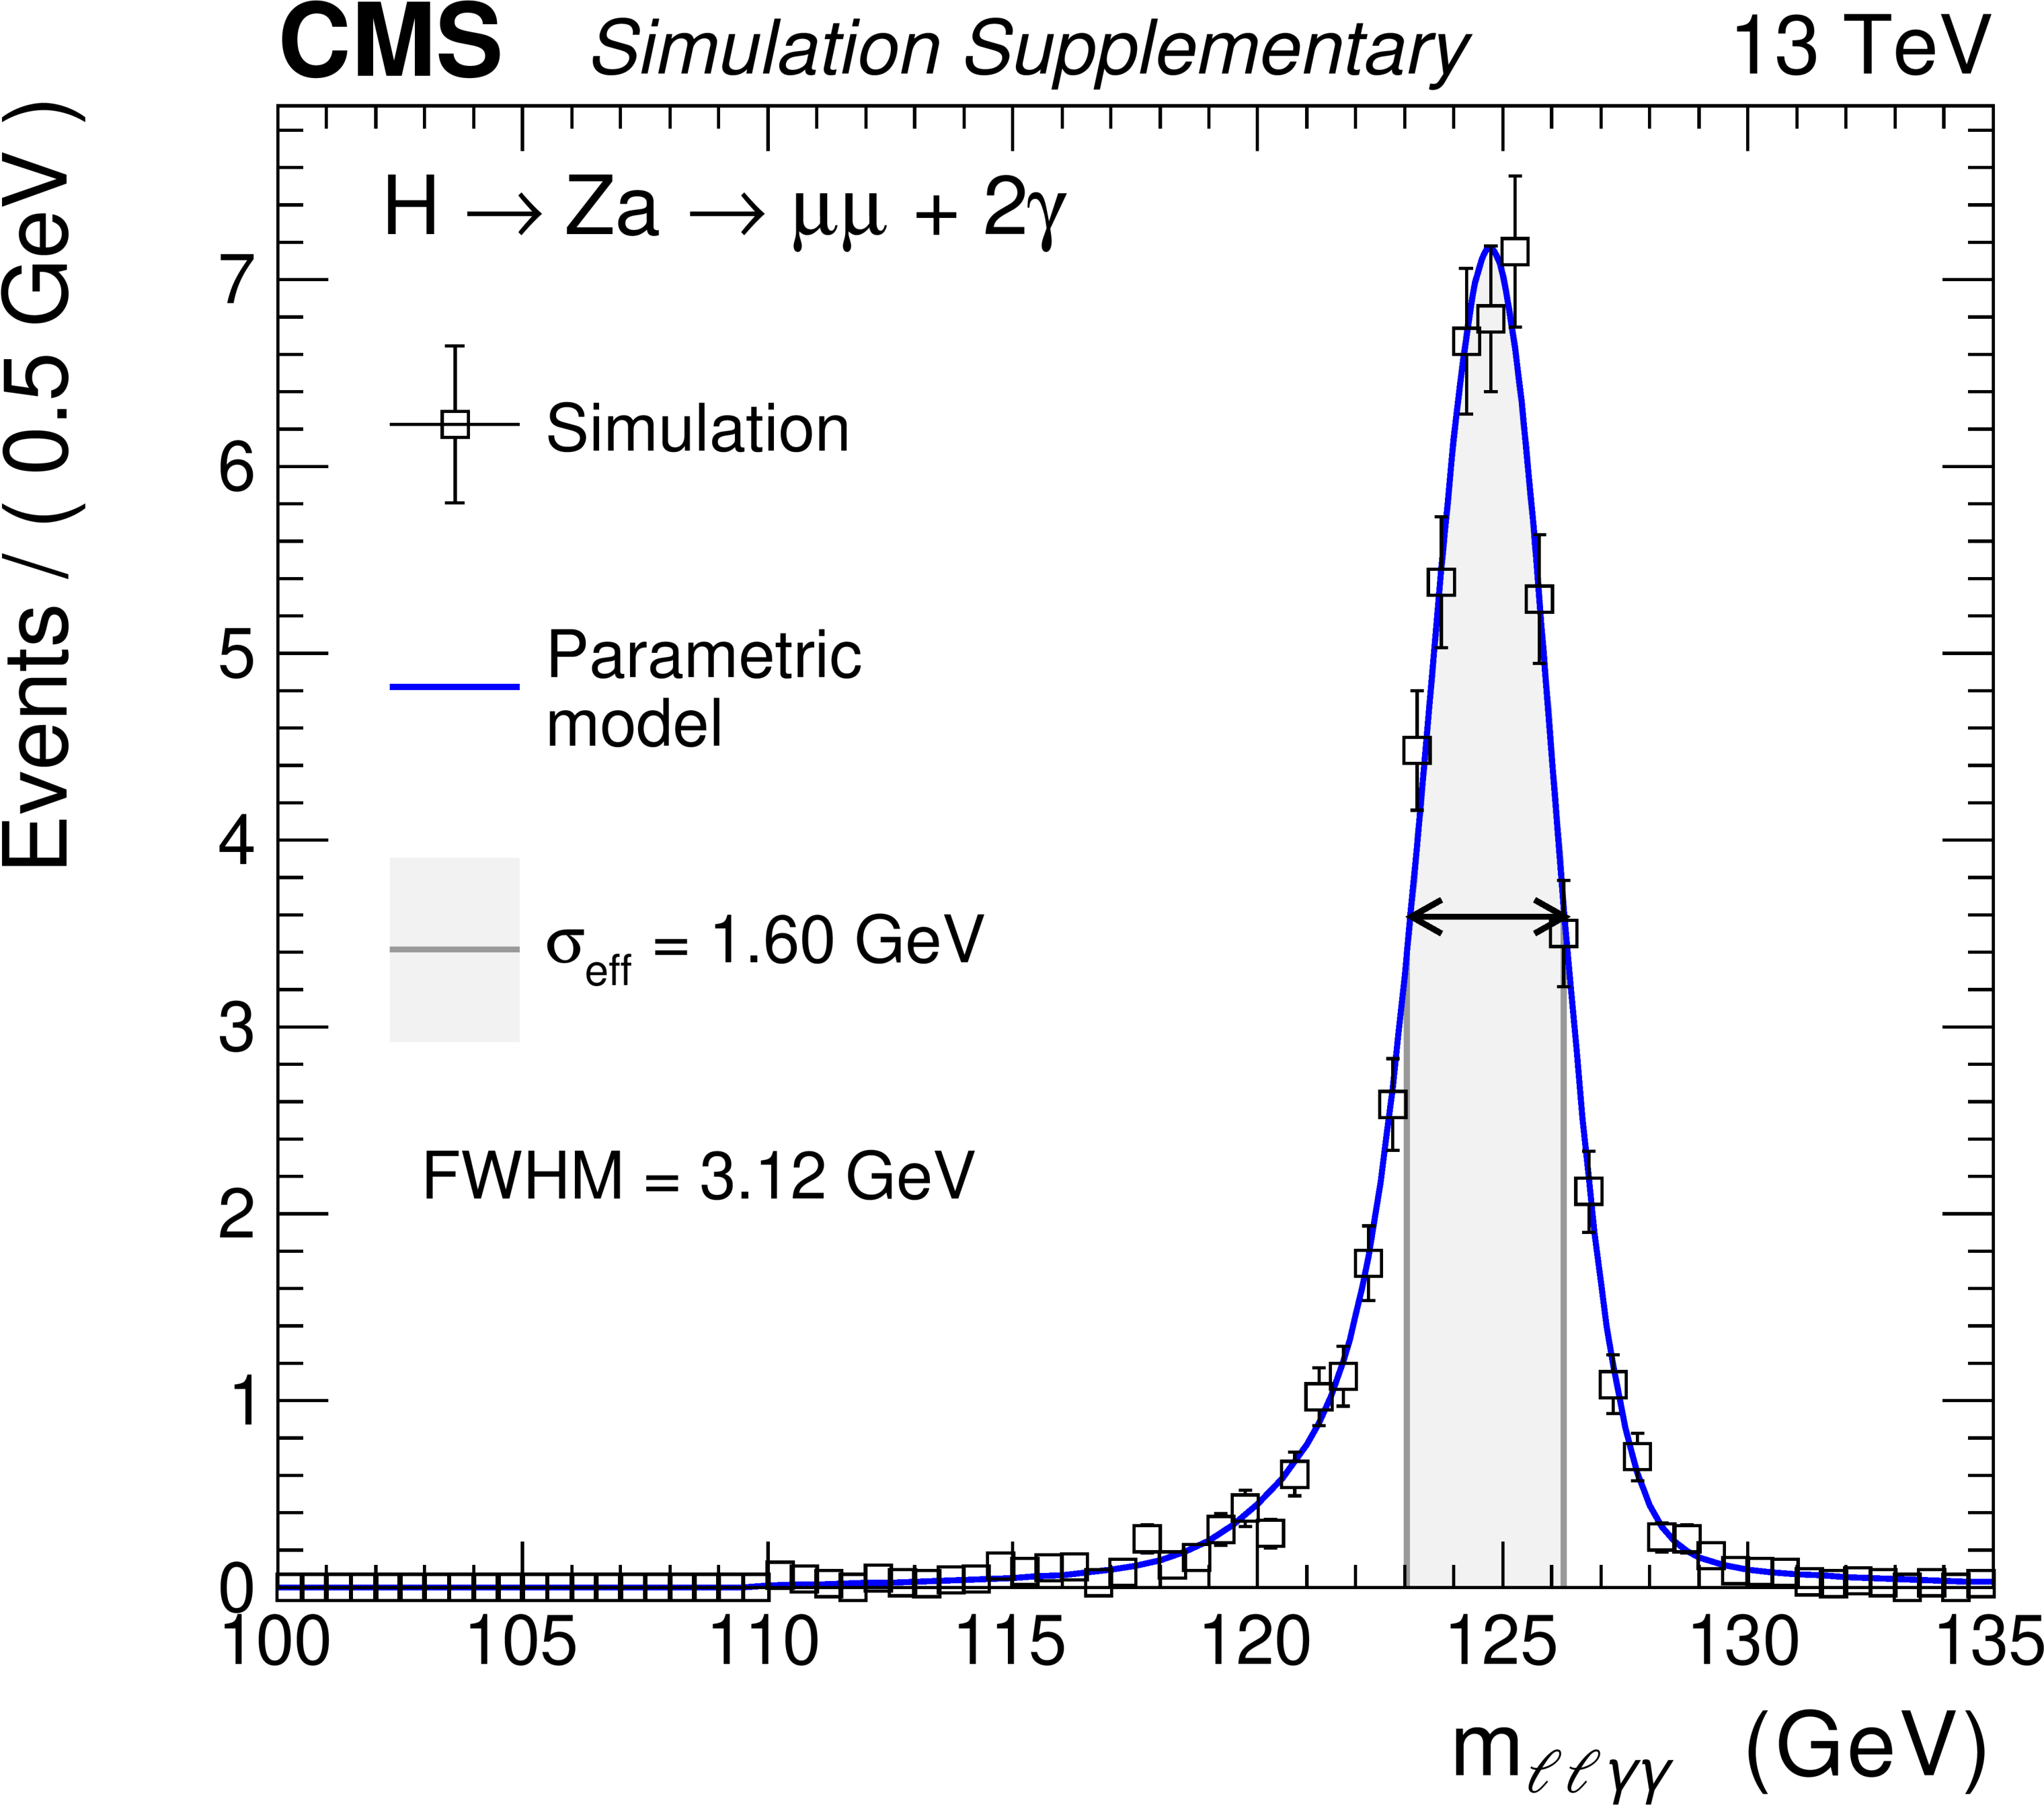
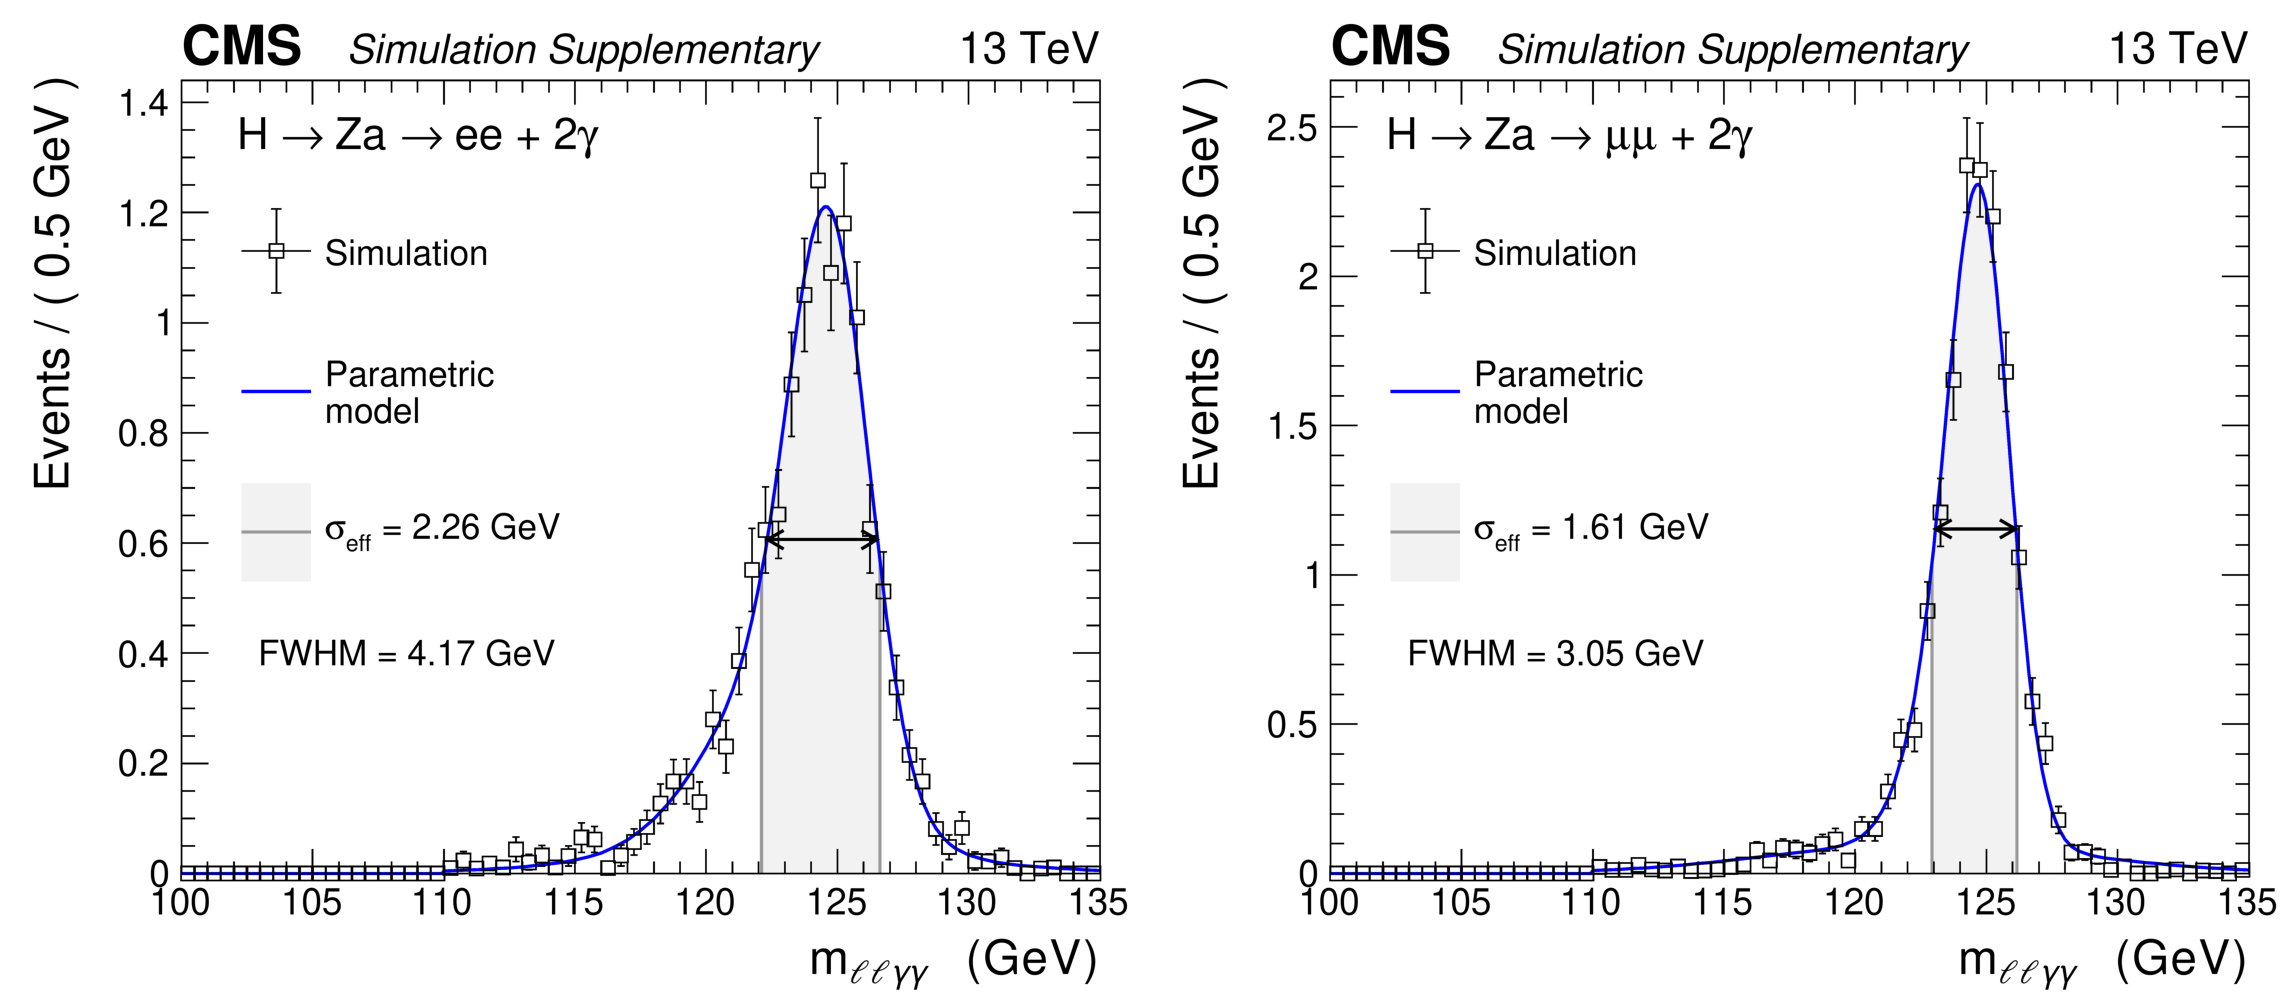
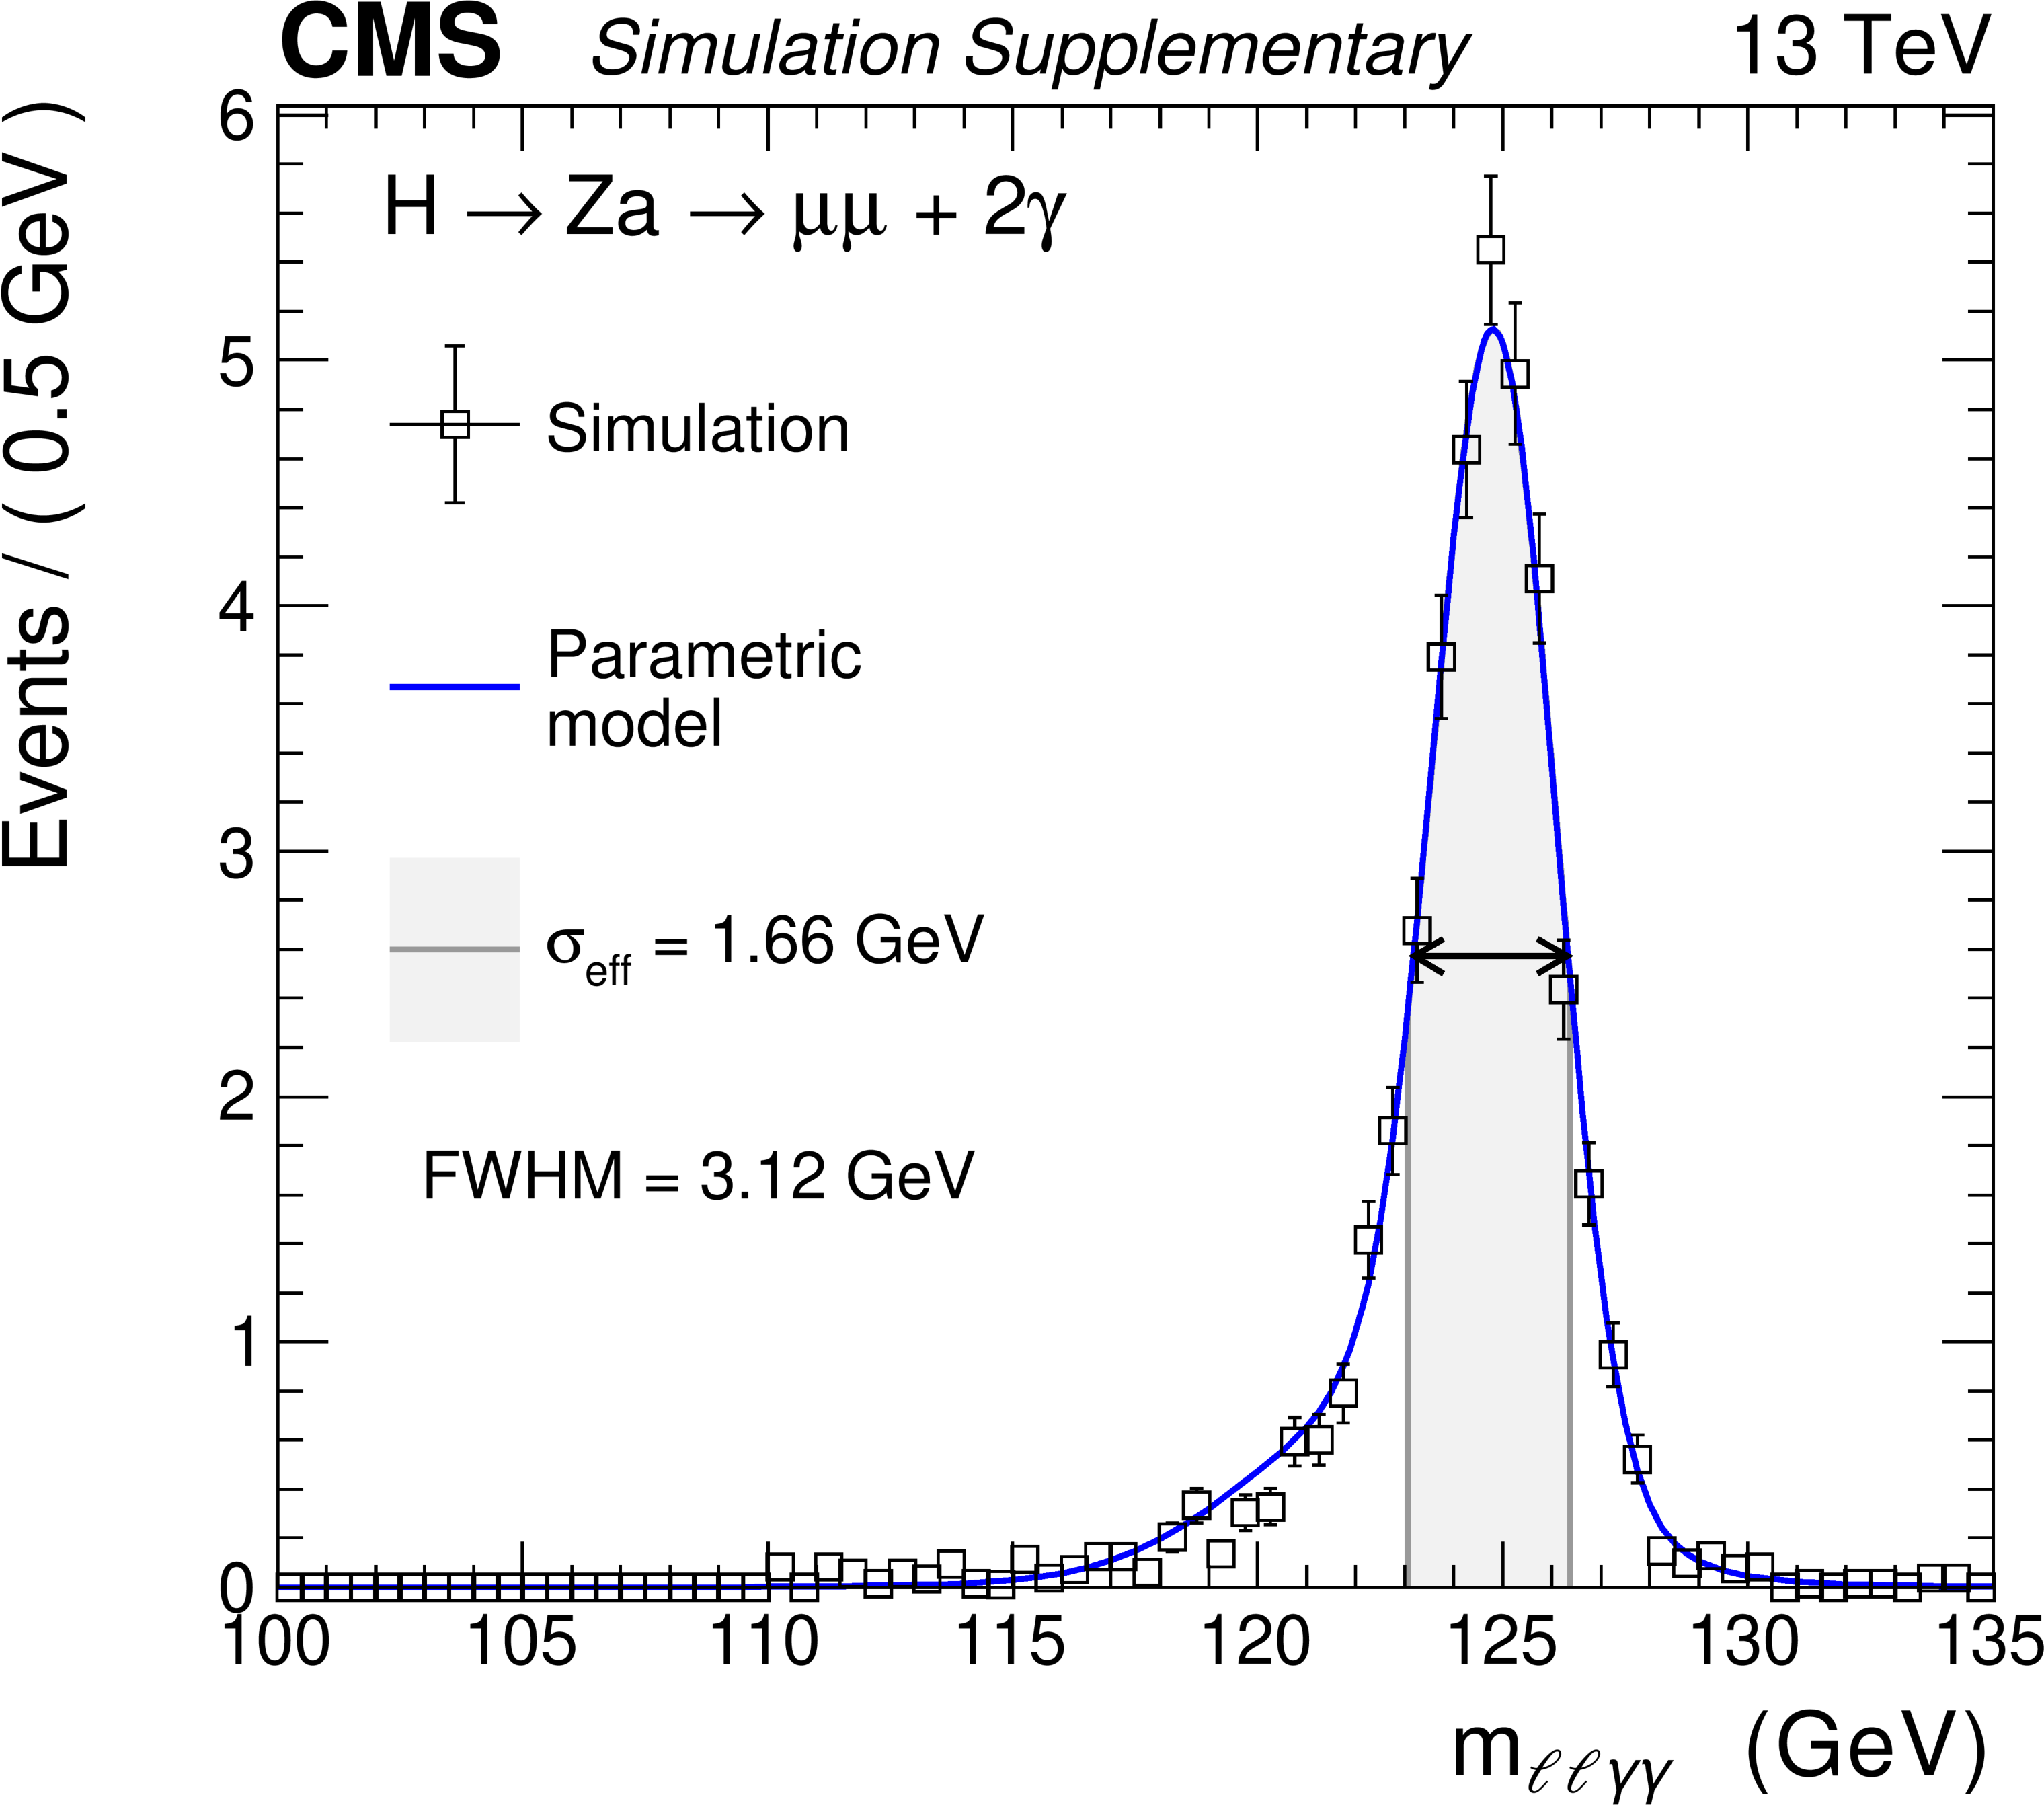
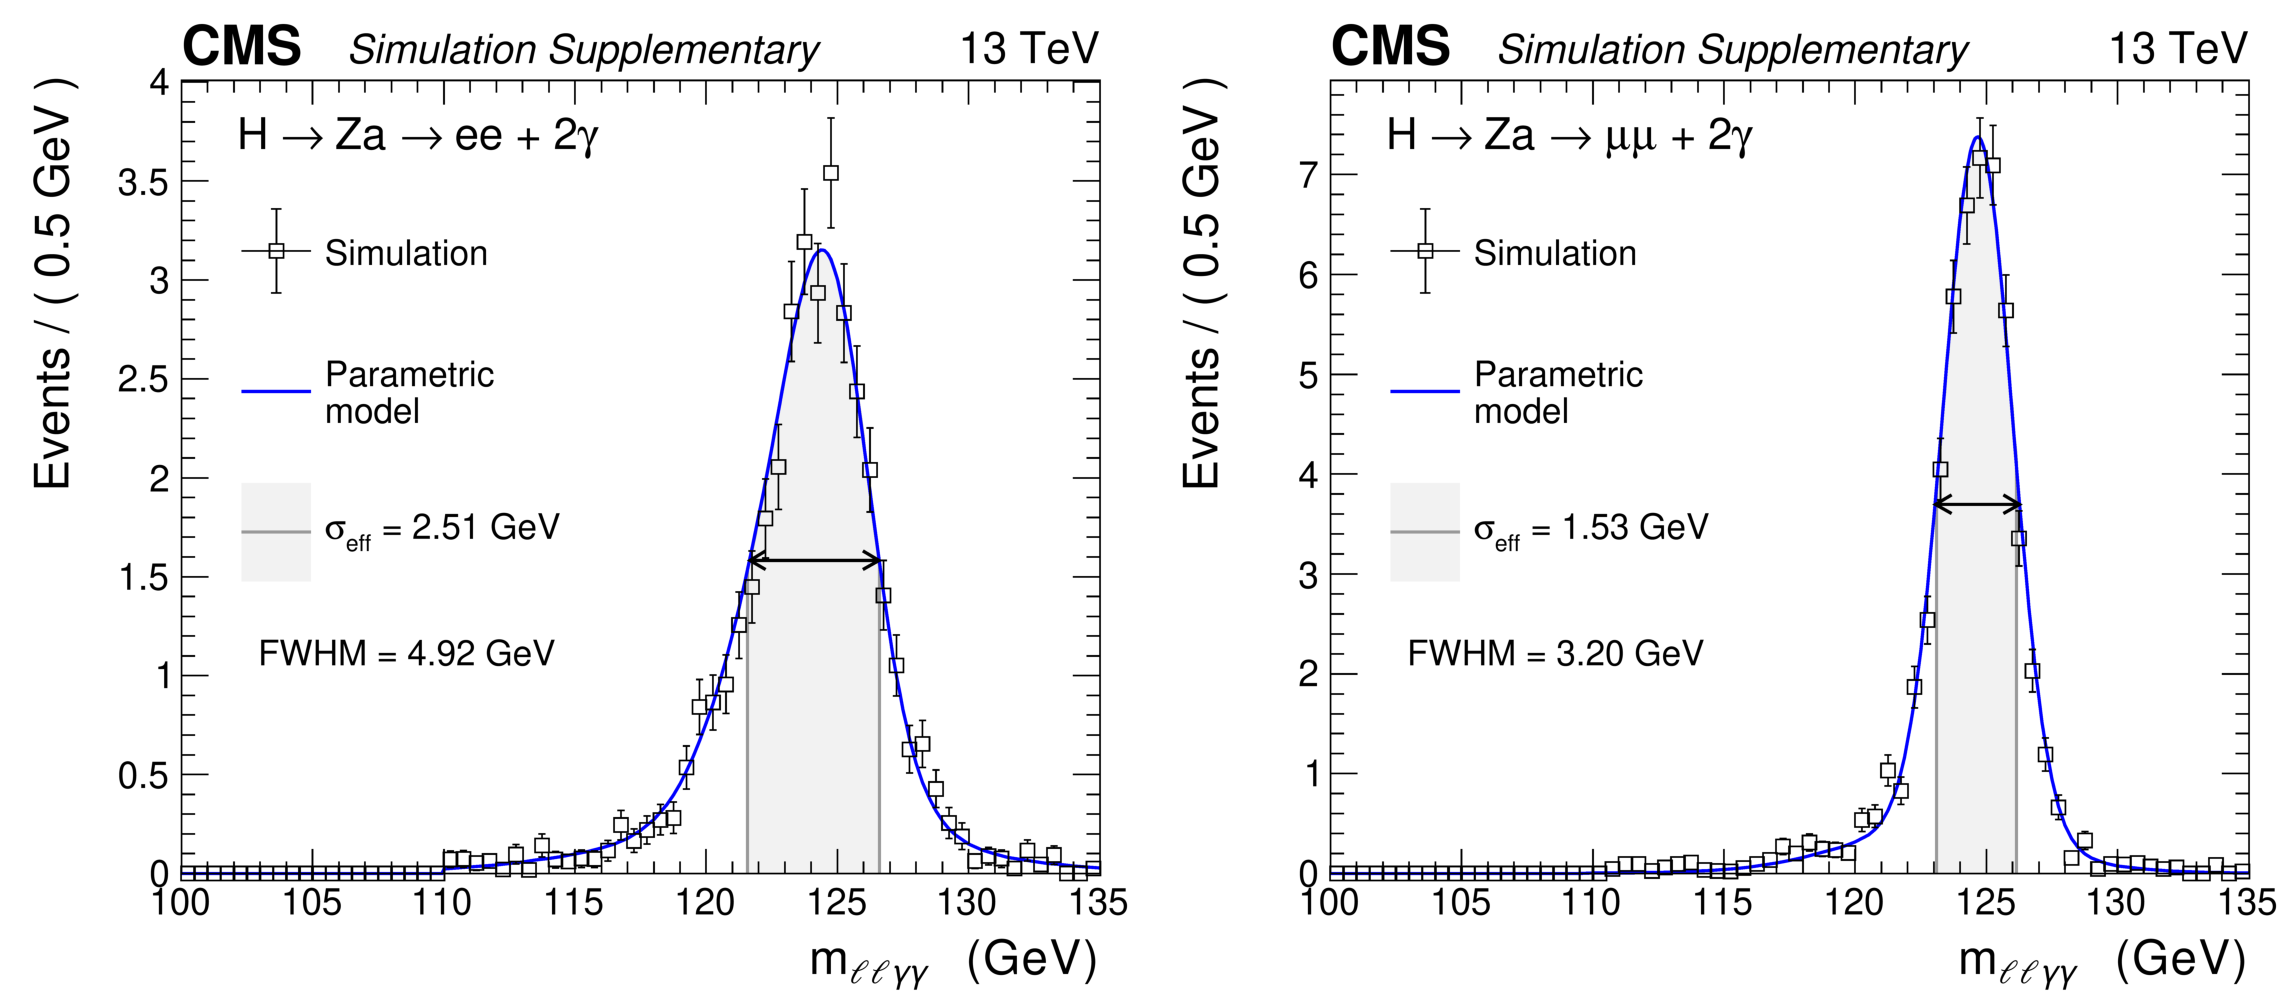
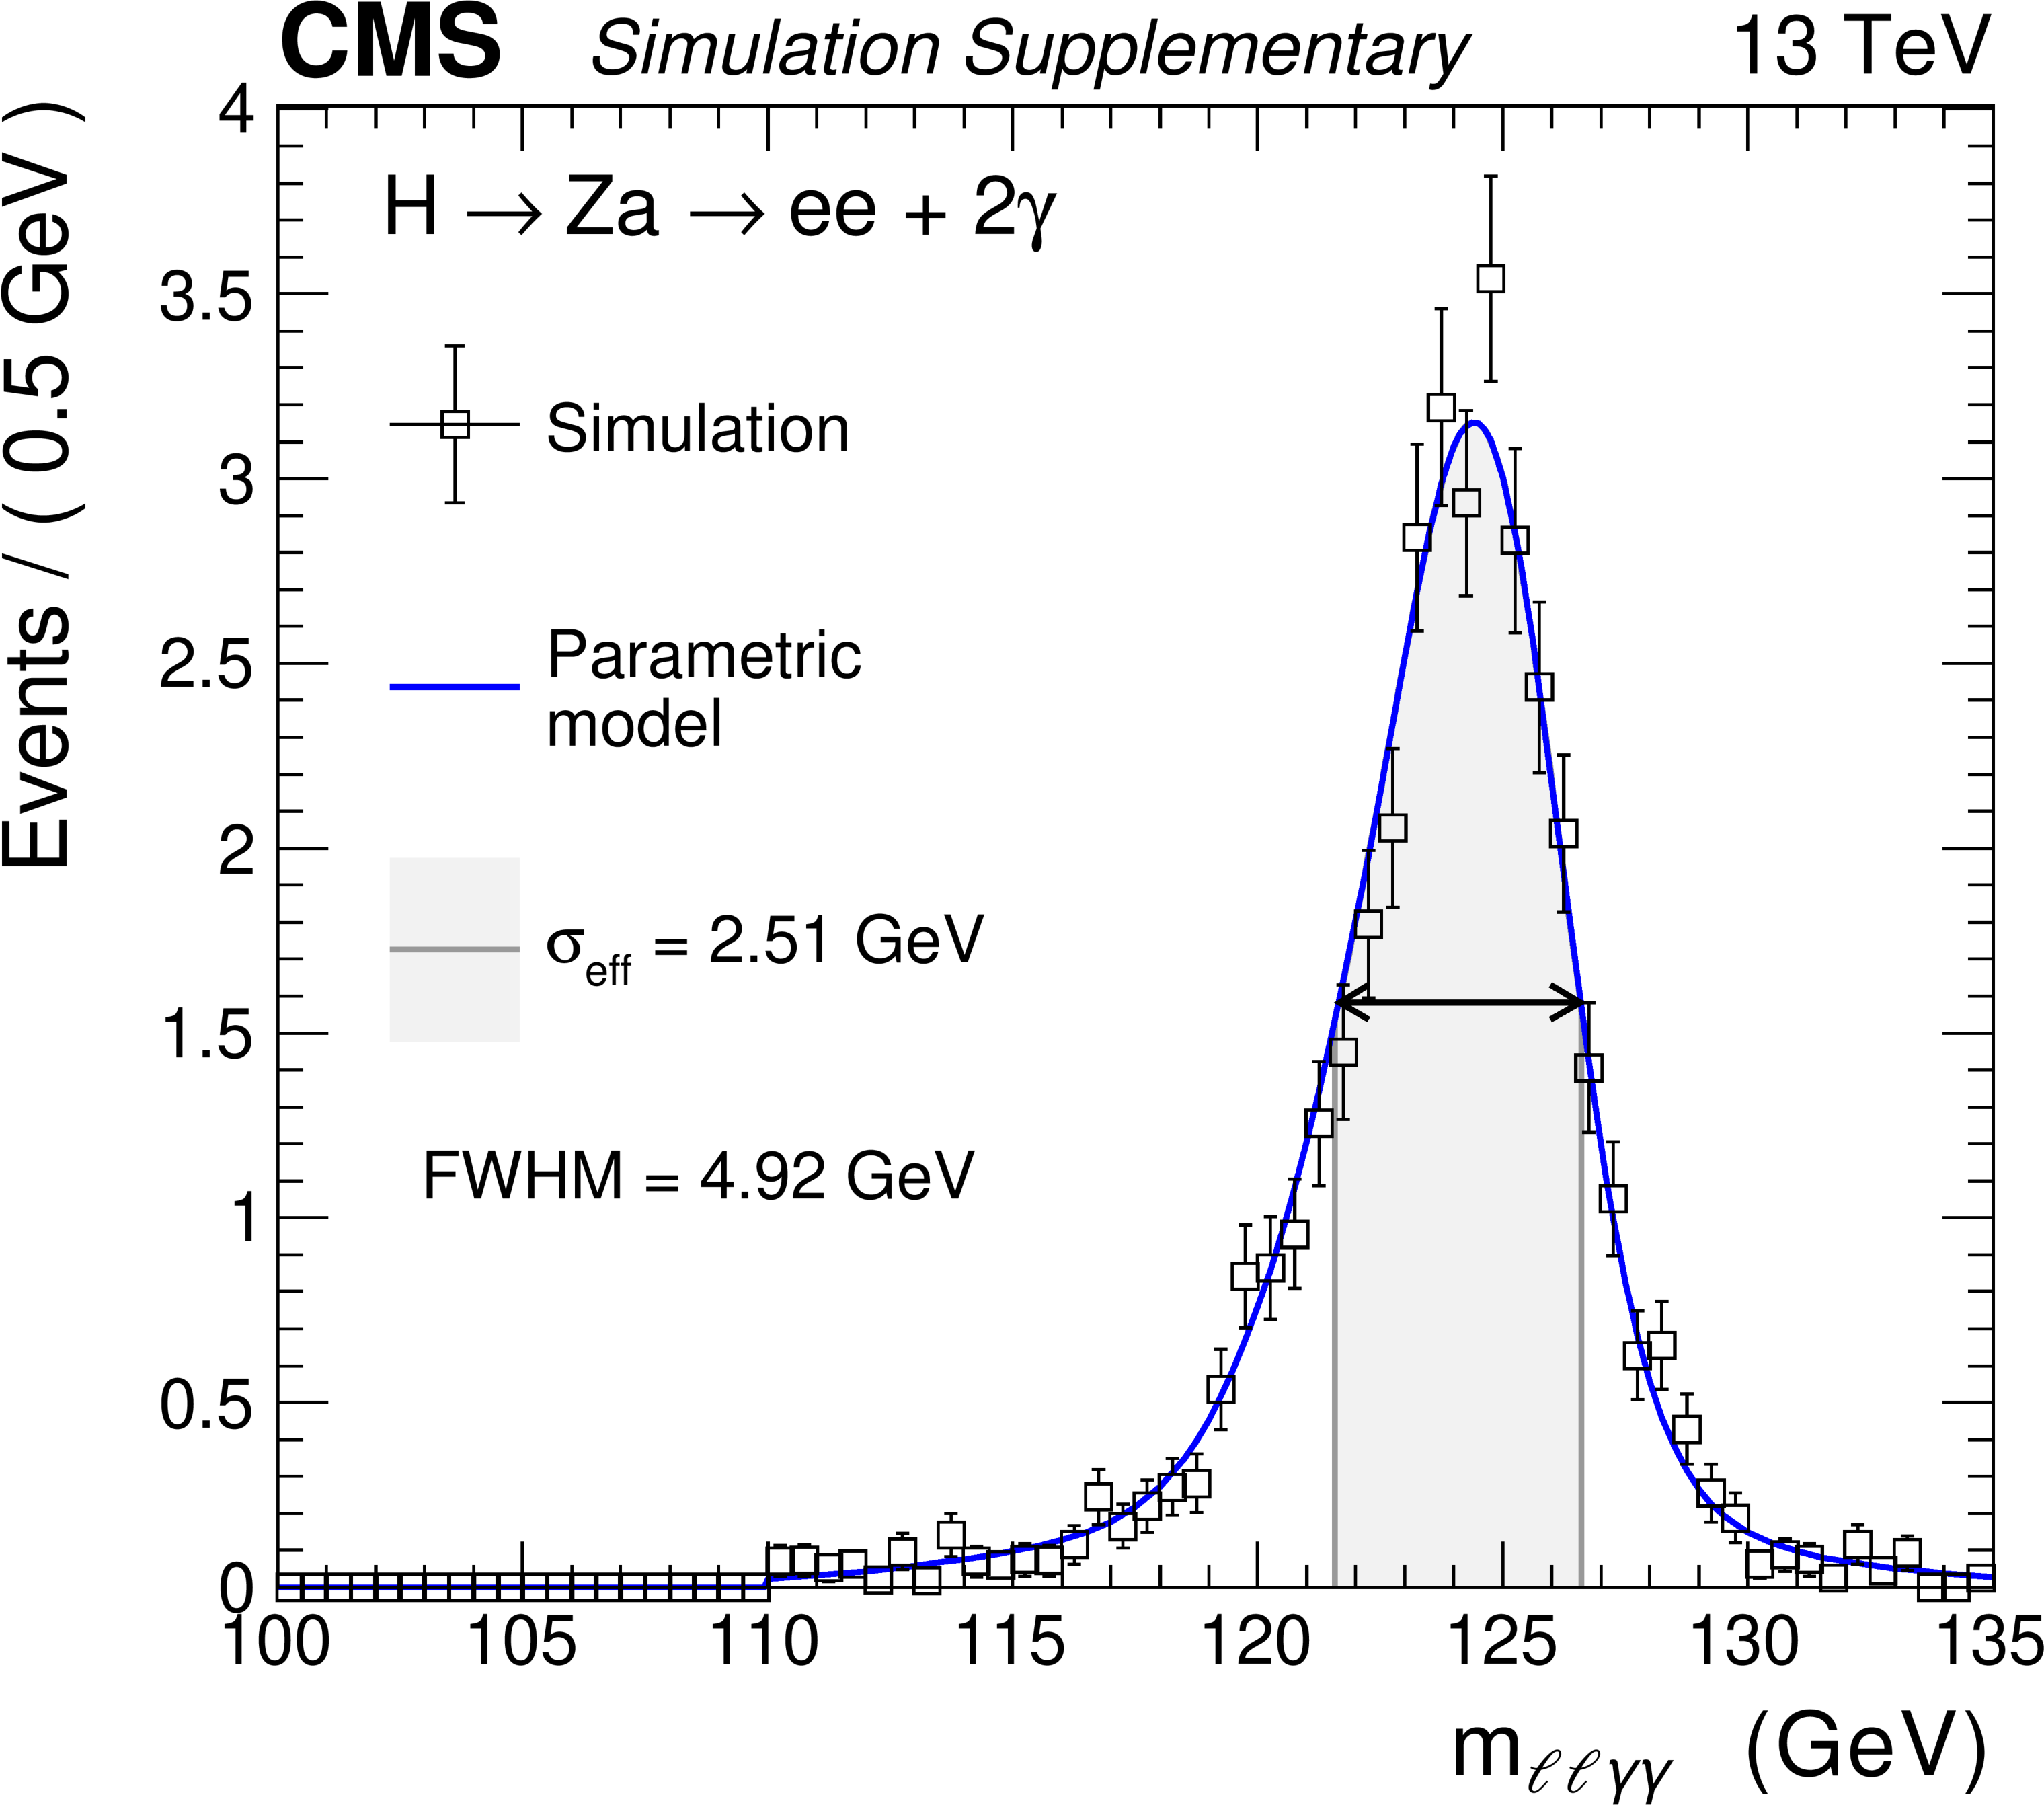
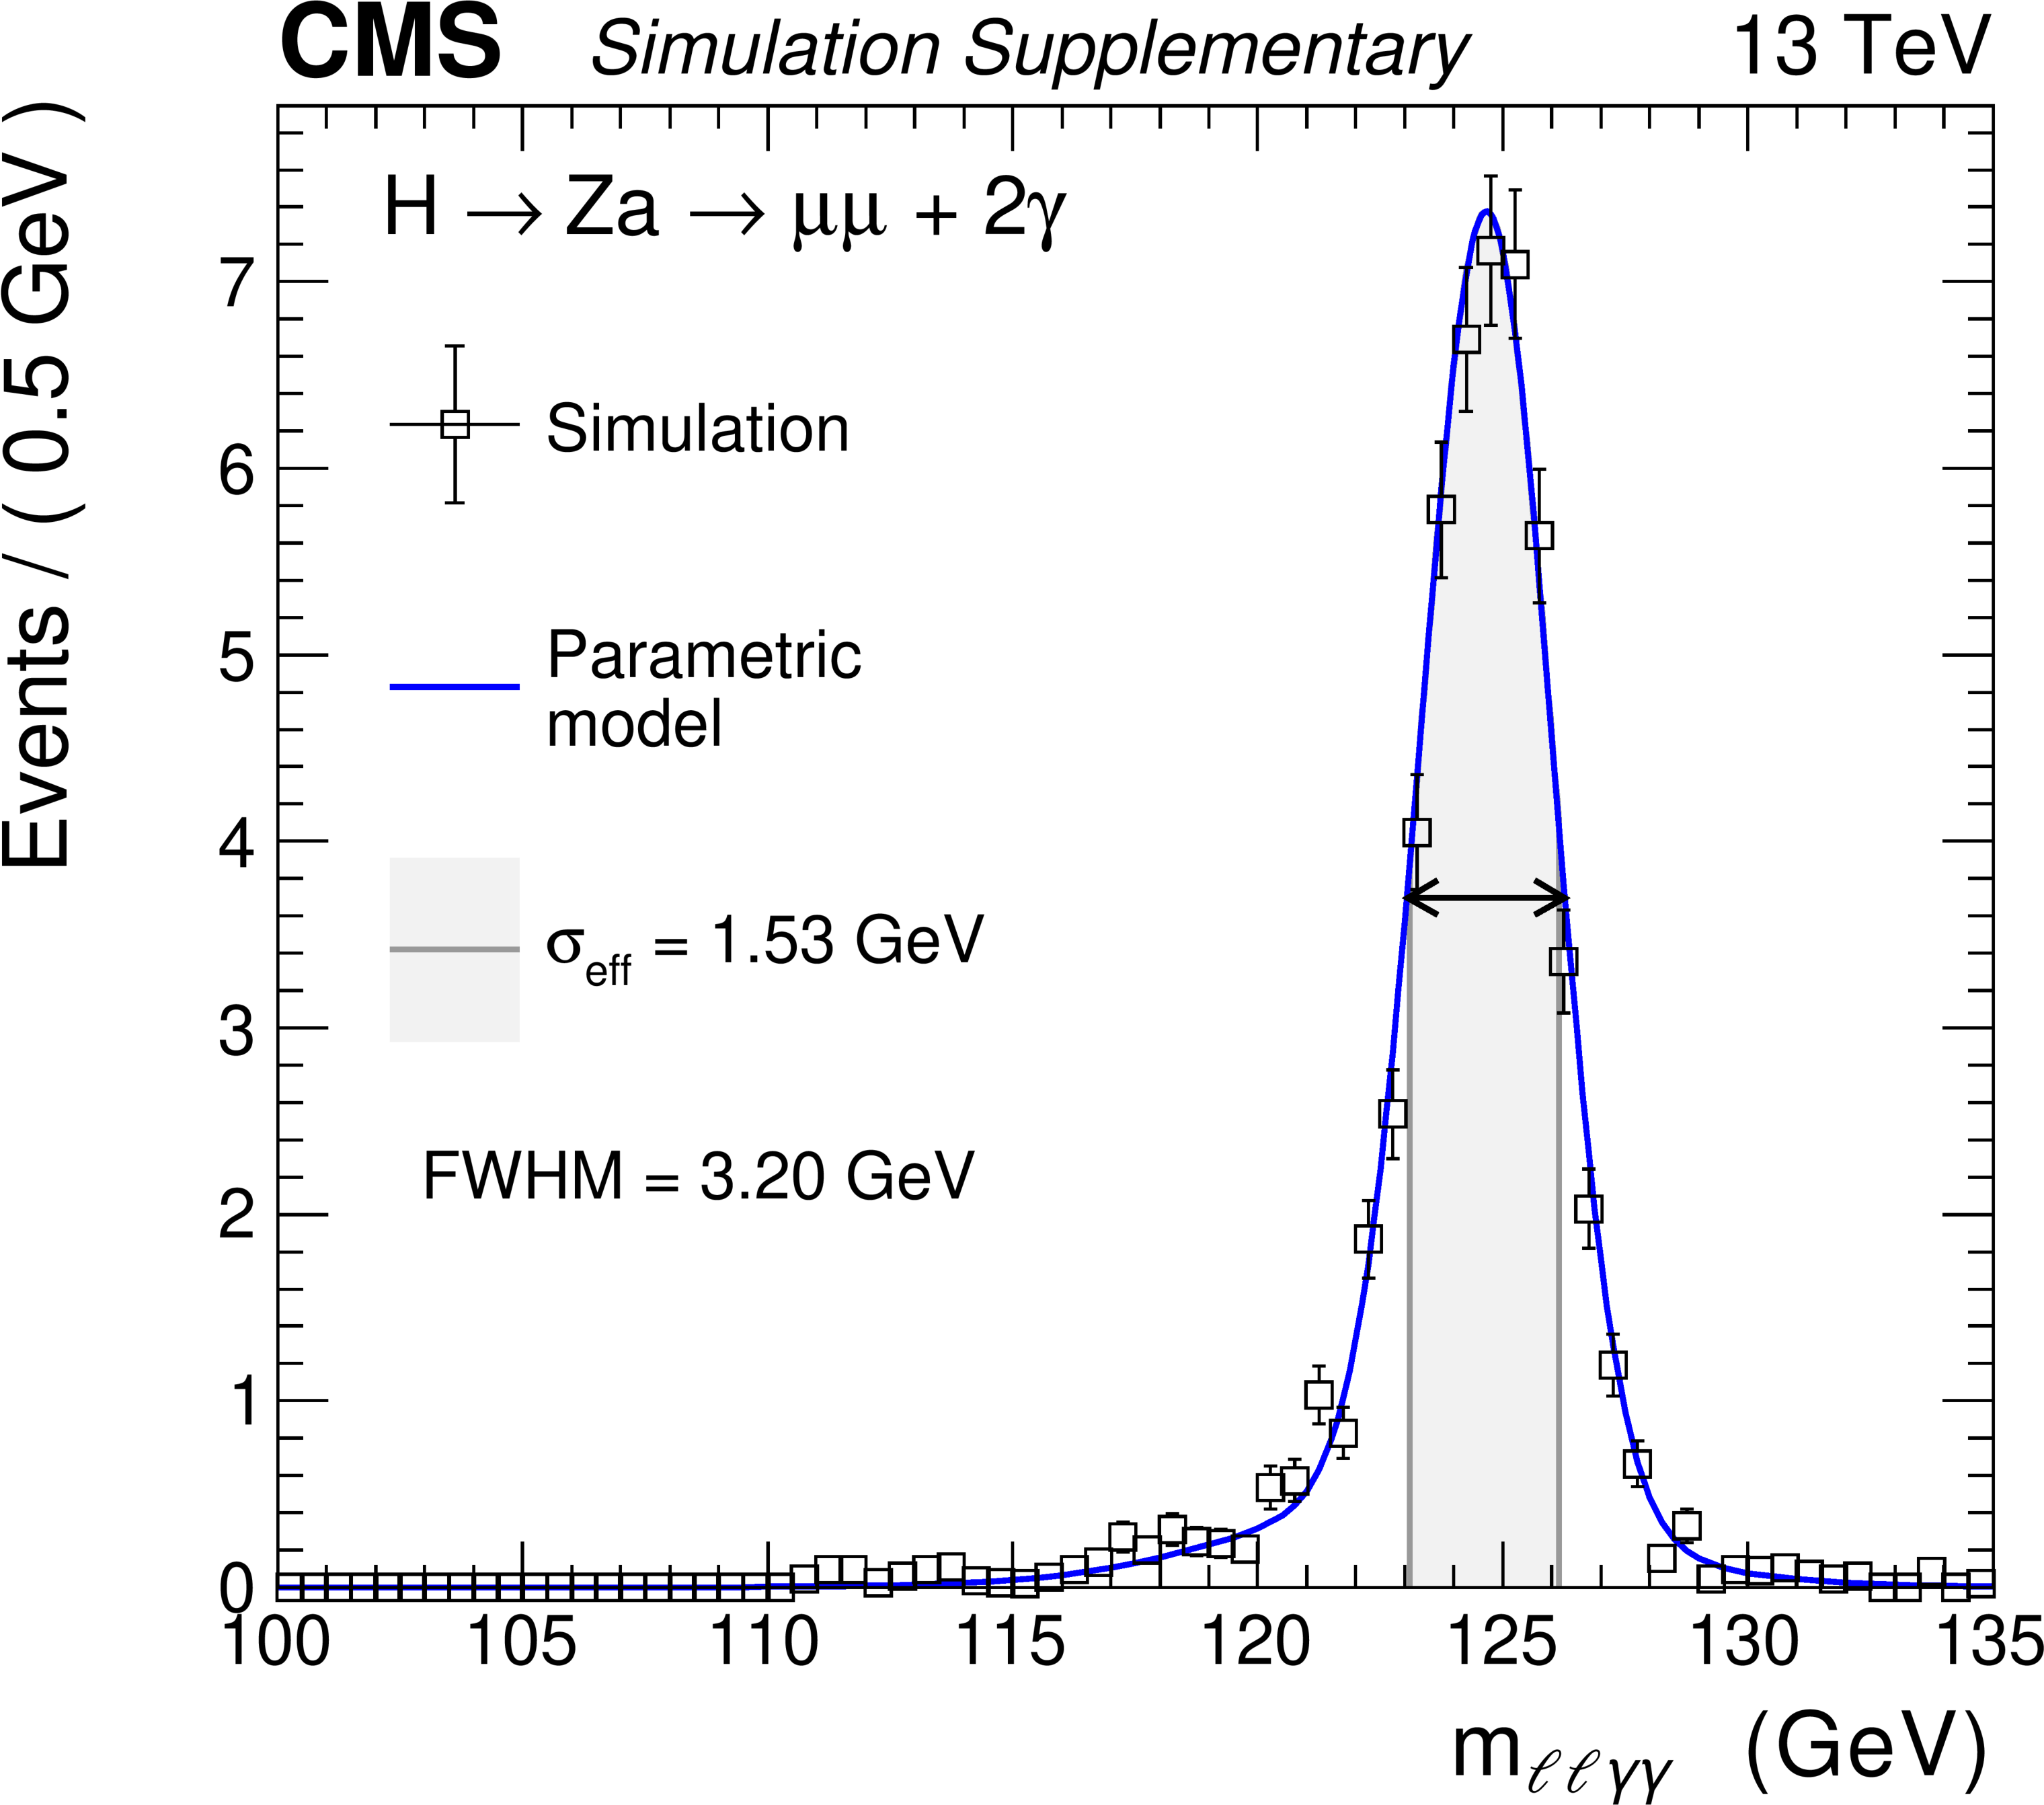
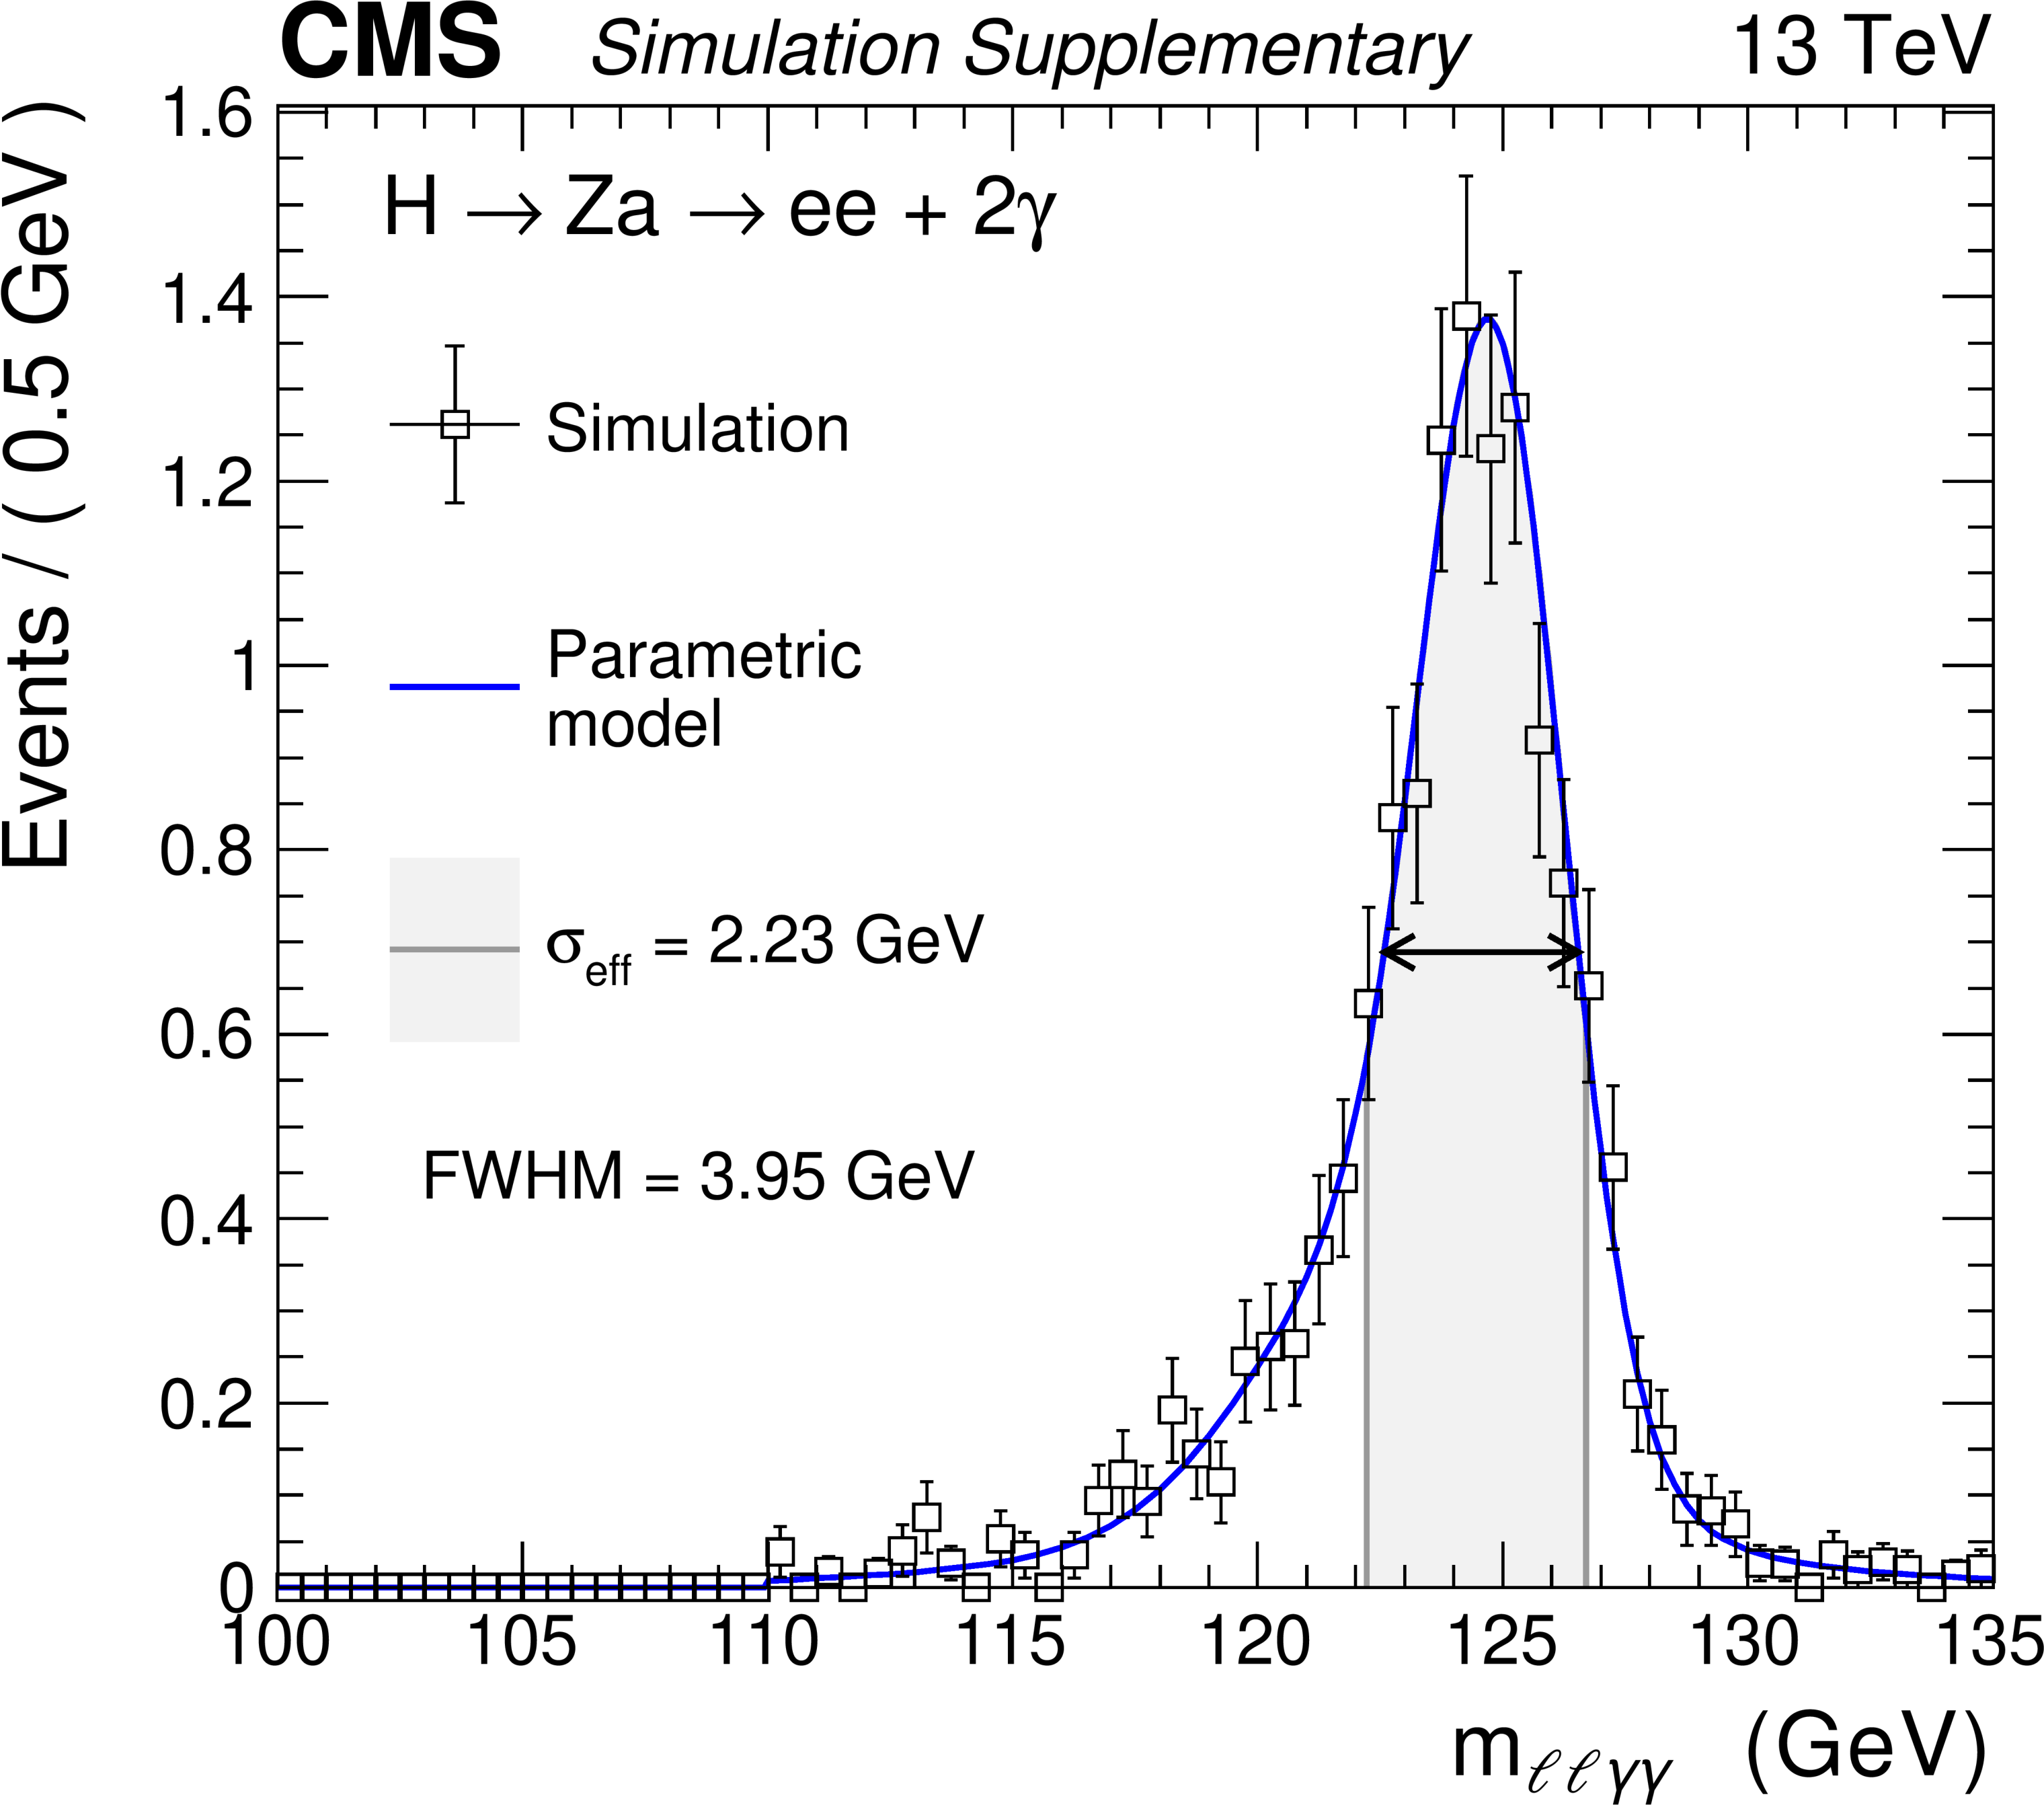
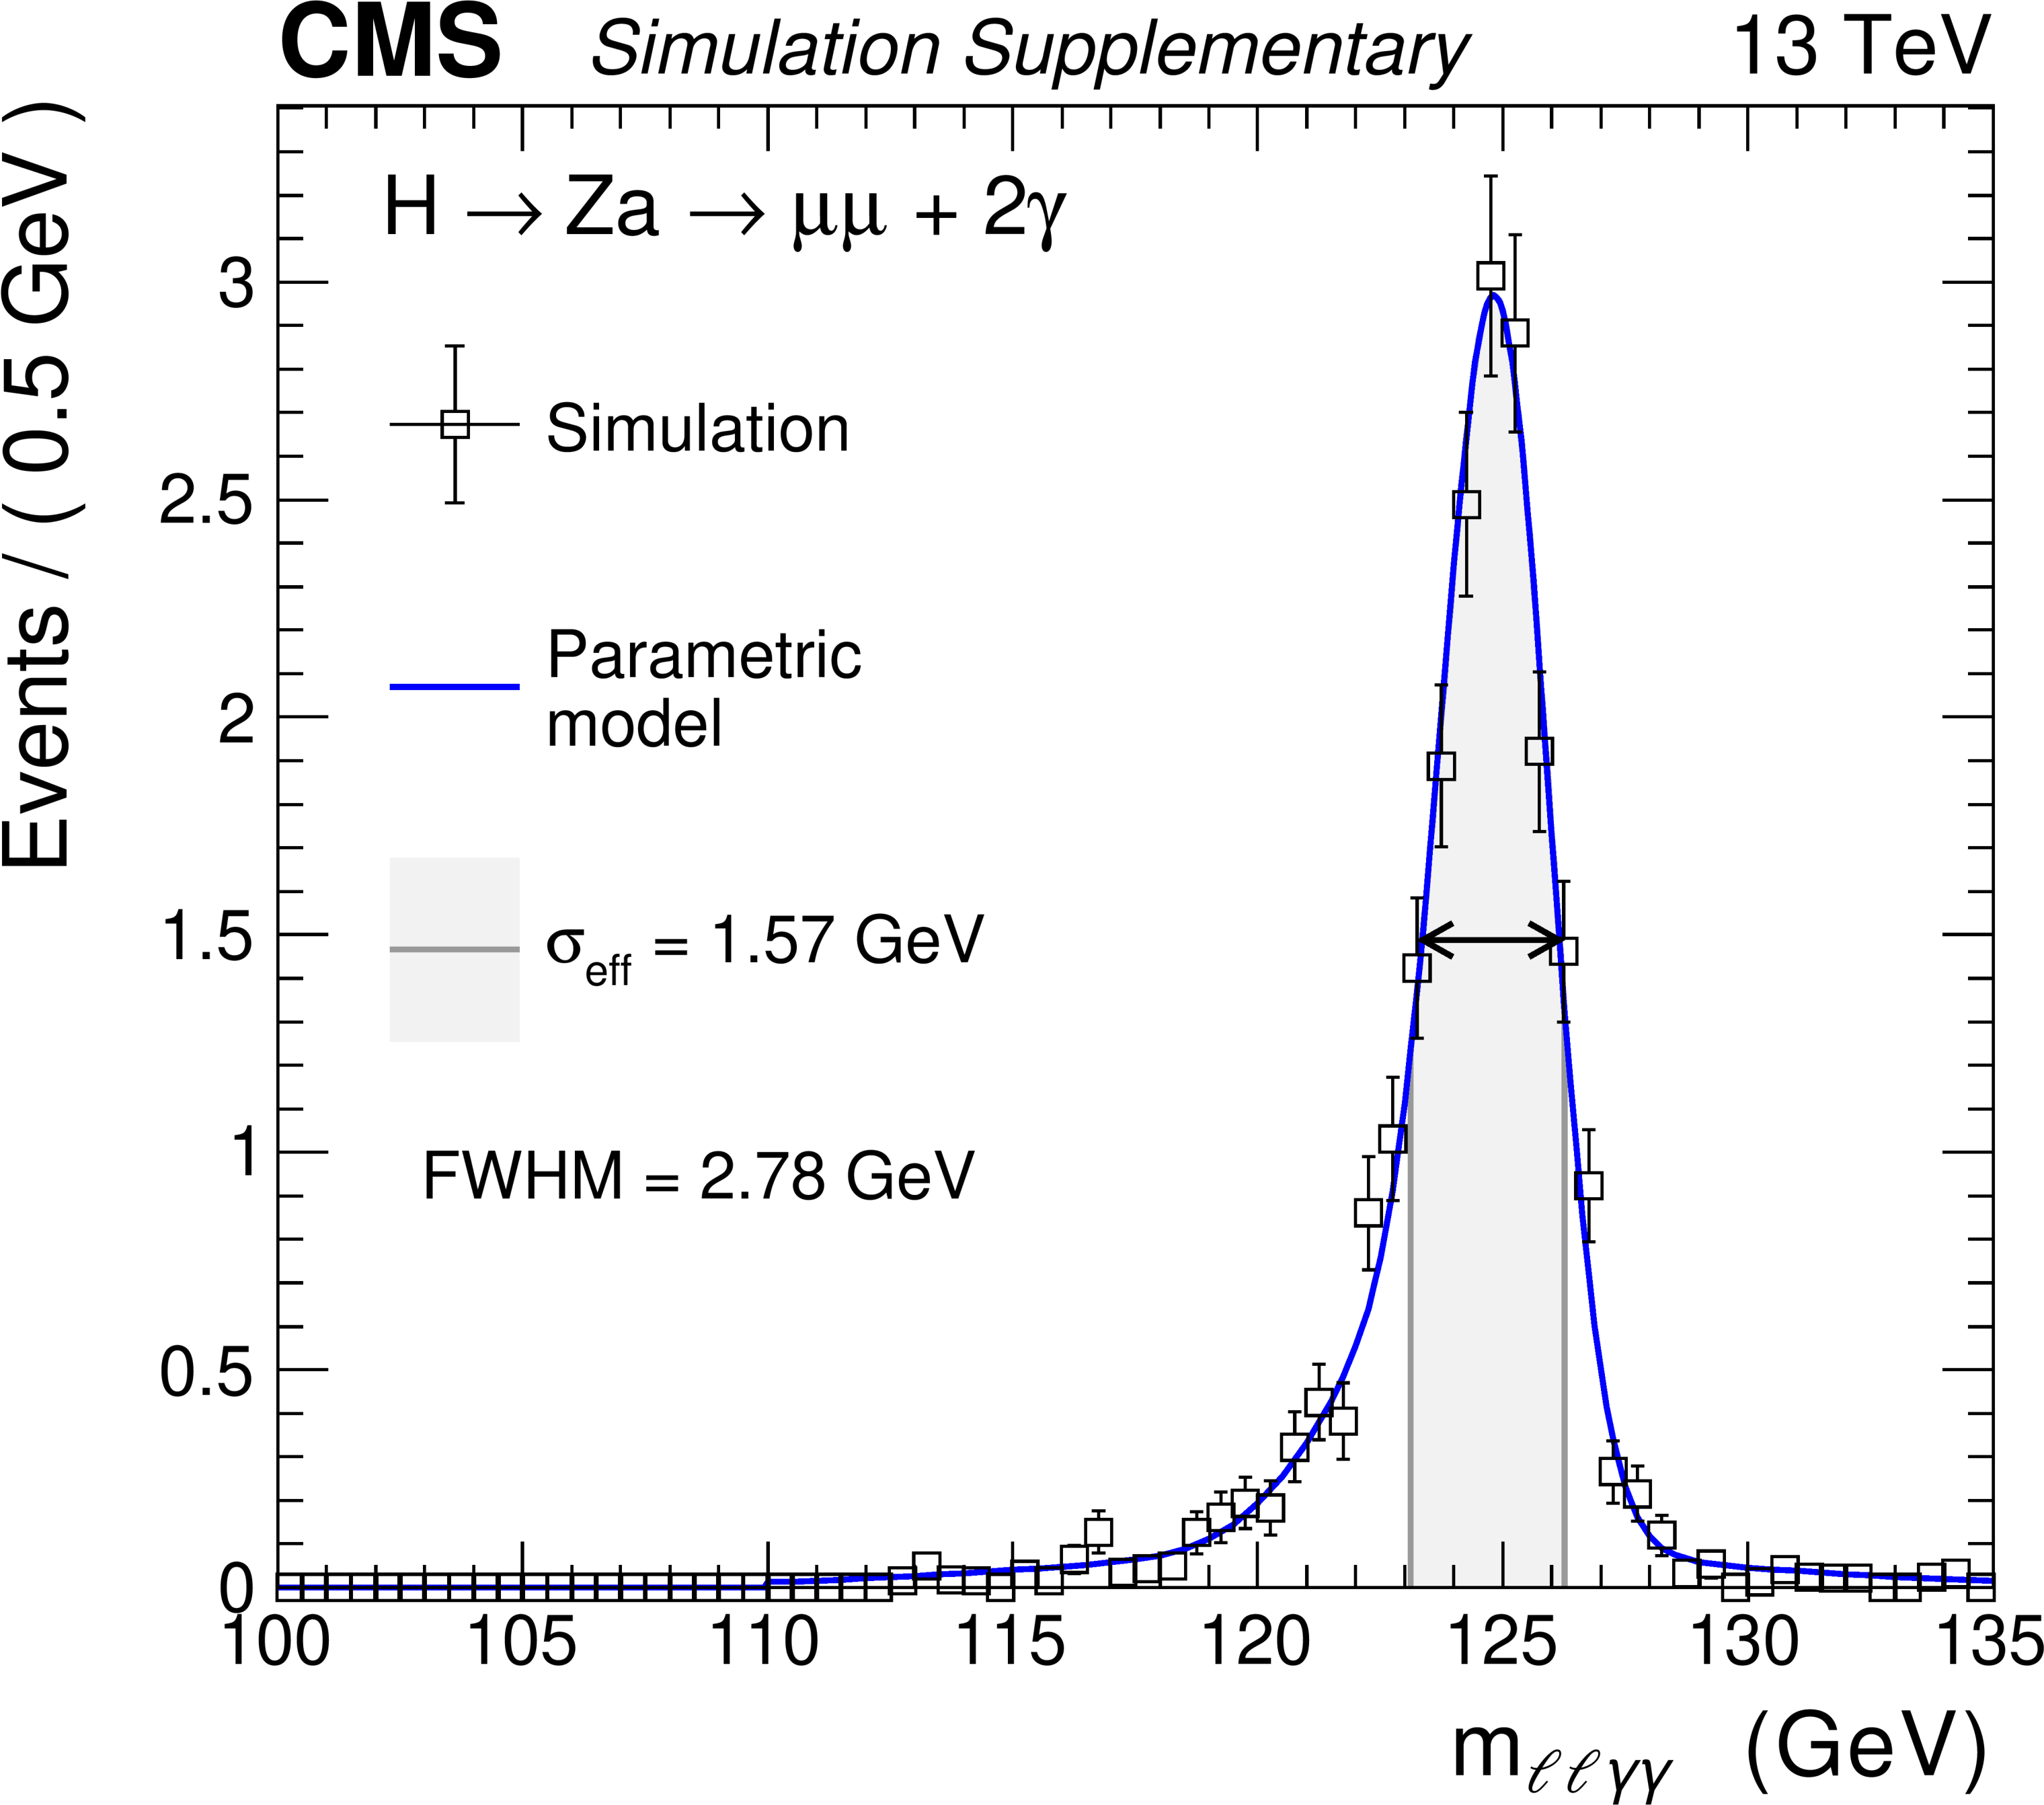
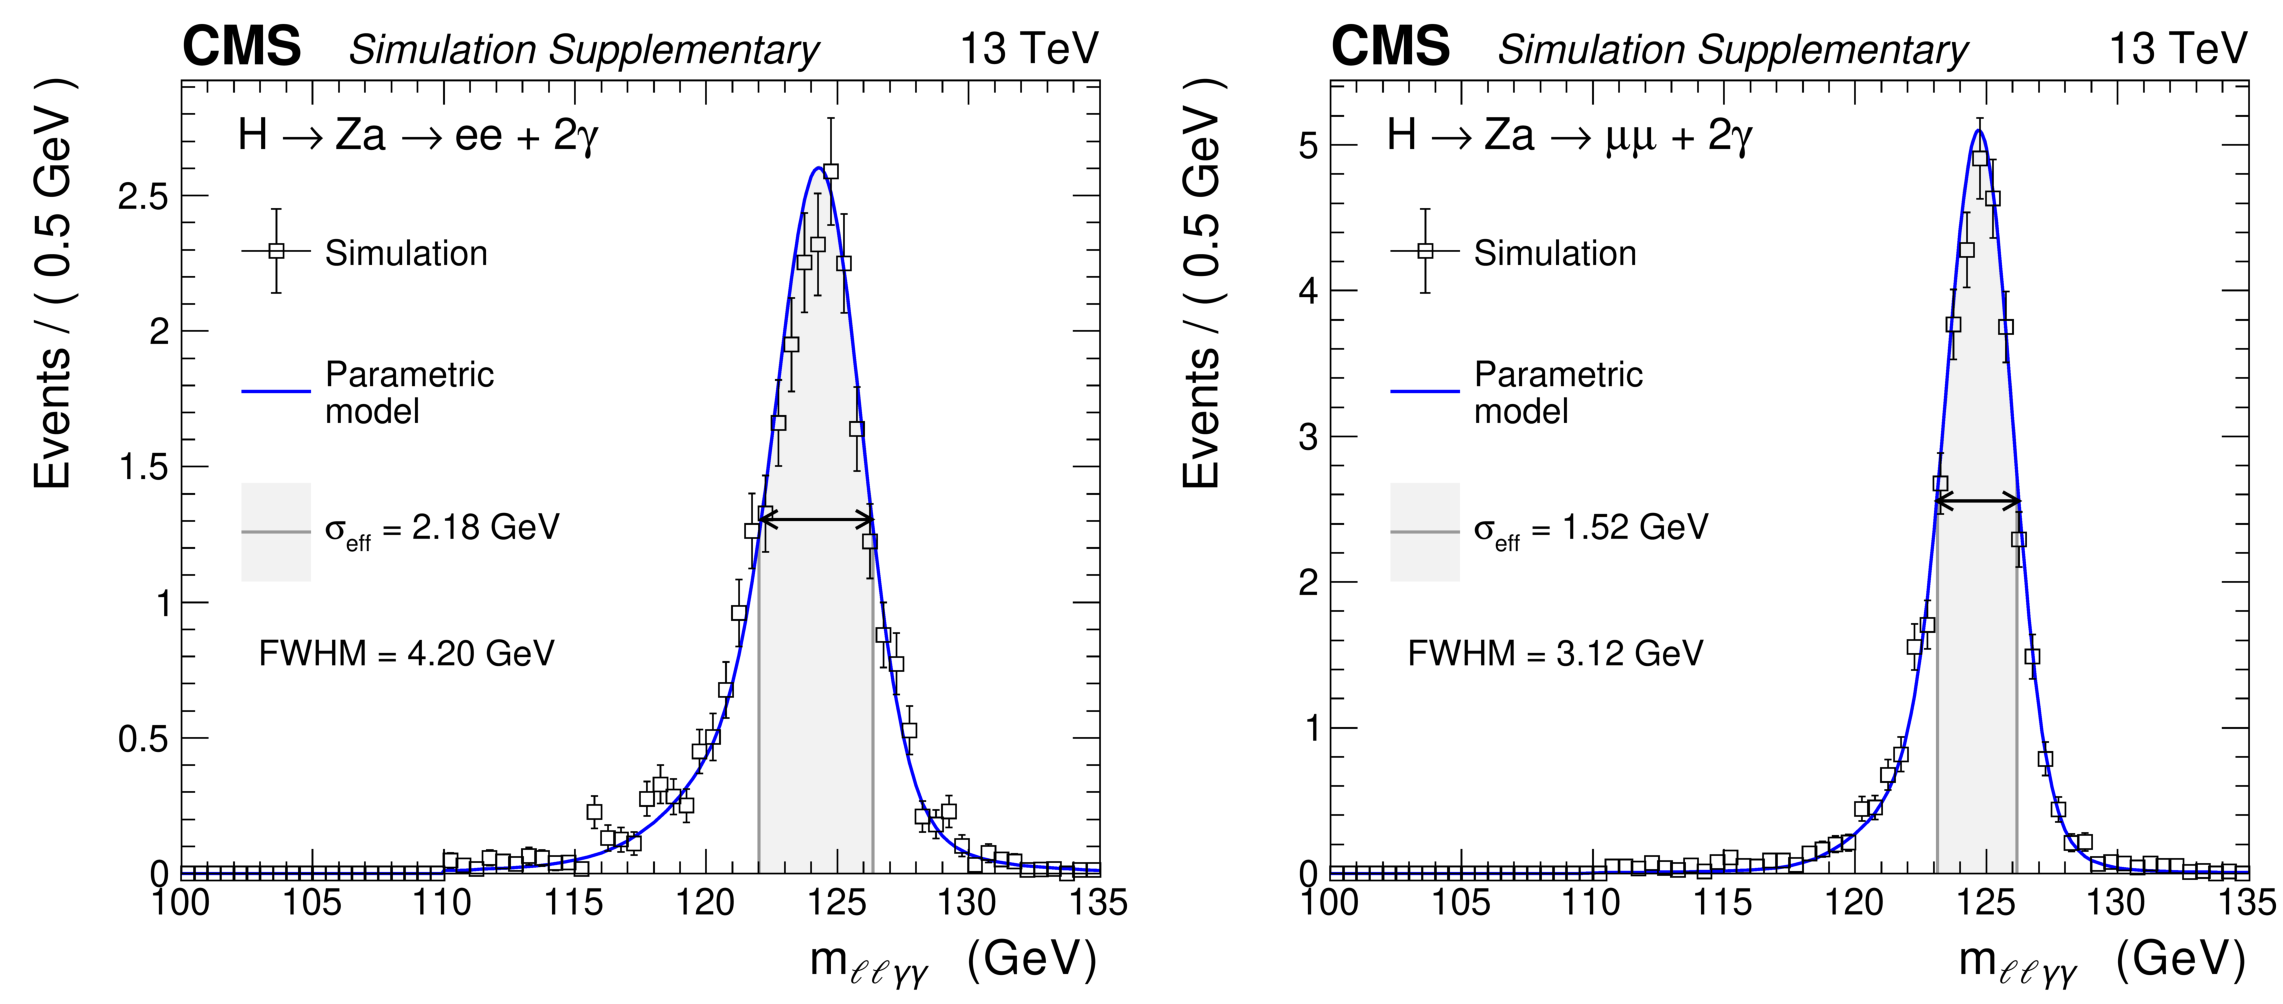
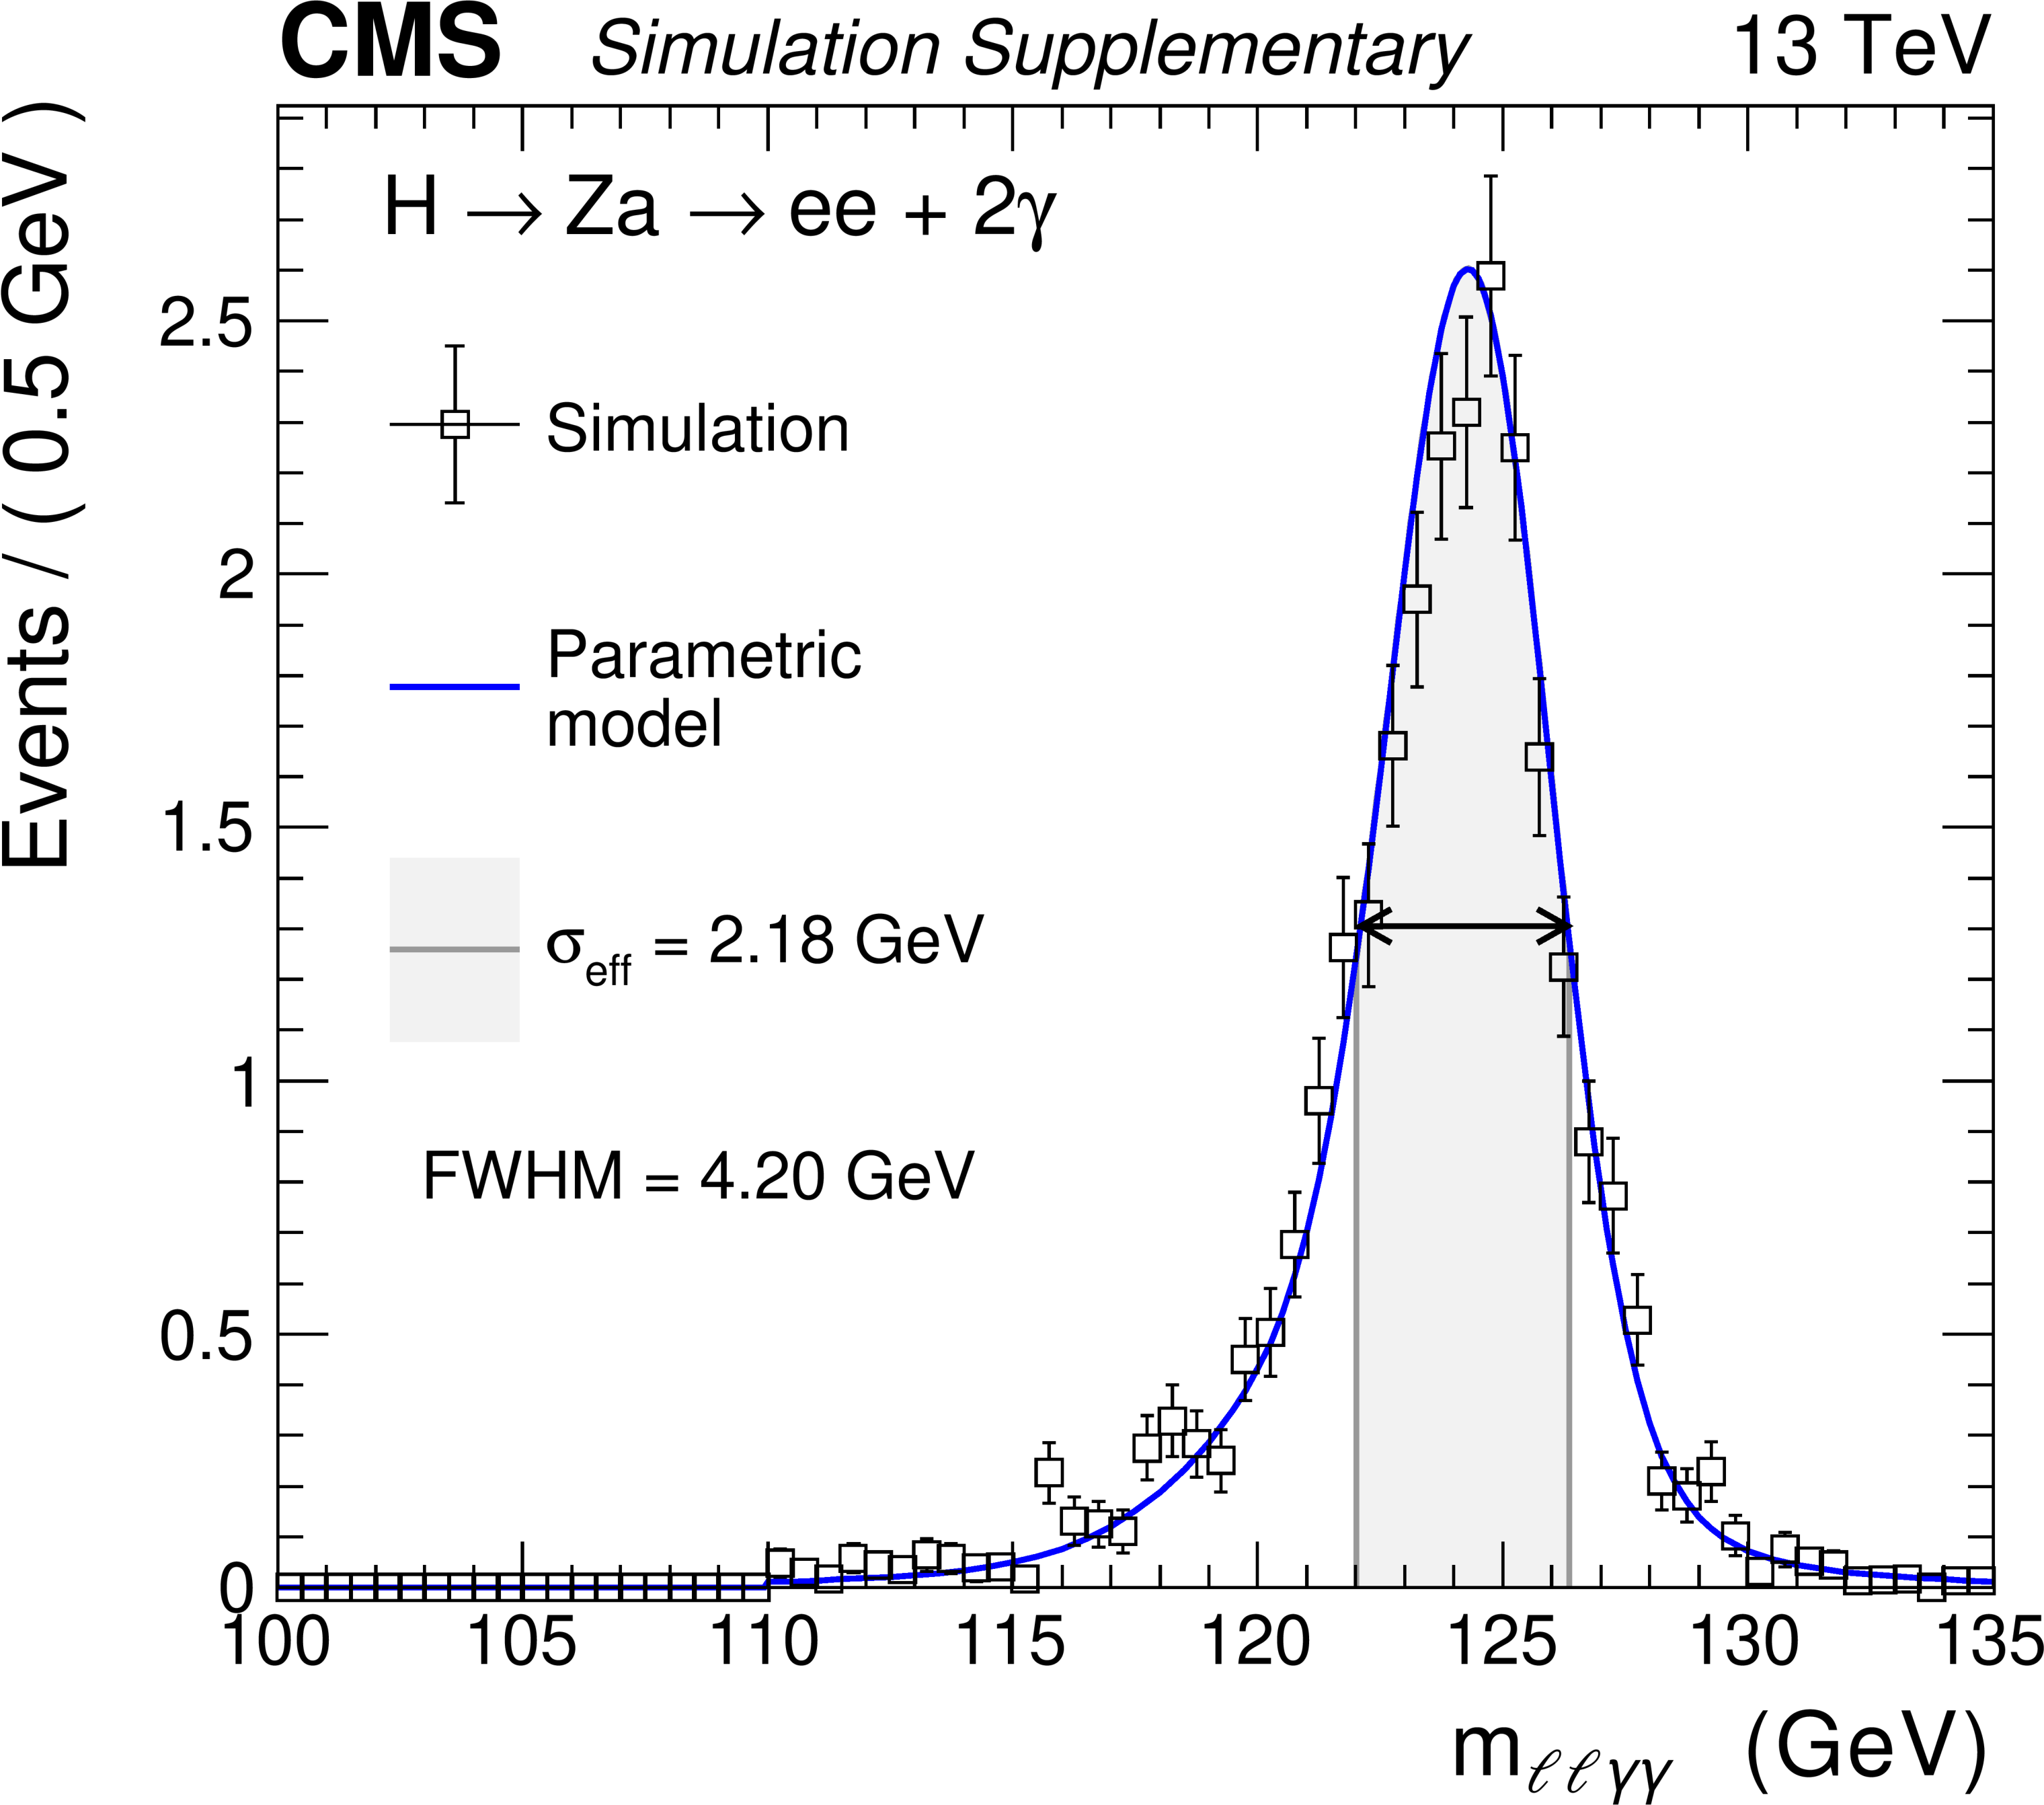
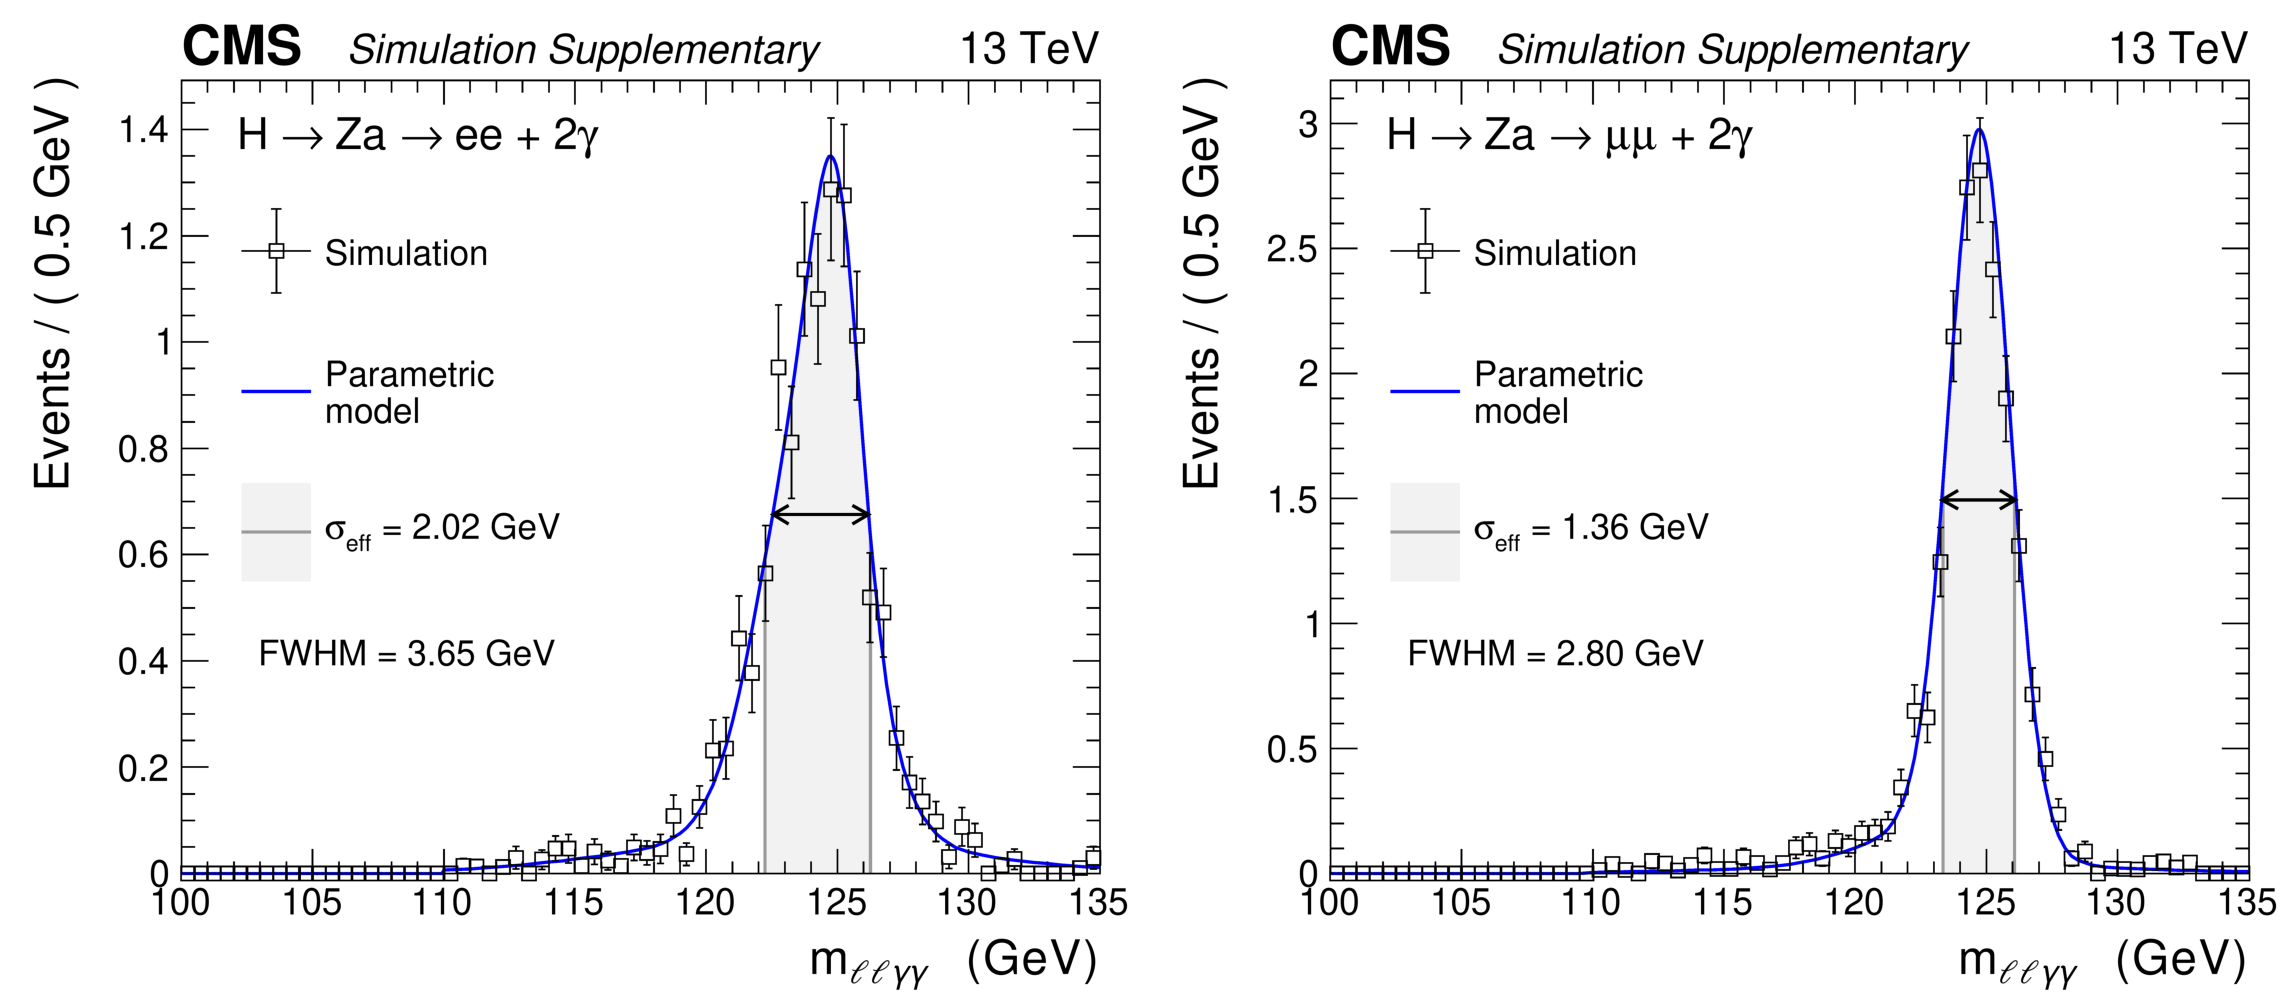
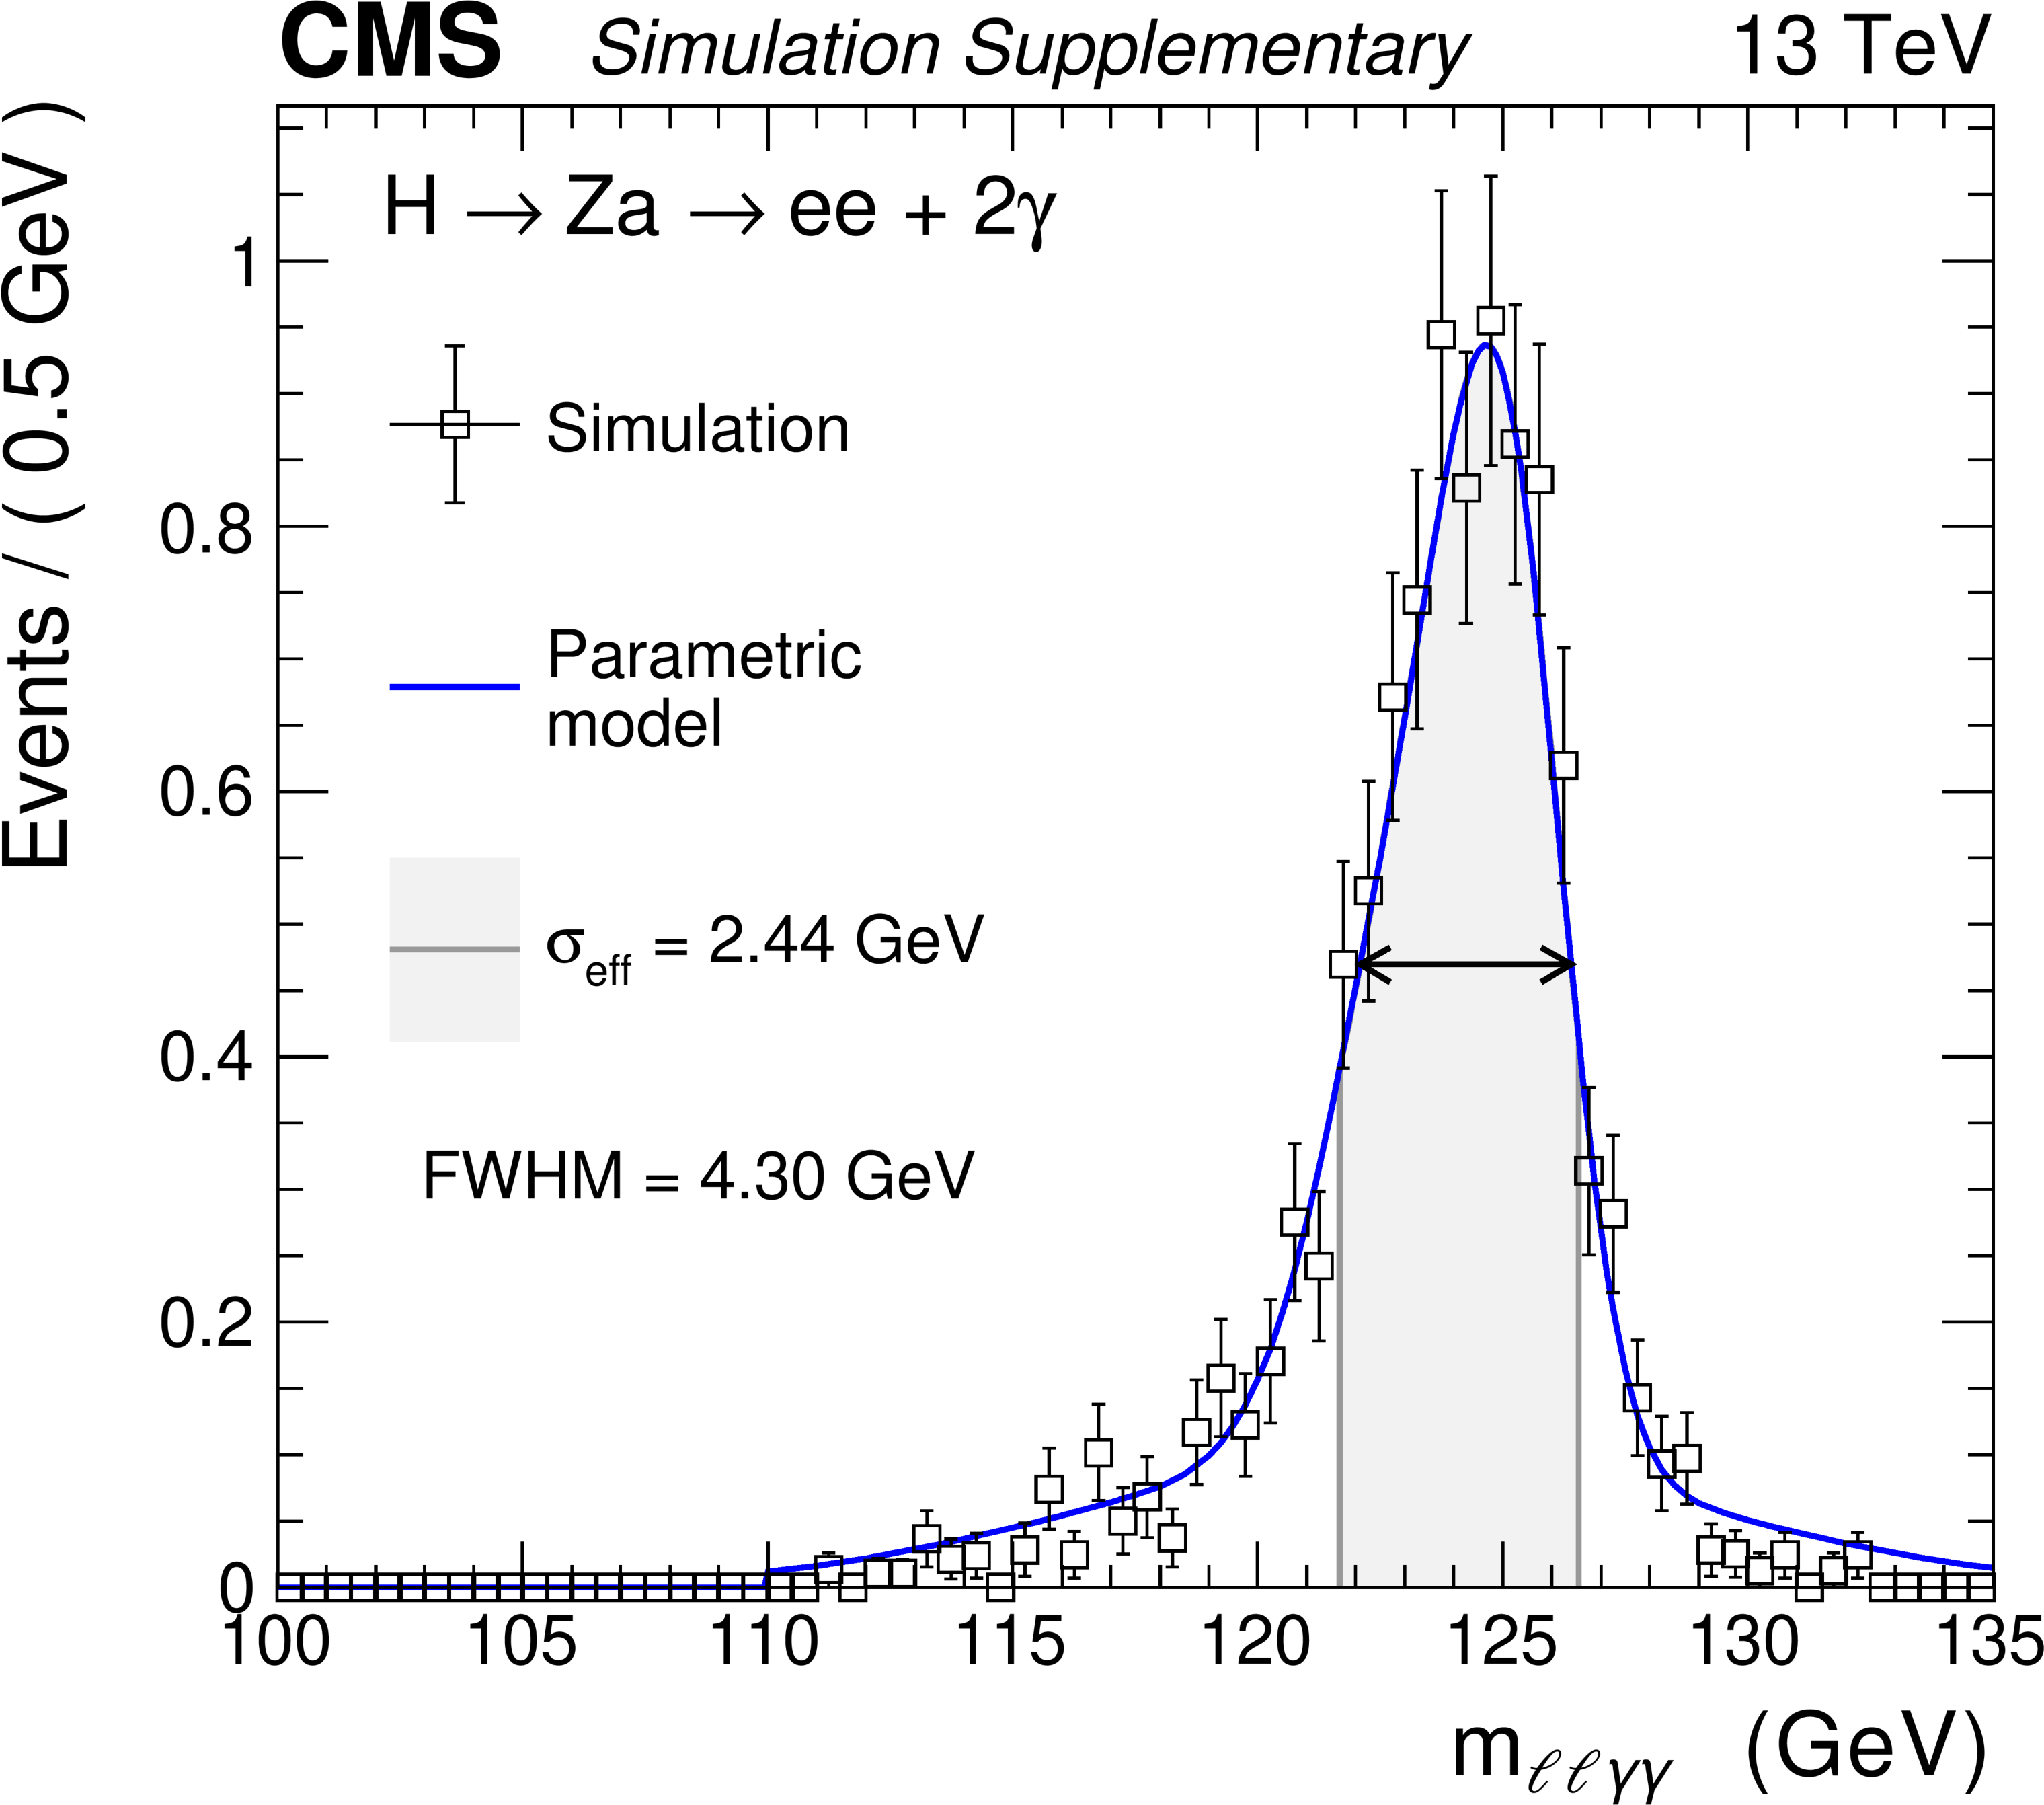
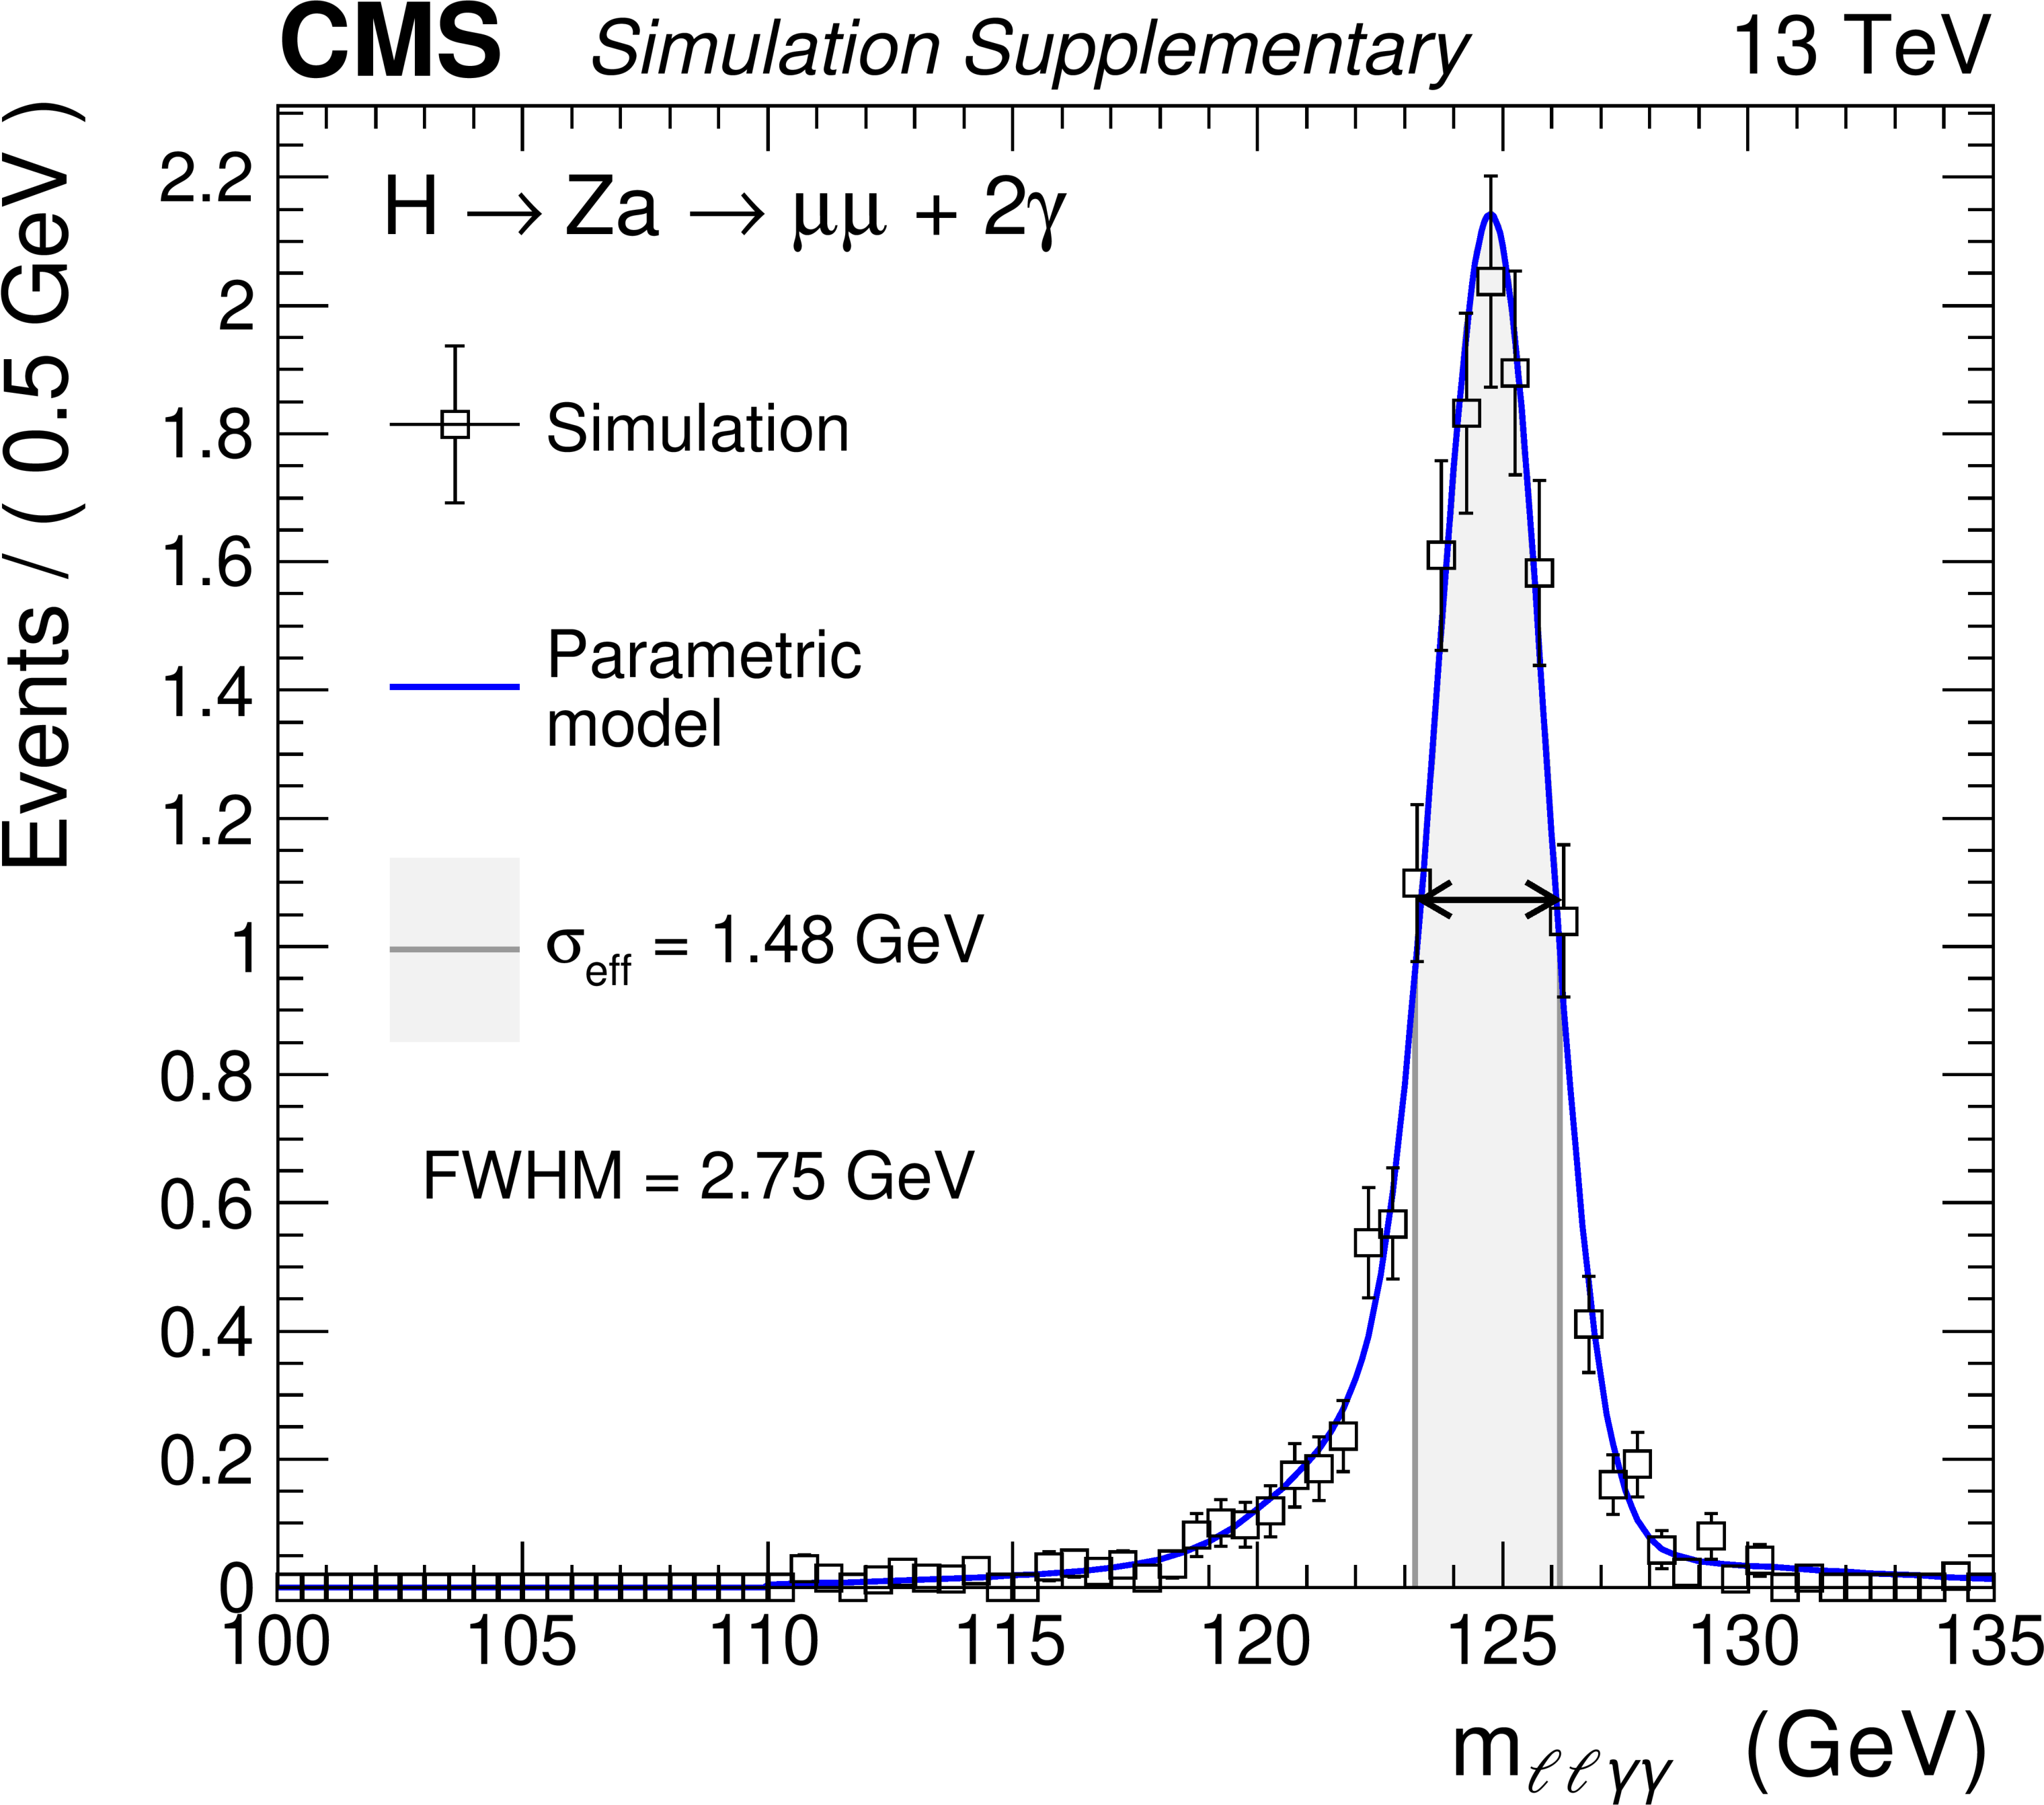
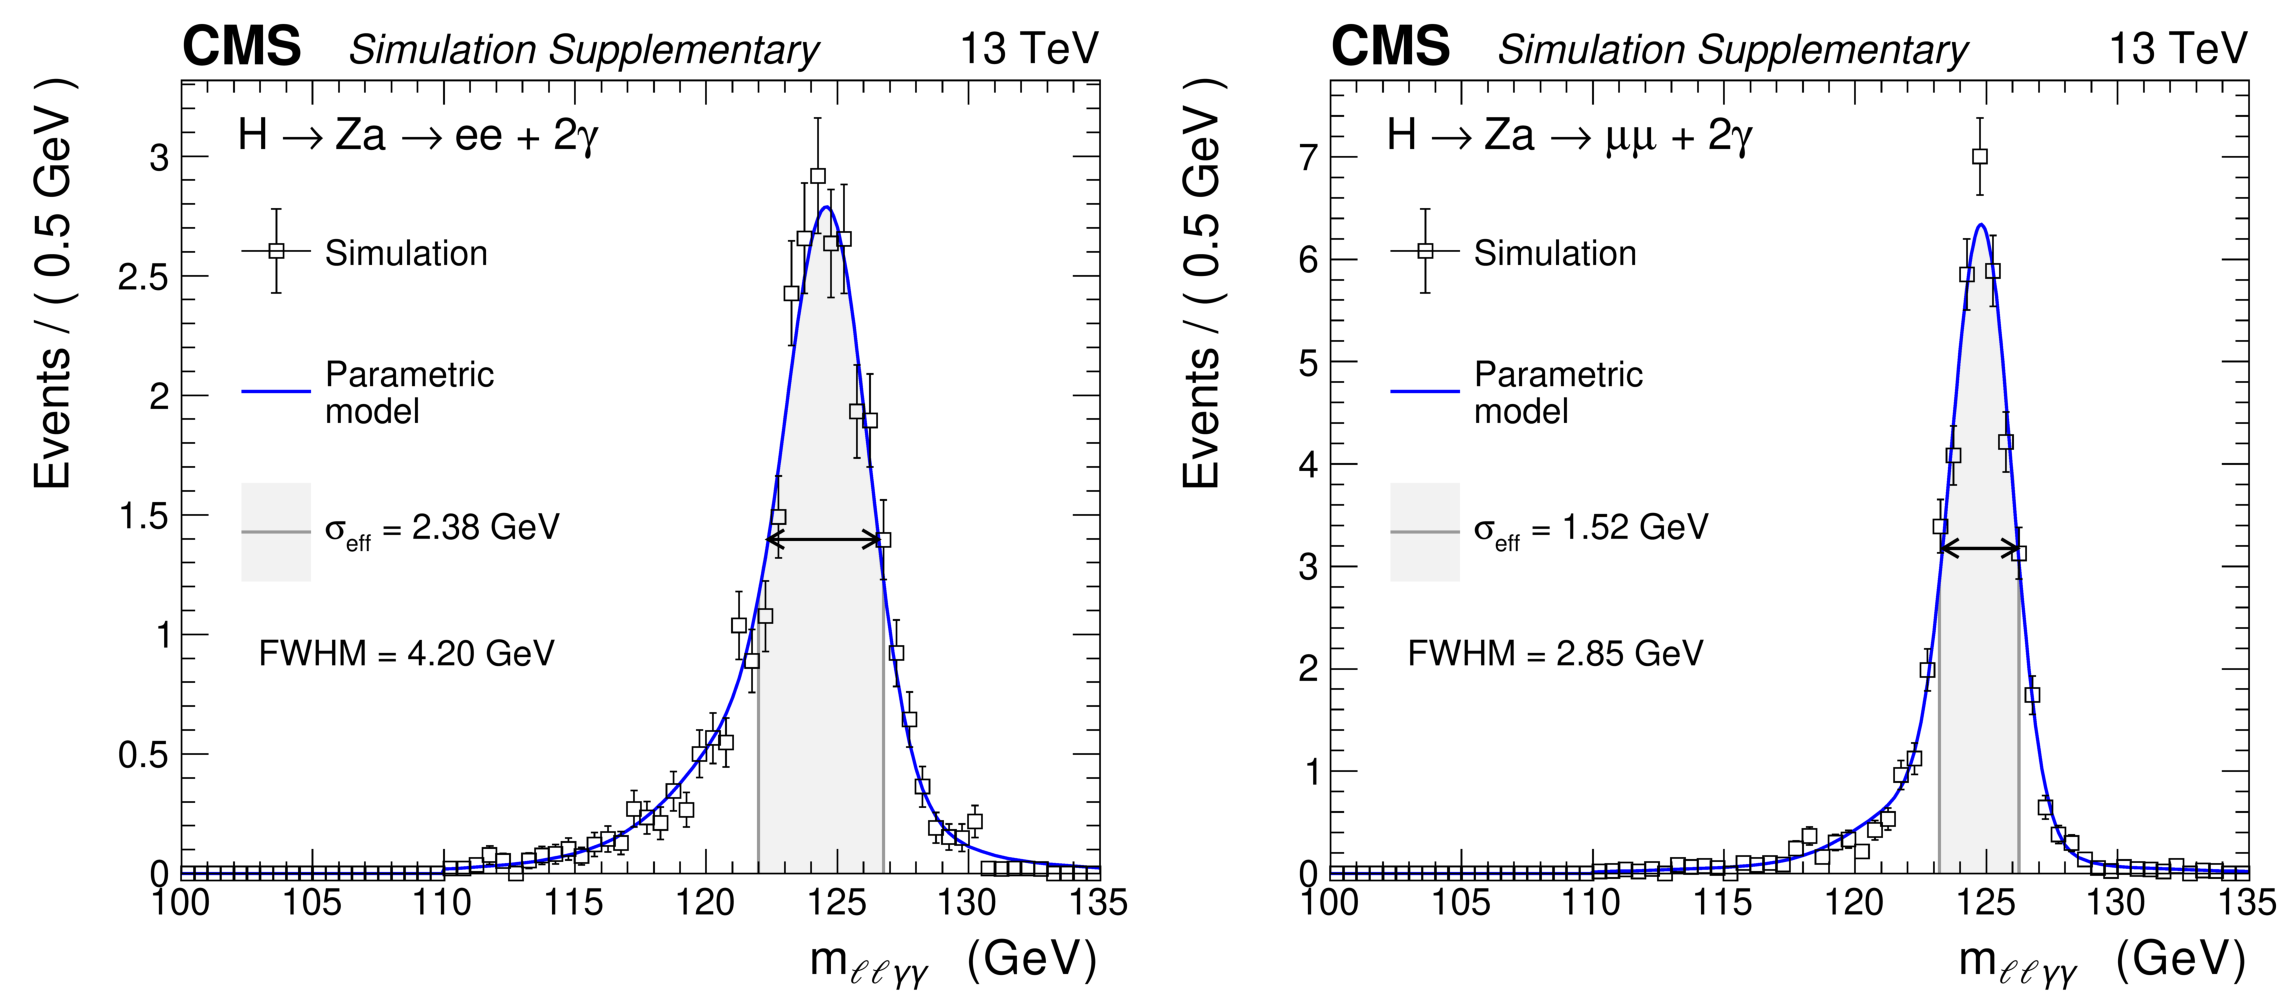
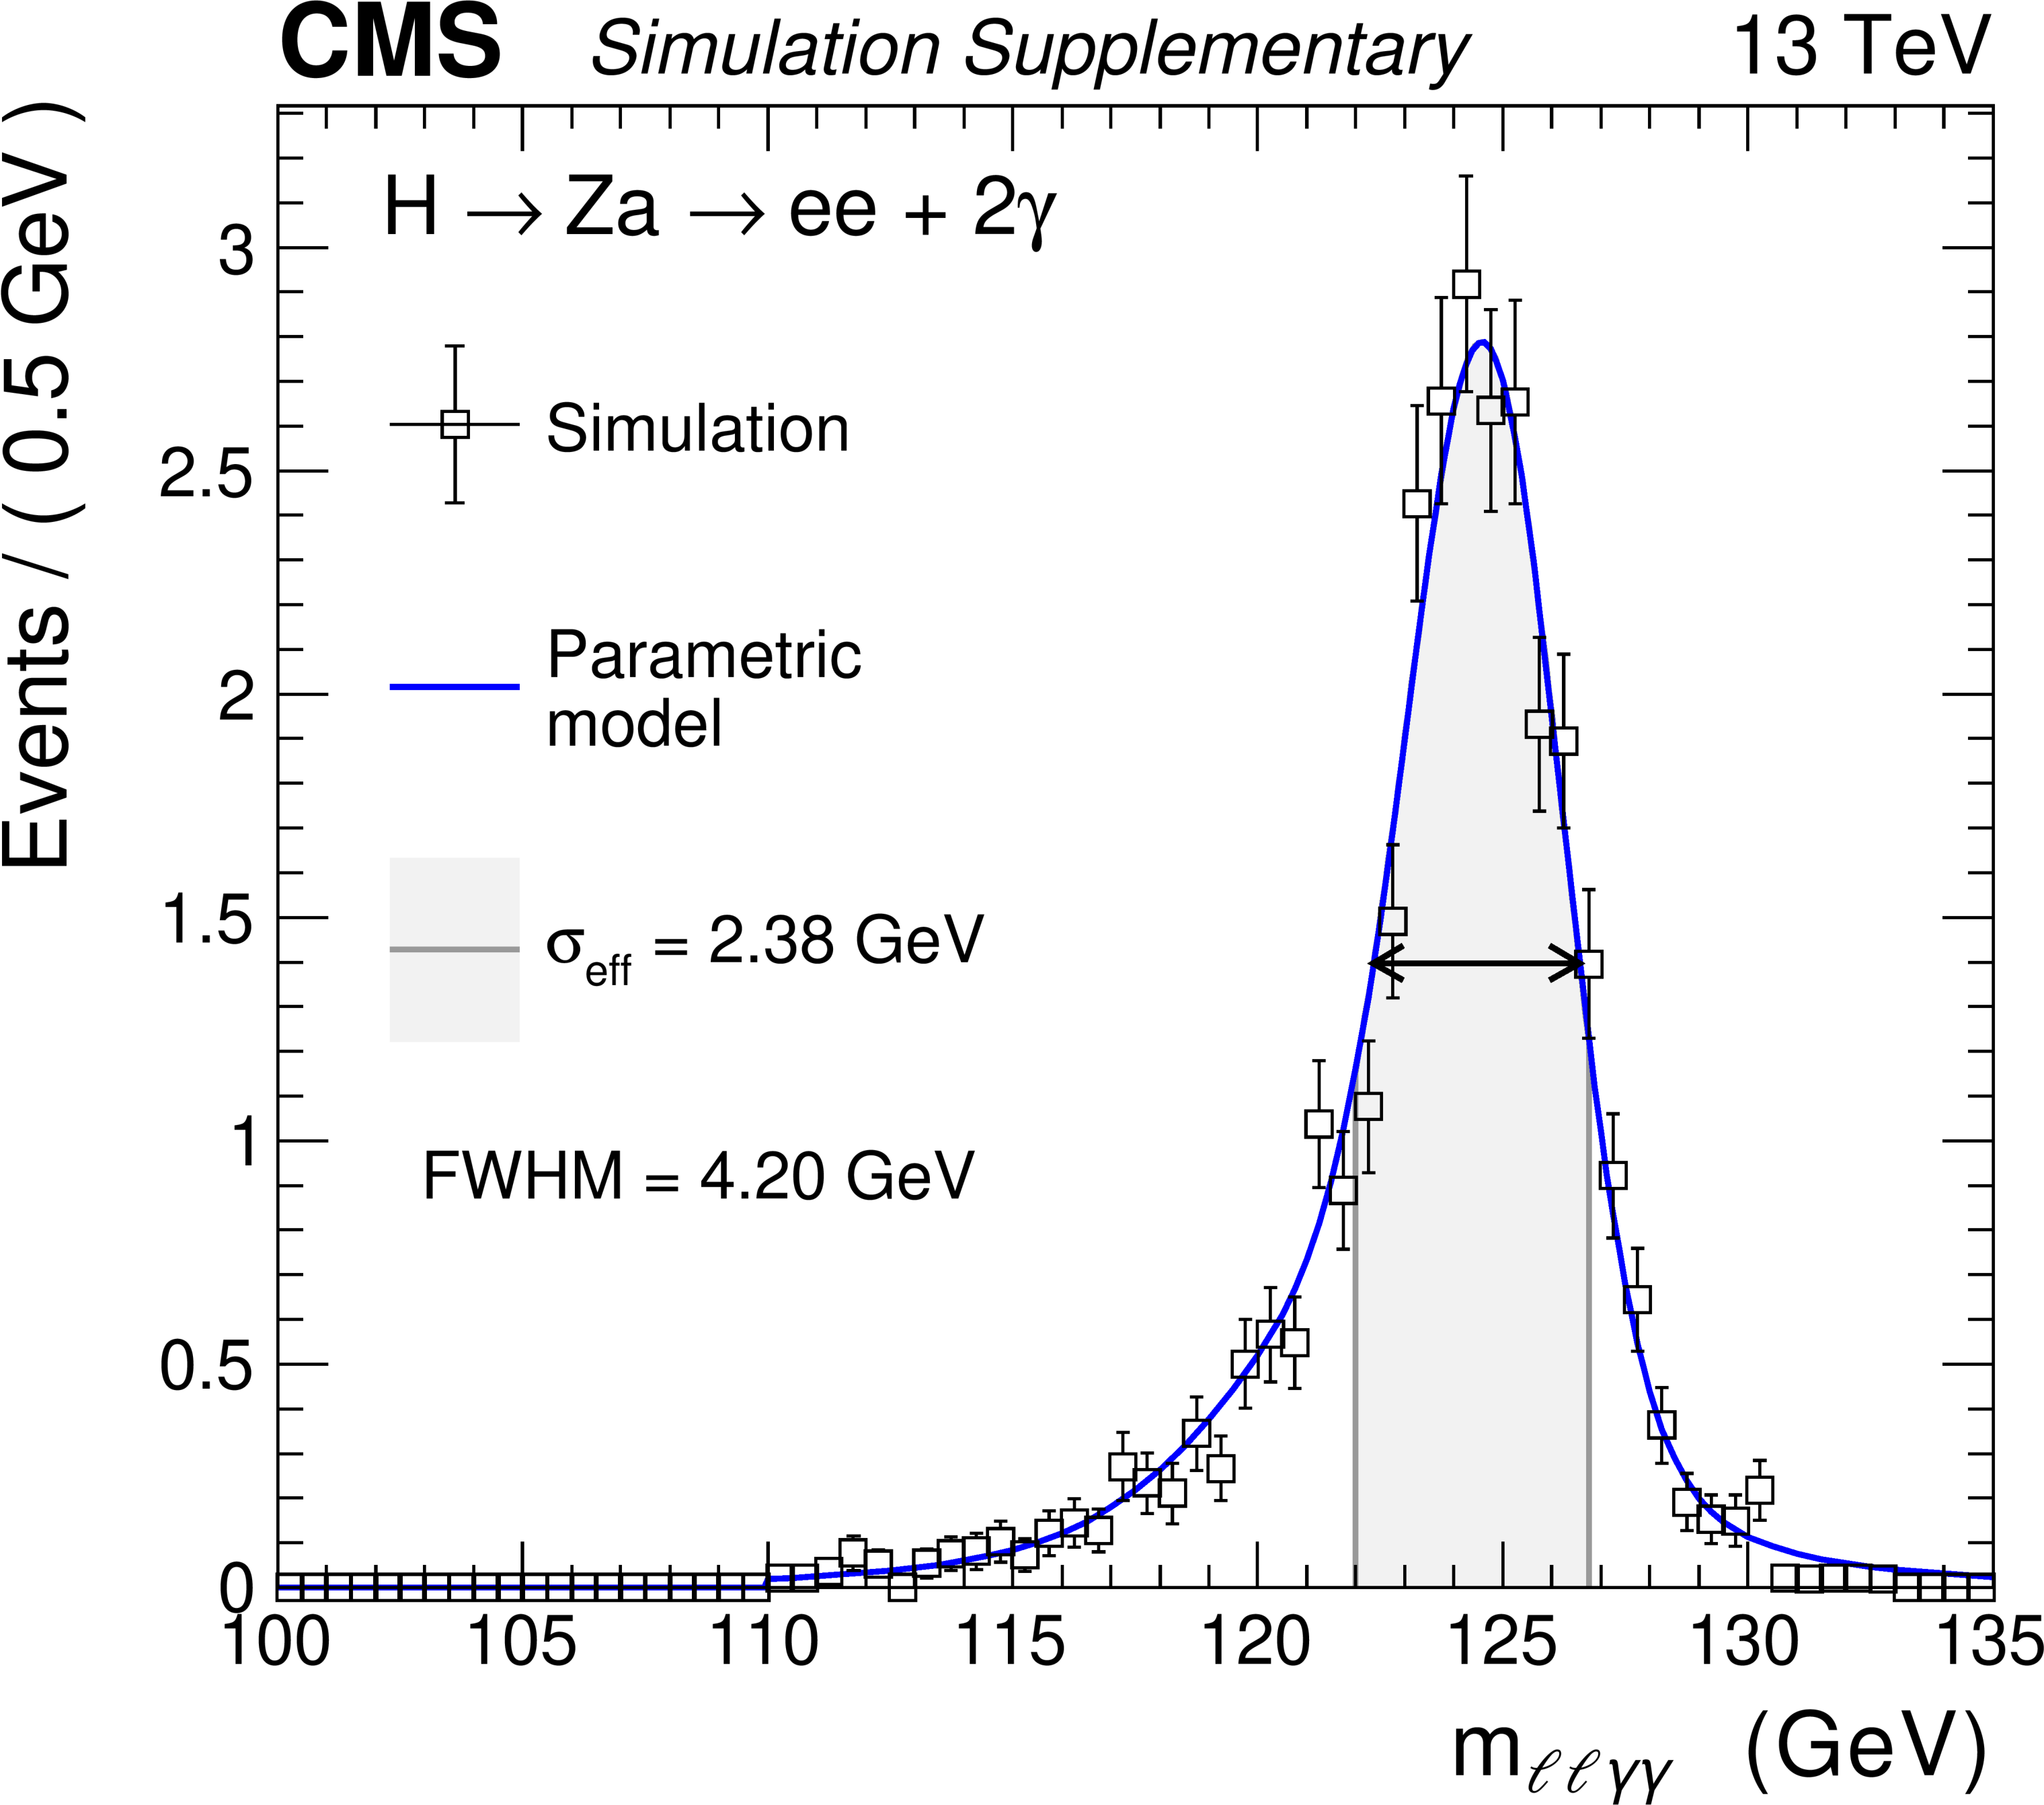
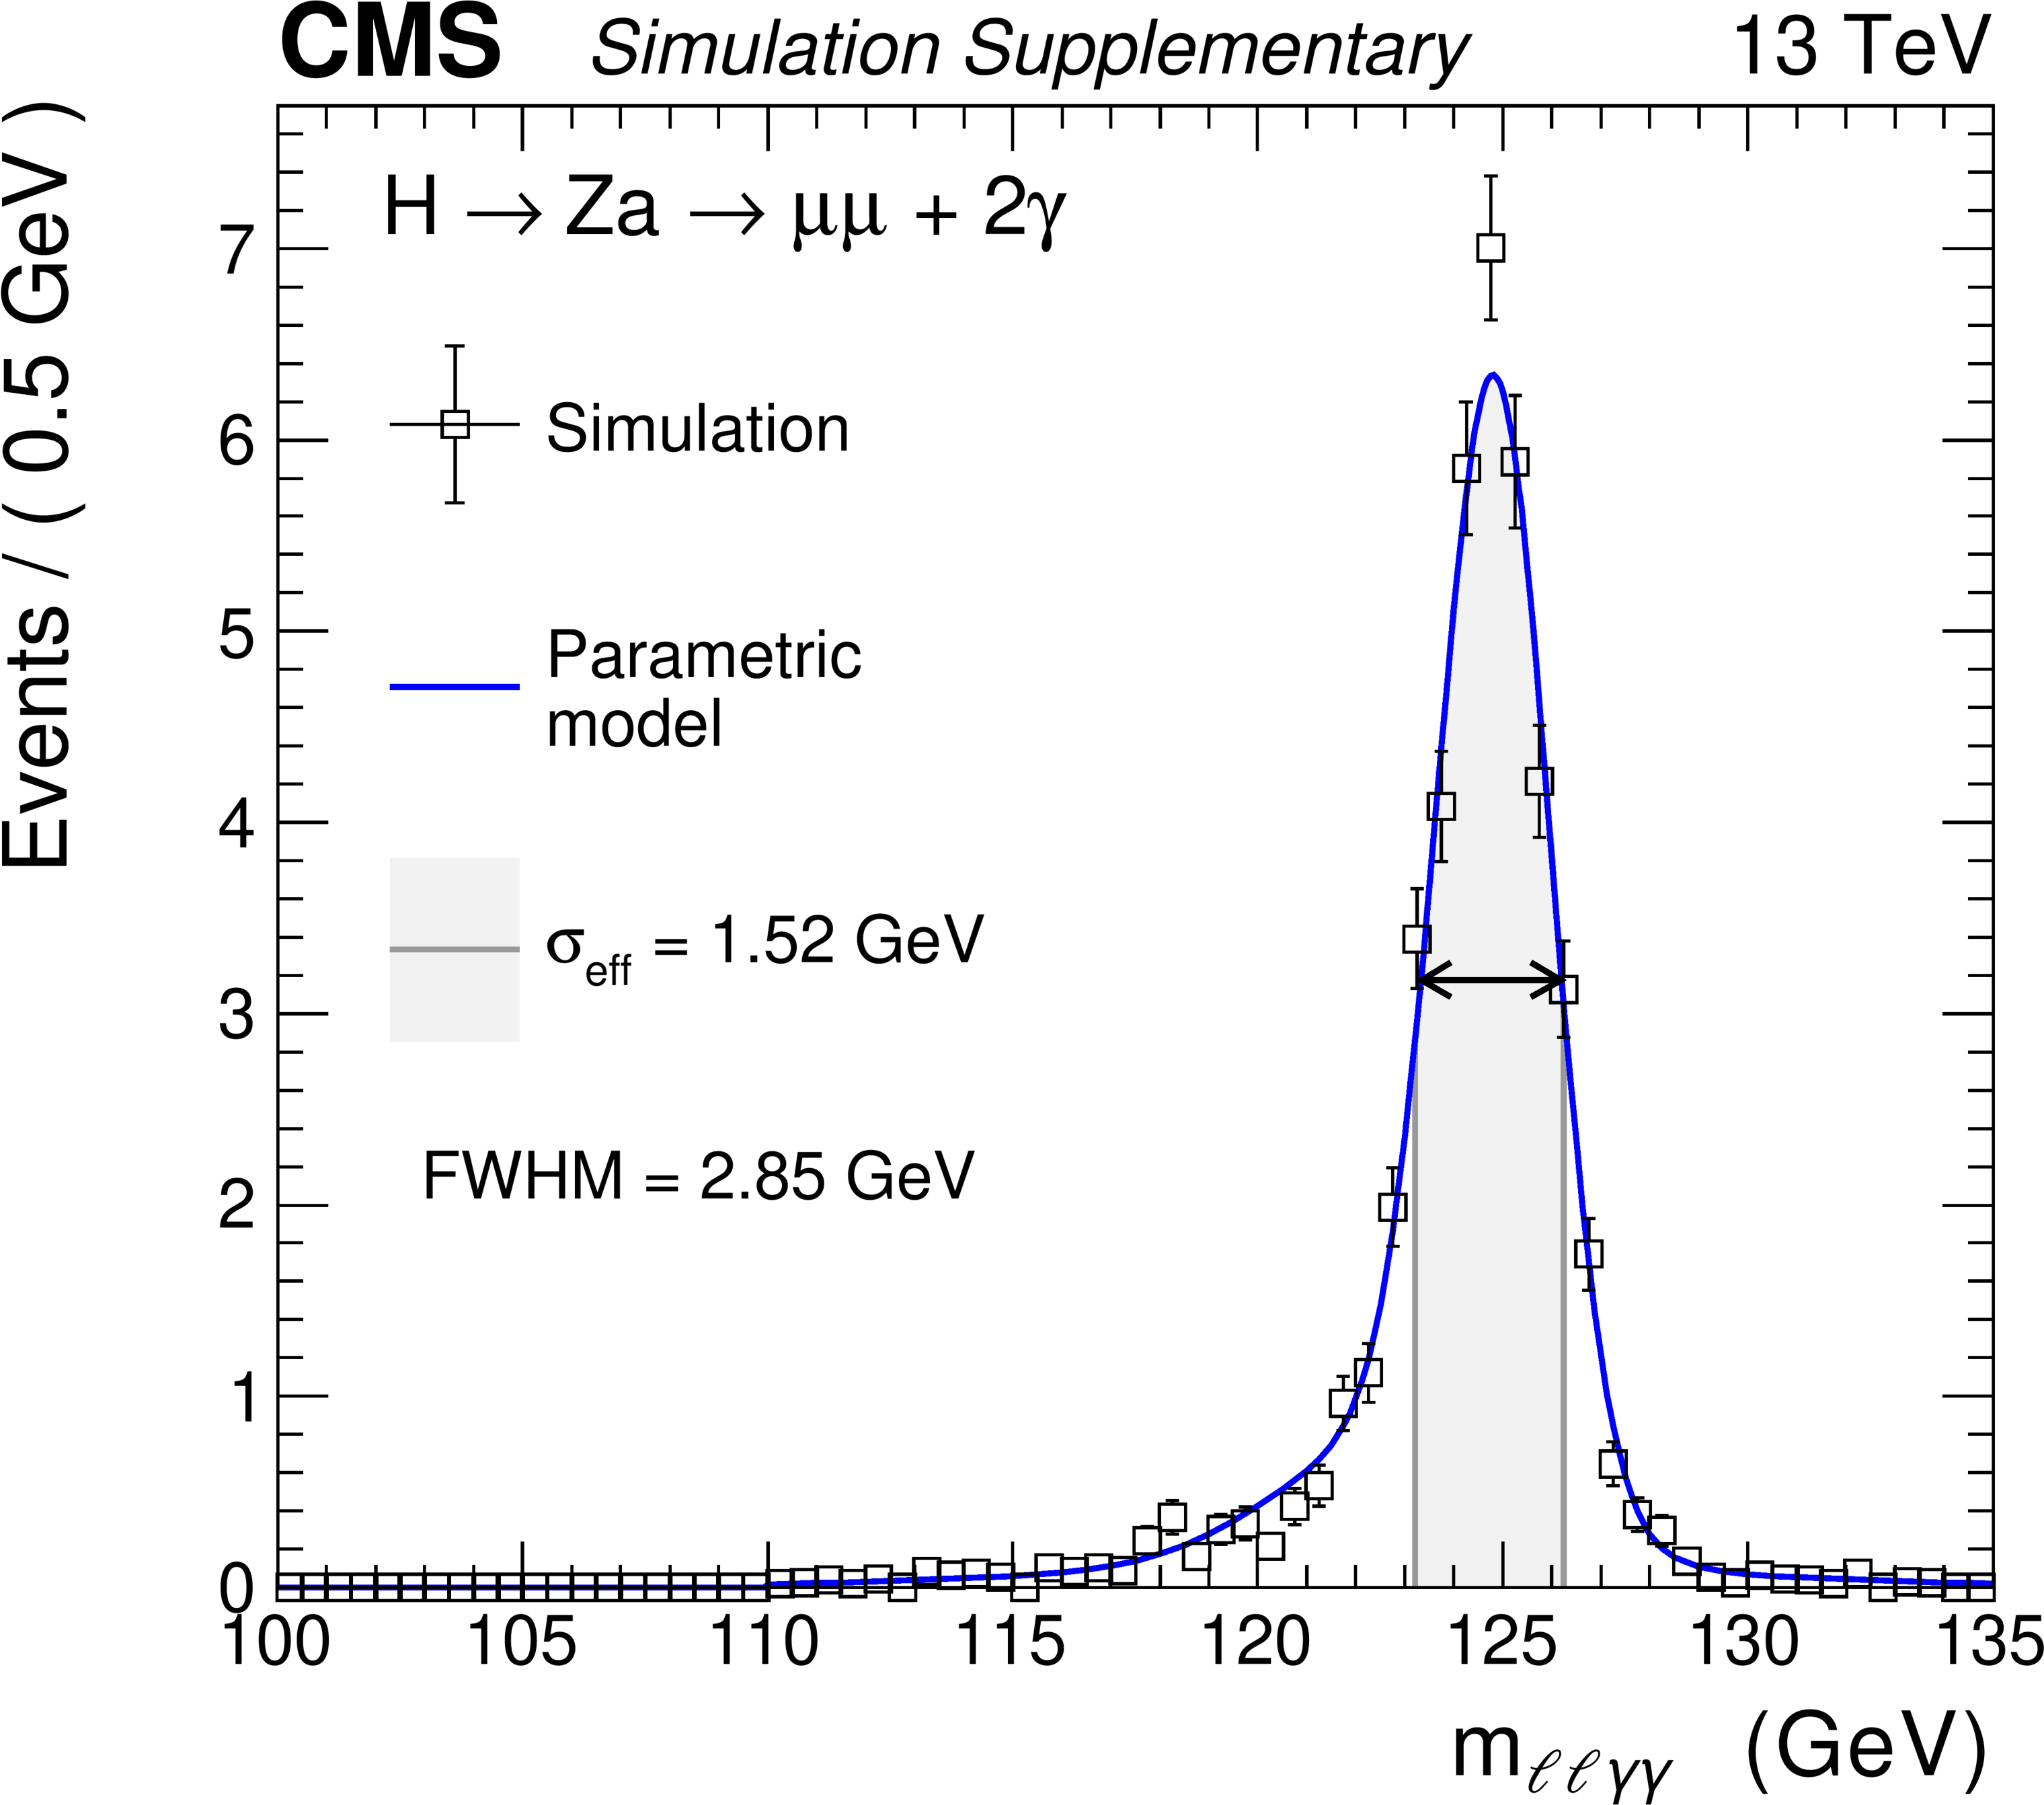
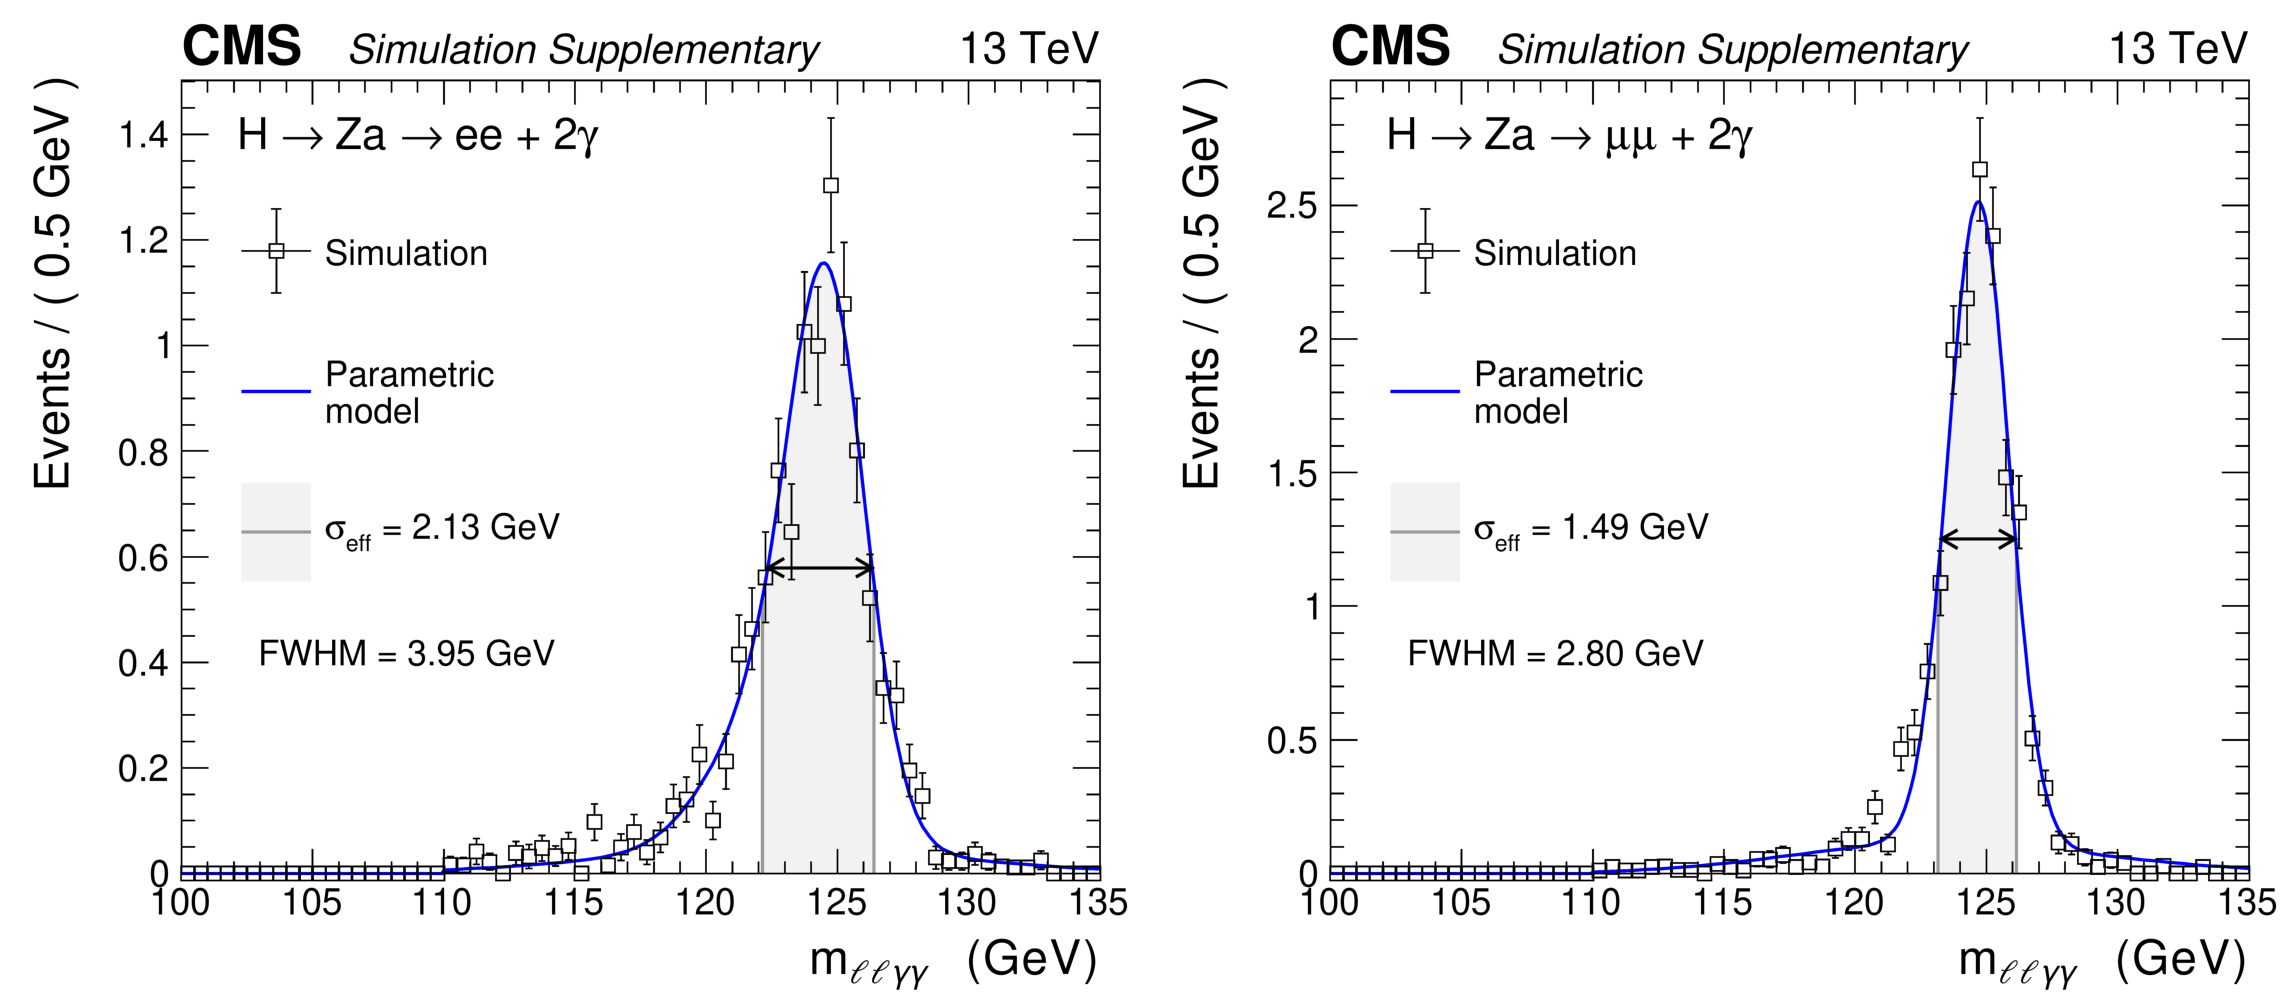
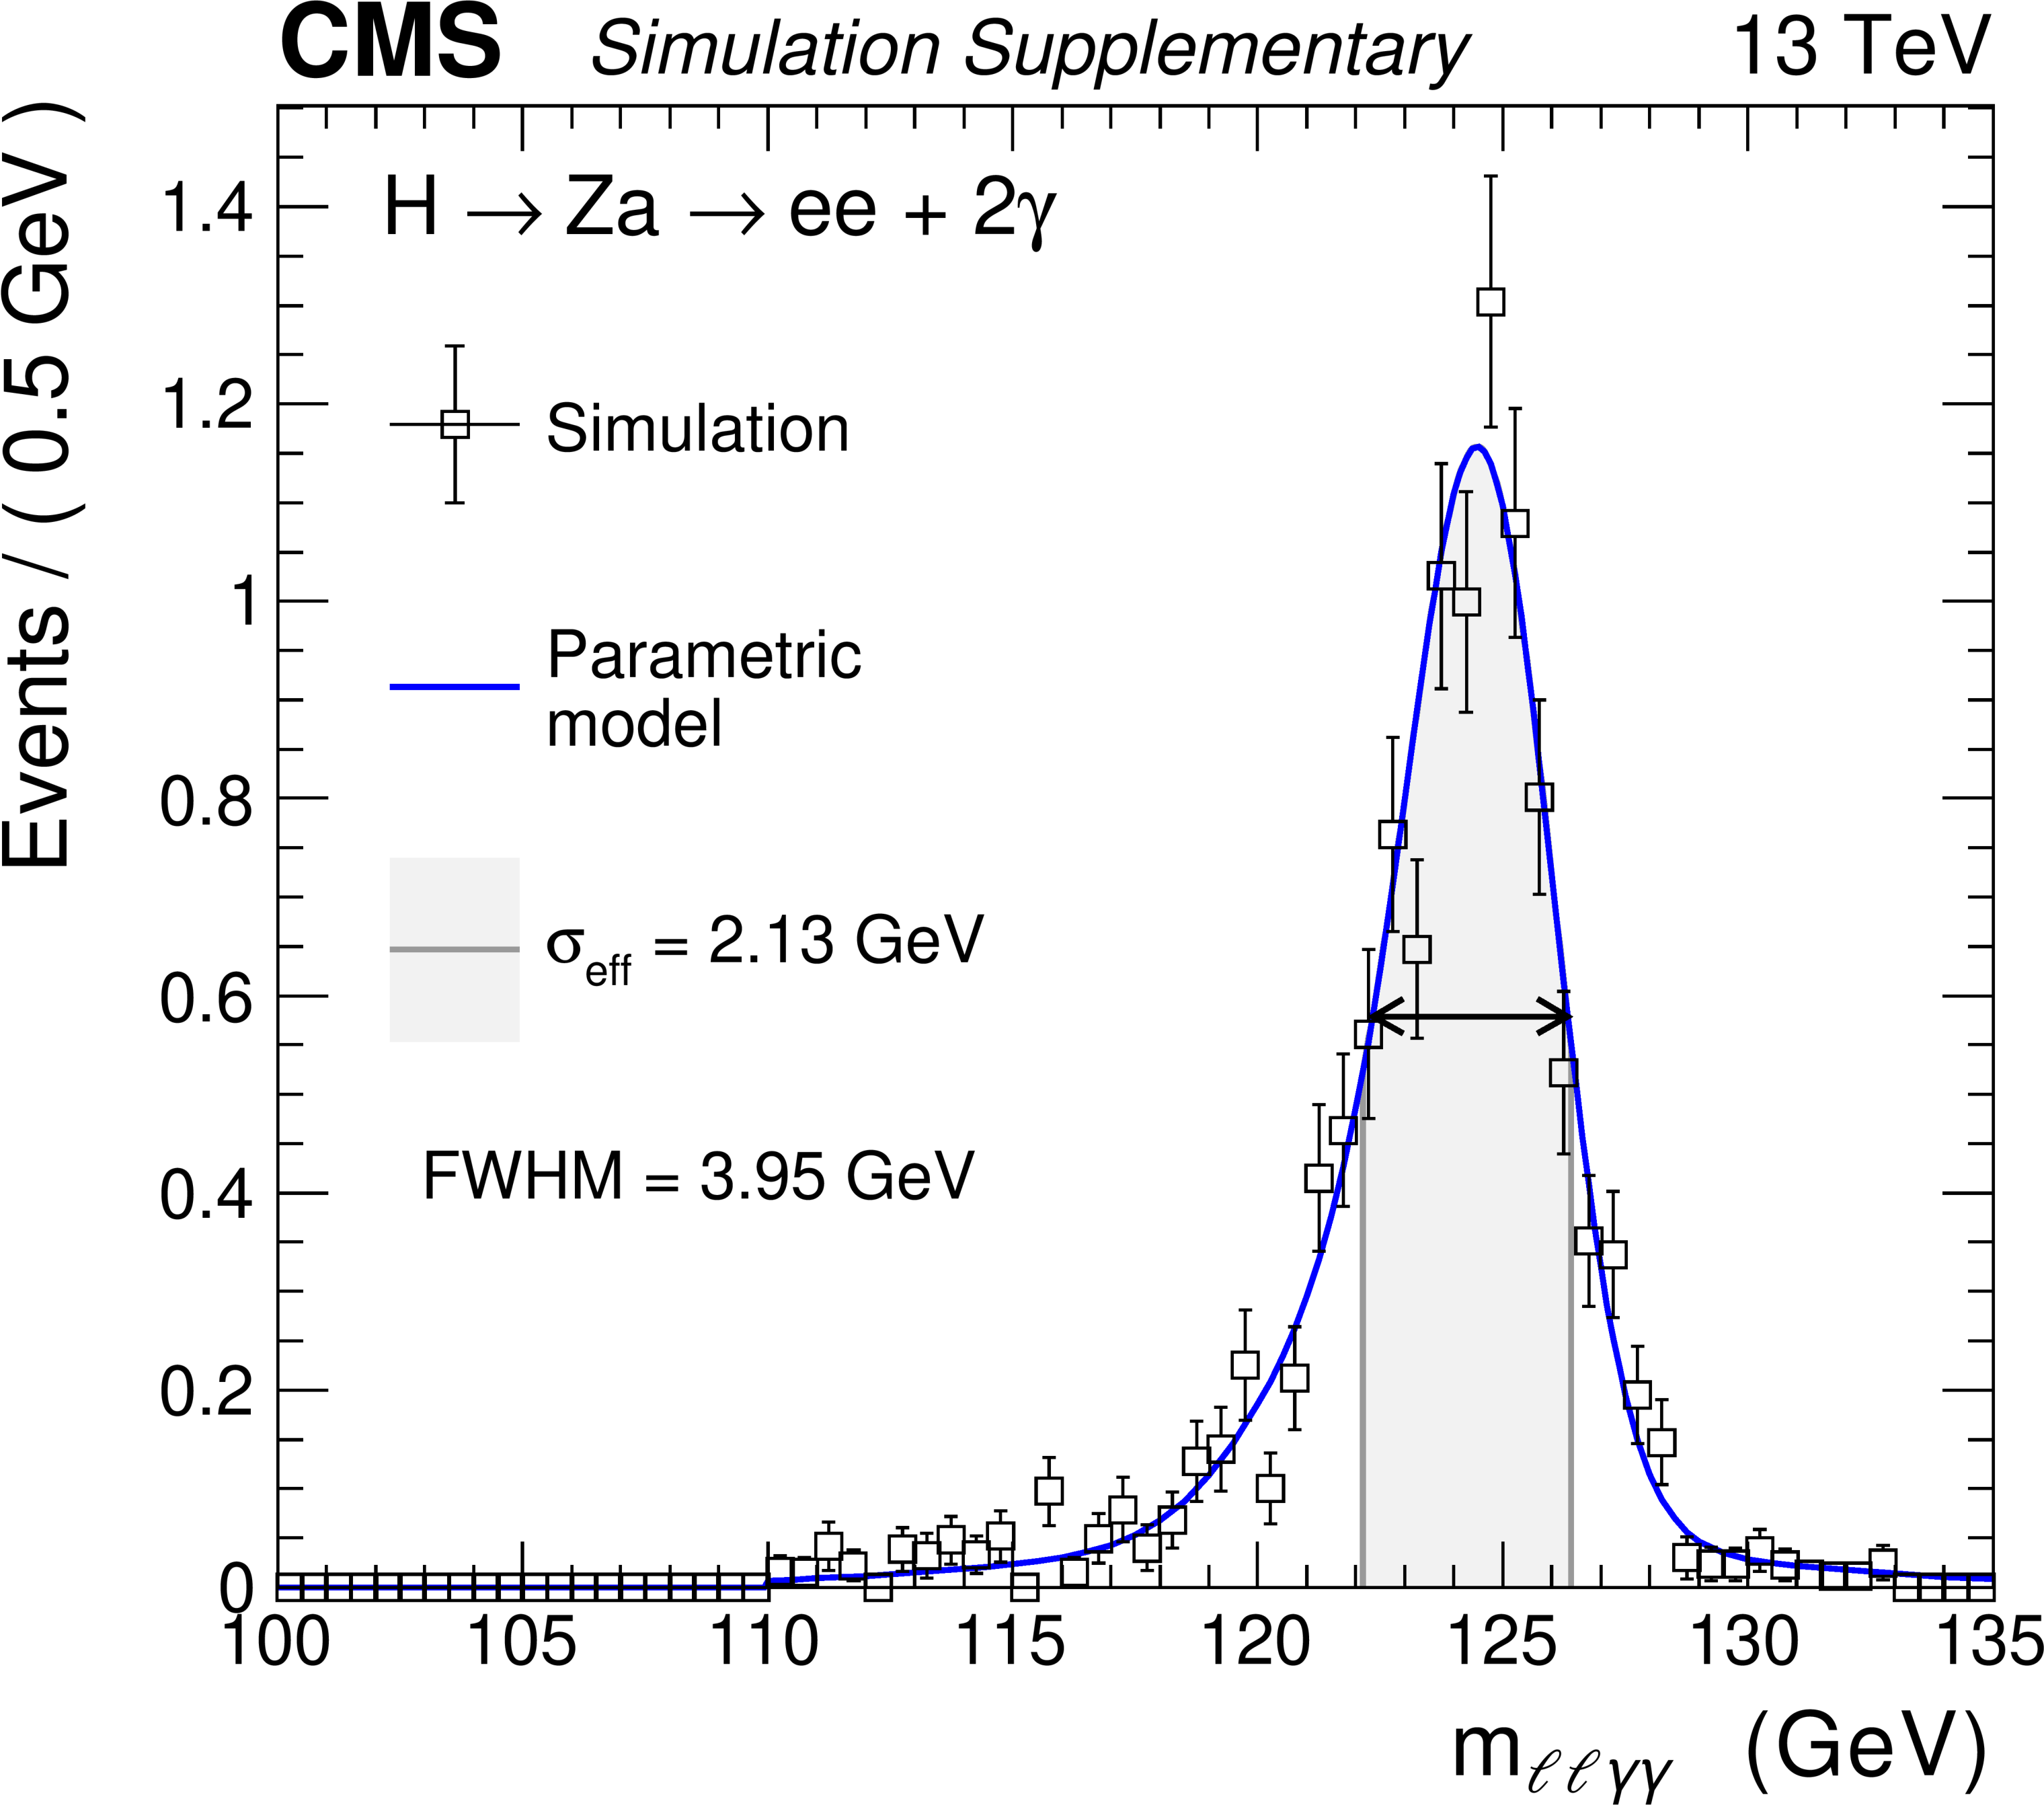
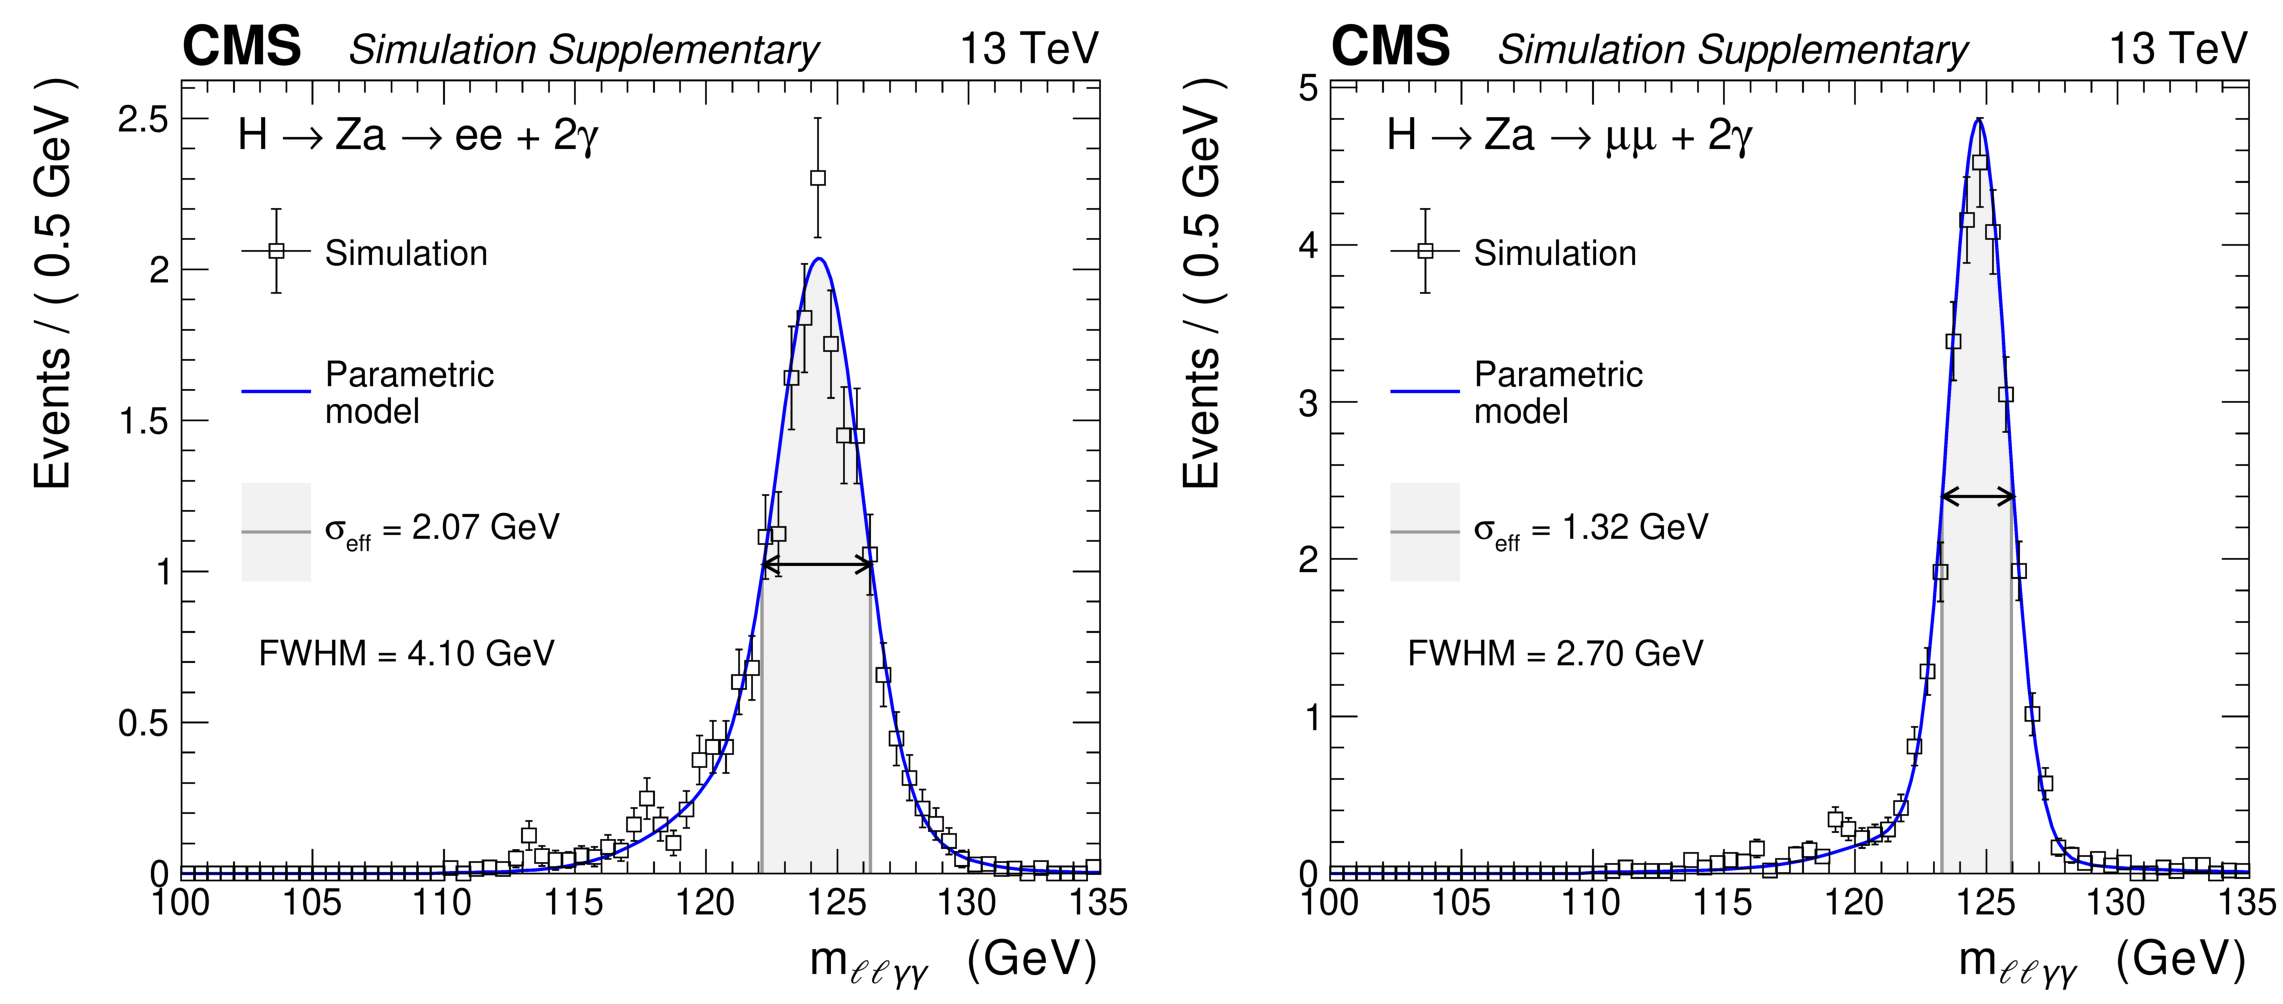
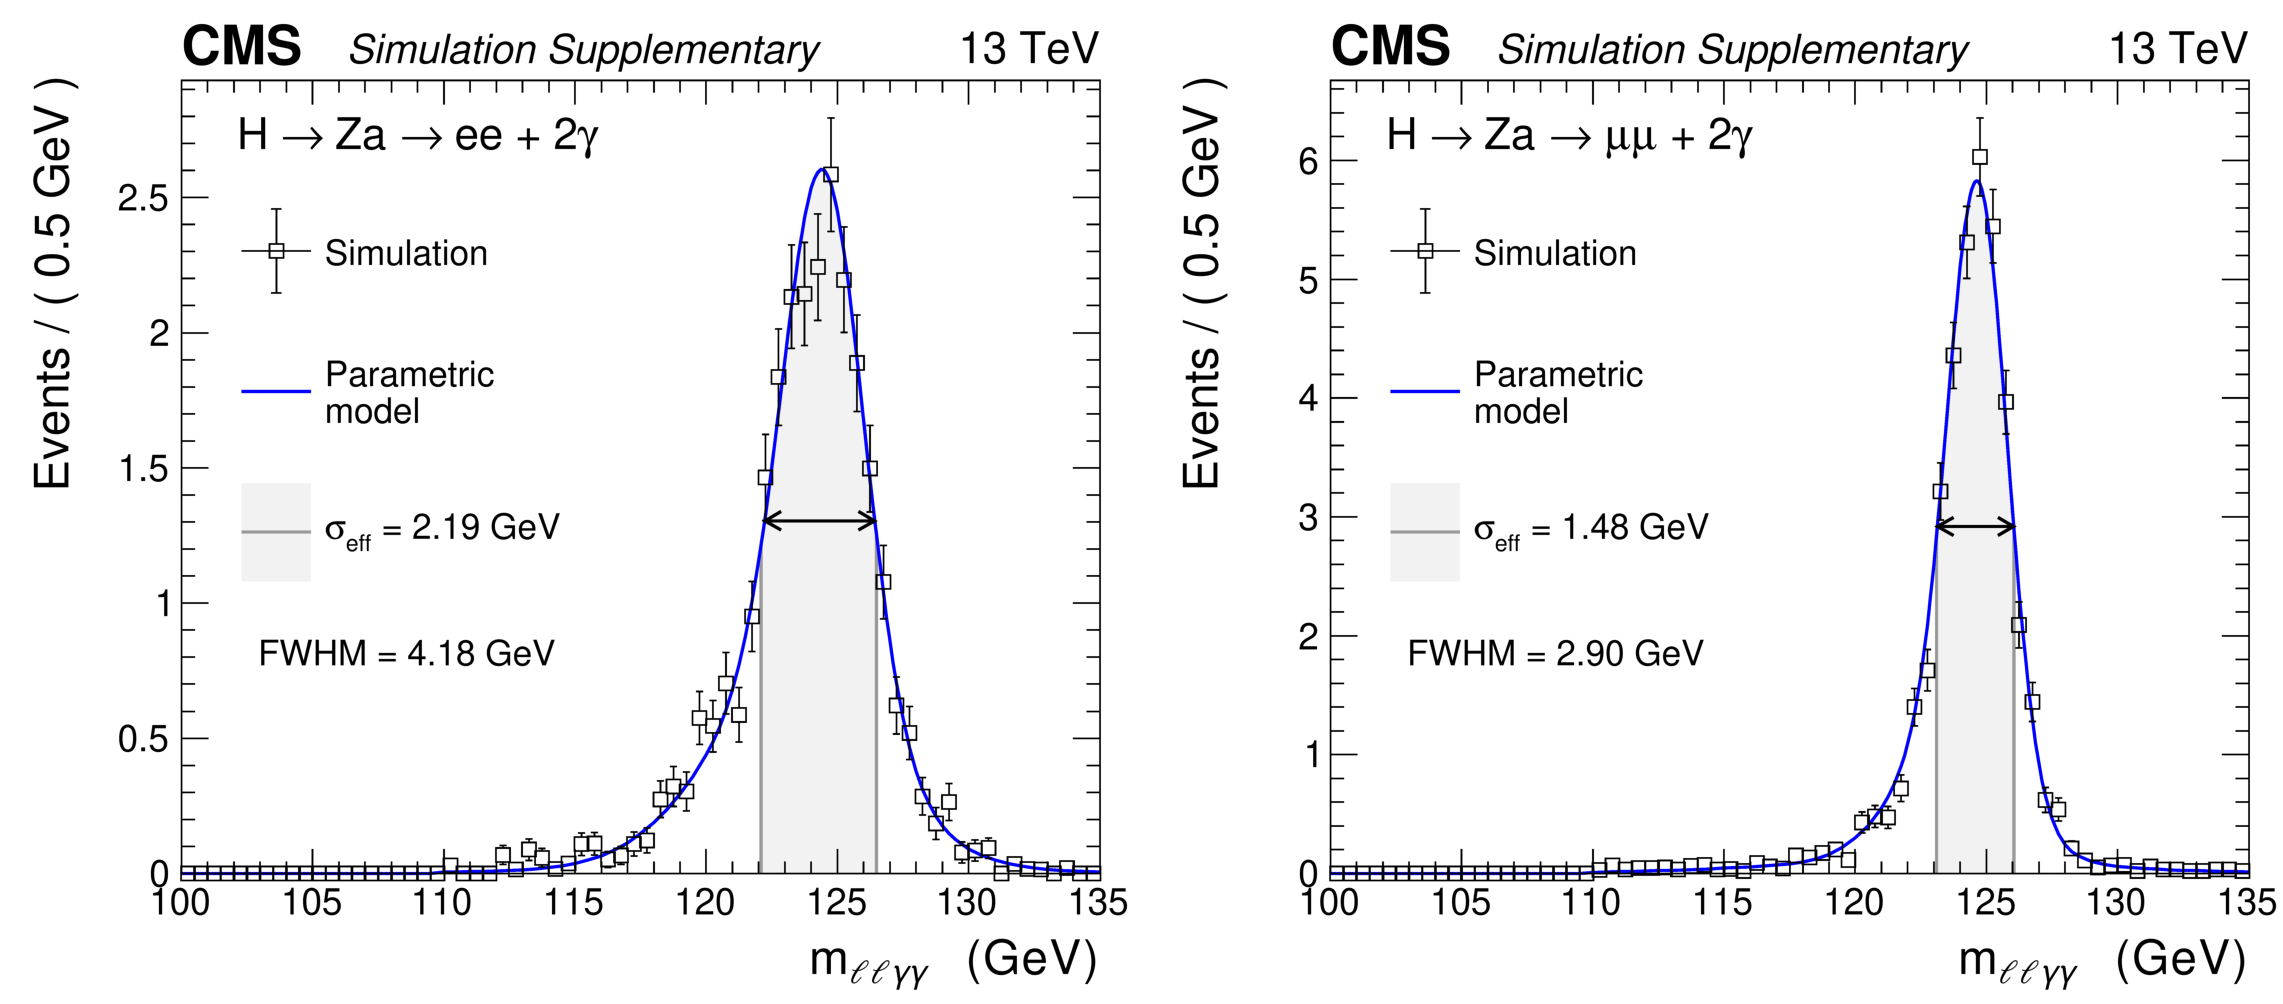
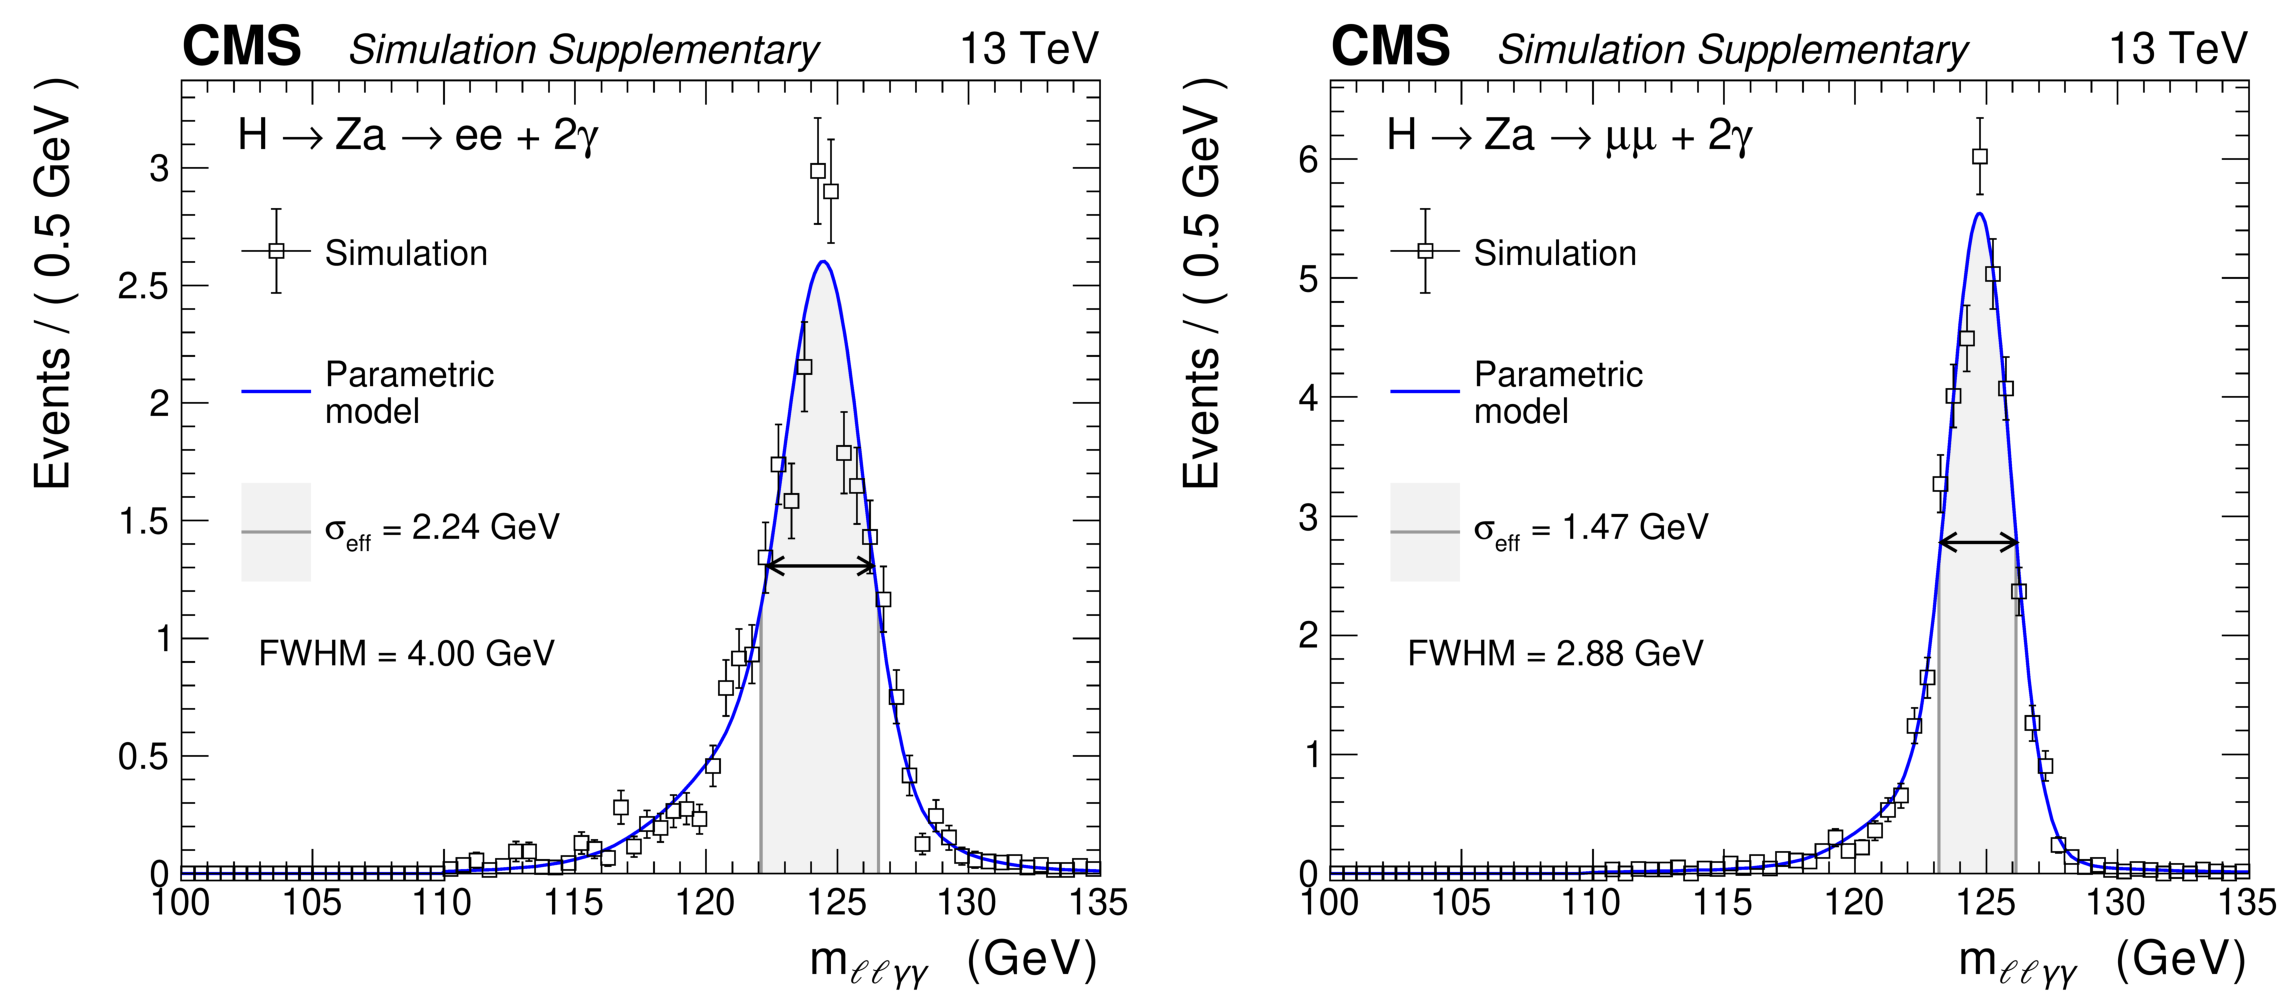
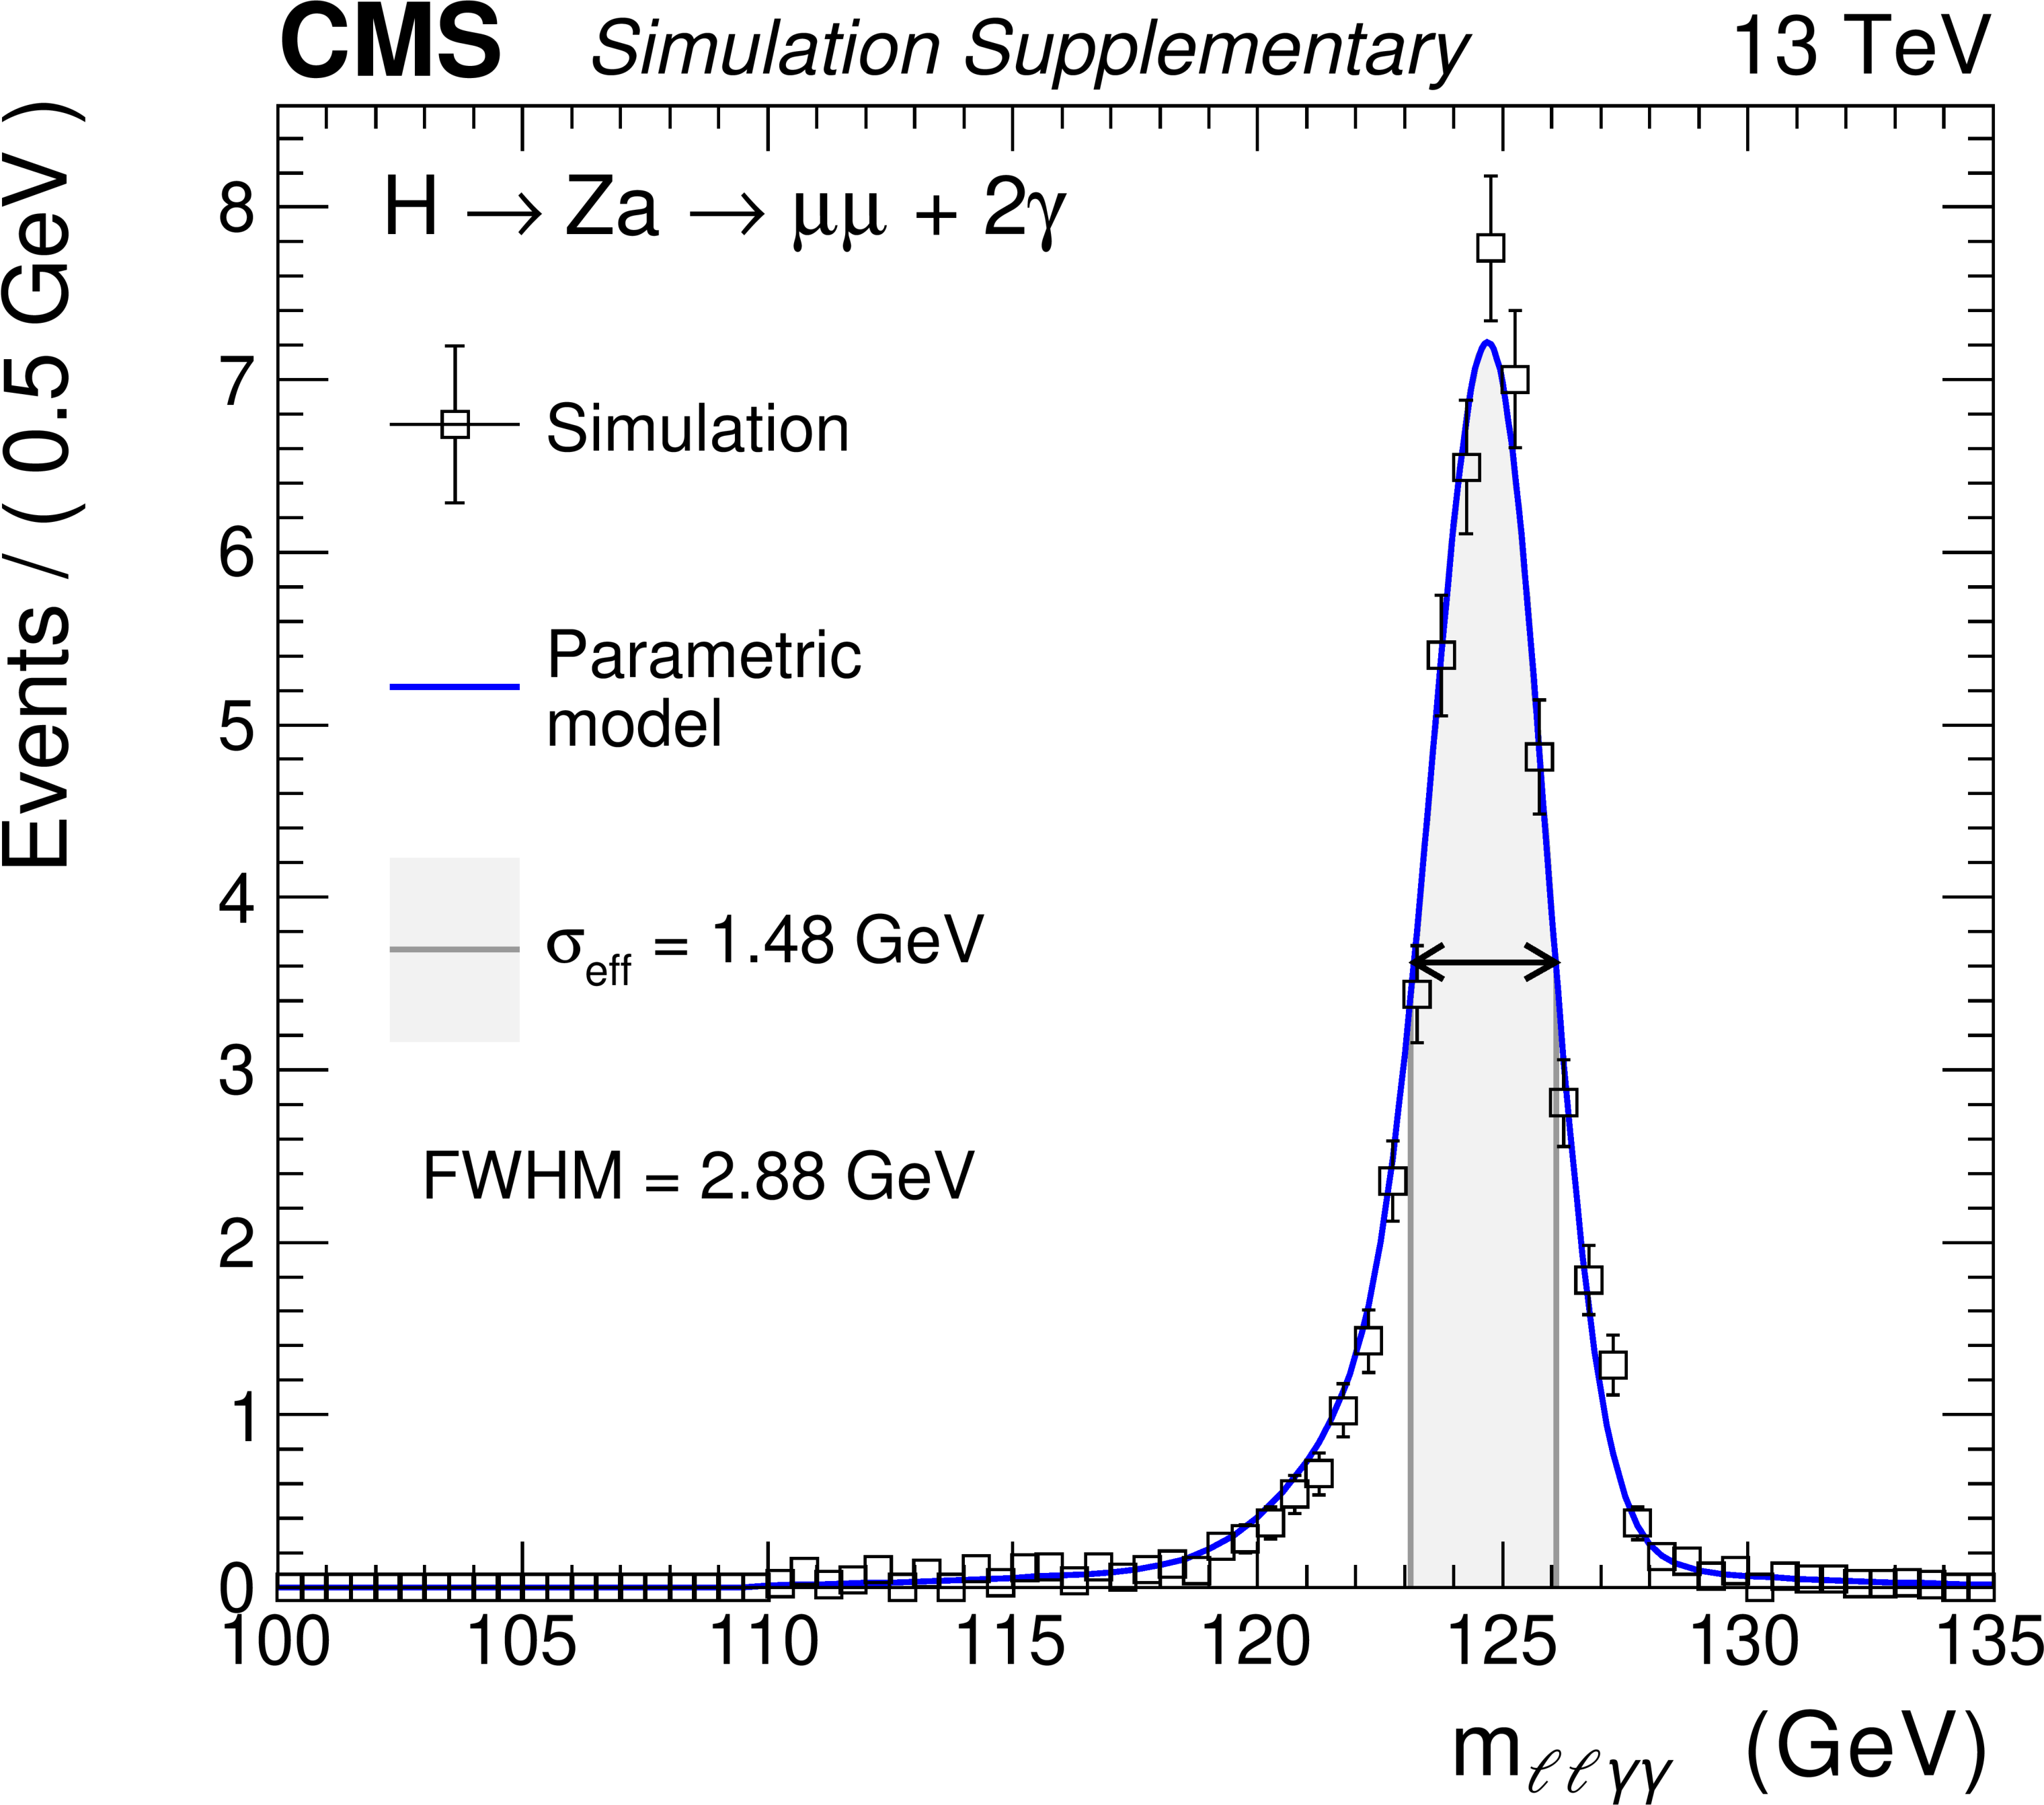
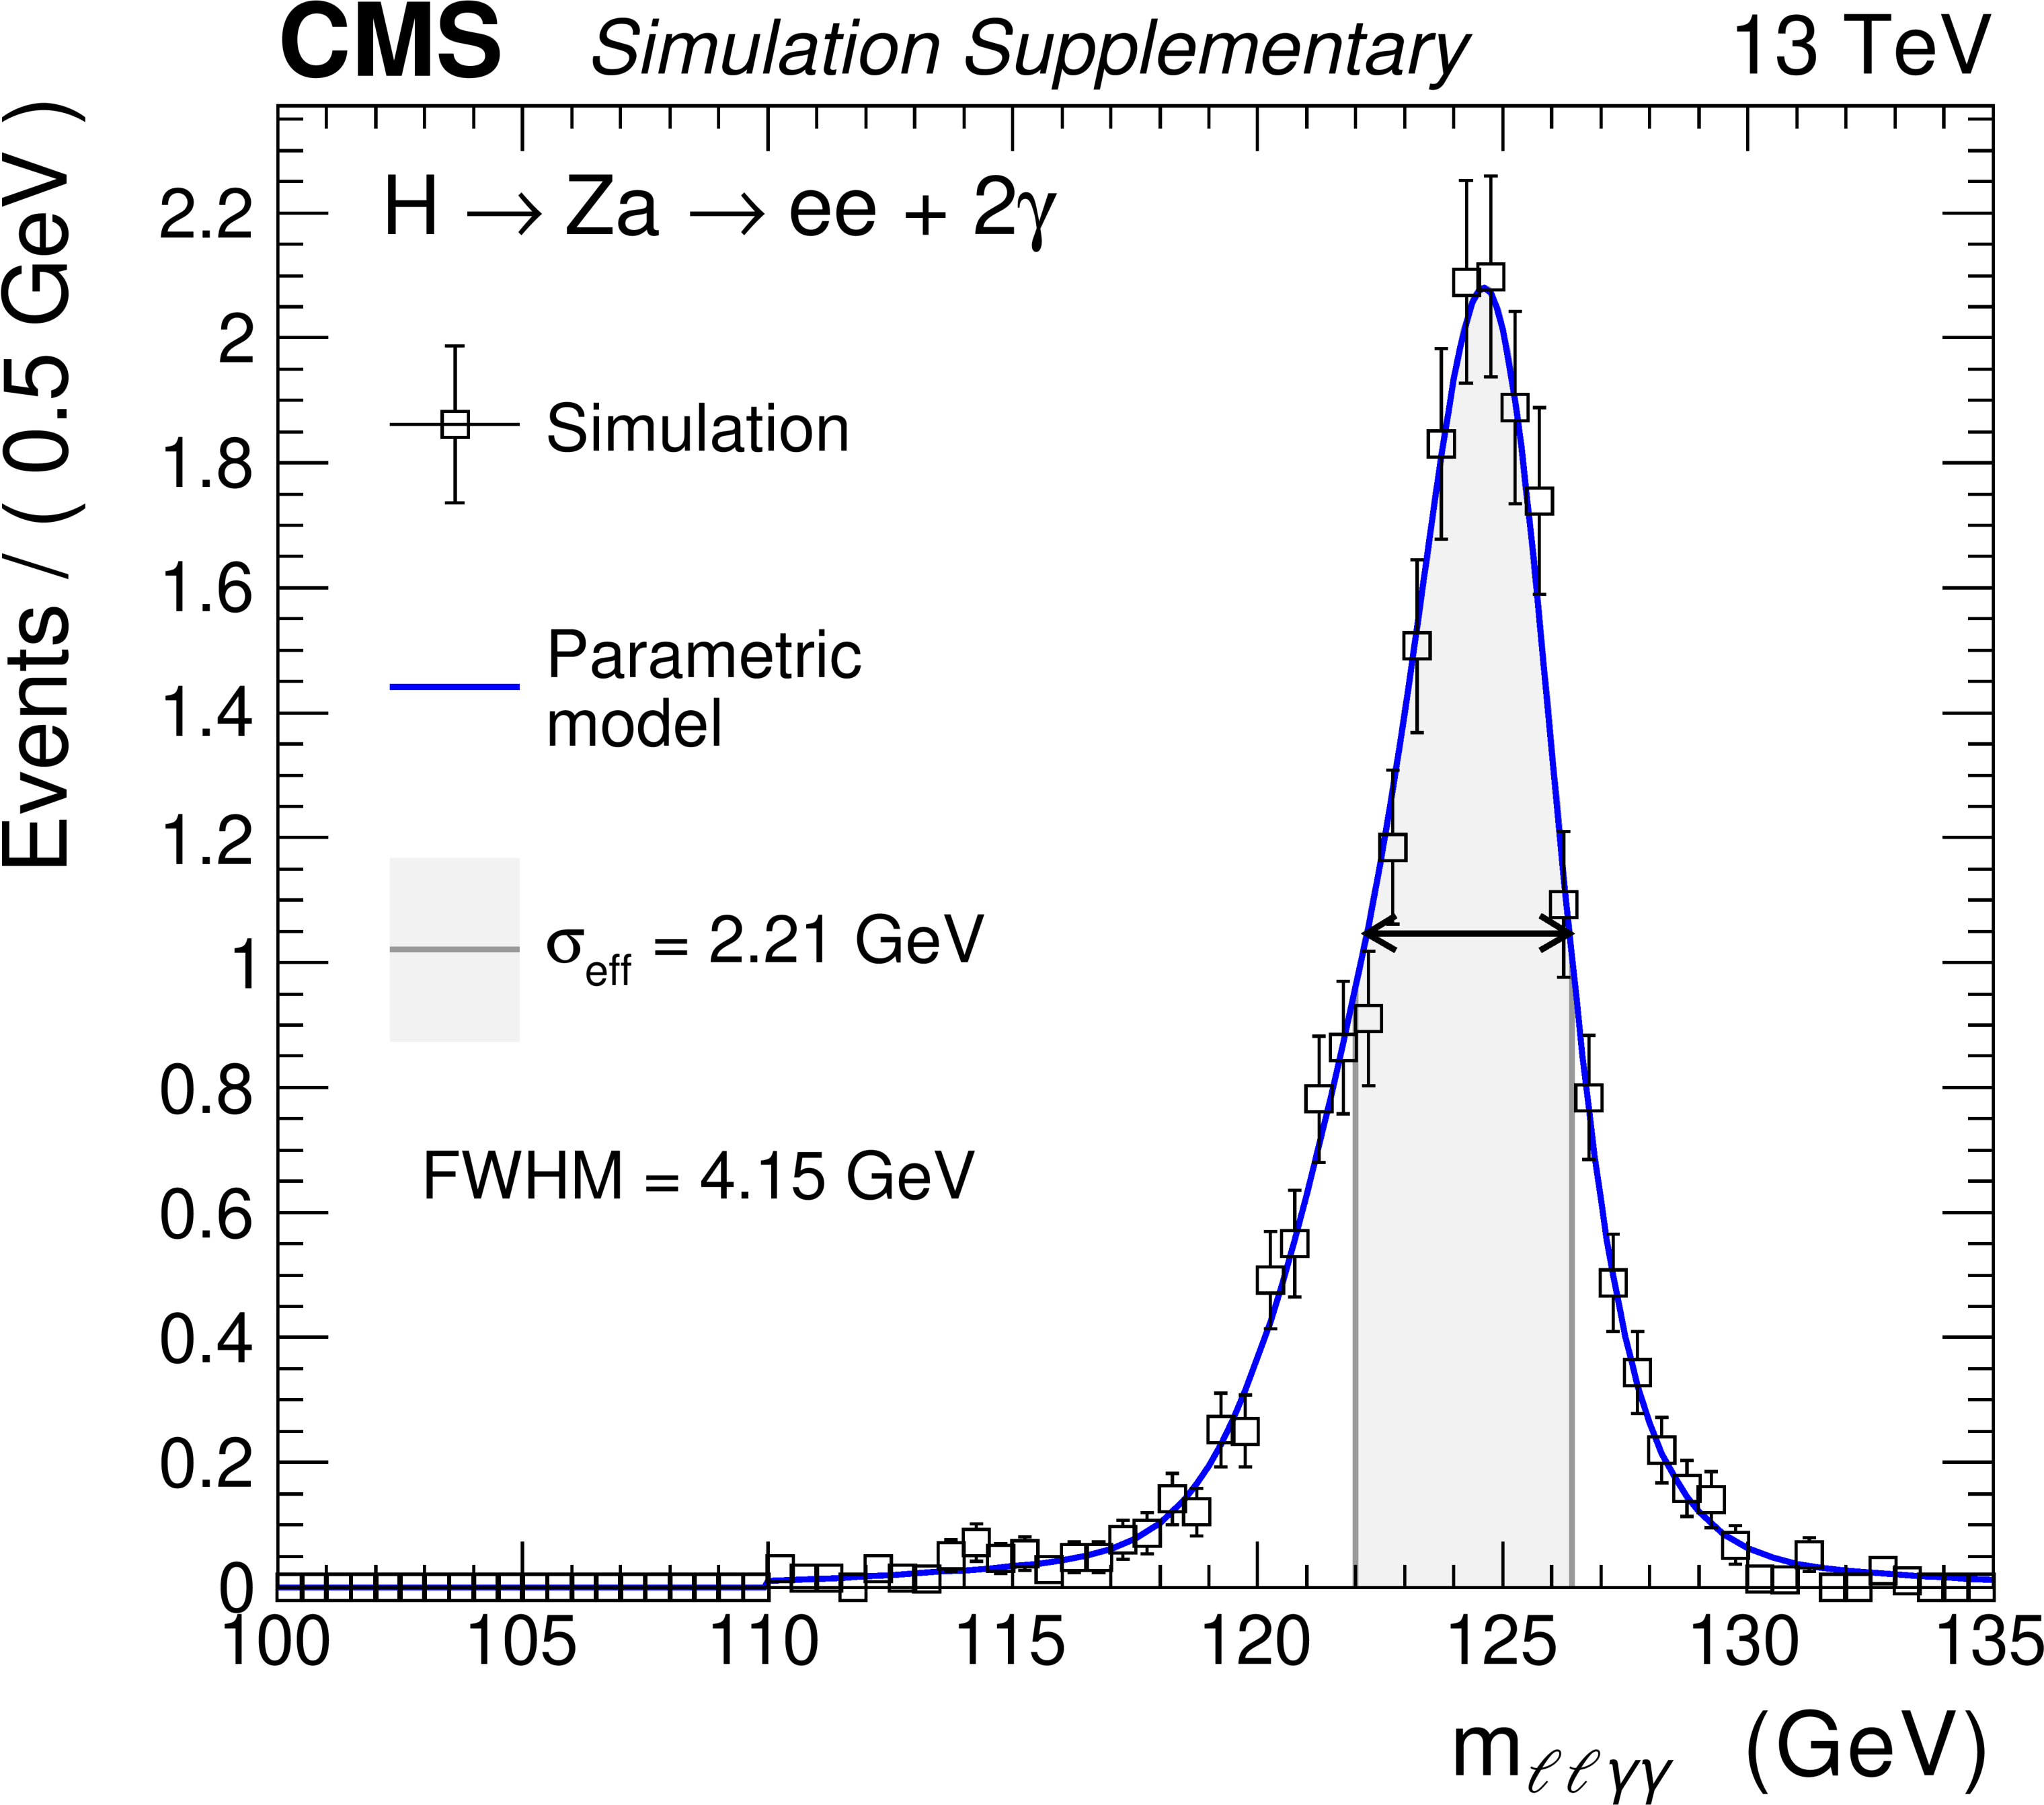
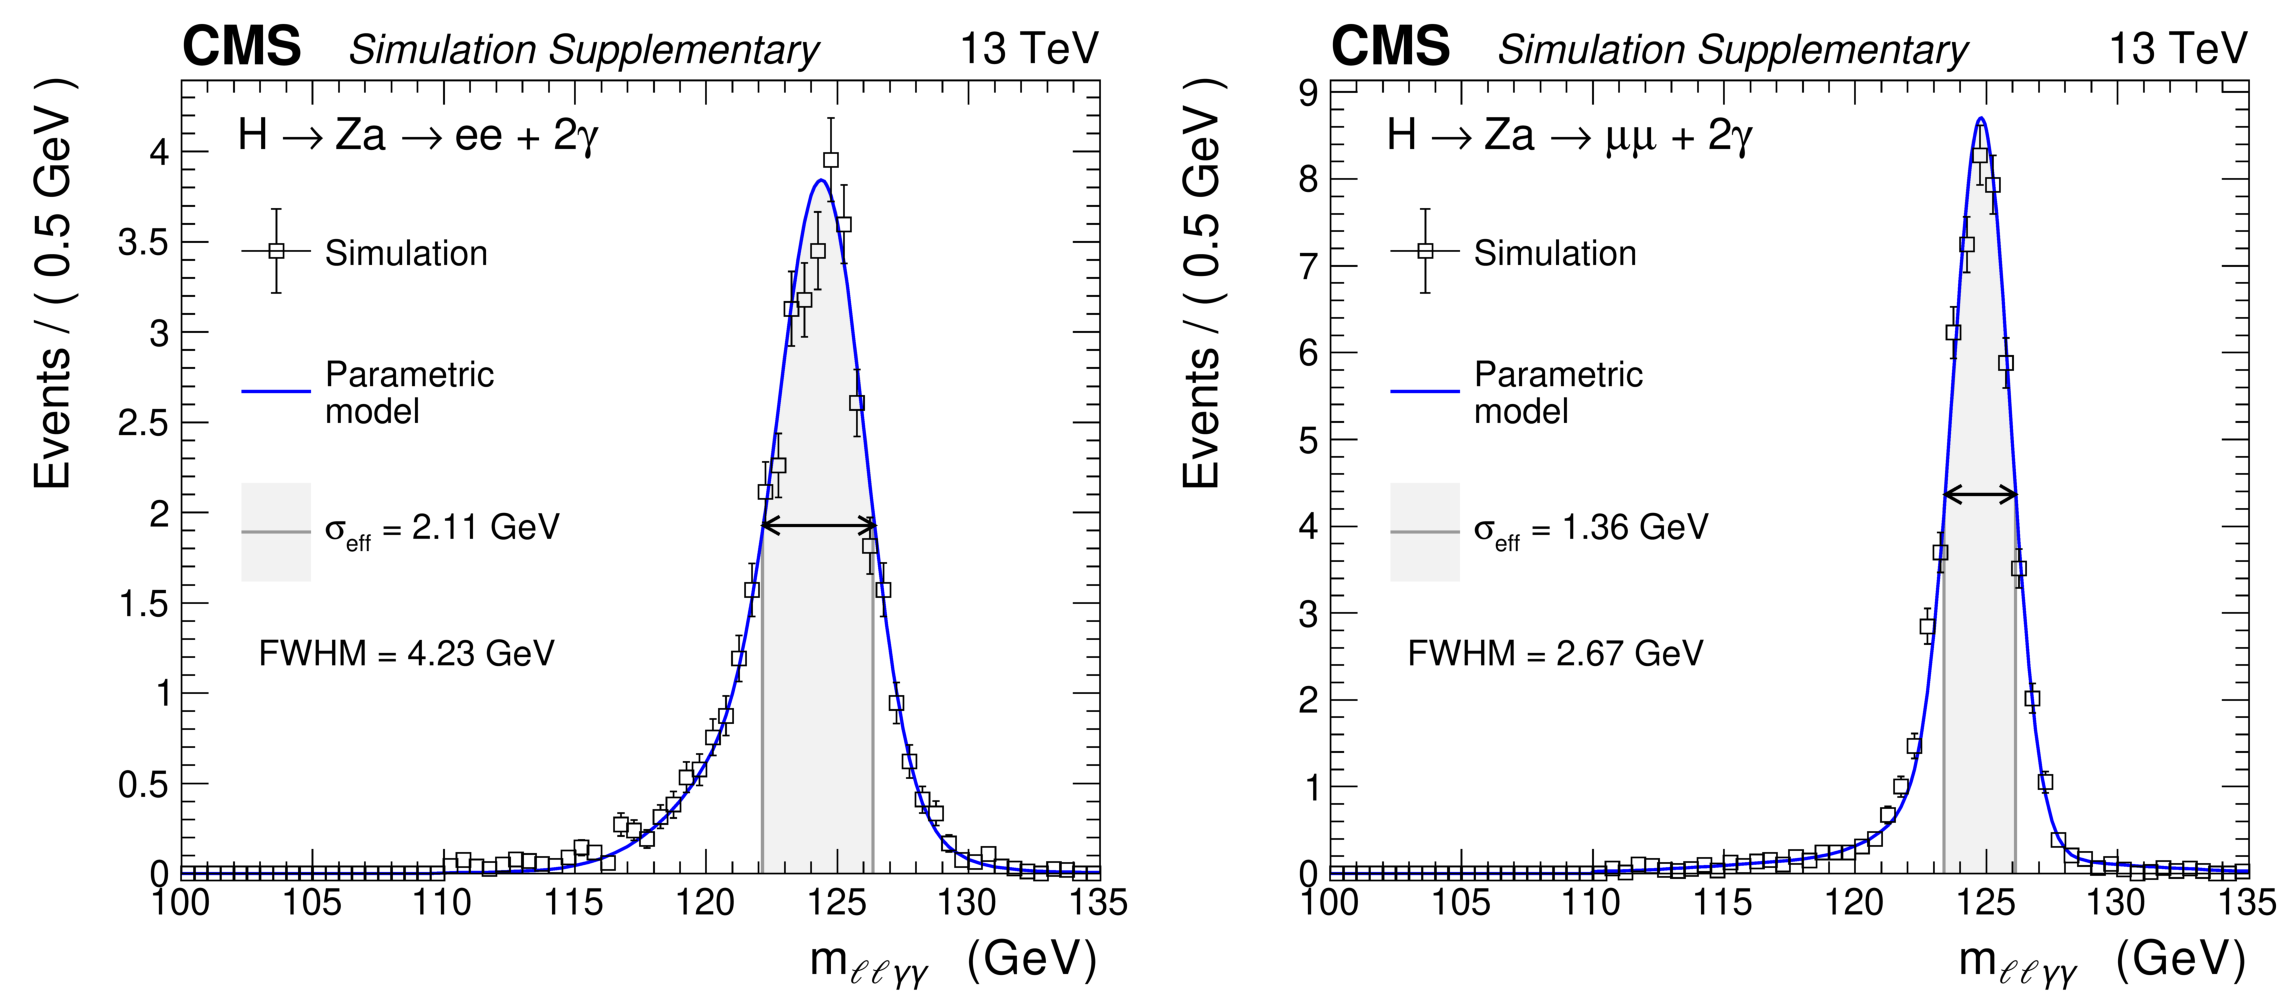
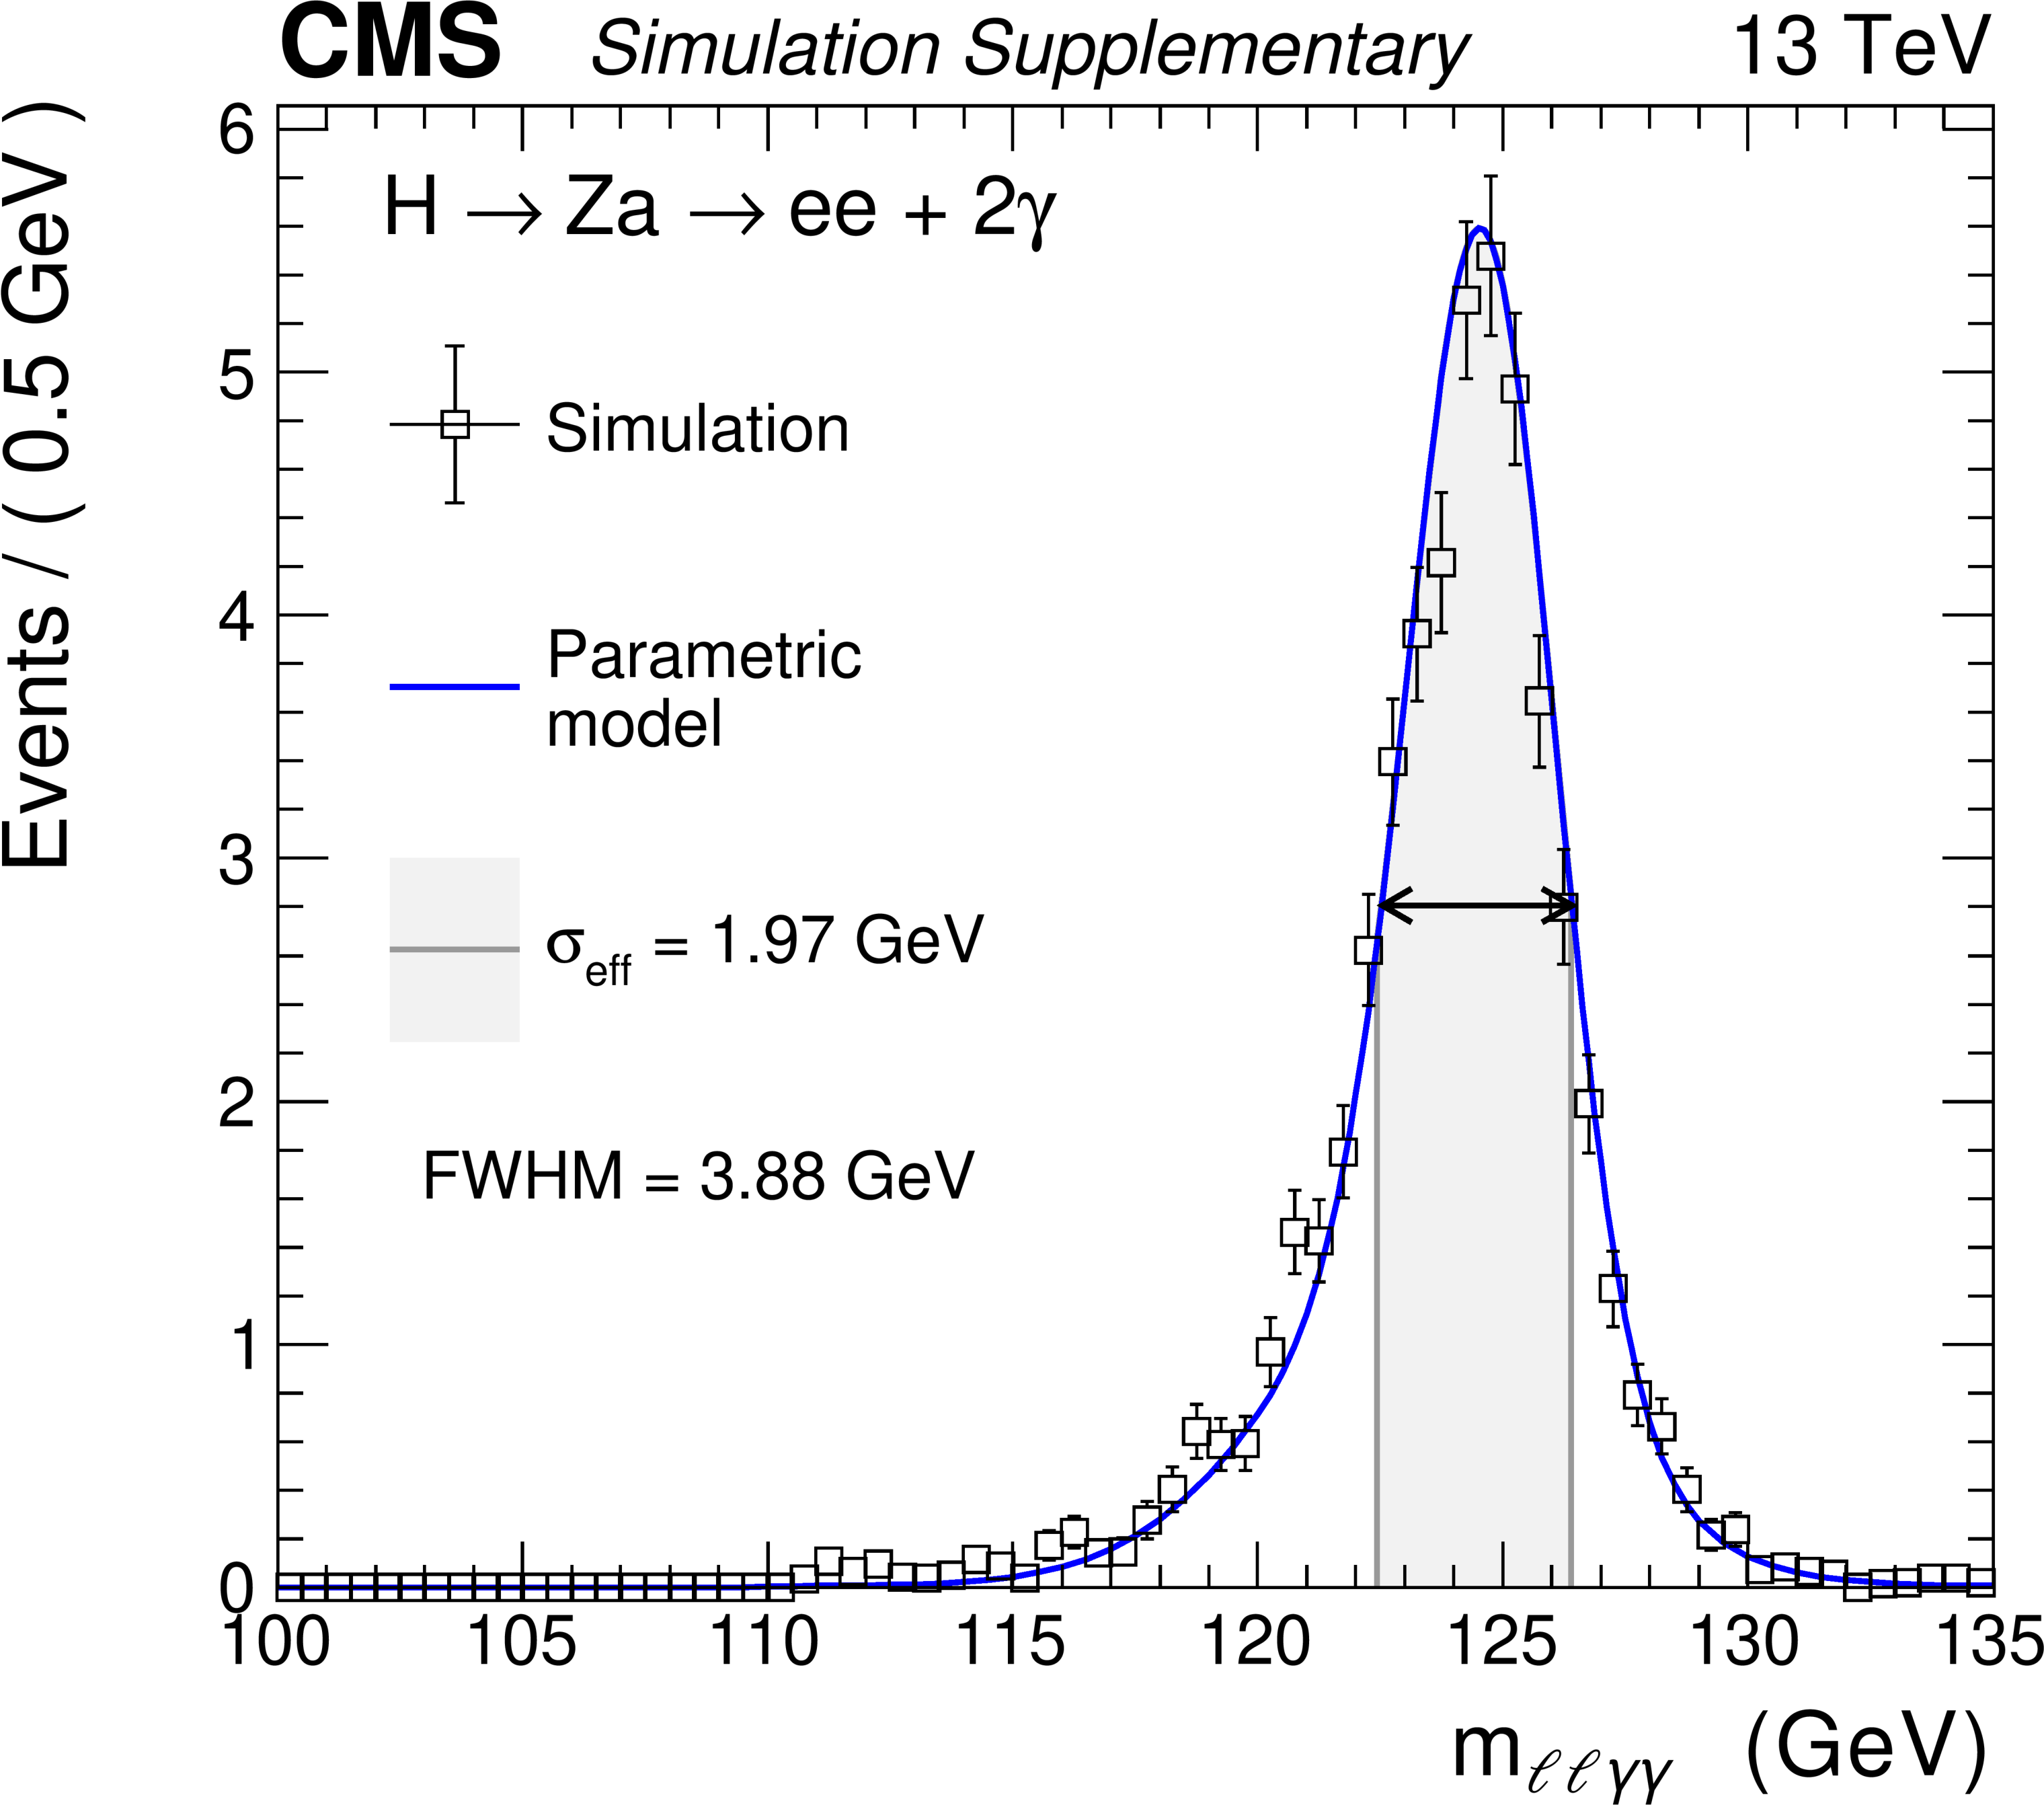
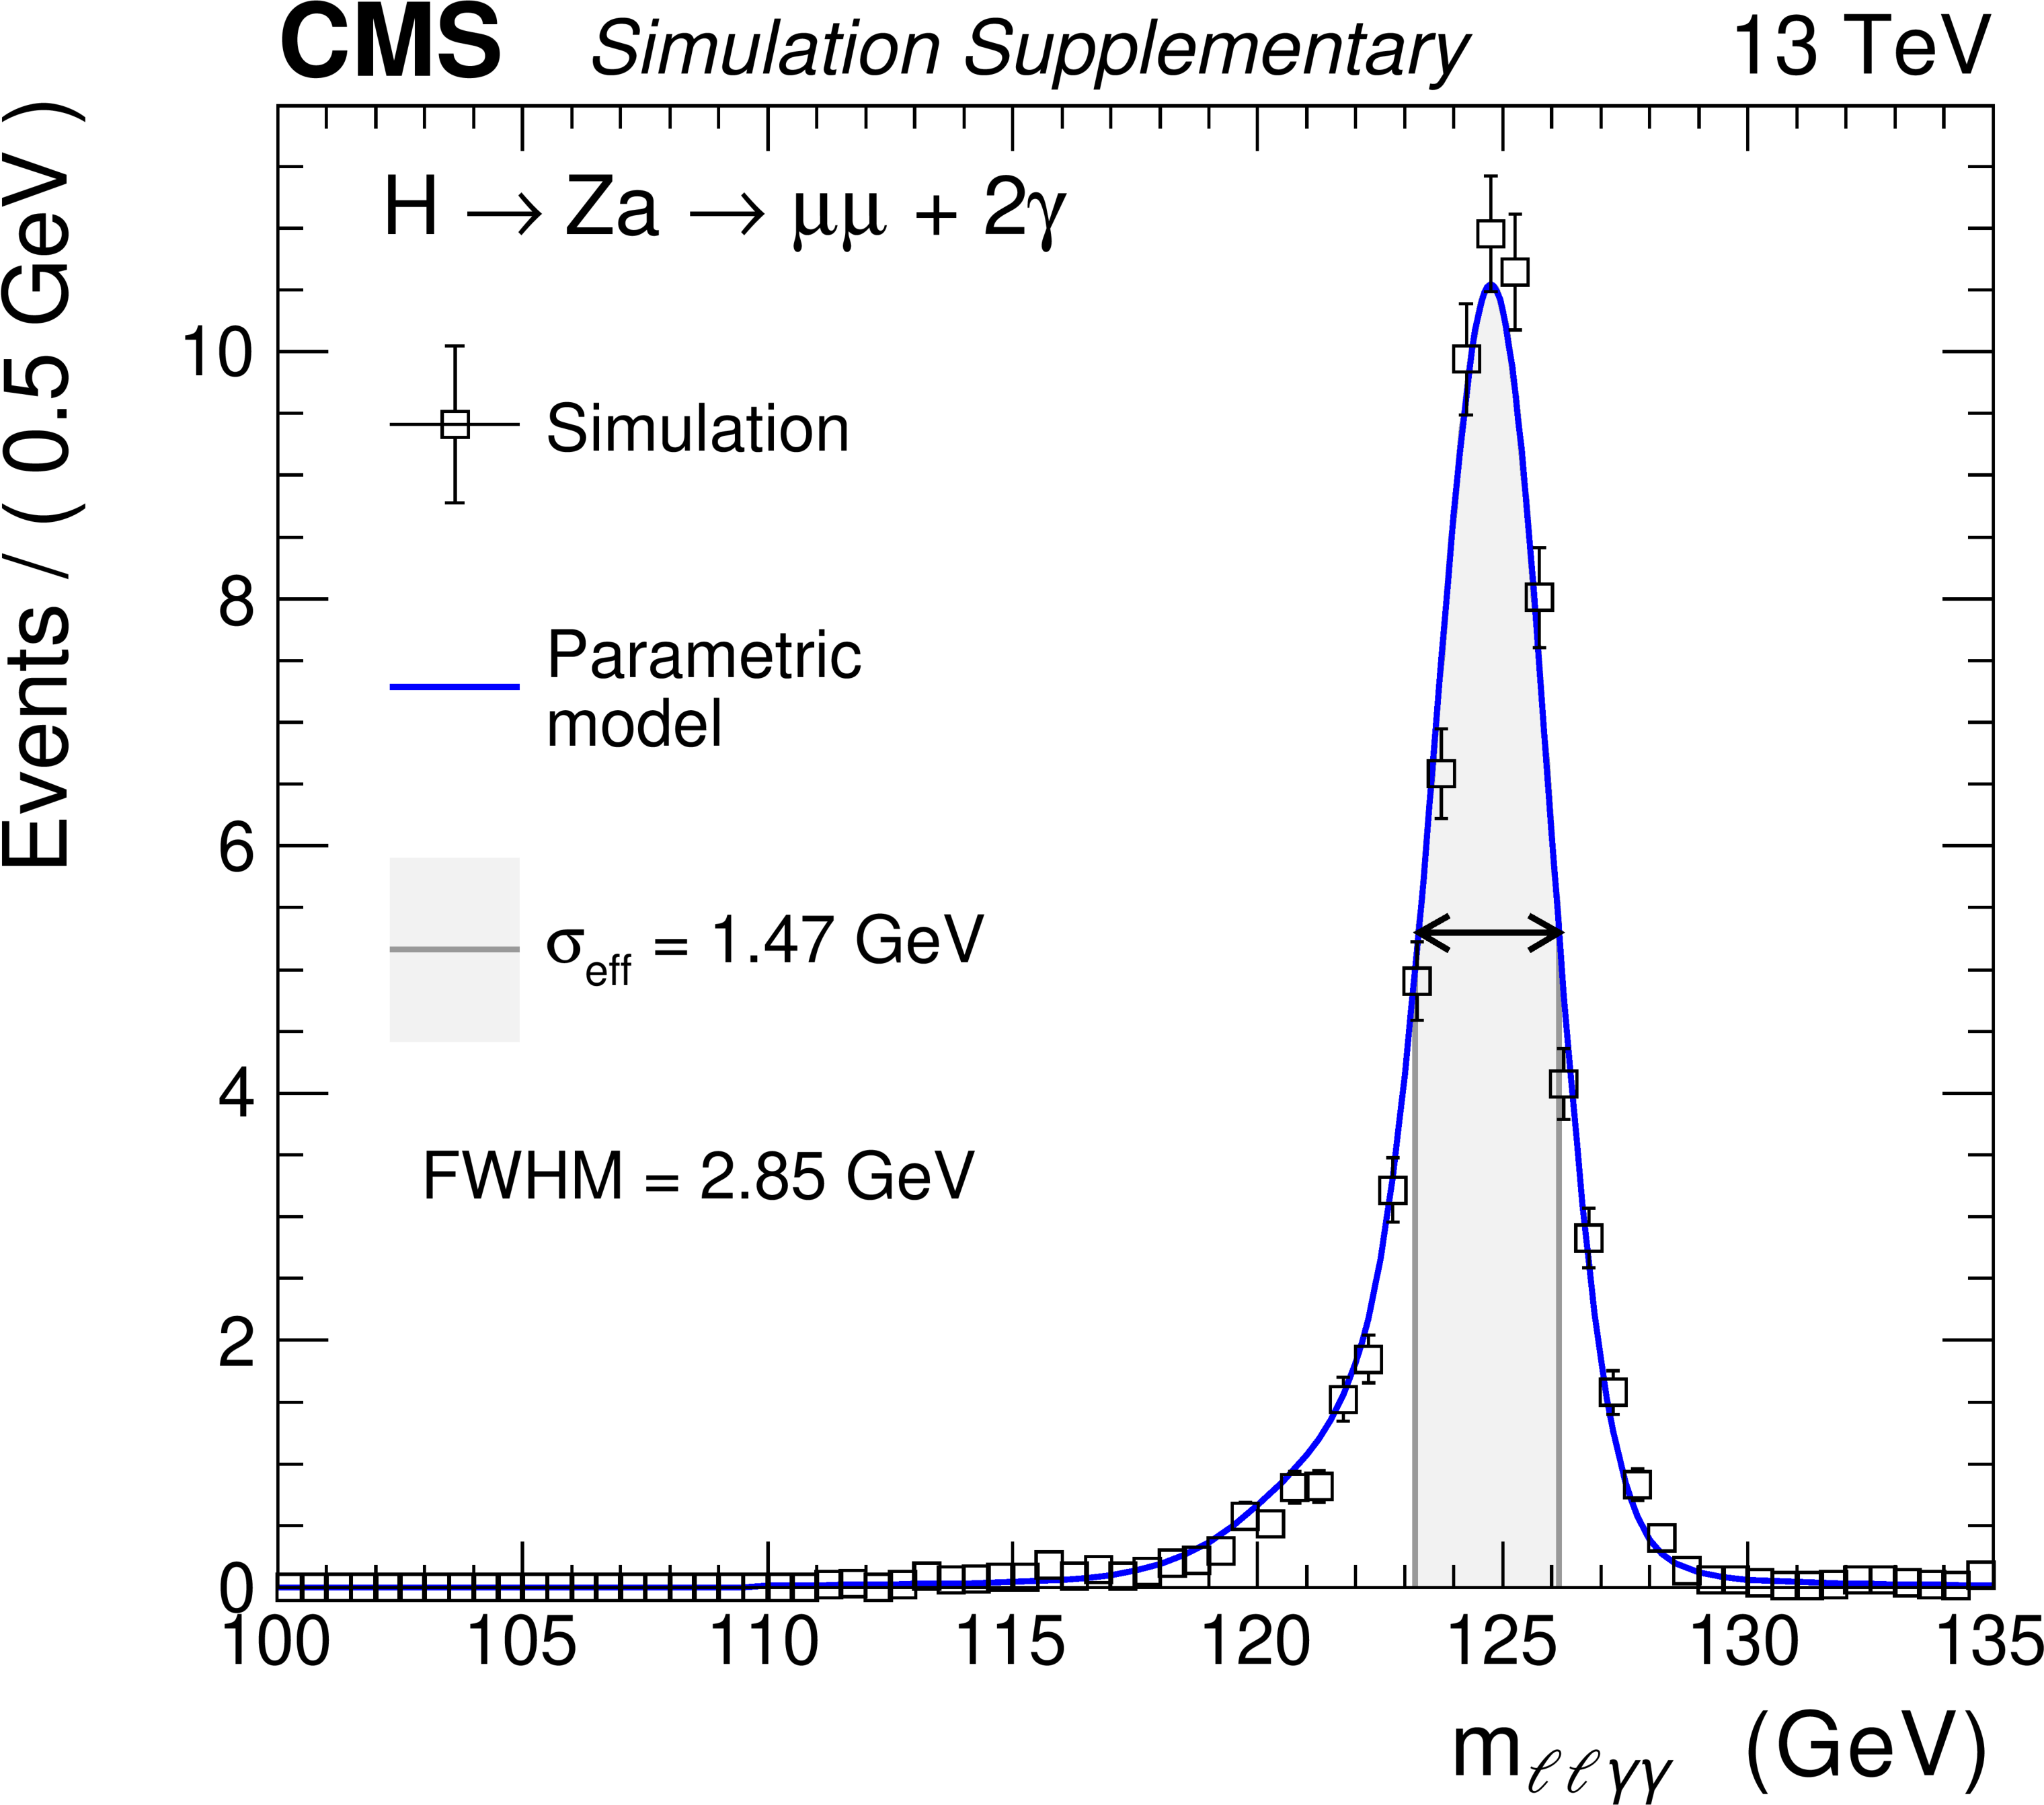
Figure 4:
Fit to the simulated $ m_{\ell\ell\gamma\gamma} $ distributions for a signal with $ m_{\mathrm{a}}= $ 30 GeV in the electron (left) and muon (right) channels for the year 2018. |
png pdf |
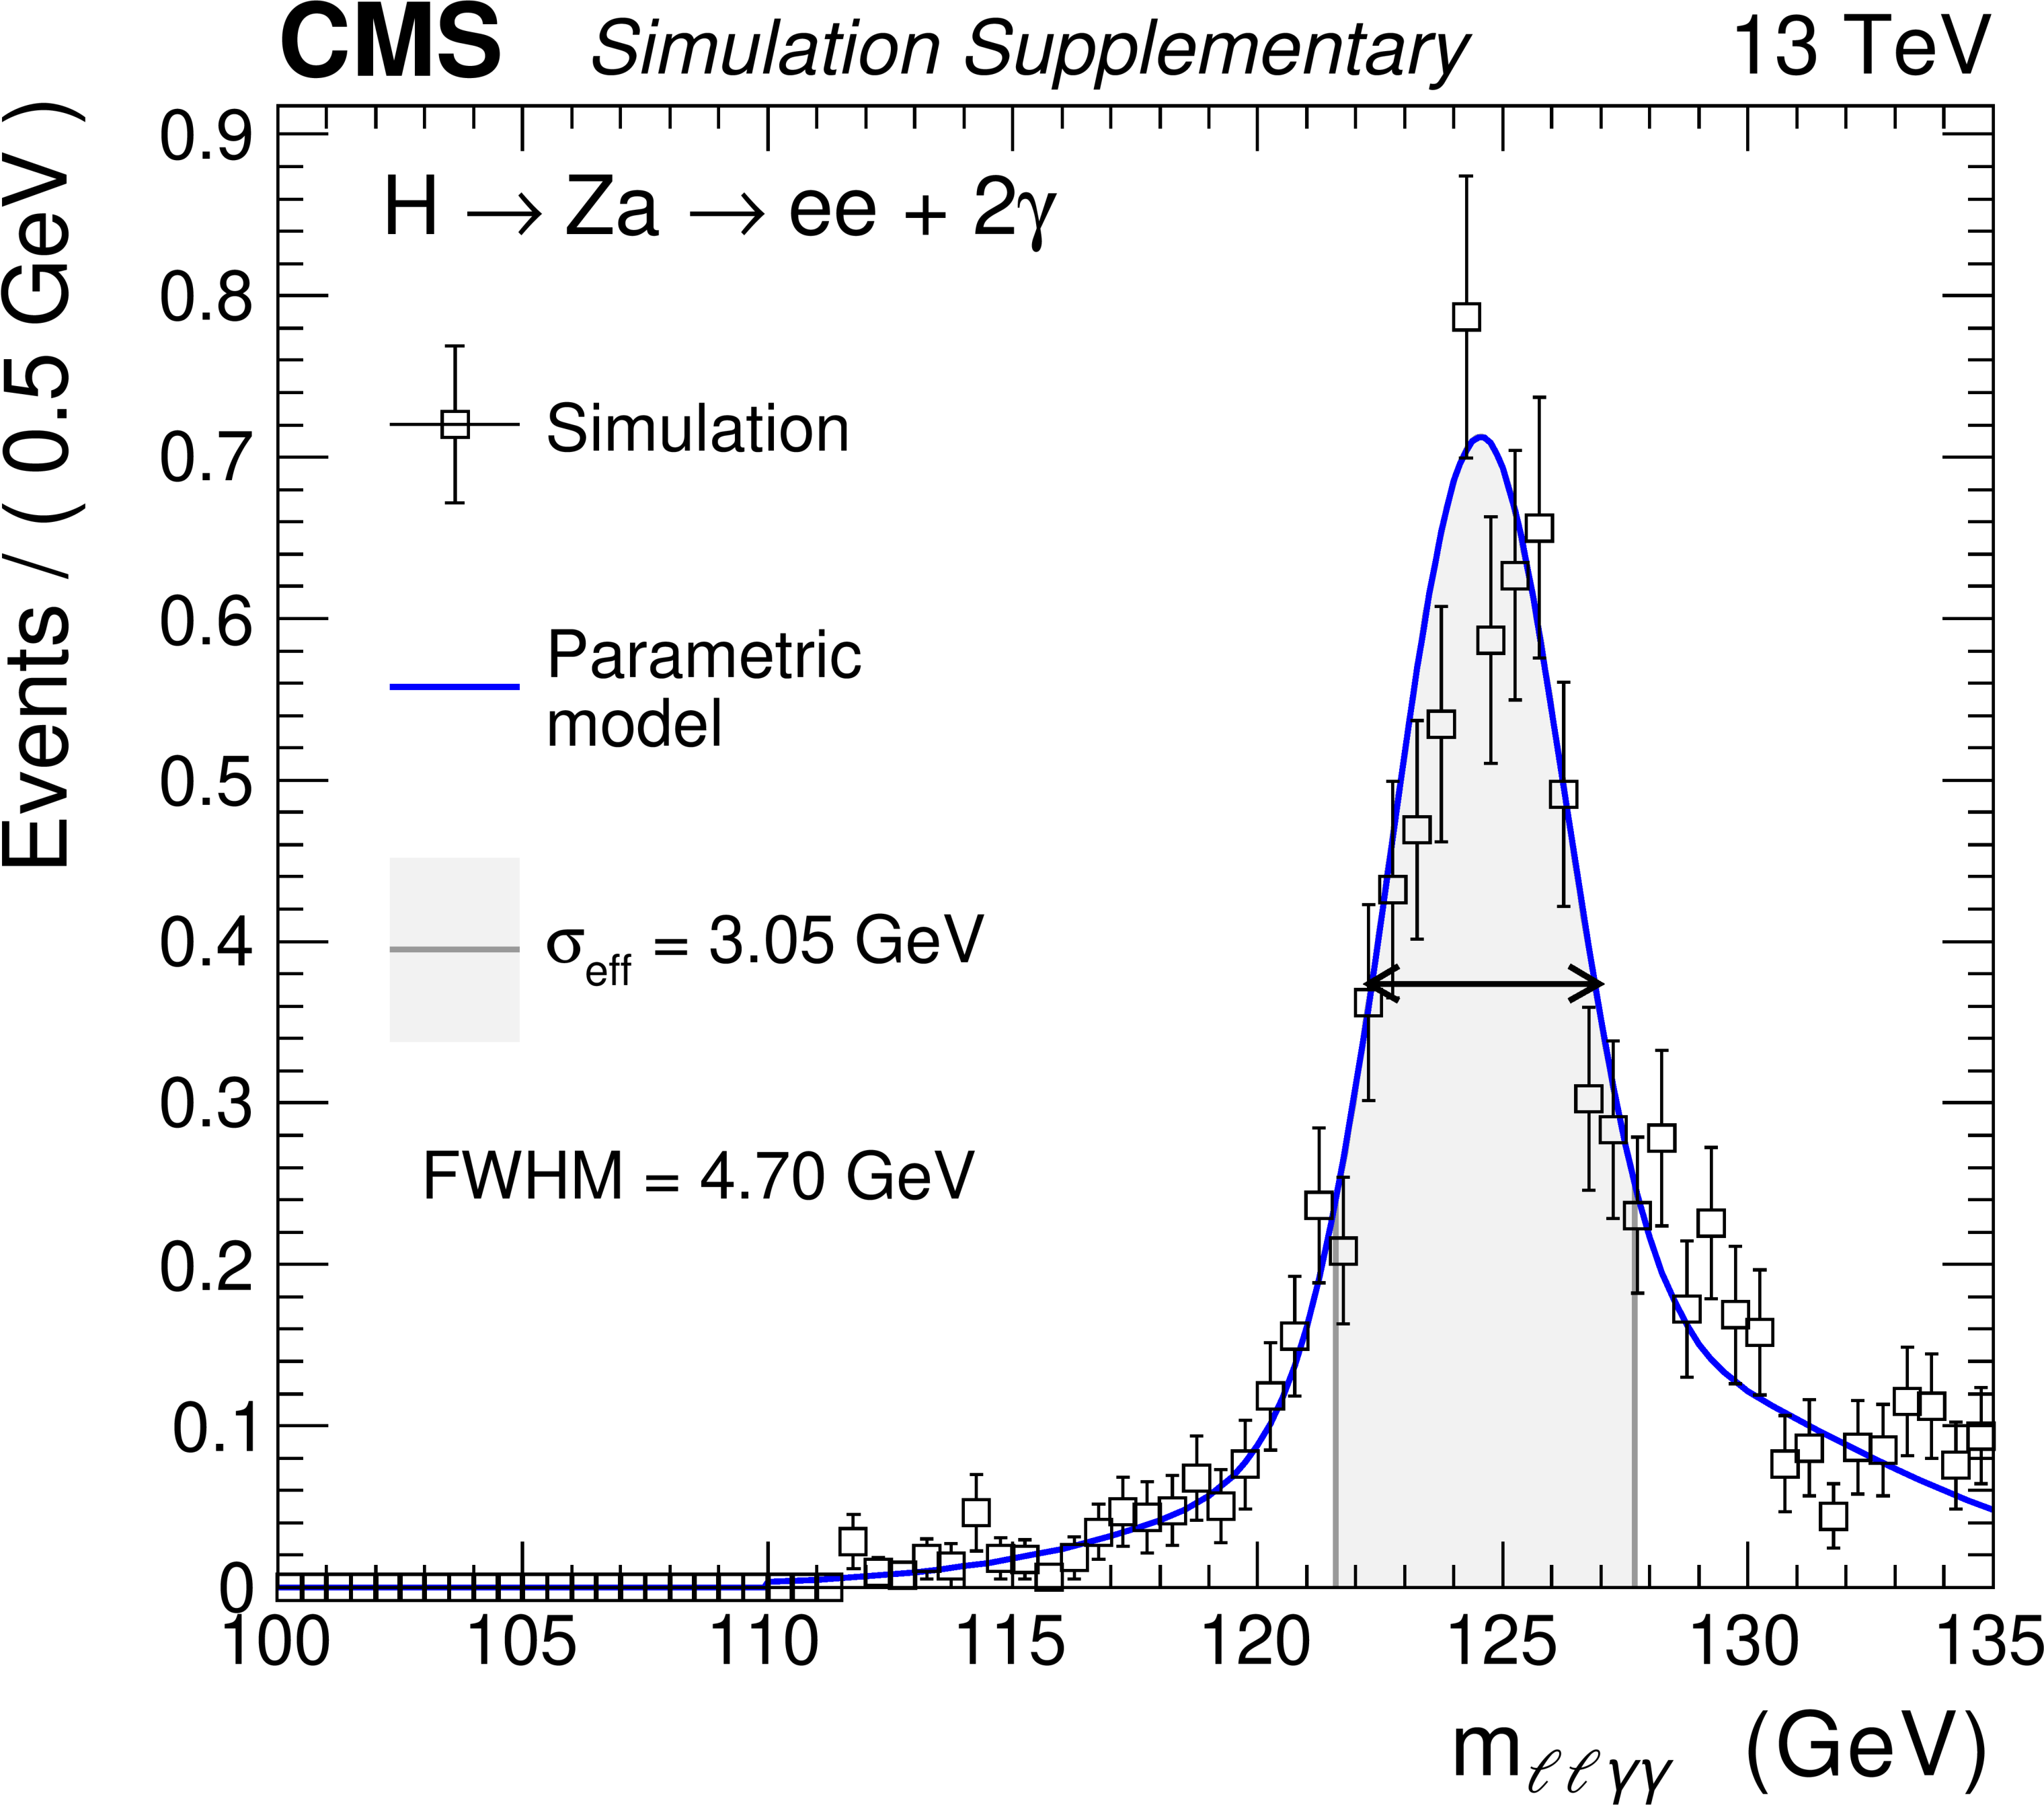
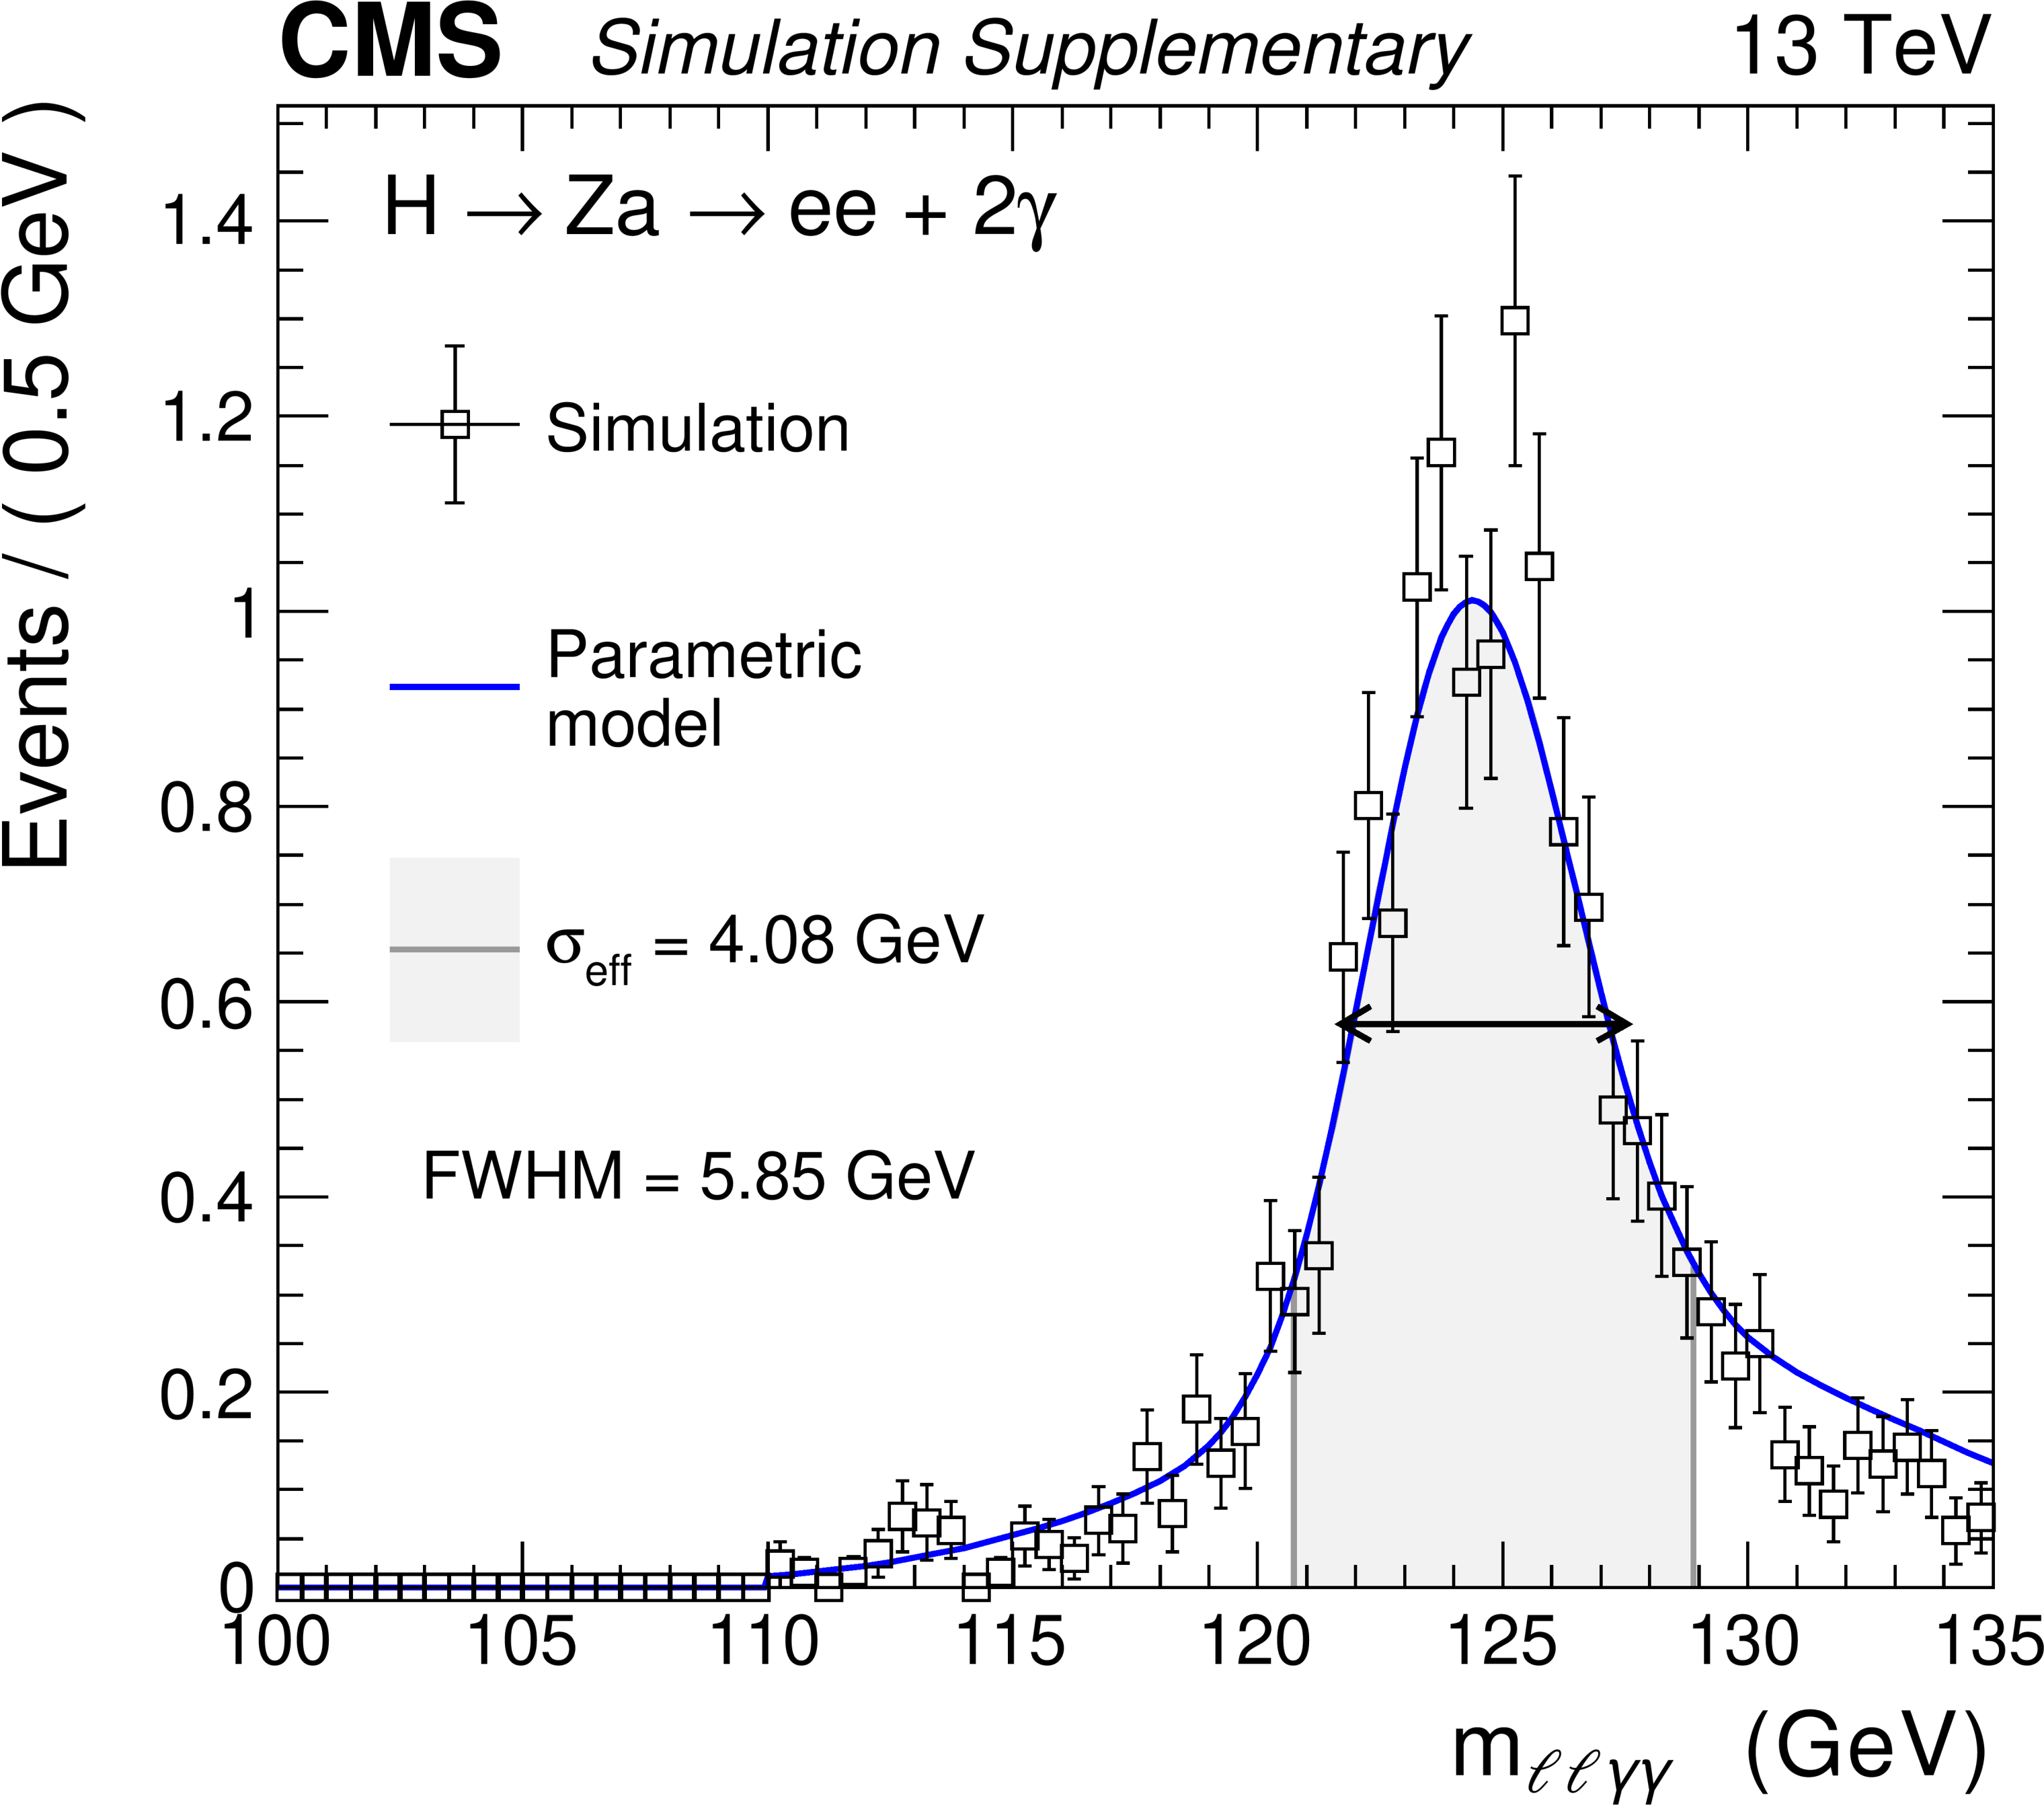
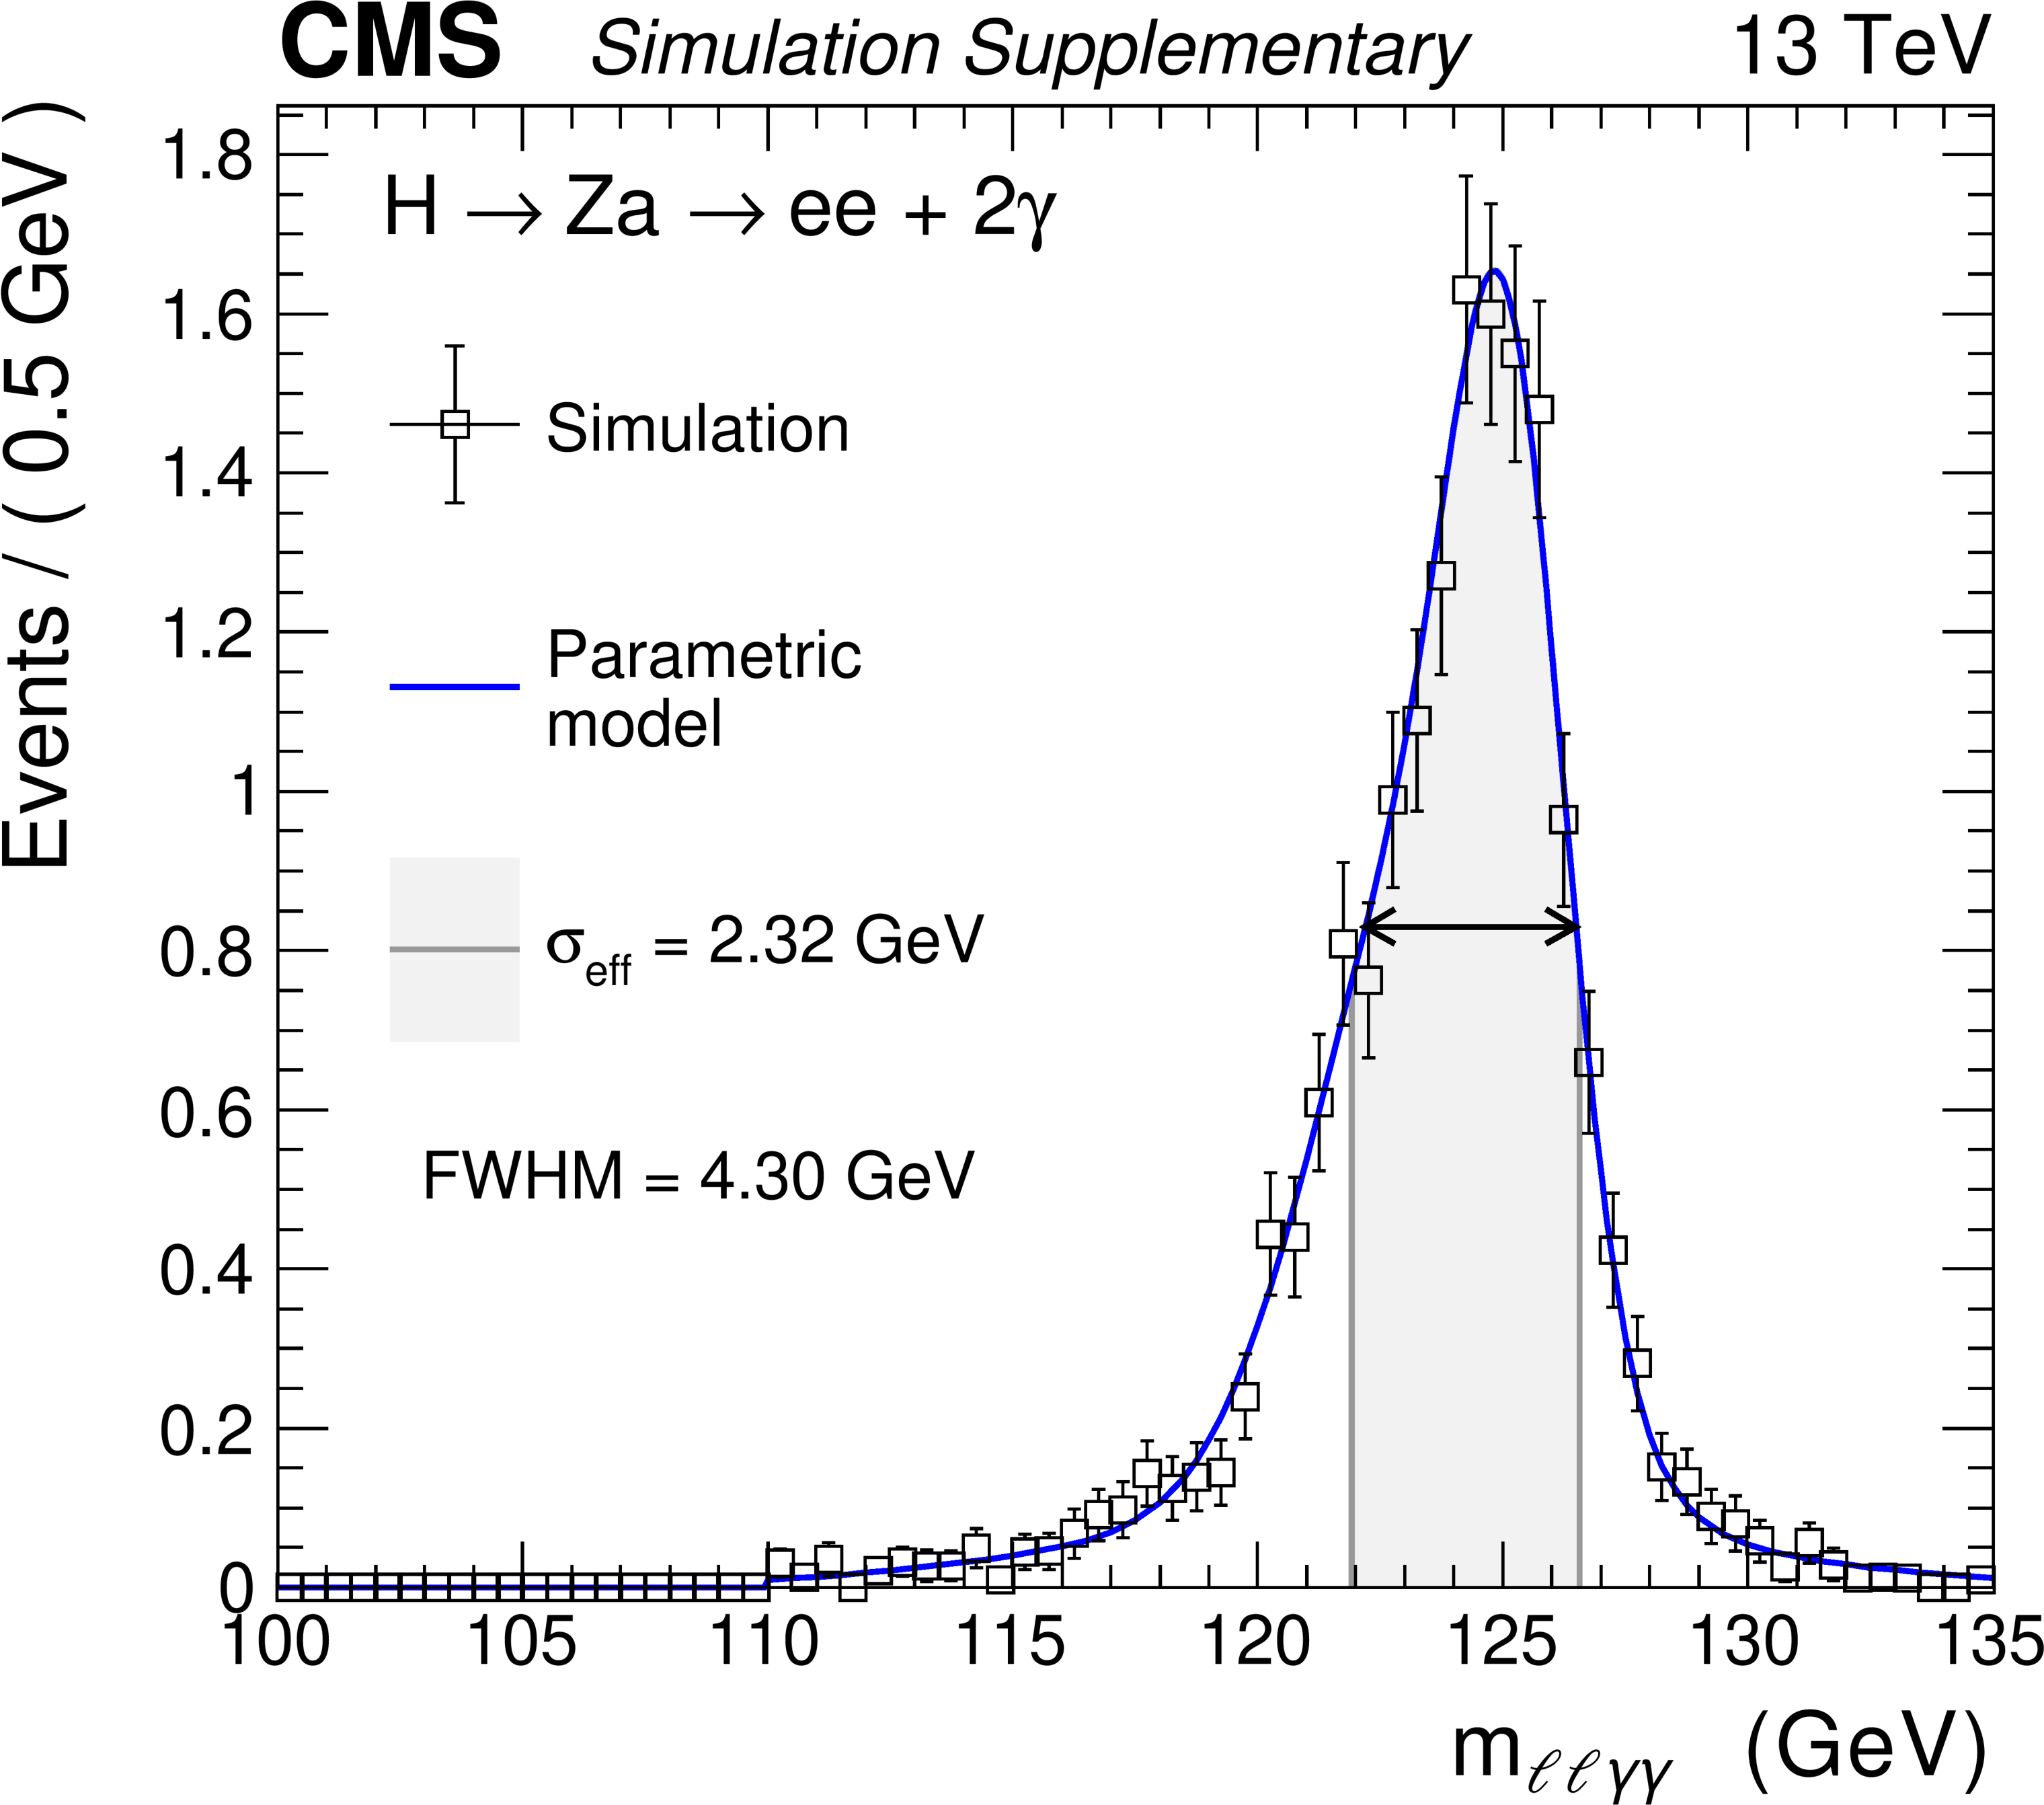
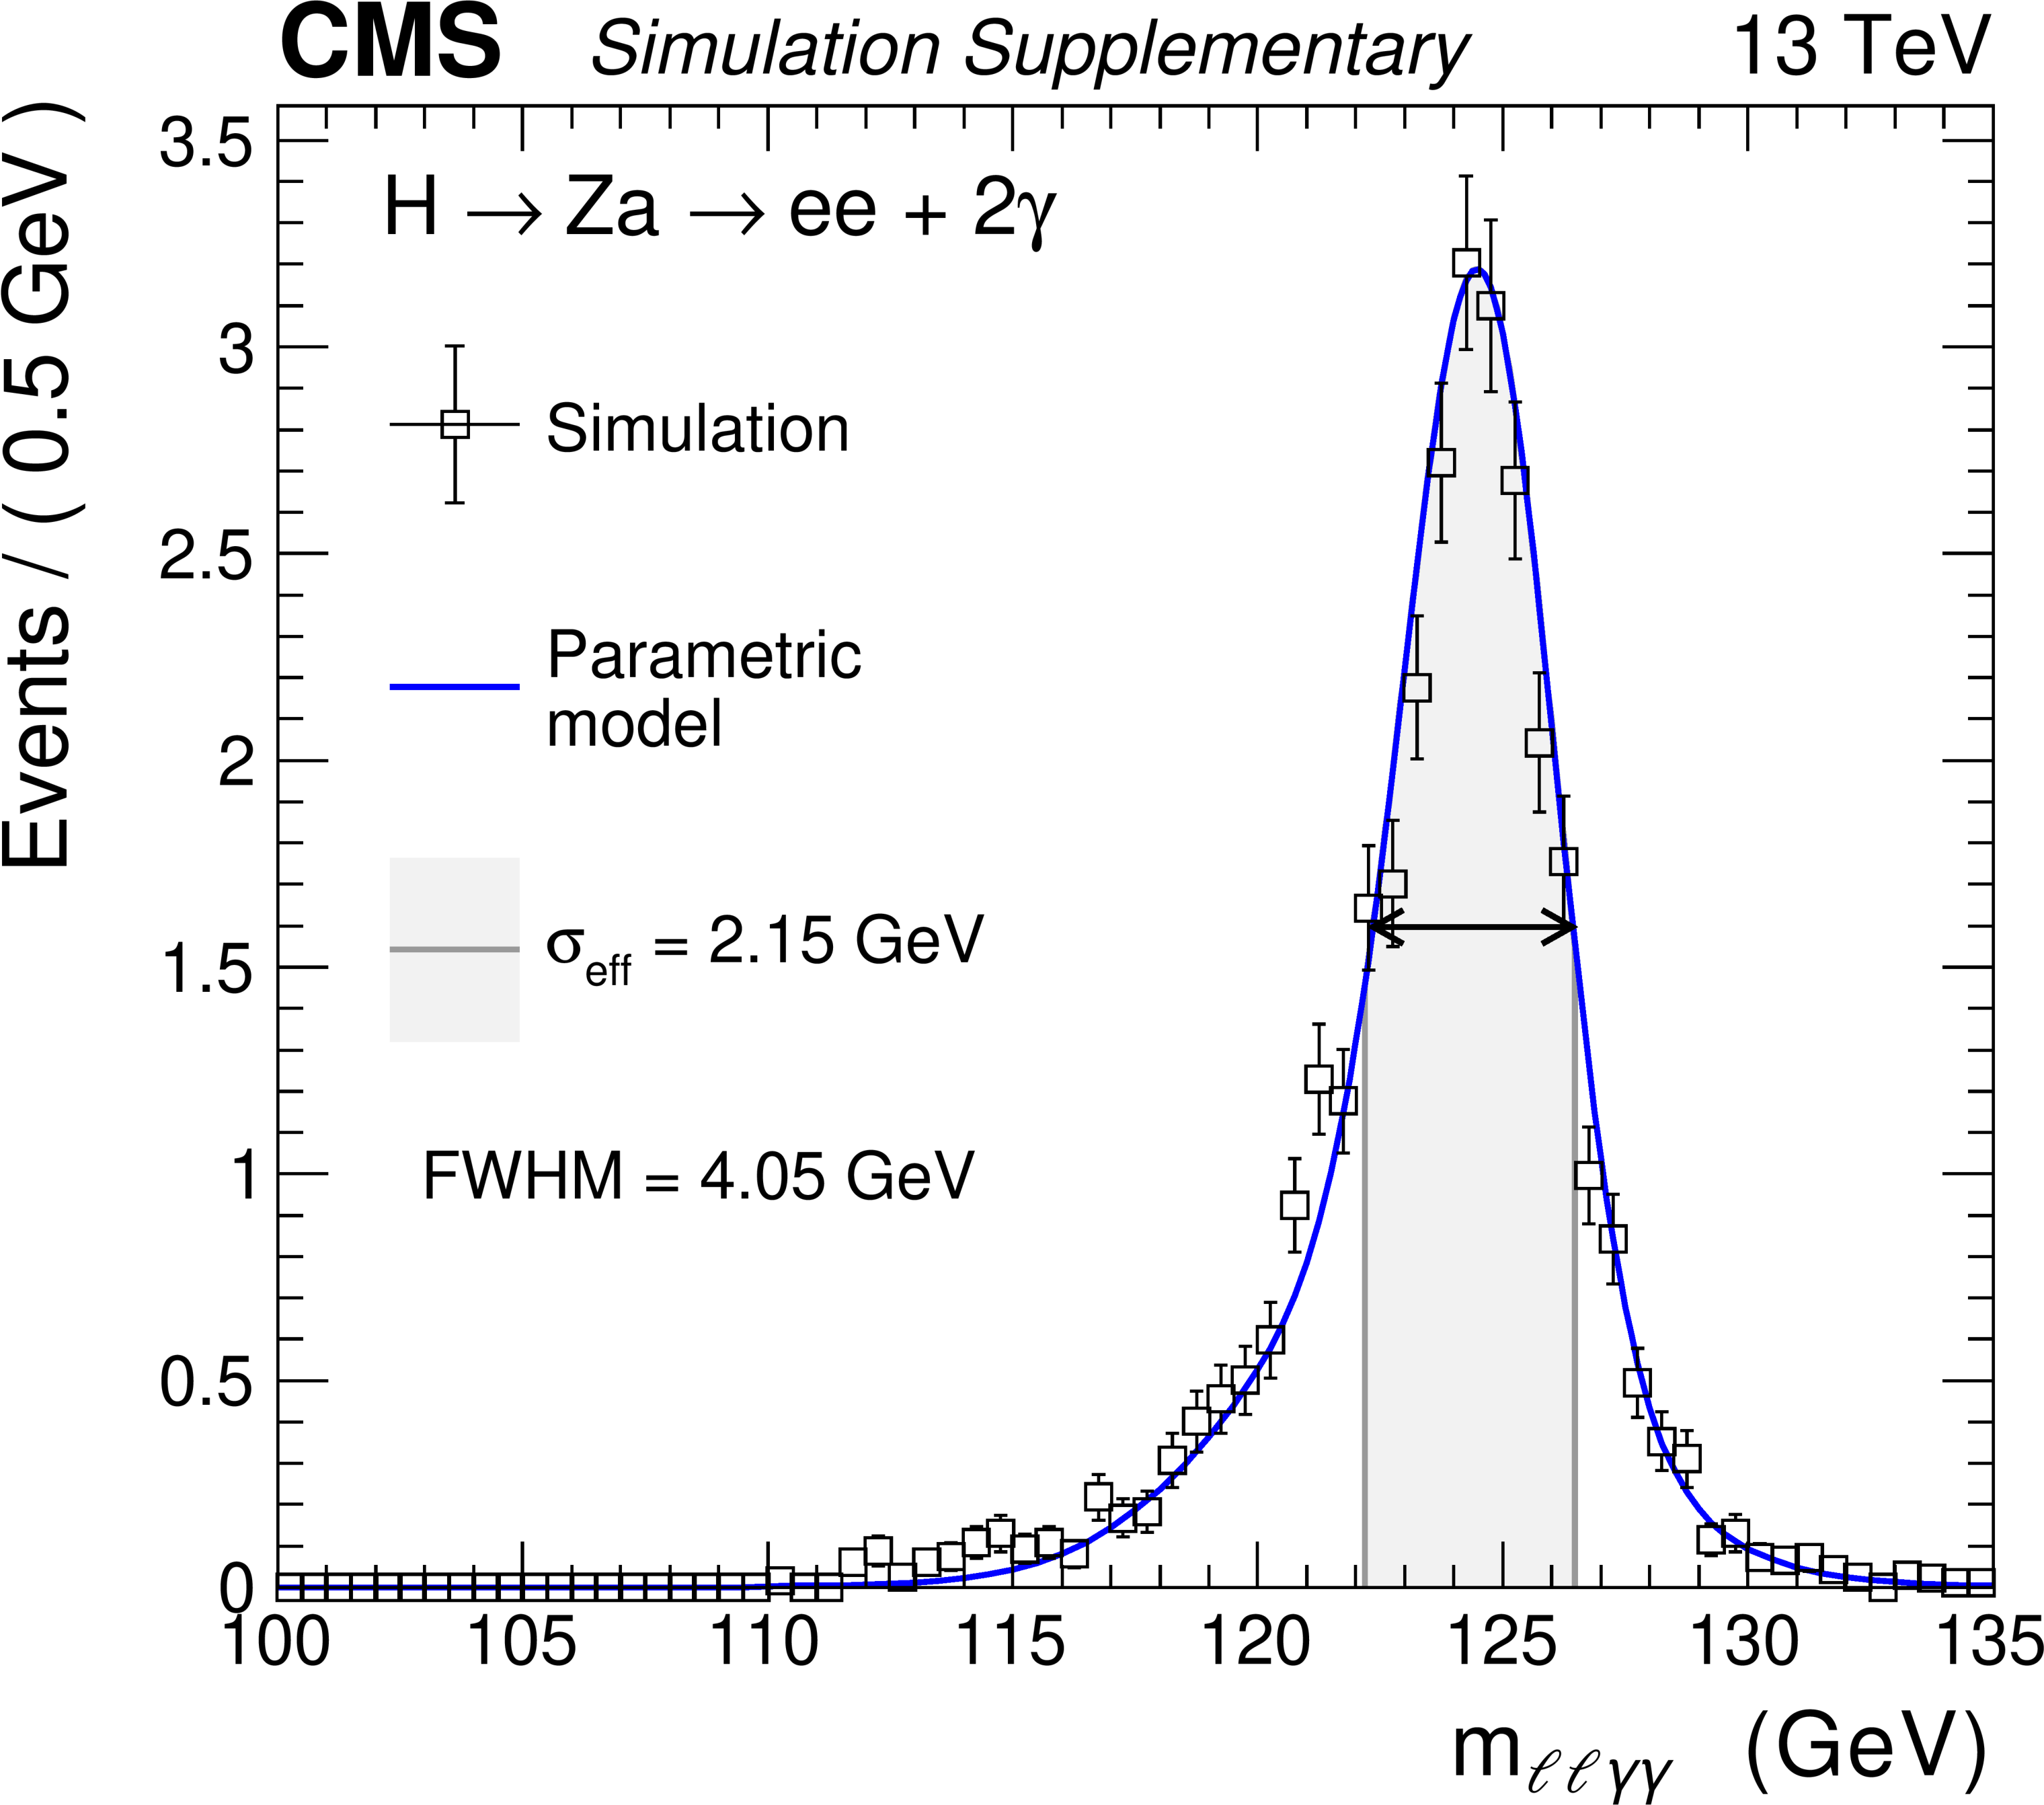
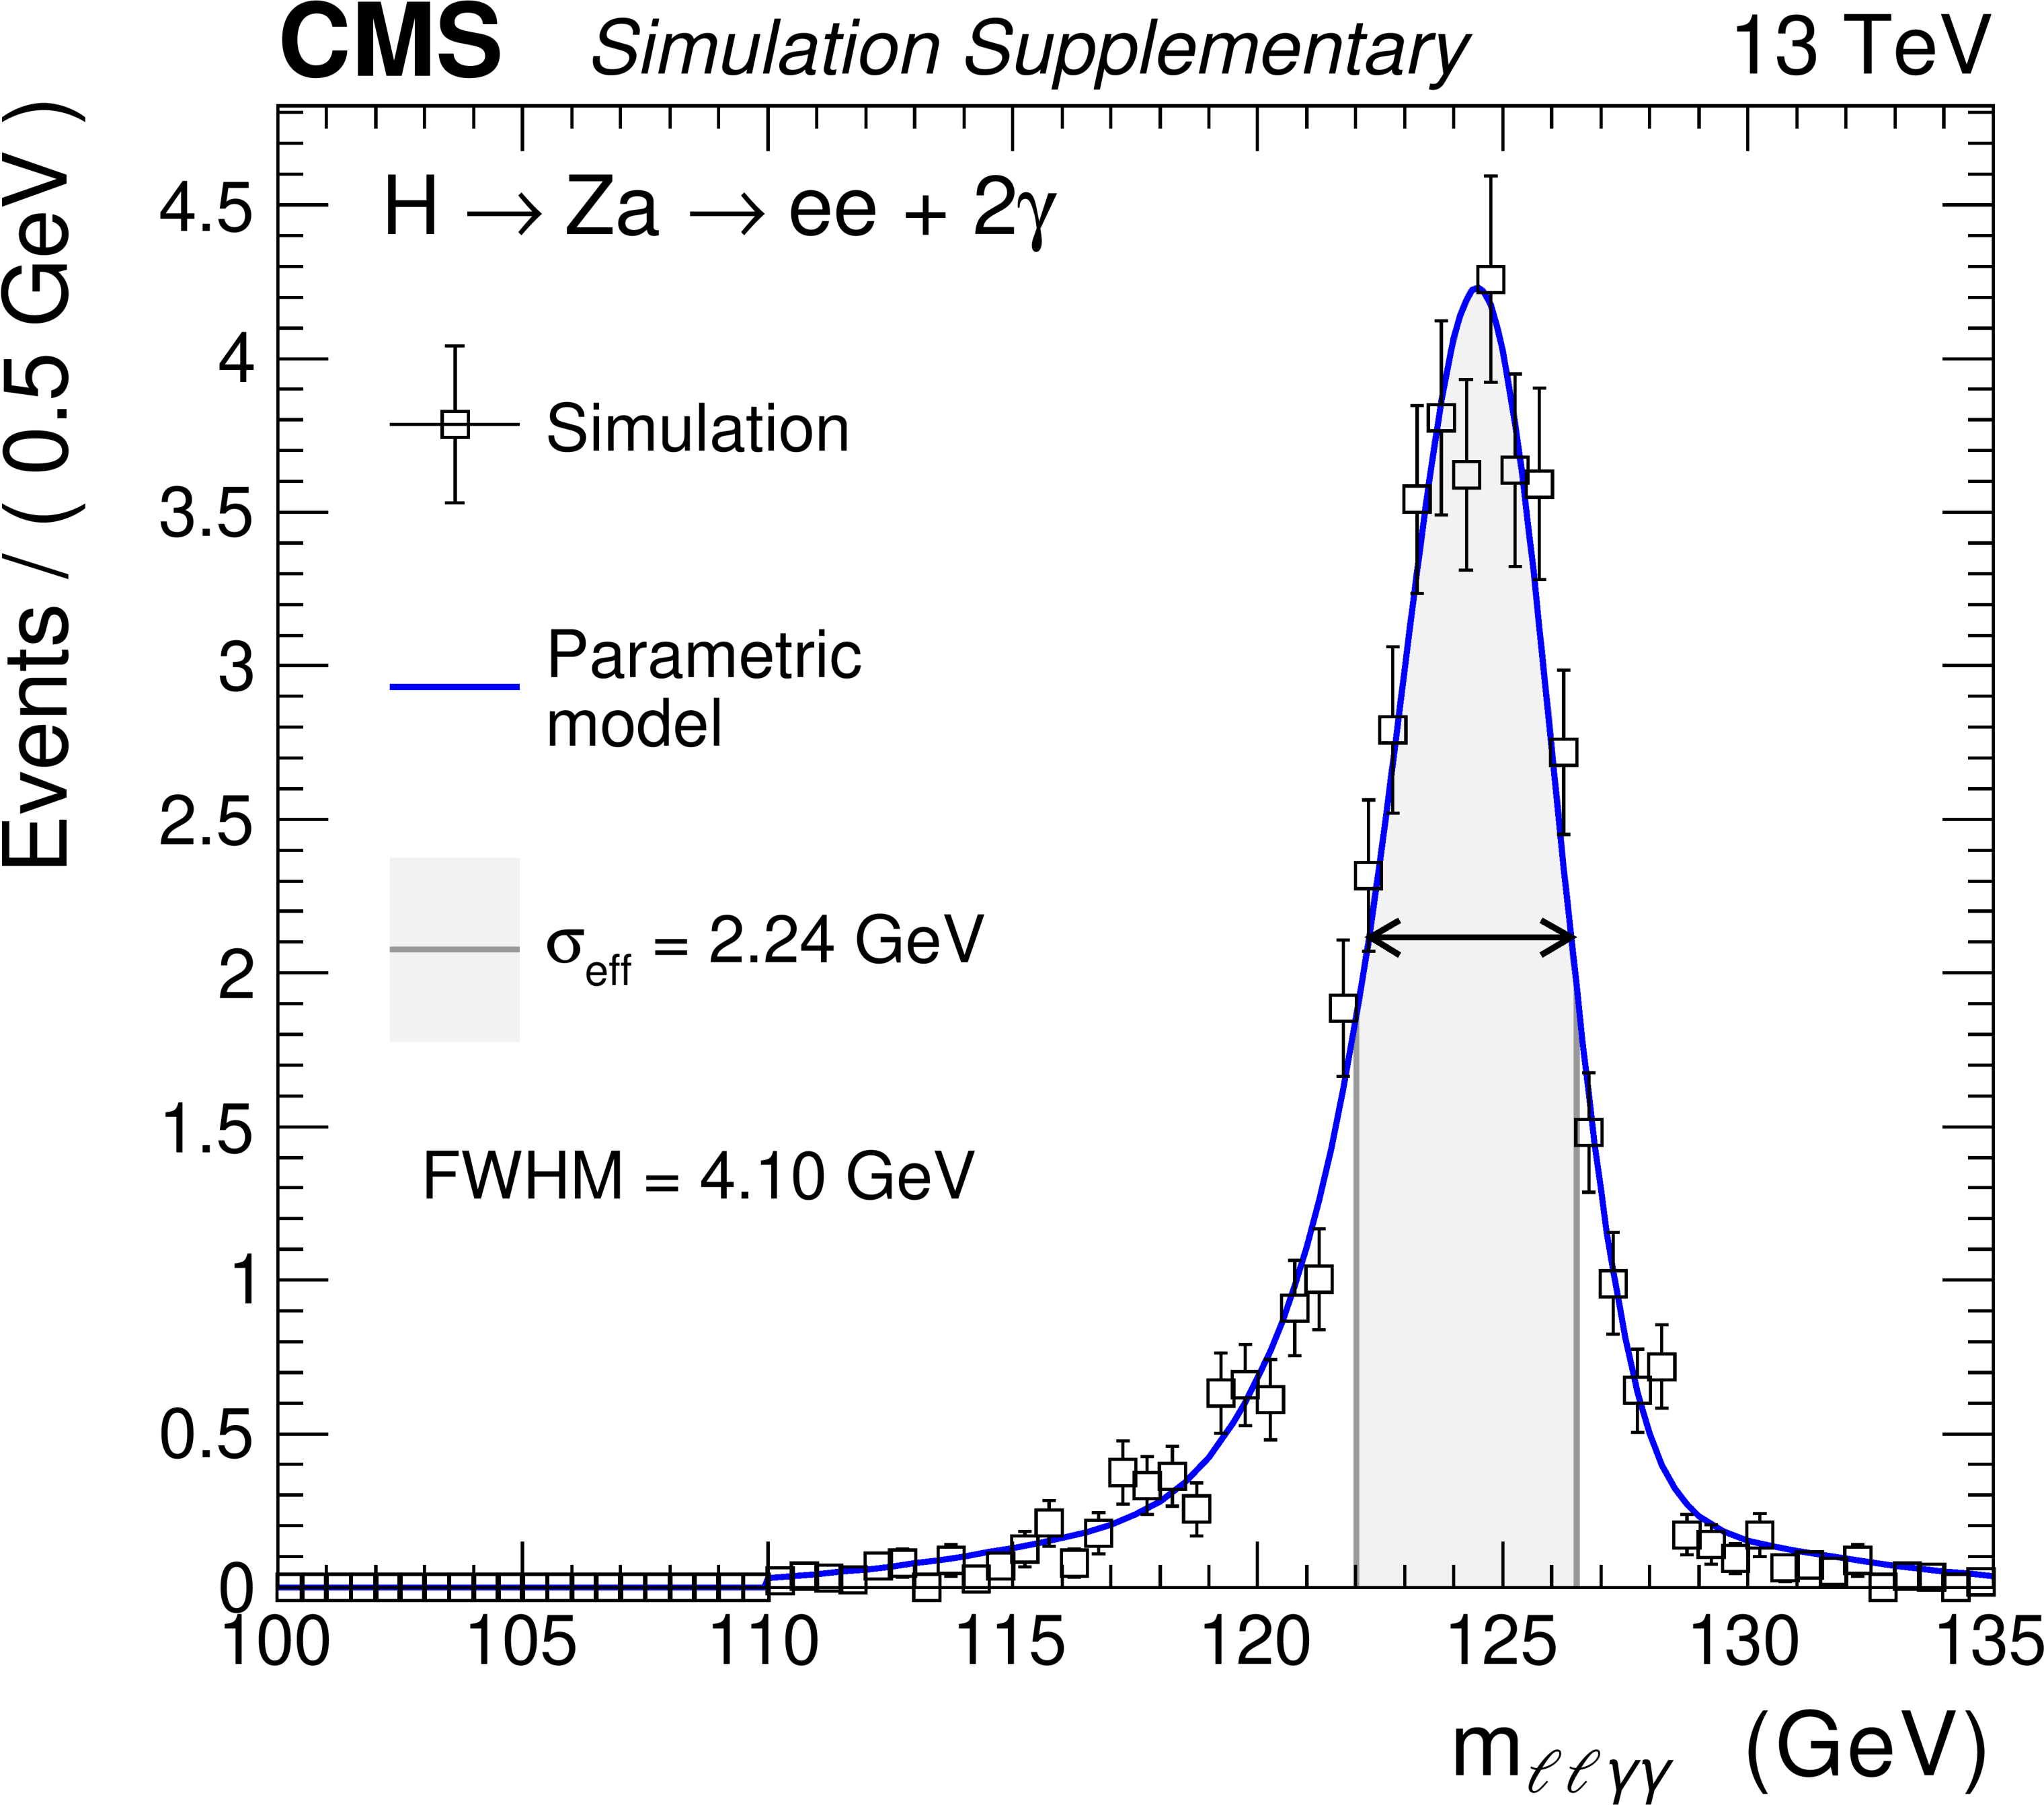
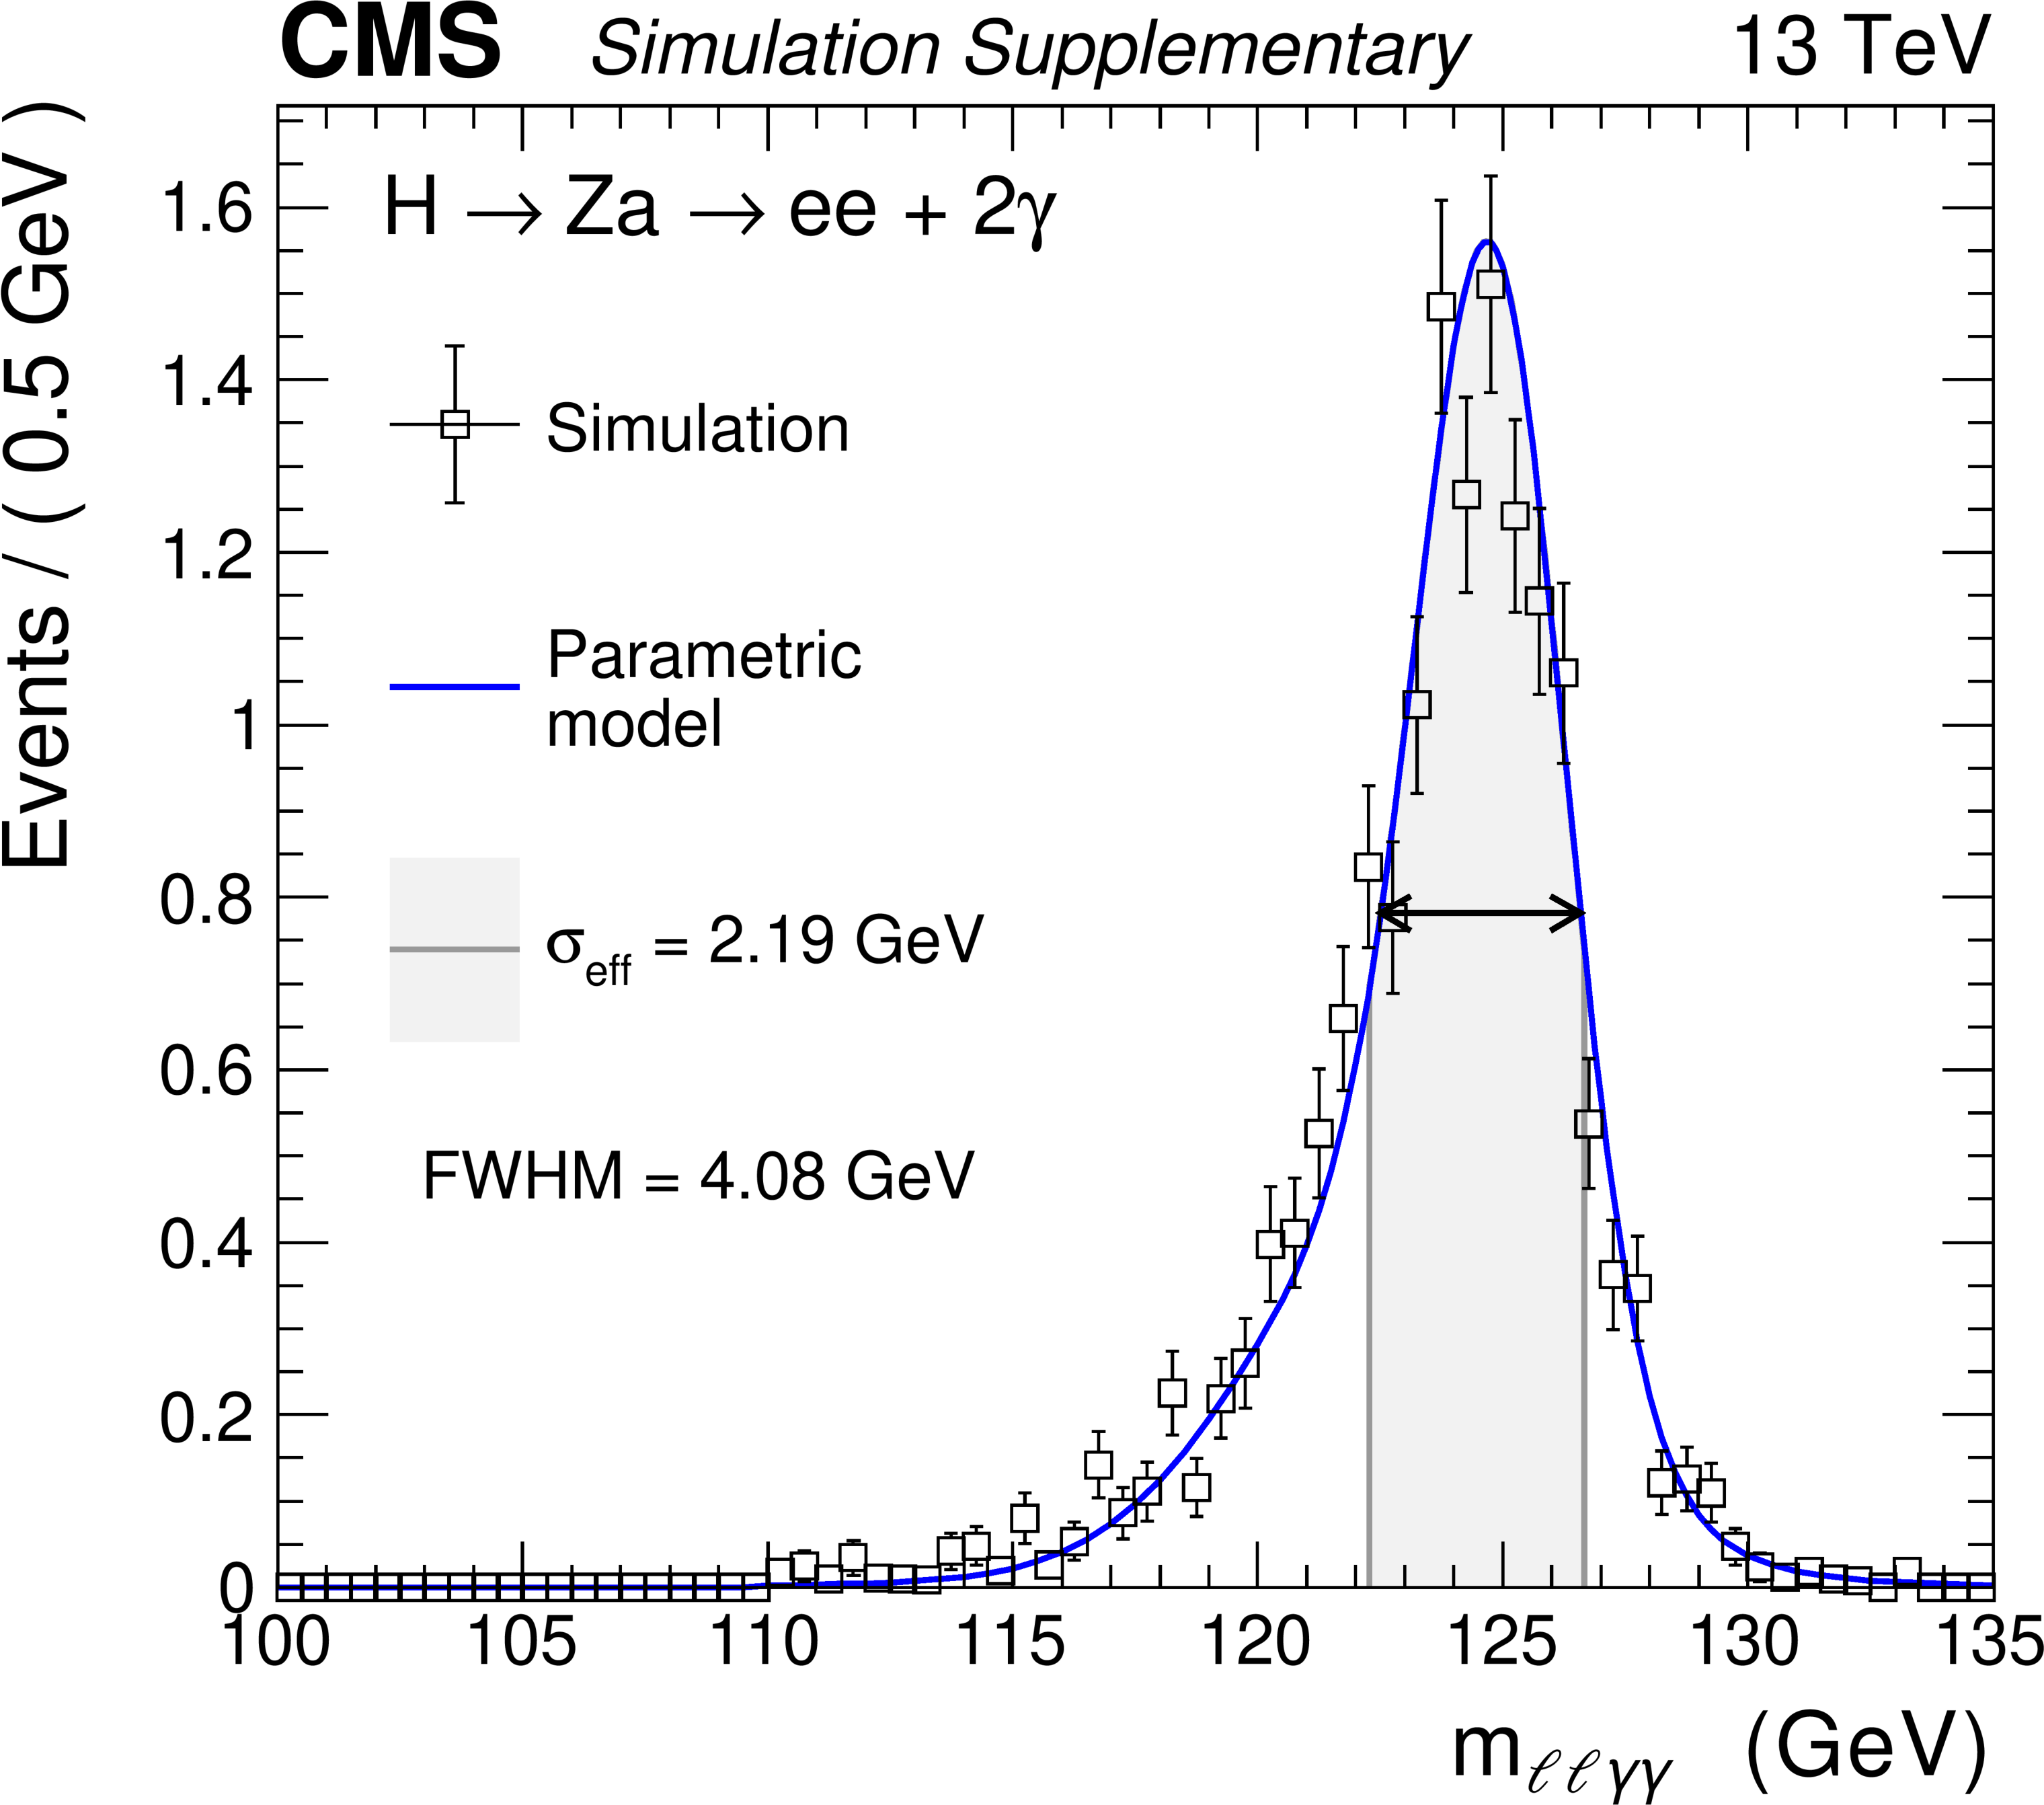
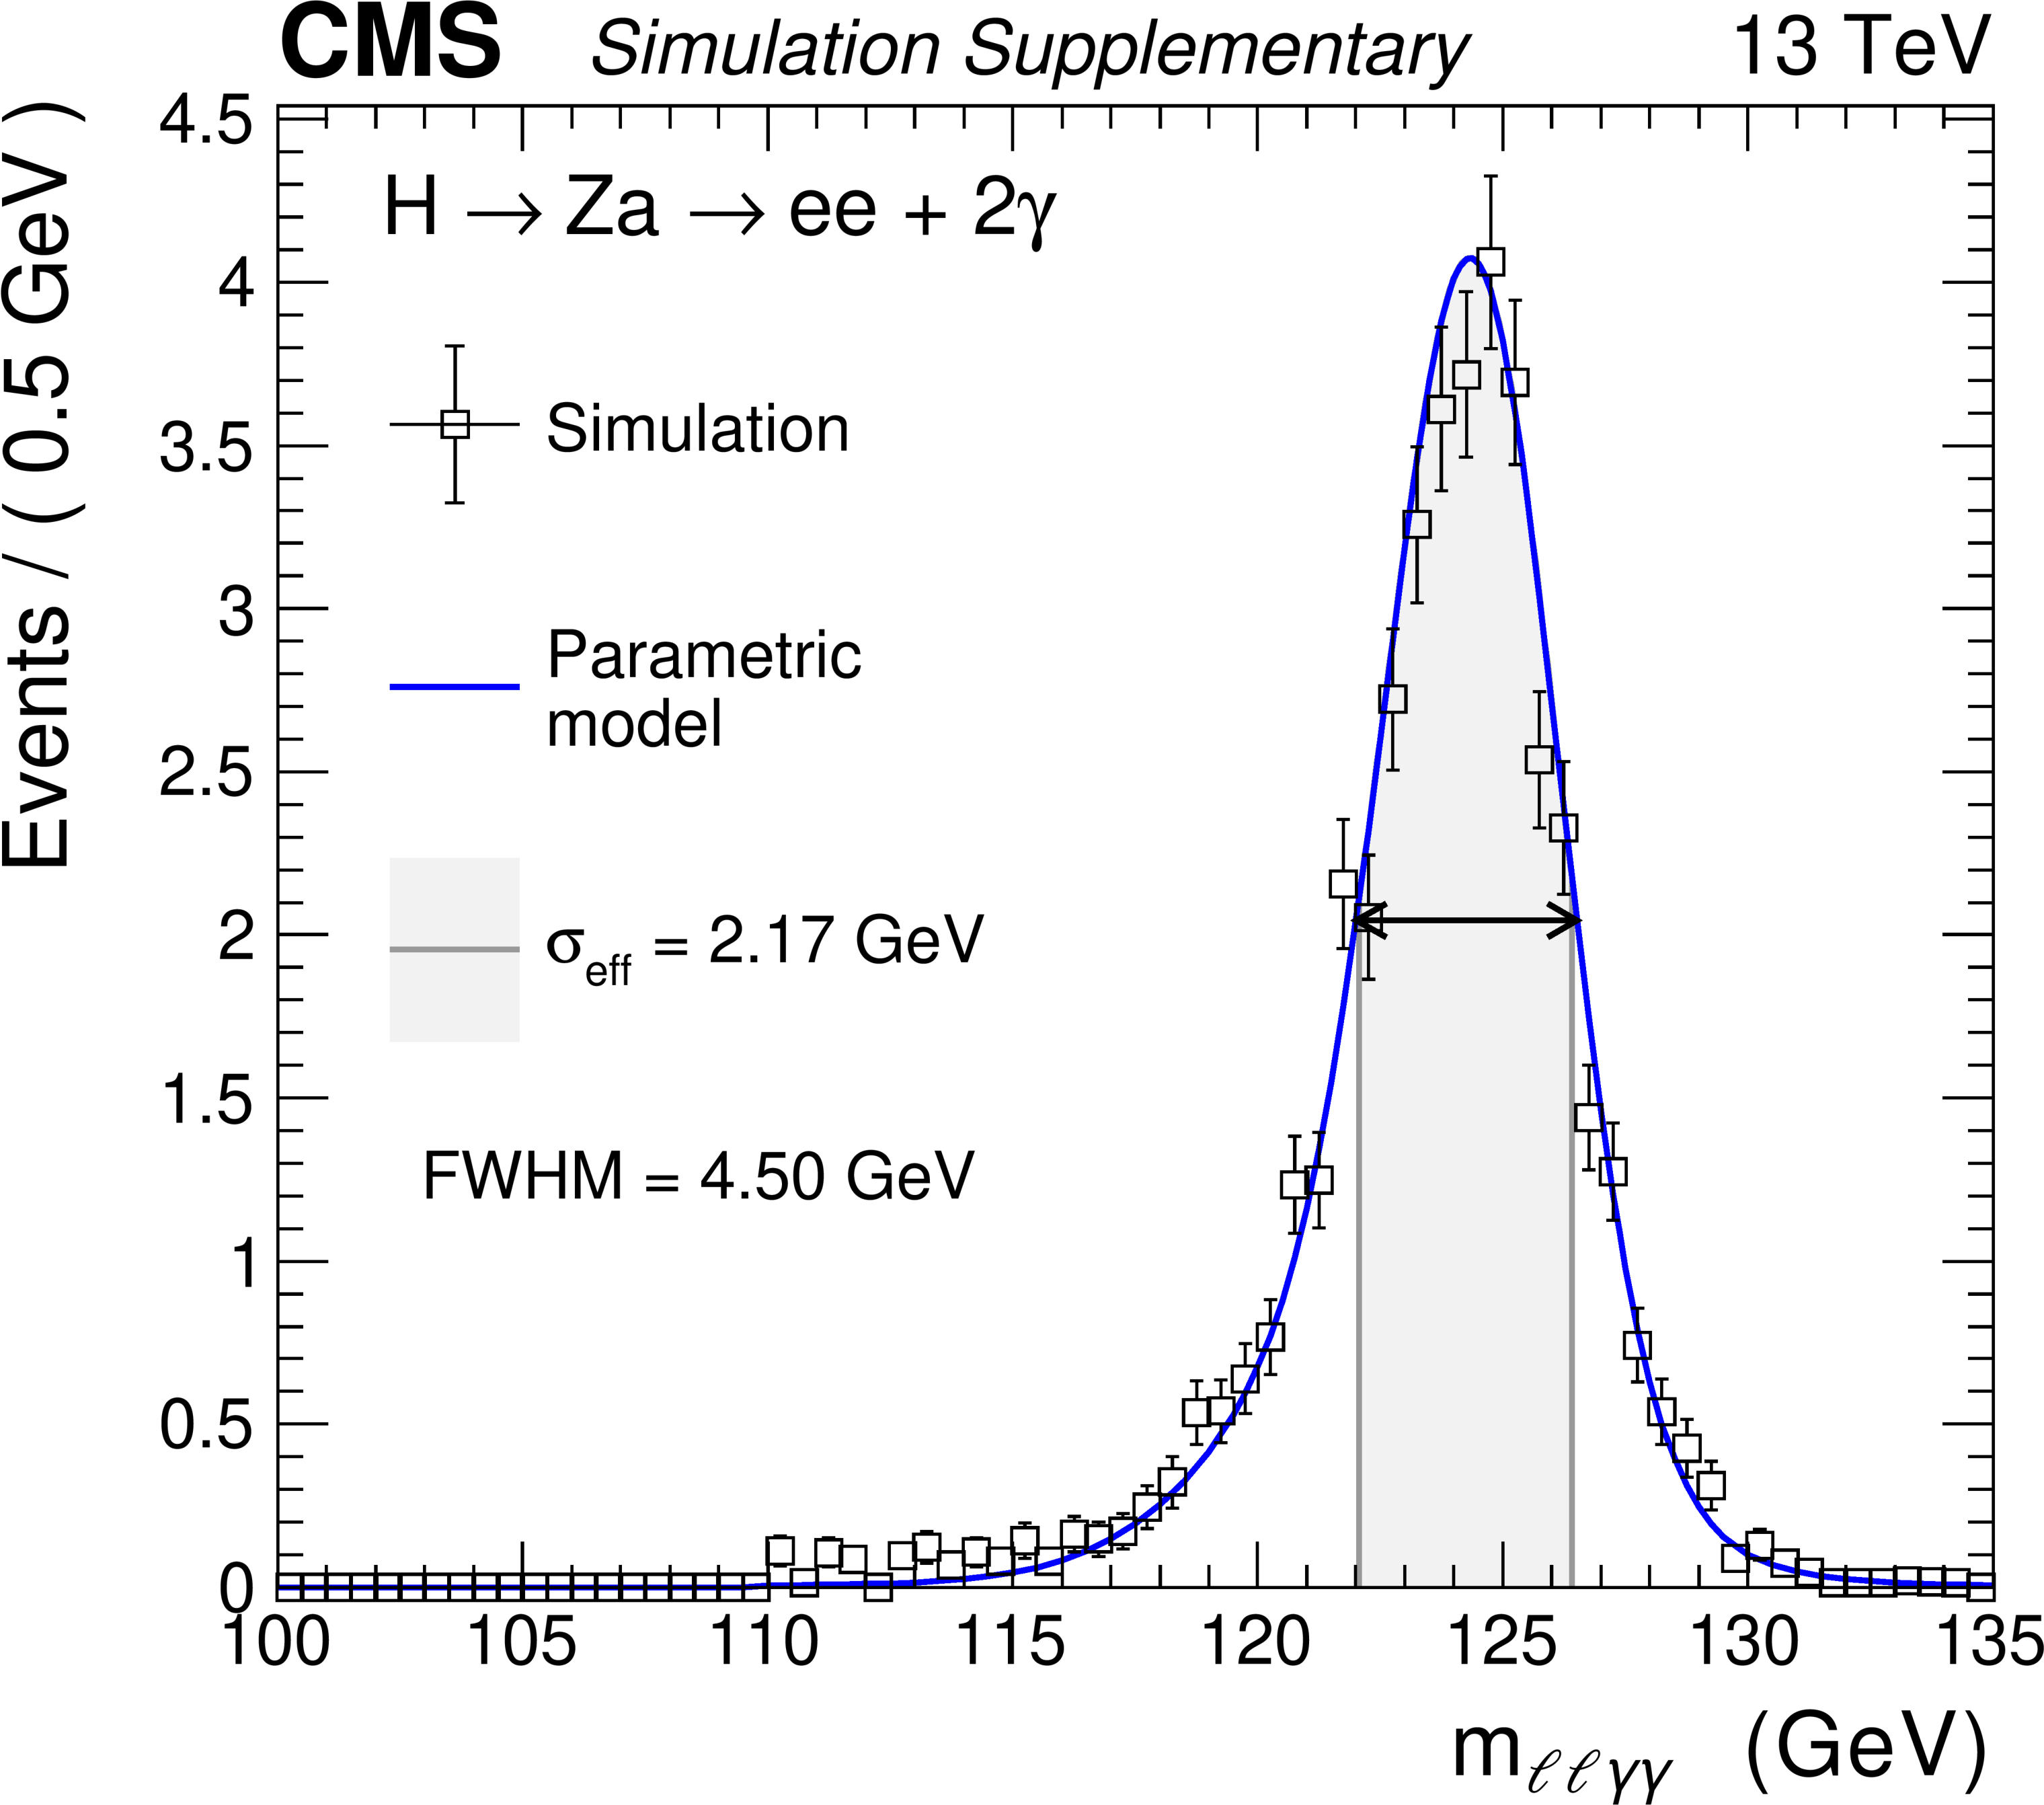
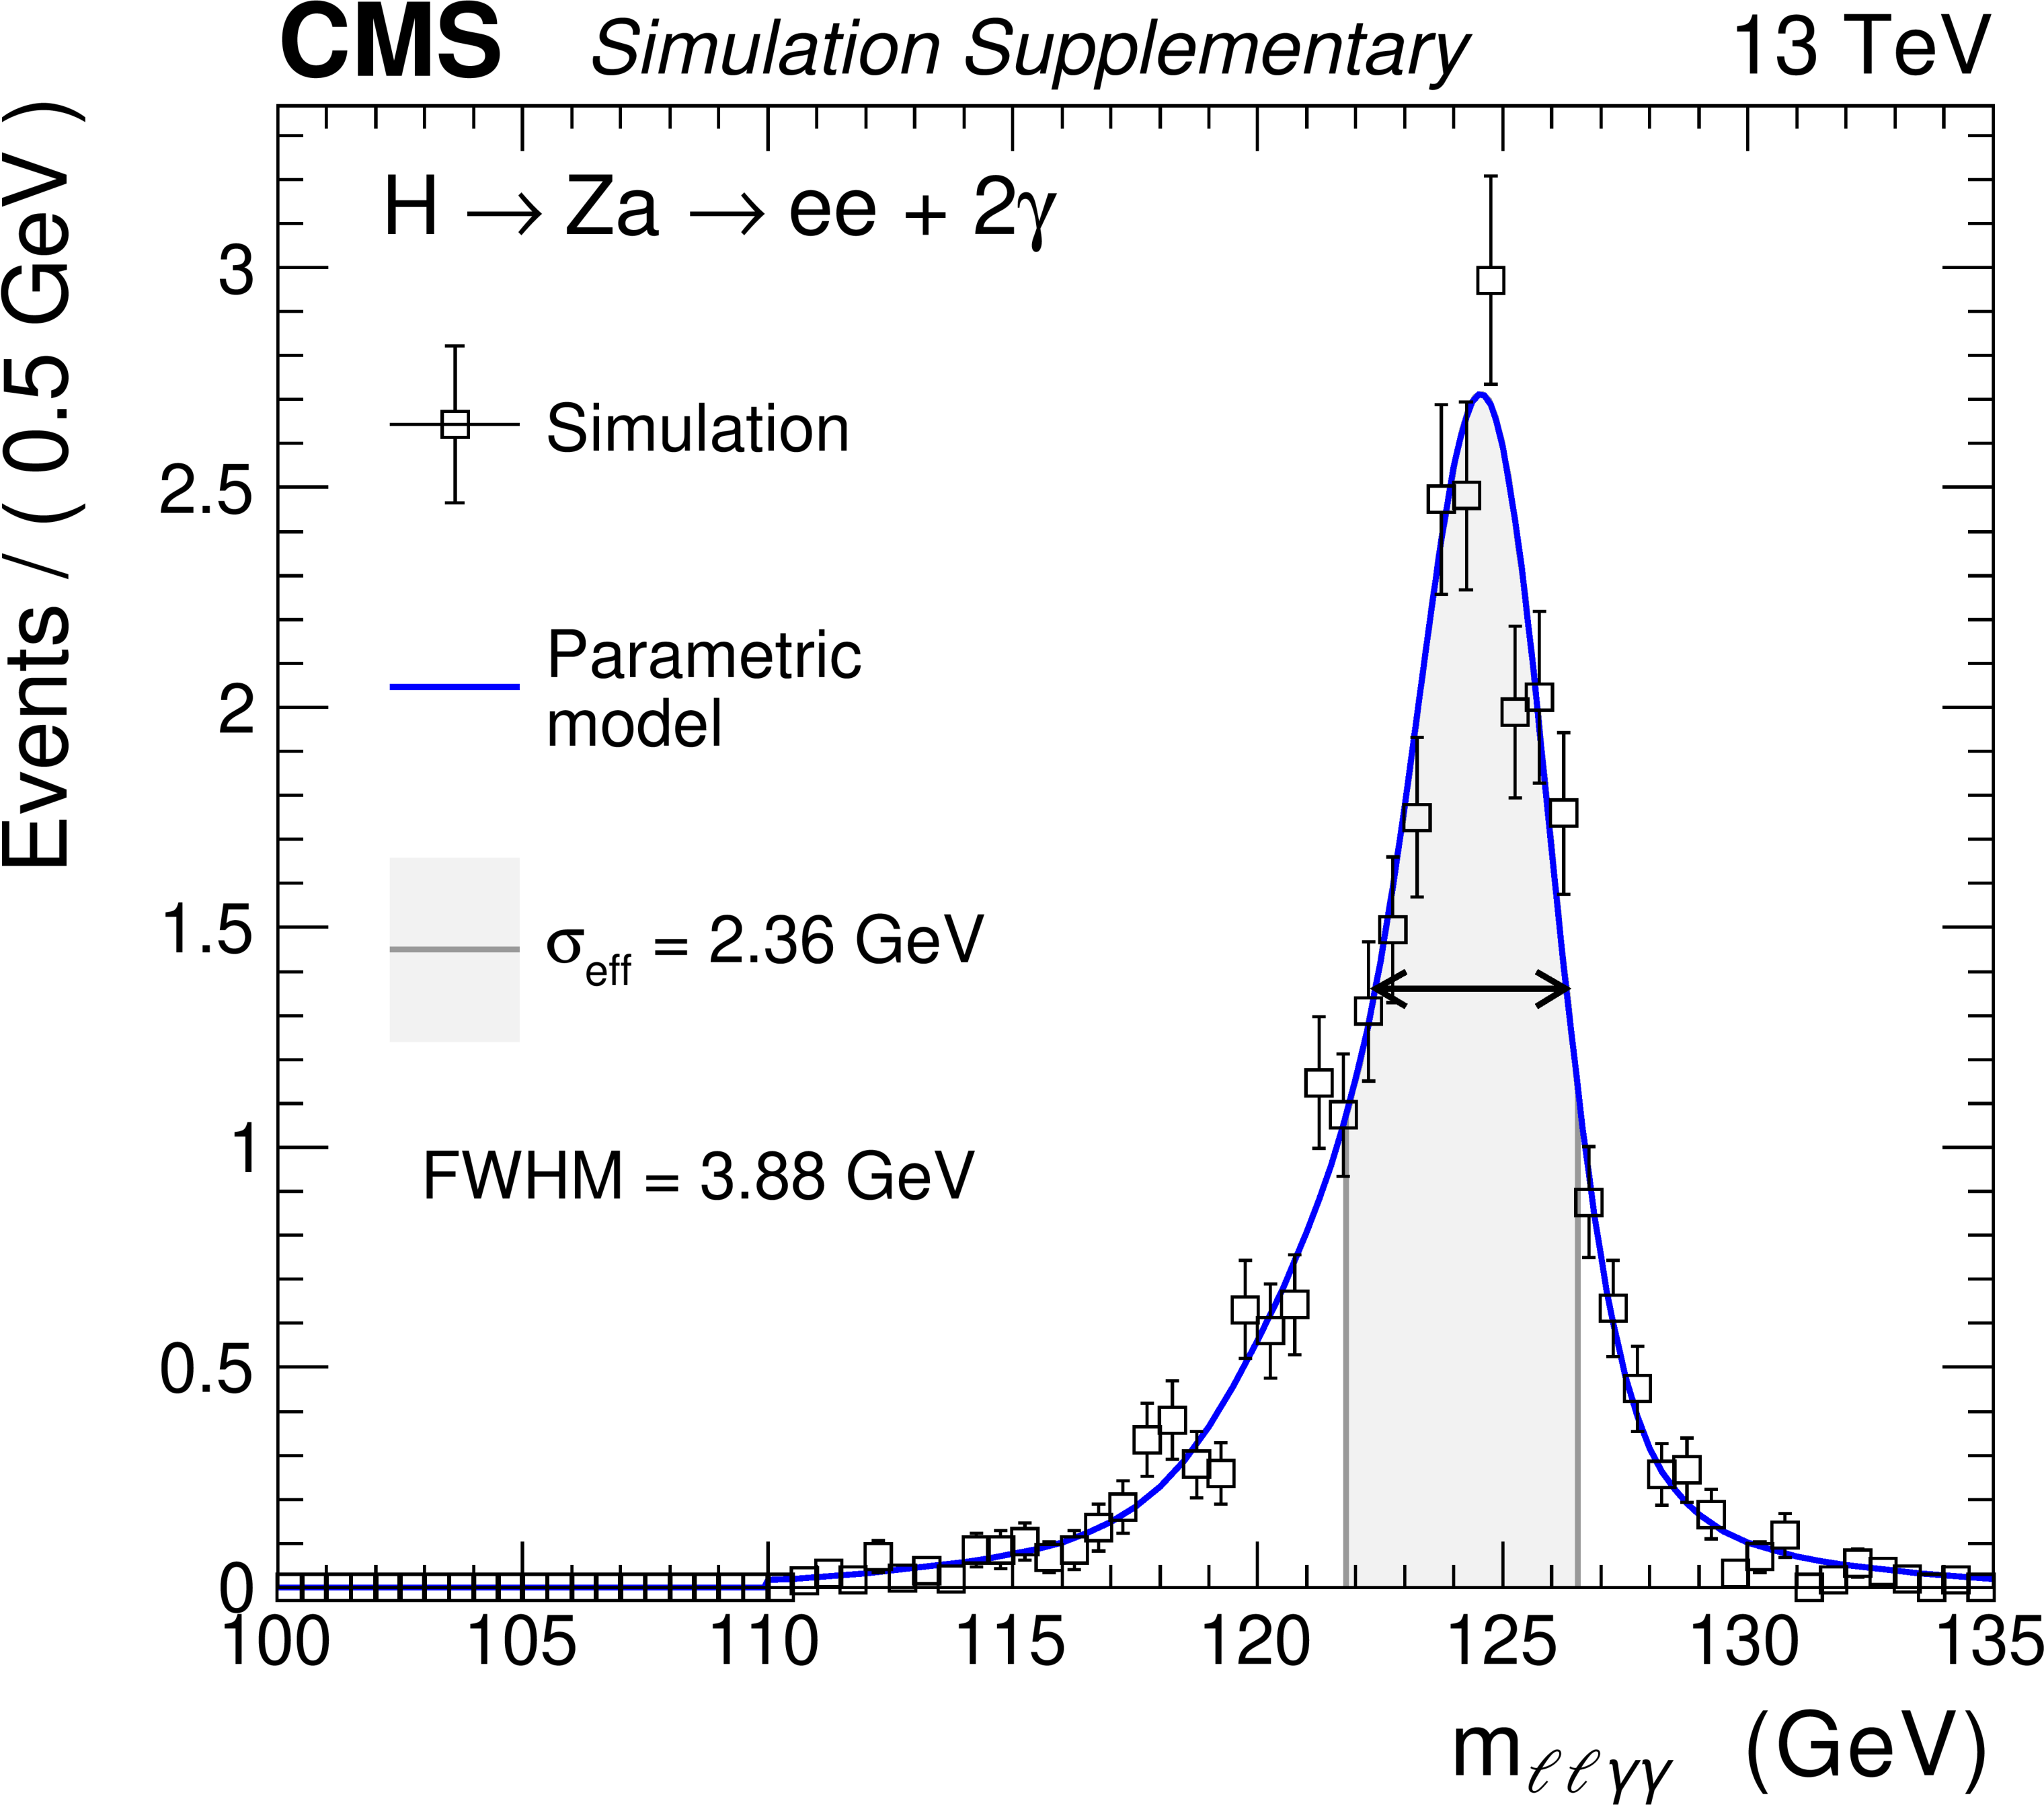
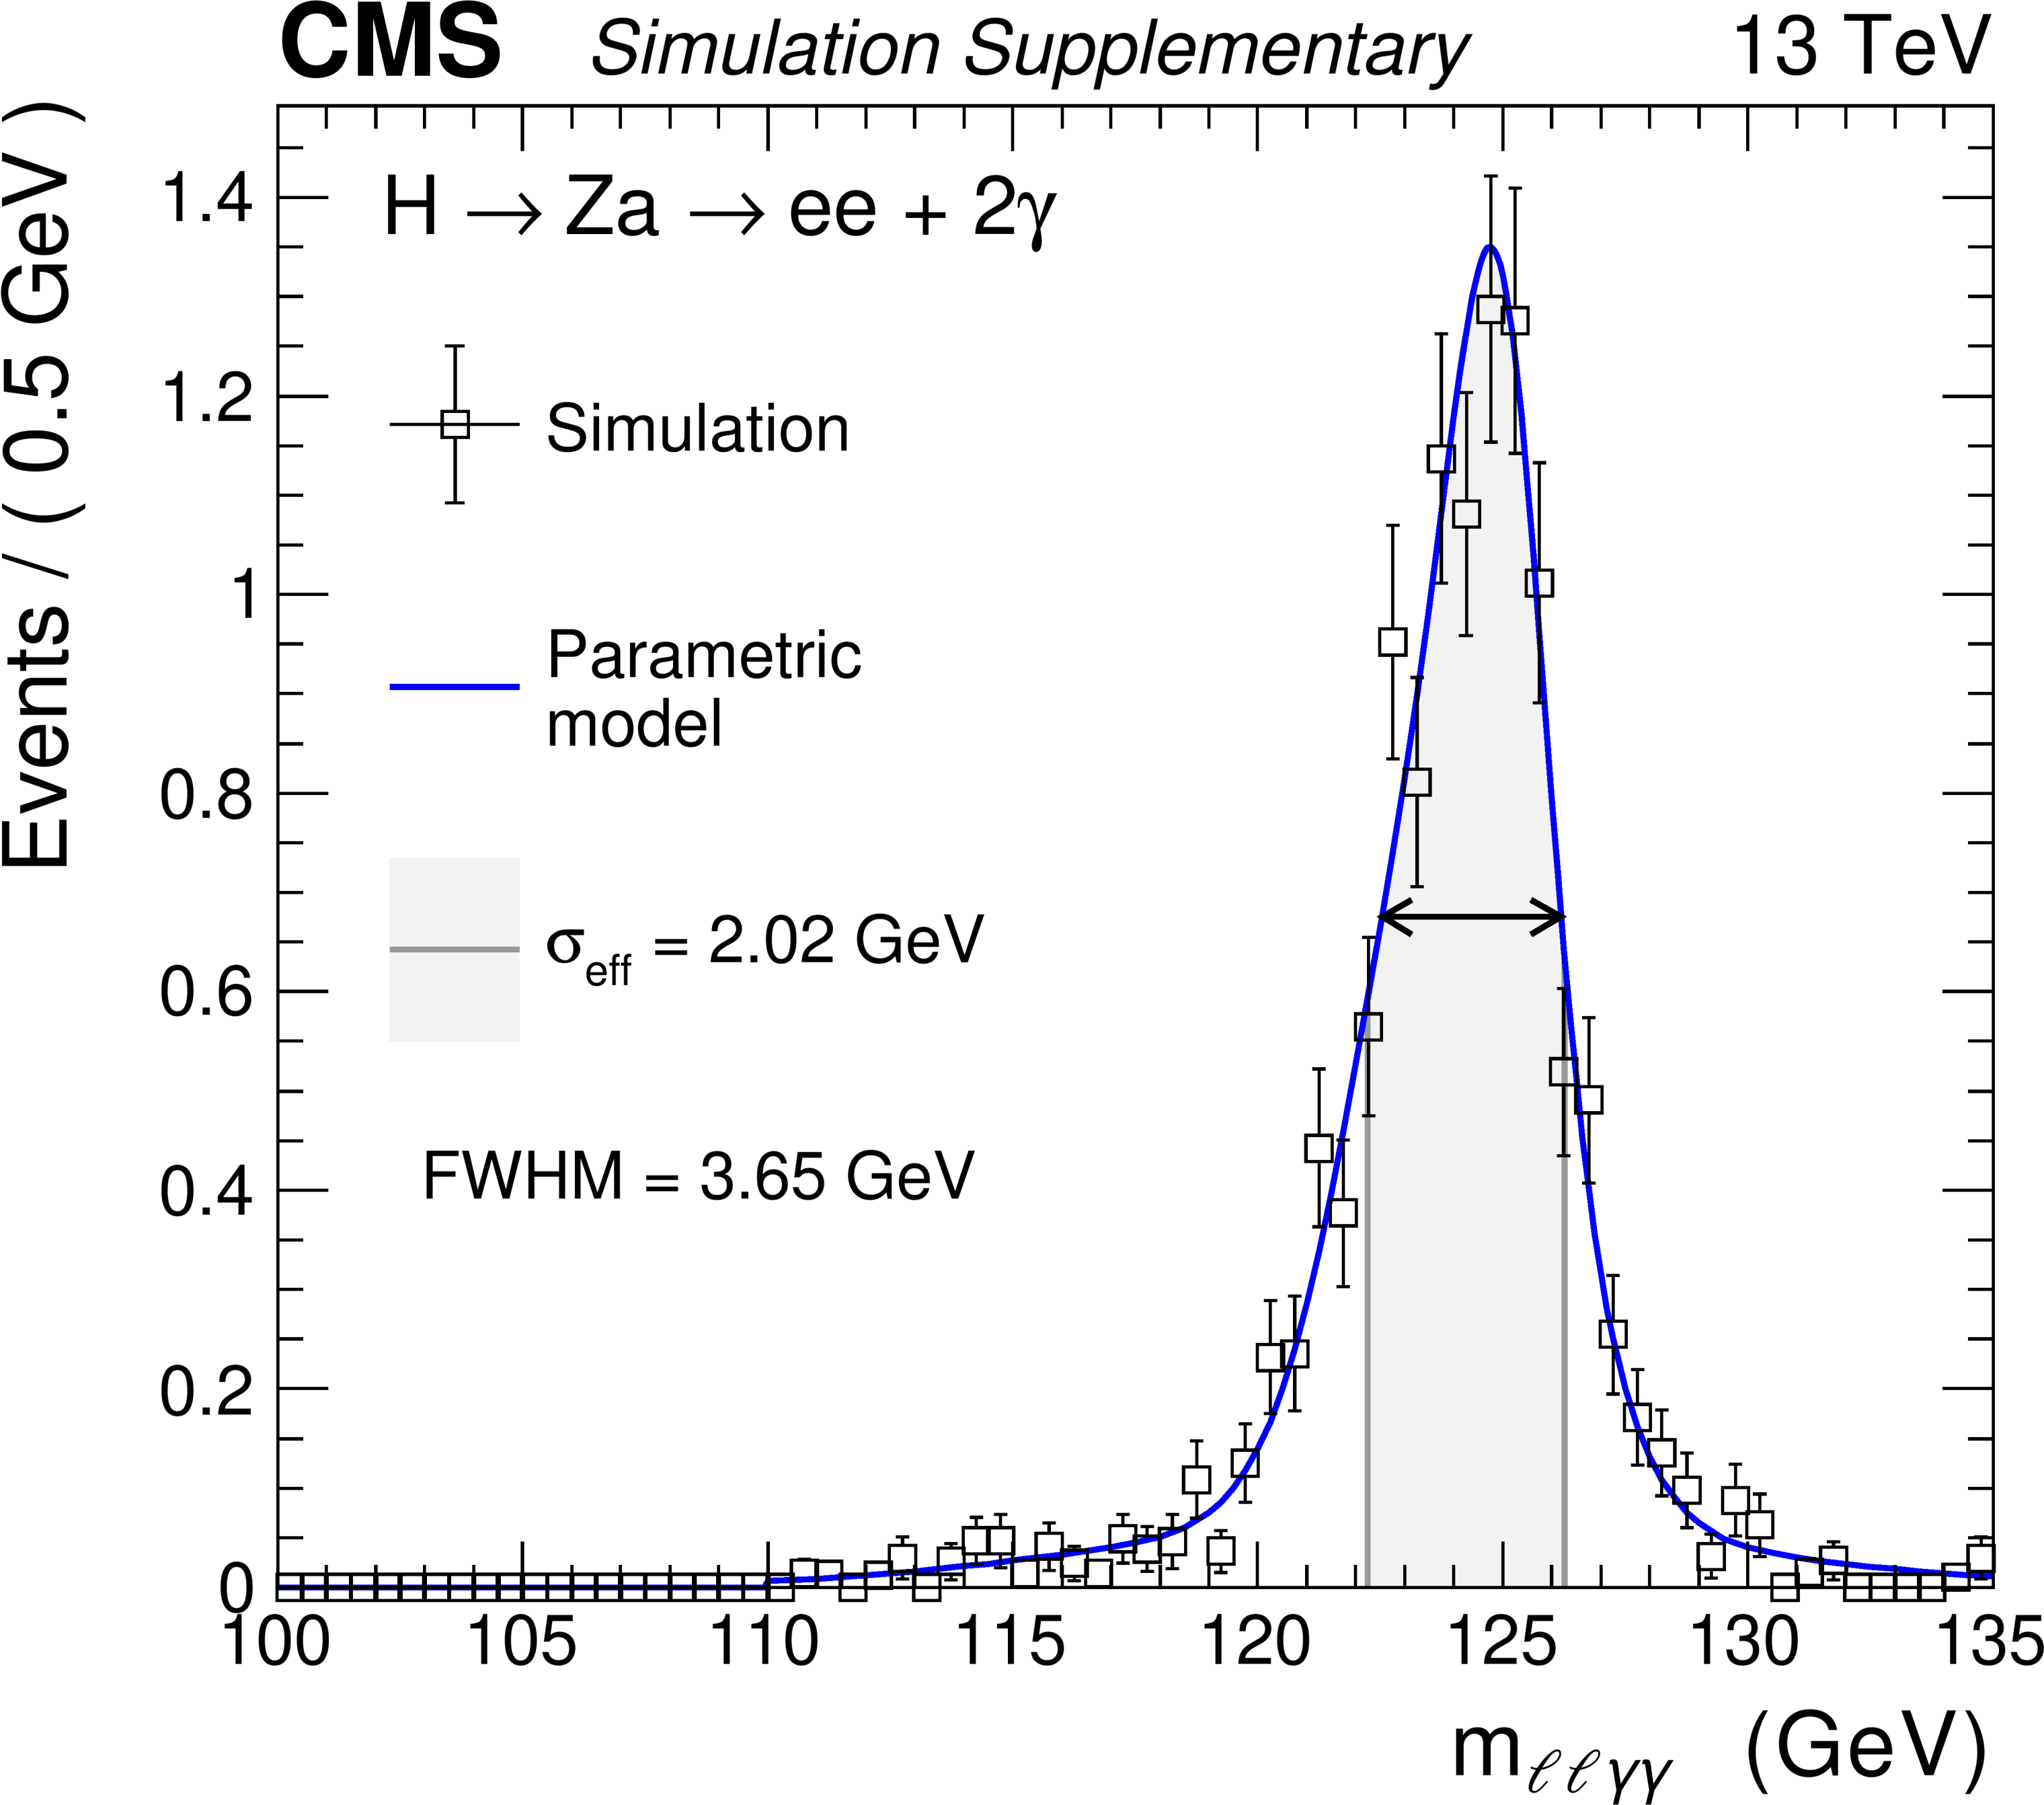
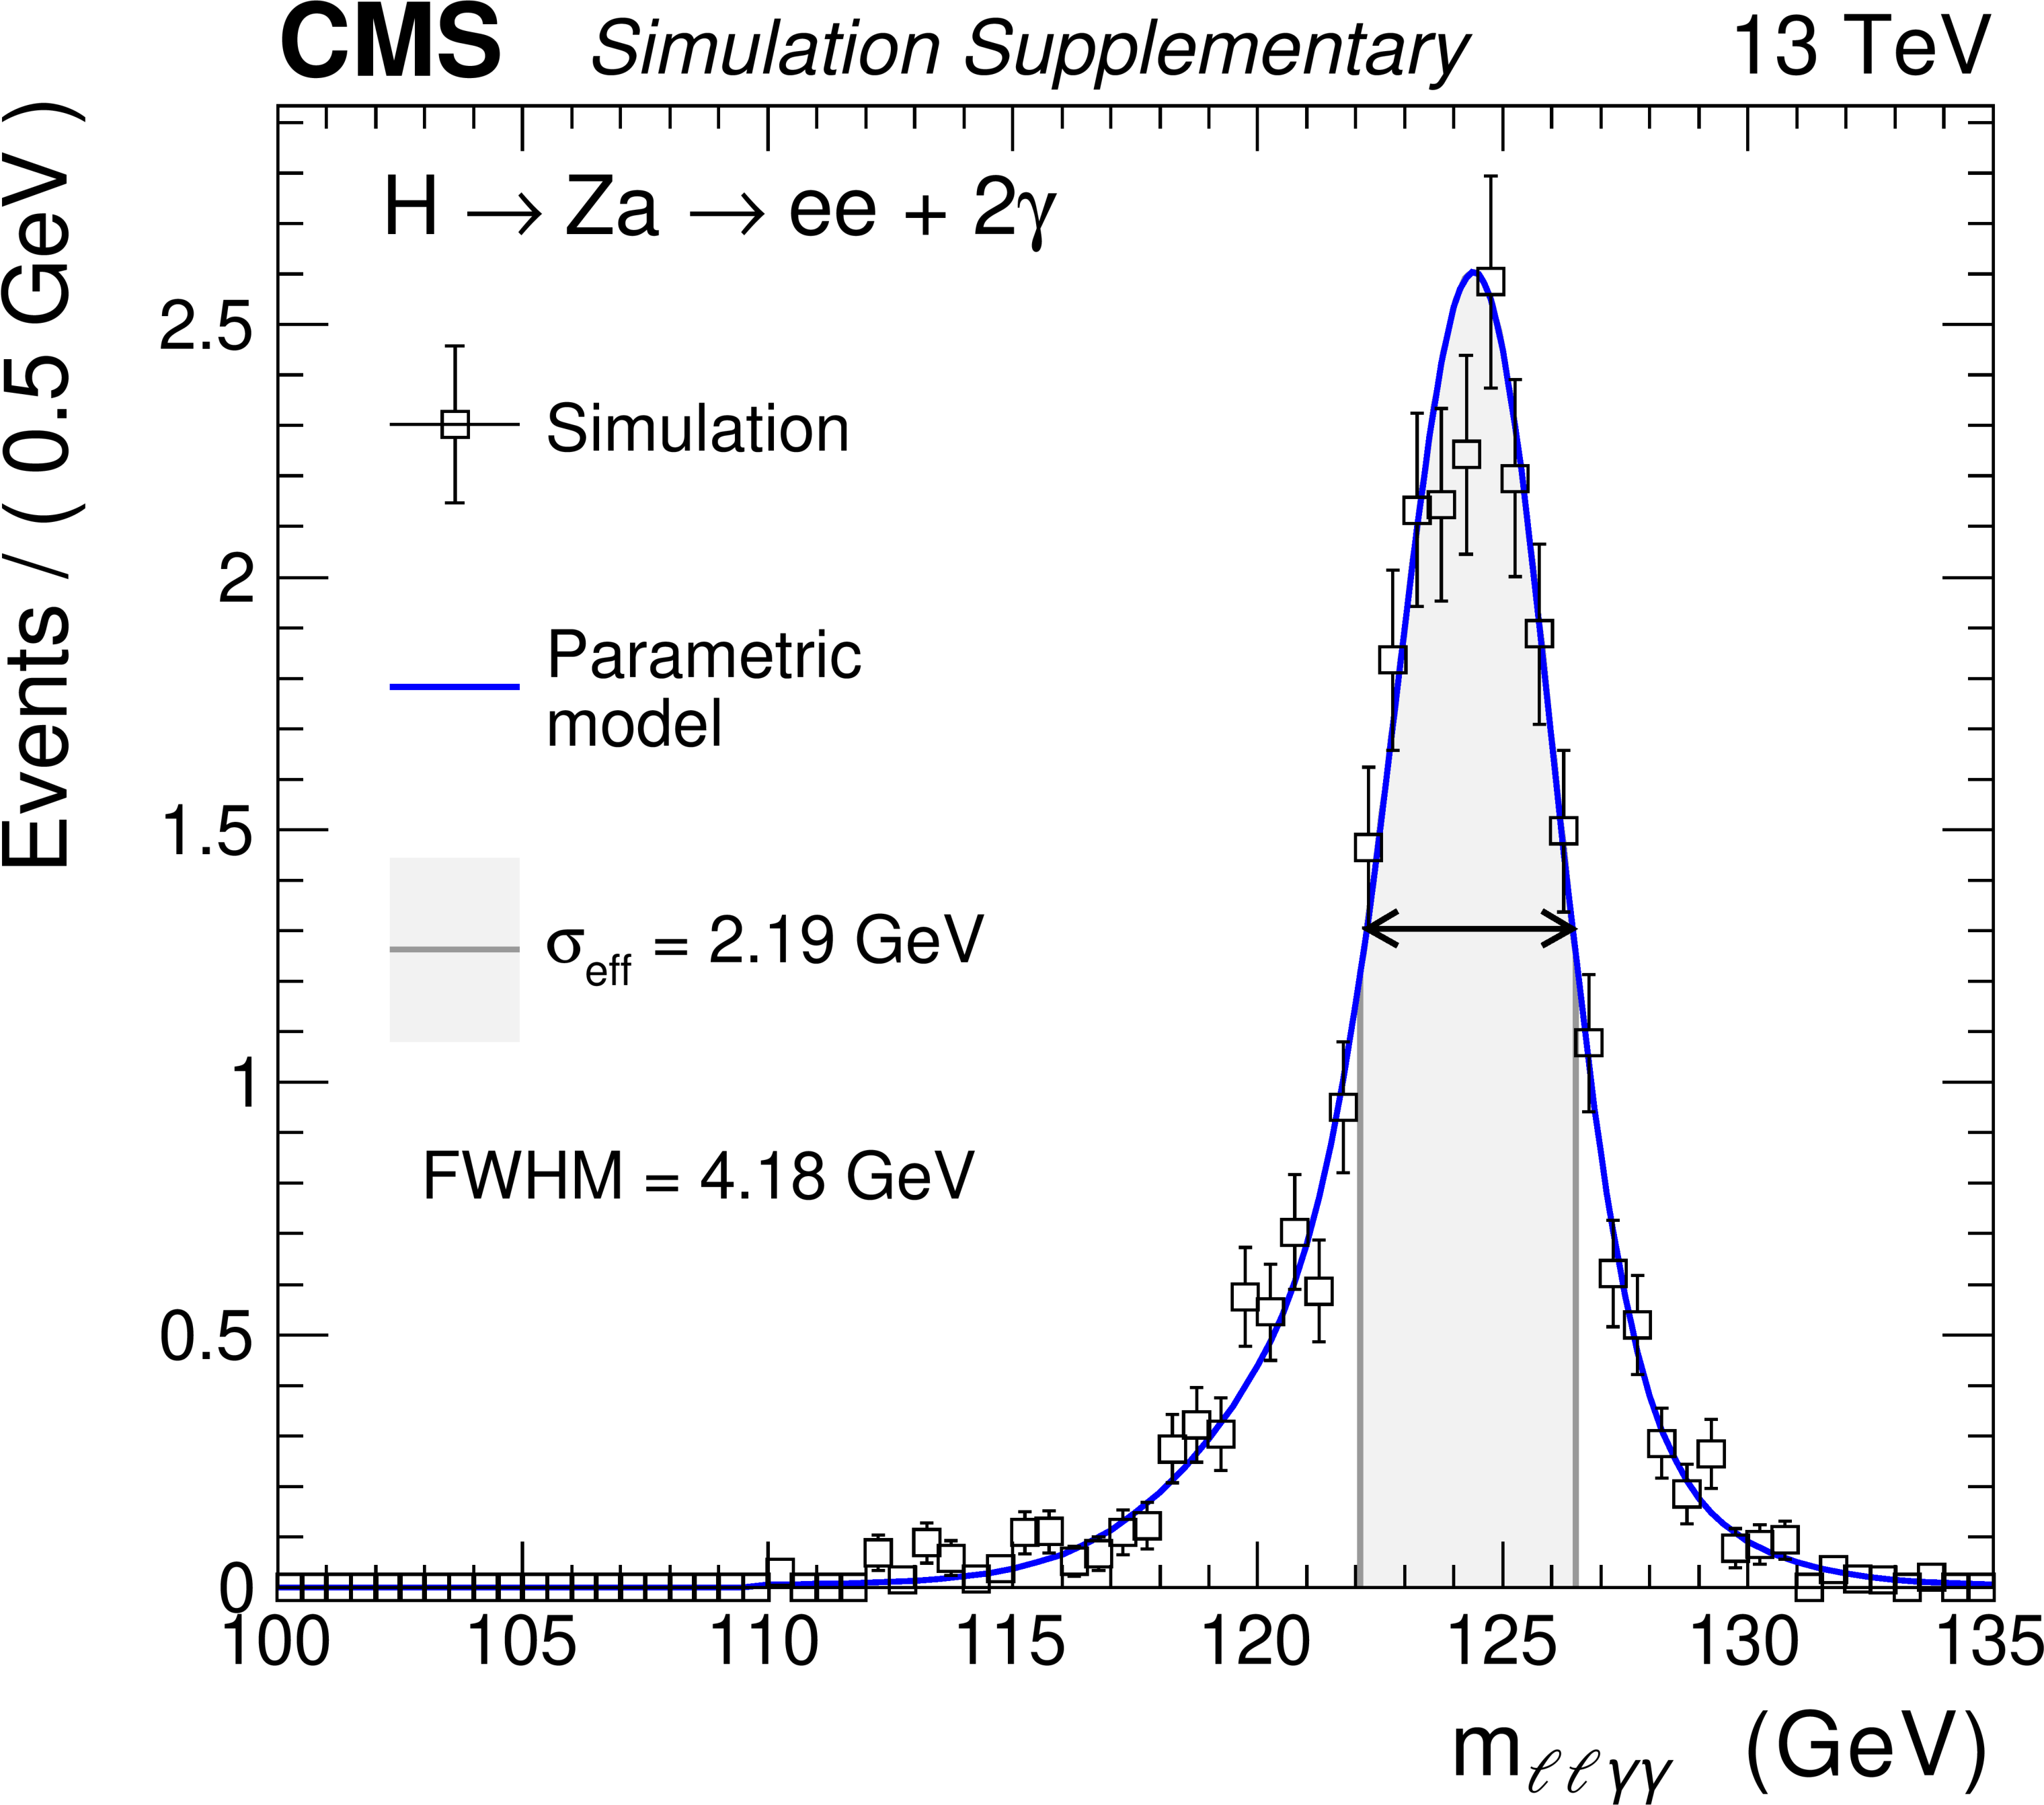
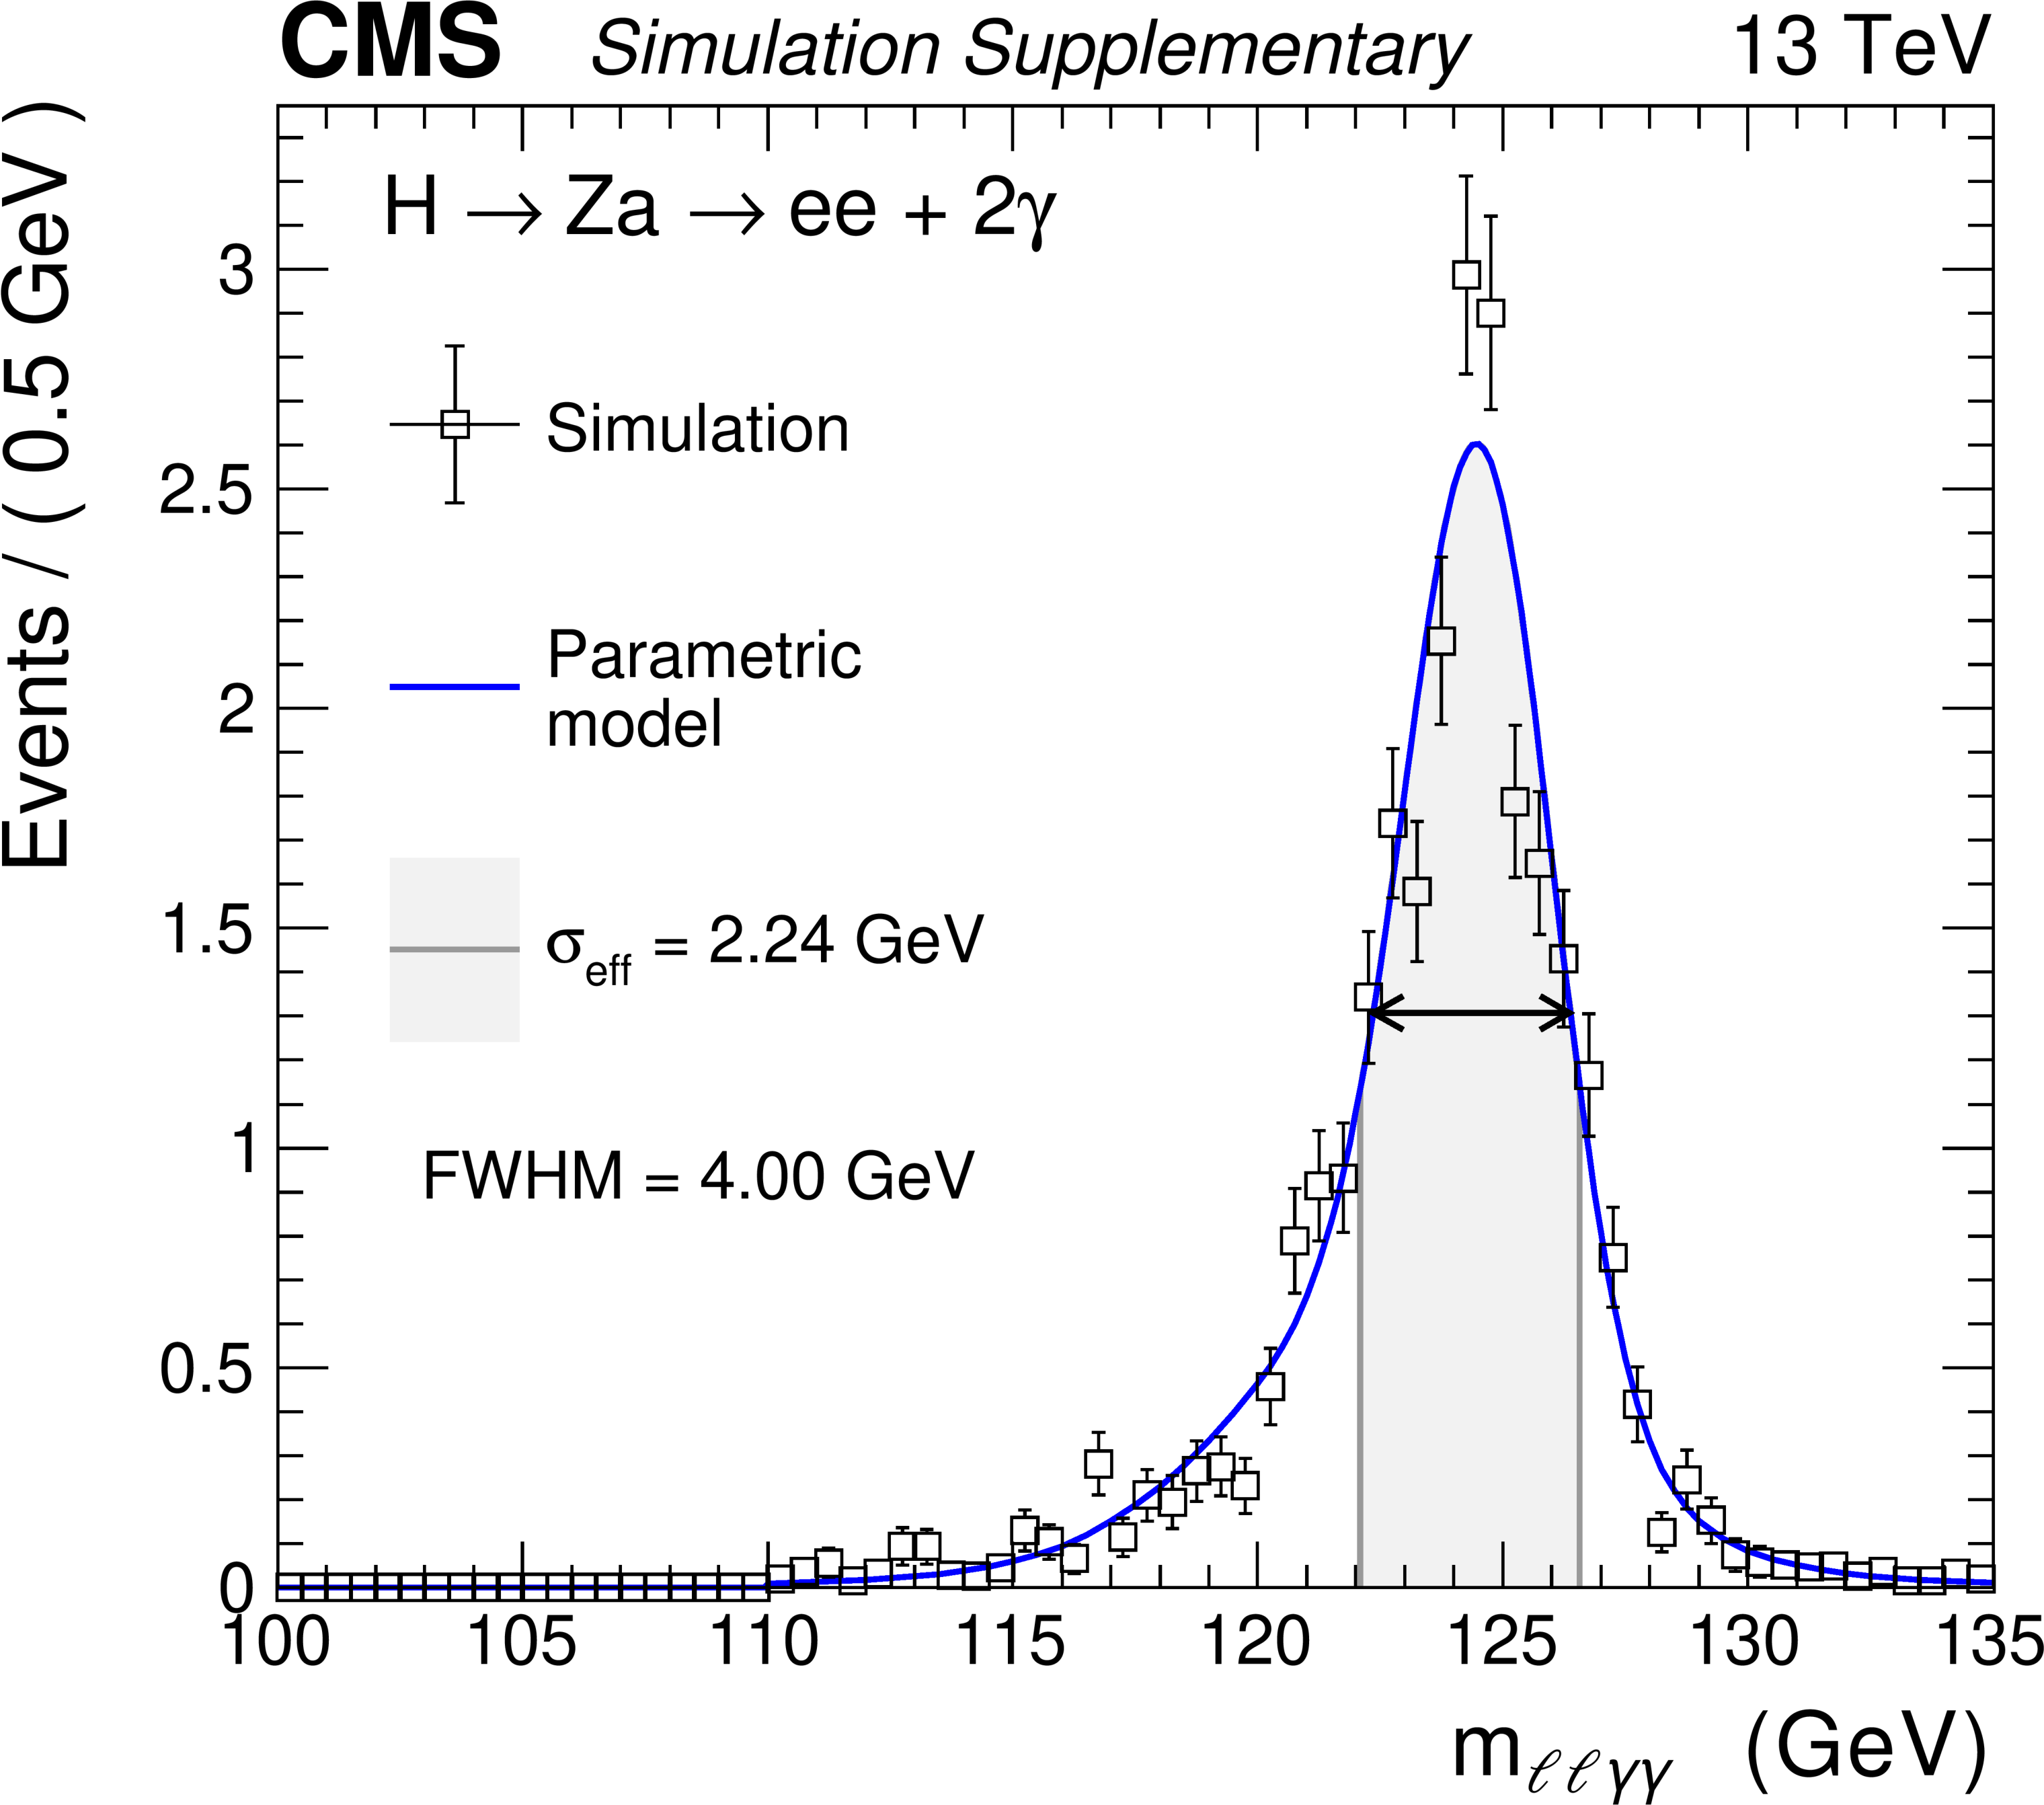
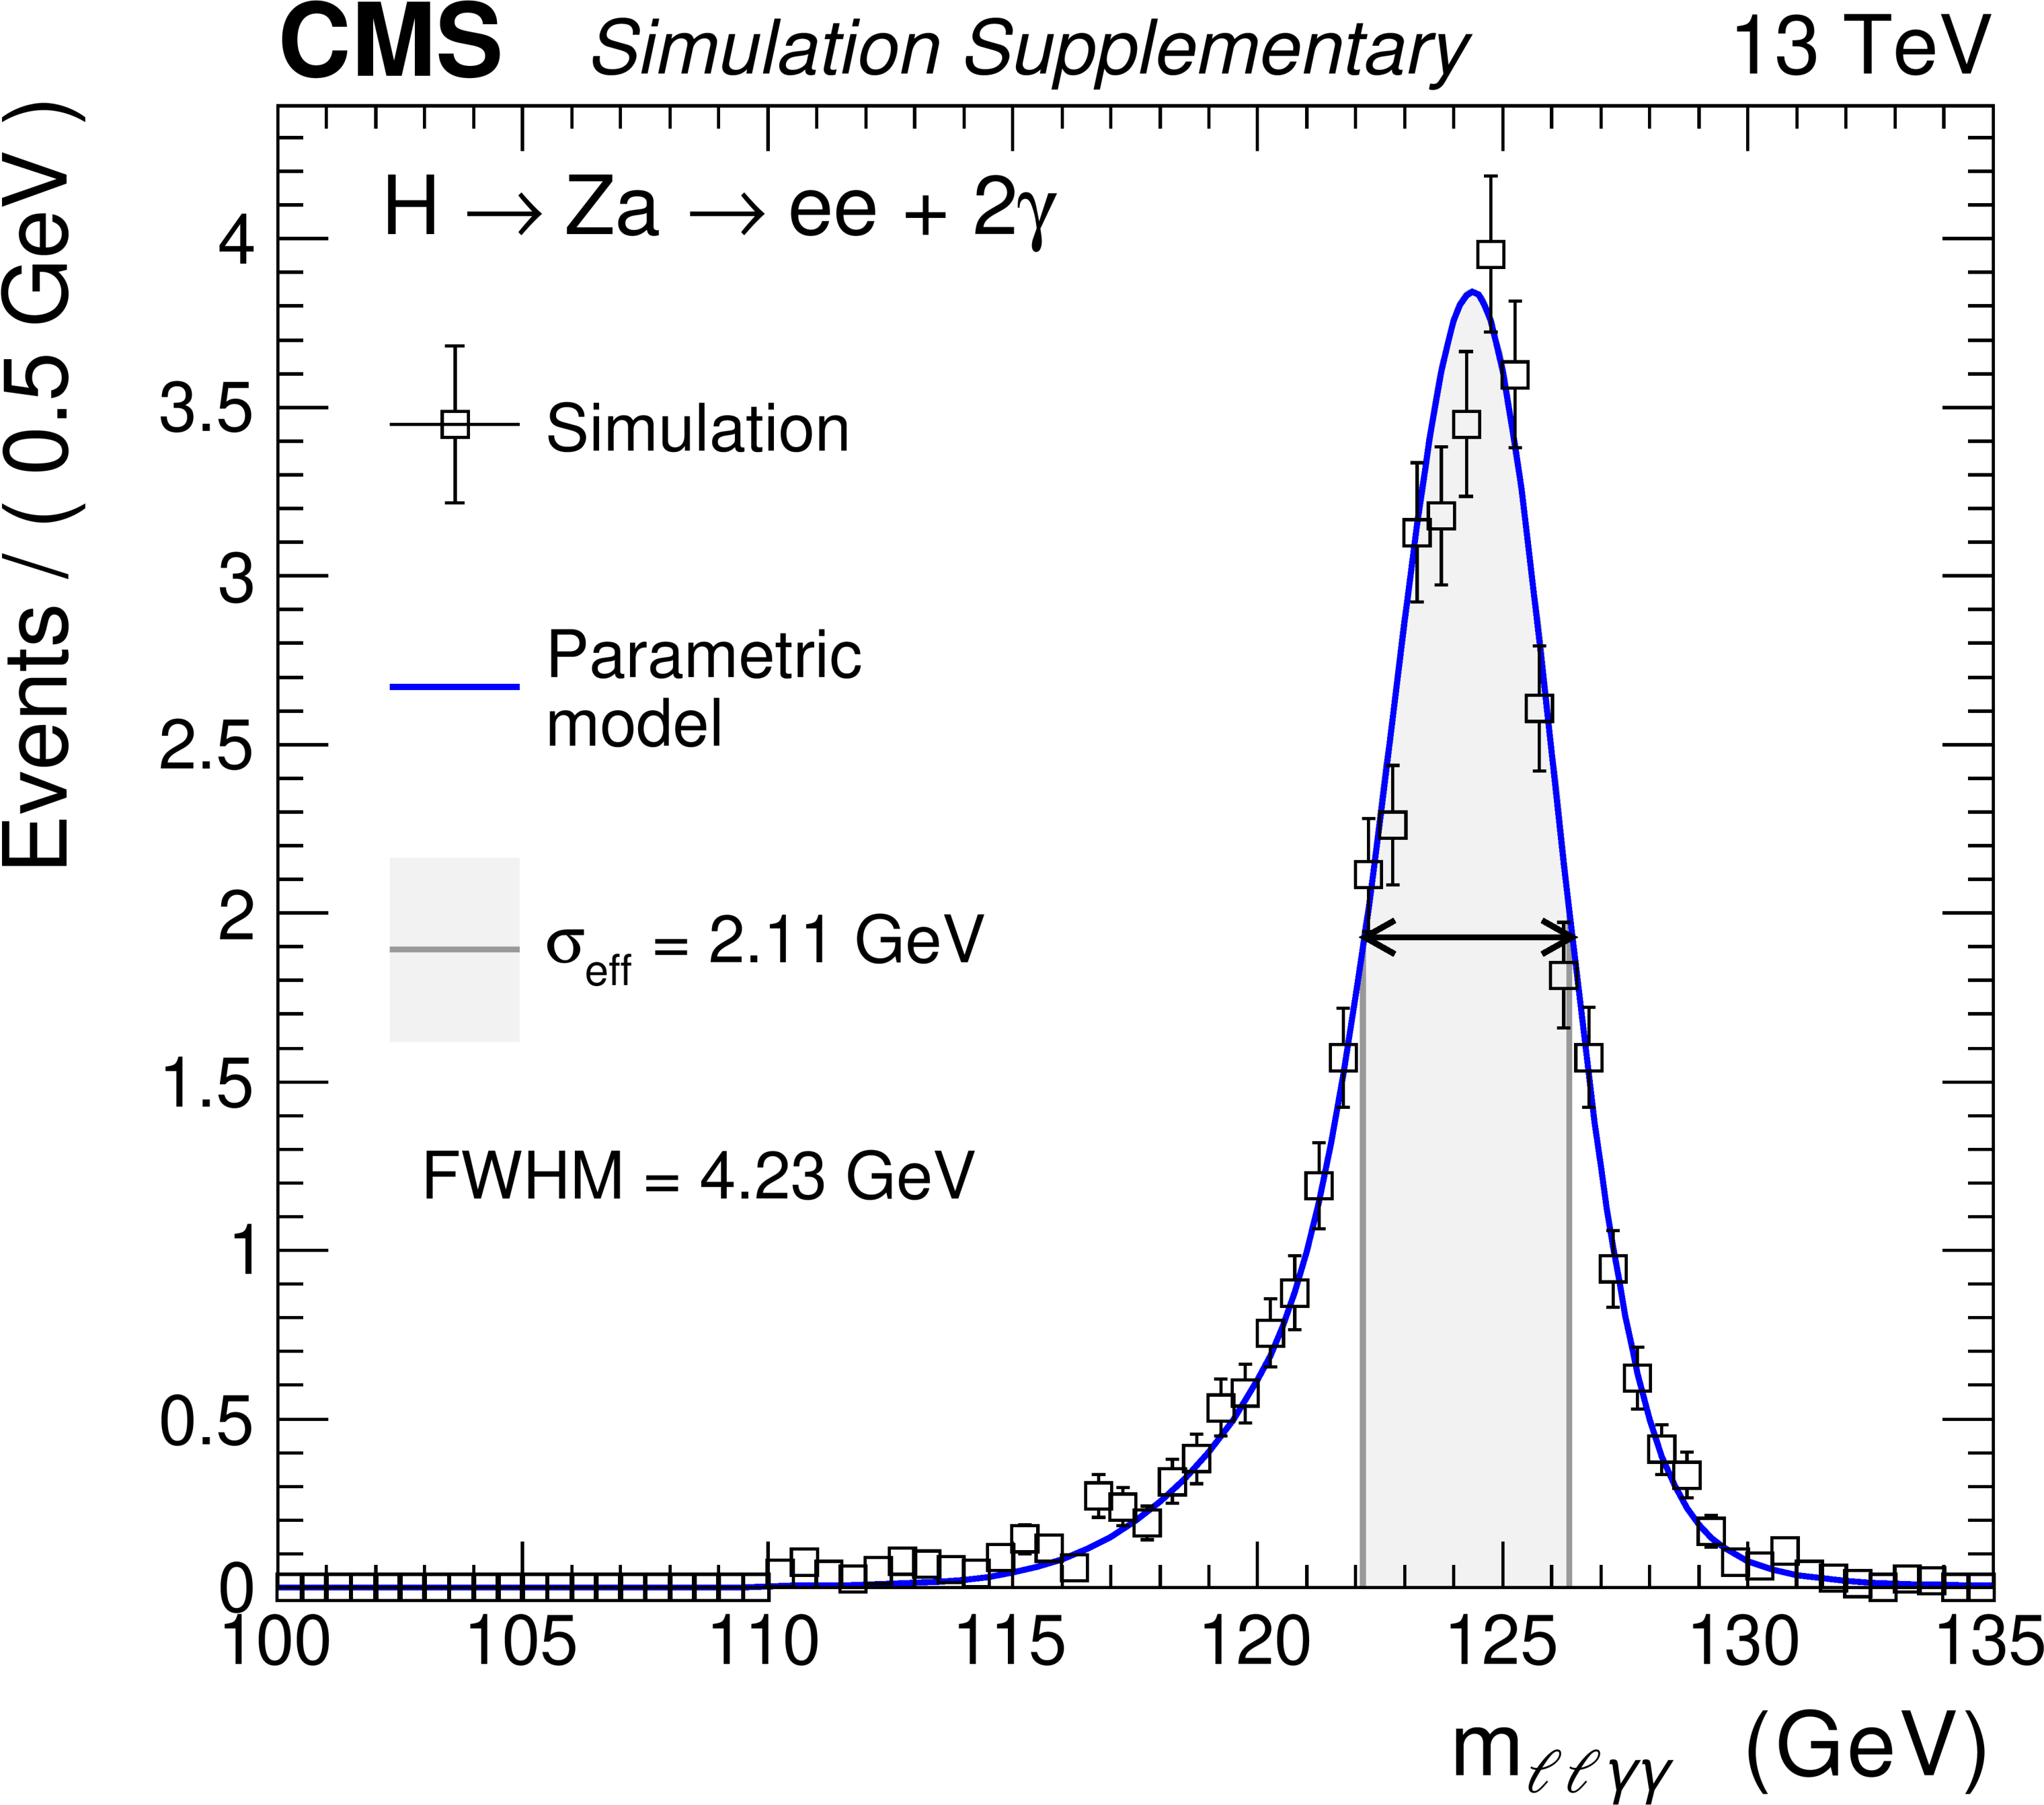
Figure 4-a:
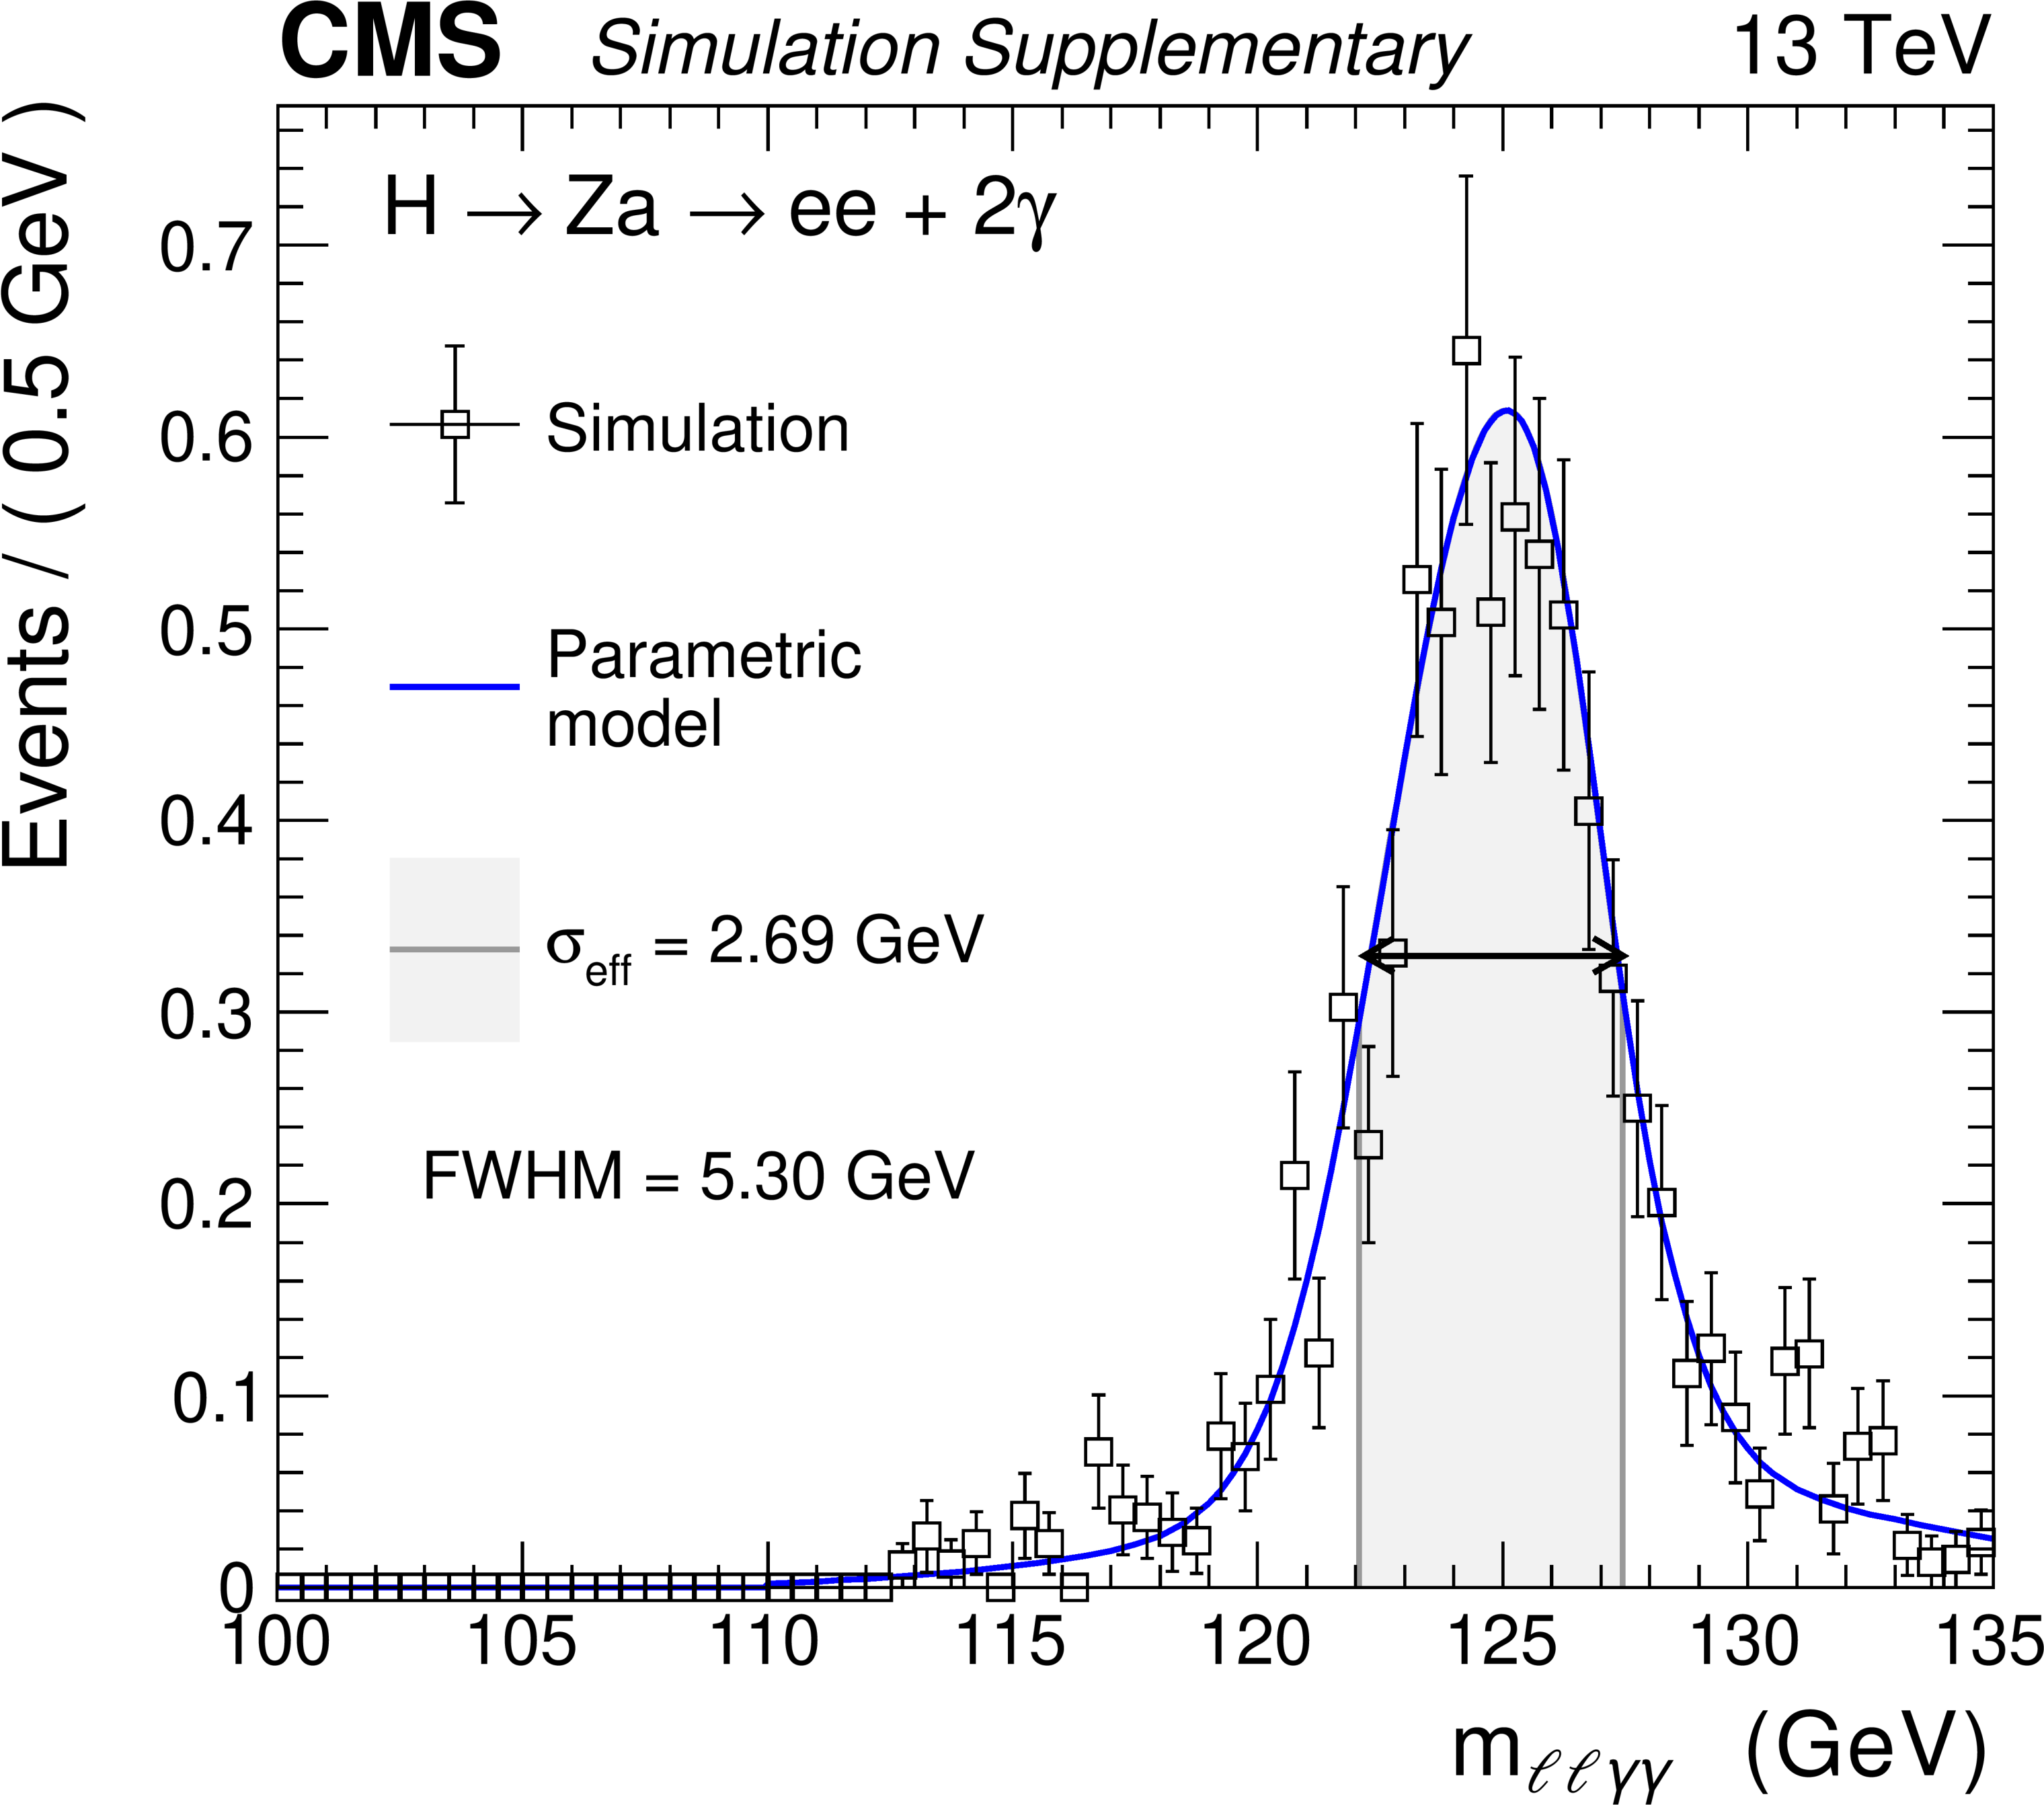
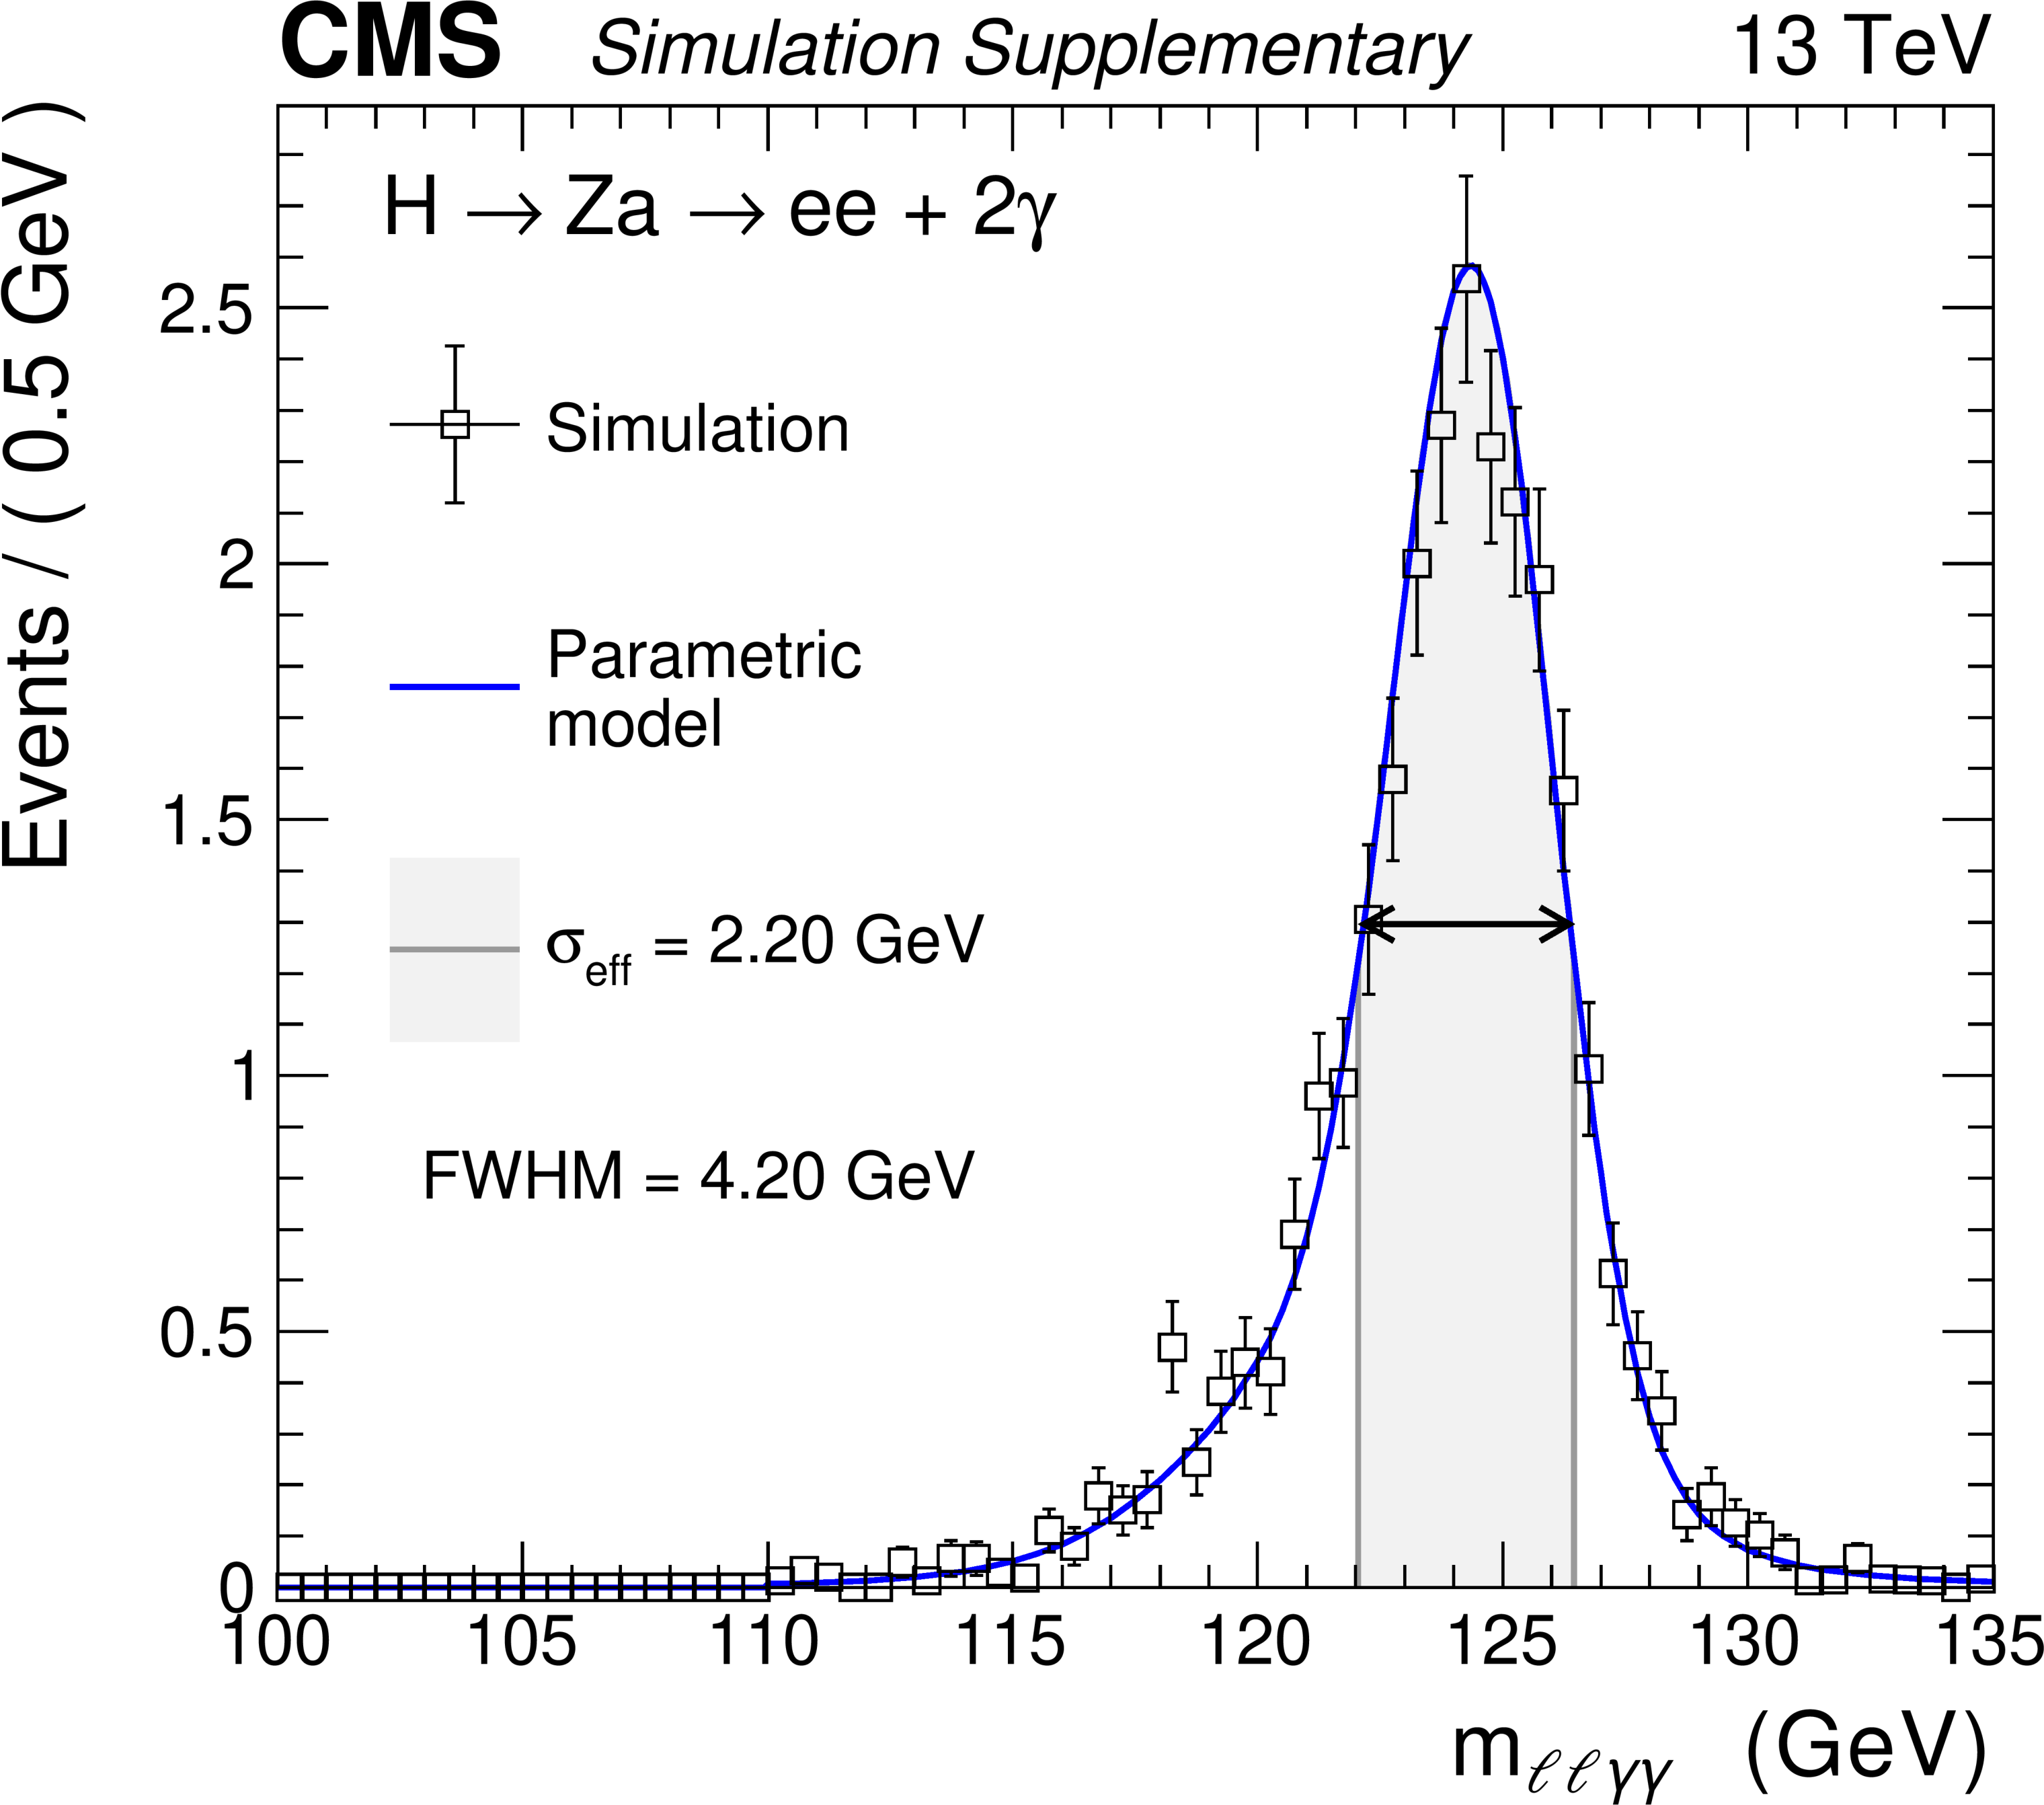
Fit to the simulated $ m_{\ell\ell\gamma\gamma} $ distributions for a signal with $ m_{\mathrm{a}}= $ 30 GeV in the electron channel for the year 2018. |
png pdf |
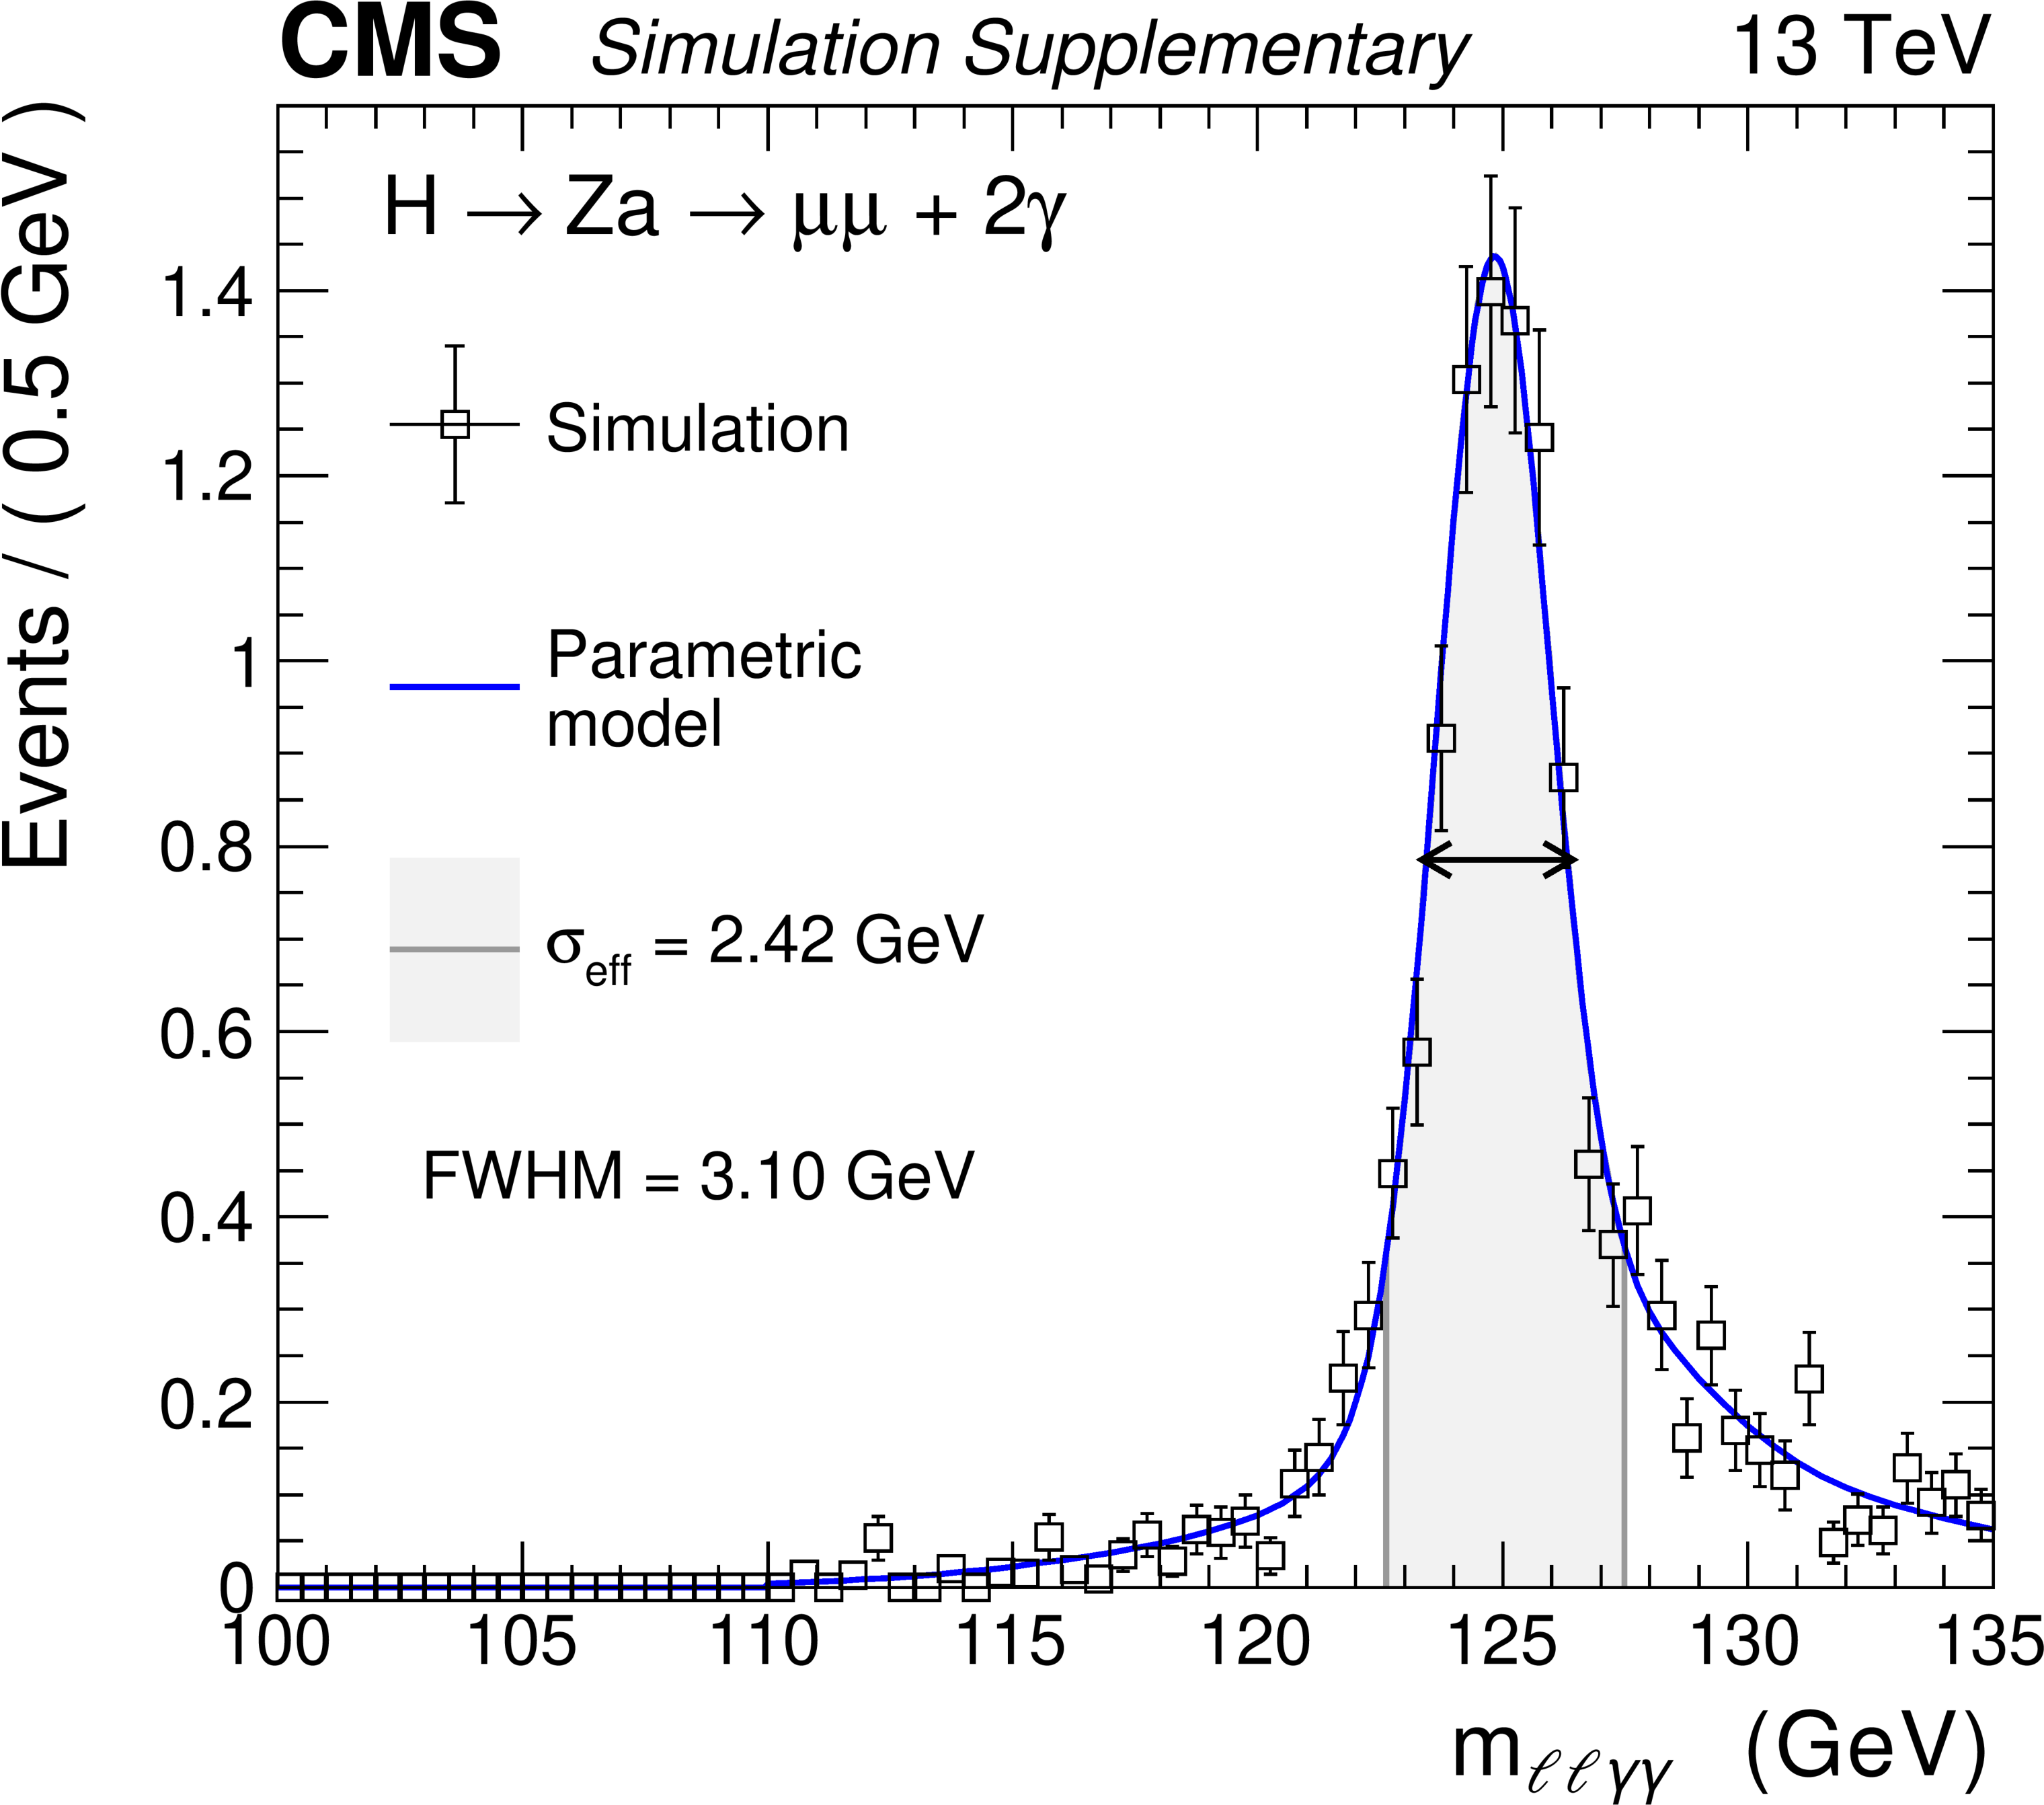
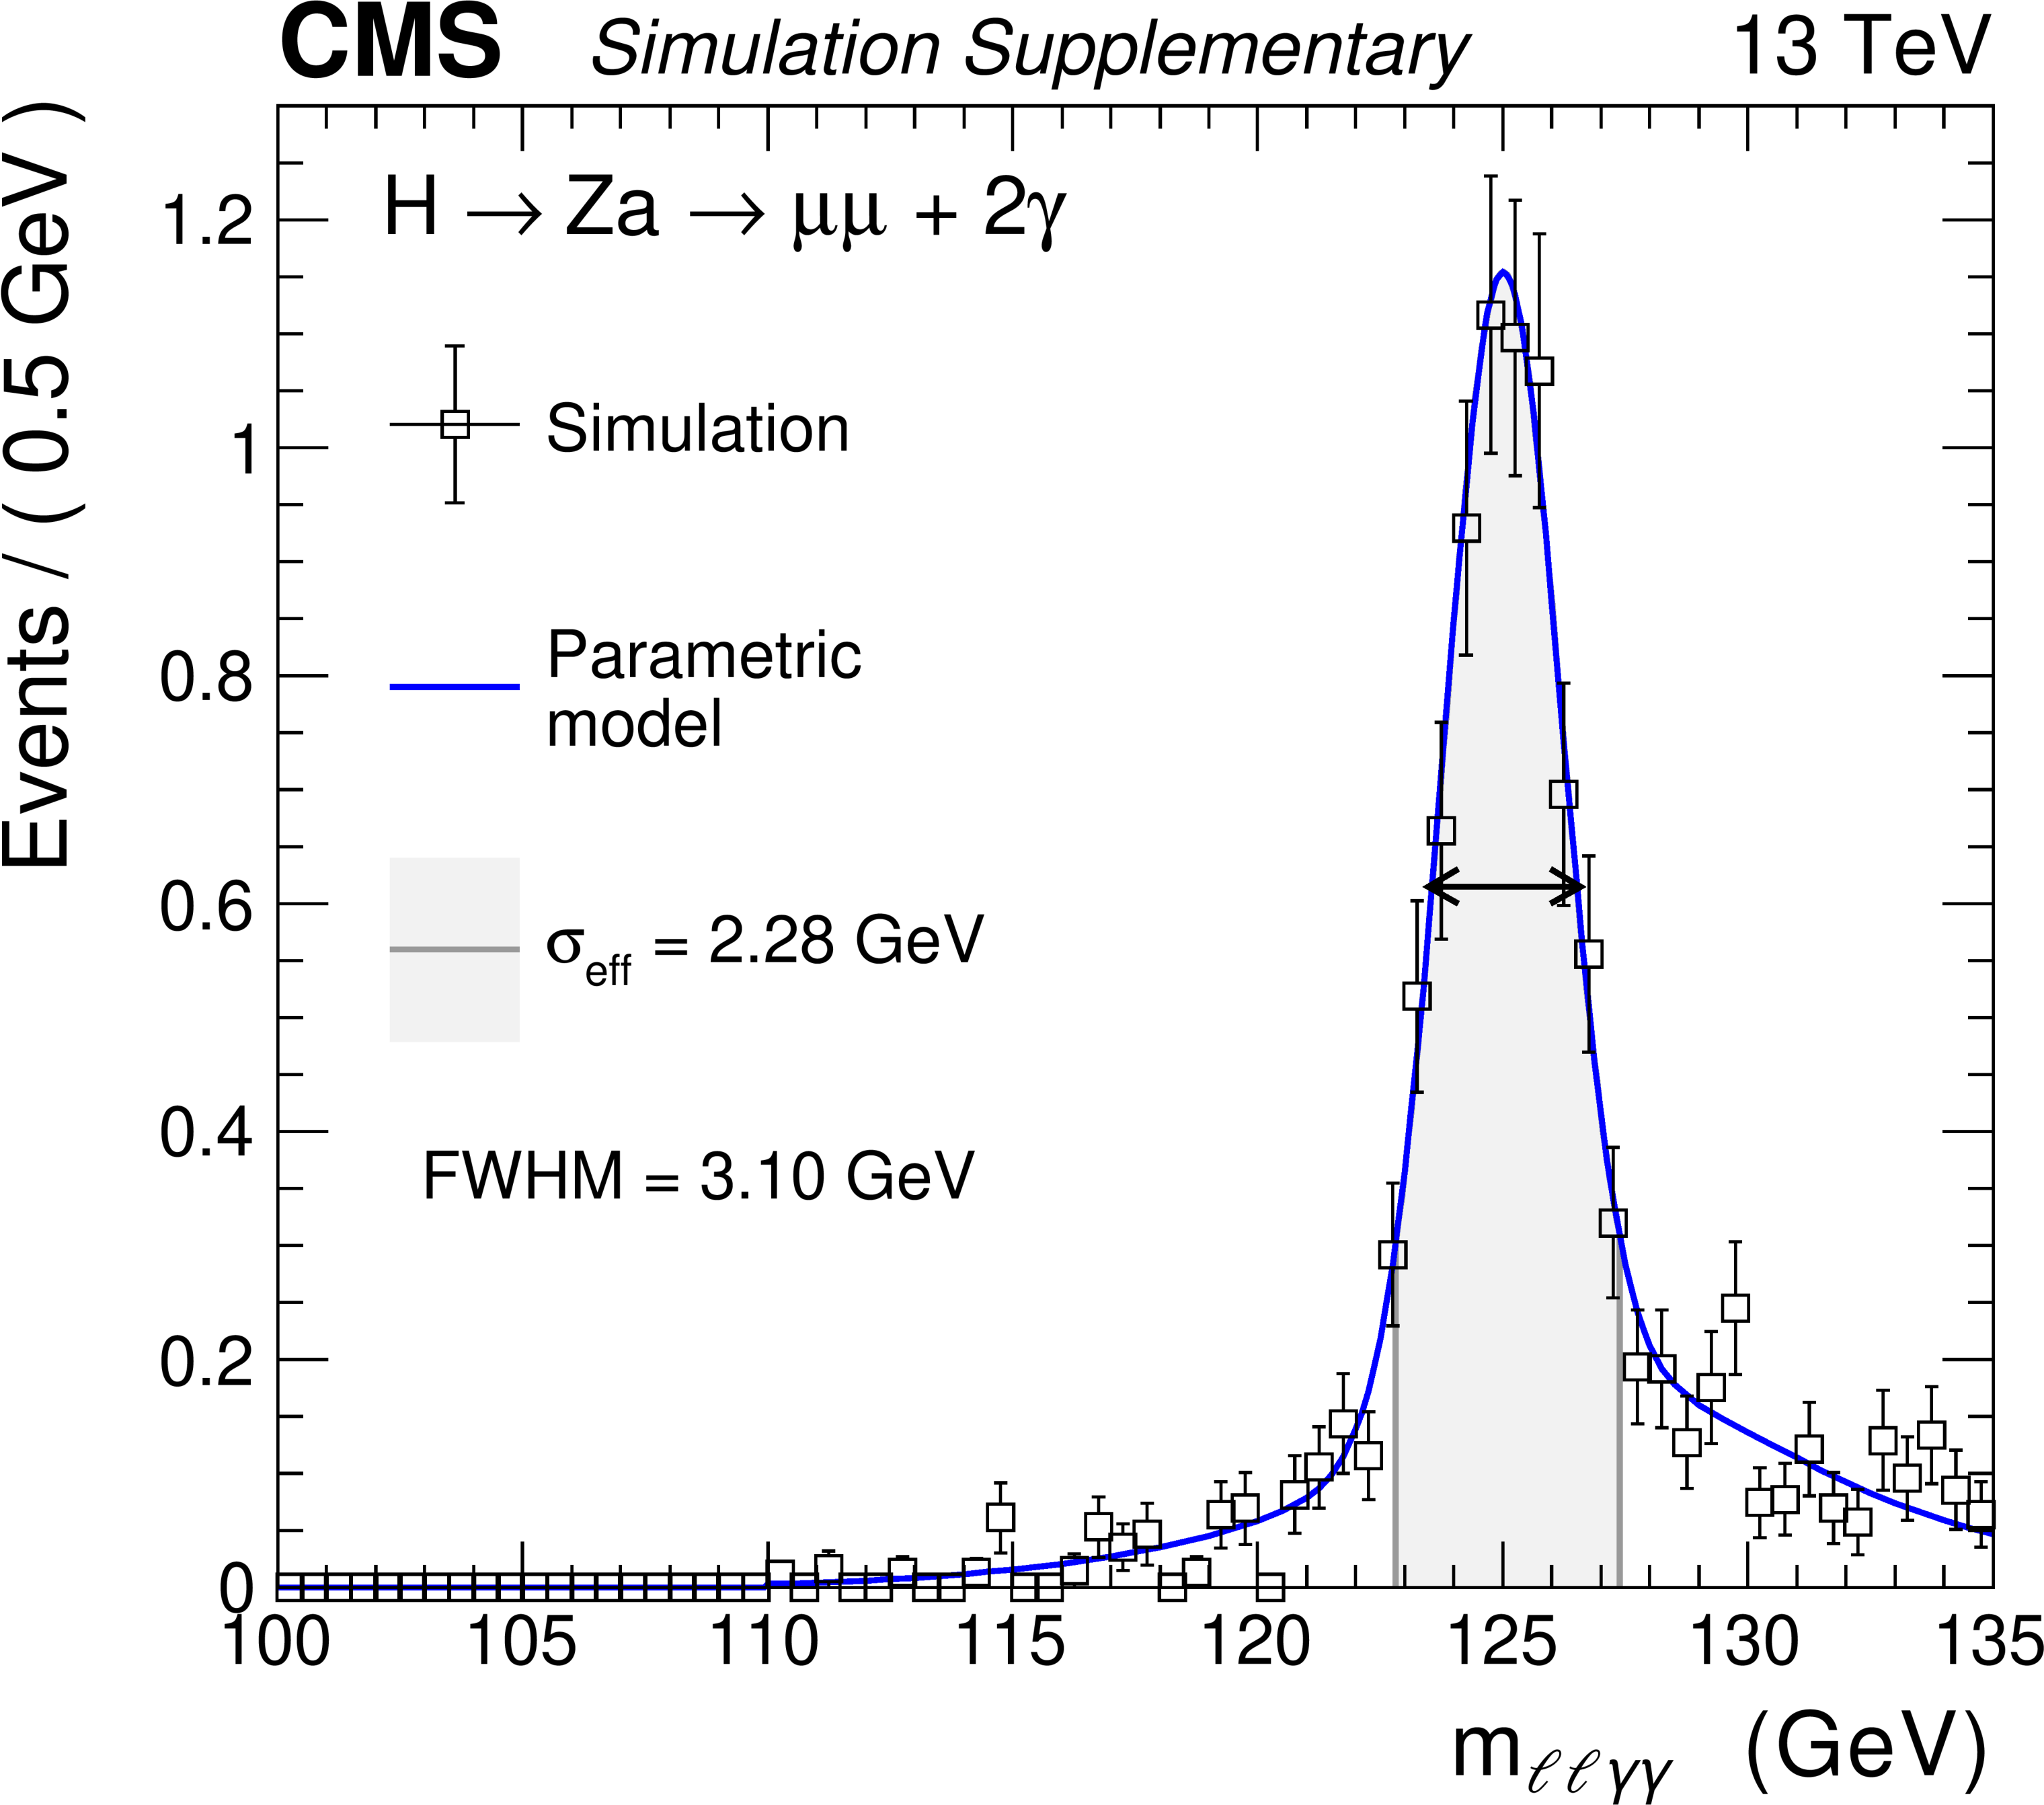
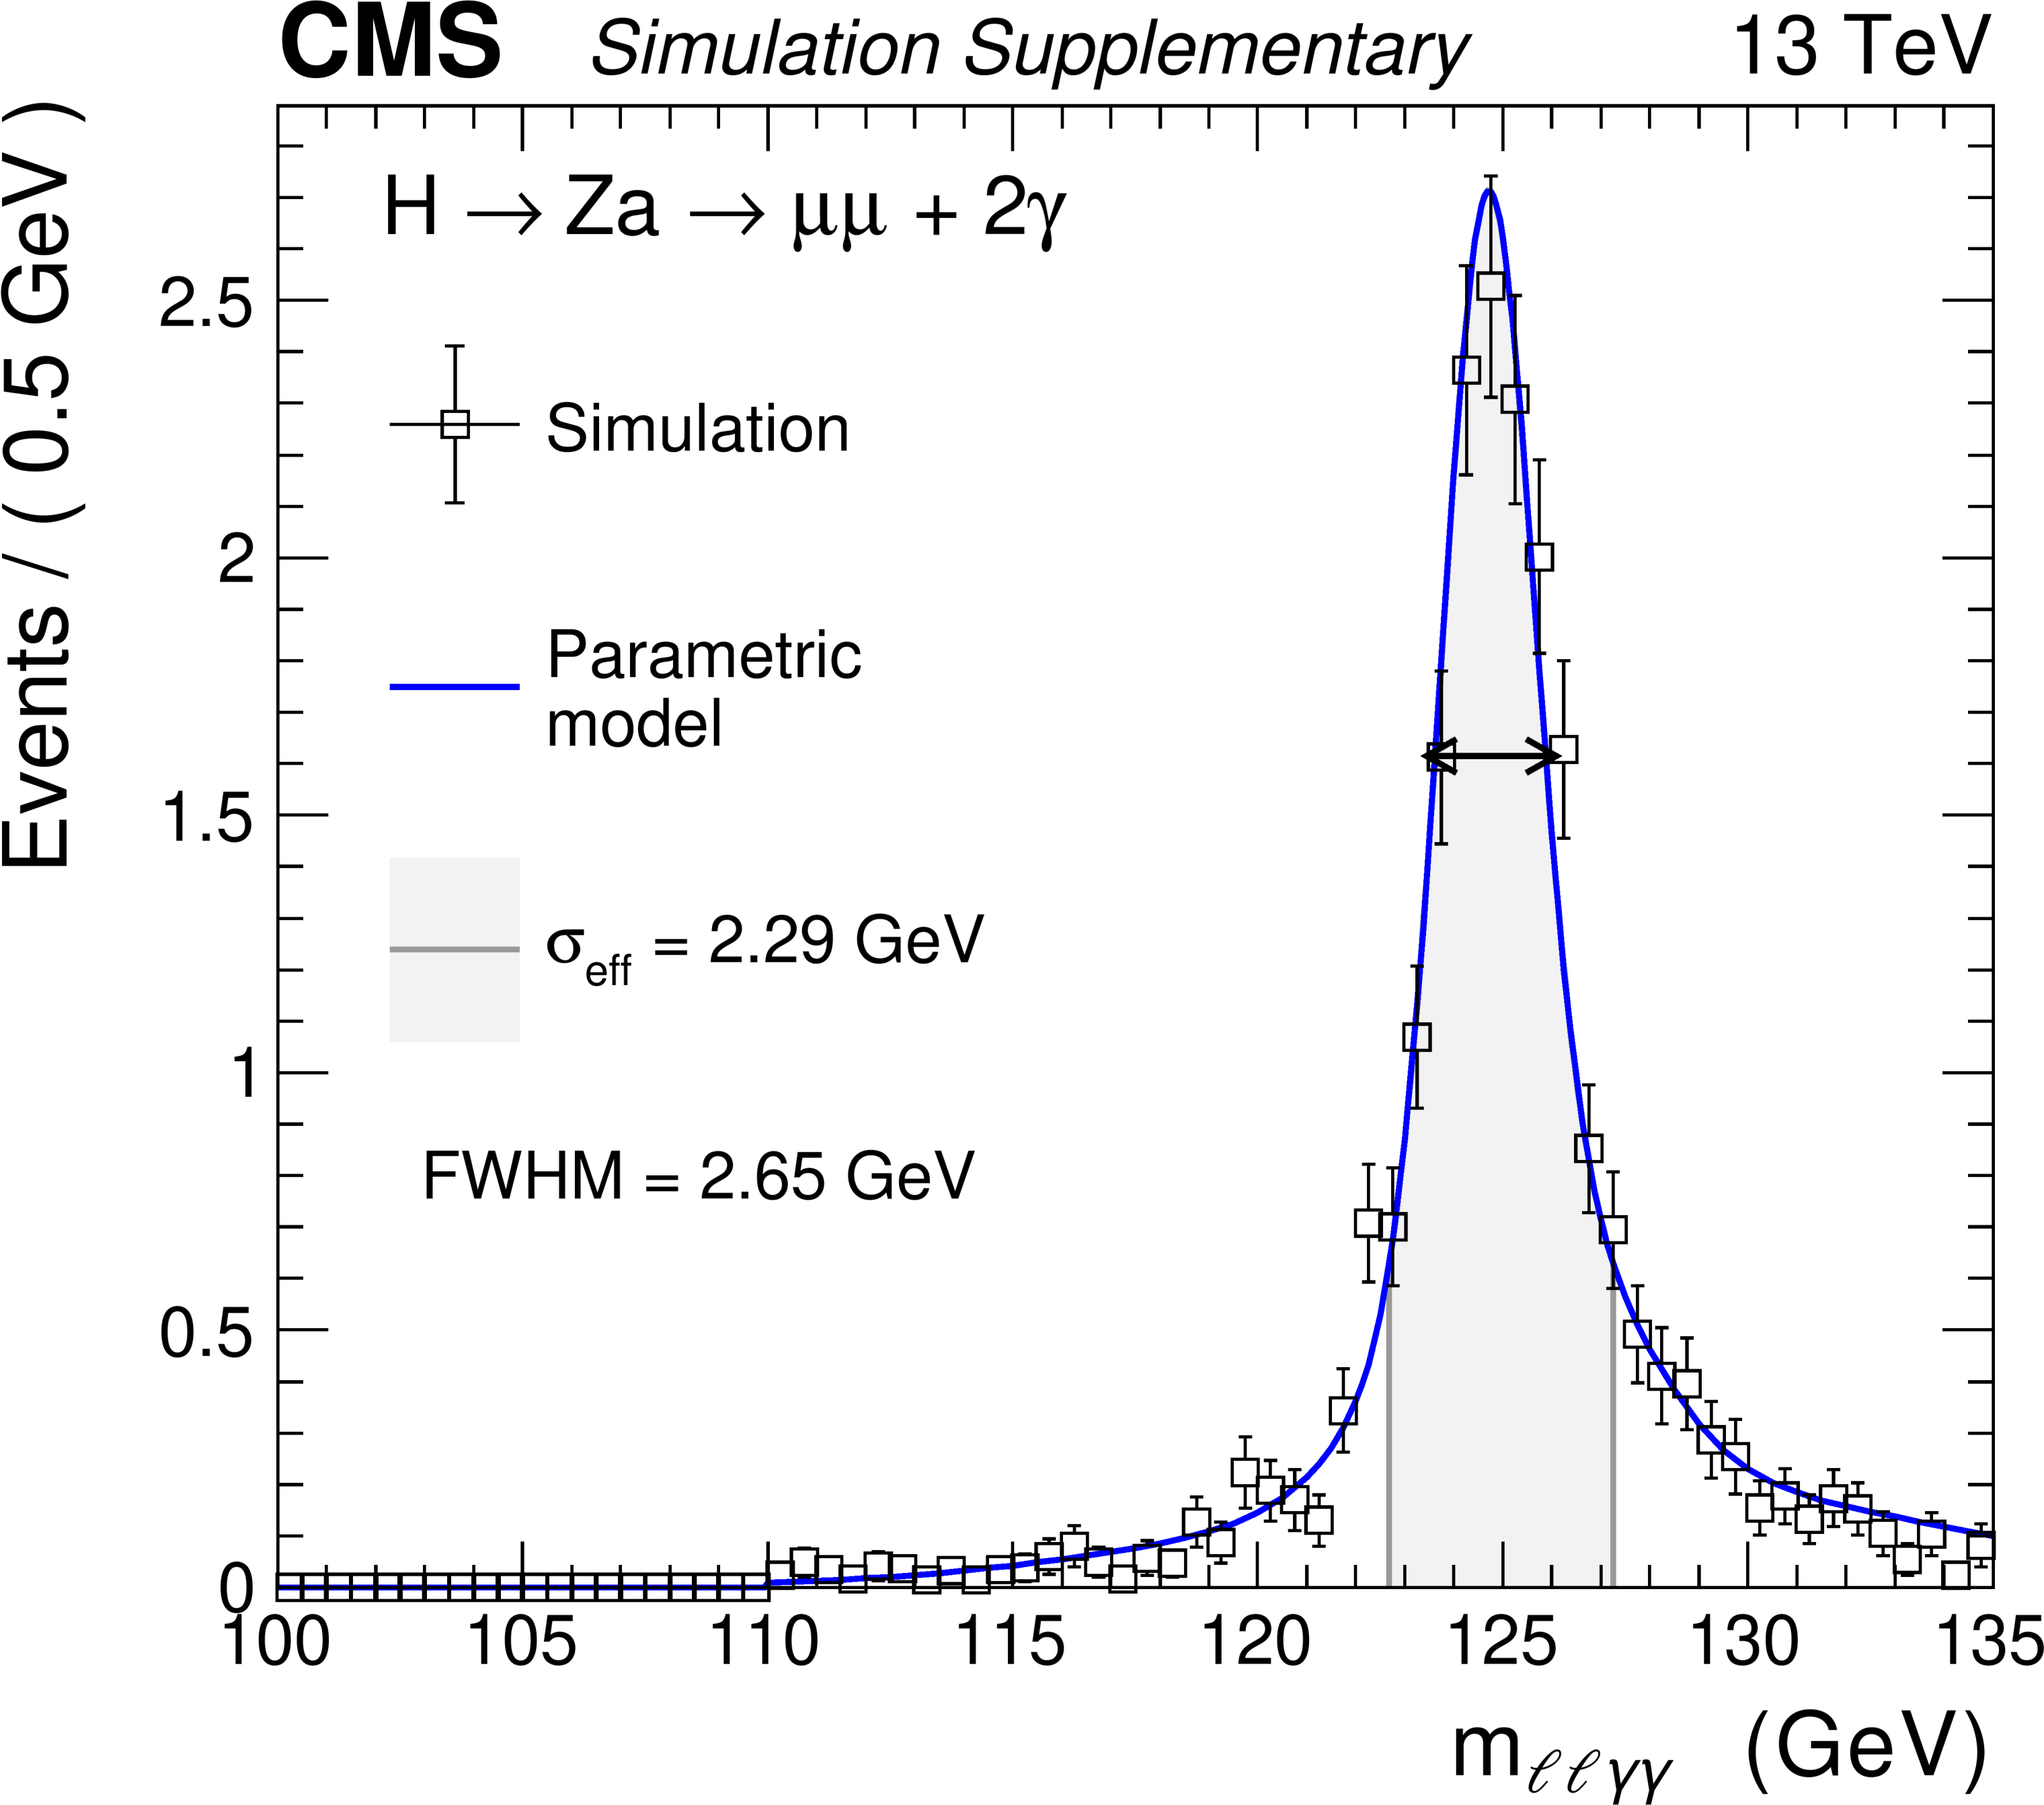
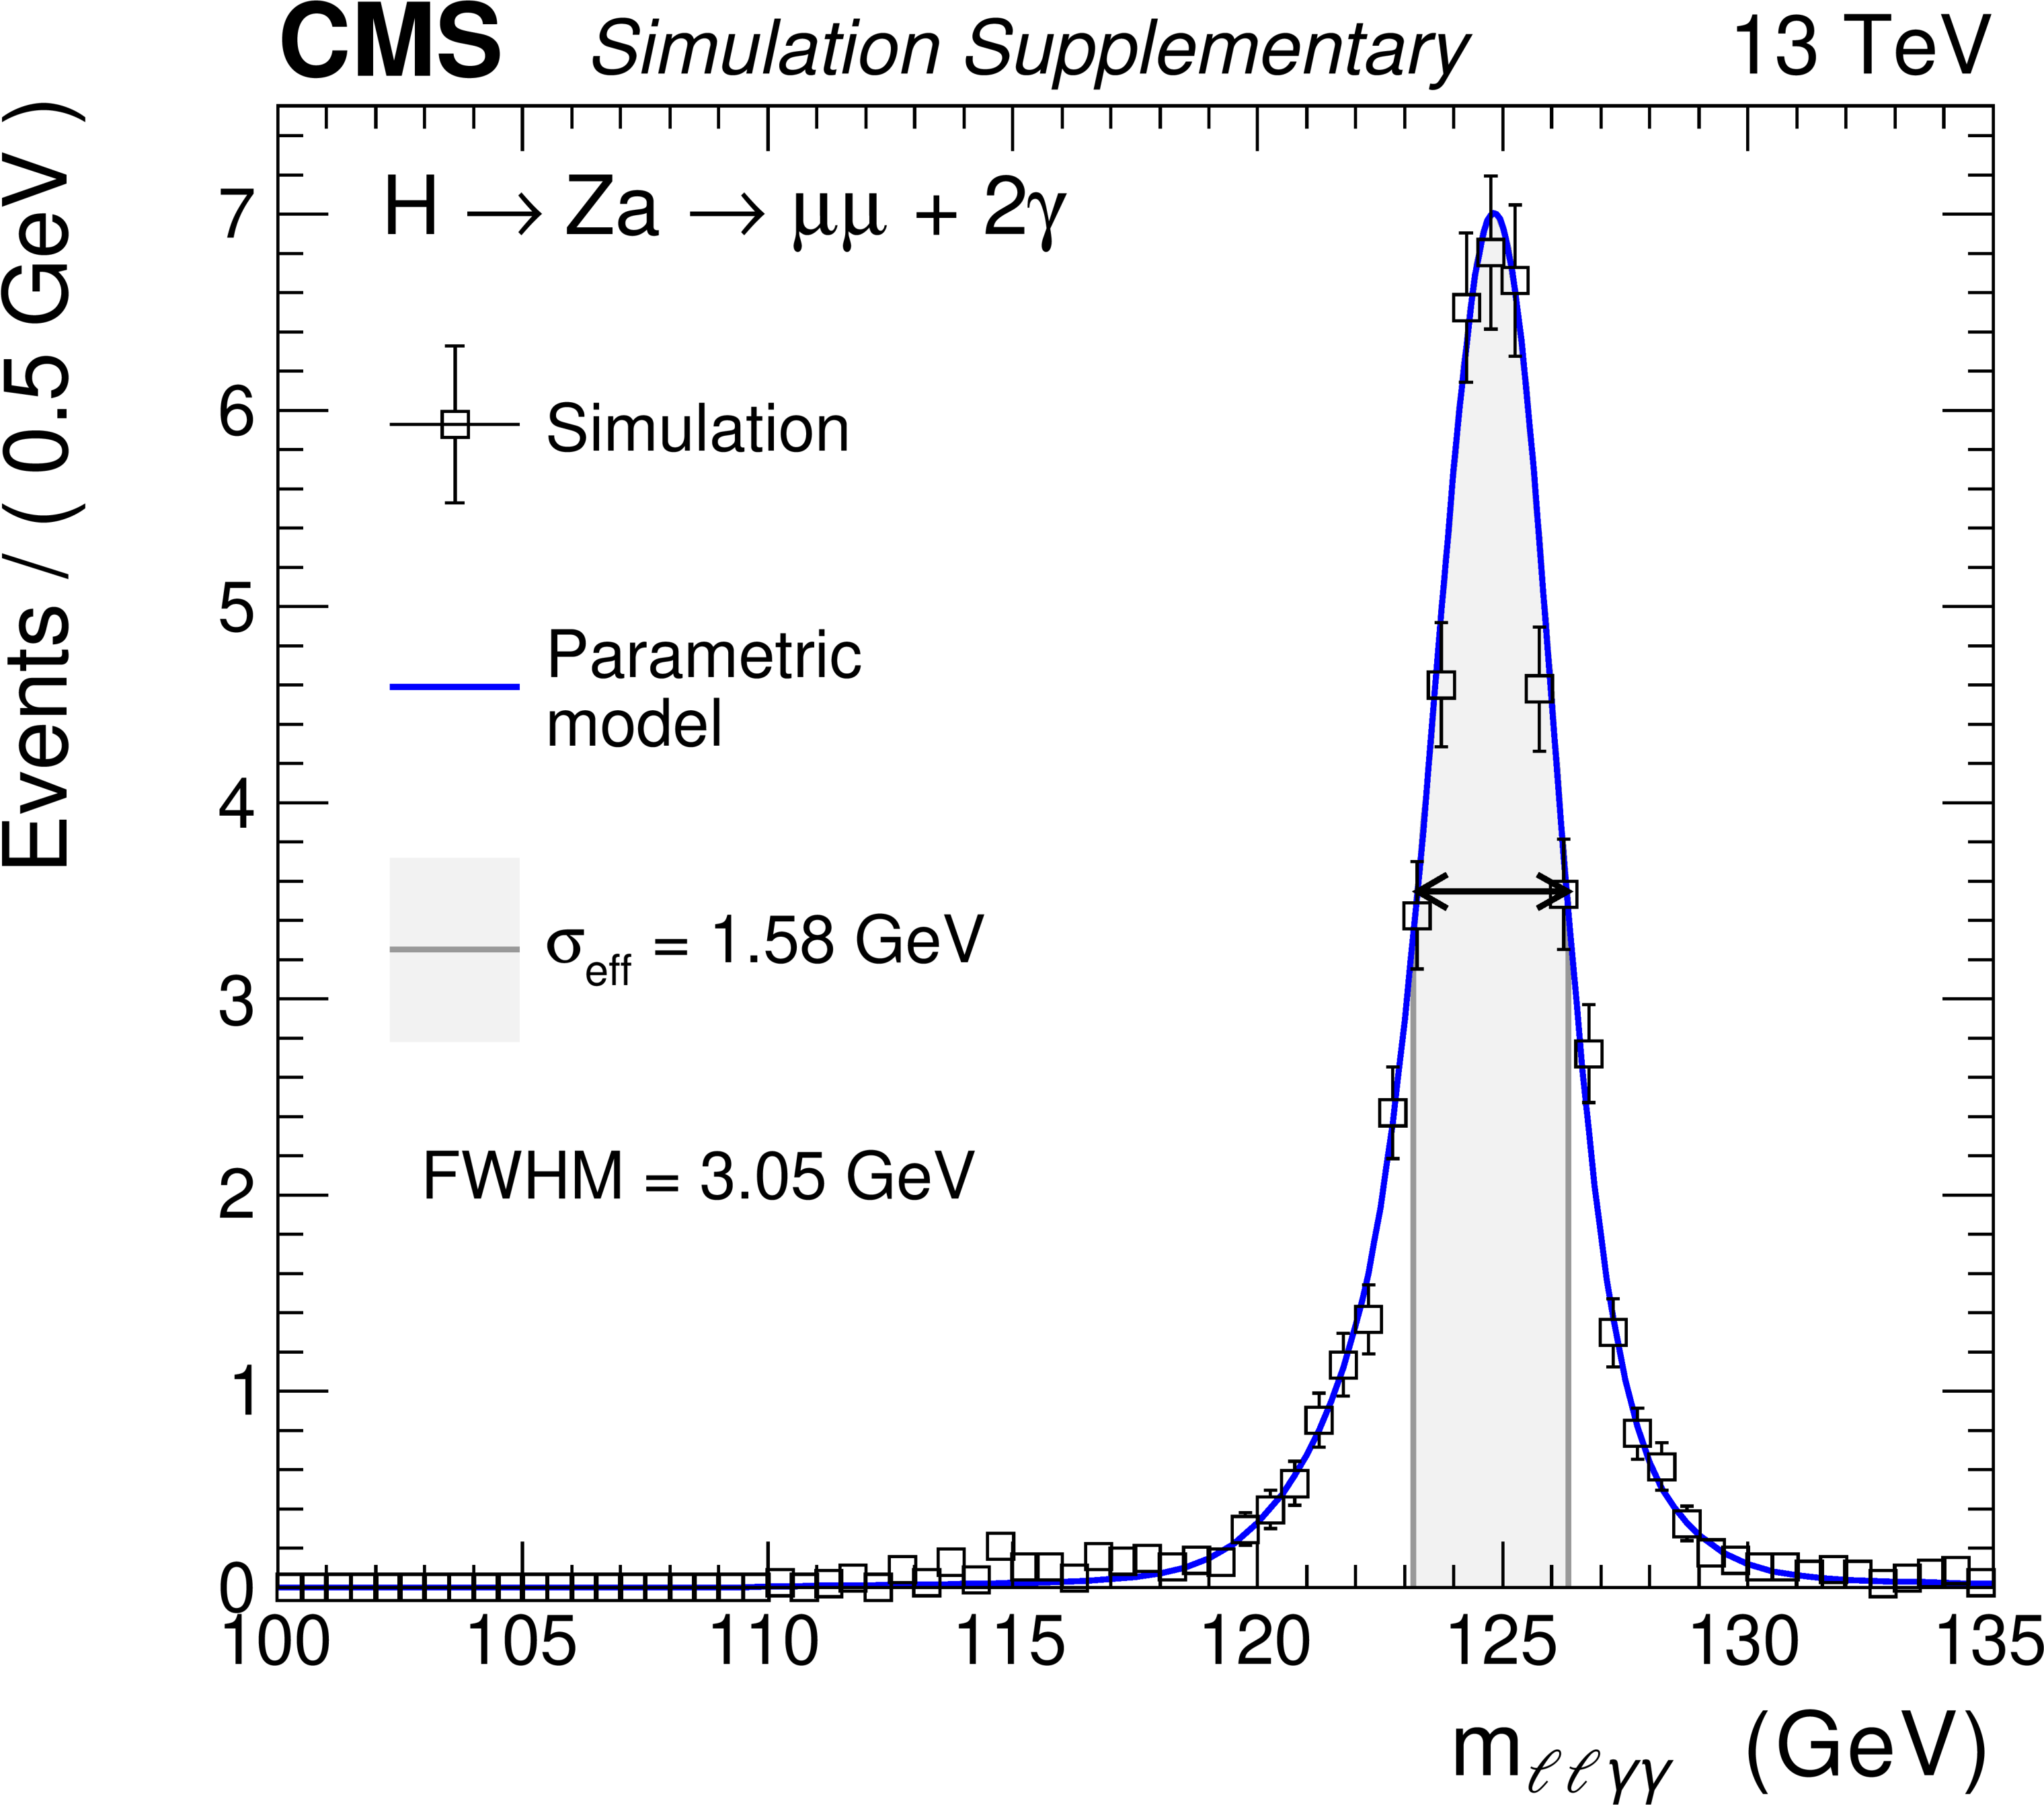
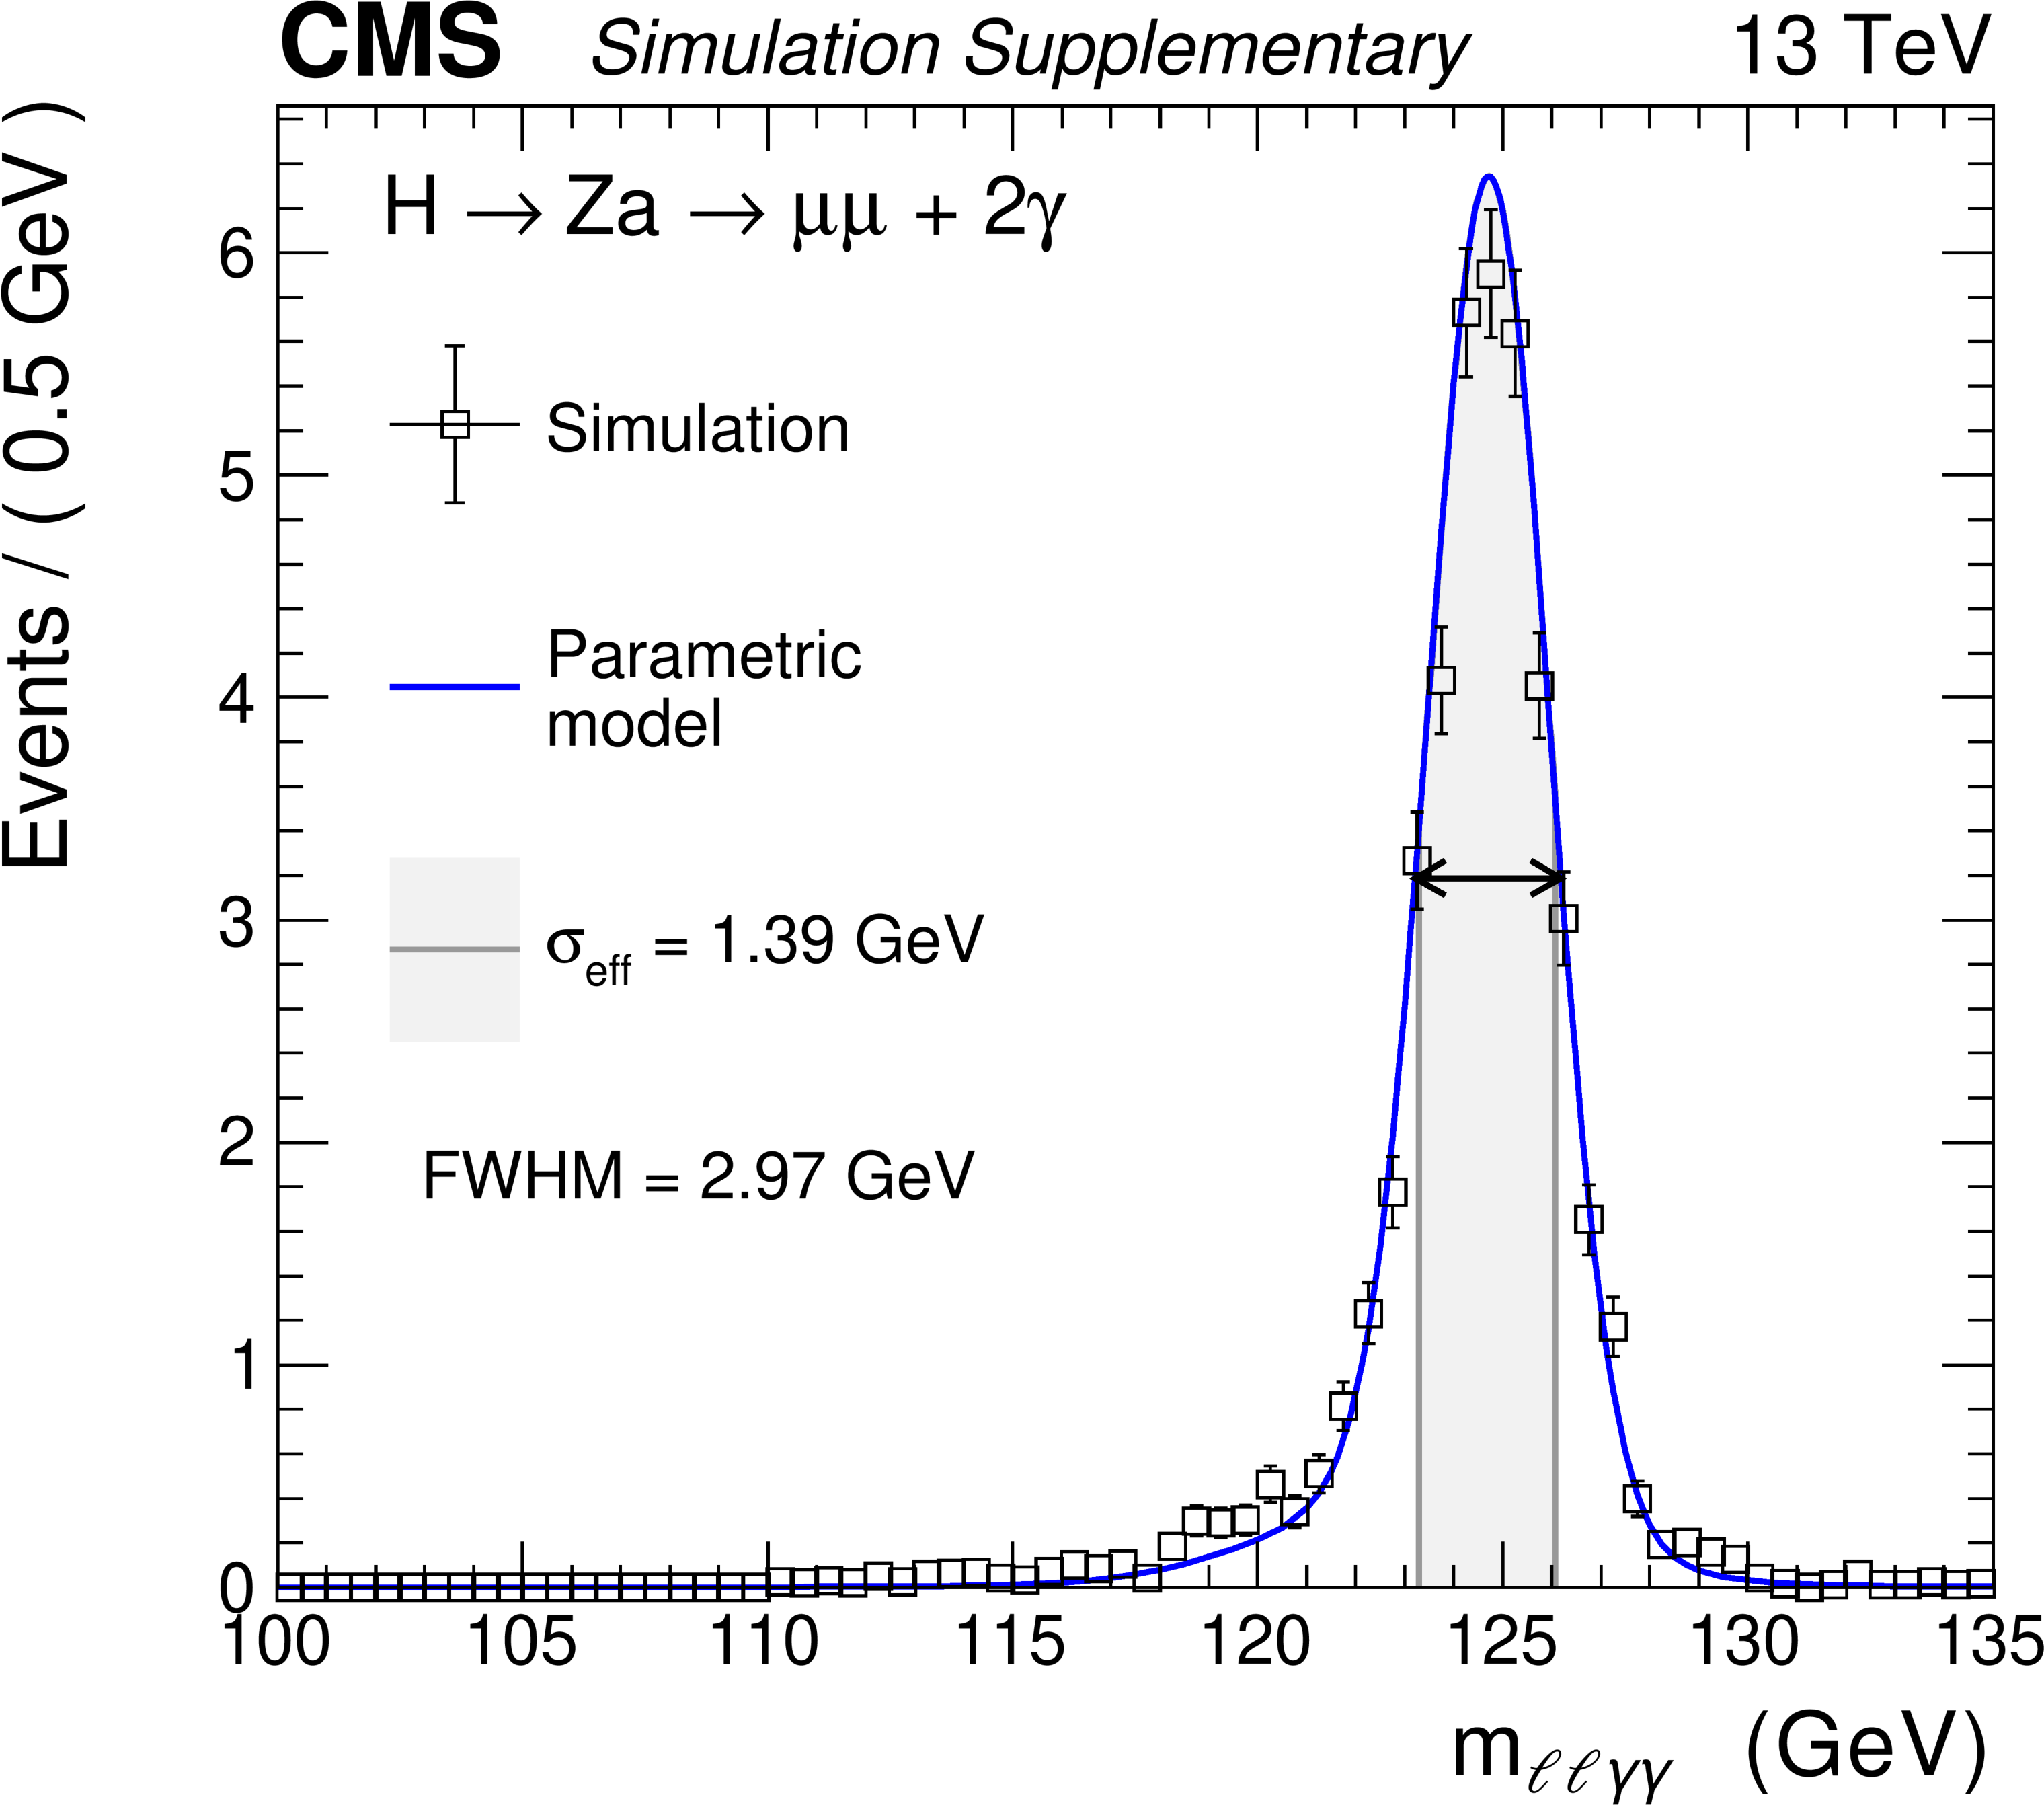
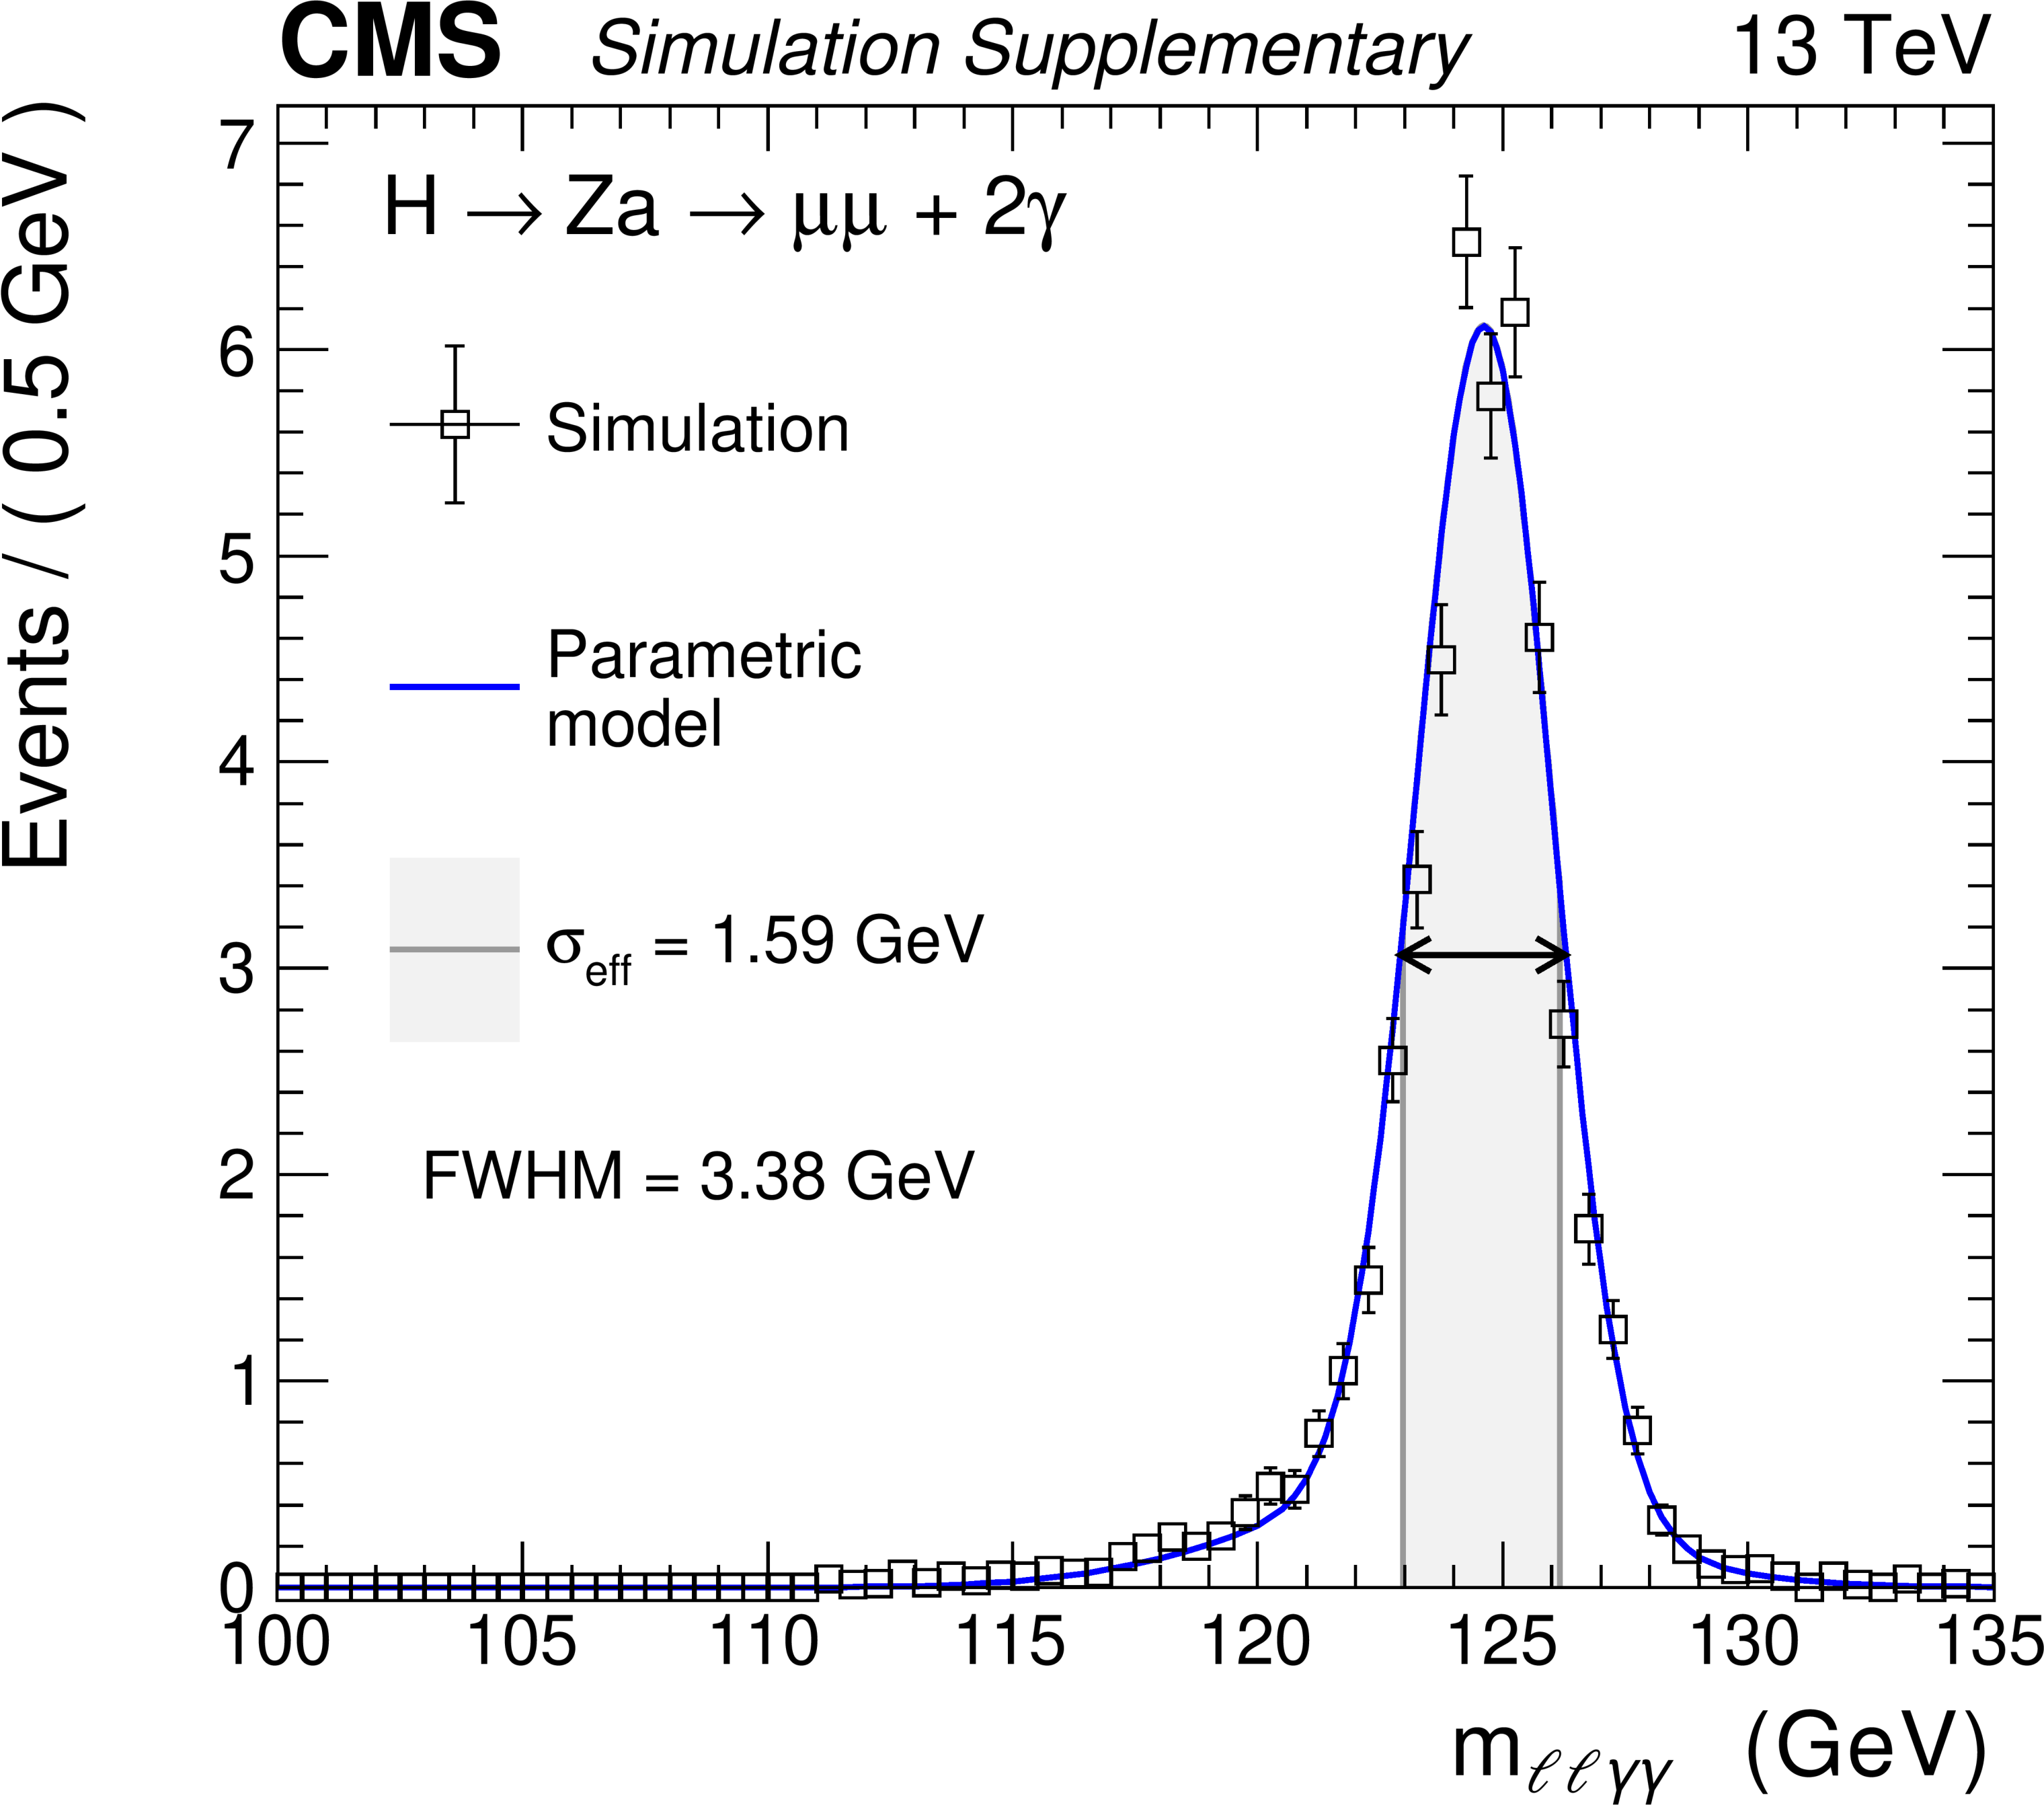
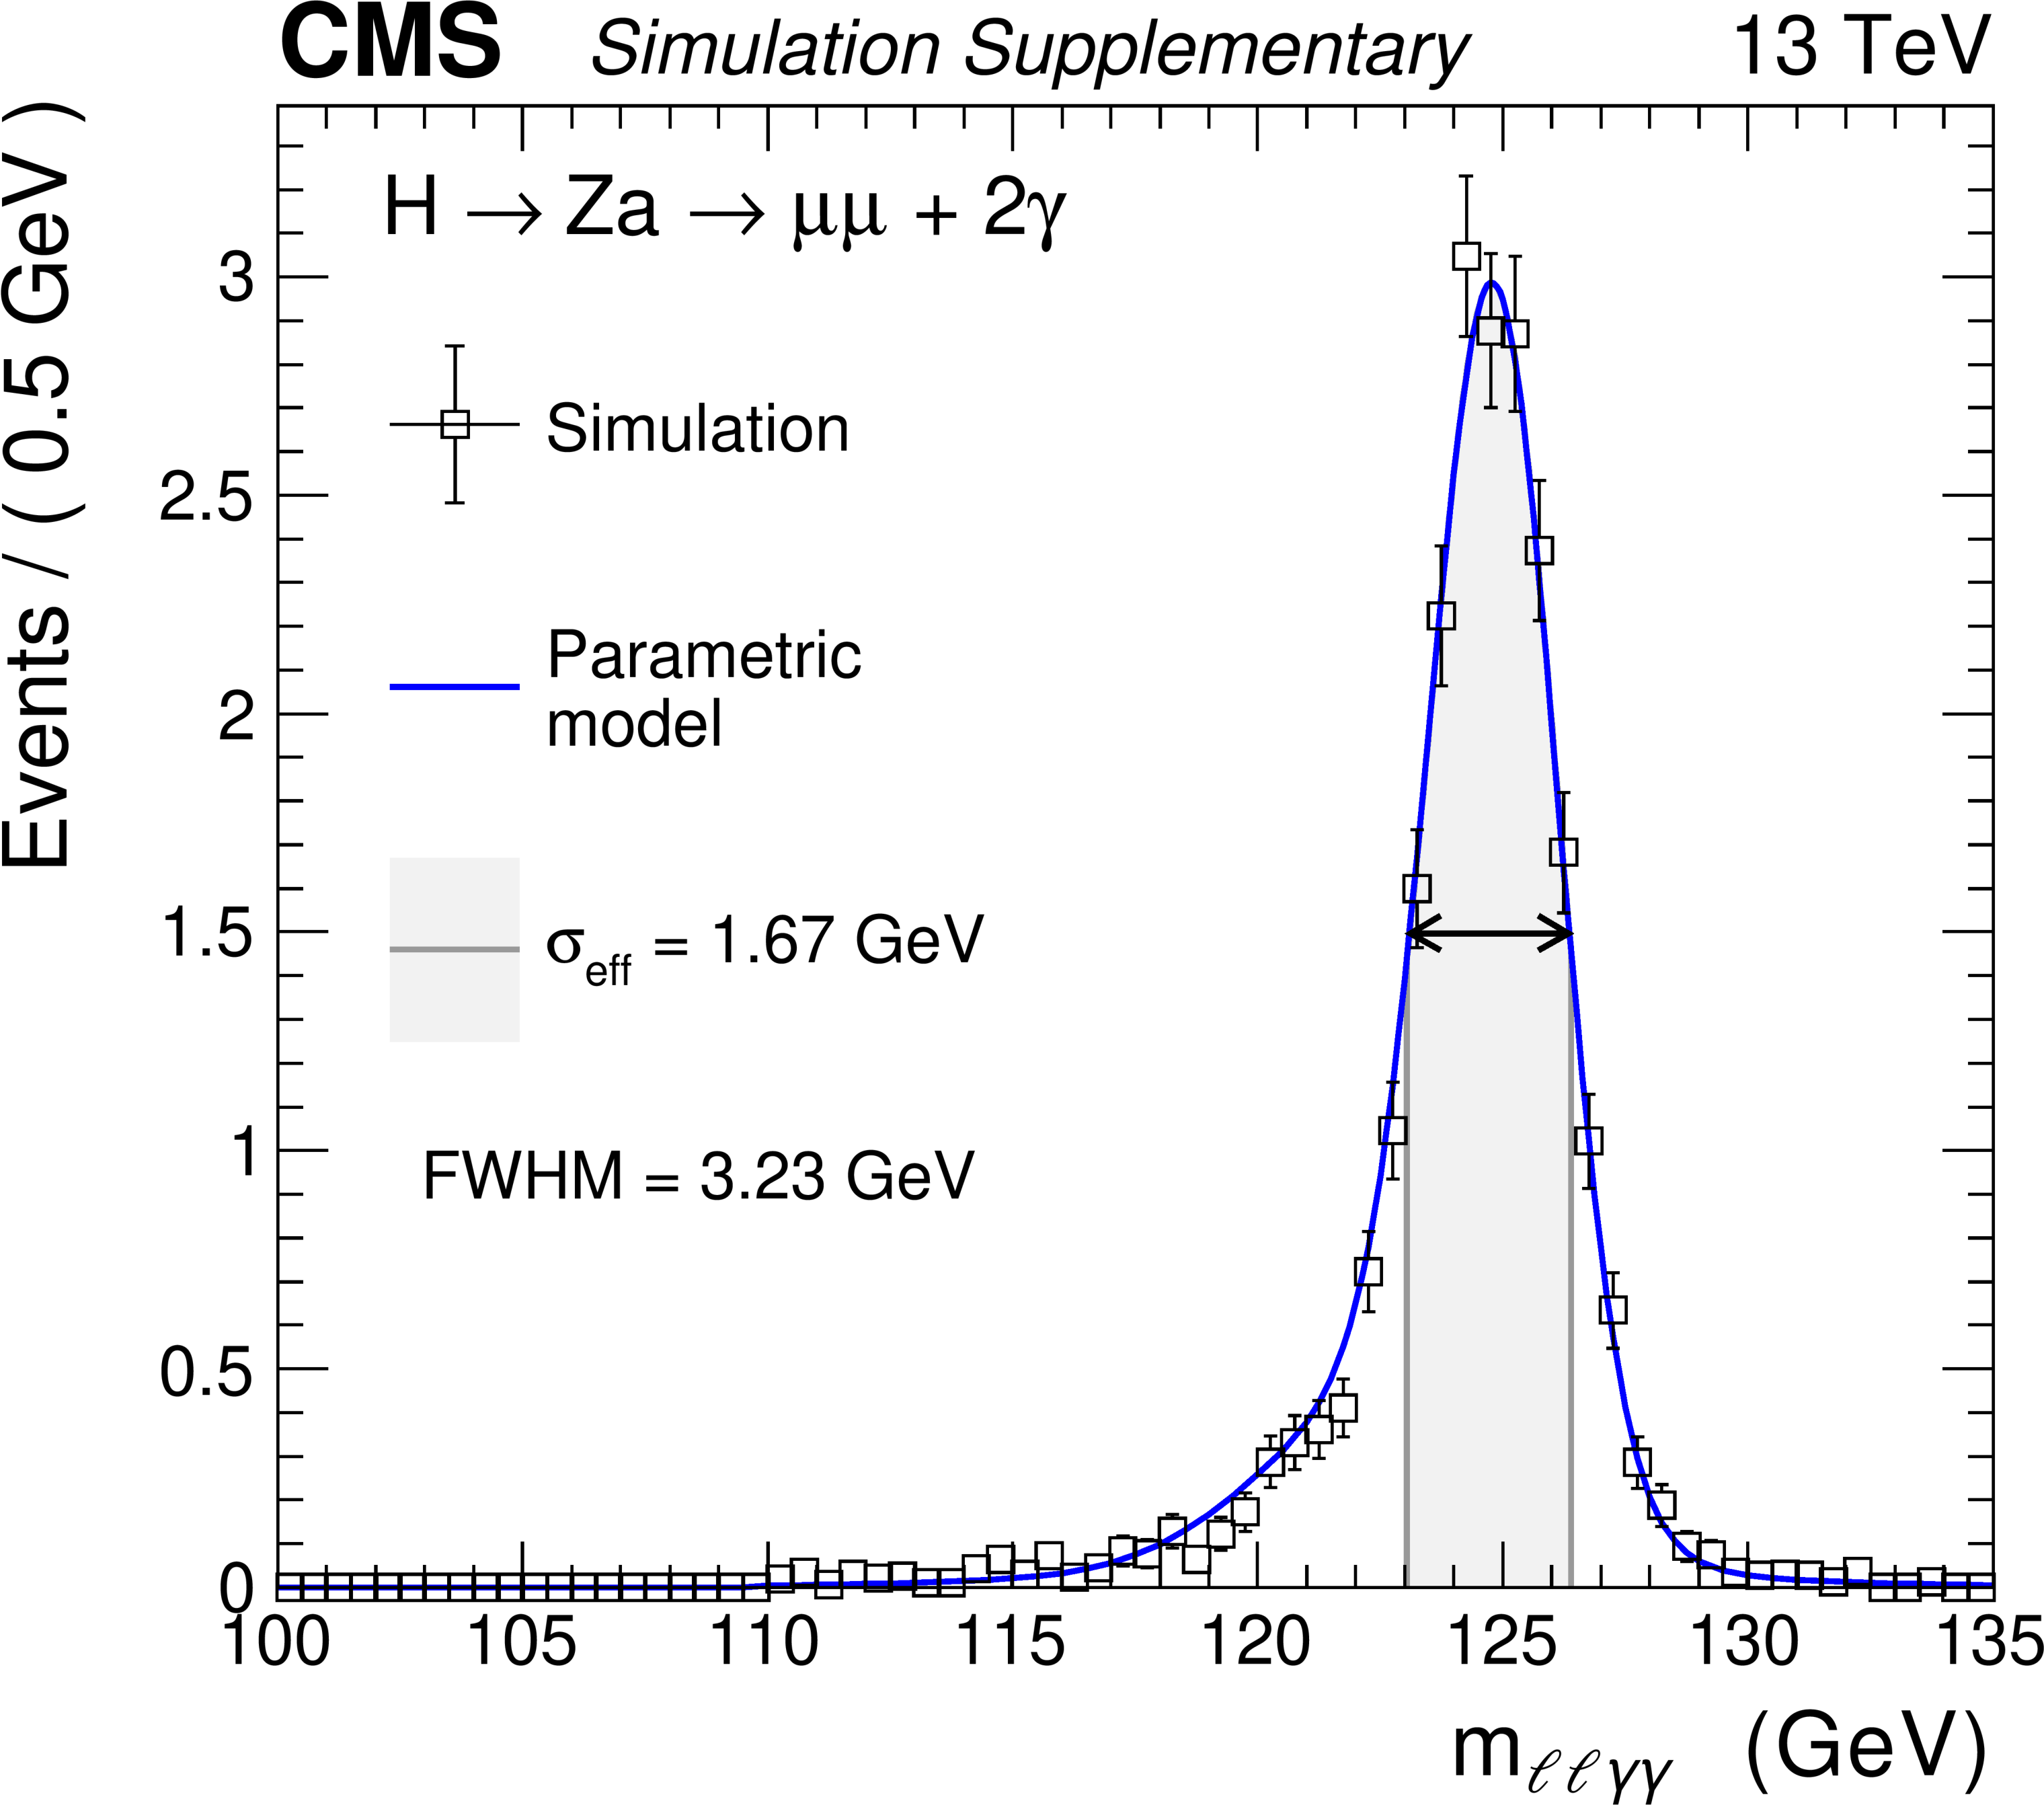
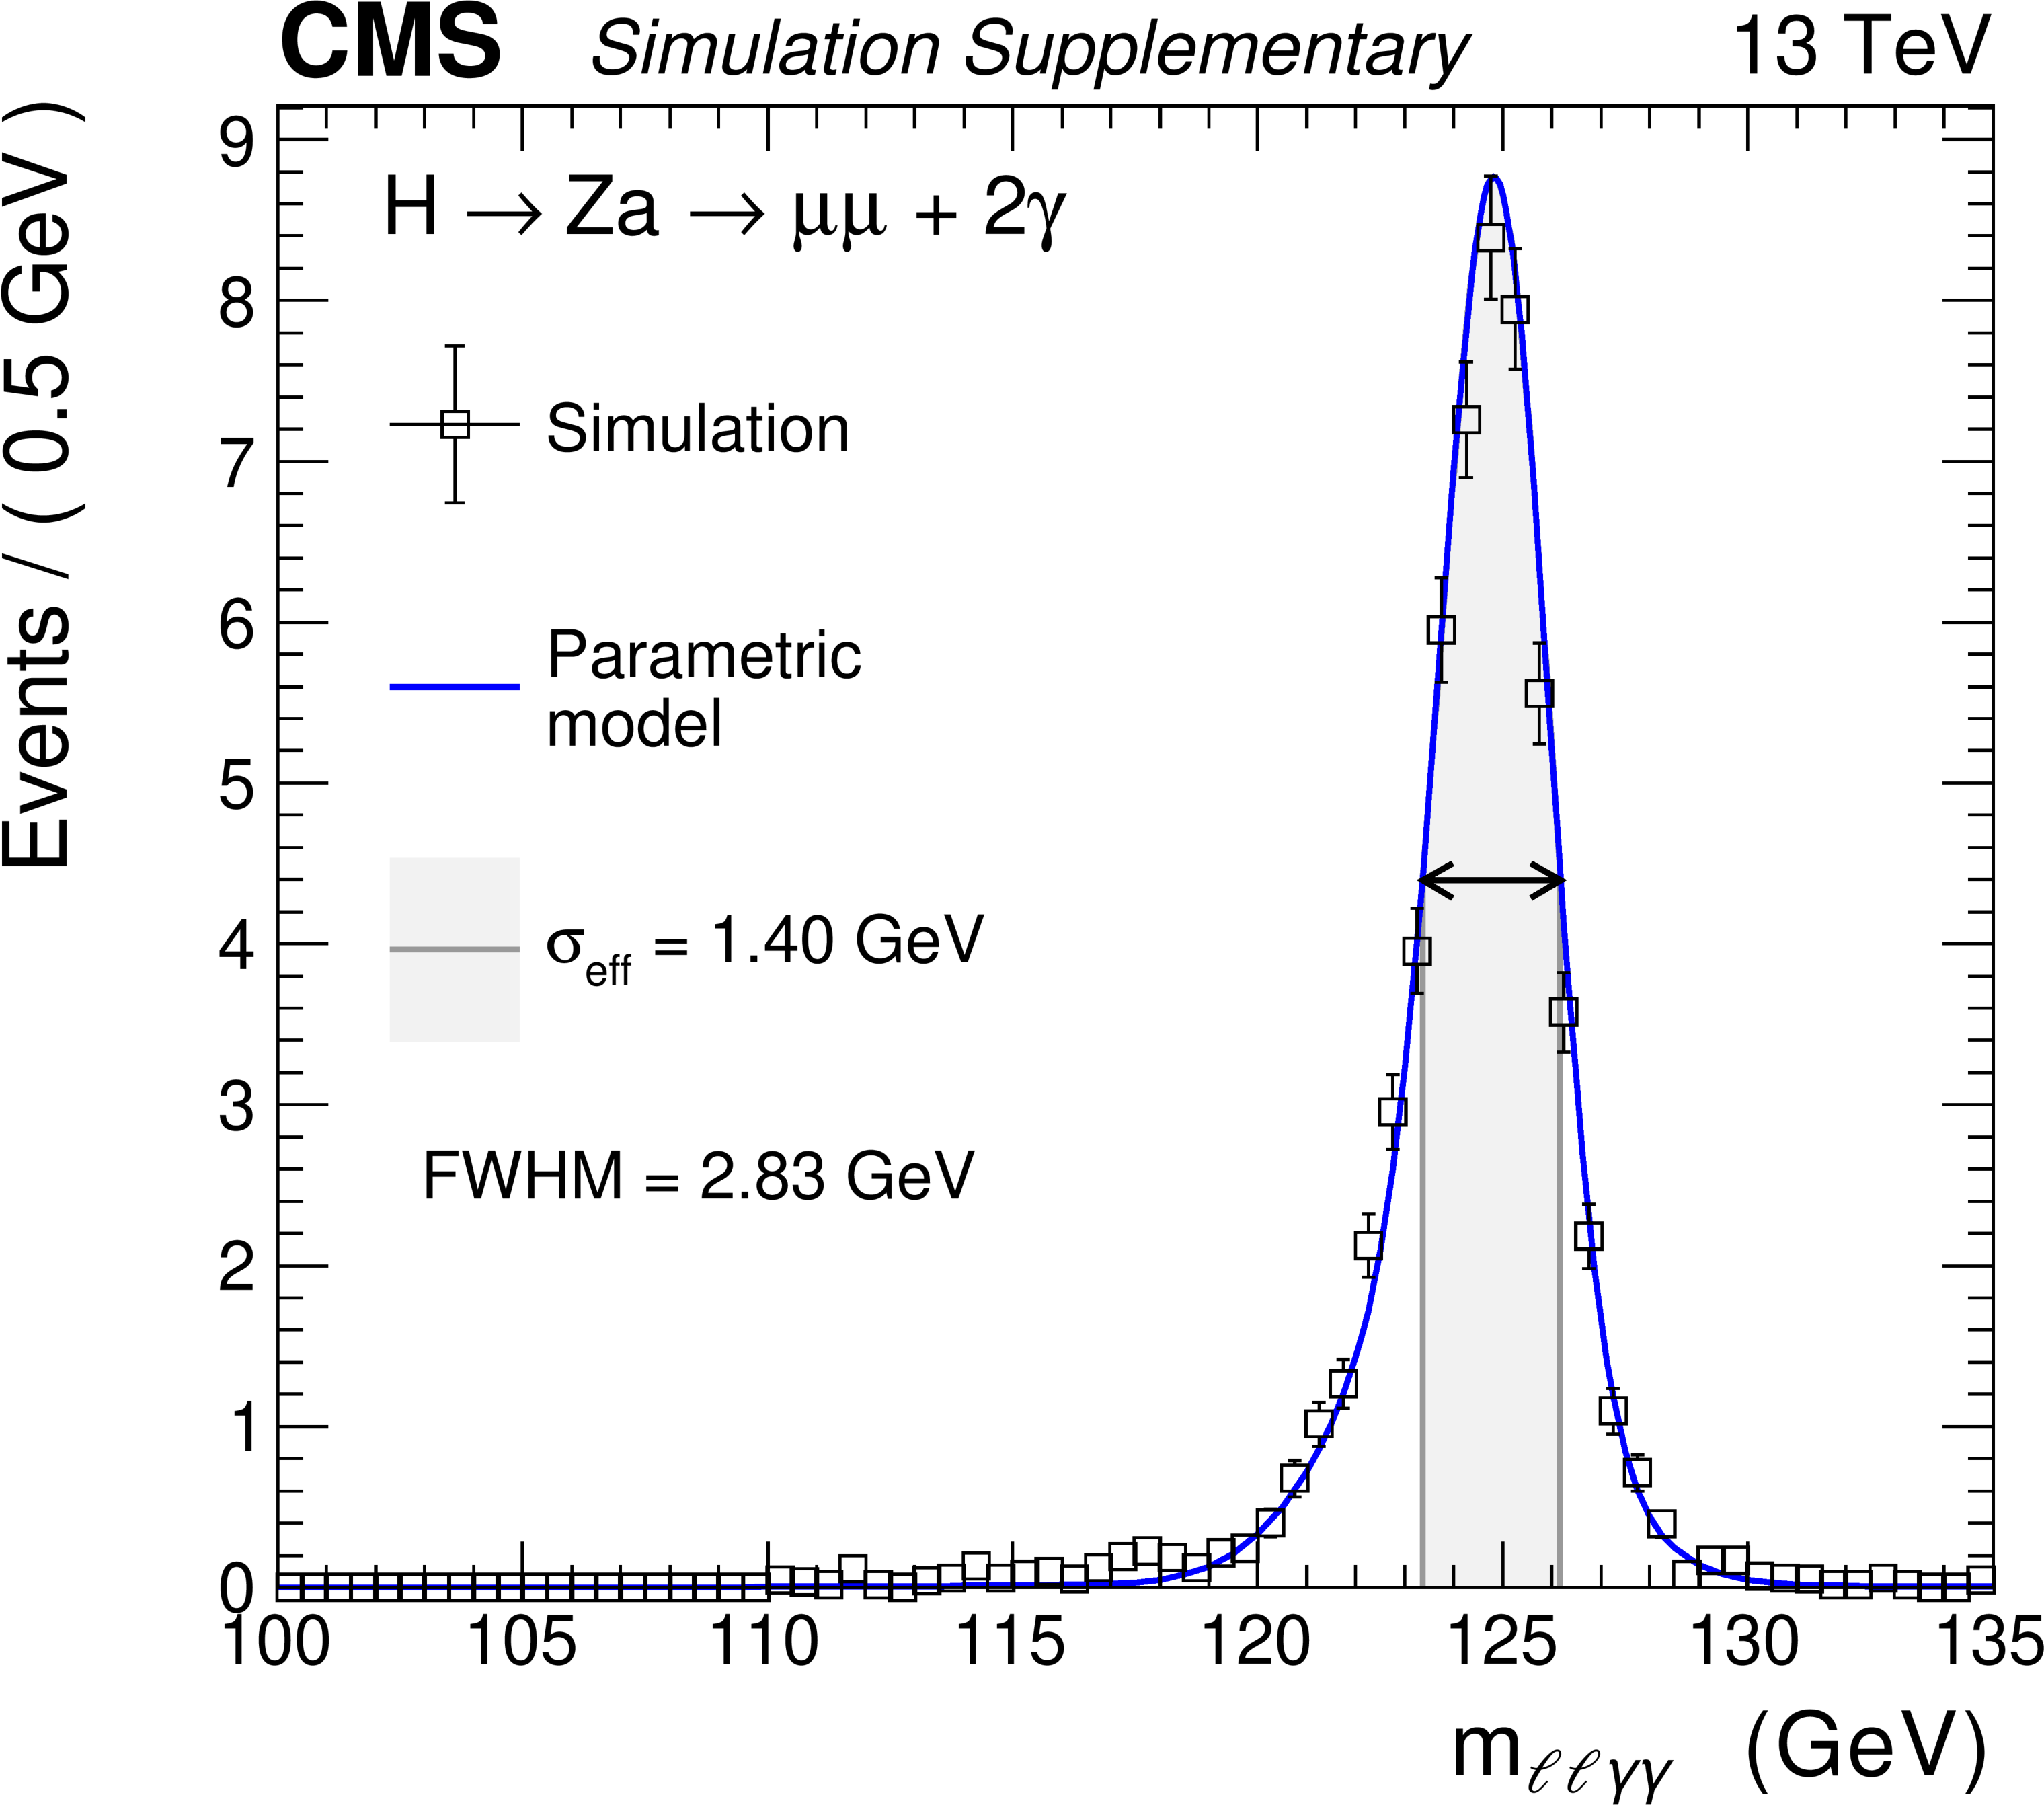
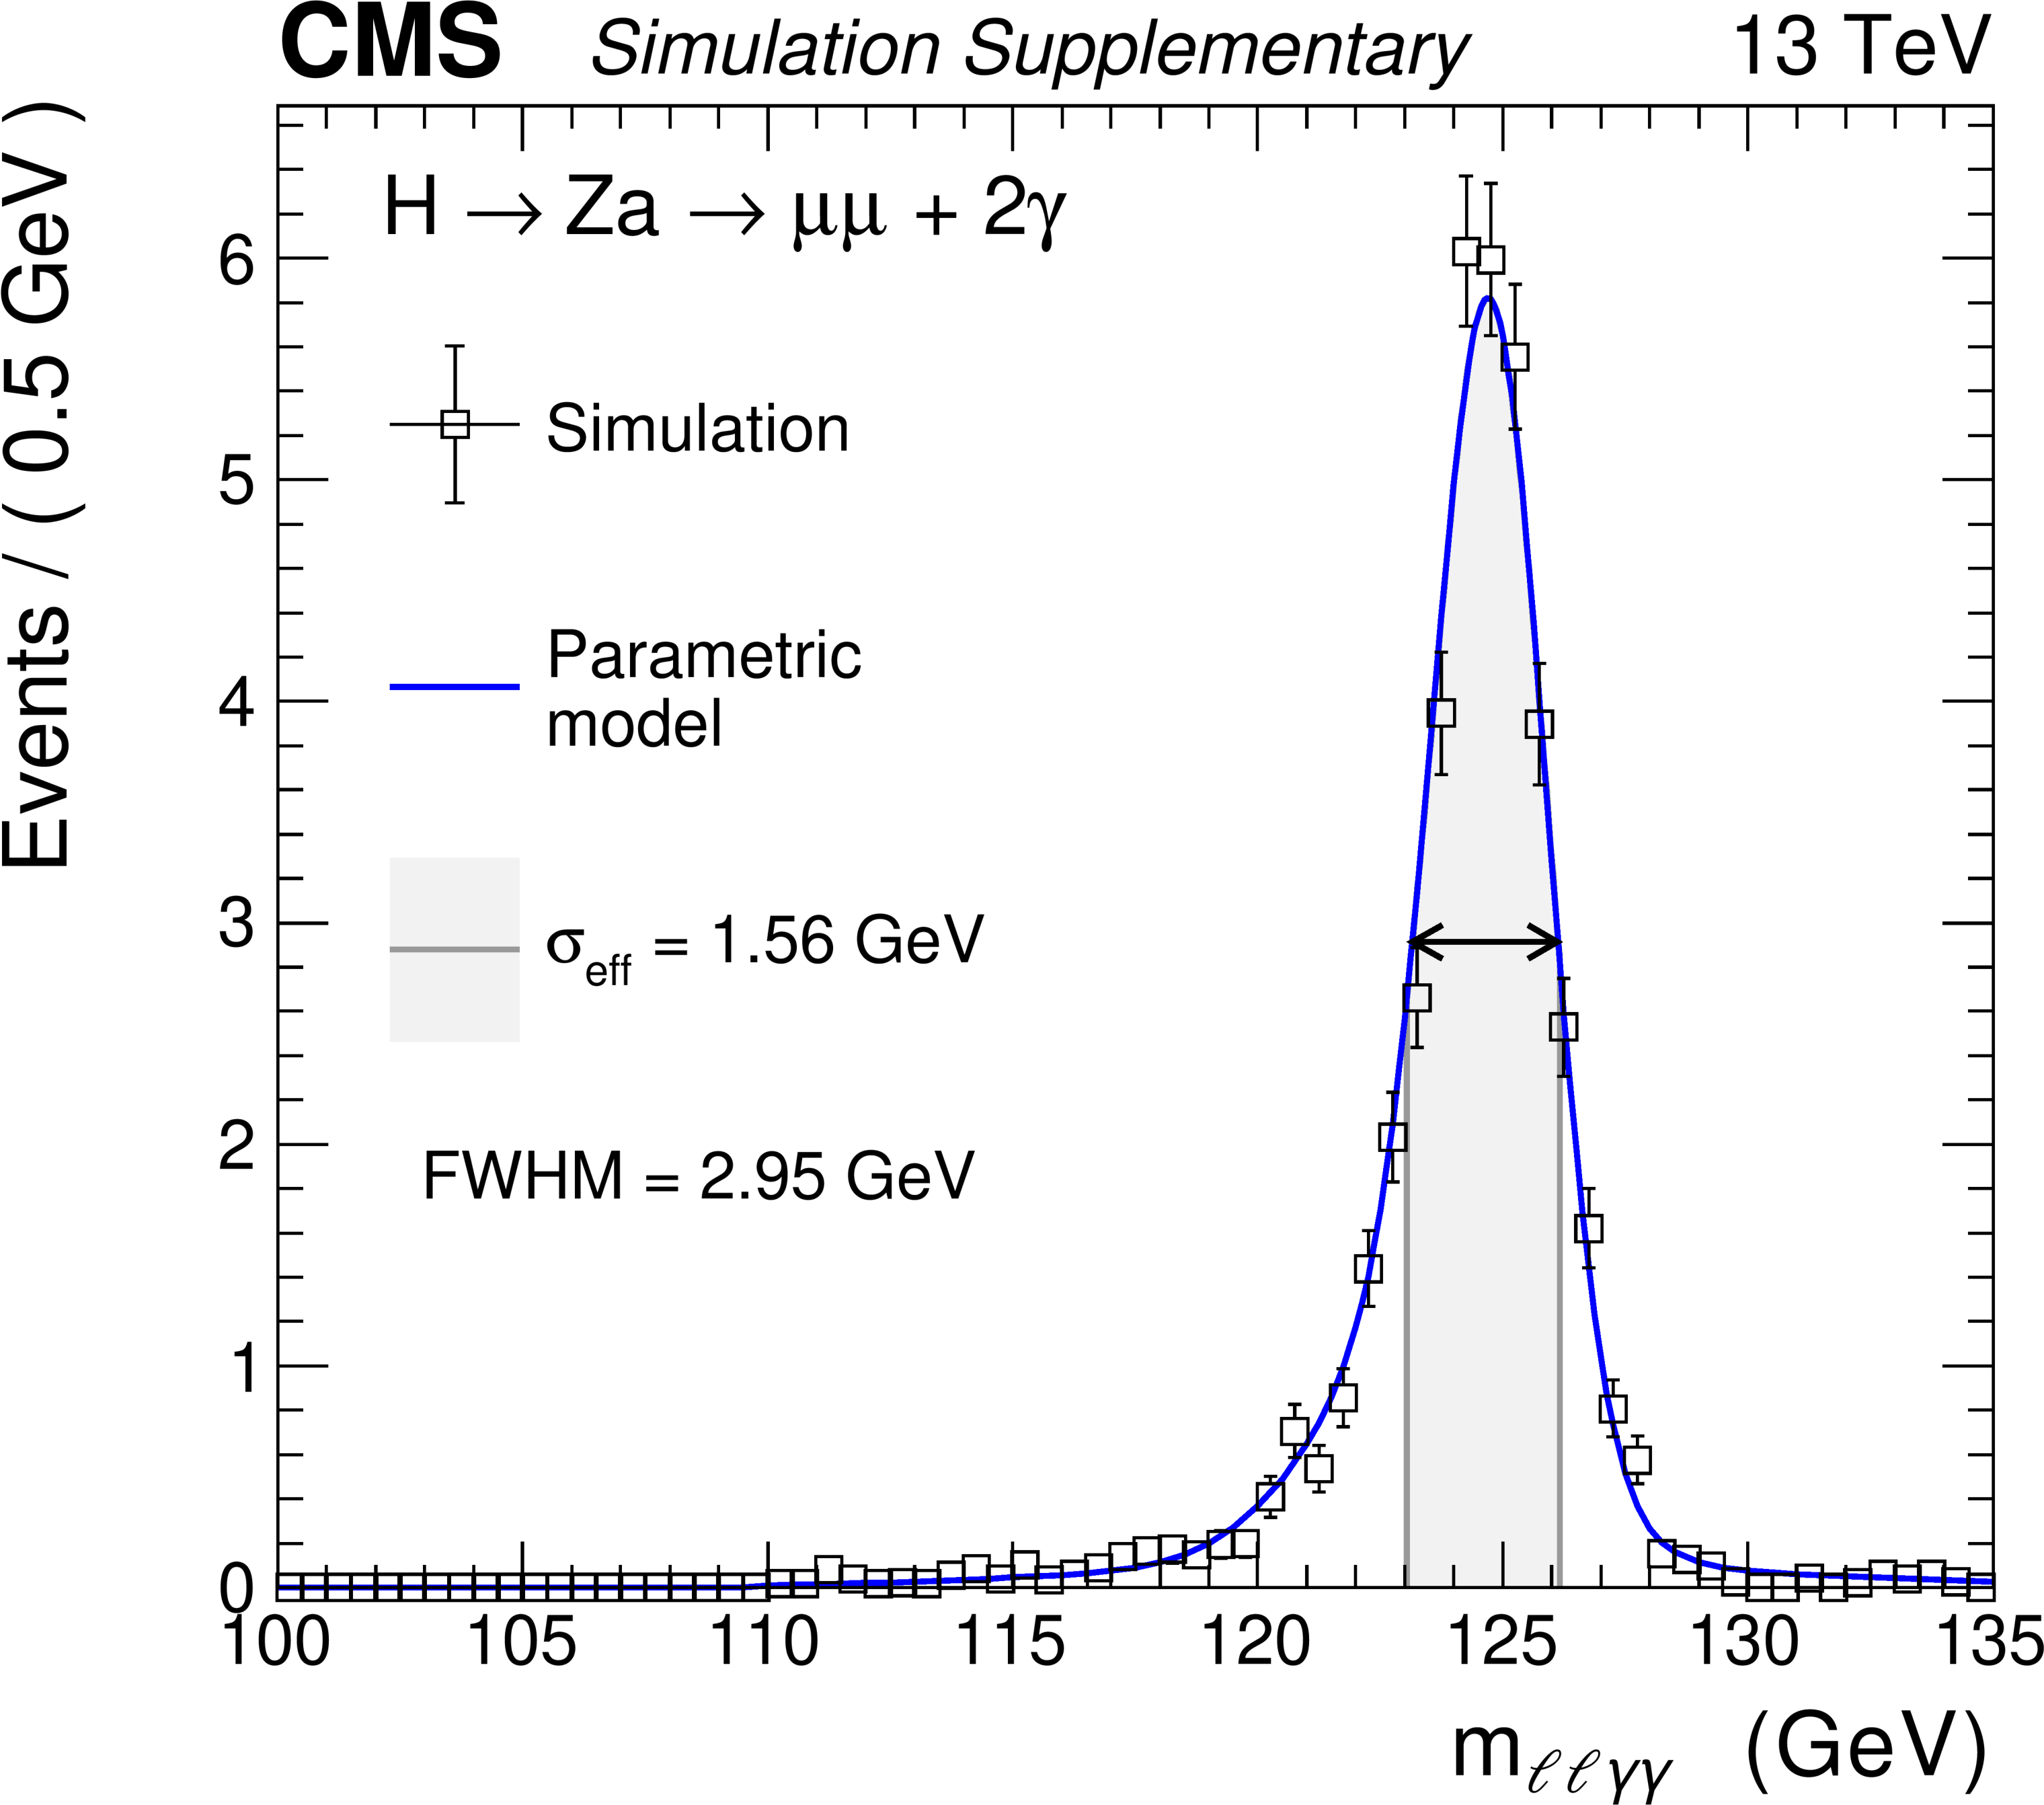
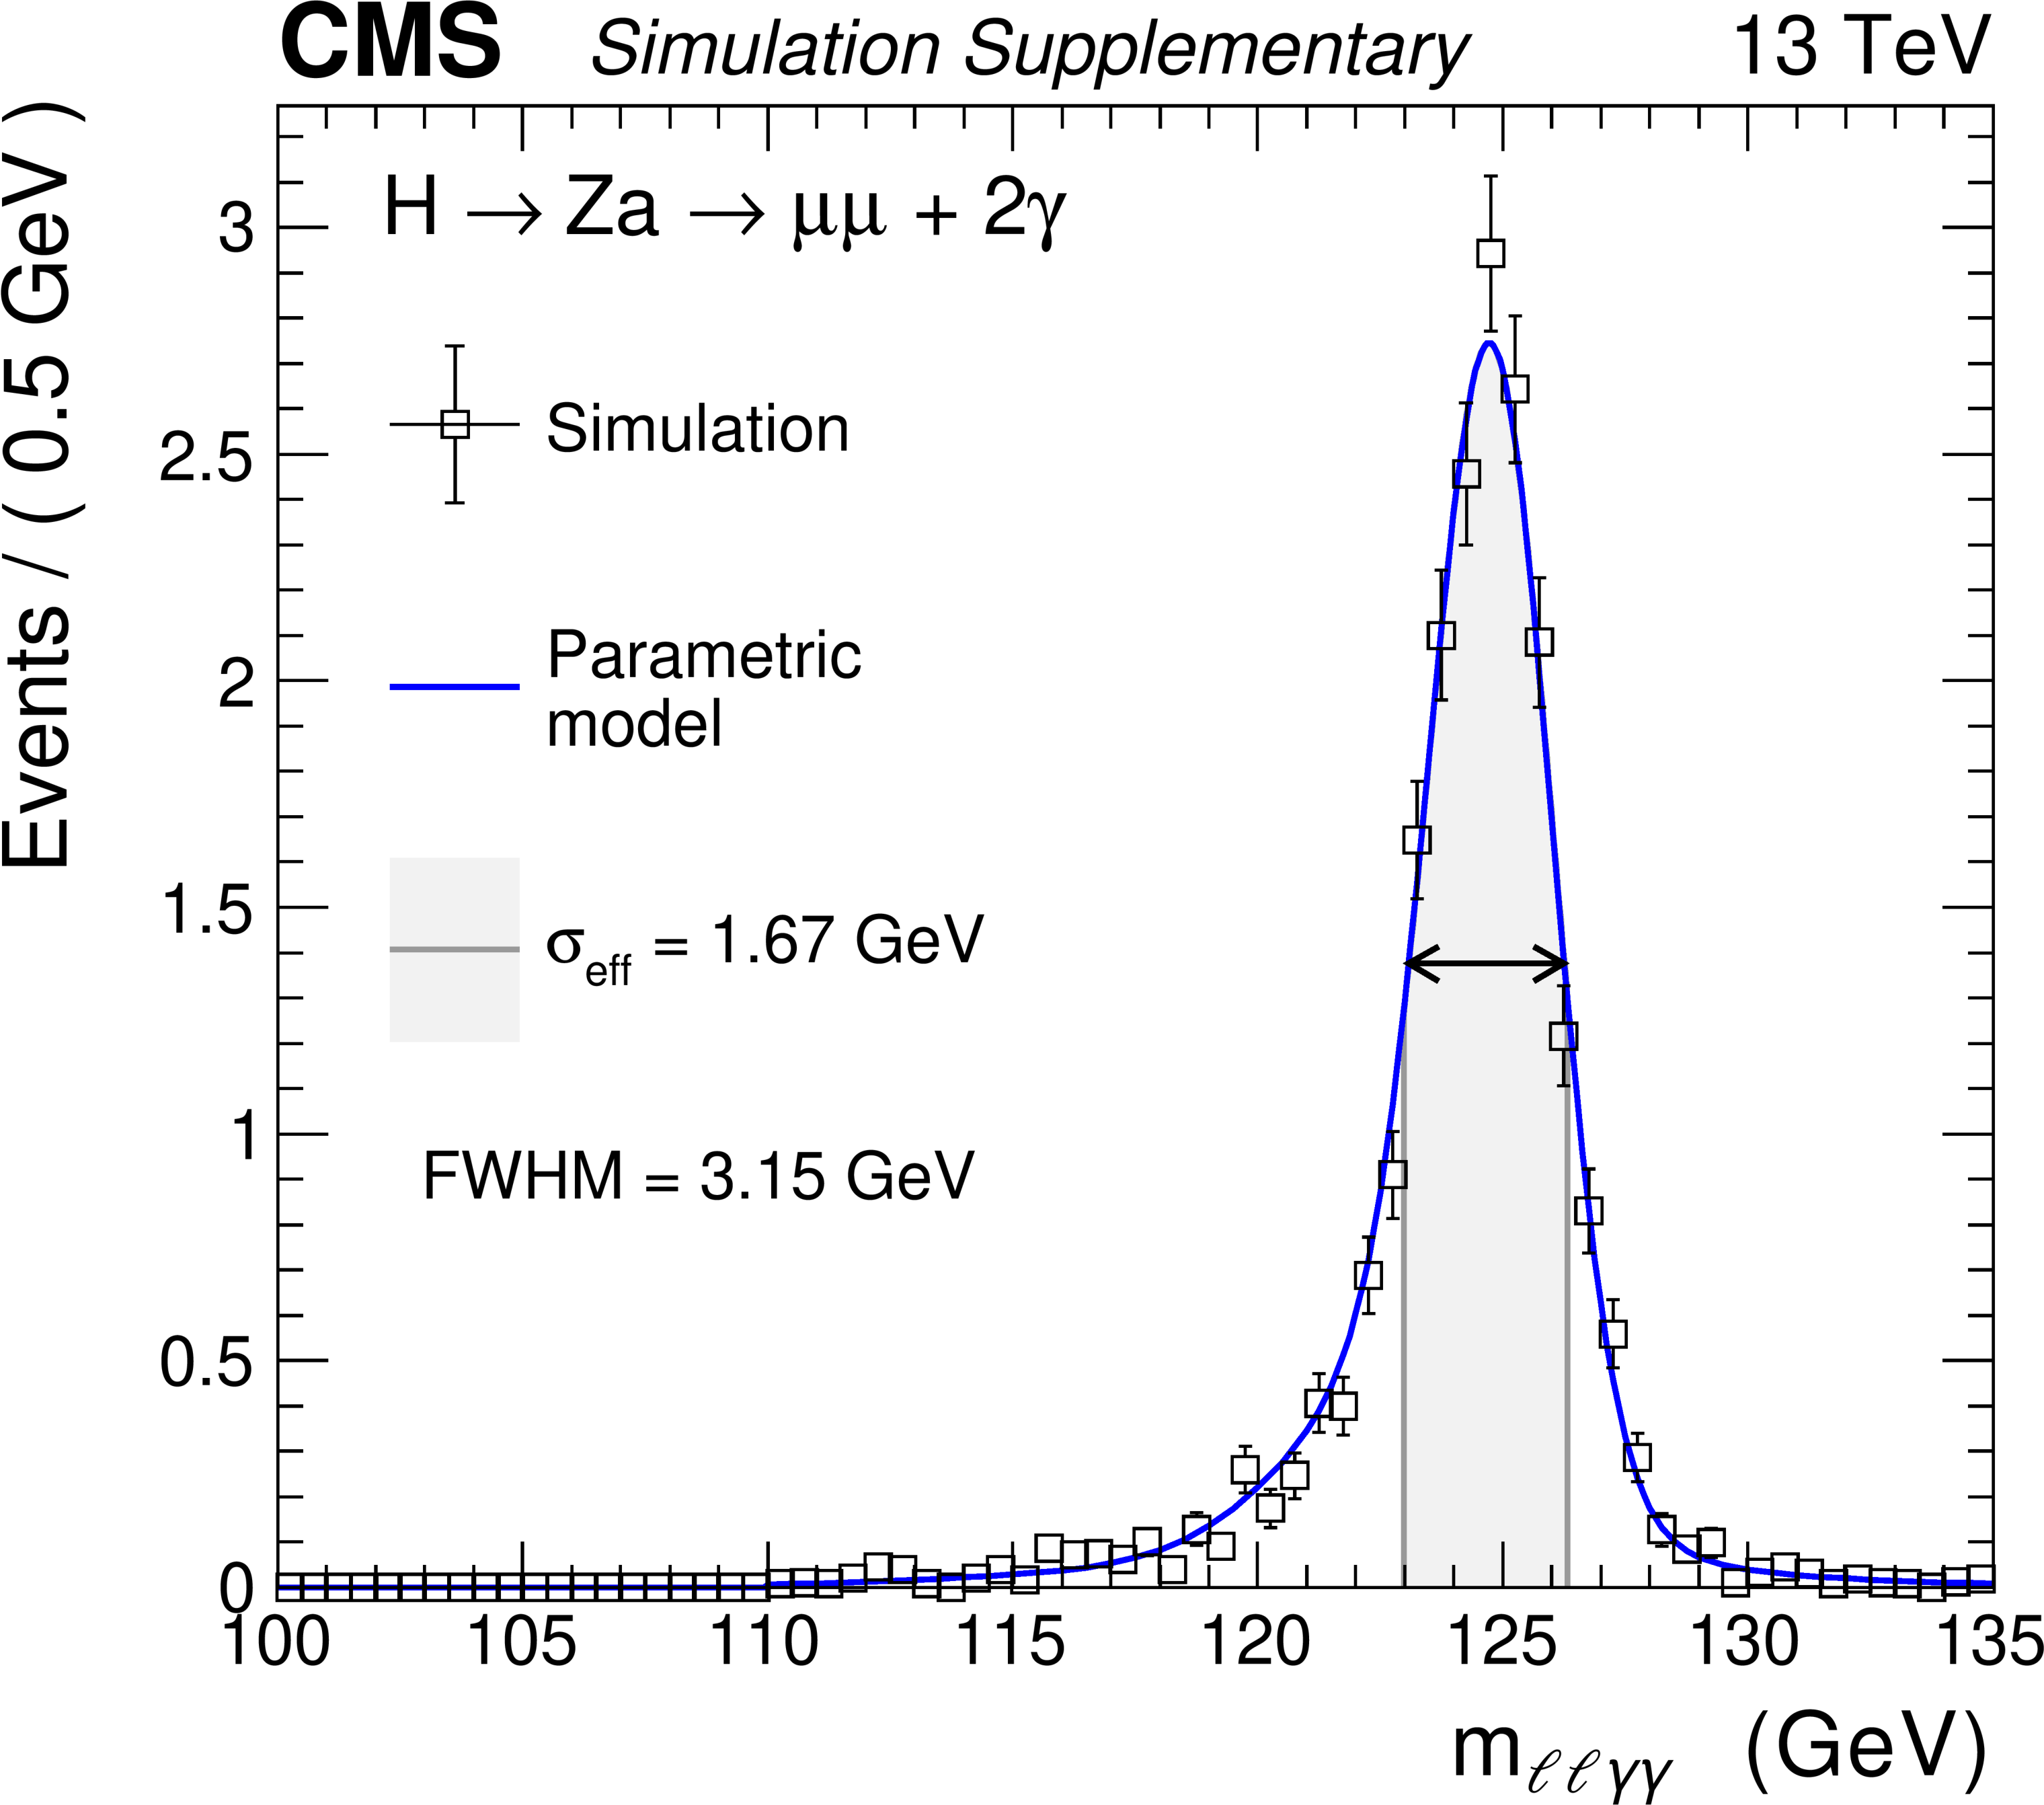
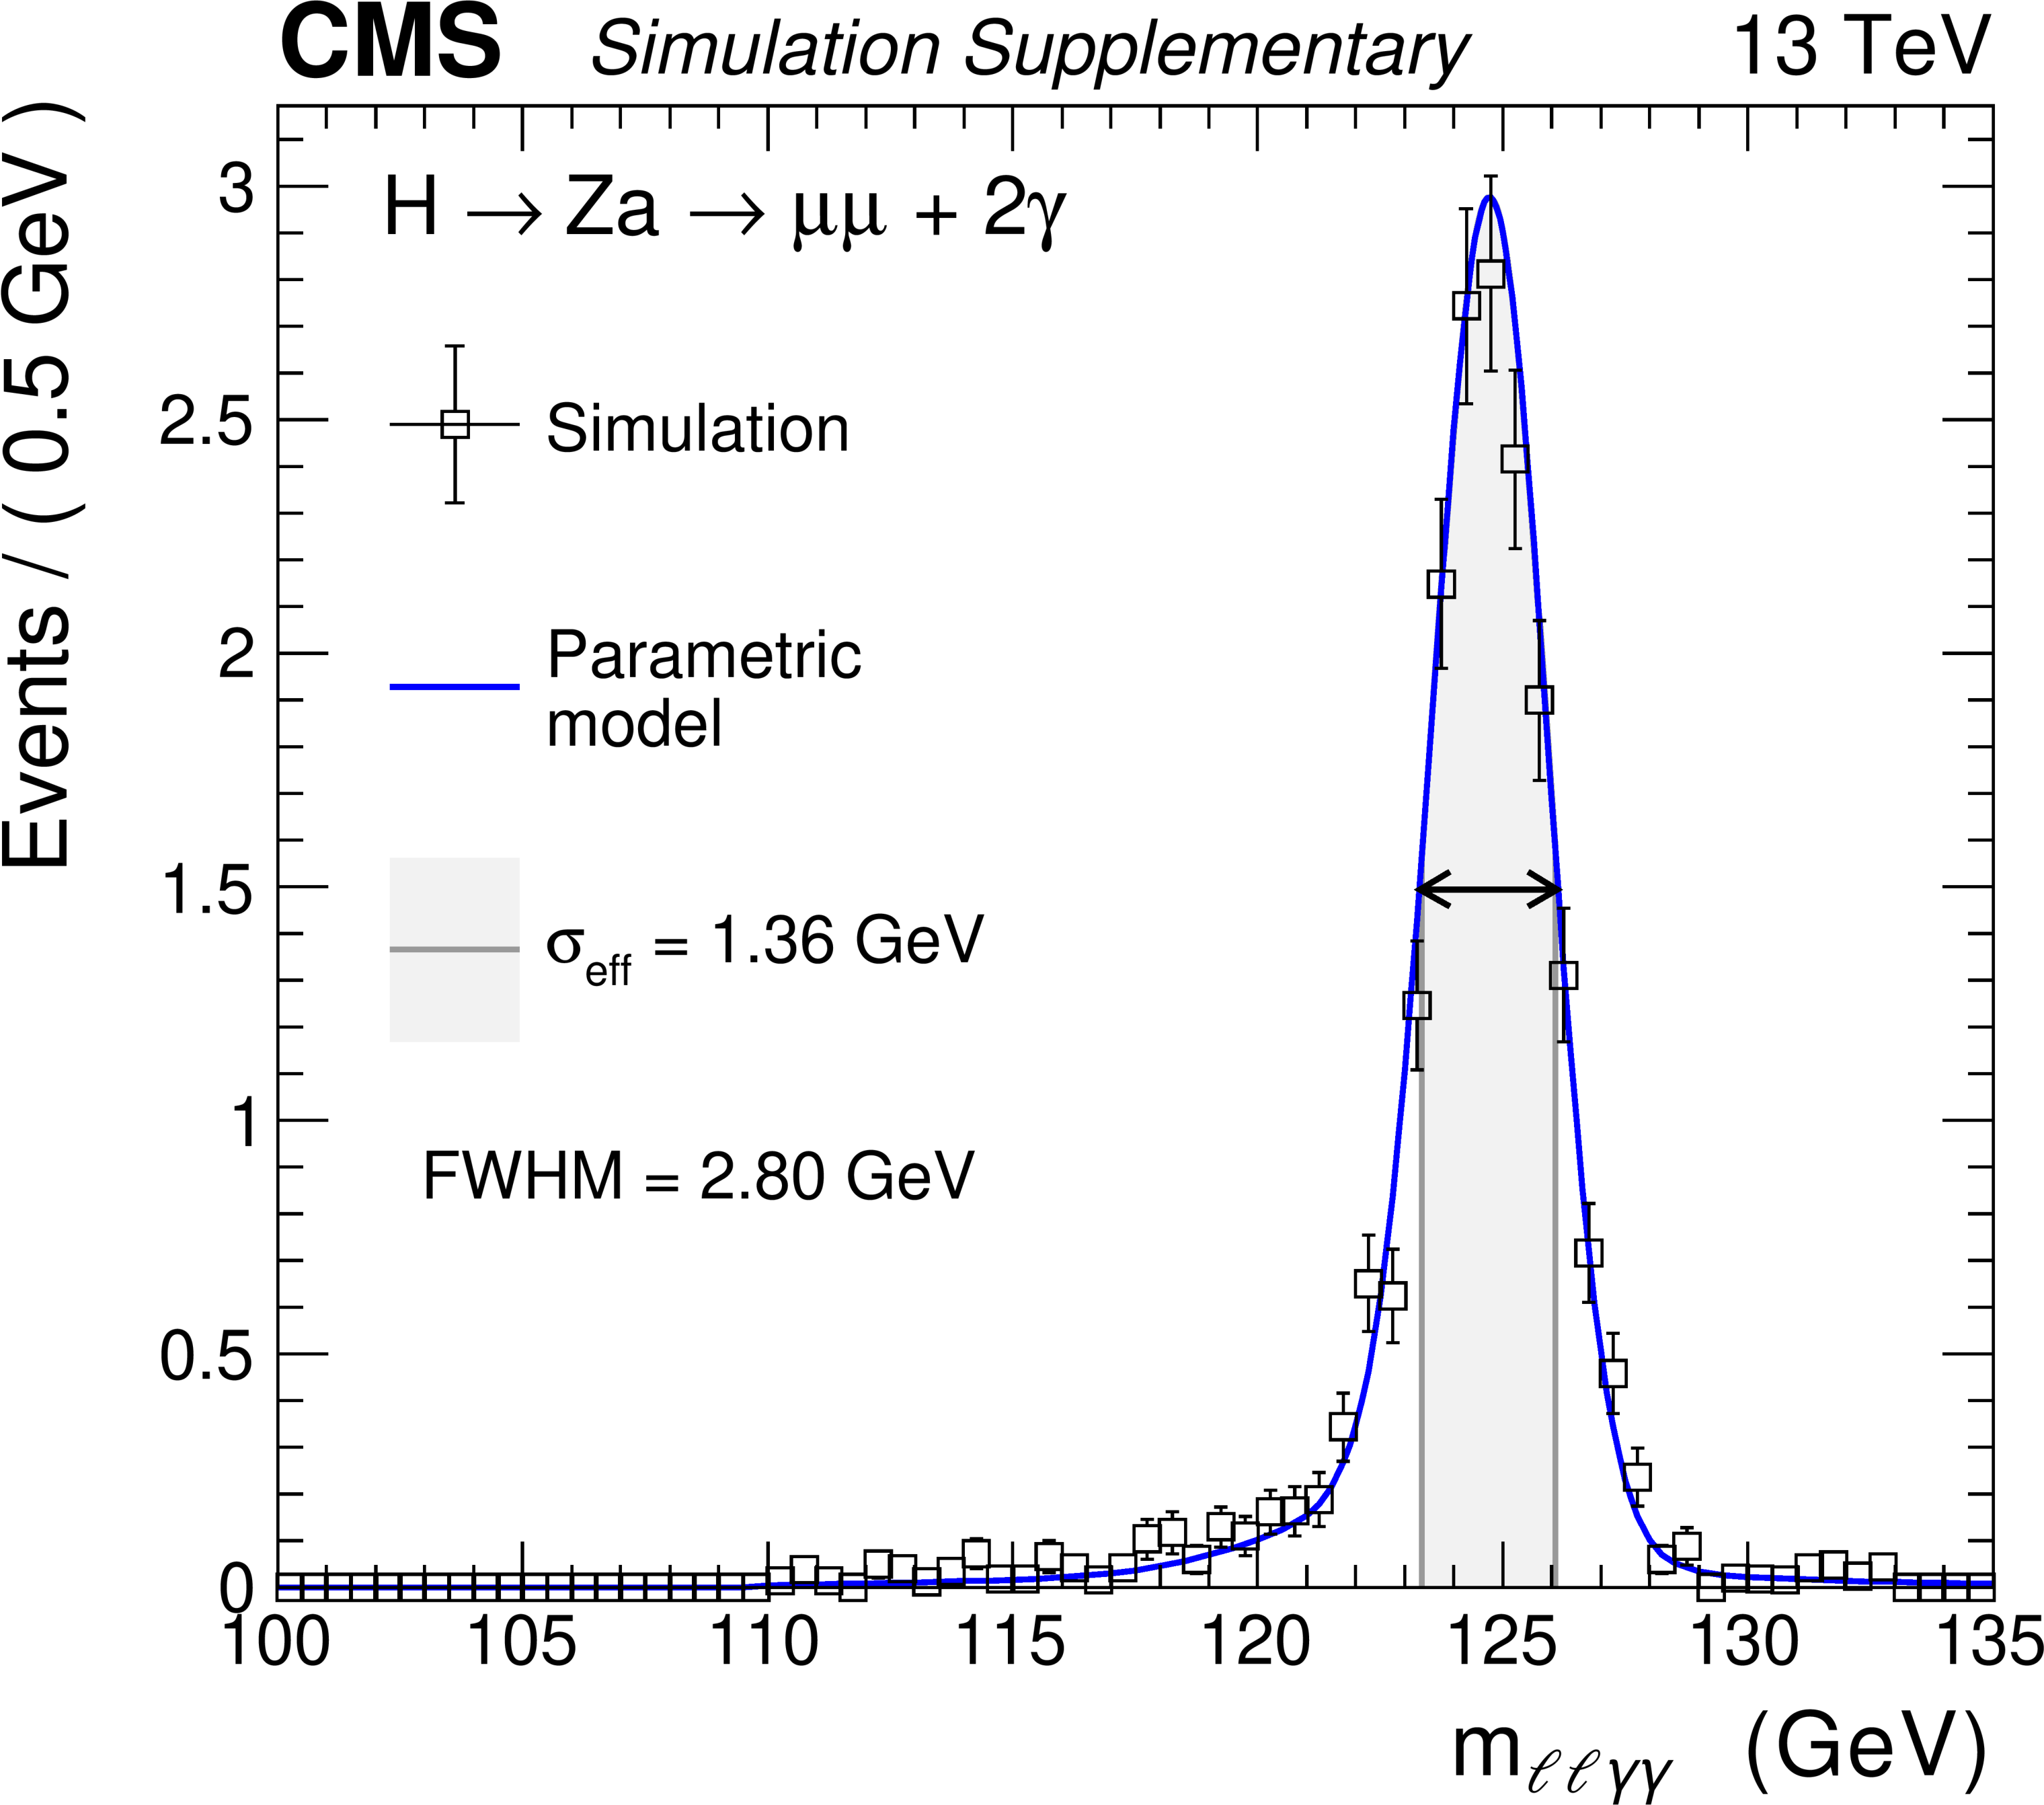
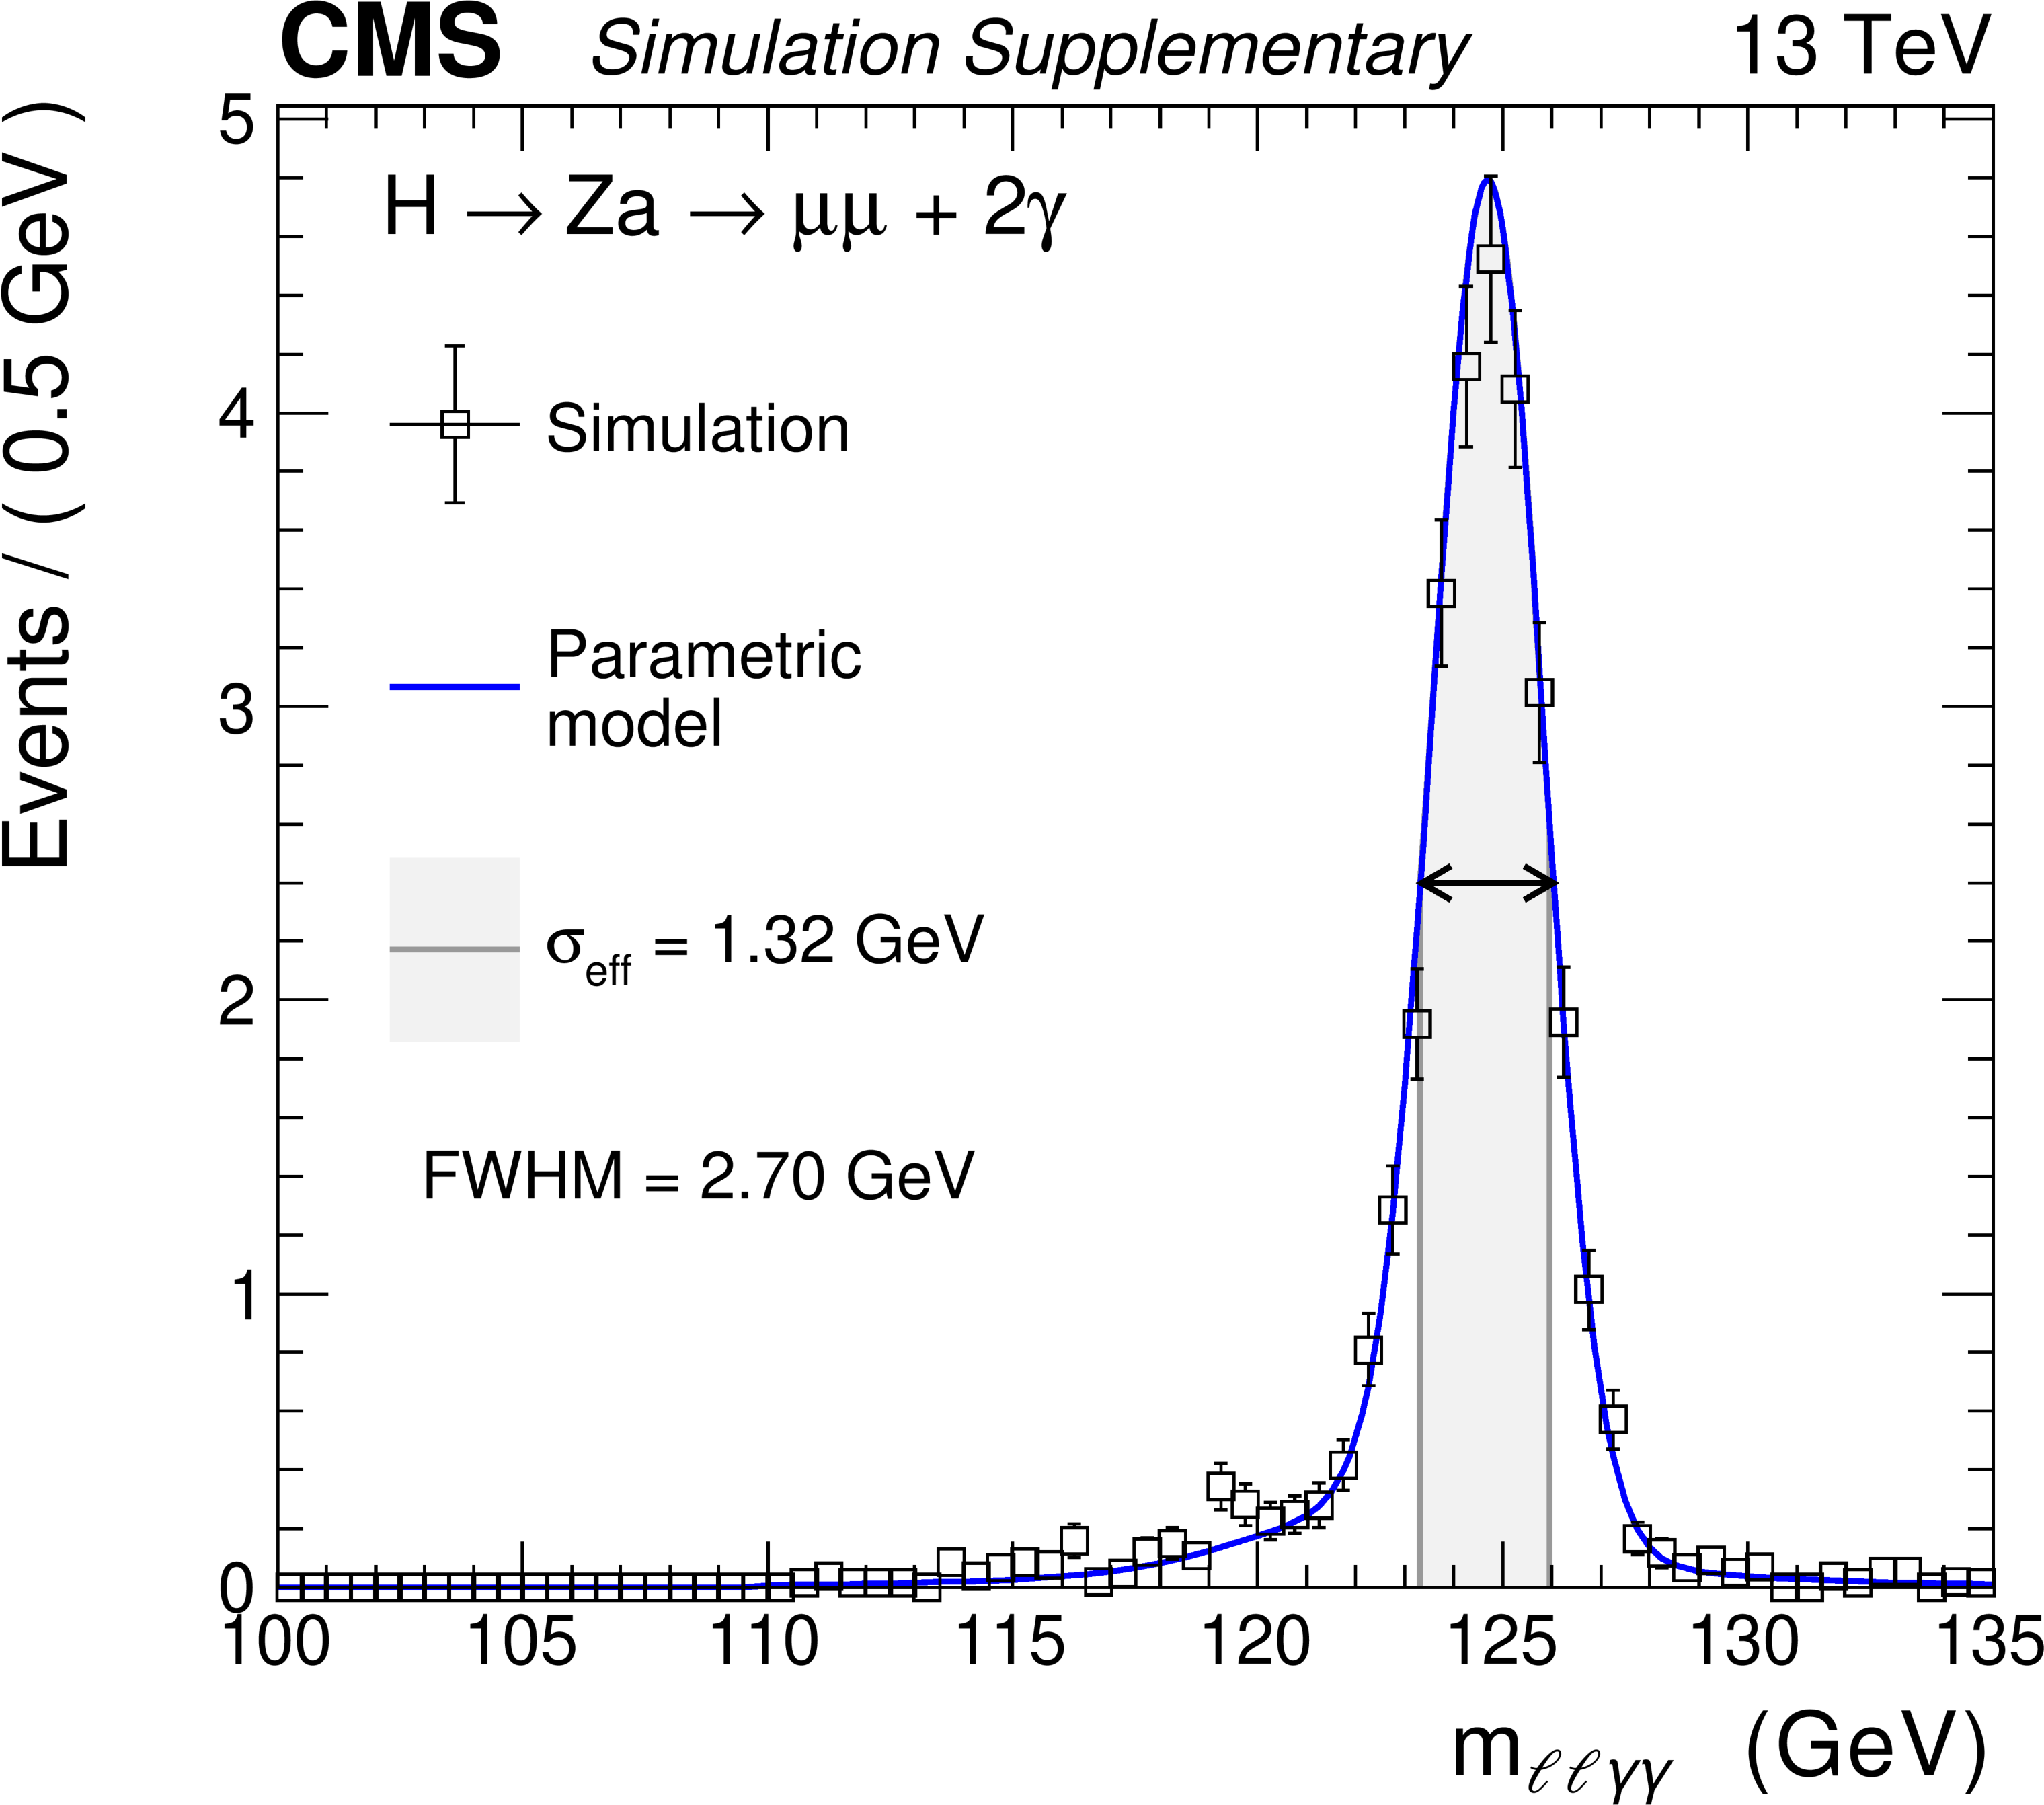
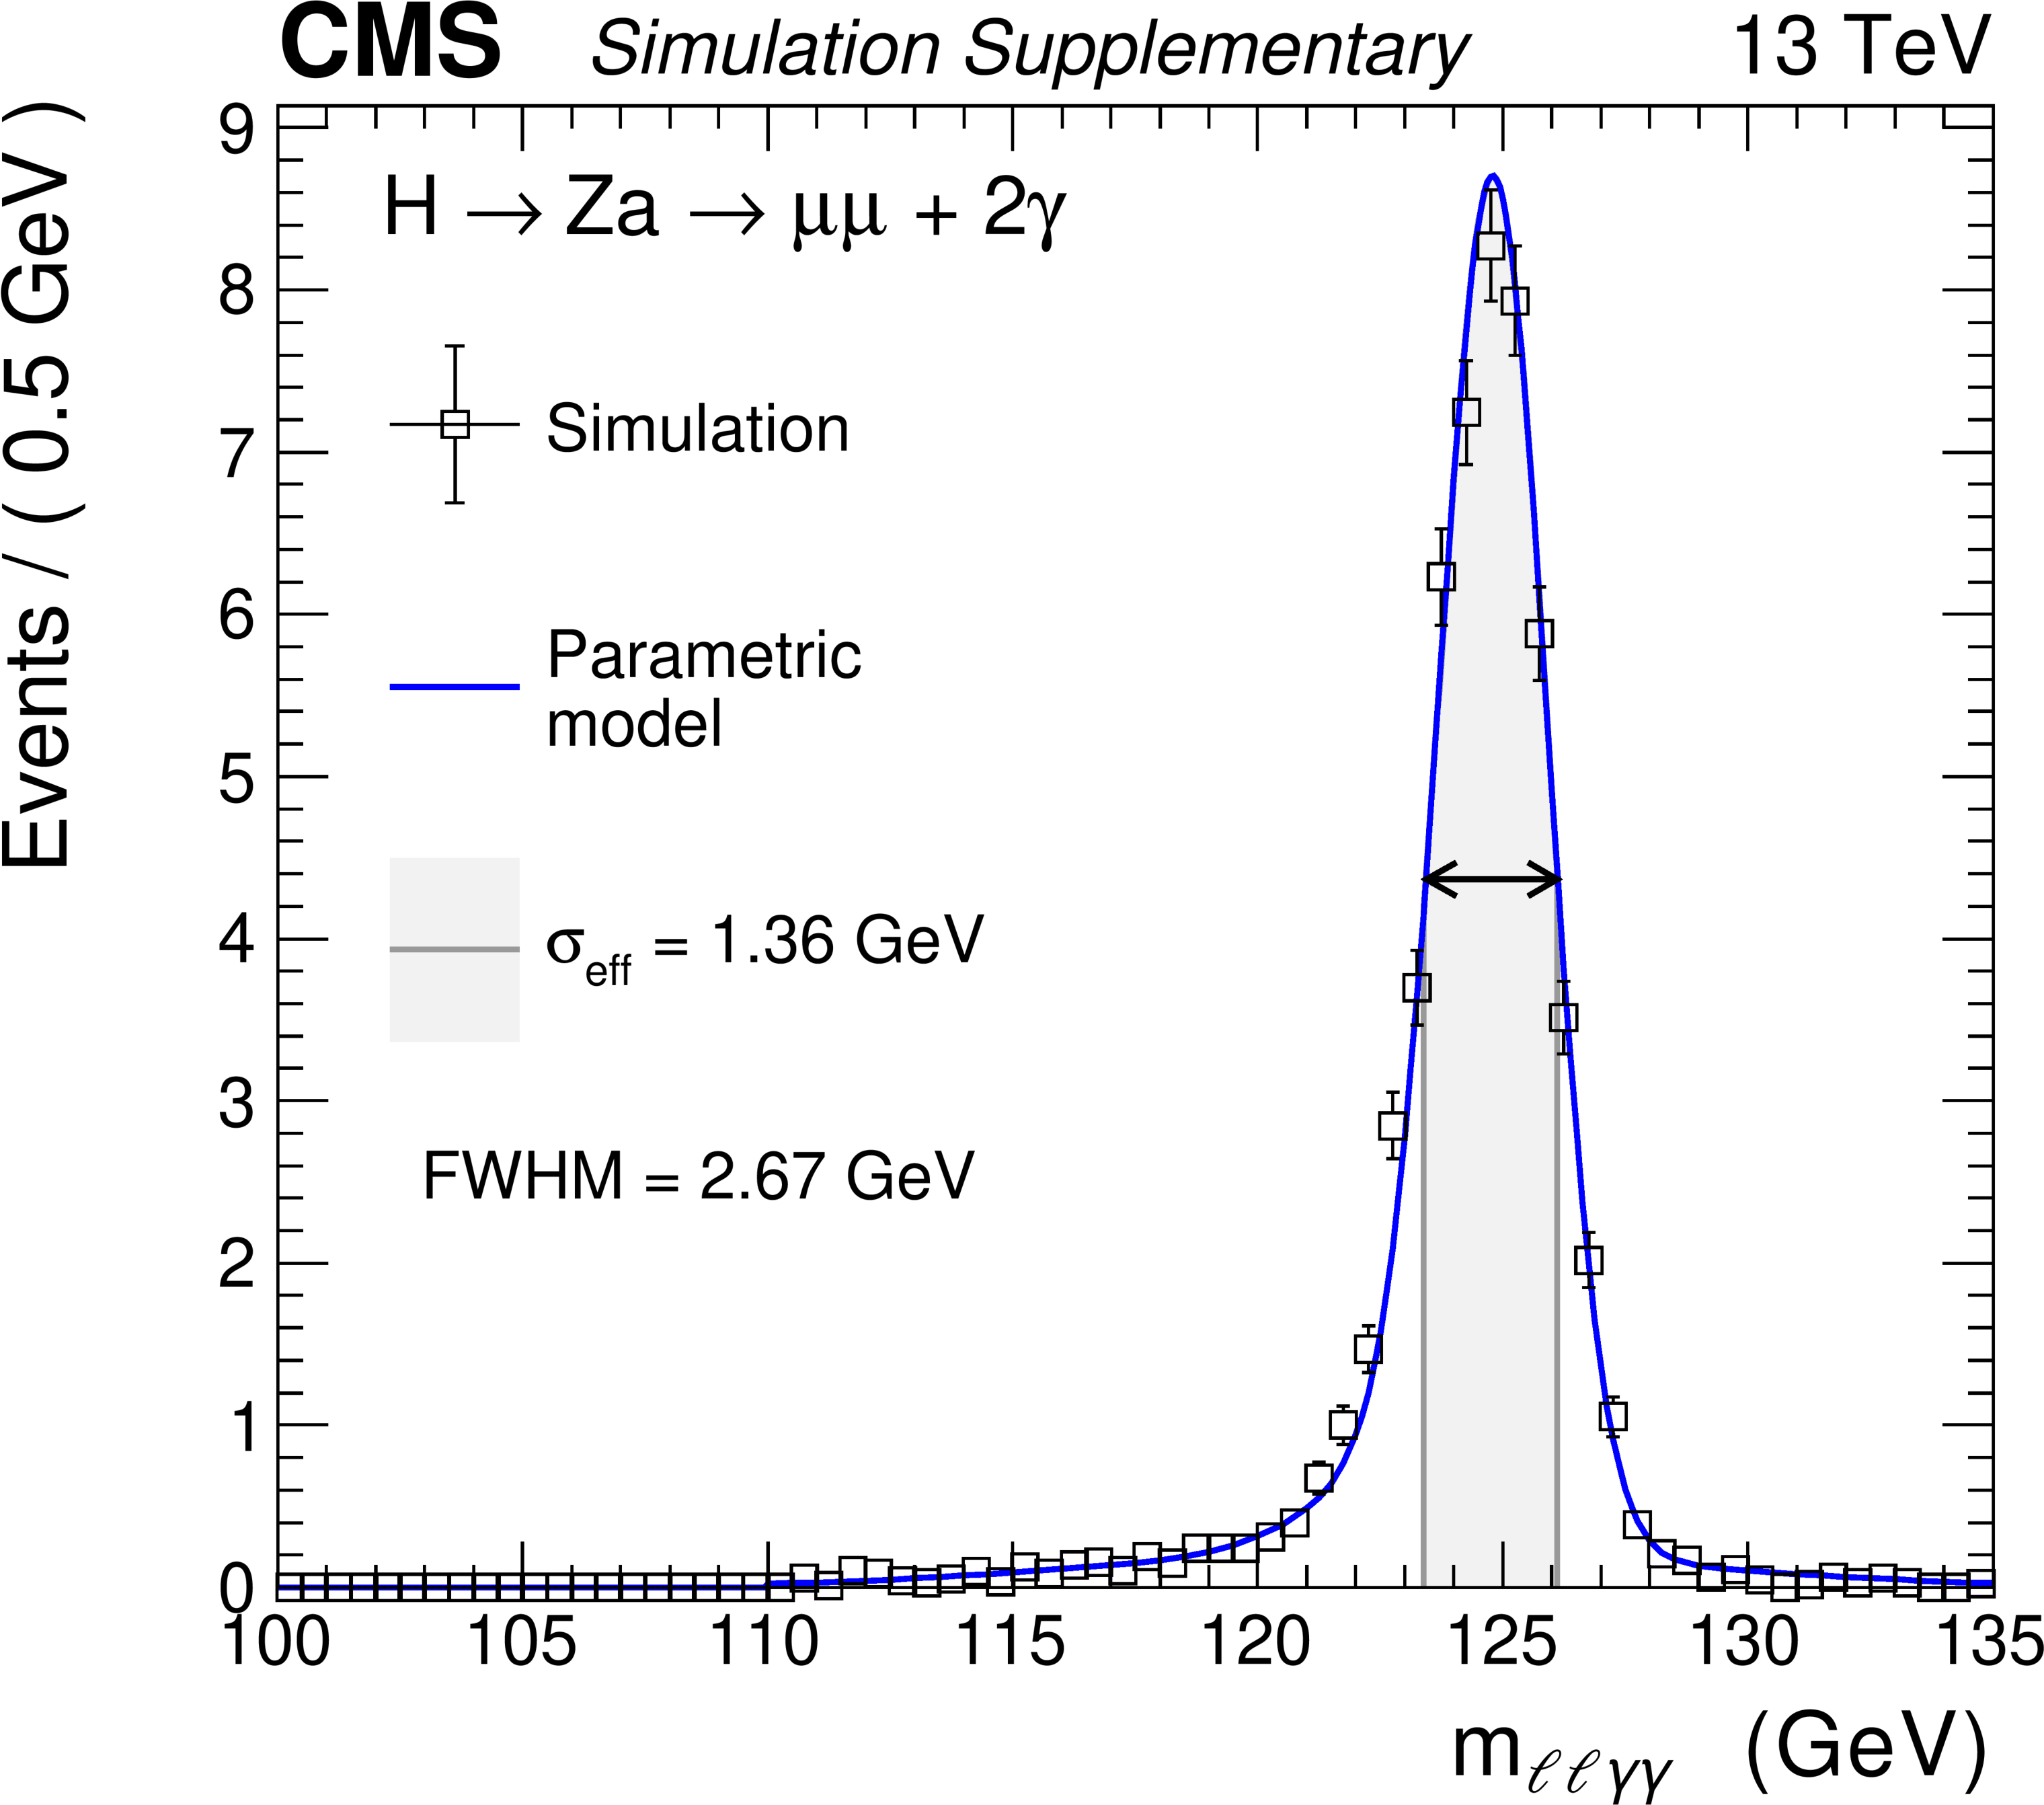
Figure 4-b:
Fit to the simulated $ m_{\ell\ell\gamma\gamma} $ distributions for a signal with $ m_{\mathrm{a}}= $ 30 GeV in the muon channel for the year 2018. |
png pdf |
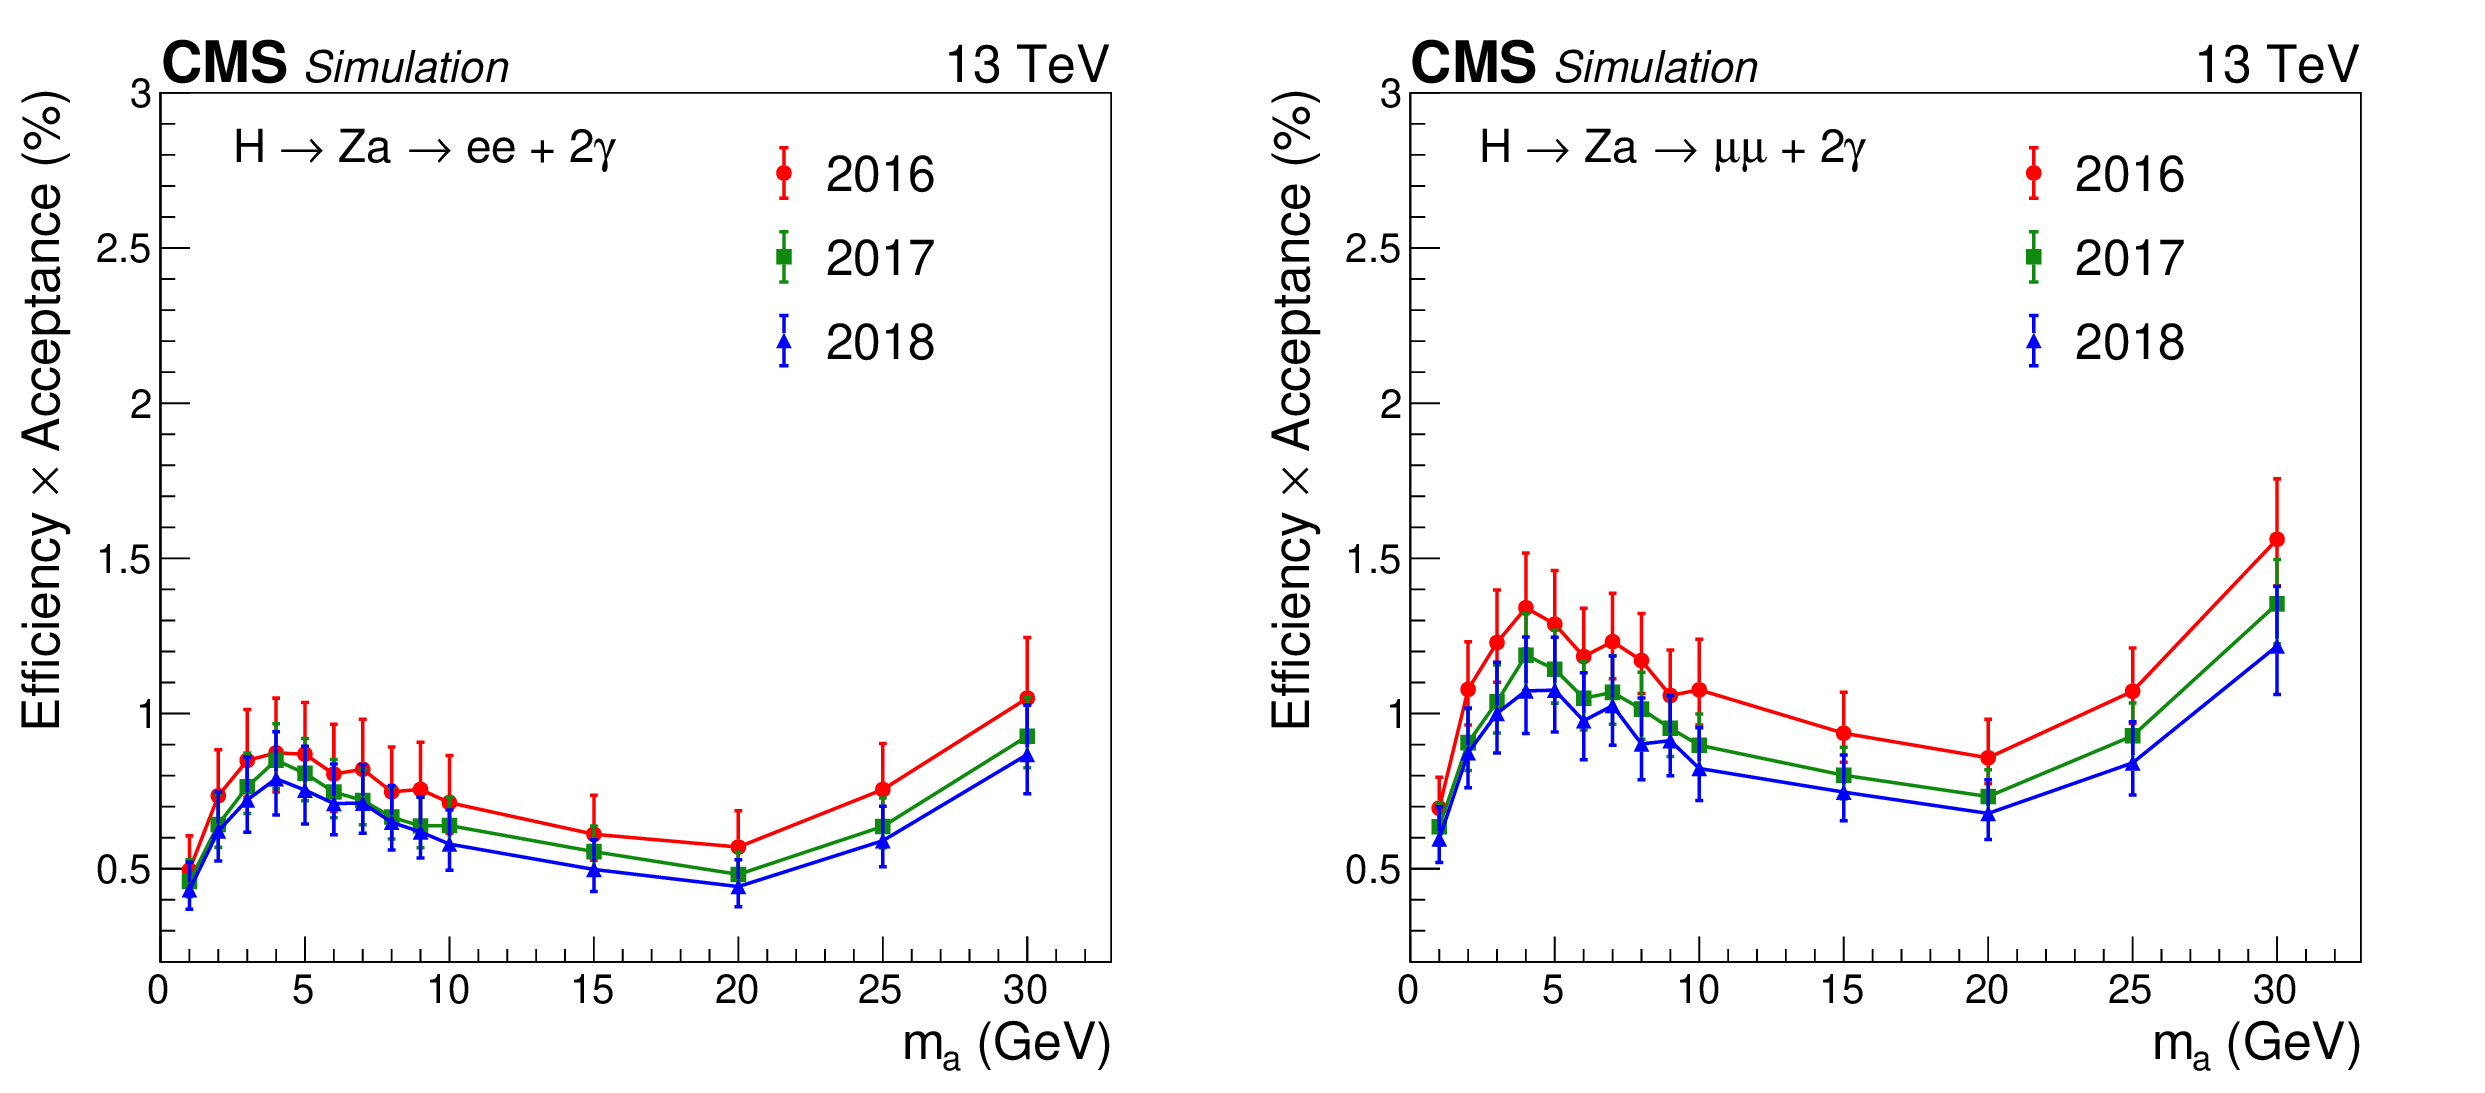
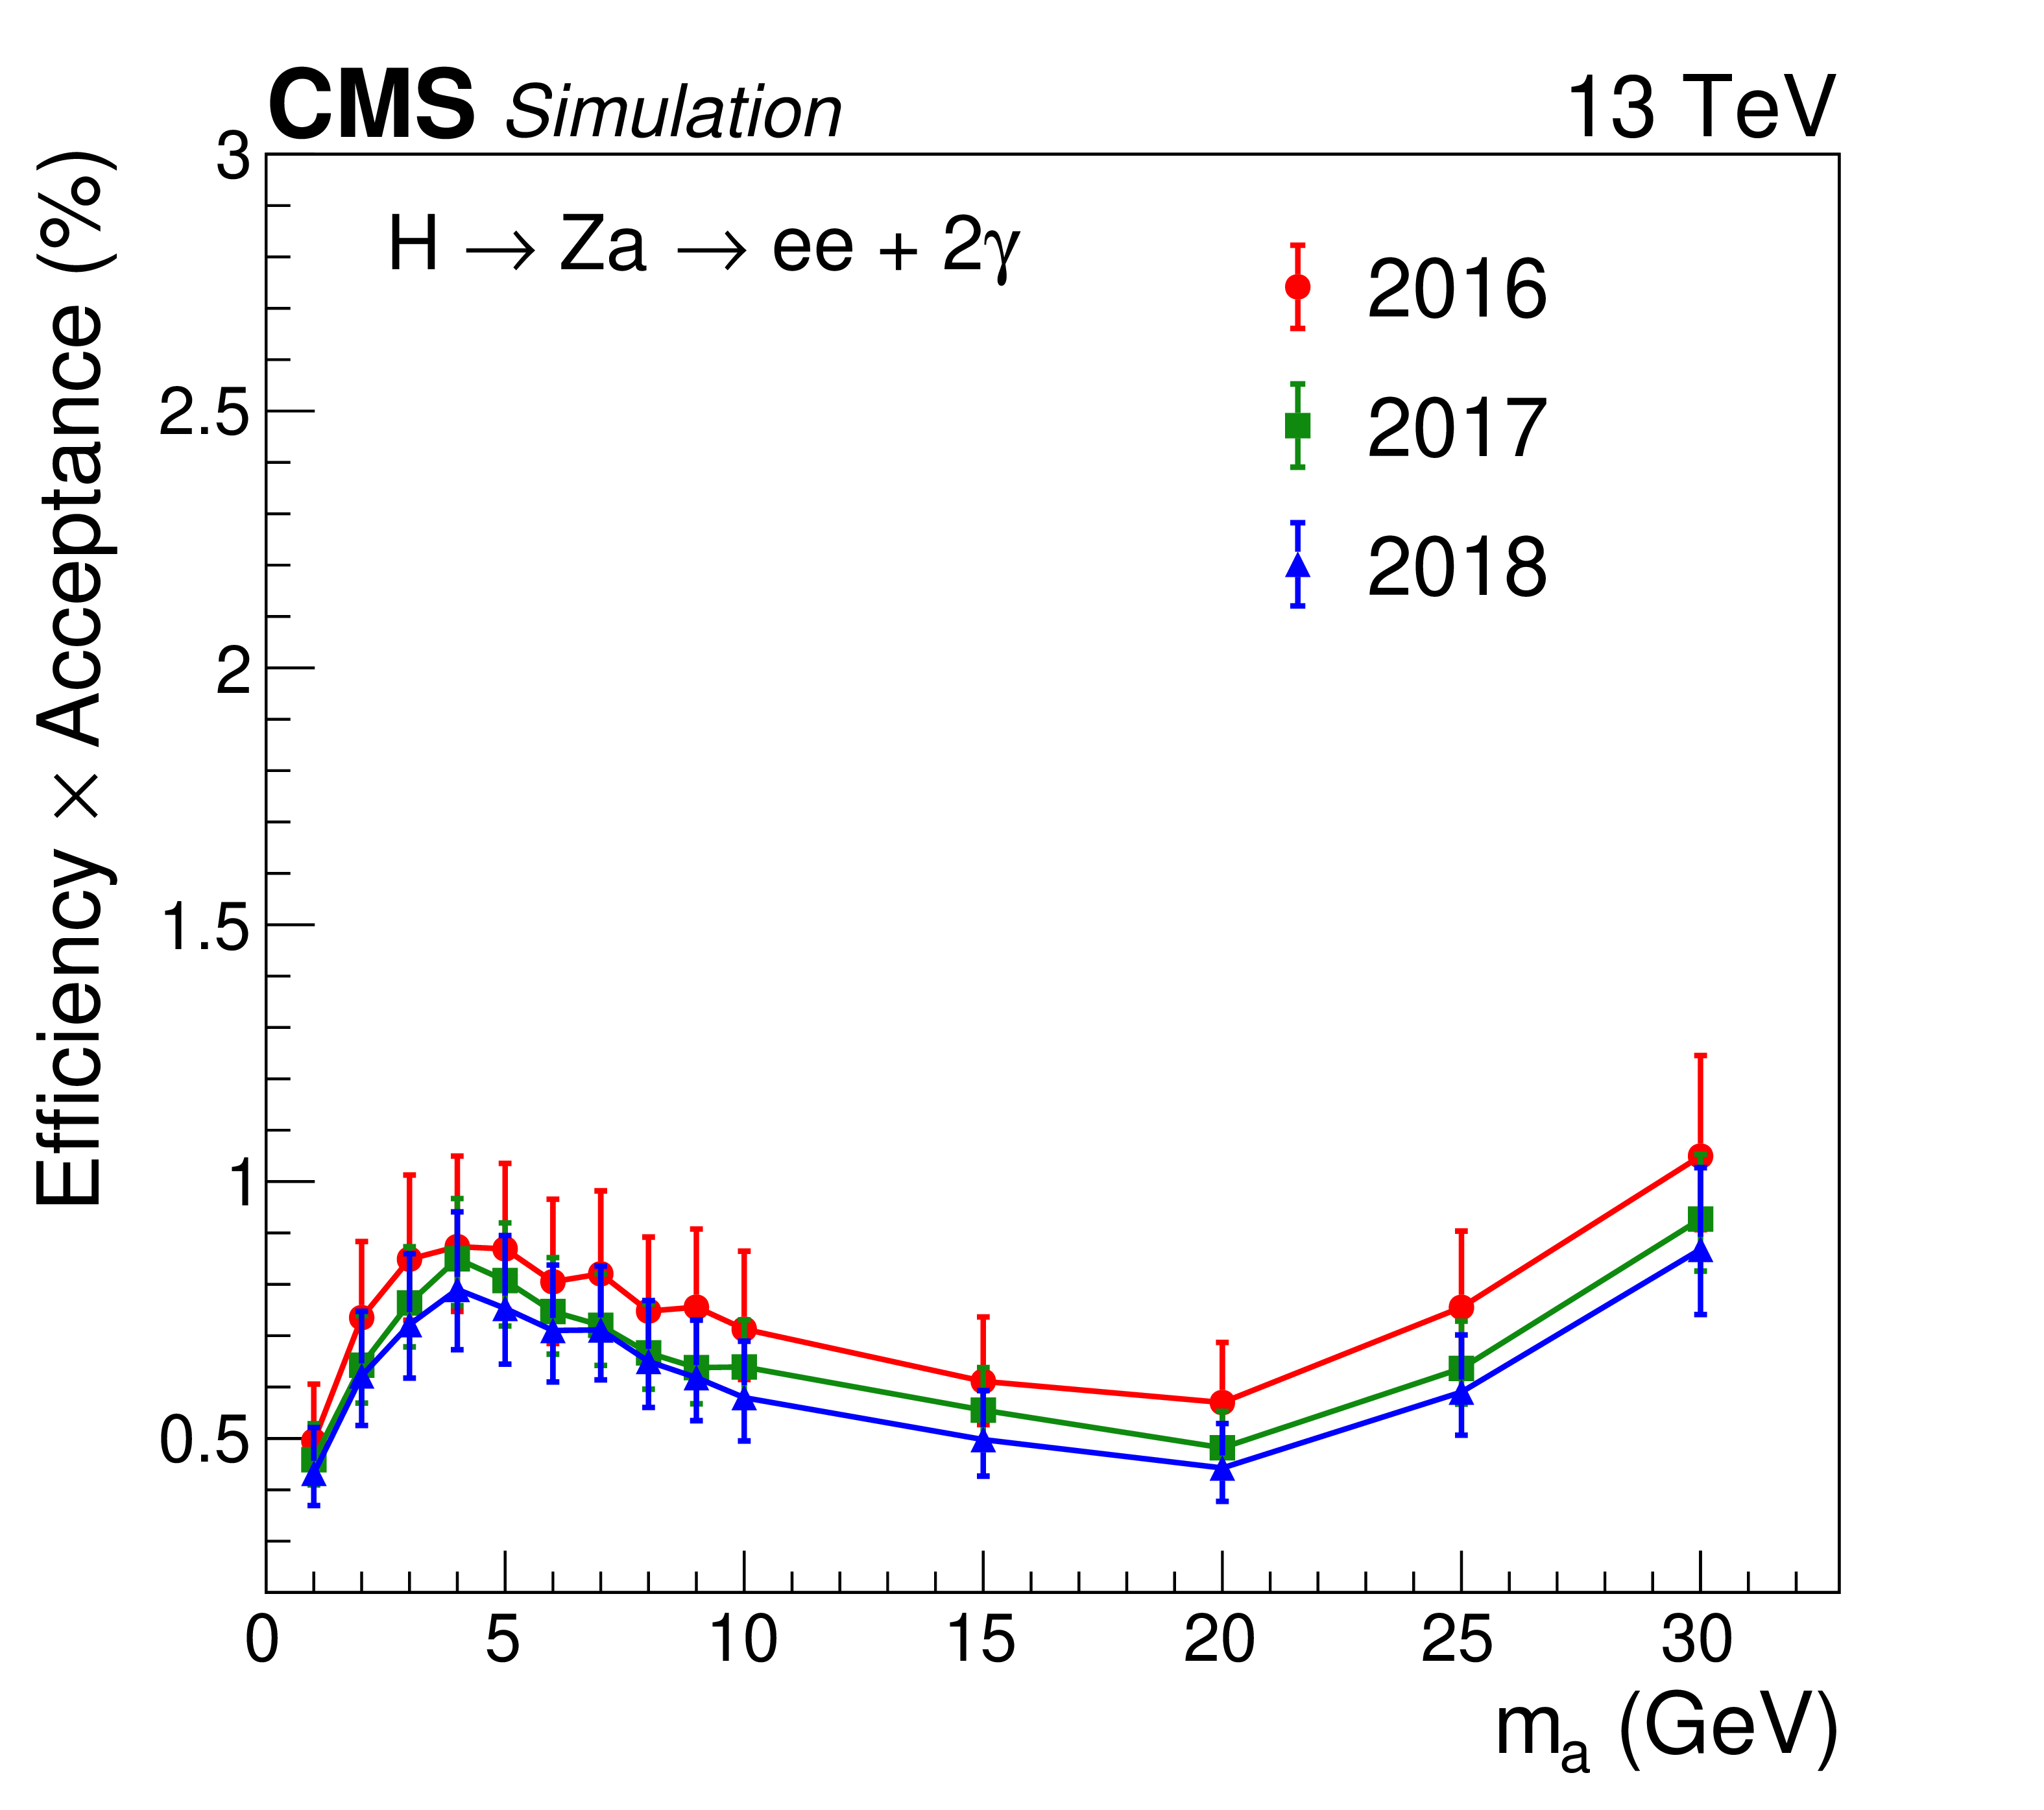
Figure 5:
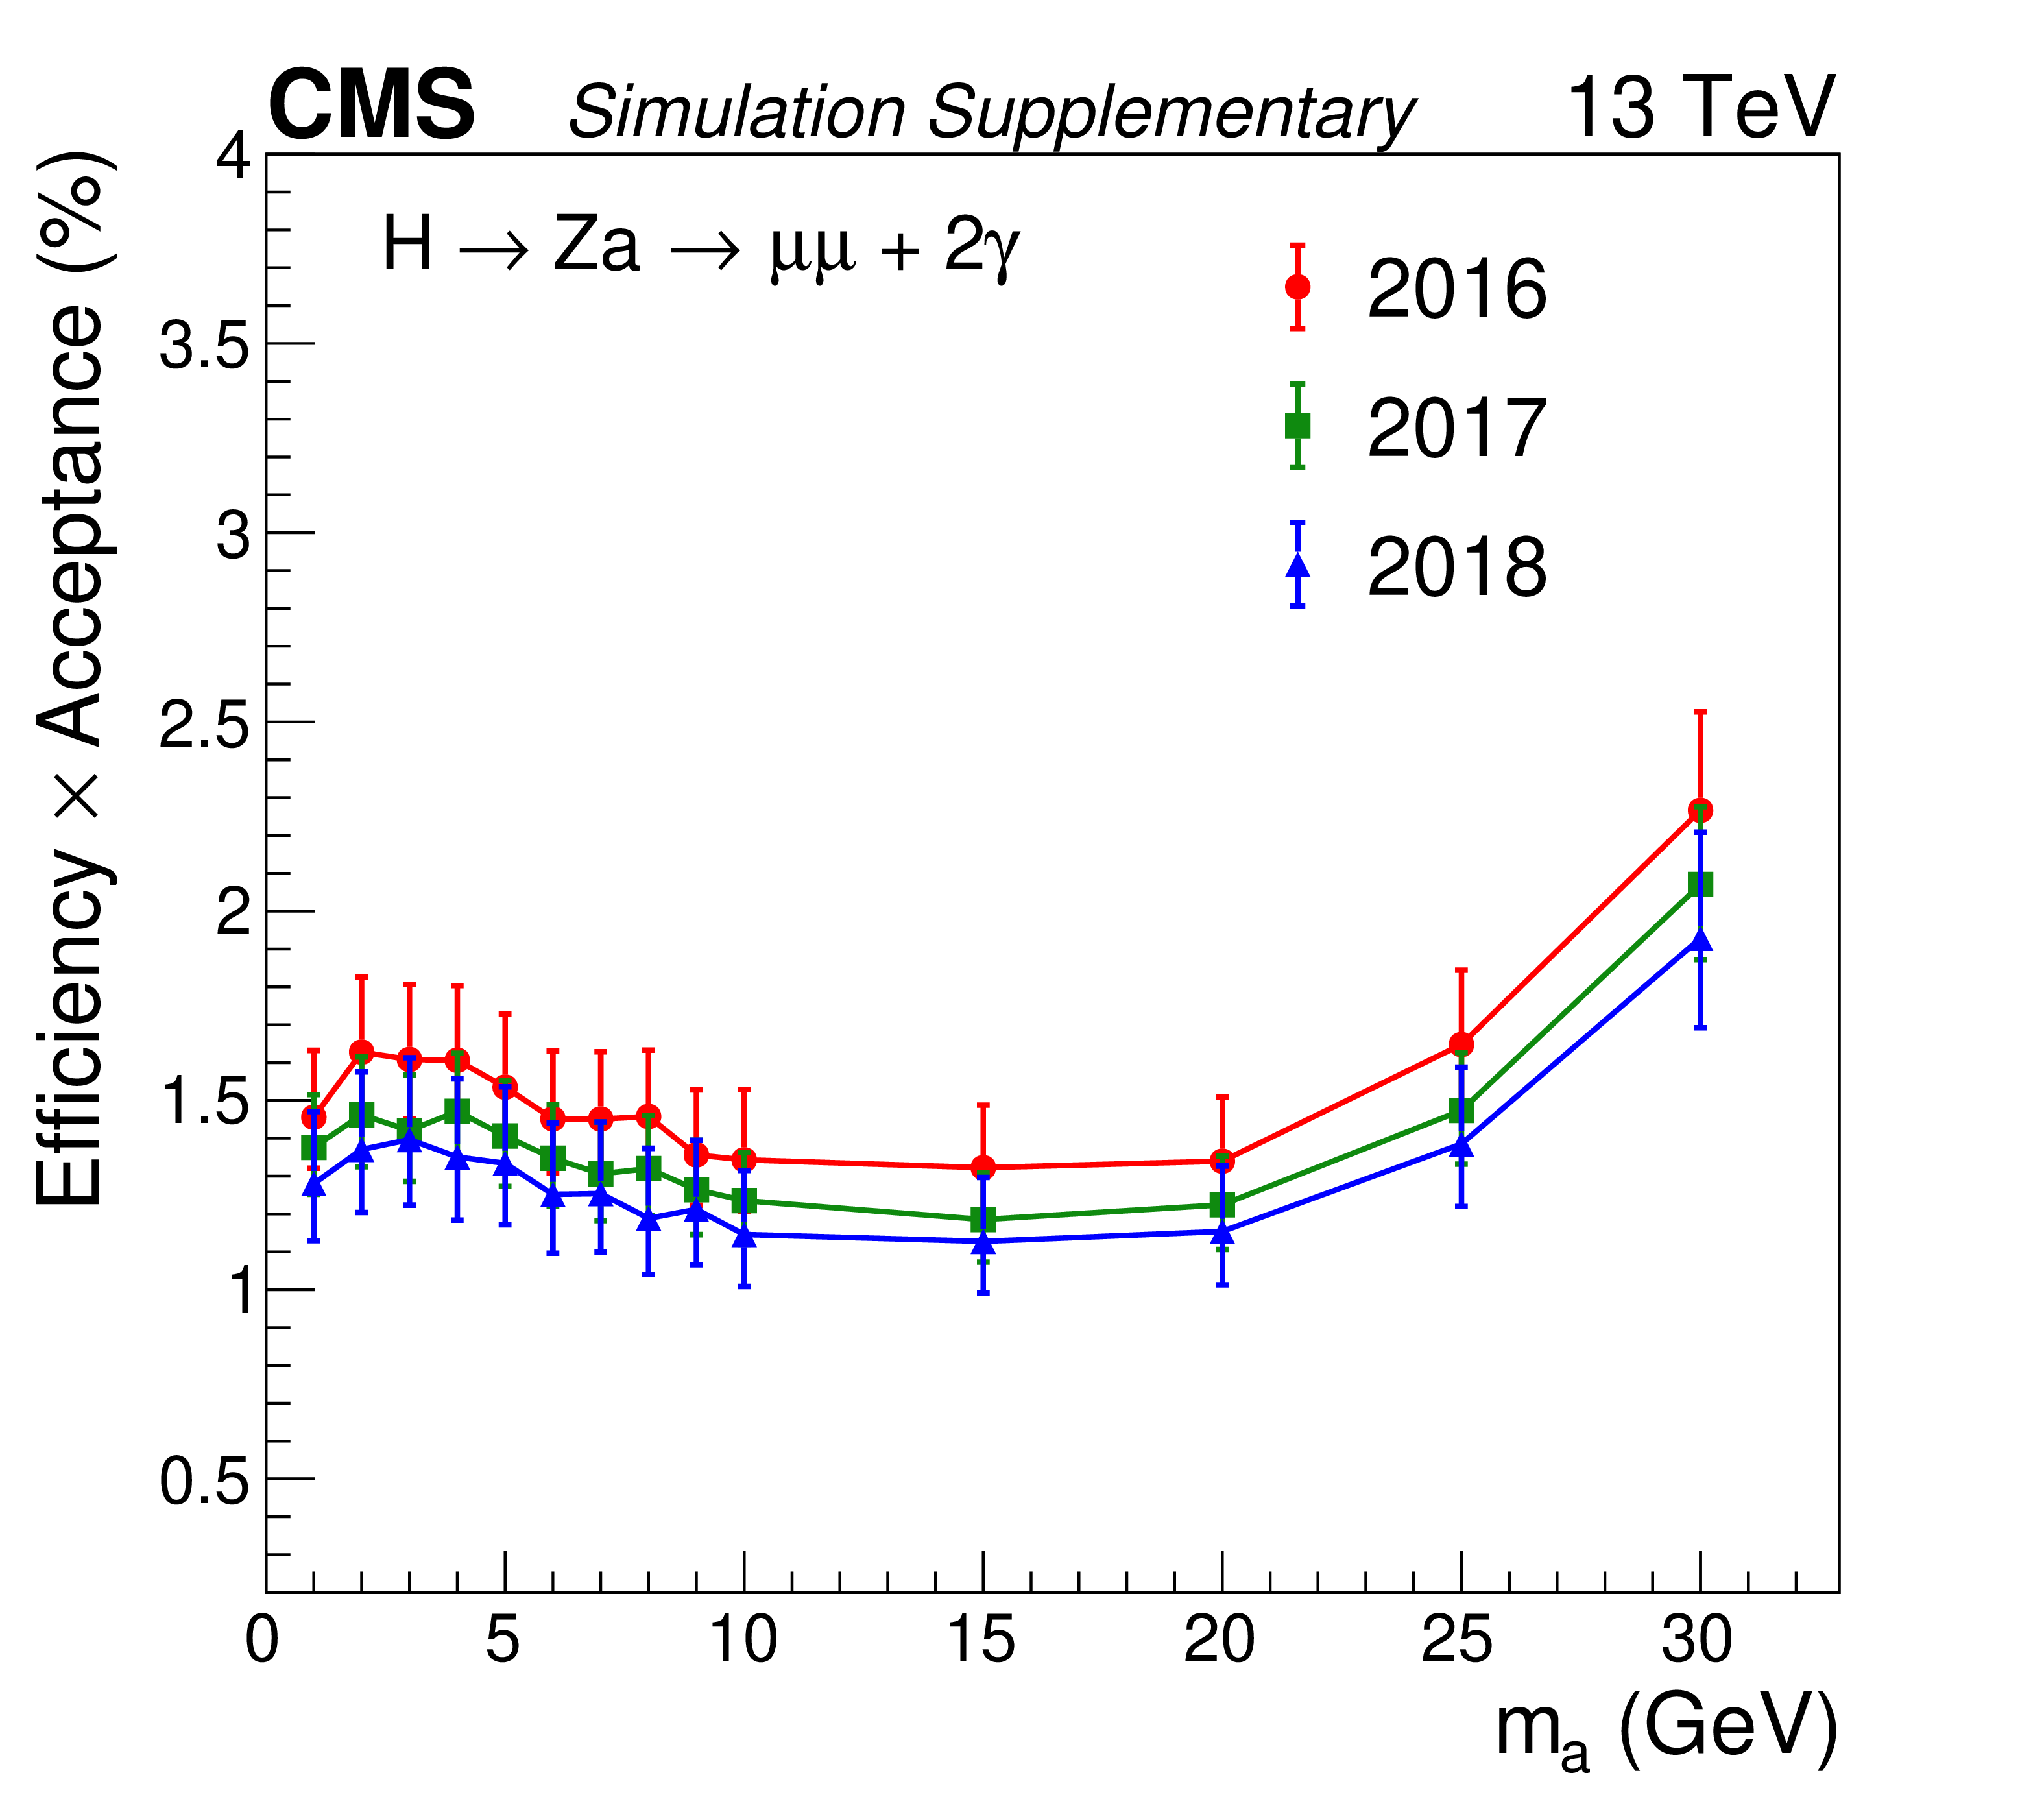
Product of detector efficiency and analysis acceptance for signal samples with various $ m_{\mathrm{a}} $ values for the electron (left) and muon channel (right). The error bars include statistical and systematic uncertainties. The photon efficiency, lepton efficiency, and pileup modeling uncertainties are taken into account for the systematic uncertainty. |
png pdf |
Figure 5-a:
Product of detector efficiency and analysis acceptance for signal samples with various $ m_{\mathrm{a}} $ values for the electron channel. The error bars include statistical and systematic uncertainties. The photon efficiency, lepton efficiency, and pileup modeling uncertainties are taken into account for the systematic uncertainty. |

png pdf |
Figure 5-b:
Product of detector efficiency and analysis acceptance for signal samples with various $ m_{\mathrm{a}} $ values for the muon channel. The error bars include statistical and systematic uncertainties. The photon efficiency, lepton efficiency, and pileup modeling uncertainties are taken into account for the systematic uncertainty. |
png pdf |
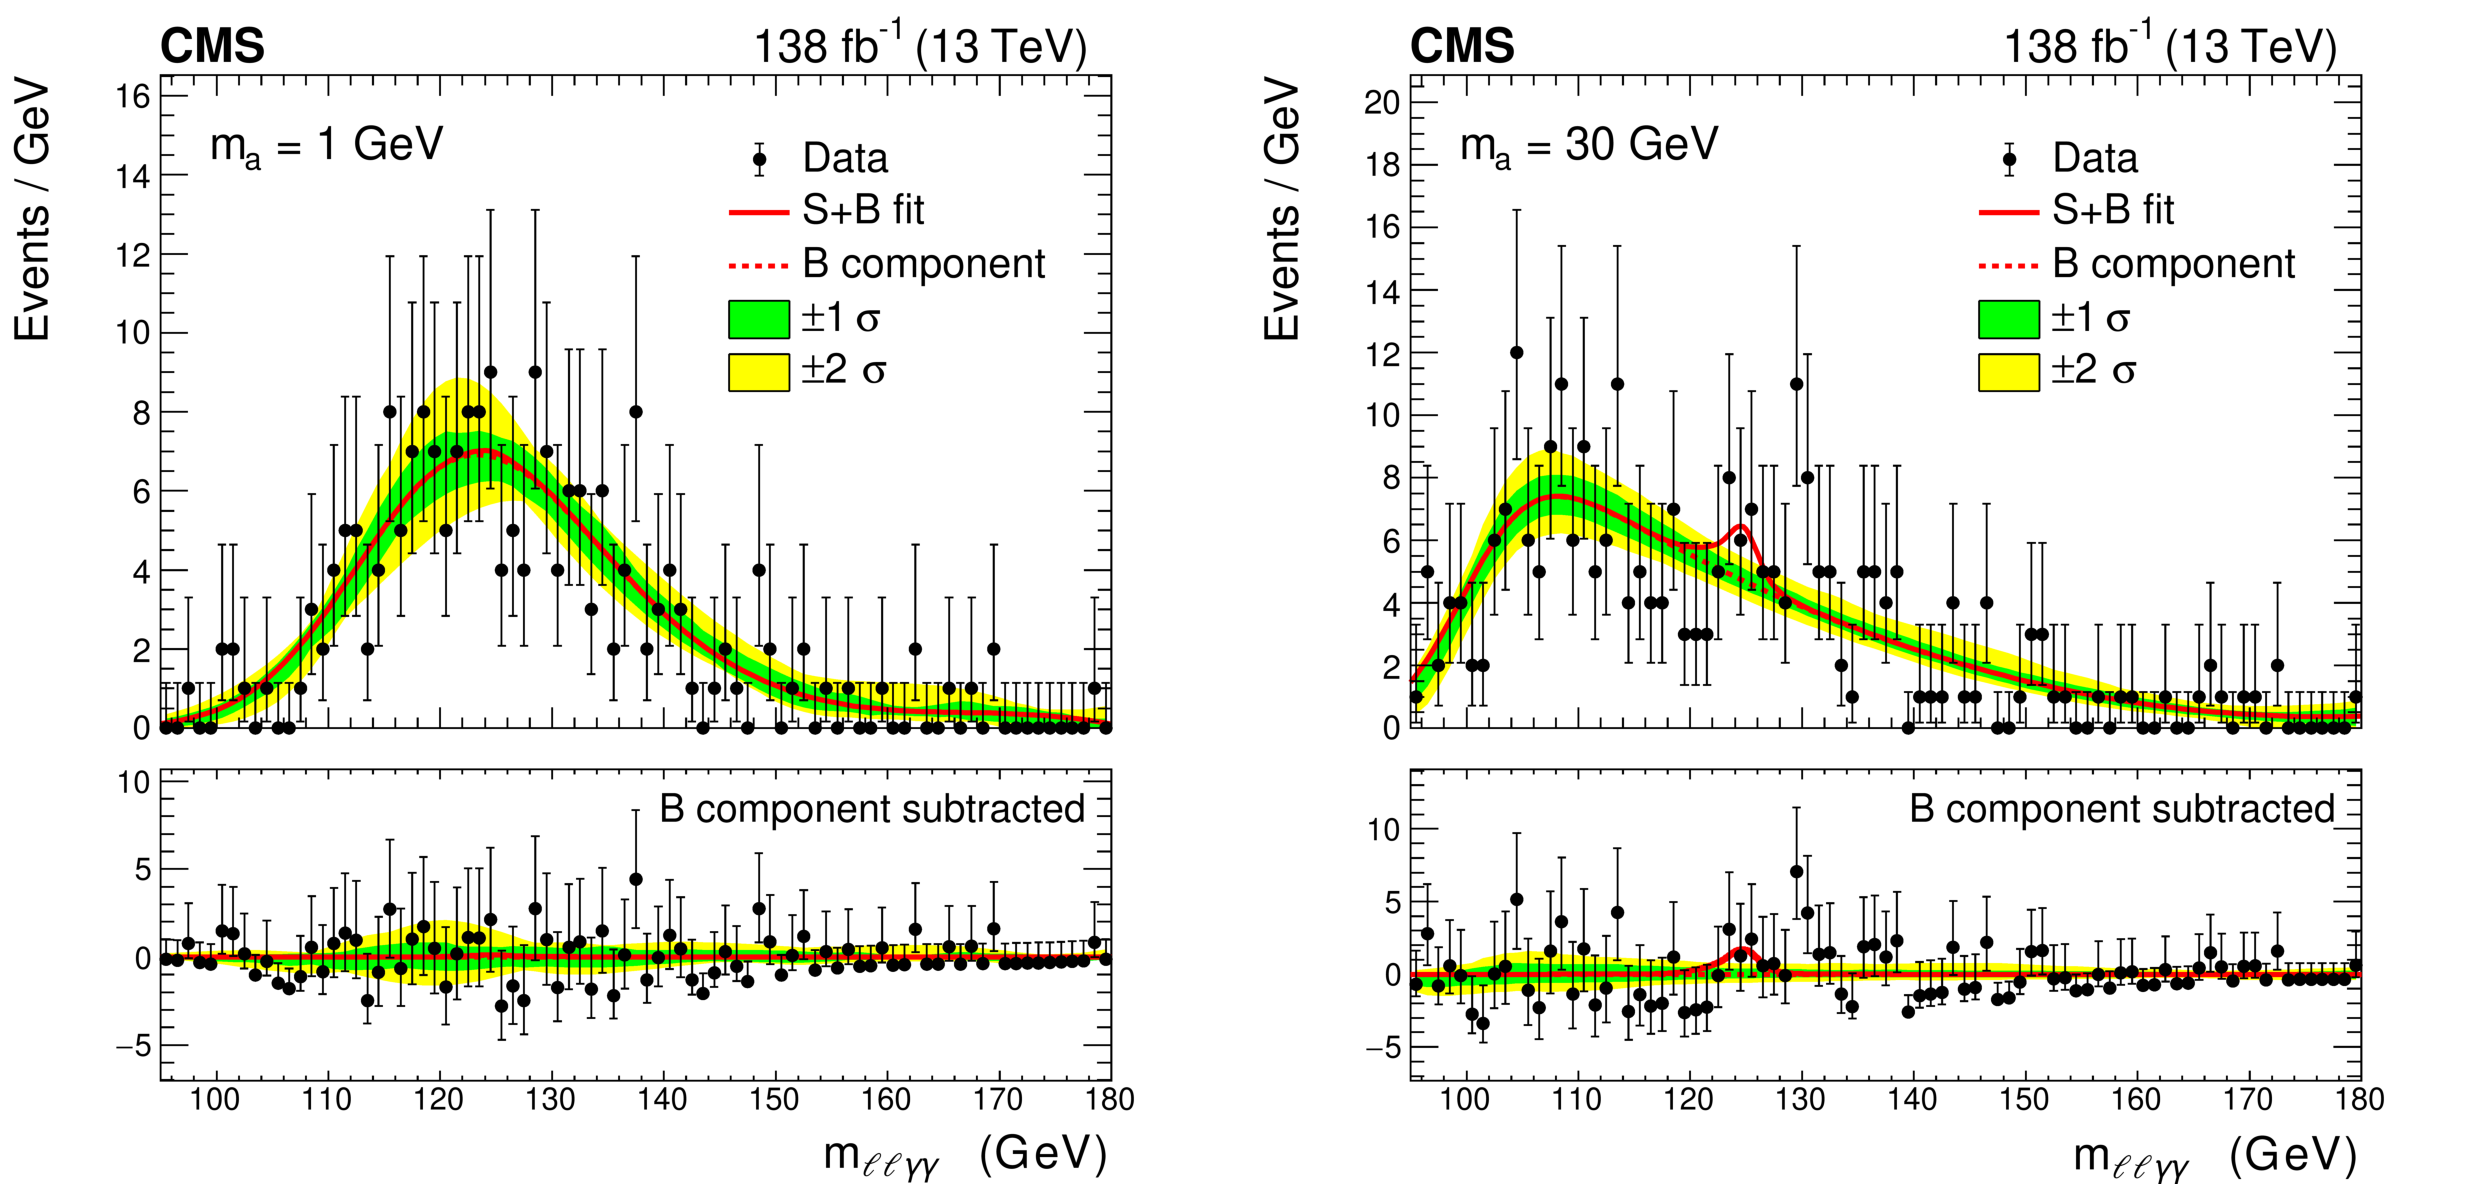
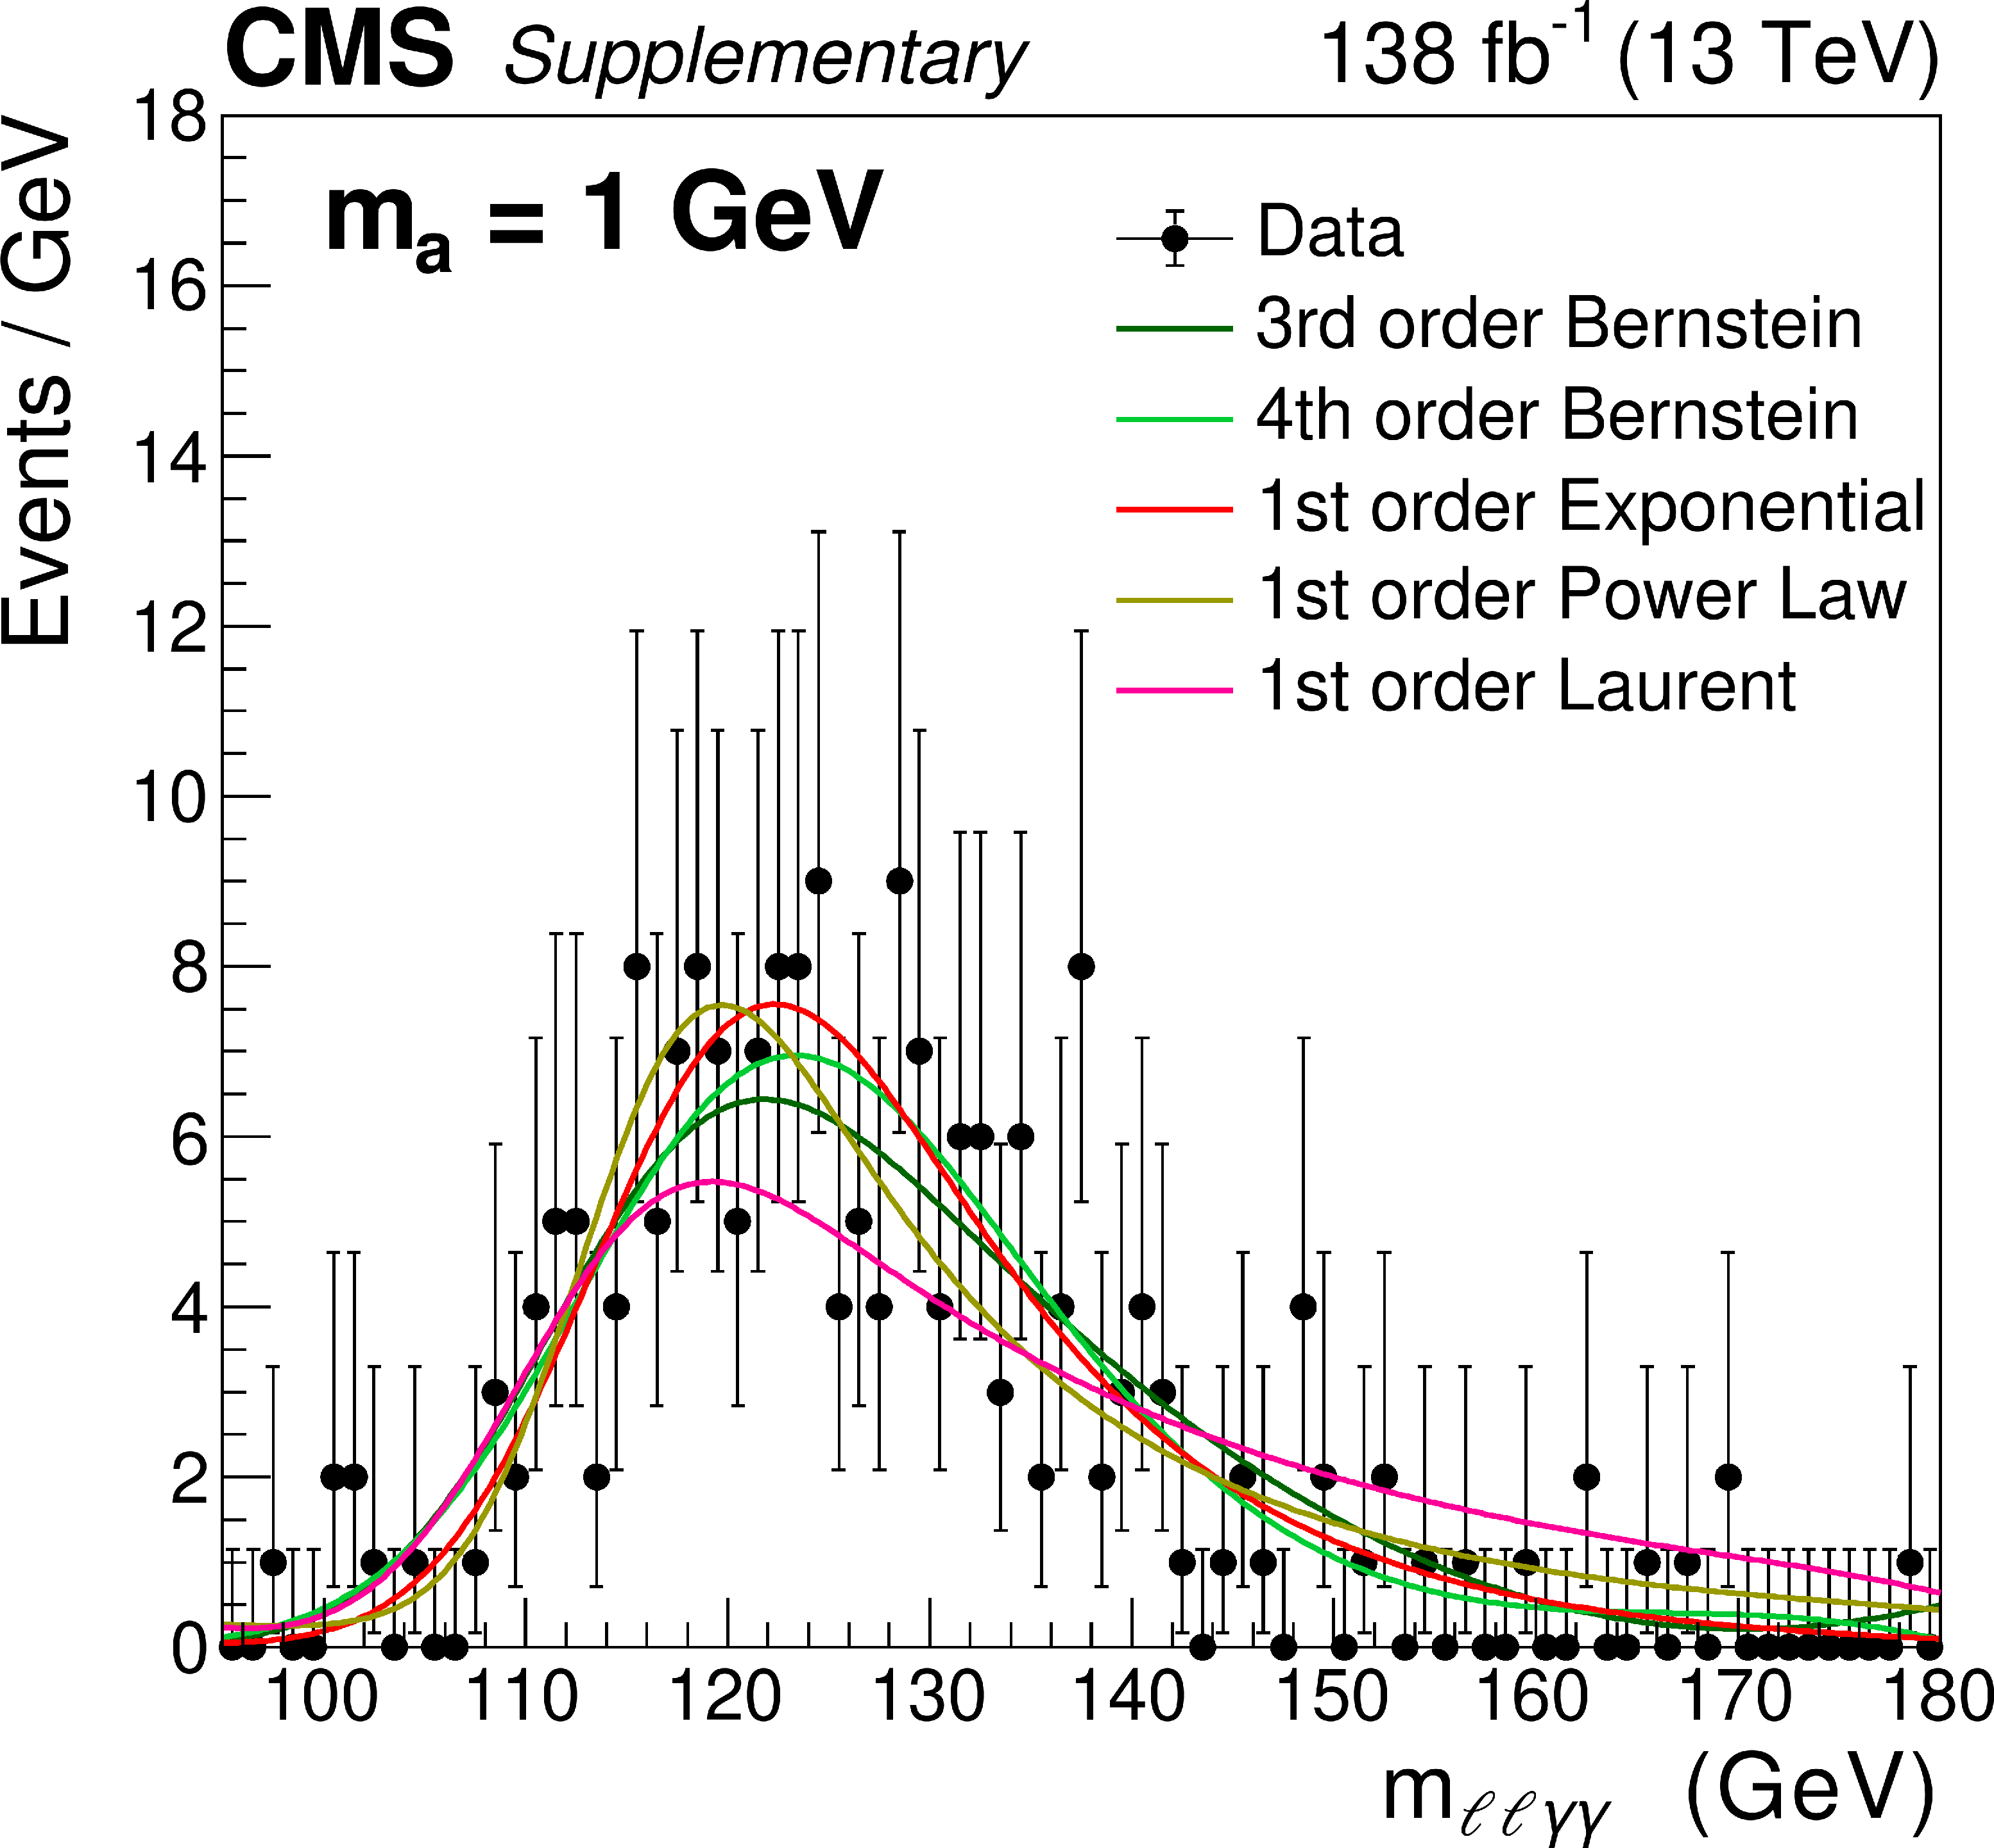
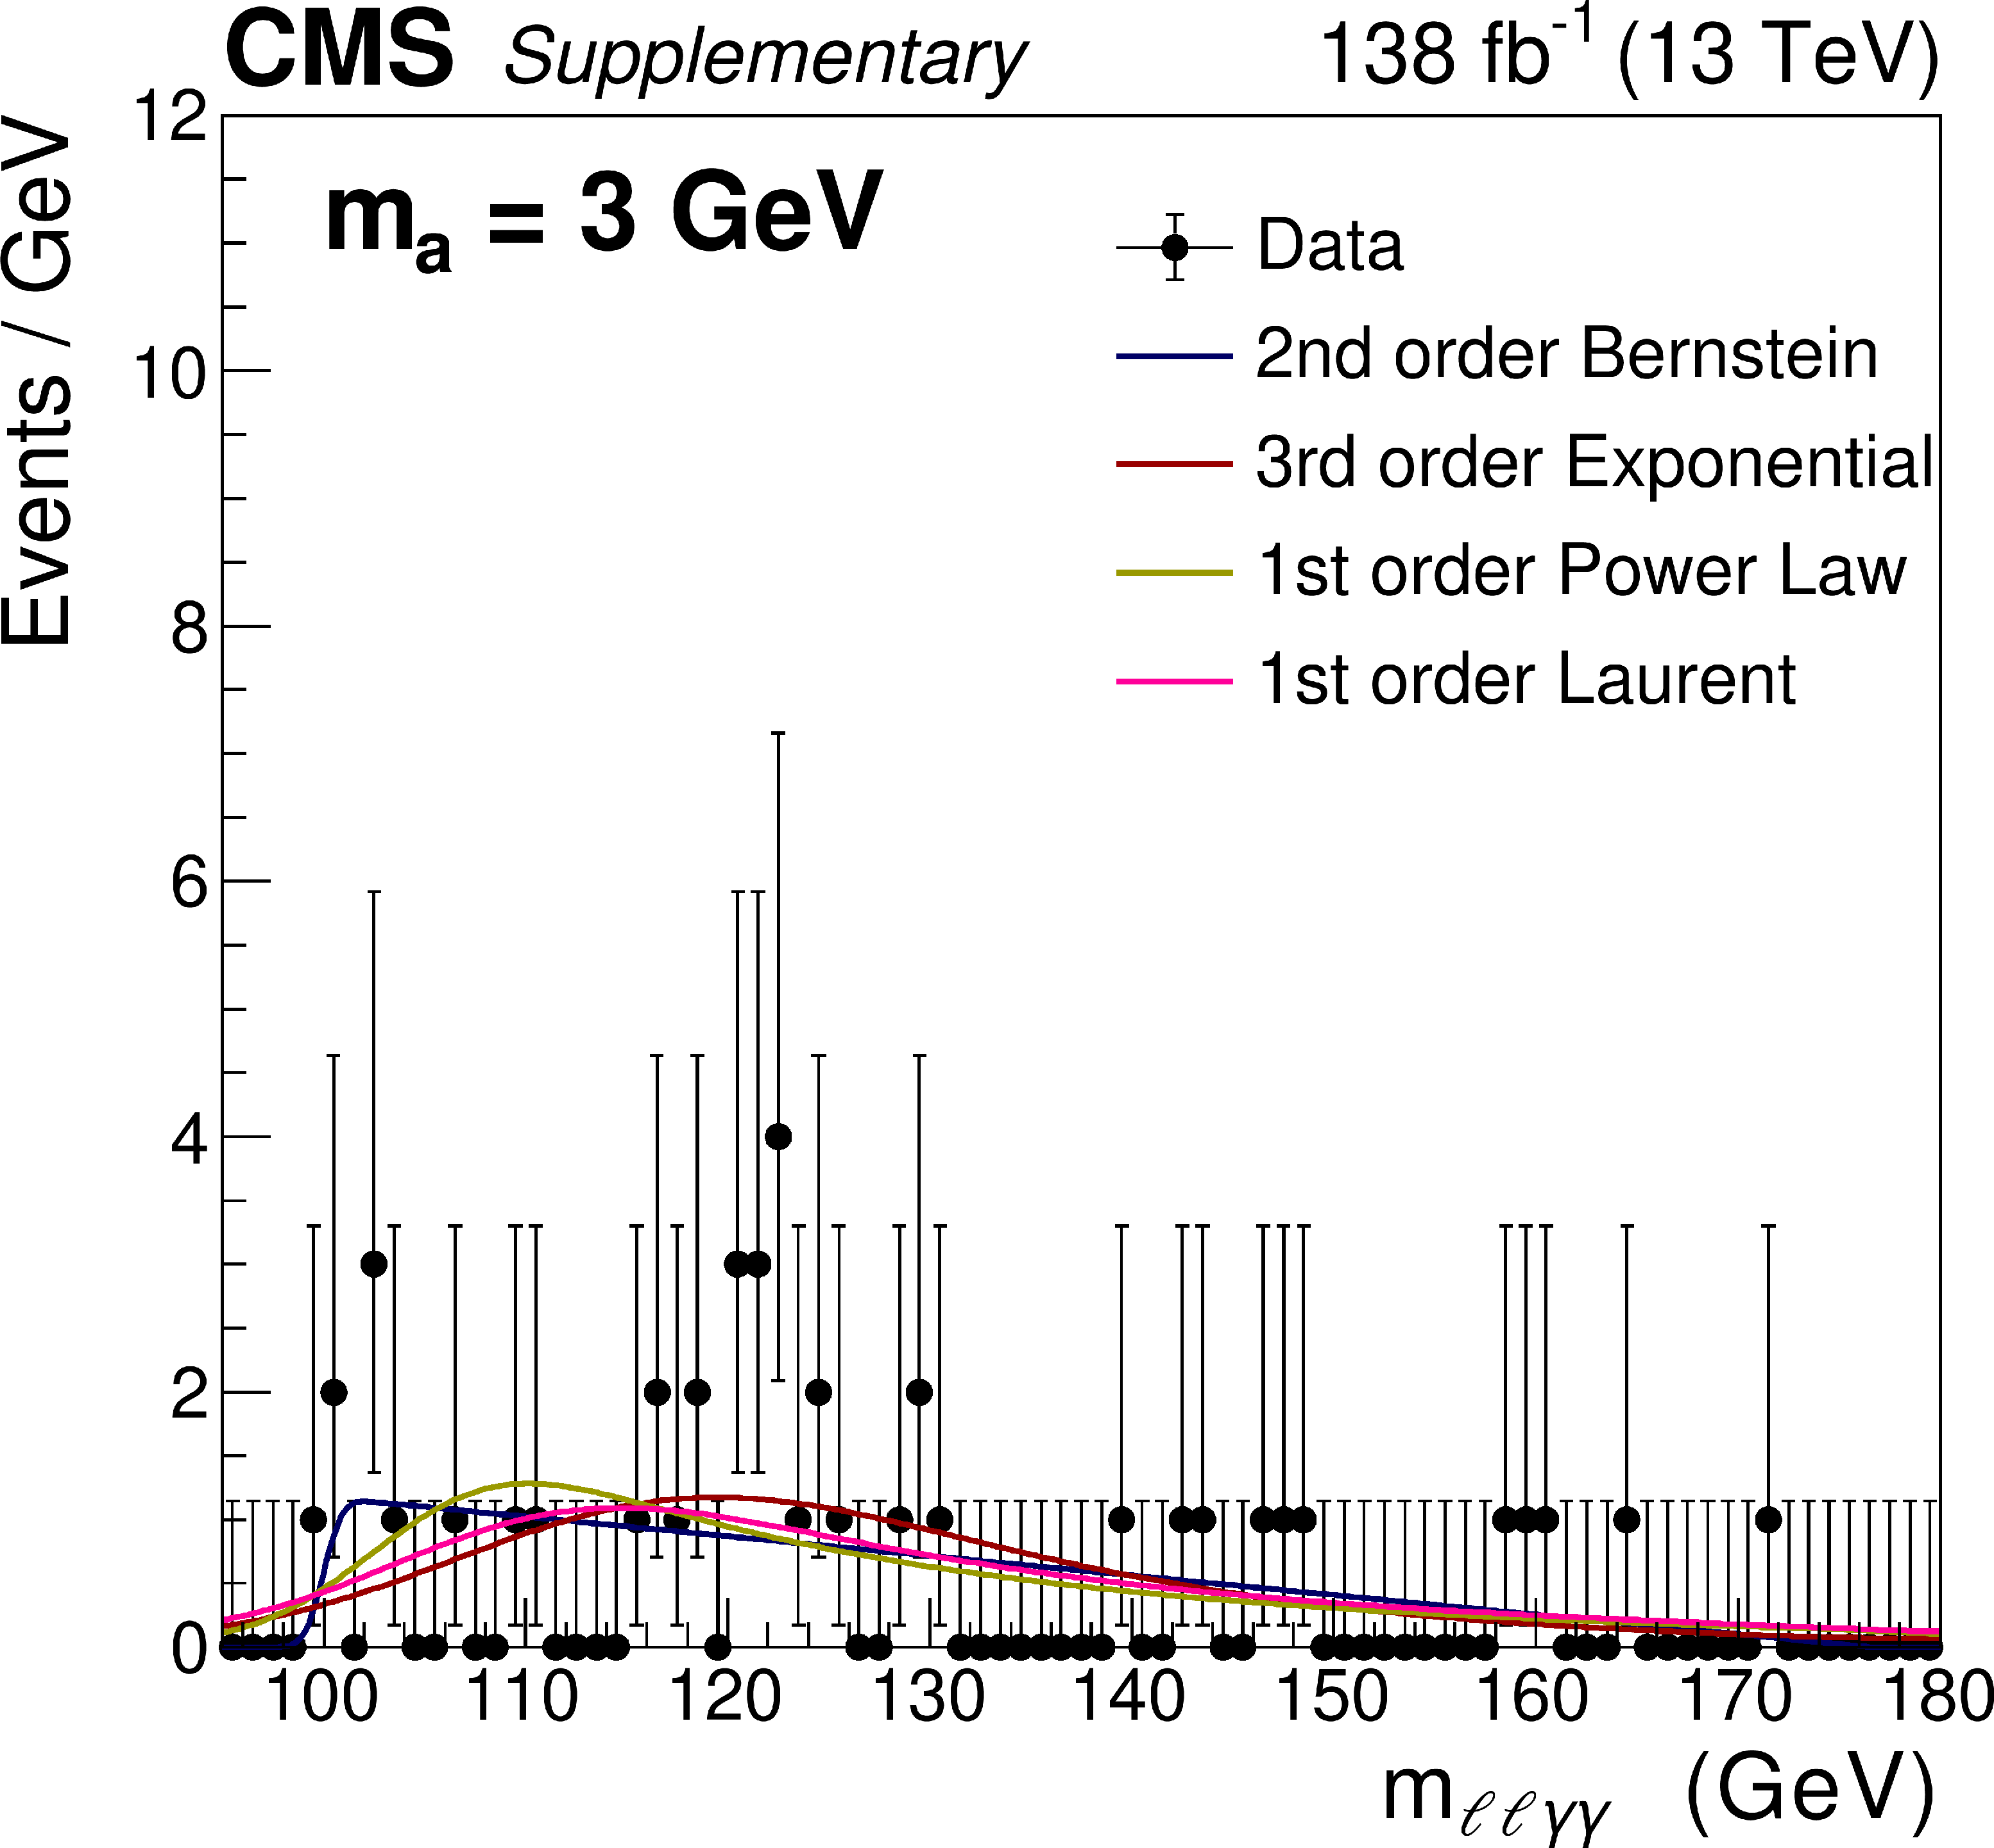
Figure 6:
Invariant mass $ m_{\ell\ell\gamma\gamma} $ distribution in data (black points). The signal-plus-background model fit is shown for $ m_{\mathrm{a}} = $ 1 (left) and 30 (right) GeV, where the solid red line shows the total signal-plus-background contribution, and the dashed red line shows the background component only. The lower panels show the residual signal yield after the background subtraction. The one (green, inner) and two (yellow, outer) standard deviation bands show the uncertainties in the fitted background model. These bands include the uncertainty due to the choice of function and the uncertainty in the fitted parameters. |

png pdf |
Figure 6-a:
Invariant mass $ m_{\ell\ell\gamma\gamma} $ distribution in data (black points). The signal-plus-background model fit is shown for $ m_{\mathrm{a}} = $ 1 GeV, where the solid red line shows the total signal-plus-background contribution, and the dashed red line shows the background component only. The lower panel shows the residual signal yield after the background subtraction. The one (green, inner) and two (yellow, outer) standard deviation bands show the uncertainties in the fitted background model. These bands include the uncertainty due to the choice of function and the uncertainty in the fitted parameters. |
png pdf |
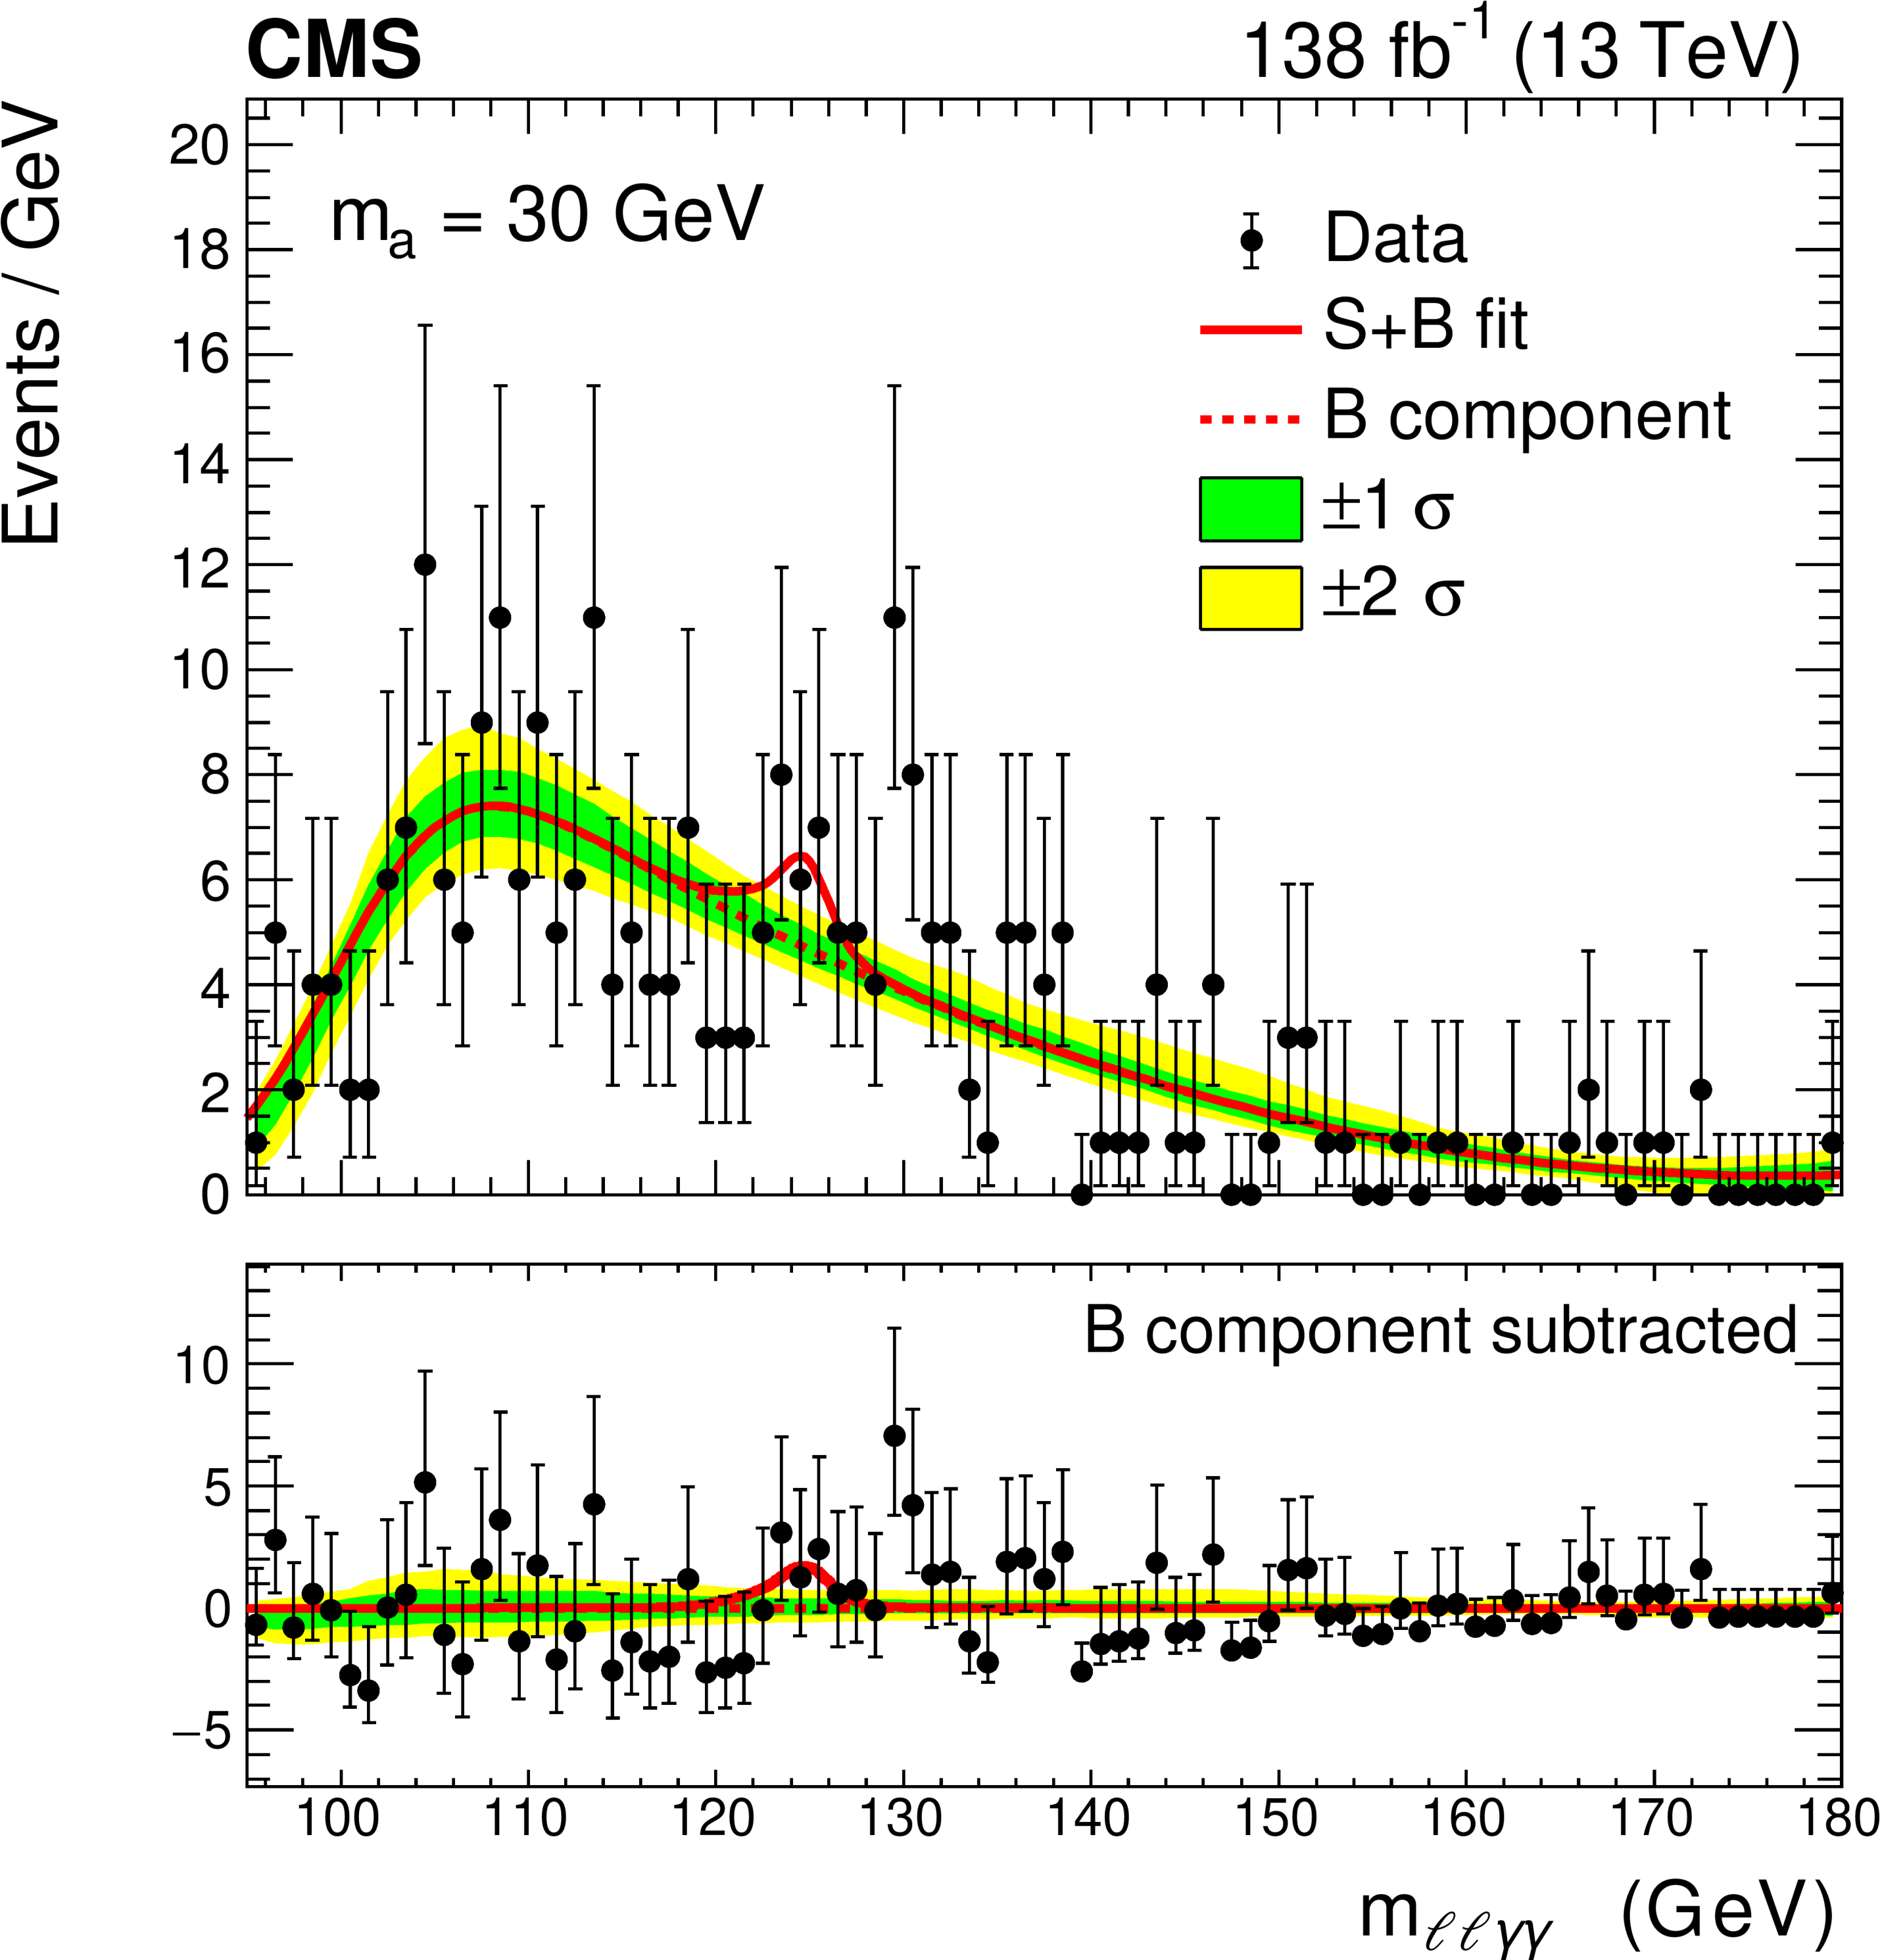
Figure 6-b:
Invariant mass $ m_{\ell\ell\gamma\gamma} $ distribution in data (black points). The signal-plus-background model fit is shown for $ m_{\mathrm{a}} = $ 30 GeV, where the solid red line shows the total signal-plus-background contribution, and the dashed red line shows the background component only. The lower panel shows the residual signal yield after the background subtraction. The one (green, inner) and two (yellow, outer) standard deviation bands show the uncertainties in the fitted background model. These bands include the uncertainty due to the choice of function and the uncertainty in the fitted parameters. |
png pdf |
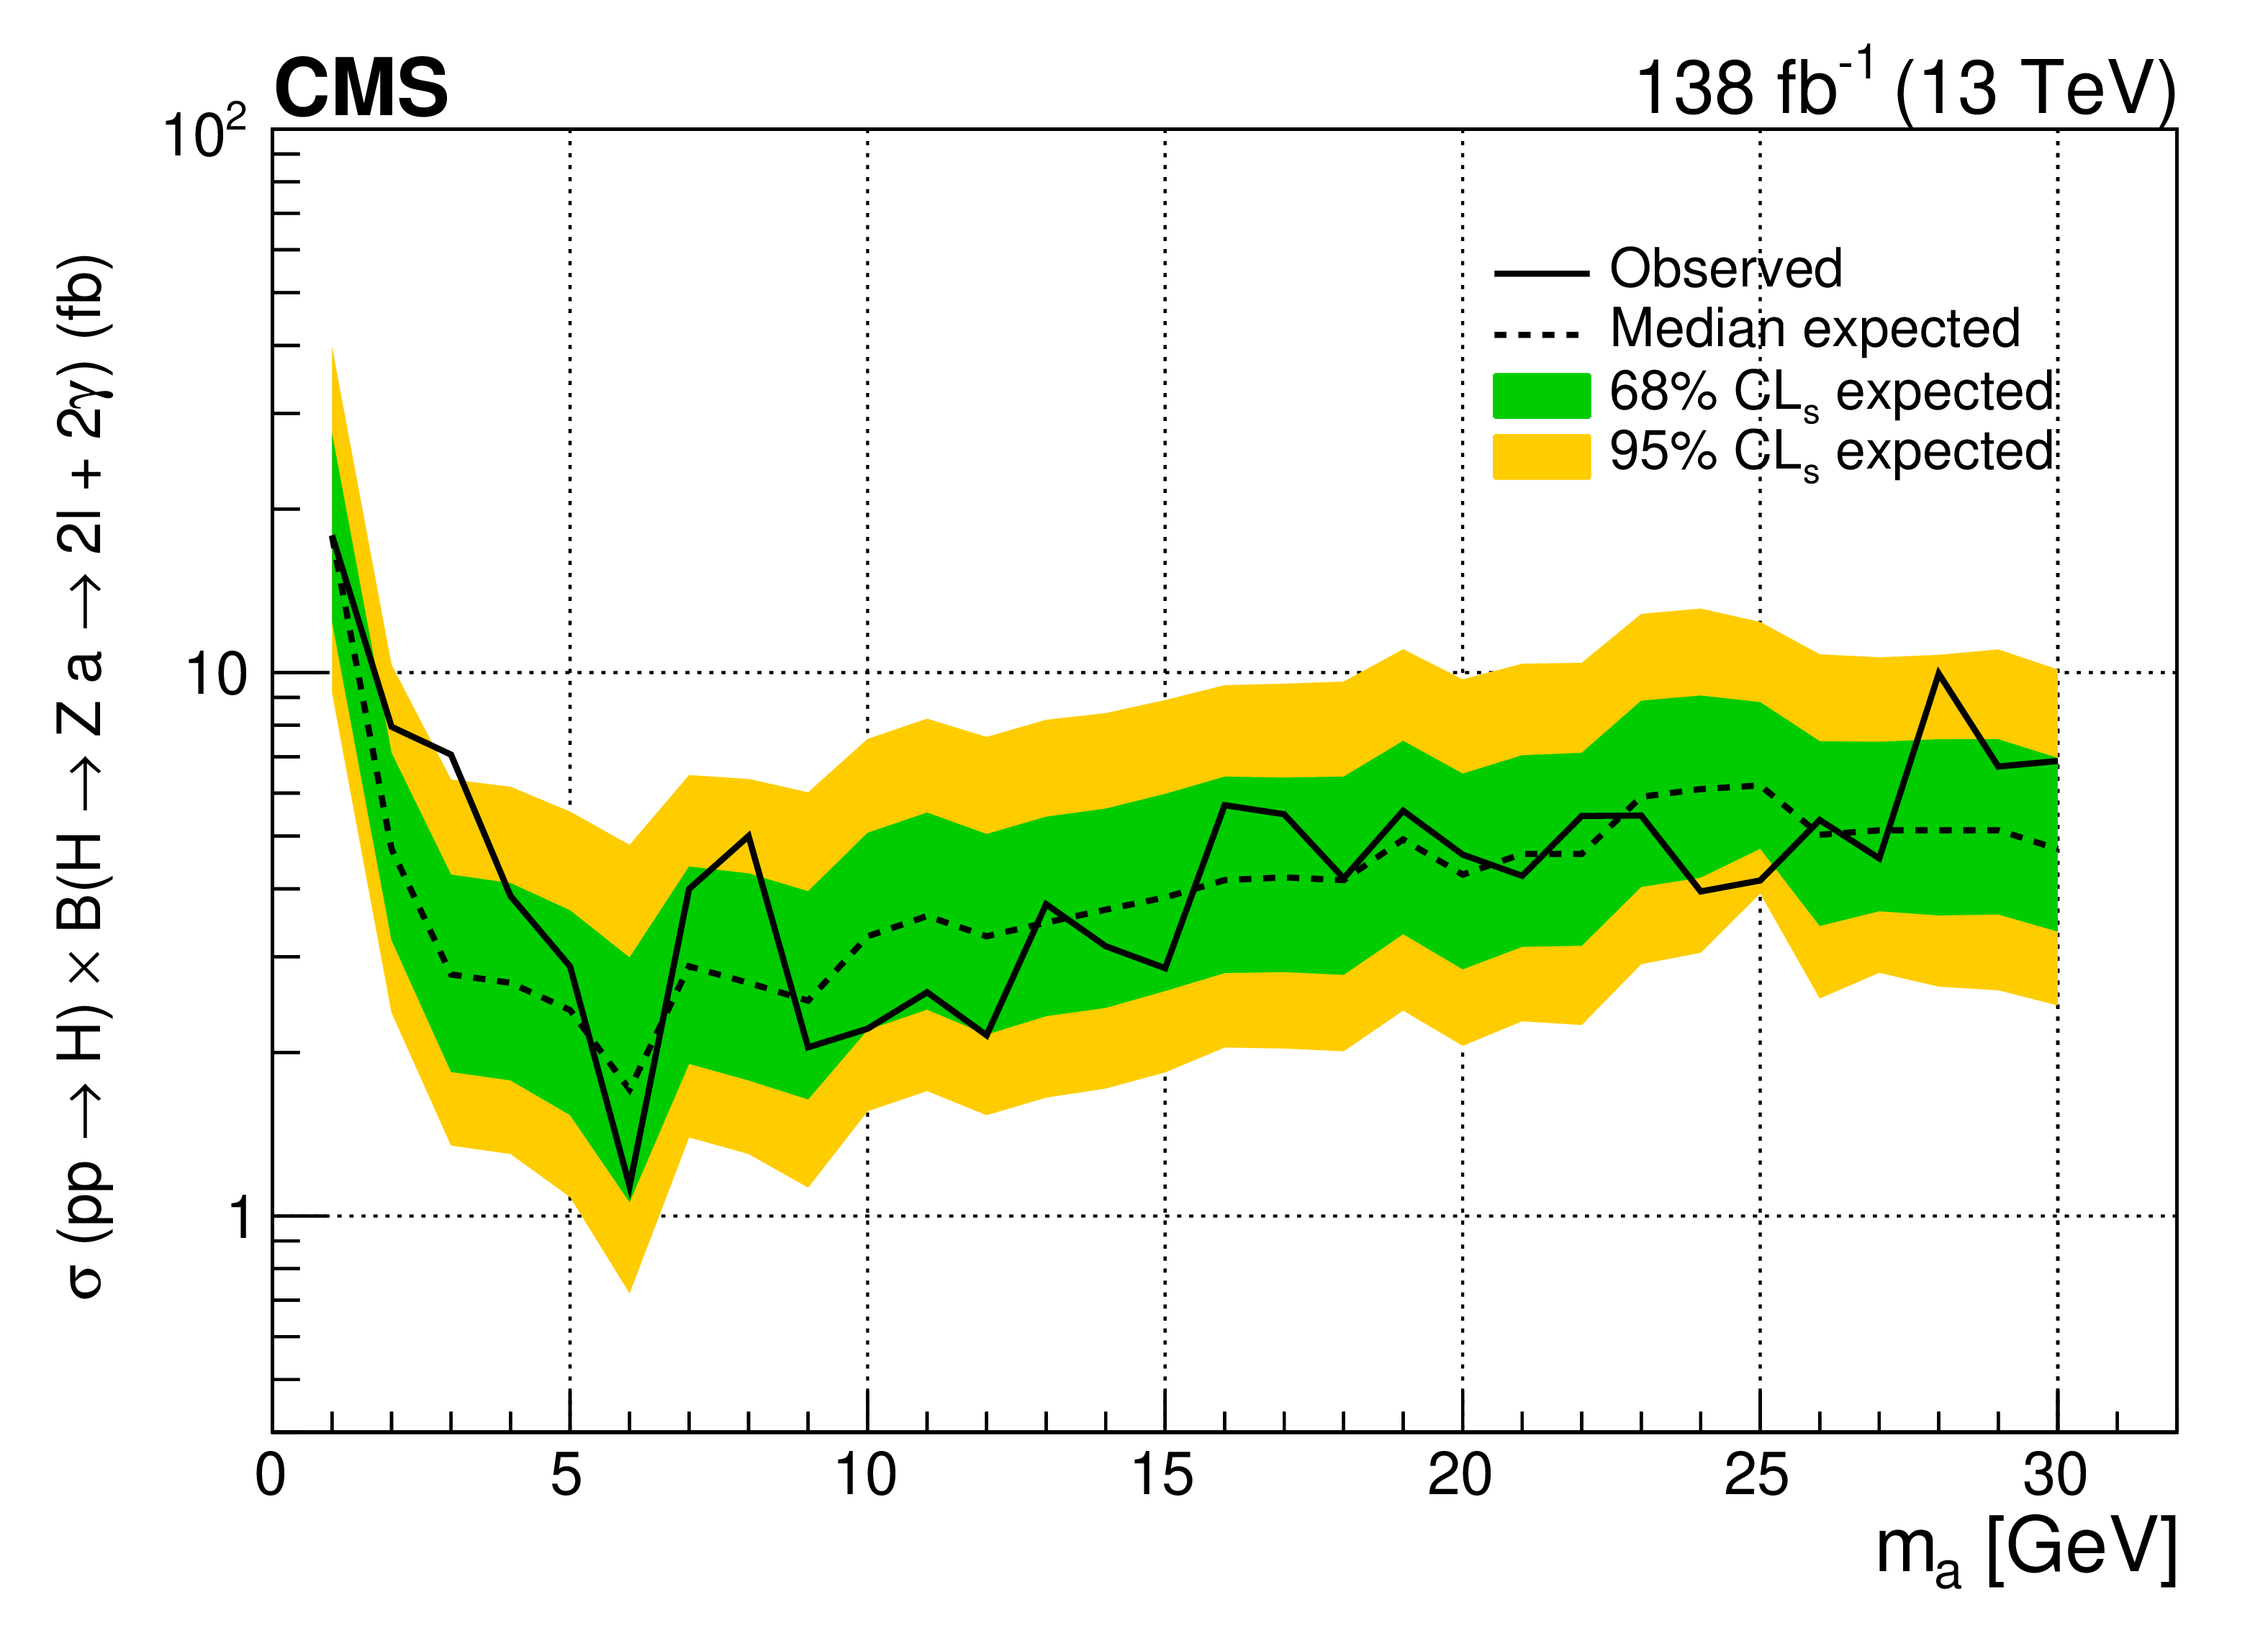
Figure 7:
Expected and observed 95% CL limits on the product of the production cross section of the H boson and its branching fraction into a dilepton and a diphoton pair via a Z boson and a pseudoscalar, $ \sigma (\mathrm{p}\mathrm{p} \to \mathrm{H})\, \mathcal{B}(\mathrm{H} \to \mathrm{Z} \mathrm{a} \to \ell\ell\gamma\gamma) $. The dashed black curve is the expected upper limit, while the one and two standard-deviation bands are shown in green and yellow, respectively. The solid black curve is the observed upper limit. |
png pdf |
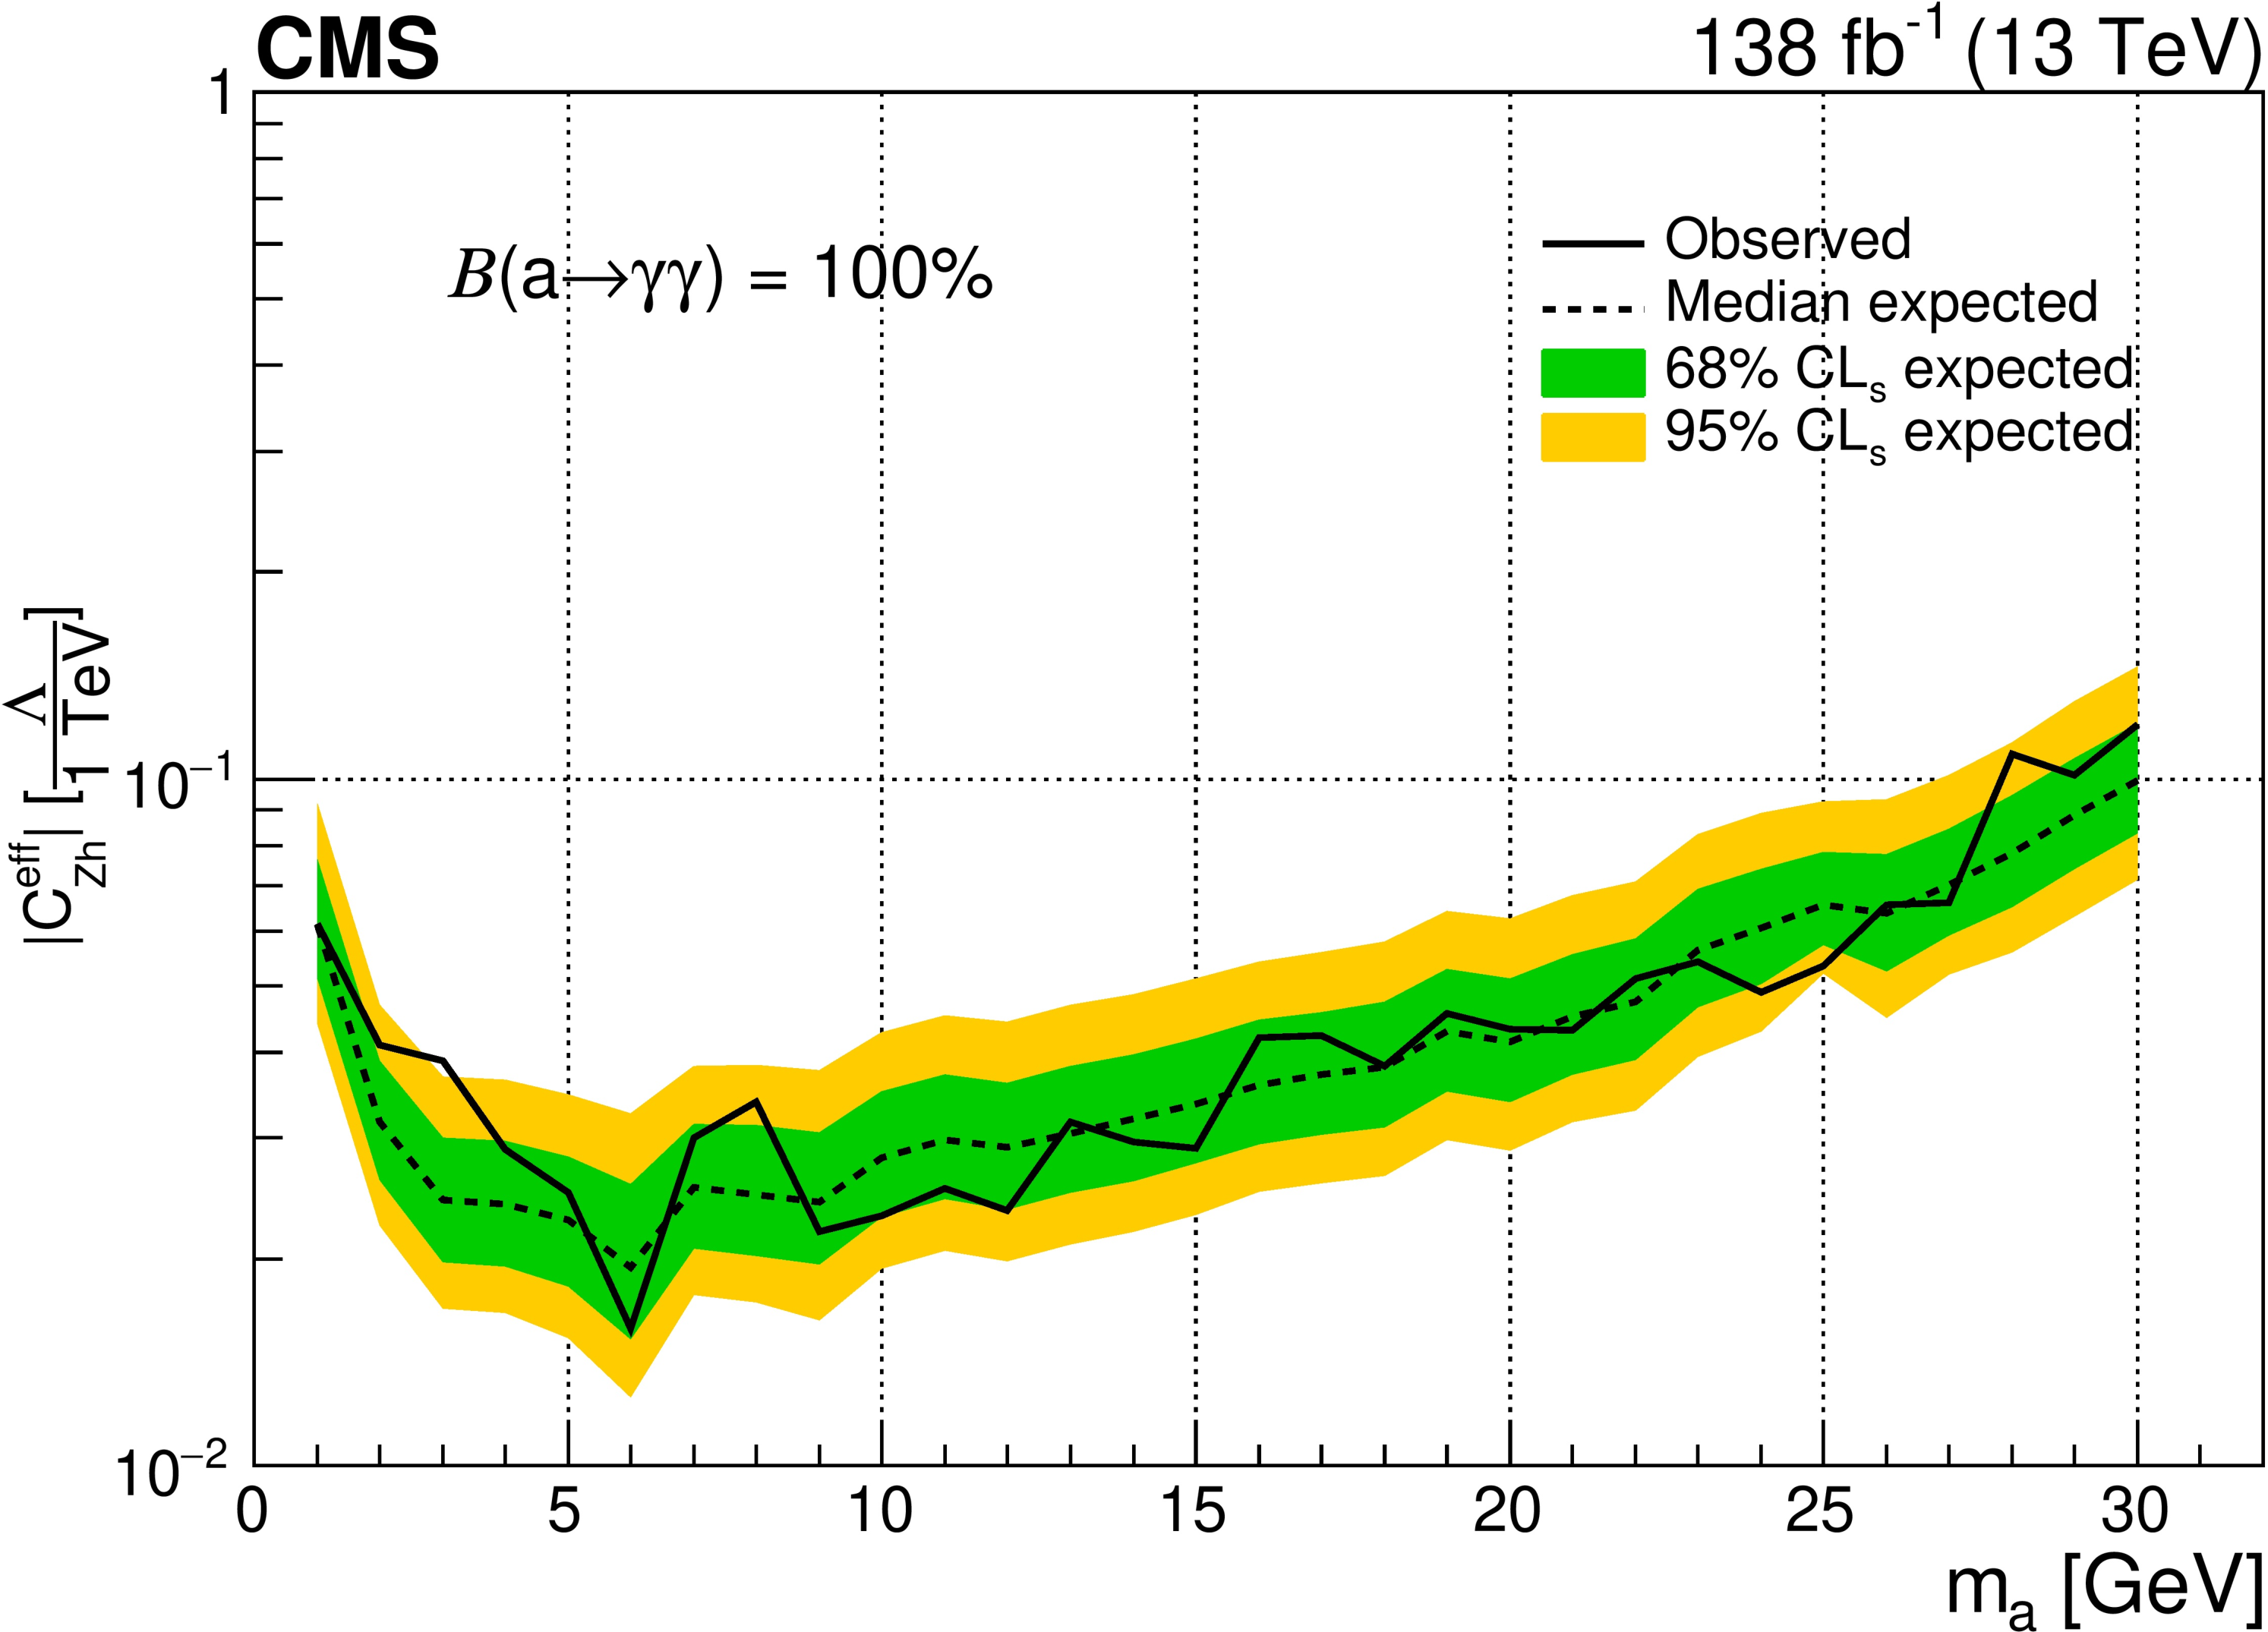
Figure 8:
Expected and observed limits at 95% CL on $ C_{\mathrm{Z}\mathrm{H}}^\text{eff}/\Lambda $, assuming the ALP decays exclusively to a photon pair. The dashed black curve is the expected upper limit, while the one and two standard-deviation bands are shown in green and yellow, respectively. The solid black curve is the observed upper limit. |
| Tables | |

png pdf |
Table 1:
Minimum BDT output values used to define the signal region, with the associated signal efficiencies and background yields. The statistical uncertainties is also shown. |
png pdf |
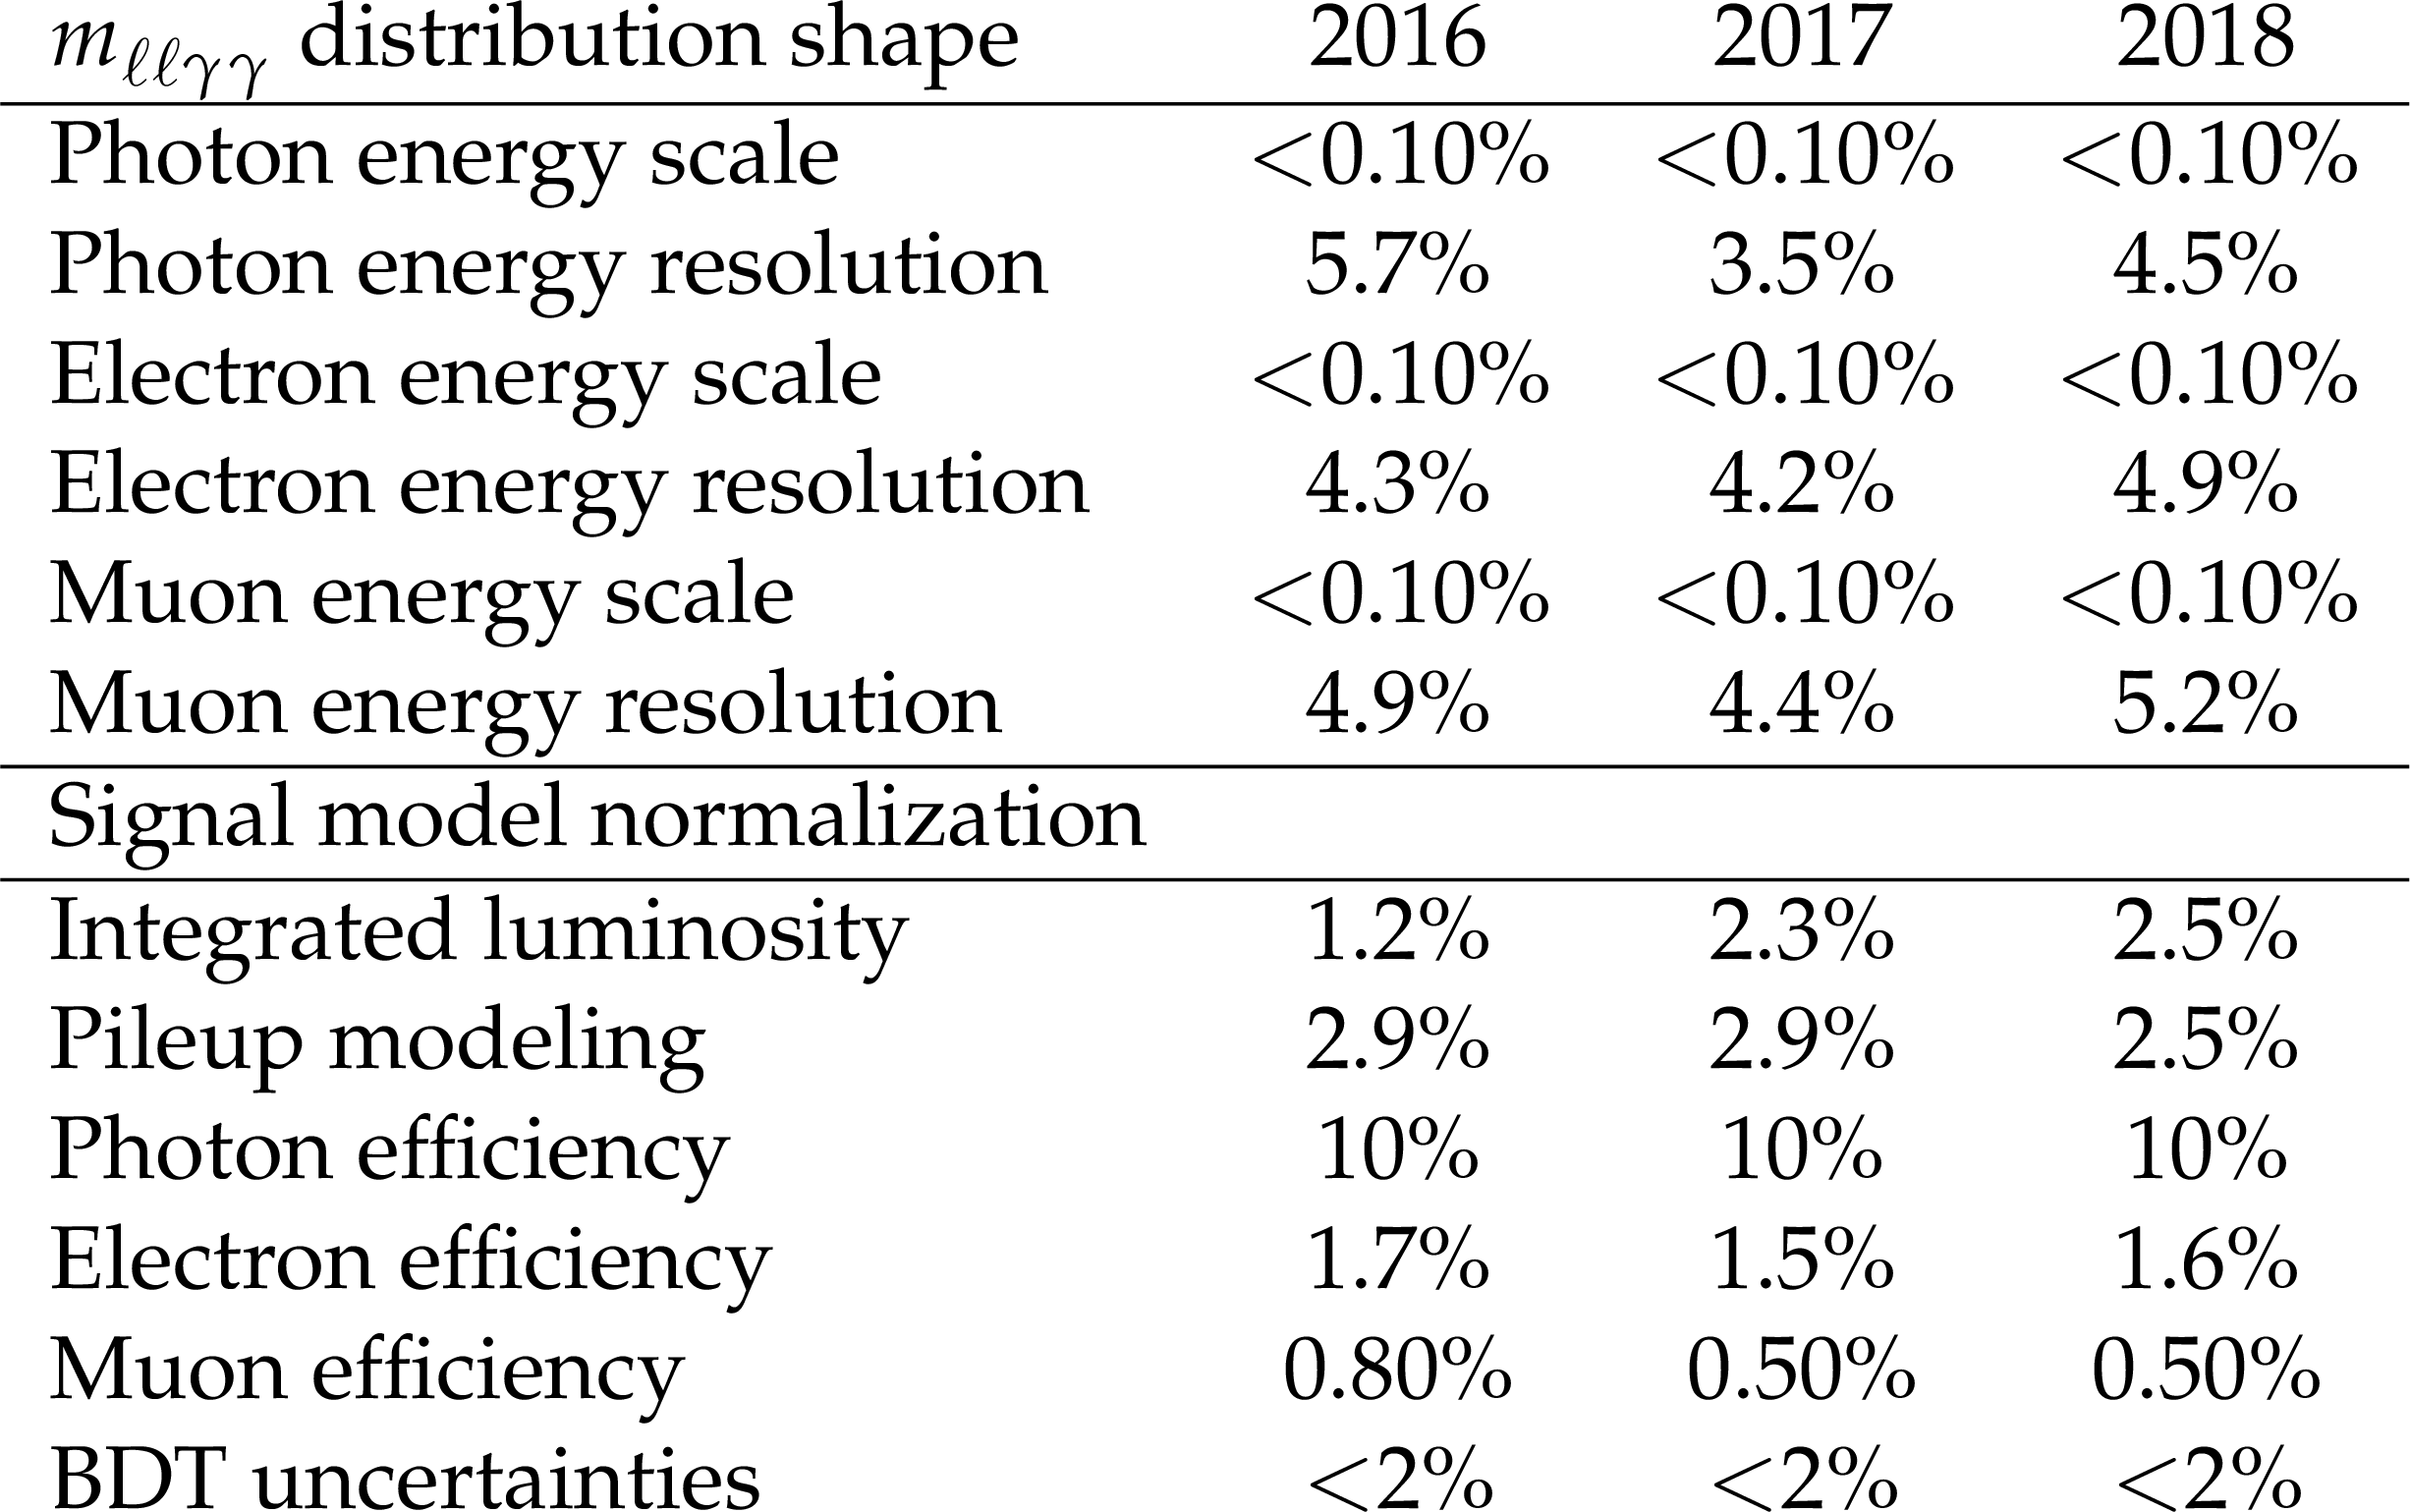
Table 2:
Sources of systematic uncertainties and their impact on the signal strength for each data-taking period. |
| Summary |
| A search for Higgs boson (H) decays to a Z boson and an axion-like particle (ALP), which subsequently decay into a lepton pair and a photon pair, respectively, is presented. The analysis is based on proton-proton collision data collected at $ \sqrt{s} = $ 13 TeV by the CMS experiment in 2016-2018, corresponding to an integrated luminosity of 138 fb$ ^{-1} $. The analysis probes pseudoscalar masses ($ m_{\mathrm{a}} $) in the range 1-30 GeV. This is the first search for Higgs boson decays in the final state of two leptons and two photons. Upper limits are set at 95% confidence level on the production cross section of the Higgs boson times its branching fraction into a dilepton and a diphoton pair via a Z boson and a pseudoscalar, $ \sigma (\mathrm{p}\mathrm{p}\to \mathrm{H})\, \mathcal{B}(\mathrm{H}\to\mathrm{Z} \mathrm{a} \to \ell\ell\gamma\gamma) $, where $ \ell = $ e, $ \mu $. The observed (expected) limits varies in the range 1.1-17.8 (1.7-17.9) fb within the probed $ m_{\mathrm{a}} $ interval of 1-30 GeV. The largest excess with respect to the standard model prediction is observed for $ m_{\mathrm{a}}= $ 3 GeV and has a local (global) significance of 2.6 (1.3) standard deviations. Constraints are set on the ALP model parameter $ C_{\mathrm{Z}\mathrm{H}}^\text{eff}/\Lambda $, which describes the coupling between the Higgs boson, Z boson, and ALP. |
| Additional Figures | |
png pdf |
Additional Figure 1:
Fit of the $ m_{\ell\ell\gamma\gamma} $ distribution of signal events with $ m_{a} = $ 1 GeV in the electron (left) and muon (right) channels with the detector settings of the 2016 pre-VFP data taking period, where VFP means Preamplifier Feedback Voltage Bias correction due to inefficiency in the strip modules of the tracker during the 2016 data taking year. |
png pdf |
Additional Figure 1-a:
Fit of the $ m_{\ell\ell\gamma\gamma} $ distribution of signal events with $ m_{a} = $ 1 GeV in the electron channel with the detector settings of the 2016 pre-VFP data taking period, where VFP means Preamplifier Feedback Voltage Bias correction due to inefficiency in the strip modules of the tracker during the 2016 data taking year. |
png pdf |
Additional Figure 1-b:
Fit of the $ m_{\ell\ell\gamma\gamma} $ distribution of signal events with $ m_{a} = $ 1 GeV in the muon channel with the detector settings of the 2016 pre-VFP data taking period, where VFP means Preamplifier Feedback Voltage Bias correction due to inefficiency in the strip modules of the tracker during the 2016 data taking year. |
png pdf |
Additional Figure 2:
Fit of the $ m_{\ell\ell\gamma\gamma} $ distribution of signal events with $ m_{a} = $ 1 GeV in the electron (left) and muon (right) channels with the detector settings of the 2016 post-VFP data taking period, where VFP means Preamplifier Feedback Voltage Bias correction due to inefficiency in the strip modules of the tracker during the 2016 data taking year. |
png pdf |
Additional Figure 2-a:
Fit of the $ m_{\ell\ell\gamma\gamma} $ distribution of signal events with $ m_{a} = $ 1 GeV in the electron channel with the detector settings of the 2016 post-VFP data taking period, where VFP means Preamplifier Feedback Voltage Bias correction due to inefficiency in the strip modules of the tracker during the 2016 data taking year. |
png pdf |
Additional Figure 2-b:
Fit of the $ m_{\ell\ell\gamma\gamma} $ distribution of signal events with $ m_{a} = $ 1 GeV in the muon channel with the detector settings of the 2016 post-VFP data taking period, where VFP means Preamplifier Feedback Voltage Bias correction due to inefficiency in the strip modules of the tracker during the 2016 data taking year. |
png pdf |
Additional Figure 3:
Fit of the $ m_{\ell\ell\gamma\gamma} $ distribution of signal events with $ m_{a} = $ 1 GeV in the electron (left) and muon (right) channels with the detector settings of the 2017 data taking period. |
png pdf |
Additional Figure 3-a:
Fit of the $ m_{\ell\ell\gamma\gamma} $ distribution of signal events with $ m_{a} = $ 1 GeV in the electron channel with the detector settings of the 2017 data taking period. |
png pdf |
Additional Figure 3-b:
Fit of the $ m_{\ell\ell\gamma\gamma} $ distribution of signal events with $ m_{a} = $ 1 GeV in the muon channel with the detector settings of the 2017 data taking period. |

png pdf |
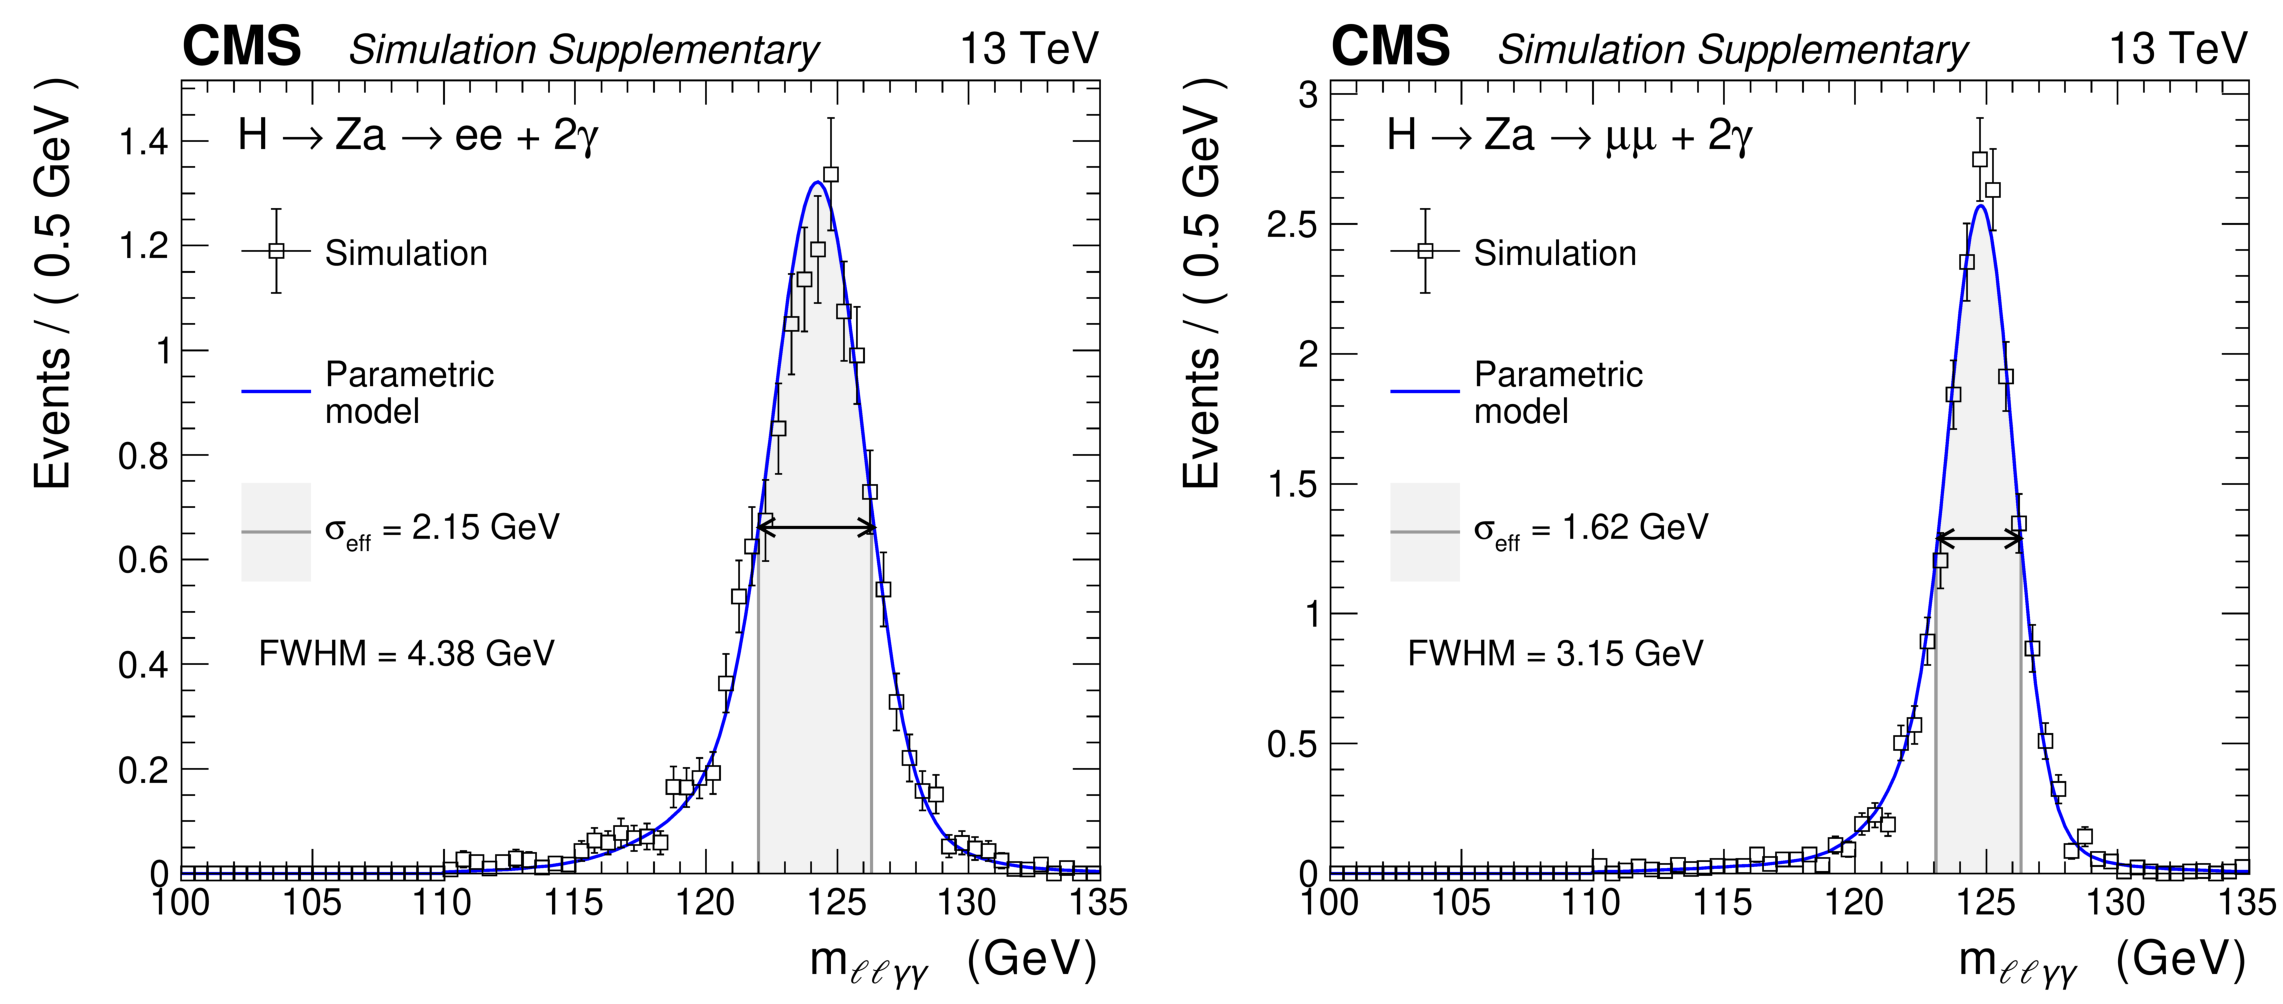
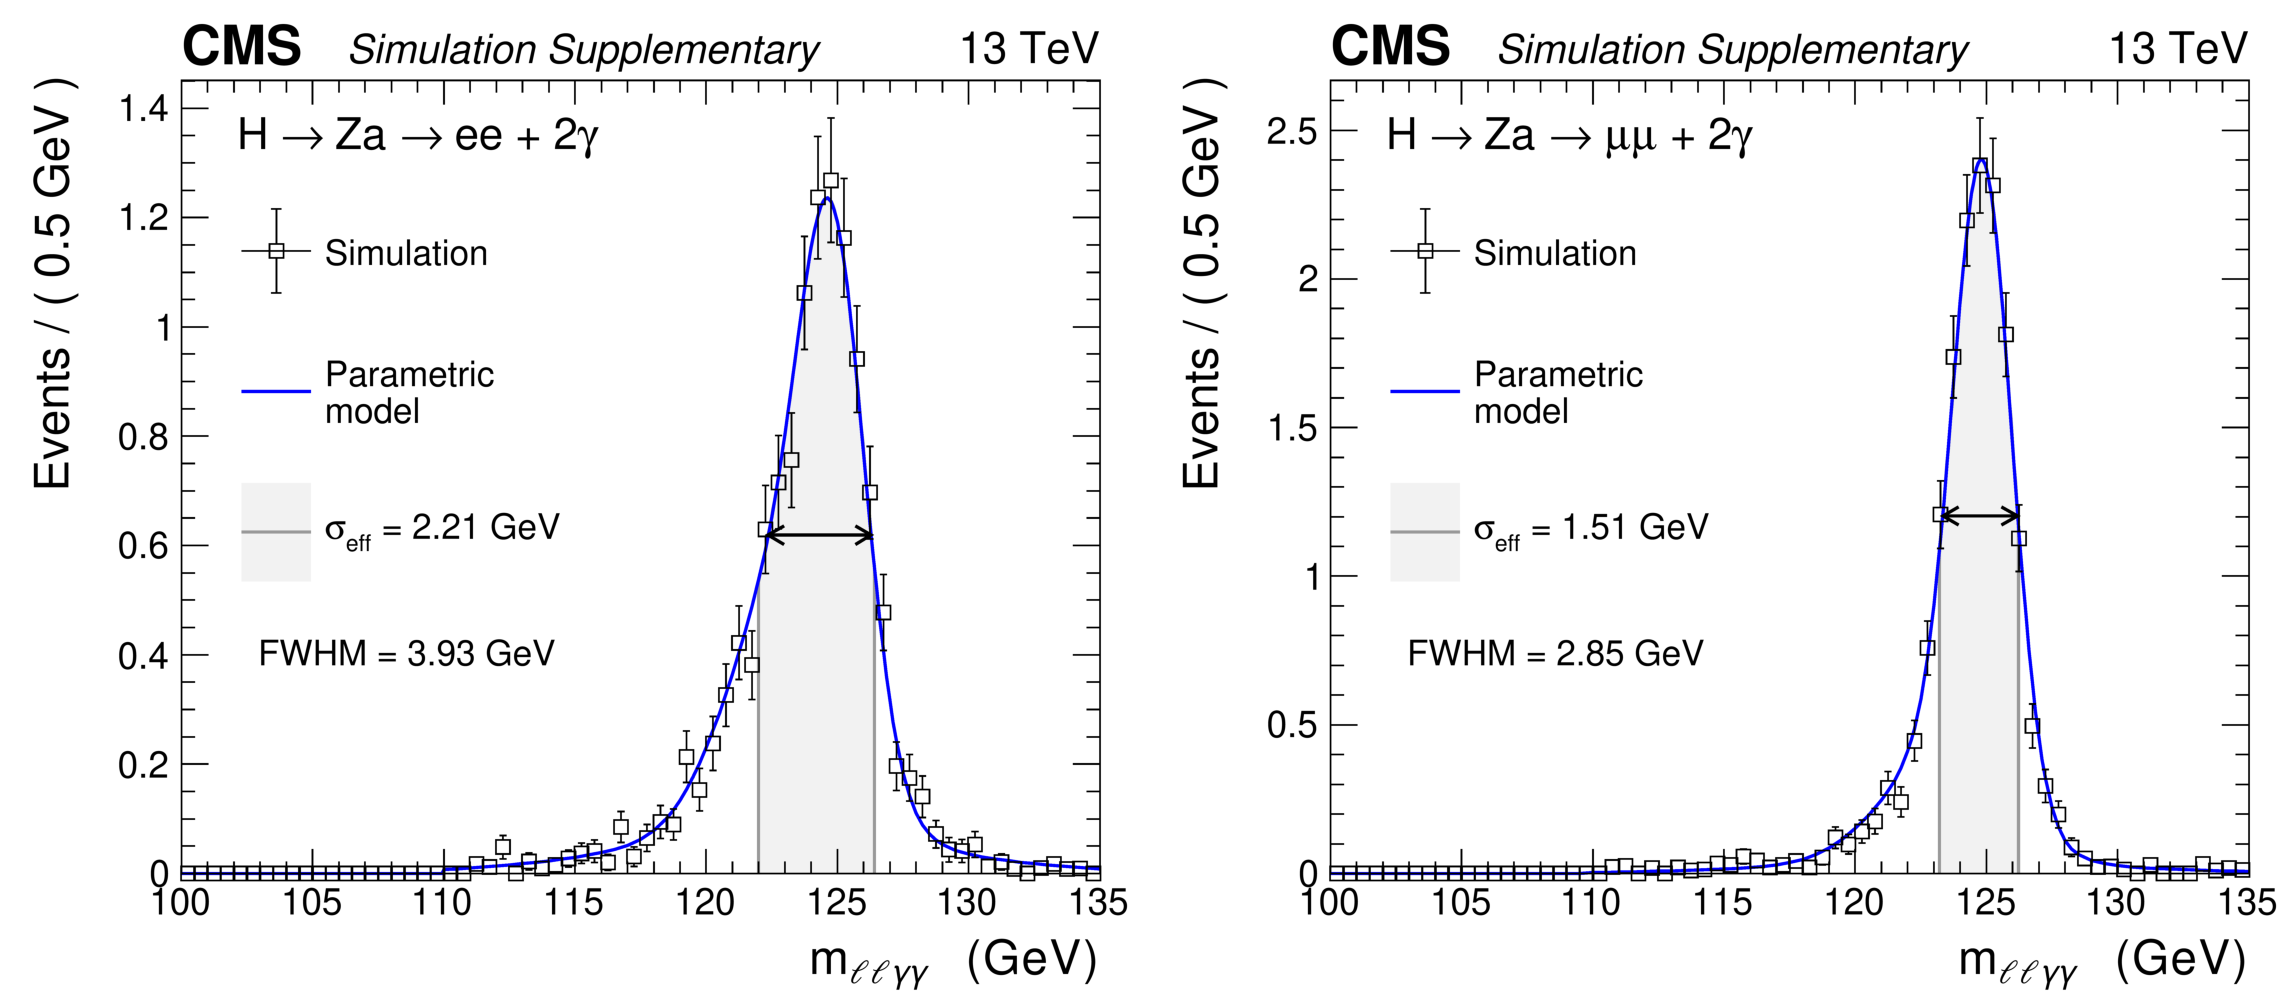
Additional Figure 4:
Fit of the $ m_{\ell\ell\gamma\gamma} $ distribution of signal events with $ m_{a} = $ 1 GeV in the electron (left) and muon (right) channels with the detector settings of the 2018 data taking period. |

png pdf |
Additional Figure 4-a:
Fit of the $ m_{\ell\ell\gamma\gamma} $ distribution of signal events with $ m_{a} = $ 1 GeV in the electron channel with the detector settings of the 2018 data taking period. |
png pdf |
Additional Figure 4-b:
Fit of the $ m_{\ell\ell\gamma\gamma} $ distribution of signal events with $ m_{a} = $ 1 GeV in the muon channel with the detector settings of the 2018 data taking period. |

png pdf |
Additional Figure 5:
Fit of the $ m_{\ell\ell\gamma\gamma} $ distribution of signal events with $ m_{a} = $ 2 GeV in the electron (left) and muon (right) channels with the detector settings of the 2016 pre-VFP data taking period, where VFP means Preamplifier Feedback Voltage Bias correction due to inefficiency in the strip modules of the tracker during the 2016 data taking year. |
png pdf |
Additional Figure 5-a:
Fit of the $ m_{\ell\ell\gamma\gamma} $ distribution of signal events with $ m_{a} = $ 2 GeV in the electron channel with the detector settings of the 2016 pre-VFP data taking period, where VFP means Preamplifier Feedback Voltage Bias correction due to inefficiency in the strip modules of the tracker during the 2016 data taking year. |
png pdf |
Additional Figure 5-b:
Fit of the $ m_{\ell\ell\gamma\gamma} $ distribution of signal events with $ m_{a} = $ 2 GeV in the muon channel with the detector settings of the 2016 pre-VFP data taking period, where VFP means Preamplifier Feedback Voltage Bias correction due to inefficiency in the strip modules of the tracker during the 2016 data taking year. |
png pdf |
Additional Figure 6:
Fit of the $ m_{\ell\ell\gamma\gamma} $ distribution of signal events with $ m_{a} = $ 2 GeV in the electron (left) and muon (right) channels with the detector settings of the 2016 post-VFP data taking period, where VFP means Preamplifier Feedback Voltage Bias correction due to inefficiency in the strip modules of the tracker during the 2016 data taking year. |

png pdf |
Additional Figure 6-a:
Fit of the $ m_{\ell\ell\gamma\gamma} $ distribution of signal events with $ m_{a} = $ 2 GeV in the electron channel with the detector settings of the 2016 post-VFP data taking period, where VFP means Preamplifier Feedback Voltage Bias correction due to inefficiency in the strip modules of the tracker during the 2016 data taking year. |

png pdf |
Additional Figure 6-b:
Fit of the $ m_{\ell\ell\gamma\gamma} $ distribution of signal events with $ m_{a} = $ 2 GeV in the muon channel with the detector settings of the 2016 post-VFP data taking period, where VFP means Preamplifier Feedback Voltage Bias correction due to inefficiency in the strip modules of the tracker during the 2016 data taking year. |
png pdf |
Additional Figure 7:
Fit of the $ m_{\ell\ell\gamma\gamma} $ distribution of signal events with $ m_{a} = $ 2 GeV in the electron (left) and muon (right) channels with the detector settings of the 2017 data taking period. |
png pdf |
Additional Figure 7-a:
Fit of the $ m_{\ell\ell\gamma\gamma} $ distribution of signal events with $ m_{a} = $ 2 GeV in the electron channel with the detector settings of the 2017 data taking period. |
png pdf |
Additional Figure 7-b:
Fit of the $ m_{\ell\ell\gamma\gamma} $ distribution of signal events with $ m_{a} = $ 2 GeV in the muon channel with the detector settings of the 2017 data taking period. |
png pdf |
Additional Figure 8:
Fit of the $ m_{\ell\ell\gamma\gamma} $ distribution of signal events with $ m_{a} = $ 2 GeV in the electron (left) and muon (right) channels with the detector settings of the 2018 data taking period. |
png pdf |
Additional Figure 8-a:
Fit of the $ m_{\ell\ell\gamma\gamma} $ distribution of signal events with $ m_{a} = $ 2 GeV in the electron channel with the detector settings of the 2018 data taking period. |
png pdf |
Additional Figure 8-b:
Fit of the $ m_{\ell\ell\gamma\gamma} $ distribution of signal events with $ m_{a} = $ 2 GeV in the muon channel with the detector settings of the 2018 data taking period. |
png pdf |
Additional Figure 9:
Fit of the $ m_{\ell\ell\gamma\gamma} $ distribution of signal events with $ m_{a} = $ 3 GeV in the electron (left) and muon (right) channels with the detector settings of the 2016 pre-VFP data taking period, where VFP means Preamplifier Feedback Voltage Bias correction due to inefficiency in the strip modules of the tracker during the 2016 data taking year. |
png pdf |
Additional Figure 9-a:
Fit of the $ m_{\ell\ell\gamma\gamma} $ distribution of signal events with $ m_{a} = $ 3 GeV in the electron channel with the detector settings of the 2016 pre-VFP data taking period, where VFP means Preamplifier Feedback Voltage Bias correction due to inefficiency in the strip modules of the tracker during the 2016 data taking year. |

png pdf |
Additional Figure 9-b:
Fit of the $ m_{\ell\ell\gamma\gamma} $ distribution of signal events with $ m_{a} = $ 3 GeV in the muon channel with the detector settings of the 2016 pre-VFP data taking period, where VFP means Preamplifier Feedback Voltage Bias correction due to inefficiency in the strip modules of the tracker during the 2016 data taking year. |

png pdf |
Additional Figure 10:
Fit of the $ m_{\ell\ell\gamma\gamma} $ distribution of signal events with $ m_{a} = $ 3 GeV in the electron (left) and muon (right) channels with the detector settings of the 2016 post-VFP data taking period, where VFP means Preamplifier Feedback Voltage Bias correction due to inefficiency in the strip modules of the tracker during the 2016 data taking year. |
png pdf |
Additional Figure 10-a:
Fit of the $ m_{\ell\ell\gamma\gamma} $ distribution of signal events with $ m_{a} = $ 3 GeV in the electron channel with the detector settings of the 2016 post-VFP data taking period, where VFP means Preamplifier Feedback Voltage Bias correction due to inefficiency in the strip modules of the tracker during the 2016 data taking year. |
png pdf |
Additional Figure 10-b:
Fit of the $ m_{\ell\ell\gamma\gamma} $ distribution of signal events with $ m_{a} = $ 3 GeV in the muon channel with the detector settings of the 2016 post-VFP data taking period, where VFP means Preamplifier Feedback Voltage Bias correction due to inefficiency in the strip modules of the tracker during the 2016 data taking year. |
png pdf |
Additional Figure 11:
Fit of the $ m_{\ell\ell\gamma\gamma} $ distribution of signal events with $ m_{a} = $ 3 GeV in the electron (left) and muon (right) channels with the detector settings of the 2017 data taking period. |
png pdf |
Additional Figure 11-a:
Fit of the $ m_{\ell\ell\gamma\gamma} $ distribution of signal events with $ m_{a} = $ 3 GeV in the electron channel with the detector settings of the 2017 data taking period. |
png pdf |
Additional Figure 11-b:
Fit of the $ m_{\ell\ell\gamma\gamma} $ distribution of signal events with $ m_{a} = $ 3 GeV in the muon channel with the detector settings of the 2017 data taking period. |
png pdf |
Additional Figure 12:
Fit of the $ m_{\ell\ell\gamma\gamma} $ distribution of signal events with $ m_{a} = $ 3 GeV in the electron (left) and muon (right) channels with the detector settings of the 2018 data taking period. |
png pdf |
Additional Figure 12-a:
Fit of the $ m_{\ell\ell\gamma\gamma} $ distribution of signal events with $ m_{a} = $ 3 GeV in the electron channel with the detector settings of the 2018 data taking period. |

png pdf |
Additional Figure 12-b:
Fit of the $ m_{\ell\ell\gamma\gamma} $ distribution of signal events with $ m_{a} = $ 3 GeV in the muon channel with the detector settings of the 2018 data taking period. |

png pdf |
Additional Figure 13:
Fit of the $ m_{\ell\ell\gamma\gamma} $ distribution of signal events with $ m_{a} = $ 4 GeV in the electron (left) and muon (right) channels with the detector settings of the 2016 pre-VFP data taking period, where VFP means Preamplifier Feedback Voltage Bias correction due to inefficiency in the strip modules of the tracker during the 2016 data taking year. |

png pdf |
Additional Figure 13-a:
Fit of the $ m_{\ell\ell\gamma\gamma} $ distribution of signal events with $ m_{a} = $ 4 GeV in the electron channel with the detector settings of the 2016 pre-VFP data taking period, where VFP means Preamplifier Feedback Voltage Bias correction due to inefficiency in the strip modules of the tracker during the 2016 data taking year. |

png pdf |
Additional Figure 13-b:
Fit of the $ m_{\ell\ell\gamma\gamma} $ distribution of signal events with $ m_{a} = $ 4 GeV in the muon channel with the detector settings of the 2016 pre-VFP data taking period, where VFP means Preamplifier Feedback Voltage Bias correction due to inefficiency in the strip modules of the tracker during the 2016 data taking year. |
png pdf |
Additional Figure 14:
Fit of the $ m_{\ell\ell\gamma\gamma} $ distribution of signal events with $ m_{a} = $ 4 GeV in the electron (left) and muon (right) channels with the detector settings of the 2016 post-VFP data taking period, where VFP means Preamplifier Feedback Voltage Bias correction due to inefficiency in the strip modules of the tracker during the 2016 data taking year. |
png pdf |
Additional Figure 14-a:
Fit of the $ m_{\ell\ell\gamma\gamma} $ distribution of signal events with $ m_{a} = $ 4 GeV in the electron channel with the detector settings of the 2016 post-VFP data taking period, where VFP means Preamplifier Feedback Voltage Bias correction due to inefficiency in the strip modules of the tracker during the 2016 data taking year. |

png pdf |
Additional Figure 14-b:
Fit of the $ m_{\ell\ell\gamma\gamma} $ distribution of signal events with $ m_{a} = $ 4 GeV in the muon channel with the detector settings of the 2016 post-VFP data taking period, where VFP means Preamplifier Feedback Voltage Bias correction due to inefficiency in the strip modules of the tracker during the 2016 data taking year. |
png pdf |
Additional Figure 15:
Fit of the $ m_{\ell\ell\gamma\gamma} $ distribution of signal events with $ m_{a} = $ 4 GeV in the electron (left) and muon (right) channels with the detector settings of the 2017 data taking period. |

png pdf |
Additional Figure 15-a:
Fit of the $ m_{\ell\ell\gamma\gamma} $ distribution of signal events with $ m_{a} = $ 4 GeV in the electron channel with the detector settings of the 2017 data taking period. |

png pdf |
Additional Figure 15-b:
Fit of the $ m_{\ell\ell\gamma\gamma} $ distribution of signal events with $ m_{a} = $ 4 GeV in the muon channel with the detector settings of the 2017 data taking period. |

png pdf |
Additional Figure 16:
Fit of the $ m_{\ell\ell\gamma\gamma} $ distribution of signal events with $ m_{a} = $ 4 GeV in the electron (left) and muon (right) channels with the detector settings of the 2018 data taking period. |
png pdf |
Additional Figure 16-a:
Fit of the $ m_{\ell\ell\gamma\gamma} $ distribution of signal events with $ m_{a} = $ 4 GeV in the electron channel with the detector settings of the 2018 data taking period. |
png pdf |
Additional Figure 16-b:
Fit of the $ m_{\ell\ell\gamma\gamma} $ distribution of signal events with $ m_{a} = $ 4 GeV in the muon channel with the detector settings of the 2018 data taking period. |

png pdf |
Additional Figure 17:
Fit of the $ m_{\ell\ell\gamma\gamma} $ distribution of signal events with $ m_{a} = $ 5 GeV in the electron (left) and muon (right) channels with the detector settings of the 2016 pre-VFP data taking period, where VFP means Preamplifier Feedback Voltage Bias correction due to inefficiency in the strip modules of the tracker during the 2016 data taking year. |
png pdf |
Additional Figure 17-a:
Fit of the $ m_{\ell\ell\gamma\gamma} $ distribution of signal events with $ m_{a} = $ 5 GeV in the electron channel with the detector settings of the 2016 pre-VFP data taking period, where VFP means Preamplifier Feedback Voltage Bias correction due to inefficiency in the strip modules of the tracker during the 2016 data taking year. |
png pdf |
Additional Figure 17-b:
Fit of the $ m_{\ell\ell\gamma\gamma} $ distribution of signal events with $ m_{a} = $ 5 GeV in the muon channel with the detector settings of the 2016 pre-VFP data taking period, where VFP means Preamplifier Feedback Voltage Bias correction due to inefficiency in the strip modules of the tracker during the 2016 data taking year. |
png pdf |
Additional Figure 18:
Fit of the $ m_{\ell\ell\gamma\gamma} $ distribution of signal events with $ m_{a} = $ 5 GeV in the electron (left) and muon (right) channels with the detector settings of the 2016 post-VFP data taking period, where VFP means Preamplifier Feedback Voltage Bias correction due to inefficiency in the strip modules of the tracker during the 2016 data taking year. |
png pdf |
Additional Figure 18-a:
Fit of the $ m_{\ell\ell\gamma\gamma} $ distribution of signal events with $ m_{a} = $ 5 GeV in the electron channel with the detector settings of the 2016 post-VFP data taking period, where VFP means Preamplifier Feedback Voltage Bias correction due to inefficiency in the strip modules of the tracker during the 2016 data taking year. |
png pdf |
Additional Figure 18-b:
Fit of the $ m_{\ell\ell\gamma\gamma} $ distribution of signal events with $ m_{a} = $ 5 GeV in the muon channel with the detector settings of the 2016 post-VFP data taking period, where VFP means Preamplifier Feedback Voltage Bias correction due to inefficiency in the strip modules of the tracker during the 2016 data taking year. |
png pdf |
Additional Figure 19:
Fit of the $ m_{\ell\ell\gamma\gamma} $ distribution of signal events with $ m_{a} = $ 5 GeV in the electron (left) and muon (right) channels with the detector settings of the 2017 data taking period. |

png pdf |
Additional Figure 19-a:
Fit of the $ m_{\ell\ell\gamma\gamma} $ distribution of signal events with $ m_{a} = $ 5 GeV in the electron channel with the detector settings of the 2017 data taking period. |
png pdf |
Additional Figure 19-b:
Fit of the $ m_{\ell\ell\gamma\gamma} $ distribution of signal events with $ m_{a} = $ 5 GeV in the muon channel with the detector settings of the 2017 data taking period. |
png pdf |
Additional Figure 20:
Fit of the $ m_{\ell\ell\gamma\gamma} $ distribution of signal events with $ m_{a} = $ 5 GeV in the electron (left) and muon (right) channels with the detector settings of the 2018 data taking period. |
png pdf |
Additional Figure 20-a:
Fit of the $ m_{\ell\ell\gamma\gamma} $ distribution of signal events with $ m_{a} = $ 5 GeV in the electron channel with the detector settings of the 2018 data taking period. |

png pdf |
Additional Figure 20-b:
Fit of the $ m_{\ell\ell\gamma\gamma} $ distribution of signal events with $ m_{a} = $ 5 GeV in the muon channel with the detector settings of the 2018 data taking period. |
png pdf |
Additional Figure 21:
Fit of the $ m_{\ell\ell\gamma\gamma} $ distribution of signal events with $ m_{a} = $ 6 GeV in the electron (left) and muon (right) channels with the detector settings of the 2016 pre-VFP data taking period, where VFP means Preamplifier Feedback Voltage Bias correction due to inefficiency in the strip modules of the tracker during the 2016 data taking year. |
png pdf |
Additional Figure 21-a:
Fit of the $ m_{\ell\ell\gamma\gamma} $ distribution of signal events with $ m_{a} = $ 6 GeV in the electron channel with the detector settings of the 2016 pre-VFP data taking period, where VFP means Preamplifier Feedback Voltage Bias correction due to inefficiency in the strip modules of the tracker during the 2016 data taking year. |
png pdf |
Additional Figure 21-b:
Fit of the $ m_{\ell\ell\gamma\gamma} $ distribution of signal events with $ m_{a} = $ 6 GeV in the muon channel with the detector settings of the 2016 pre-VFP data taking period, where VFP means Preamplifier Feedback Voltage Bias correction due to inefficiency in the strip modules of the tracker during the 2016 data taking year. |
png pdf |
Additional Figure 22:
Fit of the $ m_{\ell\ell\gamma\gamma} $ distribution of signal events with $ m_{a} = $ 6 GeV in the electron (left) and muon (right) channels with the detector settings of the 2016 post-VFP data taking period, where VFP means Preamplifier Feedback Voltage Bias correction due to inefficiency in the strip modules of the tracker during the 2016 data taking year. |
png pdf |
Additional Figure 22-a:
Fit of the $ m_{\ell\ell\gamma\gamma} $ distribution of signal events with $ m_{a} = $ 6 GeV in the electron channel with the detector settings of the 2016 post-VFP data taking period, where VFP means Preamplifier Feedback Voltage Bias correction due to inefficiency in the strip modules of the tracker during the 2016 data taking year. |

png pdf |
Additional Figure 22-b:
Fit of the $ m_{\ell\ell\gamma\gamma} $ distribution of signal events with $ m_{a} = $ 6 GeV in the muon channel with the detector settings of the 2016 post-VFP data taking period, where VFP means Preamplifier Feedback Voltage Bias correction due to inefficiency in the strip modules of the tracker during the 2016 data taking year. |
png pdf |
Additional Figure 23:
Fit of the $ m_{\ell\ell\gamma\gamma} $ distribution of signal events with $ m_{a} = $ 6 GeV in the electron (left) and muon (right) channels with the detector settings of the 2017 data taking period. |
png pdf |
Additional Figure 23-a:
Fit of the $ m_{\ell\ell\gamma\gamma} $ distribution of signal events with $ m_{a} = $ 6 GeV in the electron channel with the detector settings of the 2017 data taking period. |
png pdf |
Additional Figure 23-b:
Fit of the $ m_{\ell\ell\gamma\gamma} $ distribution of signal events with $ m_{a} = $ 6 GeV in the muon channel with the detector settings of the 2017 data taking period. |
png pdf |
Additional Figure 24:
Fit of the $ m_{\ell\ell\gamma\gamma} $ distribution of signal events with $ m_{a} = $ 6 GeV in the electron (left) and muon (right) channels with the detector settings of the 2018 data taking period. |
png pdf |
Additional Figure 24-a:
Fit of the $ m_{\ell\ell\gamma\gamma} $ distribution of signal events with $ m_{a} = $ 6 GeV in the electron channel with the detector settings of the 2018 data taking period. |
png pdf |
Additional Figure 24-b:
Fit of the $ m_{\ell\ell\gamma\gamma} $ distribution of signal events with $ m_{a} = $ 6 GeV in the muon channel with the detector settings of the 2018 data taking period. |
png pdf |
Additional Figure 25:
Fit of the $ m_{\ell\ell\gamma\gamma} $ distribution of signal events with $ m_{a} = $ 7 GeV in the electron (left) and muon (right) channels with the detector settings of the 2016 pre-VFP data taking period, where VFP means Preamplifier Feedback Voltage Bias correction due to inefficiency in the strip modules of the tracker during the 2016 data taking year. |
png pdf |
Additional Figure 25-a:
Fit of the $ m_{\ell\ell\gamma\gamma} $ distribution of signal events with $ m_{a} = $ 7 GeV in the electron channel with the detector settings of the 2016 pre-VFP data taking period, where VFP means Preamplifier Feedback Voltage Bias correction due to inefficiency in the strip modules of the tracker during the 2016 data taking year. |
png pdf |
Additional Figure 25-b:
Fit of the $ m_{\ell\ell\gamma\gamma} $ distribution of signal events with $ m_{a} = $ 7 GeV in the muon channel with the detector settings of the 2016 pre-VFP data taking period, where VFP means Preamplifier Feedback Voltage Bias correction due to inefficiency in the strip modules of the tracker during the 2016 data taking year. |
png pdf |
Additional Figure 26:
Fit of the $ m_{\ell\ell\gamma\gamma} $ distribution of signal events with $ m_{a} = $ 7 GeV in the electron (left) and muon (right) channels with the detector settings of the 2016 post-VFP data taking period, where VFP means Preamplifier Feedback Voltage Bias correction due to inefficiency in the strip modules of the tracker during the 2016 data taking year. |

png pdf |
Additional Figure 26-a:
Fit of the $ m_{\ell\ell\gamma\gamma} $ distribution of signal events with $ m_{a} = $ 7 GeV in the electron channel with the detector settings of the 2016 post-VFP data taking period, where VFP means Preamplifier Feedback Voltage Bias correction due to inefficiency in the strip modules of the tracker during the 2016 data taking year. |

png pdf |
Additional Figure 26-b:
Fit of the $ m_{\ell\ell\gamma\gamma} $ distribution of signal events with $ m_{a} = $ 7 GeV in the muon channel with the detector settings of the 2016 post-VFP data taking period, where VFP means Preamplifier Feedback Voltage Bias correction due to inefficiency in the strip modules of the tracker during the 2016 data taking year. |
png pdf |
Additional Figure 27:
Fit of the $ m_{\ell\ell\gamma\gamma} $ distribution of signal events with $ m_{a} = $ 7 GeV in the electron (left) and muon (right) channels with the detector settings of the 2017 data taking period. |
png pdf |
Additional Figure 27-a:
Fit of the $ m_{\ell\ell\gamma\gamma} $ distribution of signal events with $ m_{a} = $ 7 GeV in the electron channel with the detector settings of the 2017 data taking period. |
png pdf |
Additional Figure 27-b:
Fit of the $ m_{\ell\ell\gamma\gamma} $ distribution of signal events with $ m_{a} = $ 7 GeV in the muon channel with the detector settings of the 2017 data taking period. |

png pdf |
Additional Figure 28:
Fit of the $ m_{\ell\ell\gamma\gamma} $ distribution of signal events with $ m_{a} = $ 7 GeV in the electron (left) and muon (right) channels with the detector settings of the 2018 data taking period. |
png pdf |
Additional Figure 28-a:
Fit of the $ m_{\ell\ell\gamma\gamma} $ distribution of signal events with $ m_{a} = $ 7 GeV in the electron channel with the detector settings of the 2018 data taking period. |

png pdf |
Additional Figure 28-b:
Fit of the $ m_{\ell\ell\gamma\gamma} $ distribution of signal events with $ m_{a} = $ 7 GeV in the muon channel with the detector settings of the 2018 data taking period. |
png pdf |
Additional Figure 29:
Fit of the $ m_{\ell\ell\gamma\gamma} $ distribution of signal events with $ m_{a} = $ 8 GeV in the electron (left) and muon (right) channels with the detector settings of the 2016 pre-VFP data taking period, where VFP means Preamplifier Feedback Voltage Bias correction due to inefficiency in the strip modules of the tracker during the 2016 data taking year. |
png pdf |
Additional Figure 29-a:
Fit of the $ m_{\ell\ell\gamma\gamma} $ distribution of signal events with $ m_{a} = $ 8 GeV in the electron channel with the detector settings of the 2016 pre-VFP data taking period, where VFP means Preamplifier Feedback Voltage Bias correction due to inefficiency in the strip modules of the tracker during the 2016 data taking year. |
png pdf |
Additional Figure 29-b:
Fit of the $ m_{\ell\ell\gamma\gamma} $ distribution of signal events with $ m_{a} = $ 8 GeV in the muon channel with the detector settings of the 2016 pre-VFP data taking period, where VFP means Preamplifier Feedback Voltage Bias correction due to inefficiency in the strip modules of the tracker during the 2016 data taking year. |
png pdf |
Additional Figure 30:
Fit of the $ m_{\ell\ell\gamma\gamma} $ distribution of signal events with $ m_{a} = $ 8 GeV in the electron (left) and muon (right) channels with the detector settings of the 2016 post-VFP data taking period, where VFP means Preamplifier Feedback Voltage Bias correction due to inefficiency in the strip modules of the tracker during the 2016 data taking year. |
png pdf |
Additional Figure 30-a:
Fit of the $ m_{\ell\ell\gamma\gamma} $ distribution of signal events with $ m_{a} = $ 8 GeV in the electron channel with the detector settings of the 2016 post-VFP data taking period, where VFP means Preamplifier Feedback Voltage Bias correction due to inefficiency in the strip modules of the tracker during the 2016 data taking year. |

png pdf |
Additional Figure 30-b:
Fit of the $ m_{\ell\ell\gamma\gamma} $ distribution of signal events with $ m_{a} = $ 8 GeV in the muon channel with the detector settings of the 2016 post-VFP data taking period, where VFP means Preamplifier Feedback Voltage Bias correction due to inefficiency in the strip modules of the tracker during the 2016 data taking year. |
png pdf |
Additional Figure 31:
Fit of the $ m_{\ell\ell\gamma\gamma} $ distribution of signal events with $ m_{a} = $ 8 GeV in the electron (left) and muon (right) channels with the detector settings of the 2017 data taking period. |
png pdf |
Additional Figure 31-a:
Fit of the $ m_{\ell\ell\gamma\gamma} $ distribution of signal events with $ m_{a} = $ 8 GeV in the electron channel with the detector settings of the 2017 data taking period. |
png pdf |
Additional Figure 31-b:
Fit of the $ m_{\ell\ell\gamma\gamma} $ distribution of signal events with $ m_{a} = $ 8 GeV in the muon channel with the detector settings of the 2017 data taking period. |
png pdf |
Additional Figure 32:
Fit of the $ m_{\ell\ell\gamma\gamma} $ distribution of signal events with $ m_{a} = $ 8 GeV in the electron (left) and muon (right) channels with the detector settings of the 2018 data taking period. |
png pdf |
Additional Figure 32-a:
Fit of the $ m_{\ell\ell\gamma\gamma} $ distribution of signal events with $ m_{a} = $ 8 GeV in the electron channel with the detector settings of the 2018 data taking period. |
png pdf |
Additional Figure 32-b:
Fit of the $ m_{\ell\ell\gamma\gamma} $ distribution of signal events with $ m_{a} = $ 8 GeV in the muon channel with the detector settings of the 2018 data taking period. |
png pdf |
Additional Figure 33:
Fit of the $ m_{\ell\ell\gamma\gamma} $ distribution of signal events with $ m_{a} = $ 9 GeV in the electron (left) and muon (right) channels with the detector settings of the 2016 pre-VFP data taking period, where VFP means Preamplifier Feedback Voltage Bias correction due to inefficiency in the strip modules of the tracker during the 2016 data taking year. |
png pdf |
Additional Figure 33-a:
Fit of the $ m_{\ell\ell\gamma\gamma} $ distribution of signal events with $ m_{a} = $ 9 GeV in the electron channel with the detector settings of the 2016 pre-VFP data taking period, where VFP means Preamplifier Feedback Voltage Bias correction due to inefficiency in the strip modules of the tracker during the 2016 data taking year. |
png pdf |
Additional Figure 33-b:
Fit of the $ m_{\ell\ell\gamma\gamma} $ distribution of signal events with $ m_{a} = $ 9 GeV in the muon channel with the detector settings of the 2016 pre-VFP data taking period, where VFP means Preamplifier Feedback Voltage Bias correction due to inefficiency in the strip modules of the tracker during the 2016 data taking year. |
png pdf |
Additional Figure 34:
Fit of the $ m_{\ell\ell\gamma\gamma} $ distribution of signal events with $ m_{a} = $ 9 GeV in the electron (left) and muon (right) channels with the detector settings of the 2016 post-VFP data taking period, where VFP means Preamplifier Feedback Voltage Bias correction due to inefficiency in the strip modules of the tracker during the 2016 data taking year. |

png pdf |
Additional Figure 34-a:
Fit of the $ m_{\ell\ell\gamma\gamma} $ distribution of signal events with $ m_{a} = $ 9 GeV in the electron channel with the detector settings of the 2016 post-VFP data taking period, where VFP means Preamplifier Feedback Voltage Bias correction due to inefficiency in the strip modules of the tracker during the 2016 data taking year. |

png pdf |
Additional Figure 34-b:
Fit of the $ m_{\ell\ell\gamma\gamma} $ distribution of signal events with $ m_{a} = $ 9 GeV in the muon channel with the detector settings of the 2016 post-VFP data taking period, where VFP means Preamplifier Feedback Voltage Bias correction due to inefficiency in the strip modules of the tracker during the 2016 data taking year. |
png pdf |
Additional Figure 35:
Fit of the $ m_{\ell\ell\gamma\gamma} $ distribution of signal events with $ m_{a} = $ 9 GeV in the electron (left) and muon (right) channels with the detector settings of the 2017 data taking period. |
png pdf |
Additional Figure 35-a:
Fit of the $ m_{\ell\ell\gamma\gamma} $ distribution of signal events with $ m_{a} = $ 9 GeV in the electron channel with the detector settings of the 2017 data taking period. |
png pdf |
Additional Figure 35-b:
Fit of the $ m_{\ell\ell\gamma\gamma} $ distribution of signal events with $ m_{a} = $ 9 GeV in the muon channel with the detector settings of the 2017 data taking period. |
png pdf |
Additional Figure 36:
Fit of the $ m_{\ell\ell\gamma\gamma} $ distribution of signal events with $ m_{a} = $ 9 GeV in the electron (left) and muon (right) channels with the detector settings of the 2018 data taking period. |
png pdf |
Additional Figure 36-a:
Fit of the $ m_{\ell\ell\gamma\gamma} $ distribution of signal events with $ m_{a} = $ 9 GeV in the electron channel with the detector settings of the 2018 data taking period. |
png pdf |
Additional Figure 36-b:
Fit of the $ m_{\ell\ell\gamma\gamma} $ distribution of signal events with $ m_{a} = $ 9 GeV in the muon channel with the detector settings of the 2018 data taking period. |

png pdf |
Additional Figure 37:
Fit of the $ m_{\ell\ell\gamma\gamma} $ distribution of signal events with $ m_{a} = $ 10 GeV in the electron (left) and muon (right) channels with the detector settings of the 2016 pre-VFP data taking period, where VFP means Preamplifier Feedback Voltage Bias correction due to inefficiency in the strip modules of the tracker during the 2016 data taking year. |
png pdf |
Additional Figure 37-a:
Fit of the $ m_{\ell\ell\gamma\gamma} $ distribution of signal events with $ m_{a} = $ 10 GeV in the electron channel with the detector settings of the 2016 pre-VFP data taking period, where VFP means Preamplifier Feedback Voltage Bias correction due to inefficiency in the strip modules of the tracker during the 2016 data taking year. |
png pdf |
Additional Figure 37-b:
Fit of the $ m_{\ell\ell\gamma\gamma} $ distribution of signal events with $ m_{a} = $ 10 GeV in the muon channel with the detector settings of the 2016 pre-VFP data taking period, where VFP means Preamplifier Feedback Voltage Bias correction due to inefficiency in the strip modules of the tracker during the 2016 data taking year. |
png pdf |
Additional Figure 38:
Fit of the $ m_{\ell\ell\gamma\gamma} $ distribution of signal events with $ m_{a} = $ 10 GeV in the electron (left) and muon (right) channels with the detector settings of the 2016 post-VFP data taking period, where VFP means Preamplifier Feedback Voltage Bias correction due to inefficiency in the strip modules of the tracker during the 2016 data taking year. |

png pdf |
Additional Figure 38-a:
Fit of the $ m_{\ell\ell\gamma\gamma} $ distribution of signal events with $ m_{a} = $ 10 GeV in the electron channel with the detector settings of the 2016 post-VFP data taking period, where VFP means Preamplifier Feedback Voltage Bias correction due to inefficiency in the strip modules of the tracker during the 2016 data taking year. |
png pdf |
Additional Figure 38-b:
Fit of the $ m_{\ell\ell\gamma\gamma} $ distribution of signal events with $ m_{a} = $ 10 GeV in the muon channel with the detector settings of the 2016 post-VFP data taking period, where VFP means Preamplifier Feedback Voltage Bias correction due to inefficiency in the strip modules of the tracker during the 2016 data taking year. |
png pdf |
Additional Figure 39:
Fit of the $ m_{\ell\ell\gamma\gamma} $ distribution of signal events with $ m_{a} = $ 10 GeV in the electron (left) and muon (right) channels with the detector settings of the 2017 data taking period. |
png pdf |
Additional Figure 39-a:
Fit of the $ m_{\ell\ell\gamma\gamma} $ distribution of signal events with $ m_{a} = $ 10 GeV in the electron channel with the detector settings of the 2017 data taking period. |

png pdf |
Additional Figure 39-b:
Fit of the $ m_{\ell\ell\gamma\gamma} $ distribution of signal events with $ m_{a} = $ 10 GeV in the muon channel with the detector settings of the 2017 data taking period. |
png pdf |
Additional Figure 40:
Fit of the $ m_{\ell\ell\gamma\gamma} $ distribution of signal events with $ m_{a} = $ 10 GeV in the electron (left) and muon (right) channels with the detector settings of the 2018 data taking period. |
png pdf |
Additional Figure 40-a:
Fit of the $ m_{\ell\ell\gamma\gamma} $ distribution of signal events with $ m_{a} = $ 10 GeV in the electron channel with the detector settings of the 2018 data taking period. |

png pdf |
Additional Figure 40-b:
Fit of the $ m_{\ell\ell\gamma\gamma} $ distribution of signal events with $ m_{a} = $ 10 GeV in the muon channel with the detector settings of the 2018 data taking period. |
png pdf |
Additional Figure 41:
Fit of the $ m_{\ell\ell\gamma\gamma} $ distribution of signal events with $ m_{a} = $ 15 GeV in the electron (left) and muon (right) channels with the detector settings of the 2016 pre-VFP data taking period, where VFP means Preamplifier Feedback Voltage Bias correction due to inefficiency in the strip modules of the tracker during the 2016 data taking year. |
png pdf |
Additional Figure 41-a:
Fit of the $ m_{\ell\ell\gamma\gamma} $ distribution of signal events with $ m_{a} = $ 15 GeV in the electron channel with the detector settings of the 2016 pre-VFP data taking period, where VFP means Preamplifier Feedback Voltage Bias correction due to inefficiency in the strip modules of the tracker during the 2016 data taking year. |
png pdf |
Additional Figure 41-b:
Fit of the $ m_{\ell\ell\gamma\gamma} $ distribution of signal events with $ m_{a} = $ 15 GeV in the muon channel with the detector settings of the 2016 pre-VFP data taking period, where VFP means Preamplifier Feedback Voltage Bias correction due to inefficiency in the strip modules of the tracker during the 2016 data taking year. |
png pdf |
Additional Figure 42:
Fit of the $ m_{\ell\ell\gamma\gamma} $ distribution of signal events with $ m_{a} = $ 15 GeV in the electron (left) and muon (right) channels with the detector settings of the 2016 post-VFP data taking period, where VFP means Preamplifier Feedback Voltage Bias correction due to inefficiency in the strip modules of the tracker during the 2016 data taking year. |
png pdf |
Additional Figure 42-a:
Fit of the $ m_{\ell\ell\gamma\gamma} $ distribution of signal events with $ m_{a} = $ 15 GeV in the electron channel with the detector settings of the 2016 post-VFP data taking period, where VFP means Preamplifier Feedback Voltage Bias correction due to inefficiency in the strip modules of the tracker during the 2016 data taking year. |
png pdf |
Additional Figure 42-b:
Fit of the $ m_{\ell\ell\gamma\gamma} $ distribution of signal events with $ m_{a} = $ 15 GeV in the muon channel with the detector settings of the 2016 post-VFP data taking period, where VFP means Preamplifier Feedback Voltage Bias correction due to inefficiency in the strip modules of the tracker during the 2016 data taking year. |

png pdf |
Additional Figure 43:
Fit of the $ m_{\ell\ell\gamma\gamma} $ distribution of signal events with $ m_{a} = $ 15 GeV in the electron (left) and muon (right) channels with the detector settings of the 2017 data taking period. |

png pdf |
Additional Figure 43-a:
Fit of the $ m_{\ell\ell\gamma\gamma} $ distribution of signal events with $ m_{a} = $ 15 GeV in the electron channel with the detector settings of the 2017 data taking period. |

png pdf |
Additional Figure 43-b:
Fit of the $ m_{\ell\ell\gamma\gamma} $ distribution of signal events with $ m_{a} = $ 15 GeV in the muon channel with the detector settings of the 2017 data taking period. |
png pdf |
Additional Figure 44:
Fit of the $ m_{\ell\ell\gamma\gamma} $ distribution of signal events with $ m_{a} = $ 15 GeV in the electron (left) and muon (right) channels with the detector settings of the 2018 data taking period. |
png pdf |
Additional Figure 44-a:
Fit of the $ m_{\ell\ell\gamma\gamma} $ distribution of signal events with $ m_{a} = $ 15 GeV in the electron channel with the detector settings of the 2018 data taking period. |
png pdf |
Additional Figure 44-b:
Fit of the $ m_{\ell\ell\gamma\gamma} $ distribution of signal events with $ m_{a} = $ 15 GeV in the muon channel with the detector settings of the 2018 data taking period. |
png pdf |
Additional Figure 45:
Fit of the $ m_{\ell\ell\gamma\gamma} $ distribution of signal events with $ m_{a} = $ 20 GeV in the electron (left) and muon (right) channels with the detector settings of the 2016 pre-VFP data taking period, where VFP means Preamplifier Feedback Voltage Bias correction due to inefficiency in the strip modules of the tracker during the 2016 data taking year. |
png pdf |
Additional Figure 45-a:
Fit of the $ m_{\ell\ell\gamma\gamma} $ distribution of signal events with $ m_{a} = $ 20 GeV in the electron channel with the detector settings of the 2016 pre-VFP data taking period, where VFP means Preamplifier Feedback Voltage Bias correction due to inefficiency in the strip modules of the tracker during the 2016 data taking year. |

png pdf |
Additional Figure 45-b:
Fit of the $ m_{\ell\ell\gamma\gamma} $ distribution of signal events with $ m_{a} = $ 20 GeV in the muon channel with the detector settings of the 2016 pre-VFP data taking period, where VFP means Preamplifier Feedback Voltage Bias correction due to inefficiency in the strip modules of the tracker during the 2016 data taking year. |

png pdf |
Additional Figure 46:
Fit of the $ m_{\ell\ell\gamma\gamma} $ distribution of signal events with $ m_{a} = $ 20 GeV in the electron (left) and muon (right) channels with the detector settings of the 2016 post-VFP data taking period, where VFP means Preamplifier Feedback Voltage Bias correction due to inefficiency in the strip modules of the tracker during the 2016 data taking year. |

png pdf |
Additional Figure 46-a:
Fit of the $ m_{\ell\ell\gamma\gamma} $ distribution of signal events with $ m_{a} = $ 20 GeV in the electron channel with the detector settings of the 2016 post-VFP data taking period, where VFP means Preamplifier Feedback Voltage Bias correction due to inefficiency in the strip modules of the tracker during the 2016 data taking year. |

png pdf |
Additional Figure 46-b:
Fit of the $ m_{\ell\ell\gamma\gamma} $ distribution of signal events with $ m_{a} = $ 20 GeV in the muon channel with the detector settings of the 2016 post-VFP data taking period, where VFP means Preamplifier Feedback Voltage Bias correction due to inefficiency in the strip modules of the tracker during the 2016 data taking year. |
png pdf |
Additional Figure 47:
Fit of the $ m_{\ell\ell\gamma\gamma} $ distribution of signal events with $ m_{a} = $ 20 GeV in the electron (left) and muon (right) channels with the detector settings of the 2017 data taking period. |

png pdf |
Additional Figure 47-a:
Fit of the $ m_{\ell\ell\gamma\gamma} $ distribution of signal events with $ m_{a} = $ 20 GeV in the electron channel with the detector settings of the 2017 data taking period. |
png pdf |
Additional Figure 47-b:
Fit of the $ m_{\ell\ell\gamma\gamma} $ distribution of signal events with $ m_{a} = $ 20 GeV in the muon channel with the detector settings of the 2017 data taking period. |
png pdf |
Additional Figure 48:
Fit of the $ m_{\ell\ell\gamma\gamma} $ distribution of signal events with $ m_{a} = $ 20 GeV in the electron (left) and muon (right) channels with the detector settings of the 2018 data taking period. |
png pdf |
Additional Figure 48-a:
Fit of the $ m_{\ell\ell\gamma\gamma} $ distribution of signal events with $ m_{a} = $ 20 GeV in the electron channel with the detector settings of the 2018 data taking period. |

png pdf |
Additional Figure 48-b:
Fit of the $ m_{\ell\ell\gamma\gamma} $ distribution of signal events with $ m_{a} = $ 20 GeV in the muon channel with the detector settings of the 2018 data taking period. |

png pdf |
Additional Figure 49:
Fit of the $ m_{\ell\ell\gamma\gamma} $ distribution of signal events with $ m_{a} = $ 25 GeV in the electron (left) and muon (right) channels with the detector settings of the 2016 pre-VFP data taking period, where VFP means Preamplifier Feedback Voltage Bias correction due to inefficiency in the strip modules of the tracker during the 2016 data taking year. |

png pdf |
Additional Figure 49-a:
Fit of the $ m_{\ell\ell\gamma\gamma} $ distribution of signal events with $ m_{a} = $ 25 GeV in the electron channel with the detector settings of the 2016 pre-VFP data taking period, where VFP means Preamplifier Feedback Voltage Bias correction due to inefficiency in the strip modules of the tracker during the 2016 data taking year. |

png pdf |
Additional Figure 49-b:
Fit of the $ m_{\ell\ell\gamma\gamma} $ distribution of signal events with $ m_{a} = $ 25 GeV in the muon channel with the detector settings of the 2016 pre-VFP data taking period, where VFP means Preamplifier Feedback Voltage Bias correction due to inefficiency in the strip modules of the tracker during the 2016 data taking year. |
png pdf |
Additional Figure 50:
Fit of the $ m_{\ell\ell\gamma\gamma} $ distribution of signal events with $ m_{a} = $ 25 GeV in the electron (left) and muon (right) channels with the detector settings of the 2016 post-VFP data taking period, where VFP means Preamplifier Feedback Voltage Bias correction due to inefficiency in the strip modules of the tracker during the 2016 data taking year. |

png pdf |
Additional Figure 50-a:
Fit of the $ m_{\ell\ell\gamma\gamma} $ distribution of signal events with $ m_{a} = $ 25 GeV in the electron channel with the detector settings of the 2016 post-VFP data taking period, where VFP means Preamplifier Feedback Voltage Bias correction due to inefficiency in the strip modules of the tracker during the 2016 data taking year. |

png pdf |
Additional Figure 50-b:
Fit of the $ m_{\ell\ell\gamma\gamma} $ distribution of signal events with $ m_{a} = $ 25 GeV in the muon channel with the detector settings of the 2016 post-VFP data taking period, where VFP means Preamplifier Feedback Voltage Bias correction due to inefficiency in the strip modules of the tracker during the 2016 data taking year. |
png pdf |
Additional Figure 51:
Fit of the $ m_{\ell\ell\gamma\gamma} $ distribution of signal events with $ m_{a} = $ 25 GeV in the electron (left) and muon (right) channels with the detector settings of the 2017 data taking period. |
png pdf |
Additional Figure 51-a:
Fit of the $ m_{\ell\ell\gamma\gamma} $ distribution of signal events with $ m_{a} = $ 25 GeV in the electron channel with the detector settings of the 2017 data taking period. |

png pdf |
Additional Figure 51-b:
Fit of the $ m_{\ell\ell\gamma\gamma} $ distribution of signal events with $ m_{a} = $ 25 GeV in the muon channel with the detector settings of the 2017 data taking period. |
png pdf |
Additional Figure 52:
Fit of the $ m_{\ell\ell\gamma\gamma} $ distribution of signal events with $ m_{a} = $ 25 GeV in the electron (left) and muon (right) channels with the detector settings of the 2018 data taking period. |
png pdf |
Additional Figure 52-a:
Fit of the $ m_{\ell\ell\gamma\gamma} $ distribution of signal events with $ m_{a} = $ 25 GeV in the electron channel with the detector settings of the 2018 data taking period. |
png pdf |
Additional Figure 52-b:
Fit of the $ m_{\ell\ell\gamma\gamma} $ distribution of signal events with $ m_{a} = $ 25 GeV in the muon channel with the detector settings of the 2018 data taking period. |

png pdf |
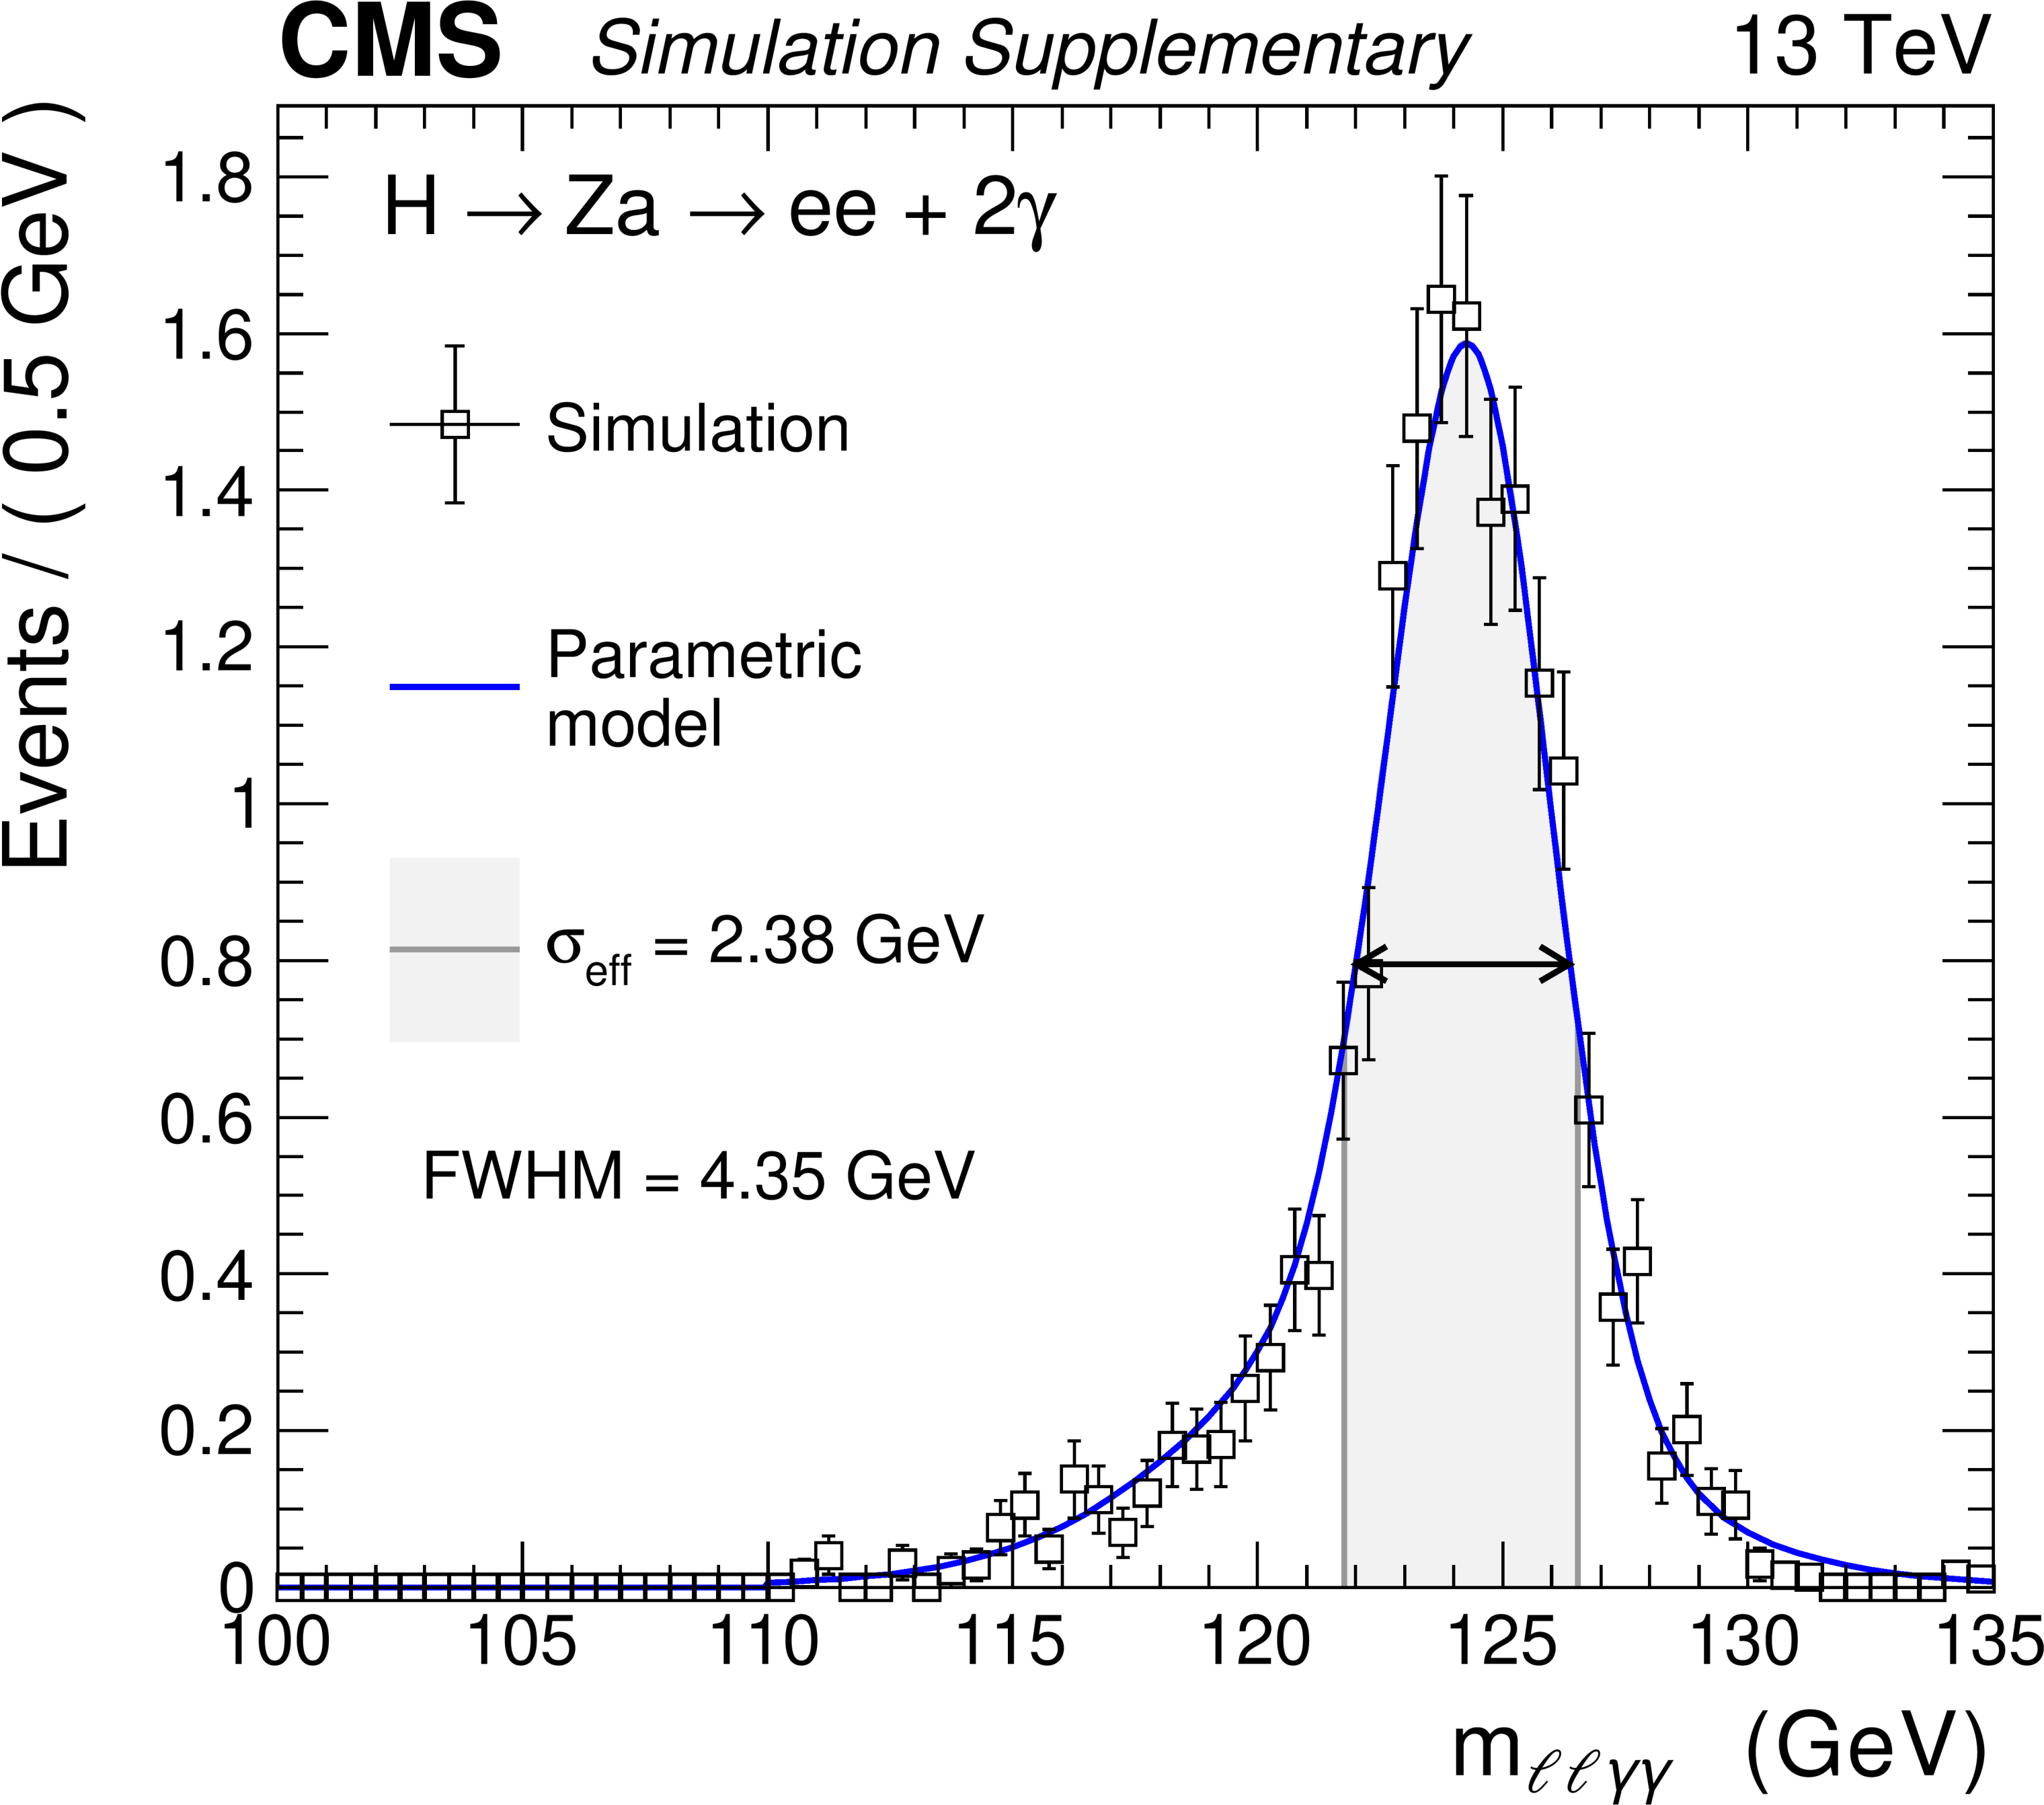
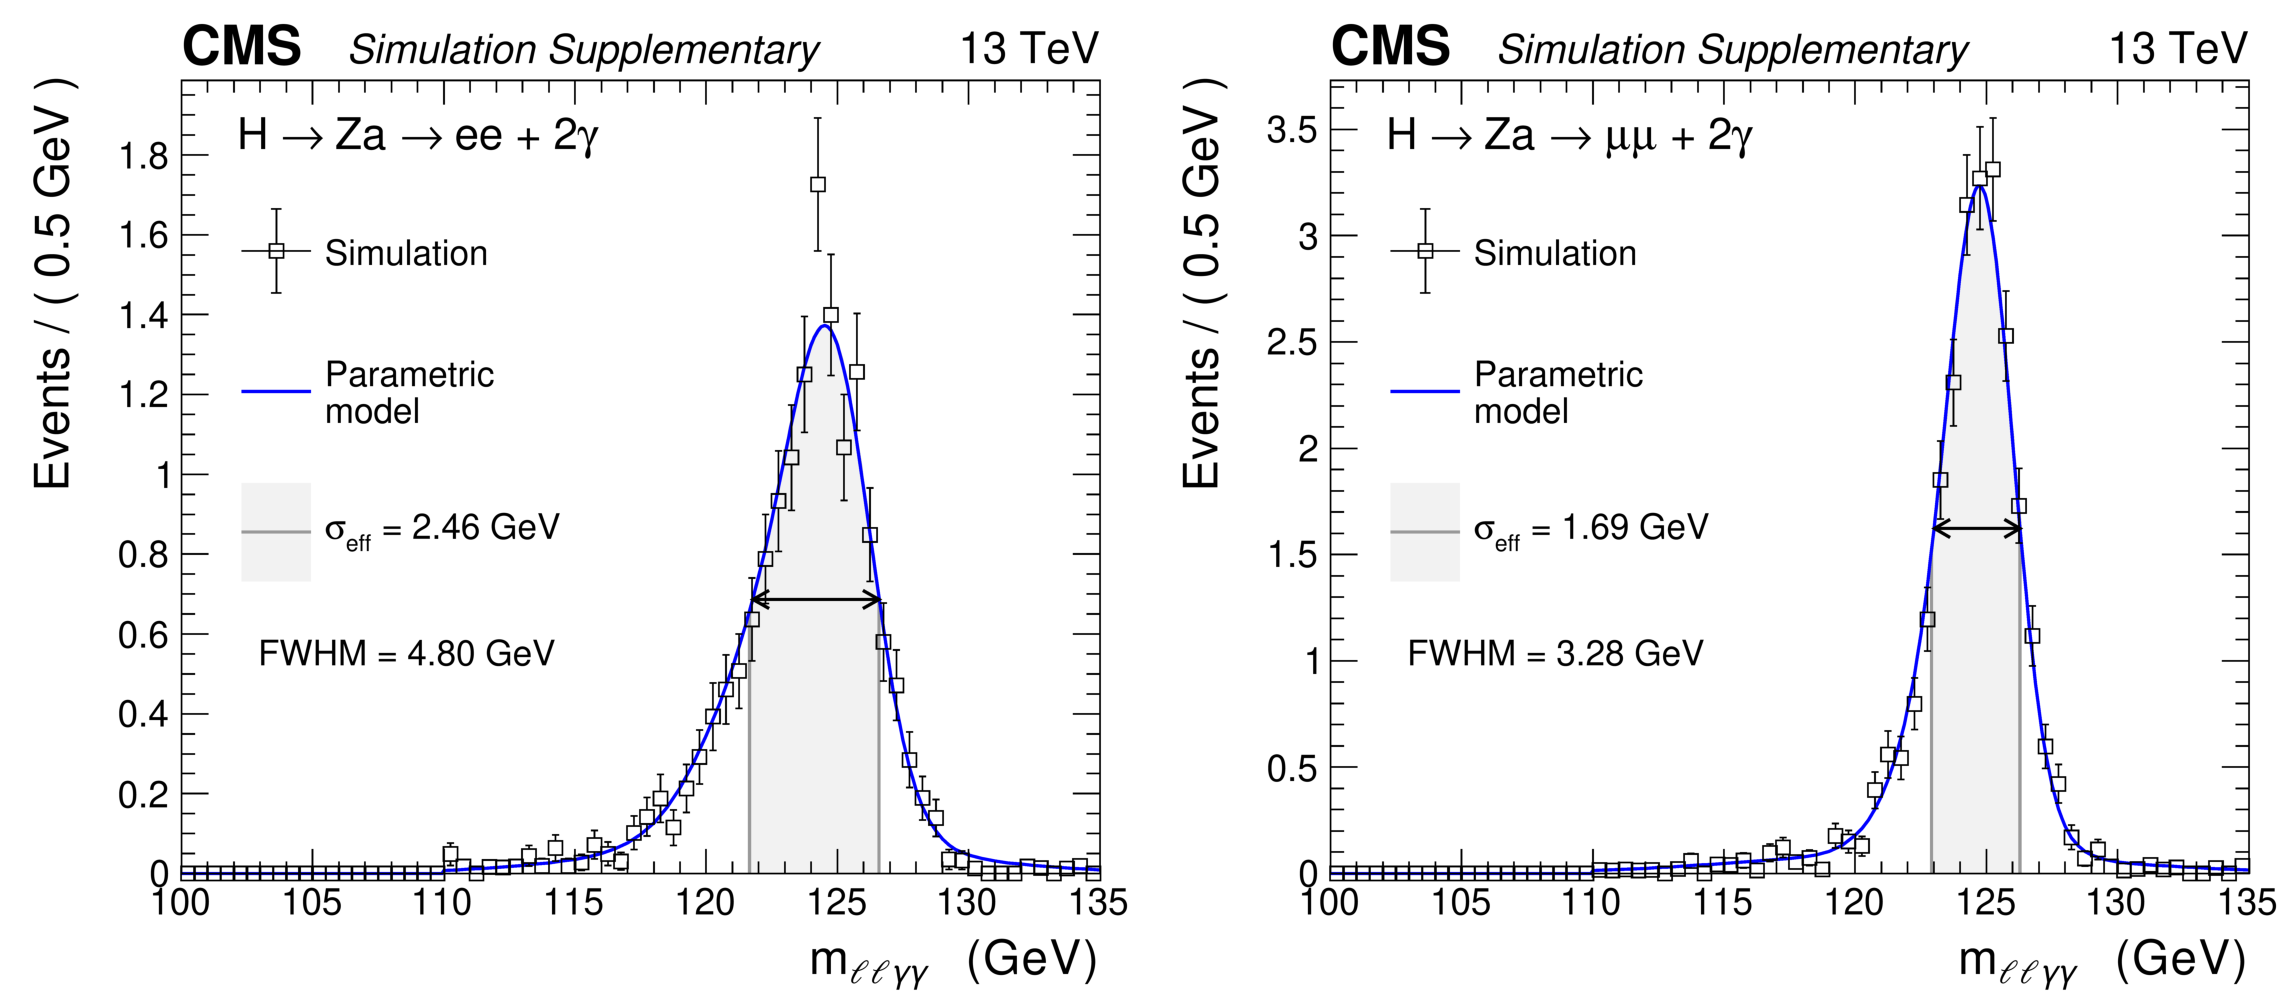
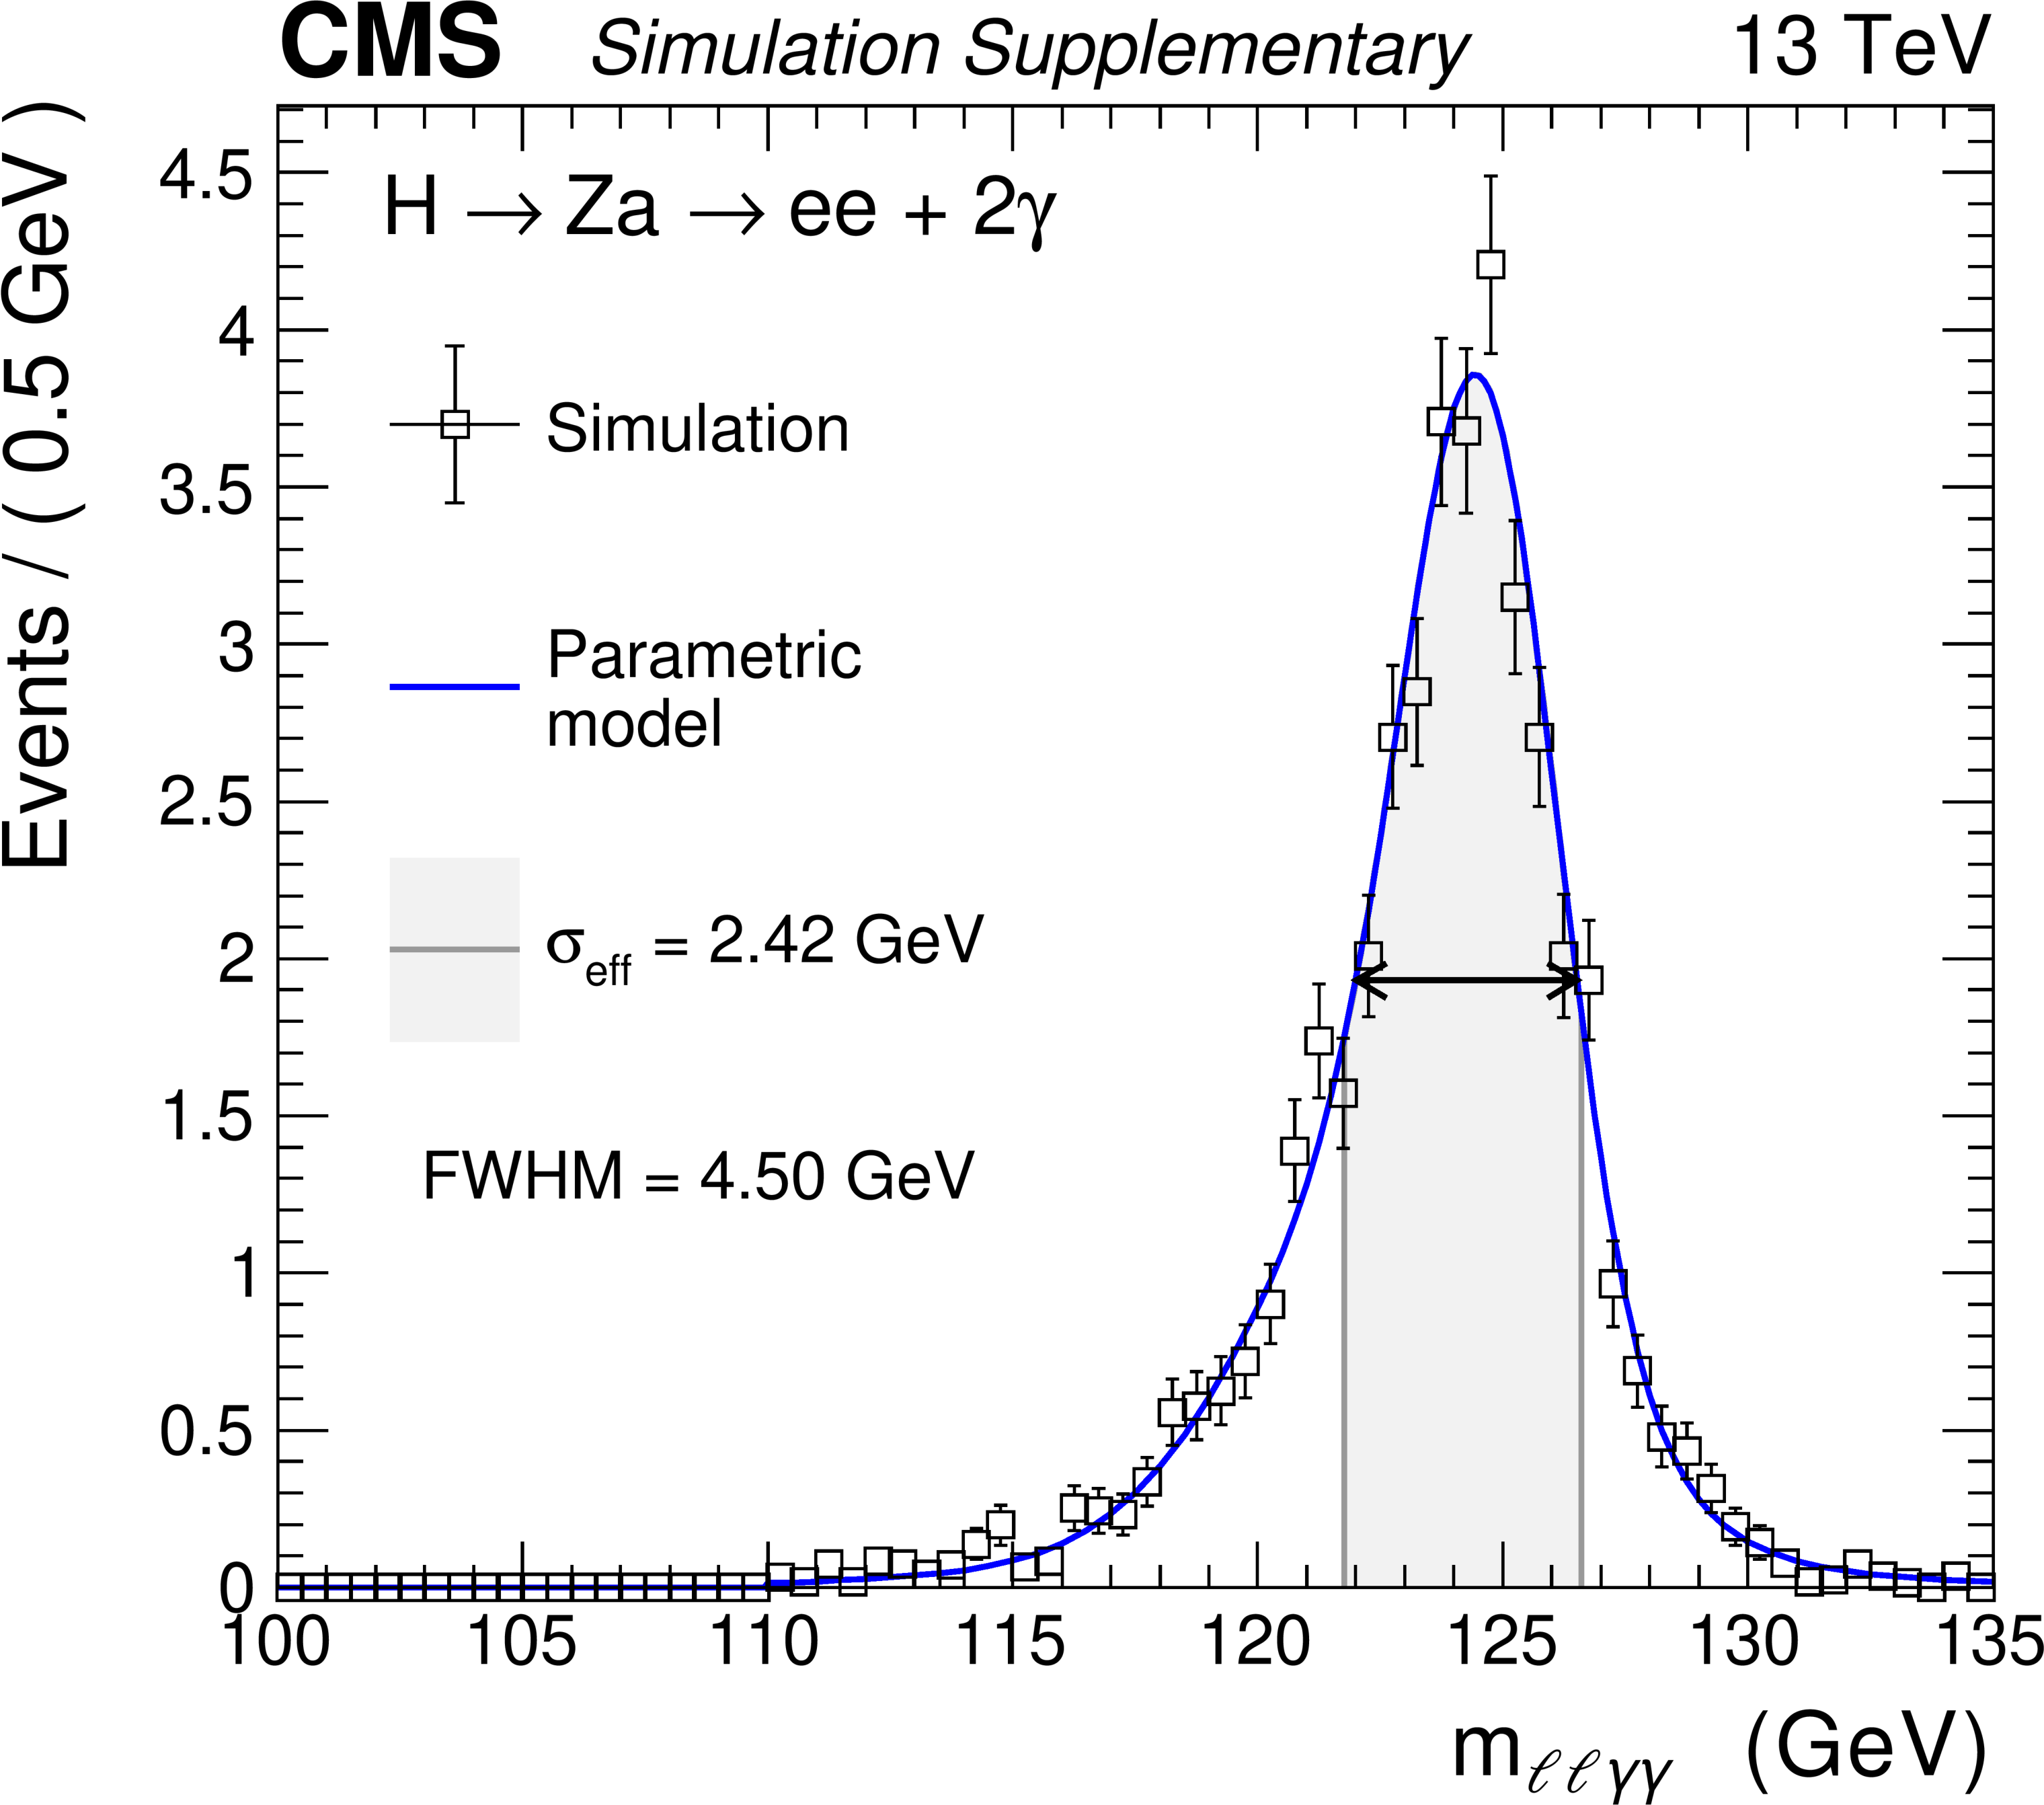
Additional Figure 53:
Fit of the $ m_{\ell\ell\gamma\gamma} $ distribution of signal events with $ m_{a} = $ 30 GeV in the electron (left) and muon (right) channels with the detector settings of the 2016 pre-VFP data taking period, where VFP means Preamplifier Feedback Voltage Bias correction due to inefficiency in the strip modules of the tracker during the 2016 data taking year. |
png pdf |
Additional Figure 53-a:
Fit of the $ m_{\ell\ell\gamma\gamma} $ distribution of signal events with $ m_{a} = $ 30 GeV in the electron channel with the detector settings of the 2016 pre-VFP data taking period, where VFP means Preamplifier Feedback Voltage Bias correction due to inefficiency in the strip modules of the tracker during the 2016 data taking year. |
png pdf |
Additional Figure 53-b:
Fit of the $ m_{\ell\ell\gamma\gamma} $ distribution of signal events with $ m_{a} = $ 30 GeV in the muon channel with the detector settings of the 2016 pre-VFP data taking period, where VFP means Preamplifier Feedback Voltage Bias correction due to inefficiency in the strip modules of the tracker during the 2016 data taking year. |

png pdf |
Additional Figure 54:
Fit of the $ m_{\ell\ell\gamma\gamma} $ distribution of signal events with $ m_{a} = $ 30 GeV in the electron (left) and muon (right) channels with the detector settings of the 2016 post-VFP data taking period, where VFP means Preamplifier Feedback Voltage Bias correction due to inefficiency in the strip modules of the tracker during the 2016 data taking year. |
png pdf |
Additional Figure 54-a:
Fit of the $ m_{\ell\ell\gamma\gamma} $ distribution of signal events with $ m_{a} = $ 30 GeV in the electron channel with the detector settings of the 2016 post-VFP data taking period, where VFP means Preamplifier Feedback Voltage Bias correction due to inefficiency in the strip modules of the tracker during the 2016 data taking year. |

png pdf |
Additional Figure 54-b:
Fit of the $ m_{\ell\ell\gamma\gamma} $ distribution of signal events with $ m_{a} = $ 30 GeV in the muon channel with the detector settings of the 2016 post-VFP data taking period, where VFP means Preamplifier Feedback Voltage Bias correction due to inefficiency in the strip modules of the tracker during the 2016 data taking year. |
png pdf |
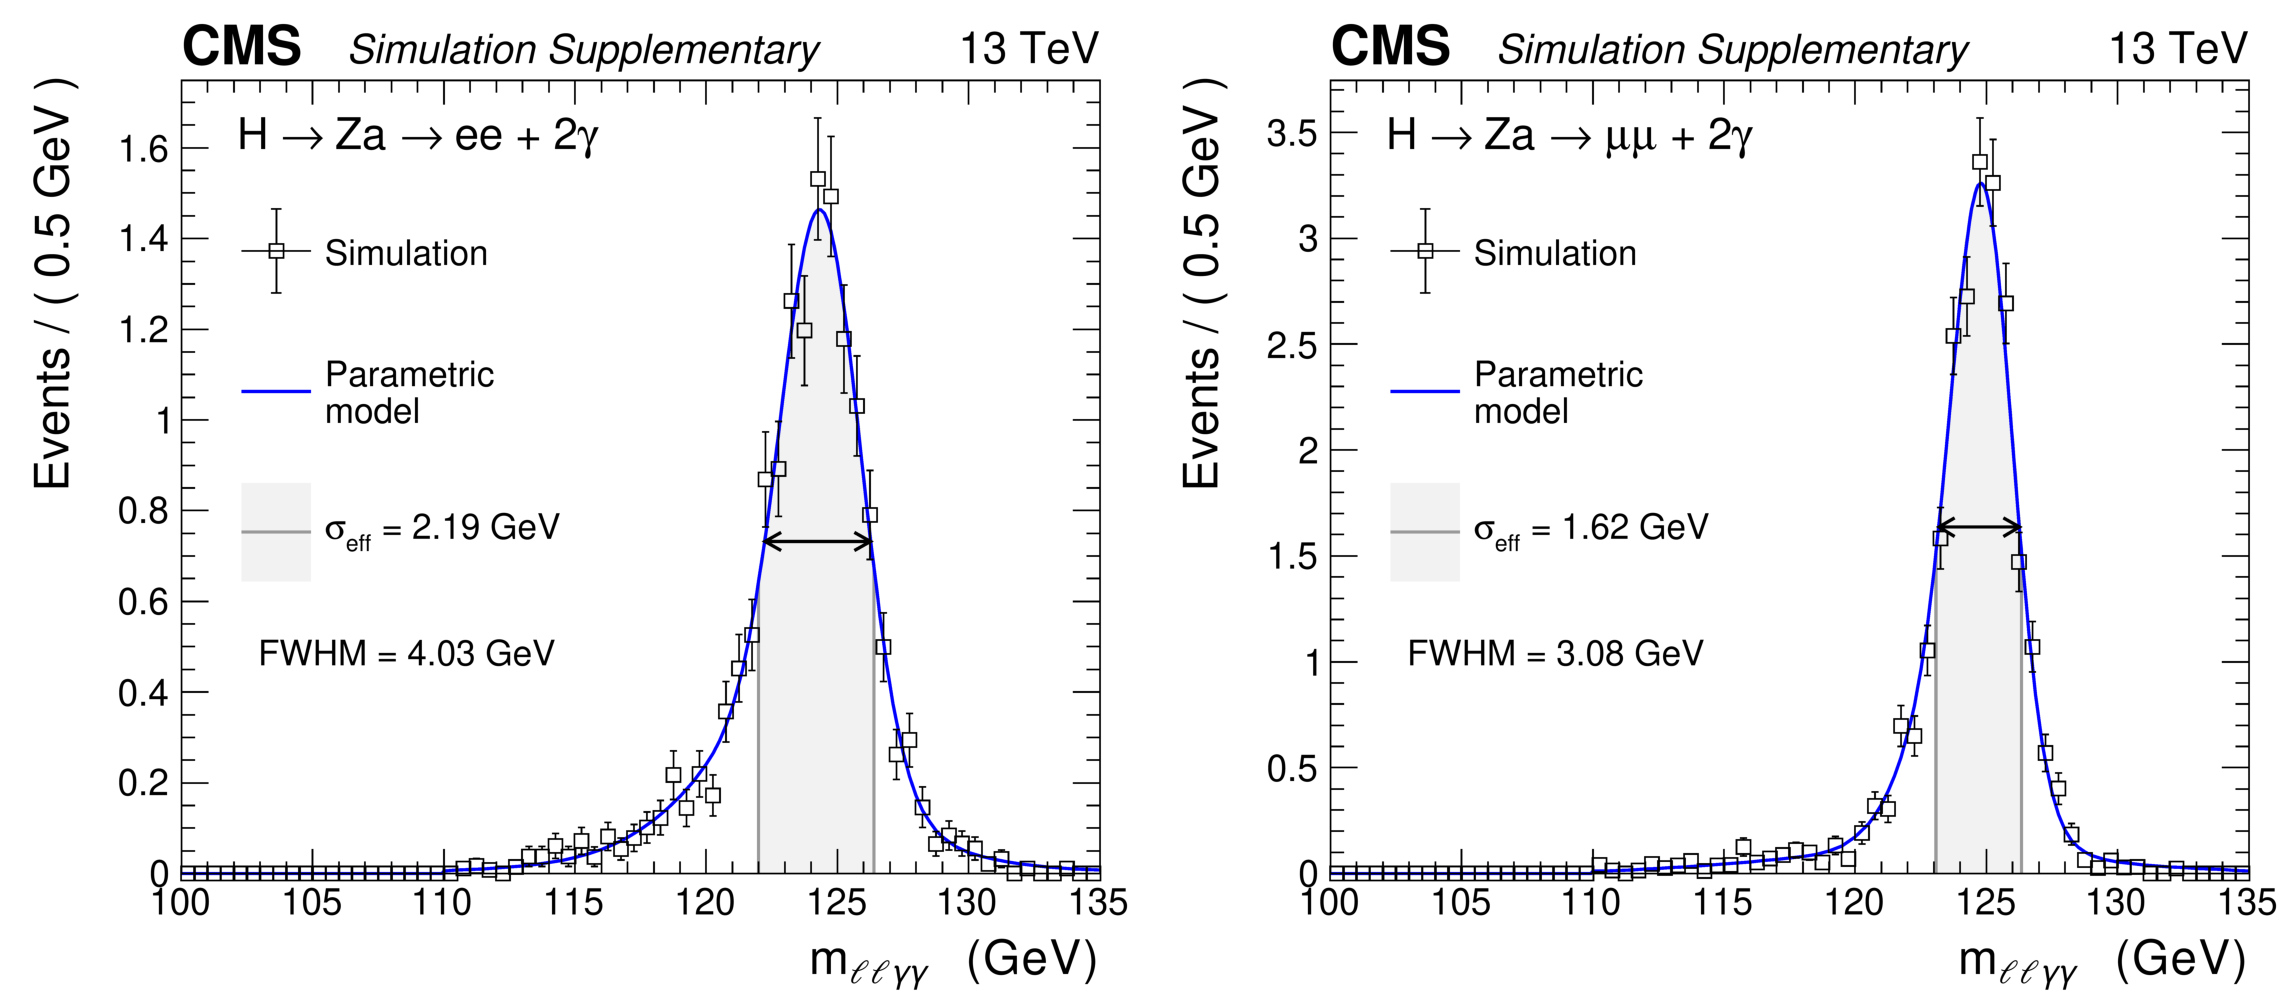
Additional Figure 55:
Fit of the $ m_{\ell\ell\gamma\gamma} $ distribution of signal events with $ m_{a} = $ 30 GeV in the electron (left) and muon (right) channels with the detector settings of the 2017 data taking period. |
png pdf |
Additional Figure 55-a:
Fit of the $ m_{\ell\ell\gamma\gamma} $ distribution of signal events with $ m_{a} = $ 30 GeV in the electron channel with the detector settings of the 2017 data taking period. |
png pdf |
Additional Figure 55-b:
Fit of the $ m_{\ell\ell\gamma\gamma} $ distribution of signal events with $ m_{a} = $ 30 GeV in the muon channel with the detector settings of the 2017 data taking period. |
png pdf |
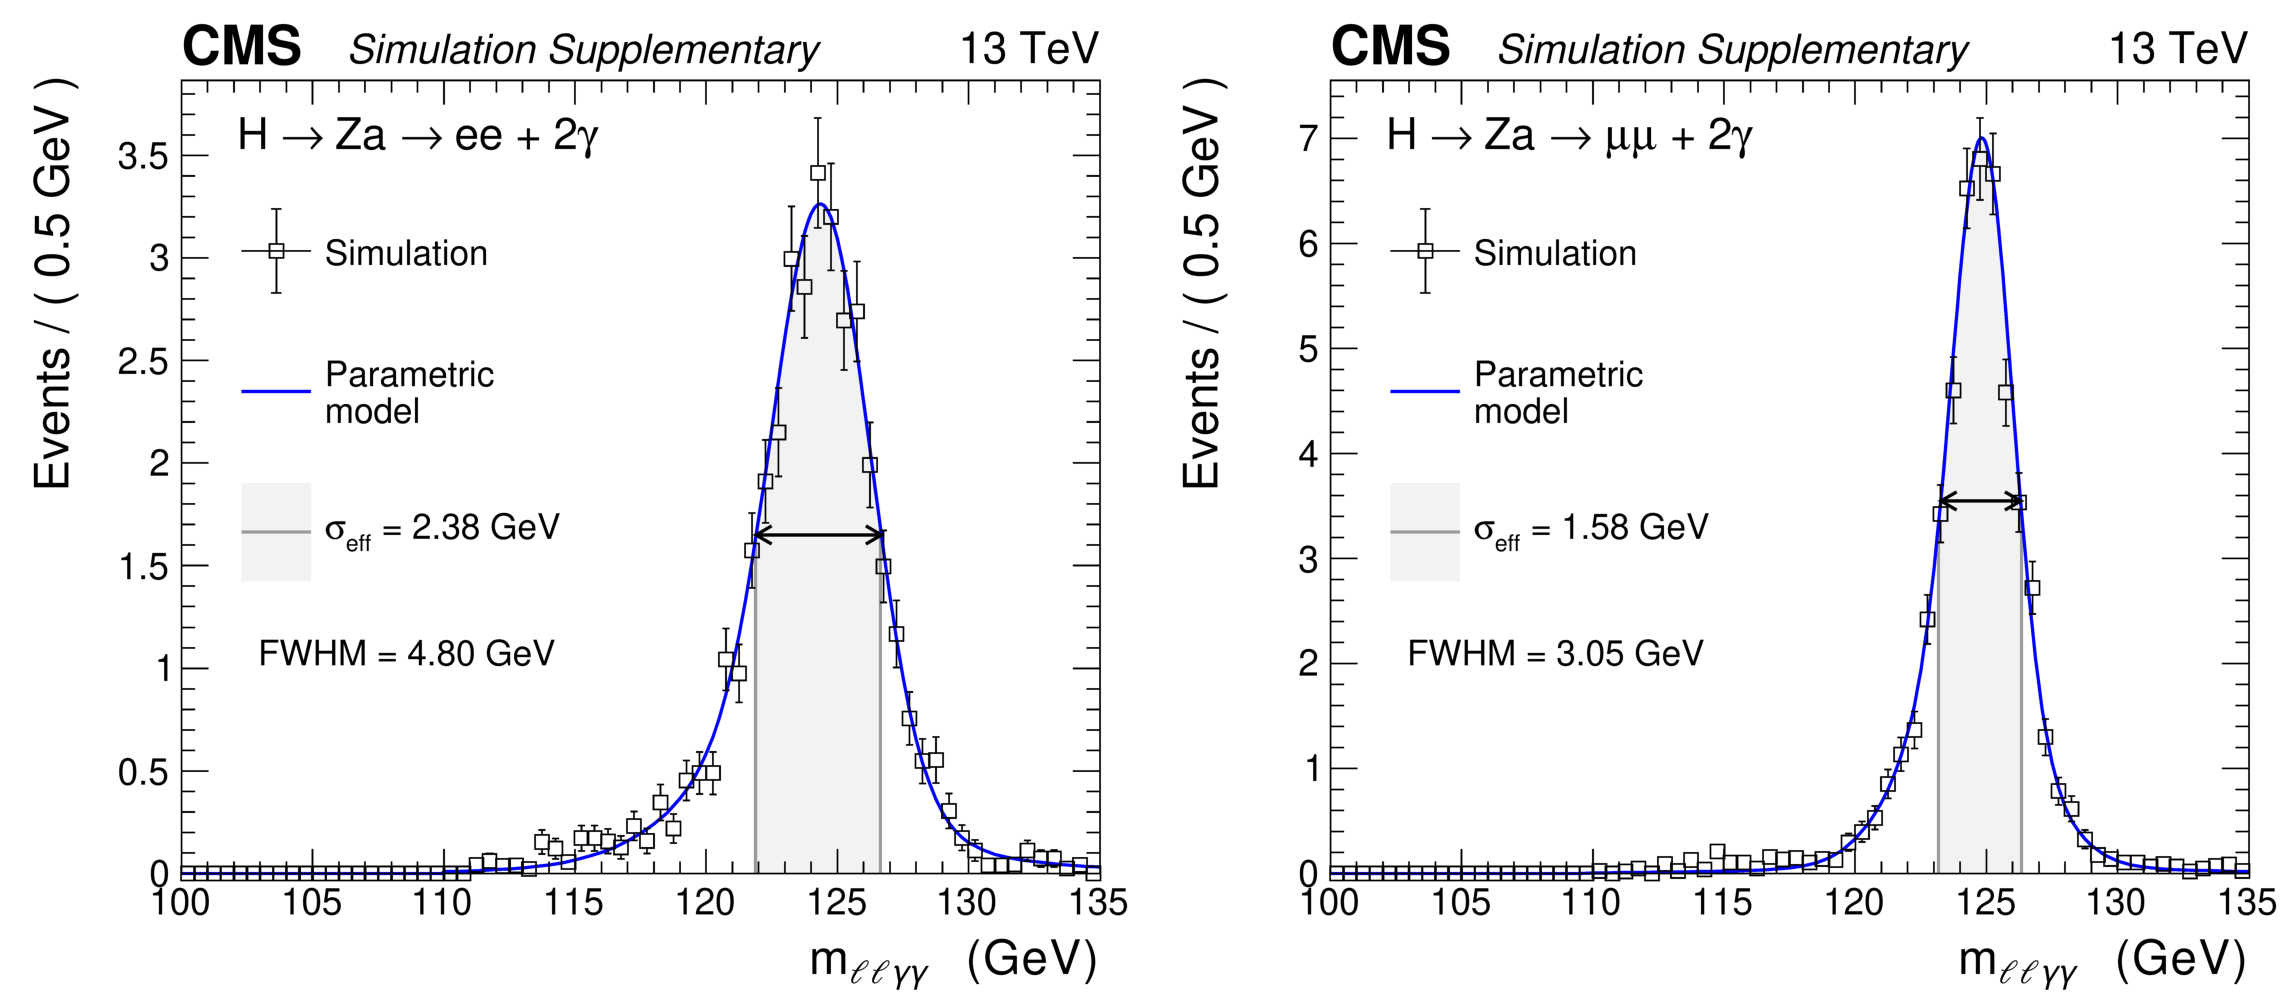
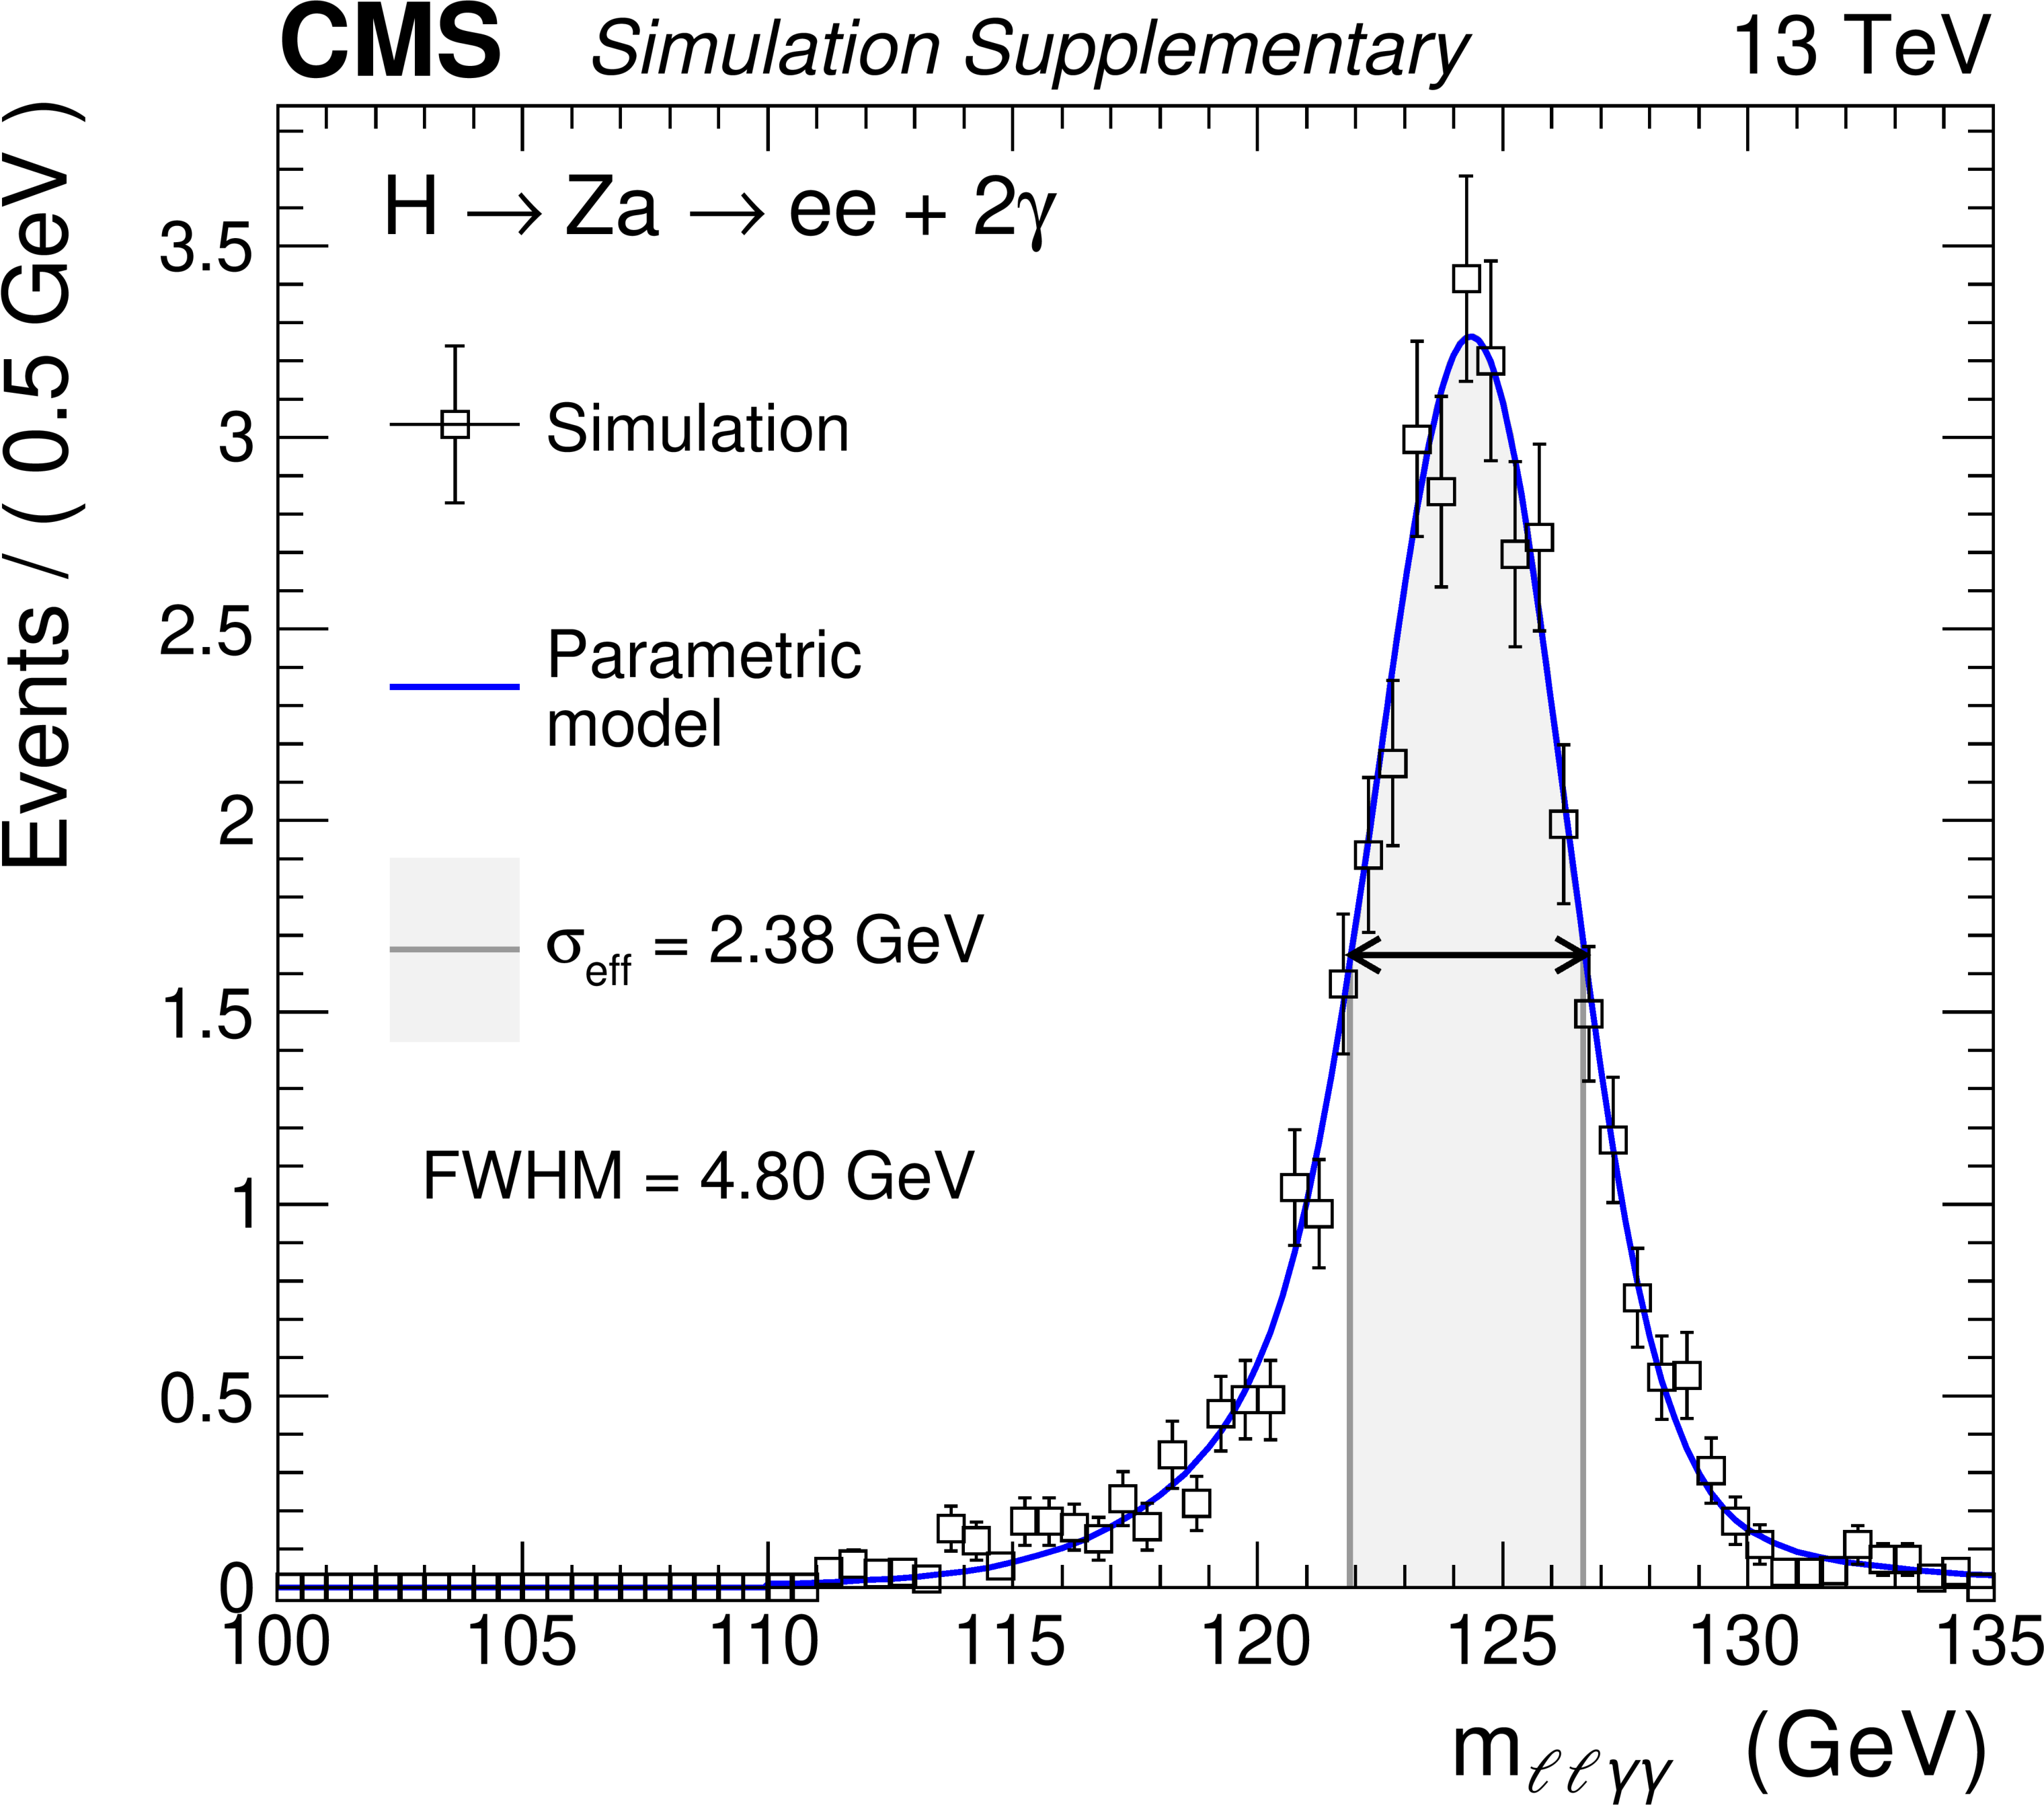
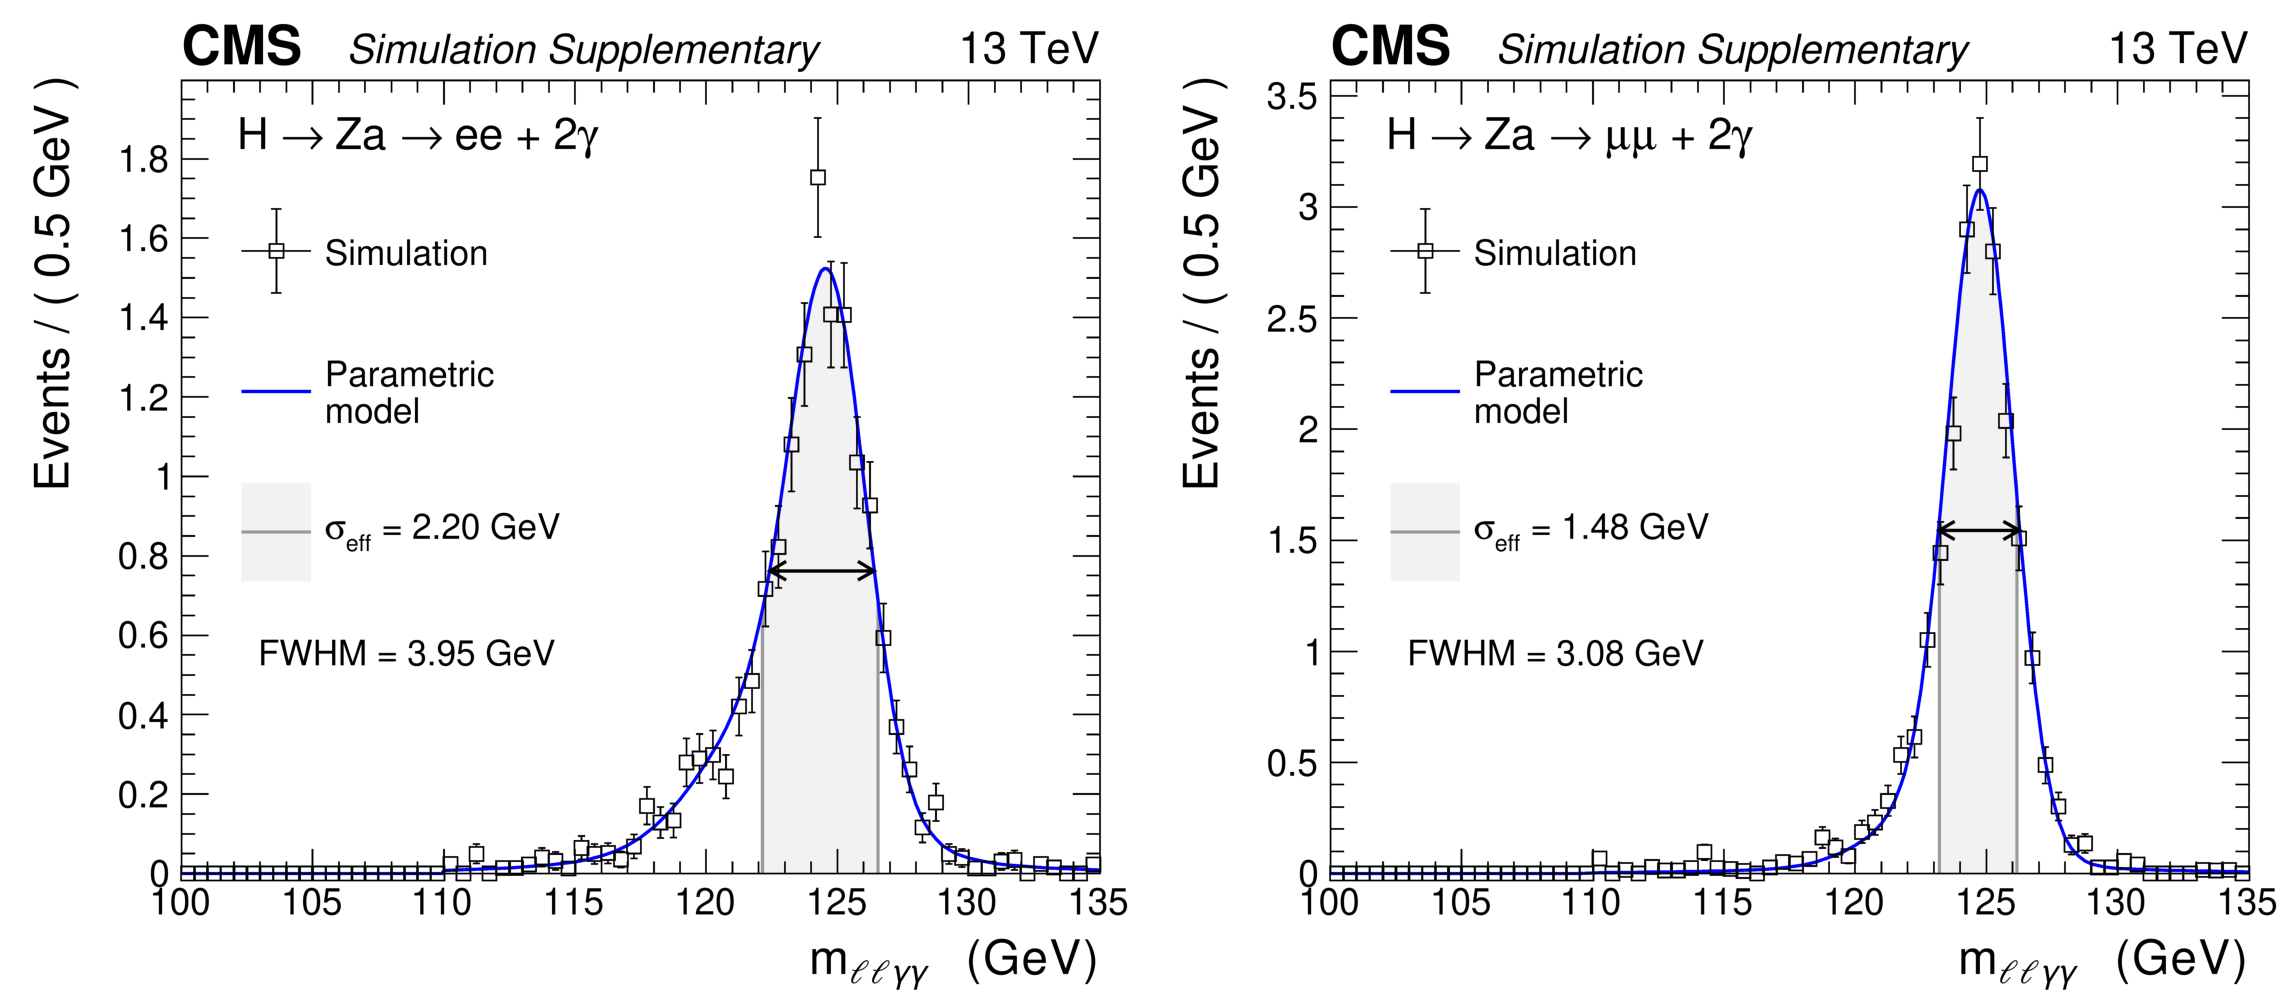
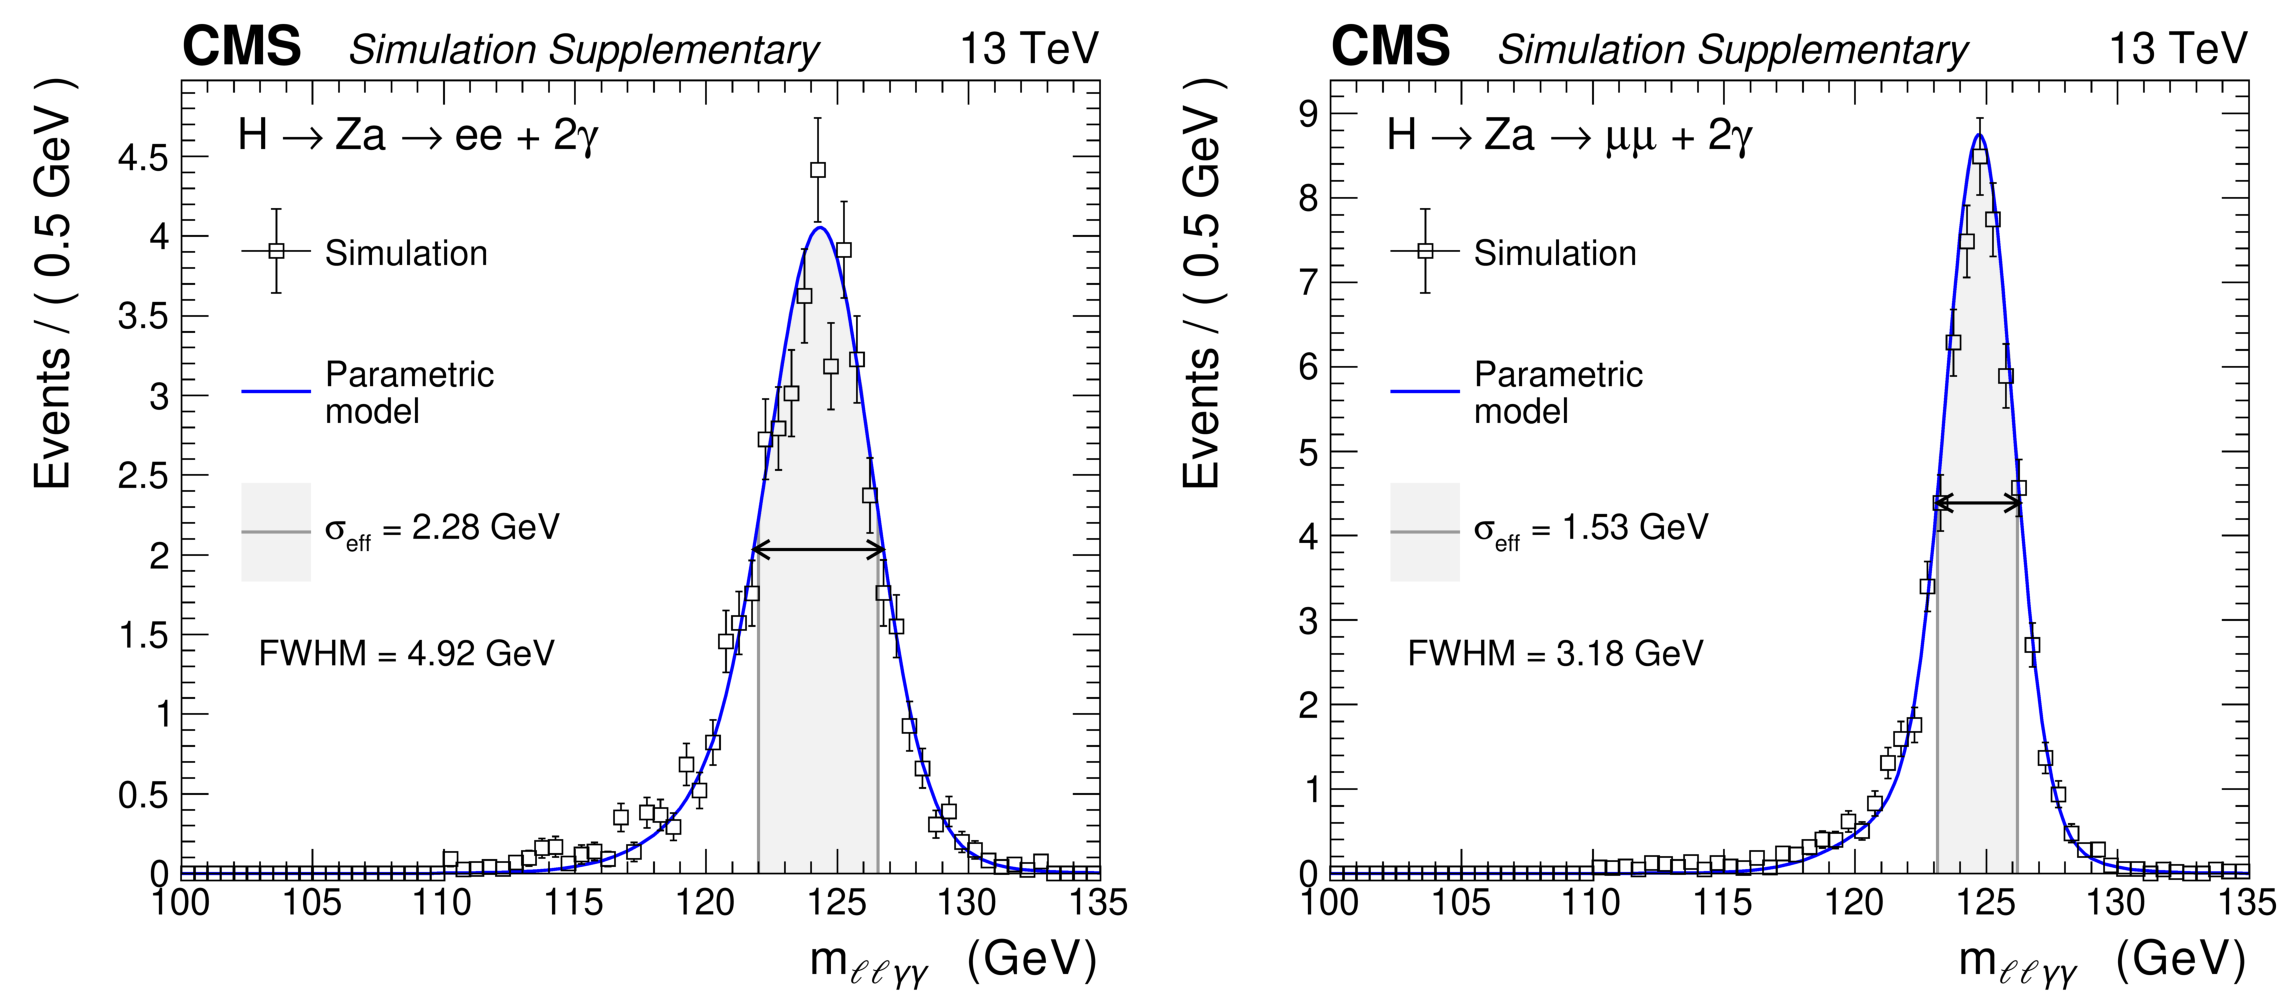
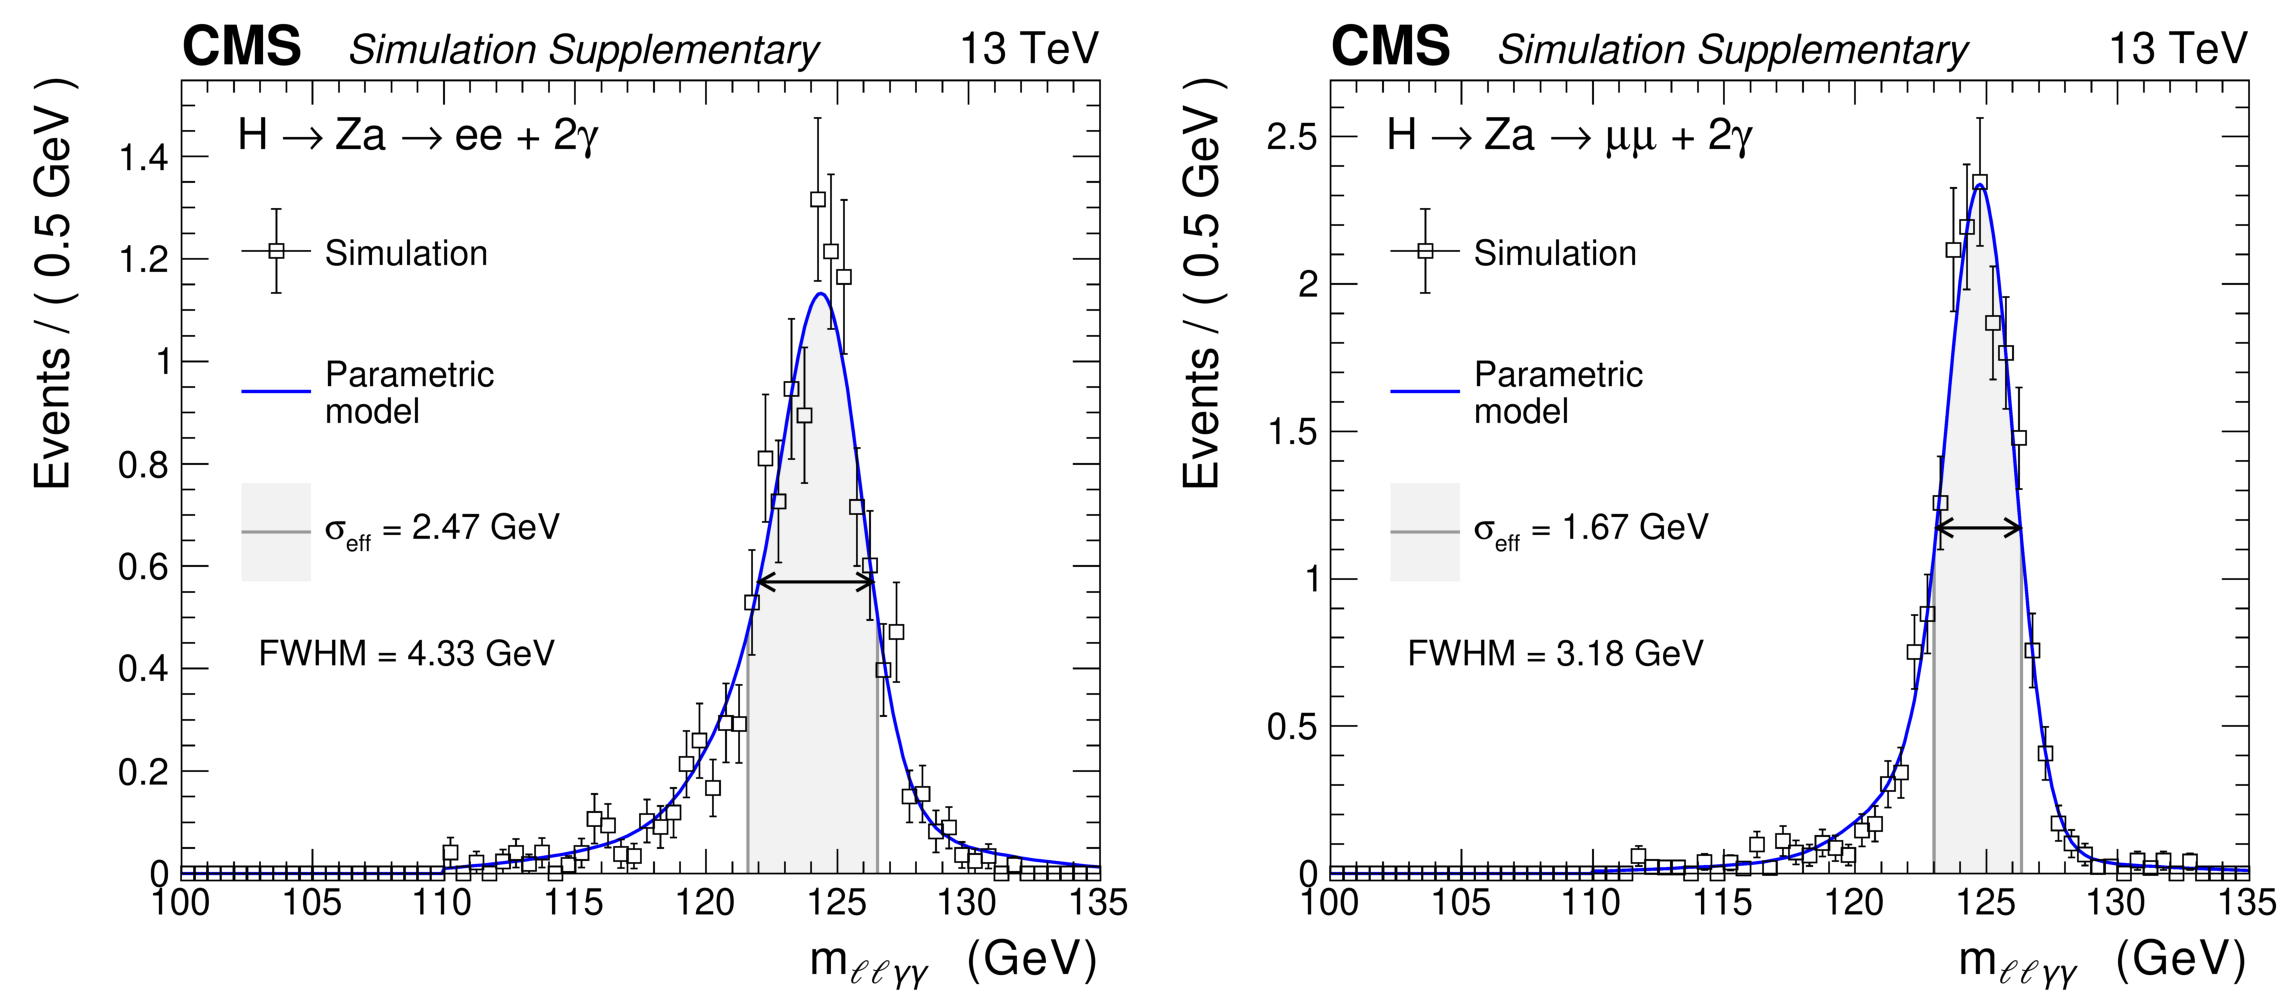
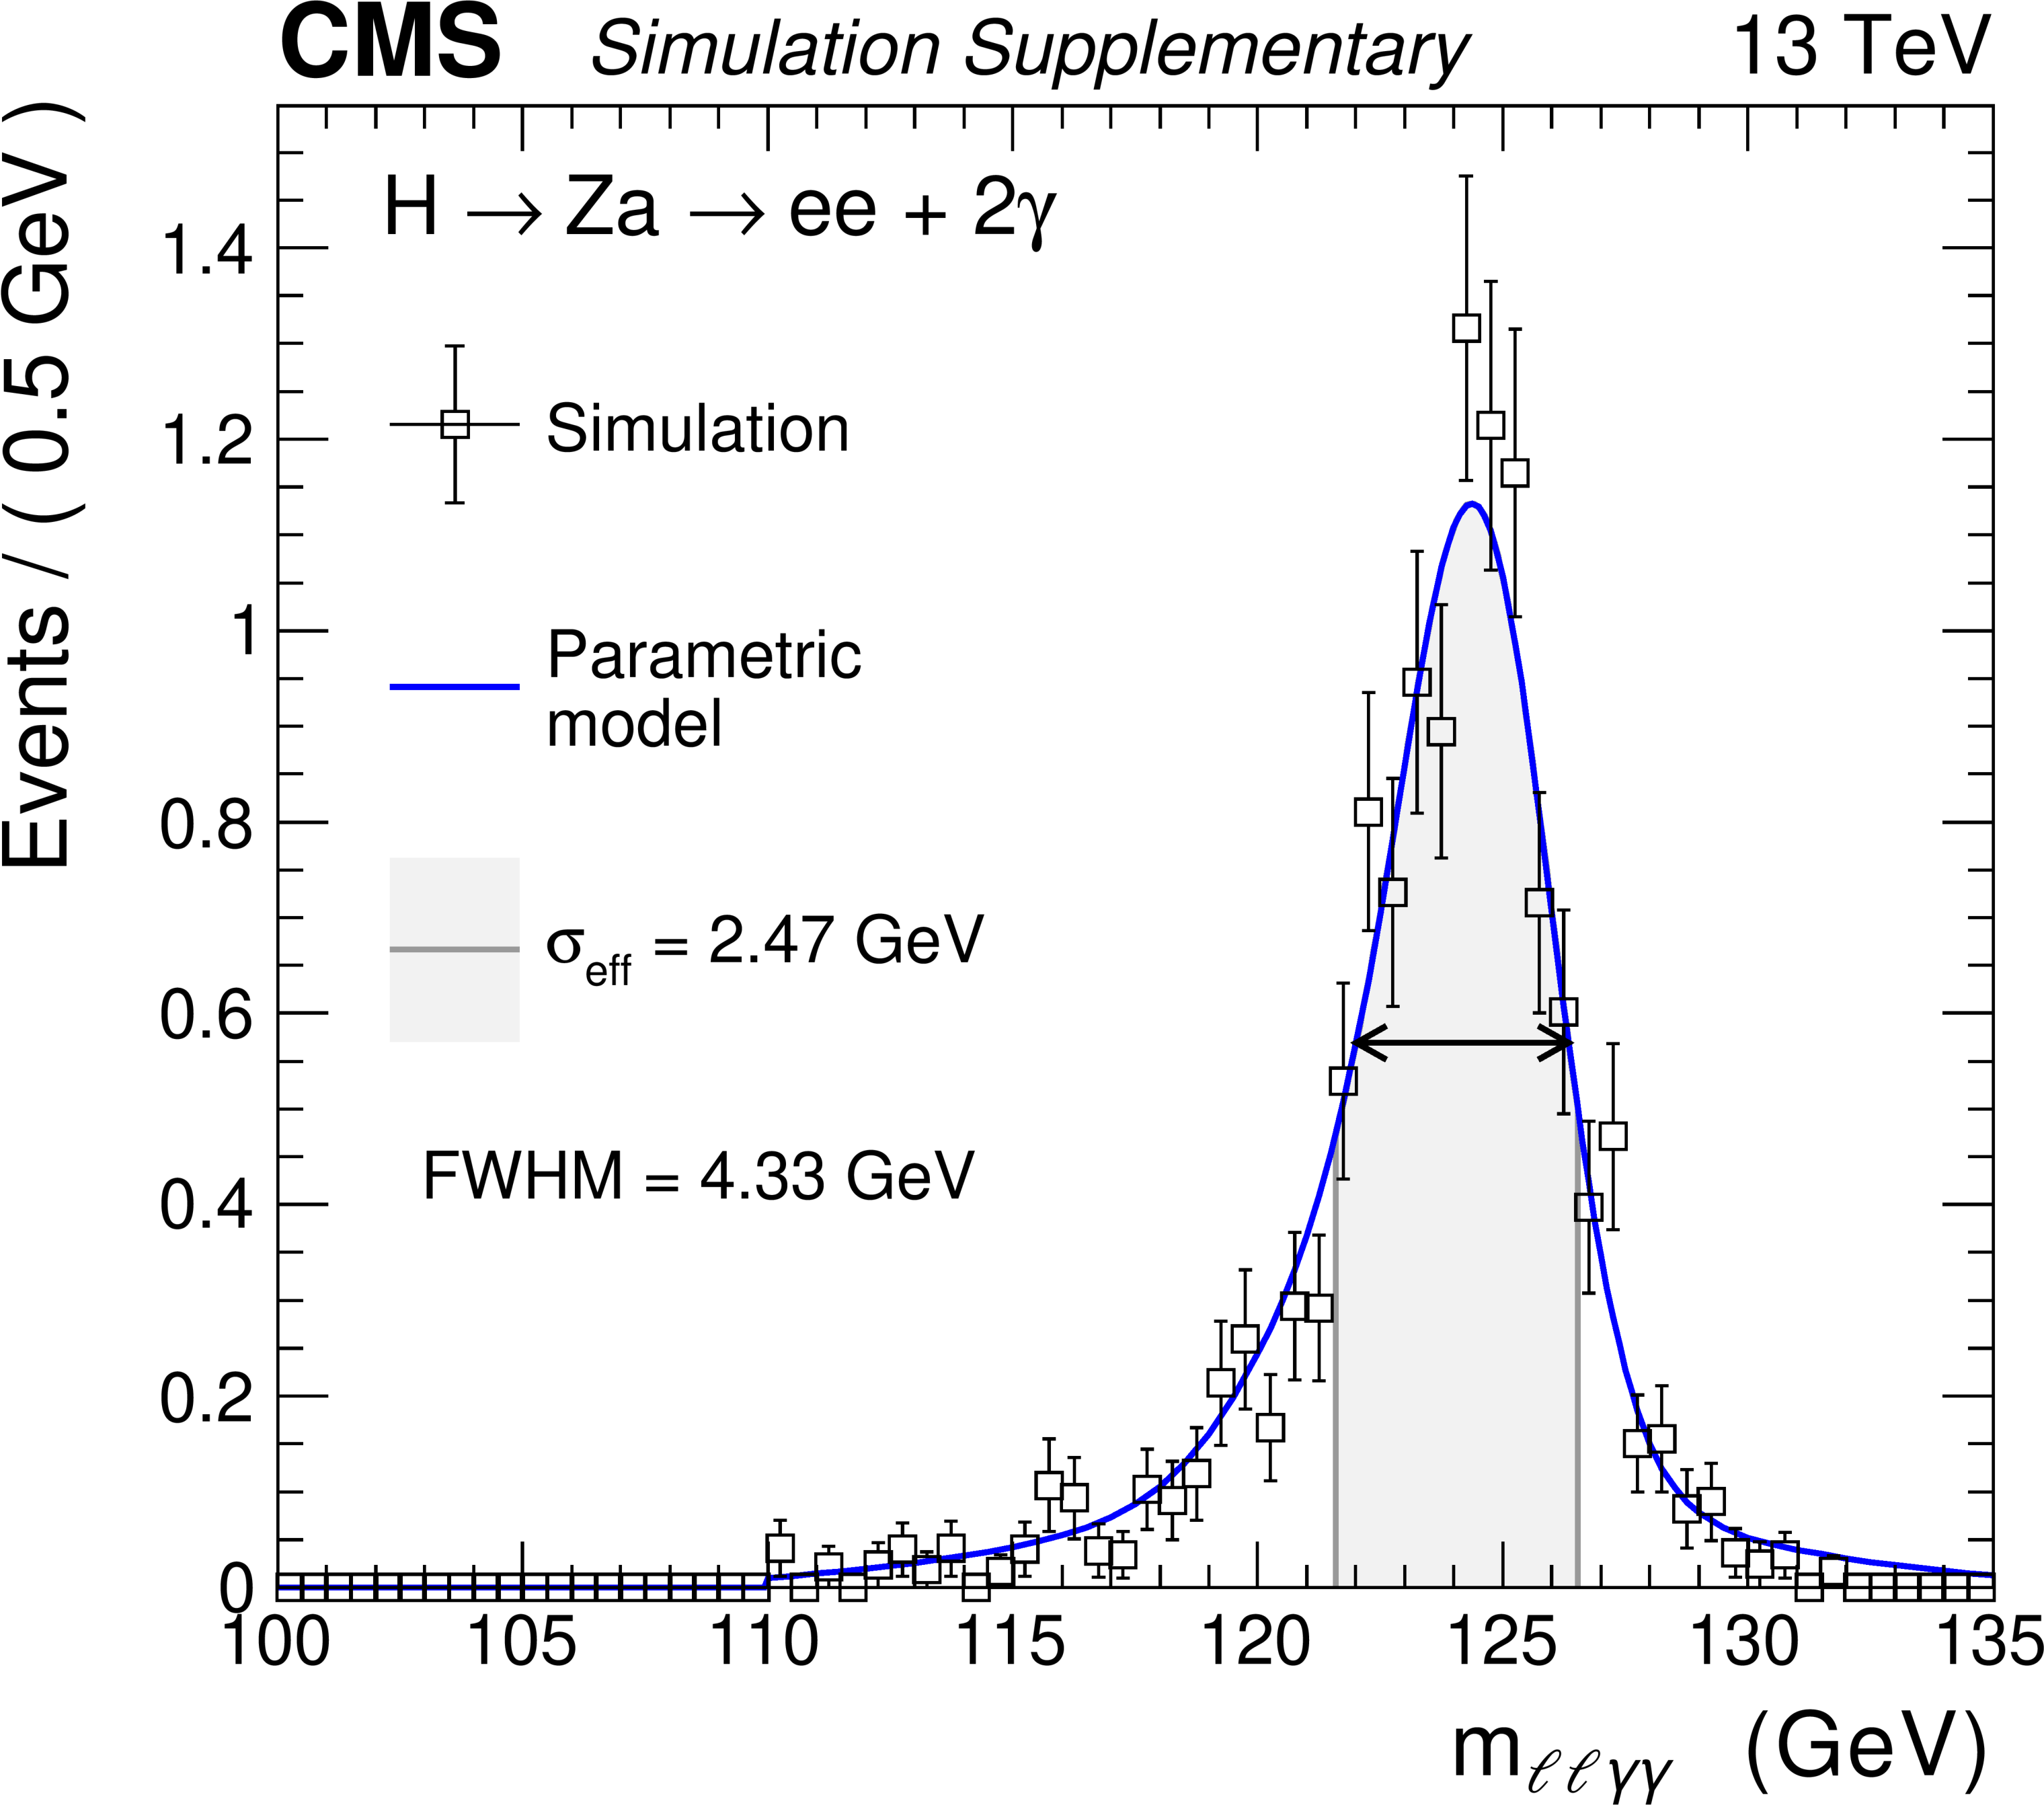
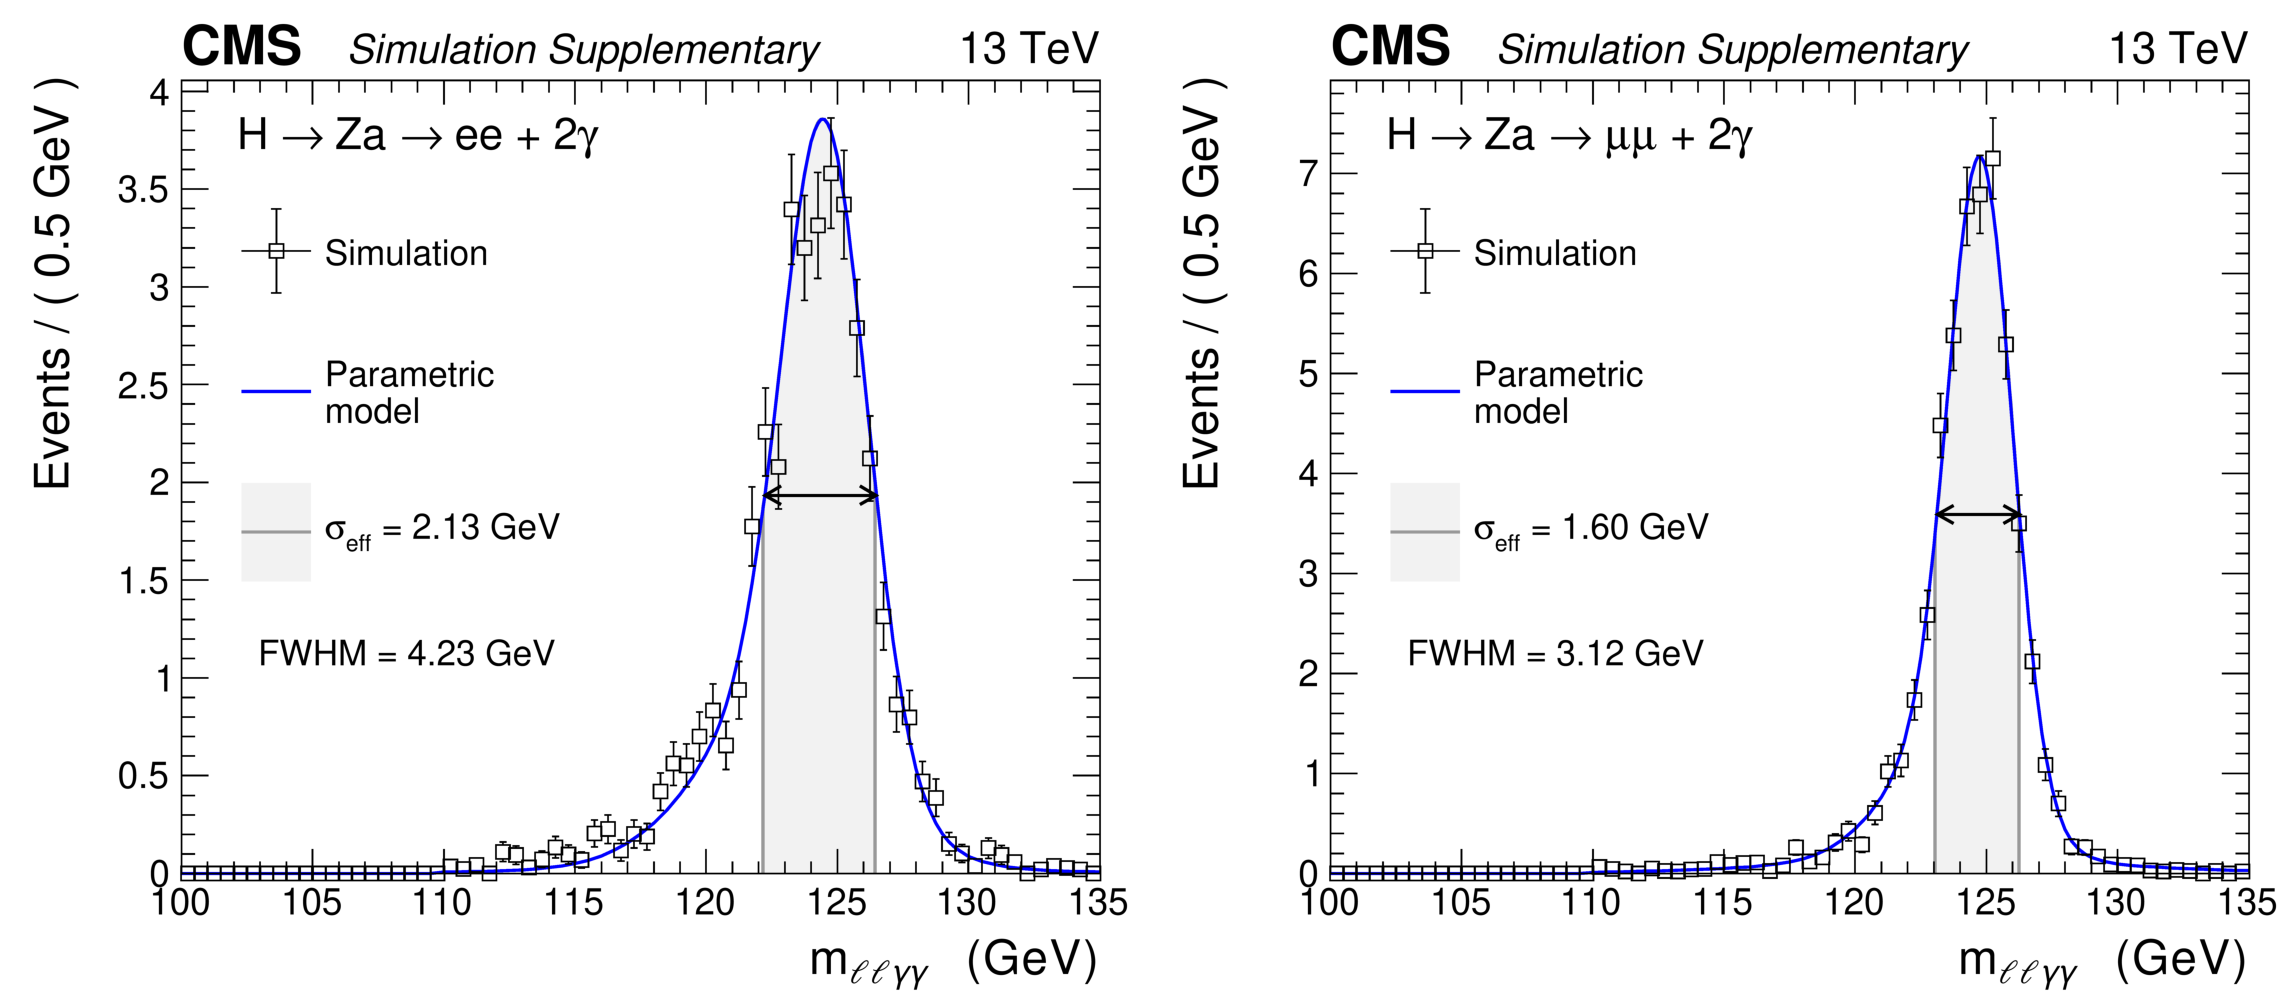
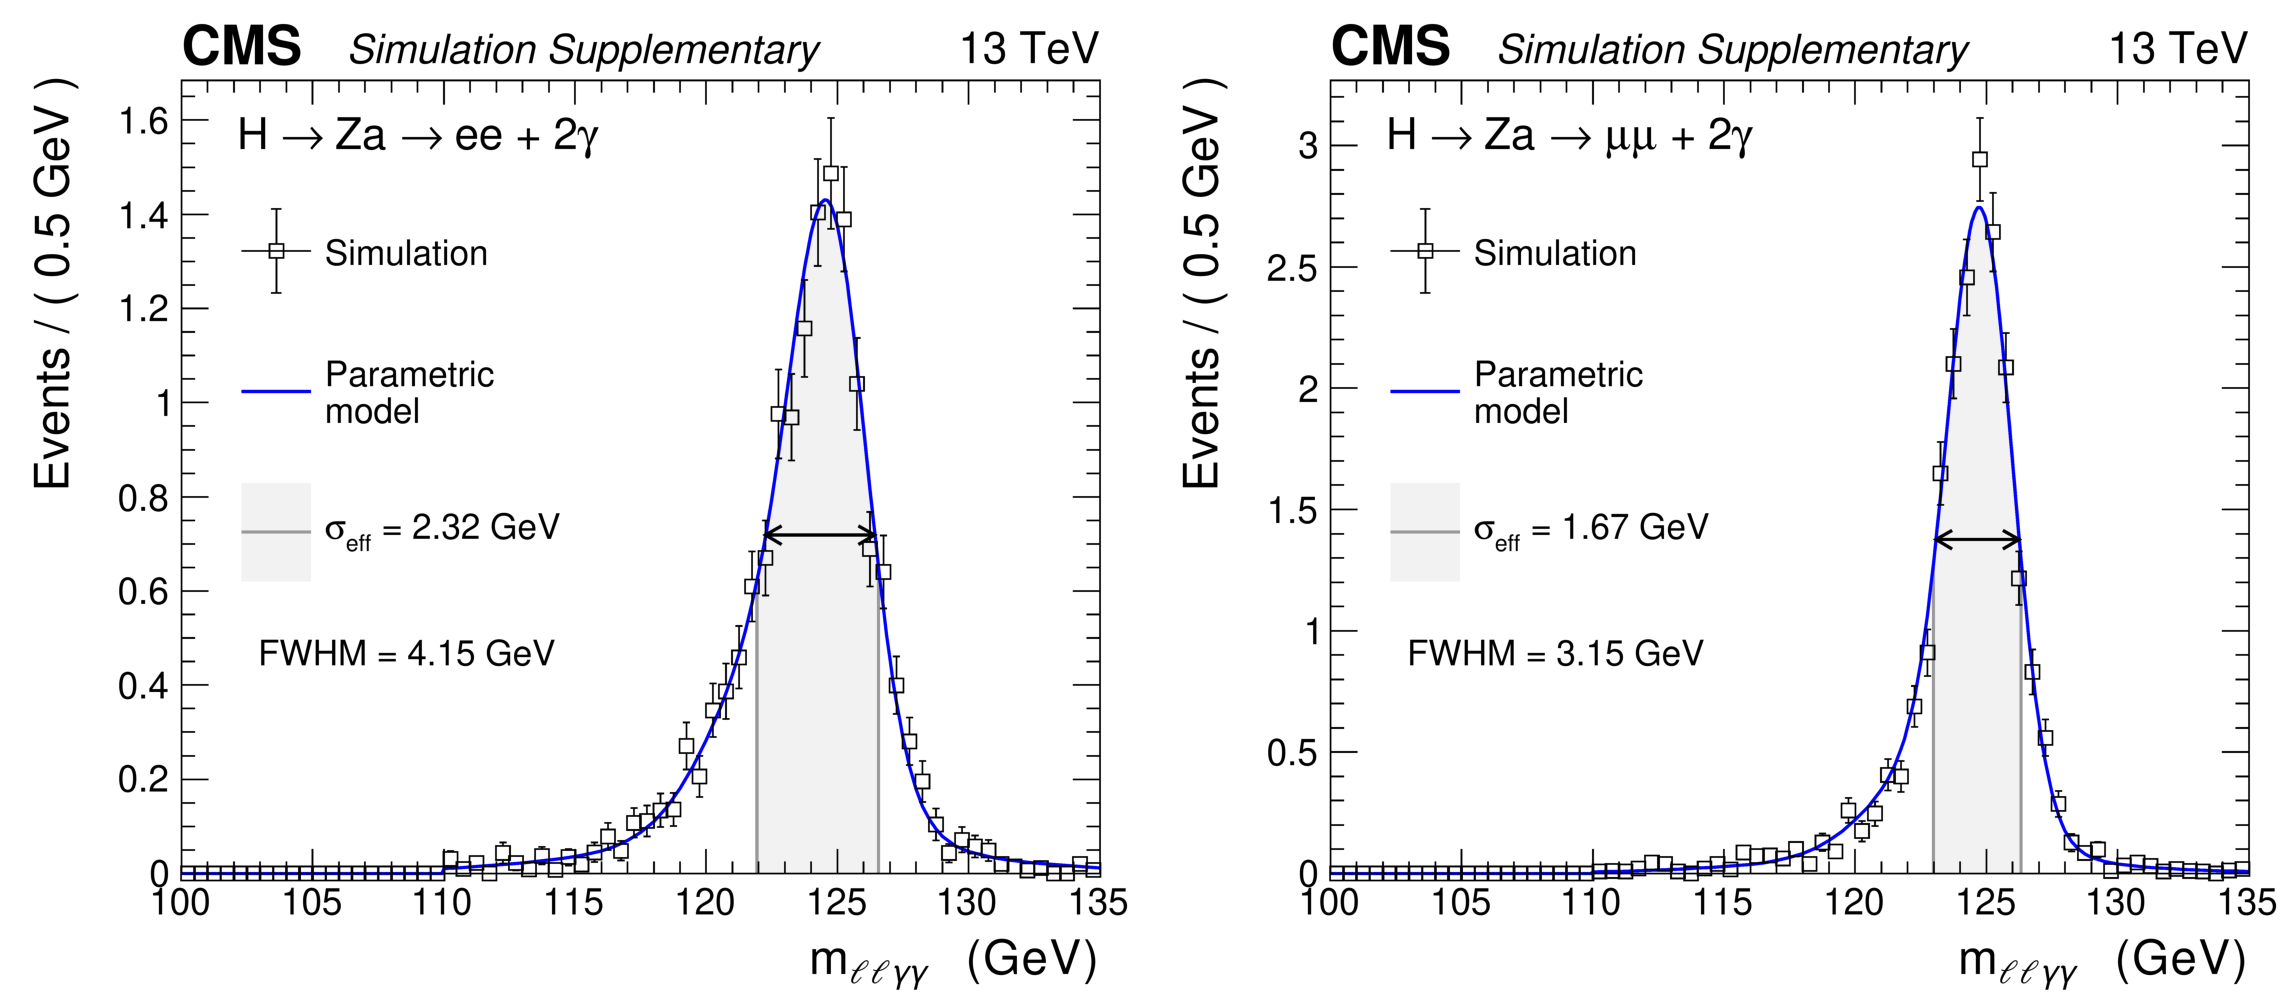
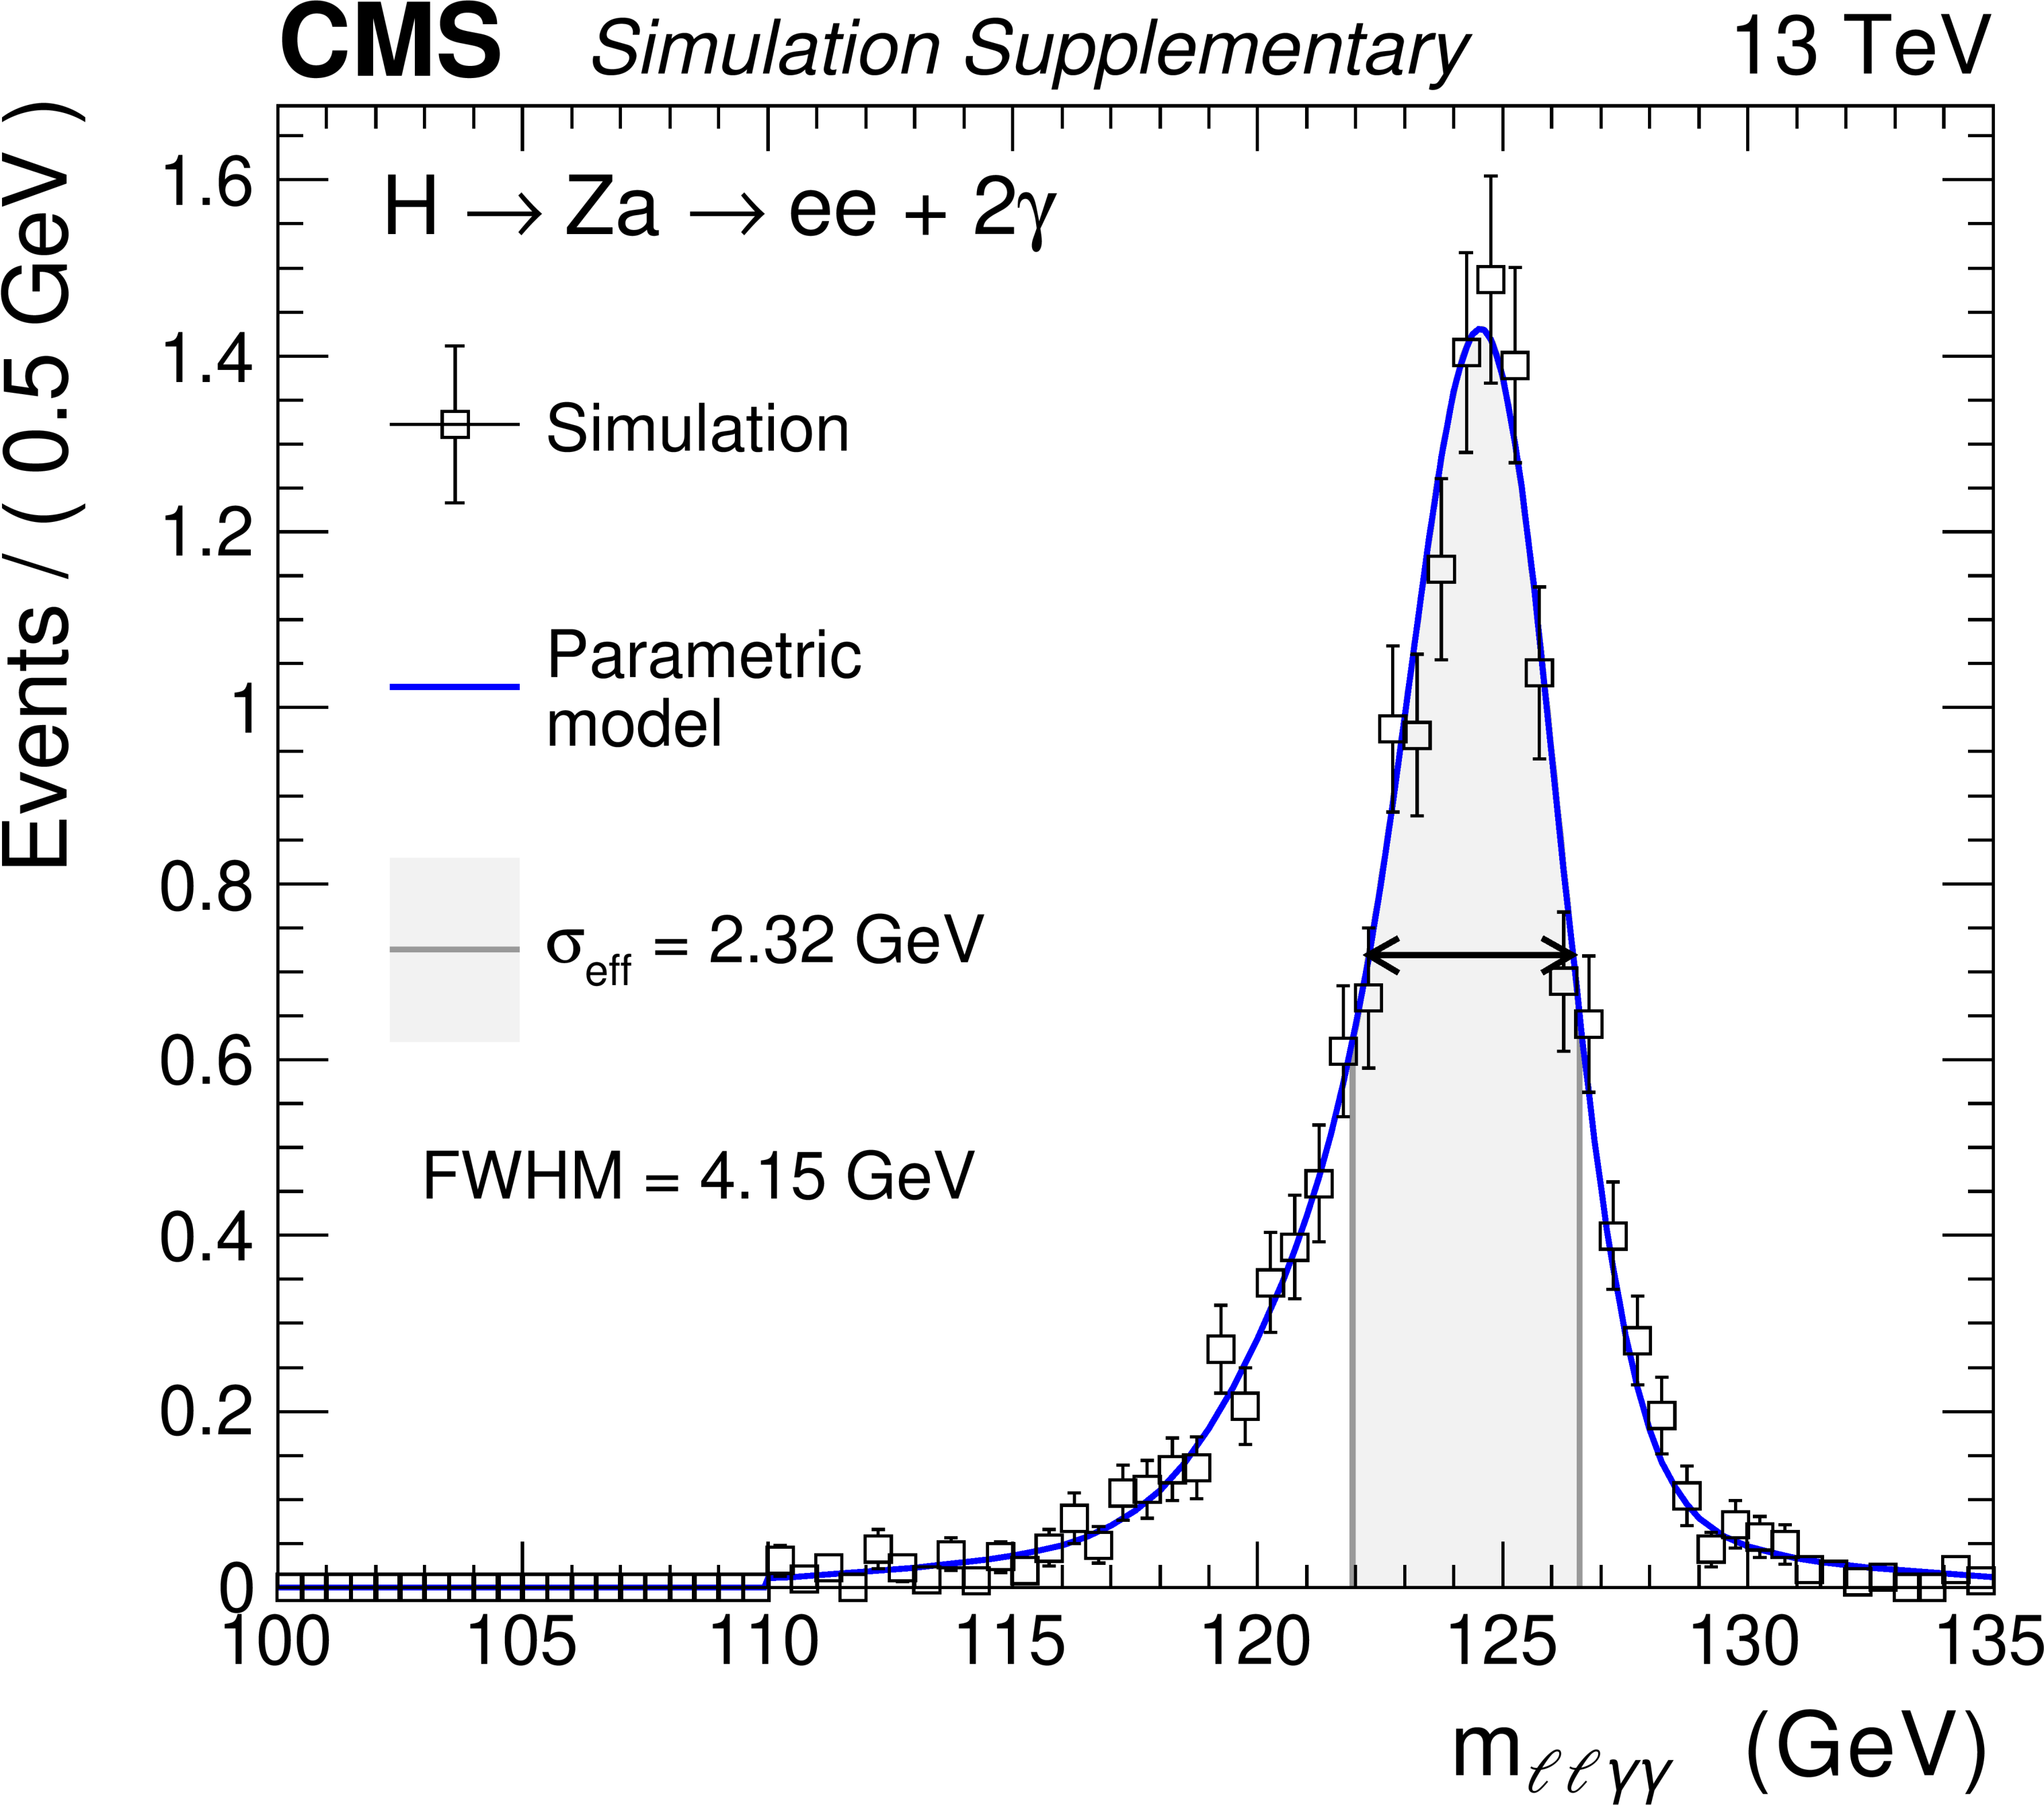
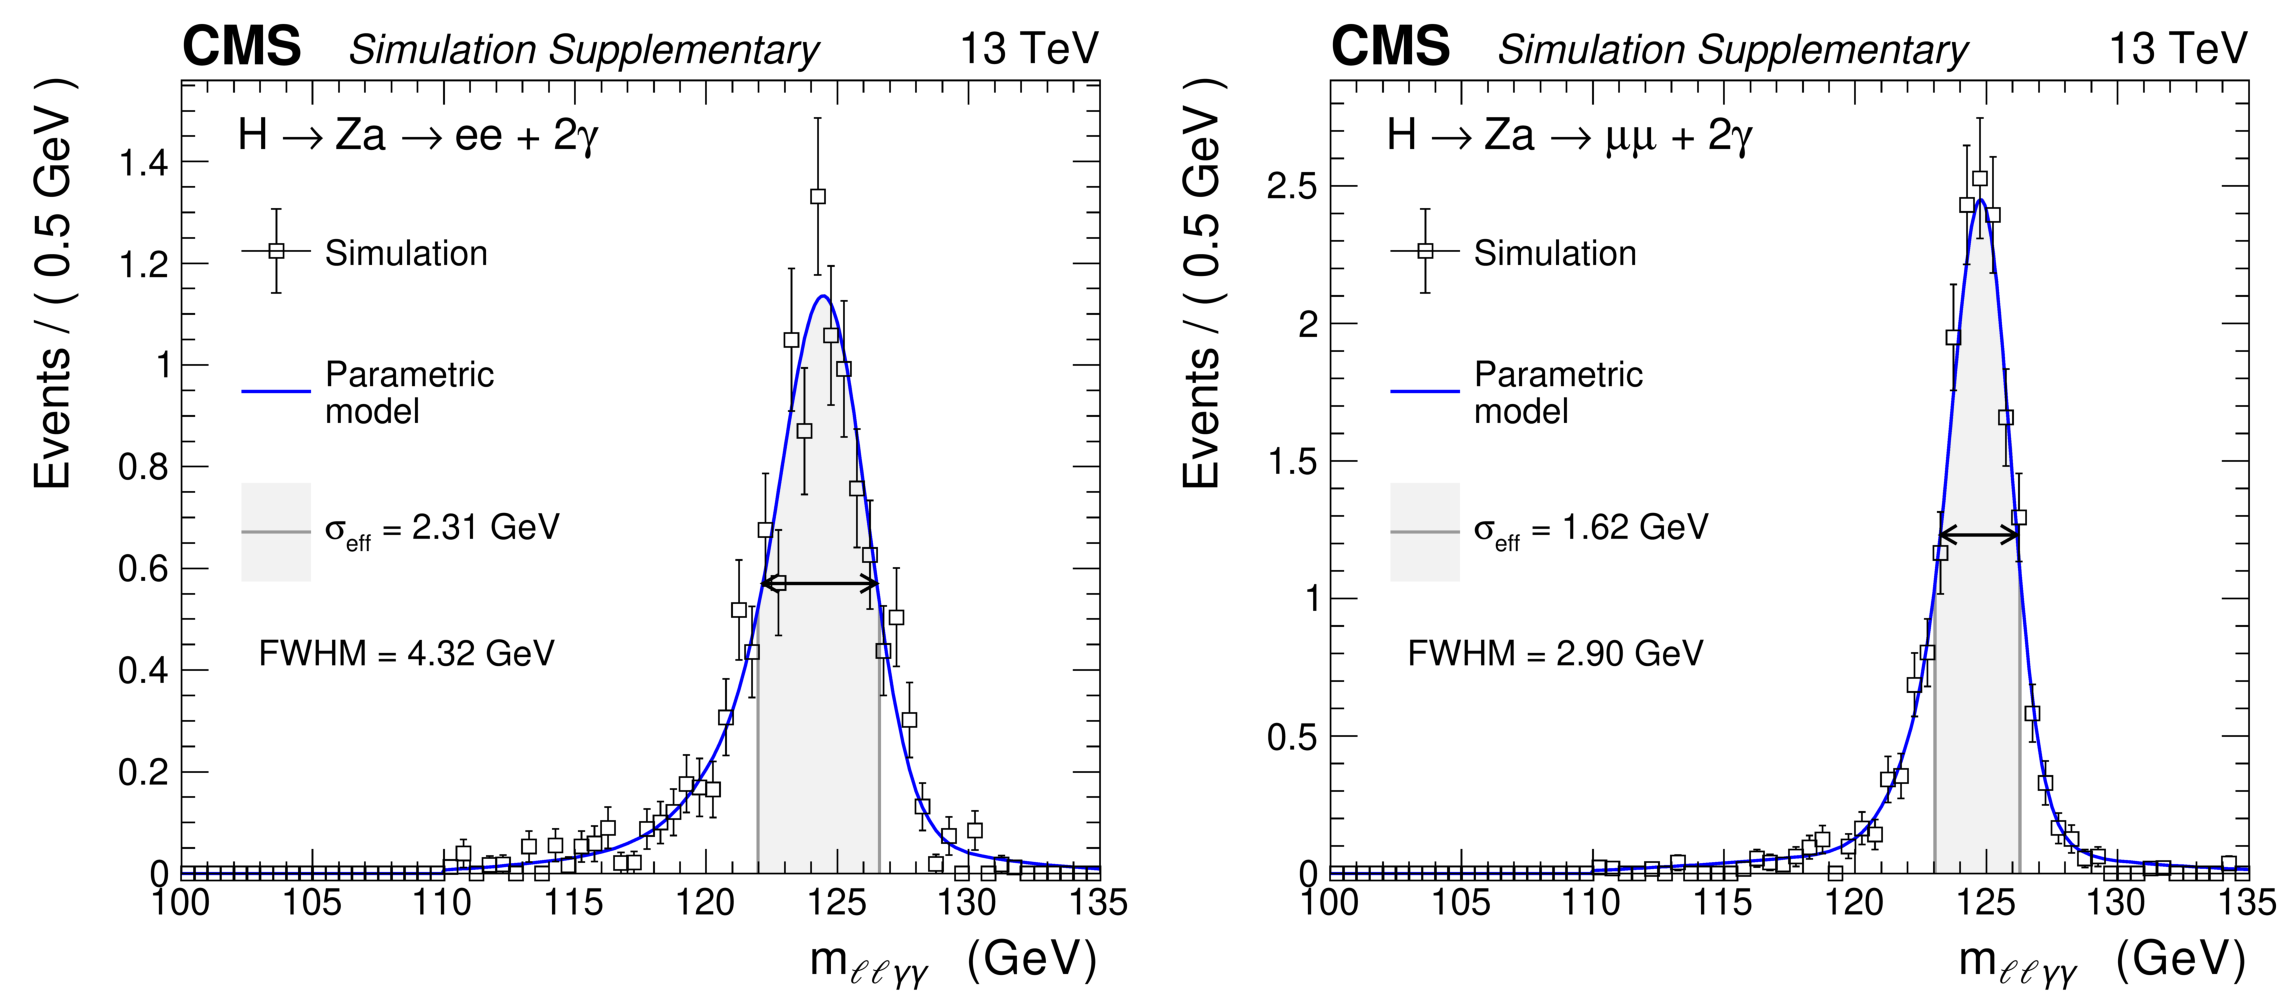
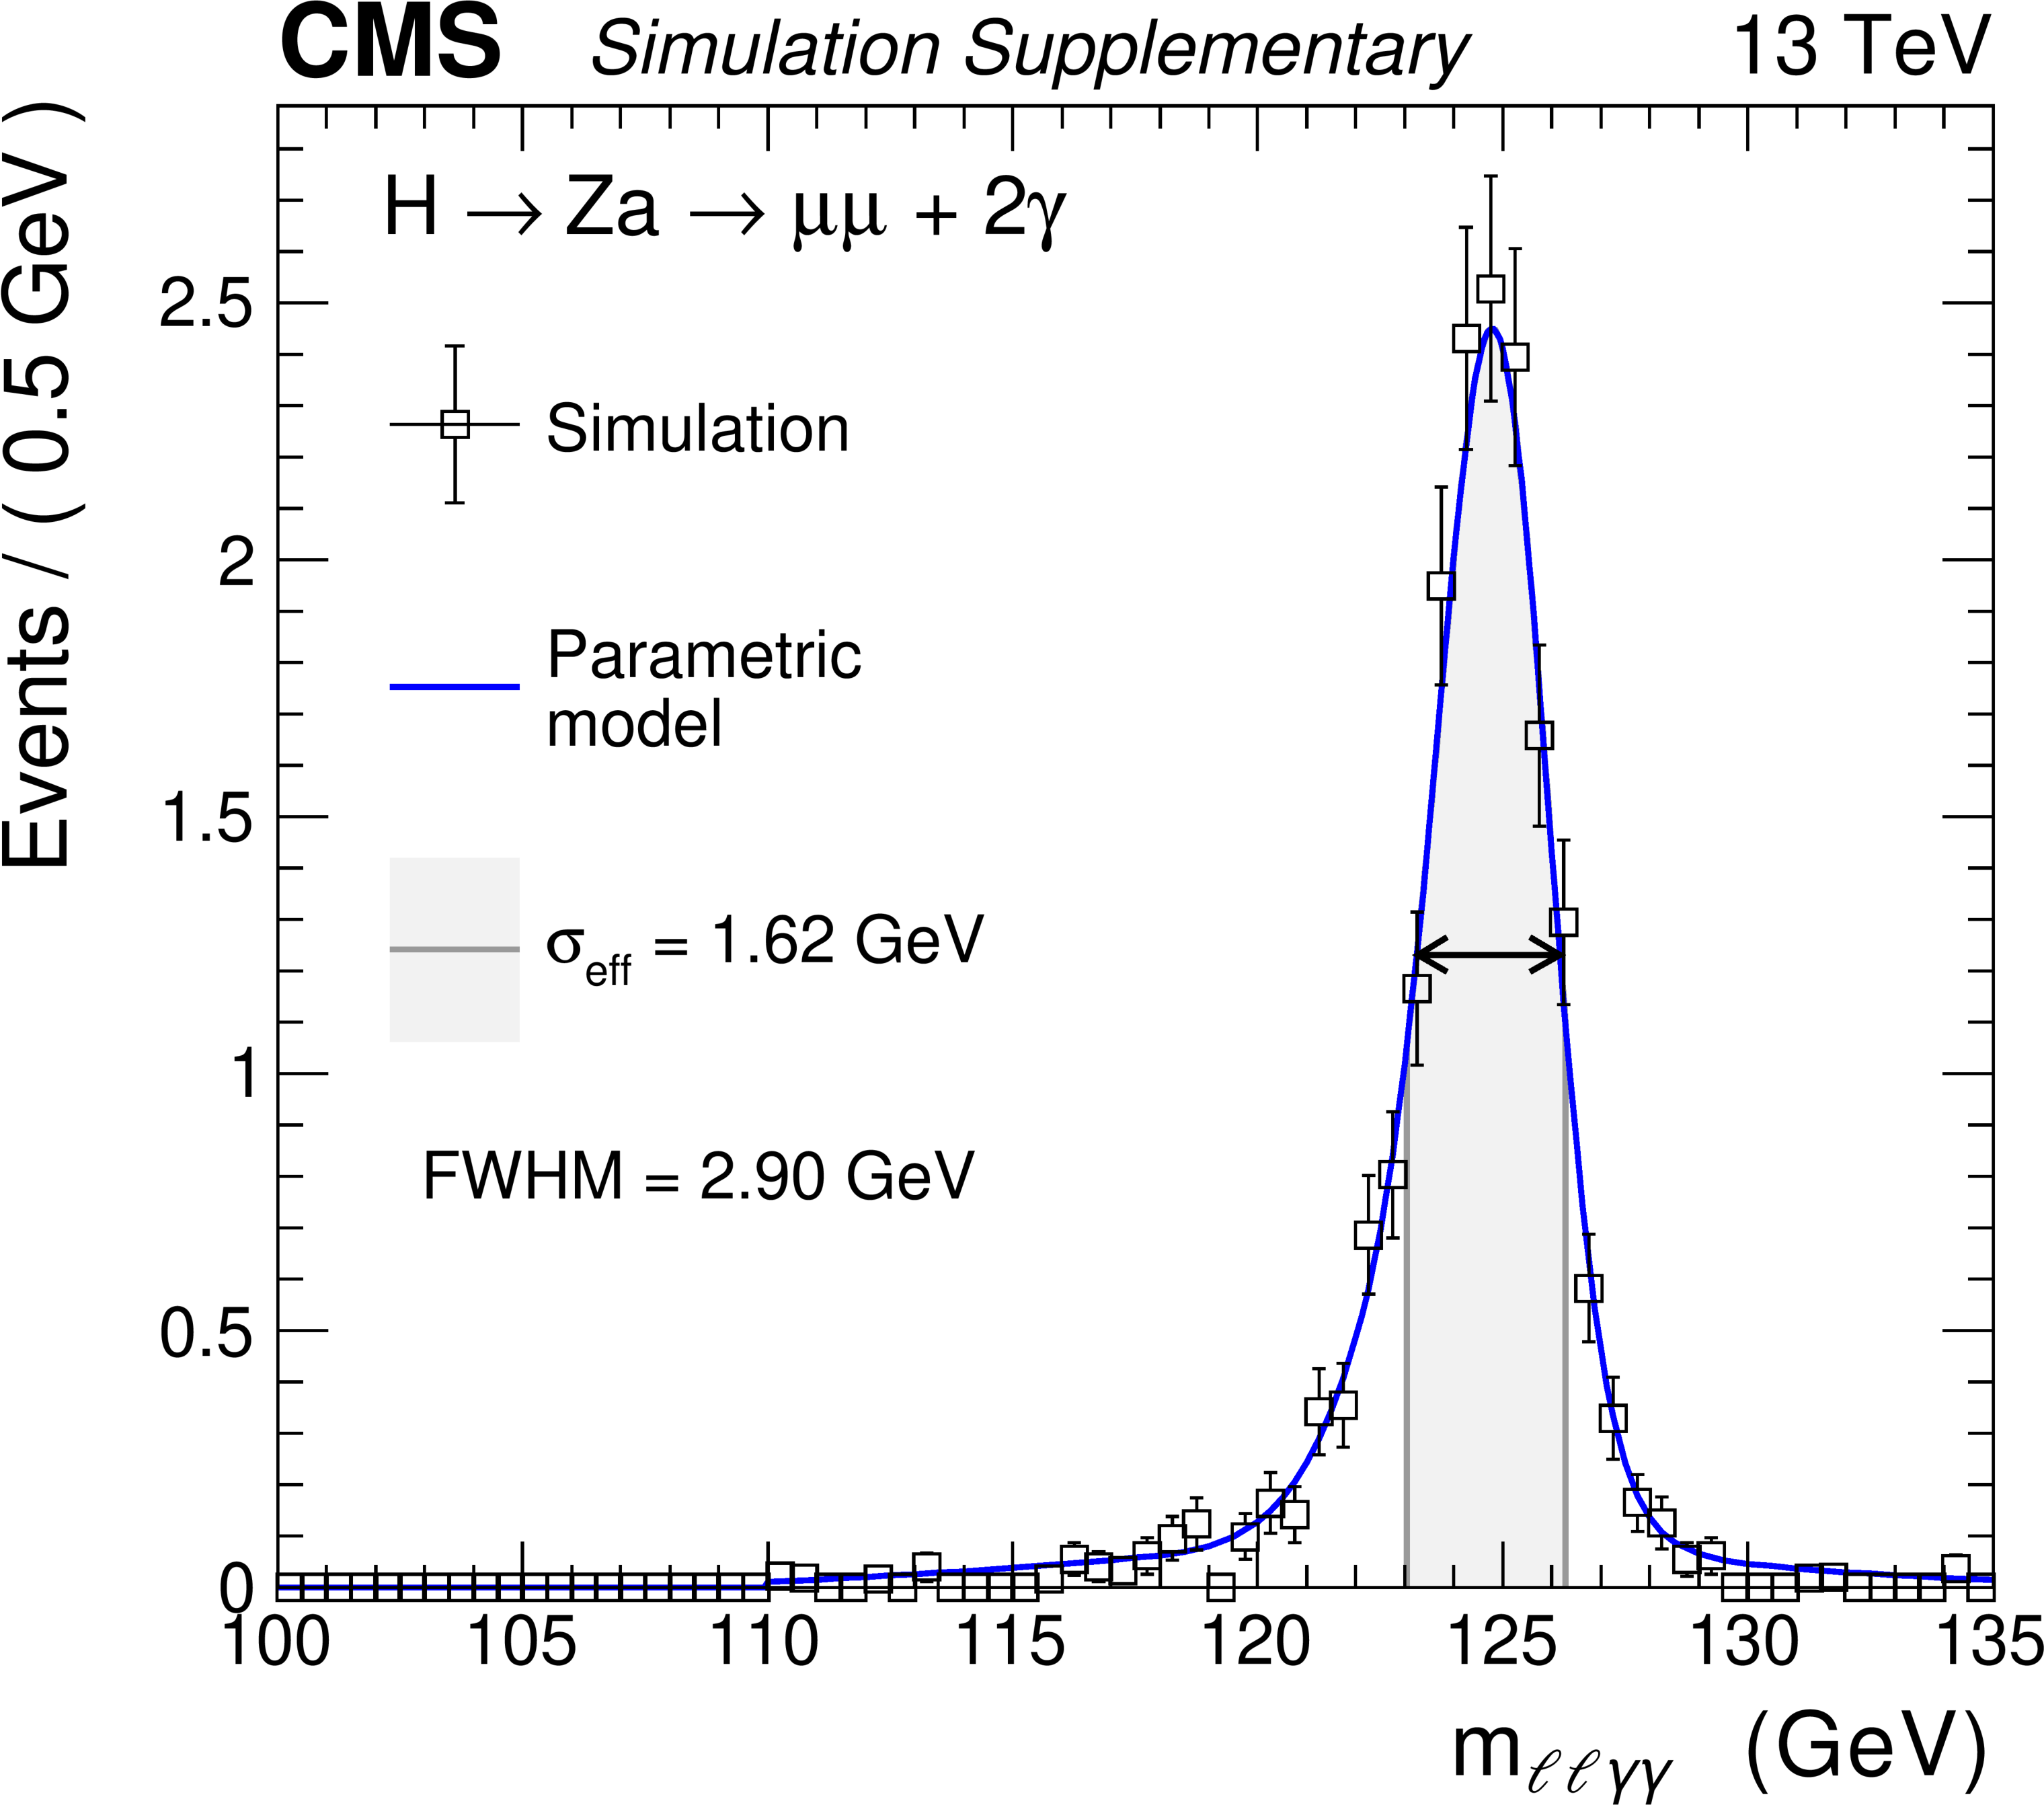
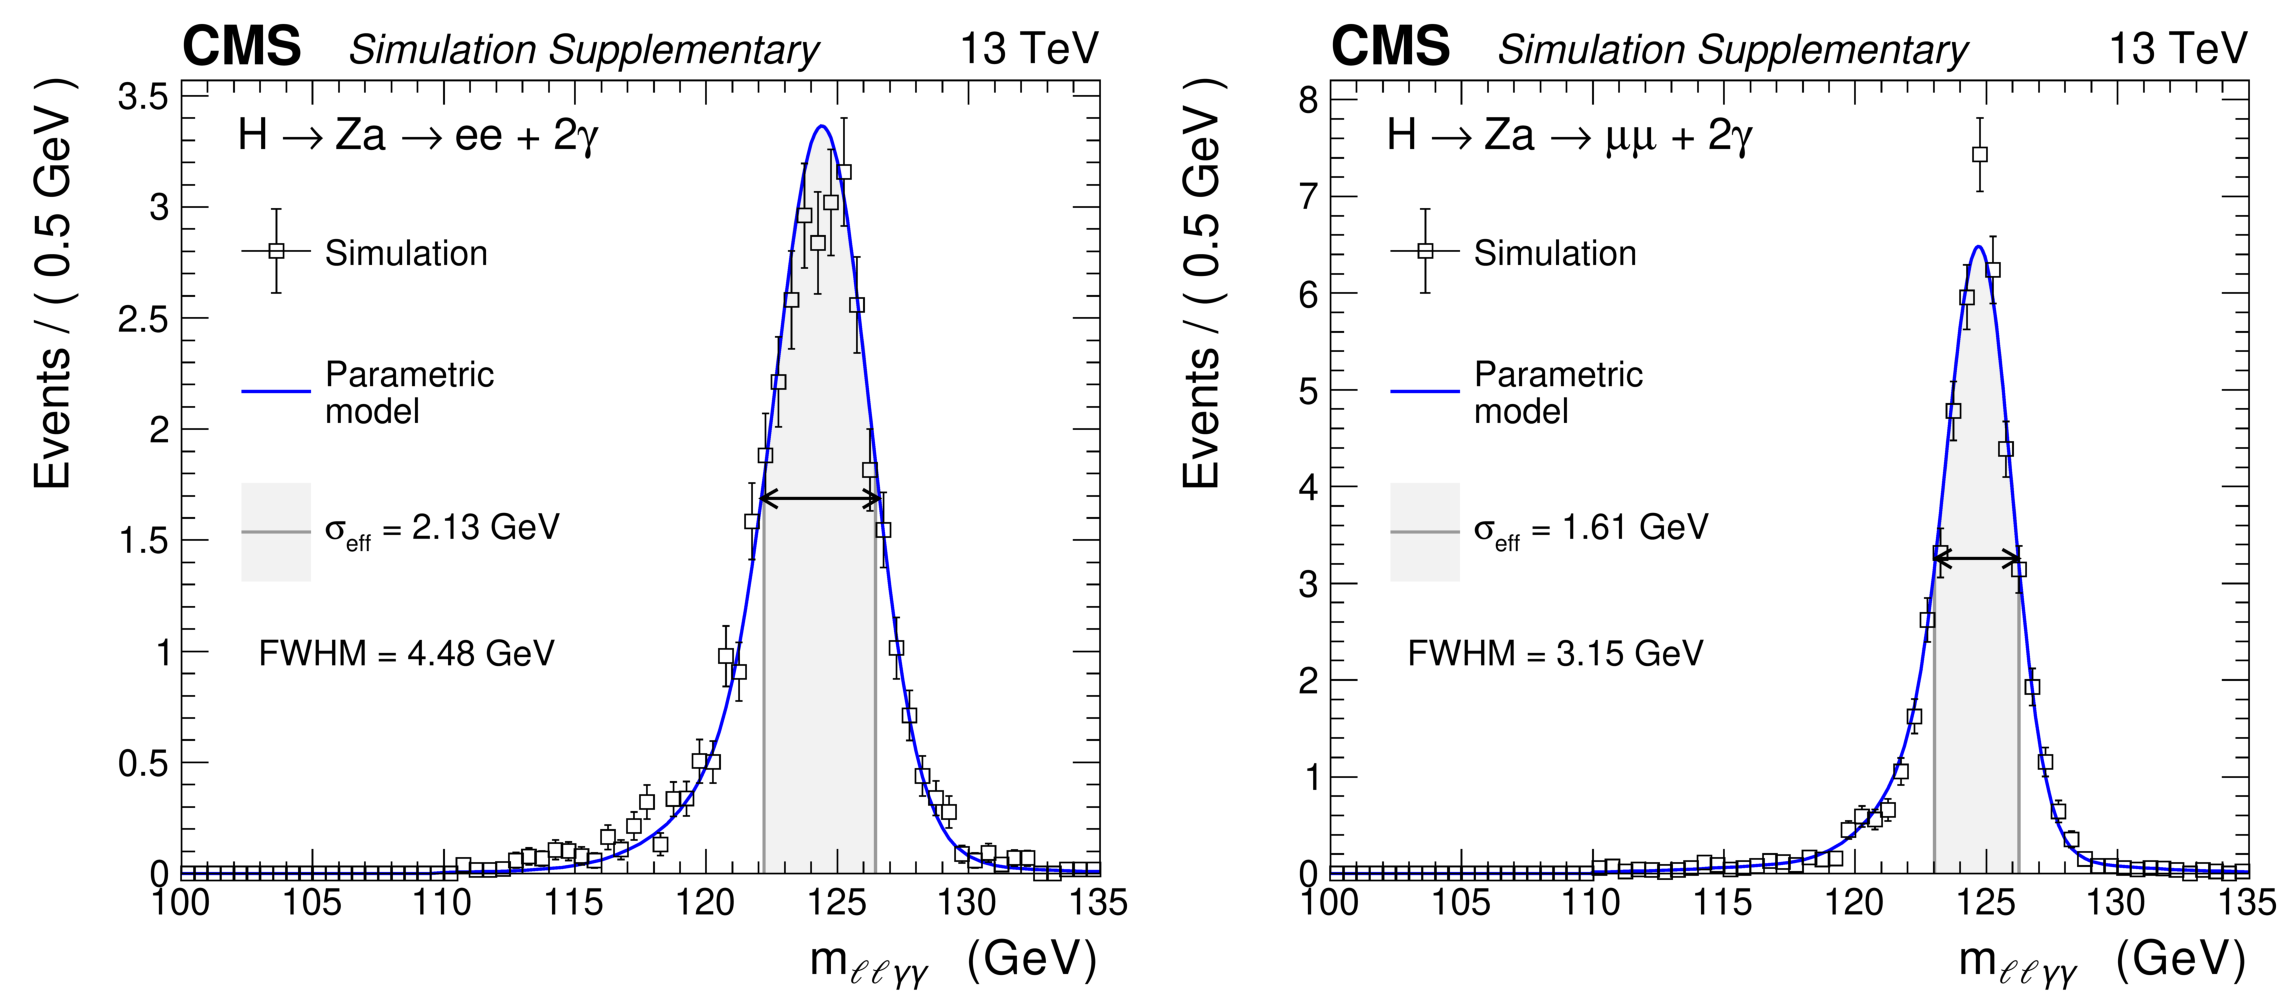
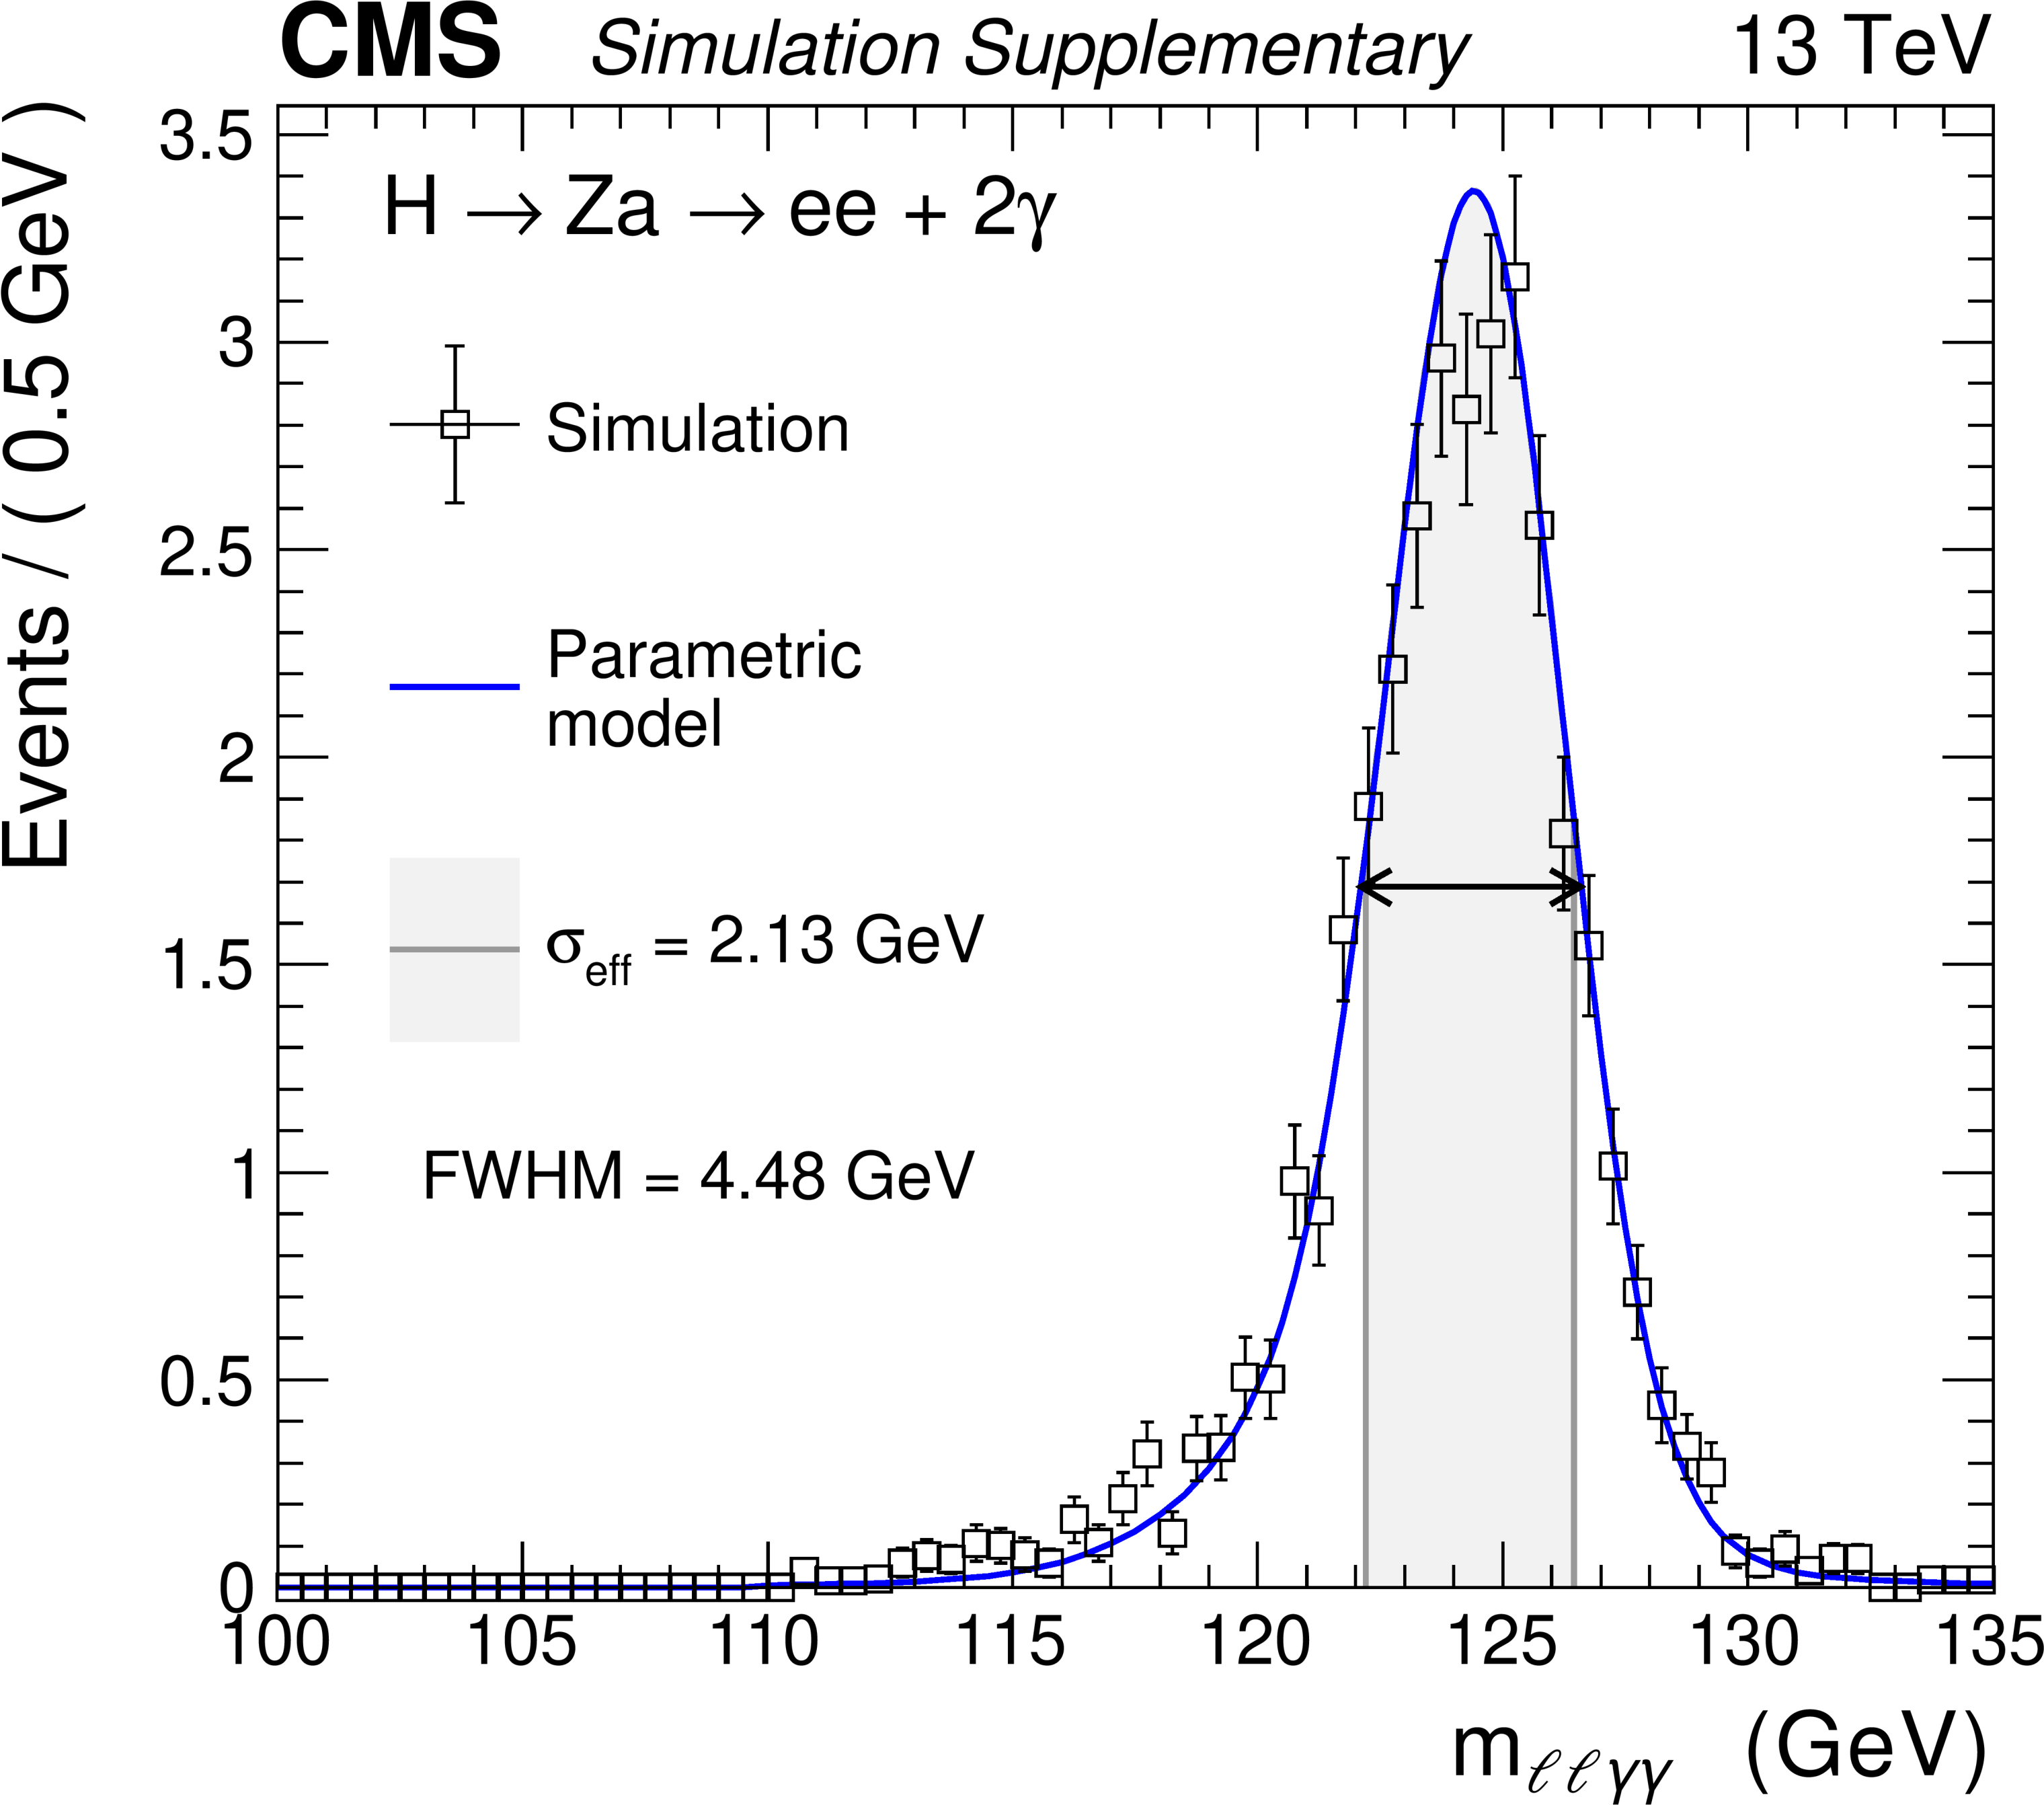
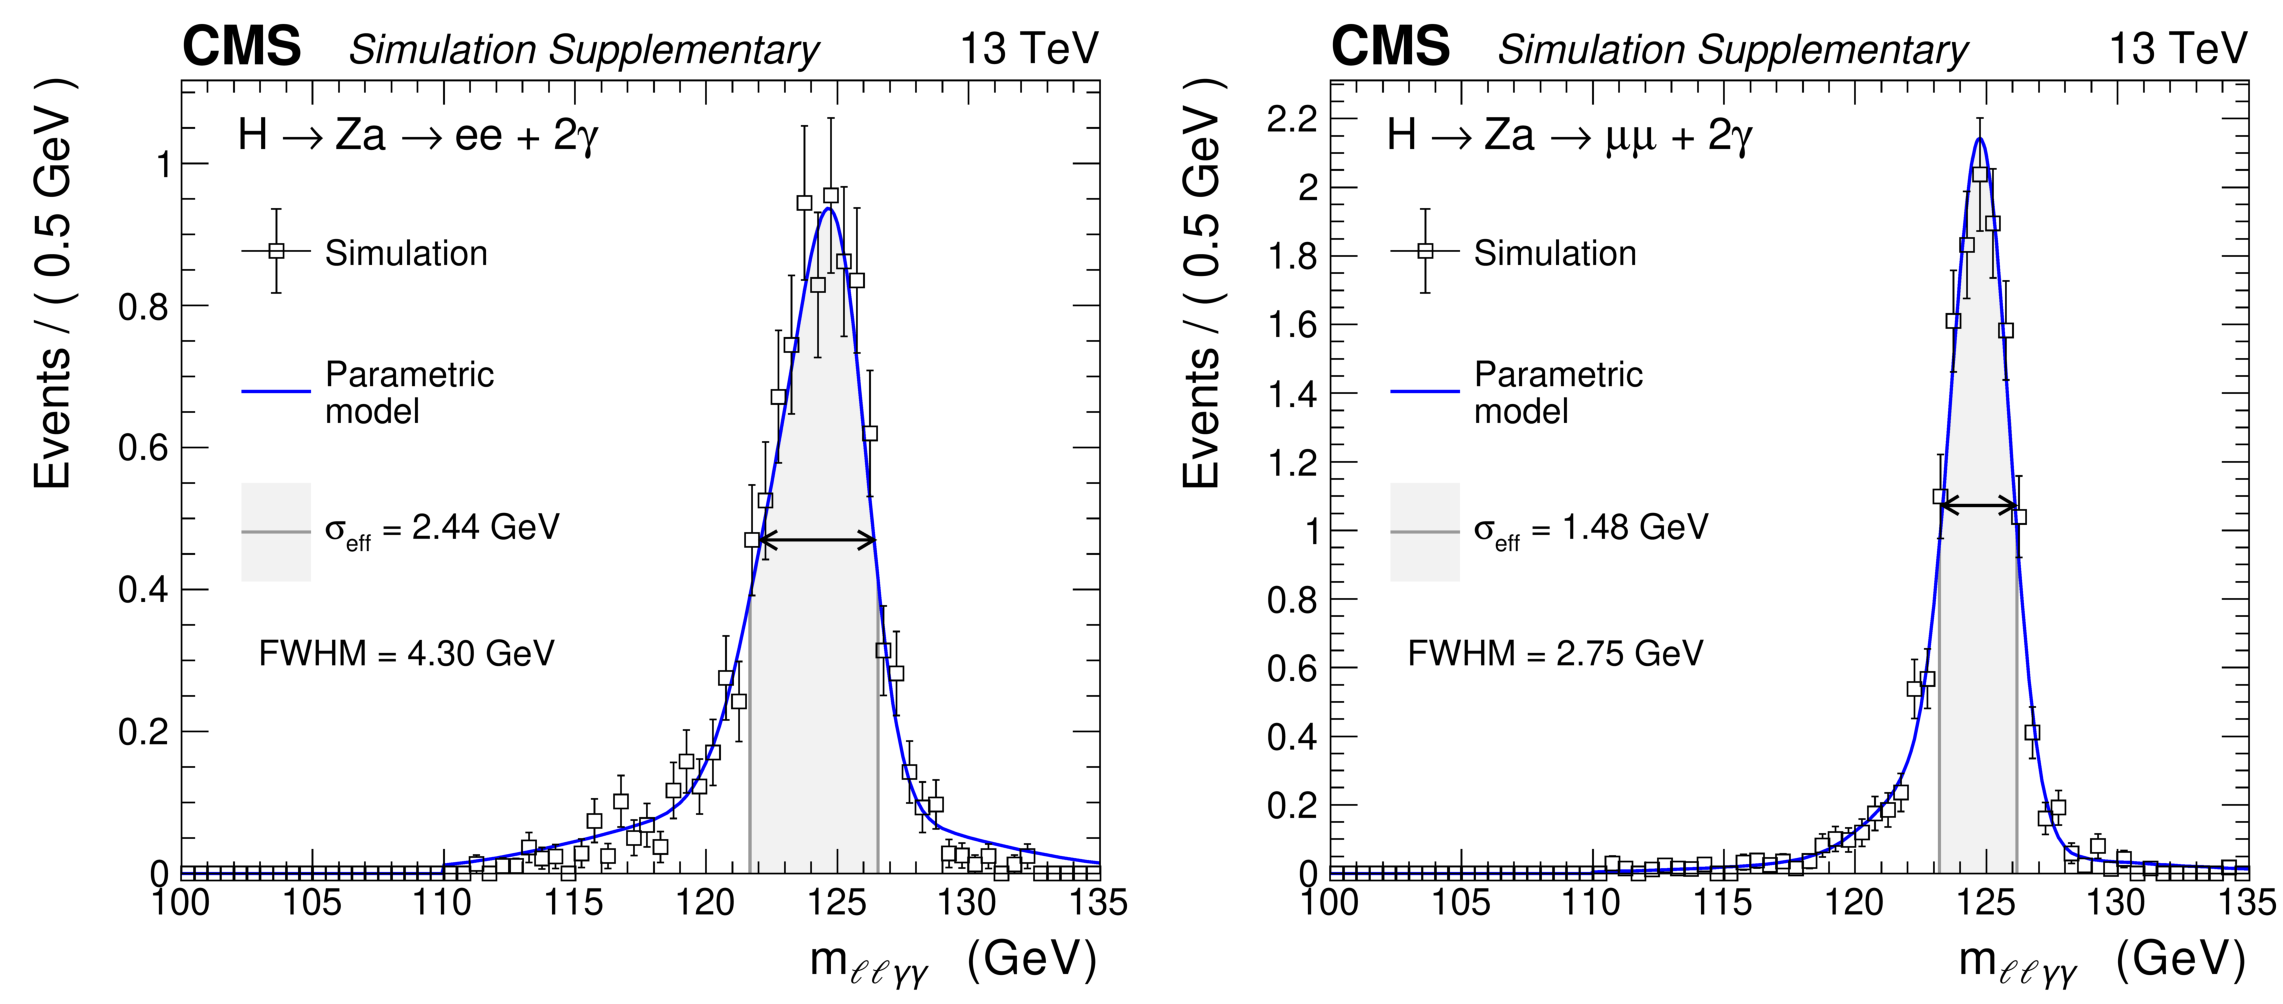
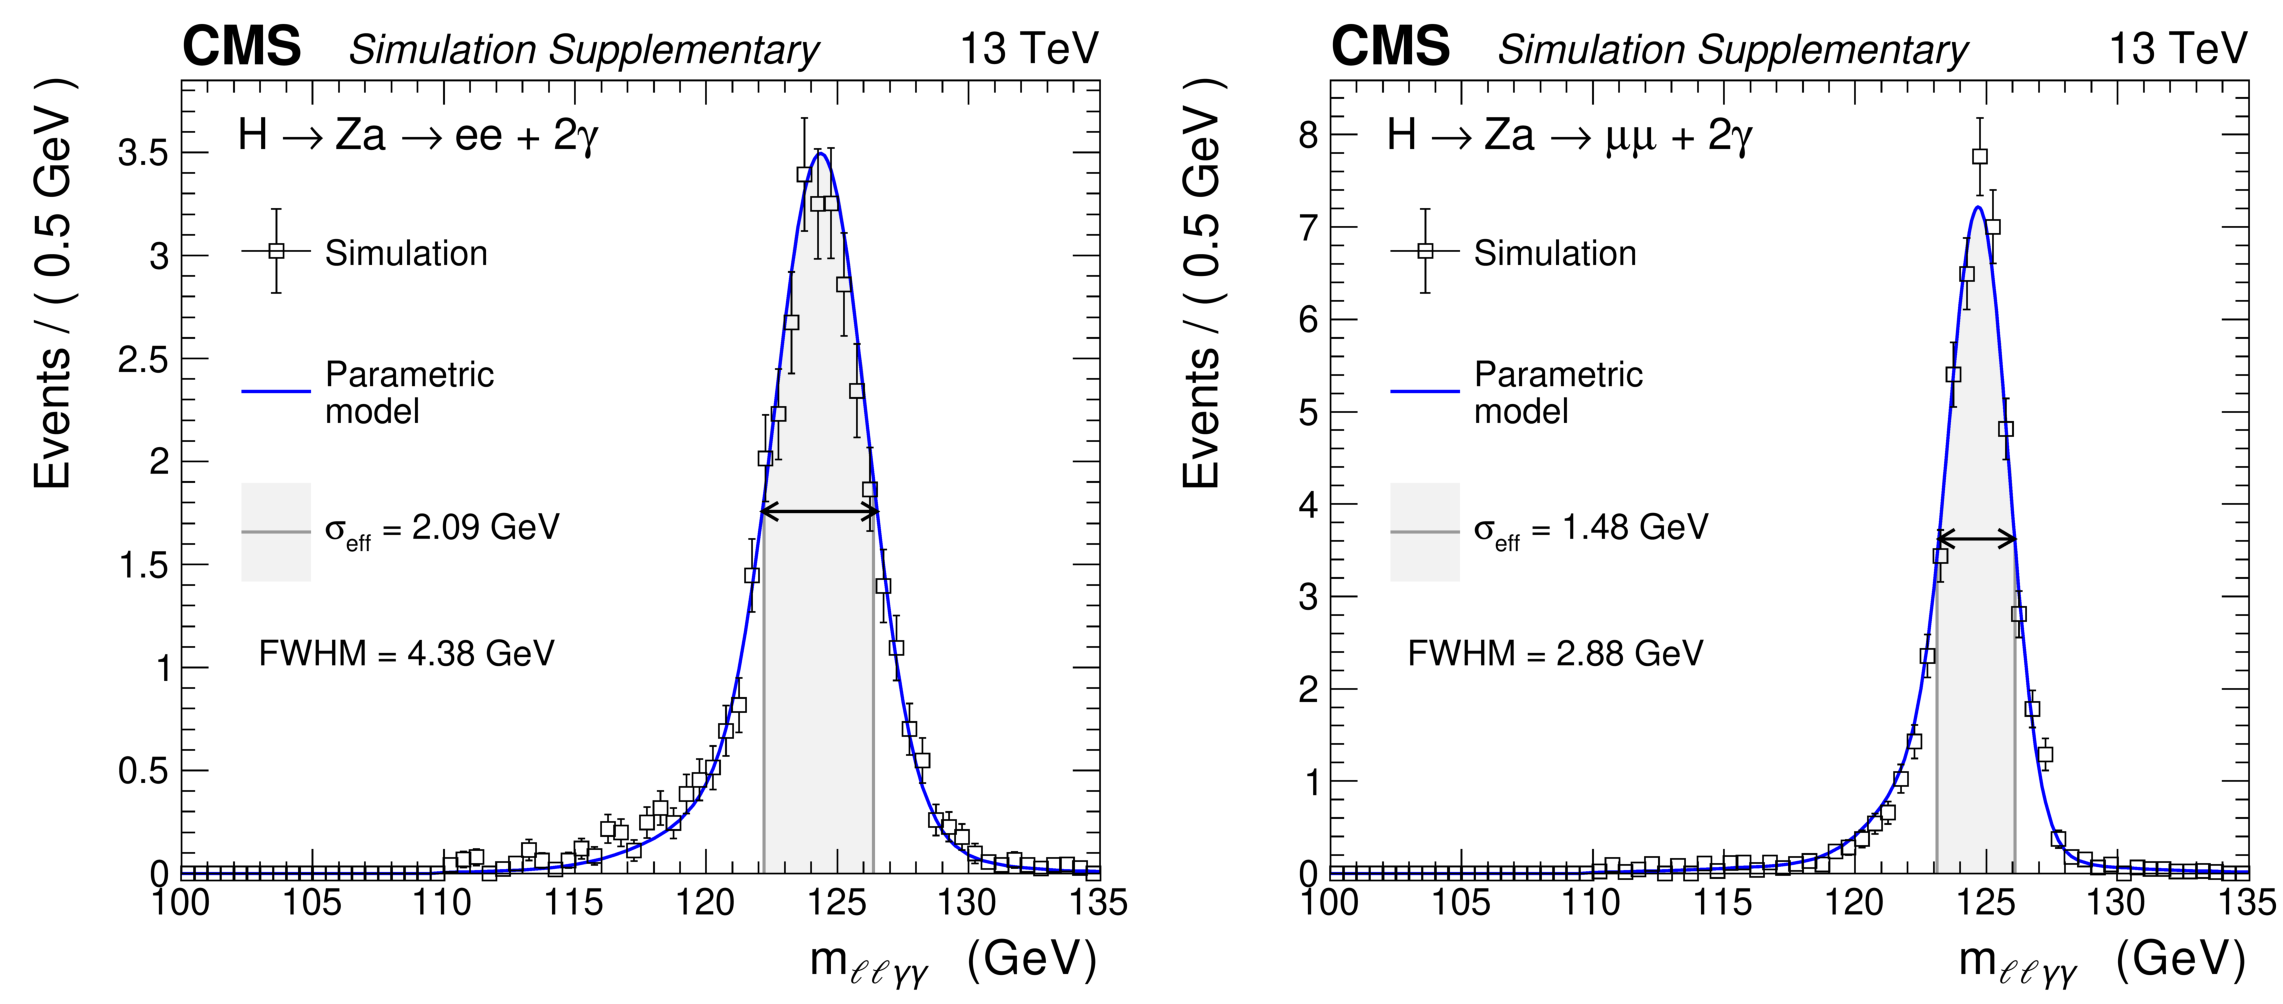
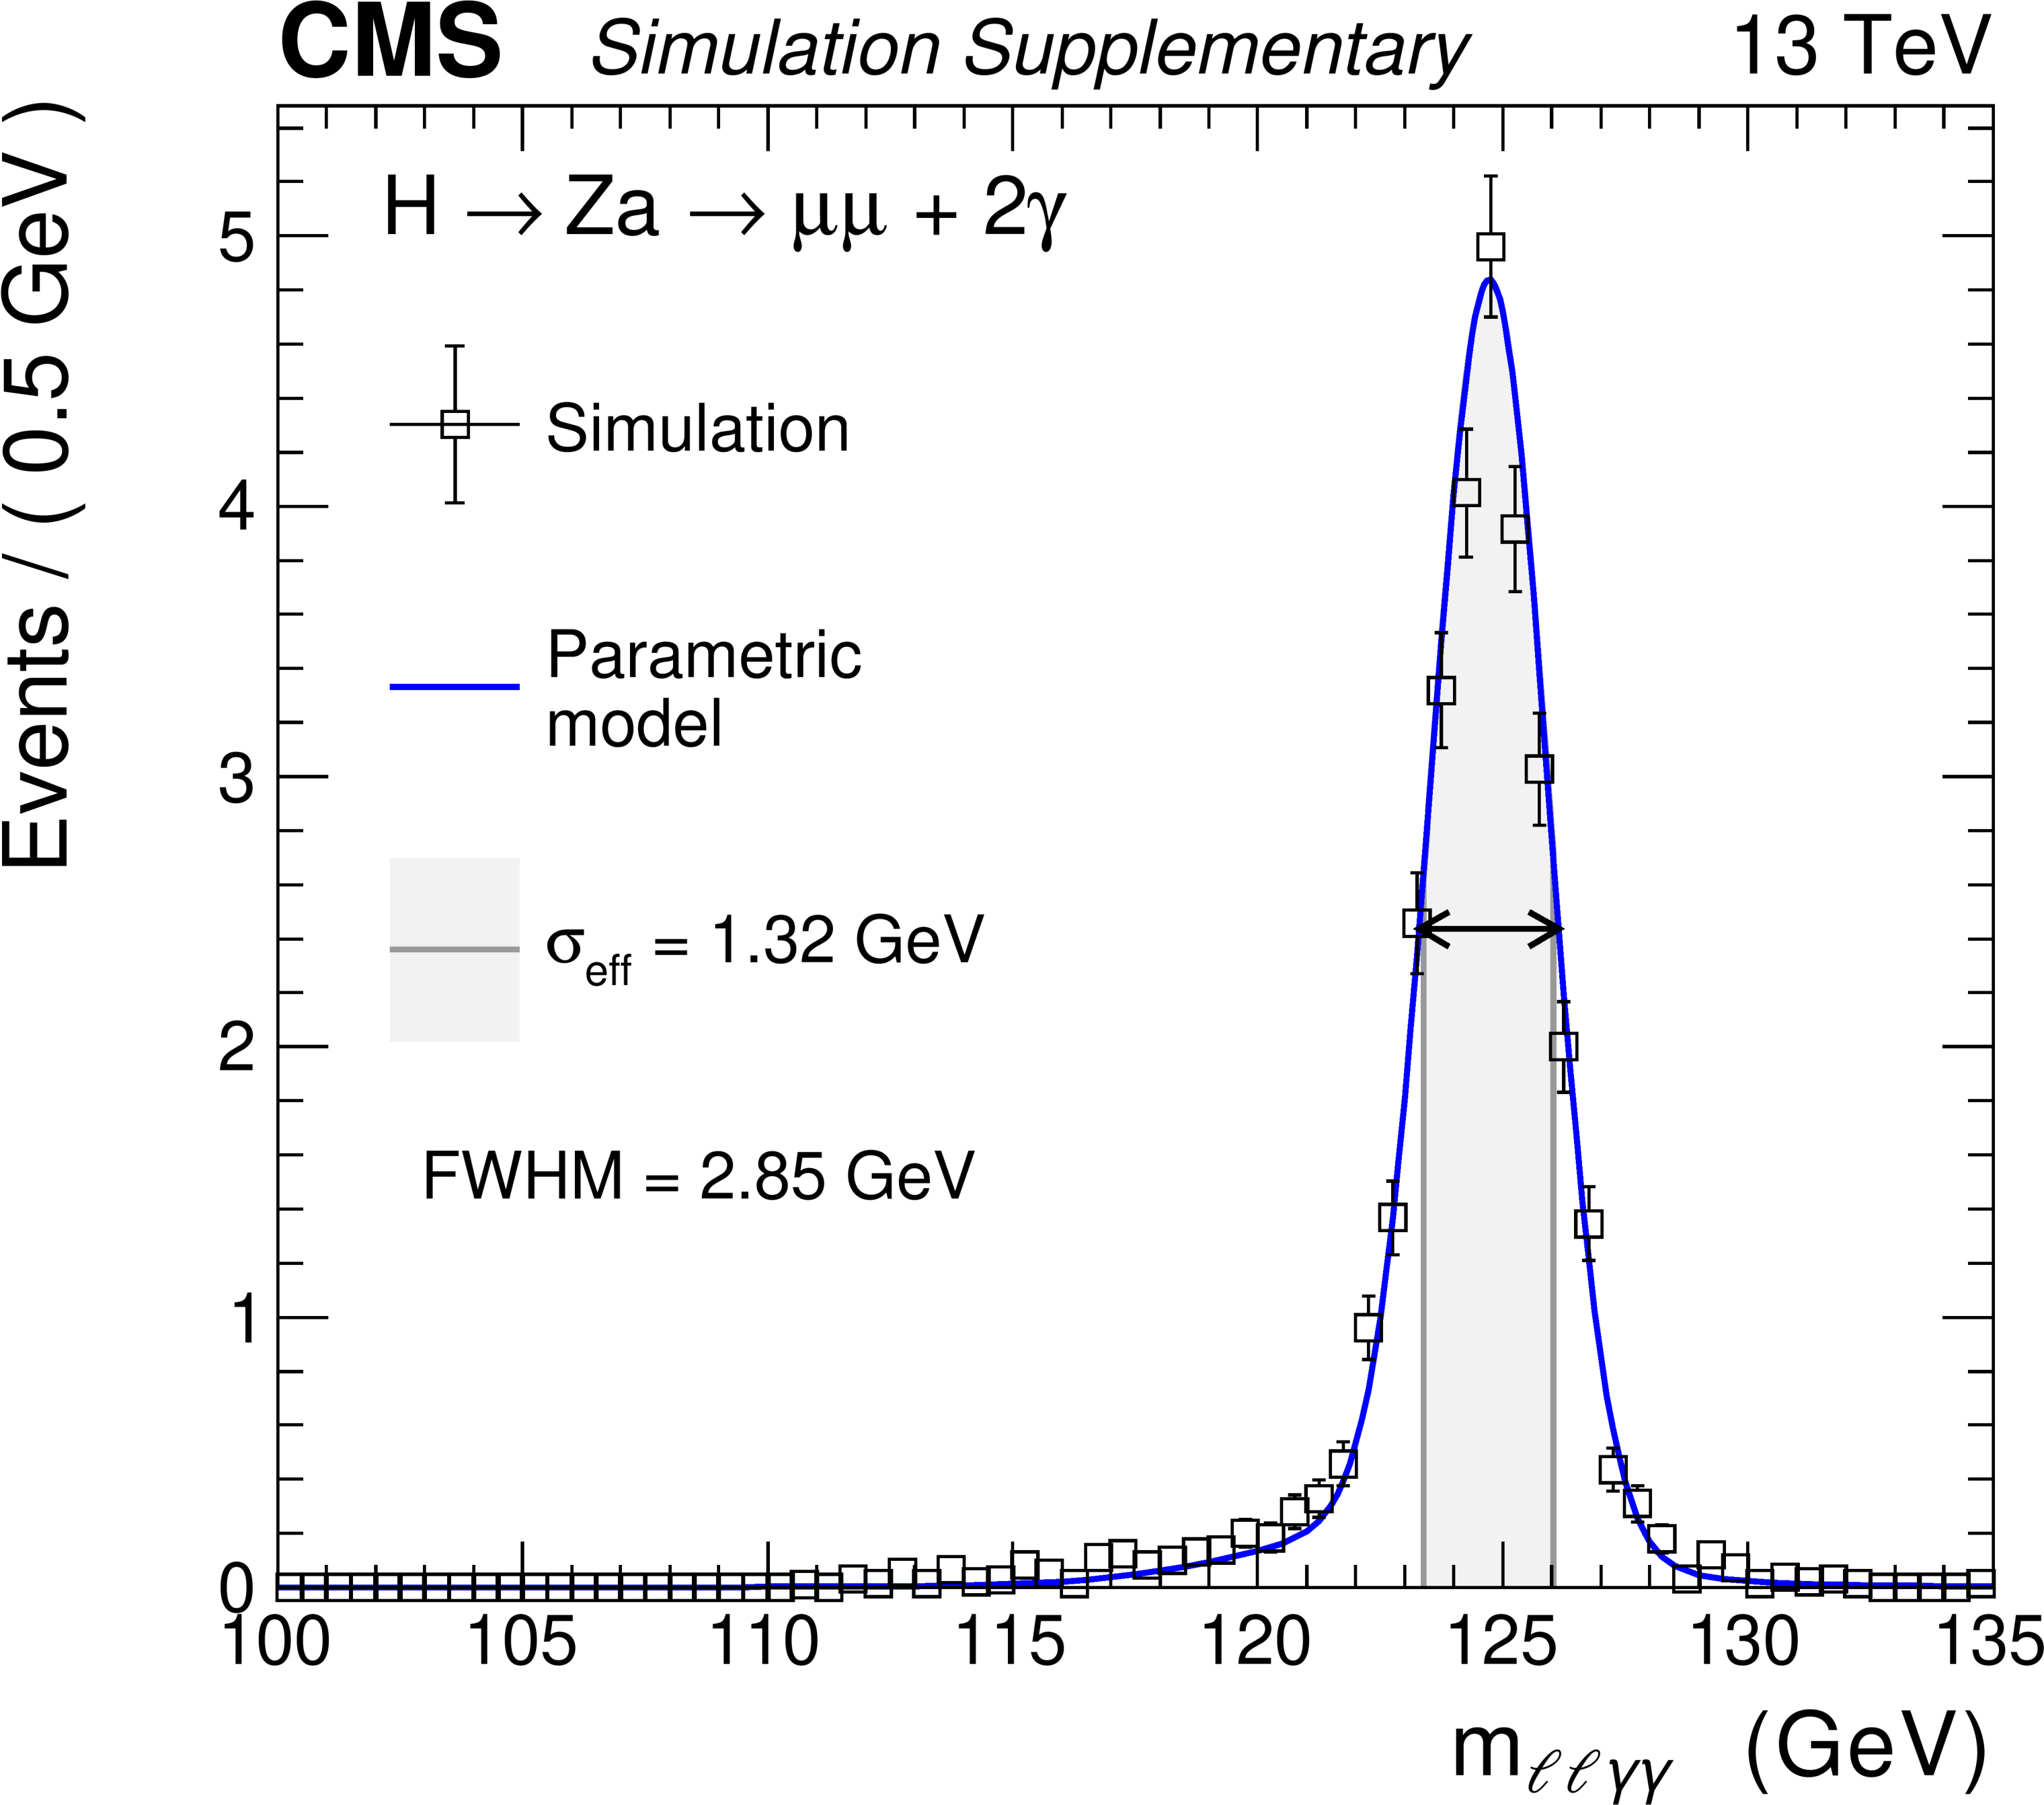
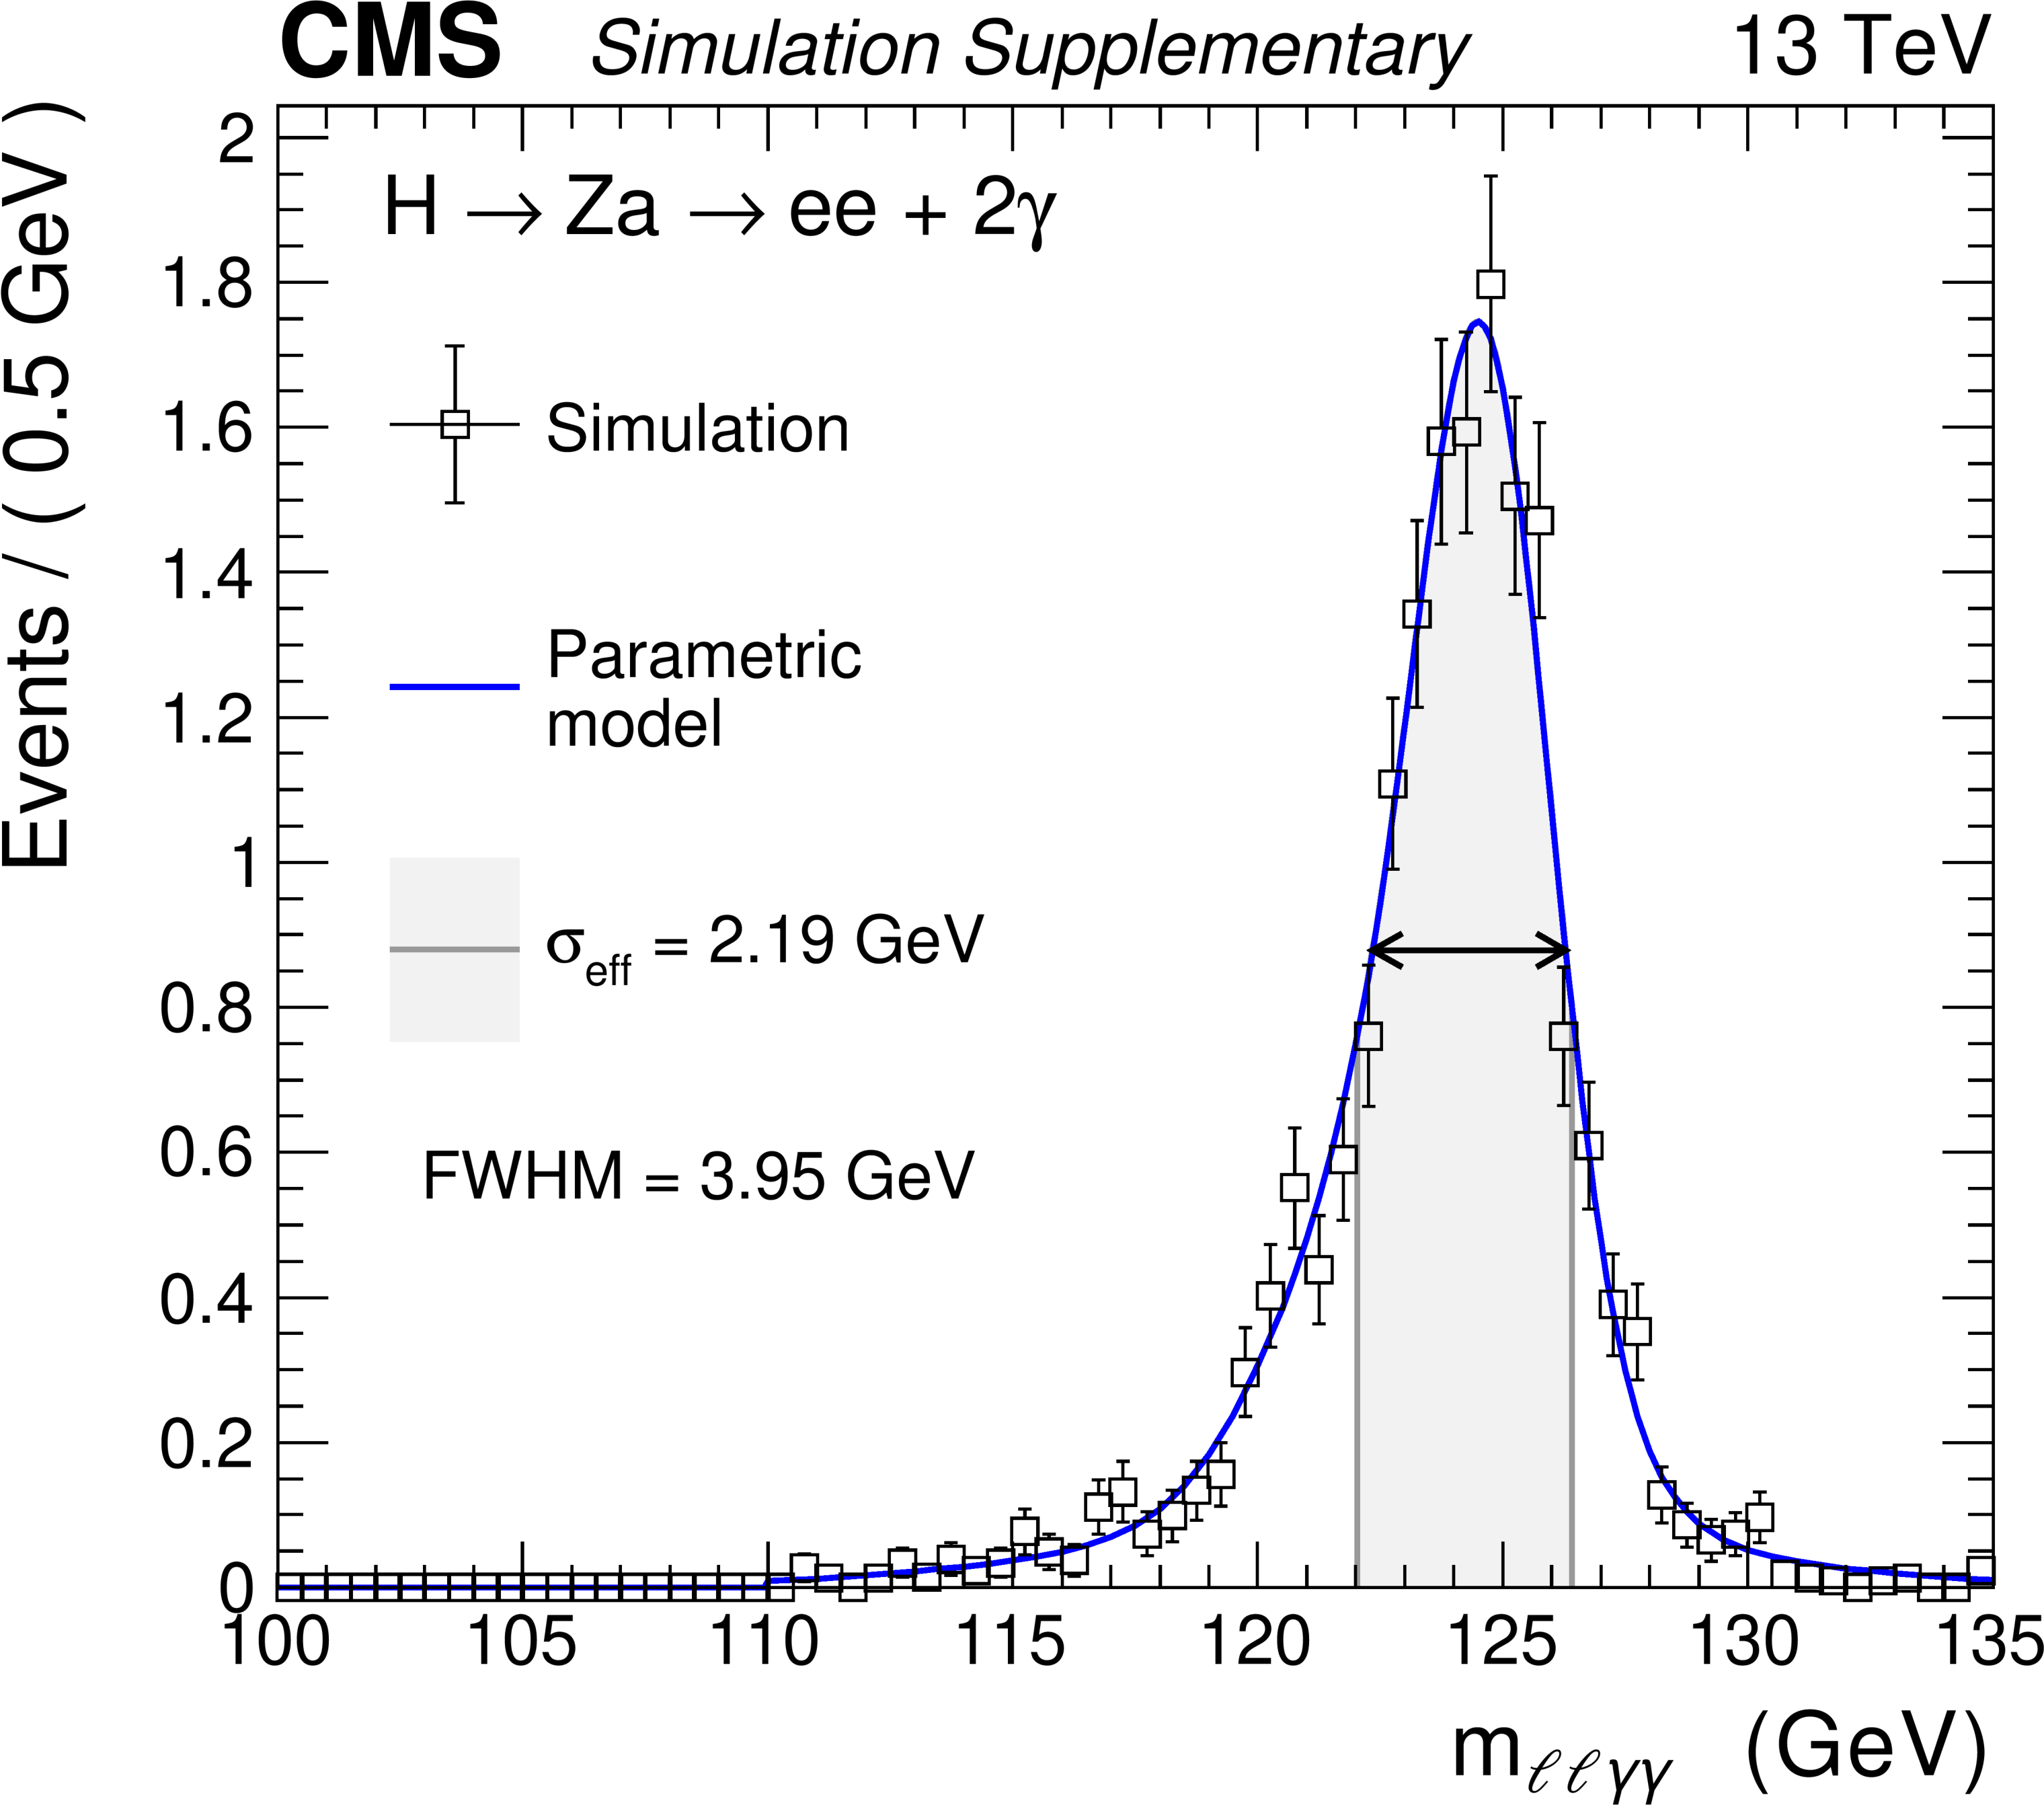
Additional Figure 56:
Fit of the $ m_{\ell\ell\gamma\gamma} $ distribution of signal events with $ m_{a} = $ 30 GeV in the electron (left) and muon (right) channels with the detector settings of the 2018 data taking period. |
png pdf |
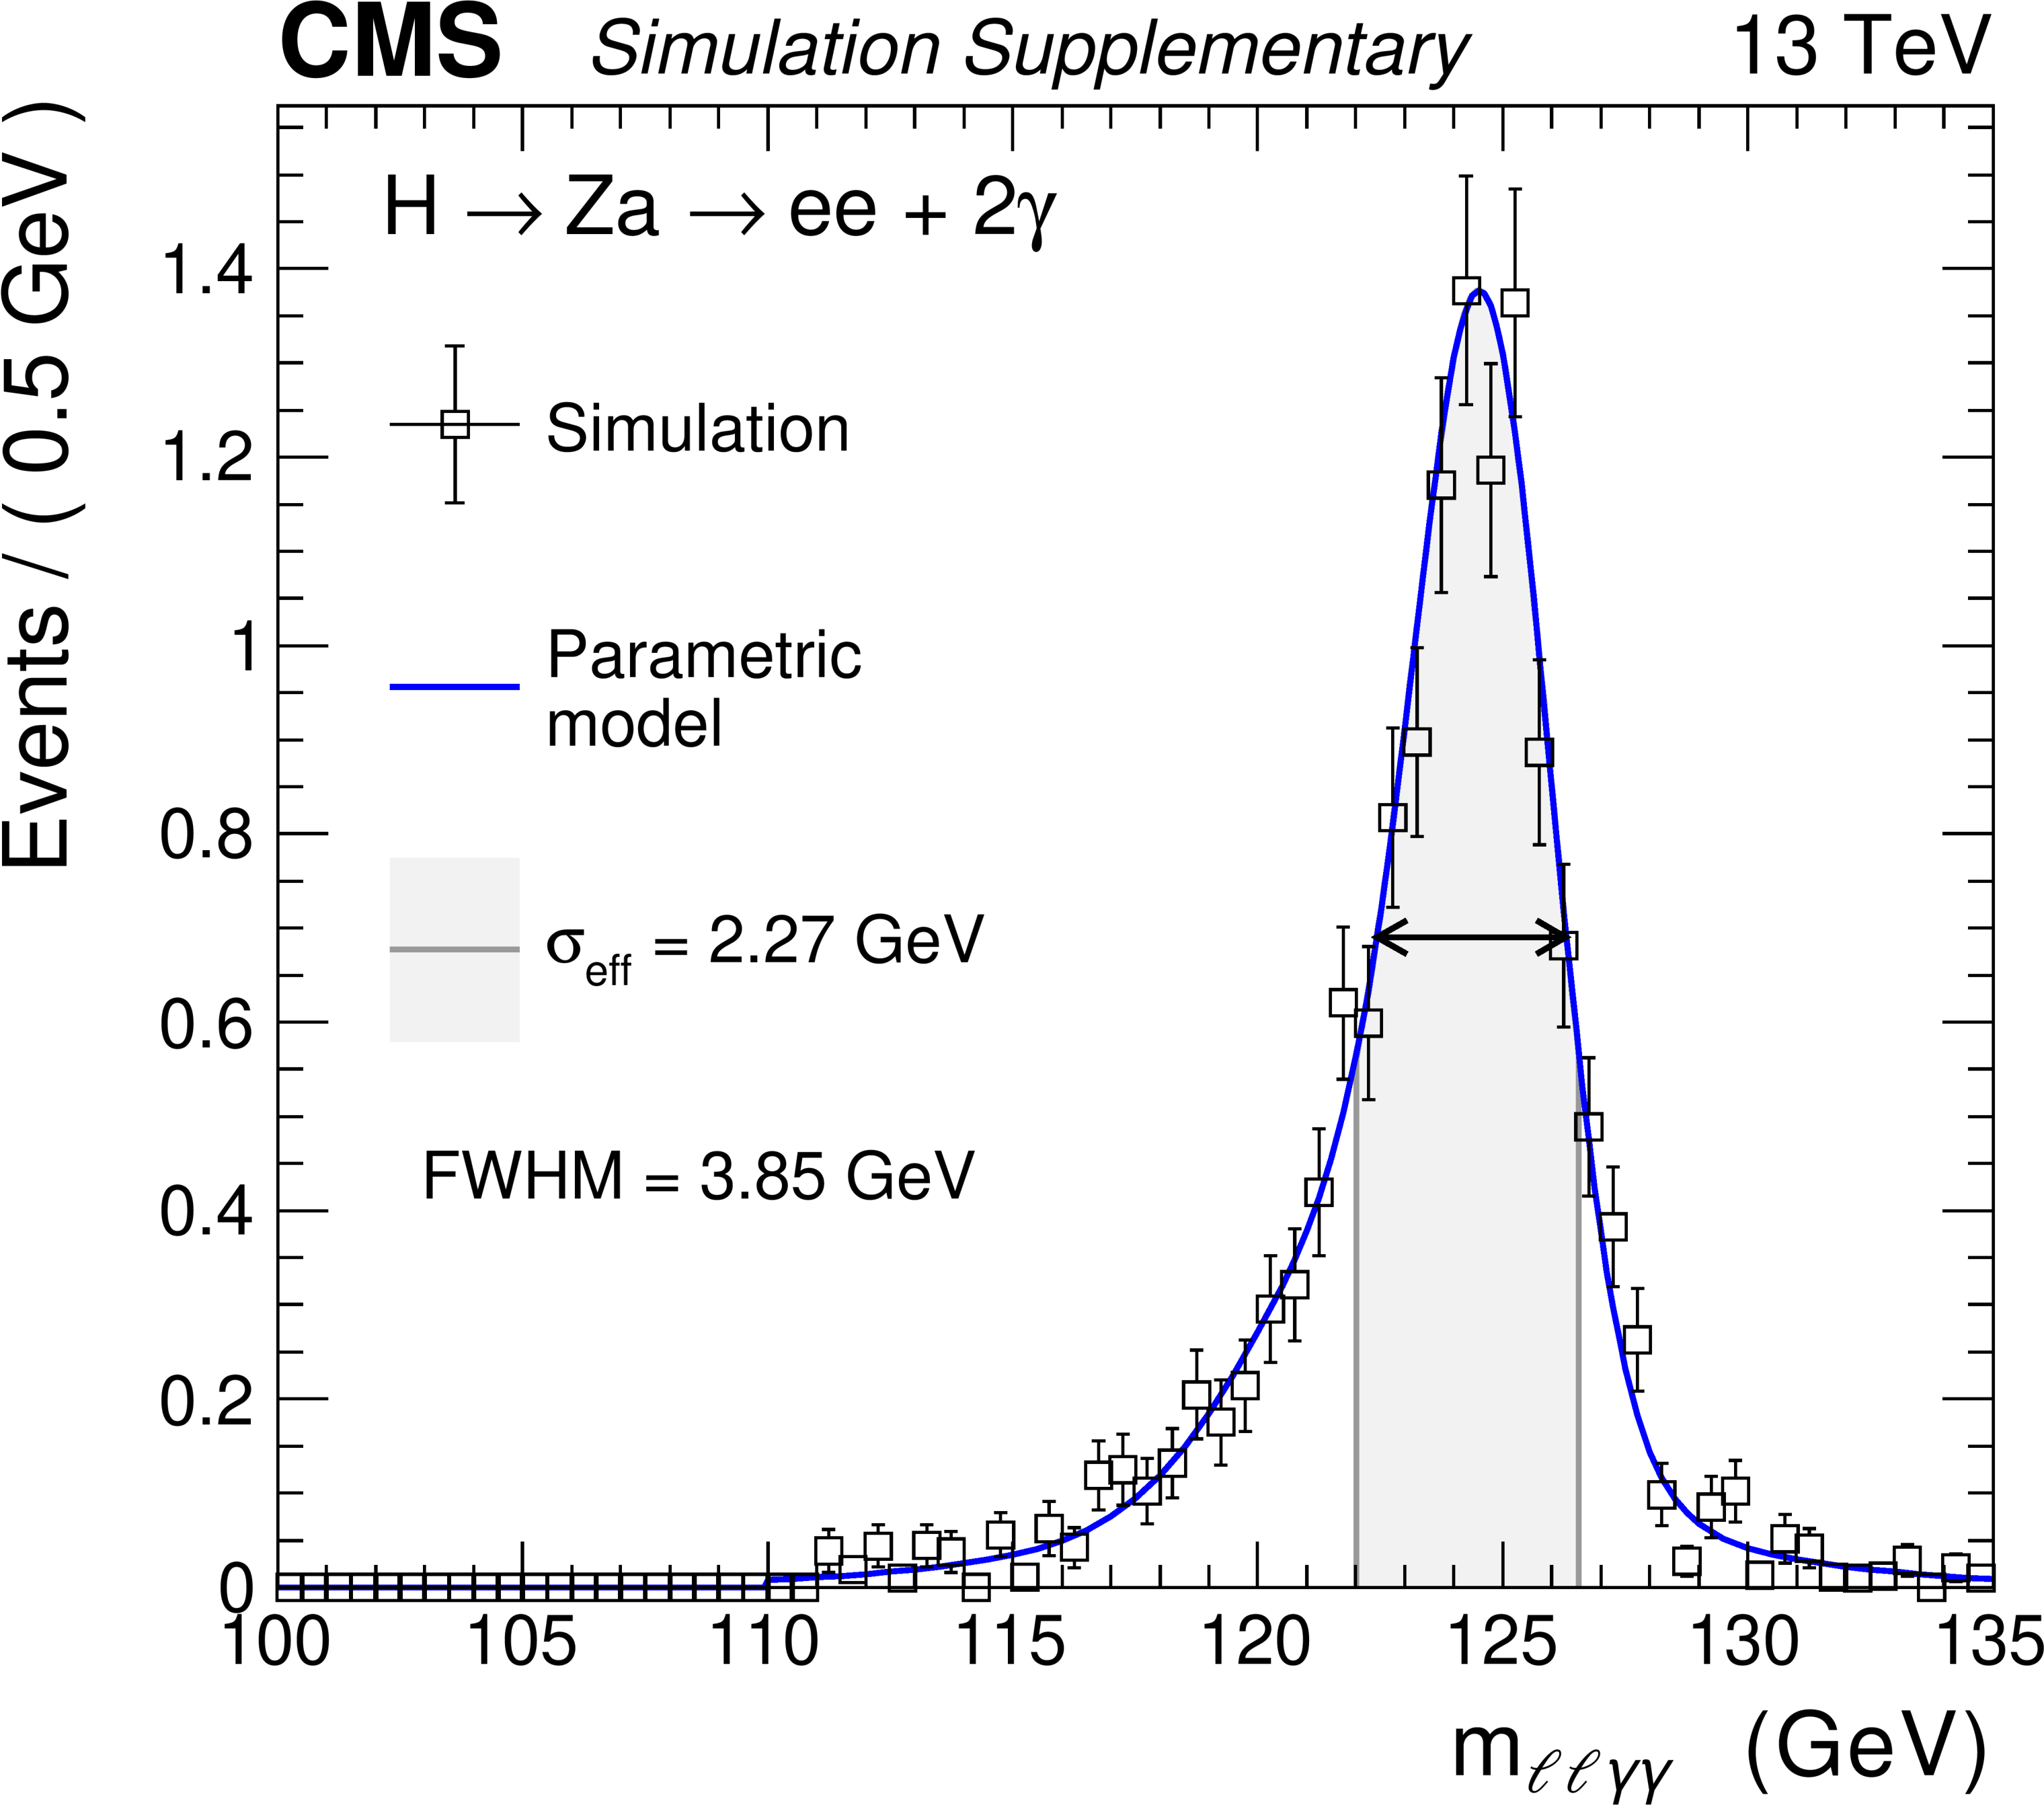
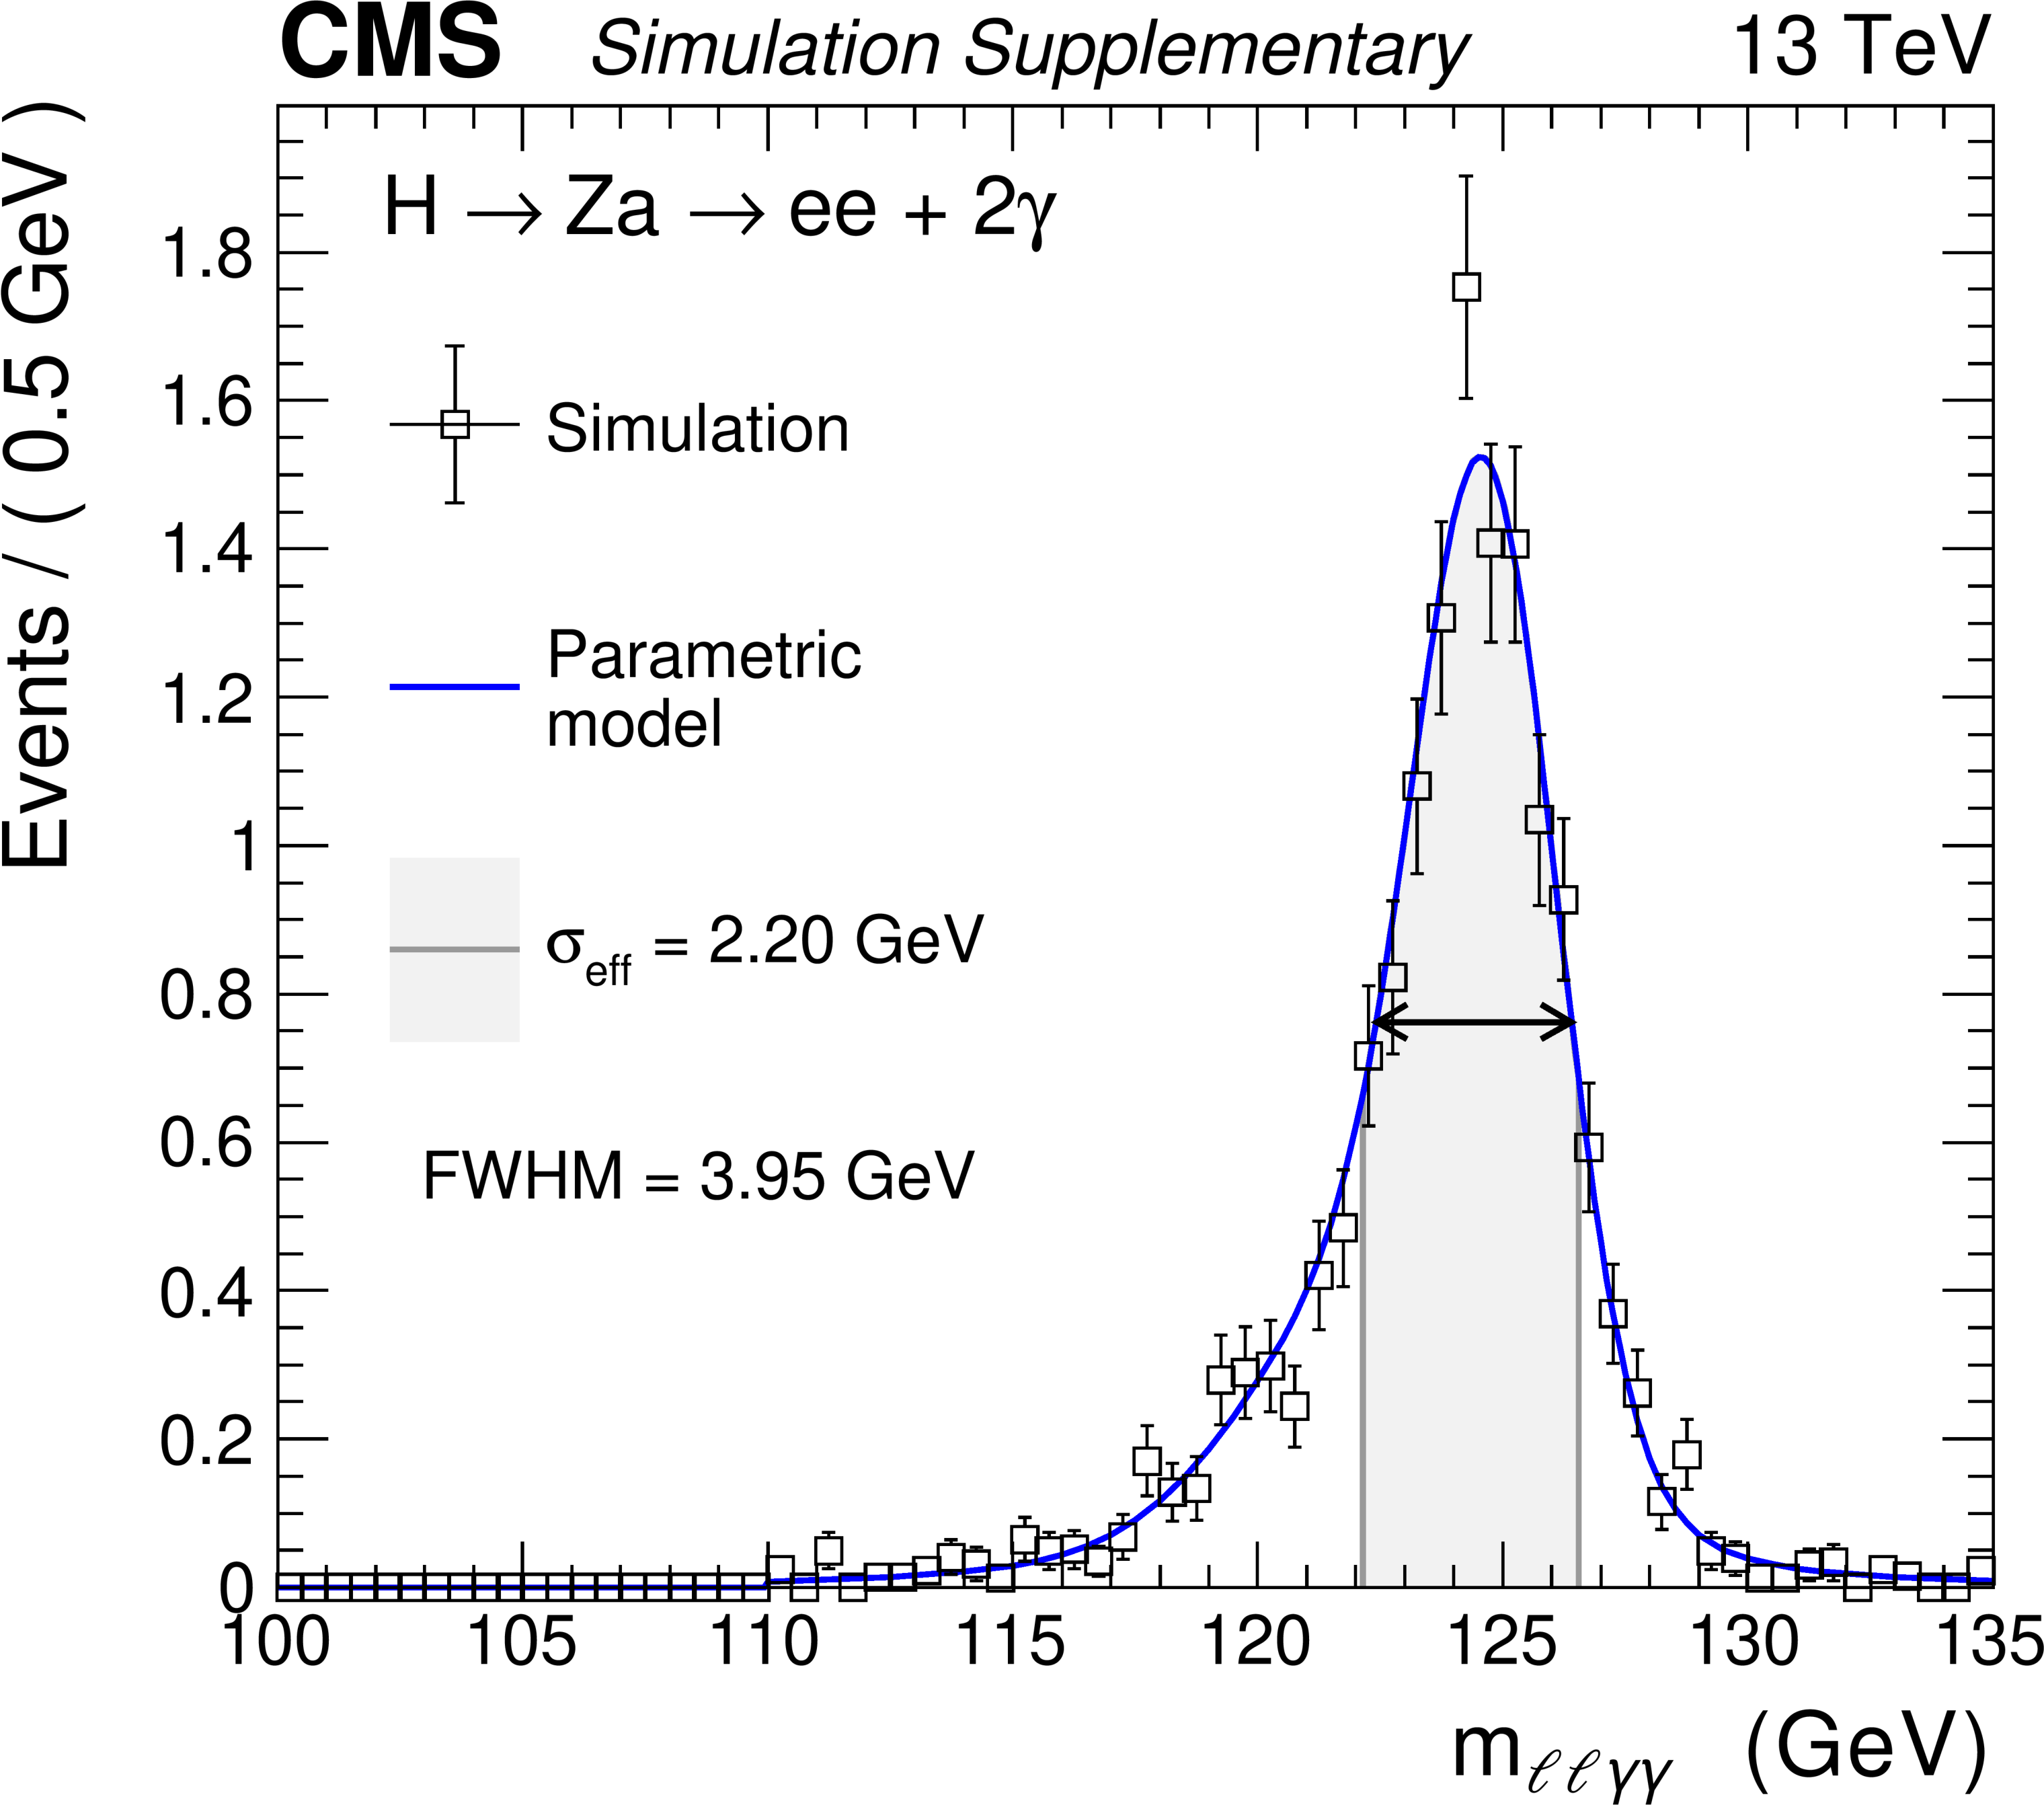
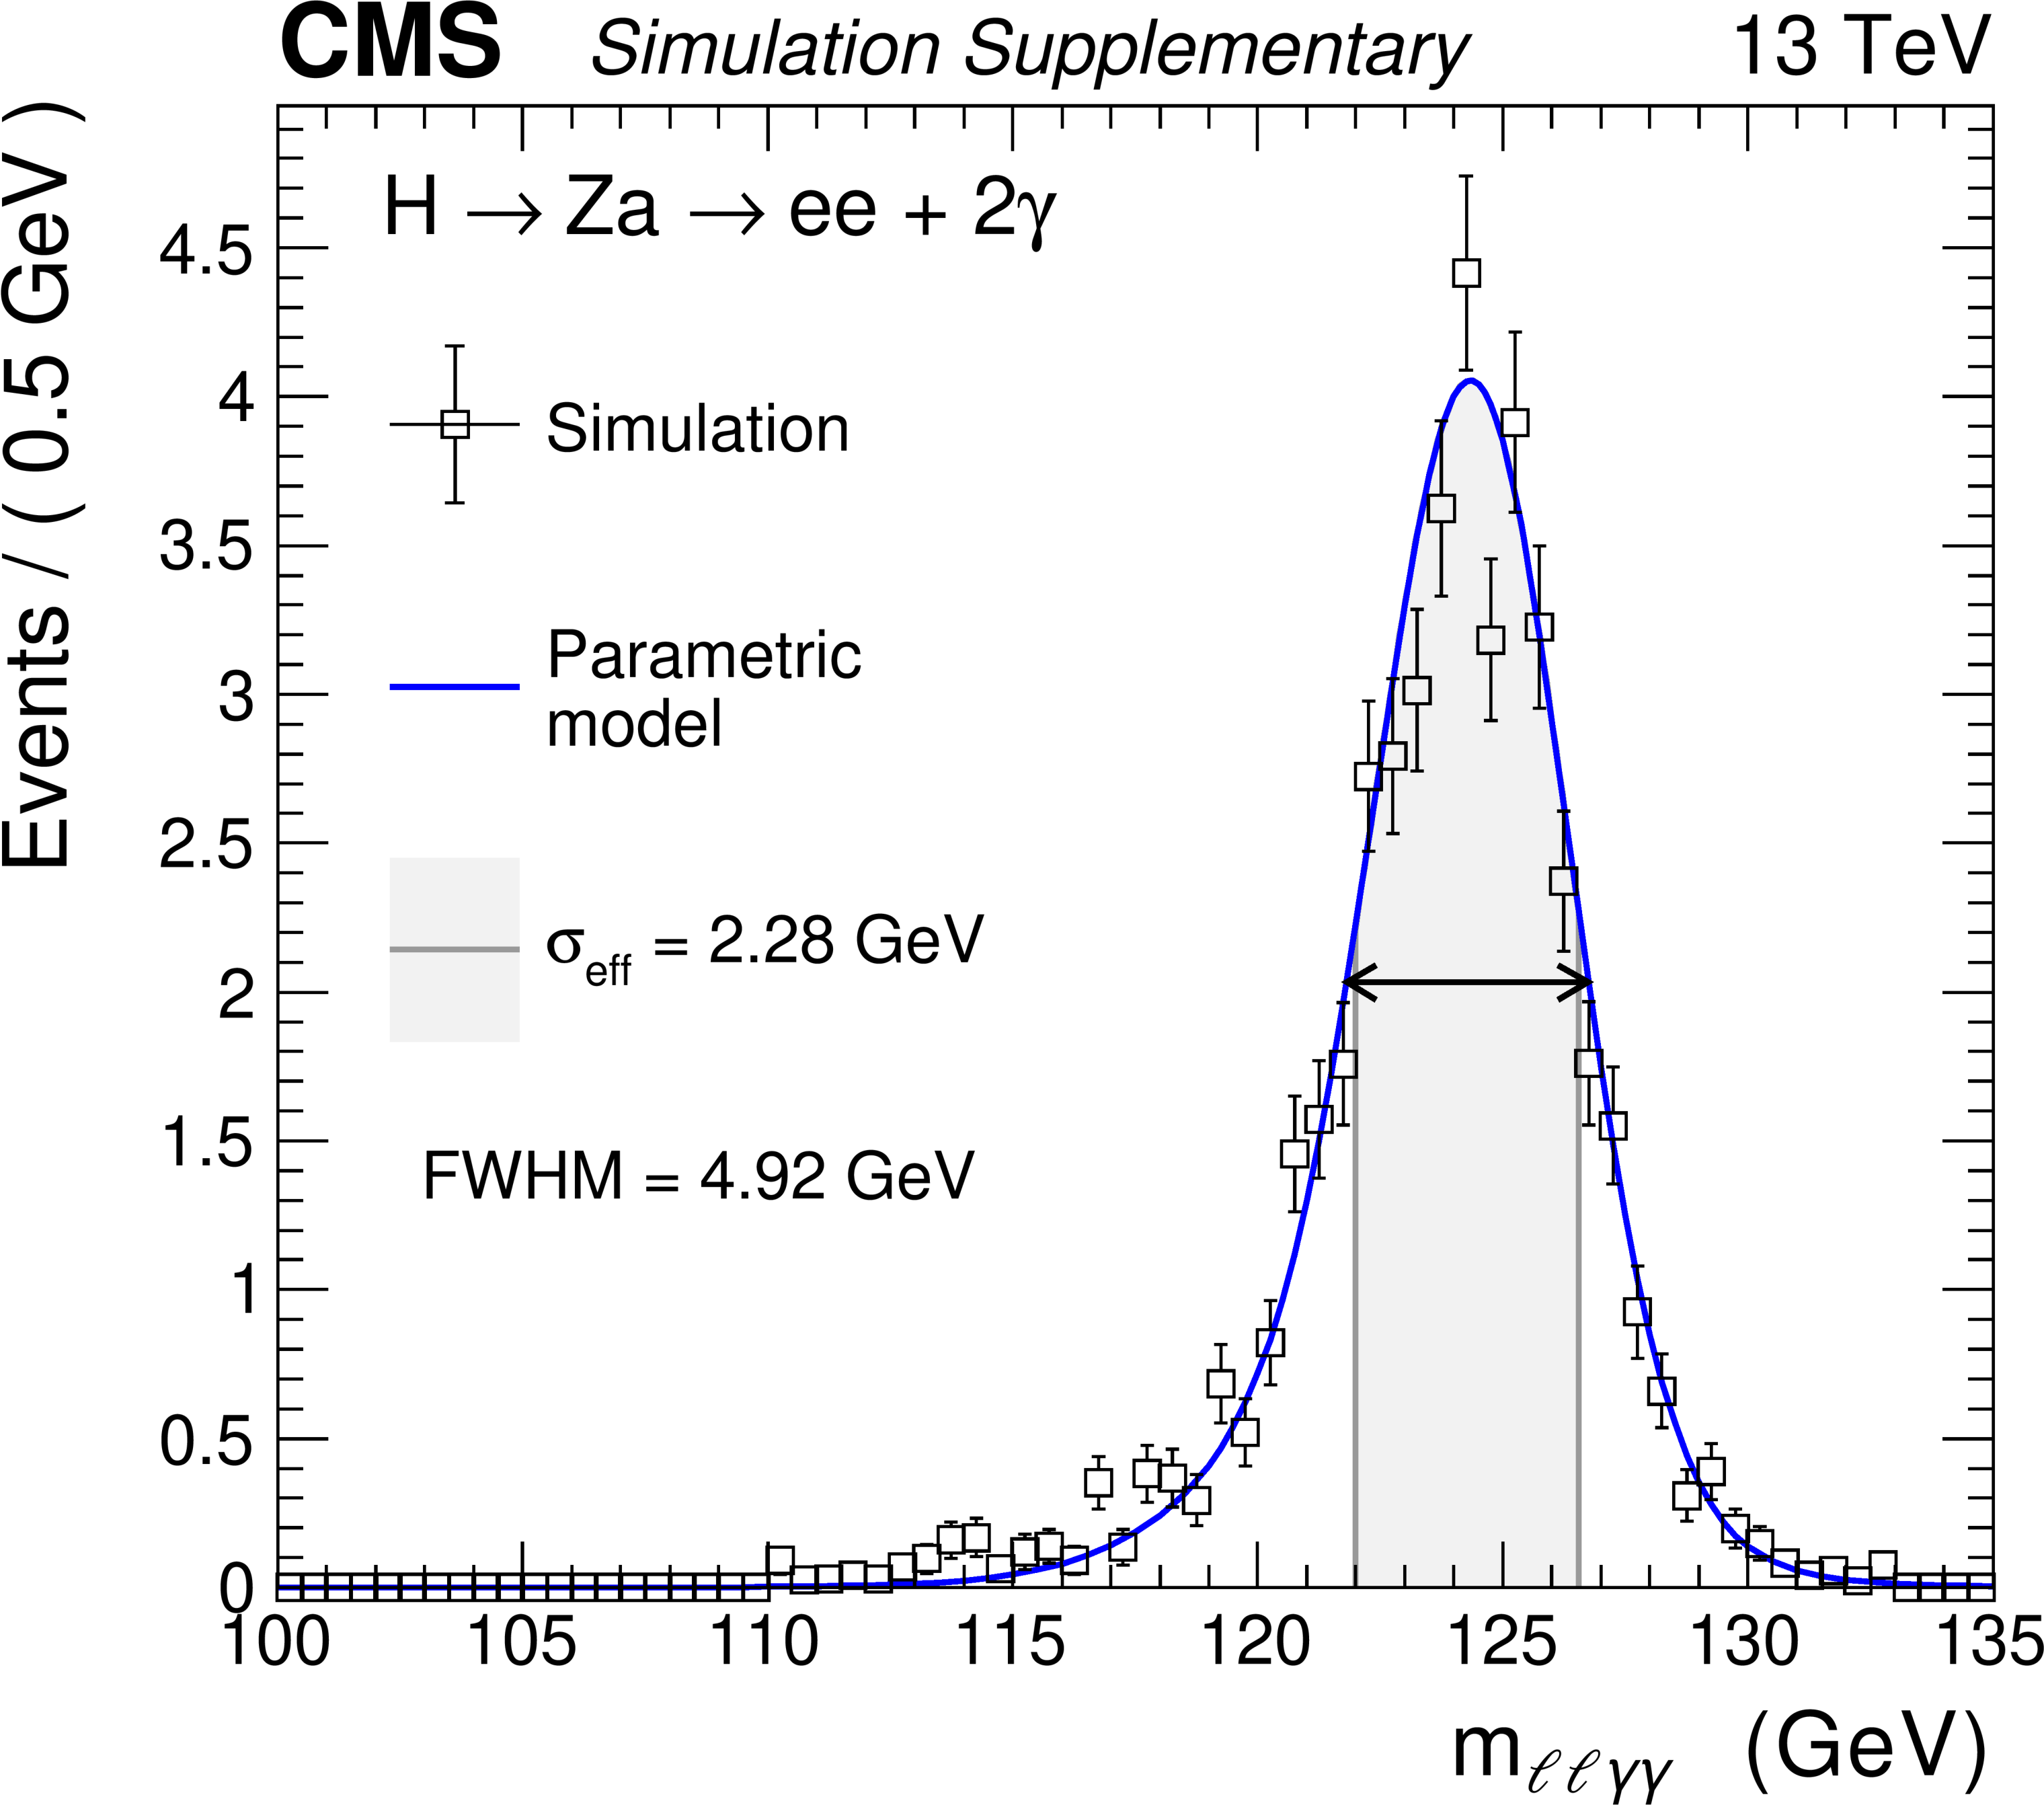
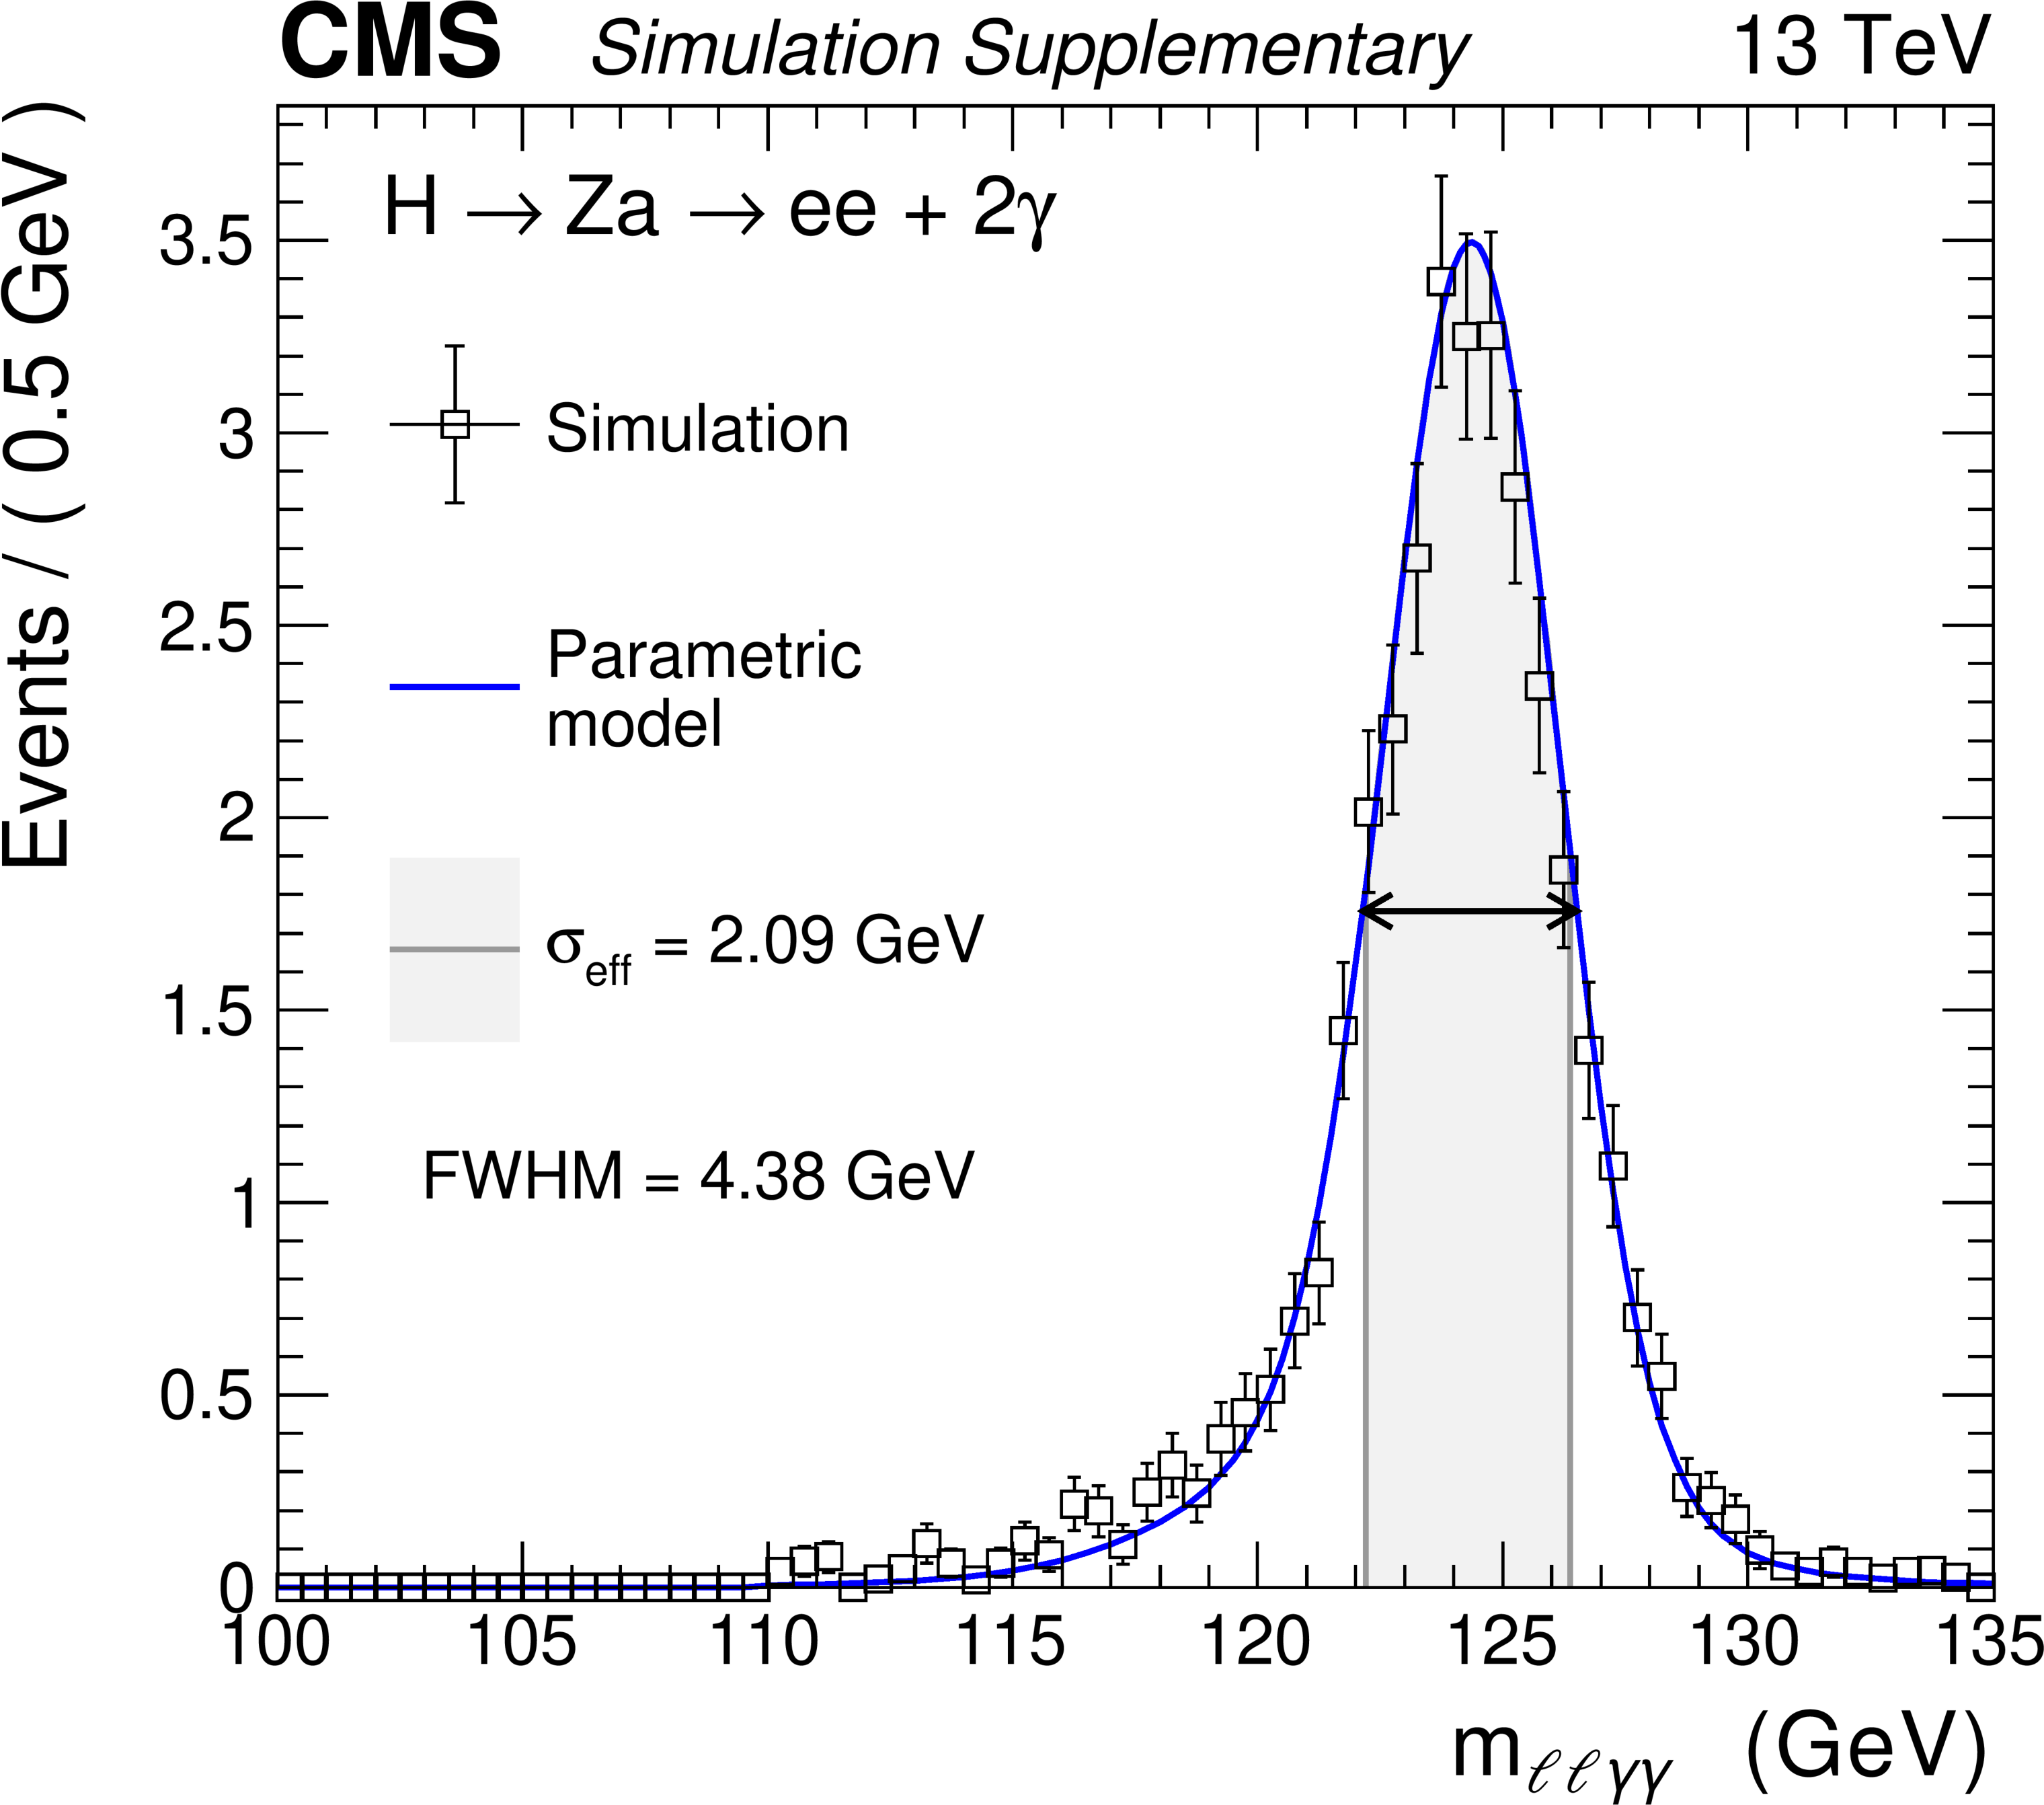
Additional Figure 56-a:
Fit of the $ m_{\ell\ell\gamma\gamma} $ distribution of signal events with $ m_{a} = $ 30 GeV in the electron channel with the detector settings of the 2018 data taking period. |
png pdf |
Additional Figure 56-b:
Fit of the $ m_{\ell\ell\gamma\gamma} $ distribution of signal events with $ m_{a} = $ 30 GeV in the muon channel with the detector settings of the 2018 data taking period. |
png pdf |
Additional Figure 57:
Functional forms used to model the $ m_{\ell\ell\gamma\gamma} $ distribution of background events with the analysis selection criteria for a signal with $ m_{a} = $ 1 GeV. |

png pdf |
Additional Figure 58:
Functional forms used to model the $ m_{\ell\ell\gamma\gamma} $ distribution of background events with the analysis selection criteria for a signal with $ m_{a} = $ 2 GeV. |
png pdf |
Additional Figure 59:
Functional forms used to model the $ m_{\ell\ell\gamma\gamma} $ distribution of background events with the analysis selection criteria for a signal with $ m_{a} = $ 3 GeV. |
png pdf |
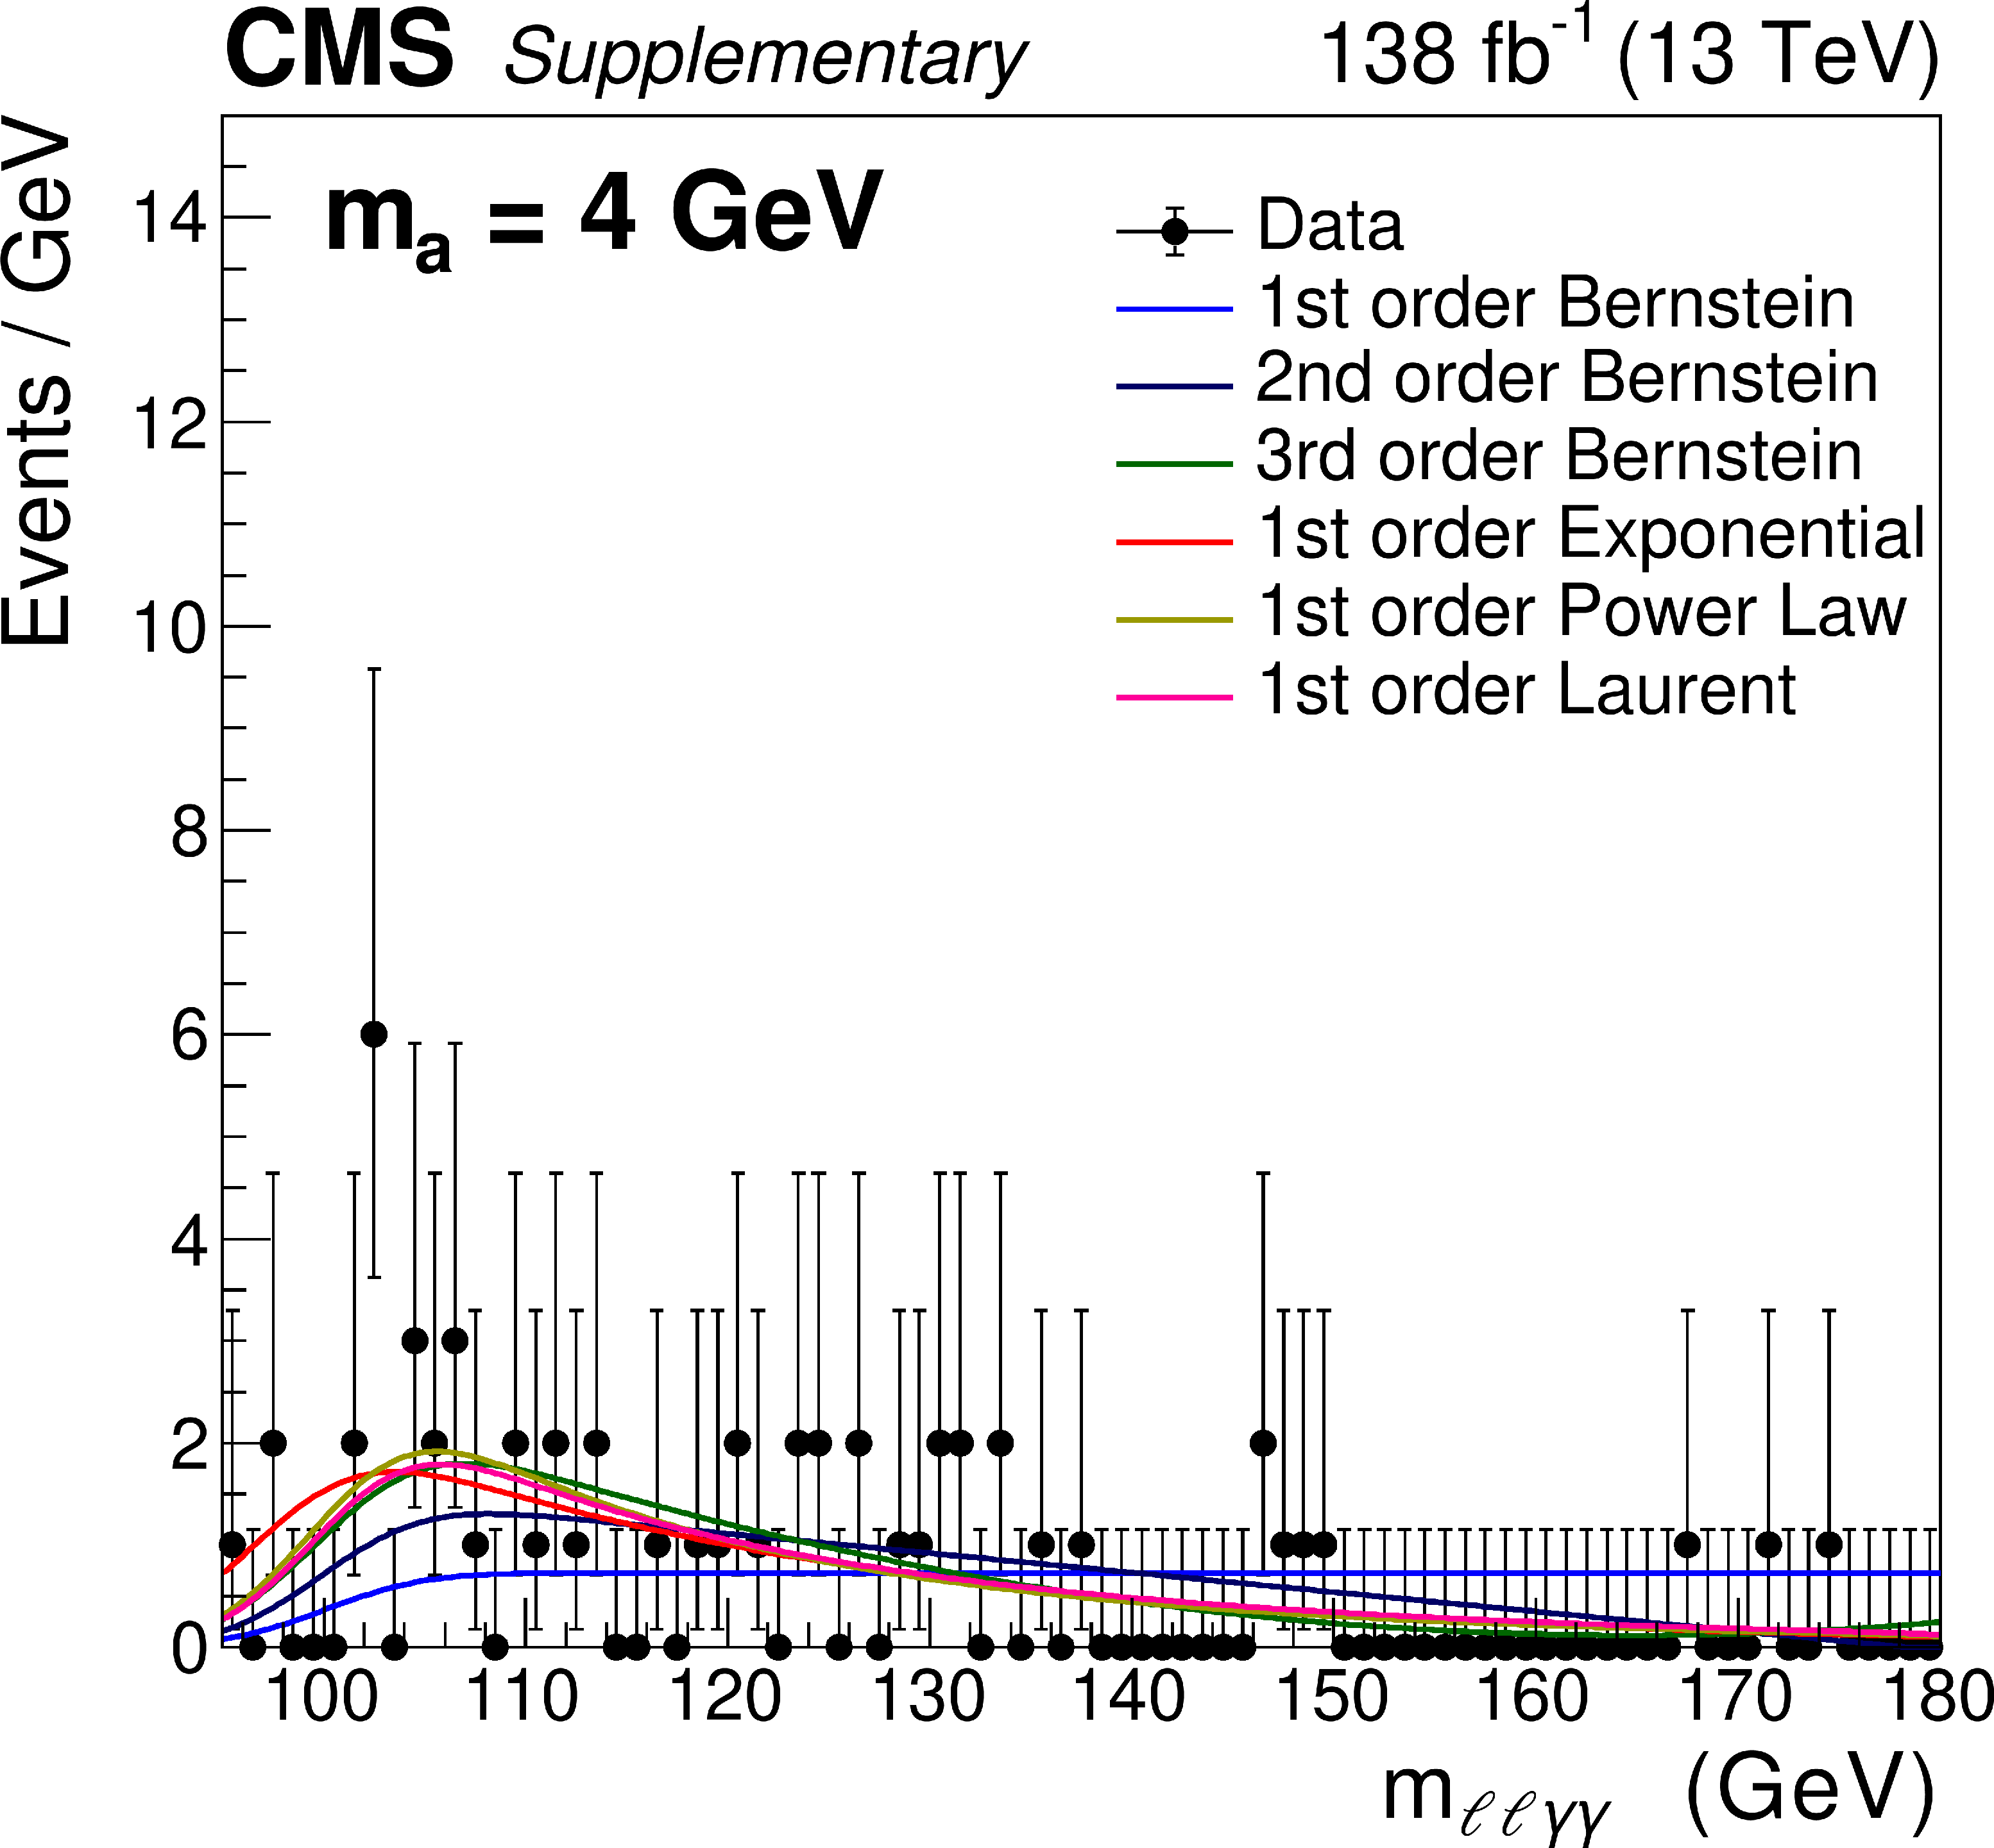
Additional Figure 60:
Functional forms used to model the $ m_{\ell\ell\gamma\gamma} $ distribution of background events with the analysis selection criteria for a signal with $ m_{a} = $ 4 GeV. |
png pdf |
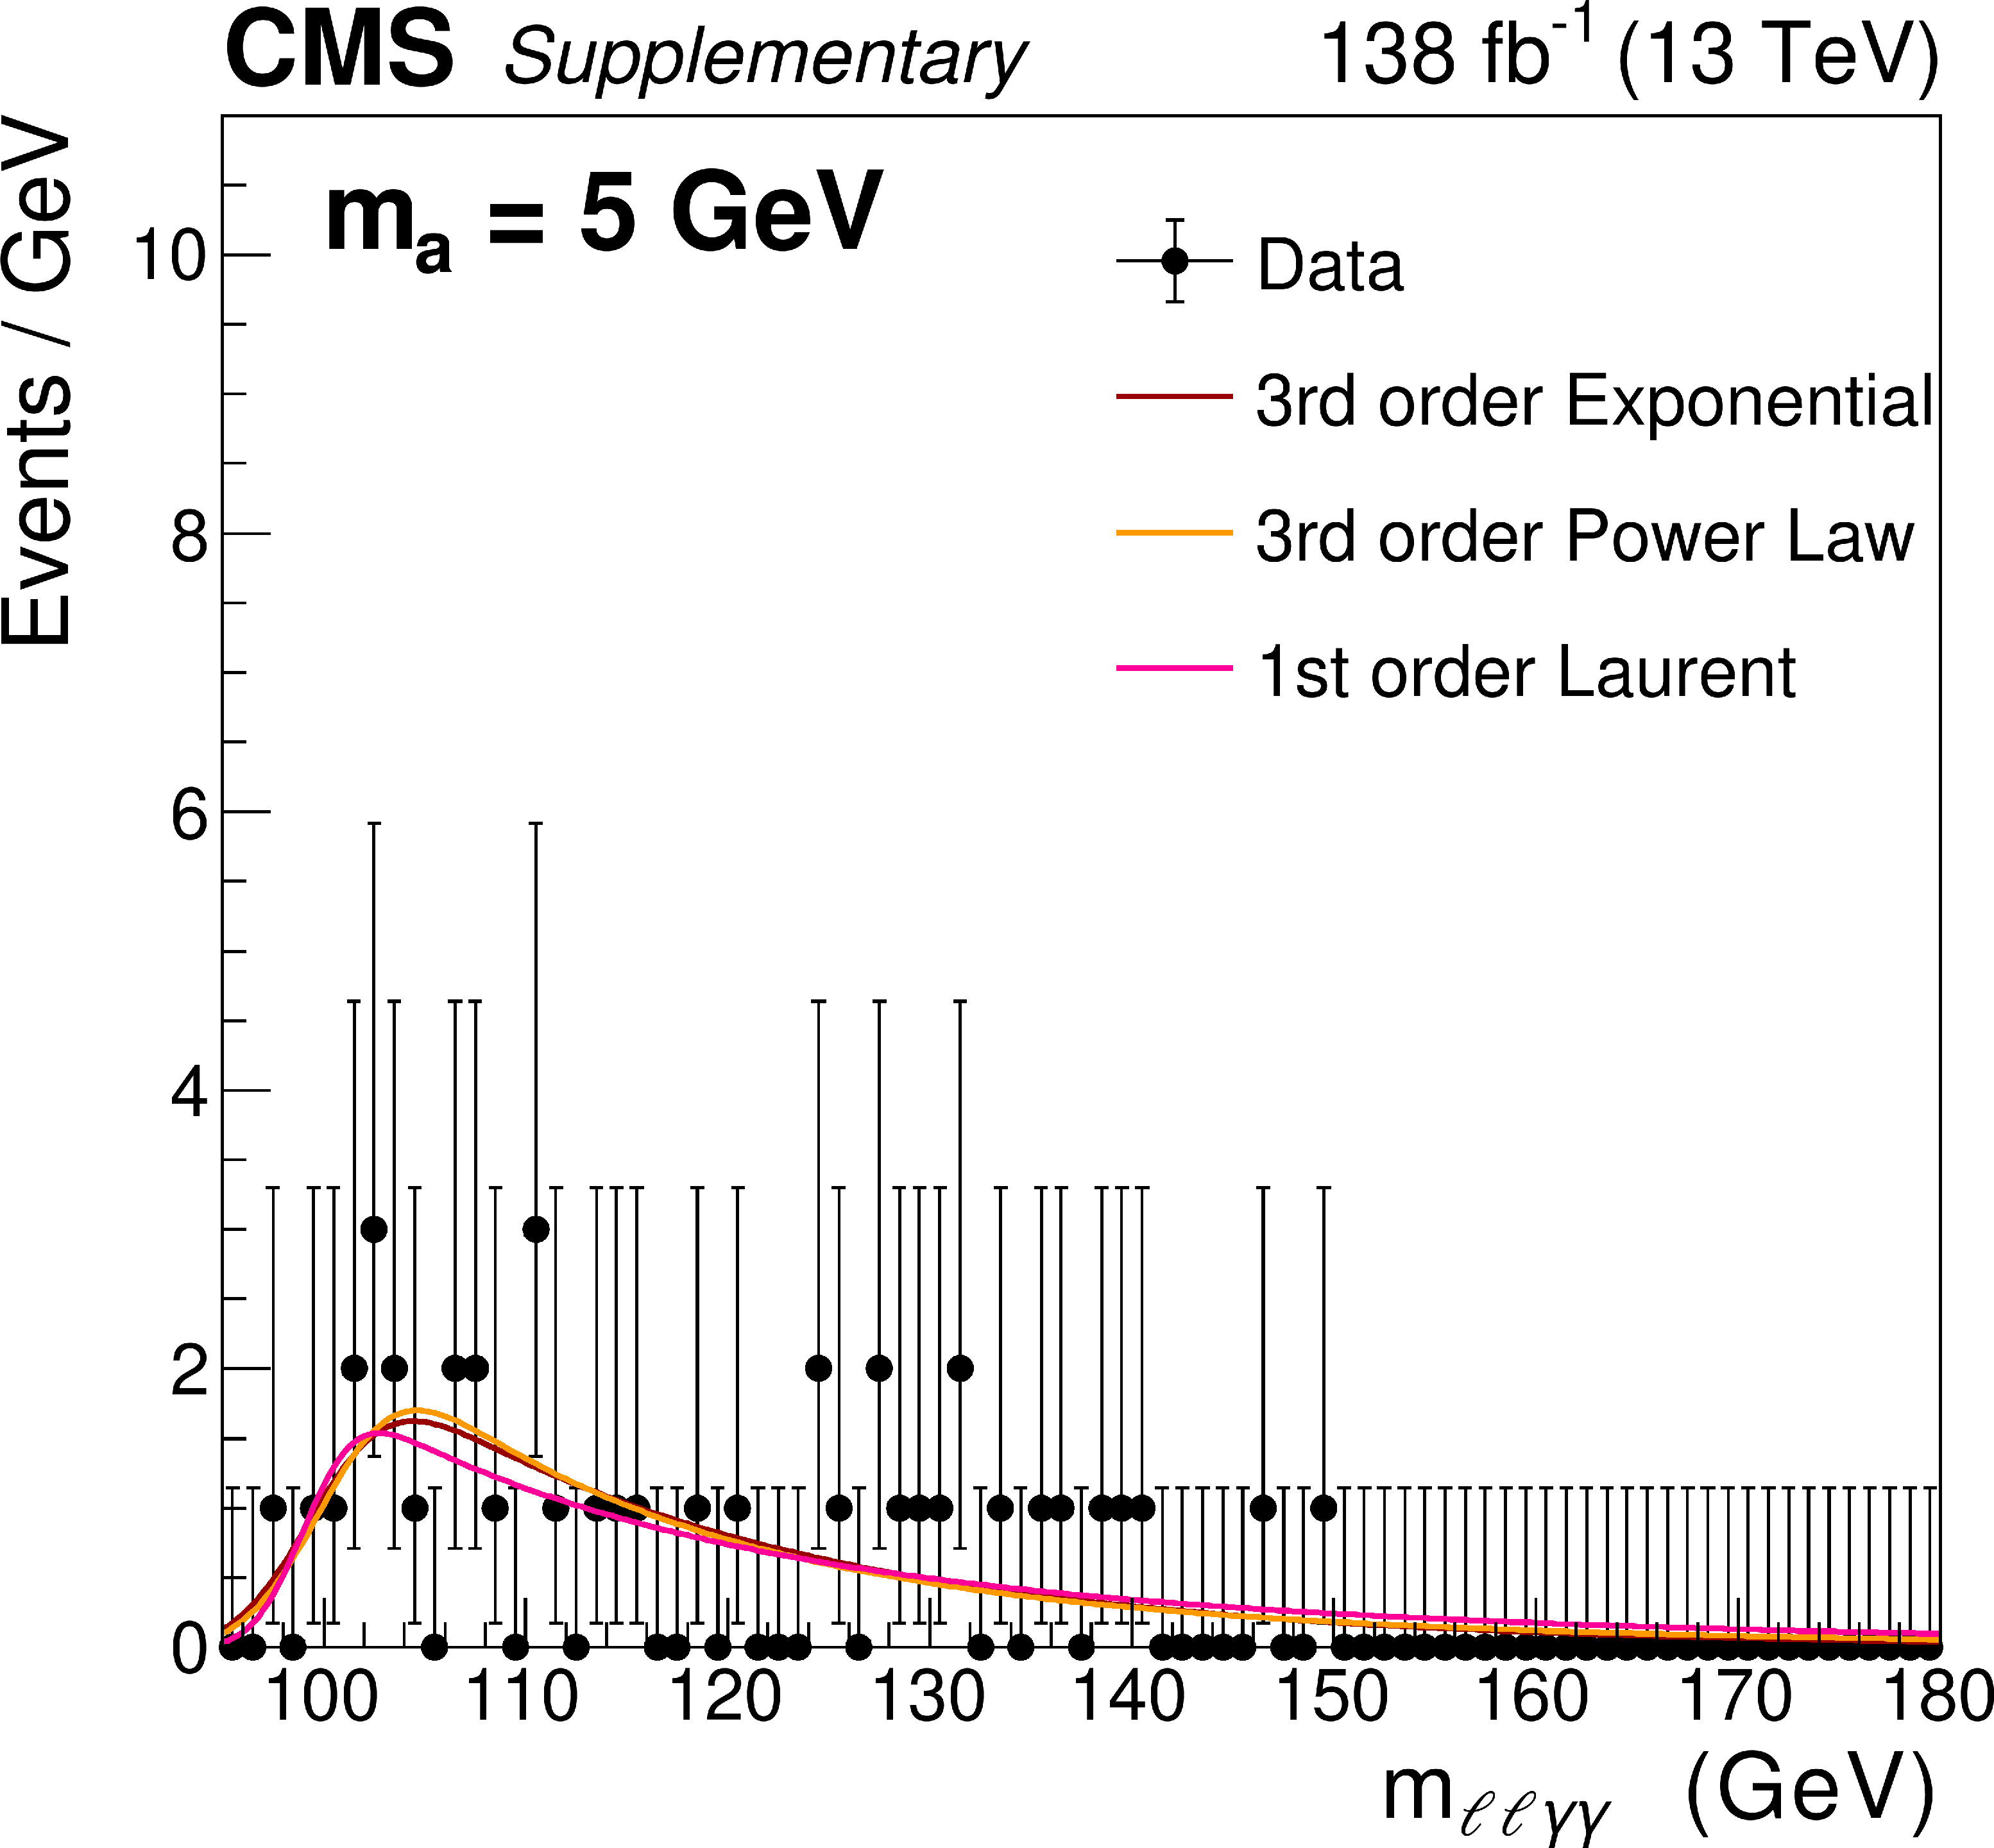
Additional Figure 61:
Functional forms used to model the $ m_{\ell\ell\gamma\gamma} $ distribution of background events with the analysis selection criteria for a signal with $ m_{a} = $ 5 GeV. |

png pdf |
Additional Figure 62:
Functional forms used to model the $ m_{\ell\ell\gamma\gamma} $ distribution of background events with the analysis selection criteria for a signal with $ m_{a} = $ 6 GeV. |

png pdf |
Additional Figure 63:
Functional forms used to model the $ m_{\ell\ell\gamma\gamma} $ distribution of background events with the analysis selection criteria for a signal with $ m_{a} = $ 7 GeV. |

png pdf |
Additional Figure 64:
Functional forms used to model the $ m_{\ell\ell\gamma\gamma} $ distribution of background events with the analysis selection criteria for a signal with $ m_{a} = $ 8 GeV. |
png pdf |
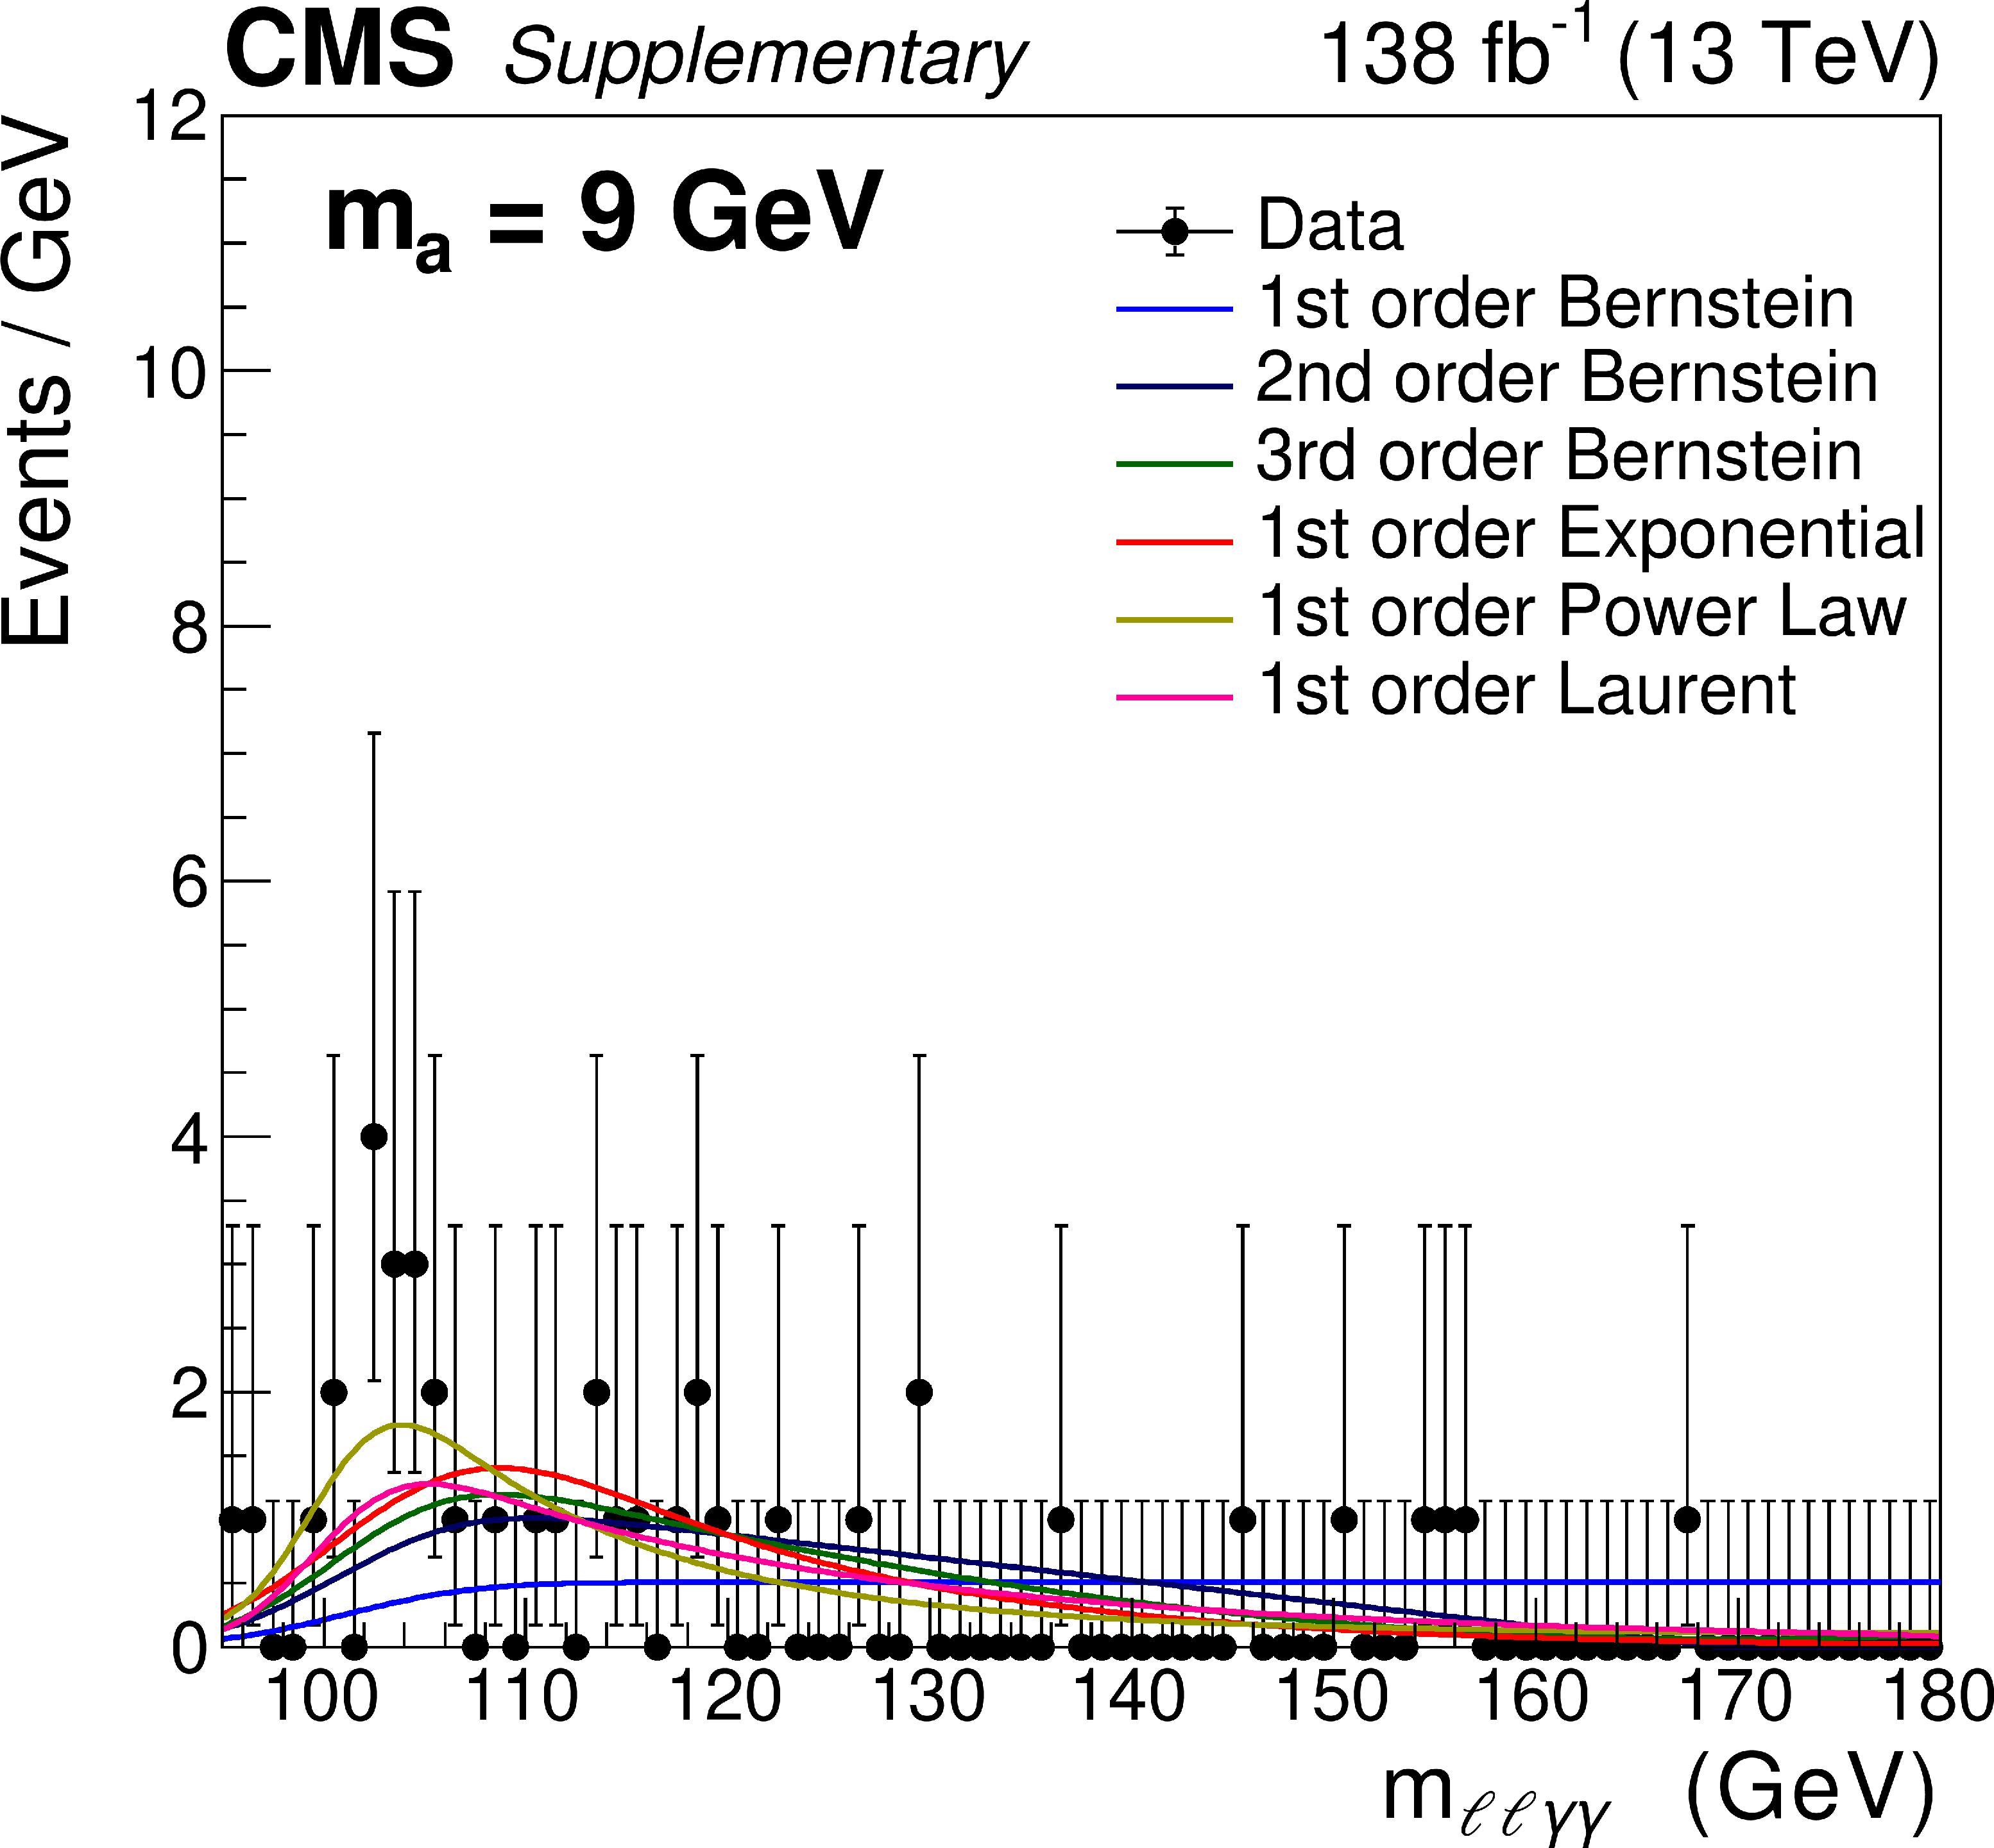
Additional Figure 65:
Functional forms used to model the $ m_{\ell\ell\gamma\gamma} $ distribution of background events with the analysis selection criteria for a signal with $ m_{a} = $ 9 GeV. |
png pdf |
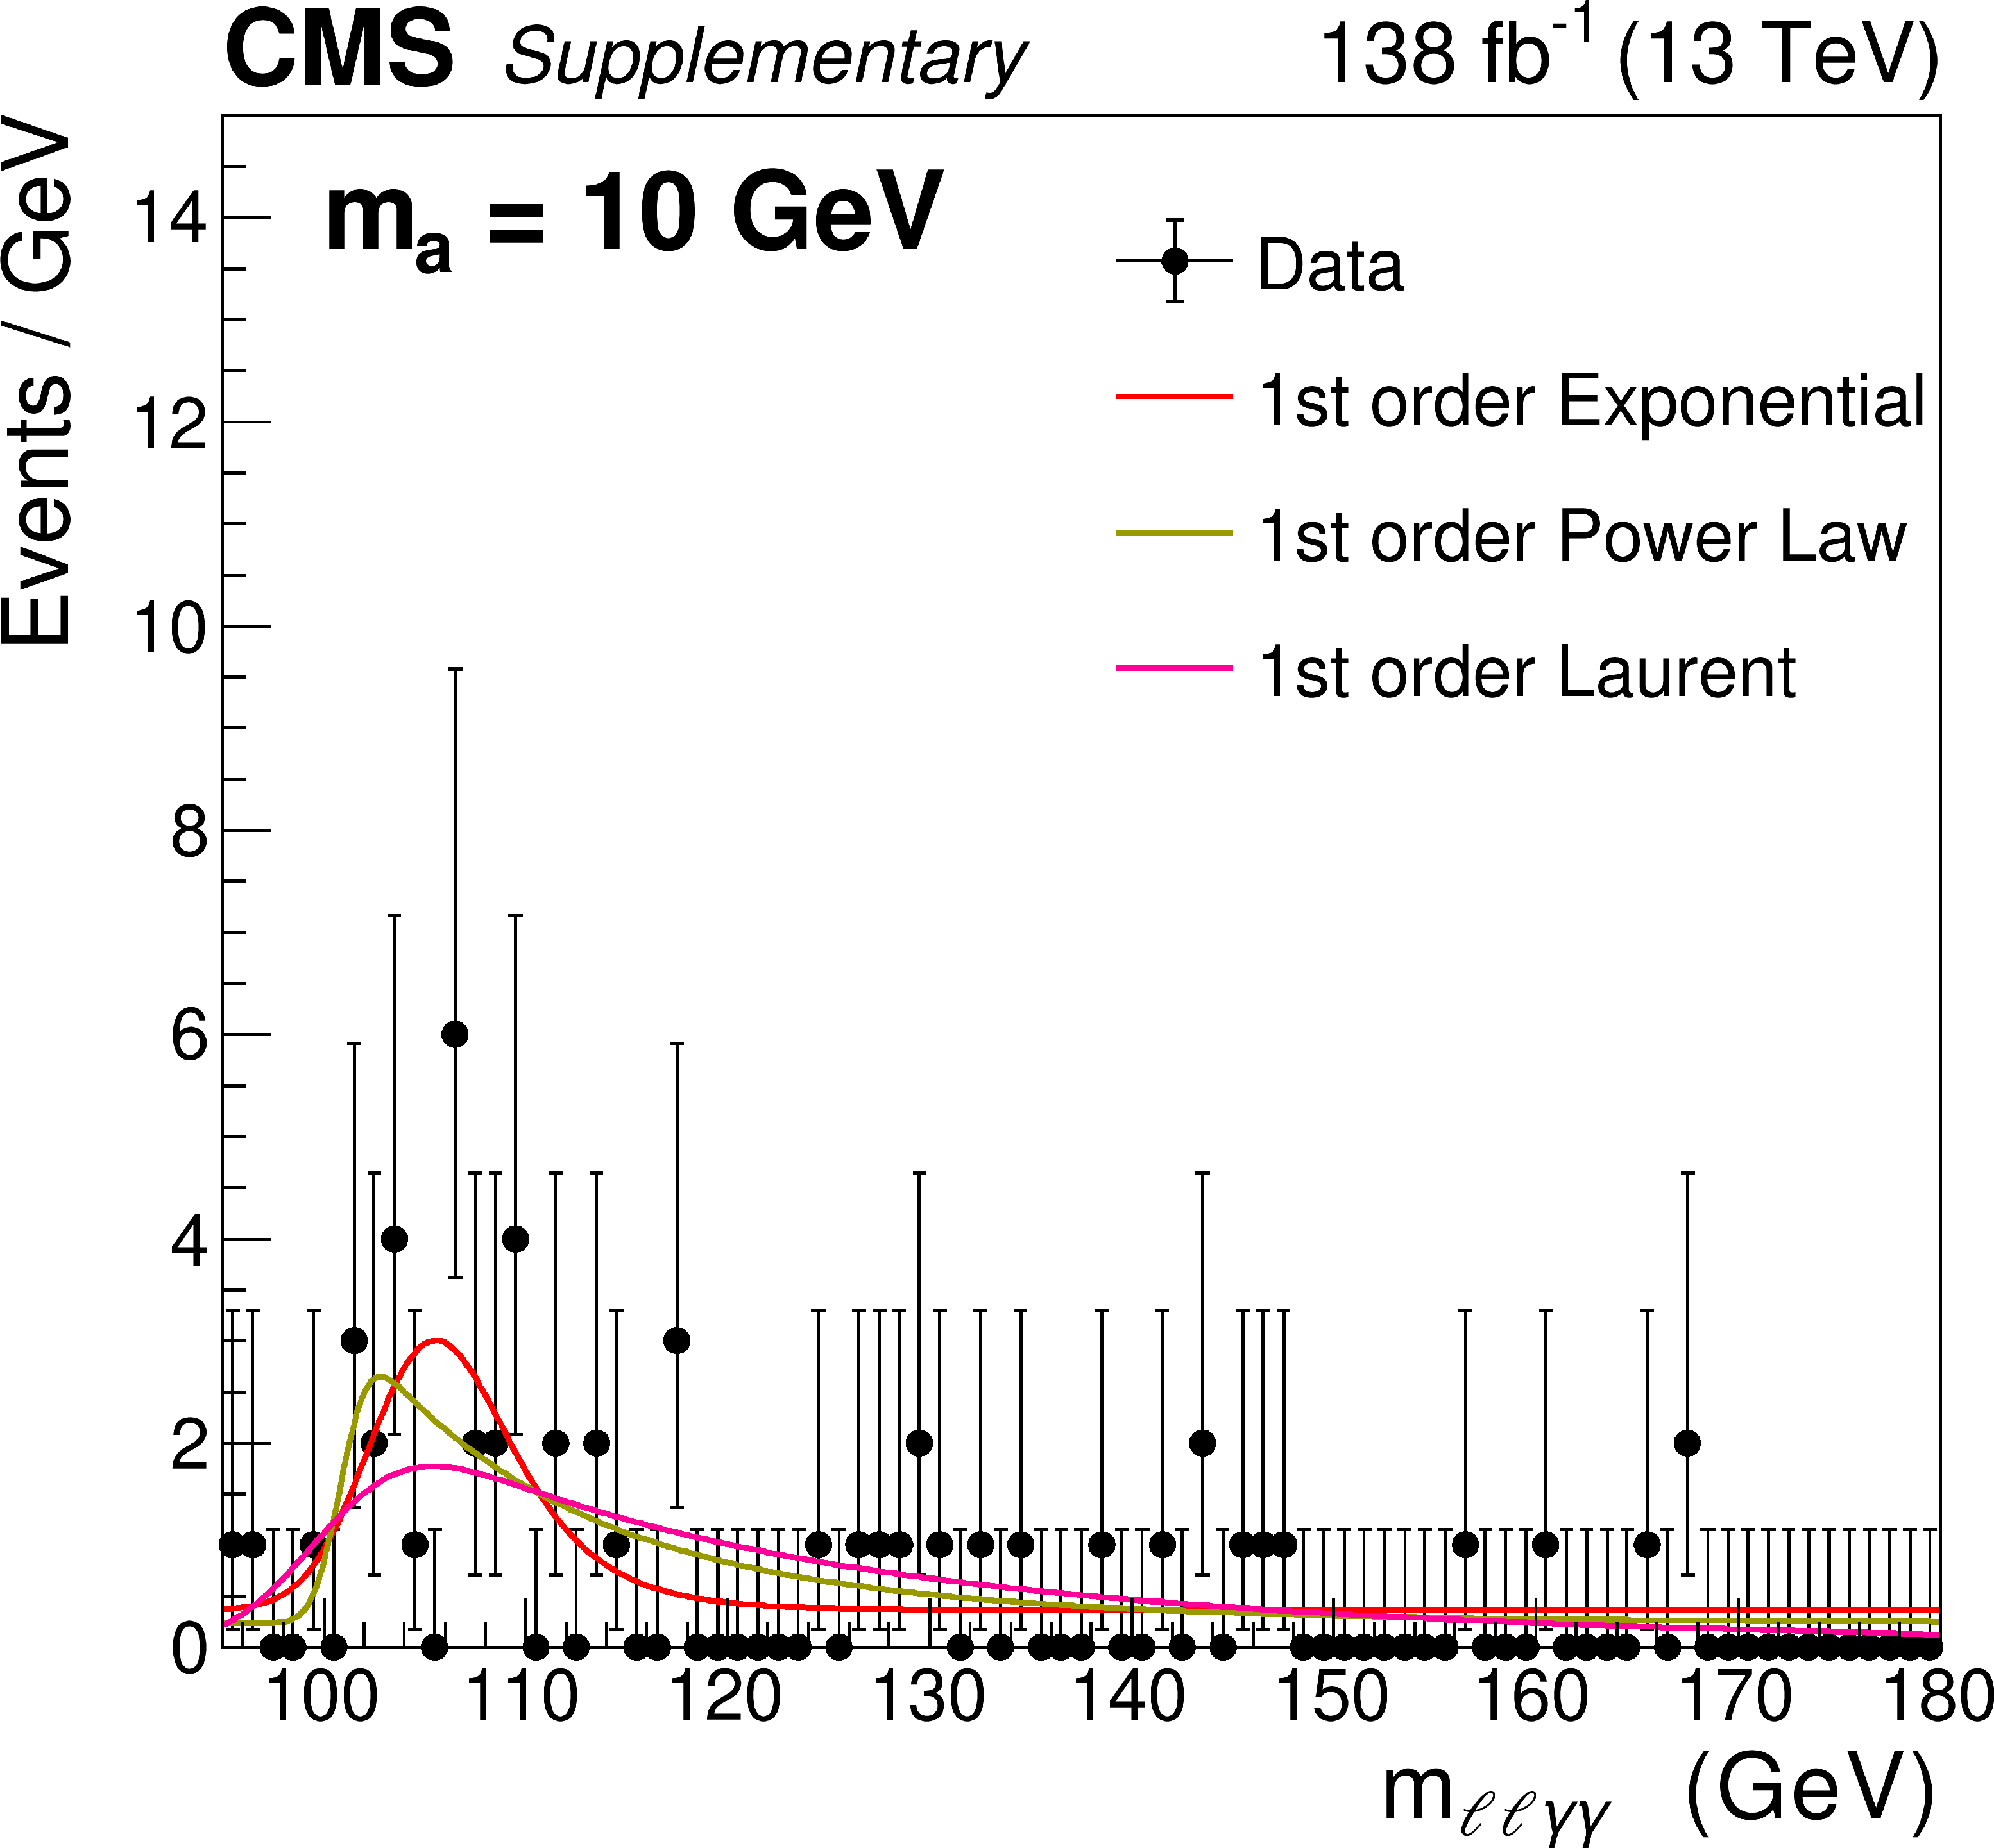
Additional Figure 66:
Functional forms used to model the $ m_{\ell\ell\gamma\gamma} $ distribution of background events with the analysis selection criteria for a signal with $ m_{a} = $ 10 GeV. |

png pdf |
Additional Figure 67:
Functional forms used to model the $ m_{\ell\ell\gamma\gamma} $ distribution of background events with the analysis selection criteria for a signal with $ m_{a} = $ 15 GeV. |
png pdf |
Additional Figure 68:
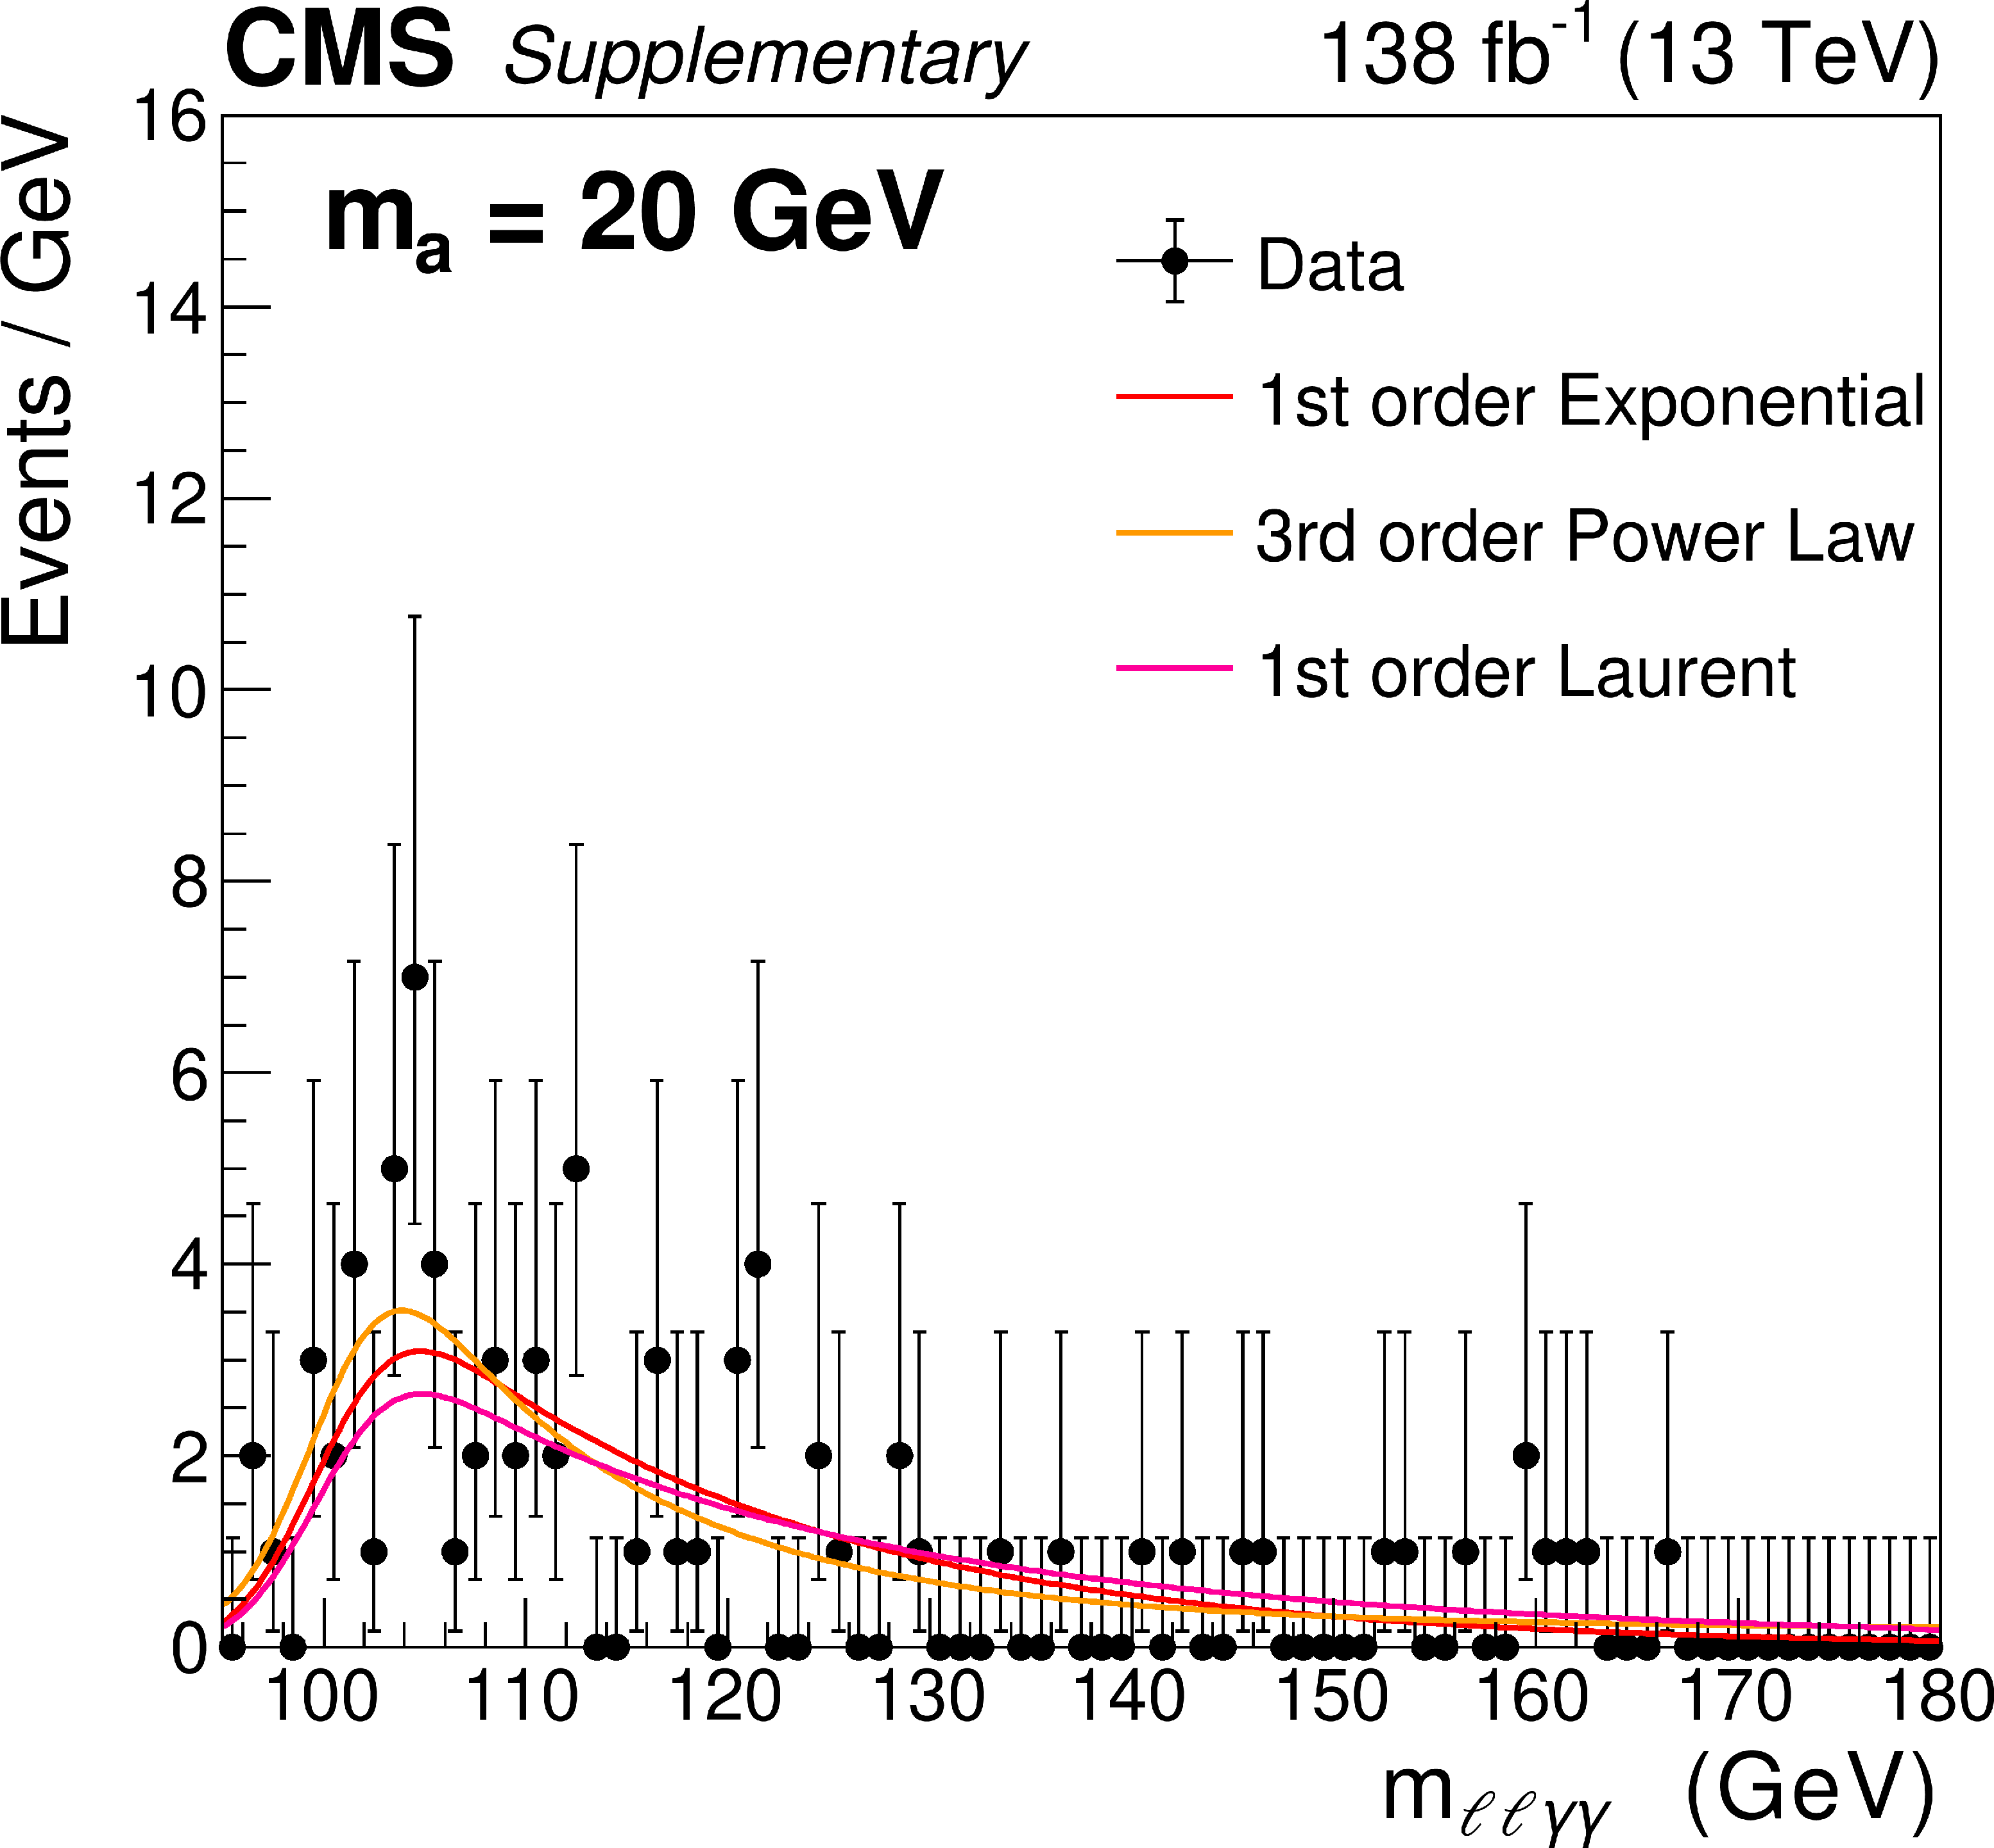
Functional forms used to model the $ m_{\ell\ell\gamma\gamma} $ distribution of background events with the analysis selection criteria for a signal with $ m_{a} = $ 20 GeV. |
png pdf |
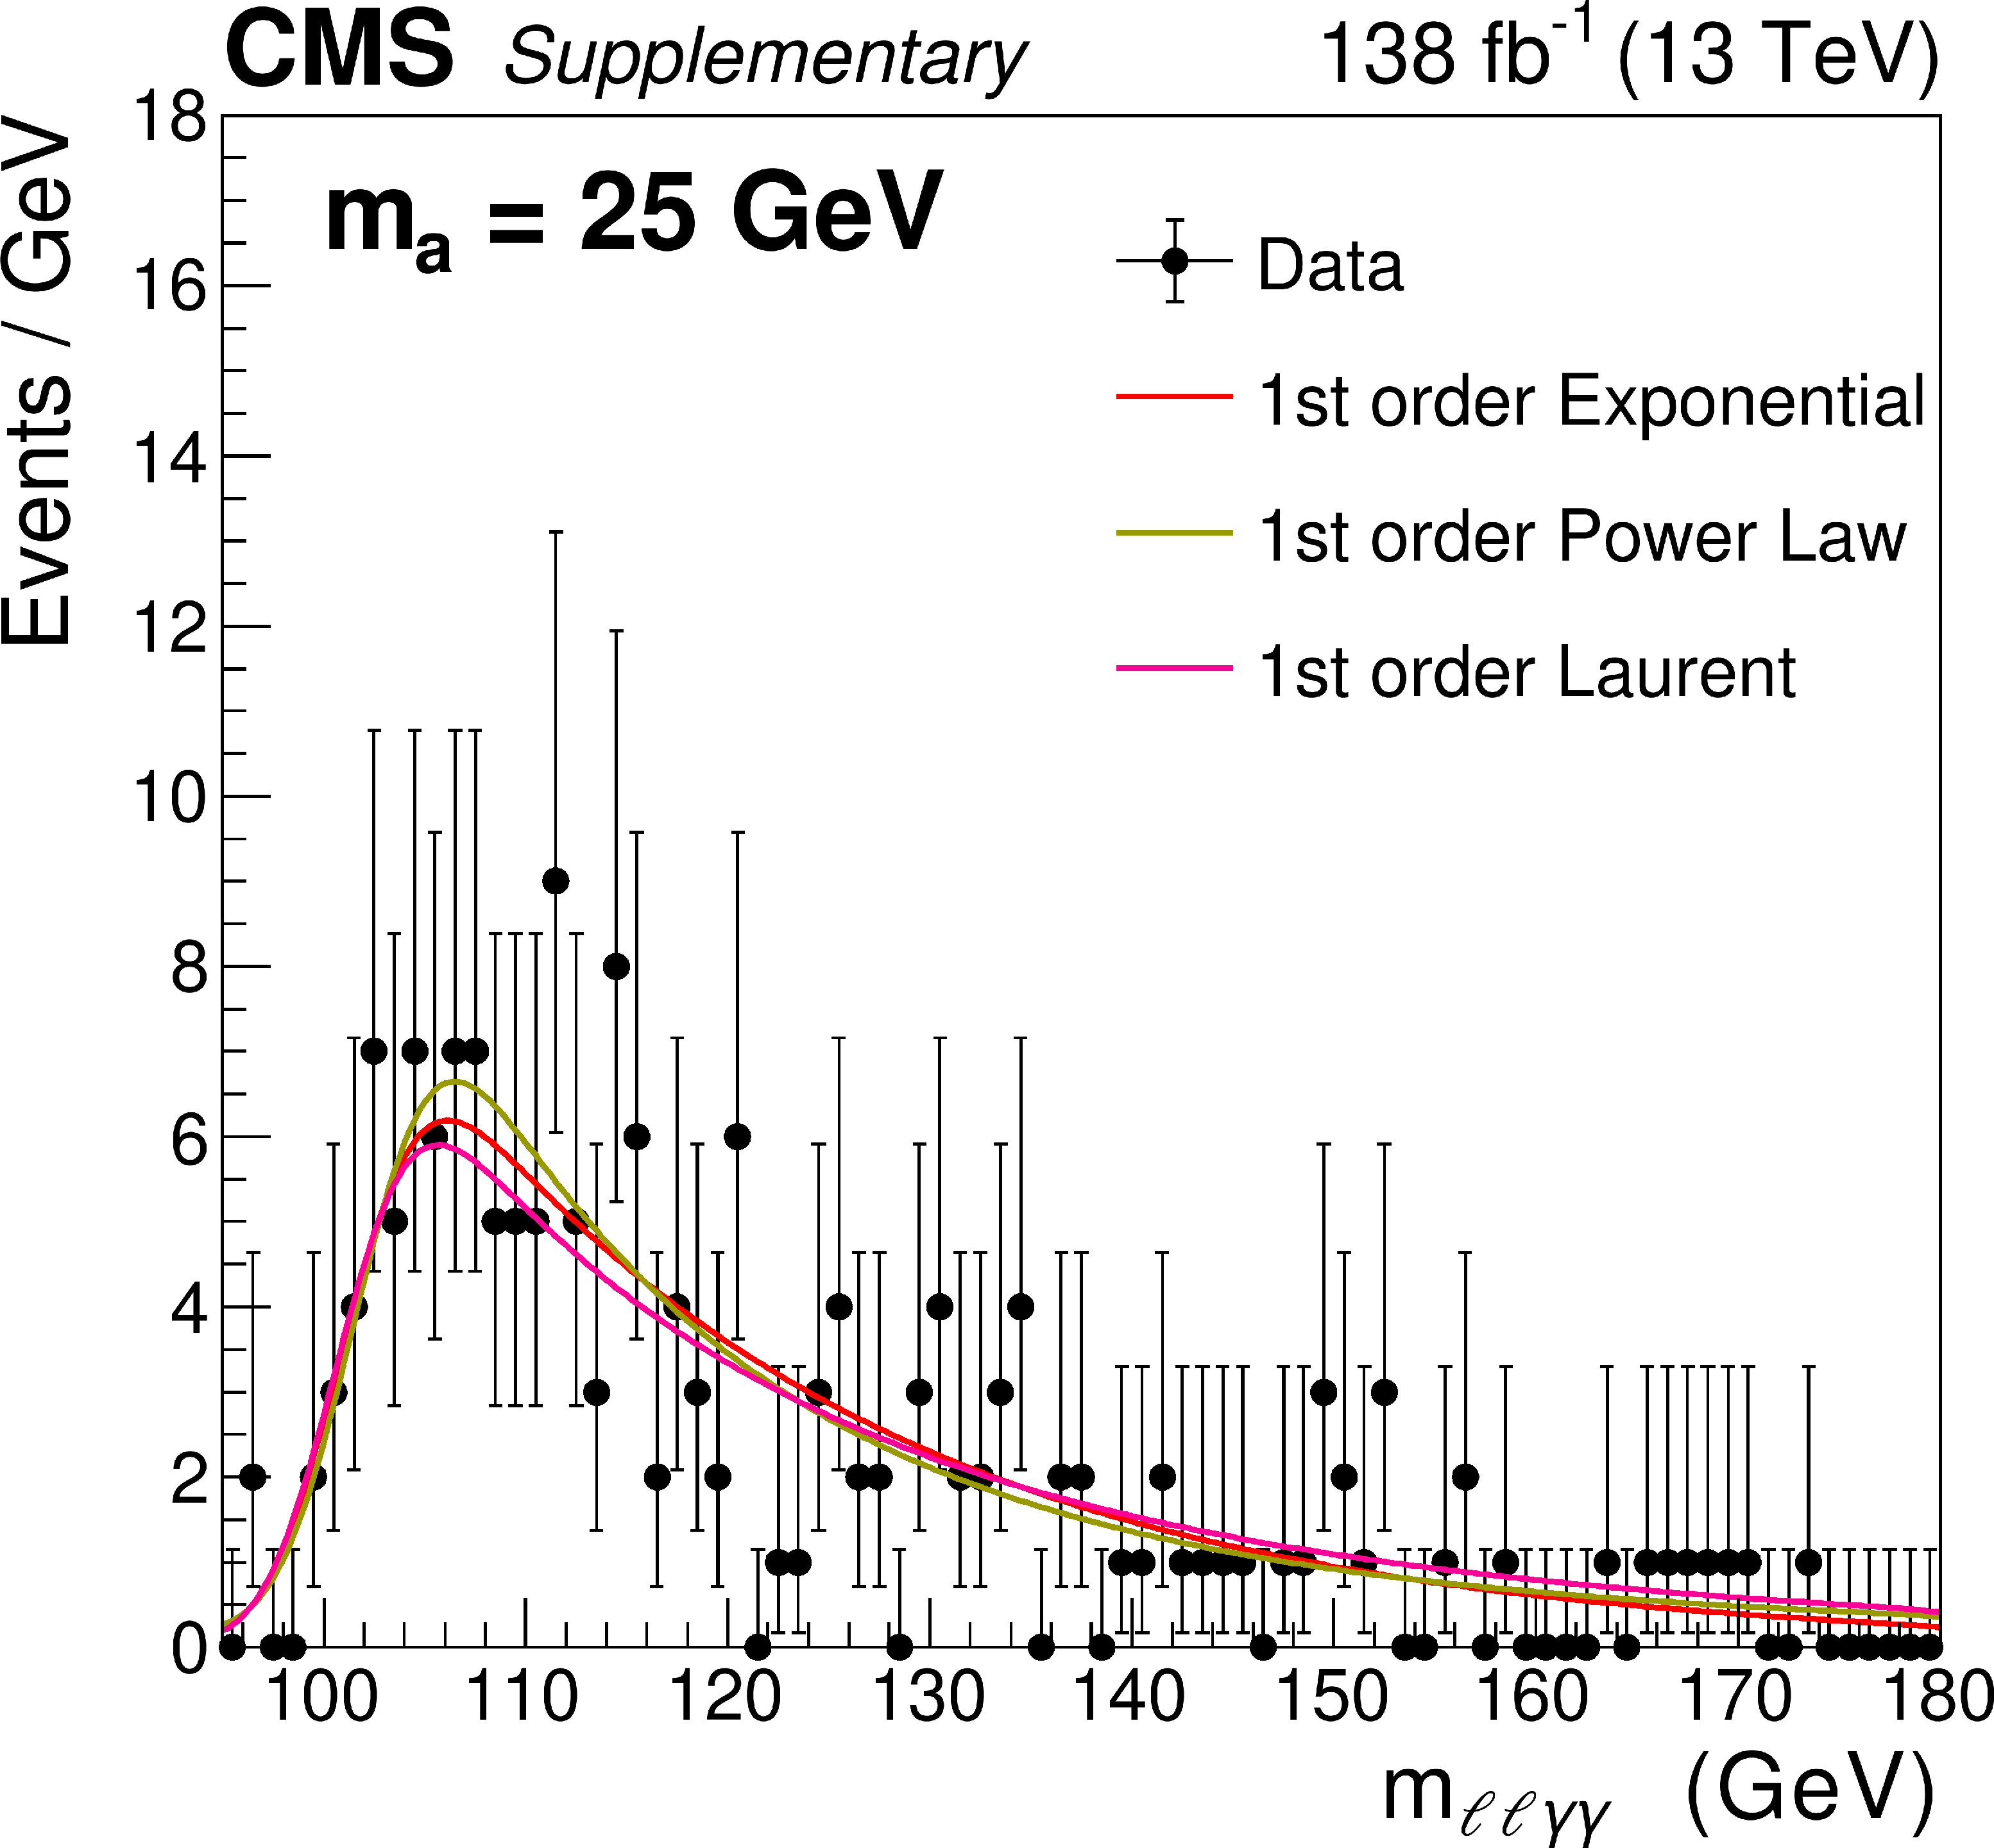
Additional Figure 69:
Functional forms used to model the $ m_{\ell\ell\gamma\gamma} $ distribution of background events with the analysis selection criteria for a signal with $ m_{a} = $ 25 GeV. |
png pdf |
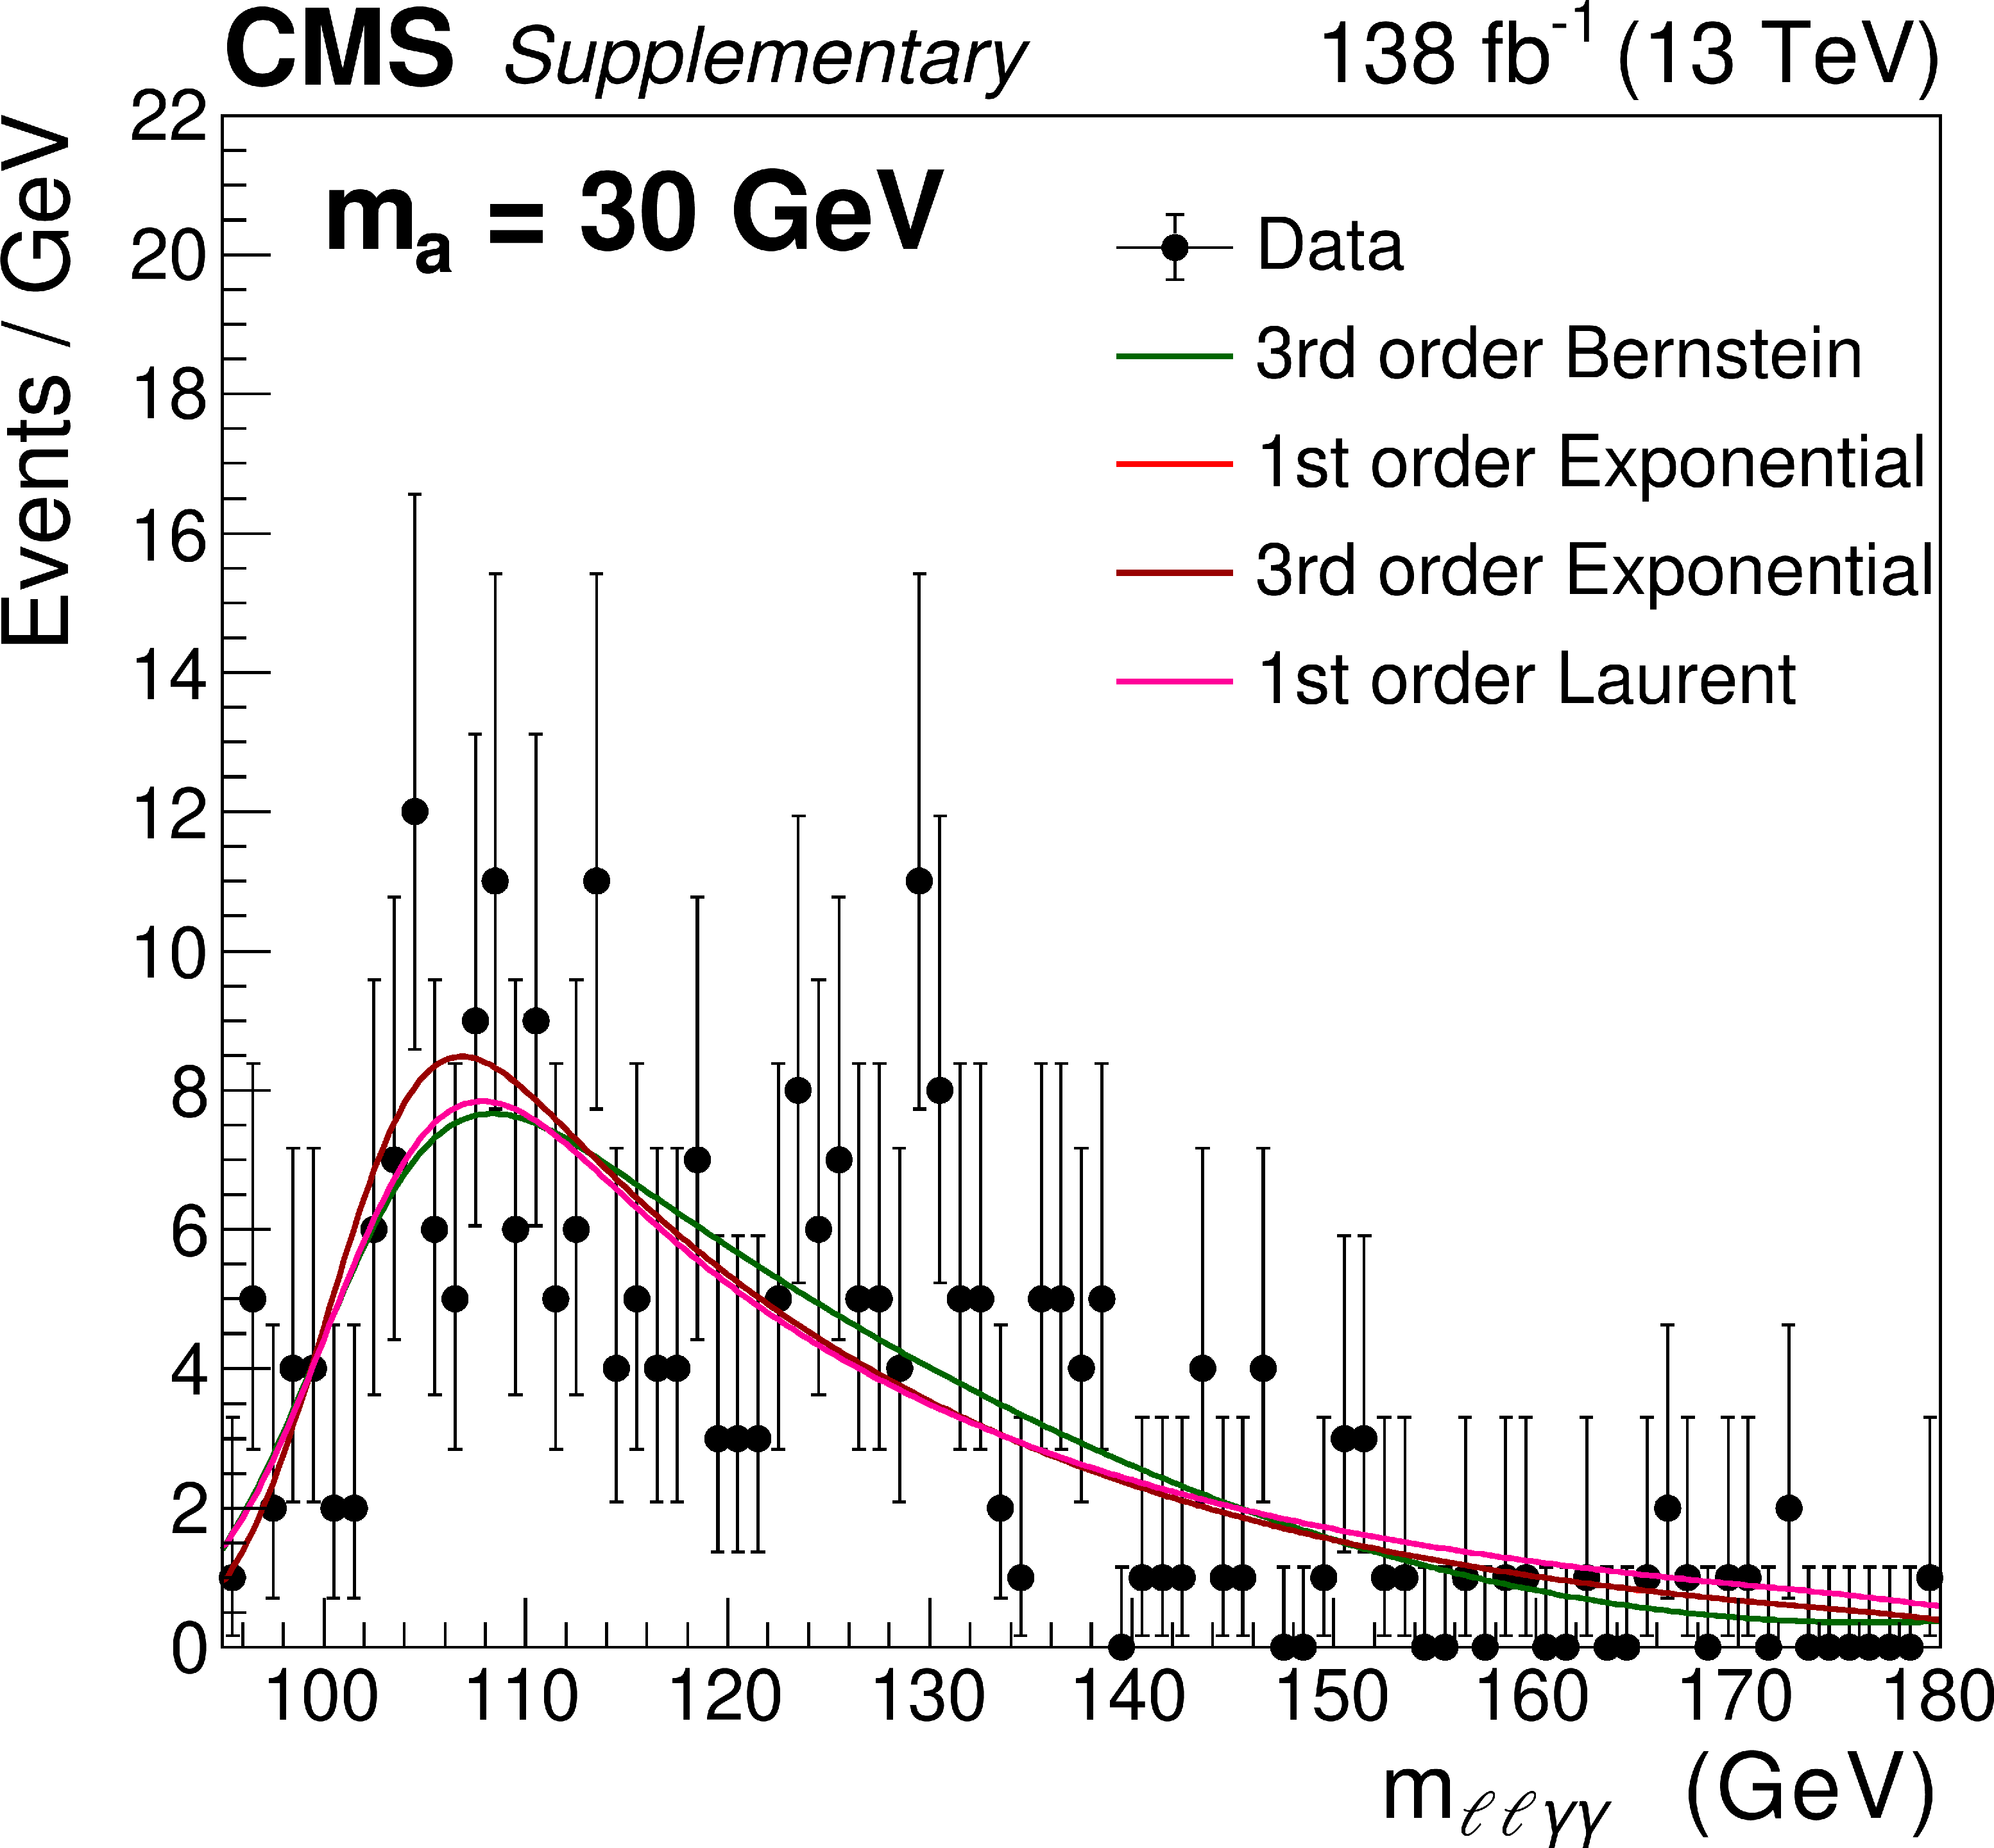
Additional Figure 70:
Functional forms used to model the $ m_{\ell\ell\gamma\gamma} $ distribution of background events with the analysis selection criteria for a signal with $ m_{a} = $ 30 GeV. |
png pdf |
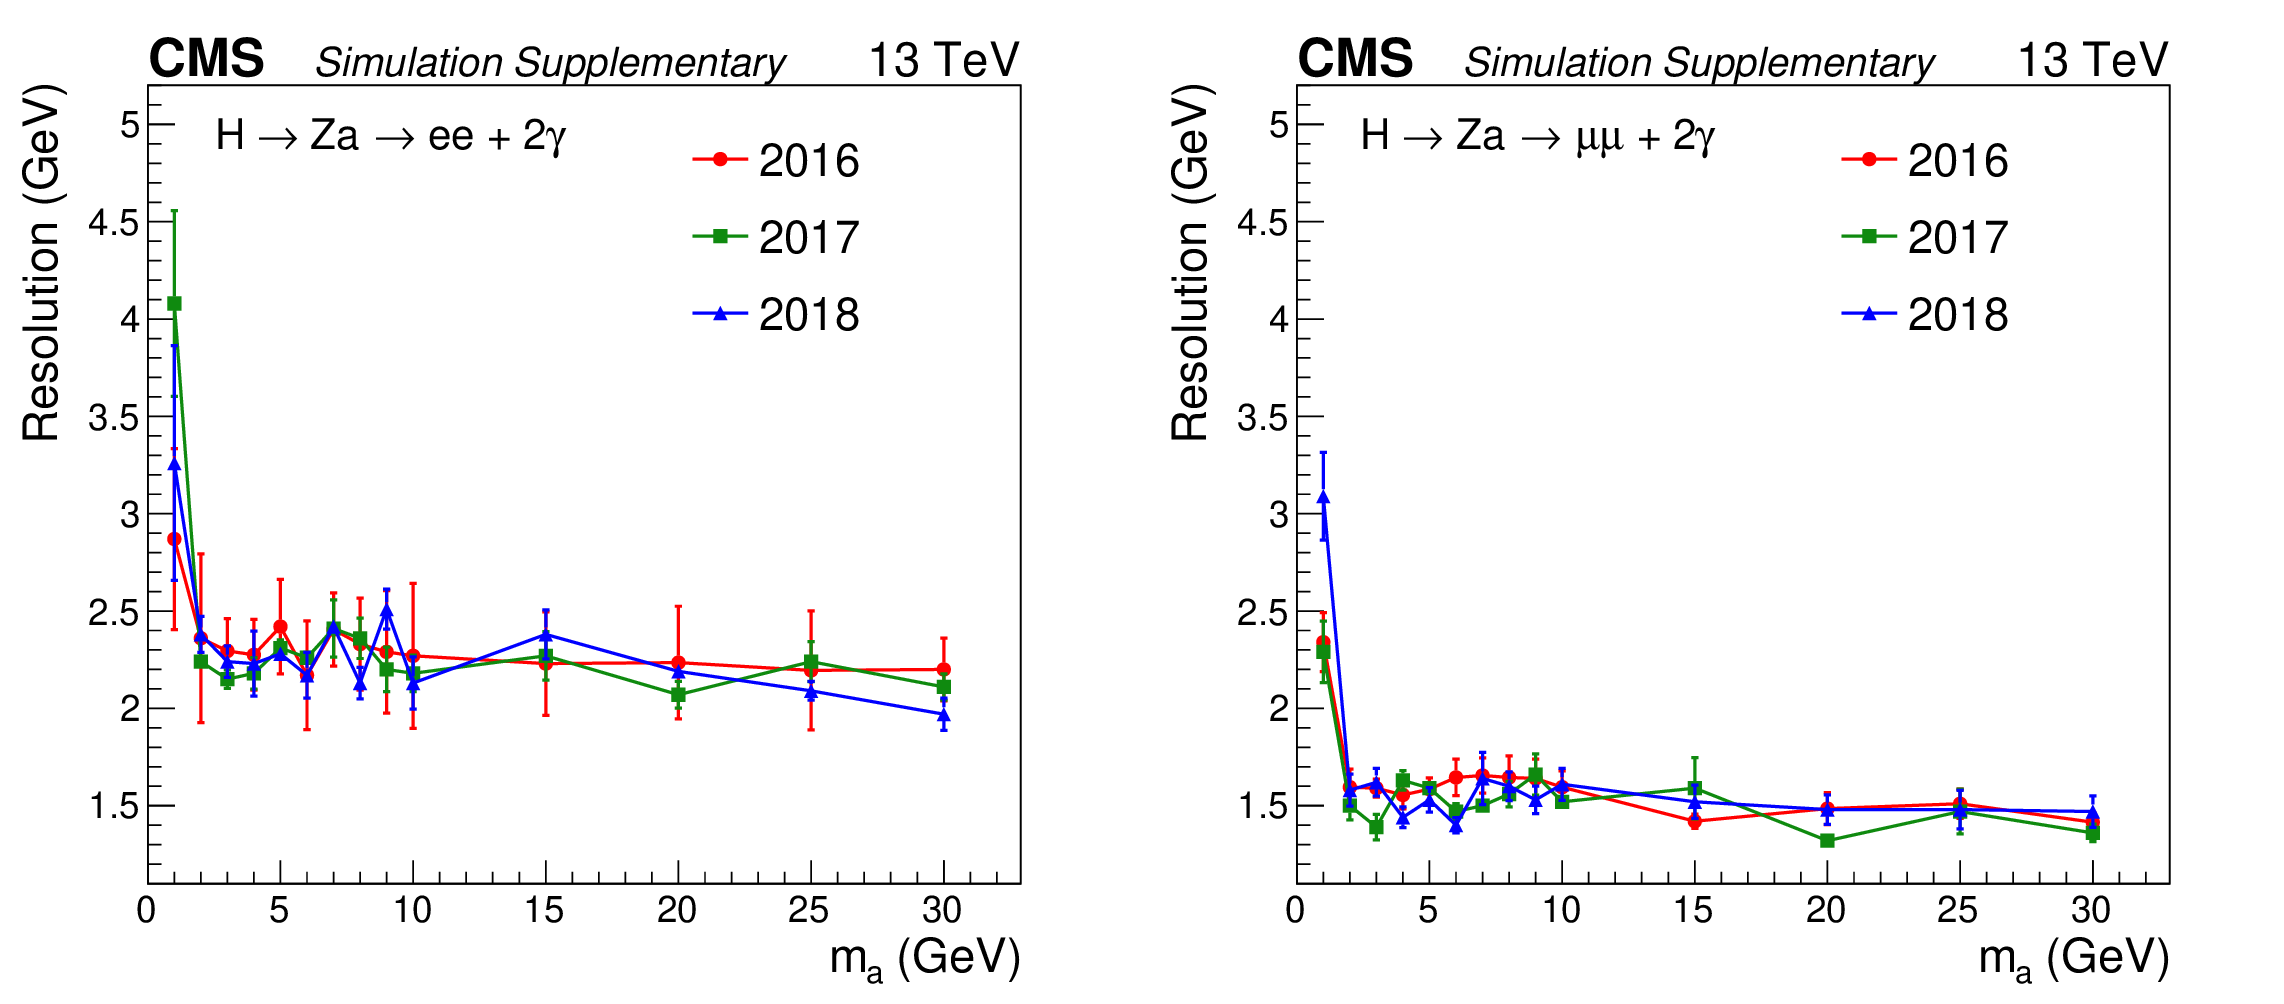
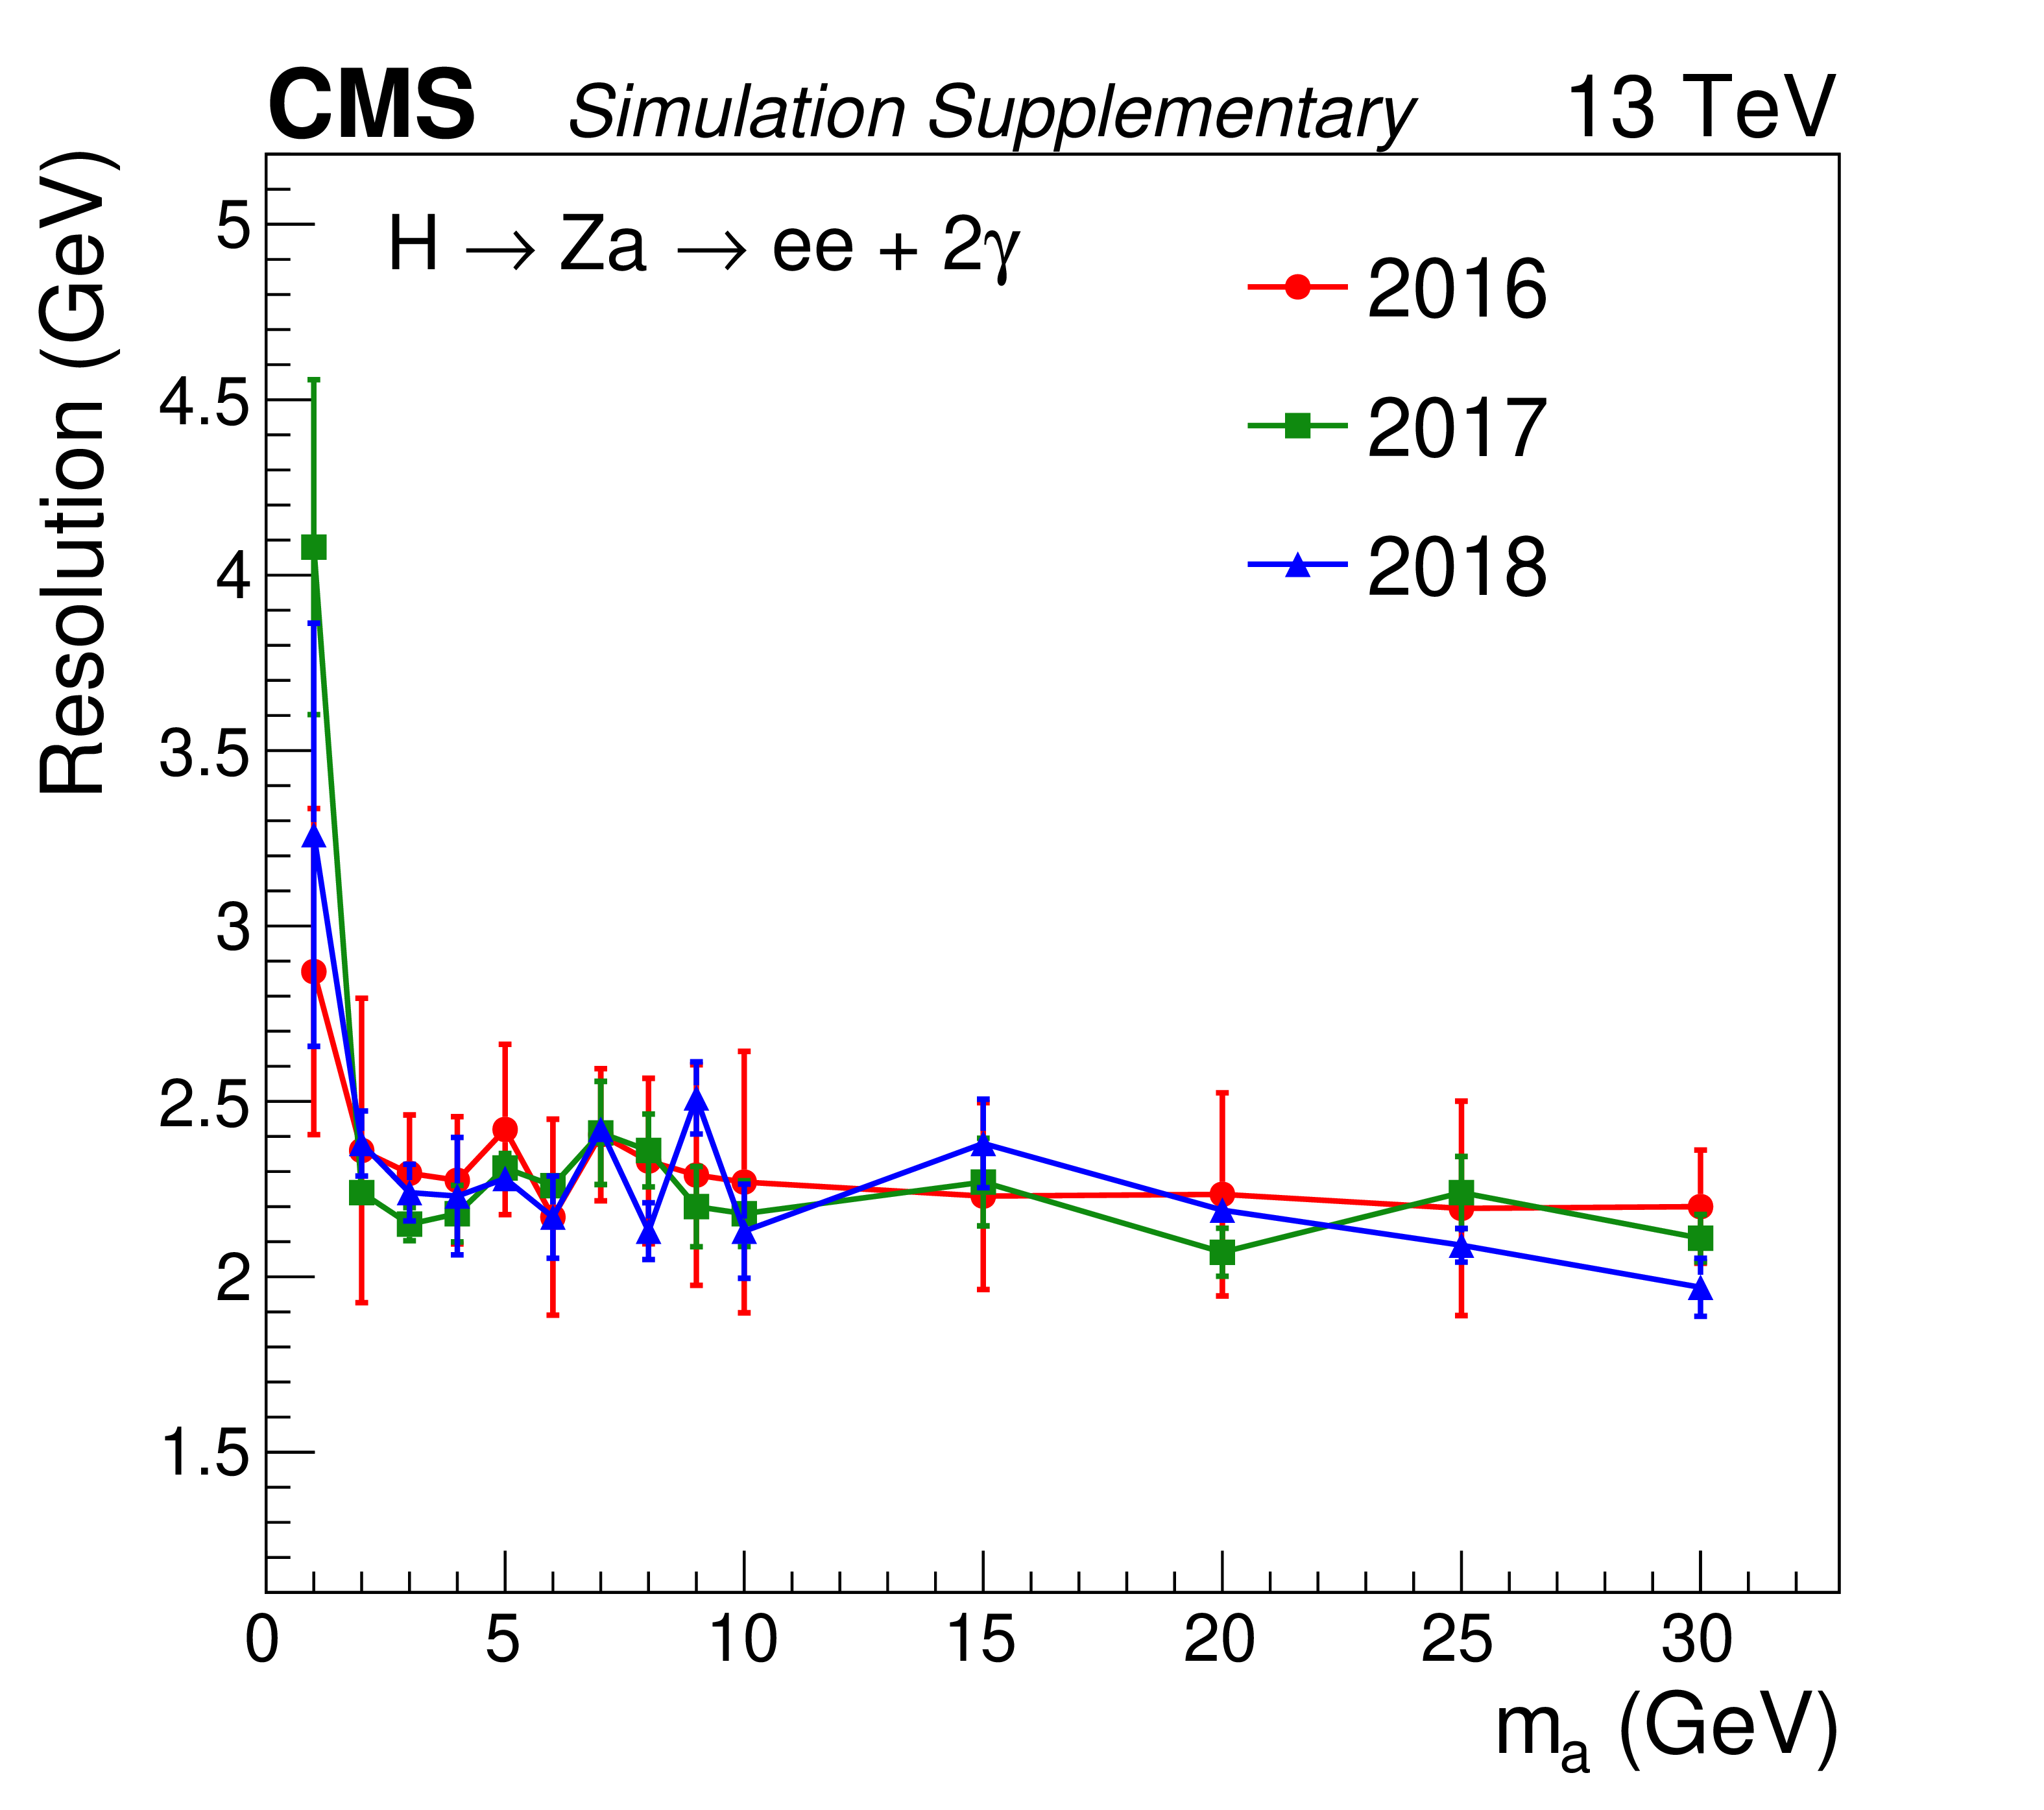
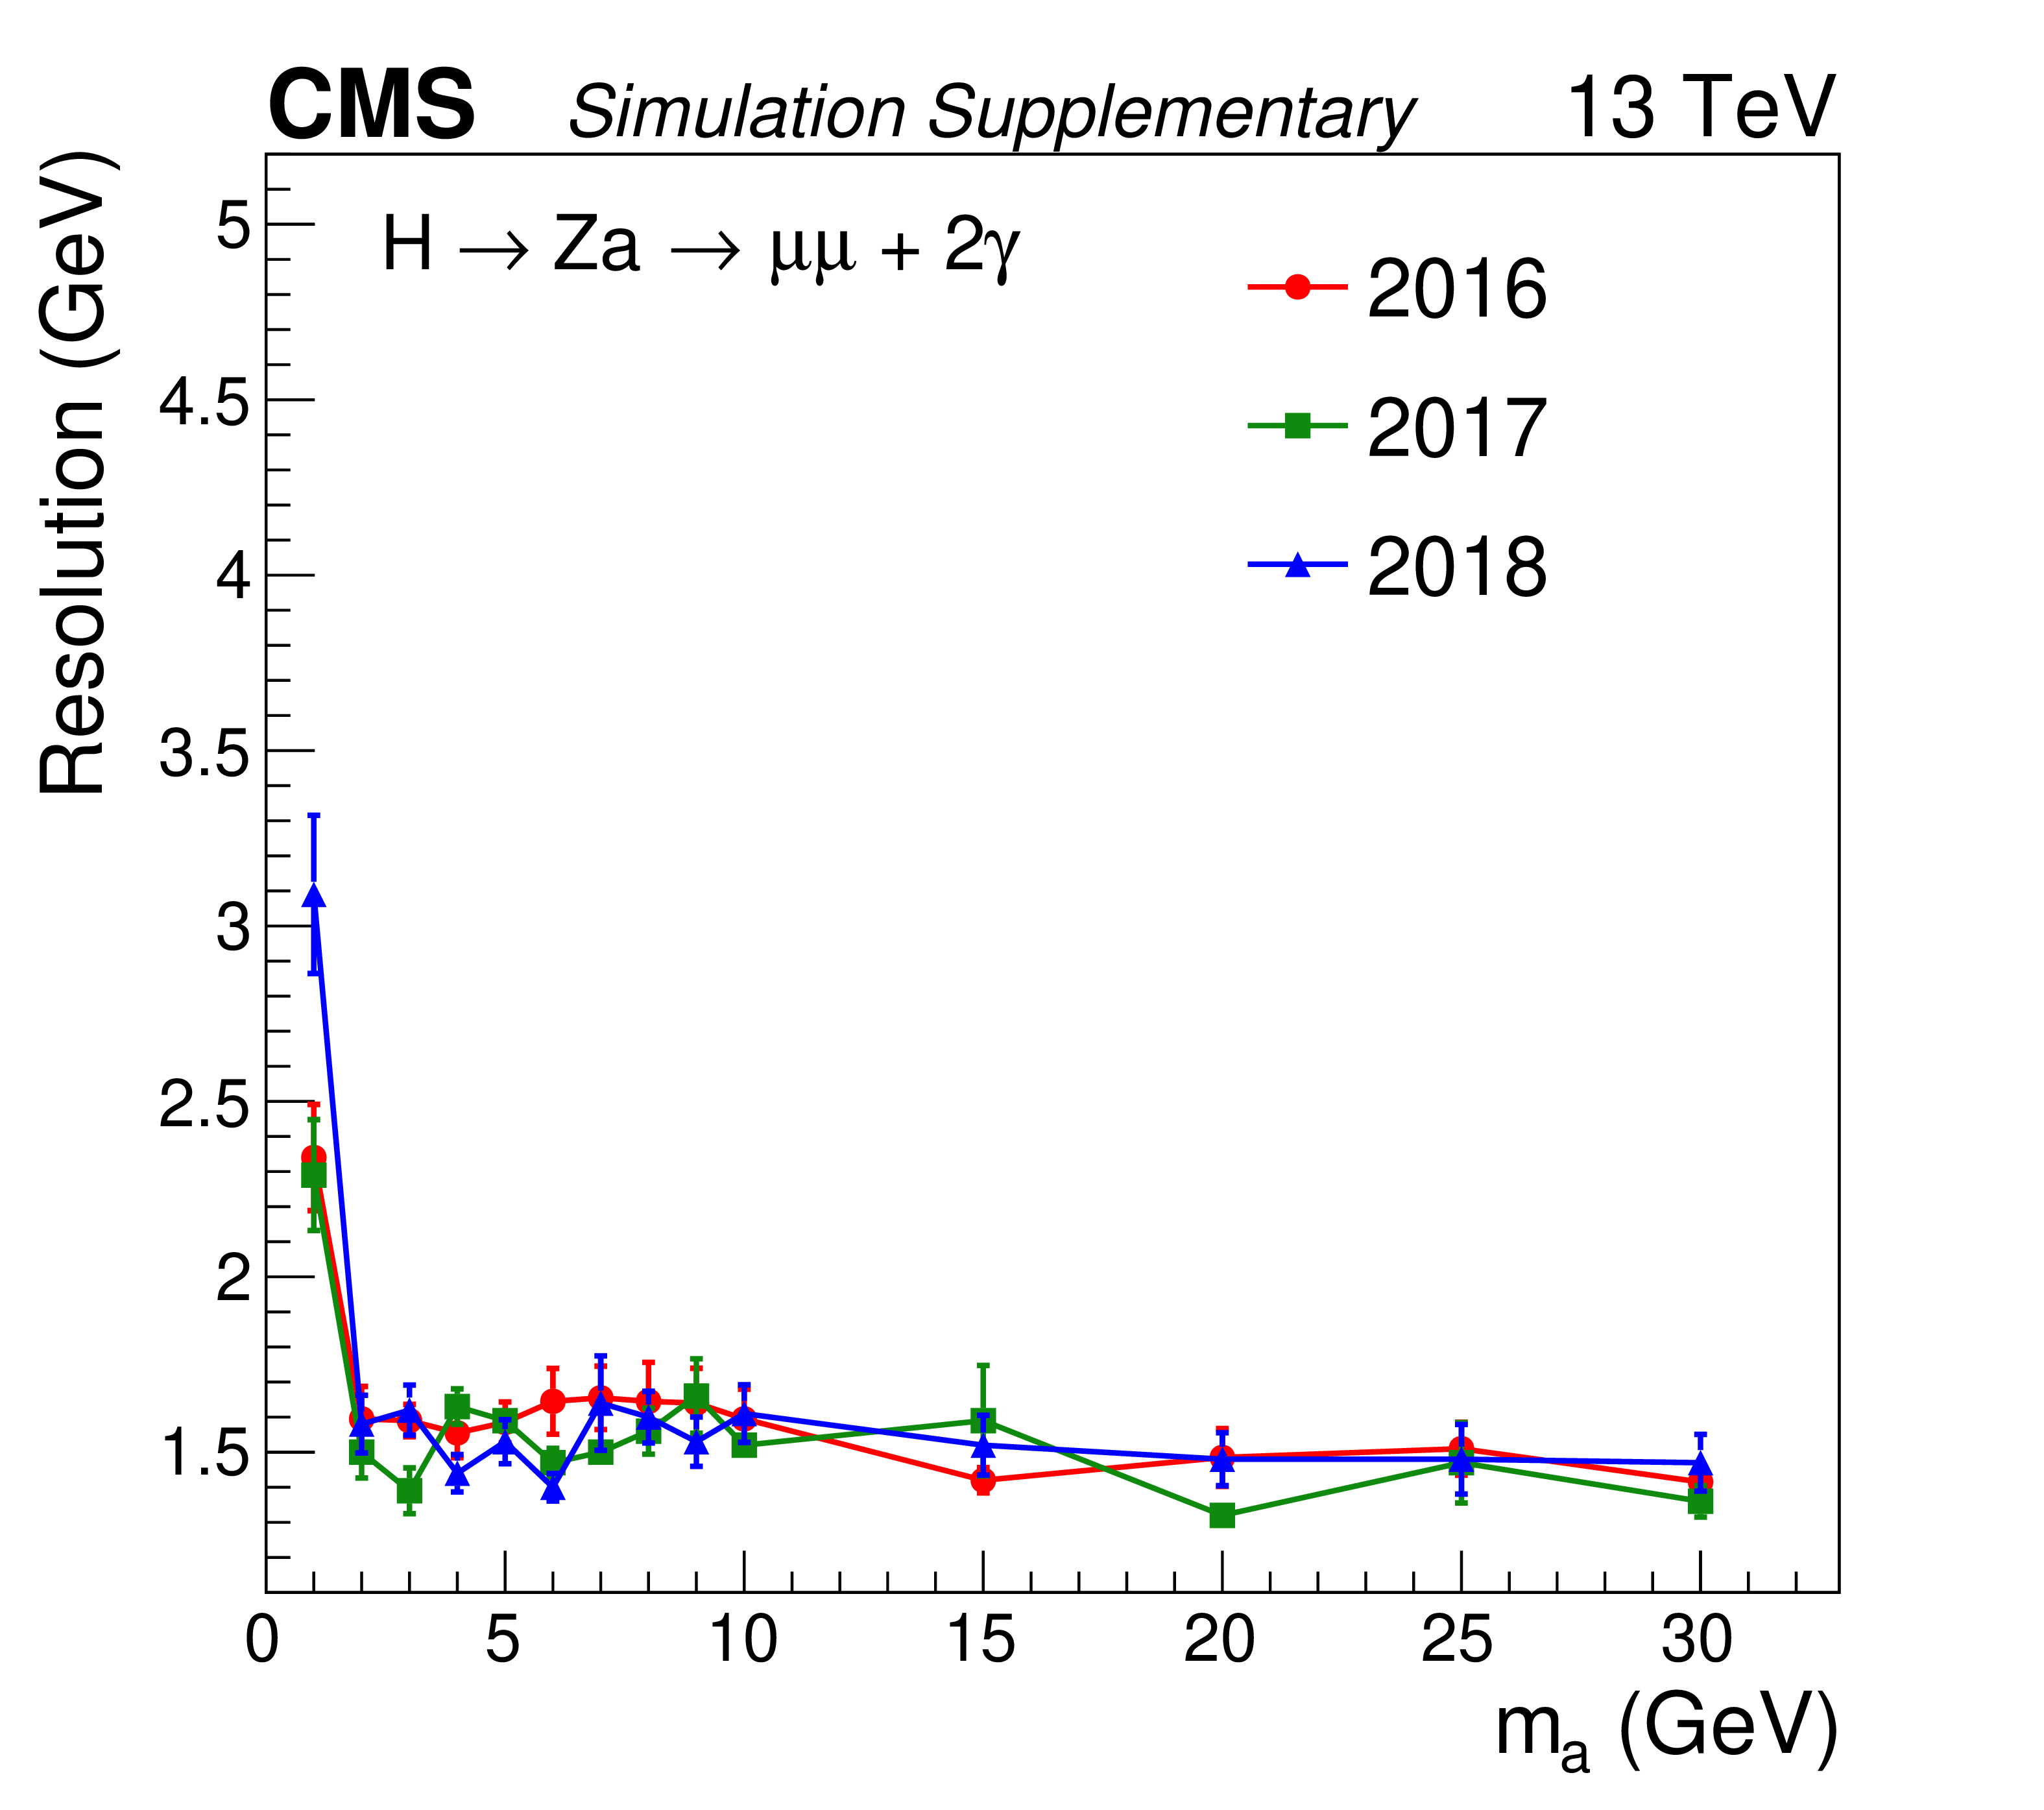
Additional Figure 71:
Resolution of the $ m_{\ell\ell\gamma\gamma} $ variable in signal events for different $ m_{a} $ hypotheses in the electron (left) and muon (right) channels. |
png pdf |
Additional Figure 71-a:
Resolution of the $ m_{\ell\ell\gamma\gamma} $ variable in signal events for different $ m_{a} $ hypotheses in the electron (left) and muon (right) channels. |
png pdf |
Additional Figure 71-b:
Resolution of the $ m_{\ell\ell\gamma\gamma} $ variable in signal events for different $ m_{a} $ hypotheses in the electron (left) and muon (right) channels. |

png pdf |
Additional Figure 72:
Product of detector efficiency and analysis acceptance for signal samples with various $ m_{a} $ values for the electron (left) and muon channel (right) before the BDT selection. |

png pdf |
Additional Figure 72-a:
Product of detector efficiency and analysis acceptance for signal samples with various $ m_{a} $ values for the electron channel before the BDT selection. |
png pdf |
Additional Figure 72-b:
Product of detector efficiency and analysis acceptance for signal samples with various $ m_{a} $ values for the muon channel before the BDT selection. |
| References | ||||
| 1 | ATLAS Collaboration | Observation of a new particle in the search for the standard model Higgs boson with the ATLAS detector at the LHC | PLB 716 (2012) 1 | 1207.7214 |
| 2 | CMS Collaboration | Observation of a new boson at a mass of 125 GeV with the CMS experiment at the LHC | PLB 716 (2012) 30 | CMS-HIG-12-028 1207.7235 |
| 3 | CMS Collaboration | Observation of a new boson with mass near 125 GeV in pp collisions at $ \sqrt{s} = $ 7 and 8 TeV | JHEP 06 (2013) 081 | CMS-HIG-12-036 1303.4571 |
| 4 | ATLAS Collaboration | A detailed map of Higgs boson interactions by the ATLAS experiment ten years after the discovery | Nature 607 (2022) 52 | 2207.00092 |
| 5 | CMS Collaboration | A portrait of the Higgs boson by the CMS experiment ten years after the discovery. | Nature 607 (2022) 60 | CMS-HIG-22-001 2207.00043 |
| 6 | R. D. Peccei and H. R. Quinn | $ \mathrm{CP} $ conservation in the presence of pseudoparticles | PRL 38 (1977) 1440 | |
| 7 | M. A. Buen-Abad, J. Fan, M. Reece, and C. Sun | Challenges for an axion explanation of the muon $ g - $ 2 measurement | JHEP 09 (2021) 101 | 2104.03267 |
| 8 | H. Georgi, D. B. Kaplan, and L. Randall | Manifesting the invisible axion at low energies | PLB 169 (1986) 73 | |
| 9 | M. Bauer, M. Neubert, and A. Thamm | Collider probes of axion-like particles | JHEP 12 (2017) 044 | 1708.00443 |
| 10 | ATLAS Collaboration | Search for boosted diphoton resonances in the 10 to 70 GeV mass range using 138 fb$ ^{-1} $ of 13 TeV pp collisions with the ATLAS detector | JHEP 07 (2023) 155 | 2211.04172 |
| 11 | ATLAS Collaboration | Search for new phenomena in events with a photon and missing transverse momentum in $ pp $ collisions at $ \sqrt{s}= $ 13 TeV with the ATLAS detector | JHEP 06 (2016) 059 | 1604.01306 |
| 12 | ATLAS Collaboration | Search for dark matter in association with an energetic photon in $ pp $ collisions at $ \sqrt{s} = $ 13 TeV with the ATLAS detector | JHEP 02 (2021) 226 | 2011.05259 |
| 13 | ATLAS Collaboration | Measurement of light-by-light scattering and search for axion-like particles with 2.2 nb$ ^{-1} $ of Pb+Pb data with the ATLAS detector | JHEP 03 (2021) 243 | 2008.05355 |
| 14 | CMS Collaboration | Search for the exotic decay of the Higgs boson into two light pseudoscalars with four photons in the final state in proton-proton collisions at $ \sqrt{s} = $ 13 TeV | JHEP 07 (2023) 148 | CMS-HIG-21-003 2208.01469 |
| 15 | CMS Collaboration | Search for exotic Higgs boson decays H $ \to \mathcal{A}\mathcal{A} \to $ 4$ \gamma $ with events containing two merged diphotons in proton-proton collisions at $ \sqrt{s} = $ 13 TeV | PRL 131 (2023) 101801 | CMS-HIG-21-016 2209.06197 |
| 16 | CMS Collaboration | Search for low-mass dilepton resonances in Higgs boson decays to four-lepton final states in proton-proton collisions at $ \sqrt{s}=$ 13 TeV | EPJC 82 (2022) 290 | CMS-HIG-19-007 2111.01299 |
| 17 | A. Abbasabadi and W. W. Repko | Note on the rare decay of a Higgs boson into photons and a $ Z $ boson | PRD 71 (2005) 017304 | |
| 18 | CMS Collaboration | Reconstruction of decays to merged photons using end-to-end deep learning with domain continuation in the CMS detector | PRD 108 (2023) 052002 | CMS-EGM-20-001 2204.12313 |
| 19 | CMS Collaboration | HEPData record for this analysis | link | |
| 20 | CMS Collaboration | The CMS experiment at the CERN LHC | JINST 3 (2008) S08004 | |
| 21 | CMS Collaboration | Performance of the CMS Level-1 trigger in proton-proton collisions at $ \sqrt{s} = $ 13 TeV | JINST 15 (2020) P10017 | CMS-TRG-17-001 2006.10165 |
| 22 | CMS Collaboration | The CMS trigger system | JINST 12 (2017) P01020 | CMS-TRG-12-001 1609.02366 |
| 23 | J. Alwall et al. | The automated computation of tree-level and next-to-leading order differential cross sections, and their matching to parton shower simulations | JHEP 07 (2014) 079 | 1405.0301 |
| 24 | J. Alwall et al. | Comparative study of various algorithms for the merging of parton showers and matrix elements in hadronic collisions | EPJC 53 (2008) 473 | 0706.2569 |
| 25 | R. Frederix and S. Frixione | Merging meets matching in MC@NLO | JHEP 12 (2012) 061 | 1209.6215 |
| 26 | CMS Collaboration | Observation of the diphoton decay of the Higgs boson and measurement of its properties | EPJC 74 (2014) 3076 | CMS-HIG-13-001 1407.0558 |
| 27 | CMS Collaboration | Measurements of Higgs boson properties in the diphoton decay channel in proton-proton collisions at $ \sqrt{s} = $ 13 TeV | JHEP 11 (2018) 185 | CMS-HIG-16-040 1804.02716 |
| 28 | NNPDF Collaboration | Parton distributions for the LHC Run II | JHEP 04 (2015) 040 | 1410.8849 |
| 29 | NNPDF Collaboration | Parton distributions from high-precision collider data | EPJC 77 (2017) 663 | 1706.00428 |
| 30 | T. Sjöstrand et al. | An introduction to PYTHIA 8.2 | Comput. Phys. Commun. 191 (2015) 159 | 1410.3012 |
| 31 | CMS Collaboration | Event generator tunes obtained from underlying event and multiparton scattering measurements | EPJC 76 (2016) 155 | CMS-GEN-14-001 1512.00815 |
| 32 | CMS Collaboration | Extraction and validation of a new set of CMS PYTHIA8 tunes from underlying-event measurements | EPJC 80 (2020) 4 | CMS-GEN-17-001 1903.12179 |
| 33 | GEANT4 Collaboration | GEANT 4: a simulation toolkit | NIM A 506 (2003) 250 | |
| 34 | J. Allison et al. | GEANT 4 developments and applications | IEEE Trans. Nucl. Sci. 53 (2006) 270 | |
| 35 | CMS Collaboration | Technical proposal for the Phase-II upgrade of the Compact Muon Solenoid | CMS Technical Proposal CERN-LHCC-2015-010, CMS-TDR-15-02, 2015 CDS |
|
| 36 | CMS Collaboration | Particle-flow reconstruction and global event description with the CMS detector | JINST 12 (2017) P10003 | CMS-PRF-14-001 1706.04965 |
| 37 | CMS Collaboration | Electron and photon reconstruction and identification with the CMS experiment at the CERN LHC | JINST 16 (2021) P05014 | CMS-EGM-17-001 2012.06888 |
| 38 | CMS Collaboration | Performance of the CMS muon detector and muon reconstruction with proton-proton collisions at $ \sqrt{s}= $ 13 TeV | JINST 13 (2018) P06015 | CMS-MUO-16-001 1804.04528 |
| 39 | CMS Collaboration | Measurements of properties of the Higgs boson decaying into the four-lepton final state in pp collisions at $ \sqrt{s}= $ 13 TeV | JHEP 11 (2017) 047 | CMS-HIG-16-041 1706.09936 |
| 40 | CMS Collaboration | Measurements of inclusive $ W $ and $ Z $ cross sections in pp collisions at $ \sqrt{s}= $ 7 TeV | JHEP 01 (2011) 080 | CMS-EWK-10-002 1012.2466 |
| 41 | P. Baldi et al. | Parameterized neural networks for high-energy physics | EPJC 76 (2016) 235 | 1601.07913 |
| 42 | G. Cowan, K. Cranmer, E. Gross, and O. Vitells | Asymptotic formulae for likelihood-based tests of new physics | EPJC 11 (2011) 1554 | 1007.1727 |
| 43 | J. H. Friedman | SMART User's Guide | Stanford University Department of Statistics Technical Report LCS_01, 1984 link |
|
| 44 | J. H. Friedman | A variable span scatterplot smoother | Stanford University Department of Statistics Technical Report LCS\_05, 1984 link |
|
| 45 | CMS Collaboration | Precise determination of the mass of the Higgs boson and tests of compatibility of its couplings with the standard model predictions using proton collisions at 7 and 8 TeV | EPJC 75 (2015) 212 | CMS-HIG-14-009 1412.8662 |
| 46 | R. A. Fisher | On the interpretation of $ \chi^{2} $ from contingency tables, and the calculation of p | J. Royal Stat. Soc 85 (1922) 87 | |
| 47 | P. D. Dauncey, M. Kenzie, N. Wardle, and G. J. Davies | Handling uncertainties in background shapes: the discrete profiling method | JINST 10 (2015) P04015 | 1408.6865 |
| 48 | CMS Collaboration | Precision luminosity measurement in proton-proton collisions at $ \sqrt{s}= $ 13 TeV in 2015 and 2016 | EPJC 81 (2021) 800 | CMS-LUM-17-003 2104.01927 |
| 49 | CMS Collaboration | CMS luminosity measurement for the 2017 data-taking period at $ \sqrt{s} = $ 13 TeV | CMS Physics Analysis Summary, 2018 CMS-PAS-LUM-17-004 |
CMS-PAS-LUM-17-004 |
| 50 | CMS Collaboration | CMS luminosity measurement for the 2018 data-taking period at $ \sqrt{s} = $ 13 TeV | CMS Physics Analysis Summary, 2019 CMS-PAS-LUM-18-002 |
CMS-PAS-LUM-18-002 |
| 51 | T. Junk | Confidence level computation for combining searches with small statistics | NIM A 434 (1999) 435 | hep-ex/9902006 |
| 52 | A. L. Read | Presentation of search results: the $ \text{CL}_\text{s} $ technique | JPG 28 (2002) 2693 | |
| 53 | ATLAS and CMS Collaborations, and LHC Higgs Combination Group | Procedure for the LHC Higgs boson search combination in Summer 2011 | Technical Report CMS-NOTE-2011-005, ATL-PHYS-PUB-2011-11, 2011 | |
|
|
Compact Muon Solenoid LHC, CERN |
|

|

|

|

|

|