

Compact Muon Solenoid
LHC, CERN
| CMS-LUM-21-001 ; CERN-EP-2023-163 | ||
| Luminosity determination using Z boson production at the CMS experiment | ||
| CMS Collaboration | ||
| 2 September 2023 | ||
| Eur. Phys. J. C 84 (2024) 26 | ||
| Abstract: The measurement of Z boson production is presented as a method to determine the integrated luminosity of CMS data sets. The analysis uses proton-proton collision data, recorded by the CMS experiment at the CERN LHC in 2017 at a center-of-mass energy of 13 TeV. Events with Z bosons decaying into a pair of muons are selected. The total number of Z bosons produced in a fiducial volume is determined, together with the identification efficiencies and correlations from the same dataset, in small intervals of 20 pb$^{-1}$ of integrated luminosity, thus facilitating the efficiency and rate measurement as a function of time and instantaneous luminosity. Using the ratio of the efficiency-corrected numbers of Z bosons, the precisely measured integrated luminosity of one data set is used to determine the luminosity of another. For the first time, a full quantitative uncertainty analysis of the use of Z bosons for the integrated luminosity measurement is performed. The uncertainty in the extrapolation between two data sets, recorded in 2017 at low and high instantaneous luminosity, is less than 0.5%. We show that the Z boson rate measurement constitutes a precise method, complementary to traditional methods, with the potential to improve the measurement of the integrated luminosity. | ||
| Links: e-print arXiv:2309.01008 [hep-ex] (PDF) ; CDS record ; inSPIRE record ; Physics Briefing ; CADI line (restricted) ; | ||
| Figures | |
png pdf |
Figure 1:
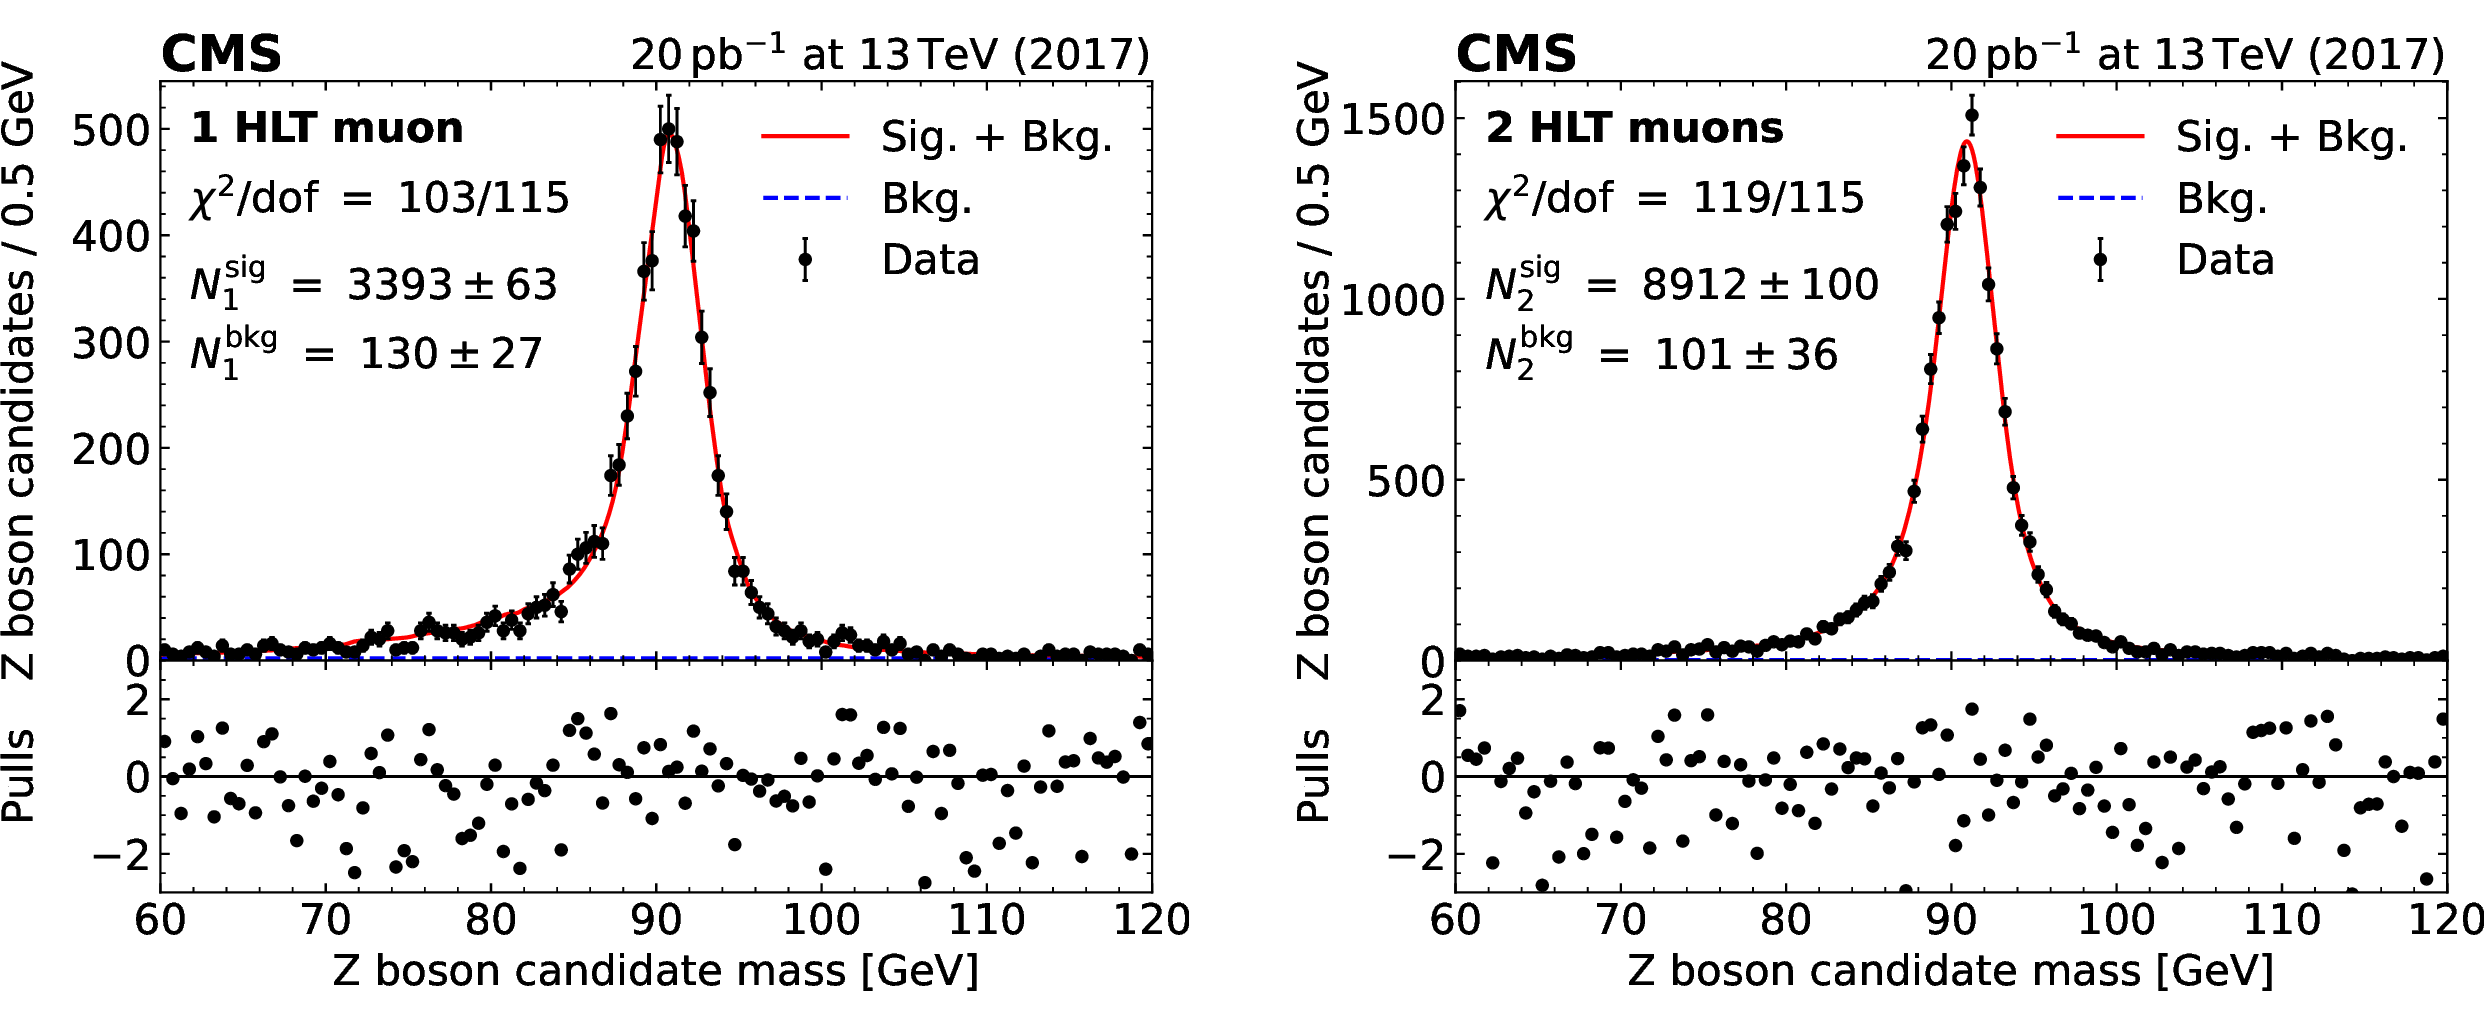
The upper panels show the reconstructed invariant mass distributions of Z boson candidates in a 20 pb$^{-1}$ sample of data for events where one (left ) or two (right ) muons pass the single-muon trigger selection. The blue curve shows the fitted background contribution and the red curve illustrates the modeled signal-plus-background contribution. The error bars indicate the statistical uncertainties. The numbers of signal and background candidates are given by $ N_i^{\text{sig}}=N_i - N_i^{\text{bkg}} $ and $ N_i^{\text{bkg}} $, respectively. Also indicated are the $ \chi^2 $ values per degree of freedom (dof). The lower panels contain the pulls of the distributions, defined as the difference between the data and the fit model in each bin, divided by the statistical uncertainty estimated from the expected number of entries given by the model. |

png pdf |
Figure 1-a:
The upper panel shows the reconstructed invariant mass distributions of Z boson candidates in a 20 pb$^{-1}$ sample of data for events where one muon passes the single-muon trigger selection. The blue curve shows the fitted background contribution and the red curve illustrates the modeled signal-plus-background contribution. The error bars indicate the statistical uncertainties. The numbers of signal and background candidates are given by $ N_i^{\text{sig}}=N_i - N_i^{\text{bkg}} $ and $ N_i^{\text{bkg}} $, respectively. Also indicated are the $ \chi^2 $ values per degree of freedom (dof). The lower panel contains the pull of the distribution, defined as the difference between the data and the fit model in each bin, divided by the statistical uncertainty estimated from the expected number of entries given by the model. |
png pdf |
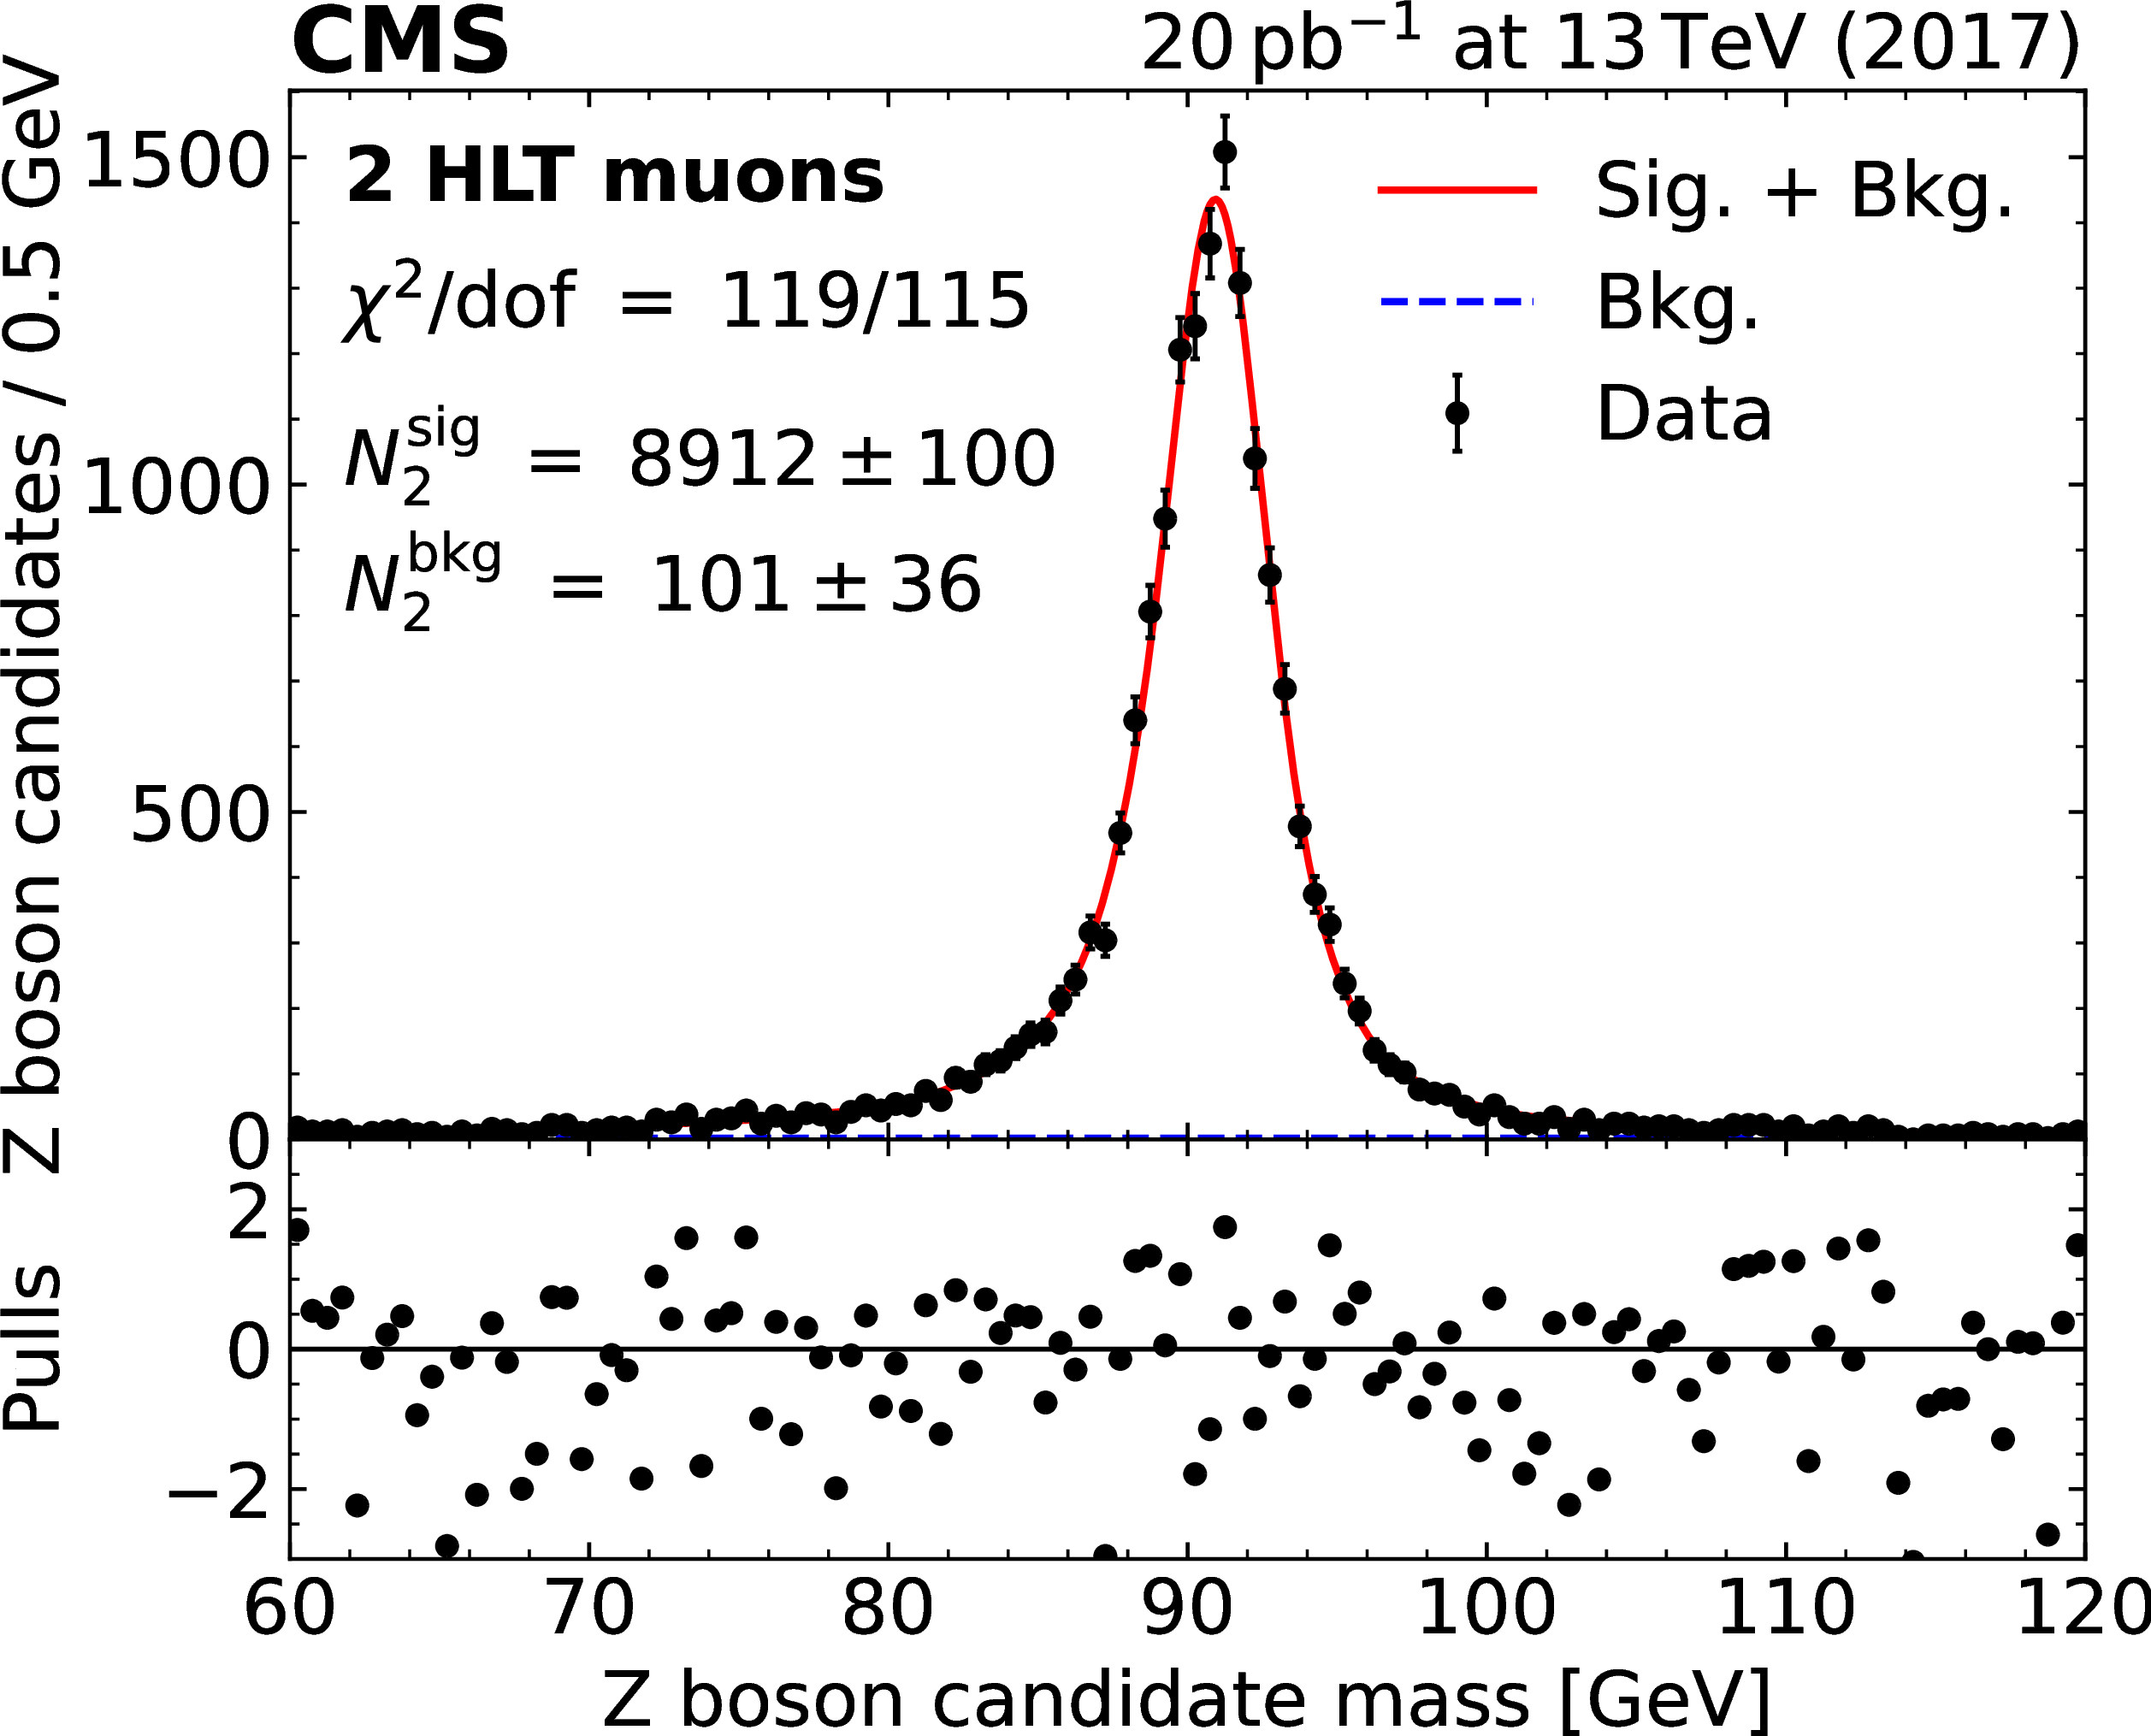
Figure 1-b:
The upper panel shows the reconstructed invariant mass distributions of Z boson candidates in a 20 pb$^{-1}$ sample of data for events where two muons pass the single-muon trigger selection. The blue curve shows the fitted background contribution and the red curve illustrates the modeled signal-plus-background contribution. The error bars indicate the statistical uncertainties. The numbers of signal and background candidates are given by $ N_i^{\text{sig}}=N_i - N_i^{\text{bkg}} $ and $ N_i^{\text{bkg}} $, respectively. Also indicated are the $ \chi^2 $ values per degree of freedom (dof). The lower panel contains the pull of the distribution, defined as the difference between the data and the fit model in each bin, divided by the statistical uncertainty estimated from the expected number of entries given by the model. |
png pdf |
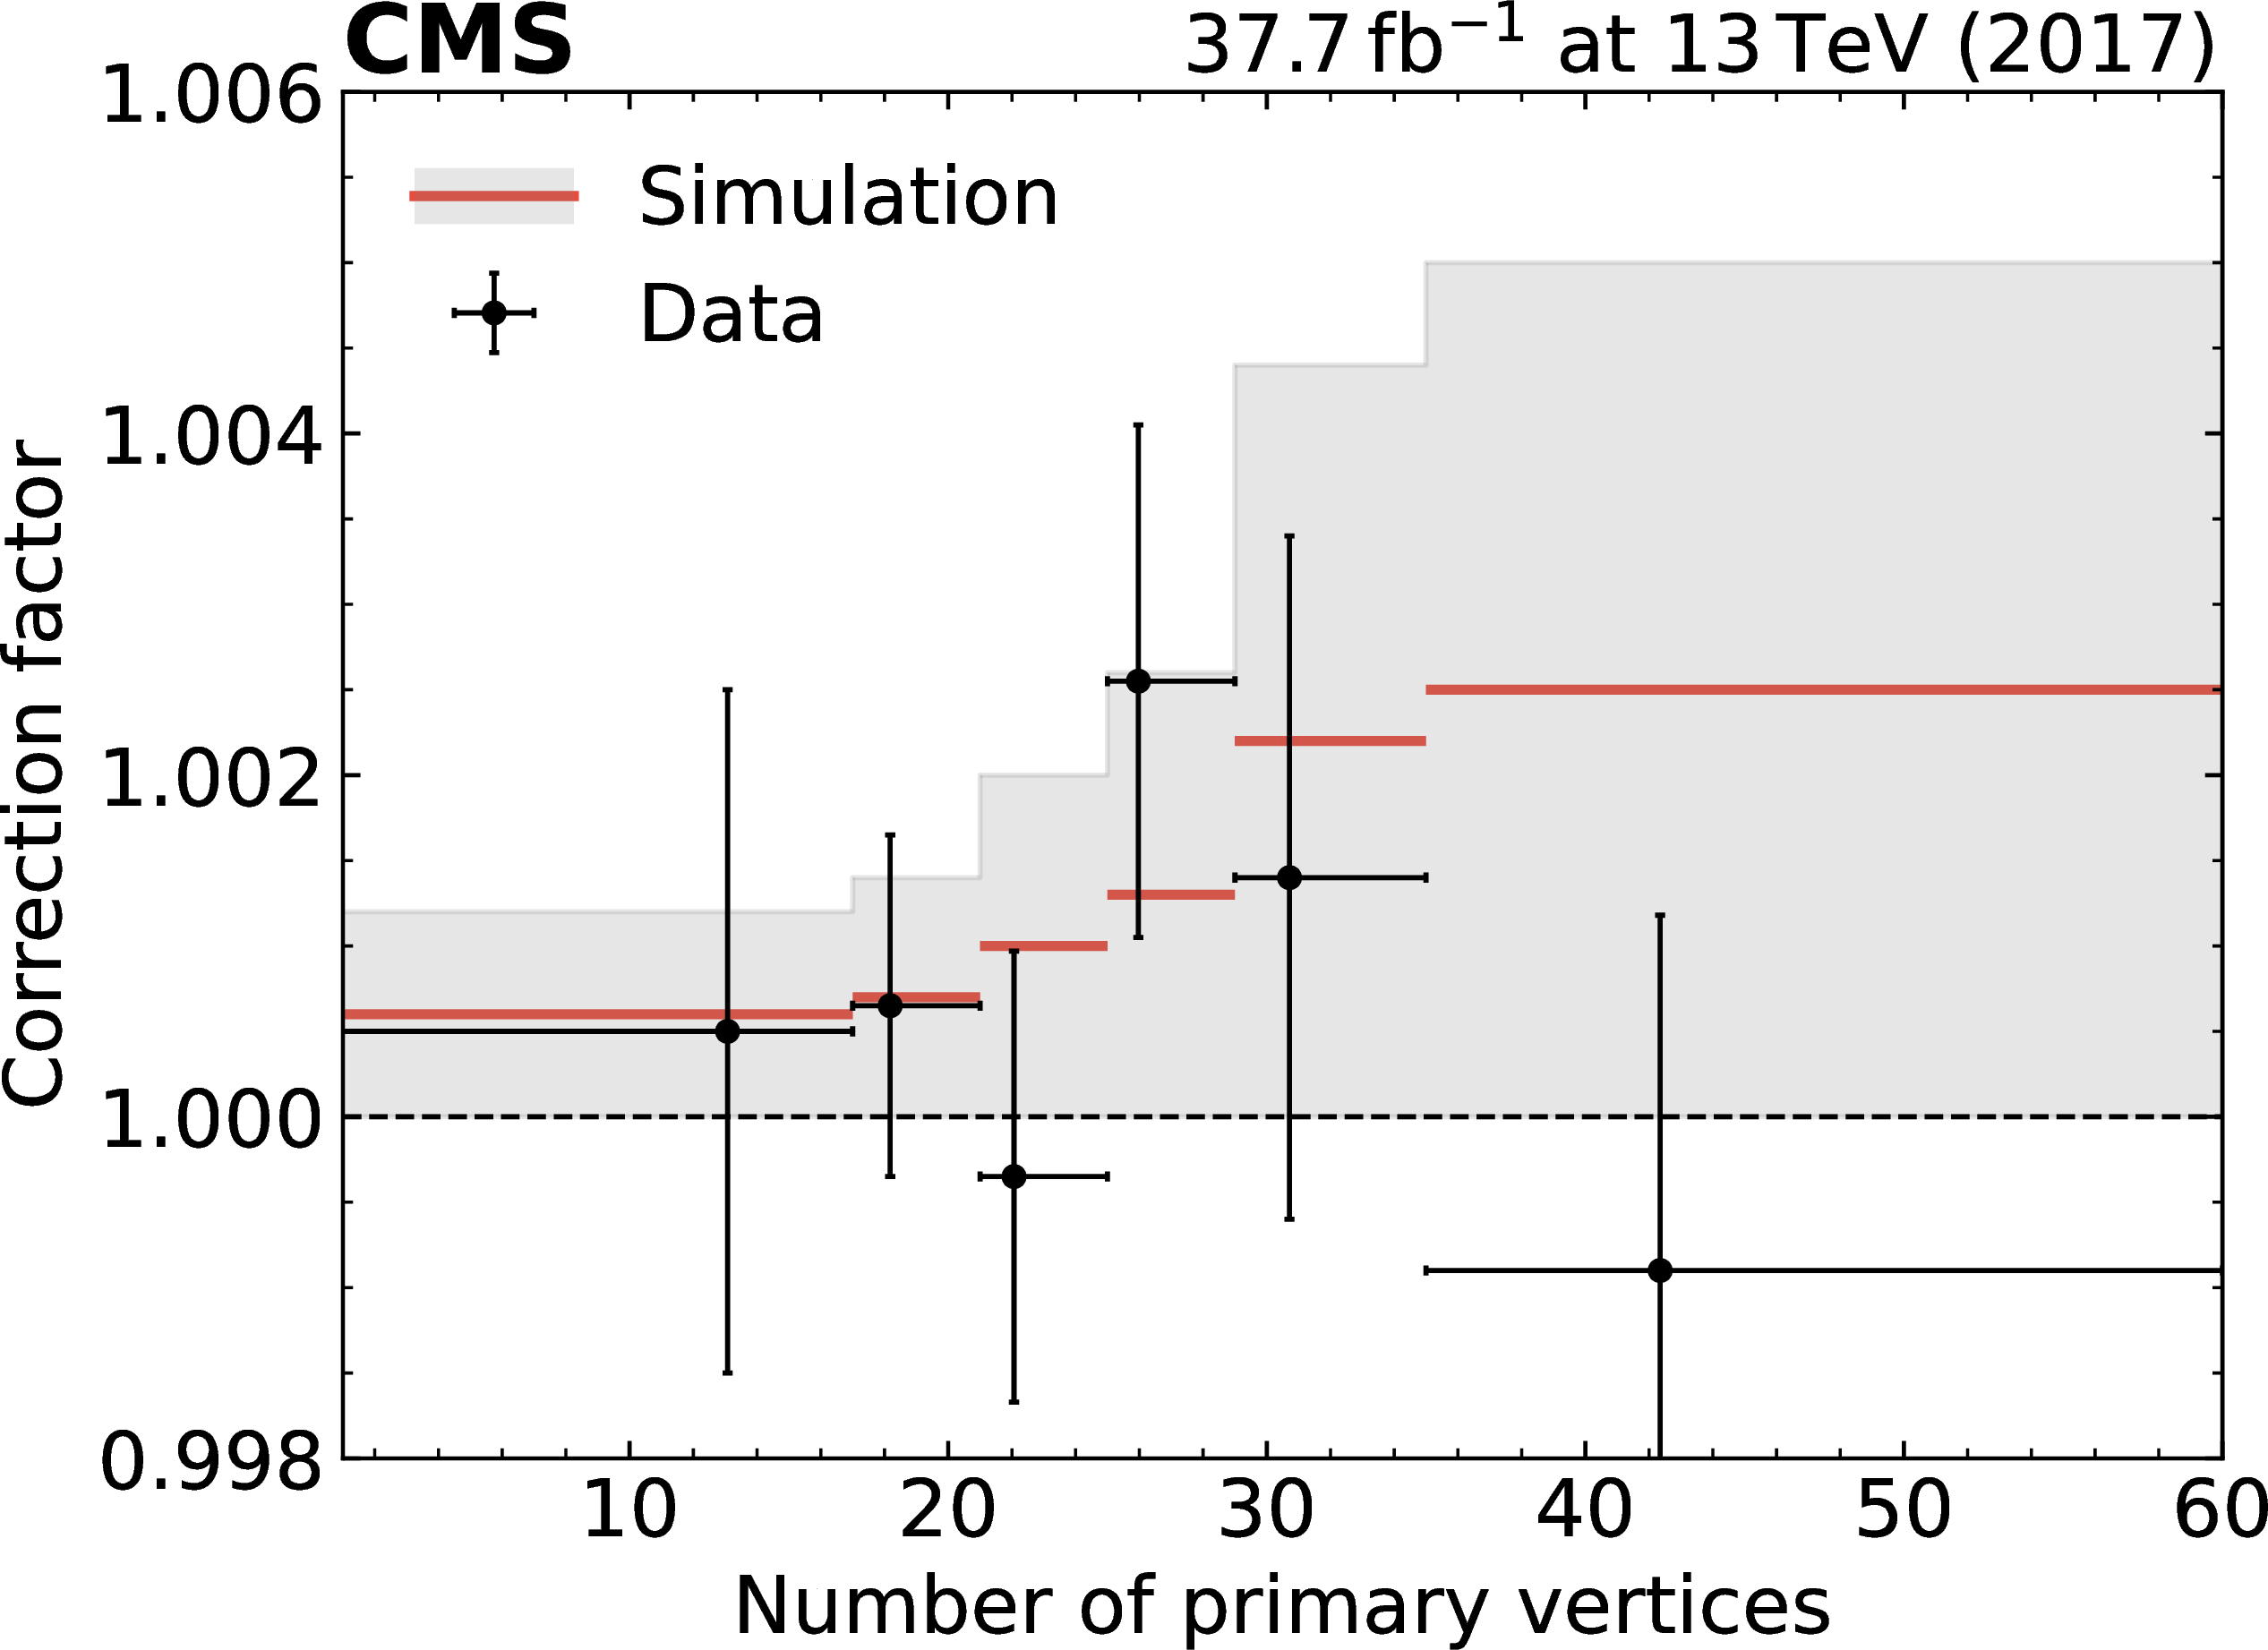
Figure 2:
Correction factor $ C_{\mathrm{HLT}} $ for the correlation between the measured muon trigger efficiencies of the two muons as a function of the number of reconstructed primary vertices, $ N_{\mathrm{PV}} $, in the simulation (lines) and the data (points). The data points are drawn at the mean value of $ N_{\mathrm{PV}} $ in each bin of the measurement. The horizontal error bars on the points show the bin width, and the vertical error bars show the statistical uncertainty. The gray band indicates the $ \pm$100% uncertainty in the correction factor. |
png pdf |
Figure 3:
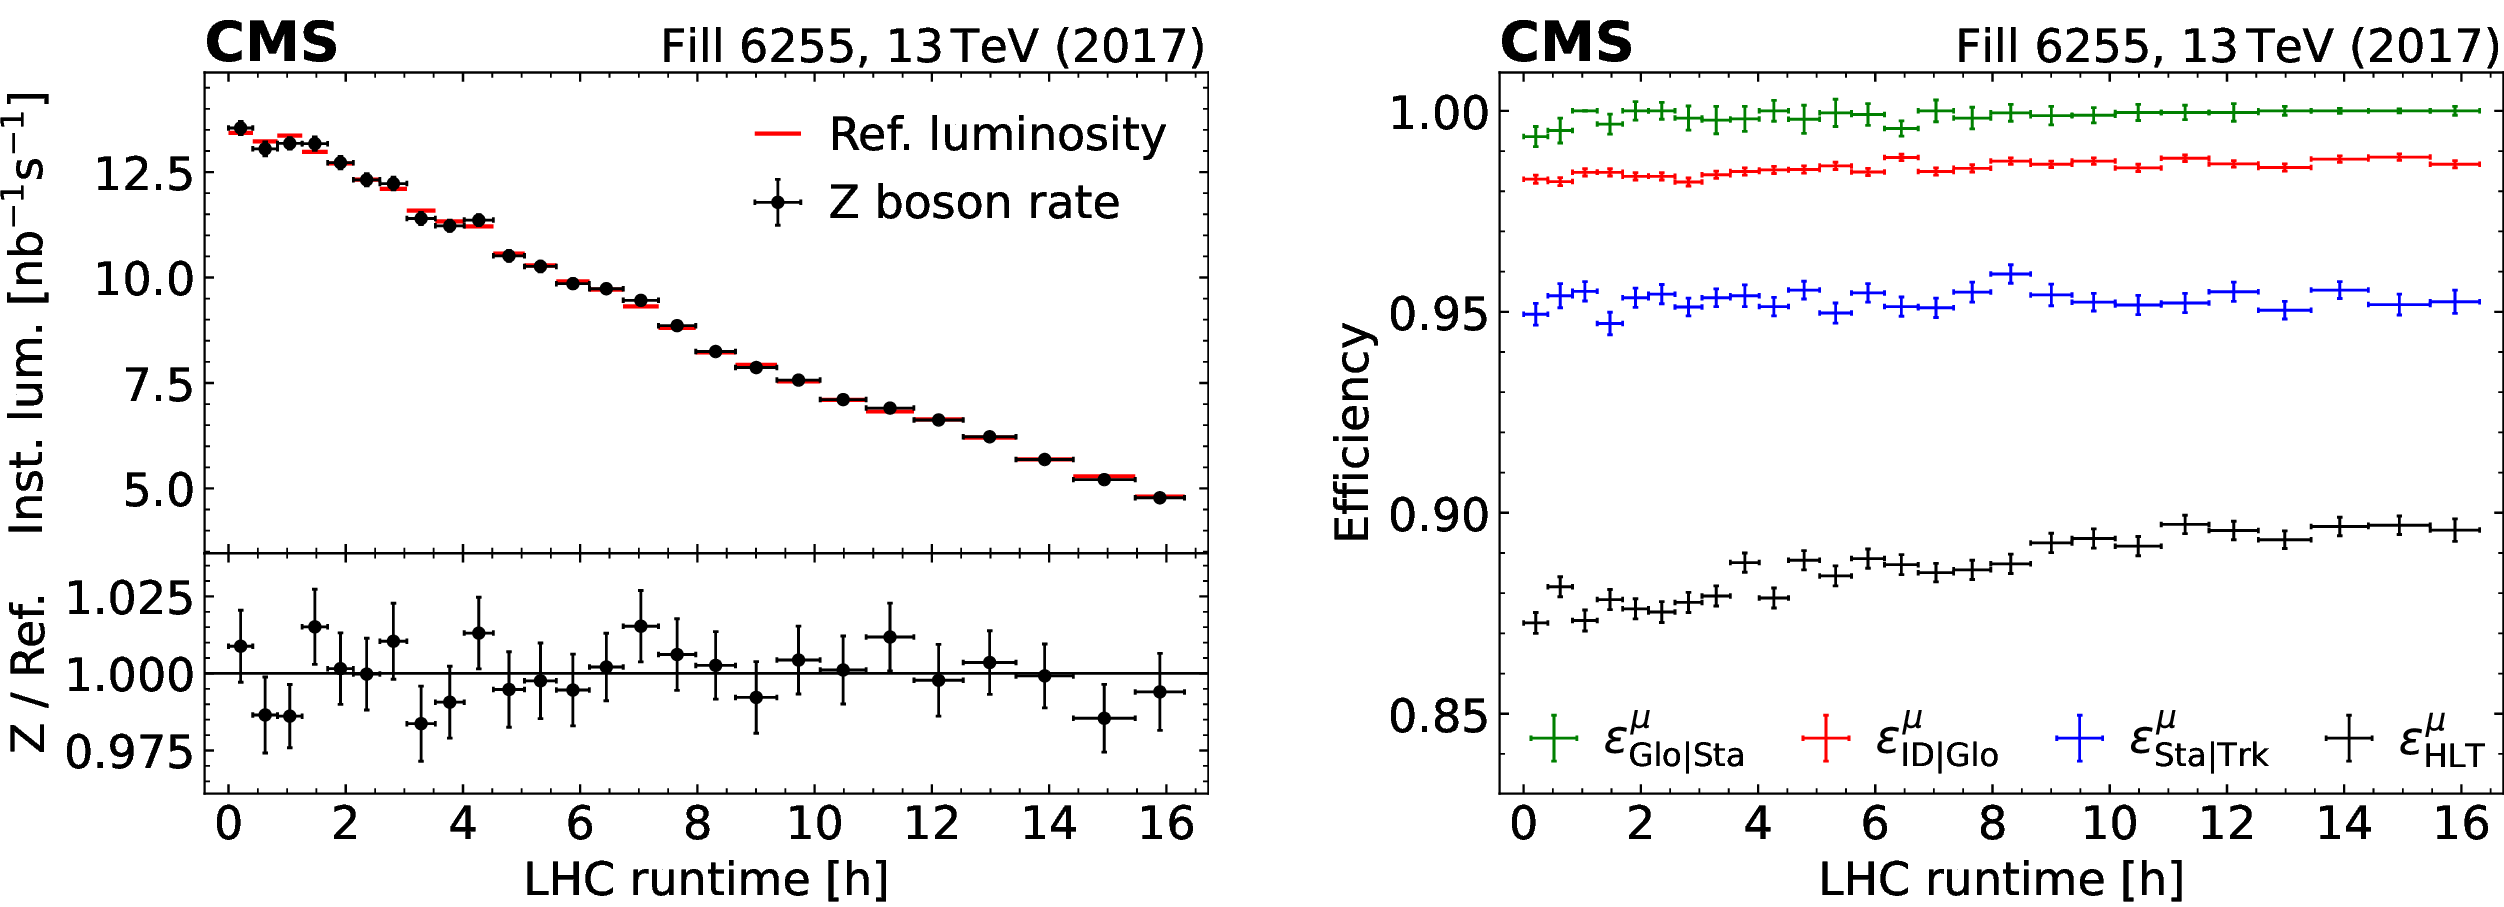
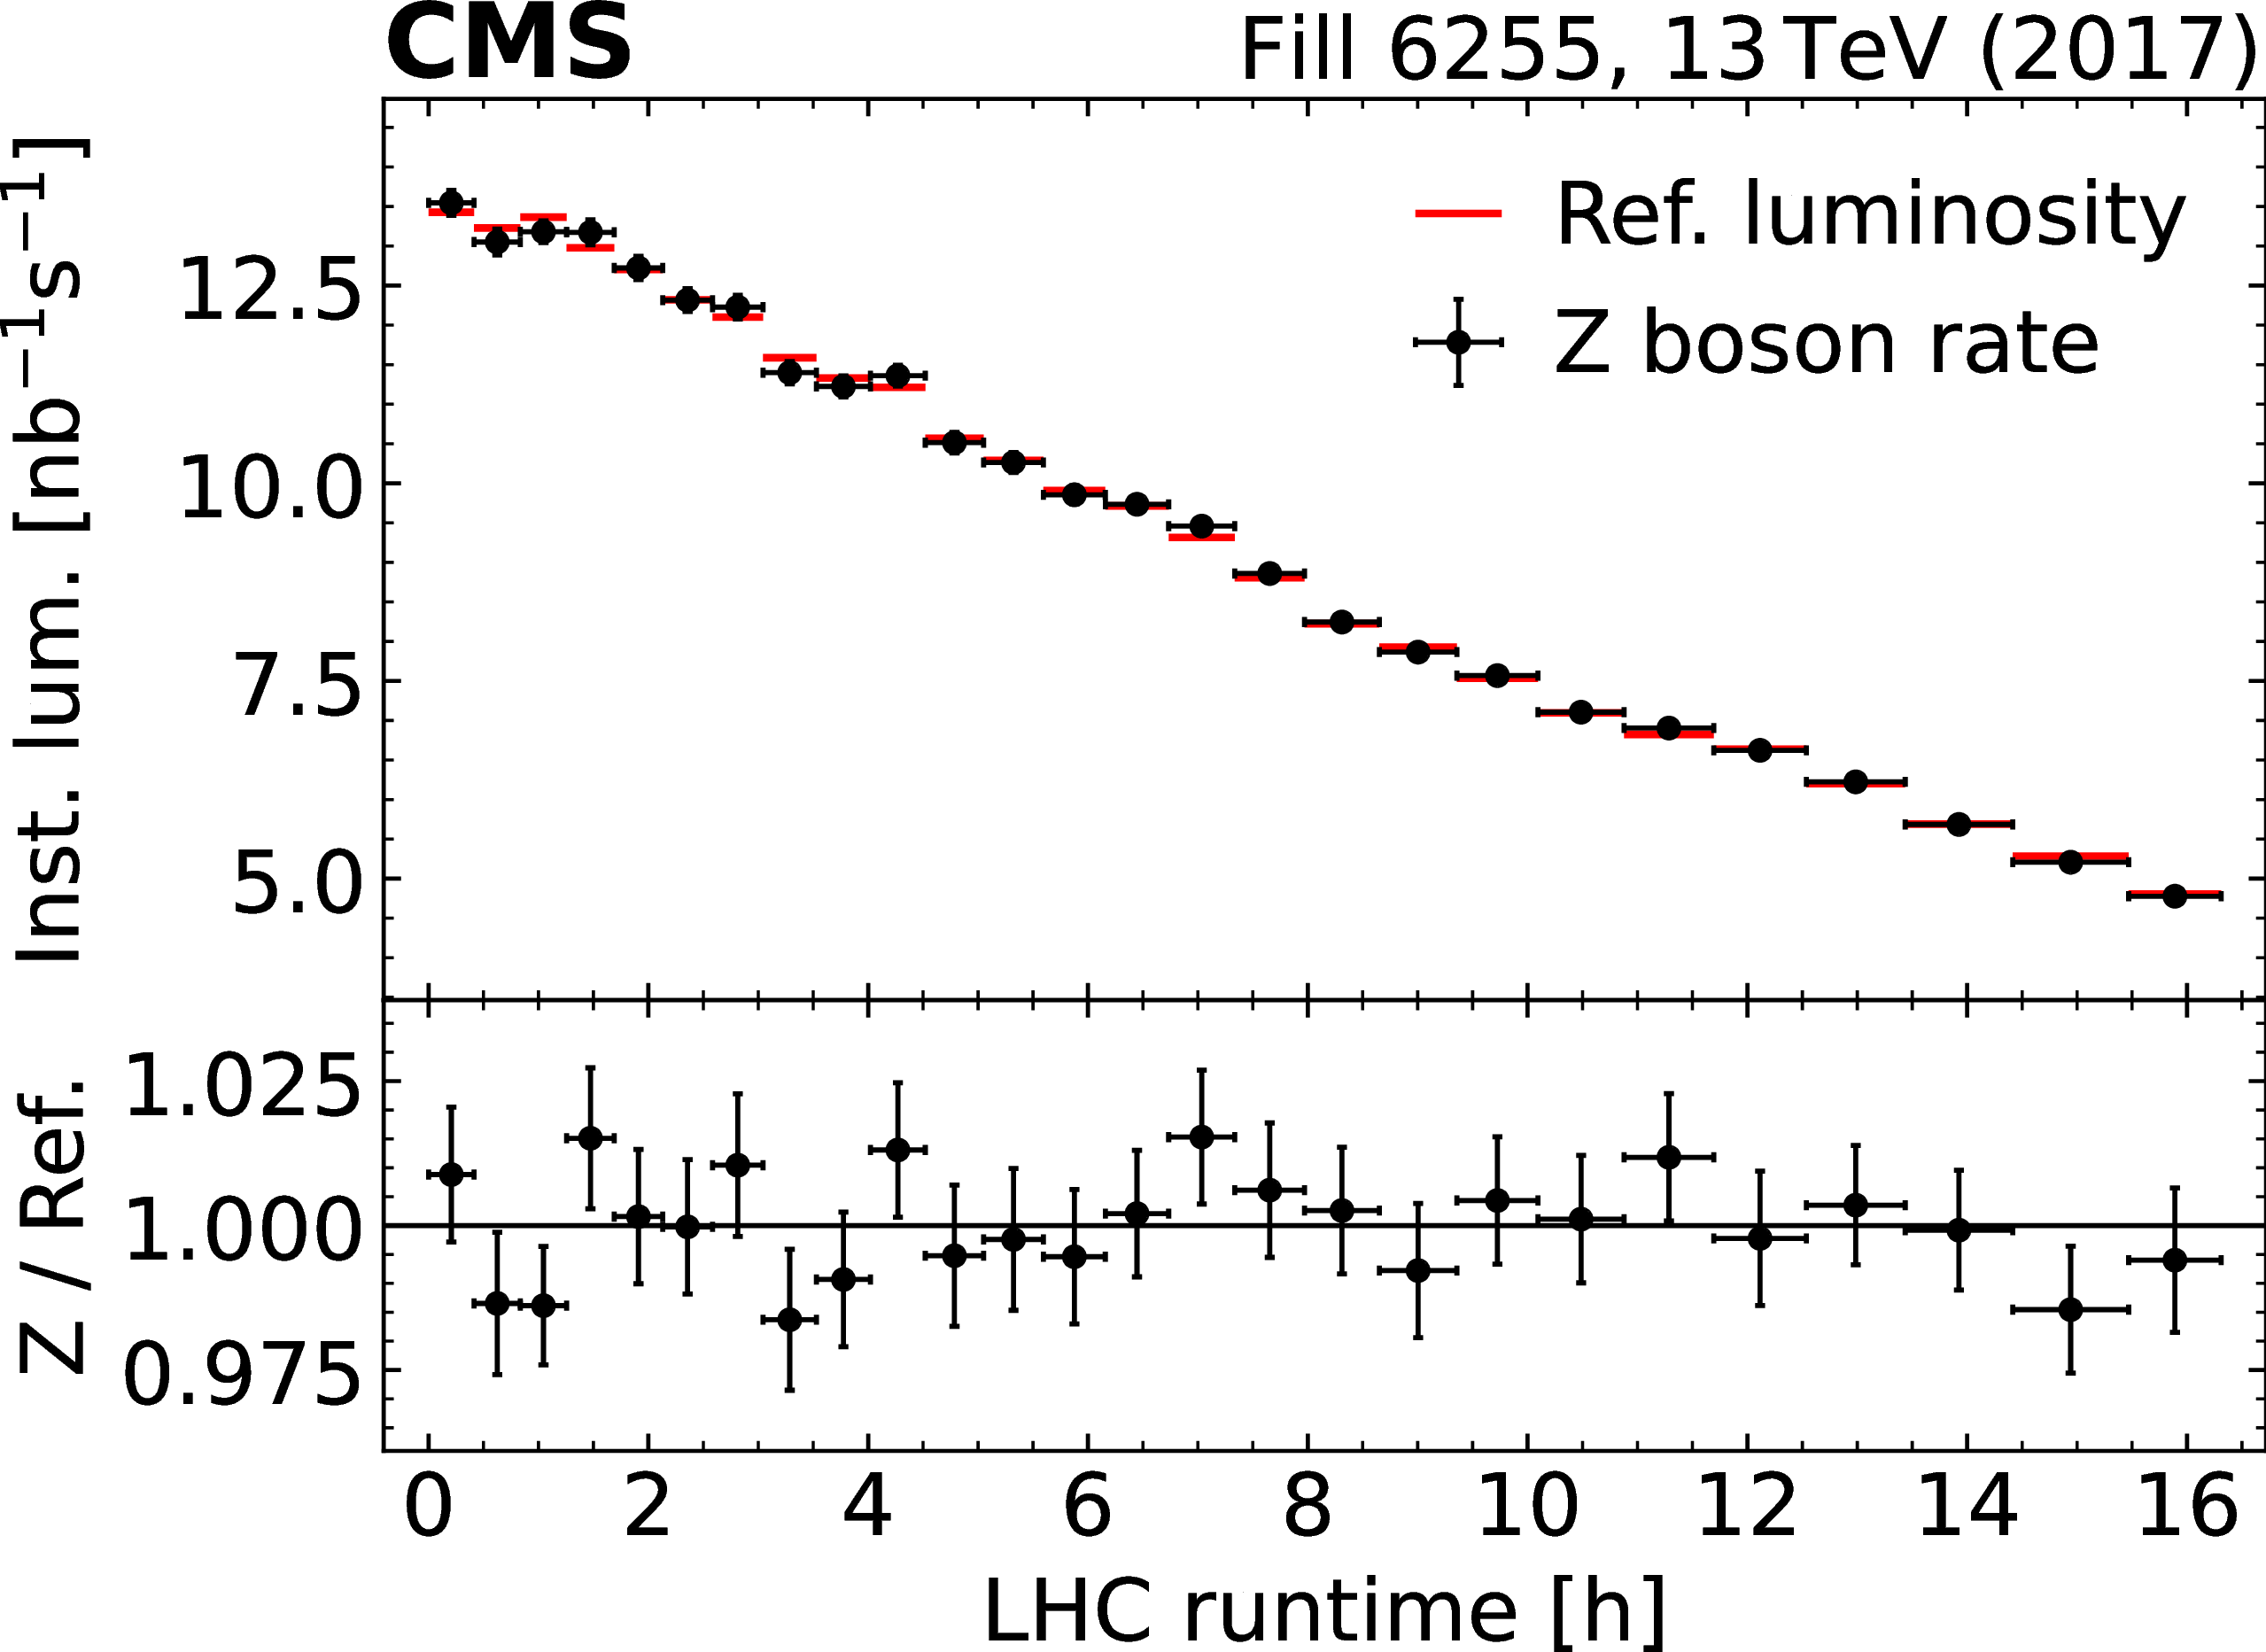
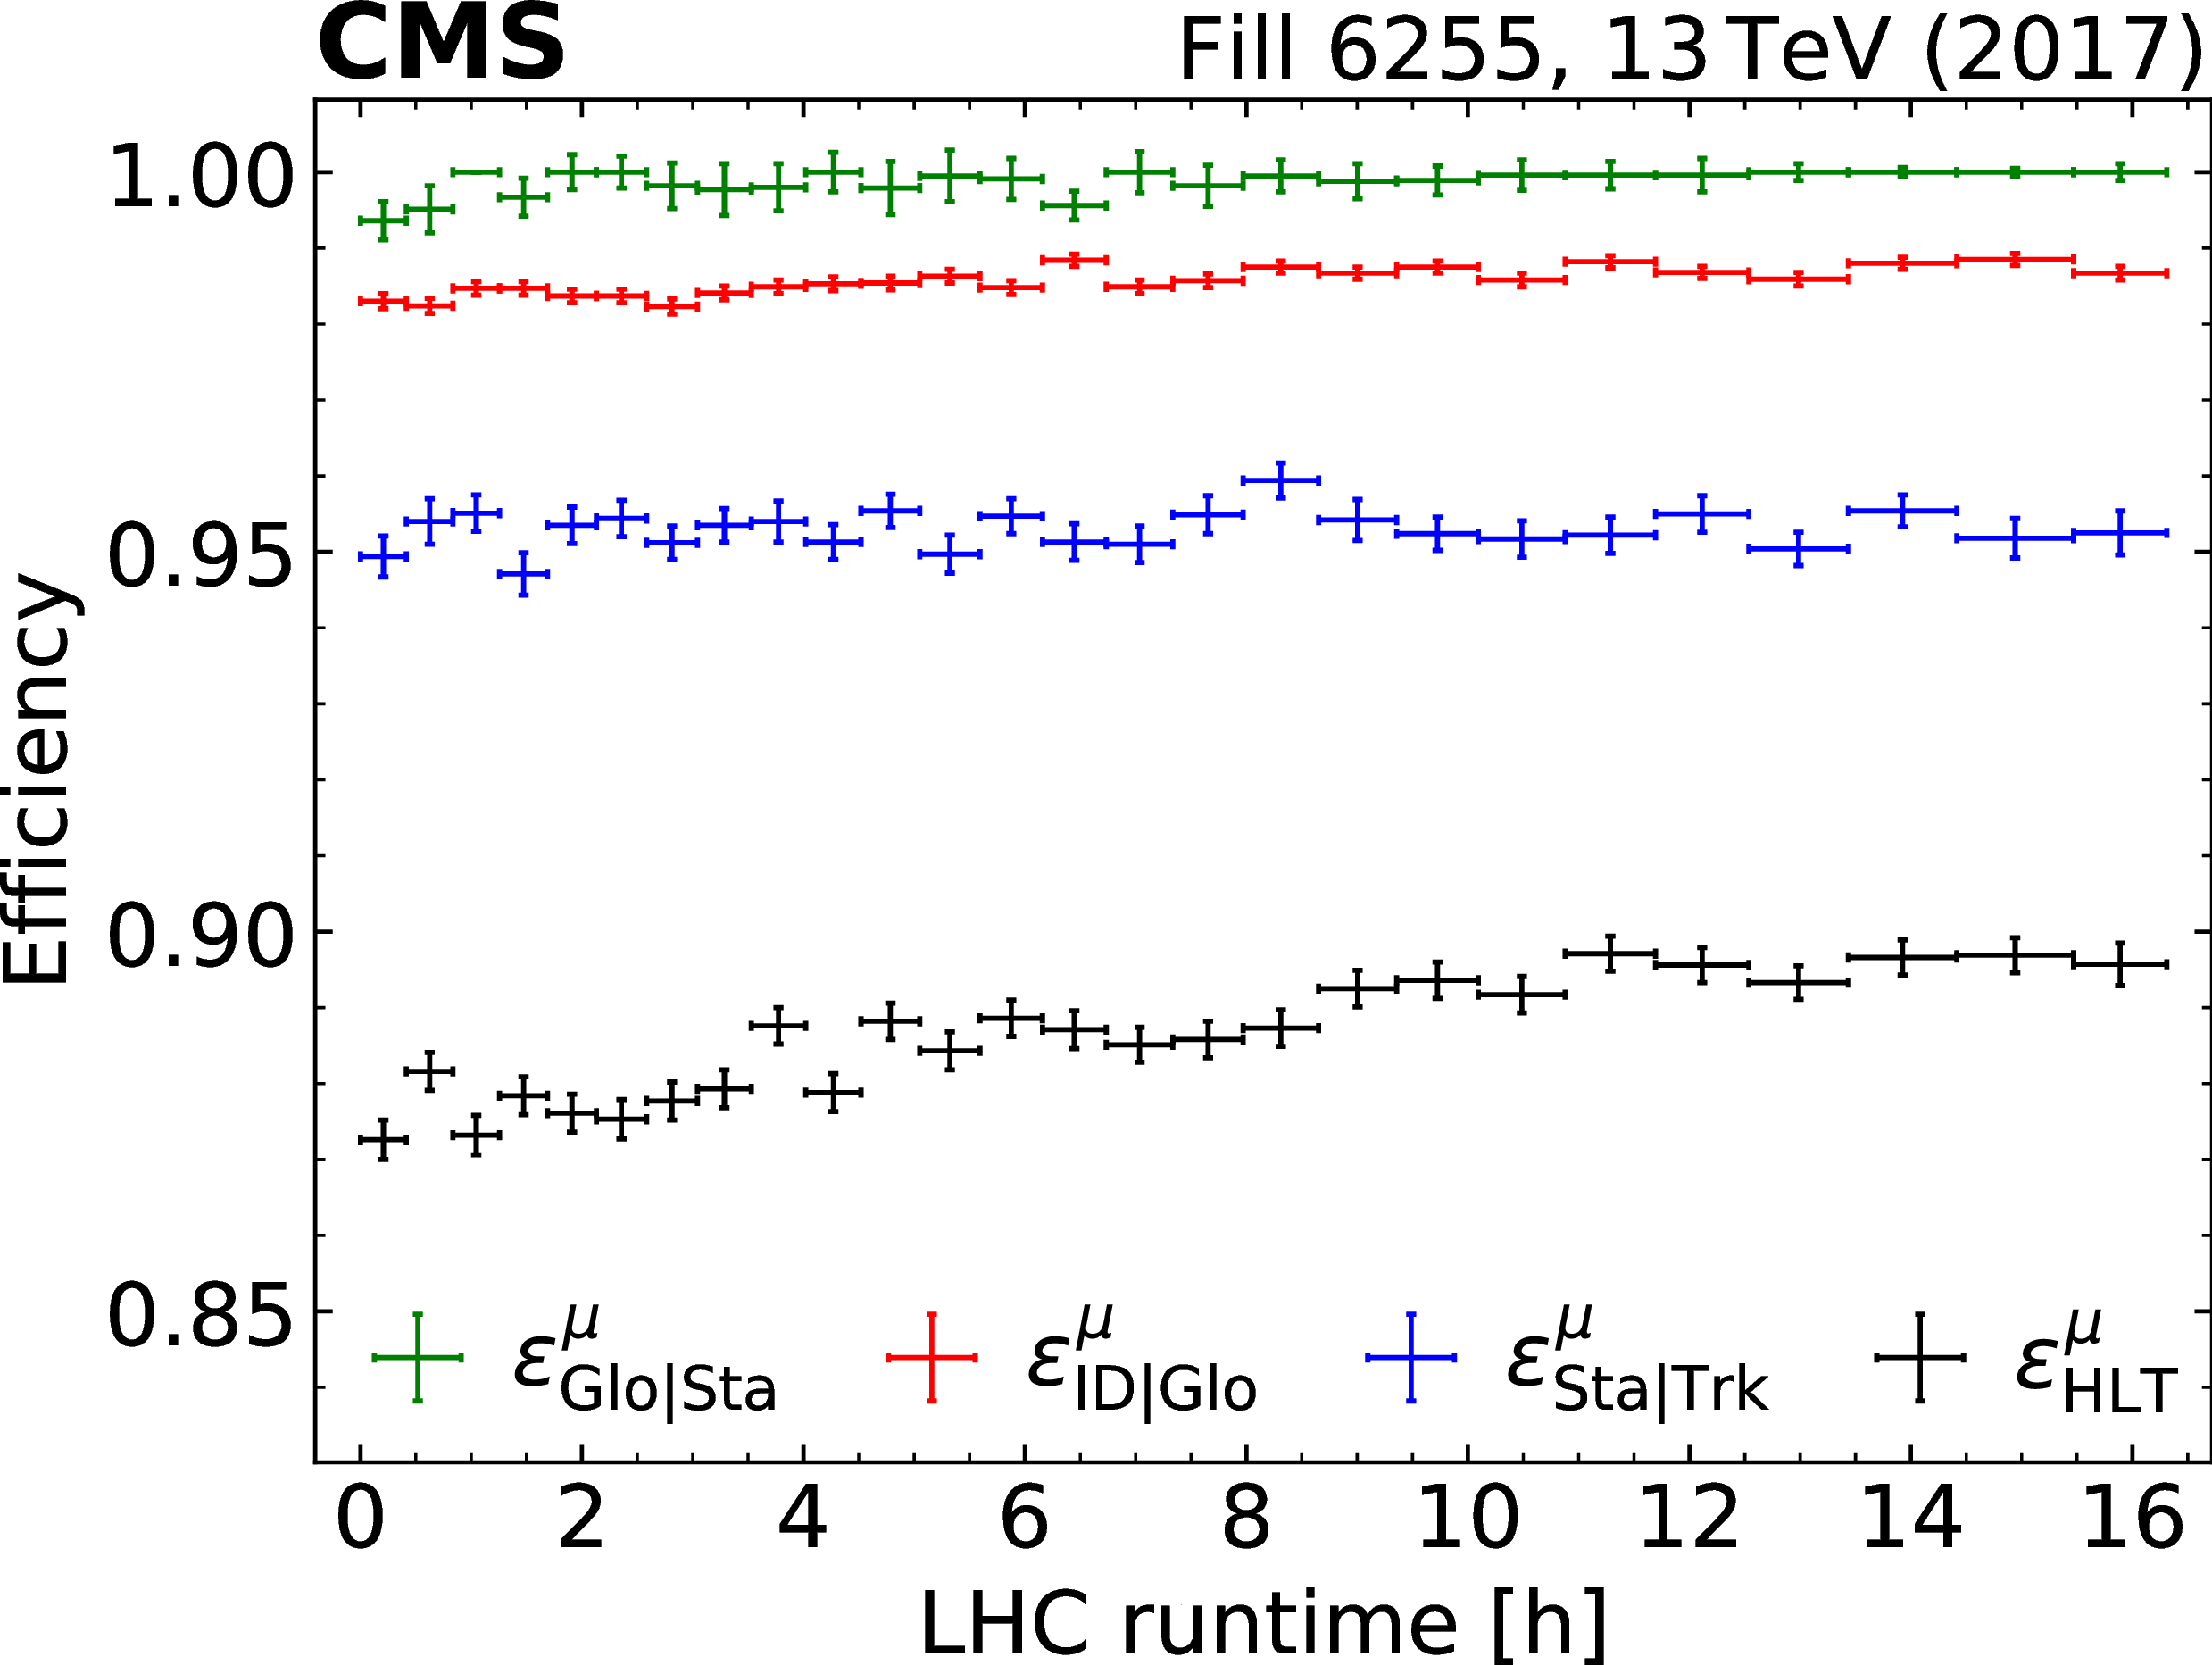
left: the efficiency-corrected Z boson rate, compared to the reference luminosity measurement, in the LHC fill 6255, recorded on September 29, 2017. Each bin corresponds to about 20 pb$^{-1}$, as determined by the reference measurement. For shape comparison, the integrated Z boson rate is normalized to the reference integrated luminosity. The panel at the bottom shows the ratio of the two measurements. The vertical error bars show the statistical uncertainty in the Z boson rate. right: the measured single-muon efficiencies as functions of time for the same LHC fill. The vertical error bars show the statistical uncertainty in the efficiency. |
png pdf |
Figure 3-a:
The efficiency-corrected Z boson rate, compared to the reference luminosity measurement, in the LHC fill 6255, recorded on September 29, 2017. Each bin corresponds to about 20 pb$^{-1}$, as determined by the reference measurement. For shape comparison, the integrated Z boson rate is normalized to the reference integrated luminosity. The panel at the bottom shows the ratio of the two measurements. The vertical error bars show the statistical uncertainty in the Z boson rate. |
png pdf |
Figure 3-b:
The measured single-muon efficiencies as functions of time for the same LHC fill. The vertical error bars show the statistical uncertainty in the efficiency. |
png pdf |
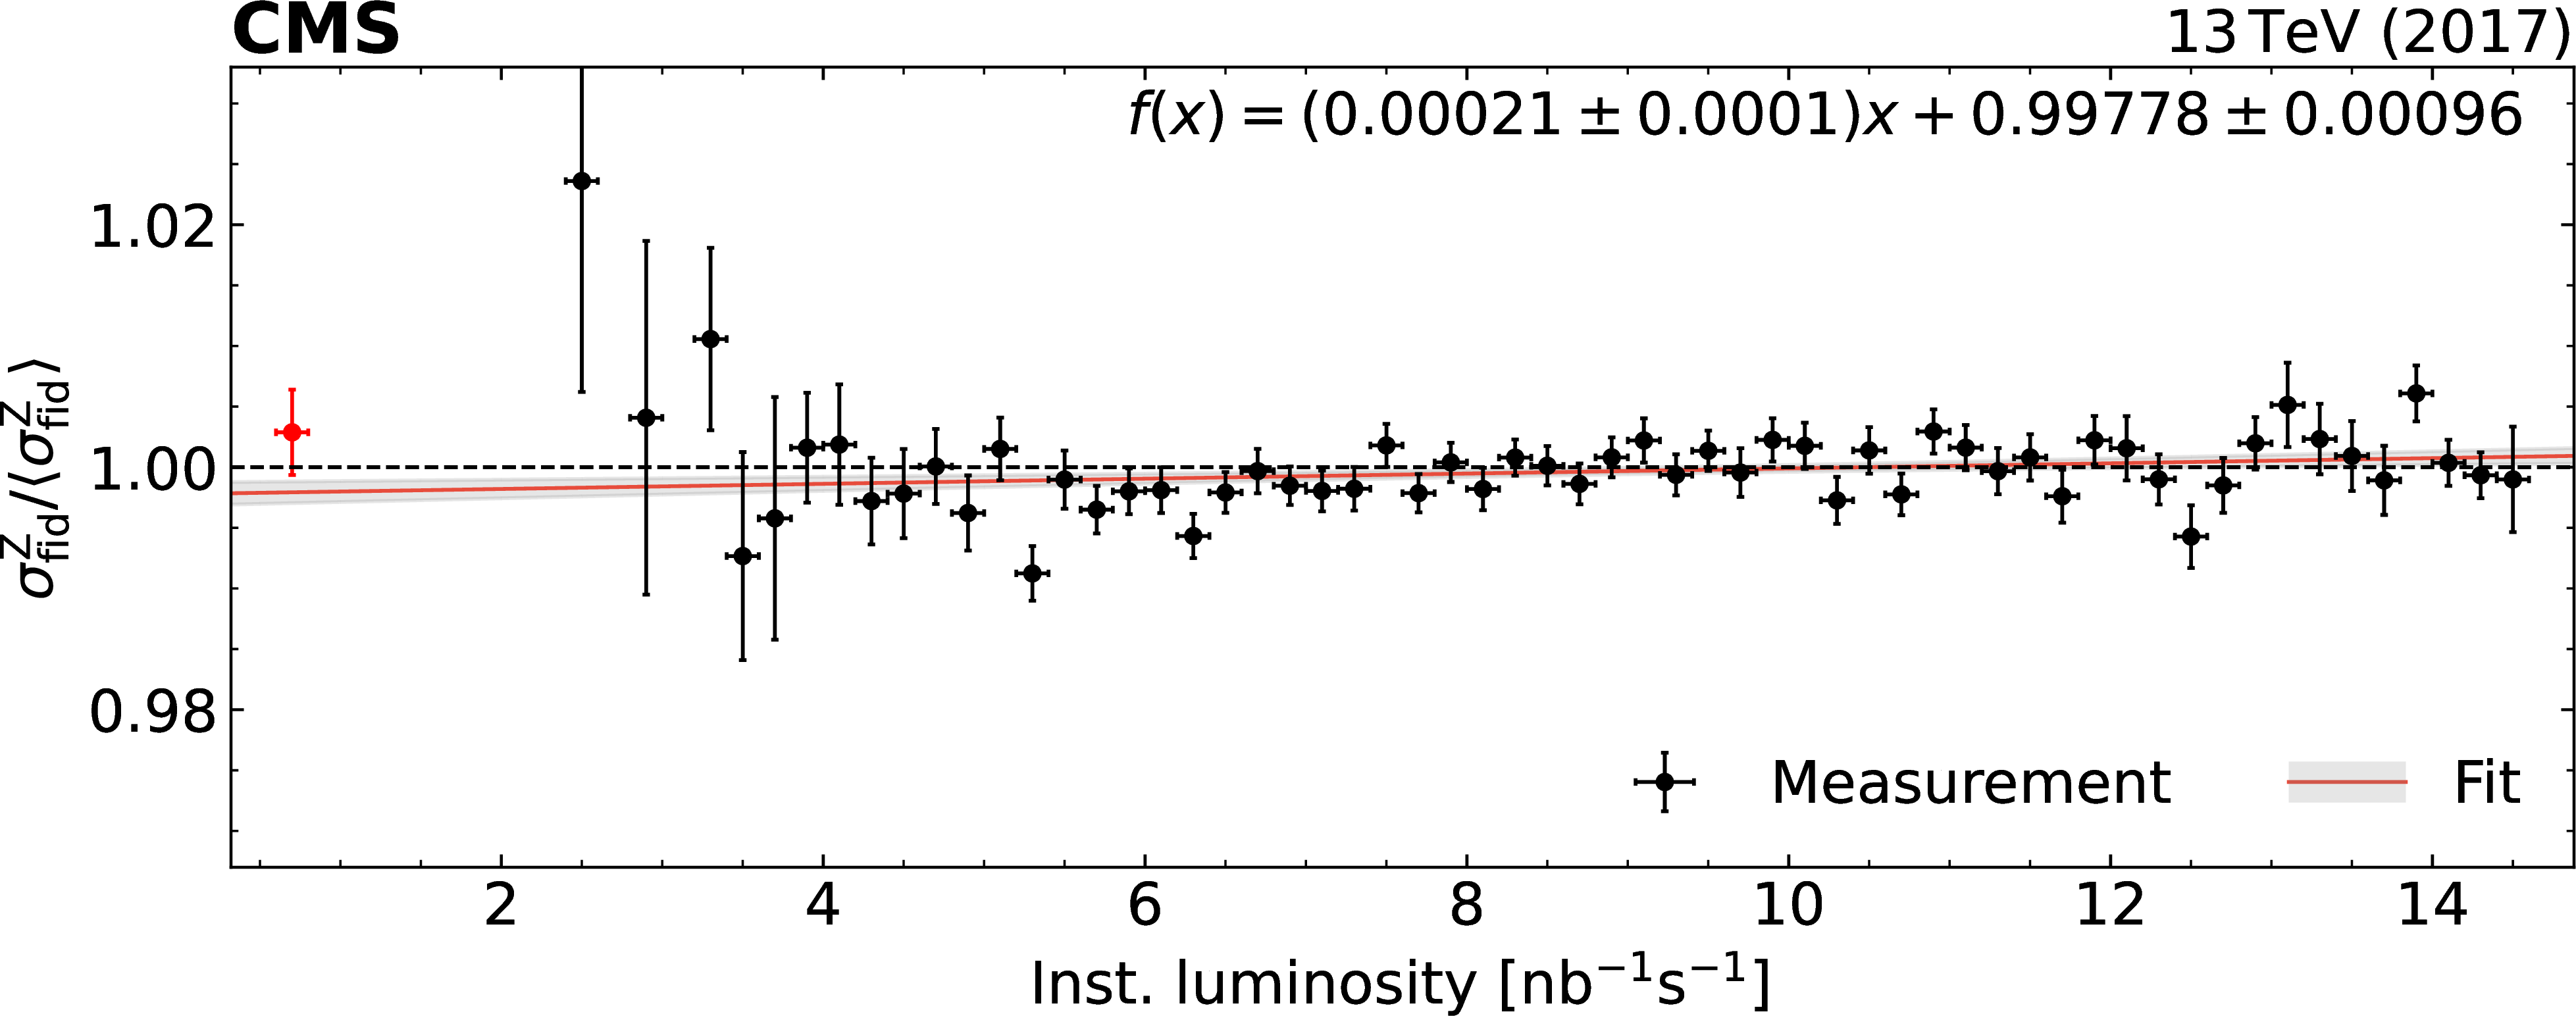
Figure 4:
Fiducial Z boson production cross section as a function of the instantaneous recorded luminosity, normalized to the average measured cross section. In each point, multiple measurements of the delivered Z boson rates are combined, the error bars correspond to the statistical uncertainties of the Z boson rate measurement. The leftmost point, highlighted in red, corresponds to the lowPU data. The result of a fit to a linear function is shown as a red line and the statistical uncertainties are covered by the gray band. |

png pdf |
Figure 5:
Distribution of the ratio of integrated luminosities between Z boson counting and the reference luminometer. The entries, each corresponding to one interval of 20 pb$^{-1}$ of highPU data, are weighted with the respective measured luminosity. |

png pdf |
Figure 6:
The luminosity as measured from Z bosons divided by the reference luminosity as a function of the integrated luminosity for the 2017 highPU data. Each green point represents the ratio from one measurement of the number of Z bosons. The blue lines show the averages of 50 consecutive measurements, each containing about 1 fb$ ^{-1} $ of data. The gray band has a width of 1.5%, corresponding to the uncertainty in the ratio of the integrated reference luminosities from the lowPU to the one of highPU [32]. |
| Tables | |
png pdf |
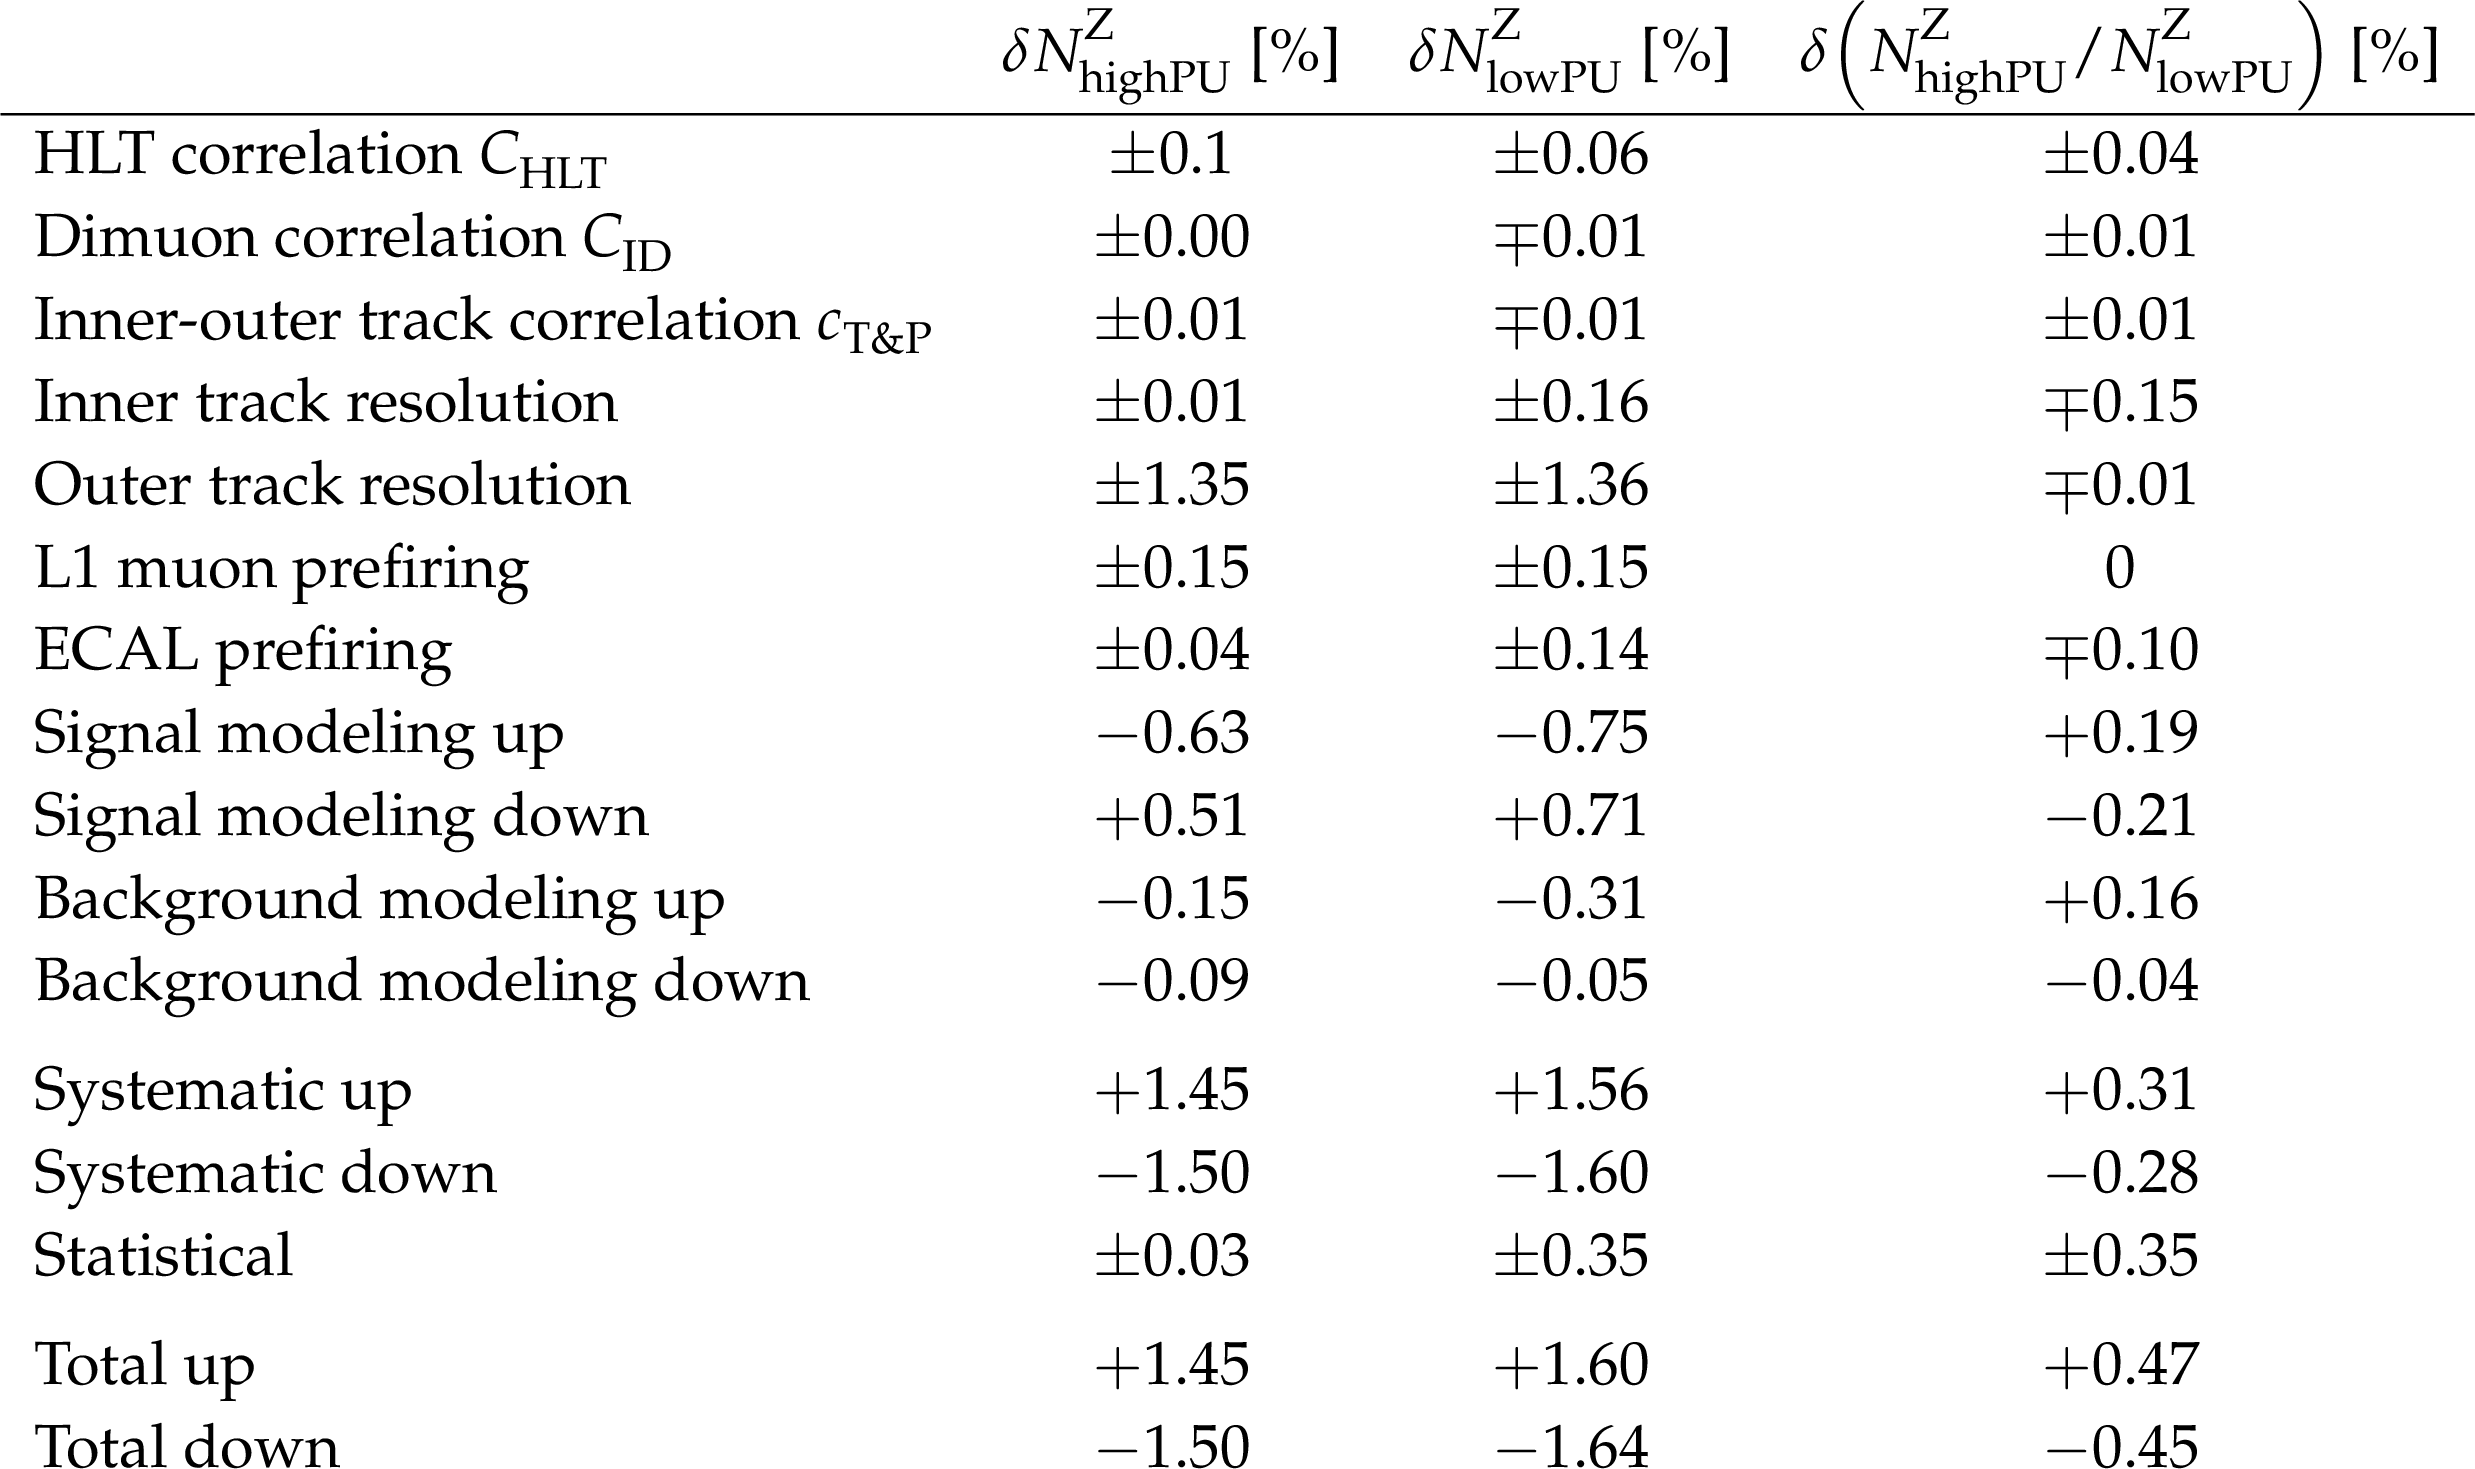
Table 1:
Summary of the uncertainties in the number of delivered Z bosons in the 2017 highPU and lowPU data, and their ratio. The symbol $ \delta $ denotes the relative uncertainty, i.e., $ \delta x = \Delta x / x $. The systematic and statistical uncertainties are added in quadrature to obtain the total uncertainty. |
png pdf |
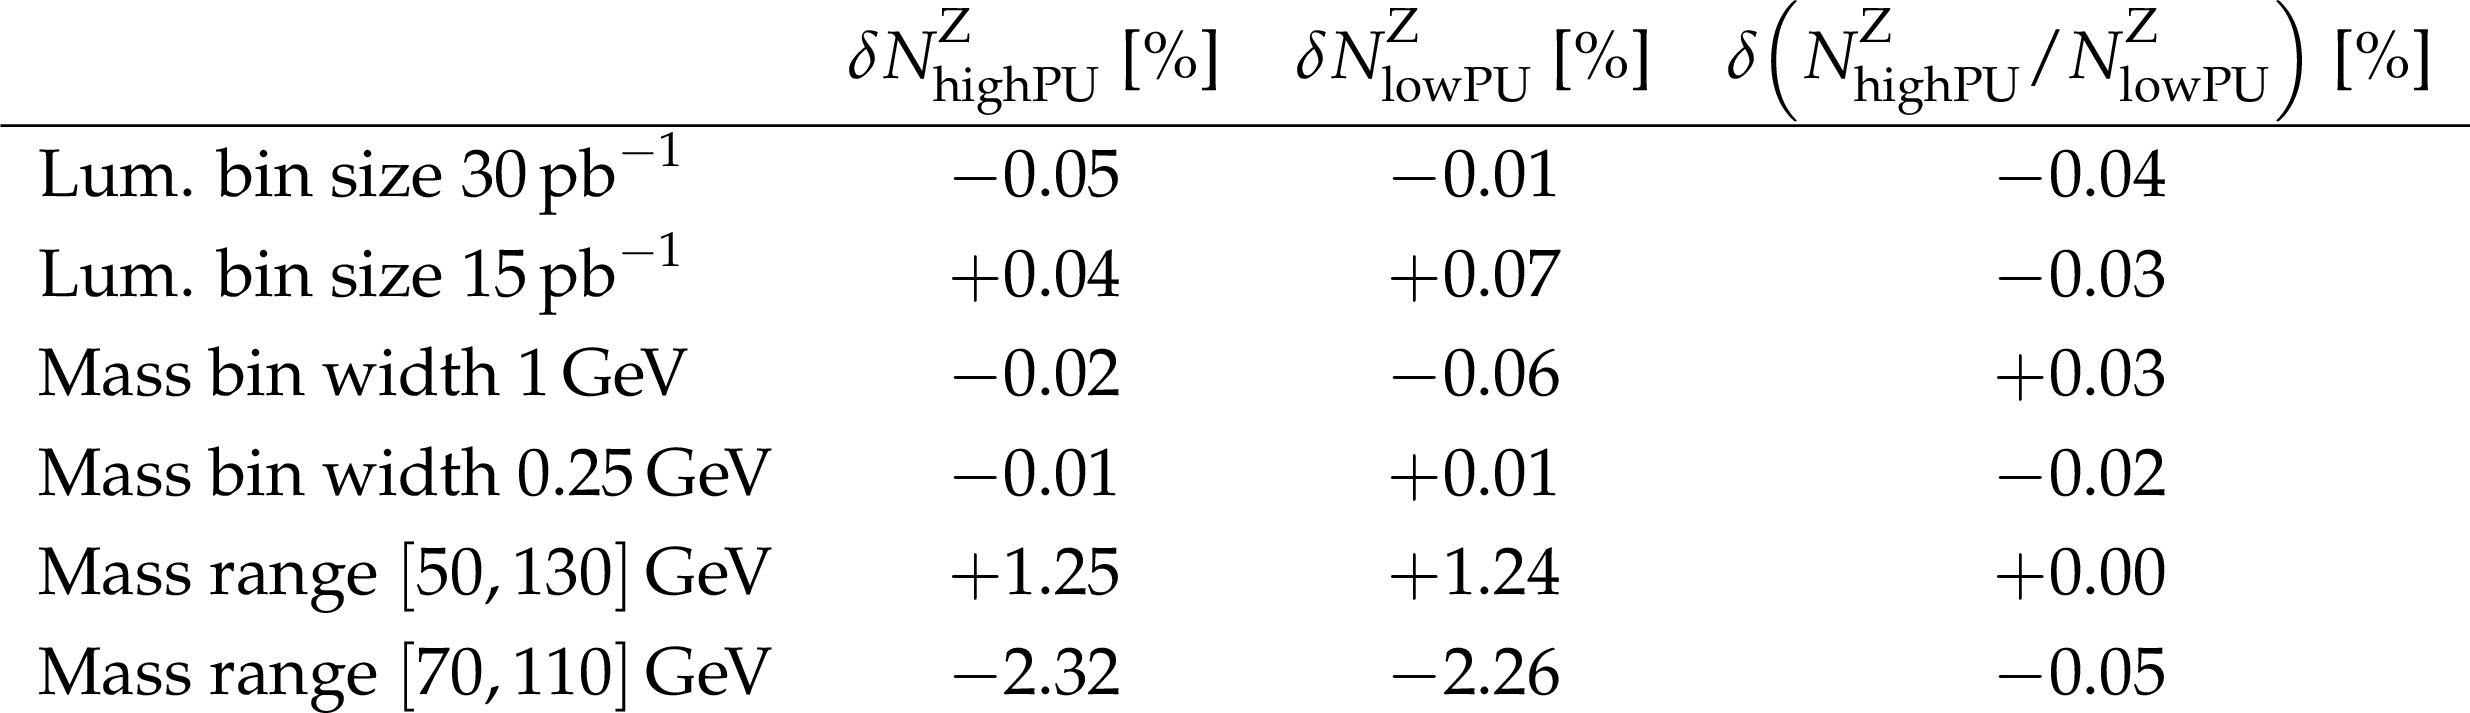
Table 2:
Summary of cross checks performed by varying the length of the luminosity interval, the bin width of the $ m_{\mu\mu} $ histograms, and the range of the fit. As in Table 1, the resulting variations of the number of Z bosons in the 2017 highPU and lowPU data, and their ratio, are shown. The $ \delta $ denotes the relative variations, i.e., $ \delta x = \Delta x / x $. |
| Summary |
| The precision measurement of the Z boson production rate provides a complementary method to transfer integrated luminosity measurements between data sets. This study makes use of events with Z bosons decaying into a pair of muons. The data were recorded with the CMS experiment at the CERN LHC in 2017, at a proton-proton center-of-mass energy of 13 TeV. The integrated luminosity of a larger data sample recorded in 2017 is obtained from that of a smaller data set recorded at lower pileup using the ratio of the efficiency-corrected numbers of Z bosons counted in the two data sets. The full set of efficiencies and correlation correction factors for triggering, reconstruction, and selection are determined in intervals of 20 pb$^{-1}$ from the same Z boson data samples. Monte Carlo simulations are used only to describe the shape of the resonant Z boson signal and for the study of possible biases of the method. A detailed quantitative study of the systematic uncertainties and their dependencies on pileup is performed for the first time. In the integrated luminosity ratio, the systematic uncertainties cancel almost completely, with the exception of the pileup-dependent effects. The resulting uncertainty in the ratio is 0.5%. With its high precision, the Z boson counting is competitive with and independent of conventional methods for the extrapolation and integration of luminosity. |
| References | ||||
| 1 | CMS Collaboration | Measurement of the inclusive W and Z production cross sections in pp collisions at $ \sqrt{s}= $ 7 TeV with the CMS experiment | JHEP 10 (2011) 132 | CMS-EWK-10-005 1107.4789 |
| 2 | CMS Collaboration | Measurement of the differential Drell-Yan cross section in proton-proton collisions at $ \sqrt{s}= $ 13 TeV | JHEP 12 (2019) 059 | CMS-SMP-17-001 1812.10529 |
| 3 | CMS Collaboration | Measurements of differential Z boson production cross sections in proton-proton collisions at $ \sqrt{s}= $ 13 TeV | JHEP 12 (2019) 061 | CMS-SMP-17-010 1909.04133 |
| 4 | CMS Collaboration | Measurement of the mass dependence of the transverse momentum of lepton pairs in Drell-Yan production in proton-proton collisions at $ \sqrt{s}= $ 13 TeV | EPJC 83 (2023) 628 | CMS-SMP-20-003 2205.04897 |
| 5 | ATLAS Collaboration | Measurement of W$^{\pm} $ and Z boson production cross sections in pp collisions at $ \sqrt{s}= $ 13 TeV with the ATLAS detector | PLB 759 (2016) 601 | 1603.09222 |
| 6 | Y. Li and F. Petriello | Combining QCD and electroweak corrections to dilepton production in the framework of the FEWZ simulation code | PRD 86 (2012) 094034 | 1208.5967 |
| 7 | P. F. Monni et al. | MiNNLOps: a new method to match NNLO QCD to parton showers | JHEP 05 (2020) 143 | 1908.06987 |
| 8 | C. Duhr and B. Mistlberger | Lepton-pair production at hadron colliders at N$^{3}$LO in QCD | JHEP 03 (2022) 116 | 2111.10379 |
| 9 | S. Alekhin, J. Blümlein, S. Moch, and R. Plačakytė | Parton distribution functions, $ \alpha_\mathrm{S} $, and heavy-quark masses for LHC Run II | PRD 96 (2017) 014011 | 1701.05838 |
| 10 | NNPDF Collaboration | Parton distributions from high-precision collider data | EPJC 77 (2017) 663 | 1706.00428 |
| 11 | S. Dulat et al. | New parton distribution functions from a global analysis of quantum chromodynamics | PRD 93 (2016) 033006 | 1506.07443 |
| 12 | L. A. Harland-Lang, A. D. Martin, P. Motylinski, and R. S. Thorne | Parton distributions in the LHC era: MMHT 2014 PDFs | EPJC 75 (2015) 204 | 1412.3989 |
| 13 | CMS Collaboration | Search for invisible decays of a Higgs boson produced through vector boson fusion in proton-proton collisions at $ \sqrt{s}= $ 13 TeV | PLB 793 (2019) 520 | CMS-HIG-17-023 1809.05937 |
| 14 | Particle Data Group, R. L. Workman et al. | Review of particle physics | Prog. Theor. Exp. Phys. (2022) 083C01 | |
| 15 | CMS Collaboration | Electron and photon reconstruction and identification with the CMS experiment at the CERN LHC | JINST 16 (2021) P05014 | CMS-EGM-17-001 2012.06888 |
| 16 | CMS Collaboration | Performance of the CMS muon detector and muon reconstruction with proton-proton collisions at $ \sqrt{s}= $ 13 TeV | JINST 13 (2018) P06015 | CMS-MUO-16-001 1804.04528 |
| 17 | ATLAS Collaboration | Muon reconstruction performance of the ATLAS detector in proton-proton collision data at $ \sqrt{s}= $ 13 TeV | EPJC 76 (2016) 292 | 1603.05598 |
| 18 | M. Dittmar, F. Pauss, and D. Zürcher | Towards a precise parton luminosity determination at the CERN LHC | PRD 56 (1997) 7284 | hep-ex/9705004 |
| 19 | C. Schwick and B. Petersen | LPC's view on Run 2' | in Proc. 9th Evian Workshop on LHC beam operation, CERN-ACC-2019-059, 2019 link |
|
| 20 | ATLAS Collaboration | Luminosity determination in pp collisions at $ \sqrt{s}= $ 13 TeV using the ATLAS detector at the LHC | Submitted to EPJC, 2022 | 2212.09379 |
| 21 | R. Bonciani et al. | Mixed strong-electroweak corrections to the Drell-Yan process | PRL 128 (2022) 012002 | 2106.11953 |
| 22 | M. Delto, M. Jaquier, K. Melnikov, and R. Röntsch | Mixed QCD$ \otimes $QED corrections to on-shell Z boson production at the LHC | JHEP 01 (2020) 043 | 1909.08428 |
| 23 | S. van der Meer | Calibration of the effective beam height in the ISR | ISR Report CERN-ISR-PO-68-31, 1968 | |
| 24 | P. Grafström and W. Kozanecki | Luminosity determination at proton colliders | Prog. Part. Nucl. Phys. 81 (2015) 97 | |
| 25 | LHCb Collaboration | Precision luminosity measurements at LHCb | JINST 9 (2014) P12005 | 1410.0149 |
| 26 | ALICE Collaboration | Measurement of visible cross sections in proton-lead collisions at $ \sqrt{s}= $ 5.02 TeV in van der Meer scans with the ALICE detector | JINST 9 (2014) P11003 | 1405.1849 |
| 27 | ATLAS Collaboration | Luminosity determination in pp collisions at $ \sqrt{s}= $ 8 TeV using the ATLAS detector at the LHC | EPJC 76 (2016) 653 | 1608.03953 |
| 28 | CMS Collaboration | Precision luminosity measurement in proton-proton collisions at $ \sqrt{s}= $ 13 TeV in 2015 and 2016 at CMS | EPJC 81 (2021) 800 | CMS-LUM-17-003 2104.01927 |
| 29 | CMS Collaboration | Pileup mitigation at CMS in 13 TeV data | JINST 15 (2020) P09018 | CMS-JME-18-001 2003.00503 |
| 30 | A. Dainese et al. | Physics at the HL-LHC, and perspectives at the HE-LHC | CERN Report CERN-2019-007, 2019 link |
|
| 31 | J. Salfeld-Nebgen and D. Marlow | Data-driven precision luminosity measurements with Z bosons at the LHC and HL-LHC | JINST 13 (2018) P12016 | 1806.02184 |
| 32 | CMS Collaboration | CMS luminosity measurement for the 2017 data-taking period at $ \sqrt{s}= $ 13 TeV | CMS Physics Analysis Summary, 2018 CMS-PAS-LUM-17-004 |
CMS-PAS-LUM-17-004 |
| 33 | CMS Collaboration | The CMS experiment at the CERN LHC | JINST 3 (2008) S08004 | |
| 34 | CMS Collaboration | Description and performance of track and primary-vertex reconstruction with the CMS tracker | JINST 9 (2014) P10009 | CMS-TRK-11-001 1405.6569 |
| 35 | CMS Tracker Group Collaboration | The CMS Phase-1 pixel detector upgrade | JINST 16 (2021) P02027 | 2012.14304 |
| 36 | CMS Collaboration | Particle-flow reconstruction and global event description with the CMS detector | JINST 12 (2017) P10003 | CMS-PRF-14-001 1706.04965 |
| 37 | M. Cacciari, G. P. Salam, and G. Soyez | The anti-$ k_{\mathrm{T}} $ jet clustering algorithm | JHEP 04 (2008) 063 | 0802.1189 |
| 38 | M. Cacciari, G. P. Salam, and G. Soyez | FASTJET user manual | EPJC 72 (2012) 1896 | 1111.6097 |
| 39 | CMS Collaboration | Performance of missing transverse momentum reconstruction in proton-proton collisions at $ \sqrt{s}= $ 13 TeV using the CMS detector | JINST 14 (2019) P07004 | CMS-JME-17-001 1903.06078 |
| 40 | CMS Collaboration | Technical proposal for the Phase-II upgrade of the Compact Muon Solenoid | CMS Technical Proposal CERN-LHCC-2015-010, CMS-TDR-15-02, 2015 CDS |
|
| 41 | CMS Collaboration | Performance of the CMS Level-1 trigger in proton-proton collisions at $ \sqrt{s}= $ 13 TeV | JINST 15 (2020) P10017 | CMS-TRG-17-001 2006.10165 |
| 42 | CMS Collaboration | The CMS trigger system | JINST 12 (2017) P01020 | CMS-TRG-12-001 1609.02366 |
| 43 | CMS BRIL Collaboration | The pixel luminosity telescope: a detector for luminosity measurement at CMS using silicon pixel sensors | EPJC 83 (2023) 673 | 2206.08870 |
| 44 | M. Guthoff on behalf of the CMS Collaboration | The new fast beam condition monitor using poly-crystalline diamond sensors for luminosity measurement at CMS | in Proc. 14th Pisa Meeting on Advanced Detectors: Frontier Detectors for Frontier Physics, 2019 NIM A 936 (2019) 717 |
|
| 45 | J. Alwall et al. | The automated computation of tree-level and next-to-leading order differential cross sections, and their matching to parton shower simulations | JHEP 07 (2014) 079 | 1405.0301 |
| 46 | T. Sjöstrand et al. | An introduction to PYTHIA8.2 | Comput. Phys. Commun. 191 (2015) 159 | 1410.3012 |
| 47 | CMS Collaboration | Extraction and validation of a new set of CMS PYTHIA8 tunes from underlying-event measurements | EPJC 80 (2020) 4 | CMS-GEN-17-001 1903.12179 |
| 48 | GEANT4 Collaboration | GEANT 4--a simulation toolkit | NIM A 506 (2003) 250 | |
| 49 | CMS Collaboration | Performance of the CMS muon trigger system in proton-proton collisions at $ \sqrt{s}= $ 13 TeV | JINST 16 (2021) P07001 | CMS-MUO-19-001 2102.04790 |
| 50 | R. Frühwirth | Application of Kalman filtering to track and vertex fitting | NIM A 262 (1987) 444 | |
| 51 | M. J. Oreglia | A study of the reactions $ {\psi^\prime\to\gamma\gamma\psi} $ | PhD thesis, Stanford University, SLAC-R-236, 1980 link |
|
| 52 | S. Das | A simple alternative to the Crystal Ball function | 1603.08591 | |
|
|
Compact Muon Solenoid LHC, CERN |
|

|

|

|

|

|