

Compact Muon Solenoid
LHC, CERN
| CMS-SMP-20-003 ; CERN-EP-2022-053 | ||
| Measurement of the mass dependence of the transverse momentum of lepton pairs in Drell--Yan production in proton-proton collisions at $ \sqrt{s} = $ 13 TeV | ||
| CMS Collaboration | ||
| 10 May 2022 | ||
| Eur. Phys. J. C 83 (2023) 628 | ||
| Abstract: The double differential cross sections of the Drell--Yan lepton pair ($ \ell^+\ell^- $, dielectron or dimuon) production are measured as functions of the invariant mass $ m_{\ell\ell} $, transverse momentum $ p_{\mathrm{T}}(\ell\ell) $, and $ \varphi^{*}_{\eta} $. The $ \varphi^{*}_{\eta} $ observable, derived from angular measurements of the leptons and highly correlated with $ p_{\mathrm{T}}(\ell\ell) $, is used to probe the low-$ p_{\mathrm{T}}(\ell\ell) $ region in a complementary way. Dilepton masses up to 1 TeV are investigated. Additionally, a measurement is performed requiring at least one jet in the final state. To benefit from partial cancellation of the systematic uncertainty, the ratios of the differential cross sections for various $ m_{\ell\ell} $ ranges to those in the Z mass peak interval are presented. The collected data correspond to an integrated luminosity of 36.3 fb$ ^{-1} $ of proton--proton collisions recorded with the CMS detector at the LHC at a centre-of-mass energy of 13 TeV. Measurements are compared with predictions based on perturbative quantum chromodynamics, including soft-gluon resummation. | ||
| Links: e-print arXiv:2205.04897 [hep-ex] (PDF) ; CDS record ; inSPIRE record ; HepData record ; Physics Briefing ; CADI line (restricted) ; | ||
| Additional resources can be found there. |
| Figures | |

png pdf |
Figure 1:
Distributions of events passing the selection requirements in the muon (left) and electron channels (right). Each plot also presents in the lower part a ratio of simulation over data. Only statistical uncertainties are shown as error bars on the data points, whereas the ratio presents the statistical uncertainty in the simulation and the data. The plots show the number of events without normalization to the bin width. The different background contributions are discussed in the text. |

png pdf |
Figure 1-a:
Distributions of events passing the selection requirements in the muon (left) and electron channels (right). Each plot also presents in the lower part a ratio of simulation over data. Only statistical uncertainties are shown as error bars on the data points, whereas the ratio presents the statistical uncertainty in the simulation and the data. The plots show the number of events without normalization to the bin width. The different background contributions are discussed in the text. |

png pdf |
Figure 1-b:
Distributions of events passing the selection requirements in the muon (left) and electron channels (right). Each plot also presents in the lower part a ratio of simulation over data. Only statistical uncertainties are shown as error bars on the data points, whereas the ratio presents the statistical uncertainty in the simulation and the data. The plots show the number of events without normalization to the bin width. The different background contributions are discussed in the text. |

png pdf |
Figure 2:
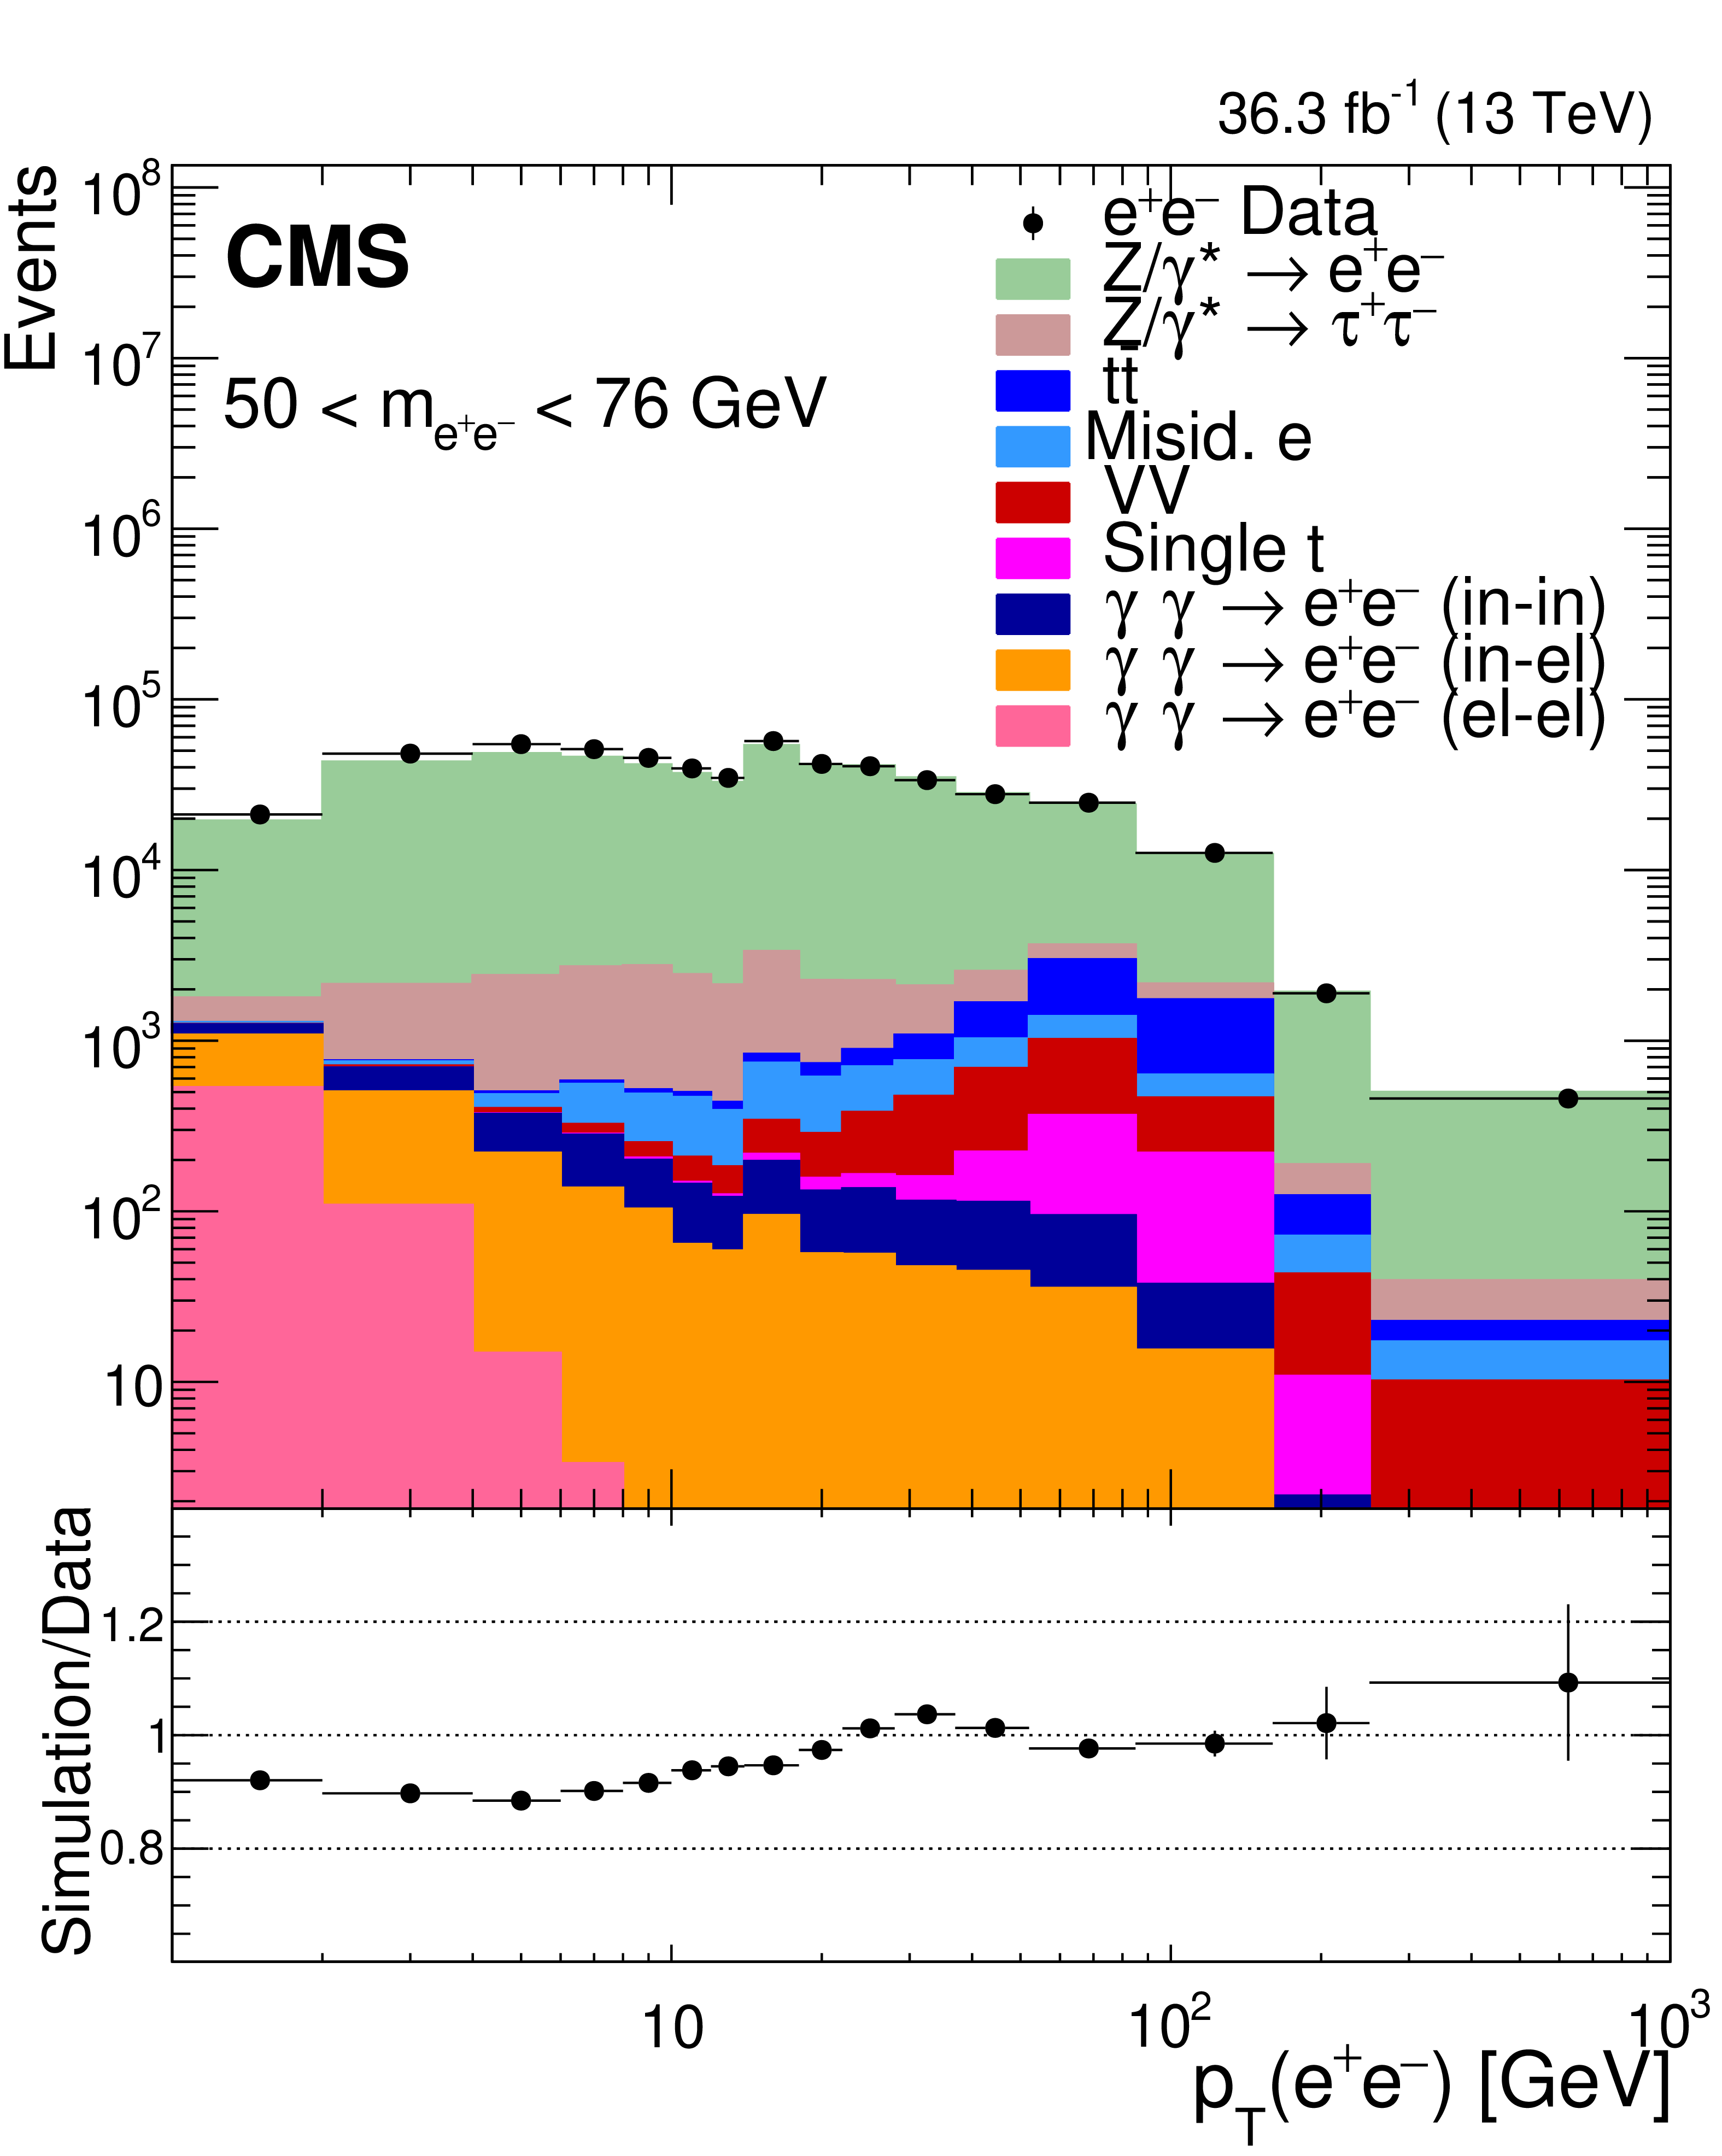
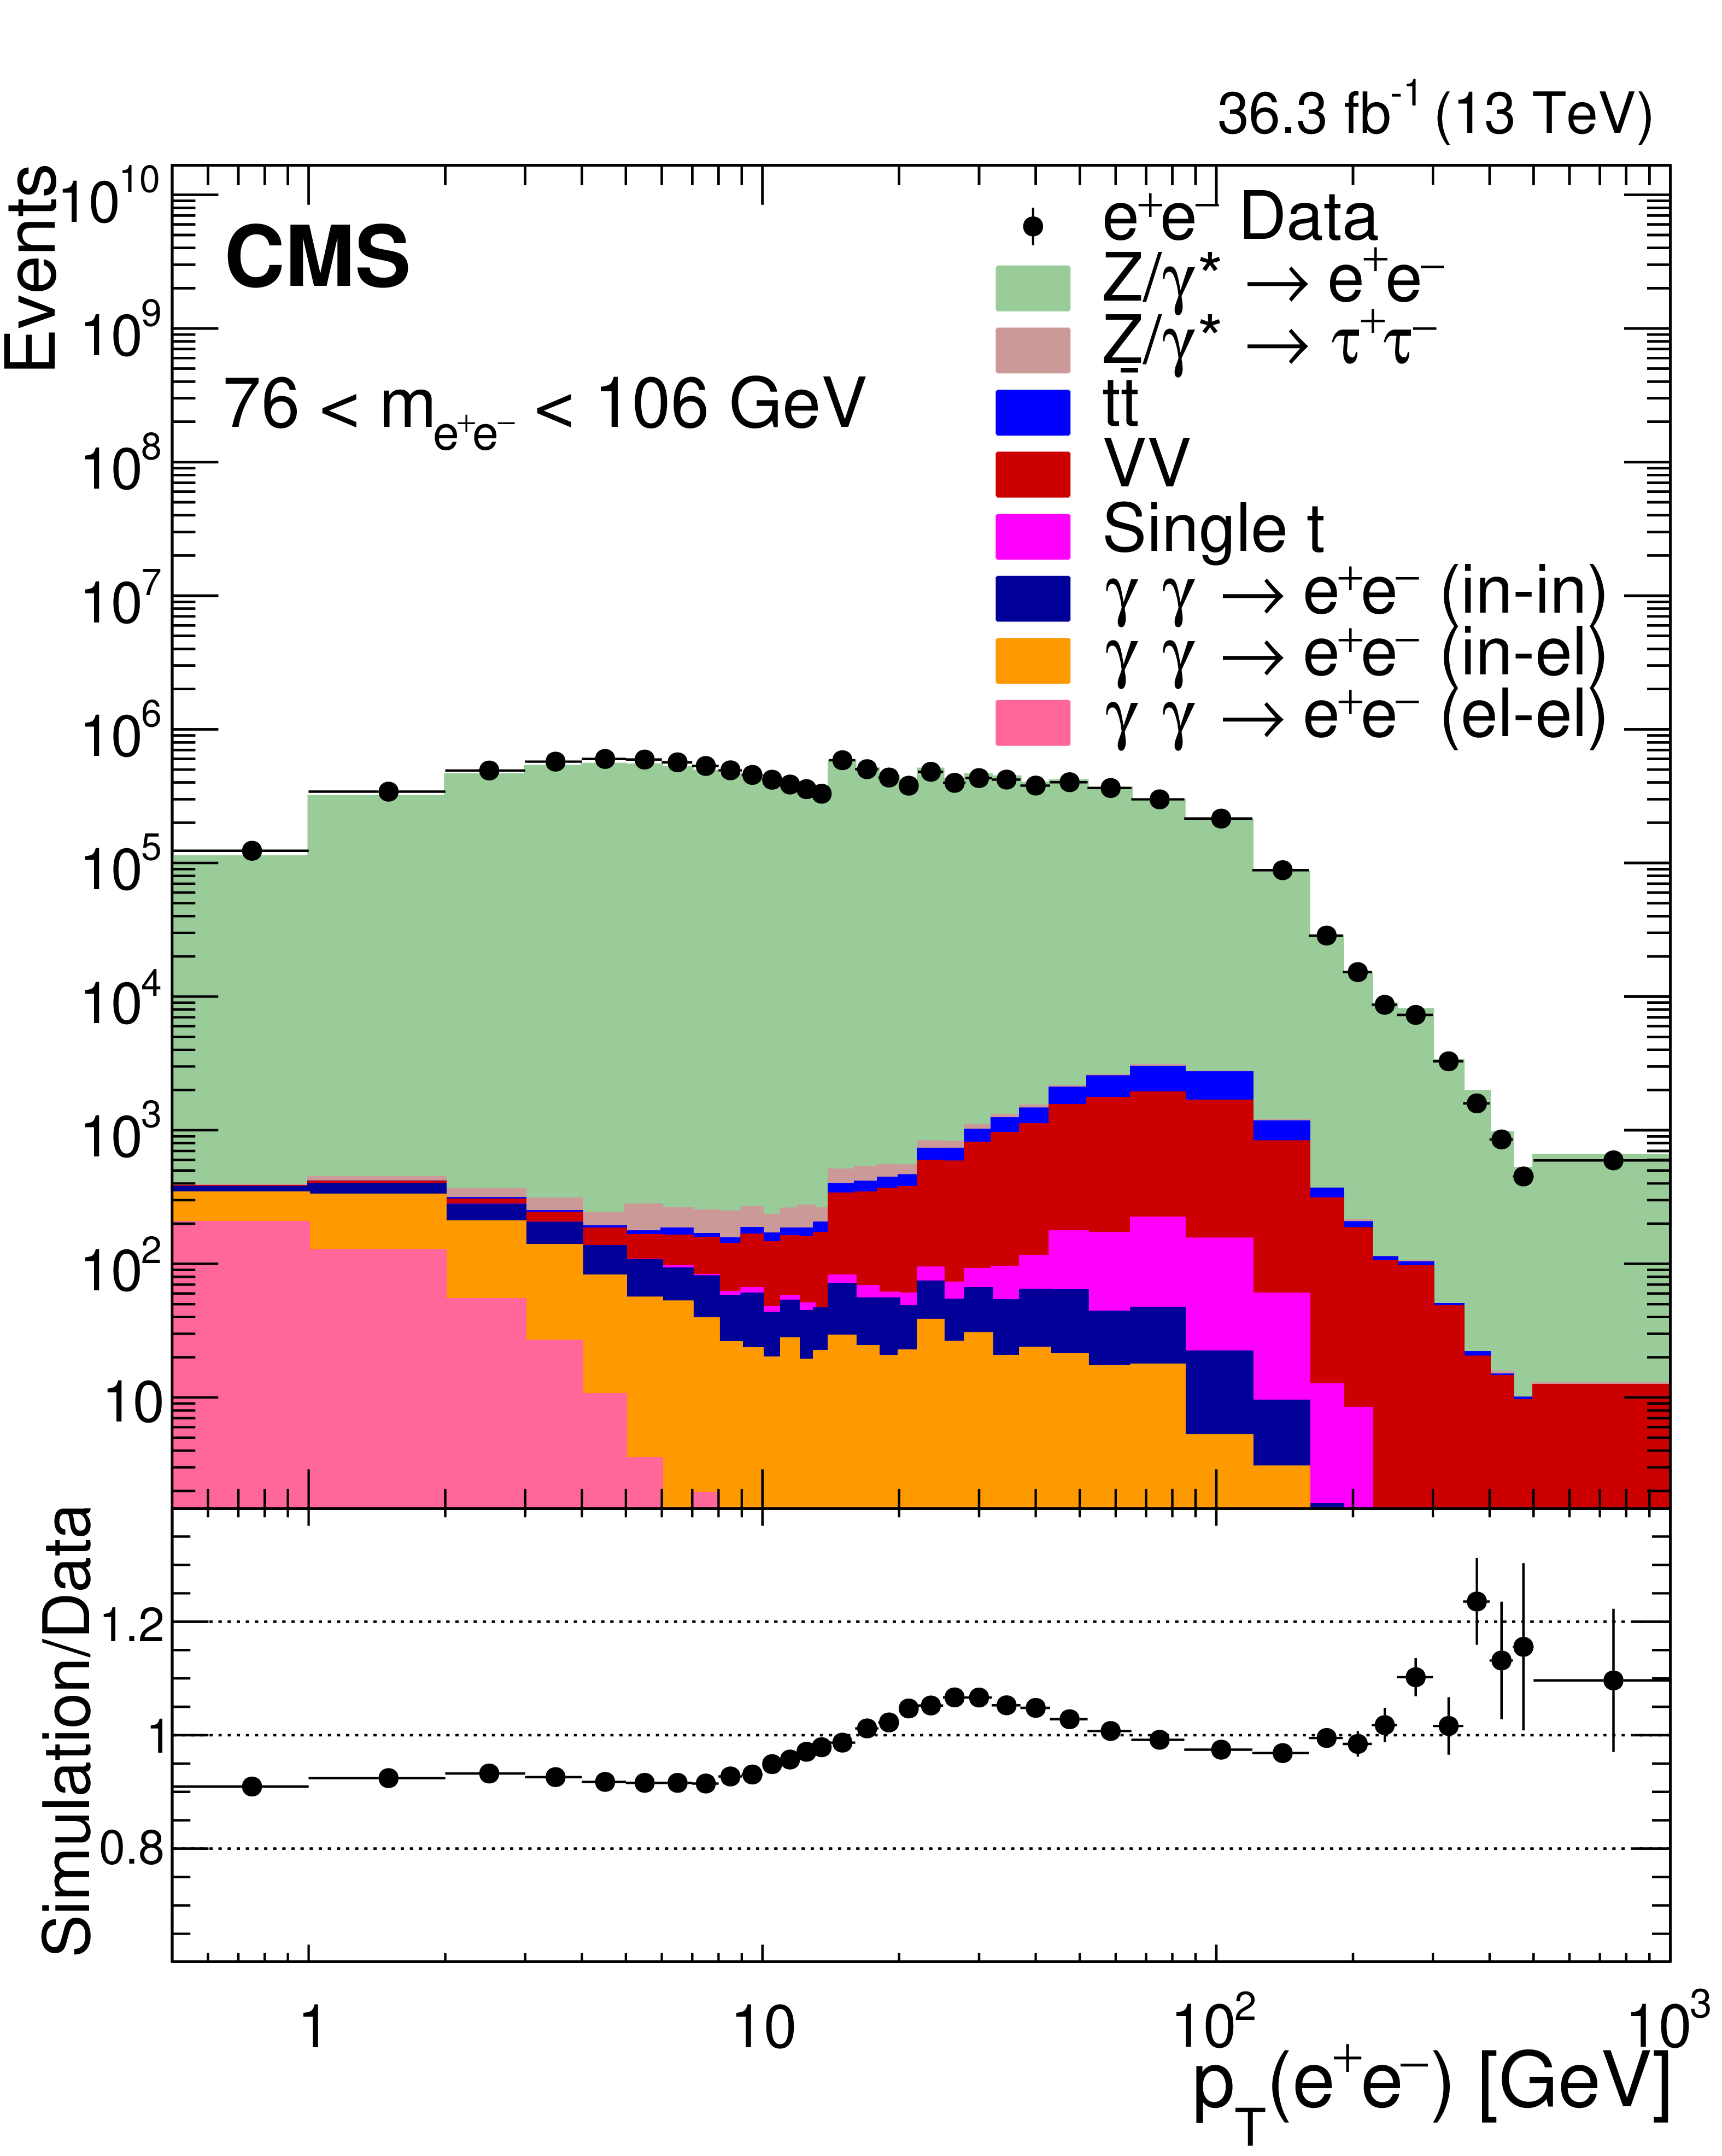
Distributions of events passing the selection requirements in the electron channel as a function of the dilepton $ p_{\mathrm{T}} $ in five ranges of invariant mass: 50 to 76 GeV (upper left), 76 to 106 GeV (upper right), 106 to 170 GeV (middle left), 170 to 350 GeV (middle right), and 350 to 1000 GeV (lower). More details are given in Fig. 1. |
png pdf |
Figure 2-a:
Distributions of events passing the selection requirements in the electron channel as a function of the dilepton $ p_{\mathrm{T}} $ in five ranges of invariant mass: 50 to 76 GeV (upper left), 76 to 106 GeV (upper right), 106 to 170 GeV (middle left), 170 to 350 GeV (middle right), and 350 to 1000 GeV (lower). More details are given in Fig. 1. |
png pdf |
Figure 2-b:
Distributions of events passing the selection requirements in the electron channel as a function of the dilepton $ p_{\mathrm{T}} $ in five ranges of invariant mass: 50 to 76 GeV (upper left), 76 to 106 GeV (upper right), 106 to 170 GeV (middle left), 170 to 350 GeV (middle right), and 350 to 1000 GeV (lower). More details are given in Fig. 1. |

png pdf |
Figure 2-c:
Distributions of events passing the selection requirements in the electron channel as a function of the dilepton $ p_{\mathrm{T}} $ in five ranges of invariant mass: 50 to 76 GeV (upper left), 76 to 106 GeV (upper right), 106 to 170 GeV (middle left), 170 to 350 GeV (middle right), and 350 to 1000 GeV (lower). More details are given in Fig. 1. |

png pdf |
Figure 2-d:
Distributions of events passing the selection requirements in the electron channel as a function of the dilepton $ p_{\mathrm{T}} $ in five ranges of invariant mass: 50 to 76 GeV (upper left), 76 to 106 GeV (upper right), 106 to 170 GeV (middle left), 170 to 350 GeV (middle right), and 350 to 1000 GeV (lower). More details are given in Fig. 1. |

png pdf |
Figure 2-e:
Distributions of events passing the selection requirements in the electron channel as a function of the dilepton $ p_{\mathrm{T}} $ in five ranges of invariant mass: 50 to 76 GeV (upper left), 76 to 106 GeV (upper right), 106 to 170 GeV (middle left), 170 to 350 GeV (middle right), and 350 to 1000 GeV (lower). More details are given in Fig. 1. |

png pdf |
Figure 3:
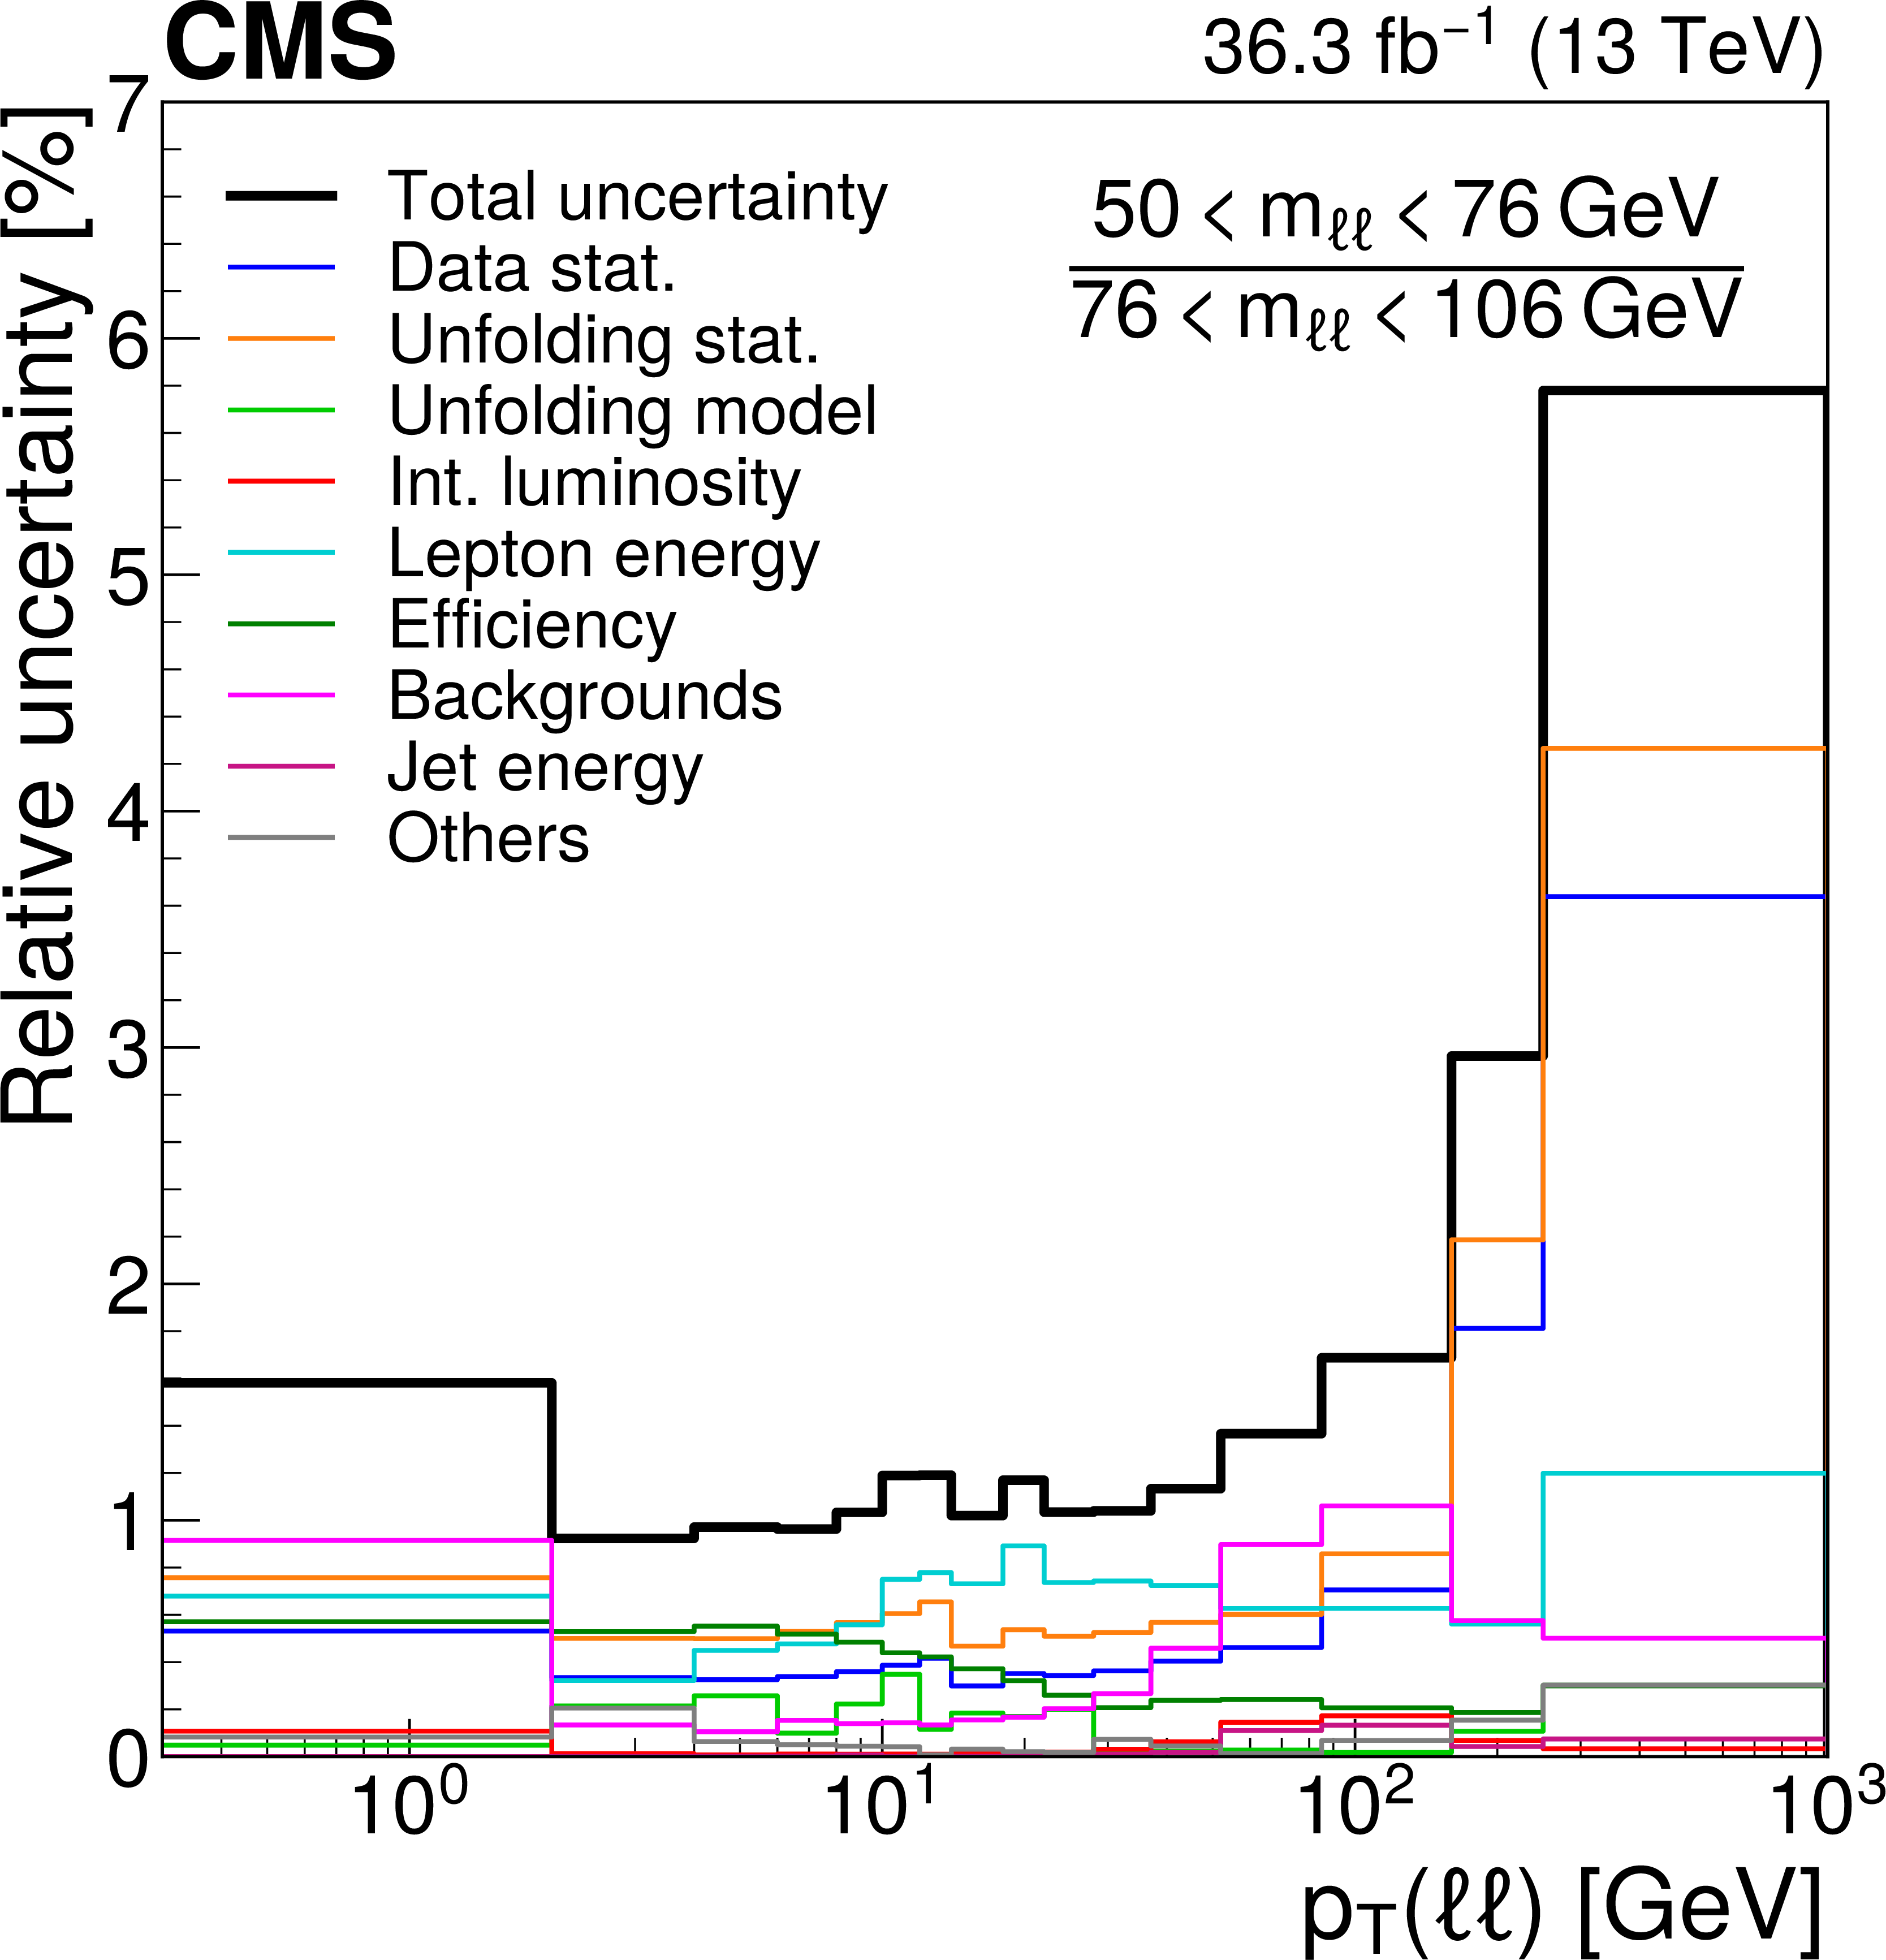
Estimates of the uncertainties in inclusive differential cross sections in $ p_{\mathrm{T}}(\ell\ell) $ in various invariant mass ranges: 50 $ < m_{\ell\ell} < 76\,\text{Ge\hspace{-.08em}V} $ (upper left), 76 $ < m_{\ell\ell} < 106\,\text{Ge\hspace{-.08em}V} $ (upper right), 106 $ < m_{\ell\ell} < 170\,\text{Ge\hspace{-.08em}V} $ (middle left), 170 $ < m_{\ell\ell} < 350\,\text{Ge\hspace{-.08em}V} $ (middle right), and 350 $ < m_{\ell\ell} < 1000\,\text{Ge\hspace{-.08em}V} $ (lower). The black line is the quadratic sum of the colored lines. |

png pdf |
Figure 3-a:
Estimates of the uncertainties in inclusive differential cross sections in $ p_{\mathrm{T}}(\ell\ell) $ in various invariant mass ranges: 50 $ < m_{\ell\ell} < 76\,\text{Ge\hspace{-.08em}V} $ (upper left), 76 $ < m_{\ell\ell} < 106\,\text{Ge\hspace{-.08em}V} $ (upper right), 106 $ < m_{\ell\ell} < 170\,\text{Ge\hspace{-.08em}V} $ (middle left), 170 $ < m_{\ell\ell} < 350\,\text{Ge\hspace{-.08em}V} $ (middle right), and 350 $ < m_{\ell\ell} < 1000\,\text{Ge\hspace{-.08em}V} $ (lower). The black line is the quadratic sum of the colored lines. |

png pdf |
Figure 3-b:
Estimates of the uncertainties in inclusive differential cross sections in $ p_{\mathrm{T}}(\ell\ell) $ in various invariant mass ranges: 50 $ < m_{\ell\ell} < 76\,\text{Ge\hspace{-.08em}V} $ (upper left), 76 $ < m_{\ell\ell} < 106\,\text{Ge\hspace{-.08em}V} $ (upper right), 106 $ < m_{\ell\ell} < 170\,\text{Ge\hspace{-.08em}V} $ (middle left), 170 $ < m_{\ell\ell} < 350\,\text{Ge\hspace{-.08em}V} $ (middle right), and 350 $ < m_{\ell\ell} < 1000\,\text{Ge\hspace{-.08em}V} $ (lower). The black line is the quadratic sum of the colored lines. |

png pdf |
Figure 3-c:
Estimates of the uncertainties in inclusive differential cross sections in $ p_{\mathrm{T}}(\ell\ell) $ in various invariant mass ranges: 50 $ < m_{\ell\ell} < 76\,\text{Ge\hspace{-.08em}V} $ (upper left), 76 $ < m_{\ell\ell} < 106\,\text{Ge\hspace{-.08em}V} $ (upper right), 106 $ < m_{\ell\ell} < 170\,\text{Ge\hspace{-.08em}V} $ (middle left), 170 $ < m_{\ell\ell} < 350\,\text{Ge\hspace{-.08em}V} $ (middle right), and 350 $ < m_{\ell\ell} < 1000\,\text{Ge\hspace{-.08em}V} $ (lower). The black line is the quadratic sum of the colored lines. |

png pdf |
Figure 3-d:
Estimates of the uncertainties in inclusive differential cross sections in $ p_{\mathrm{T}}(\ell\ell) $ in various invariant mass ranges: 50 $ < m_{\ell\ell} < 76\,\text{Ge\hspace{-.08em}V} $ (upper left), 76 $ < m_{\ell\ell} < 106\,\text{Ge\hspace{-.08em}V} $ (upper right), 106 $ < m_{\ell\ell} < 170\,\text{Ge\hspace{-.08em}V} $ (middle left), 170 $ < m_{\ell\ell} < 350\,\text{Ge\hspace{-.08em}V} $ (middle right), and 350 $ < m_{\ell\ell} < 1000\,\text{Ge\hspace{-.08em}V} $ (lower). The black line is the quadratic sum of the colored lines. |

png pdf |
Figure 3-e:
Estimates of the uncertainties in inclusive differential cross sections in $ p_{\mathrm{T}}(\ell\ell) $ in various invariant mass ranges: 50 $ < m_{\ell\ell} < 76\,\text{Ge\hspace{-.08em}V} $ (upper left), 76 $ < m_{\ell\ell} < 106\,\text{Ge\hspace{-.08em}V} $ (upper right), 106 $ < m_{\ell\ell} < 170\,\text{Ge\hspace{-.08em}V} $ (middle left), 170 $ < m_{\ell\ell} < 350\,\text{Ge\hspace{-.08em}V} $ (middle right), and 350 $ < m_{\ell\ell} < 1000\,\text{Ge\hspace{-.08em}V} $ (lower). The black line is the quadratic sum of the colored lines. |

png pdf |
Figure 4:
Estimates of the uncertainties in inclusive differential cross section ratios in $ p_{\mathrm{T}}(\ell\ell) $ for invariant mass ranges with respect to the peak region 76 $ < m_{\ell\ell} < 106\,\text{Ge\hspace{-.08em}V} $: 50 $ < m_{\ell\ell} < 76\,\text{Ge\hspace{-.08em}V} $ (upper left), 106 $ < m_{\ell\ell} < 170\,\text{Ge\hspace{-.08em}V} $ (upper right), 170 $ < m_{\ell\ell} < 350\,\text{Ge\hspace{-.08em}V} $ (lower left), and 350 $ < m_{\ell\ell} < 1000\,\text{Ge\hspace{-.08em}V} $ (lower right). The black line is the quadratic sum of the colored lines. |
png pdf |
Figure 4-a:
Estimates of the uncertainties in inclusive differential cross section ratios in $ p_{\mathrm{T}}(\ell\ell) $ for invariant mass ranges with respect to the peak region 76 $ < m_{\ell\ell} < 106\,\text{Ge\hspace{-.08em}V} $: 50 $ < m_{\ell\ell} < 76\,\text{Ge\hspace{-.08em}V} $ (upper left), 106 $ < m_{\ell\ell} < 170\,\text{Ge\hspace{-.08em}V} $ (upper right), 170 $ < m_{\ell\ell} < 350\,\text{Ge\hspace{-.08em}V} $ (lower left), and 350 $ < m_{\ell\ell} < 1000\,\text{Ge\hspace{-.08em}V} $ (lower right). The black line is the quadratic sum of the colored lines. |

png pdf |
Figure 4-b:
Estimates of the uncertainties in inclusive differential cross section ratios in $ p_{\mathrm{T}}(\ell\ell) $ for invariant mass ranges with respect to the peak region 76 $ < m_{\ell\ell} < 106\,\text{Ge\hspace{-.08em}V} $: 50 $ < m_{\ell\ell} < 76\,\text{Ge\hspace{-.08em}V} $ (upper left), 106 $ < m_{\ell\ell} < 170\,\text{Ge\hspace{-.08em}V} $ (upper right), 170 $ < m_{\ell\ell} < 350\,\text{Ge\hspace{-.08em}V} $ (lower left), and 350 $ < m_{\ell\ell} < 1000\,\text{Ge\hspace{-.08em}V} $ (lower right). The black line is the quadratic sum of the colored lines. |

png pdf |
Figure 4-c:
Estimates of the uncertainties in inclusive differential cross section ratios in $ p_{\mathrm{T}}(\ell\ell) $ for invariant mass ranges with respect to the peak region 76 $ < m_{\ell\ell} < 106\,\text{Ge\hspace{-.08em}V} $: 50 $ < m_{\ell\ell} < 76\,\text{Ge\hspace{-.08em}V} $ (upper left), 106 $ < m_{\ell\ell} < 170\,\text{Ge\hspace{-.08em}V} $ (upper right), 170 $ < m_{\ell\ell} < 350\,\text{Ge\hspace{-.08em}V} $ (lower left), and 350 $ < m_{\ell\ell} < 1000\,\text{Ge\hspace{-.08em}V} $ (lower right). The black line is the quadratic sum of the colored lines. |

png pdf |
Figure 4-d:
Estimates of the uncertainties in inclusive differential cross section ratios in $ p_{\mathrm{T}}(\ell\ell) $ for invariant mass ranges with respect to the peak region 76 $ < m_{\ell\ell} < 106\,\text{Ge\hspace{-.08em}V} $: 50 $ < m_{\ell\ell} < 76\,\text{Ge\hspace{-.08em}V} $ (upper left), 106 $ < m_{\ell\ell} < 170\,\text{Ge\hspace{-.08em}V} $ (upper right), 170 $ < m_{\ell\ell} < 350\,\text{Ge\hspace{-.08em}V} $ (lower left), and 350 $ < m_{\ell\ell} < 1000\,\text{Ge\hspace{-.08em}V} $ (lower right). The black line is the quadratic sum of the colored lines. |

png pdf |
Figure 5:
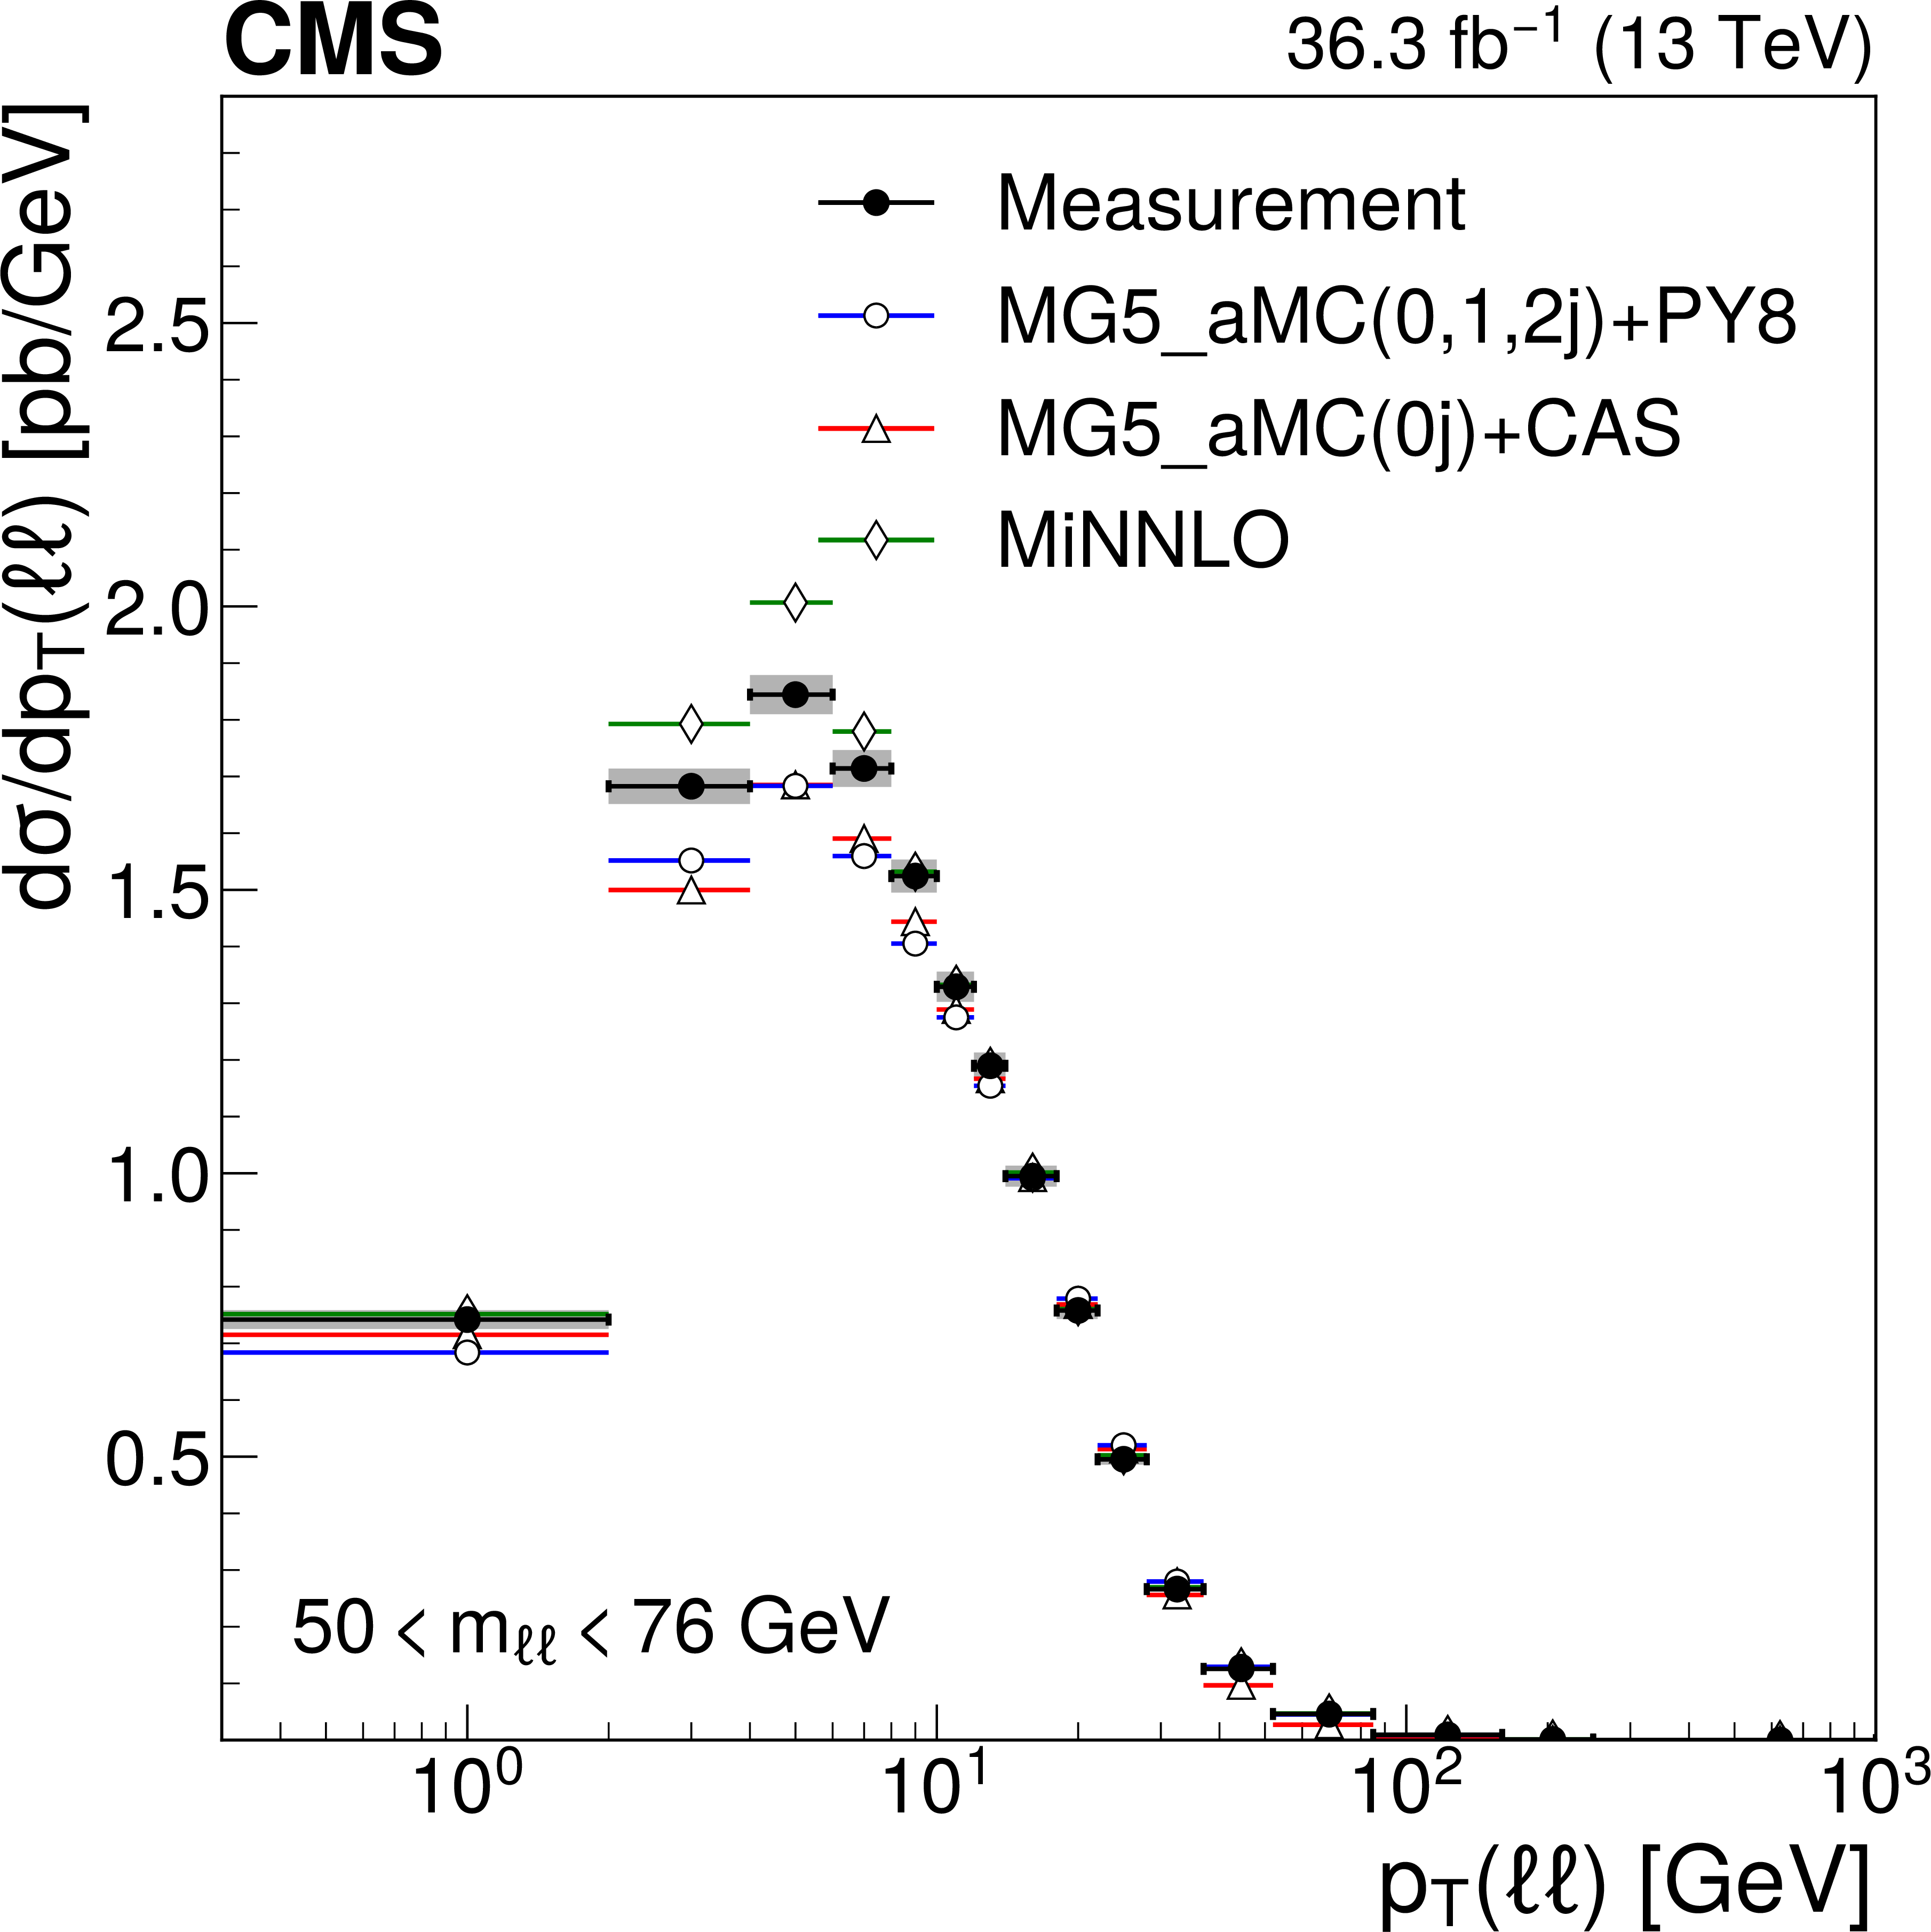
Differential cross sections in $ p_{\mathrm{T}}(\ell\ell) $ in various invariant mass ranges: 50 $ < m_{\ell\ell} < 76\,\text{Ge\hspace{-.08em}V} $ (upper left), 76 $ < m_{\ell\ell} < 106\,\text{Ge\hspace{-.08em}V} $ (upper right), 106 $ < m_{\ell\ell} < 170\,\text{Ge\hspace{-.08em}V} $ (middle left), 170 $ < m_{\ell\ell} < 350\,\text{Ge\hspace{-.08em}V} $ (middle right), and 350 $ < m_{\ell\ell} < 1000\,\text{Ge\hspace{-.08em}V} $ (lower). The error bars on data points (black dots) correspond to the statistical uncertainty of the measurement and the shaded bands around the data points correspond to the total experimental uncertainty. The measurement is compared with MG5\_aMC (0, 1, and 2 jets at NLO) + PYTHIA8 (blue dots), \textsc{MiNNLO$ _\mathrm{PS} $ (green diamonds) and MG5\_aMC (0 jet at NLO)+ PB (CASCADE) (red triangles). |
png pdf |
Figure 5-a:
Differential cross sections in $ p_{\mathrm{T}}(\ell\ell) $ in various invariant mass ranges: 50 $ < m_{\ell\ell} < 76\,\text{Ge\hspace{-.08em}V} $ (upper left), 76 $ < m_{\ell\ell} < 106\,\text{Ge\hspace{-.08em}V} $ (upper right), 106 $ < m_{\ell\ell} < 170\,\text{Ge\hspace{-.08em}V} $ (middle left), 170 $ < m_{\ell\ell} < 350\,\text{Ge\hspace{-.08em}V} $ (middle right), and 350 $ < m_{\ell\ell} < 1000\,\text{Ge\hspace{-.08em}V} $ (lower). The error bars on data points (black dots) correspond to the statistical uncertainty of the measurement and the shaded bands around the data points correspond to the total experimental uncertainty. The measurement is compared with MG5\_aMC (0, 1, and 2 jets at NLO) + PYTHIA8 (blue dots), \textsc{MiNNLO$ _\mathrm{PS} $ (green diamonds) and MG5\_aMC (0 jet at NLO)+ PB (CASCADE) (red triangles). |

png pdf |
Figure 5-b:
Differential cross sections in $ p_{\mathrm{T}}(\ell\ell) $ in various invariant mass ranges: 50 $ < m_{\ell\ell} < 76\,\text{Ge\hspace{-.08em}V} $ (upper left), 76 $ < m_{\ell\ell} < 106\,\text{Ge\hspace{-.08em}V} $ (upper right), 106 $ < m_{\ell\ell} < 170\,\text{Ge\hspace{-.08em}V} $ (middle left), 170 $ < m_{\ell\ell} < 350\,\text{Ge\hspace{-.08em}V} $ (middle right), and 350 $ < m_{\ell\ell} < 1000\,\text{Ge\hspace{-.08em}V} $ (lower). The error bars on data points (black dots) correspond to the statistical uncertainty of the measurement and the shaded bands around the data points correspond to the total experimental uncertainty. The measurement is compared with MG5\_aMC (0, 1, and 2 jets at NLO) + PYTHIA8 (blue dots), \textsc{MiNNLO$ _\mathrm{PS} $ (green diamonds) and MG5\_aMC (0 jet at NLO)+ PB (CASCADE) (red triangles). |

png pdf |
Figure 5-c:
Differential cross sections in $ p_{\mathrm{T}}(\ell\ell) $ in various invariant mass ranges: 50 $ < m_{\ell\ell} < 76\,\text{Ge\hspace{-.08em}V} $ (upper left), 76 $ < m_{\ell\ell} < 106\,\text{Ge\hspace{-.08em}V} $ (upper right), 106 $ < m_{\ell\ell} < 170\,\text{Ge\hspace{-.08em}V} $ (middle left), 170 $ < m_{\ell\ell} < 350\,\text{Ge\hspace{-.08em}V} $ (middle right), and 350 $ < m_{\ell\ell} < 1000\,\text{Ge\hspace{-.08em}V} $ (lower). The error bars on data points (black dots) correspond to the statistical uncertainty of the measurement and the shaded bands around the data points correspond to the total experimental uncertainty. The measurement is compared with MG5\_aMC (0, 1, and 2 jets at NLO) + PYTHIA8 (blue dots), \textsc{MiNNLO$ _\mathrm{PS} $ (green diamonds) and MG5\_aMC (0 jet at NLO)+ PB (CASCADE) (red triangles). |

png pdf |
Figure 5-d:
Differential cross sections in $ p_{\mathrm{T}}(\ell\ell) $ in various invariant mass ranges: 50 $ < m_{\ell\ell} < 76\,\text{Ge\hspace{-.08em}V} $ (upper left), 76 $ < m_{\ell\ell} < 106\,\text{Ge\hspace{-.08em}V} $ (upper right), 106 $ < m_{\ell\ell} < 170\,\text{Ge\hspace{-.08em}V} $ (middle left), 170 $ < m_{\ell\ell} < 350\,\text{Ge\hspace{-.08em}V} $ (middle right), and 350 $ < m_{\ell\ell} < 1000\,\text{Ge\hspace{-.08em}V} $ (lower). The error bars on data points (black dots) correspond to the statistical uncertainty of the measurement and the shaded bands around the data points correspond to the total experimental uncertainty. The measurement is compared with MG5\_aMC (0, 1, and 2 jets at NLO) + PYTHIA8 (blue dots), \textsc{MiNNLO$ _\mathrm{PS} $ (green diamonds) and MG5\_aMC (0 jet at NLO)+ PB (CASCADE) (red triangles). |

png pdf |
Figure 5-e:
Differential cross sections in $ p_{\mathrm{T}}(\ell\ell) $ in various invariant mass ranges: 50 $ < m_{\ell\ell} < 76\,\text{Ge\hspace{-.08em}V} $ (upper left), 76 $ < m_{\ell\ell} < 106\,\text{Ge\hspace{-.08em}V} $ (upper right), 106 $ < m_{\ell\ell} < 170\,\text{Ge\hspace{-.08em}V} $ (middle left), 170 $ < m_{\ell\ell} < 350\,\text{Ge\hspace{-.08em}V} $ (middle right), and 350 $ < m_{\ell\ell} < 1000\,\text{Ge\hspace{-.08em}V} $ (lower). The error bars on data points (black dots) correspond to the statistical uncertainty of the measurement and the shaded bands around the data points correspond to the total experimental uncertainty. The measurement is compared with MG5\_aMC (0, 1, and 2 jets at NLO) + PYTHIA8 (blue dots), \textsc{MiNNLO$ _\mathrm{PS} $ (green diamonds) and MG5\_aMC (0 jet at NLO)+ PB (CASCADE) (red triangles). |

png pdf |
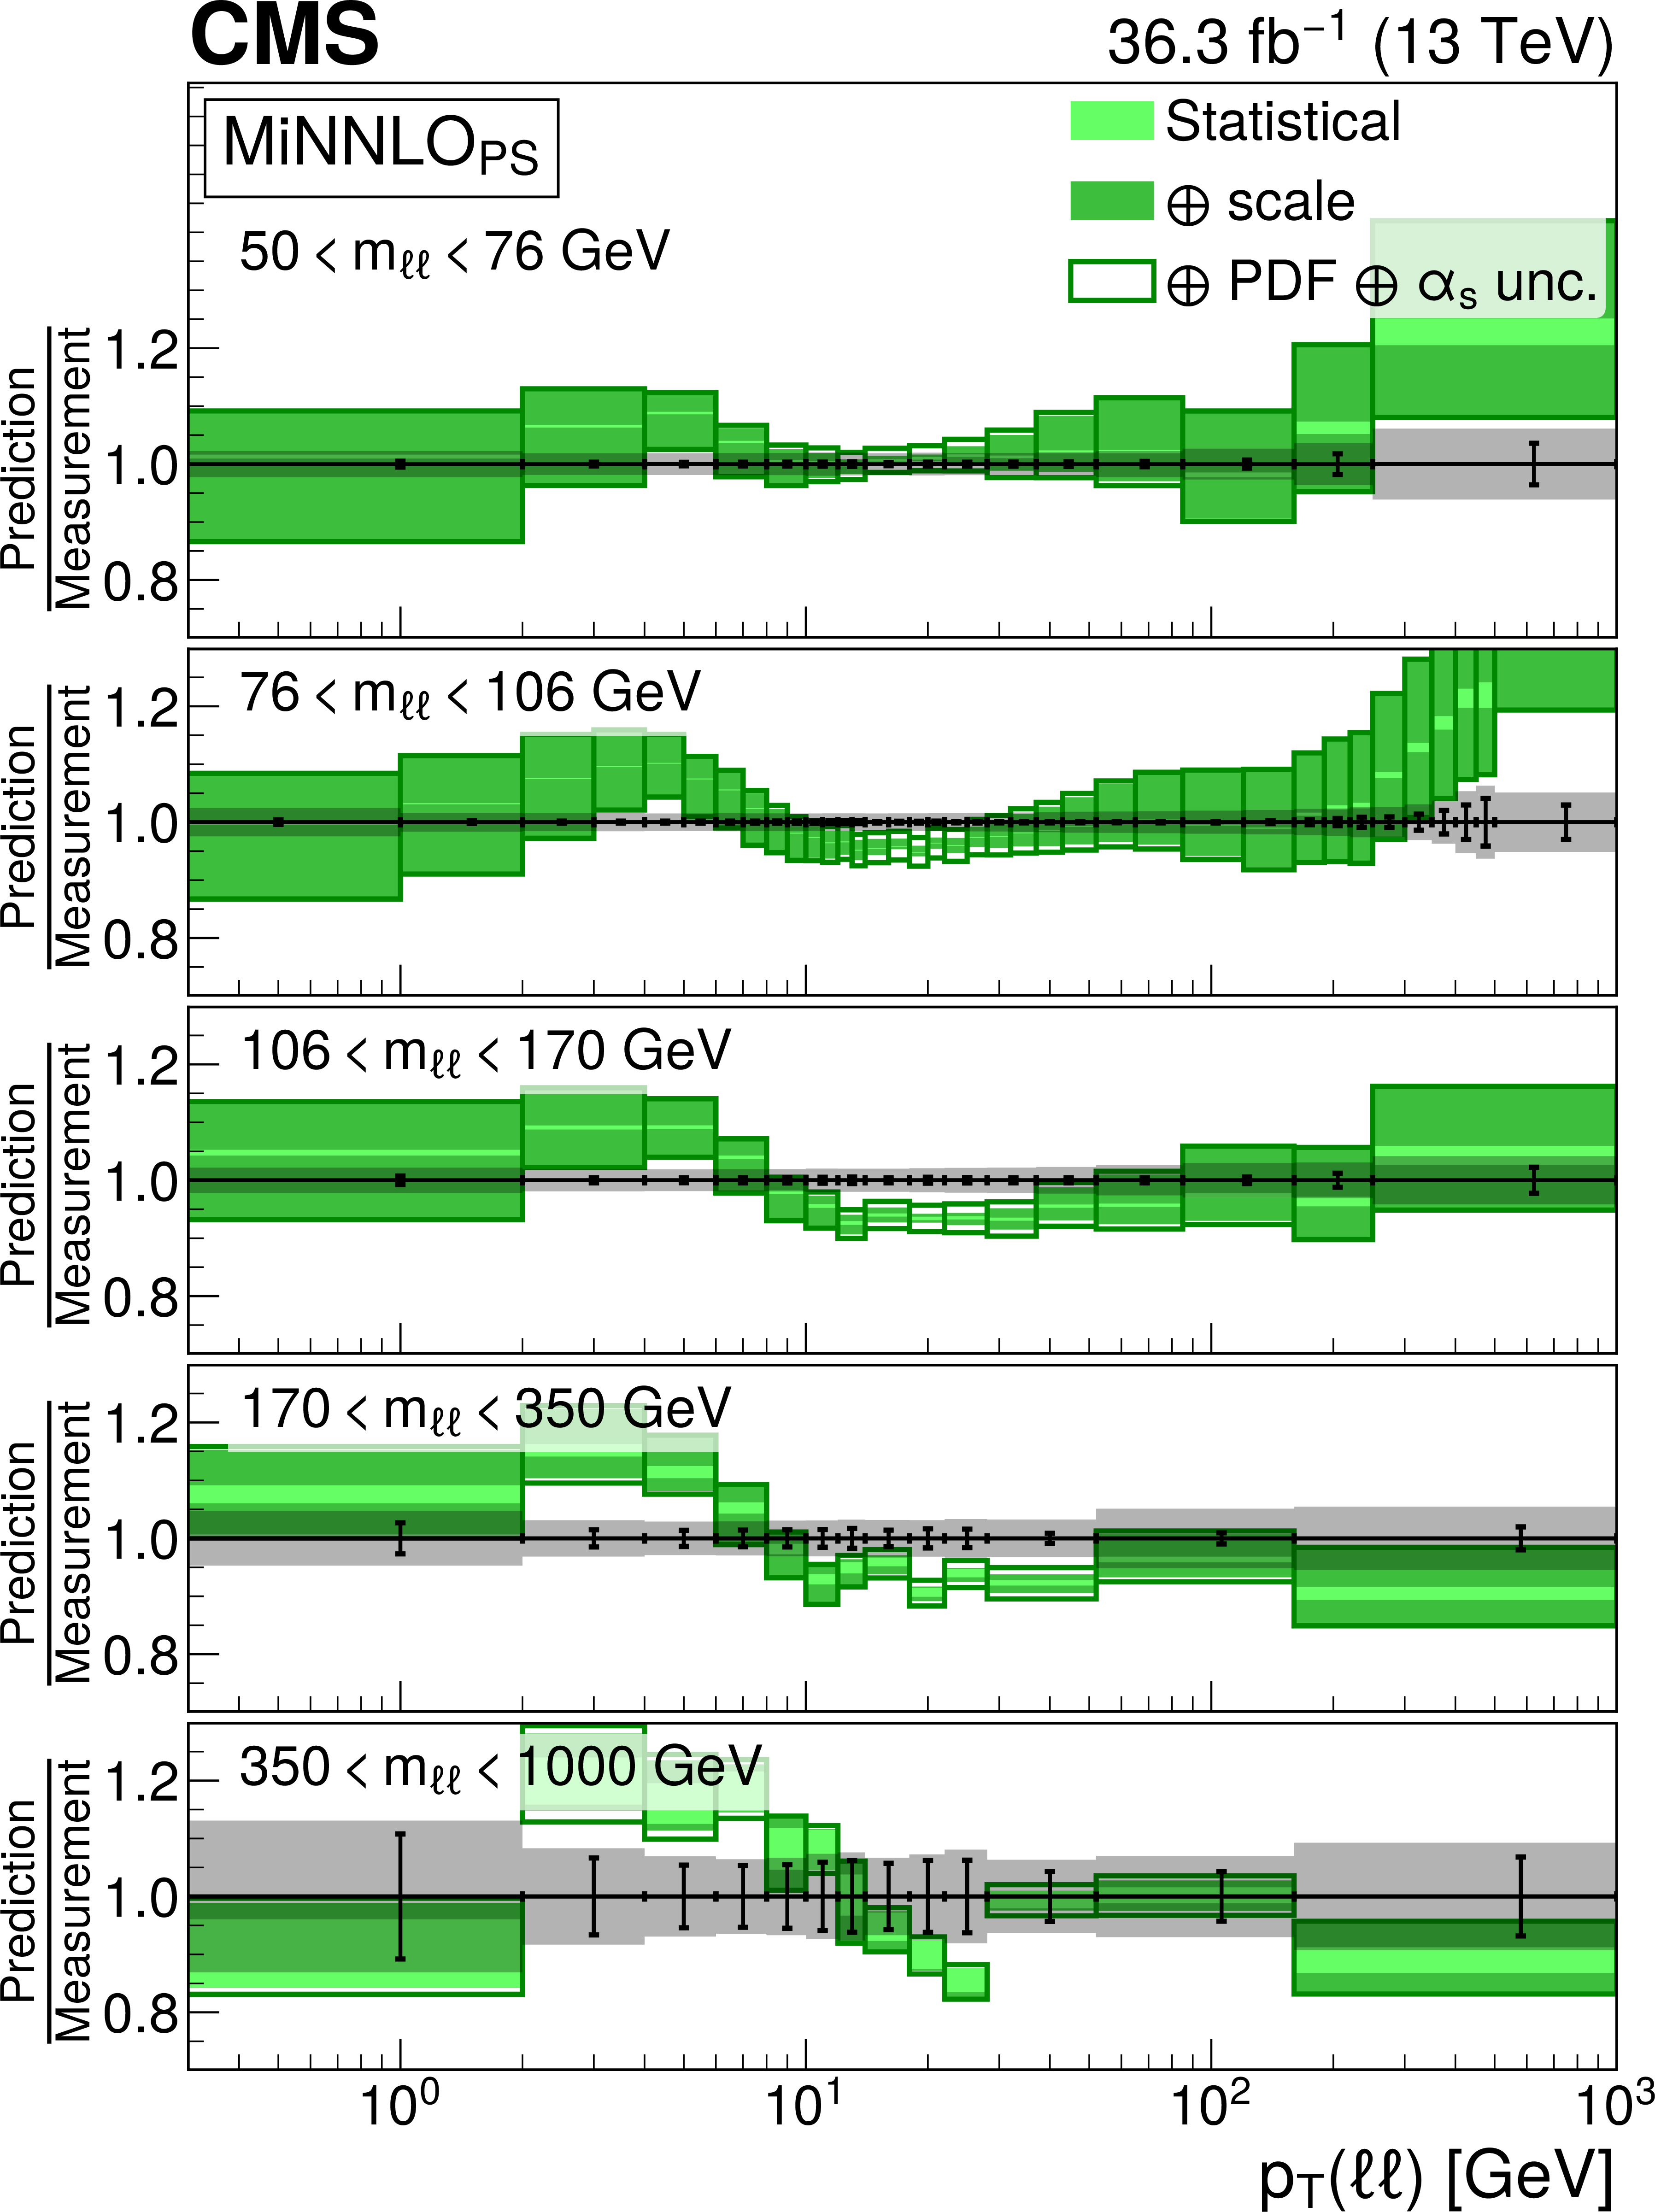
Figure 6:
Comparison to Monte Carlo predictions based on a matrix element with parton shower merging. The ratio of MG5\_aMC (0, 1, and 2 jets at NLO) + PYTHIA8 (left) and \textsc{MiNNLO$ _\mathrm{PS} $ (right) predictions to the measured differential cross sections in $ p_{\mathrm{T}}(\ell\ell) $ are presented for various $ m_{\ell\ell} $ ranges. The error bars correspond to the statistical uncertainty of the measurement and the shaded bands to the total experimental uncertainty. The light color band corresponds to the statistical uncertainty of the simulation and the dark color band includes the scale uncertainty. The largest bands include PDF and $ \alpha_\mathrm{S} $ uncertainties, added in quadrature. |

png pdf |
Figure 6-a:
Comparison to Monte Carlo predictions based on a matrix element with parton shower merging. The ratio of MG5\_aMC (0, 1, and 2 jets at NLO) + PYTHIA8 (left) and \textsc{MiNNLO$ _\mathrm{PS} $ (right) predictions to the measured differential cross sections in $ p_{\mathrm{T}}(\ell\ell) $ are presented for various $ m_{\ell\ell} $ ranges. The error bars correspond to the statistical uncertainty of the measurement and the shaded bands to the total experimental uncertainty. The light color band corresponds to the statistical uncertainty of the simulation and the dark color band includes the scale uncertainty. The largest bands include PDF and $ \alpha_\mathrm{S} $ uncertainties, added in quadrature. |
png pdf |
Figure 6-b:
Comparison to Monte Carlo predictions based on a matrix element with parton shower merging. The ratio of MG5\_aMC (0, 1, and 2 jets at NLO) + PYTHIA8 (left) and \textsc{MiNNLO$ _\mathrm{PS} $ (right) predictions to the measured differential cross sections in $ p_{\mathrm{T}}(\ell\ell) $ are presented for various $ m_{\ell\ell} $ ranges. The error bars correspond to the statistical uncertainty of the measurement and the shaded bands to the total experimental uncertainty. The light color band corresponds to the statistical uncertainty of the simulation and the dark color band includes the scale uncertainty. The largest bands include PDF and $ \alpha_\mathrm{S} $ uncertainties, added in quadrature. |

png pdf |
Figure 7:
Comparison to TMD based predictions. The ratio of MG5\_aMC (0 jet at NLO) + PB (CASCADE) (left) and ARTEMIDE (right) predictions to the measured differential cross sections in $ p_{\mathrm{T}}(\ell\ell) $ are presented for various $ m_{\ell\ell} $ ranges. The error bars correspond to the statistical uncertainty of the measurement and the shaded bands to the total experimental uncertainty. The light (dark) green band around ARTEMIDE predictions represent the nonperturbative (QCD scale) uncertainties, the darker green representing the QED FSR correction uncertainties. The range of invalidity is shaded with a gray band. The light color band around CASCADE prediction corresponds to the statistical uncertainty of the simulation and the dark color band includes the scale uncertainty. The largest bands include TMD uncertainty, added in quadrature. |

png pdf |
Figure 7-a:
Comparison to TMD based predictions. The ratio of MG5\_aMC (0 jet at NLO) + PB (CASCADE) (left) and ARTEMIDE (right) predictions to the measured differential cross sections in $ p_{\mathrm{T}}(\ell\ell) $ are presented for various $ m_{\ell\ell} $ ranges. The error bars correspond to the statistical uncertainty of the measurement and the shaded bands to the total experimental uncertainty. The light (dark) green band around ARTEMIDE predictions represent the nonperturbative (QCD scale) uncertainties, the darker green representing the QED FSR correction uncertainties. The range of invalidity is shaded with a gray band. The light color band around CASCADE prediction corresponds to the statistical uncertainty of the simulation and the dark color band includes the scale uncertainty. The largest bands include TMD uncertainty, added in quadrature. |

png pdf |
Figure 7-b:
Comparison to TMD based predictions. The ratio of MG5\_aMC (0 jet at NLO) + PB (CASCADE) (left) and ARTEMIDE (right) predictions to the measured differential cross sections in $ p_{\mathrm{T}}(\ell\ell) $ are presented for various $ m_{\ell\ell} $ ranges. The error bars correspond to the statistical uncertainty of the measurement and the shaded bands to the total experimental uncertainty. The light (dark) green band around ARTEMIDE predictions represent the nonperturbative (QCD scale) uncertainties, the darker green representing the QED FSR correction uncertainties. The range of invalidity is shaded with a gray band. The light color band around CASCADE prediction corresponds to the statistical uncertainty of the simulation and the dark color band includes the scale uncertainty. The largest bands include TMD uncertainty, added in quadrature. |
png pdf |
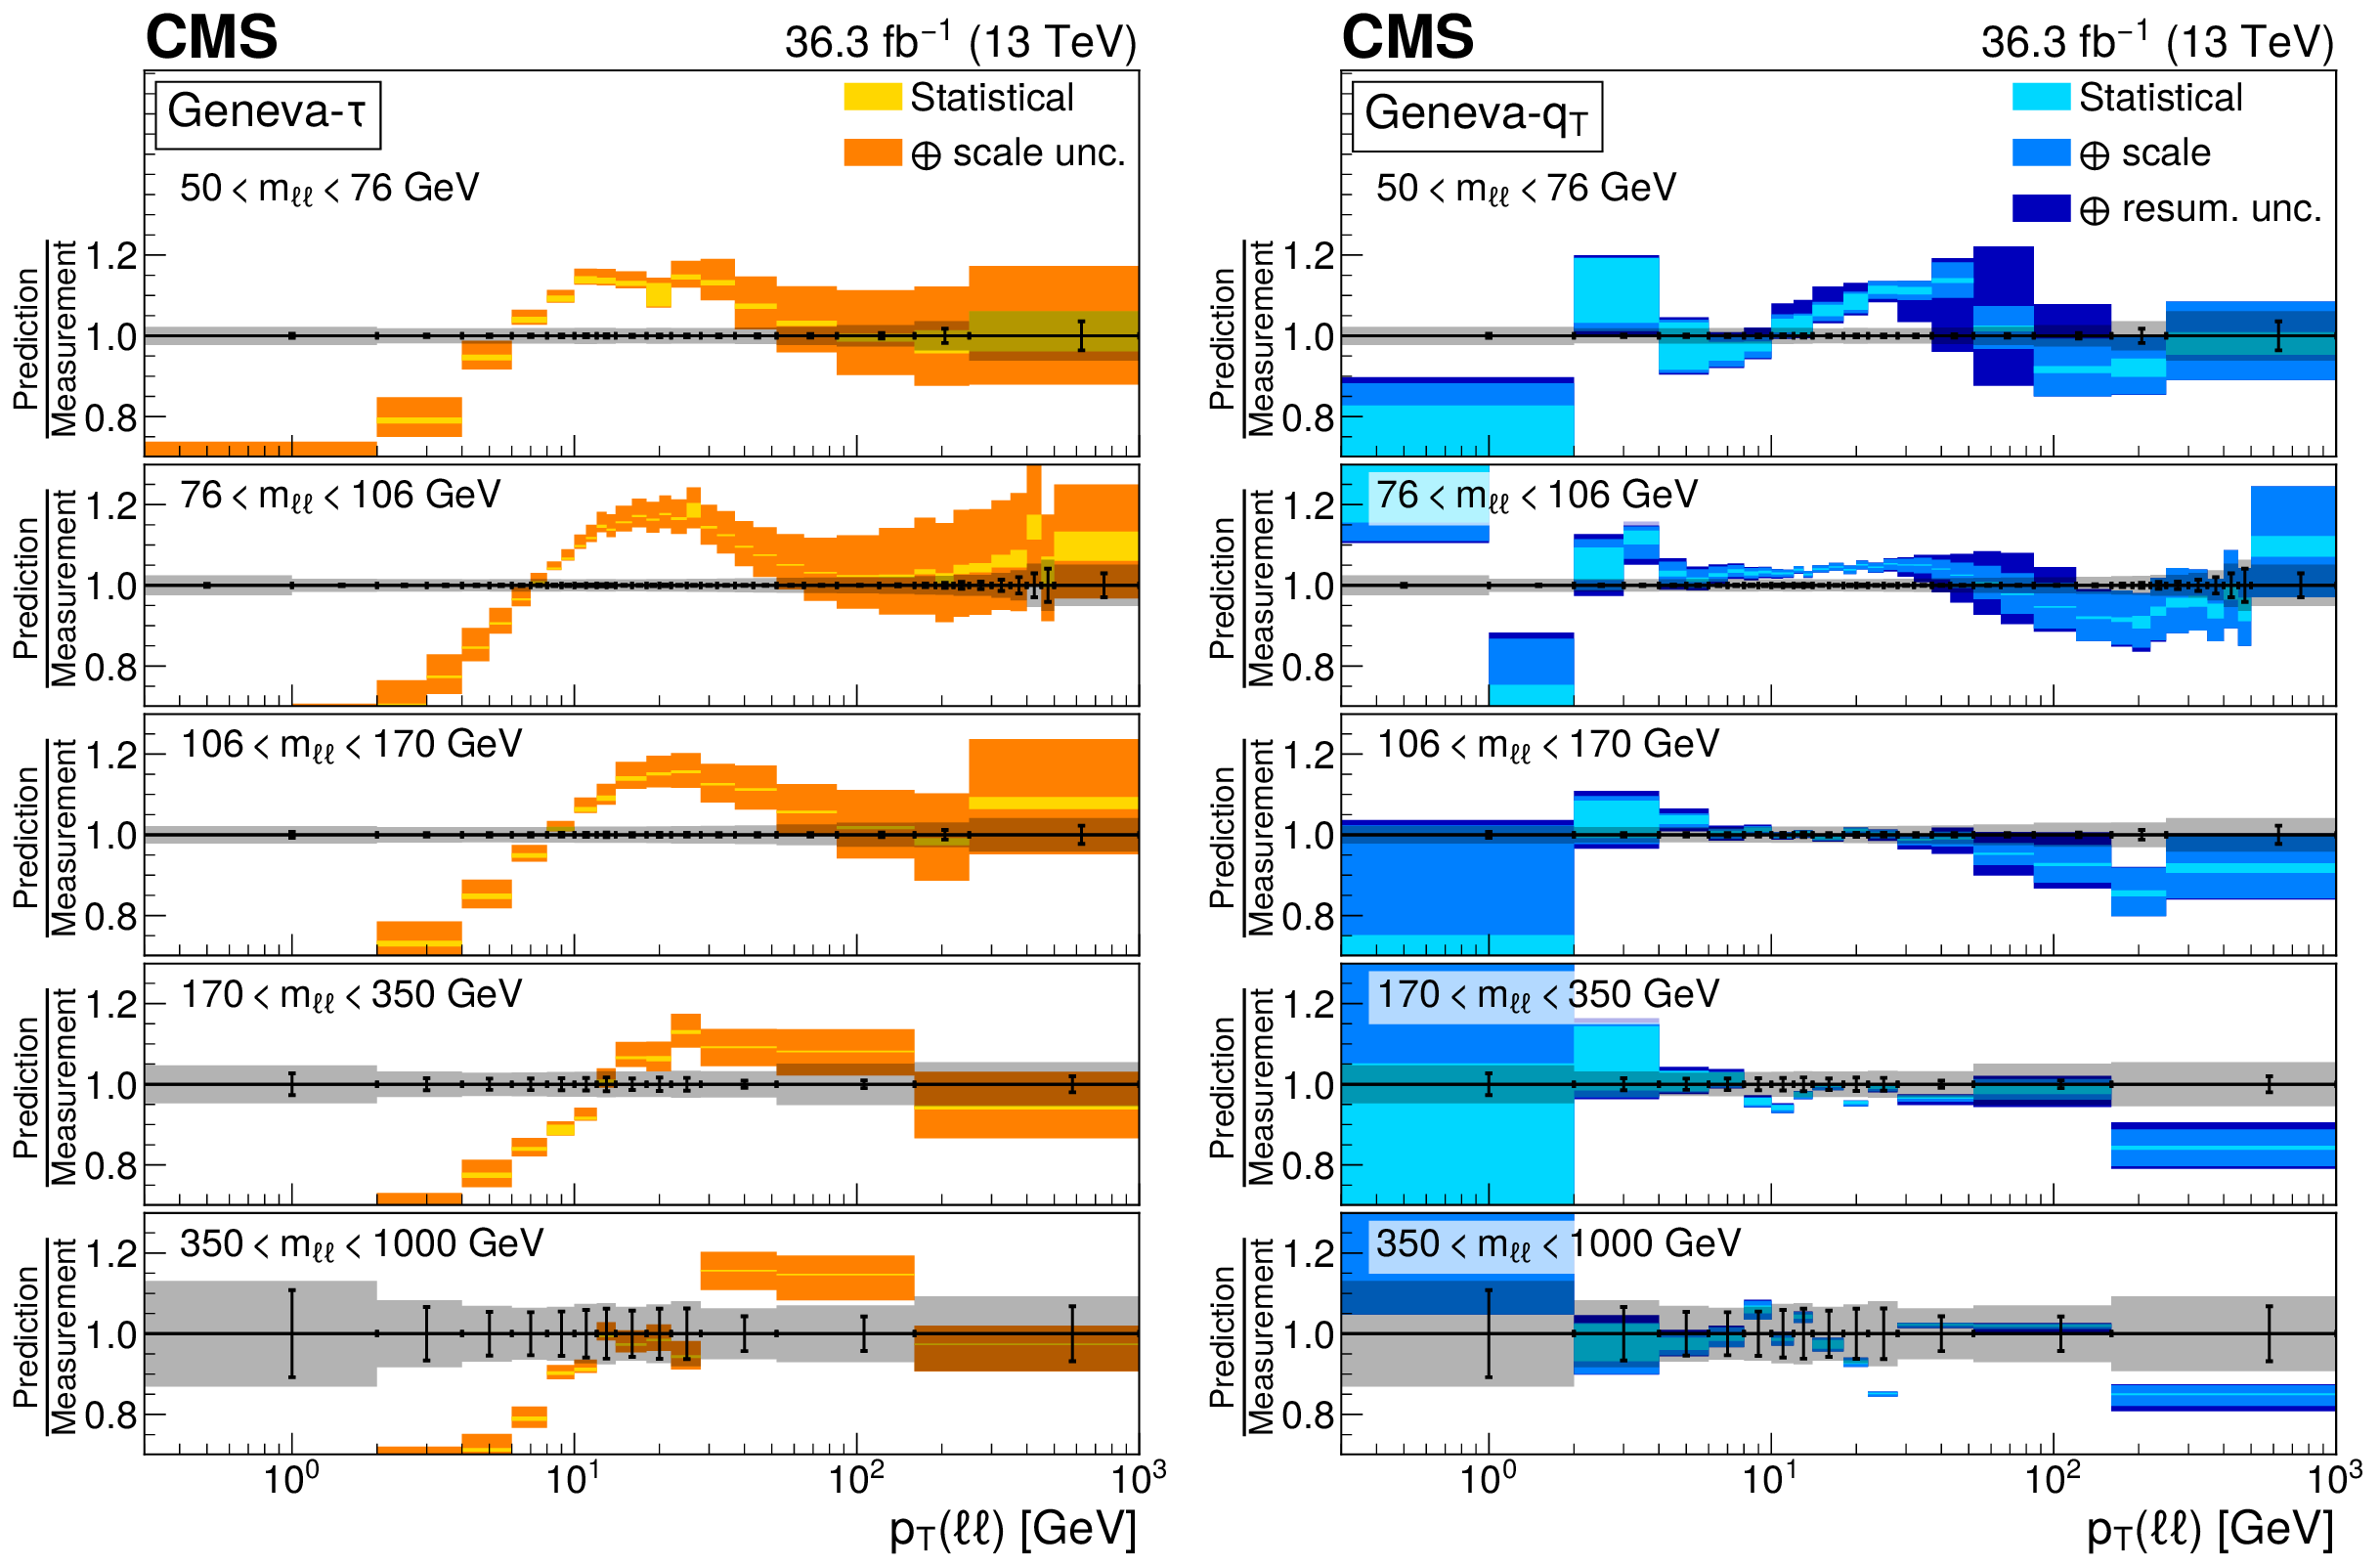
Figure 8:
Comparison to resummation based predictions. The ratio of GENEVA-$ \tau $ (left) and GENEVA-$ q_\mathrm{T} $ (right) predictions to the measured differential cross sections in $ p_{\mathrm{T}}(\ell\ell) $ are presented for various $ m_{\ell\ell} $ ranges. The error bars correspond to the statistical uncertainty of the measurement and the shaded bands to the total experimental uncertainty. The light color bands around the predictions represents the statistical uncertainties and the middle color bands represents the scale uncertainties. The dark outer bands of GENEVA-$ q_\mathrm{T} $ prediction represent the resummation uncertainties. |

png pdf |
Figure 8-a:
Comparison to resummation based predictions. The ratio of GENEVA-$ \tau $ (left) and GENEVA-$ q_\mathrm{T} $ (right) predictions to the measured differential cross sections in $ p_{\mathrm{T}}(\ell\ell) $ are presented for various $ m_{\ell\ell} $ ranges. The error bars correspond to the statistical uncertainty of the measurement and the shaded bands to the total experimental uncertainty. The light color bands around the predictions represents the statistical uncertainties and the middle color bands represents the scale uncertainties. The dark outer bands of GENEVA-$ q_\mathrm{T} $ prediction represent the resummation uncertainties. |

png pdf |
Figure 8-b:
Comparison to resummation based predictions. The ratio of GENEVA-$ \tau $ (left) and GENEVA-$ q_\mathrm{T} $ (right) predictions to the measured differential cross sections in $ p_{\mathrm{T}}(\ell\ell) $ are presented for various $ m_{\ell\ell} $ ranges. The error bars correspond to the statistical uncertainty of the measurement and the shaded bands to the total experimental uncertainty. The light color bands around the predictions represents the statistical uncertainties and the middle color bands represents the scale uncertainties. The dark outer bands of GENEVA-$ q_\mathrm{T} $ prediction represent the resummation uncertainties. |

png pdf |
Figure 9:
Ratios of differential cross sections in $ p_{\mathrm{T}}(\ell\ell) $ for invariant mass ranges with respect to the peak region 76 $ < m_{\ell\ell} < 106\,\text{Ge\hspace{-.08em}V} $: 50 $ < m_{\ell\ell} < 76\,\text{Ge\hspace{-.08em}V} $ (upper left), 106 $ < m_{\ell\ell} < 170\,\text{Ge\hspace{-.08em}V} $ (upper right), 170 $ < m_{\ell\ell} < 350\,\text{Ge\hspace{-.08em}V} $ (lower left), and 350 $ < m_{\ell\ell} < 1000\,\text{Ge\hspace{-.08em}V} $ (lower right). Details on the presentation of the results are given in Fig. 5 caption. |

png pdf |
Figure 9-a:
Ratios of differential cross sections in $ p_{\mathrm{T}}(\ell\ell) $ for invariant mass ranges with respect to the peak region 76 $ < m_{\ell\ell} < 106\,\text{Ge\hspace{-.08em}V} $: 50 $ < m_{\ell\ell} < 76\,\text{Ge\hspace{-.08em}V} $ (upper left), 106 $ < m_{\ell\ell} < 170\,\text{Ge\hspace{-.08em}V} $ (upper right), 170 $ < m_{\ell\ell} < 350\,\text{Ge\hspace{-.08em}V} $ (lower left), and 350 $ < m_{\ell\ell} < 1000\,\text{Ge\hspace{-.08em}V} $ (lower right). Details on the presentation of the results are given in Fig. 5 caption. |

png pdf |
Figure 9-b:
Ratios of differential cross sections in $ p_{\mathrm{T}}(\ell\ell) $ for invariant mass ranges with respect to the peak region 76 $ < m_{\ell\ell} < 106\,\text{Ge\hspace{-.08em}V} $: 50 $ < m_{\ell\ell} < 76\,\text{Ge\hspace{-.08em}V} $ (upper left), 106 $ < m_{\ell\ell} < 170\,\text{Ge\hspace{-.08em}V} $ (upper right), 170 $ < m_{\ell\ell} < 350\,\text{Ge\hspace{-.08em}V} $ (lower left), and 350 $ < m_{\ell\ell} < 1000\,\text{Ge\hspace{-.08em}V} $ (lower right). Details on the presentation of the results are given in Fig. 5 caption. |

png pdf |
Figure 9-c:
Ratios of differential cross sections in $ p_{\mathrm{T}}(\ell\ell) $ for invariant mass ranges with respect to the peak region 76 $ < m_{\ell\ell} < 106\,\text{Ge\hspace{-.08em}V} $: 50 $ < m_{\ell\ell} < 76\,\text{Ge\hspace{-.08em}V} $ (upper left), 106 $ < m_{\ell\ell} < 170\,\text{Ge\hspace{-.08em}V} $ (upper right), 170 $ < m_{\ell\ell} < 350\,\text{Ge\hspace{-.08em}V} $ (lower left), and 350 $ < m_{\ell\ell} < 1000\,\text{Ge\hspace{-.08em}V} $ (lower right). Details on the presentation of the results are given in Fig. 5 caption. |

png pdf |
Figure 9-d:
Ratios of differential cross sections in $ p_{\mathrm{T}}(\ell\ell) $ for invariant mass ranges with respect to the peak region 76 $ < m_{\ell\ell} < 106\,\text{Ge\hspace{-.08em}V} $: 50 $ < m_{\ell\ell} < 76\,\text{Ge\hspace{-.08em}V} $ (upper left), 106 $ < m_{\ell\ell} < 170\,\text{Ge\hspace{-.08em}V} $ (upper right), 170 $ < m_{\ell\ell} < 350\,\text{Ge\hspace{-.08em}V} $ (lower left), and 350 $ < m_{\ell\ell} < 1000\,\text{Ge\hspace{-.08em}V} $ (lower right). Details on the presentation of the results are given in Fig. 5 caption. |
png pdf |
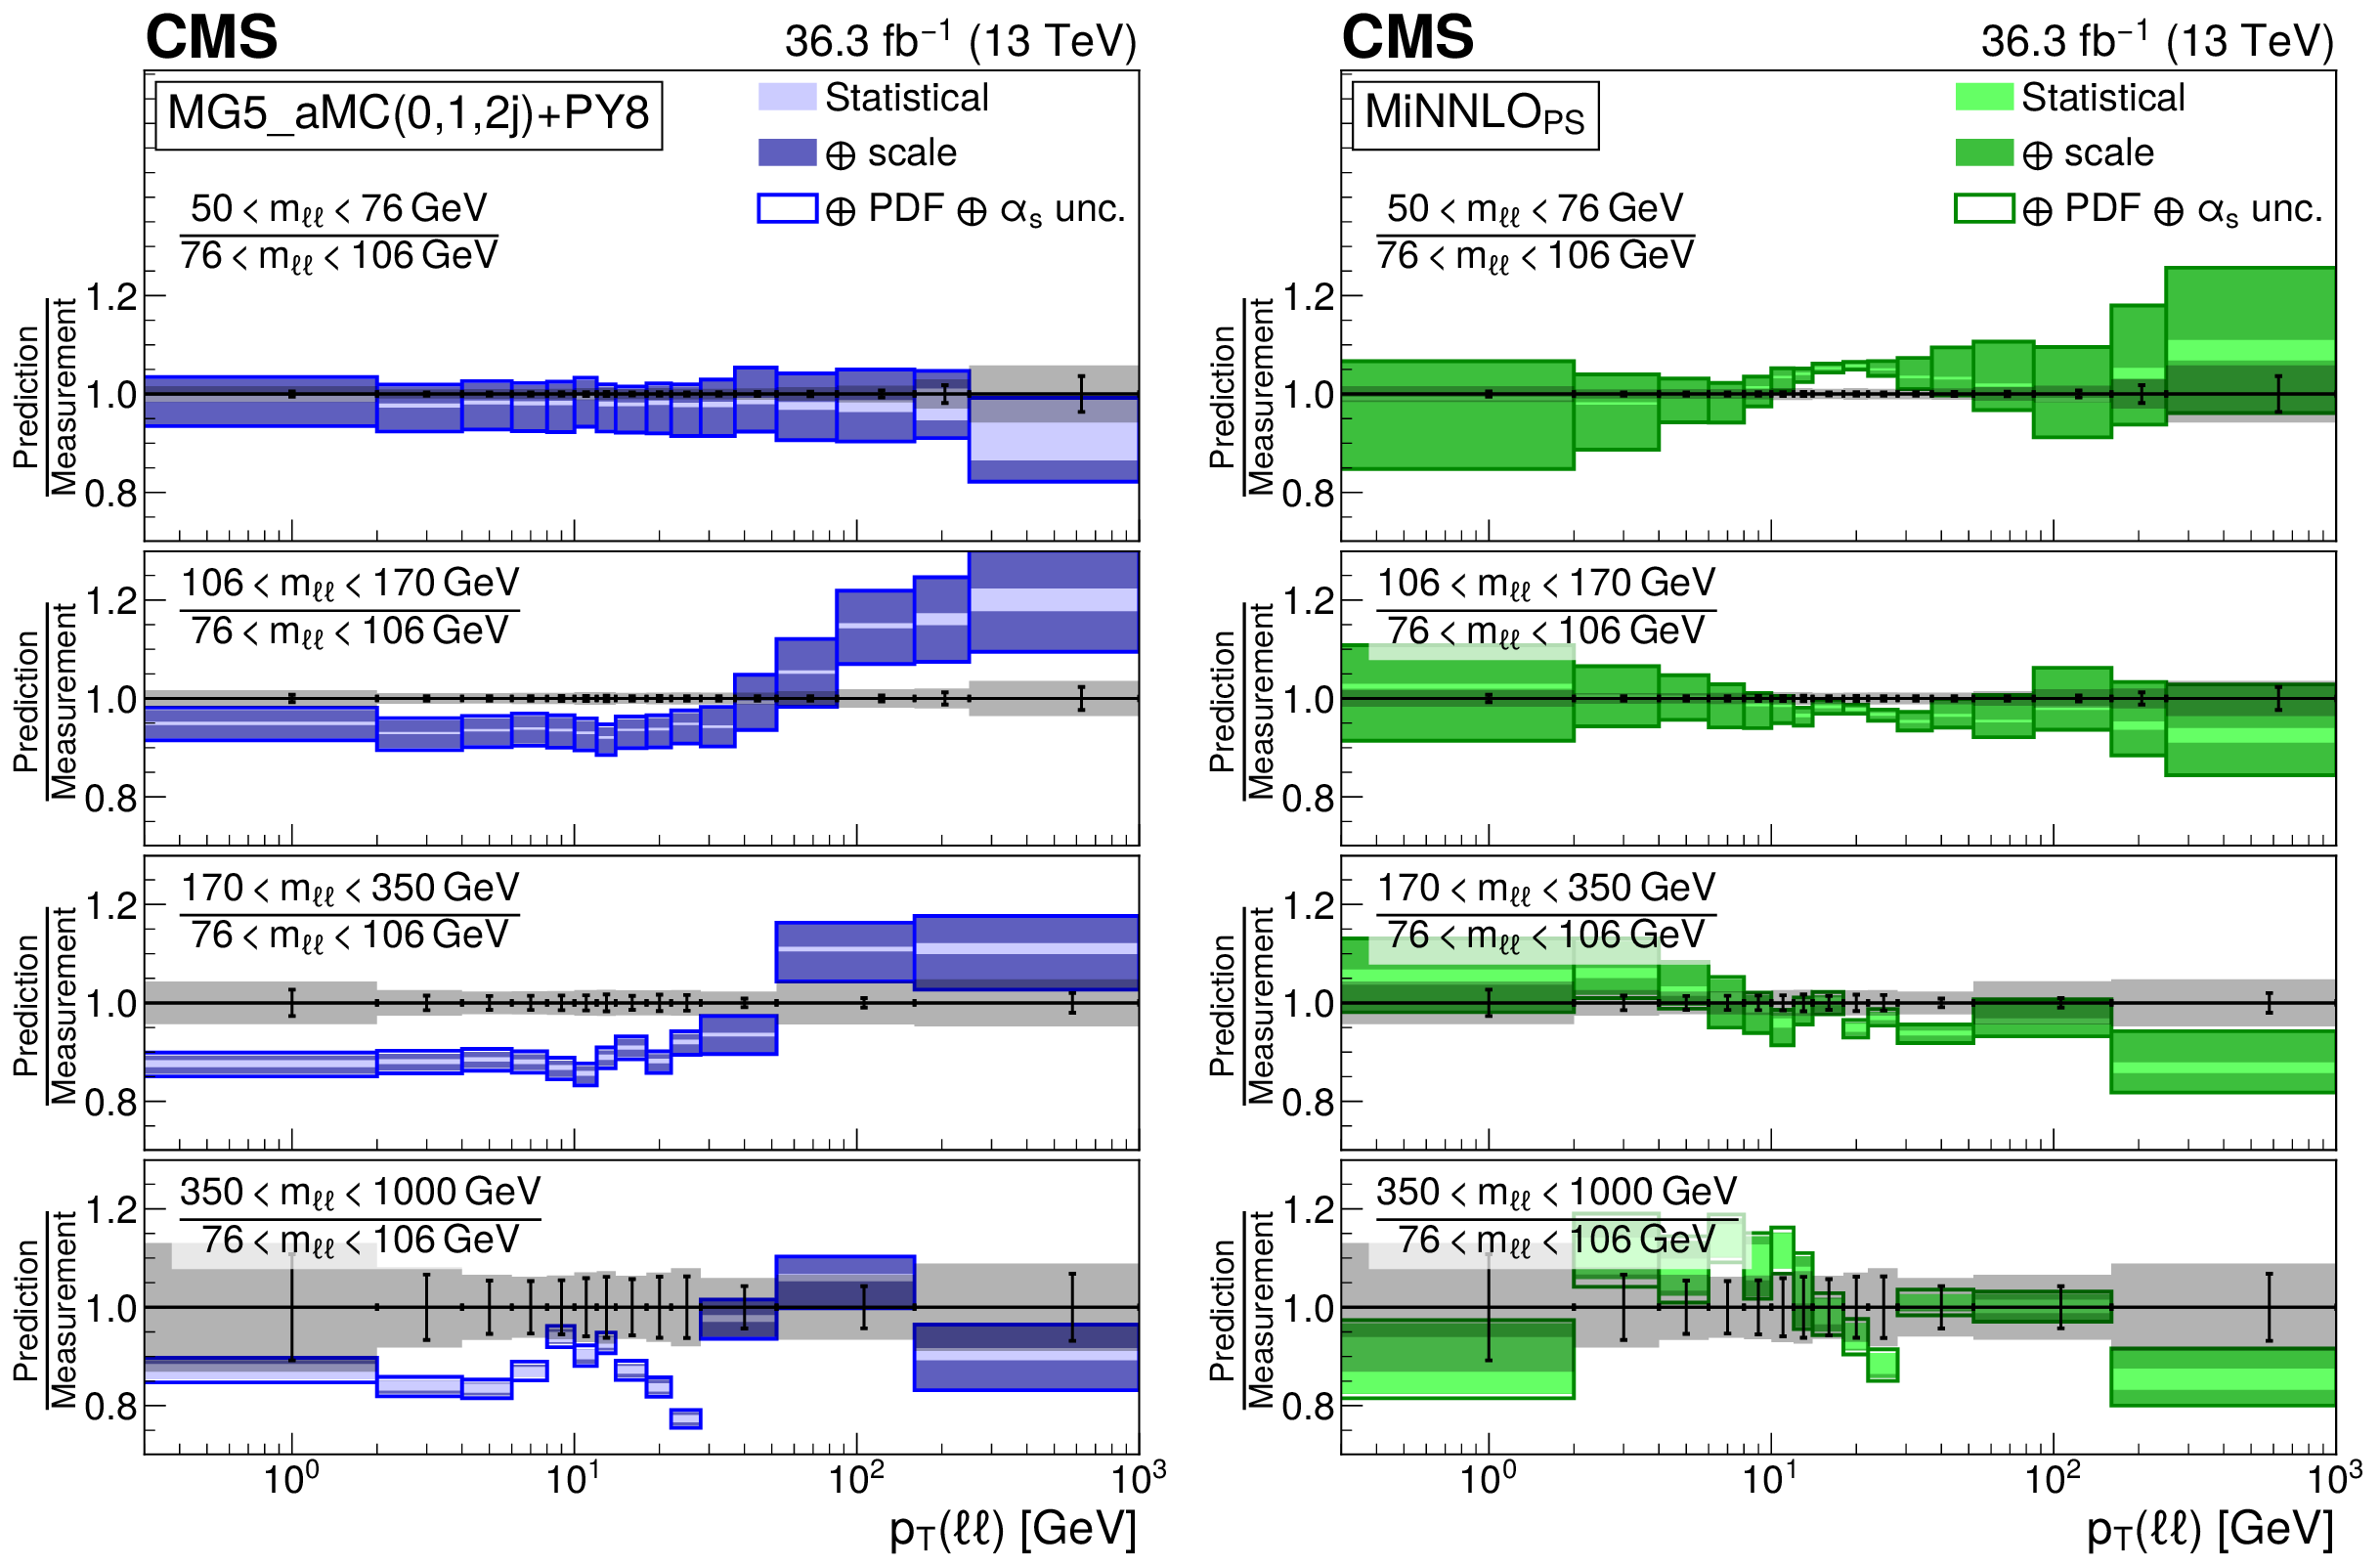
Figure 10:
Comparison to Monte Carlo predictions based on a matrix element with parton shower merging. The distributions show the ratio of differential cross sections as a function of $ p_{\mathrm{T}}(\ell\ell) $ for a given $ m_{\ell\ell} $ range to the cross section at the peak region 76 $ < m_{\ell\ell} < 106\,\text{Ge\hspace{-.08em}V} $. The predictions are MG5\_aMC (0, 1, and 2 jets at NLO) + PYTHIA8 (left) and \textsc{MiNNLO$ _\mathrm{PS} $ (right). Details on the presentation of the results are given in Fig. 6 caption. |

png pdf |
Figure 10-a:
Comparison to Monte Carlo predictions based on a matrix element with parton shower merging. The distributions show the ratio of differential cross sections as a function of $ p_{\mathrm{T}}(\ell\ell) $ for a given $ m_{\ell\ell} $ range to the cross section at the peak region 76 $ < m_{\ell\ell} < 106\,\text{Ge\hspace{-.08em}V} $. The predictions are MG5\_aMC (0, 1, and 2 jets at NLO) + PYTHIA8 (left) and \textsc{MiNNLO$ _\mathrm{PS} $ (right). Details on the presentation of the results are given in Fig. 6 caption. |

png pdf |
Figure 10-b:
Comparison to Monte Carlo predictions based on a matrix element with parton shower merging. The distributions show the ratio of differential cross sections as a function of $ p_{\mathrm{T}}(\ell\ell) $ for a given $ m_{\ell\ell} $ range to the cross section at the peak region 76 $ < m_{\ell\ell} < 106\,\text{Ge\hspace{-.08em}V} $. The predictions are MG5\_aMC (0, 1, and 2 jets at NLO) + PYTHIA8 (left) and \textsc{MiNNLO$ _\mathrm{PS} $ (right). Details on the presentation of the results are given in Fig. 6 caption. |

png pdf |
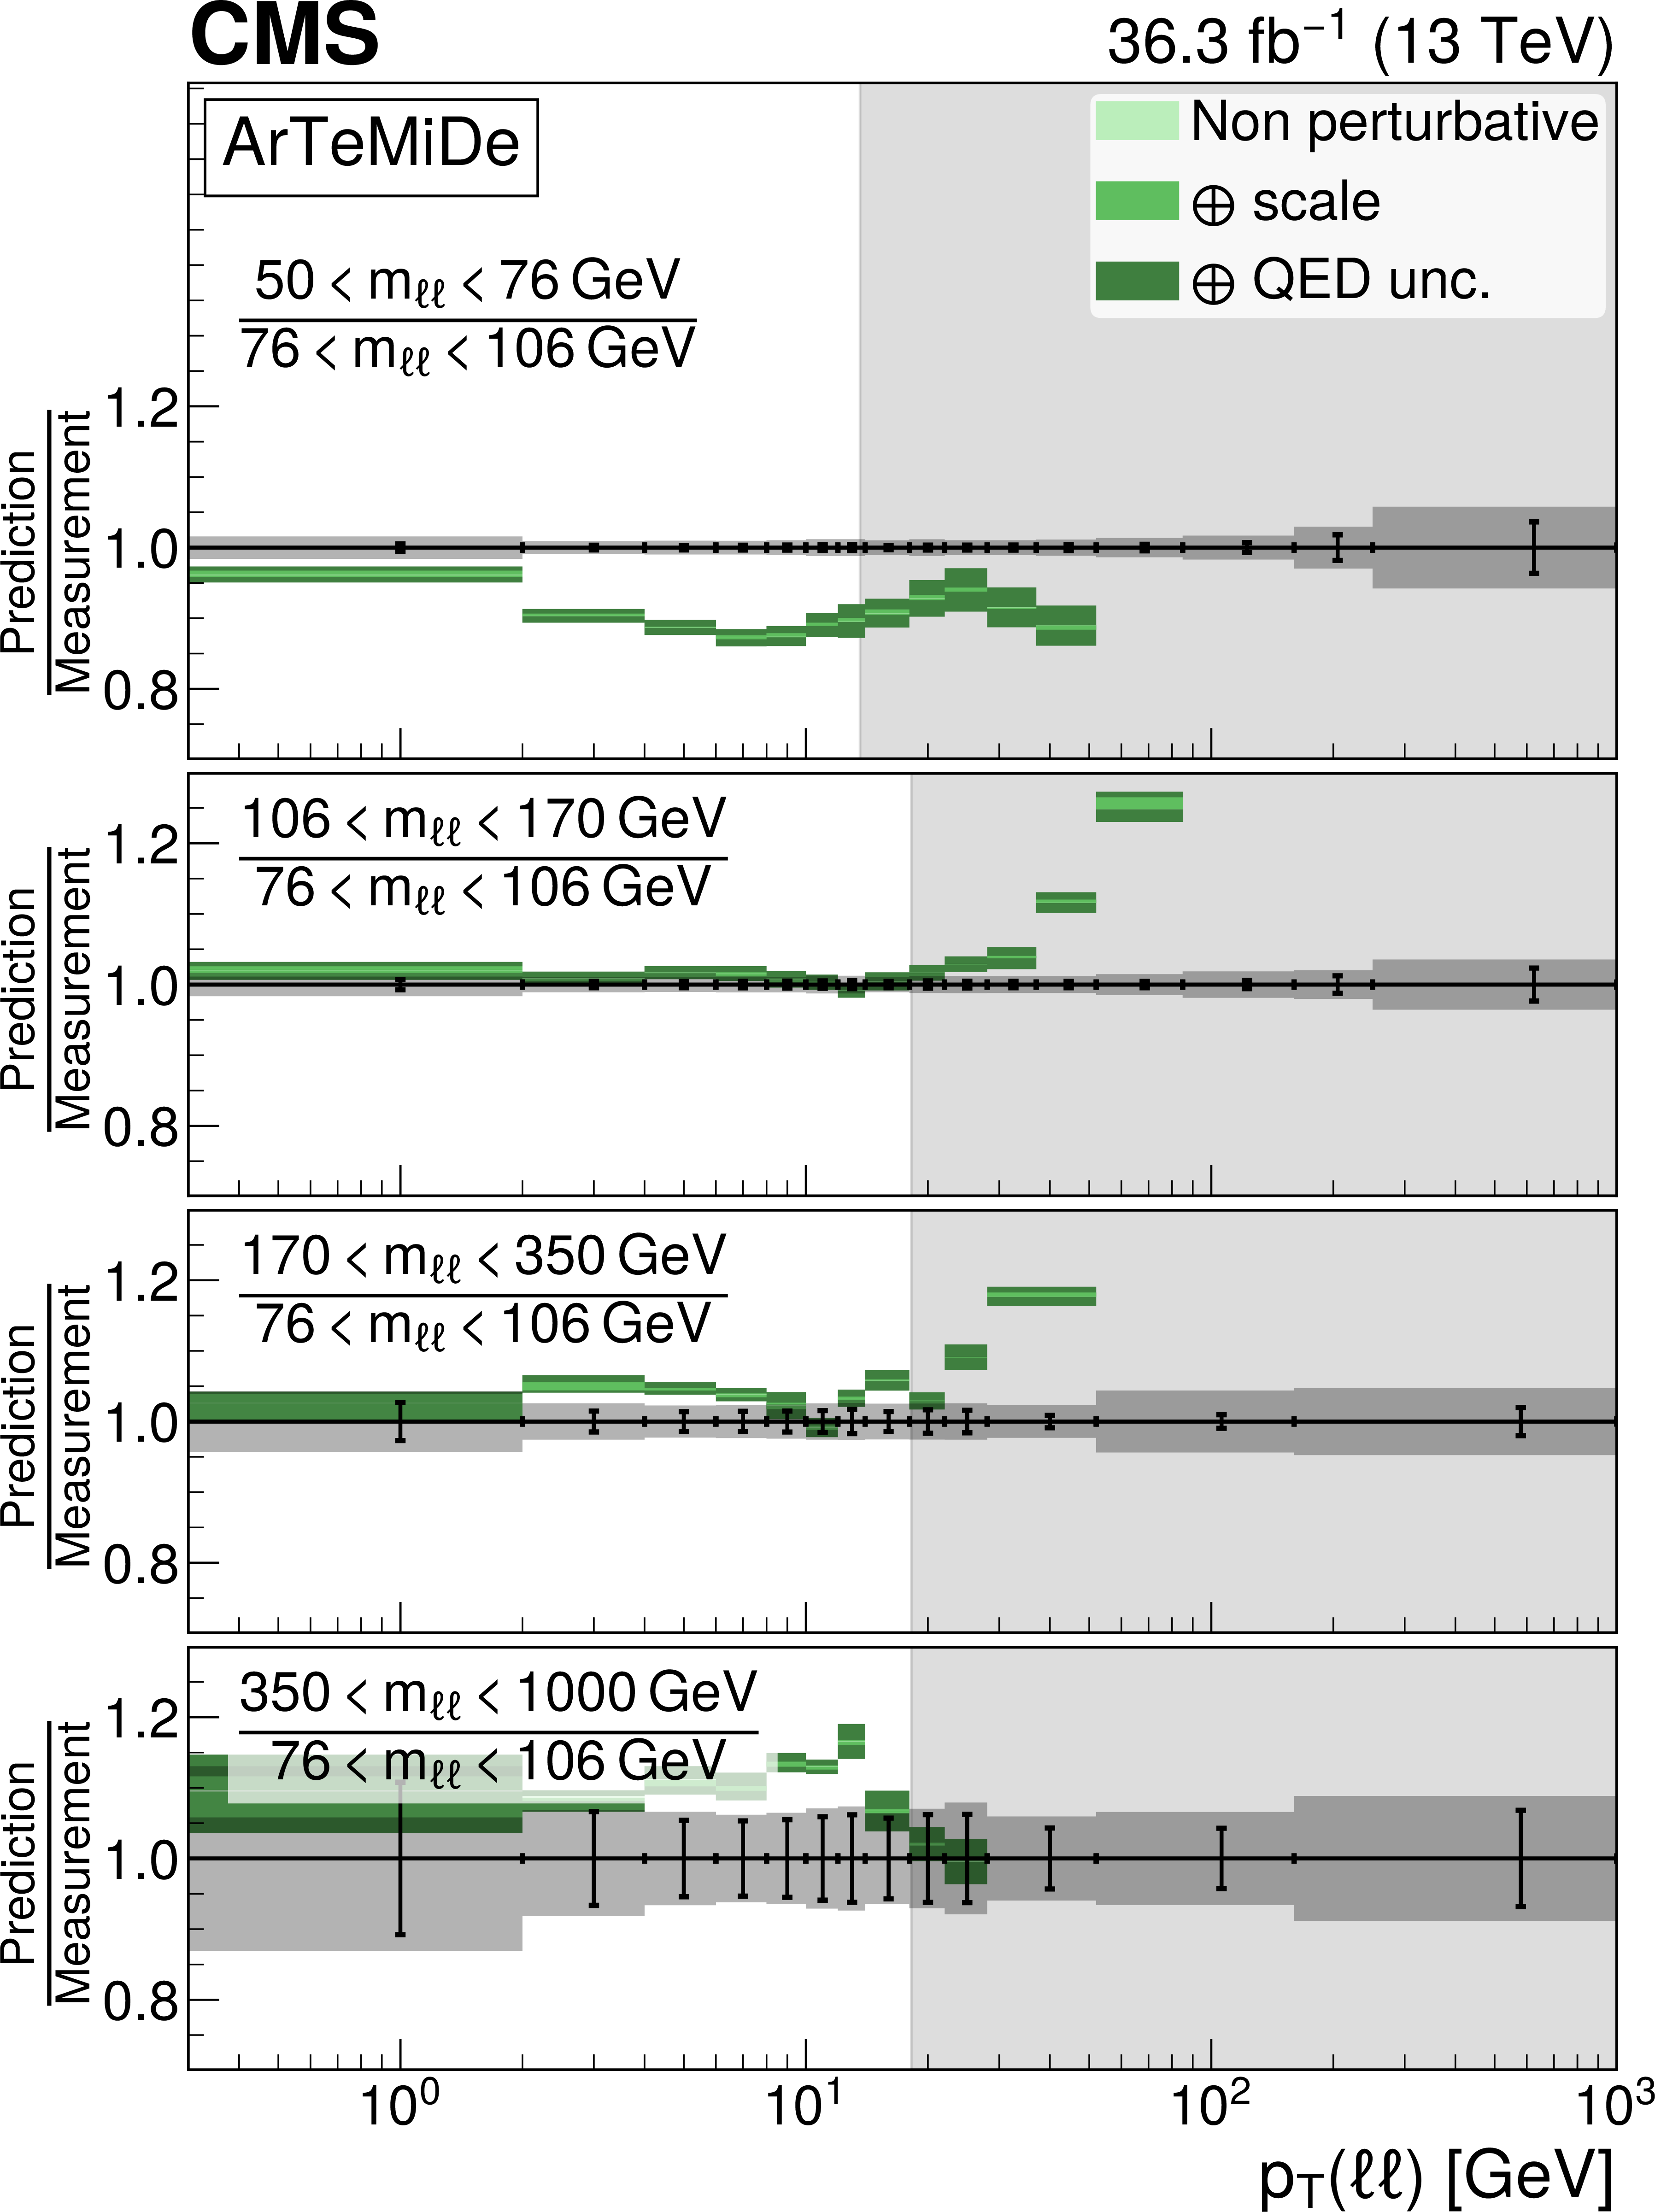
Figure 11:
Comparison to TMD based predictions. The distributions show the ratio of differential cross sections as a function of $ p_{\mathrm{T}}(\ell\ell) $ for a given $ m_{\ell\ell} $ range to the cross section at the peak region 76 $ < m_{\ell\ell} < 106\,\text{Ge\hspace{-.08em}V} $. The predictions are MG5\_aMC (0 jet at NLO) + PB (CASCADE) (left) and ARTEMIDE (right). Details on the presentation of the results are given in Fig. 7 caption. |

png pdf |
Figure 11-a:
Comparison to TMD based predictions. The distributions show the ratio of differential cross sections as a function of $ p_{\mathrm{T}}(\ell\ell) $ for a given $ m_{\ell\ell} $ range to the cross section at the peak region 76 $ < m_{\ell\ell} < 106\,\text{Ge\hspace{-.08em}V} $. The predictions are MG5\_aMC (0 jet at NLO) + PB (CASCADE) (left) and ARTEMIDE (right). Details on the presentation of the results are given in Fig. 7 caption. |
png pdf |
Figure 11-b:
Comparison to TMD based predictions. The distributions show the ratio of differential cross sections as a function of $ p_{\mathrm{T}}(\ell\ell) $ for a given $ m_{\ell\ell} $ range to the cross section at the peak region 76 $ < m_{\ell\ell} < 106\,\text{Ge\hspace{-.08em}V} $. The predictions are MG5\_aMC (0 jet at NLO) + PB (CASCADE) (left) and ARTEMIDE (right). Details on the presentation of the results are given in Fig. 7 caption. |

png pdf |
Figure 12:
Comparison to resummation based predictions. The distributions show the ratio of differential cross sections as a function of $ p_{\mathrm{T}}(\ell\ell) $ for a given $ m_{\ell\ell} $ range to the cross section at the peak region 76 $ < m_{\ell\ell} < 106\,\text{Ge\hspace{-.08em}V} $. The predictions are GENEVA-$ \tau $ (left) and GENEVA-$ q_\mathrm{T} $ (right). Details on the presentation of the results are given in Fig. 8 caption. |

png pdf |
Figure 12-a:
Comparison to resummation based predictions. The distributions show the ratio of differential cross sections as a function of $ p_{\mathrm{T}}(\ell\ell) $ for a given $ m_{\ell\ell} $ range to the cross section at the peak region 76 $ < m_{\ell\ell} < 106\,\text{Ge\hspace{-.08em}V} $. The predictions are GENEVA-$ \tau $ (left) and GENEVA-$ q_\mathrm{T} $ (right). Details on the presentation of the results are given in Fig. 8 caption. |

png pdf |
Figure 12-b:
Comparison to resummation based predictions. The distributions show the ratio of differential cross sections as a function of $ p_{\mathrm{T}}(\ell\ell) $ for a given $ m_{\ell\ell} $ range to the cross section at the peak region 76 $ < m_{\ell\ell} < 106\,\text{Ge\hspace{-.08em}V} $. The predictions are GENEVA-$ \tau $ (left) and GENEVA-$ q_\mathrm{T} $ (right). Details on the presentation of the results are given in Fig. 8 caption. |
png pdf |
Figure 13:
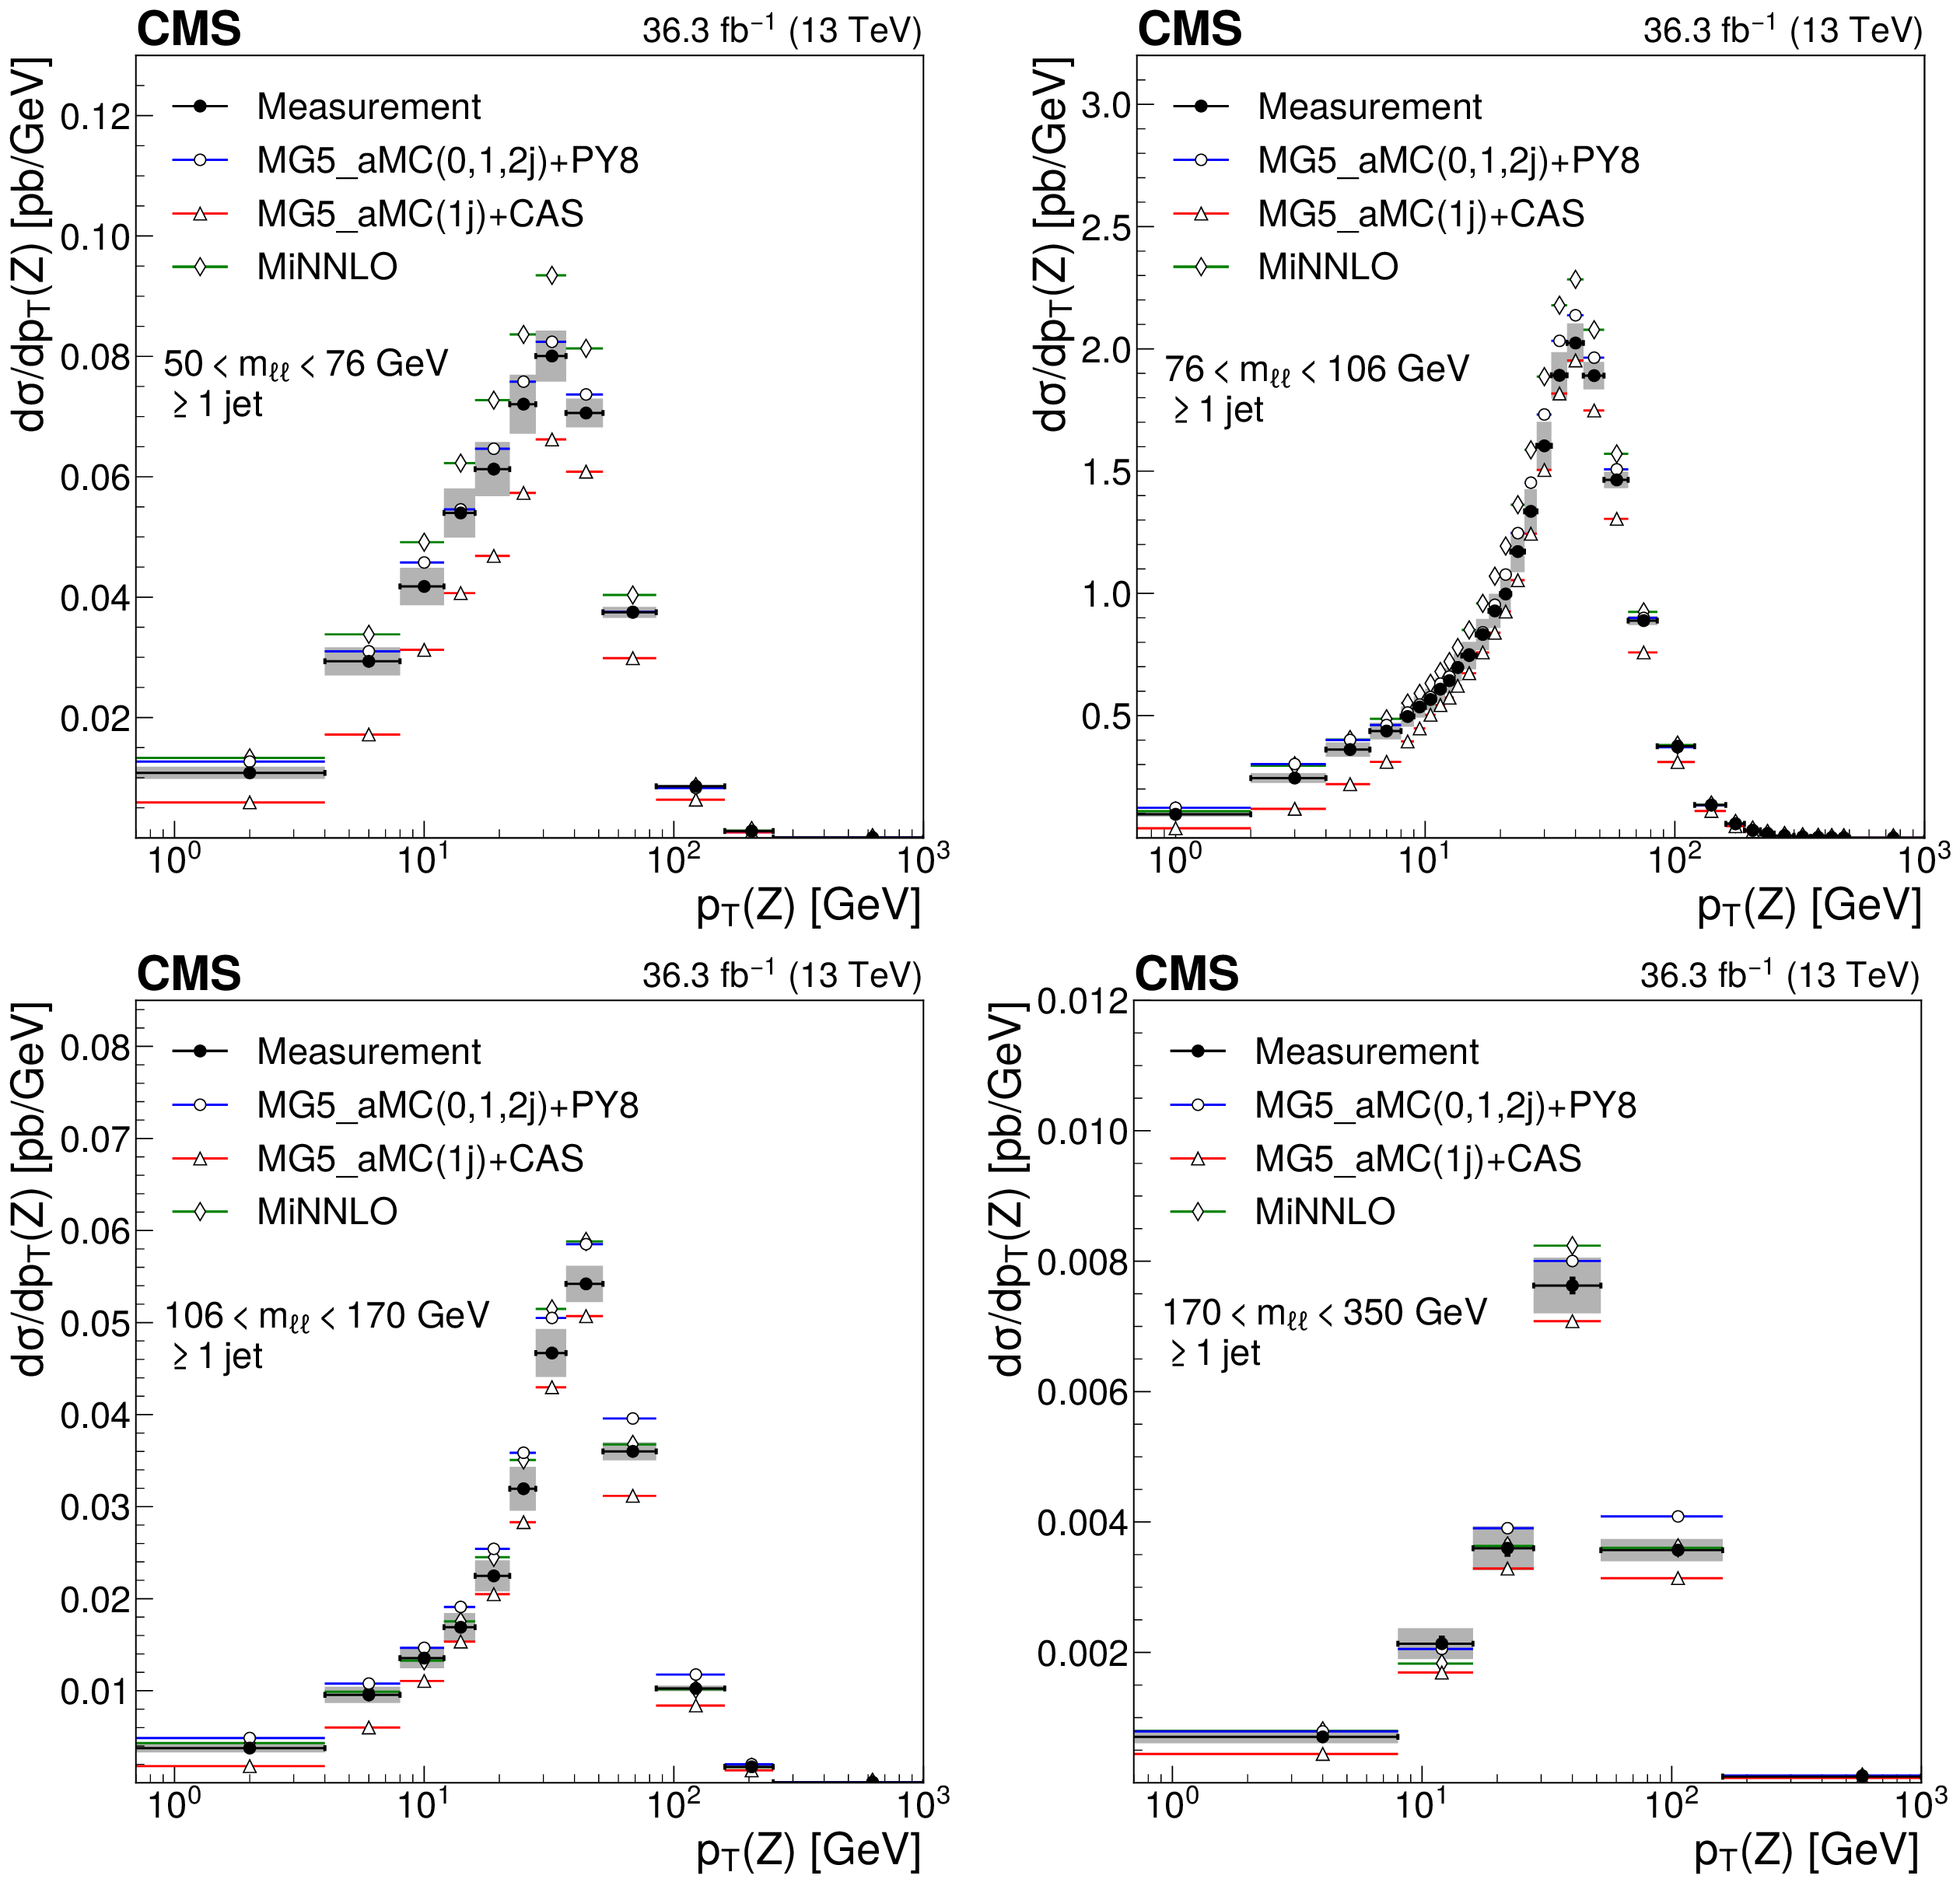
Differential cross sections in $ p_{\mathrm{T}}(\ell\ell) $ for one or more jets in various invariant mass ranges: 50 $ < m_{\ell\ell} < 76\,\text{Ge\hspace{-.08em}V} $ (upper left), 76 $ < m_{\ell\ell} < 106\,\text{Ge\hspace{-.08em}V} $ (upper right), 106 $ < m_{\ell\ell} < 170\,\text{Ge\hspace{-.08em}V} $ (lower left), and 170 $ < m_{\ell\ell} < 350\,\text{Ge\hspace{-.08em}V} $ (lower right). The measurement is compared with MG5\_aMC (0, 1, and 2 jets at NLO) + PYTHIA8 (blue dots), \textsc{MiNNLO$ _\mathrm{PS} $ (green diamonds) and MG5\_aMC (1 jet at NLO)+ PB (CASCADE) (red triangles). Details on the presentation of the results are given in Fig. 5 caption. |

png pdf |
Figure 13-a:
Differential cross sections in $ p_{\mathrm{T}}(\ell\ell) $ for one or more jets in various invariant mass ranges: 50 $ < m_{\ell\ell} < 76\,\text{Ge\hspace{-.08em}V} $ (upper left), 76 $ < m_{\ell\ell} < 106\,\text{Ge\hspace{-.08em}V} $ (upper right), 106 $ < m_{\ell\ell} < 170\,\text{Ge\hspace{-.08em}V} $ (lower left), and 170 $ < m_{\ell\ell} < 350\,\text{Ge\hspace{-.08em}V} $ (lower right). The measurement is compared with MG5\_aMC (0, 1, and 2 jets at NLO) + PYTHIA8 (blue dots), \textsc{MiNNLO$ _\mathrm{PS} $ (green diamonds) and MG5\_aMC (1 jet at NLO)+ PB (CASCADE) (red triangles). Details on the presentation of the results are given in Fig. 5 caption. |

png pdf |
Figure 13-b:
Differential cross sections in $ p_{\mathrm{T}}(\ell\ell) $ for one or more jets in various invariant mass ranges: 50 $ < m_{\ell\ell} < 76\,\text{Ge\hspace{-.08em}V} $ (upper left), 76 $ < m_{\ell\ell} < 106\,\text{Ge\hspace{-.08em}V} $ (upper right), 106 $ < m_{\ell\ell} < 170\,\text{Ge\hspace{-.08em}V} $ (lower left), and 170 $ < m_{\ell\ell} < 350\,\text{Ge\hspace{-.08em}V} $ (lower right). The measurement is compared with MG5\_aMC (0, 1, and 2 jets at NLO) + PYTHIA8 (blue dots), \textsc{MiNNLO$ _\mathrm{PS} $ (green diamonds) and MG5\_aMC (1 jet at NLO)+ PB (CASCADE) (red triangles). Details on the presentation of the results are given in Fig. 5 caption. |

png pdf |
Figure 13-c:
Differential cross sections in $ p_{\mathrm{T}}(\ell\ell) $ for one or more jets in various invariant mass ranges: 50 $ < m_{\ell\ell} < 76\,\text{Ge\hspace{-.08em}V} $ (upper left), 76 $ < m_{\ell\ell} < 106\,\text{Ge\hspace{-.08em}V} $ (upper right), 106 $ < m_{\ell\ell} < 170\,\text{Ge\hspace{-.08em}V} $ (lower left), and 170 $ < m_{\ell\ell} < 350\,\text{Ge\hspace{-.08em}V} $ (lower right). The measurement is compared with MG5\_aMC (0, 1, and 2 jets at NLO) + PYTHIA8 (blue dots), \textsc{MiNNLO$ _\mathrm{PS} $ (green diamonds) and MG5\_aMC (1 jet at NLO)+ PB (CASCADE) (red triangles). Details on the presentation of the results are given in Fig. 5 caption. |

png pdf |
Figure 13-d:
Differential cross sections in $ p_{\mathrm{T}}(\ell\ell) $ for one or more jets in various invariant mass ranges: 50 $ < m_{\ell\ell} < 76\,\text{Ge\hspace{-.08em}V} $ (upper left), 76 $ < m_{\ell\ell} < 106\,\text{Ge\hspace{-.08em}V} $ (upper right), 106 $ < m_{\ell\ell} < 170\,\text{Ge\hspace{-.08em}V} $ (lower left), and 170 $ < m_{\ell\ell} < 350\,\text{Ge\hspace{-.08em}V} $ (lower right). The measurement is compared with MG5\_aMC (0, 1, and 2 jets at NLO) + PYTHIA8 (blue dots), \textsc{MiNNLO$ _\mathrm{PS} $ (green diamonds) and MG5\_aMC (1 jet at NLO)+ PB (CASCADE) (red triangles). Details on the presentation of the results are given in Fig. 5 caption. |
png pdf |
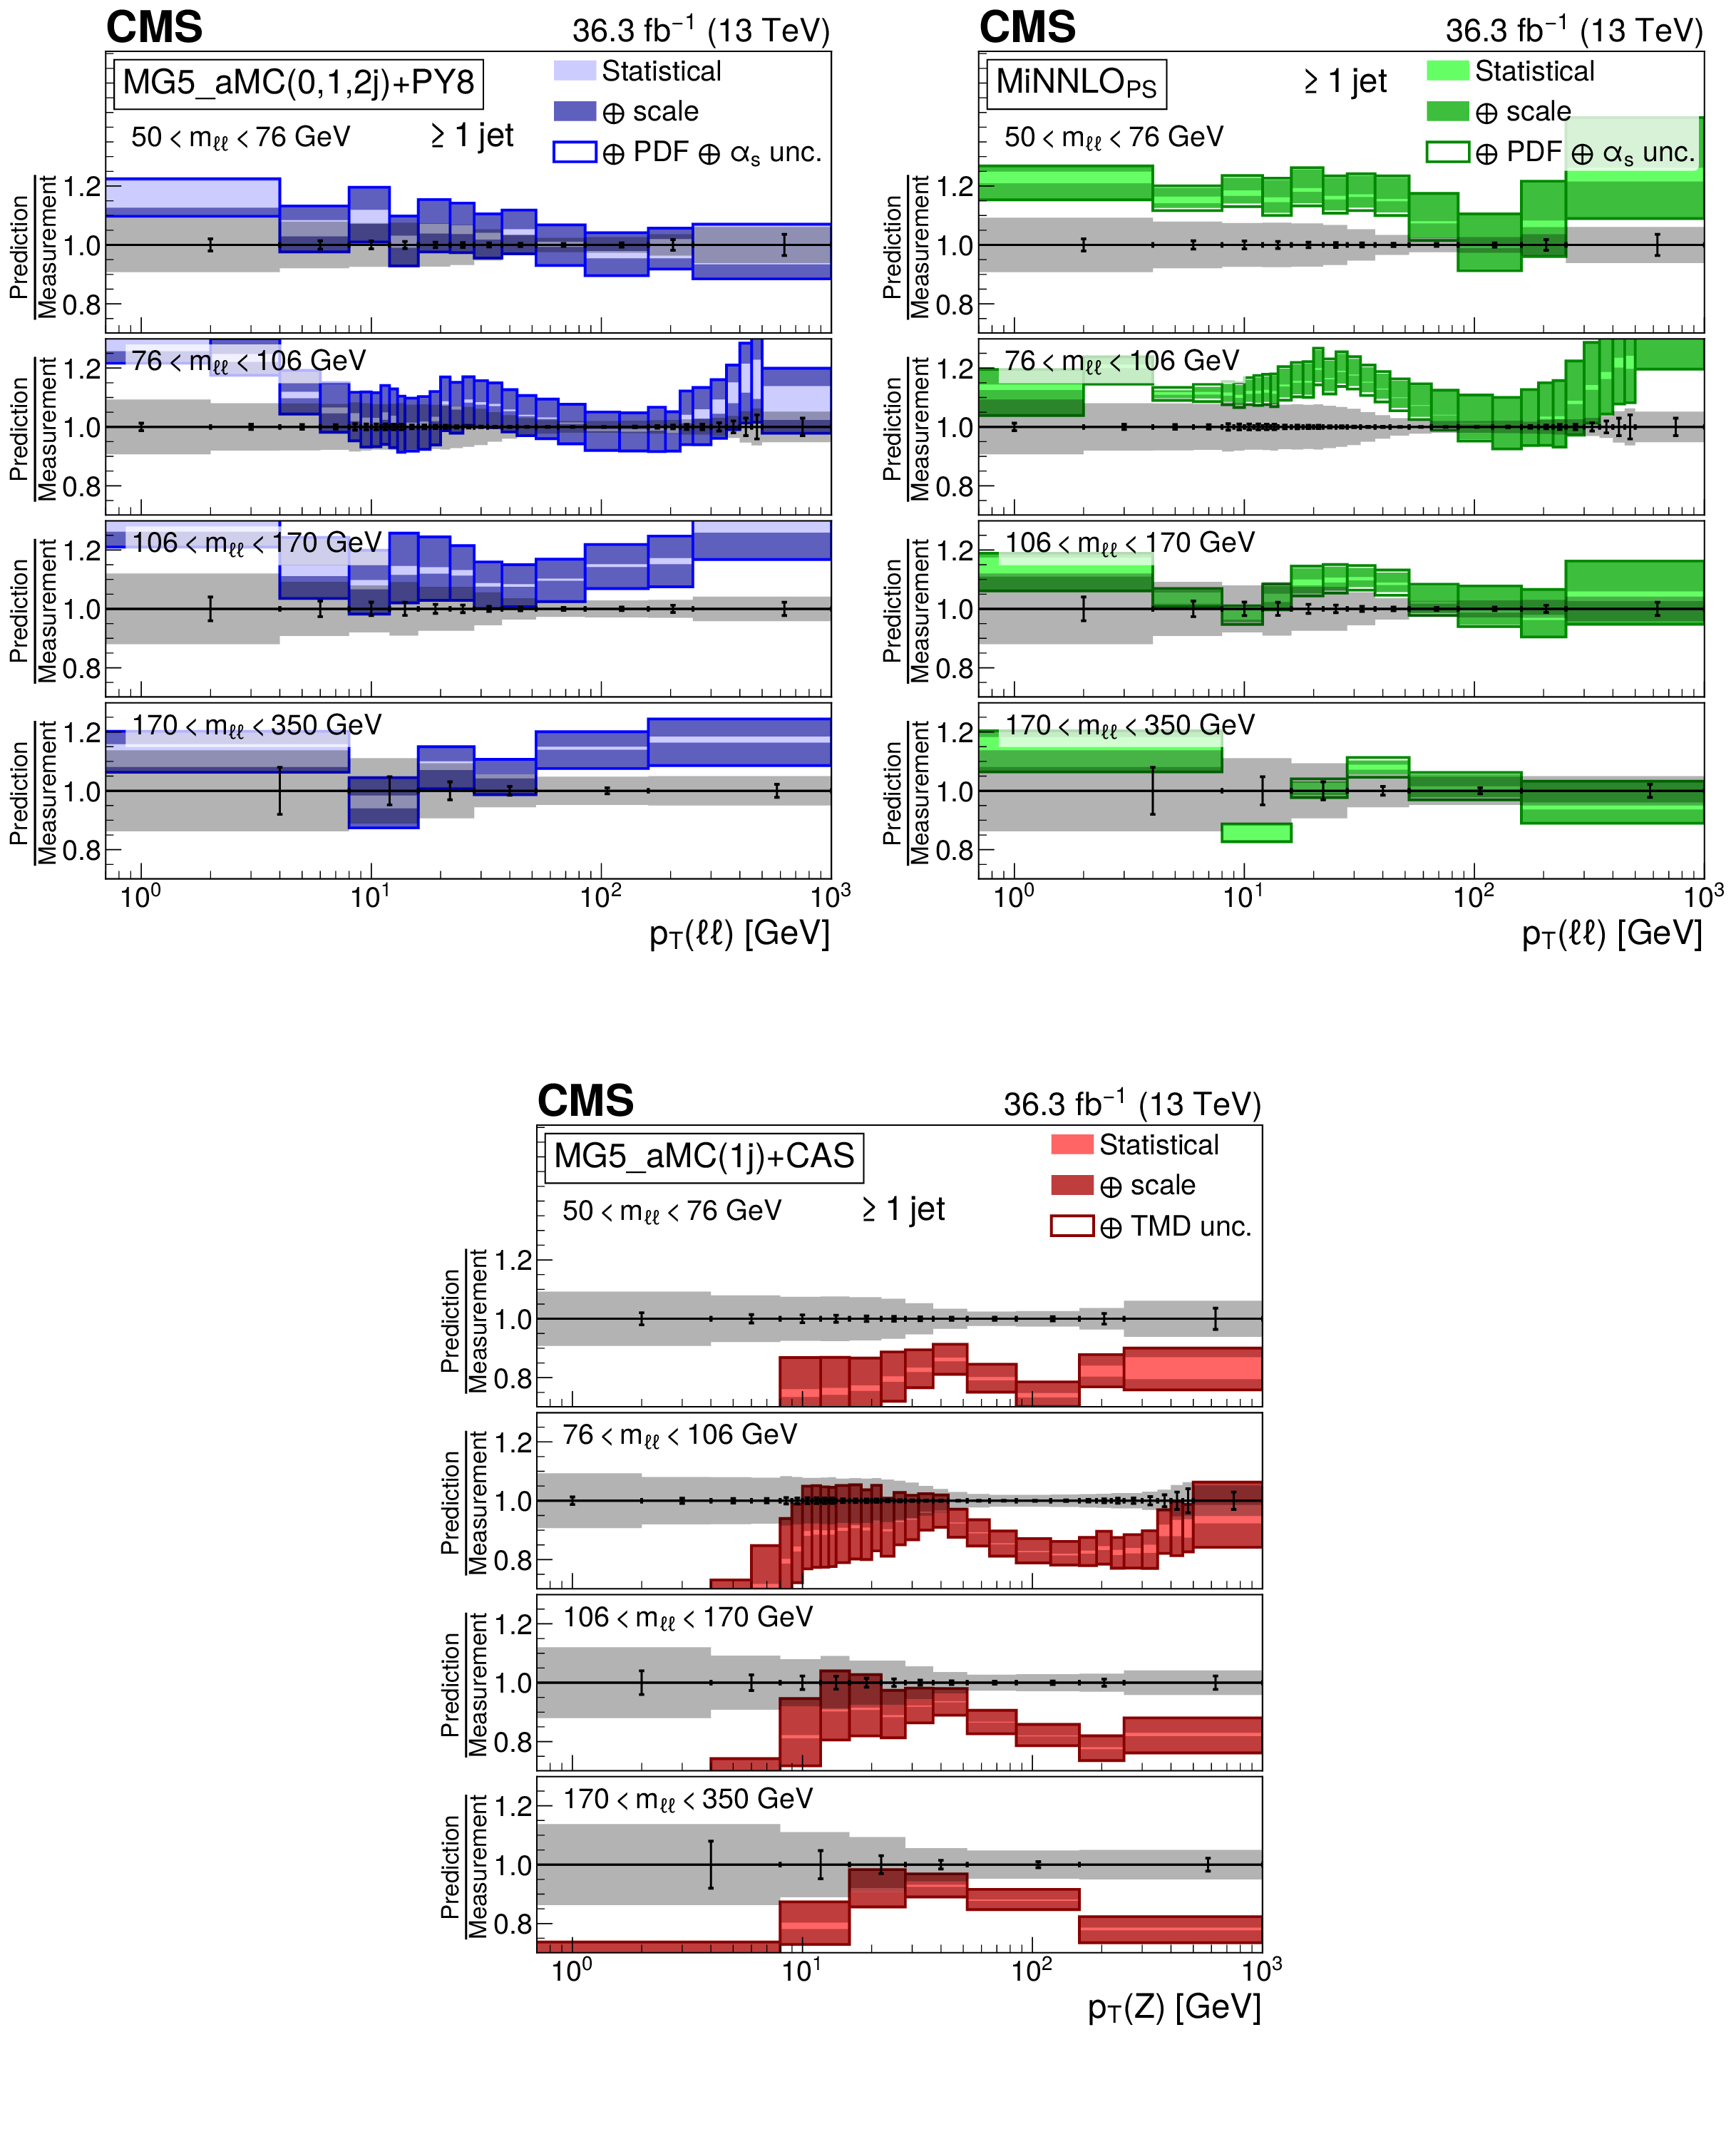
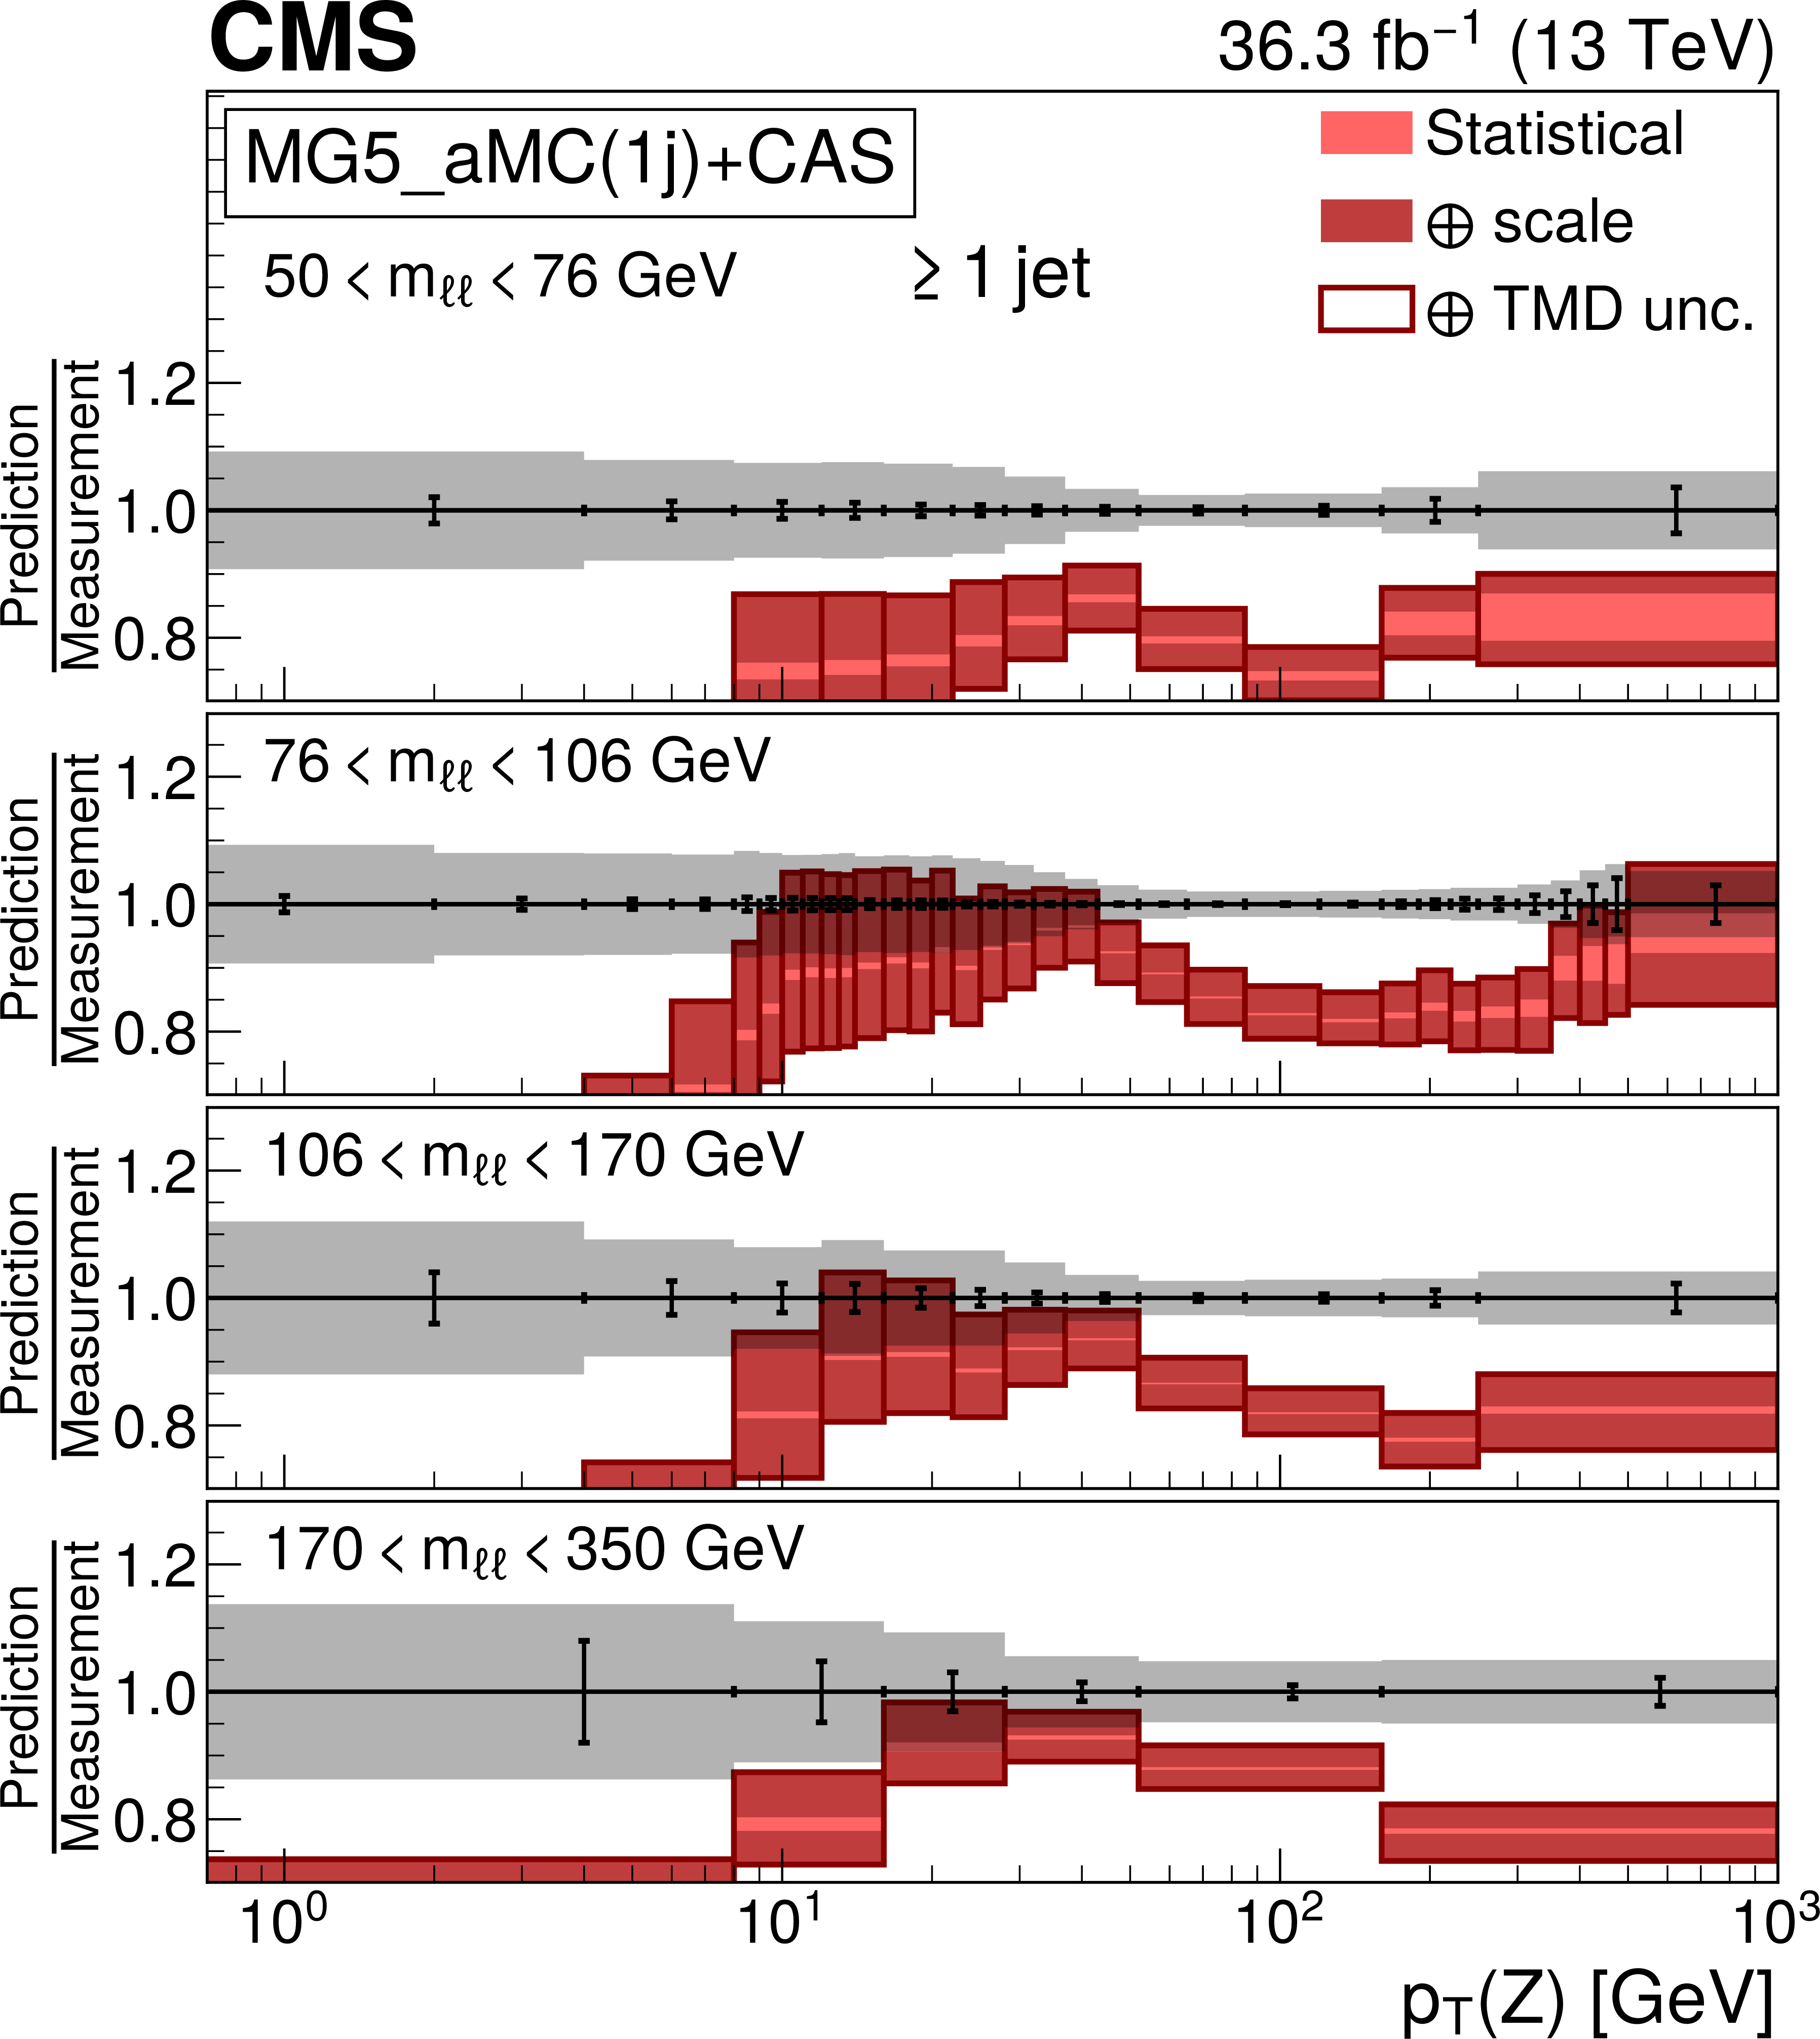
Figure 14:
Comparison of the differential cross sections in $ p_{\mathrm{T}}(\ell\ell) $ to predictions in various invariant mass ranges for the one or more jets case. The measurement is compared with MG5\_aMC (0, 1, and 2 jets at NLO) + PYTHIA8 (upper left), \textsc{MiNNLO$ _\mathrm{PS} $ (upper right) and MG5\_aMC (1 jet at NLO) + PB (CASCADE) (lower). Details on the presentation of the results are given in Fig. 6 caption. |

png pdf |
Figure 14-a:
Comparison of the differential cross sections in $ p_{\mathrm{T}}(\ell\ell) $ to predictions in various invariant mass ranges for the one or more jets case. The measurement is compared with MG5\_aMC (0, 1, and 2 jets at NLO) + PYTHIA8 (upper left), \textsc{MiNNLO$ _\mathrm{PS} $ (upper right) and MG5\_aMC (1 jet at NLO) + PB (CASCADE) (lower). Details on the presentation of the results are given in Fig. 6 caption. |

png pdf |
Figure 14-b:
Comparison of the differential cross sections in $ p_{\mathrm{T}}(\ell\ell) $ to predictions in various invariant mass ranges for the one or more jets case. The measurement is compared with MG5\_aMC (0, 1, and 2 jets at NLO) + PYTHIA8 (upper left), \textsc{MiNNLO$ _\mathrm{PS} $ (upper right) and MG5\_aMC (1 jet at NLO) + PB (CASCADE) (lower). Details on the presentation of the results are given in Fig. 6 caption. |
png pdf |
Figure 14-c:
Comparison of the differential cross sections in $ p_{\mathrm{T}}(\ell\ell) $ to predictions in various invariant mass ranges for the one or more jets case. The measurement is compared with MG5\_aMC (0, 1, and 2 jets at NLO) + PYTHIA8 (upper left), \textsc{MiNNLO$ _\mathrm{PS} $ (upper right) and MG5\_aMC (1 jet at NLO) + PB (CASCADE) (lower). Details on the presentation of the results are given in Fig. 6 caption. |
png pdf |
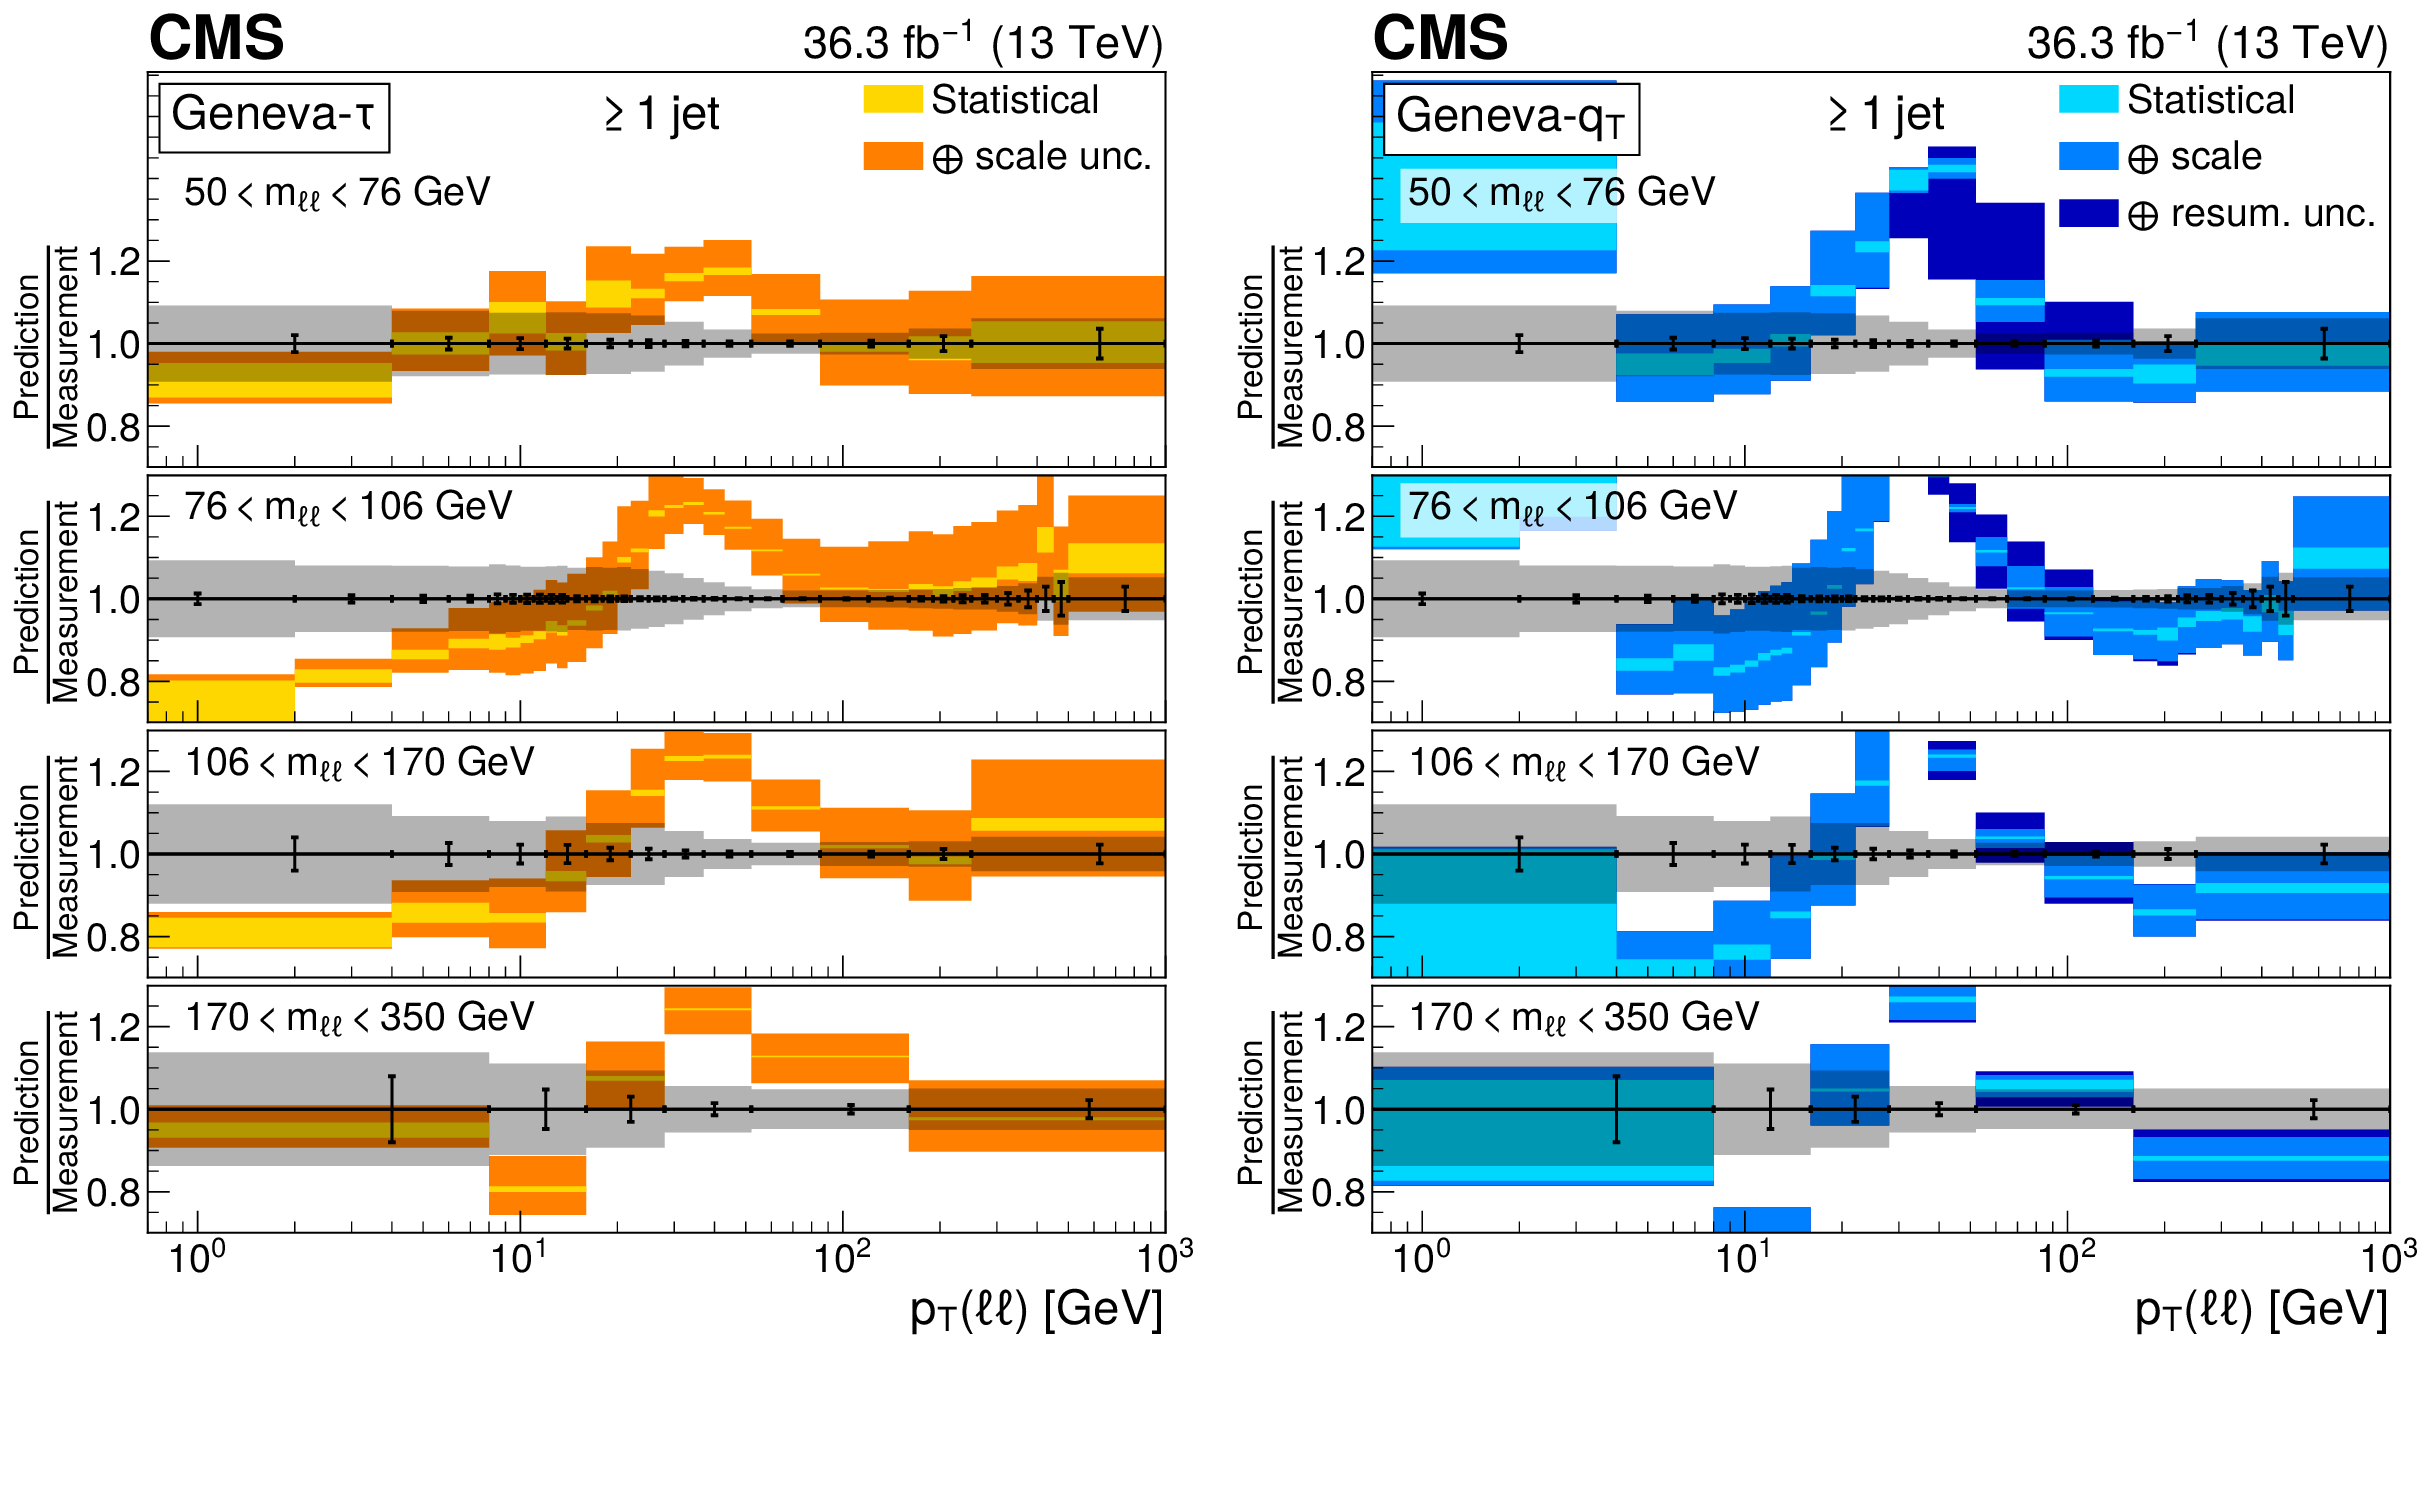
Figure 15:
Comparison of the differential cross sections in $ p_{\mathrm{T}}(\ell\ell) $ to predictions in various invariant mass ranges for the one or more jets case. The measurement is compared with GENEVA-$ \tau $ (left) and GENEVA-$ q_\mathrm{T} $ (right) predictions. Details on the presentation of the results are given in Fig. 8 caption. |
png pdf |
Figure 15-a:
Comparison of the differential cross sections in $ p_{\mathrm{T}}(\ell\ell) $ to predictions in various invariant mass ranges for the one or more jets case. The measurement is compared with GENEVA-$ \tau $ (left) and GENEVA-$ q_\mathrm{T} $ (right) predictions. Details on the presentation of the results are given in Fig. 8 caption. |

png pdf |
Figure 15-b:
Comparison of the differential cross sections in $ p_{\mathrm{T}}(\ell\ell) $ to predictions in various invariant mass ranges for the one or more jets case. The measurement is compared with GENEVA-$ \tau $ (left) and GENEVA-$ q_\mathrm{T} $ (right) predictions. Details on the presentation of the results are given in Fig. 8 caption. |

png pdf |
Figure 16:
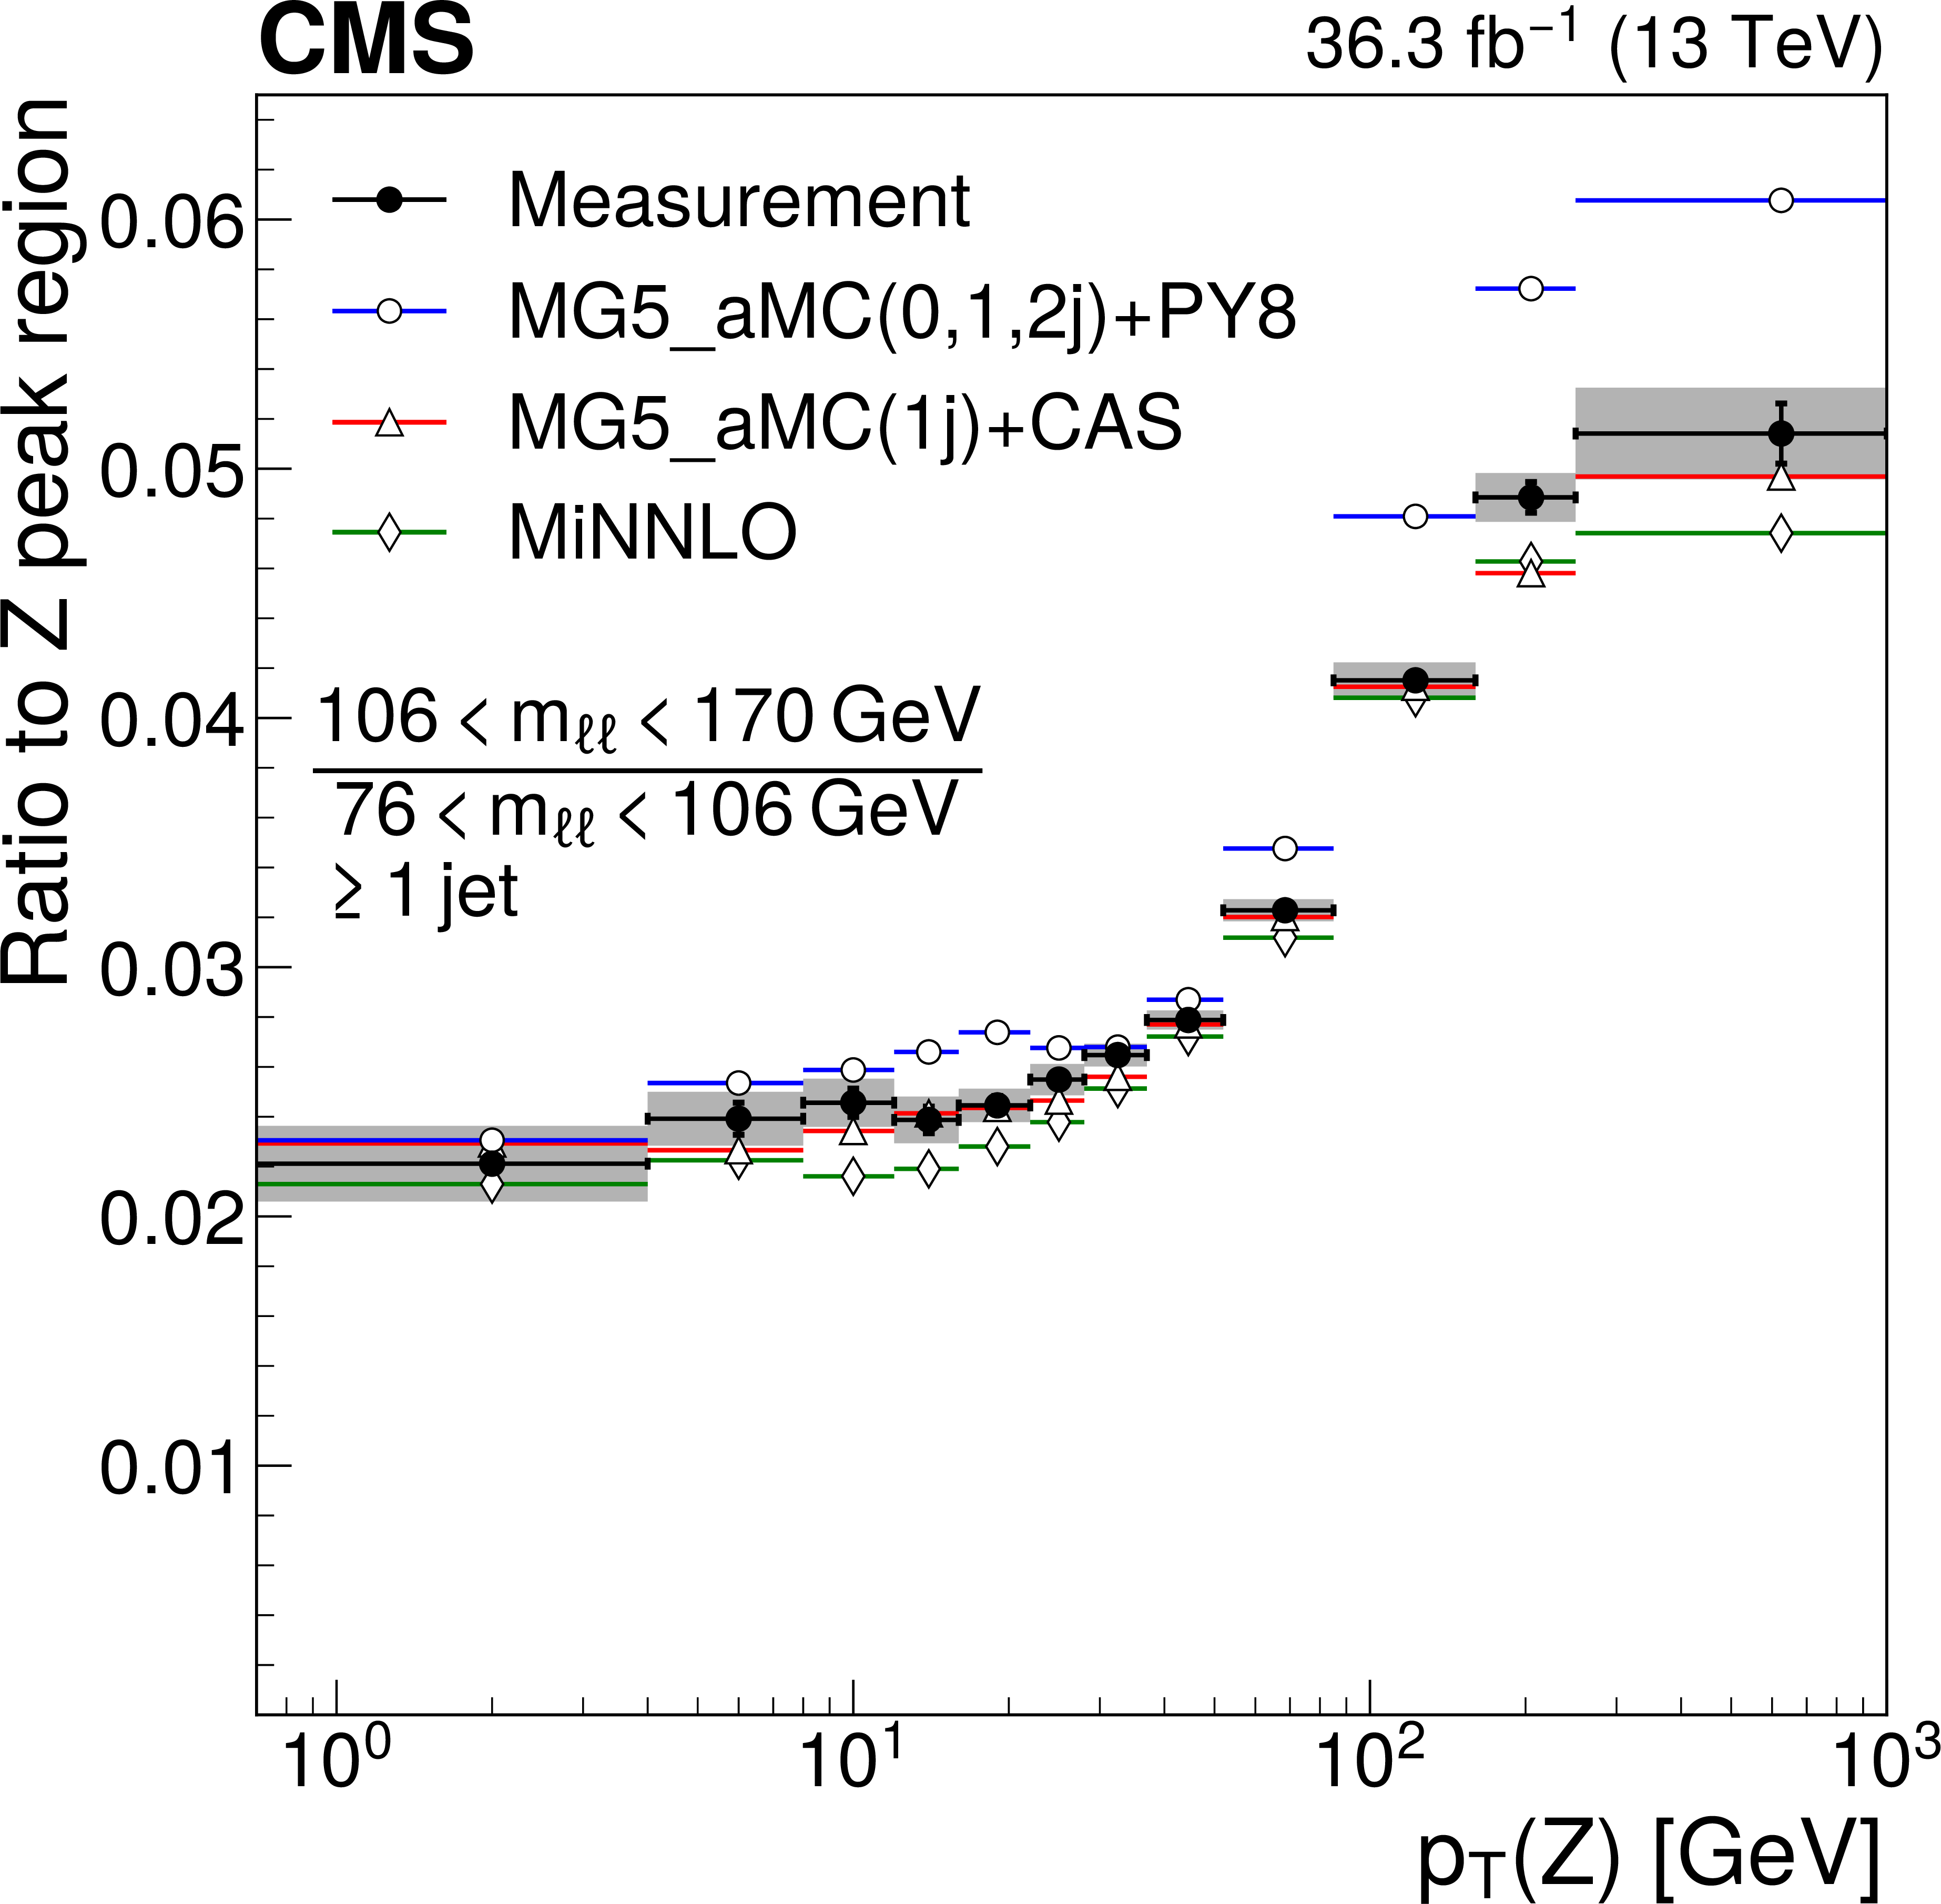
Ratios of differential cross sections in $ p_{\mathrm{T}}(\ell\ell) $ for one or more jets in various invariant mass ranges with respect to the peak region 76 $ < m_{\ell\ell} < 106\,\text{Ge\hspace{-.08em}V} $: 50 $ < m_{\ell\ell} < 76\,\text{Ge\hspace{-.08em}V} $ (upper left), 106 $ < m_{\ell\ell} < 170\,\text{Ge\hspace{-.08em}V} $ (upper right), and 170 $ < m_{\ell\ell} < 350\,\text{Ge\hspace{-.08em}V} $ (lower). The measurement is compared with MG5\_aMC (0, 1, and 2 jets at NLO) + PYTHIA8 (blue dots), \textsc{MiNNLO$ _\mathrm{PS} $ (green diamonds) and MG5\_aMC (1 jet at NLO)+ PB (CASCADE) (red triangles). Details on the presentation of the results are given in Fig. 5 caption. |

png pdf |
Figure 16-a:
Ratios of differential cross sections in $ p_{\mathrm{T}}(\ell\ell) $ for one or more jets in various invariant mass ranges with respect to the peak region 76 $ < m_{\ell\ell} < 106\,\text{Ge\hspace{-.08em}V} $: 50 $ < m_{\ell\ell} < 76\,\text{Ge\hspace{-.08em}V} $ (upper left), 106 $ < m_{\ell\ell} < 170\,\text{Ge\hspace{-.08em}V} $ (upper right), and 170 $ < m_{\ell\ell} < 350\,\text{Ge\hspace{-.08em}V} $ (lower). The measurement is compared with MG5\_aMC (0, 1, and 2 jets at NLO) + PYTHIA8 (blue dots), \textsc{MiNNLO$ _\mathrm{PS} $ (green diamonds) and MG5\_aMC (1 jet at NLO)+ PB (CASCADE) (red triangles). Details on the presentation of the results are given in Fig. 5 caption. |
png pdf |
Figure 16-b:
Ratios of differential cross sections in $ p_{\mathrm{T}}(\ell\ell) $ for one or more jets in various invariant mass ranges with respect to the peak region 76 $ < m_{\ell\ell} < 106\,\text{Ge\hspace{-.08em}V} $: 50 $ < m_{\ell\ell} < 76\,\text{Ge\hspace{-.08em}V} $ (upper left), 106 $ < m_{\ell\ell} < 170\,\text{Ge\hspace{-.08em}V} $ (upper right), and 170 $ < m_{\ell\ell} < 350\,\text{Ge\hspace{-.08em}V} $ (lower). The measurement is compared with MG5\_aMC (0, 1, and 2 jets at NLO) + PYTHIA8 (blue dots), \textsc{MiNNLO$ _\mathrm{PS} $ (green diamonds) and MG5\_aMC (1 jet at NLO)+ PB (CASCADE) (red triangles). Details on the presentation of the results are given in Fig. 5 caption. |

png pdf |
Figure 16-c:
Ratios of differential cross sections in $ p_{\mathrm{T}}(\ell\ell) $ for one or more jets in various invariant mass ranges with respect to the peak region 76 $ < m_{\ell\ell} < 106\,\text{Ge\hspace{-.08em}V} $: 50 $ < m_{\ell\ell} < 76\,\text{Ge\hspace{-.08em}V} $ (upper left), 106 $ < m_{\ell\ell} < 170\,\text{Ge\hspace{-.08em}V} $ (upper right), and 170 $ < m_{\ell\ell} < 350\,\text{Ge\hspace{-.08em}V} $ (lower). The measurement is compared with MG5\_aMC (0, 1, and 2 jets at NLO) + PYTHIA8 (blue dots), \textsc{MiNNLO$ _\mathrm{PS} $ (green diamonds) and MG5\_aMC (1 jet at NLO)+ PB (CASCADE) (red triangles). Details on the presentation of the results are given in Fig. 5 caption. |

png pdf |
Figure 17:
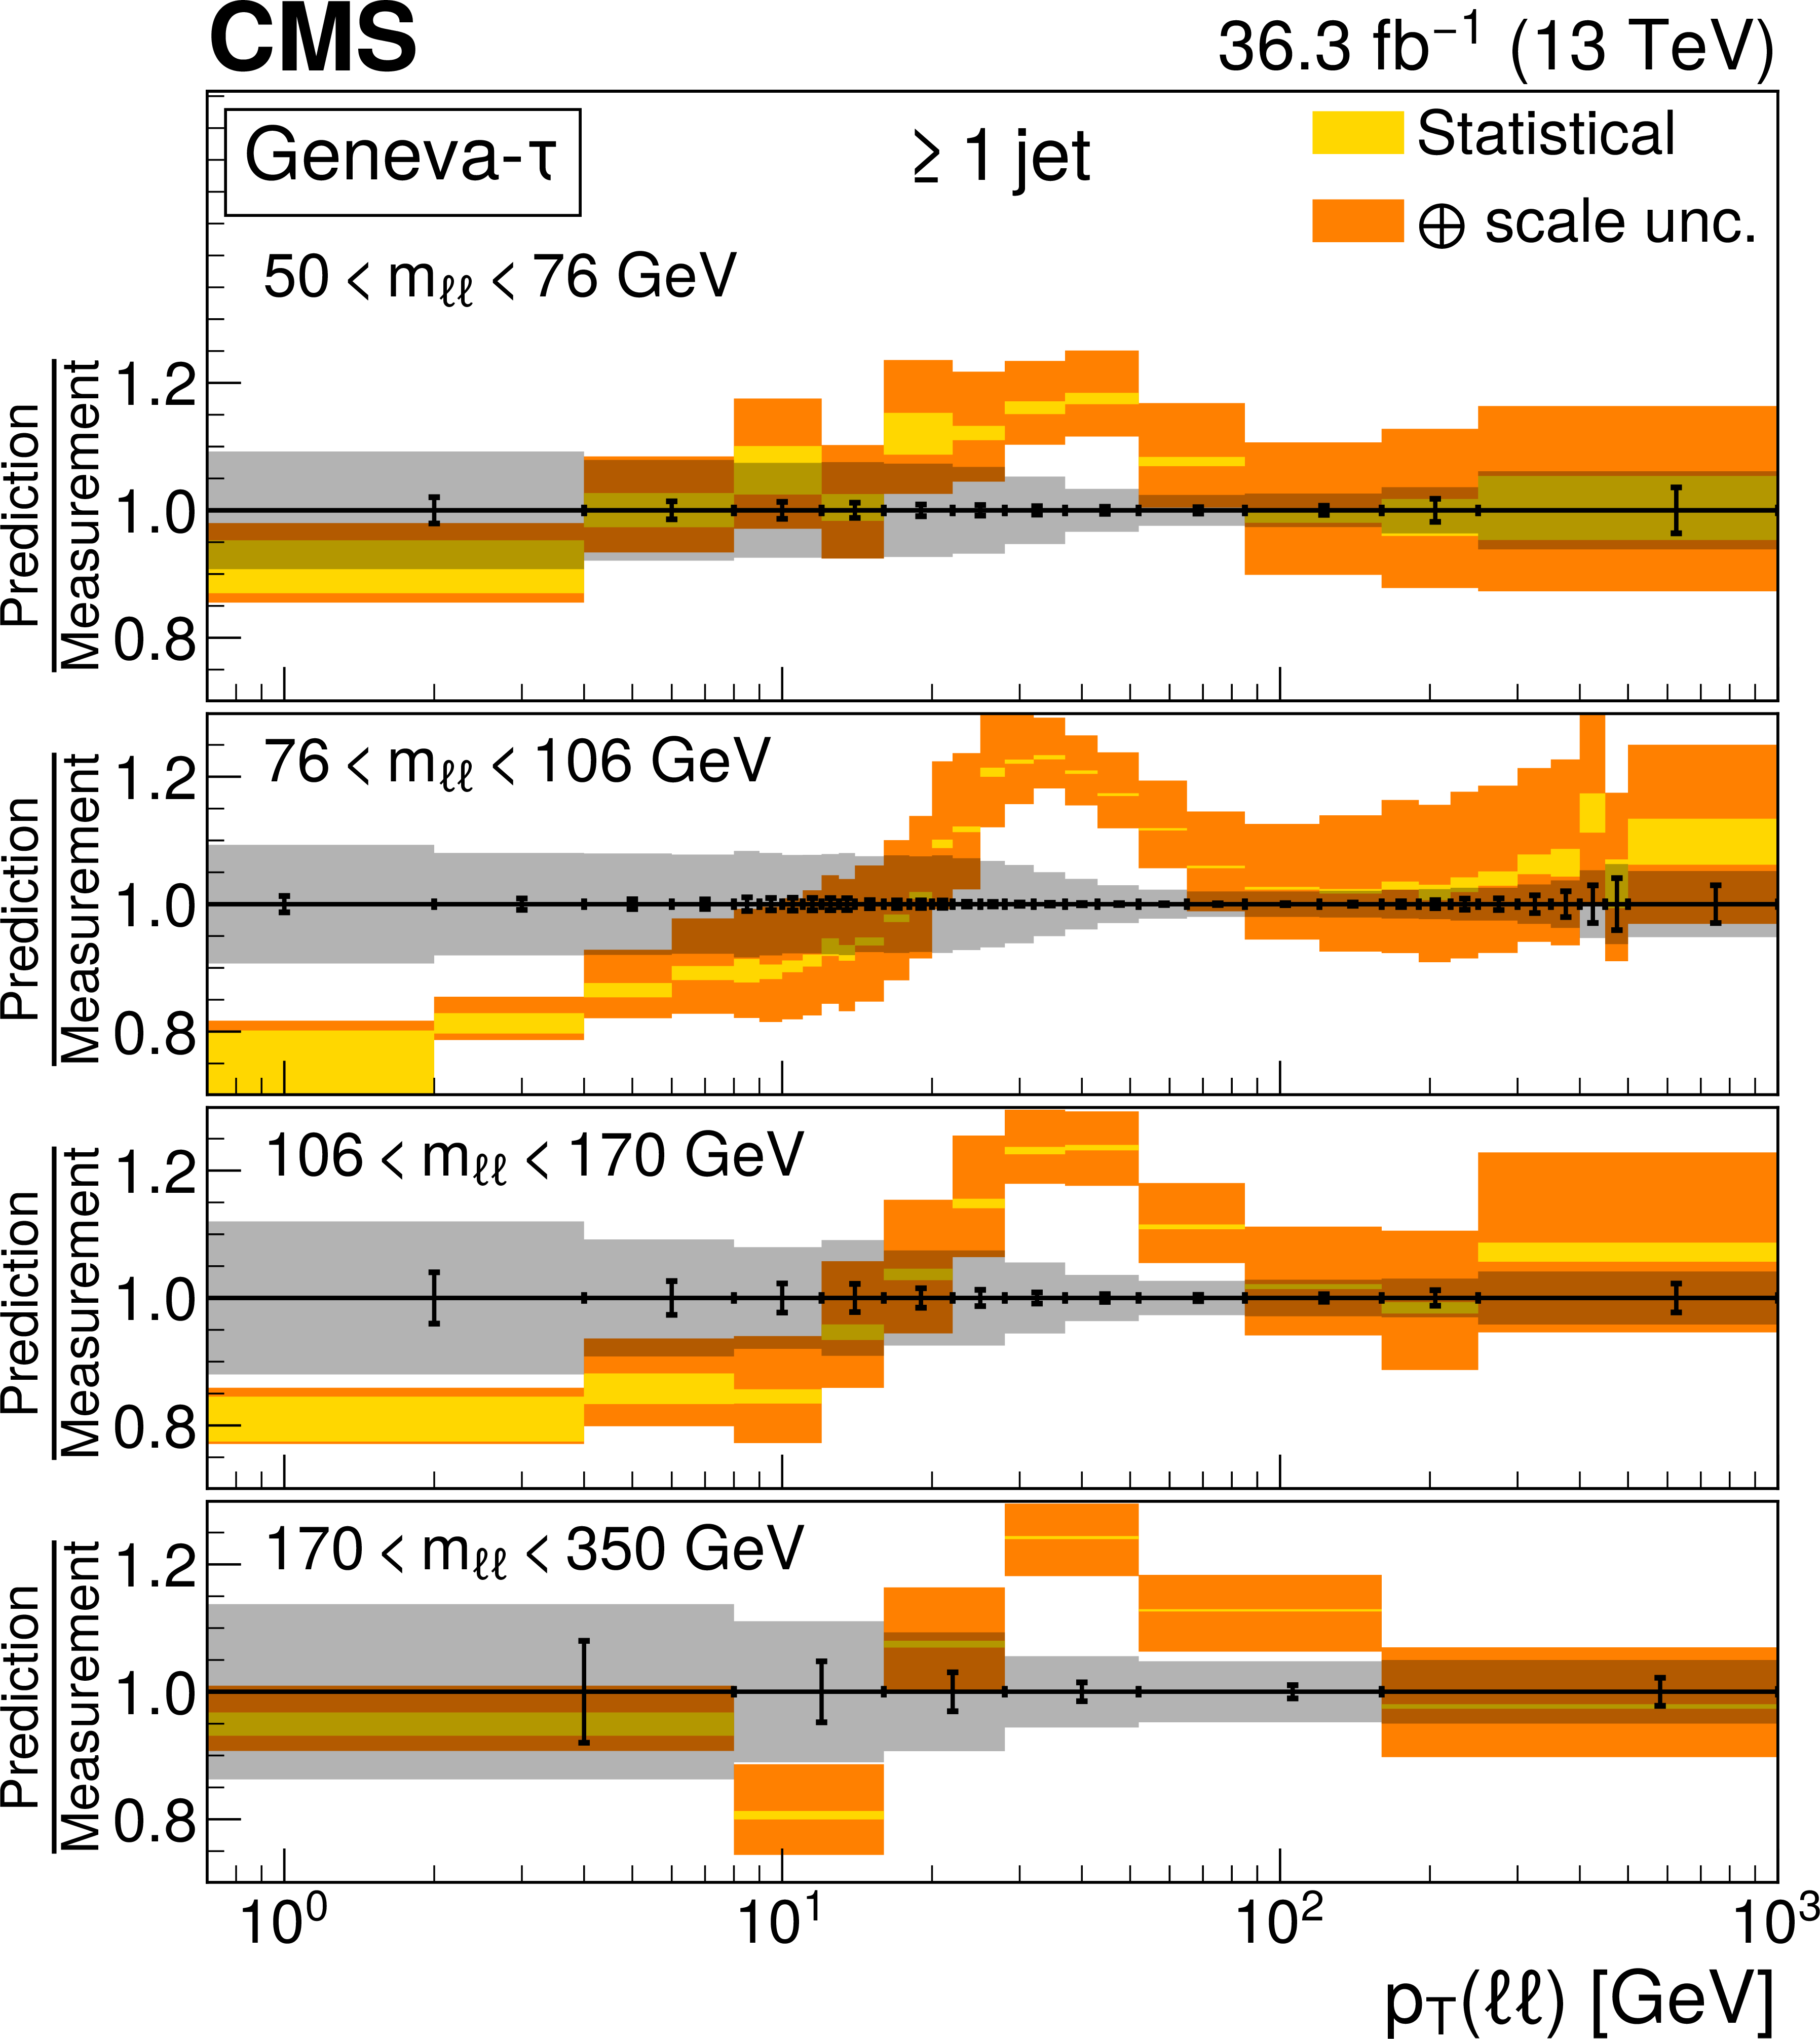
Comparison of the ratios of differential cross sections in $ p_{\mathrm{T}}(\ell\ell) $ for one or more jets in various invariant mass ranges with respect to the peak region 76 $ < m_{\ell\ell} < 106\,\text{Ge\hspace{-.08em}V} $. The measured ratio is compared with MG5\_aMC (0, 1, and 2 jets at NLO) + PYTHIA8 (upper left), \textsc{MiNNLO$ _\mathrm{PS} $ (upper right) and MG5\_aMC (1 jet at NLO) + PB (CASCADE) (lower). Details on the presentation of the results are given in Fig. 6 caption. |

png pdf |
Figure 17-a:
Comparison of the ratios of differential cross sections in $ p_{\mathrm{T}}(\ell\ell) $ for one or more jets in various invariant mass ranges with respect to the peak region 76 $ < m_{\ell\ell} < 106\,\text{Ge\hspace{-.08em}V} $. The measured ratio is compared with MG5\_aMC (0, 1, and 2 jets at NLO) + PYTHIA8 (upper left), \textsc{MiNNLO$ _\mathrm{PS} $ (upper right) and MG5\_aMC (1 jet at NLO) + PB (CASCADE) (lower). Details on the presentation of the results are given in Fig. 6 caption. |

png pdf |
Figure 17-b:
Comparison of the ratios of differential cross sections in $ p_{\mathrm{T}}(\ell\ell) $ for one or more jets in various invariant mass ranges with respect to the peak region 76 $ < m_{\ell\ell} < 106\,\text{Ge\hspace{-.08em}V} $. The measured ratio is compared with MG5\_aMC (0, 1, and 2 jets at NLO) + PYTHIA8 (upper left), \textsc{MiNNLO$ _\mathrm{PS} $ (upper right) and MG5\_aMC (1 jet at NLO) + PB (CASCADE) (lower). Details on the presentation of the results are given in Fig. 6 caption. |

png pdf |
Figure 17-c:
Comparison of the ratios of differential cross sections in $ p_{\mathrm{T}}(\ell\ell) $ for one or more jets in various invariant mass ranges with respect to the peak region 76 $ < m_{\ell\ell} < 106\,\text{Ge\hspace{-.08em}V} $. The measured ratio is compared with MG5\_aMC (0, 1, and 2 jets at NLO) + PYTHIA8 (upper left), \textsc{MiNNLO$ _\mathrm{PS} $ (upper right) and MG5\_aMC (1 jet at NLO) + PB (CASCADE) (lower). Details on the presentation of the results are given in Fig. 6 caption. |

png pdf |
Figure 18:
Comparison of the ratios of differential cross sections in $ p_{\mathrm{T}}(\ell\ell) $ for one or more jets in various invariant mass ranges with respect to the peak region 76 $ < m_{\ell\ell} < 106\,\text{Ge\hspace{-.08em}V} $. The measured ratio is compared with GENEVA-$ \tau $ (left) and GENEVA-$ q_\mathrm{T} $ (right) predictions. Details on the presentation of the results are given in Fig. 8 caption. |

png pdf |
Figure 18-a:
Comparison of the ratios of differential cross sections in $ p_{\mathrm{T}}(\ell\ell) $ for one or more jets in various invariant mass ranges with respect to the peak region 76 $ < m_{\ell\ell} < 106\,\text{Ge\hspace{-.08em}V} $. The measured ratio is compared with GENEVA-$ \tau $ (left) and GENEVA-$ q_\mathrm{T} $ (right) predictions. Details on the presentation of the results are given in Fig. 8 caption. |

png pdf |
Figure 18-b:
Comparison of the ratios of differential cross sections in $ p_{\mathrm{T}}(\ell\ell) $ for one or more jets in various invariant mass ranges with respect to the peak region 76 $ < m_{\ell\ell} < 106\,\text{Ge\hspace{-.08em}V} $. The measured ratio is compared with GENEVA-$ \tau $ (left) and GENEVA-$ q_\mathrm{T} $ (right) predictions. Details on the presentation of the results are given in Fig. 8 caption. |

png pdf |
Figure 19:
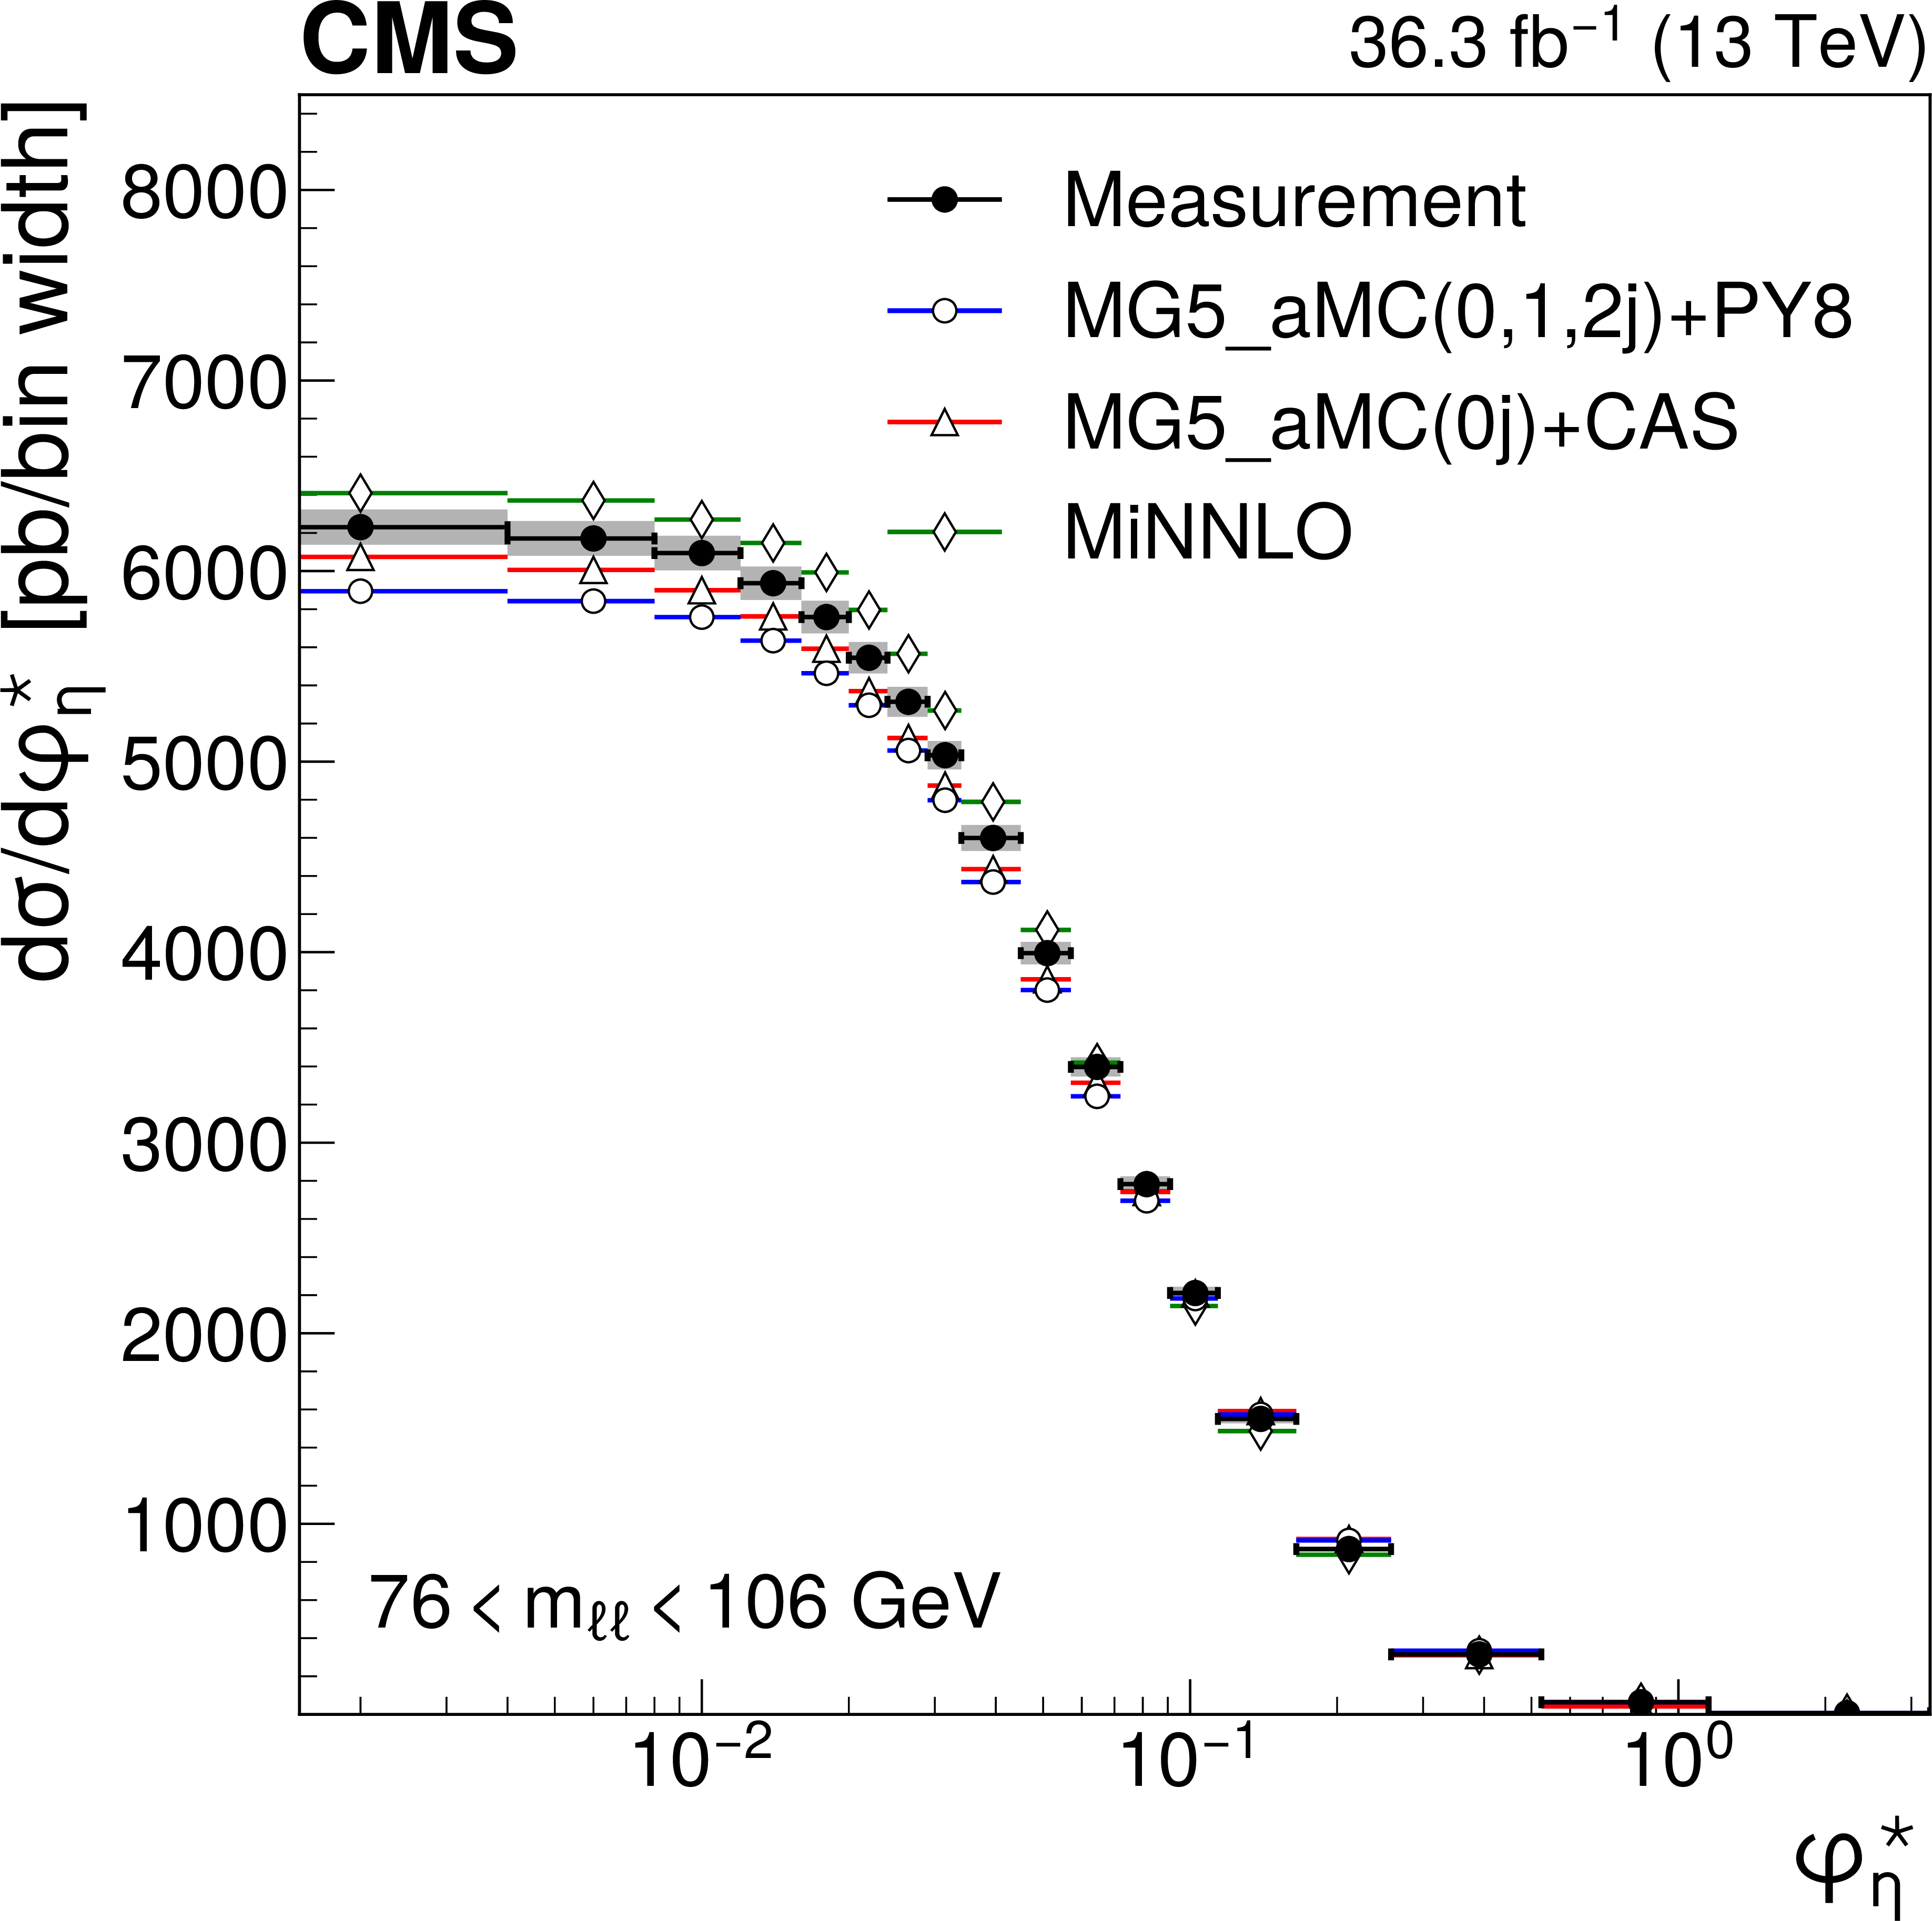
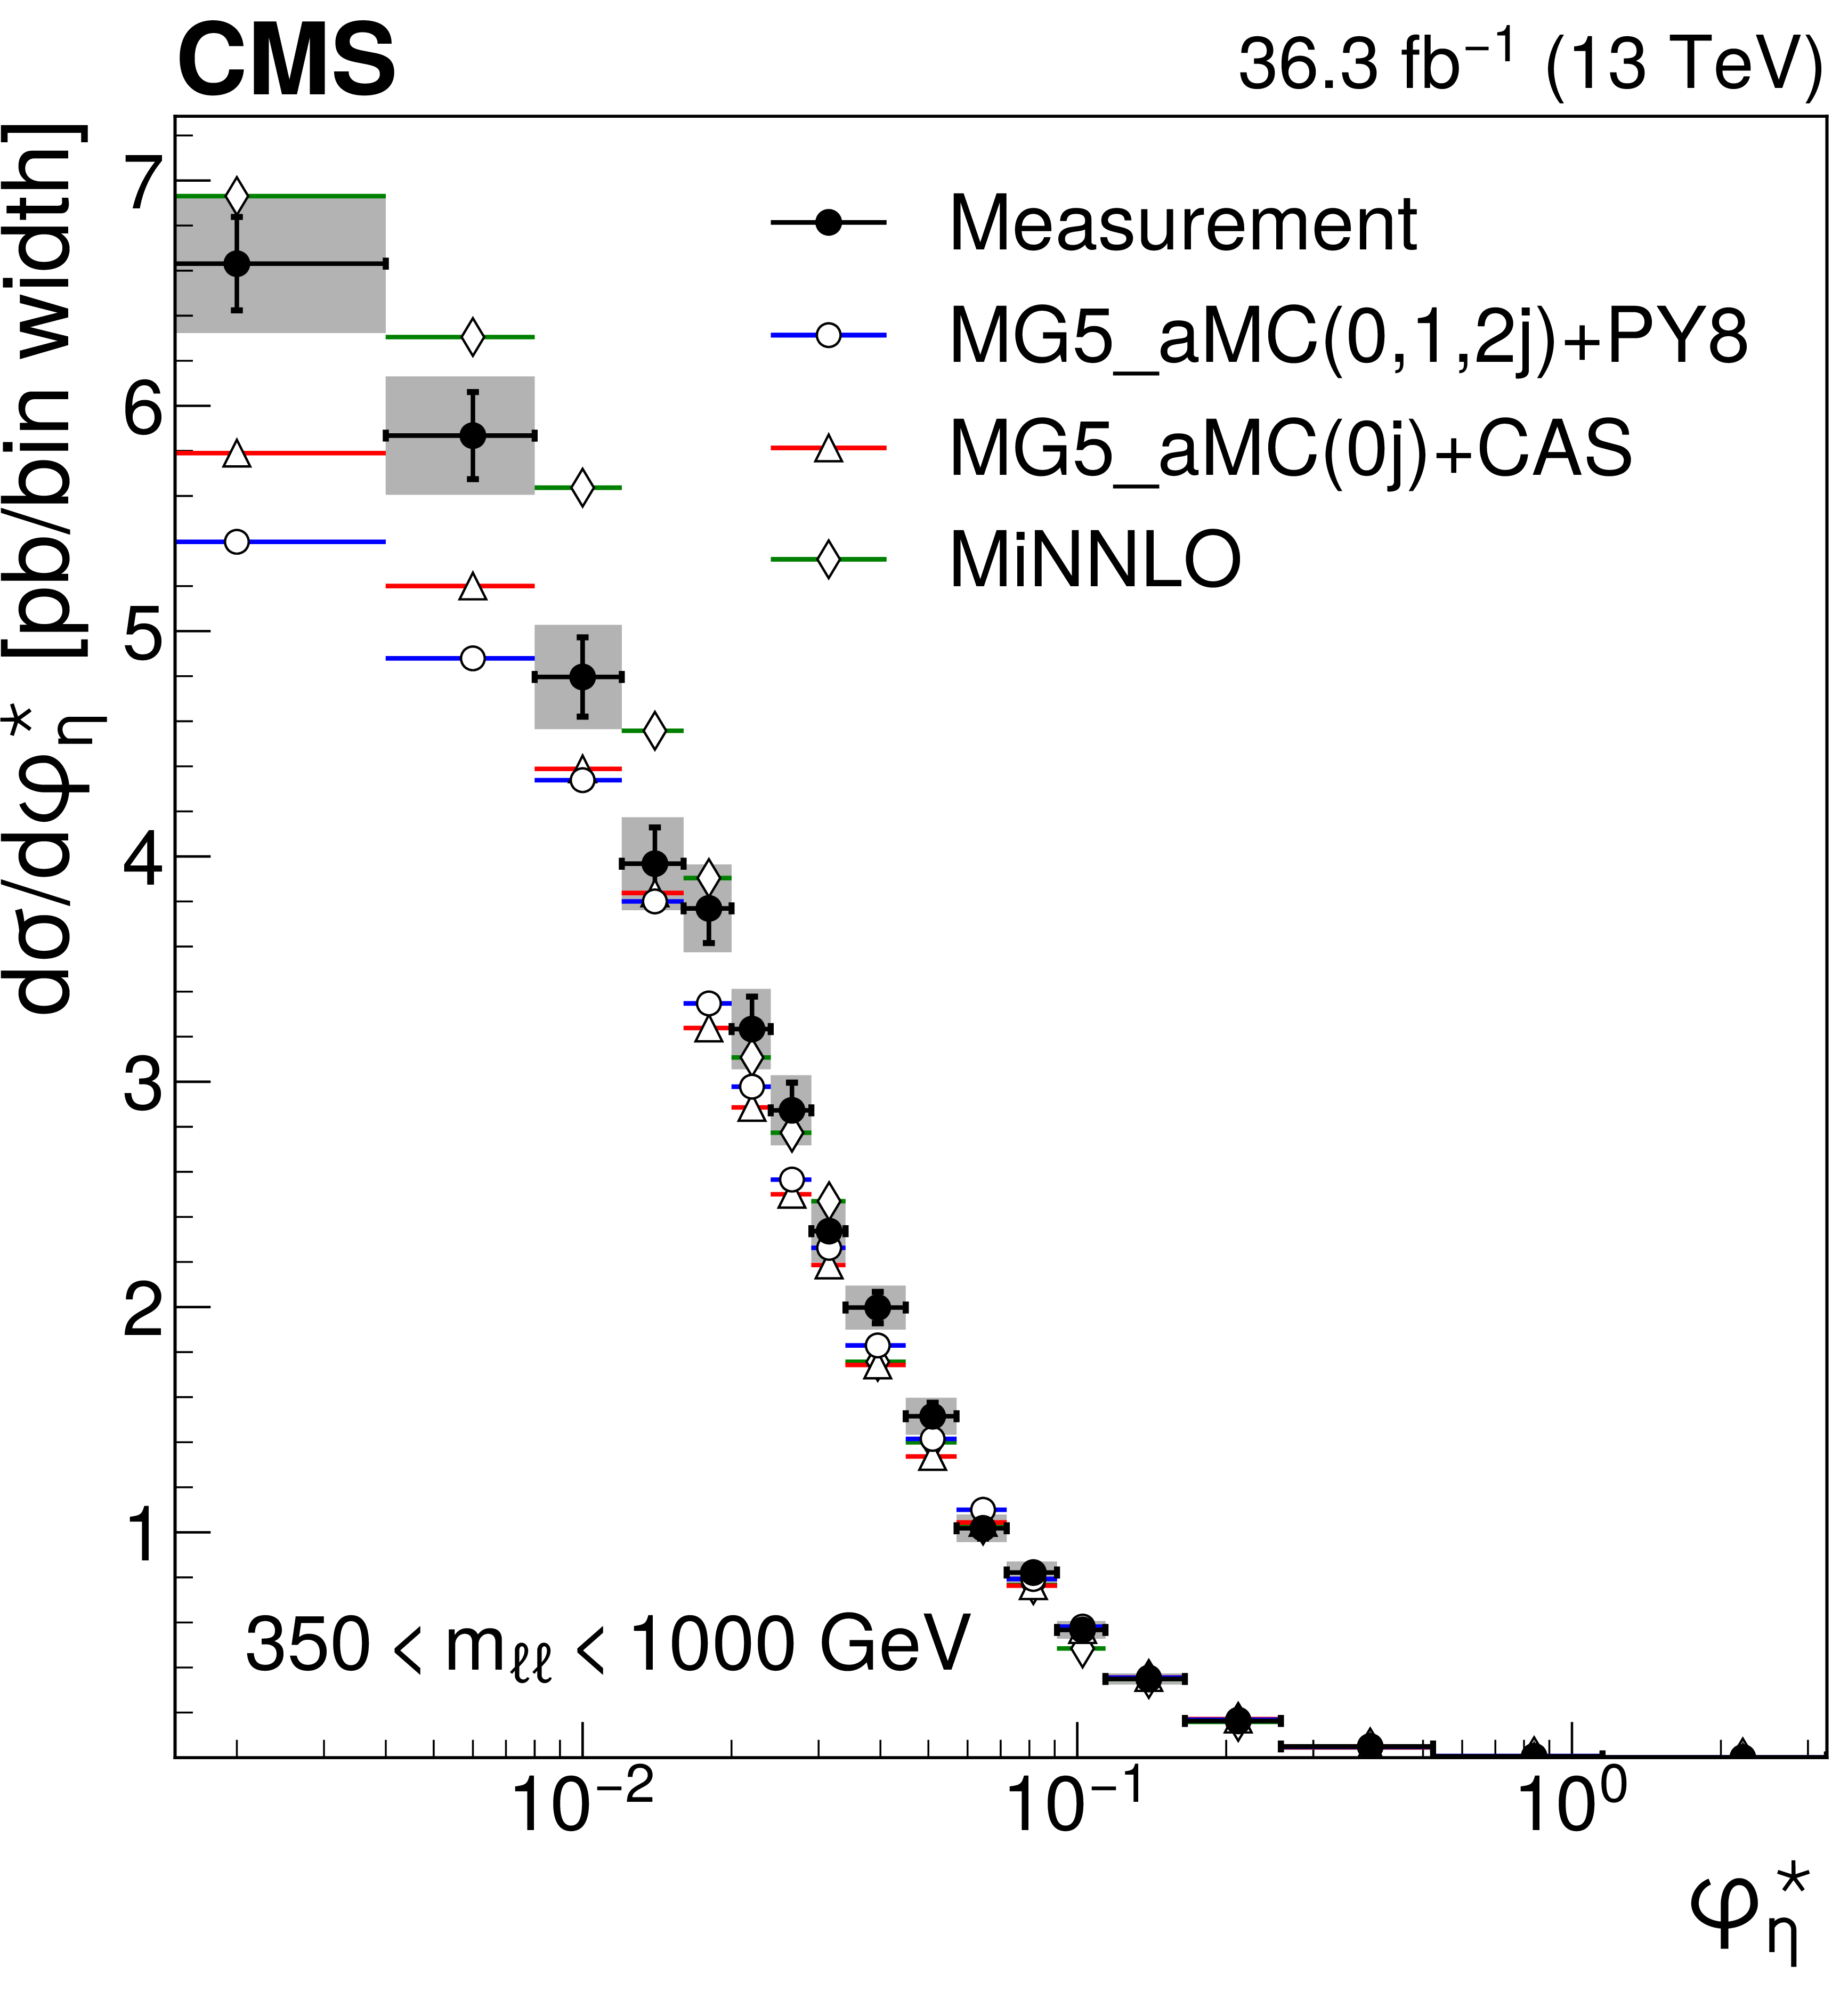
Differential cross sections in $ \varphi^{*}_{\eta}(\ell\ell) $ in various invariant mass ranges: 50 $ < m_{\ell\ell} < 76\,\text{Ge\hspace{-.08em}V} $ (upper left), 76 $ < m_{\ell\ell} < 106\,\text{Ge\hspace{-.08em}V} $ (upper right), 106 $ < m_{\ell\ell} < 170\,\text{Ge\hspace{-.08em}V} $ (middle left), 170 $ < m_{\ell\ell} < 350\,\text{Ge\hspace{-.08em}V} $ (middle right), and 350 $ < m_{\ell\ell} < 1000\,\text{Ge\hspace{-.08em}V} $ (lower). The measurement is compared with MG5\_aMC (0, 1, and 2 jets at NLO) + PYTHIA8 (blue dots), \textsc{MiNNLO$ _\mathrm{PS} $ (green diamonds) and MG5\_aMC (0 jet at NLO)+ PB (CASCADE) (red triangles). Details on the presentation of the results are given in Fig. 5 caption. |

png pdf |
Figure 19-a:
Differential cross sections in $ \varphi^{*}_{\eta}(\ell\ell) $ in various invariant mass ranges: 50 $ < m_{\ell\ell} < 76\,\text{Ge\hspace{-.08em}V} $ (upper left), 76 $ < m_{\ell\ell} < 106\,\text{Ge\hspace{-.08em}V} $ (upper right), 106 $ < m_{\ell\ell} < 170\,\text{Ge\hspace{-.08em}V} $ (middle left), 170 $ < m_{\ell\ell} < 350\,\text{Ge\hspace{-.08em}V} $ (middle right), and 350 $ < m_{\ell\ell} < 1000\,\text{Ge\hspace{-.08em}V} $ (lower). The measurement is compared with MG5\_aMC (0, 1, and 2 jets at NLO) + PYTHIA8 (blue dots), \textsc{MiNNLO$ _\mathrm{PS} $ (green diamonds) and MG5\_aMC (0 jet at NLO)+ PB (CASCADE) (red triangles). Details on the presentation of the results are given in Fig. 5 caption. |
png pdf |
Figure 19-b:
Differential cross sections in $ \varphi^{*}_{\eta}(\ell\ell) $ in various invariant mass ranges: 50 $ < m_{\ell\ell} < 76\,\text{Ge\hspace{-.08em}V} $ (upper left), 76 $ < m_{\ell\ell} < 106\,\text{Ge\hspace{-.08em}V} $ (upper right), 106 $ < m_{\ell\ell} < 170\,\text{Ge\hspace{-.08em}V} $ (middle left), 170 $ < m_{\ell\ell} < 350\,\text{Ge\hspace{-.08em}V} $ (middle right), and 350 $ < m_{\ell\ell} < 1000\,\text{Ge\hspace{-.08em}V} $ (lower). The measurement is compared with MG5\_aMC (0, 1, and 2 jets at NLO) + PYTHIA8 (blue dots), \textsc{MiNNLO$ _\mathrm{PS} $ (green diamonds) and MG5\_aMC (0 jet at NLO)+ PB (CASCADE) (red triangles). Details on the presentation of the results are given in Fig. 5 caption. |

png pdf |
Figure 19-c:
Differential cross sections in $ \varphi^{*}_{\eta}(\ell\ell) $ in various invariant mass ranges: 50 $ < m_{\ell\ell} < 76\,\text{Ge\hspace{-.08em}V} $ (upper left), 76 $ < m_{\ell\ell} < 106\,\text{Ge\hspace{-.08em}V} $ (upper right), 106 $ < m_{\ell\ell} < 170\,\text{Ge\hspace{-.08em}V} $ (middle left), 170 $ < m_{\ell\ell} < 350\,\text{Ge\hspace{-.08em}V} $ (middle right), and 350 $ < m_{\ell\ell} < 1000\,\text{Ge\hspace{-.08em}V} $ (lower). The measurement is compared with MG5\_aMC (0, 1, and 2 jets at NLO) + PYTHIA8 (blue dots), \textsc{MiNNLO$ _\mathrm{PS} $ (green diamonds) and MG5\_aMC (0 jet at NLO)+ PB (CASCADE) (red triangles). Details on the presentation of the results are given in Fig. 5 caption. |

png pdf |
Figure 19-d:
Differential cross sections in $ \varphi^{*}_{\eta}(\ell\ell) $ in various invariant mass ranges: 50 $ < m_{\ell\ell} < 76\,\text{Ge\hspace{-.08em}V} $ (upper left), 76 $ < m_{\ell\ell} < 106\,\text{Ge\hspace{-.08em}V} $ (upper right), 106 $ < m_{\ell\ell} < 170\,\text{Ge\hspace{-.08em}V} $ (middle left), 170 $ < m_{\ell\ell} < 350\,\text{Ge\hspace{-.08em}V} $ (middle right), and 350 $ < m_{\ell\ell} < 1000\,\text{Ge\hspace{-.08em}V} $ (lower). The measurement is compared with MG5\_aMC (0, 1, and 2 jets at NLO) + PYTHIA8 (blue dots), \textsc{MiNNLO$ _\mathrm{PS} $ (green diamonds) and MG5\_aMC (0 jet at NLO)+ PB (CASCADE) (red triangles). Details on the presentation of the results are given in Fig. 5 caption. |
png pdf |
Figure 19-e:
Differential cross sections in $ \varphi^{*}_{\eta}(\ell\ell) $ in various invariant mass ranges: 50 $ < m_{\ell\ell} < 76\,\text{Ge\hspace{-.08em}V} $ (upper left), 76 $ < m_{\ell\ell} < 106\,\text{Ge\hspace{-.08em}V} $ (upper right), 106 $ < m_{\ell\ell} < 170\,\text{Ge\hspace{-.08em}V} $ (middle left), 170 $ < m_{\ell\ell} < 350\,\text{Ge\hspace{-.08em}V} $ (middle right), and 350 $ < m_{\ell\ell} < 1000\,\text{Ge\hspace{-.08em}V} $ (lower). The measurement is compared with MG5\_aMC (0, 1, and 2 jets at NLO) + PYTHIA8 (blue dots), \textsc{MiNNLO$ _\mathrm{PS} $ (green diamonds) and MG5\_aMC (0 jet at NLO)+ PB (CASCADE) (red triangles). Details on the presentation of the results are given in Fig. 5 caption. |

png pdf |
Figure 20:
Comparison of the differential cross sections in $ \varphi^{*}_{\eta}(\ell\ell) $ to predictions in various $ m_{\ell\ell} $ ranges. The measurement is compared with MG5\_aMC (0, 1, and 2 jets at NLO) + PYTHIA8 (upper left), \textsc{MiNNLO$ _\mathrm{PS} $ (upper right) and MG5\_aMC + PB (CASCADE) (lower). Details on the presentation of the results are given in Fig. 6 caption. |

png pdf |
Figure 20-a:
Comparison of the differential cross sections in $ \varphi^{*}_{\eta}(\ell\ell) $ to predictions in various $ m_{\ell\ell} $ ranges. The measurement is compared with MG5\_aMC (0, 1, and 2 jets at NLO) + PYTHIA8 (upper left), \textsc{MiNNLO$ _\mathrm{PS} $ (upper right) and MG5\_aMC + PB (CASCADE) (lower). Details on the presentation of the results are given in Fig. 6 caption. |
png pdf |
Figure 20-b:
Comparison of the differential cross sections in $ \varphi^{*}_{\eta}(\ell\ell) $ to predictions in various $ m_{\ell\ell} $ ranges. The measurement is compared with MG5\_aMC (0, 1, and 2 jets at NLO) + PYTHIA8 (upper left), \textsc{MiNNLO$ _\mathrm{PS} $ (upper right) and MG5\_aMC + PB (CASCADE) (lower). Details on the presentation of the results are given in Fig. 6 caption. |

png pdf |
Figure 20-c:
Comparison of the differential cross sections in $ \varphi^{*}_{\eta}(\ell\ell) $ to predictions in various $ m_{\ell\ell} $ ranges. The measurement is compared with MG5\_aMC (0, 1, and 2 jets at NLO) + PYTHIA8 (upper left), \textsc{MiNNLO$ _\mathrm{PS} $ (upper right) and MG5\_aMC + PB (CASCADE) (lower). Details on the presentation of the results are given in Fig. 6 caption. |

png pdf |
Figure 21:
Comparison of the differential cross sections in $ \varphi^{*}_{\eta}(\ell\ell) $ to predictions in various $ m_{\ell\ell} $ ranges. The measurement is compared with GENEVA-$ \tau $ (left) and GENEVA-$ q_\mathrm{T} $ (right) predictions. Details on the presentation of the results are given in Fig. 8 caption. |
png pdf |
Figure 21-a:
Comparison of the differential cross sections in $ \varphi^{*}_{\eta}(\ell\ell) $ to predictions in various $ m_{\ell\ell} $ ranges. The measurement is compared with GENEVA-$ \tau $ (left) and GENEVA-$ q_\mathrm{T} $ (right) predictions. Details on the presentation of the results are given in Fig. 8 caption. |
png pdf |
Figure 21-b:
Comparison of the differential cross sections in $ \varphi^{*}_{\eta}(\ell\ell) $ to predictions in various $ m_{\ell\ell} $ ranges. The measurement is compared with GENEVA-$ \tau $ (left) and GENEVA-$ q_\mathrm{T} $ (right) predictions. Details on the presentation of the results are given in Fig. 8 caption. |
png pdf |
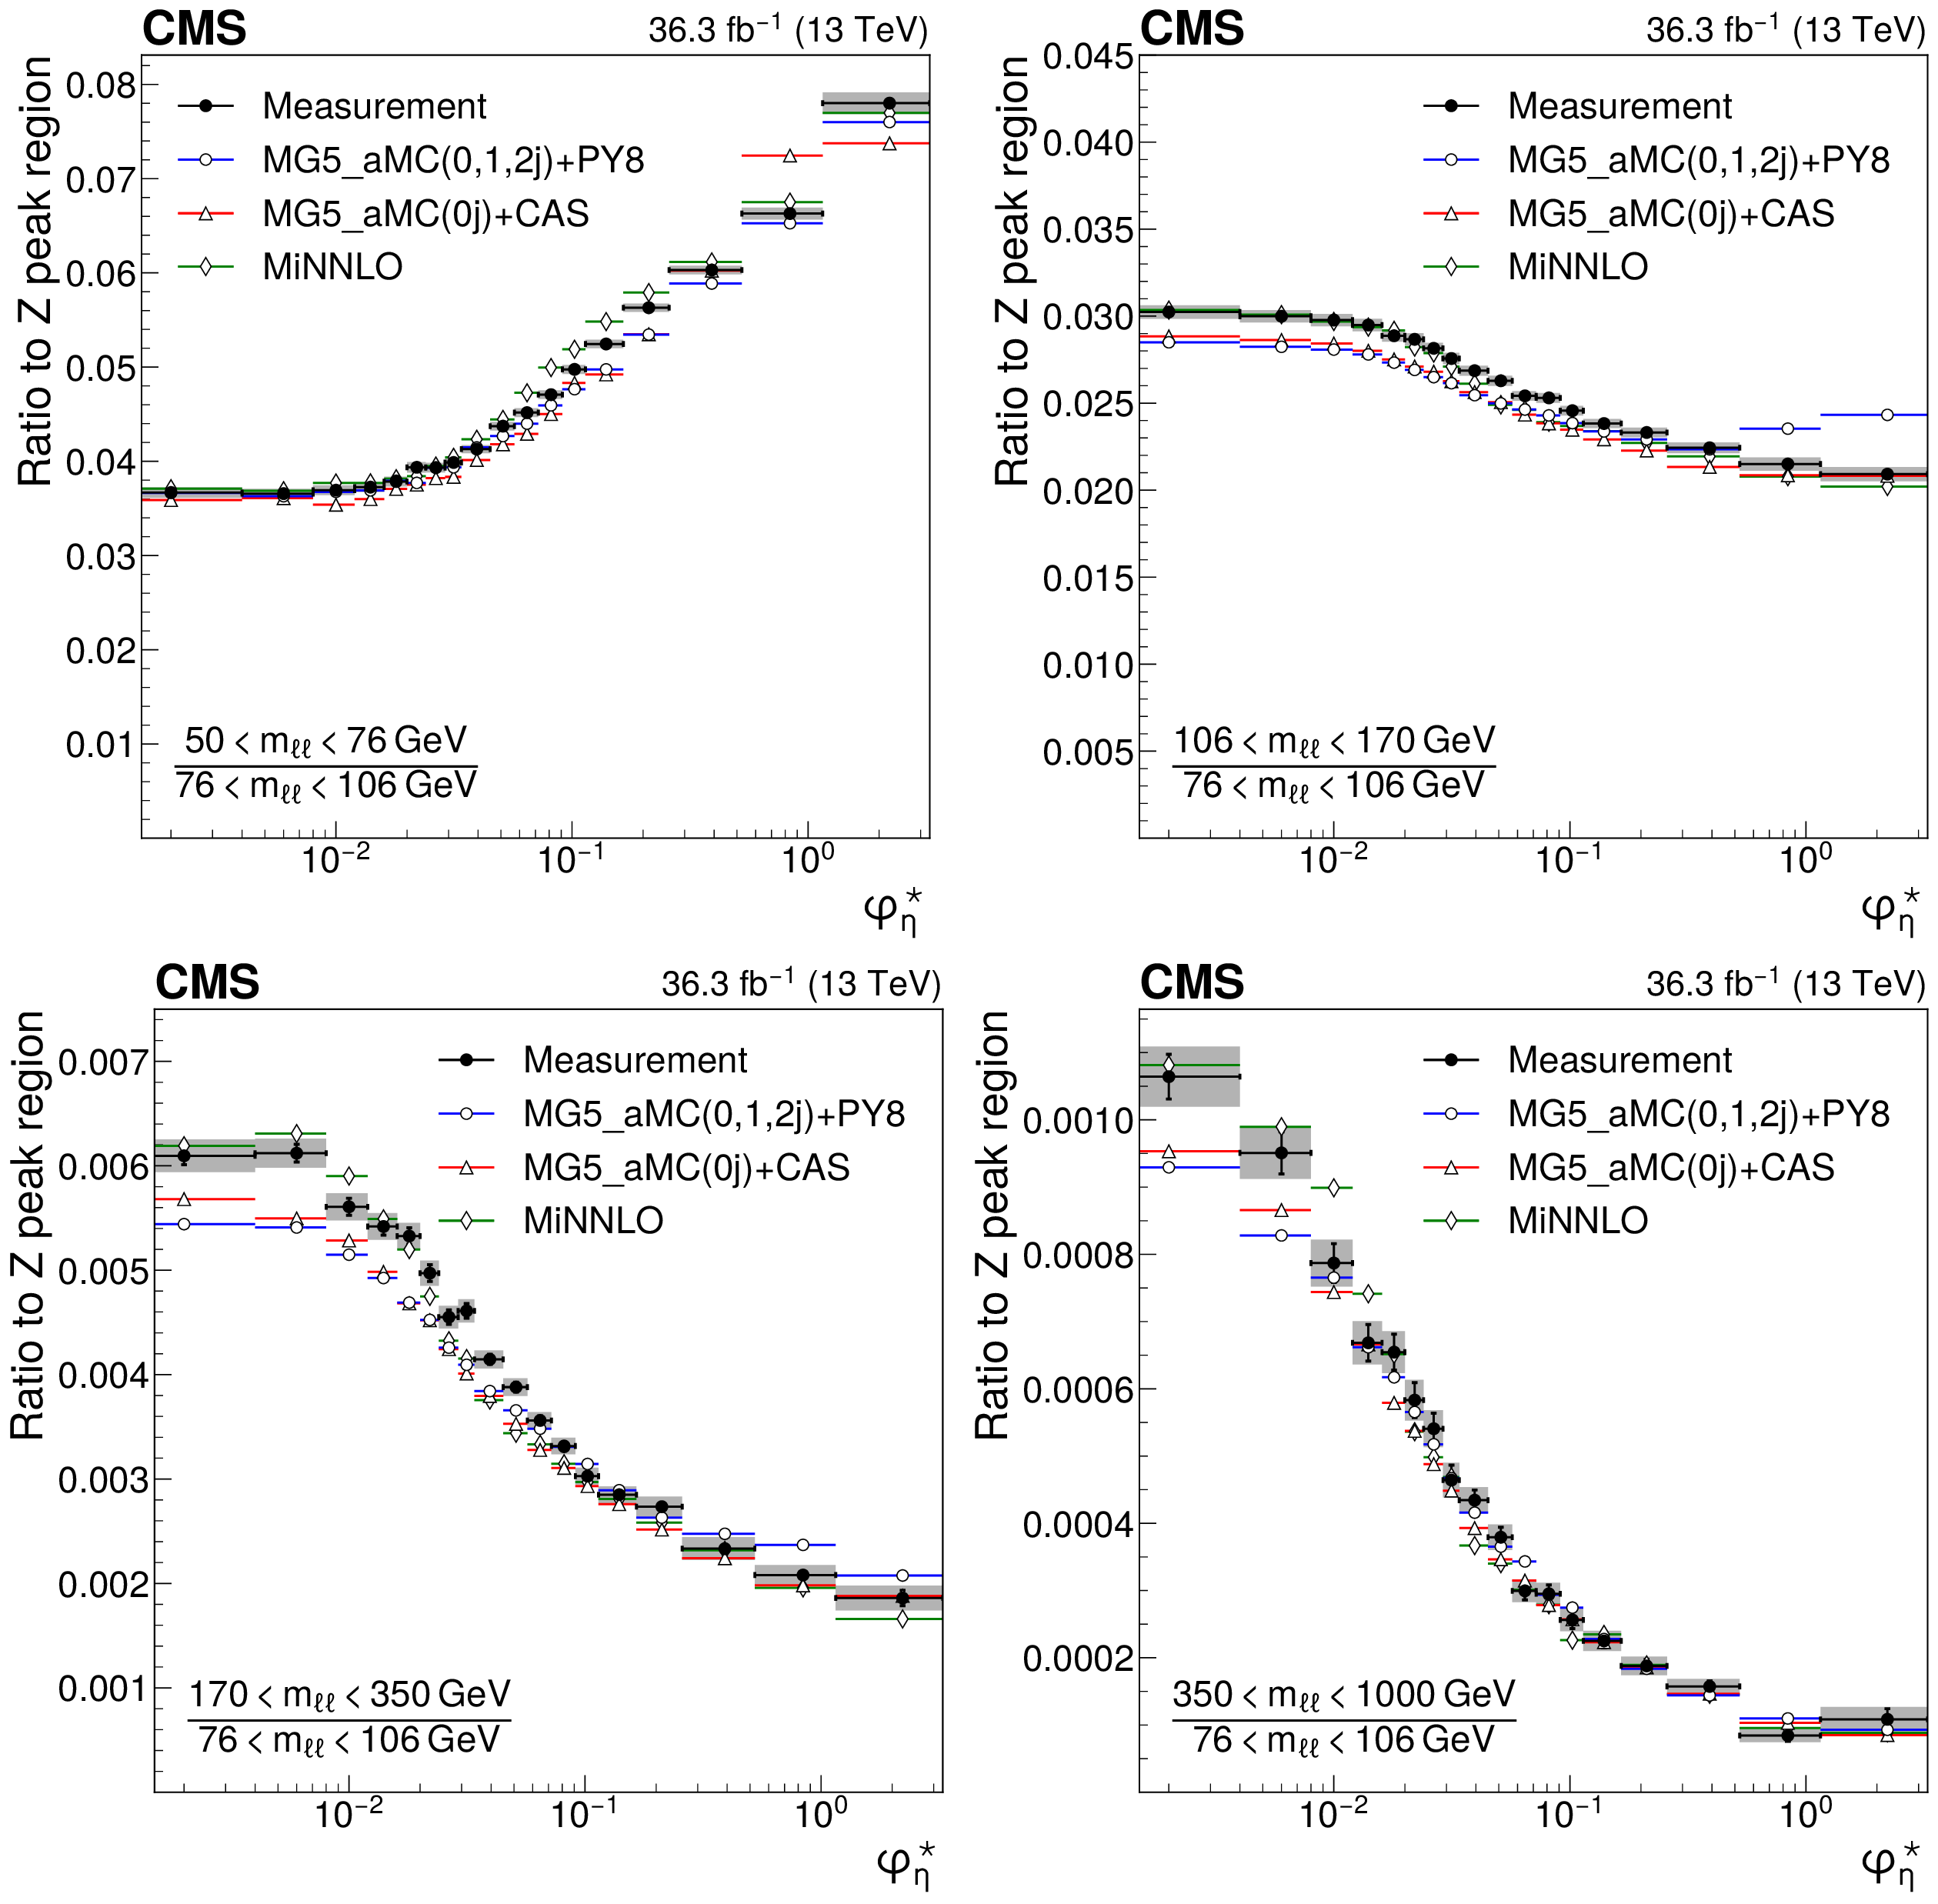
Figure 22:
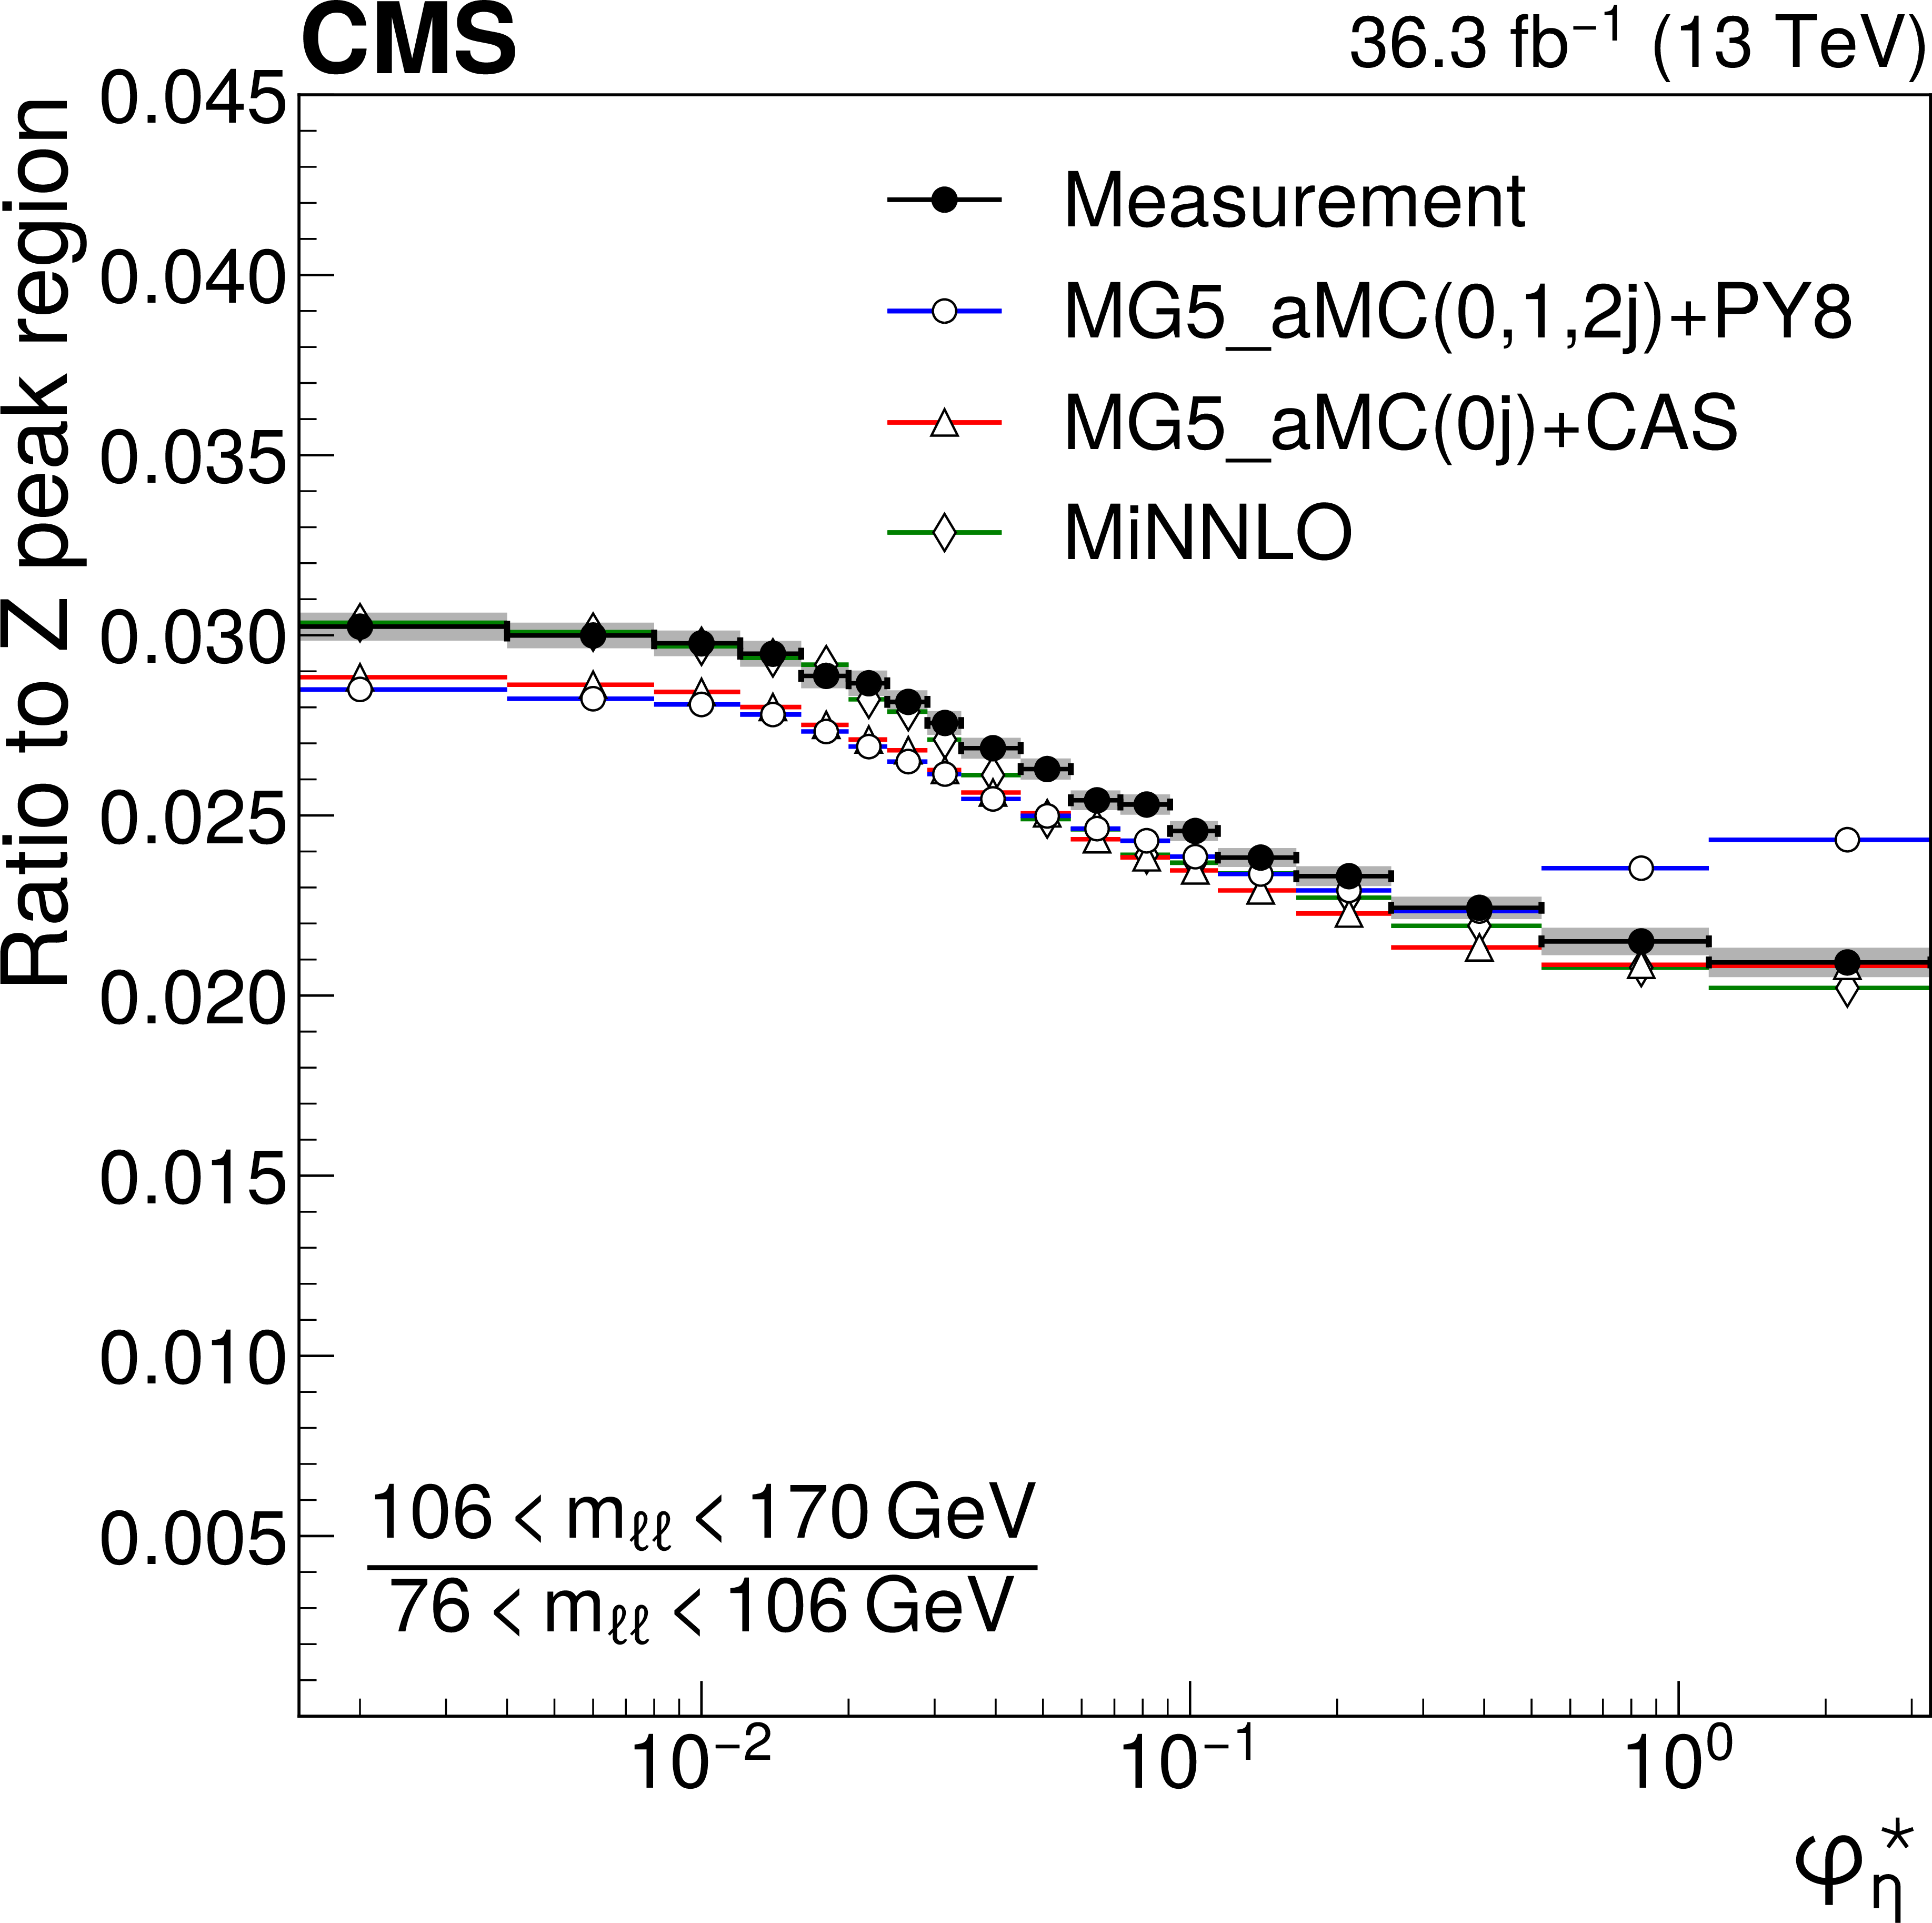
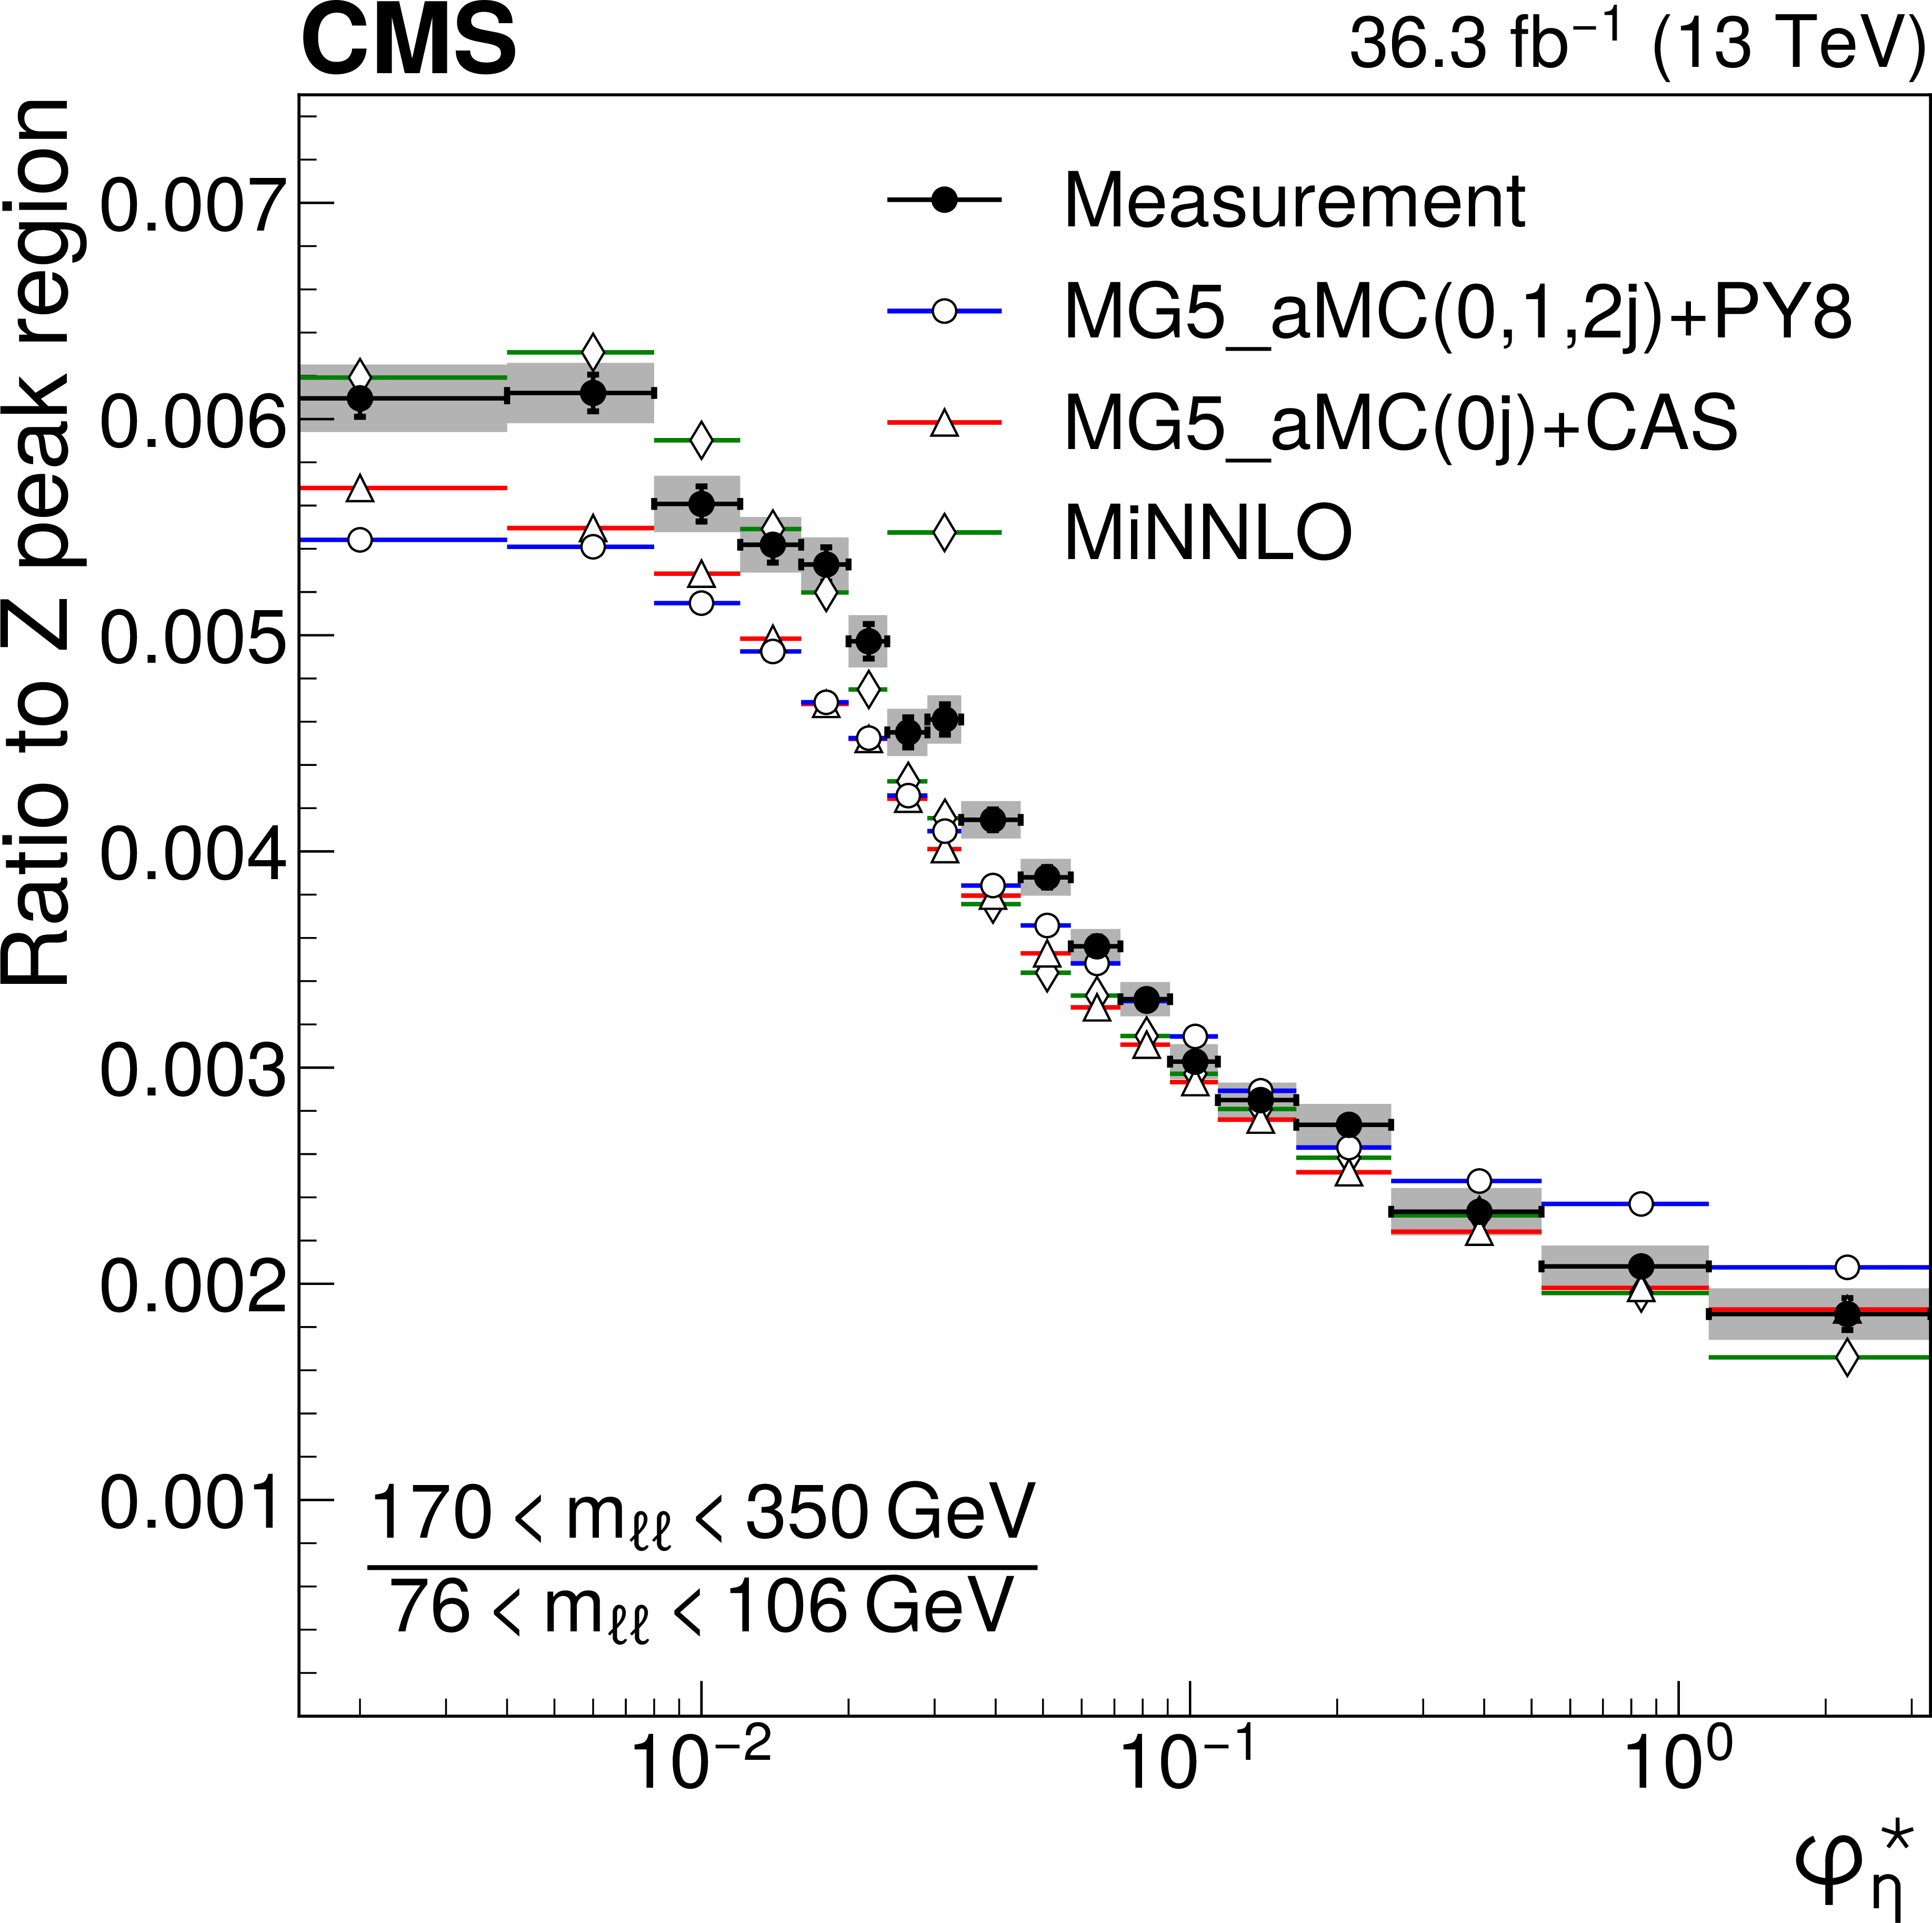
Ratios of differential cross sections in $ \varphi^{*}_{\eta}(\ell\ell) $ for invariant mass ranges with respect to the peak region 76 $ < m_{\ell\ell} < 106\,\text{Ge\hspace{-.08em}V} $: 50 $ < m_{\ell\ell} < 76\,\text{Ge\hspace{-.08em}V} $ (upper left), 106 $ < m_{\ell\ell} < 170\,\text{Ge\hspace{-.08em}V} $ (upper right), 170 $ < m_{\ell\ell} < 350\,\text{Ge\hspace{-.08em}V} $ (lower left), and 350 $ < m_{\ell\ell} < 1000\,\text{Ge\hspace{-.08em}V} $ (lower right). The measurement is compared with MG5\_aMC (0, 1, and 2 jets at NLO) + PYTHIA8 (blue dots), \textsc{MiNNLO$ _\mathrm{PS} $ (green diamonds) and MG5\_aMC (0 jet at NLO)+ PB (CASCADE) (red triangles). Details on the presentation of the results are given in Fig. 5 caption. |

png pdf |
Figure 22-a:
Ratios of differential cross sections in $ \varphi^{*}_{\eta}(\ell\ell) $ for invariant mass ranges with respect to the peak region 76 $ < m_{\ell\ell} < 106\,\text{Ge\hspace{-.08em}V} $: 50 $ < m_{\ell\ell} < 76\,\text{Ge\hspace{-.08em}V} $ (upper left), 106 $ < m_{\ell\ell} < 170\,\text{Ge\hspace{-.08em}V} $ (upper right), 170 $ < m_{\ell\ell} < 350\,\text{Ge\hspace{-.08em}V} $ (lower left), and 350 $ < m_{\ell\ell} < 1000\,\text{Ge\hspace{-.08em}V} $ (lower right). The measurement is compared with MG5\_aMC (0, 1, and 2 jets at NLO) + PYTHIA8 (blue dots), \textsc{MiNNLO$ _\mathrm{PS} $ (green diamonds) and MG5\_aMC (0 jet at NLO)+ PB (CASCADE) (red triangles). Details on the presentation of the results are given in Fig. 5 caption. |
png pdf |
Figure 22-b:
Ratios of differential cross sections in $ \varphi^{*}_{\eta}(\ell\ell) $ for invariant mass ranges with respect to the peak region 76 $ < m_{\ell\ell} < 106\,\text{Ge\hspace{-.08em}V} $: 50 $ < m_{\ell\ell} < 76\,\text{Ge\hspace{-.08em}V} $ (upper left), 106 $ < m_{\ell\ell} < 170\,\text{Ge\hspace{-.08em}V} $ (upper right), 170 $ < m_{\ell\ell} < 350\,\text{Ge\hspace{-.08em}V} $ (lower left), and 350 $ < m_{\ell\ell} < 1000\,\text{Ge\hspace{-.08em}V} $ (lower right). The measurement is compared with MG5\_aMC (0, 1, and 2 jets at NLO) + PYTHIA8 (blue dots), \textsc{MiNNLO$ _\mathrm{PS} $ (green diamonds) and MG5\_aMC (0 jet at NLO)+ PB (CASCADE) (red triangles). Details on the presentation of the results are given in Fig. 5 caption. |
png pdf |
Figure 22-c:
Ratios of differential cross sections in $ \varphi^{*}_{\eta}(\ell\ell) $ for invariant mass ranges with respect to the peak region 76 $ < m_{\ell\ell} < 106\,\text{Ge\hspace{-.08em}V} $: 50 $ < m_{\ell\ell} < 76\,\text{Ge\hspace{-.08em}V} $ (upper left), 106 $ < m_{\ell\ell} < 170\,\text{Ge\hspace{-.08em}V} $ (upper right), 170 $ < m_{\ell\ell} < 350\,\text{Ge\hspace{-.08em}V} $ (lower left), and 350 $ < m_{\ell\ell} < 1000\,\text{Ge\hspace{-.08em}V} $ (lower right). The measurement is compared with MG5\_aMC (0, 1, and 2 jets at NLO) + PYTHIA8 (blue dots), \textsc{MiNNLO$ _\mathrm{PS} $ (green diamonds) and MG5\_aMC (0 jet at NLO)+ PB (CASCADE) (red triangles). Details on the presentation of the results are given in Fig. 5 caption. |

png pdf |
Figure 22-d:
Ratios of differential cross sections in $ \varphi^{*}_{\eta}(\ell\ell) $ for invariant mass ranges with respect to the peak region 76 $ < m_{\ell\ell} < 106\,\text{Ge\hspace{-.08em}V} $: 50 $ < m_{\ell\ell} < 76\,\text{Ge\hspace{-.08em}V} $ (upper left), 106 $ < m_{\ell\ell} < 170\,\text{Ge\hspace{-.08em}V} $ (upper right), 170 $ < m_{\ell\ell} < 350\,\text{Ge\hspace{-.08em}V} $ (lower left), and 350 $ < m_{\ell\ell} < 1000\,\text{Ge\hspace{-.08em}V} $ (lower right). The measurement is compared with MG5\_aMC (0, 1, and 2 jets at NLO) + PYTHIA8 (blue dots), \textsc{MiNNLO$ _\mathrm{PS} $ (green diamonds) and MG5\_aMC (0 jet at NLO)+ PB (CASCADE) (red triangles). Details on the presentation of the results are given in Fig. 5 caption. |

png pdf |
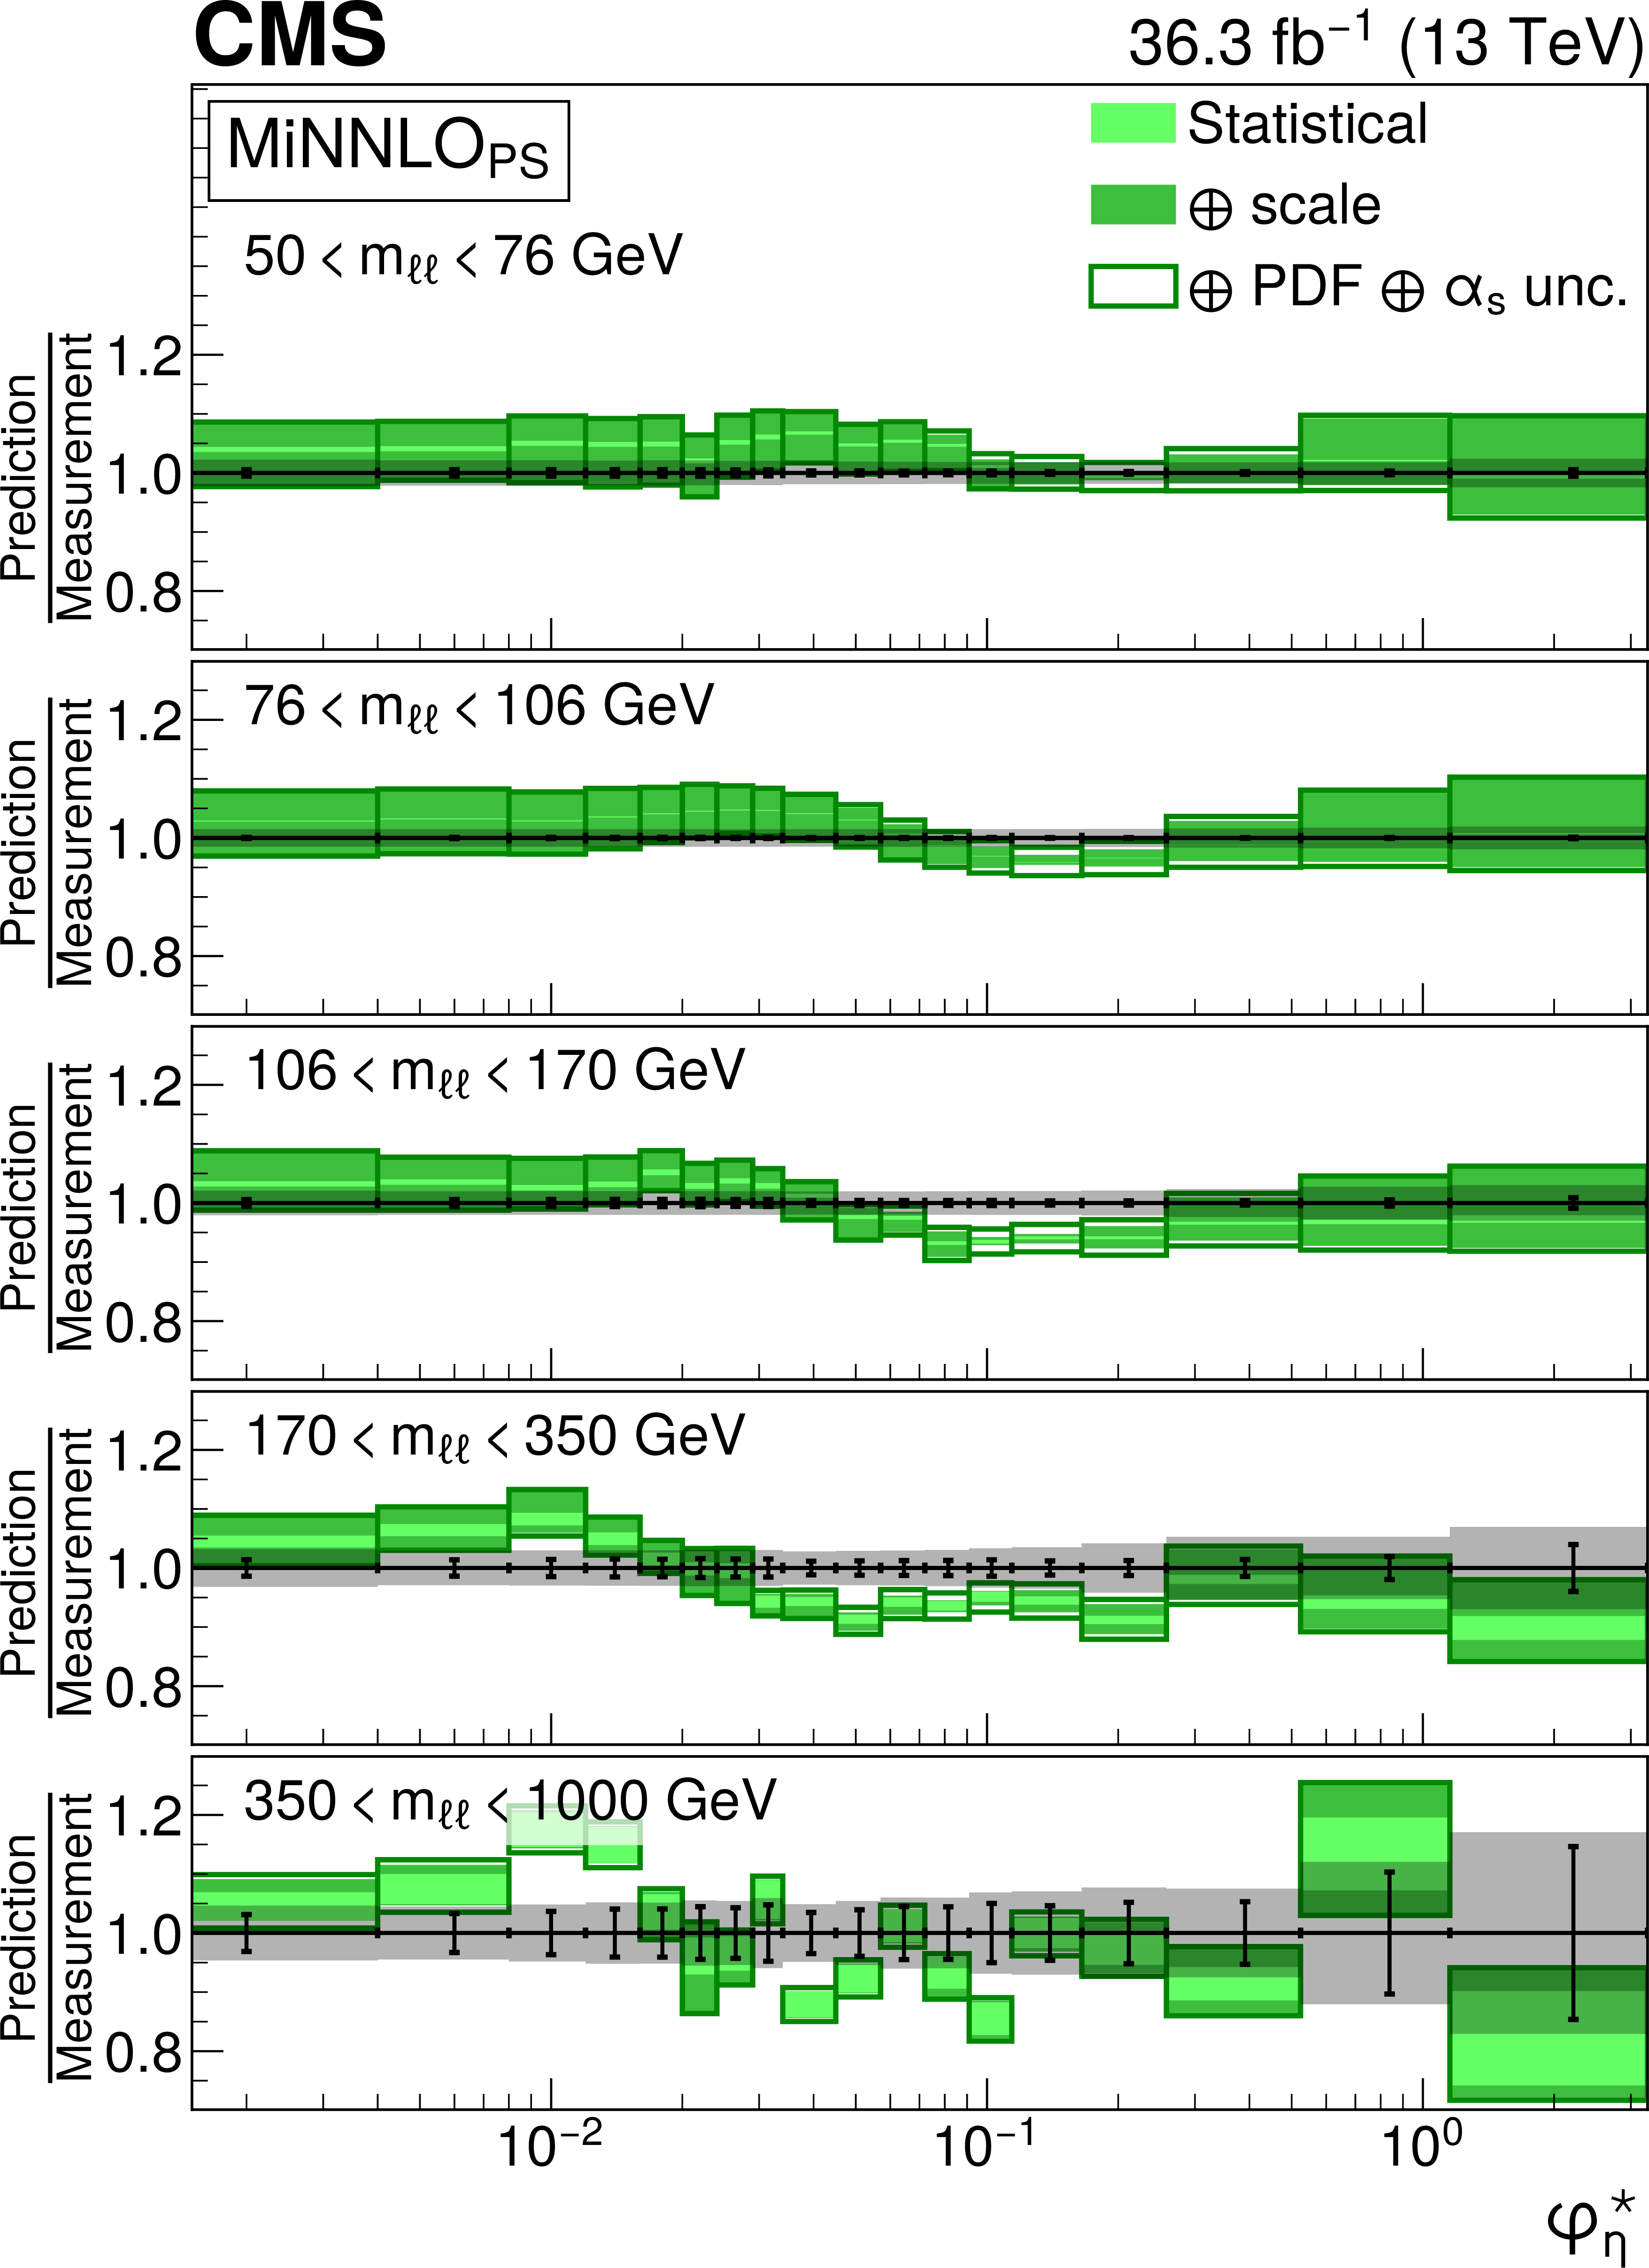
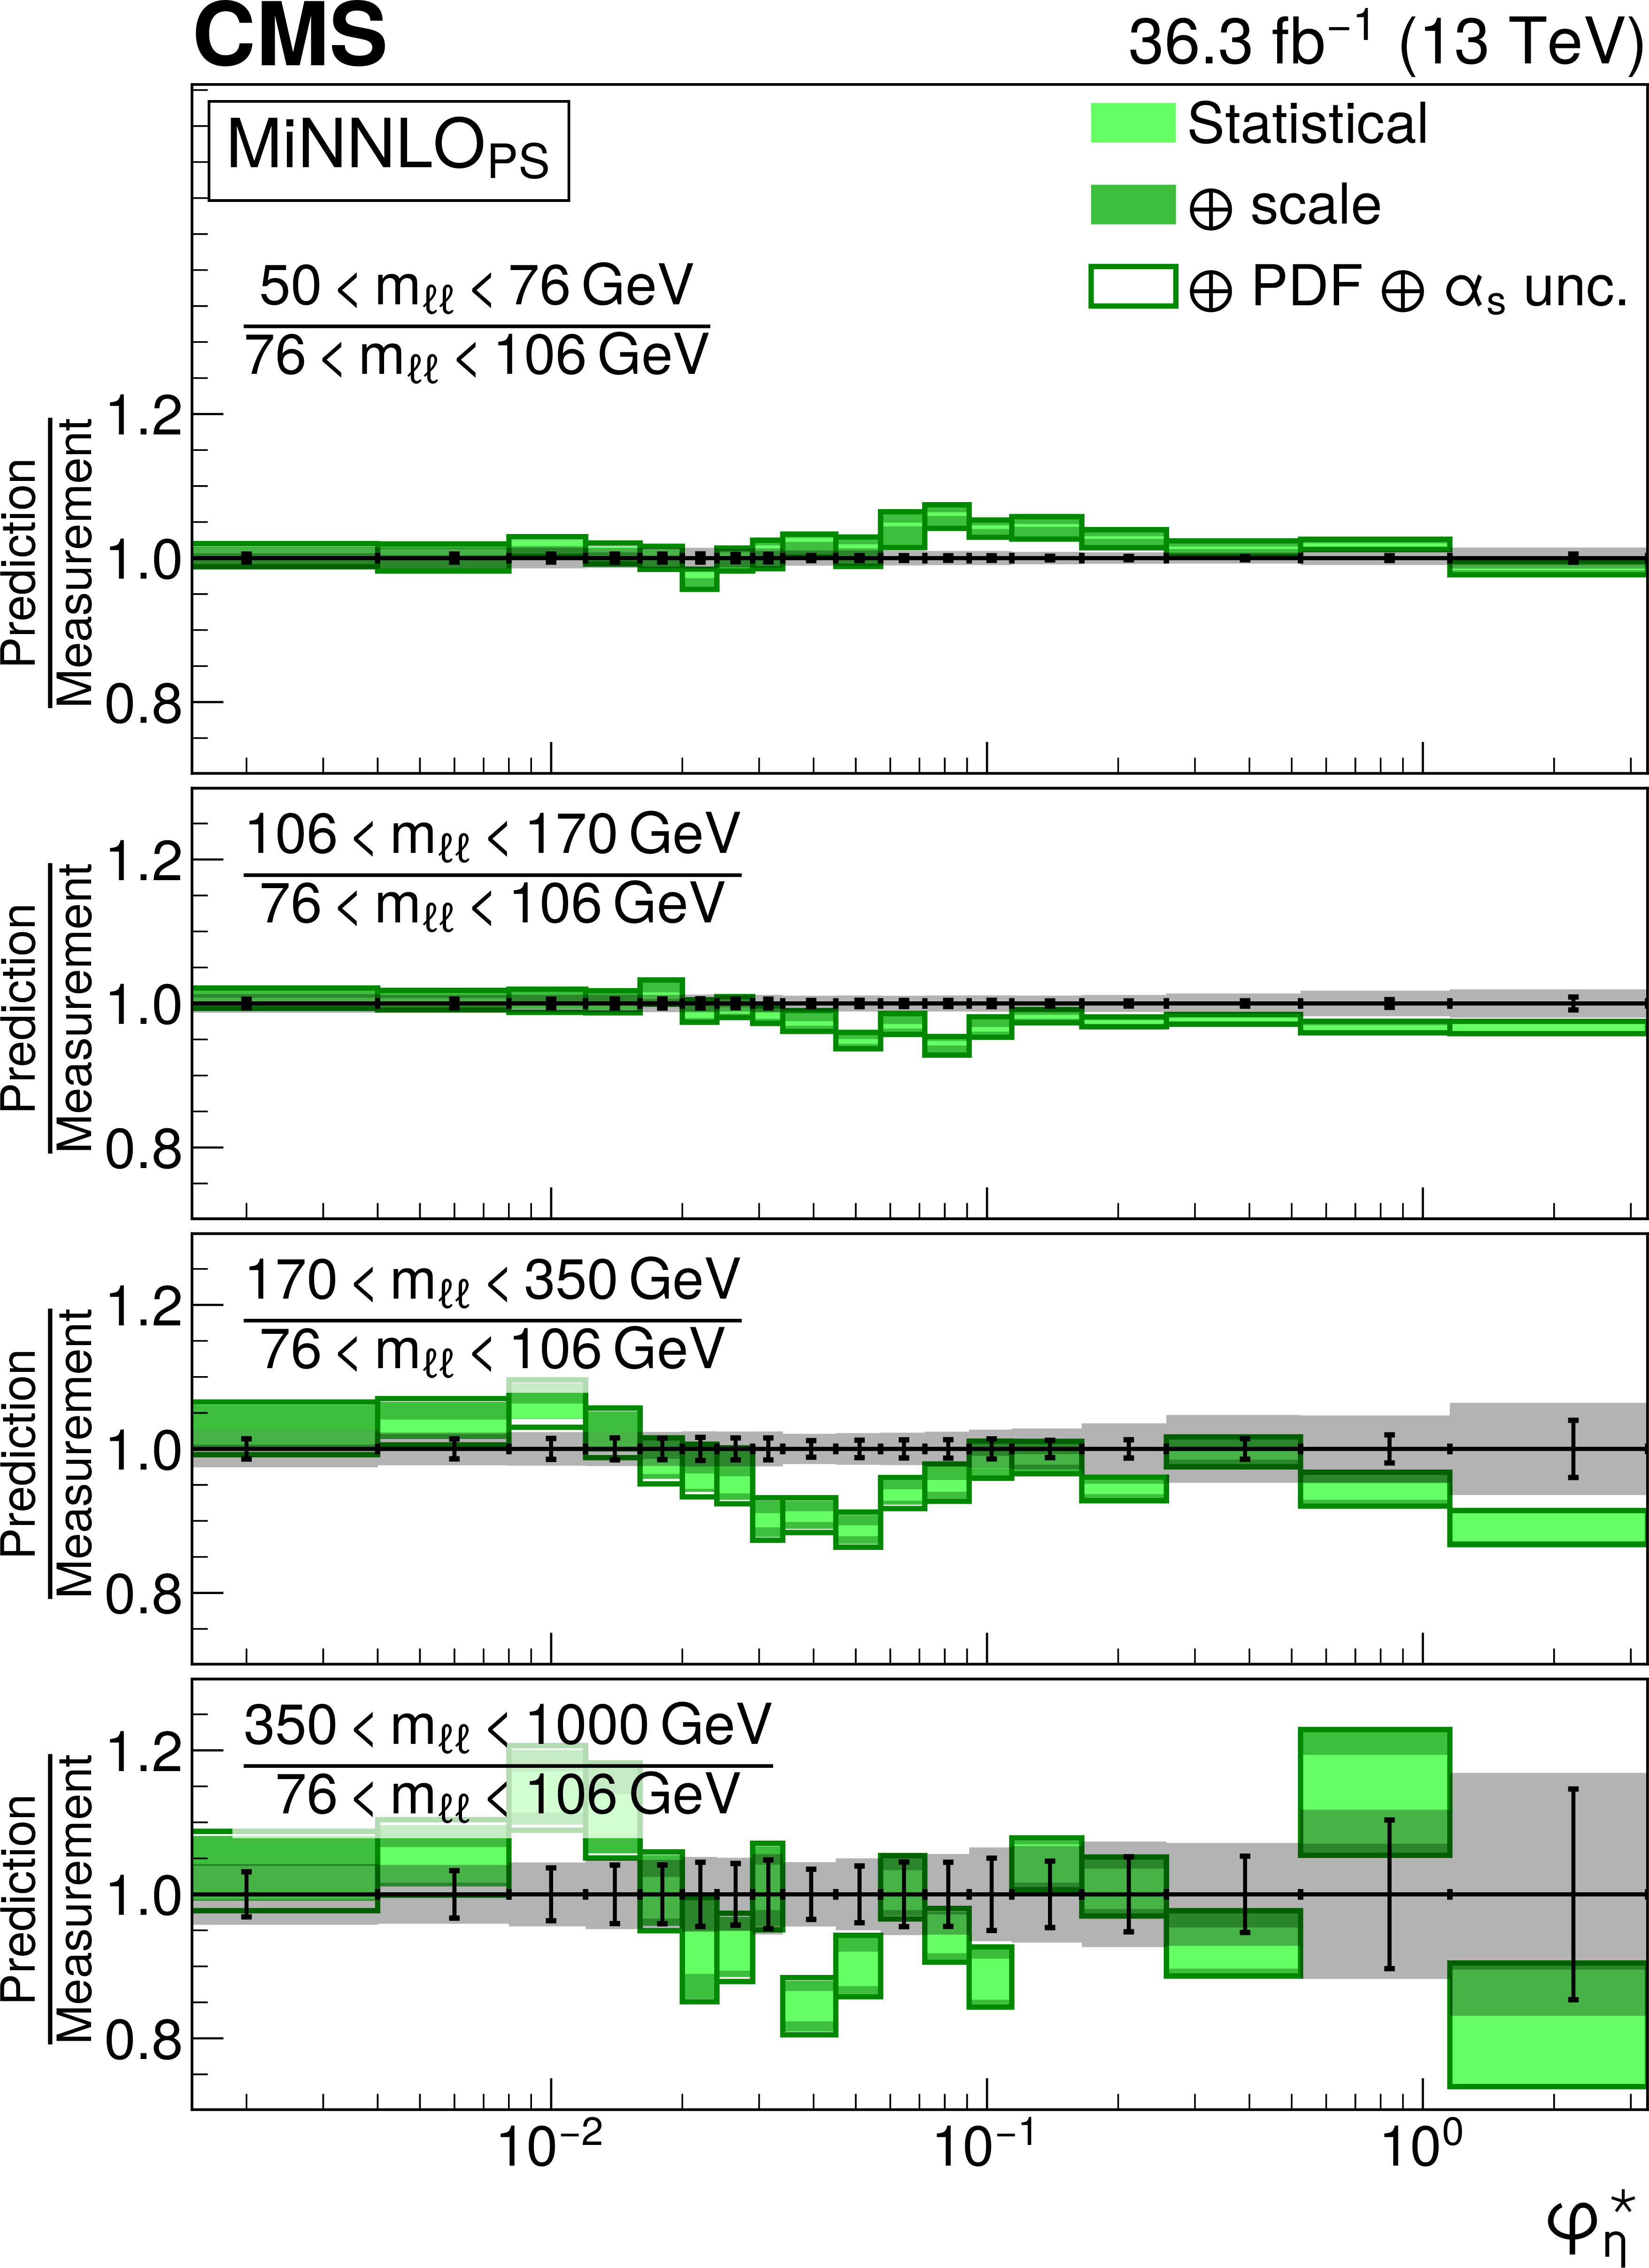
Figure 23:
Ratios of differential cross sections in $ \varphi^{*}_{\eta}(\ell\ell) $ for invariant $ m_{\ell\ell} $ with respect to the peak region 76 $ < m_{\ell\ell} < 106\,\text{Ge\hspace{-.08em}V} $. Compared to model predictions from MG5\_aMC (0, 1, and 2 jets at NLO) + PYTHIA8 (upper left), \textsc{MiNNLO$ _\mathrm{PS} $ (upper right) and MG5\_aMC (0 jet at NLO) + PB (CASCADE) (lower). Details on the presentation of the results are given in Fig. 6 caption. |

png pdf |
Figure 23-a:
Ratios of differential cross sections in $ \varphi^{*}_{\eta}(\ell\ell) $ for invariant $ m_{\ell\ell} $ with respect to the peak region 76 $ < m_{\ell\ell} < 106\,\text{Ge\hspace{-.08em}V} $. Compared to model predictions from MG5\_aMC (0, 1, and 2 jets at NLO) + PYTHIA8 (upper left), \textsc{MiNNLO$ _\mathrm{PS} $ (upper right) and MG5\_aMC (0 jet at NLO) + PB (CASCADE) (lower). Details on the presentation of the results are given in Fig. 6 caption. |
png pdf |
Figure 23-b:
Ratios of differential cross sections in $ \varphi^{*}_{\eta}(\ell\ell) $ for invariant $ m_{\ell\ell} $ with respect to the peak region 76 $ < m_{\ell\ell} < 106\,\text{Ge\hspace{-.08em}V} $. Compared to model predictions from MG5\_aMC (0, 1, and 2 jets at NLO) + PYTHIA8 (upper left), \textsc{MiNNLO$ _\mathrm{PS} $ (upper right) and MG5\_aMC (0 jet at NLO) + PB (CASCADE) (lower). Details on the presentation of the results are given in Fig. 6 caption. |

png pdf |
Figure 23-c:
Ratios of differential cross sections in $ \varphi^{*}_{\eta}(\ell\ell) $ for invariant $ m_{\ell\ell} $ with respect to the peak region 76 $ < m_{\ell\ell} < 106\,\text{Ge\hspace{-.08em}V} $. Compared to model predictions from MG5\_aMC (0, 1, and 2 jets at NLO) + PYTHIA8 (upper left), \textsc{MiNNLO$ _\mathrm{PS} $ (upper right) and MG5\_aMC (0 jet at NLO) + PB (CASCADE) (lower). Details on the presentation of the results are given in Fig. 6 caption. |

png pdf |
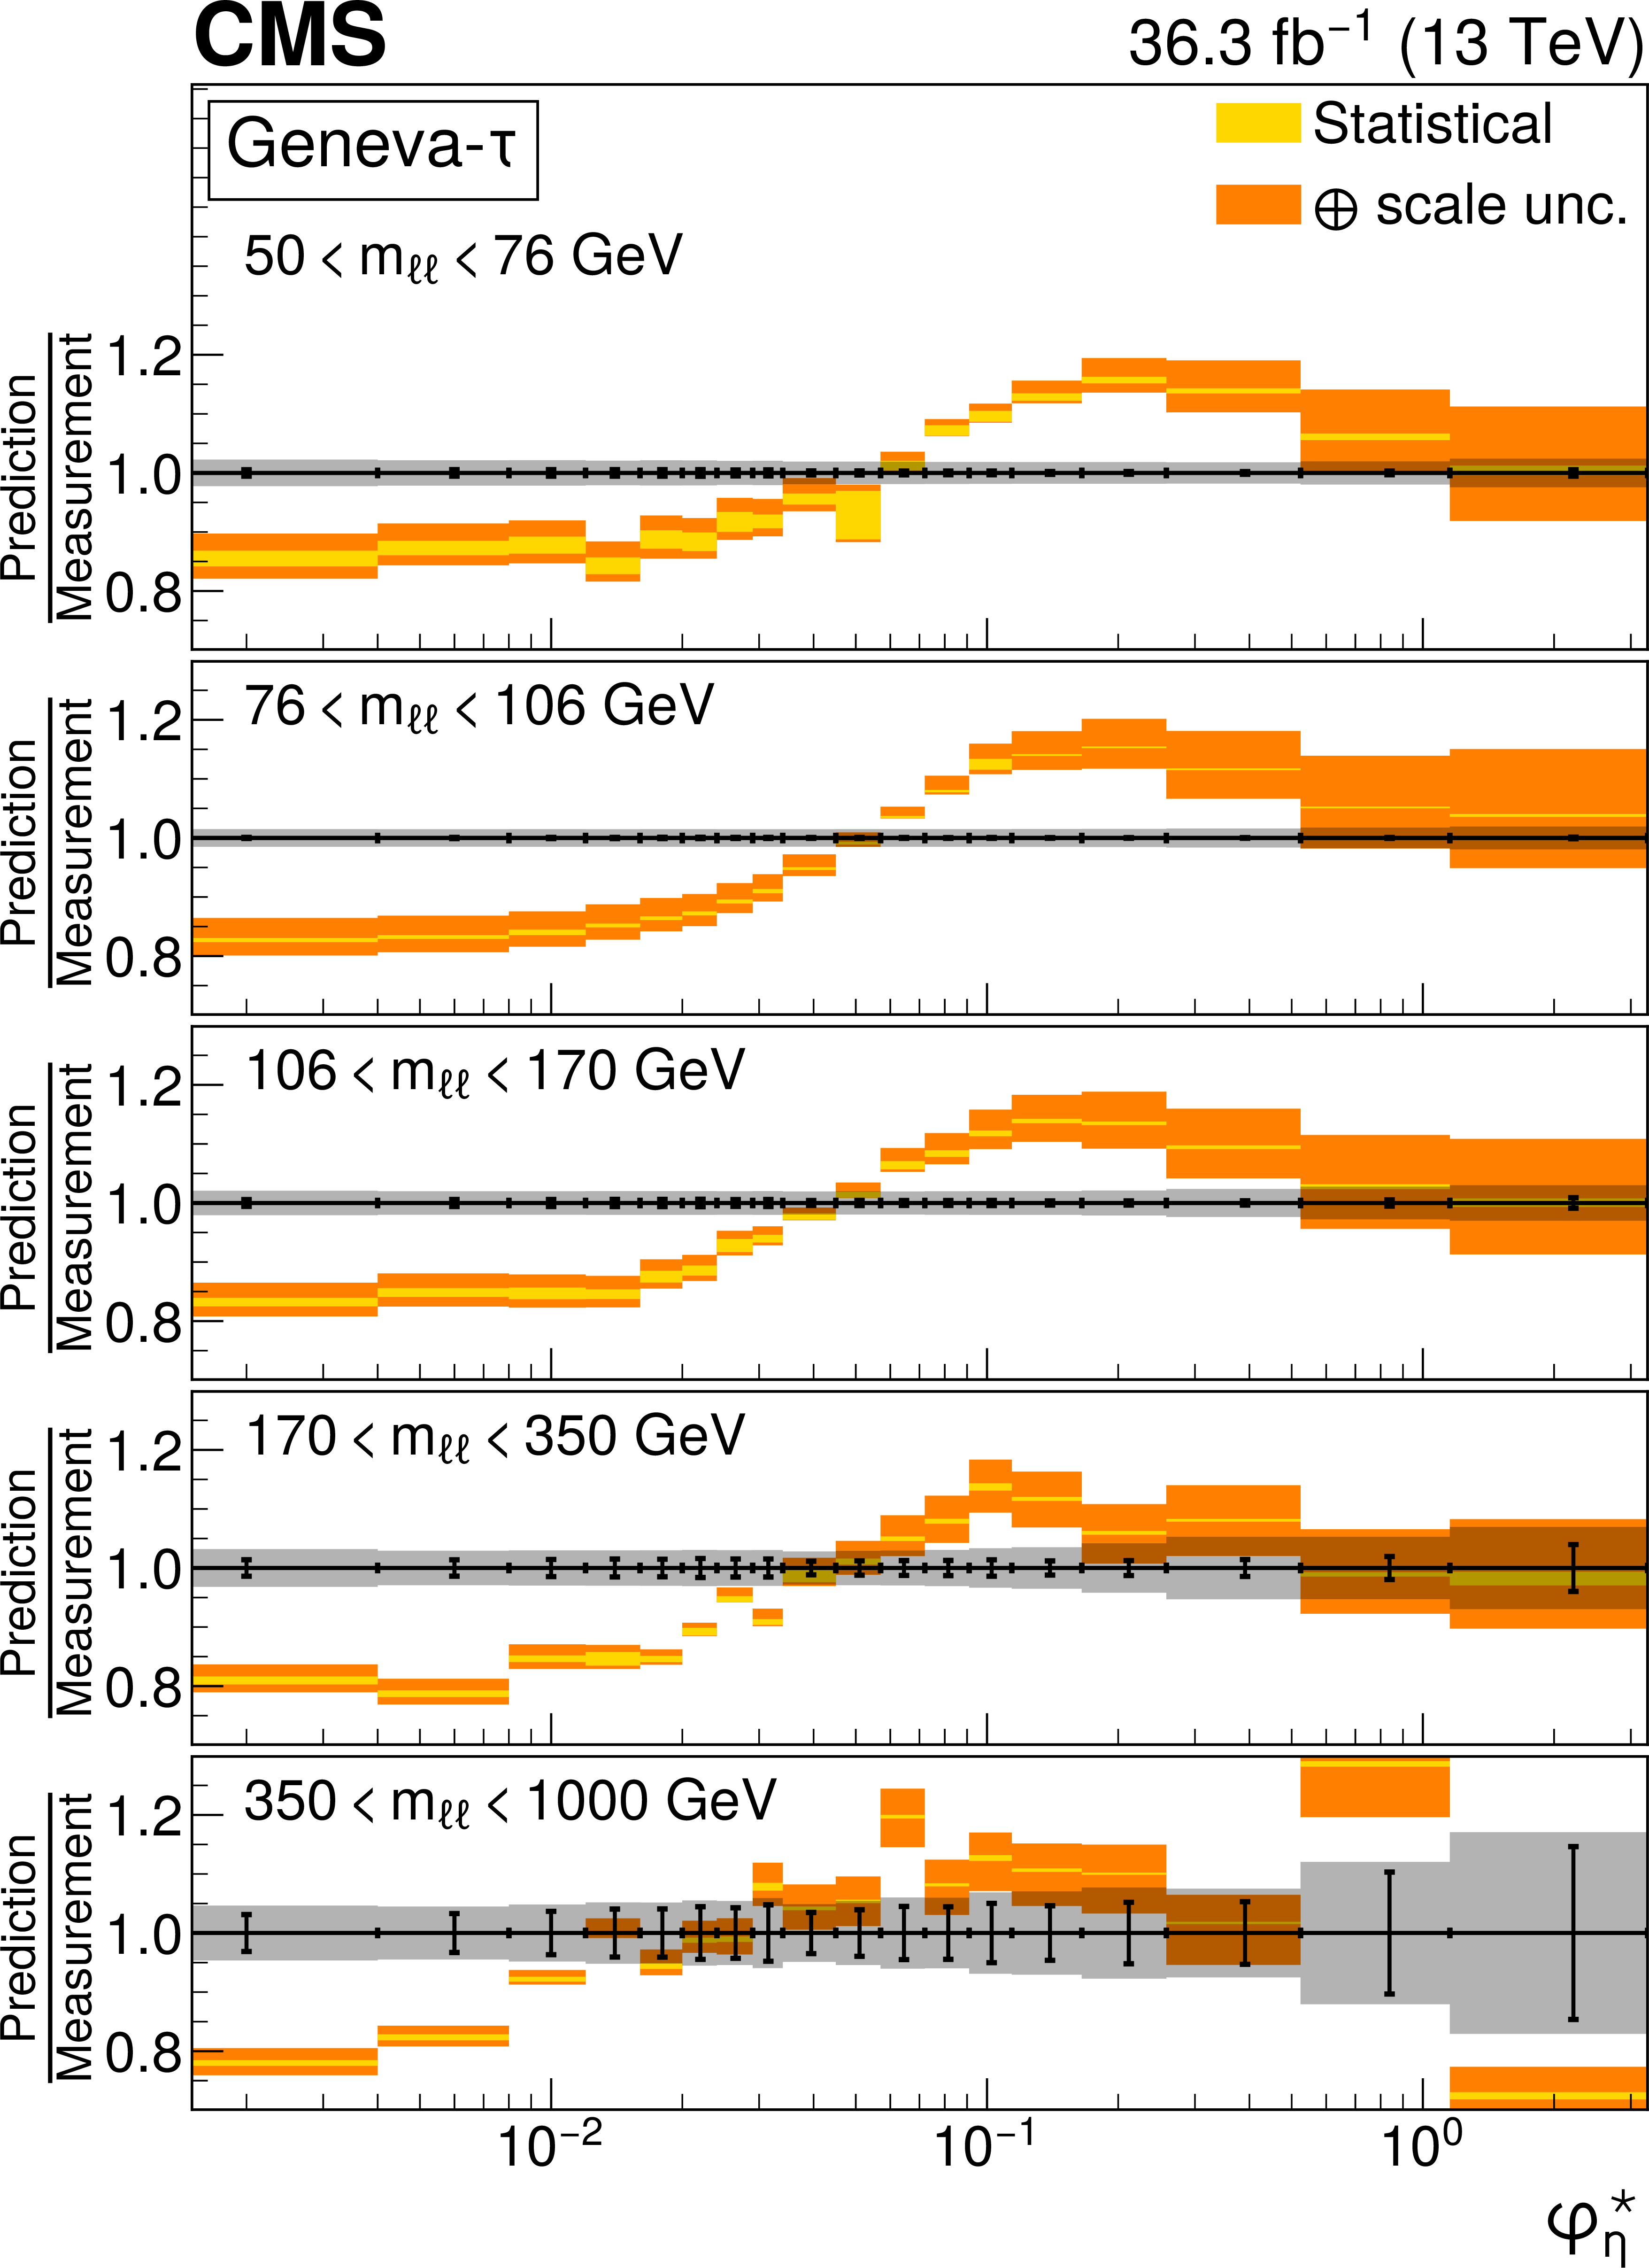
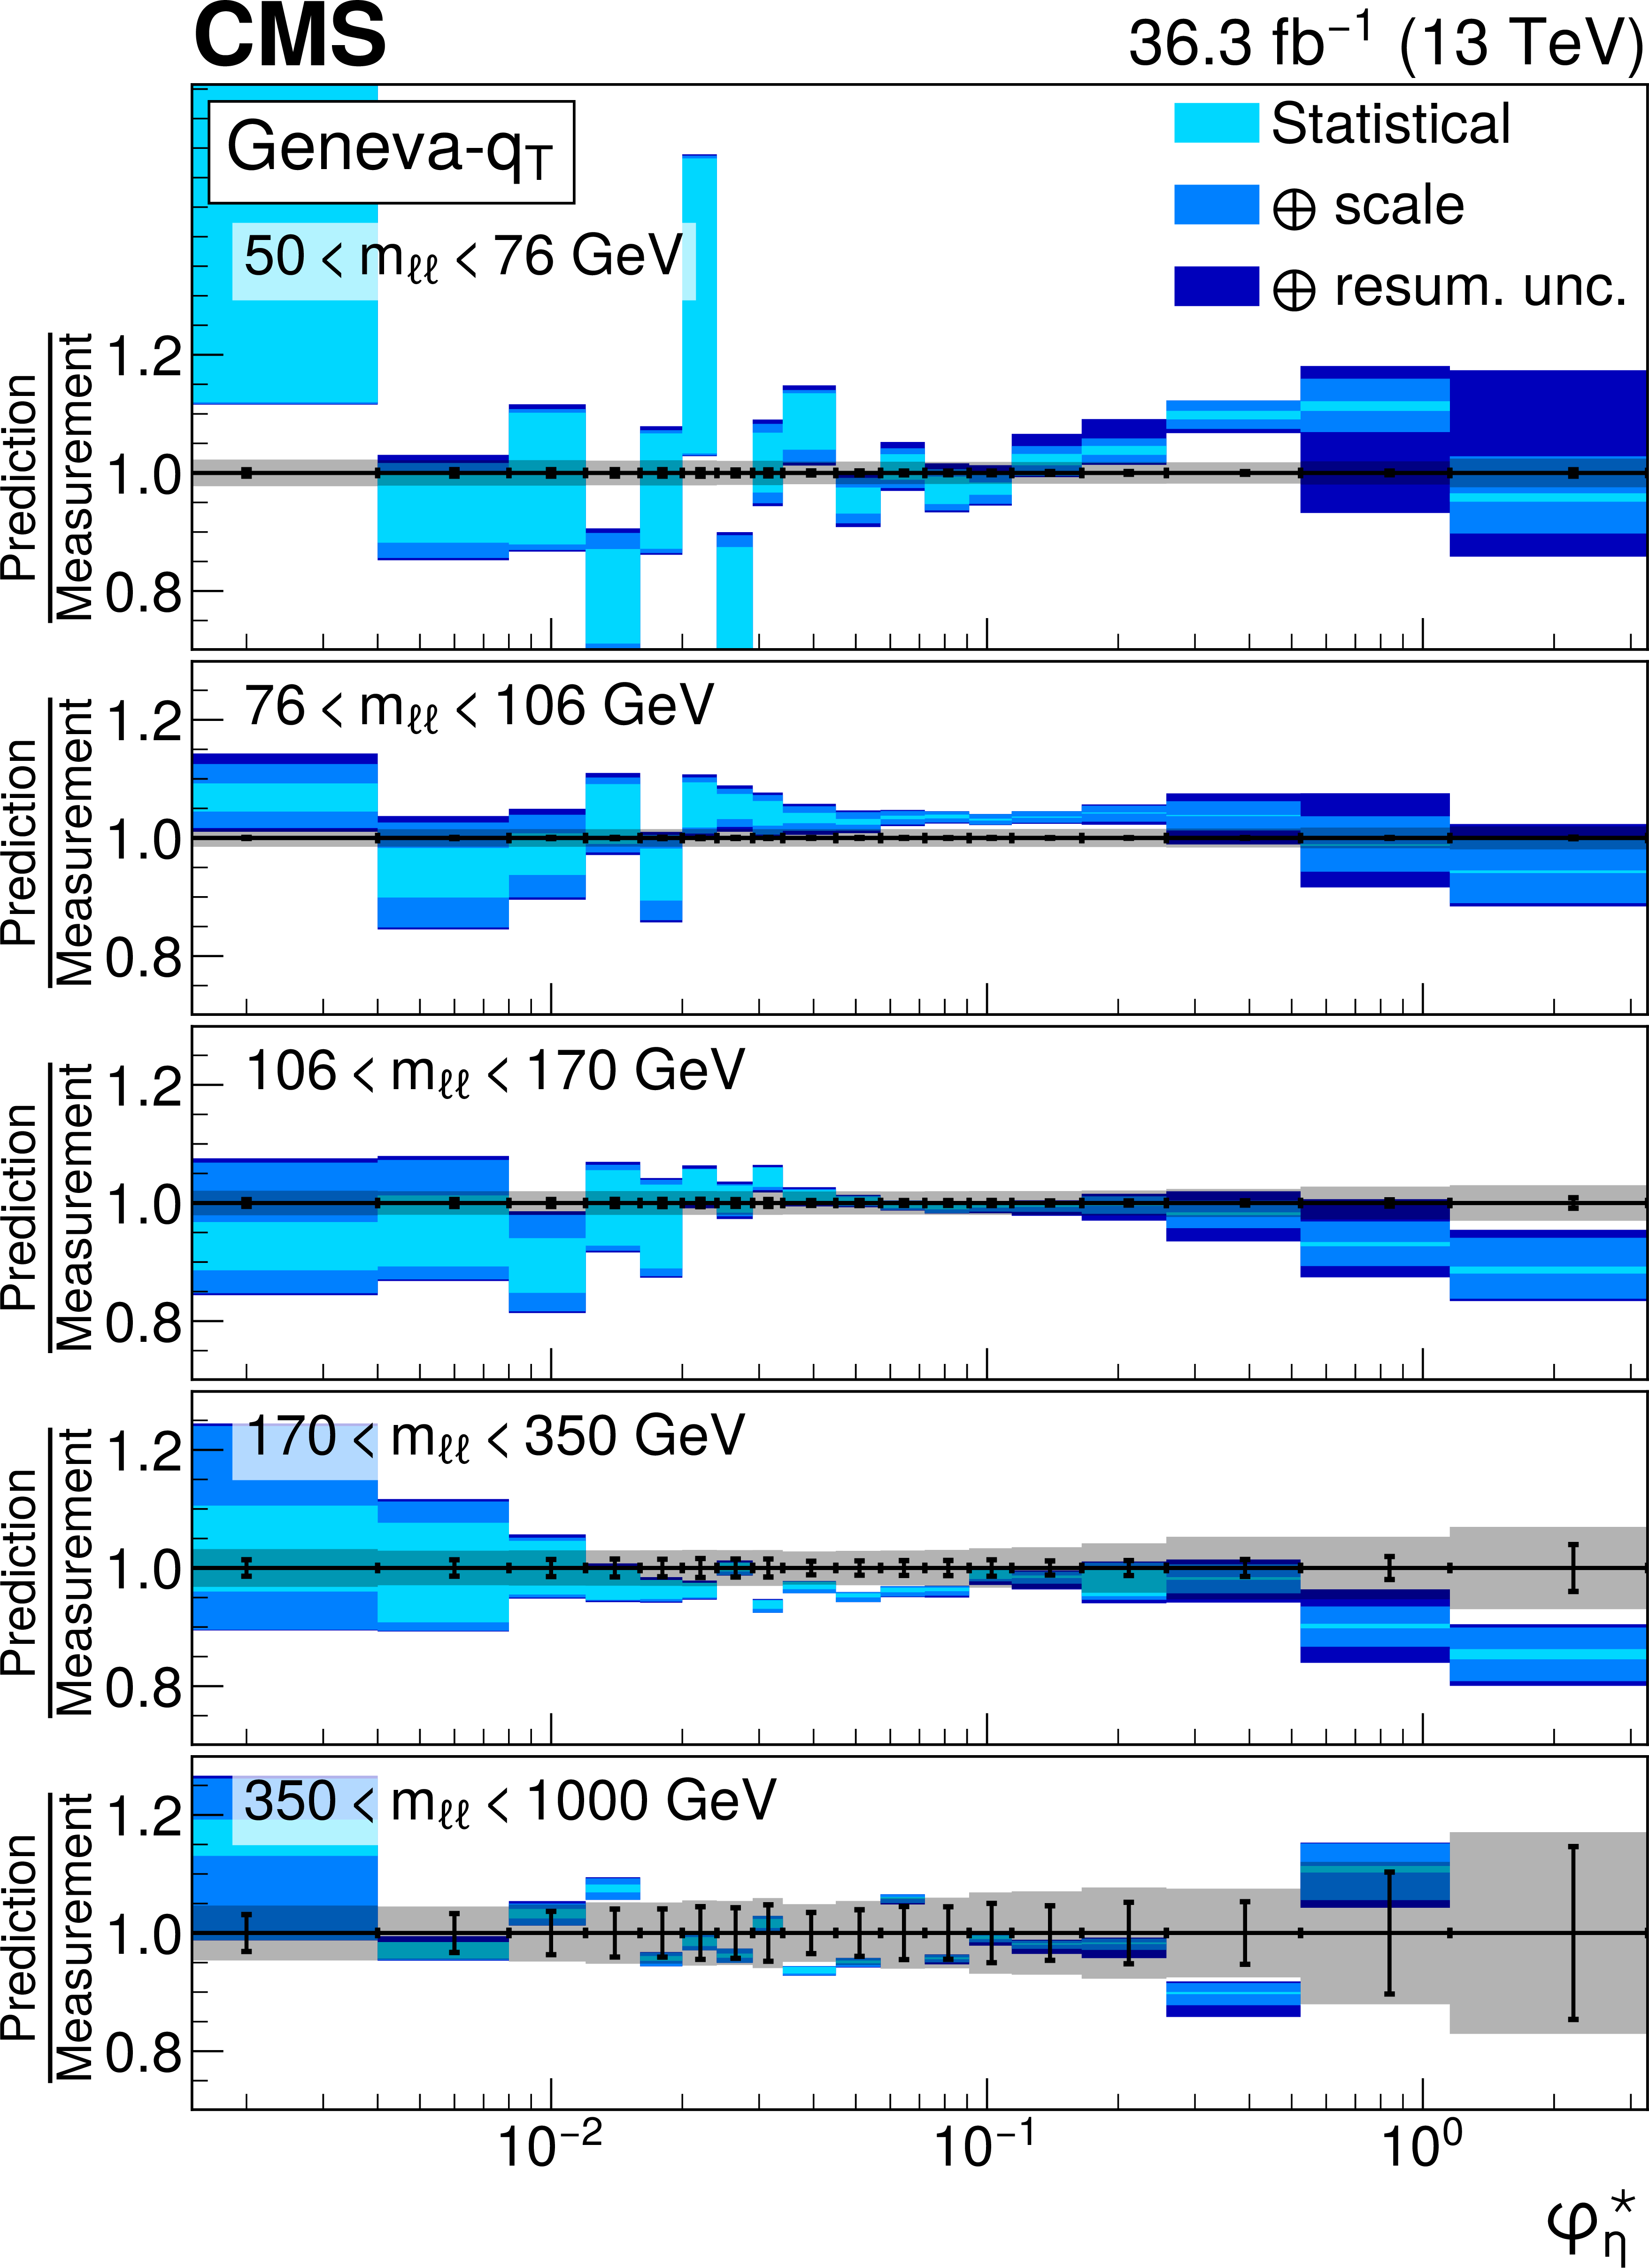
Figure 24:
Ratios of differential cross sections in $ \varphi^{*}_{\eta}(\ell\ell) $ for invariant $ m_{\ell\ell} $ with respect to the peak region 76 $ < m_{\ell\ell} < 106\,\text{Ge\hspace{-.08em}V} $. Compared to model predictions from GENEVA-$ \tau $ (left) and GENEVA-$ q_\mathrm{T} $ (right). Details on the presentation of the results are given in Fig. 8 caption. |

png pdf |
Figure 24-a:
Ratios of differential cross sections in $ \varphi^{*}_{\eta}(\ell\ell) $ for invariant $ m_{\ell\ell} $ with respect to the peak region 76 $ < m_{\ell\ell} < 106\,\text{Ge\hspace{-.08em}V} $. Compared to model predictions from GENEVA-$ \tau $ (left) and GENEVA-$ q_\mathrm{T} $ (right). Details on the presentation of the results are given in Fig. 8 caption. |

png pdf |
Figure 24-b:
Ratios of differential cross sections in $ \varphi^{*}_{\eta}(\ell\ell) $ for invariant $ m_{\ell\ell} $ with respect to the peak region 76 $ < m_{\ell\ell} < 106\,\text{Ge\hspace{-.08em}V} $. Compared to model predictions from GENEVA-$ \tau $ (left) and GENEVA-$ q_\mathrm{T} $ (right). Details on the presentation of the results are given in Fig. 8 caption. |
| Summary |
| Measurements of differential Drell--Yan cross sections in proton-proton collisions at $ \sqrt{s} = $ 13 TeV in the dielectron and dimuon final states are presented, using data collected with the CMS detector, corresponding to an integrated luminosity of 36.3 fb$ ^{-1} $. The measurements are corrected for detector effects and the two leptonic channels are combined. Differential cross sections in the dilepton transverse momentum, $ p_{\mathrm{T}}(\ell\ell) $, and in the lepton angular variable $ \varphi^{*}_{\eta} $ are measured for different values of the dilepton mass, $ m_{\ell\ell} $, between 50 GeV and 1 TeV. To highlight the evolution with the dilepton mass scale, ratios of these distributions for various masses are presented. In addition, dilepton transverse momentum distributions are shown in the presence of at least one jet within the detector acceptance. The rising behaviour of the Drell--Yan inclusive cross section at small $ p_{\mathrm{T}}(\ell\ell) $ is attributed to soft QCD radiations, whereas the tail at large $ p_{\mathrm{T}}(\ell\ell) $ is only expected to be well described by models relying on higher-order matrix element calculations. Therefore, this variable provides a good sensitivity to initial-state QCD radiations and can be compared with different predictions relying on matrix element calculations at different orders and using different methods to resum the initial-state soft QCD radiations. The measurements show that the peak in the $ p_{\mathrm{T}}(\ell\ell) $ distribution, located around 5 GeV, is not significantly modified by changing the $ m_{\ell\ell} $ value in the covered range. However, for higher values of $ m_{\ell\ell} $ above the peak, the $ p_{\mathrm{T}}(\ell\ell) $ distributions fall less steeply. The $ \varphi^{*}_{\eta} $ variable, highly correlated with $ p_{\mathrm{T}}(\ell\ell) $, offers a complementary access to the underlying QCD dynamics. Since it is based only on angle measurements of the final-state charged leptons, it offers, a priori, measurements with greater accuracy. However, these measurements demonstrate that the $ \varphi^{*}_{\eta} $ distributions discriminate between the models less than the $ p_{\mathrm{T}}(\ell\ell) $ distributions, since they wash out the peak structure of the $ p_{\mathrm{T}}(\ell\ell) $ distributions, which reflect the initial-state QCD radiation effects in a more detailed way. \begintolerant 5000 This publication presents comparisons of the measurements to six predictions using different treatments of soft initial-state QCD radiations. Two of them, MG5\_aMC + PYTHIA 8 and \textsc{MiNNLO$ _\mathrm{PS} $, are based on a matrix element calculation merged with parton showers. Two others, ARTEMIDE and CASCADE use transverse momentum dependent parton distributions (TMD). Finally, GENEVA combines a higher-order resummation with a Drell--Yan calculation at next-to-next-to-leading order (NNLO), in two different ways. One carries out the resummation at next-to-next-to-leading logarithm in the 0-jettiness variable $ \tau_0 $, the other at $ \mathrm{N^3LL} $ in the $ q_\mathrm{T} $ variable. \endtolerant \begintolerant 5000 The comparison of the measurement with the MG5\_aMC + PYTHIA 8 Monte Carlo predictions using matrix element calculations including $ \mathrm{Z} + 0,1, $ 2 partons at next-to-leading order (NLO) merged with a parton shower, shows generally good agreement, except at $ p_{\mathrm{T}}(\ell\ell) $ values below 10 GeV both for the inclusive and one jet cross sections. This disagreement is enhanced for masses away from the Z mass peak and is more pronounced for the higher dilepton masses, reaching 20% for the highest mass bin. \endtolerant \begintolerant 5000 The \textsc{MiNNLO$ _\mathrm{PS} $ prediction provides the best global description of the data among the predictions presented in this paper, both for the inclusive and the one jet cross sections. This approach, based on NNLO matrix element and PYTHIA8 parton shower and MPI, describes well the large $ p_{\mathrm{T}}(\ell\ell) $ cross sections and ratios, except for $ p_{\mathrm{T}}(\ell\ell) $ values above 400 GeV for dilepton masses around the Z mass peak. A good description of the medium and low $ p_{\mathrm{T}}(\ell\ell) $ cross sections is obtained using a modified primordial $ k_{\mathrm{T}} $ parameter of the CP5 parton shower tune. \endtolerant \begintolerant 5000 MG5\_aMC + PB(CASCADE) predictions are based on Parton Branching TMDs obtained only from a fit to electron-proton deep inelastic scattering measurements performed at HERA. These TMDs are merged with NLO matrix element calculations. Low $ p_{\mathrm{T}}(\ell\ell) $ values are globally well described but with too low cross sections at medium $ p_{\mathrm{T}}(\ell\ell) $ values. This discrepancy increases with increasing $ m_{\ell\ell} $ in a way similar to the MG5\_aMC + PYTHIA 8 predictions. The high part of the $ p_{\mathrm{T}}(\ell\ell) $ distribution is not described by CASCADE due to missing higher fixed-order terms. The model can not describe the low $ p_{\mathrm{T}}(\ell\ell) $ region of the cross section in the presence of one jet due to the missing double parton scattering contributions. The recent inclusion of multi-jet merging allows a larger $ p_{\mathrm{T}}(\ell\ell) $\ region to be described as well. \endtolerant \begintolerant 5000 ARTEMIDE provides predictions based on TMDs extracted from previous measurements including the Drell-Yan transverse momentum cross section at the LHC at the Z mass peak. By construction, the validity of ARTEMIDE predictions are limited to the range $ p_{\mathrm{T}}(\ell\ell) < 0.2 \ m_{\ell\ell} $. In that range, they describe well the present measurements up to the highest dilepton masses. \endtolerant \begintolerant 5000 The GENEVA prediction, combining resummation in the 0-jettiness variable $ \tau_0 $ (GENEVA-$ \tau $) and NNLO matrix element does not describe the measurement well for $ p_{\mathrm{T}}(\ell\ell) $ values below 40 GeV. For the high $ p_{\mathrm{T}}(\ell\ell) $ region the inclusion of NNLO in the matrix element provides a good description of the measured cross section. The recent GENEVA prediction (GENEVA-$ q_\mathrm{T} $), using a $ q_\mathrm{T} $ resummation, provides a much better description of the measured inclusive cross sections, describing very well the data in the full $ p_{\mathrm{T}}(\ell\ell) $ range except for middle $ p_{\mathrm{T}}(\ell\ell) $ values in the lowest mass bin. Both GENEVA approaches predict too hard $ p_{\mathrm{T}}(\ell\ell) $ spectra for the one jet cross sections. \endtolerant \begintolerant 5000 The ratio distributions presented in this paper confirm most of the observations based on the comparison between the measurement and the predictions at the cross section level. The observed scale dependence is well described by the different models. Furthermore the partial cancellation of the uncertainties in the cross section ratios allows a higher level of precision to be reached for both the measurement and the predictions. \endtolerant \begintolerant 5000 The present analysis shows the relevance of measuring the Drell--Yan cross section in a wide range in dilepton masses to probe the interplay between the transverse momentum and the mass scales of the process. Important theoretical efforts have been made during the last decade to improve the detailed description of high energy processes involving multiple scales and partonic final states. The understanding of the Drell--Yan process directly benefited from these developments. The present paper shows that they individually describe the measurements well in the regions they were designed for. Nevertheless, no model is able to reproduce all dependencies over the complete covered range. Further progress might come from combining these approaches. \endtolerant |
| Additional Resources |
| Compressed tarball (113M) including measured differential cross sections as a function of ${p_{\mathrm{T}}}(\ell\ell)$ and ${\varphi^{*}_{\eta}}$ in five ${m_{{\ell} {\ell} }}$ mass intervals, along with corresponding covariance matrices. | |
| Below are these results, in yaml format, as described in the HepData submission file. In all measurements, the values are normalized by the bin width. | |
Dilepton
transverse momentum, ${p_{\mathrm{T}}}(\ell\ell)$.
| |
Dilepton
transverse momentum, ${p_{\mathrm{T}}}(\ell\ell)$. At least
one jet is required.
| |
${\varphi^{*}_{\eta}}$ observable.
| |
Dilepton
transverse momentum, ${p_{\mathrm{T}}}(\ell\ell)$. Normalised
to the [76-106] GeV mass interval.
| |
Dilepton
transverse momentum, ${p_{\mathrm{T}}}(\ell\ell)$. Normalised
to the [76-106] GeV mass interval. At least one jet is required.
| |
${\varphi^{*}_{\eta}}$ observable. Normalised
to the [76-106] GeV mass interval.
| |
Response matrices for ${p_{\mathrm{T}}}(\ell\ell)$.
| |
Response matrices for ${p_{\mathrm{T}}}(\ell\ell)$. At
least one jet is required.
| |
Response matrices for ${\varphi^{*}_{\eta}}$.
| |
| License cc-by-4.0. The content of these files can be shared and adapted but you must give appropriate credit and cannot restrict access to others. |
| References | ||||
| 1 | S. D. Drell and T.-M. Yan | Massive lepton pair production in hadron-hadron collisions at high energies | PRL 25 (1970) 316 | |
| 2 | Y. L. Dokshitzer, D. Diakonov, and S. I. Troyan | On the transverse momentum distribution of massive lepton pairs | PLB 79 (1978) 269 | |
| 3 | J. C. Collins, D. E. Soper, and G. F. Sterman | Transverse momentum distribution in Drell-Yan pair and W and Z boson production | NPB 250 (1985) 199 | |
| 4 | R. Hamberg, W. L. van Neerven, and T. Matsuura | A complete calculation of the order $ \alpha_s^2 $ correction to the Drell-Yan $ K $-factor | NPB 359 (1991) 343 | |
| 5 | S. Catani et al. | Vector boson production at hadron colliders: a fully exclusive QCD calculation at NNLO | PRL 103 (2009) 082001 | 0903.2120 |
| 6 | S. Catani and M. Grazzini | An NNLO subtraction formalism in hadron collisions and its application to Higgs boson production at the LHC | PRL 98 (2007) 222002 | hep-ph/0703012 |
| 7 | K. Melnikov and F. Petriello | Electroweak gauge boson production at hadron colliders through $ \mathcal O(\alpha_s^2) $ | PRD 74 (2006) 114017 | hep-ph/0609070 |
| 8 | A. Bacchetta et al. | Extraction of partonic transverse momentum distributions from semi-inclusive deep-inelastic scattering, Drell-Yan and Z-boson production | [Erratum: JHEP 06, 051 ()], 2017 JHEP 06 (2017) 081 |
1703.10157 |
| 9 | A. Bacchetta et al. | Transverse-momentum-dependent parton distributions up to N$ ^{3} $LL from Drell-Yan data | JHEP 07 (2020) 117 | 1912.07550 |
| 10 | S. Camarda et al. | DYTurbo: Fast predictions for Drell-Yan processes | [Erratum: Eur.Phys.J.C 80, 440 ()], 2020 EPJC 80 (2020) 251 |
1910.07049 |
| 11 | W. Bizo \'n et al. | Fiducial distributions in Higgs and Drell-Yan production at N$ ^{3} $LL+NNLO | JHEP 12 (2018) 132 | 1805.05916 |
| 12 | M. A. Ebert, J. K. L. Michel, I. W. Stewart, and F. J. Tackmann | Drell-Yan $ q_{T} $ resummation of fiducial power corrections at N$ ^{3} $LL | JHEP 04 (2021) 102 | 2006.11382 |
| 13 | T. Becher and T. Neumann | Fiducial $ q_T $ resummation of color-singlet processes at N$ ^3 $LL+NNLO | JHEP 03 (2021) 199 | 2009.11437 |
| 14 | F. Hautmann et al. | Soft-gluon resolution scale in QCD evolution equations | PLB 772 (2017) 446 | 1704.01757 |
| 15 | F. Hautmann et al. | Collinear and TMD quark and gluon densities from parton branching solution of QCD evolution equations | JHEP 01 (2018) 070 | 1708.03279 |
| 16 | A. Banfi et al. | Optimisation of variables for studying dilepton transverse momentum distributions at hadron colliders | EPJC 71 (2011) 1600 | 1009.1580 |
| 17 | A. Banfi, M. Dasgupta, S. Marzani, and L. Tomlinson | Predictions for Drell-Yan $ \phi^* $ and $ Q_T $ observables at the LHC | PLB 715 (2012) 152 | 1205.4760 |
| 18 | S. Marzani | $ Q_T $ and $ \phi^* $ observables in Drell-Yan processes | Eur. Phys. J. Web Conf. 49 (2013) 14007 | |
| 19 | L. Moureaux | Measurement of the transverse momentum of Drell-Yan lepton pairs over a wide mass range in proton-proton collisions at $ \sqrt s = 13\:\mathrm{TeV} $ in CMS | PhD thesis, Université libre de Bruxelles, . ep, 2021 Presented 24 (2021) S |
|
| 20 | CMS Collaboration | Measurement of the inclusive $ W $ and $ Z $ production cross sections in $ \mathrm{pp} $ collisions at $ \sqrt{s}= $ 7 TeV | JHEP 10 (2011) 132 | CMS-EWK-10-005 1107.4789 |
| 21 | CMS Collaboration | Measurement of the Drell-Yan cross section in $ \mathrm{pp} $ collisions at $ \sqrt{s}= $ 7 TeV | JHEP 10 (2011) 007 | CMS-EWK-10-007 1108.0566 |
| 22 | CMS Collaboration | Measurement of the differential and double-differential Drell-Yan cross sections in proton-proton collisions at $ \sqrt{s} = $ 7 TeV | JHEP 12 (2013) 030 | CMS-SMP-13-003 1310.7291 |
| 23 | CMS Collaboration | Measurements of differential and double-differential Drell-Yan cross sections in proton-proton collisions at 8 TeV | EPJC 75 (2015) 147 | CMS-SMP-14-003 1412.1115 |
| 24 | CMS Collaboration | Measurement of the Z boson differential cross section in transverse momentum and rapidity in proton-proton collisions at 8 TeV | PLB 749 (2015) 187 | CMS-SMP-13-013 1504.03511 |
| 25 | CMS Collaboration | Measurement of the differential Drell-Yan cross section in proton-proton collisions at $ \sqrt{\mathrm{s}} $ = 13 TeV | JHEP 12 (2019) 059 | CMS-SMP-17-001 1812.10529 |
| 26 | CMS Collaboration | Measurements of differential Z boson production cross sections in proton-proton collisions at $ \sqrt{s} $ = 13 TeV | JHEP 12 (2019) 061 | CMS-SMP-17-010 1909.04133 |
| 27 | ATLAS Collaboration | Measurement of the inclusive $ W^\pm $ and $ Z/\gamma^* $ cross sections in the electron and muon decay channels in $ \mathrm{pp} $ collisions at $ \sqrt{s}= $ 7 TeV with the ATLAS detector | PRD 85 (2012) 072004 | 1109.5141 |
| 28 | ATLAS Collaboration | Measurement of the high-mass Drell--Yan differential cross-section in pp collisions at $ \sqrt s= $ 7 TeV with the ATLAS detector | PLB 725 (2013) 223 | 1305.4192 |
| 29 | ATLAS Collaboration | Measurement of the $ Z/\gamma^* $ boson transverse momentum distribution in pp collisions at $ \sqrt{s} $ = 7 TeV with the ATLAS detector | JHEP 09 (2014) 145 | 1406.3660 |
| 30 | ATLAS Collaboration | Measurement of the low-mass Drell-Yan differential cross section at $ \sqrt{s} $ = 7 TeV using the ATLAS detector | JHEP 06 (2014) 112 | 1404.1212 |
| 31 | ATLAS Collaboration | Measurement of the transverse momentum and $ \phi ^*_{\eta } $ distributions of Drell-Yan lepton pairs in proton-proton collisions at $ \sqrt{s}= $ 8 TeV with the ATLAS detector | EPJC 76 (2016) 291 | 1512.02192 |
| 32 | ATLAS Collaboration | Precision measurement and interpretation of inclusive $ W^+ $, $ W^- $ and $ Z/\gamma ^* $ production cross sections with the ATLAS detector | EPJC 77 (2017) 367 | 1612.03016 |
| 33 | ATLAS Collaboration | Measurement of the transverse momentum distribution of Drell-Yan lepton pairs in proton-proton collisions at $ \sqrt{s}= $ 13 TeV with the ATLAS detector | EPJC 80 (2020) 616 | 1912.02844 |
| 34 | LHCb Collaboration | Inclusive $ W $ and $ Z $ production in the forward region at $ \sqrt{s} = $ 7 TeV | JHEP 06 (2012) 058 | 1204.1620 |
| 35 | LHCb Collaboration | Measurement of the cross-section for $ Z \to e^+e^- $ production in $ \mathrm{pp} $ collisions at $ \sqrt{s}= $ 7 TeV | JHEP 02 (2013) 106 | 1212.4620 |
| 36 | LHCb Collaboration | Measurement of the forward $ Z $ boson production cross-section in $ \mathrm{pp} $ collisions at $ \sqrt{s}= $ 7 TeV | JHEP 08 (2015) 039 | 1505.07024 |
| 37 | LHCb Collaboration | Measurement of forward W and Z boson production in $ \mathrm{pp} $ collisions at $ \sqrt{s}= $ 8 TeV | JHEP 01 (2016) 155 | 1511.08039 |
| 38 | LHCb Collaboration | Measurement of the forward Z boson production cross-section in $ \mathrm{pp} $ collisions at $ \sqrt{s} = $ 13 TeV | JHEP 09 (2016) 136 | 1607.06495 |
| 39 | CDF Collaboration | The transverse momentum and total cross section of $ \rm{ e^+e^-} $ pairs in the Z boson region from $ \mathrm{p}\bar{\mathrm{p}} $ collisions at $ \sqrt{s} = $ 1.8 TeV | PRL 84 (2000) 845 | hep-ex/0001021 |
| 40 | D0 Collaboration | Differential production cross section of Z bosons as a function of transverse momentum at $ \sqrt{s} = $ 1.8 TeV | PRL 84 (2000) 2792 | hep-ex/9909020 |
| 41 | D0 Collaboration | Measurement of the shape of the boson transverse momentum distribution in $ \mathrm{p} \bar{\mathrm{p}} \to \mathrm{Z} / \gamma^{*} \to \mathrm{e}^+ \mathrm{e}^- + X $ events produced at $ \sqrt{s}=1.96 \,\text{Te\hspace{-.08em}V} $ | PRL 100 (2008) 102002 | 0712.0803 |
| 42 | D0 Collaboration | Measurement of the normalized $ \mathrm{Z}/\gamma^* \to \mu^+\mu^- $ transverse momentum distribution in $ \mathrm{p}\bar{\mathrm{p}} $ collisions at $ \sqrt{s}= $ 1.96 TeV | PLB 693 (2010) 522 | 1006.0618 |
| 43 | D0 Collaboration | Precise study of the $ \mathrm{Z}/\gamma^* $ boson transverse momentum distribution in $ \mathrm{p}\overline{\mathrm{p}} $ collisions using a novel technique | PRL 106 (2011) 122001 | 1010.0262 |
| 44 | CDF Collaboration | Transverse momentum cross section of $ e^+e^- $ pairs in the $ Z $-boson region from $ p\bar{p} $ collisions at $ \sqrt{s}= $ 1.96 TeV | PRD 86 (2012) 052010 | 1207.7138 |
| 45 | D0 Collaboration | Measurement of the $ {\phi}_{\eta}^{*} $ distribution of muon pairs with masses between 30 and 500 GeV in 10.4 $ \text{ }\text{ }{\mathrm{fb}}^{-1} $ of $ \mathrm{p}\bar{\mathrm{p}} $ collisions | PRD 91 (2015) 072002 | 1410.8052 |
| 46 | CMS Collaboration | Particle-flow reconstruction and global event description with the CMS detector | JINST 12 (2017) P10003 | CMS-PRF-14-001 1706.04965 |
| 47 | CMS Collaboration | Electron and photon reconstruction and identification with the CMS experiment at the CERN LHC | JINST 16 (2021) P05014 | CMS-EGM-17-001 2012.06888 |
| 48 | CMS Collaboration | Performance of the CMS muon detector and muon reconstruction with proton-proton collisions at $ \sqrt{s}= $ 13 TeV | JINST 13 (2018) P06015 | CMS-MUO-16-001 1804.04528 |
| 49 | A. Bodek et al. | Extracting muon momentum scale corrections for hadron collider experiments | EPJC 72 (2012) 2194 | 1208.3710 |
| 50 | M. Cacciari, G. P. Salam, and G. Soyez | The anti-$ k_{\mathrm{T}} $ jet clustering algorithm | JHEP 04 (2008) 063 | 0802.1189 |
| 51 | M. Cacciari, G. P. Salam, and G. Soyez | FastJet user manual | EPJC 72 (2012) 1896 | 1111.6097 |
| 52 | CMS Collaboration | Technical proposal for the Phase-II upgrade of the Compact Muon Solenoid | CMS Technical Proposal CERN-LHCC-2015-010, CMS-TDR-15-02, 2015 CDS |
|
| 53 | CMS Collaboration | Performance of the CMS Level-1 trigger in proton-proton collisions at $ \sqrt{s} = $ 13\,TeV | JINST 15 (2020) P10017 | CMS-TRG-17-001 2006.10165 |
| 54 | CMS Collaboration | The CMS trigger system | JINST 12 (2017) P01020 | CMS-TRG-12-001 1609.02366 |
| 55 | CMS Collaboration | The CMS experiment at the CERN LHC | JINST 3 (2008) S08004 | |
| 56 | CMS Collaboration | Pileup mitigation at CMS in 13 TeV data | JINST 15 (2020) P09018 | CMS-JME-18-001 2003.00503 |
| 57 | CMS Collaboration | Identification of heavy-flavour jets with the CMS detector in pp collisions at 13 TeV | JINST 13 (2018) P05011 | CMS-BTV-16-002 1712.07158 |
| 58 | J. Alwall et al. | The automated computation of tree-level and next-to-leading order differential cross sections, and their matching to parton shower simulations | JHEP 07 (2014) 079 | 1405.0301 |
| 59 | R. Frederix and S. Frixione | Merging meets matching in MC@NLO | JHEP 12 (2012) 061 | 1209.6215 |
| 60 | T. Sjöstrand et al. | An introduction to PYTHIA 8.2 | Comput. Phys. Commun. 191 (2015) 159 | 1410.3012 |
| 61 | CMS Collaboration | Event generator tunes obtained from underlying event and multiparton scattering measurements | EPJC 76 (2016) 155 | CMS-GEN-14-001 1512.00815 |
| 62 | NNPDF Collaboration | Parton distributions for the LHC Run II | JHEP 04 (2015) 040 | 1410.8849 |
| 63 | P. Nason | A new method for combining NLO QCD with shower Monte Carlo algorithms | JHEP 11 (2004) 040 | hep-ph/0409146 |
| 64 | S. Frixione, P. Nason, and C. Oleari | Matching NLO QCD computations with parton shower simulations: the POWHEG method | JHEP 11 (2007) 070 | 0709.2092 |
| 65 | S. Alioli, P. Nason, C. Oleari, and E. Re | A general framework for implementing NLO calculations in shower Monte Carlo programs: the POWHEG BOX | JHEP 06 (2010) 043 | 1002.2581 |
| 66 | S. Frixione, P. Nason, and G. Ridolfi | A positive-weight next-to-leading-order Monte Carlo for heavy flavour hadroproduction | JHEP 09 (2007) 126 | 0707.3088 |
| 67 | P. Nason and G. Zanderighi | $ \mathrm{W}^+ \mathrm{W}^- $, WZ and ZZ production in the \sc powheg-box-v2 | EPJC 74 (2014) 2702 | 1311.1365 |
| 68 | J. A. M. Vermaseren | Two photon processes at very high-energies | NPB 229 (1983) 347 | |
| 69 | S. P. Baranov, O. Duenger, H. Shooshtari, and J. A. M. Vermaseren | LPAIR: A generator for lepton pair production | in Workshop on Physics at HERA, 1991 | |
| 70 | A. Suri and D. R. Yennie | The space-time phenomenology of photon absorption and inelastic electron scattering | Annals Phys. 72 (1972) 243 | |
| 71 | J. M. Campbell, R. K. Ellis, and W. T. Giele | A multi-threaded version of MCFM | EPJC 75 (2015) 246 | 1503.06182 |
| 72 | T. Gehrmann et al. | $ W^+W^- $ production at hadron colliders in next to next to leading order QCD | PRL 113 (2014) 212001 | 1408.5243 |
| 73 | M. Czakon and A. Mitov | Top++: A program for the calculation of the top-pair cross-section at hadron colliders | Comput. Phys. Commun. 185 (2014) 2930 | 1112.5675 |
| 74 | \GEANTfour Collaboration | $ GEANT $ 4---a simulation toolkit | NIM A 506 (2003) 250 | |
| 75 | G. D'Agostini | A multidimensional unfolding method based on Bayes' theorem | NIM A 362 (1995) 487 | |
| 76 | CMS Collaboration | Measurement of differential cross sections for Z boson production in association with jets in proton-proton collisions at $ \sqrt{s} = $ 13 TeV | EPJC 78 (2018) 965 | CMS-SMP-16-015 1804.05252 |
| 77 | CMS Collaboration | Measurements of differential production cross sections for a Z boson in association with jets in pp collisions at $ \sqrt{s}= $ 8 TeV | JHEP 04 (2017) 022 | CMS-SMP-14-013 1611.03844 |
| 78 | CMS Collaboration | Precision luminosity measurement in proton-proton collisions at $ \sqrt{s} = $ 13 TeV in 2015 and 2016 at CMS | EPJC 81 (2021) 800 | CMS-LUM-17-003 2104.01927 |
| 79 | A. Manohar, P. Nason, G. P. Salam, and G. Zanderighi | How bright is the proton? A precise determination of the photon parton distribution function | PRL 117 (2016) 242002 | 1607.04266 |
| 80 | A. V. Manohar, P. Nason, G. P. Salam, and G. Zanderighi | The photon content of the proton | JHEP 12 (2017) 046 | 1708.01256 |
| 81 | P. F. Monni et al. | MiNNLO$ _{\text{PS}} $: a new method to match NNLO QCD to parton showers | JHEP 05 (2020) 143 | 1908.06987 |
| 82 | P. F. Monni, E. Re, and M. Wiesemann | MiNNLO$ _{\text {PS}} $: optimizing 2 $ \rightarrow $ 1 hadronic processes | EPJC 80 (2020) 1075 | 2006.04133 |
| 83 | NNPDF Collaboration | Parton distributions from high-precision collider data | EPJC 77 (2017) 663 | 1706.00428 |
| 84 | CMS Collaboration | Extraction and validation of a new set of CMS PYTHIA8 tunes from underlying-event measurements | EPJC 80 (2020) 4 | CMS-GEN-17-001 1903.12179 |
| 85 | S. Baranov et al. | CASCADE3 A Monte Carlo event generator based on TMDs | EPJC 81 (2021) 425 | 2101.10221 |
| 86 | A. Bermudez Martinez et al. | Production of Z-bosons in the parton branching method | PRD 100 (2019) 074027 | 1906.00919 |
| 87 | A. Bermudez Martinez et al. | Collinear and TMD parton densities from fits to precision DIS measurements in the parton branching method | PRD 99 (2019) 074008 | 1804.11152 |
| 88 | T. Sjöstrand, S. Mrenna, and P. Z. Skands | PYTHIA 6.4 physics and manual | JHEP 05 (2006) 026 | hep-ph/0603175 |
| 89 | A. Bermudez Martinez, F. Hautmann, and M. L. Mangano | TMD evolution and multi-jet merging | PLB 822 (2021) 136700 | 2107.01224 |
| 90 | I. Scimemi and A. Vladimirov | Analysis of vector boson production within TMD factorization | EPJC 78 (2018) 89 | 1706.01473 |
| 91 | I. Scimemi and A. Vladimirov | Non-perturbative structure of semi-inclusive deep-inelastic and Drell-Yan scattering at small transverse momentum | JHEP 06 (2020) 137 | 1912.06532 |
| 92 | CMSnoop | arTeMiDe public repository | \href. \urlhttps://github.com/VladimirovAlexey/artemide-public,, 2020 | |
| 93 | S. Alioli et al. | Combining higher-order resummation with multiple NLO calculations and parton showers in GENEVA | JHEP 09 (2013) 120 | 1211.7049 |
| 94 | S. Alioli et al. | Drell-Yan production at NNLL'+NNLO matched to parton showers | PRD 92 (2015) 094020 | 1508.01475 |
| 95 | S. Alioli et al. | Matching NNLO predictions to parton showers using $ {\mathrm{N}}^{3}\mathrm{LL} $ color-singlet transverse momentum resummation in GENEVA | PRD 104 (2021) 094020 | 2102.08390 |
| 96 | I. W. Stewart, F. J. Tackmann, and W. J. Waalewijn | N-jettiness: An inclusive event shape to veto jets | PRL 105 (2010) 092002 | 1004.2489 |
| 97 | P. F. Monni, E. Re, and P. Torrielli | Higgs transverse-momentum resummation in direct space | PRL 116 (2016) 242001 | 1604.02191 |
| 98 | W. Bizon et al. | Momentum-space resummation for transverse observables and the Higgs p$ _{\perp} $ at N$ ^{3} $LL+NNLO | JHEP 02 (2018) 108 | 1705.09127 |
| 99 | J. Butterworth et al. | PDF4LHC recommendations for LHC Run II | JPG 43 (2016) 023001 | 1510.03865 |
| 100 | CMS Collaboration | HEPData record for this analysis | link | |
|
|
Compact Muon Solenoid LHC, CERN |
|

|

|

|

|

|