

Compact Muon Solenoid
LHC, CERN
| CMS-SMP-21-005 ; CERN-EP-2023-105 | ||
| Measurement of the production cross section for a W boson in association with a charm quark in proton-proton collisions at $ \sqrt{s}= $ 13 TeV | ||
| CMS Collaboration | ||
| 4 August 2023 | ||
| Eur. Phys. J. C 84 (2024) 27 | ||
| Abstract: The strange quark content of the proton is probed through the measurement of the production cross section for a W boson and a charm (c) quark in proton-proton collisions at a center-of-mass energy of 13 TeV. The analysis uses a data sample corresponding to a total integrated luminosity of 138 fb$^{-1}$ collected with the CMS detector at the LHC. The W bosons are identified through their leptonic decays to an electron or a muon, and a neutrino. Charm jets are tagged using the presence of a muon or a secondary vertex inside the jet. The Wc production cross section and the cross section ratio $ R_\mathrm{c}^{\pm} = \sigma(\mathrm{W^{+}}\,+\,\bar{\mathrm{c}})/\sigma(\mathrm{W^{-}}\,+\,\mathrm{c}) $ are measured inclusively and differentially as functions of the transverse momentum and the pseudorapidity of the lepton originating from the W boson decay. The precision of the measurements is improved with respect to previous studies, reaching 1% in $ R_\mathrm{c}^{\pm} $. The measurements are compared with theoretical predictions up to next-to-next-to-leading order in perturbative quantum chromodynamics. | ||
| Links: e-print arXiv:2308.02285 [hep-ex] (PDF) ; CDS record ; inSPIRE record ; HepData record ; CADI line (restricted) ; | ||
| Figures | |
png pdf |
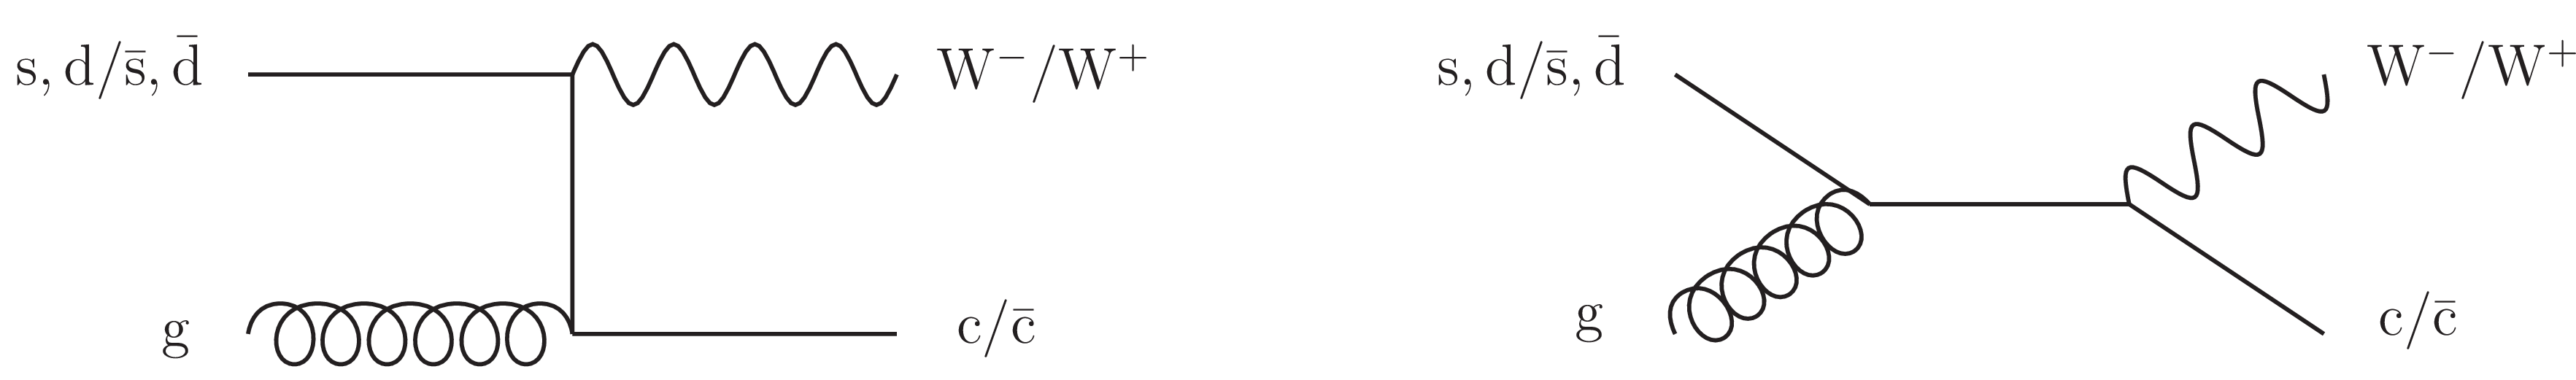
Figure 1:
Leading order Feynman diagrams for the associated production of a W boson and a charm quark. The electric charges of the W boson and c quark have opposite signs. |
png pdf |
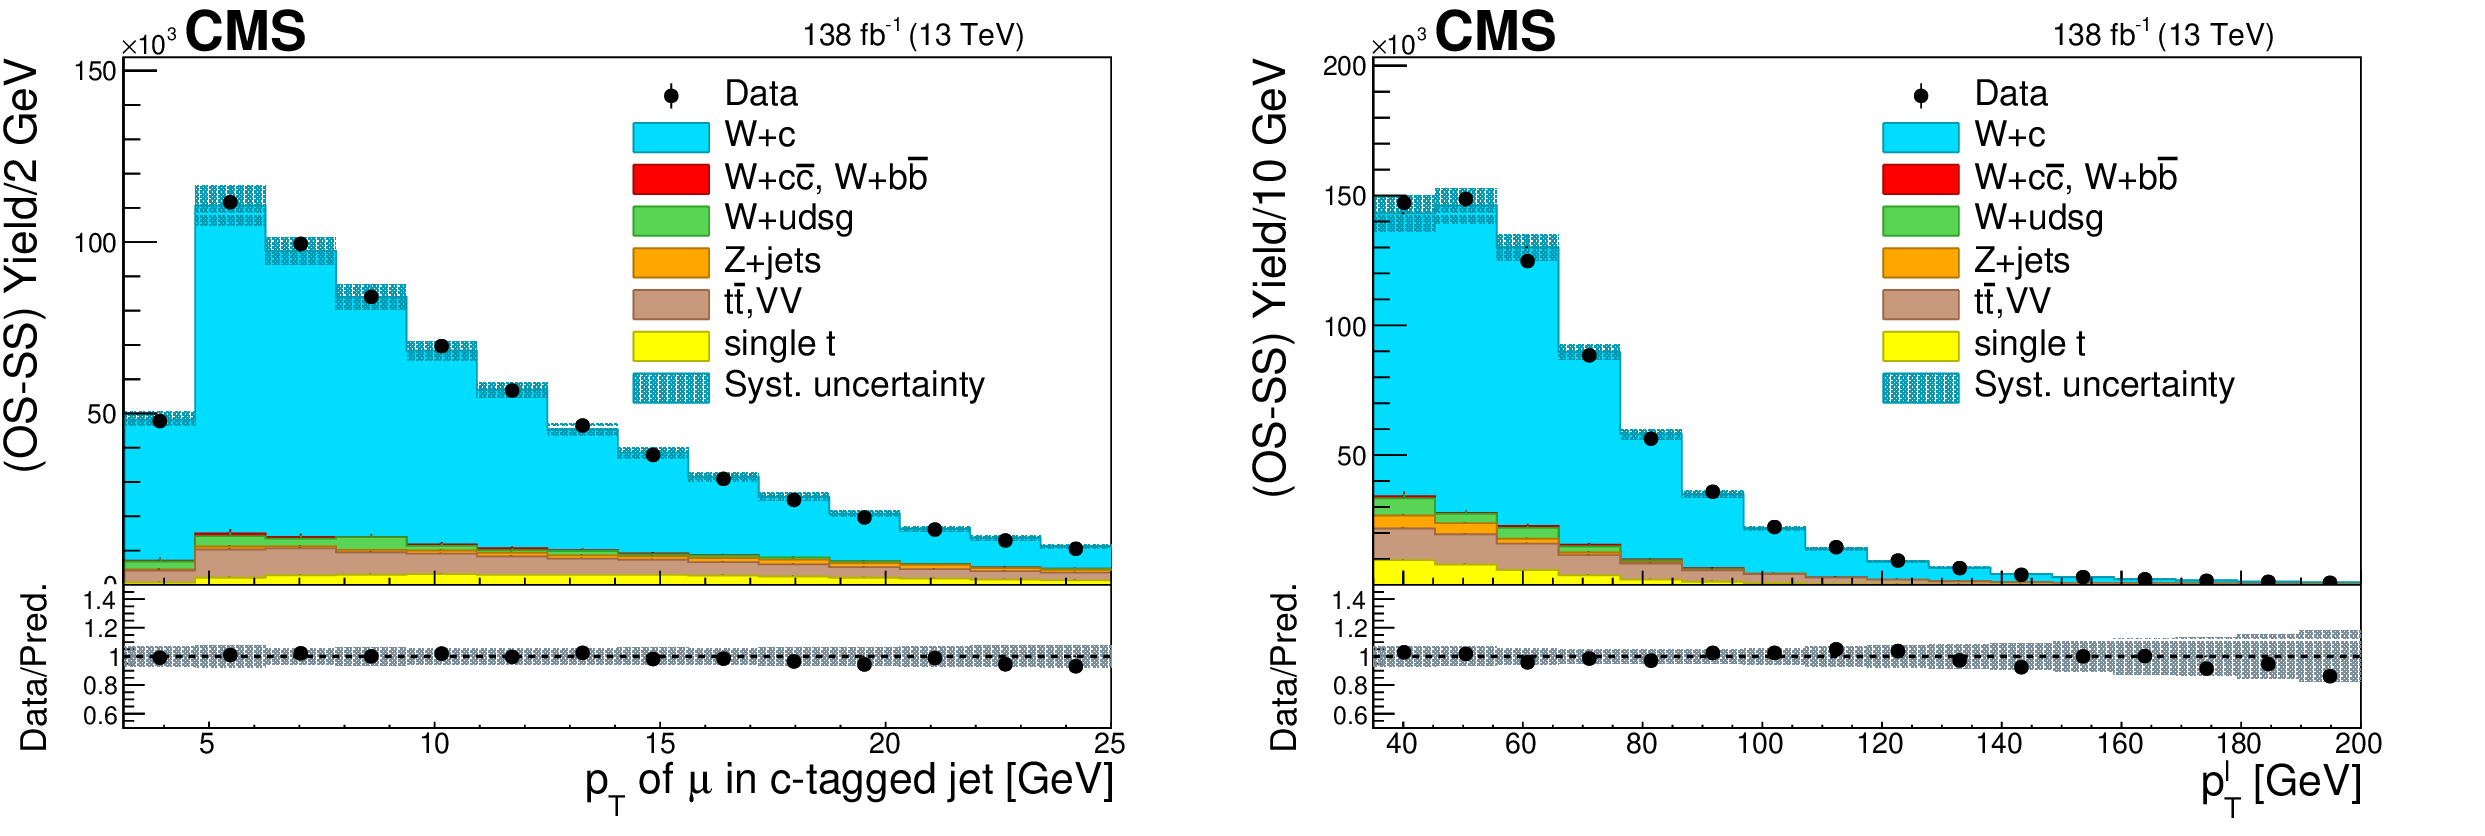
Figure 2:
Distributions after OS-SS subtraction of the $ p_{\mathrm{T}} $ of the muon inside the $ \mathrm{c}\text{ jet} $ (left) and the $ p_{\mathrm{T}} $ of the lepton from the W decay (right) for events in the SL sample, summing up the contributions of the W boson decay channels to electrons and muons. The contributions of the various processes are estimated with the simulated samples. The statistical uncertainty in the data is smaller than the size of the data dots. The hatched areas represent the sum in quadrature of statistical and systematic uncertainties in the MC simulation. The ratio of data to simulation is shown in the lower panels. The uncertainty band in the ratio includes the statistical uncertainty in the data, and the statistical and systematic uncertainties in the MC simulation. |
png pdf |
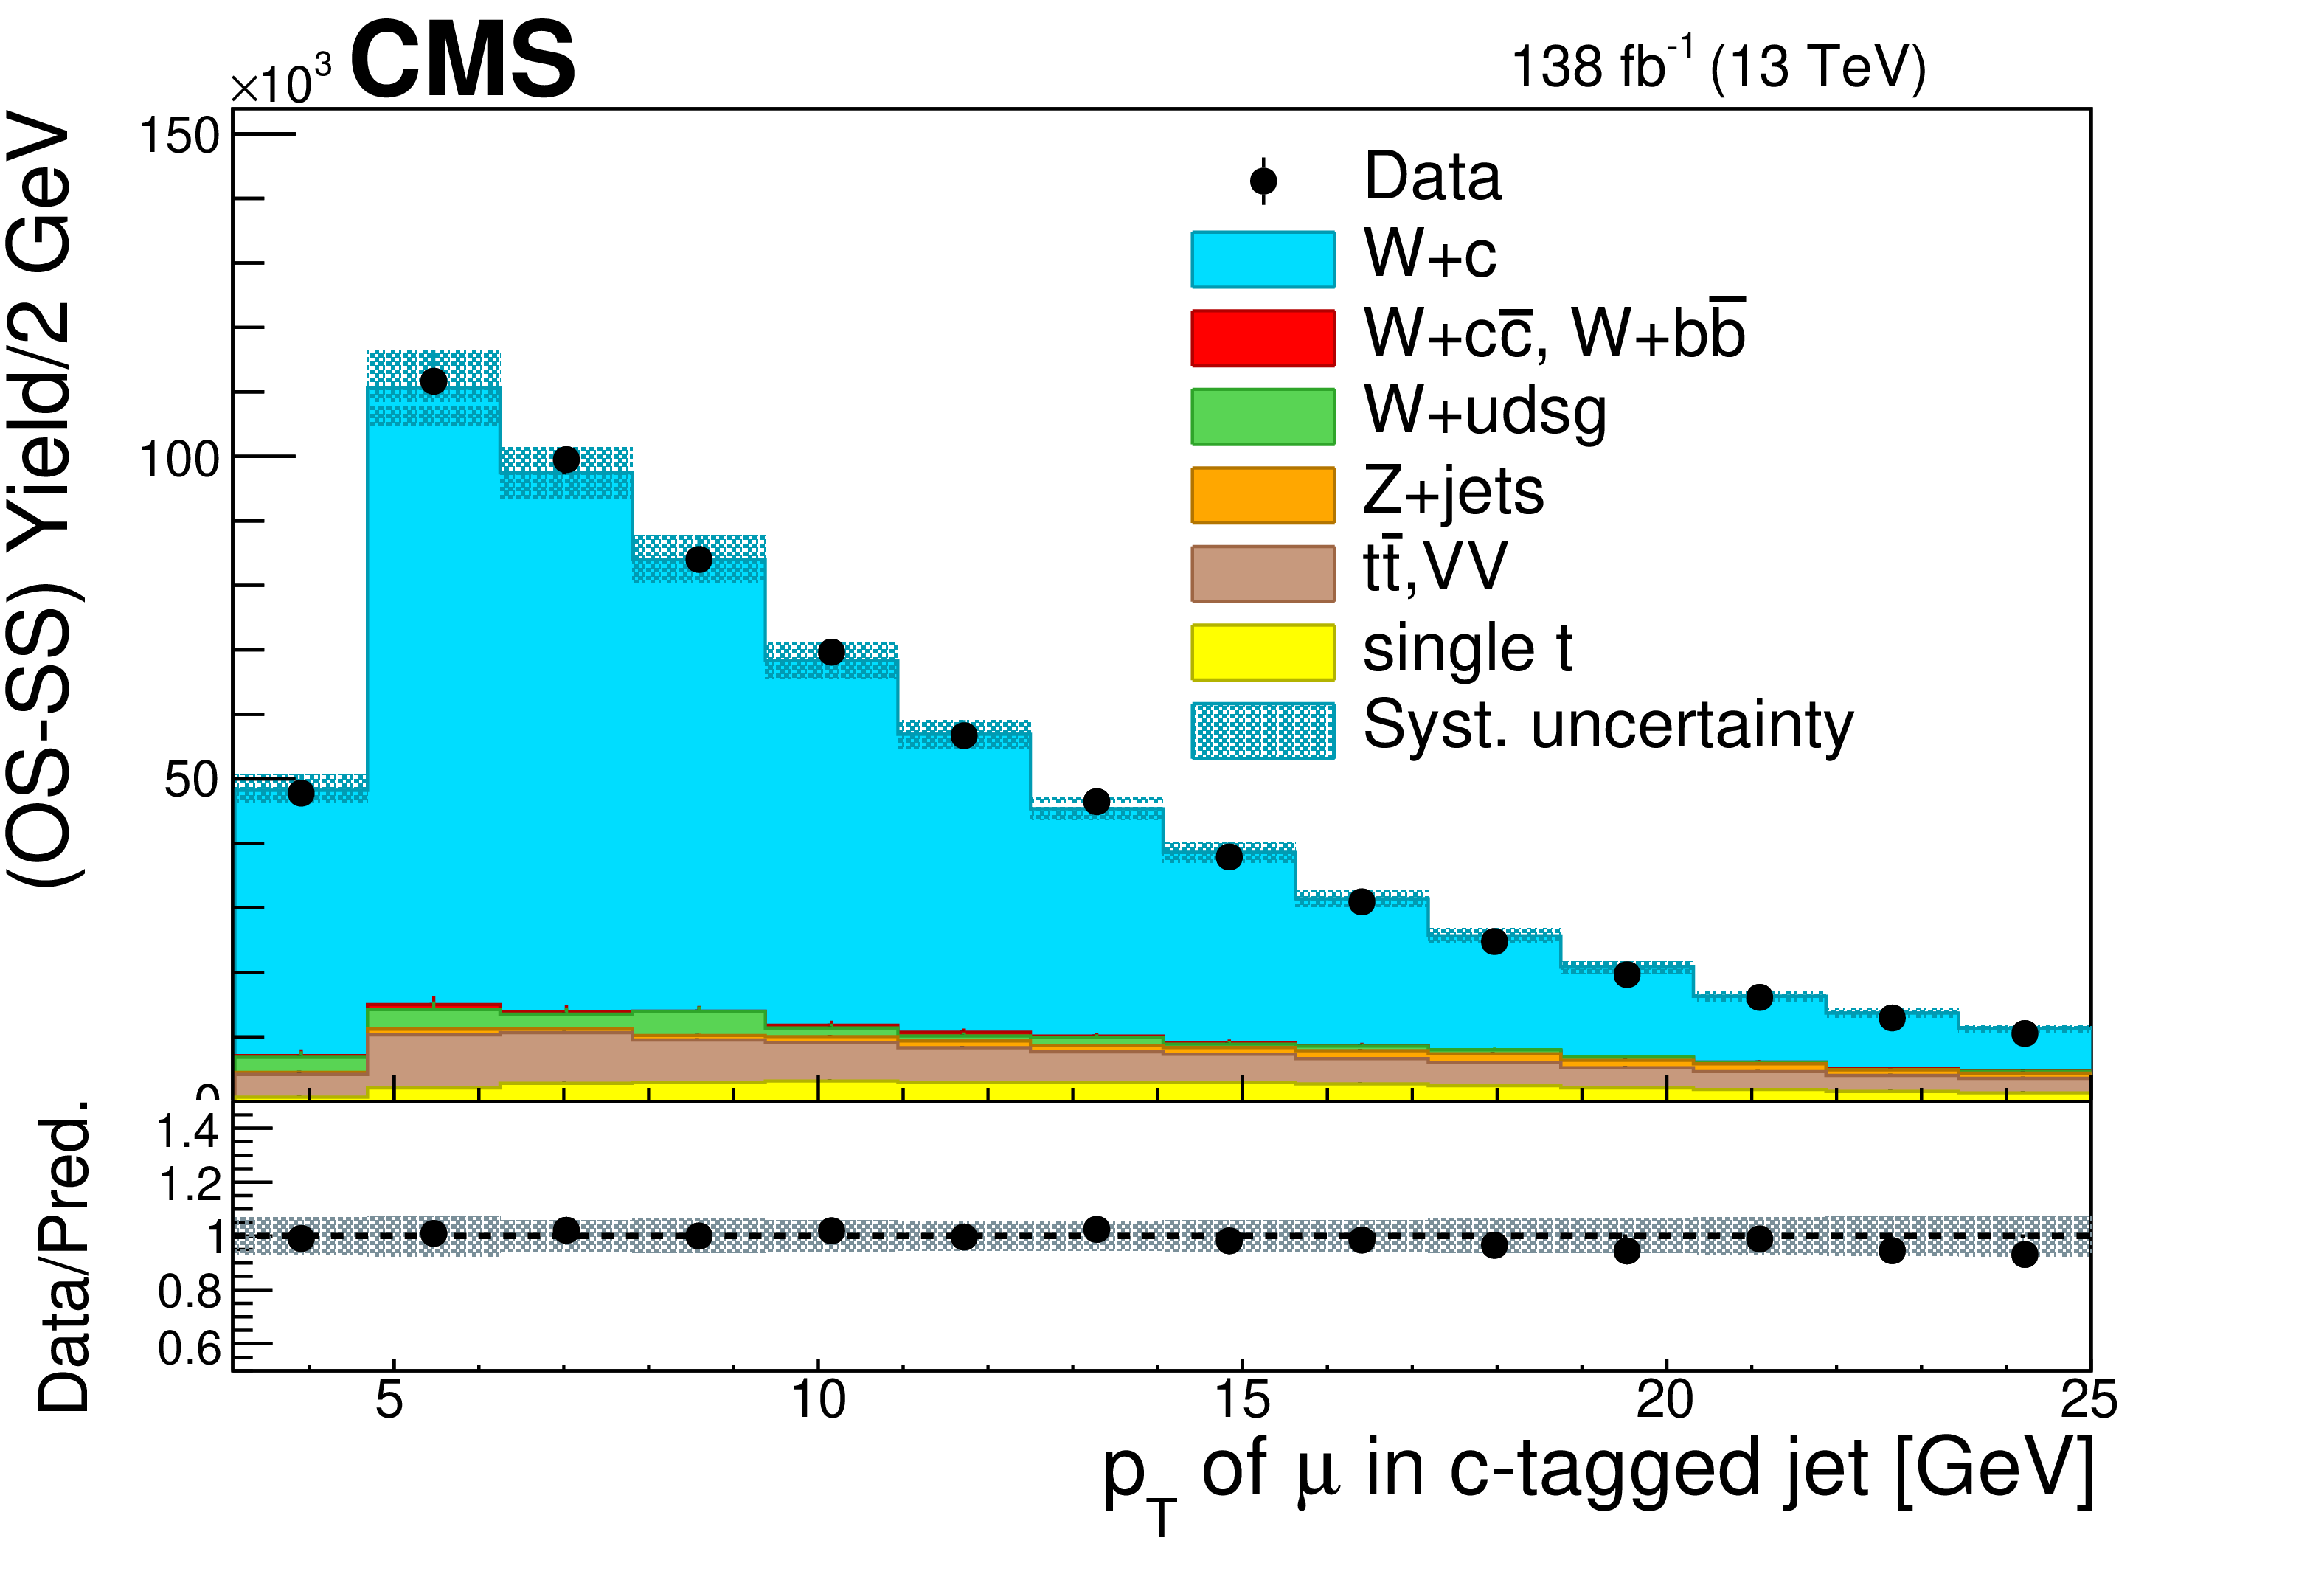
Figure 2-a:
Distribution after OS-SS subtraction of the $ p_{\mathrm{T}} $ of the muon inside the $ \mathrm{c}\text{ jet} $ for events in the SL sample, summing up the contributions of the W boson decay channels to electrons and muons. The contributions of the various processes are estimated with the simulated samples. The statistical uncertainty in the data is smaller than the size of the data dots. The hatched areas represent the sum in quadrature of statistical and systematic uncertainties in the MC simulation. The ratio of data to simulation is shown in the lower panel. The uncertainty band in the ratio includes the statistical uncertainty in the data, and the statistical and systematic uncertainties in the MC simulation. |
png pdf |
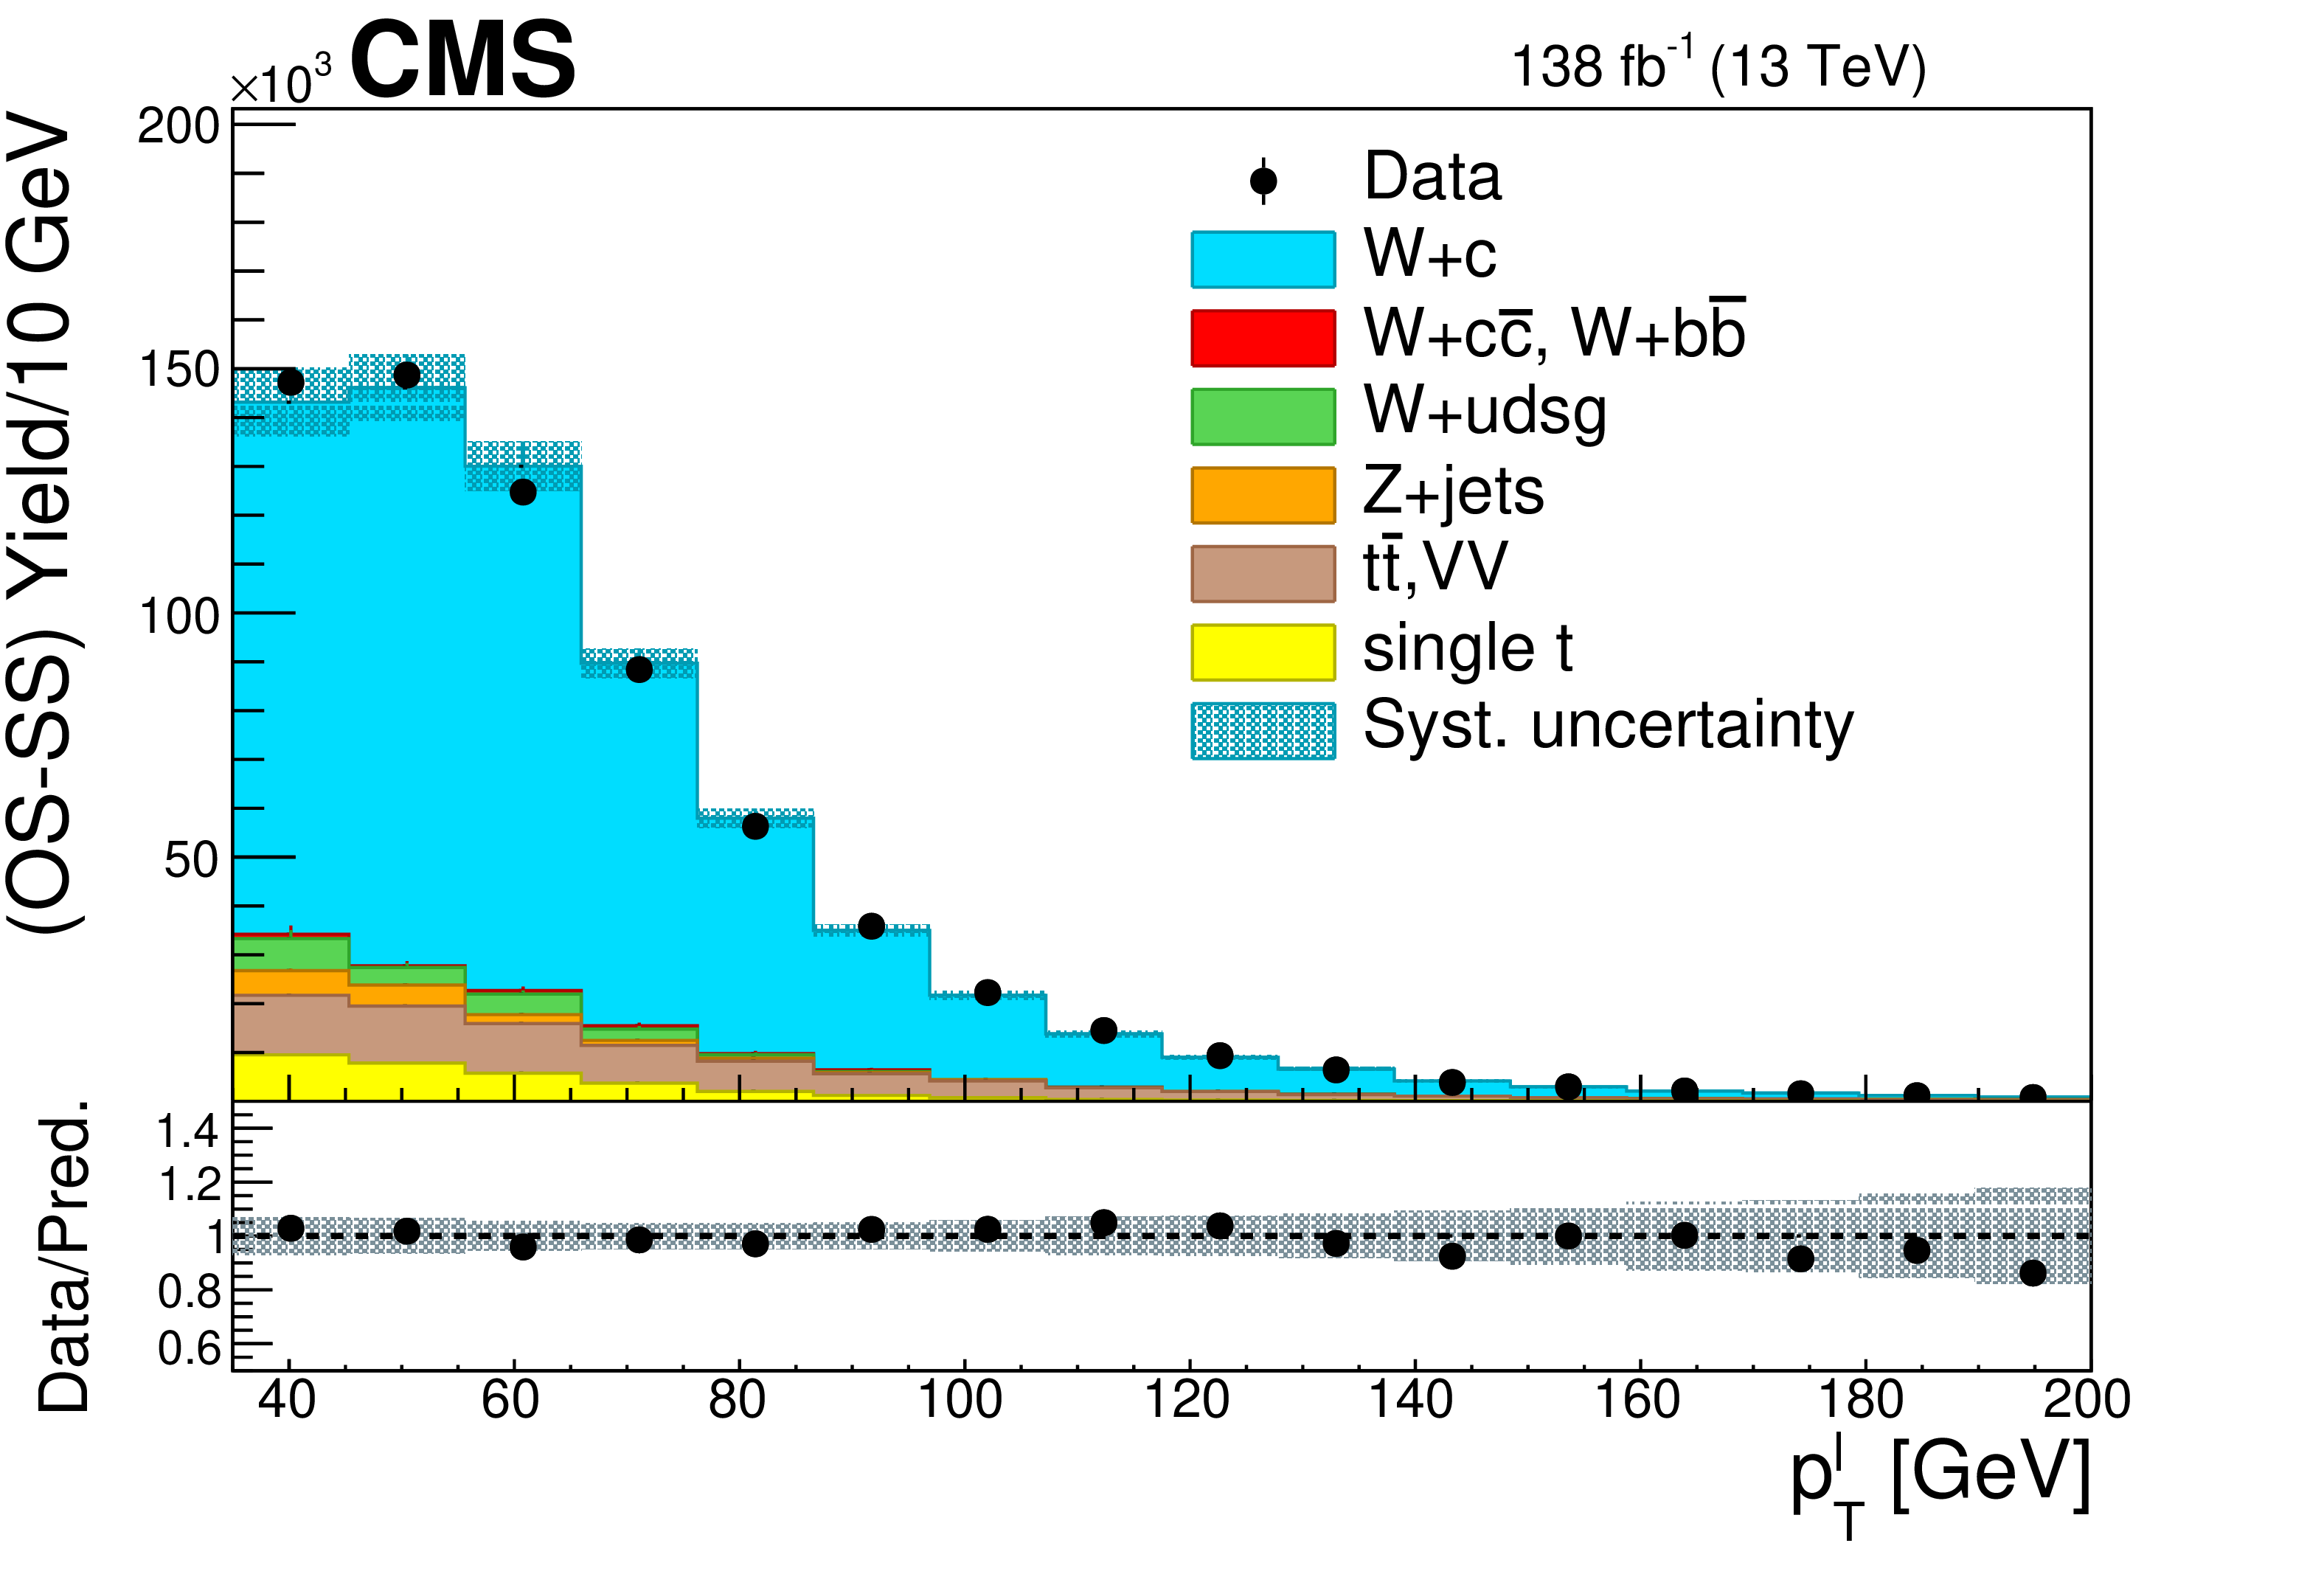
Figure 2-b:
Distribution after OS-SS subtraction of the $ p_{\mathrm{T}} $ of the lepton from the W decay for events in the SL sample, summing up the contributions of the W boson decay channels to electrons and muons. The contributions of the various processes are estimated with the simulated samples. The statistical uncertainty in the data is smaller than the size of the data dots. The hatched areas represent the sum in quadrature of statistical and systematic uncertainties in the MC simulation. The ratio of data to simulation is shown in the lower panel. The uncertainty band in the ratio includes the statistical uncertainty in the data, and the statistical and systematic uncertainties in the MC simulation. |

png pdf |
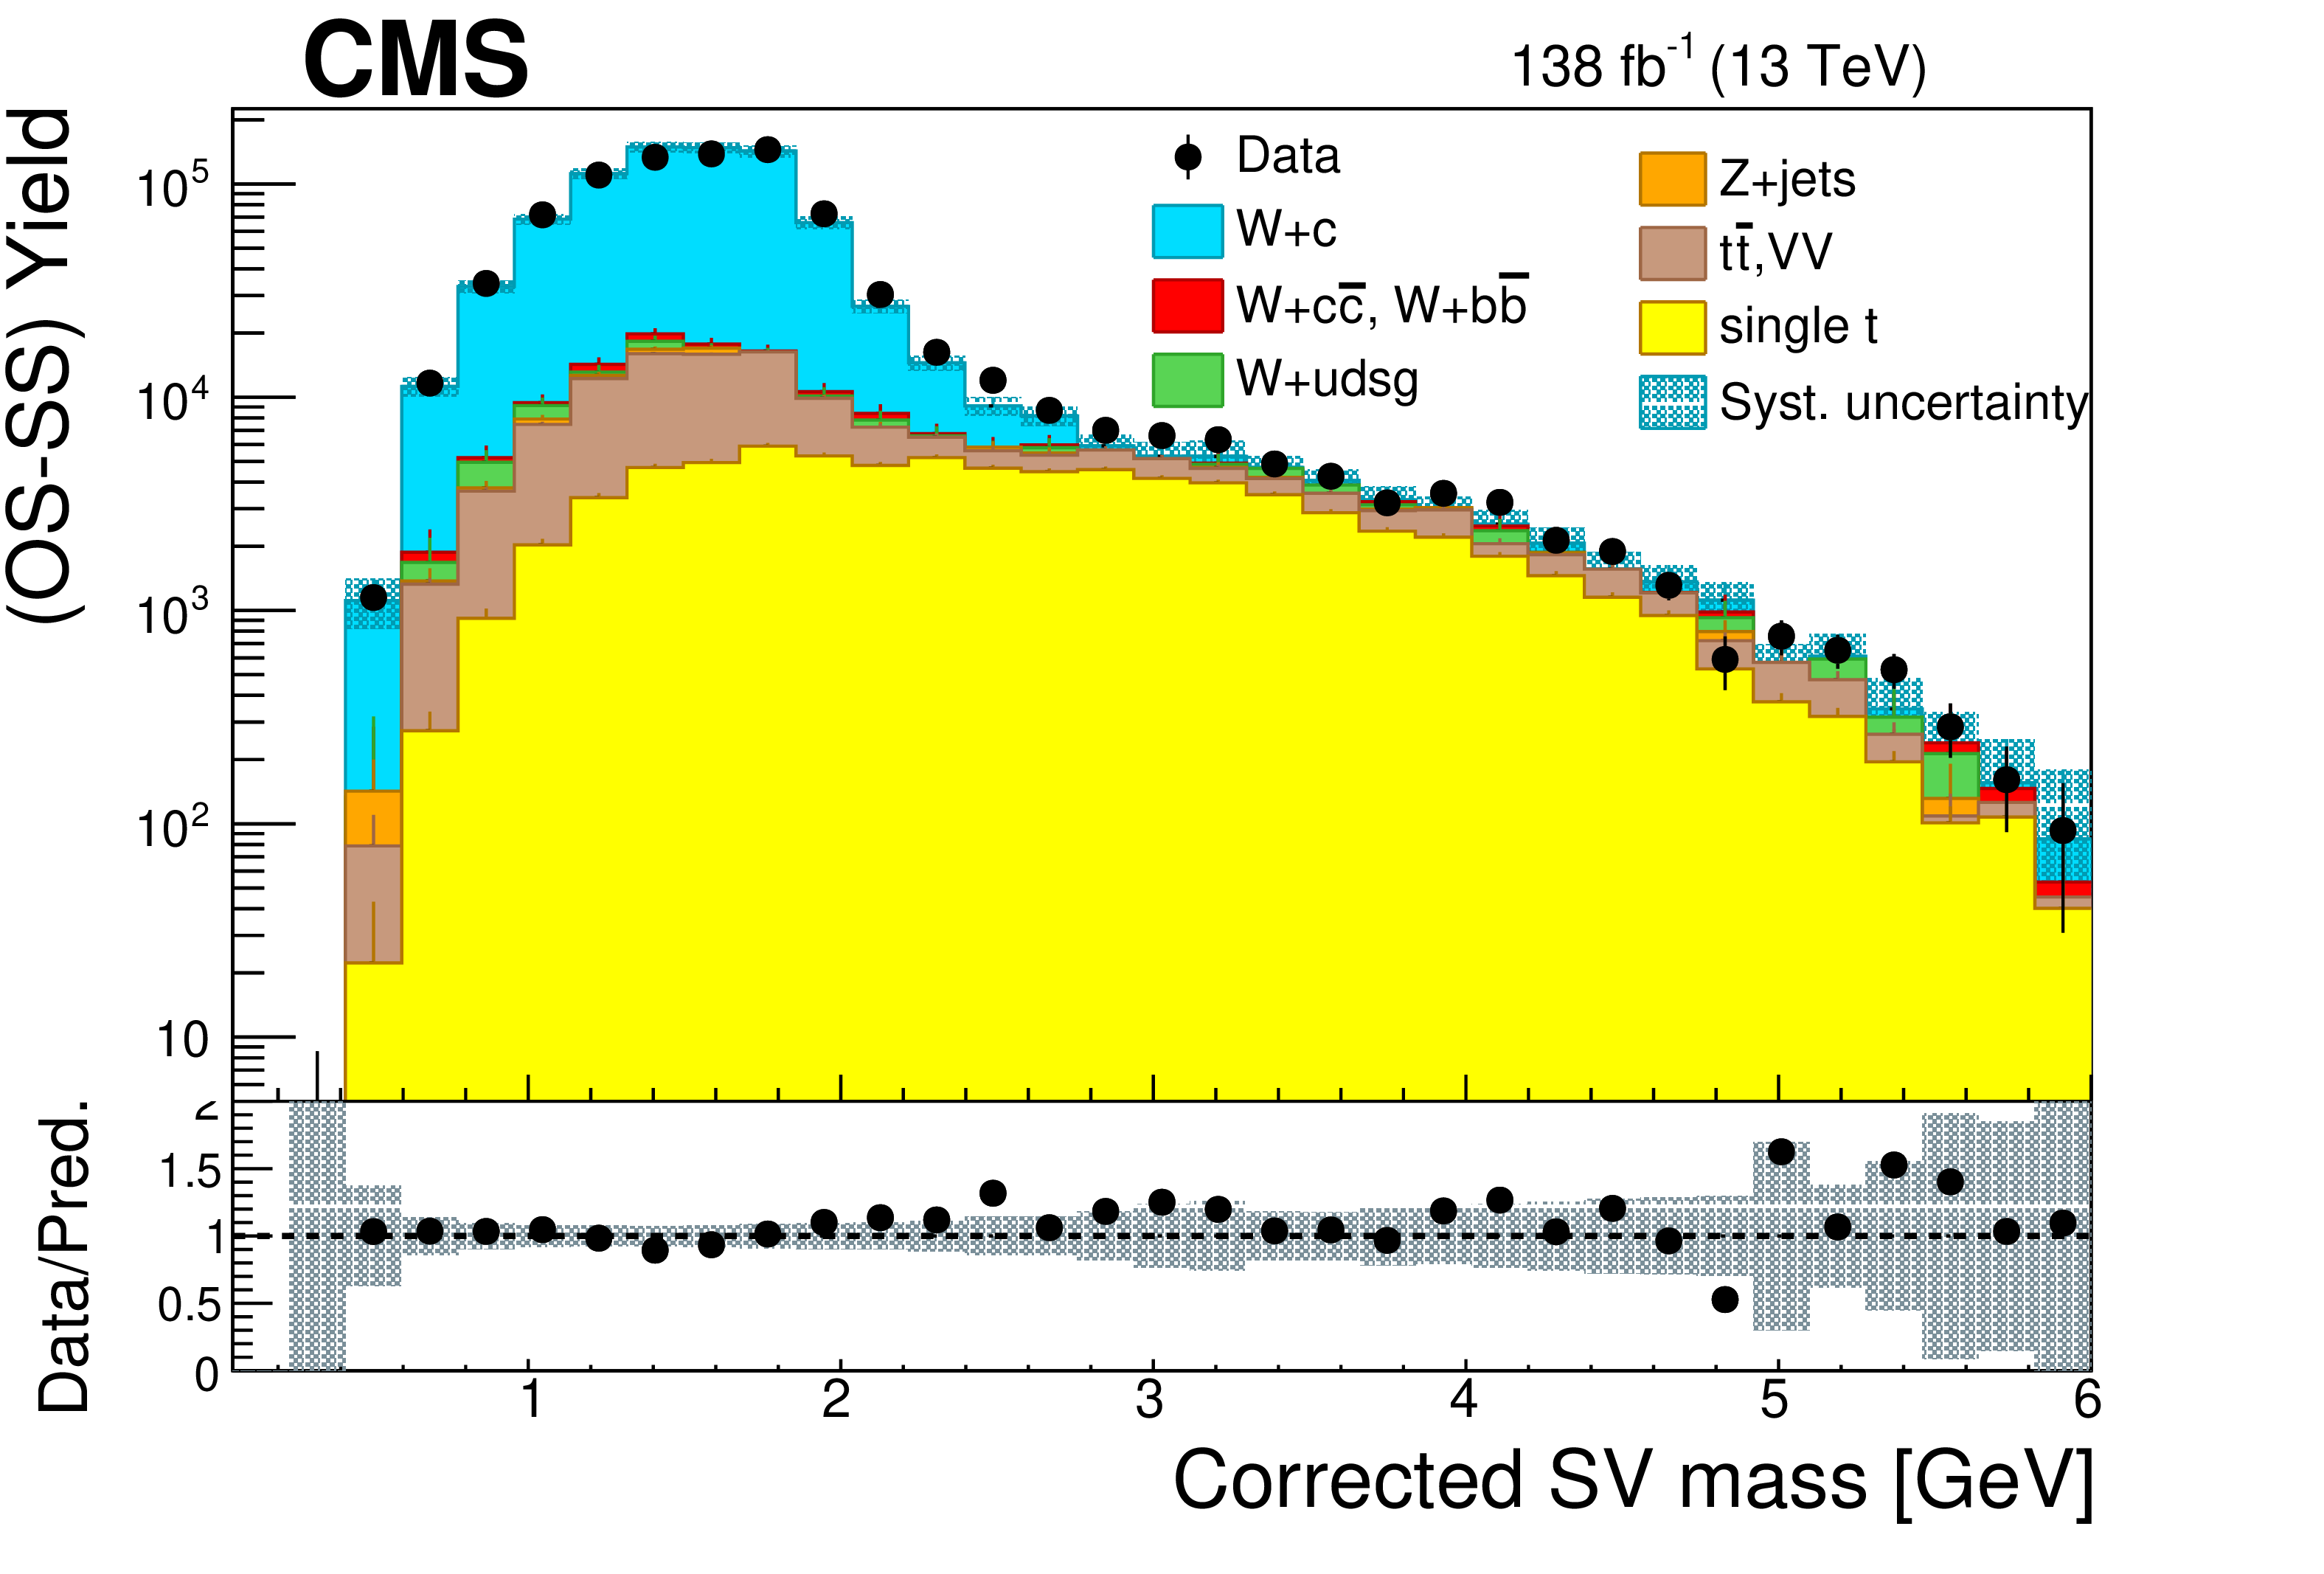
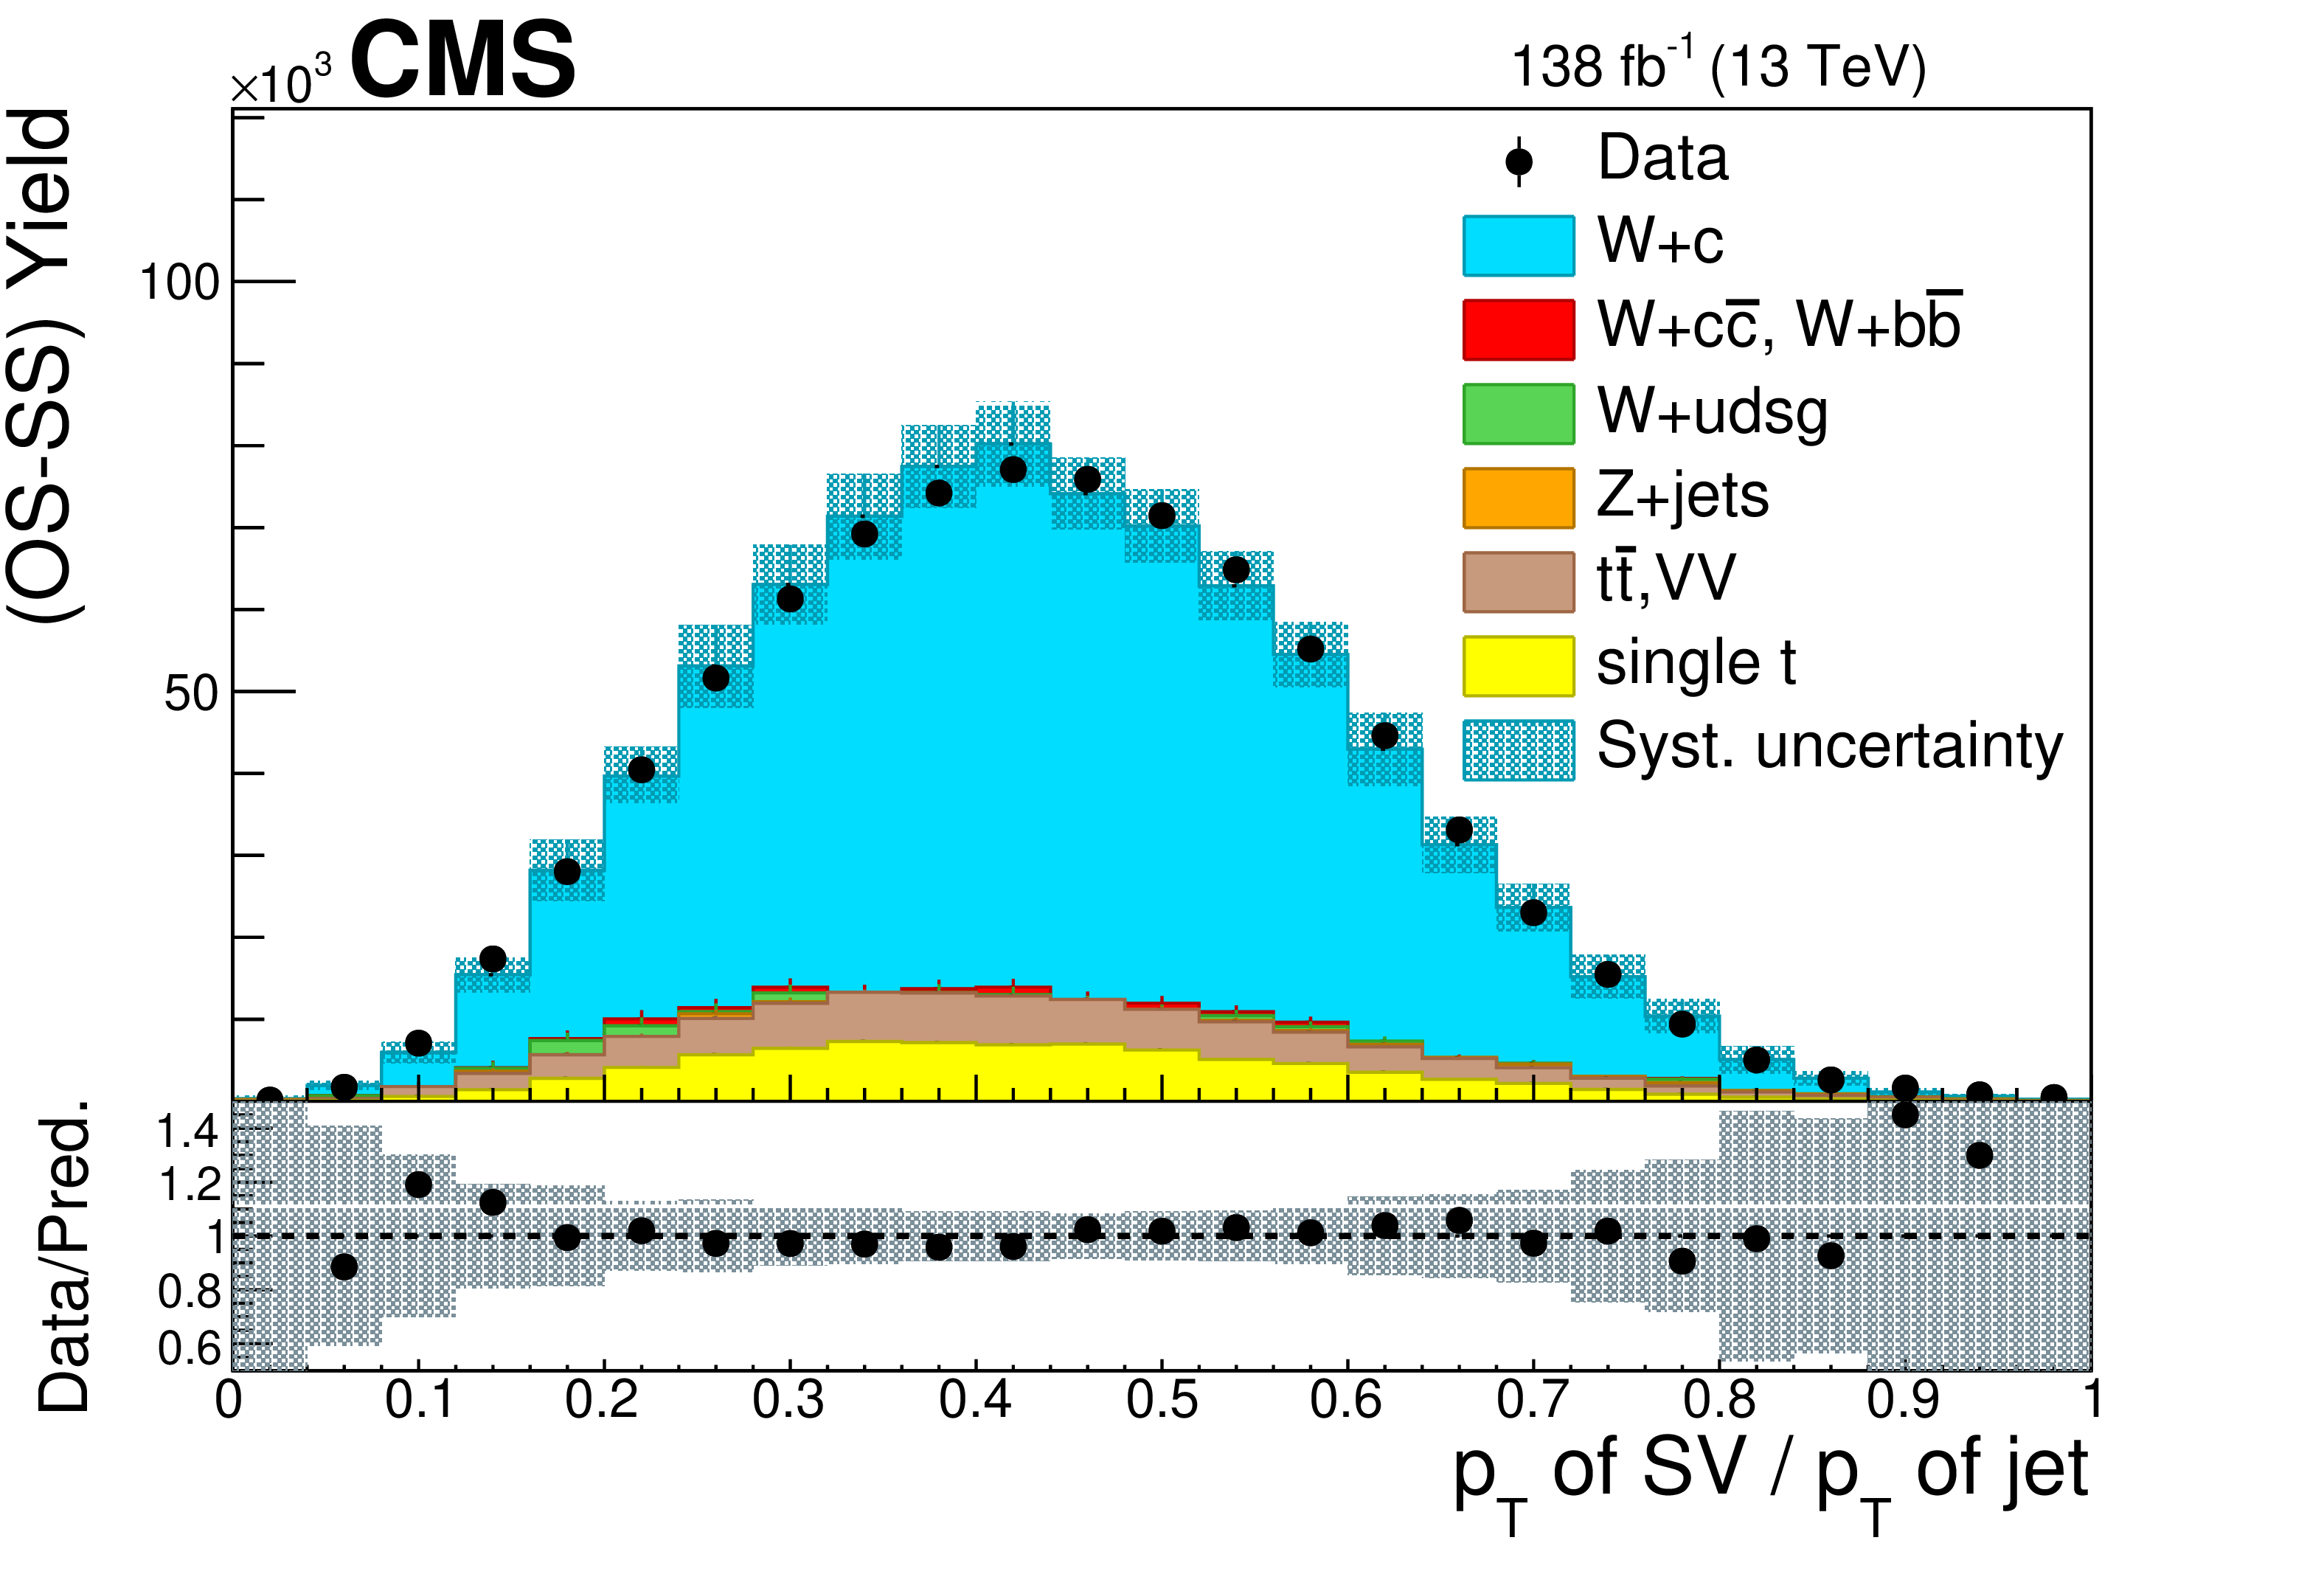
Figure 3:
Distributions after OS-SS subtraction of the corrected SV mass (left) and SV transverse momentum divided by the jet transverse momentum (right) for events in the SV sample, summing up the contributions of the W boson decay channels to electrons and muons. The contributions from all processes are estimated with the simulated samples. The statistical uncertainty in the data is smaller than the size of the data dots for most of the data points. The hatched areas represent the sum in quadrature of statistical and systematic uncertainties in the MC simulation. The ratio of data to simulation is shown in the lower panels. The uncertainty band in the ratio includes the statistical uncertainty in the data, and the statistical and systematic uncertainties in the MC simulation. |
png pdf |
Figure 3-a:
Distribution after OS-SS subtraction of the corrected SV mass for events in the SV sample, summing up the contributions of the W boson decay channels to electrons and muons. The contributions from all processes are estimated with the simulated samples. The statistical uncertainty in the data is smaller than the size of the data dots for most of the data points. The hatched areas represent the sum in quadrature of statistical and systematic uncertainties in the MC simulation. The ratio of data to simulation is shown in the lower panel. The uncertainty band in the ratio includes the statistical uncertainty in the data, and the statistical and systematic uncertainties in the MC simulation. |
png pdf |
Figure 3-b:
Distribution after OS-SS subtraction of the SV transverse momentum divided by the jet transverse momentum for events in the SV sample, summing up the contributions of the W boson decay channels to electrons and muons. The contributions from all processes are estimated with the simulated samples. The statistical uncertainty in the data is smaller than the size of the data dots for most of the data points. The hatched areas represent the sum in quadrature of statistical and systematic uncertainties in the MC simulation. The ratio of data to simulation is shown in the lower panel. The uncertainty band in the ratio includes the statistical uncertainty in the data, and the statistical and systematic uncertainties in the MC simulation. |
png pdf |
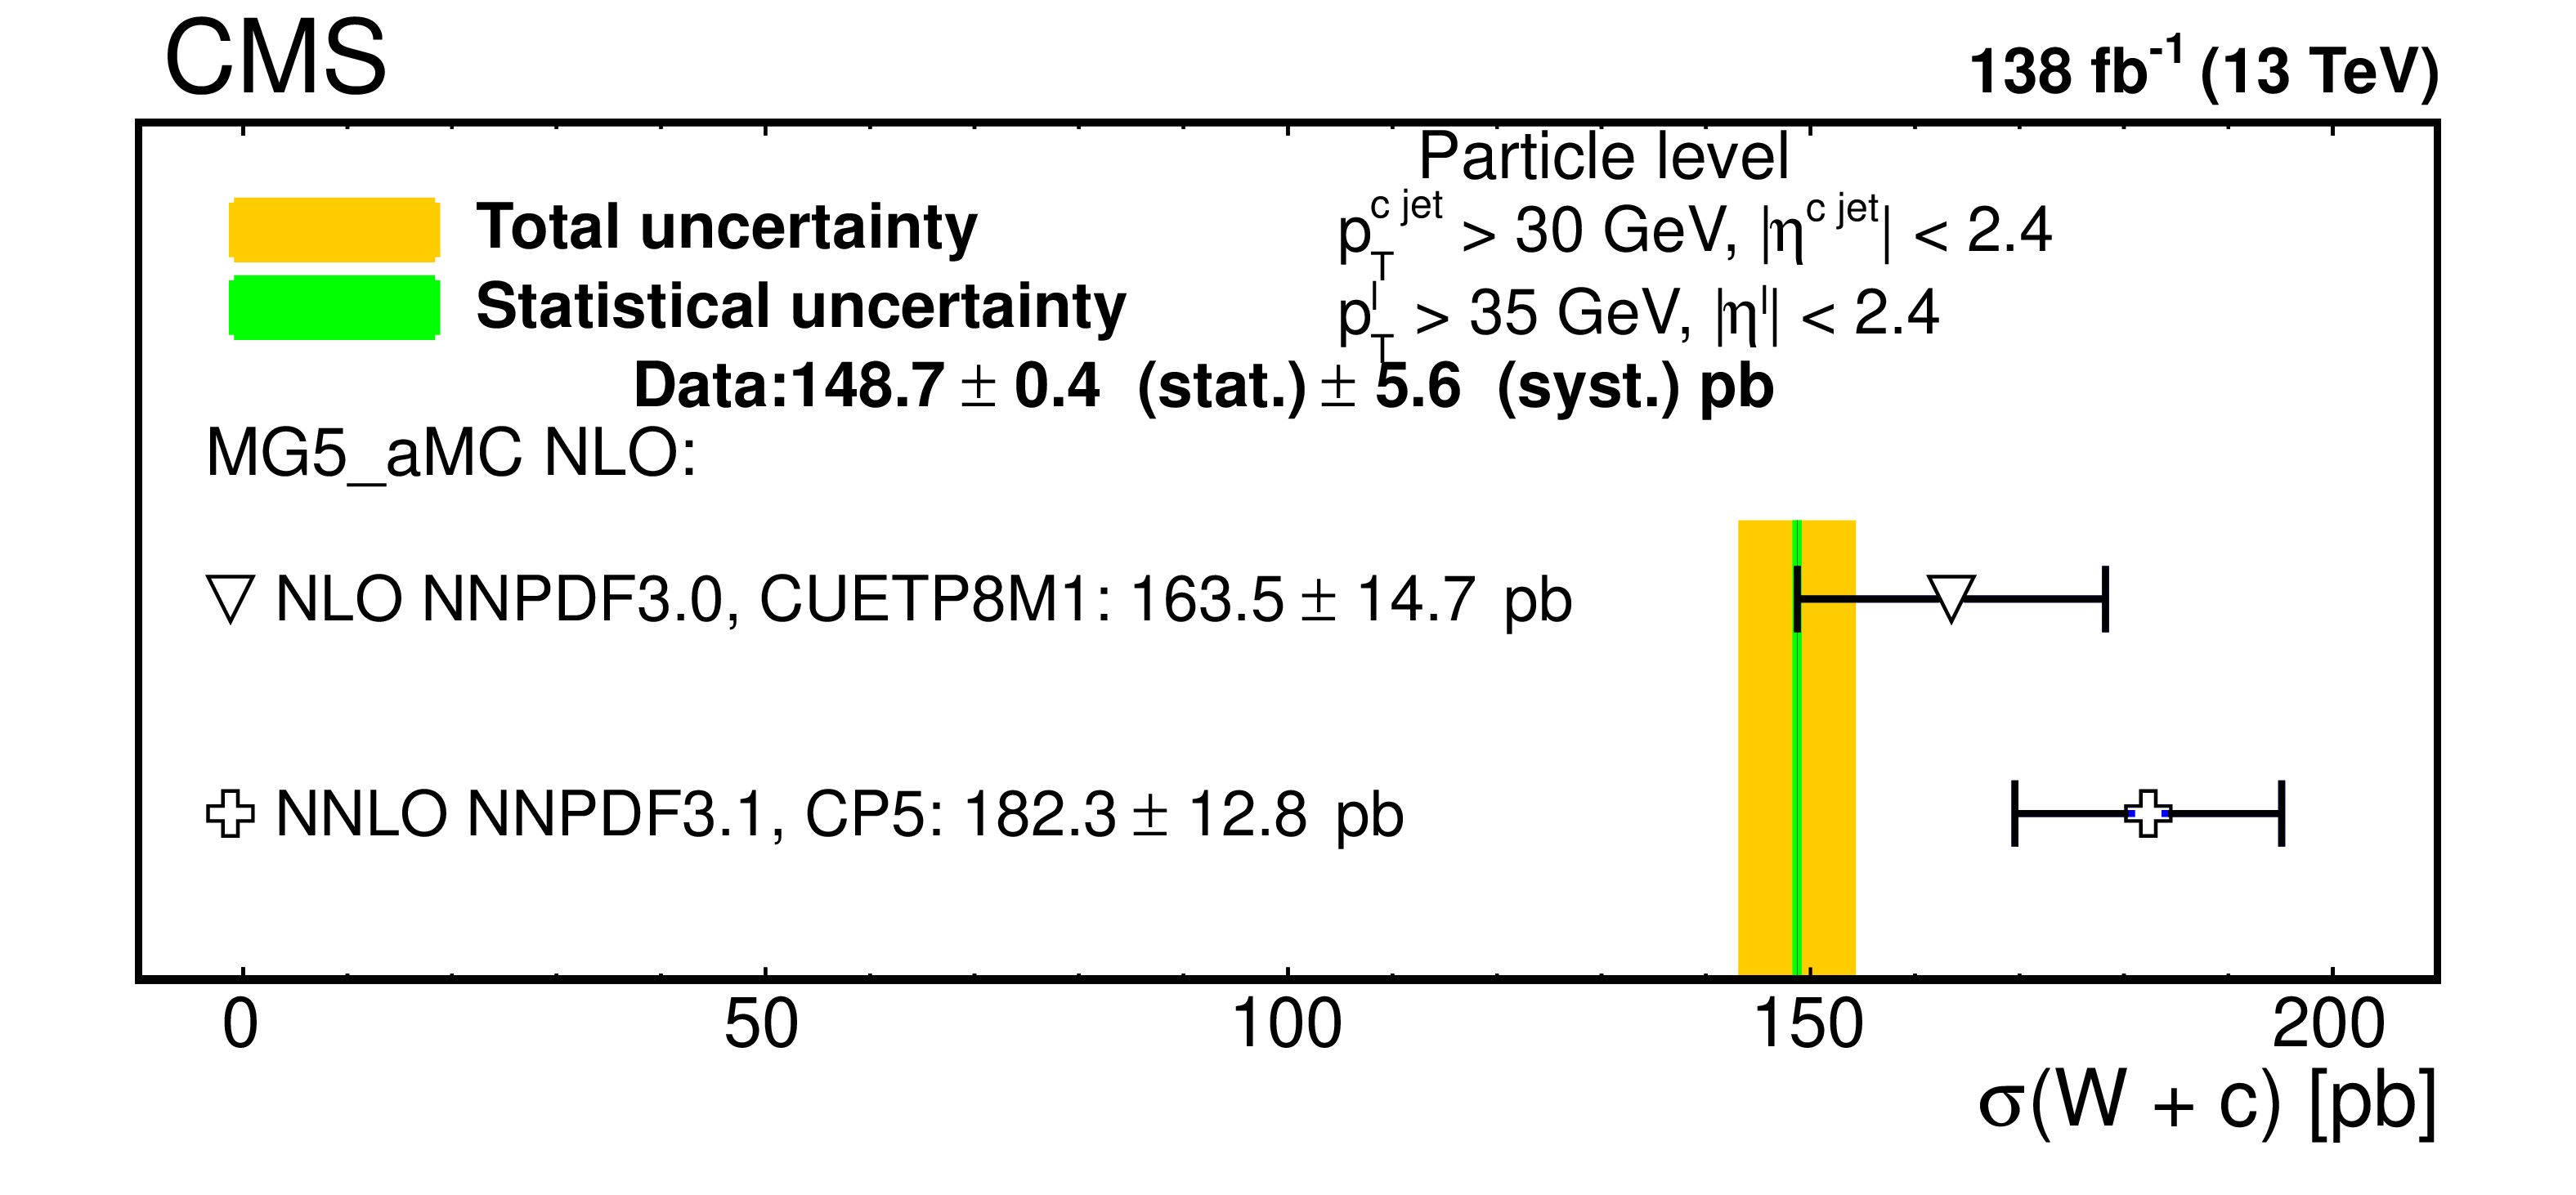
Figure 4:
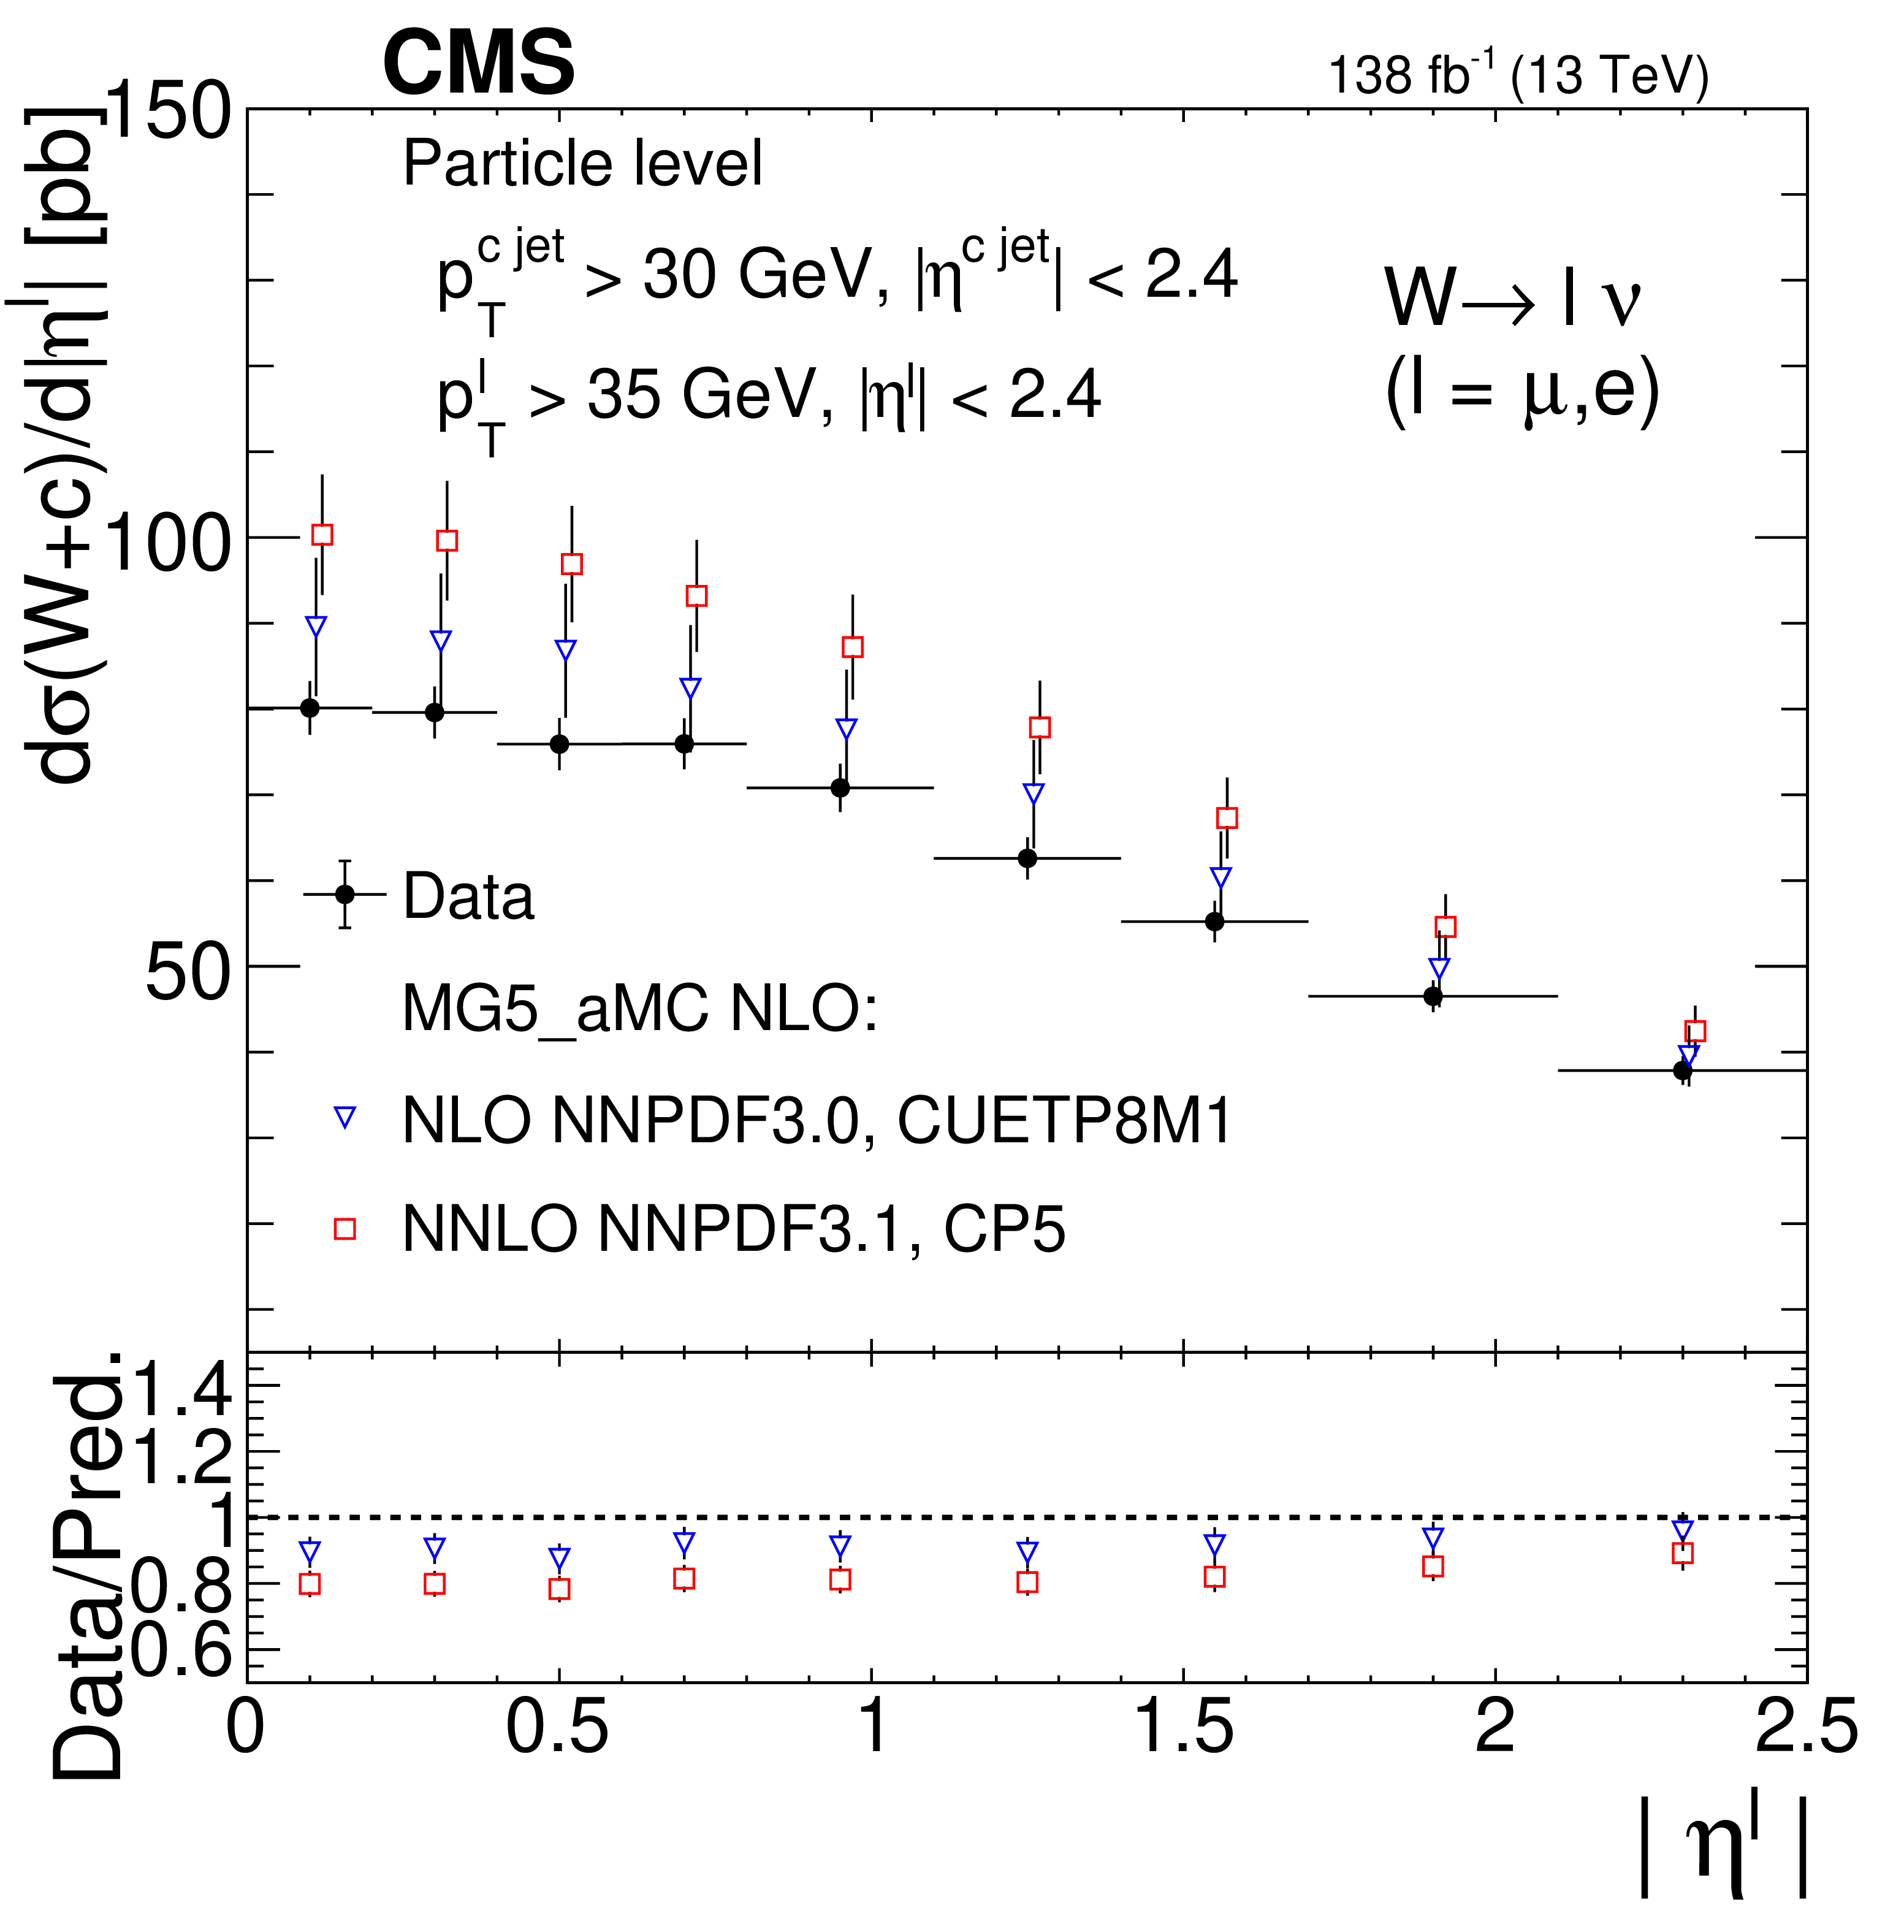
Comparison of the measured fiducial $ \sigma(\mathrm{W}\,+\,\mathrm{c}) $ cross section unfolded to the particle level with the predictions from the MadGraph-5_aMC@NLO simulation using two different PDF sets (NLO NNPDF3.0 and NNLO NNPDF3.1). Two different tunes (CUETP8M1 and CP5) for the parton showering, hadronization and underlying event modeling in PYTHIAeight are also used. Horizontal error bars indicate the total uncertainty in the predictions. |
png pdf |
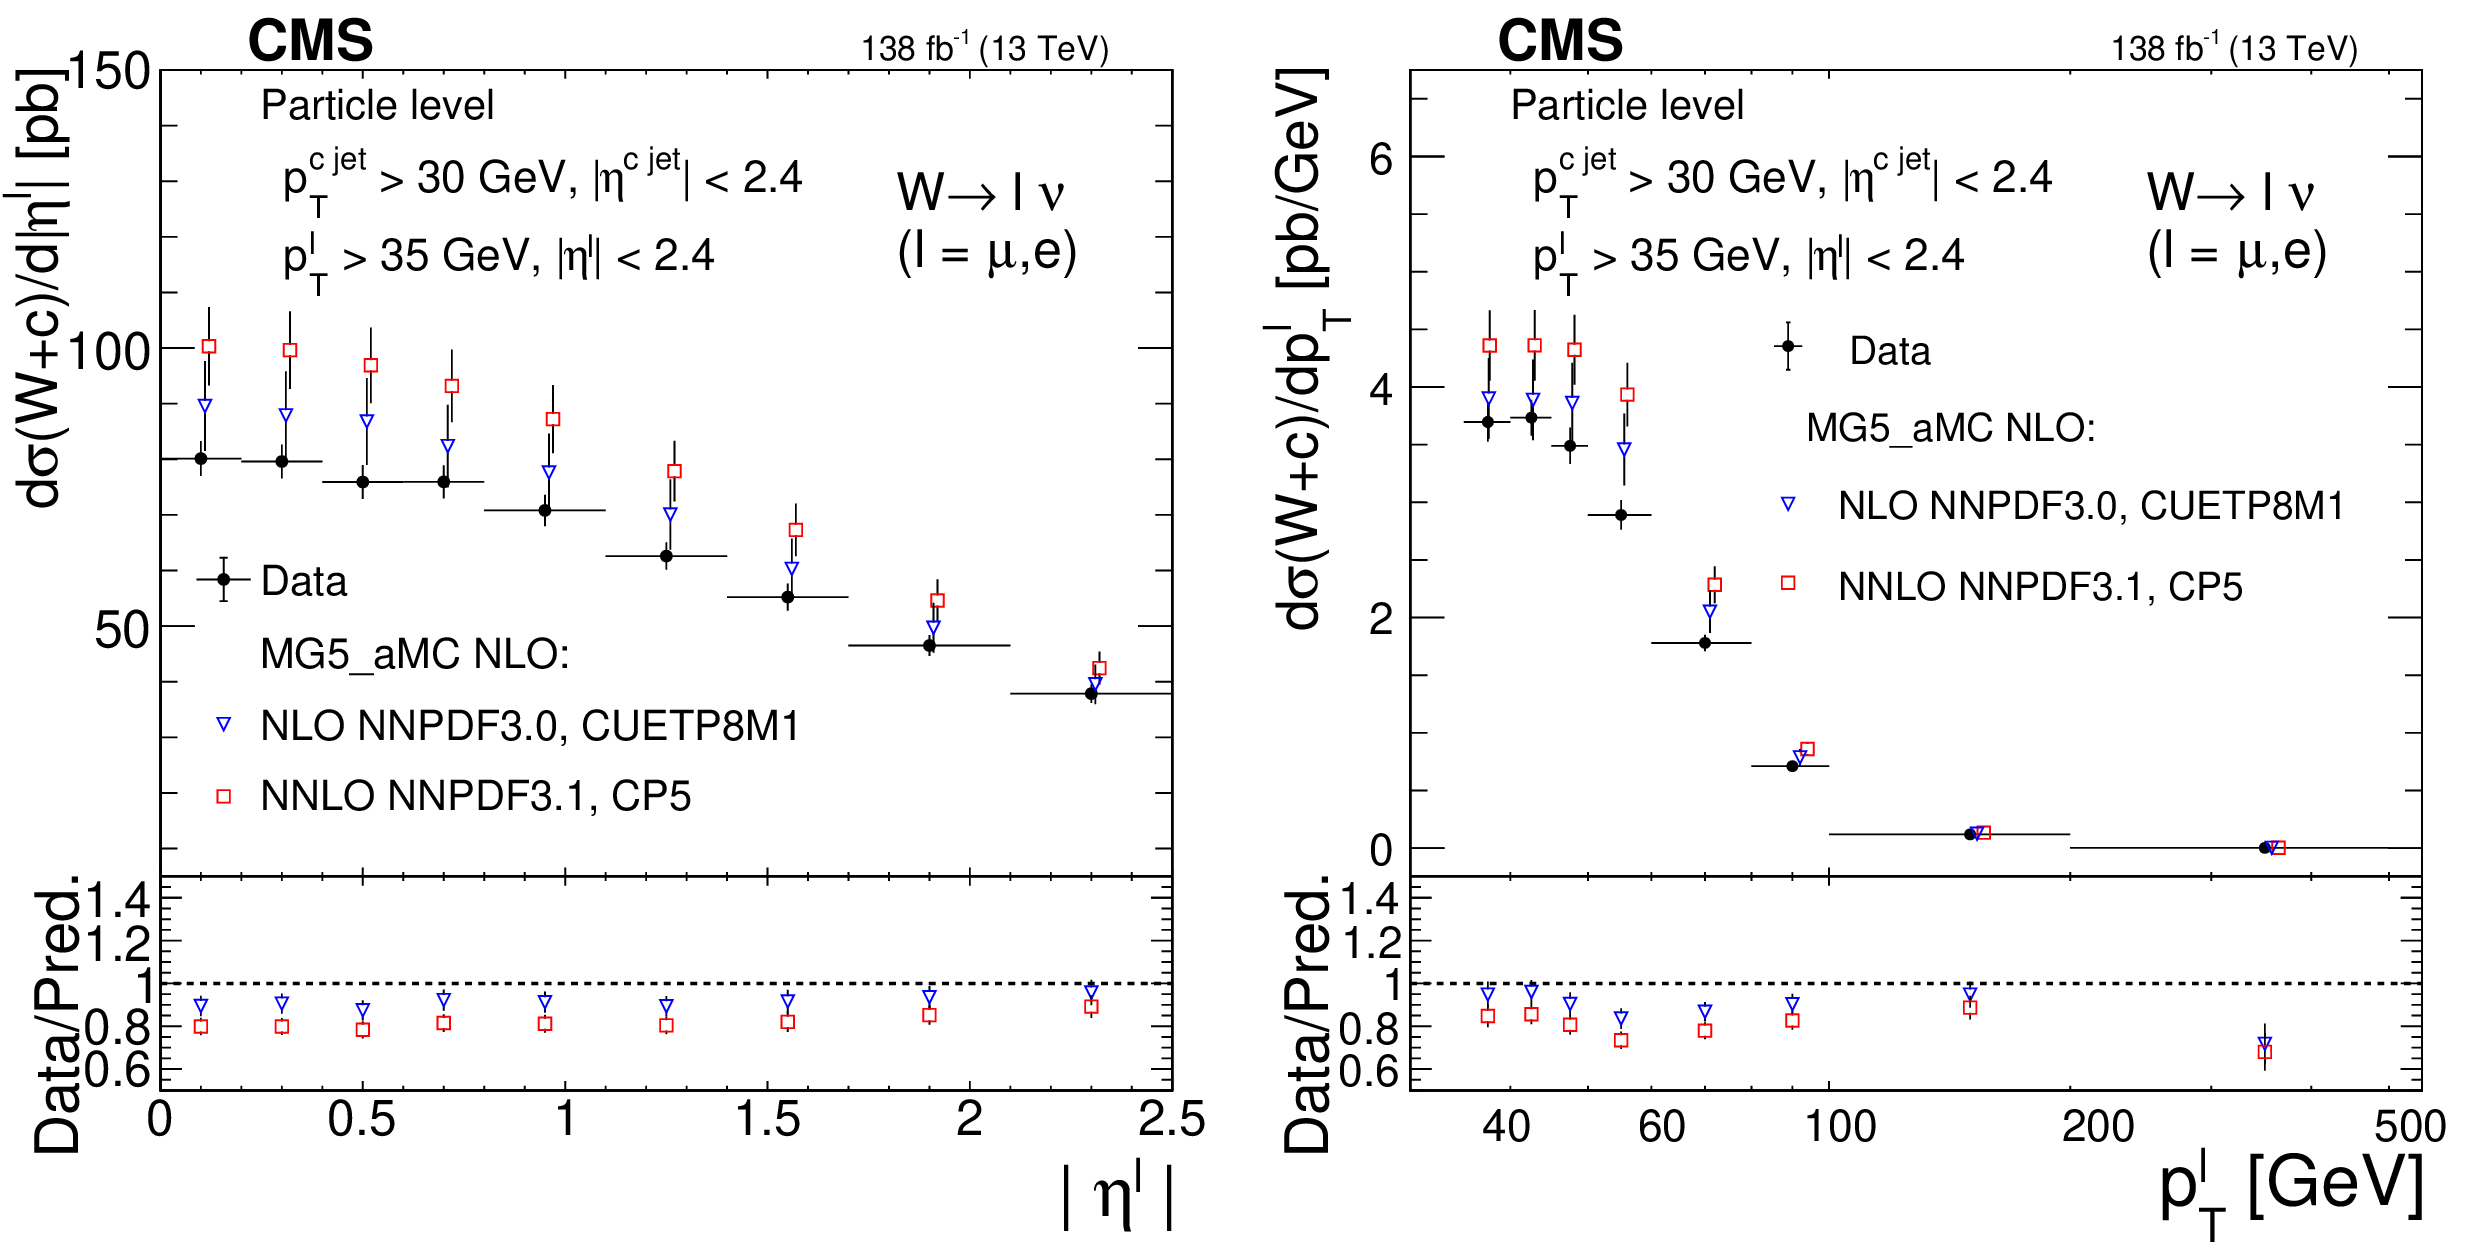
Figure 5:
Measured differential cross sections $ \mathrm{d}\sigma(\mathrm{W}\,+\,\mathrm{c})/\mathrm{d}|\eta^\ell| $ (left) and $ \mathrm{d}\sigma(\mathrm{W}\,+\,\mathrm{c})/\mathrm{d}{p_{\mathrm{T}}^\ell} $ (right) unfolded to the particle level, compared with the predictions of the MadGraph-5_aMC@NLO simulation. Two different PDF sets (NLO NNPDF3.0 and NNLO NNPDF3.1) are used. Error bars on data points include statistical and systematic uncertainties. Symbols showing the theoretical expectations are slightly displaced in the horizontal axis for better visibility. The ratios of data to predictions are shown in the lower panels. The uncertainty in the ratio includes the uncertainties in both data and prediction. |
png pdf |
Figure 5-a:
Measured differential cross section $ \mathrm{d}\sigma(\mathrm{W}\,+\,\mathrm{c})/\mathrm{d}|\eta^\ell| $, unfolded to the particle level, compared with the predictions of the MadGraph-5_aMC@NLO simulation. Two different PDF sets (NLO NNPDF3.0 and NNLO NNPDF3.1) are used. Error bars on data points include statistical and systematic uncertainties. Symbols showing the theoretical expectations are slightly displaced in the horizontal axis for better visibility. The ratios of data to predictions are shown in the lower panel. The uncertainty in the ratio includes the uncertainties in both data and prediction. |

png pdf |
Figure 5-b:
Measured differential cross section $ \mathrm{d}\sigma(\mathrm{W}\,+\,\mathrm{c})/\mathrm{d}{p_{\mathrm{T}}^\ell} $, unfolded to the particle level, compared with the predictions of the MadGraph-5_aMC@NLO simulation. Two different PDF sets (NLO NNPDF3.0 and NNLO NNPDF3.1) are used. Error bars on data points include statistical and systematic uncertainties. Symbols showing the theoretical expectations are slightly displaced in the horizontal axis for better visibility. The ratios of data to predictions are shown in the lower panel. The uncertainty in the ratio includes the uncertainties in both data and prediction. |
png pdf |
Figure 6:
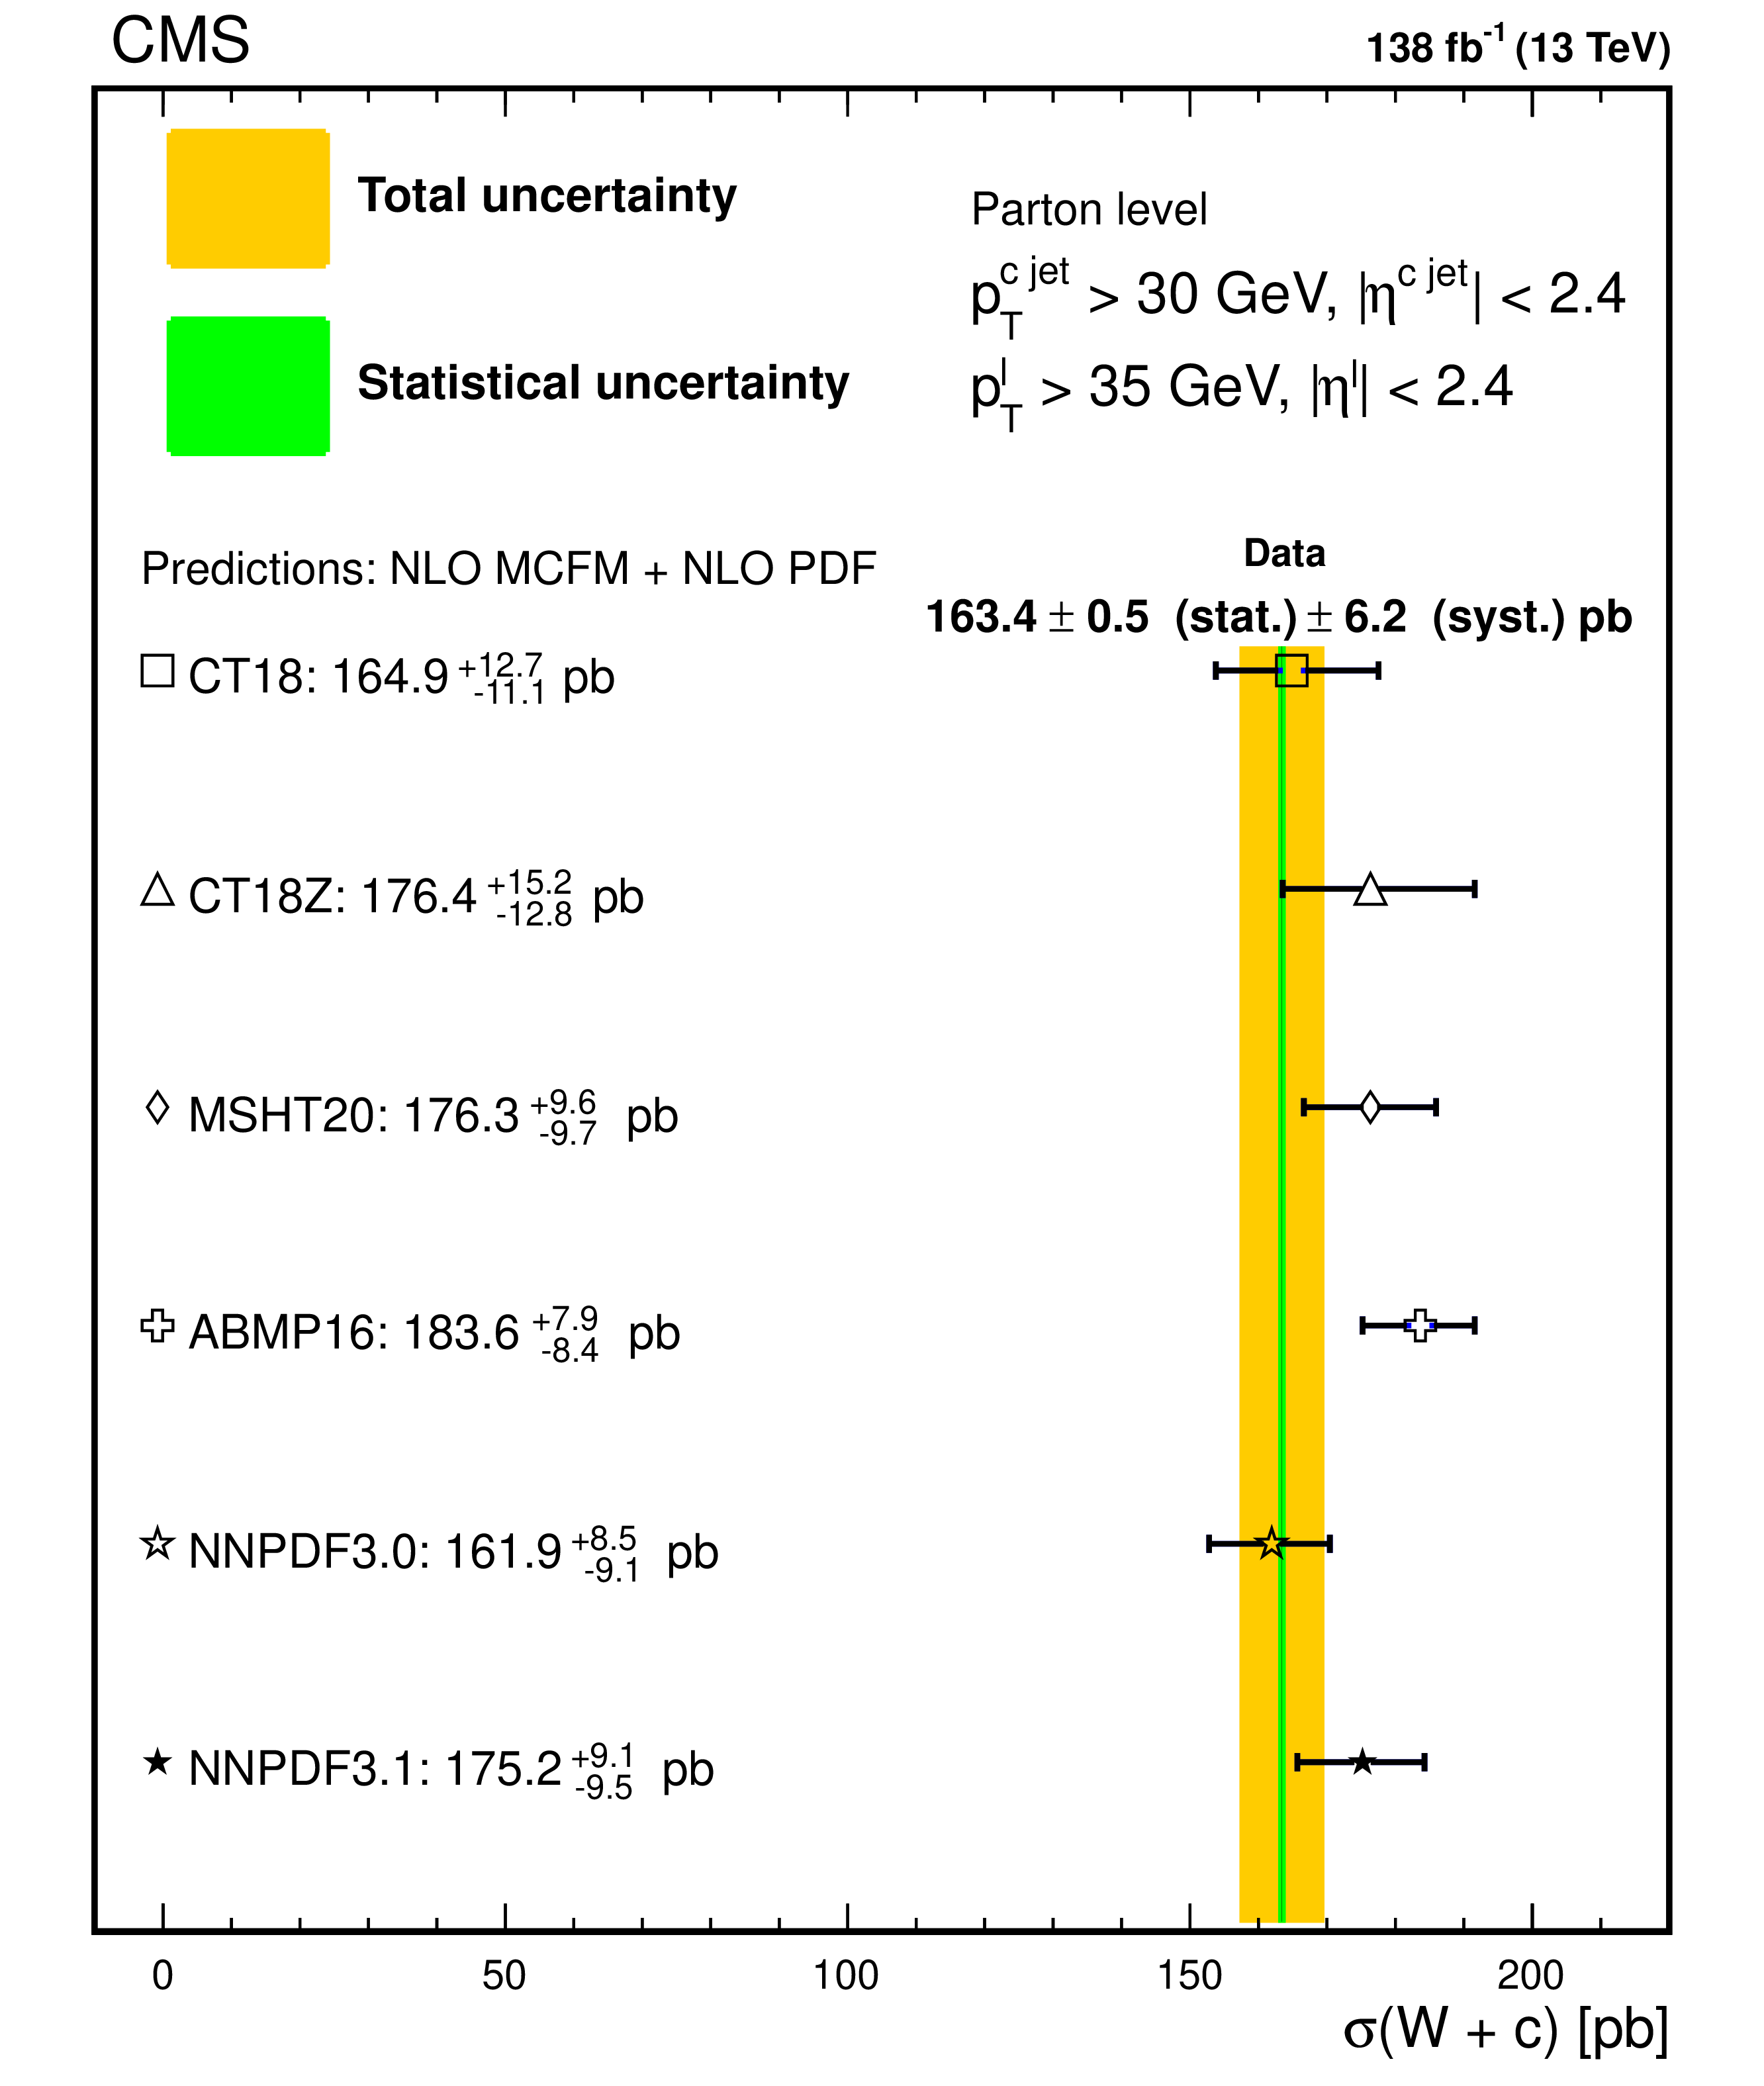
Comparison of the experimental measurement of $ \sigma(\mathrm{W}\,+\,\mathrm{c}) $, unfolded to the parton level, with the predictions from the NLO QCD MCFM calculations using different NLO PDF sets. Horizontal error bars indicate the total uncertainty in the predictions. |

png pdf |
Figure 7:
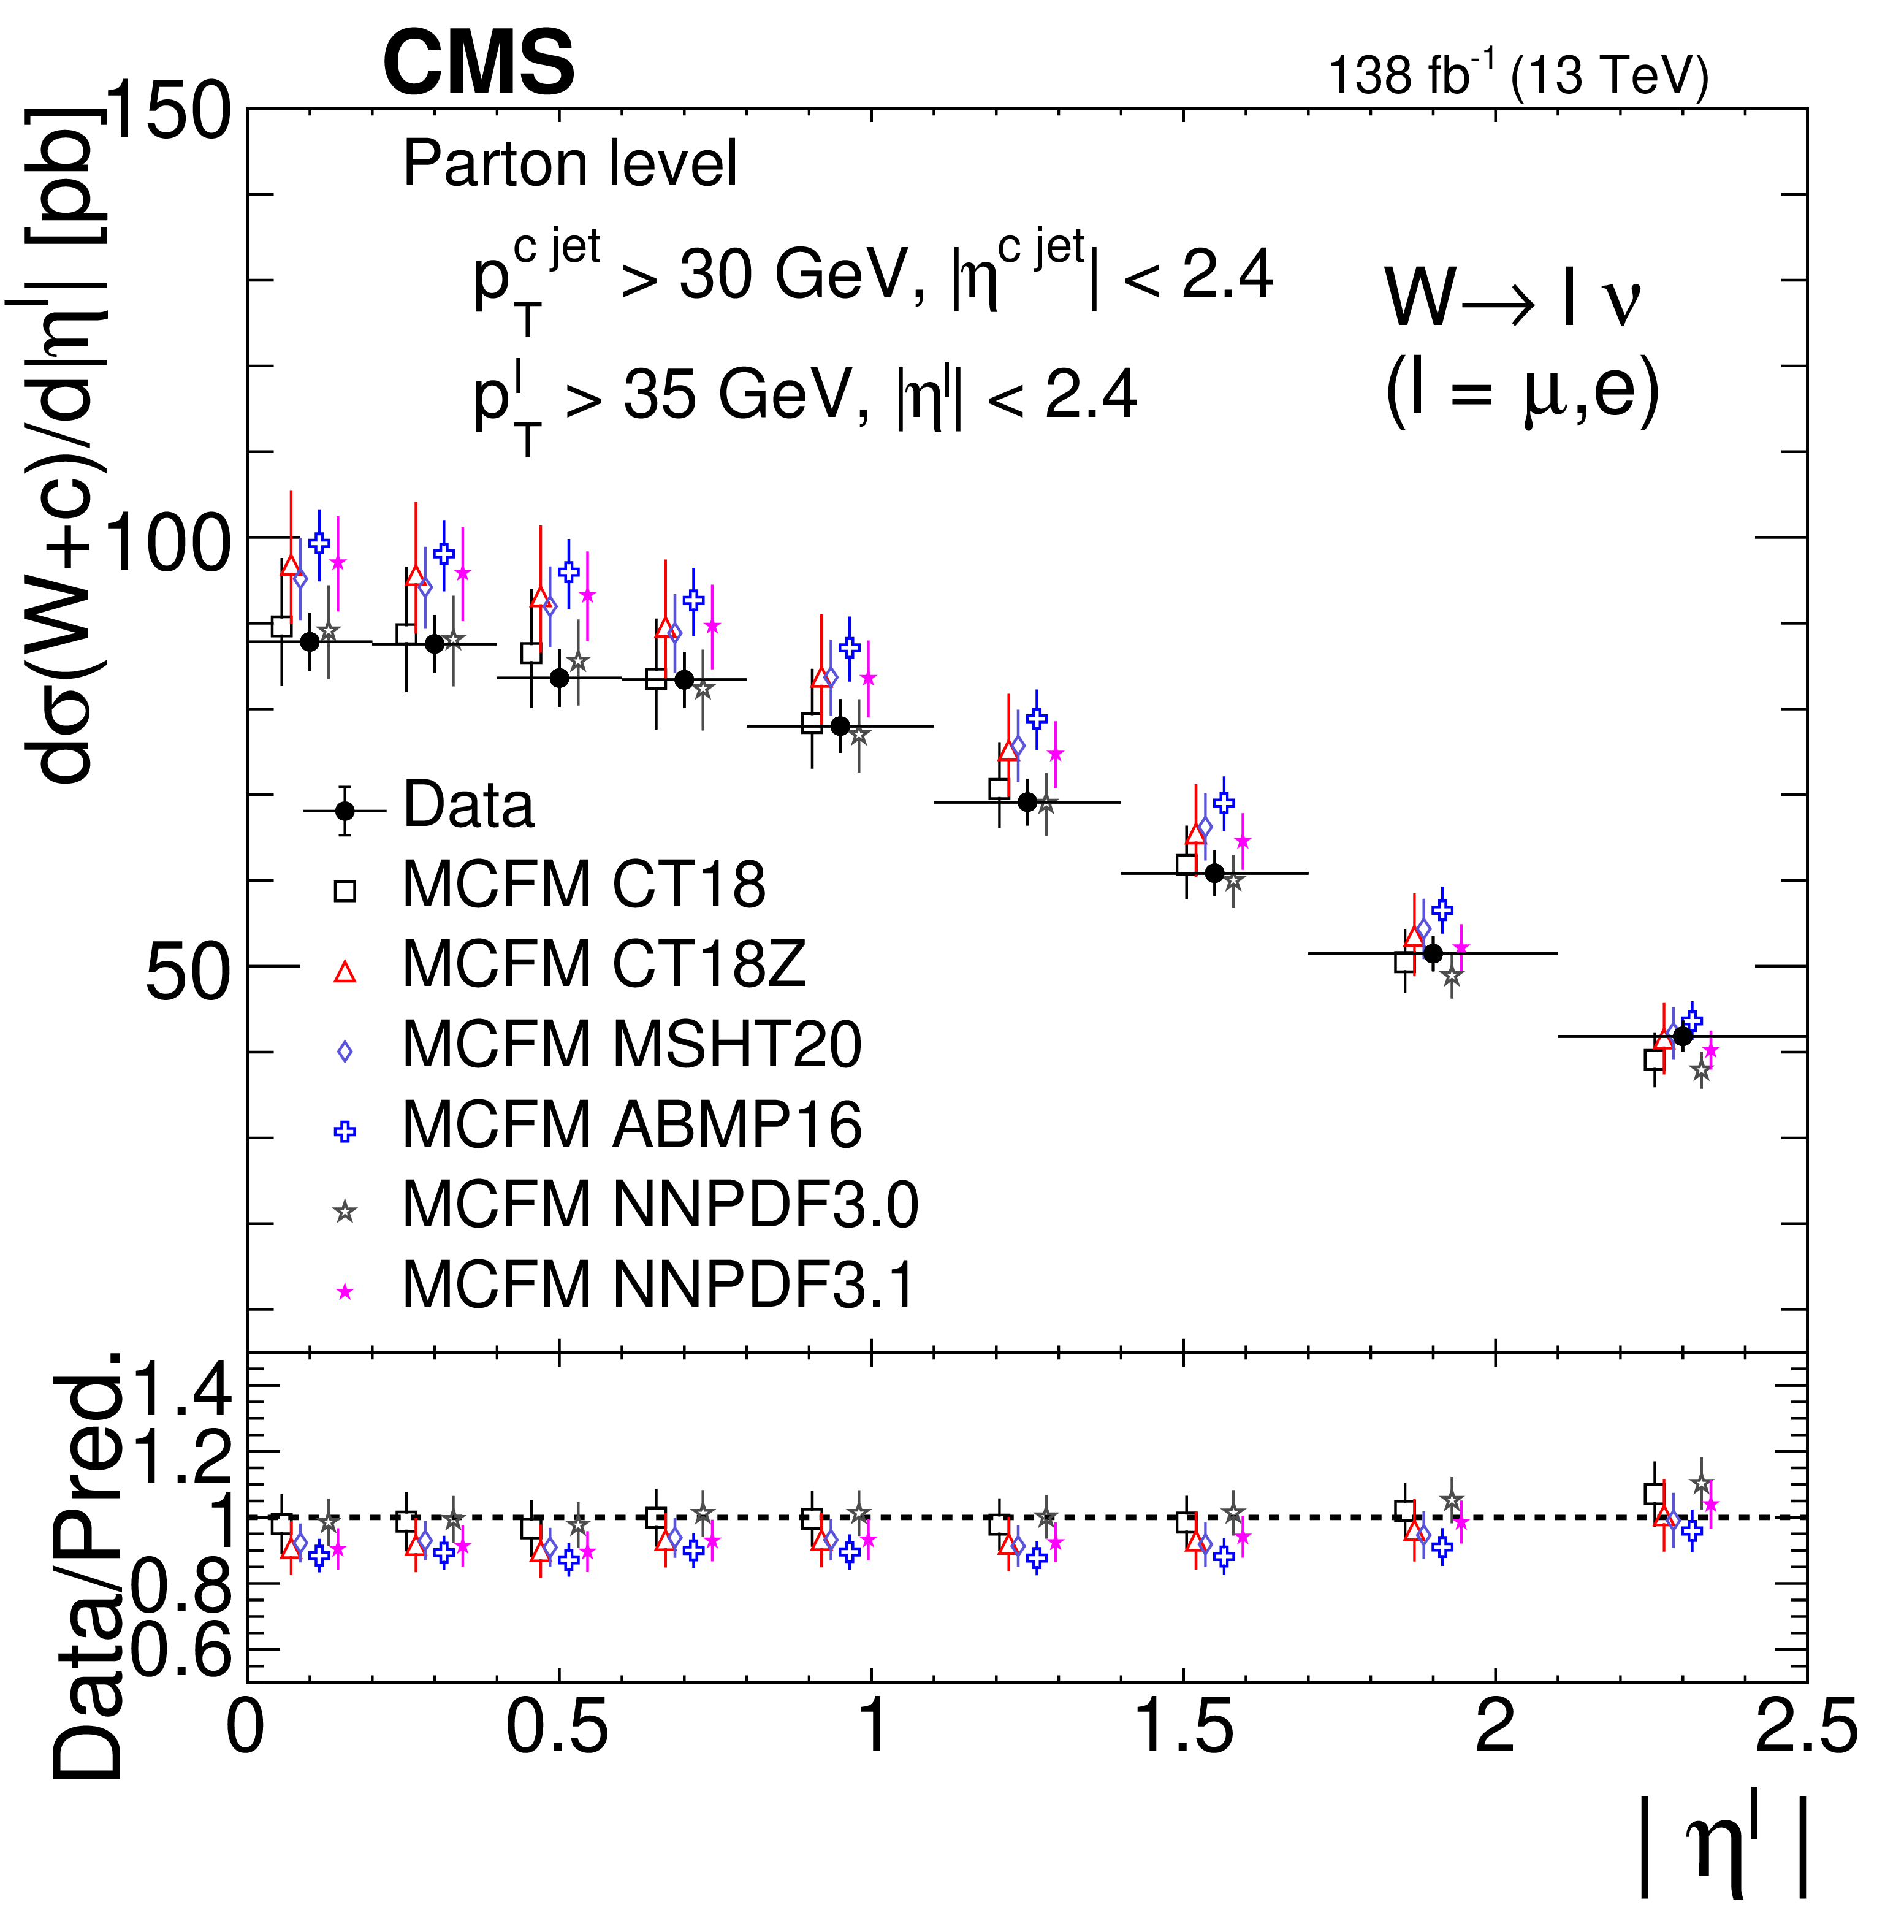
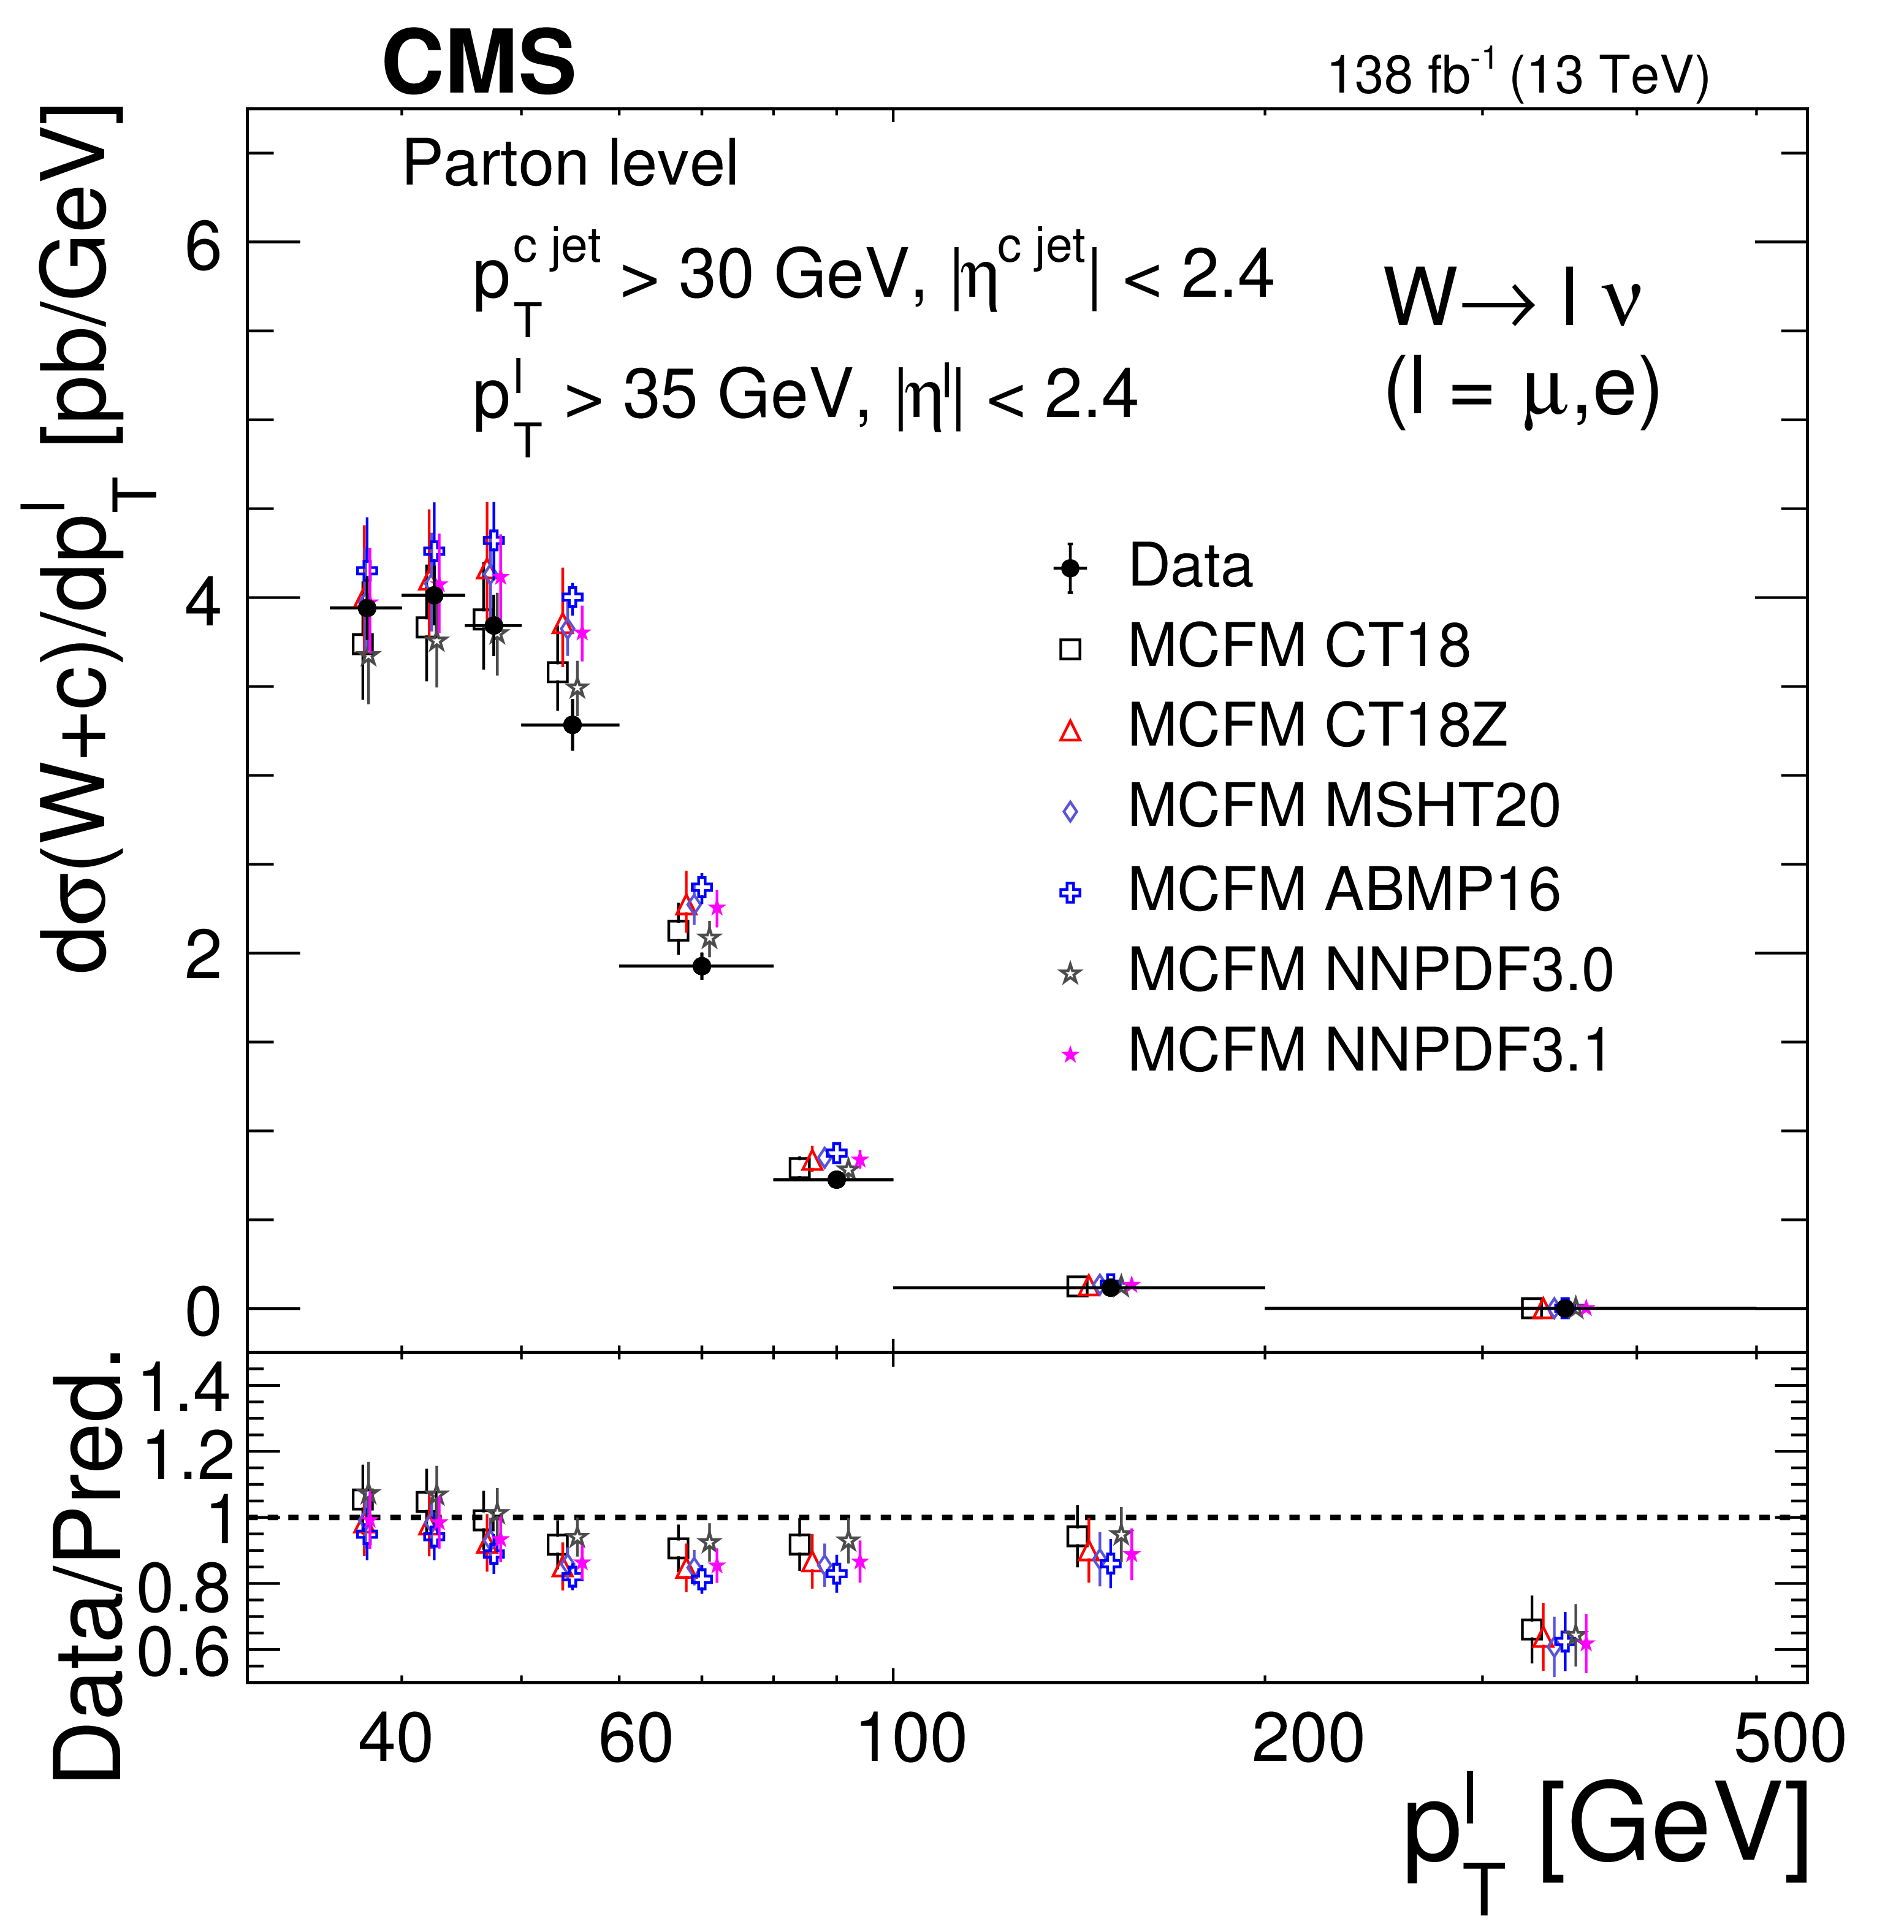
Measured differential cross sections $ \mathrm{d}\sigma(\mathrm{W}\,+\,\mathrm{c})/\mathrm{d}|\eta^\ell| $ (left) and $ \mathrm{d}\sigma(\mathrm{W}\,+\,\mathrm{c})/\mathrm{d}{p_{\mathrm{T}}^\ell} $ (right) unfolded to the parton level, compared with the predictions from the MCFM NLO calculations using different NLO PDF sets. Error bars on data points include statistical and systematic uncertainties. Symbols showing the theoretical expectations are slightly displaced in the horizontal axis for better visibility. The ratios of data to predictions are shown in the lower panels. The uncertainty in the ratio includes the uncertainties in both data and prediction. |
png pdf |
Figure 7-a:
Measured differential cross section $ \mathrm{d}\sigma(\mathrm{W}\,+\,\mathrm{c})/\mathrm{d}|\eta^\ell| $, unfolded to the parton level, compared with the predictions from the MCFM NLO calculations using different NLO PDF sets. Error bars on data points include statistical and systematic uncertainties. Symbols showing the theoretical expectations are slightly displaced in the horizontal axis for better visibility. The ratios of data to predictions are shown in the lower panel. The uncertainty in the ratio includes the uncertainties in both data and prediction. |
png pdf |
Figure 7-b:
Measured differential cross section $ \mathrm{d}\sigma(\mathrm{W}\,+\,\mathrm{c})/\mathrm{d}{p_{\mathrm{T}}^\ell} $, unfolded to the parton level, compared with the predictions from the MCFM NLO calculations using different NLO PDF sets. Error bars on data points include statistical and systematic uncertainties. Symbols showing the theoretical expectations are slightly displaced in the horizontal axis for better visibility. The ratios of data to predictions are shown in the lower panel. The uncertainty in the ratio includes the uncertainties in both data and prediction. |

png pdf |
Figure 8:
Comparison of the experimental measurement of $ R_\mathrm{c}^{\pm} $ with the NLO QCD MCFM calculations using different NLO PDF sets. Horizontal error bars indicate the total uncertainty in the predictions. |
png pdf |
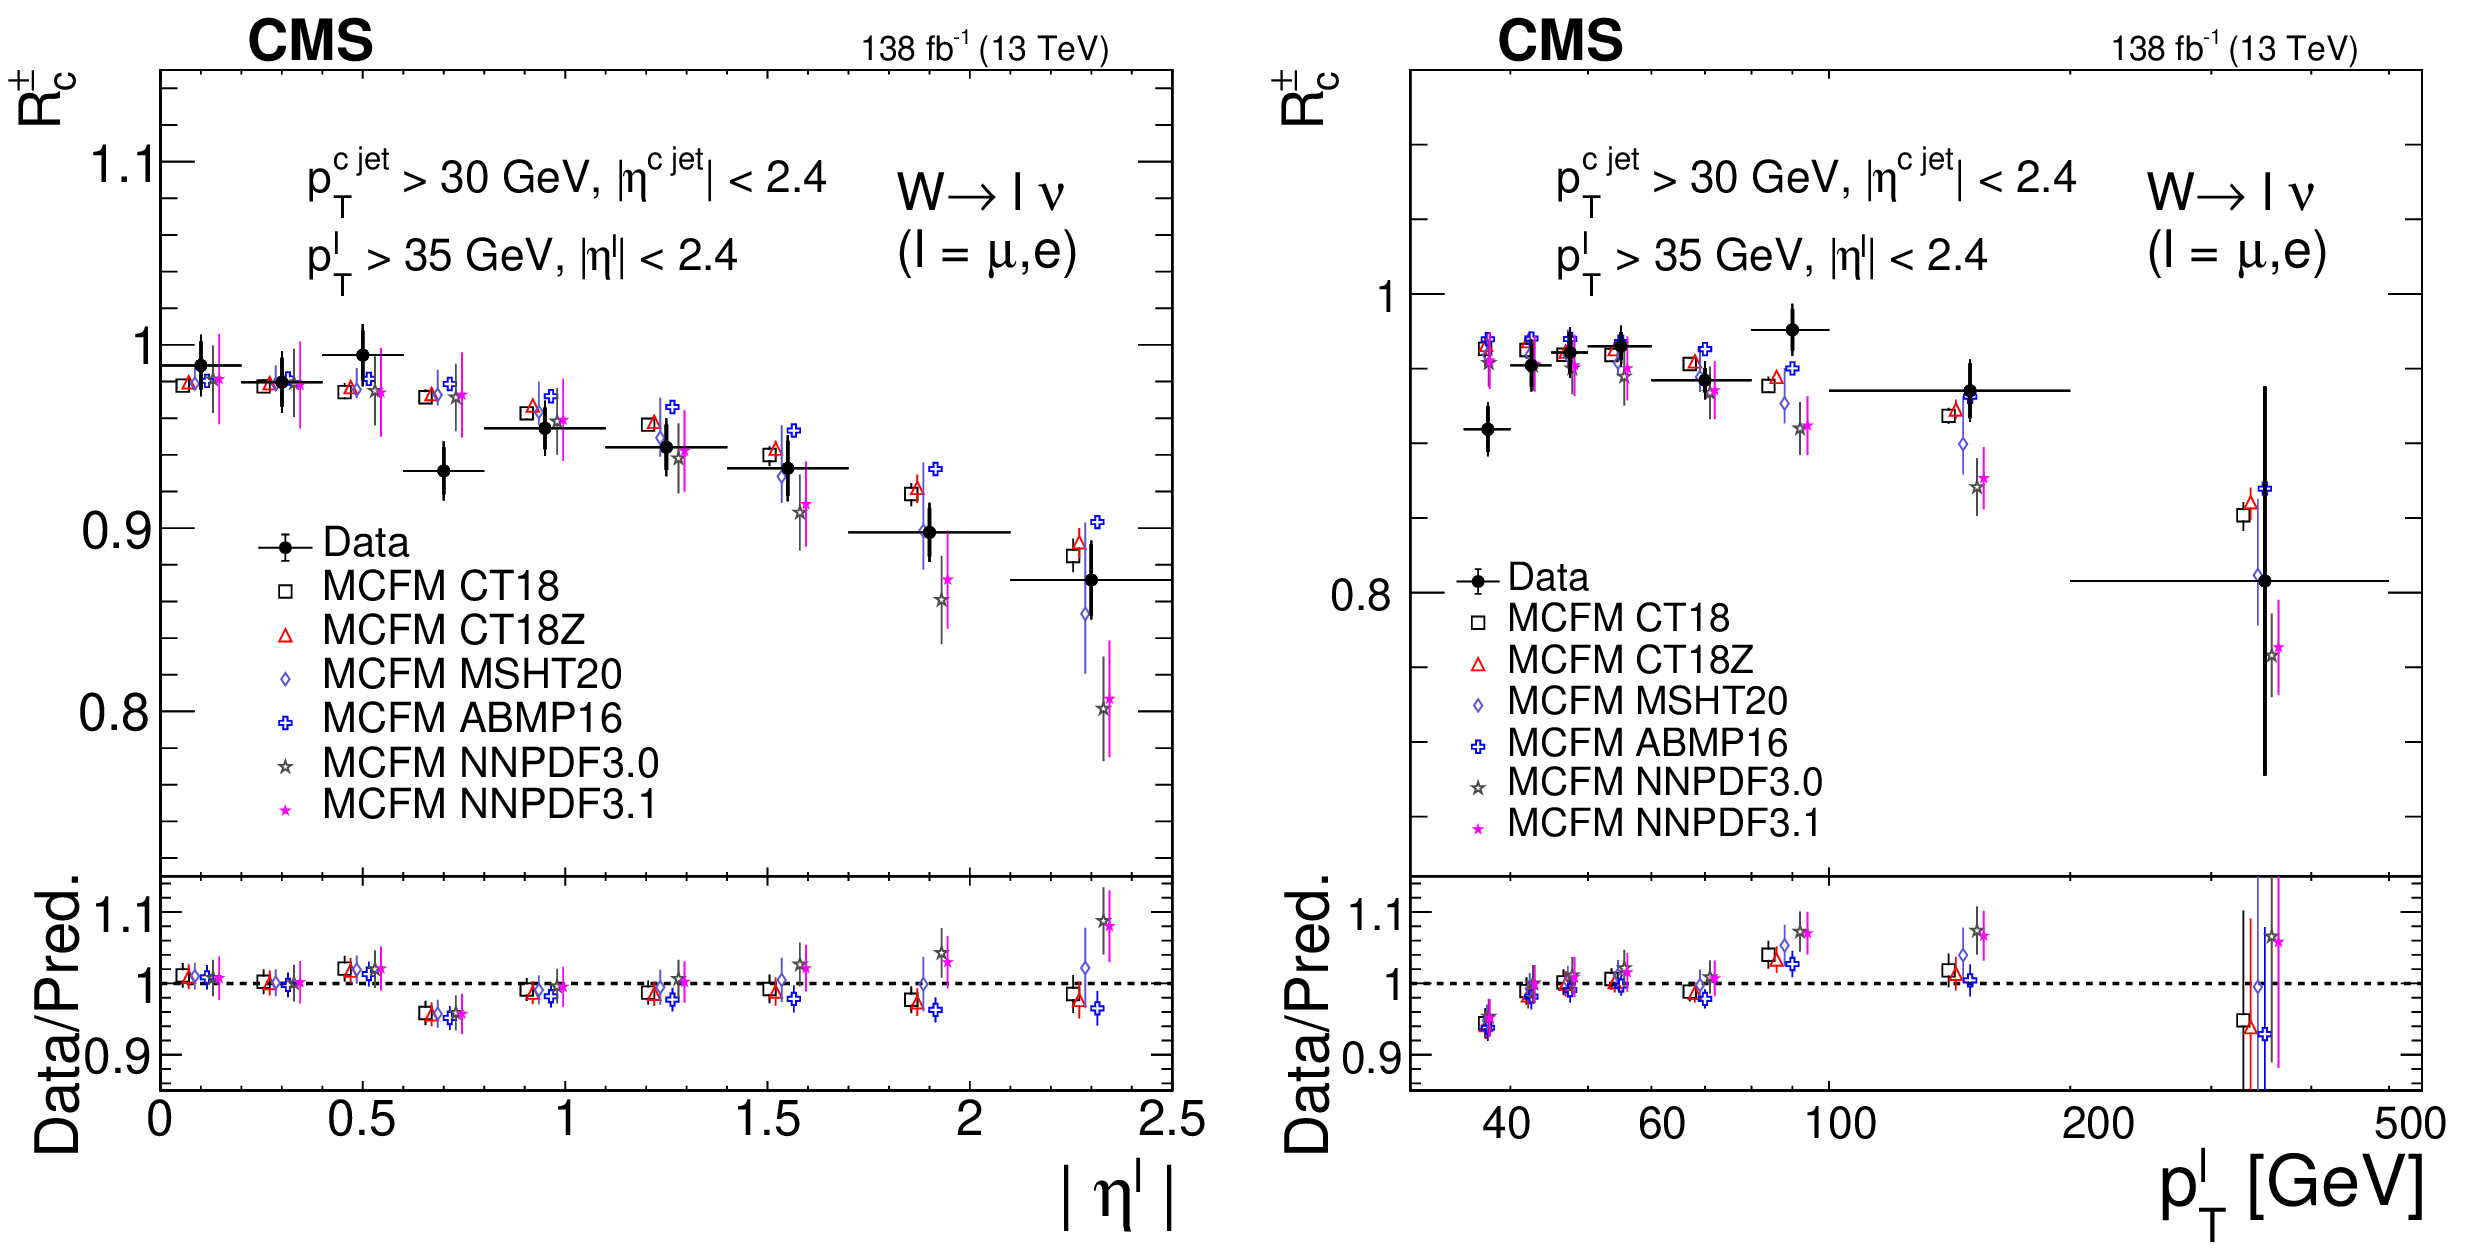
Figure 9:
Measured cross section ratio $ R_\mathrm{c}^{\pm} $ as a function of the absolute value of $ \eta^\ell $ (left) and $ p_{\mathrm{T}}^\ell $ (right), compared with the NLO QCD MCFM calculations using different NLO PDF sets. Error bars on data points include statistical and systematic uncertainties. Symbols showing the theoretical expectations are slightly displaced in the horizontal axis for better visibility. The ratios of data to predictions are shown in the lower panels. The uncertainty in the ratio includes the uncertainties in both data and prediction. |
png pdf |
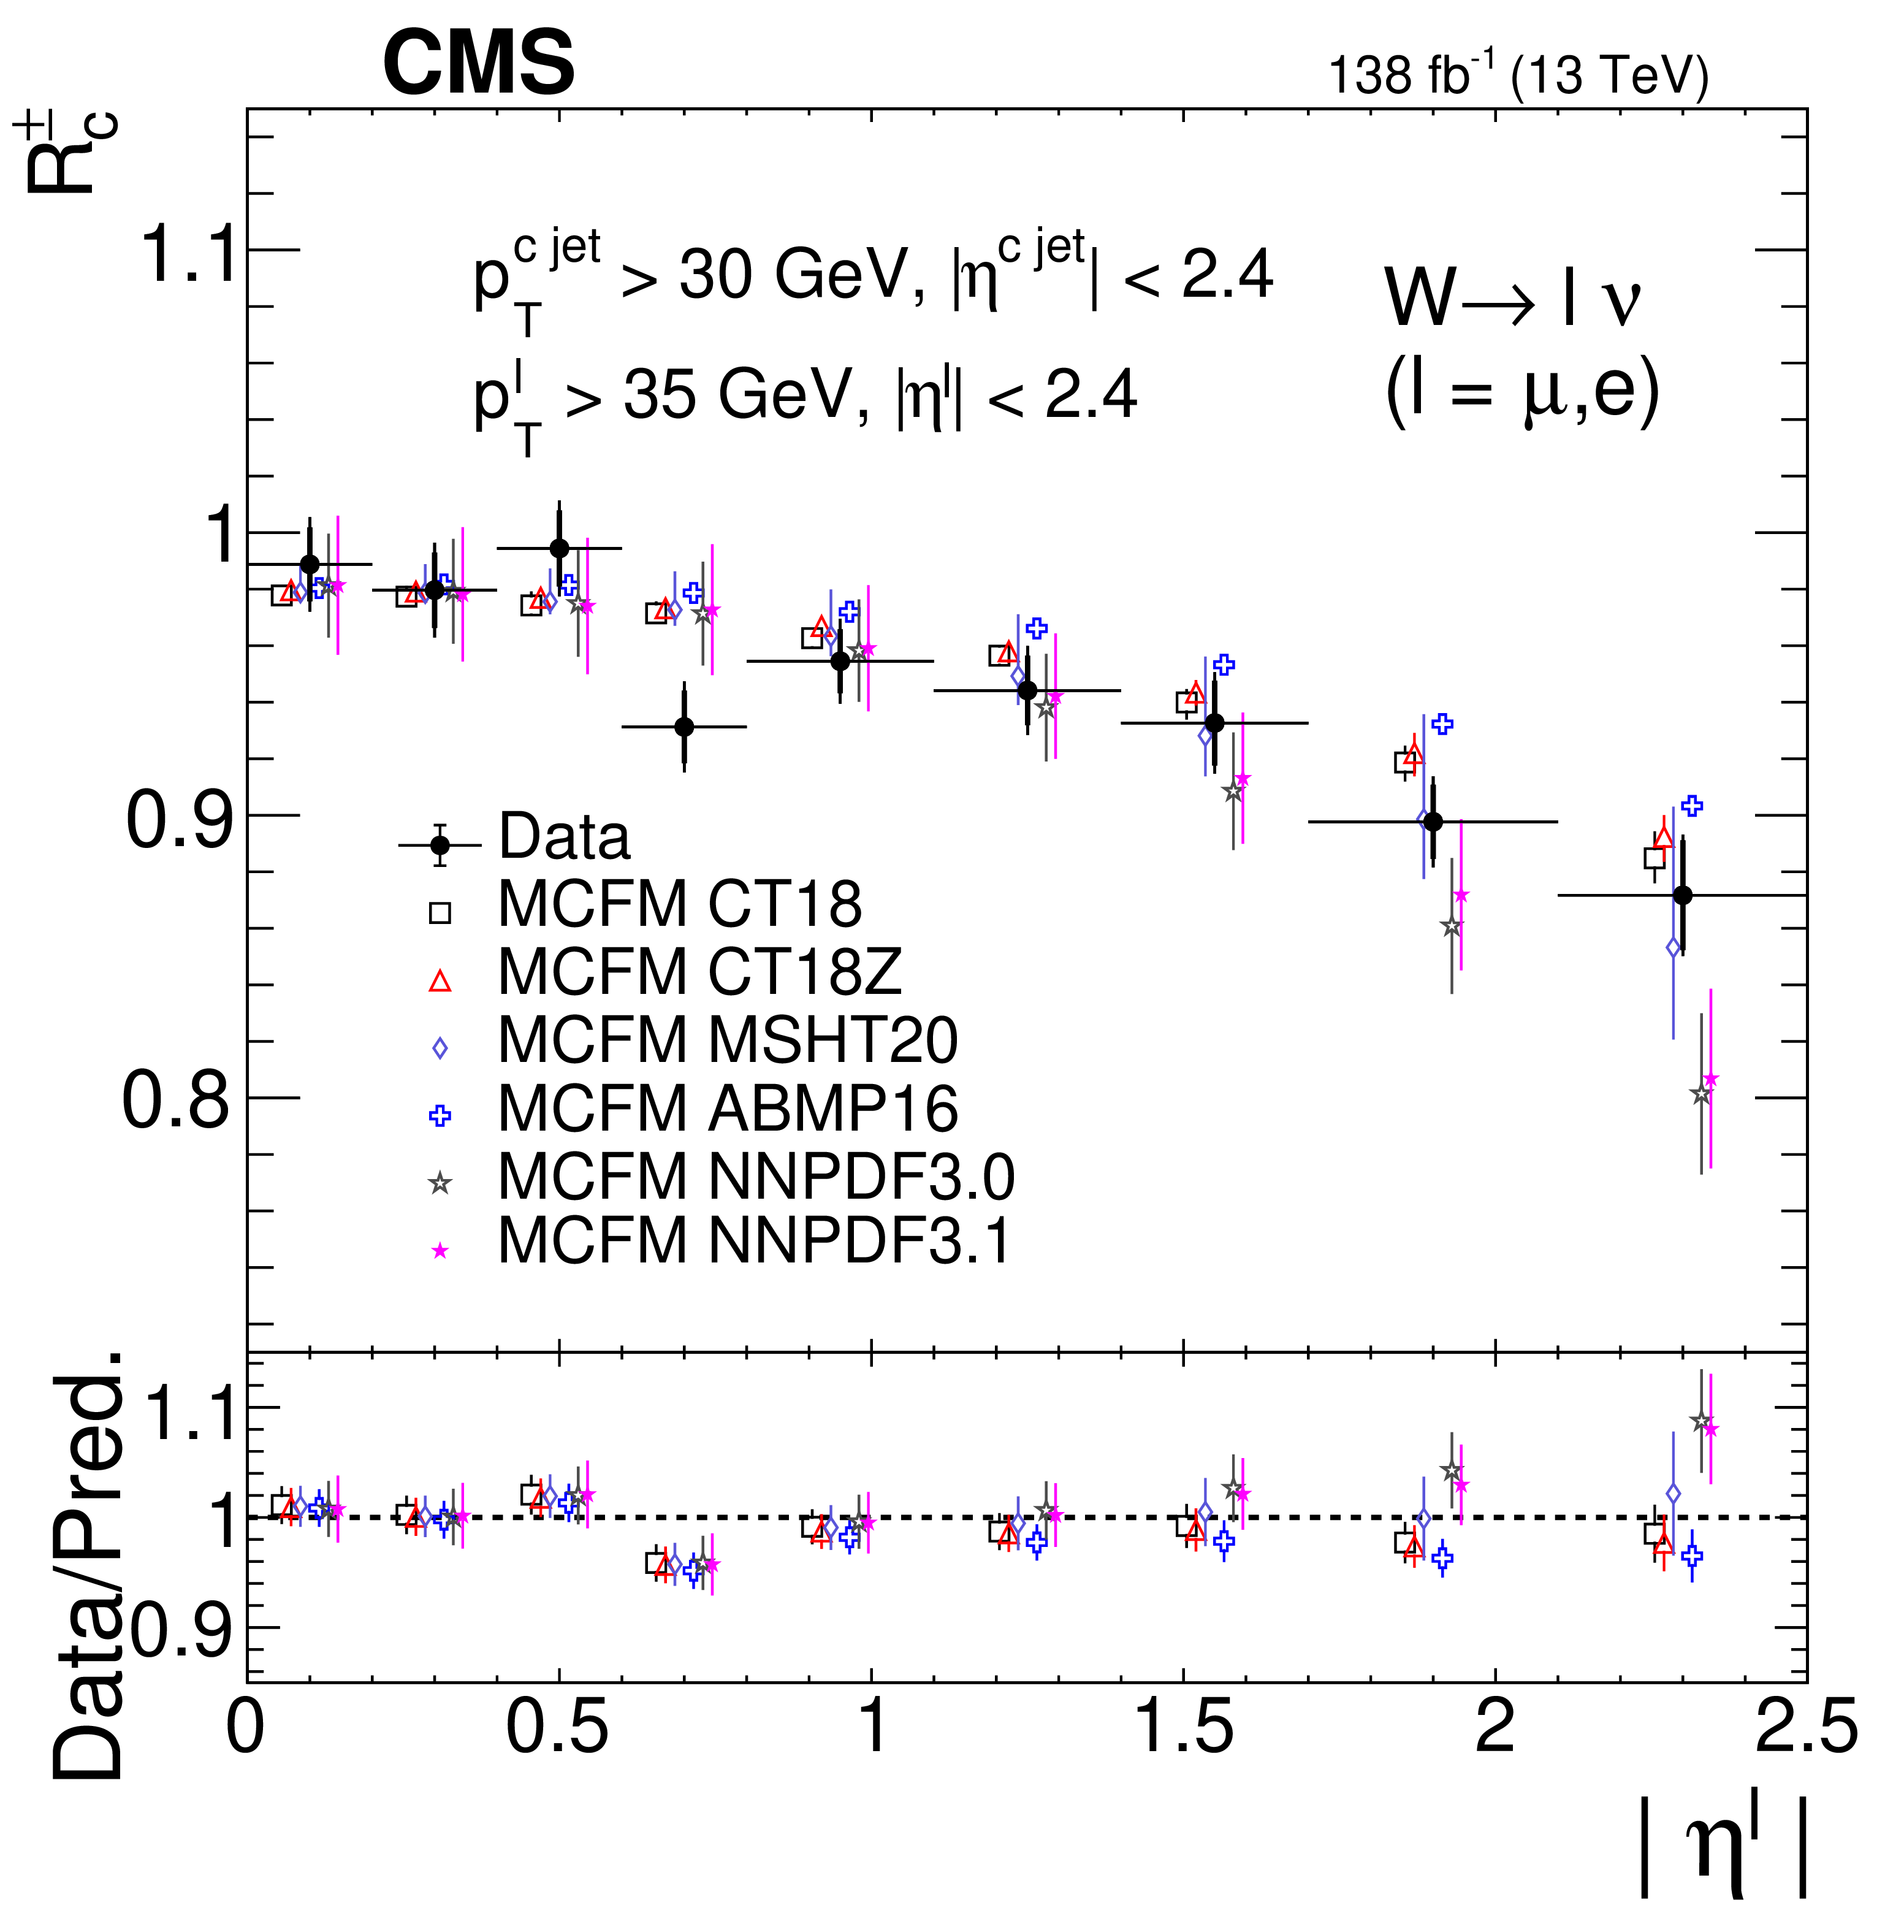
Figure 9-a:
Measured cross section ratio $ R_\mathrm{c}^{\pm} $ as a function of the absolute value of $ \eta^\ell $, compared with the NLO QCD MCFM calculations using different NLO PDF sets. Error bars on data points include statistical and systematic uncertainties. Symbols showing the theoretical expectations are slightly displaced in the horizontal axis for better visibility. The ratio of data to prediction is shown in the lower panel. The uncertainty in the ratio includes the uncertainties in both data and prediction. |
png pdf |
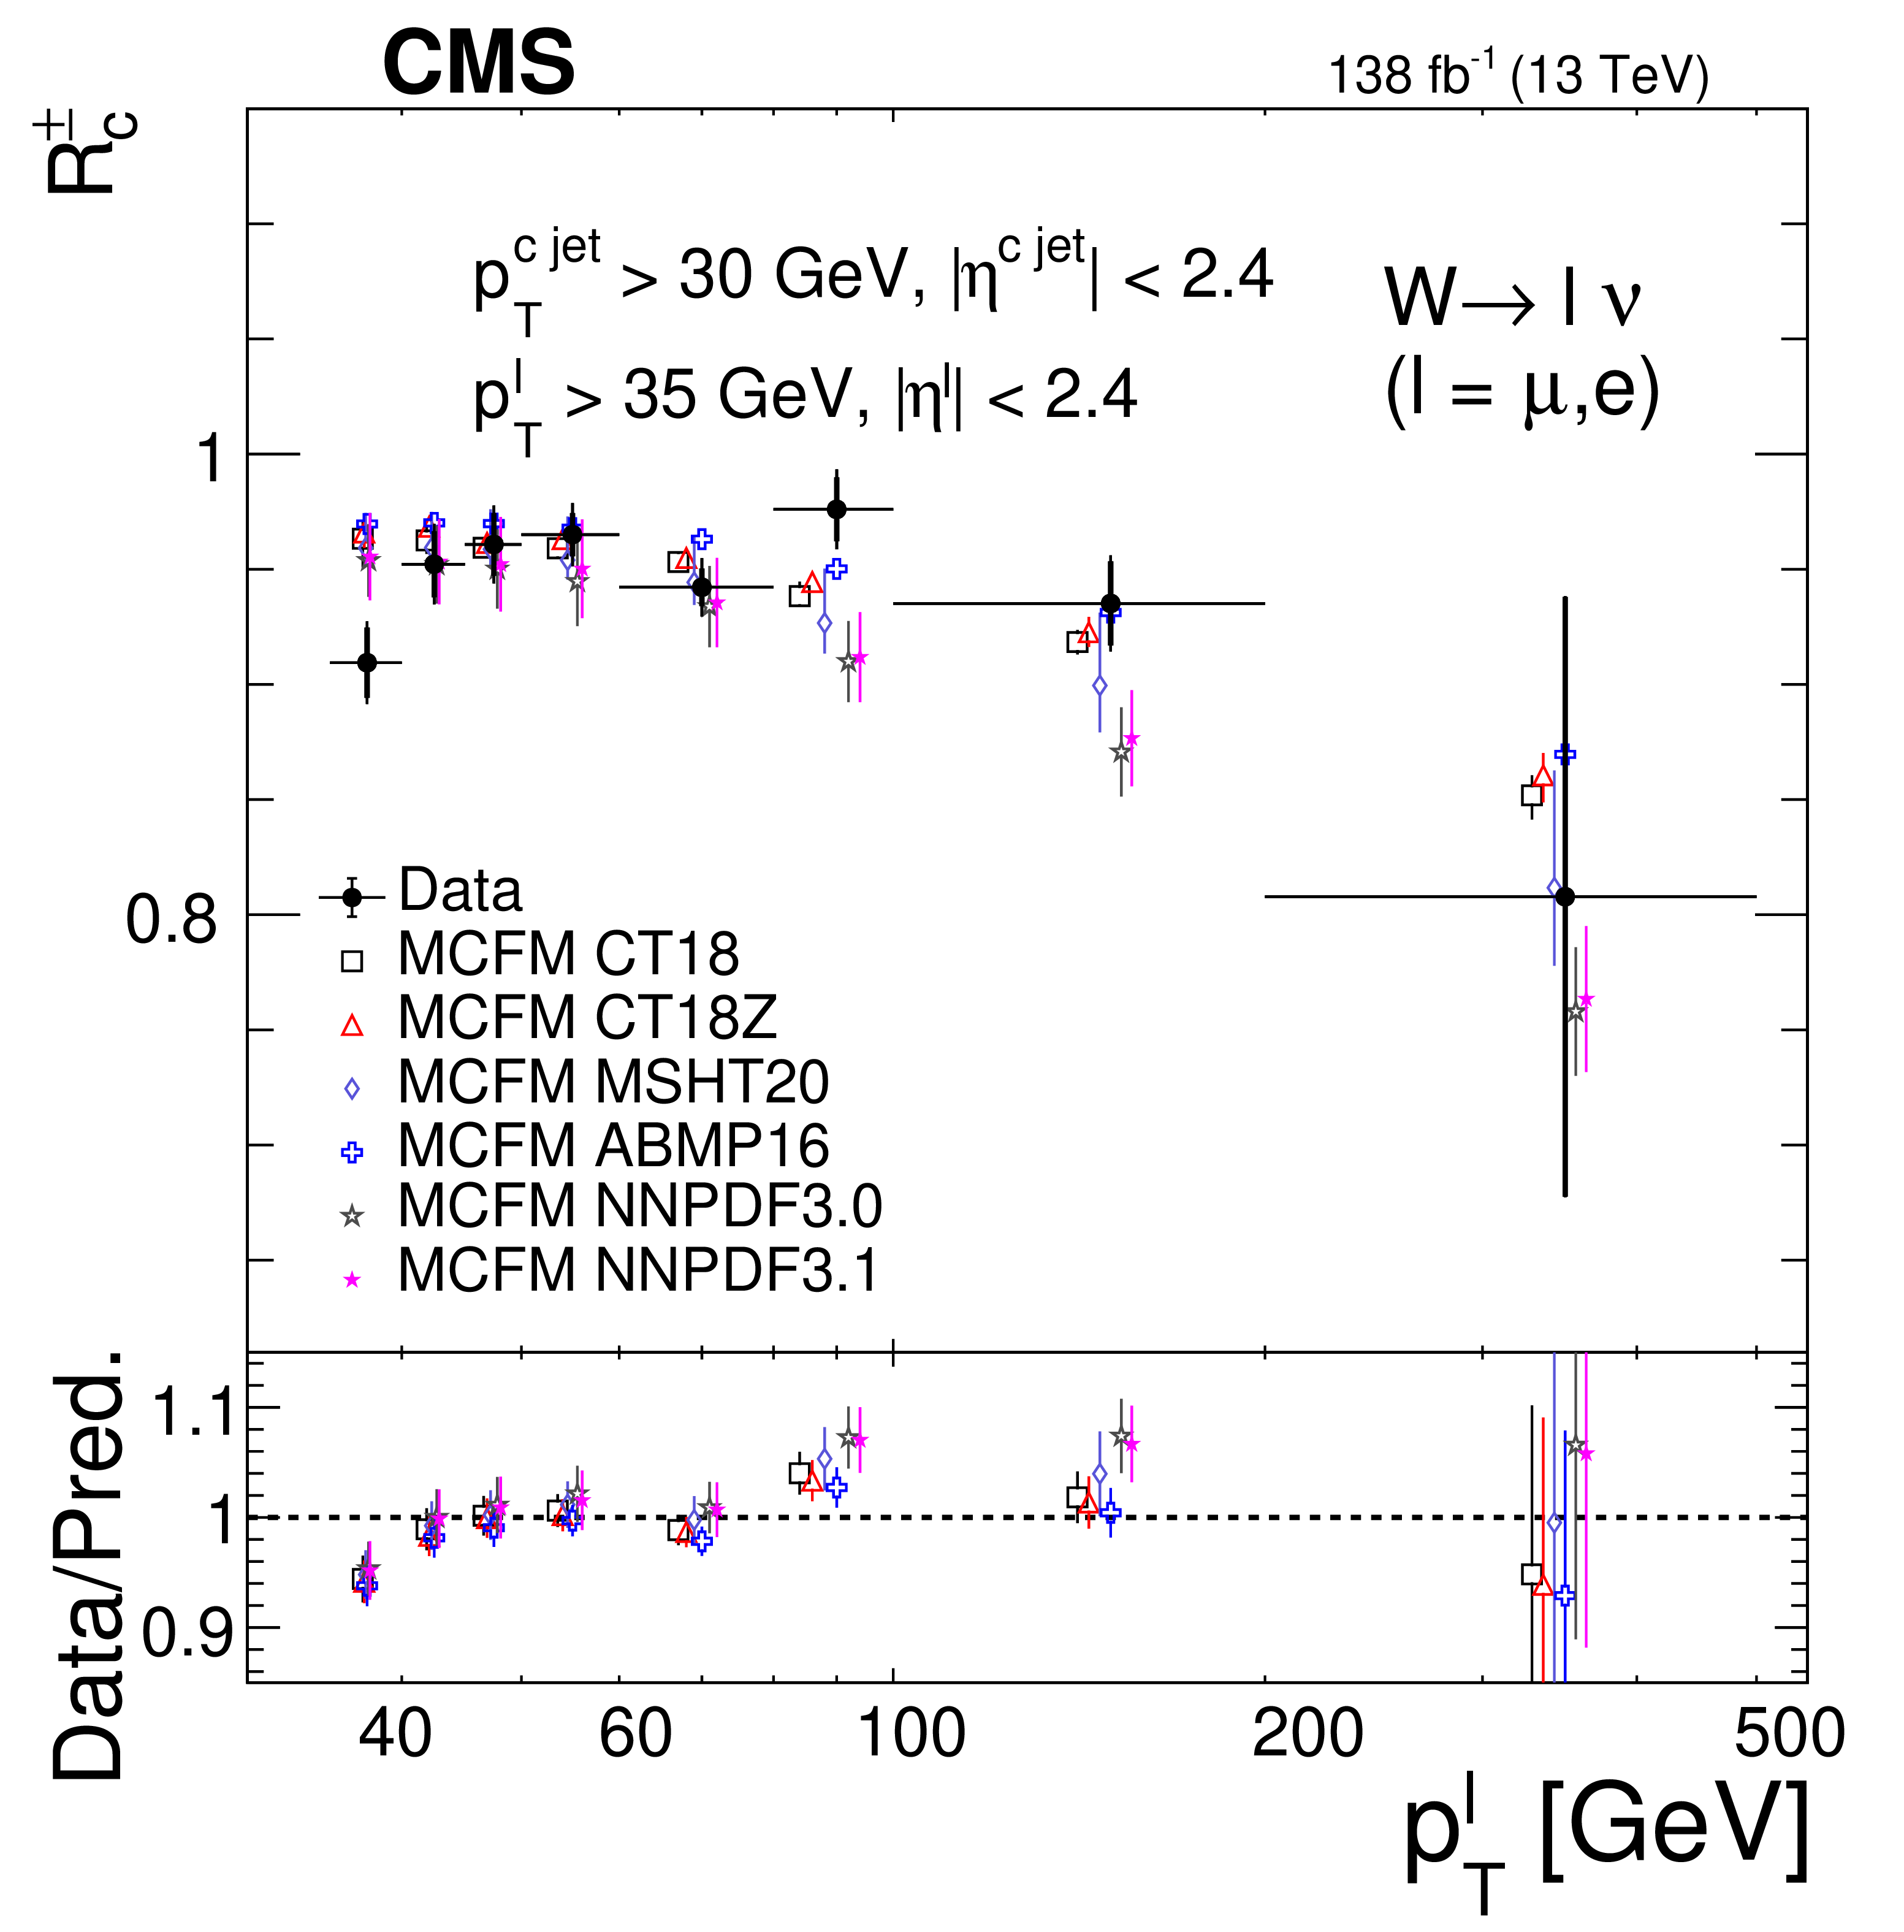
Figure 9-b:
Measured cross section ratio $ R_\mathrm{c}^{\pm} $ as a function of the absolute value of $ p_{\mathrm{T}}^\ell $, compared with the NLO QCD MCFM calculations using different NLO PDF sets. Error bars on data points include statistical and systematic uncertainties. Symbols showing the theoretical expectations are slightly displaced in the horizontal axis for better visibility. The ratio of data to prediction is shown in the lower panel. The uncertainty in the ratio includes the uncertainties in both data and prediction. |
png pdf |
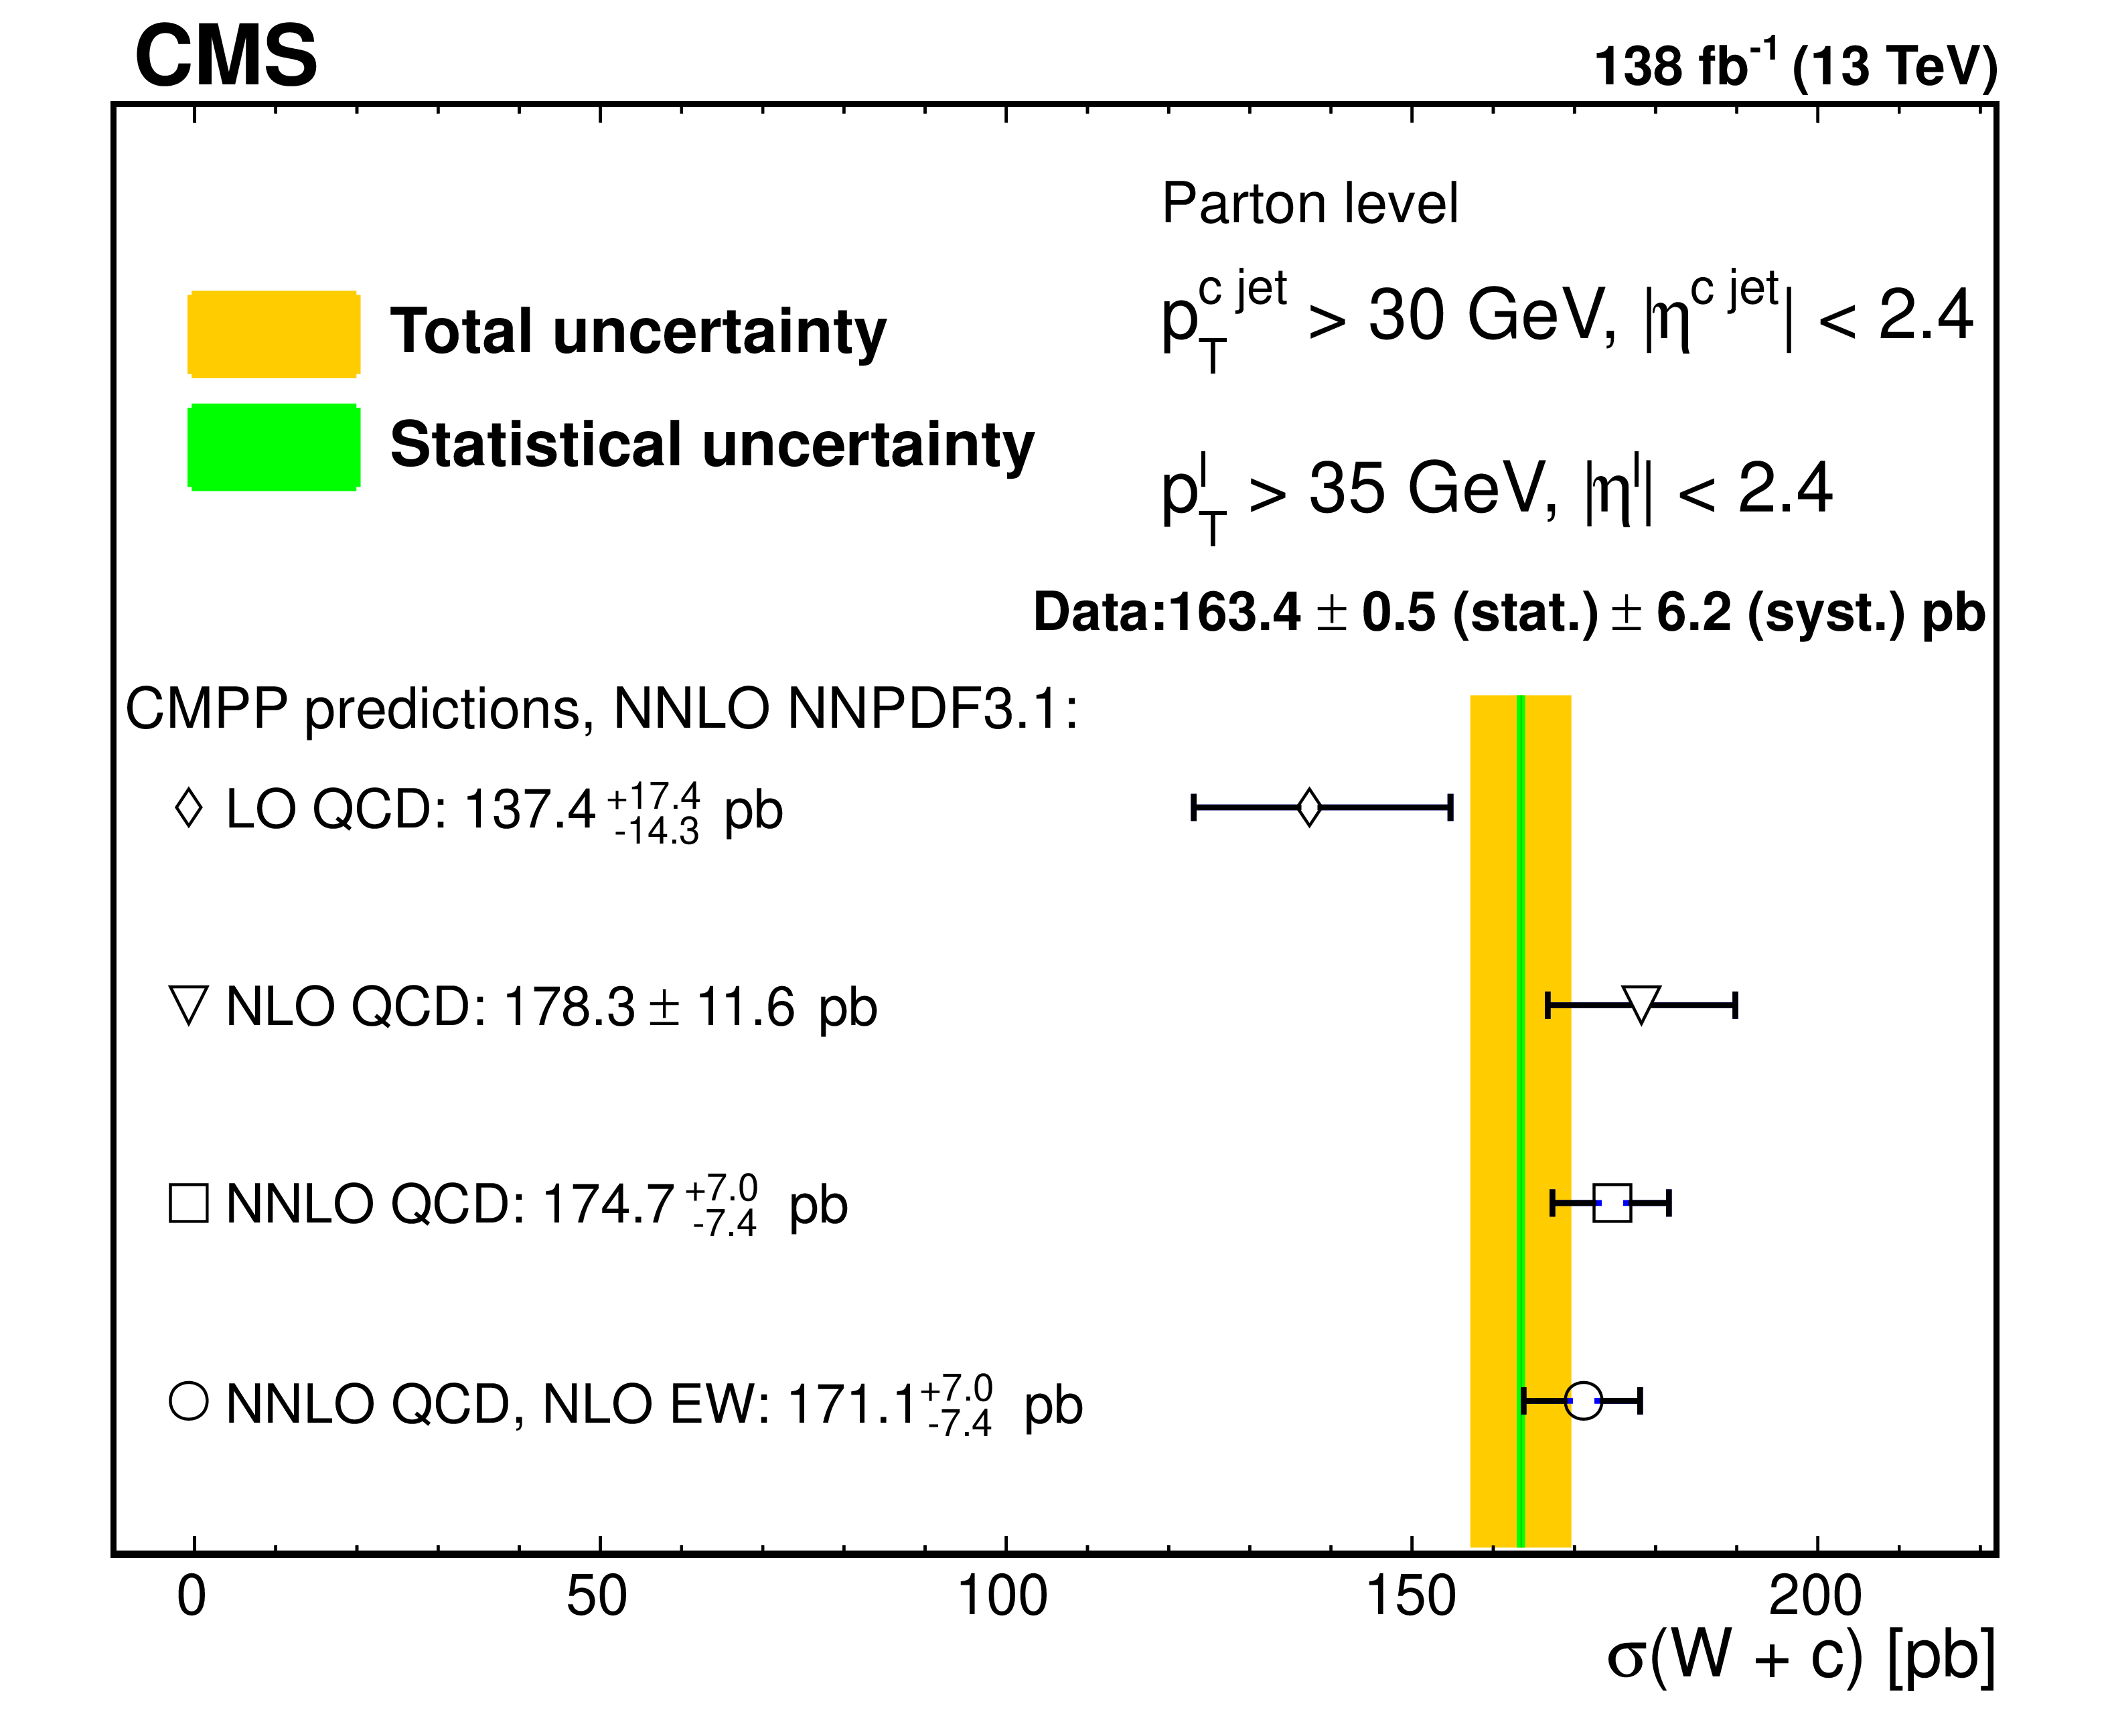
Figure 10:
Comparison of the experimental measurement of $ \sigma(\mathrm{W}\,+\,\mathrm{c}) $ with the OS-SS LO, NLO, and NNLO QCD predictions, and NLO EW corrections. The NNLO QCD NNPDF3.1 PDF set is used for computing all the predictions. CMPP stands for the authors of the calculations [15]. Horizontal error bars indicate the total uncertainty in the predictions. |
png pdf |
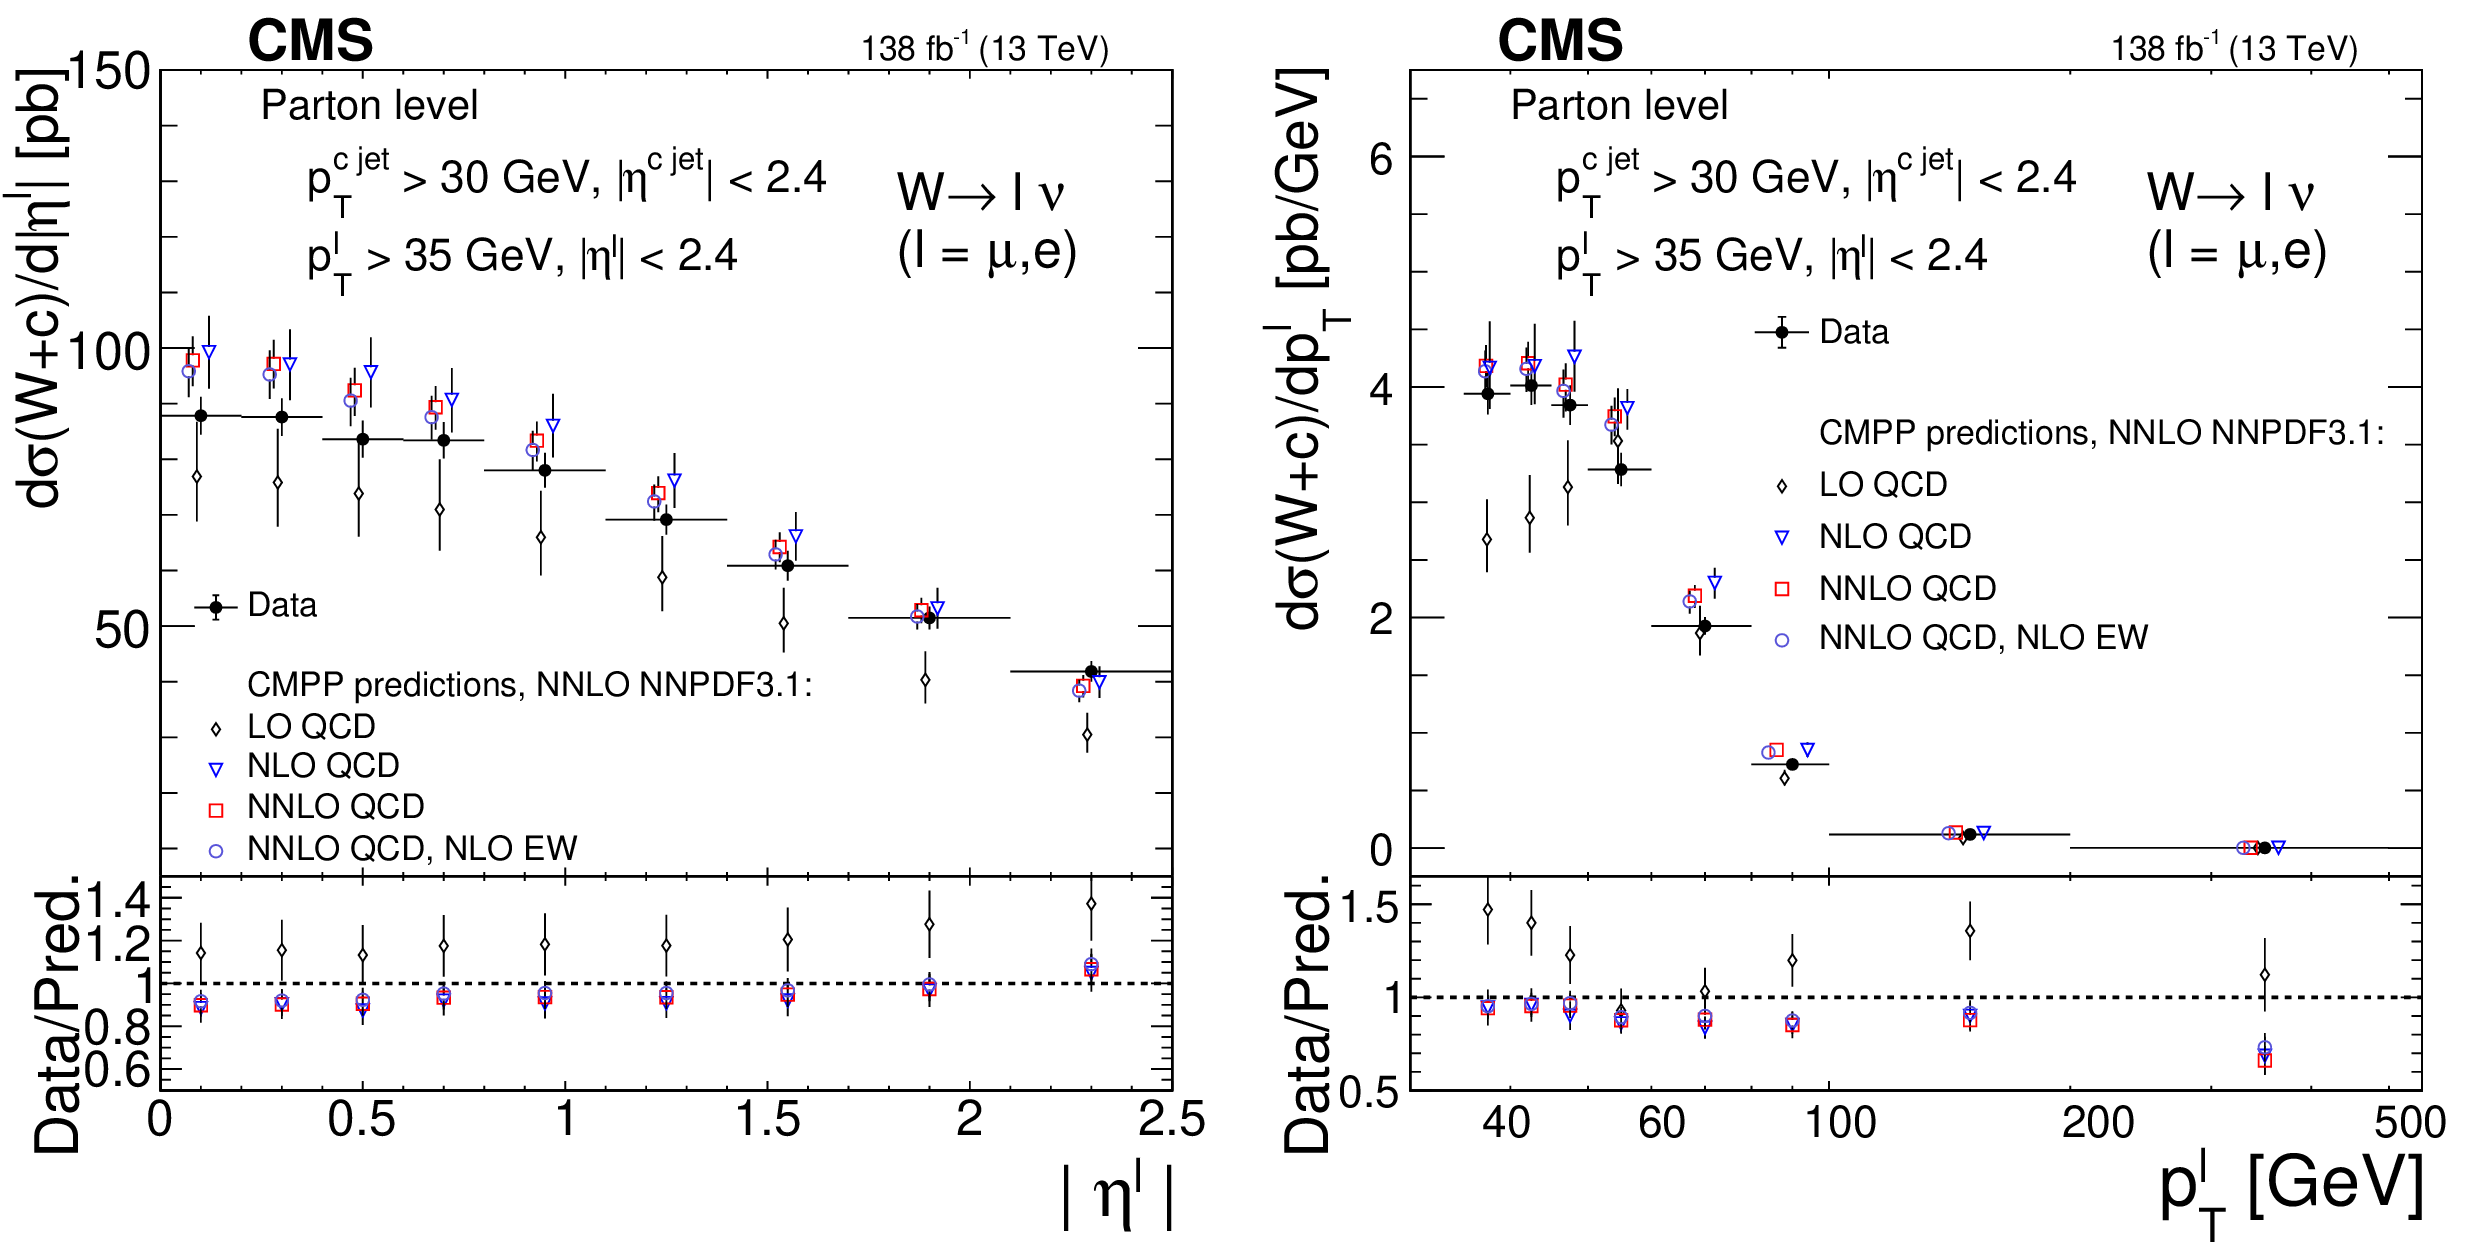
Figure 11:
Comparison of the measured differential cross sections $ \mathrm{d}\sigma(\mathrm{W}\,+\,\mathrm{c})/\mathrm{d}|\eta^\ell| $ (left) and $ \mathrm{d}\sigma(\mathrm{W}\,+\,\mathrm{c})/\mathrm{d}{p_{\mathrm{T}}^\ell} $ (right) with the OS-SS LO, NLO, and NNLO QCD predictions, and NLO EW corrections. The NNLO QCD NNPDF3.1 PDF set is used for computing all the predictions. CMPP stands for the authors of the calculations [15]. Error bars on data points include statistical and systematic uncertainties. Symbols showing the theoretical expectations are slightly displaced in the horizontal axis for better visibility. The ratios of data to predictions are shown in the lower panels. The uncertainty in the ratio includes the uncertainties in both data and prediction. |
png pdf |
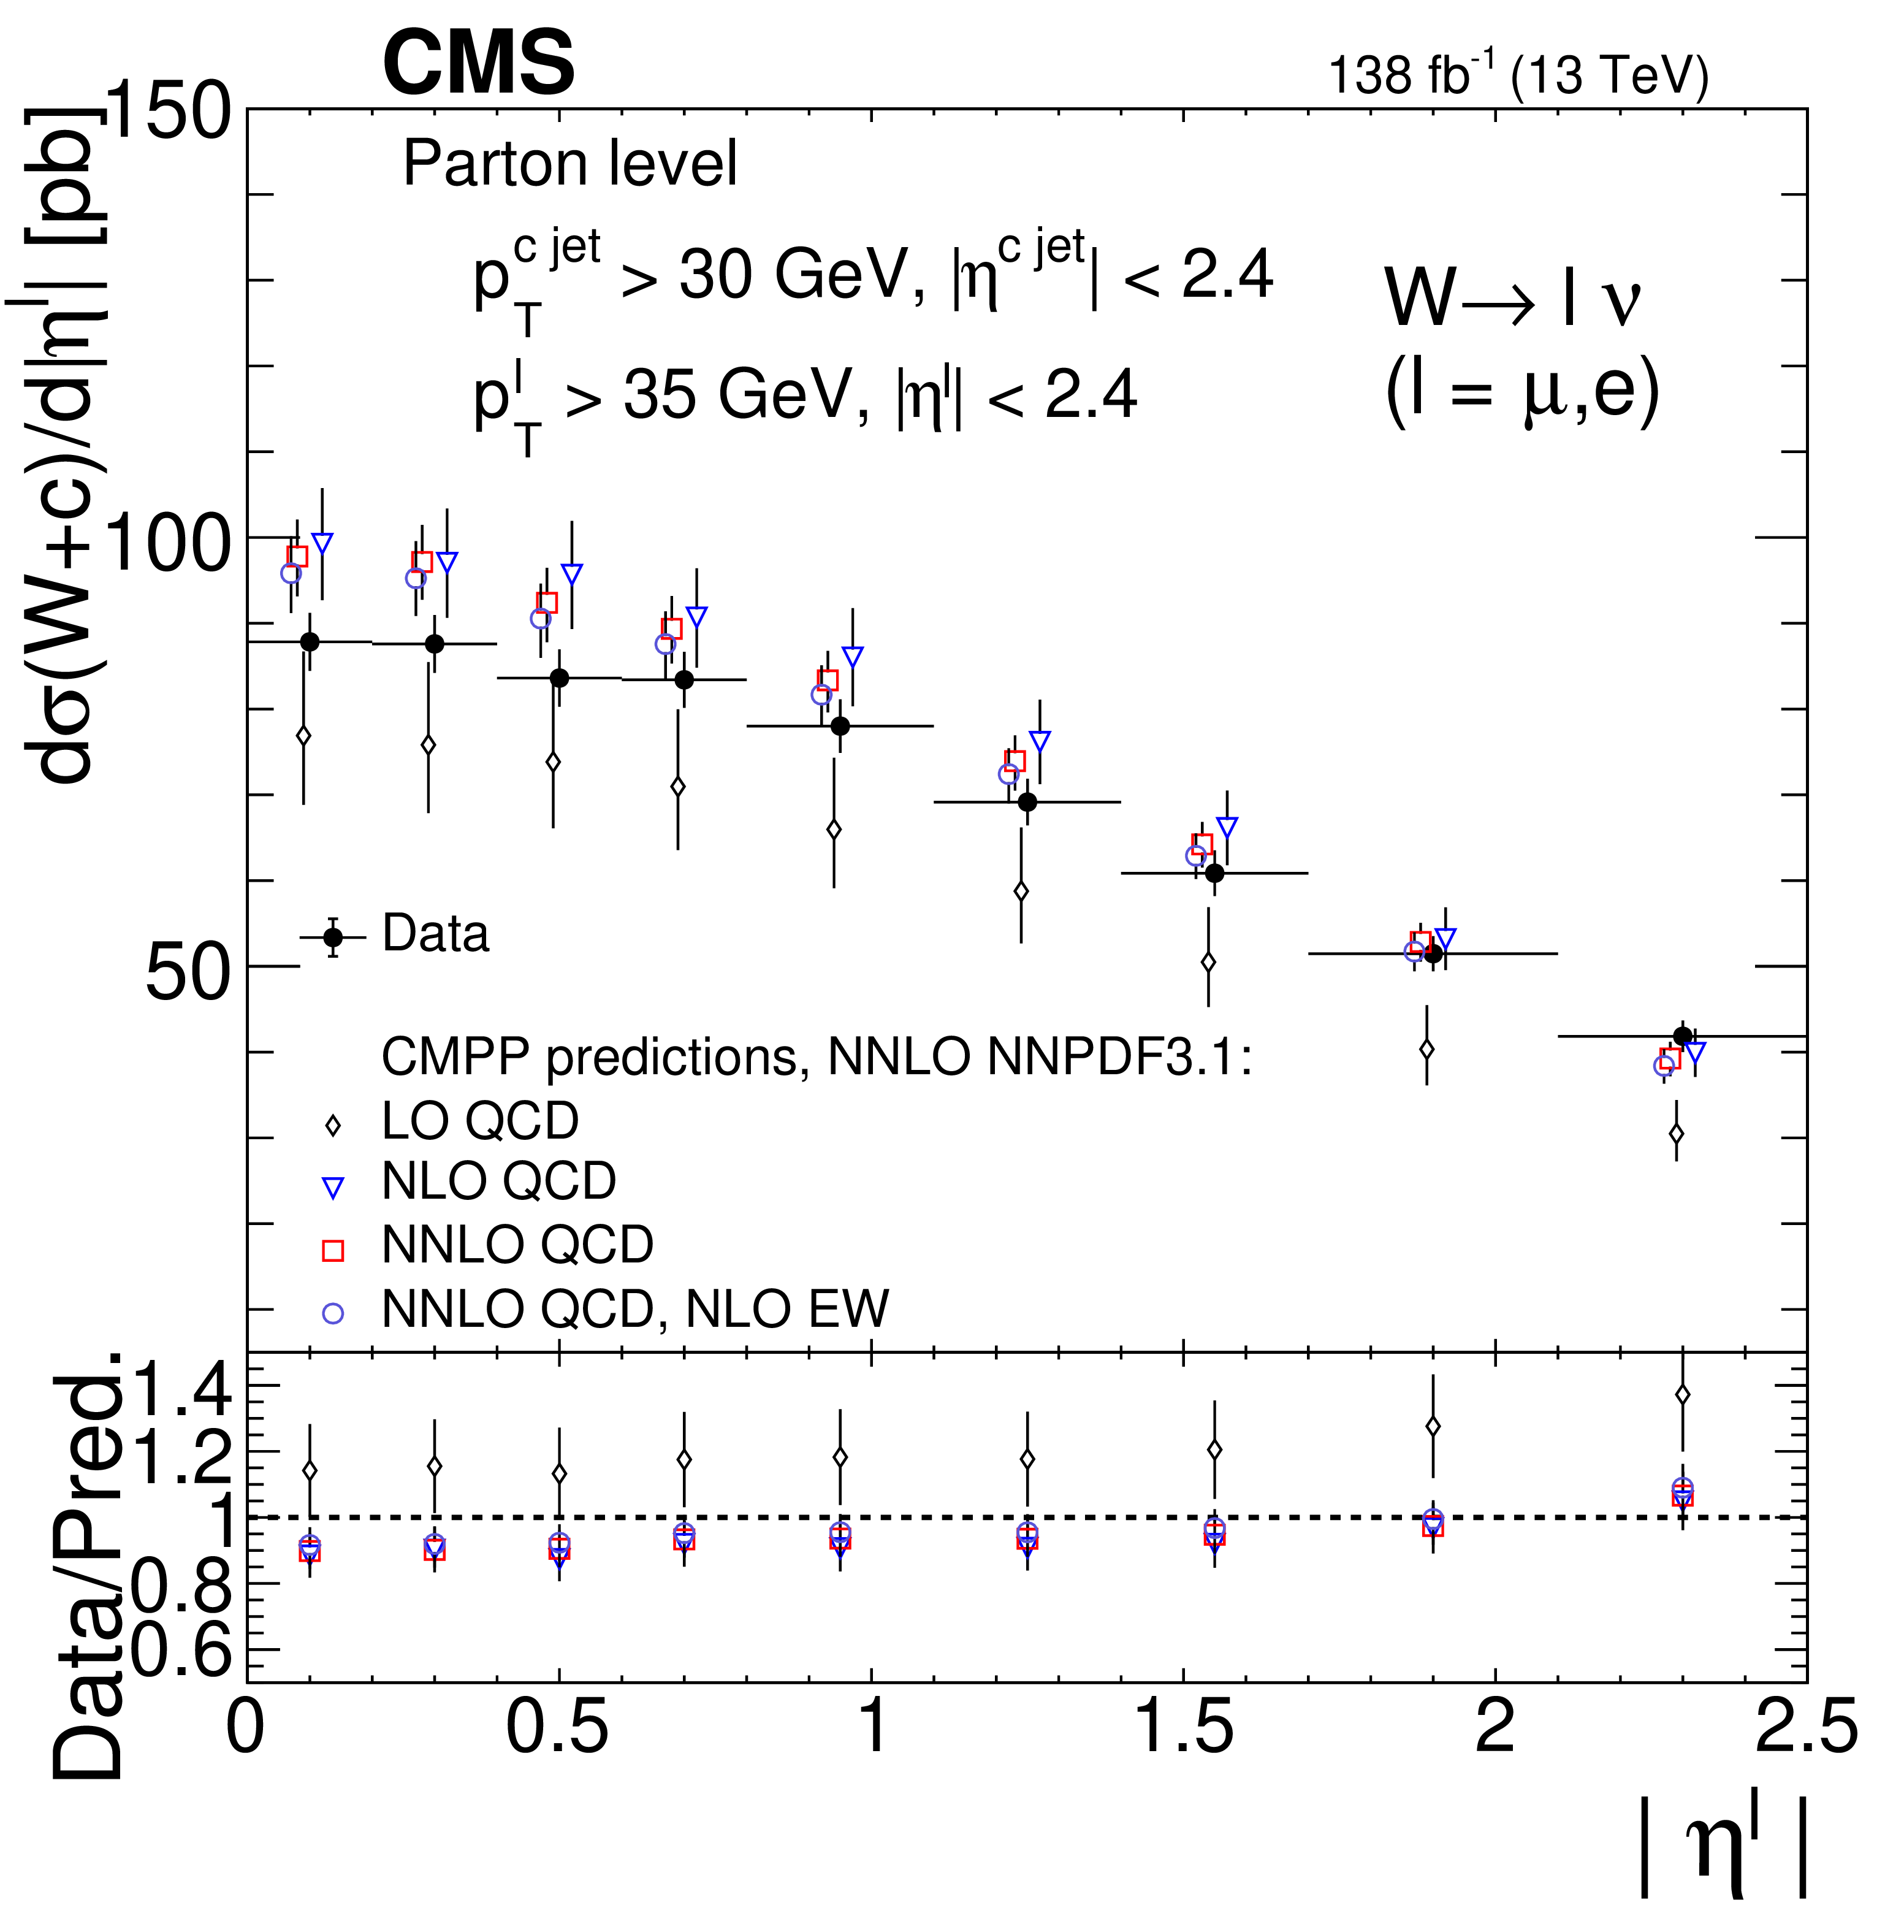
Figure 11-a:
Comparison of the measured differential cross section $ \mathrm{d}\sigma(\mathrm{W}\,+\,\mathrm{c})/\mathrm{d}|\eta^\ell| $ with the OS-SS LO, NLO, and NNLO QCD predictions, and NLO EW corrections. The NNLO QCD NNPDF3.1 PDF set is used for computing all the predictions. CMPP stands for the authors of the calculations [15]. Error bars on data points include statistical and systematic uncertainties. Symbols showing the theoretical expectations are slightly displaced in the horizontal axis for better visibility. The ratio of data to prediction is shown in the lower panel. The uncertainty in the ratio includes the uncertainties in both data and prediction. |
png pdf |
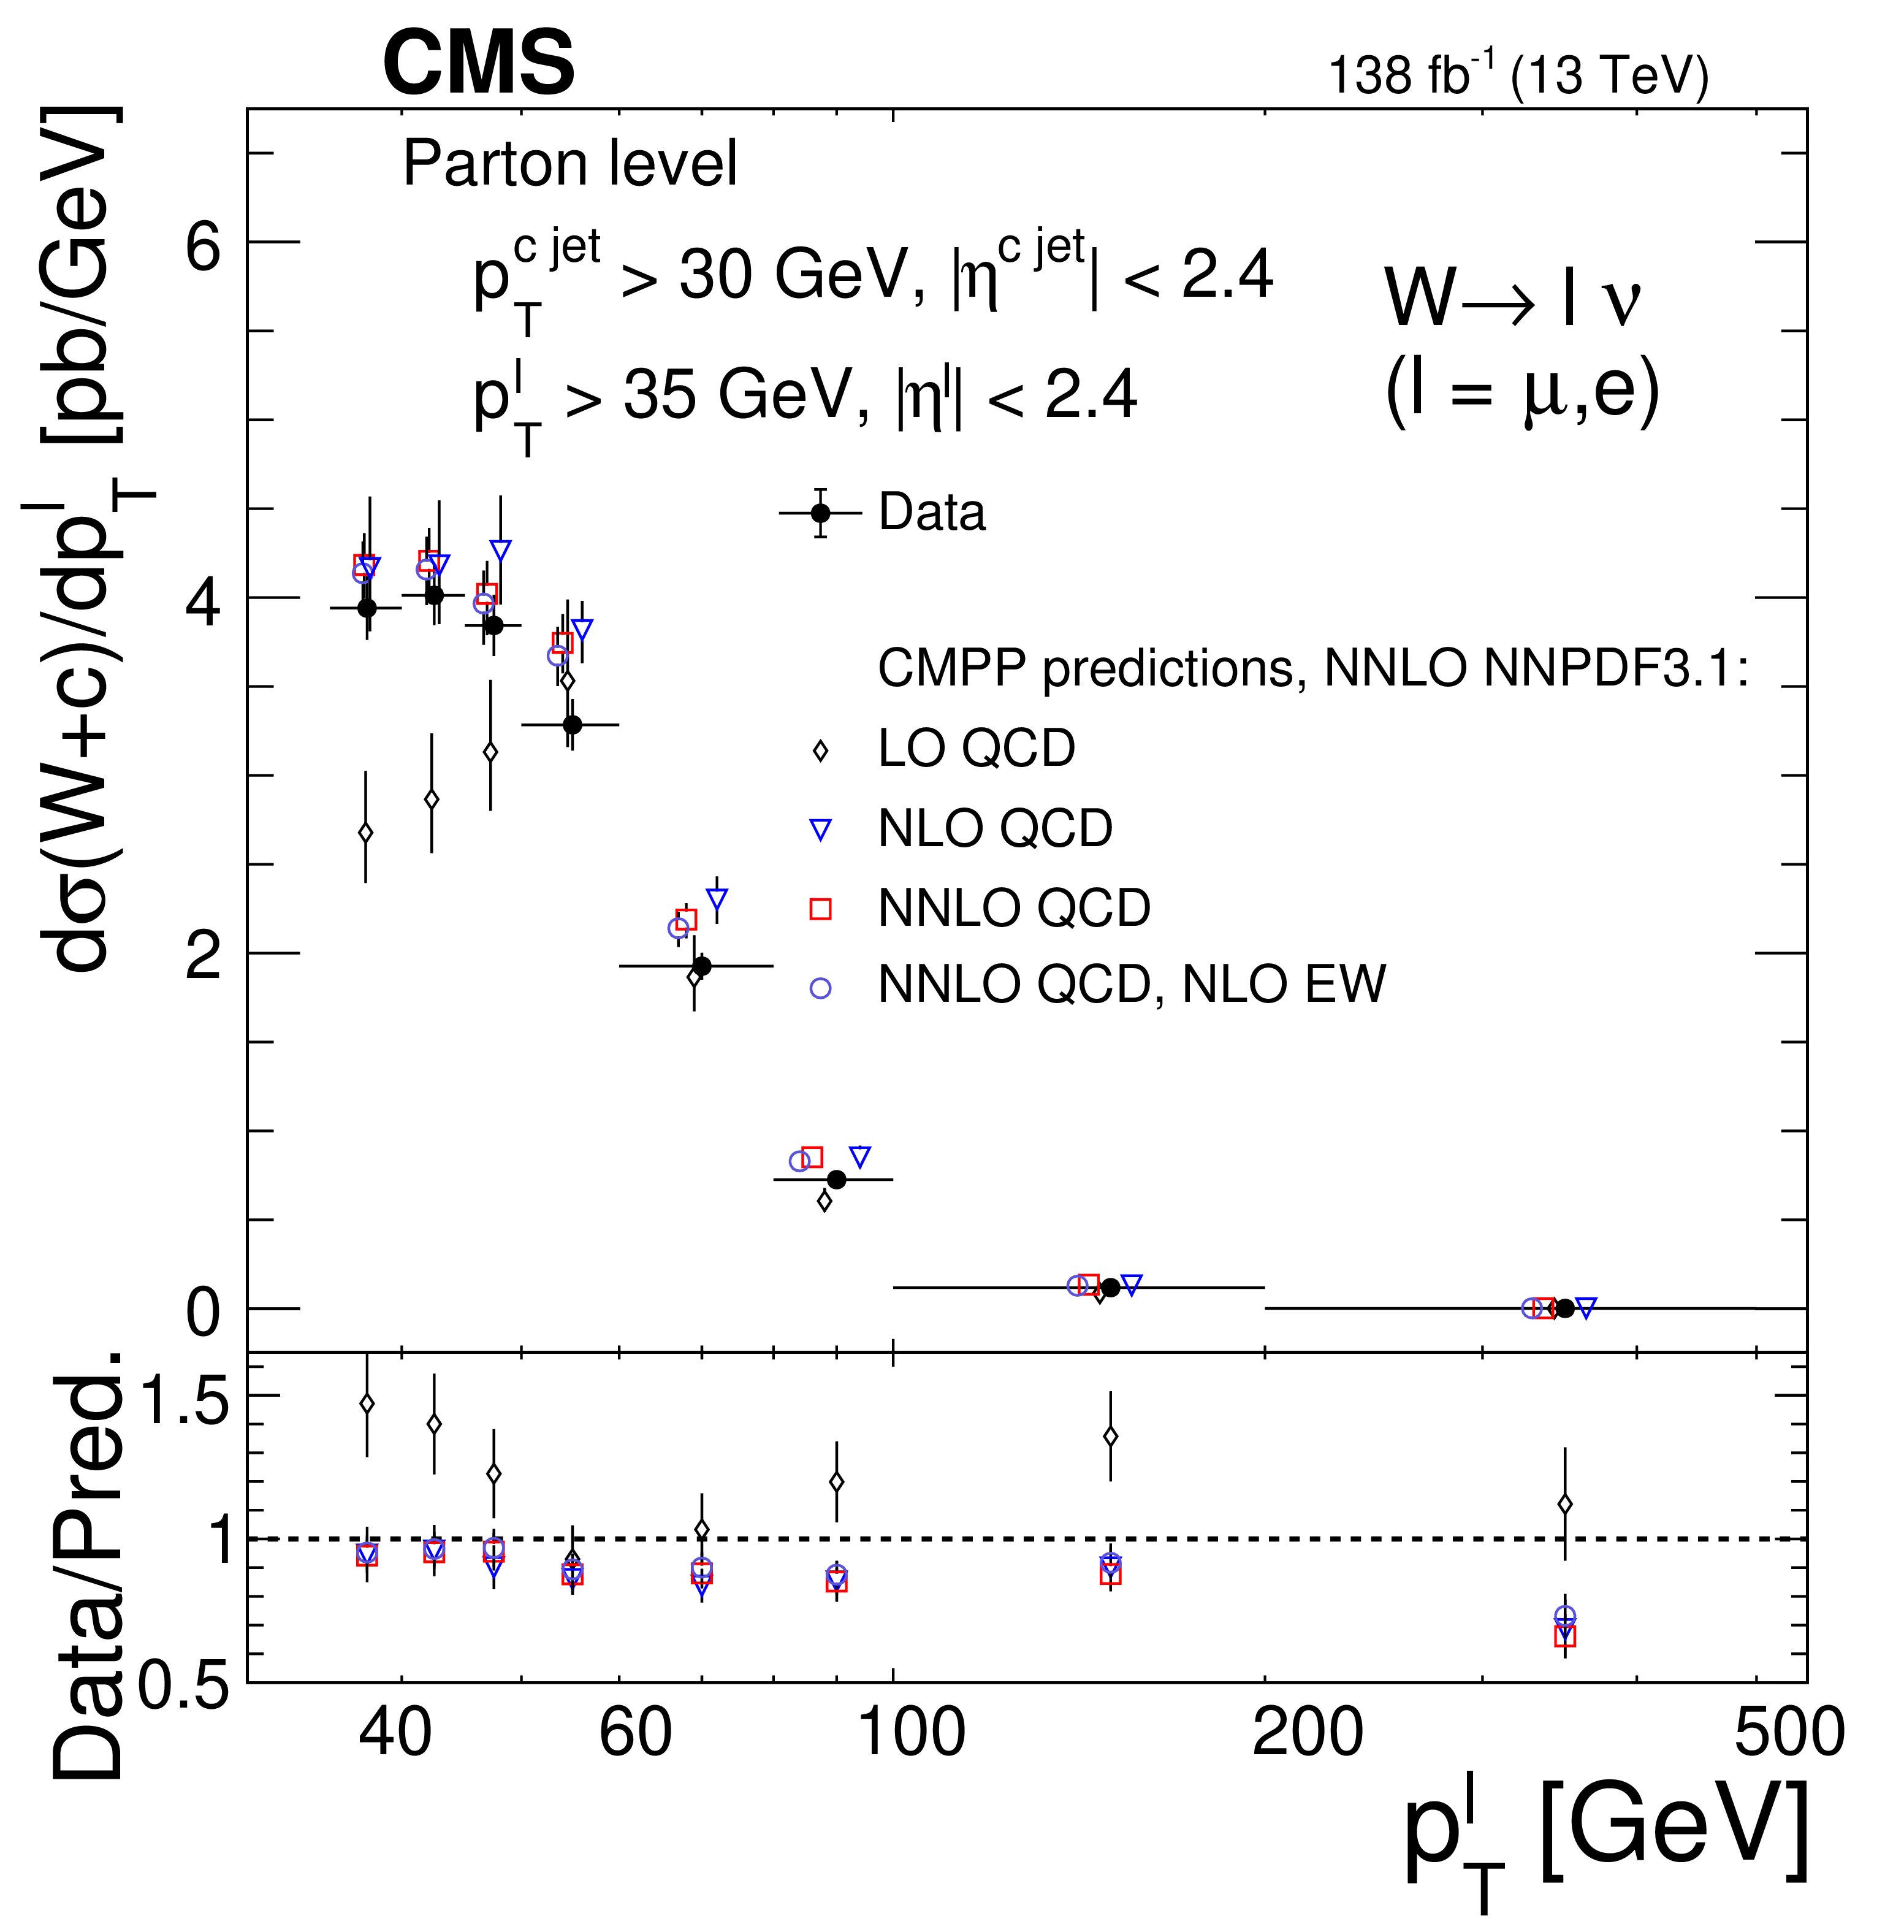
Figure 11-b:
Comparison of the measured differential cross section $ \mathrm{d}\sigma(\mathrm{W}\,+\,\mathrm{c})/\mathrm{d}{p_{\mathrm{T}}^\ell} $ with the OS-SS LO, NLO, and NNLO QCD predictions, and NLO EW corrections. The NNLO QCD NNPDF3.1 PDF set is used for computing all the predictions. CMPP stands for the authors of the calculations [15]. Error bars on data points include statistical and systematic uncertainties. Symbols showing the theoretical expectations are slightly displaced in the horizontal axis for better visibility. The ratio of data to prediction is shown in the lower panel. The uncertainty in the ratio includes the uncertainties in both data and prediction. |

png pdf |
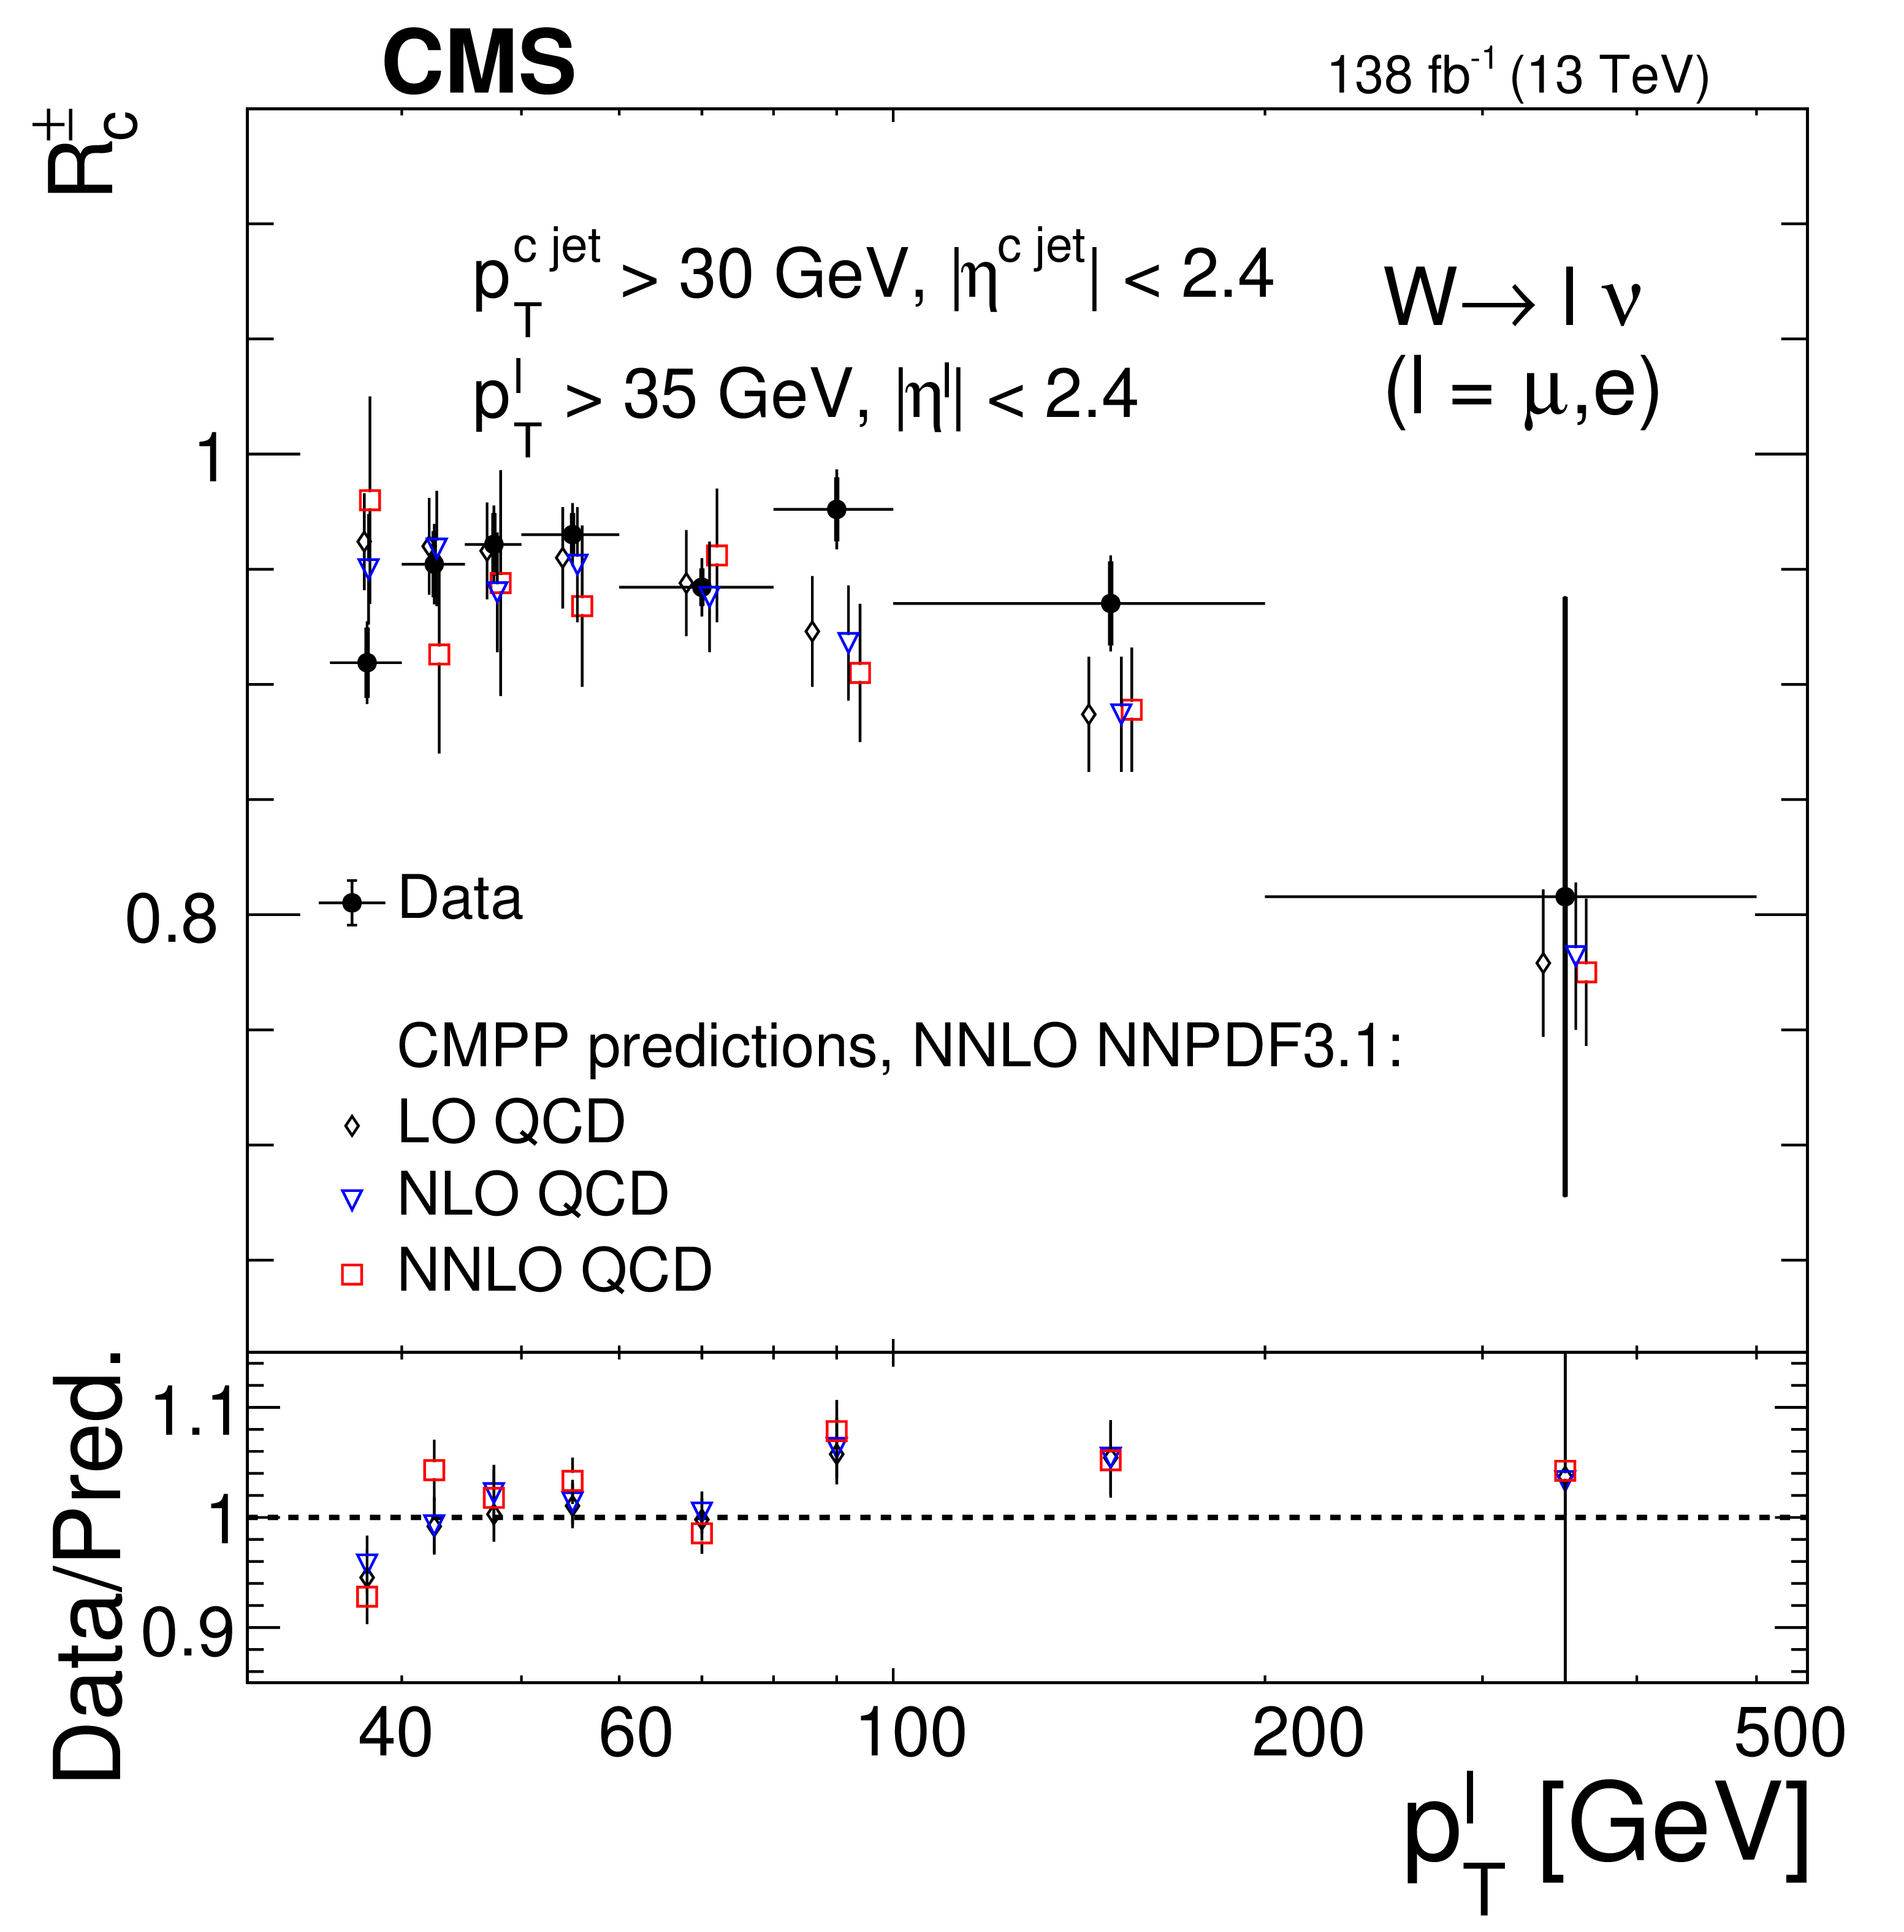
Figure 12:
Comparison of the experimental measurement of $ R_\mathrm{c}^{\pm} $ with the OS-SS LO, NLO and NNLO QCD predictions. The NNLO QCD NNPDF3.1 PDF set is used for computing all the predictions. CMPP stands for the authors of the calculations [15]. Horizontal error bars indicate the total uncertainty in the predictions. |

png pdf |
Figure 13:
Comparison of the measured differential cross section ratio $ R_\mathrm{c}^{\pm} $ as a function of the absolute value of $ \eta^\ell $ (left) and $ p_{\mathrm{T}}^\ell $ (right) with the OS-SS LO, NLO, and NNLO QCD predictions. The NNLO QCD NNPDF3.1 PDF set is used for computing all the predictions. CMPP stands for the authors of the calculations [15]. Error bars on data points include statistical and systematic uncertainties. Symbols showing the theoretical expectations are slightly displaced in the horizontal axis for better visibility. The ratios of data to predictions are shown in the lower panels. The uncertainty in the ratio includes the uncertainties in the data and prediction. |
png pdf |
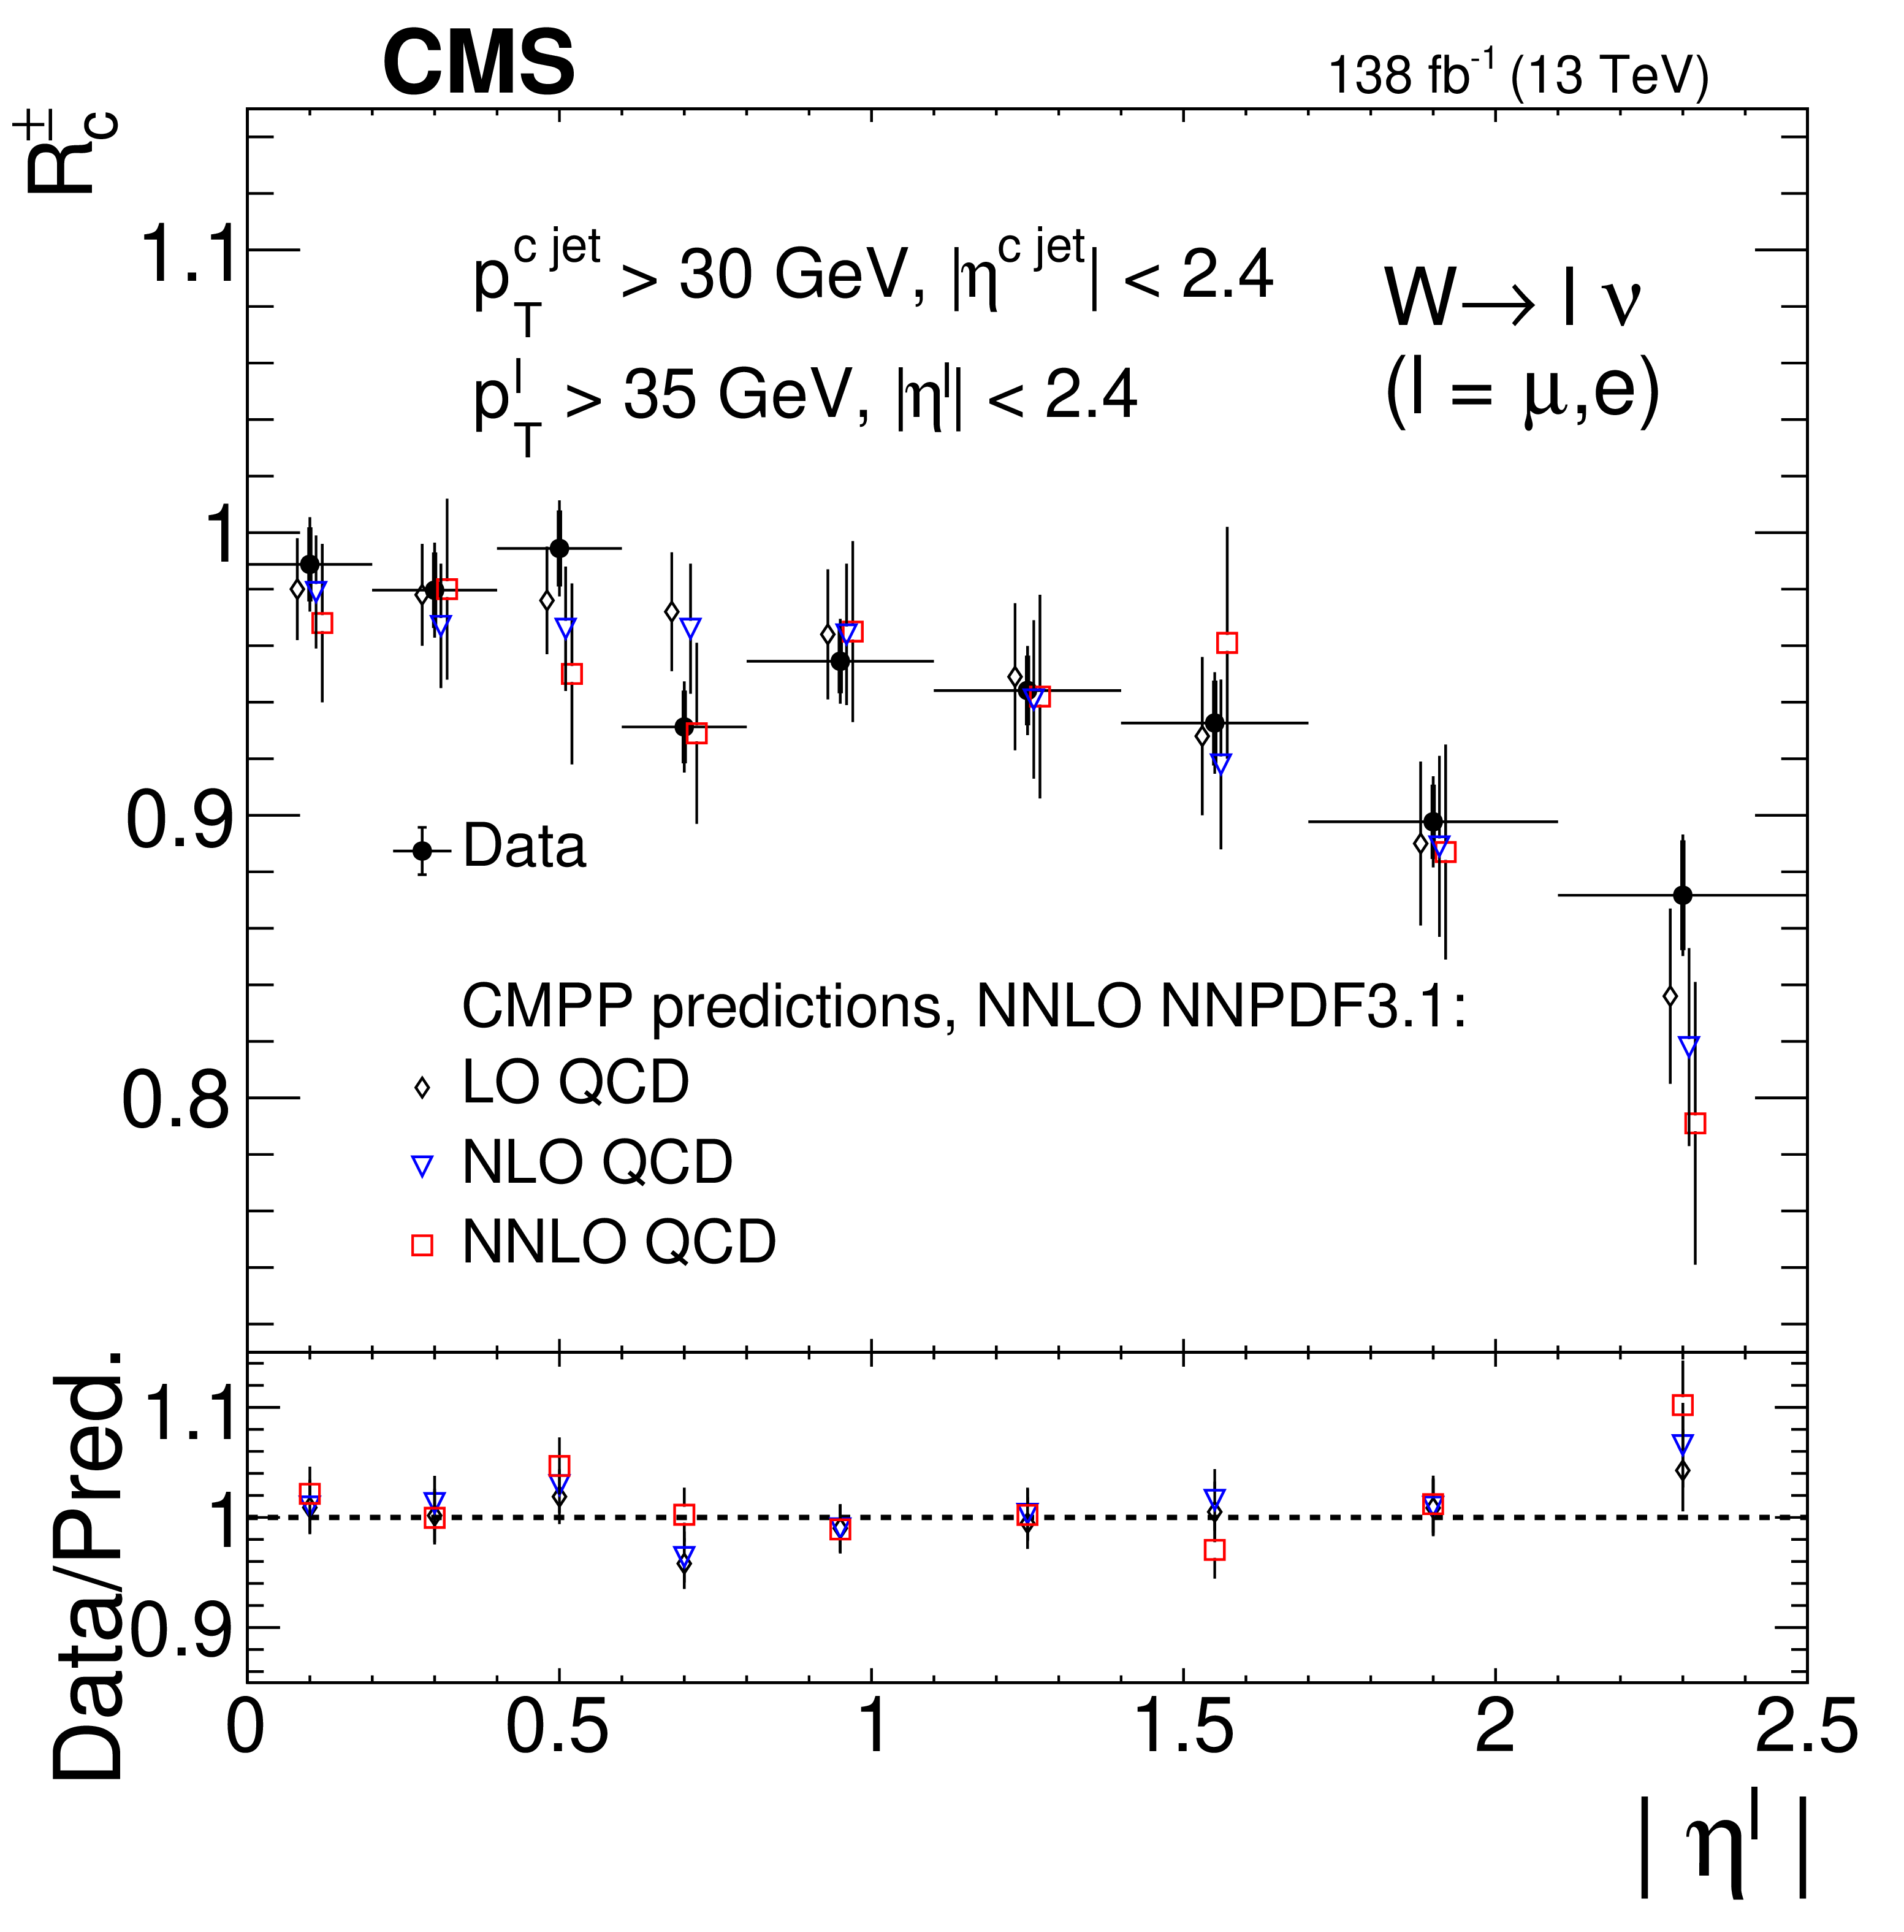
Figure 13-a:
Comparison of the measured differential cross section ratio $ R_\mathrm{c}^{\pm} $ as a function of the absolute value of $ \eta^\ell $ with the OS-SS LO, NLO, and NNLO QCD predictions. The NNLO QCD NNPDF3.1 PDF set is used for computing all the predictions. CMPP stands for the authors of the calculations [15]. Error bars on data points include statistical and systematic uncertainties. Symbols showing the theoretical expectations are slightly displaced in the horizontal axis for better visibility. The ratio of data to prediction is shown in the lower panel. The uncertainty in the ratio includes the uncertainties in the data and prediction. |
png pdf |
Figure 13-b:
Comparison of the measured differential cross section ratio $ R_\mathrm{c}^{\pm} $ as a function of the absolute value of $ p_{\mathrm{T}}^\ell $ with the OS-SS LO, NLO, and NNLO QCD predictions. The NNLO QCD NNPDF3.1 PDF set is used for computing all the predictions. CMPP stands for the authors of the calculations [15]. Error bars on data points include statistical and systematic uncertainties. Symbols showing the theoretical expectations are slightly displaced in the horizontal axis for better visibility. The ratio of data to prediction is shown in the lower panel. The uncertainty in the ratio includes the uncertainties in the data and prediction. |
| Tables | |
png pdf |
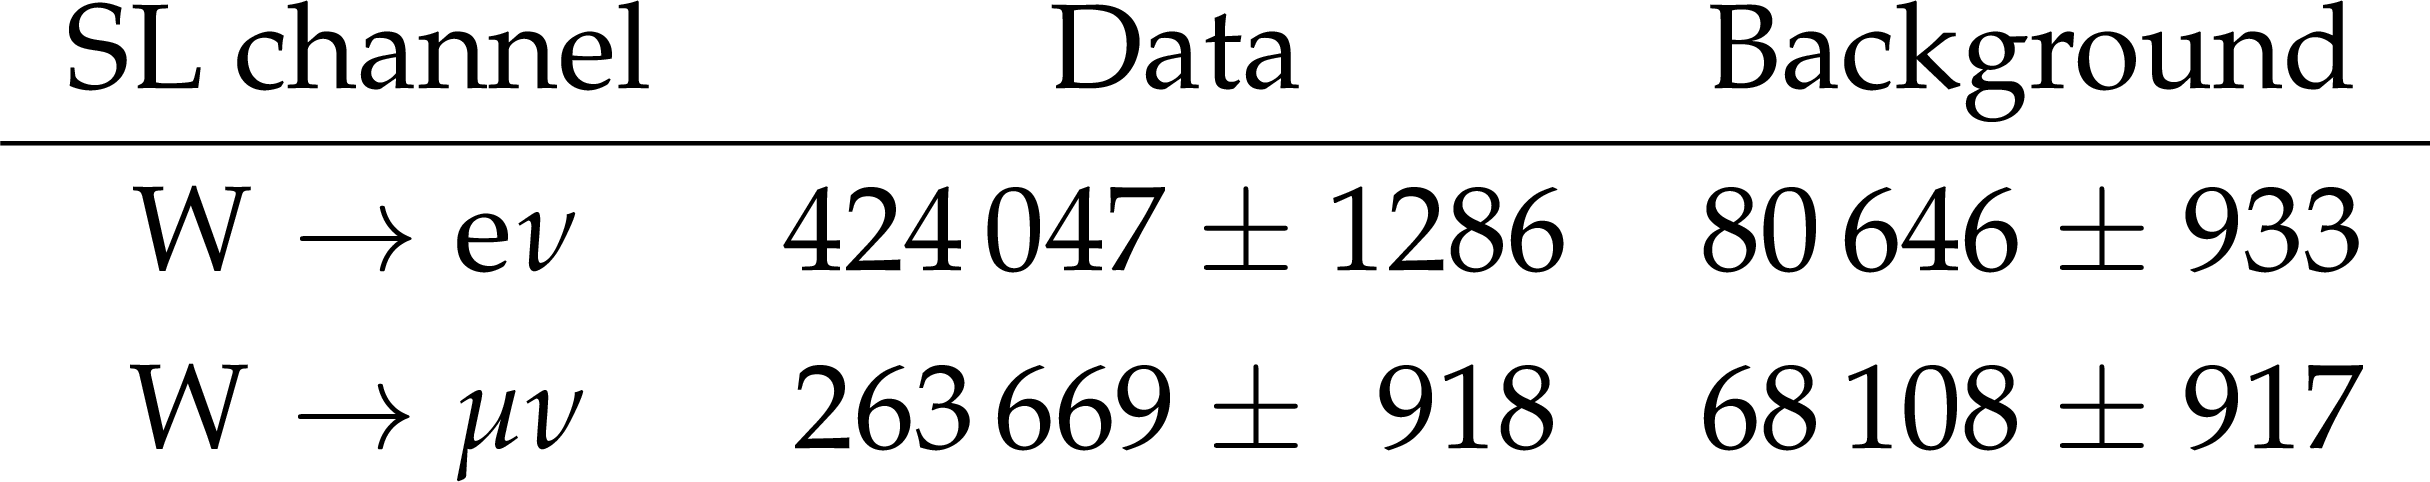
Table 1:
Data and background event yields (with statistical uncertainties) after selection and OS-SS subtraction for the SL channels (electron and muon W decay modes). |

png pdf |
Table 2:
Simulated signal and background composition (in percentage) of the SL sample after selection and OS-SS subtraction. The $ \mathrm{W} + {\mathrm{Q}\bar{\mathrm{Q}}} $ stands for the sum of the contributions of $ \mathrm{W} + \mathrm{c} \bar{\mathrm{c}} $ and $ \mathrm{W} + \mathrm{b} \bar{\mathrm{b}} $. |

png pdf |
Table 3:
Data and background event yields (with statistical uncertainties) after selection and OS-SS subtraction for the SV channels (electron and muon W decay modes). |

png pdf |
Table 4:
Simulated signal and background composition (in percentage) of the SV sample after selection and OS-SS subtraction. The $ \mathrm{W} + {\mathrm{Q}\bar{\mathrm{Q}}} $ stands for the sum of the contributions of $ \mathrm{W} + \mathrm{c} \bar{\mathrm{c}} $ and $ \mathrm{W} + \mathrm{b} \bar{\mathrm{b}} $. |
png pdf |
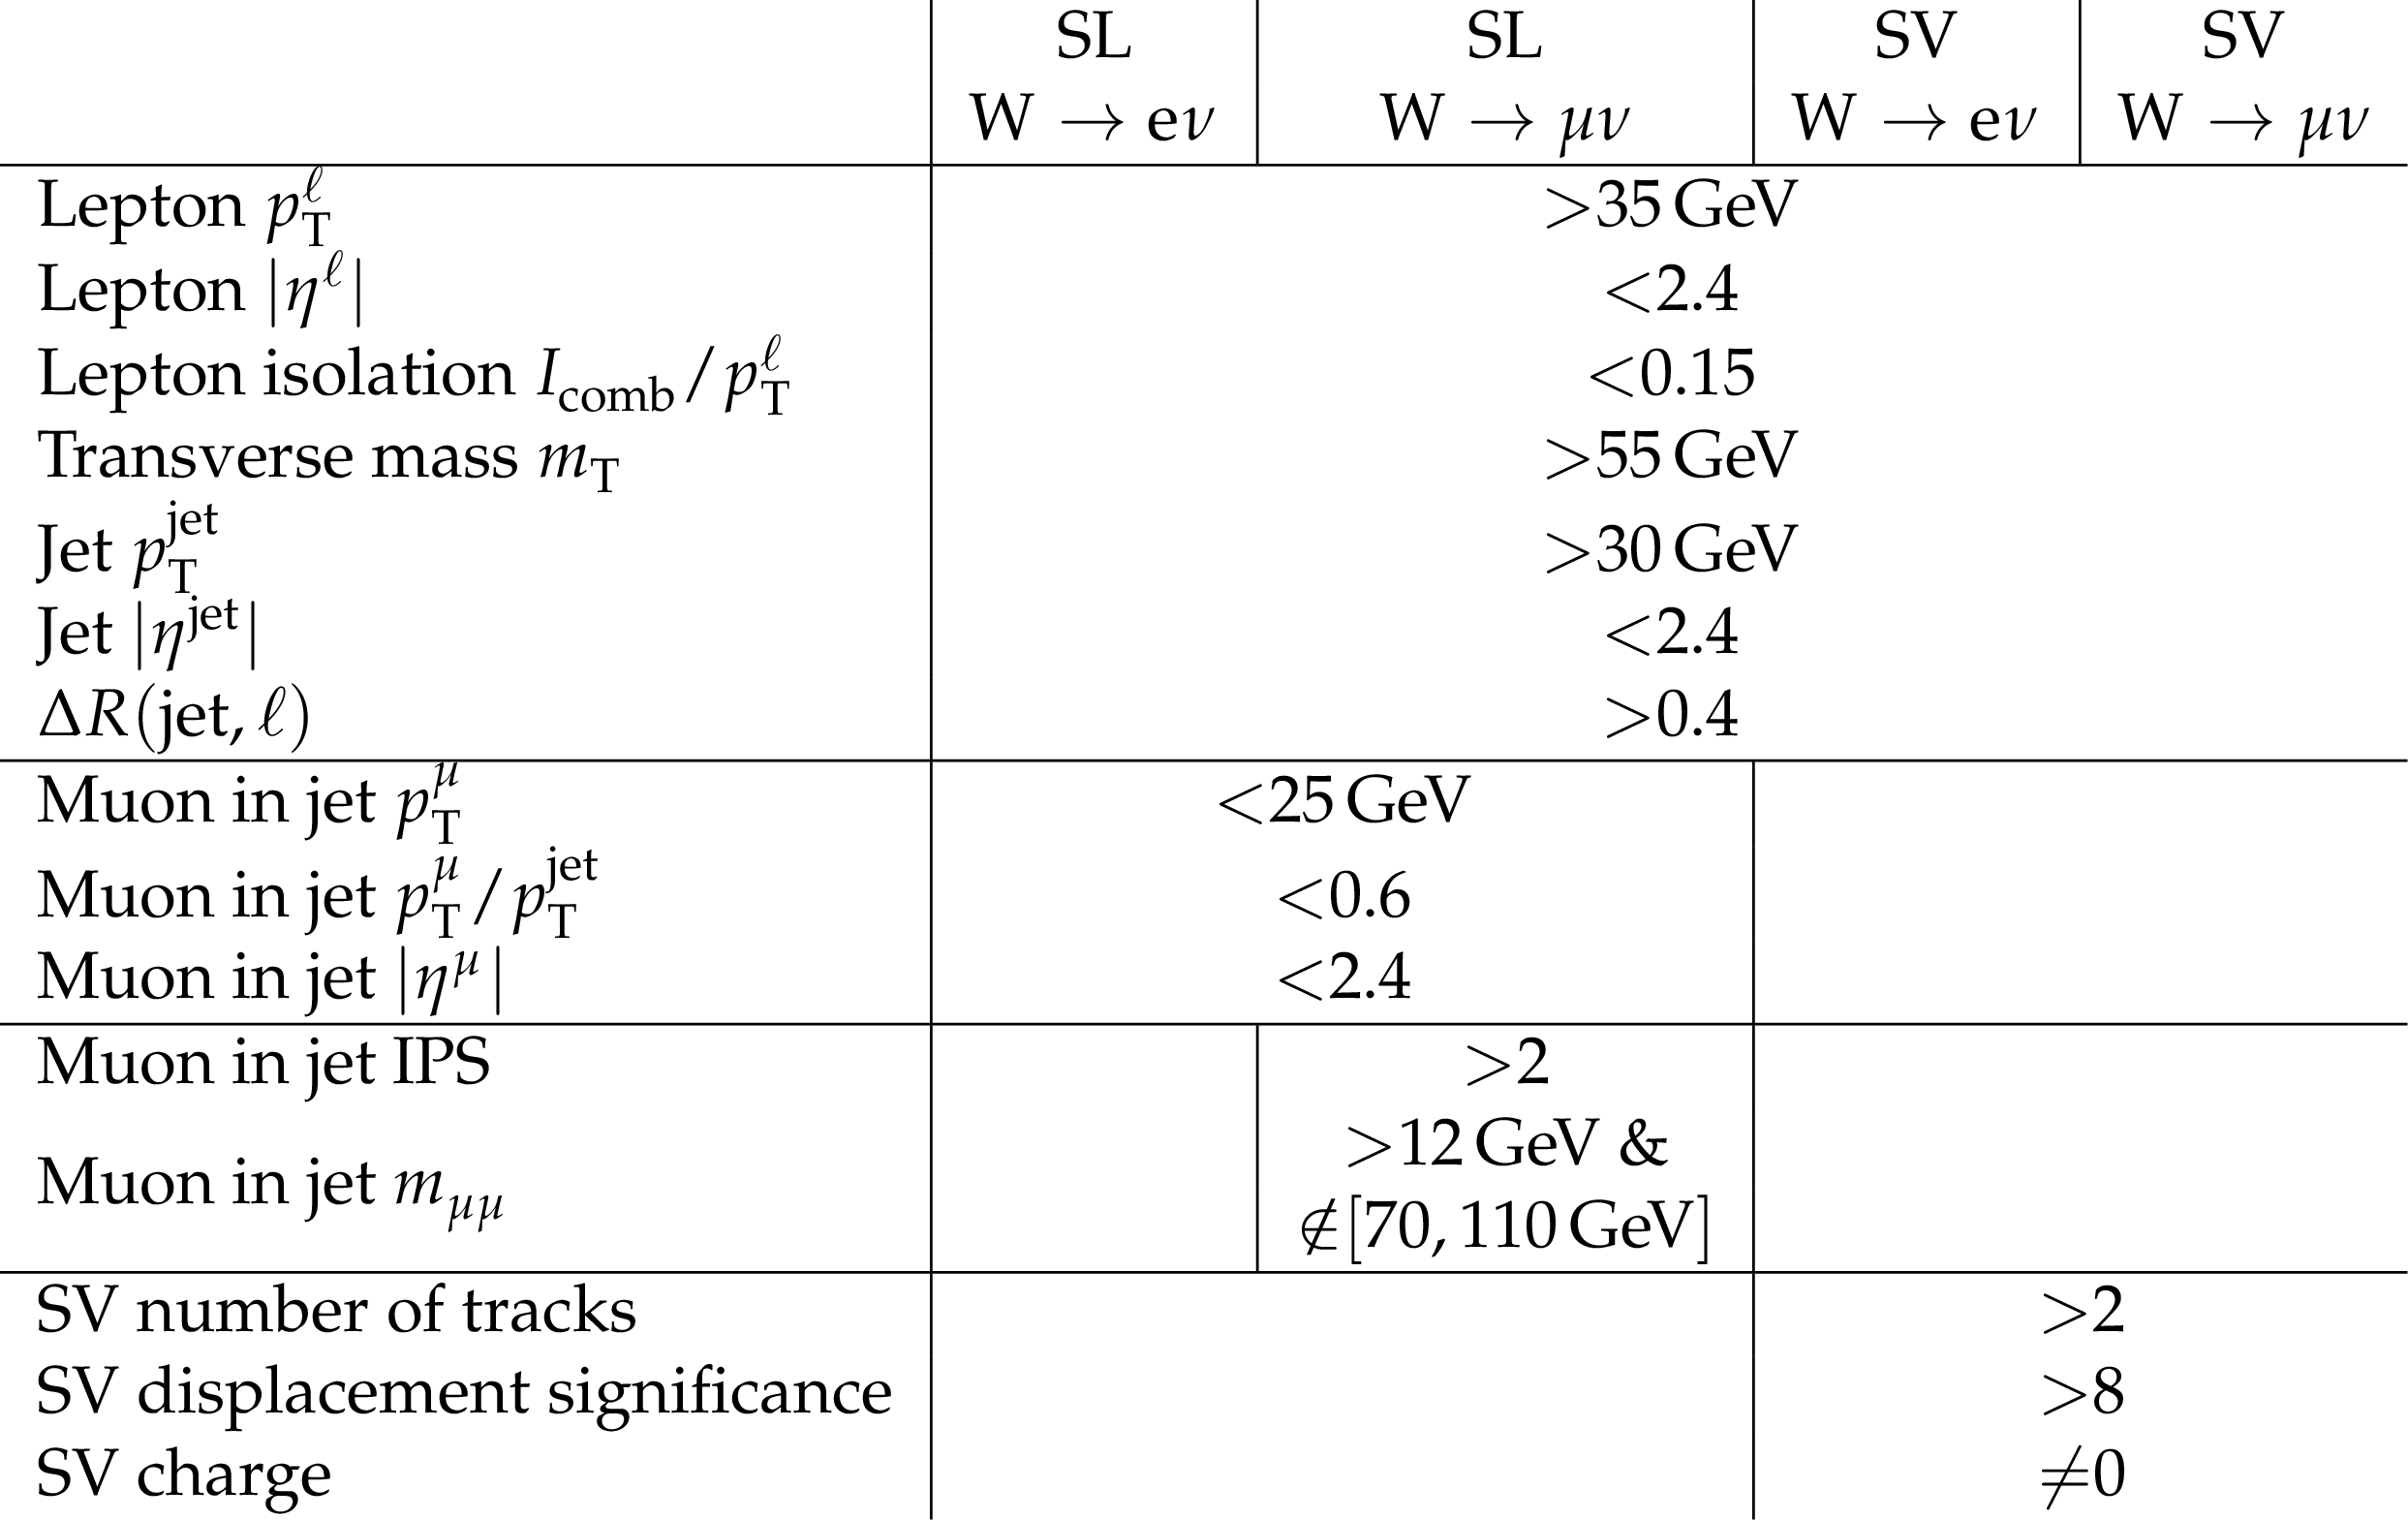
Table 5:
Summary of the selection requirements for the four selection channels of the analysis. |

png pdf |
Table 6:
Summary of the main systematic uncertainties, in percentage of the measured fiducial cross section, for the four selection channels of the analysis. |
png pdf |
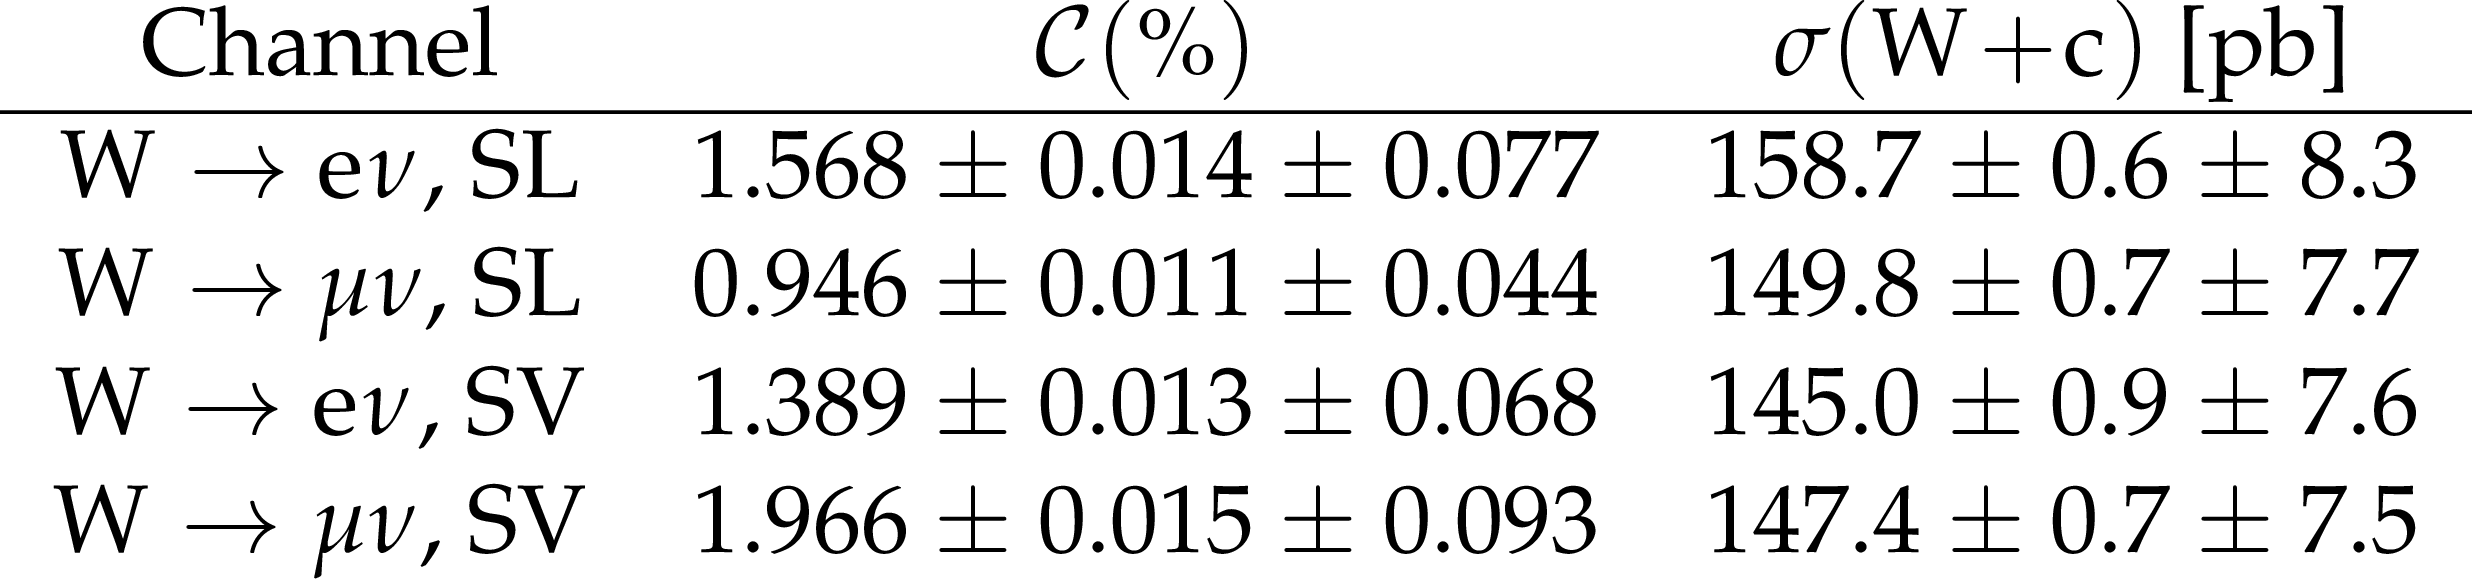
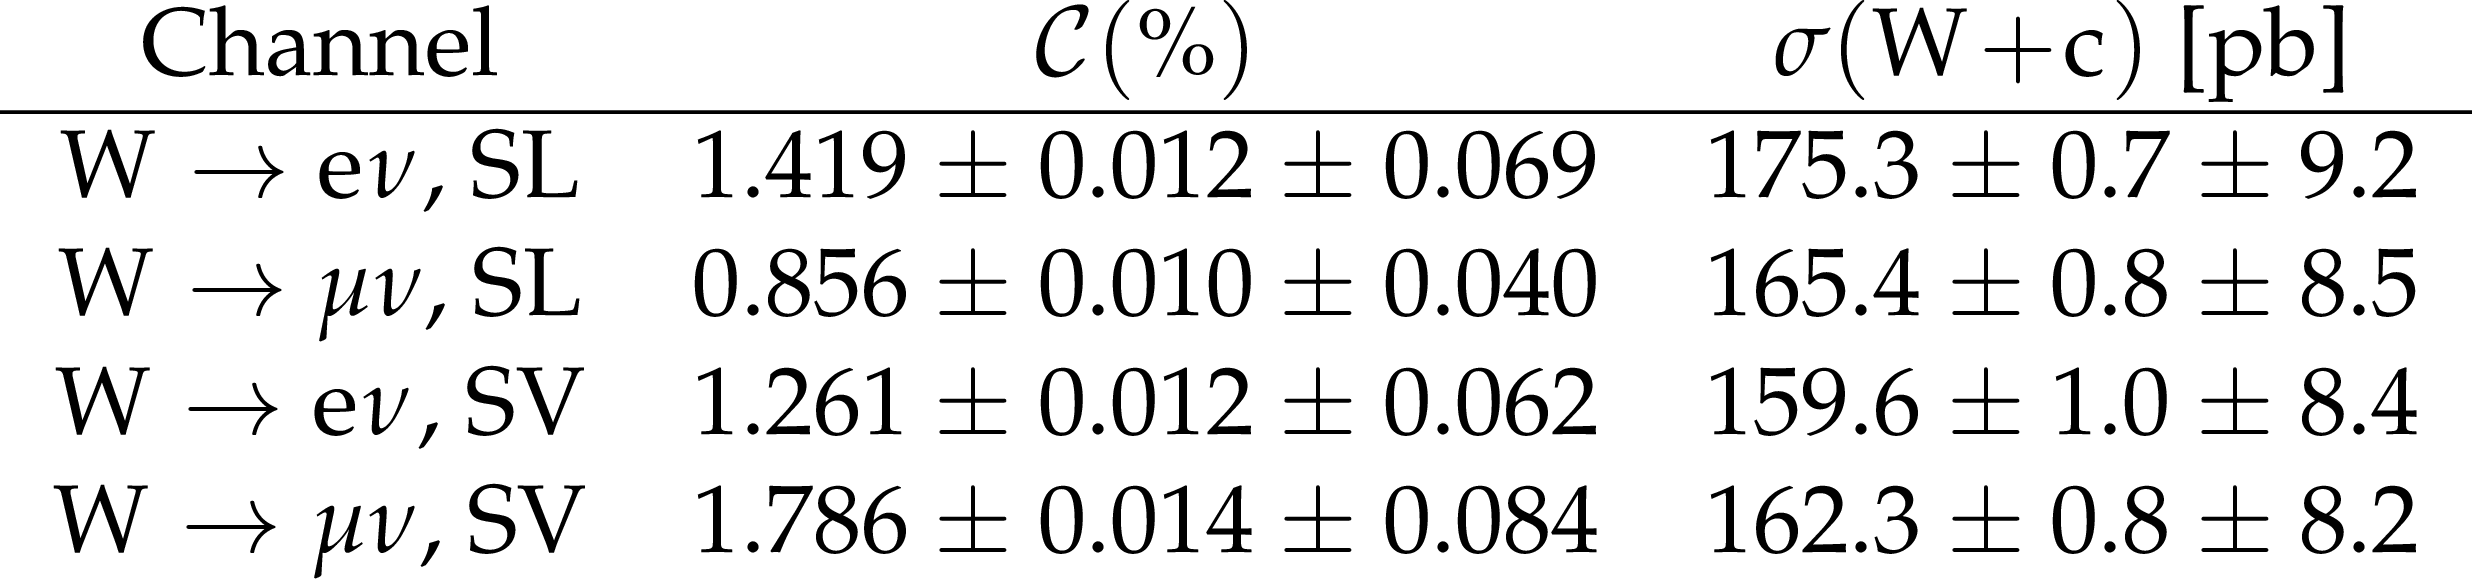
Table 7:
Measured production cross sections $ \sigma(\mathrm{W}\,+\,\mathrm{c}) $ unfolded to the particle level in the four selection channels together with statistical (first) and systematic (second) uncertainties. The acceptance times efficiency values ($ \mathcal{C} $) are also given. |
png pdf |
Table 8:
Measured production cross sections $ \sigma(\mathrm{W}\,+\,\mathrm{c}) $ unfolded to the parton level in the four selection channels together with statistical (first) and systematic (second) uncertainties. The acceptance times efficiency values ($ {\cal C} $) are also given. |
png pdf |
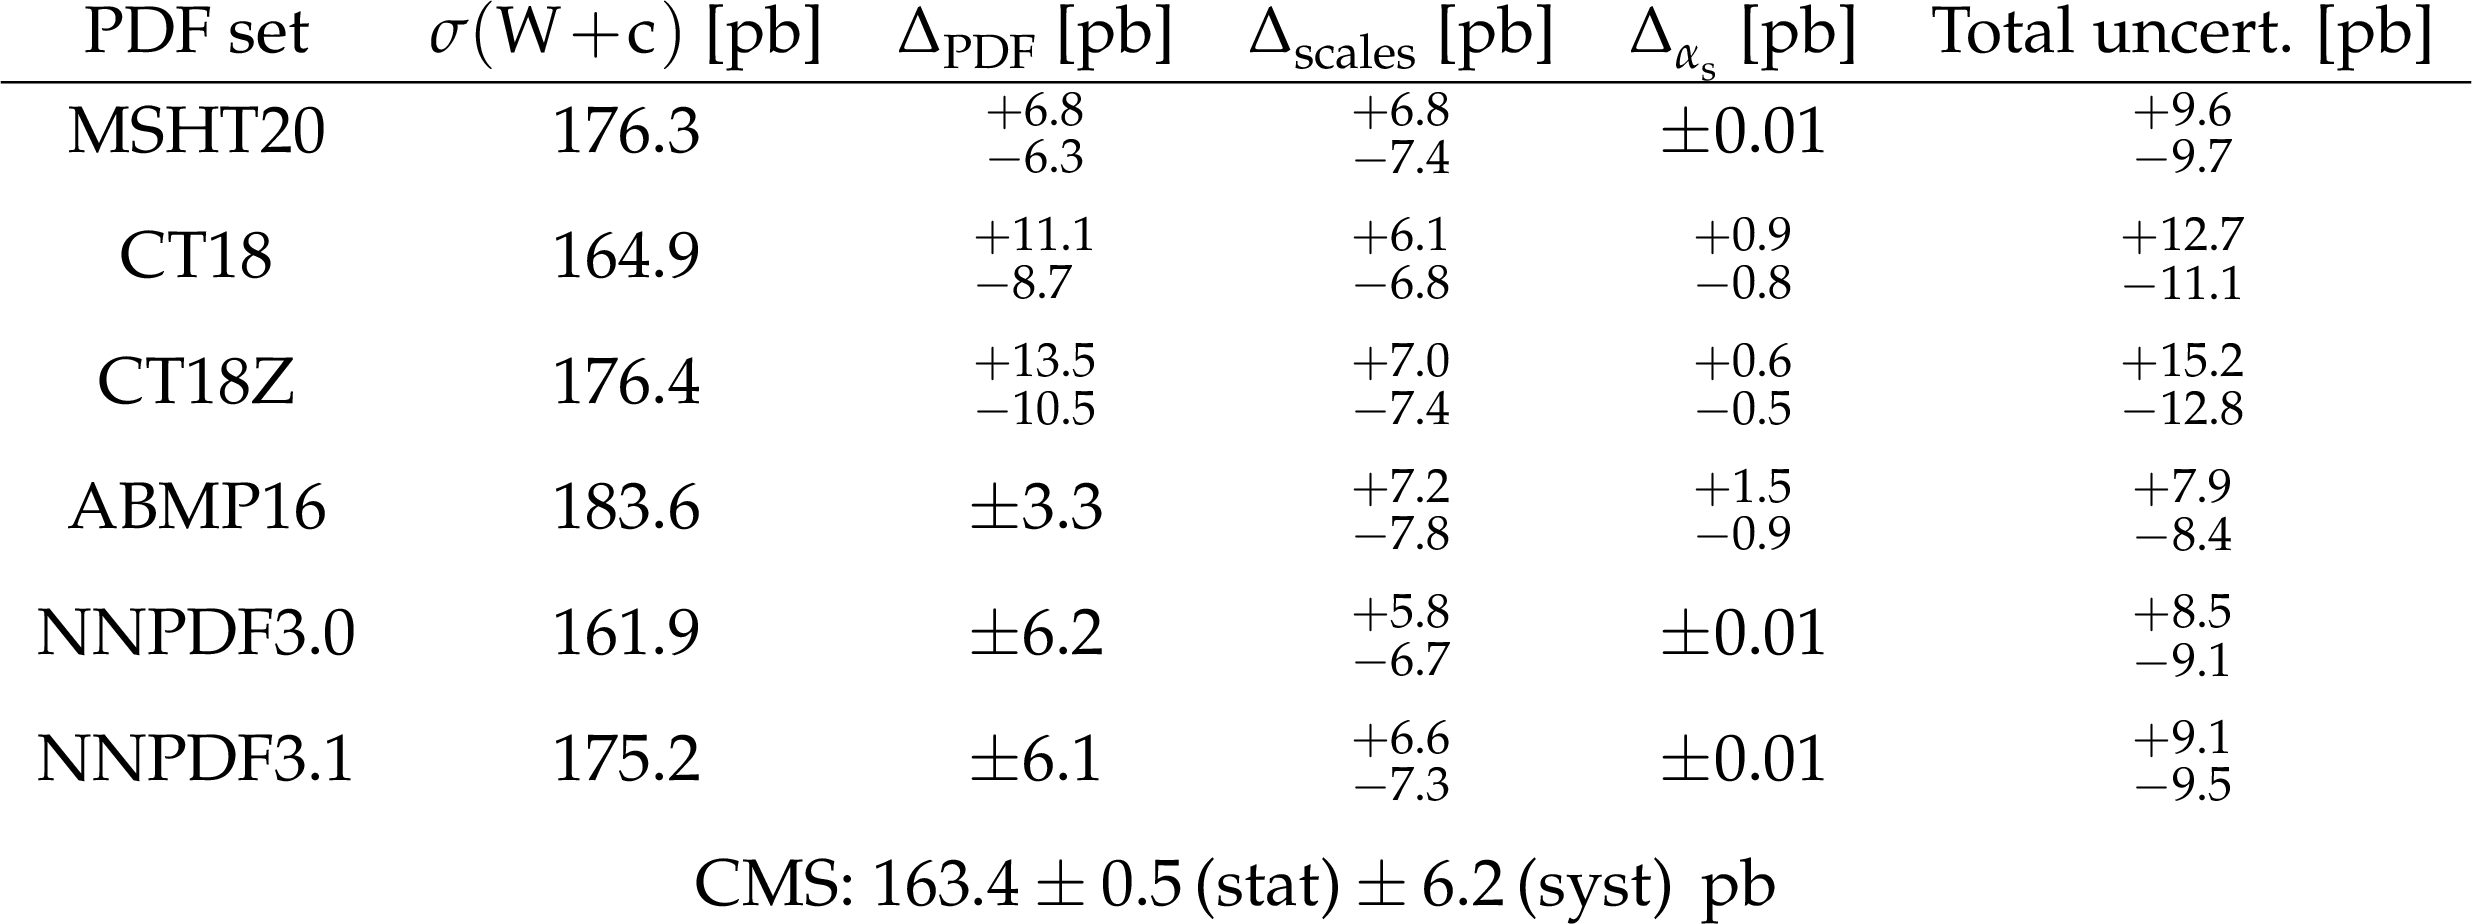
Table 9:
Predictions for $ \sigma(\mathrm{W}\,+\,\mathrm{c}) $ production from MCFM at NLO in QCD for the phase space of the analysis. For every PDF set, the central value of the prediction is given, together with the uncertainty as prescribed from the PDF set, and the uncertainties associated with the scale variations and with the value of $ \alpha_{\mathrm{s}} $. The total uncertainty is given in the last column. The last row in the table gives the experimental result presented in this paper. |
png pdf |
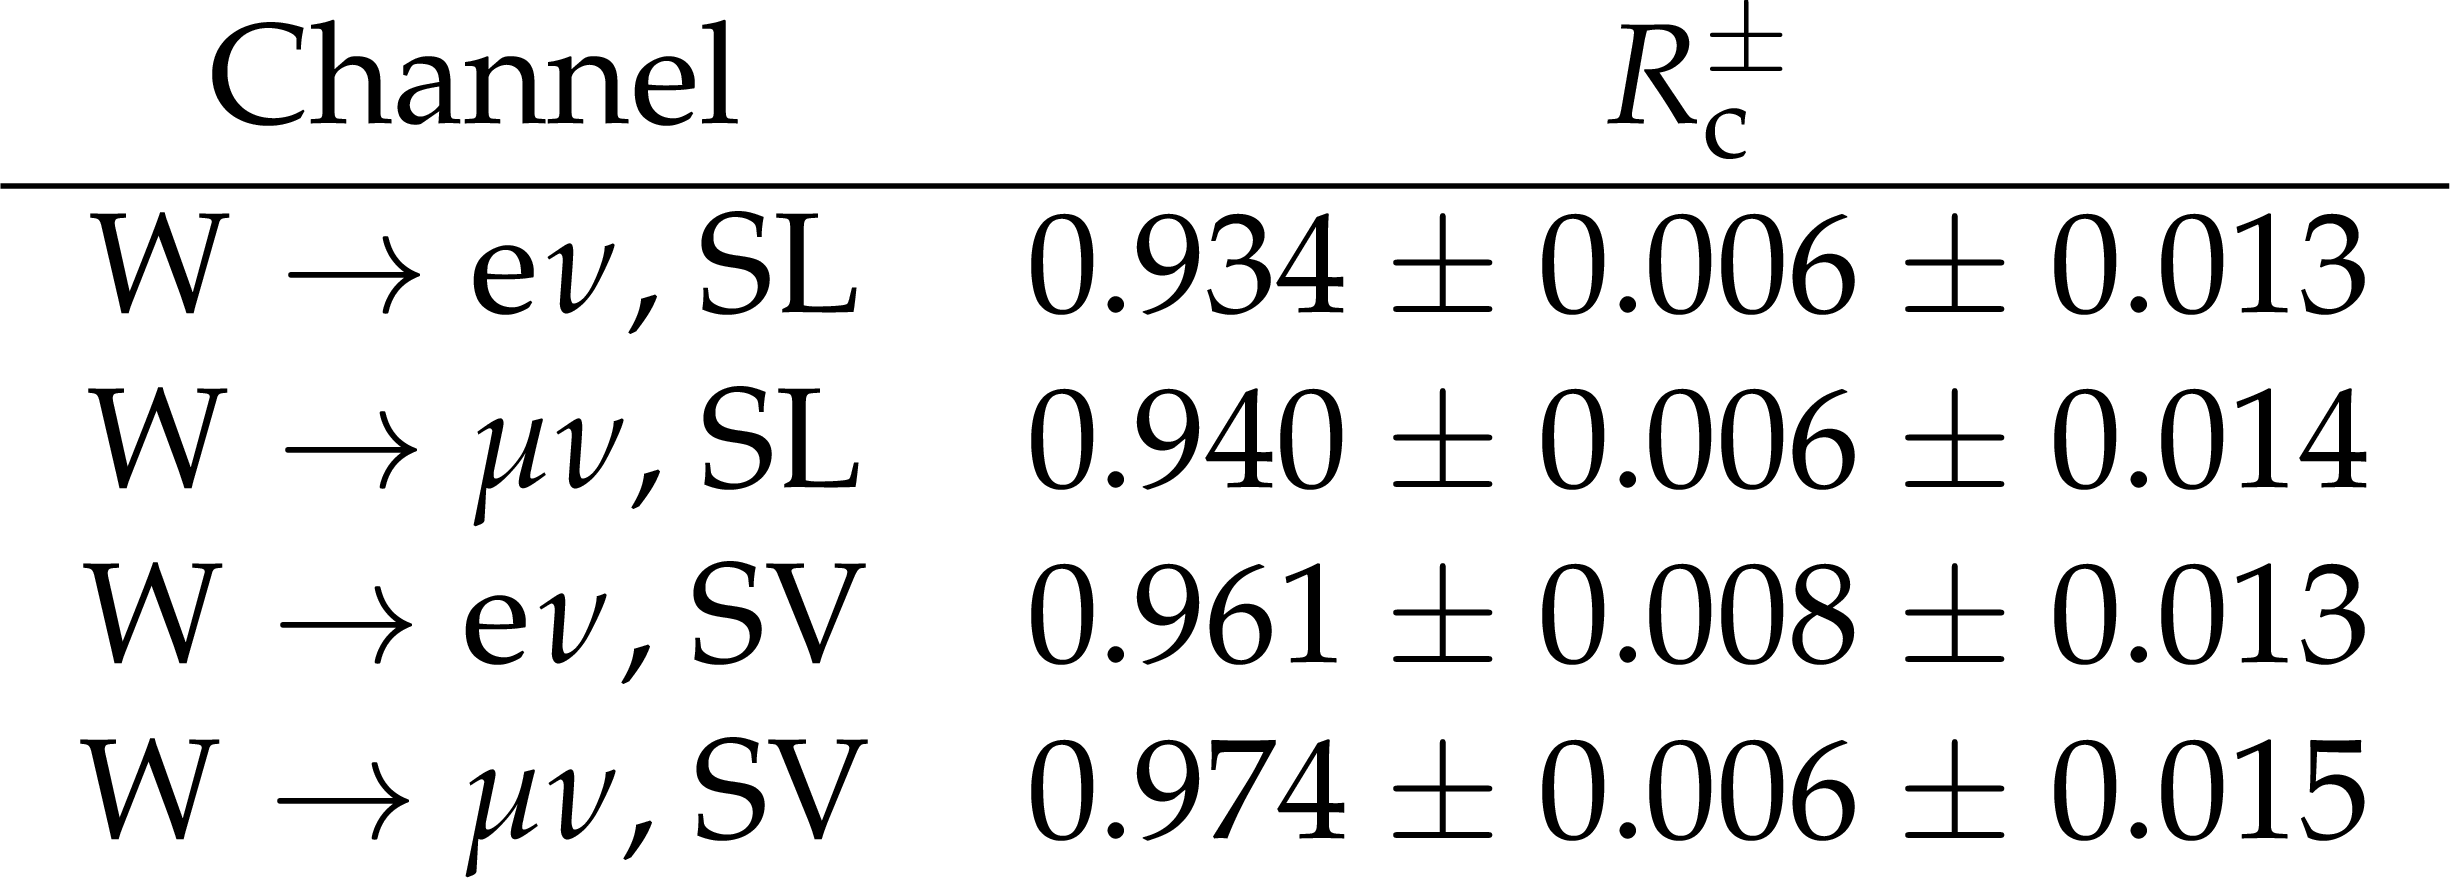
Table 10:
Measured production cross section ratio $ R_\mathrm{c}^{\pm} $ in the four selection channels. Statistical (first) and systematic (second) uncertainties are also given. |
png pdf |
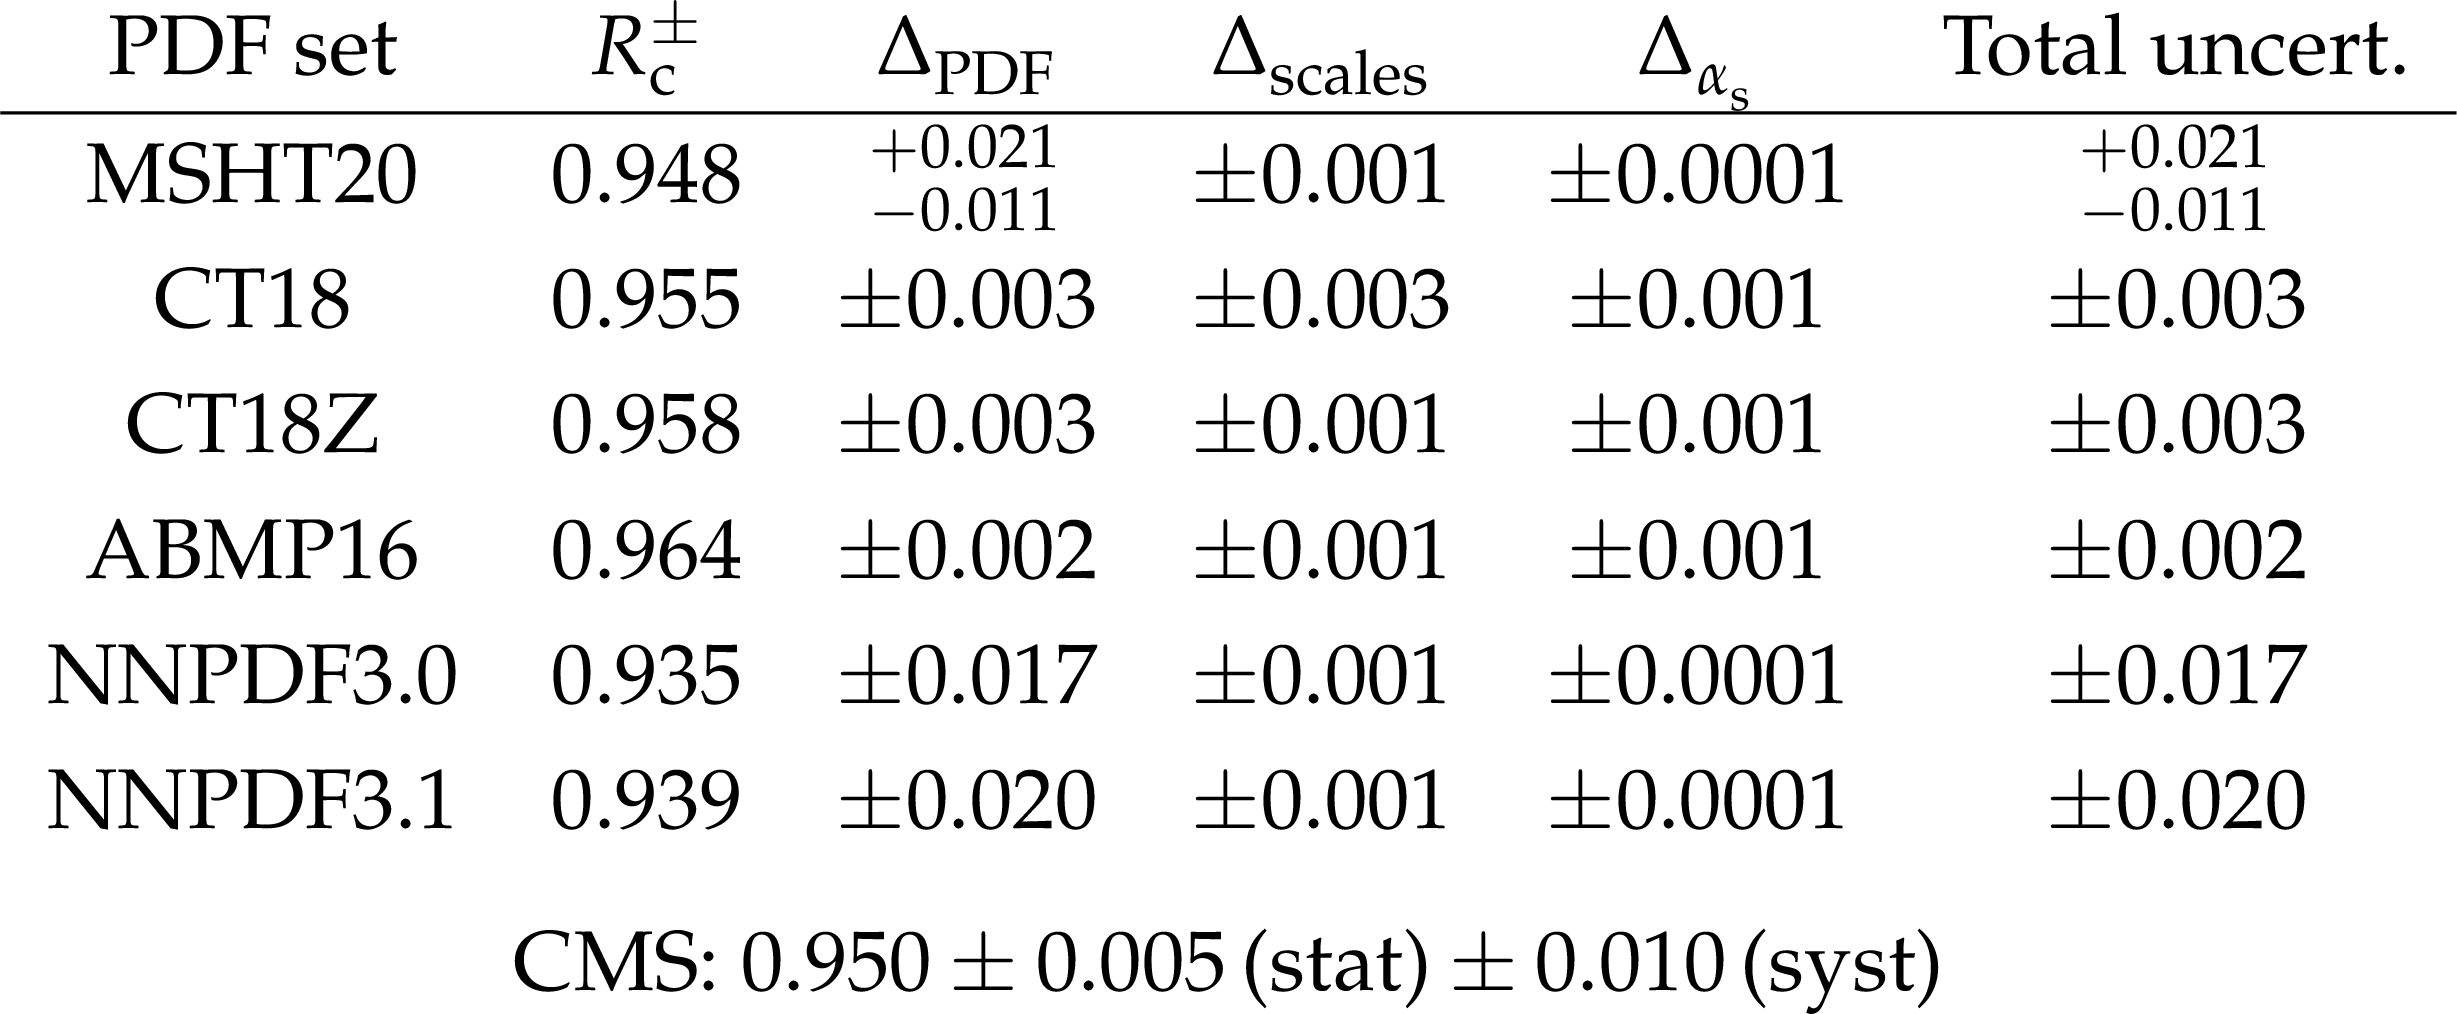
Table 11:
Theoretical predictions for $ R_\mathrm{c}^{\pm} $ calculated with MCFM at NLO. The kinematic selection follows the experimental requirements. For every PDF set, the central value of the prediction is given, together with the uncertainty as prescribed from the PDF set, and the uncertainties associated with the scale variations and with the value of $ \alpha_{\mathrm{s}} $. The total uncertainty is given in the last column. The last row in the table gives the experimental result presented in this paper. |

png pdf |
Table 12:
Predictions for $ \sigma(\mathrm{W}\,+\,\mathrm{c}) $ in the phase space of the analysis. For each QCD and EW order, the central values of the OS, SS and OS-SS predictions are given, together with the statistical, scales, PDF, and total uncertainties of the OS-SS prediction. All values are given in pb. The last row in the table gives the experimental result presented in this paper. |
png pdf |
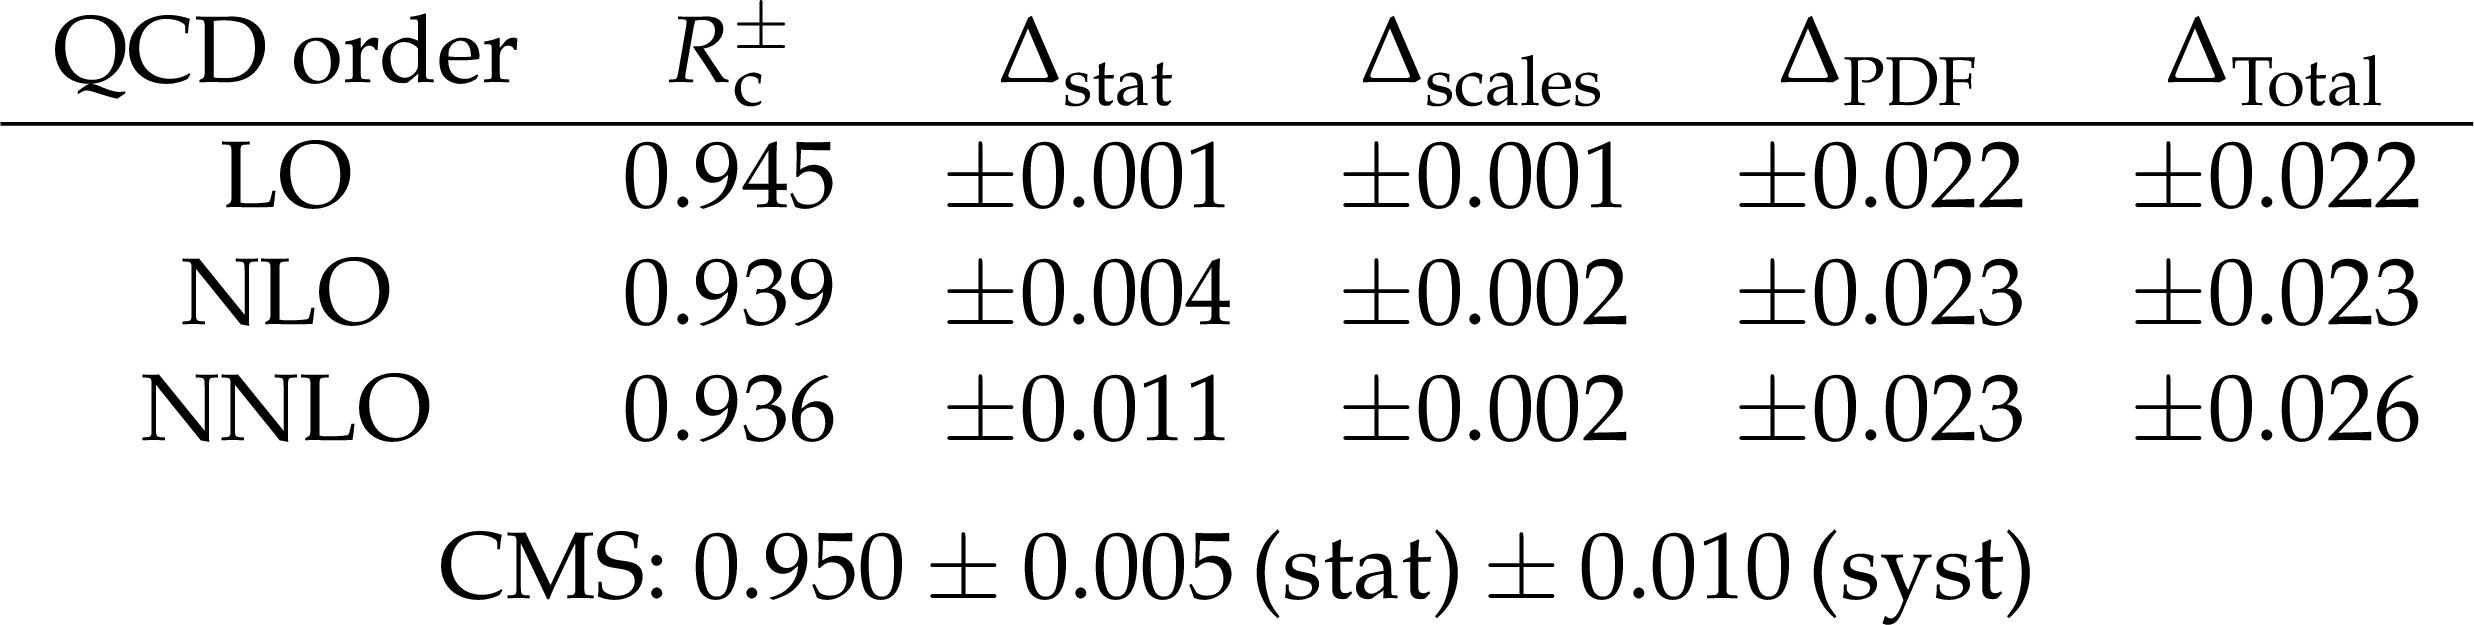
Table 13:
Theoretical predictions for $ R_\mathrm{c}^{\pm} $. For each QCD order, the central values are given, together with the MC statistical, scales, PDF, and total uncertainties. The last row in the table gives the experimental result presented in this paper. |
| Summary |
|
The associated production of a W boson with a charm quark (Wc) in proton-proton (pp) collisions at a center-of-mass energy of 13 TeV was studied with a data sample collected by the CMS experiment corresponding to an integrated luminosity of 138 fb$^{-1}$. The Wc process is selected based on the presence of a high transverse momentum lepton (electron or muon), coming from a W boson decay, and a jet with the signature of a charm hadron decay. Charm hadron decays are identified either by the presence of a muon inside a jet or by reconstructing a secondary decay vertex within the jet. Measurements are combined from the four different channels: electron and muon W boson decay channels, muon and secondary vertex charm identification channels. Cross section measurements, within a fiducial region defined by the kinematics of the lepton from the W boson decay and the jet originated by the charm quark ($ p_{\mathrm{T}}^{\ell} > $ 35 GeV, $ |\eta^{\ell}| < $ 2.4, $ p_{\mathrm{T}}^{\mathrm{c}\text{ jet} } > $ 30 GeV, $ |\eta^{\mathrm{c}\text{ jet} }| < $ 2.4), are unfolded to the particle and parton levels. Cross sections are also measured differentially, as functions of $ |\eta^\ell| $ and $ p_{\mathrm{T}}^\ell $. The cross section ratio for the processes $ \mathrm{W^+}\,+\,\bar{\mathrm{c}} $ and $ \mathrm{W^-}\,+\,\mathrm{c} $ is measured as well, achieving the highest precision in this measurement to date. The measured fiducial $ \sigma(\mathrm{W}\,+\,\mathrm{c}) $ production cross section unfolded to the particle level is: |
| References | ||||
| 1 | U. Baur et al. | The charm content of W + 1 jet events as a probe of the strange quark distribution function | PLB 318 (1993) 544 | hep-ph/9308370 |
| 2 | S. Catani, D. de Florian, G. Rodrigo, and W. Vogelsang | Perturbative generation of a strange-quark asymmetry in the nucleon | PRL 93 (2004) 152003 | hep-ph/0404240 |
| 3 | H. Lai et al. | The strange parton distribution of the nucleon: global analysis and applications | JHEP 04 (2007) 089 | hep-ph/0702268 |
| 4 | F. Faura et al. | The strangest proton? | EPJC 80 (2020) 1168 | 2009.00014 |
| 5 | CMS Collaboration | Measurement of associated Z + charm production in proton-proton collisions at $ \sqrt{s} = $ 8 TeV | EPJC 78 (2018) 287 | CMS-SMP-15-009 1711.02143 |
| 6 | CMS Collaboration | Search for Higgs boson decay to a charm quark-antiquark pair in proton-proton collisions at $ \sqrt{s}= $ 13 TeV | Accepted for publication in PRL, 2022 | CMS-HIG-21-008 2205.05550 |
| 7 | CMS Collaboration | Measurement of associated W+charm production in pp collisions at $ \sqrt{s} = $ 7 TeV | JHEP 02 (2014) 013 | CMS-SMP-12-002 1310.1138 |
| 8 | CMS Collaboration | Measurements of the production of a W boson in association with a charm quark in proton-proton collisions at $ \sqrt{s}= $ 8 TeV | EPJC 82 (2022) 1094 | CMS-SMP-18-013 2112.00895 |
| 9 | CMS Collaboration | Measurement of associated production of a W boson and a charm quark in proton-proton collisions at $ \sqrt{s} = $ 13 TeV | EPJC 79 (2019) 269 | CMS-SMP-17-014 1811.10021 |
| 10 | ATLAS Collaboration | Measurement of the production of a W boson in association with a charm quark in pp collisions at $ \sqrt{s}= $ 7 TeV with the ATLAS detector | JHEP 05 (2014) 068 | 1402.6263 |
| 11 | ATLAS Collaboration | Measurement of the production of a $ W $ boson in association with a charmed hadron in pp collisions at $ \sqrt{s} = $ 13 TeV with the ATLAS detector | link | |
| 12 | LHCb Collaboration | Study of W boson production in association with beauty and charm | PRD 92 (2015) 052001 | 1505.04051 |
| 13 | W. J. Stirling and E. Vryonidou | Charm production in association with an electroweak gauge boson at the LHC | PRL 109 (2012) 082002 | 1203.6781 |
| 14 | M. Czakon, A. Mitov, M. Pellen, and R. Poncelet | NNLO QCD predictions for W + c-jet production at the LHC | JHEP 06 (2021) 100 | 2011.01011 |
| 15 | M. Czakon, A. Mitov, M. Pellen, and R. Poncelet | A detailed investigation of W + c-jet at the LHC | JHEP 02 (2023) 241 | 2212.00467 |
| 16 | J. Campbell and T. Neumann | Precision phenomenology with MCFM | JHEP 12 (2019) 034 | 1909.09117 |
| 17 | CMS Collaboration | HEPData record for this analysis | link | |
| 18 | CMS Collaboration | Track impact parameter resolution in the 2017 dataset with the CMS Phase-1 pixel detector | CMS Detector Performance Note, CMS-DP-2020-032, 2020 CDS |
|
| 19 | CMS Collaboration | The CMS experiment at the CERN LHC | JINST 3 (2008) S08004 | |
| 20 | CMS Collaboration | Performance of the CMS Level-1 trigger in proton-proton collisions at $ \sqrt{s} = $ 13 TeV | JINST 15 (2020) P10017 | CMS-TRG-17-001 2006.10165 |
| 21 | CMS Collaboration | The CMS trigger system | JINST 12 (2017) P01020 | CMS-TRG-12-001 1609.02366 |
| 22 | W. Adam et al. | The CMS Phase-1 pixel detector upgrade | JINST 16 (2021) P02027 | 2012.14304 |
| 23 | CMS | Performance of b tagging algorithms in proton-proton collisions at 13 TeV with Phase-1 CMS detector | CMS Detector Performance Note, CMS-DP-2018-033, 2018 | |
| 24 | J. Alwall et al. | The automated computation of tree-level and next-to-leading order differential cross sections, and their matching to parton shower simulations | JHEP 07 (2014) 079 | 1405.0301 |
| 25 | S. Alioli, P. Nason, C. Oleari, and E. Re | A general framework for implementing NLO calculations in shower Monte Carlo programs: the POWHEG BOX | JHEP 06 (2010) 043 | 1002.2581 |
| 26 | T. Sj$\ddot \rm o $strand et al. | An introduction to PYTHIA 8.2 | Comput. Phys. Commun. 191 (2015) 159 | 1410.3012 |
| 27 | NNPDF Collaboration | Parton distributions for the LHC Run II | JHEP 04 (2015) 040 | 1410.8849 |
| 28 | NNPDF Collaboration | Parton distributions from high-precision collider data | EPJC 77 (2017) 663 | 1706.00428 |
| 29 | P. Skands, S. Carrazza, and J. Rojo | Tuning PYTHIA 8.1: the Monash 2013 Tune | EPJC 74 (2014) 3024 | 1404.5630 |
| 30 | CMS Collaboration | Event generator tunes obtained from underlying event and multiparton scattering measurements | EPJC 76 (2016) 155 | CMS-GEN-14-001 1512.00815 |
| 31 | CMS Collaboration | Extraction and validation of a new set of CMS PYTHIA 8 tunes from underlying-event measurements | EPJC 80 (2020) 4 | CMS-GEN-17-001 1903.12179 |
| 32 | R. Frederix and S. Frixione | Merging meets matching in MC@NLO | JHEP 12 (2012) 061 | 1209.6215 |
| 33 | M. Lisovyi, A. Verbytskyi, and O. Zenaiev | Combined analysis of charm-quark fragmentation-fraction measurements | EPJC 76 (2016) 397 | 1509.01061 |
| 34 | R. L. Workman and others (Particle Data Group) | Review of Particle Physics | PTEP 2022 (2022) 083C01 | |
| 35 | GEANT 4 Collaboration | GEANT 4 --- a simulation toolkit | NIM A 506 (2003) 250 | |
| 36 | CMS Collaboration | Particle-flow reconstruction and global event description with the CMS detector | JINST 12 (2017) P10003 | CMS-PRF-14-001 1706.04965 |
| 37 | CMS Collaboration | Technical proposal for the phase-II upgrade of the Compact Muon Solenoid | CMS Technical Proposal, CERN-LHCC-2015-010, CMS-TDR-15-02, 2020 CDS |
|
| 38 | CMS Collaboration | Electron and photon reconstruction and identification with the CMS experiment at the CERN LHC | JINST 16 (2021) P05014 | CMS-EGM-17-001 2012.06888 |
| 39 | CMS Collaboration | ECAL 2016 refined calibration and run 2 summary plots | CMS Detector Performance Note, CMS-DP-2020-021, 2020 CDS |
|
| 40 | CMS Collaboration | Performance of the CMS muon detector and muon reconstruction with proton-proton collisions at $ \sqrt{s}= $ 13 TeV | JINST 13 (2018) P06015 | CMS-MUO-16-001 1804.04528 |
| 41 | M. Cacciari, G. P. Salam, and G. Soyez | The anti-$ k_{\mathrm{T}} $ jet clustering algorithm | JHEP 04 (2008) 063 | 0802.1189 |
| 42 | M. Cacciari, G. P. Salam, and G. Soyez | FastJet user manual | EPJC 72 (2012) 1896 | 1111.6097 |
| 43 | CMS Collaboration | Jet energy scale and resolution in the CMS experiment in pp collisions at 8 TeV | JINST 12 (2017) P02014 | CMS-JME-13-004 1607.03663 |
| 44 | CMS Collaboration | Performance of missing transverse momentum reconstruction in proton-proton collisions at $ \sqrt{s} = $ 13 TeV using the CMS detector | JINST 14 (2019) P07004 | CMS-JME-17-001 1903.06078 |
| 45 | CMS Collaboration | Measurement of the inclusive W and Z production cross sections in pp collisions at $ \sqrt{s}= $ 7 TeV with the CMS experiment | JHEP 10 (2011) 132 | CMS-EWK-10-005 1107.4789 |
| 46 | M. Cacciari and G. P. Salam | Pileup subtraction using jet areas | PLB 659 (2008) 119 | 0707.1378 |
| 47 | CMS Collaboration | Identification of heavy-flavour jets with the CMS detector in pp collisions at 13 TeV | JINST 13 (2018) P05011 | CMS-BTV-16-002 1712.07158 |
| 48 | CMS Collaboration | Identification of b-quark jets with the CMS experiment | JINST 8 (2013) P04013 | CMS-BTV-12-001 1211.4462 |
| 49 | CMS Collaboration | Measurement of $ {\mathrm b}\bar{\mathrm b} $ angular correlations based on secondary vertex reconstruction at $ \sqrt{s}= $ 7 TeV | JHEP 03 (2011) 136 | CMS-BPH-10-010 1102.3194 |
| 50 | CMS Collaboration | Measurement of the cross section and angular correlations for associated production of a Z boson with b hadrons in pp collisions at $ \sqrt{s}= $ 7 TeV | JHEP 12 (2013) 039 | CMS-EWK-11-015 1310.1349 |
| 51 | W. Waltenberger, R. Frühwirth, and P. Vanlaer | Adaptive vertex fitting | JPG 34 (2007) N343 | |
| 52 | A. Ali and F. Barreiro | The final states $ \ell^\pm K^\pm K^\pm $ X in jets as signatures of $ B_s^0$-$\bar{B}_s^0 $ mixings | Z. Phys. C 30 (1986) 635 | |
| 53 | M. Gronau, A. Nippe, and J. L. Rosner | Method for flavor tagging in neutral B meson decays | PRD 47 (1993) 1988 | hep-ph/9211311 |
| 54 | LHCb Collaboration | Identification of beauty and charm quark jets at LHCb | JINST 10 (2015) P06013 | 1504.07670 |
| 55 | CMS Collaboration | Measurement of the inelastic proton-proton cross section at $ \sqrt{s}= $ 13 TeV | JHEP 07 (2018) 161 | CMS-FSQ-15-005 1802.02613 |
| 56 | CMS Collaboration | Precision luminosity measurement in proton-proton collisions at $ \sqrt{s} = $ 13 TeV in 2015 and 2016 at CMS | EPJC 81 (2021) 800 | CMS-LUM-17-003 2104.01927 |
| 57 | CMS Collaboration | CMS luminosity measurement for the 2017 data-taking period at $ \sqrt{s} $ = 13 TeV | CMS Physics Analysis Summary, CMS-PAS-LUM-17-004, 2018 CMS-PAS-LUM-17-004 |
CMS-PAS-LUM-17-004 |
| 58 | CMS Collaboration | CMS luminosity measurement for the 2018 data-taking period at $ \sqrt{s} $ = 13 TeV | CMS Physics Analysis Summary, CMS-PAS-LUM-18-002, 2019 CMS-PAS-LUM-18-002 |
CMS-PAS-LUM-18-002 |
| 59 | J. Butterworth et al. | PDF4LHC recommendations for LHC run II | JPG 43 (2016) 023001 | 1510.03865 |
| 60 | L. Lyons, D. Gibaut, and P. Clifford | How to combine correlated estimates of a single physical quantity | NIM A 270 (1988) 110 | |
| 61 | S. Bailey et al. | Parton distributions from LHC, HERA, Tevatron and fixed target data: MSHT20 PDFs | EPJC 81 (2021) 341 | 2012.04684 |
| 62 | T.-J. Hou et al. | New CTEQ global analysis of quantum chromodynamics with high-precision data from the LHC | PRD 103 (2021) 014013 | 1912.10053 |
| 63 | S. Alekhin, J. Blümlein, and S. Moch | NLO PDFs from the ABMP16 fit | EPJC 78 (2018) 477 | 1803.07537 |
| 64 | A. Buckley et al. | LHAPDF6: parton density access in the LHC precision era | EPJC 75 (2015) 132 | 1412.7420 |
| 65 | ATLAS Collaboration | Precision measurement and interpretation of inclusive W$^+ $, W$^- $ and Z$/\gamma^* $ production cross sections with the ATLAS detector | EPJC 77 (2017) 367 | 1612.03016 |
| 66 | M. Czakon, A. Mitov, and R. Poncelet | Infrared-safe flavoured anti-k$ _\mathrm{T} $ jets | JHEP 04 (2023) 138 | 2205.11879 |
| 67 | S. Carrazza, S. Forte, Z. Kassabov, and J. Rojo | Specialized minimal PDFs for optimized LHC calculations | EPJC 76 (2016) 205 | 1602.00005 |
|
|
Compact Muon Solenoid LHC, CERN |
|

|

|

|

|

|