

Compact Muon Solenoid
LHC, CERN
| CMS-TOP-17-020 ; CERN-EP-2019-018 | ||
| Search for new physics in top quark production in dilepton final states in proton-proton collisions at $\sqrt{s} =$ 13 TeV | ||
| CMS Collaboration | ||
| 26 March 2019 | ||
| Eur. Phys. J. C 79 (2019) 886 | ||
| Abstract: A search for new physics in top quark production is performed in proton-proton collisions at 13 TeV. The data set corresponds to an integrated luminosity of 35.9 fb$^{-1}$ collected in 2016 with the CMS detector. Events with two opposite-sign isolated leptons (electrons or muons), and b quark jets in the final state are selected. The search is sensitive to new physics in top quark pair production and in single top quark production in association with a W boson. No significant deviation from the standard model expectation is observed. Results are interpreted in the framework of effective field theory and constraints on the relevant effective couplings are set, one at a time, using a dedicated multivariate analysis. This analysis differs from previous searches for new physics in the top quark sector by explicitly separating tW from $\mathrm{t\bar{t}}$ events and exploiting the specific sensitivity of the tW process to new physics. | ||
| Links: e-print arXiv:1903.11144 [hep-ex] (PDF) ; CDS record ; inSPIRE record ; CADI line (restricted) ; | ||
| Figures | |
png pdf |
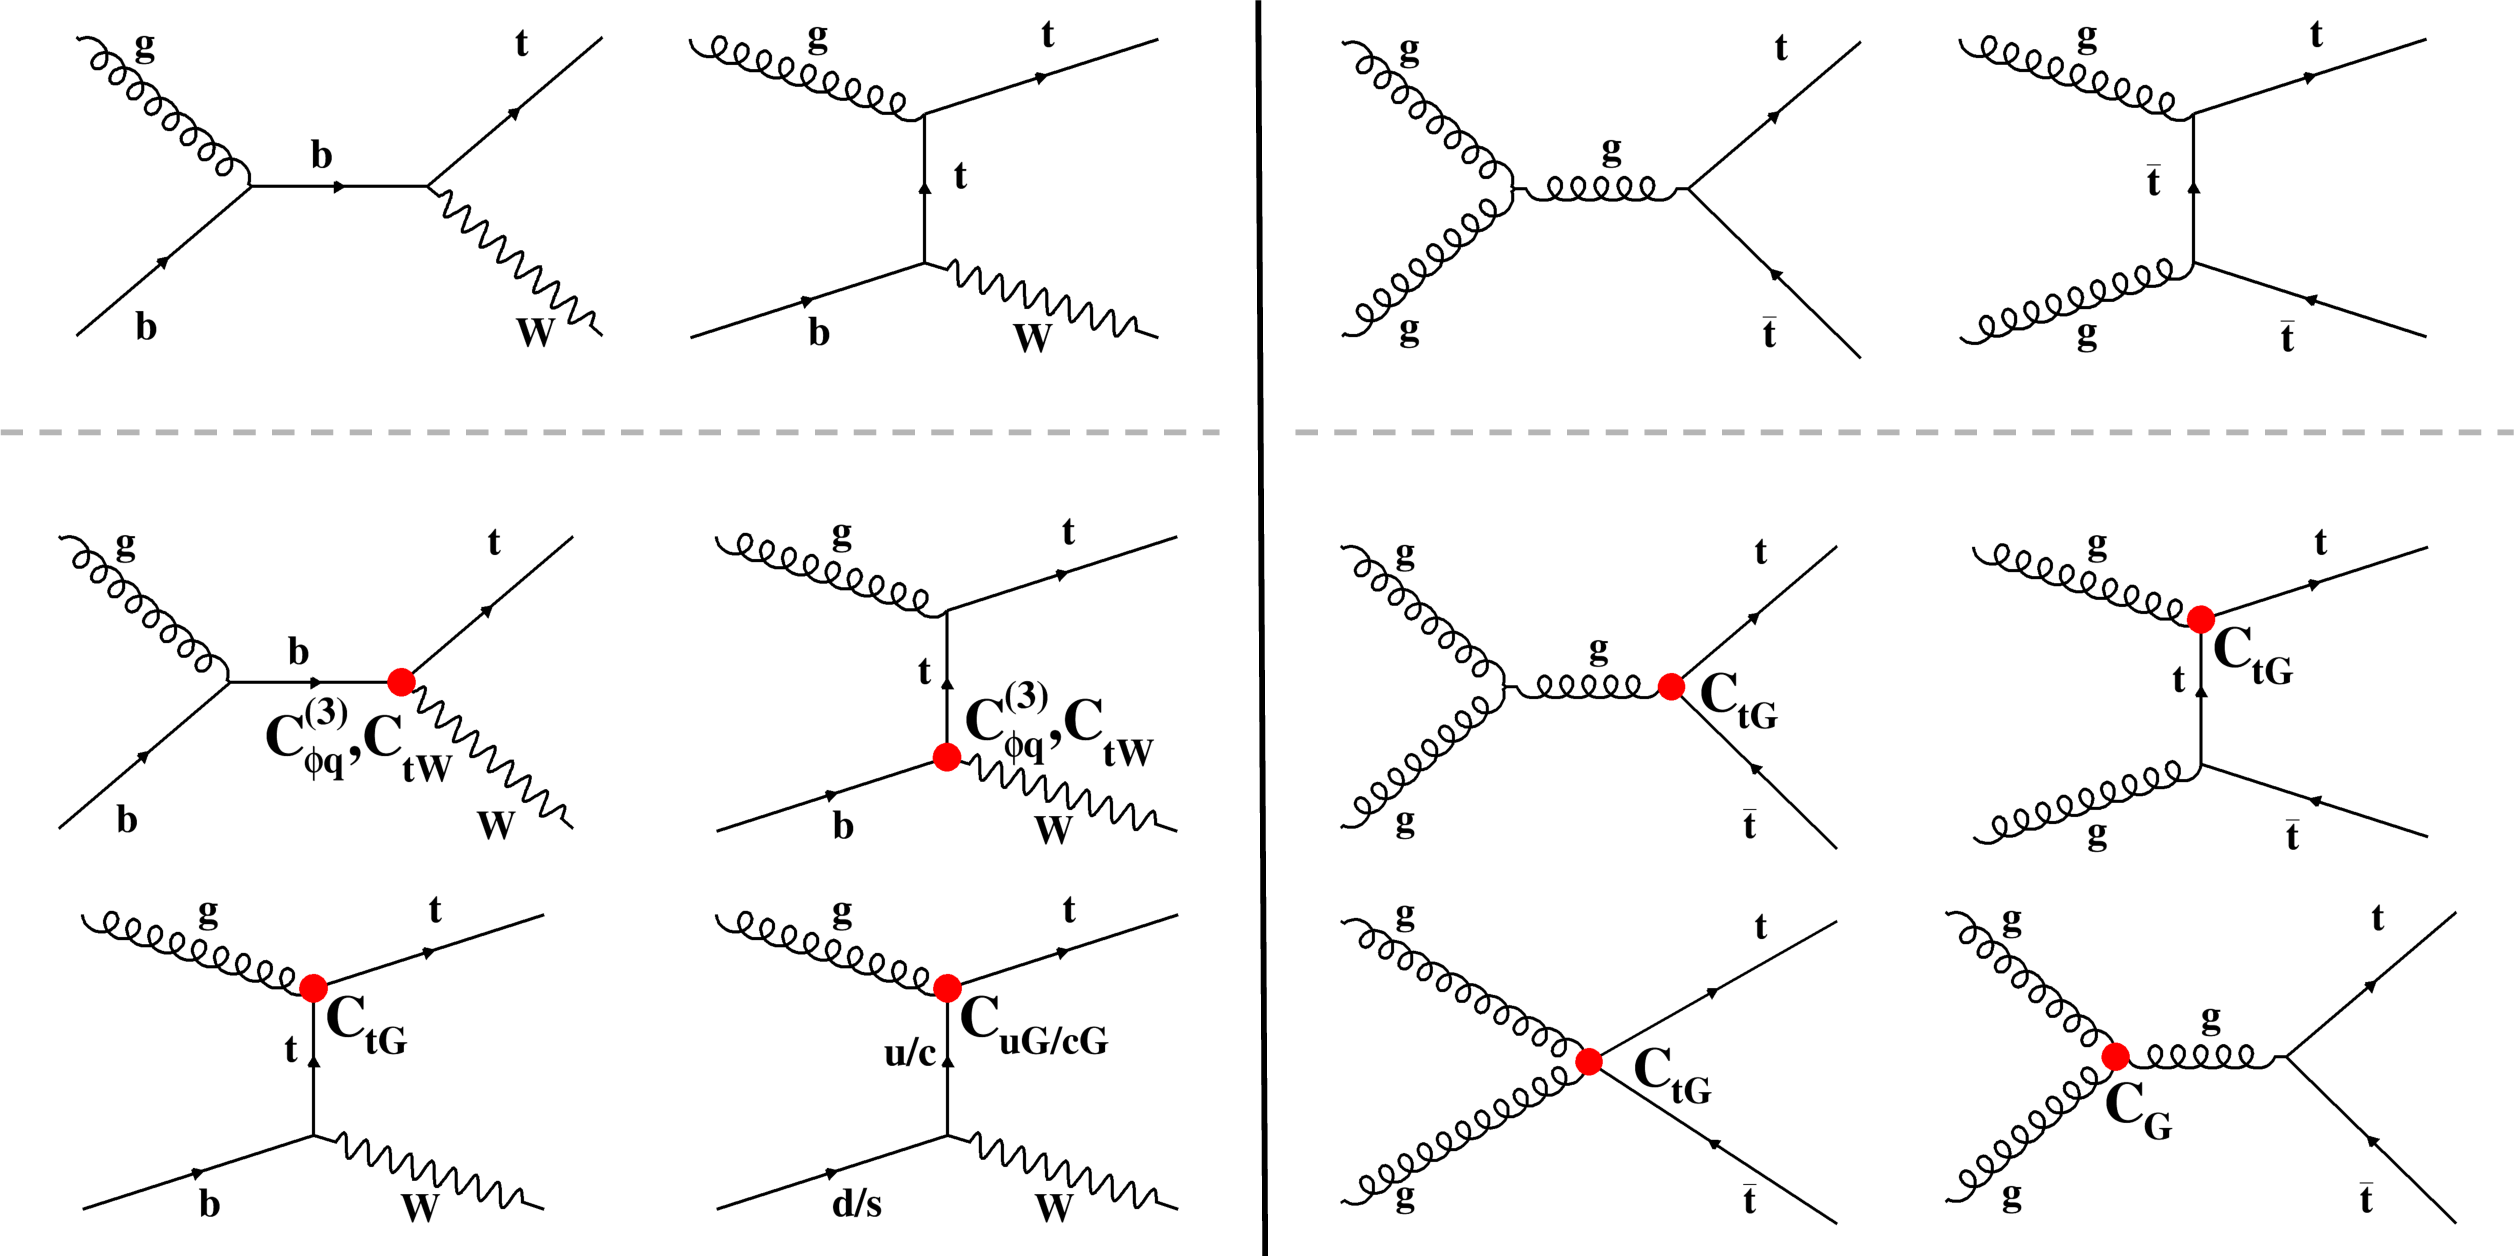
Figure 1:
Representative Feynman diagrams for the tW (left panel) and ${\mathrm{t} {}\mathrm{\bar{t}}}$ (right panel) production at leading order. The upper row presents the SM diagrams, the middle and lower rows present diagrams corresponding to the $O_{\phi \mathrm{q}}^{(3)}$, $O_{\mathrm{t} \mathrm{W}}$,$O_{\mathrm{t} \mathrm{G}}$, $O_{\mathrm{G}}$ and $O_{\mathrm {u/cG}}$ contributions. |
png pdf |
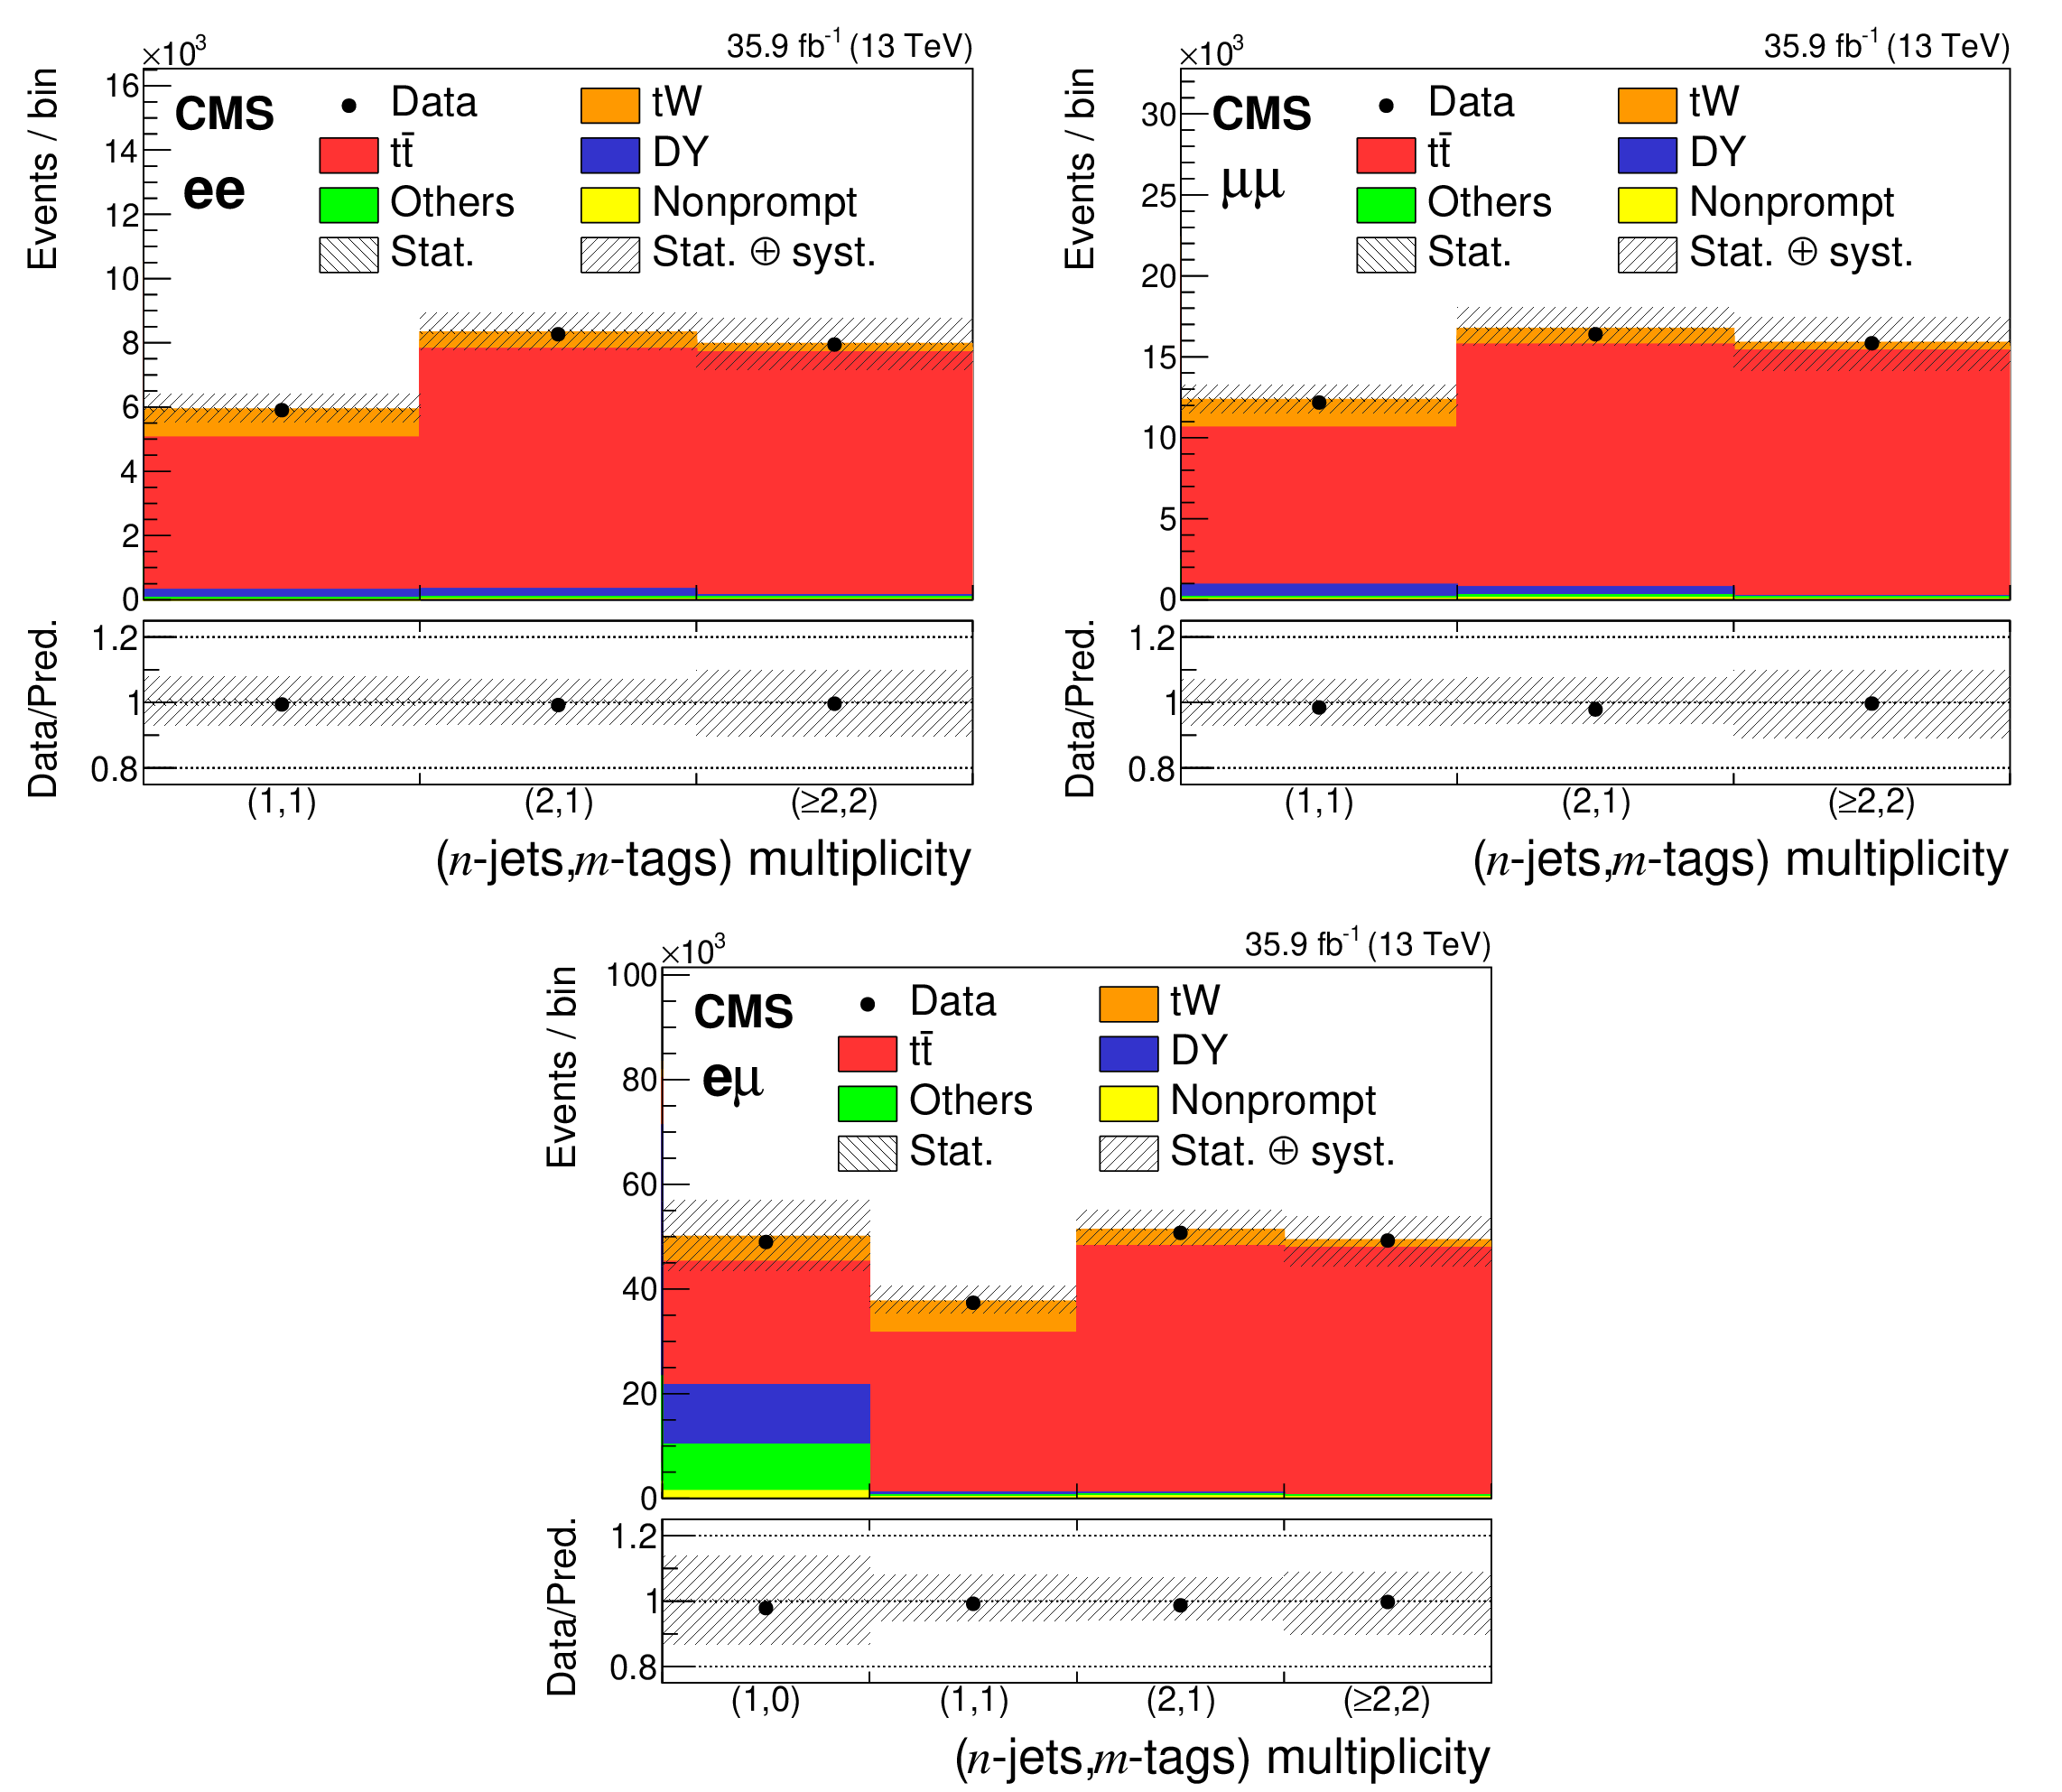
Figure 2:
The observed number of events and SM background predictions in the search regions of the analysis for the $\mathrm{e} \mathrm{e} $ (upper left), $\mu \mu $ (upper right), and $\mathrm{e} \mu $ (lower) channels. The hatched bands correspond to the quadratic sum of statistical and systematic uncertainties in the event yield for the SM background predictions. The ratios of data to the sum of the predicted yields are shown at the bottom of each plot. The narrow hatched bands represent the contribution from the statistical uncertainty in the MC simulation. |
png pdf |
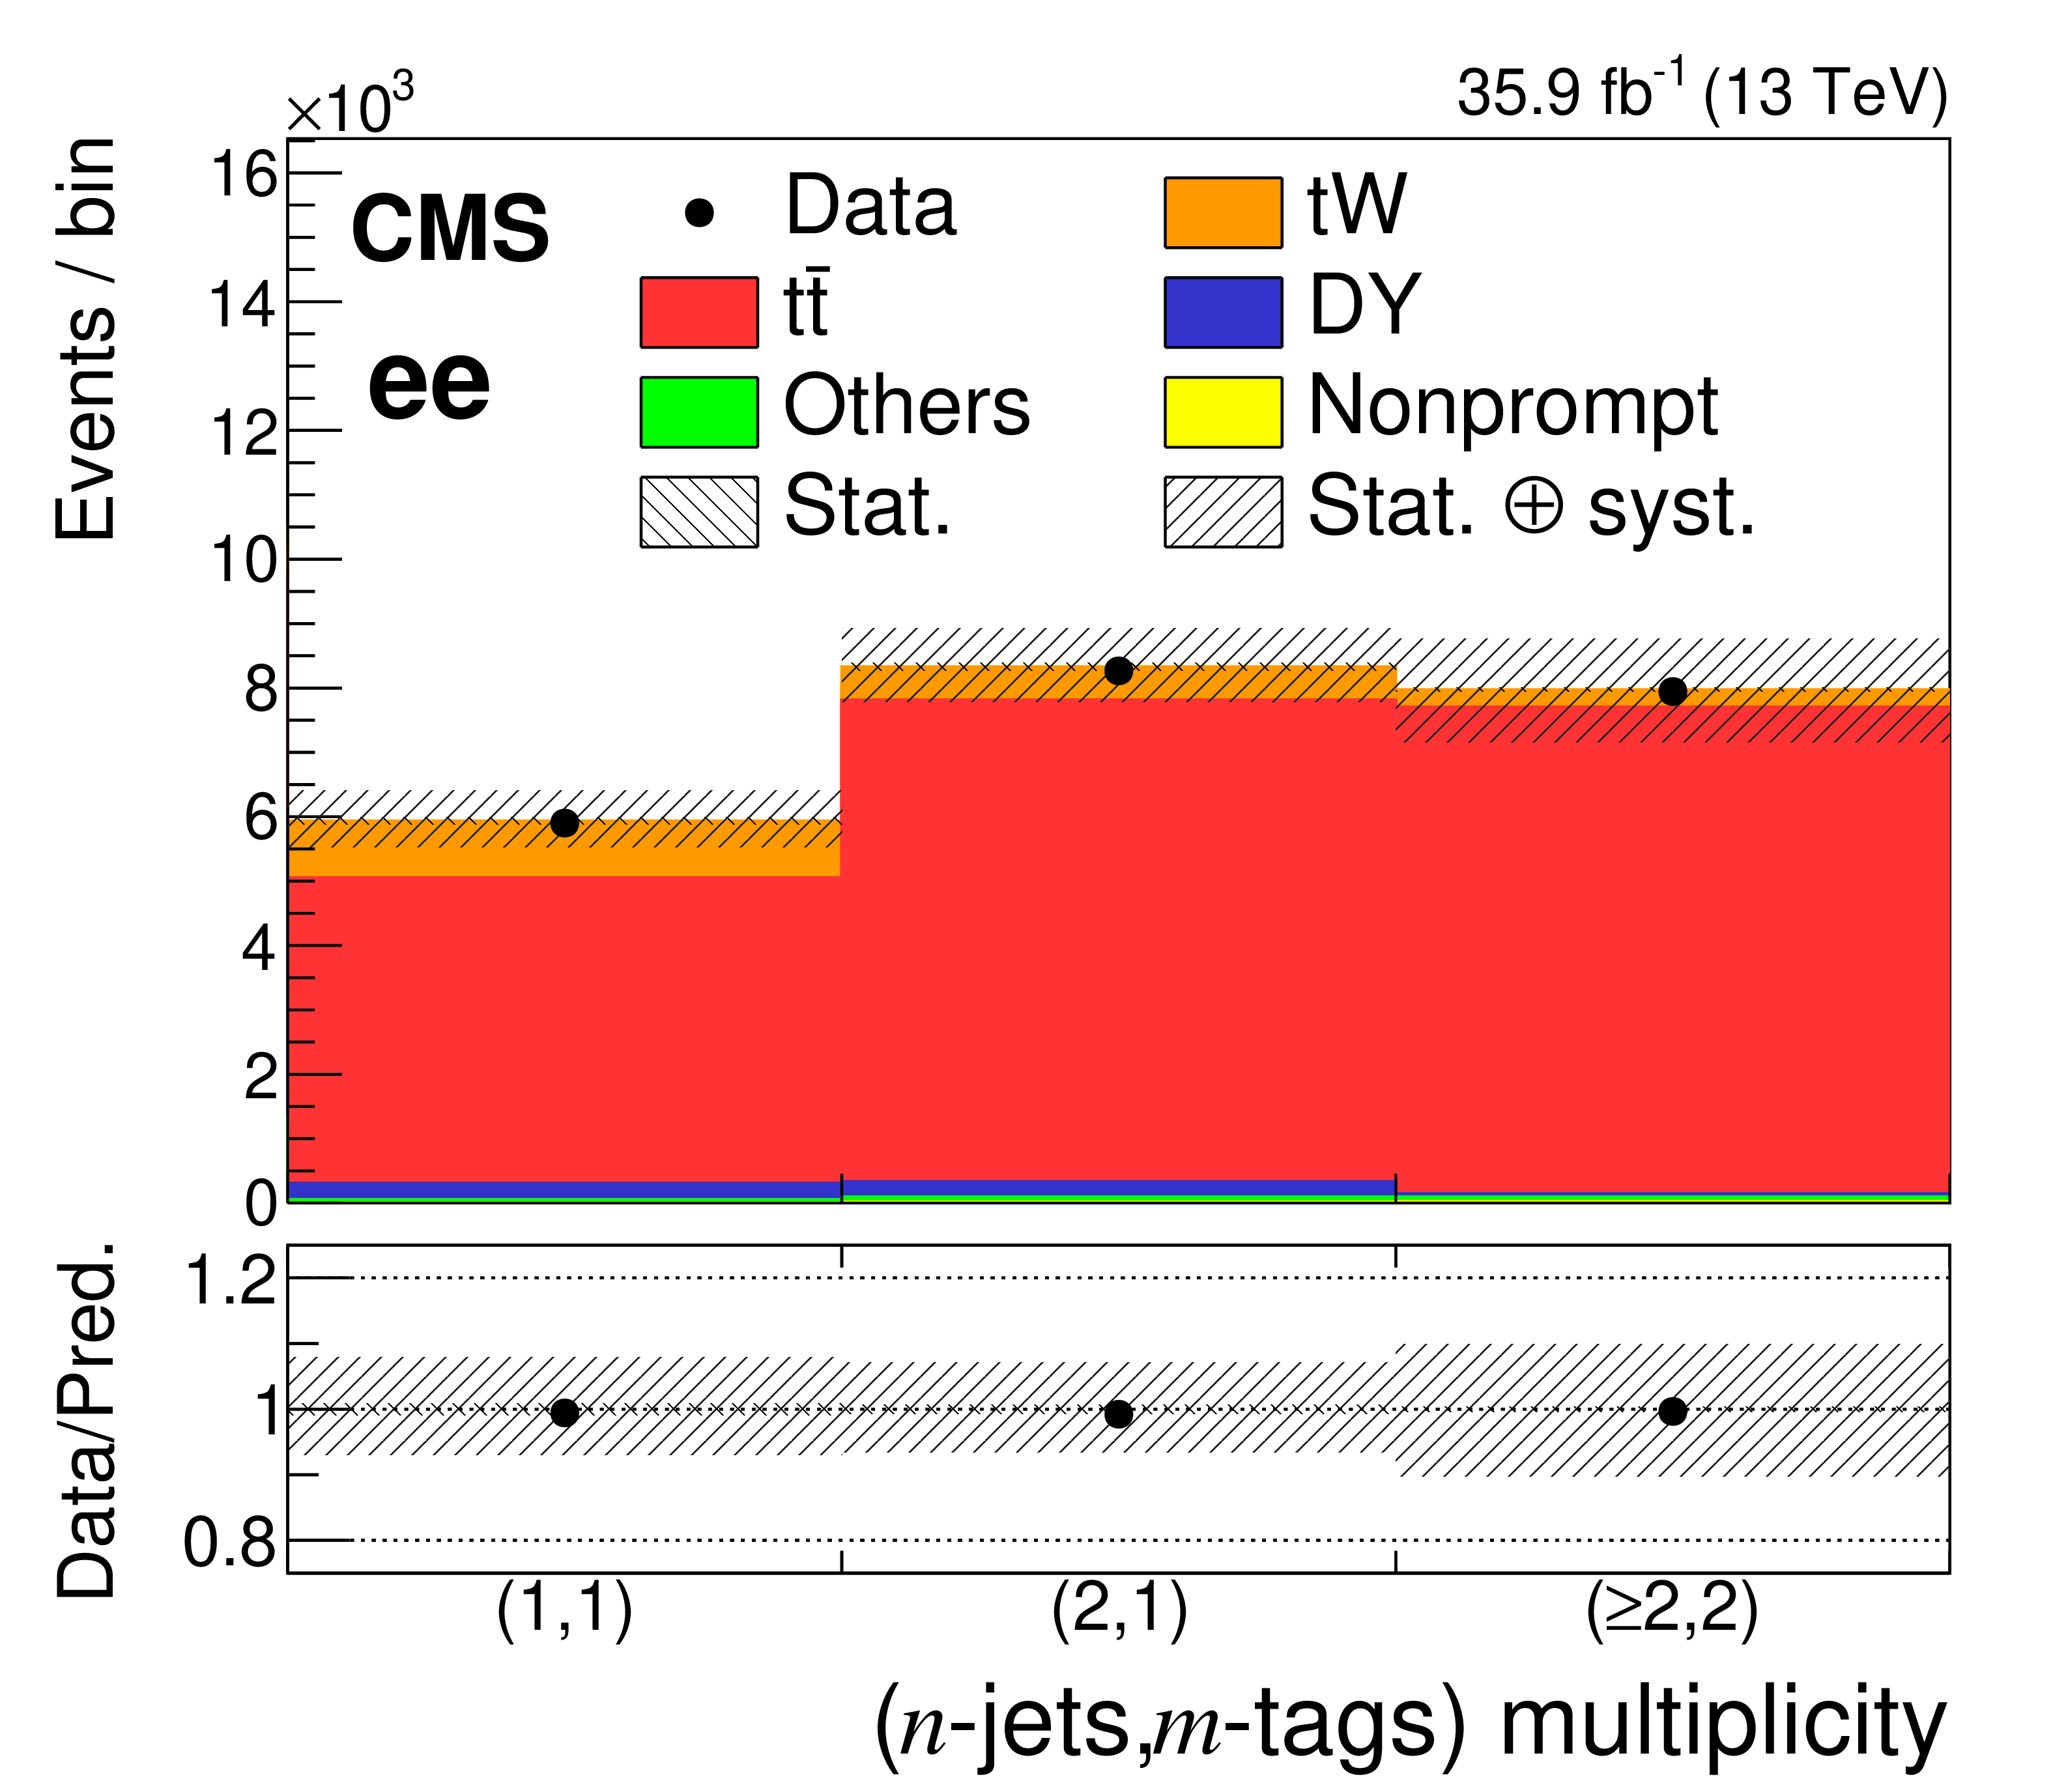
Figure 2-a:
The observed number of events and SM background predictions in the search regions of the analysis for the $\mathrm{e} \mathrm{e} $ channel. The hatched bands correspond to the quadratic sum of statistical and systematic uncertainties in the event yield for the SM background predictions. The ratios of data to the sum of the predicted yields are shown at the bottom of the plot. The narrow hatched bands represent the contribution from the statistical uncertainty in the MC simulation. |
png pdf |
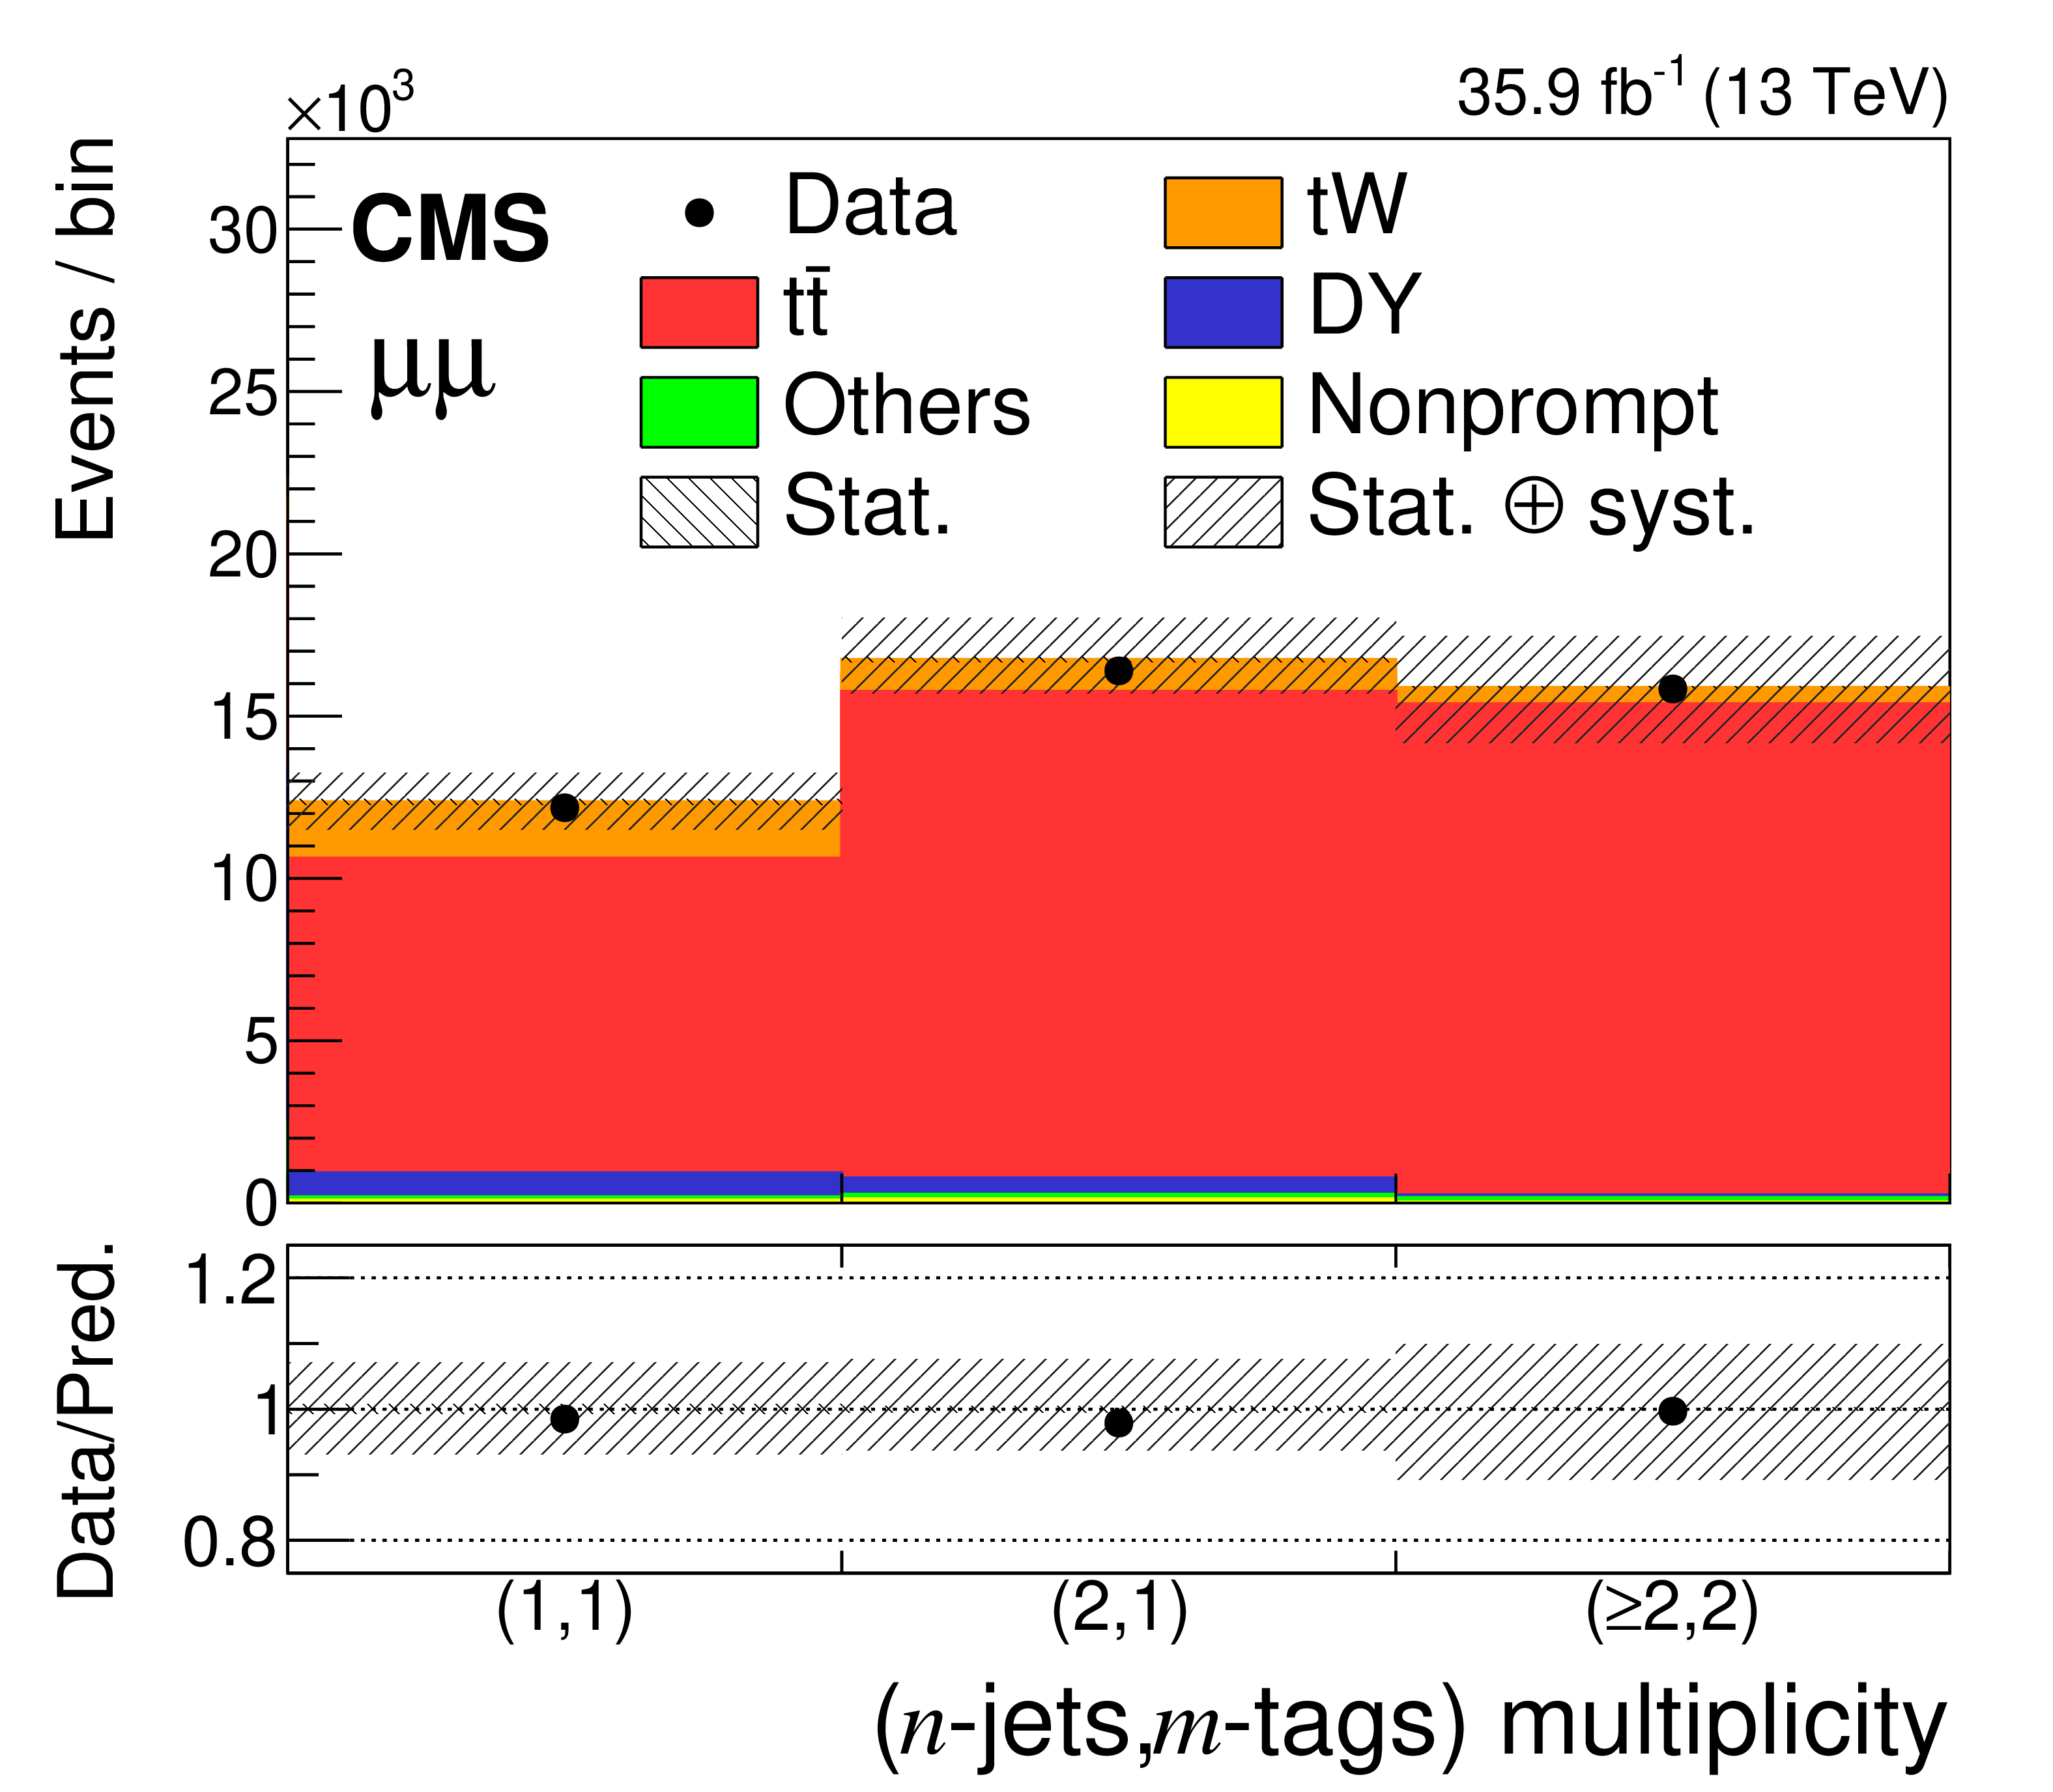
Figure 2-b:
The observed number of events and SM background predictions in the search regions of the analysis for the $\mu \mu $ $channel. The hatched bands correspond to the quadratic sum of statistical and systematic uncertainties in the event yield for the SM background predictions. The ratios of data to the sum of the predicted yields are shown at the bottom of the plot. The narrow hatched bands represent the contribution from the statistical uncertainty in the MC simulation. |

png pdf |
Figure 2-c:
The observed number of events and SM background predictions in the search regions of the analysis for the $\mathrm{e} \mu $ channel. The hatched bands correspond to the quadratic sum of statistical and systematic uncertainties in the event yield for the SM background predictions. The ratios of data to the sum of the predicted yields are shown at the bottom of the plot. The narrow hatched bands represent the contribution from the statistical uncertainty in the MC simulation. |
png pdf |
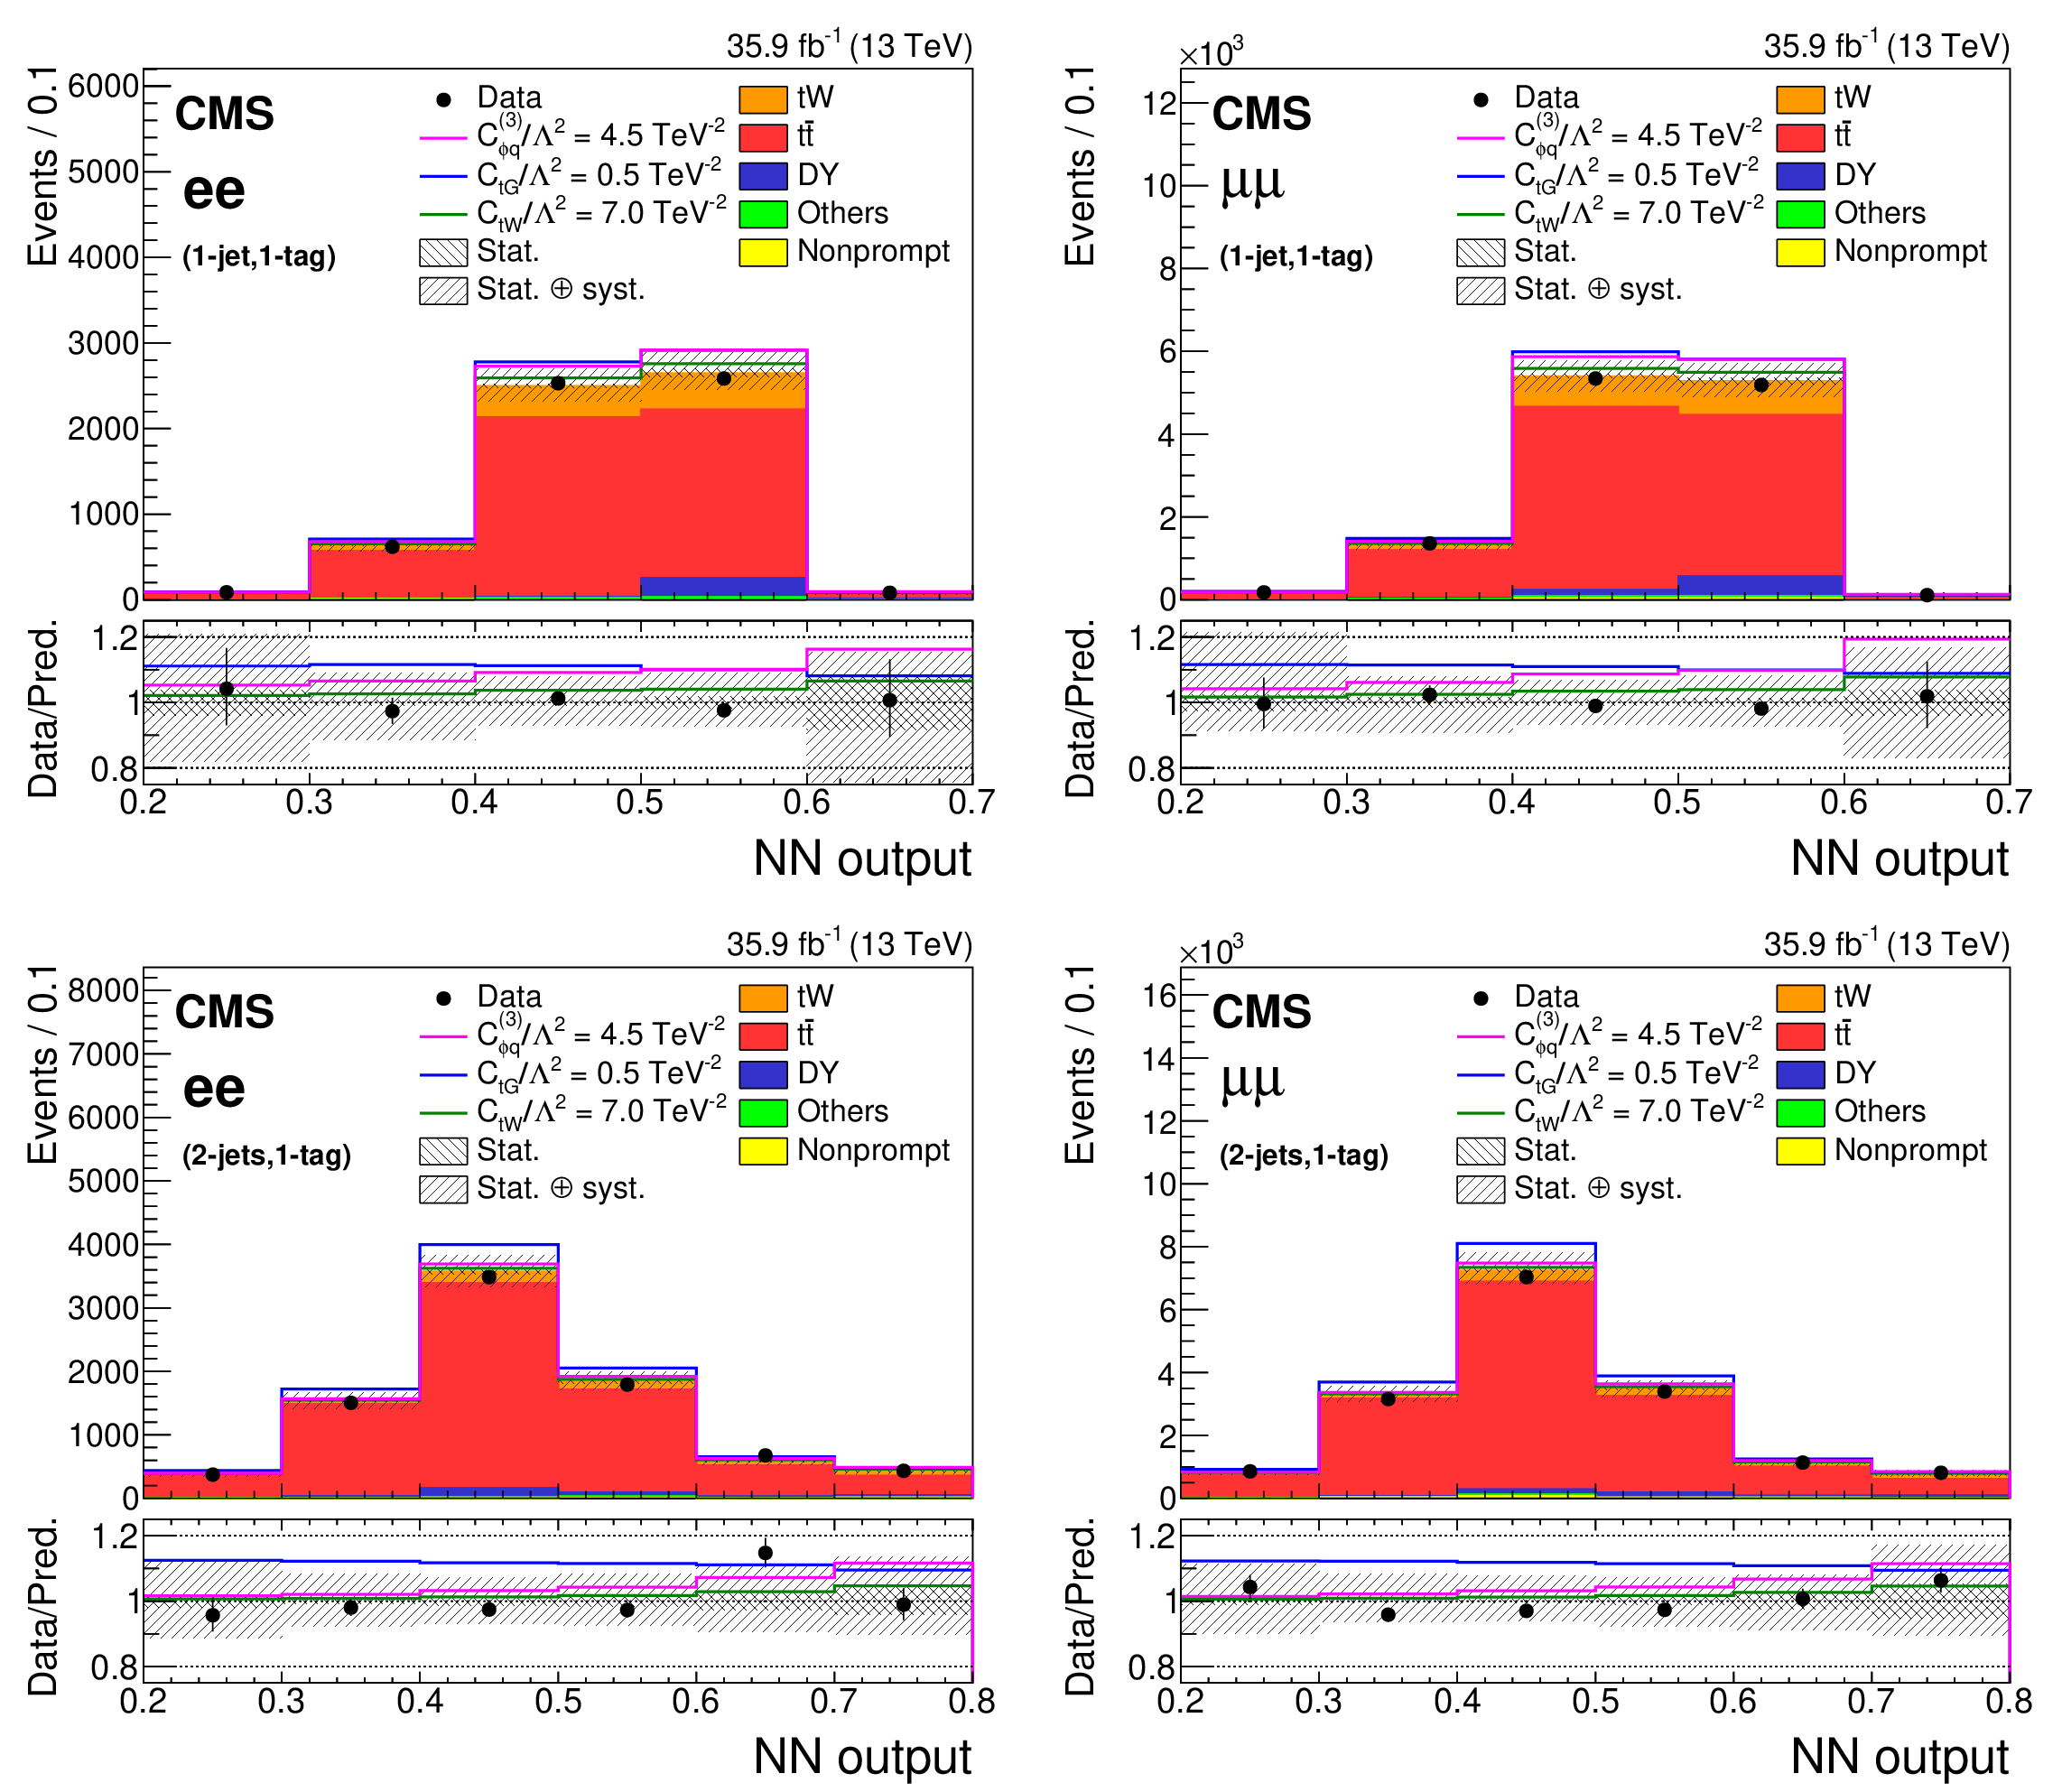
Figure 3:
The NN output distributions for data and simulation for the $\mathrm{e} \mathrm{e} $ (left) and $\mu \mu $ (right) channels in 1-jet, 1-tag (upper) and 2-jets, 1-tag (lower) categories. The hatched bands correspond to the quadratic sum of the statistical and systematic uncertainties in the event yield for the sum of signal and background predictions. The ratios of data to the sum of the predicted yields are shown at the lower panel of each graph. The narrow hatched bands represent the contribution from the statistical uncertainty in the MC simulation. In each plot, the expected distributions assuming specific values for the effective couplings (given in the legend) are shown as the solid curves. |

png pdf |
Figure 3-a:
The NN output distributions for data and simulation for the $\mathrm{e} \mathrm{e} $ channel in the 1-jet, 1-tag category. The hatched bands correspond to the quadratic sum of the statistical and systematic uncertainties in the event yield for the sum of signal and background predictions. The ratios of data to the sum of the predicted yields are shown at the lower panel of the graph. The narrow hatched bands represent the contribution from the statistical uncertainty in the MC simulation. The expected distributions assuming specific values for the effective couplings (given in the legend) are shown as the solid curves. |
png pdf |
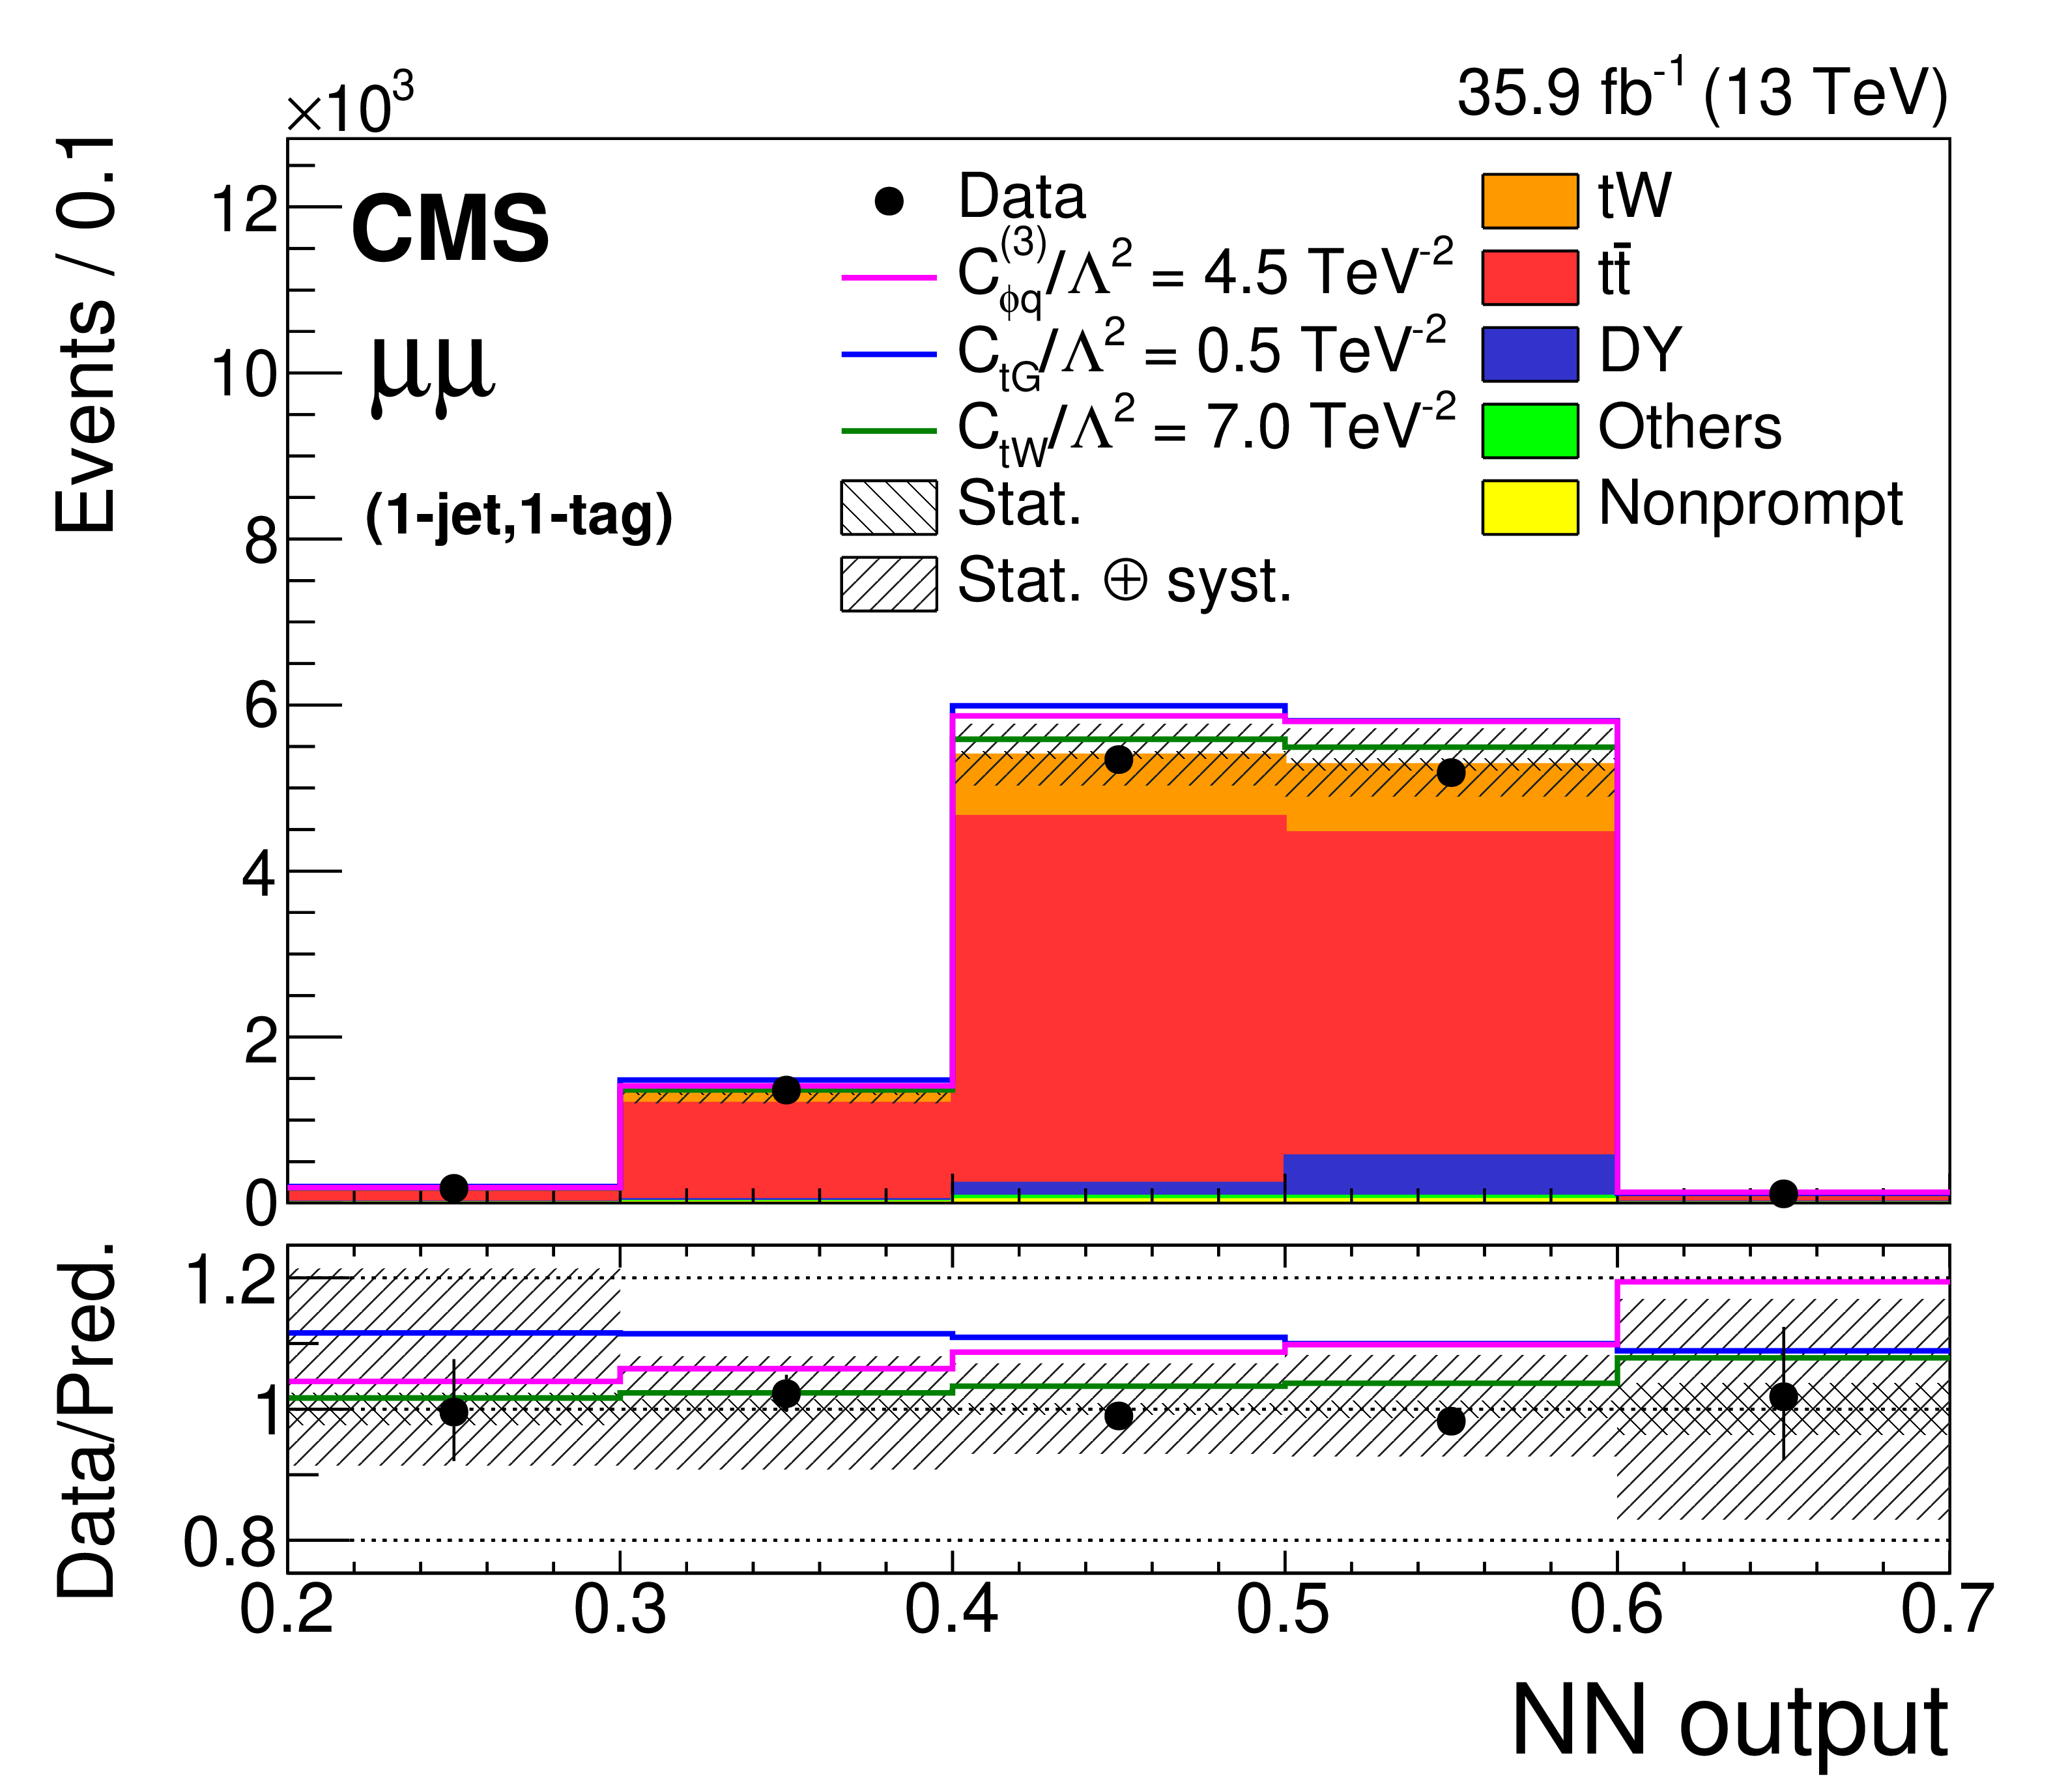
Figure 3-b:
The NN output distributions for data and simulation for the $\mu \mu $ channel in the 1-jet, 1-tag category. The hatched bands correspond to the quadratic sum of the statistical and systematic uncertainties in the event yield for the sum of signal and background predictions. The ratios of data to the sum of the predicted yields are shown at the lower panel of the graph. The narrow hatched bands represent the contribution from the statistical uncertainty in the MC simulation. The expected distributions assuming specific values for the effective couplings (given in the legend) are shown as the solid curves. |
png pdf |
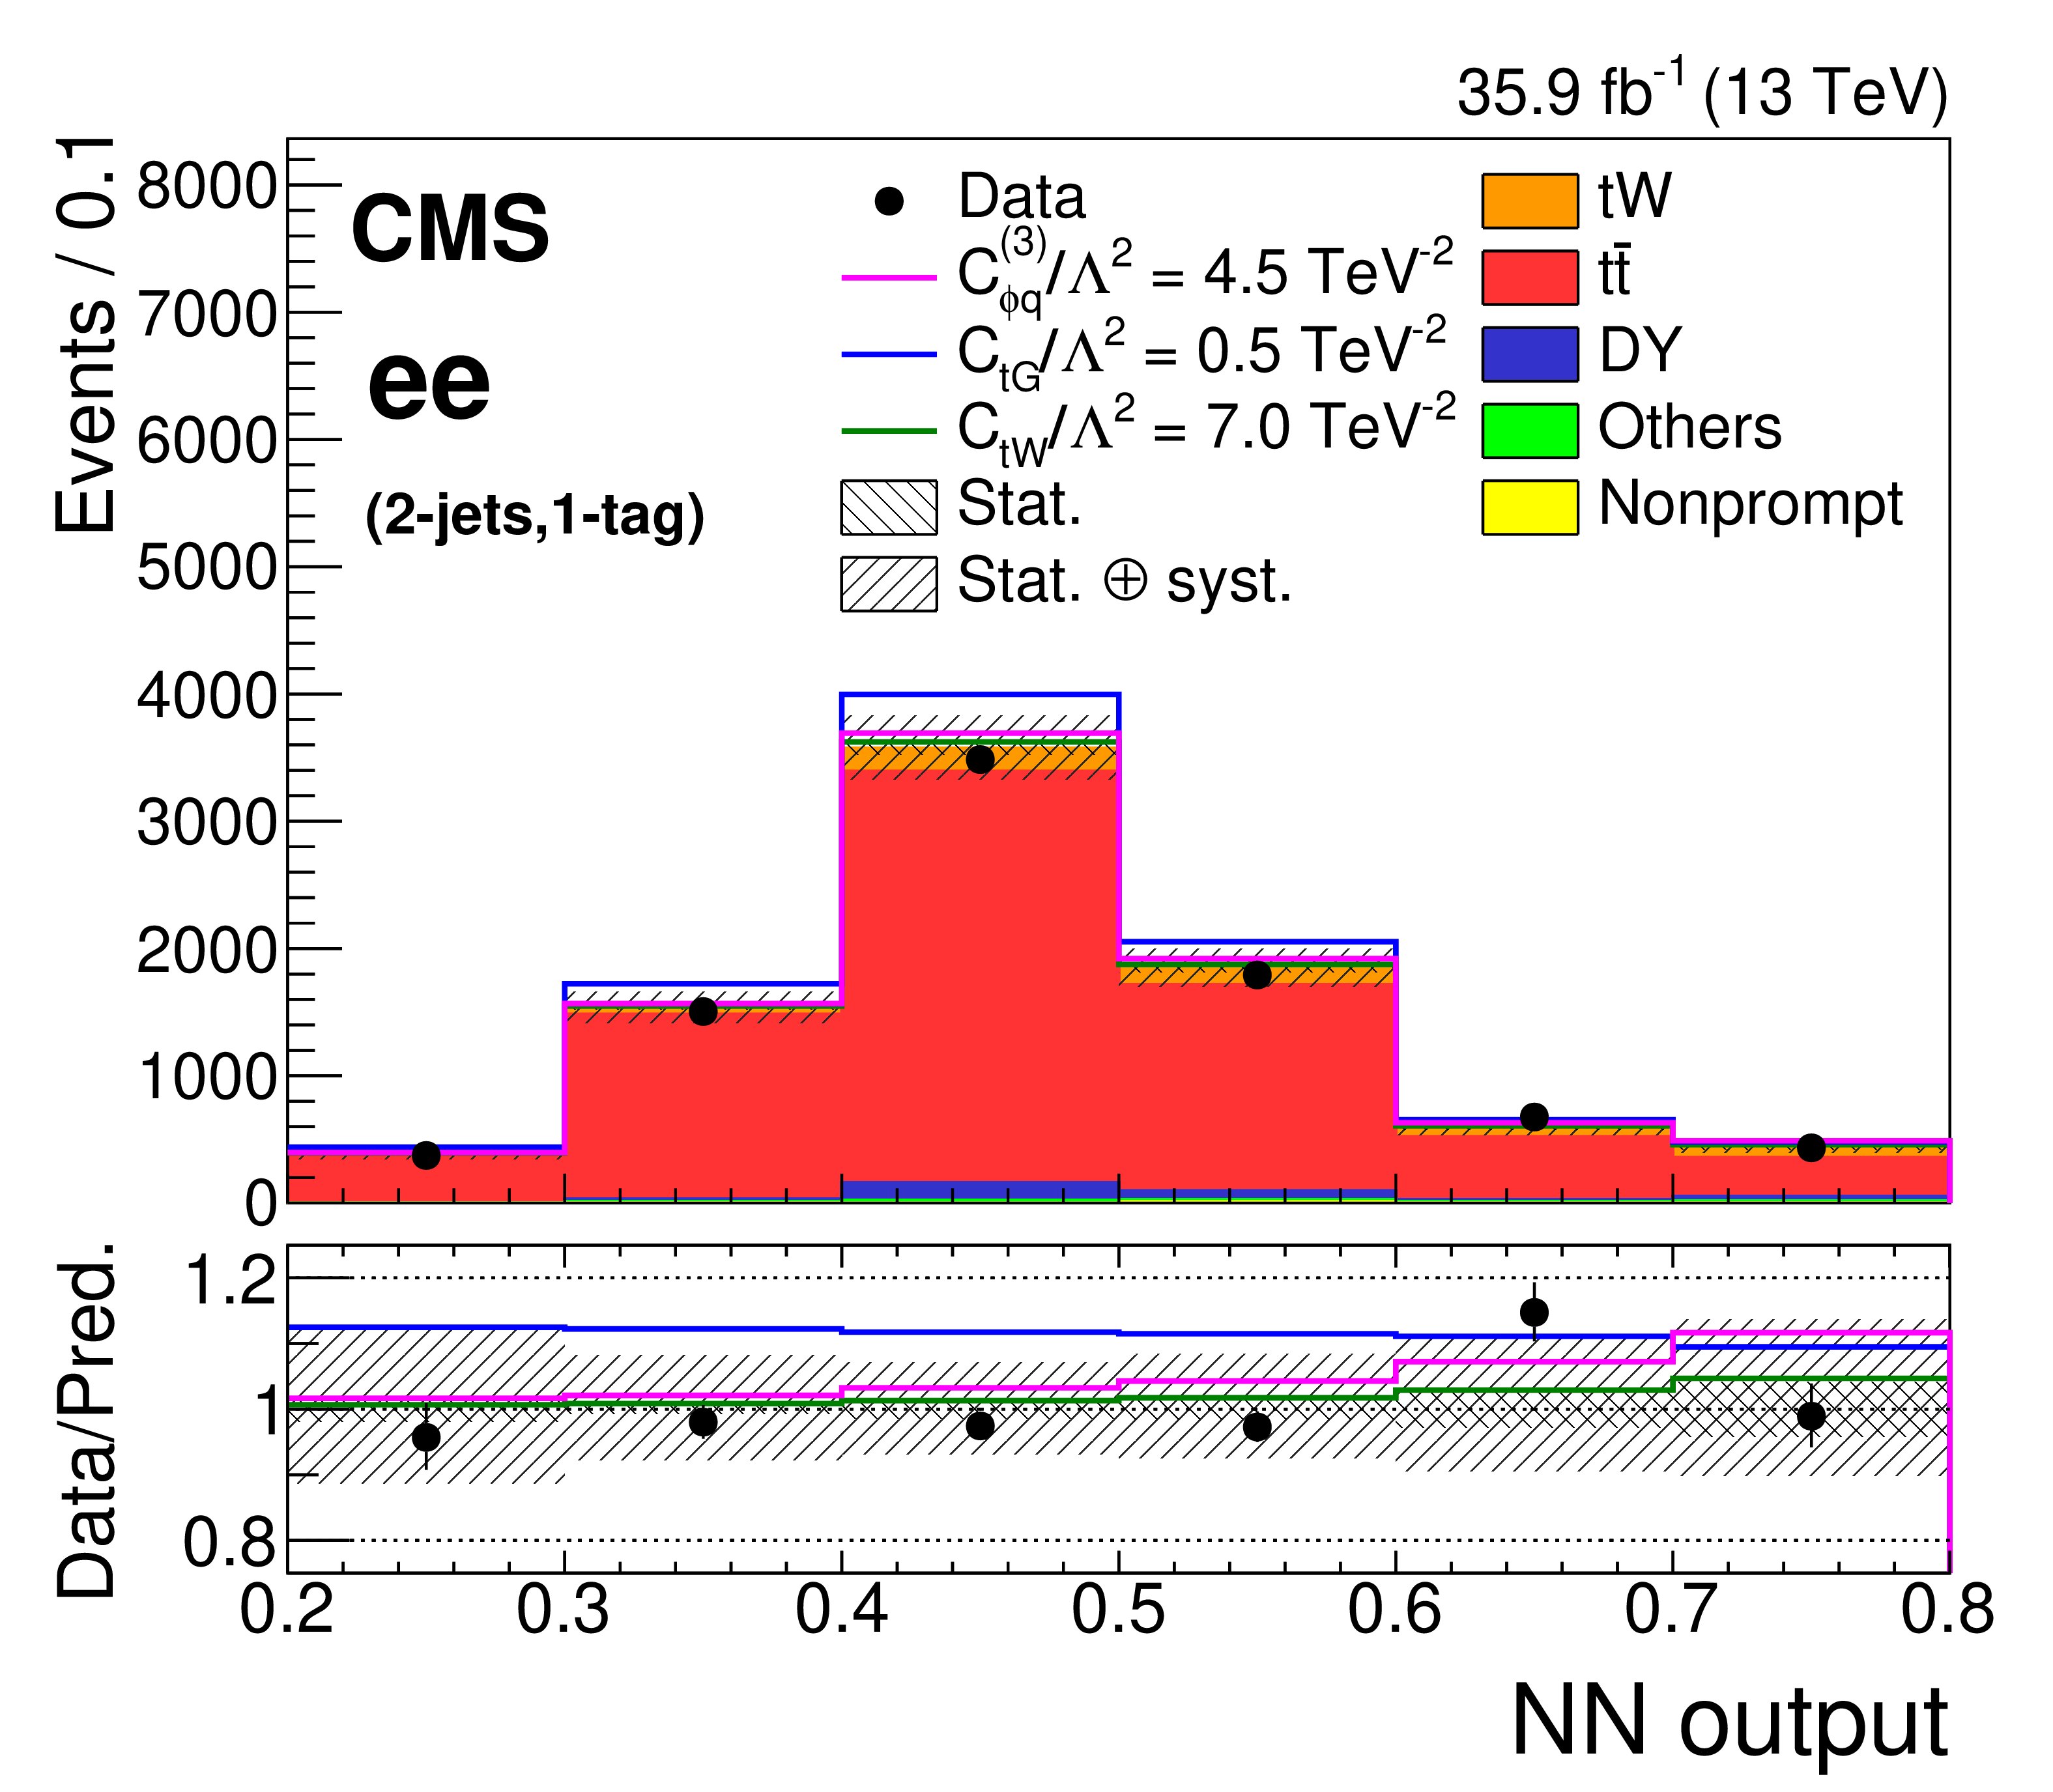
Figure 3-c:
The NN output distributions for data and simulation for the $\mathrm{e} \mathrm{e} $ channel in the 2-jets, 1-tag category. The hatched bands correspond to the quadratic sum of the statistical and systematic uncertainties in the event yield for the sum of signal and background predictions. The ratios of data to the sum of the predicted yields are shown at the lower panel of the graph. The narrow hatched bands represent the contribution from the statistical uncertainty in the MC simulation. The expected distributions assuming specific values for the effective couplings (given in the legend) are shown as the solid curves. |
png pdf |
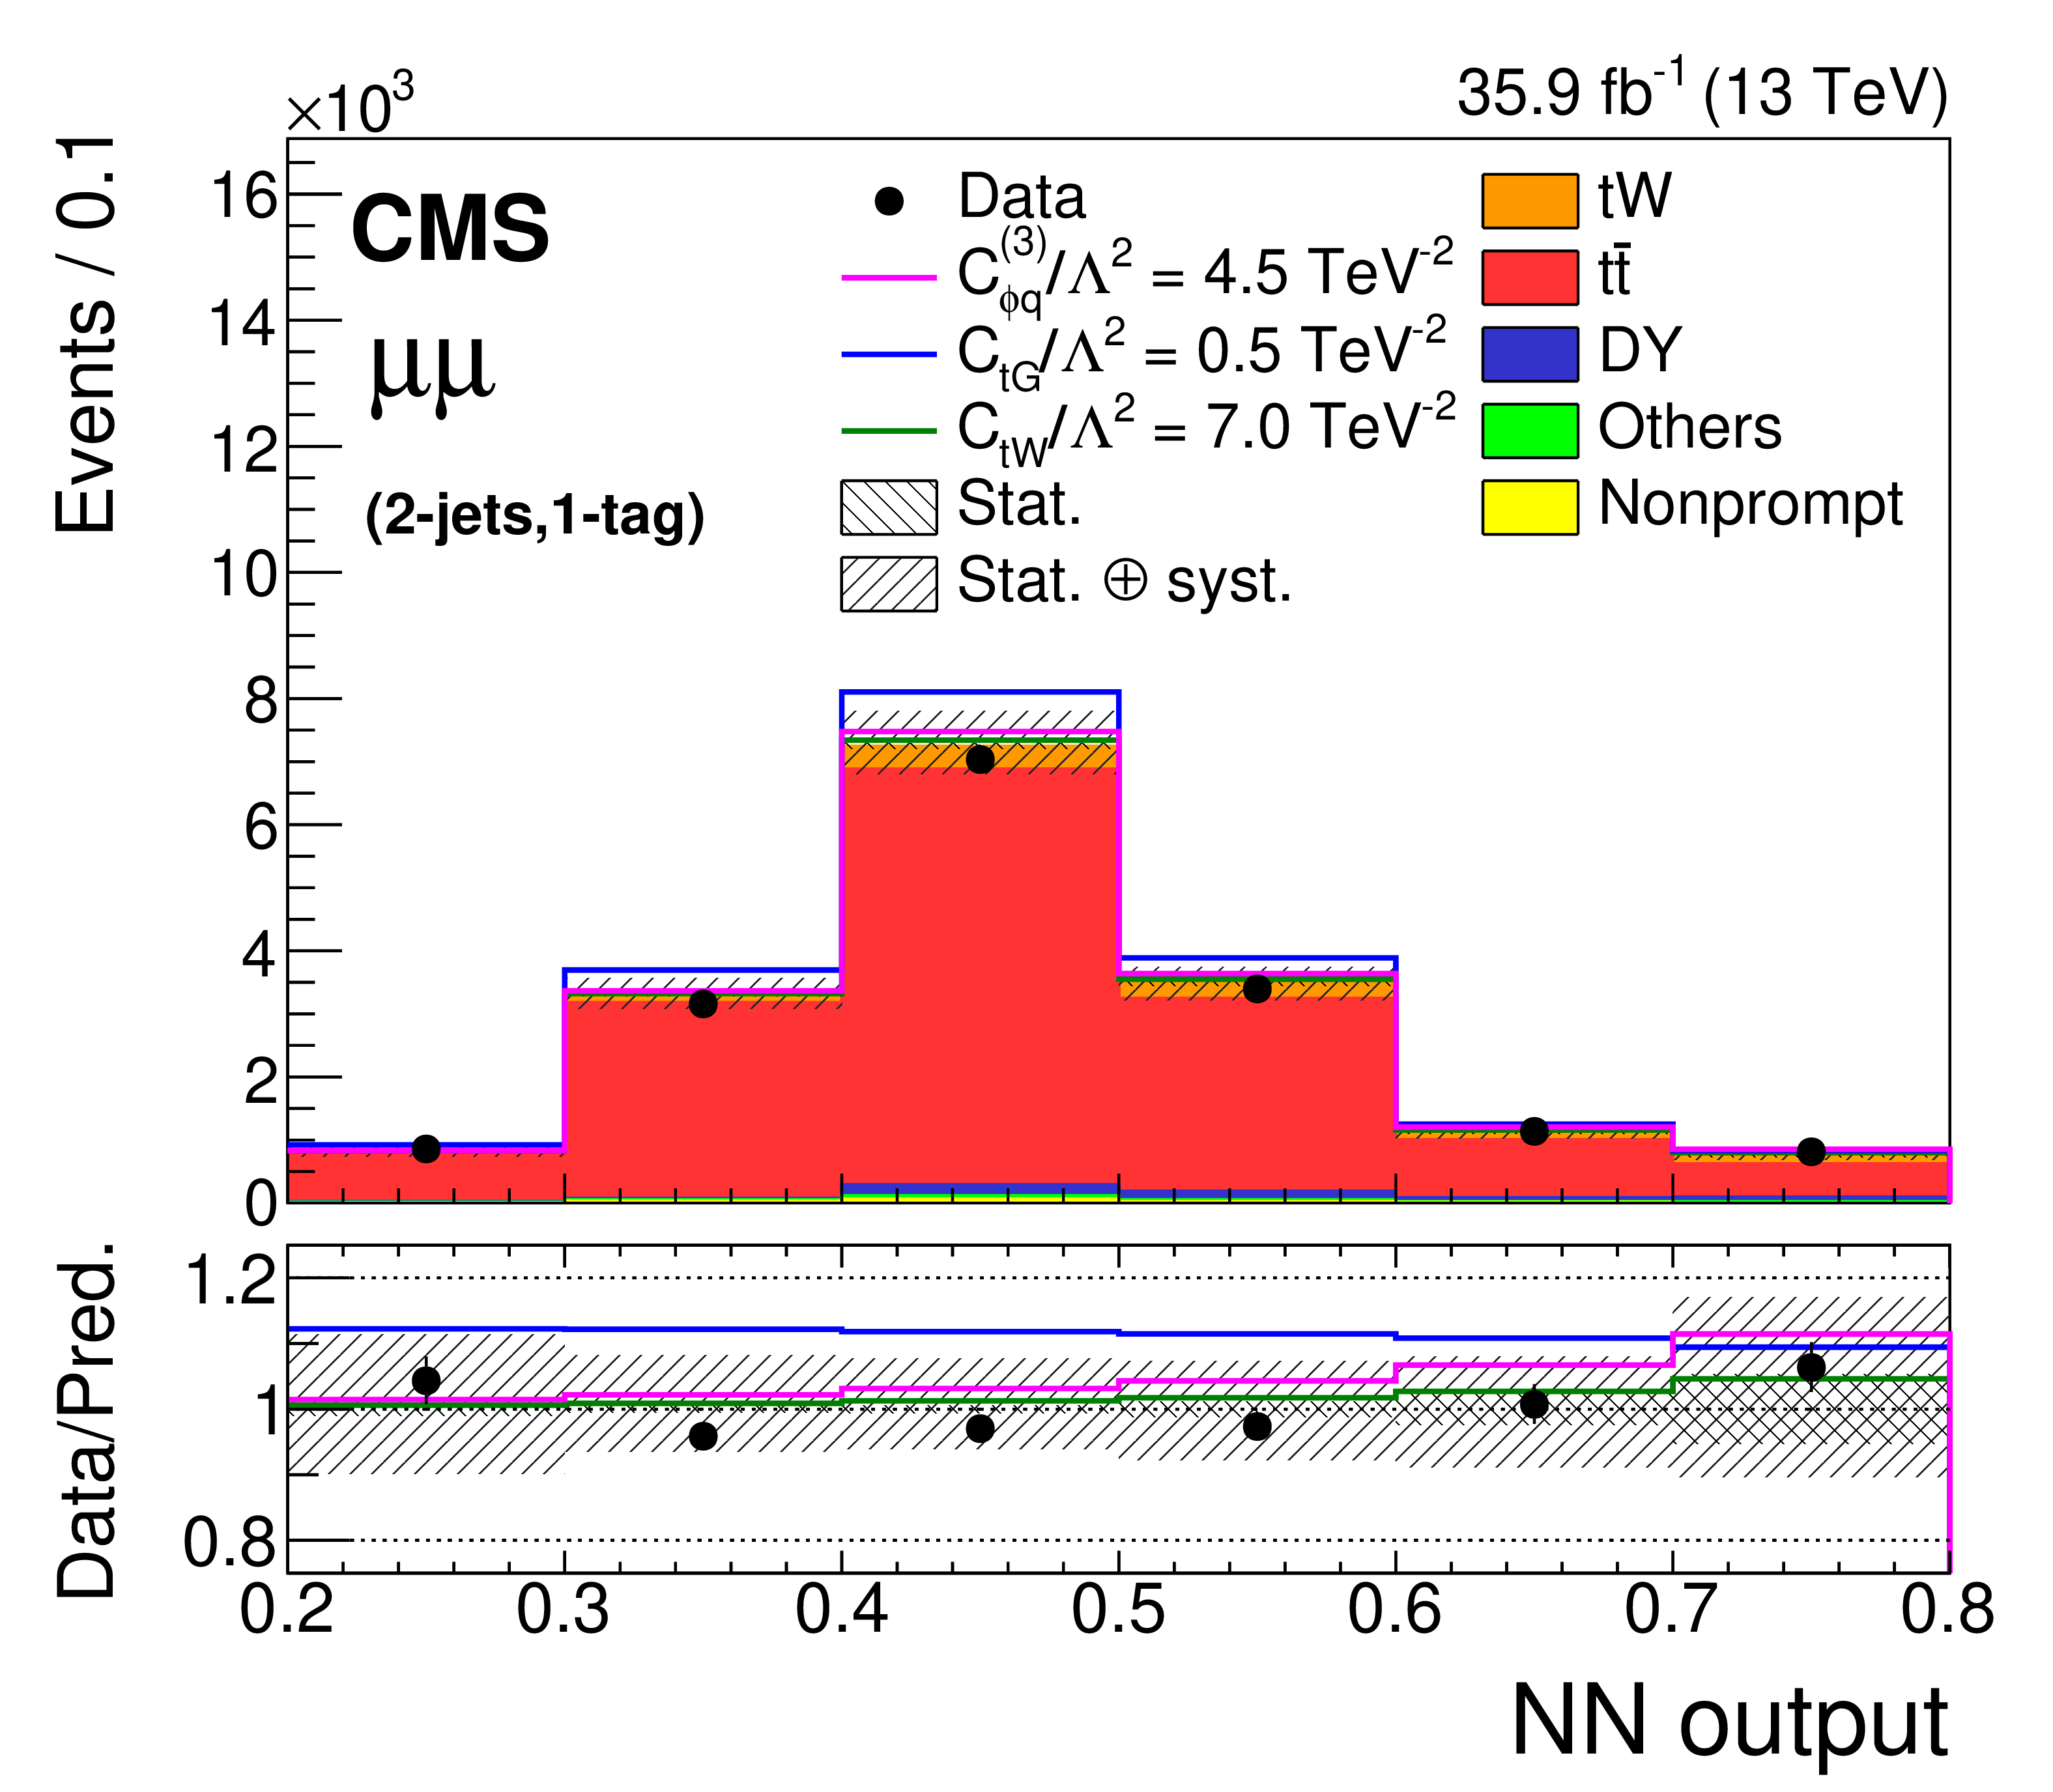
Figure 3-d:
The NN output distributions for data and simulation for the $\mu \mu $ channel in the 2-jets, 1-tag category. The hatched bands correspond to the quadratic sum of the statistical and systematic uncertainties in the event yield for the sum of signal and background predictions. The ratios of data to the sum of the predicted yields are shown at the lower panel of the graph. The narrow hatched bands represent the contribution from the statistical uncertainty in the MC simulation. The expected distributions assuming specific values for the effective couplings (given in the legend) are shown as the solid curves. |

png pdf |
Figure 4:
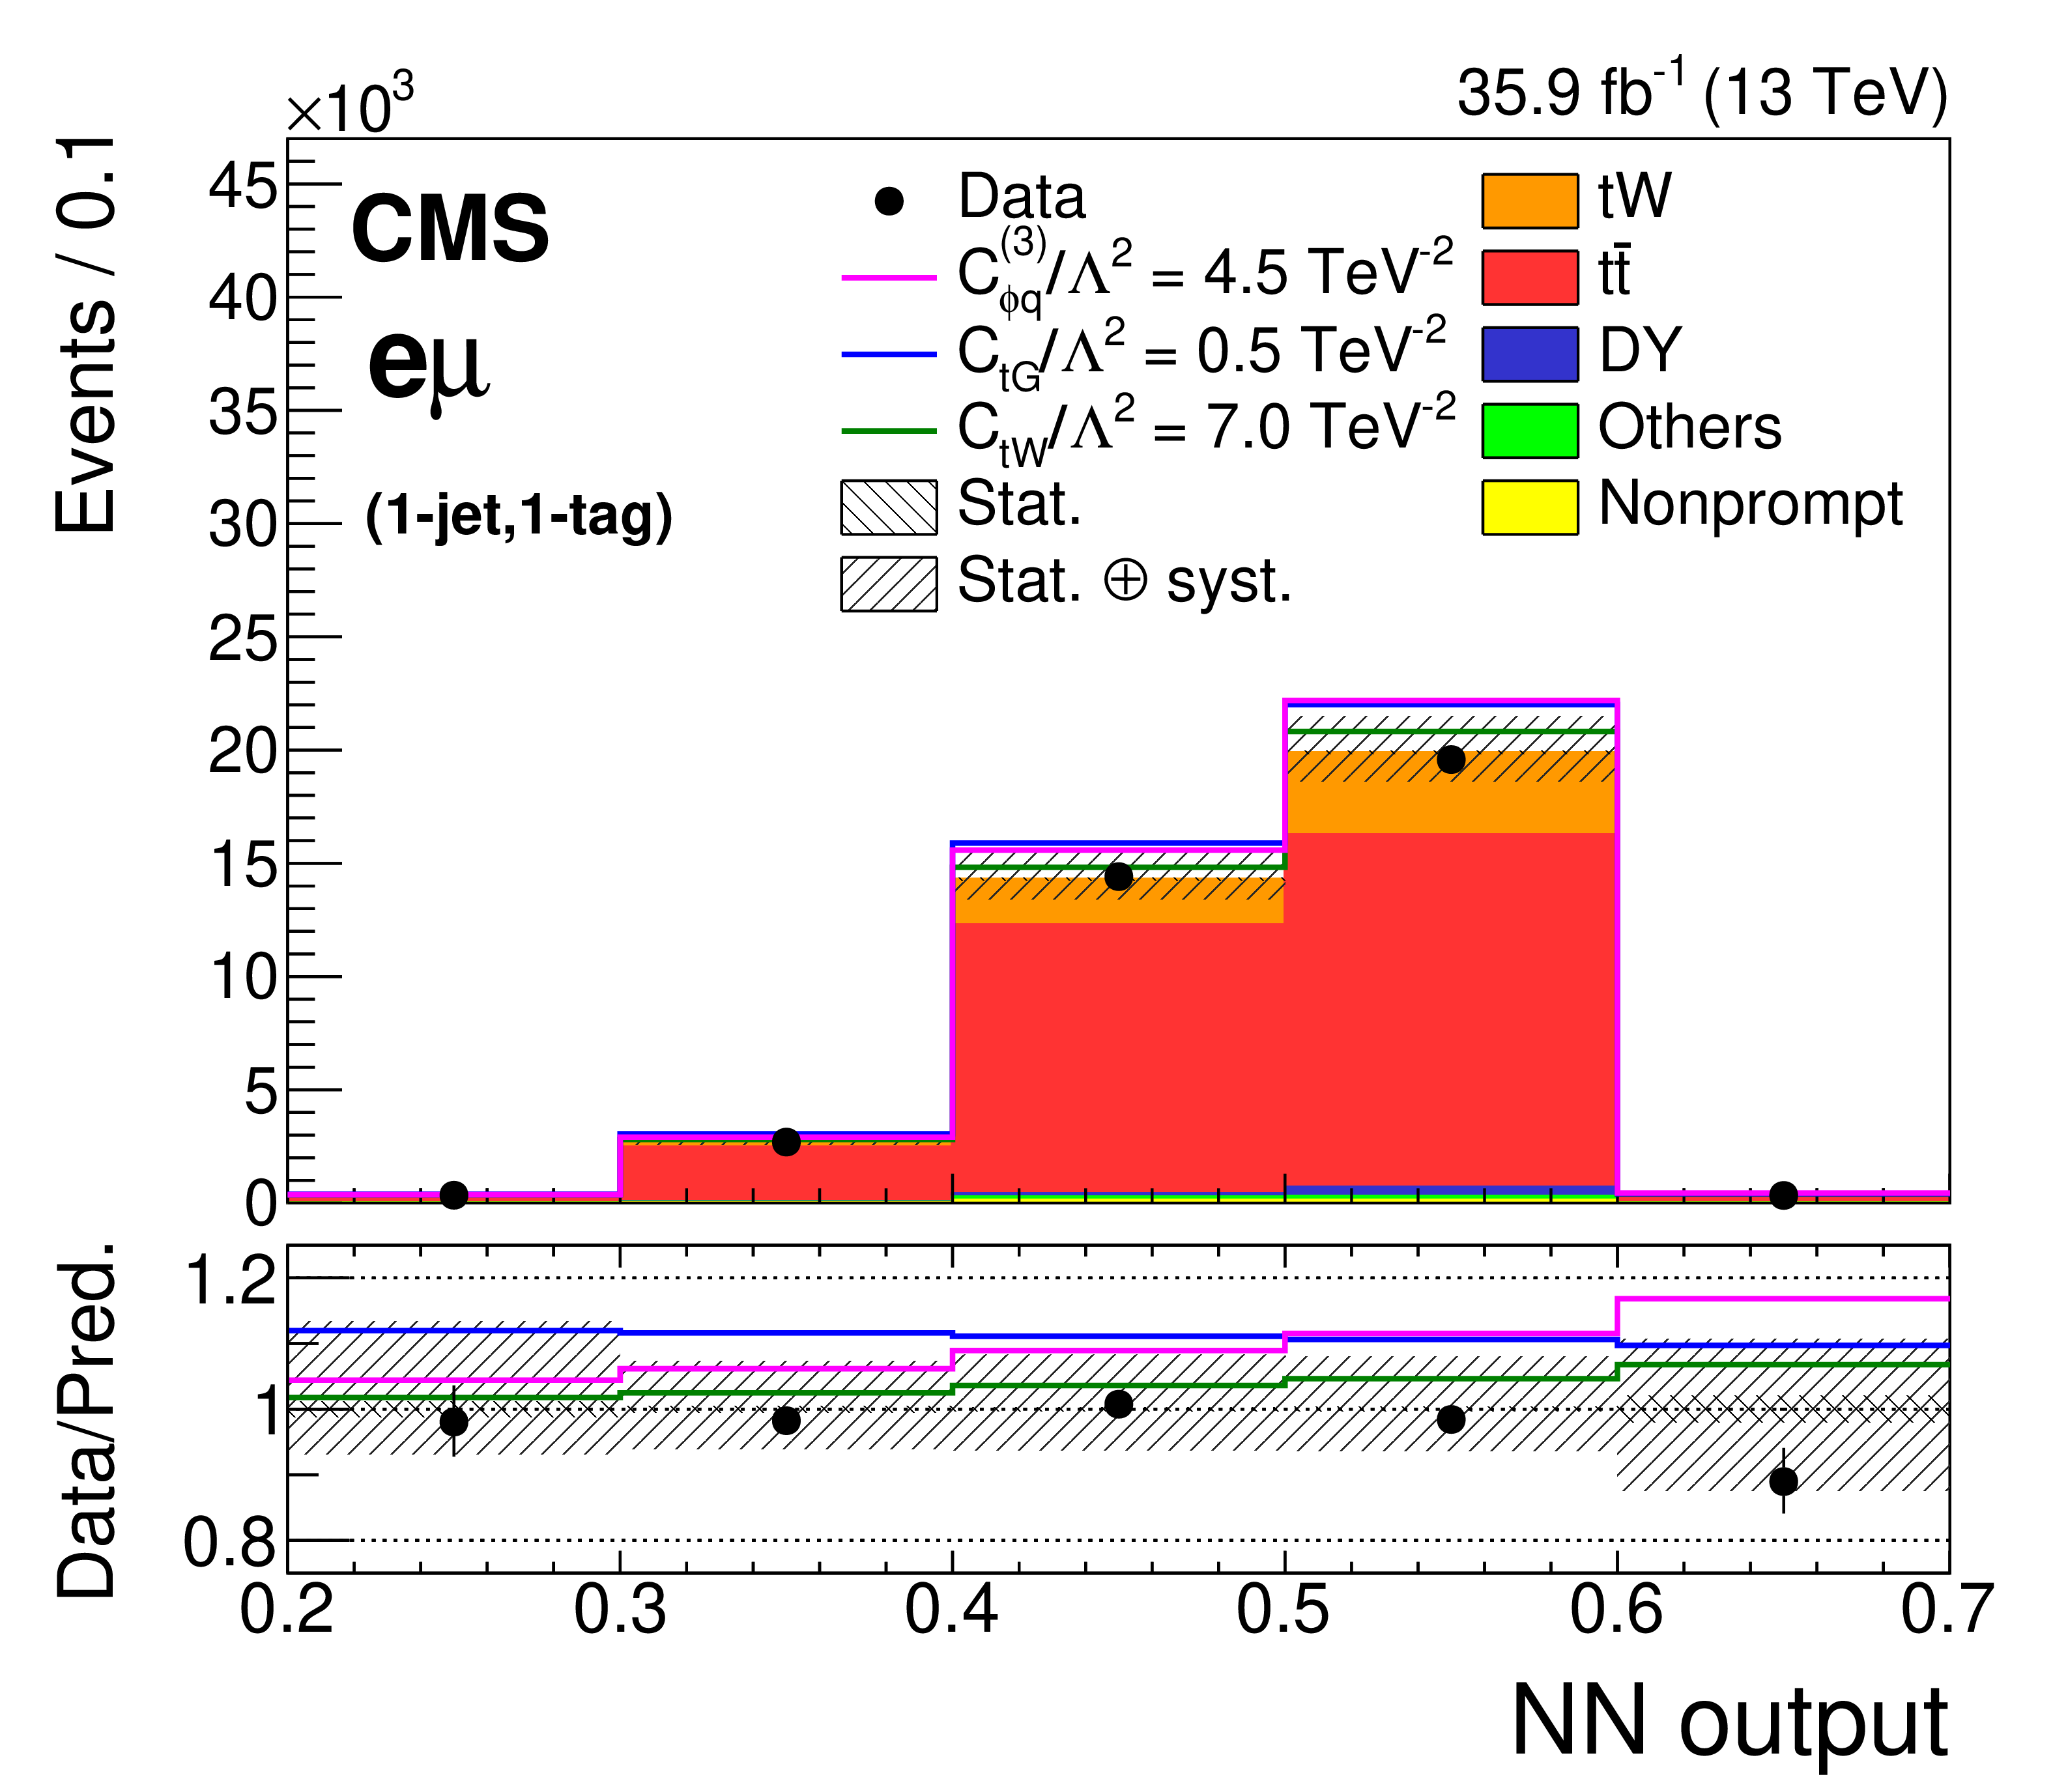
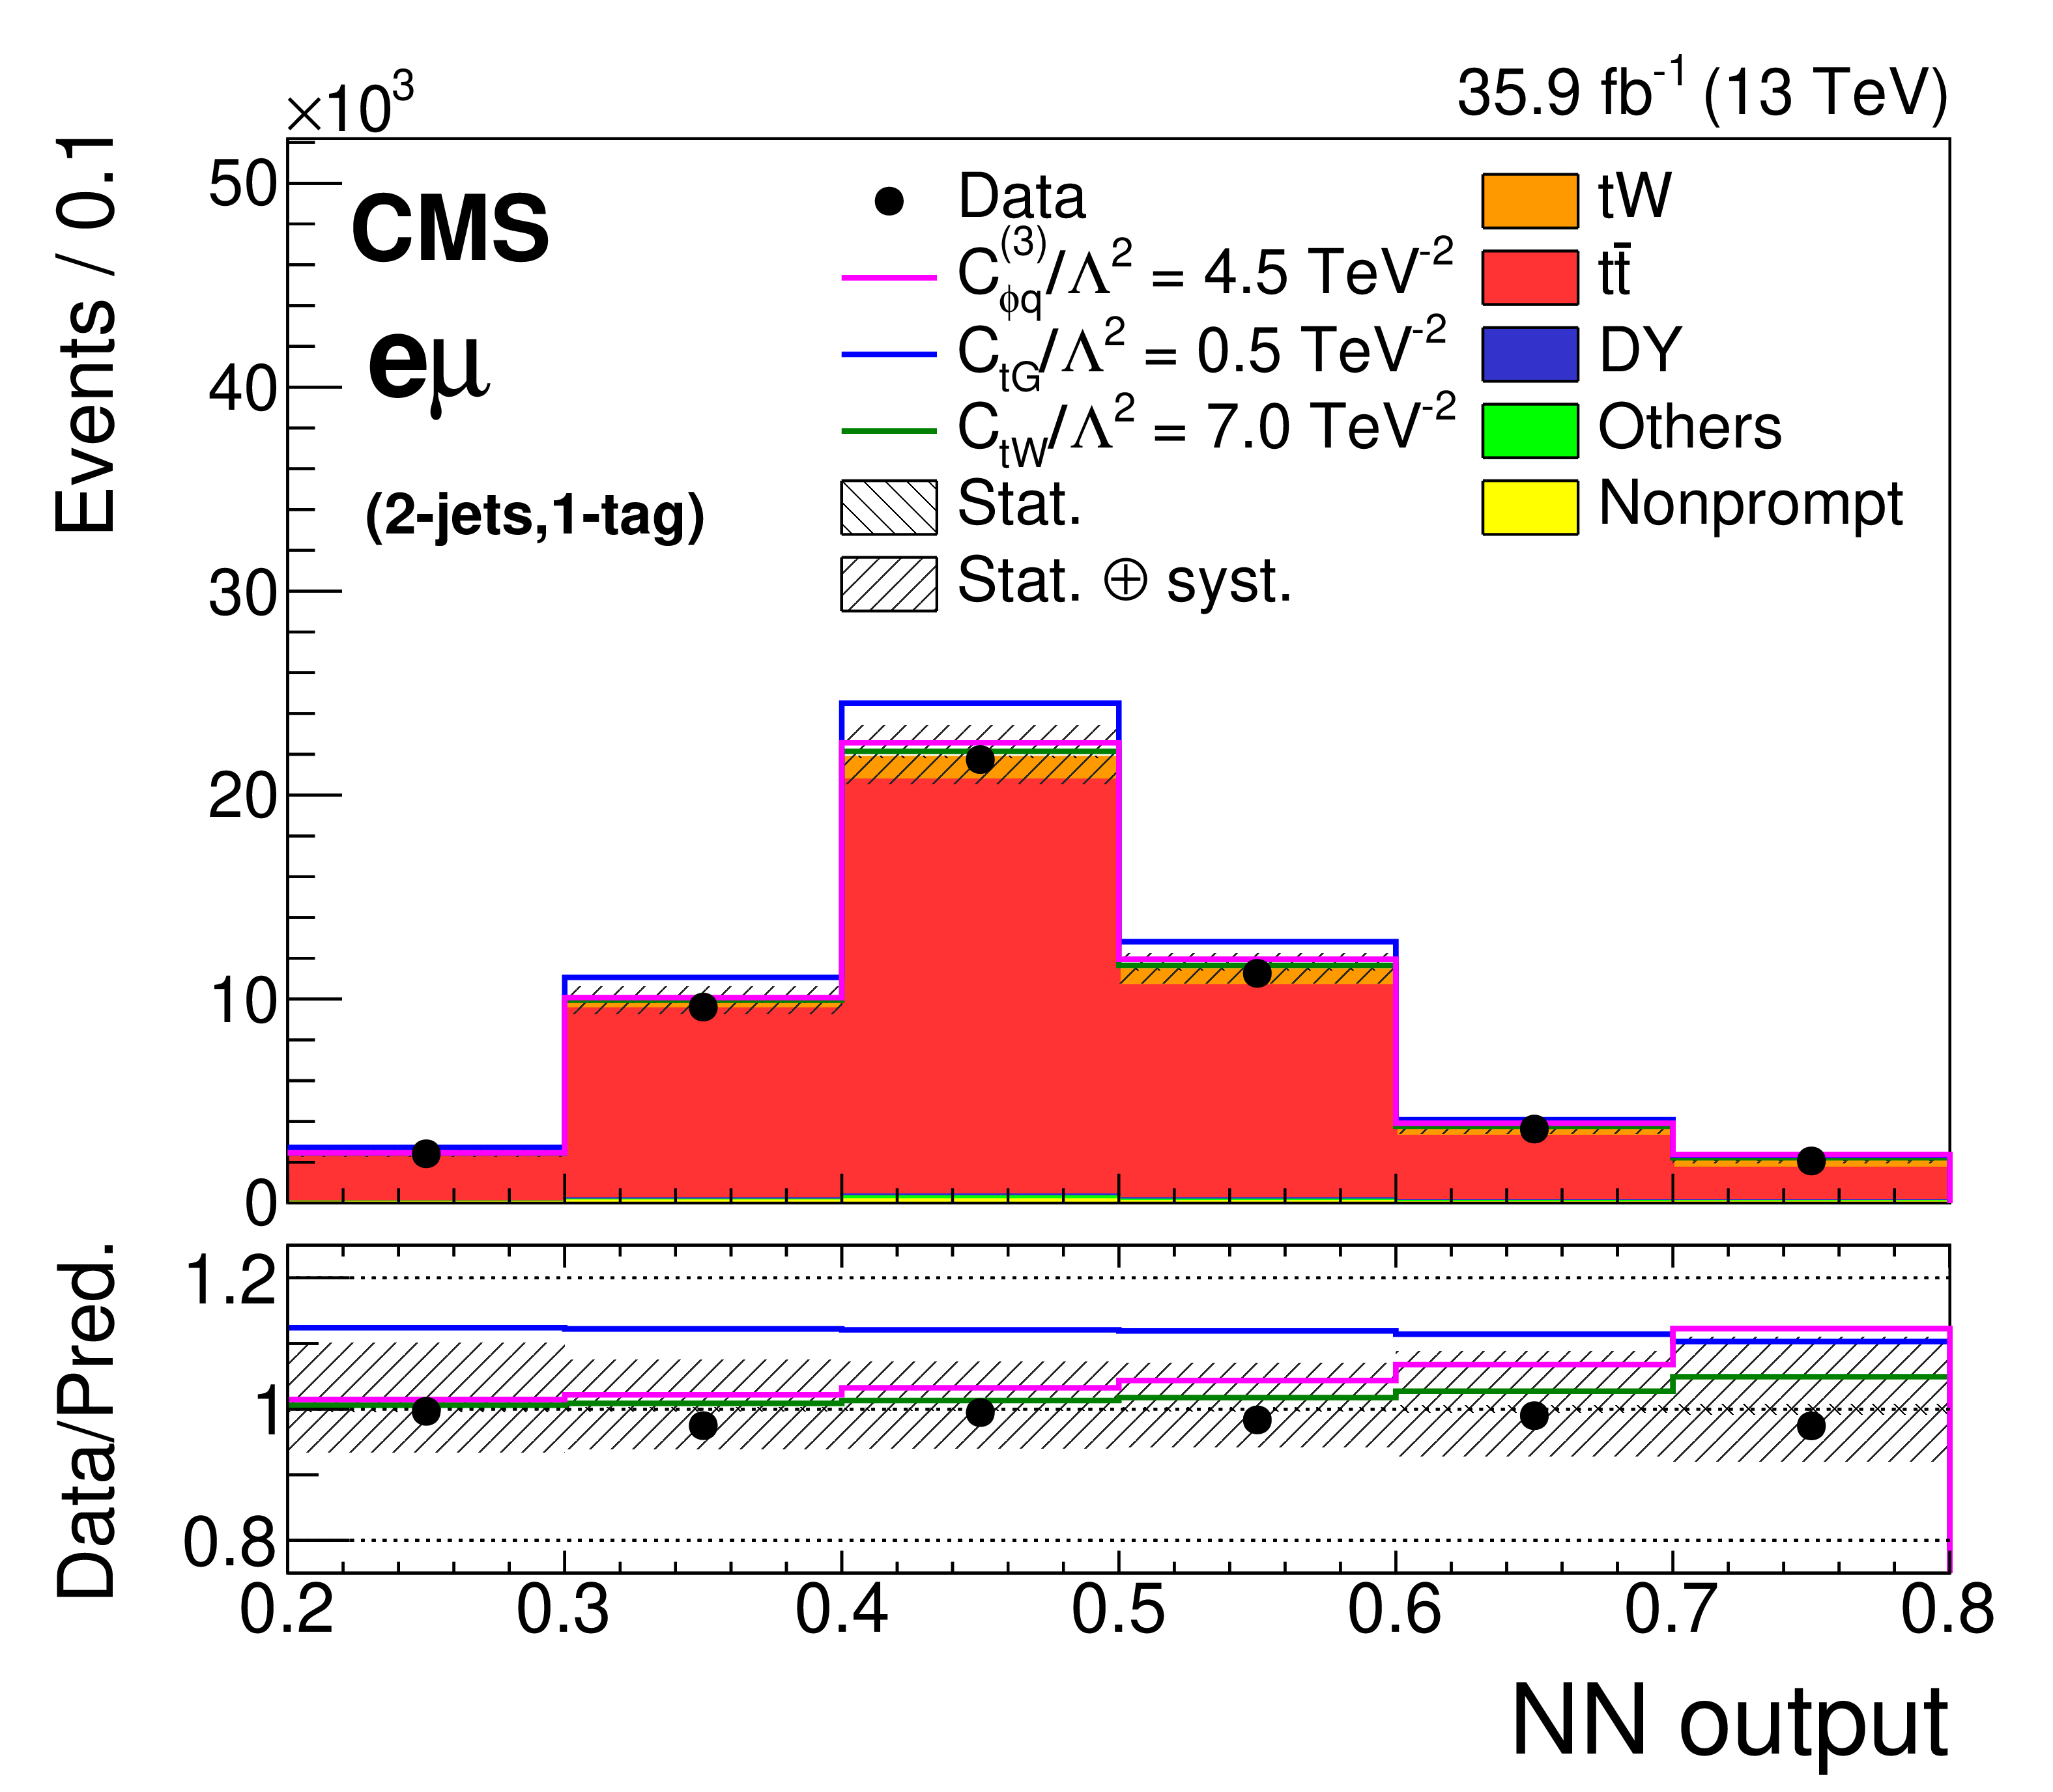
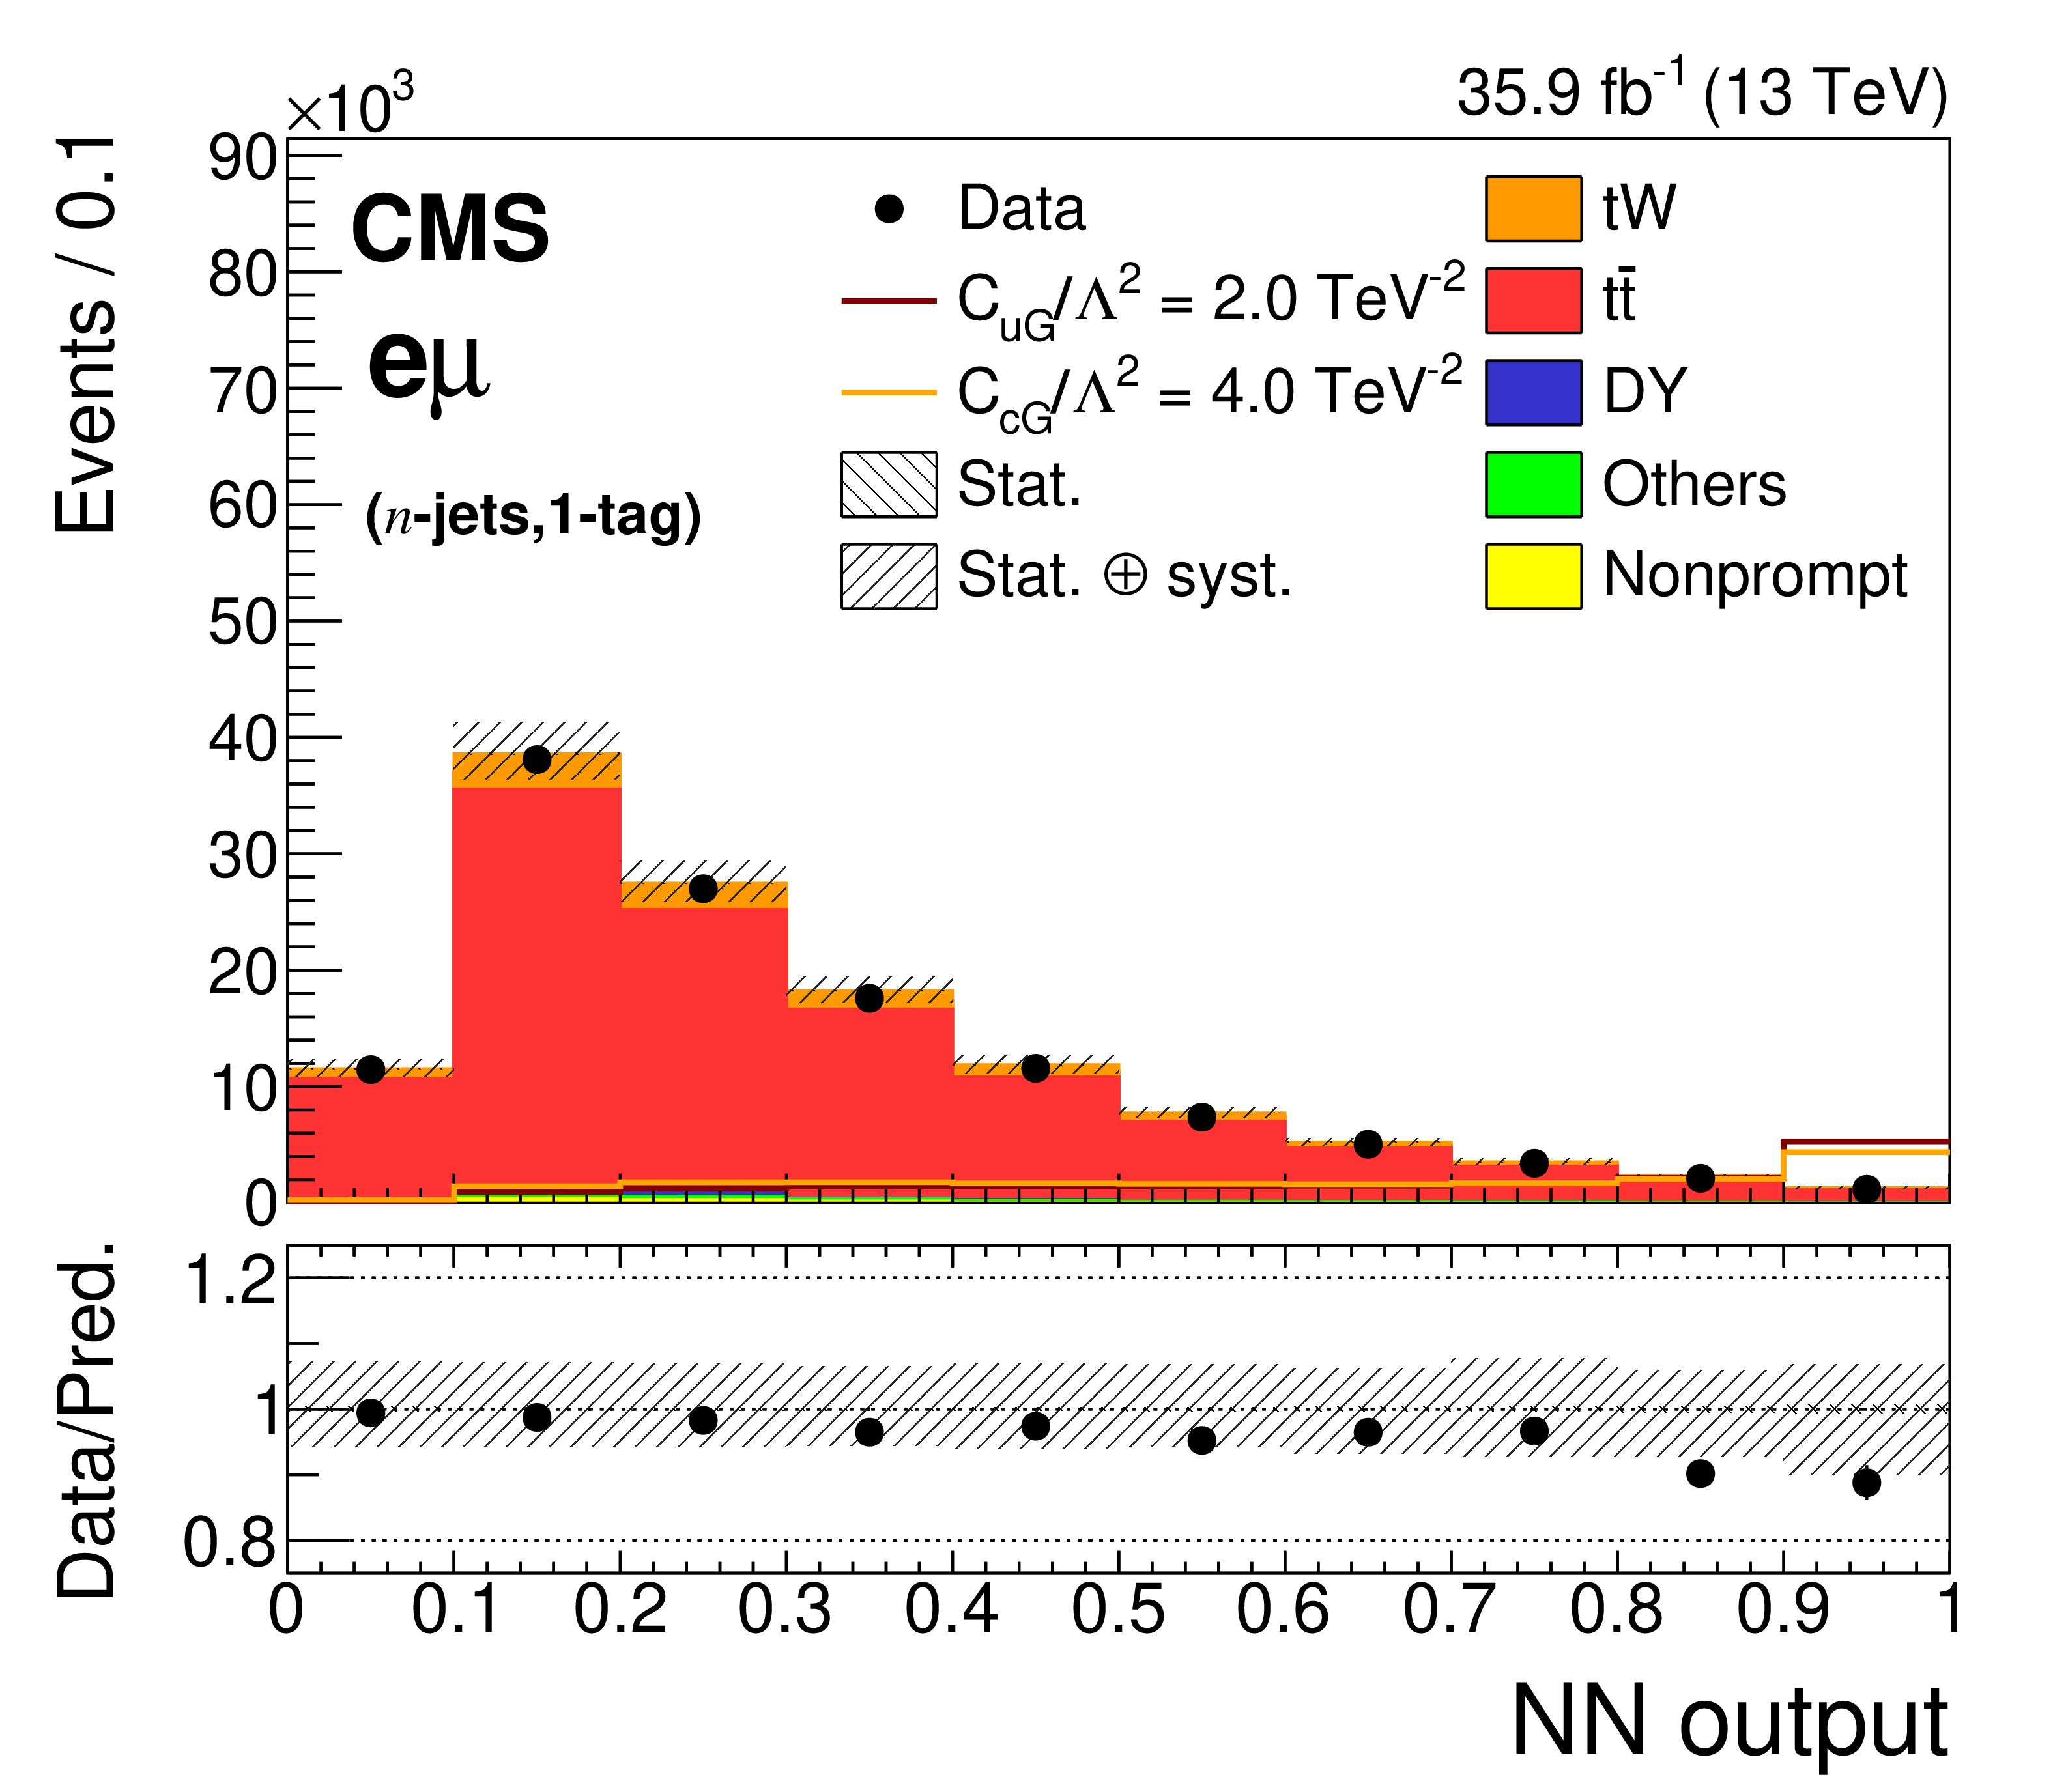
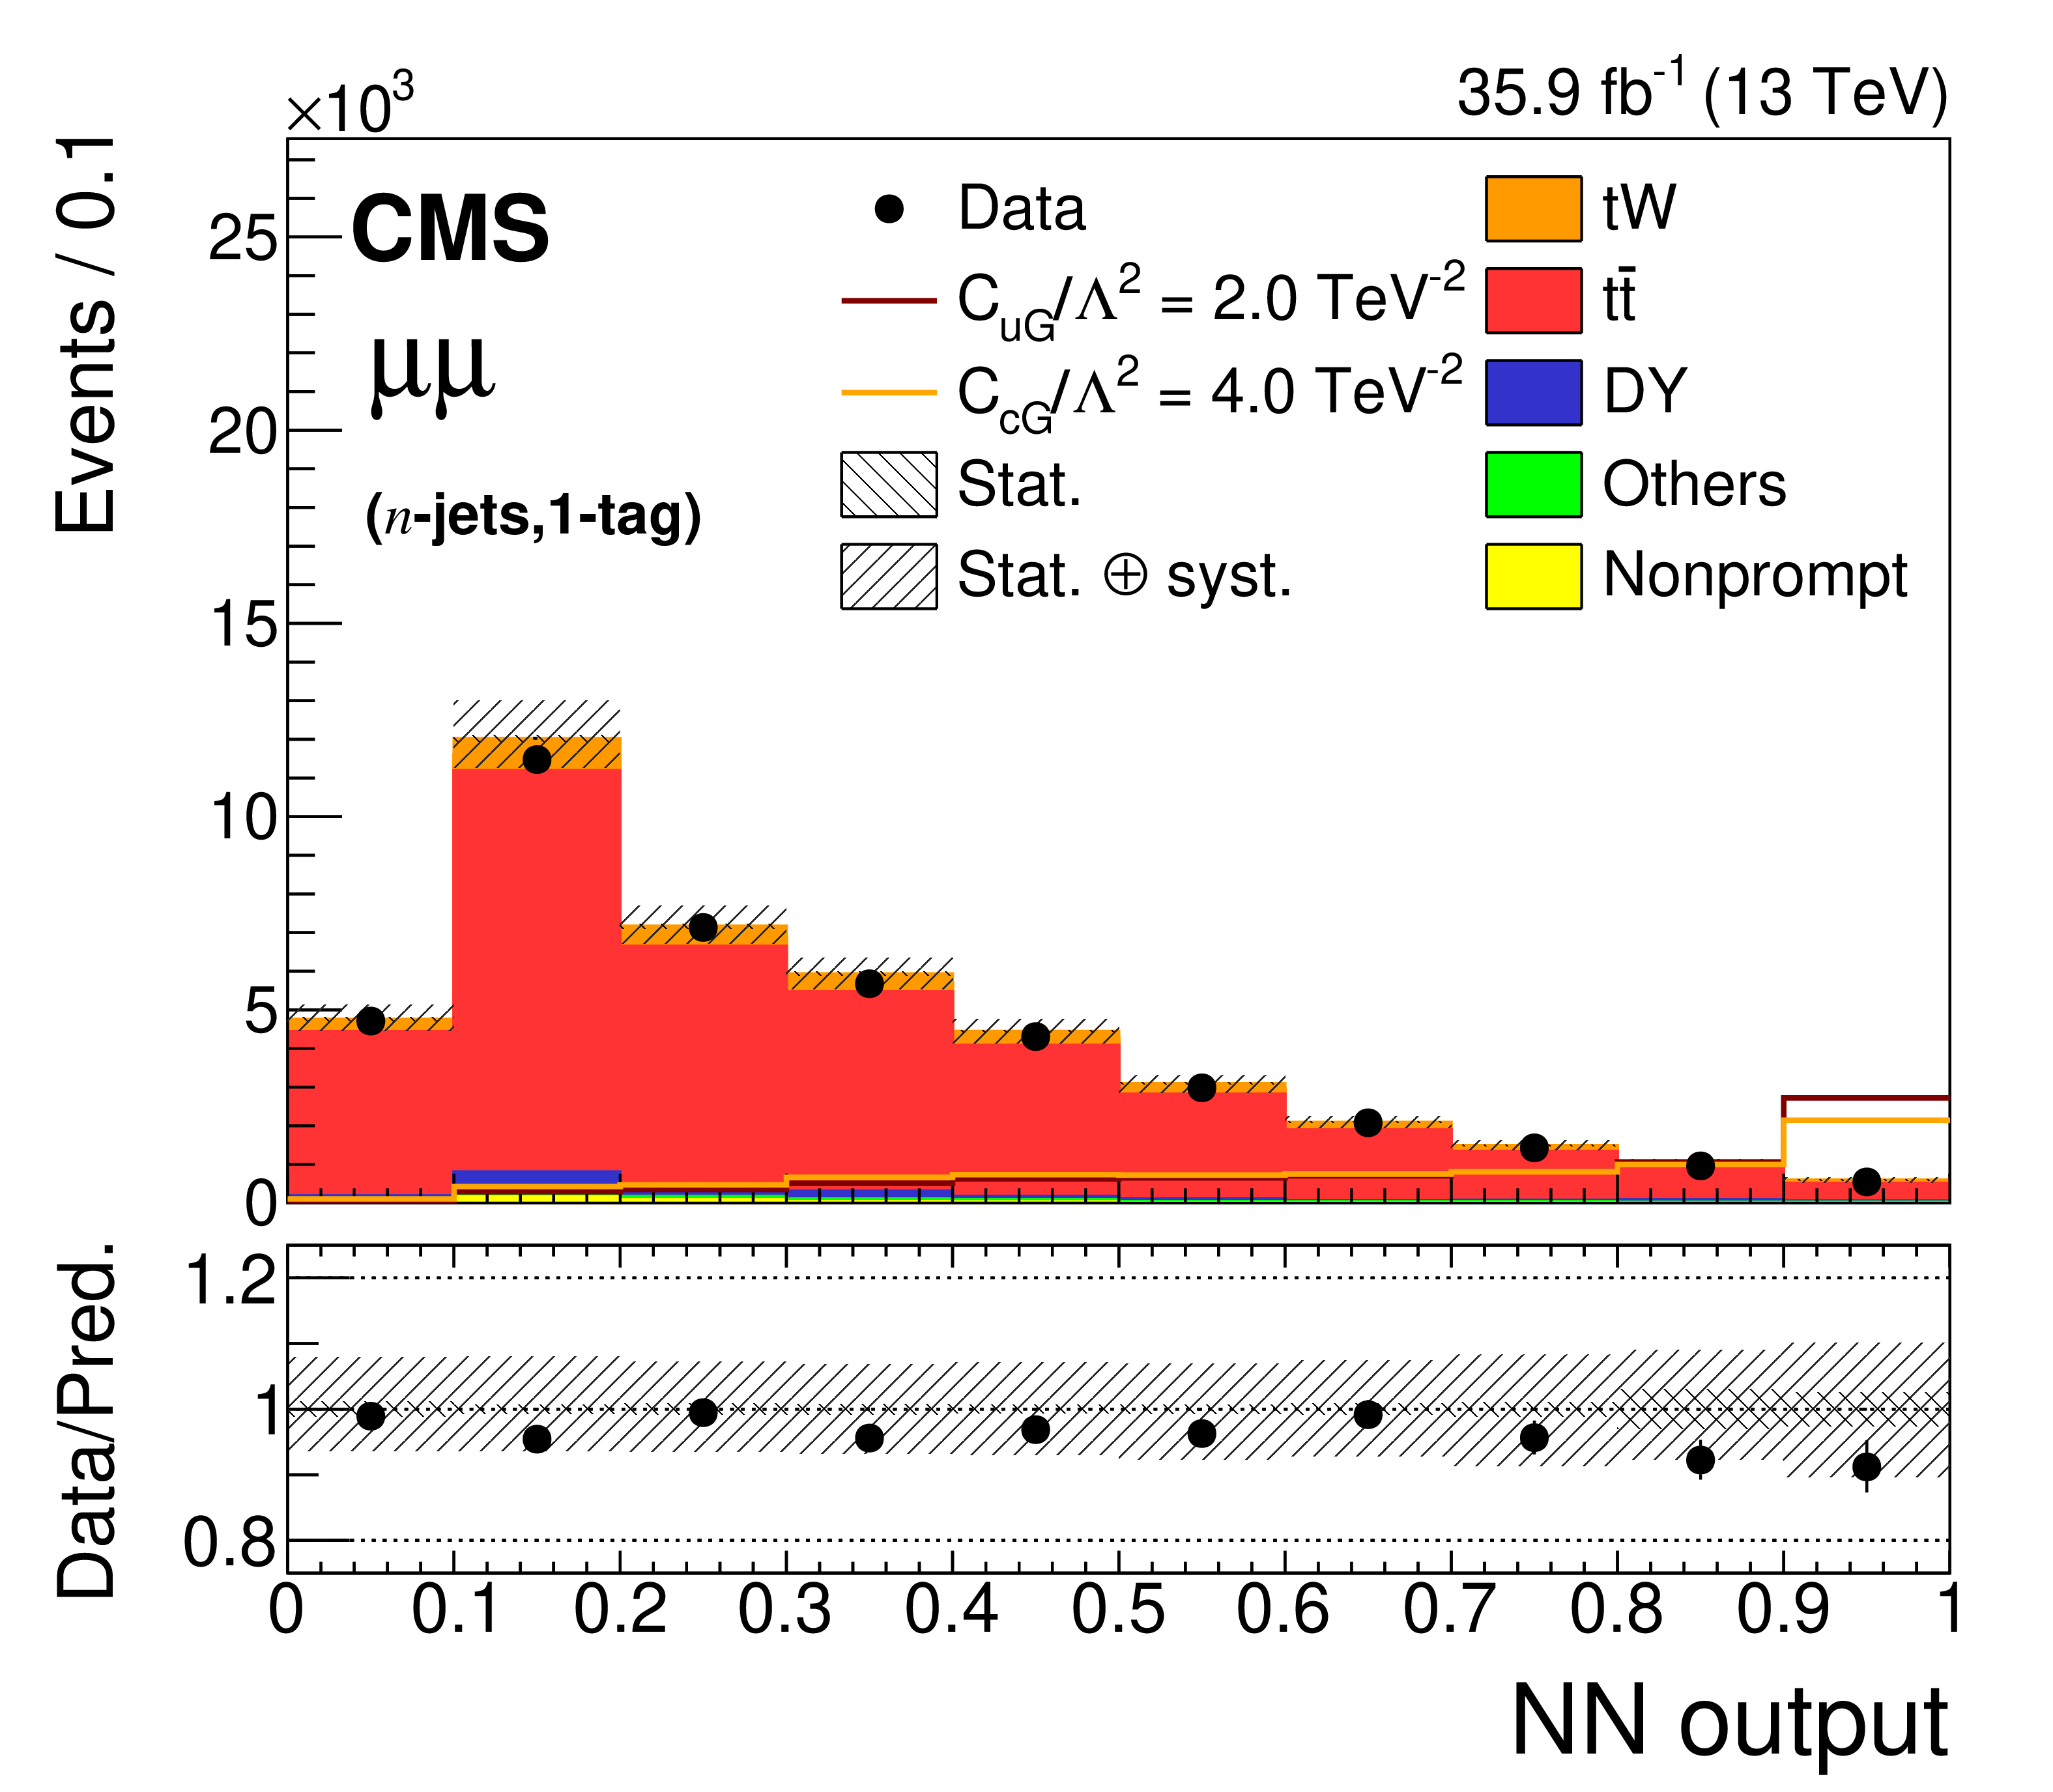
The NN output distributions for (left) data and simulation for the $\mathrm{e} \mu $ channel in 1-jet, 1-tag (upper) and 2-jets, 1-tag (middle) and 1-jet, 0-tag (lower) categories; and for (right) data, simulation, and FCNC signals in the $n$-jets, 1-tag category used in the limit setting for the $\mathrm{e} \mathrm{e} $ (upper), $\mathrm{e} \mu $ (middle), and $\mu \mu $ (lower) channels. The hatched bands correspond to the quadratic sum of the statistical and systematic uncertainties in the event yield for the sum of signal and background predictions. The ratios of data to the sum of the predicted yields are shown at the the lower panel of each graph. The narrow hatched bands represent the contribution from the statistical uncertainty in the MC simulation. In each plot, the expected distributions assuming specific values for the effective couplings (given in the legend) are shown as the solid curves. |
png pdf |
Figure 4-a:
The NN output distributions for data and simulation for the $\mathrm{e} \mu $ channel in the 1-jet, 1-tag category. The hatched bands correspond to the quadratic sum of the statistical and systematic uncertainties in the event yield for the sum of signal and background predictions. The ratios of data to the sum of the predicted yields are shown at the the lower panel of the graph. The narrow hatched bands represent the contribution from the statistical uncertainty in the MC simulation. The expected distributions assuming specific values for the effective couplings (given in the legend) are shown as the solid curves. |

png pdf |
Figure 4-b:
The NN output distributions for data, simulation, and FCNC signals in the $n$-jets, 1-tag category used in the limit setting for the $\mathrm{e} \mathrm{e} $ channel. The hatched bands correspond to the quadratic sum of the statistical and systematic uncertainties in the event yield for the sum of signal and background predictions. The ratios of data to the sum of the predicted yields are shown at the the lower panel of the graph. The narrow hatched bands represent the contribution from the statistical uncertainty in the MC simulation. The expected distributions assuming specific values for the effective couplings (given in the legend) are shown as the solid curves. |
png pdf |
Figure 4-c:
The NN output distributions for data and simulation for the $\mathrm{e} \mu $ channel in the 2-jets, 1-tag category. The hatched bands correspond to the quadratic sum of the statistical and systematic uncertainties in the event yield for the sum of signal and background predictions. The ratios of data to the sum of the predicted yields are shown at the the lower panel of the graph. The narrow hatched bands represent the contribution from the statistical uncertainty in the MC simulation. The expected distributions assuming specific values for the effective couplings (given in the legend) are shown as the solid curves. |
png pdf |
Figure 4-d:
The NN output distributions for data, simulation, and FCNC signals in the $n$-jets, 1-tag category used in the limit setting for the $\mathrm{e} \mu $ channel. The hatched bands correspond to the quadratic sum of the statistical and systematic uncertainties in the event yield for the sum of signal and background predictions. The ratios of data to the sum of the predicted yields are shown at the the lower panel of the graph. The narrow hatched bands represent the contribution from the statistical uncertainty in the MC simulation. The expected distributions assuming specific values for the effective couplings (given in the legend) are shown as the solid curves. |

png pdf |
Figure 4-e:
The NN output distributions for data and simulation for the $\mathrm{e} \mu $ channel in the 1-jet, 0-tag category. The hatched bands correspond to the quadratic sum of the statistical and systematic uncertainties in the event yield for the sum of signal and background predictions. The ratios of data to the sum of the predicted yields are shown at the the lower panel of the graph. The narrow hatched bands represent the contribution from the statistical uncertainty in the MC simulation. The expected distributions assuming specific values for the effective couplings (given in the legend) are shown as the solid curves. |
png pdf |
Figure 4-f:
The NN output distributions for data, simulation, and FCNC signals in the $n$-jets, 1-tag category used in the limit setting for the $\mu \mu $ channel. The hatched bands correspond to the quadratic sum of the statistical and systematic uncertainties in the event yield for the sum of signal and background predictions. The ratios of data to the sum of the predicted yields are shown at the the lower panel of the graph. The narrow hatched bands represent the contribution from the statistical uncertainty in the MC simulation. The expected distributions assuming specific values for the effective couplings (given in the legend) are shown as the solid curves. |
png pdf |
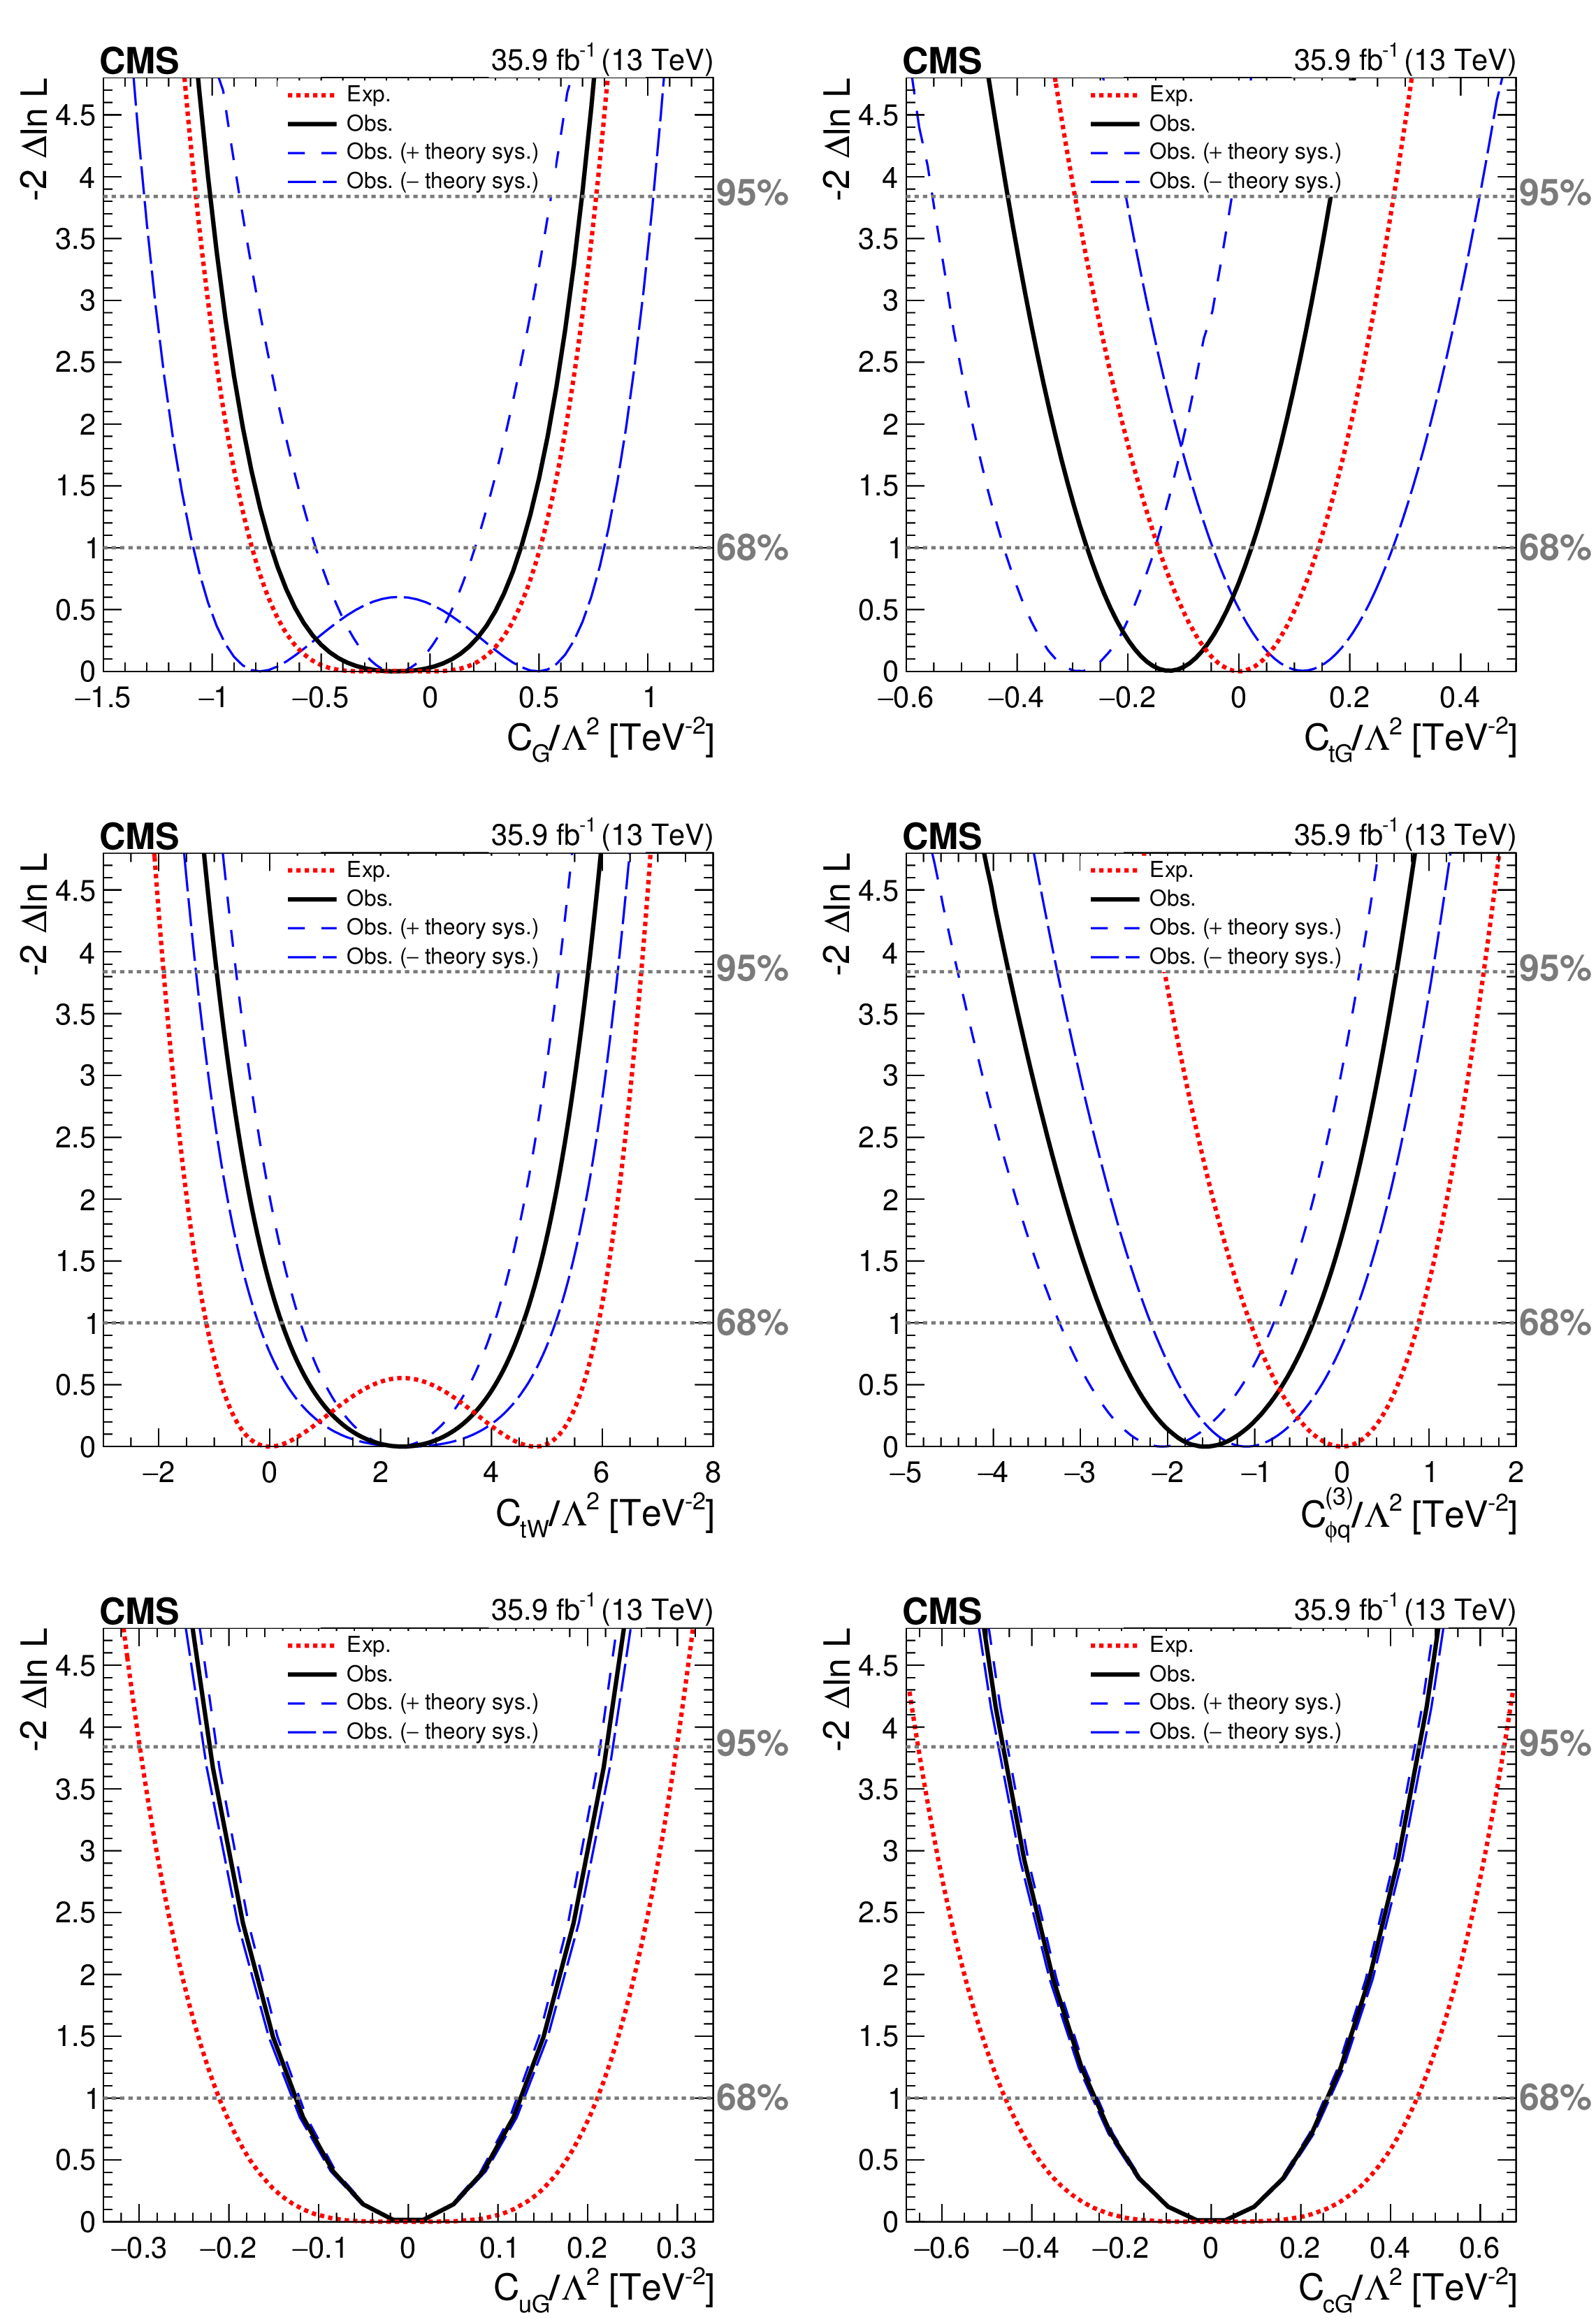
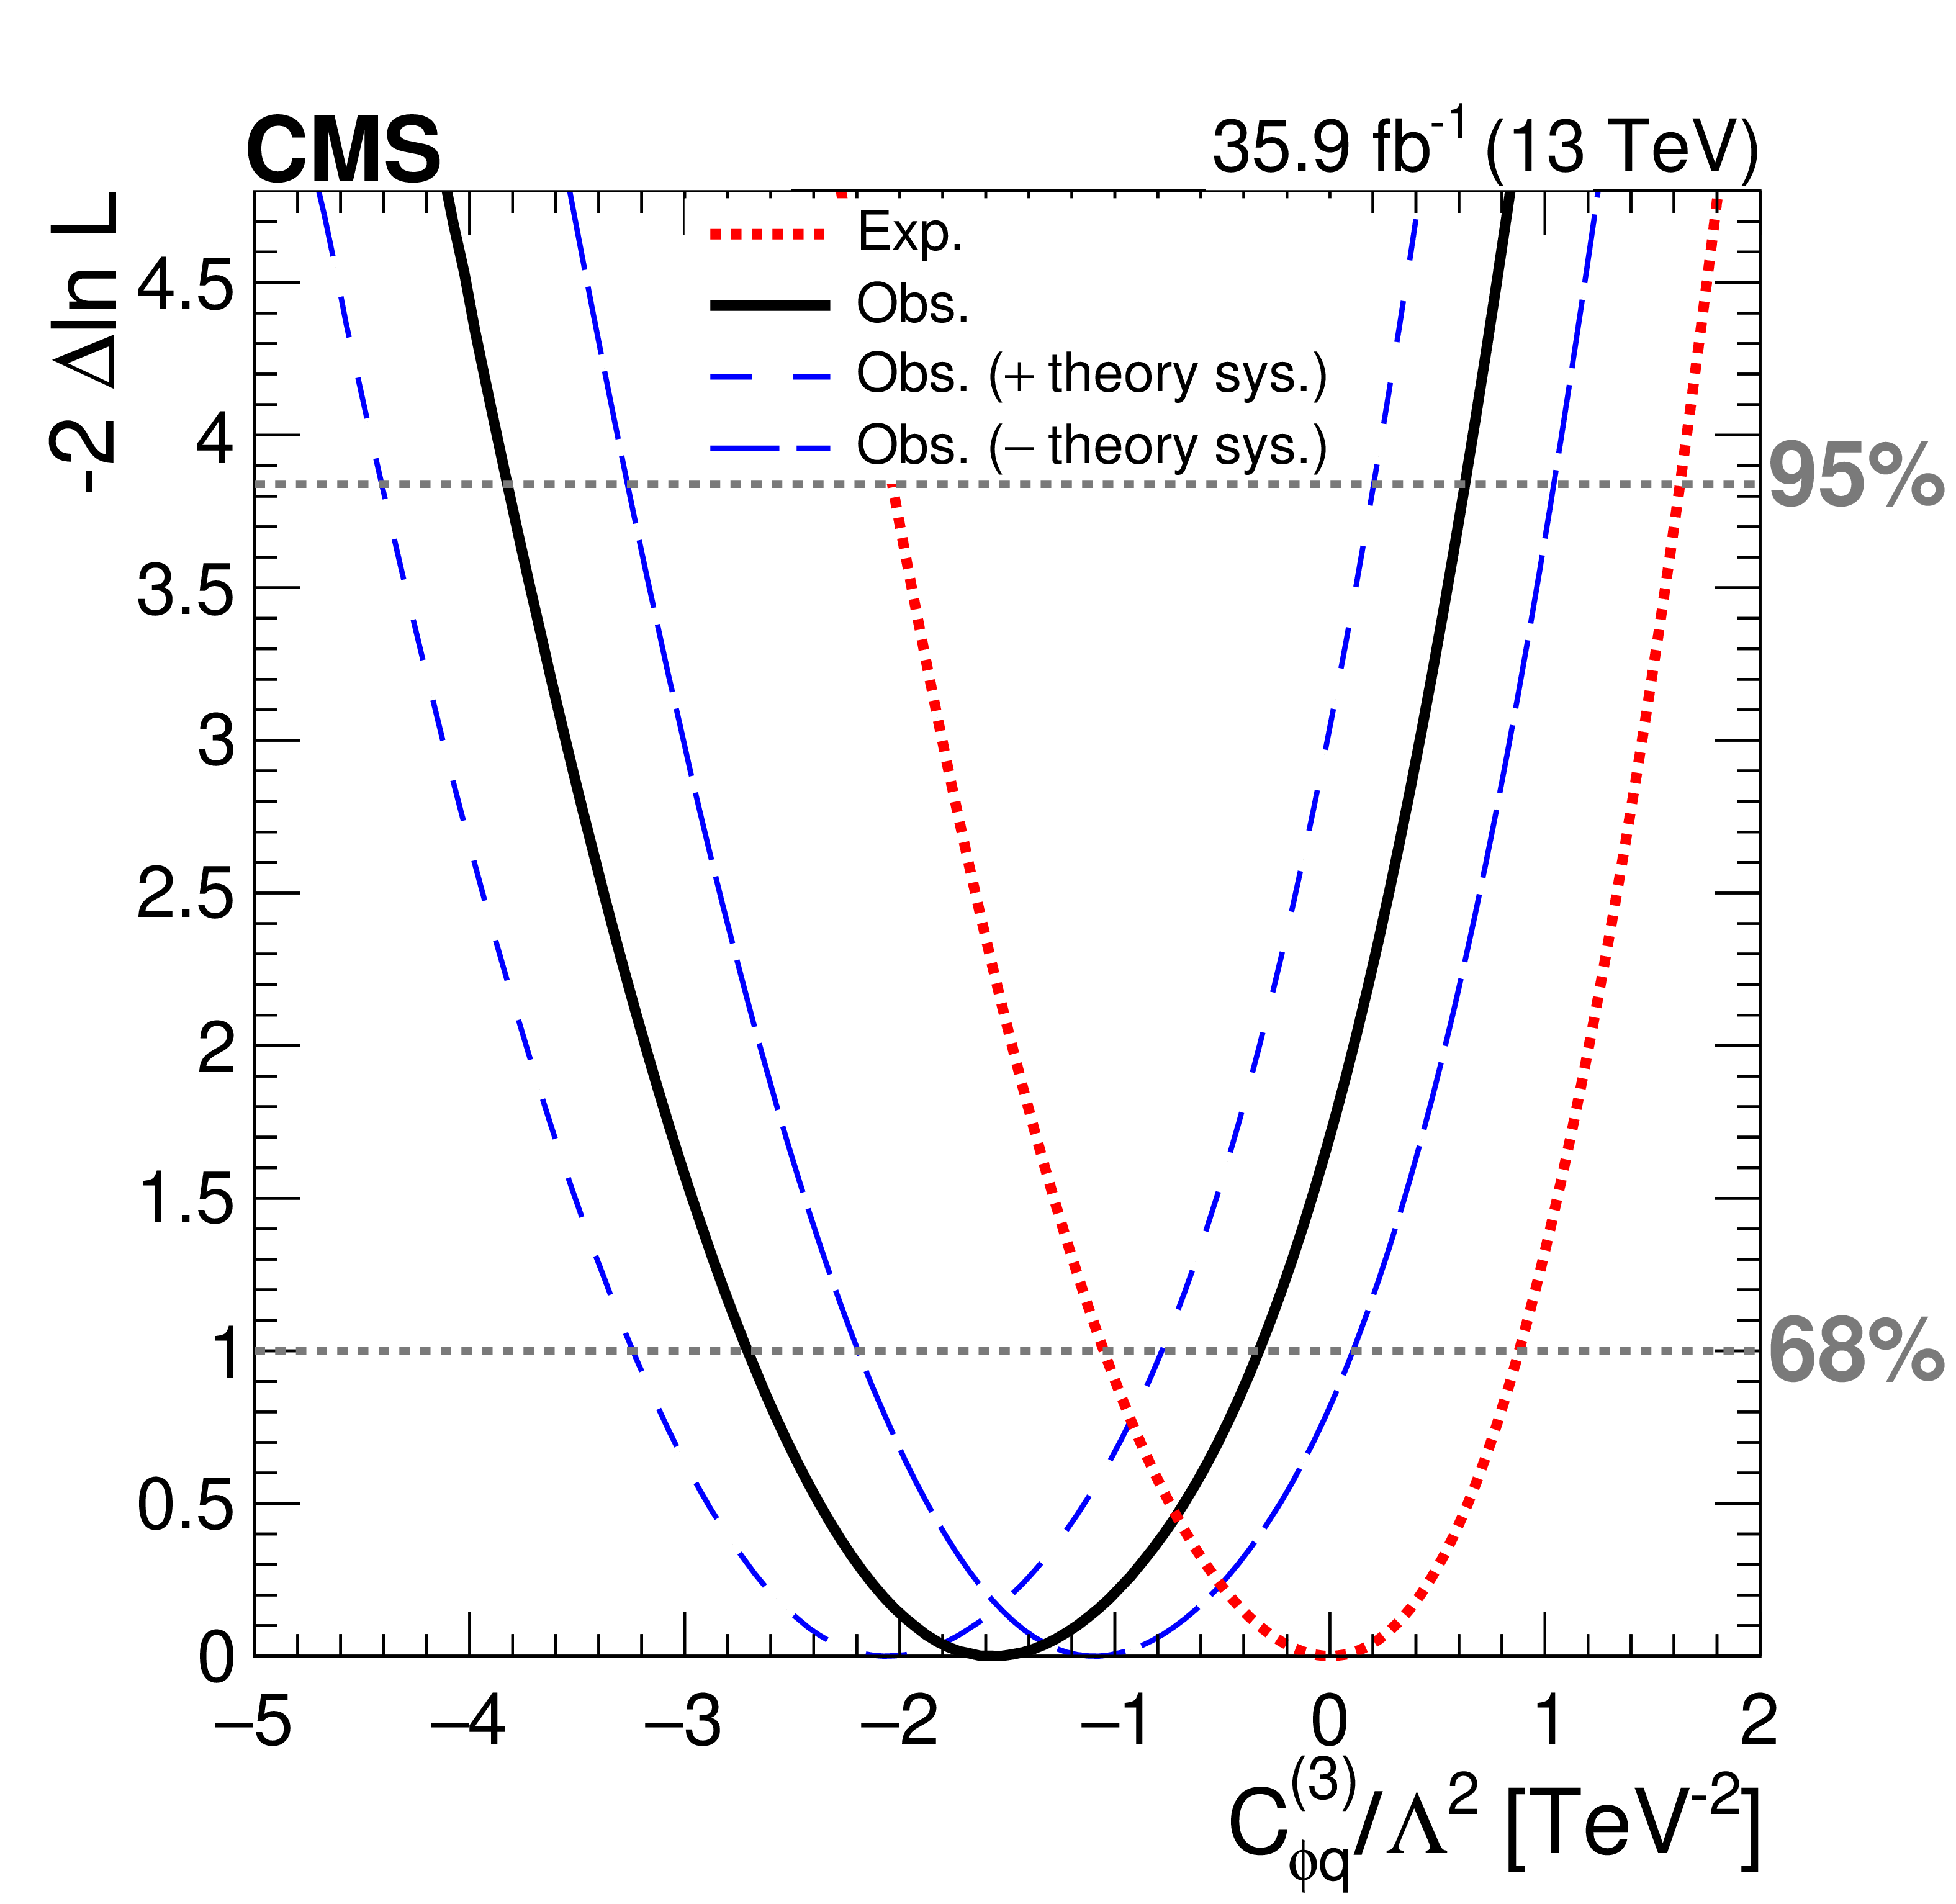
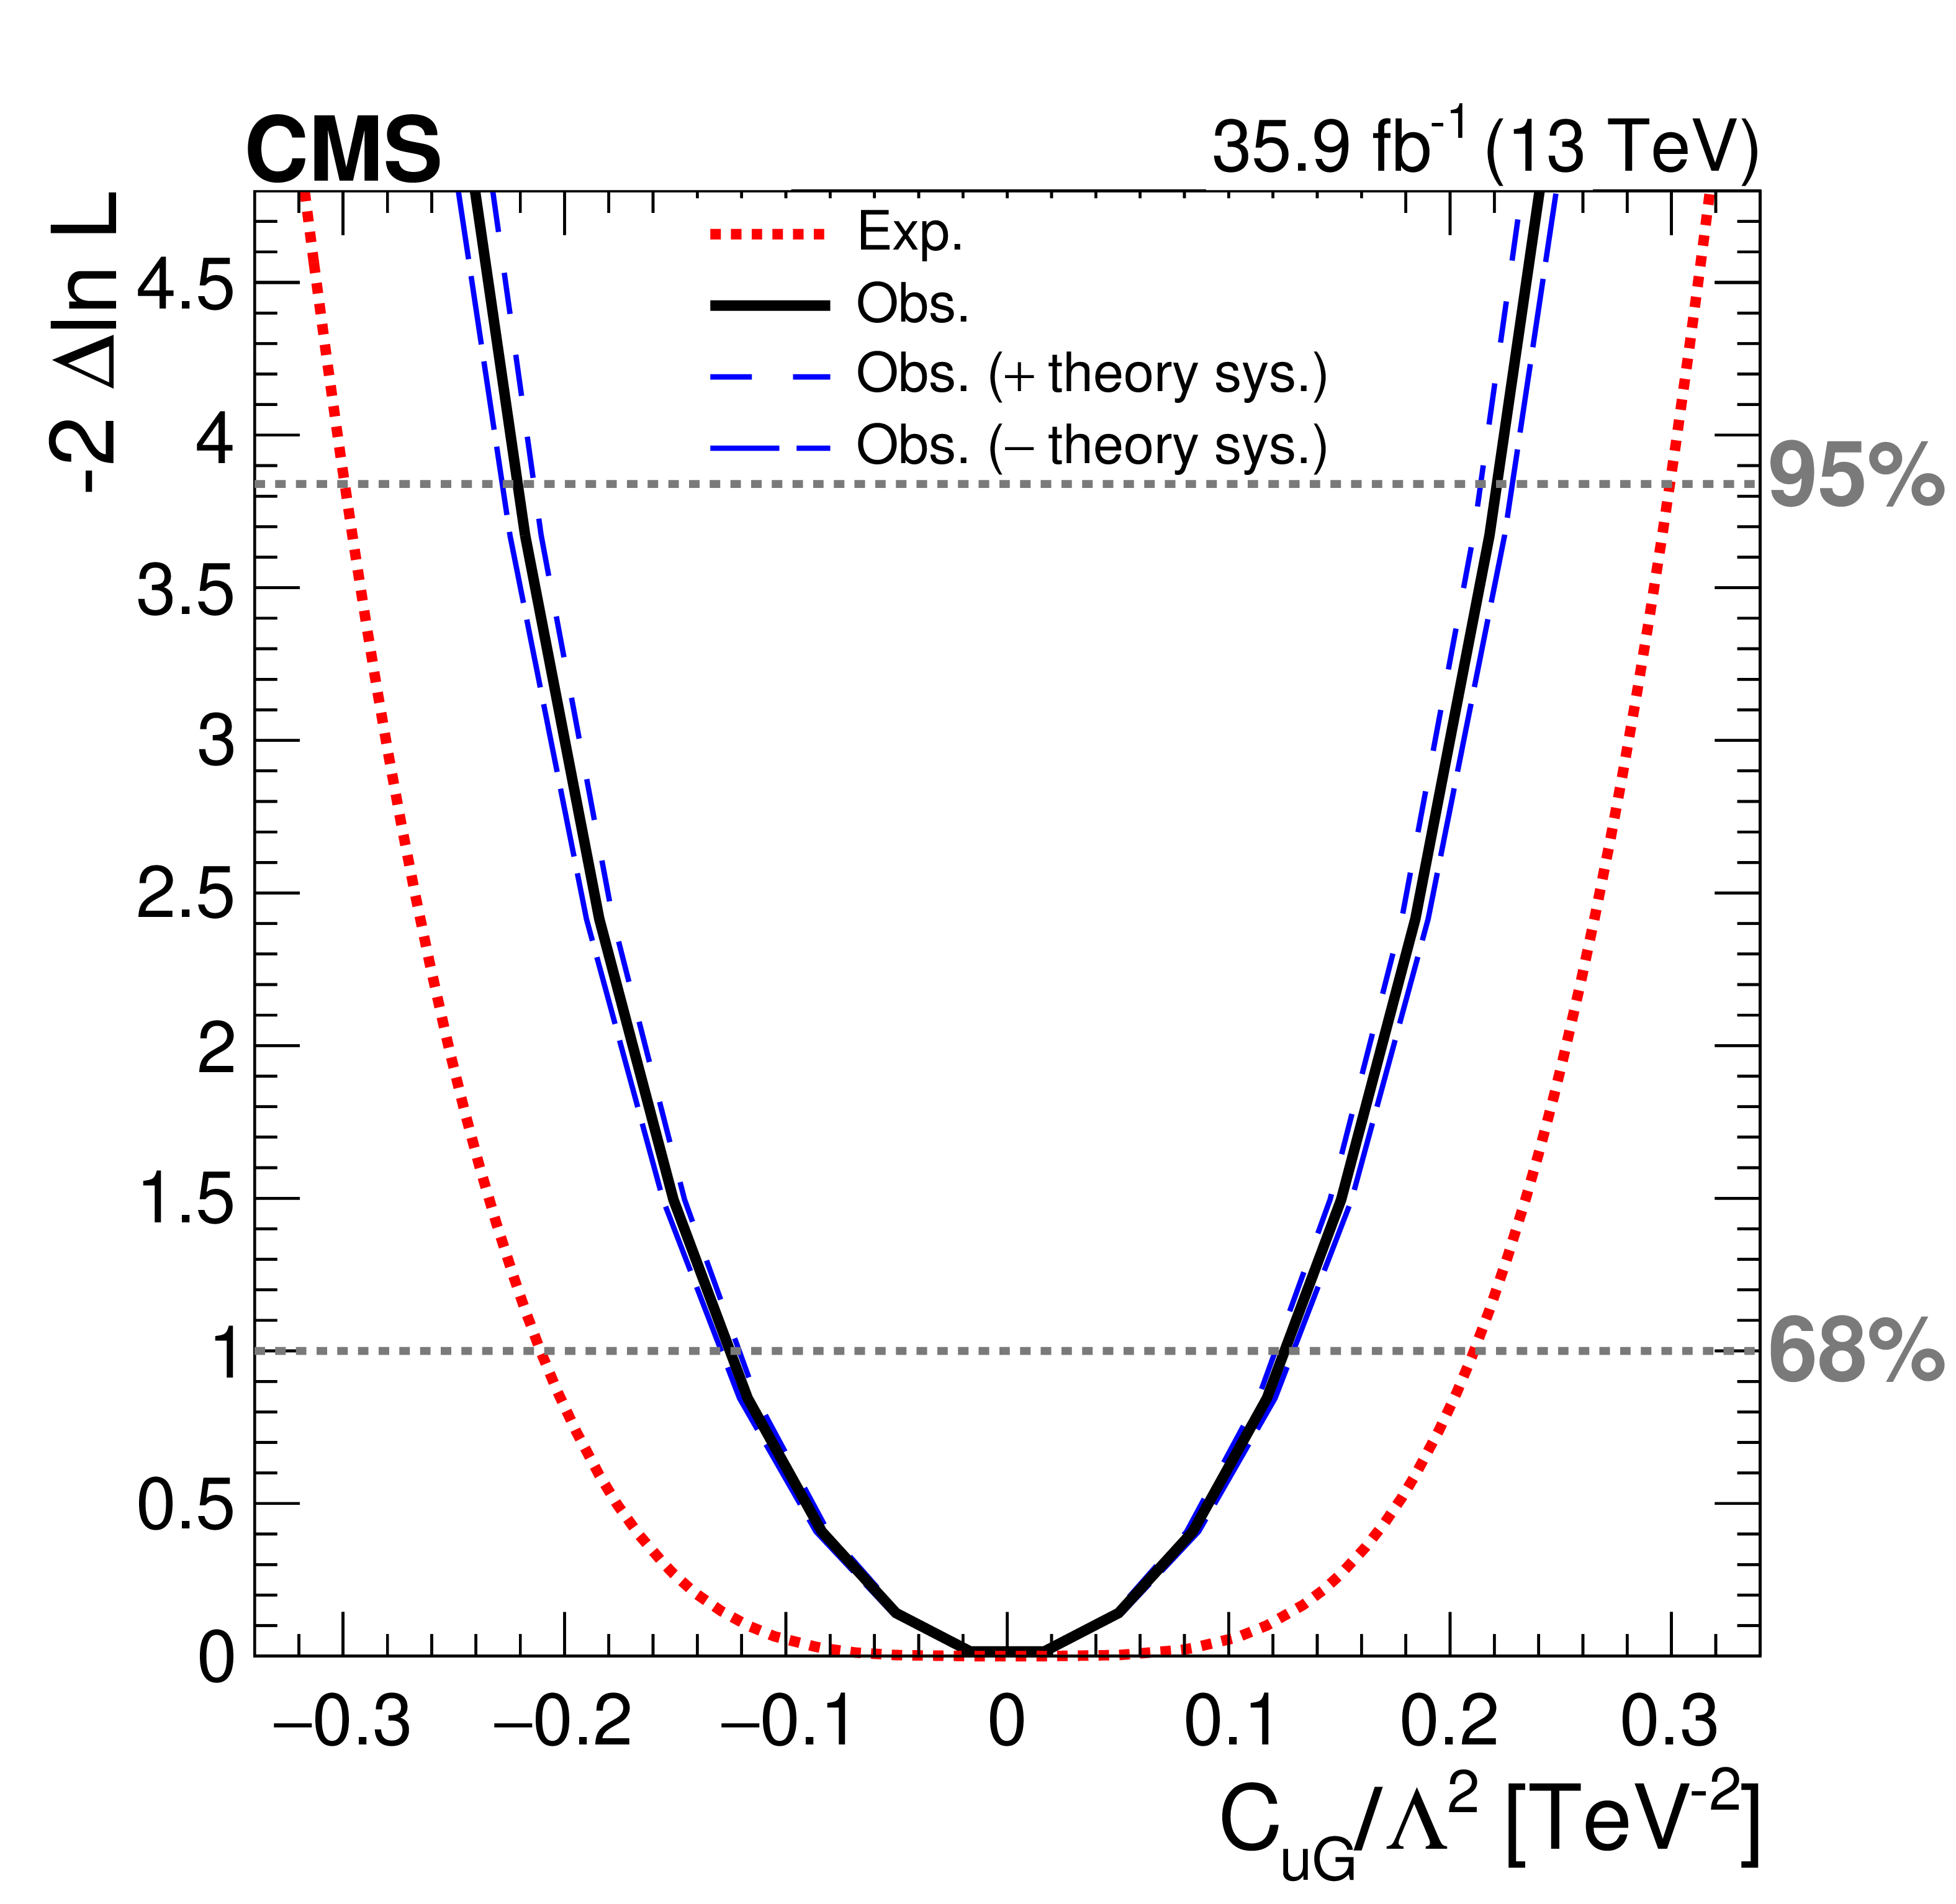
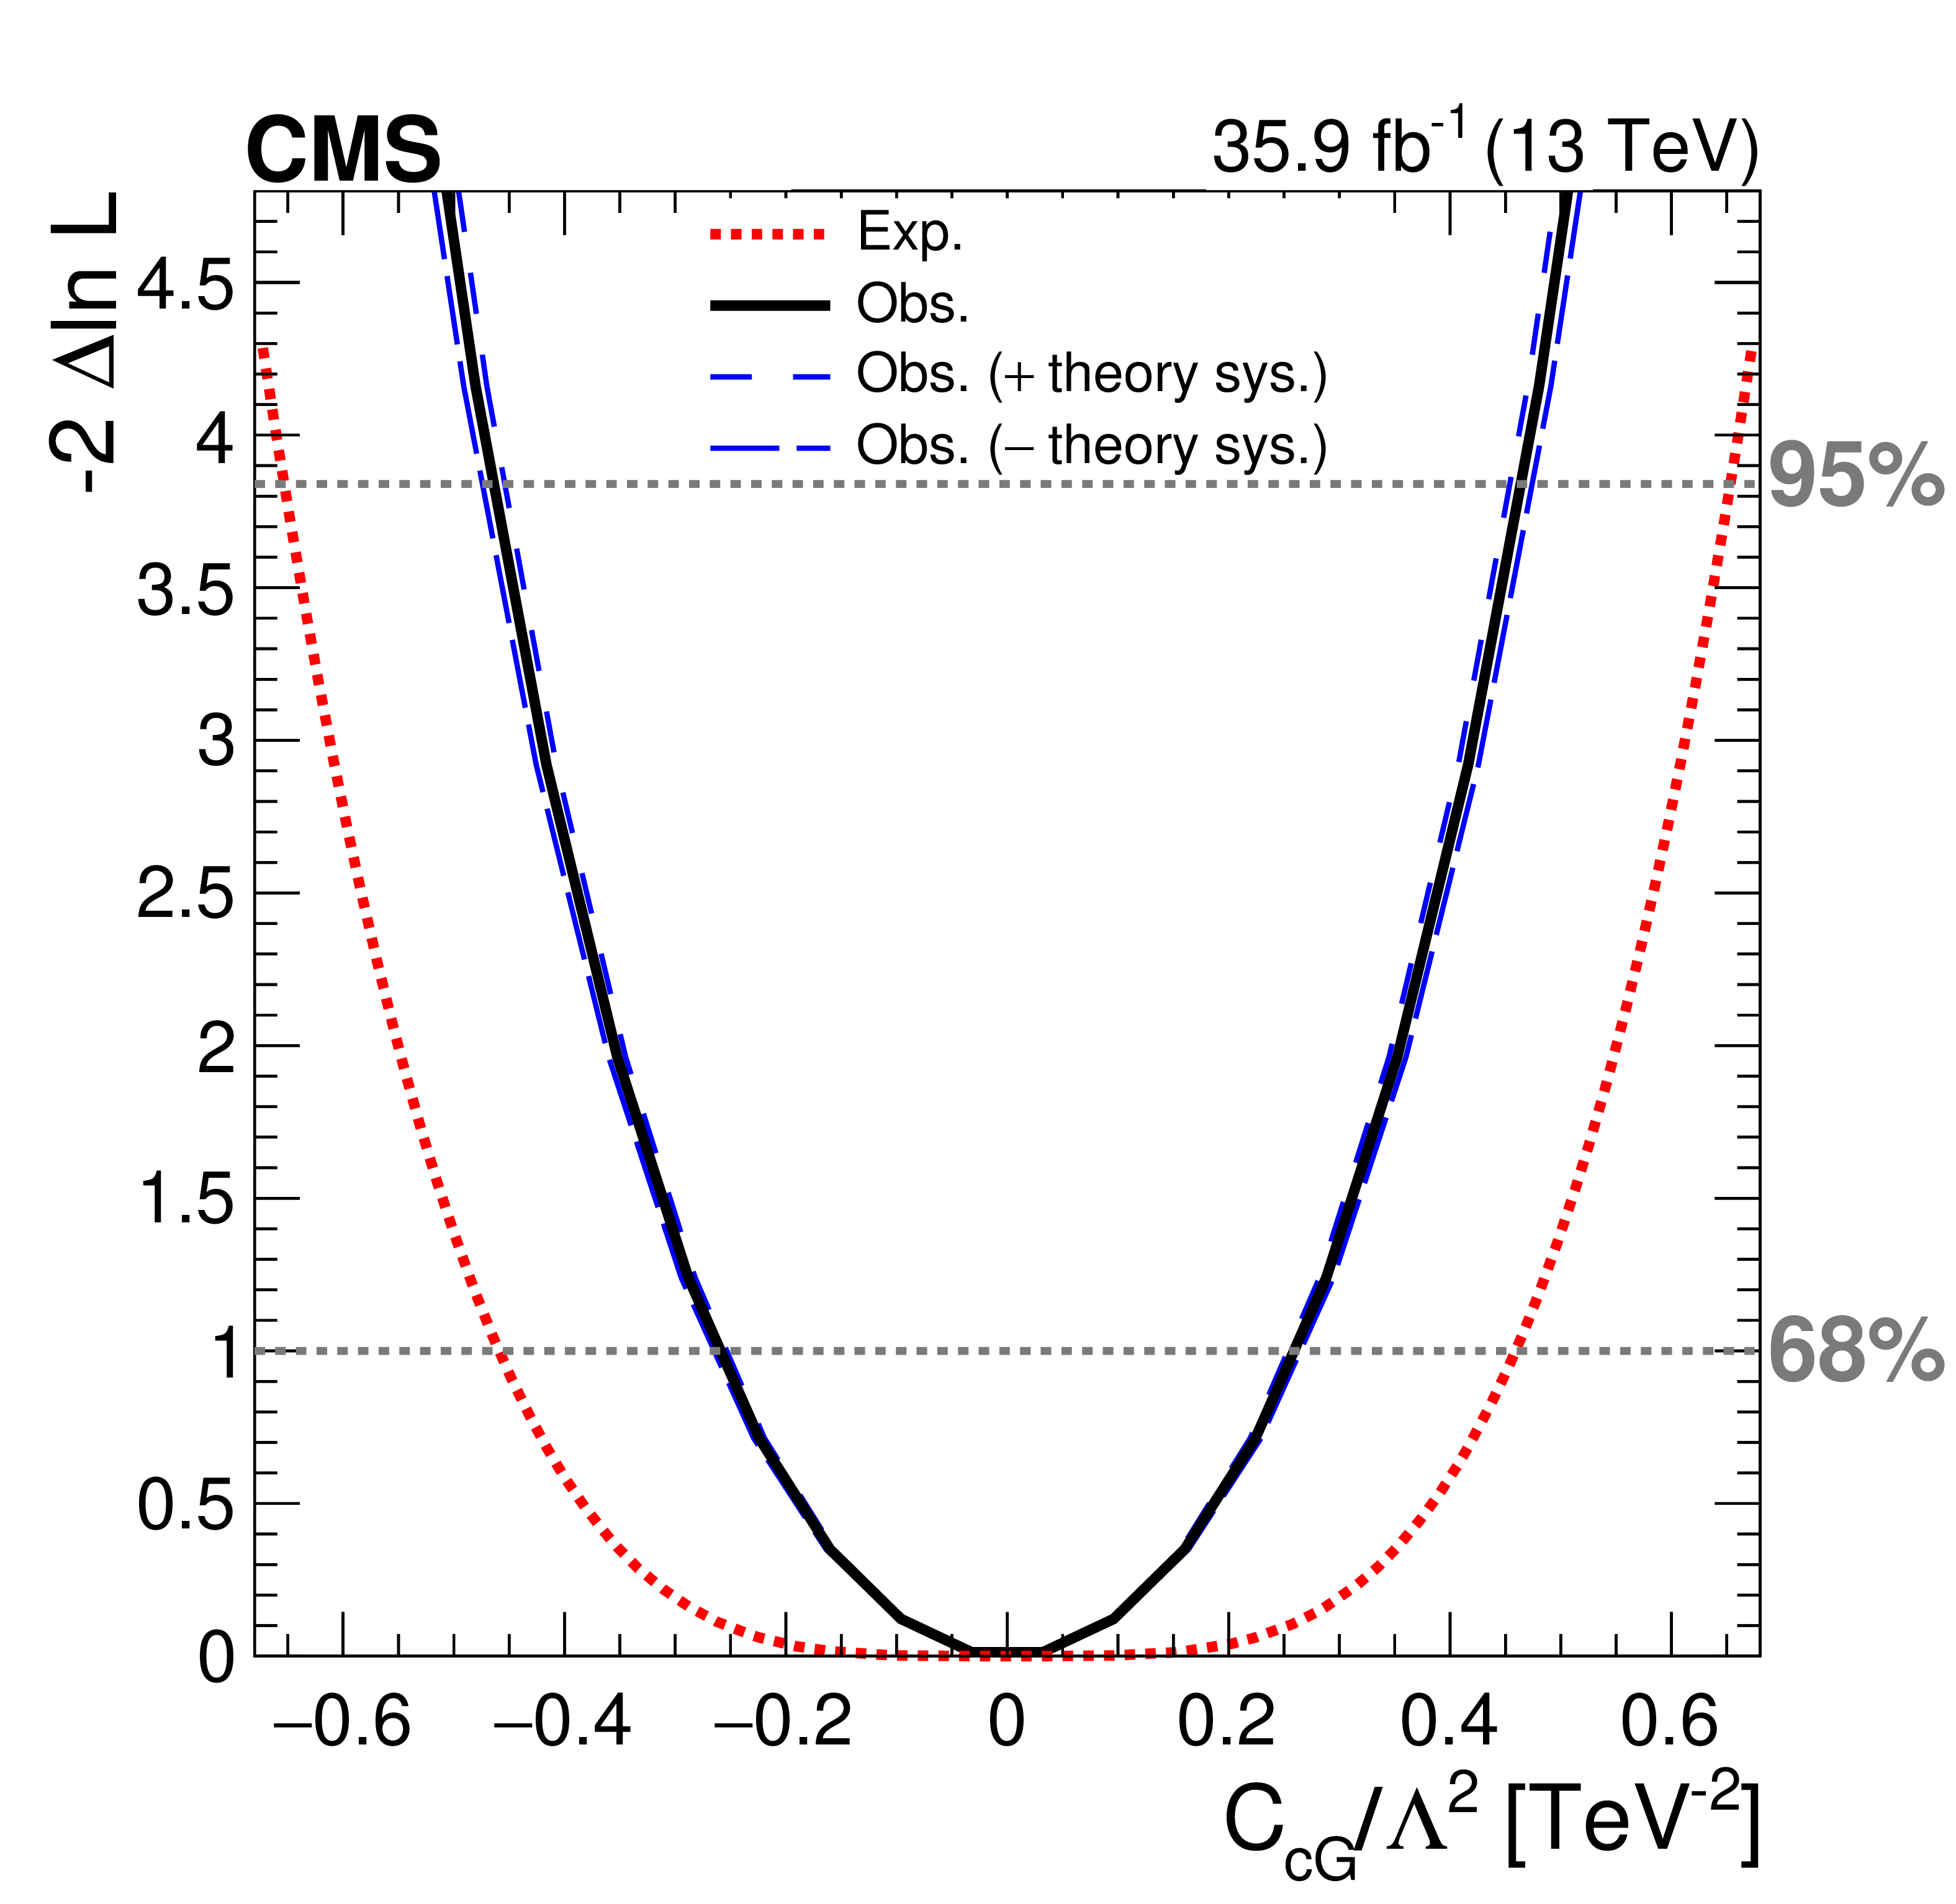
Figure 5:
Observed (solid) and expected (dotted) log likelihoods for the effective couplings: $\mathrm{C}_{\mathrm{G}}$ (upper left), $\mathrm{C}_{\mathrm{t} \mathrm{G}}$ (upper right), $\mathrm{C}_{\mathrm{t} \mathrm{W}}$ (middle left), $\mathrm{C}_{\phi \mathrm{q}}$ (middle right), $\mathrm{C}_{\mathrm{u} \mathrm{G}}$ (lower left), and $\mathrm{C}_{\mathrm{c} \mathrm{G}}$ (lower right). The dashed curves represent fits to the observed data with the variations of normalization due to the theoretical uncertainties. |
png pdf |
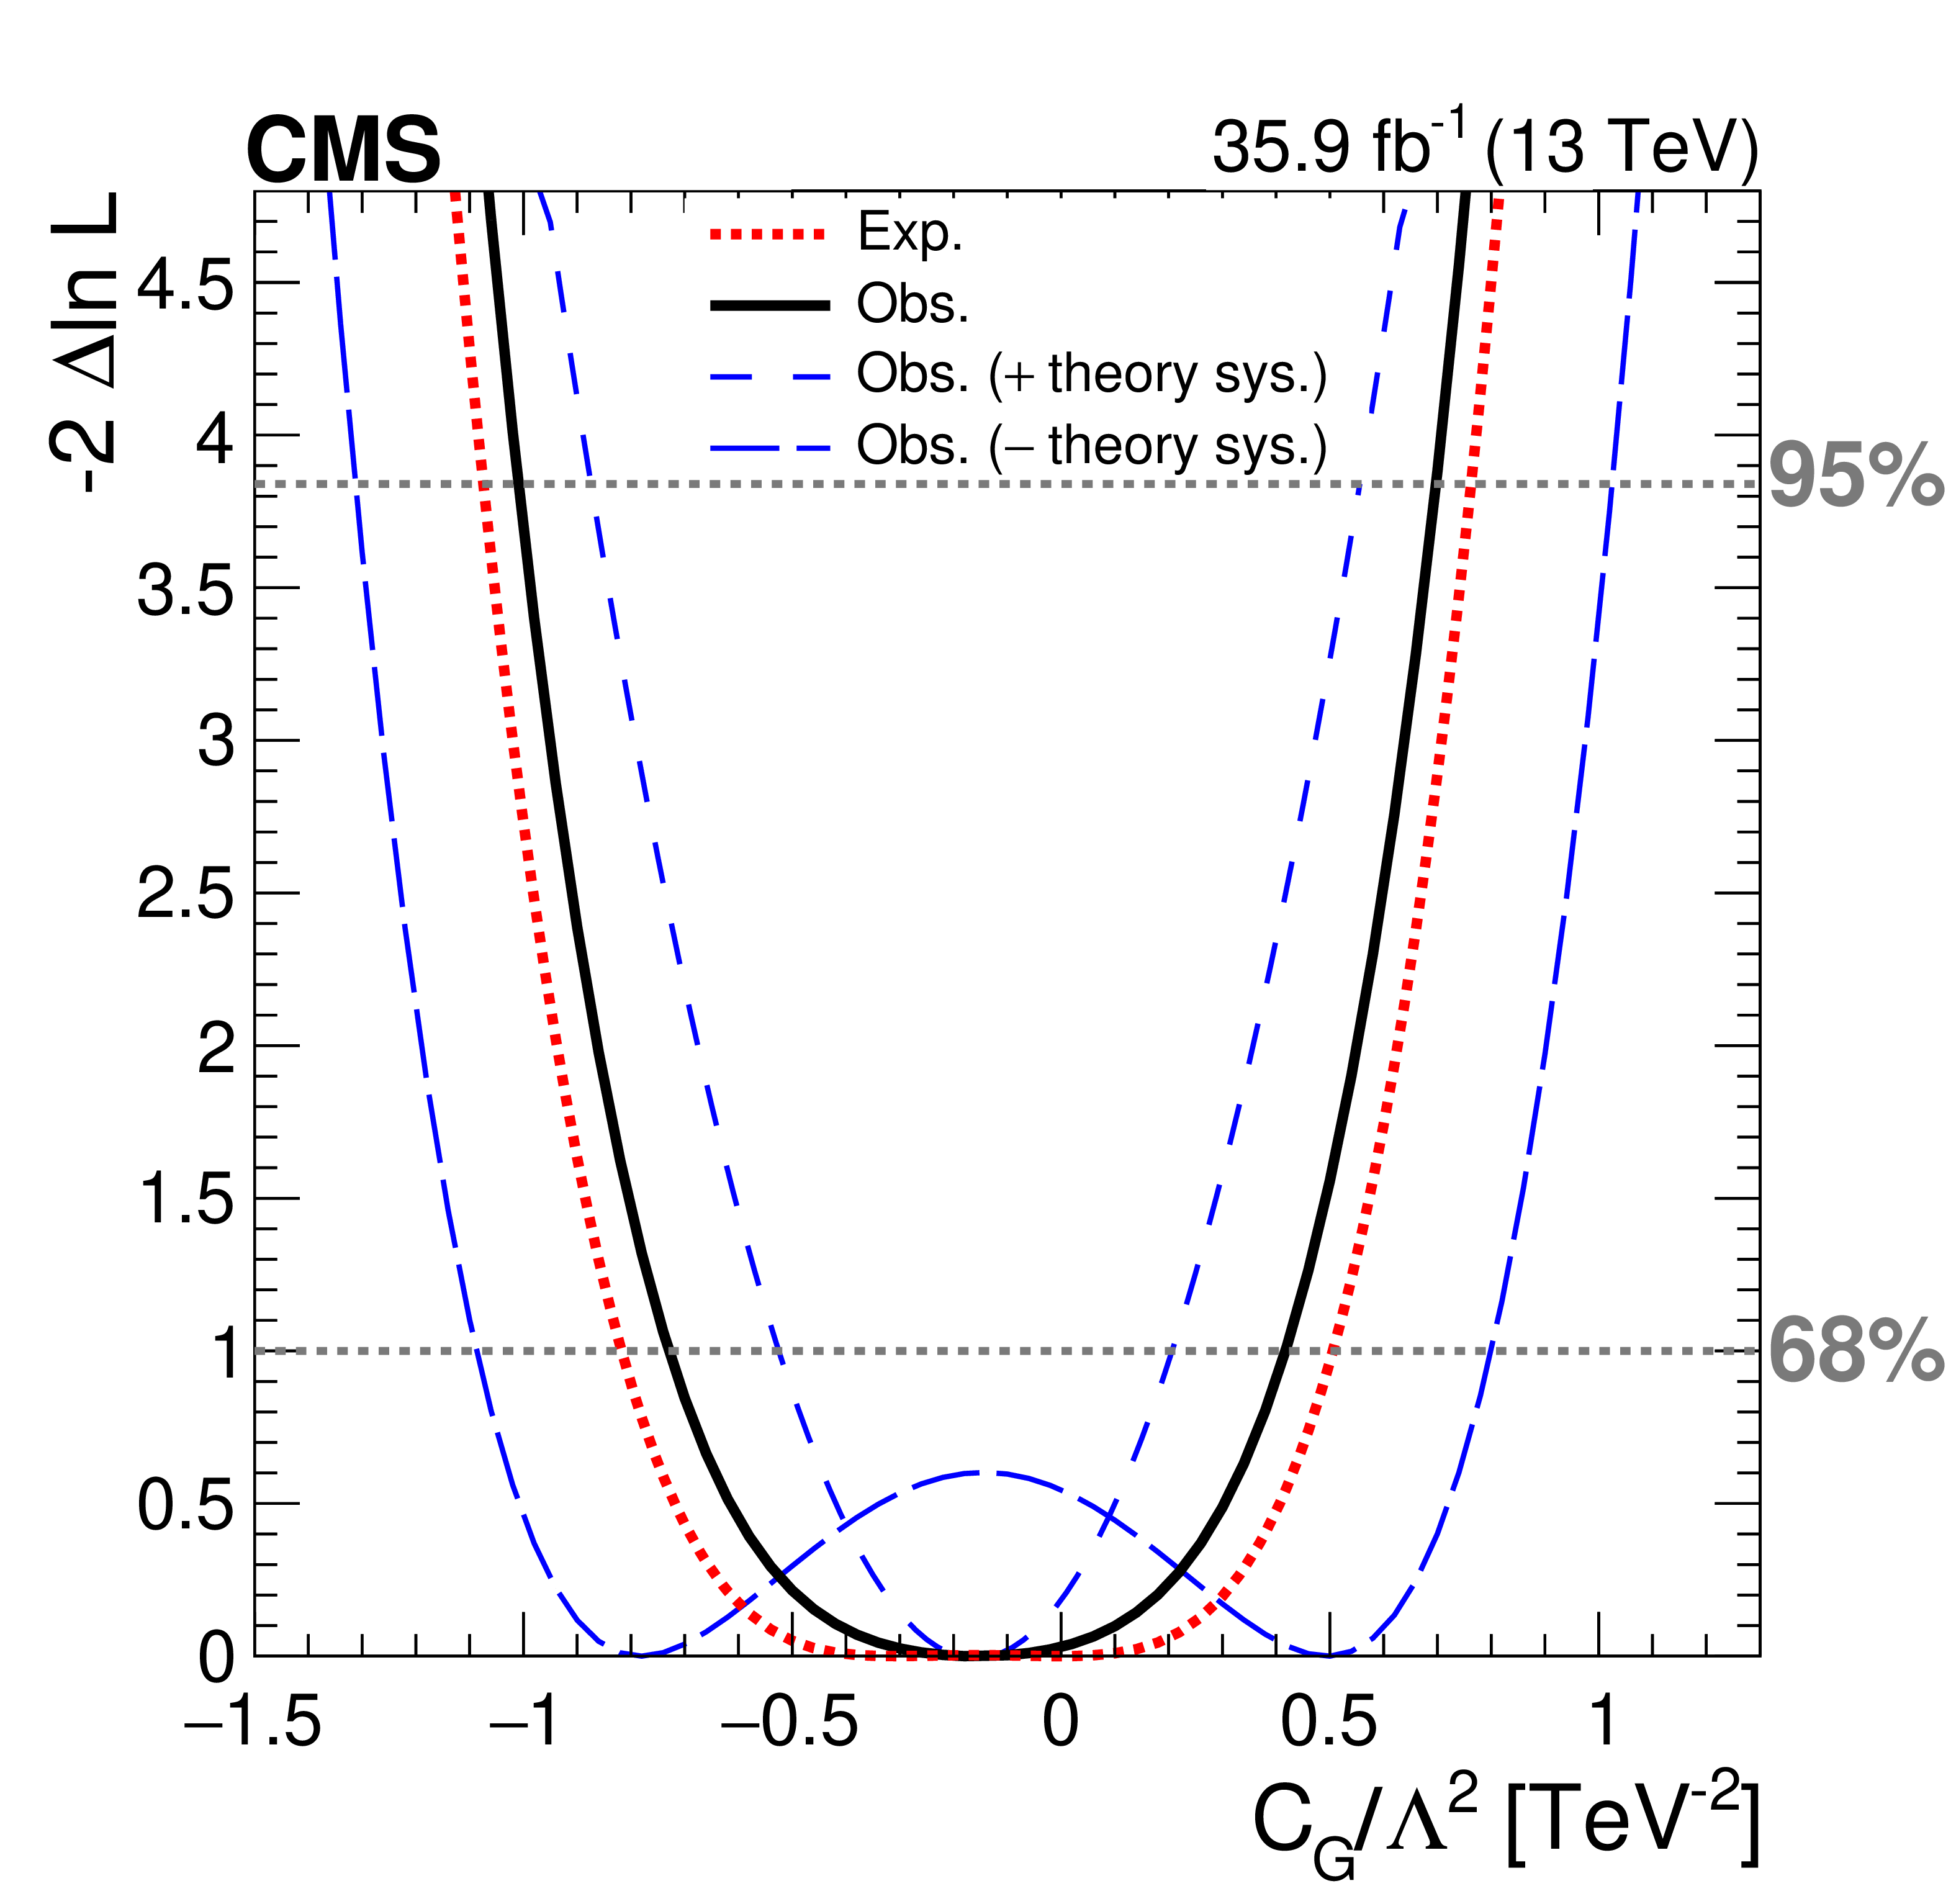
Figure 5-a:
Observed (solid) and expected (dotted) log likelihoods for the $\mathrm{C}_{\mathrm{G}}$ effective coupling. The dashed curves represent fits to the observed data with the variations of normalization due to the theoretical uncertainties. |
png pdf |
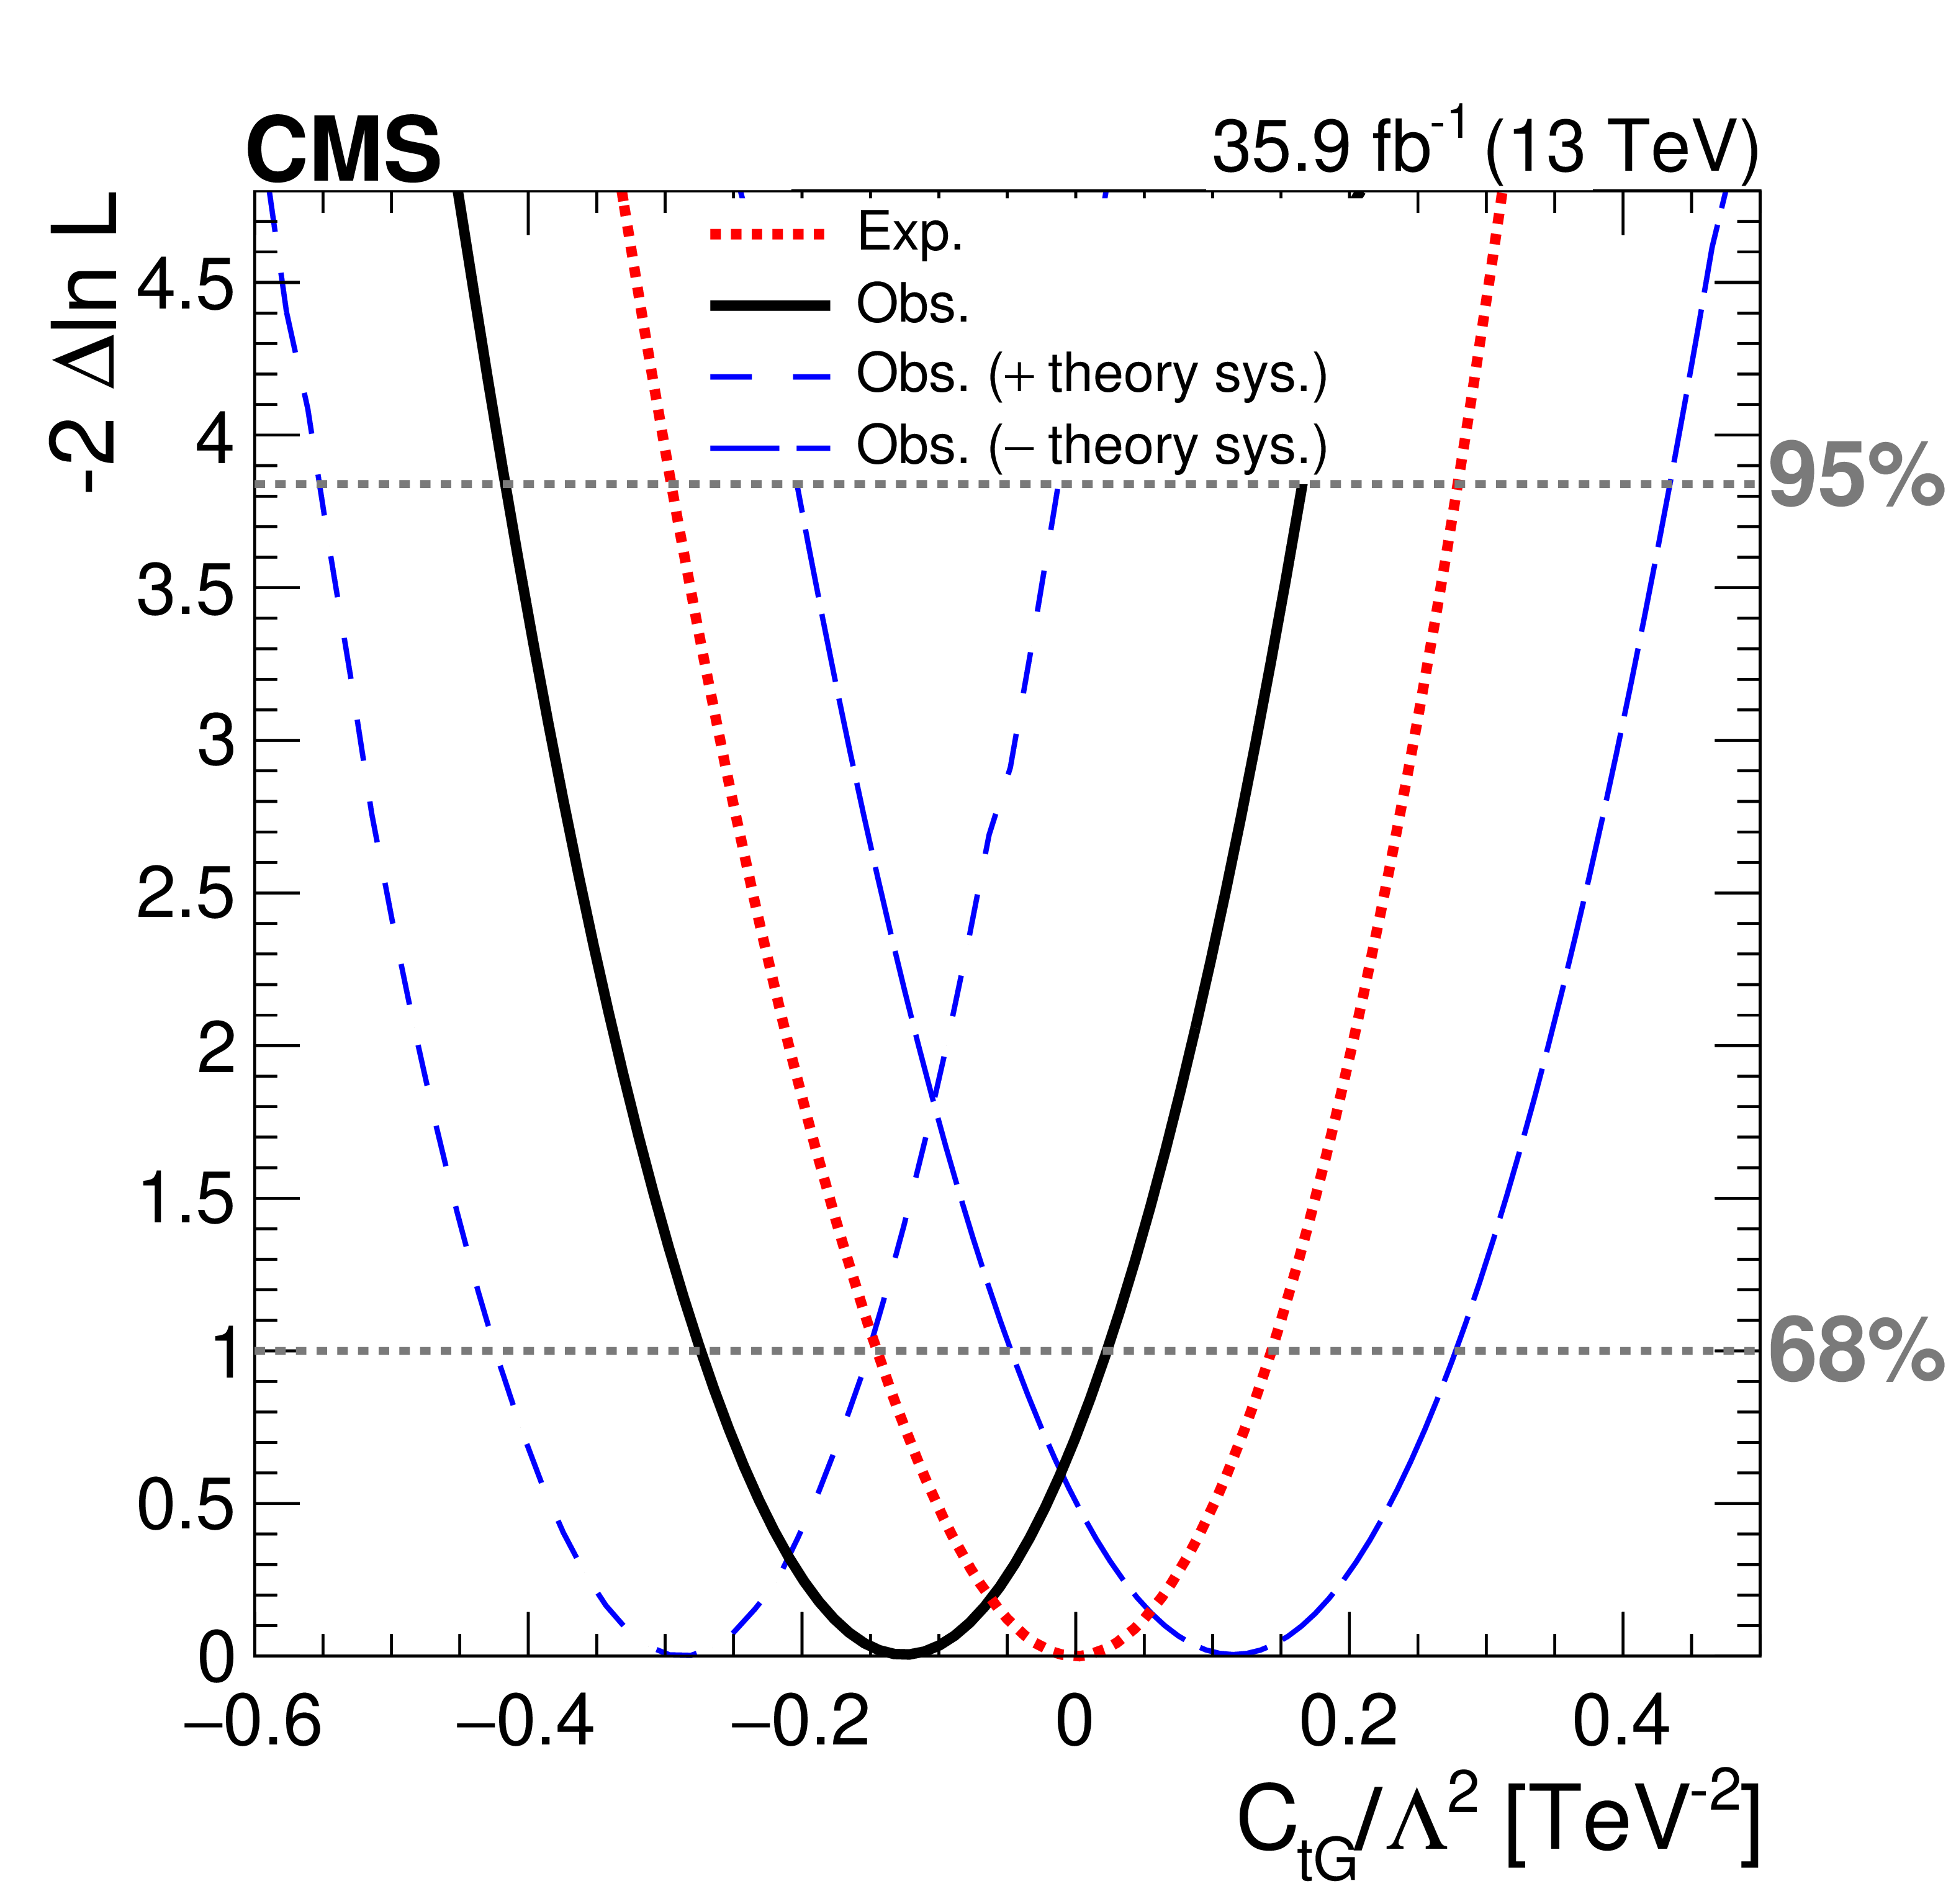
Figure 5-b:
Observed (solid) and expected (dotted) log likelihoods for the $\mathrm{C}_{\mathrm{t} \mathrm{G}}$ $effective coupling. The dashed curves represent fits to the observed data with the variations of normalization due to the theoretical uncertainties. |
png pdf |
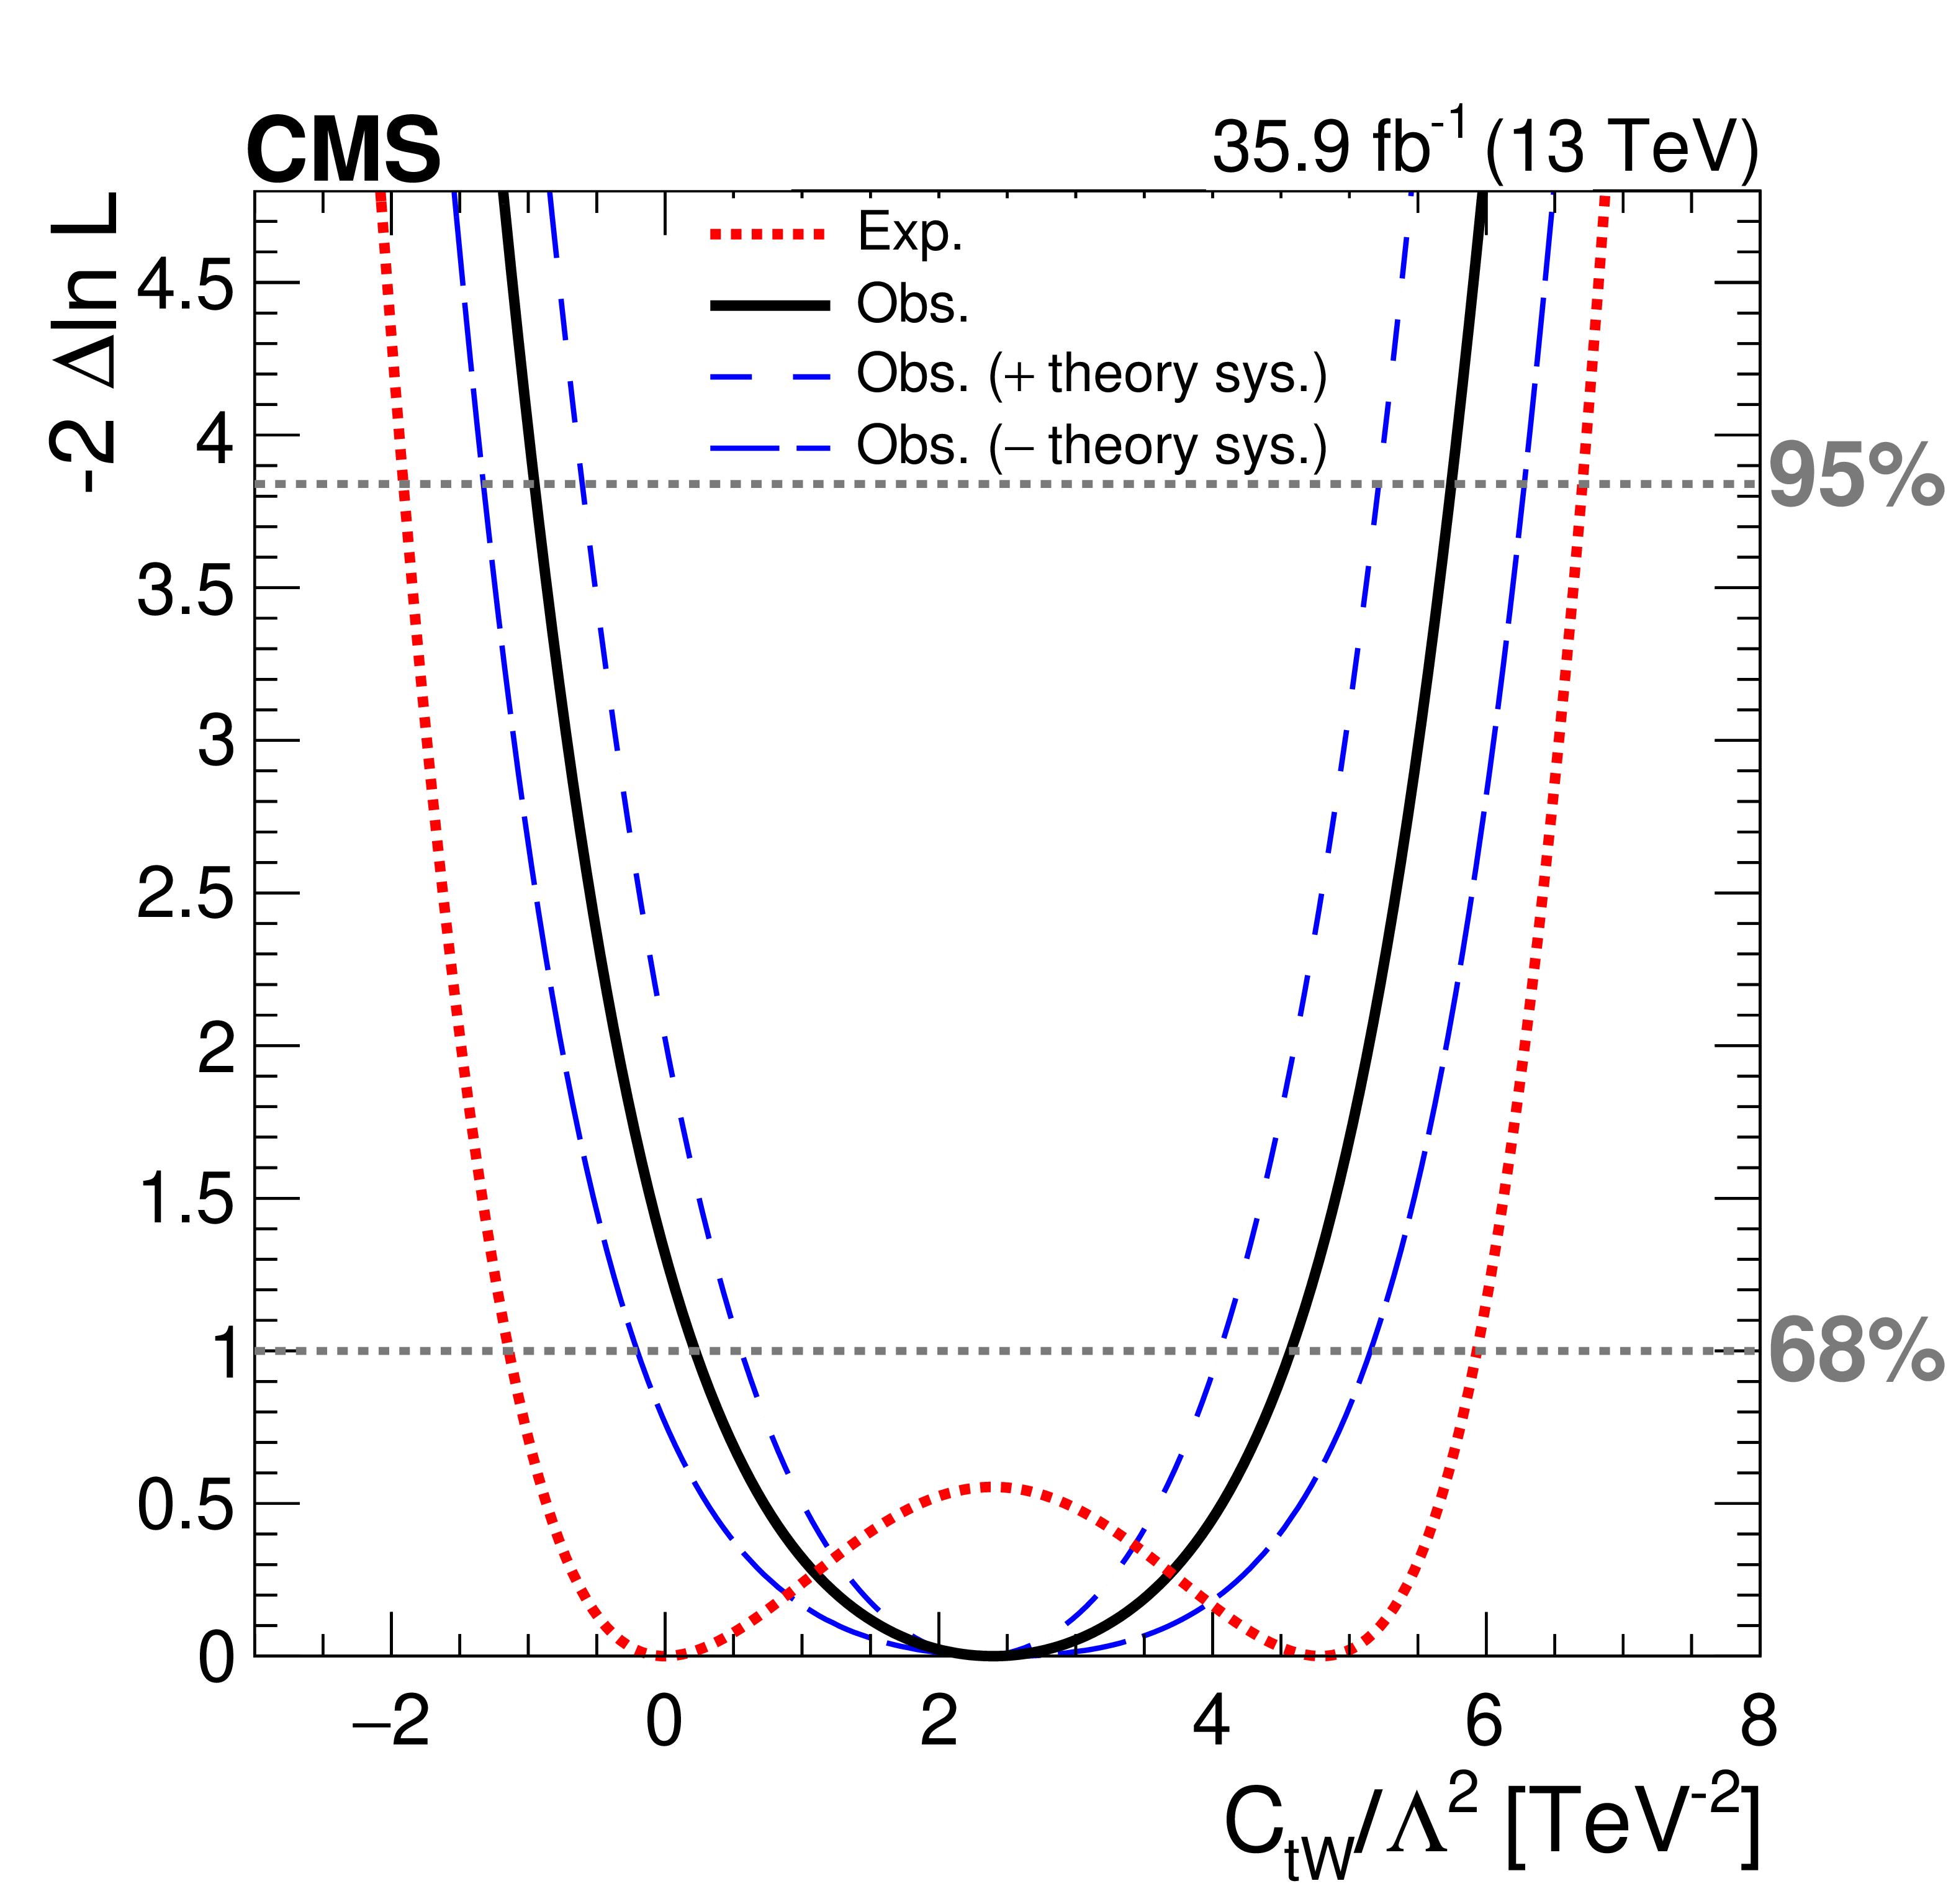
Figure 5-c:
Observed (solid) and expected (dotted) log likelihoods for the $\mathrm{C}_{\mathrm{t} \mathrm{W}}$ effective coupling. The dashed curves represent fits to the observed data with the variations of normalization due to the theoretical uncertainties. |
png pdf |
Figure 5-d:
Observed (solid) and expected (dotted) log likelihoods for the $\mathrm{C}_{\phi \mathrm{q}}$ effective coupling. The dashed curves represent fits to the observed data with the variations of normalization due to the theoretical uncertainties. |
png pdf |
Figure 5-e:
Observed (solid) and expected (dotted) log likelihoods for the $\mathrm{C}_{\mathrm{u} \mathrm{G}}$ effective coupling. The dashed curves represent fits to the observed data with the variations of normalization due to the theoretical uncertainties. |
png pdf |
Figure 5-f:
Observed (solid) and expected (dotted) log likelihoods for the $\mathrm{C}_{\mathrm{c} \mathrm{G}}$ effective coupling. The dashed curves represent fits to the observed data with the variations of normalization due to the theoretical uncertainties. |
png pdf |
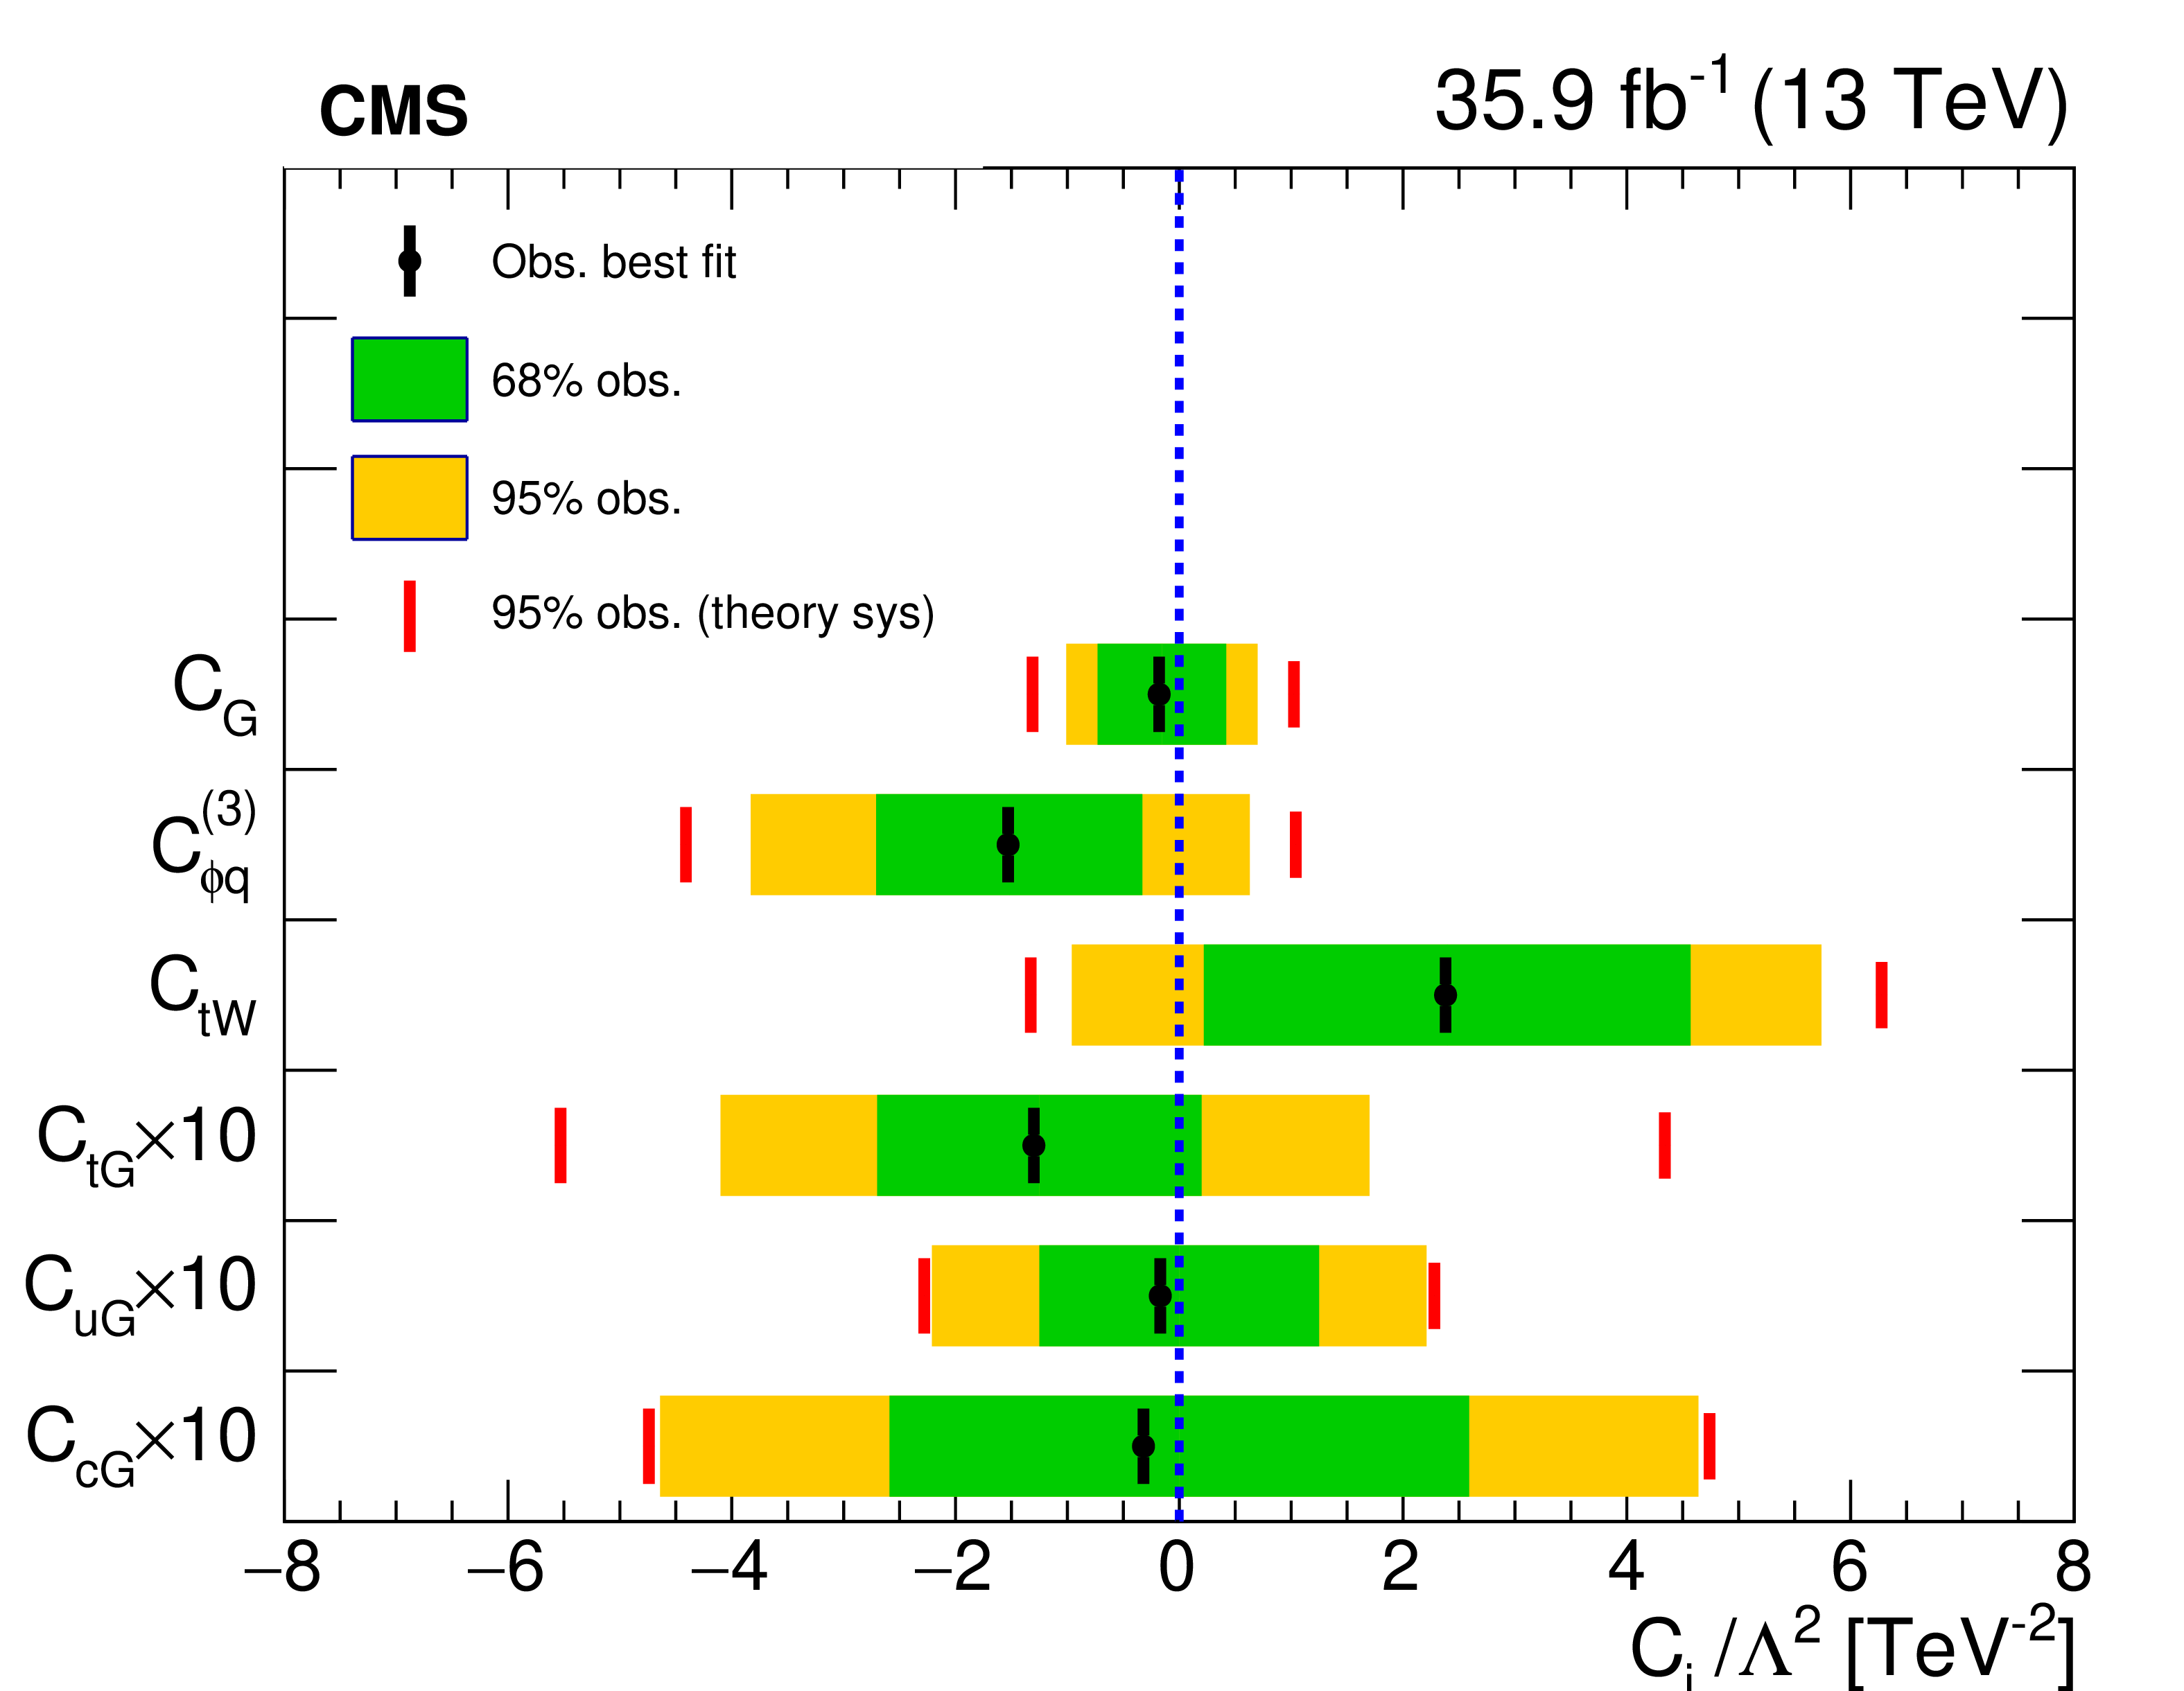
Figure 6:
Observed best fits together with one and two standard deviation bounds on the top quark effective couplings. The dashed line shows the SM expectation and the vertical lines indicate the 95% CL bounds including the theoretical uncertainties. |
| Tables | |

png pdf |
Table 1:
Contribution to the cross section due to the interference between the SM diagrams and diagrams with one EFT vertex ($\sigma _i^{(1)}$), and the pure new physics ($\sigma _i^{(2)}$) for ${\mathrm{t} {}\mathrm{\bar{t}}}$ and tW production [in {\text {\tmspace +\thinmuskip {.1667em}pb}} ] for the various effective couplings for $\Lambda = $ 1 TeV. The respective $K$ factors ($\sigma _i^{\mathrm {NLO}}/\sigma _i^{\mathrm {LO}}$) are also shown. |
png pdf |
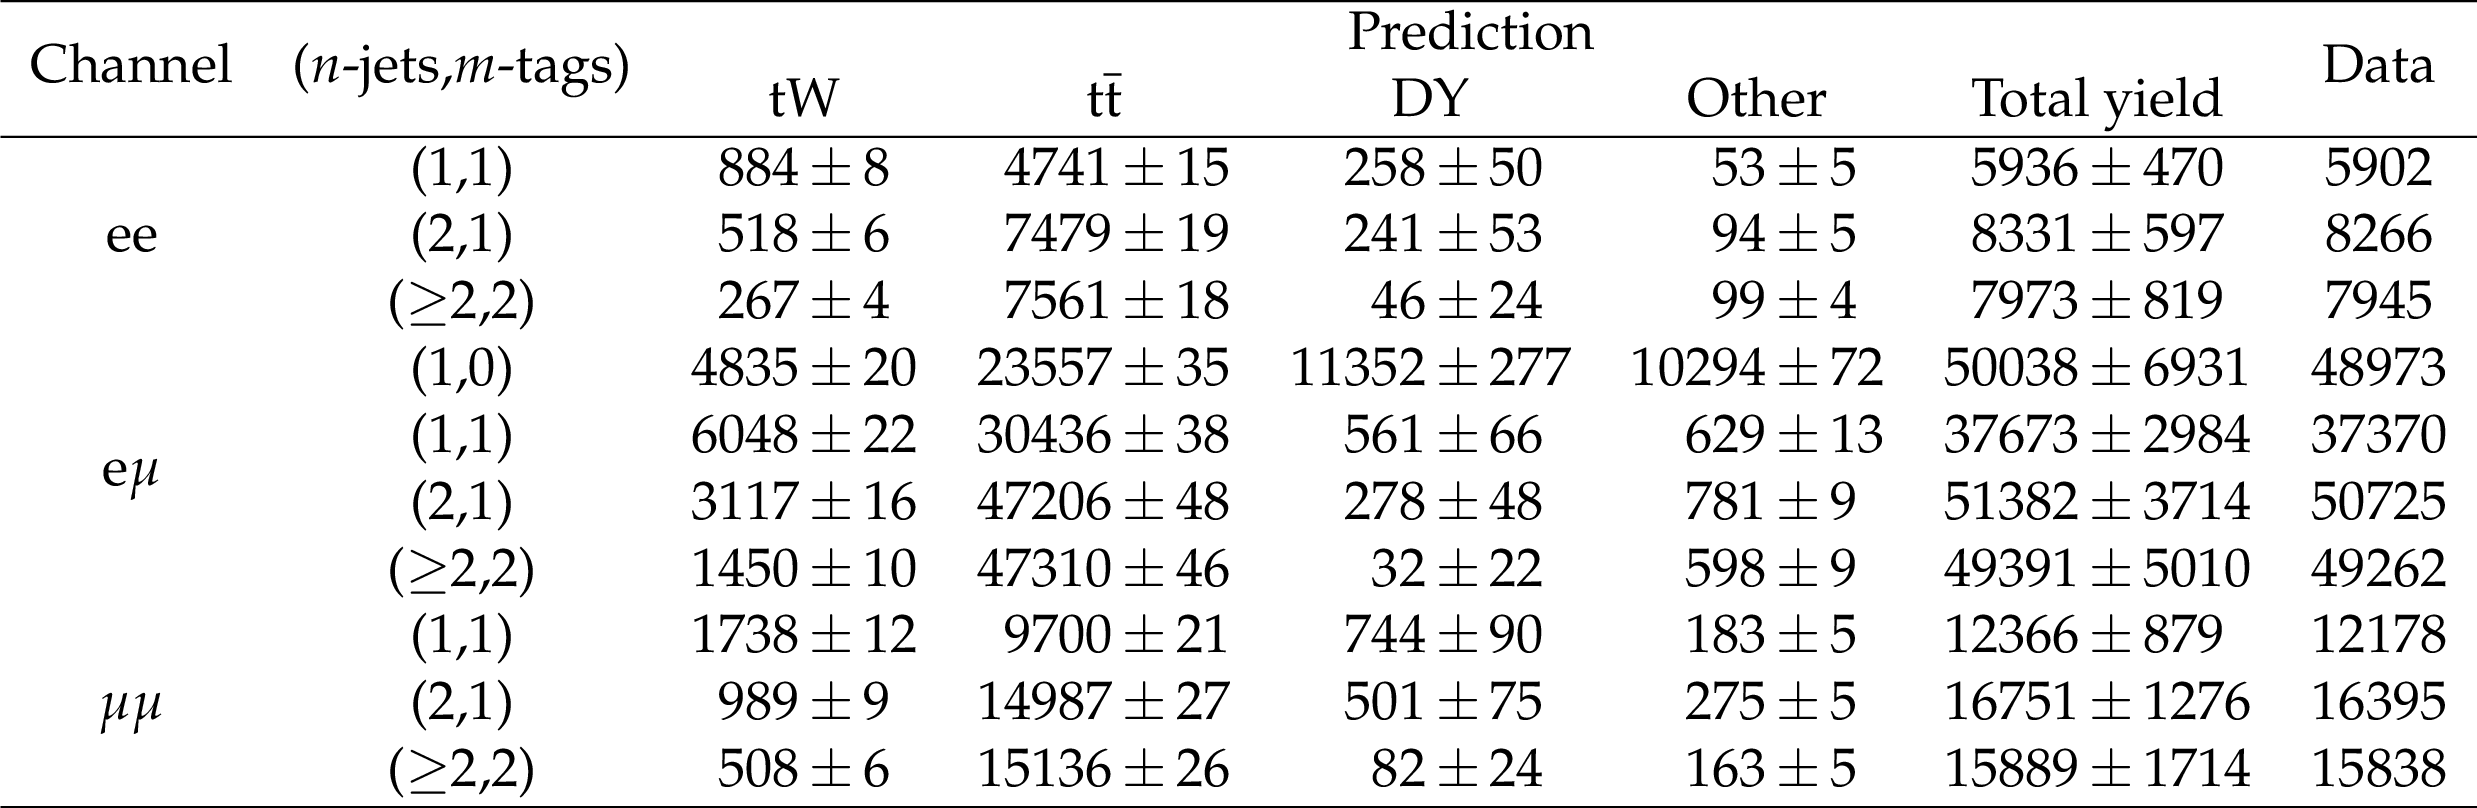
Table 2:
Number of expected events from tW, ${\mathrm{t} {}\mathrm{\bar{t}}}$ and DY production, from the remaining backgrounds (other), total background contribution and observed events in data after all selections for the $\mathrm{e} \mathrm{e} $, $\mathrm{e} \mu $, and $\mu \mu $ channels and for different ($n$-jets,$m$-tags) categories. The uncertainties correspond to the statistical contribution only for the individual background predictions and to the quadratic sum of the statistical and systematic contributions for the total background predictions. |
png pdf |
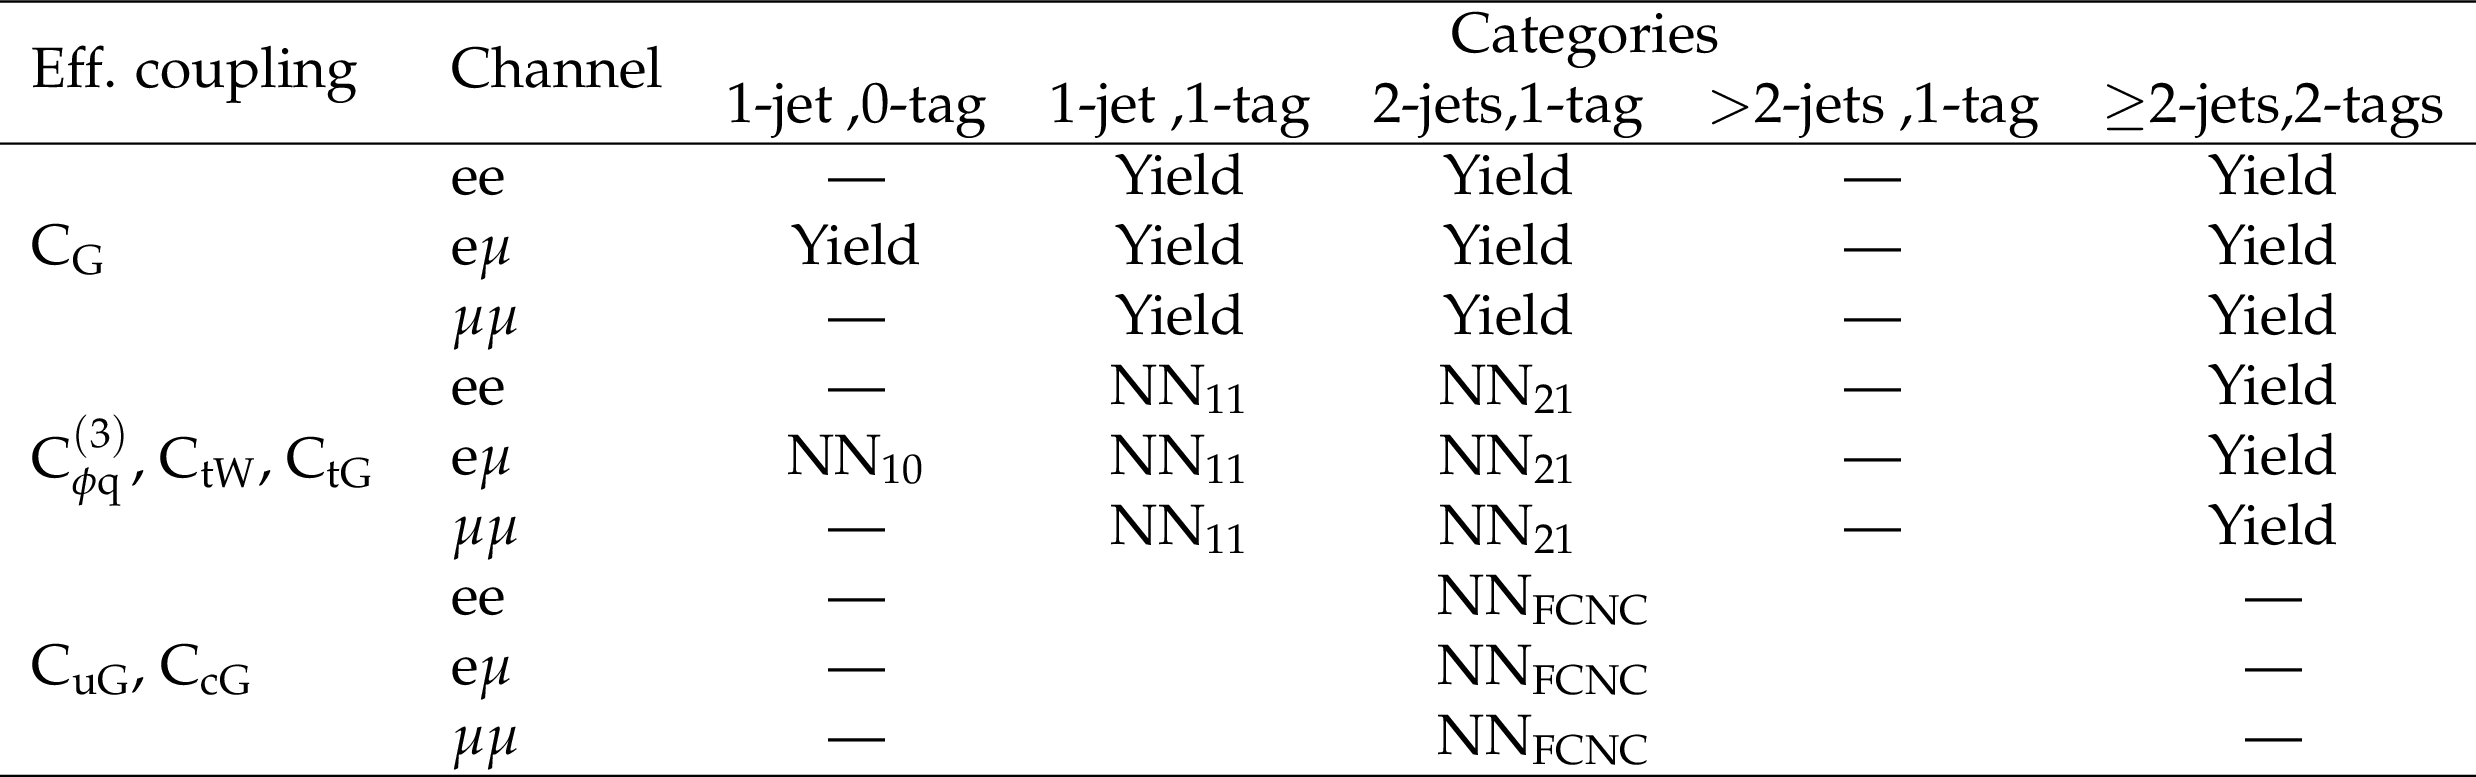
Table 3:
Summary of the observables used to probe the effective couplings in various ($n$-jets,$m$-tags) categories in the $\mathrm{e} \mathrm{e} $, $\mathrm{e} \mu $, and $\mu \mu $ channels. |
png pdf |
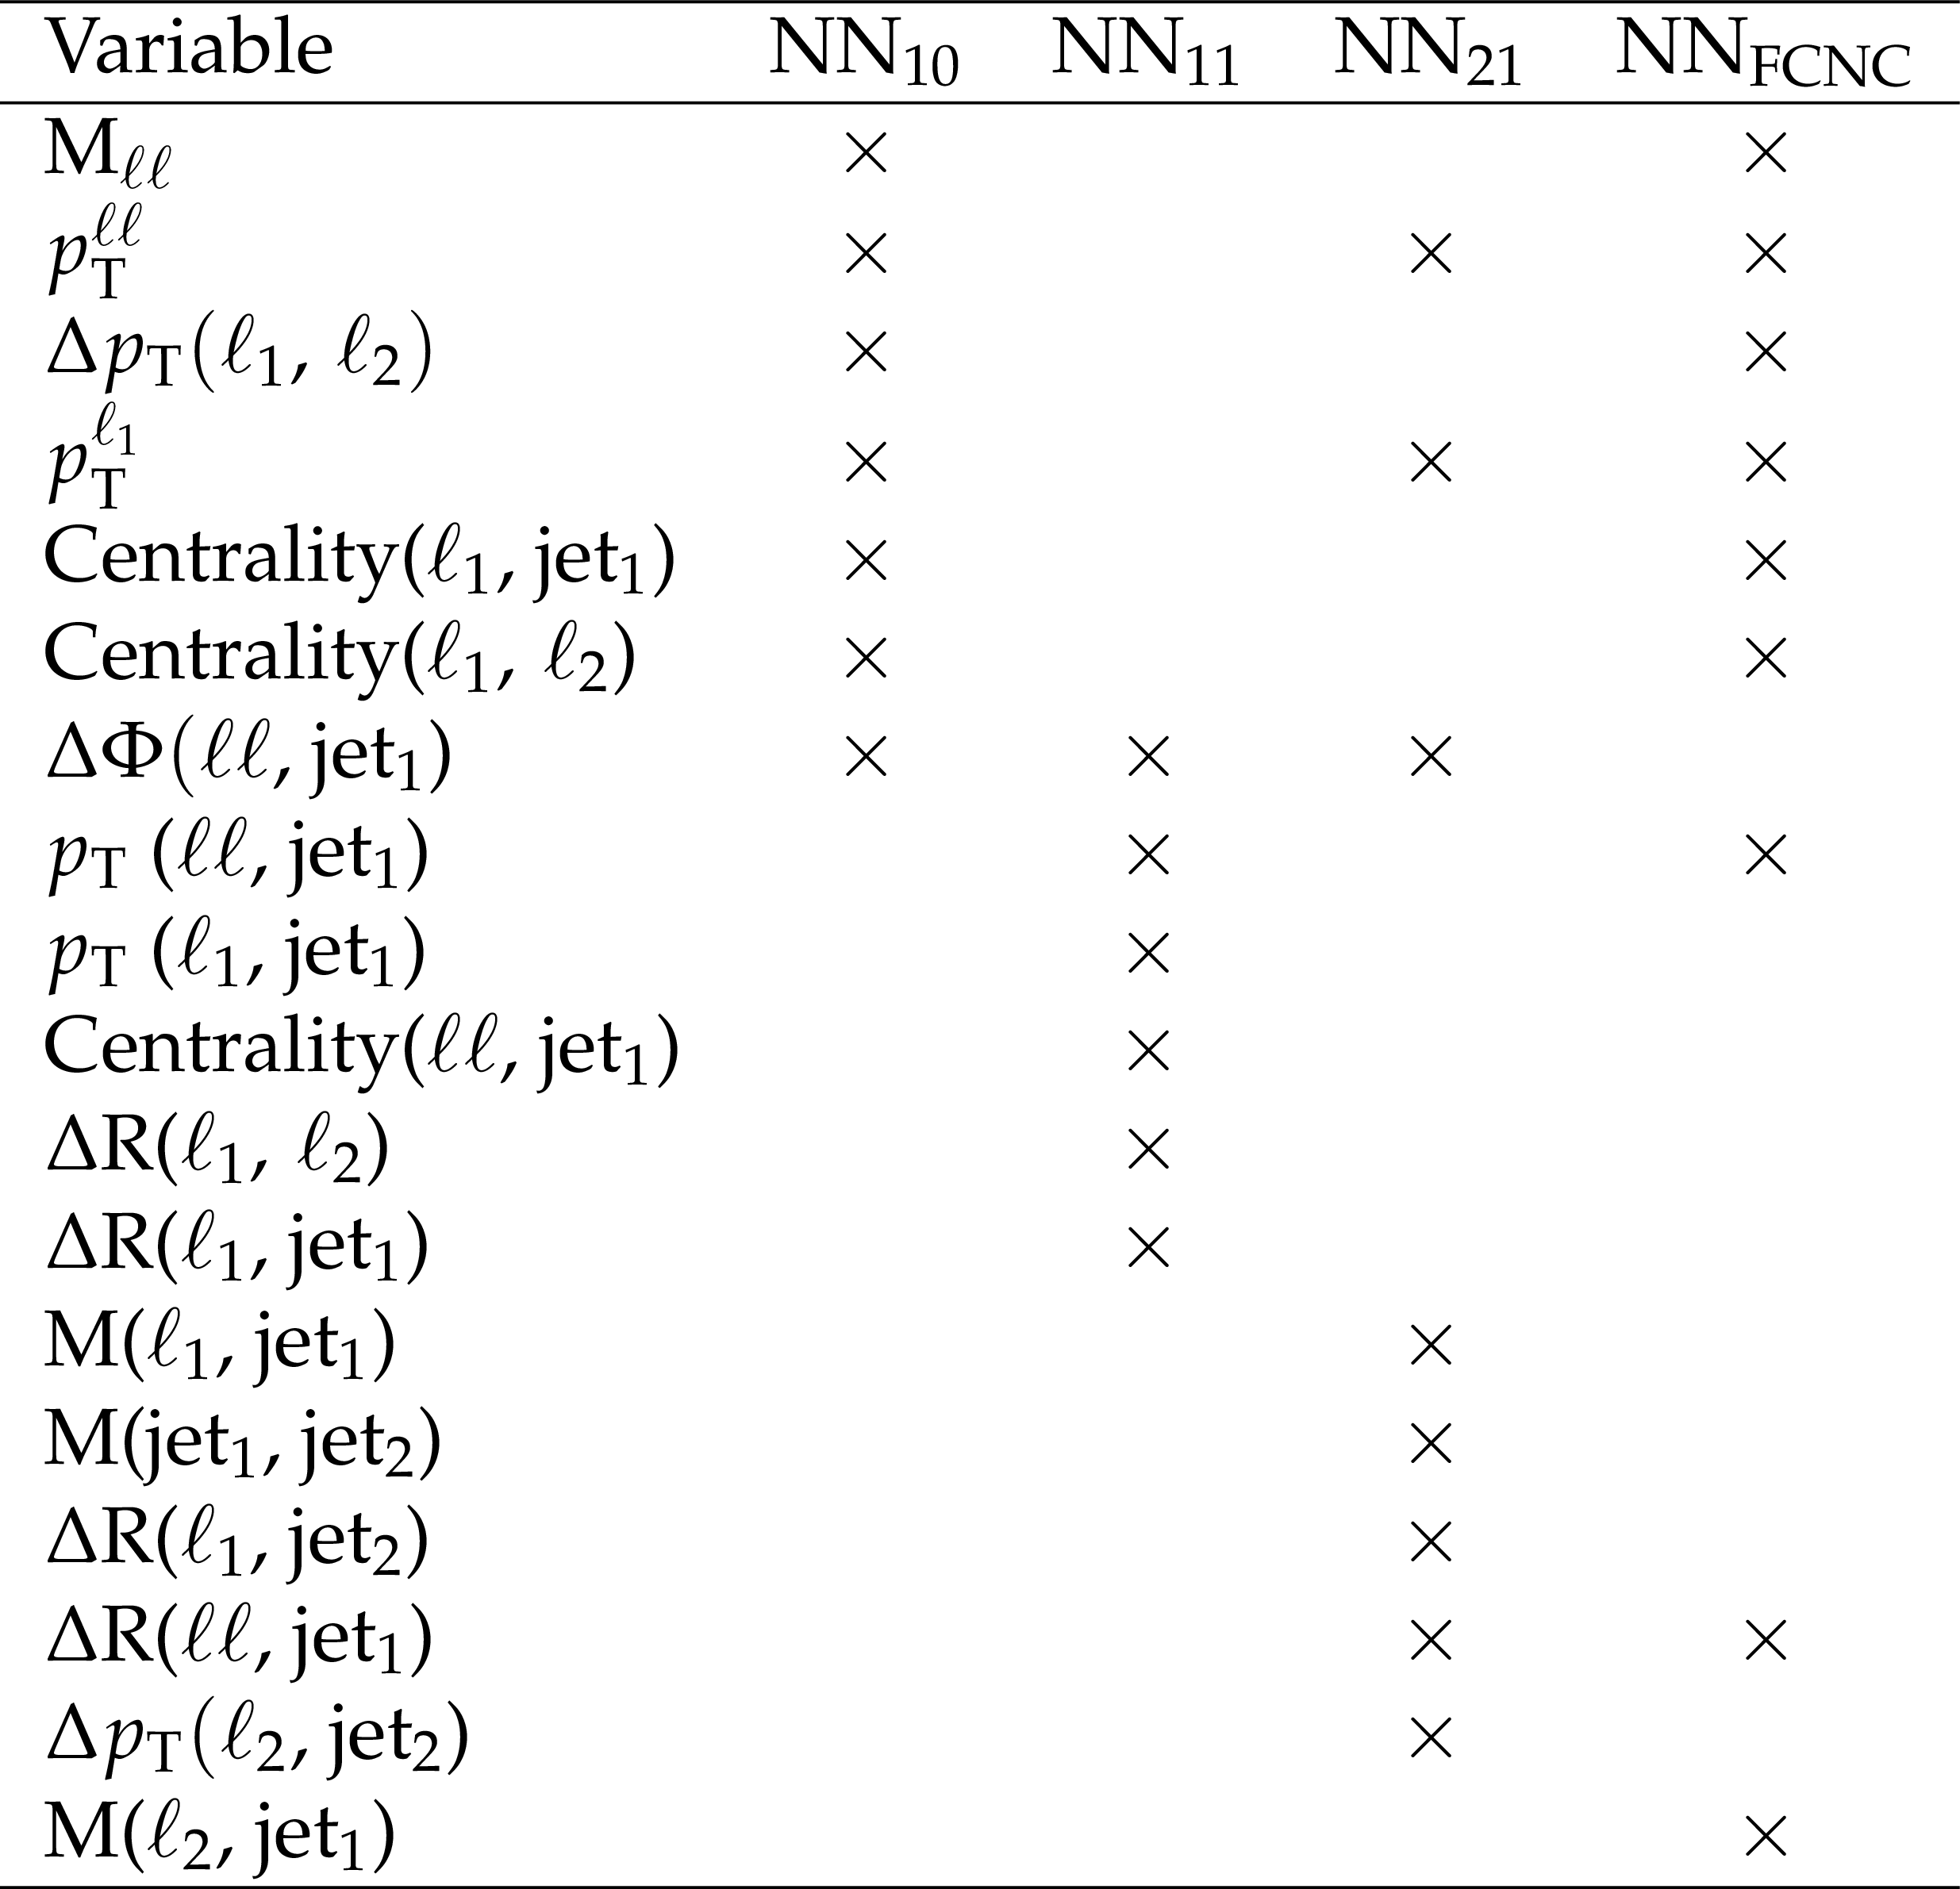
Table 4:
Input variables for the NN used in the analysis in various bins of $n$-jets and $m$-tags. The symbols "$\times $" indicate the input variables used in the four NNs. |
png pdf |
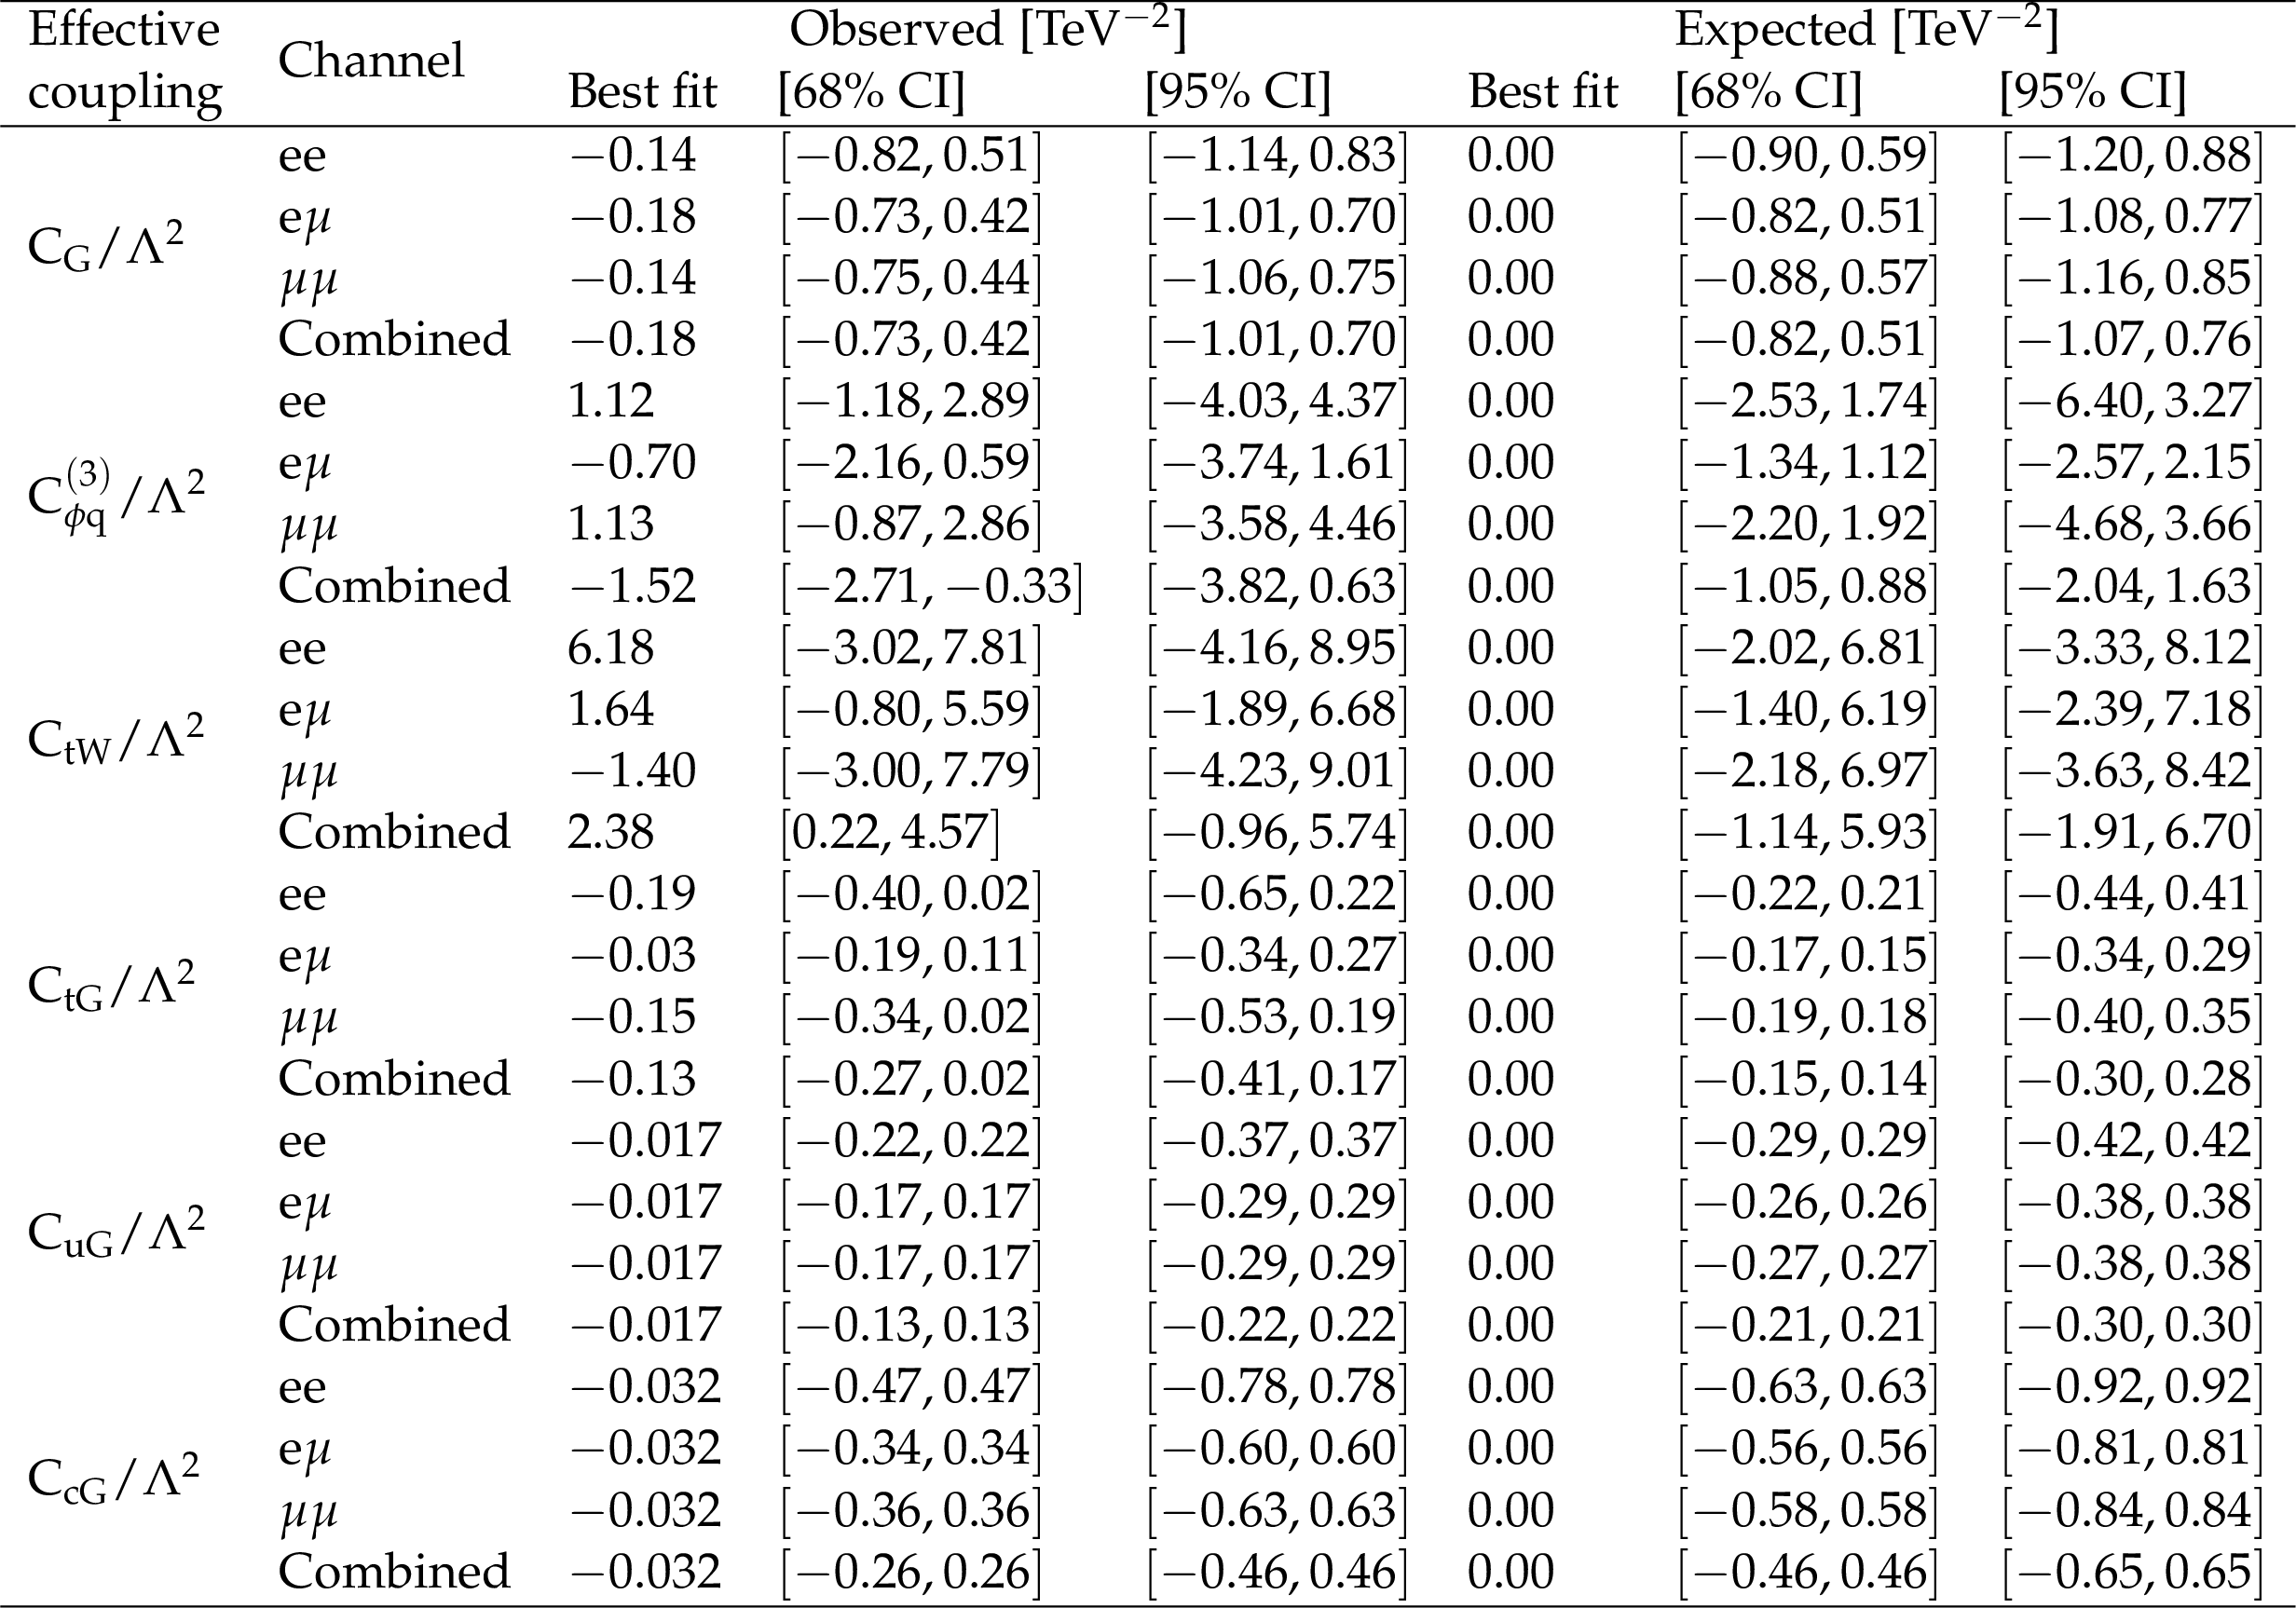
Table 5:
Summary of the observed and expected allowed intervals on the effective couplings obtained in the $\mathrm{e} \mathrm{e} $, $\mathrm{e} \mu $, and $\mu \mu $ channels, and all channels combined. All sources of systematic uncertainty, described in Section 5, are taken into account with the exception of the uncertainties on the SM cross section predictions for the tt and tW processes. |
png pdf |
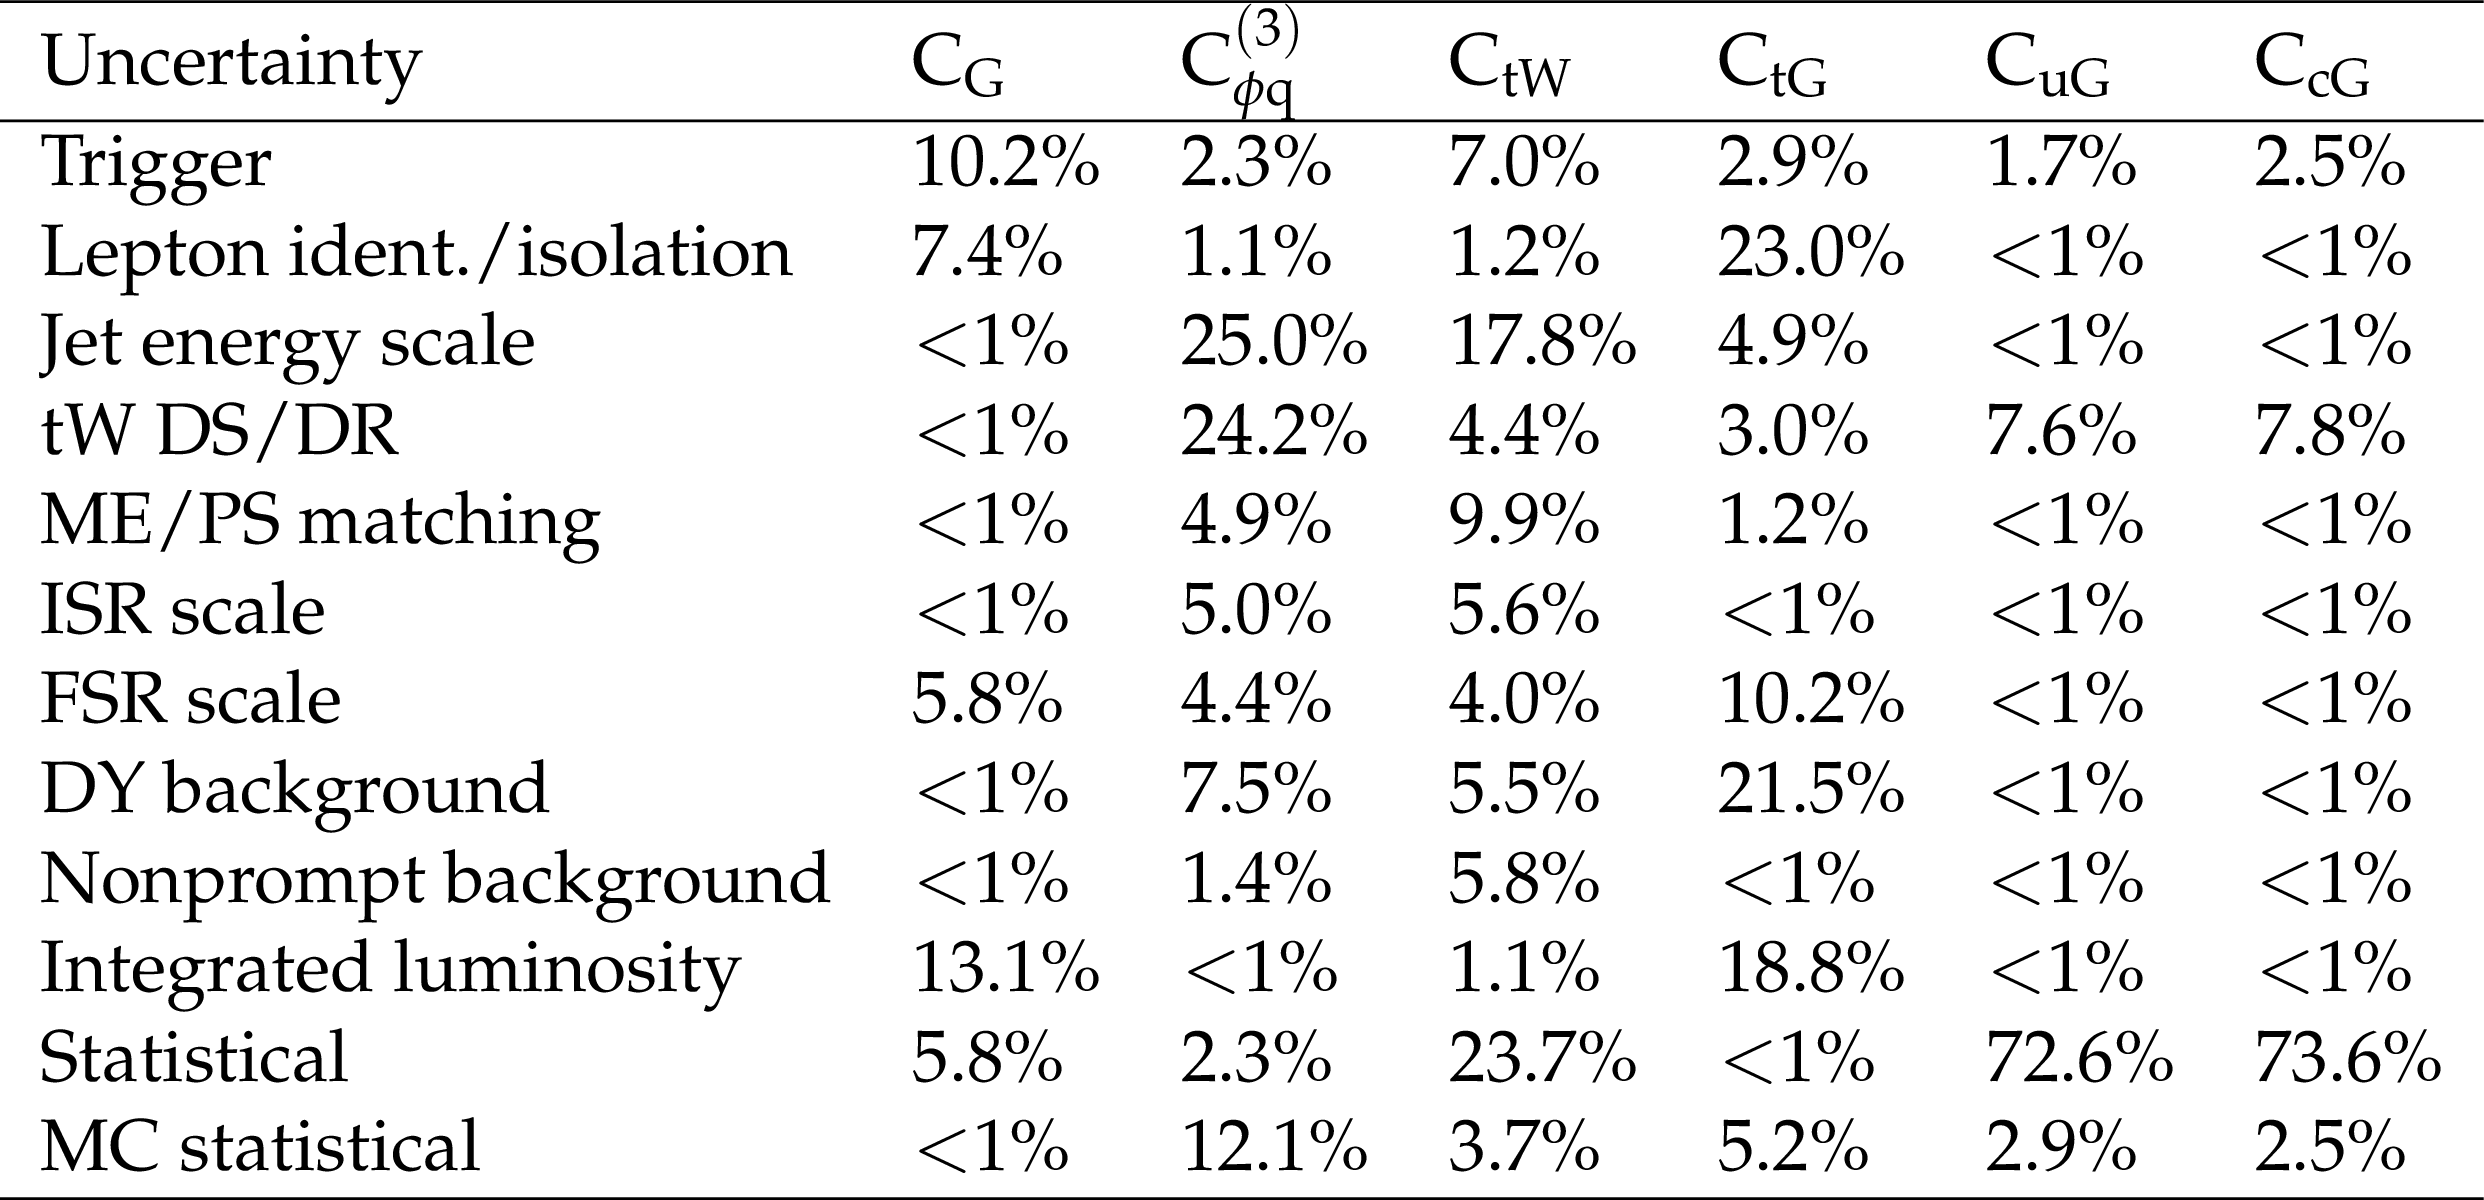
Table 6:
Estimation of the effect of the most important uncertainty sources on the observed allowed intervals of in the fit. |
| Summary |
| A search for new physics in top quark interactions is performed using $\mathrm{t\bar{t}}$ and tW events in dilepton final states. The analysis is based on data collected in pp collisions at 13 TeV by the CMS detector in 2016, corresponding to an integrated luminosity of 35.9 fb$^{-1}$. No significant excess above the standard model background expectation is observed. For the first time, both $\mathrm{t\bar{t}}$ and tW production are used simultaneously in a model independent search for effective couplings. The six effective couplings, $\mathrm{C}_{\mathrm{G}}$, $\mathrm{C}_{\mathrm{t}\mathrm{G}}$, $\mathrm{C}_{\mathrm{t}\mathrm{W}}$, $\mathrm{C}_{\phi \mathrm{q}}^{(3)}$, $\mathrm{C}_{\mathrm{u}\mathrm{G}}$, and $\mathrm{C}_{\mathrm{c}\mathrm{G}}$ are constrained using a dedicated multivariate analysis. The constraints presented, obtained by considering one operator at a time, are a useful first step toward more global approaches. |
| References | ||||
| 1 | D0 Collaboration | Combination of searches for anomalous top quark couplings with 5.4 fb$ ^{-1} $ of p$ \bar{\text{p}} $ collisions | PLB 713 (2012) 165 | 1204.2332 |
| 2 | ATLAS Collaboration | Probing the Wtb vertex structure in $ t $-channel single-top-quark production and decay in pp collisions at $ \sqrt{\mathrm{s}}= $ 8 TeV with the ATLAS detector | JHEP 04 (2017) 124 | 1702.08309 |
| 3 | ATLAS Collaboration | Measurement of the $ W $ boson polarisation in $ \mathrm{t\bar{t}} $ events from pp collisions at $ \sqrt{s} = $ 8 TeV in the lepton+jets channel with ATLAS | EPJC 77 (2017) 264 | 1612.02577 |
| 4 | CMS Collaboration | Search for anomalous Wtb couplings and flavour-changing neutral currents in $ t $-channel single top quark production in pp collisions at $ \sqrt{s} = $ 7 and 8 TeV | JHEP 02 (2017) 028 | CMS-TOP-14-007 1610.03545 |
| 5 | CMS Collaboration | Measurement of the W boson helicity in events with a single reconstructed top quark in pp collisions at $ \sqrt{s}= $ 8 TeV | JHEP 01 (2015) 053 | CMS-TOP-12-020 1410.1154 |
| 6 | CMS Collaboration | Measurements of $ \mathrm{t\bar{t}} $ spin correlations and top quark polarization using dilepton final states in pp collisions at $ \sqrt{s} = $ 8 TeV | PRD 93 (2016) 052007 | CMS-TOP-14-023 1601.01107 |
| 7 | D0 Collaboration | Search for flavor changing neutral currents via quark-gluon couplings in single top quark production using 2.3 fb$ ^{-1} $ of p$ \bar{\rm p} $ collisions | PLB 693 (2010) 81 | 1006.3575 |
| 8 | CDF Collaboration | Search for top-quark production via flavor-changing neutral currents in W+1 jet events at CDF | PRL 102 (2009) 151801 | 0812.3400 |
| 9 | ATLAS Collaboration | Search for single top-quark production via flavour-changing neutral currents at 8 TeV with the ATLAS detector | EPJC 76 (2016) 55 | 1509.00294 |
| 10 | CMS Collaboration | Measurements of $ \mathrm{t\overline{t}} $ differential cross sections in proton-proton collisions at $ \sqrt{s}= $ 13 TeV using events containing two leptons | JHEP 02 (2019) 149 | CMS-TOP-17-014 1811.06625 |
| 11 | W. Buchmuller and D. Wyler | Effective Lagrangian analysis of new interactions and flavor conservation | NPB 268 (1986) 621 | |
| 12 | B. Grzadkowski, M. Iskrzynski, M. Misiak, and J. Rosiek | Dimension-six terms in the standard model Lagrangian | JHEP 10 (2010) 085 | 1008.4884 |
| 13 | C. Zhang and S. Willenbrock | Effective-field-theory approach to top-quark production and decay | PRD 83 (2011) 034006 | 1008.3869 |
| 14 | A. Buckley et al. | Constraining top quark effective theory in the LHC Run II era | JHEP 04 (2016) 015 | 1512.03360 |
| 15 | N. P. Hartland et al. | A Monte Carlo global analysis of the standard model effective field theory: the top quark sector | JHEP 04 (2019) 100 | 1901.05965 |
| 16 | G. Durieux, F. Maltoni, and C. Zhang | Global approach to top-quark flavor-changing interactions | PRD 91 (2015) 074017 | 1412.7166 |
| 17 | J. A. Aguilar Saavedra et al. | Interpreting top-quark LHC measurements in the standard-model effective field theory | 1802.07237 | |
| 18 | R. M. Godbole, M. E. Peskin, S. D. Rindani, and R. K. Singh | Why the angular distribution of the top decay lepton is unchanged by anomalous $ tbW $ couplings | PLB 790 (2019) 322--325 | 1809.06285 |
| 19 | A. Stange and S. Willenbrock | Yukawa correction to top quark production at the Tevatron | PRD 48 (1993) 2054 | hep-ph/9302291 |
| 20 | C.-S. Li, B.-Q. Hu, J.-M. Yang, and C.-G. Hu | Supersymmetric QCD corrections to top quark production in p$ \overline{\rm p} $ collisions | PRD 52 (1995) 5014 | |
| 21 | F. Krauss, S. Kuttimalai, and T. Plehn | LHC multijet events as a probe for anomalous dimension-six gluon interactions | PRD 95 (2017) 035024 | 1611.00767 |
| 22 | P. L. Cho and E. H. Simmons | Searching for G$ ^3 $ in $ \mathrm{t\bar{t}} $ production | PRD 51 (1995) 2360 | hep-ph/9408206 |
| 23 | V. Hirschi, F. Maltoni, I. Tsinikos, and E. Vryonidou | Constraining anomalous gluon self-interactions at the LHC: a reappraisal | JHEP 07 (2018) 093 | 1806.04696 |
| 24 | CMS Collaboration | The CMS experiment at the CERN LHC | JINST 3 (2008) S08004 | CMS-00-001 |
| 25 | S. Frixione, P. Nason, and C. Oleari | Matching NLO QCD computations with parton shower simulations: the POWHEG method | JHEP 11 (2007) 070 | 0709.2092 |
| 26 | S. Alioli, P. Nason, C. Oleari, and E. Re | A general framework for implementing NLO calculations in shower Monte Carlo programs: the POWHEG BOX | JHEP 06 (2010) 043 | 1002.2581 |
| 27 | E. Re | Single-top Wt-channel production matched with parton showers using the POWHEG method | EPJC 71 (2011) 1547 | 1009.2450 |
| 28 | S. Alioli, P. Nason, C. Oleari, and E. Re | NLO single-top production matched with shower in POWHEG: $ s $- and $ t $-channel contributions | JHEP 09 (2009) 111 | 0907.4076 |
| 29 | T. Sjostrand et al. | An Introduction to PYTHIA 8.2 | CPC 191 (2015) 159 | 1410.3012 |
| 30 | CMS Collaboration | Event generator tunes obtained from underlying event and multiparton scattering measurements | EPJC 76 (2016) 155 | CMS-GEN-14-001 1512.00815 |
| 31 | CMS Collaboration | Investigations of the impact of the parton shower tuning in PYTHIA 8 in the modelling of $ \mathrm{t\overline{t}} $ at $ \sqrt{s}= $ 8 and 13 TeV | CMS-PAS-TOP-16-021 | CMS-PAS-TOP-16-021 |
| 32 | NNPDF Collaboration | Parton distributions for the LHC Run II | JHEP 04 (2015) 040 | 1410.8849 |
| 33 | M. Czakon and A. Mitov | Top++: A program for the calculation of the top-pair cross-section at hadron colliders | CPC 185 (2014) 2930 | 1112.5675 |
| 34 | N. Kidonakis | Theoretical results for electroweak-boson and single-top production | in Proceedings, 23rd International Workshop on Deep-Inelastic Scattering and Related Subjects (DIS 2015), p. 170 Dallas, Texas, USA, April, 2015 PoS(DIS2015)170 | 1506.04072 |
| 35 | M. Czakon et al. | Top-pair production at the LHC through NNLO QCD and NLO EW | JHEP 10 (2017) 186 | 1705.04105 |
| 36 | J. Alwall et al. | MadGraph/MadEvent v4: the new web generation | JHEP 09 (2007) 028 | 0706.2334 |
| 37 | J. Alwall et al. | The automated computation of tree-level and next-to-leading order differential cross sections, and their matching to parton shower simulations | JHEP 07 (2014) 079 | 1405.0301 |
| 38 | R. Frederix and S. Frixione | Merging meets matching in MC@NLO | JHEP 12 (2012) 061 | 1209.6215 |
| 39 | GEANT4 Collaboration | GEANT4--a simulation toolkit | NIMA 506 (2003) 250 | |
| 40 | J. Allison et al. | GEANT4 developments and applications | IEEE Trans. Nucl. Sci. 53 (2006) 270 | |
| 41 | C. Degrande et al. | UFO --- the universal feynRules output | CPC 183 (2012) 1201 | 1108.2040 |
| 42 | A. Alloul et al. | FeynRules 2.0 --- A complete toolbox for tree-level phenomenology | CPC 185 (2014) 2250 | 1310.1921 |
| 43 | D. B. Franzosi and C. Zhang | Probing the top-quark chromomagnetic dipole moment at next-to-leading order in QCD | PRD 91 (2015) 114010 | 1503.08841 |
| 44 | C. Zhang | Single top production at next-to-leading order in the standard model effective field theory | PRL 116 (2016) 162002 | 1601.06163 |
| 45 | CMS Collaboration | The CMS trigger system | JINST 12 (2017) P01020 | CMS-TRG-12-001 1609.02366 |
| 46 | CMS Collaboration | Particle-flow reconstruction and global event description with the CMS detector | JINST 12 (2017) P10003 | CMS-PRF-14-001 1706.04965 |
| 47 | CMS Collaboration | Performance of electron reconstruction and selection with the CMS detector in proton-proton collisions at $ \sqrt{s}= $ 8 TeV | JINST 10 (2015) P06005 | CMS-EGM-13-001 1502.02701 |
| 48 | CMS Collaboration | Performance of the CMS muon detector and muon reconstruction with proton-proton collisions at $ \sqrt{s}= $ 13 TeV | JINST 13 (2018) P06015 | CMS-MUO-16-001 1804.04528 |
| 49 | M. Cacciari, G. P. Salam, and G. Soyez | FastJet user manual | EPJC 72 (2012) 1896 | 1111.6097 |
| 50 | M. Cacciari, G. P. Salam, and G. Soyez | The anti-$ k_t $ jet clustering algorithm | JHEP 04 (2008) 063 | 0802.1189 |
| 51 | M. Cacciari and G. P. Salam | Dispelling the $ N^{3} $ myth for the $ k_{\rm t} $ jet-finder | PLB 641 (2006) 57 | hep-ph/0512210 |
| 52 | CMS Collaboration | Jet energy scale and resolution in the CMS experiment in pp collisions at 8 TeV | JINST 12 (2017) P02014 | CMS-JME-13-004 1607.03663 |
| 53 | CMS Collaboration | Identification of heavy-flavour jets with the CMS detector in pp collisions at 13 TeV | JINST 13 (2018) P05011 | CMS-BTV-16-002 1712.07158 |
| 54 | CMS Collaboration | Performance of the CMS missing transverse momentum reconstruction in pp data at $ \sqrt{s} = $ 8 TeV | JINST 10 (2015) P02006 | CMS-JME-13-003 1411.0511 |
| 55 | CMS Collaboration | First measurement of the cross section for top-quark pair production in proton-proton collisions at $ \sqrt{s}= $ 7 TeV | PLB 695 (2011) 424 | CMS-TOP-10-001 1010.5994 |
| 56 | B. H. Denby | The use of neural networks in high-energy physics | Neural Comput. 5 (1993) 505 | |
| 57 | CMS Collaboration | Measurement of the production cross section for single top quarks in association with W bosons in proton-proton collisions at $ \sqrt{s}= $ 13 TeV | JHEP 10 (2018) 117 | CMS-TOP-17-018 1805.07399 |
| 58 | CMS Collaboration | CMS luminosity measurements for the 2016 data taking period | CMS-PAS-LUM-17-001 | CMS-PAS-LUM-17-001 |
| 59 | CMS Collaboration | Measurements of inclusive W and Z cross sections in pp collisions at $ \sqrt{s}= $ 7 TeV | JHEP 01 (2011) 080 | CMS-EWK-10-002 1012.2466 |
| 60 | CMS Collaboration | Determination of jet energy calibration and transverse momentum resolution in CMS | JINST 6 (2011) P11002 | CMS-JME-10-011 1107.4277 |
| 61 | CMS Collaboration | Measurement of the inelastic proton-proton cross section at $ \sqrt{s}= $ 13 TeV | JHEP 07 (2018) 161 | CMS-FSQ-15-005 1802.02613 |
| 62 | CMS Collaboration | Measurement of differential cross sections for Z boson production in association with jets in proton-proton collisions at $ \sqrt{s} = $ 13 TeV | EPJC 78 (2018) 965 | CMS-SMP-16-015 1804.05252 |
| 63 | CMS Collaboration | Measurement of the cross section for top quark pair production in association with a W or Z boson in proton-proton collisions at $ \sqrt{s} = $ 13 TeV | JHEP 08 (2018) 011 | CMS-TOP-17-005 1711.02547 |
| 64 | J. Butterworth et al. | PDF4LHC recommendations for LHC Run II | JPG 43 (2016) 023001 | 1510.03865 |
| 65 | CMS Collaboration | Measurement of the top quark mass using proton-proton data at $ {\sqrt{s}} = $ 7 and 8 TeV | PRD 93 (2016) 072004 | CMS-TOP-14-022 1509.04044 |
| 66 | S. Frixione et al. | Single-top hadroproduction in association with a W boson | JHEP 07 (2008) 029 | 0805.3067 |
| 67 | J. M. Campbell and F. Tramontano | Next-to-leading order corrections to Wt production and decay | NPB 726 (2005) 109 | hep-ph/0506289 |
| 68 | A. Belyaev and E. Boos | Single top quark tW+X production at the CERN LHC: a closer look | PRD 63 (2001) 034012 | hep-ph/0003260 |
| 69 | P. Skands, S. Carrazza, and J. Rojo | Tuning PYTHIA 8.1: the Monash 2013 tune | EPJC 74 (2014) 3024 | 1404.5630 |
| 70 | CMS Collaboration | Precise determination of the mass of the Higgs boson and tests of compatibility of its couplings with the standard model predictions using proton collisions at 7 and 8 TeV | EPJC 75 (2015) 212 | CMS-HIG-14-009 1412.8662 |
|
|
Compact Muon Solenoid LHC, CERN |
|

|

|

|

|

|