

Compact Muon Solenoid
LHC, CERN
| CMS-TOP-18-007 ; CERN-EP-2021-143 | ||
| Search for CP violating top quark couplings in pp collisions at $\sqrt{s} = $ 13 TeV | ||
| CMS Collaboration | ||
| 16 May 2022 | ||
| JHEP 07 (2023) 023 | ||
| Abstract: Results are presented from a search for CP violation in top quark pair production, using proton-proton collisions at a center-of-mass energy of 13 TeV. The data used for this analysis consist of final states with two charged leptons collected by the CMS experiment, and correspond to an integrated luminosity of 35.9 fb$^{-1}$. The search uses two observables, ${\mathcal{O}_{1}} $ and ${\mathcal{O}_{3}} $, which are Lorentz scalars. The observable ${\mathcal{O}_{1}} $ is constructed from the four-momenta of the charged leptons and the reconstructed top quarks, while ${\mathcal{O}_{3}} $ consists of the four-momenta of the charged leptons and the b quarks originating from the top quarks. Asymmetries in these observables are sensitive to CP violation, and their measurement is used to determine the chromoelectric dipole moment of the top quark. The results are consistent with the expectation from the standard model. | ||
| Links: e-print arXiv:2205.07434 [hep-ex] (PDF) ; CDS record ; inSPIRE record ; HepData record ; CADI line (restricted) ; | ||
| Figures | |

png pdf |
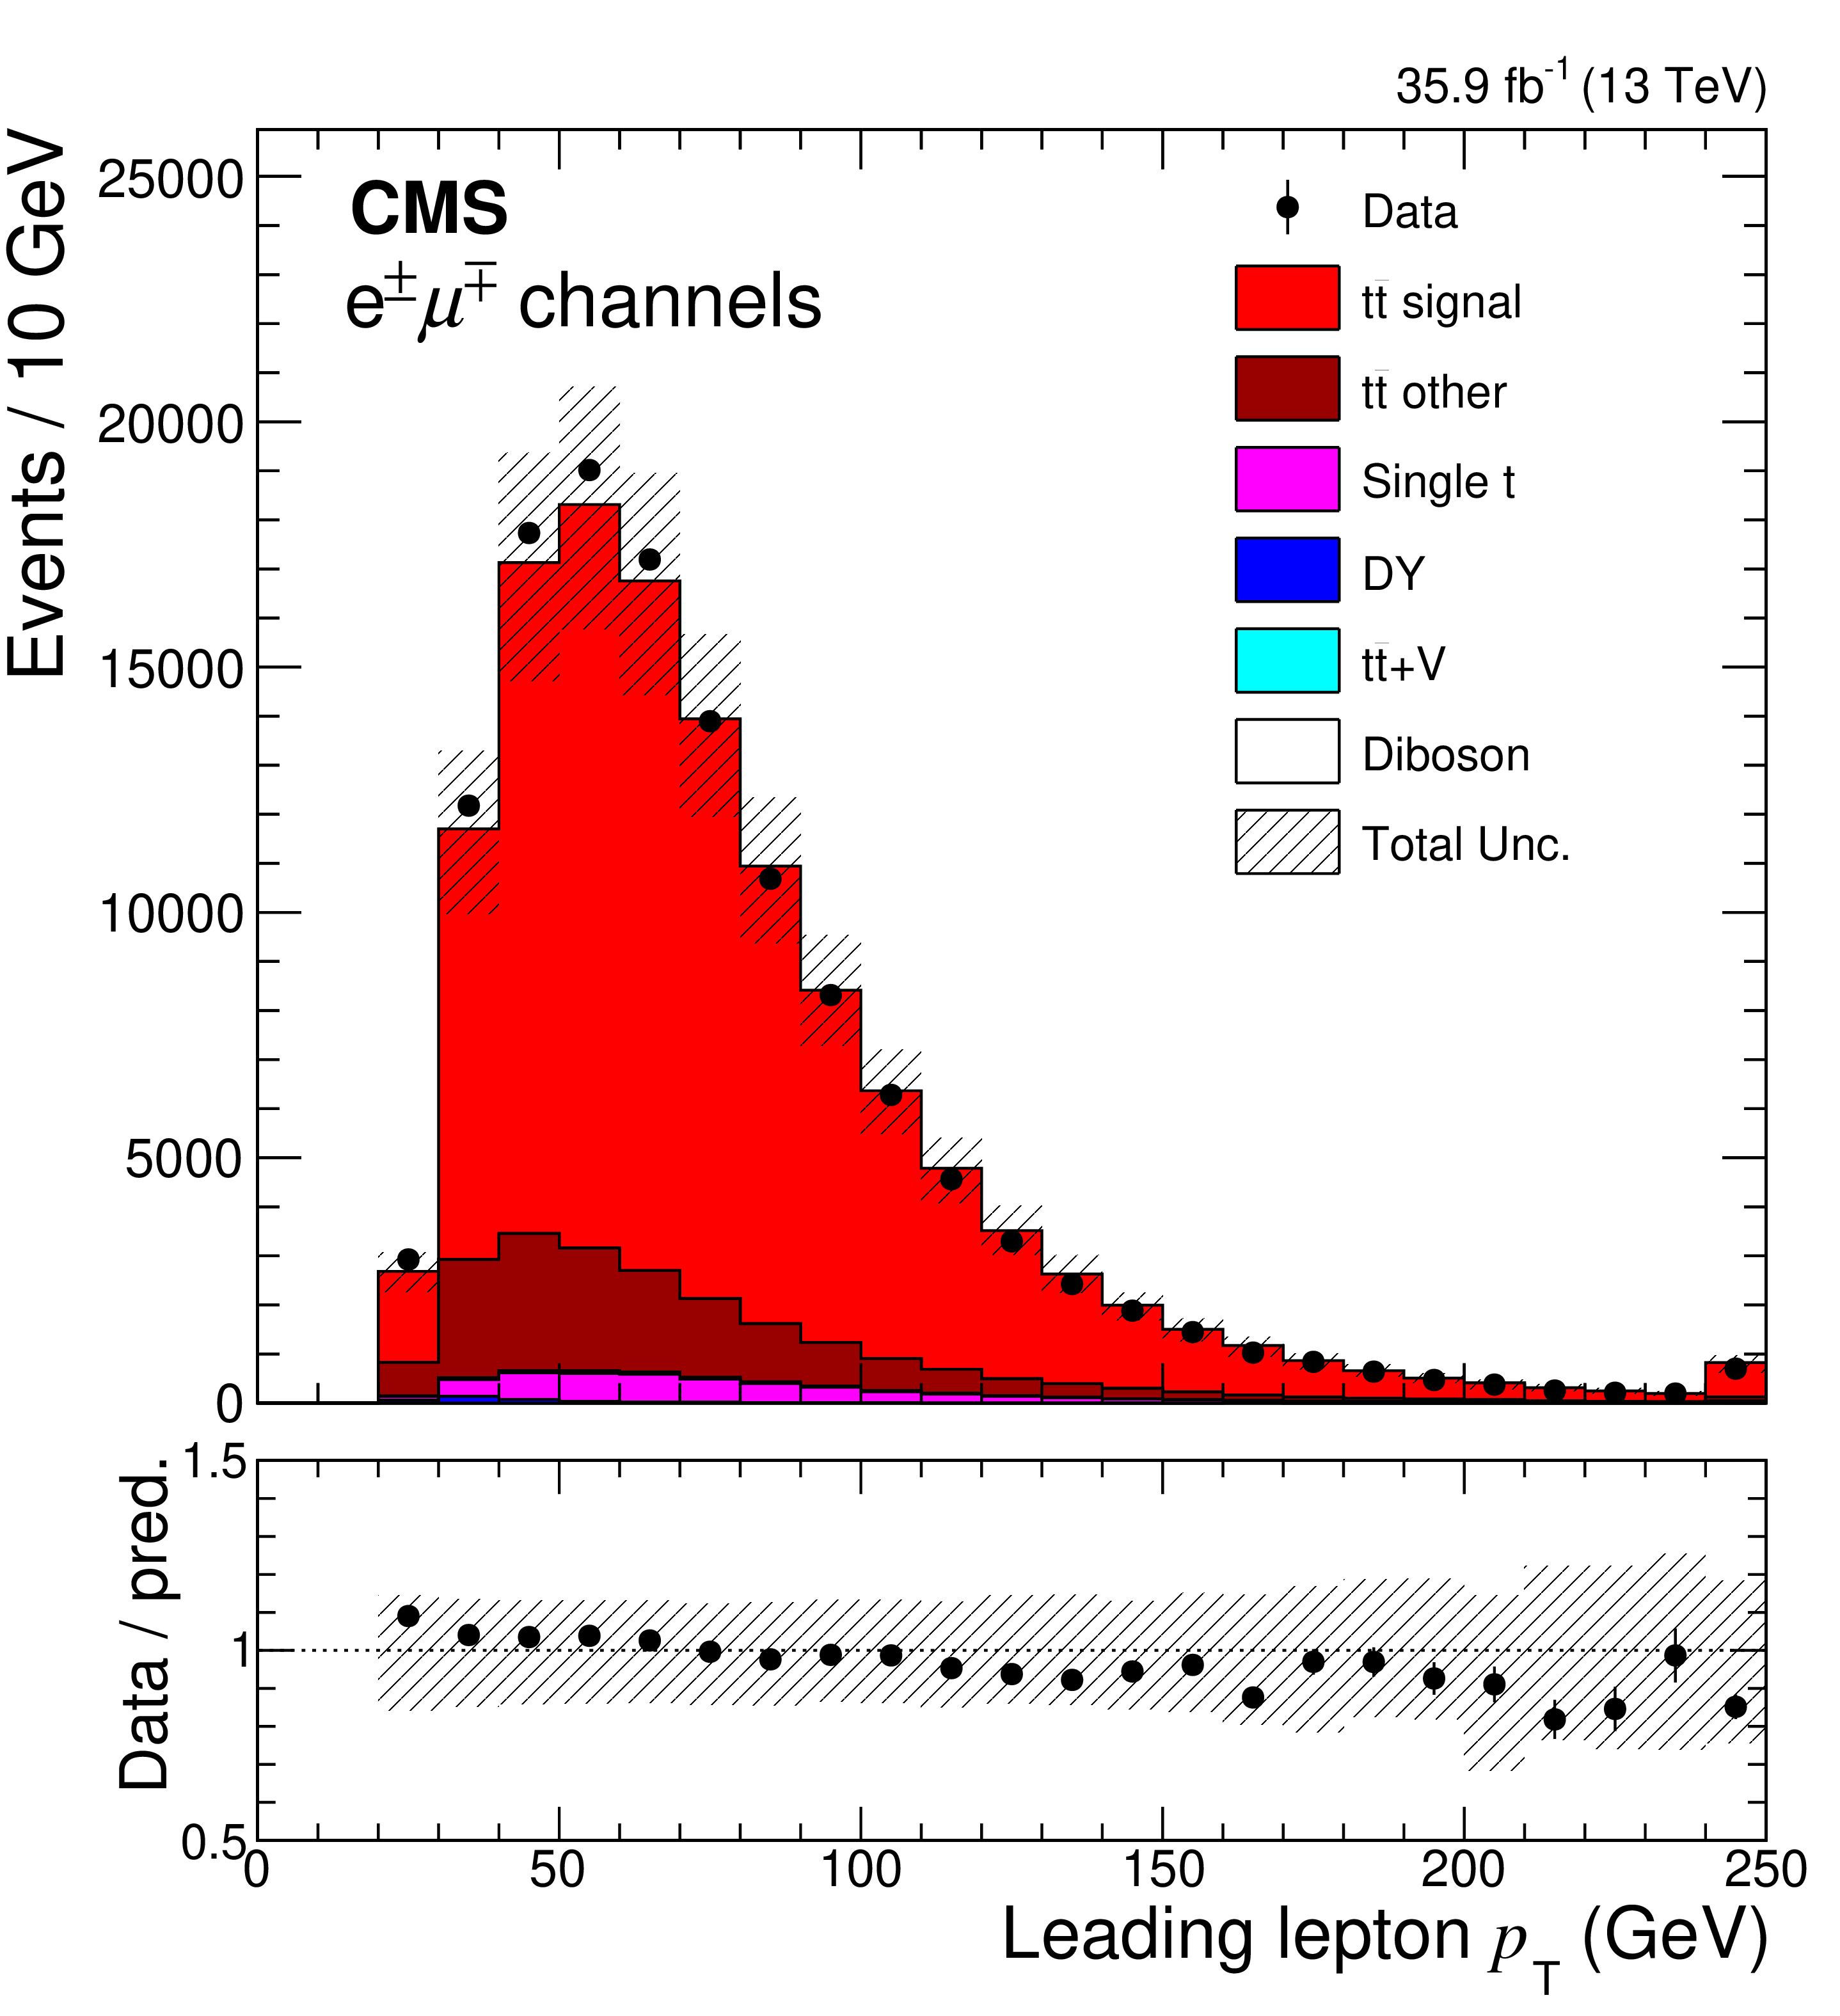
Figure 1:
The comparisons of the predictions and observed data in the kinematic distributions of the ${p_{\mathrm {T}}}$ of the leading lepton (upper left), subleading lepton (upper right), leading jet (lower left), and subleading jet (lower right) in the ${\mathrm{e^{\pm}} {\mu ^\mp}}$ channels. The vertical bars on the markers of the observed data represent the statistical uncertainties. The shaded band in the predicted distributions includes statistical and systematic uncertainties. The last bin in each plot includes overflow events. The ratio of the data to the predictions from simulation is presented in the lower panel of each figure. |
png pdf |
Figure 1-a:
The comparisons of the predictions and observed data in the kinematic distributions of the ${p_{\mathrm {T}}}$ of the leading lepton in the ${\mathrm{e^{\pm}} {\mu ^\mp}}$ channels. The vertical bars on the markers of the observed data represent the statistical uncertainties. The shaded band in the predicted distributions includes statistical and systematic uncertainties. The last bin includes overflow events. The ratio of the data to the predictions from simulation is presented in the lower panel. |
png pdf |
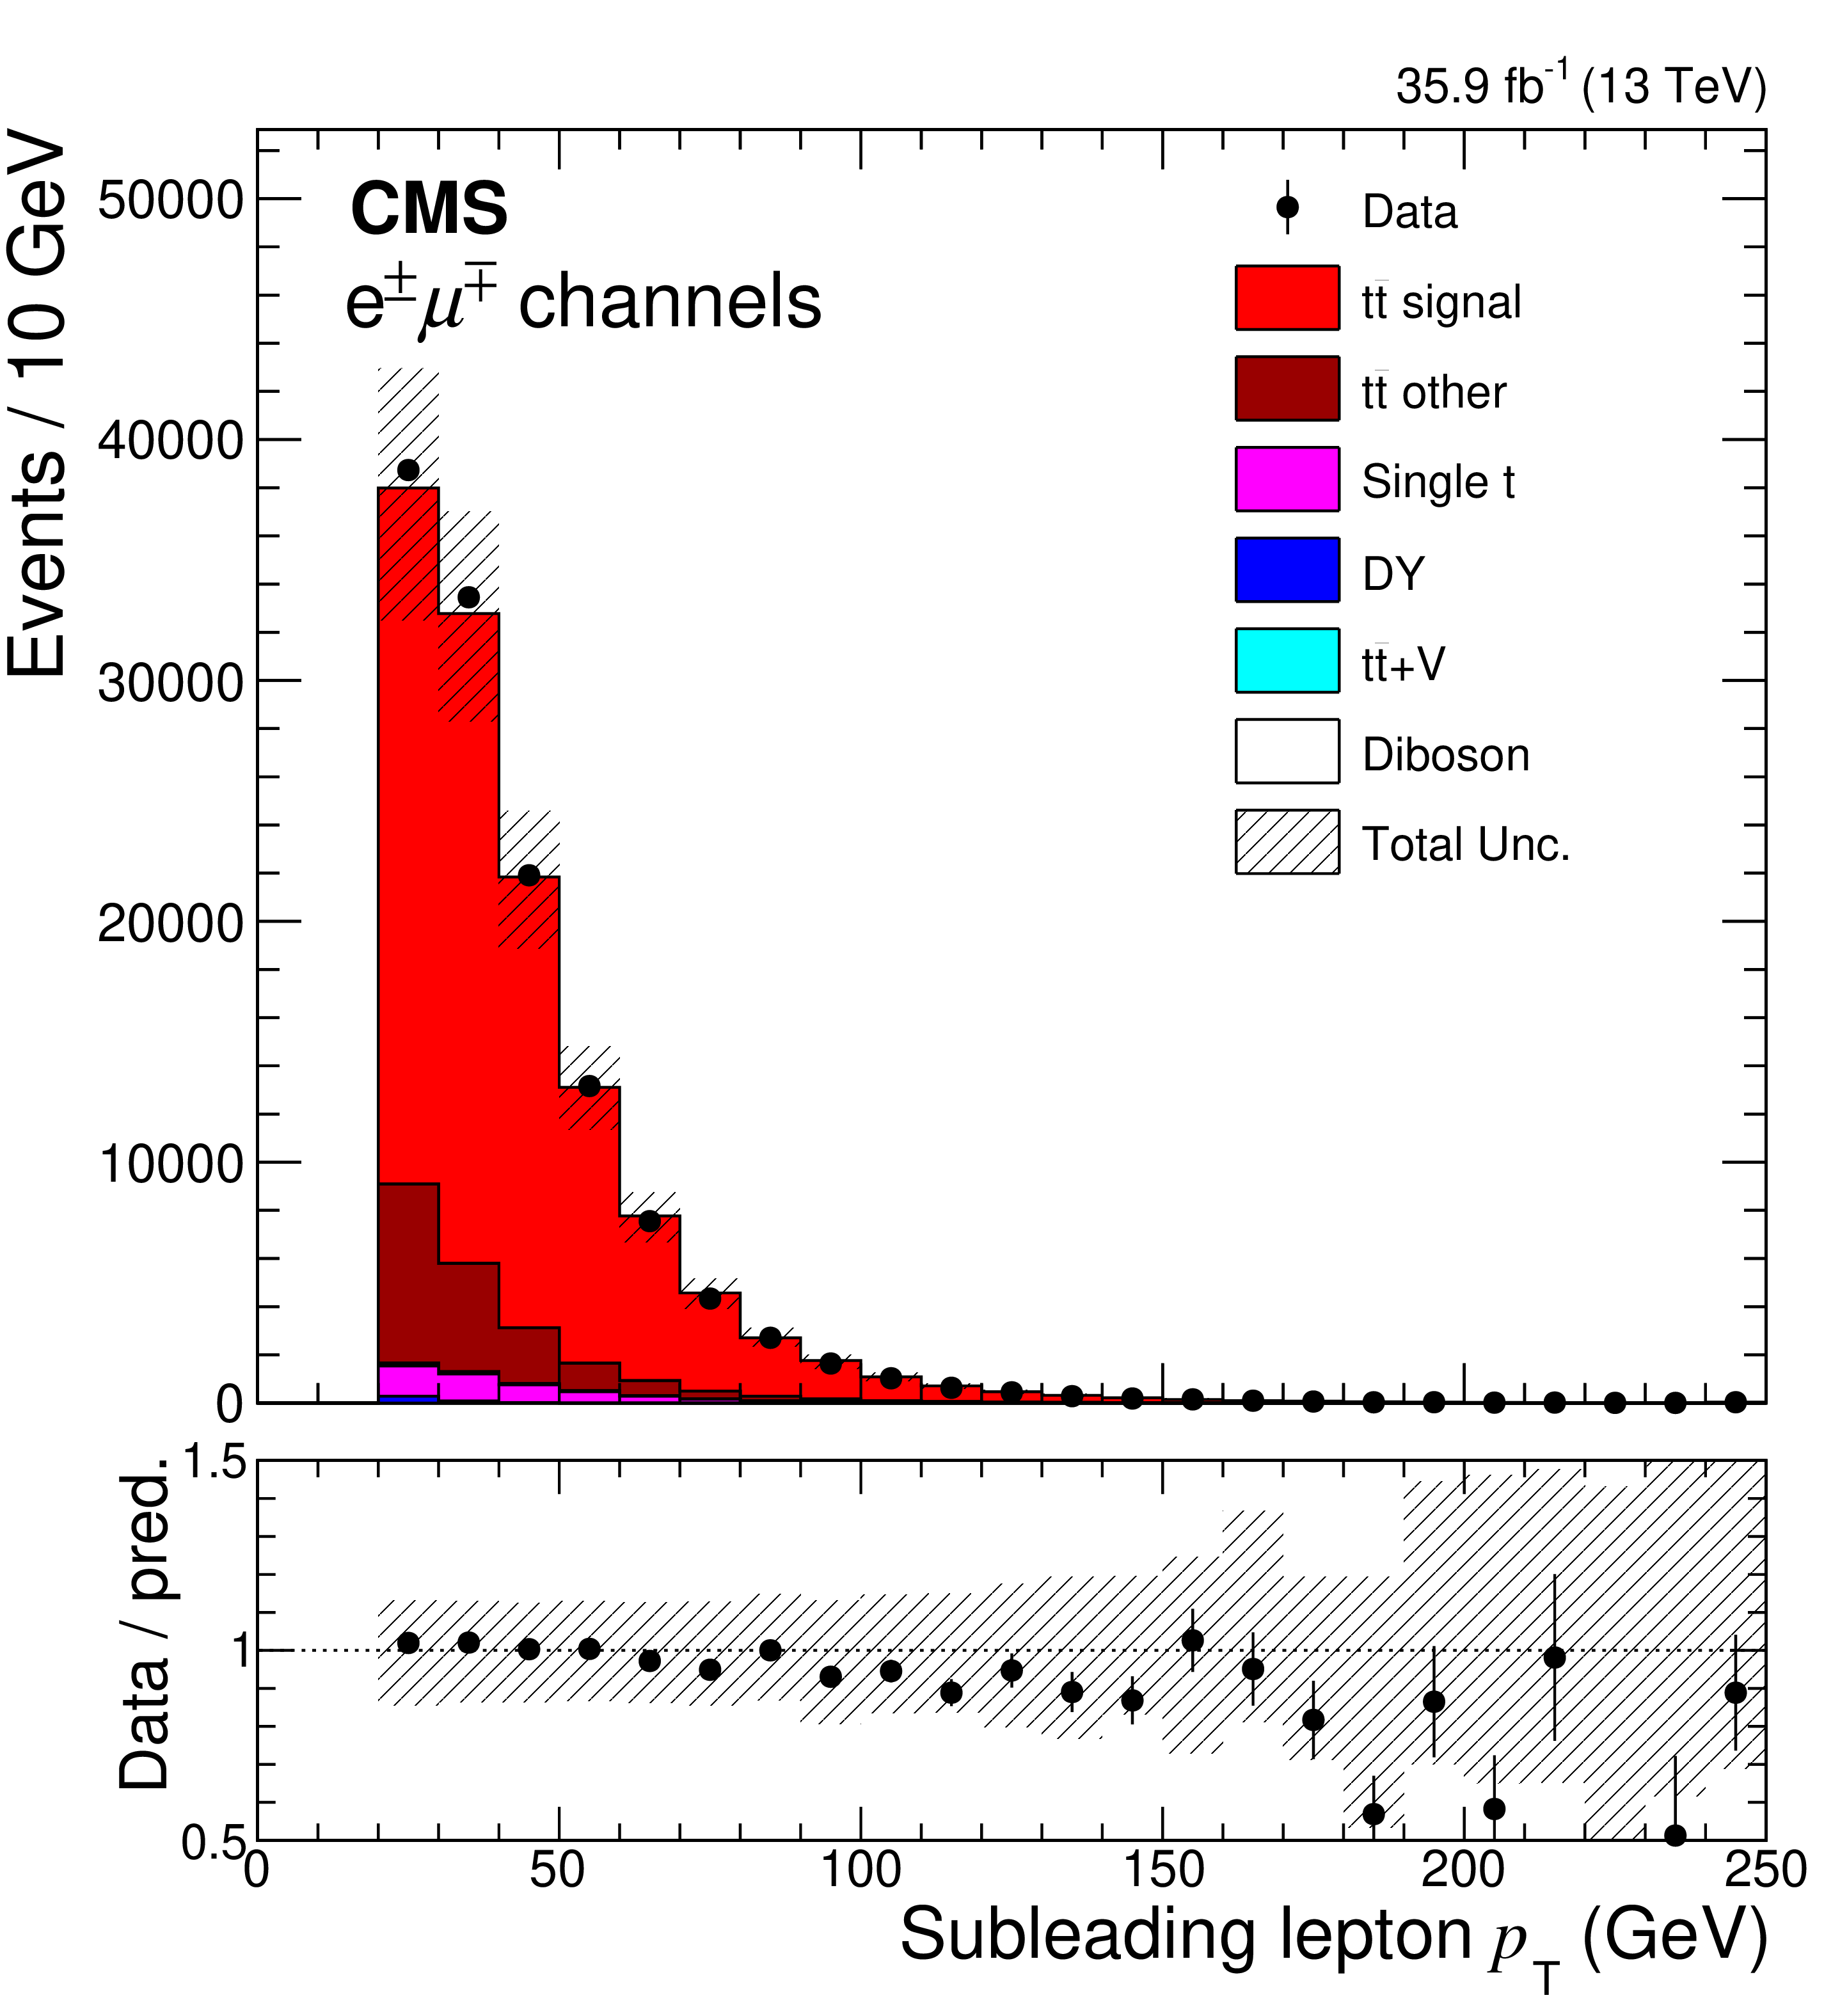
Figure 1-b:
The comparisons of the predictions and observed data in the kinematic distributions of the ${p_{\mathrm {T}}}$ of the subleading lepton in the ${\mathrm{e^{\pm}} {\mu ^\mp}}$ channels. The vertical bars on the markers of the observed data represent the statistical uncertainties. The shaded band in the predicted distributions includes statistical and systematic uncertainties. The last bin includes overflow events. The ratio of the data to the predictions from simulation is presented in the lower panel. |

png pdf |
Figure 1-c:
The comparisons of the predictions and observed data in the kinematic distributions of the ${p_{\mathrm {T}}}$ of the leading jet in the ${\mathrm{e^{\pm}} {\mu ^\mp}}$ channels. The vertical bars on the markers of the observed data represent the statistical uncertainties. The shaded band in the predicted distributions includes statistical and systematic uncertainties. The last bin includes overflow events. The ratio of the data to the predictions from simulation is presented in the lower panel. |

png pdf |
Figure 1-d:
The comparisons of the predictions and observed data in the kinematic distributions of the ${p_{\mathrm {T}}}$ of the subleading jet in the ${\mathrm{e^{\pm}} {\mu ^\mp}}$ channels. The vertical bars on the markers of the observed data represent the statistical uncertainties. The shaded band in the predicted distributions includes statistical and systematic uncertainties. The last bin includes overflow events. The ratio of the data to the predictions from simulation is presented in the lower panel. |
png pdf |
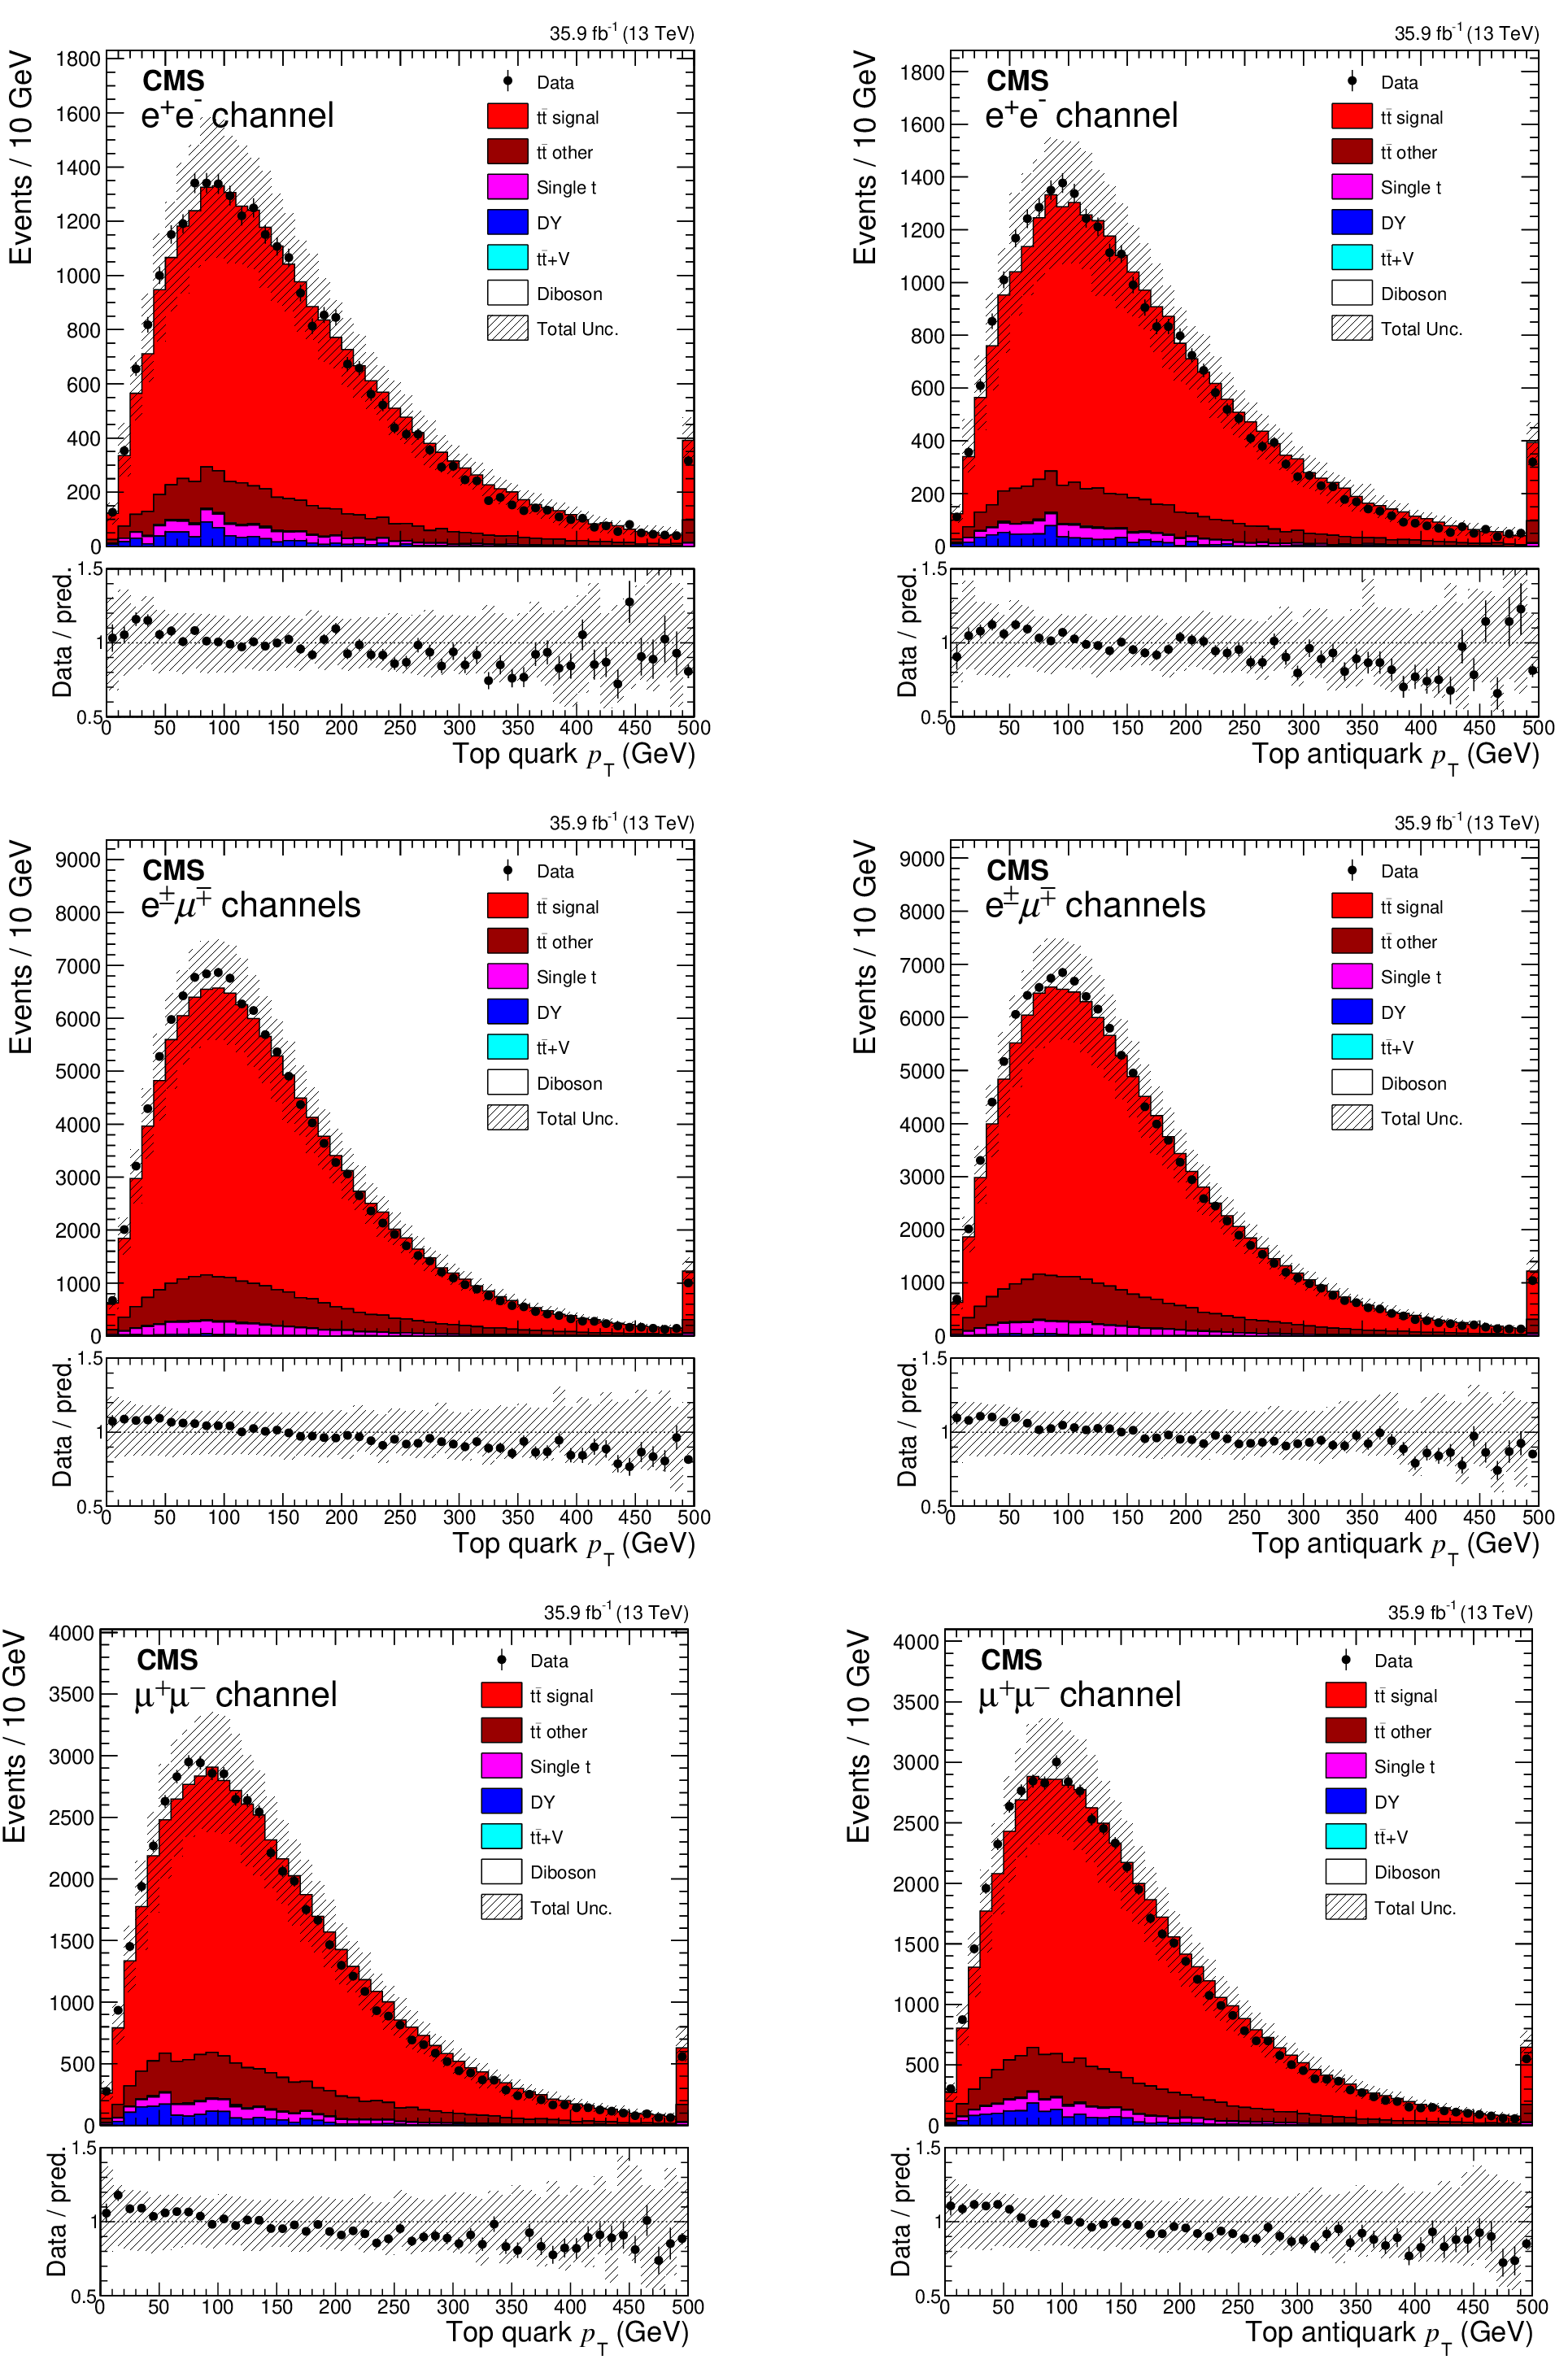
Figure 2:
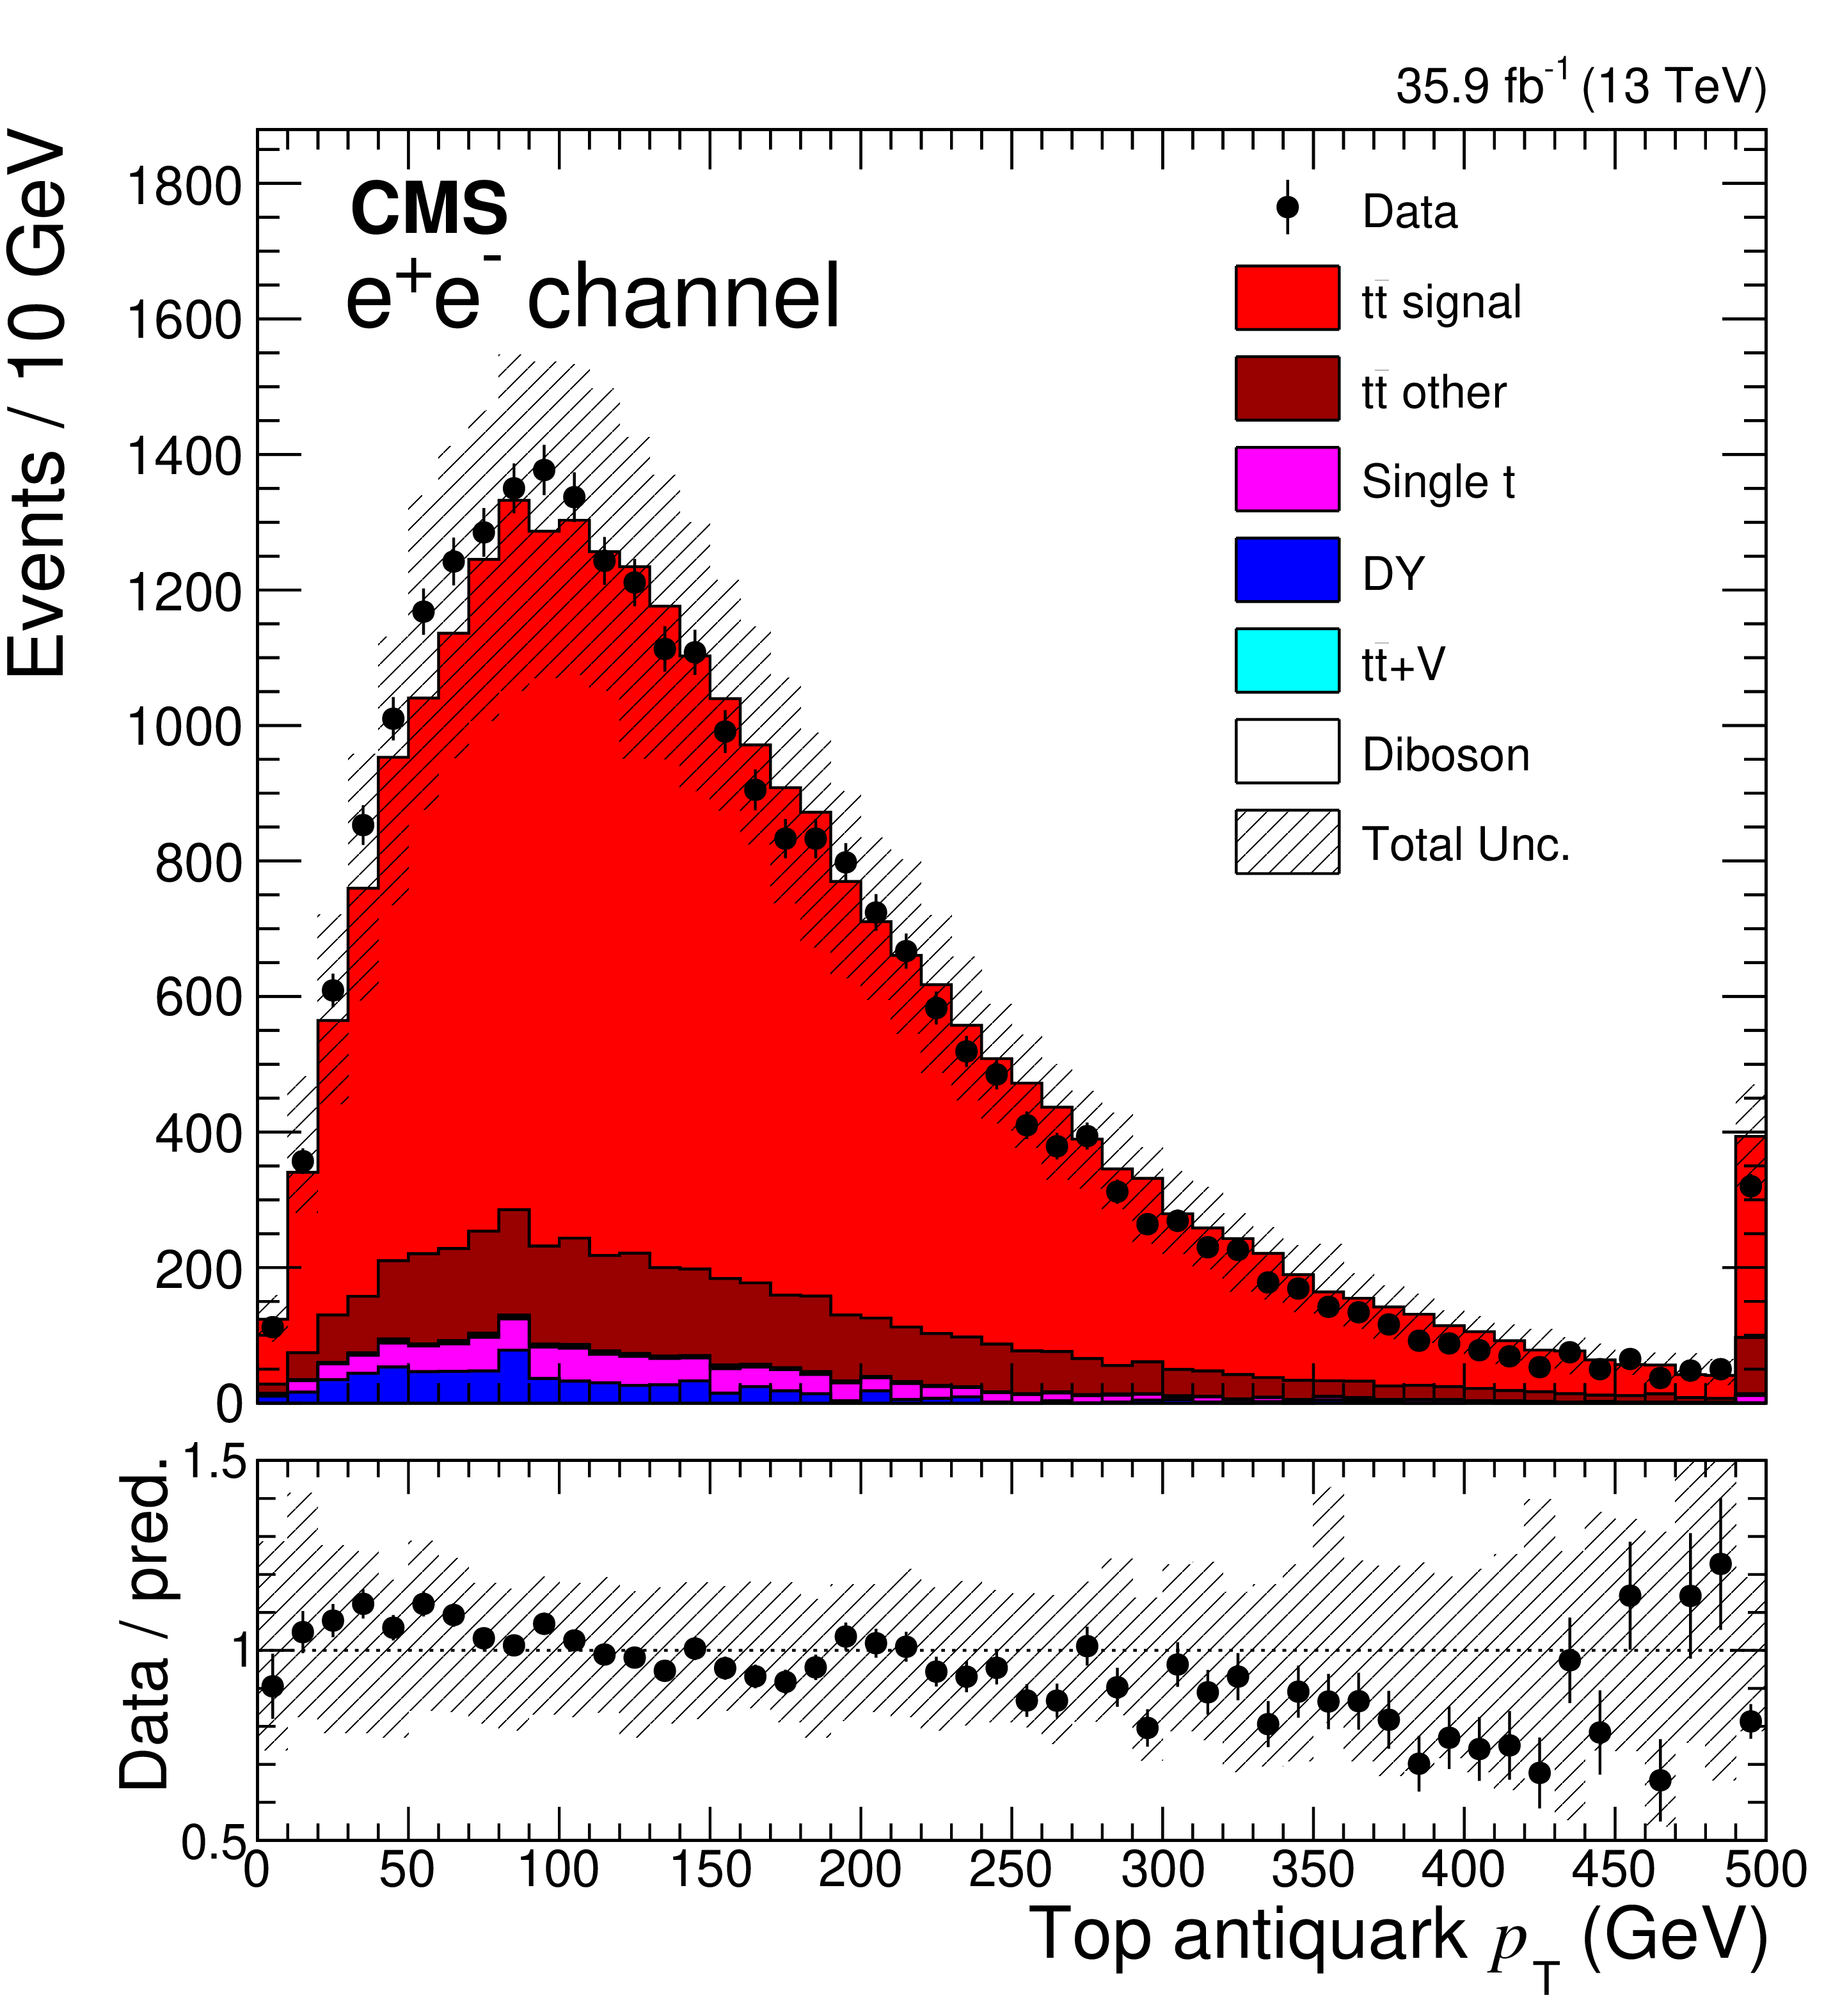
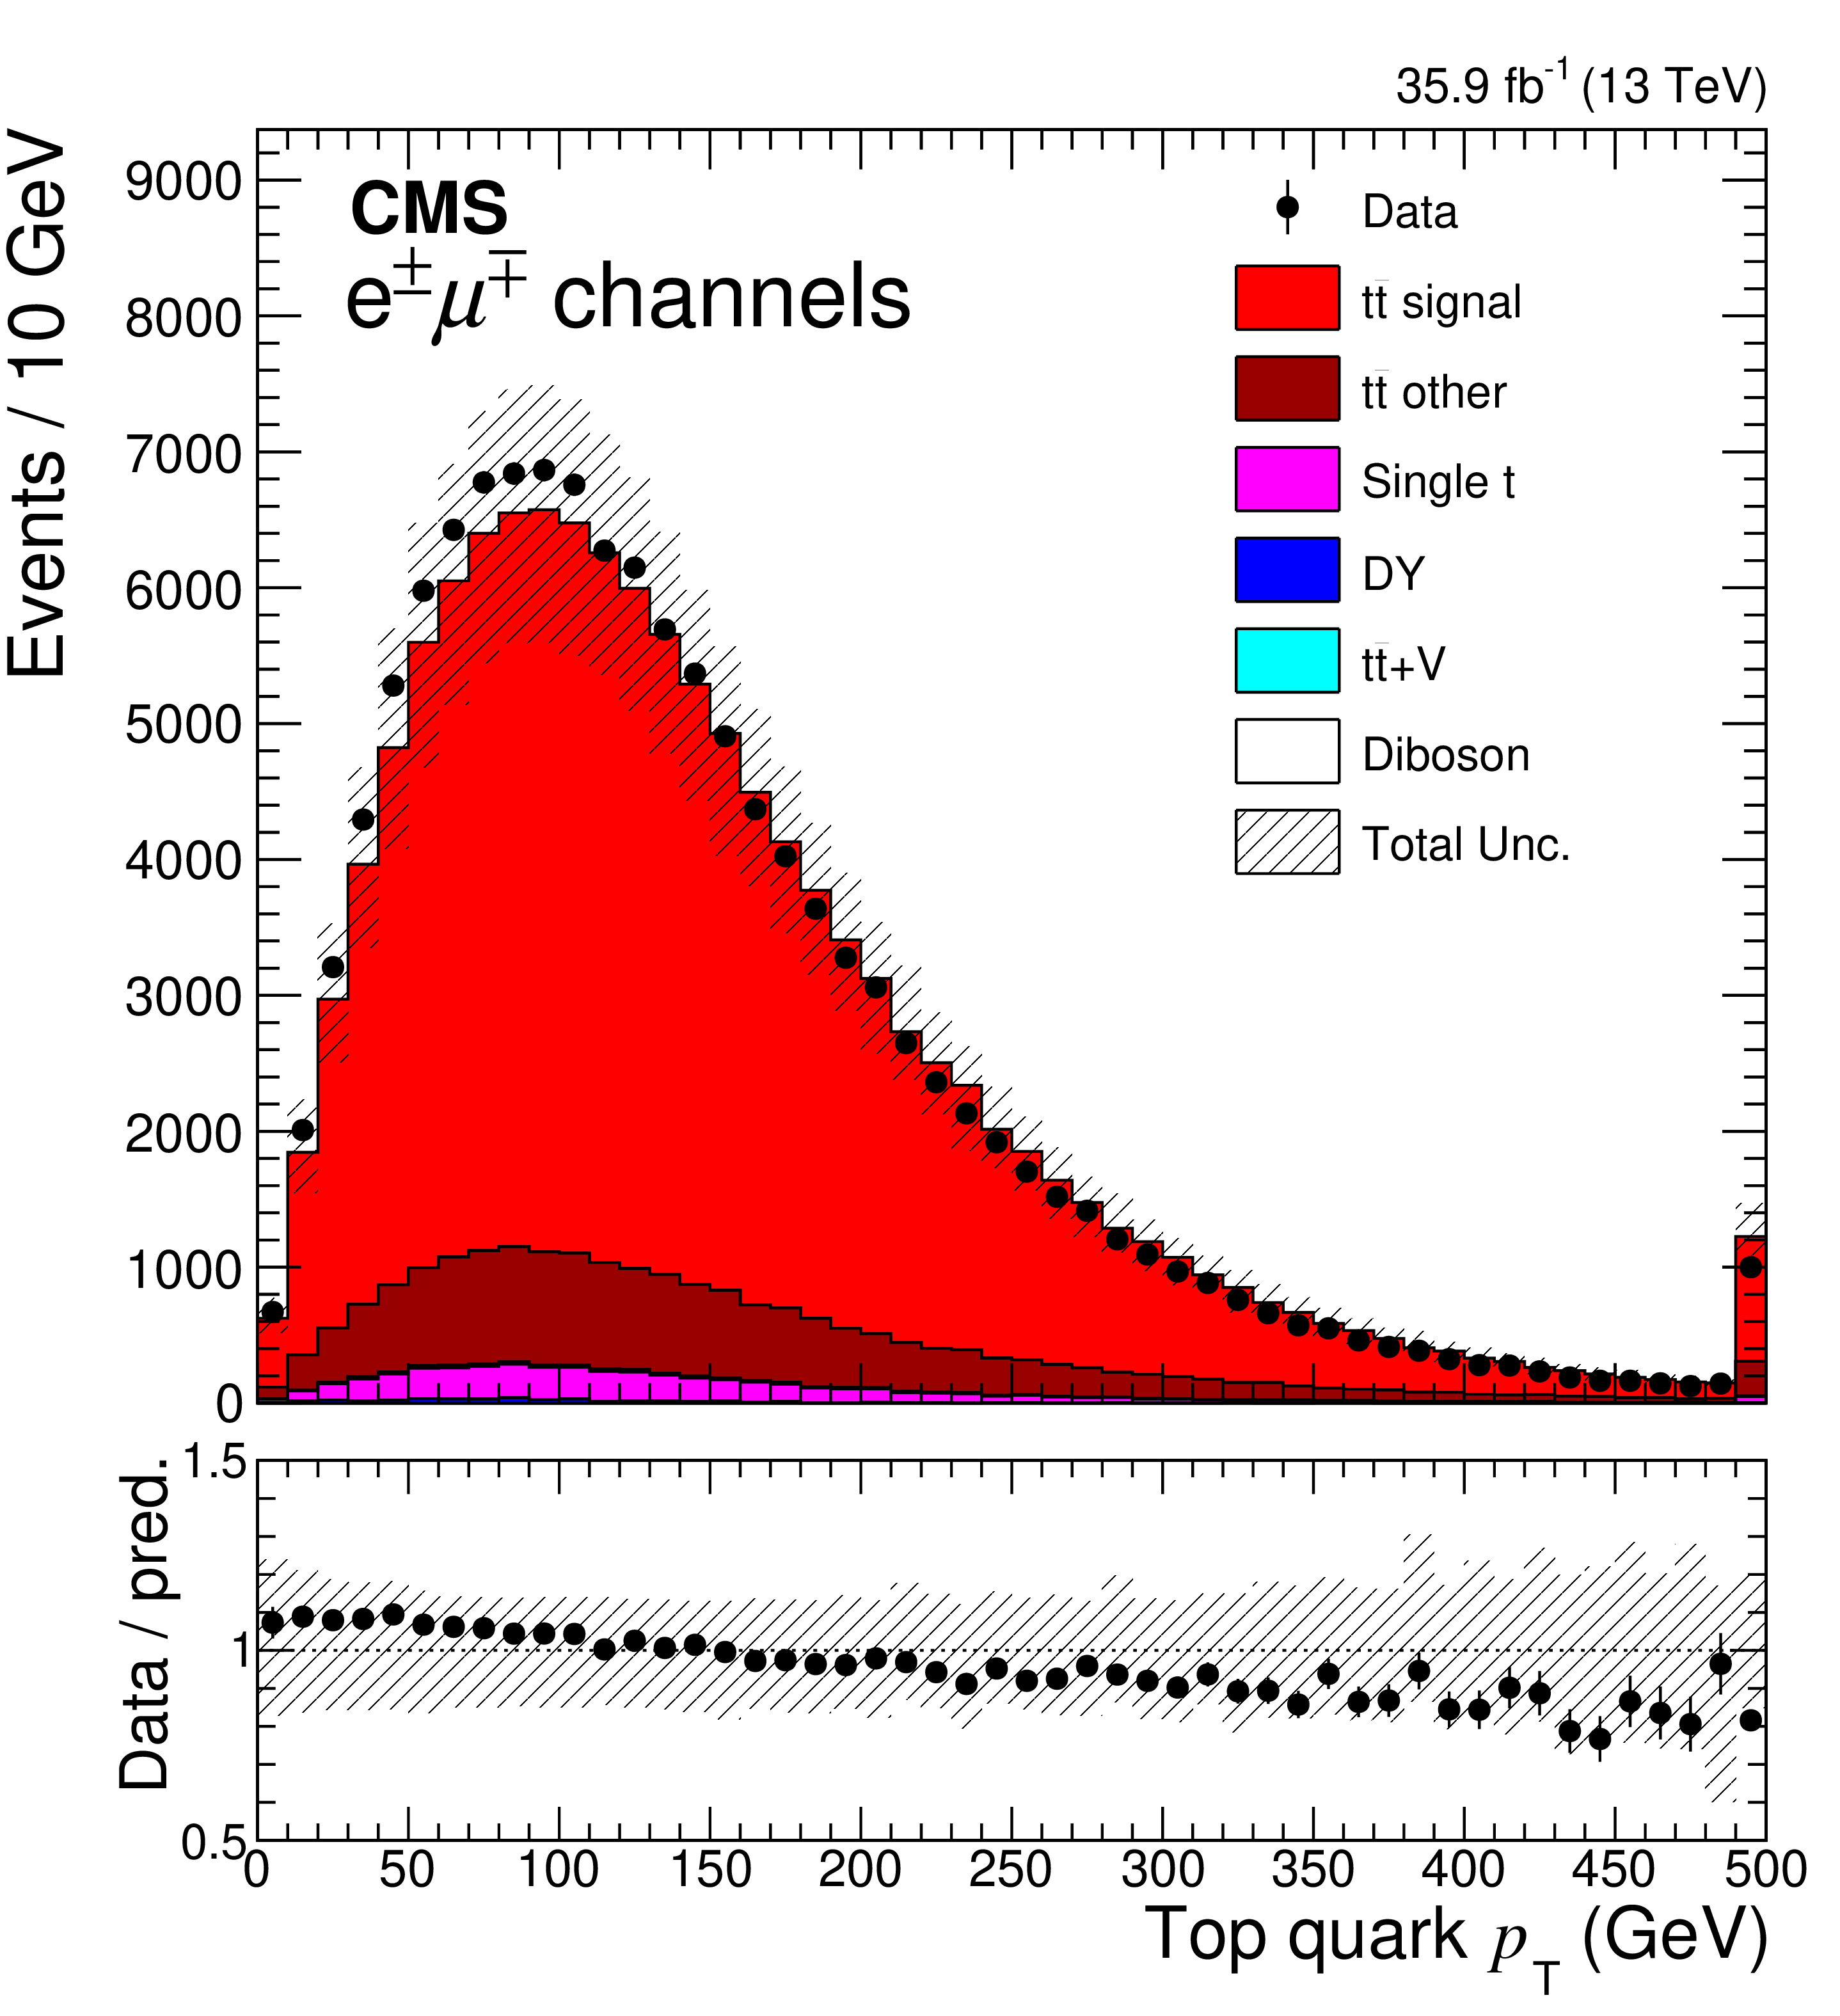
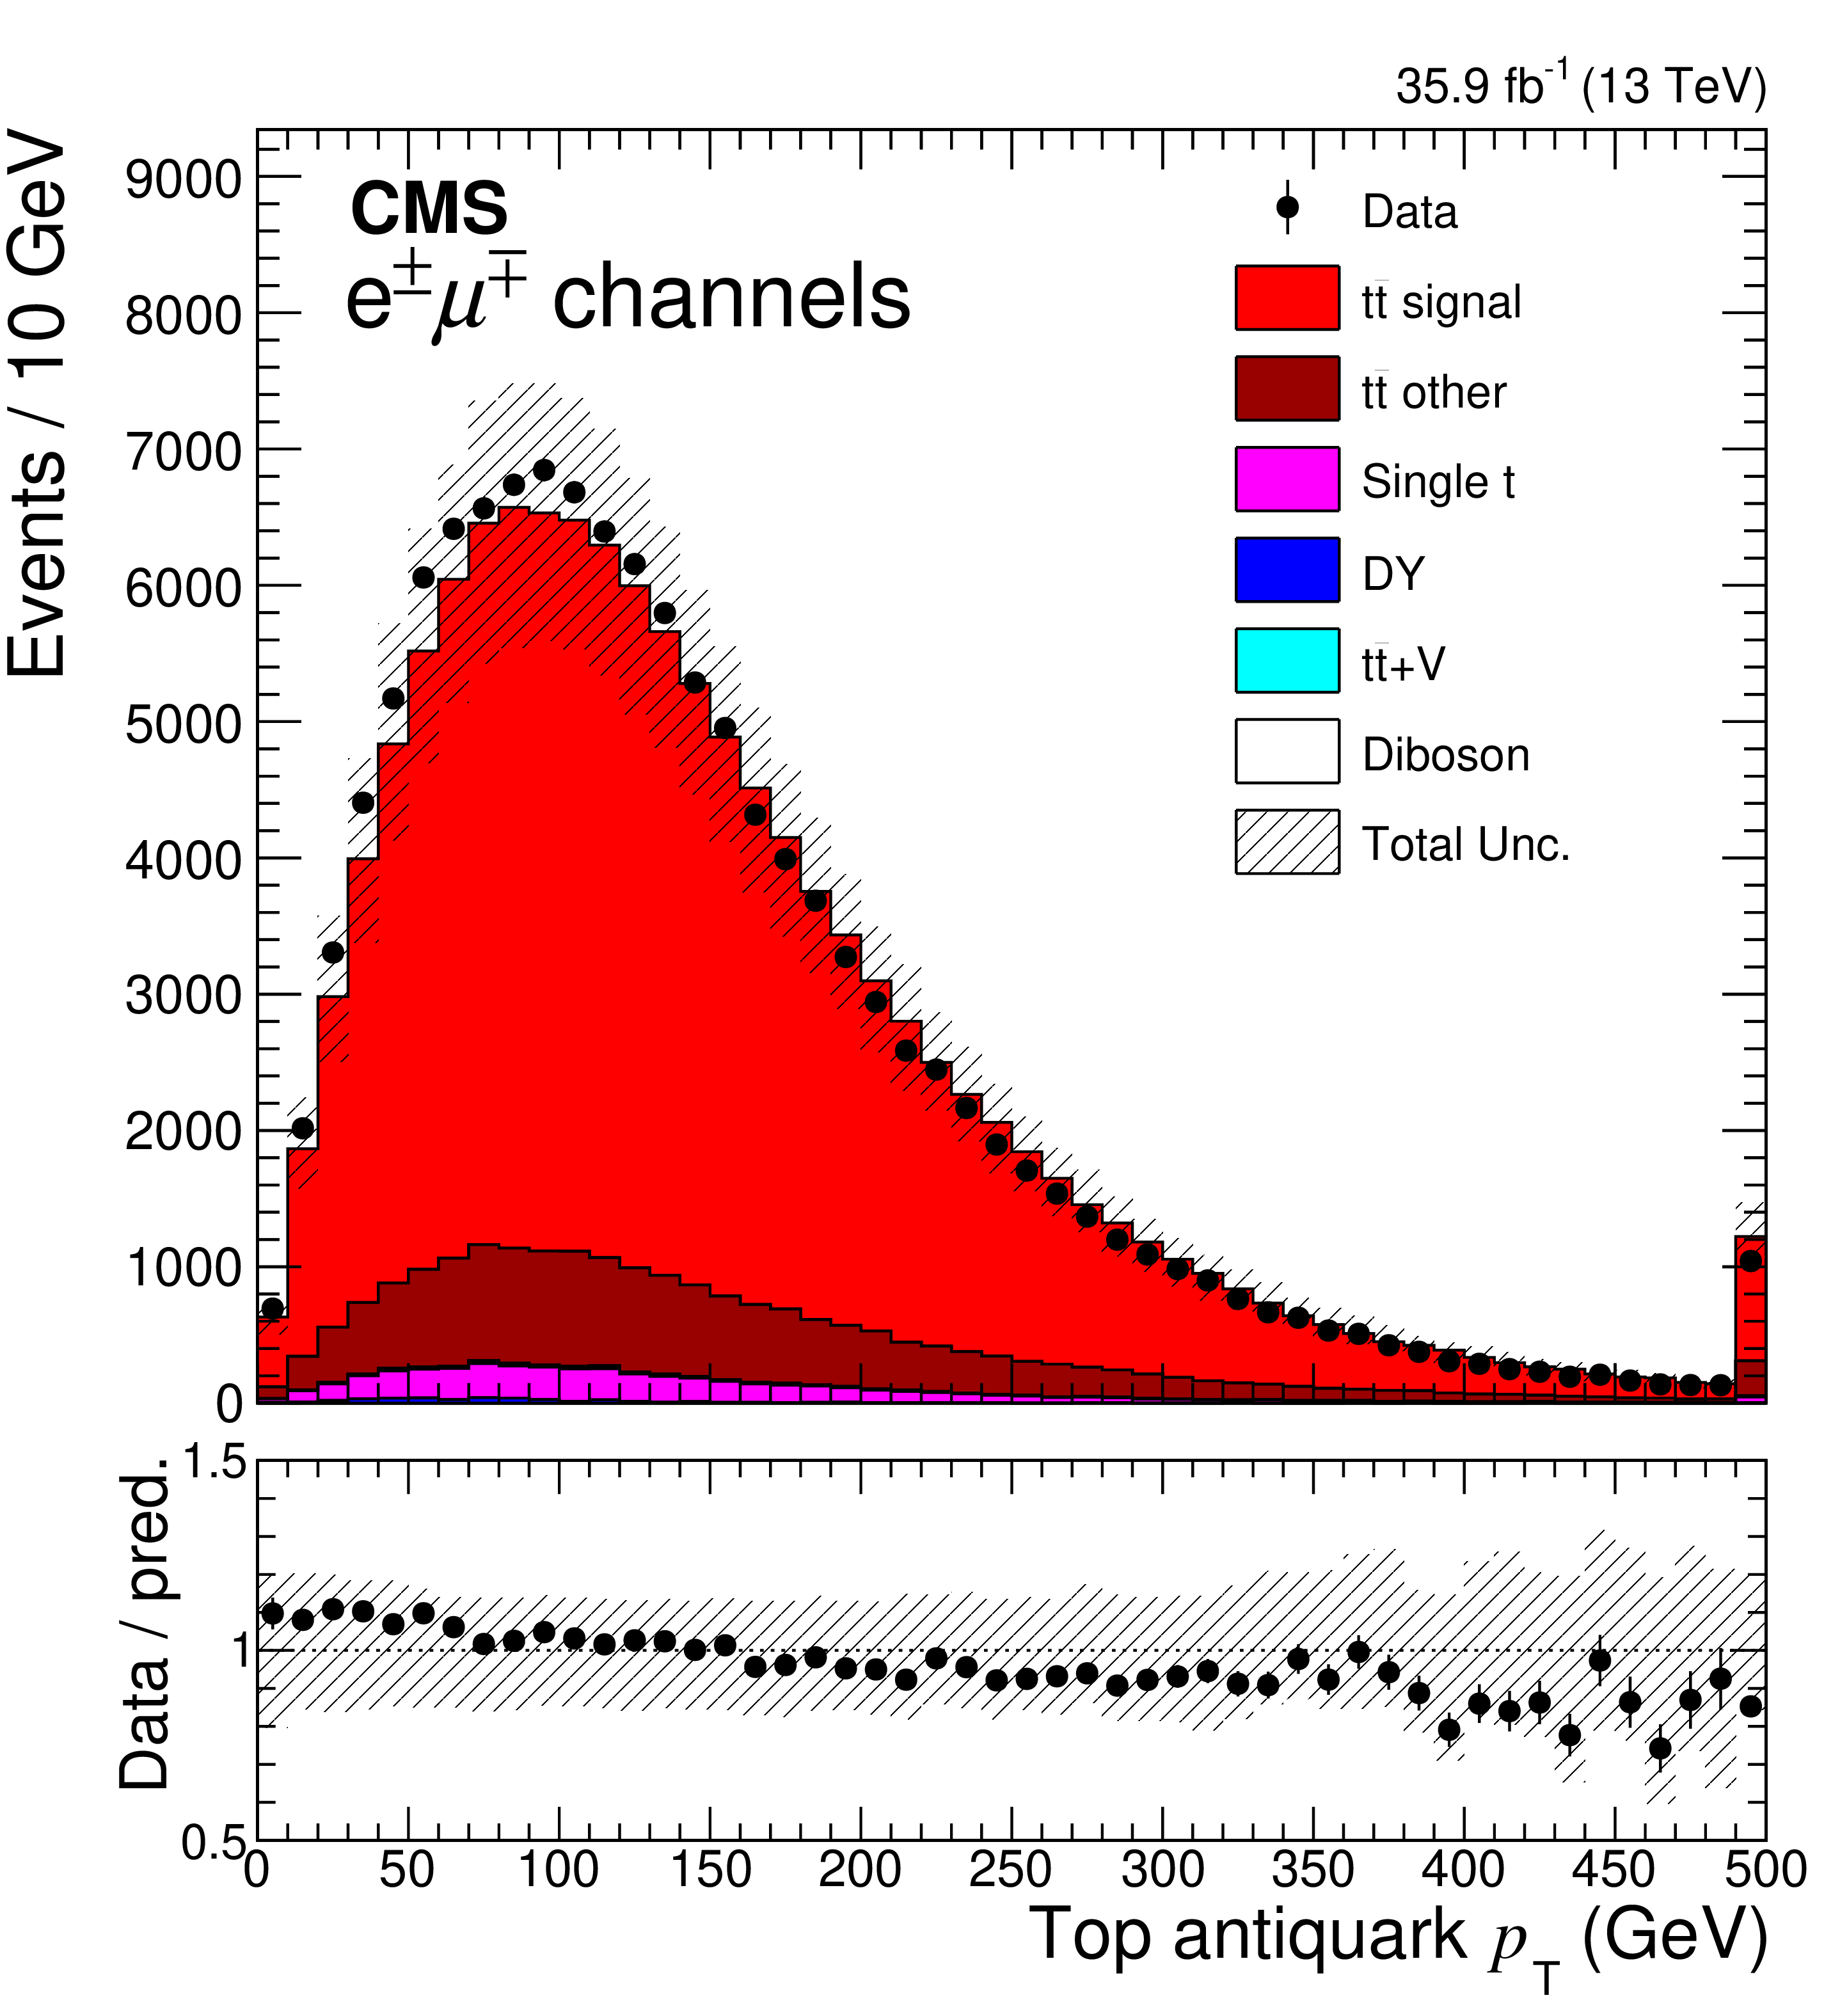
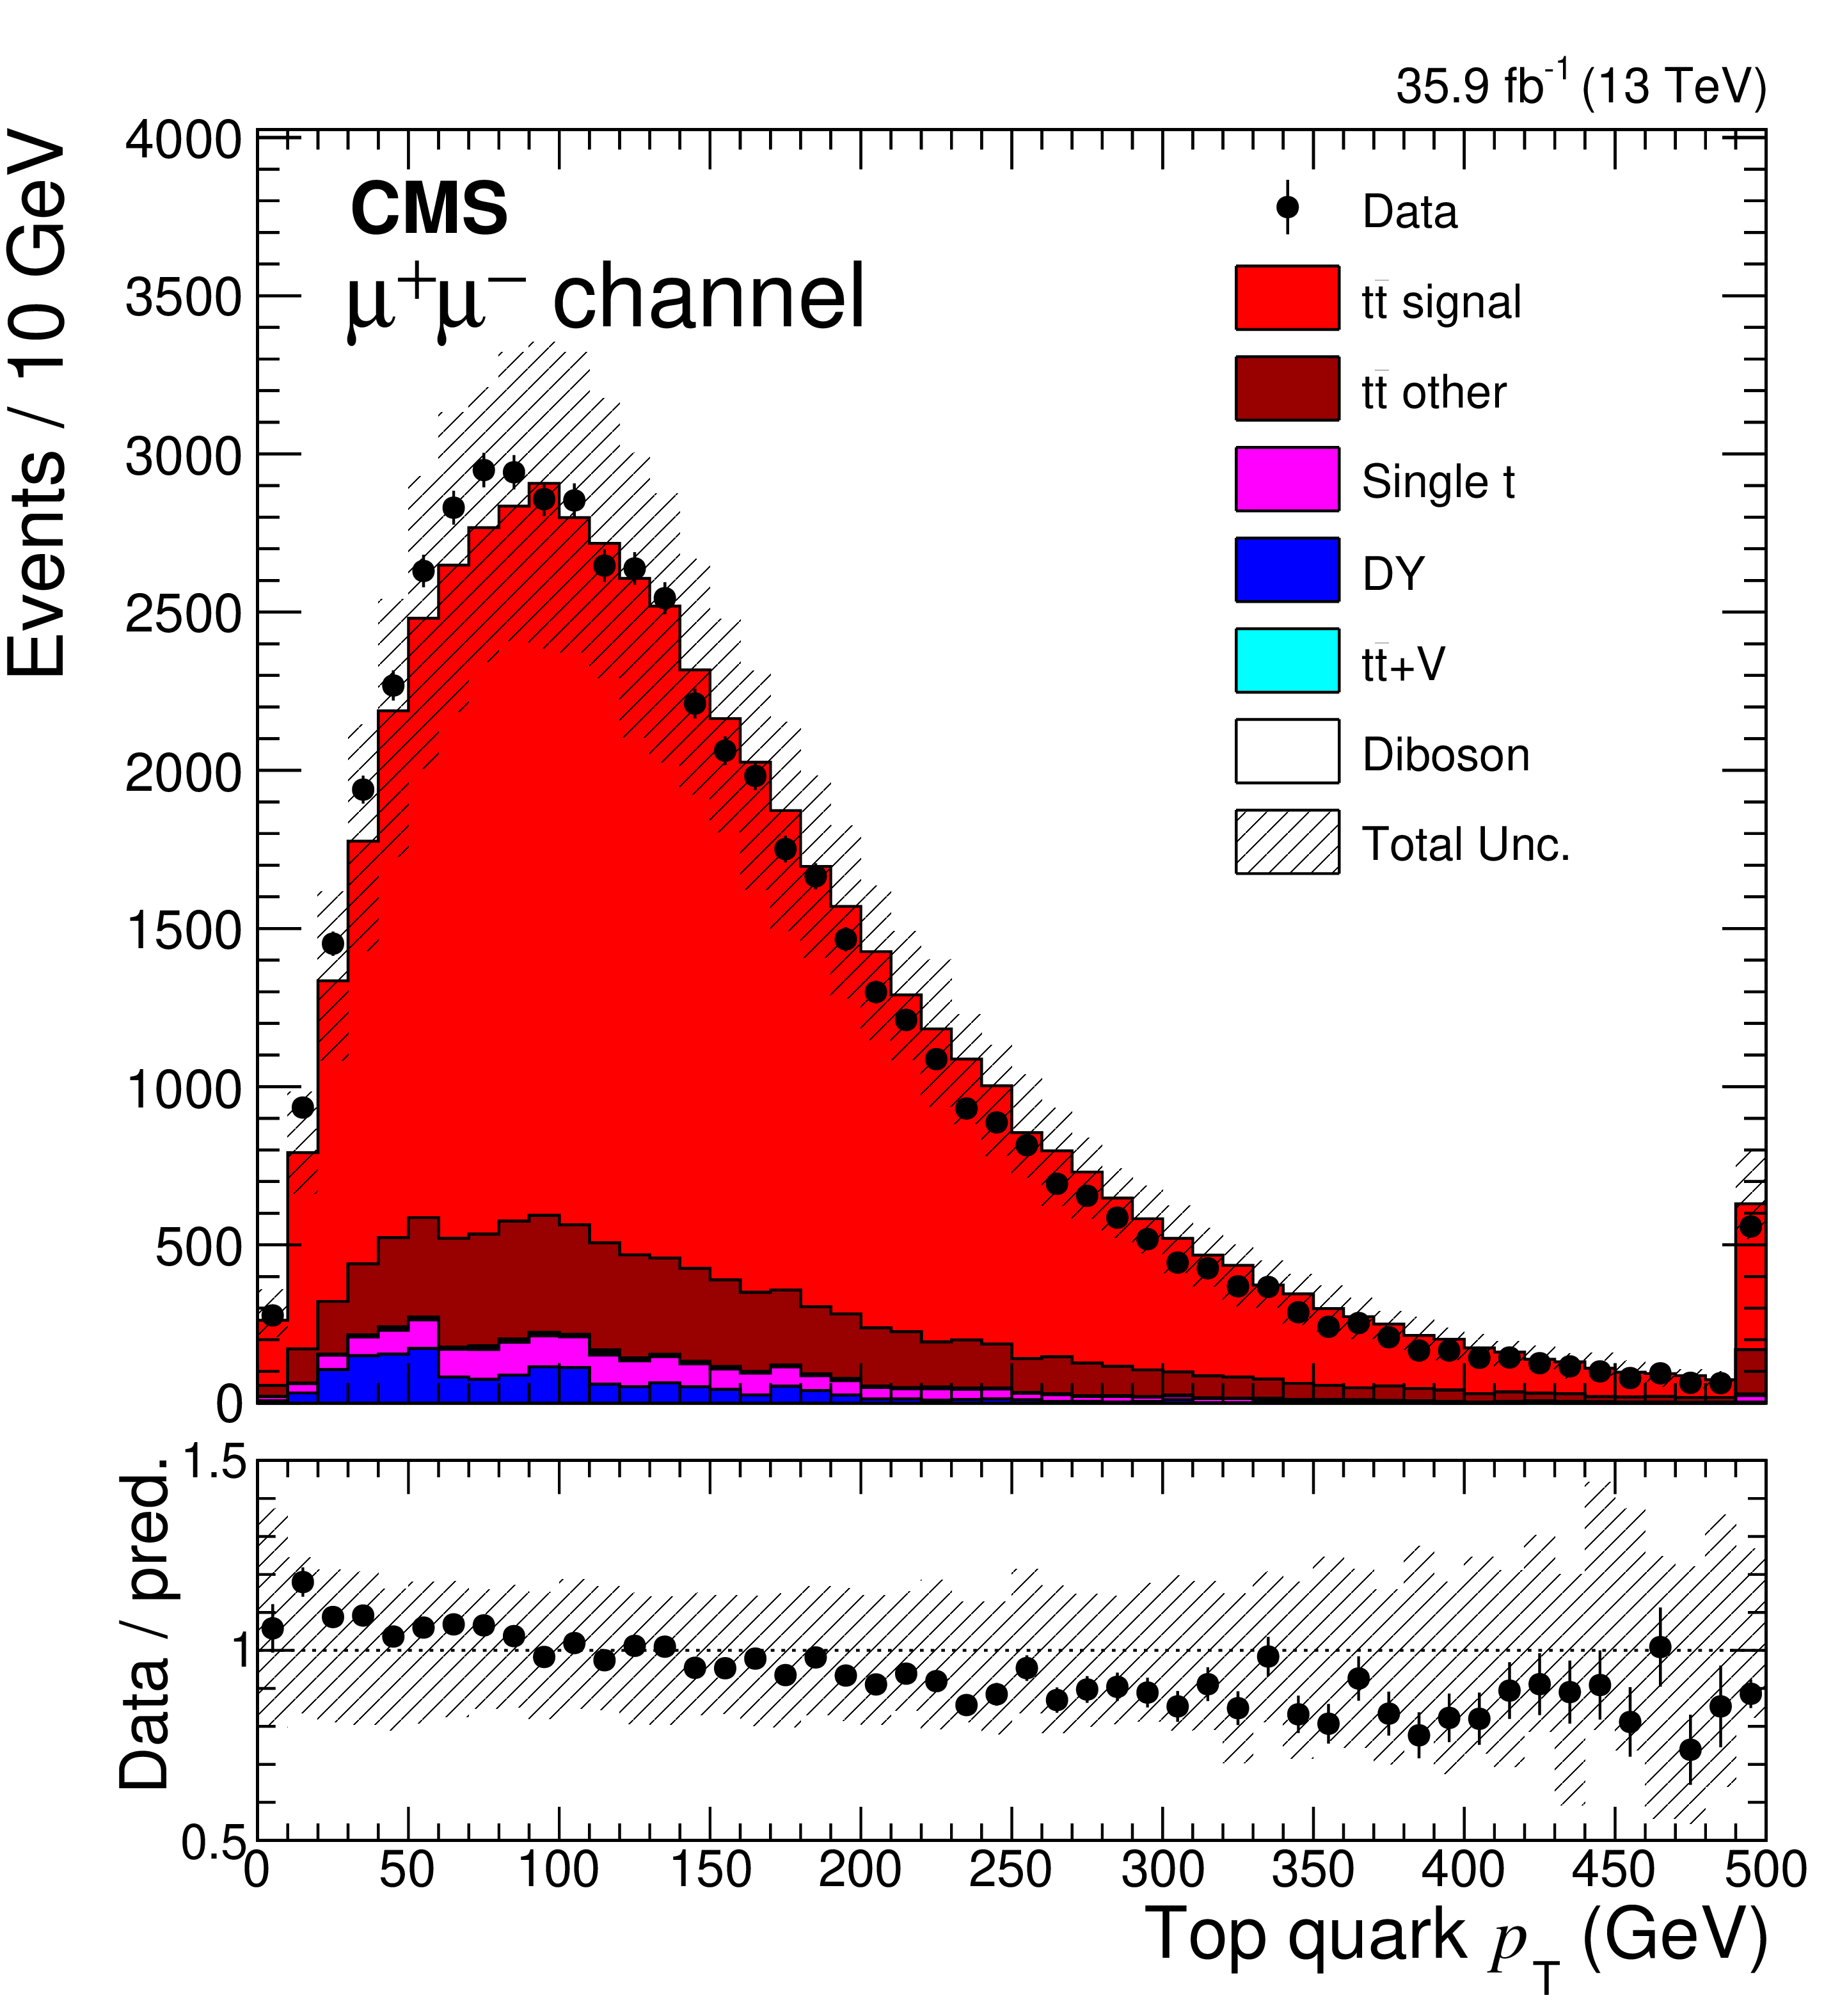
The comparisons of the predictions and observed data in the ${p_{\mathrm {T}}}$ distributions in the top quark (left) and antiquark (right) in the ${\mathrm{e^{+}} \mathrm{e^{-}}}$ (upper), ${\mathrm{e^{\pm}} {\mu ^\mp}}$ (middle) and ${\mu^{+} \mu^{-}}$ (lower) channels. The vertical bars on the markers of the observed data represent the statistical uncertainties. The shaded band in the predicted distributions includes statistical and systematic uncertainties. The last bin in each plot includes overflow events. The ratio of the data to the predictions from simulation is presented in the lower panel of each figure. |
png pdf |
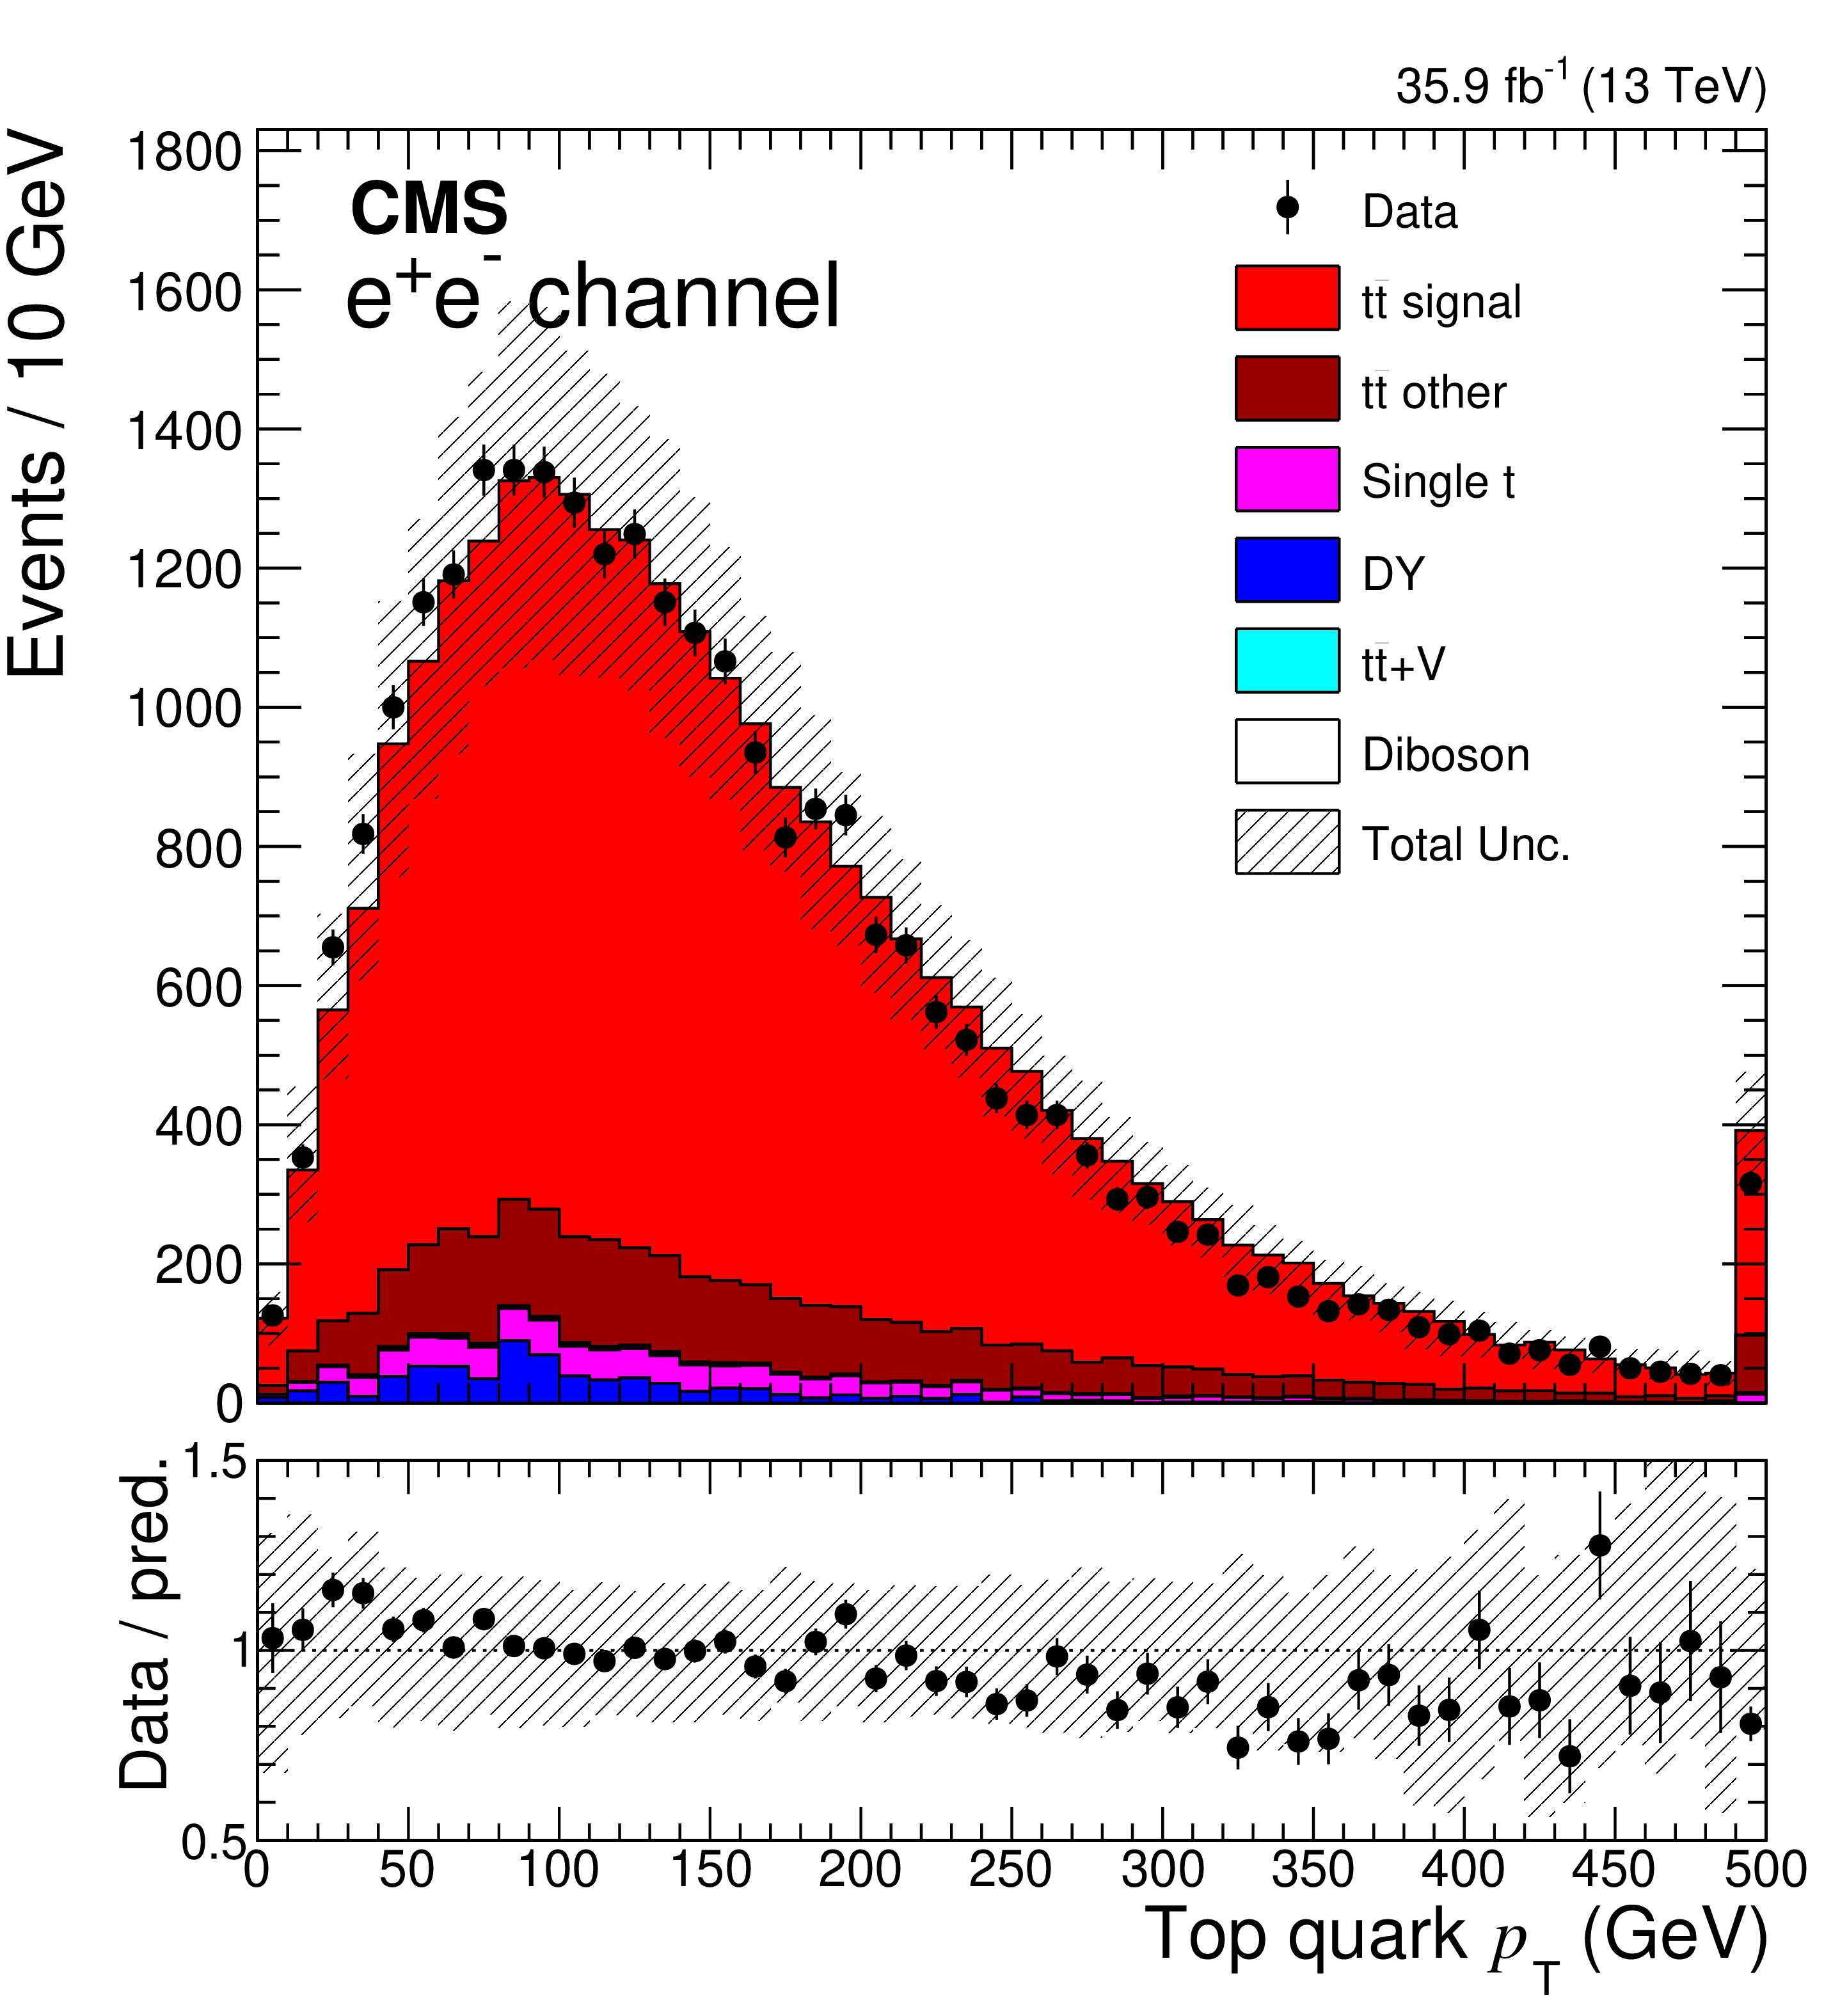
Figure 2-a:
The comparisons of the predictions and observed data in the ${p_{\mathrm {T}}}$ distributions in the top quark in the ${\mathrm{e^{+}} \mathrm{e^{-}}}$ channel. The vertical bars on the markers of the observed data represent the statistical uncertainties. The shaded band in the predicted distributions includes statistical and systematic uncertainties. The last bin includes overflow events. The ratio of the data to the predictions from simulation is presented in the lower panel. |
png pdf |
Figure 2-b:
The comparisons of the predictions and observed data in the ${p_{\mathrm {T}}}$ distributions in the top antiquark in the ${\mathrm{e^{+}} \mathrm{e^{-}}}$ channel. The vertical bars on the markers of the observed data represent the statistical uncertainties. The shaded band in the predicted distributions includes statistical and systematic uncertainties. The last bin includes overflow events. The ratio of the data to the predictions from simulation is presented in the lower panel. |
png pdf |
Figure 2-c:
The comparisons of the predictions and observed data in the ${p_{\mathrm {T}}}$ distributions in the top quark in the ${\mathrm{e^{\pm}} {\mu ^\mp}}$ channel. The vertical bars on the markers of the observed data represent the statistical uncertainties. The shaded band in the predicted distributions includes statistical and systematic uncertainties. The last bin includes overflow events. The ratio of the data to the predictions from simulation is presented in the lower panel. |
png pdf |
Figure 2-d:
The comparisons of the predictions and observed data in the ${p_{\mathrm {T}}}$ distributions in the top antiquark in the ${\mathrm{e^{\pm}} {\mu ^\mp}}$ channel. The vertical bars on the markers of the observed data represent the statistical uncertainties. The shaded band in the predicted distributions includes statistical and systematic uncertainties. The last bin includes overflow events. The ratio of the data to the predictions from simulation is presented in the lower panel. |
png pdf |
Figure 2-e:
The comparisons of the predictions and observed data in the ${p_{\mathrm {T}}}$ distributions in the top quark in the ${\mu^{+} \mu^{-}}$ channel. The vertical bars on the markers of the observed data represent the statistical uncertainties. The shaded band in the predicted distributions includes statistical and systematic uncertainties. The last bin includes overflow events. The ratio of the data to the predictions from simulation is presented in the lower panel. |

png pdf |
Figure 2-f:
The comparisons of the predictions and observed data in the ${p_{\mathrm {T}}}$ distributions in the top antiquark in the ${\mu^{+} \mu^{-}}$ channel. The vertical bars on the markers of the observed data represent the statistical uncertainties. The shaded band in the predicted distributions includes statistical and systematic uncertainties. The last bin includes overflow events. The ratio of the data to the predictions from simulation is presented in the lower panel. |
png pdf |
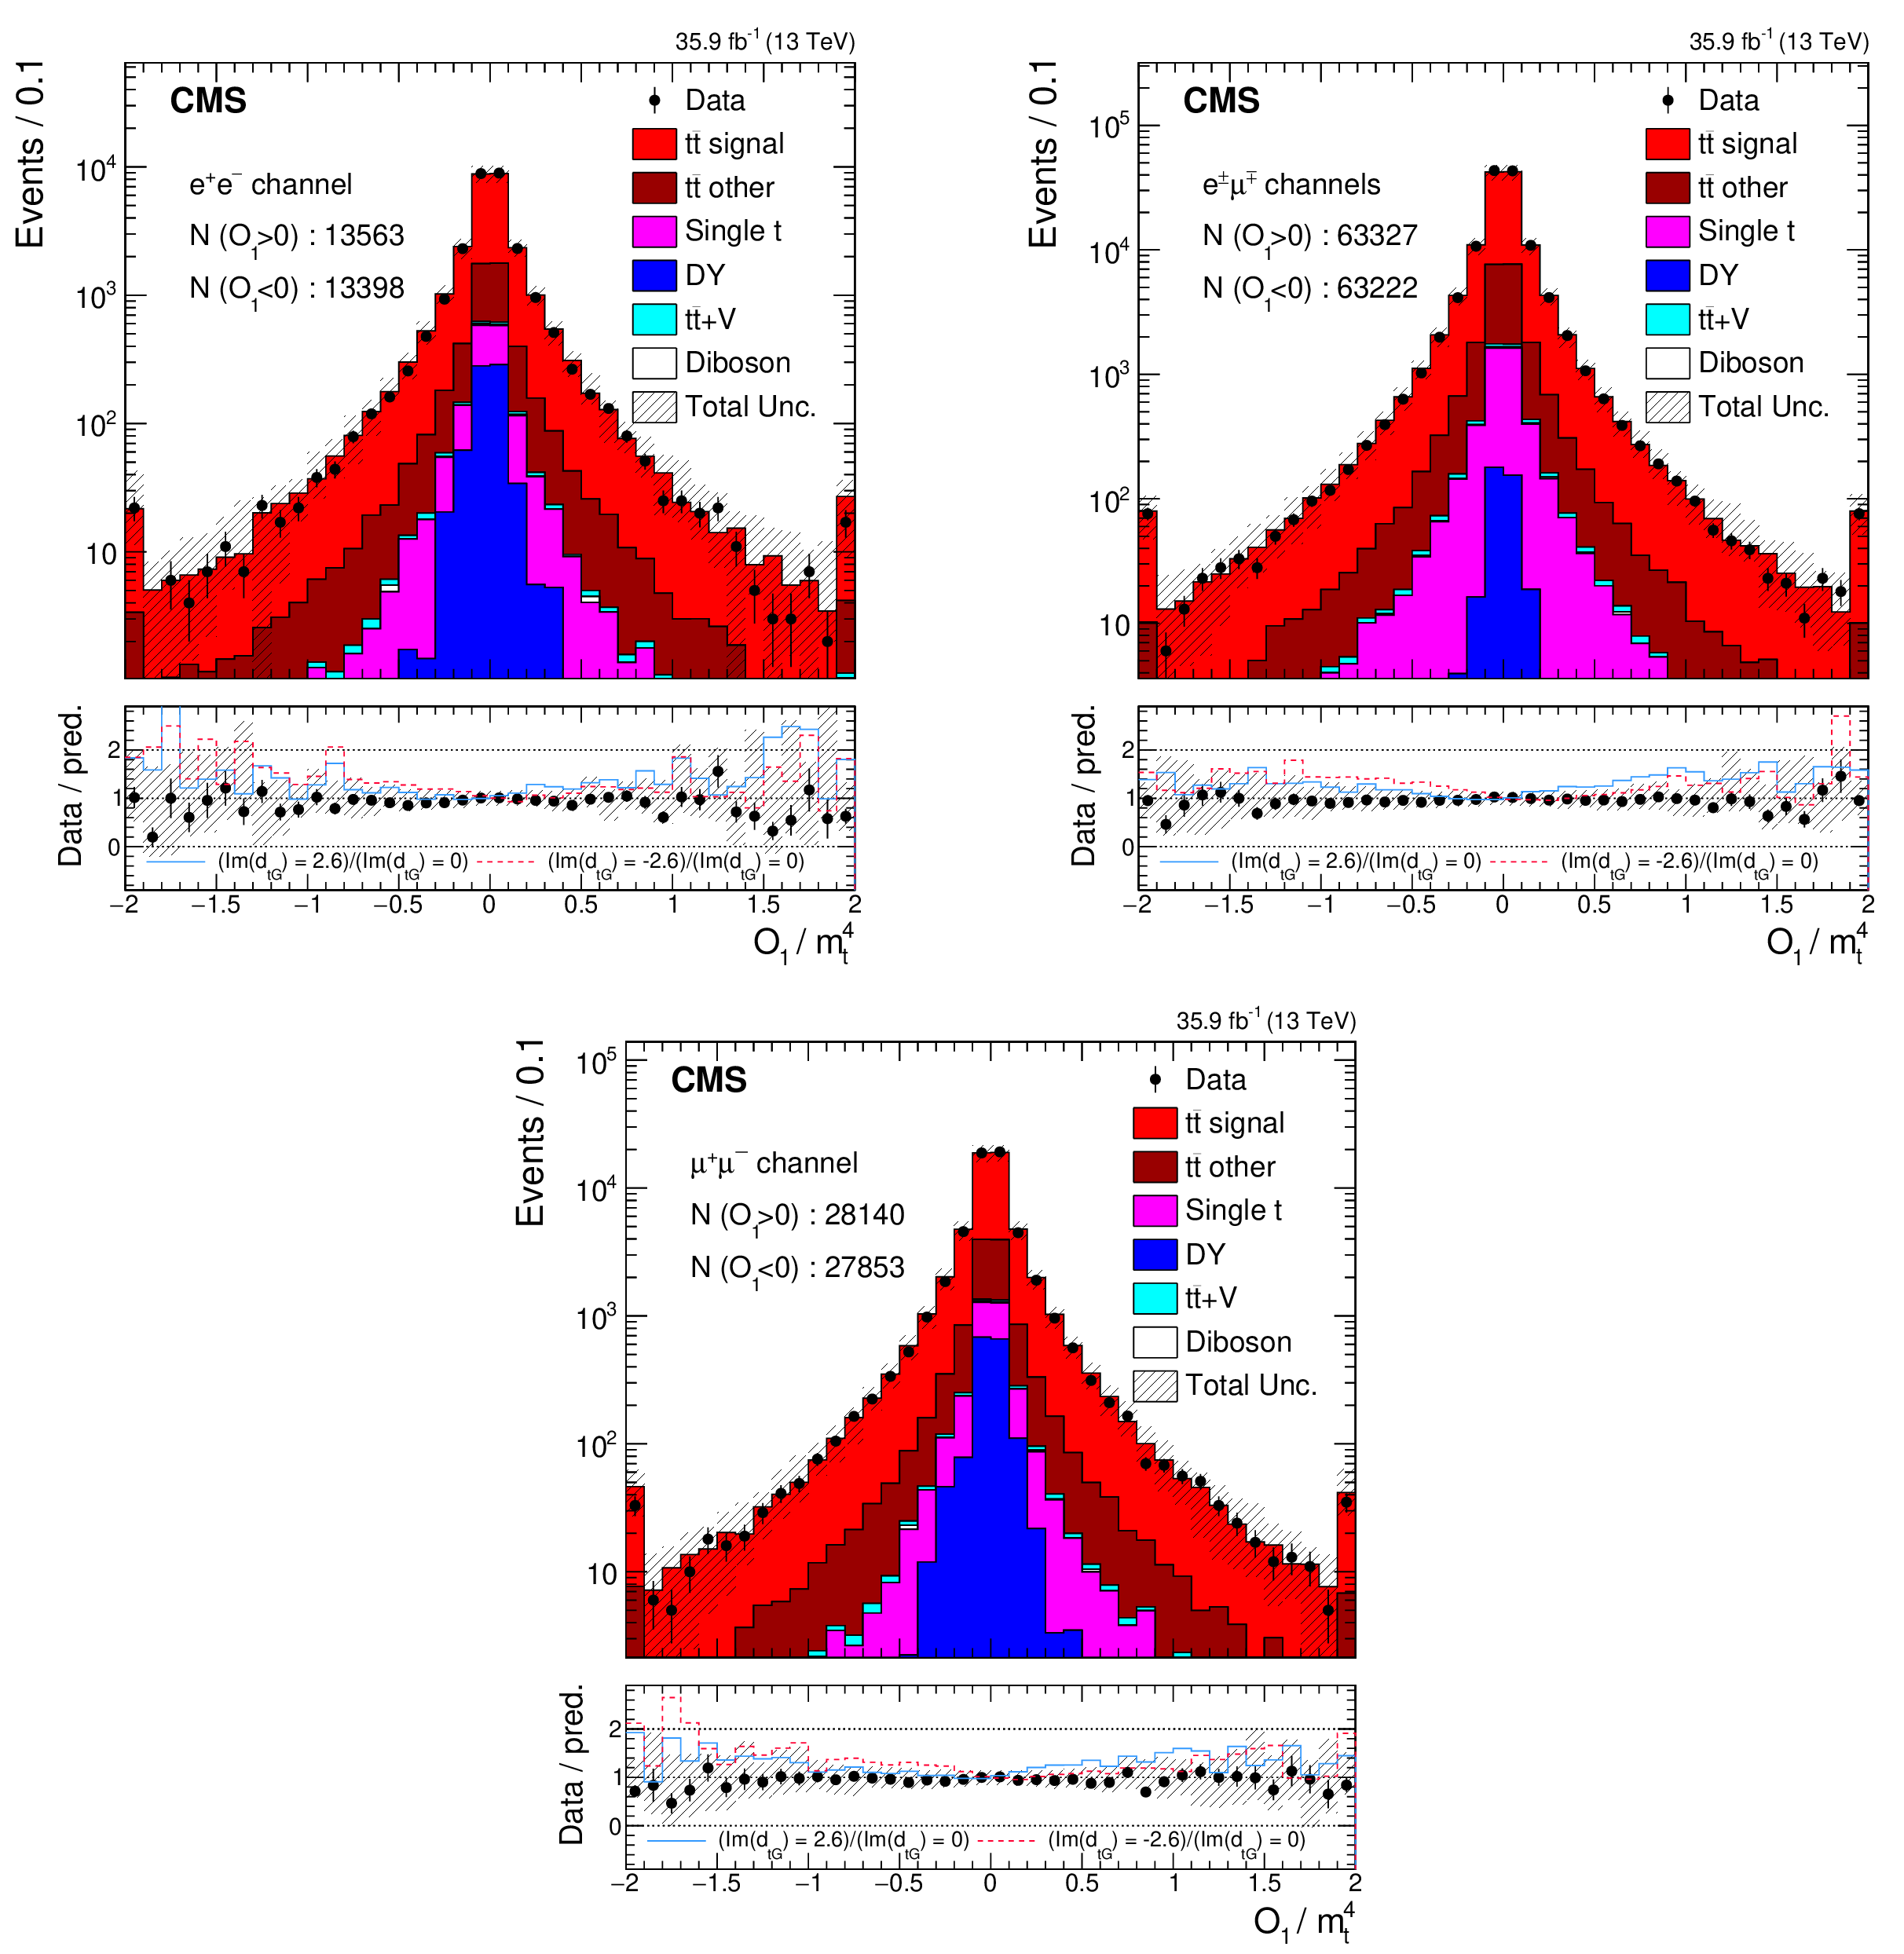
Figure 3:
The comparisons of the predictions and observed data in ${\mathcal {O}_{1}}$ in the ${\mathrm{e^{+}} \mathrm{e^{-}}}$ (upper left), ${\mathrm{e^{\pm}} {\mu ^\mp}}$ (upper right), and ${\mu^{+} \mu^{-}}$ (lower) channel. The vertical bars on the markers of the observed data represent the statistical uncertainties. The shaded band in the predicted distributions includes statistical and systematic uncertainties. The first and last bins in each plot include underflow and overflow events, respectively. The ratio of the data to the predictions from simulation is presented in the lower panel of each figure. The solid blue shows the ratio ${(\mathrm{Im}{({d_{\mathrm{t} G}})} =2.6)/(\mathrm{Im}{({d_{\mathrm{t} G}})} =0)}$, and the dashed red line represents the ratio ${(\mathrm{Im}{({d_{\mathrm{t} G}})} =-2.6)/(\mathrm{Im}{({d_{\mathrm{t} G}})} =0)}$, using the CEDM samples. |
png pdf |
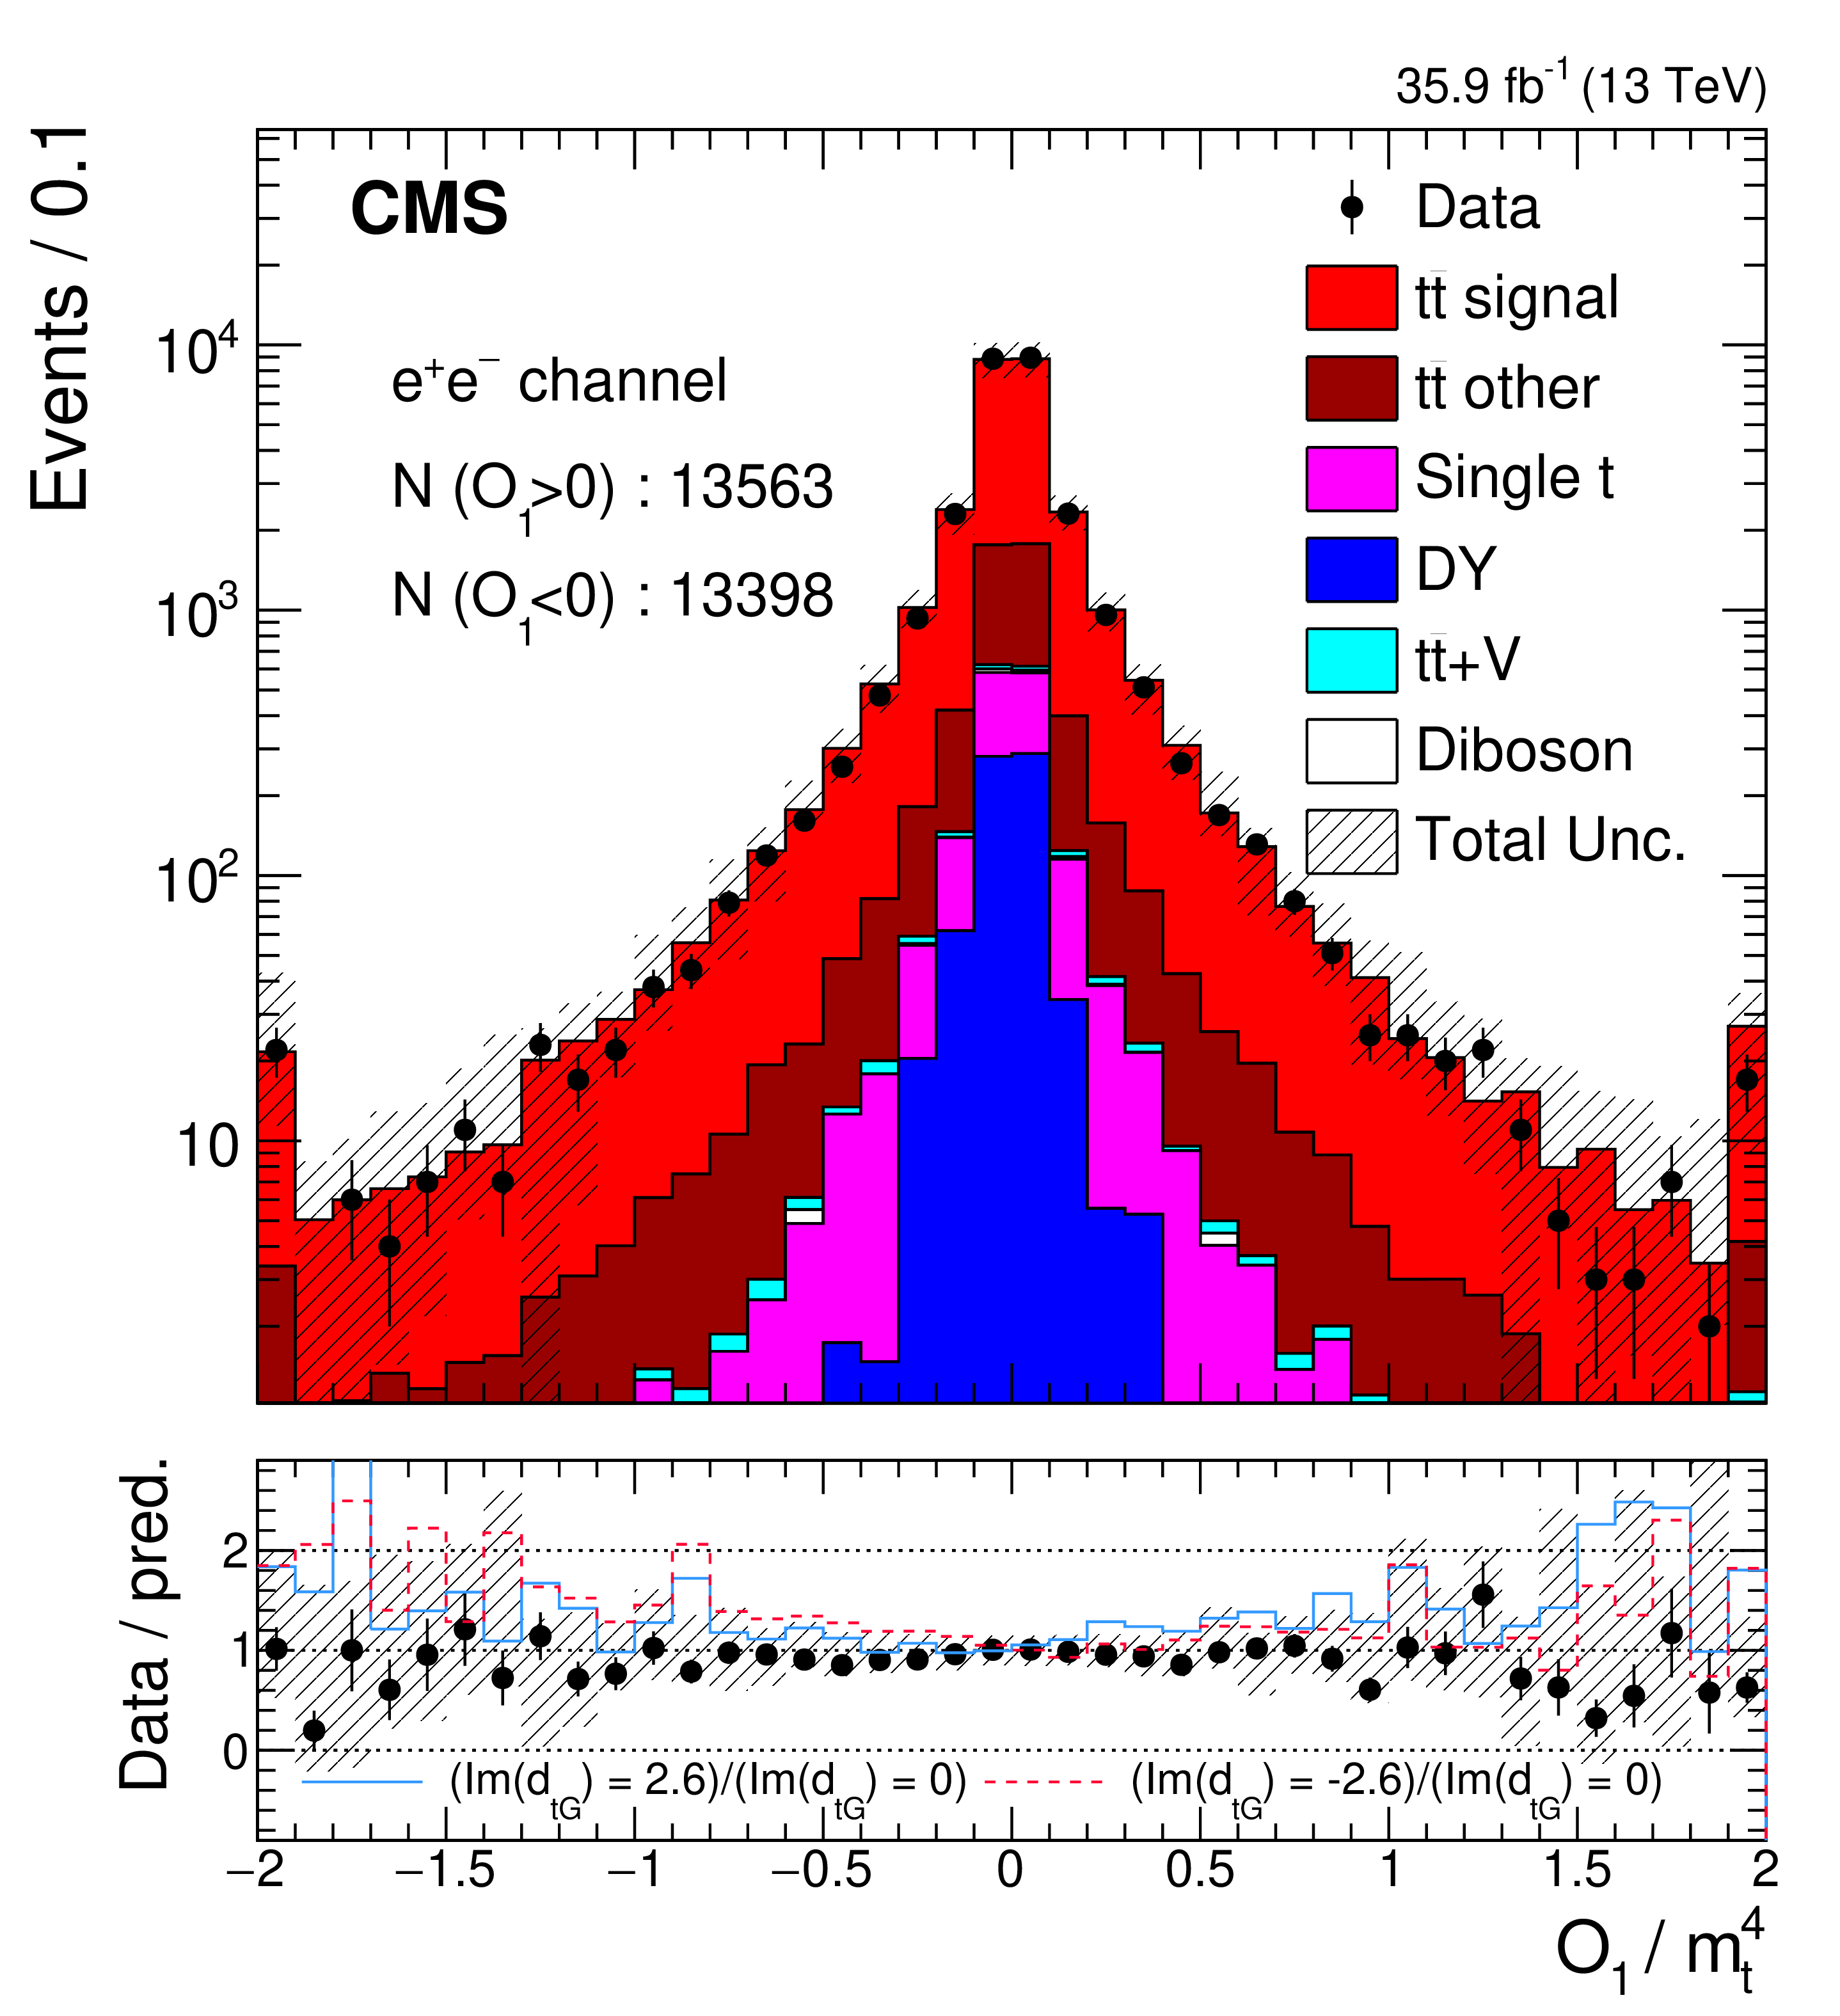
Figure 3-a:
The comparisons of the predictions and observed data in ${\mathcal {O}_{1}}$ in the ${\mathrm{e^{+}} \mathrm{e^{-}}}$ channel. The vertical bars on the markers of the observed data represent the statistical uncertainties. The shaded band in the predicted distributions includes statistical and systematic uncertainties. The first and last bins include underflow and overflow events, respectively. The ratio of the data to the predictions from simulation is presented in the lower panel. The solid blue shows the ratio ${(\mathrm{Im}{({d_{\mathrm{t} G}})} =2.6)/(\mathrm{Im}{({d_{\mathrm{t} G}})} =0)}$, and the dashed red line represents the ratio ${(\mathrm{Im}{({d_{\mathrm{t} G}})} =-2.6)/(\mathrm{Im}{({d_{\mathrm{t} G}})} =0)}$, using the CEDM samples. |

png pdf |
Figure 3-b:
The comparisons of the predictions and observed data in ${\mathcal {O}_{1}}$ in the ${\mathrm{e^{\pm}} {\mu ^\mp}}$ channel. The vertical bars on the markers of the observed data represent the statistical uncertainties. The shaded band in the predicted distributions includes statistical and systematic uncertainties. The first and last bins include underflow and overflow events, respectively. The ratio of the data to the predictions from simulation is presented in the lower panel. The solid blue shows the ratio ${(\mathrm{Im}{({d_{\mathrm{t} G}})} =2.6)/(\mathrm{Im}{({d_{\mathrm{t} G}})} =0)}$, and the dashed red line represents the ratio ${(\mathrm{Im}{({d_{\mathrm{t} G}})} =-2.6)/(\mathrm{Im}{({d_{\mathrm{t} G}})} =0)}$, using the CEDM samples. |
png pdf |
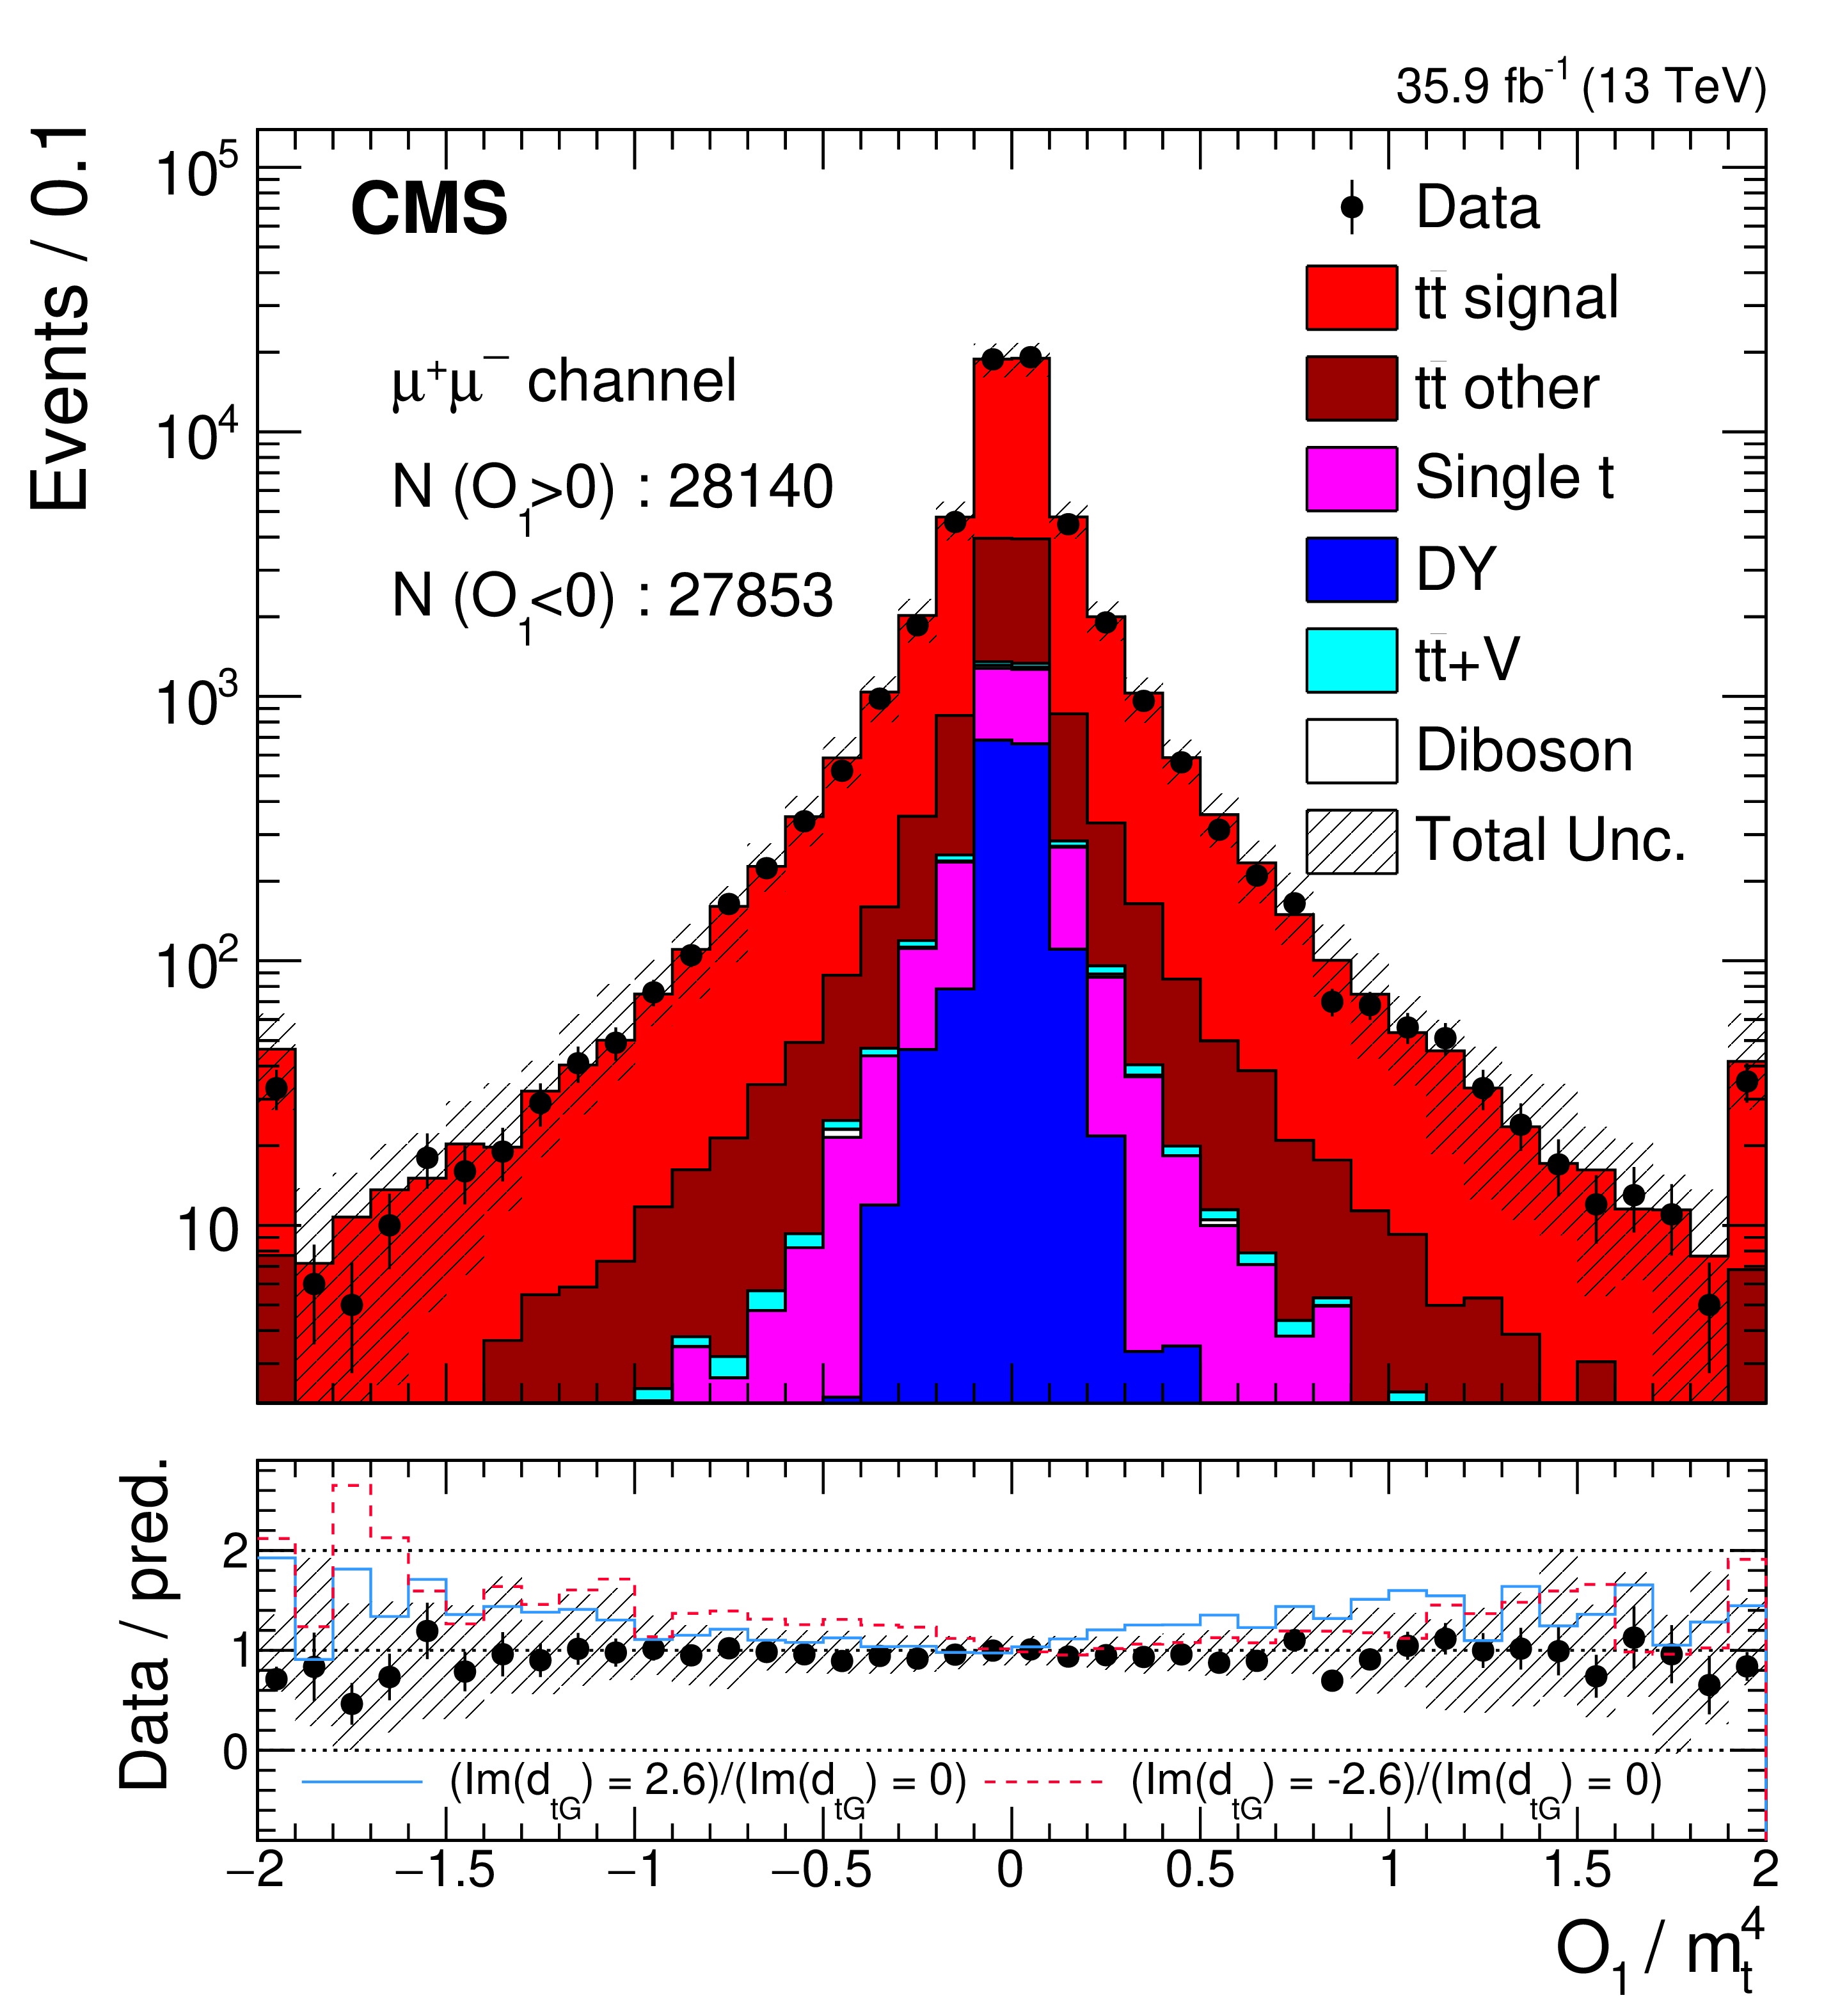
Figure 3-c:
The comparisons of the predictions and observed data in ${\mathcal {O}_{1}}$ in the ${\mu^{+} \mu^{-}}$ channel. The vertical bars on the markers of the observed data represent the statistical uncertainties. The shaded band in the predicted distributions includes statistical and systematic uncertainties. The first and last bins include underflow and overflow events, respectively. The ratio of the data to the predictions from simulation is presented in the lower panel. The solid blue shows the ratio ${(\mathrm{Im}{({d_{\mathrm{t} G}})} =2.6)/(\mathrm{Im}{({d_{\mathrm{t} G}})} =0)}$, and the dashed red line represents the ratio ${(\mathrm{Im}{({d_{\mathrm{t} G}})} =-2.6)/(\mathrm{Im}{({d_{\mathrm{t} G}})} =0)}$, using the CEDM samples. |
png pdf |
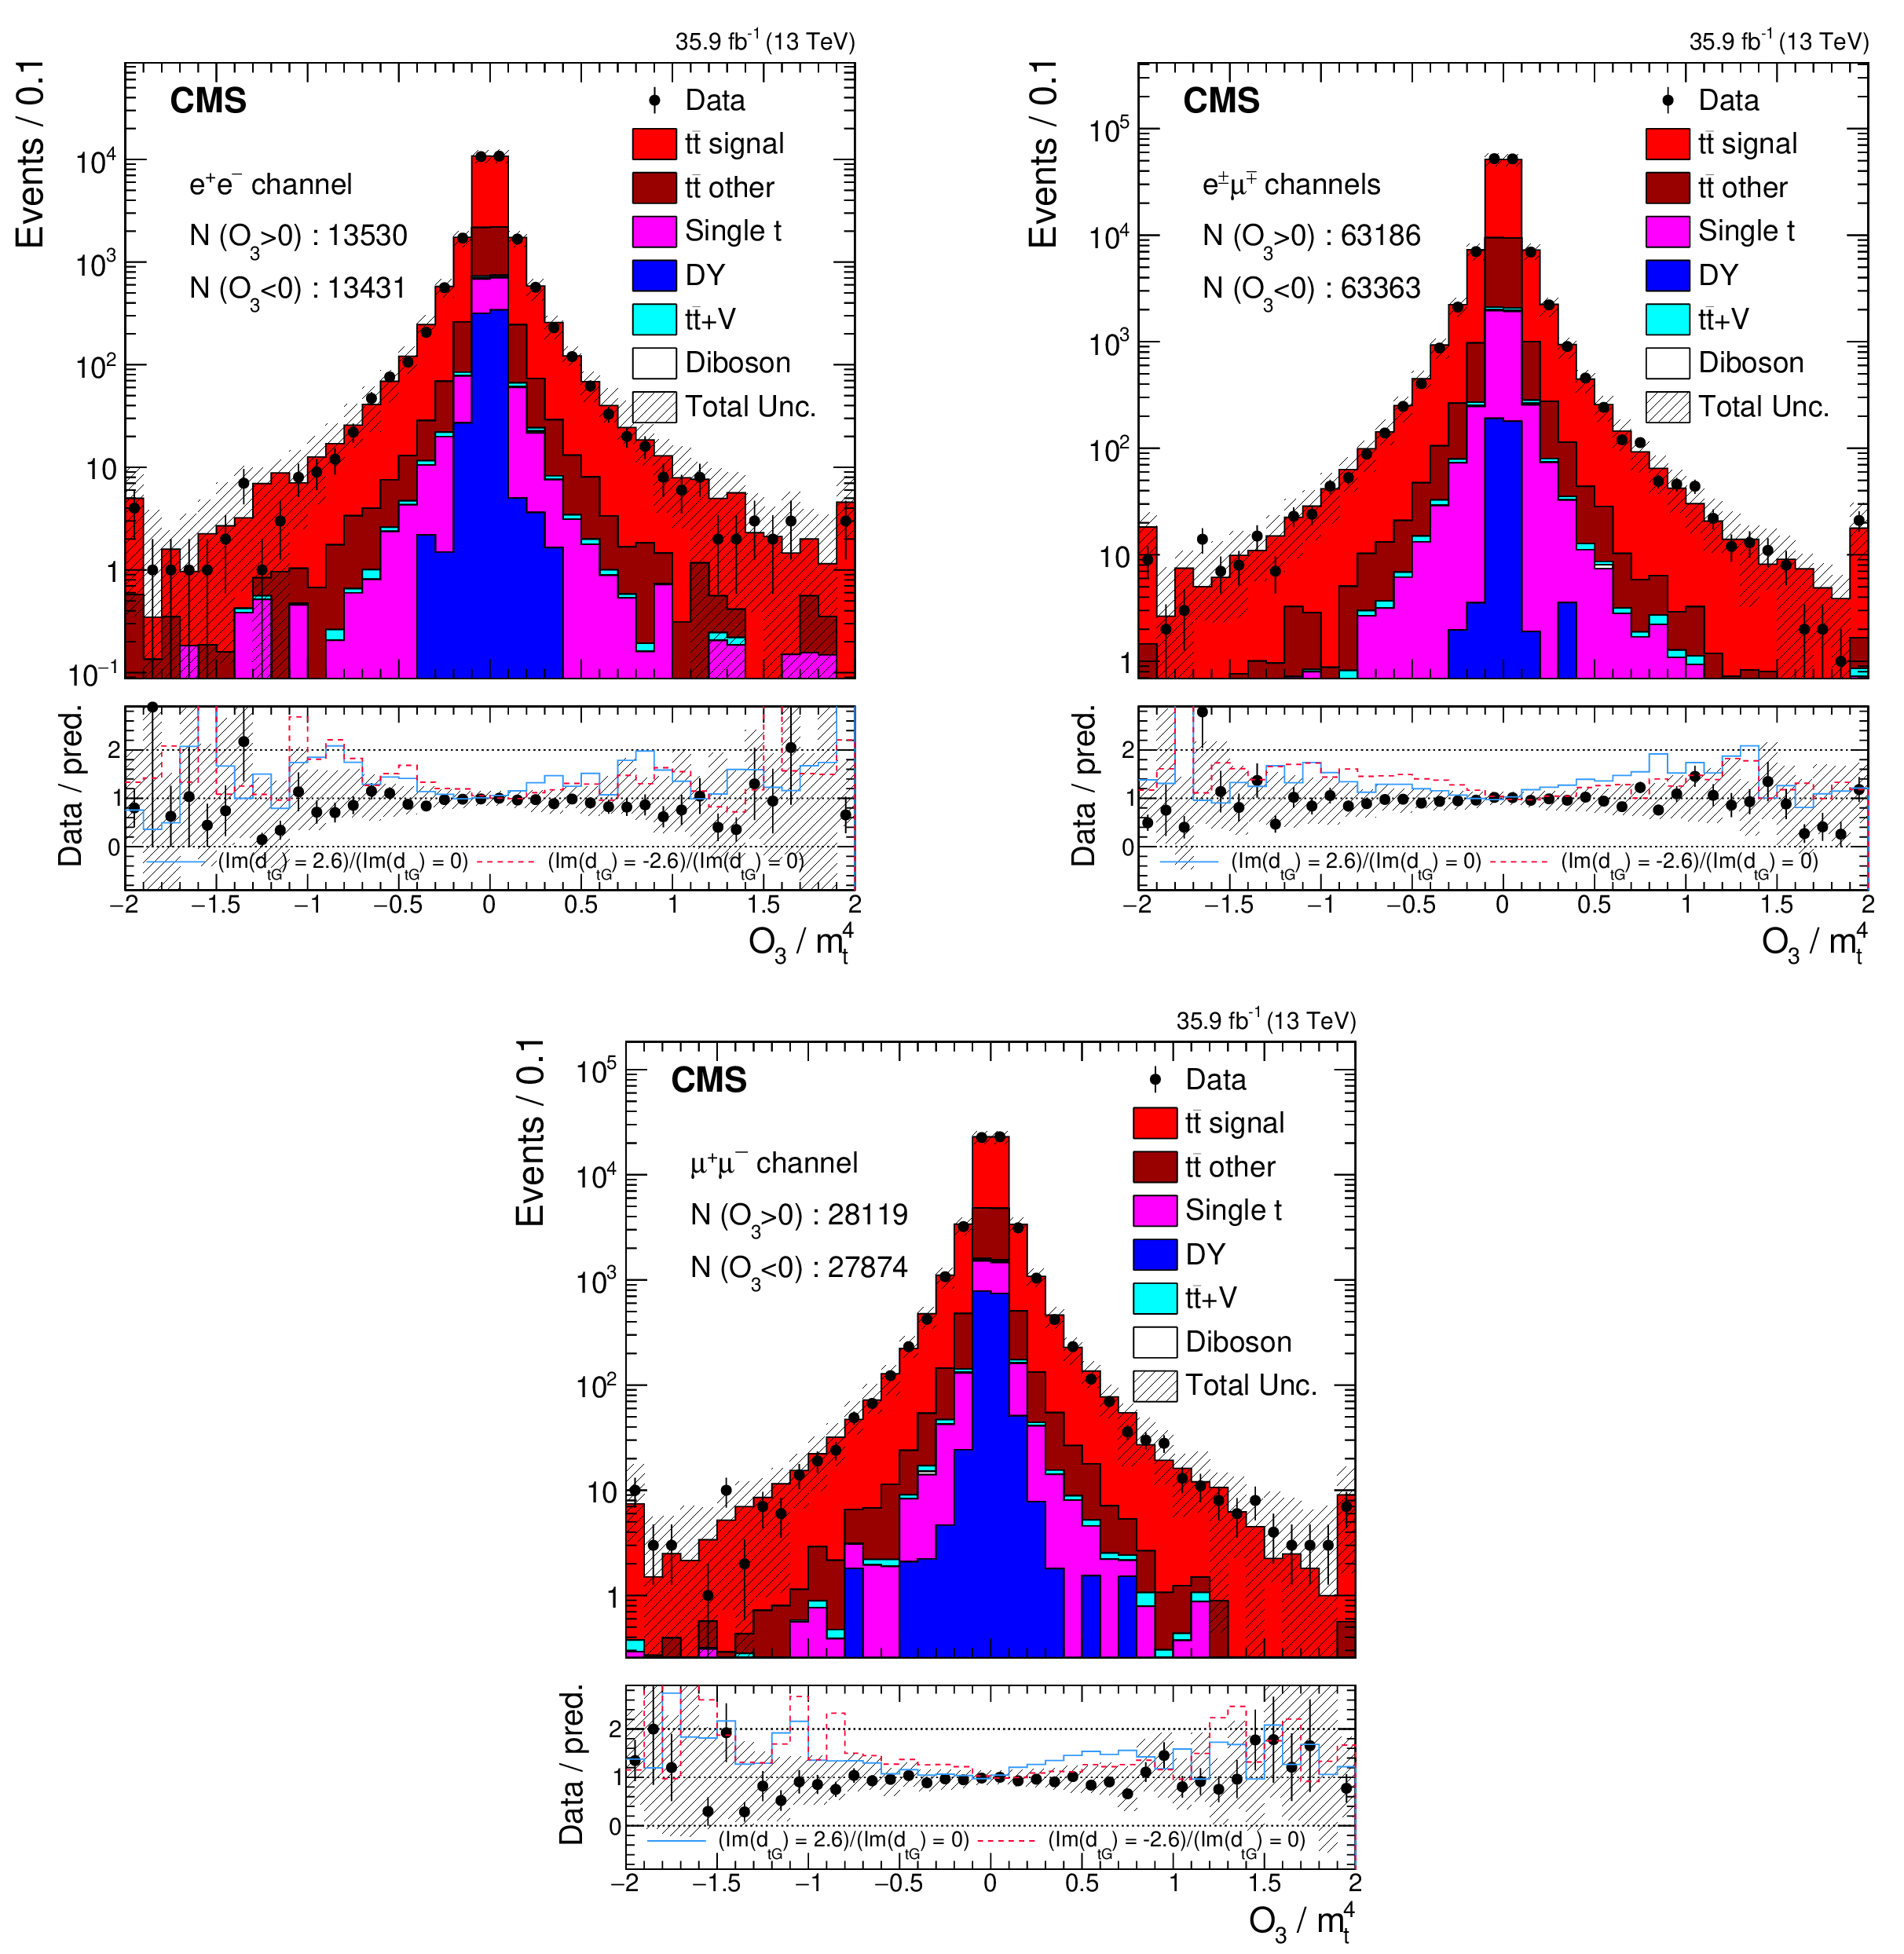
Figure 4:
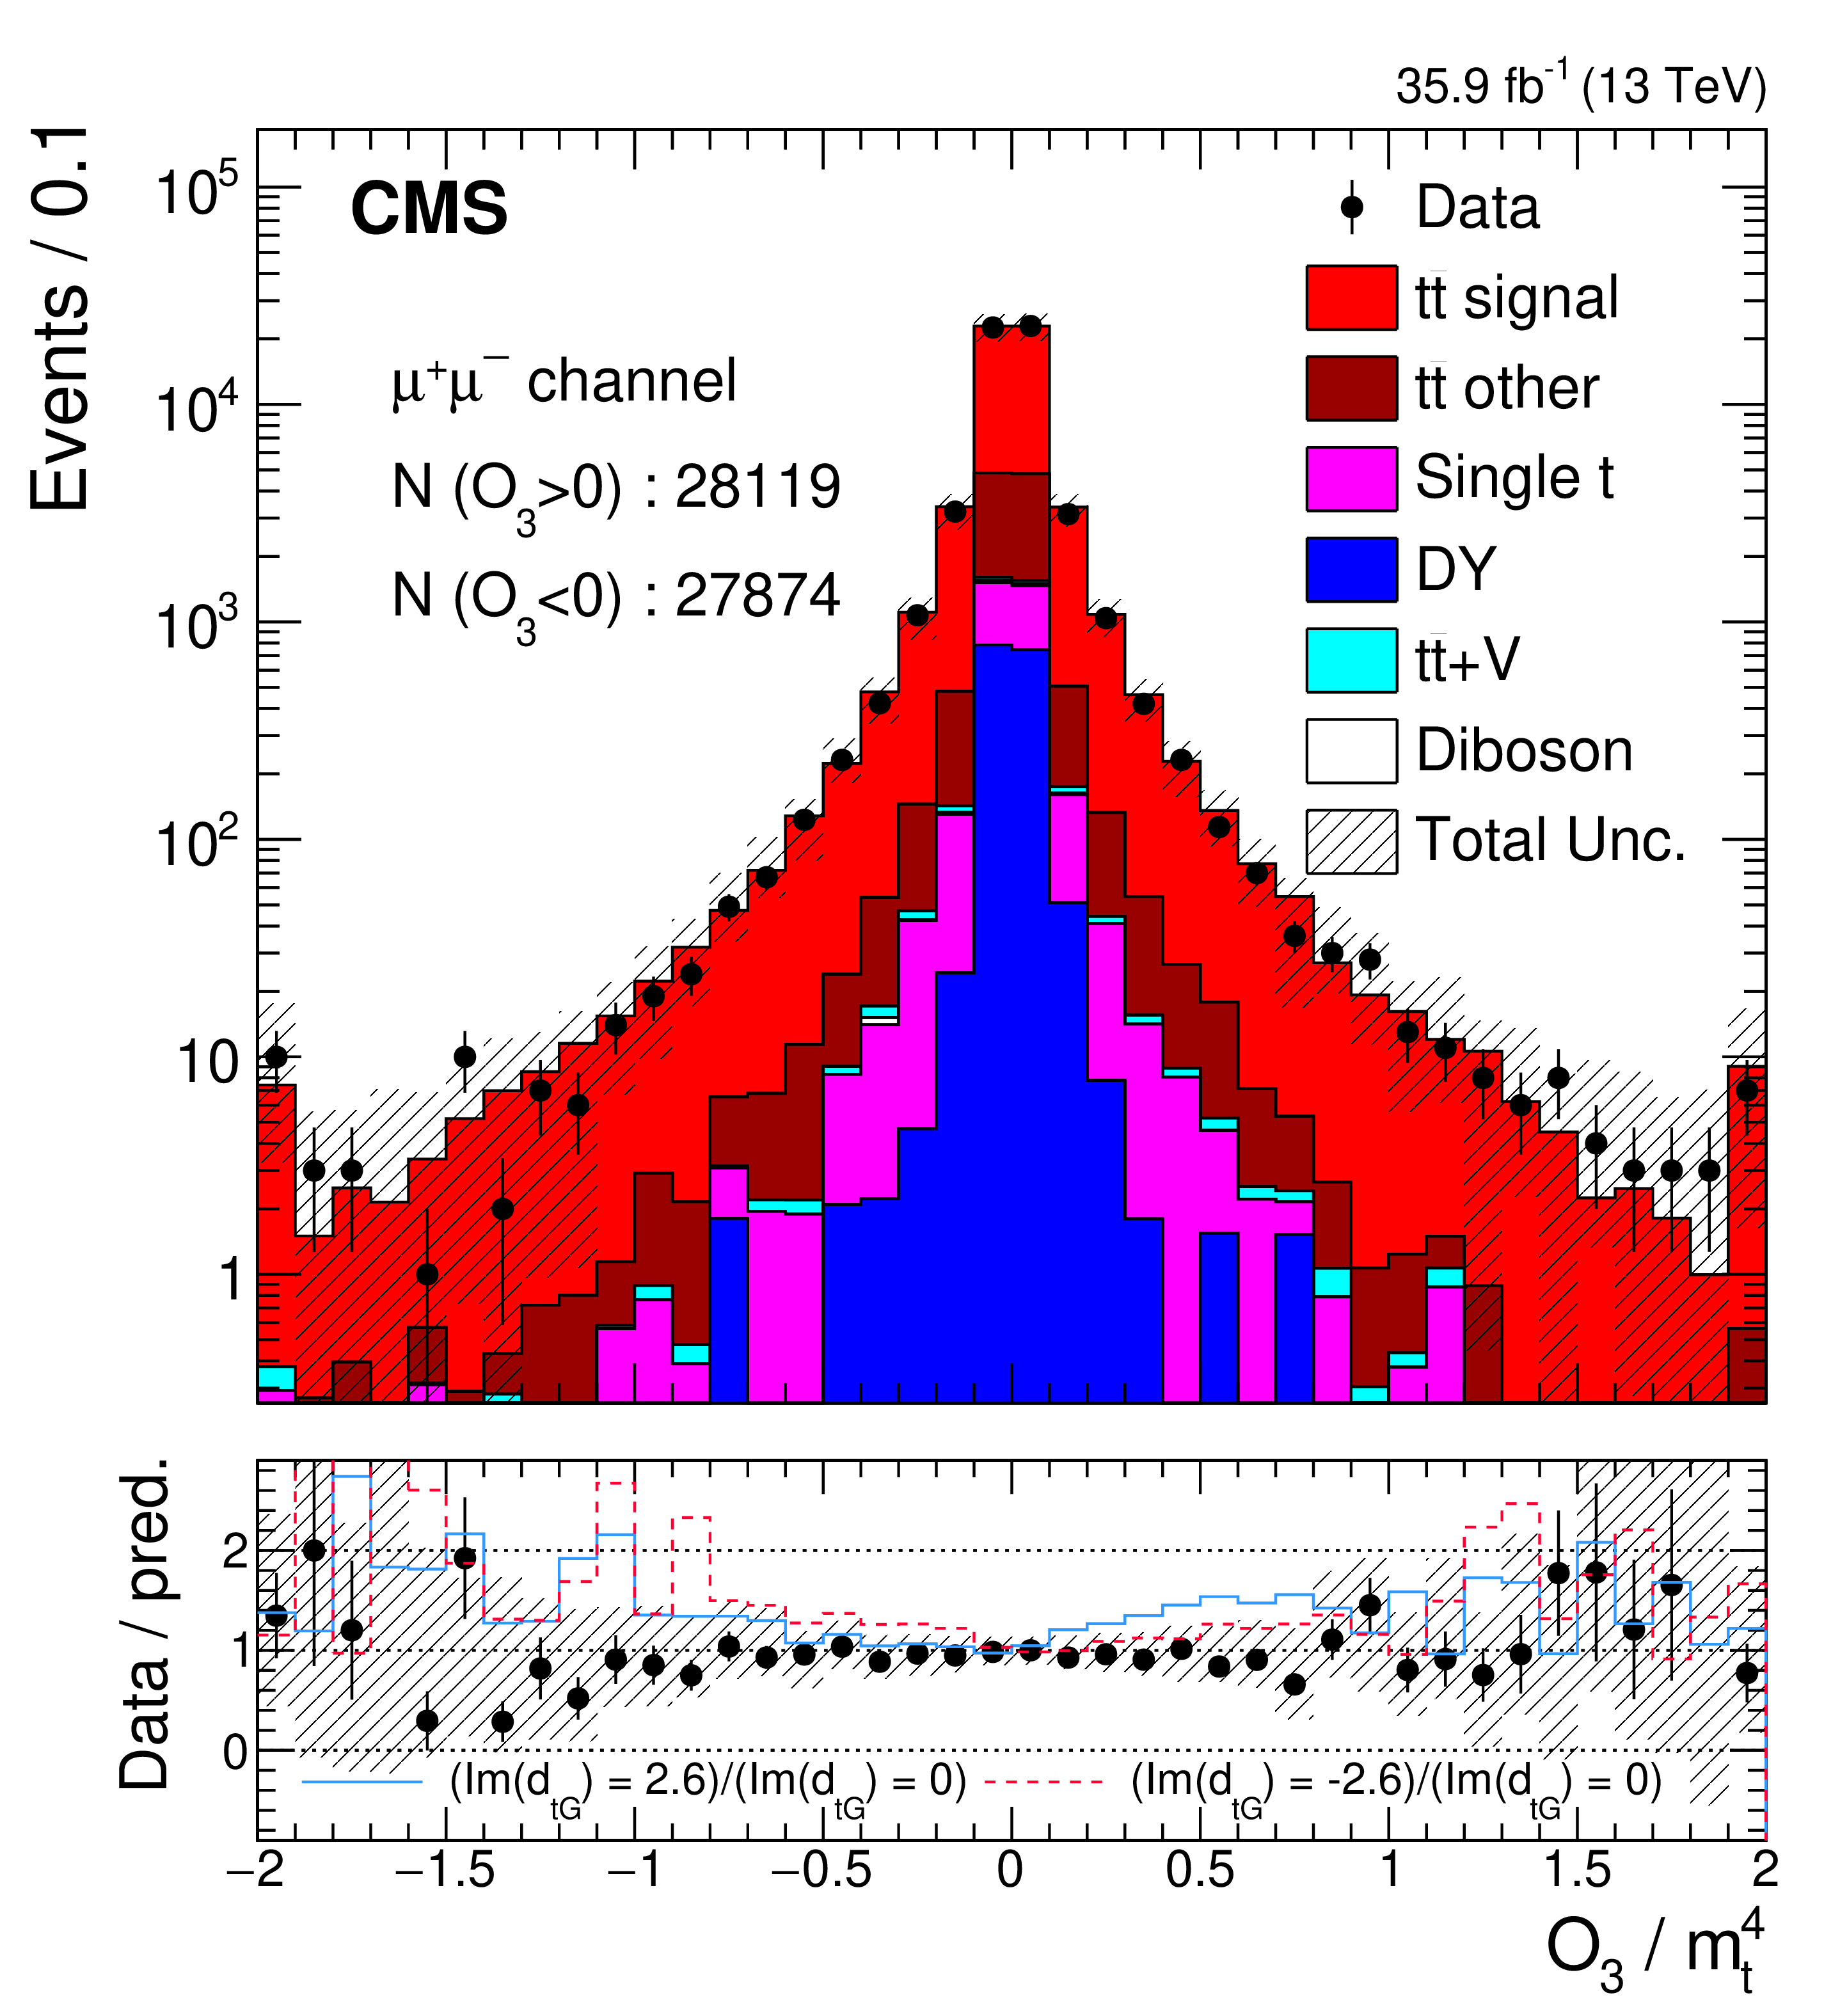
The comparisons of the predictions and observed data in ${\mathcal {O}_{3}}$ in the ${\mathrm{e^{+}} \mathrm{e^{-}}}$ (upper left), ${\mathrm{e^{\pm}} {\mu ^\mp}}$ (upper right), and ${\mu^{+} \mu^{-}}$ (lower) channel. The vertical bars on the markers of the observed data represent the statistical uncertainties. The shaded band in the predicted distributions includes statistical and systematic uncertainties. The ratio of the data to the predictions from simulation is presented in the lower panel of each figure. The first and last bins in each plot includes underflow and overflow events, respectively. The solid blue line shows the ratio ${(\mathrm{Im}{({d_{\mathrm{t} G}})} =2.6)/(\mathrm{Im}{({d_{\mathrm{t} G}})} =0)}$, and the dashed red line represents the ratio ${(\mathrm{Im}{({d_{\mathrm{t} G}})} =-2.6)/(\mathrm{Im}{({d_{\mathrm{t} G}})} =0)}$, using the CEDM samples. |

png pdf |
Figure 4-a:
The comparisons of the predictions and observed data in ${\mathcal {O}_{3}}$ in the ${\mathrm{e^{+}} \mathrm{e^{-}}}$ channel. The vertical bars on the markers of the observed data represent the statistical uncertainties. The shaded band in the predicted distributions includes statistical and systematic uncertainties. The ratio of the data to the predictions from simulation is presented in the lower panel. The first and last bins include underflow and overflow events, respectively. The solid blue line shows the ratio ${(\mathrm{Im}{({d_{\mathrm{t} G}})} =2.6)/(\mathrm{Im}{({d_{\mathrm{t} G}})} =0)}$, and the dashed red line represents the ratio ${(\mathrm{Im}{({d_{\mathrm{t} G}})} =-2.6)/(\mathrm{Im}{({d_{\mathrm{t} G}})} =0)}$, using the CEDM samples. |

png pdf |
Figure 4-b:
The comparisons of the predictions and observed data in ${\mathcal {O}_{3}}$ in the ${\mathrm{e^{\pm}} {\mu ^\mp}}$ channel. The vertical bars on the markers of the observed data represent the statistical uncertainties. The shaded band in the predicted distributions includes statistical and systematic uncertainties. The ratio of the data to the predictions from simulation is presented in the lower panel. The first and last bins include underflow and overflow events, respectively. The solid blue line shows the ratio ${(\mathrm{Im}{({d_{\mathrm{t} G}})} =2.6)/(\mathrm{Im}{({d_{\mathrm{t} G}})} =0)}$, and the dashed red line represents the ratio ${(\mathrm{Im}{({d_{\mathrm{t} G}})} =-2.6)/(\mathrm{Im}{({d_{\mathrm{t} G}})} =0)}$, using the CEDM samples. |
png pdf |
Figure 4-c:
The comparisons of the predictions and observed data in ${\mathcal {O}_{3}}$ in the ${\mu^{+} \mu^{-}}$ channel. The vertical bars on the markers of the observed data represent the statistical uncertainties. The shaded band in the predicted distributions includes statistical and systematic uncertainties. The ratio of the data to the predictions from simulation is presented in the lower panel. The first and last bins include underflow and overflow events, respectively. The solid blue line shows the ratio ${(\mathrm{Im}{({d_{\mathrm{t} G}})} =2.6)/(\mathrm{Im}{({d_{\mathrm{t} G}})} =0)}$, and the dashed red line represents the ratio ${(\mathrm{Im}{({d_{\mathrm{t} G}})} =-2.6)/(\mathrm{Im}{({d_{\mathrm{t} G}})} =0)}$, using the CEDM samples. |

png pdf |
Figure 5:
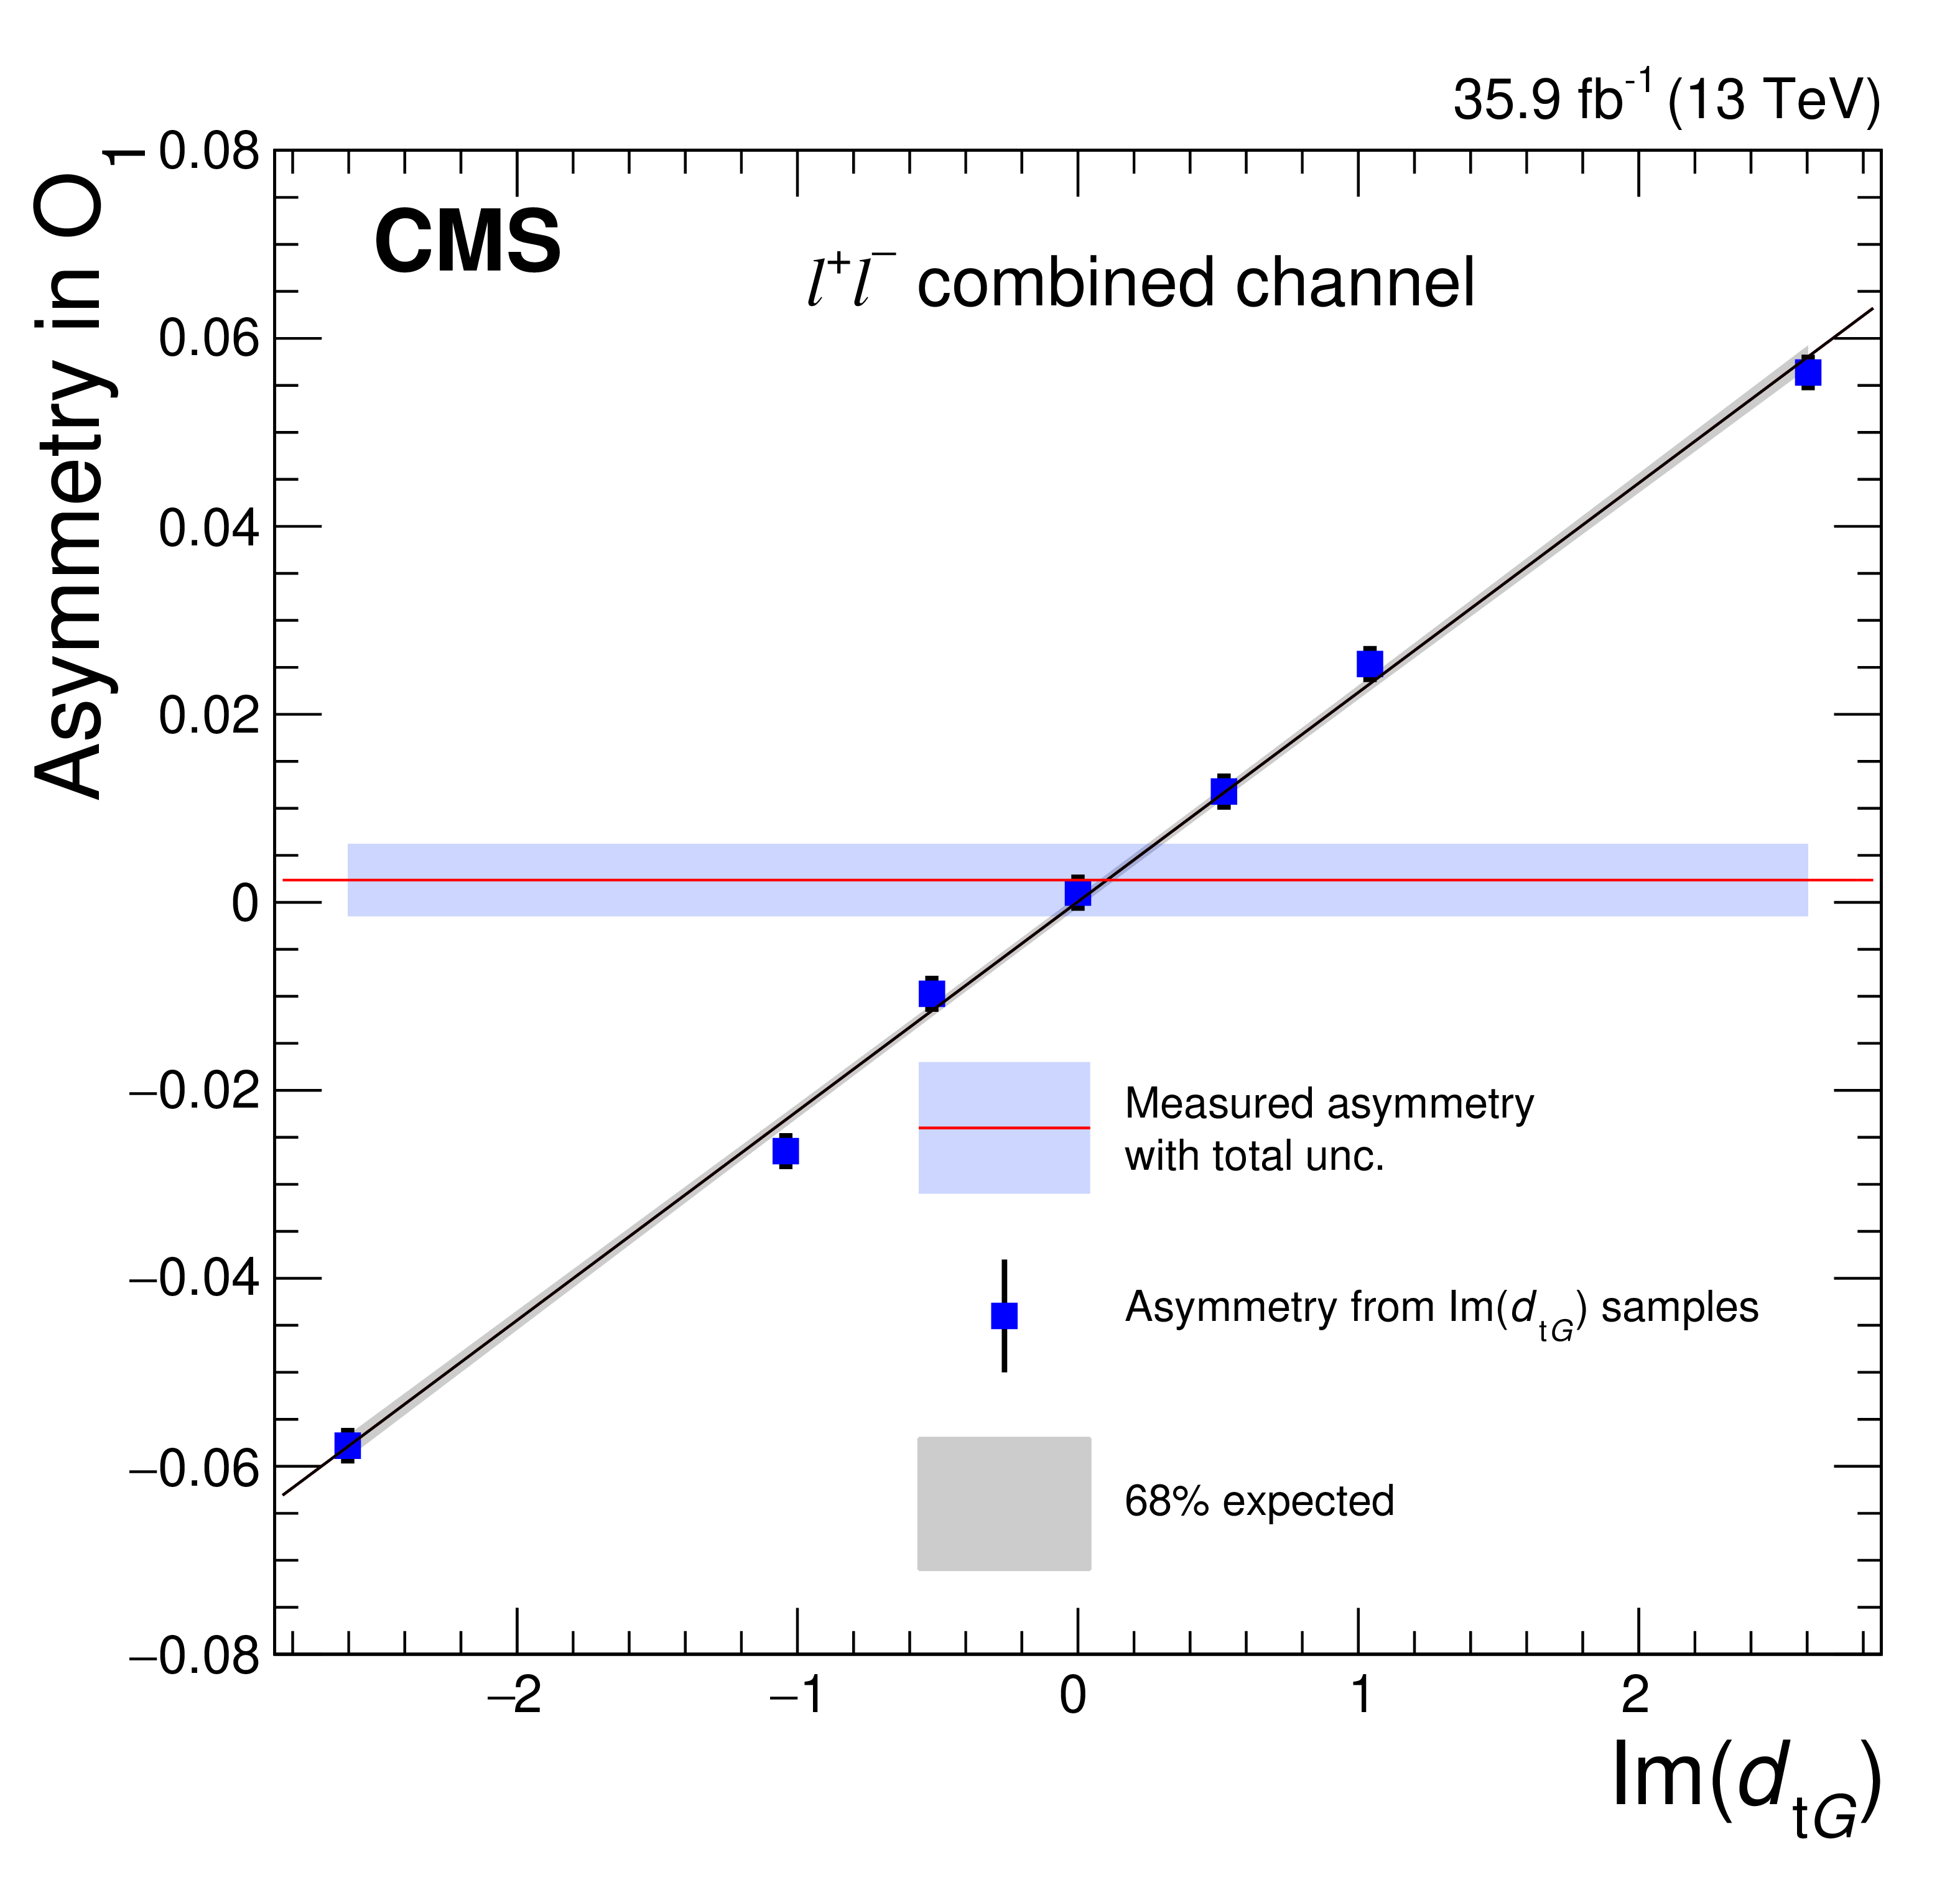
Asymmetries as a function of $\mathrm{Im}{({d_{\mathrm{t} G}})}$ for ${\mathcal {O}_{1}}$ (left) and ${\mathcal {O}_{3}}$ (right), for the combined dilepton channels. The inner and outer bands correspond to the uncertainties at the 68 and 95% confidence levels, respectively, of the linear fits. The square markers are the asymmetries measured using simulated samples corresponding to the different $\mathrm{Im}{({d_{\mathrm{t} G}})}$ values. The horizontal line indicates the measured asymmetry, and the shaded region reflects the total statistical and systematic uncertainty. |
png pdf |
Figure 5-a:
Asymmetries as a function of $\mathrm{Im}{({d_{\mathrm{t} G}})}$ for ${\mathcal {O}_{3}}$, for the combined dilepton channels. The inner and outer bands correspond to the uncertainties at the 68 and 95% confidence levels, respectively, of the linear fits. The square markers are the asymmetries measured using simulated samples corresponding to the different $\mathrm{Im}{({d_{\mathrm{t} G}})}$ values. The horizontal line indicates the measured asymmetry, and the shaded region reflects the total statistical and systematic uncertainty. |

png pdf |
Figure 5-b:
Asymmetries as a function of $\mathrm{Im}{({d_{\mathrm{t} G}})}$ for ${\mathcal {O}_{1}}$ (left) and ${\mathcal {O}_{3}}$ (right), for the combined dilepton channels. The inner and outer bands correspond to the uncertainties at the 68 and 95% confidence levels, respectively, of the linear fits. The square markers are the asymmetries measured using simulated samples corresponding to the different $\mathrm{Im}{({d_{\mathrm{t} G}})}$ values. The horizontal line indicates the measured asymmetry, and the shaded region reflects the total statistical and systematic uncertainty. |
| Tables | |
png pdf |
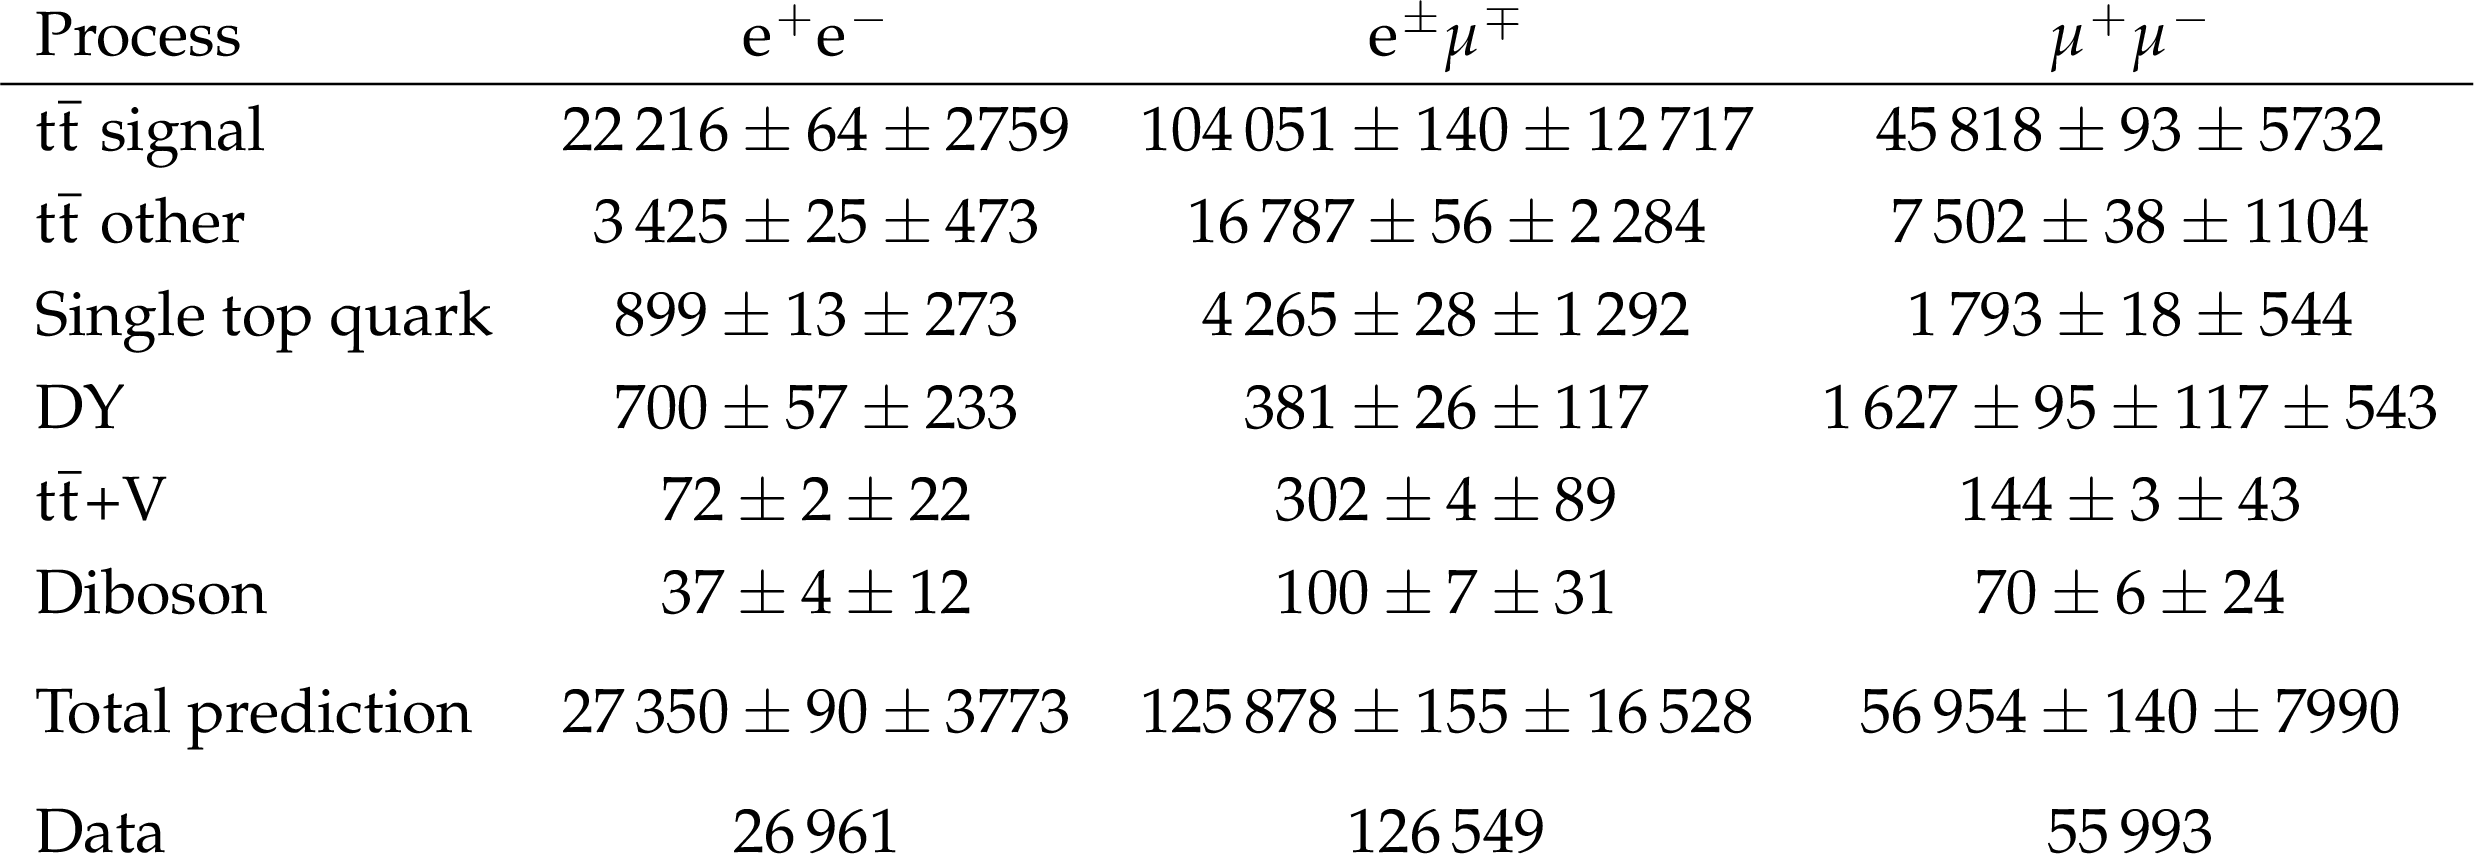
Table 1:
Simulated event yields with their statistical uncertainties for the three dilepton channels, after implementing event selection criteria, and normalized as described in the text. Observed selected events are also shown. |
png pdf |
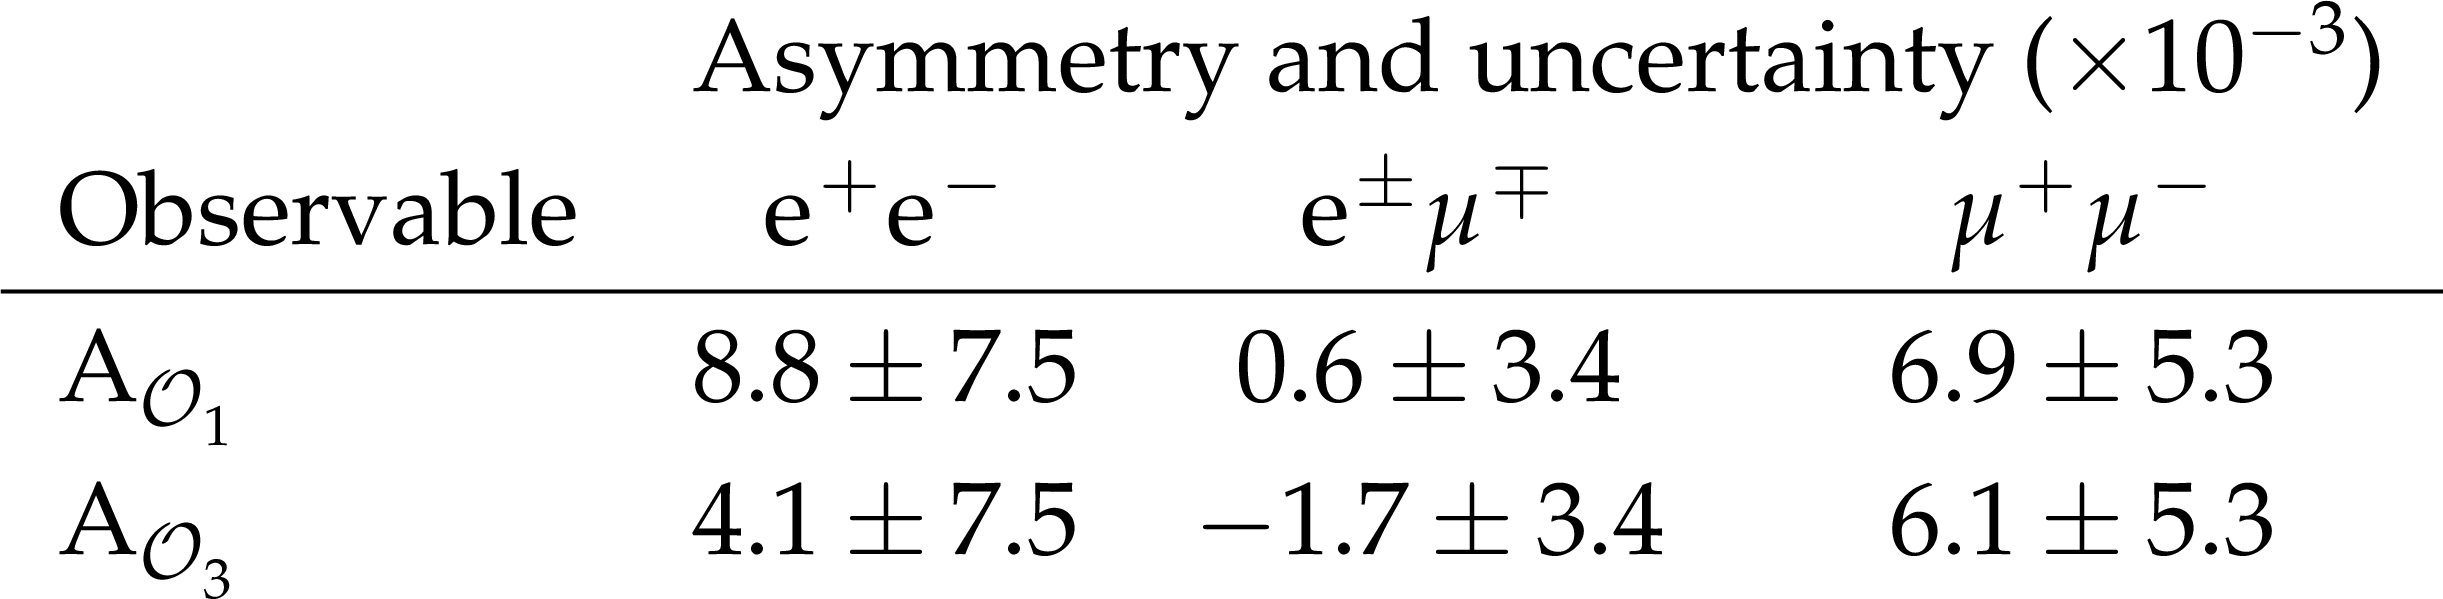
Table 2:
Measured asymmetries of ${\mathcal {O}_{1}}$ and ${\mathcal {O}_{3}}$ with statistical uncertainties. |
png pdf |
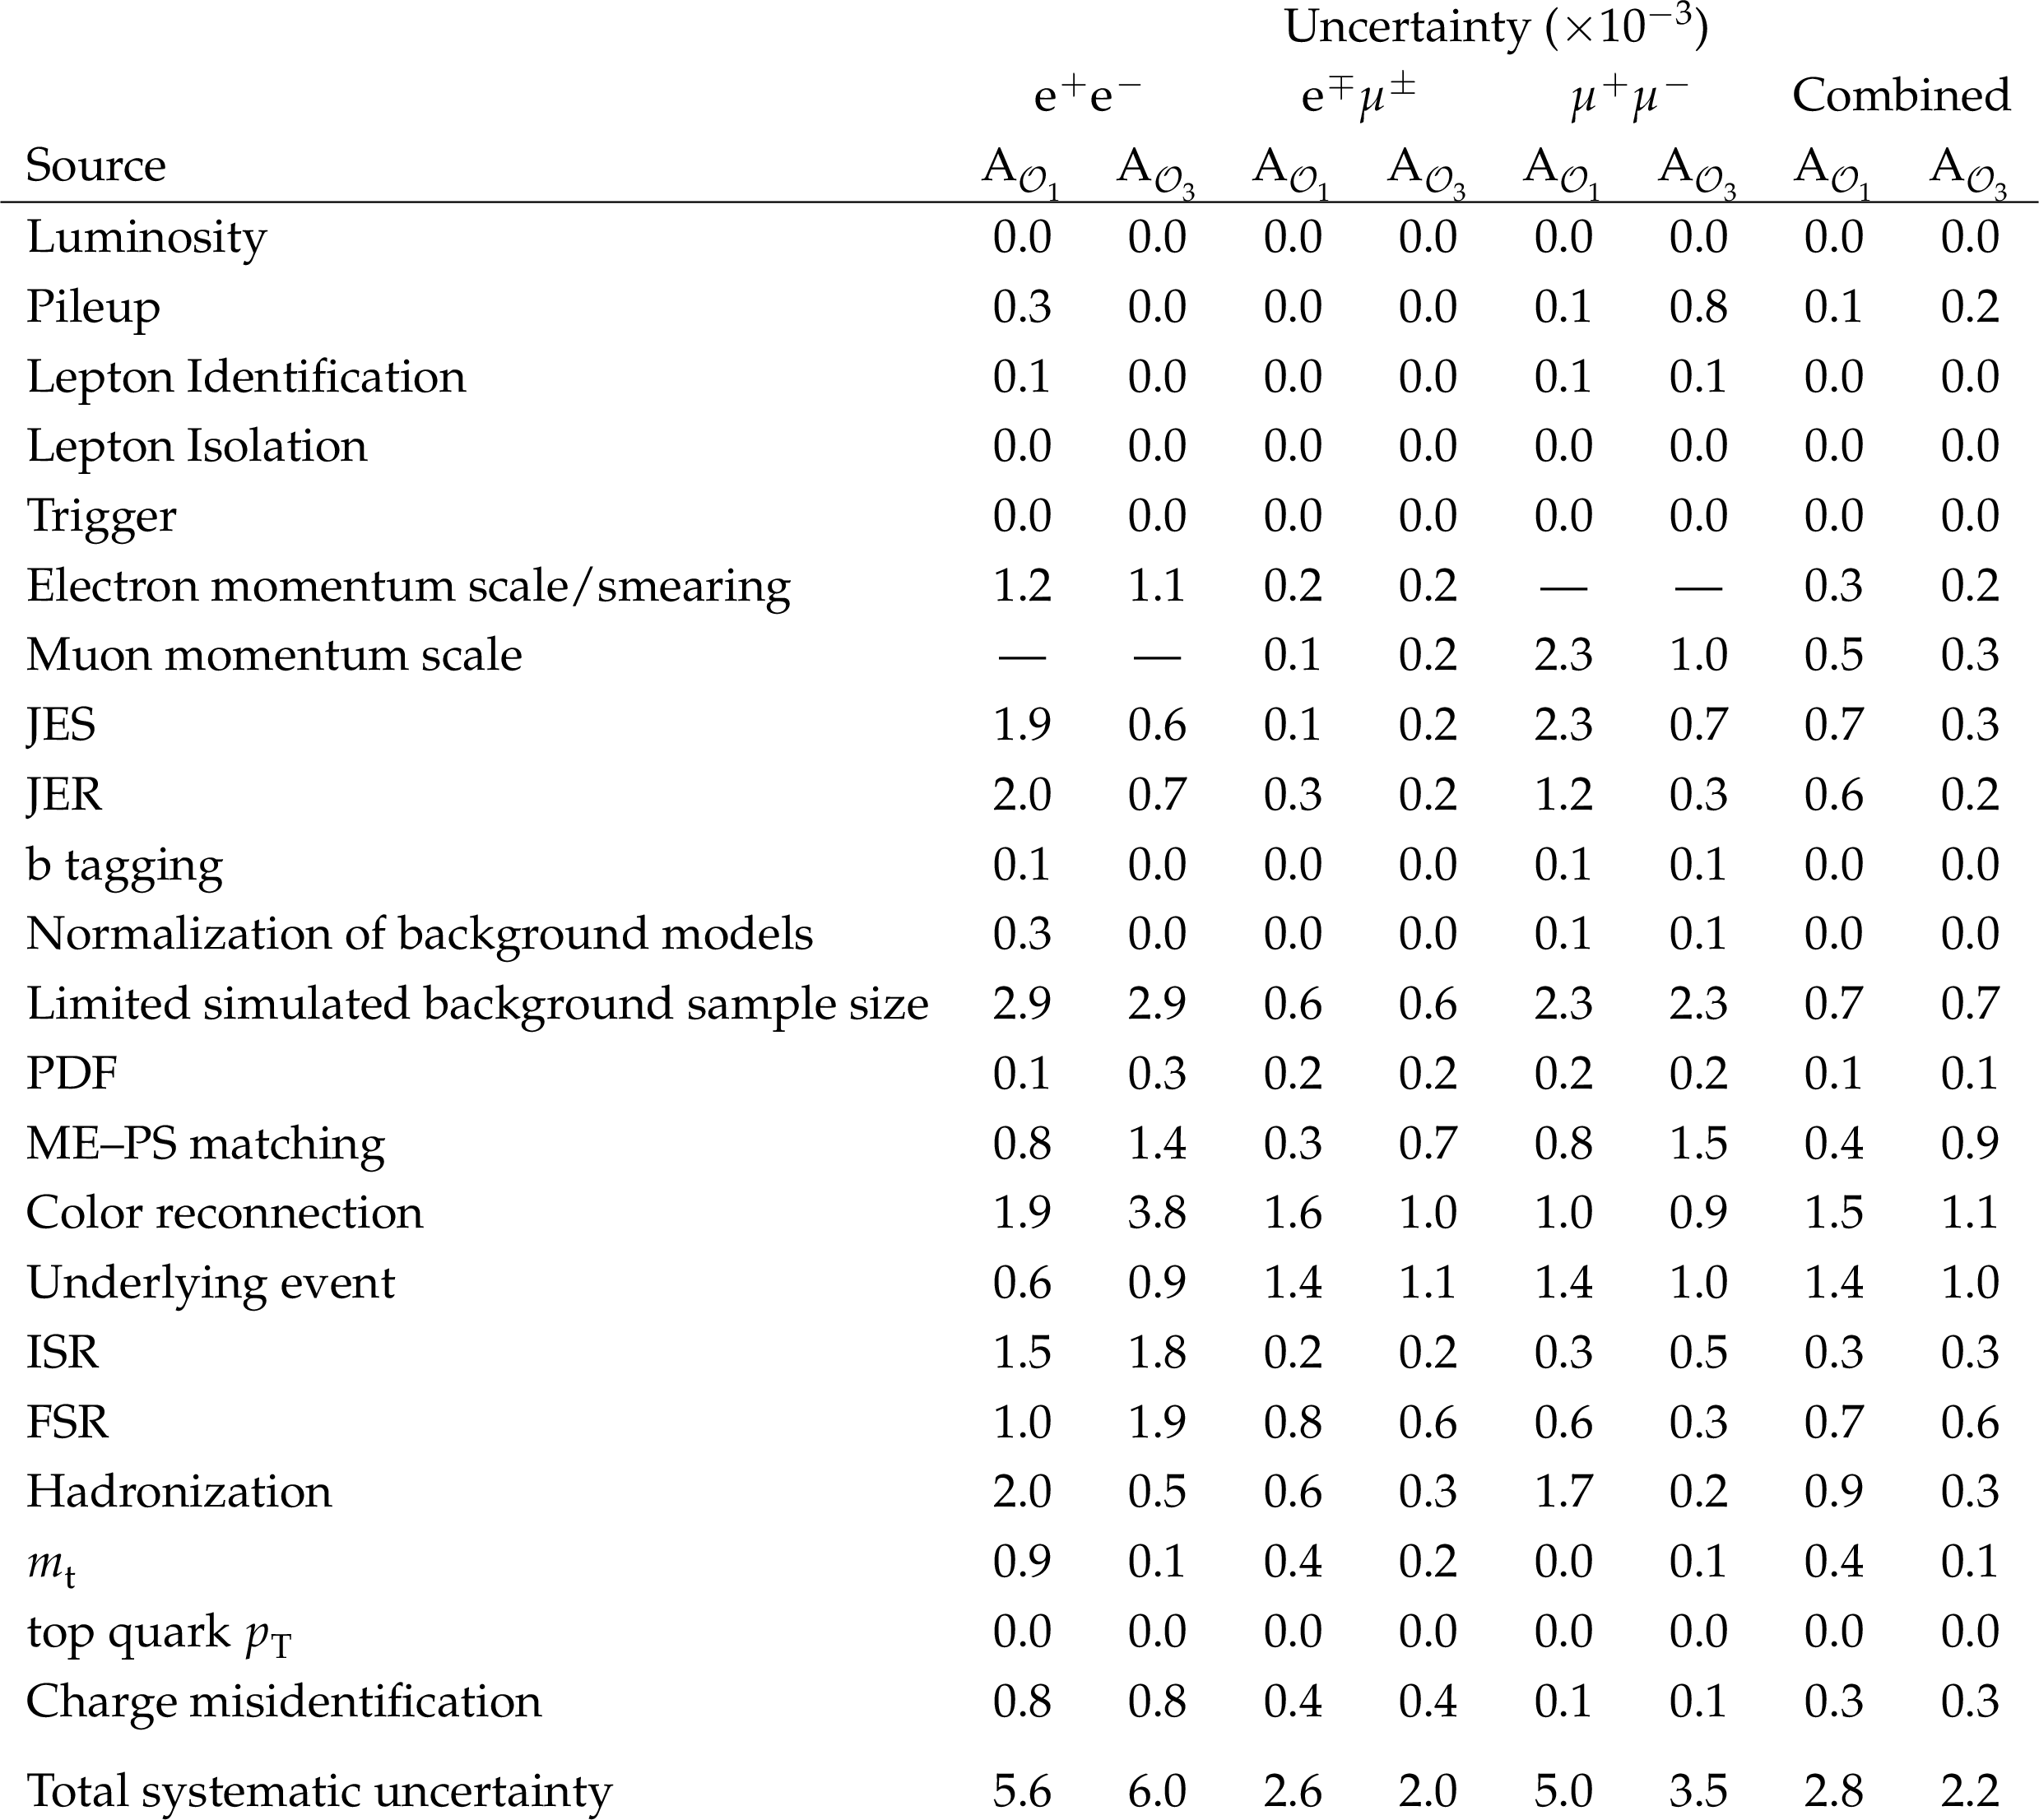
Table 3:
Systematic uncertainties in the measured asymmetries of ${\mathcal {O}_{1}}$ and ${\mathcal {O}_{3}}$, for the individual and combined channels. |
png pdf |
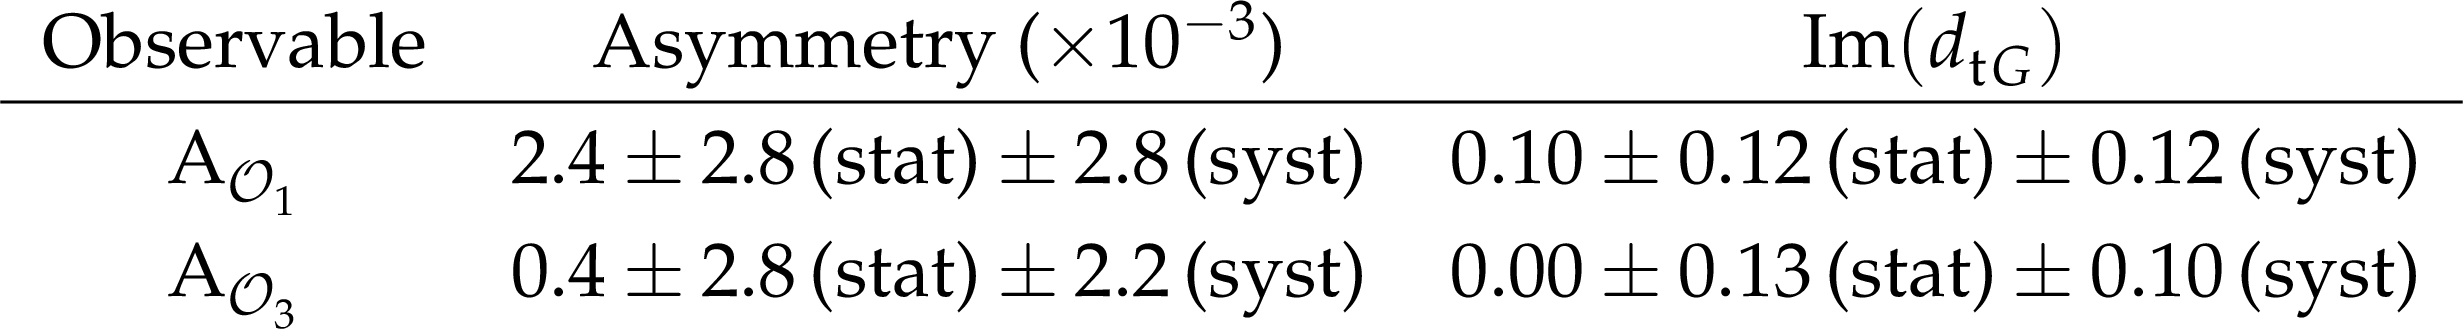
Table 4:
The measured dimensionless CEDM $\mathrm{Im}{({d_{\mathrm{t} G}})}$, extracted using the asymmetries in ${\mathcal {O}_{1}}$ and ${\mathcal {O}_{3}}$, with their uncertainties. |
| Summary |
| Violations of CP symmetry are studied in top quark pair production in the dilepton final state. The analysis is based on proton-proton collisions at a center-of-mass energy of 13 TeV, collected by the CMS experiment and corresponding to an integrated luminosity of 35.9 fb$^{-1}$. The analysis uses two observables, ${\mathcal{O}_{1}} $ and ${\mathcal{O}_{3}} $, which are related to the Levi-Civita tensor contracted with the four-momenta of the leptons, the jets originating from the b quarks, and the top quarks. Asymmetries are measured in these observables and converted to measurements of the chromoelectric dipole moment (CEDM) of the top quark, represented by the dimensionless CEDM $\mathrm{Im}{({d_{\mathrm{t} G}} )} $. In the SM prediction the size of CP violation and the CEDM is negligible. The measured $\mathrm{Im}{({d_{\mathrm{t} G}} )} $ based on the asymmetries of the ${\mathcal{O}_{1}} $ and ${\mathcal{O}_{3}} $ observables in the combined dilepton channels are 0.10 $\pm$ 0.12 (stat) $\pm$ 0.12 (syst), and 0.00 $\pm$ 0.13 (stat) $\pm$ 0.10 (syst), respectively. These results are consistent with the expectation of the standard model (SM), since in the SM prediction, the size of CP violation and the CEDM ($\mathrm{Im}{({d_{\mathrm{t} G}} )} $) is negligible. In this analysis, the extracted CEDMs are compared with the CEDM measured in the $\mathrm{t\bar{t}}$ spin correlation analysis [62], and the sensitivity is found to be similar. |
| References | ||||
| 1 | J. H. Christenson, J. W. Cronin, V. L. Fitch, and R. Turlay | Evidence for the 2$ \pi $ decay of the $ {\mathrm{K}_2^0} $ meson | PRL 13 (1964) 138 | |
| 2 | BaBar and Belle Collaborations | The physics of the B factories | EPJC 74 (2014) 3026 | 1406.6311 |
| 3 | LHCb Collaboration | Observation of CP violation in charm decays | PRL 122 (2019) 211803 | 1903.08726 |
| 4 | LHCb Collaboration | First observation of CP violation in the decays of $ \mathrm{B}^{0}_{\mathrm{s}} $ mesons | PRL 110 (2013) 221601 | 1304.6173 |
| 5 | A. D. Sakharov | Violation of CP invariance, C asymmetry, and baryon asymmetry of the universe | Pisma Zh. Eksp. Teor. Fiz. 5 (1967) 32 | |
| 6 | G. R. Farrar and M. E. Shaposhnikov | Baryon asymmetry of the universe in the standard model | PRD 50 (1994) 774 | hep-ph/9305275 |
| 7 | S. K. Gupta, A. S. Mete, and G. Valencia | CP violating anomalous top-quark couplings at the LHC | PRD 80 (2009) 034013 | 0905.1074 |
| 8 | A. Hayreter and G. Valencia | T-odd correlations from the top-quark chromoelectric dipole moment in lepton plus jets top-pair events | PRD 93 (2016) 014020 | 1511.01464 |
| 9 | D. Atwood, S. Bar-Shalom, G. Eilam, and A. Soni | CP violation in top physics | PR 347 (2001) 1 | hep-ph/0006032 |
| 10 | G. Valencia | CP violation in top-quark pair production and decay | PoS HQL2012 (2012) 050 | 1301.0962 |
| 11 | CMS Collaboration | Search for CP violation in $ \mathrm{t\bar{t}} $ production and decay in proton-proton collisions at $ \sqrt{s} = $ 8 TeV | JHEP 03 (2017) 101 | CMS-TOP-16-001 1611.08931 |
| 12 | CMS Collaboration | Search for CP violation using $ \mathrm{t\bar{t}} $ events in the lepton+jets channel in pp collisions at $ \sqrt{s} $ = 13 TeV | JHEP 06 (2023) 081 | CMS-TOP-20-005 2205.02314 |
| 13 | CMS Collaboration | HEPData record for this analysis | link | |
| 14 | CMS Collaboration | The CMS trigger system | JINST 12 (2017) P01020 | CMS-TRG-12-001 1609.02366 |
| 15 | CMS Collaboration | The CMS experiment at the CERN LHC | JINST 3 (2008) S08004 | CMS-00-001 |
| 16 | P. Nason | A new method for combining NLO QCD with shower Monte Carlo algorithms | JHEP 11 (2004) 040 | hep-ph/0409146 |
| 17 | S. Frixione, G. Ridolfi, and P. Nason | A positive-weight next-to-leading-order Monte Carlo for heavy flavour hadroproduction | JHEP 09 (2007) 126 | 0707.3088 |
| 18 | S. Frixione, P. Nason, and C. Oleari | Matching NLO QCD computations with parton shower simulations: the POWHEG method | JHEP 11 (2007) 070 | 0709.2092 |
| 19 | S. Alioli, P. Nason, C. Oleari, and E. Re | NLO single-top production matched with shower in POWHEG: $ s $- and $ t $-channel contributions | JHEP 09 (2009) 111 | 0907.4076 |
| 20 | S. Alioli, P. Nason, C. Oleari, and E. Re | A general framework for implementing NLO calculations in shower Monte Carlo programs: the POWHEG box | JHEP 06 (2010) 043 | 1002.2581 |
| 21 | E. Re | Single-top Wt-channel production matched with parton showers using the POWHEG method | EPJC 71 (2011) 1547 | 1009.2450 |
| 22 | J. M. Campbell, R. K. Ellis, P. Nason, and E. Re | Top-pair production and decay at NLO matched with parton showers | JHEP 04 (2015) 114 | 1412.1828 |
| 23 | T. Sjostrand et al. | An introduction to PYTHIA 8.2 | CPC 191 (2015) 159 | 1410.3012 |
| 24 | P. Skands, S. Carrazza, and J. Rojo | Tuning PYTHIA 8.1: the Monash 2013 tune | EPJC 74 (2014) 3024 | 1404.5630 |
| 25 | CMS Collaboration | Investigations of the impact of the parton shower tuning in PYTHIA 8 in the modelling of $ \mathrm{t\bar{t}} $ at $ \sqrt{s} = $ 8 and 13 TeV | CMS-PAS-TOP-16-021 | CMS-PAS-TOP-16-021 |
| 26 | J. Alwall et al. | Comparative study of various algorithms for the merging of parton showers and matrix elements in hadronic collisions | EPJC 53 (2008) 473 | 0706.2569 |
| 27 | CMS Collaboration | Event generator tunes obtained from underlying event and multiparton scattering measurements | EPJC 76 (2016) 155 | CMS-GEN-14-001 1512.00815 |
| 28 | GEANT4 Collaboration | $ GEANT4-a $ simulation toolkit | NIMA 506 (2003) 250 | |
| 29 | CMS Collaboration | Measurement of the inelastic proton-proton cross section at $ \sqrt{s} = $ 13 TeV | JHEP 07 (2018) 161 | CMS-FSQ-15-005 1802.02613 |
| 30 | K. Melnikov and F. Petriello | Electroweak gauge boson production at hadron colliders through $ {O({\alpha_S}^2)} $ | PRD 74 (2006) 114017 | hep-ph/0609070 |
| 31 | N. Kidonakis | NNLL threshold resummation for top-pair and single-top production | Phys. Part. Nucl. 45 (2014) 714 | 1210.7813 |
| 32 | J. M. Campbell and R. K. Ellis | $ MCFM $ for the Tevatron and the LHC | NPB Proc. Suppl. 205-206 (2010) 10 | 1007.3492 |
| 33 | J. M. Campbell, R. K. Ellis, and C. Williams | Vector boson pair production at the LHC | JHEP 07 (2011) 018 | 1105.0020 |
| 34 | F. Maltoni, D. Pagani, and I. Tsinikos | Associated production of a top-quark pair with vector bosons at NLO in QCD: impact on $ {\mathrm{t\bar{t}}\mathrm{H}} $ searches at the LHC | JHEP 02 (2016) 113 | 1507.05640 |
| 35 | M. Czakon and A. Mitov | Top++: A program for the calculation of the top-pair cross-section at hadron colliders | CPC 185 (2014) 2930 | 1112.5675 |
| 36 | CMS Collaboration | Particle-flow reconstruction and global event description with the CMS detector | JINST 12 (2017) P10003 | CMS-PRF-14-001 1706.04965 |
| 37 | CMS Collaboration | Performance of electron reconstruction and selection with the CMS detector in proton-proton collisions at $ \sqrt{s} = $ 8 TeV | JINST 10 (2015) P06005 | CMS-EGM-13-001 1502.02701 |
| 38 | CMS Collaboration | Electron and photon performance in CMS with the full 2016 data sample | CDS | |
| 39 | CMS Collaboration | Performance of the CMS muon detector and muon reconstruction with proton-proton collisions at $ \sqrt{s} = $ 13 TeV | JINST 13 (2018) P06015 | CMS-MUO-16-001 1804.04528 |
| 40 | M. Cacciari, G. P. Salam, and G. Soyez | The anti-$ {k_{\mathrm{T}}} $ jet clustering algorithm | JHEP 04 (2008) 063 | 0802.1189 |
| 41 | M. Cacciari, G. P. Salam, and G. Soyez | FastJet user manual | EPJC 72 (2012) 1896 | 1111.6097 |
| 42 | CMS Collaboration | Jet energy scale and resolution in the CMS experiment in pp collisions at 8 TeV | JINST 12 (2017) P02014 | CMS-JME-13-004 1607.03663 |
| 43 | CMS Collaboration | Identification of heavy-flavour jets with the CMS detector in pp collisions at 13 TeV | JINST 13 (2018) P05011 | CMS-BTV-16-002 1712.07158 |
| 44 | CMS Collaboration | Measurement of the differential cross section for top quark pair production in pp collisions at $ \sqrt{s} = $ 8 TeV | EPJC 75 (2015) 542 | CMS-TOP-12-028 1505.04480 |
| 45 | CMS Collaboration | Measurements of $ \mathrm{t\bar{t}} $ differential cross sections in proton-proton collisions at $ \sqrt{s} = $ 13 TeV using events containing two leptons | JHEP 02 (2019) 149 | CMS-TOP-17-014 1811.06625 |
| 46 | Particle Data Group, P. A. Zyla et al. | Review of particle physics | Prog. Theor. Exp. Phys. 2020 (2020) 083C01 | |
| 47 | CMS Collaboration | CMS luminosity measurements for the 2016 data-taking period | CMS-PAS-LUM-17-001 | CMS-PAS-LUM-17-001 |
| 48 | CMS Collaboration | Precision luminosity measurement in proton-proton collisions at $ \sqrt{s} = $ 13 TeV in 2015 and 2016 at CMS | EPJC 81 (2021) 800 | CMS-LUM-17-003 2104.01927 |
| 49 | CMS Collaboration | Measurement of the $ \mathrm{t\bar{t}} $ production cross section, the top quark mass, and the strong coupling constant using dilepton events in pp collisions at $ \sqrt{s} = $ 13 TeV | EPJC 79 (2019) 368 | CMS-TOP-17-001 1812.10505 |
| 50 | CMS Collaboration | Measurement of the Drell--Yan cross sections in pp collisions at $ \sqrt{s} = $ 7 TeV with the CMS experiment | JHEP 10 (2011) 007 | CMS-EWK-10-007 1108.0566 |
| 51 | CMS Collaboration | Measurement of the top quark pair production cross section in proton-proton collisions at $ \sqrt{s} = $ 13 TeV with the CMS detector | PRL 116 (2016) 052002 | CMS-TOP-15-003 1510.05302 |
| 52 | J. Butterworth et al. | PDF4LHC recommendations for LHC Run II | JPG 43 (2016) 023001 | 1510.03865 |
| 53 | CMS Collaboration | Measurement of differential top-quark pair production cross sections in pp collisions at $ \sqrt{s} = $ 7 TeV | EPJC 73 (2013) 2339 | CMS-TOP-11-013 1211.2220 |
| 54 | CMS Collaboration | Measurement of the $ \mathrm{t\bar{t}} $ production cross section in the all-jets final state in pp collisions at $ \sqrt{s} = $ 8 TeV | EPJC 76 (2016) 128 | CMS-TOP-14-018 1509.06076 |
| 55 | CMS Collaboration | Measurement of differential cross sections for top quark pair production using the lepton+jets final state in proton-proton collisions at 13 TeV | PRD 95 (2017) 092001 | CMS-TOP-16-008 1610.04191 |
| 56 | ALEPH Collaboration | Study of the fragmentation of b quarks into B mesons at the Z peak | PLB 512 (2001) 30 | hep-ex/0106051 |
| 57 | DELPHI Collaboration | A study of the b-quark fragmentation function with the DELPHI detector at LEP I and an averaged distribution obtained at the Z pole | EPJC 71 (2011) 1557 | 1102.4748 |
| 58 | M. G. Bowler | e$^{+}$e$^{-}$ production of heavy quarks in the string model | Z. Phys. C 11 (1981) 169 | |
| 59 | C. Peterson, D. Schlatter, I. Schmitt, and P. M. Zerwas | Scaling violations in inclusive e$^{+}$e$^{-}$ annihilation spectra | PRD 27 (1983) 105 | |
| 60 | S. Argyropoulos and T. Sjostrand | Effects of color reconnection on $ \mathrm{t\bar{t}} $ final states at the LHC | JHEP 11 (2014) 043 | 1407.6653 |
| 61 | J. R. Christiansen and P. Z. Skands | String formation beyond leading colour | JHEP 08 (2015) 003 | 1505.01681 |
| 62 | L. Lyons, D. Gibaut, and P. Clifford | How to combine correlated estimates of a single physical quantity | NIMA 270 (1988) 110 | |
| 63 | CMS Collaboration | Measurement of the top quark polarization and $ \mathrm{t\bar{t}} $ spin correlations using dilepton final states in proton-proton collisions at $ \sqrt{s} = $ 13 TeV | PRD 100 (2019) 072002 | CMS-TOP-18-006 1907.03729 |
| 64 | W. Bernreuther, D. Heisler, and Z.-G. Si | A set of top quark spin correlation and polarization observables for the LHC: Standard model predictions and new physics contributions | JHEP 12 (2015) 026 | 1508.05271 |
|
|
Compact Muon Solenoid LHC, CERN |
|

|

|

|

|

|