

Compact Muon Solenoid
LHC, CERN
| CMS-TOP-21-014 ; CERN-EP-2022-155 | ||
| Measurement of the $\mathrm{t\bar{t}}$ charge asymmetry in events with highly Lorentz-boosted top quarks in pp collisions at $\sqrt{s} = $ 13 TeV | ||
| CMS Collaboration | ||
| 4 August 2022 | ||
| Phys. Lett. B 846 (2023) 137703 | ||
| Abstract: The measurement of the charge asymmetry in top quark pair events with highly Lorentz-boosted top quarks decaying to a single lepton and jets is presented. The analysis is performed using proton-proton collisions at $ \sqrt{s}= $ 13 TeV with the CMS detector at the LHC and corresponding to an integrated luminosity of 138 fb$ ^{-1} $. The selection is optimized for top quarks produced with large Lorentz boosts, resulting in nonisolated leptons and overlapping jets. The top quark charge asymmetry is measured for events with a $\mathrm{t\bar{t}}$ invariant mass larger than 750 GeV and corrected for detector and acceptance effects using a binned maximum likelihood fit. The measured top quark charge asymmetry of (0.42$_{- 0.69}^{+ 0.64}$)% is in good agreement with the standard model prediction at next-to-next-to-leading order in quantum chromodynamic perturbation theory with next-to-leading-order electroweak corrections. The result is also presented for two invariant mass ranges, 750-900 and $ {>} $900 GeV. | ||
| Links: e-print arXiv:2208.02751 [hep-ex] (PDF) ; CDS record ; inSPIRE record ; HepData record ; Physics Briefing ; CADI line (restricted) ; | ||
| Figures | |
png pdf |
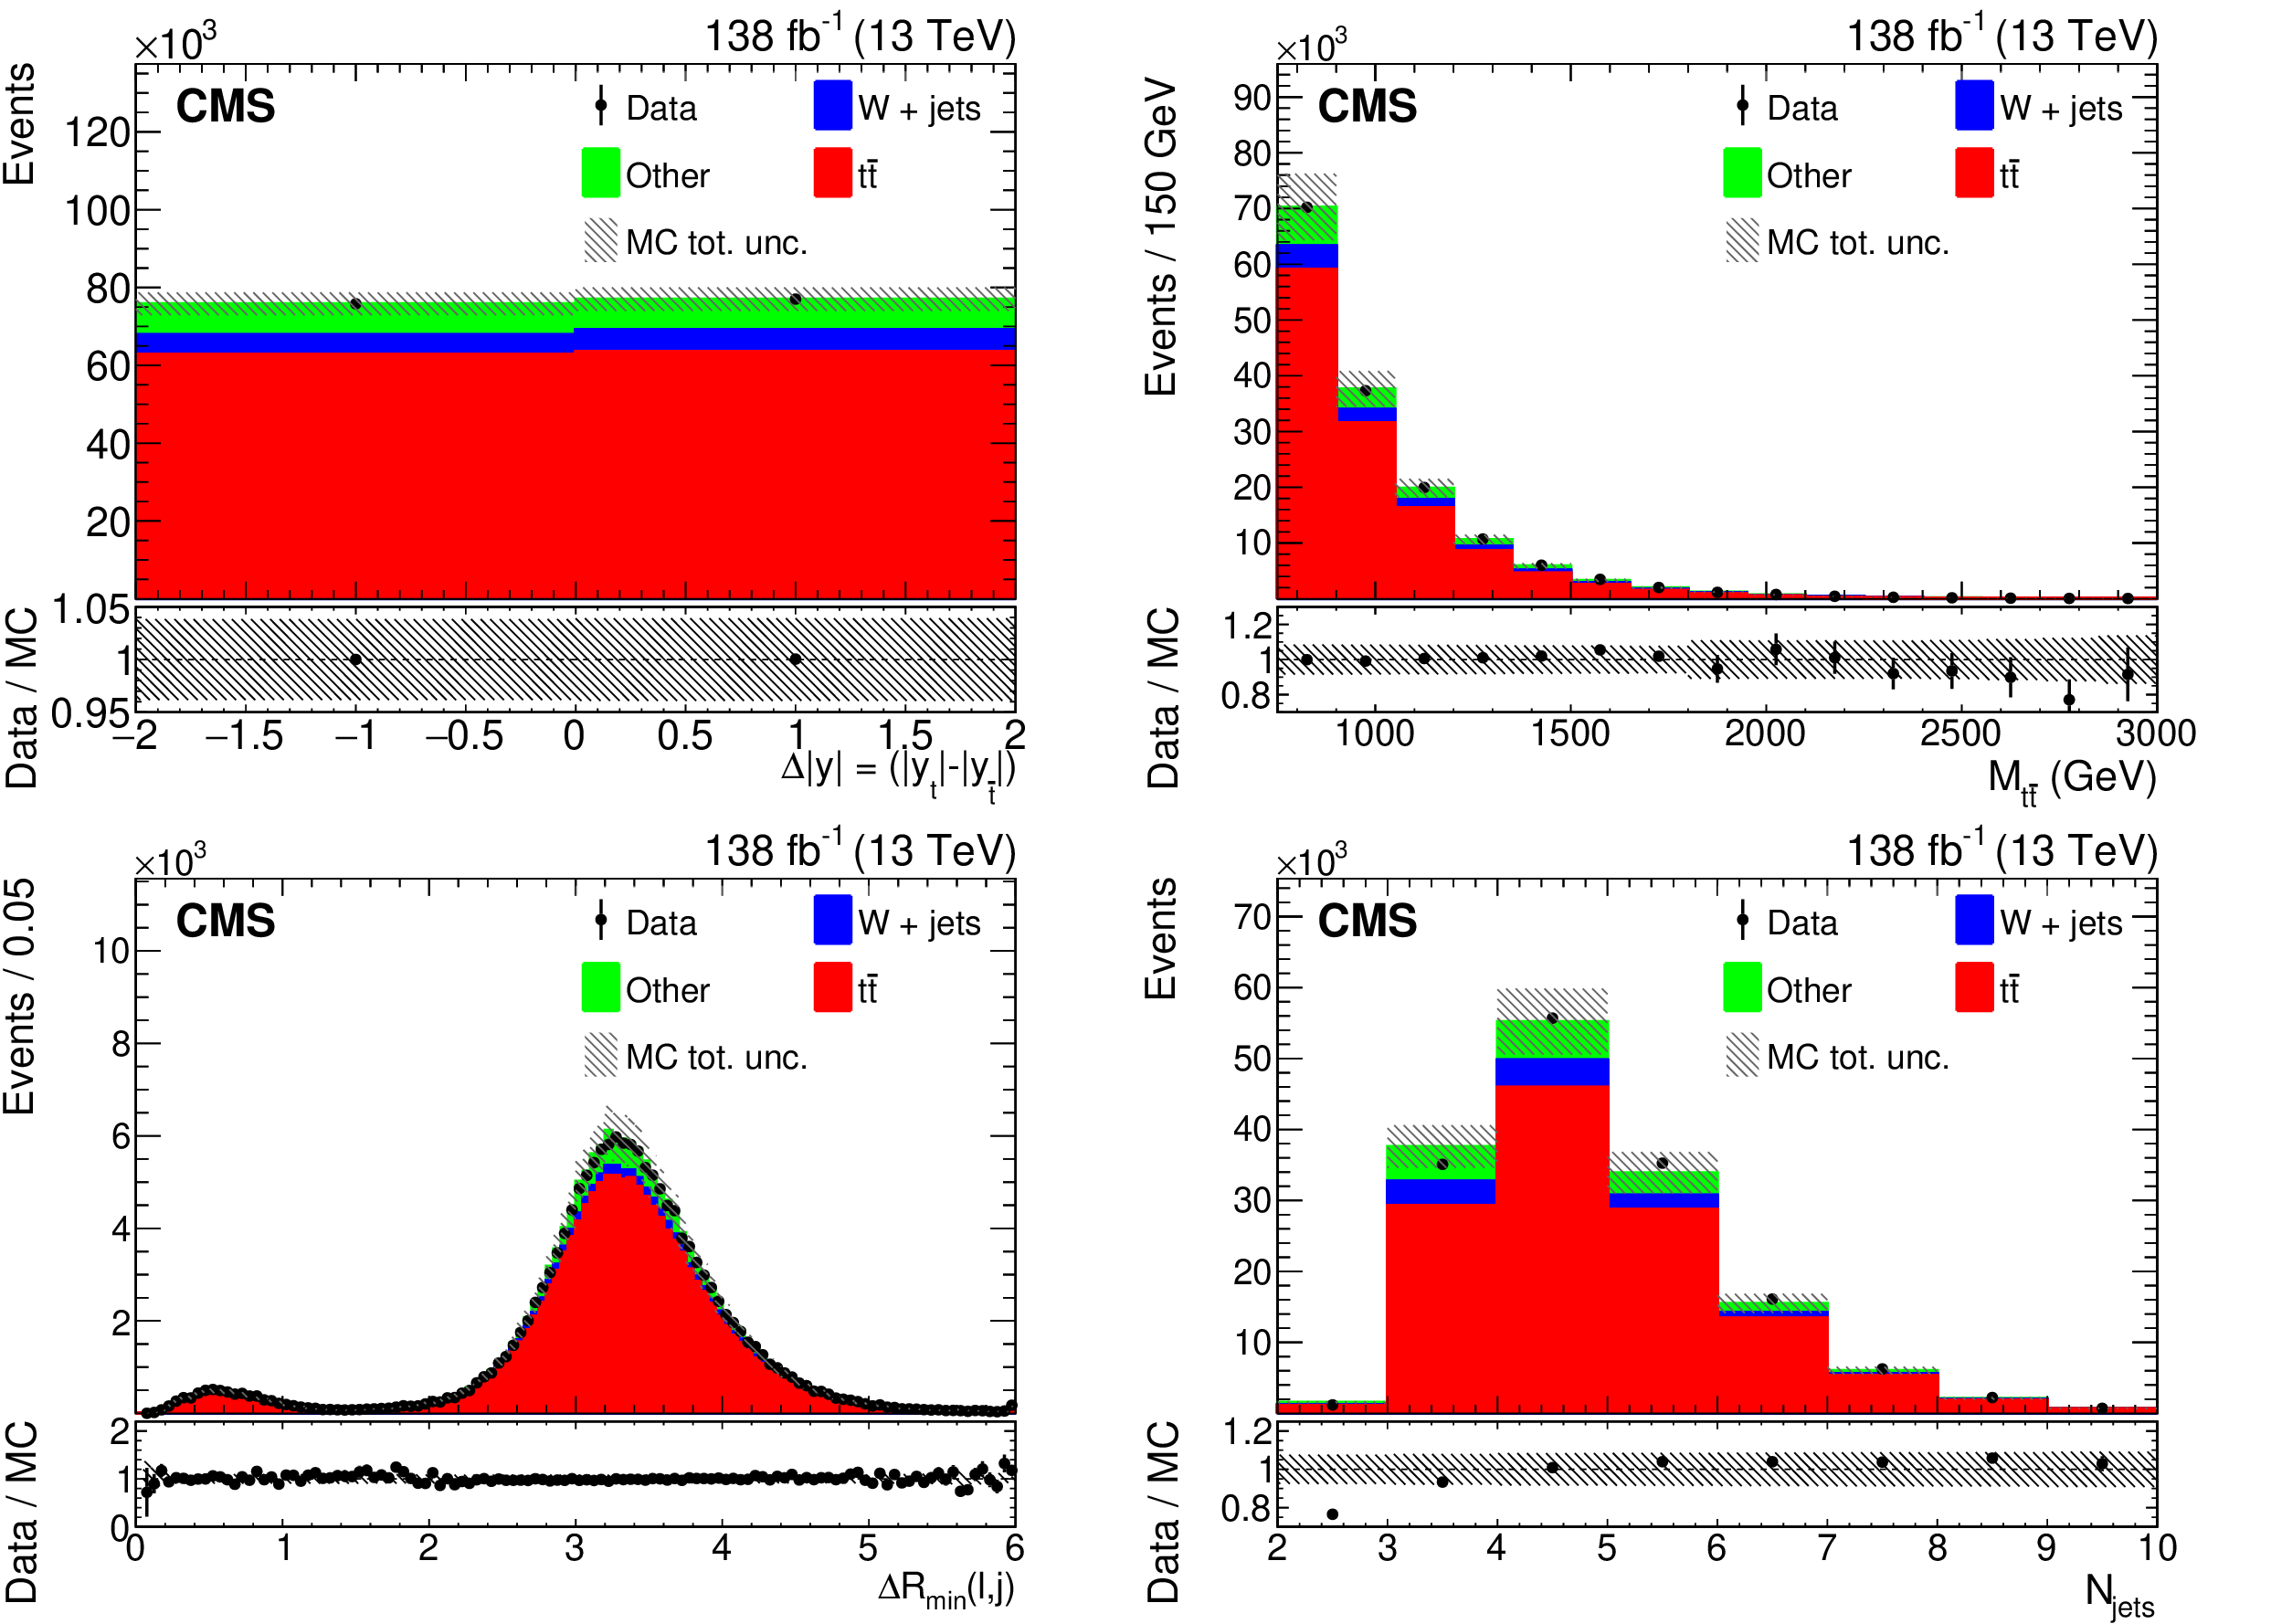
Figure 1:
Comparison between data and MC simulation for kinematic distributions based on events in the signal candidate sample (described in Section 6): $\Delta |y|$ (upper left), reconstructed $ {M_{{\mathrm{t} \mathrm{\bar{t}}}}} $ (upper right), distance between the lepton and the closest AK4 jet $ {\Delta R_{\text {min}}(\ell, j)} $ (lower left), and the number of AK4 jets (lower right). The vertical bars on the points show the statistical uncertainty in the data. The shaded bands represent the total uncertainty in the MC predictions (described in Section 5). The lower panels give the ratio of the data to the sum of the MC predictions. |

png pdf |
Figure 1-a:
Comparison between data and MC simulation for kinematic distributions based on events in the signal candidate sample (described in Section 6): $\Delta |y|$ (upper left), reconstructed $ {M_{{\mathrm{t} \mathrm{\bar{t}}}}} $ (upper right), distance between the lepton and the closest AK4 jet $ {\Delta R_{\text {min}}(\ell, j)} $ (lower left), and the number of AK4 jets (lower right). The vertical bars on the points show the statistical uncertainty in the data. The shaded bands represent the total uncertainty in the MC predictions (described in Section 5). The lower panels give the ratio of the data to the sum of the MC predictions. |
png pdf |
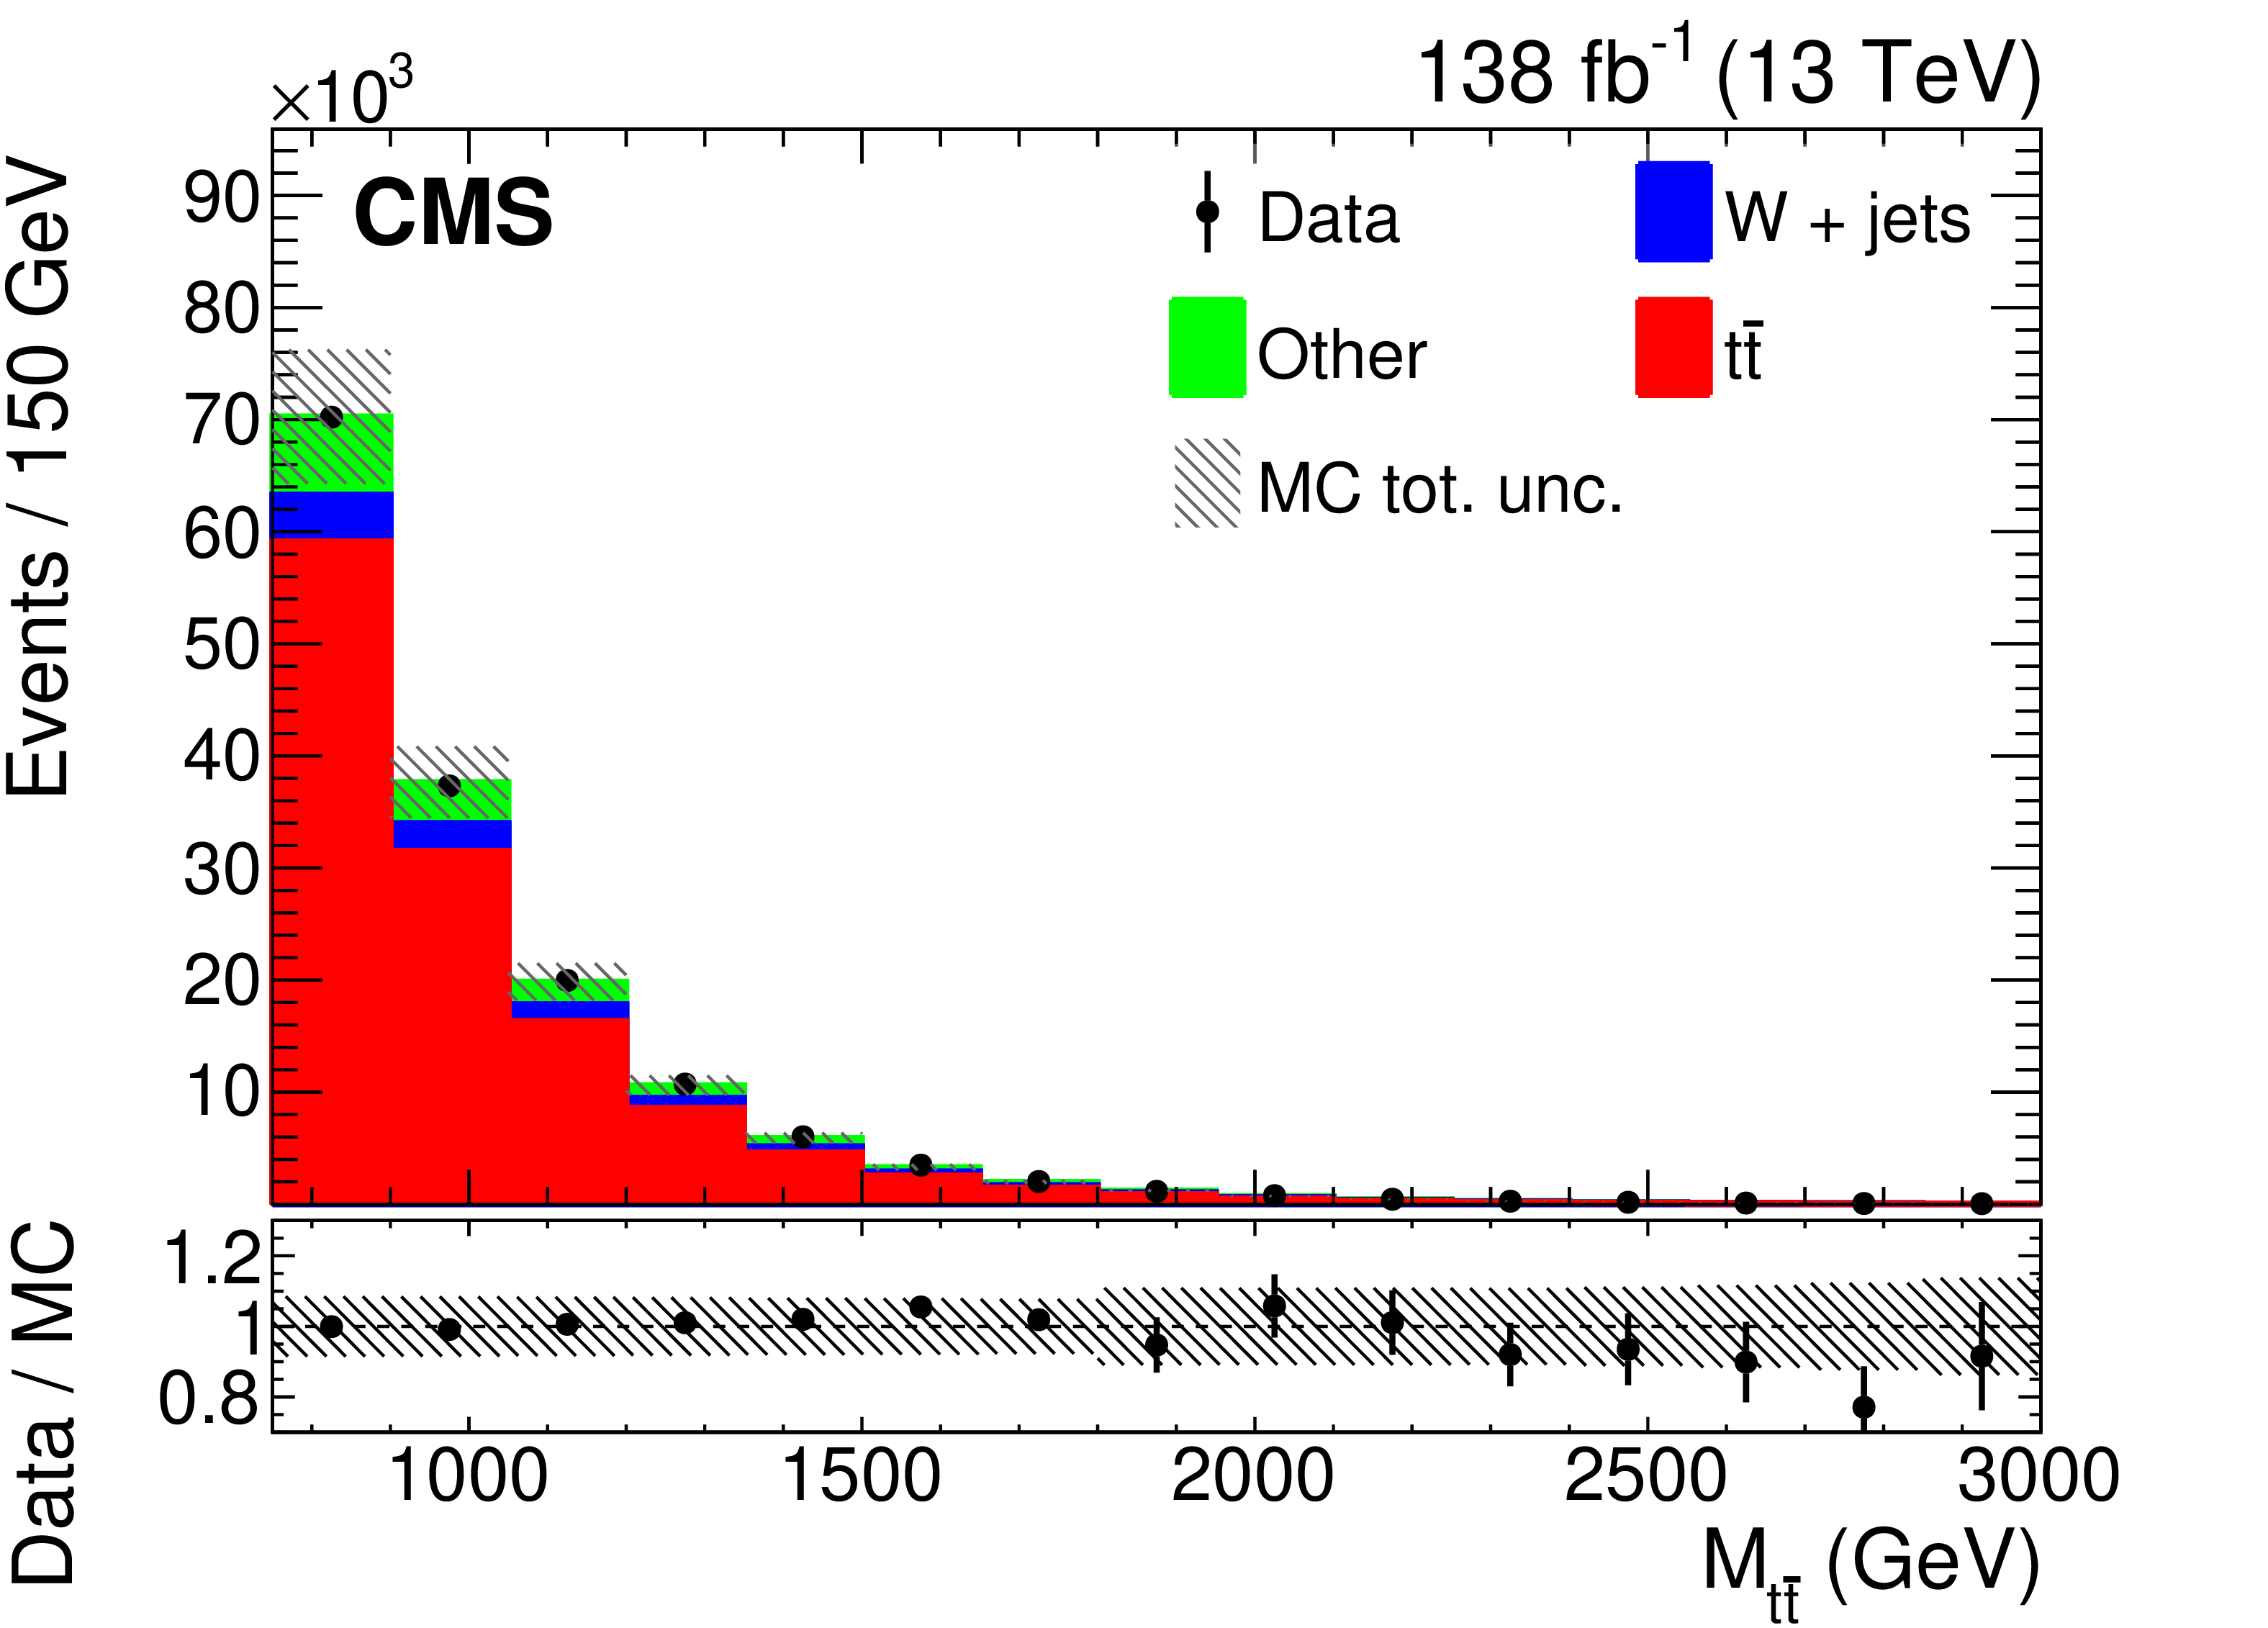
Figure 1-b:
Comparison between data and MC simulation for kinematic distributions based on events in the signal candidate sample (described in Section 6): $\Delta |y|$ (upper left), reconstructed $ {M_{{\mathrm{t} \mathrm{\bar{t}}}}} $ (upper right), distance between the lepton and the closest AK4 jet $ {\Delta R_{\text {min}}(\ell, j)} $ (lower left), and the number of AK4 jets (lower right). The vertical bars on the points show the statistical uncertainty in the data. The shaded bands represent the total uncertainty in the MC predictions (described in Section 5). The lower panels give the ratio of the data to the sum of the MC predictions. |

png pdf |
Figure 1-c:
Comparison between data and MC simulation for kinematic distributions based on events in the signal candidate sample (described in Section 6): $\Delta |y|$ (upper left), reconstructed $ {M_{{\mathrm{t} \mathrm{\bar{t}}}}} $ (upper right), distance between the lepton and the closest AK4 jet $ {\Delta R_{\text {min}}(\ell, j)} $ (lower left), and the number of AK4 jets (lower right). The vertical bars on the points show the statistical uncertainty in the data. The shaded bands represent the total uncertainty in the MC predictions (described in Section 5). The lower panels give the ratio of the data to the sum of the MC predictions. |

png pdf |
Figure 1-d:
Comparison between data and MC simulation for kinematic distributions based on events in the signal candidate sample (described in Section 6): $\Delta |y|$ (upper left), reconstructed $ {M_{{\mathrm{t} \mathrm{\bar{t}}}}} $ (upper right), distance between the lepton and the closest AK4 jet $ {\Delta R_{\text {min}}(\ell, j)} $ (lower left), and the number of AK4 jets (lower right). The vertical bars on the points show the statistical uncertainty in the data. The shaded bands represent the total uncertainty in the MC predictions (described in Section 5). The lower panels give the ratio of the data to the sum of the MC predictions. |
png pdf |
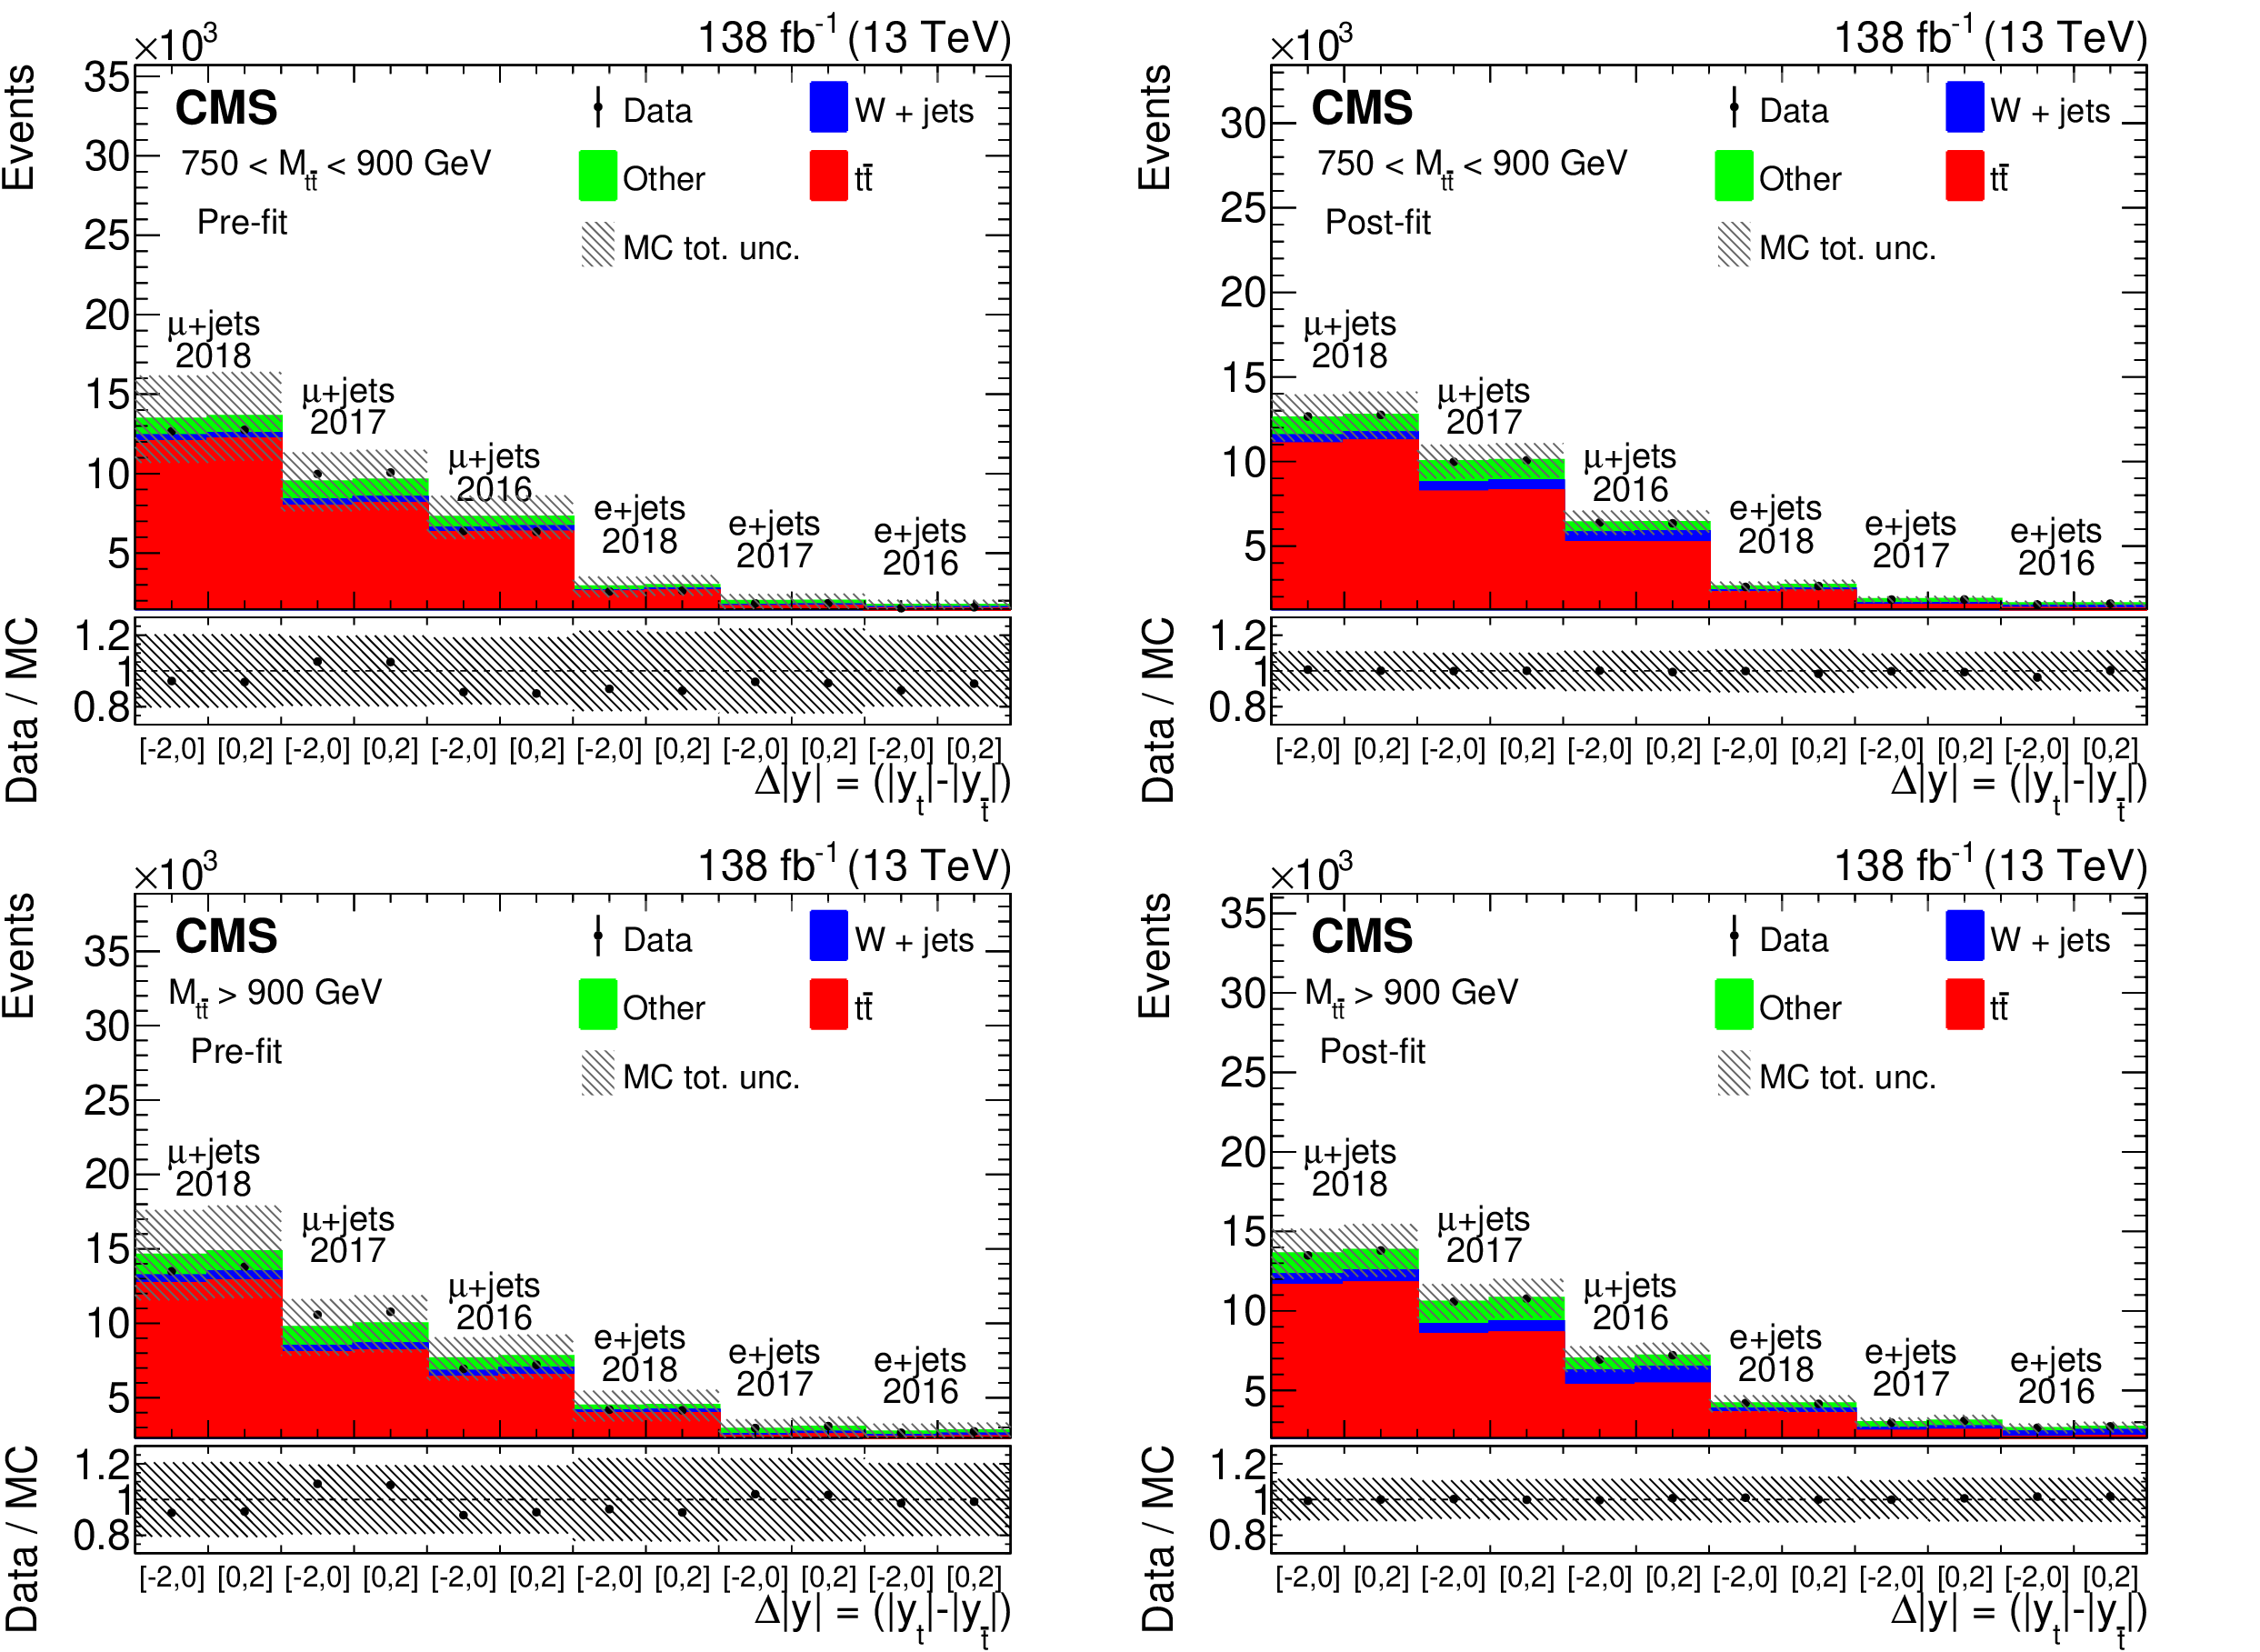
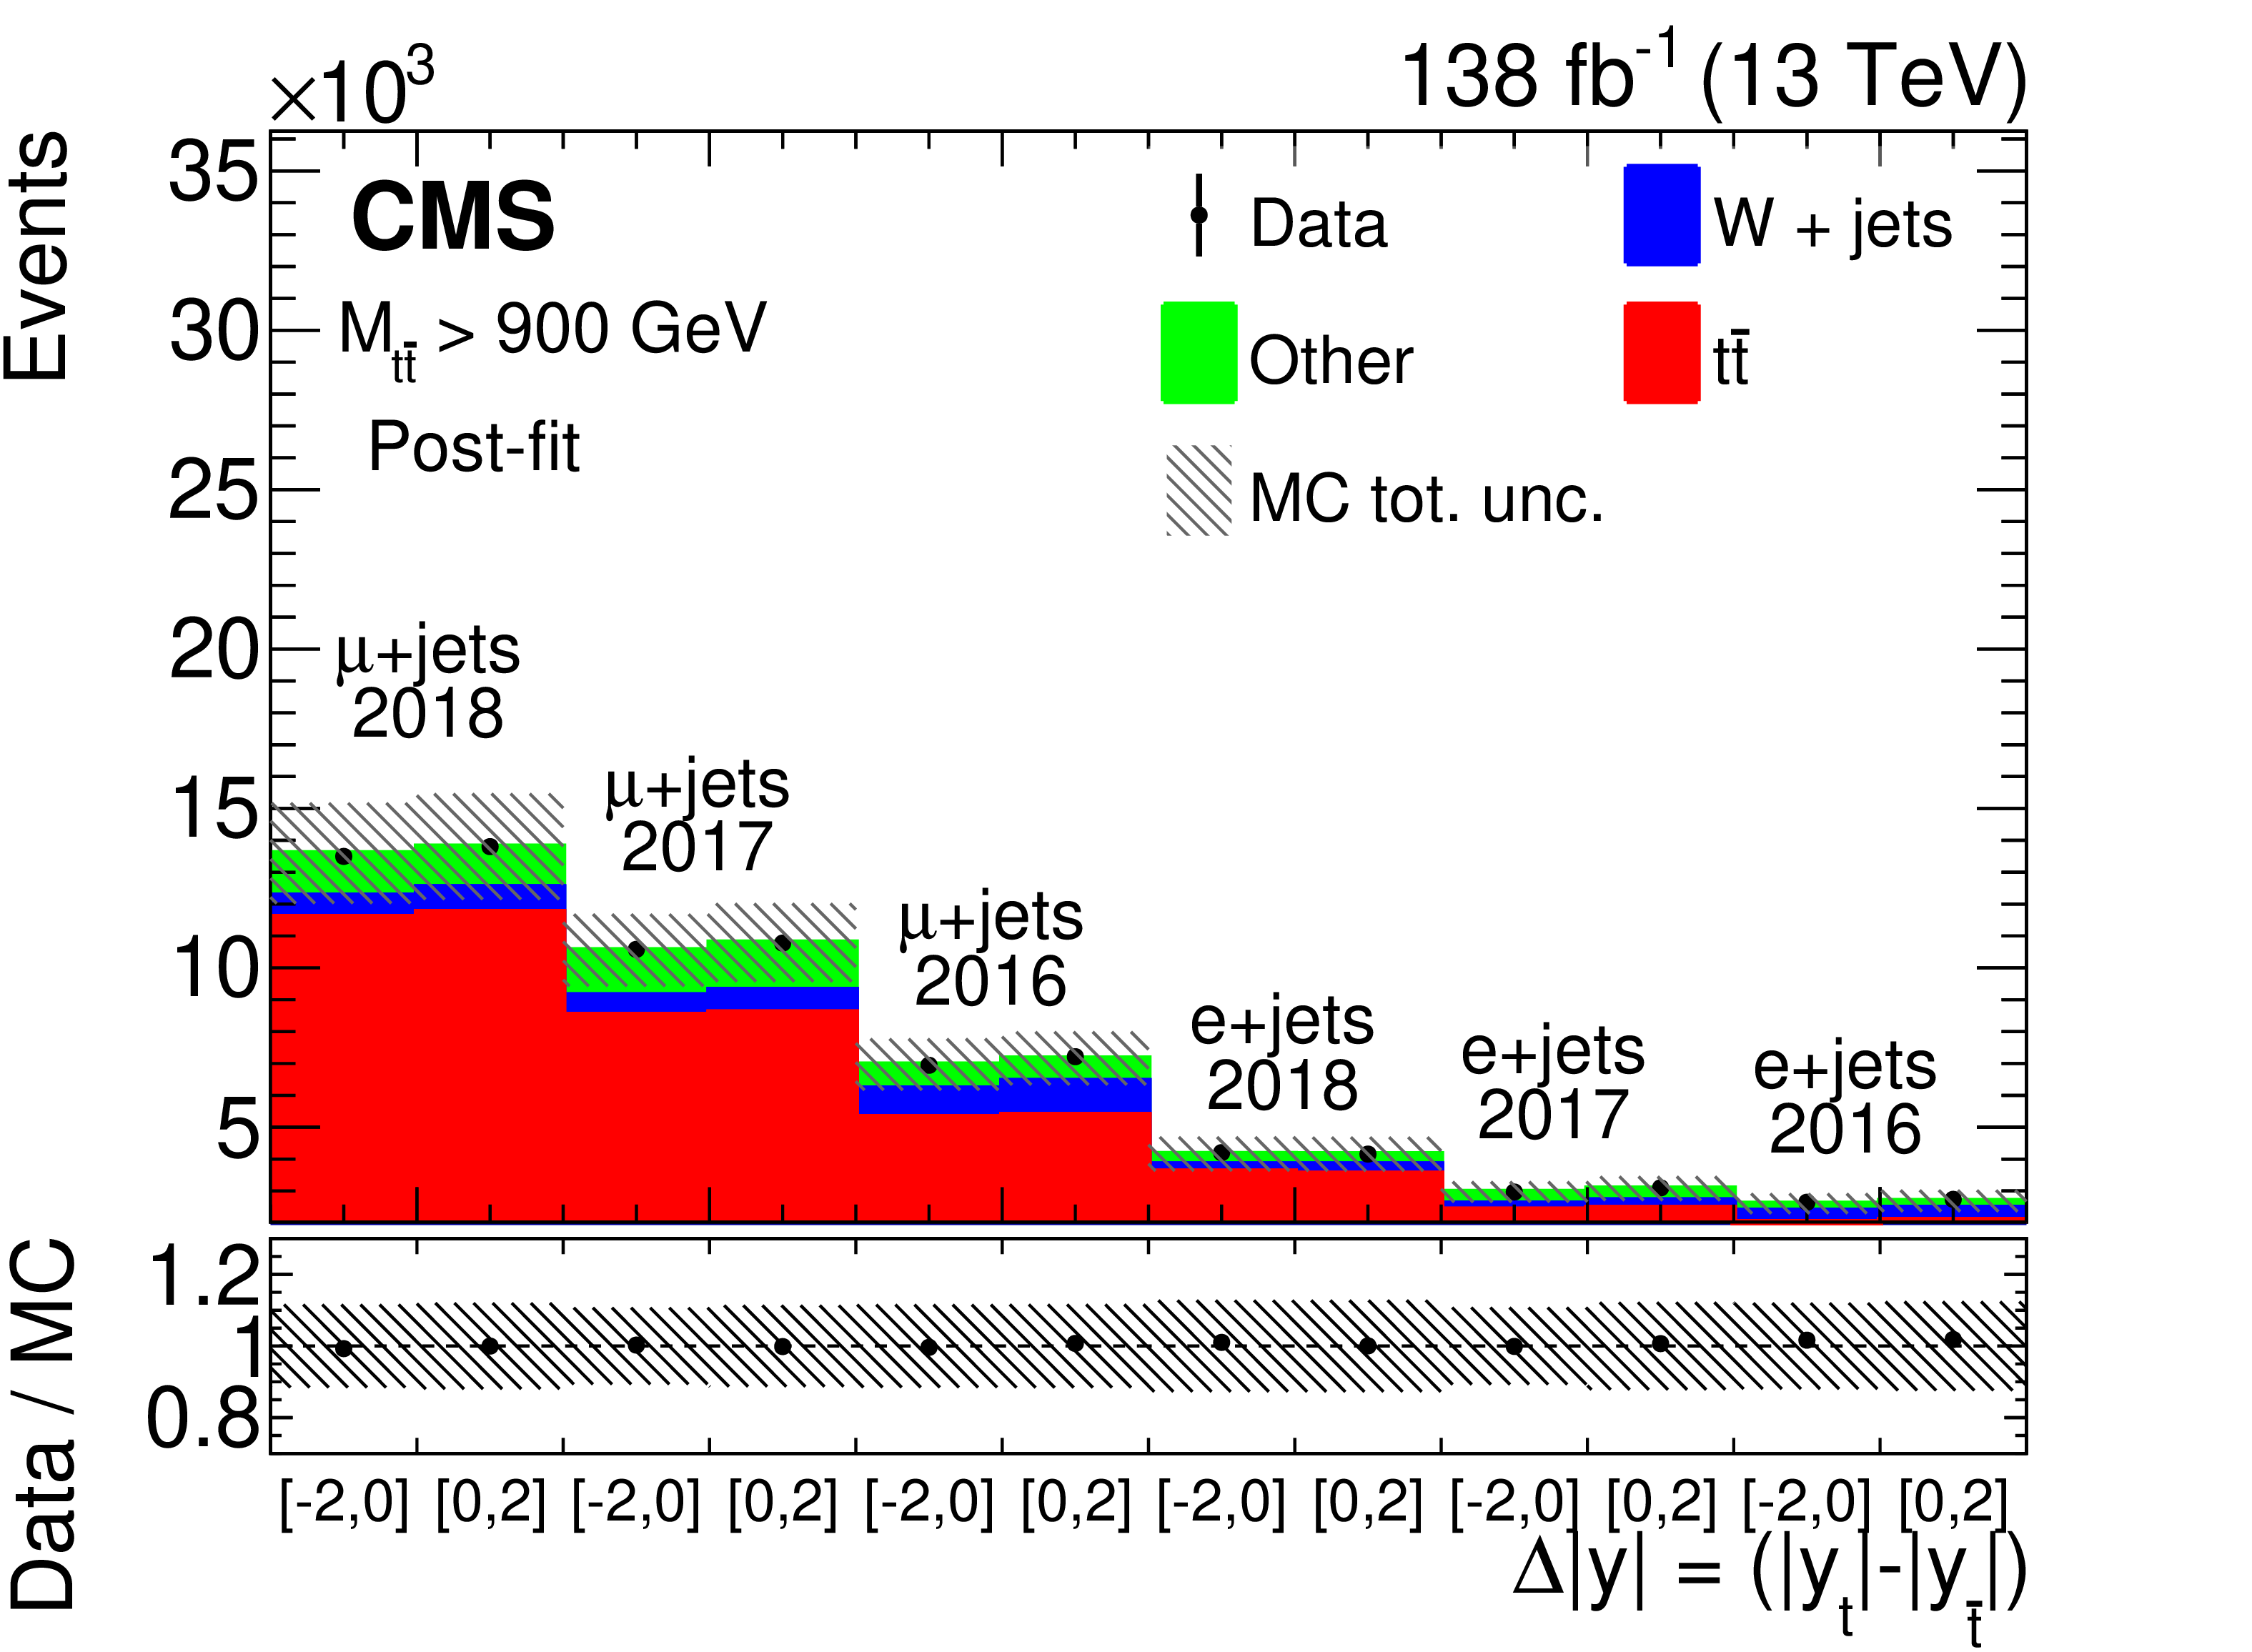
Figure 2:
Comparison between data and MC simulation for $ {\Delta |y|} $ for each of the 12 analysis channels, both before (left) and after (right) the likelihood normalization. The plots in the upper row correspond to 750 $ < {M_{{\mathrm{t} \mathrm{\bar{t}}}}} < $ 900 GeV, and the plots in the lower row to $ {M_{{\mathrm{t} \mathrm{\bar{t}}}}} > $ 900 GeV. The vertical bars on the points represent the statistical uncertainties in the data and the shaded bands give the combined MC statistical and systematic uncertainties. The lower panels display the ratio of the data yields to the sum of the MC predictions. |
png pdf |
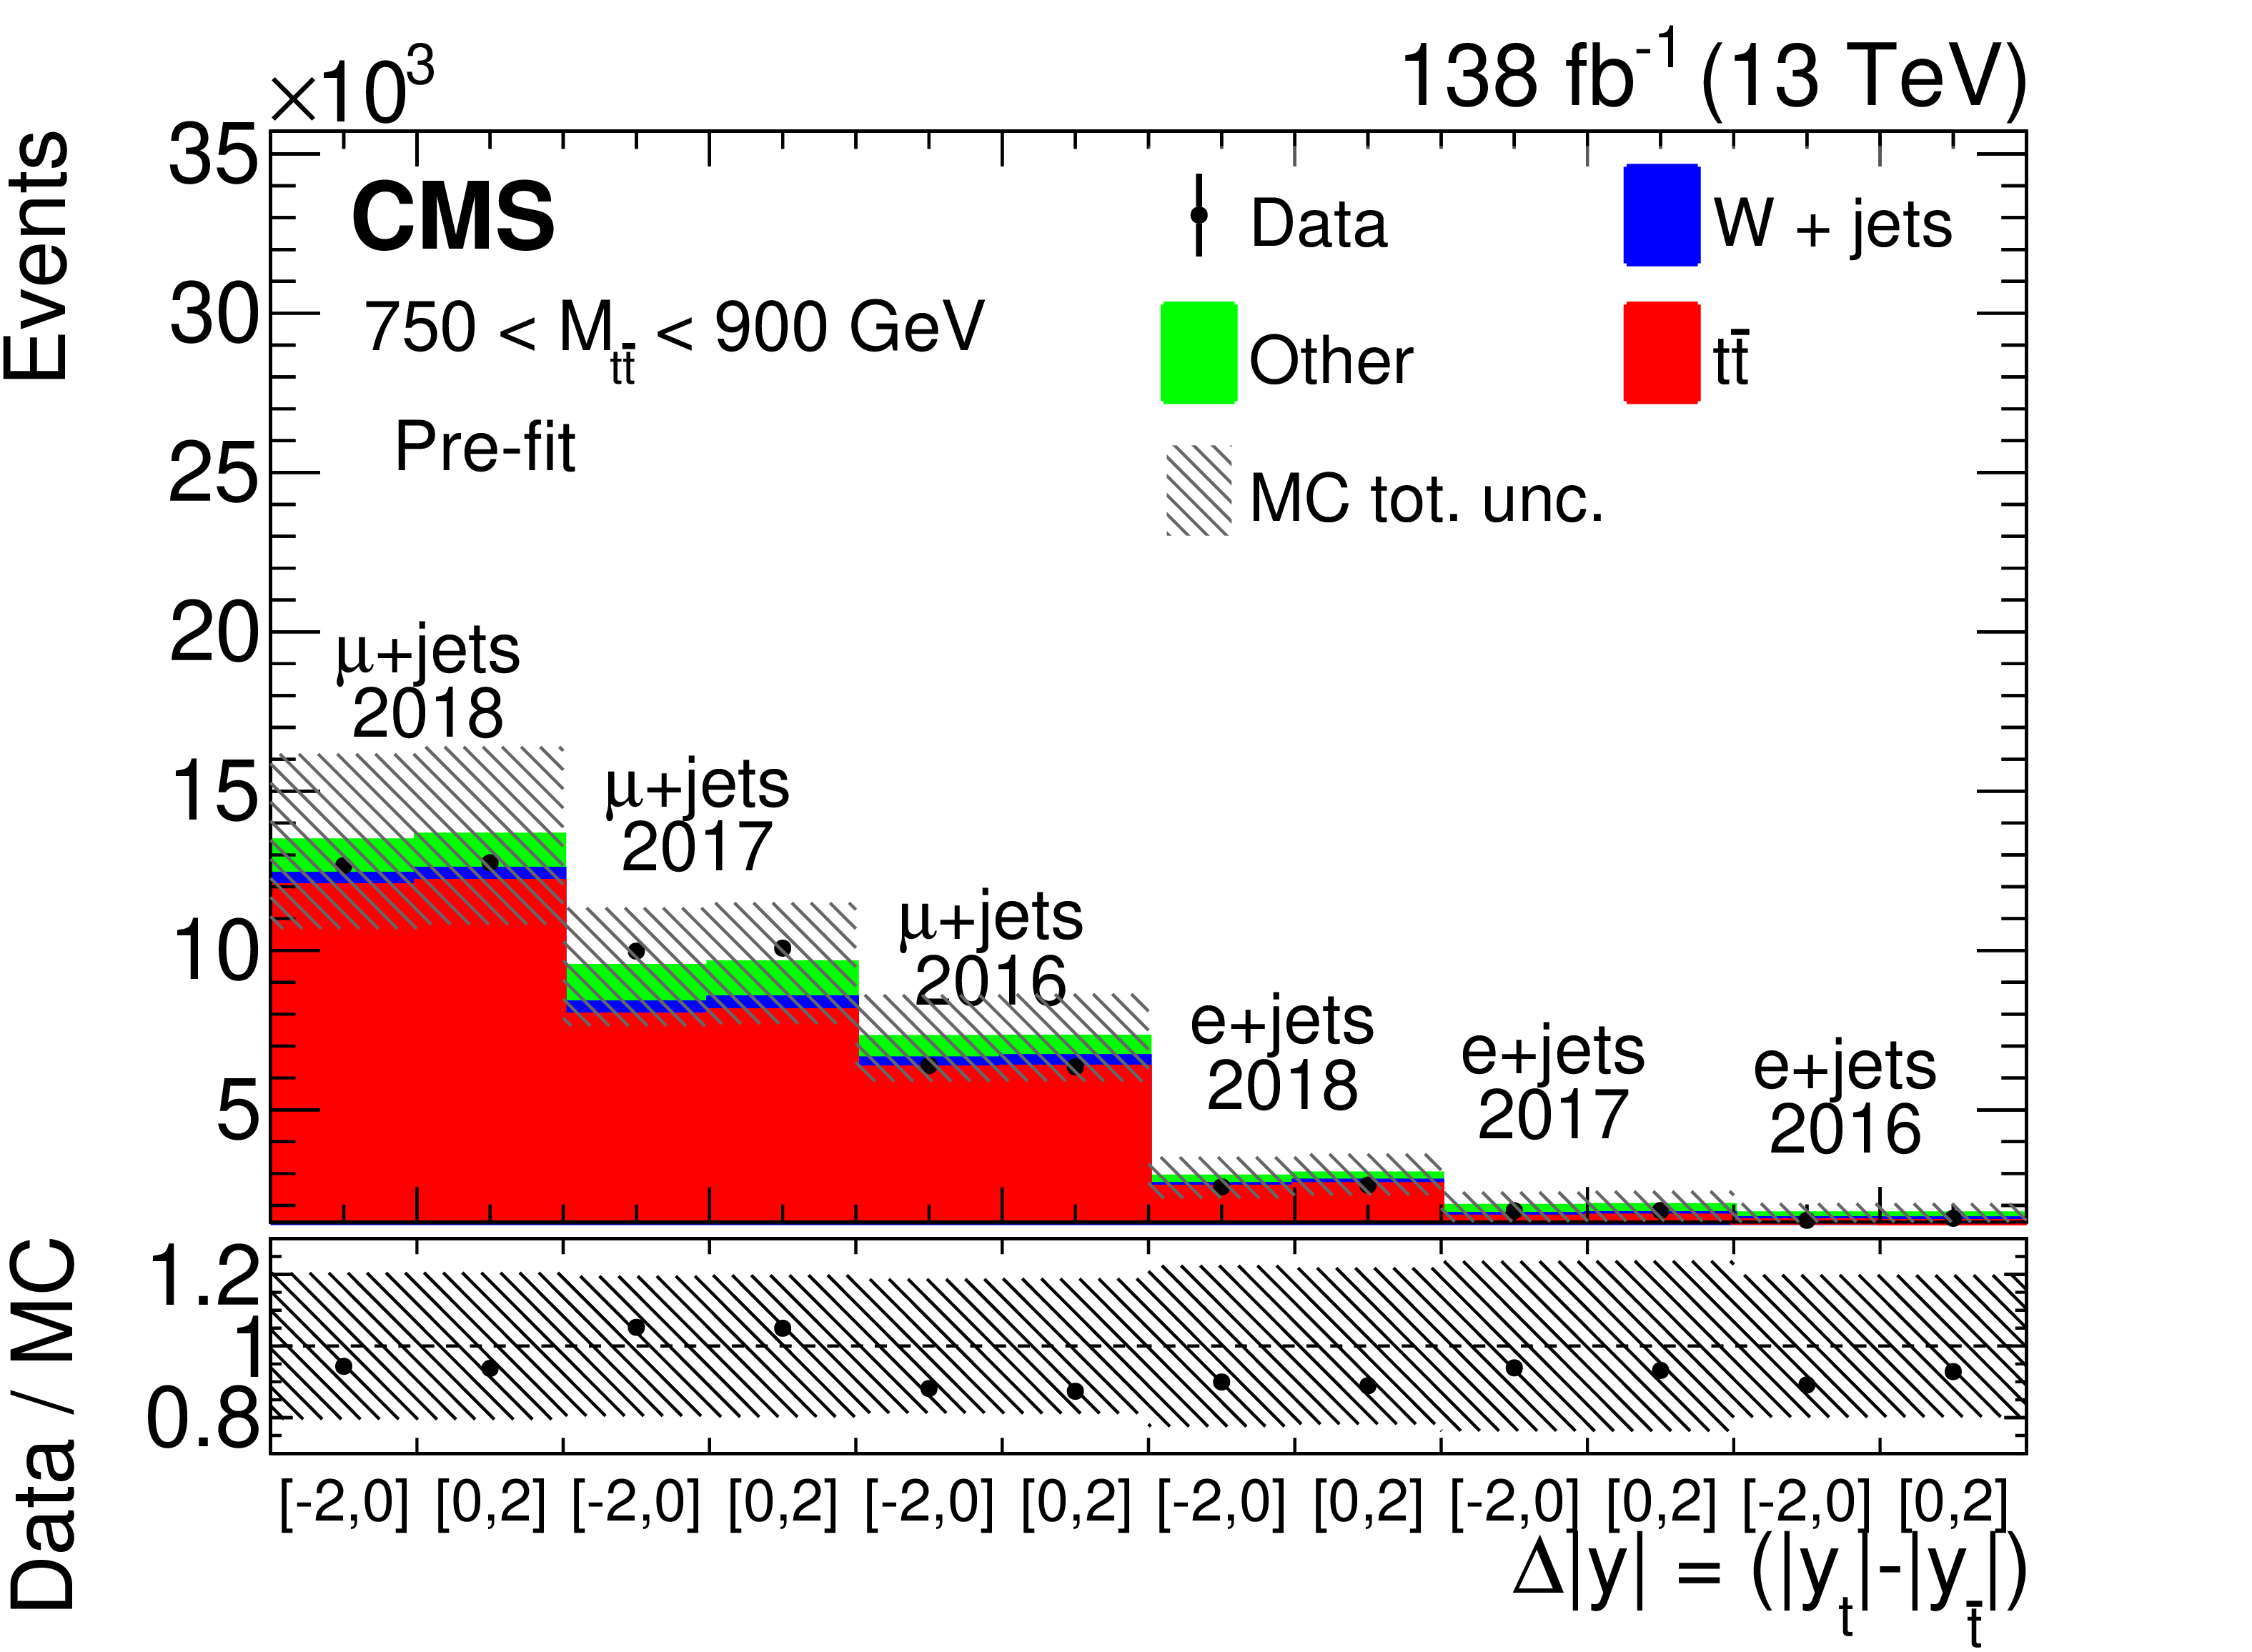
Figure 2-a:
Comparison between data and MC simulation for $ {\Delta |y|} $ for each of the 12 analysis channels, both before (left) and after (right) the likelihood normalization. The plots in the upper row correspond to 750 $ < {M_{{\mathrm{t} \mathrm{\bar{t}}}}} < $ 900 GeV, and the plots in the lower row to $ {M_{{\mathrm{t} \mathrm{\bar{t}}}}} > $ 900 GeV. The vertical bars on the points represent the statistical uncertainties in the data and the shaded bands give the combined MC statistical and systematic uncertainties. The lower panels display the ratio of the data yields to the sum of the MC predictions. |

png pdf |
Figure 2-b:
Comparison between data and MC simulation for $ {\Delta |y|} $ for each of the 12 analysis channels, both before (left) and after (right) the likelihood normalization. The plots in the upper row correspond to 750 $ < {M_{{\mathrm{t} \mathrm{\bar{t}}}}} < $ 900 GeV, and the plots in the lower row to $ {M_{{\mathrm{t} \mathrm{\bar{t}}}}} > $ 900 GeV. The vertical bars on the points represent the statistical uncertainties in the data and the shaded bands give the combined MC statistical and systematic uncertainties. The lower panels display the ratio of the data yields to the sum of the MC predictions. |

png pdf |
Figure 2-c:
Comparison between data and MC simulation for $ {\Delta |y|} $ for each of the 12 analysis channels, both before (left) and after (right) the likelihood normalization. The plots in the upper row correspond to 750 $ < {M_{{\mathrm{t} \mathrm{\bar{t}}}}} < $ 900 GeV, and the plots in the lower row to $ {M_{{\mathrm{t} \mathrm{\bar{t}}}}} > $ 900 GeV. The vertical bars on the points represent the statistical uncertainties in the data and the shaded bands give the combined MC statistical and systematic uncertainties. The lower panels display the ratio of the data yields to the sum of the MC predictions. |
png pdf |
Figure 2-d:
Comparison between data and MC simulation for $ {\Delta |y|} $ for each of the 12 analysis channels, both before (left) and after (right) the likelihood normalization. The plots in the upper row correspond to 750 $ < {M_{{\mathrm{t} \mathrm{\bar{t}}}}} < $ 900 GeV, and the plots in the lower row to $ {M_{{\mathrm{t} \mathrm{\bar{t}}}}} > $ 900 GeV. The vertical bars on the points represent the statistical uncertainties in the data and the shaded bands give the combined MC statistical and systematic uncertainties. The lower panels display the ratio of the data yields to the sum of the MC predictions. |
png pdf |
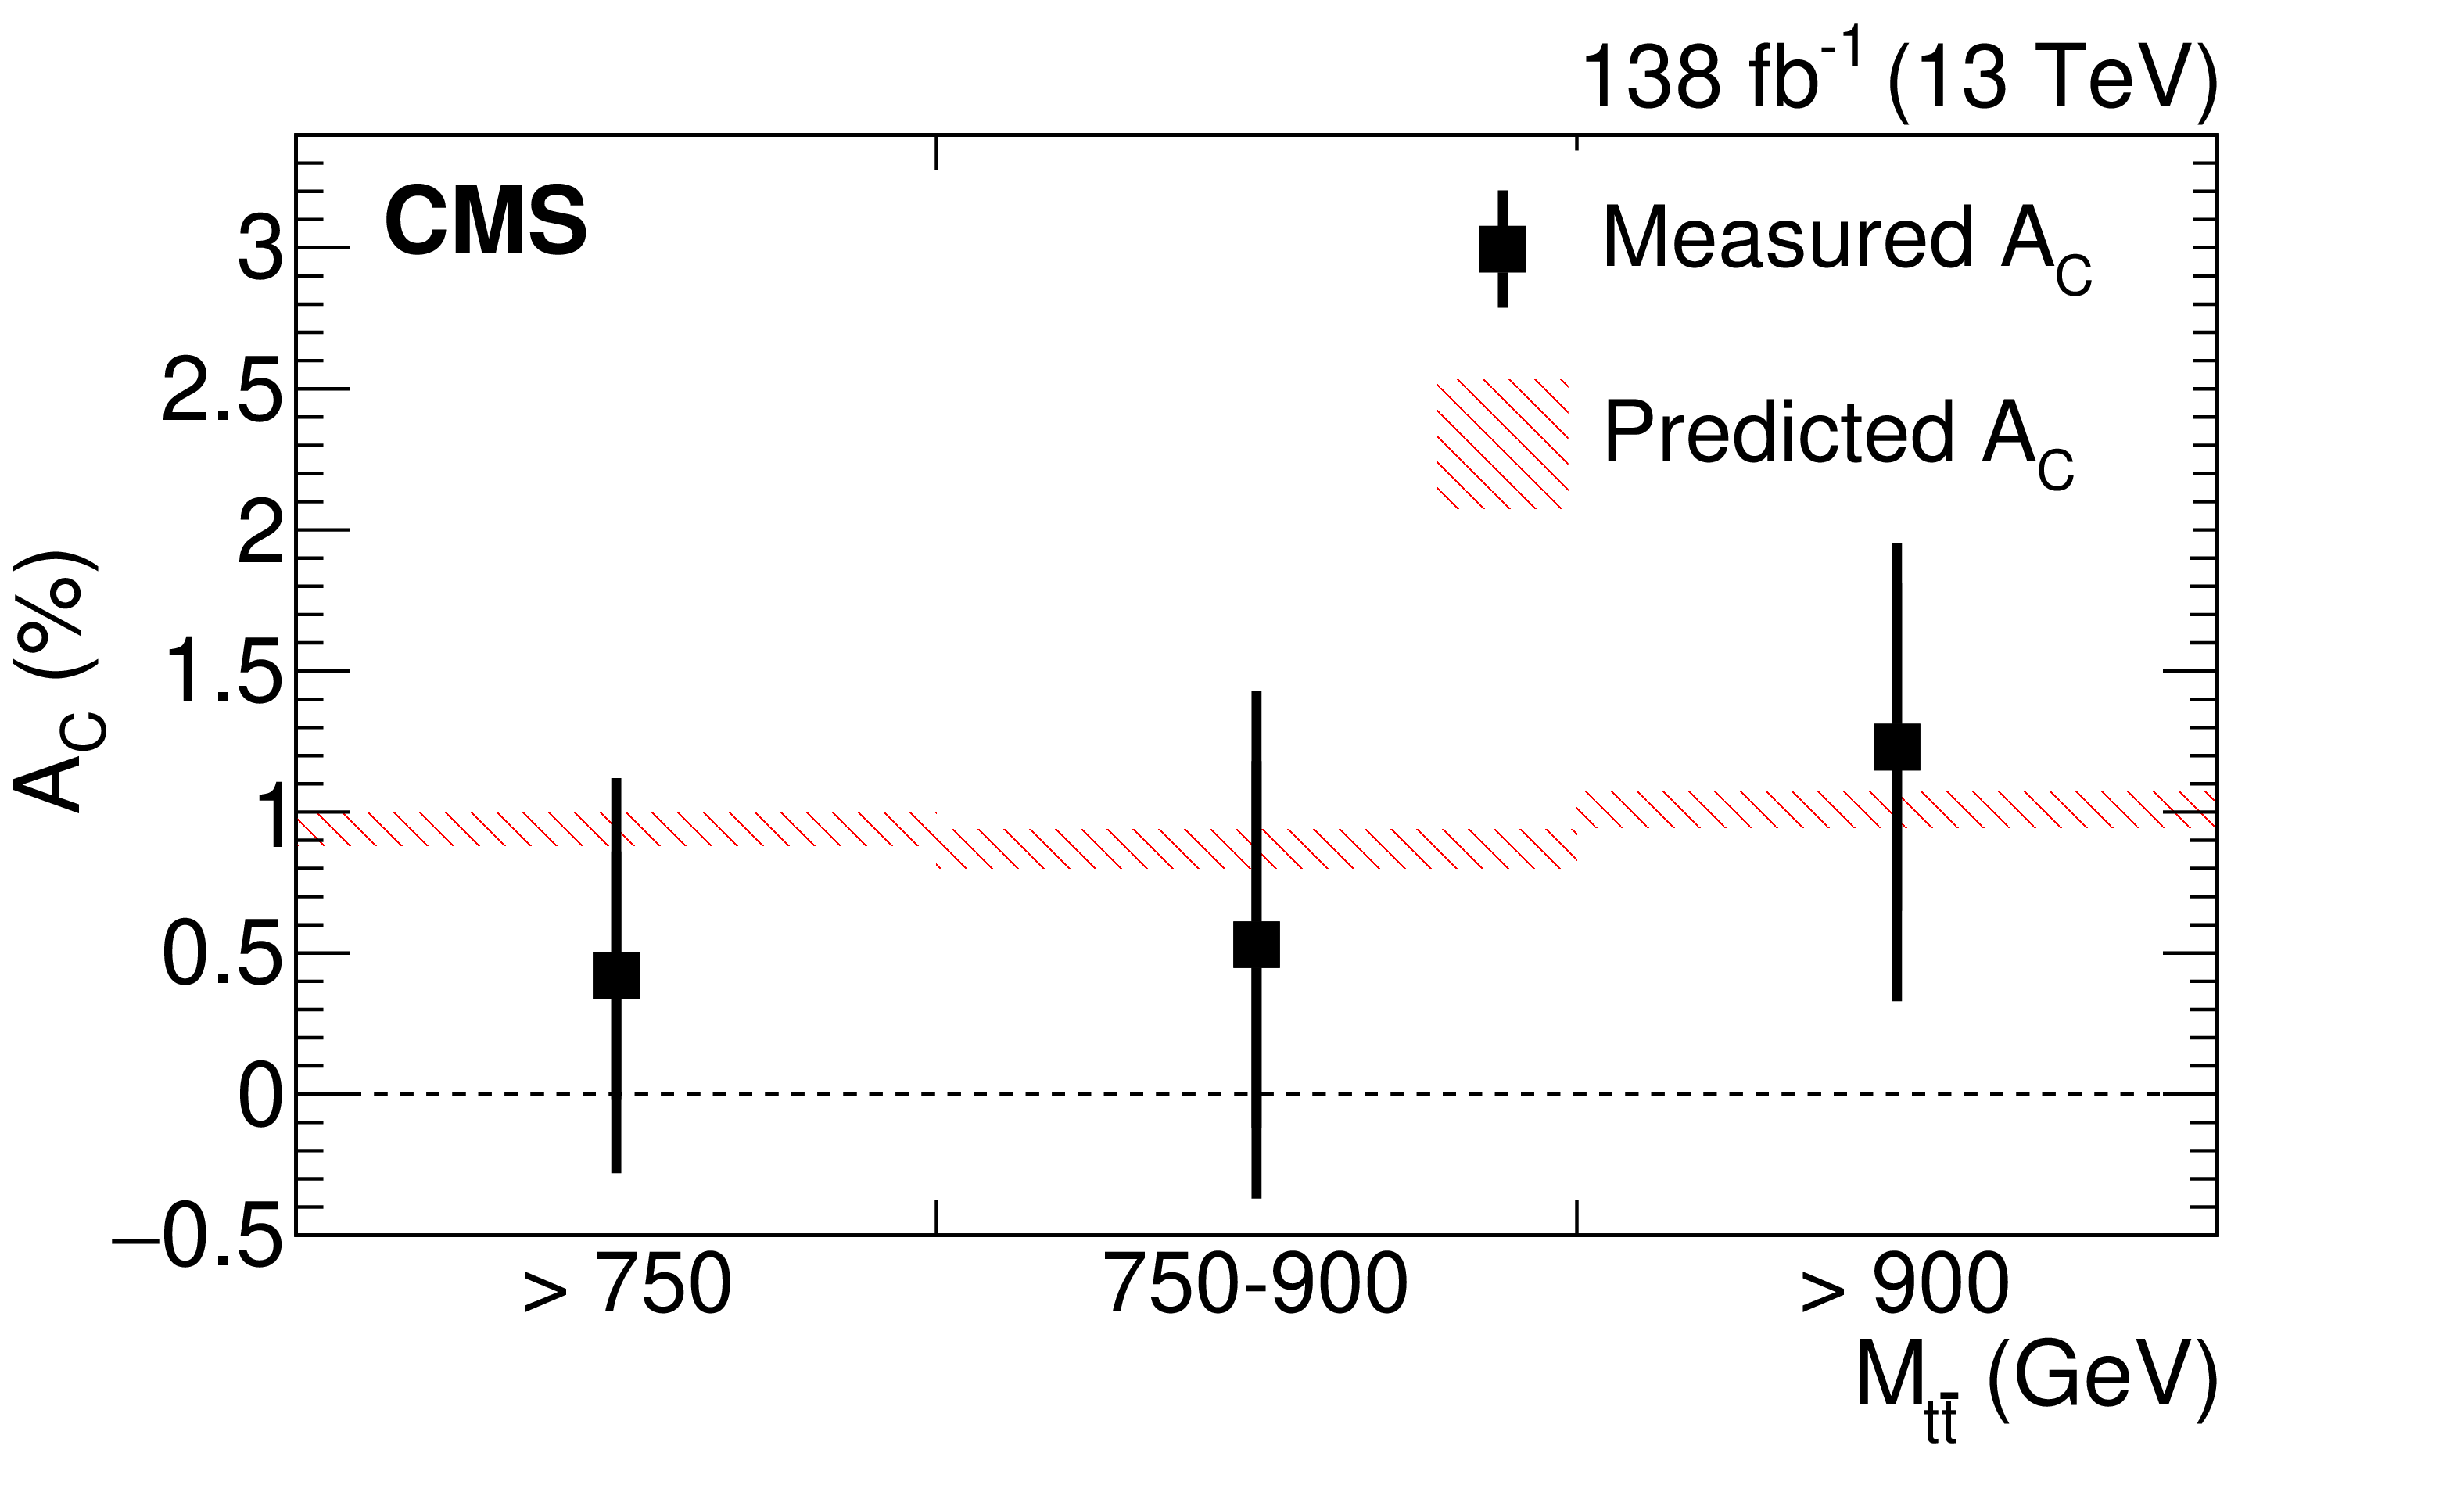
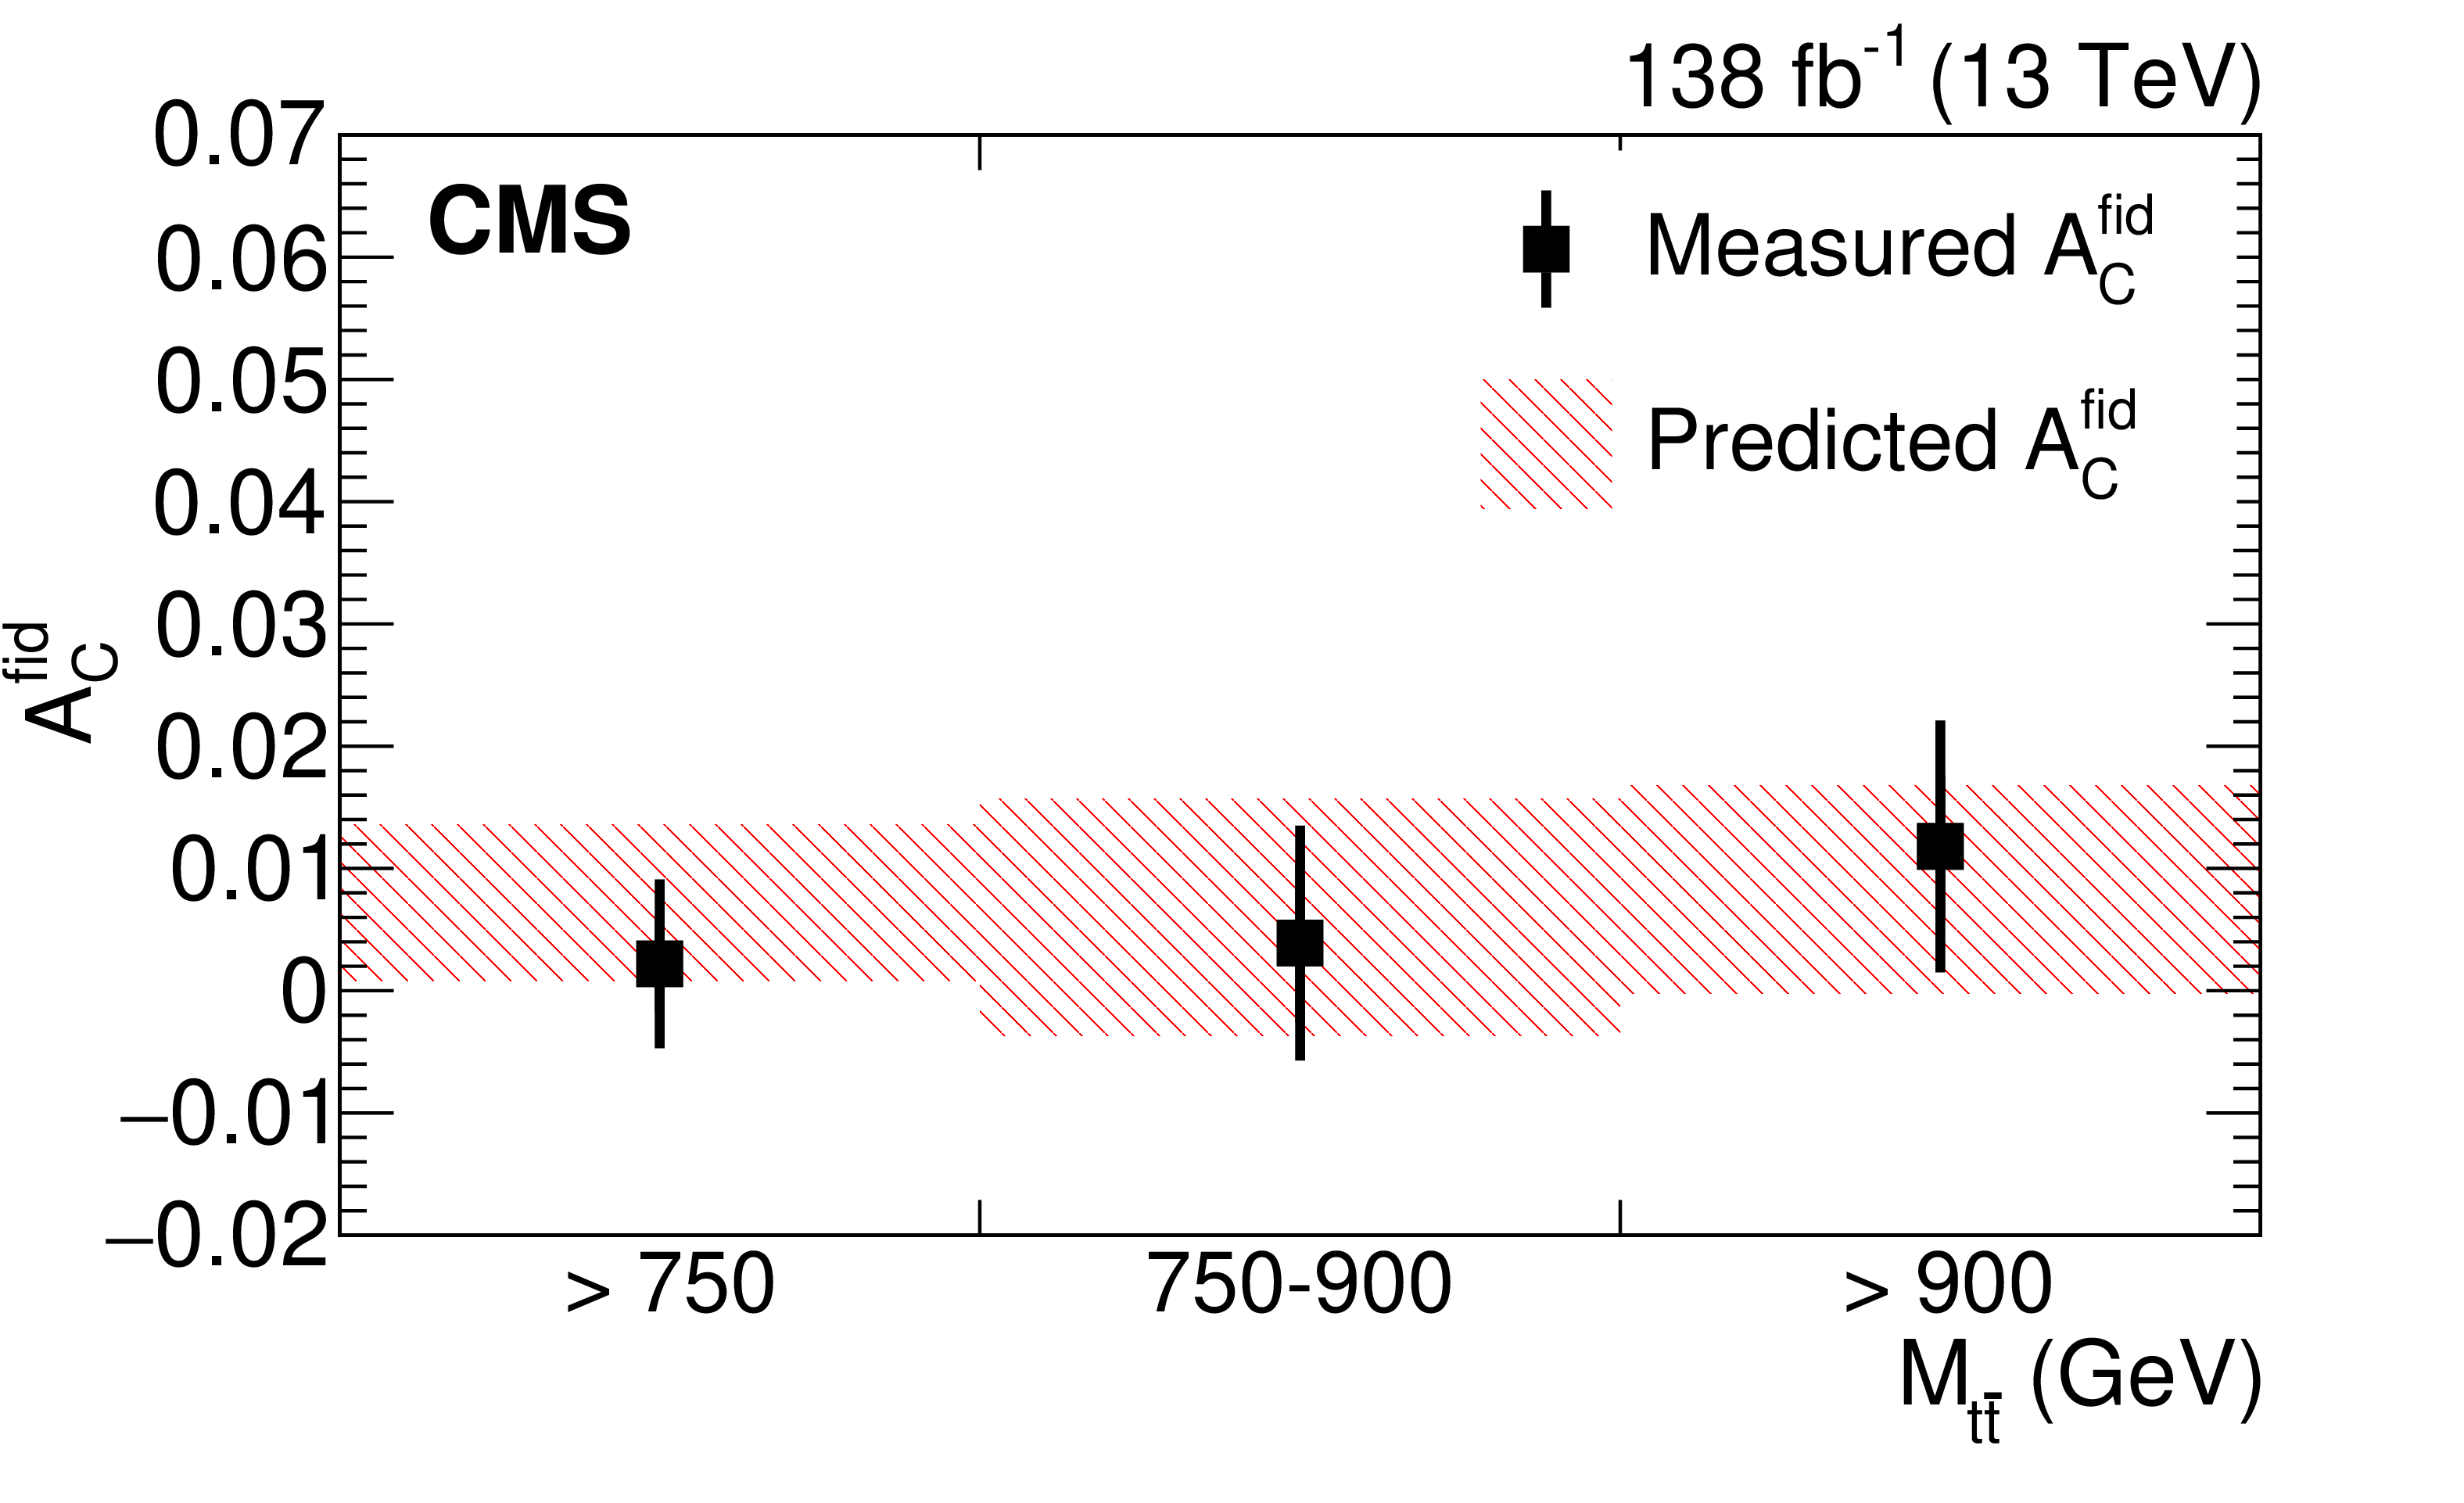
Figure 3:
Measured ${{A_{\text {C}}} ^{\text {fid}}}$ (left) and measured ${A_{\text {C}}}$ in the full phase space (right) presented in different mass regions after combining the $ \mu $+jets and e+jets channels. The vertical bars represent the total uncertainties, with the inner tick mark indicating the statistical uncertainty in the observed data. The measured values are compared to the theoretical prediction, including NNLO QCD and NLO EW corrections from Ref. [4]. The theoretical prediction in the fiducial region is obtained by fitting Asimov data that passed the signal candidate selection described in Sections 3 and 4. |
png pdf |
Figure 3-a:
Measured ${{A_{\text {C}}} ^{\text {fid}}}$ (left) and measured ${A_{\text {C}}}$ in the full phase space (right) presented in different mass regions after combining the $ \mu $+jets and e+jets channels. The vertical bars represent the total uncertainties, with the inner tick mark indicating the statistical uncertainty in the observed data. The measured values are compared to the theoretical prediction, including NNLO QCD and NLO EW corrections from Ref. [4]. The theoretical prediction in the fiducial region is obtained by fitting Asimov data that passed the signal candidate selection described in Sections 3 and 4. |

png pdf |
Figure 3-b:
Measured ${{A_{\text {C}}} ^{\text {fid}}}$ (left) and measured ${A_{\text {C}}}$ in the full phase space (right) presented in different mass regions after combining the $ \mu $+jets and e+jets channels. The vertical bars represent the total uncertainties, with the inner tick mark indicating the statistical uncertainty in the observed data. The measured values are compared to the theoretical prediction, including NNLO QCD and NLO EW corrections from Ref. [4]. The theoretical prediction in the fiducial region is obtained by fitting Asimov data that passed the signal candidate selection described in Sections 3 and 4. |
png pdf |
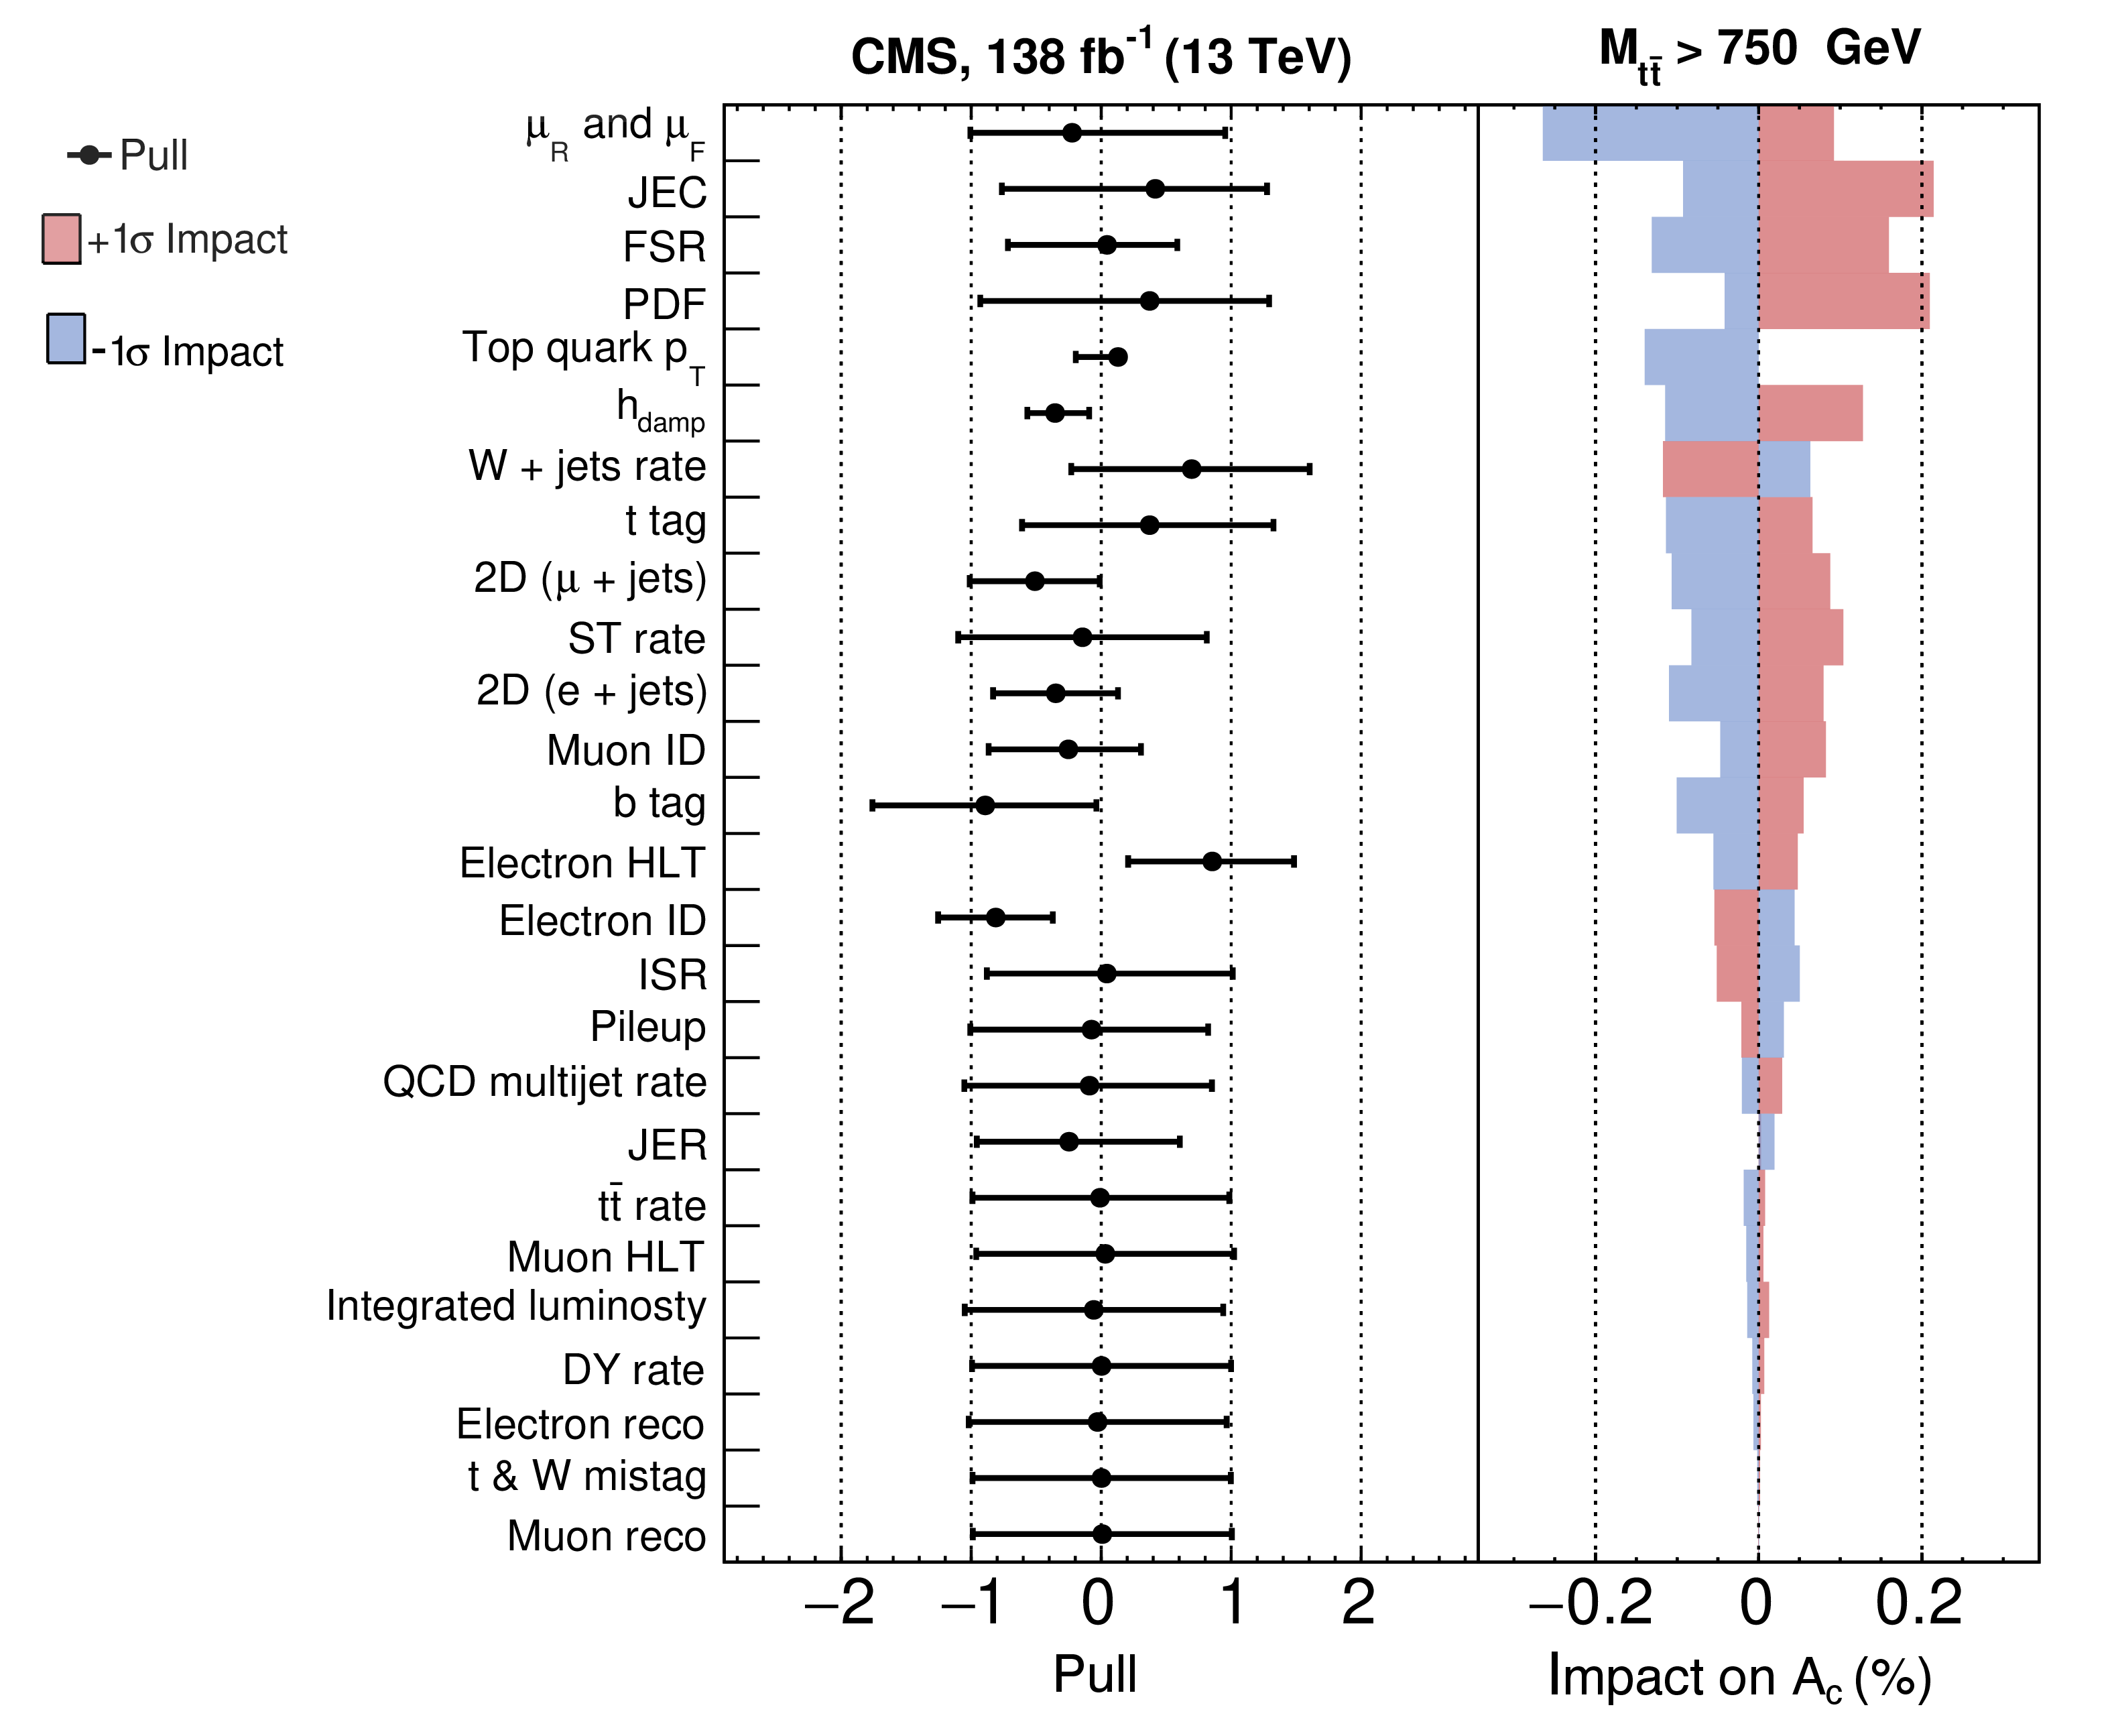
Figure 4:
The $ \pm 1 $ standard deviation ($\sigma $) impacts of the nuisance parameters corresponding to the systematic uncertainties in the full phase space $ {A_{\text {C}}} $ measurement for $ {M_{{\mathrm{t} \mathrm{\bar{t}}}}} > $ 750 GeV. The red and blue bars show the effect on the unfolded $ {A_{\text {C}}} $ values for up and down variations of the systematic uncertainty. The MC statistical uncertainties are omitted here. |
| Tables | |
png pdf |
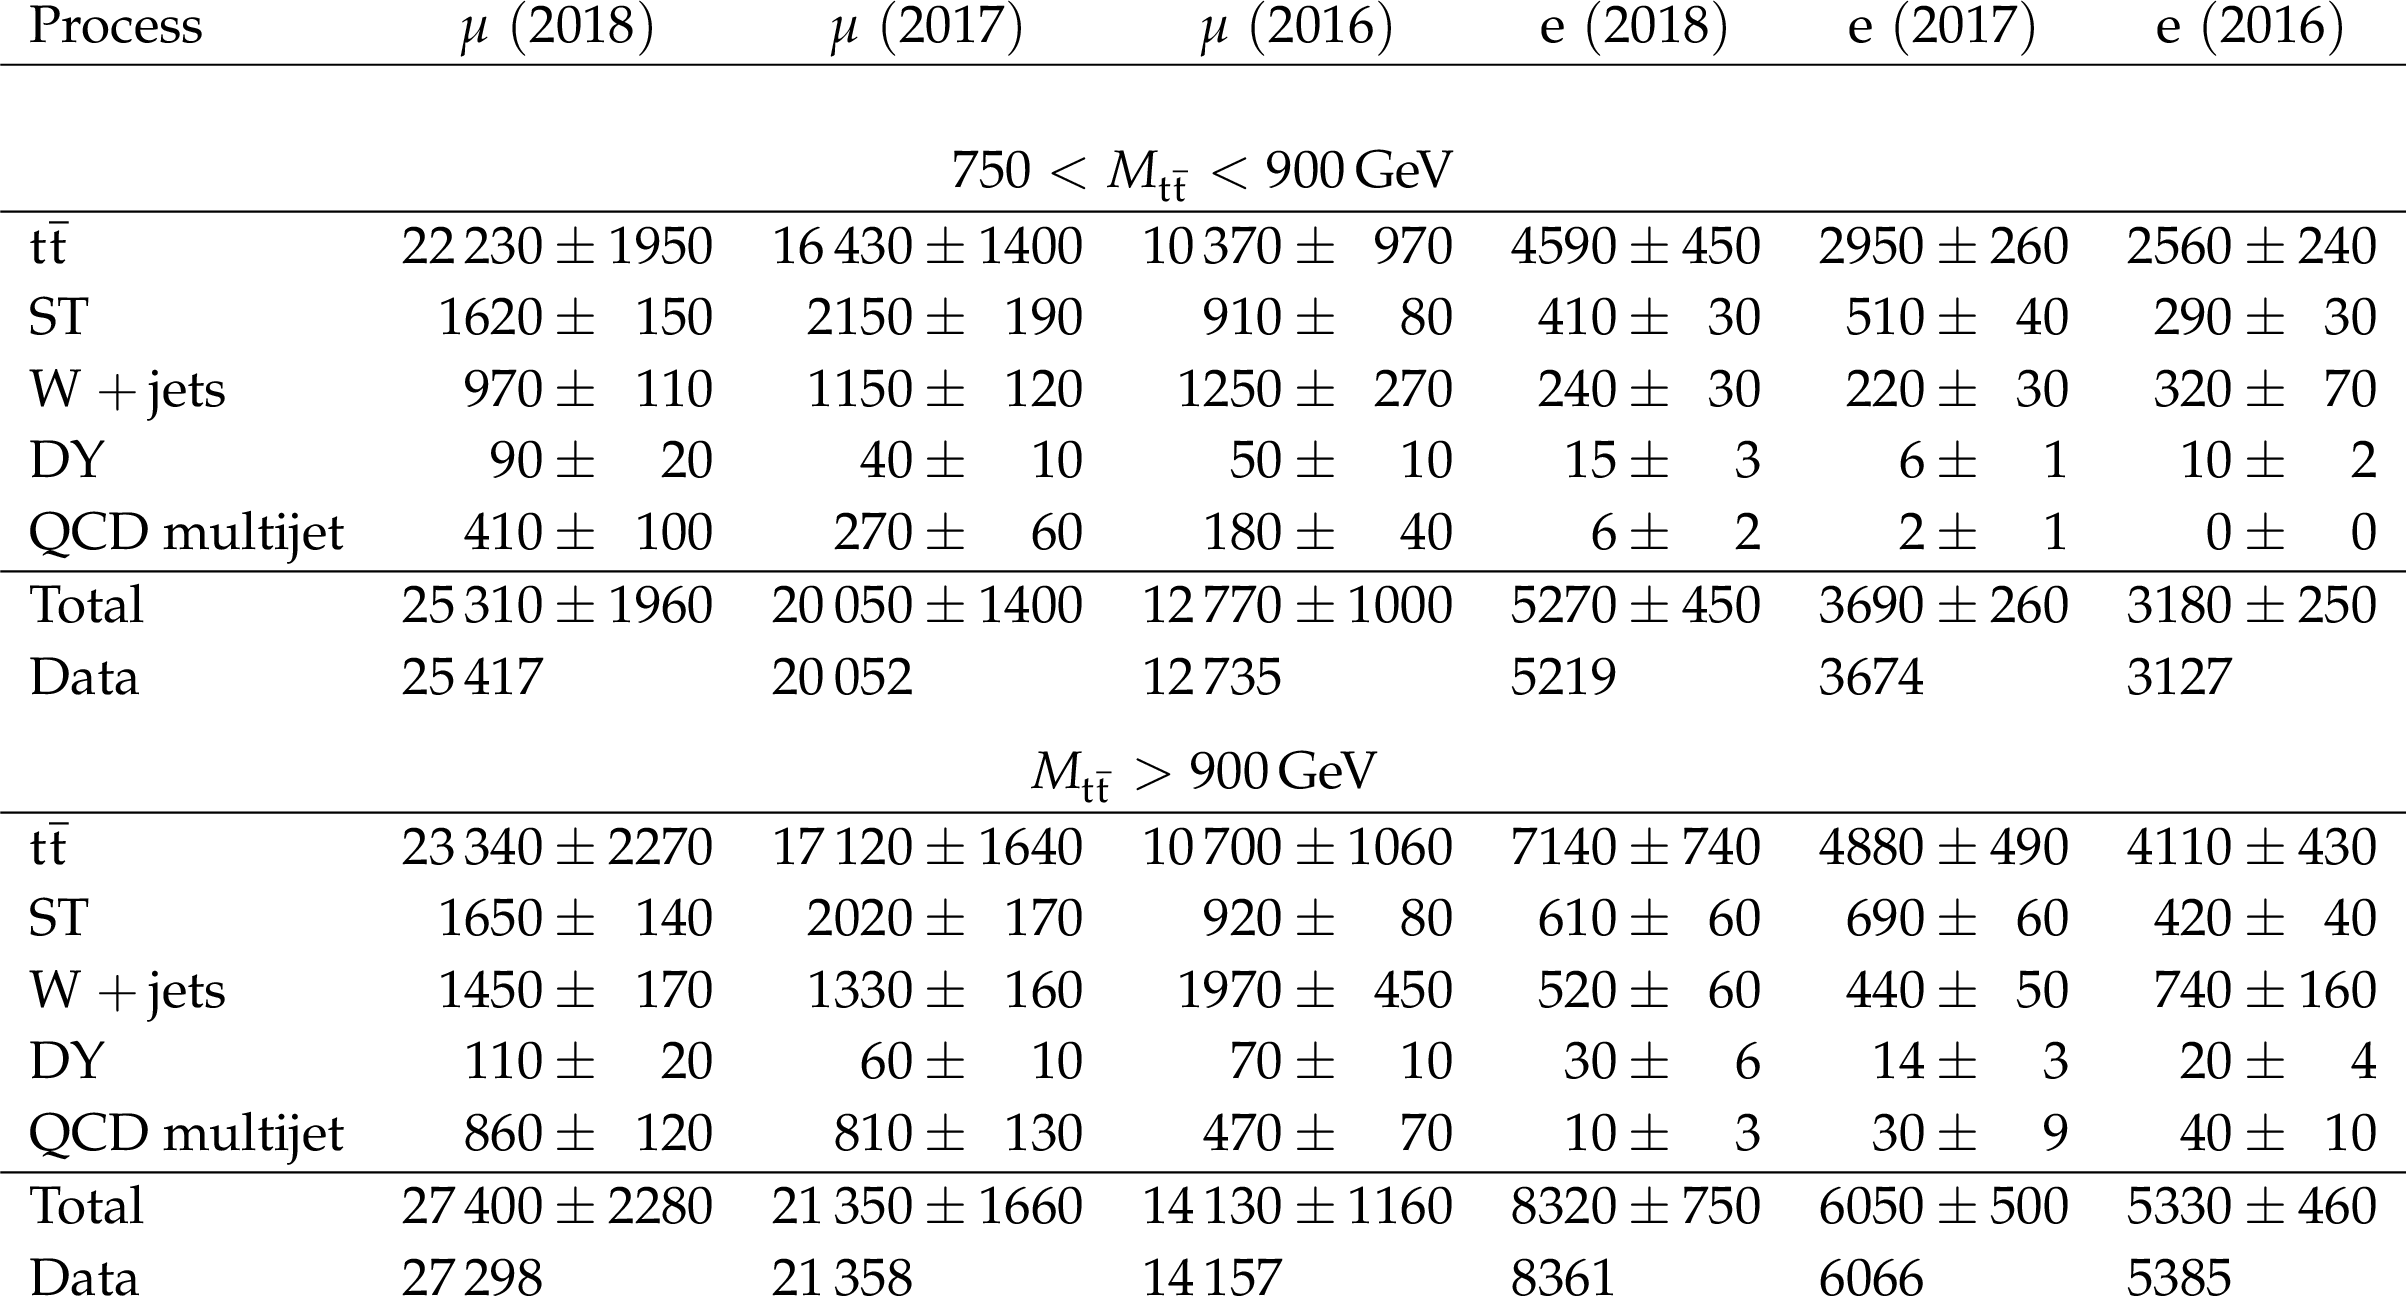
Table 1:
The signal event yields in data and MC simulations after the likelihood fit for each of the 12 channels ($ \mu $+jets, e+jets, 3 years; and two mass regions). The uncertainties in the MC predictions include both statistical and systematic components. |

png pdf |
Table 2:
Measured unfolded charge asymmetry in the fiducial phase space (upper rows) and the full phase space (lower rows) shown for individual channels compared with the theoretical prediction from MC. Results are shown for events with $ {M_{{\mathrm{t} \mathrm{\bar{t}}}}} > $ 750 GeV and for two invariant mass ranges, 750-900 and ${>}$900 GeV. The statistical (stat) and systematic (syst) uncertainties in the data, the MC statistical uncertainty (MC stat), and the total uncertainty in the measured values (Total) are also shown. All values are in percent. |
| Summary |
| A measurement of the charge asymmetry in $\mathrm{t\bar{t}}$ events with highly boosted top quarks produced in proton-proton collisions at $ \sqrt{s}= $ 13 TeV is presented based on 138 fb$ ^{-1} $ of data collected by the CMS experiment at the LHC. The selection is optimized for top quarks produced with high Lorentz boosts that yield collimated decay products that are partially or fully merged and can result in nonisolated leptons and overlapping jets. The measured top quark charge asymmetry ($ A_{\text{C}} $) is corrected for detector and acceptance effects using a binned maximum likelihood fit. This is the first CMS measurement to use 13 TeV data and a binned maximum likelihood unfolding technique to measure $ A_{\text{C}} $ directly at parton level in the full phase space. In addition, it is the first result that focuses exclusively on the highly Lorentz-boosted regime, using dedicated reconstruction techniques for the hadronically and leptonically decaying top quarks at both the trigger and offline stages. Since the relative contribution of valence quarks increases at high momentum transfer, $ A_{\text{C}} $ is especially sensitive to beyond the standard model processes in this highly boosted phase space. The resulting unfolded charge asymmetry for $\mathrm{t\bar{t}}$ events with invariant masses satisfying $ M_{\mathrm{t\bar{t}}} > $ 750 GeV is (0.42$_{- 0.69}^{+ 0.64}$)%, where the uncertainty includes both statistical and systematic components. The corresponding theoretical prediction at next-to-next-to-leading order in QCD perturbation theory with next-to-leading-order electroweak corrections from Ref. [5] is (0.94 $ ^{+ 0.05}_{-0.07} $)%. Good agreement between the measurement and the most precise standard model prediction is thus observed. The result demonstrates that top quark properties can be precisely measured in the highly boosted topology. |
| References | ||||
| 1 | M. Czakon, P. Fiedler, and A. Mitov | Total top-quark pair-production cross section at hadron colliders through $ \mathcal{O}(\alpha^4_s) $ | PRL 110 (2013) 252004 | 1303.6254 |
| 2 | S. Catani et al. | Top-quark pair production at the LHC: Fully differential QCD predictions at NNLO | JHEP 07 (2019) 100 | 1906.06535 |
| 3 | CDF and D0 Collaborations | Combined forward-backward asymmetry measurements in top-antitop quark production at the Tevatron | PRL 120 (2018) 042001 | 1709.04894 |
| 4 | M. Czakon, P. Fiedler, and A. Mitov | Resolving the Tevatron top quark forward-backward asymmetry puzzle: Fully differential next-to-next-to-leading-order calculation | PRL 115 (2015) 052001 | 1411.3007 |
| 5 | M. Czakon et al. | Top-quark charge asymmetry at the LHC and Tevatron through NNLO QCD and NLO EW | PRD 98 (2018) 014003 | 1711.03945 |
| 6 | M. Czakon, D. Heymes, and A. Mitov | High-precision differential predictions for top-quark pairs at the LHC | PRL 116 (2016) 082003 | 1511.00549 |
| 7 | J. Rojo et al. | The PDF4LHC report on PDFs and LHC data: results from Run I and preparation for Run II | JPG 42 (2015) 103103 | 1507.00556 |
| 8 | J. A. Aguilar-Saavedra, A. Juste, and F. Rubbo | Boosting the $ \mathrm{t\bar{t}} $ charge asymmetry | PLB 707 (2012) 92 | 1109.3710 |
| 9 | O. Antunano, J. H. Kuhn, and G. Rodrigo | Top quarks, axigluons and charge asymmetries at hadron colliders | PRD 77 (2008) 014003 | 0709.1652 |
| 10 | P. H. Frampton, J. Shu, and K. Wang | Axigluon as possible explanation for pp $\rightarrow\mathrm{t\bar{t}} $ forward-backward asymmetry | PLB 683 (2010) 294 | 0911.2955 |
| 11 | J. L. Rosner | Prominent decay modes of a leptophobic Z' | PLB 387 (1996) 113 | hep-ph/9607207 |
| 12 | P. Ferrario and G. Rodrigo | Massive color-octet bosons and the charge asymmetries of top quarks at hadron colliders | PRD 78 (2008) 094018 | 0809.3354 |
| 13 | P. Ferrario and G. Rodrigo | Constraining heavy colored resonances from top-antitop quark events | PRD 80 (2009) 051701 | 0906.5541 |
| 14 | J. A. Aguilar-Saavedra and M. Perez-Victoria | Asymmetries in $ \mathrm{t\bar{t}} $ production: LHC versus Tevatron | PRD 84 (2011) 115013 | 1105.4606 |
| 15 | J. A. Aguilar-Saavedra and M. Perez-Victoria | Simple models for the top asymmetry: Constraints and predictions | JHEP 09 (2011) 097 | 1107.0841 |
| 16 | R. Benbrik, C.-H. Chen, and M. El Kacimi | Colored bosons on top FBA and angular cross section for $ \mathrm{t\bar{t}} $ production | PLB 725 (2013) 372 | 1304.2273 |
| 17 | D.-W. Jung, P. Ko, J. S. Lee, and S.-h. Nam | Model independent analysis of the forward-backward asymmetry of top quark production at the Tevatron | PLB 691 (2010) 238 | 0912.1105 |
| 18 | ATLAS and CMS Collaborations | Combination of inclusive and differential $ \mathrm{t} \overline{\mathrm{t}} $ charge asymmetry measurements using ATLAS and CMS data at $ \sqrt{s}= $ 7 and 8 TeV | JHEP 04 (2018) 033 | 1709.05327 |
| 19 | C. Zhang and S. Willenbrock | Effective-field-theory approach to top-quark production and decay | PRD 83 (2011) 034006 | 1008.3869 |
| 20 | J. Ellis et al. | Top, Higgs, diboson and electroweak fit to the Standard Model effective field theory | JHEP 04 (2021) 279 | 2012.02779 |
| 21 | ATLAS Collaboration | Differential $ t\bar{t} $ cross-section measurements using boosted top quarks in the all-hadronic final state with 139 fb$ ^{-1} $ of ATLAS data | 5, 2022 | 2205.02817 |
| 22 | CMS Collaboration | Search for resonant $ \mathrm{t}\overline{\mathrm{t}} $ production in proton-proton collisions at $ \sqrt{s}= $ 13 TeV | JHEP 04 (2019) 031 | CMS-B2G-17-017 1810.05905 |
| 23 | CMS Collaboration | HEPData record for this analysis | link | |
| 24 | CMS Collaboration | Performance of the CMS Level-1 trigger in proton-proton collisions at $ \sqrt{s} = $ 13 TeV | JINST 15 (2020) P10017 | CMS-TRG-17-001 2006.10165 |
| 25 | CMS Collaboration | The CMS trigger system | JINST 12 (2017) P01020 | CMS-TRG-12-001 1609.02366 |
| 26 | CMS Collaboration | The CMS experiment at the CERN LHC | JINST 3 (2008) S08004 | CMS-00-001 |
| 27 | CMS Collaboration | Particle-flow reconstruction and global event description with the CMS detector | JINST 12 (2017) P10003 | CMS-PRF-14-001 1706.04965 |
| 28 | CMS Collaboration | Description and performance of track and primary-vertex reconstruction with the CMS tracker | JINST 9 (2014) P10009 | CMS-TRK-11-001 1405.6569 |
| 29 | CMS Collaboration | Technical proposal for the Phase-II upgrade of the Compact Muon Solenoid | CMS-PAS-TDR-15-002 | CMS-PAS-TDR-15-002 |
| 30 | M. Cacciari, G. P. Salam, and G. Soyez | The anti-$ {k_{\mathrm{T}}} $ jet clustering algorithm | JHEP 04 (2008) 063 | 0802.1189 |
| 31 | M. Cacciari, G. P. Salam, and G. Soyez | FastJet user manual | EPJC 72 (2012) 1896 | 1111.6097 |
| 32 | D. Bertolini, P. Harris, M. Low, and N. Tran | Pileup per particle identification | JHEP 10 (2014) 059 | 1407.6013 |
| 33 | CMS Collaboration | Pileup mitigation at CMS in 13 TeV data | JINST 15 (2020) P09018 | CMS-JME-18-001 2003.00503 |
| 34 | CMS Collaboration | Performance of missing transverse momentum reconstruction in proton-proton collisions at $ \sqrt{s} = $ 13 TeV using the CMS detector | JINST 14 (2019) P07004 | CMS-JME-17-001 1903.06078 |
| 35 | CMS Collaboration | Determination of jet energy calibration and transverse momentum resolution in CMS | JINST 6 (2011) P11002 | CMS-JME-10-011 1107.4277 |
| 36 | CMS Collaboration | Jet energy scale and resolution in the CMS experiment in pp collisions at 8 TeV | JINST 12 (2017) P02014 | CMS-JME-13-004 1607.03663 |
| 37 | CMS Collaboration | Identification of heavy, energetic, hadronically decaying particles using machine-learning techniques | JINST 15 (2020) P06005 | CMS-JME-18-002 2004.08262 |
| 38 | A. J. Larkoski, S. Marzani, G. Soyez, and J. Thaler | Soft drop | JHEP 05 (2014) 146 | 1402.2657 |
| 39 | J. Thaler and K. Van Tilburg | Identifying boosted objects with N-subjettiness | JHEP 03 (2011) 015 | 1011.2268 |
| 40 | CMS Collaboration | Identification of heavy-flavour jets with the CMS detector in pp collisions at 13 TeV | JINST 13 (2018) P05011 | CMS-BTV-16-002 1712.07158 |
| 41 | E. Bols et al. | Jet flavour classification using DeepJet | JINST 15 (2020) P12012 | 2008.10519 |
| 42 | CMS Collaboration | Precision luminosity measurement in proton-proton collisions at $ \sqrt{s} = $ 13 TeV in 2015 and 2016 at CMS | EPJC 81 (2021) 800 | CMS-LUM-17-003 2104.01927 |
| 43 | CMS Collaboration | CMS luminosity measurement for the 2017 data-taking period at $ \sqrt{s} = $ 13 TeV | CMS-PAS-LUM-17-004 | CMS-PAS-LUM-17-004 |
| 44 | CMS Collaboration | CMS luminosity measurement for the 2018 data-taking period at $ \sqrt{s} = $ 13 TeV | CMS-PAS-LUM-18-002 | CMS-PAS-LUM-18-002 |
| 45 | CMS Collaboration | Measurement of differential $ \mathrm{t\bar{t}} $ production cross sections in the full kinematic range using lepton+jets events from proton-proton collisions at $ \sqrt {s} = $ 13 TeV | PRD 104 (2021) 092013 | CMS-TOP-20-001 2108.02803 |
| 46 | S. Frixione, P. Nason, and G. Ridolfi | A Positive-weight next-to-leading-order Monte Carlo for heavy flavour hadroproduction | JHEP 09 (2007) 126 | 0707.3088 |
| 47 | S. Alioli, P. Nason, C. Oleari, and E. Re | A general framework for implementing NLO calculations in shower Monte Carlo programs: the POWHEG BOX | JHEP 06 (2010) 043 | 1002.2581 |
| 48 | J. Alwall et al. | The automated computation of tree-level and next-to-leading order differential cross sections, and their matching to parton shower simulations | JHEP 07 (2014) 079 | 1405.0301 |
| 49 | T. Sjostrand et al. | An introduction to PYTHIA 8.2 | CPC 191 (2015) 159 | 1410.3012 |
| 50 | CMS Collaboration | Extraction and validation of a new set of CMS PYTHIA 8 tunes from underlying-event measurements | EPJC 80 (2020) 4 | CMS-GEN-17-001 1903.12179 |
| 51 | GEANT4 Collaboration | GEANT 4 --- a simulation toolkit | NIM A 506 (2003) 250 | |
| 52 | NNPDF Collaboration | Parton distributions for the LHC Run II | JHEP 04 (2015) 040 | 1410.8849 |
| 53 | CMS Collaboration | Search for $ \mathrm{t\bar{t}} $ resonances in highly-boosted lepton+jets and fully hadronic final stated in proton-proton collisions at 13 TeV | JHEP 07 (2017) 001 | CMS-B2G-16-015 1704.03366 |
| 54 | CMS Collaboration | Measurement of the top quark polarization and spin correlations using dilepton final states in proton-proton collisions at 13 TeV | PRD 100 (2019) 072002 | CMS-TOP-18-006 1907.03729 |
| 55 | M. Czakon and A. Mitov | Top++: A program for the calculation of the top-pair cross-section at hadron colliders | Comput. Phys. Commun. 185 (2014) 2930 | 1112.5675 |
| 56 | CMS Collaboration | Measurement of the inelastic proton-proton cross section at $ \sqrt{s}= $ 13 TeV | JHEP 07 (2018) 161 | CMS-FSQ-15-005 1802.02613 |
| 57 | CMS Collaboration | Performance of the DeepJet b tagging algorithm using 41.9 fb$^{-1}$ of data from proton-proton collisions at 13 TeV with the Phase 1 CMS detector | CDS | |
| 58 | NNPDF Collaboration | Parton distributions from high-precision collider data | EPJC 77 (2017) 663 | 1706.00428 |
| 59 | ATLAS, CMS, and the LHC Higgs Combination Group | Procedure for the LHC Higgs boson search combination in Summer 2011 | CMS-NOTE-2011-005, ATL-PHYS-PUB-2011-11, 2011 link |
|
| 60 | R. J. Barlow and C. Beeston | Fitting using finite Monte Carlo samples | CPC 77 (1993) 219 | |
| 61 | CMS Collaboration | Combine: Software tools used for statistical analysis | link | |
|
|
Compact Muon Solenoid LHC, CERN |
|

|

|

|

|

|