

Compact Muon Solenoid
LHC, CERN
| CMS-B2G-20-003 ; CERN-EP-2022-020 | ||
| Search for new particles in an extended Higgs sector with four b quarks in the final state at $ \sqrt{s} = $ 13 TeV | ||
| CMS Collaboration | ||
| 1 March 2022 | ||
| Phys. Lett. B 835 (2022) 137566 | ||
| Abstract: A search for a massive resonance X decaying to a pair of spin-0 bosons $ \phi $ that themselves decay to pairs of bottom quarks, is presented. The analysis is restricted to the mass ranges $ m_\phi $ from 25 to 100 GeV and $ m_\mathrm{X} $ from 1 to 3 TeV. For these mass ranges, the decay products of each $ \phi $ boson are expected to merge into a single large-radius jet. Jet substructure and flavor identification techniques are used to identify these jets. The search is based on CERN LHC proton-proton collision data at $ \sqrt{s}= $ 13 TeV, collected with the CMS detector in 2016--2018, corresponding to an integrated luminosity of 138 fb$ ^{-1} $. Model-specific limits, where the two new particles arise from an extended Higgs sector, are set on the product of the production cross section and branching fraction for $ \mathrm{X} \to \phi\phi \to (\mathrm{b}\overline{\mathrm{b}})(\mathrm{b}\overline{\mathrm{b}}) $ as a function of the resonances' masses, where both the $ \mathrm{X} \to \phi\phi $ and $ \phi \to \mathrm{b}\overline{\mathrm{b}} $ branching fractions are assumed to be 100%. These limits are the first of their kind on this process, ranging between 30 and 1 fb at 95% confidence level for the considered mass ranges. | ||
| Links: e-print arXiv:2203.00480 [hep-ex] (PDF) ; CDS record ; inSPIRE record ; HepData record ; Physics Briefing ; CADI line (restricted) ; | ||
| Figures | |

png pdf |
Figure 1:
Feynman diagram of the production and decay of $ \mathrm{X} \to \phi\phi \to (\mathrm{b}\overline{\mathrm{b}})(\mathrm{b}\overline{\mathrm{b}}) $. The dominant production mechanism occurs via a fermion loop as shown in the diagram. Additional partons may be present, produced by initial-state or final-state radiation. |
png pdf |
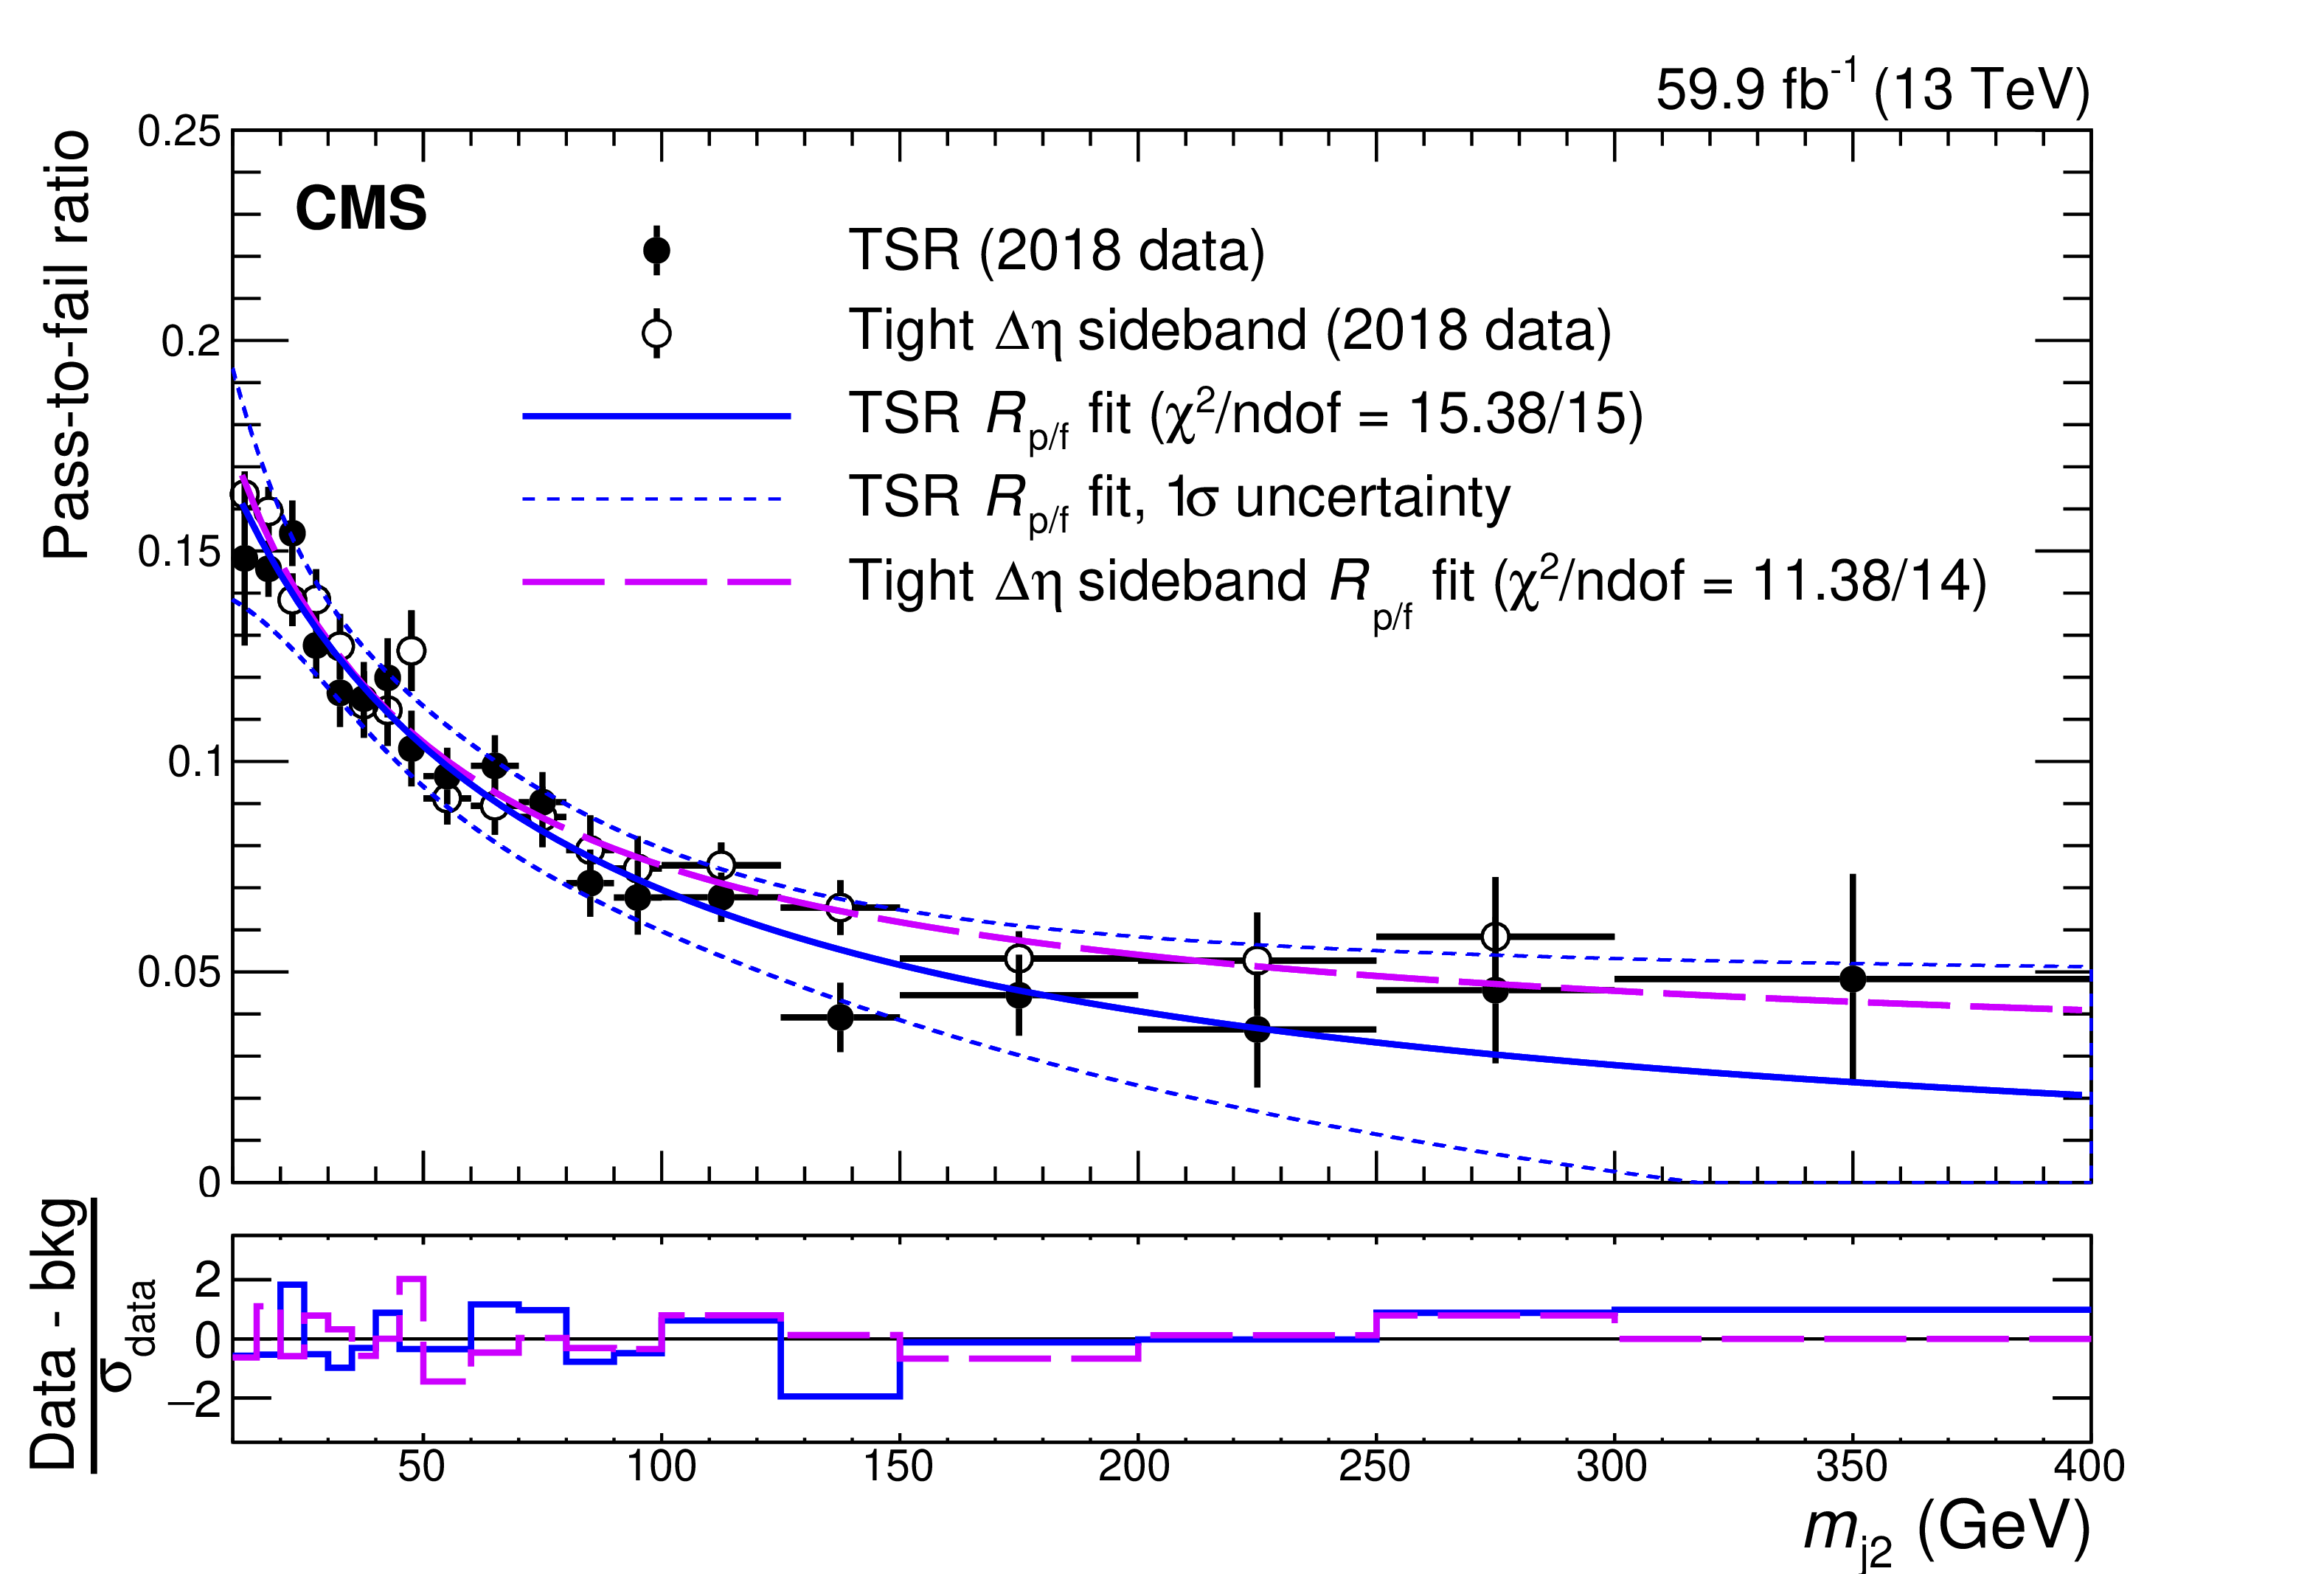
Figure 2:
Distributions of the ratio of event passing and failing the $ D^{\mathrm{b}\mathrm{b}}_{\mathrm{j}_2} > $ 0.6 requirement, as a function of the subleading jet groomed mass $ m_{\mathrm{j}_2} $, in 2018 data, for the TSR (filled markers) and the tight $ |\Delta\eta| $ sidebands (open markers). The arctangent $ R_{\text{p/f}} $ fit from which the background is estimated is shown by the solid line in the case of the TSR, and by the thick dashed line for the sideband, with the resulting $ \chi^2 $ and degrees of freedom indicated in the legend. The 1$ \sigma $ uncertainty band of the fit in the TSR, from which systematic uncertainties on the QCD background estimate are derived, is shown by the thin dashed lines. Similar results were obtained for 2016 and 2017 data and in the three LSRs. The lower panel shows the difference between the observed data and the fits, divided by the statistical uncertainty of the ratio of passing and failing events in the data for each bin. |

png pdf |
Figure 3:
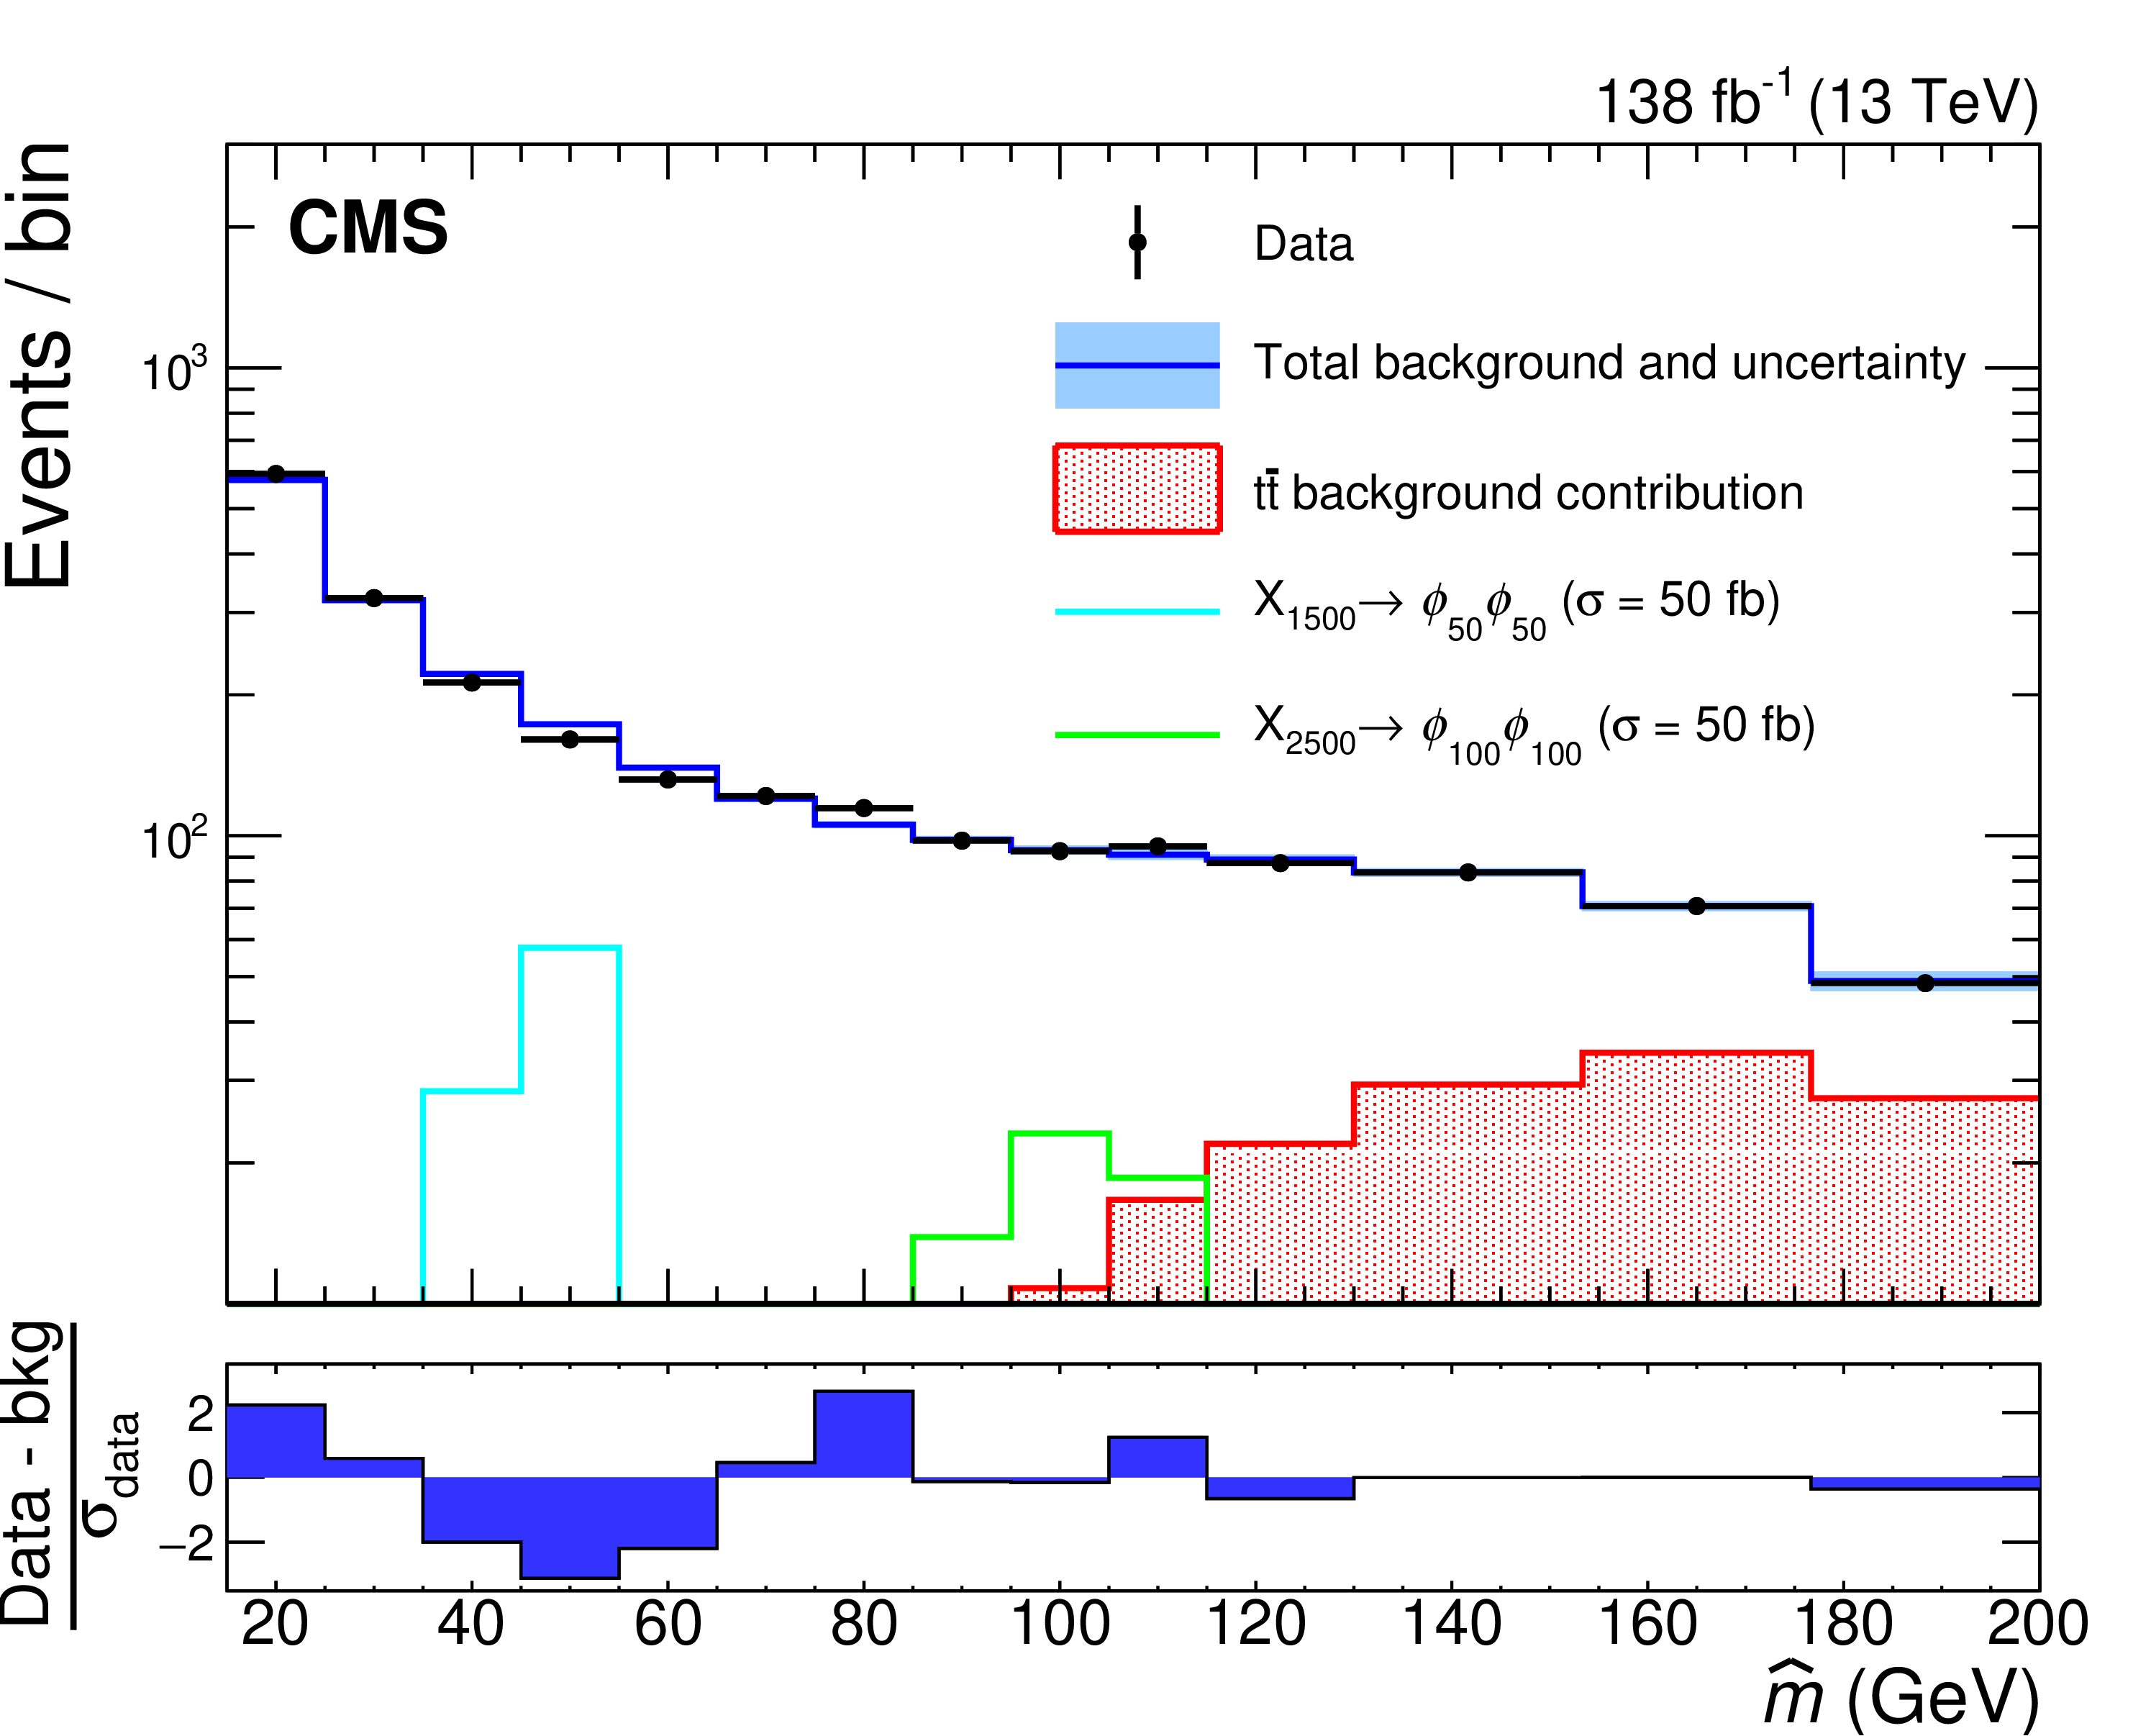
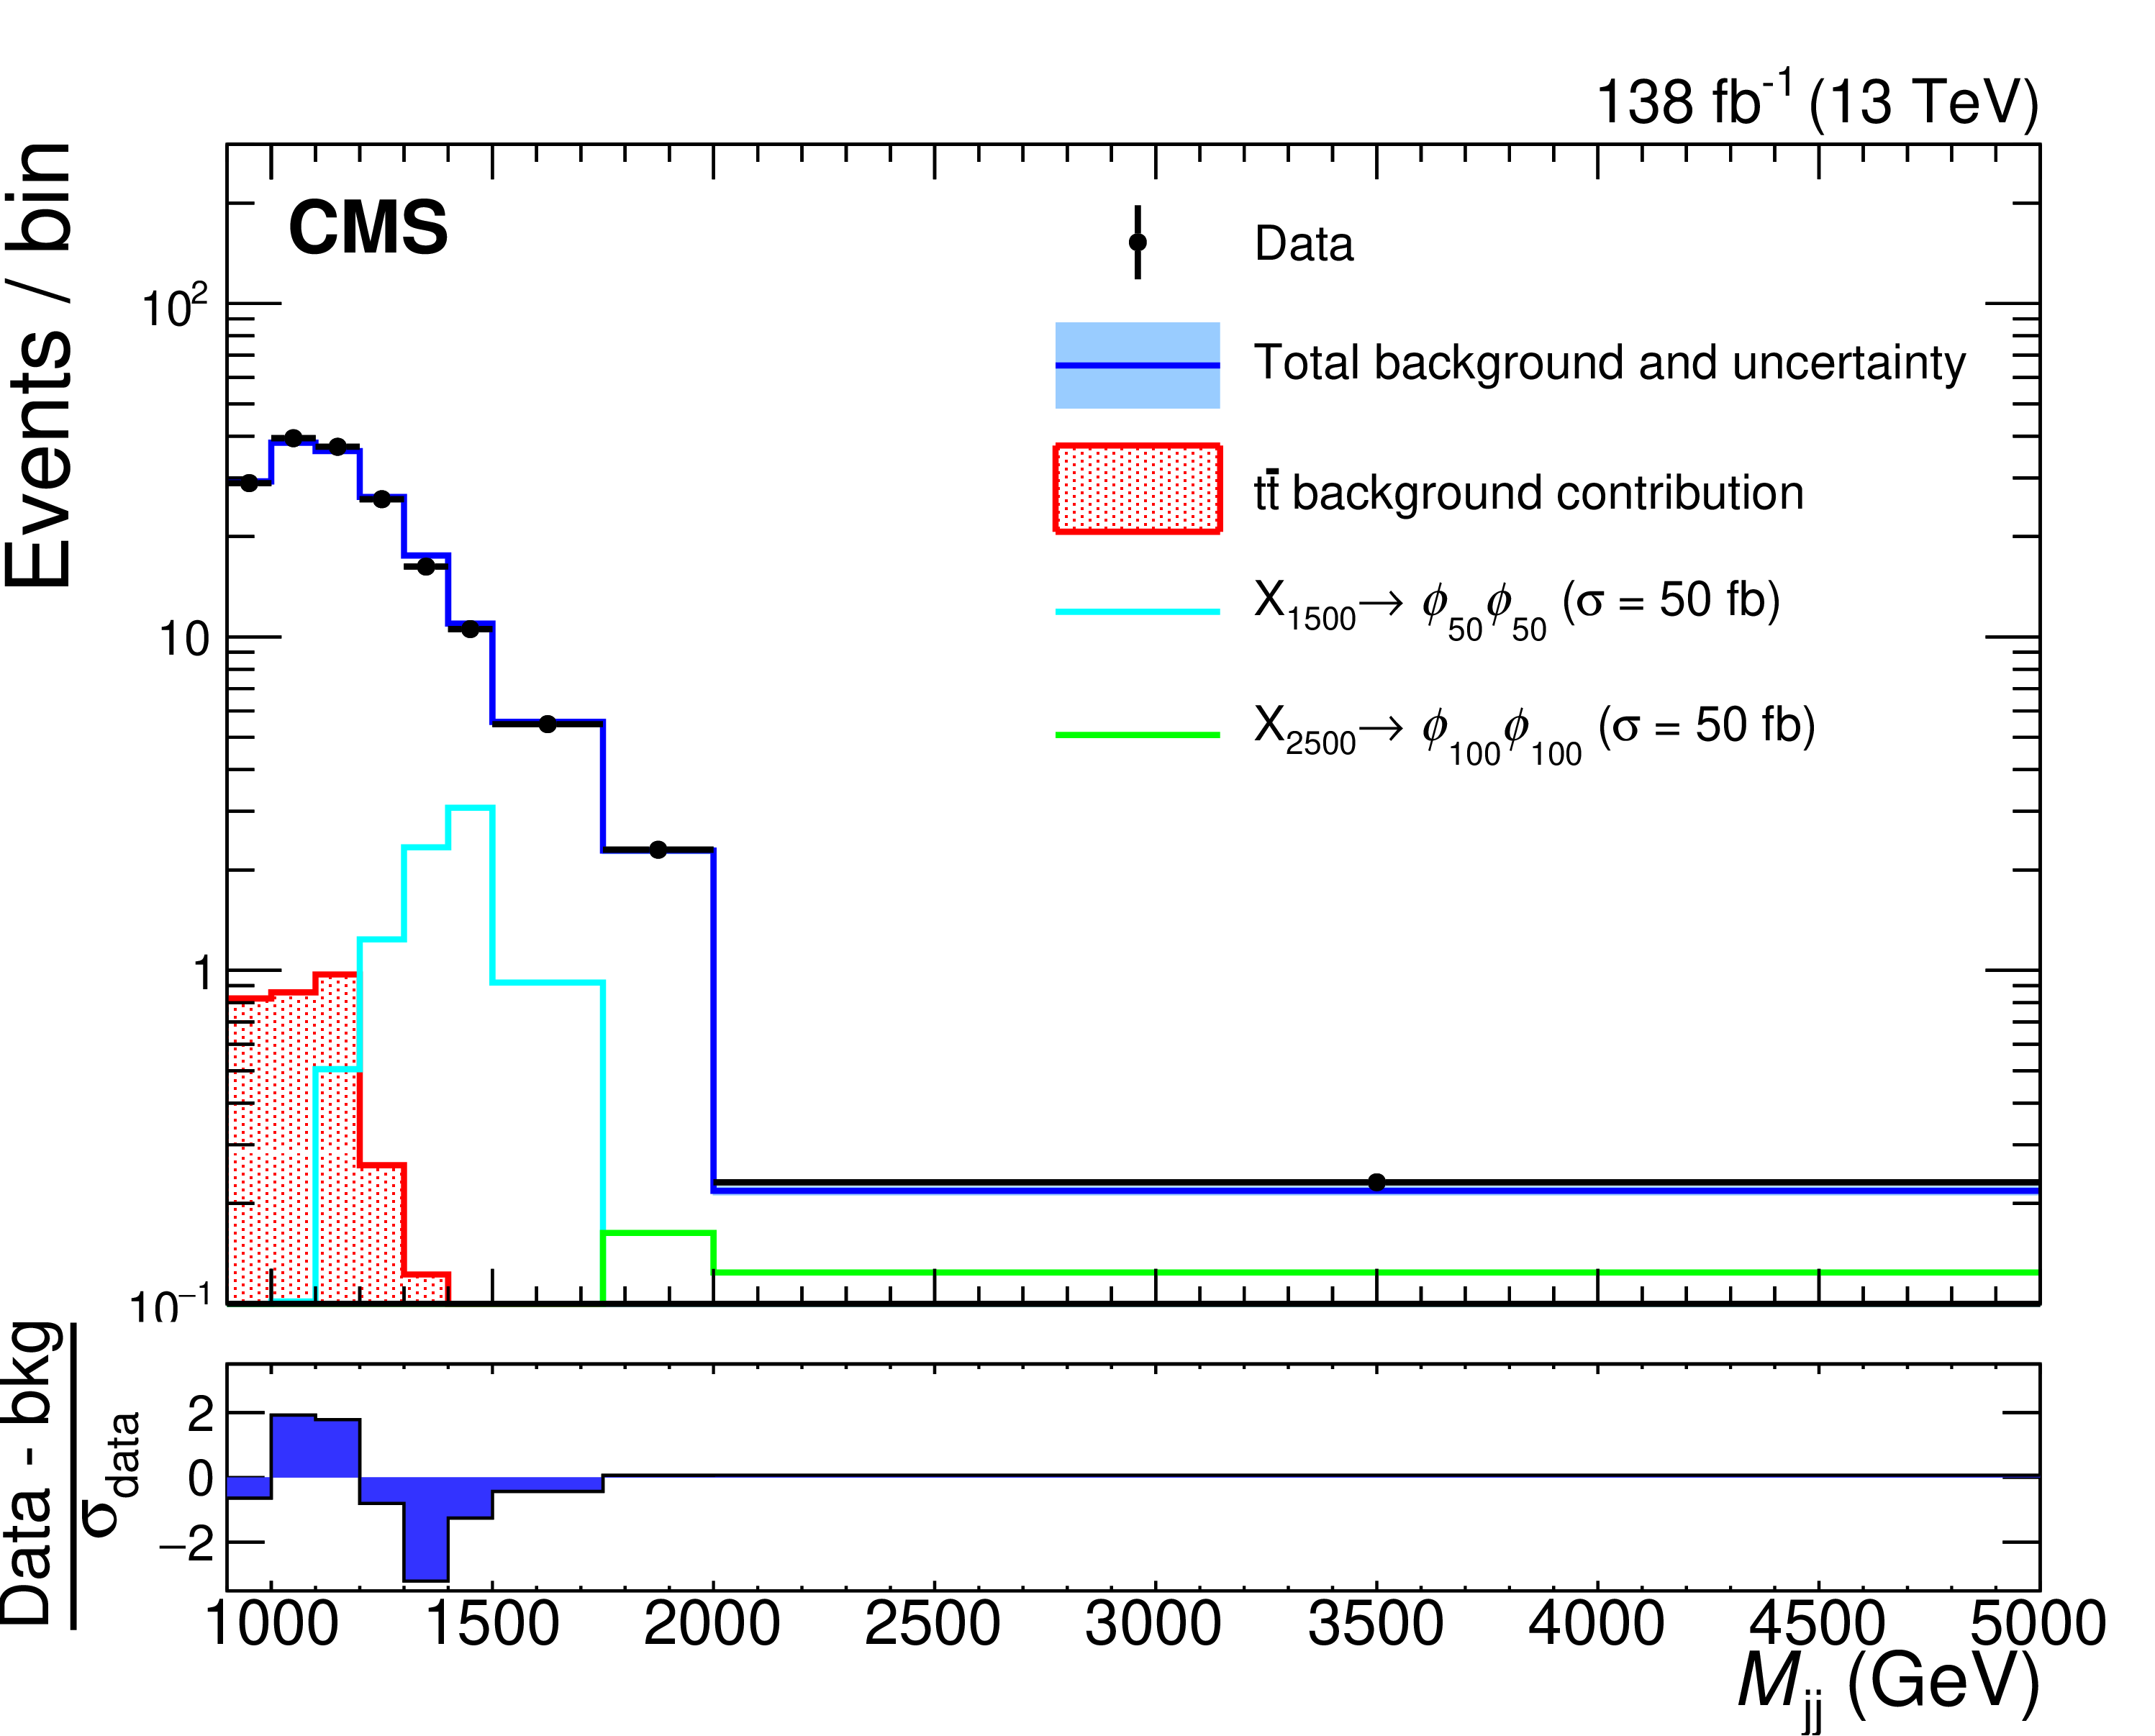
Distributions of average jet mass (left) and dijet mass (right), and background estimate of the combined search regions after the final fit is performed. The blue (solid) line represents the sum of the estimated QCD and $ \mathrm{t} \overline{\mathrm{t}} $ backgrounds, and the red filled histogram shows the $ \mathrm{t} \overline{\mathrm{t}} $ contribution alone. The shaded areas around the background estimate in the upper panels represent the total uncertainty in the total background estimate in that bin. The shapes of two representative signals, each normalized to cross sections of 50 fb, are indicated by solid colored lines. The lower panel shows the difference between the observed data and the background prediction, divided by $ \sigma_{\text{data}} $, the statistical uncertainty of the data in each bin. |
png pdf |
Figure 3-a:
Distribution of average jet mass, and background estimate of the combined search regions after the final fit is performed. The blue (solid) line represents the sum of the estimated QCD and $ \mathrm{t} \overline{\mathrm{t}} $ backgrounds, and the red filled histogram shows the $ \mathrm{t} \overline{\mathrm{t}} $ contribution alone. The shaded area around the background estimate in the upper panel represents the total uncertainty in the total background estimate in that bin. The shapes of two representative signals, each normalized to cross sections of 50 fb, are indicated by solid colored lines. The lower panel shows the difference between the observed data and the background prediction, divided by $ \sigma_{\text{data}} $, the statistical uncertainty of the data in each bin. |
png pdf |
Figure 3-b:
Distribution of average dijet mass, and background estimate of the combined search regions after the final fit is performed. The blue (solid) line represents the sum of the estimated QCD and $ \mathrm{t} \overline{\mathrm{t}} $ backgrounds, and the red filled histogram shows the $ \mathrm{t} \overline{\mathrm{t}} $ contribution alone. The shaded area around the background estimate in the upper panel represents the total uncertainty in the total background estimate in that bin. The shapes of two representative signals, each normalized to cross sections of 50 fb, are indicated by solid colored lines. The lower panel shows the difference between the observed data and the background prediction, divided by $ \sigma_{\text{data}} $, the statistical uncertainty of the data in each bin. |

png pdf |
Figure 4:
The average jet mass distributions in consecutive dijet mass intervals. The vertical dashed lines separate the average jet mass distributions in each bin of $ M_{\mathrm{jj}} $. The individual bins within such subdivisions correspond to the $ \hat{m} $ spectrum (from 15 to 200 GeV), as seen in Fig. 3 (left). Representative signal shapes are also shown; we note that they peak in the $ \hat{m} $ spectrum within subdivisions, and may appear in multiple $ M_{\mathrm{jj}} $ bins. The blue (solid) line represents the sum of the estimated QCD and $ \mathrm{t} \overline{\mathrm{t}} $ backgrounds, and the red filled histogram shows the $ \mathrm{t} \overline{\mathrm{t}} $ contribution alone. The shaded areas around the background estimate in the upper panels represent the total uncertainty in the total background estimate in that bin. The shapes of three representative signals, each normalized to cross sections of 50 fb are indicated by solid colored lines. The lower panel shows the difference between the observed data and the background prediction, divided by $ \sigma_{\text{data}} $, the statistical uncertainty of the data in each bin. |
png pdf |
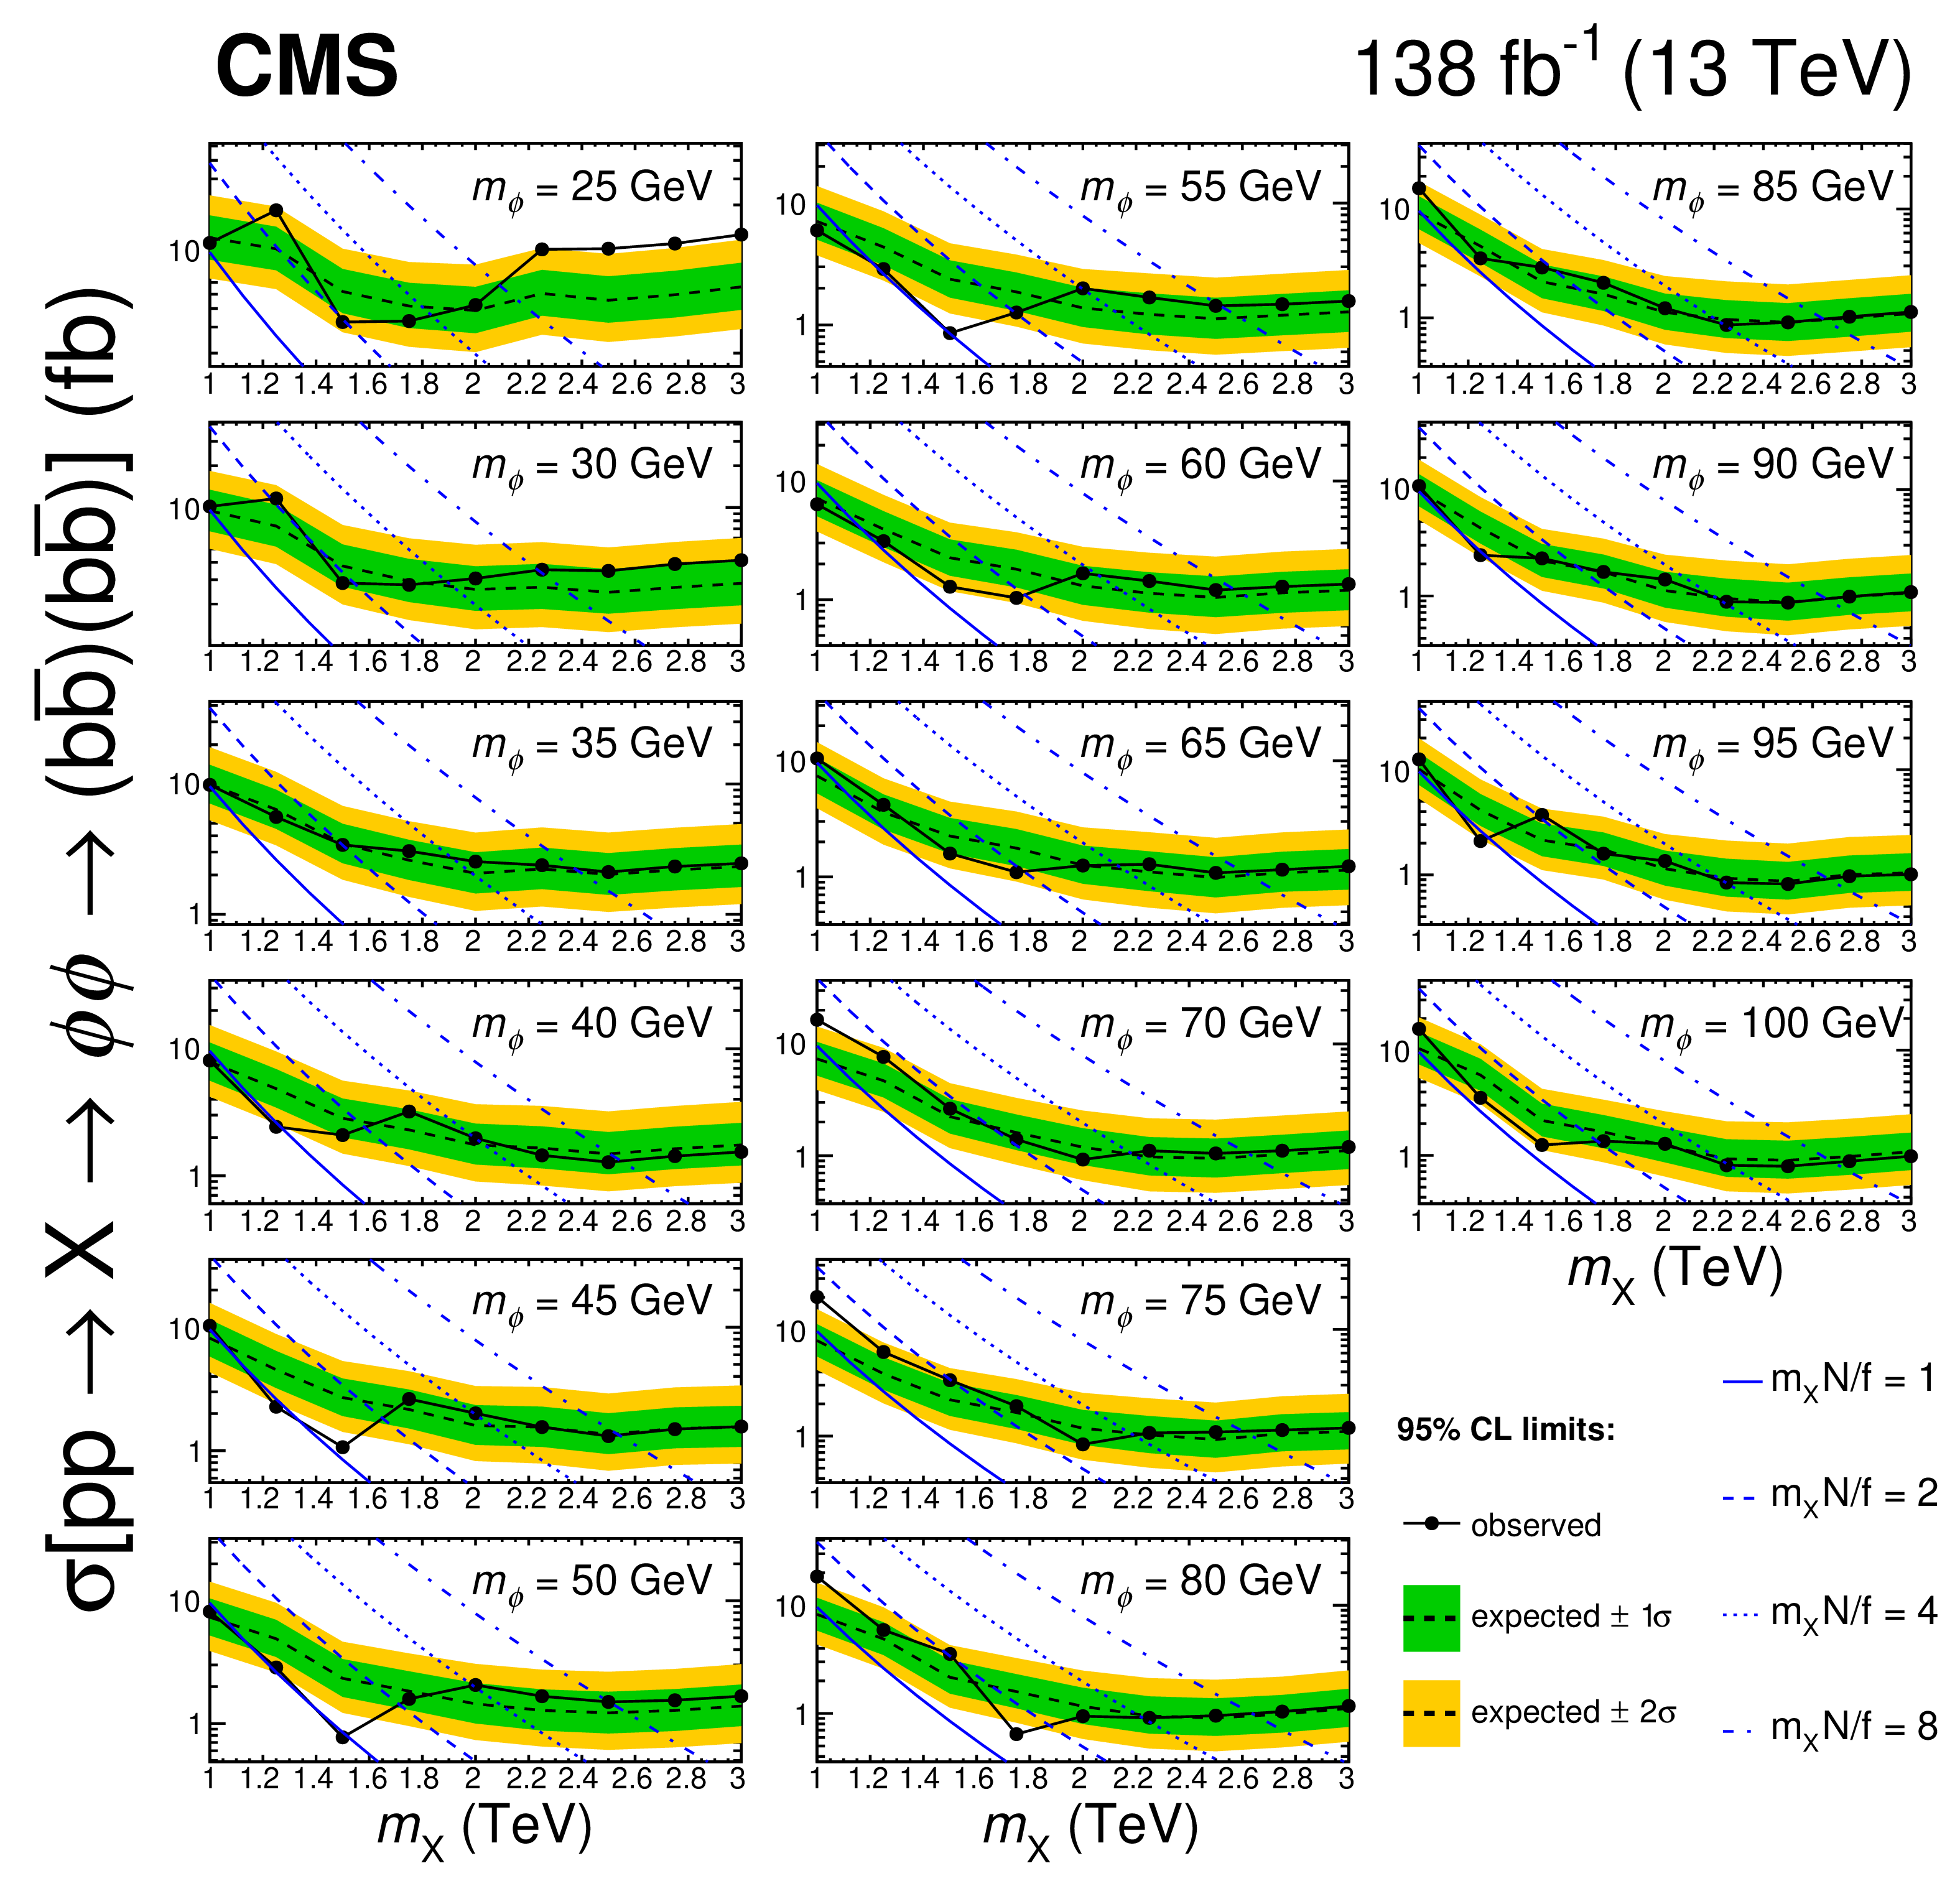
Figure 5:
Upper limits at 95% CL on the cross section of the process $ \mathrm{p}\mathrm{p} \to \mathrm{X} \to \phi\phi \to (\mathrm{b}\overline{\mathrm{b}})(\mathrm{b}\overline{\mathrm{b}}) $, as a function of the mass of $ m_\mathrm{X} $, for different values of $ m_\phi $. Both the $ \mathrm{X} \to \phi\phi $ and $ \phi \to \mathrm{b} \overline{\mathrm{b}} $ branching fractions are assumed to be 100%. Each subpanel shows the limits for a fixed value of $ m_\phi $. The observed limits are shown as solid black lines with markers, while the expected limits are dotted. The yellow (outer) and green (inner) bands represent one and two standard deviation intervals. The theoretical cross section for different values of the parameter $ m_{\mathrm{X}} N/f $ are shown with dotted and dashed curves. |
| Tables | |
png pdf |
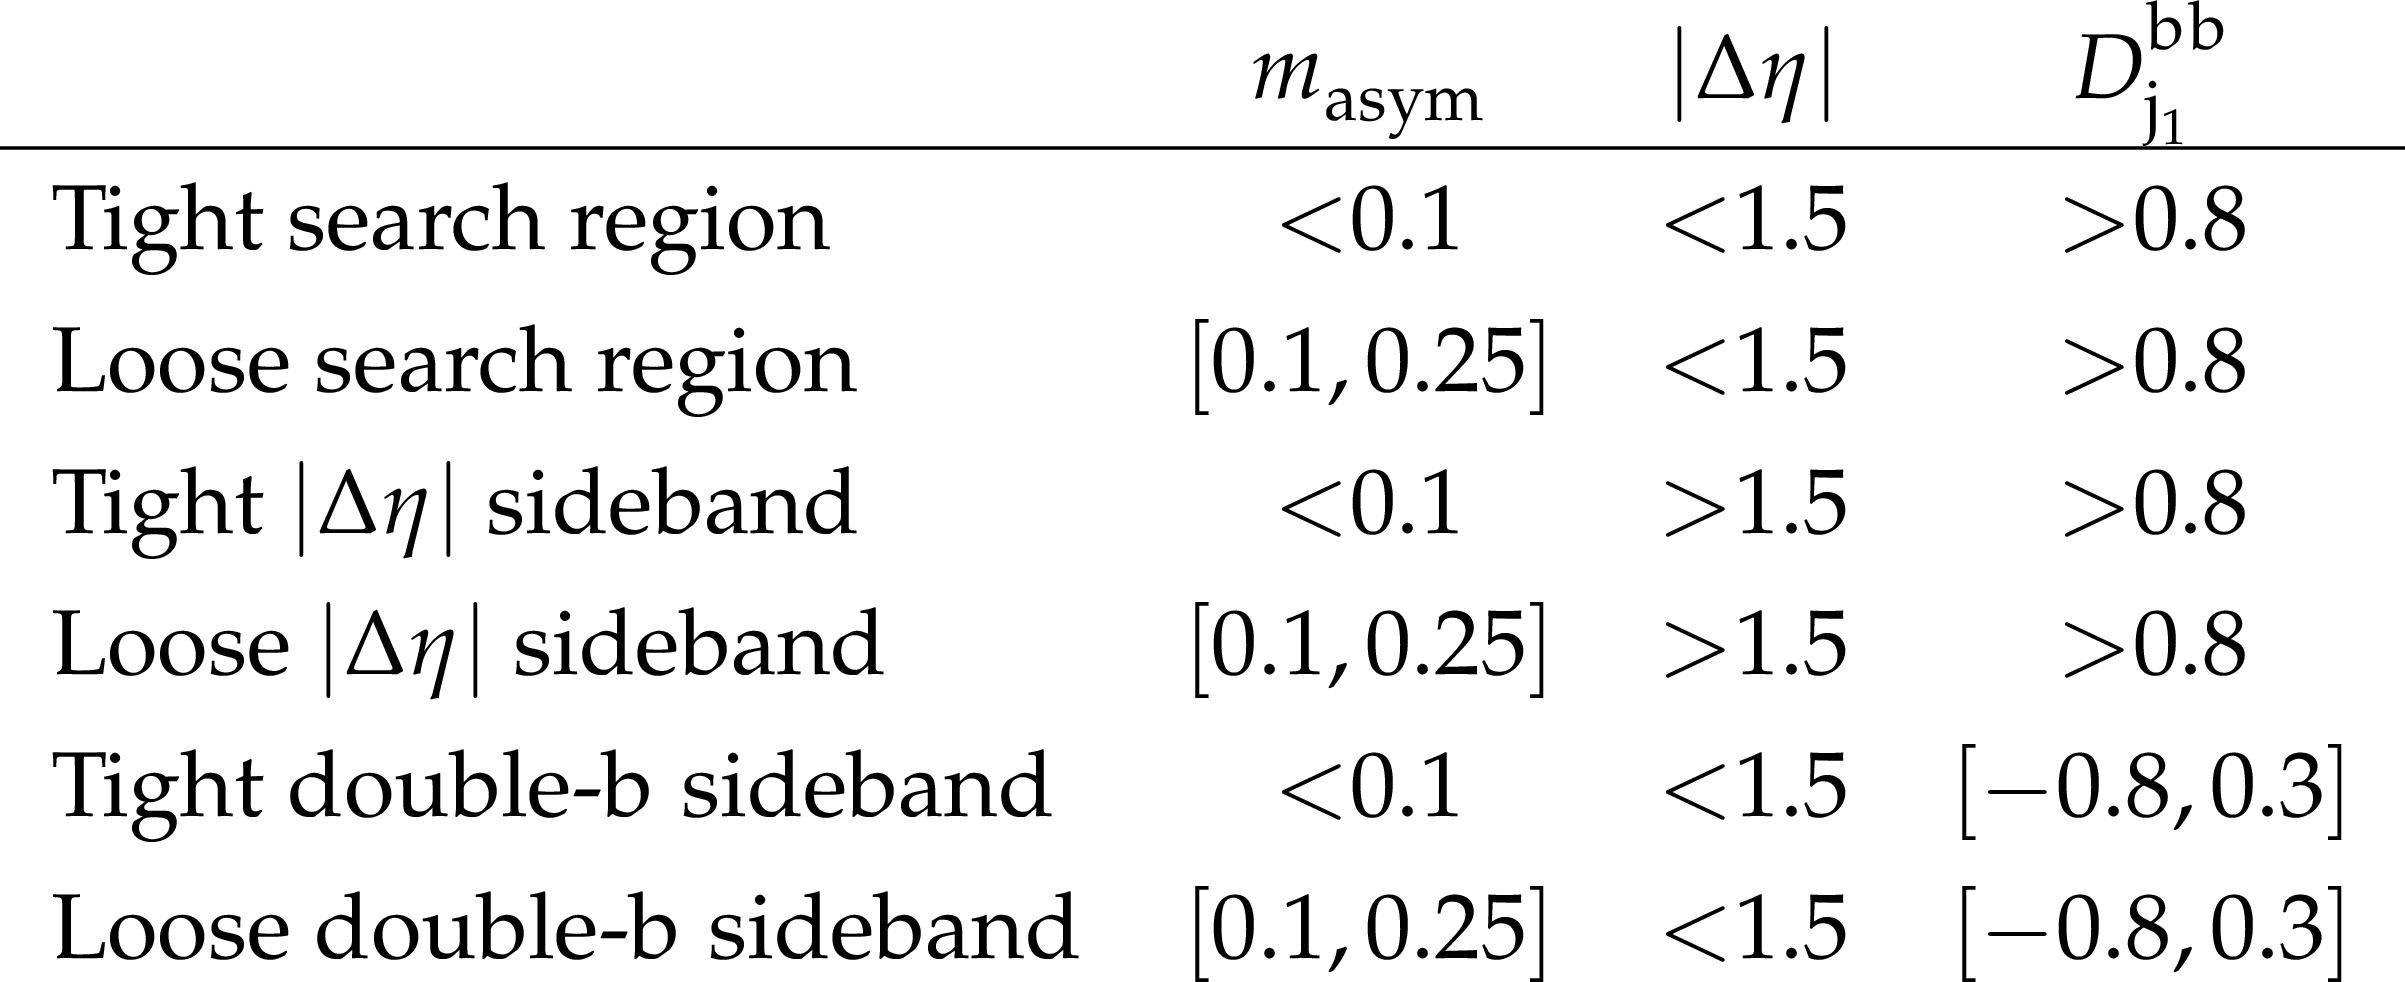
Table 1:
Search and control regions used in the analysis. A selection on the subleading jet double-b-tagger discriminant $ D^{\mathrm{b}\mathrm{b}}_{\mathrm{j}_2} > $ 0.6 further separates each region into ``passing'' and ``failing'' categories. |

png pdf |
Table 2:
Sources of systematic uncertainties considered in the analysis. The uncertainty in the integrated luminosity only affects the normalization; for the rest, both the shape and normalization are affected. The parameters affecting only the normalization have log-normal priors, and those affecting the shape (or both the shape and normalization) have Gaussian priors, except for the statistical uncertainty in the failing region, whose parameters were sampled from a $ \Gamma $ distribution. Uncertainties marked with R are correlated between the TSR and LSR for a given year of data-taking, and those marked with Y are correlated between both search regions in all three years. All other uncertainties are uncorrelated between search regions. The values indicated in the table represent the pre-fit values of the uncertainty in the parameter. When a range is given, it indicates the typical variation of the size of the uncertainty over the average jet mass and dijet mass distribution. We note that all $ \mathrm{t} \overline{\mathrm{t}} $ uncertainties are propagated into the QCD backgroound estimate. |
| Summary |
| A search for massive resonances (X) decaying to pairs of spin-0 bosons ($ \phi $) that themselves decay into b quark-antiquark pairs has been presented. The analysis is restricted to the case where the mass ratio of the resonance and the scalar bosons is such that each pair of b quarks is reconstructed as a single large-radius jet. Data from proton-proton collisions at the LHC at $ \sqrt{s}= $ 13 TeV collected in 2016--2018 with the CMS detector, corresponding to an integrated luminosity of 138 fb$ ^{-1} $, have been used. Upper limits are set at 95% confidence level on the product of production cross section and branching fraction as a function of mass for $ \mathrm{X} \to \phi\phi\to (\mathrm{b}\overline{\mathrm{b}})(\mathrm{b}\overline{\mathrm{b}}) $, where both the $ \mathrm{X} \to \phi\phi $ and $ \phi \to \mathrm{b} \overline{\mathrm{b}} $ branching fractions are assumed to be 100%. These are the first limits on this process, and range between 30 and 1 fb for a $ \phi $ mass in the range 25--100 GeV and an X mass in the range 1--3 TeV. |
| References | ||||
| 1 | CMS Collaboration | Observation of a new boson at a mass of 125 GeV with the CMS experiment at the LHC | PLB 716 (2012) 30 | CMS-HIG-12-028 1207.7235 |
| 2 | CMS Collaboration | Observation of a new boson with mass near 125 GeV in pp collisions at $ \sqrt{s}= $ 7 and 8 TeV | JHEP 06 (2013) 081 | CMS-HIG-12-036 1303.4571 |
| 3 | ATLAS Collaboration | Observation of a new particle in the search for the Standard Model Higgs boson with the ATLAS detector at the LHC | PLB 716 (2012) 1 | 1207.7214 |
| 4 | G. C. Dorsch, S. J. Huber, K. Mimasu, and J. M. No | Hierarchical versus degenerate 2HDM: The LHC Run 1 legacy at the onset of Run 2 | PRD 93 (2016) 115033 | 1601.04545 |
| 5 | F. Kling, J. M. No, and S. Su | Anatomy of exotic Higgs decays in 2HDM | JHEP 09 (2016) 093 | 1604.01406 |
| 6 | S. Baum and N. R. Shah | Two Higgs doublets and a complex singlet: disentangling the decay topologies and associated phenomenology | JHEP 12 (2018) 044 | 1808.02667 |
| 7 | D. Barducci, G. Bélanger, C. Hugonie, and A. Pukhov | Status and prospects of the nMSSM after LHC Run-1 | JHEP 01 (2016) 050 | 1510.00246 |
| 8 | U. Ellwanger and M. Rodríguez-Vazquez | Simultaneous search for extra light and heavy Higgs bosons via cascade decays | JHEP 11 (2017) 008 | 1707.08522 |
| 9 | S. Baum, N. R. Shah, and K. Freese | The NMSSM is within reach of the LHC: mass correlations \& decay signatures | JHEP 04 (2019) 011 | 1901.02332 |
| 10 | T. Robens, T. Stefaniak, and J. Wittbrodt | Two-real-scalar-singlet extension of the SM: LHC phenomenology and benchmark scenarios | EPJC 80 (2020) 151 | 1908.08554 |
| 11 | CMS Collaboration | The CMS experiment at the CERN LHC | JINST 3 (2008) S08004 | |
| 12 | CMS Collaboration | Precision luminosity measurement in proton-proton collisions at $ \sqrt{s} = $ 13 TeV in 2015 and 2016 at CMS | EPJC 81 (2021) 800 | CMS-LUM-17-003 2104.01927 |
| 13 | CMS Collaboration | CMS luminosity measurement for the 2017 data-taking period at $ \sqrt{s} = $ 13 TeV | CMS Physics Analysis Summary, 2018 CMS-PAS-LUM-17-004 |
CMS-PAS-LUM-17-004 |
| 14 | CMS Collaboration | CMS luminosity measurement for the 2018 data-taking period at $ \sqrt{s} = $ 13 TeV | CMS Physics Analysis Summary, 2019 CMS-PAS-LUM-18-002 |
CMS-PAS-LUM-18-002 |
| 15 | ATLAS Collaboration | Search for Higgs boson pair production in the $ \mathrm{b}\overline{\mathrm{b}}\mathrm{b}\overline{\mathrm{b}} $ final state from pp collisions at $ \sqrt{s} = $ 8 TeV with the ATLAS detector | EPJC 75 (2015) 412 | 1506.00285 |
| 16 | ATLAS Collaboration | Search for pair production of Higgs bosons in the $ \mathrm{b}\overline{\mathrm{b}}\mathrm{b}\overline{\mathrm{b}} $ final state using proton--proton collisions at $ \sqrt{s} = $ 13 TeV with the ATLAS detector | PRD 94 (2016) 052002 | 1606.04782 |
| 17 | ATLAS Collaboration | Search for pair production of Higgs bosons in the $ \mathrm{b}\overline{\mathrm{b}}\mathrm{b}\overline{\mathrm{b}} $ final state using proton--proton collisions at $ \sqrt{s} = $ 13 TeV with the ATLAS detector | JHEP 01 (2019) 030 | 1804.06174 |
| 18 | CMS Collaboration | Search for a massive resonance decaying to a pair of Higgs bosons in the four b quark final state in proton--proton collisions at $ \sqrt{s}= $ 13 TeV | PLB 781 (2018) 244 | 1710.04960 |
| 19 | CMS Collaboration | Search for production of Higgs boson pairs in the four b quark final state using large-area jets in proton--proton collisions at $ \sqrt{s}= $ 13 TeV | JHEP 01 (2019) 040 | 1808.01473 |
| 20 | CMS Collaboration | HEPData record for this analysis | link | |
| 21 | CMS Collaboration | The CMS trigger system | JINST 12 (2017) P01020 | CMS-TRG-12-001 1609.02366 |
| 22 | CMS Collaboration | Performance of electron reconstruction and selection with the CMS detector in proton--proton collisions at $ \sqrt{s} = $ 8 TeV | JINST 10 (2015) P06005 | CMS-EGM-13-001 1502.02701 |
| 23 | CMS Collaboration | Performance of the CMS muon detector and muon reconstruction with proton--proton collisions at $ \sqrt{s}= $ 13 TeV | JINST 13 (2018) P06015 | CMS-MUO-16-001 1804.04528 |
| 24 | CMS Collaboration | Performance of photon reconstruction and identification with the CMS detector in proton--proton collisions at $ \sqrt{s} $ = 8 TeV | JINST 10 (2015) P08010 | CMS-EGM-14-001 1502.02702 |
| 25 | CMS Collaboration | Description and performance of track and primary-vertex reconstruction with the CMS tracker | JINST 9 (2014) P10009 | CMS-TRK-11-001 1405.6569 |
| 26 | CMS Collaboration | Particle-flow reconstruction and global event description with the CMS detector | JINST 12 (2017) P10003 | CMS-PRF-14-001 1706.04965 |
| 27 | CMS Collaboration | Performance of reconstruction and identification of $ \tau $ leptons decaying to hadrons and $ \nu_\tau $ in pp collisions at $ \sqrt{s}= $ 13 TeV | JINST 13 (2018) P10005 | CMS-TAU-16-003 1809.02816 |
| 28 | CMS Collaboration | Jet energy scale and resolution in the CMS experiment in pp collisions at 8 TeV | JINST 12 (2017) P02014 | CMS-JME-13-004 1607.03663 |
| 29 | CMS Collaboration | Performance of missing transverse momentum reconstruction in proton--proton collisions at $ \sqrt{s} = $ 13\,TeV using the CMS detector | JINST 14 (2019) P07004 | CMS-JME-17-001 1903.06078 |
| 30 | J. Alwall et al. | The automated computation of tree-level and next-to-leading order differential cross sections, and their matching to parton shower simulations | JHEP 07 (2014) 079 | 1405.0301 |
| 31 | G. Bozzi, S. Catani, D. de Florian, and M. Grazzini | The $ q_T $ spectrum of the Higgs boson at the LHC in QCD perturbation theory | PLB 564 (2003) 65 | hep-ph/0302104 |
| 32 | G. Bozzi, S. Catani, D. de Florian, and M. Grazzini | Transverse-momentum resummation and the spectrum of the Higgs boson at the LHC | NPB 737 (2006) 73 | hep-ph/0508068 |
| 33 | D. de Florian, G. Ferrera, M. Grazzini, and D. Tommasini | Transverse-momentum resummation: Higgs boson production at the Tevatron and the LHC | JHEP 11 (2011) 064 | 1109.2109 |
| 34 | P. Nason | A new method for combining NLO QCD with shower Monte Carlo algorithms | JHEP 11 (2004) 040 | hep-ph/0409146 |
| 35 | S. Frixione, P. Nason, and C. Oleari | Matching NLO QCD computations with parton shower simulations: the POWHEG method | JHEP 11 (2007) 070 | 0709.2092 |
| 36 | S. Alioli, P. Nason, C. Oleari, and E. Re | A general framework for implementing NLO calculations in shower Monte Carlo programs: the POWHEG BOX | JHEP 06 (2010) 043 | 1002.2581 |
| 37 | S. Alioli, S.-O. Moch, and P. Uwer | Hadronic top-quark pair-production with one jet and parton showering | JHEP 01 (2012) 137 | 1110.5251 |
| 38 | T. Sjöstrand et al. | An introduction to PYTHIA 8.2 | Comput. Phys. Commun. 191 (2015) 159 | 1410.3012 |
| 39 | J. Alwall et al. | Comparative study of various algorithms for the merging of parton showers and matrix elements in hadronic collisions | EPJC 53 (2008) 473 | 0706.2569 |
| 40 | CMS Collaboration | Event generator tunes obtained from underlying event and multiparton scattering measurements | EPJC 76 (2016) 155 | CMS-GEN-14-001 1512.00815 |
| 41 | CMS Collaboration | Extraction and validation of a new set of CMS PYTHIA8 tunes from underlying-event measurements | EPJC 80 (2020) 4 | CMS-GEN-17-001 1903.12179 |
| 42 | NNPDF Collaboration | Parton distributions for the LHC Run II | JHEP 04 (2015) 040 | 1410.8849 |
| 43 | GEANT4 Collaboration | GEANT 4 -- a simulation toolkit | NIM A 506 (2003) 250 | |
| 44 | M. Cacciari, G. P. Salam, and G. Soyez | FastJet user manual | EPJC 72 (2012) 1896 | 1111.6097 |
| 45 | M. Cacciari, G. P. Salam, and G. Soyez | The anti-$ k_{\mathrm{T}} $ clustering algorithm | JHEP 04 (2008) 063 | 0802.1189 |
| 46 | D. Bertolini, P. Harris, M. Low, and N. Tran | Pileup per particle identification | JHEP 10 (2014) 059 | 1407.6013 |
| 47 | CMS Collaboration | Pileup mitigation at CMS in 13 TeV data | JINST 15 (2020) P09018 | CMS-JME-18-001 2003.00503 |
| 48 | CMS Collaboration | Determination of jet energy calibration and transverse momentum resolution in CMS | JINST 6 (2011) 11002 | CMS-JME-10-011 1107.4277 |
| 49 | CMS Collaboration | Identification of heavy-flavour jets with the CMS detector in pp collisions at 13 TeV | JINST 13 (2018) P05011 | CMS-BTV-16-002 1712.07158 |
| 50 | M. Dasgupta, A. Fregoso, S. Marzani, and G. P. Salam | Towards an understanding of jet substructure | JHEP 09 (2013) 029 | 1307.0007 |
| 51 | A. J. Larkoski, S. Marzani, G. Soyez, and J. Thaler | Soft drop | JHEP 05 (2014) 146 | 1402.2657 |
| 52 | G. Punzi | Sensitivity of searches for new signals and its optimization | in PHYSTAT: Statistical Problems in Particle Physics, Astrophysics, and Cosmology, L. Lyons, R.P. Mount, and R. Reitmeyer, eds. eConf C030908 MODT002, 2003 link |
physics/0308063 |
| 53 | CMS Collaboration | Measurement of differential cross sections for top quark pair production using the lepton+jets final state in proton--proton collisions at 13 TeV | PRD 95 (2017) 092001 | CMS-TOP-16-008 1610.04191 |
| 54 | CMS Collaboration | Measurement of normalized differential $ \mathrm{t} \overline{\mathrm{t}} $ cross sections in the dilepton channel from pp collisions at $ \sqrt{s} = $ 13 TeV | JHEP 04 (2018) 060 | CMS-TOP-16-007 1708.07638 |
| 55 | ATLAS Collaboration | Measurements of normalized differential cross sections for $ \mathrm{t} \overline{\mathrm{t}} $ production in pp collisions at $ \sqrt{s}= $ 7 TeV using the ATLAS detector | PRD 90 (2014) 072004 | 1407.0371 |
| 56 | R. A. Fisher | On the interpretation of $ \chi^{2} $ from contingency tables, and the calculation of P | J. Roy. Statis. 85 (1922) 87 | |
| 57 | E. Gross and O. Vitells | Trial factors for the look elsewhere effect in high energy physics | EPJC 70 (2010) 525 | |
| 58 | T. Junk | Confidence level computation for combining searches with small statistics | NIM A 434 (1999) 435 | hep-ex/9902006 |
| 59 | A. L. Read | Presentation of search results: the CL$ _s $ technique | JPG 28 (2002) 2693 | |
| 60 | G. Cowan, K. Cranmer, E. Gross, and O. Vitells | Asymptotic formulae for likelihood-based tests of new physics | EPJC 71 (2011) 1554 | 1007.1727 |
|
|
Compact Muon Solenoid LHC, CERN |
|

|

|

|

|

|