

Compact Muon Solenoid
LHC, CERN
| CMS-EXO-22-016 ; CERN-EP-2023-122 | ||
| Search for a high-mass dimuon resonance produced in association with b quark jets at $ \sqrt{s}= $ 13 TeV | ||
| CMS Collaboration | ||
| 14 July 2023 | ||
| JHEP 10 (2023) 043 | ||
| Abstract: A search for high-mass dimuon resonance production in association with one or more b quark jets is presented. The study uses proton-proton collision data collected with the CMS detector at the LHC corresponding to an integrated luminosity of 138 fb$^{-1}$ at a center-of-mass energy of 13 TeV. Model-independent limits are derived on the number of signal events with exactly one or more than one b quark jet. Results are also interpreted in a lepton-flavor-universal model with Z' boson couplings to a $ \mathrm{b}\mathrm{b} $ quark pair ($ g_{\mathrm{b}} $), an $ \mathrm{s}\mathrm{b} $ quark pair ($ g_{\mathrm{b}}\delta_{\mathrm{b}\mathrm{s}} $), and any same-flavor charged lepton ($ g_{\ell} $) or neutrino pair ($ g_{\nu} $), with $ |g_{\nu}|=|g_{\ell}| $. For a Z' boson with a mass $ m_{\mathrm{Z}' }= $ 350 GeV (2 TeV) and $ |\delta_{\mathrm{b}\mathrm{s}}| < $ 0.25, the majority of the parameter space with 0.0057 $ < |g_{\ell}| < $ 0.35 (0.25 $ < |g_{\ell}| < $ 0.43) and 0.0079 $ < |g_{\mathrm{b}}| < $ 0.46 (0.34 $ < |g_{\mathrm{b}}| < $ 0.57) is excluded at 95% confidence level. Finally, constraints are set on a Z' model with parameters consistent with low-energy $ \mathrm{b}\to\mathrm{s}\ell\ell $ measurements. In this scenario, most of the allowed parameter space is excluded for a Z' boson with 350 $ < m_{\mathrm{Z}' } < $ 500 GeV, while the constraints are less stringent for higher $ m_{\mathrm{Z}' } $ hypotheses. This is the first dedicated search at the LHC for a high-mass dimuon resonance produced in association with multiple b quark jets, and the constraints obtained on models with this signature are the most stringent to date. | ||
| Links: e-print arXiv:2307.08708 [hep-ex] (PDF) ; CDS record ; inSPIRE record ; HepData record ; Physics Briefing ; CADI line (restricted) ; | ||
| Figures | |
png pdf |
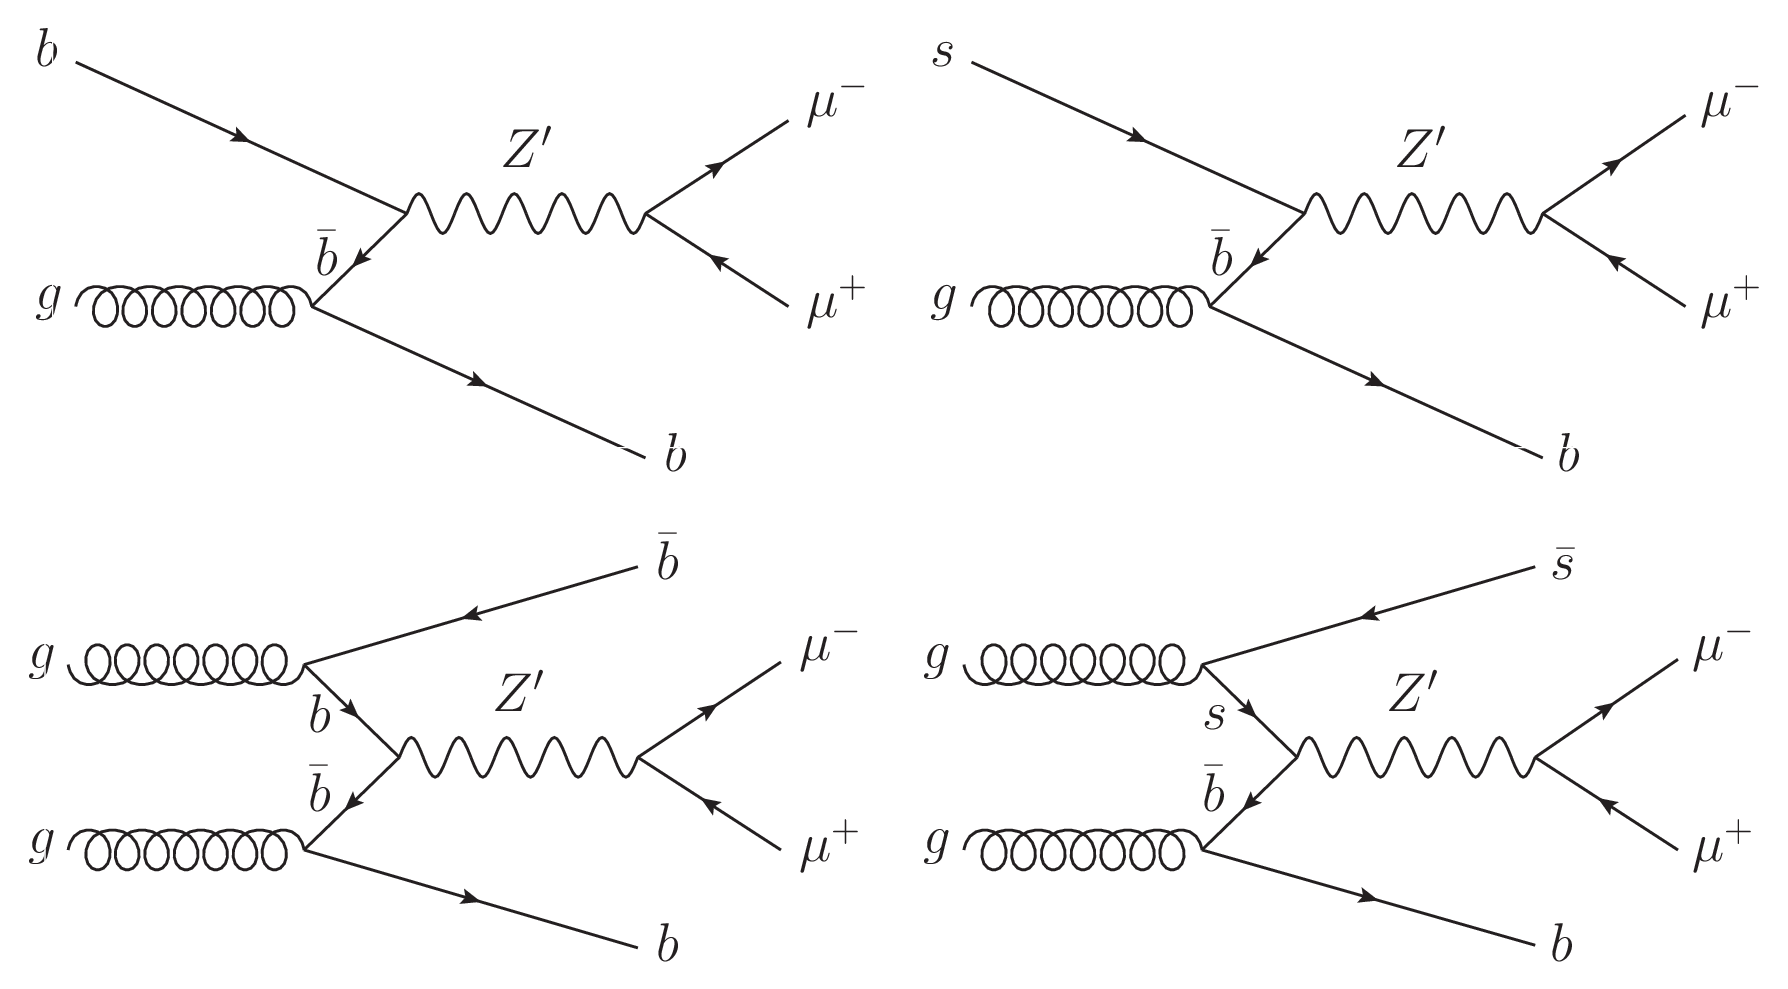
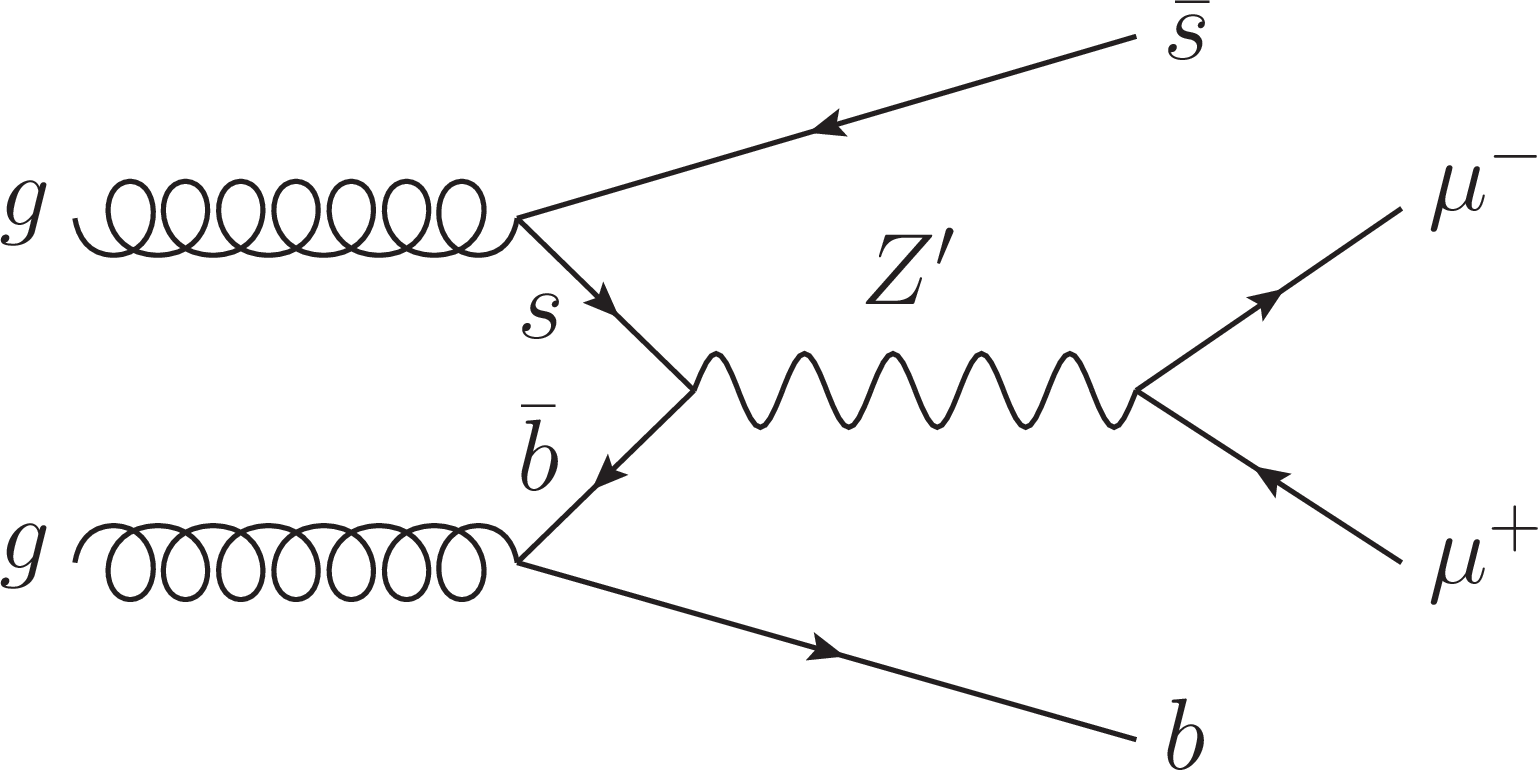
Figure 1:
Feynman diagrams of $ \mathrm{Z}' \to \mu^{-} \mu^{+} $ with a Z' boson produced via $ \mathrm{b} \overline{\mathrm{b}} \to \mathrm{Z}' $ or $ \mathrm{s} \overline{\mathrm{b}} \to \mathrm{Z}' $, with at least one b quark in the final state. While a $ \mathrm{Z}' \mathrm{b}\mathrm{b} $ coupling may be present in any generic model, a $ \mathrm{Z}' \mathrm{s}\mathrm{b} $ coupling could arise through flavor mixing between the second- and third-generation quarks. |
png pdf |
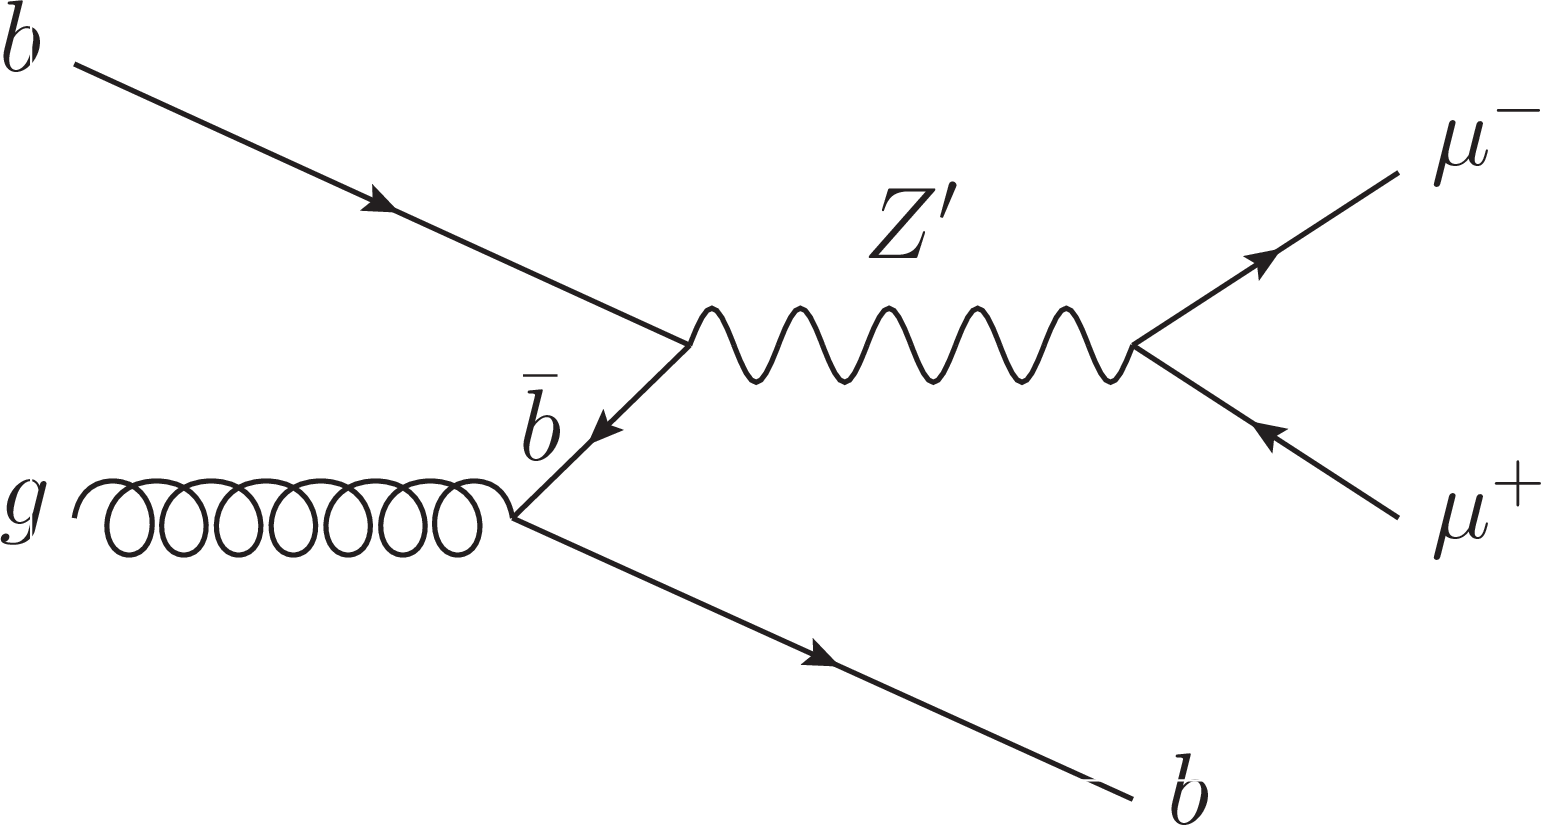
Figure 1-a:
Feynman diagram of $ \mathrm{Z}' \to \mu^{-} \mu^{+} $ with a Z' boson produced via $ \mathrm{b} \overline{\mathrm{b}} \to \mathrm{Z}' $, with one b quark in the final state. |
png pdf |
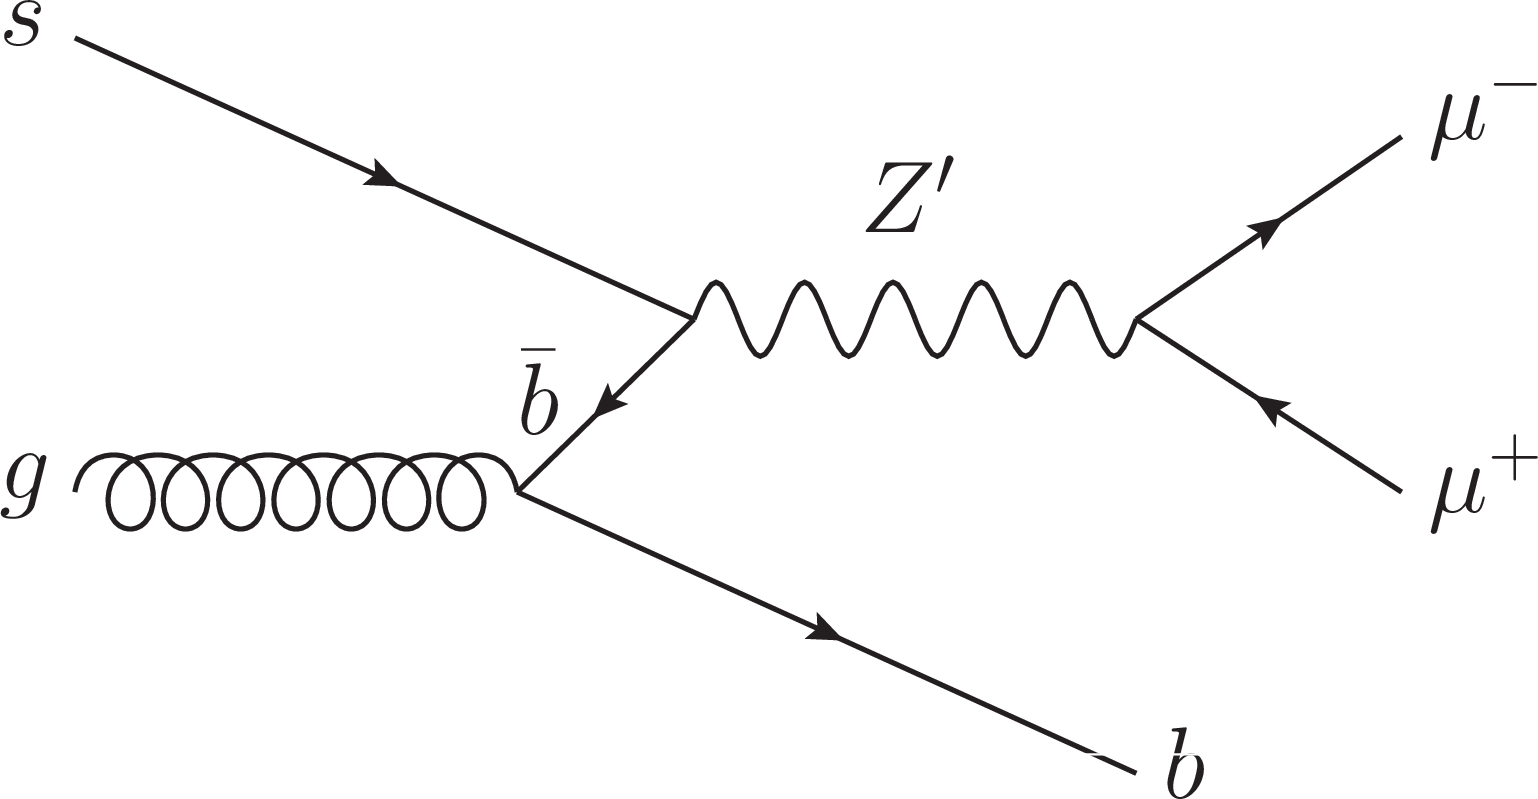
Figure 1-b:
Feynman diagram of $ \mathrm{Z}' \to \mu^{-} \mu^{+} $ with a Z' boson produced via $ \mathrm{s} \overline{\mathrm{b}} \to \mathrm{Z}' $, with one b quark in the final state. While a $ \mathrm{Z}' \mathrm{b}\mathrm{b} $ coupling may be present in any generic model, a $ \mathrm{Z}' \mathrm{s}\mathrm{b} $ coupling could arise through flavor mixing between the second- and third-generation quarks. |
png pdf |
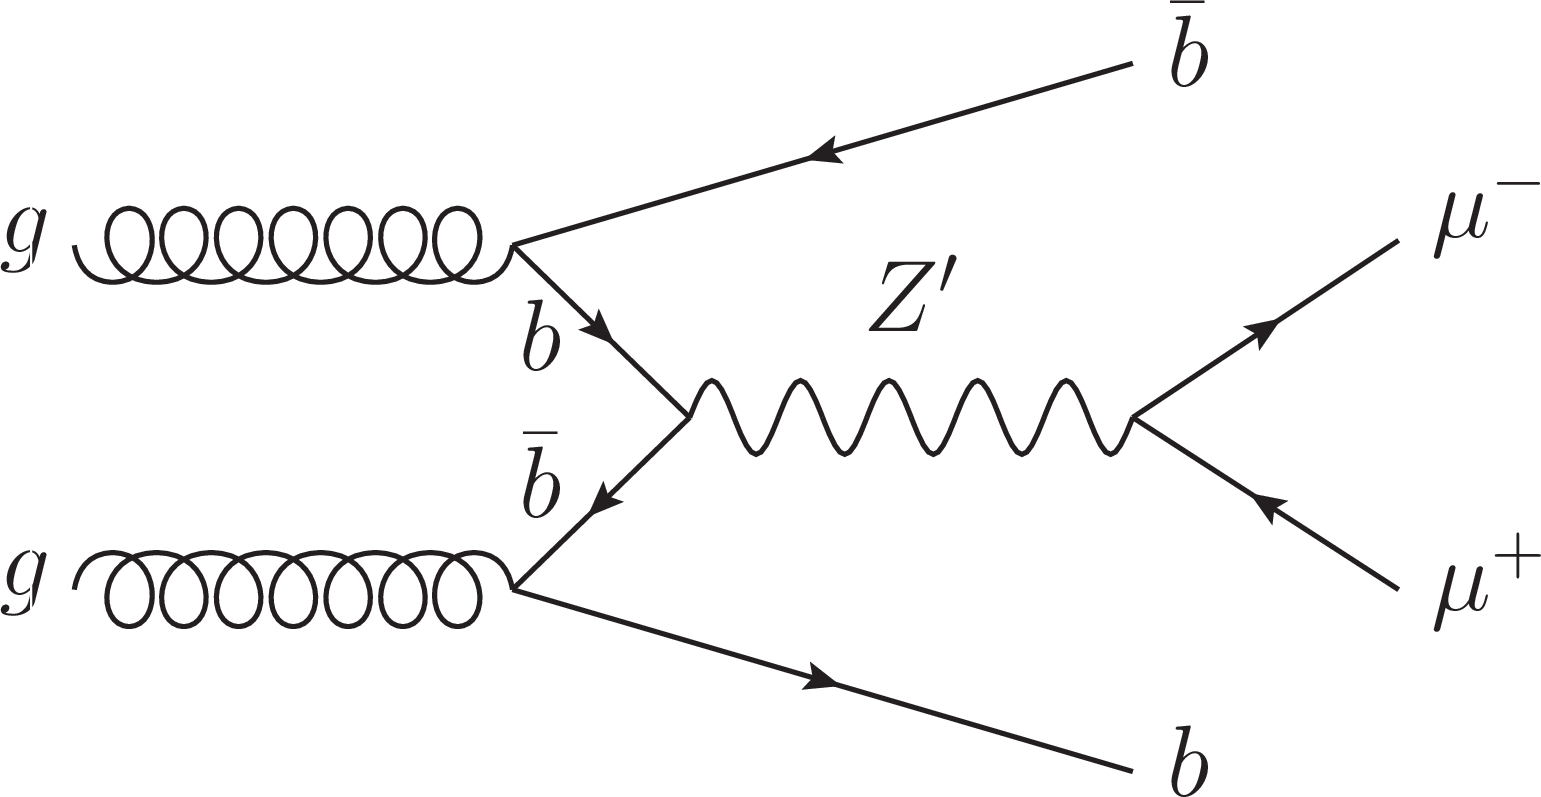
Figure 1-c:
Feynman diagram of $ \mathrm{Z}' \to \mu^{-} \mu^{+} $ with a Z' boson produced via $ \mathrm{b} \overline{\mathrm{b}} \to \mathrm{Z}' $, with two b quark in the final state. |
png pdf |
Figure 1-d:
Feynman diagram of $ \mathrm{Z}' \to \mu^{-} \mu^{+} $ with a Z' boson produced via $ \mathrm{s} \overline{\mathrm{b}} \to \mathrm{Z}' $, with one b quark in the final state. While a $ \mathrm{Z}' \mathrm{b}\mathrm{b} $ coupling may be present in any generic model, a $ \mathrm{Z}' \mathrm{s}\mathrm{b} $ coupling could arise through flavor mixing between the second- and third-generation quarks. |
png pdf |
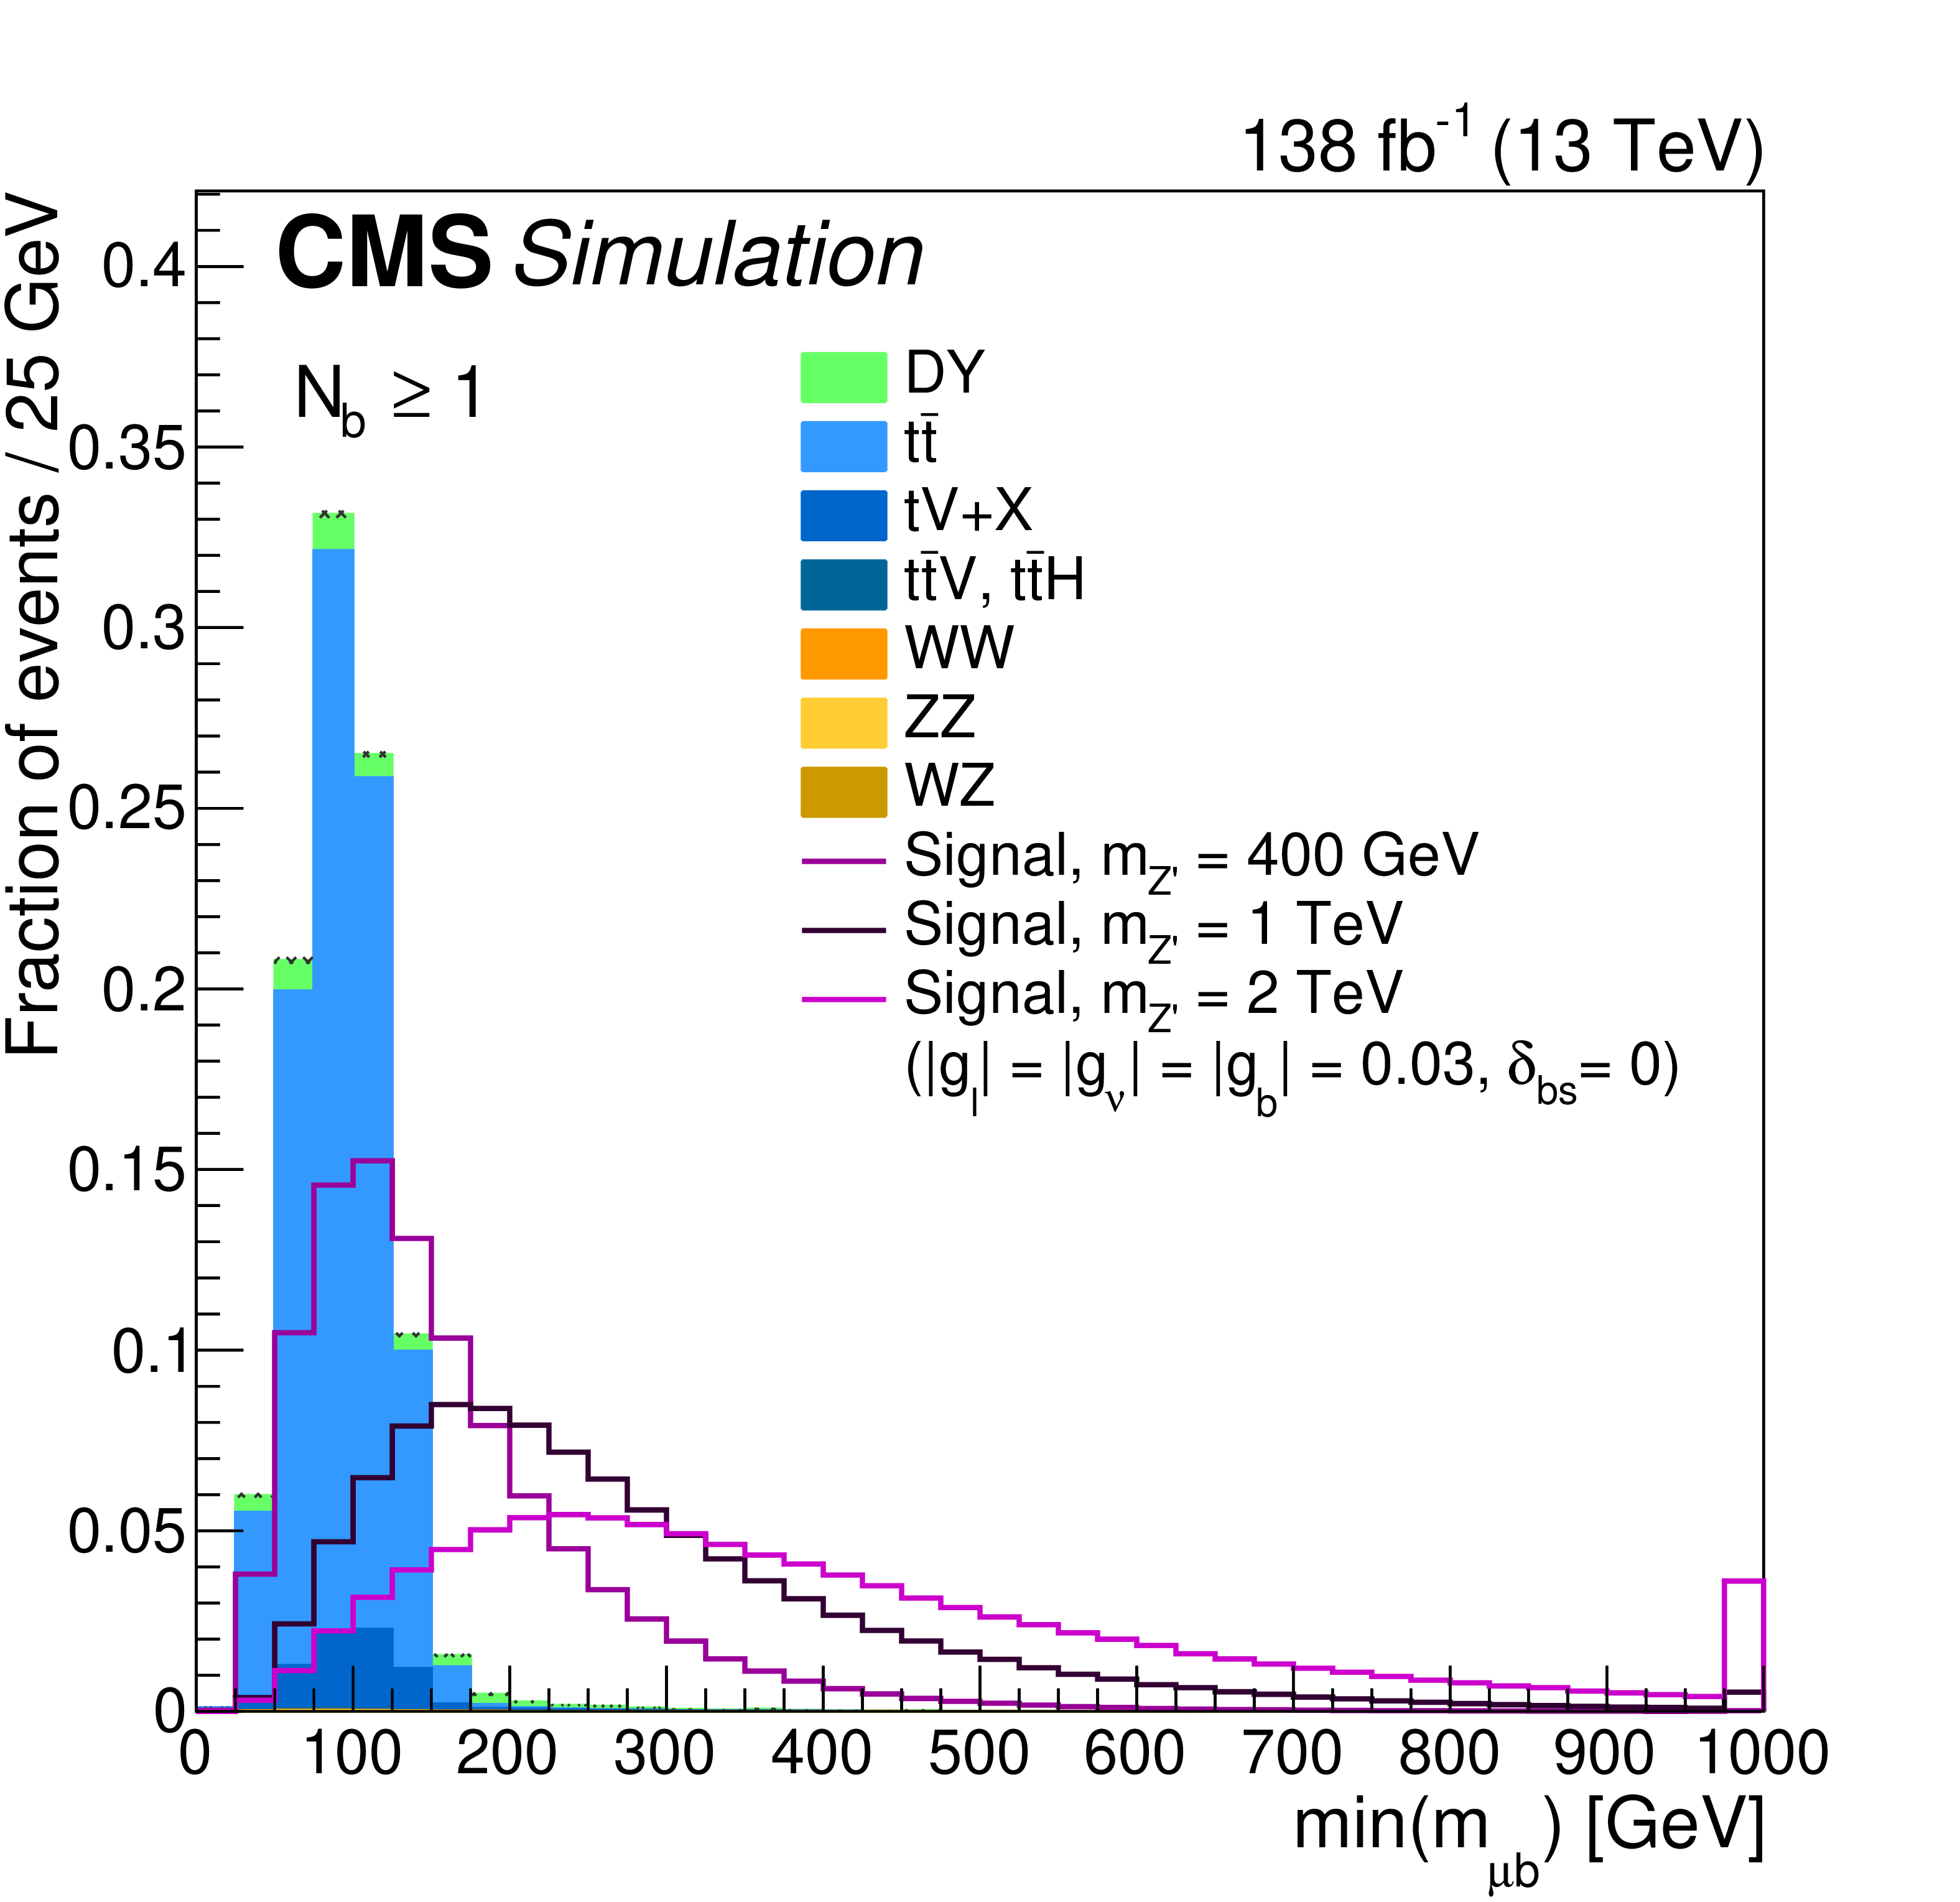
Figure 2:
Distribution of $ \min(m_{\mu\mathrm{b}\!}) $ as obtained from simulation in events with $ N_{\mathrm{b}}\geq $ 1 passing all the other selection requirements. In this search, we require $ \min(m_{\mu\mathrm{b}\!}) > $ 175 GeV. The stacked histogram displays the expected distribution from the simulation of the SM backgrounds, while the overlaid open histograms illustrate the size and shape of the Z' contribution from the LFU model described in Eq. (1), for several Z' mass hypotheses. For illustrative purposes, we choose couplings $ |g_{\ell}| = |g_{\nu}| = |g_{\mathrm{b}}| = $ 0.03 and $ \delta_{\mathrm{b}\mathrm{s}}= $ 0. The contribution of background processes other than DY and $ \mathrm{t} \overline{\mathrm{t}} $ is so small that it is only barely visible at the bottom of the stacked histogram. The hatched region indicates the statistical uncertainty arising from the limited size of the SM simulated samples (Section 3). Histograms are normalized to unit area. |
png pdf |
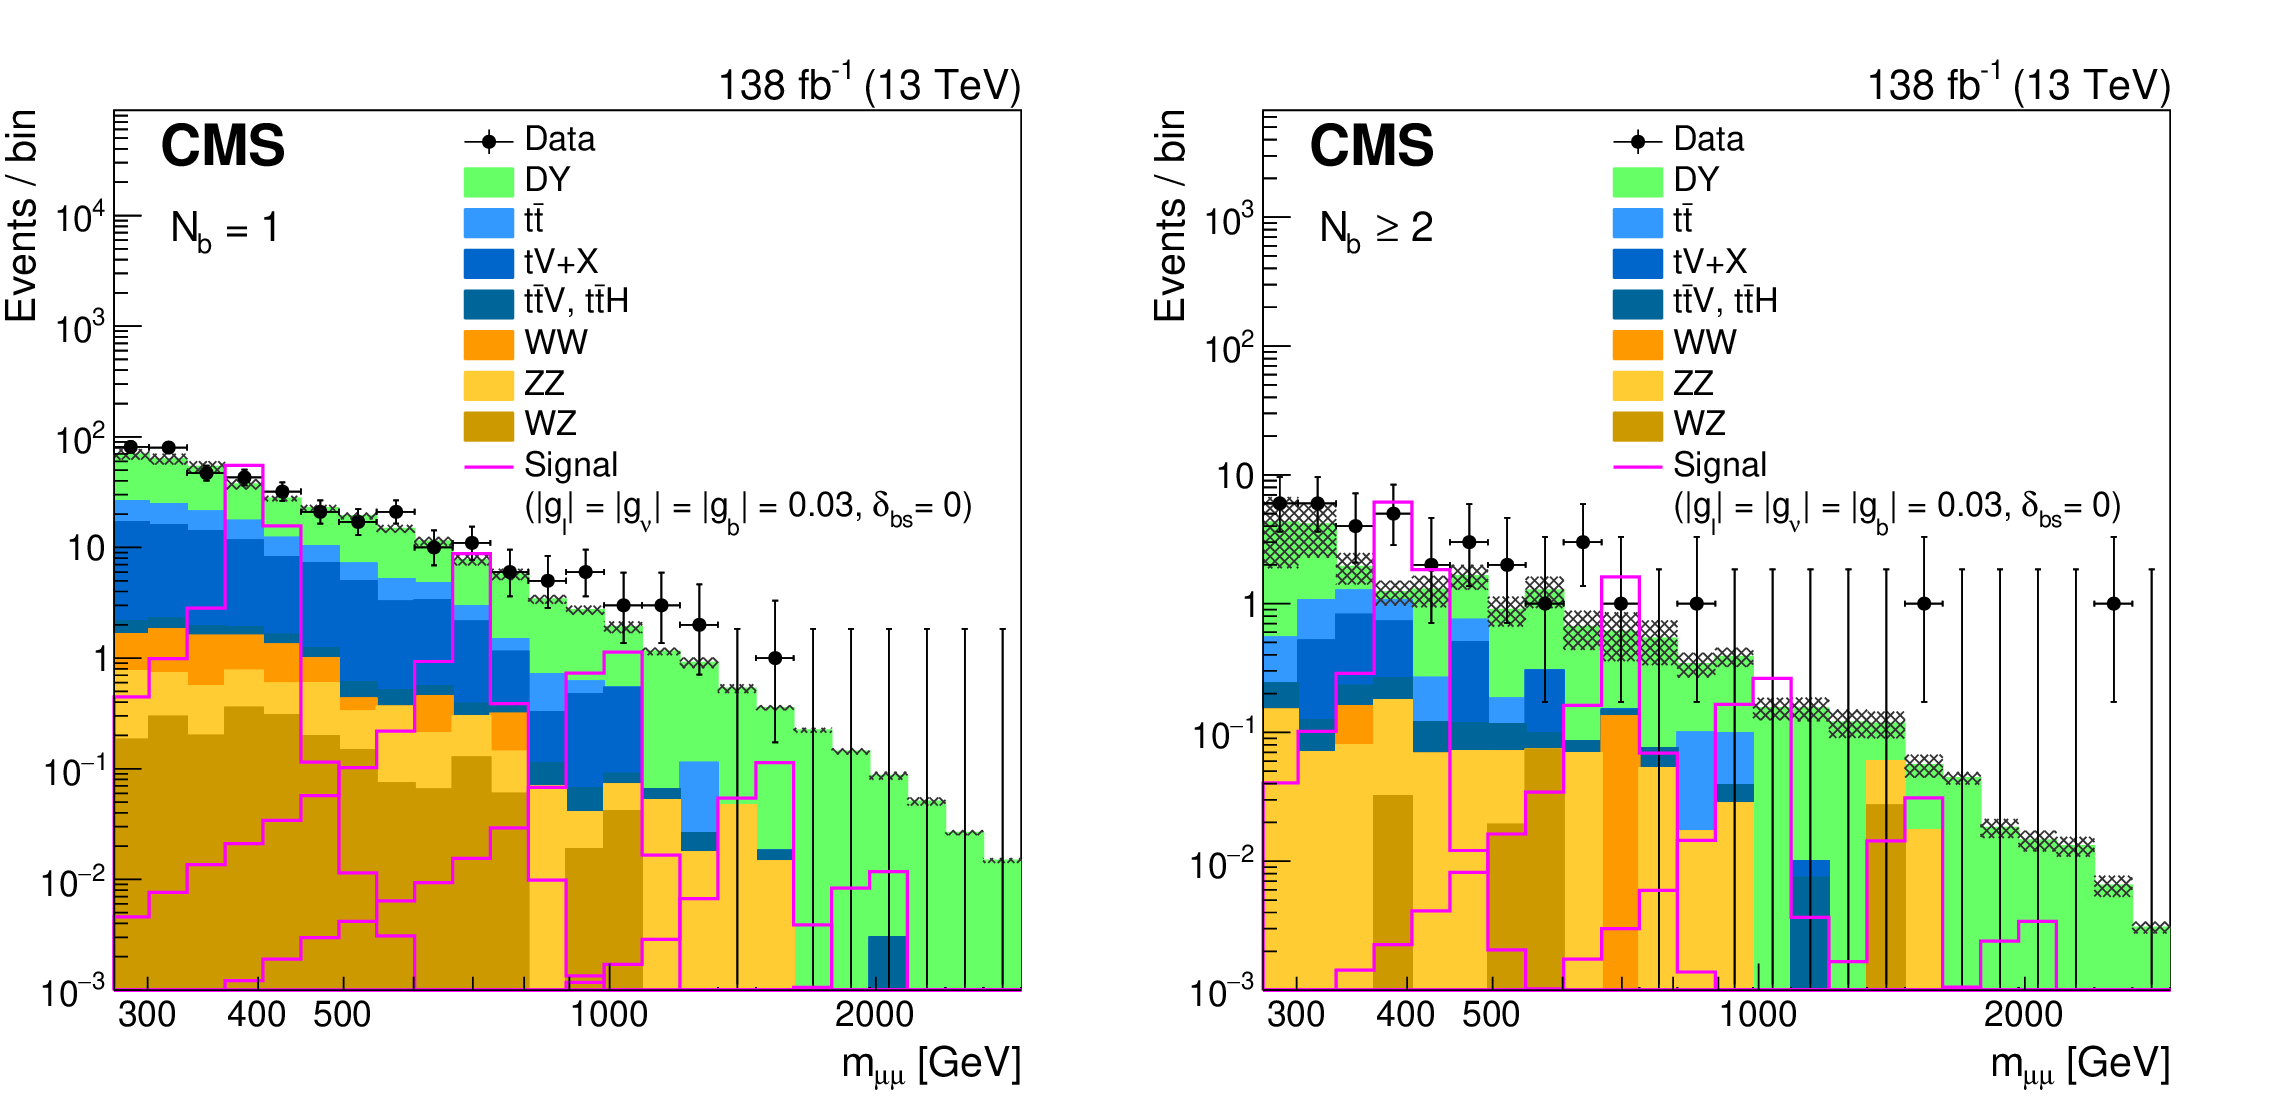
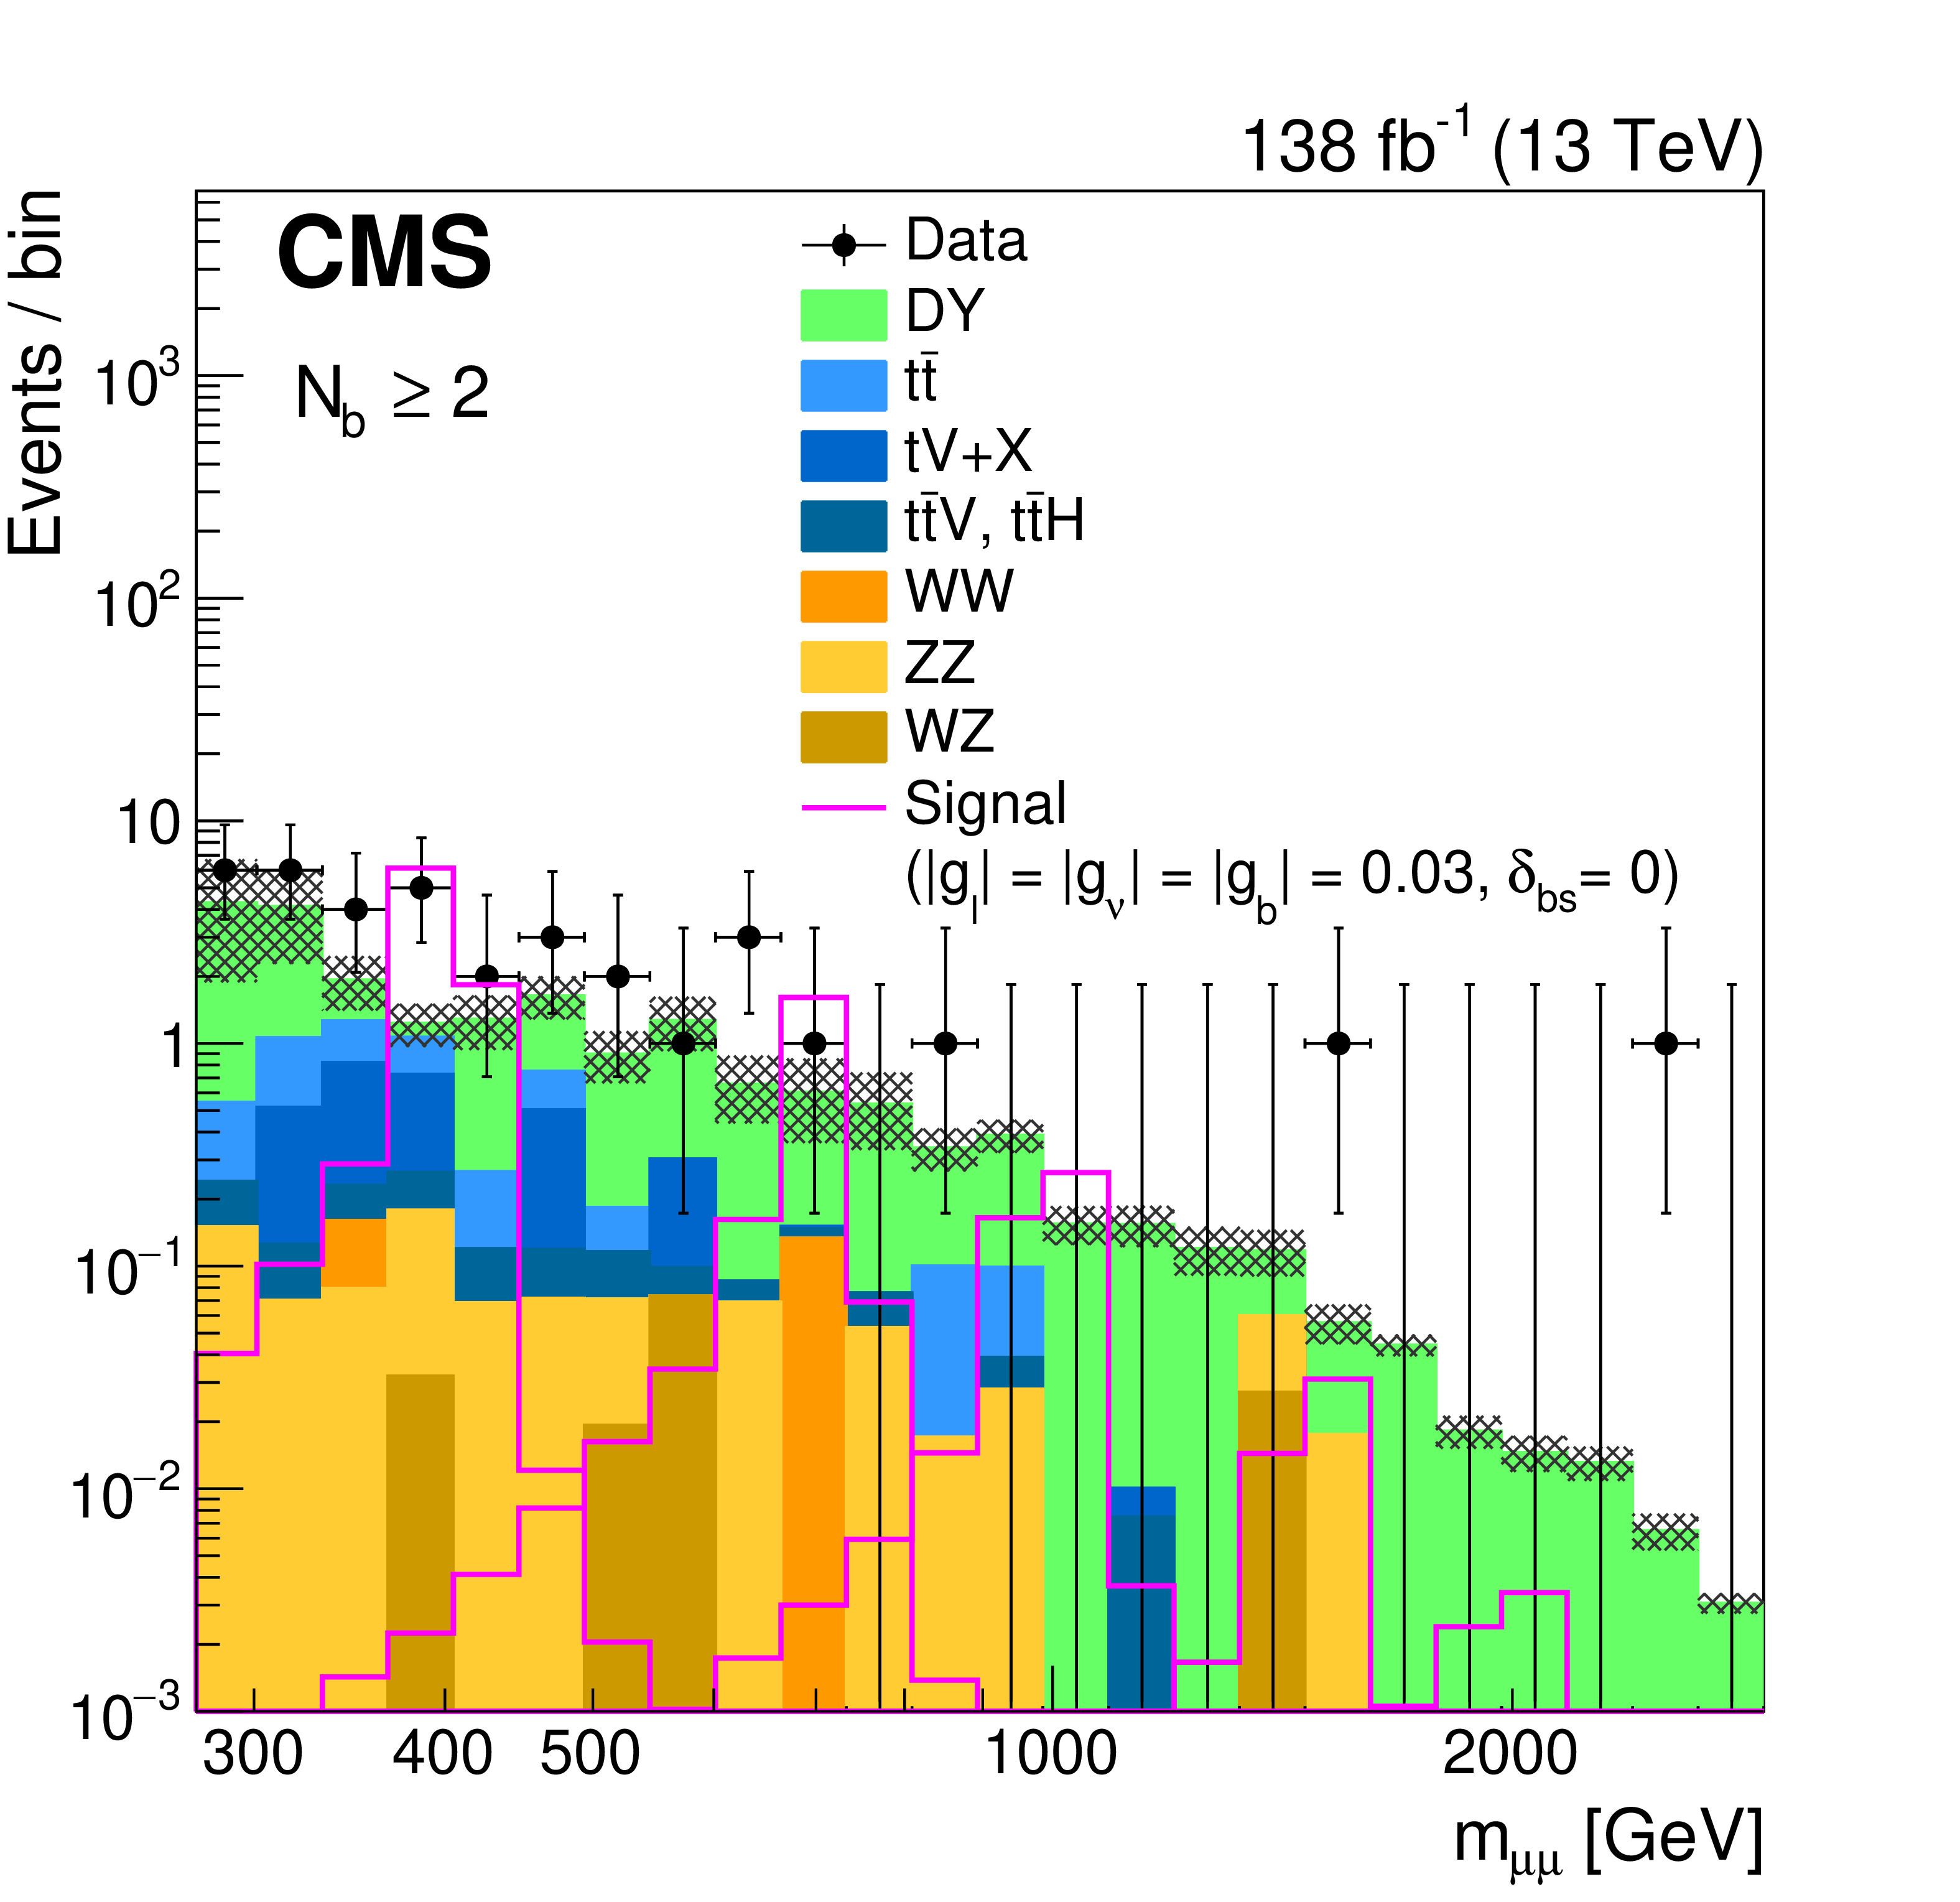
Figure 3:
Distributions of $ m_{\mu\mu} $ in the $ N_{\mathrm{b}}= $ 1 (left) and $ N_{\mathrm{b}}\geq $ 2 (right) event categories. The stacked histogram displays the expected distribution from the SM background simulation. The overlaid open distributions illustrate the Z' contribution from the LFU model at $ |g_{\ell}| = |g_{\nu}| = |g_{\mathrm{b}}| = $ 0.03 and $ \delta_{\mathrm{b}\mathrm{s}}= $ 0 for a variety of Z' mass hypotheses. The observed data are shown as black points with statistical error bars. The hatched region indicates the statistical uncertainty arising from the limited size of the SM simulated samples. The size of the bins increases as a function of $ m_{\mu\mu} $. In extracting the results of the search, the background is estimated directly from data, so the SM background simulation is only illustrative in these distributions. |
png pdf |
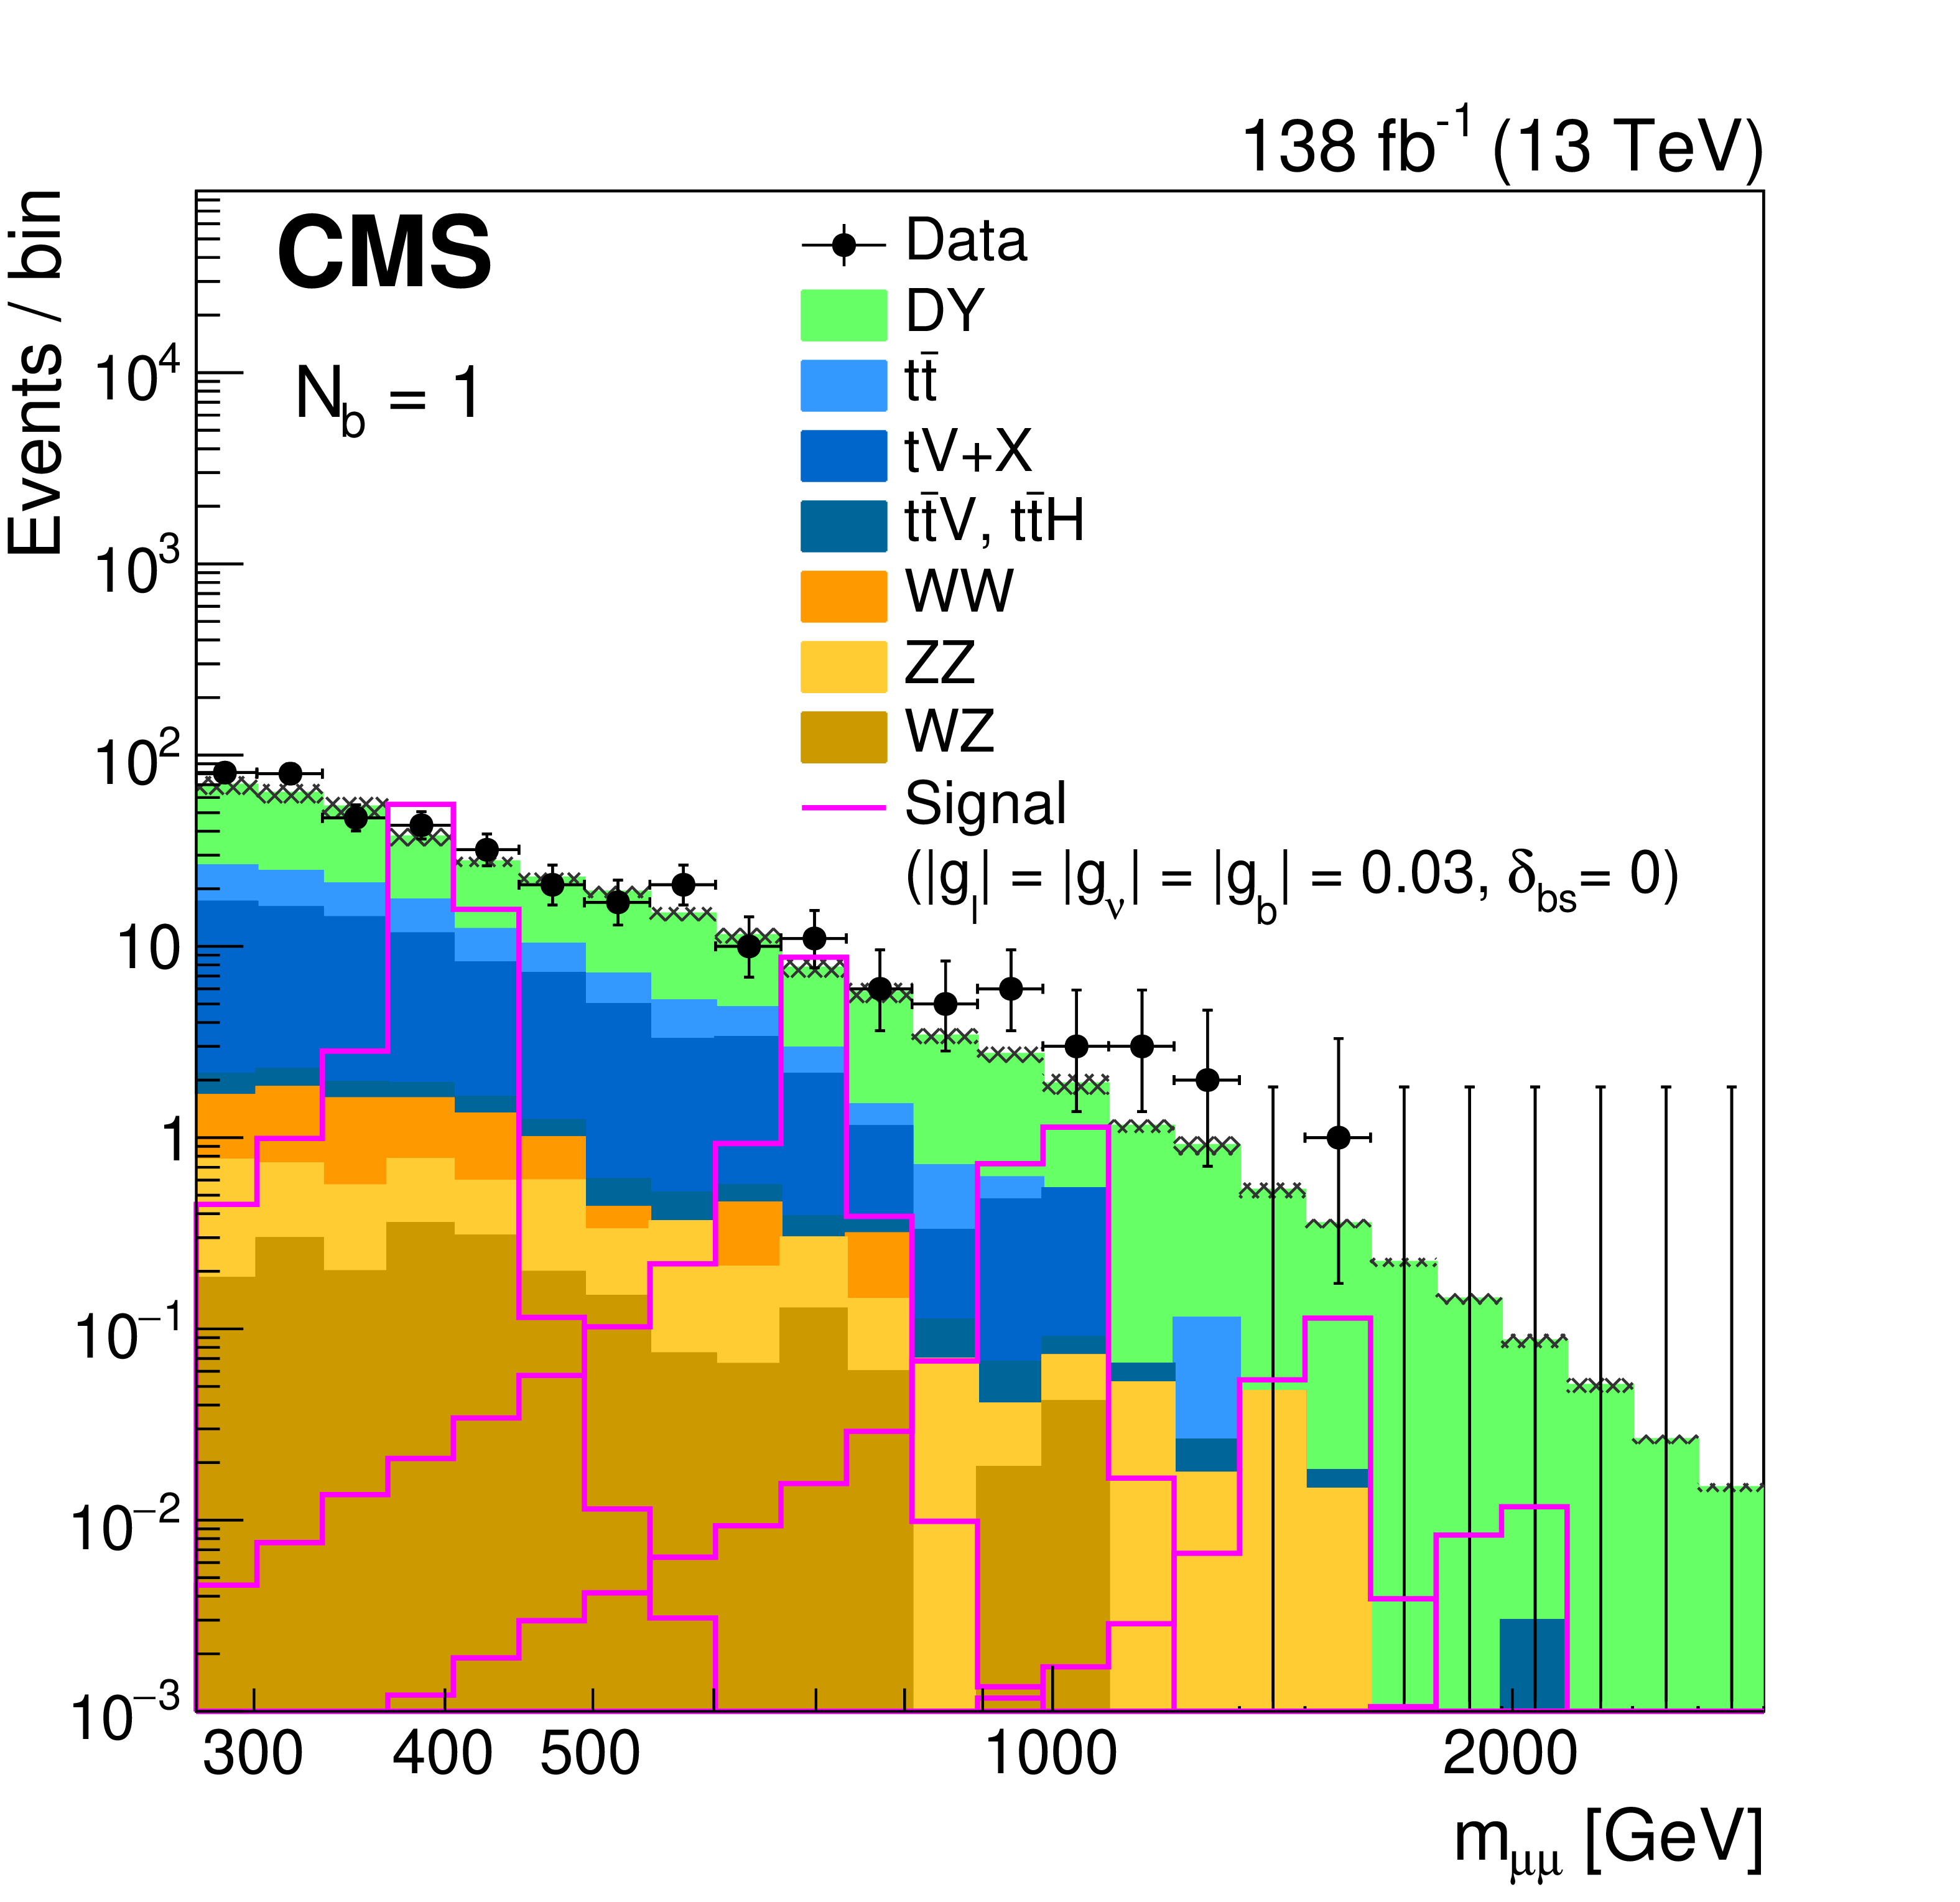
Figure 3-a:
Distribution of $ m_{\mu\mu} $ in the $ N_{\mathrm{b}}= $ 1 event category. The stacked histogram displays the expected distribution from the SM background simulation. The overlaid open distributions illustrate the Z' contribution from the LFU model at $ |g_{\ell}| = |g_{\nu}| = |g_{\mathrm{b}}| = $ 0.03 and $ \delta_{\mathrm{b}\mathrm{s}}= $ 0 for a variety of Z' mass hypotheses. The observed data are shown as black points with statistical error bars. The hatched region indicates the statistical uncertainty arising from the limited size of the SM simulated samples. The size of the bins increases as a function of $ m_{\mu\mu} $. In extracting the results of the search, the background is estimated directly from data, so the SM background simulation is only illustrative in these distributions. |
png pdf |
Figure 3-b:
Distribution of $ m_{\mu\mu} $ in the $ N_{\mathrm{b}}\geq $ 2 event category. The stacked histogram displays the expected distribution from the SM background simulation. The overlaid open distributions illustrate the Z' contribution from the LFU model at $ |g_{\ell}| = |g_{\nu}| = |g_{\mathrm{b}}| = $ 0.03 and $ \delta_{\mathrm{b}\mathrm{s}}= $ 0 for a variety of Z' mass hypotheses. The observed data are shown as black points with statistical error bars. The hatched region indicates the statistical uncertainty arising from the limited size of the SM simulated samples. The size of the bins increases as a function of $ m_{\mu\mu} $. In extracting the results of the search, the background is estimated directly from data, so the SM background simulation is only illustrative in these distributions. |
png pdf |
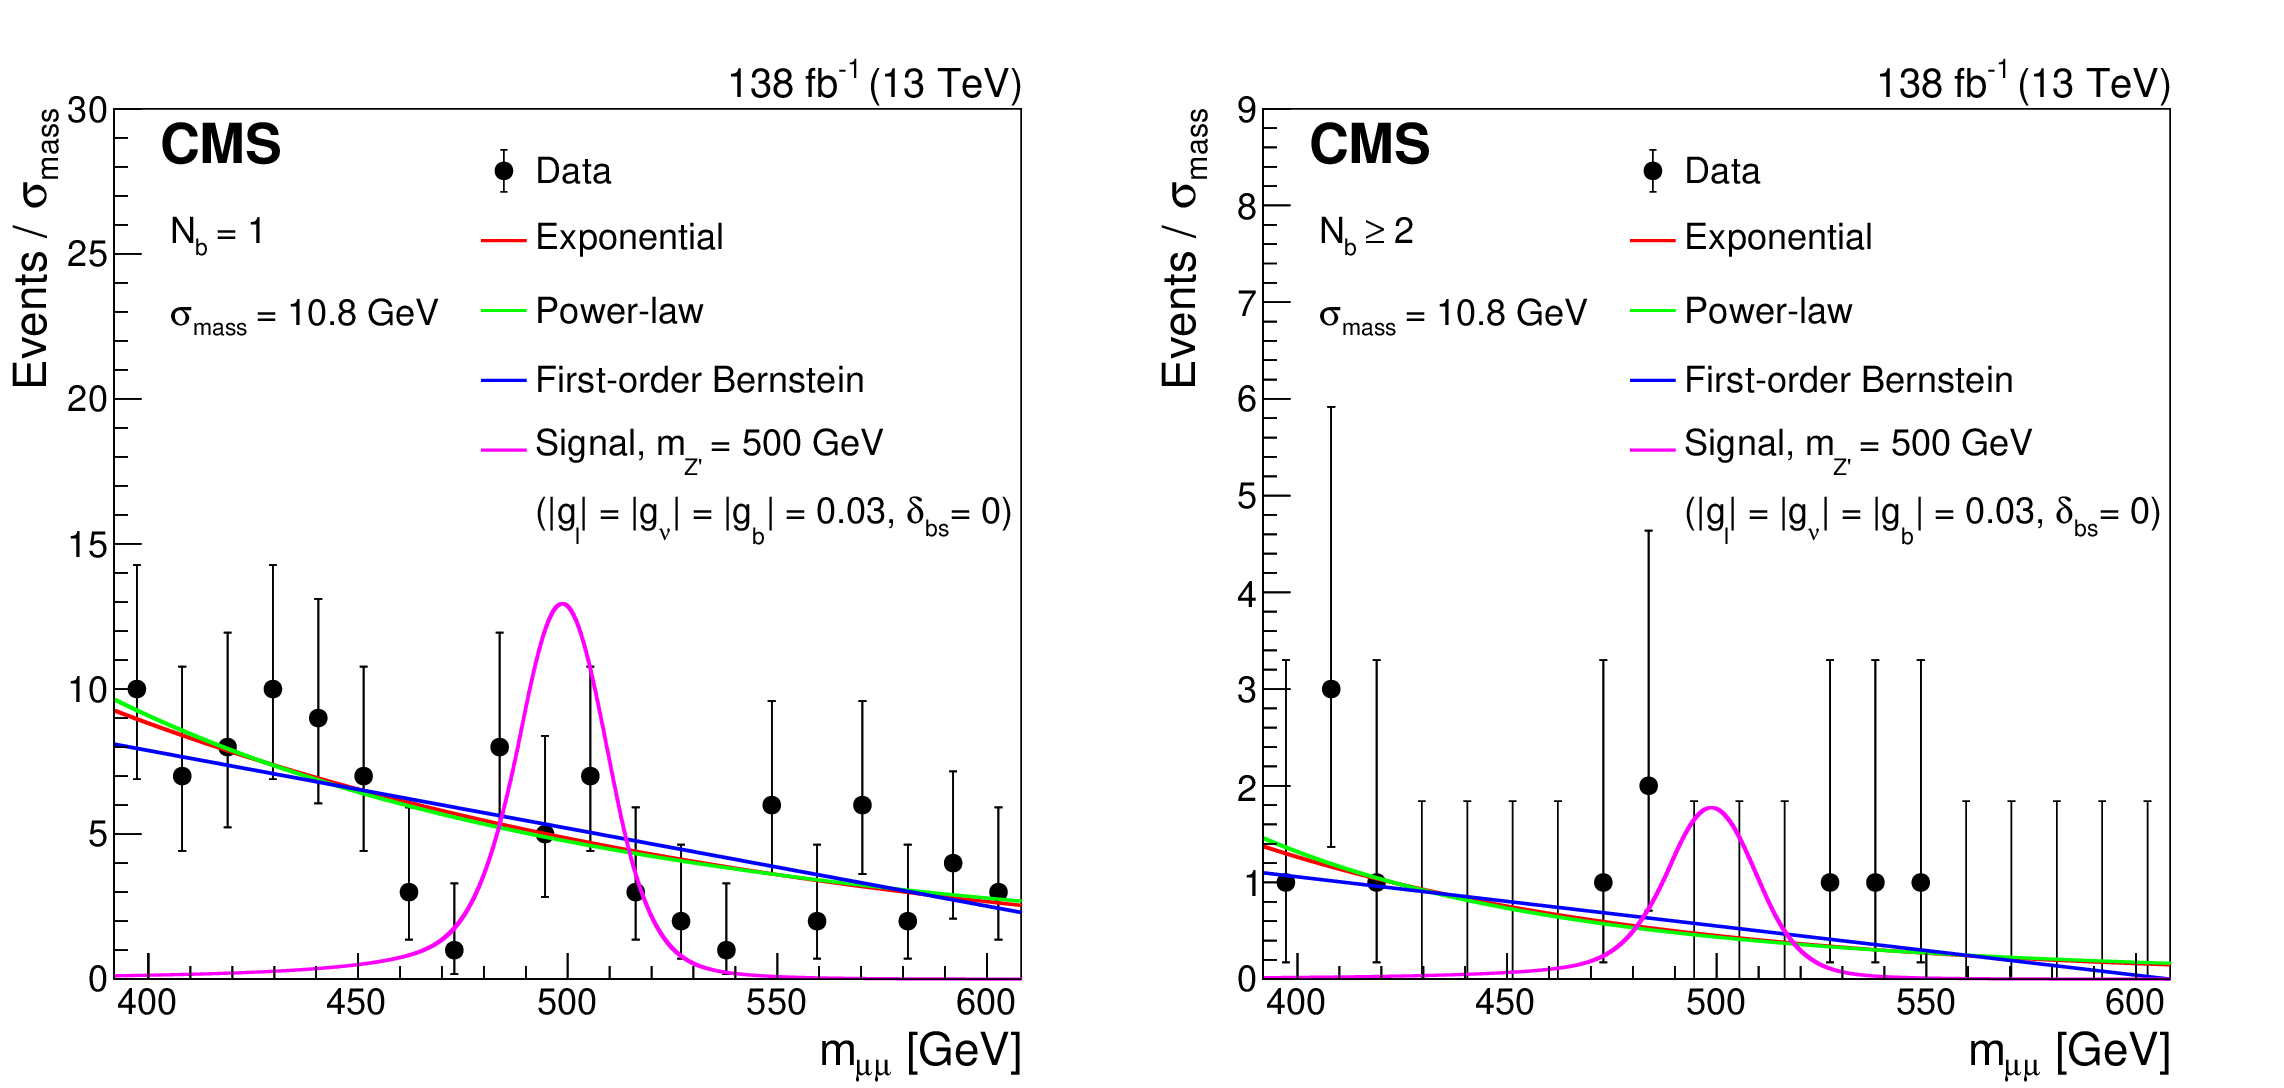
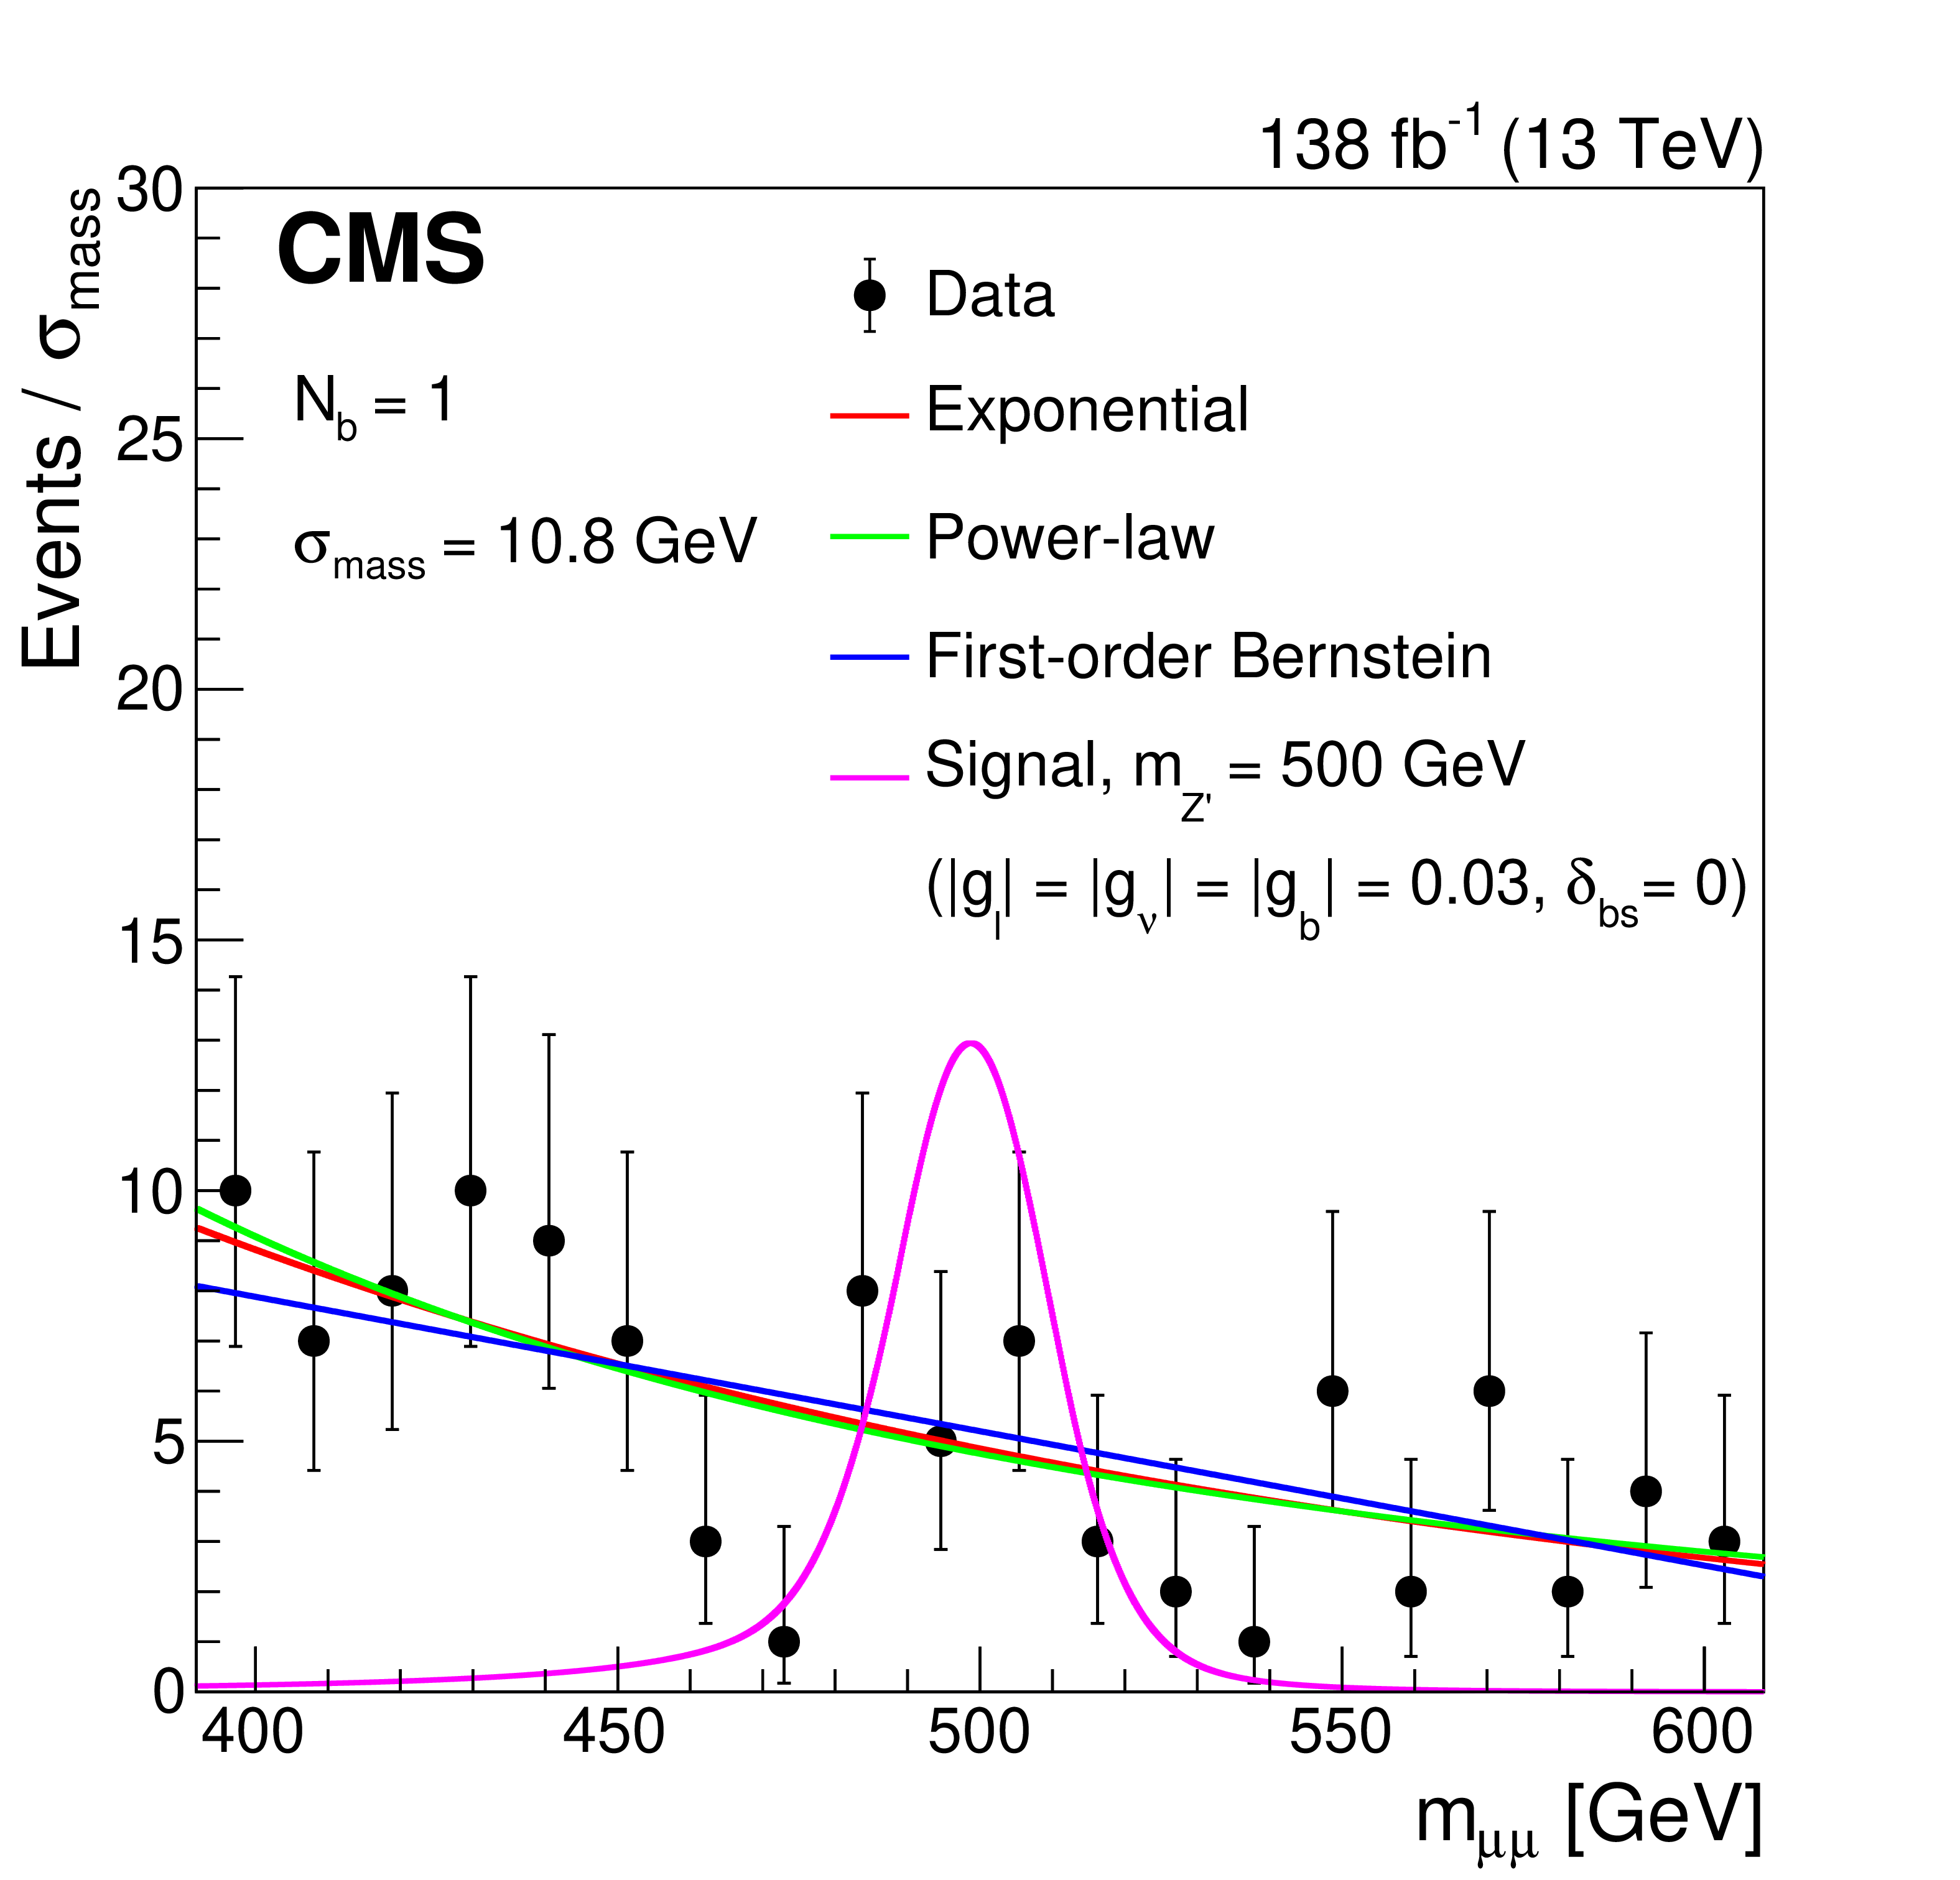
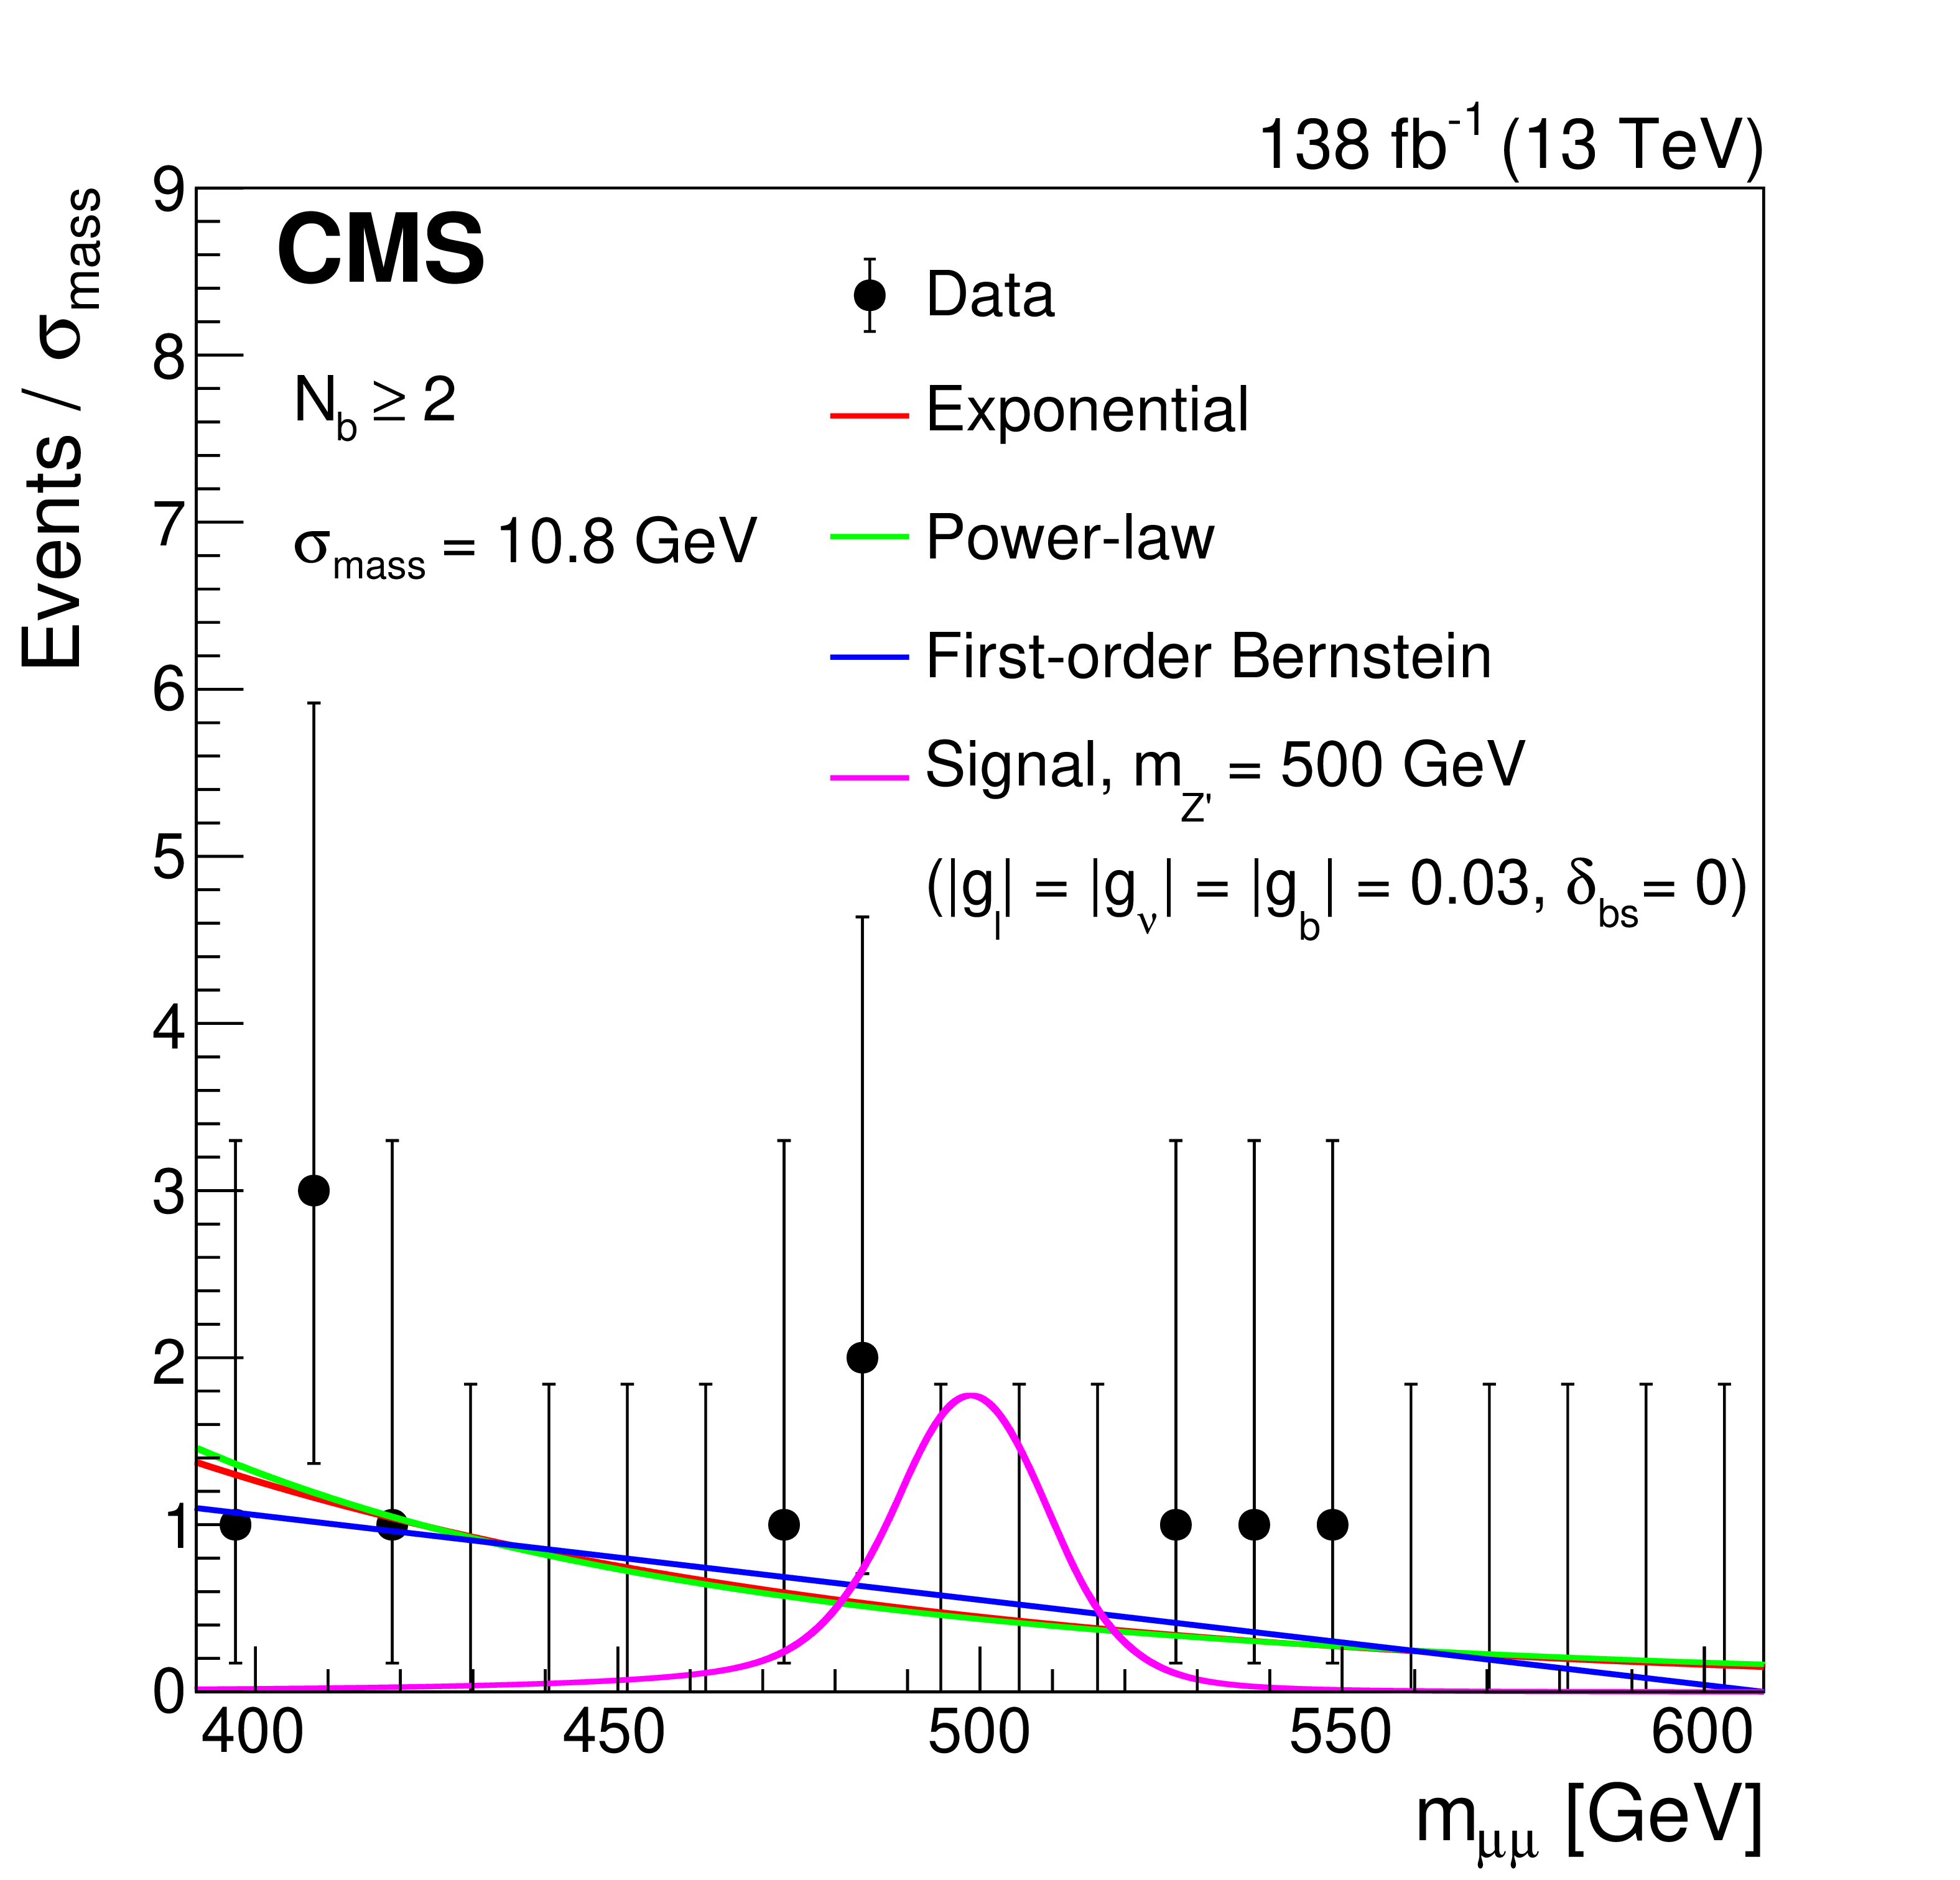
Figure 4:
Invariant mass $ m_{\mu\mu} $ distributions in the $ N_{\mathrm{b}}= $ 1 (left) and $ N_{\mathrm{b}}\geq $ 2 (right) categories, shown together with the corresponding selected background functional forms used as input to the \textitdiscrete profiling method [49] when probing the $ m_{\mathrm{Z}' }= $ 500 GeV hypothesis. The expected signal distribution for the LFU model described in Eq. (1), with couplings $ |g_{\ell}| = |g_{\nu}| = |g_{\mathrm{b}}| = $ 0.03 and $ \delta_{\mathrm{b}\mathrm{s}}= $ 0, is overlaid. The displayed mass range corresponds to the fit window used for this $ m_{\mathrm{Z}' } $ hypothesis, which is $ \pm $10$\sigma_{\text{mass}} $ around the probed $ m_{\mathrm{Z}' } $ value. While the likelihood fits are performed on unbinned data, here we present the data in binned histograms with binning chosen to reflect the size of $ \sigma_{\text{mass}} $. |
png pdf |
Figure 4-a:
Invariant mass $ m_{\mu\mu} $ distributions in the $ N_{\mathrm{b}}= $ 1 category, shown together with the corresponding selected background functional forms used as input to the discrete profiling method [49] when probing the $ m_{\mathrm{Z}' }= $ 500 GeV hypothesis. The expected signal distribution for the LFU model described in Eq. (1), with couplings $ |g_{\ell}| = |g_{\nu}| = |g_{\mathrm{b}}| = $ 0.03 and $ \delta_{\mathrm{b}\mathrm{s}}= $ 0, is overlaid. The displayed mass range corresponds to the fit window used for this $ m_{\mathrm{Z}' } $ hypothesis, which is $ \pm $ 10$\sigma_{\text{mass}} $ around the probed $ m_{\mathrm{Z}' } $ value. While the likelihood fits are performed on unbinned data, here we present the data in binned histograms with binning chosen to reflect the size of $ \sigma_{\text{mass}} $. |
png pdf |
Figure 4-b:
Invariant mass $ m_{\mu\mu} $ distributions in the $ N_{\mathrm{b}}\geq $ 2 category, shown together with the corresponding selected background functional forms used as input to the discrete profiling method [49] when probing the $ m_{\mathrm{Z}' }= $ 500 GeV hypothesis. The expected signal distribution for the LFU model described in Eq. (1), with couplings $ |g_{\ell}| = |g_{\nu}| = |g_{\mathrm{b}}| = $ 0.03 and $ \delta_{\mathrm{b}\mathrm{s}}= $ 0, is overlaid. The displayed mass range corresponds to the fit window used for this $ m_{\mathrm{Z}' } $ hypothesis, which is $ \pm $ 10$\sigma_{\text{mass}} $ around the probed $ m_{\mathrm{Z}' } $ value. While the likelihood fits are performed on unbinned data, here we present the data in binned histograms with binning chosen to reflect the size of $ \sigma_{\text{mass}} $. |
png pdf |
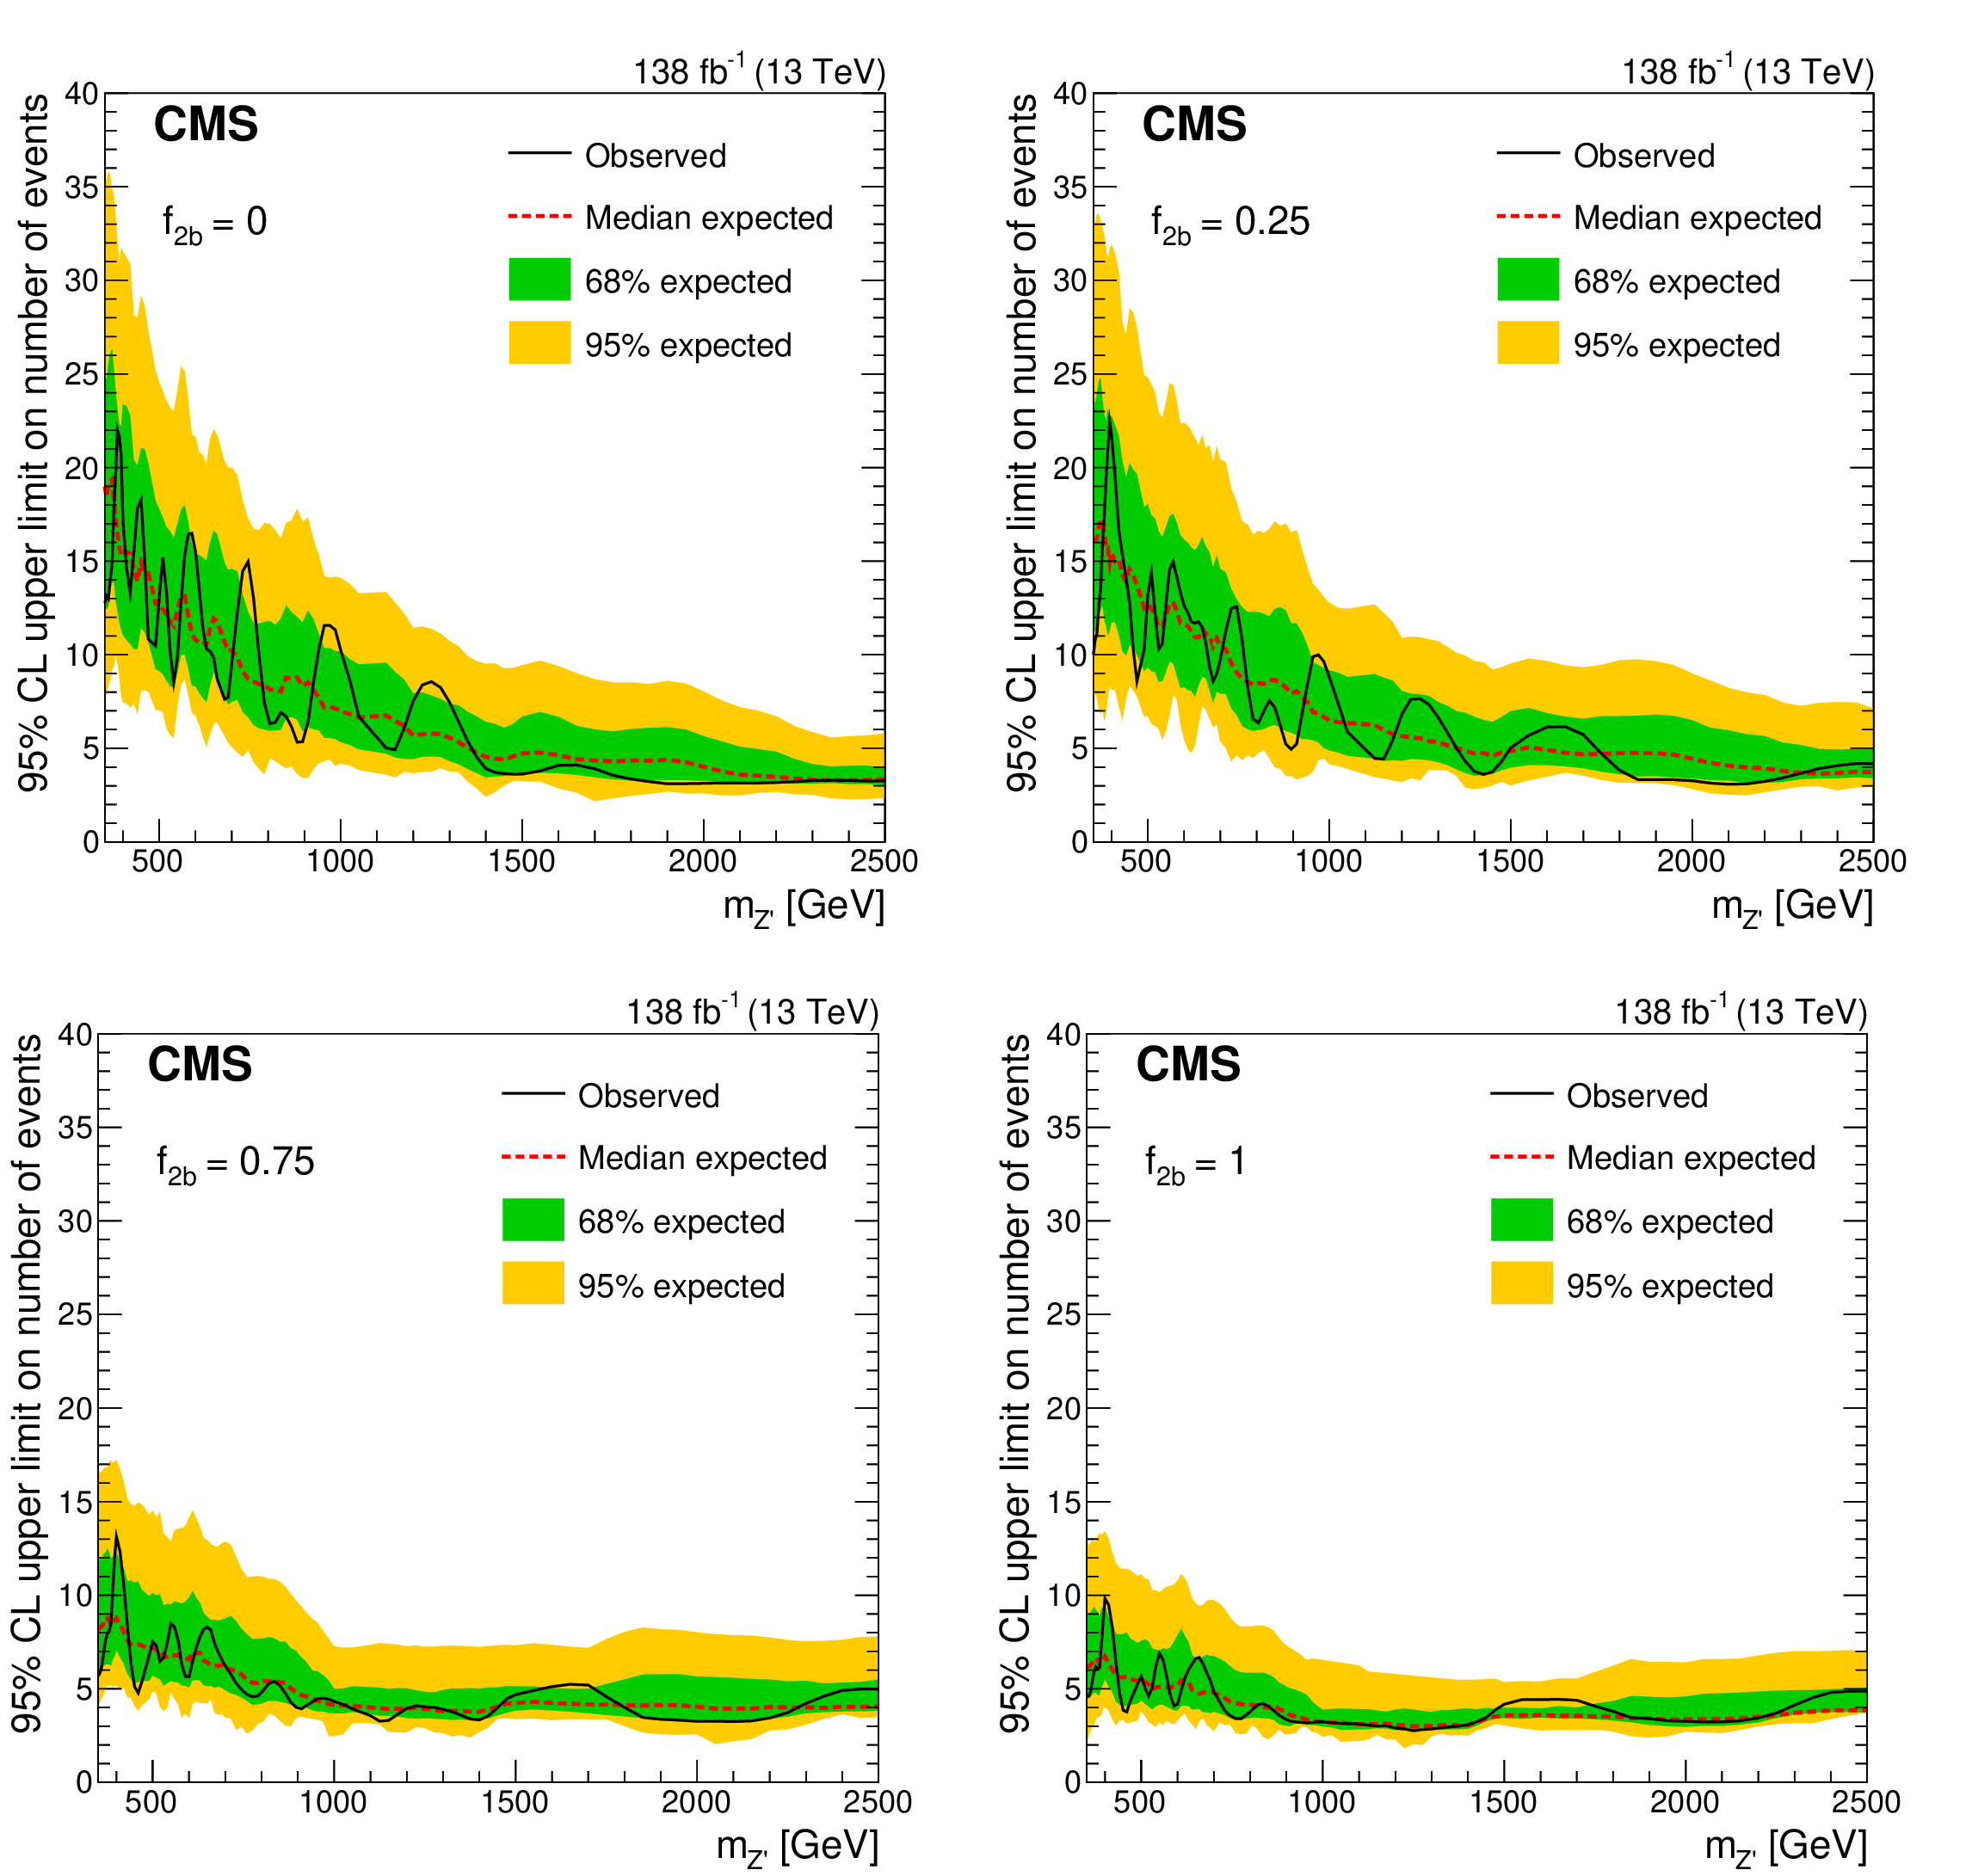
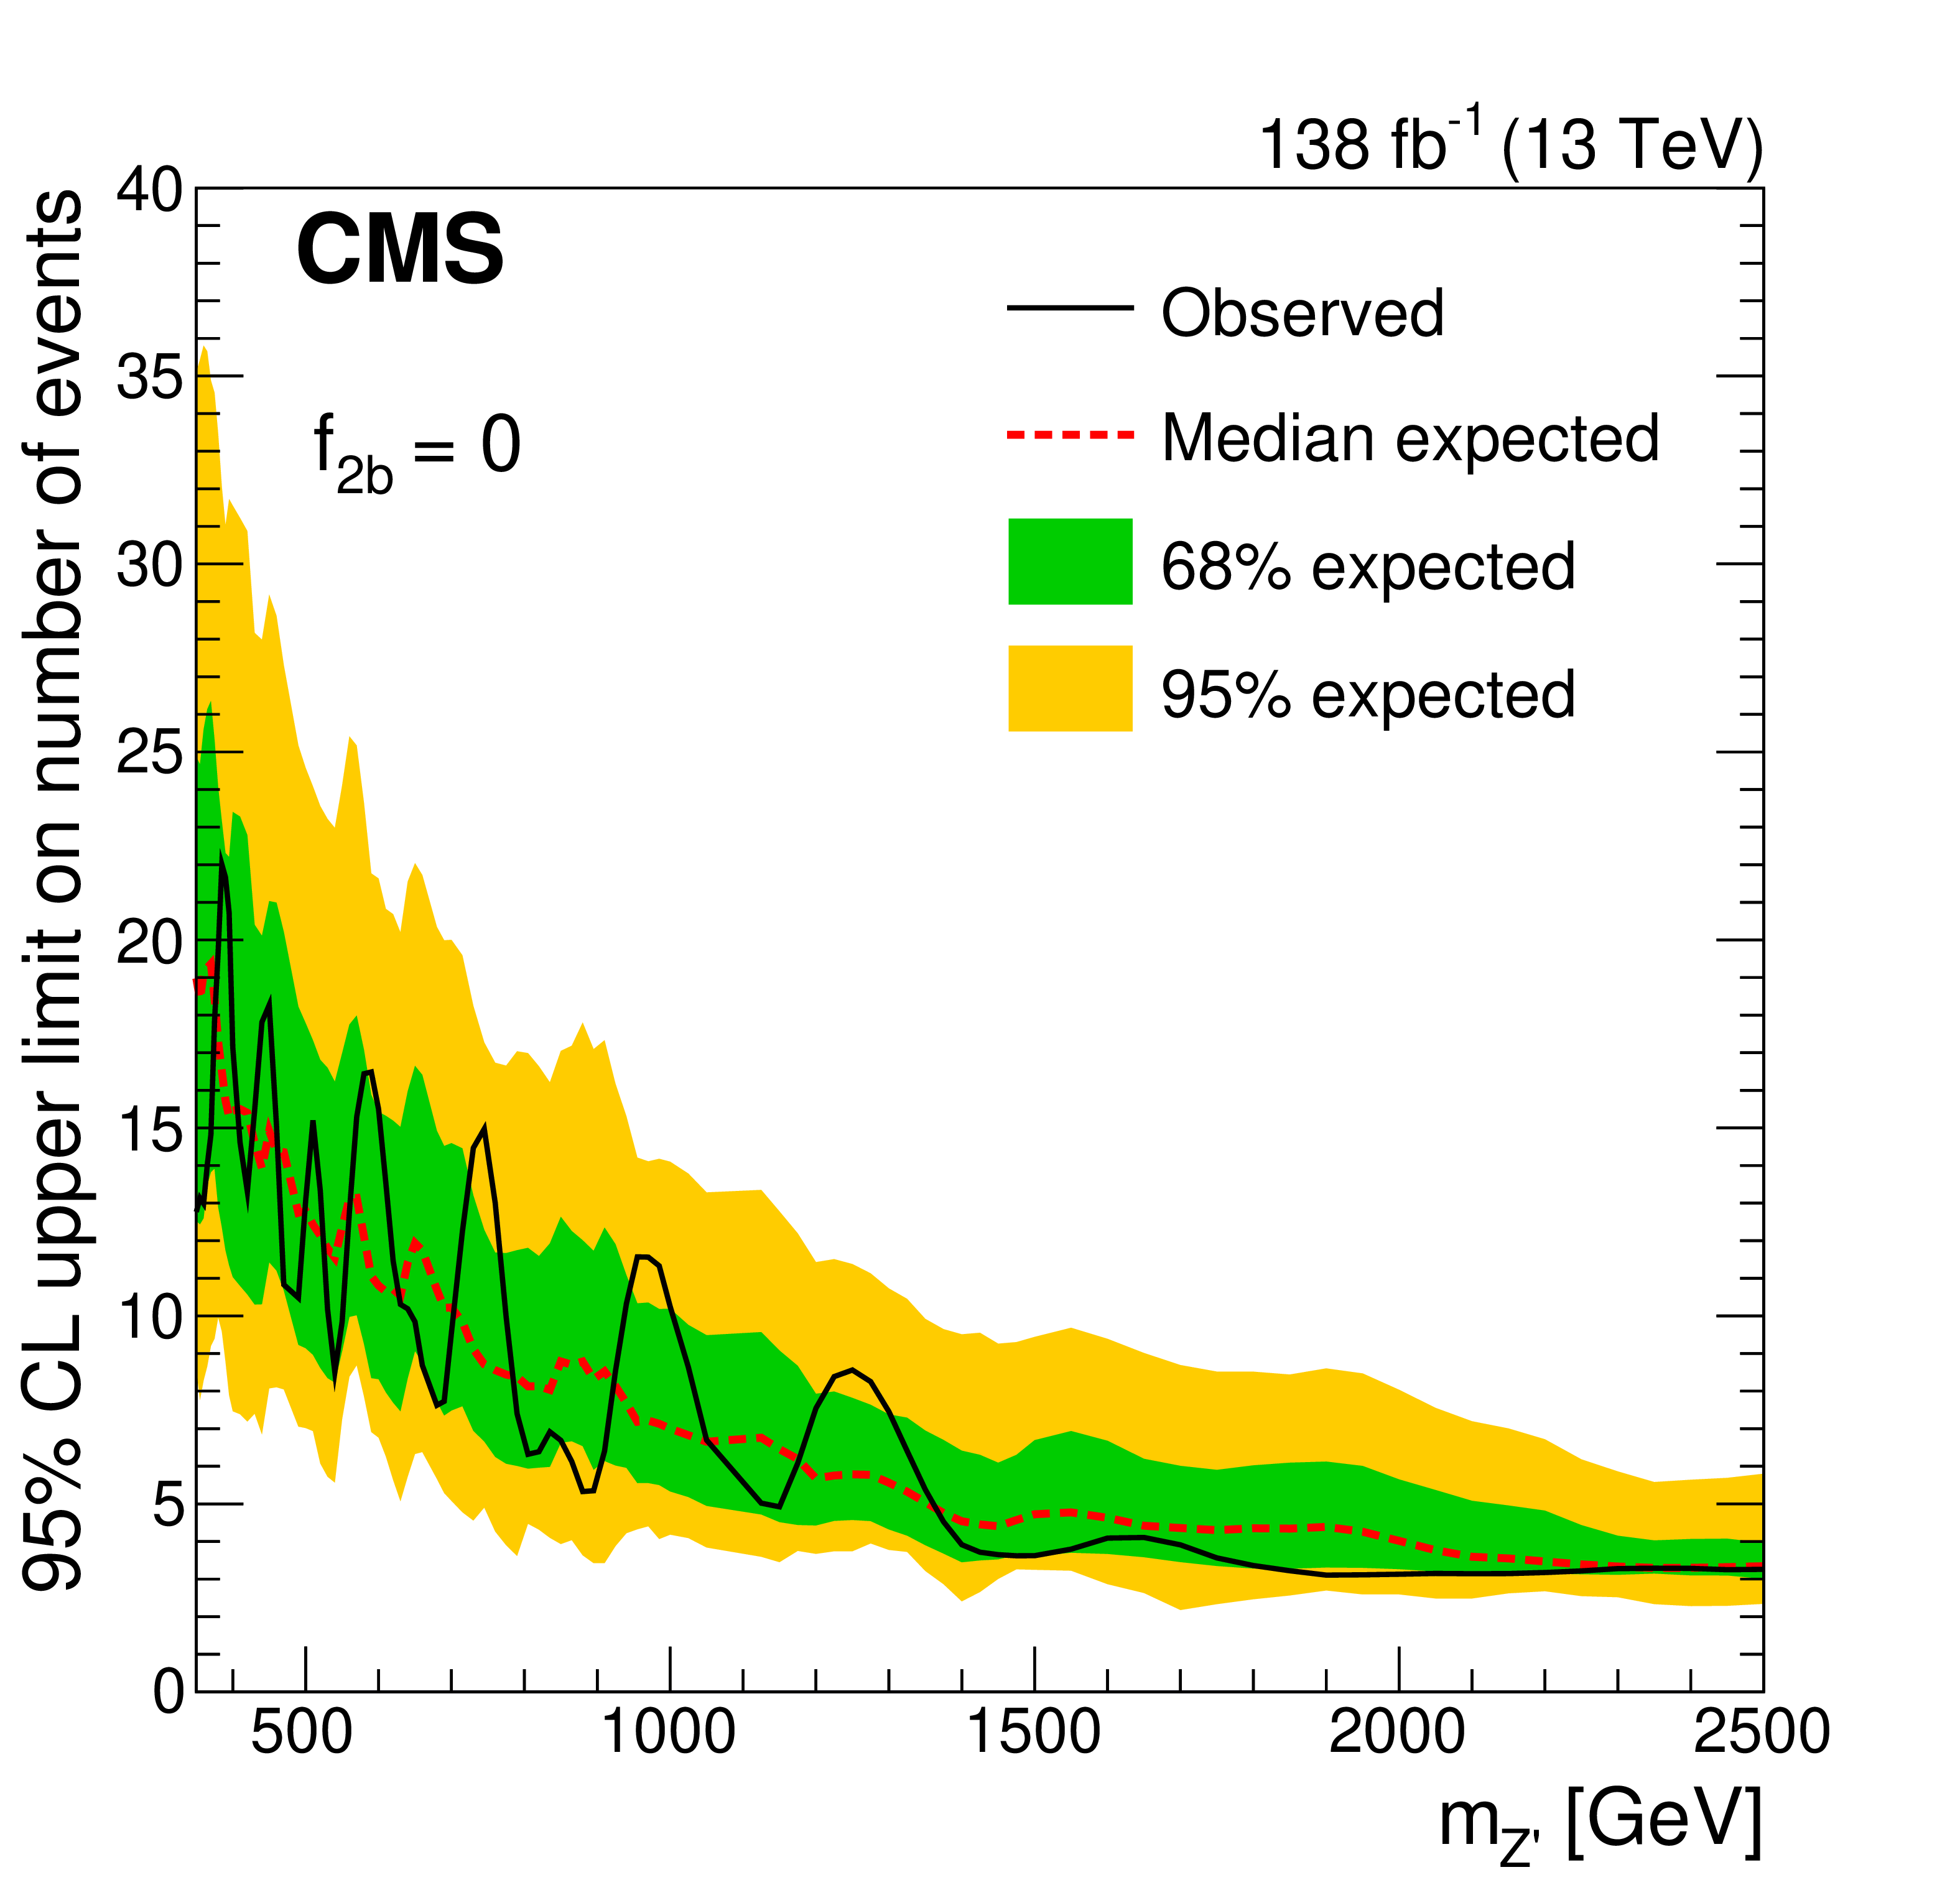
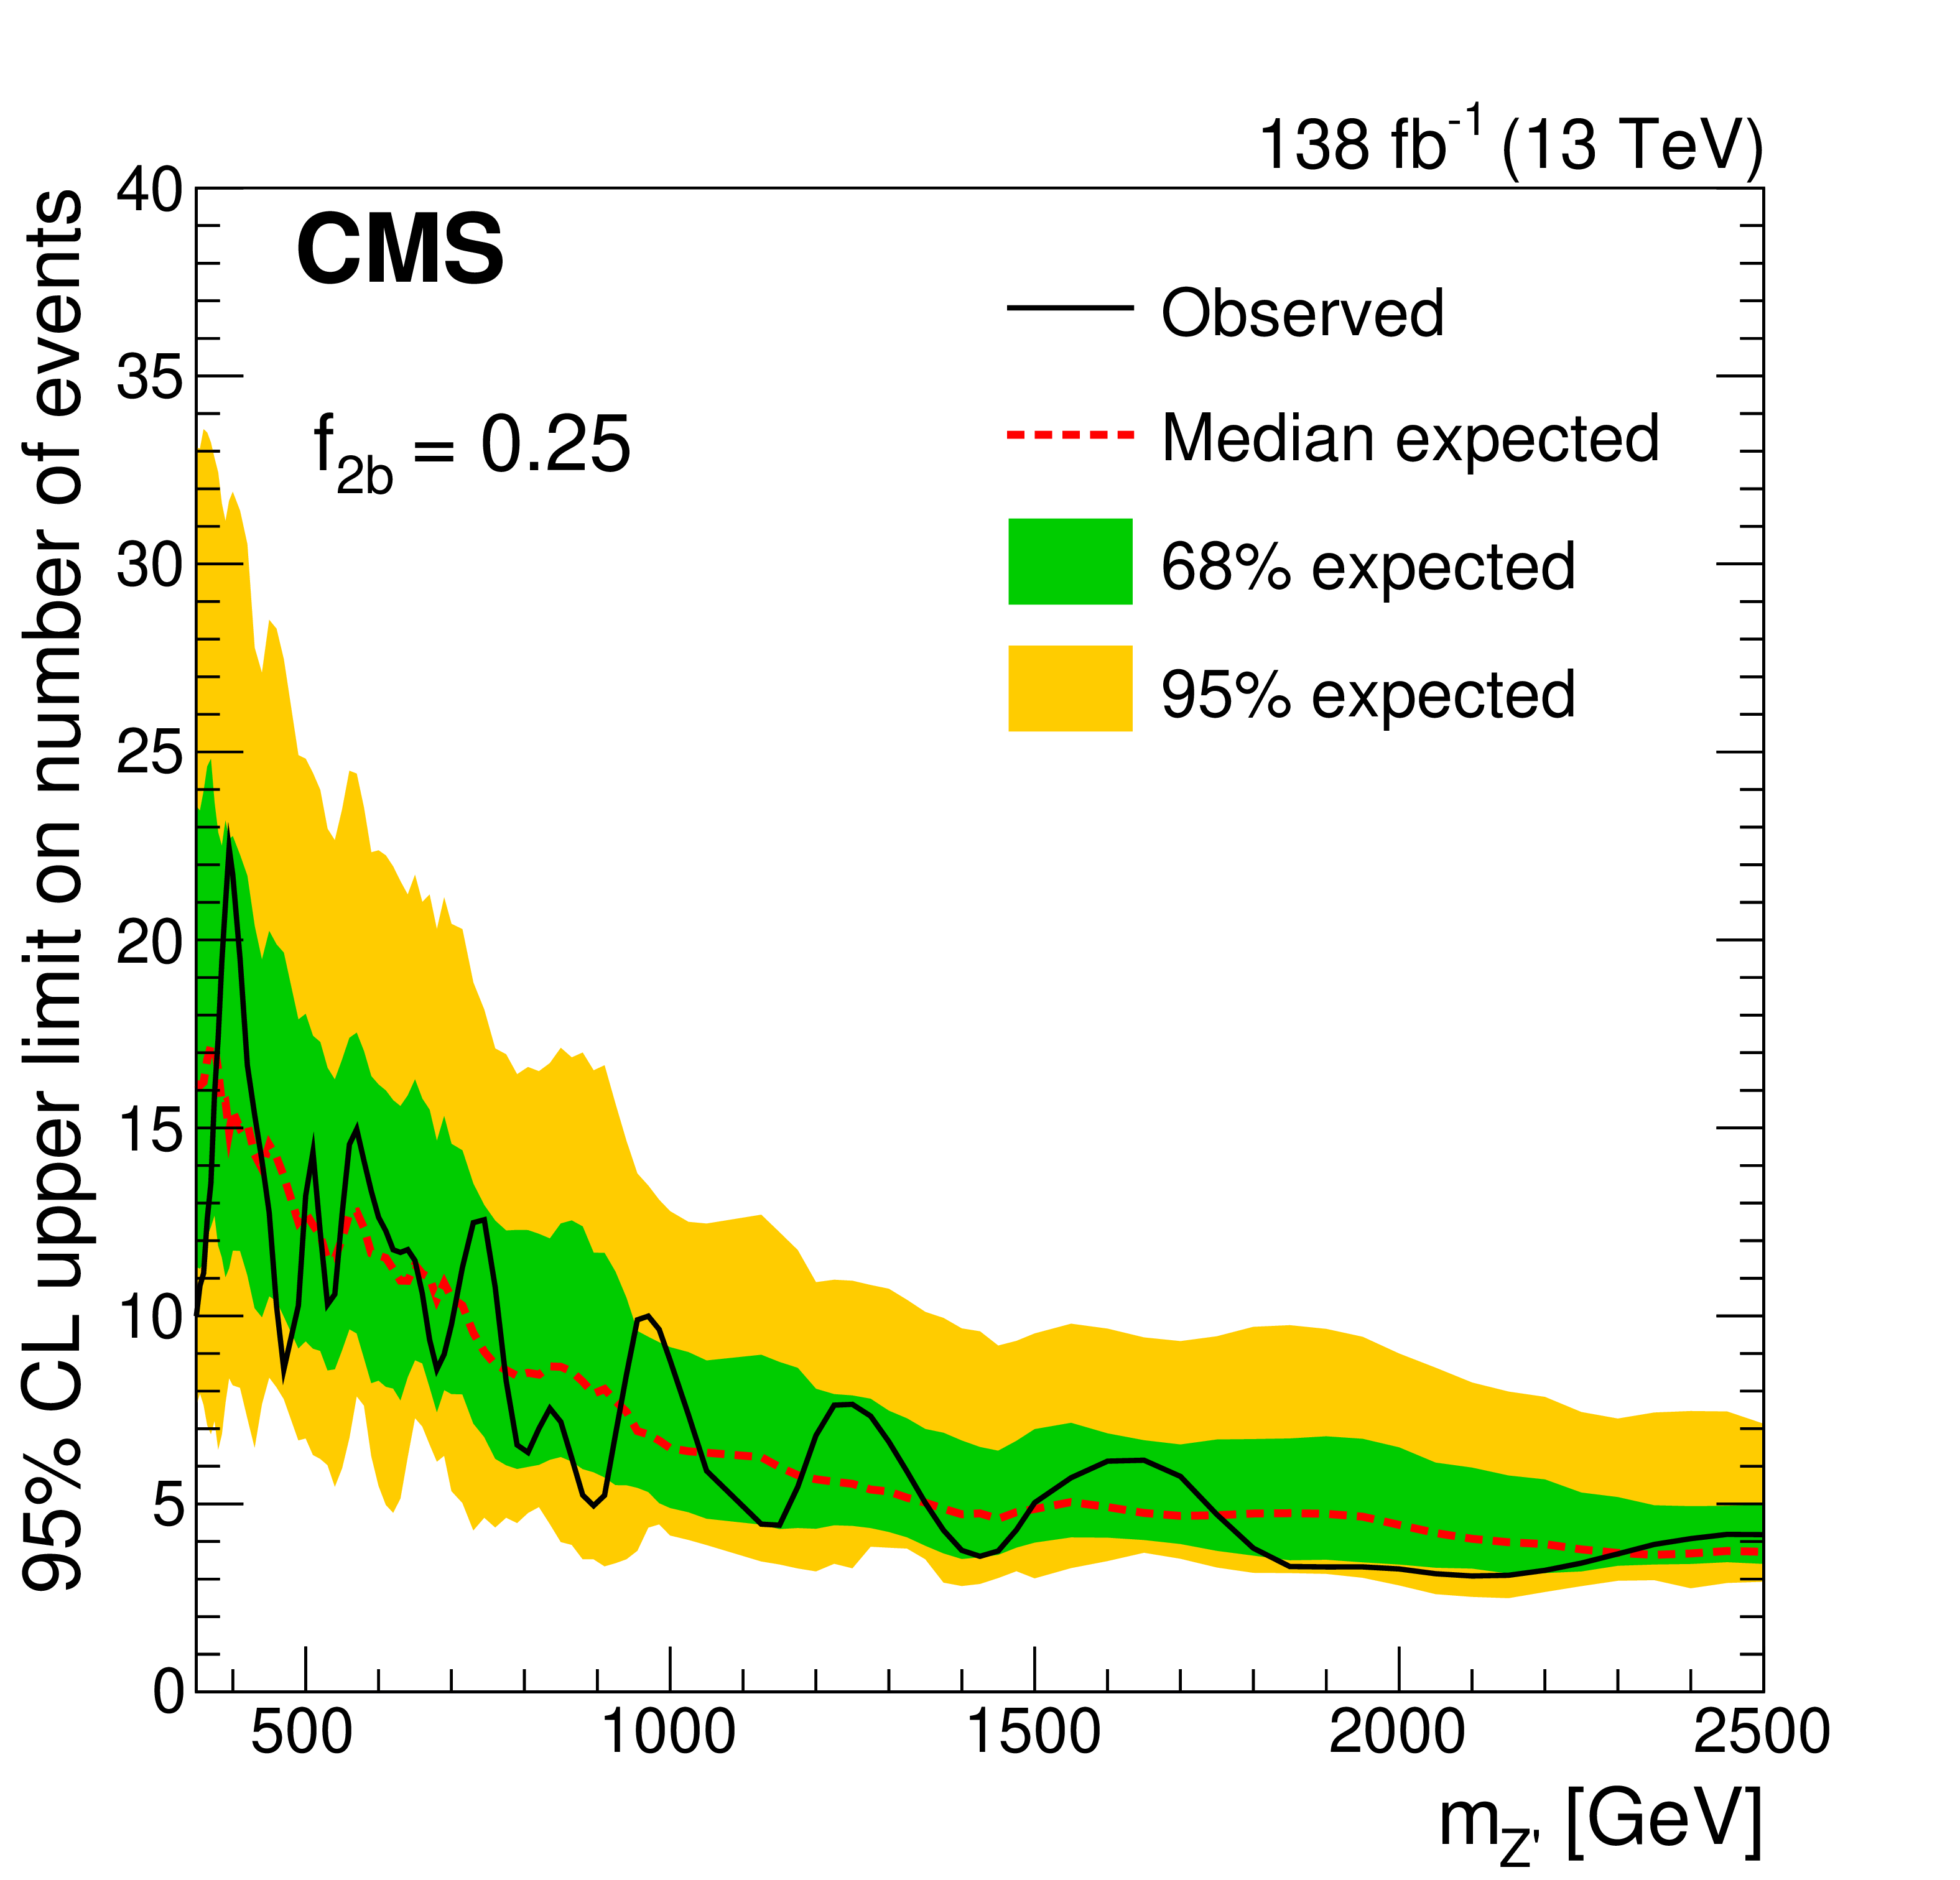
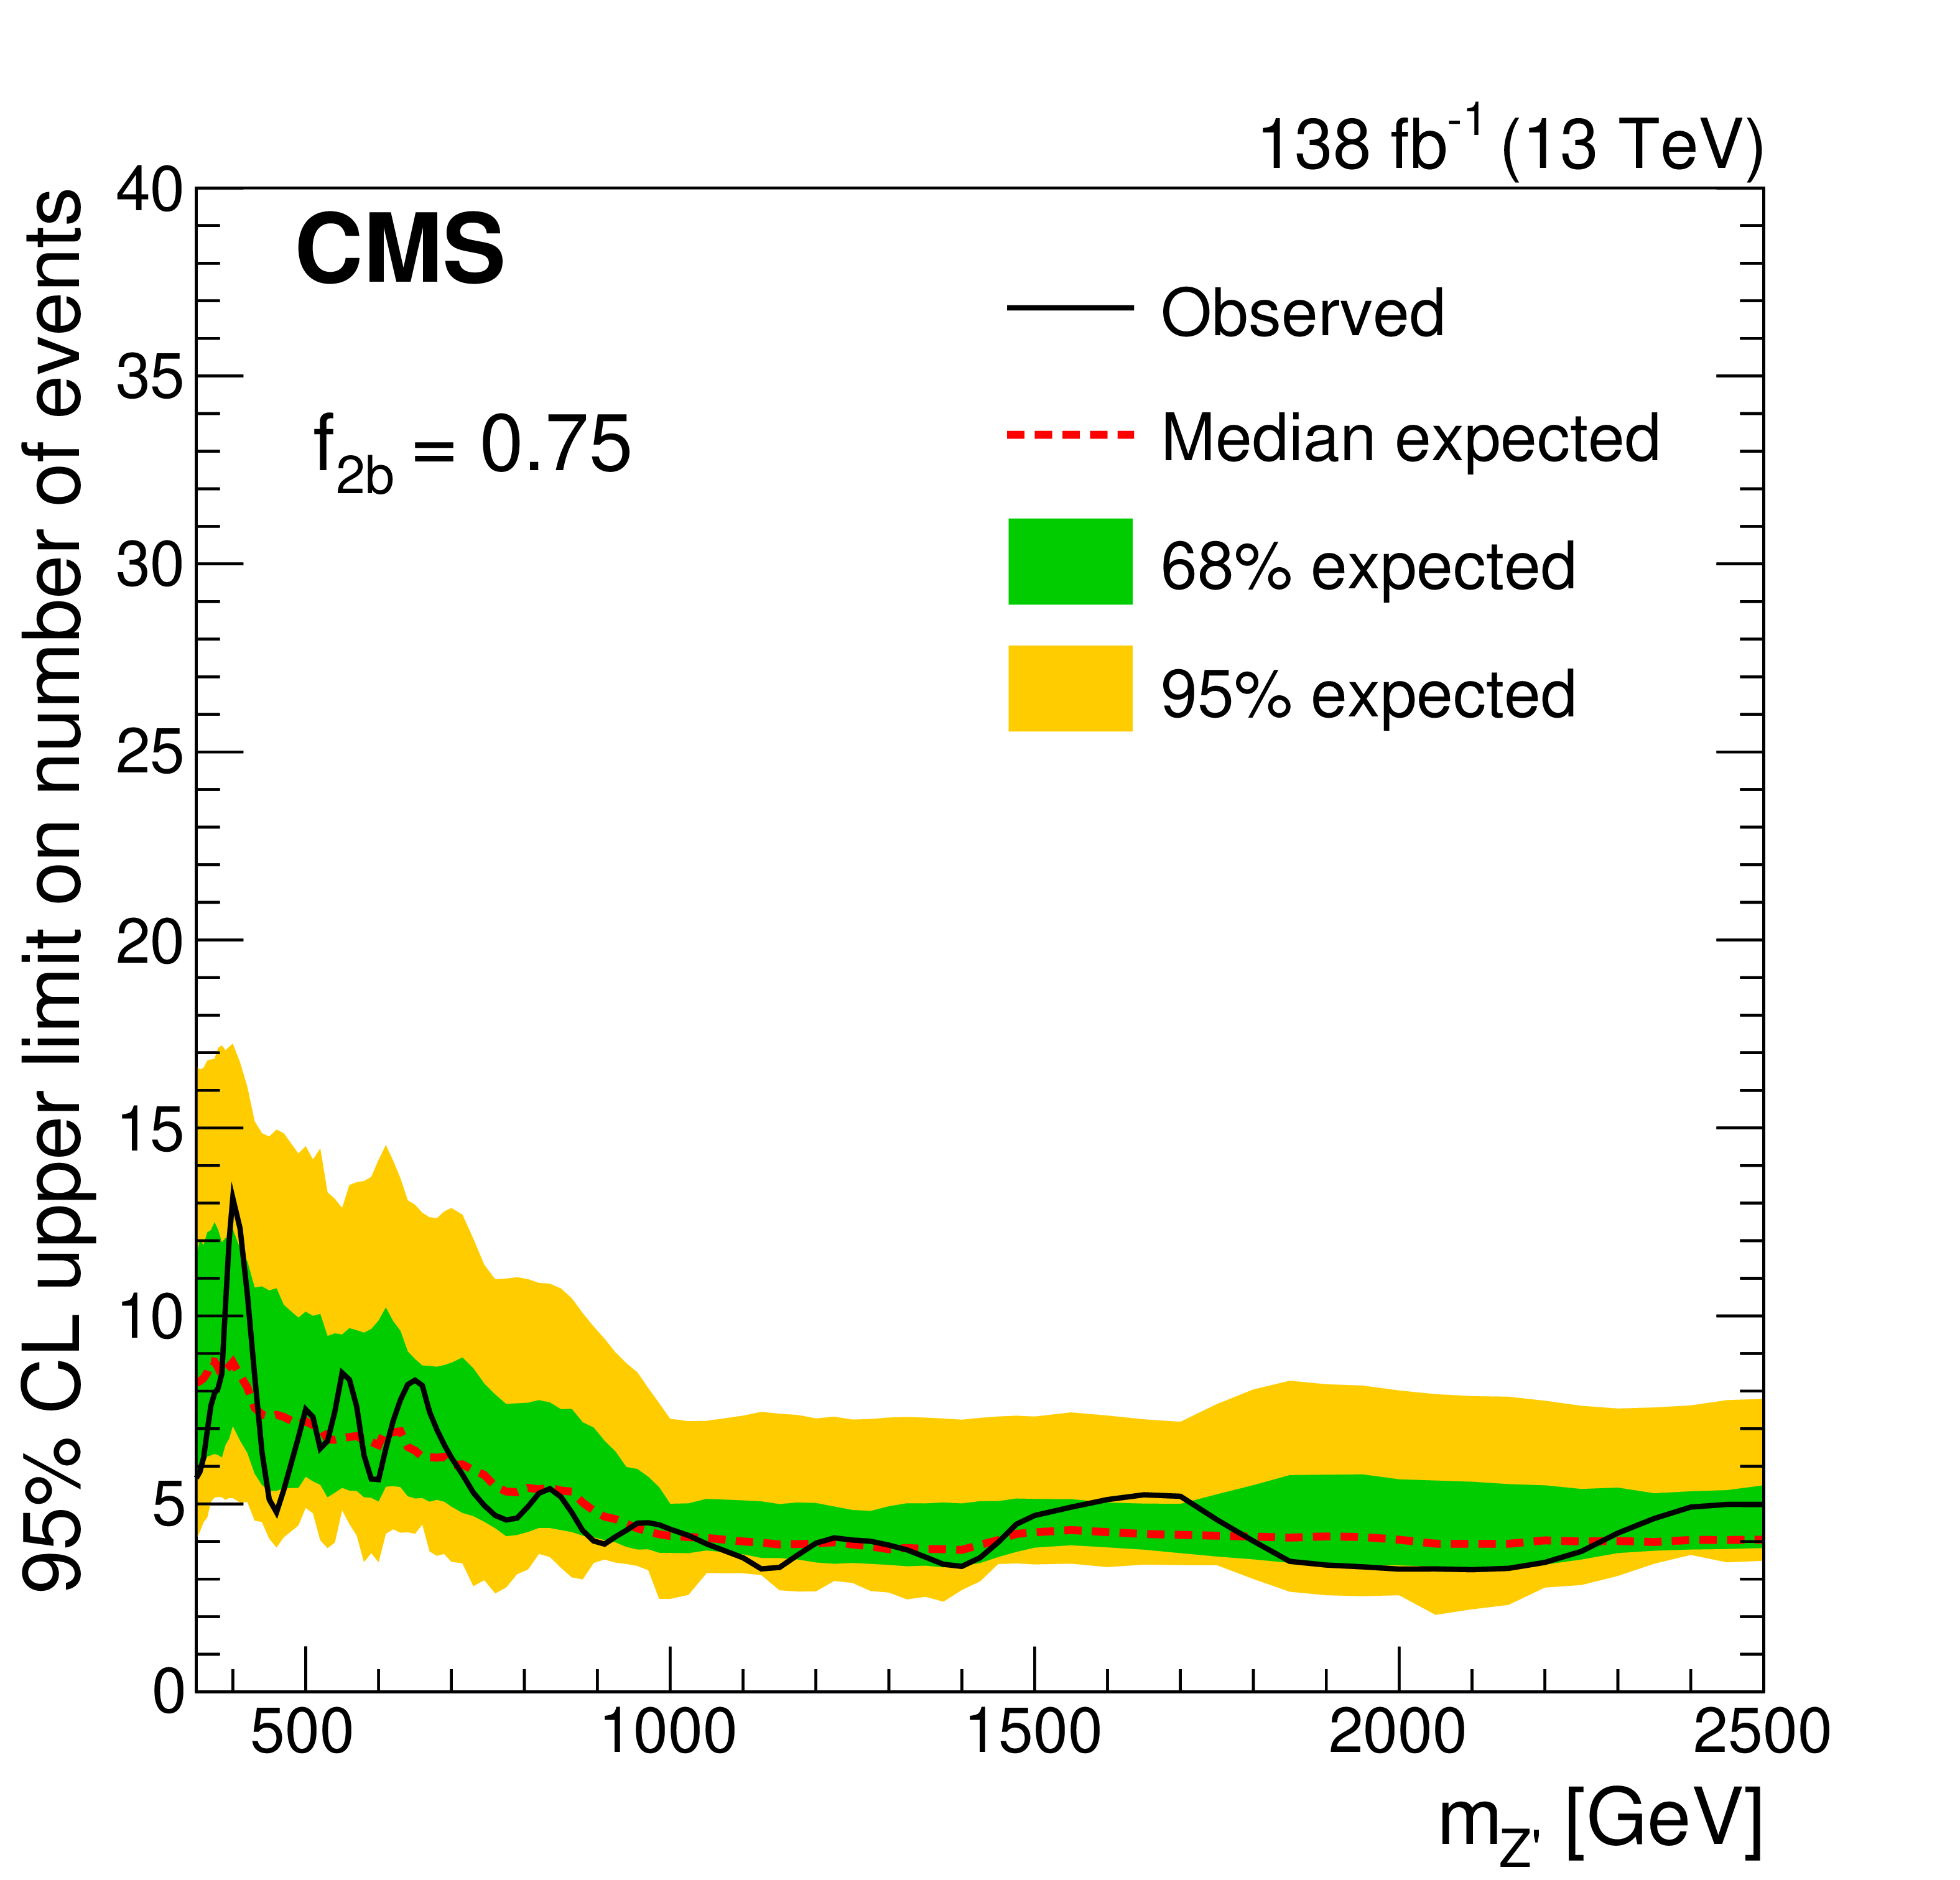
Figure 5:
Exclusion limits at 95% CL on the number of selected BSM events with $ N_{\mathrm{b}} \geq $ 1 as functions of $ m_{\mathrm{Z}' } $ for the different representative values of $ f_{2\mathrm{b}}= $ 0 (upper left), 0.25 (upper right), 0.75 (lower left), and 1 (lower right). The quantity $ f_{2\mathrm{b}} $ is the fraction of BSM events passing the analysis selection that have at least two b quark jets. The solid black (dashed red) curve represents the observed (median expected) exclusion. The inner green (outer yellow) band indicates the region containing 68 (95)% of the distribution of limits expected under the background-only hypothesis. |
png pdf |
Figure 5-a:
Exclusion limits at 95% CL on the number of selected BSM events with $ N_{\mathrm{b}} \geq $ 1 as functions of $ m_{\mathrm{Z}' } $ for the different representative values of $ f_{2\mathrm{b}}= $ 0. The quantity $ f_{2\mathrm{b}} $ is the fraction of BSM events passing the analysis selection that have at least two b quark jets. The solid black (dashed red) curve represents the observed (median expected) exclusion. The inner green (outer yellow) band indicates the region containing 68 (95)% of the distribution of limits expected under the background-only hypothesis. |
png pdf |
Figure 5-b:
Exclusion limits at 95% CL on the number of selected BSM events with $ N_{\mathrm{b}} \geq $ 1 as functions of $ m_{\mathrm{Z}' } $ for the different representative values of $ f_{2\mathrm{b}}= $ 0.25. The quantity $ f_{2\mathrm{b}} $ is the fraction of BSM events passing the analysis selection that have at least two b quark jets. The solid black (dashed red) curve represents the observed (median expected) exclusion. The inner green (outer yellow) band indicates the region containing 68 (95)% of the distribution of limits expected under the background-only hypothesis. |
png pdf |
Figure 5-c:
Exclusion limits at 95% CL on the number of selected BSM events with $ N_{\mathrm{b}} \geq $ 1 as functions of $ m_{\mathrm{Z}' } $ for the different representative values of $ f_{2\mathrm{b}}= $ 0.75. The quantity $ f_{2\mathrm{b}} $ is the fraction of BSM events passing the analysis selection that have at least two b quark jets. The solid black (dashed red) curve represents the observed (median expected) exclusion. The inner green (outer yellow) band indicates the region containing 68 (95)% of the distribution of limits expected under the background-only hypothesis. |
png pdf |
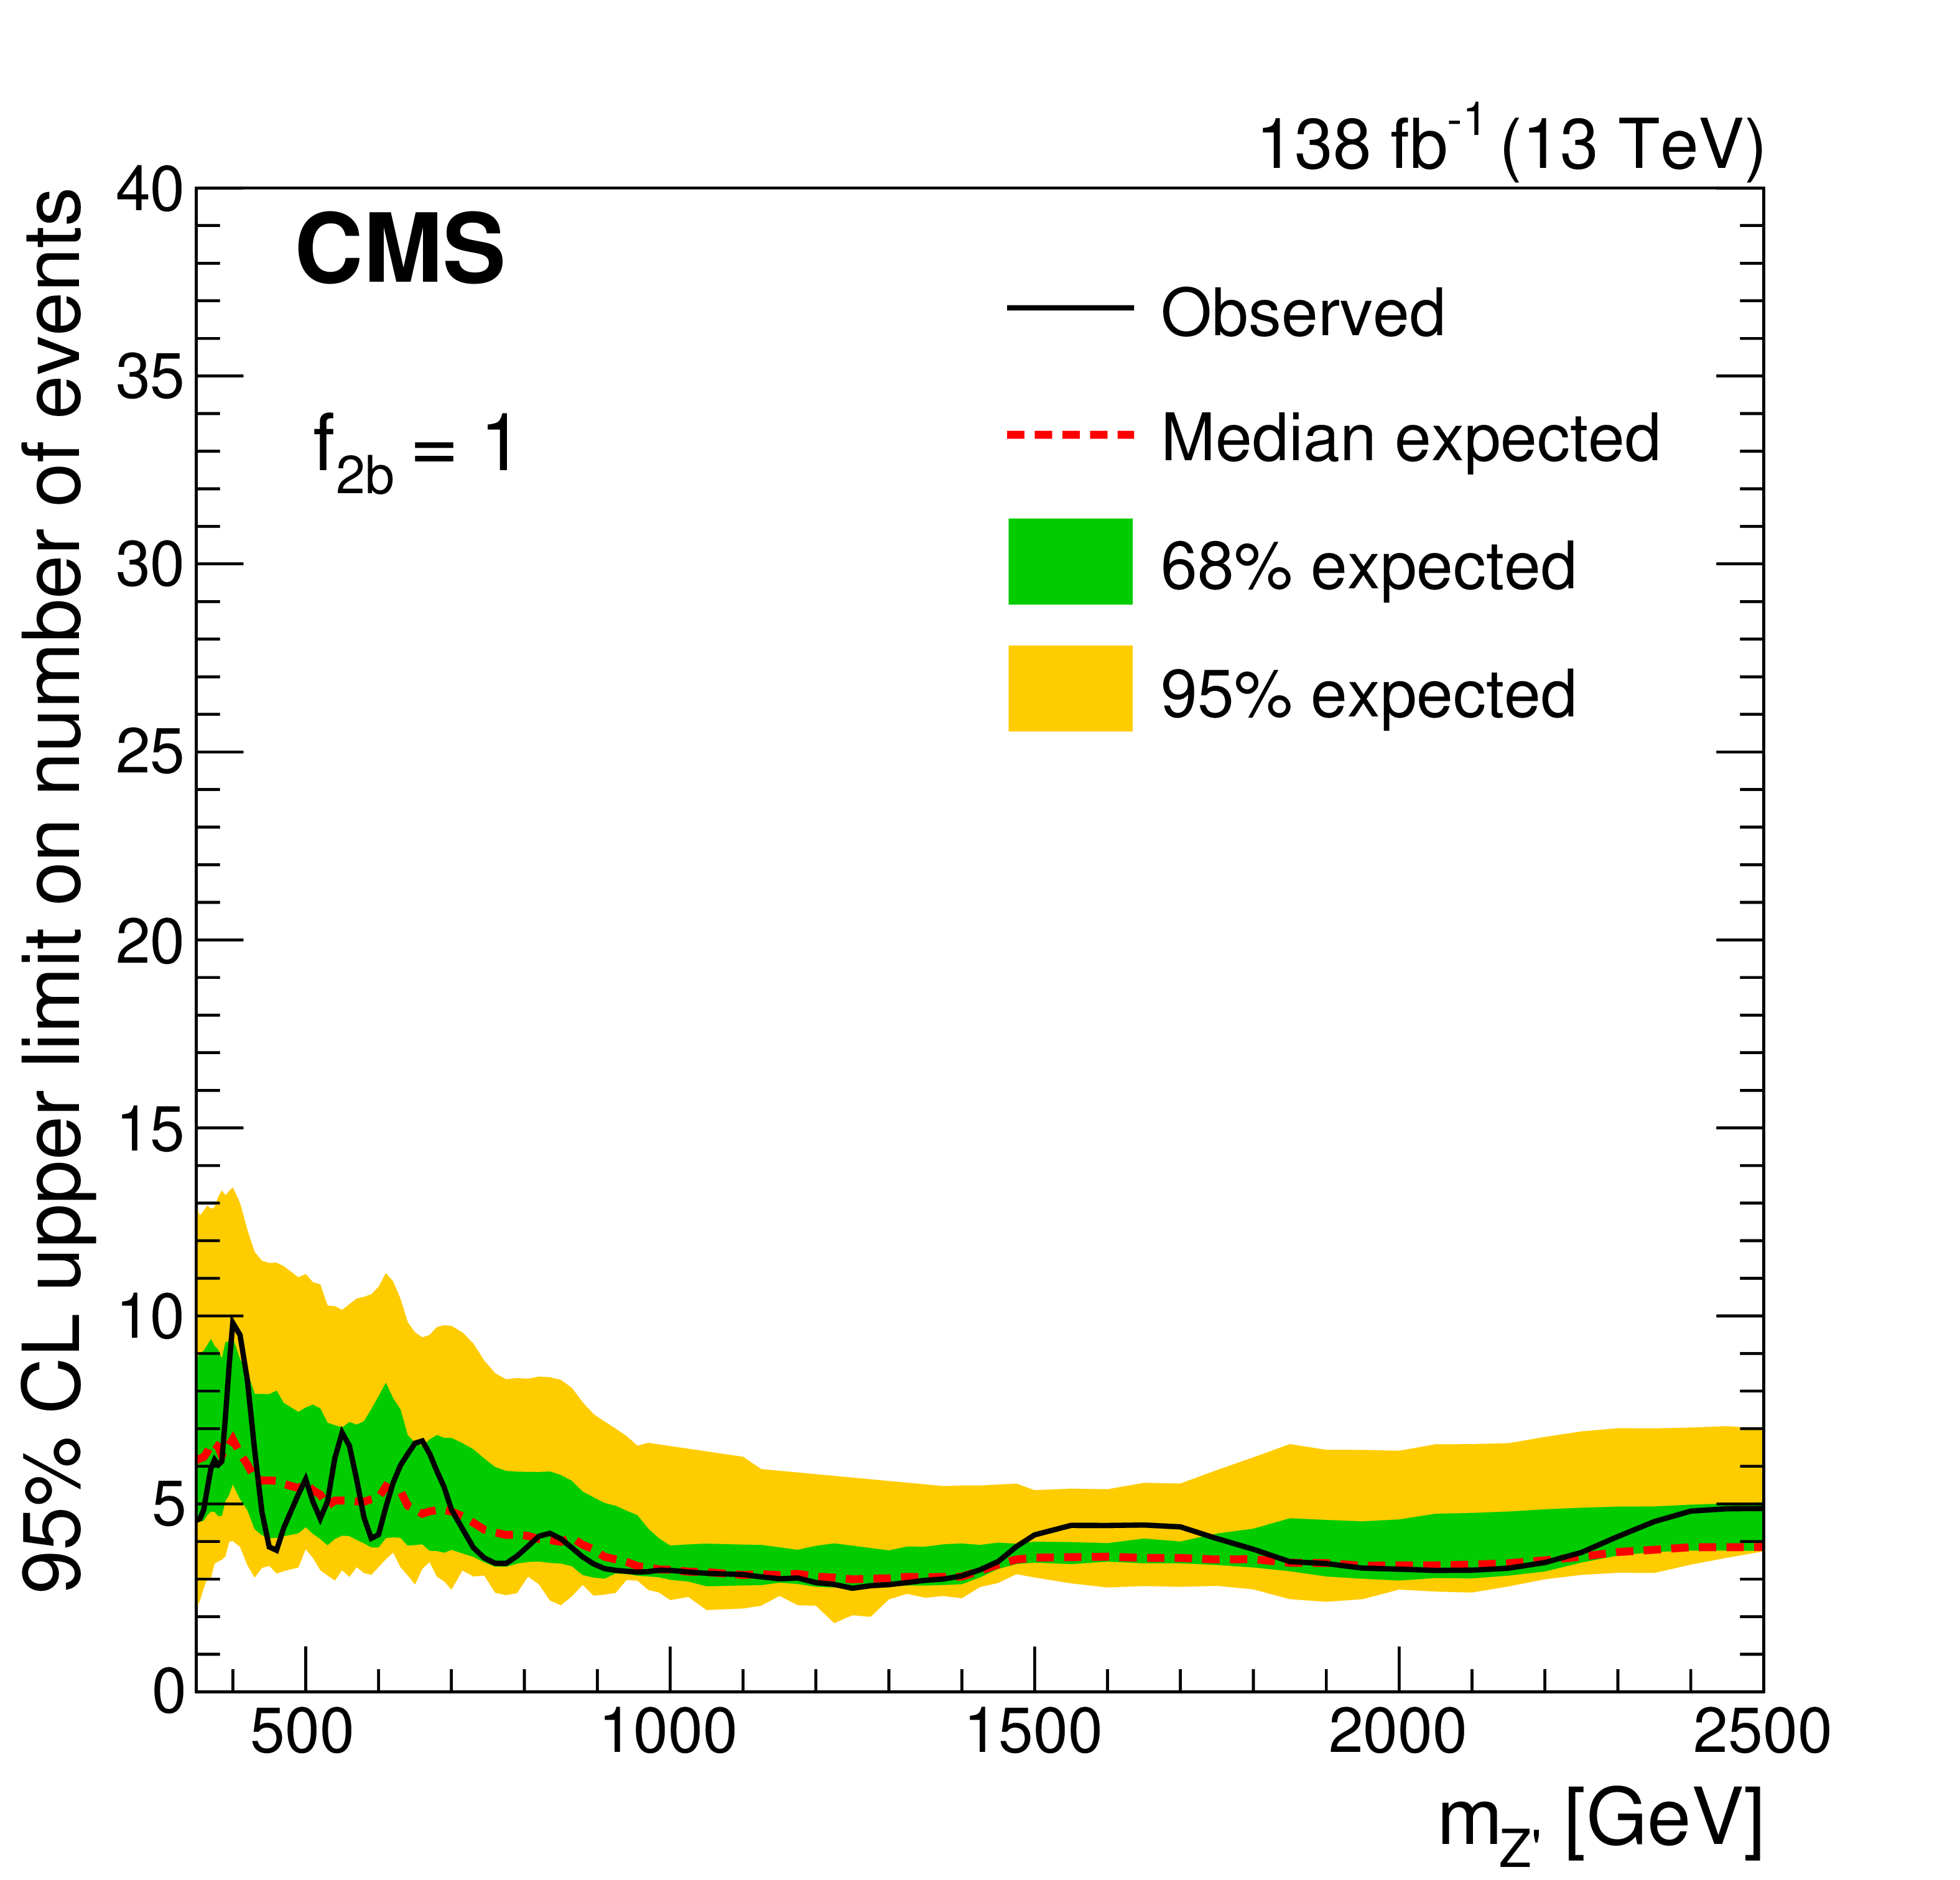
Figure 5-d:
Exclusion limits at 95% CL on the number of selected BSM events with $ N_{\mathrm{b}} \geq $ 1 as functions of $ m_{\mathrm{Z}' } $ for the different representative values of $ f_{2\mathrm{b}}= $ 1. The quantity $ f_{2\mathrm{b}} $ is the fraction of BSM events passing the analysis selection that have at least two b quark jets. The solid black (dashed red) curve represents the observed (median expected) exclusion. The inner green (outer yellow) band indicates the region containing 68 (95)% of the distribution of limits expected under the background-only hypothesis. |
png pdf |
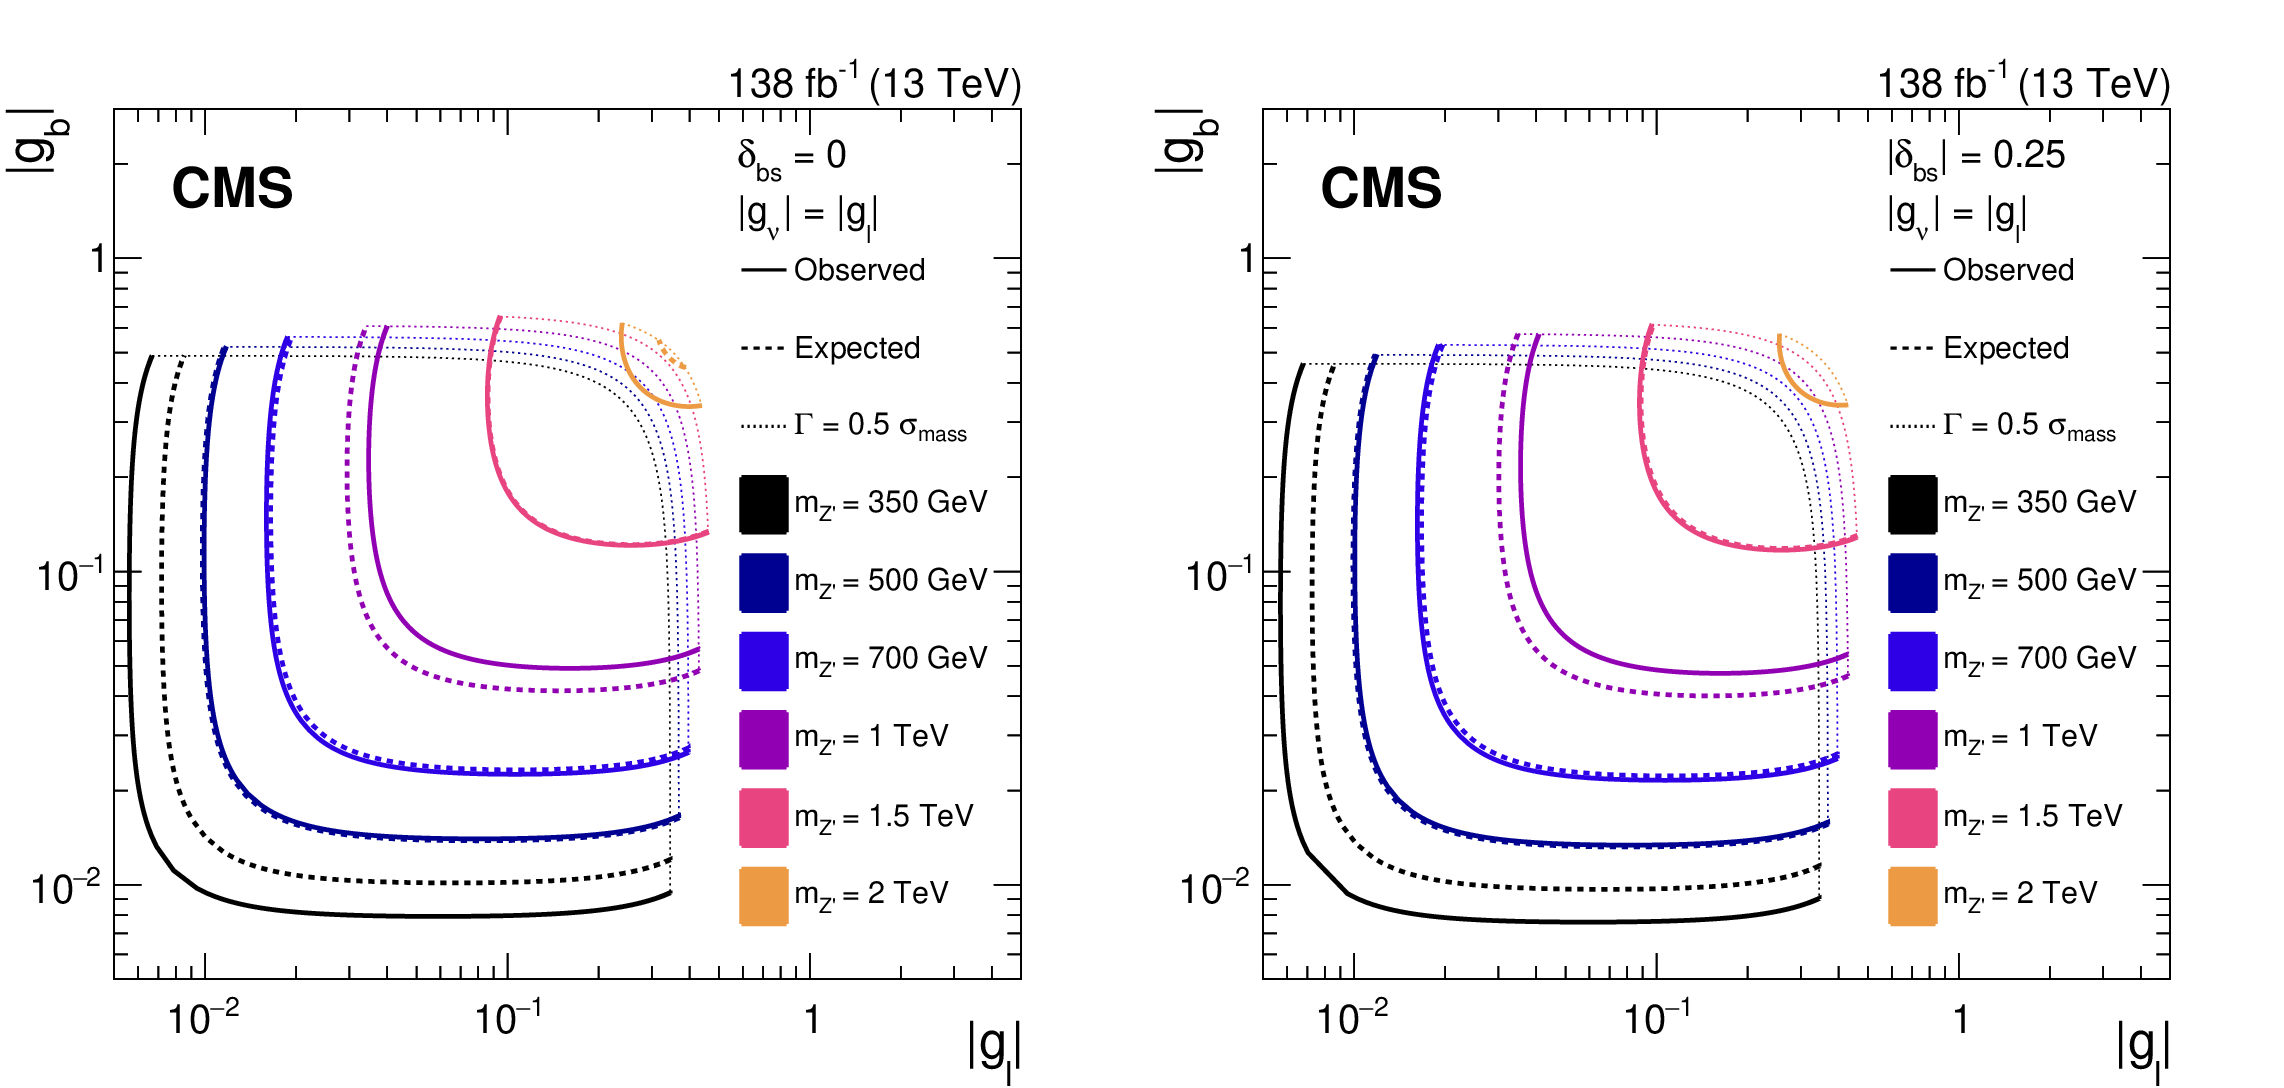
Figure 6:
Observed (solid) and median expected (dashed) exclusion limits at 95% CL in the $ |g_{\mathrm{b}}| $-$ |g_{\ell}| $ plane for the LFU model. The scenarios considered have $ |\delta_{\mathrm{b}\mathrm{s}}| $ values of either 0 (left) or 0.25 (right). In all cases, we assume $ |g_{\nu}| = |g_{\ell}| $. The exclusion limits are given up to coupling values at which the Z' width is equal to half of the $ \mu\mu $ invariant mass resolution, marked by the dotted curves. Beyond these coupling values, the narrow width approximation intrinsic to the search strategy is not considered valid. The enclosed regions are excluded. |
png pdf |
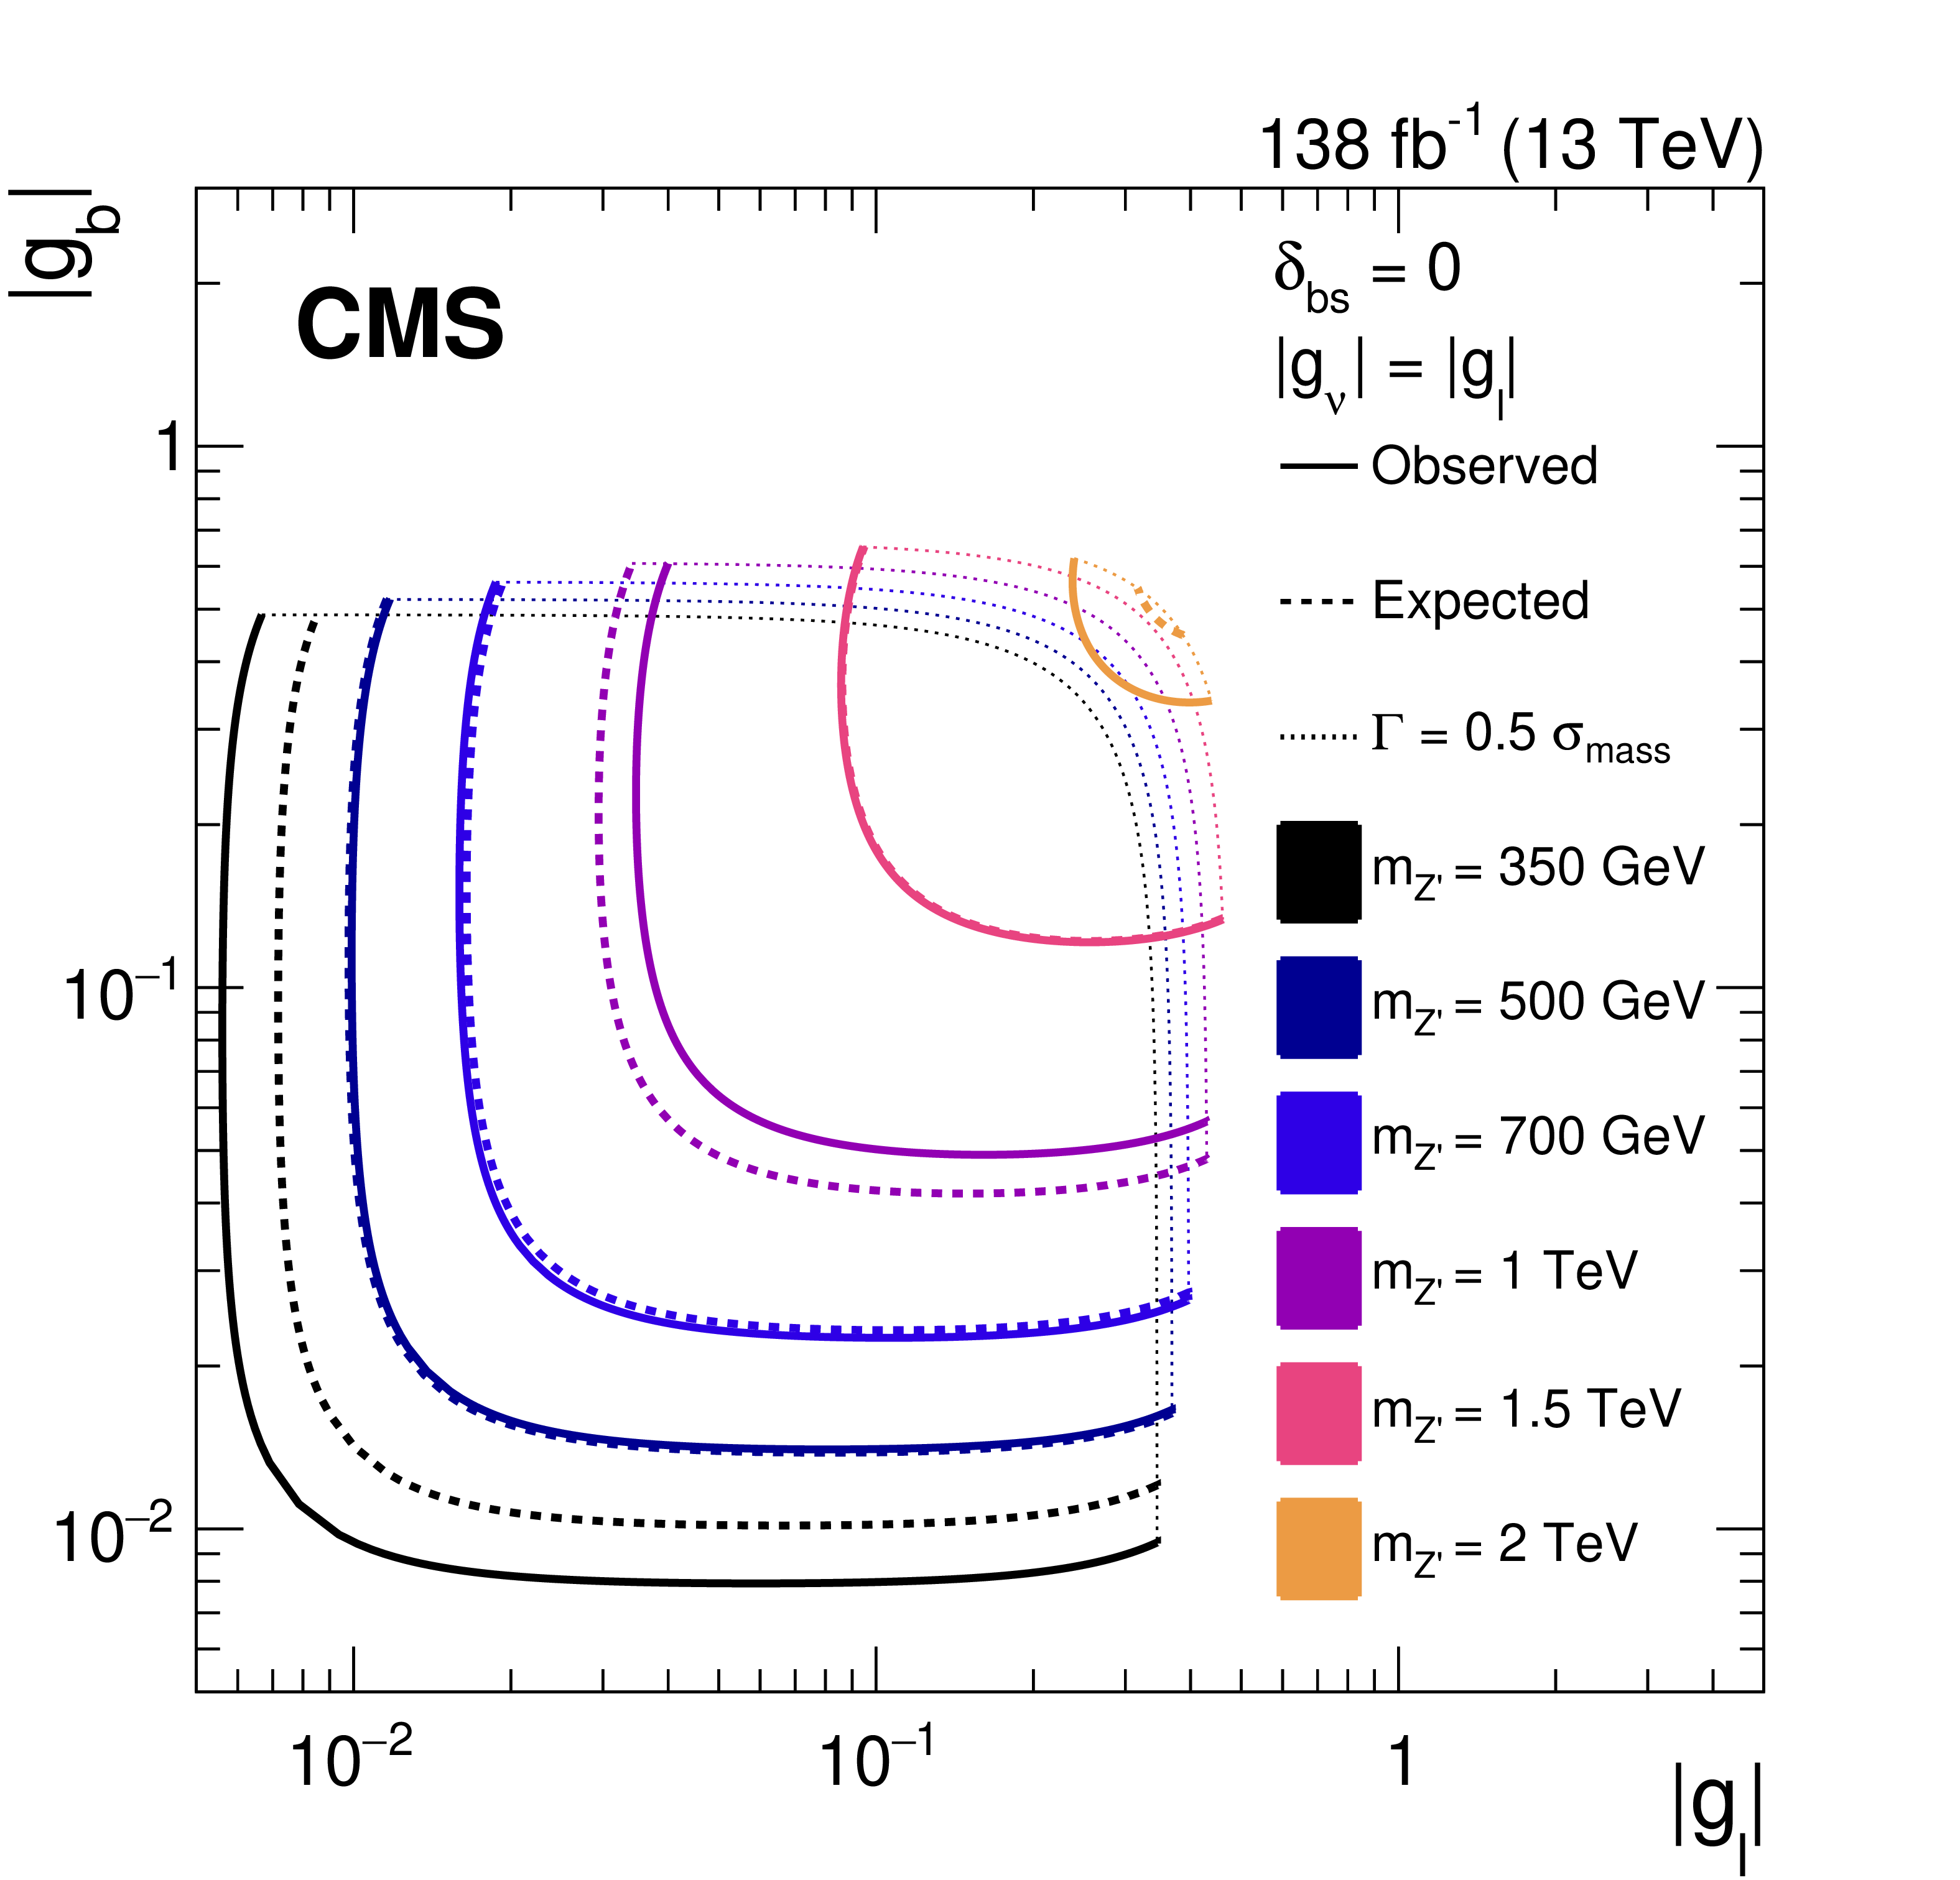
Figure 6-a:
Observed (solid) and median expected (dashed) exclusion limits at 95% CL in the $ |g_{\mathrm{b}}| $-$ |g_{\ell}| $ plane for the LFU model. The considered scenario has $ |\delta_{\mathrm{b}\mathrm{s}}| = $ 0. We assume $ |g_{\nu}| = |g_{\ell}| $. The exclusion limits are given up to coupling values at which the Z' width is equal to half of the $ \mu\mu $ invariant mass resolution, marked by the dotted curves. Beyond these coupling values, the narrow width approximation intrinsic to the search strategy is not considered valid. The enclosed regions are excluded. |
png pdf |
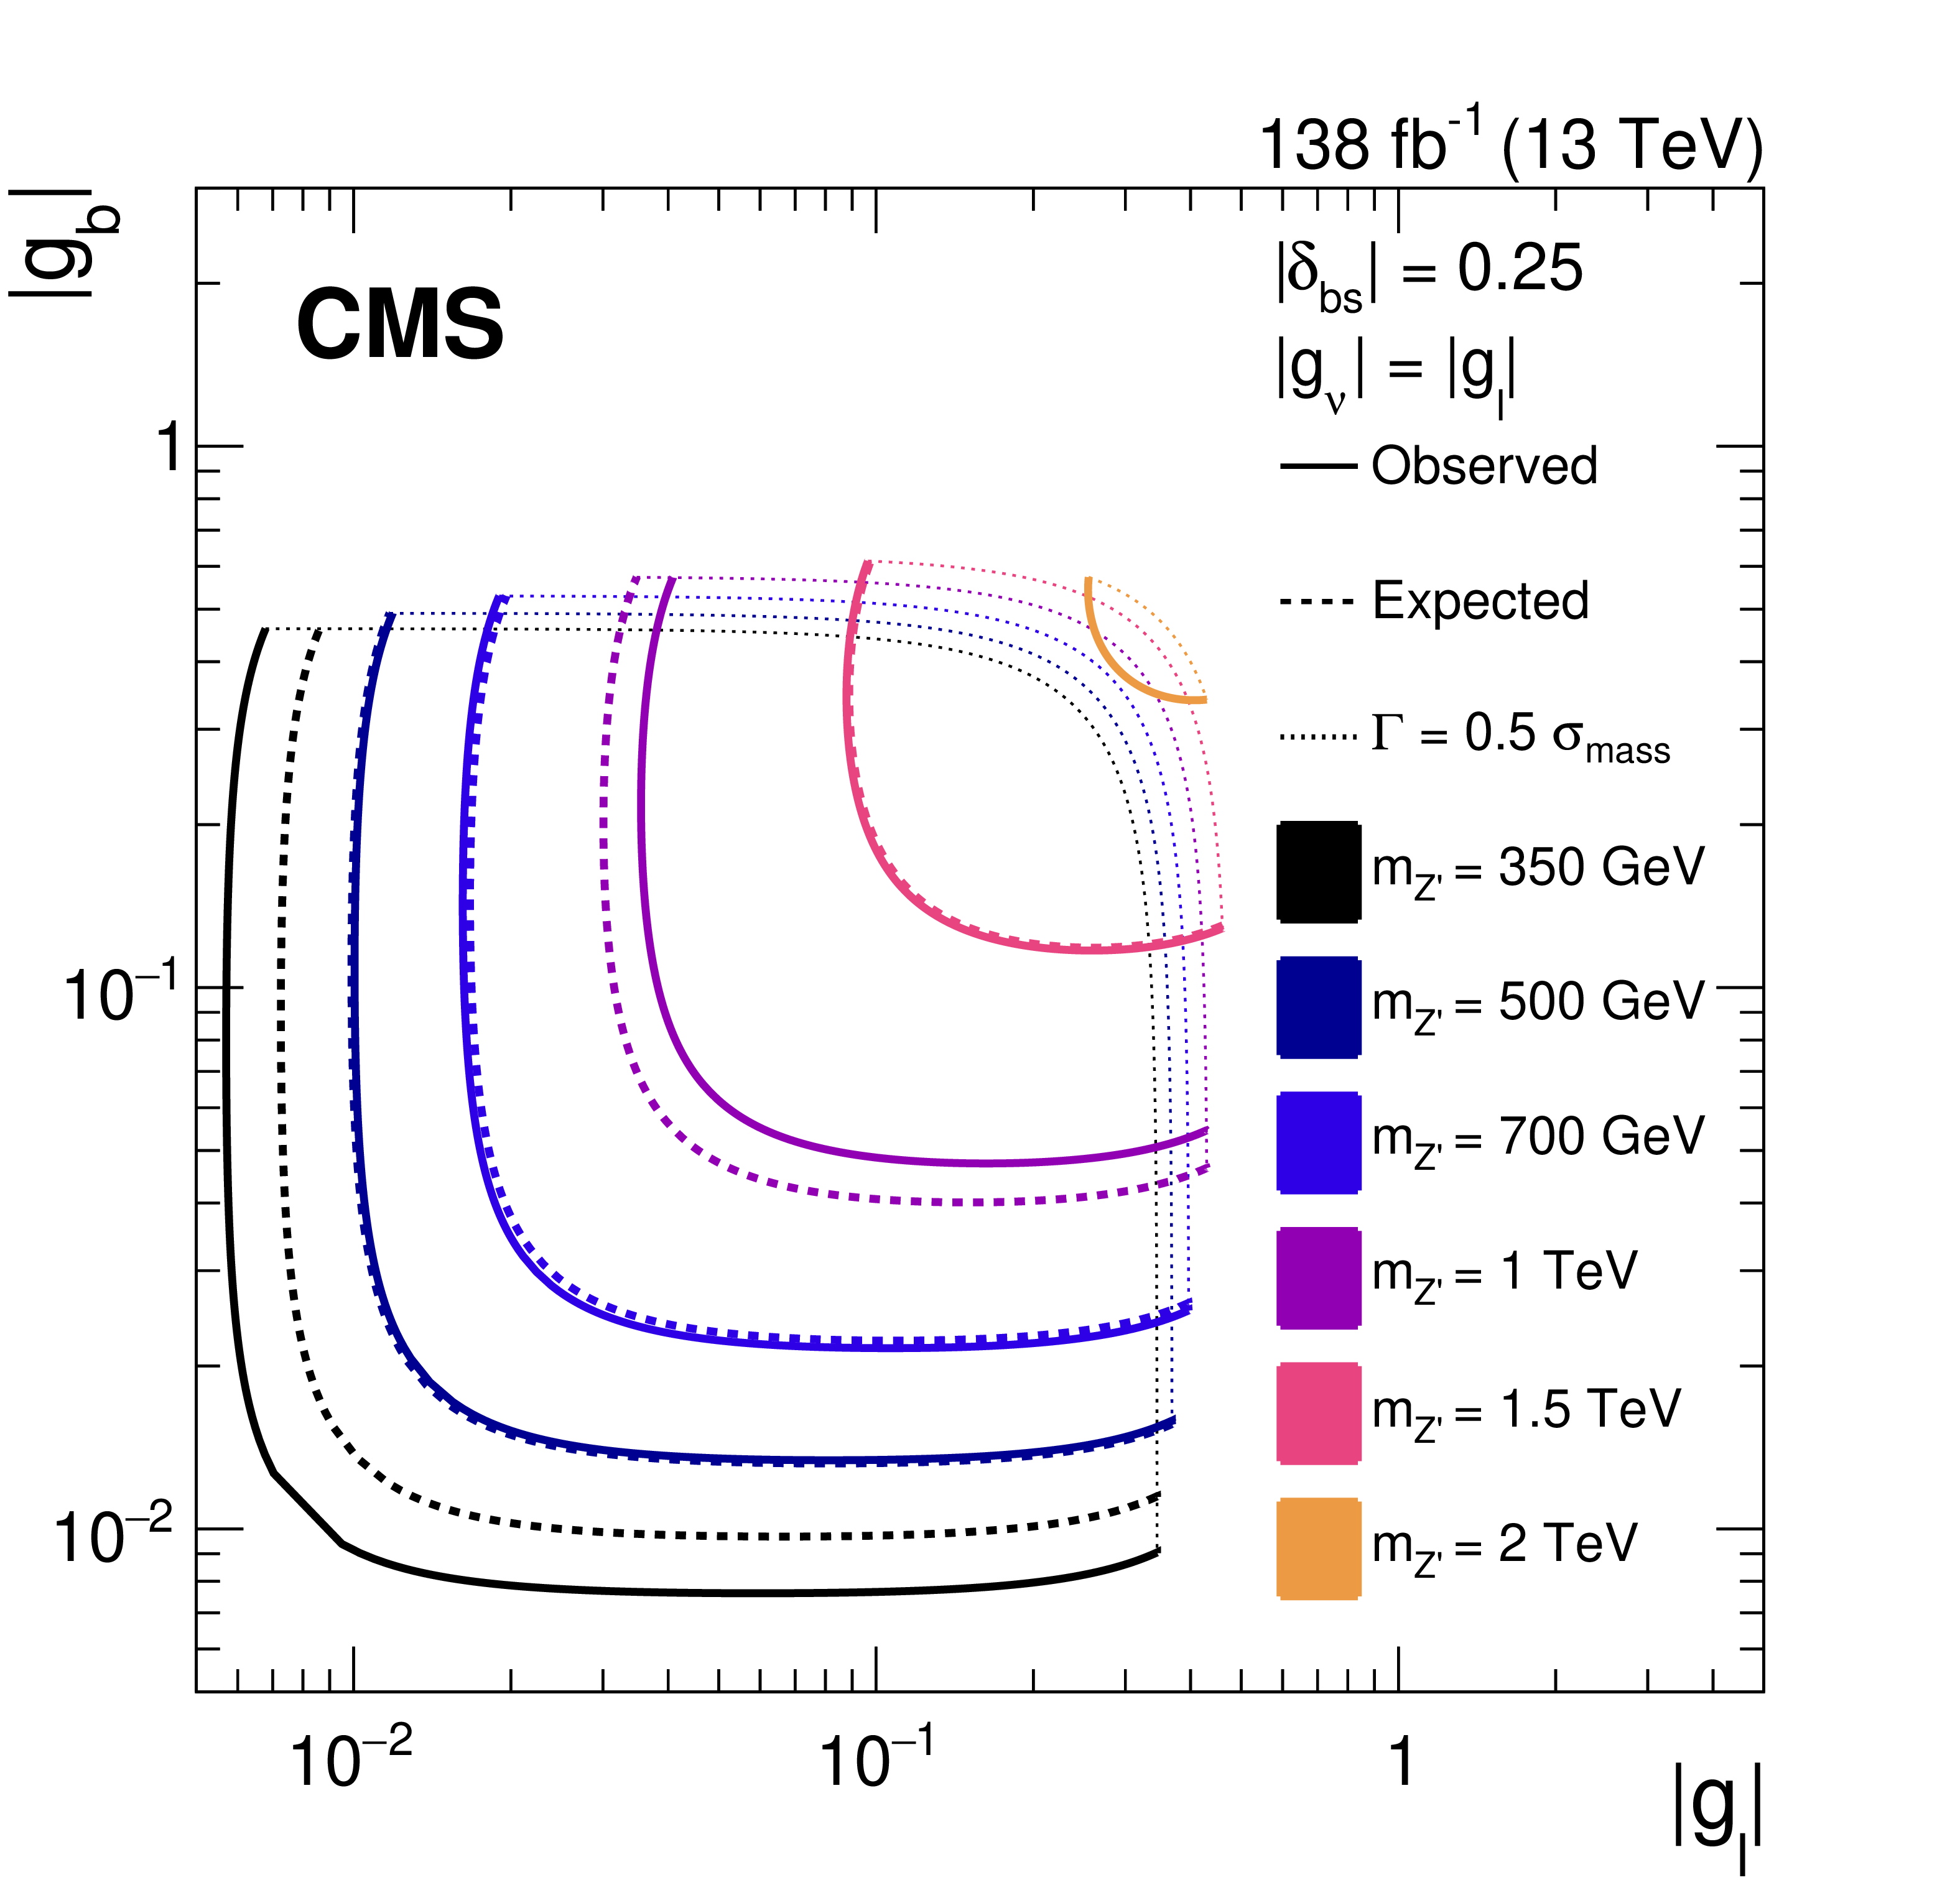
Figure 6-b:
Observed (solid) and median expected (dashed) exclusion limits at 95% CL in the $ |g_{\mathrm{b}}| $-$ |g_{\ell}| $ plane for the LFU model. The considered scenario has $ |\delta_{\mathrm{b}\mathrm{s}}| = $ 0.25. We assume $ |g_{\nu}| = |g_{\ell}| $. The exclusion limits are given up to coupling values at which the Z' width is equal to half of the $ \mu\mu $ invariant mass resolution, marked by the dotted curves. Beyond these coupling values, the narrow width approximation intrinsic to the search strategy is not considered valid. The enclosed regions are excluded. |
png pdf |
Figure 7:
Exclusion limits at 95% CL in the $ |\theta_{23}| $-$ |g_{\mathrm{Z}' }| $ plane for the $ B_{3}\!-\!L_{2} $ model [9], for representative values of $ m_{\mathrm{Z}' }= $ 500 GeV (upper left), $ m_{\mathrm{Z}' }= $ 1 TeV (upper right), $ m_{\mathrm{Z}' }= $ 1.5 TeV (lower left), and $ m_{\mathrm{Z}' }= $ 2 TeV (lower right). The solid black (dashed red) curves represent the observed (median expected) exclusions. The dotted curves denote the coupling values at which the Z' width equals one half of the $ \mu\mu $ invariant mass resolution. For larger values of the couplings, the narrow width approximation intrinsic to the search strategy is not considered valid. For a given mass, the region enclosed between the solid black (dashed red) and dotted curves is (expected to be) excluded. The dotted curve for $ m_{\mathrm{Z}' } = $ 500 GeV lies beyond the displayed $ |g_{\mathrm{Z}' }| $ range and is, therefore, not shown. The shaded blue area represents the region preferred from the global fit in Ref. [9] at 95% CL. The region above the green dash-dotted curve is incompatible at 95% CL with the measurement of the mass difference between the mass eigenstates of the neutral $ \mathrm{B}_{s} $ mesons [12]. |
png pdf |
Figure 7-a:
Exclusion limits at 95% CL in the $ |\theta_{23}| $-$ |g_{\mathrm{Z}' }| $ plane for the $ B_{3}\!-\!L_{2} $ model [9], for representative values of $ m_{\mathrm{Z}' }= $ 500 GeV. The solid black (dashed red) curves represent the observed (median expected) exclusions. The dotted curves denote the coupling values at which the Z' width equals one half of the $ \mu\mu $ invariant mass resolution. For larger values of the couplings, the narrow width approximation intrinsic to the search strategy is not considered valid. For a given mass, the region enclosed between the solid black (dashed red) and dotted curves is (expected to be) excluded. The dotted curve for $ m_{\mathrm{Z}' } = $ 500 GeV lies beyond the displayed $ |g_{\mathrm{Z}' }| $ range and is, therefore, not shown. The shaded blue area represents the region preferred from the global fit in Ref. [9] at 95% CL. The region above the green dash-dotted curve is incompatible at 95% CL with the measurement of the mass difference between the mass eigenstates of the neutral $ \mathrm{B}_{s} $ mesons [12]. |
png pdf |
Figure 7-b:
Exclusion limits at 95% CL in the $ |\theta_{23}| $-$ |g_{\mathrm{Z}' }| $ plane for the $ B_{3}\!-\!L_{2} $ model [9], for representative values of $ m_{\mathrm{Z}' }= $ 1 TeV. The solid black (dashed red) curves represent the observed (median expected) exclusions. The dotted curves denote the coupling values at which the Z' width equals one half of the $ \mu\mu $ invariant mass resolution. For larger values of the couplings, the narrow width approximation intrinsic to the search strategy is not considered valid. For a given mass, the region enclosed between the solid black (dashed red) and dotted curves is (expected to be) excluded. The shaded blue area represents the region preferred from the global fit in Ref. [9] at 95% CL. The region above the green dash-dotted curve is incompatible at 95% CL with the measurement of the mass difference between the mass eigenstates of the neutral $ \mathrm{B}_{s} $ mesons [12]. |
png pdf |
Figure 7-c:
Exclusion limits at 95% CL in the $ |\theta_{23}| $-$ |g_{\mathrm{Z}' }| $ plane for the $ B_{3}\!-\!L_{2} $ model [9], for representative values of $ m_{\mathrm{Z}' }= $ 1.5 TeV. The solid black (dashed red) curves represent the observed (median expected) exclusions. The dotted curves denote the coupling values at which the Z' width equals one half of the $ \mu\mu $ invariant mass resolution. For larger values of the couplings, the narrow width approximation intrinsic to the search strategy is not considered valid. For a given mass, the region enclosed between the solid black (dashed red) and dotted curves is (expected to be) excluded. The shaded blue area represents the region preferred from the global fit in Ref. [9] at 95% CL. The region above the green dash-dotted curve is incompatible at 95% CL with the measurement of the mass difference between the mass eigenstates of the neutral $ \mathrm{B}_{s} $ mesons [12]. |
png pdf |
Figure 7-d:
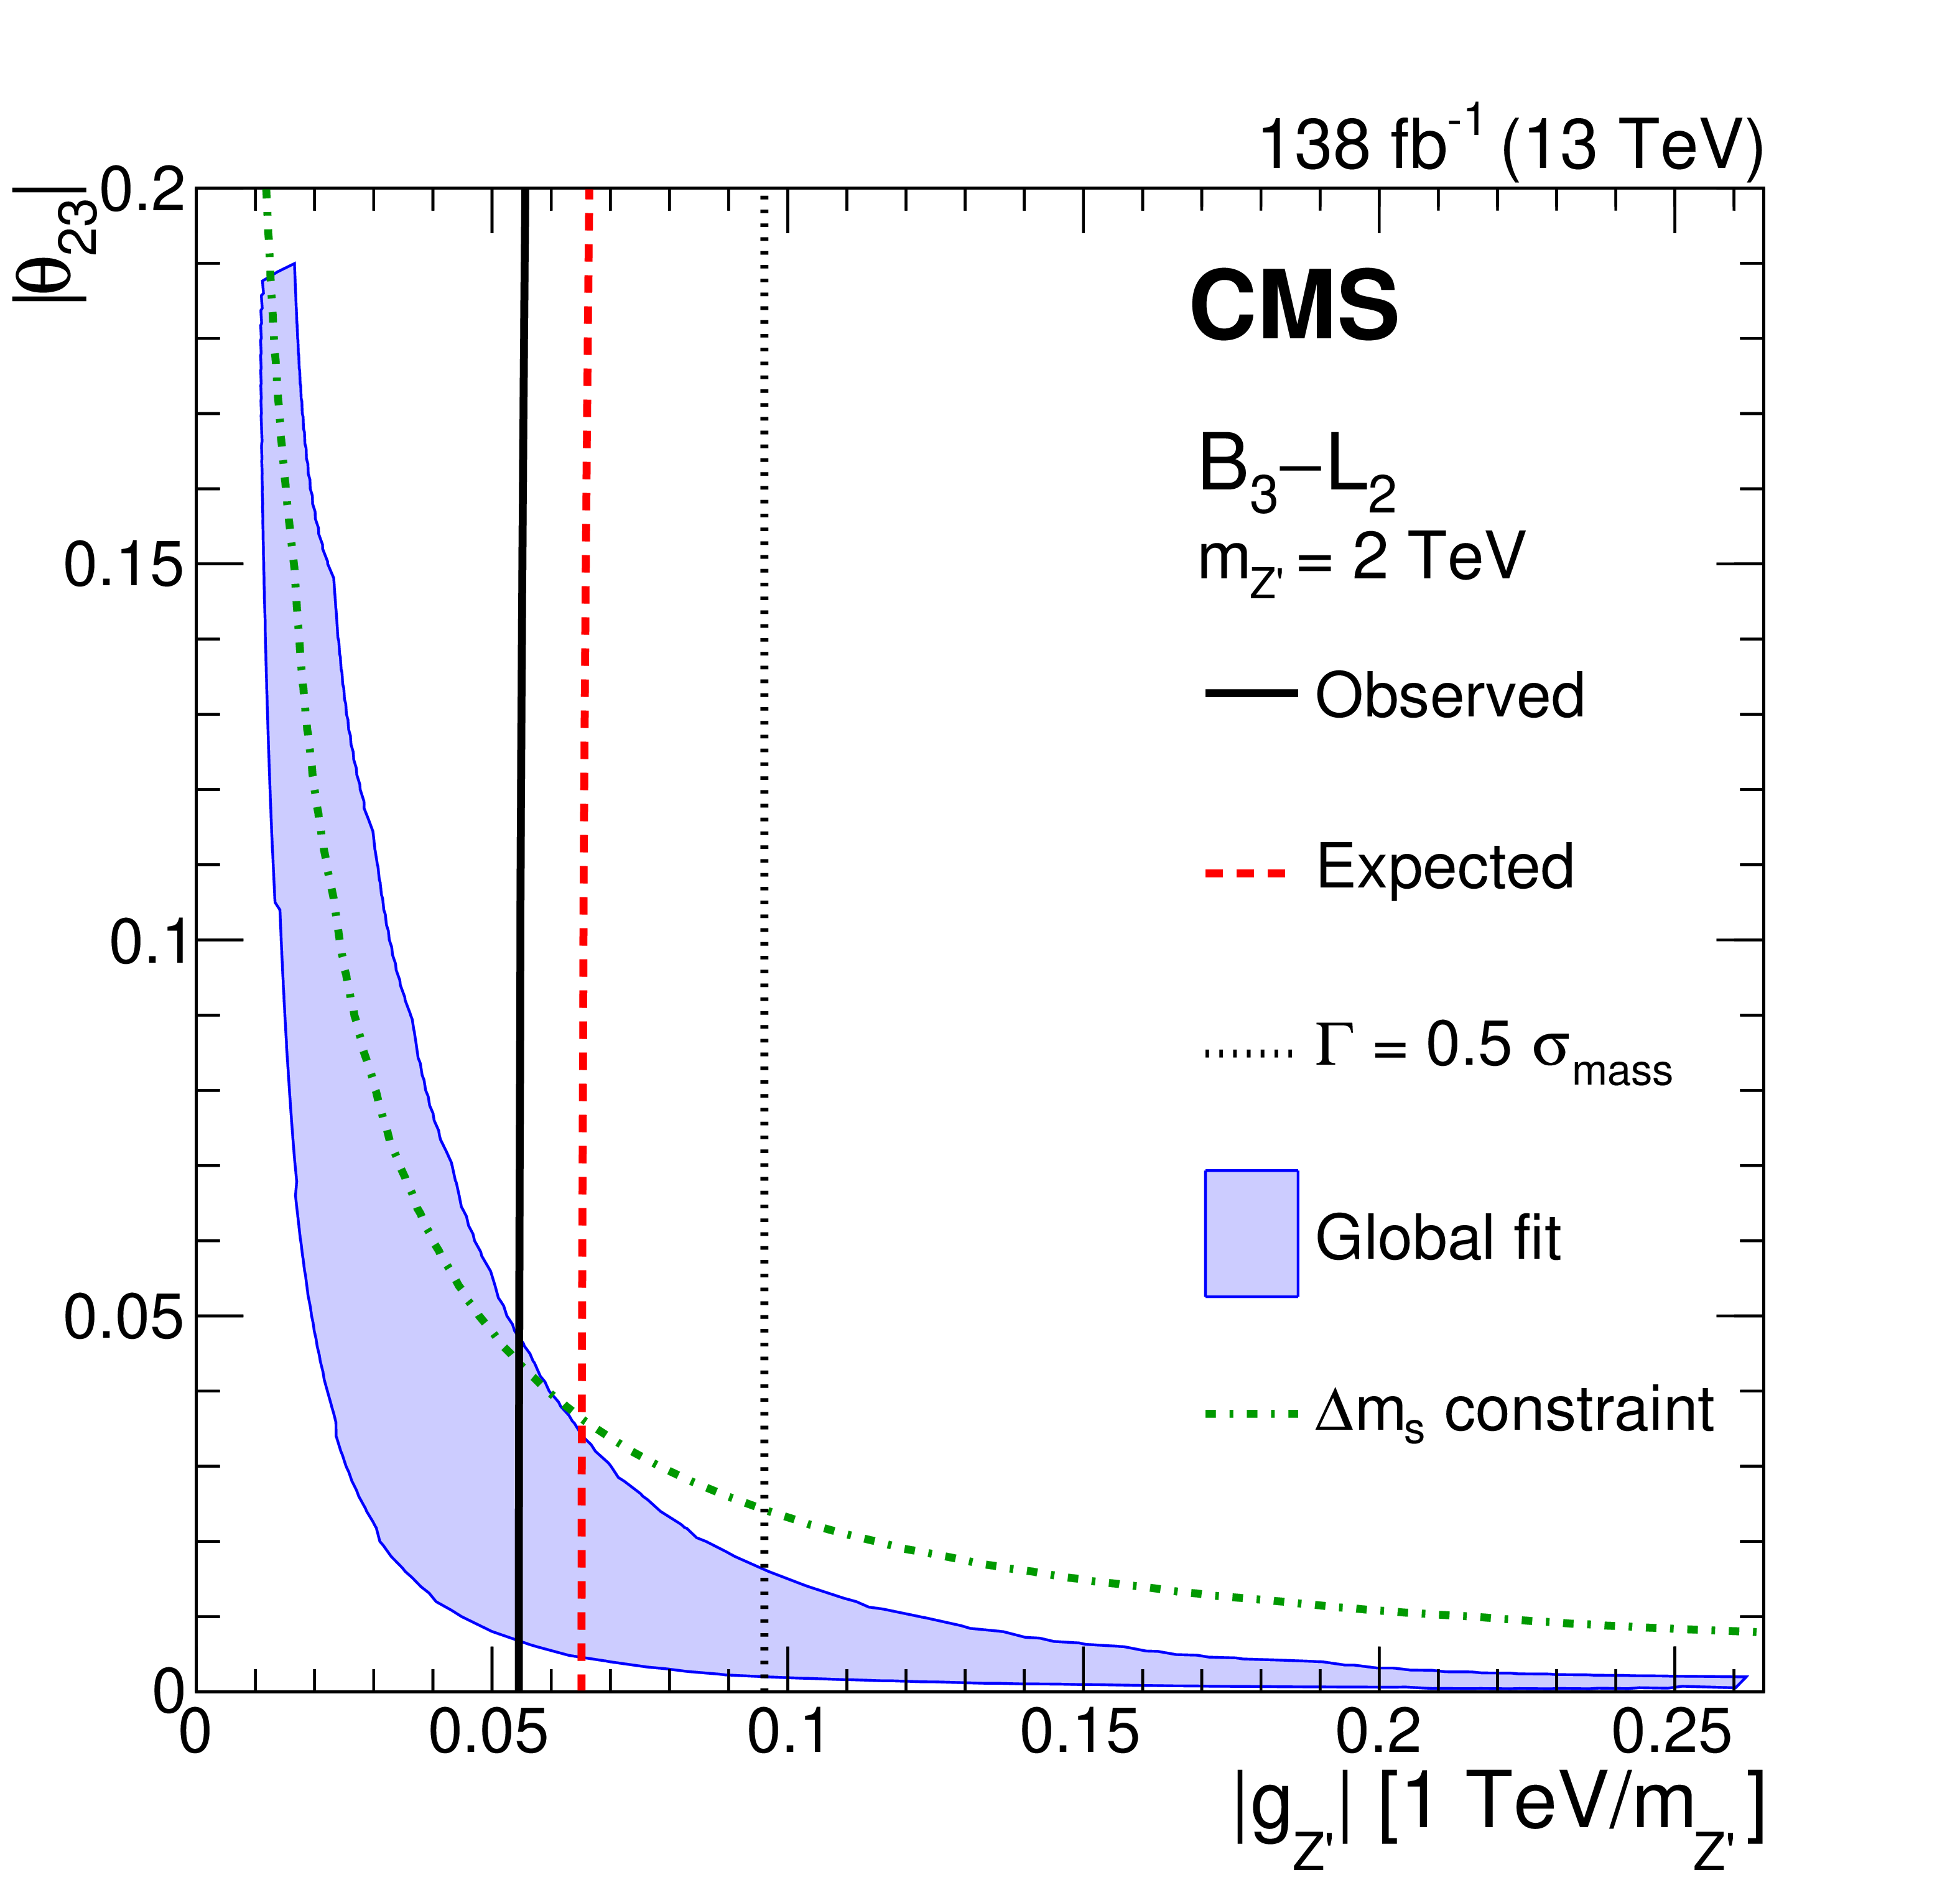
Exclusion limits at 95% CL in the $ |\theta_{23}| $-$ |g_{\mathrm{Z}' }| $ plane for the $ B_{3}\!-\!L_{2} $ model [9], for representative values of $ m_{\mathrm{Z}' }= $ 2 TeV. The solid black (dashed red) curves represent the observed (median expected) exclusions. The dotted curves denote the coupling values at which the Z' width equals one half of the $ \mu\mu $ invariant mass resolution. For larger values of the couplings, the narrow width approximation intrinsic to the search strategy is not considered valid. For a given mass, the region enclosed between the solid black (dashed red) and dotted curves is (expected to be) excluded. The shaded blue area represents the region preferred from the global fit in Ref. [9] at 95% CL. The region above the green dash-dotted curve is incompatible at 95% CL with the measurement of the mass difference between the mass eigenstates of the neutral $ \mathrm{B}_{s} $ mesons [12]. |

png pdf |
Figure 8:
Exclusion limits at 95% CL in the $ |g_{\mathrm{Z}' }| $-$ m_{\mathrm{Z}' } $ plane for the $ B_{3}\!-\!L_{2} $ model [9] for a fixed value of $ \theta_{23}= $ 0. The solid black (dashed red) curve represents the observed (median expected) exclusion. The dotted curve denotes the coupling values at which the Z' width equals one half of the $ \mu\mu $ invariant mass resolution. For larger values of the couplings, the narrow width approximation intrinsic to the search strategy is not considered valid. The region enclosed between the solid black (dashed red) and the dotted curves is (expected to be) excluded. The shaded blue area represents the $ |g_{\mathrm{Z}' }| $ range preferred from the global fit in Ref. [9] at 95% CL. |
| Tables | |
png pdf |
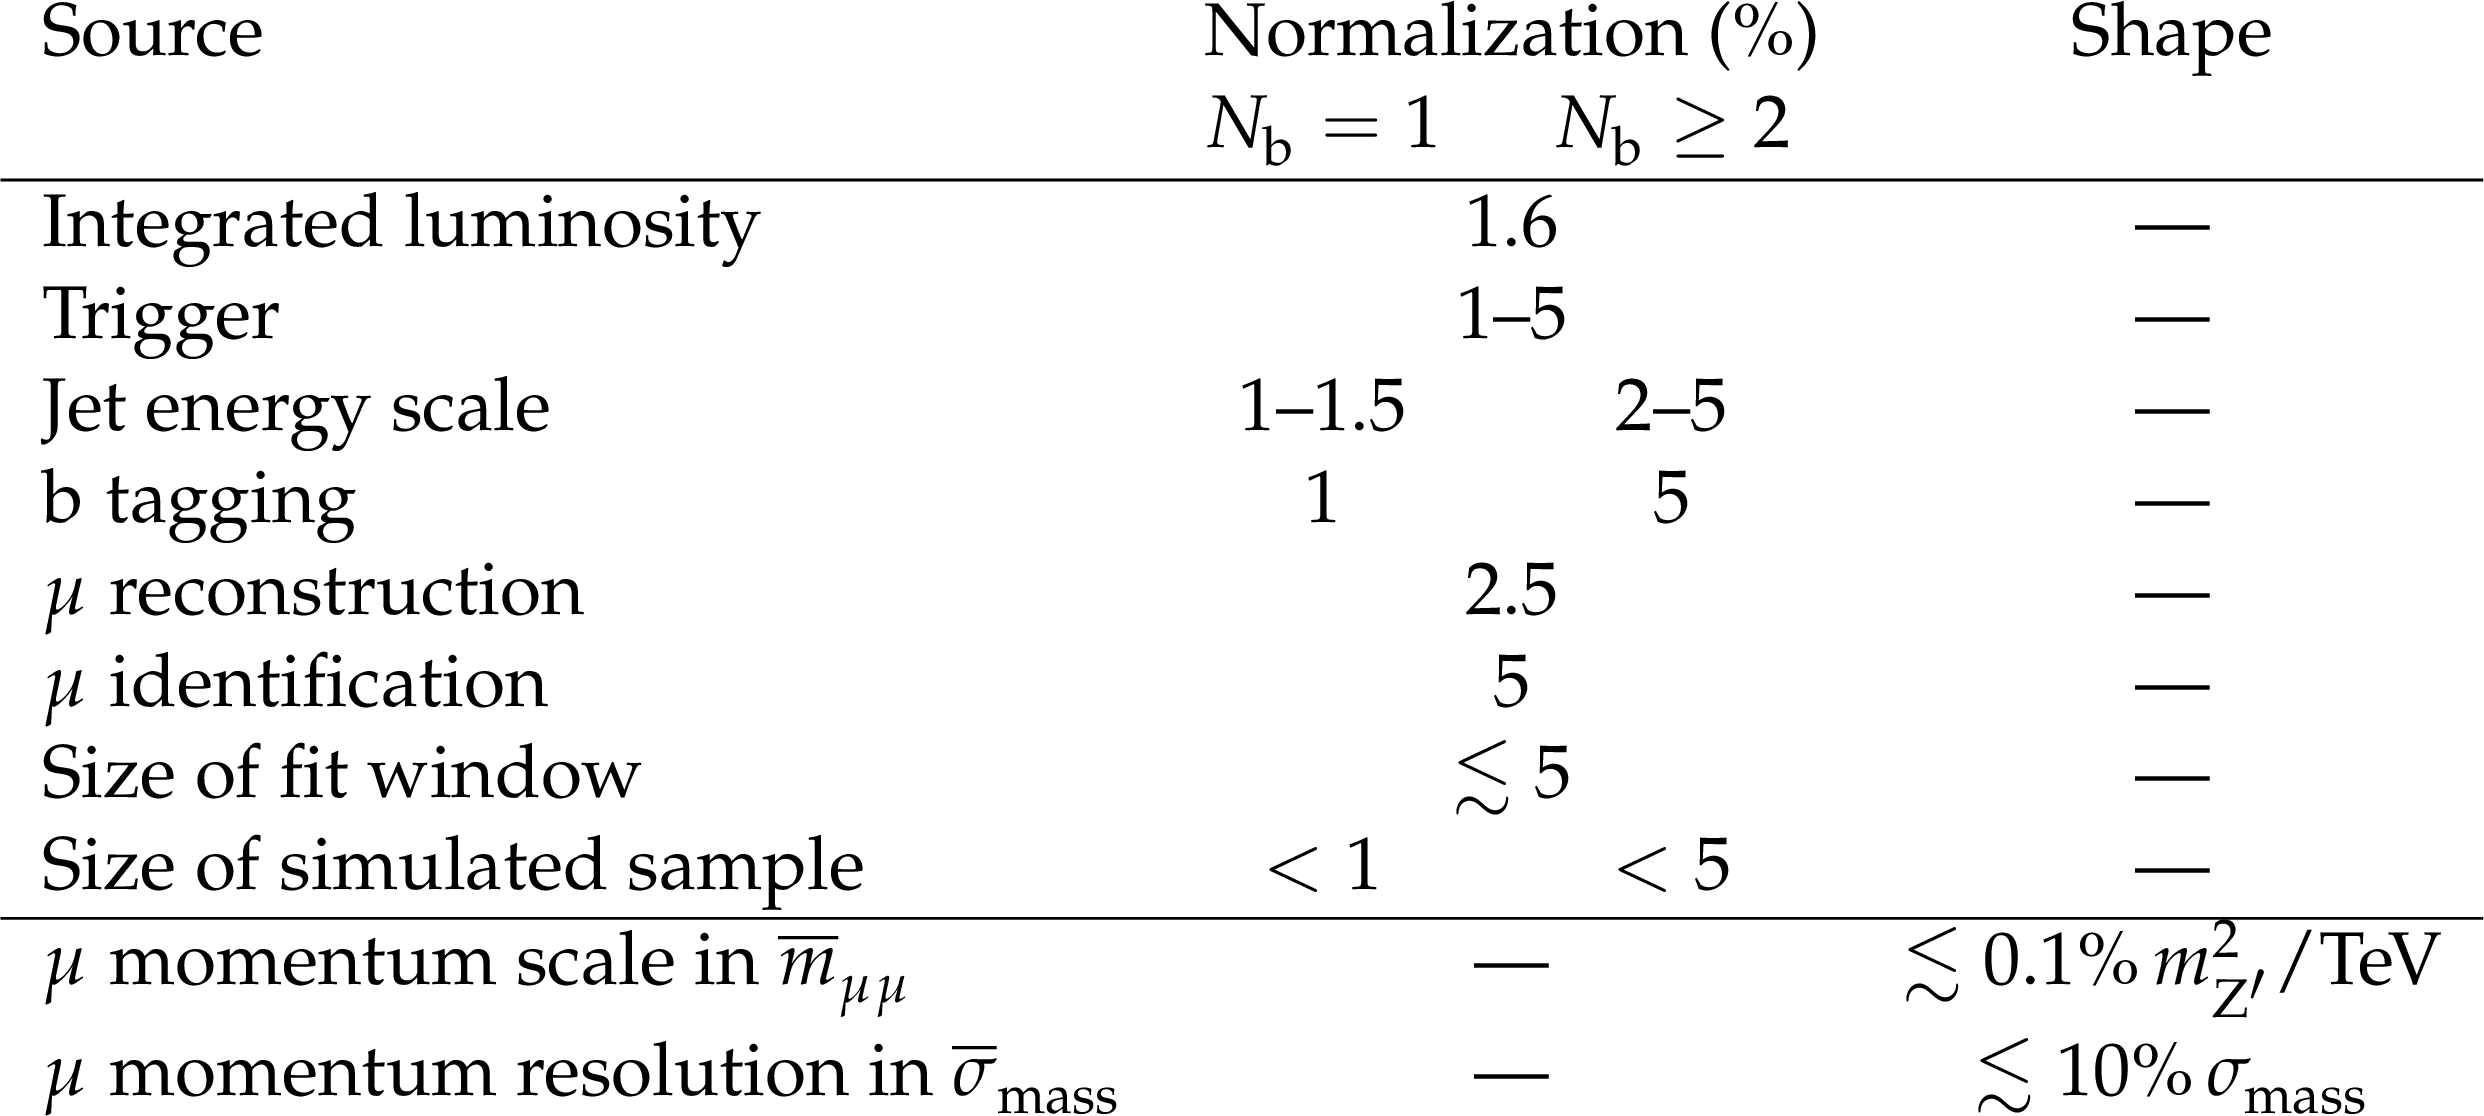
Table 1:
Summary of signal uncertainties. The uncertainties are grouped based on whether they affect the normalization or the shape of the signal, and any variations for the two categories of $ N_{\mathrm{b}} $ are shown. The fit parameter $ \overline{m}_{\mu\mu} $ corresponds to the position of the maximum of the reconstructed $ m_{\mu\mu} $ distribution, and $ \overline{\sigma}_{\text{mass}} $ is the resolution parameter used in the fit, distinguished from the values of $ \sigma_{\text{mass}} $ extracted from simulation. |
| Summary |
| A search for high-mass dimuon resonance production in association with one or more b quark jets has been presented, using data collected with the CMS experiment at the LHC that correspond to an integrated luminosity of 138 fb$^{-1}$ at a center-of-mass energy of 13 TeV. The limits are derived on the total number of signal events with $ N_{\mathrm{b}}= $ 1 and $ \geq $2, where $ N_{\mathrm{b}} $ denotes the multiplicity of b quark jets, and these limits are model independent to the extent that the signal arises from the direct production and subsequent decay of a narrow dimuon resonance. The relative fraction of events with $ N_{\mathrm{b}}\geq $ 2 is varied to probe a range of hypotheses of signal production in association with b quarks. The limits are presented as a function of the analyzed dimuon resonance mass values. Results are also interpreted in terms of a lepton-flavor-universal model that involves Z' boson couplings to b quarks ($ g_{\mathrm{b}} $) and muons, where the Z' boson couplings to all neutrinos ($ g_{\nu} $) and to all charged leptons ($ g_{\ell} $) are assumed to be equal, the $ g_{\mathrm{b}} $ coupling scales both $ \mathrm{Z}' \mathrm{b}\mathrm{b} $ and $ \mathrm{Z}' \mathrm{s}\mathrm{b} $ interactions, and the separate $ \delta_{\mathrm{b}\mathrm{s}} $ coupling solely scales the $ \mathrm{Z}' \mathrm{s}\mathrm{b} $ interaction. The exclusions in this model are presented in terms of the coupling strengths $ g_{\ell} $ and $ g_{\mathrm{b}} $, and the mass of the {\mathrm{Z}' } boson ($ m_{\mathrm{Z}' } $). For a Z' boson with $ m_{\mathrm{Z}' }= $ 350 GeV (2 TeV) and $ |\delta_{\mathrm{b}\mathrm{s}}| < $ 0.25, the majority of the parameter space with 0.0057 $ < |g_{\ell}| < $ 0.35 (0.25 $ < |g_{\ell}| < $ 0.43) and 0.0079 $ < |g_{\mathrm{b}}| < $ 0.46 (0.34 $ < |g_{\mathrm{b}}| < $ 0.57) is excluded at 95% confidence level. Constraints are also set on a specific Z' model ( $ B_3\!-\!L_2 $), constructed to accommodate possible contributions to $ \mathrm{b} \to \mathrm{s} \ell^{-} \ell^{+} $ transitions beyond the standard model. In this scenario, most of the allowed parameter space is excluded for a Z' boson with 350 $ < m_{\mathrm{Z}' } < $ 500 GeV, while the constraints are less stringent for higher $ m_{\mathrm{Z}' } $ hypotheses. This is the first dedicated search at the LHC for a high-mass, narrow dimuon resonance produced in association with multiple b quark jets, and the constraints obtained on models with this signature are the most stringent to date. |
| References | ||||
| 1 | LHCb Collaboration | Measurement of form-factor-independent observables in the decay $ {\mathrm{B}^0} \to \mathrm{K}^{*0} \mu^{+} \mu^{-} $ | PRL 111 (2013) 191801 | 1308.1707 |
| 2 | LHCb Collaboration | Differential branching fractions and isospin asymmetries of $ {\mathrm{B}} \to \mathrm{K}^{*} \mu^{+}\mu^{-} $ decays | JHEP 06 (2014) 133 | 1403.8044 |
| 3 | LHCb Collaboration | Angular analysis and differential branching fraction of the decay $ \mathrm{B}_{s}^{0}\to\phi\mu^{+}\mu^{-} $ | JHEP 09 (2015) 179 | 1506.08777 |
| 4 | LHCb Collaboration | Angular analysis of the $ {\mathrm{B}^0} \to \mathrm{K}^{*0} \mu^{+} \mu^{-} $ decay using 3 fb$^{-1}$ of integrated luminosity | JHEP 02 (2016) 104 | 1512.04442 |
| 5 | CMS Collaboration | Angular analysis of the decay $ {\mathrm{B}^0} \to \mathrm{K}^{*0} \mu^{+} \mu^{-} $ from pp collisions at $ \sqrt{s} = $ 8 TeV | PLB 753 (2016) 424 | CMS-BPH-13-010 1507.08126 |
| 6 | LHCb Collaboration | Test of lepton universality with $ {\mathrm{B}^0} \rightarrow {{\mathrm{K}}^{* 0}} \ell^{+}\ell^{-} $ decays | JHEP 08 (2017) 055 | 1705.05802 |
| 7 | C. Bobeth, M. Chrzaszcz, D. van Dyk, and J. Virto | Long-distance effects in $ {\mathrm{B}}\to \mathrm{K}^{*}\ell \ell $ from analyticity | EPJC 78 (2018) 451 | 1707.07305 |
| 8 | CMS Collaboration | Measurement of angular parameters from the decay $ {\mathrm{B}^0} \to \mathrm{K}^{*0} \mu^{+} \mu^{-} $ in proton-proton collisions at $ \sqrt{s} = $ 8 TeV | PLB 781 (2018) 517 | CMS-BPH-15-008 1710.02846 |
| 9 | ATLAS Collaboration | Angular analysis of $ \mathrm{B}_{d}^{0} \to \mathrm{K}^{*}\mu^{+}\mu^{-} $ decays in pp collisions at $ \sqrt{s}= $ 8 TeV with the ATLAS detector | JHEP 10 (2018) 047 | 1805.04000 |
| 10 | LHCb Collaboration | Search for lepton-universality violation in $ {\mathrm{B}^{+}} \to \mathrm{K^+} \ell^+\ell^- $ decays | PRL 122 (2019) 191801 | 1903.09252 |
| 11 | LHCb Collaboration | Test of lepton universality in beauty-quark decays | Nature Phys. 18 (2022) 277 | 2103.11769 |
| 12 | LHCb Collaboration | Tests of lepton universality using $ {\mathrm{B}^0} \to \mathrm{K^0_S} \ell^+ \ell^- $ and $ {\mathrm{B}^{+}} \to {{\mathrm{K}}^{* +}} \ell^+ \ell^- $ decays | PRL 128 (2022) 191802 | 2110.09501 |
| 13 | HPQCD Collaboration | $ {\mathrm{B}}\to\mathrm{K} $ and $ \mathrm{D}\to\mathrm{K} $ form factors from fully relativistic lattice QCD | PRD 107 (2023) 014510 | 2207.12468 |
| 14 | A. Leike | The phenomenology of extra neutral gauge bosons | Phys. Rept. 317 (1999) 143 | hep-ph/9805494 |
| 15 | P. Langacker | The physics of heavy Z' gauge bosons | Rev. Mod. Phys. 81 (2009) 1199 | 0801.1345 |
| 16 | LHCb Collaboration | Test of lepton universality in $ \mathrm{b} \rightarrow \mathrm{s} \ell^+ \ell^- $ decays | Submitted to PRL, 2022 | 2212.09152 |
| 17 | LHCb Collaboration | Measurement of lepton universality parameters in $ {\mathrm{B}^{+}} \to \mathrm{K^+} \ell^+\ell^- $ and $ {\mathrm{B}^0} \to {\mathrm{K}^{* 0}} \ell^+\ell^- $ decays | Submitted to PRD, 2022 | 2212.09153 |
| 18 | B. Allanach and J. Davighi | The Rumble in the Meson: a leptoquark versus a Z' to fit $ \mathrm{b} \to \mathrm{s} \mu^{+} \mu^{-} $ anomalies including 2022 LHCb $ \textrm{R}_{\mathrm{K}^{(*)}} $ measurements | JHEP 04 (2023) 033 | 2211.11766 |
| 19 | ATLAS Collaboration | Search for high-mass dilepton resonances using 139 fb$^{-1}$ of pp collision data collected at $ \sqrt{s}= $ 13 TeV with the ATLAS detector | PLB 796 (2019) 68 | 1903.06248 |
| 20 | CMS Collaboration | Search for resonant and nonresonant new phenomena in high-mass dilepton final states at $ \sqrt{s}= $ 13 TeV | JHEP 07 (2021) 208 | CMS-EXO-19-019 2103.02708 |
| 21 | Particle Data Group | Review of Particle Physics | PTEP 2022 (2022) 083C01 | |
| 22 | R. Alonso, P. Cox, C. Han, and T. T. Yanagida | Flavoured B$-$L local symmetry and anomalous rare $ {\mathrm{B}} $ decays | PLB 774 (2017) 643 | 1705.03858 |
| 23 | C. Bonilla, T. Modak, R. Srivastava, and J. W. F. Valle | $ U(1)_{B_3-3L_\mu} $ gauge symmetry as a simple description of $ \mathrm{b}\to\mathrm{s} $ anomalies | PRD 98 (2018) 095002 | 1705.00915 |
| 24 | ATLAS Collaboration | Search for scalar resonances decaying into $ \mu^{+}\mu^{-} $ in events with and without b-tagged jets produced in proton-proton collisions at $ \sqrt{s}= $ 13 TeV with the ATLAS detector | JHEP 07 (2019) 117 | 1901.08144 |
| 25 | CMS Collaboration | Search for MSSM Higgs bosons decaying to $ \mu^{+}\mu^{-} $ in proton-proton collisions at $ \sqrt{s}= $ 13 TeV | PLB 798 (2019) 134992 | CMS-HIG-18-010 1907.03152 |
| 26 | ATLAS Collaboration | Search for new phenomena in final states with two leptons and one or no b-tagged jets at $ \sqrt{s} = $ 13 TeV using the ATLAS detector | PRL 127 (2021) 141801 | 2105.13847 |
| 27 | CMS Collaboration | Search for long-lived particles decaying into muon pairs in proton-proton collisions at $ \sqrt{s}= $ 13 TeV collected with a dedicated high-rate data stream | JHEP 04 (2022) 062 | CMS-EXO-20-014 2112.13769 |
| 28 | CMS Collaboration | HEPData record for this analysis | link | |
| 29 | CMS Collaboration | The CMS experiment at the CERN LHC | JINST 3 (2008) S08004 | |
| 30 | CMS Collaboration | Performance of the CMS Level-1 trigger in proton-proton collisions at $ \sqrt{s} = $ 13 TeV | JINST 15 (2020) P10017 | CMS-TRG-17-001 2006.10165 |
| 31 | CMS Collaboration | The CMS trigger system | JINST 12 (2017) P01020 | CMS-TRG-12-001 1609.02366 |
| 32 | CMS Collaboration | Particle-flow reconstruction and global event description with the CMS detector | JINST 12 (2017) P10003 | CMS-PRF-14-001 1706.04965 |
| 33 | CMS Collaboration | Technical proposal for the Phase-II upgrade of the Compact Muon Solenoid | CMS Technical Proposal CERN-LHCC-2015-010, CMS-TDR-15-02, 2015 CDS |
|
| 34 | CMS Collaboration | Performance of the CMS muon detector and muon reconstruction with proton-proton collisions at $ \sqrt{s}= $ 13 TeV | JINST 13 (2018) P06015 | CMS-MUO-16-001 1804.04528 |
| 35 | CMS Collaboration | Performance of the reconstruction and identification of high-momentum muons in proton-proton collisions at $ \sqrt{s} = $ 13 TeV | JINST 15 (2020) P02027 | CMS-MUO-17-001 1912.03516 |
| 36 | CMS Collaboration | Measurements of inclusive W and Z cross sections in pp collisions at $ \sqrt{s}= $ 7 TeV | JHEP 01 (2011) 080 | CMS-EWK-10-002 1012.2466 |
| 37 | CMS Collaboration | Performance of the CMS muon trigger system in proton-proton collisions at $ \sqrt{s} = $ 13 TeV | JINST 16 (2021) P07001 | CMS-MUO-19-001 2102.04790 |
| 38 | CMS Collaboration | Electron and photon reconstruction and identification with the CMS experiment at the CERN LHC | JINST 16 (2021) P05014 | CMS-EGM-17-001 2012.06888 |
| 39 | M. Cacciari, G. P. Salam, and G. Soyez | The anti-$ k_{\mathrm{T}} $ jet clustering algorithm | JHEP 04 (2008) 063 | 0802.1189 |
| 40 | M. Cacciari, G. P. Salam, and G. Soyez | FastJet user manual | EPJC 72 (2012) 1896 | 1111.6097 |
| 41 | CMS Collaboration | Pileup mitigation at CMS in 13 TeV data | JINST 15 (2020) P09018 | CMS-JME-18-001 2003.00503 |
| 42 | E. Bols et al. | Jet flavour classification using DeepJet | JINST 15 (2020) 12012 | 2008.10519 |
| 43 | CMS Collaboration | Performance summary of AK4 jet b tagging with data from proton-proton collisions at 13 TeV with the CMS detector | CMS Detector Performance Note CMS-DP-2023-005, 2023 CDS |
|
| 44 | D. Bertolini, P. Harris, M. Low, and N. Tran | Pileup per particle identification | JHEP 10 (2014) 059 | 1407.6013 |
| 45 | CMS Collaboration | Performance of missing transverse momentum reconstruction in proton-proton collisions at $ \sqrt{s} = $ 13 TeV using the CMS detector | JINST 14 (2019) P07004 | CMS-JME-17-001 1903.06078 |
| 46 | S. Frixione, P. Nason, and C. Oleari | Matching NLO QCD computations with parton shower simulations: the POWHEG method | JHEP 11 (2007) 070 | 0709.2092 |
| 47 | S. Alioli, P. Nason, C. Oleari, and E. Re | NLO single-top production matched with shower in POWHEG: $ s $- and $ t $-channel contributions | JHEP 09 (2009) 111 | 0907.4076 |
| 48 | T. Melia, P. Nason, R. Röntsch, and G. Zanderighi | $ \mathrm{W^+}\mathrm{W^-} $, $\mathrm{WZ}$ and $\mathrm{ZZ}$ production in the POWHEG BOX | JHEP 11 (2011) 078 | 1107.5051 |
| 49 | P. Nason and G. Zanderighi | $ \mathrm{W^+}\mathrm{W^-} $, $\mathrm{WZ}$ and $\mathrm{ZZ}$ production in the POWHEG-BOX-V2 | EPJC 74 (2014) 2702 | 1311.1365 |
| 50 | J. Alwall et al. | The automated computation of tree-level and next-to-leading order differential cross sections, and their matching to parton shower simulations | JHEP 07 (2014) 079 | 1405.0301 |
| 51 | R. Frederix and S. Frixione | Merging meets matching in MC@NLO | JHEP 12 (2012) 061 | 1209.6215 |
| 52 | T. Sjöstrand et al. | An introduction to PYTHIA 8.2 | Comput. Phys. Commun. 191 (2015) 159 | 1410.3012 |
| 53 | CMS Collaboration | Extraction and validation of a new set of CMS PYTHIA8 tunes from underlying-event measurements | EPJC 80 (2020) 4 | CMS-GEN-17-001 1903.12179 |
| 54 | NNPDF Collaboration | Parton distributions from high-precision collider data | EPJC 77 (2017) 663 | 1706.00428 |
| 55 | GEANT 4 Collaboration | GEANT 4---a simulation toolkit | NIM A 506 (2003) 250 | |
| 56 | M. J. Oreglia | A study of the reactions $ \psi^\prime \to \gamma \gamma \psi $ | PhD thesis, Stanford University, SLAC Report SLAC-R-236, see Appendix D, 1980 link |
|
| 57 | J. E. Gaiser | Charmonium spectroscopy from radiative decays of the $ J/\psi $ and $ \psi^\prime $ | PhD thesis, Stanford University, SLAC Report SLAC-R-255, 1982 link |
|
| 58 | P. D. Dauncey, M. Kenzie, N. Wardle, and G. J. Davies | Handling uncertainties in background shapes: the discrete profiling method | JINST 10 (2015) P04015 | 1408.6865 |
| 59 | R. A. Fisher | On the interpretation of $ \chi^{2} $ from contingency tables, and the calculation of P | J. R. Stat. Soc. 85 (1922) 87 | |
| 60 | CMS Collaboration | Precision luminosity measurement in proton-proton collisions at $ \sqrt{s} = $ 13 TeV in 2015 and 2016 at CMS | EPJC 81 (2021) 800 | CMS-LUM-17-003 2104.01927 |
| 61 | CMS Collaboration | CMS luminosity measurement for the 2017 data-taking period at $ \sqrt{s} = $ 13 TeV | CMS Physics Analysis Summary, 2018 CMS-PAS-LUM-17-004 |
CMS-PAS-LUM-17-004 |
| 62 | CMS Collaboration | CMS luminosity measurement for the 2018 data-taking period at $ \sqrt{s} = $ 13 TeV | CMS Physics Analysis Summary, 2019 CMS-PAS-LUM-18-002 |
CMS-PAS-LUM-18-002 |
| 63 | T. Junk | Confidence level computation for combining searches with small statistics | NIM A 434 (1999) 435 | hep-ex/9902006 |
| 64 | A. L. Read | Presentation of search results: The $ \text{CL}_\text{s} $ technique | JPG 28 (2002) 2693 | |
| 65 | G. Cowan, K. Cranmer, E. Gross, and O. Vitells | Asymptotic formulae for likelihood-based tests of new physics | EPJC 71 (2011) 1554 | 1007.1727 |
| 66 | ATLAS and CMS Collaborations | Procedure for the LHC Higgs boson search combination in summer 2011 | ATL-PHYS-PUB-2011-011, CMS NOTE-2011/005, 2011 link |
|
|
|
Compact Muon Solenoid LHC, CERN |
|

|

|

|

|

|