

Compact Muon Solenoid
LHC, CERN
| CMS-HIG-17-027 ; CERN-EP-2019-147 | ||
| Search for heavy Higgs bosons decaying to a top quark pair in proton-proton collisions at $\sqrt{s} = $ 13 TeV | ||
| CMS Collaboration | ||
| 3 August 2019 | ||
| JHEP 04 (2020) 171 | ||
| Abstract: A search is presented for additional scalar (H) or pseudoscalar (A) Higgs bosons decaying to a top quark pair in proton-proton collisions at a center-of-mass energy of 13 TeV. The data set analyzed corresponds to an integrated luminosity of 35.9 fb$^{-1}$ collected by the CMS experiment at the LHC. Final states with one or two charged leptons are considered. The invariant mass of the reconstructed top quark pair system and variables that are sensitive to the spin of the particles decaying into the top quark pair are used to search for signatures of the H or A bosons. The interference with the standard model top quark pair background is taken into account. A moderate signal-like deviation compatible with an A boson with a mass of 400 GeV is observed with a global significance of 1.9 standard deviations. New stringent constraints are reported on the strength of the coupling of the hypothetical bosons to the top quark, with the mass of the bosons ranging from 400 to 750 GeV and their total relative width from 0.5 to 25%. The results of the search are also interpreted in a minimal supersymmetric standard model scenario. Values of $m_{\mathrm{A}}$ from 400 to 700 GeV are probed, and a region with values of $\tan\beta$ below 1.0 to 1.5, depending on $m_{\mathrm{A}}$, is excluded at 95% confidence level. | ||
| Links: e-print arXiv:1908.01115 [hep-ex] (PDF) ; CDS record ; inSPIRE record ; HepData record ; CADI line (restricted) ; | ||
| Figures & Tables | Summary | Additional Figures & Material | References | CMS Publications |
|---|
| Figures | |
png pdf |
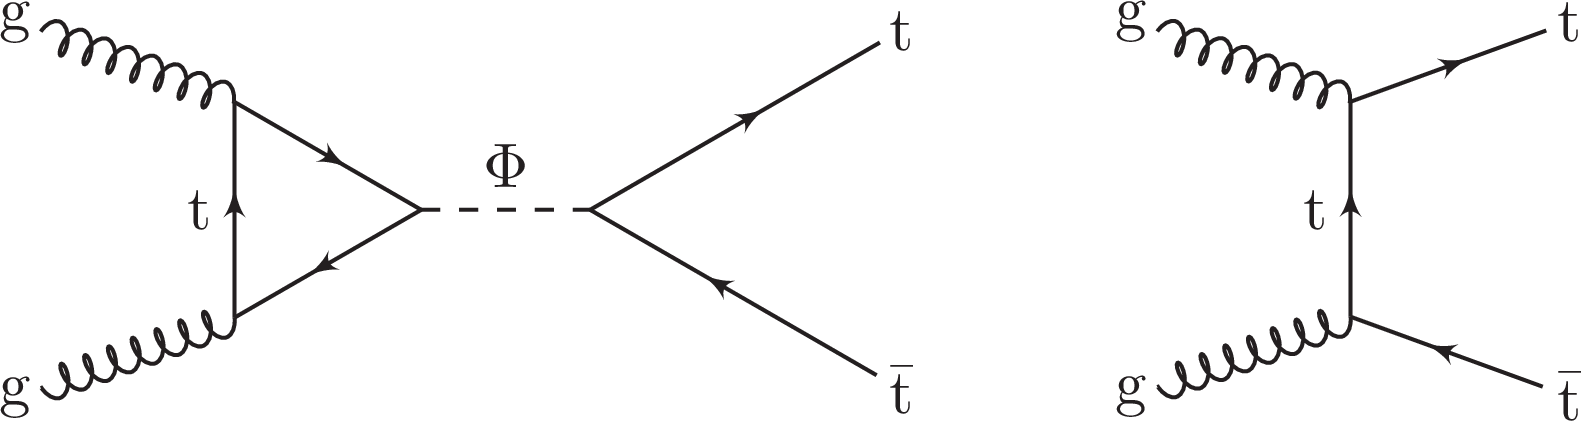
Figure 1:
The Feynman diagram for the signal process (left) and an example diagram for the SM production of top quark (right). |

png pdf |
Figure 1-a:
The Feynman diagram for the signal process. |

png pdf |
Figure 1-b:
An example of Feynman diagram for the SM production of top quark. |

png pdf |
Figure 2:
Definition of angle $ {\theta ^*_{\mathrm{t} _\ell}}$ used in the single-lepton final state. Momenta in different coordinate systems are depicted with arrows of different colors and styles. |

png pdf |
Figure 3:
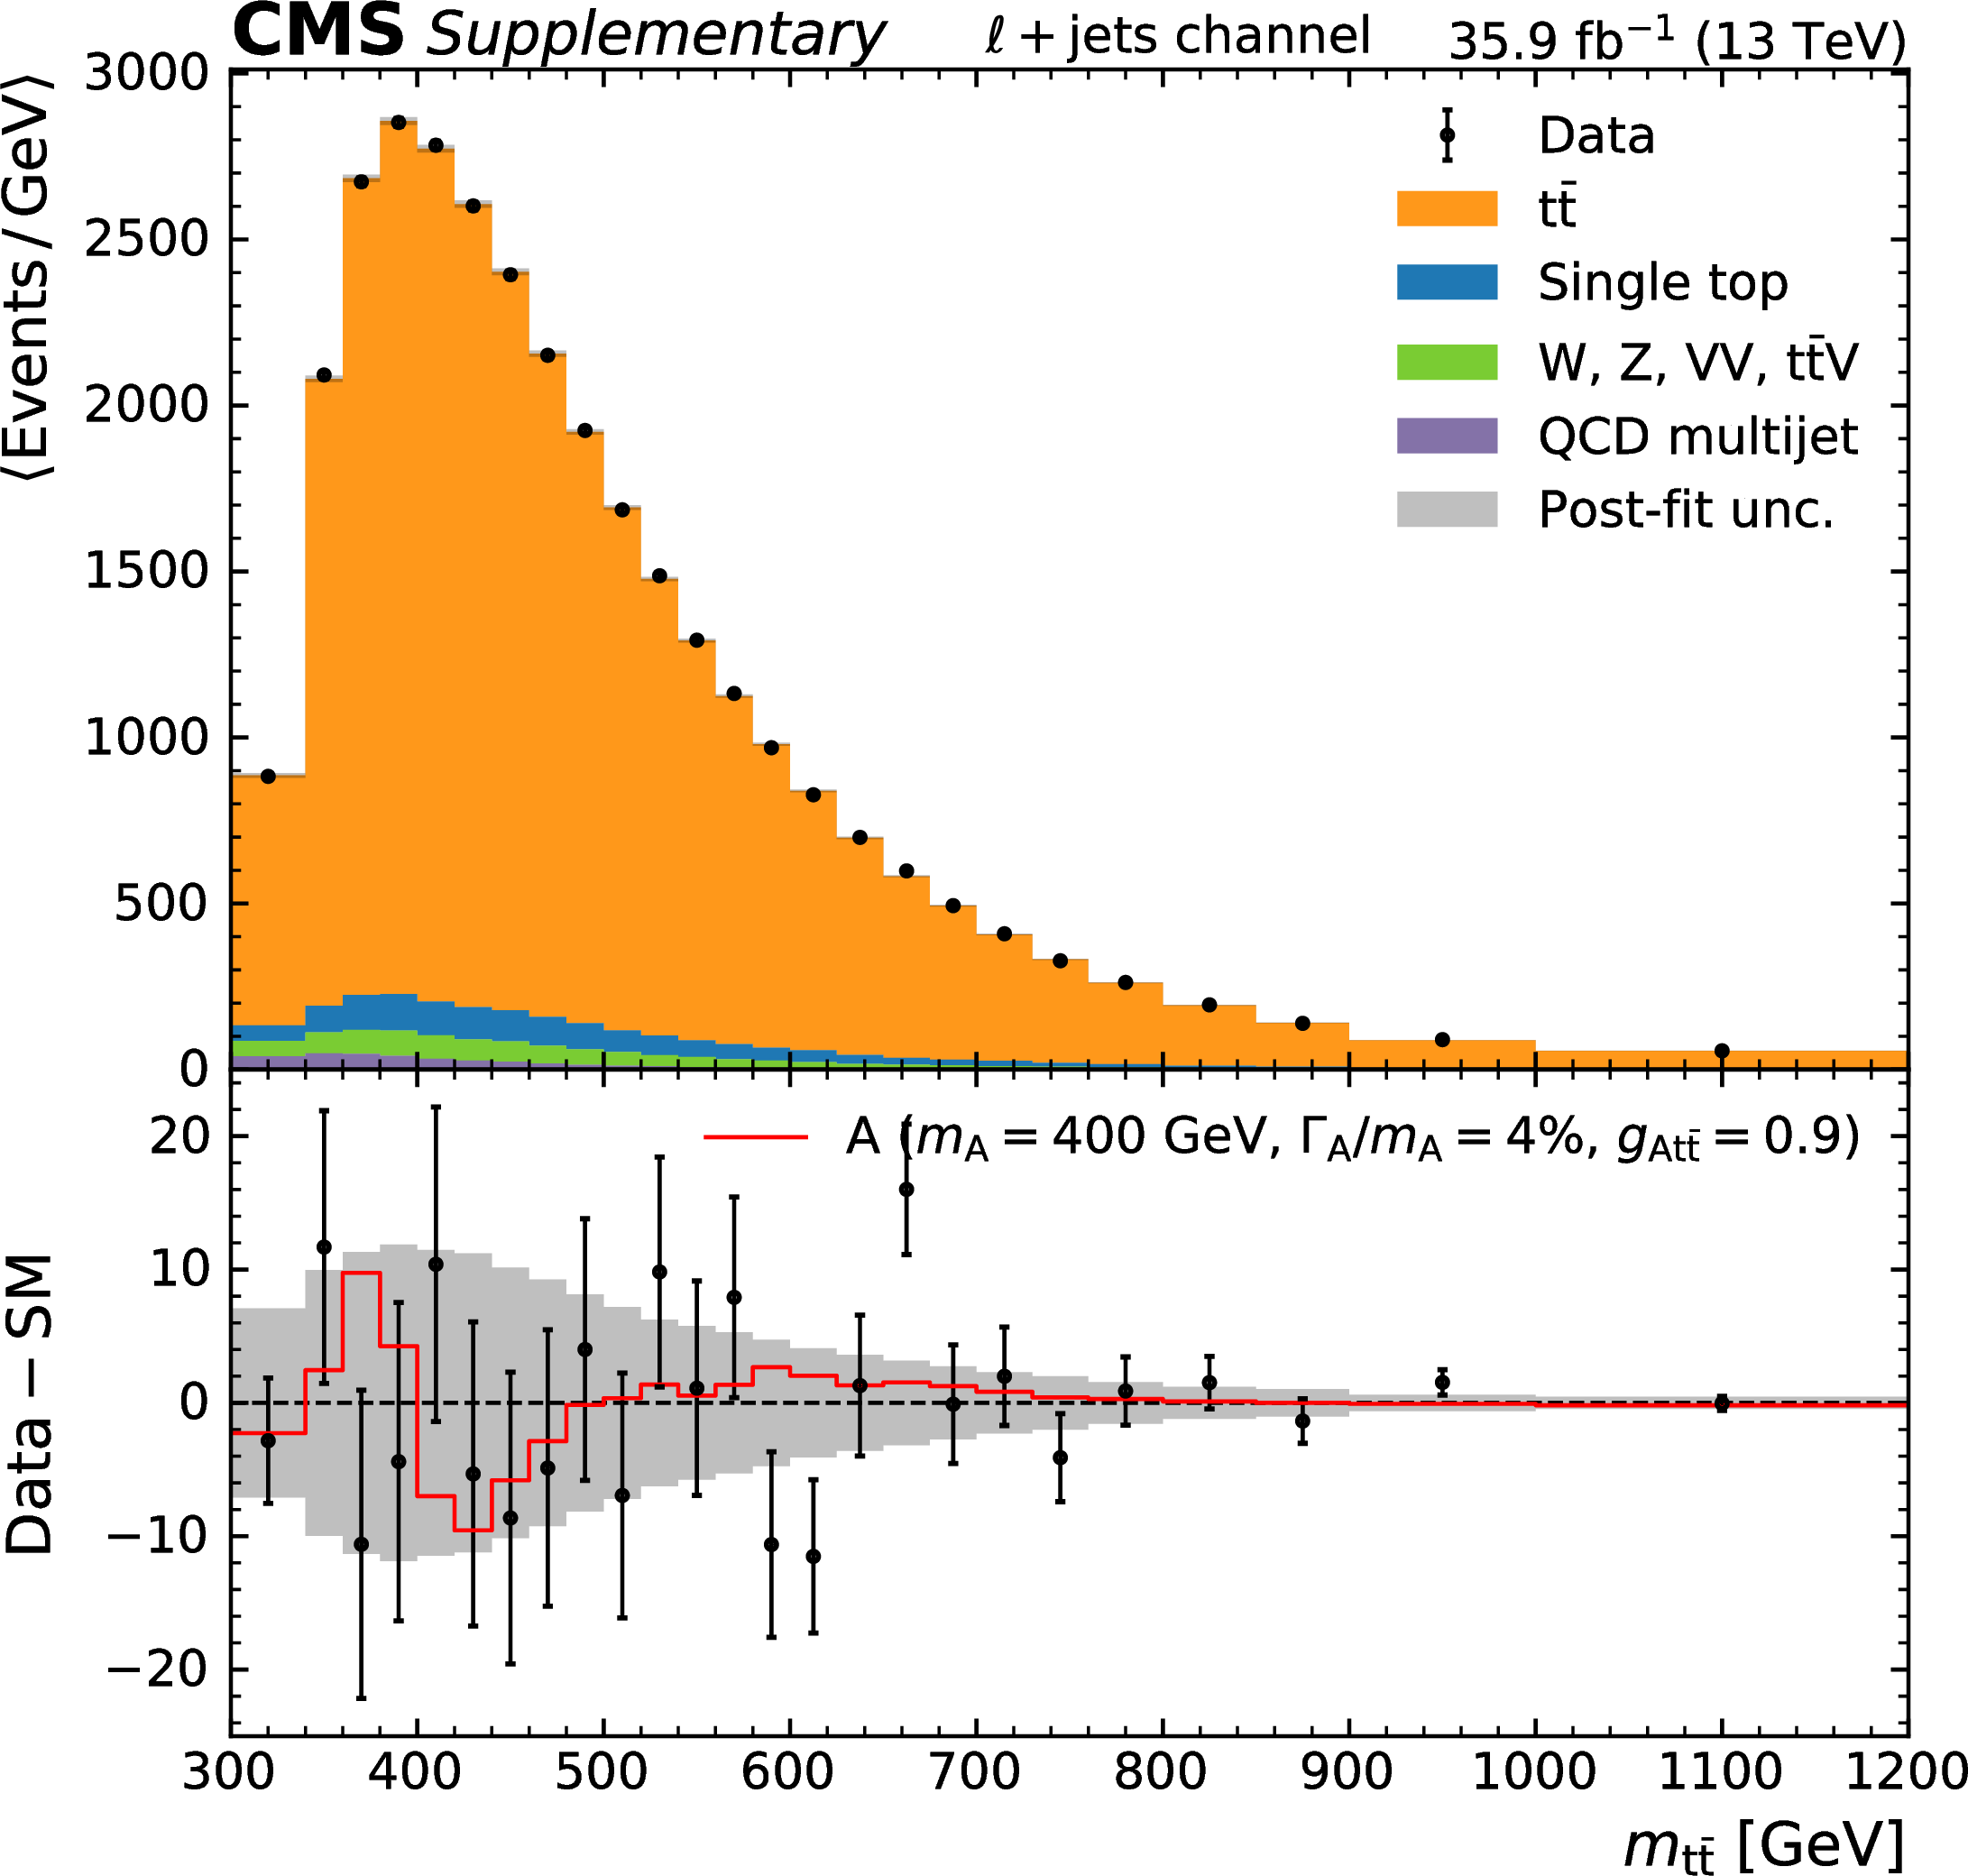
Observed and expected distributions of ${m_{{\mathrm{t} \mathrm{\bar{t}}}}}$ in different $ {| \cos {\theta ^*_{t_\ell}} |}$ regions in the e+jets (upper) and $\mu$+jets (lower) channels. The expected distributions have been obtained with a background-only fit to the data, and an approximate post-fit uncertainty is shown with a gray band. The impact of the best-fit signal is included in the lower panels for illustration. |

png pdf |
Figure 3-a:
Observed and expected distributions of ${m_{{\mathrm{t} \mathrm{\bar{t}}}}}$ in different $ {| \cos {\theta ^*_{t_\ell}} |}$ regions in the e+jets channel. The expected distributions have been obtained with a background-only fit to the data, and an approximate post-fit uncertainty is shown with a gray band. The impact of the best-fit signal is included in the lower panels for illustration. |

png pdf |
Figure 3-b:
Observed and expected distributions of ${m_{{\mathrm{t} \mathrm{\bar{t}}}}}$ in different $ {| \cos {\theta ^*_{t_\ell}} |}$ regions in the $\mu$+jets channel. The expected distributions have been obtained with a background-only fit to the data, and an approximate post-fit uncertainty is shown with a gray band. The impact of the best-fit signal is included in the lower panels for illustration. |
png pdf |
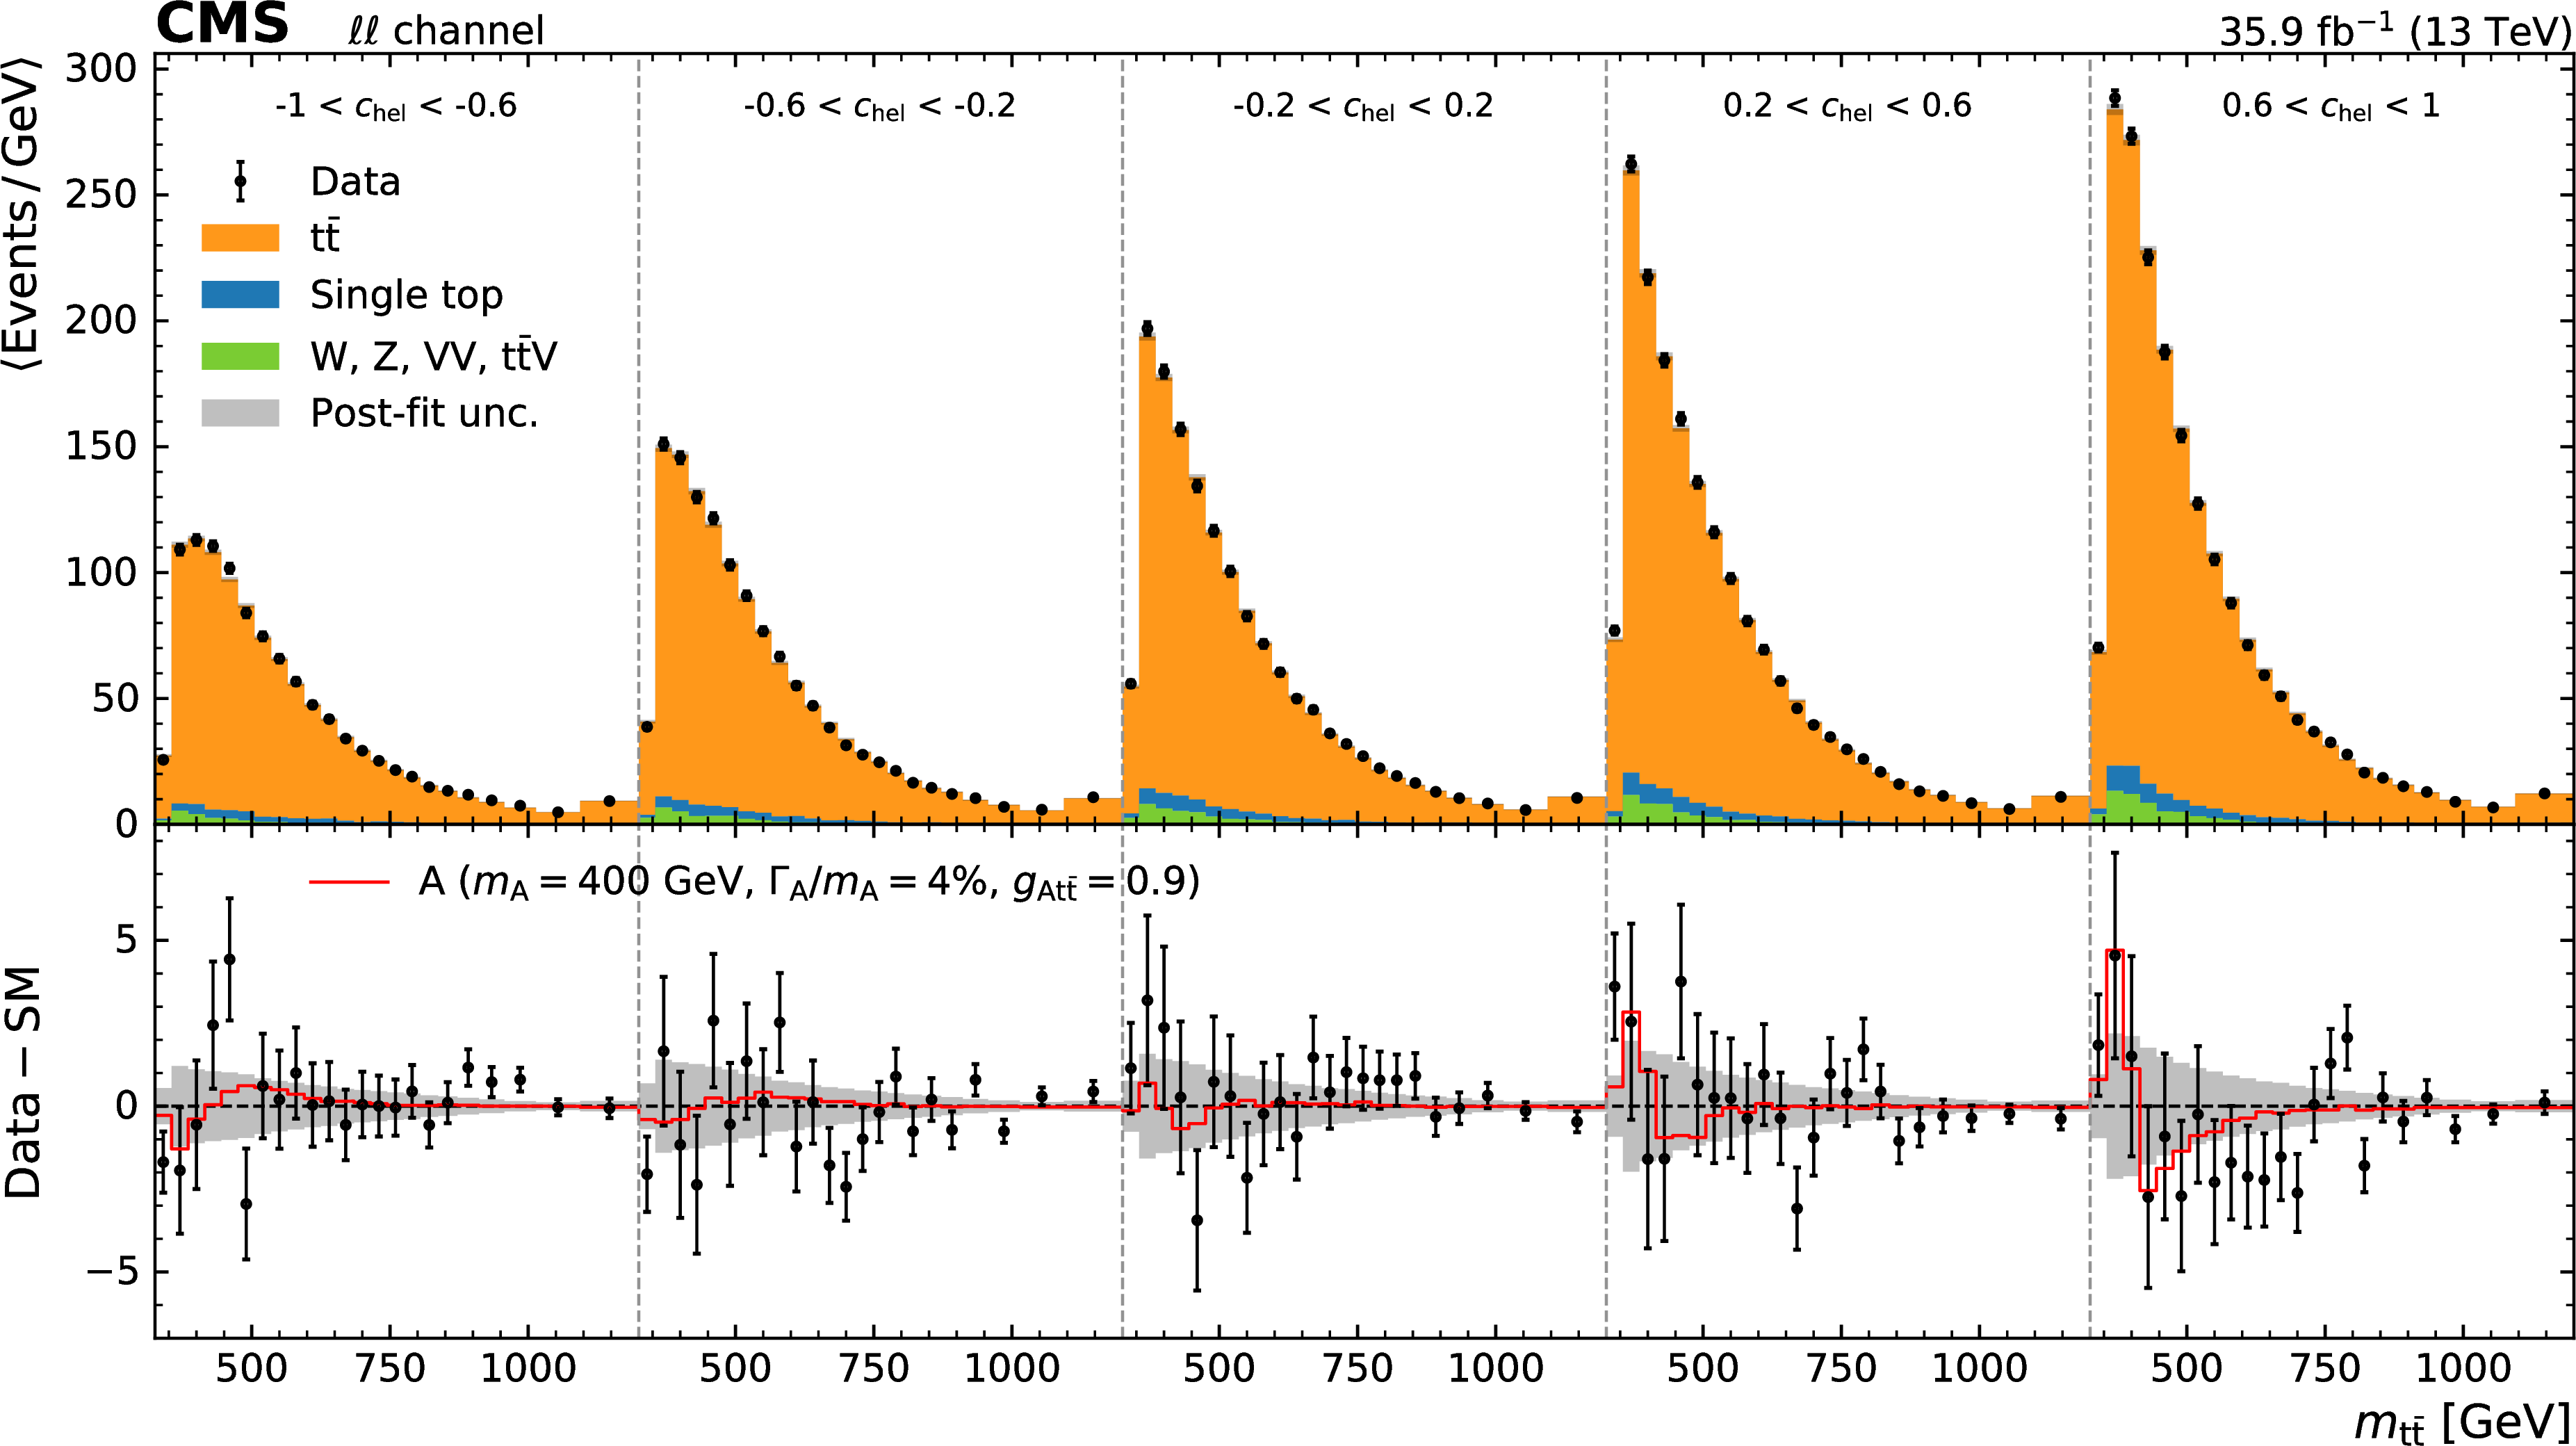
Figure 4:
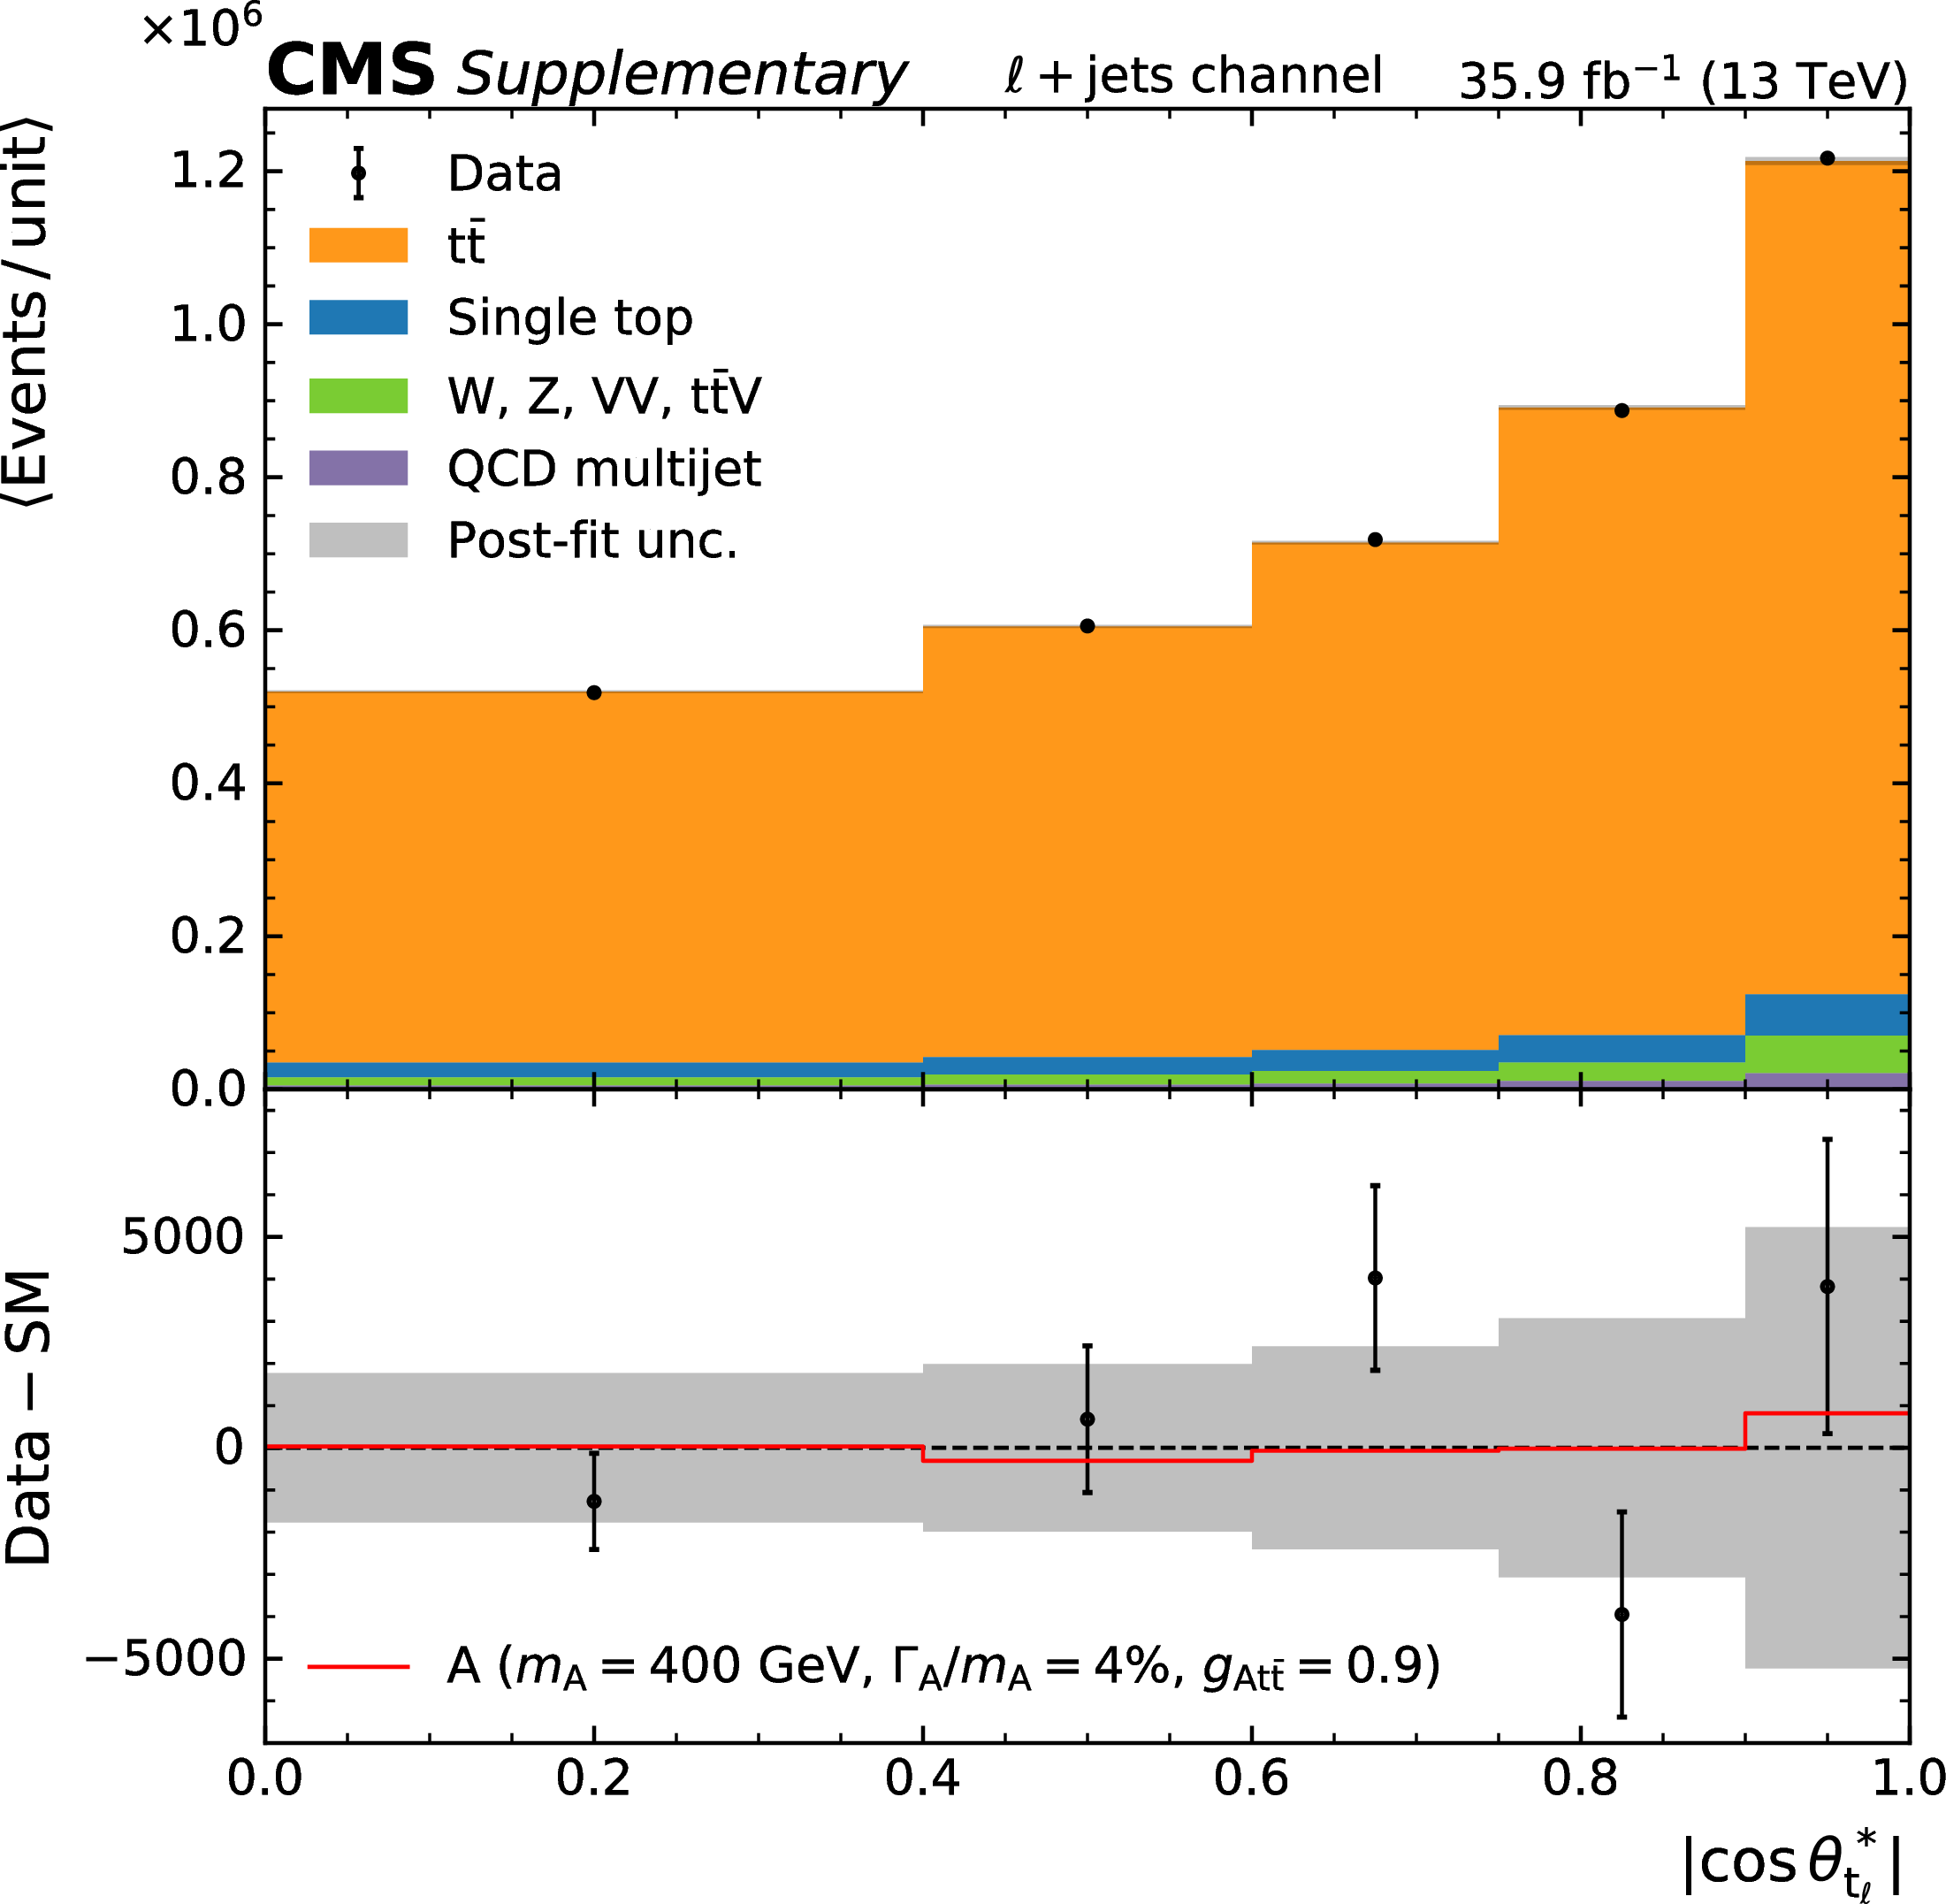
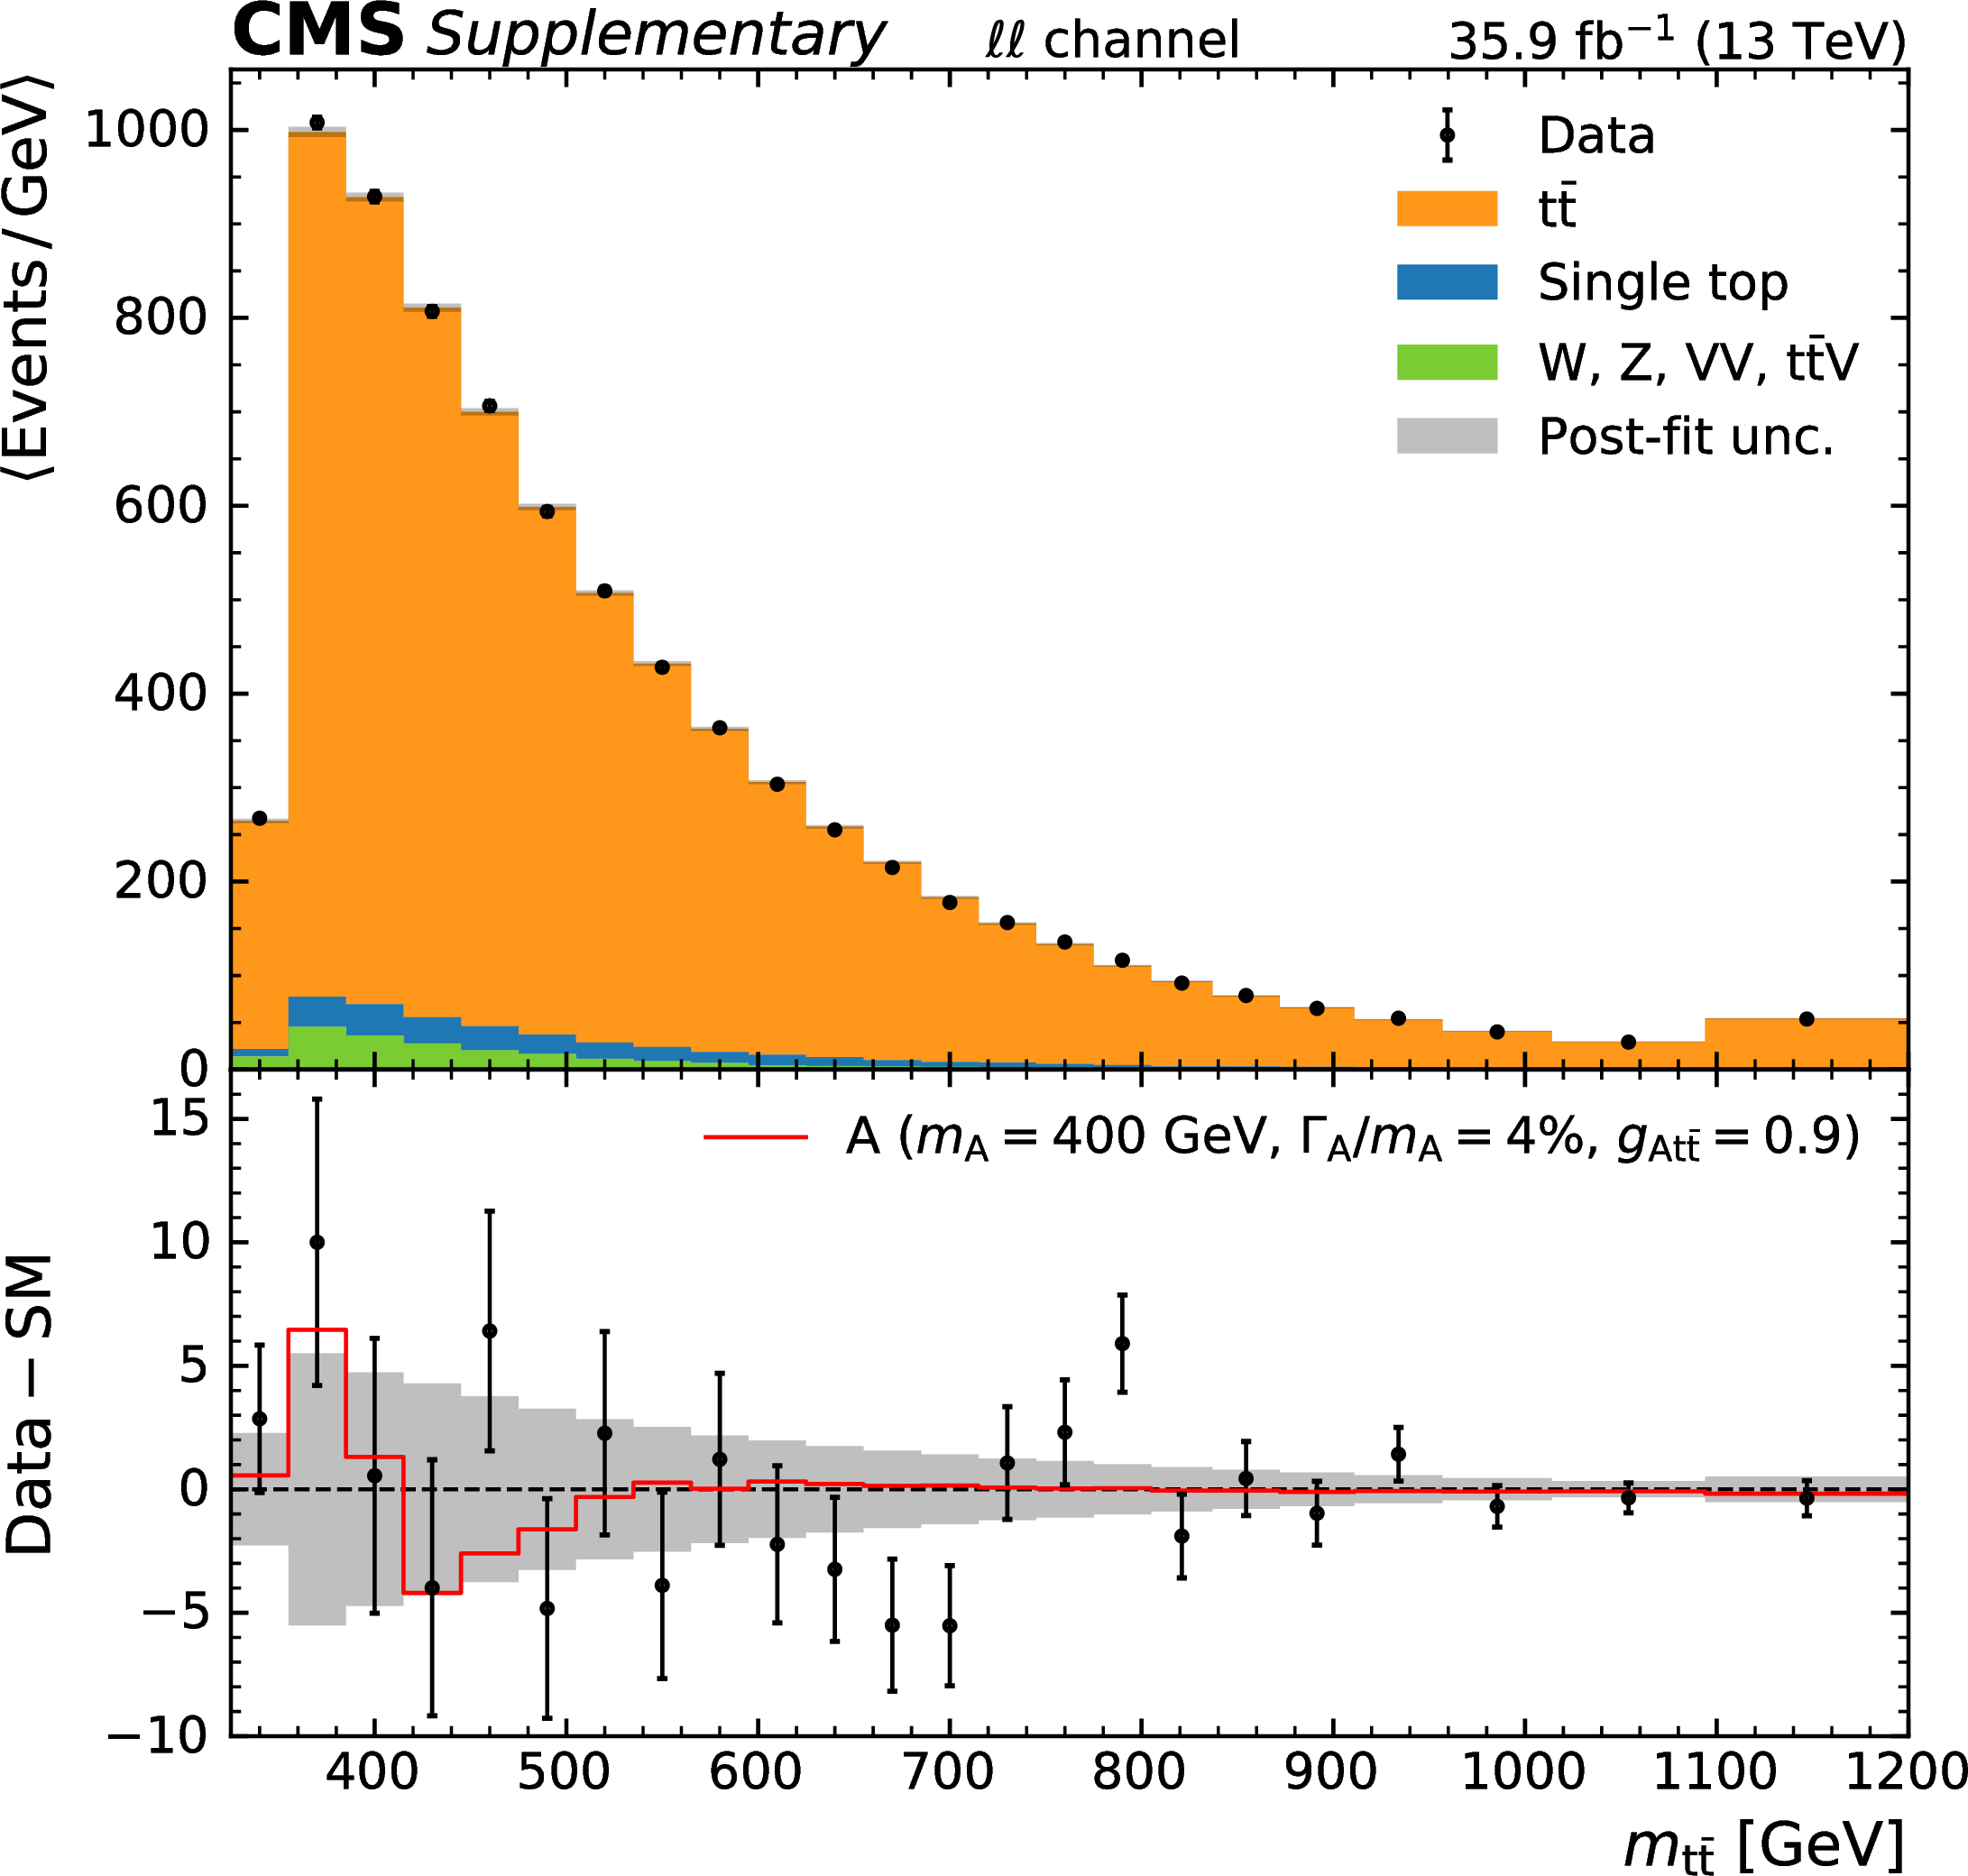
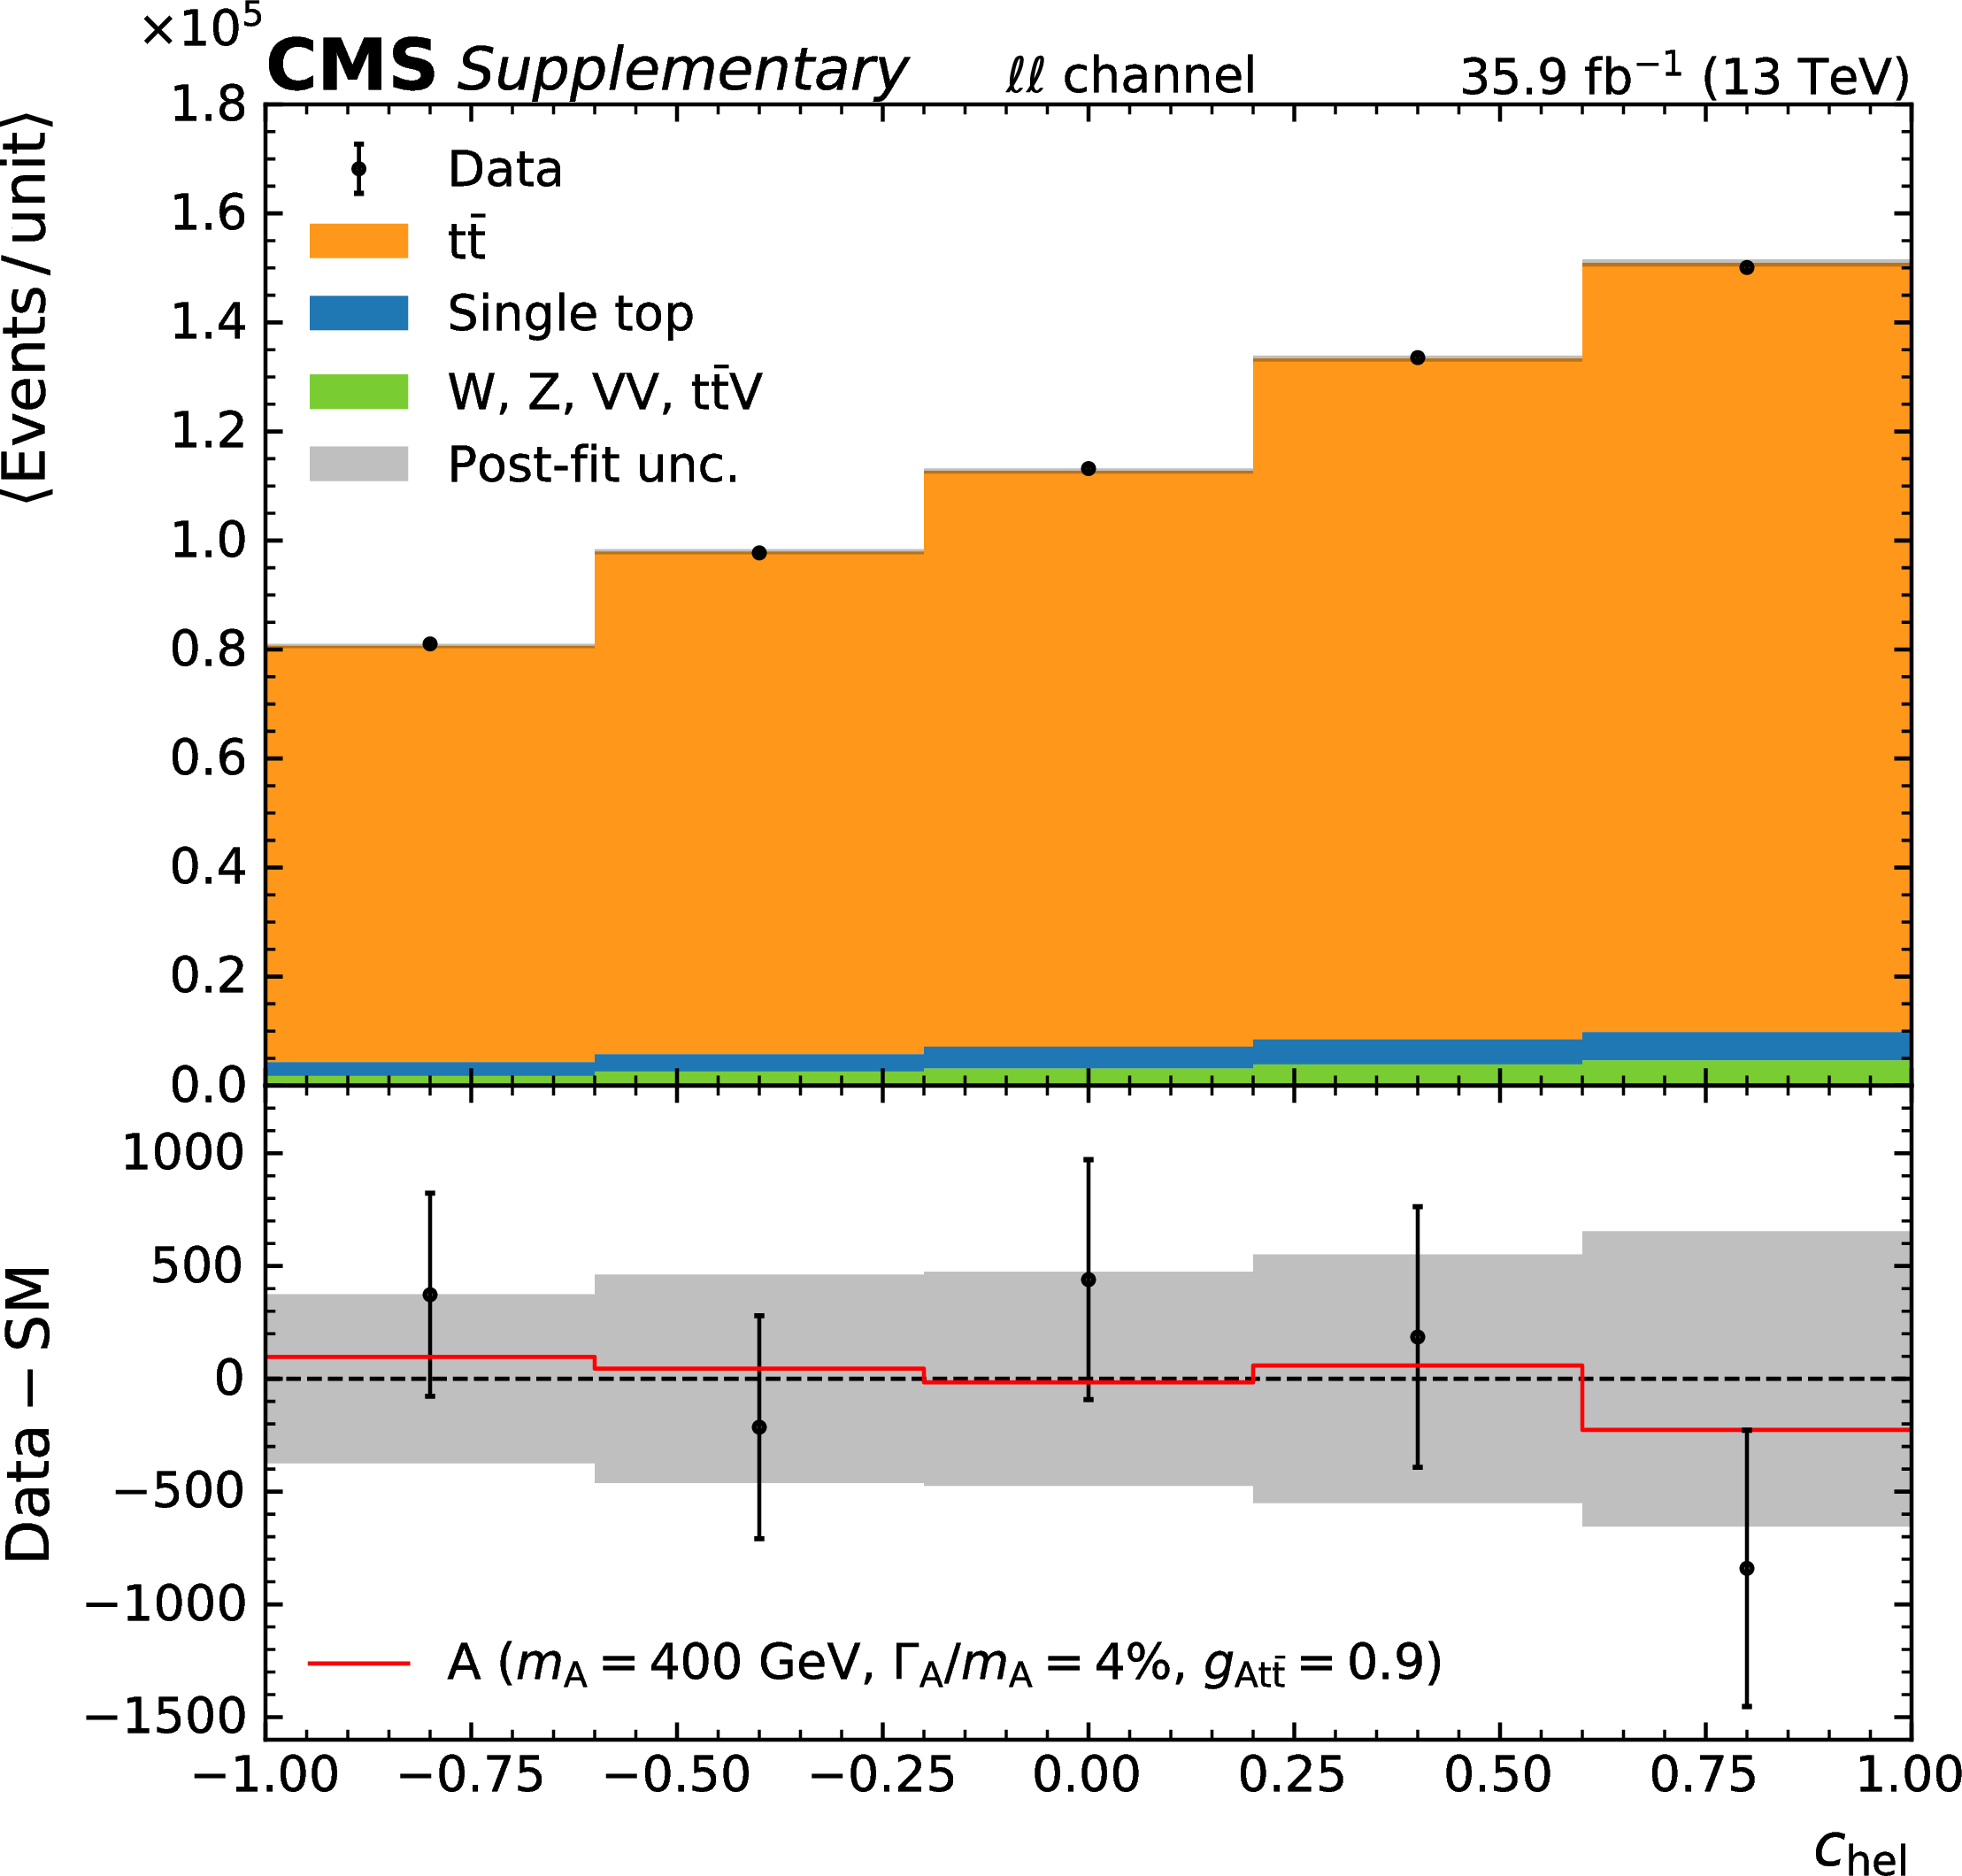
Observed and expected distributions of the observables exploited in the dilepton channel. The expected distributions have been obtained with a background-only fit to the data, and an approximate post-fit uncertainty is shown with a gray band. The impact of the best-fit signal is included in the lower panel for illustration. |
png pdf |
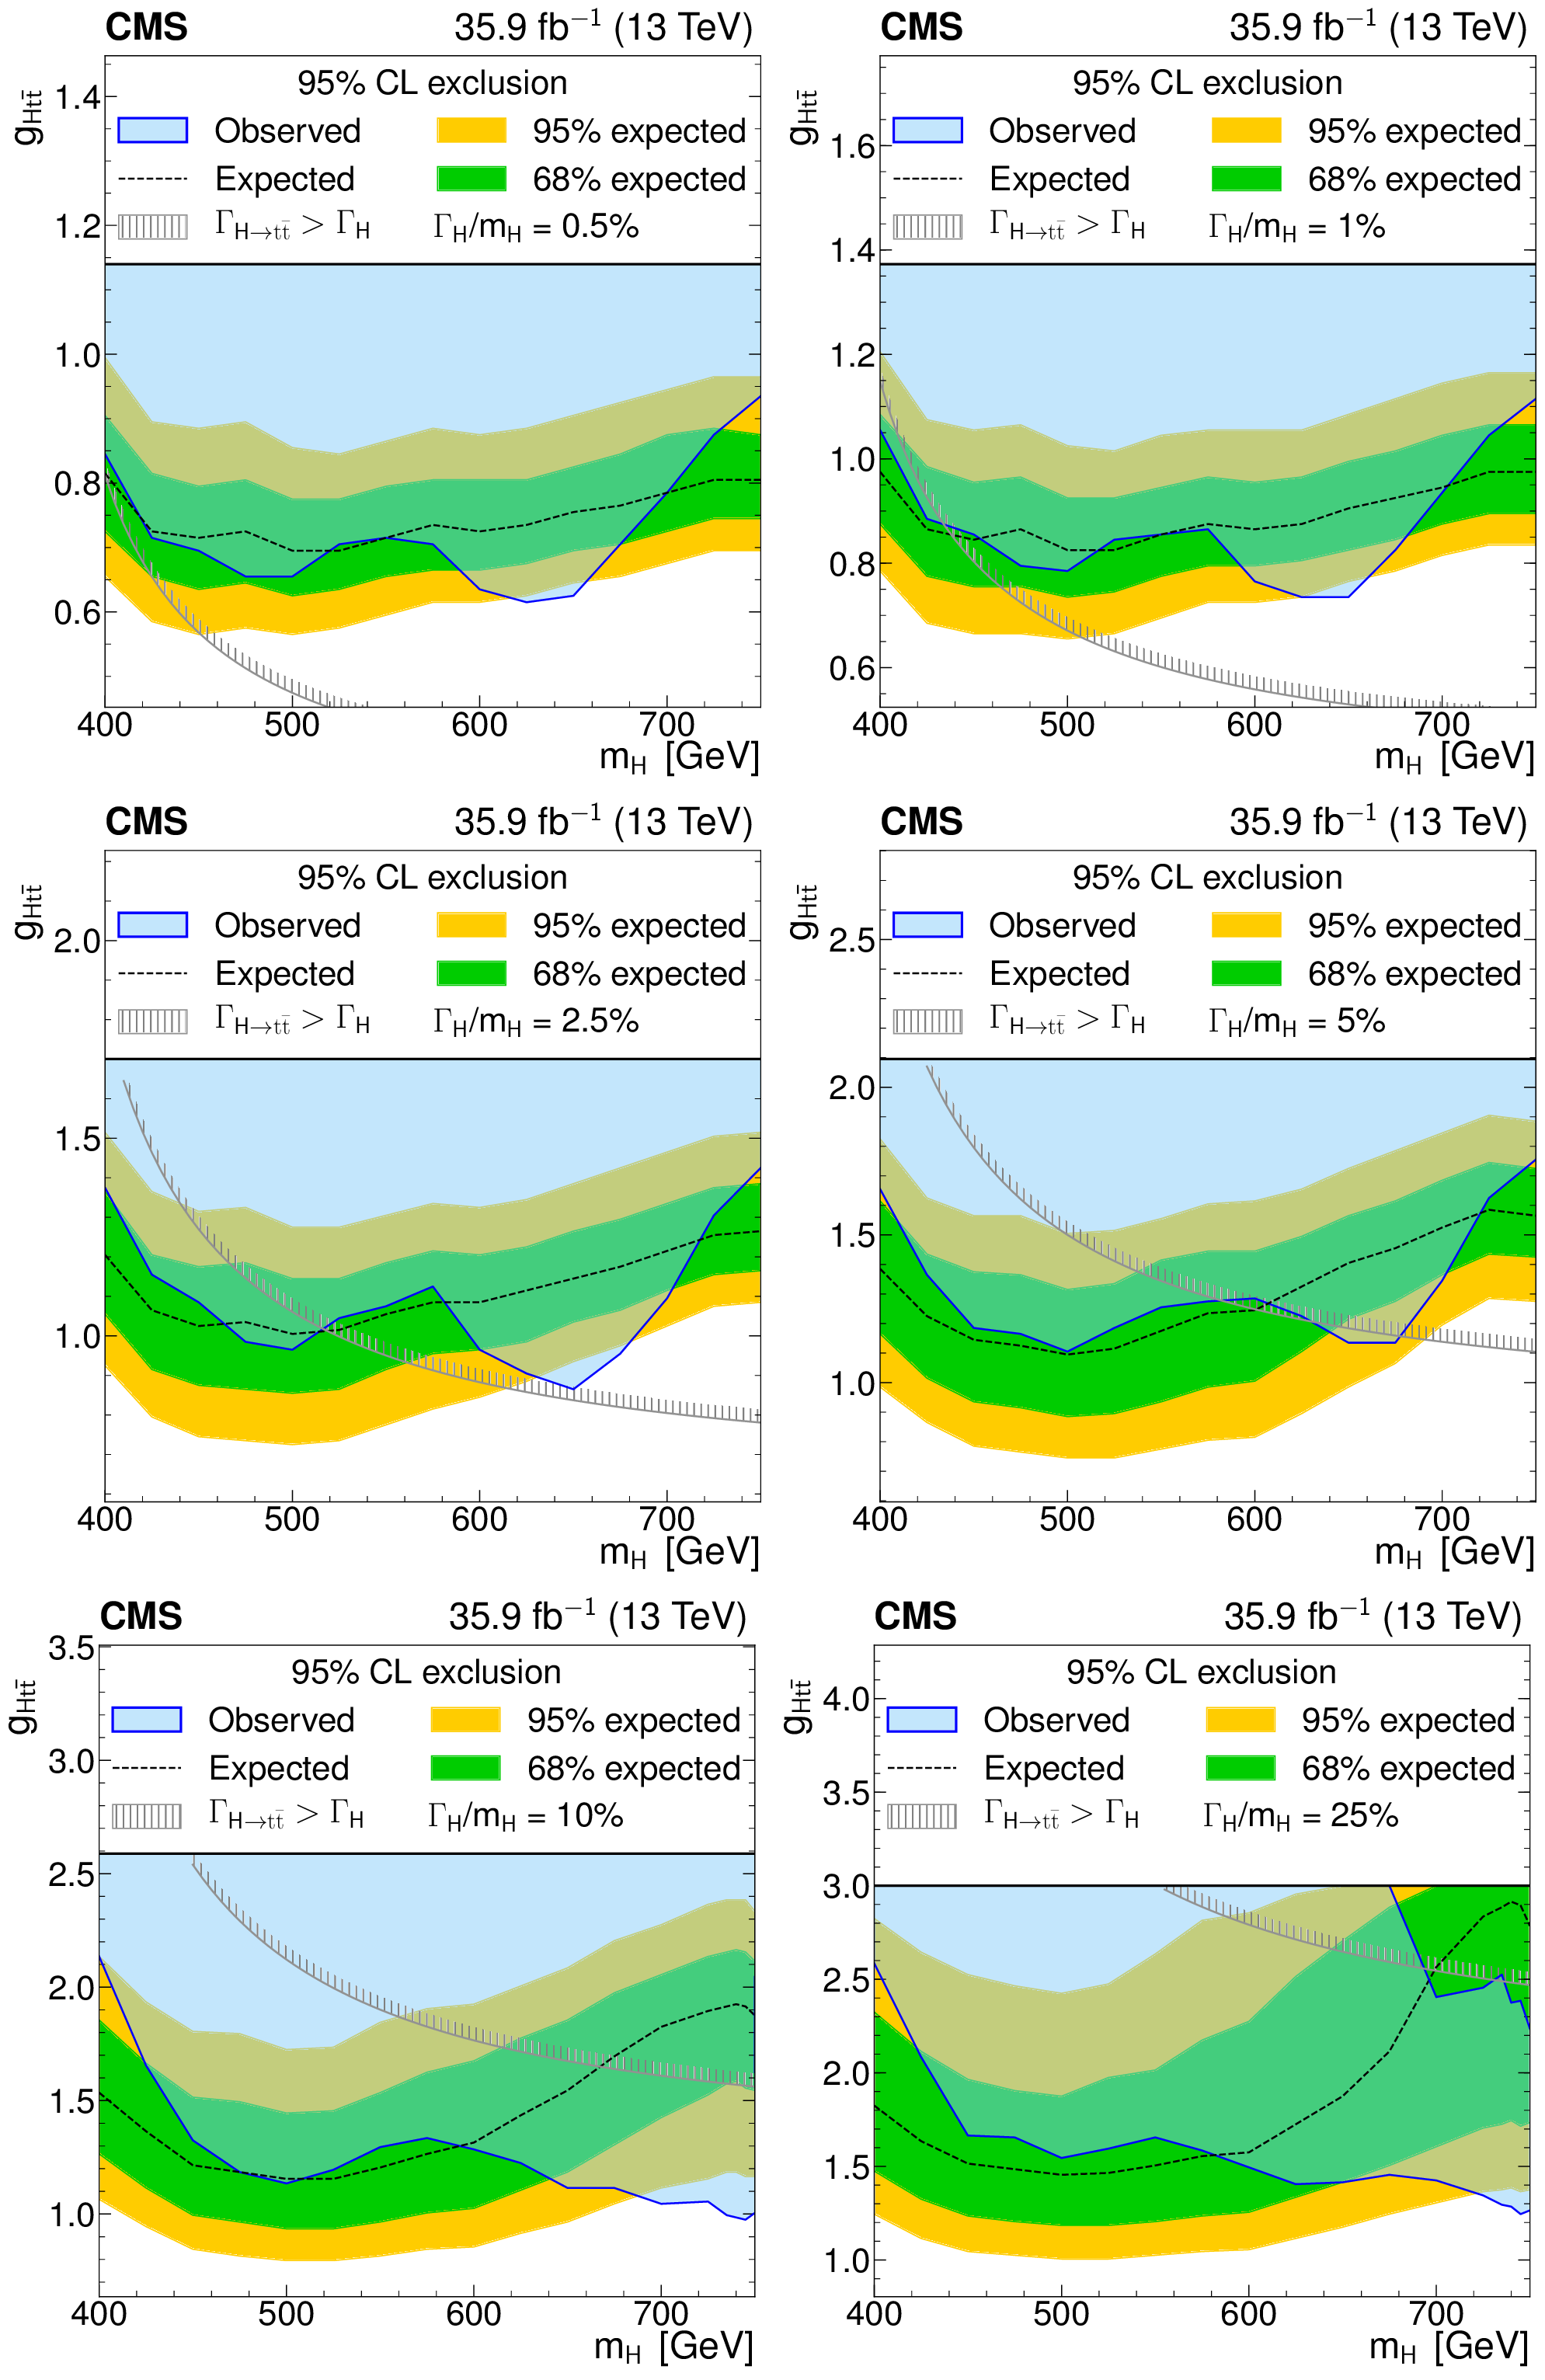
Figure 5:
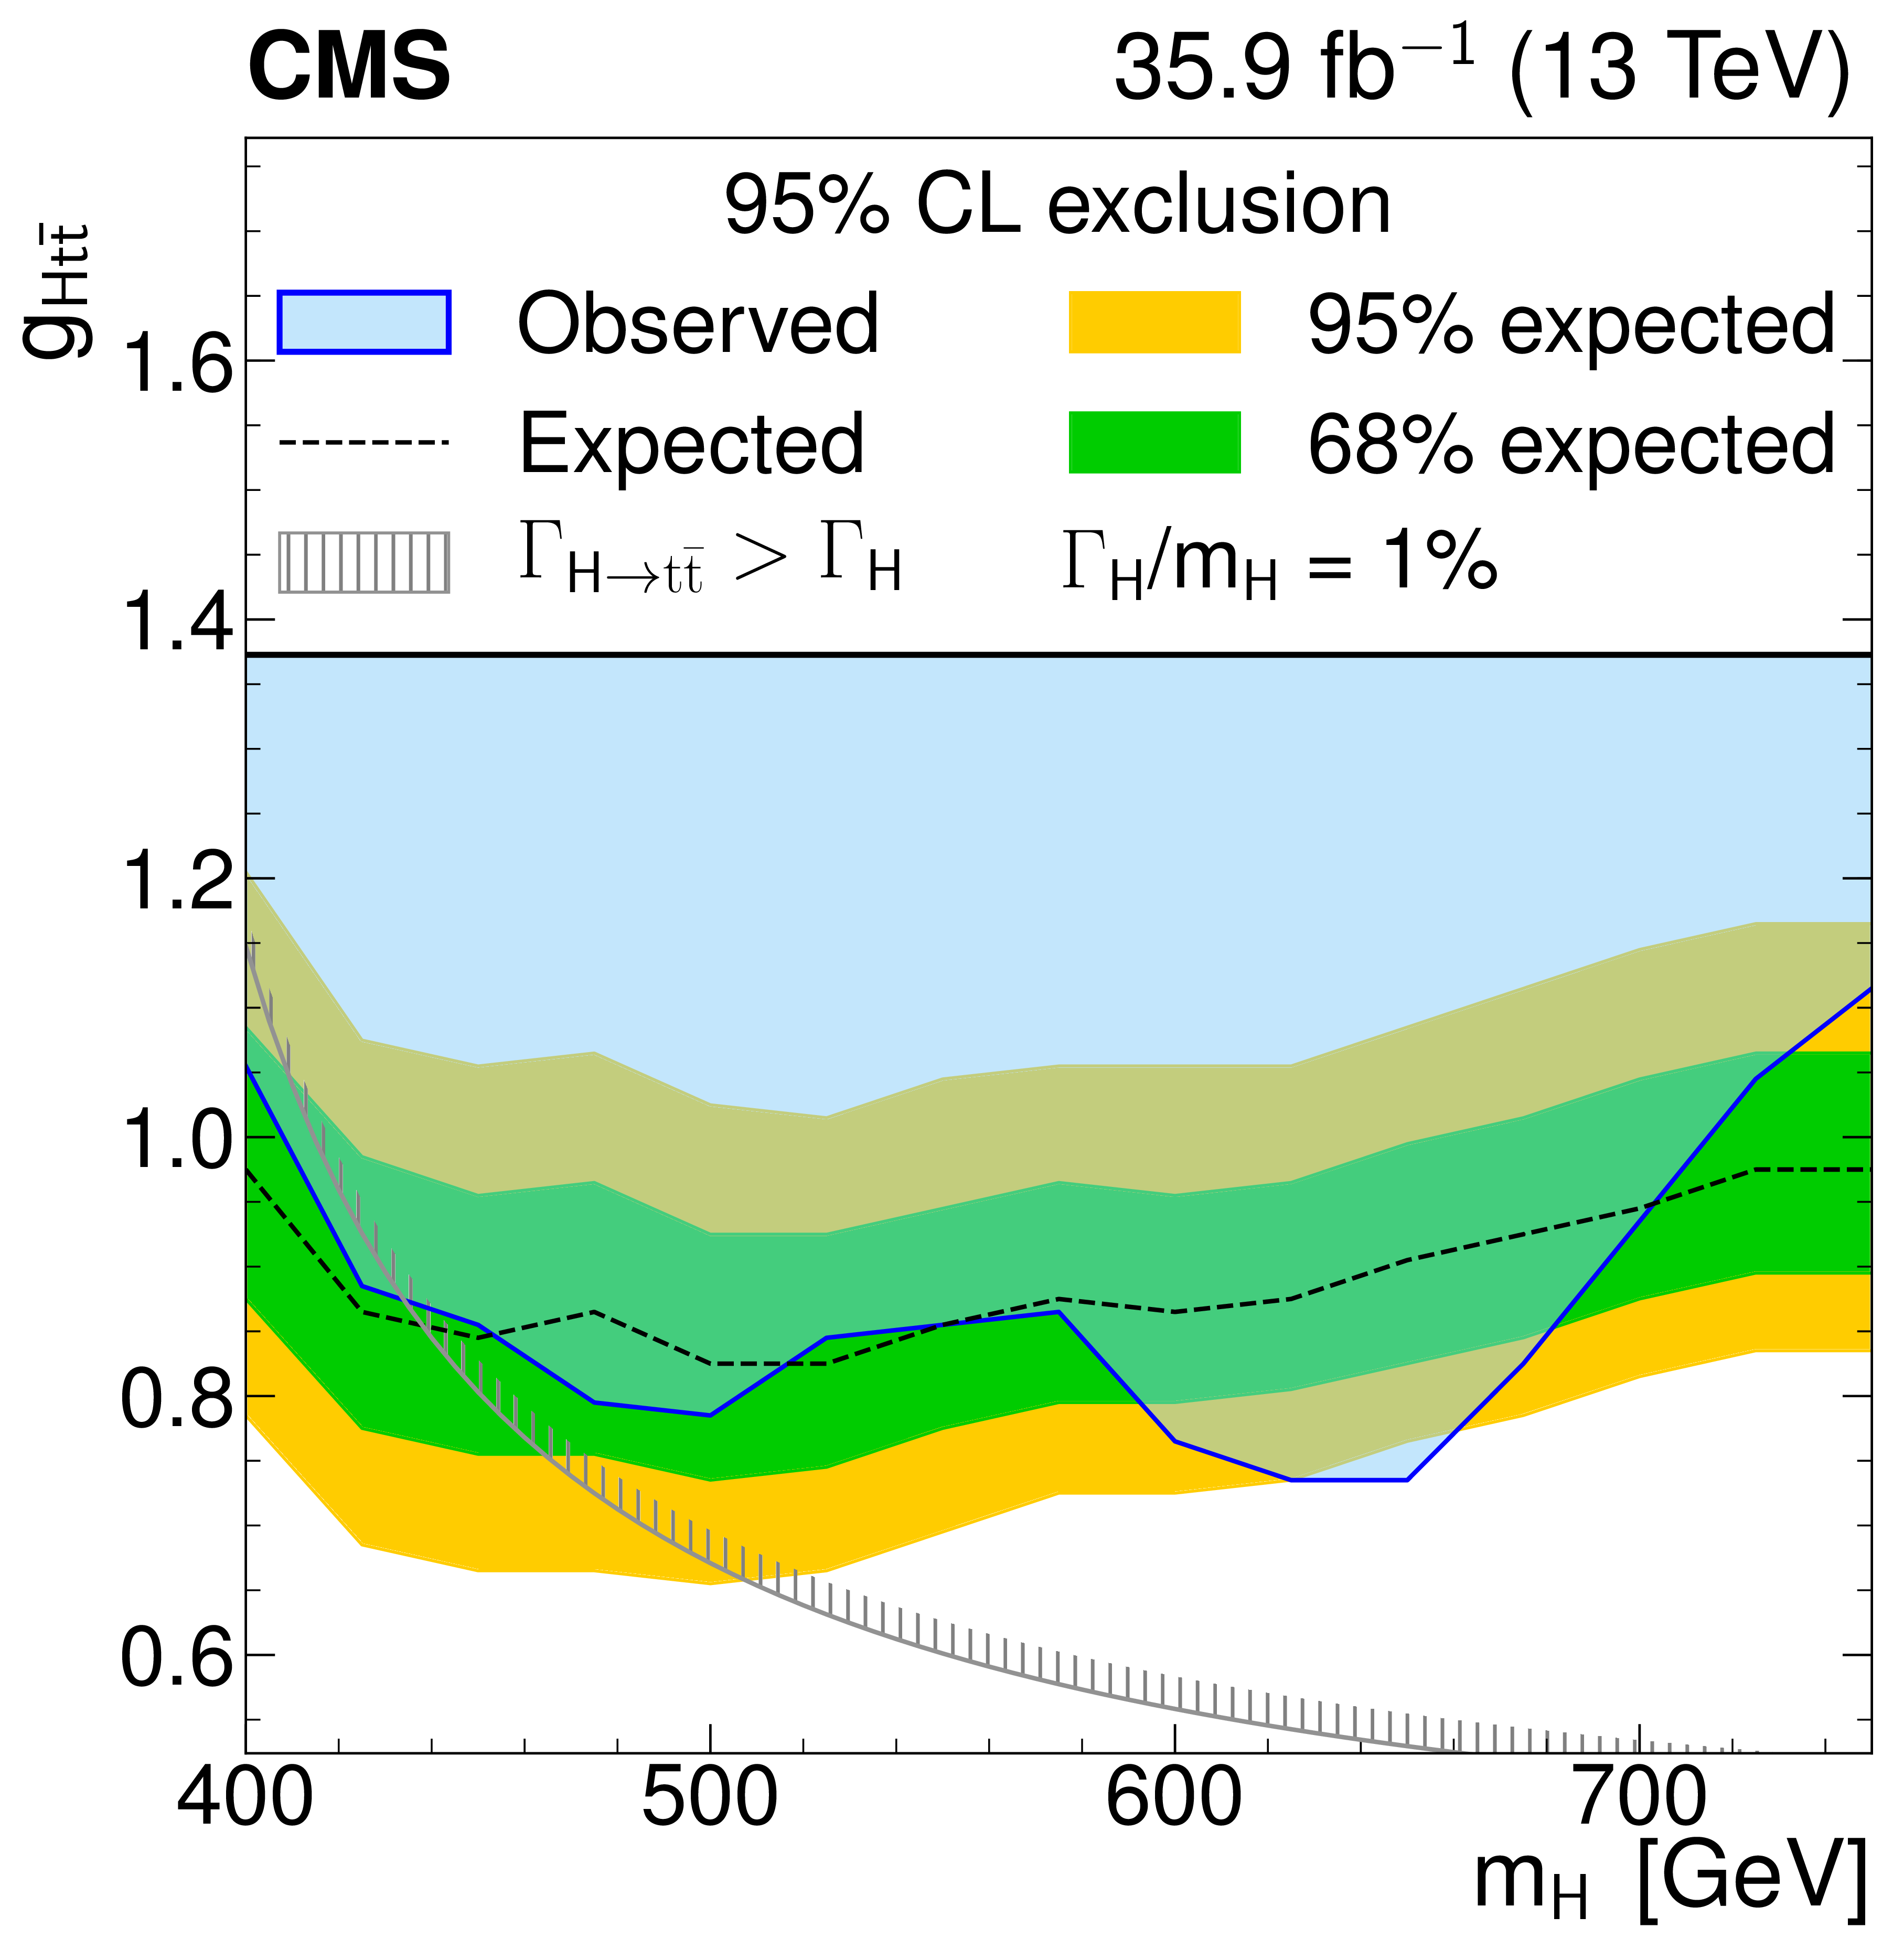
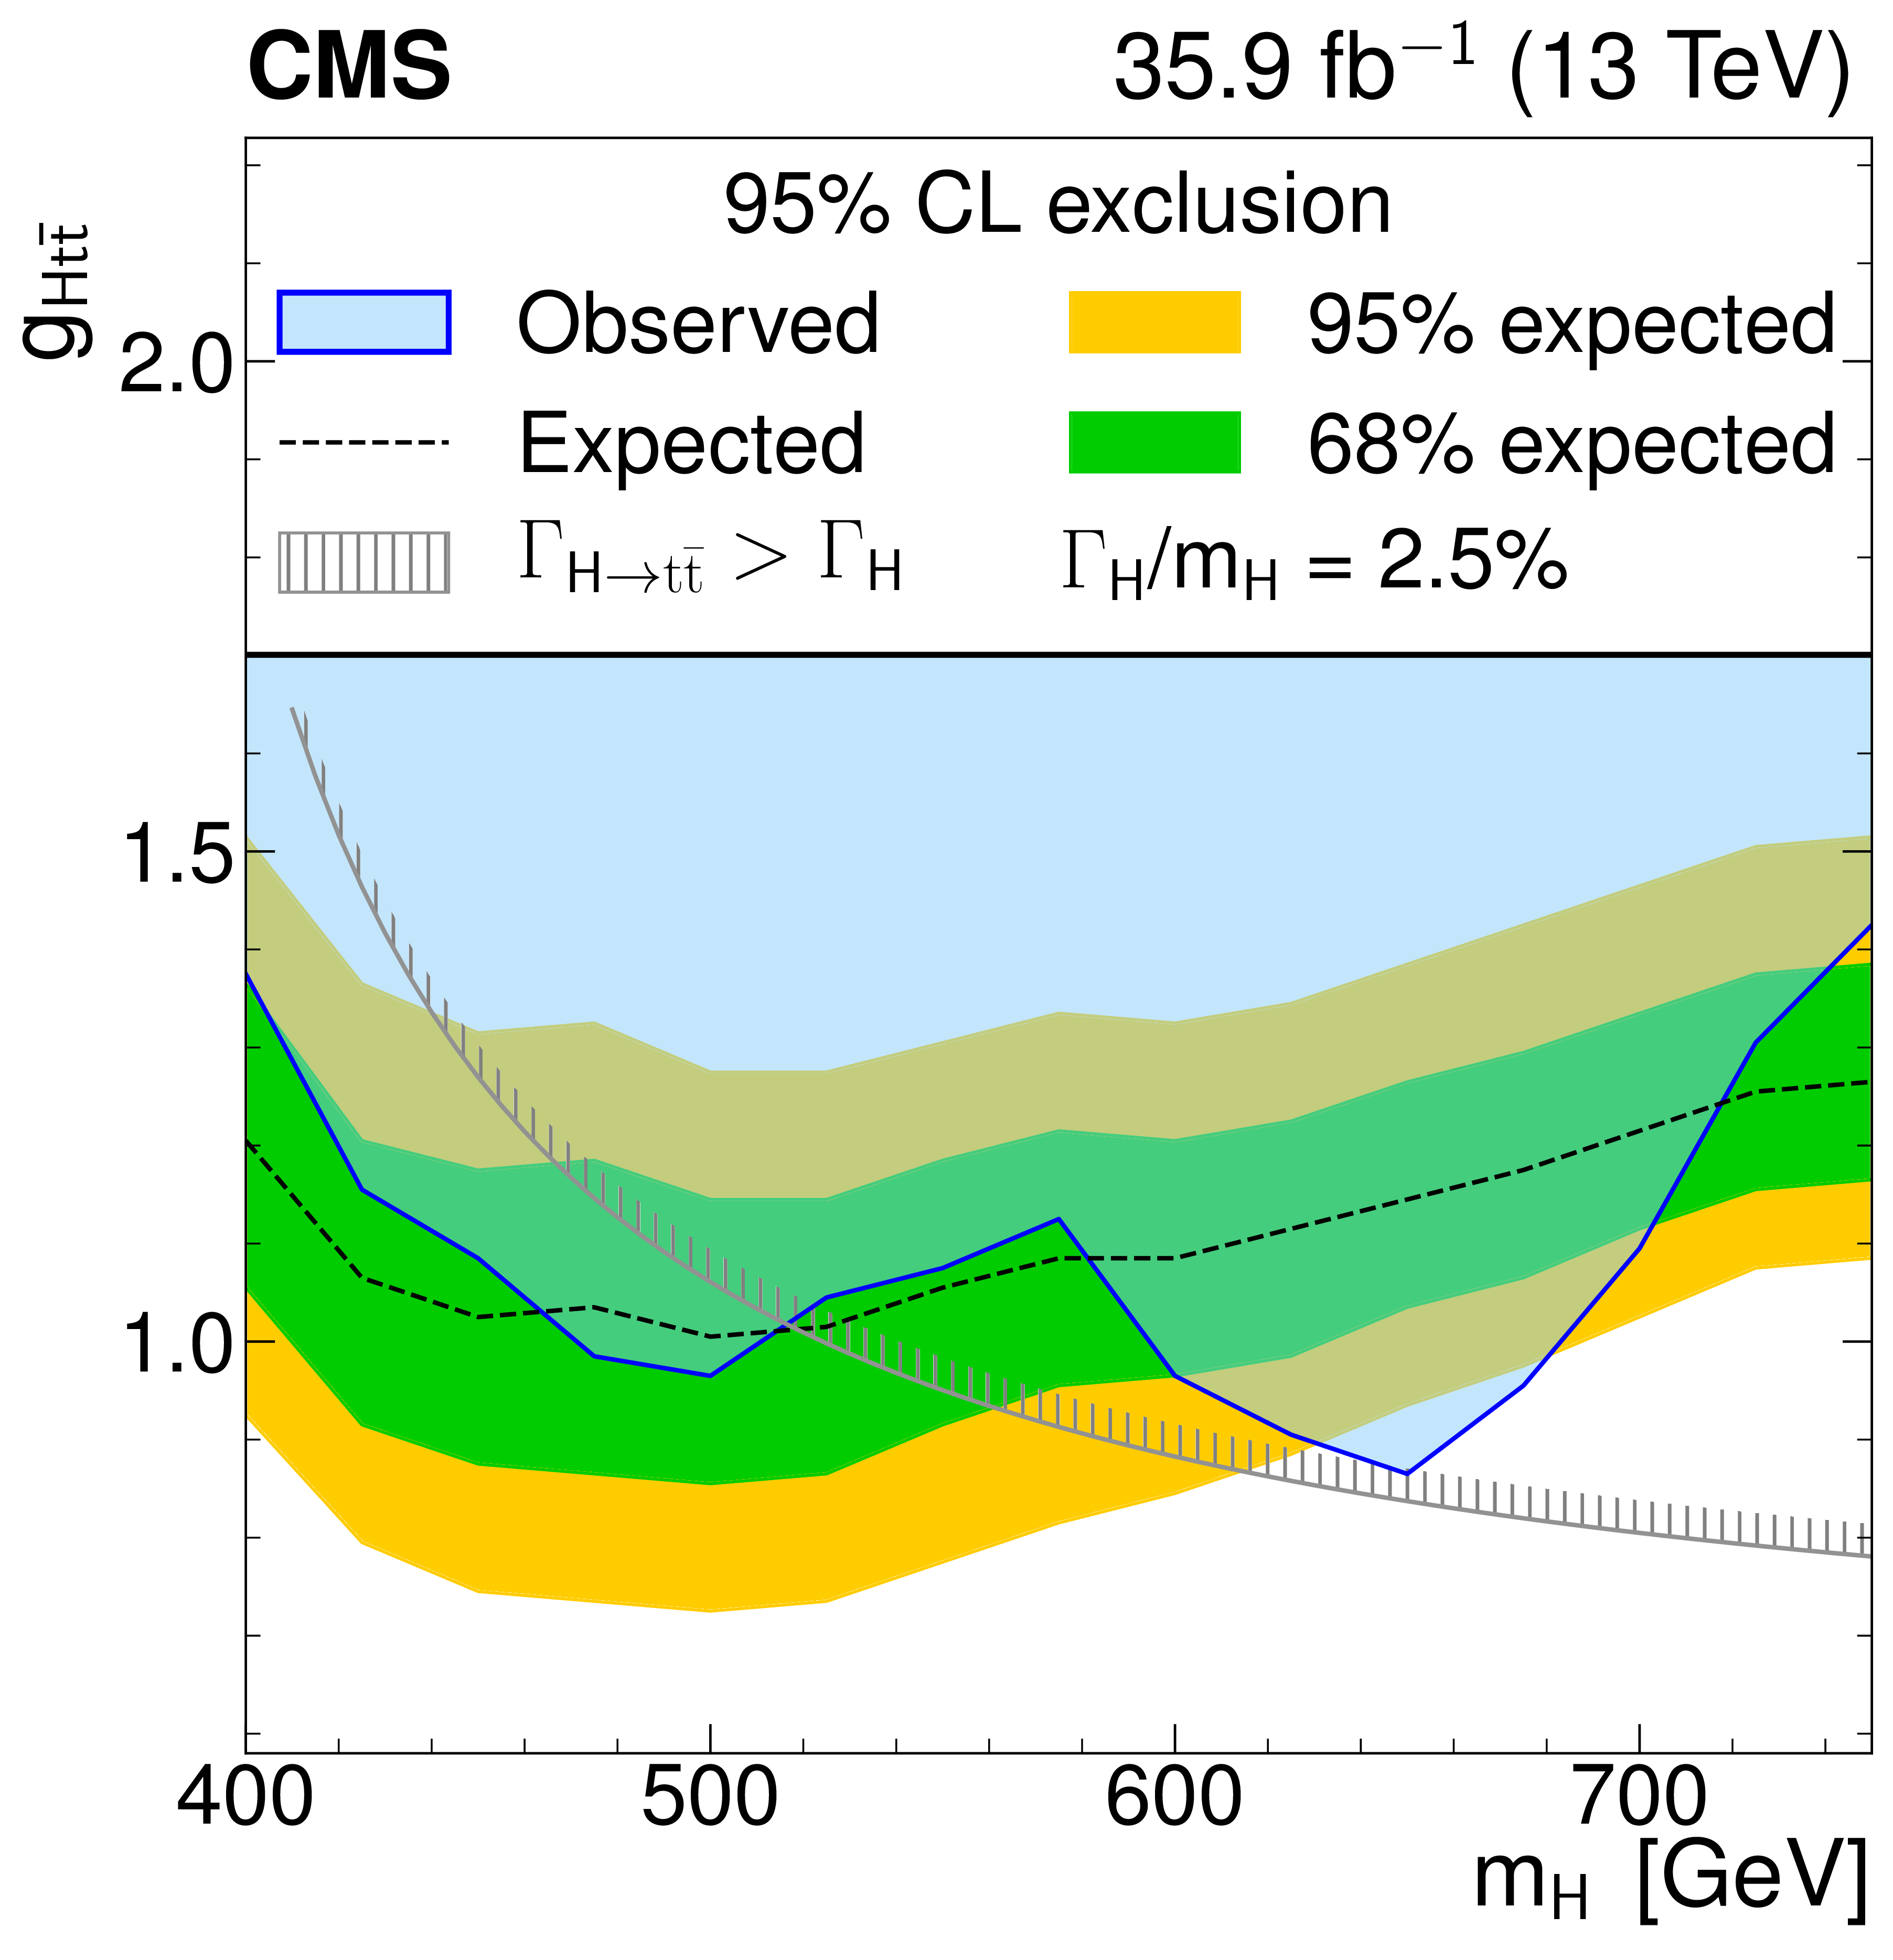
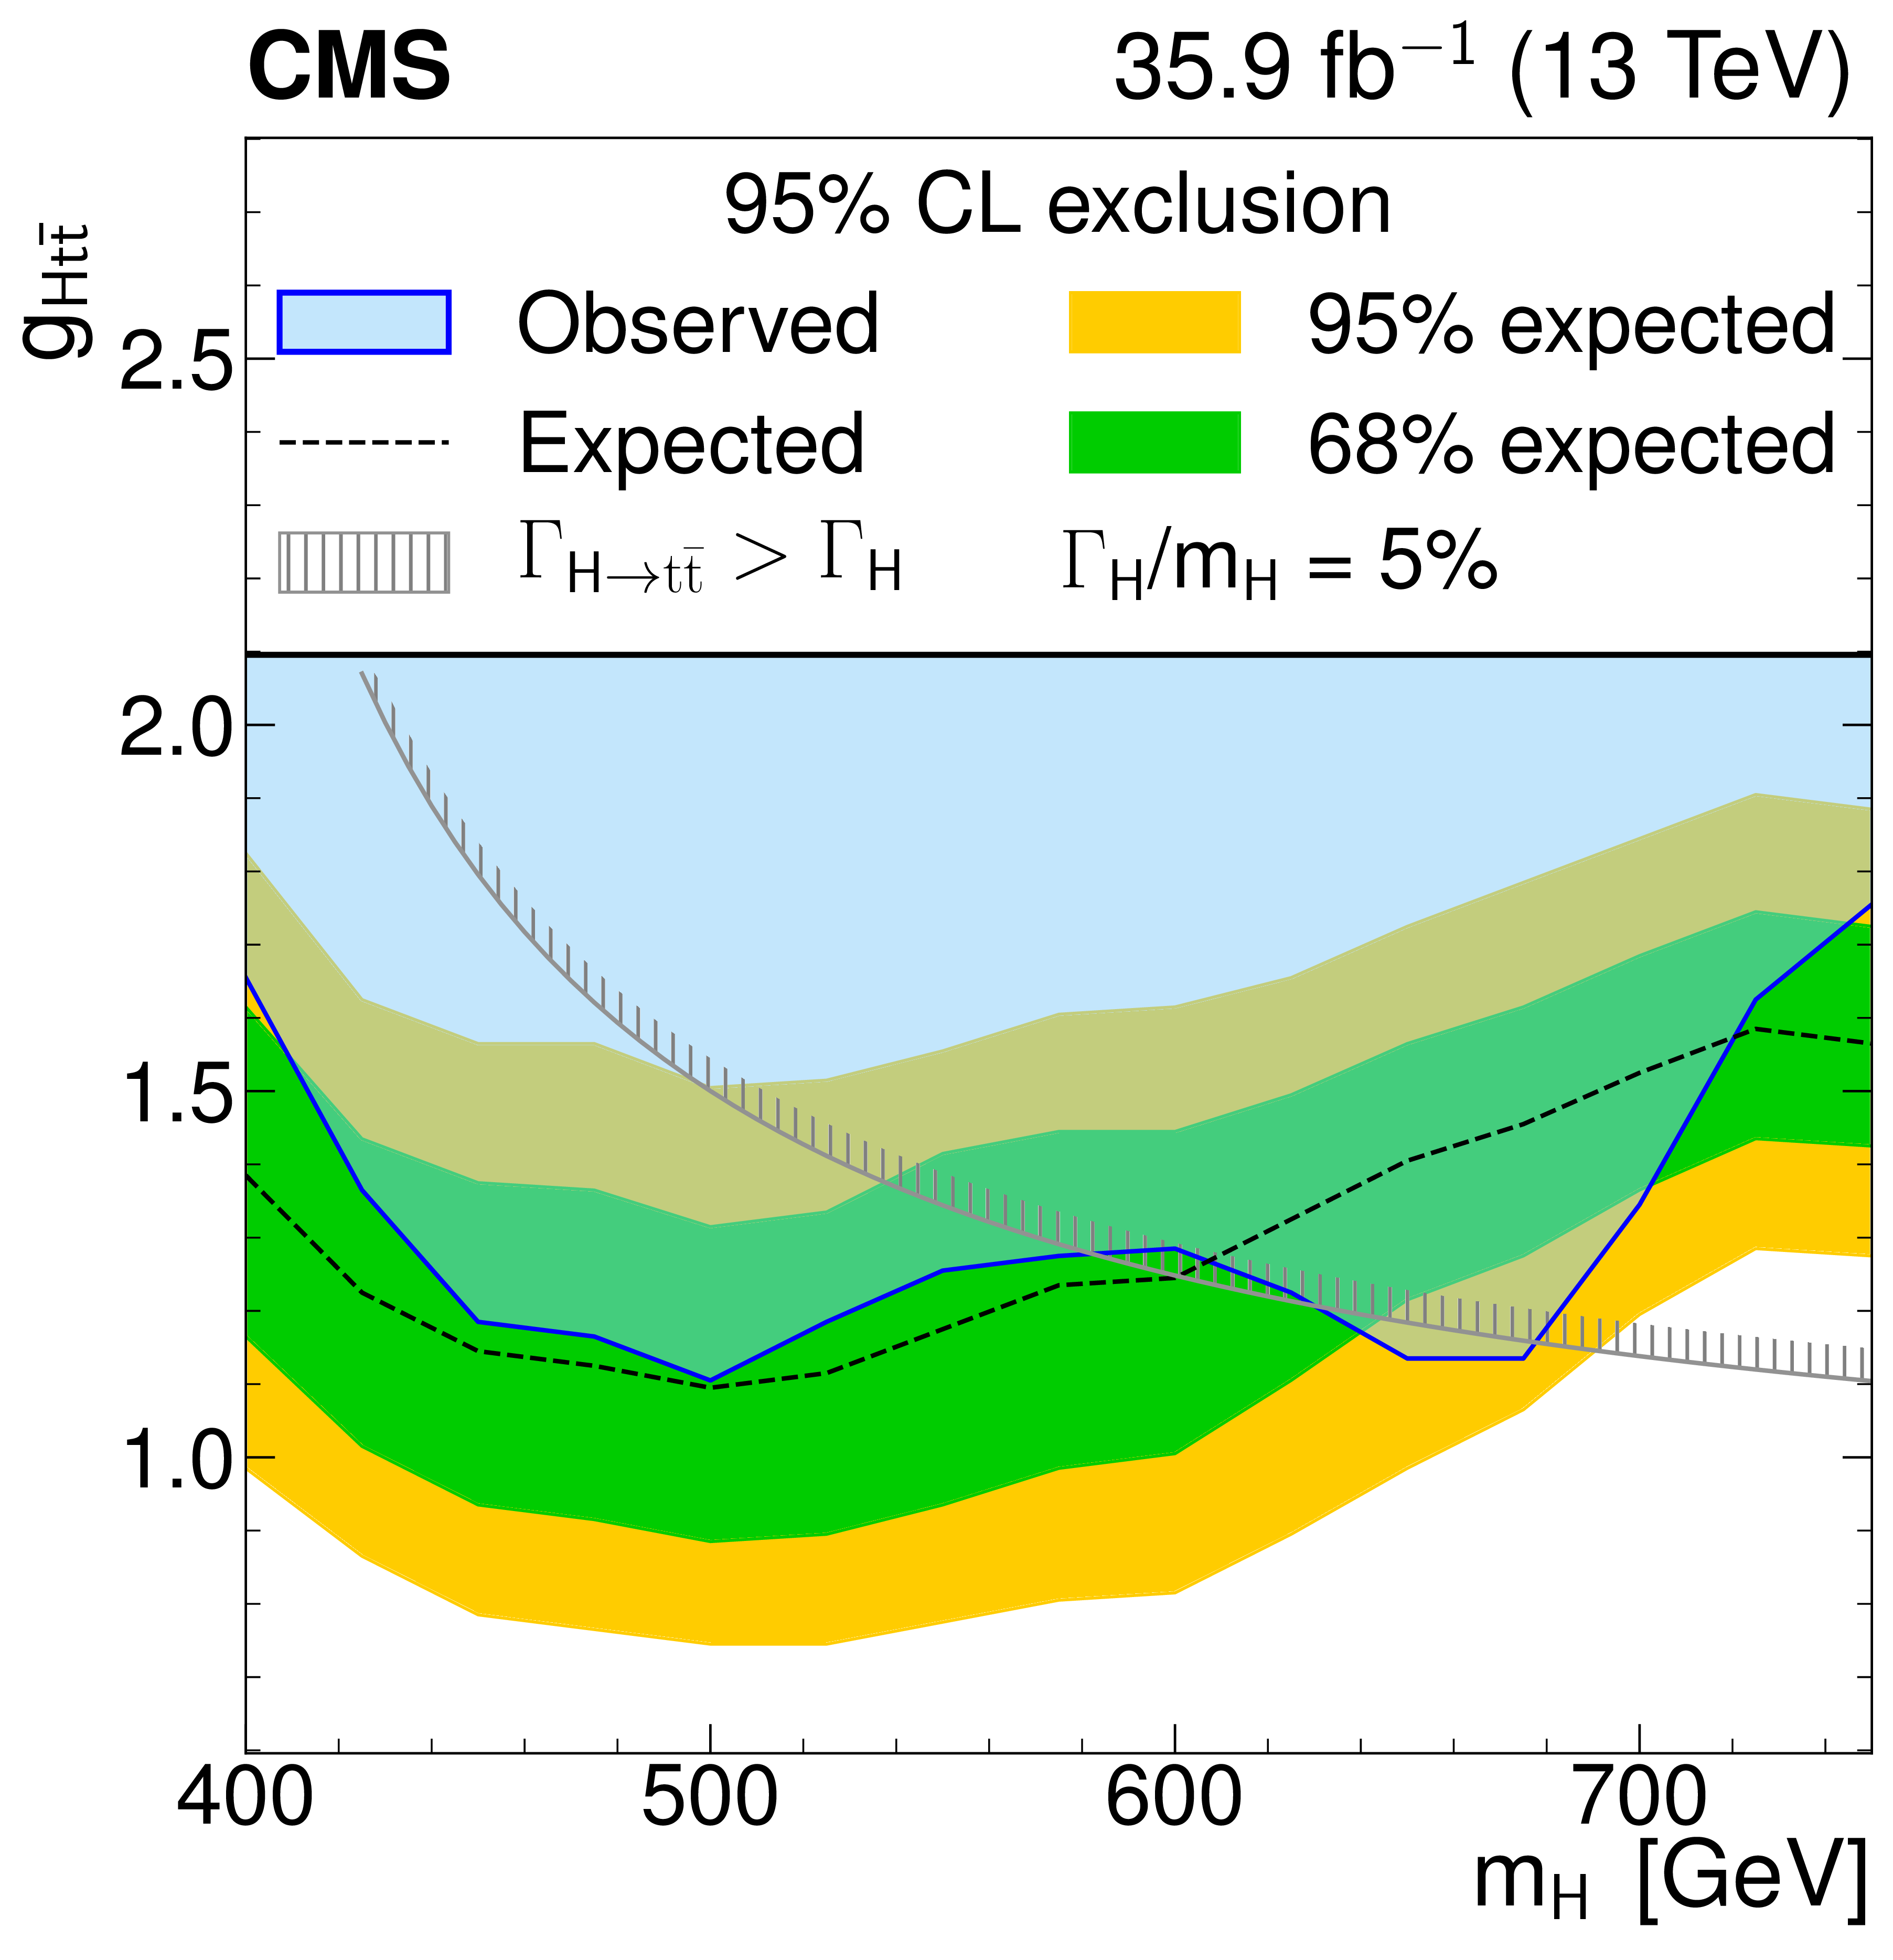
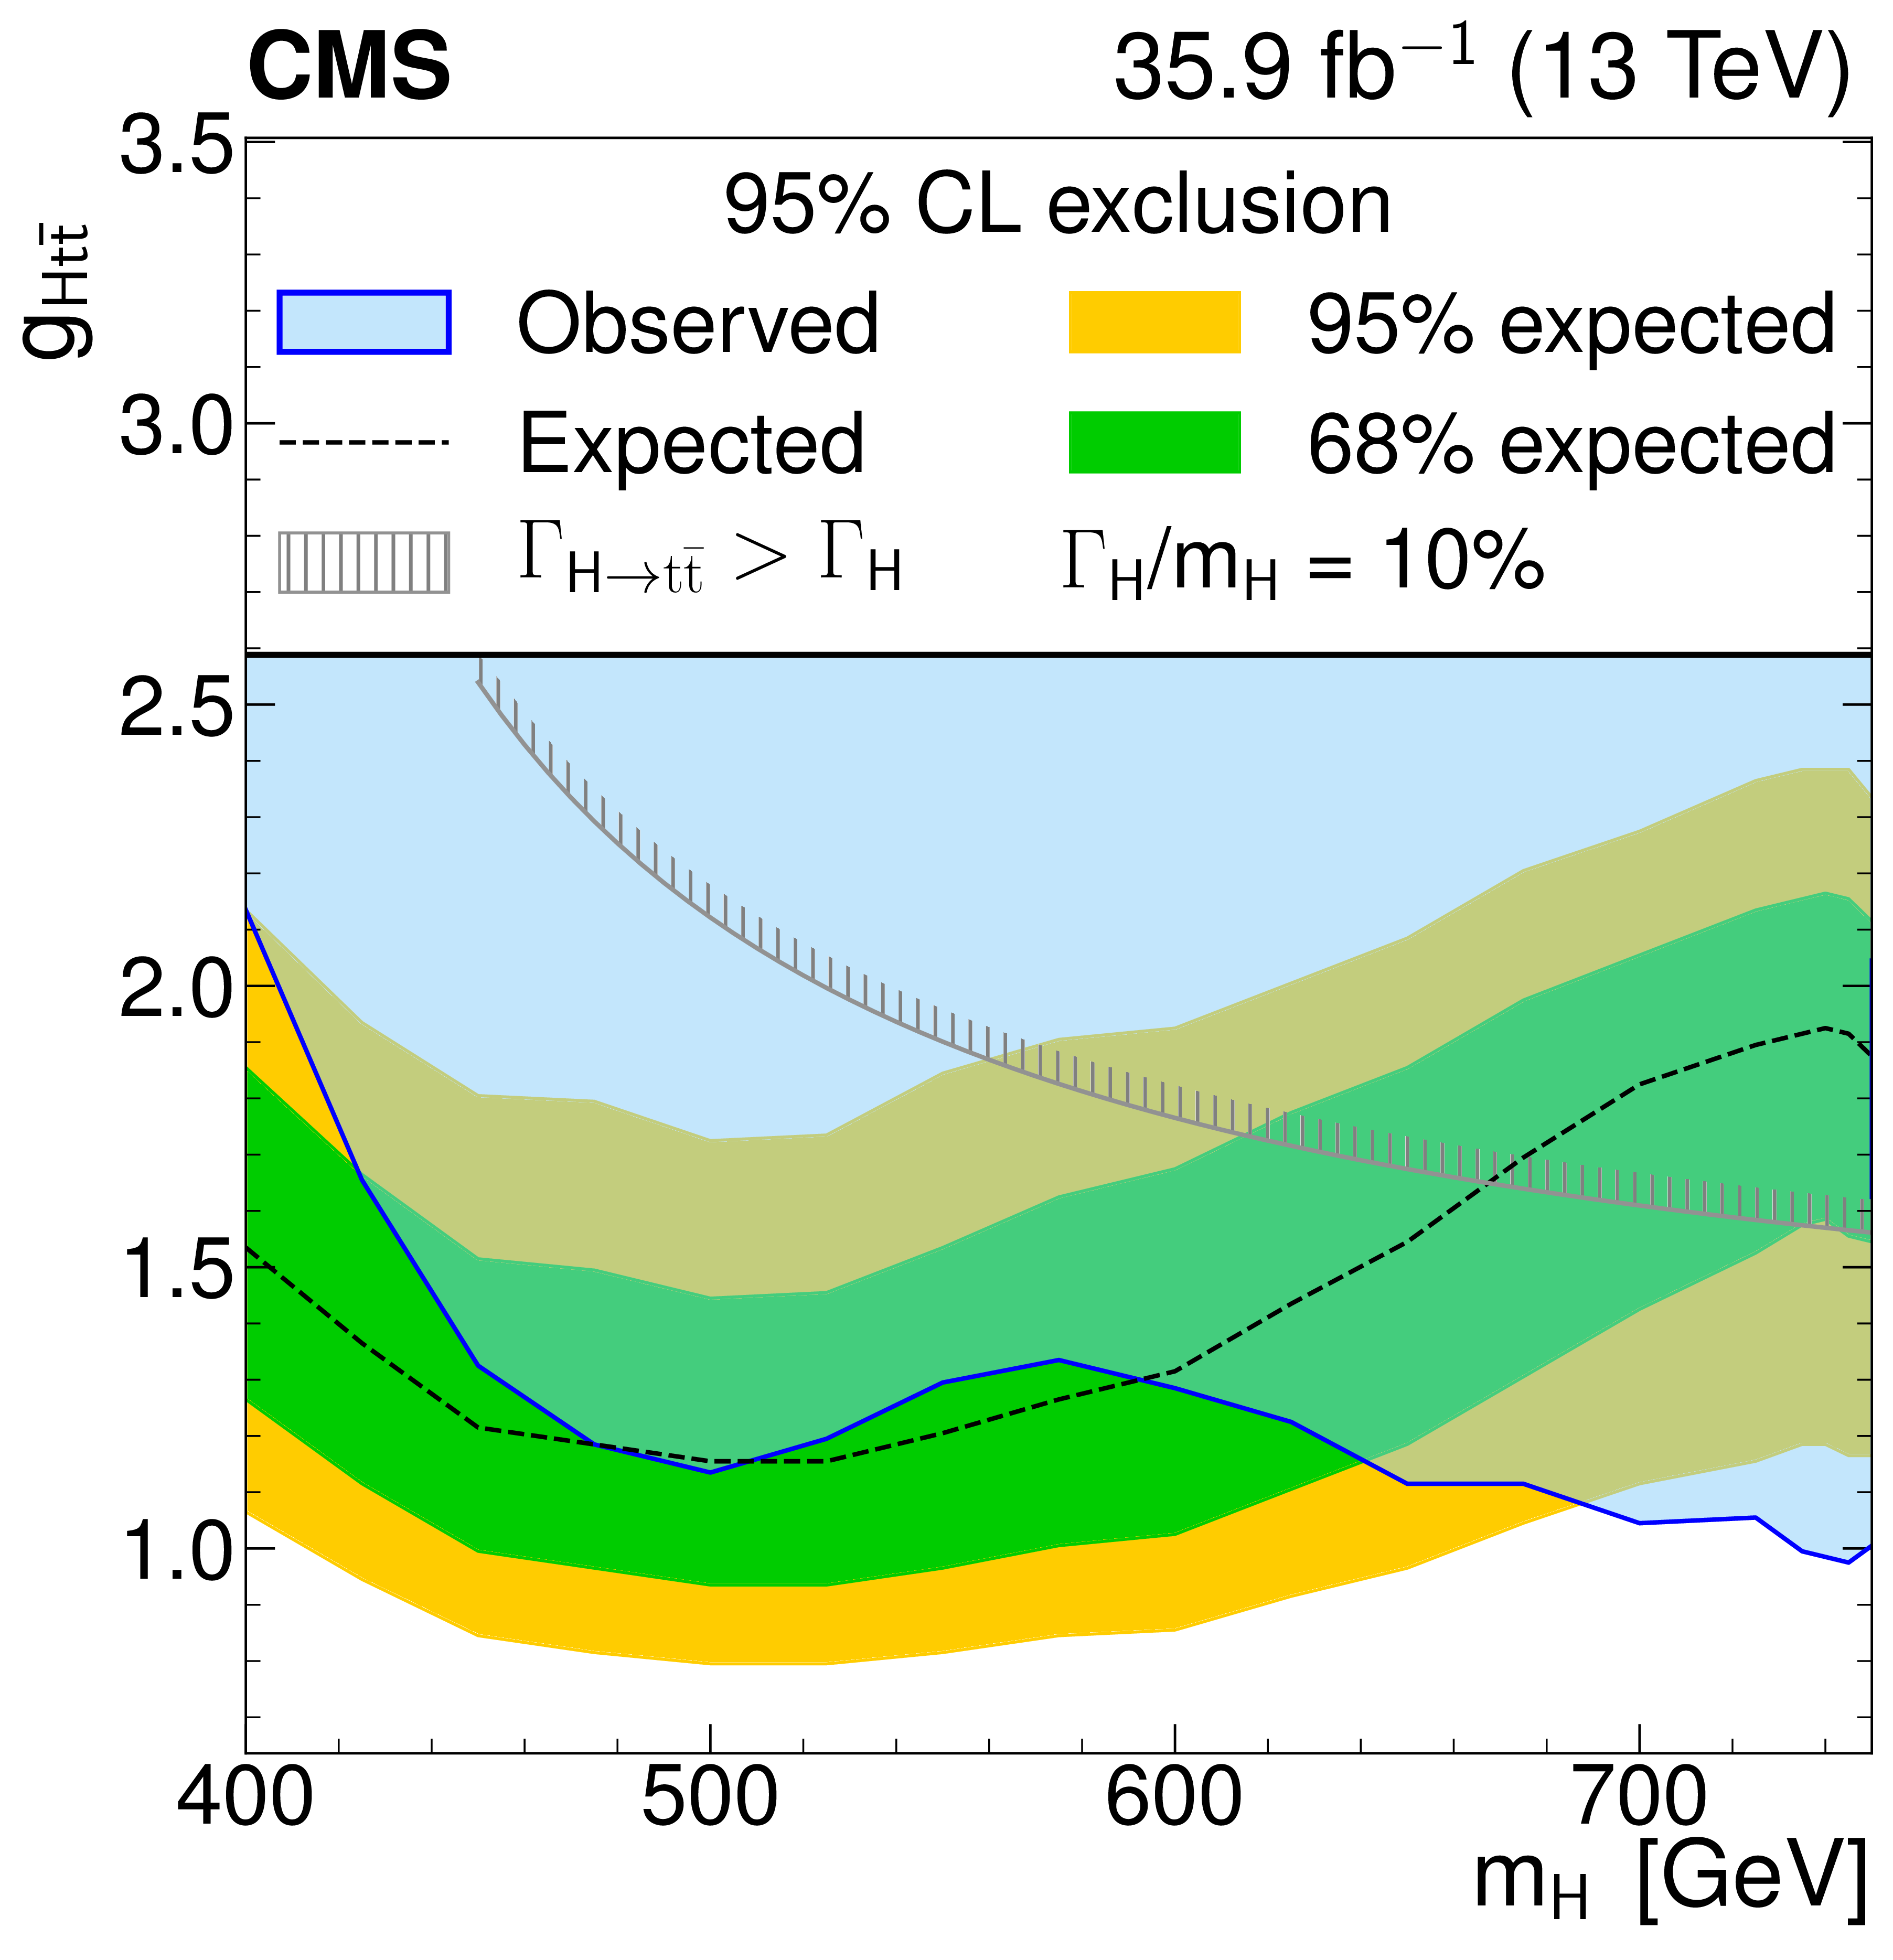
Model-independent constraints on the coupling strength modifier as a function of the heavy scalar boson mass, for relative widths of 0.5, 1, 2.5, 5, 10, and 25%. The observed constraints are indicated by the blue shaded area. The inner (green) band and the outer (yellow) band indicate the regions containing 68 and 95%, respectively, of the distribution of constraints expected under the background-only hypothesis. The unphysical region of phase space in which the partial width $\Gamma _{{\mathrm{H}}\to {\mathrm{t} \mathrm{\bar{t}}}}$ becomes larger than the total width is indicated by the hatched lines. |
png pdf |
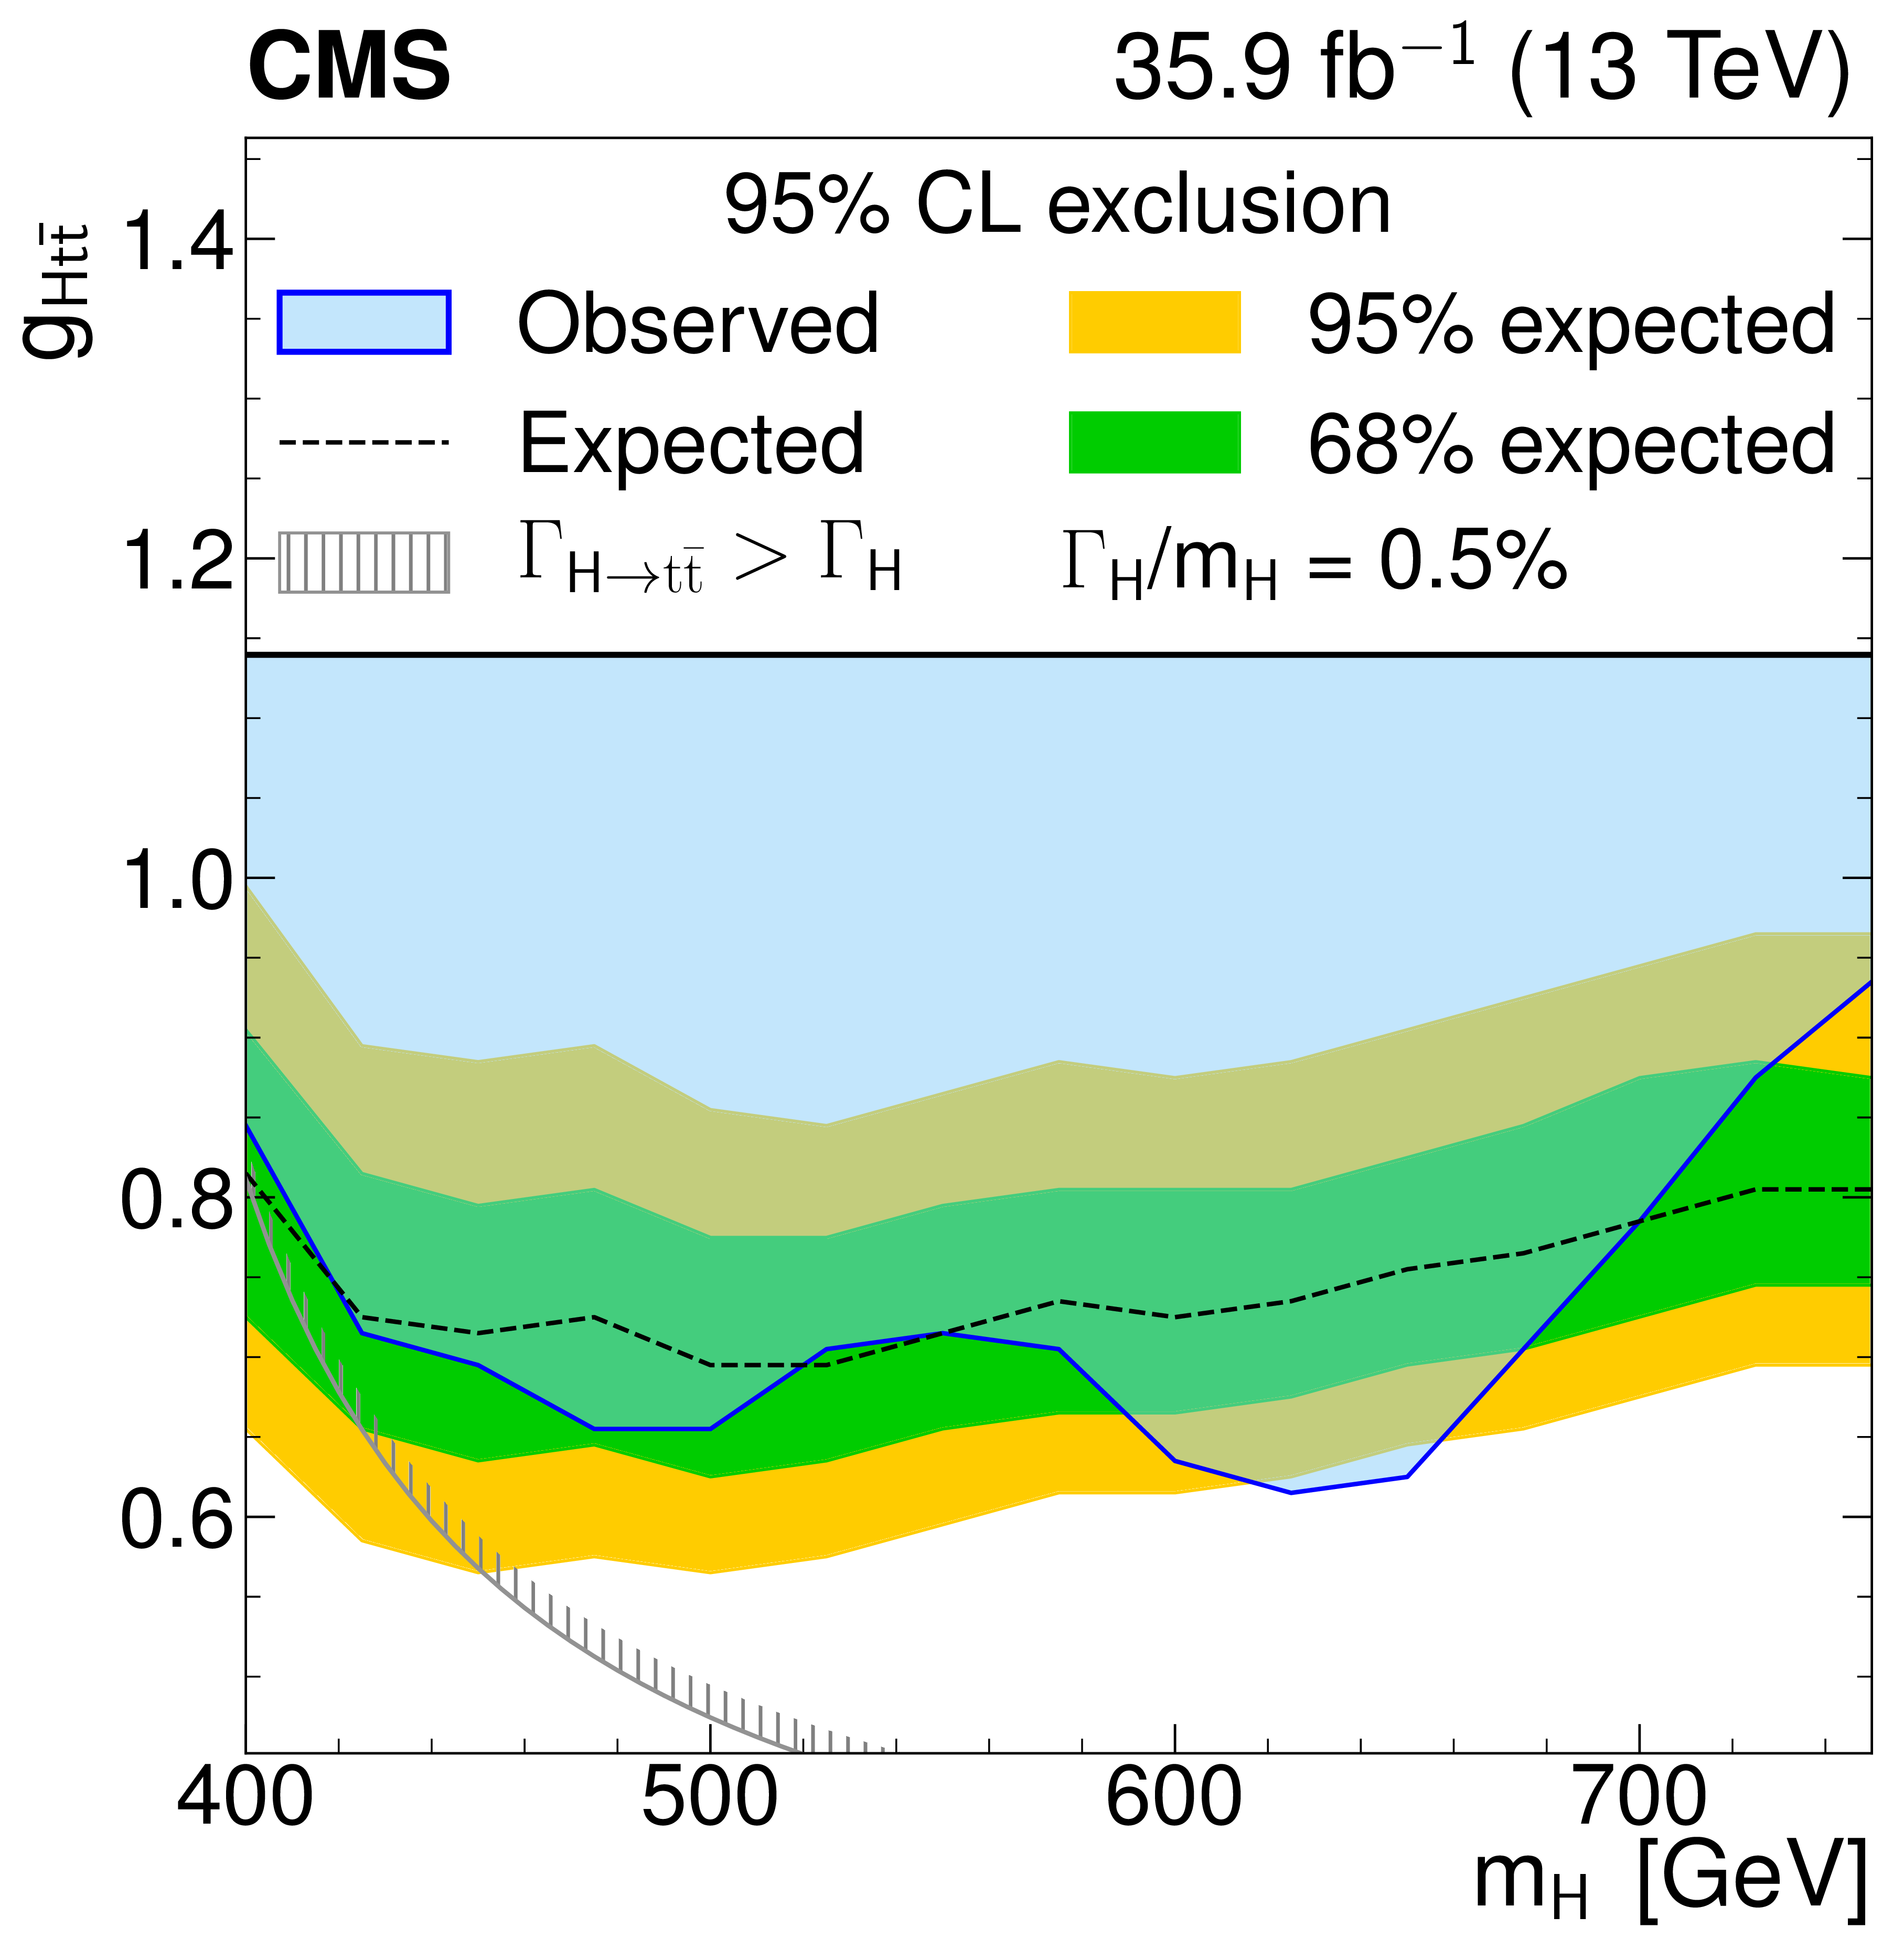
Figure 5-a:
Model-independent constraints on the coupling strength modifier as a function of the heavy scalar boson mass, for relative widths of 0.5%. The observed constraints are indicated by the blue shaded area. The inner (green) band and the outer (yellow) band indicate the regions containing 68 and 95%, respectively, of the distribution of constraints expected under the background-only hypothesis. The unphysical region of phase space in which the partial width $\Gamma _{{\mathrm{H}}\to {\mathrm{t} \mathrm{\bar{t}}}}$ becomes larger than the total width is indicated by the hatched lines. |
png pdf |
Figure 5-b:
Model-independent constraints on the coupling strength modifier as a function of the heavy scalar boson mass, for relative widths of 1%. The observed constraints are indicated by the blue shaded area. The inner (green) band and the outer (yellow) band indicate the regions containing 68 and 95%, respectively, of the distribution of constraints expected under the background-only hypothesis. The unphysical region of phase space in which the partial width $\Gamma _{{\mathrm{H}}\to {\mathrm{t} \mathrm{\bar{t}}}}$ becomes larger than the total width is indicated by the hatched lines. |
png pdf |
Figure 5-c:
Model-independent constraints on the coupling strength modifier as a function of the heavy scalar boson mass, for relative widths of 2.5%. The observed constraints are indicated by the blue shaded area. The inner (green) band and the outer (yellow) band indicate the regions containing 68 and 95%, respectively, of the distribution of constraints expected under the background-only hypothesis. The unphysical region of phase space in which the partial width $\Gamma _{{\mathrm{H}}\to {\mathrm{t} \mathrm{\bar{t}}}}$ becomes larger than the total width is indicated by the hatched lines. |
png pdf |
Figure 5-d:
Model-independent constraints on the coupling strength modifier as a function of the heavy scalar boson mass, for relative widths of 5%. The observed constraints are indicated by the blue shaded area. The inner (green) band and the outer (yellow) band indicate the regions containing 68 and 95%, respectively, of the distribution of constraints expected under the background-only hypothesis. The unphysical region of phase space in which the partial width $\Gamma _{{\mathrm{H}}\to {\mathrm{t} \mathrm{\bar{t}}}}$ becomes larger than the total width is indicated by the hatched lines. |
png pdf |
Figure 5-e:
Model-independent constraints on the coupling strength modifier as a function of the heavy scalar boson mass, for relative widths of 10%. The observed constraints are indicated by the blue shaded area. The inner (green) band and the outer (yellow) band indicate the regions containing 68 and 95%, respectively, of the distribution of constraints expected under the background-only hypothesis. The unphysical region of phase space in which the partial width $\Gamma _{{\mathrm{H}}\to {\mathrm{t} \mathrm{\bar{t}}}}$ becomes larger than the total width is indicated by the hatched lines. |

png pdf |
Figure 5-f:
Model-independent constraints on the coupling strength modifier as a function of the heavy scalar boson mass, for relative widths of 25%. The observed constraints are indicated by the blue shaded area. The inner (green) band and the outer (yellow) band indicate the regions containing 68 and 95%, respectively, of the distribution of constraints expected under the background-only hypothesis. The unphysical region of phase space in which the partial width $\Gamma _{{\mathrm{H}}\to {\mathrm{t} \mathrm{\bar{t}}}}$ becomes larger than the total width is indicated by the hatched lines. |
png pdf |
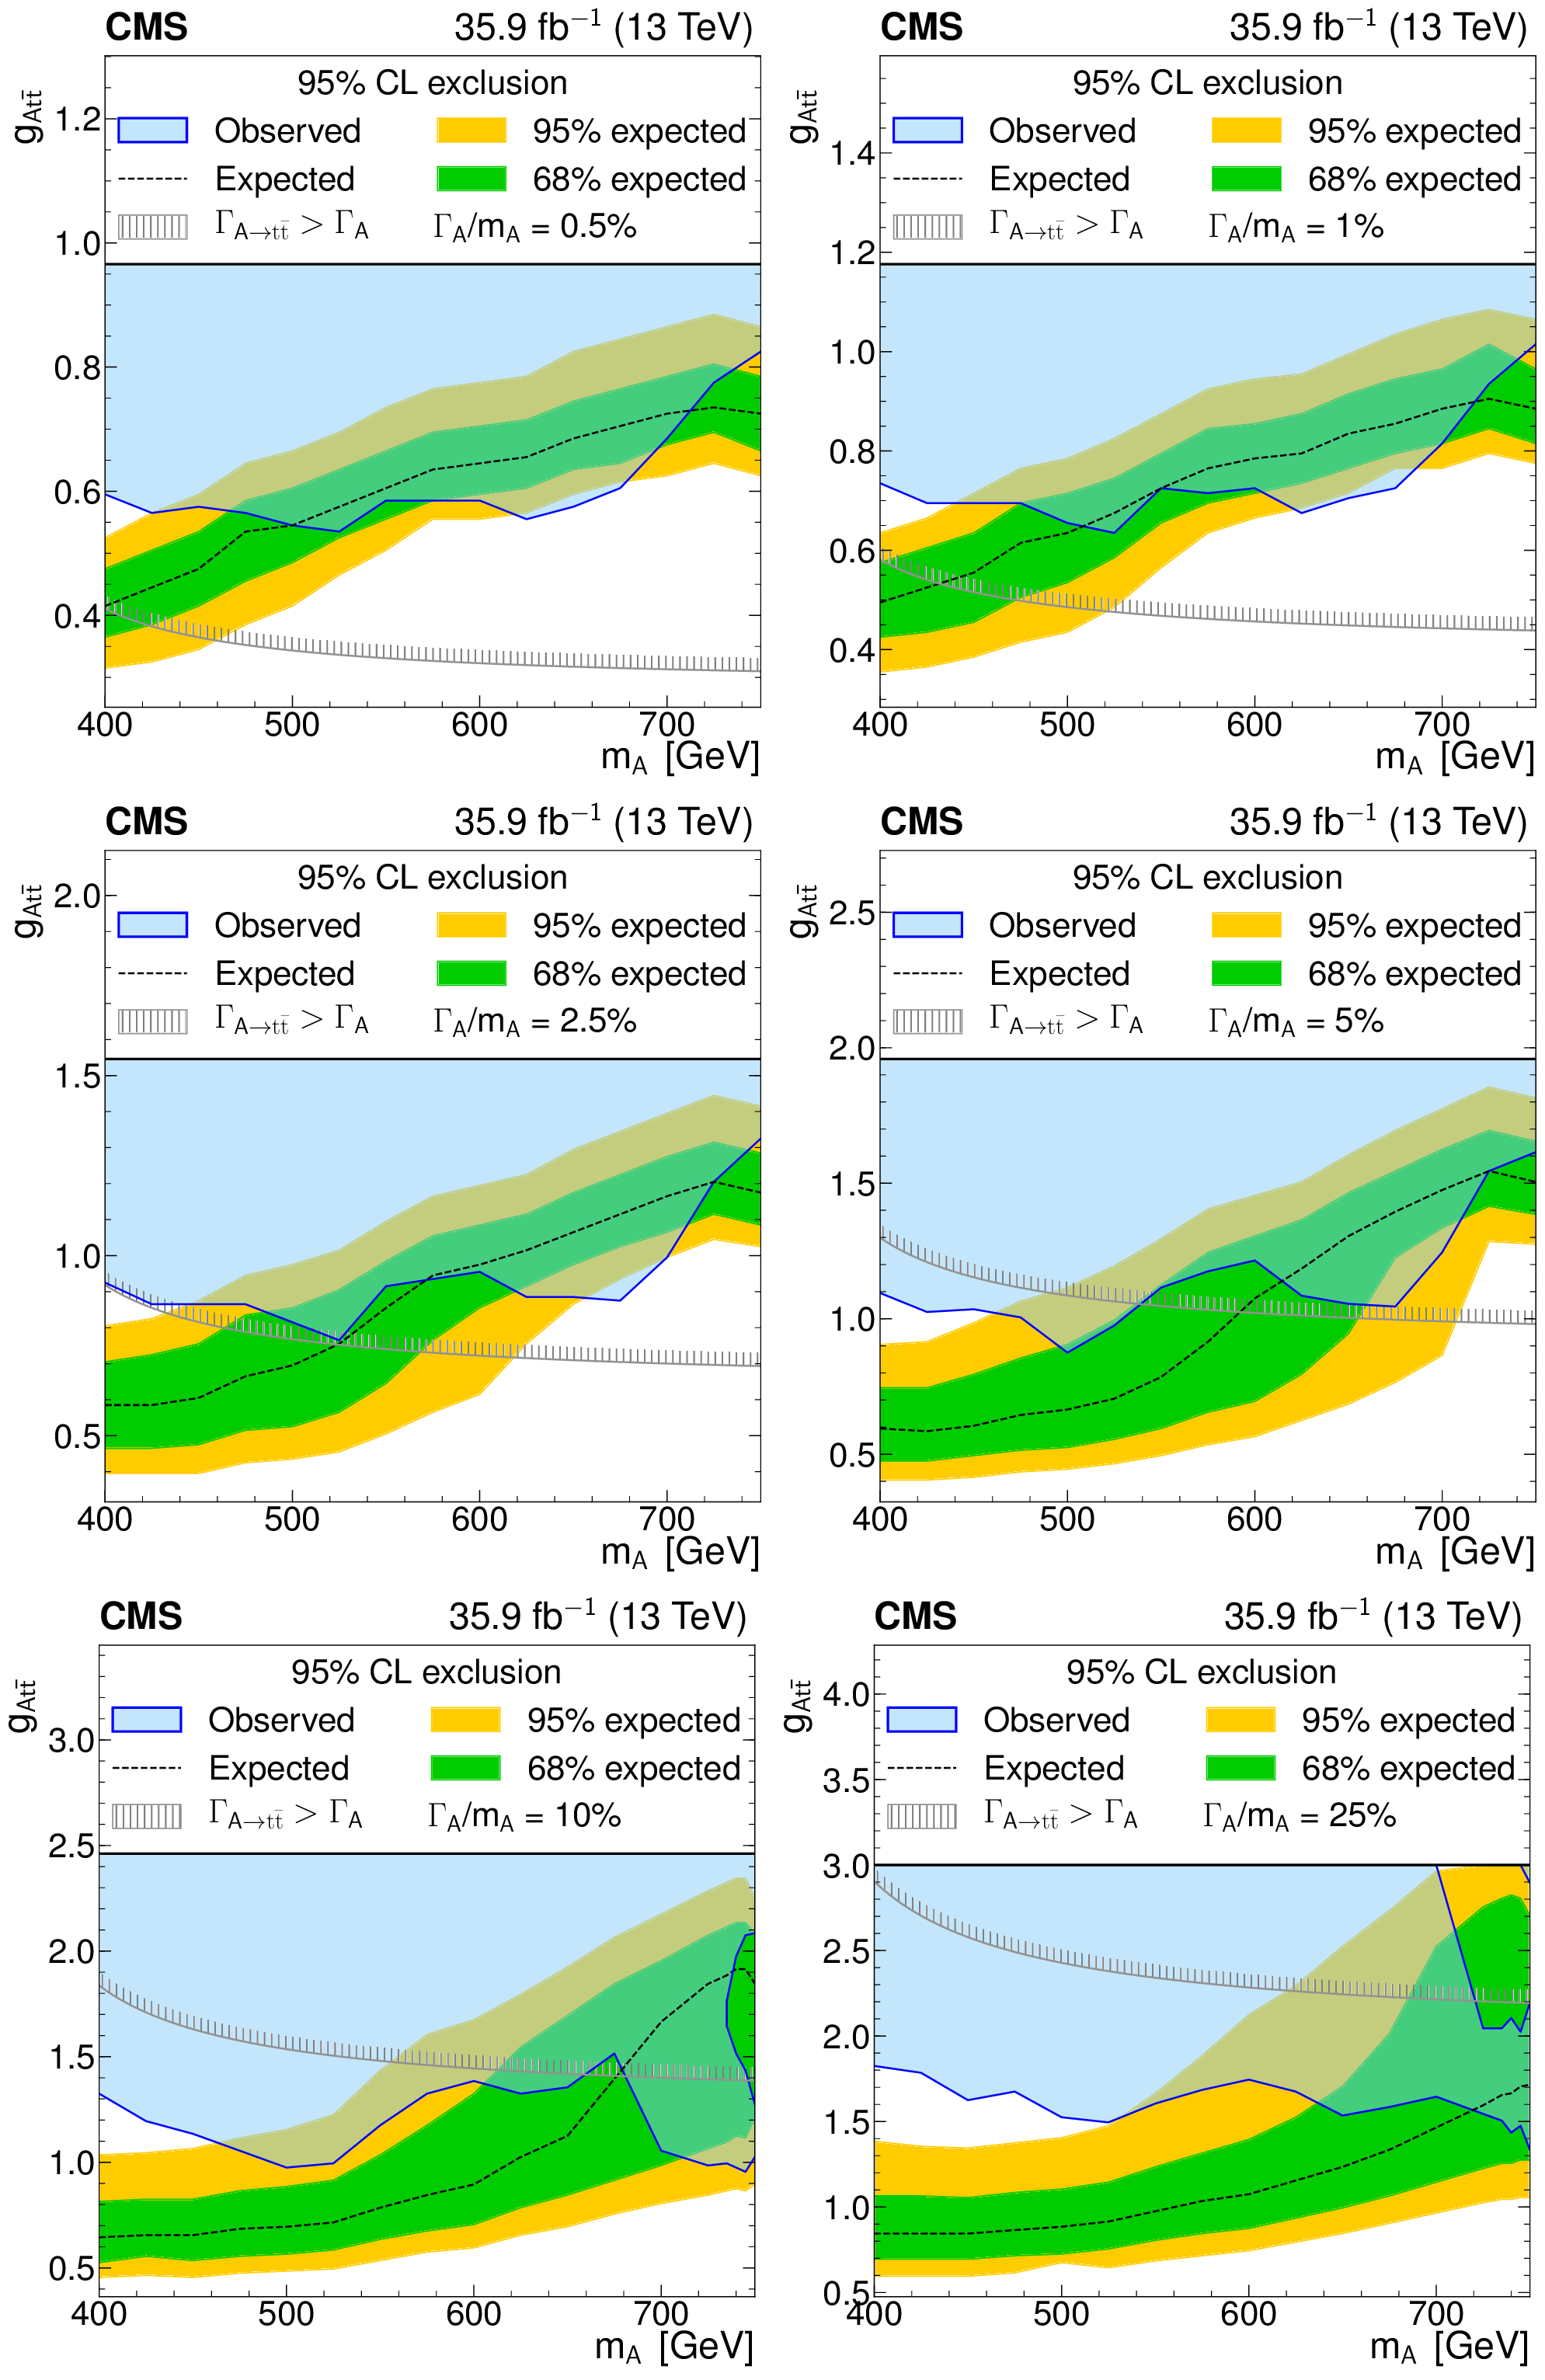
Figure 6:
Model-independent constraints on the coupling strength modifier as a function of the heavy pseudoscalar boson mass, for relative widths of 0.5, 1, 2.5, 5, 10, and 25%. The observed constraints are indicated by the blue shaded area. The inner (green) band and the outer (yellow) band indicate the regions containing 68 and 95%, respectively, of the distribution of constraints expected under the background-only hypothesis. The unphysical region of phase space in which the partial width $\Gamma _{{\mathrm{A} }}\to {\mathrm{t} \mathrm{\bar{t}}}$ becomes larger than the total width is indicated by the hatched lines. |

png pdf |
Figure 6-a:
Model-independent constraints on the coupling strength modifier as a function of the heavy pseudoscalar boson mass, for relative widths of 0.5%. The observed constraints are indicated by the blue shaded area. The inner (green) band and the outer (yellow) band indicate the regions containing 68 and 95%, respectively, of the distribution of constraints expected under the background-only hypothesis. The unphysical region of phase space in which the partial width $\Gamma _{{\mathrm{A} }}\to {\mathrm{t} \mathrm{\bar{t}}}$ becomes larger than the total width is indicated by the hatched lines. |
png pdf |
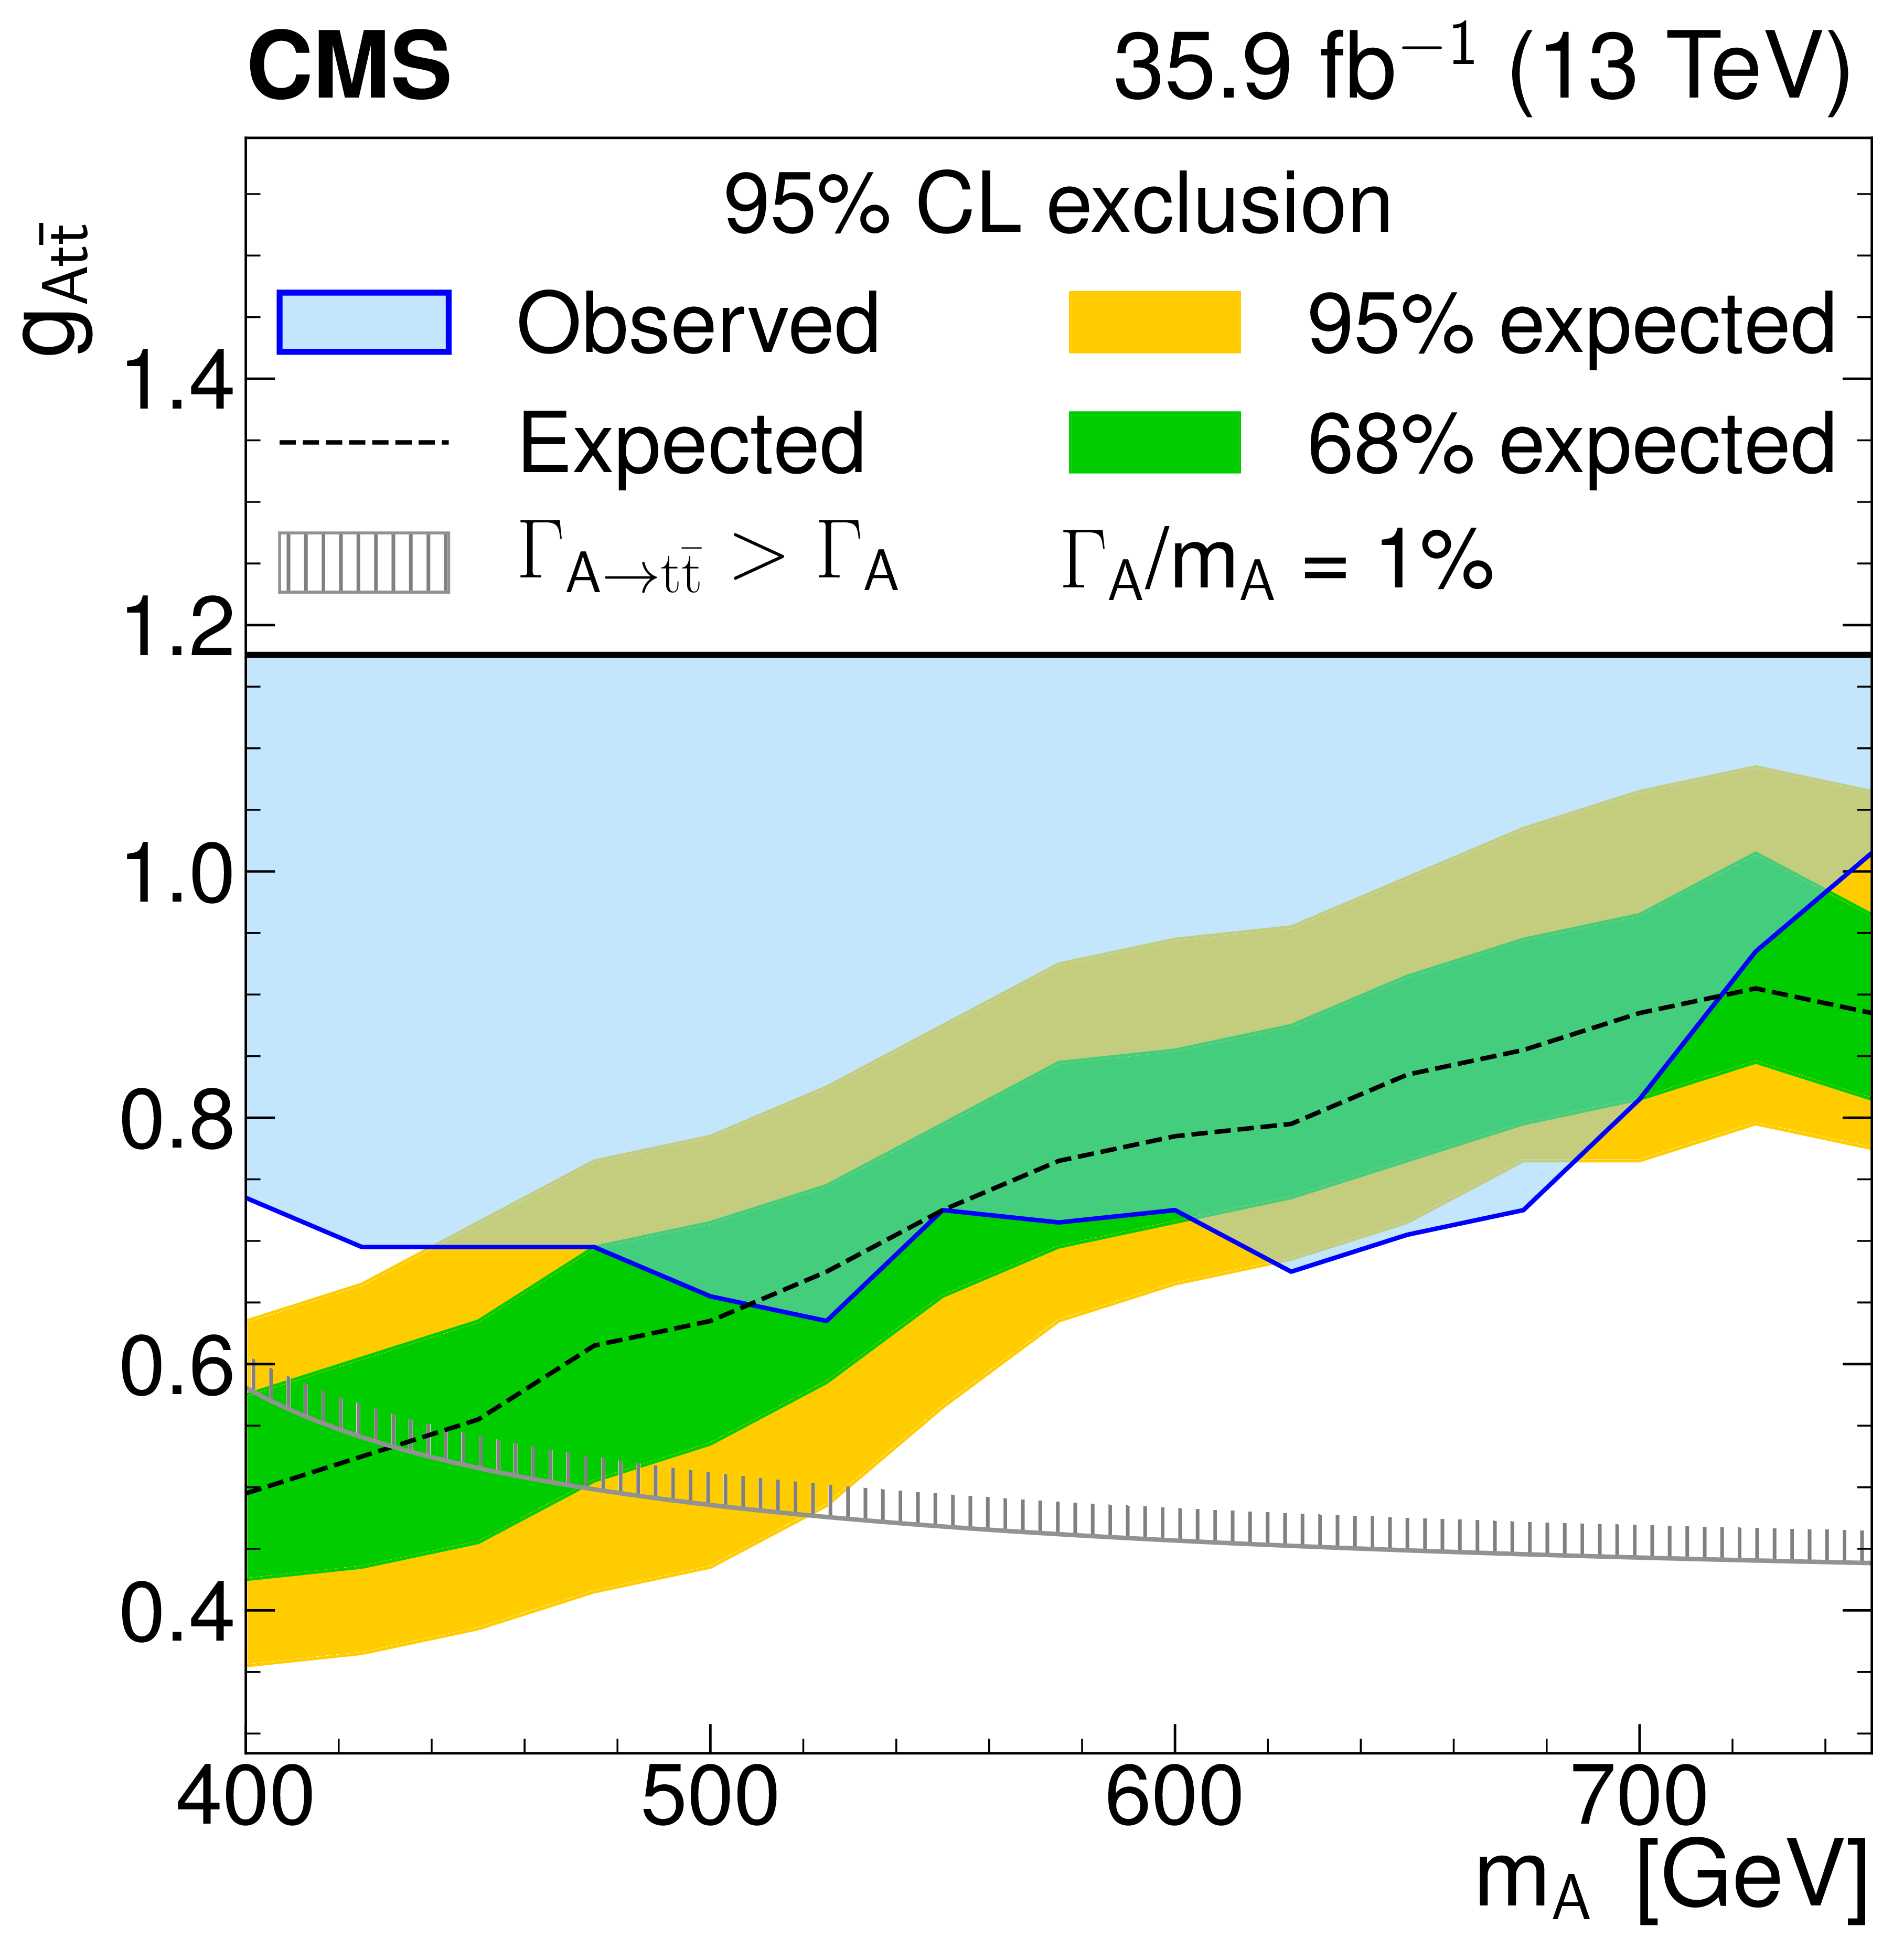
Figure 6-b:
Model-independent constraints on the coupling strength modifier as a function of the heavy pseudoscalar boson mass, for relative widths of 1%. The observed constraints are indicated by the blue shaded area. The inner (green) band and the outer (yellow) band indicate the regions containing 68 and 95%, respectively, of the distribution of constraints expected under the background-only hypothesis. The unphysical region of phase space in which the partial width $\Gamma _{{\mathrm{A} }}\to {\mathrm{t} \mathrm{\bar{t}}}$ becomes larger than the total width is indicated by the hatched lines. |

png pdf |
Figure 6-c:
Model-independent constraints on the coupling strength modifier as a function of the heavy pseudoscalar boson mass, for relative widths of 2.5%. The observed constraints are indicated by the blue shaded area. The inner (green) band and the outer (yellow) band indicate the regions containing 68 and 95%, respectively, of the distribution of constraints expected under the background-only hypothesis. The unphysical region of phase space in which the partial width $\Gamma _{{\mathrm{A} }}\to {\mathrm{t} \mathrm{\bar{t}}}$ becomes larger than the total width is indicated by the hatched lines. |
png pdf |
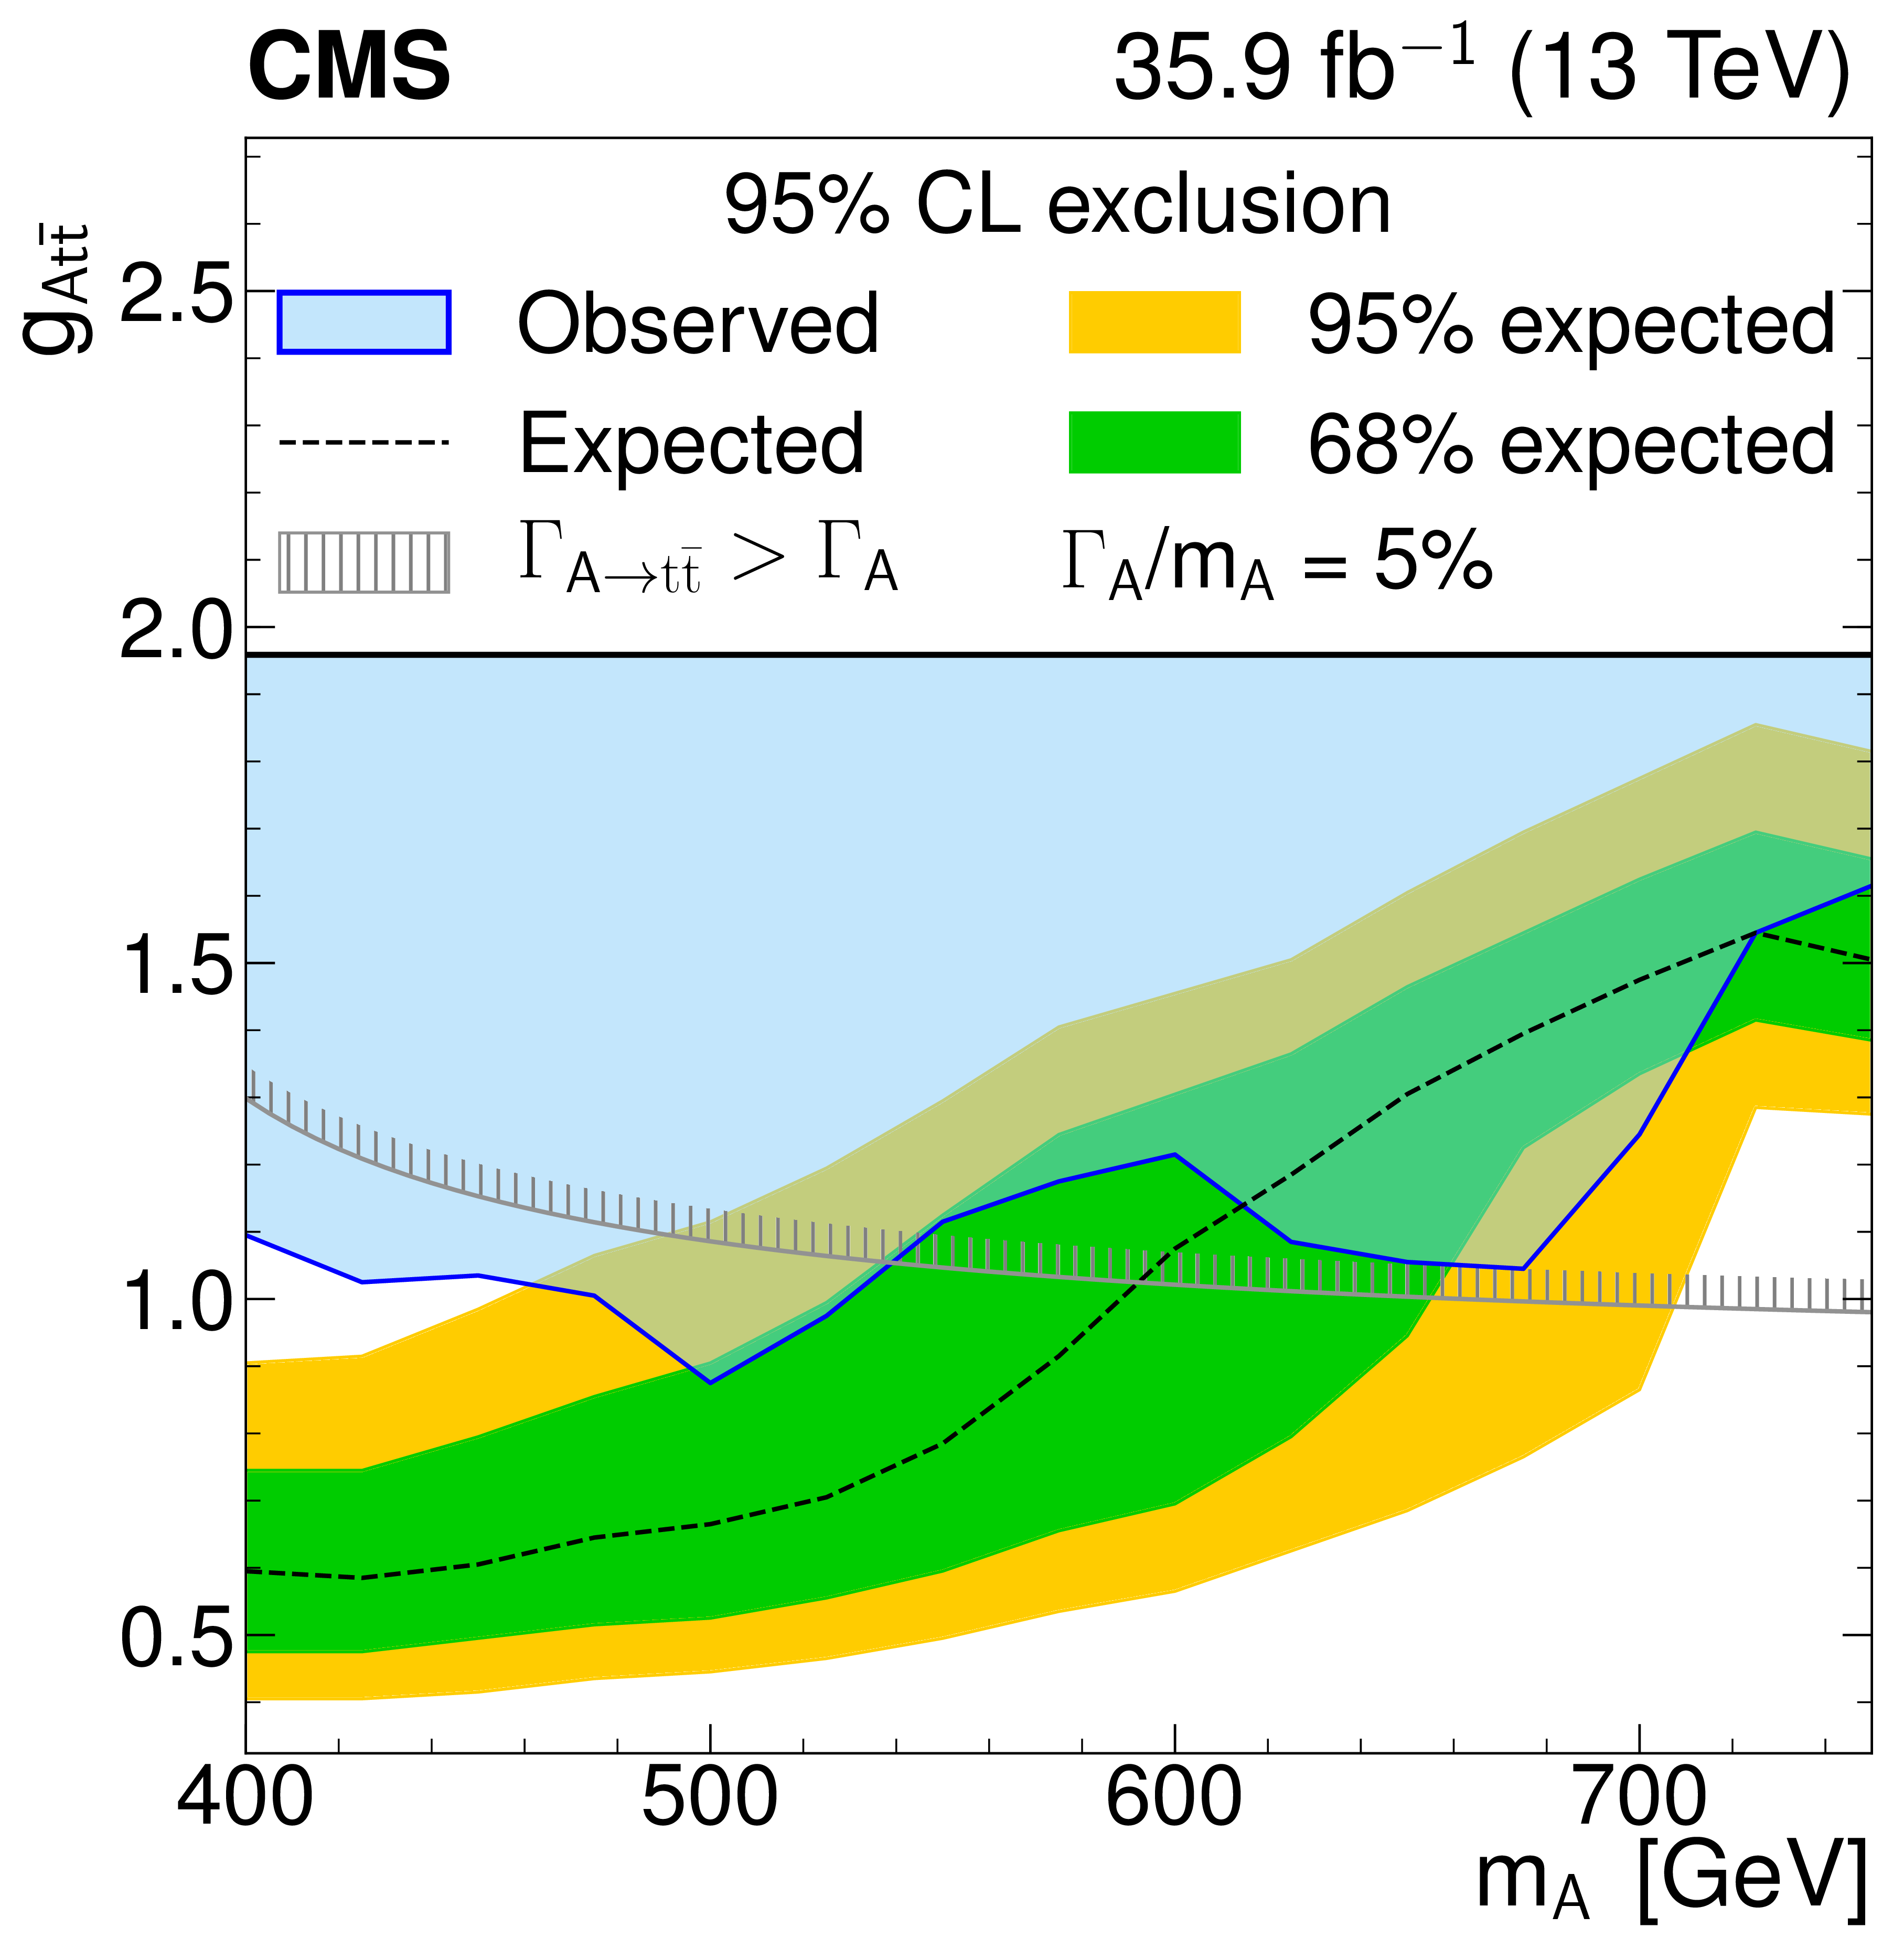
Figure 6-d:
Model-independent constraints on the coupling strength modifier as a function of the heavy pseudoscalar boson mass, for relative widths of 5%. The observed constraints are indicated by the blue shaded area. The inner (green) band and the outer (yellow) band indicate the regions containing 68 and 95%, respectively, of the distribution of constraints expected under the background-only hypothesis. The unphysical region of phase space in which the partial width $\Gamma _{{\mathrm{A} }}\to {\mathrm{t} \mathrm{\bar{t}}}$ becomes larger than the total width is indicated by the hatched lines. |

png pdf |
Figure 6-e:
Model-independent constraints on the coupling strength modifier as a function of the heavy pseudoscalar boson mass, for relative widths of 10%. The observed constraints are indicated by the blue shaded area. The inner (green) band and the outer (yellow) band indicate the regions containing 68 and 95%, respectively, of the distribution of constraints expected under the background-only hypothesis. The unphysical region of phase space in which the partial width $\Gamma _{{\mathrm{A} }}\to {\mathrm{t} \mathrm{\bar{t}}}$ becomes larger than the total width is indicated by the hatched lines. |
png pdf |
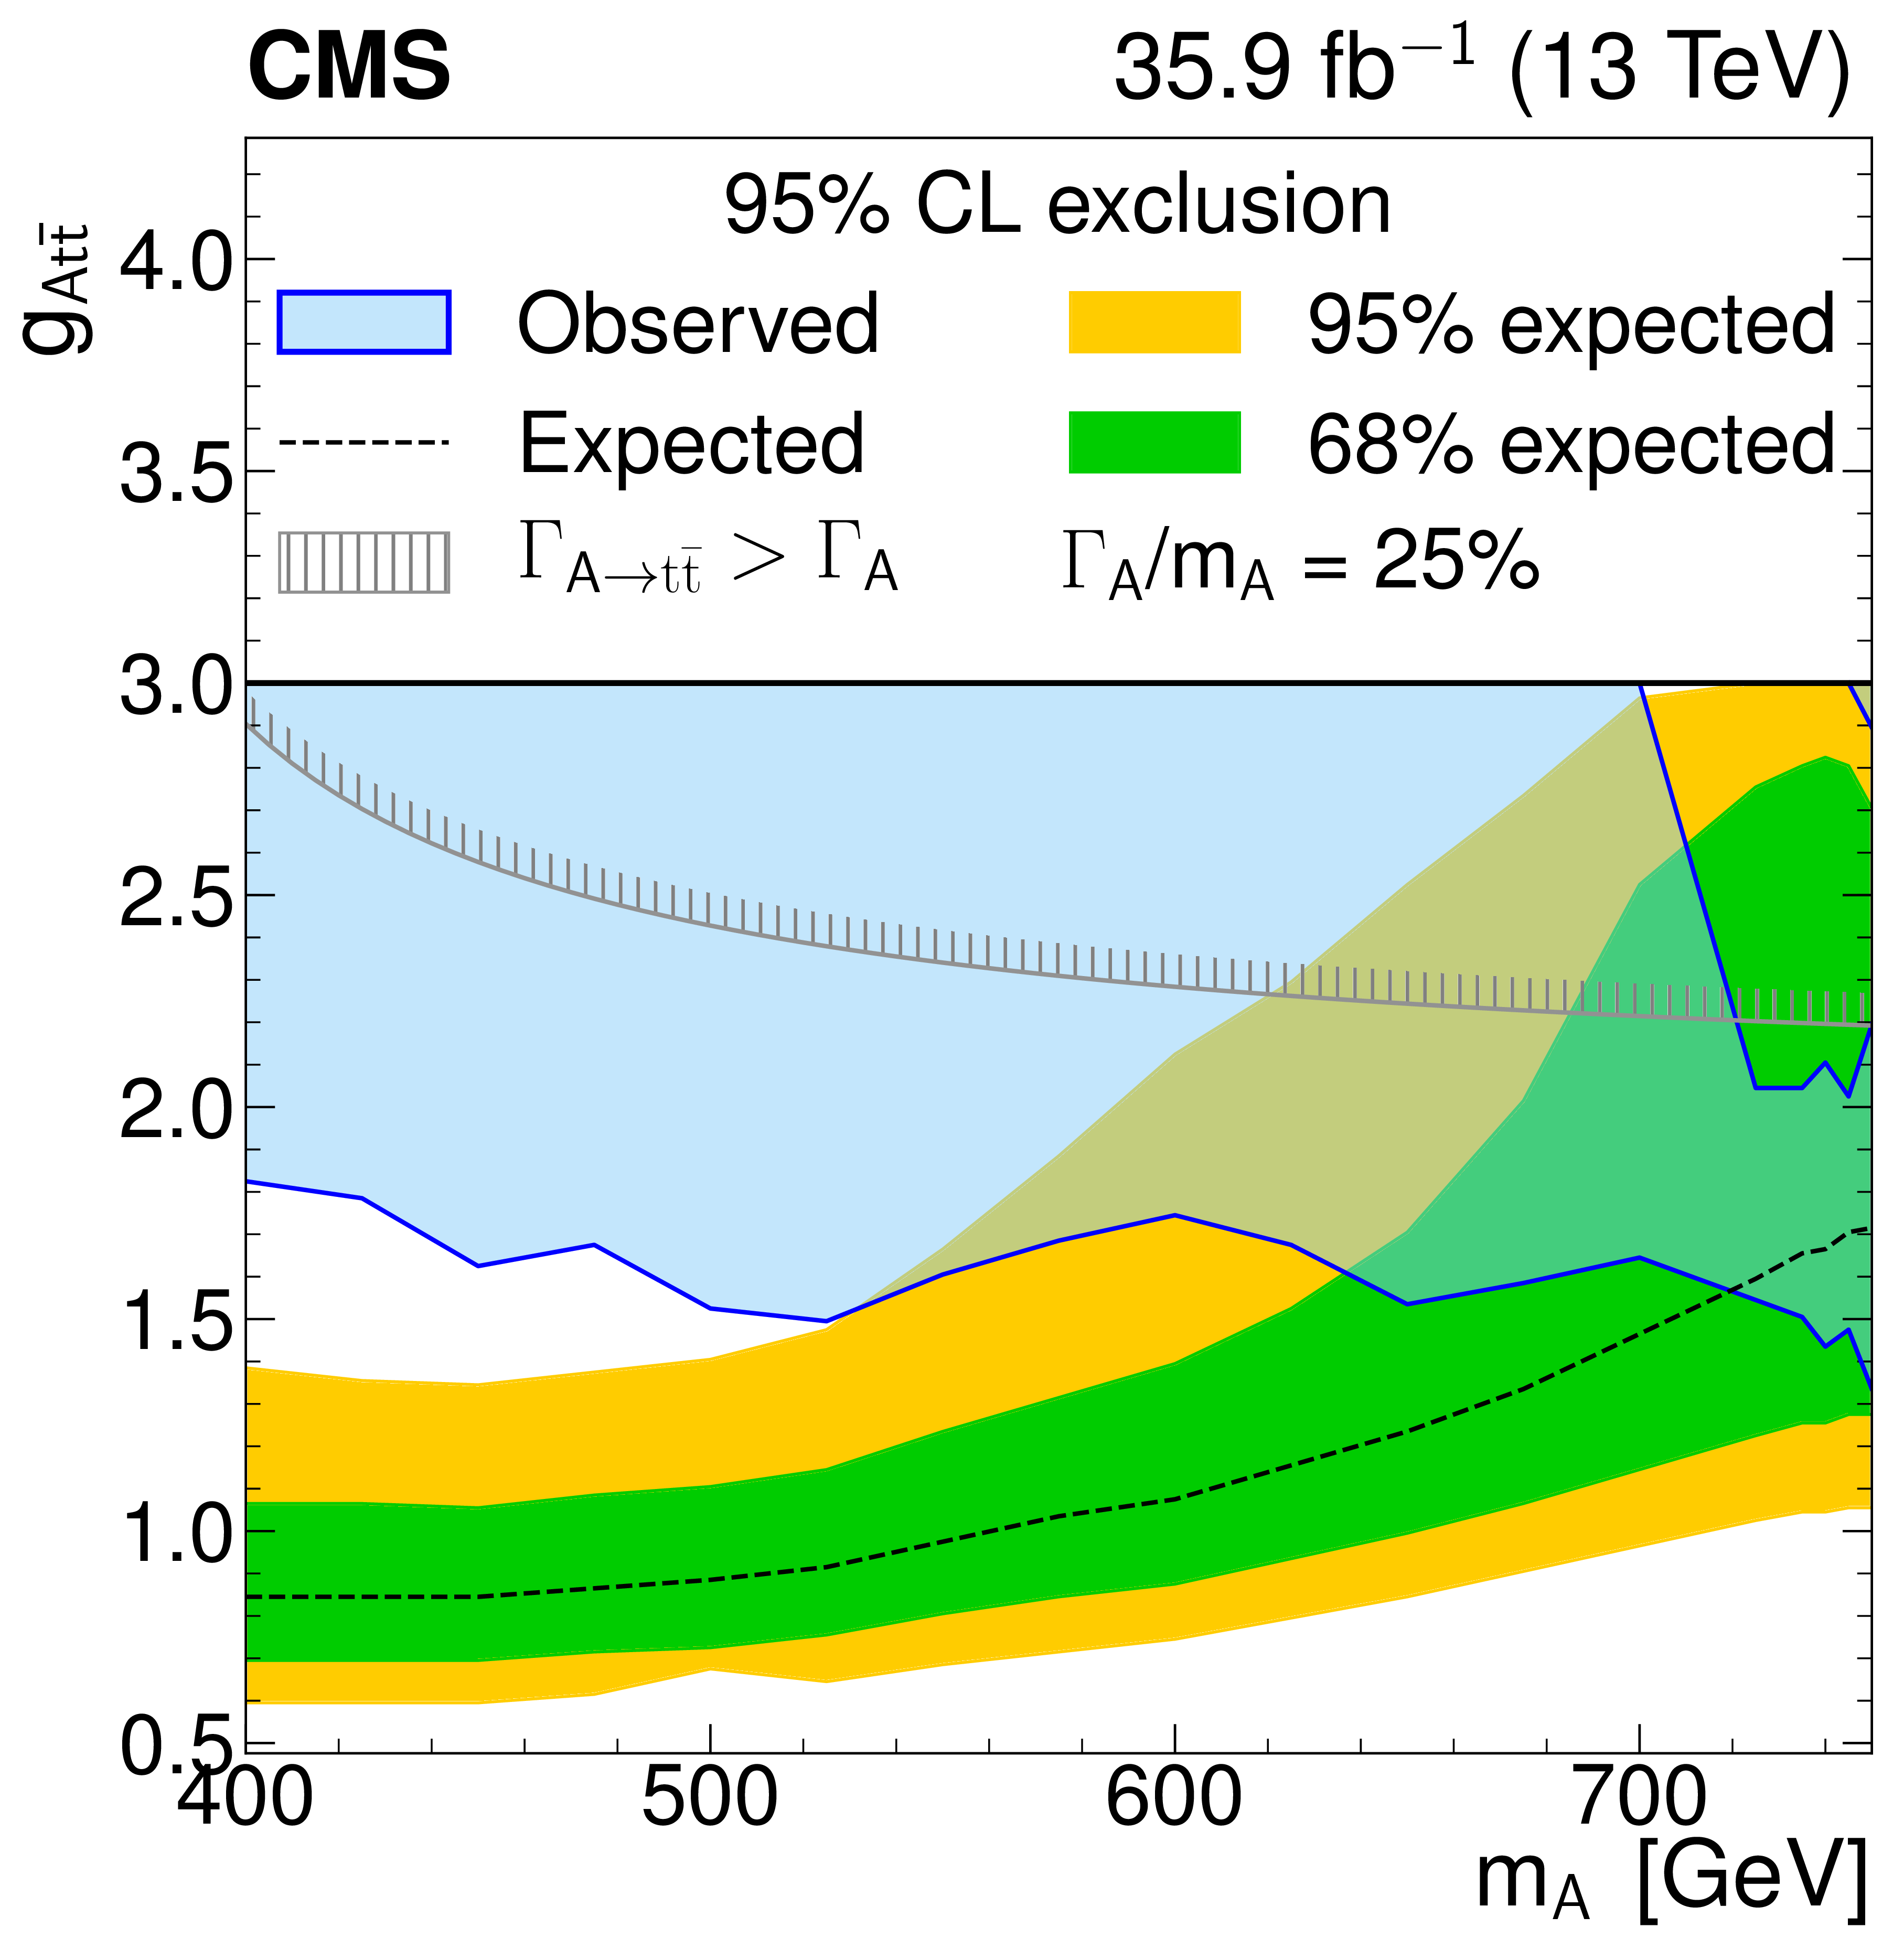
Figure 6-f:
Model-independent constraints on the coupling strength modifier as a function of the heavy pseudoscalar boson mass, for relative widths of 25%. The observed constraints are indicated by the blue shaded area. The inner (green) band and the outer (yellow) band indicate the regions containing 68 and 95%, respectively, of the distribution of constraints expected under the background-only hypothesis. The unphysical region of phase space in which the partial width $\Gamma _{{\mathrm{A} }}\to {\mathrm{t} \mathrm{\bar{t}}}$ becomes larger than the total width is indicated by the hatched lines. |
png pdf |
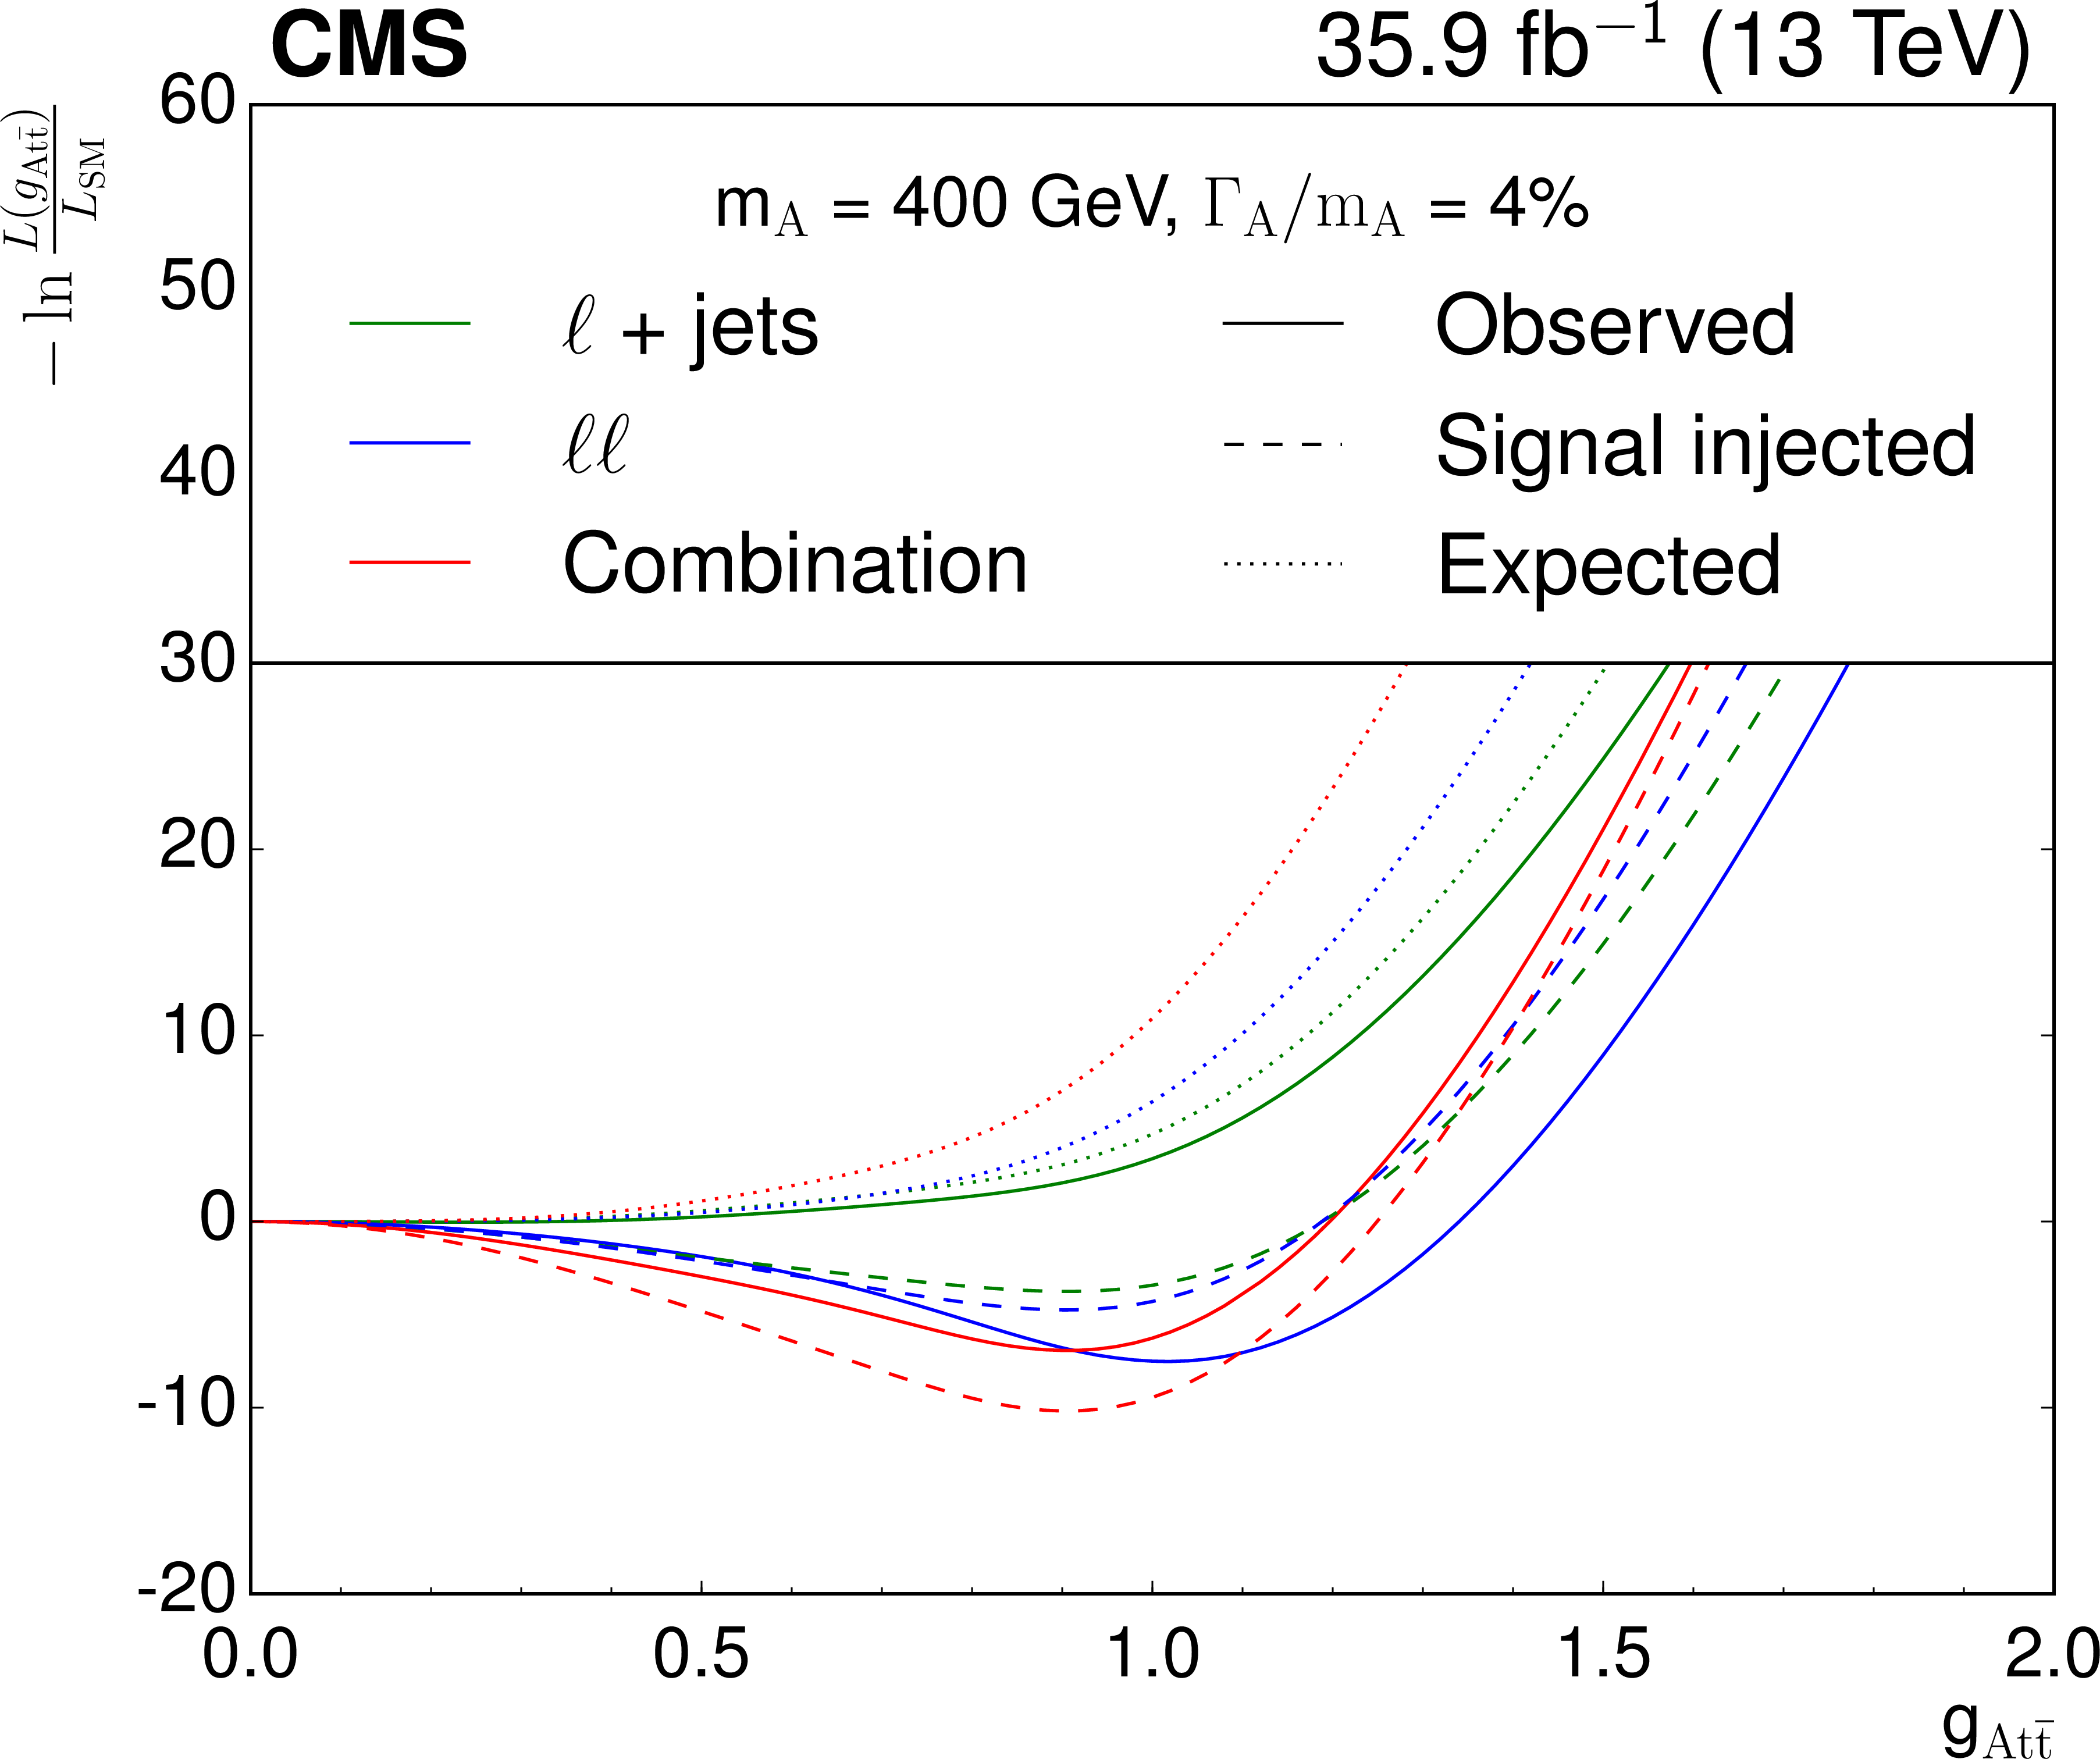
Figure 7:
Scans of profiled likelihood for the pseudoscalar hypothesis with $m_{\mathrm{A} }= $ 400 GeV and $\Gamma _{\mathrm{A} }/ m_{\mathrm{A} } = $ 4%. The scans are shown for the single- and dilepton channels separately, as well as for the combination. |
png pdf |
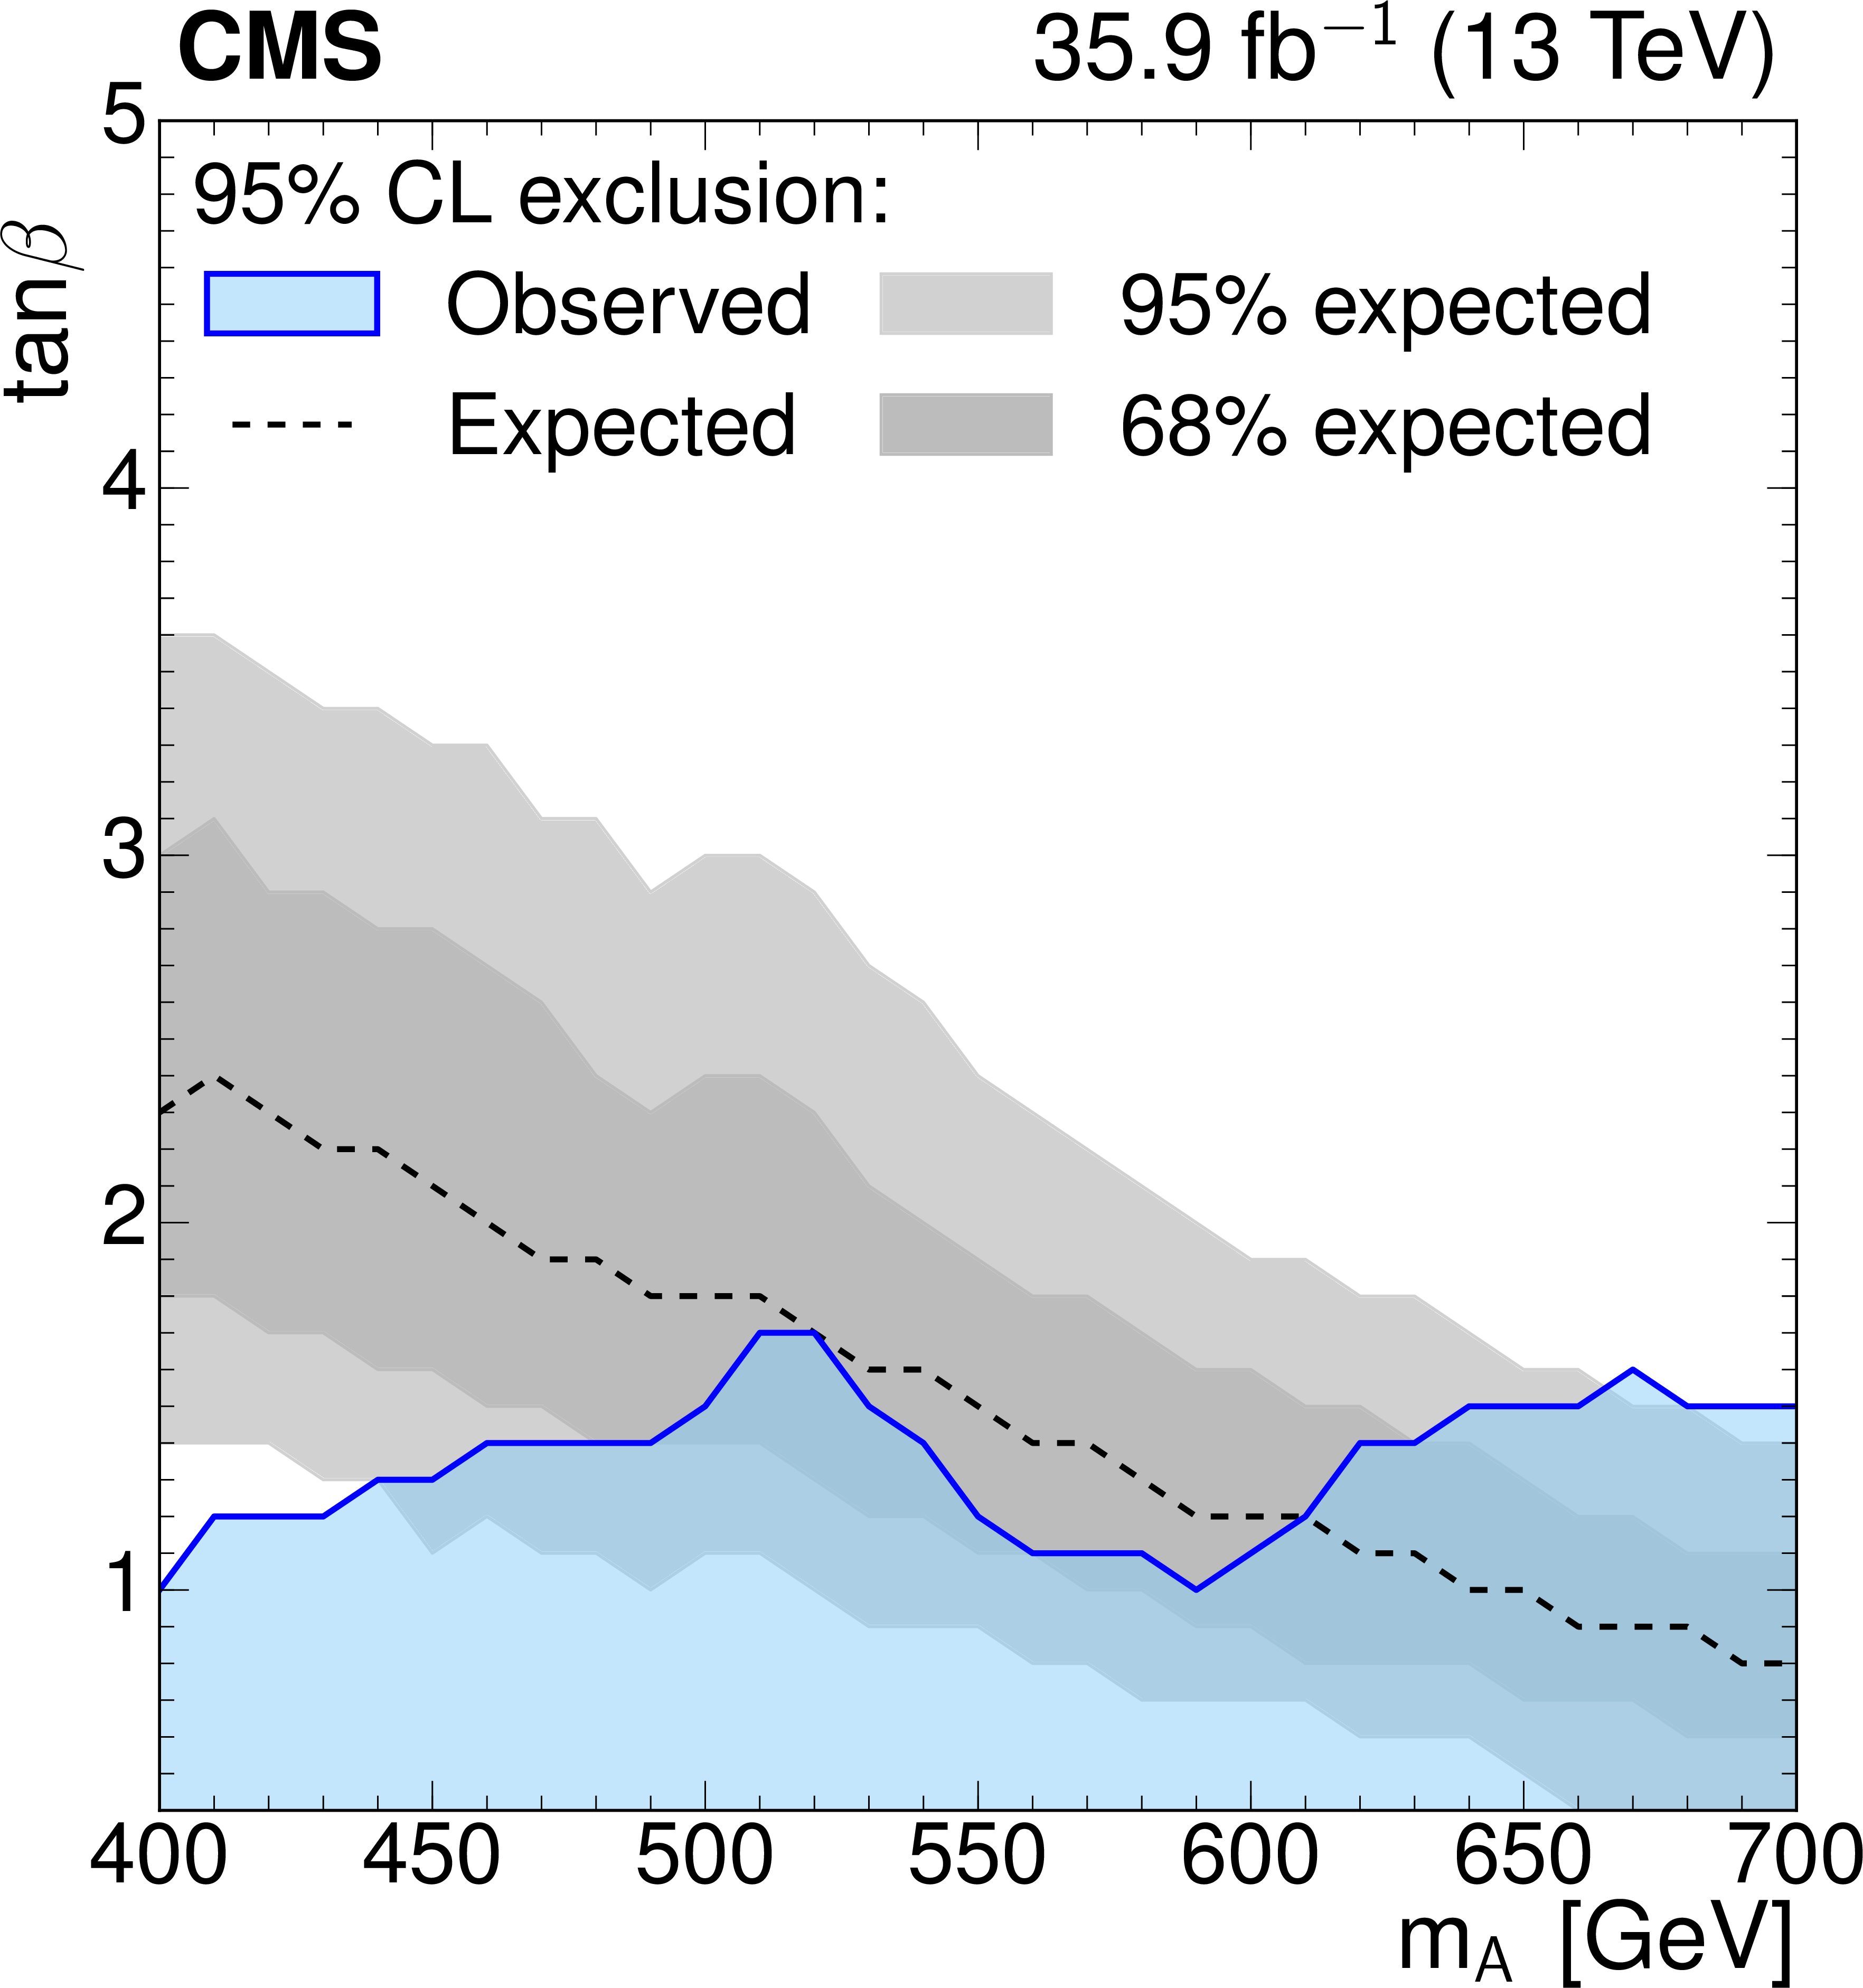
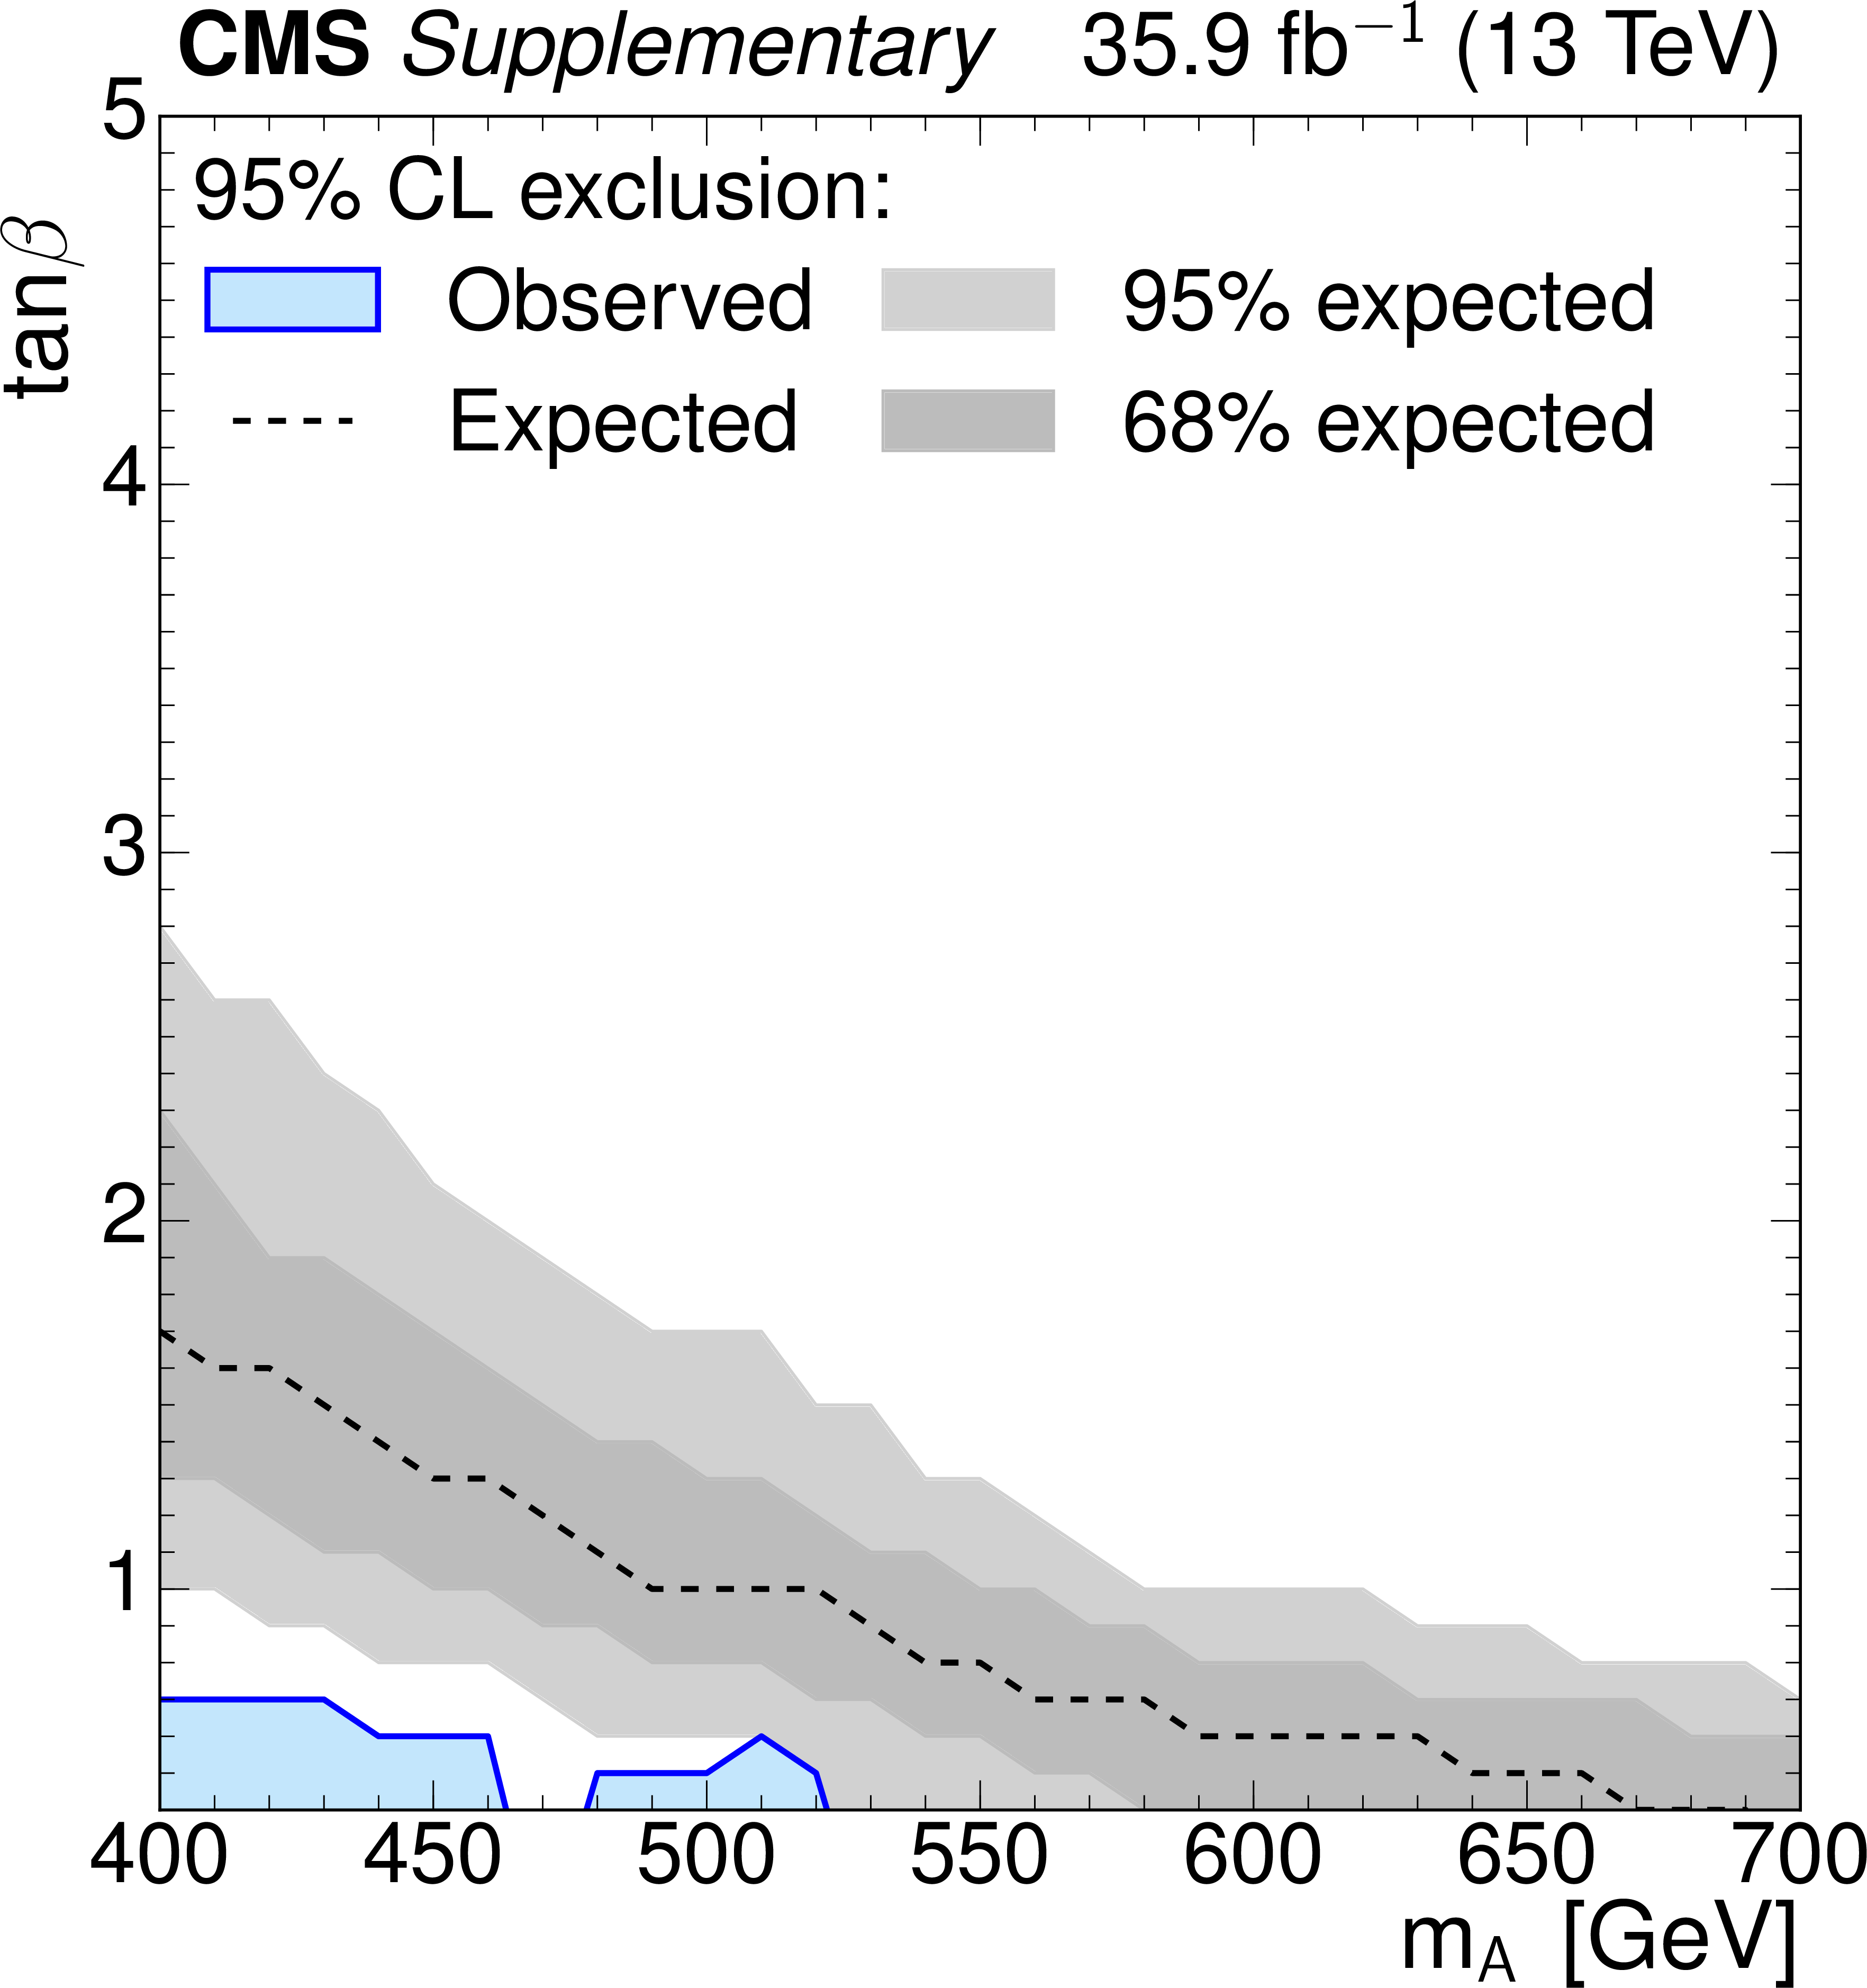
Figure 8:
Exclusion in the $(m_{\mathrm{A} }, \tan\beta)$ plane of the hMSSM. The inner (dark gray) band and the outer (light gray) band indicate the regions containing 68 and 95%, respectively, of the distribution of constraints expected under the background-only hypothesis. The observed excluded region is indicated by the blue shaded area. Both H and A boson signals are included with masses and widths that correspond to a given point in the plane. |
| Tables | |

png pdf |
Table 1:
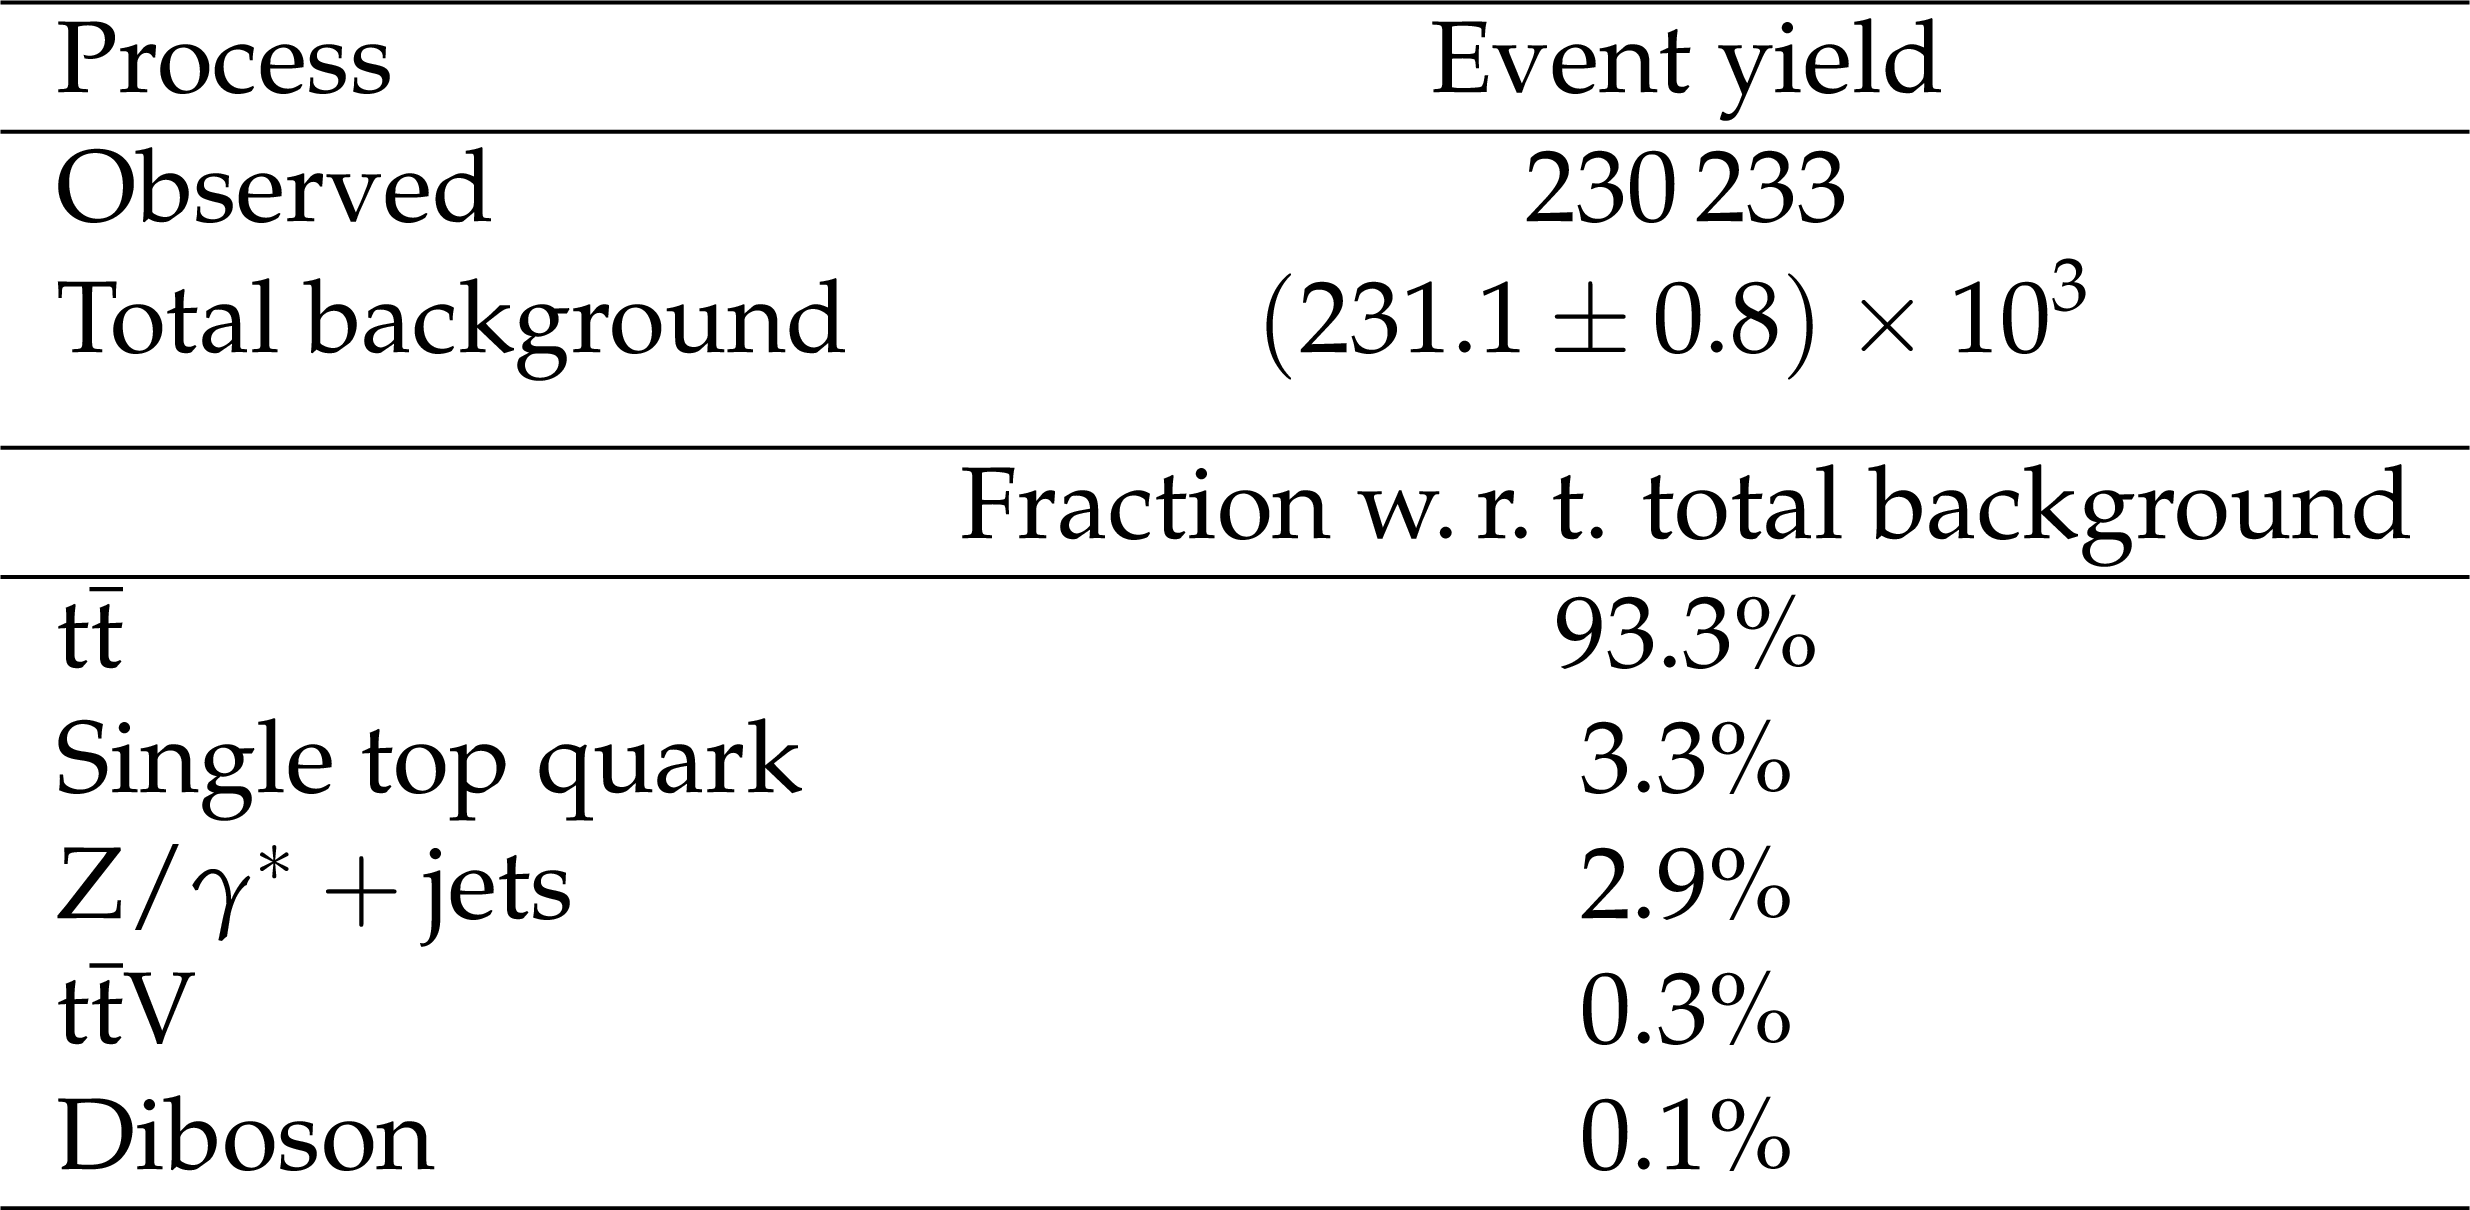
Event yields and composition of SM background in the single-electron and single-muon channels. Expected yields are computed after the background-only fit to the data as explained in the text. |
png pdf |
Table 2:
Event yields and composition of SM background in the dilepton channel. Expected yields are computed in the same way as in Table 1. |

png pdf |
Table 3:
The systematic uncertainties considered in the analysis, indicating the number of corresponding nuisance parameters (when more than one) in the statistical model, the type (affecting shape or only normalization), the affected processes, and the correlation among the lepton channels. Uncertainties tagged in the last column with "All'' are correlated among the single-lepton and dilepton channels. In case an uncertainty is only applicable to the single-electron, the single-muon, the single-lepton, or the dilepton channel, they are indicated with e, $\mu$, $\ell $, $\ell \ell $, respectively. |
| Summary |
|
Results are presented for the search for additional heavy Higgs bosons decaying to a pair of top quarks. A data sample recorded with the CMS detector at $\sqrt{s} = $ 13 TeV, corresponding to an integrated luminosity of 35.9 fb$^{-1}$, is analyzed. The final states with one or two leptons are utilized. The invariant mass of the reconstructed $\mathrm{t\bar{t}}$ system as well as angular variables sensitive to the spin of the new boson are used to search for the signal, while taking into account the interference with the standard model $\mathrm{t\bar{t}}$ production. A moderate signal-like deviation is observed for the hypothesis of a pseudoscalar Higgs boson with the mass $m_{\mathrm{A} } \approx $ 400 GeV. After accounting for the look-elsewhere effect, its significance is 1.9 standard deviations. Further improvements of the theoretical description of the standard model $\mathrm{t\bar{t}}$ process in the vicinity of the production threshold will be needed to clarify the origin of this deviation. Constraints on the strength of the coupling of the sought-for boson to top quarks are reported, separately for the scalar and pseudoscalar cases, for the mass ranging from 400 to 750 GeV and the total relative width from 0.5 to 25%. These are the most stringent constraints on this coupling to date. The results are also interpreted in the hMSSM scenario in the minimal supersymmetric standard model. This search probes the values of $m_{\mathrm{A}}$ from 400 to 700 GeV and excludes, at 95% confidence level, the region with values of $\tan\beta$ below 1.0 to 1.5, depending on $m_{\mathrm{A}}$. This extends the exclusion obtained in previous searches. |
| Additional Figures | |

png pdf |
Additional Figure 1:
Example LO parton-level cross sections for the sum of the resonant and interference parts of the heavy Higgs boson signal corresponding to masses of 400, 600, and 800 GeV. The total decay width of the boson is assumed to be 10% of its mass, and the coupling modifier $g_{\Phi {{\mathrm {t}\overline {\mathrm {t}}}}}$ is set to unity. Cross sections are taken from Dicus, Stange, Willenbrock, PLB 333 (1994) 126 [arXiv:hep-ph/9404359]. |
png pdf |
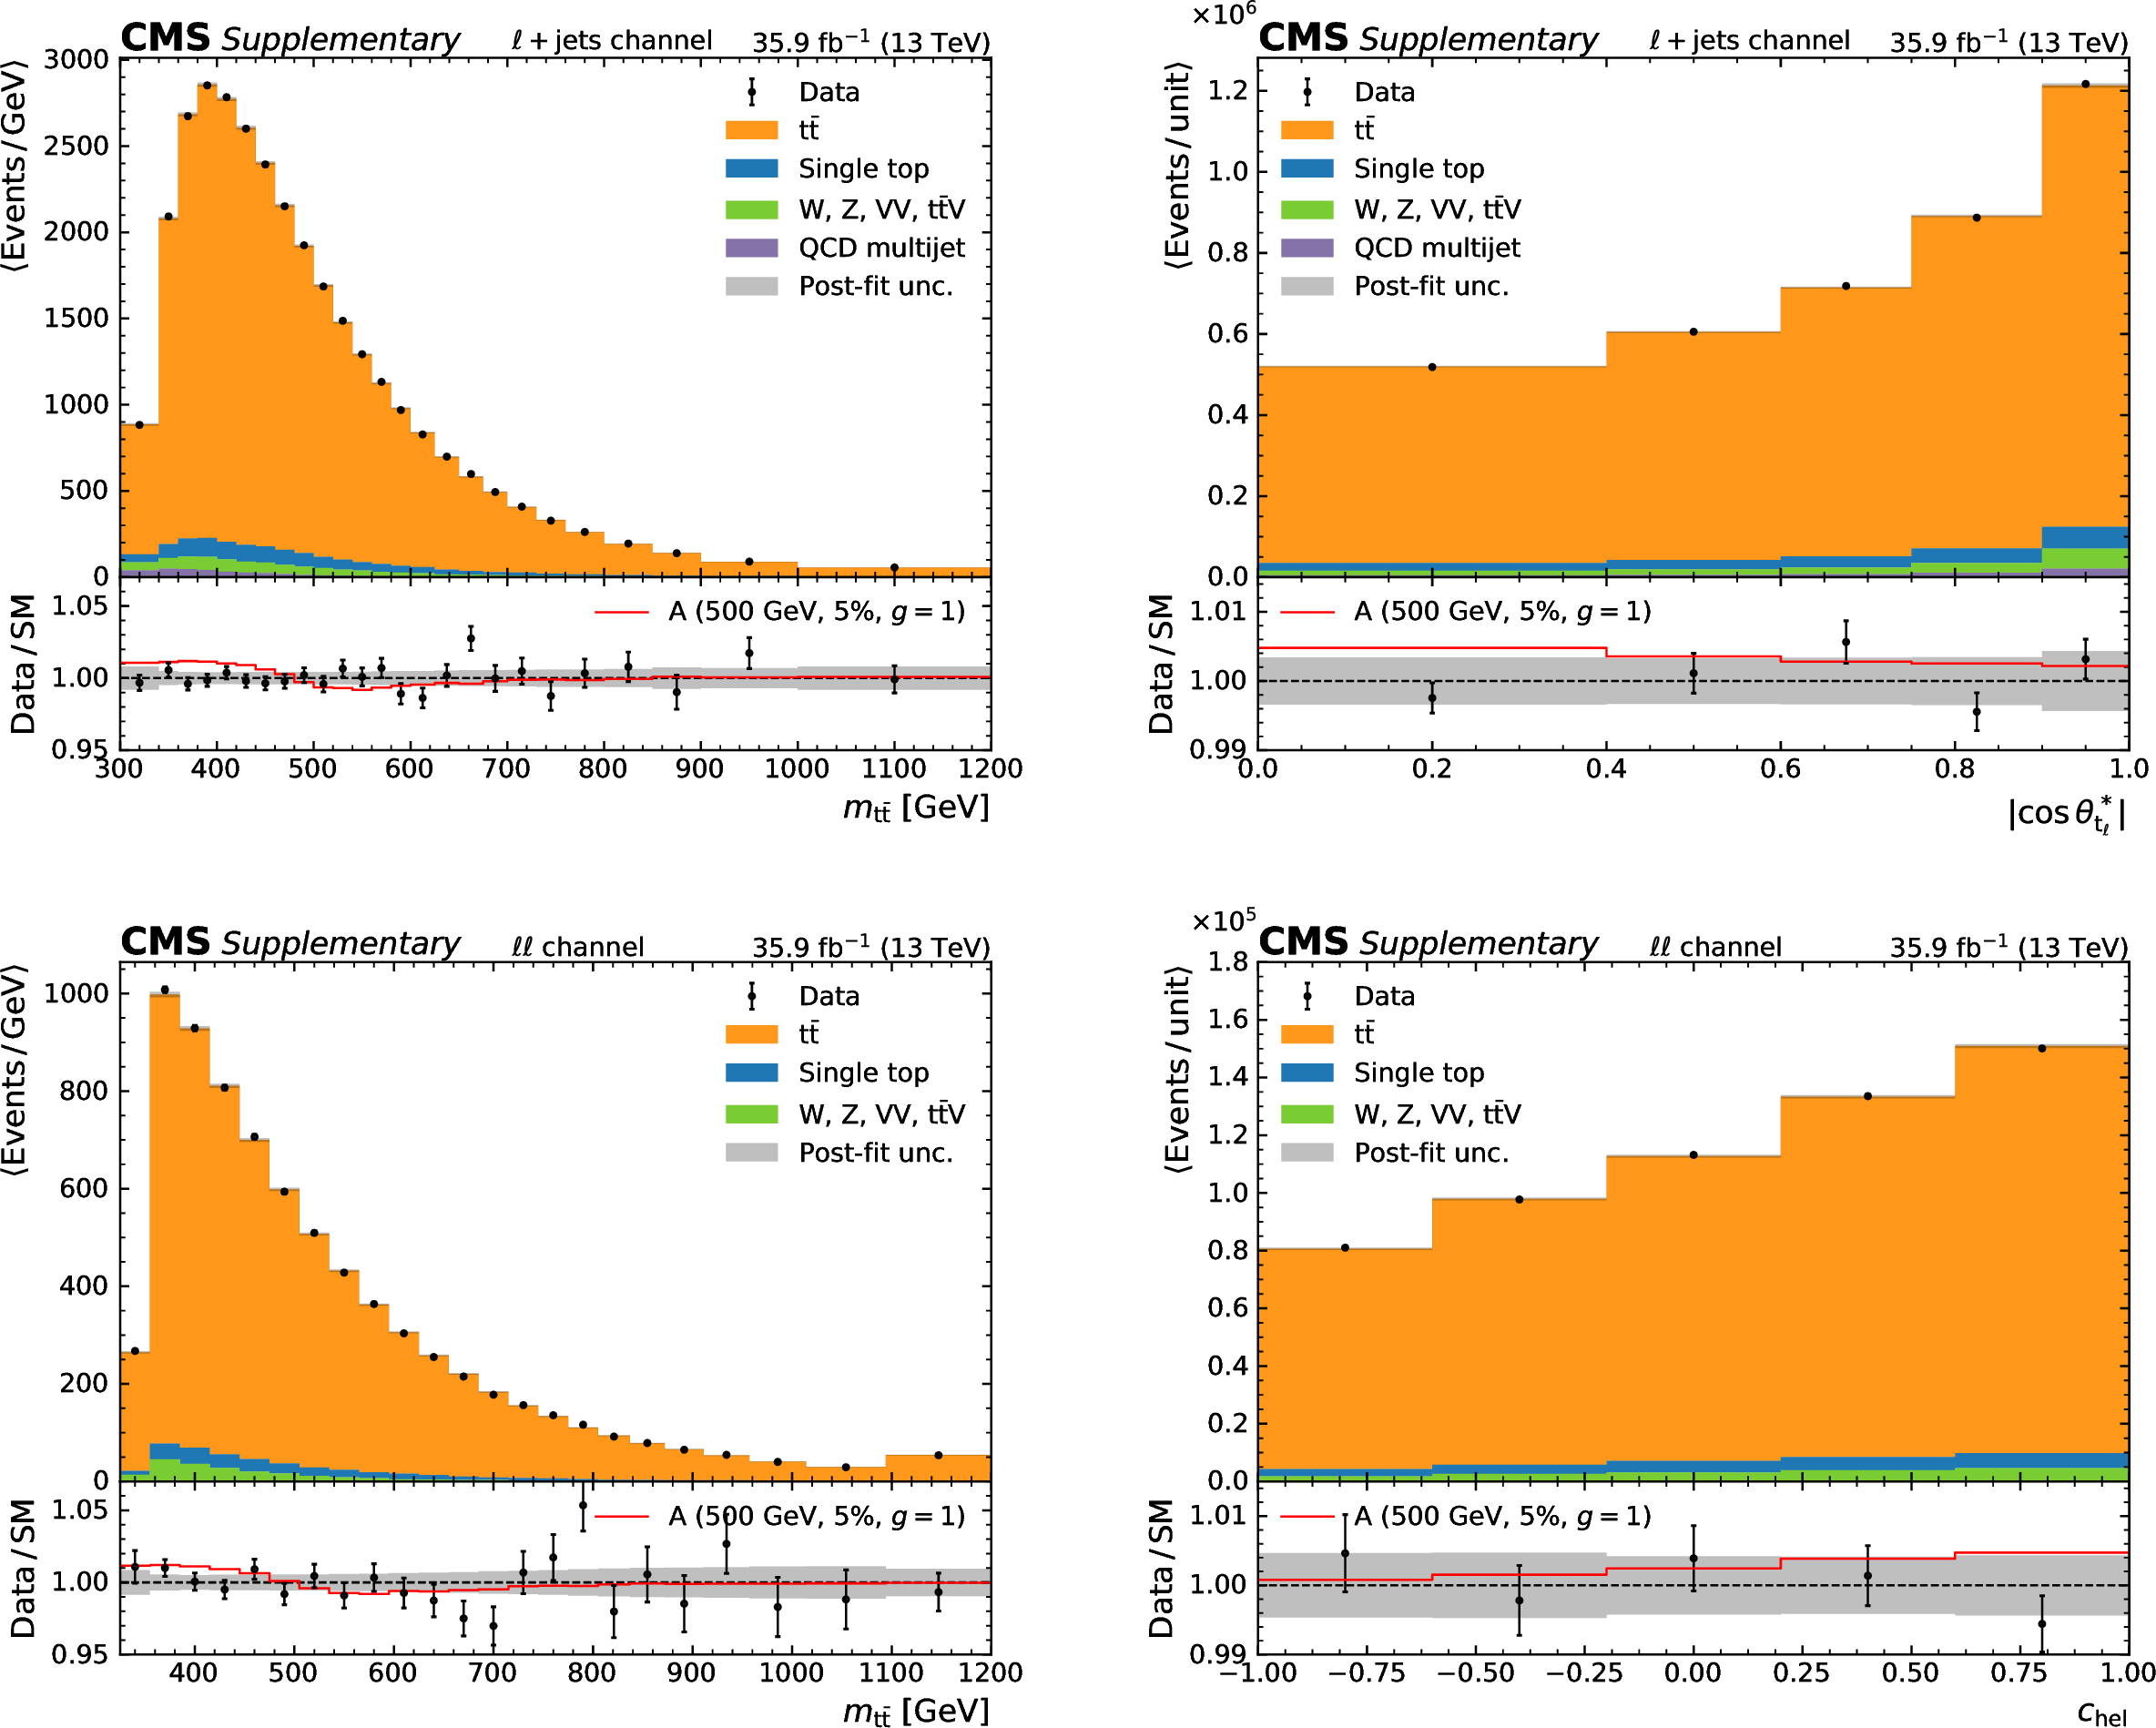
Additional Figure 2:
Post-fit one-dimensional projections of search variables: $m_{{{\mathrm {t}\overline {\mathrm {t}}}}}$ (left) and the angular observable (right), for the sum of the $ {\mu}$+jets and e+jets channels (upper), and for the dilepton channel (lower). |
png pdf |
Additional Figure 2-a:
Post-fit one-dimensional projection of $m_{{{\mathrm {t}\overline {\mathrm {t}}}}}$, for the sum of the $ {\mu}$+jets and e+jets channels. |
png pdf |
Additional Figure 2-b:
Post-fit one-dimensional projection of the angular observable, for the sum of the $ {\mu}$+jets and e+jets channels. |
png pdf |
Additional Figure 2-c:
Post-fit one-dimensional projection of $m_{{{\mathrm {t}\overline {\mathrm {t}}}}}$, for the dilepton channel. |
png pdf |
Additional Figure 2-d:
Post-fit one-dimensional projection of the angular observable, for the dilepton channel. |

png pdf |
Additional Figure 3:
Exclusion in the hMSSM obtained separately for the $\ell$+jets (a) and the dilepton channel (b). |

png pdf |
Additional Figure 3-a:
Exclusion in the hMSSM obtained separately for the $\ell$+jets. |
png pdf |
Additional Figure 3-b:
Exclusion in the hMSSM obtained separately for the dilepton channel. |
| Bounds for the different parity hypotheses |
There are two files for the different parity hypotheses (A and H) :
bounds_A.csv and
bounds_H.csv.
Note that the bounds are only valid for a single parity hypothesis, i.e. for the case that the other mass is beyond the interesting range.
Each row in a file contains:
|
| Chi2_tt distributions |
There are two files:
expected.npy and
observed.npy.
The $\chi^2_{\mathrm{t\bar{t}}}$ distributions are given as a function of the coupling modifiers $g_{\Phi\mathrm{t\bar{t}}}$ ($\Phi=$ H or A), for the scalar(H) and pseudoscalar (A) hypotheses for different scalar and pseudoscalar masses and
relative widths.
The $\chi^2_{\mathrm{t\bar{t}}}$ distribution is defined as
$ \chi^2_{\mathrm{t\bar{t}}} = -\ln [ L(g_{\Phi\mathrm{t\bar{t}}}) / L_{\text{max}} ]$,
where the likelihood function $L$ is given in Eq. (2) considering either
hypothesis A or H. Different from Figure 7, the distribution is not
normalized by the Standard Model likelihood but by $L_{\text{max}}$ such that
it vanishes for the most likely choice of mass, width, coupling
strength and nuisance parameters, providing the best description
of the data.
For pseudoscalar production the best description is achieved for
$g_{\mathrm{At\bar{t}}}=$ 0.94, $m_{\mathrm{A}}=$ 400 GeV, and
$\Gamma_{\mathrm{A}}/m_{\mathrm{A}}= $ 4.5%.
For scalar production the best description is achieved for
$g_{\mathrm{Ht\bar{t}}}=$ 0.53, $m_{\mathrm{H}}=$ 750 GeV, and
$\Gamma_{\mathrm{H}}/m_{\mathrm{H}}=$ 0.1%.
There are two attached files, observed.npy with the observed distributions
and expected.npy with the expected ones from the Asimov dataset.
The file can be read in python, e.g.
import pandas as pd
import numpy as np

infile = np.load('observed.npy')
df = pd.DataFrame(infile)
dfhypo = df[(df.parity ==  b'A') & (df.mass == 400) & (df.width == 4.5)]
print (dfhypo)
The second column shows the selected CP hypothesis, the third its mass,
and the fourth its width. The sixth column shows the negative log likelihood,
i.e. $[ L(g_{\Phi\mathrm{t\bar{t}}}) / L_{\text{max}} ]$, as as function of the coupling strength $g_{\Phi\mathrm{t\bar{t}}}$ printed in the fifth column.
The first row gives the best likelihood value for the chosen values of
parity, mass and width.
|
| For questions or comments, please contact: cms-pag-conveners-HIG@cern.ch |
| References | ||||
| 1 | ATLAS Collaboration | Observation of a new particle in the search for the standard model Higgs boson with the ATLAS detector at the LHC | PLB 716 (2012) 1 | 1207.7214 |
| 2 | CMS Collaboration | Observation of a new boson at a mass of 125 GeV with the CMS experiment at the LHC | PLB 716 (2012) 30 | CMS-HIG-12-028 1207.7235 |
| 3 | CMS Collaboration | Observation of a new boson with mass near 125 GeV in pp~collisions at $ \sqrt{s} = $ 7 and 8 TeV | JHEP 06 (2013) 081 | CMS-HIG-12-036 1303.4571 |
| 4 | G. C. Branco et al. | Theory and phenomenology of two-Higgs-doublet models | PR 516 (2012) 1 | 1106.0034 |
| 5 | J. Wess and B. Zumino | Supergauge transformations in four-dimensions | NPB 70 (1974) 39 | |
| 6 | S. Dimopoulos and H. Georgi | Softly broken supersymmetry and SU(5) | NPB 193 (1981) 150 | |
| 7 | K. Huitu et al. | Probing pseudo-Goldstone dark matter at the LHC | PRD 100 (2019) 015009 | 1812.05952 |
| 8 | M. Muhlleitner, M. O. P. Sampaio, R. Santos, and J. Wittbrodt | Phenomenological comparison of models with extended Higgs sectors | JHEP 08 (2017) 132 | 1703.07750 |
| 9 | J. Abdallah et al. | Simplified models for dark matter searches at the LHC | Phys. Dark Univ. 9--10 (2015) 8 | 1506.03116 |
| 10 | C. Arina et al. | A comprehensive approach to dark matter studies: exploration of simplified top-philic models | JHEP 11 (2016) 111 | 1605.09242 |
| 11 | N. Craig, J. Galloway, and S. Thomas | Searching for signs of the second Higgs doublet | 1305.2424 | |
| 12 | K. Lane and W. Shepherd | Natural stabilization of the Higgs boson's mass and alignment | PRD 99 (2019) 055015 | 1808.07927 |
| 13 | A. Djouadi et al. | The post-Higgs MSSM scenario: Habemus MSSM? | EPJC 73 (2013) 2650 | 1307.5205 |
| 14 | K. J. F. Gaemers and F. Hoogeveen | Higgs production and decay into heavy flavours with the gluon fusion mechanism | PLB 146 (1984) 347 | |
| 15 | D. Dicus, A. Stange, and S. Willenbrock | Higgs decay to top quarks at hadron colliders | PLB 333 (1994) 126 | hep-ph/9404359 |
| 16 | W. Bernreuther, M. Flesch, and P. Haberl | Signatures of Higgs bosons in the top quark decay channel at hadron colliders | PRD 58 (1998) 114031 | hep-ph/9709284 |
| 17 | M. Carena and Z. Liu | Challenges and opportunities for heavy scalar searches in the $ \mathrm{t\bar{t}} channel $ at the LHC | JHEP 11 (2016) 159 | 1608.07282 |
| 18 | A. Djouadi, J. Ellis, A. Popov, and J. Quevillon | Interference effects in $ \mathrm{t\bar{t}} production $ at the LHC as a window on new physics | JHEP 03 (2019) 119 | 1901.03417 |
| 19 | ATLAS Collaboration | Search for heavy Higgs bosons A/H decaying to a top quark pair in pp~collisions at $ \sqrt{s} = $ 8 TeV with the ATLAS detector | PRL 119 (2017) 191803 | 1707.06025 |
| 20 | CMS Collaboration | Search for physics beyond the standard model in events with two leptons of same sign, missing transverse momentum, and jets in proton-proton collisions at $ \sqrt{s} = $ 13 TeV | EPJC 77 (2017) 578 | CMS-SUS-16-035 1704.07323 |
| 21 | ATLAS Collaboration | Search for heavy particles decaying into top-quark pairs using lepton-plus-jets events in proton--proton collisions at $ \sqrt{s} = $ 13 TeV with the ATLAS detector | EPJC 78 (2018) 565 | 1804.10823 |
| 22 | CMS Collaboration | Search for $ \mathrm{t\bar{t}} $ resonances in highly boosted $ \text{lepton}+\text{jets} $ and fully hadronic final states in proton-proton collisions at $ \sqrt{s} = $ 13 TeV | JHEP 07 (2017) 001 | CMS-B2G-16-015 1704.03366 |
| 23 | ATLAS Collaboration | Search for charged Higgs bosons decaying into top and bottom quarks at $ \sqrt{s} = $ 13 TeV with the ATLAS detector | JHEP 11 (2018) 085 | 1808.03599 |
| 24 | CMS Collaboration | Search for a charged Higgs boson in pp collisions at $ \sqrt{s} = $ 8 TeV | JHEP 11 (2015) 018 | CMS-HIG-14-023 1508.07774 |
| 25 | CMS Collaboration | The CMS experiment at the CERN LHC | JINST 3 (2008) S08004 | CMS-00-001 |
| 26 | M. Cacciari, G. P. Salam, and G. Soyez | The anti-$ k_\text{T} $ jet clustering algorithm | JHEP 04 (2008) 063 | 0802.1189 |
| 27 | M. Cacciari, G. P. Salam, and G. Soyez | FastJet user manual | EPJC 72 (2012) 1896 | 1111.6097 |
| 28 | CMS Collaboration | Particle-flow reconstruction and global event description with the CMS detector | JINST 12 (2017) P10003 | CMS-PRF-14-001 1706.04965 |
| 29 | CMS Collaboration | Jet energy scale and resolution in the CMS experiment in pp~collisions at 8 TeV | JINST 12 (2017) P02014 | CMS-JME-13-004 1607.03663 |
| 30 | CMS Collaboration | Jet algorithms performance in 13 TeV data | CMS-PAS-JME-16-003 | CMS-PAS-JME-16-003 |
| 31 | CMS Collaboration | Identification of heavy-flavour jets with the CMS detector in pp~collisions at 13 TeV | JINST 13 (2018) P05011 | CMS-BTV-16-002 1712.07158 |
| 32 | CMS Collaboration | Performance of electron reconstruction and selection with the CMS detector in proton-proton collisions at $ \sqrt{s} = $ 8 TeV | JINST 10 (2015) P06005 | CMS-EGM-13-001 1502.02701 |
| 33 | CMS Collaboration | Performance of the CMS muon detector and muon reconstruction with proton-proton collisions at $ \sqrt{s}= $ 13 TeV | JINST 13 (2018) P06015 | CMS-MUO-16-001 1804.04528 |
| 34 | CMS Collaboration | Performance of missing transverse momentum reconstruction in proton-proton collisions at $ \sqrt{s} = $ 13 TeV using the CMS detector | JINST 14 (2019) P07004 | CMS-JME-17-001 1903.06078 |
| 35 | CMS Collaboration | CMS luminosity measurements for the 2016 data taking period | CMS-PAS-LUM-17-001 | CMS-PAS-LUM-17-001 |
| 36 | CMS Collaboration | The CMS trigger system | JINST 12 (2017) P01020 | CMS-TRG-12-001 1609.02366 |
| 37 | J. Alwall et al. | The automated computation of tree-level and next-to-leading order differential cross sections, and their matching to parton shower simulations | JHEP 07 (2014) 079 | 1405.0301 |
| 38 | M. Spira, A. Djouadi, D. Graudenz, and P. M. Zerwas | Higgs boson production at the LHC | NPB 453 (1995) 17 | hep-ph/9504378 |
| 39 | NNPDF Collaboration | Parton distributions for the LHC Run II | JHEP 04 (2015) 040 | 1410.8849 |
| 40 | T. Sjostrand et al. | An introduction to PYTHIA 8.2 | CPC 191 (2015) 159 | 1410.3012 |
| 41 | P. Skands, S. Carrazza, and J. Rojo | Tuning PYTHIA 8.1: the Monash 2013 tune | EPJC 74 (2014) 3024 | 1404.5630 |
| 42 | CMS Collaboration | Event generator tunes obtained from underlying event and multiparton scattering measurements | EPJC 76 (2016) 155 | CMS-GEN-14-001 1512.00815 |
| 43 | B. Hespel, F. Maltoni, and E. Vryonidou | Signal background interference effects in heavy scalar production and decay to a top-anti-top pair | JHEP 10 (2016) 016 | 1606.04149 |
| 44 | R. V. Harlander, S. Liebler, and H. Mantler | SusHi: A program for the calculation of Higgs production in gluon fusion and bottom-quark annihilation in the standard model and the MSSM | CPC 184 (2013) 1605 | 1212.3249 |
| 45 | D. Eriksson, J. Rathsman, and O. Stal | 2HDMC: two-Higgs-doublet model calculator physics and manual | CPC 181 (2010) 189 | 0902.0851 |
| 46 | P. Nason | A new method for combining NLO QCD with shower Monte Carlo algorithms | JHEP 11 (2004) 040 | hep-ph/0409146 |
| 47 | S. Frixione, P. Nason, and C. Oleari | Matching NLO QCD computations with parton shower simulations: the POWHEG method | JHEP 11 (2007) 070 | 0709.2092 |
| 48 | S. Alioli, P. Nason, C. Oleari, and E. Re | A general framework for implementing NLO calculations in shower Monte Carlo programs: the POWHEG BOX | JHEP 06 (2010) 043 | 1002.2581 |
| 49 | J. M. Campbell, R. K. Ellis, P. Nason, and E. Re | Top-pair production and decay at NLO matched with parton showers | JHEP 04 (2015) 114 | 1412.1828 |
| 50 | CMS Collaboration | Investigations of the impact of the parton shower tuning in Pythia 8 in the modelling of $ \mathrm{t\overline{t}} $ at $ \sqrt{s}= $ 8 and 13 TeV | CMS-PAS-TOP-16-021 | CMS-PAS-TOP-16-021 |
| 51 | M. Czakon and A. Mitov | Top++: a program for the calculation of the top-pair cross-section at hadron colliders | CPC 185 (2014) 2930 | 1112.5675 |
| 52 | M. Botje et al. | The PDF4LHC working group interim recommendations | 1101.0538 | |
| 53 | A. D. Martin, W. J. Stirling, R. S. Thorne, and G. Watt | Uncertainties on $ {\alpha_S} $ in global PDF analyses and implications for predicted hadronic cross sections | EPJC 64 (2009) 653 | 0905.3531 |
| 54 | J. Gao et al. | The CT10 NNLO global analysis of QCD | PRD 89 (2014) 033009 | 1302.6246 |
| 55 | NNPDF Collaboration | Parton distributions with LHC data | NPB 867 (2013) 244 | 1207.1303 |
| 56 | CMS Collaboration | Measurement of differential cross sections for top quark pair production using the $ \text{lepton}+\text{jets} $ final state in proton-proton collisions at 13 TeV | PRD 95 (2017) 092001 | CMS-TOP-16-008 1610.04191 |
| 57 | CMS Collaboration | Measurement of normalized differential $ \mathrm{t}\bar{\mathrm{t}} $~cross sections in the dilepton channel from pp~collisions at $ \sqrt{s} = $ 13 TeV | JHEP 04 (2018) 060 | CMS-TOP-16-007 1708.07638 |
| 58 | M. Aliev et al. | HATHOR -- HAdronic Top and Heavy quarks crOss section calculatoR | CPC 182 (2011) 1034 | 1007.1327 |
| 59 | P. Kant et al. | HATHOR for single top-quark production: Updated predictions and uncertainty estimates for single top-quark production in hadronic collisions | CPC 191 (2015) 74 | 1406.4403 |
| 60 | N. Kidonakis | Top quark production | in Proceedings, Helmholtz International Summer School on Physics of Heavy Quarks and Hadrons (HQ 2013) | 1311.0283 |
| 61 | J. Alwall et al. | Comparative study of various algorithms for the merging of parton showers and matrix elements in hadronic collisions | EPJC 53 (2008) 473 | 0706.2569 |
| 62 | K. Melnikov and F. Petriello | Electroweak gauge boson production at hadron colliders through $ O({\alpha_S}^2) $ | PRD 74 (2006) 114017 | hep-ph/0609070 |
| 63 | Y. Li and F. Petriello | Combining QCD and electroweak corrections to dilepton production in FEWZ | PRD 86 (2012) 094034 | 1208.5967 |
| 64 | S. Frixione and B. R. Webber | Matching NLO QCD computations and parton shower simulations | JHEP 06 (2002) 029 | hep-ph/0204244 |
| 65 | T. Gehrmann et al. | $ \mathrm{W}^+\mathrm{W}^- $ production at hadron colliders in NNLO QCD | PRL 113 (2014) 212001 | 1408.5243 |
| 66 | J. M. Campbell and R. K. Ellis | MCFM for the Tevatron and the LHC | NPPS 205-206 (2010) 10 | 1007.3492 |
| 67 | GEANT4 Collaboration | GEANT4--a simulation toolkit | NIMA 506 (2003) 250 | |
| 68 | B. A. Betchart, R. Demina, and A. Harel | Analytic solutions for neutrino momenta in decay of top quarks | NIMA 736 (2014) 169 | 1305.1878 |
| 69 | A. Loginov | Strategies of data-driven estimations of $ \mathrm{t}\bar{\mathrm{t}} $~backgrounds in ATLAS | Nuovo Cim. C 033 (2010) 175 | |
| 70 | CMS Collaboration | Measurements of $ \mathrm{t\overline{t}} $ differential cross sections in proton-proton collisions at $ \sqrt{s} = $ 13 TeV using events containing two leptons | JHEP 02 (2019) 149 | CMS-TOP-17-014 1811.06625 |
| 71 | CMS Collaboration | Measurement of the $ \mathrm{t\bar{t}} $ production cross section and the top quark mass in the dilepton channel in $ \mathrm{pp} $ collisions at $ \sqrt{s}= $ 7 TeV | JHEP 07 (2011) 049 | CMS-TOP-11-002 1105.5661 |
| 72 | CMS Collaboration | Measurement of the differential cross section for top quark pair production in pp collisions at $ \sqrt{s} = $ 8 TeV | EPJC 75 (2015) 542 | CMS-TOP-12-028 1505.04480 |
| 73 | W. Bernreuther, A. Brandenburg, Z. G. Si, and P. Uwer | Top quark pair production and decay at hadron colliders | NPB 690 (2004) 81 | hep-ph/0403035 |
| 74 | CMS Collaboration | Measurement of the top quark mass using proton-proton data at $ \sqrt{s} = $ 7 and 8 TeV | PRD 93 (2016) 072004 | CMS-TOP-14-022 1509.04044 |
| 75 | ATLAS Collaboration | Measurement of the inclusive cross-sections of single top-quark and top-antiquark $ t $-channel production in pp~collisions at $ \sqrt{s} = $ 13 TeV with the ATLAS detector | JHEP 04 (2017) 086 | 1609.03920 |
| 76 | CMS Collaboration | Measurement of the single top quark and antiquark production cross sections in the $ t $ channel and their ratio in proton-proton collisions at $ \sqrt{s}= $ 13 TeV | Submitted to PLB | CMS-TOP-17-011 1812.10514 |
| 77 | CMS Collaboration | Measurement of the production cross section for single top quarks in association with W~bosons in proton-proton collisions at $ \sqrt{s}= $ 13 TeV | JHEP 10 (2018) 117 | CMS-TOP-17-018 1805.07399 |
| 78 | CMS Collaboration | Measurement of the cross section for top quark pair production in association with a W or Z~boson in proton-proton collisions at $ \sqrt{s} = $ 13 TeV | JHEP 08 (2018) 011 | CMS-TOP-17-005 1711.02547 |
| 79 | ATLAS Collaboration | Measurement of the $ \mathrm{t\bar{t}Z} $ and $ \mathrm{t\bar{t}W} $ cross sections in proton-proton collisions at $ \sqrt{s}= $ 13 TeV with the ATLAS detector | PRD 99 (2019) 072009 | 1901.03584 |
| 80 | R. Barlow and C. Beeston | Fitting using finite Monte Carlo samples | CPC 77 (1993) 219 | |
| 81 | W. S. Cleveland | Robust locally weighted regression and smoothing scatterplots | J. Am. Stat. Assoc. 74 (1979) 829 | |
| 82 | W. S. Cleveland and S. J. Devlin | Locally-weighted regression: An approach to regression analysis by local fitting | J. Am. Stat. Assoc. 83 (1988) 596 | |
| 83 | S. Baker and R. D. Cousins | Clarification of the use of $ \chi^2 $ and likelihood functions in fits to histograms | NIM221 (1984) 437 | |
| 84 | G. Cowan, K. Cranmer, E. Gross, and O. Vitells | Asymptotic formulae for likelihood-based tests of new physics | EPJC 71 (2011) 1554 | 1007.1727 |
| 85 | ATLAS and CMS Collaborations, LHC Higgs Combination Group | Procedure for the LHC Higgs boson search combination in summer 2011 | CMS-NOTE-2011-005 | |
| 86 | T. Junk | Confidence level computation for combining searches with small statistics | NIMA 434 (1999) 435 | hep-ex/9902006 |
| 87 | A. L. Read | Presentation of search results: the CLs technique | JPG 28 (2002) 2693 | |
| 88 | M. Baak, S. Gadatsch, R. Harrington, and W. Verkerke | Interpolation between multi-dimensional histograms using a new non-linear moment morphing method | NIMA 771 (2015) 39 | 1410.7388 |
| 89 | L. Demortier | $ P $ values and nuisance parameters | in Statistical issues for LHC physics. Proceedings, Workshop, PHYSTAT-LHC, Geneva 2007 | |
| 90 | J. H. Kuhn, A. Scharf, and P. Uwer | Weak interactions in top-quark pair production at hadron colliders: An update | PRD 91 (2015) 014020 | 1305.5773 |
|
|
Compact Muon Solenoid LHC, CERN |
|

|

|

|

|

|