

Compact Muon Solenoid
LHC, CERN
| CMS-SMP-22-001 ; CERN-EP-2023-285 | ||
| Measurement of differential ZZ$+$jets production cross sections in pp collisions at $ \sqrt{s} = $ 13 TeV | ||
| CMS Collaboration | ||
| 3 April 2024 | ||
| Submitted to J. High Energy Phys. | ||
| Abstract: Diboson production in association with jets is studied in the fully leptonic final states, $ \mathrm{p}\mathrm{p} \to (\mathrm{Z}/\gamma^*)(\mathrm{Z}/\gamma^*){+}$jets $\to 2\ell2\ell'{+}$jets, ($ \ell,\ell' = \mathrm{e} $ or $ \mu $) in proton-proton collisions at a center-of-mass energy of 13 TeV. The data sample corresponds to an integrated luminosity of 138 fb$ ^{-1} $ collected with the CMS detector at the LHC. Differential distributions and normalized differential cross sections are measured as a function of jet multiplicity, transverse momentum $ p_{\mathrm{T}} $, pseudorapidity $ \eta $, invariant mass and $ \Delta\eta $ of the highest-$ p_{\mathrm{T}} $ and second-highest-$ p_{\mathrm{T}} $ jets, and as a function of invariant mass of the four-lepton system for events with various jet multiplicities. These differential cross sections are compared with theoretical predictions that mostly agree with the experimental data. However, in a few regions we observe discrepancies between the predicted and measured values. Further improvement of the predictions is required to describe the ZZ$+$jets production in the whole phase space. | ||
| Links: e-print arXiv:2404.02711 [hep-ex] (PDF) ; CDS record ; inSPIRE record ; Physics Briefing ; CADI line (restricted) ; | ||
| Figures | |
png pdf |
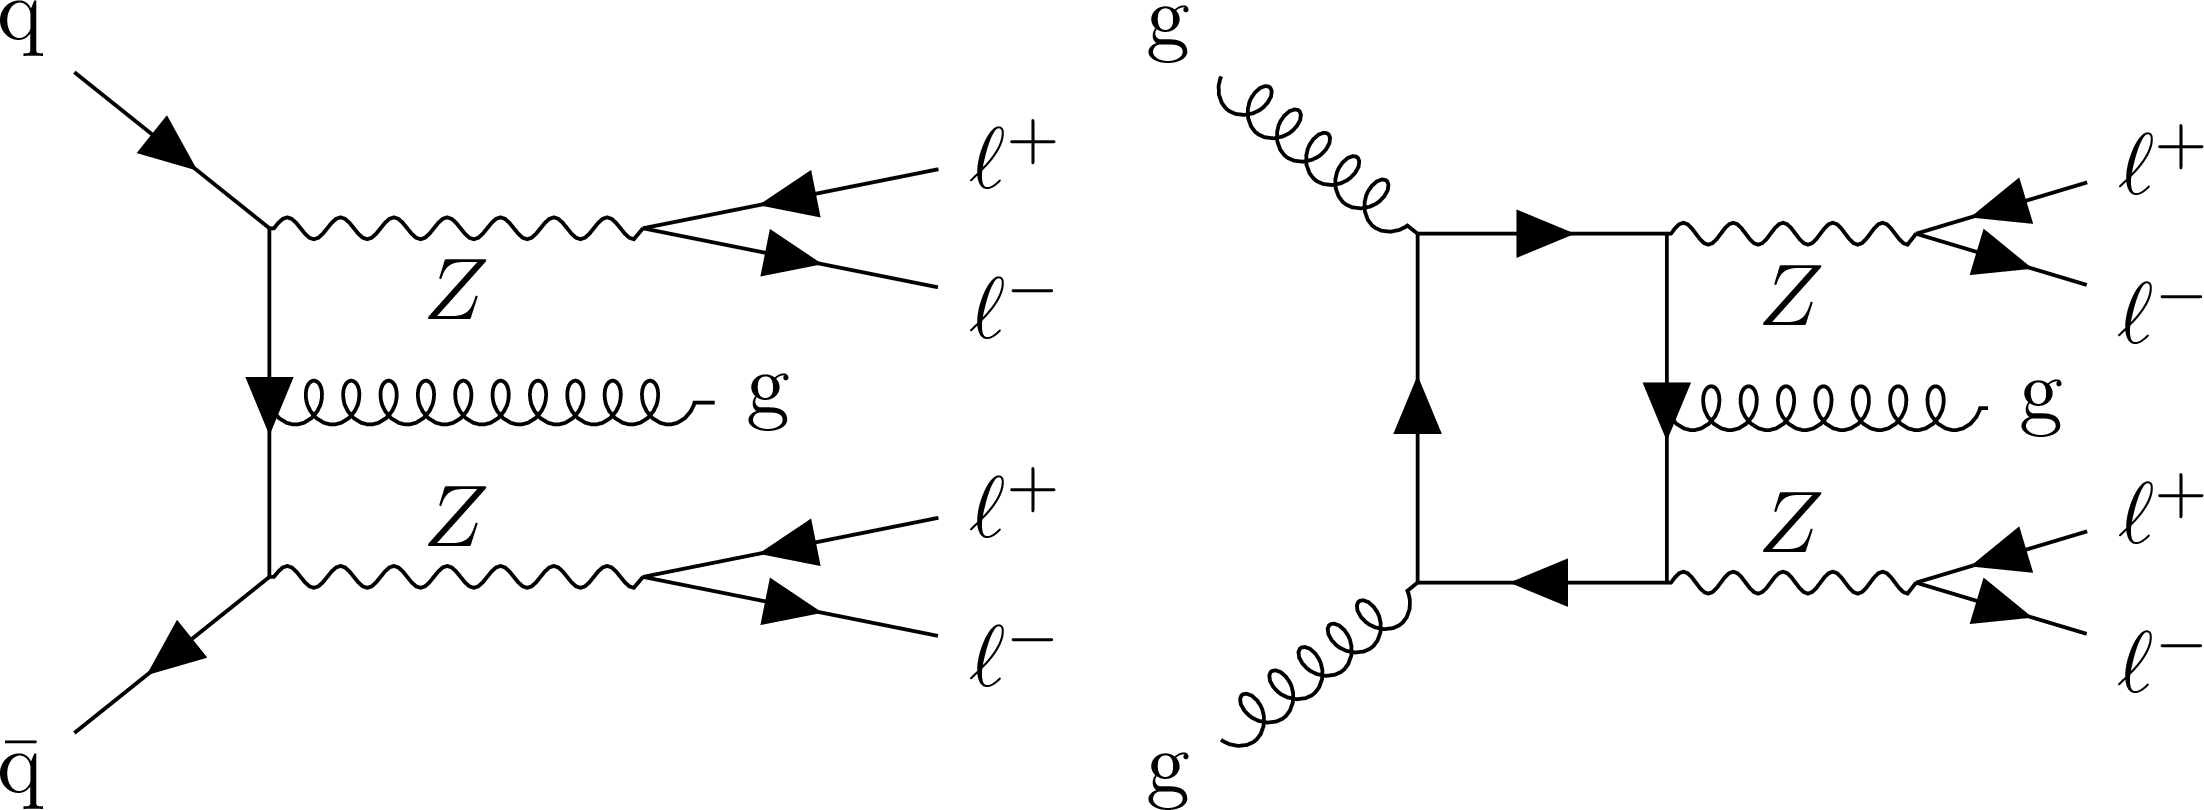
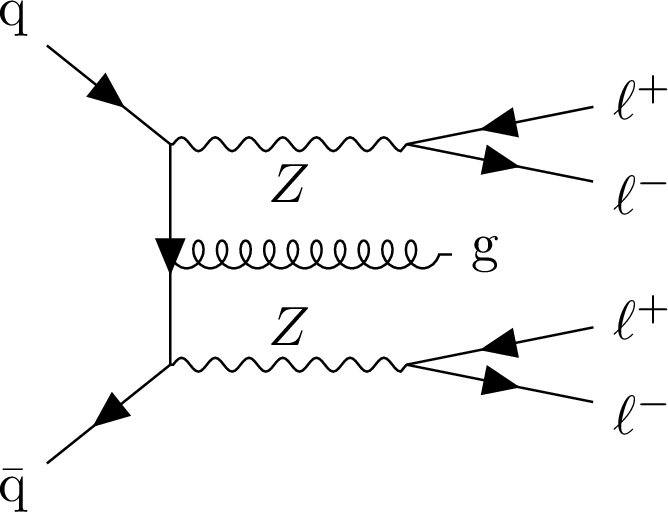
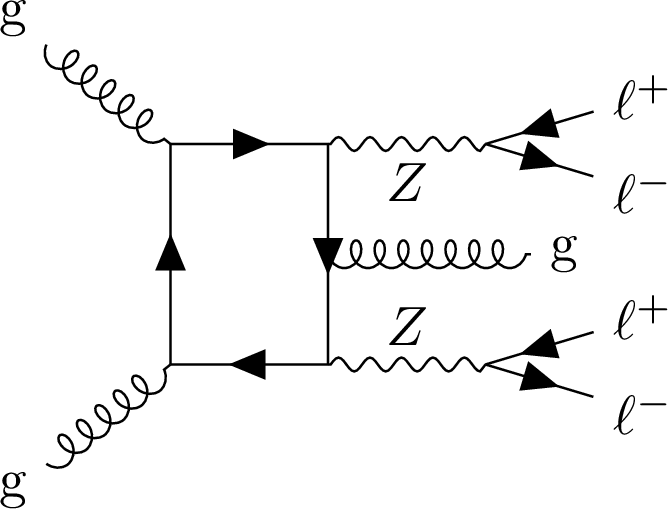
Figure 1:
Example Feynman diagrams of ZZ production associated with jets via (left) quark-initiated production and (right) loop-induced gluon fusion production. |
png pdf |
Figure 1-a:
Example Feynman diagrams of ZZ production associated with jets via (left) quark-initiated production and (right) loop-induced gluon fusion production. |
png pdf |
Figure 1-b:
Example Feynman diagrams of ZZ production associated with jets via (left) quark-initiated production and (right) loop-induced gluon fusion production. |
png pdf |
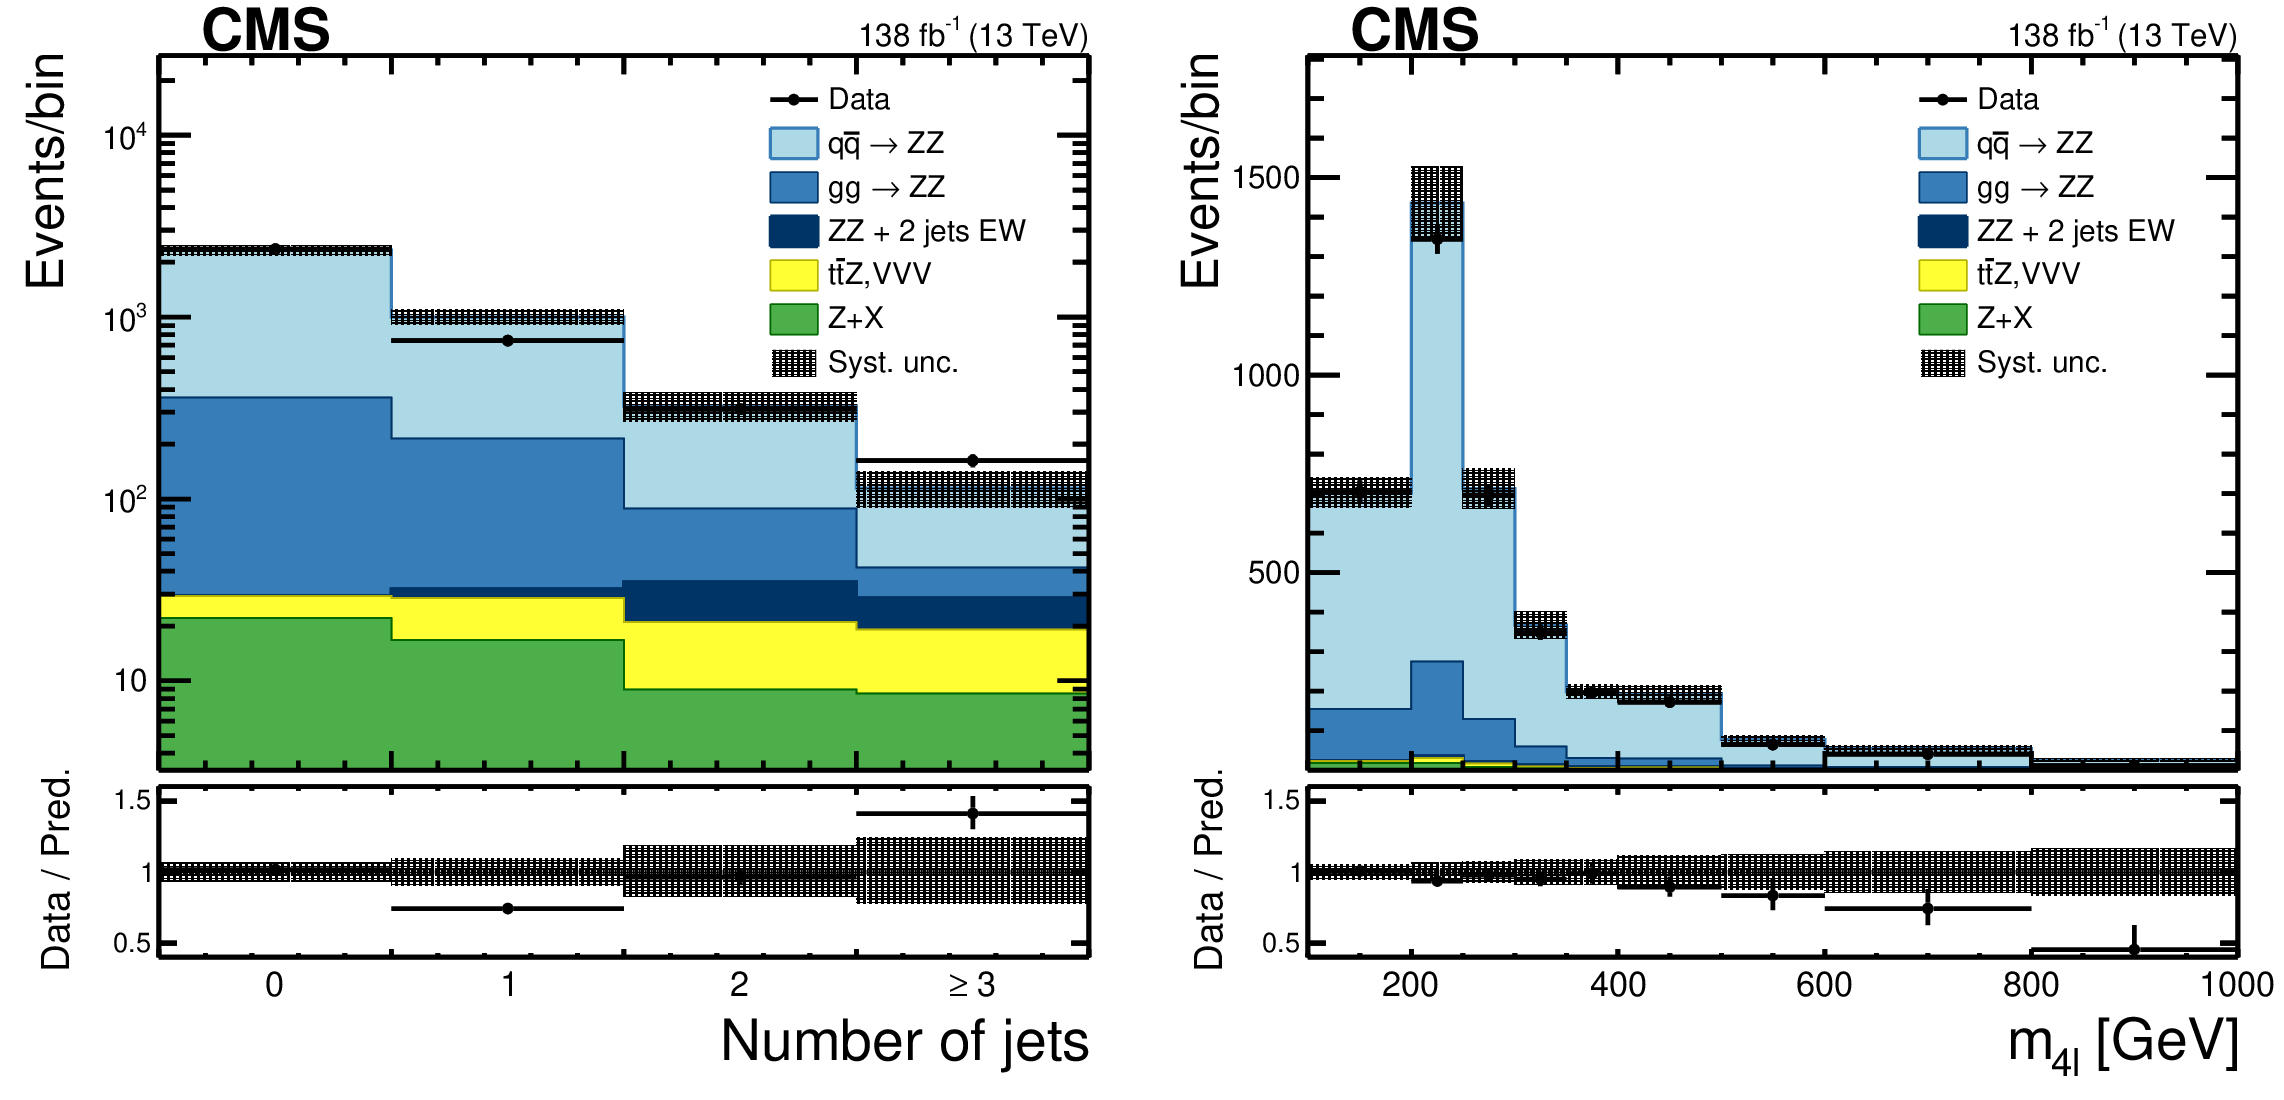
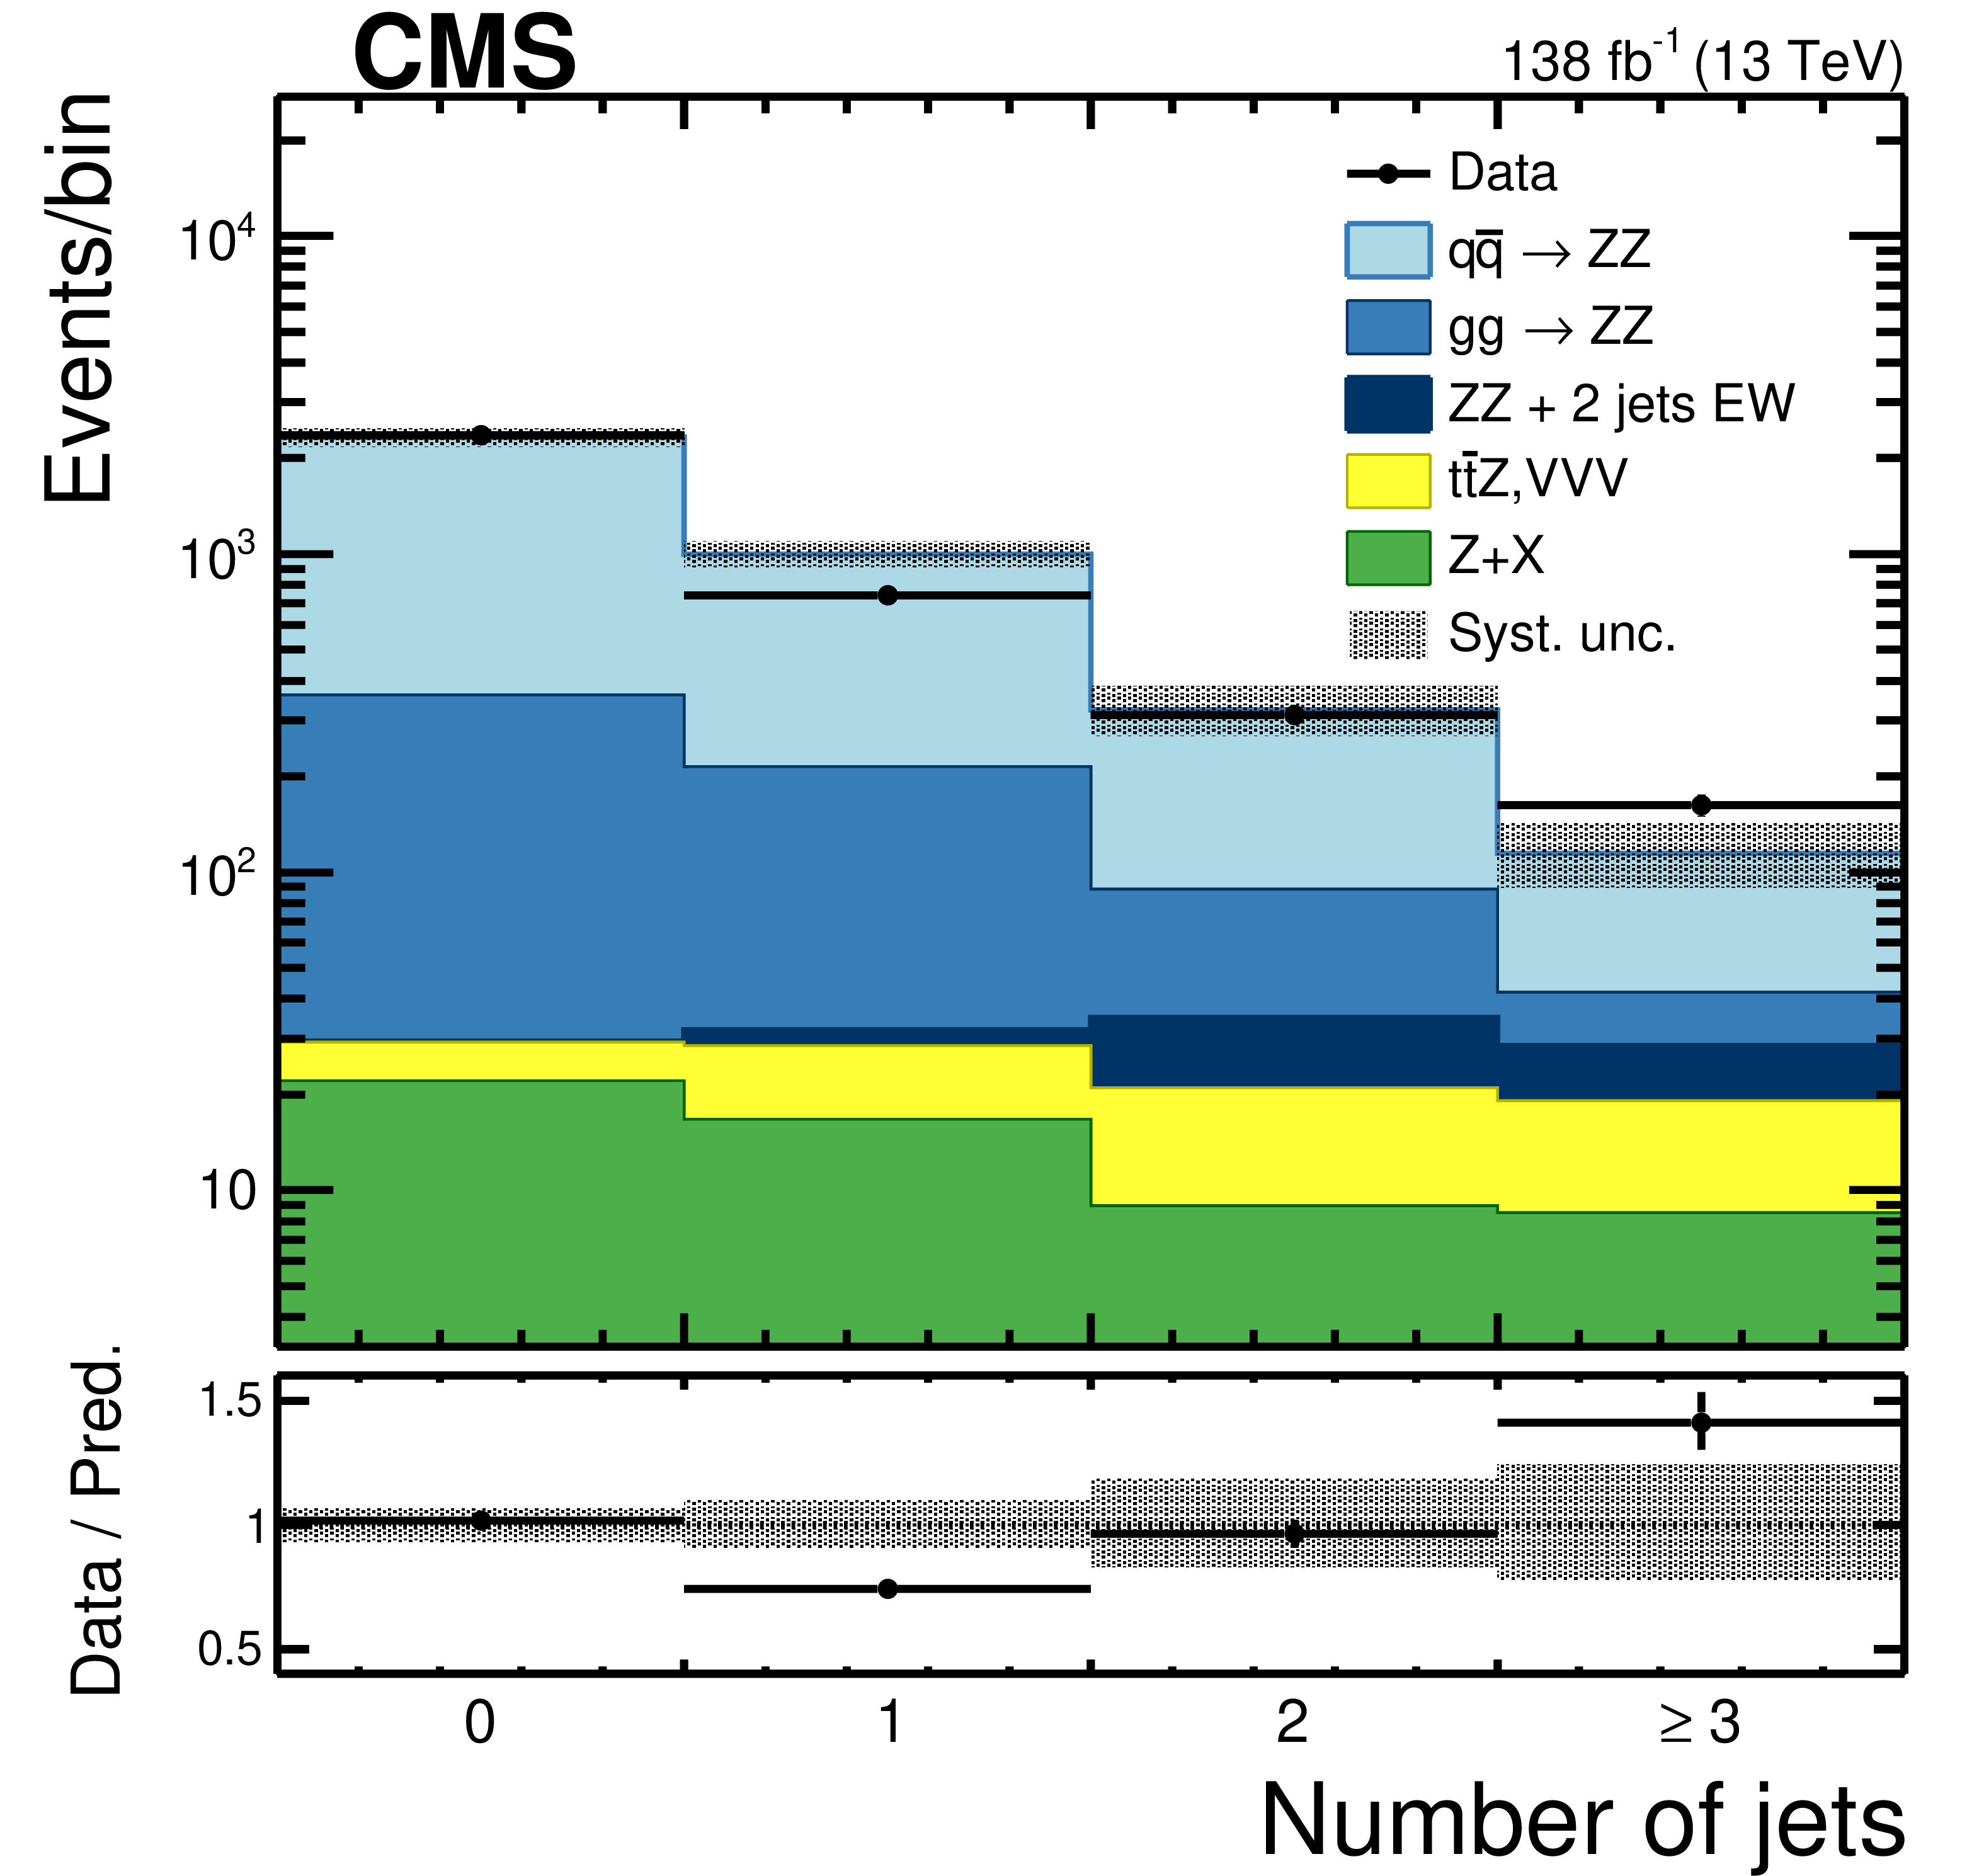
Figure 2:
Distribution of the number of jets with $ p_{\mathrm{T}} > $ 30 GeV (left) and of $ m_{\mathrm{Z}\mathrm{Z}} $ (right) for ZZ+jets events with 60 $ < m_{\mathrm{Z}_1, \mathrm{Z}_2} < $ 120 GeV for the combined 4e, 4$ \mu $, and 2e2$ \mu $ decay channels. Points represent the data, vertical bars the statistical uncertainties, and shaded histograms represent the expected standard model predictions and reducible background estimated from data. The gray band represents the systematic uncertainties in the predictions, which includes systematic uncertainties associated with trigger efficiency, lepton efficiencies, jet energy correction and jet energy resolution, pileup, luminosity, Monte Carlo generator choice, $ \mathrm{g}\mathrm{g} \! \to \! \mathrm{Z}\mathrm{Z} $ cross section, and reducible background. The overflow is included in the last bin of the distributions. |
png pdf |
Figure 2-a:
Distribution of the number of jets with $ p_{\mathrm{T}} > $ 30 GeV (left) and of $ m_{\mathrm{Z}\mathrm{Z}} $ (right) for ZZ+jets events with 60 $ < m_{\mathrm{Z}_1, \mathrm{Z}_2} < $ 120 GeV for the combined 4e, 4$ \mu $, and 2e2$ \mu $ decay channels. Points represent the data, vertical bars the statistical uncertainties, and shaded histograms represent the expected standard model predictions and reducible background estimated from data. The gray band represents the systematic uncertainties in the predictions, which includes systematic uncertainties associated with trigger efficiency, lepton efficiencies, jet energy correction and jet energy resolution, pileup, luminosity, Monte Carlo generator choice, $ \mathrm{g}\mathrm{g} \! \to \! \mathrm{Z}\mathrm{Z} $ cross section, and reducible background. The overflow is included in the last bin of the distributions. |
png pdf |
Figure 2-b:
Distribution of the number of jets with $ p_{\mathrm{T}} > $ 30 GeV (left) and of $ m_{\mathrm{Z}\mathrm{Z}} $ (right) for ZZ+jets events with 60 $ < m_{\mathrm{Z}_1, \mathrm{Z}_2} < $ 120 GeV for the combined 4e, 4$ \mu $, and 2e2$ \mu $ decay channels. Points represent the data, vertical bars the statistical uncertainties, and shaded histograms represent the expected standard model predictions and reducible background estimated from data. The gray band represents the systematic uncertainties in the predictions, which includes systematic uncertainties associated with trigger efficiency, lepton efficiencies, jet energy correction and jet energy resolution, pileup, luminosity, Monte Carlo generator choice, $ \mathrm{g}\mathrm{g} \! \to \! \mathrm{Z}\mathrm{Z} $ cross section, and reducible background. The overflow is included in the last bin of the distributions. |
png pdf |
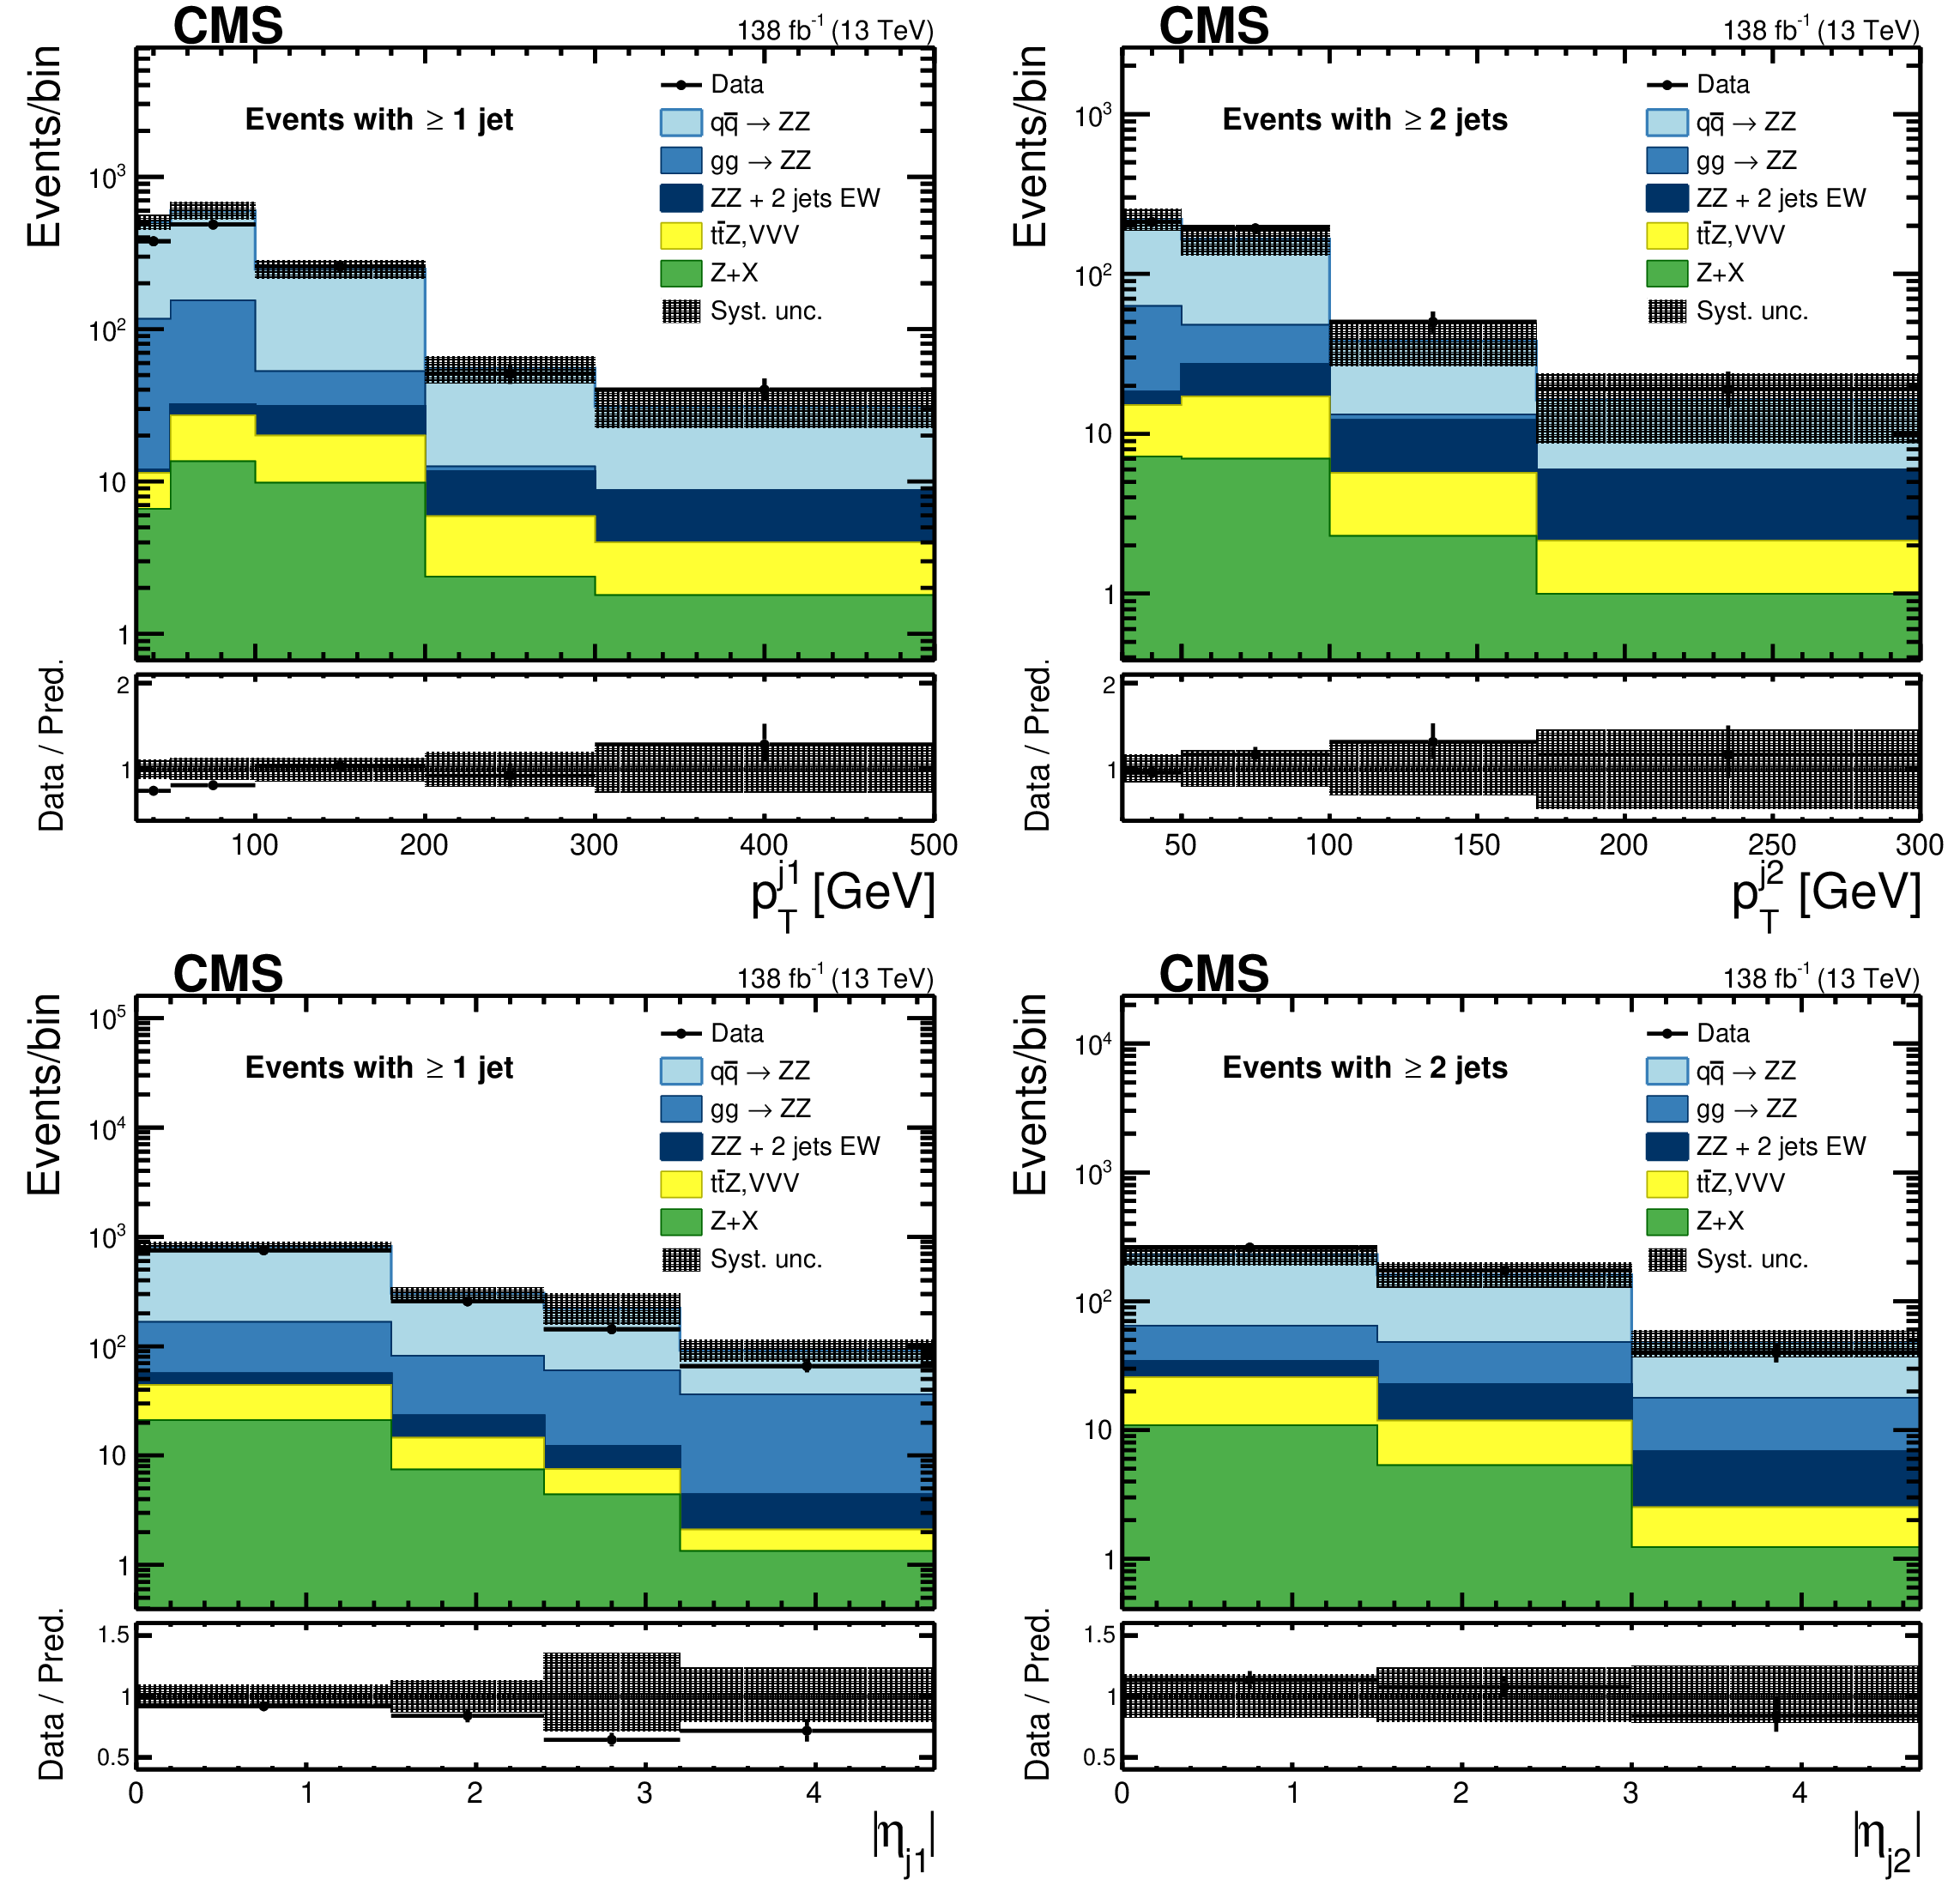
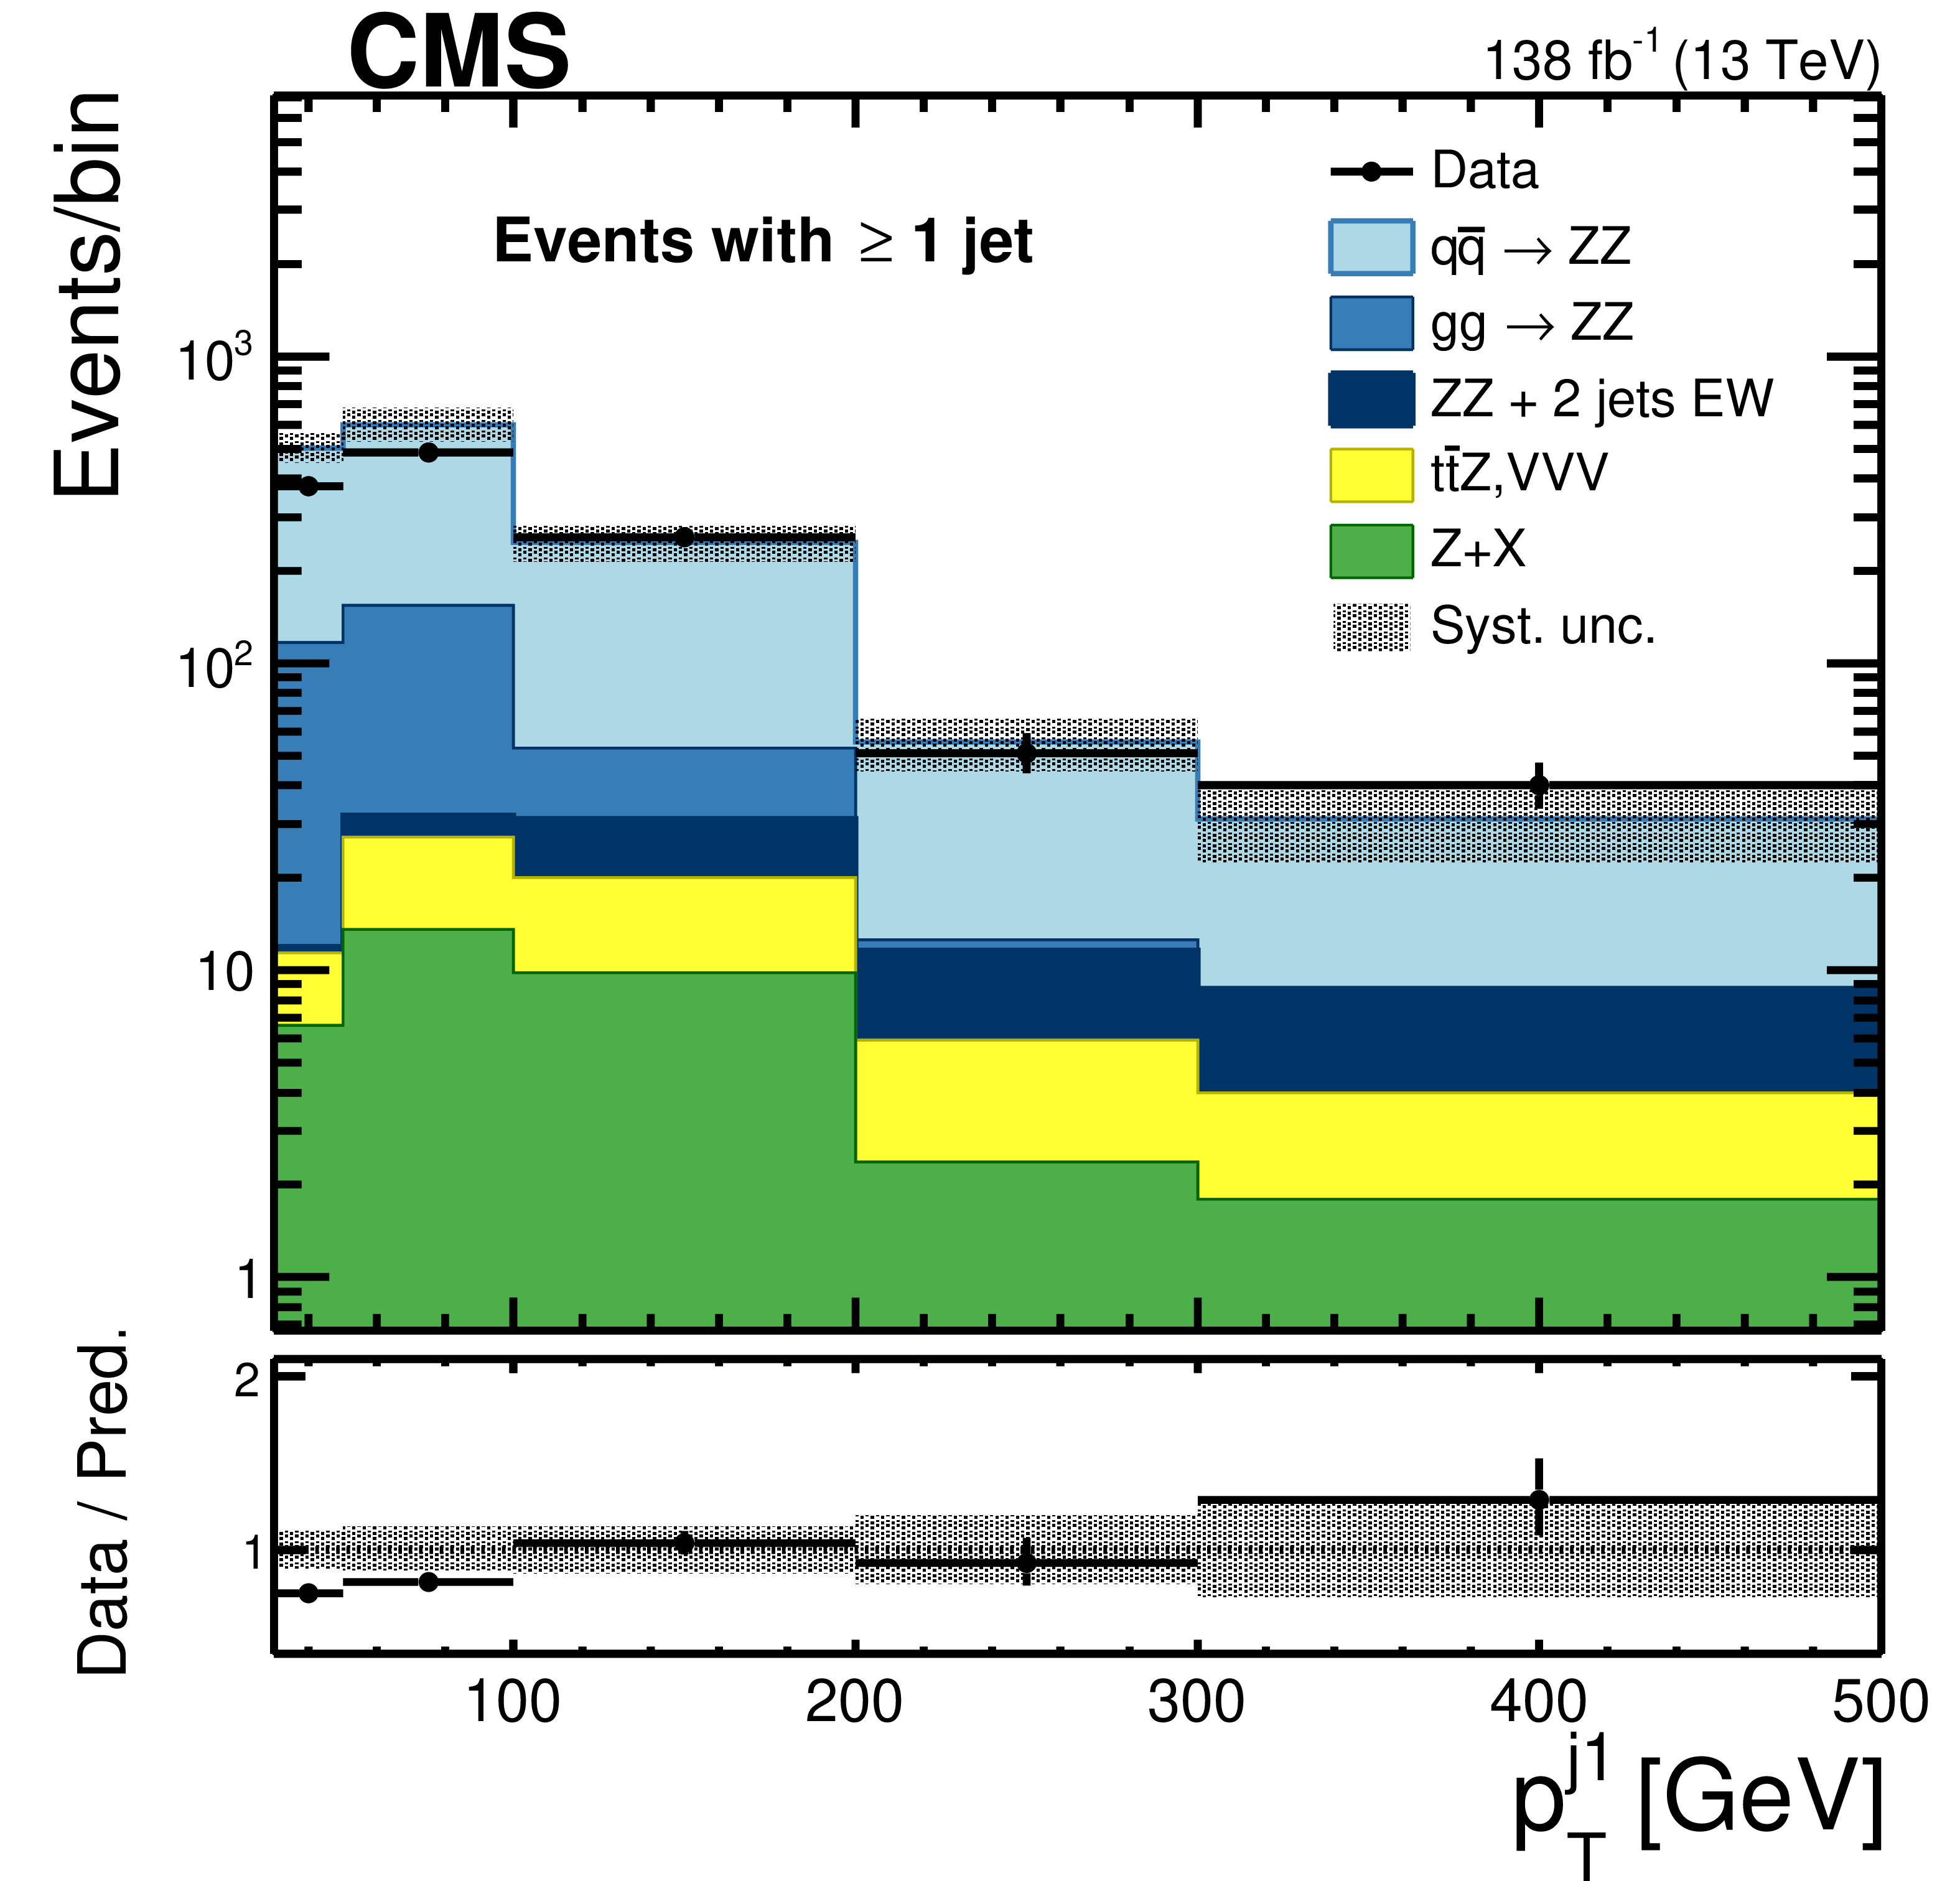
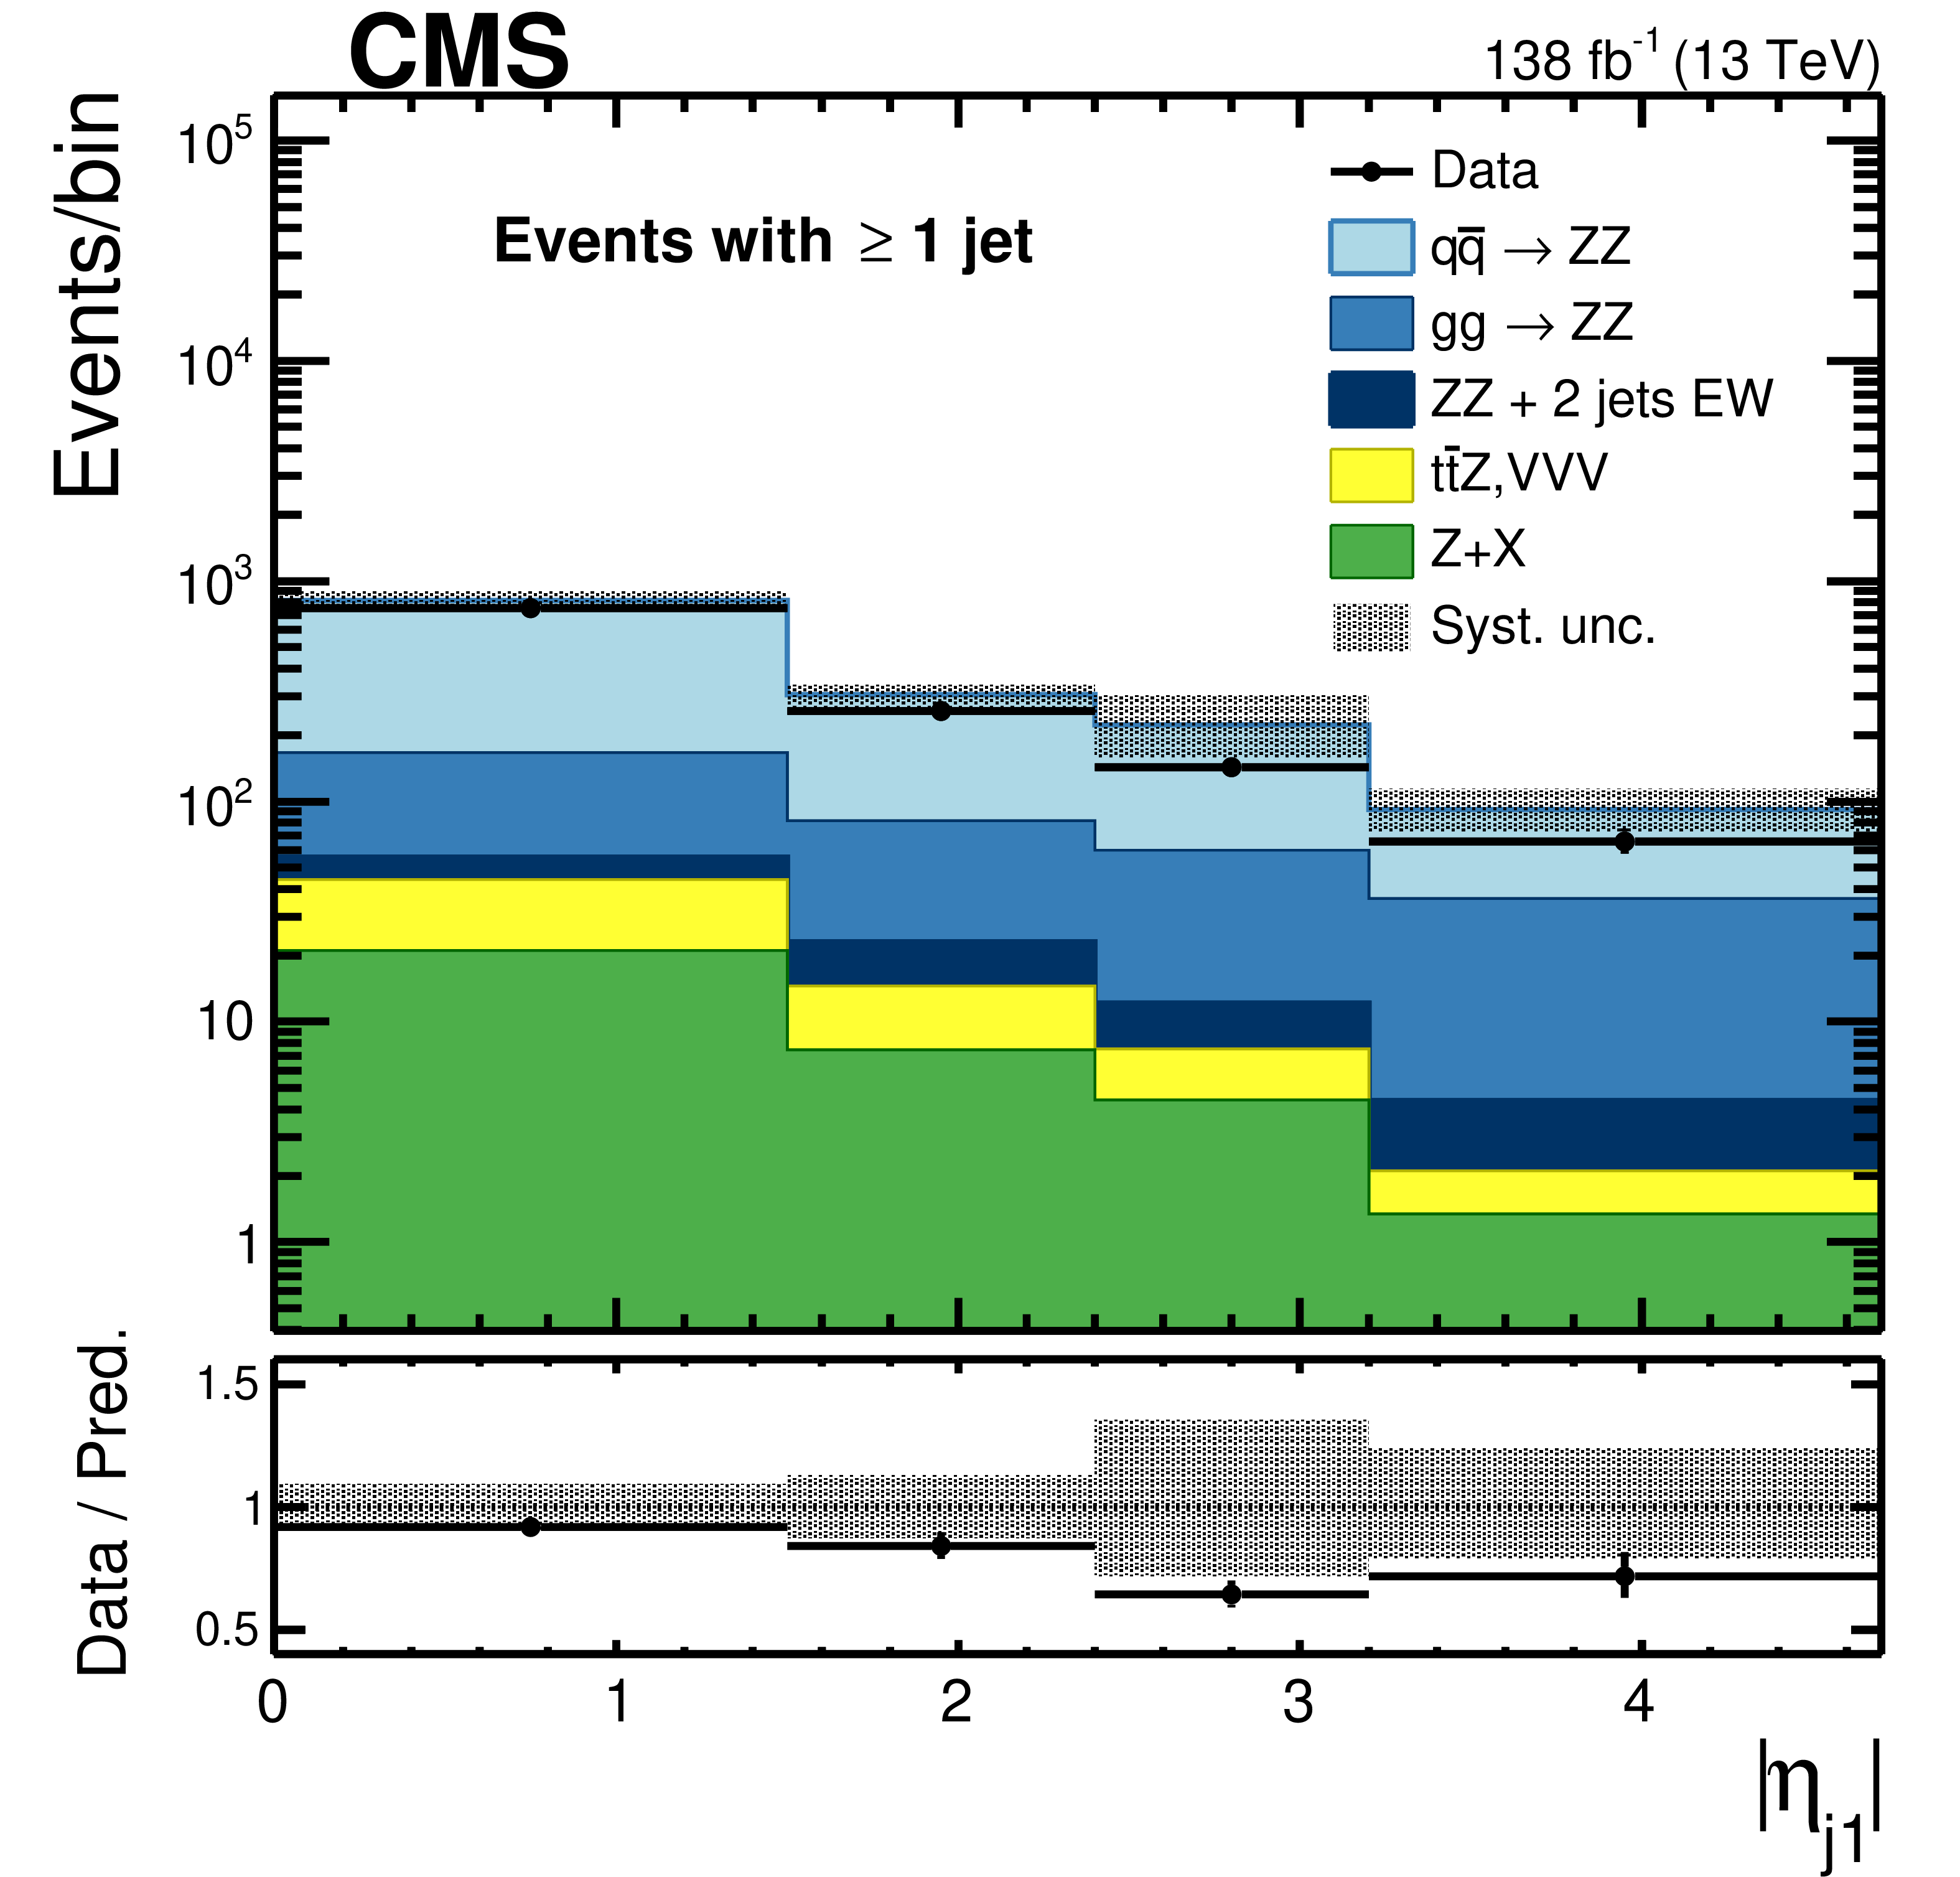
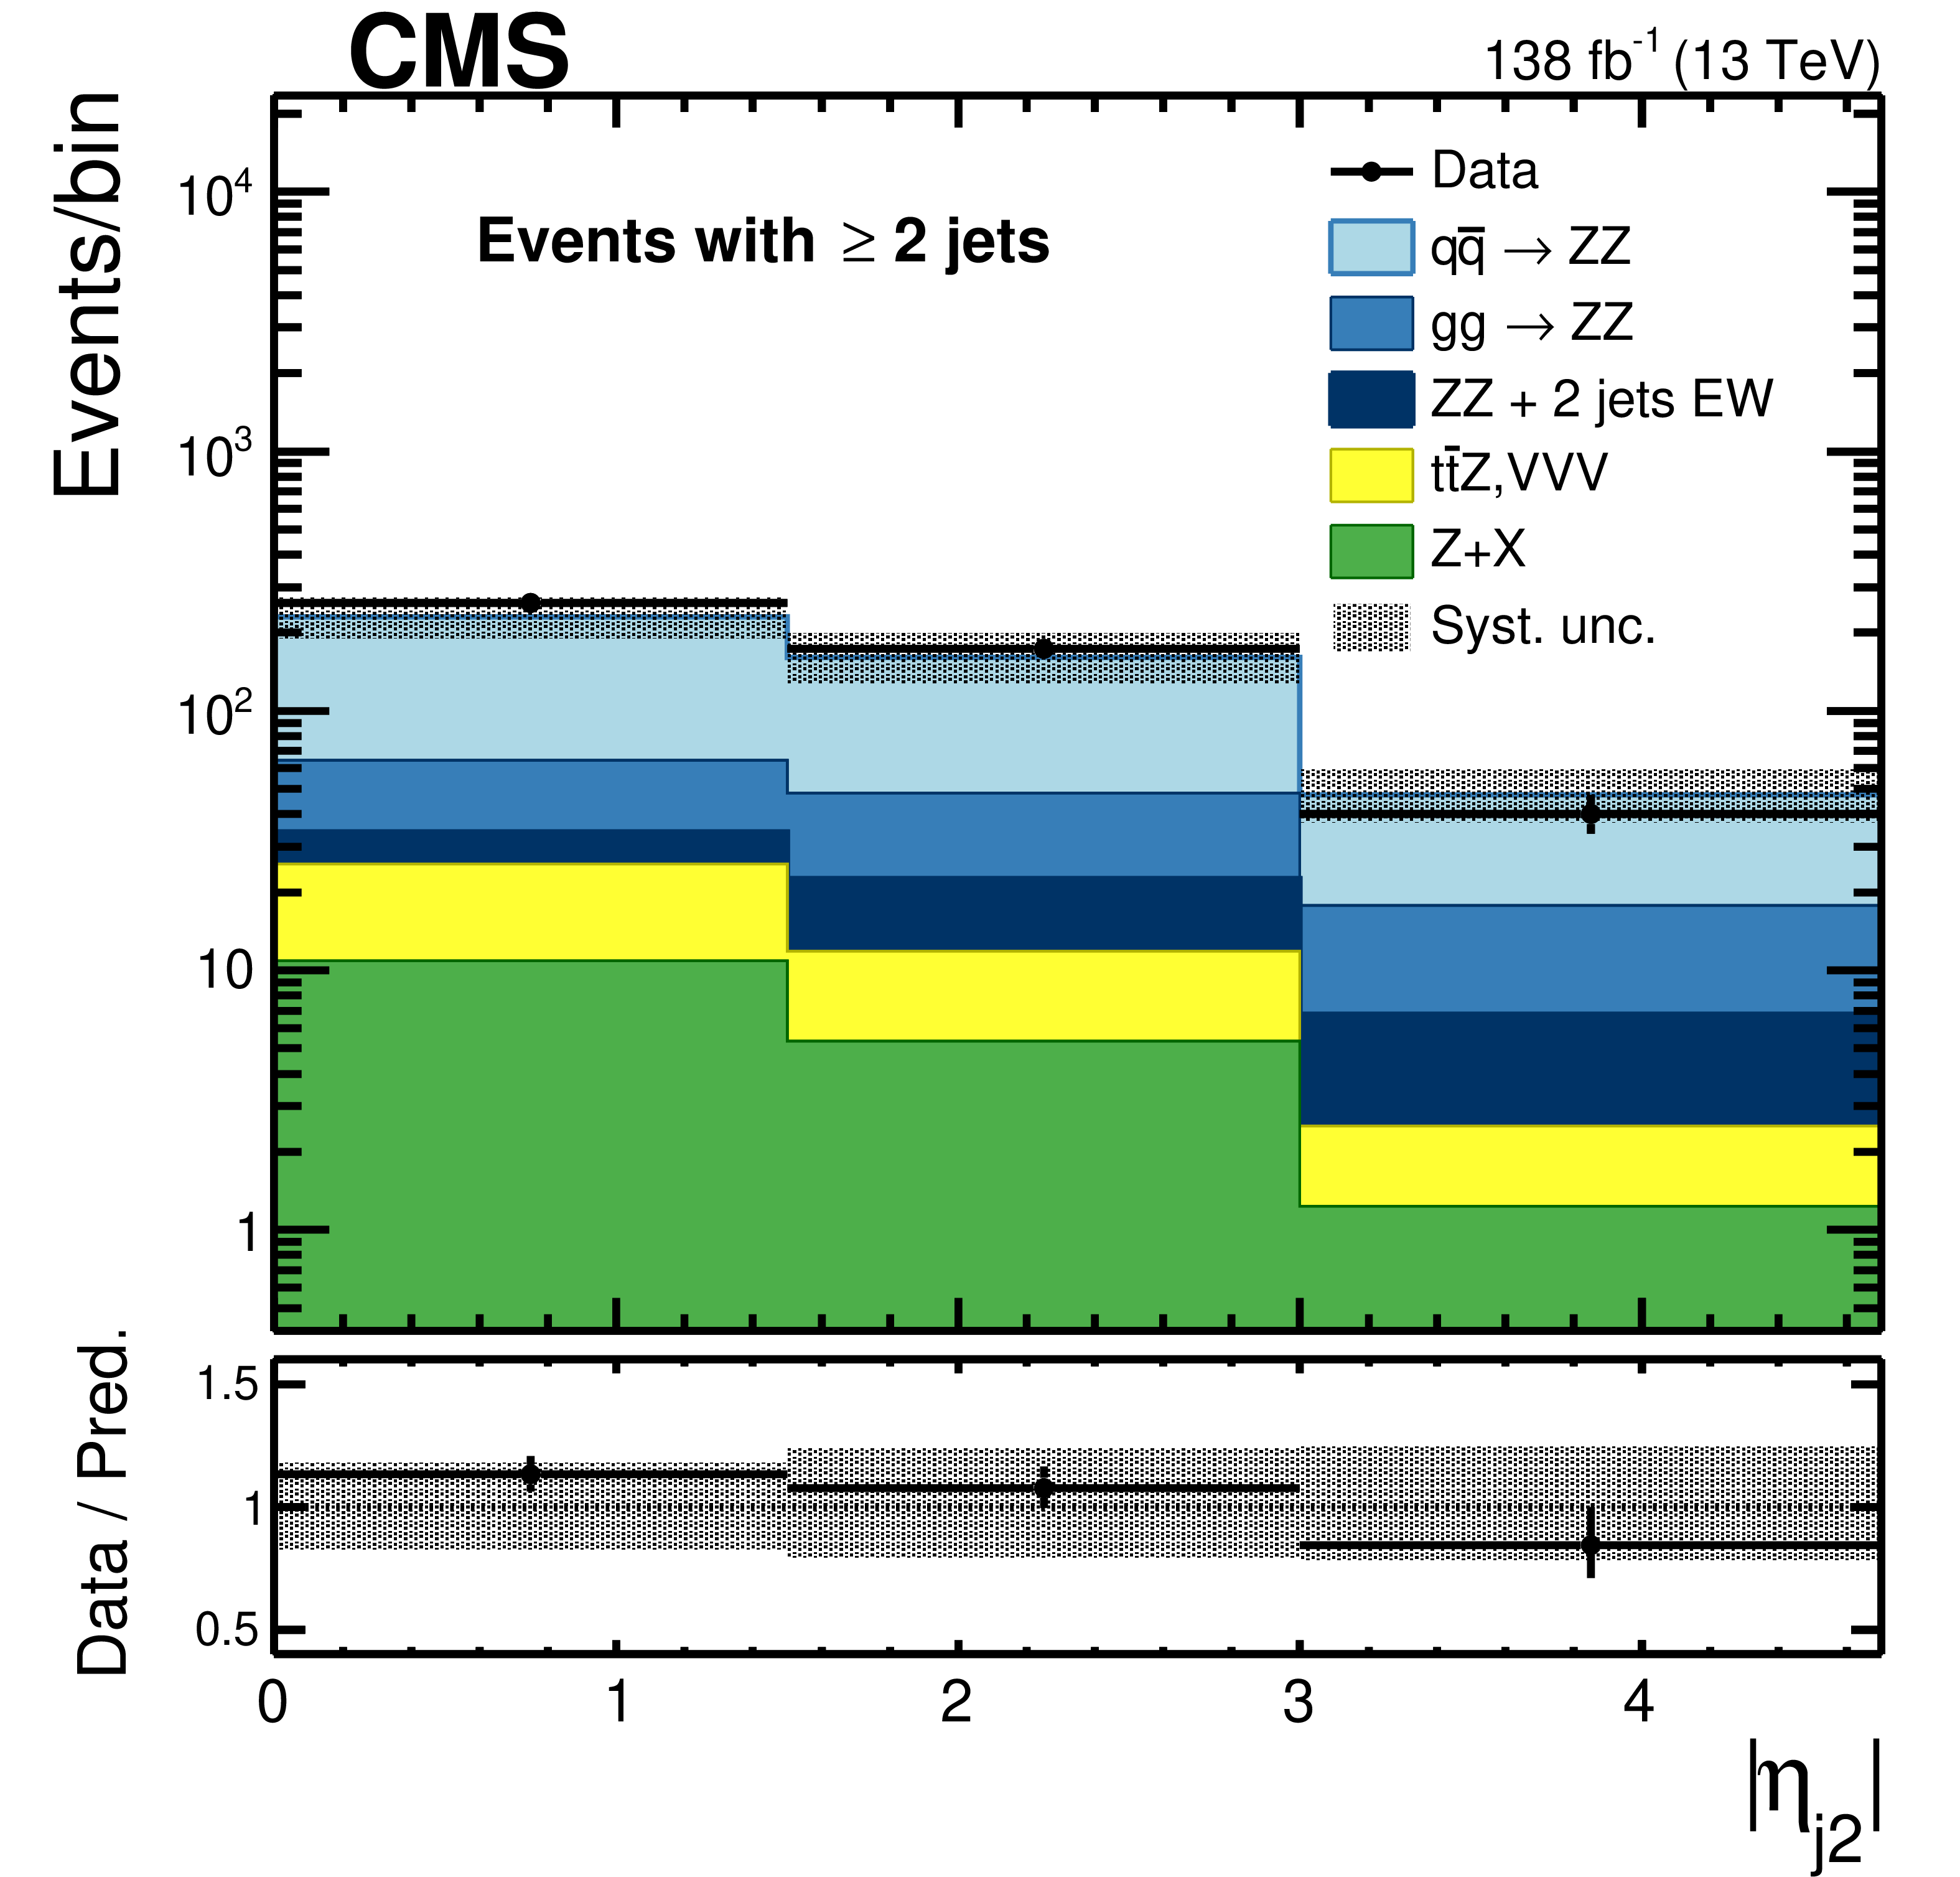
Figure 3:
Distribution of the $ p_{\mathrm{T}} $ of the highest-$ p_{\mathrm{T}} $ jet (upper left) in events with at least one jet, and of the $ p_{\mathrm{T}} $ of the second-highest-$ p_{\mathrm{T}} $ jet (upper right) in events containing at least two jets. The $ |\eta| $ distribution of the highest-$ p_{\mathrm{T}} $ (lower left) and second-highest-$ p_{\mathrm{T}} $ (lower right) jets. Events are required to have 60 $ < m_{\mathrm{Z}_1, \mathrm{Z}_2} < $ 120 GeV. Other details are as in the caption of Fig. 2. |
png pdf |
Figure 3-a:
Distribution of the $ p_{\mathrm{T}} $ of the highest-$ p_{\mathrm{T}} $ jet (upper left) in events with at least one jet, and of the $ p_{\mathrm{T}} $ of the second-highest-$ p_{\mathrm{T}} $ jet (upper right) in events containing at least two jets. The $ |\eta| $ distribution of the highest-$ p_{\mathrm{T}} $ (lower left) and second-highest-$ p_{\mathrm{T}} $ (lower right) jets. Events are required to have 60 $ < m_{\mathrm{Z}_1, \mathrm{Z}_2} < $ 120 GeV. Other details are as in the caption of Fig. 2. |

png pdf |
Figure 3-b:
Distribution of the $ p_{\mathrm{T}} $ of the highest-$ p_{\mathrm{T}} $ jet (upper left) in events with at least one jet, and of the $ p_{\mathrm{T}} $ of the second-highest-$ p_{\mathrm{T}} $ jet (upper right) in events containing at least two jets. The $ |\eta| $ distribution of the highest-$ p_{\mathrm{T}} $ (lower left) and second-highest-$ p_{\mathrm{T}} $ (lower right) jets. Events are required to have 60 $ < m_{\mathrm{Z}_1, \mathrm{Z}_2} < $ 120 GeV. Other details are as in the caption of Fig. 2. |
png pdf |
Figure 3-c:
Distribution of the $ p_{\mathrm{T}} $ of the highest-$ p_{\mathrm{T}} $ jet (upper left) in events with at least one jet, and of the $ p_{\mathrm{T}} $ of the second-highest-$ p_{\mathrm{T}} $ jet (upper right) in events containing at least two jets. The $ |\eta| $ distribution of the highest-$ p_{\mathrm{T}} $ (lower left) and second-highest-$ p_{\mathrm{T}} $ (lower right) jets. Events are required to have 60 $ < m_{\mathrm{Z}_1, \mathrm{Z}_2} < $ 120 GeV. Other details are as in the caption of Fig. 2. |
png pdf |
Figure 3-d:
Distribution of the $ p_{\mathrm{T}} $ of the highest-$ p_{\mathrm{T}} $ jet (upper left) in events with at least one jet, and of the $ p_{\mathrm{T}} $ of the second-highest-$ p_{\mathrm{T}} $ jet (upper right) in events containing at least two jets. The $ |\eta| $ distribution of the highest-$ p_{\mathrm{T}} $ (lower left) and second-highest-$ p_{\mathrm{T}} $ (lower right) jets. Events are required to have 60 $ < m_{\mathrm{Z}_1, \mathrm{Z}_2} < $ 120 GeV. Other details are as in the caption of Fig. 2. |
png pdf |
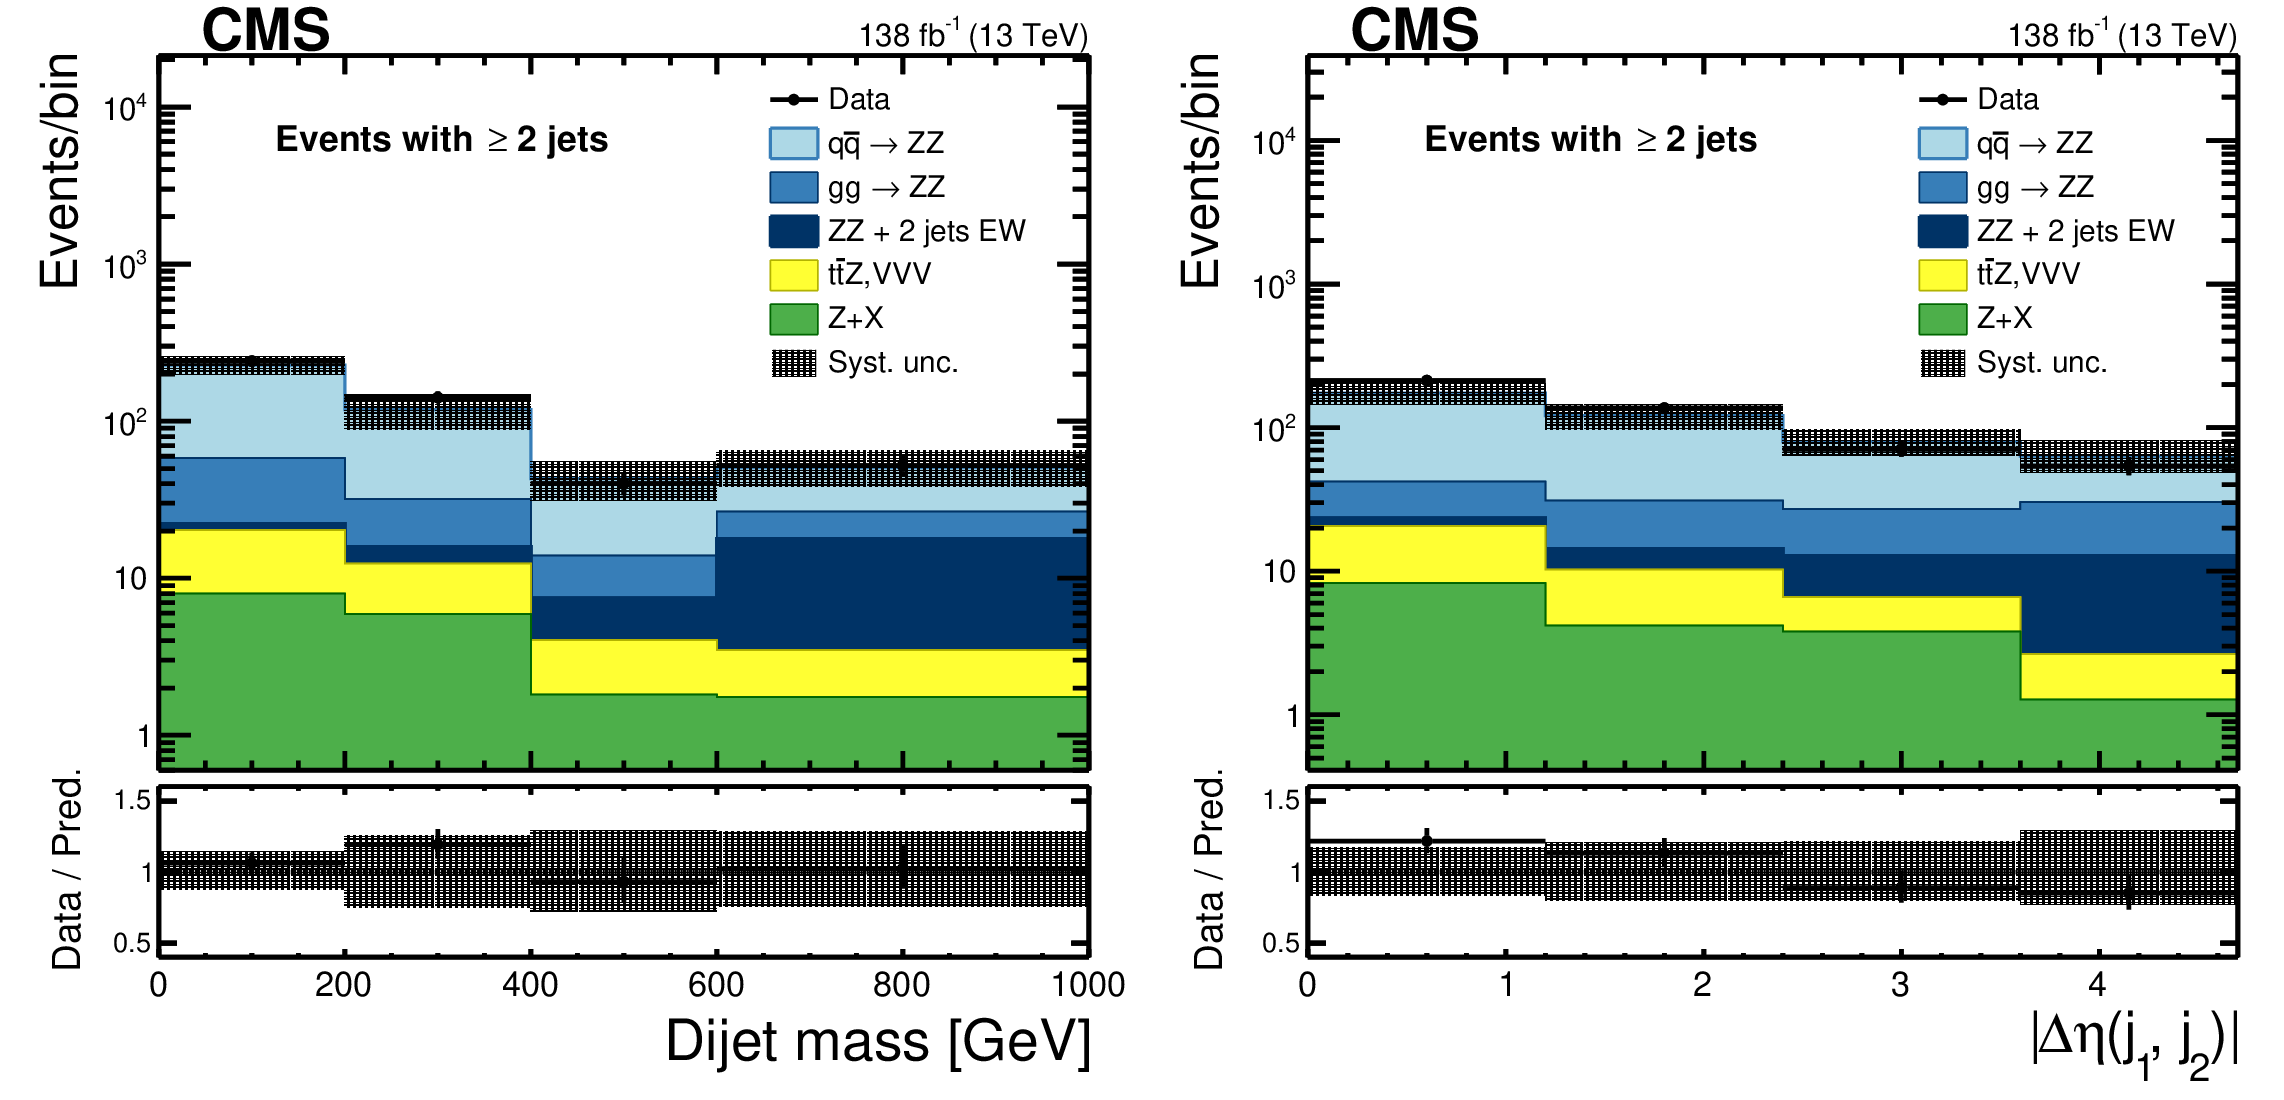
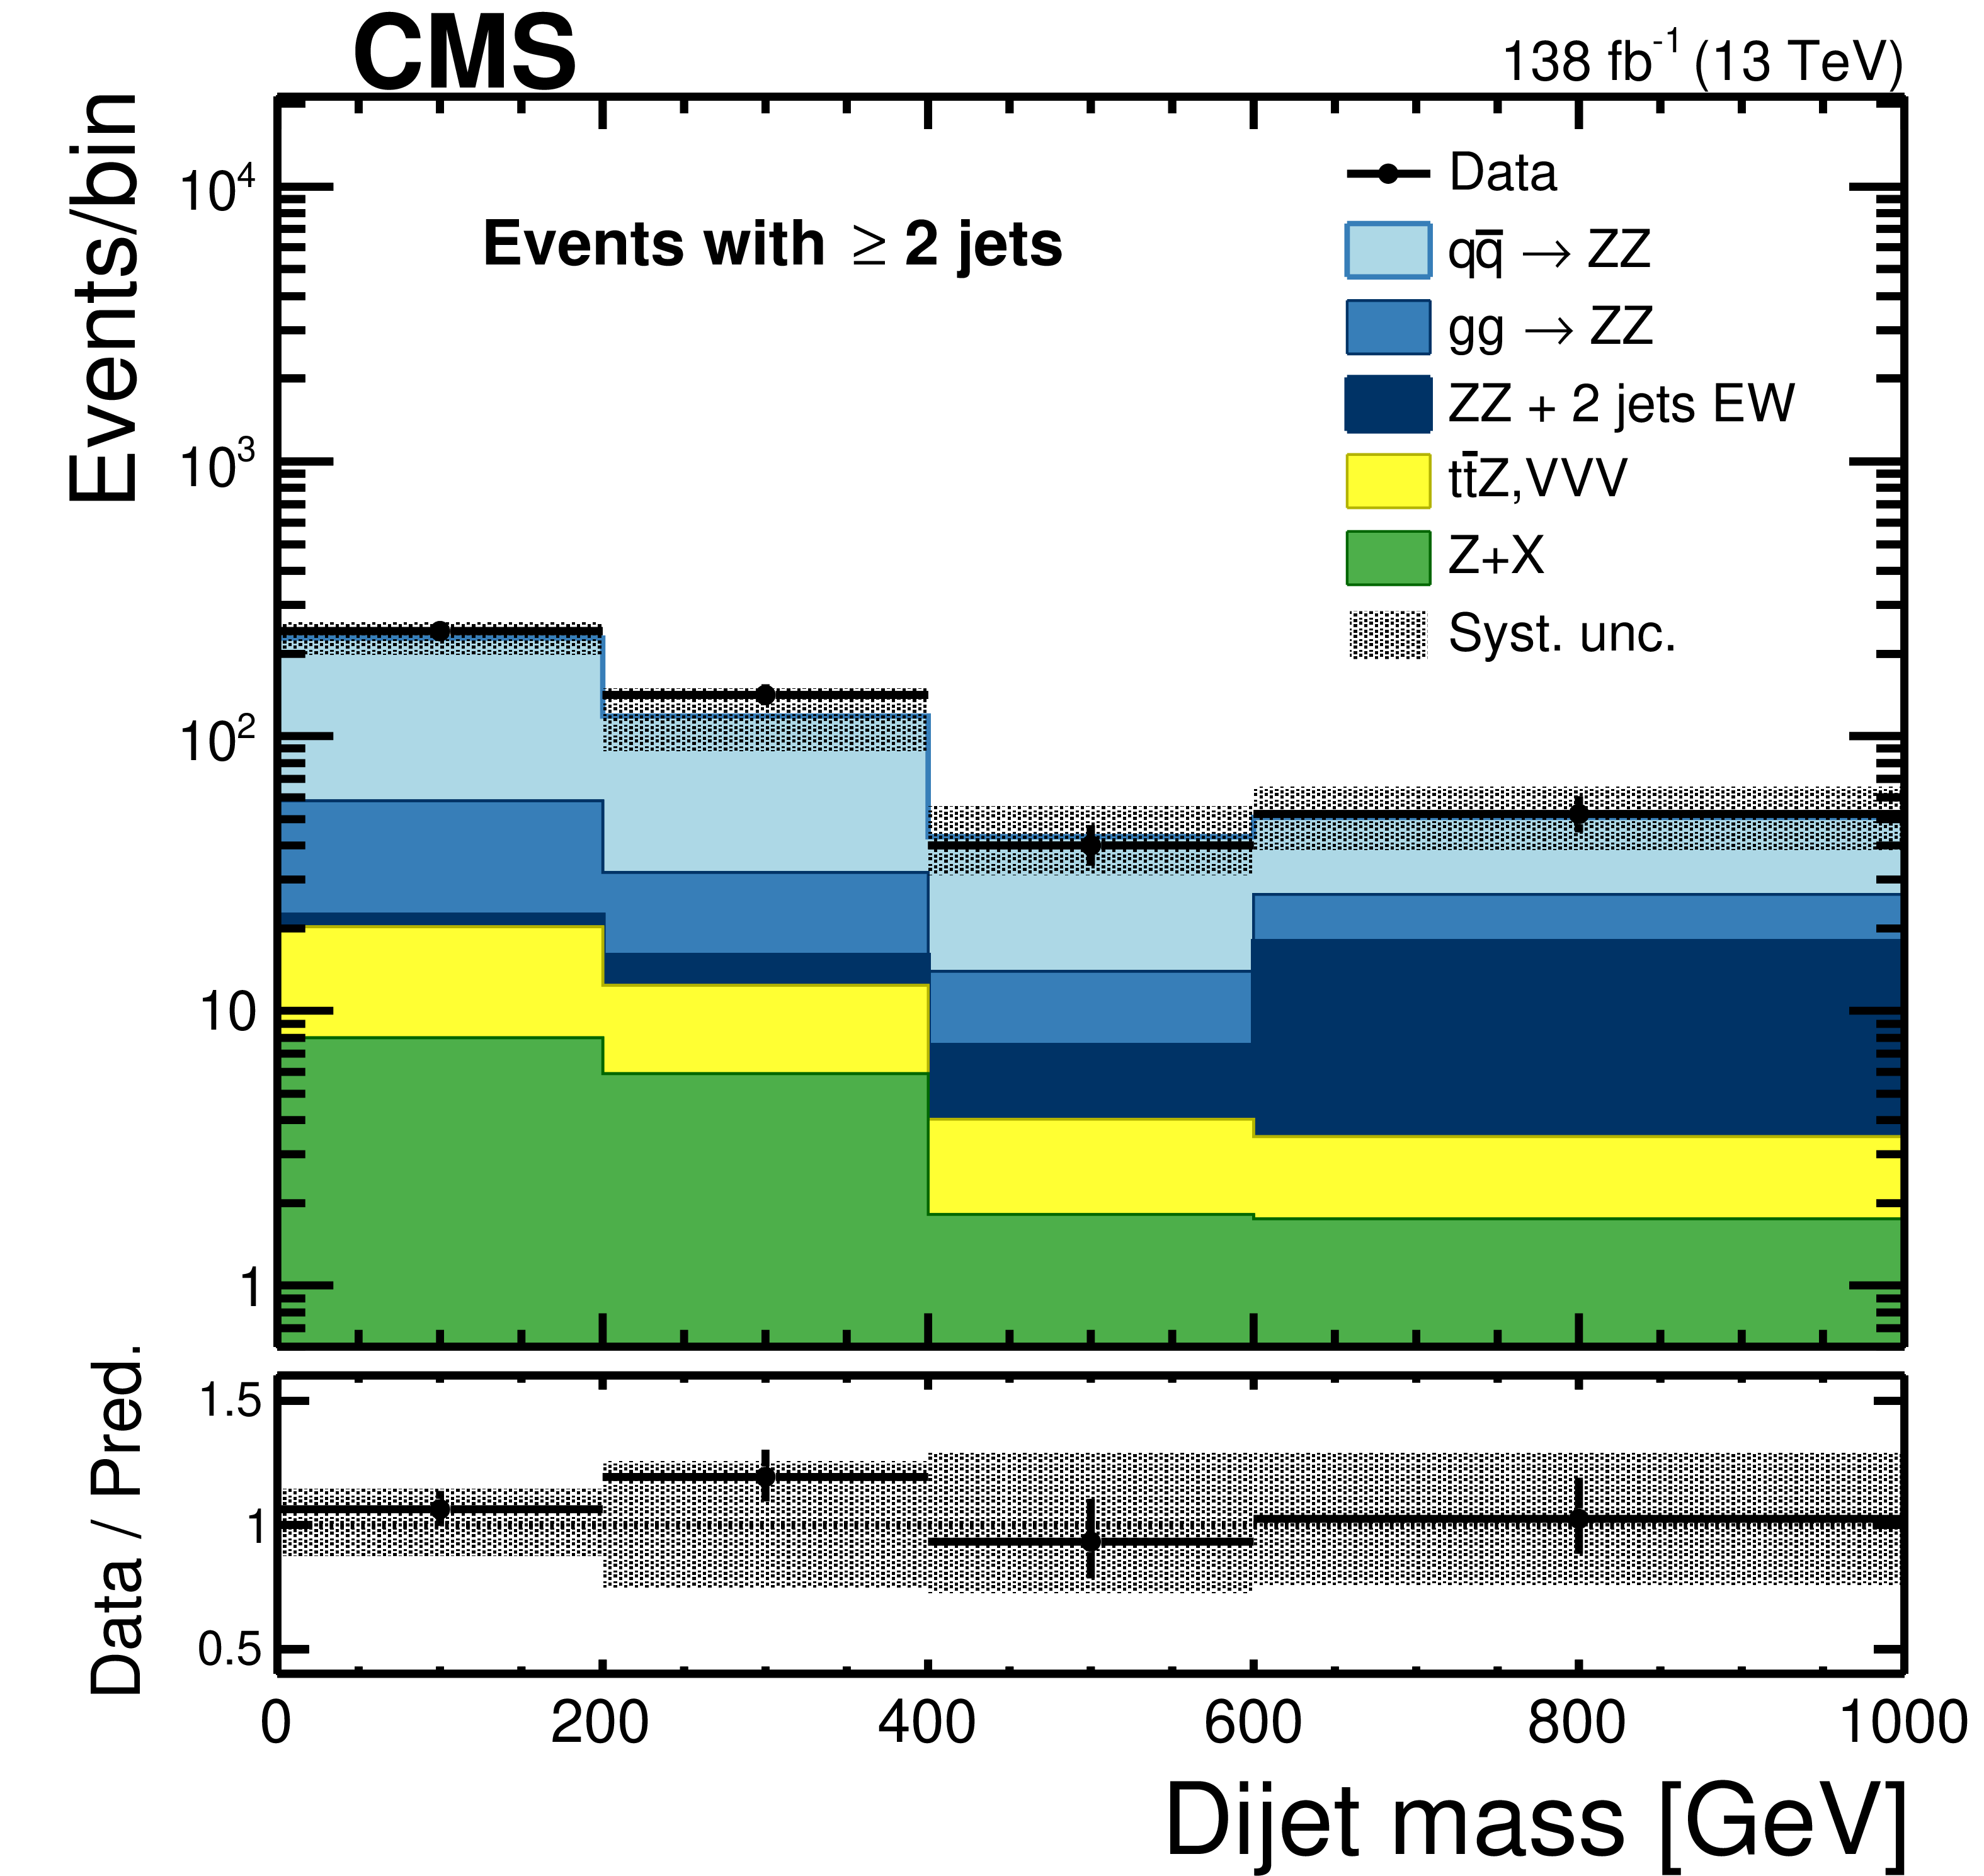
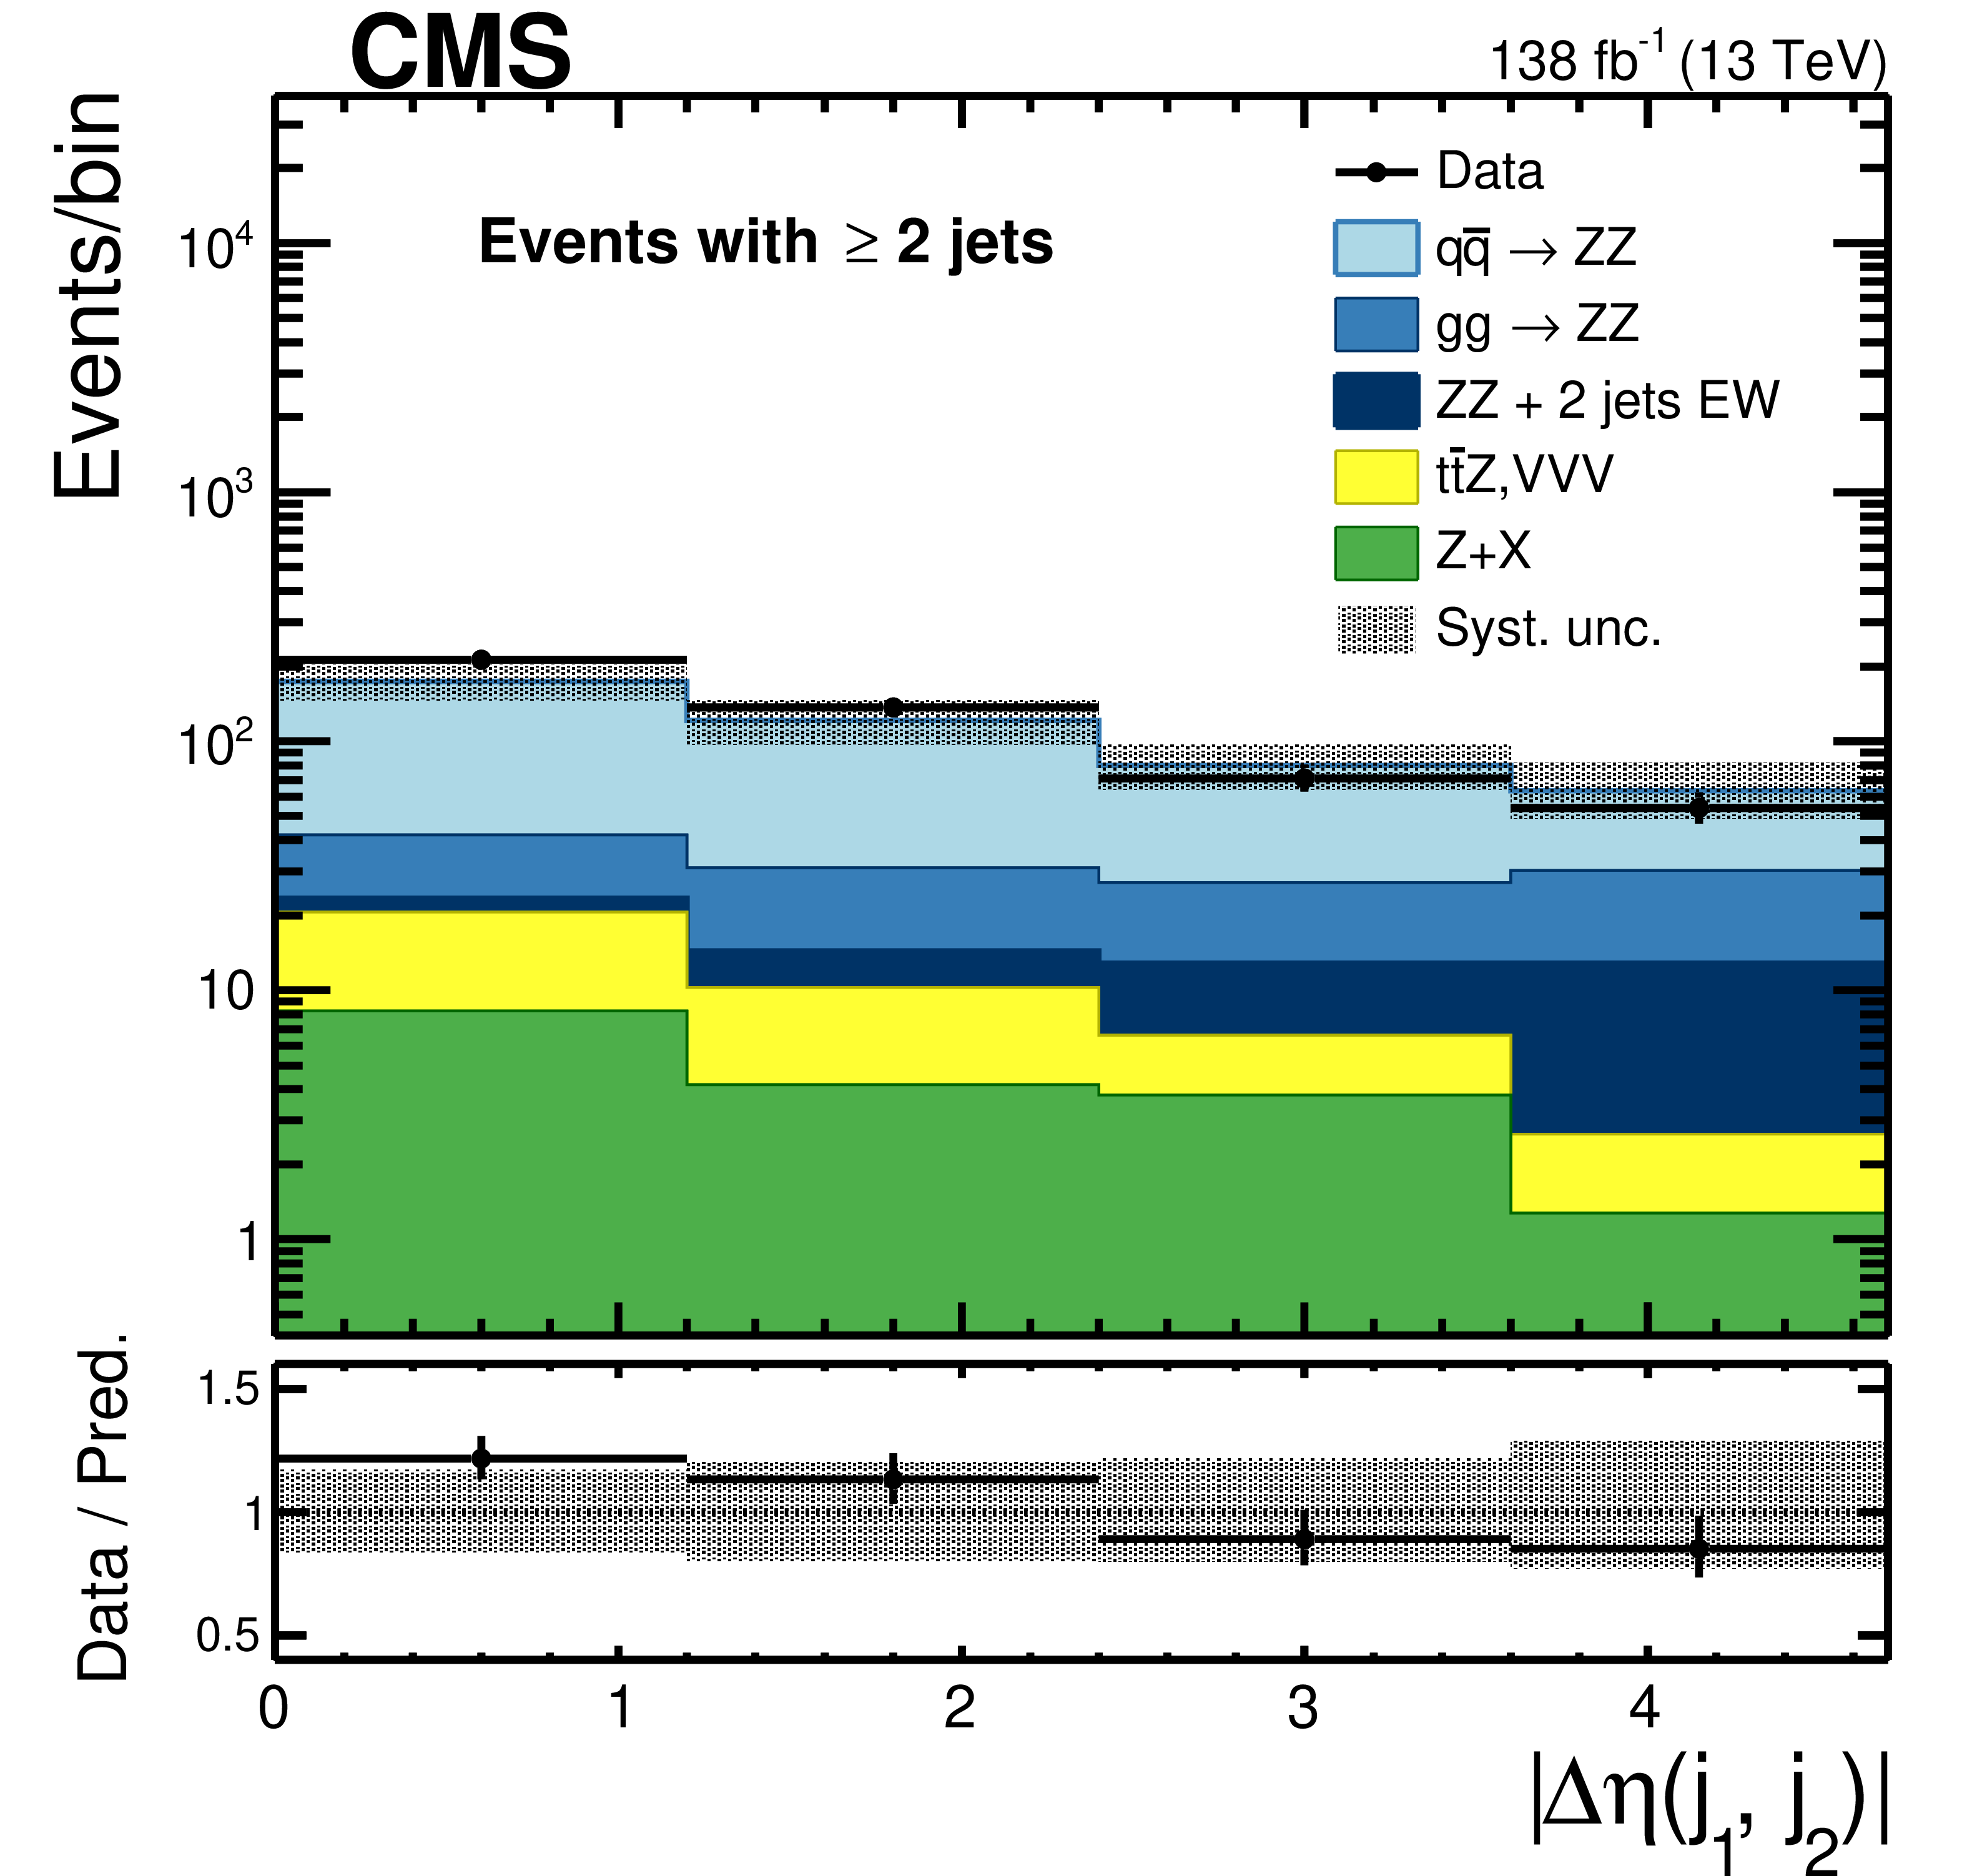
Figure 4:
The dijet mass (left) and $ |\Delta \eta| $ (right) between the two highest-$ p_{\mathrm{T}} $ jets in events with at least two jets. Events are required to have 60 $ < m_{\mathrm{Z}_1, \mathrm{Z}_2} < $ 120 GeV. Other details are as in the caption of Fig. 2. |
png pdf |
Figure 4-a:
The dijet mass (left) and $ |\Delta \eta| $ (right) between the two highest-$ p_{\mathrm{T}} $ jets in events with at least two jets. Events are required to have 60 $ < m_{\mathrm{Z}_1, \mathrm{Z}_2} < $ 120 GeV. Other details are as in the caption of Fig. 2. |
png pdf |
Figure 4-b:
The dijet mass (left) and $ |\Delta \eta| $ (right) between the two highest-$ p_{\mathrm{T}} $ jets in events with at least two jets. Events are required to have 60 $ < m_{\mathrm{Z}_1, \mathrm{Z}_2} < $ 120 GeV. Other details are as in the caption of Fig. 2. |
png pdf |
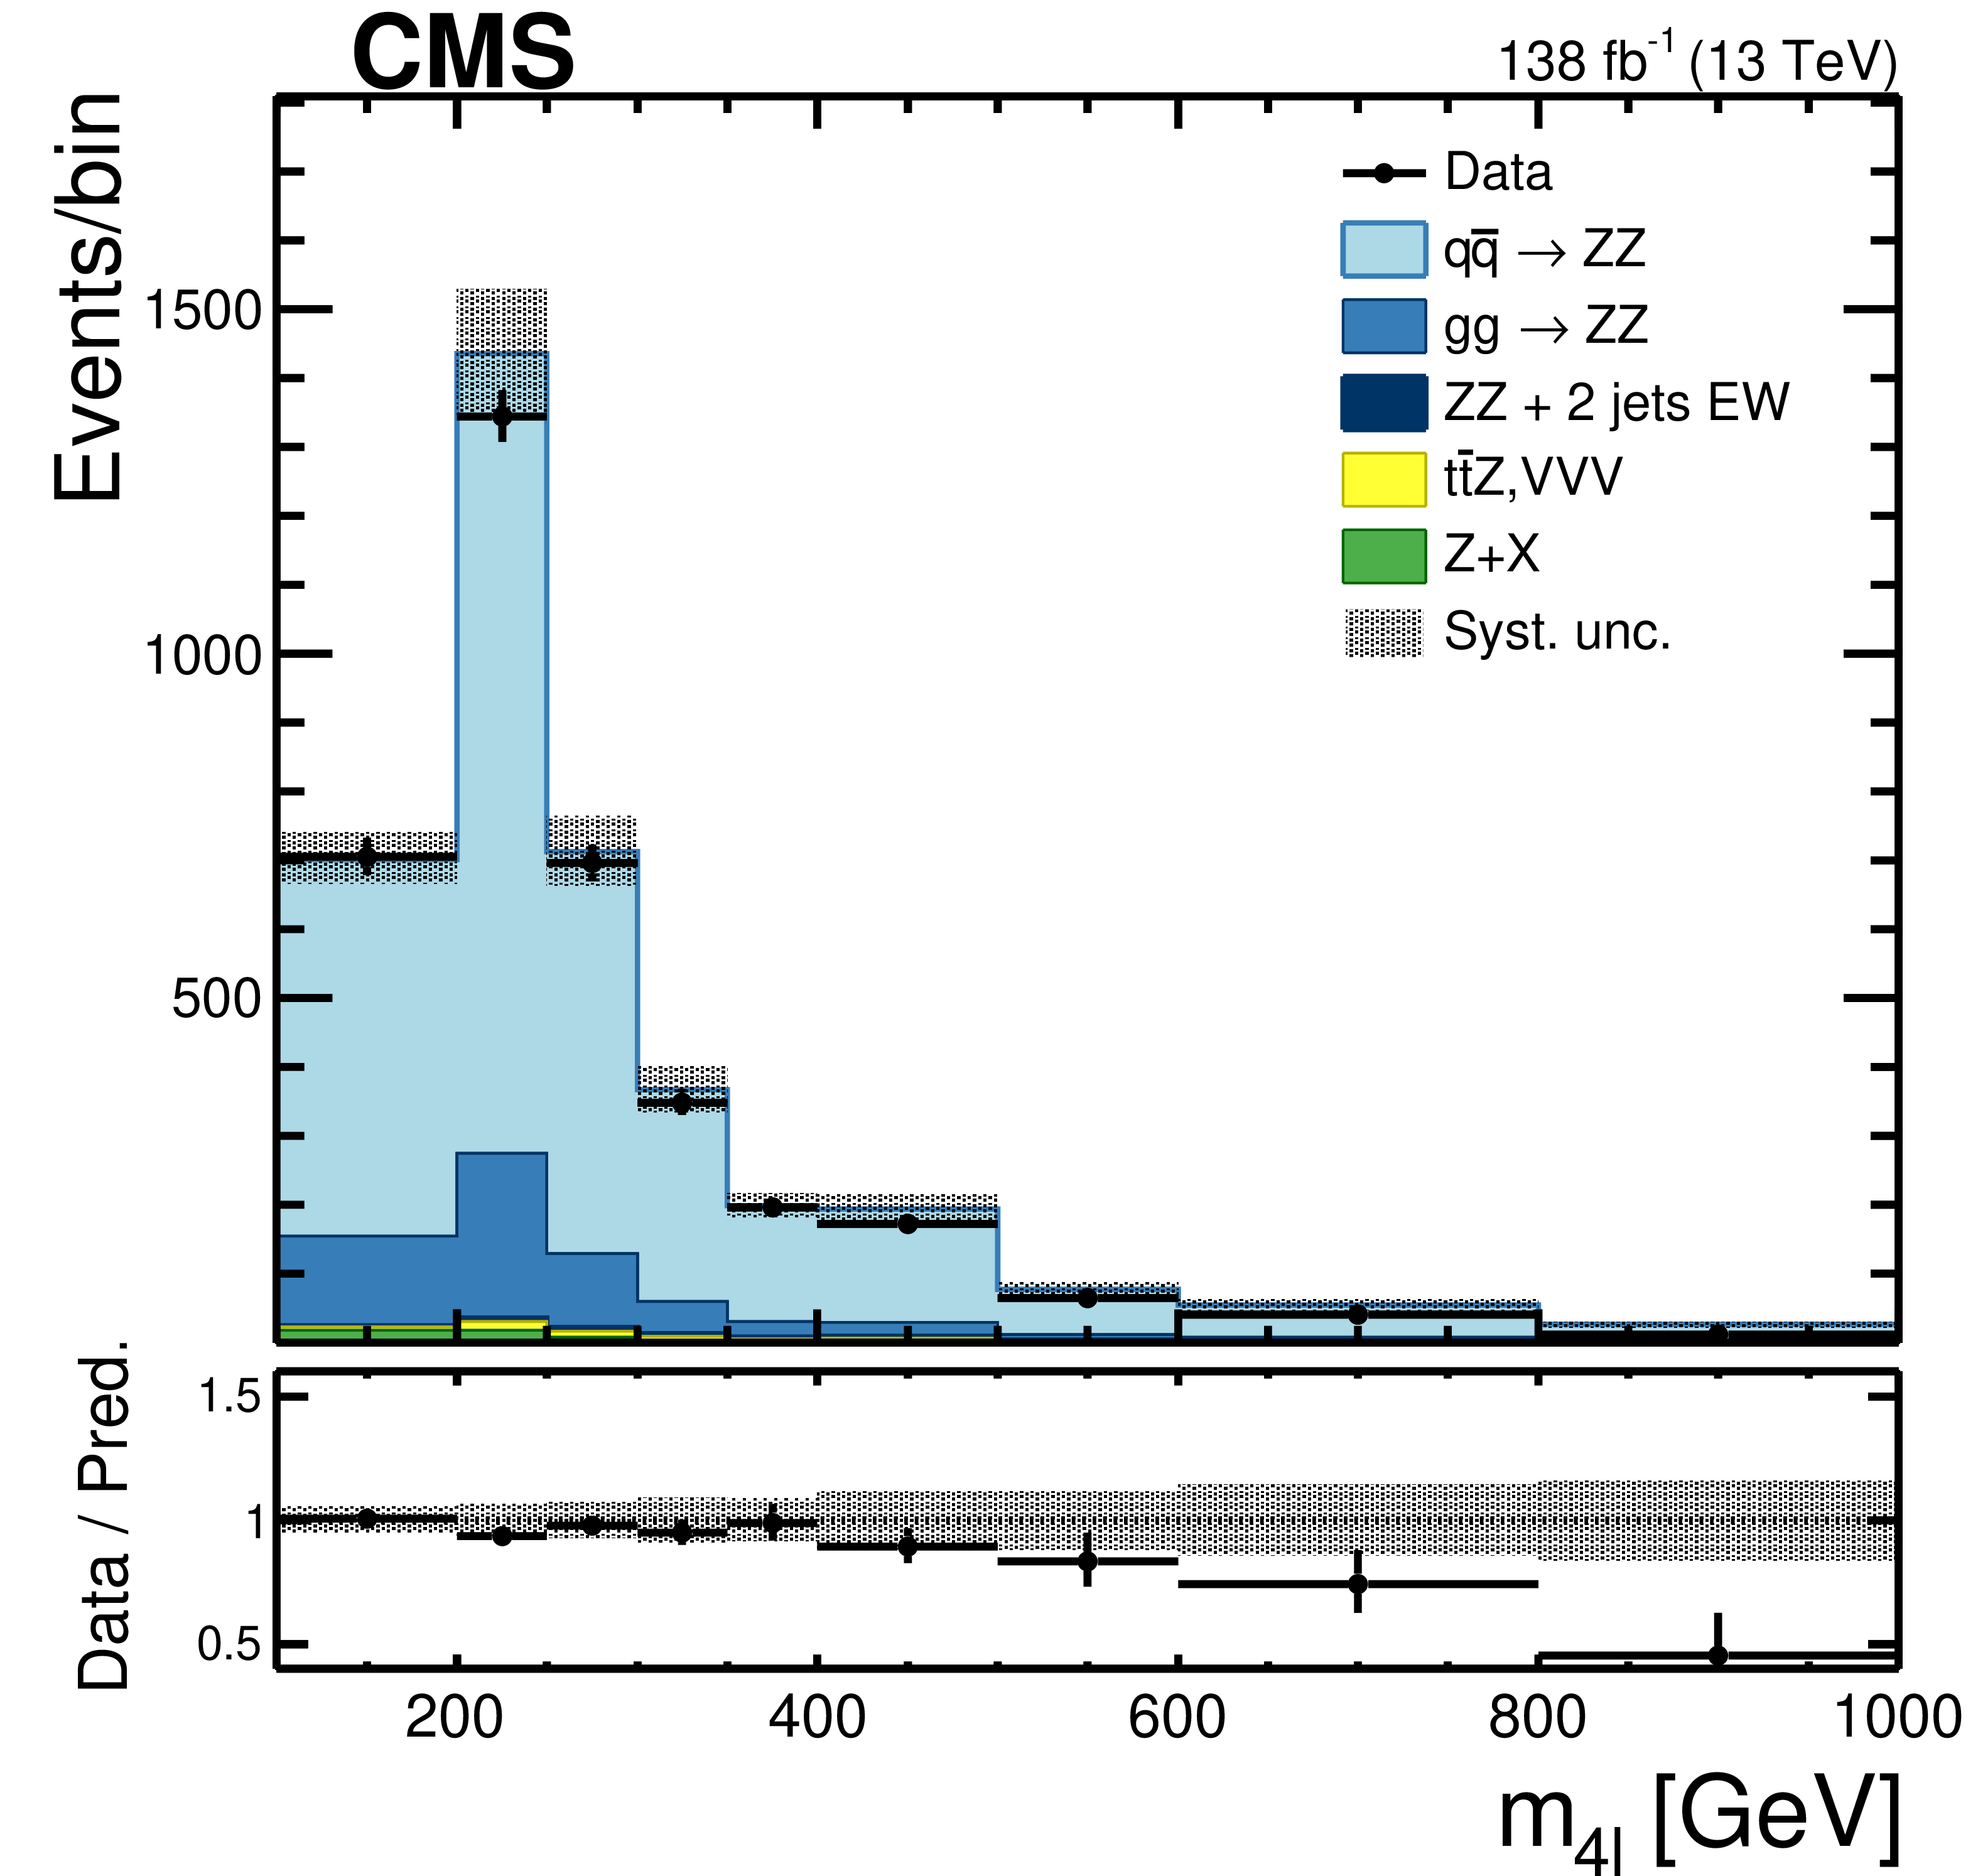
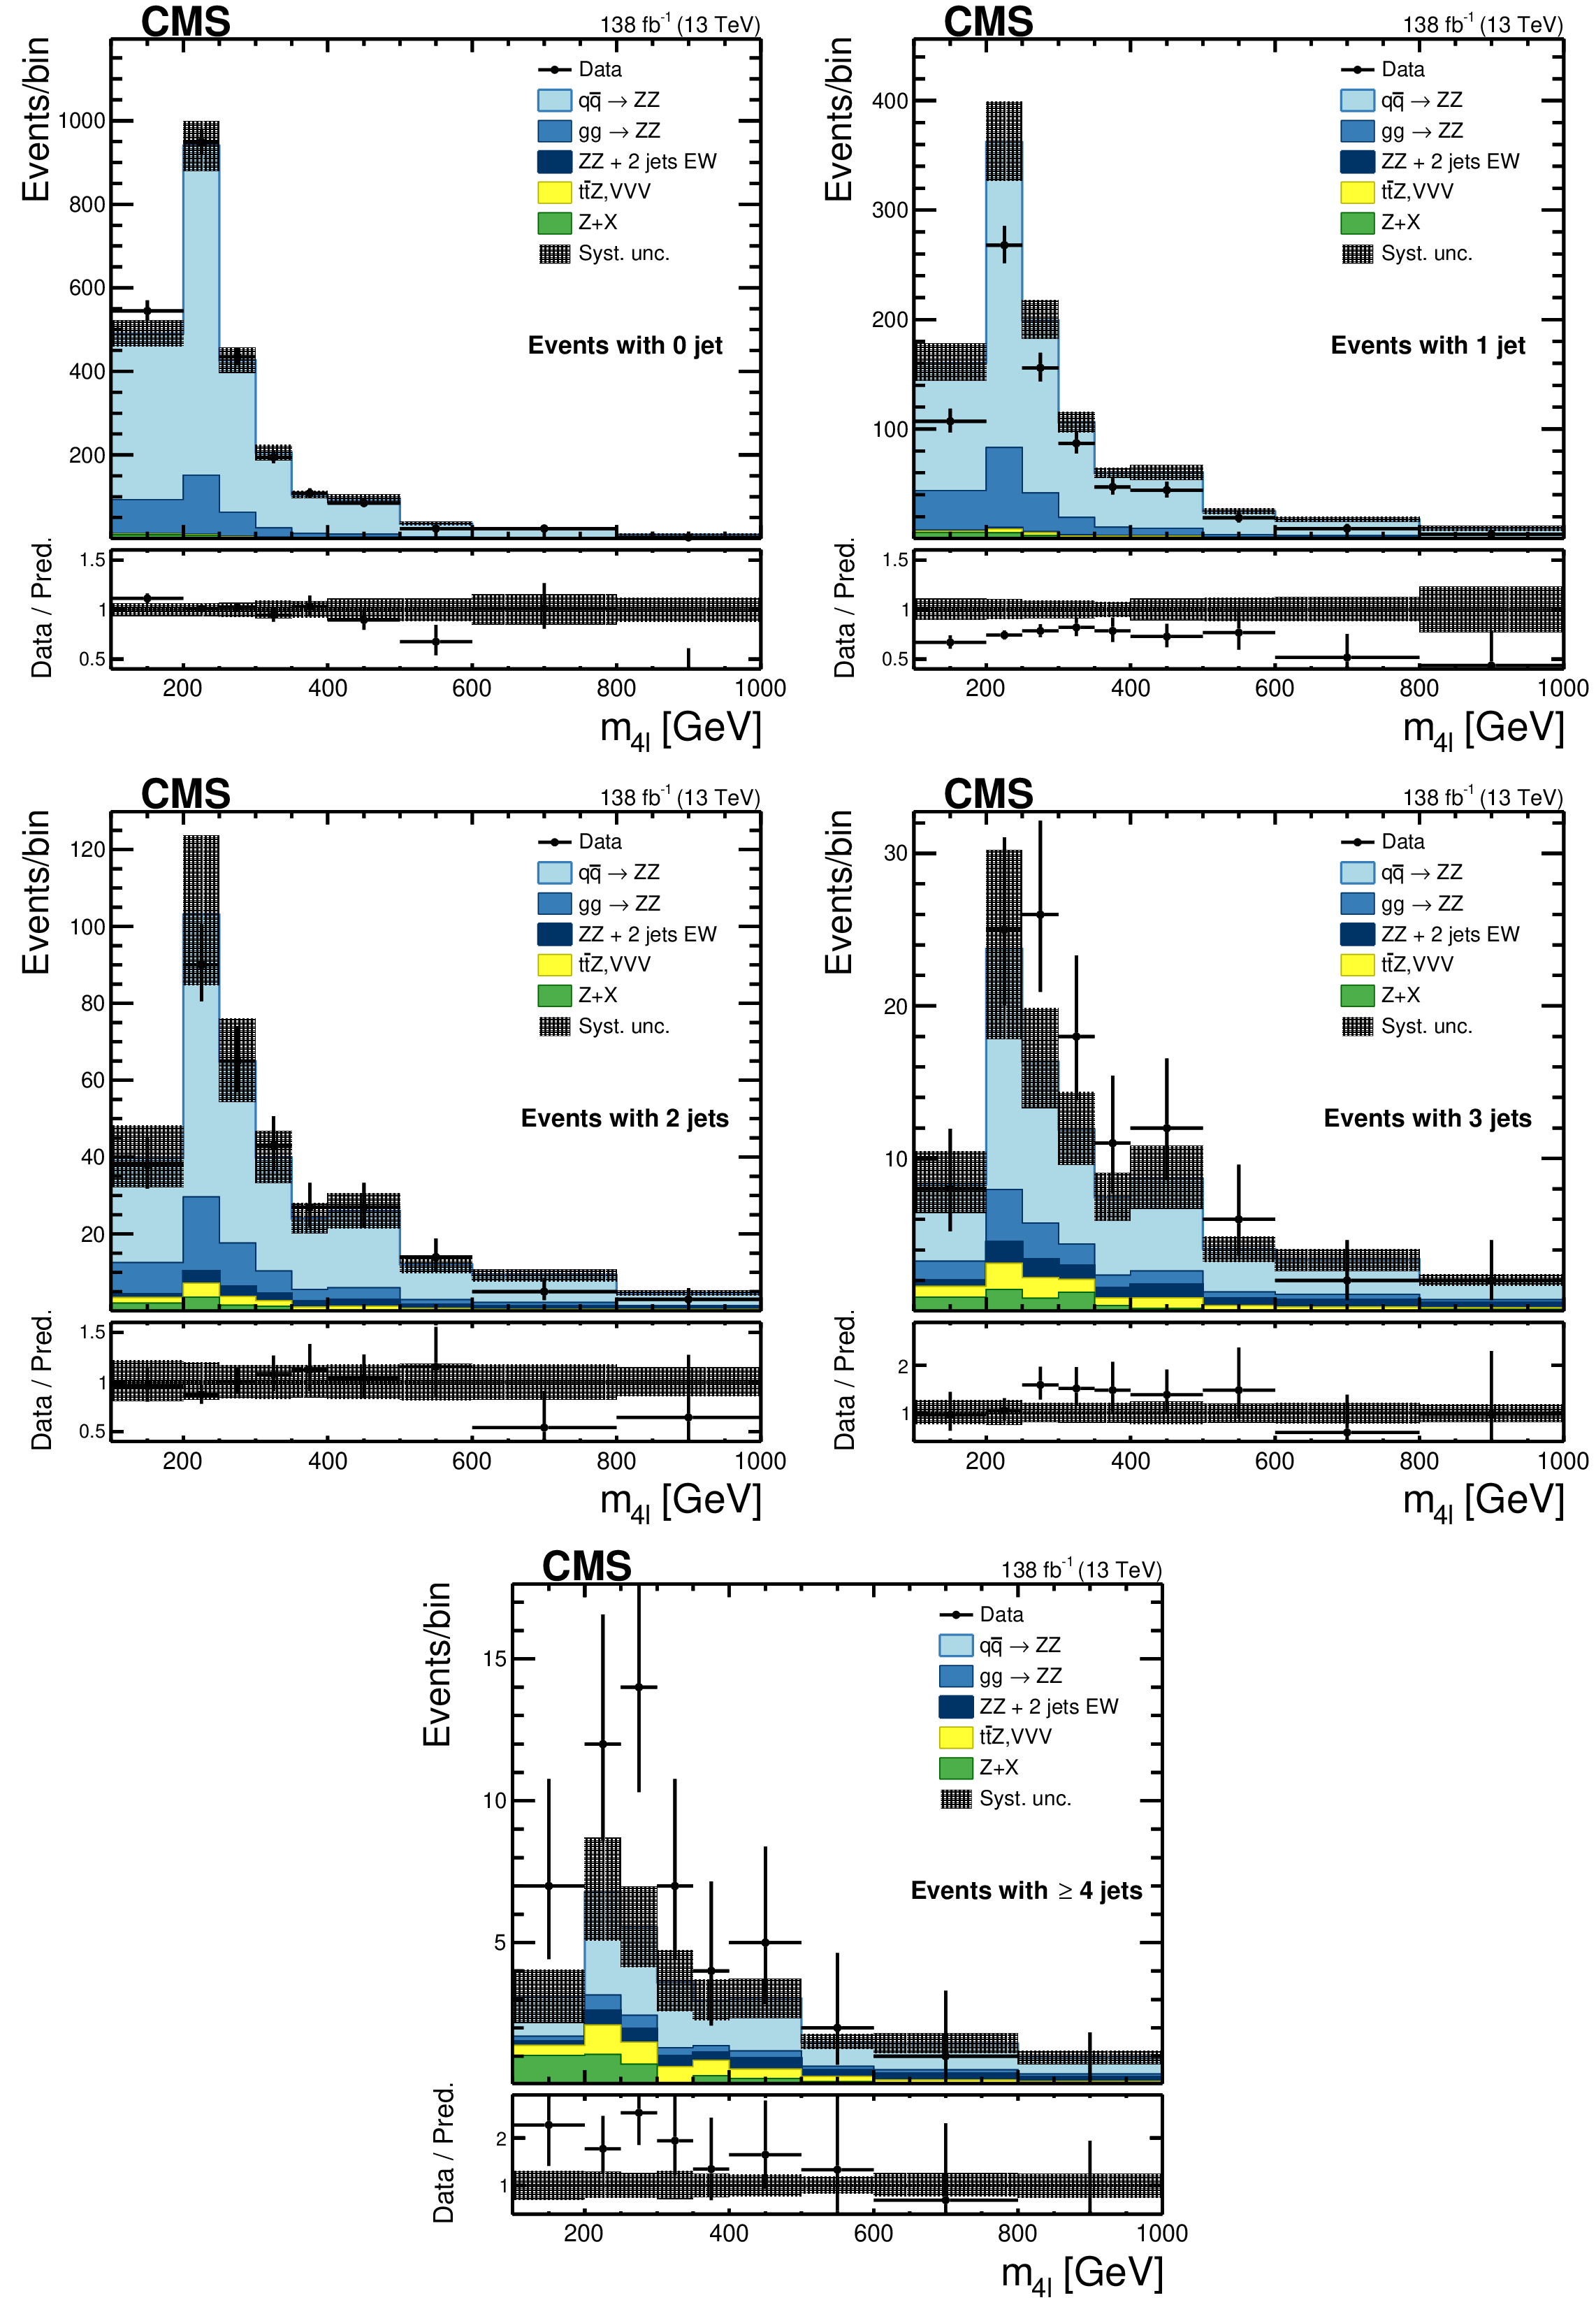
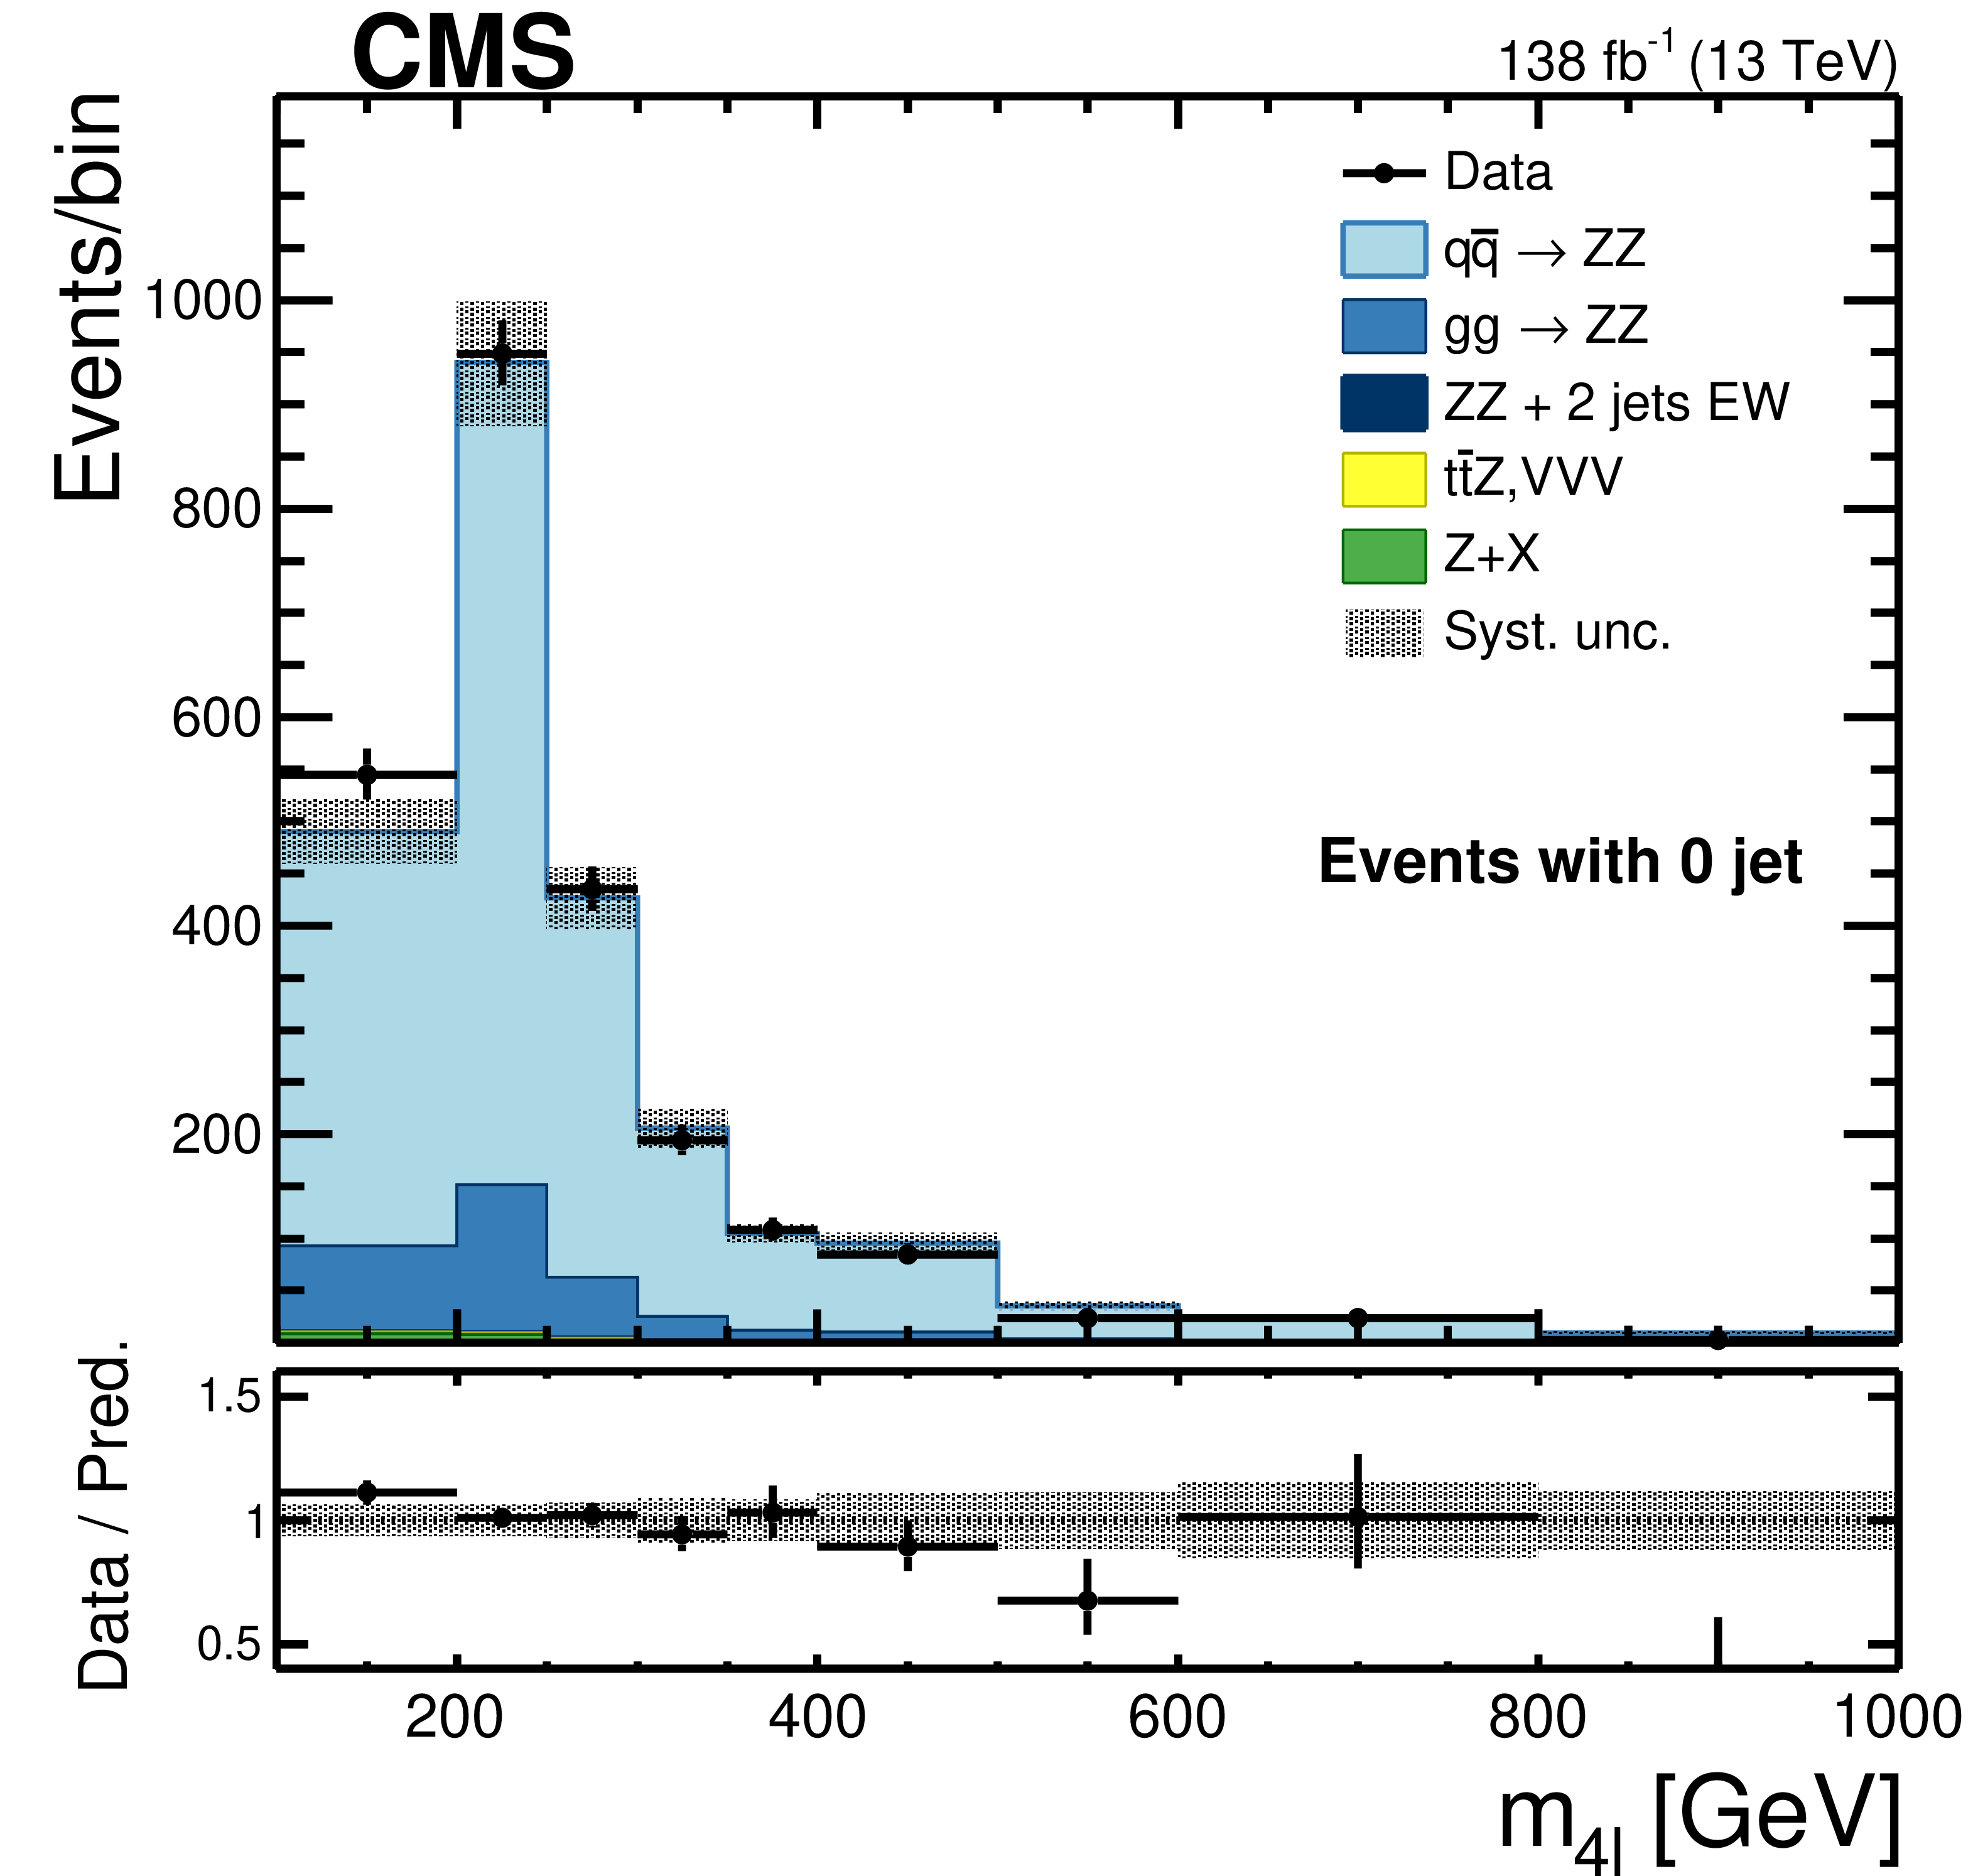
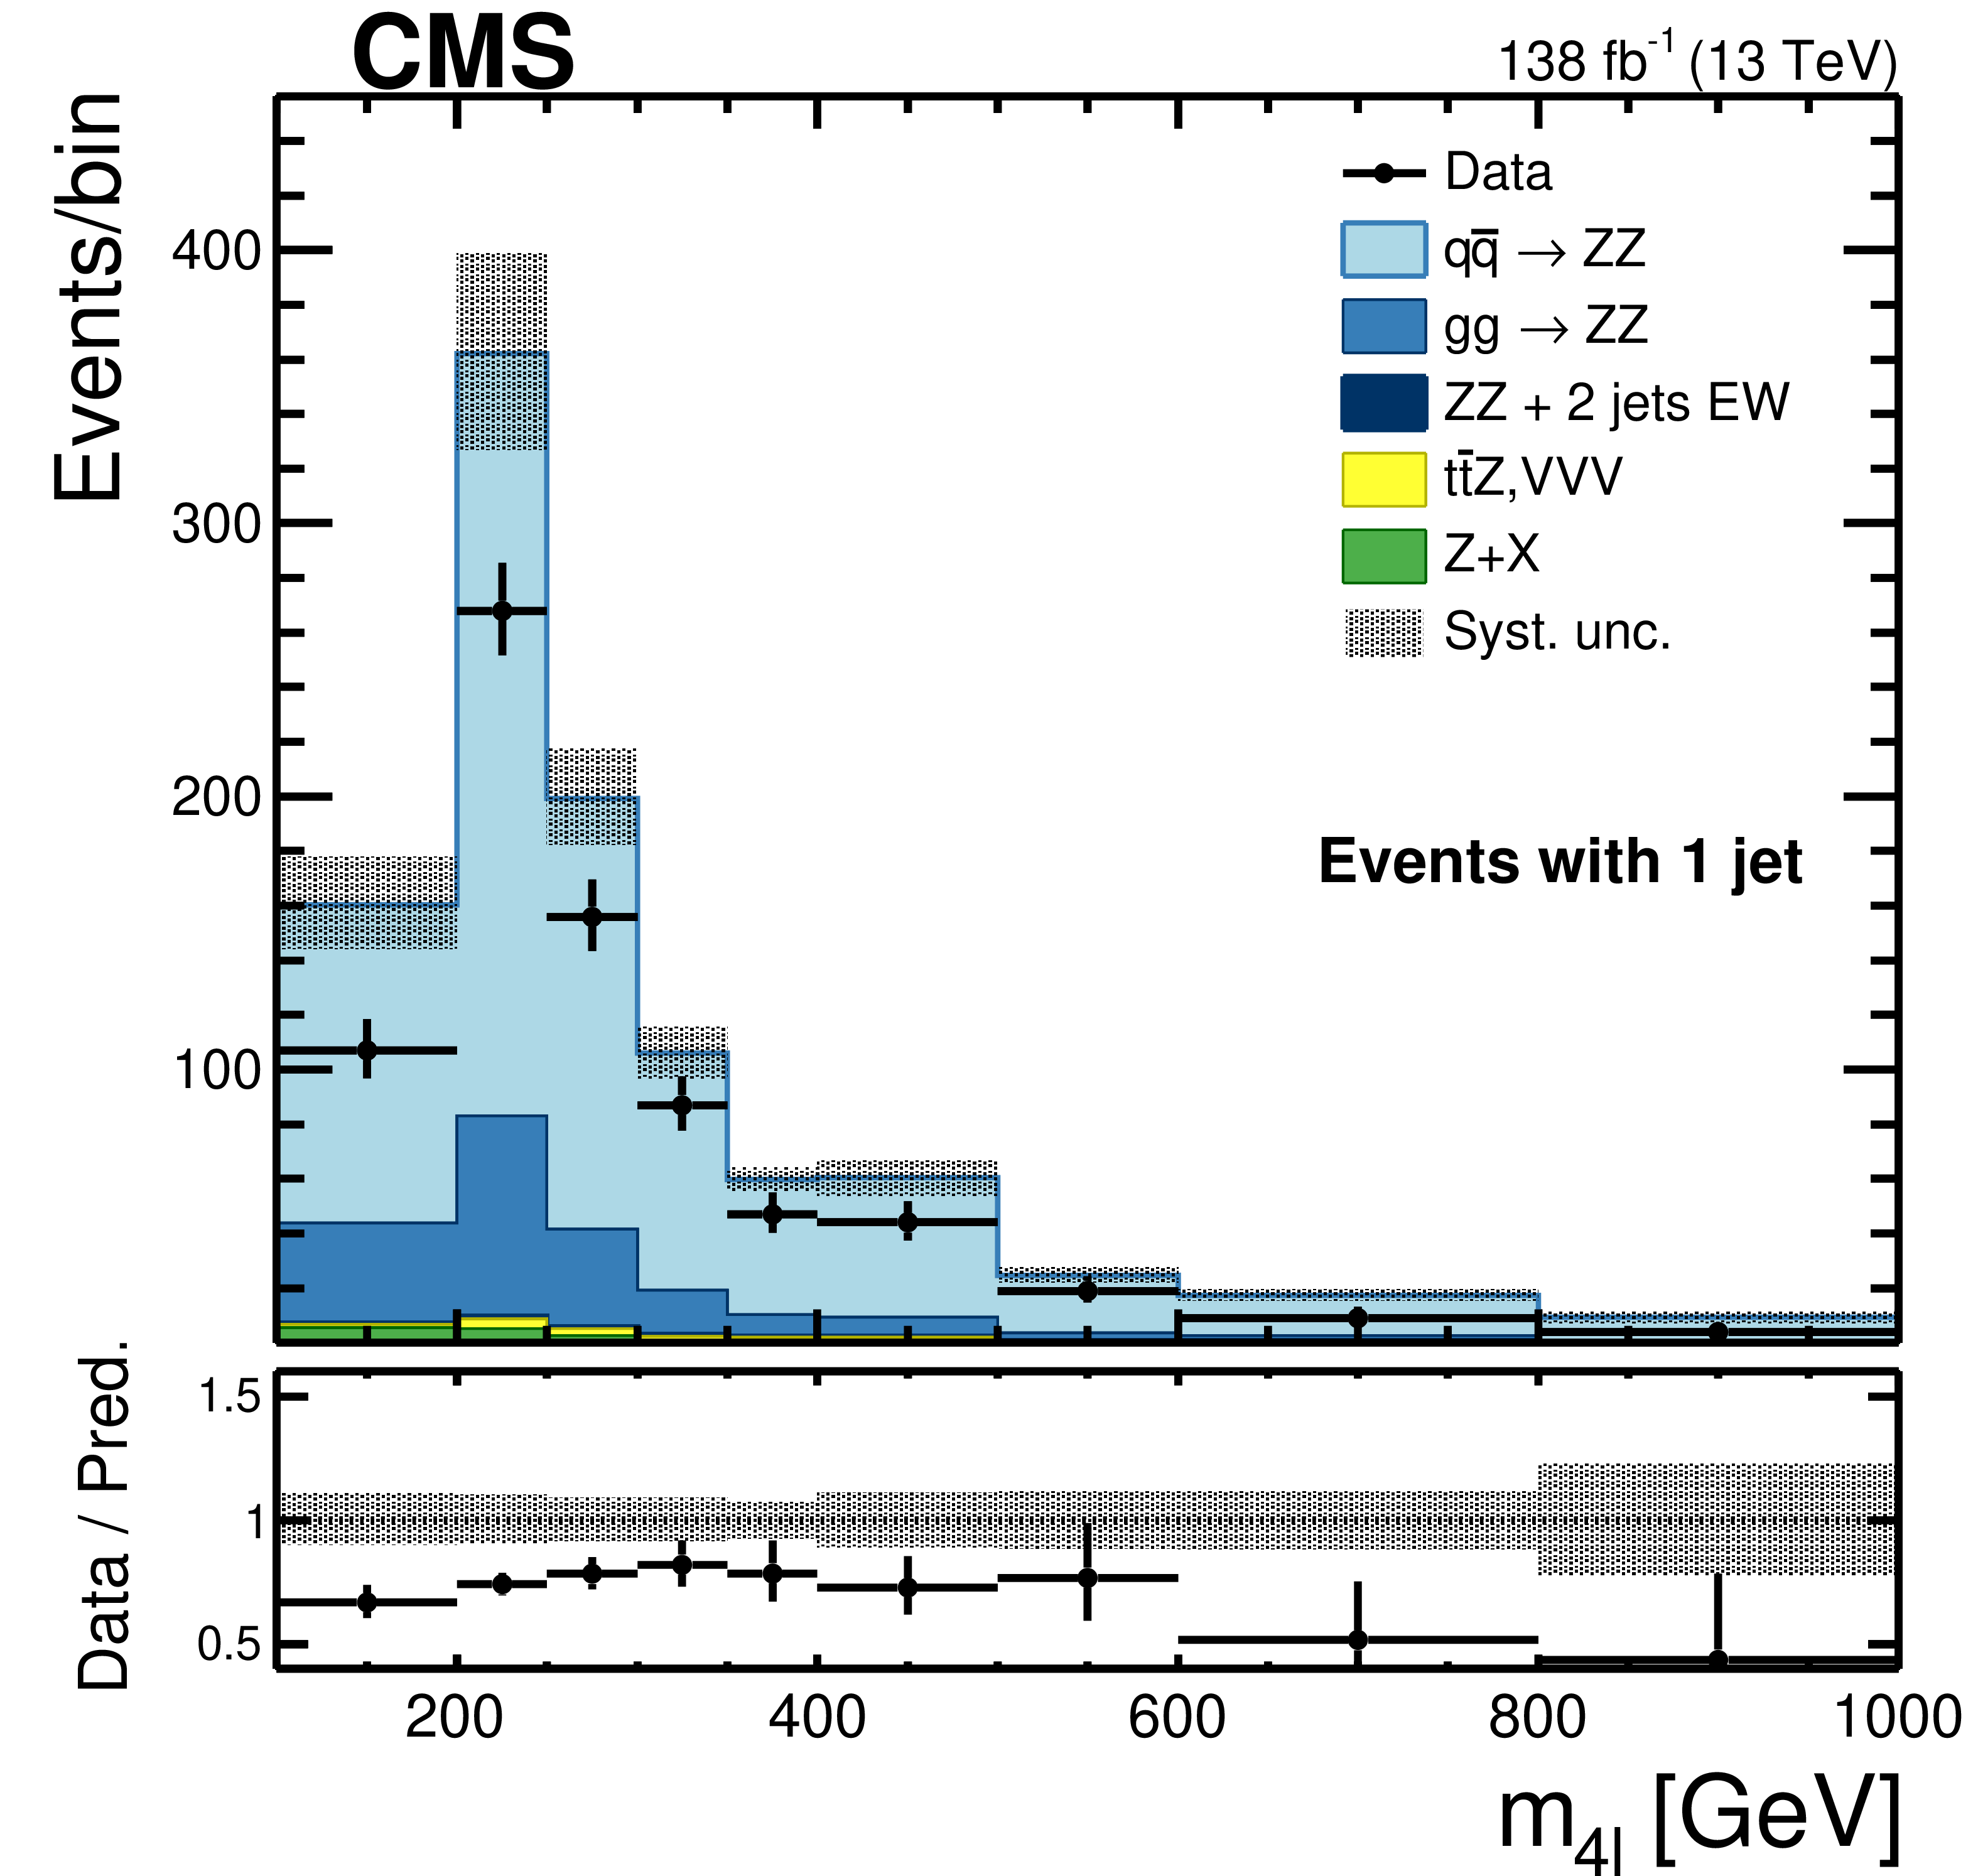
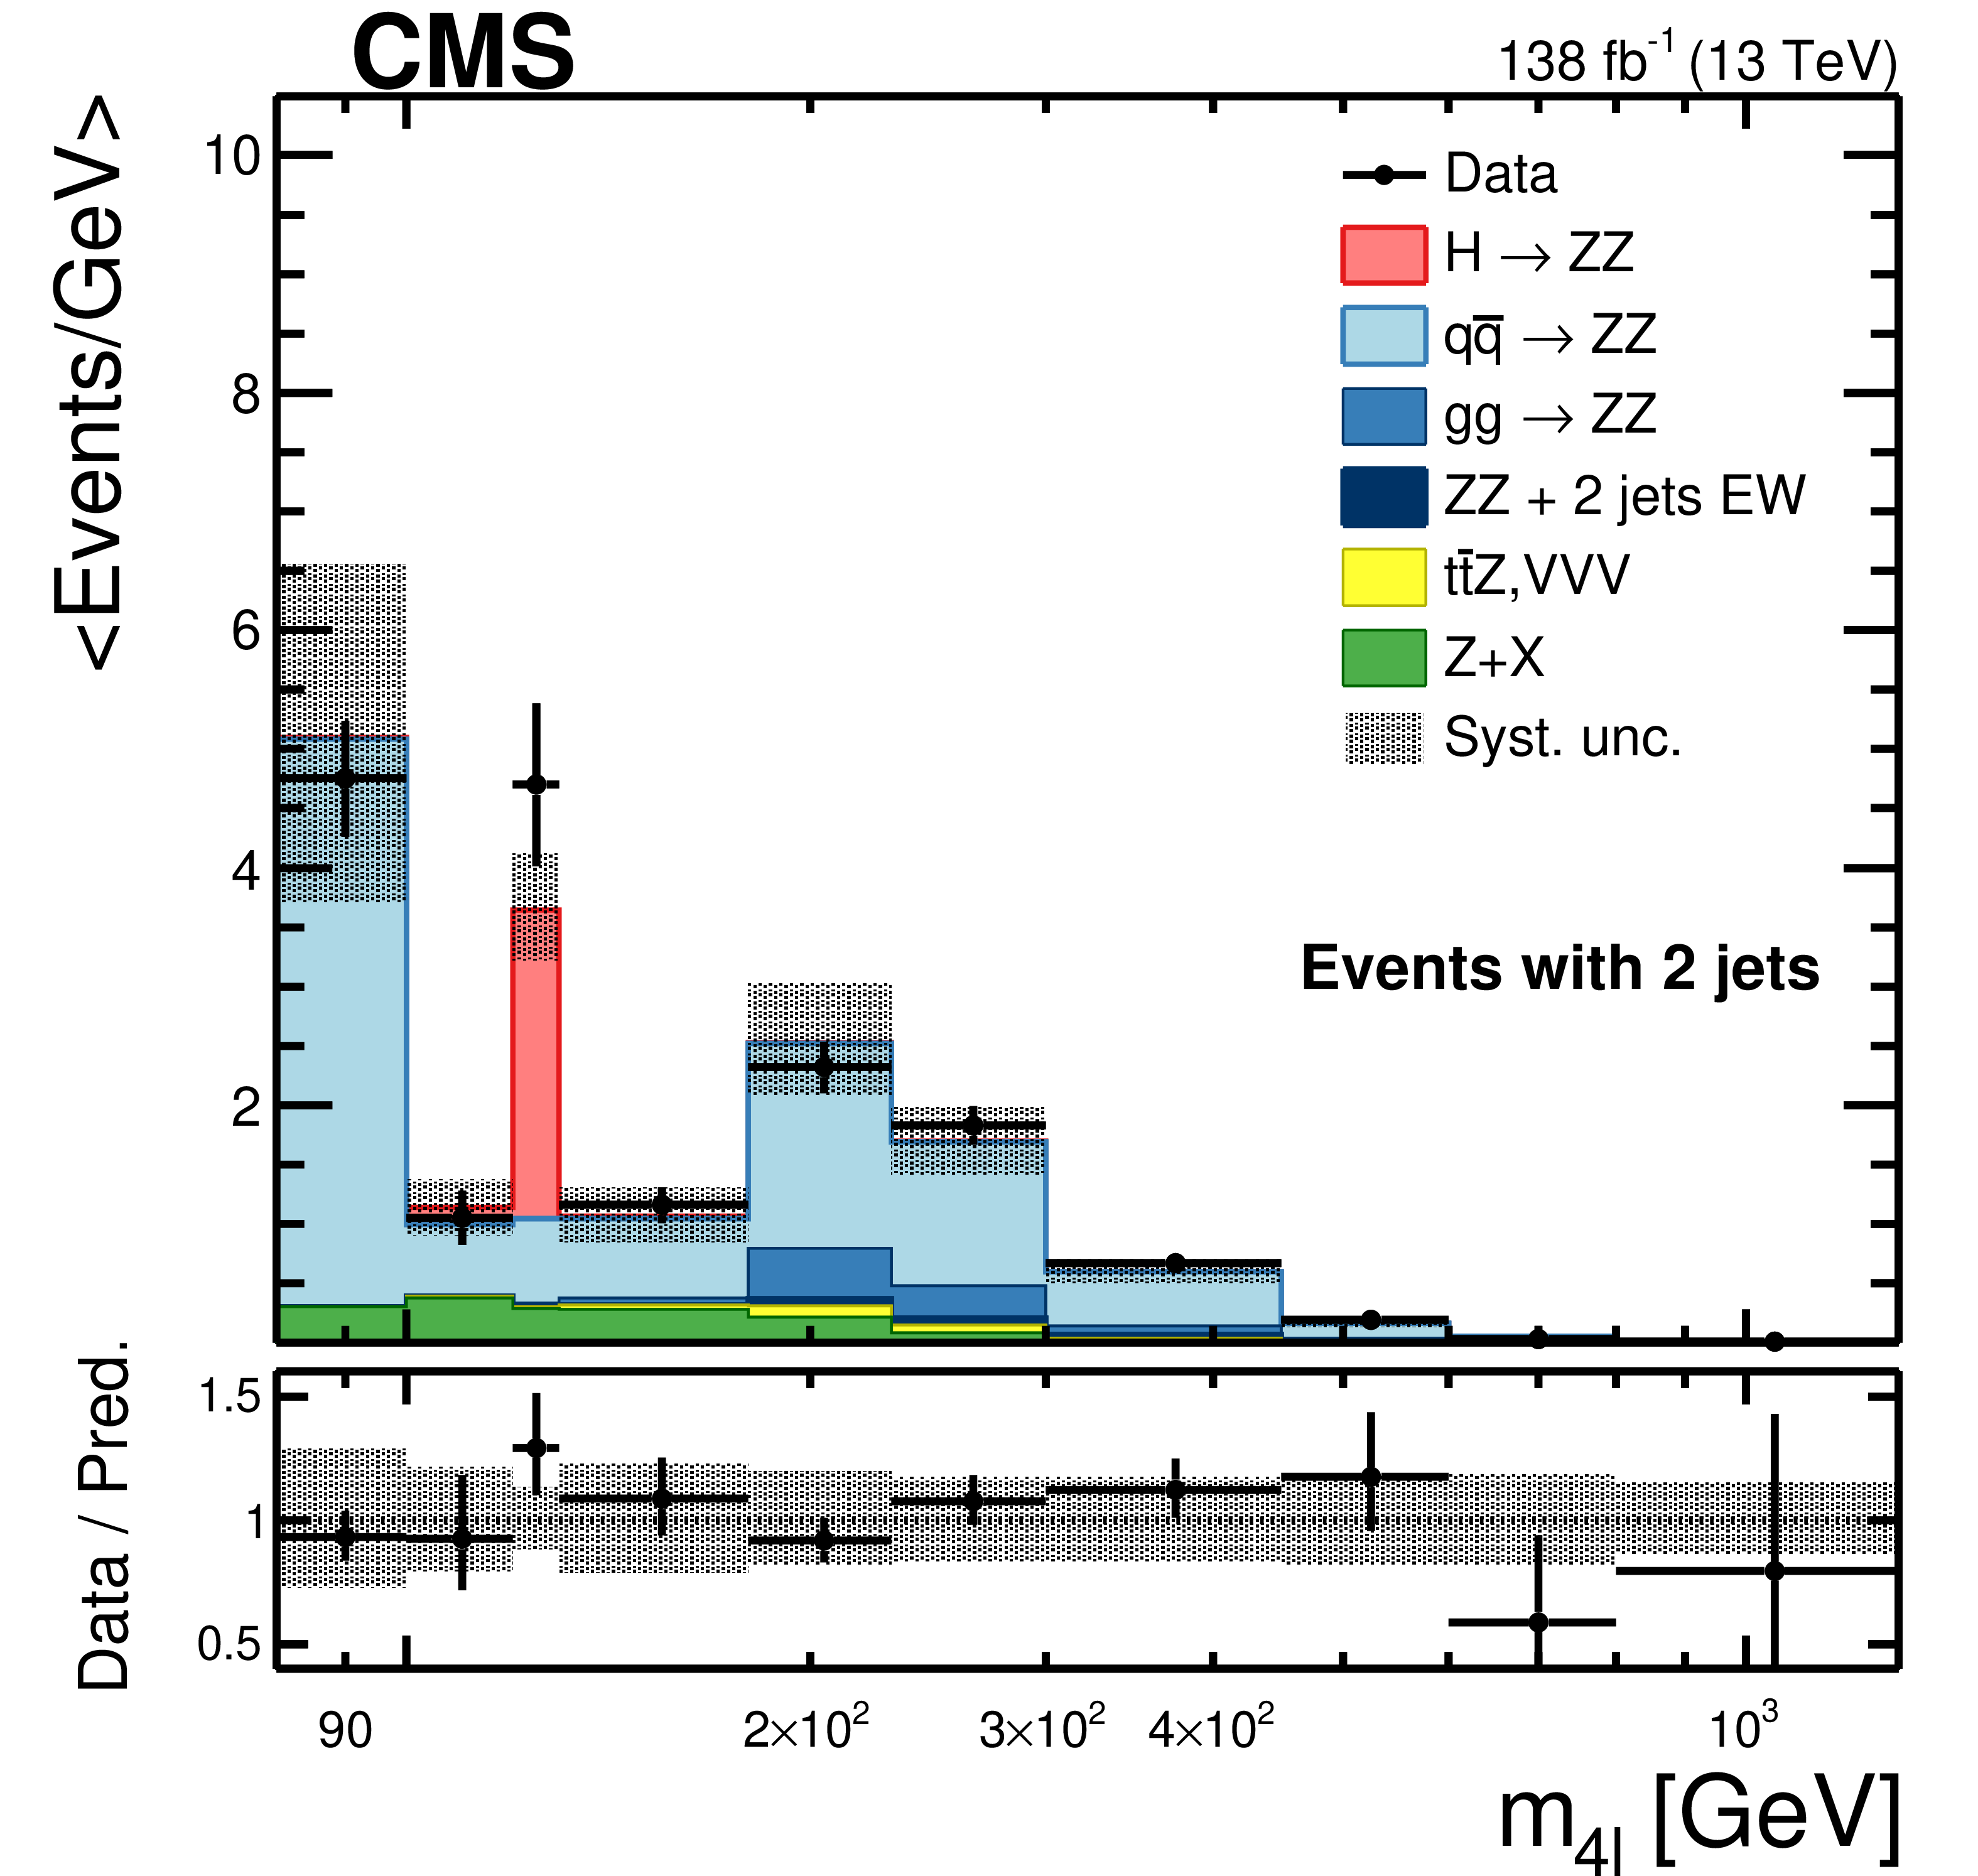
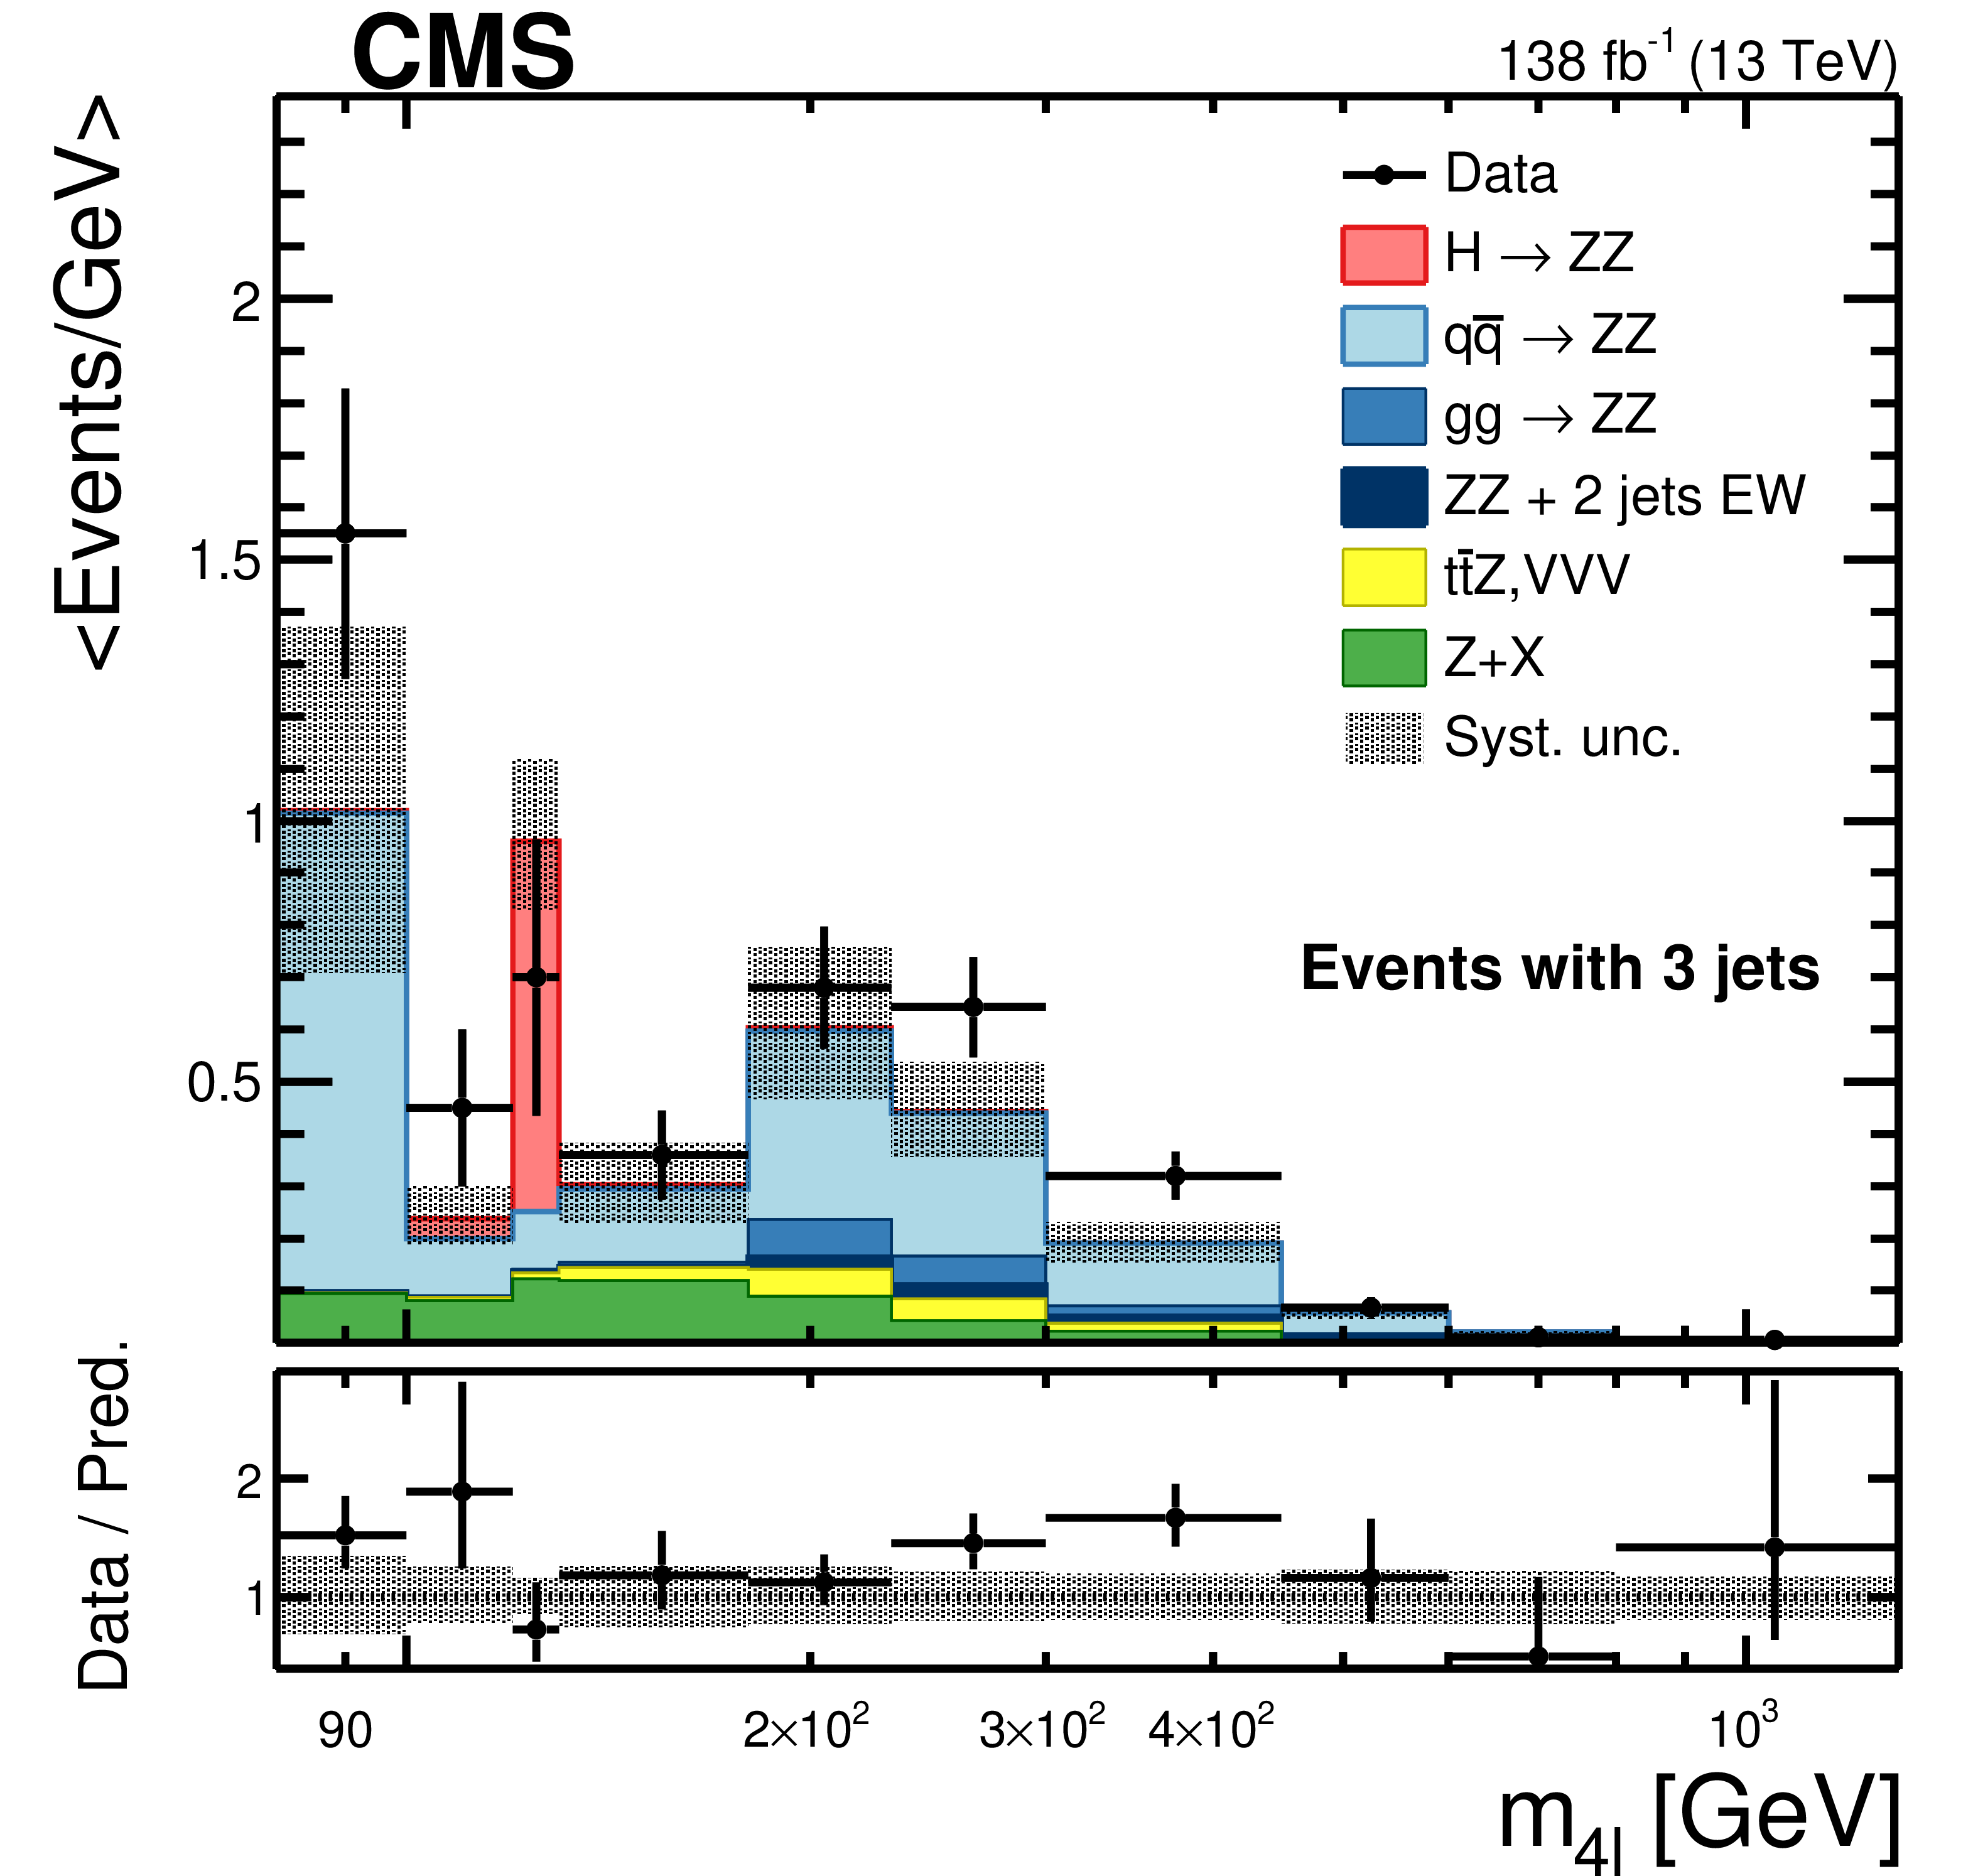
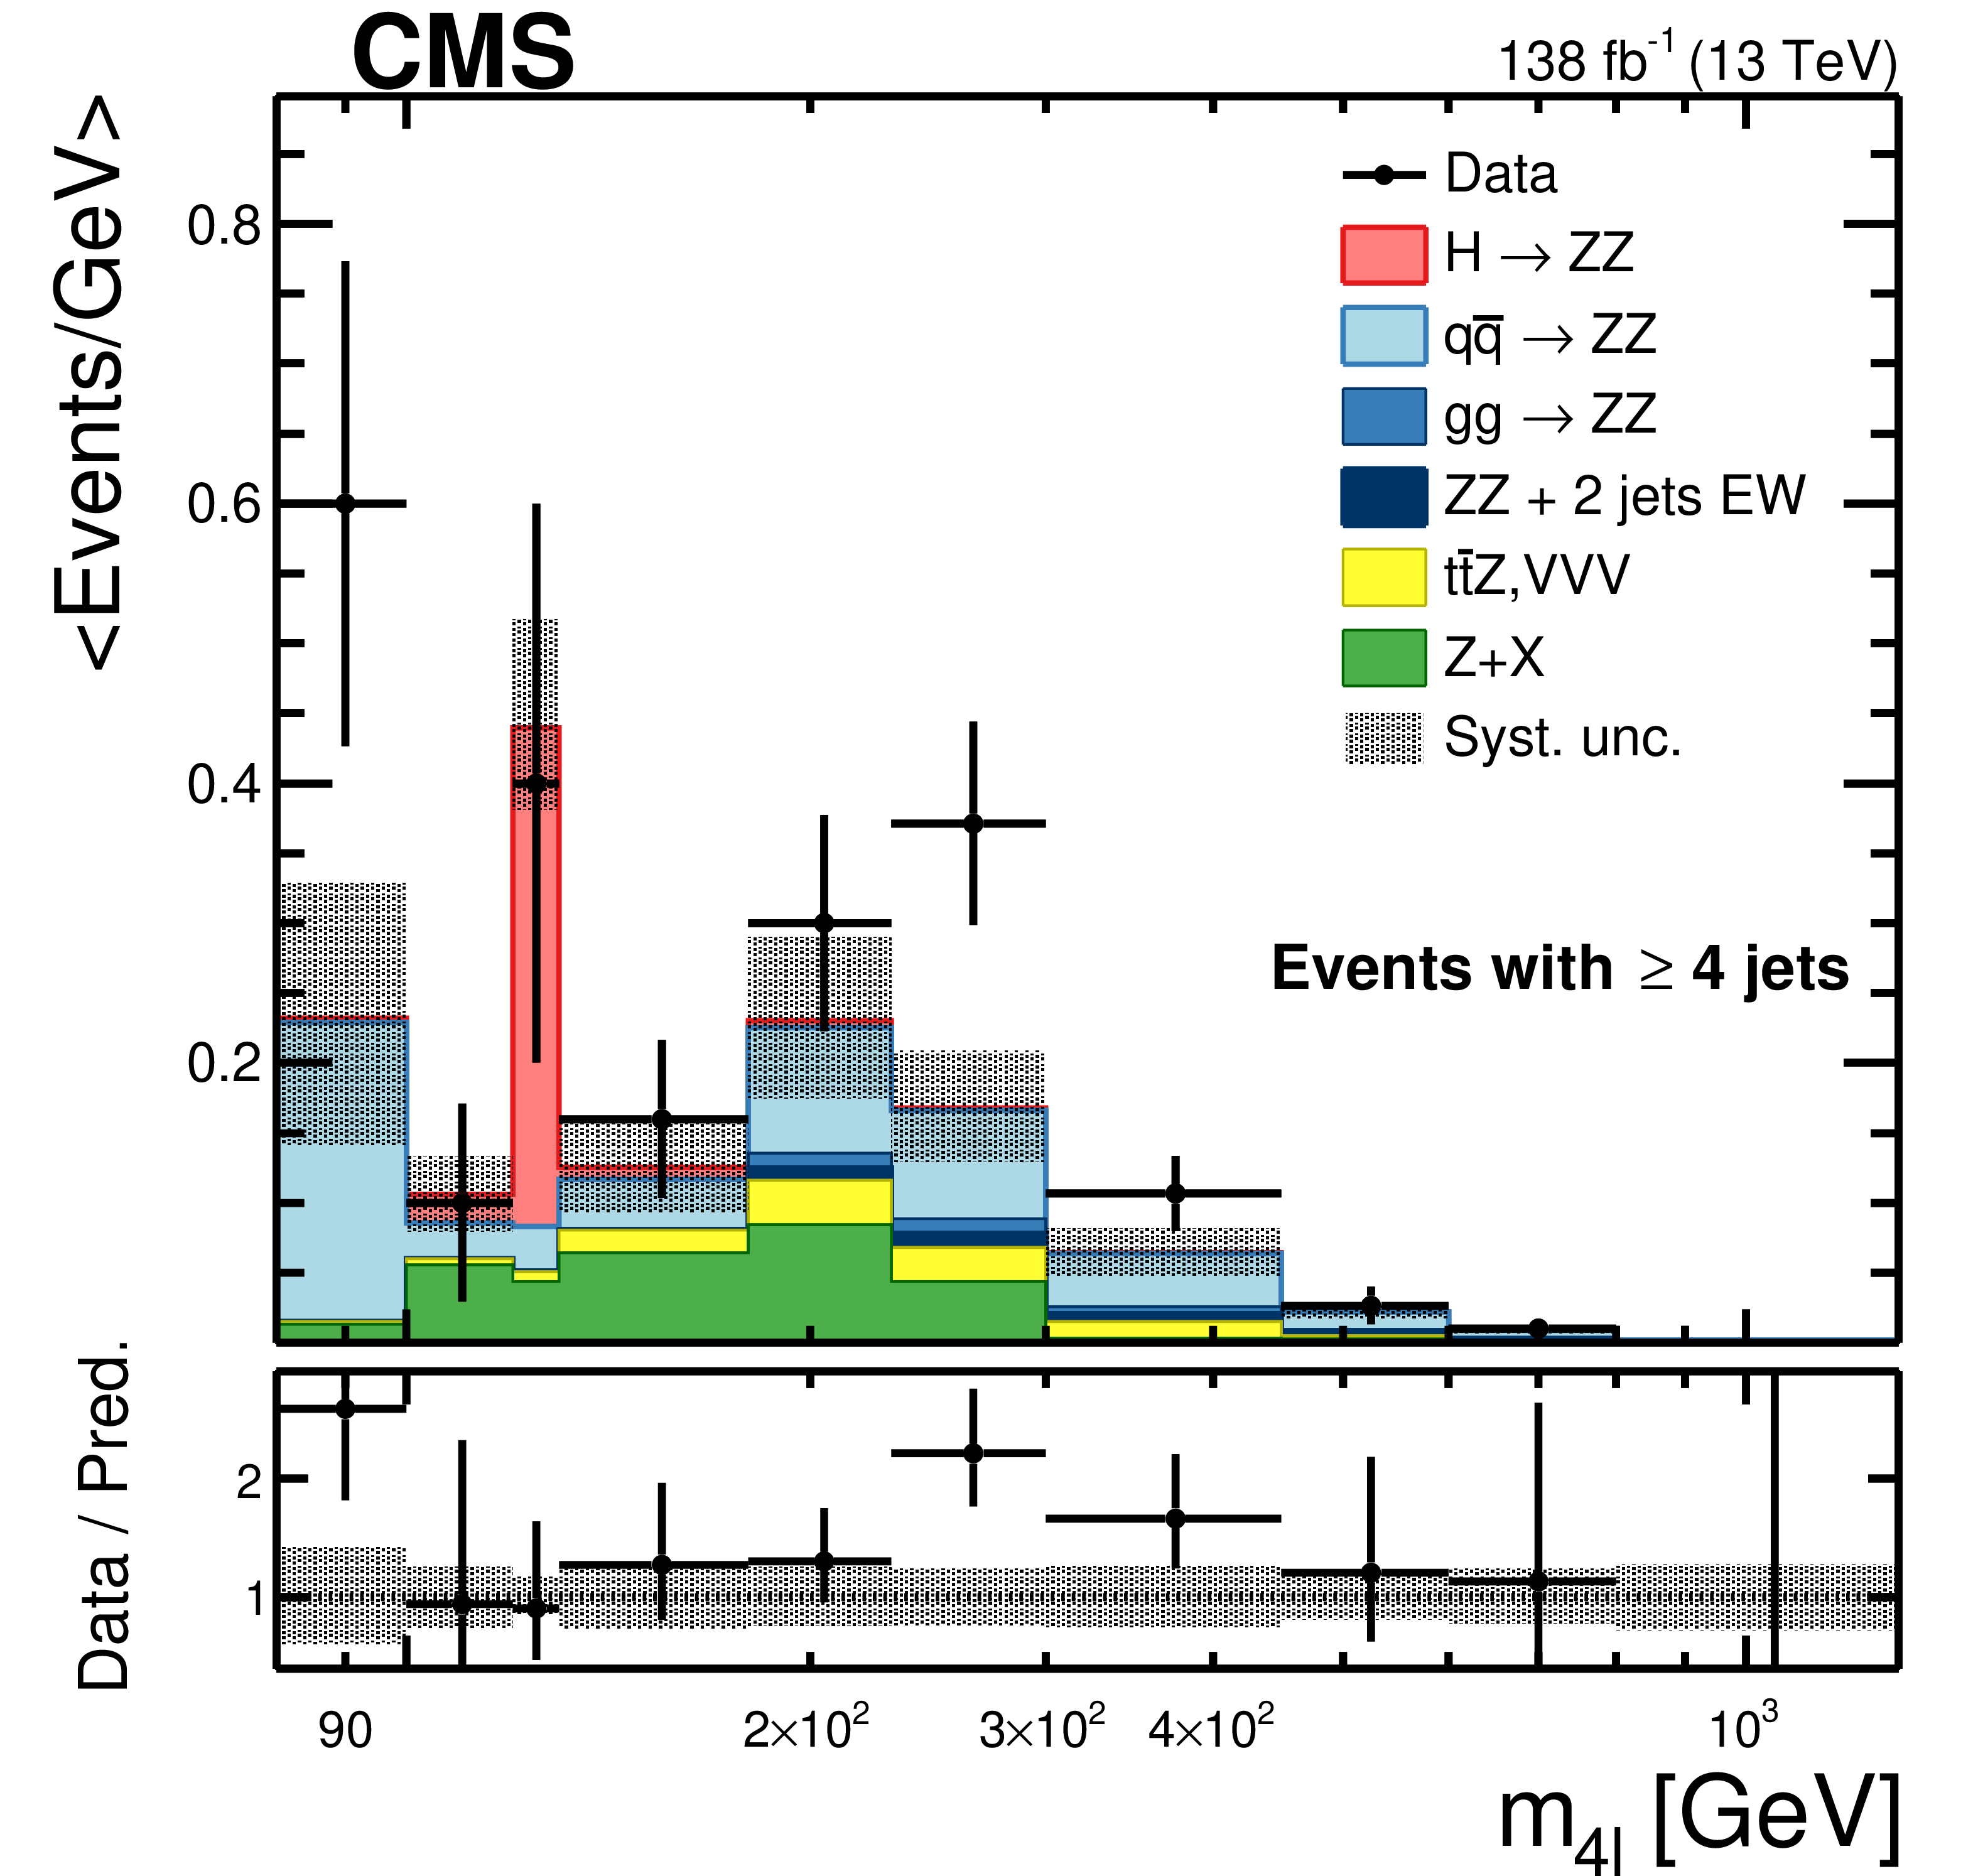
Figure 5:
The $ m_{4\ell} $ distributions for events with 60 $ < m_{\mathrm{Z}_1, \mathrm{Z}_2} < $ 120 GeV and different jet multiplicities. Other details are as in the caption of Fig. 2. |
png pdf |
Figure 5-a:
The $ m_{4\ell} $ distributions for events with 60 $ < m_{\mathrm{Z}_1, \mathrm{Z}_2} < $ 120 GeV and different jet multiplicities. Other details are as in the caption of Fig. 2. |
png pdf |
Figure 5-b:
The $ m_{4\ell} $ distributions for events with 60 $ < m_{\mathrm{Z}_1, \mathrm{Z}_2} < $ 120 GeV and different jet multiplicities. Other details are as in the caption of Fig. 2. |
png pdf |
Figure 5-c:
The $ m_{4\ell} $ distributions for events with 60 $ < m_{\mathrm{Z}_1, \mathrm{Z}_2} < $ 120 GeV and different jet multiplicities. Other details are as in the caption of Fig. 2. |
png pdf |
Figure 5-d:
The $ m_{4\ell} $ distributions for events with 60 $ < m_{\mathrm{Z}_1, \mathrm{Z}_2} < $ 120 GeV and different jet multiplicities. Other details are as in the caption of Fig. 2. |

png pdf |
Figure 5-e:
The $ m_{4\ell} $ distributions for events with 60 $ < m_{\mathrm{Z}_1, \mathrm{Z}_2} < $ 120 GeV and different jet multiplicities. Other details are as in the caption of Fig. 2. |

png pdf |
Figure 6:
The $ m_{4\ell} $ distributions in the full four-lepton invariant mass range for events with different jet multiplicities, normalized by bin width. Other details are as in the caption of Fig. 2. |

png pdf |
Figure 6-a:
The $ m_{4\ell} $ distributions in the full four-lepton invariant mass range for events with different jet multiplicities, normalized by bin width. Other details are as in the caption of Fig. 2. |
png pdf |
Figure 6-b:
The $ m_{4\ell} $ distributions in the full four-lepton invariant mass range for events with different jet multiplicities, normalized by bin width. Other details are as in the caption of Fig. 2. |
png pdf |
Figure 6-c:
The $ m_{4\ell} $ distributions in the full four-lepton invariant mass range for events with different jet multiplicities, normalized by bin width. Other details are as in the caption of Fig. 2. |
png pdf |
Figure 6-d:
The $ m_{4\ell} $ distributions in the full four-lepton invariant mass range for events with different jet multiplicities, normalized by bin width. Other details are as in the caption of Fig. 2. |
png pdf |
Figure 6-e:
The $ m_{4\ell} $ distributions in the full four-lepton invariant mass range for events with different jet multiplicities, normalized by bin width. Other details are as in the caption of Fig. 2. |
png pdf |
Figure 6-f:
The $ m_{4\ell} $ distributions in the full four-lepton invariant mass range for events with different jet multiplicities, normalized by bin width. Other details are as in the caption of Fig. 2. |

png pdf |
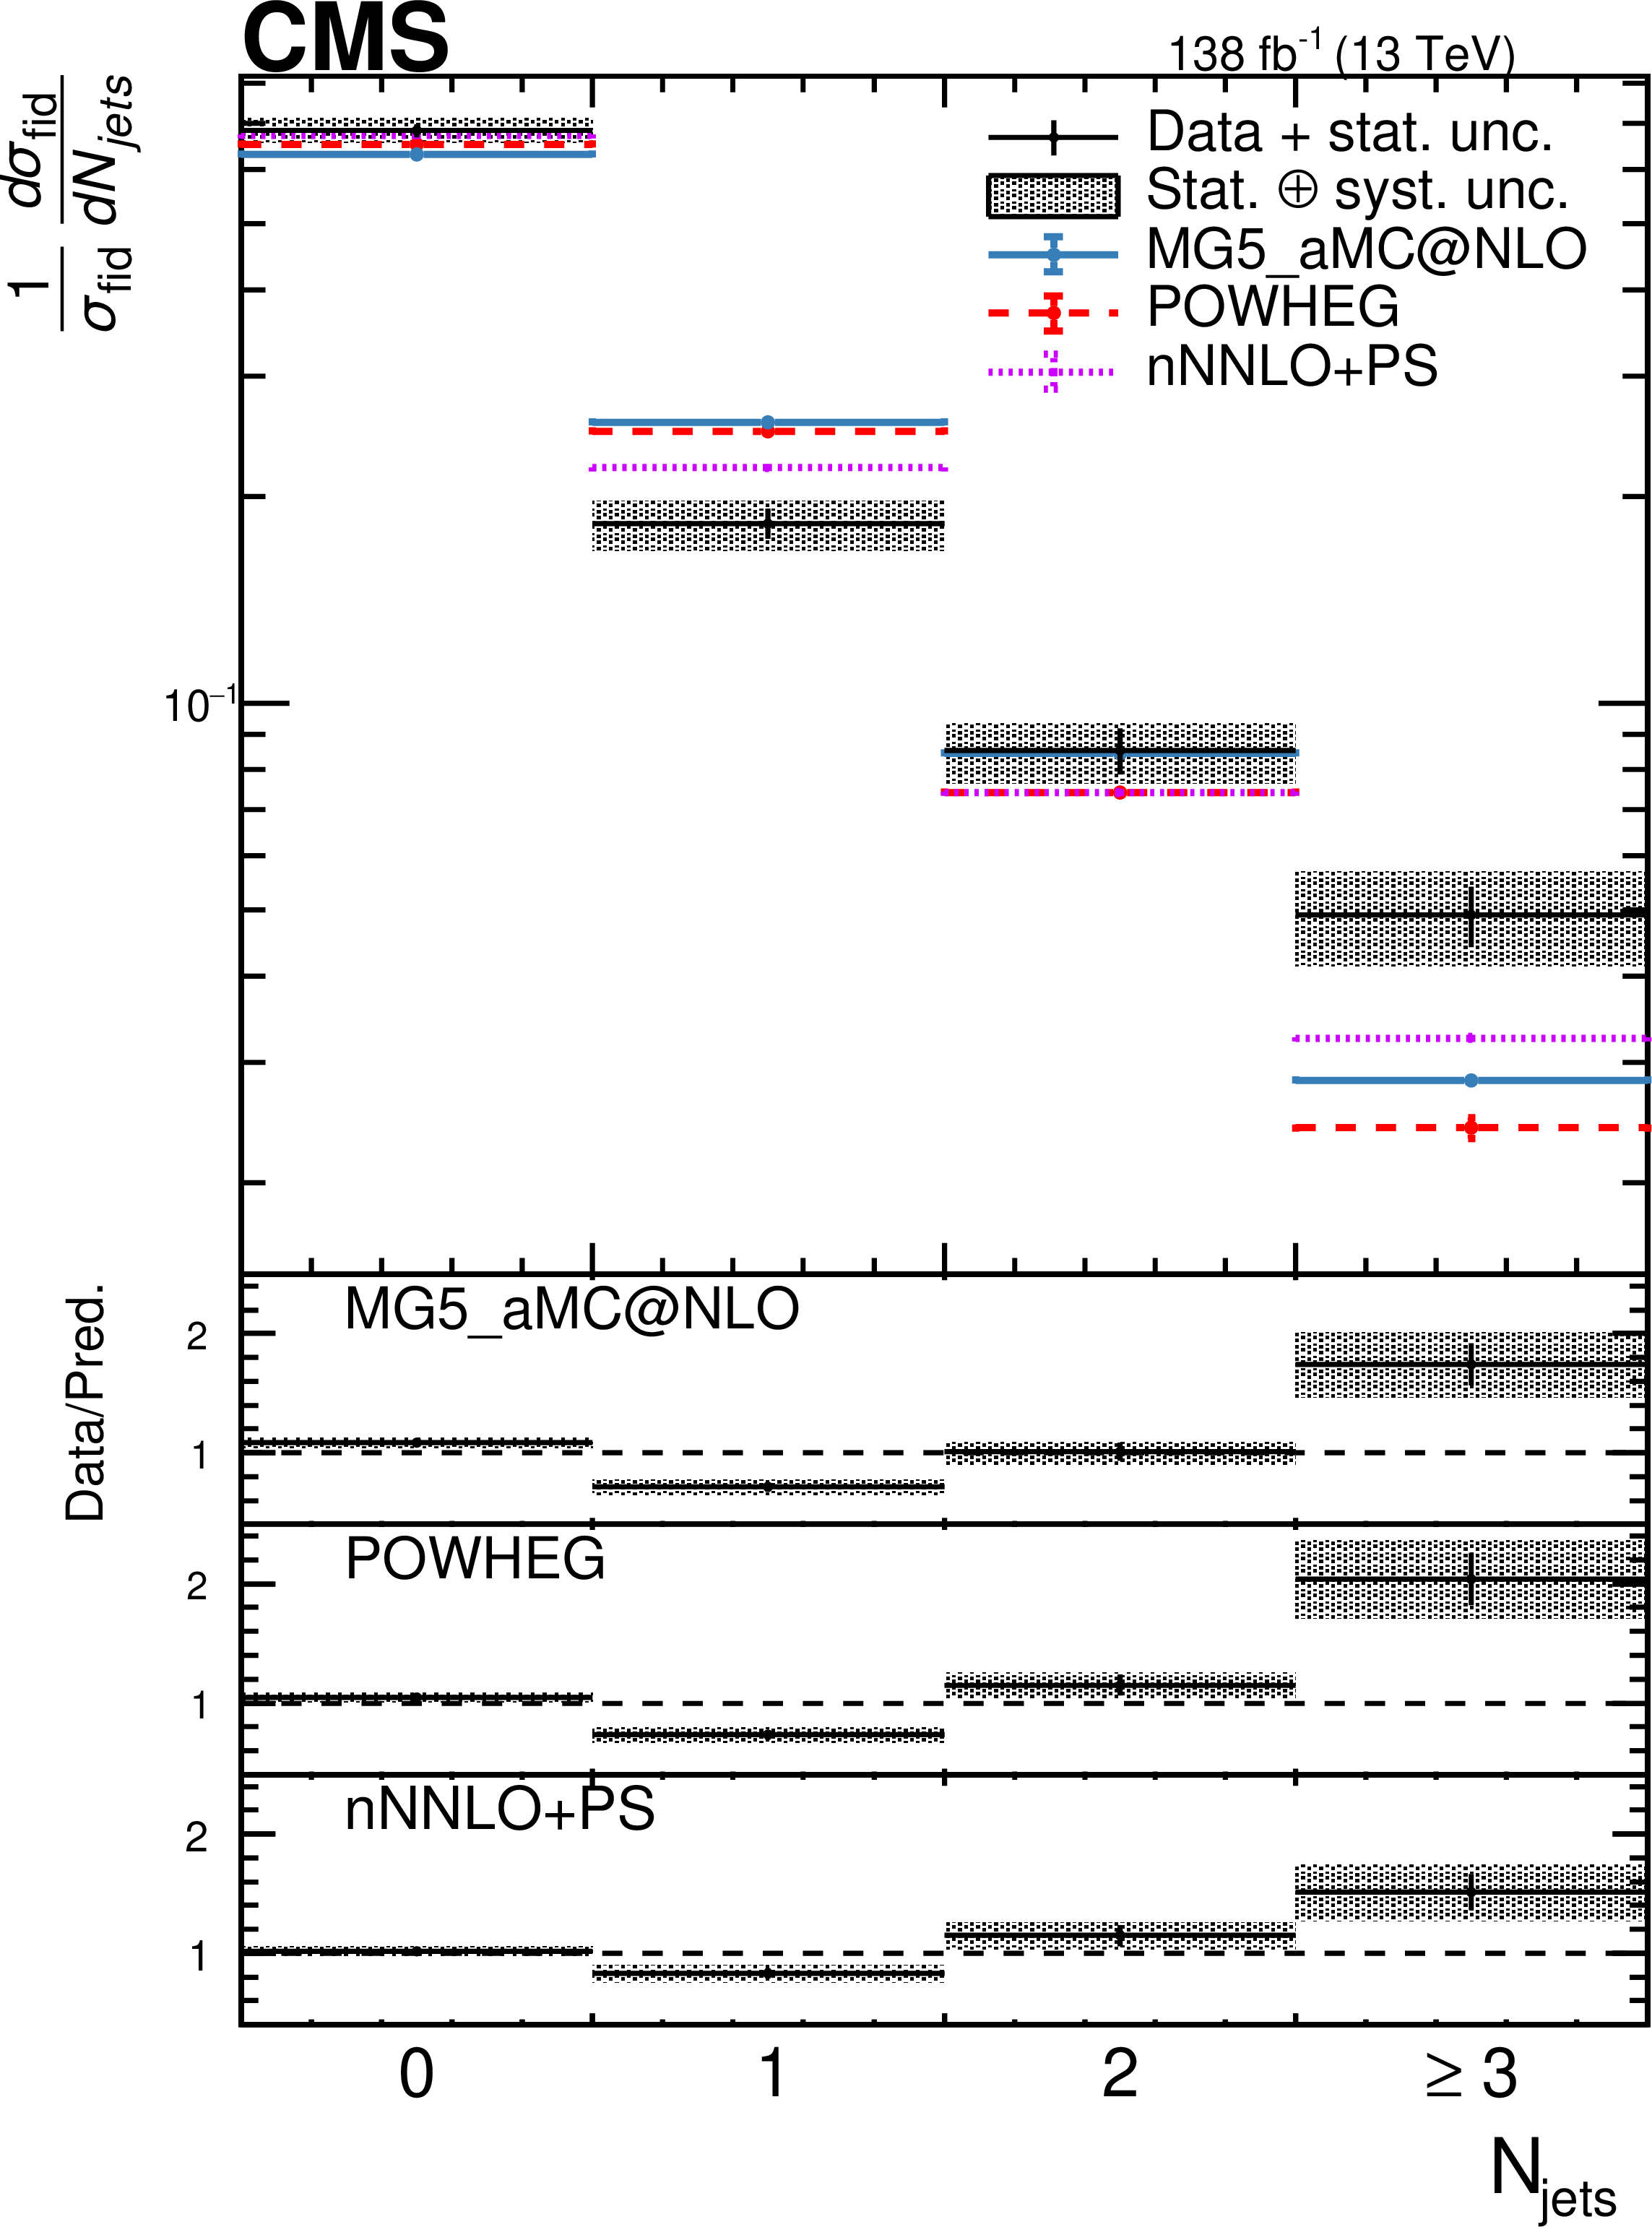
Figure 7:
Differential cross sections normalized to the fiducial cross section as a function of (left) $ m_{4\ell} $, (right) the number of jets with $ p_{\mathrm{T}} > $ 30 GeV. The on-shell Z requirement 60 $ < m_{\mathrm{Z}_1}$, ${\mathrm{Z}_2} < $ 120 GeV is applied. Points represent the unfolded data, solid histograms the MadGraph-5_aMC@NLO $ \mathrm{q}\overline{\mathrm{q}} \to \mathrm{Z}\mathrm{Z} $ predictions, and red dashed histograms the POWHEG $ \mathrm{q}\overline{\mathrm{q}} \to \mathrm{Z}\mathrm{Z} $ predictions. MCFM $\mathrm{gg} \to \mathrm{ZZ} $, POWHEG $ \mathrm{H} \to \mathrm{Z}\mathrm{Z} $, and MadGraph-5_aMC@NLO EW ZZ predictions are included in these two sets of predictions. The purple dashed histograms represent the nNNLO+PS predictions, and the yellow dashed histogram represents the nNNLO+PS prediction with EW corrections applied. Vertical bars on both MC predictions represent the statistical uncertainties. The lower panels show the ratio of the measured to the predicted cross sections. The shaded areas represent the total uncertainties calculated as the sum in quadrature of the statistical and systematic uncertainties, whereas the crosses represent the statistical uncertainties only. The overflow is included in the last bin of the distributions. |
png pdf |
Figure 7-a:
Differential cross sections normalized to the fiducial cross section as a function of (left) $ m_{4\ell} $, (right) the number of jets with $ p_{\mathrm{T}} > $ 30 GeV. The on-shell Z requirement 60 $ < m_{\mathrm{Z}_1}$, ${\mathrm{Z}_2} < $ 120 GeV is applied. Points represent the unfolded data, solid histograms the MadGraph-5_aMC@NLO $ \mathrm{q}\overline{\mathrm{q}} \to \mathrm{Z}\mathrm{Z} $ predictions, and red dashed histograms the POWHEG $ \mathrm{q}\overline{\mathrm{q}} \to \mathrm{Z}\mathrm{Z} $ predictions. MCFM $\mathrm{gg} \to \mathrm{ZZ} $, POWHEG $ \mathrm{H} \to \mathrm{Z}\mathrm{Z} $, and MadGraph-5_aMC@NLO EW ZZ predictions are included in these two sets of predictions. The purple dashed histograms represent the nNNLO+PS predictions, and the yellow dashed histogram represents the nNNLO+PS prediction with EW corrections applied. Vertical bars on both MC predictions represent the statistical uncertainties. The lower panels show the ratio of the measured to the predicted cross sections. The shaded areas represent the total uncertainties calculated as the sum in quadrature of the statistical and systematic uncertainties, whereas the crosses represent the statistical uncertainties only. The overflow is included in the last bin of the distributions. |
png pdf |
Figure 7-b:
Differential cross sections normalized to the fiducial cross section as a function of (left) $ m_{4\ell} $, (right) the number of jets with $ p_{\mathrm{T}} > $ 30 GeV. The on-shell Z requirement 60 $ < m_{\mathrm{Z}_1}$, ${\mathrm{Z}_2} < $ 120 GeV is applied. Points represent the unfolded data, solid histograms the MadGraph-5_aMC@NLO $ \mathrm{q}\overline{\mathrm{q}} \to \mathrm{Z}\mathrm{Z} $ predictions, and red dashed histograms the POWHEG $ \mathrm{q}\overline{\mathrm{q}} \to \mathrm{Z}\mathrm{Z} $ predictions. MCFM $\mathrm{gg} \to \mathrm{ZZ} $, POWHEG $ \mathrm{H} \to \mathrm{Z}\mathrm{Z} $, and MadGraph-5_aMC@NLO EW ZZ predictions are included in these two sets of predictions. The purple dashed histograms represent the nNNLO+PS predictions, and the yellow dashed histogram represents the nNNLO+PS prediction with EW corrections applied. Vertical bars on both MC predictions represent the statistical uncertainties. The lower panels show the ratio of the measured to the predicted cross sections. The shaded areas represent the total uncertainties calculated as the sum in quadrature of the statistical and systematic uncertainties, whereas the crosses represent the statistical uncertainties only. The overflow is included in the last bin of the distributions. |

png pdf |
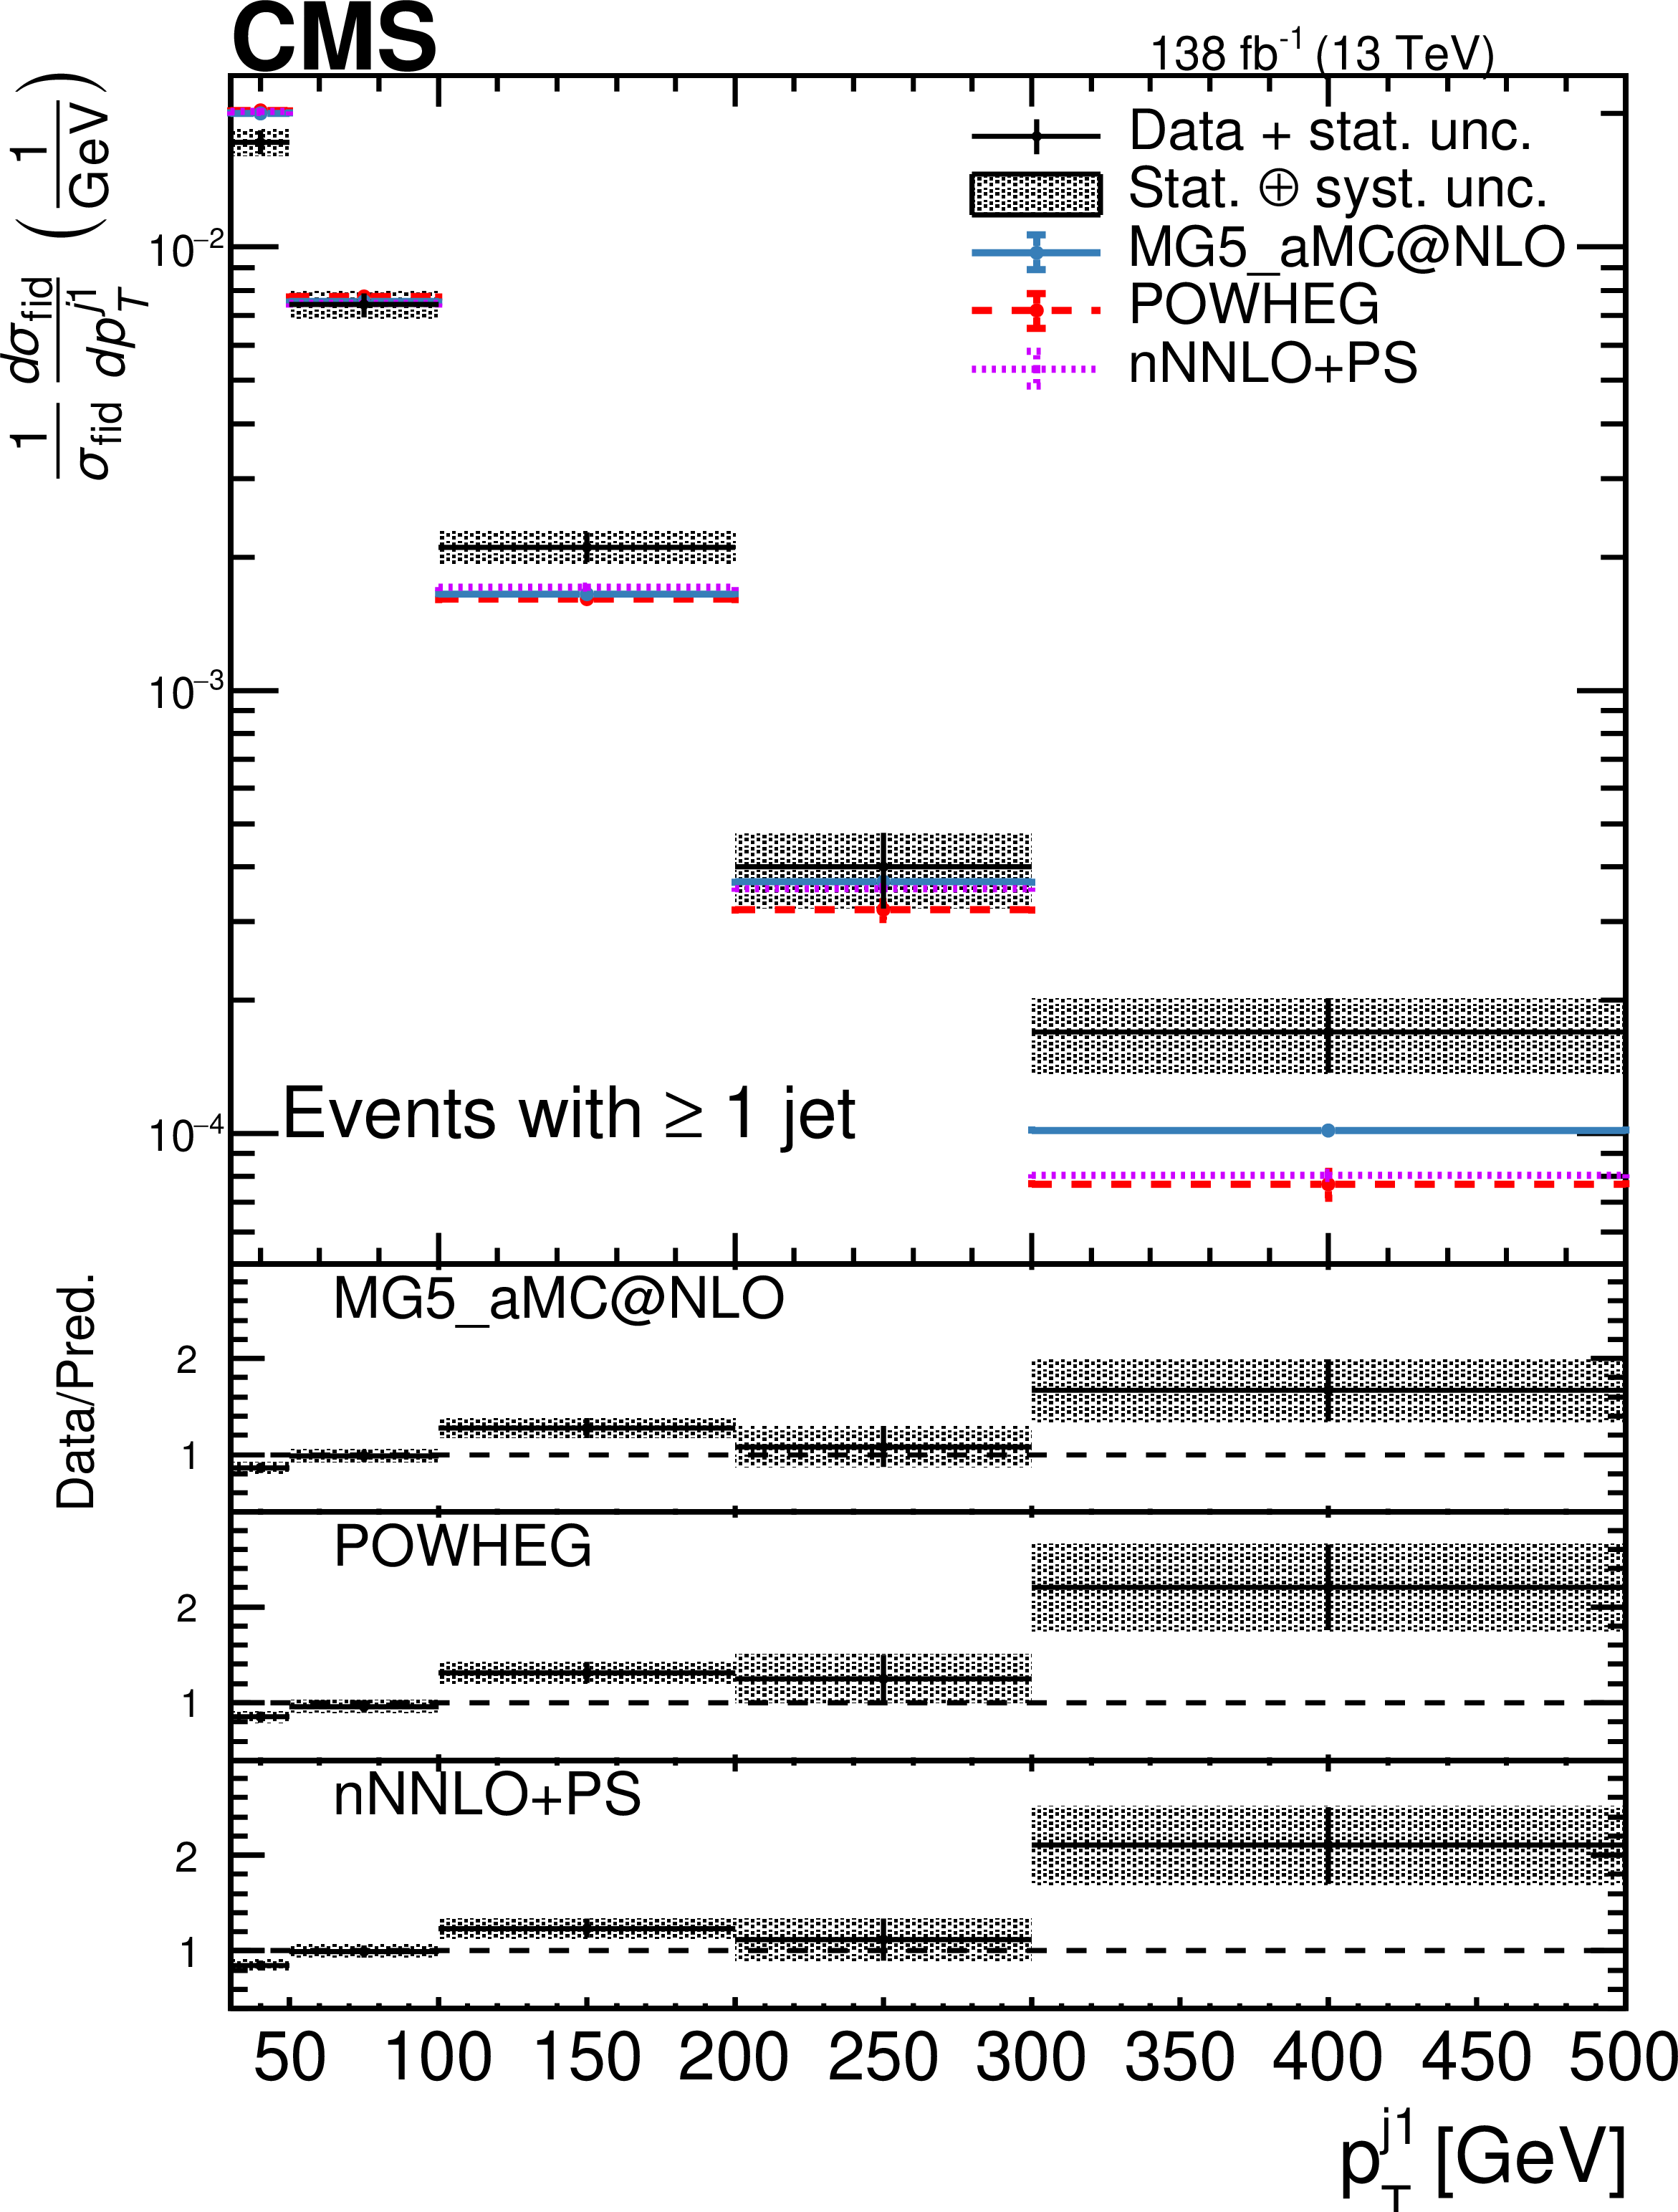
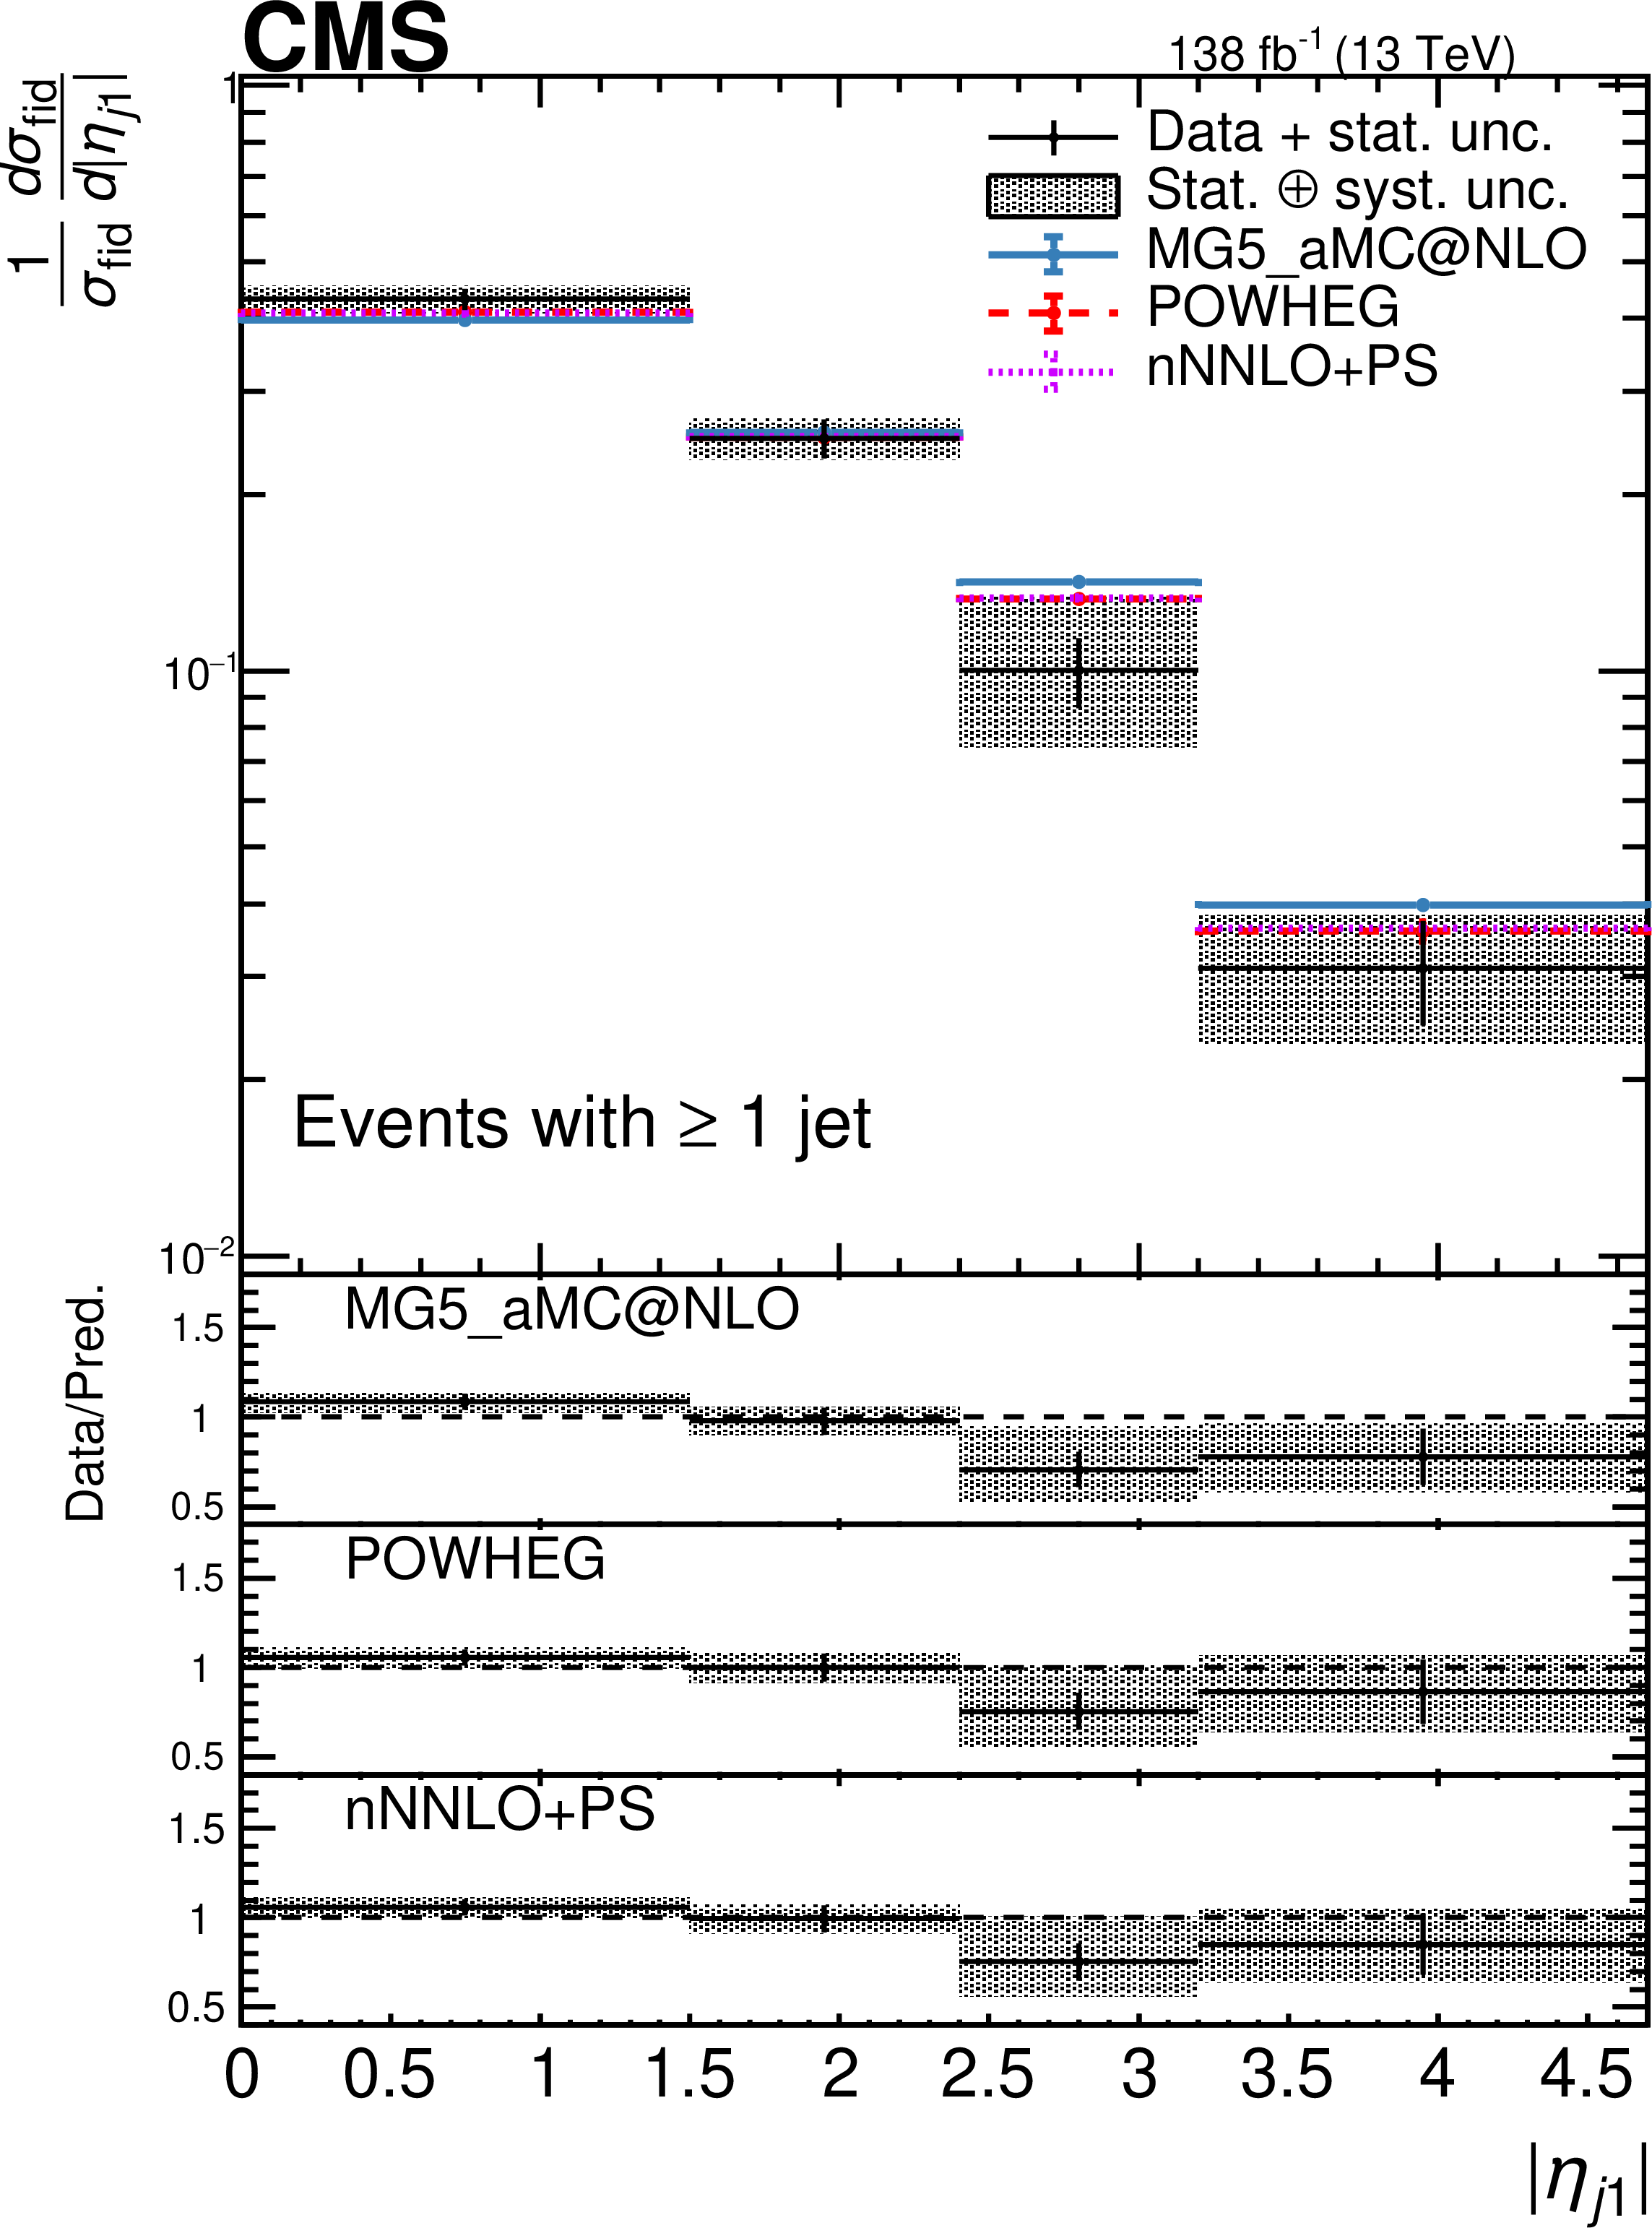
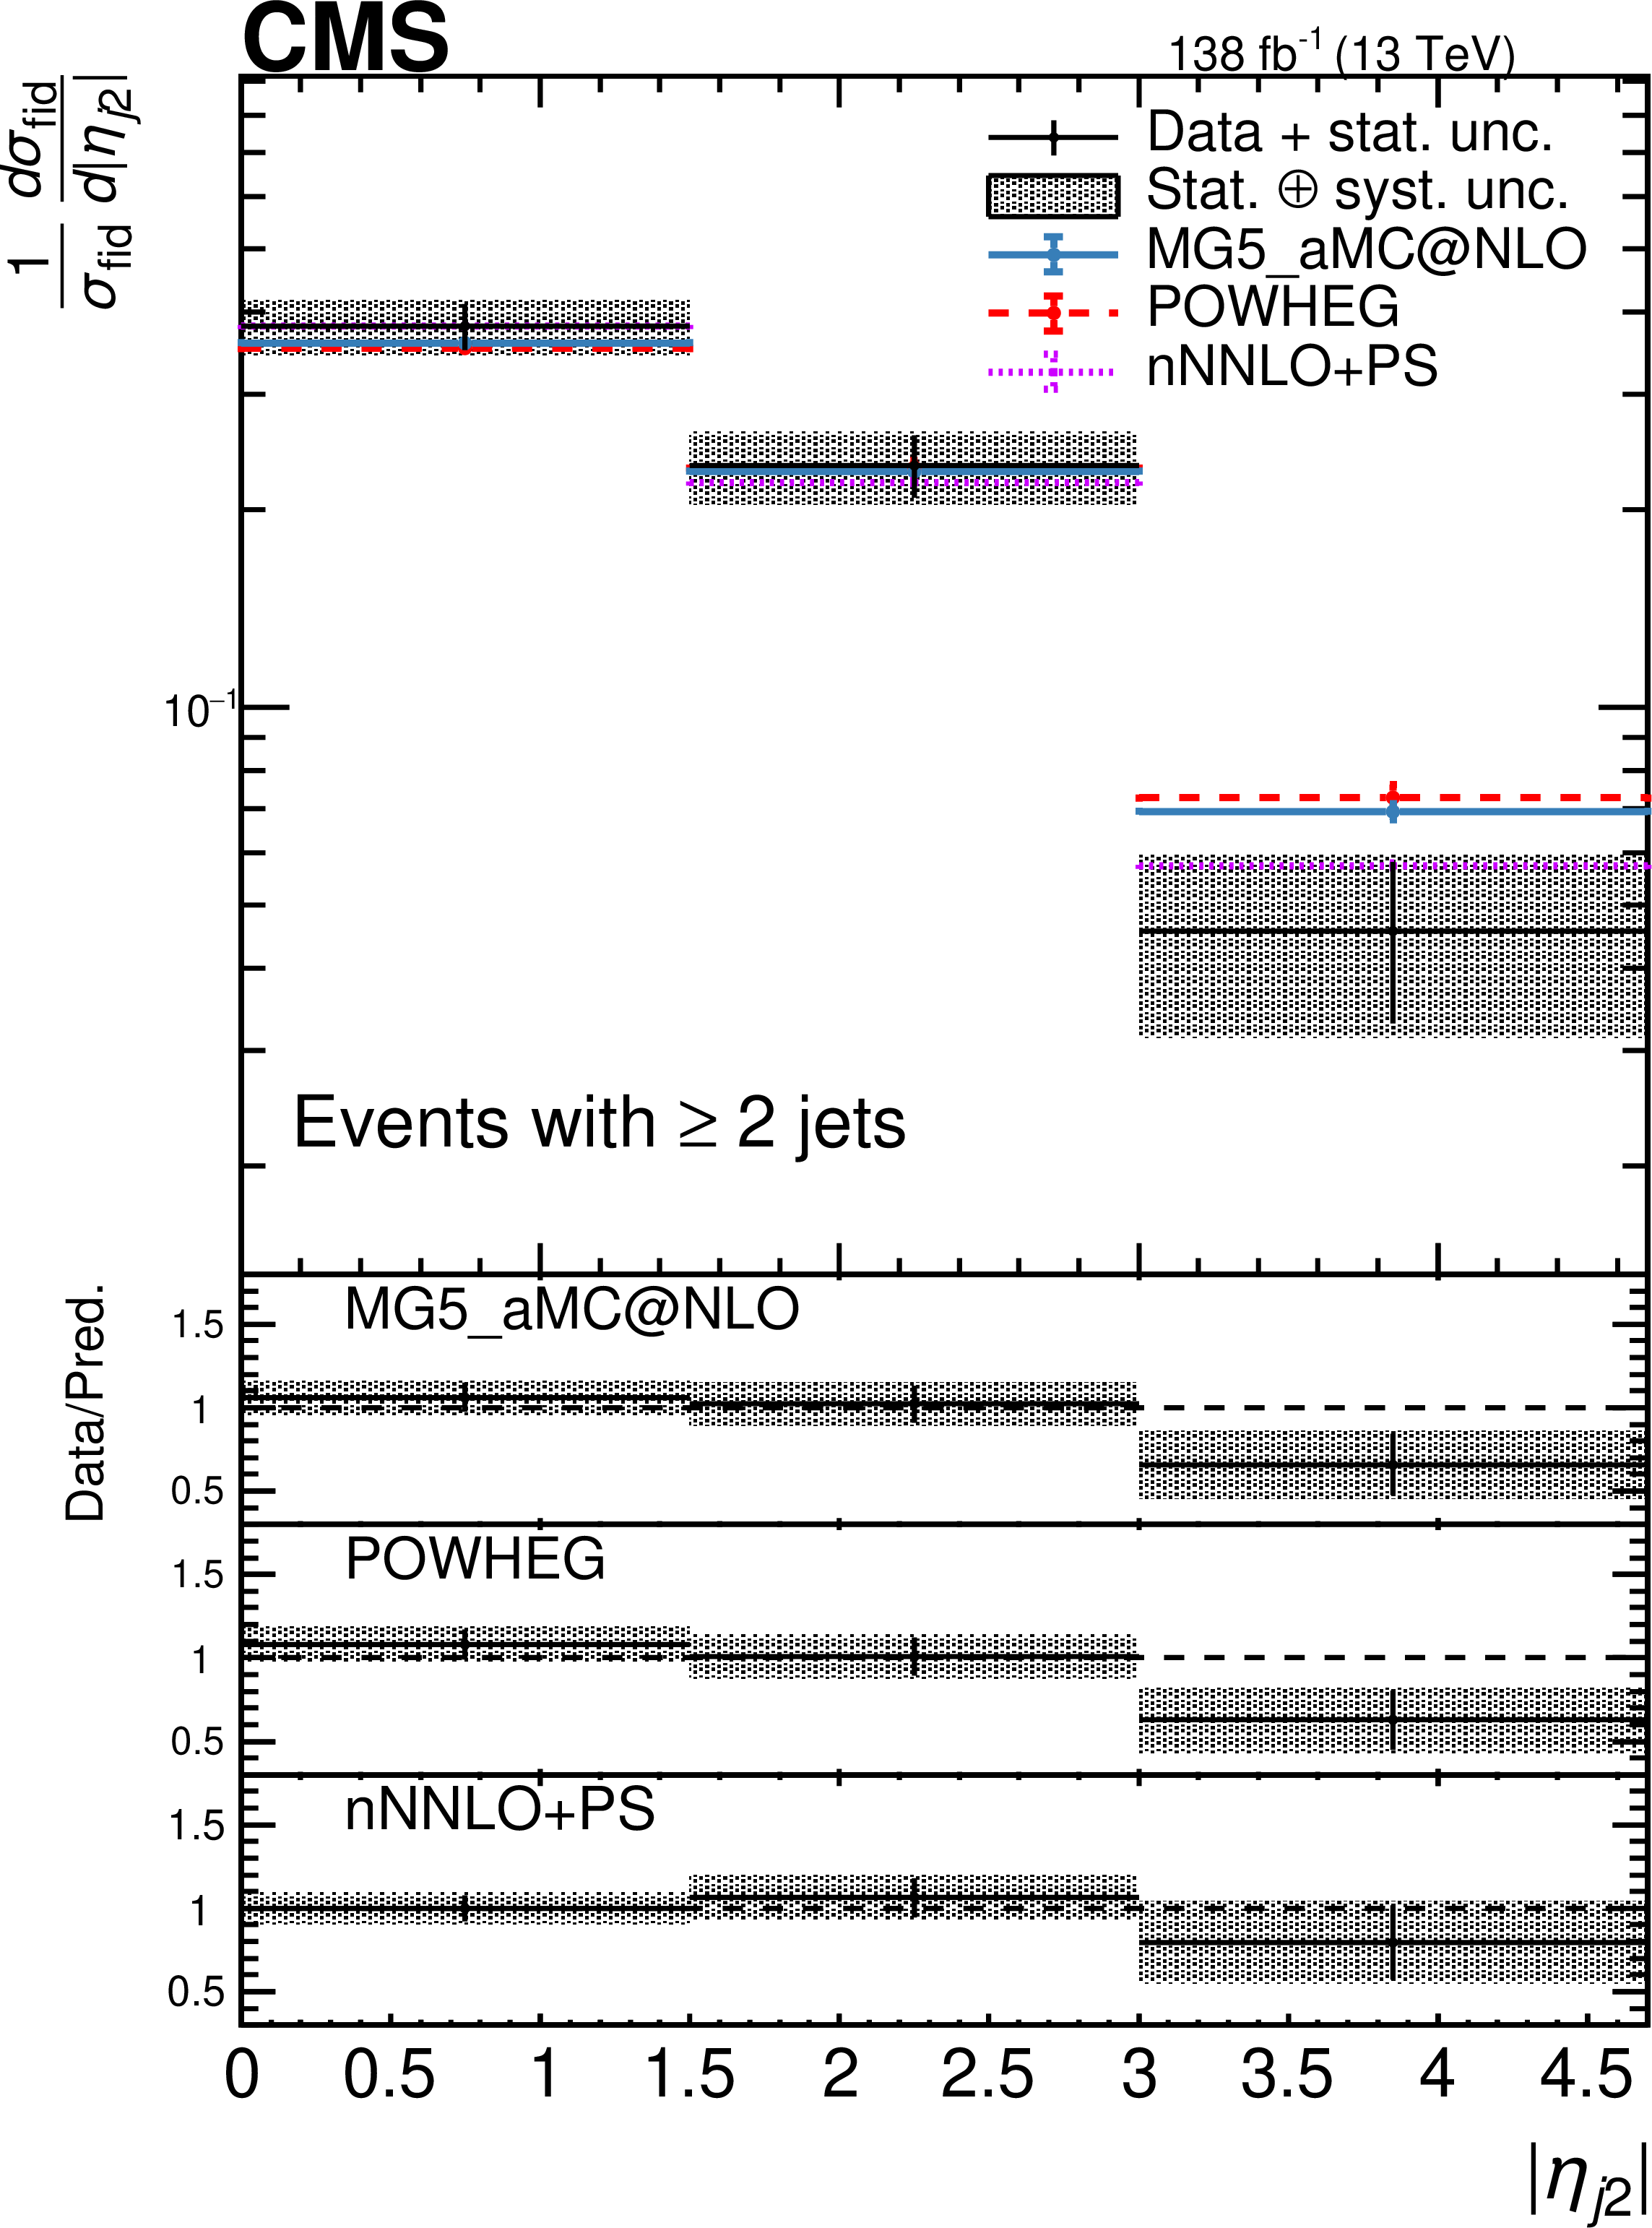
Figure 8:
Differential cross sections normalized to the fiducial cross section as a function of $ p_{\mathrm{T}} $ and $ |\eta| $ of the highest- and the second-highest-$ p_{\mathrm{T}} $ jet in events containing at least one or two jets, respectively. The on-shell Z requirement 60 $ < m_{\mathrm{Z}_1}$, $\mathrm{Z}_2 < $ 120 GeV is applied. Other details are as in the caption of Fig. 7. |
png pdf |
Figure 8-a:
Differential cross sections normalized to the fiducial cross section as a function of $ p_{\mathrm{T}} $ and $ |\eta| $ of the highest- and the second-highest-$ p_{\mathrm{T}} $ jet in events containing at least one or two jets, respectively. The on-shell Z requirement 60 $ < m_{\mathrm{Z}_1}$, $\mathrm{Z}_2 < $ 120 GeV is applied. Other details are as in the caption of Fig. 7. |

png pdf |
Figure 8-b:
Differential cross sections normalized to the fiducial cross section as a function of $ p_{\mathrm{T}} $ and $ |\eta| $ of the highest- and the second-highest-$ p_{\mathrm{T}} $ jet in events containing at least one or two jets, respectively. The on-shell Z requirement 60 $ < m_{\mathrm{Z}_1}$, $\mathrm{Z}_2 < $ 120 GeV is applied. Other details are as in the caption of Fig. 7. |
png pdf |
Figure 8-c:
Differential cross sections normalized to the fiducial cross section as a function of $ p_{\mathrm{T}} $ and $ |\eta| $ of the highest- and the second-highest-$ p_{\mathrm{T}} $ jet in events containing at least one or two jets, respectively. The on-shell Z requirement 60 $ < m_{\mathrm{Z}_1}$, $\mathrm{Z}_2 < $ 120 GeV is applied. Other details are as in the caption of Fig. 7. |
png pdf |
Figure 8-d:
Differential cross sections normalized to the fiducial cross section as a function of $ p_{\mathrm{T}} $ and $ |\eta| $ of the highest- and the second-highest-$ p_{\mathrm{T}} $ jet in events containing at least one or two jets, respectively. The on-shell Z requirement 60 $ < m_{\mathrm{Z}_1}$, $\mathrm{Z}_2 < $ 120 GeV is applied. Other details are as in the caption of Fig. 7. |
png pdf |
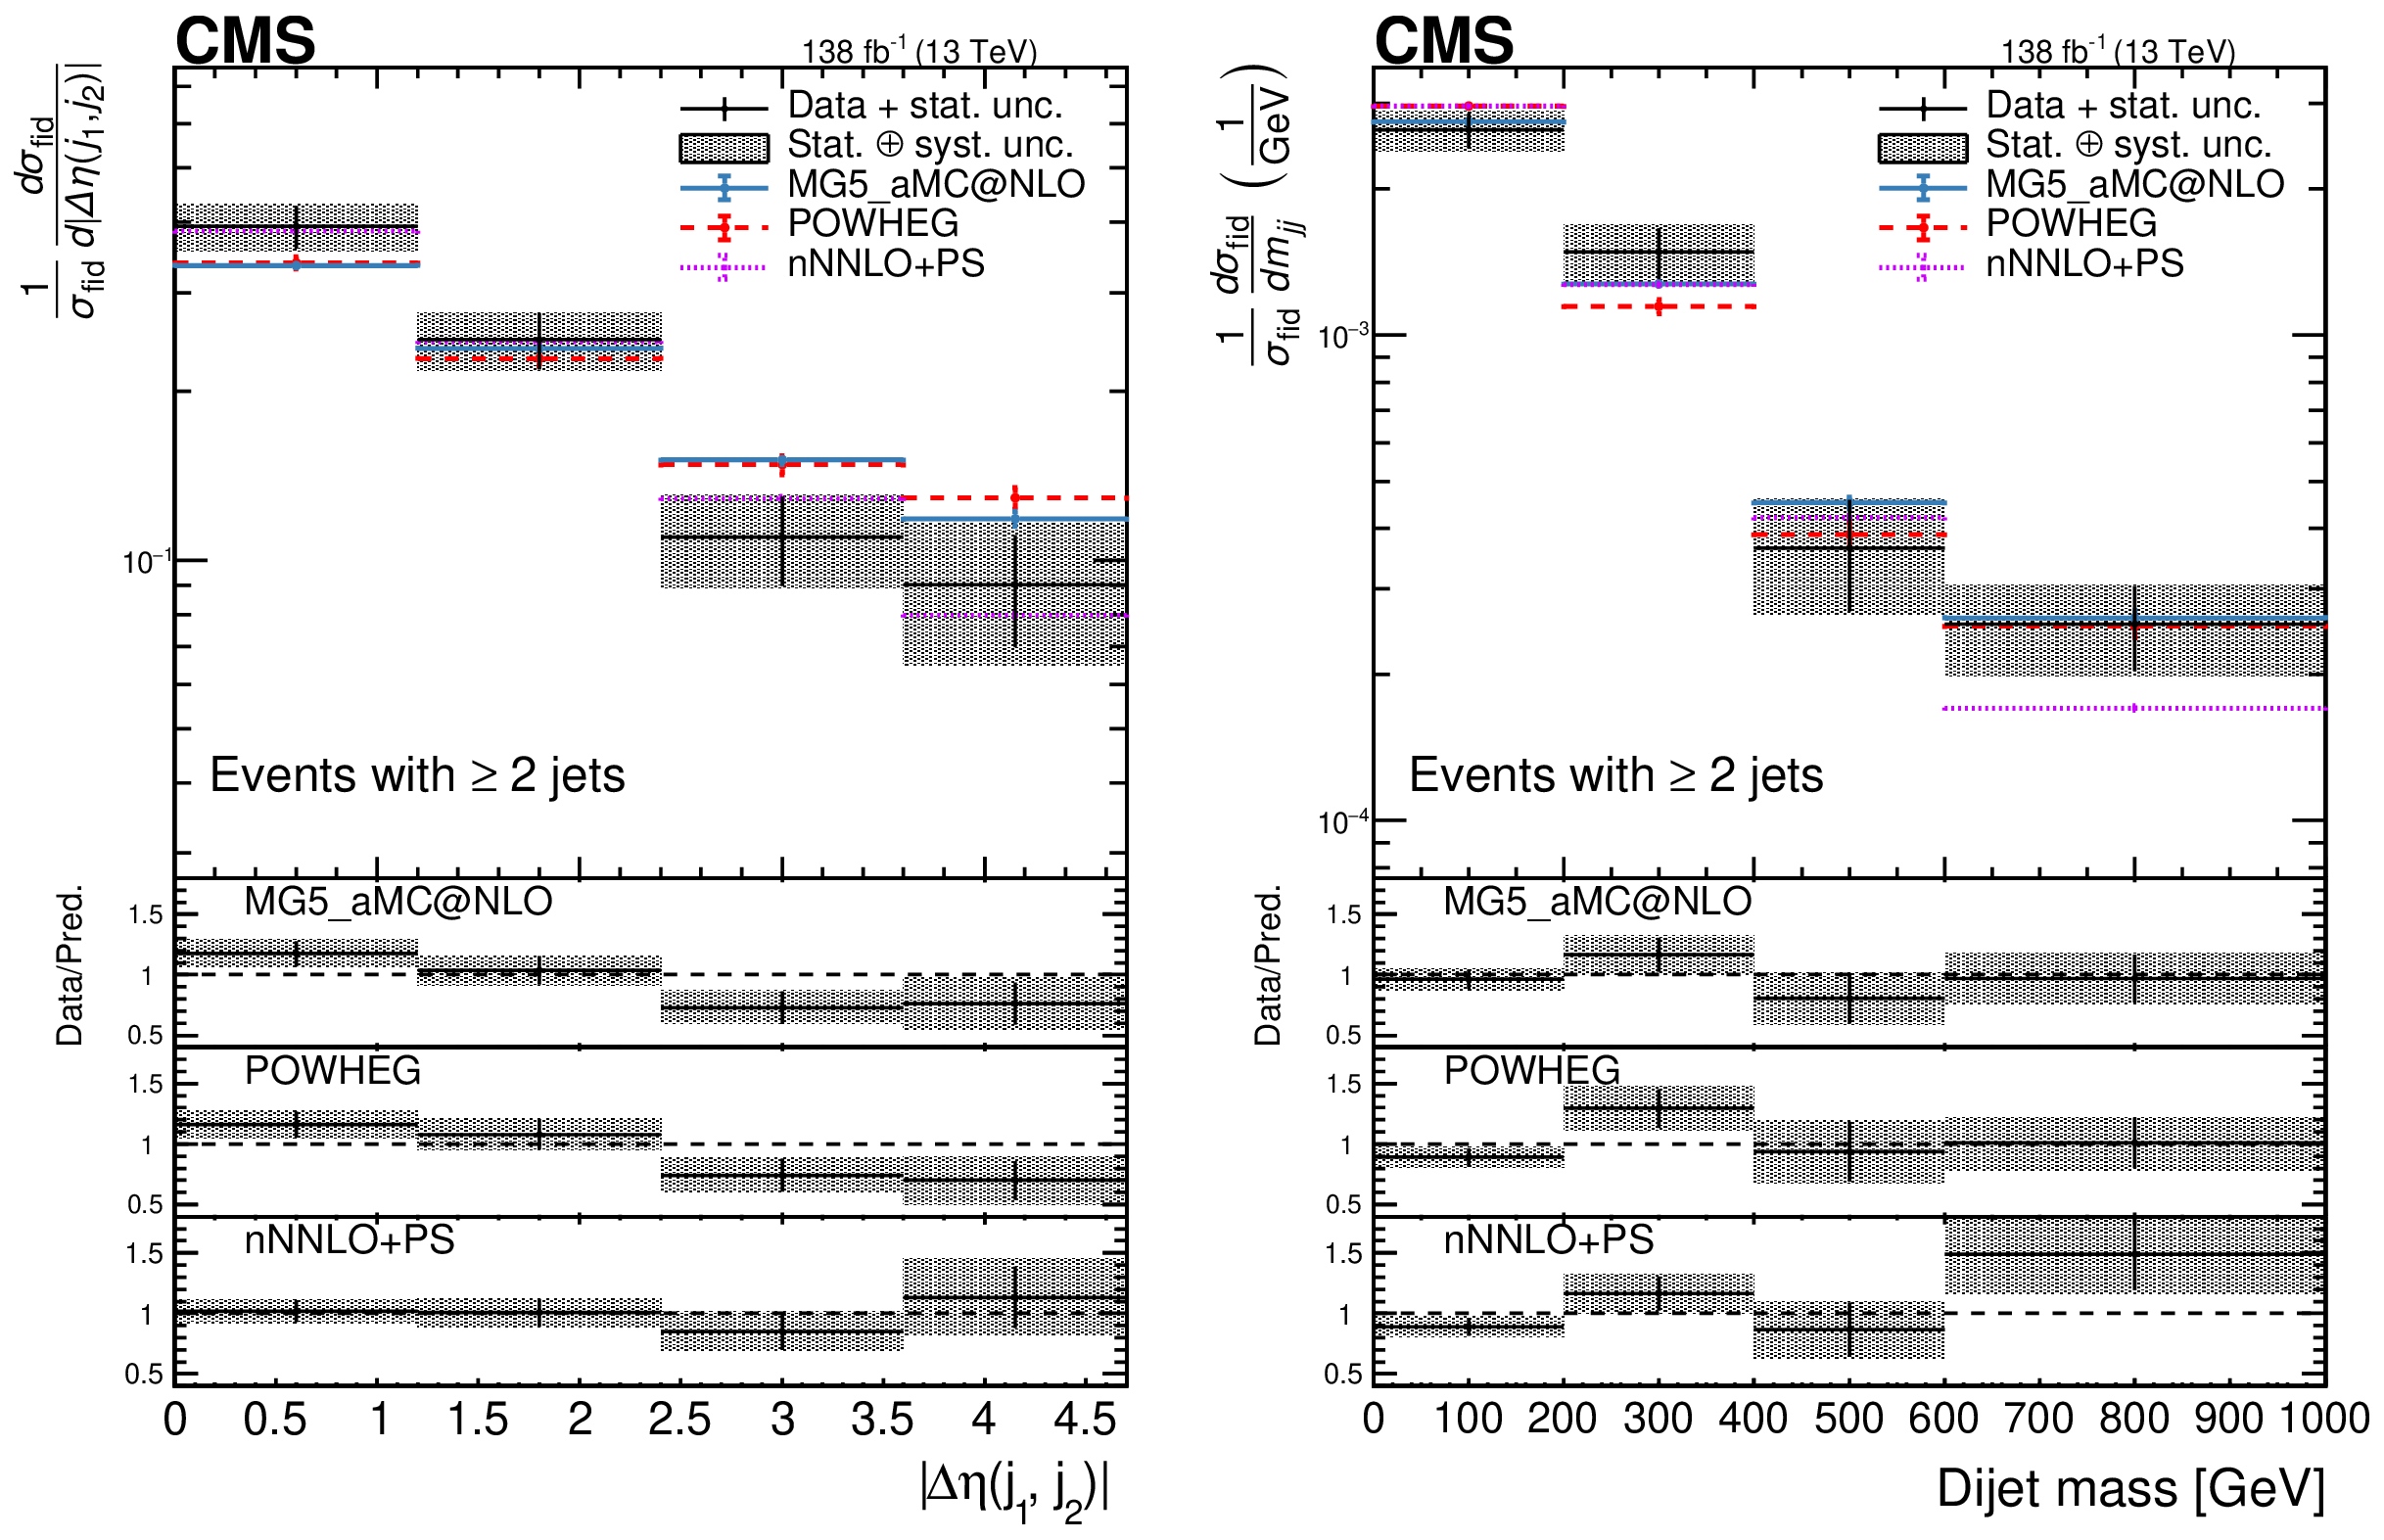
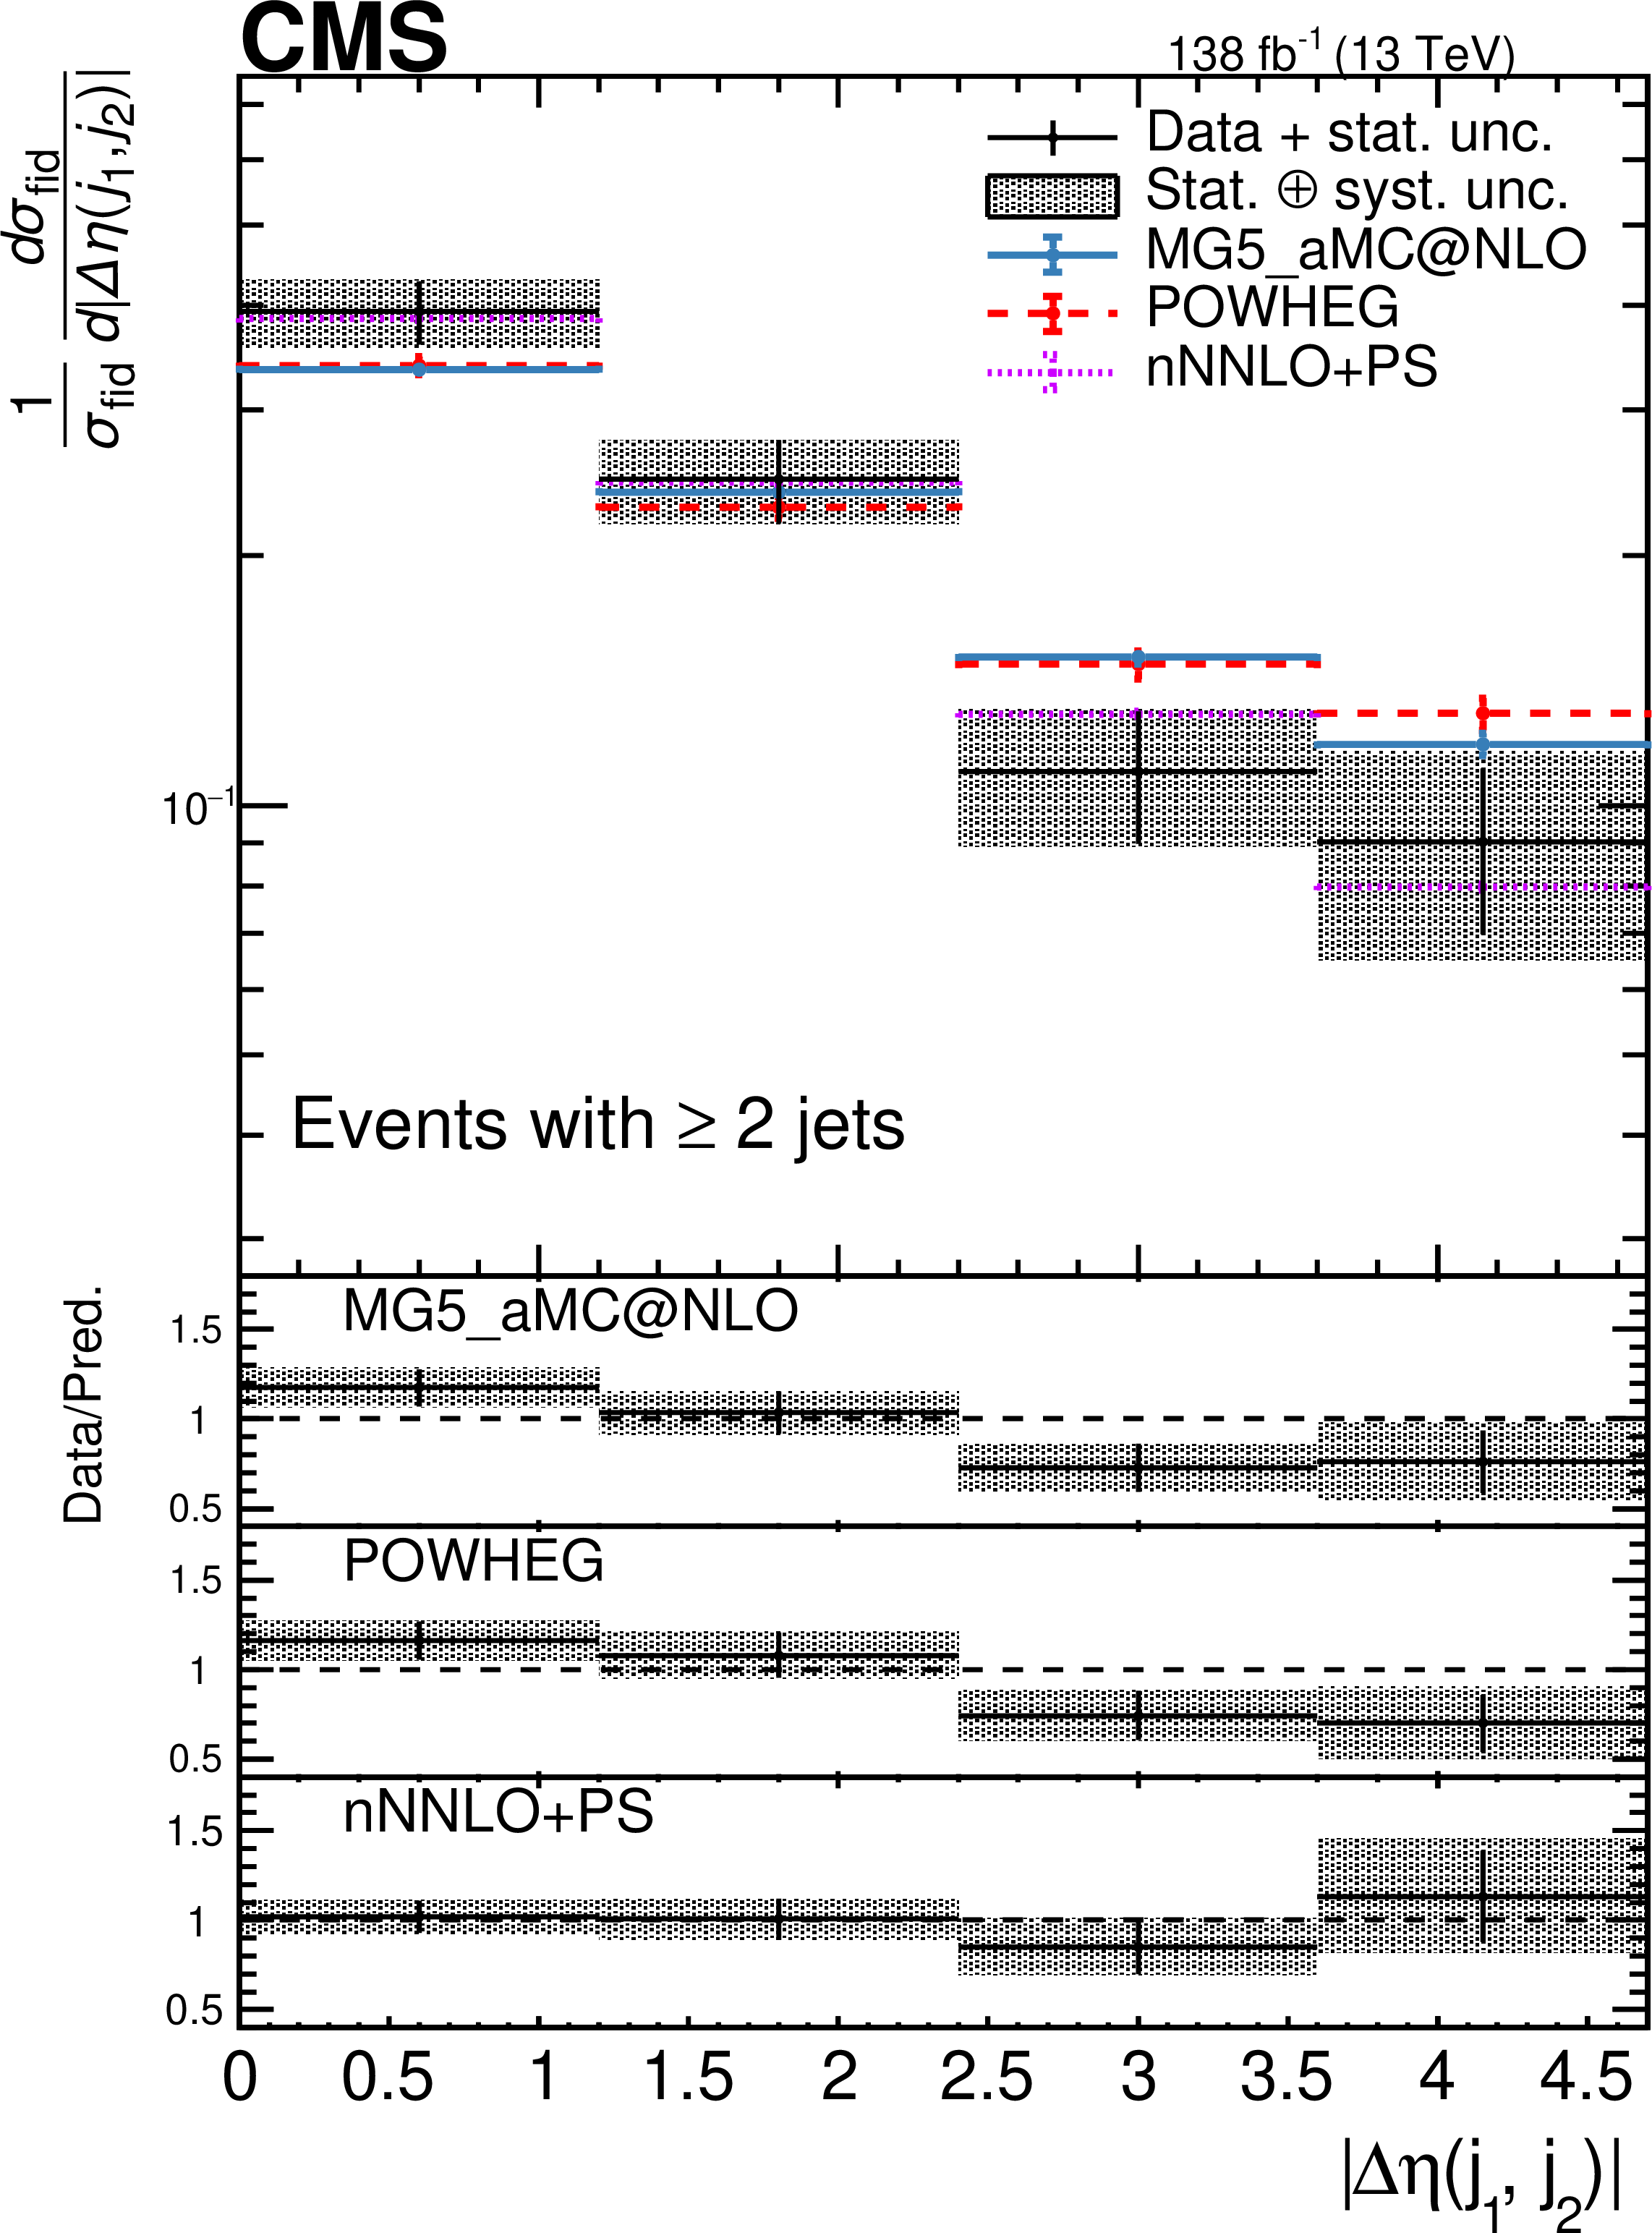
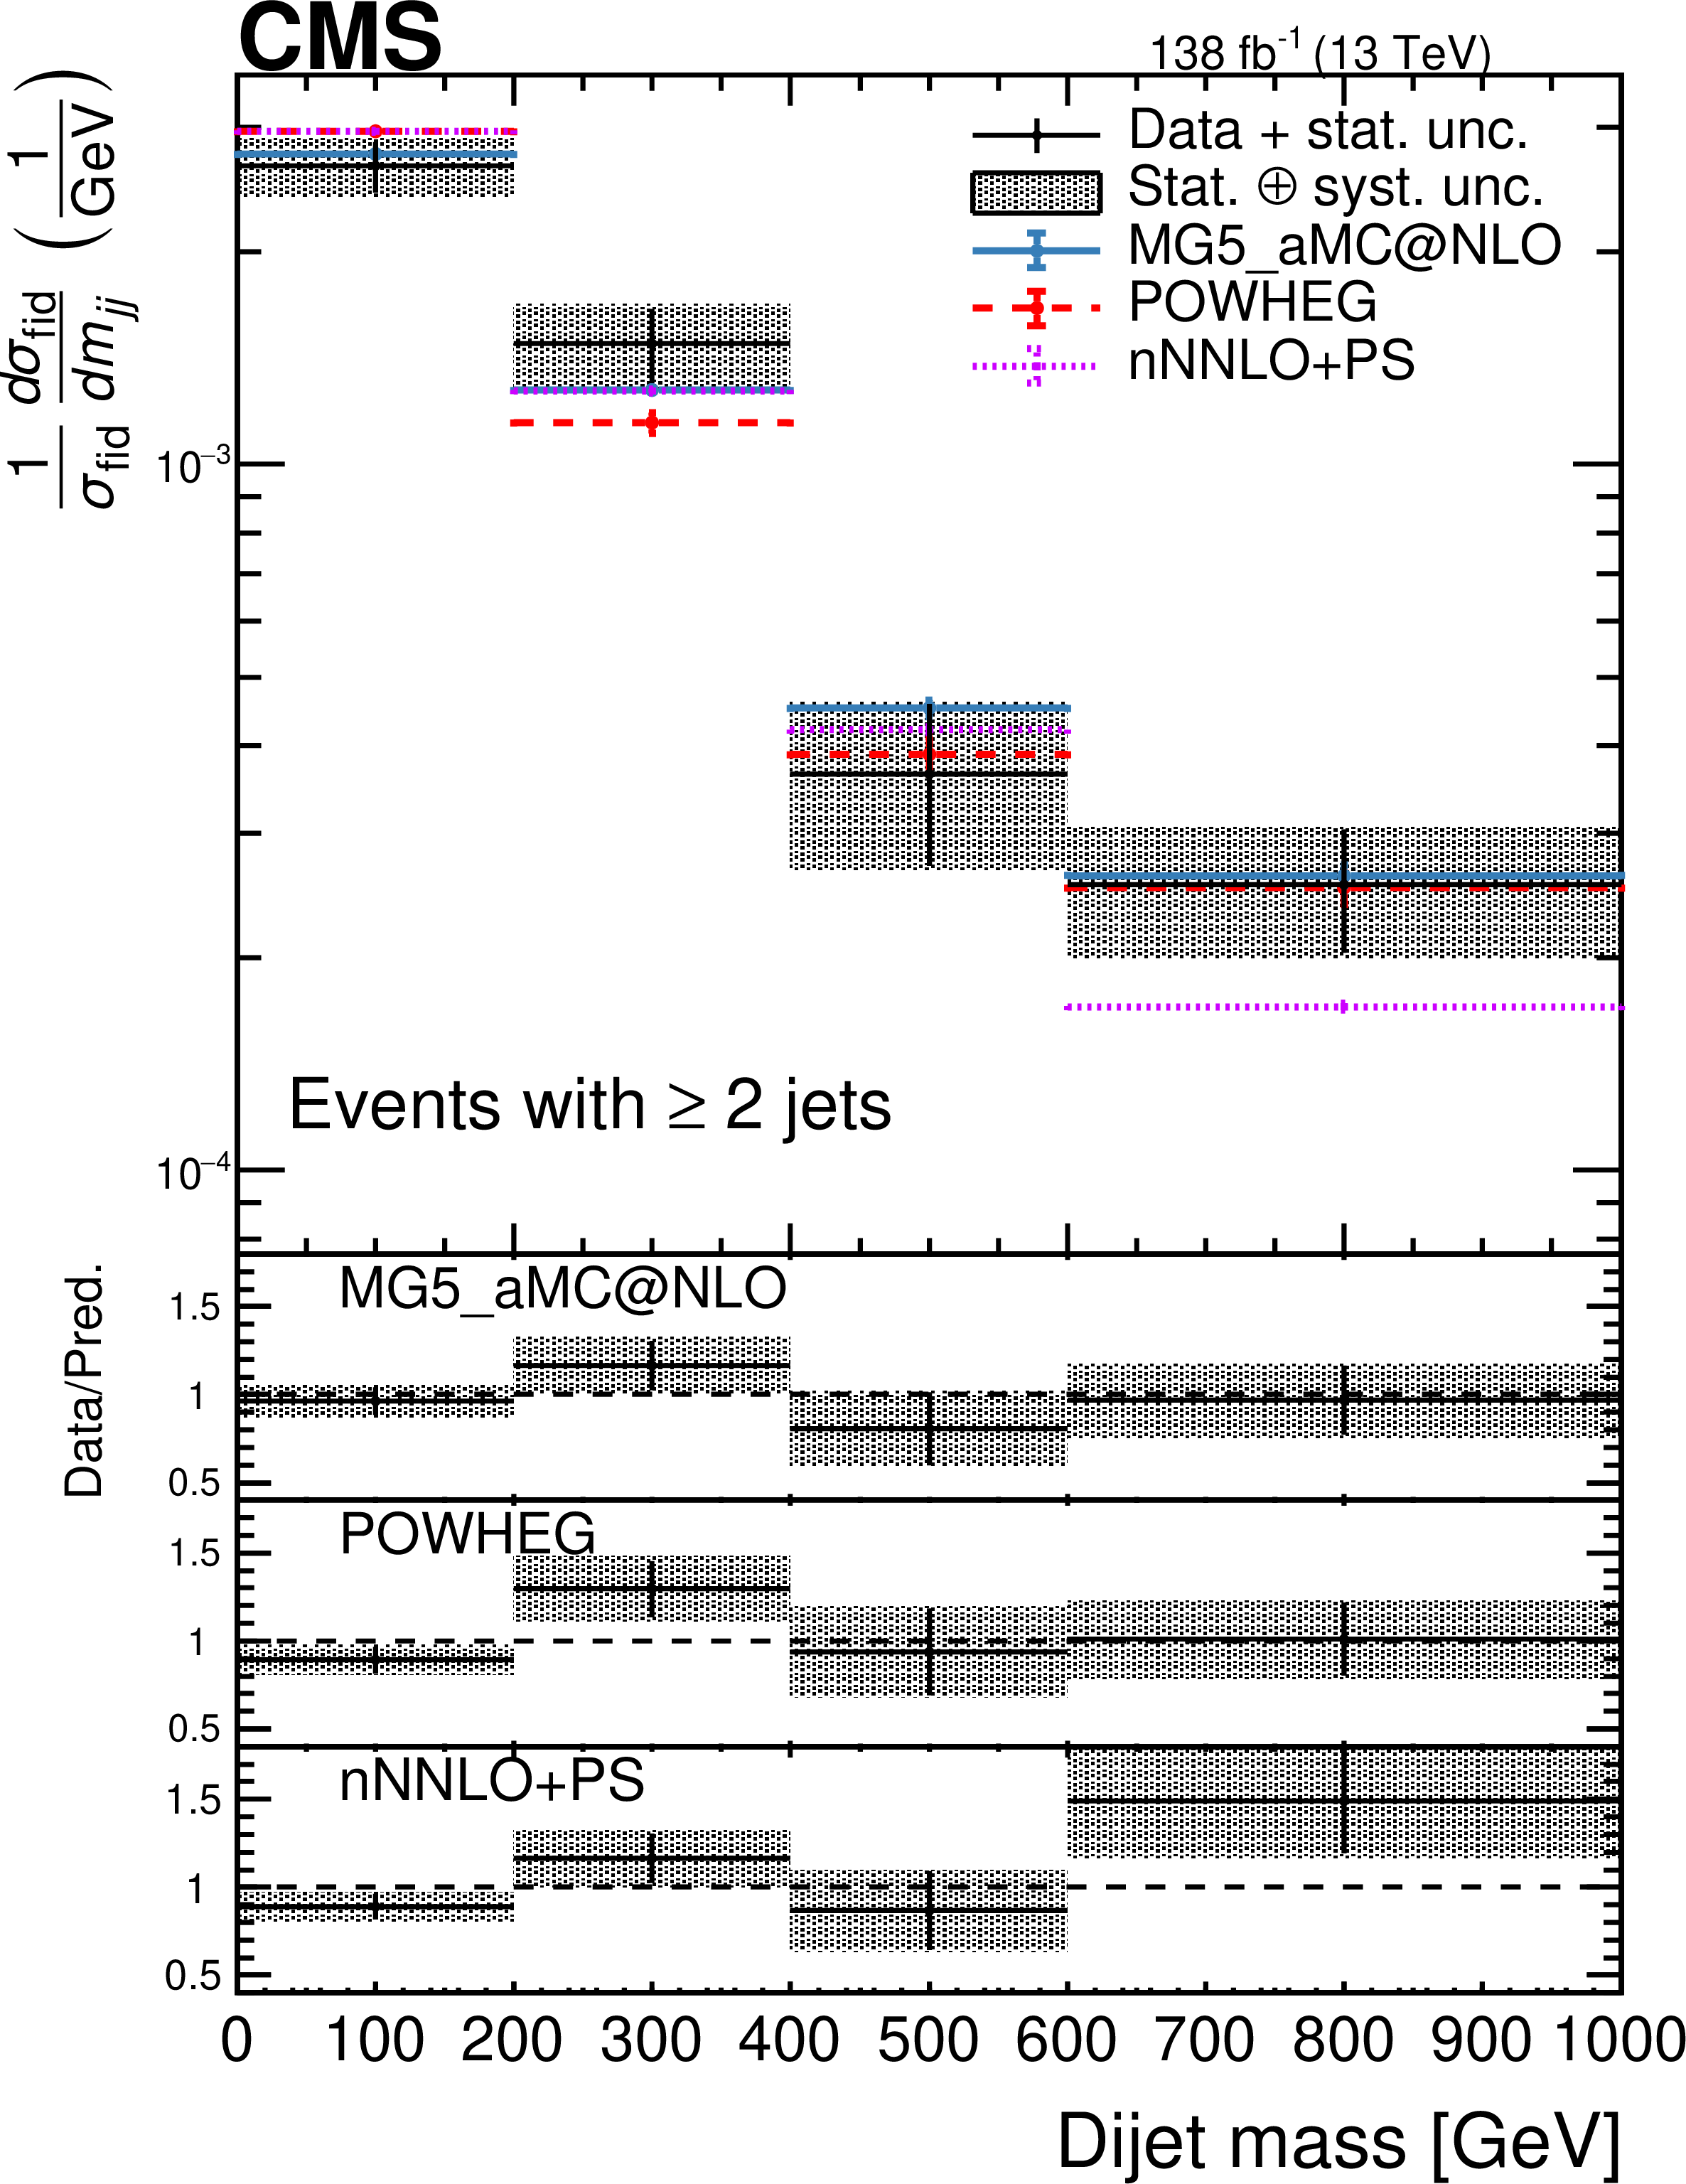
Figure 9:
Differential cross sections normalized to the fiducial cross section as a function of (left) $ |\Delta \eta| $ and (right) dijet mass between highest-$ p_{\mathrm{T}} $ jets in events with at least two jets. Events with 60 $ < m_{\mathrm{Z}_1}$, ${\mathrm{Z}_2} < $ 120 GeV requirement. Other details are as in the caption of Fig. 7. |
png pdf |
Figure 9-a:
Differential cross sections normalized to the fiducial cross section as a function of (left) $ |\Delta \eta| $ and (right) dijet mass between highest-$ p_{\mathrm{T}} $ jets in events with at least two jets. Events with 60 $ < m_{\mathrm{Z}_1}$, ${\mathrm{Z}_2} < $ 120 GeV requirement. Other details are as in the caption of Fig. 7. |
png pdf |
Figure 9-b:
Differential cross sections normalized to the fiducial cross section as a function of (left) $ |\Delta \eta| $ and (right) dijet mass between highest-$ p_{\mathrm{T}} $ jets in events with at least two jets. Events with 60 $ < m_{\mathrm{Z}_1}$, ${\mathrm{Z}_2} < $ 120 GeV requirement. Other details are as in the caption of Fig. 7. |
png pdf |
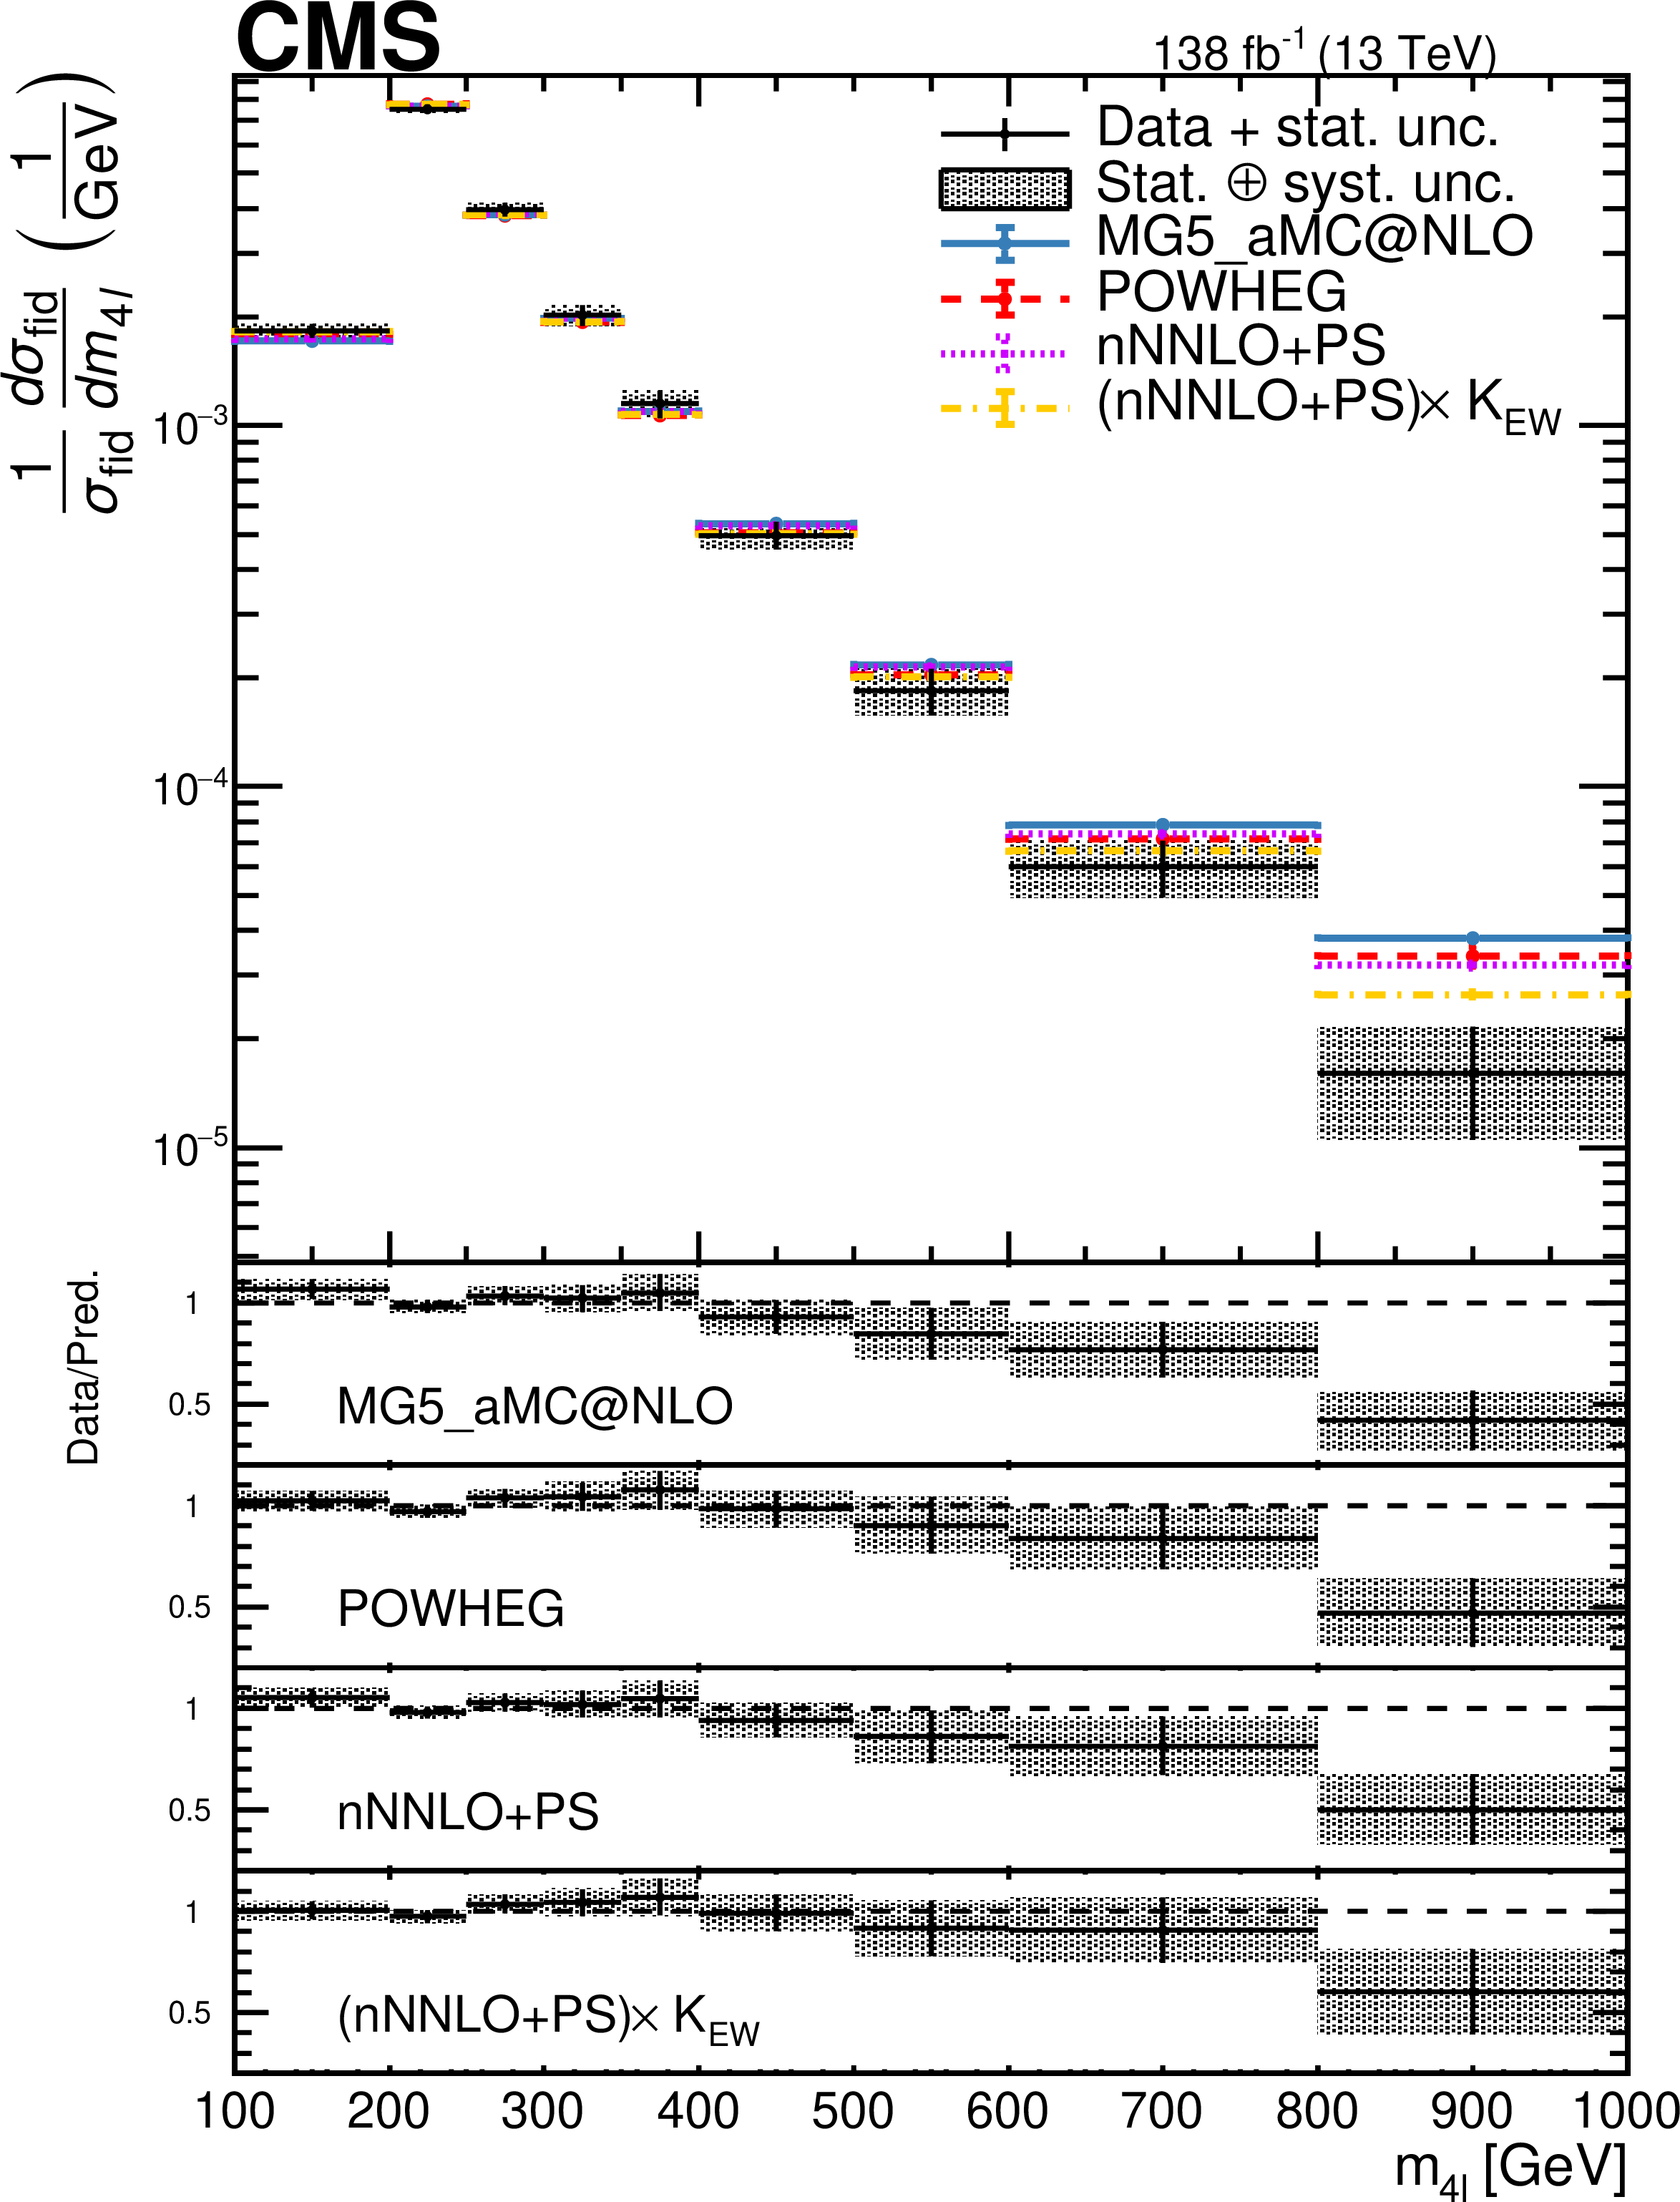
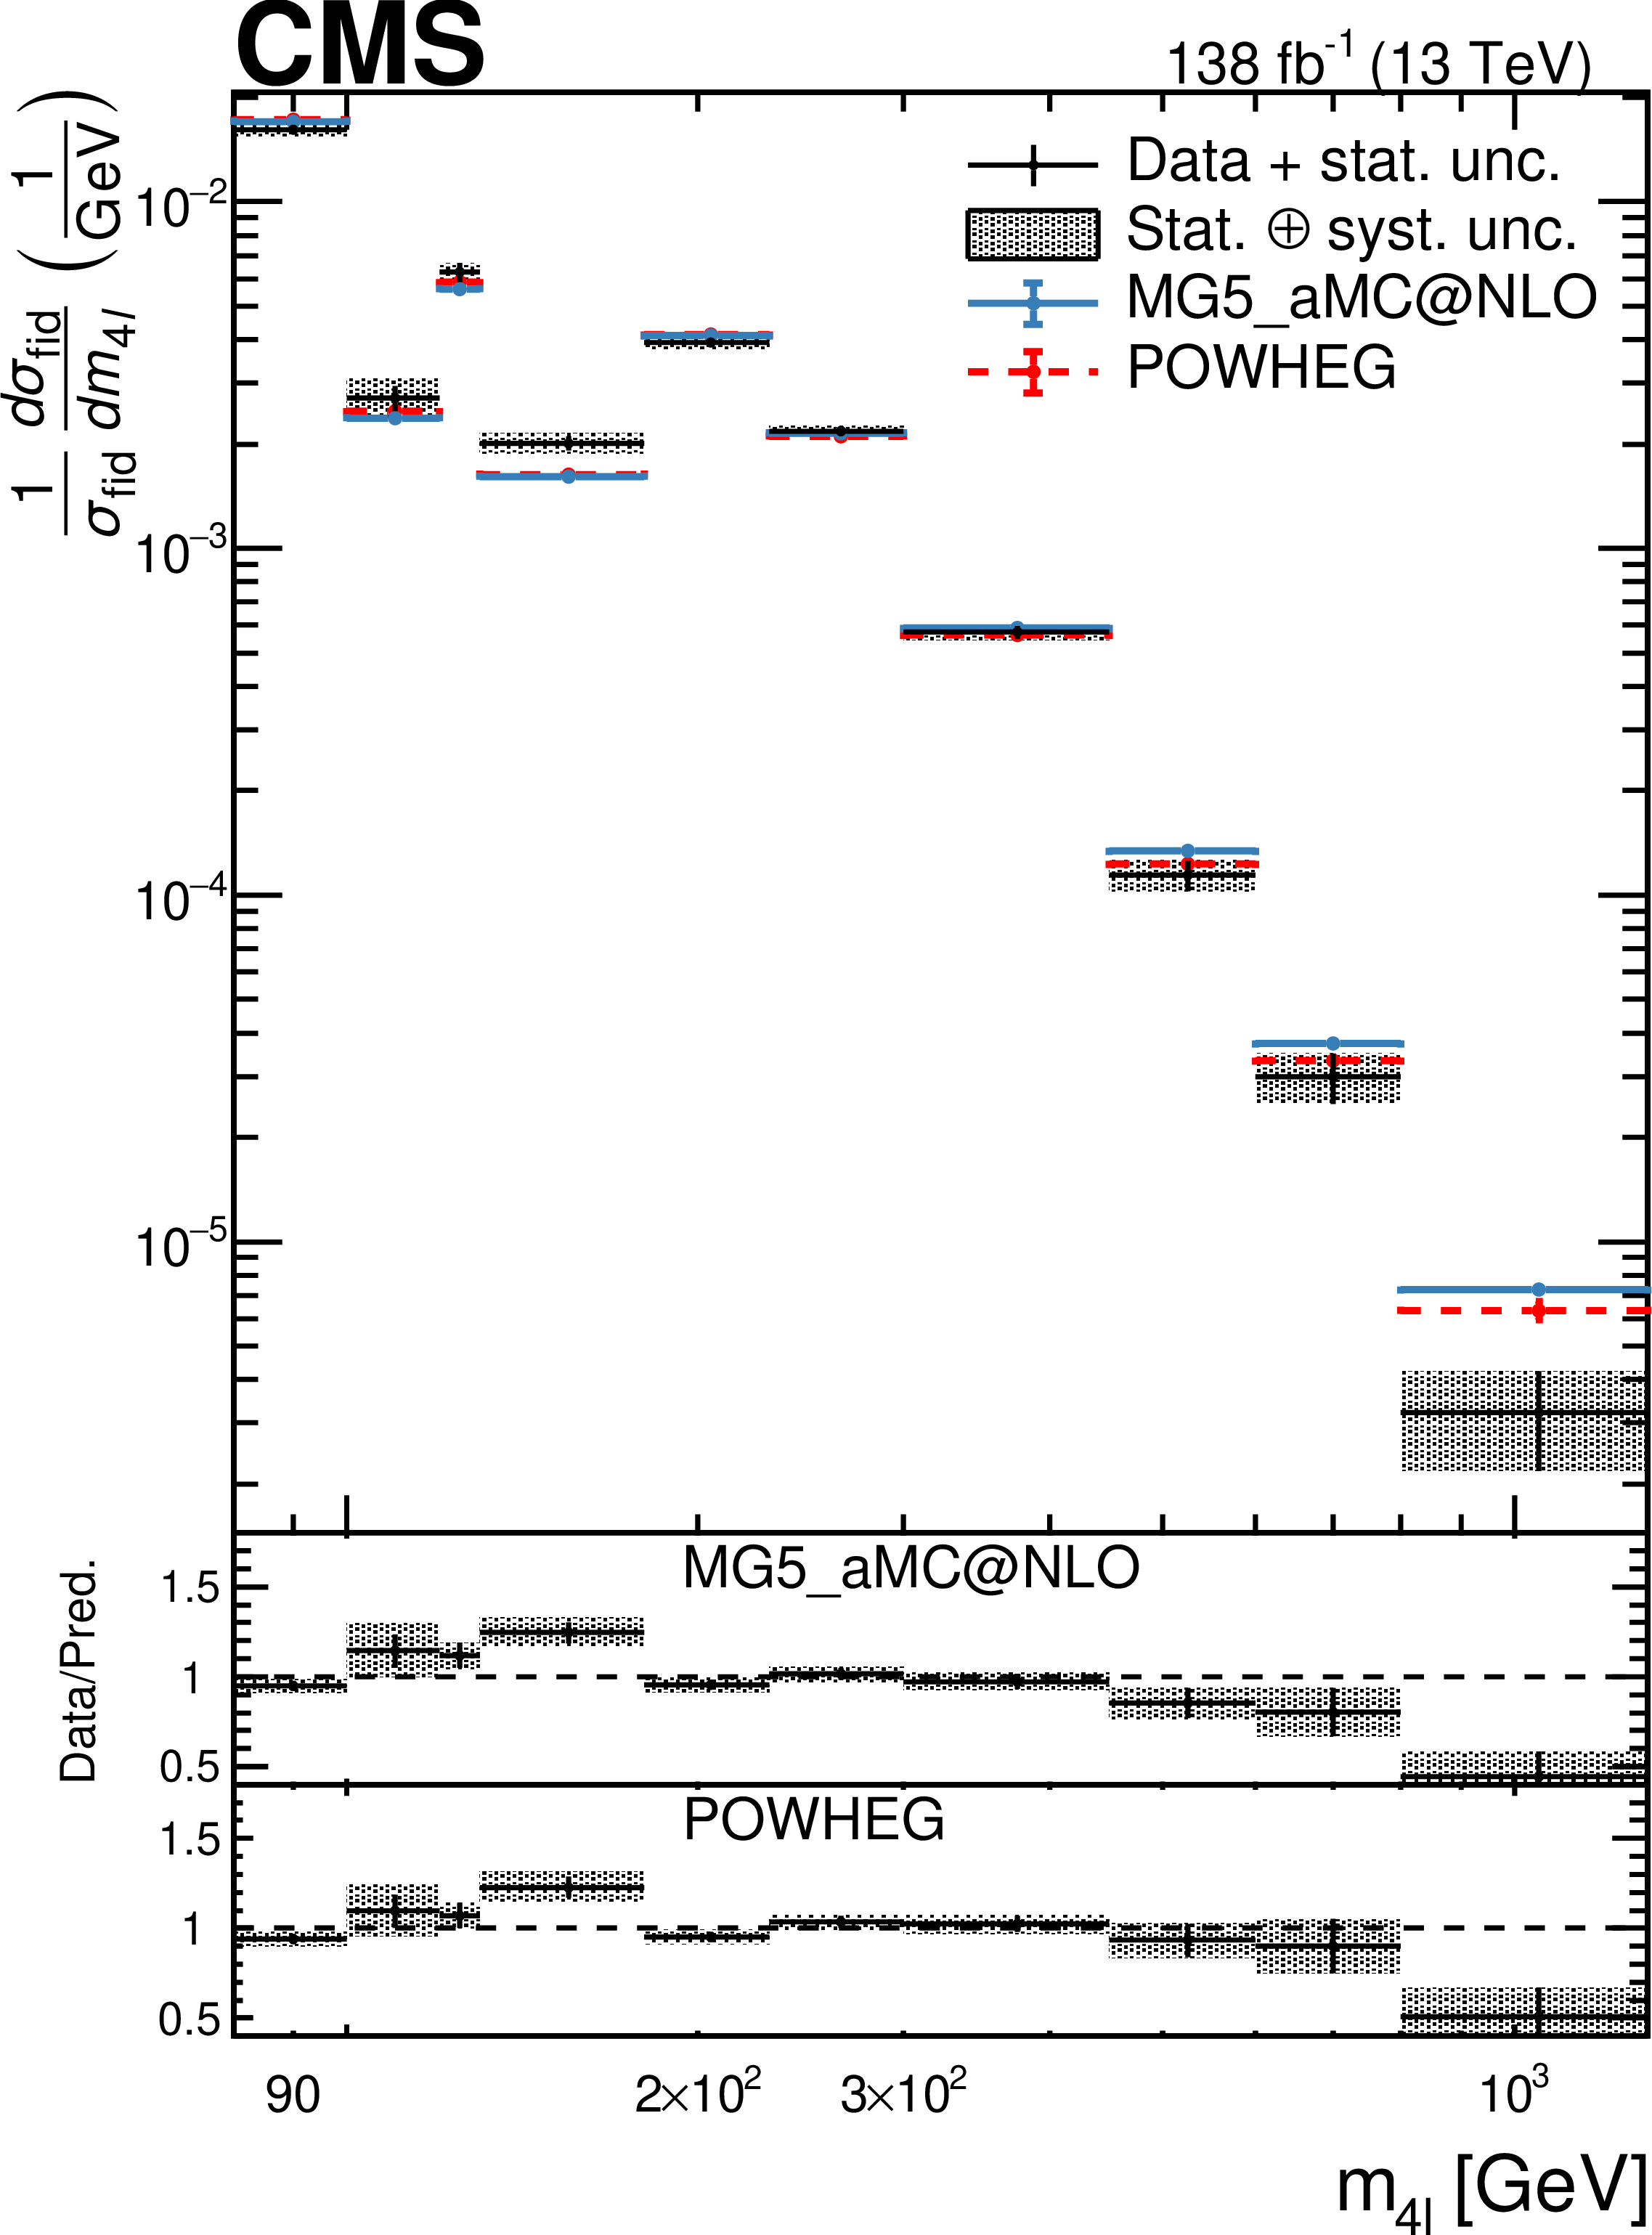
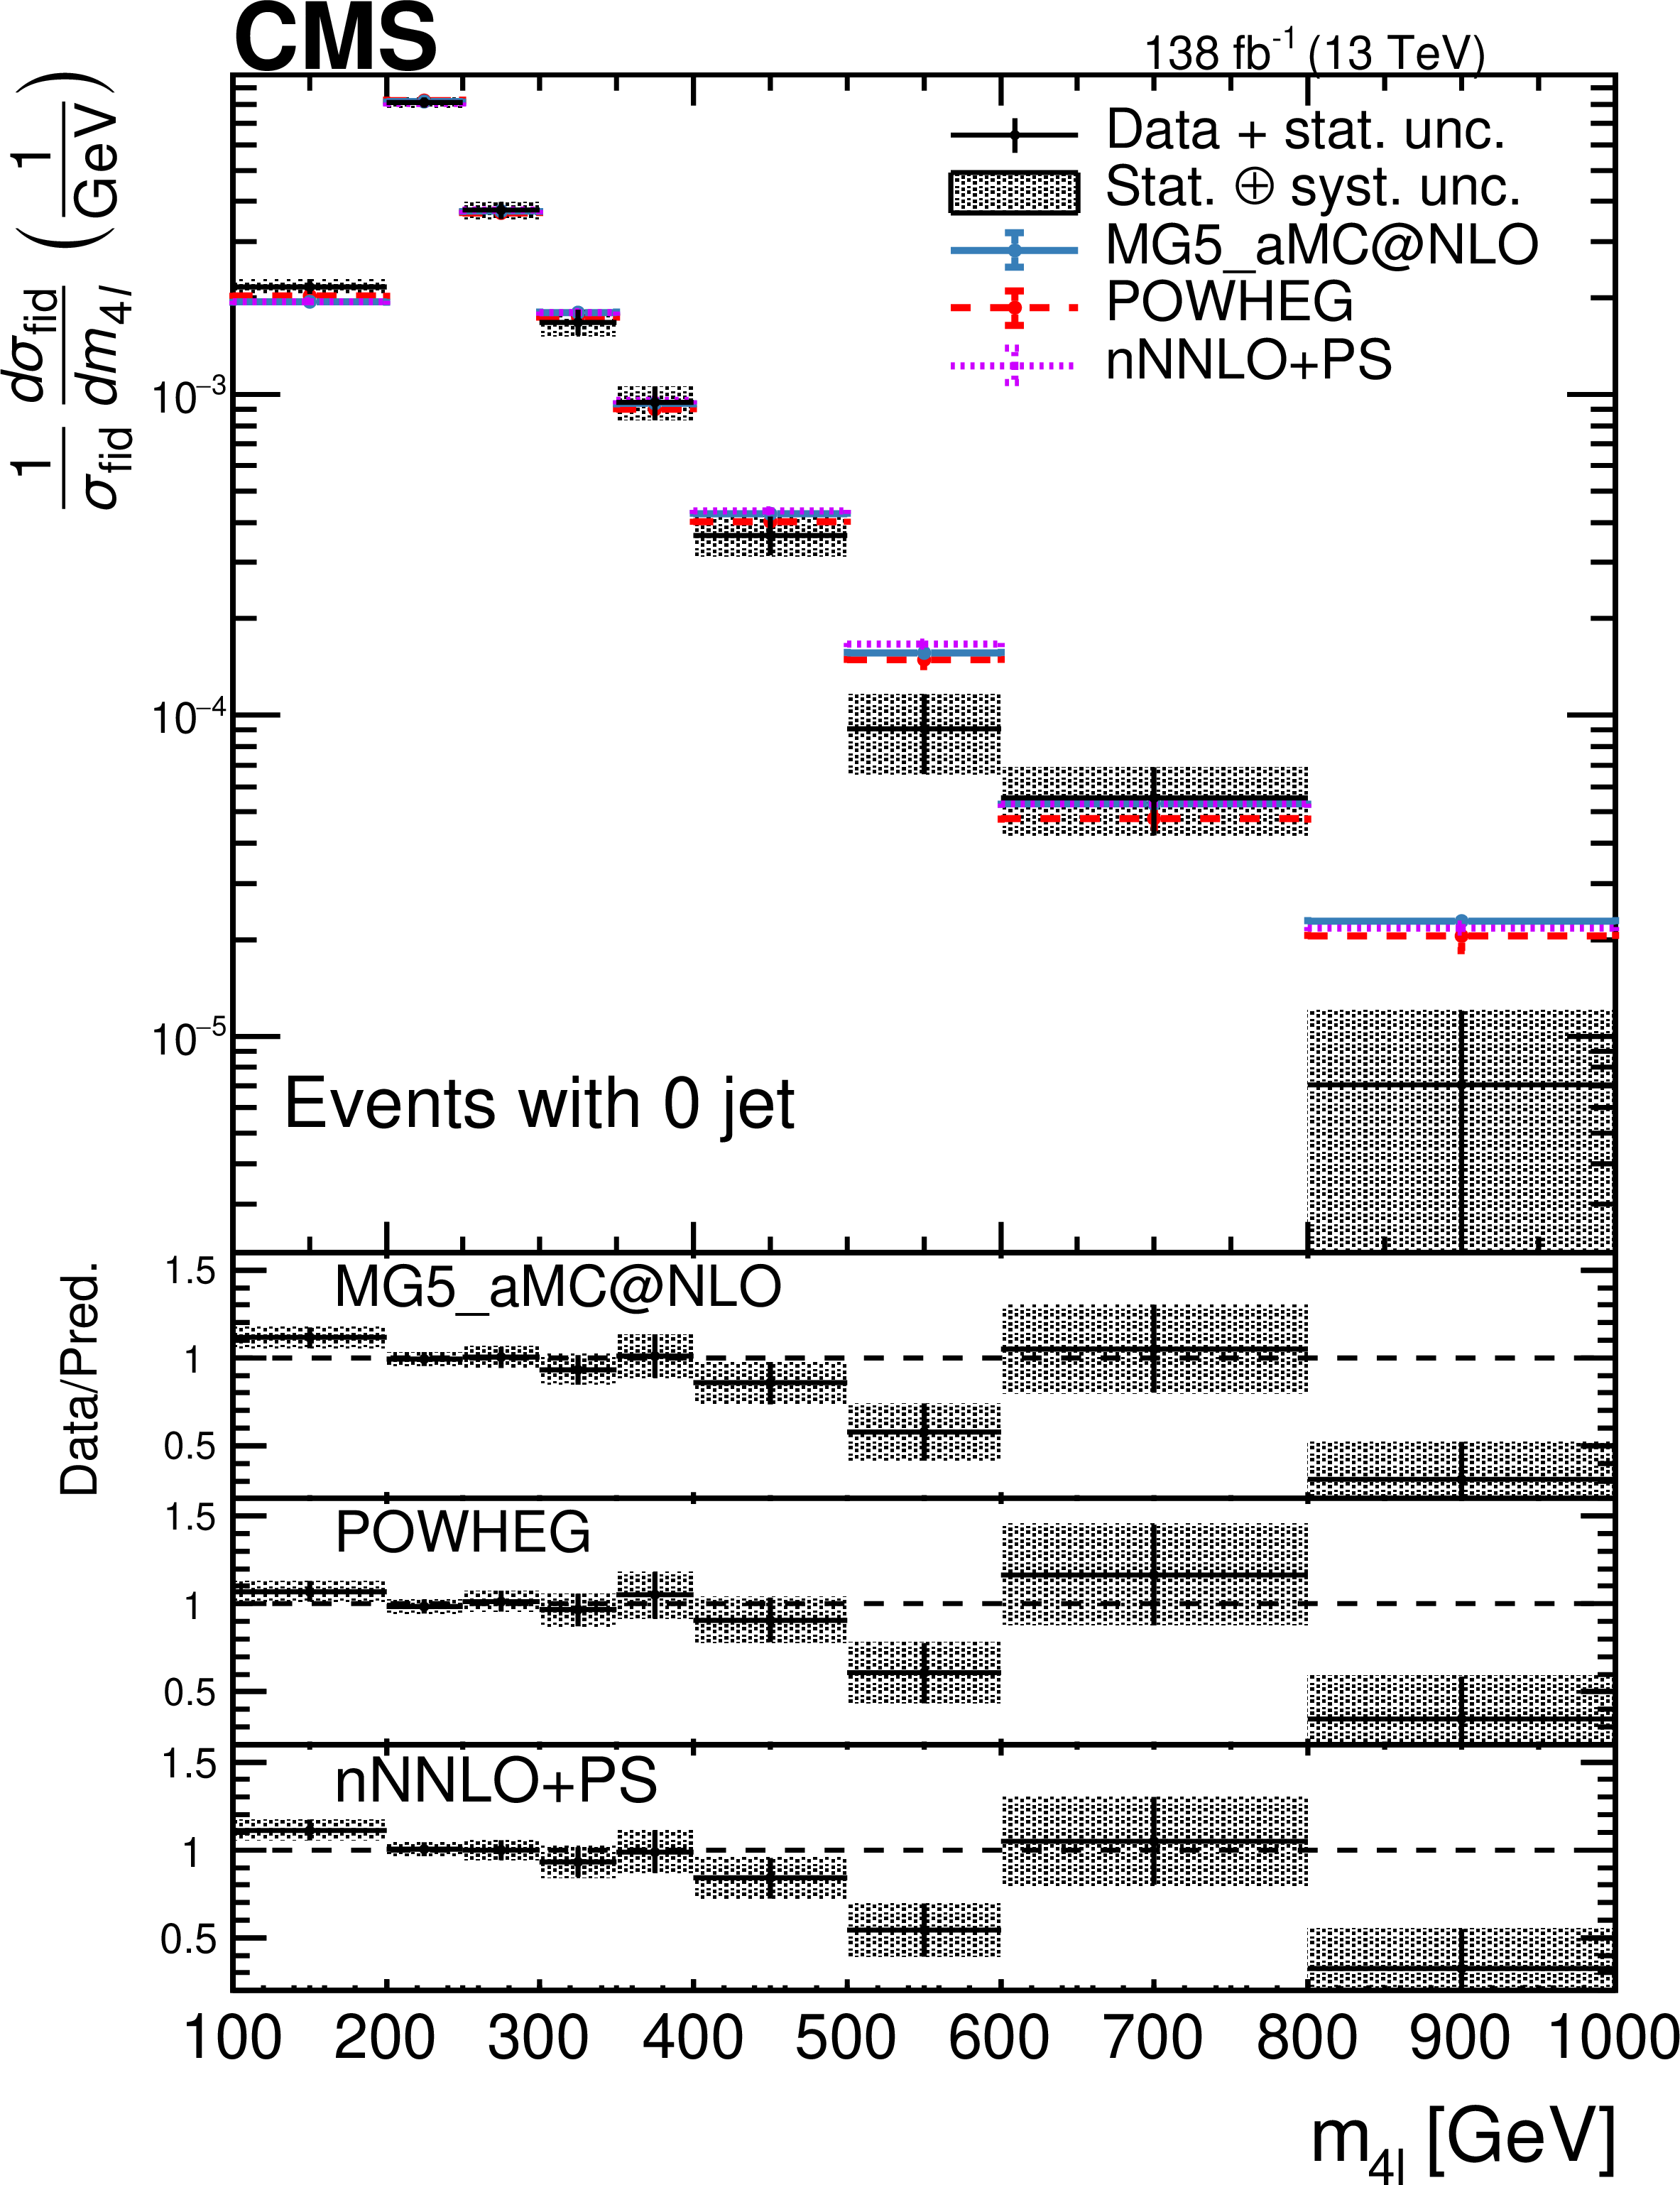
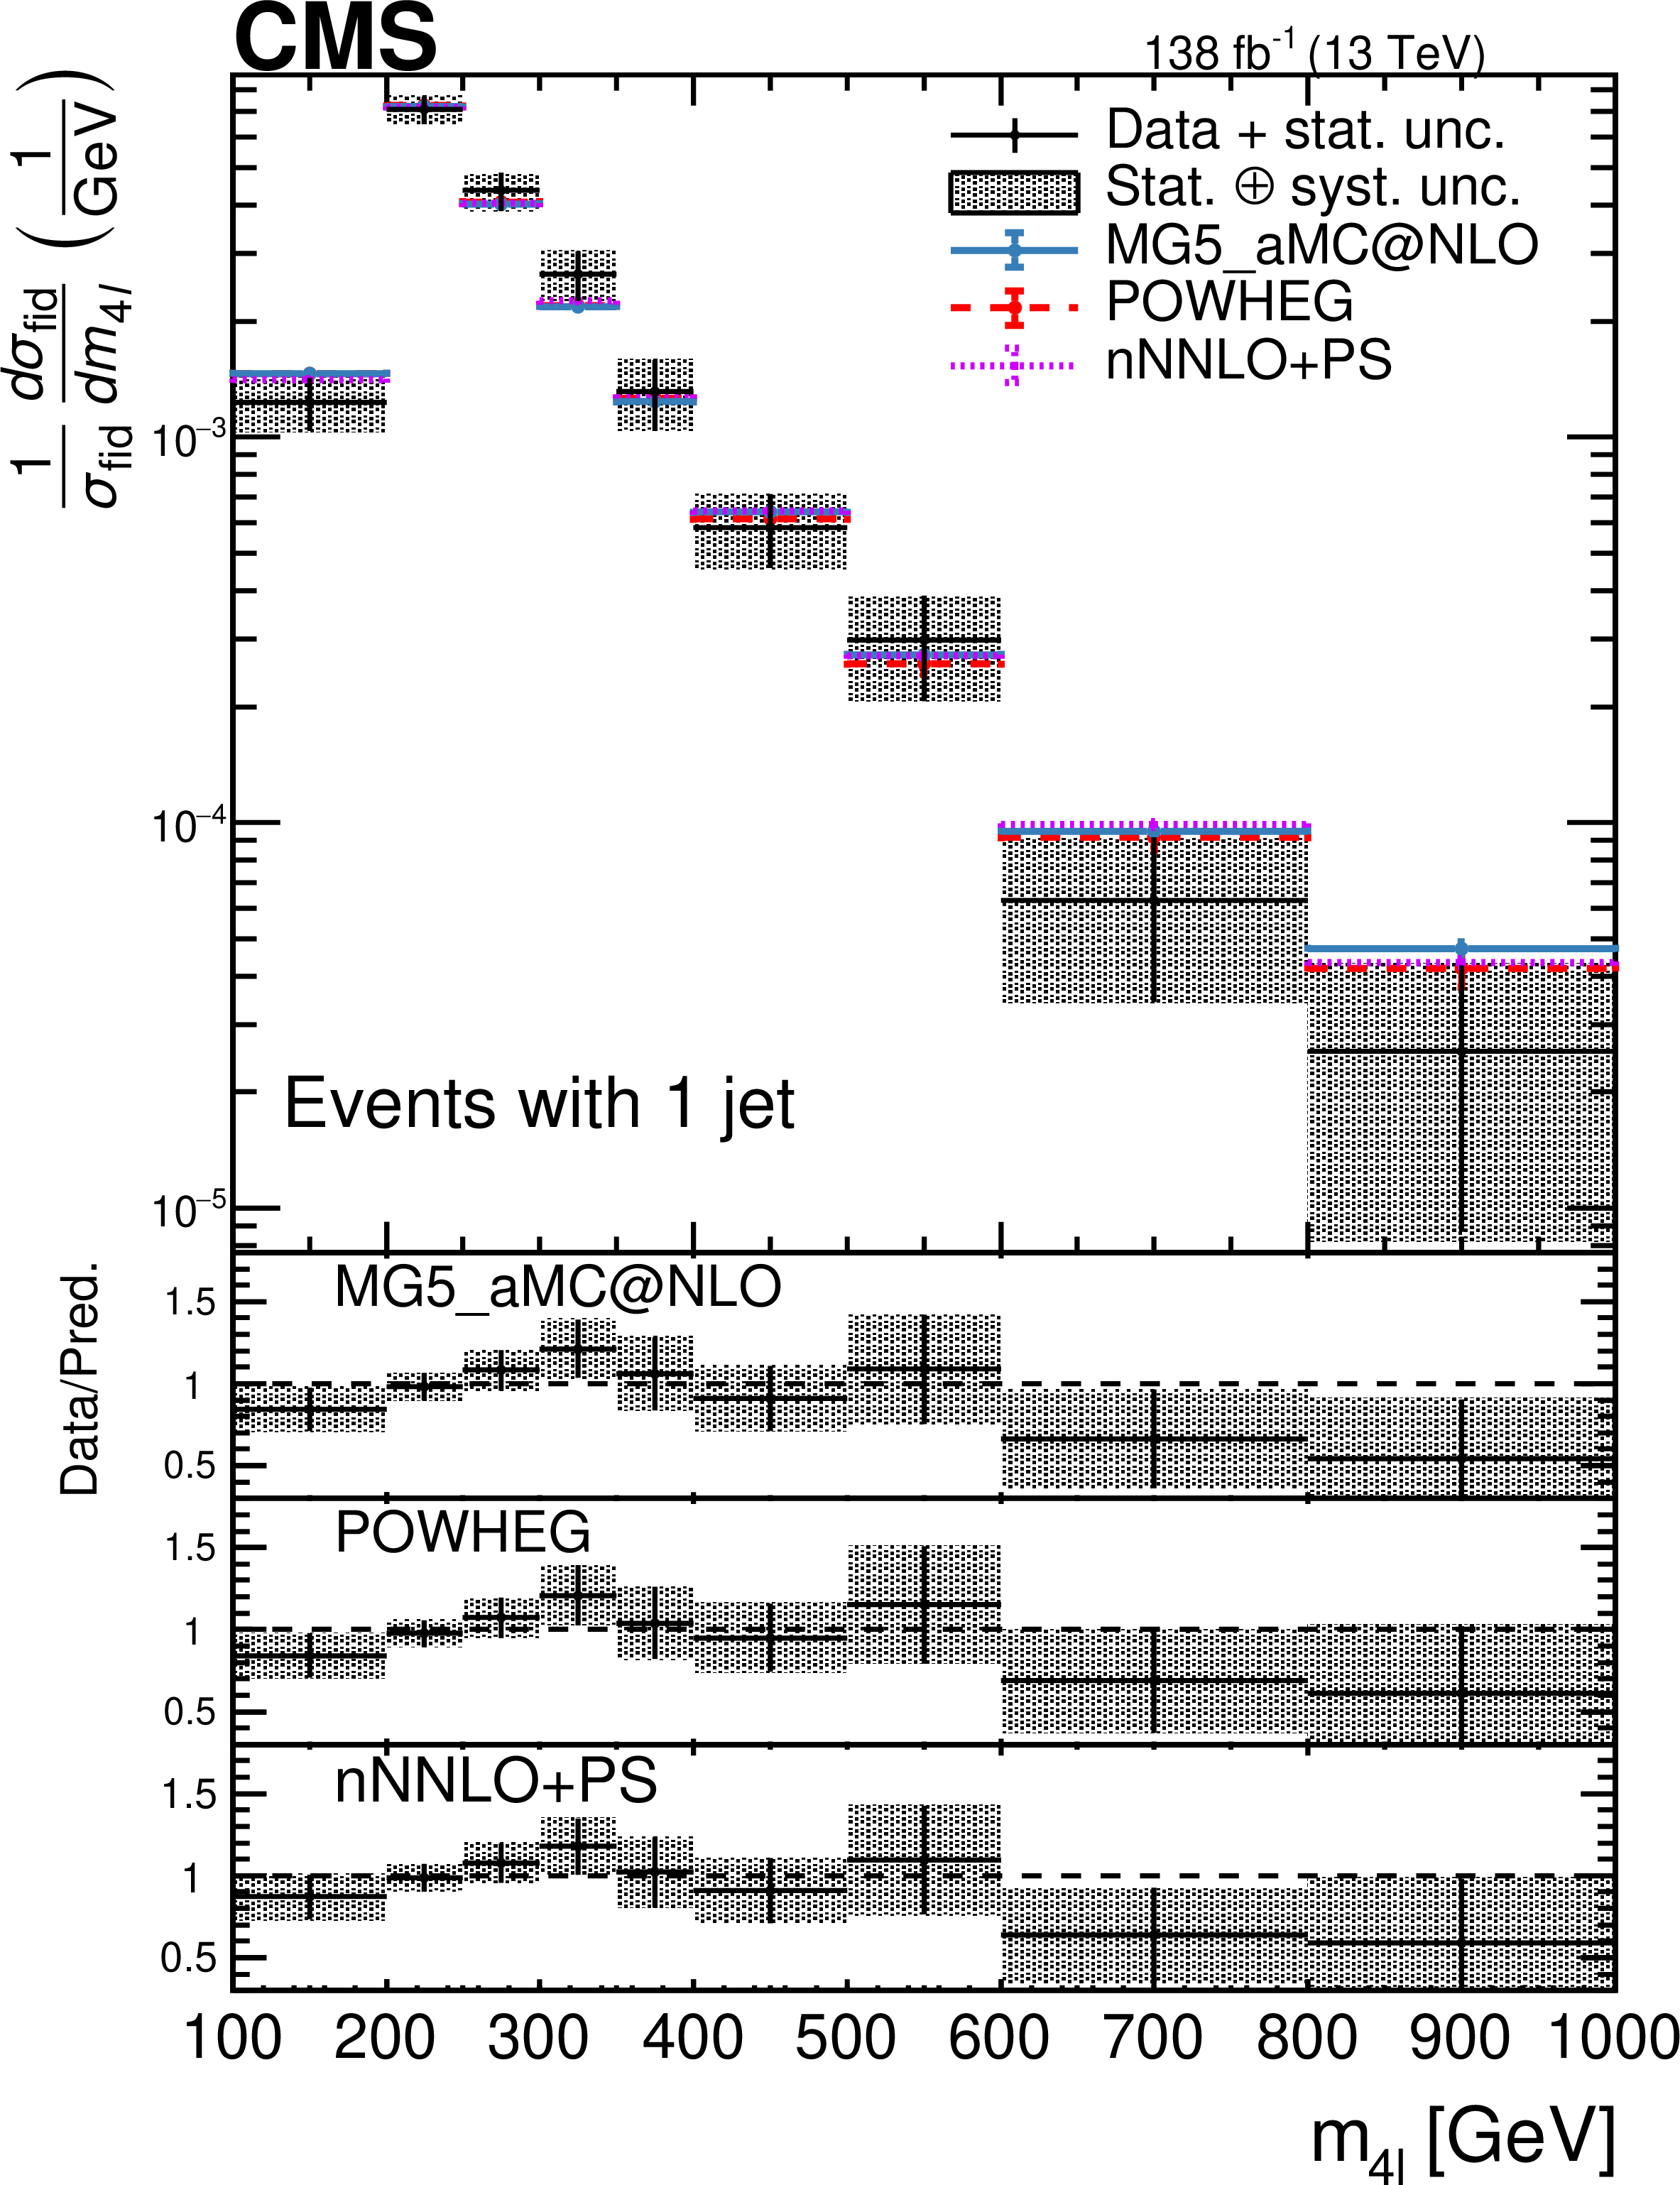
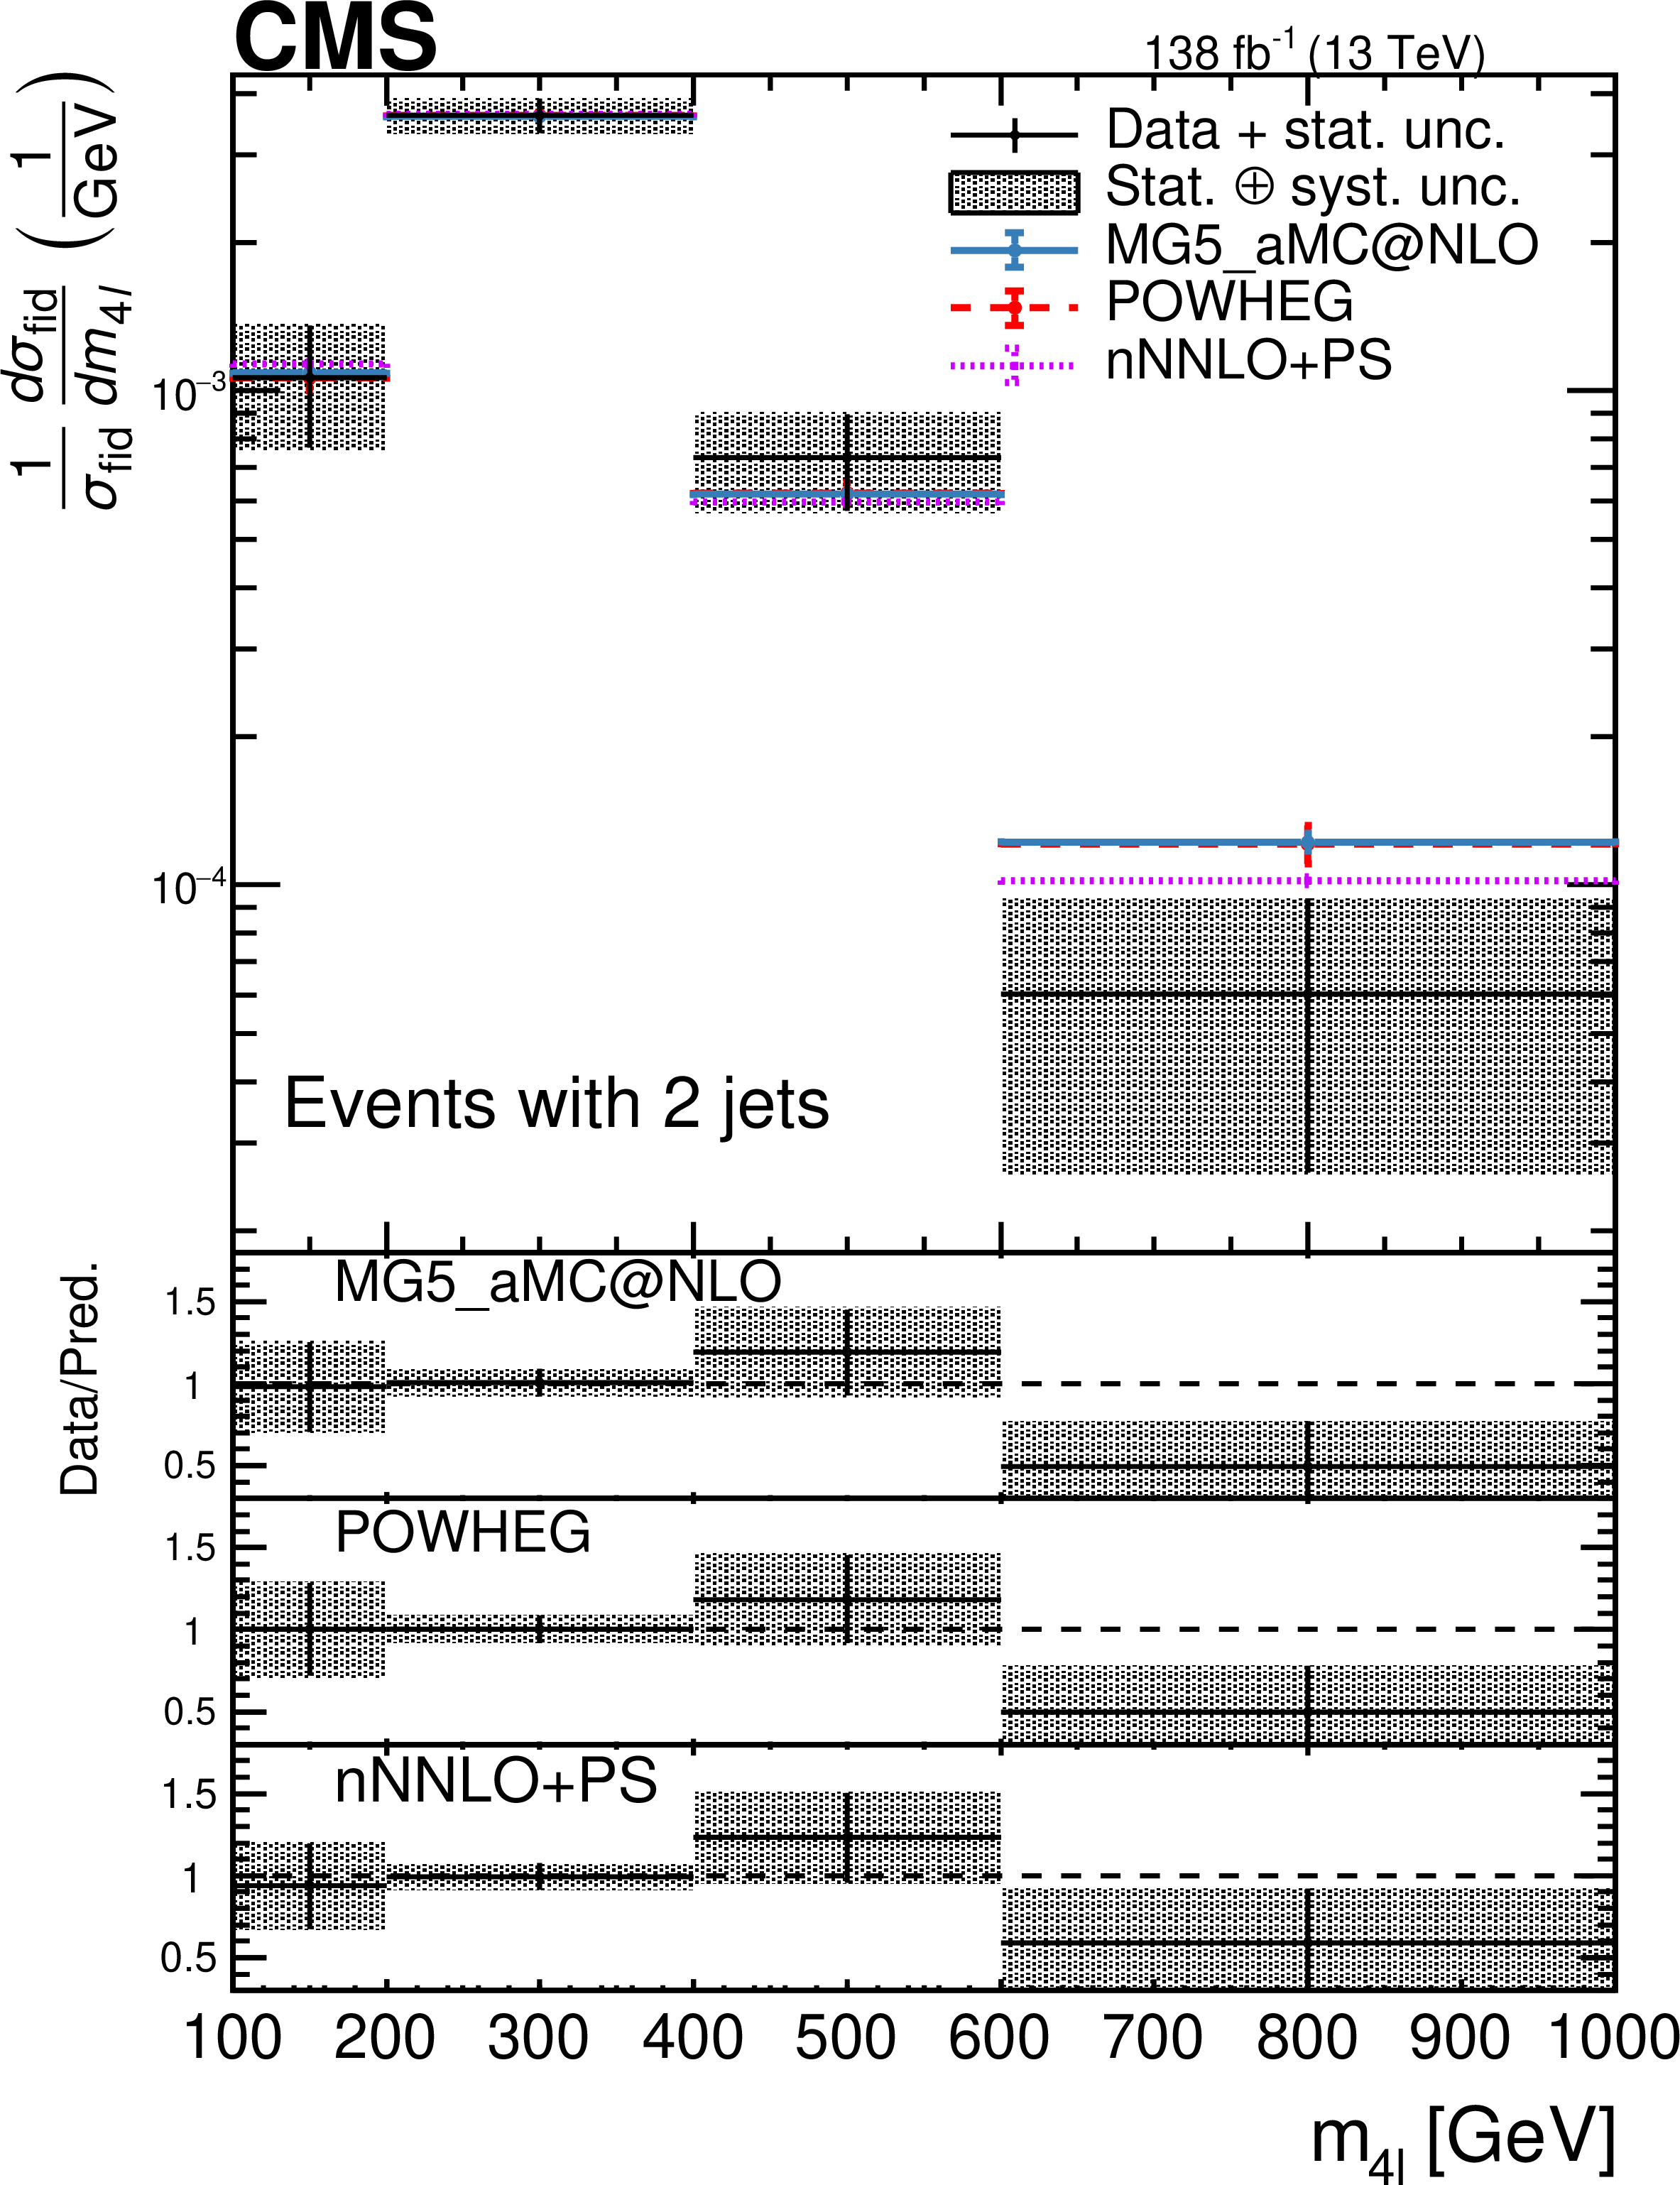
Figure 10:
Differential cross sections normalized to the fiducial cross section as a function of $ m_{4\ell} $ for the full four-lepton invariant mass range. Other details are as in the caption of Fig. 7. |

png pdf |
Figure 11:
Differential cross sections normalized to the fiducial cross section as a function of $ m_{4\ell} $ for 60 $ < m_{\mathrm{Z}_1}$, ${\mathrm{Z}_2} < $ 120 GeV and for different jet multiplicities. Other details are as in the Fig. 7 caption. |
png pdf |
Figure 11-a:
Differential cross sections normalized to the fiducial cross section as a function of $ m_{4\ell} $ for 60 $ < m_{\mathrm{Z}_1}$, ${\mathrm{Z}_2} < $ 120 GeV and for different jet multiplicities. Other details are as in the Fig. 7 caption. |
png pdf |
Figure 11-b:
Differential cross sections normalized to the fiducial cross section as a function of $ m_{4\ell} $ for 60 $ < m_{\mathrm{Z}_1}$, ${\mathrm{Z}_2} < $ 120 GeV and for different jet multiplicities. Other details are as in the Fig. 7 caption. |
png pdf |
Figure 11-c:
Differential cross sections normalized to the fiducial cross section as a function of $ m_{4\ell} $ for 60 $ < m_{\mathrm{Z}_1}$, ${\mathrm{Z}_2} < $ 120 GeV and for different jet multiplicities. Other details are as in the Fig. 7 caption. |

png pdf |
Figure 11-d:
Differential cross sections normalized to the fiducial cross section as a function of $ m_{4\ell} $ for 60 $ < m_{\mathrm{Z}_1}$, ${\mathrm{Z}_2} < $ 120 GeV and for different jet multiplicities. Other details are as in the Fig. 7 caption. |
png pdf |
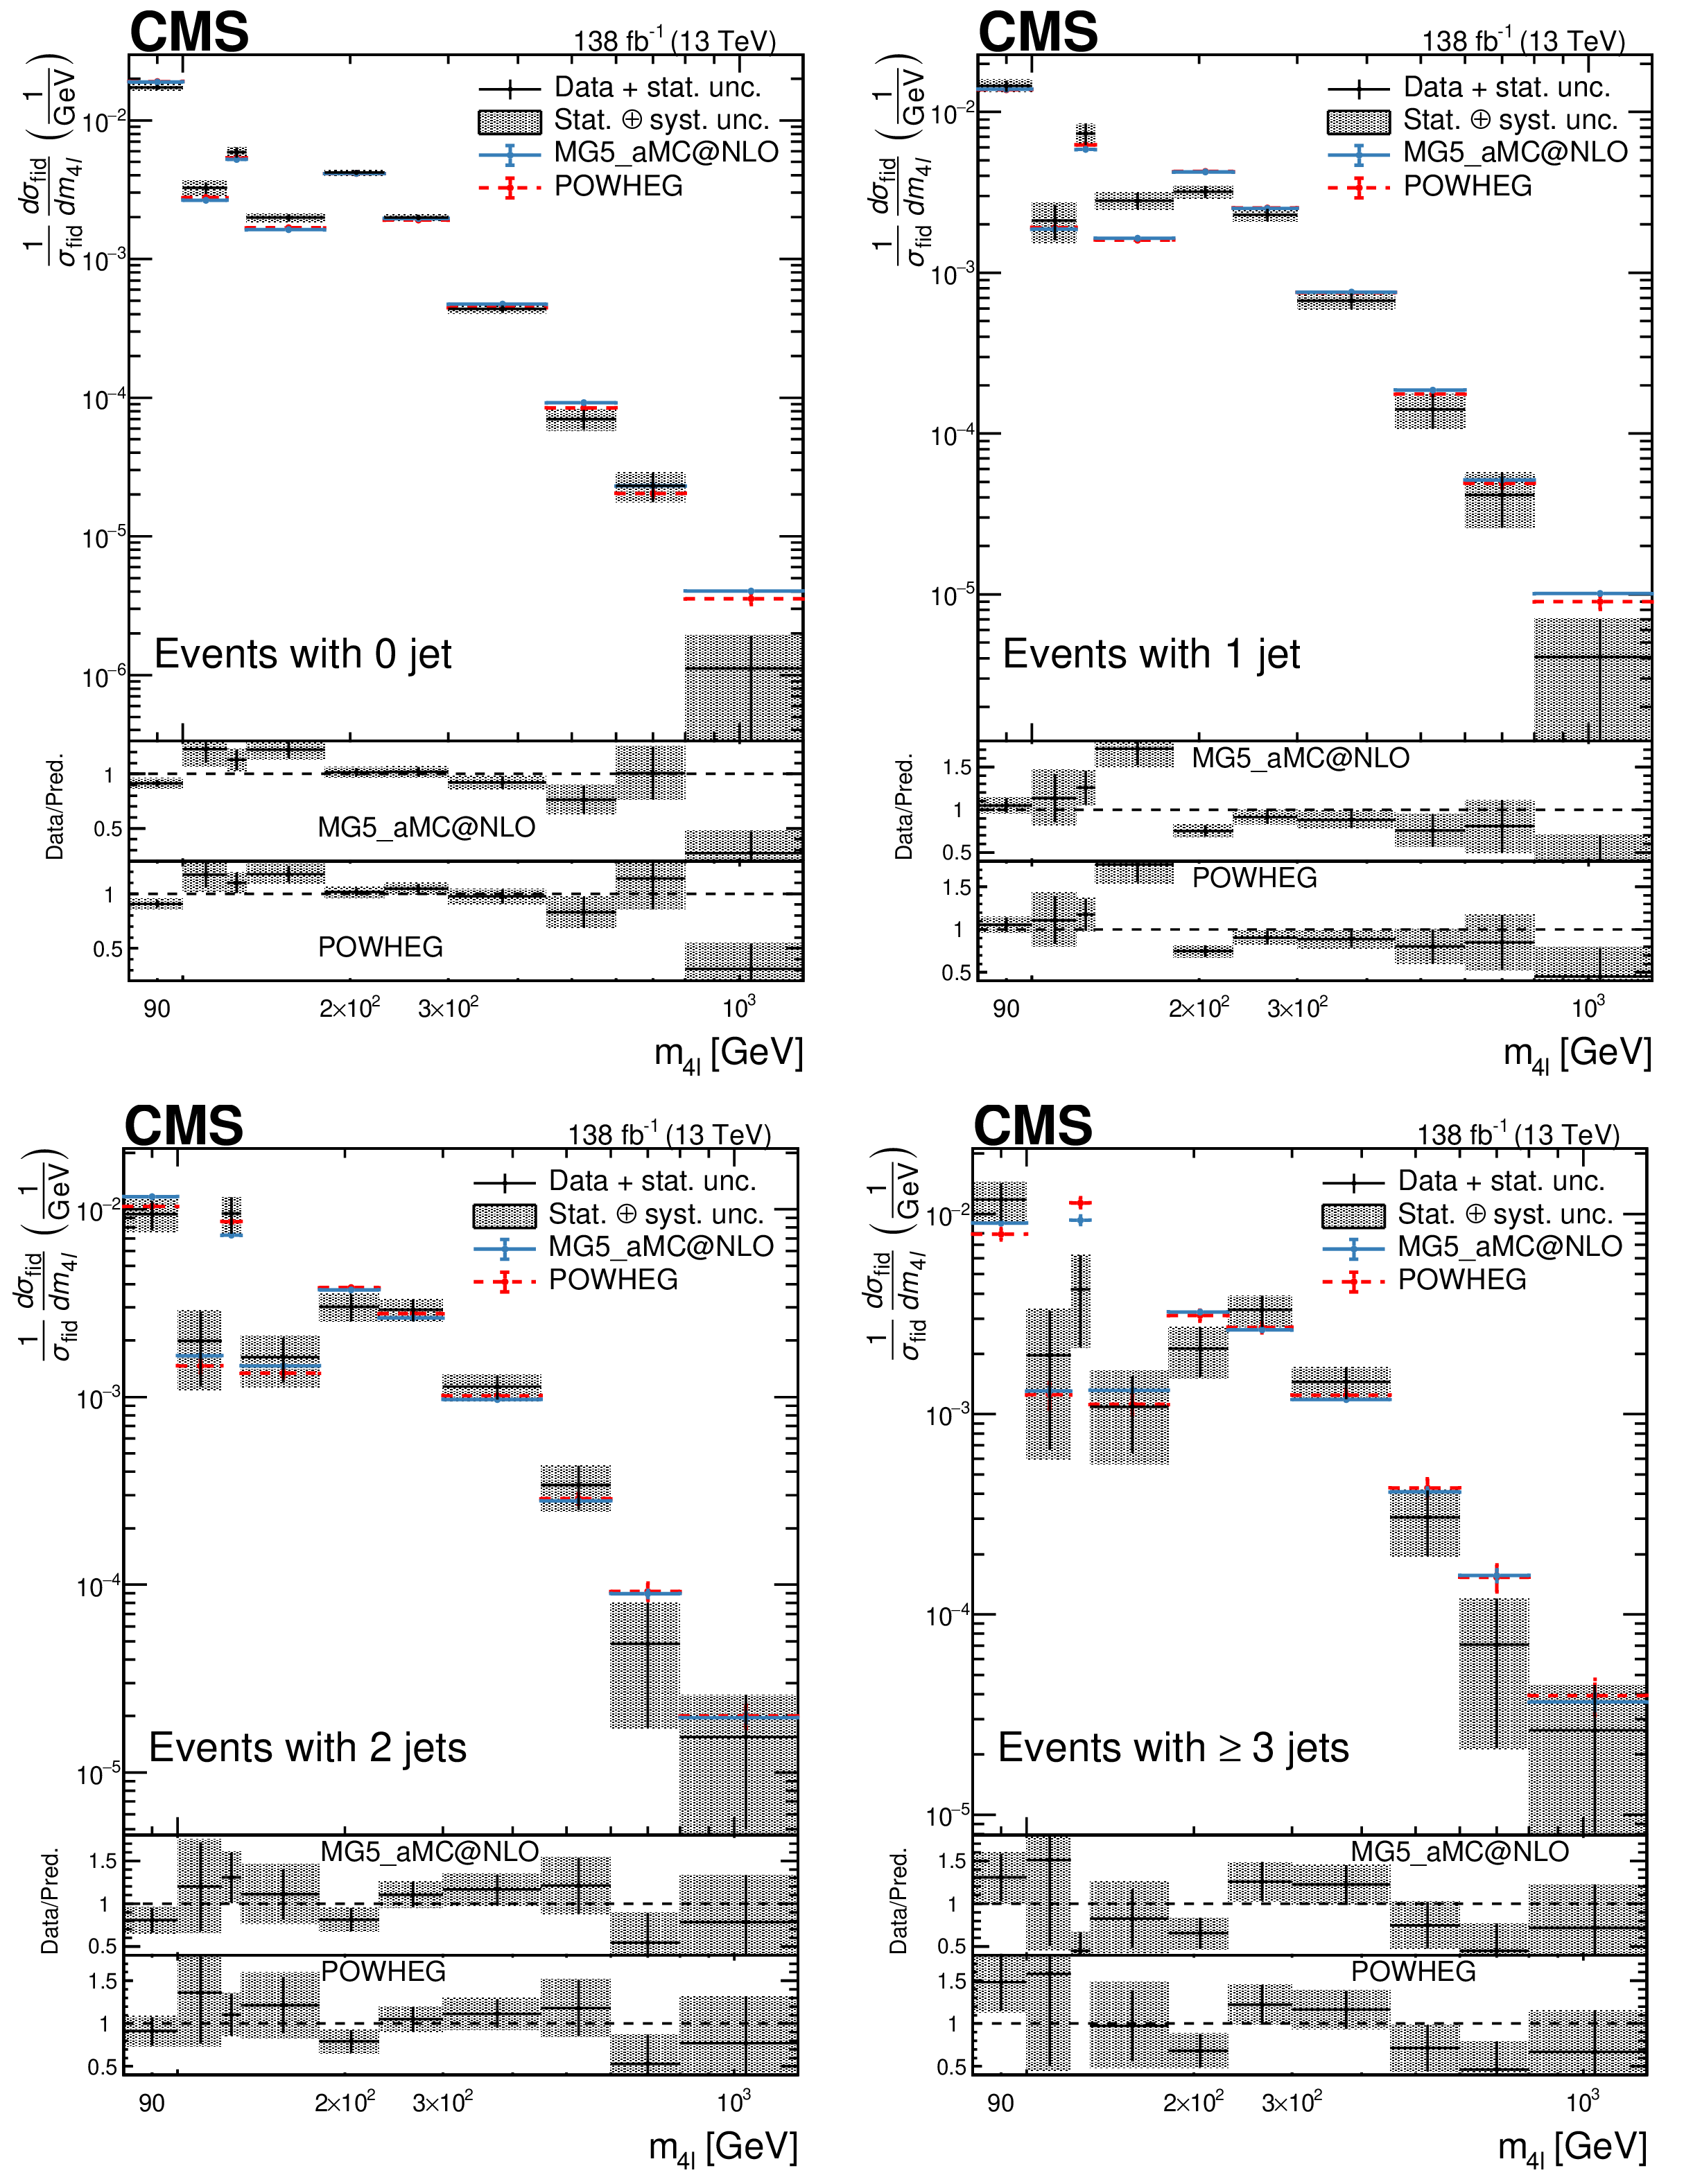
Figure 12:
Differential cross sections normalized to the fiducial cross section as a function of $ m_{4\ell} $ for the full four-lepton invariant mass range and different jet multiplicities. Other details are as in the Fig. 7 caption. |
png pdf |
Figure 12-a:
Differential cross sections normalized to the fiducial cross section as a function of $ m_{4\ell} $ for the full four-lepton invariant mass range and different jet multiplicities. Other details are as in the Fig. 7 caption. |

png pdf |
Figure 12-b:
Differential cross sections normalized to the fiducial cross section as a function of $ m_{4\ell} $ for the full four-lepton invariant mass range and different jet multiplicities. Other details are as in the Fig. 7 caption. |
png pdf |
Figure 12-c:
Differential cross sections normalized to the fiducial cross section as a function of $ m_{4\ell} $ for the full four-lepton invariant mass range and different jet multiplicities. Other details are as in the Fig. 7 caption. |
png pdf |
Figure 12-d:
Differential cross sections normalized to the fiducial cross section as a function of $ m_{4\ell} $ for the full four-lepton invariant mass range and different jet multiplicities. Other details are as in the Fig. 7 caption. |
| Tables | |
png pdf |
Table 1:
Particle-level selections used to define the fiducial phase space |
png pdf |
Table 2:
Contributions of each source of systematic uncertainty to the normalized differential cross section measurements of jet variables. Uncertainties depend on the distributions and are listed as a range. |

png pdf |
Table 3:
The contributions of each source of systematic uncertainty in the normalized differential cross sections measurements as a function of $ m_{4\ell} $ with jet multiplicity from 0 to 3 and more, in events satisfying 60 $ < m_{\mathrm{Z}_1, \mathrm{Z}_2} < $ 120 GeV. |
png pdf |
Table 4:
The contributions of each source of systematic uncertainty in the normalized differential cross sections measurements as a function of $ m_{4\ell} $ with jet multiplicity from 0 to 3 and more, in events from the full $ m_{4\ell} $ range. |
png pdf |
Table 5:
The observed and expected yields of ZZ events in different mass ranges, and estimated yields of background events, shown for each final state and for the sum. The first uncertainty is statistical, and the second one is systematic. (Due to rounding, the sum of individual entries may not match the total value shown.) |
png pdf |
Table 6:
The observed and expected yields of ZZ events in different mass ranges, and estimated yields of background events, shown for each jet multiplicity. The first uncertainty is statistical, and the second one is systematic. (Due to rounding, the sum of individual entries may not match the total value shown.) |
| Summary |
| The four-lepton production in association with jets, $ \mathrm{p}\mathrm{p} \to (\mathrm{Z}/\gamma^*)(\mathrm{Z}/\gamma^*) {+} \text{jets} \to 2\ell2\ell'{+}$jets, where $ \ell,\ell' = \mathrm{e} $ or $ \mu $, was studied in proton-proton collisions at a center-of-mass energy of 13 TeV. The data sample corresponds to an integrated luminosity of 138 fb$ ^{-1} $ collected with the CMS detector at the LHC during 2016--2018. Differential distributions and differential cross sections normalized to the ZZ fiducial cross section were measured with respect to various kinematic variables: number of jets, jet transverse momentum ($ p_{\mathrm{T}} $) and pseudorapidity ($ \eta $), invariant mass of the dijet system and $ \eta $ difference between the highest-$ p_{\mathrm{T}} $ and second-highest-$ p_{\mathrm{T}} $ jets, and invariant mass of the four leptons ($ m_{4\ell} $) for different jet multiplicities. Tabulated results are provided in HEPData [59]. In general, predictions of theoretical models agree with the data, but in some regions significant discrepancies between predicted and measured values were observed. The recent nNNLO+PS prediction improves the data/prediction agreement in the 1-jet and high jet multiplicity regions, and describes the distribution of jet multiplicities better than NLO samples generated with the event generators MadGraph-5_aMC@NLO and POWHEG. The inclusion of electroweak corrections improves the description of the $ m_{4\ell} $ distribution. These measurements demonstrate the necessity for better Monte Carlo modeling in events with complex multiboson final states and extra jets. Further improvement of the predictions is required to describe the ZZ+jets production in the whole phase space. |
| References | ||||
| 1 | CMS Collaboration | Measurement of the ZZ production cross section and search for anomalous couplings in 2 $ \ell 2\ell' $ final states in pp collisions at $ \sqrt{s}= $ 7 TeV | JHEP 01 (2013) 063 | CMS-SMP-12-007 1211.4890 |
| 2 | CMS Collaboration | Measurement of the $ \mathrm{p}\mathrm{p} \to \mathrm{Z}\mathrm{Z} $ production cross section and constraints on anomalous triple gauge couplings in four-lepton final states at $ \sqrt{s}= $ 8 TeV | PLB 740 (2015) 250 | CMS-SMP-13-005 1406.0113 |
| 3 | CMS Collaboration | Measurements of the ZZ production cross sections in the 2 $ \ell2\nu $ channel in proton-proton collisions at $ \sqrt{s} = $ 7 and 8 TeV and combined constraints on triple gauge couplings | EPJC 75 (2015) 511 | CMS-SMP-12-016 1503.05467 |
| 4 | CMS Collaboration | Measurement of the ZZ production cross section and $ \mathrm{Z} \to \ell^+\ell^-\ell^{\prime+}\ell^{\prime-} $ branching fraction in pp collisions at $ \sqrt{s}= $ 13 TeV | PLB 763 (2016) 280 | CMS-SMP-16-001 1607.08834 |
| 5 | CMS Collaboration | Measurements of the $ \mathrm {p}\mathrm {p}\rightarrow \mathrm{Z}\mathrm{Z} $ production cross section and the $ \mathrm{Z}\rightarrow 4\ell $ branching fraction, and constraints on anomalous triple gauge couplings at $ \sqrt{s} = $ 13 TeV | EPJC 78 (2018) 165 | CMS-SMP-16-017 1709.08601 |
| 6 | CMS Collaboration | Measurements of the electroweak diboson production cross sections in proton-proton collisions at $ \sqrt{s} = $ 5.02 TeV using leptonic decays | PRL 127 (2021) 191801 | CMS-SMP-20-012 2107.01137 |
| 7 | CMS Collaboration | Measurement of differential cross sections for Z boson pair production in association with jets at $ \sqrt{s} = $ 8 and 13 TeV | PLB 789 (2019) 19 | CMS-SMP-17-005 1806.11073 |
| 8 | CMS Collaboration | Measurements of $ \mathrm{p}\mathrm{p} \to \mathrm{Z}\mathrm{Z} $ production cross sections and constraints on anomalous triple gauge couplings at $ \sqrt{s}= $ 13 TeV | EPJC 81 (2021) 200 | CMS-SMP-19-001 2009.01186 |
| 9 | CMS Collaboration | Evidence for electroweak production of four charged leptons and two jets in proton-proton collisions at $ \sqrt{s}= $ 13 TeV | PLB 812 (2020) 135992 | CMS-SMP-20-001 2008.07013 |
| 10 | ATLAS Collaboration | Measurement of ZZ production in pp collisions at $ \sqrt{s}= $ 7 TeV and limits on anomalous $ \mathrm{Z}\mathrm{Z}\mathrm{Z} $ and $ \mathrm{Z}\mathrm{Z}\gamma $ couplings with the ATLAS detector | JHEP 03 (2013) 128 | 1211.6096 |
| 11 | ATLAS Collaboration | Measurements of four-lepton production in pp collisions at $ \sqrt{s}= $ 8 TeV with the ATLAS detector | PLB 753 (2016) 552 | 1509.07844 |
| 12 | ATLAS Collaboration | Measurement of the ZZ production cross section in pp collisions at $ \sqrt{s}= $ 13 TeV with the ATLAS detector | PRL 116 (2016) 101801 | 1512.05314 |
| 13 | ATLAS Collaboration | Measurement of the four-lepton invariant mass spectrum in 13 TeV proton-proton collisions with the ATLAS detector | JHEP 04 (2019) 048 | 1902.05892 |
| 14 | ATLAS Collaboration | Measurement of ZZ production in the $ \ell\ell\nu\nu $ final state with the ATLAS detector in pp collisions at $ \sqrt{s} = $ 13 TeV | JHEP 10 (2019) 127 | 1905.07163 |
| 15 | ATLAS Collaboration | $ ZZ \to \ell^{+}\ell^{-}\ell^{\prime +}\ell^{\prime -} $ cross-section measurements and search for anomalous triple gauge couplings in 13 TeV $ pp $ collisions with the ATLAS detector | PRD 97 (2018) 032005 | 1709.07703 |
| 16 | F. Cascioli et al. | ZZ production at hadron colliders in NNLO QCD | PLB 735 (2014) 311 | 1405.2219 |
| 17 | J. Alwall et al. | The automated computation of tree-level and next-to-leading order differential cross sections, and their matching to parton shower simulations | JHEP 07 (2014) 079 | 1405.0301 |
| 18 | S. Alioli, P. Nason, C. Oleari, and E. Re | A general framework for implementing NLO calculations in shower Monte Carlo programs: the POWHEG BOX | JHEP 06 (2010) 043 | 1002.2581 |
| 19 | S. Alioli, P. Nason, C. Oleari, and E. Re | NLO vector-boson production matched with shower in POWHEG | JHEP 07 (2008) 060 | 0805.4802 |
| 20 | P. Nason | A new method for combining NLO QCD with shower Monte Carlo algorithms | JHEP 11 (2004) 040 | hep-ph/0409146 |
| 21 | S. Frixione, P. Nason, and C. Oleari | Matching NLO QCD computations with parton shower simulations: the POWHEG method | JHEP 11 (2007) 070 | 0709.2092 |
| 22 | L. Buonocore et al. | ZZ production at nNNLO+PS with MiNNLO$ _{PS} $ | JHEP 01 (2022) 072 | 2108.05337 |
| 23 | CMS Collaboration | The CMS experiment at the CERN LHC | JINST 3 (2008) S08004 | |
| 24 | CMS Collaboration | Performance of electron reconstruction and selection with the CMS detector in proton-proton collisions at $ \sqrt{s} = $ 8 TeV | JINST 10 (2015) P06005 | CMS-EGM-13-001 1502.02701 |
| 25 | CMS Collaboration | Performance of CMS muon reconstruction in pp collision events at $ \sqrt{s}= $ 7 TeV | JINST 7 (2012) P10002 | CMS-MUO-10-004 1206.4071 |
| 26 | CMS Collaboration | Performance of the CMS muon detector and muon reconstruction with proton-proton collisions at $ \sqrt{s}= $ 13 TeV | JINST 13 (2018) P06015 | CMS-MUO-16-001 1804.04528 |
| 27 | CMS Collaboration | Performance of the CMS Level-1 trigger in proton-proton collisions at $ \sqrt{s} = $ 13 TeV | JINST 15 (2020) P10017 | CMS-TRG-17-001 2006.10165 |
| 28 | CMS Collaboration | The CMS trigger system | JINST 12 (2017) P01020 | CMS-TRG-12-001 1609.02366 |
| 29 | CMS Collaboration | Precision luminosity measurement in proton-proton collisions at $ \sqrt{s}= $ 13 TeV in 2015 and 2016 at CMS | EPJC 81 (2021) 800 | CMS-LUM-17-003 2104.01927 |
| 30 | CMS Collaboration | CMS luminosity measurement for the 2017 data-taking period at $ \sqrt{s}= $ 13 TeV | CMS Physics Analysis Summary, 2018 CMS-PAS-LUM-17-004 |
CMS-PAS-LUM-17-004 |
| 31 | CMS Collaboration | CMS luminosity measurement for the 2018 data-taking period at $ \sqrt{s}= $ 13 TeV | CMS Physics Analysis Summary, 2019 CMS-PAS-LUM-18-002 |
CMS-PAS-LUM-18-002 |
| 32 | J. M. Campbell and R. K. Ellis | MCFM for the Tevatron and the LHC | Nucl. Phys. B Proc. Suppl. 10 (2010) 205 | 1007.3492 |
| 33 | F. Caola, K. Melnikov, R. Röntsch, and L. Tancredi | QCD corrections to ZZ production in gluon fusion at the LHC | PRD 92 (2015) 094028 | 1509.06734 |
| 34 | T. Sjöstrand et al. | An introduction to PYTHIA 8.2 | Comput. Phys. Commun. 191 (2015) 159 | 1410.3012 |
| 35 | CMS Collaboration | Event generator tunes obtained from underlying event and multiparton scattering measurements | EPJC 76 (2016) 155 | CMS-GEN-14-001 1512.00815 |
| 36 | CMS Collaboration | Extraction and validation of a new set of CMS PYTHIA8 tunes from underlying-event measurements | EPJC 80 (2020) 4 | CMS-GEN-17-001 1903.12179 |
| 37 | NNPDF Collaboration | Parton distributions for the LHC run II | JHEP 04 (2015) 040 | 1410.8849 |
| 38 | P. F. Monni et al. | MiNNLO$ _{PS} $: a new method to match NNLO QCD to parton showers | JHEP 05 (2020) 143 | 1908.06987 |
| 39 | R. Frederix and S. Frixione | Merging meets matching in MC@NLO | JHEP 12 (2012) 061 | 1209.6215 |
| 40 | GEANT4 Collaboration | GEANT 4---a simulation toolkit | NIM A 506 (2003) 250 | |
| 41 | CMS Collaboration | Particle-flow reconstruction and global event description with the CMS detector | JINST 12 (2017) P10003 | CMS-PRF-14-001 1706.04965 |
| 42 | CMS Collaboration | Technical proposal for the Phase-II upgrade of the Compact Muon Solenoid | CMS Technical Proposal CERN-LHCC-2015-010, CMS-TDR-15-02, 2015 CDS |
|
| 43 | CMS Collaboration | Measurements of production cross sections of the Higgs boson in the four-lepton final state in proton-proton collisions at $ \sqrt{s}= $ 13 TeV | EPJC 81 (2021) 488 | CMS-HIG-19-001 2103.04956 |
| 44 | CMS Collaboration | Muon identification using multivariate techniques in the CMS experiment in proton-proton collisions at $ \sqrt{s} = $ 13 TeV | Accepted by JINST, 2023 | CMS-MUO-22-001 2310.03844 |
| 45 | CMS Collaboration | Pileup mitigation at CMS in 13 TeV data | JINST 15 (2020) P09018 | CMS-JME-18-001 2003.00503 |
| 46 | M. Cacciari and G. P. Salam | Pileup subtraction using jet areas | PLB 659 (2008) 119 | 0707.1378 |
| 47 | CMS Collaboration | Measurement of the inclusive W and Z production cross sections in pp collisions at $ \sqrt{s}= $ 7 TeV | JHEP 10 (2011) 132 | CMS-EWK-10-005 1107.4789 |
| 48 | M. Cacciari, G. P. Salam, and G. Soyez | The anti-$ k_{\mathrm{T}} $ jet clustering algorithm | JHEP 04 (2008) 063 | 0802.1189 |
| 49 | M. Cacciari, G. P. Salam, and G. Soyez | FastJet user manual | EPJC 72 (2012) 1896 | 1111.6097 |
| 50 | CMS Collaboration | Jet algorithms performance in 13 TeV data | CMS Physics Analysis Summary, 2017 CMS-PAS-JME-16-003 |
CMS-PAS-JME-16-003 |
| 51 | CMS Collaboration | Determination of jet energy calibration and transverse momentum resolution in CMS | JINST 6 (2011) P11002 | CMS-JME-10-011 1107.4277 |
| 52 | CMS Collaboration | Jet energy scale and resolution in the CMS experiment in pp collisions at 8 TeV | JINST 12 (2017) P02014 | CMS-JME-13-004 1607.03663 |
| 53 | Particle Data Group , R. L. Workman et al. | Review of particle physics | Prog. Theor. Exp. Phys. 2022 (2022) 083C01 | |
| 54 | CMS Collaboration | Measurement of the properties of a Higgs boson in the four-lepton final state | PRD 89 (2014) 092007 | CMS-HIG-13-002 1312.5353 |
| 55 | G. D'Agostini | A multidimensional unfolding method based on Bayes' theorem | NIM A 362 (1995) 487 | |
| 56 | T. Adye | Unfolding algorithms and tests using RooUnfold | in PHYSTAT 2011, CERN, 2011 link |
1105.1160 |
| 57 | CMS Collaboration | Measurement of the inelastic proton-proton cross section at $ \sqrt{s}= $ 13 TeV | JHEP 07 (2018) 161 | CMS-FSQ-15-005 1802.02613 |
| 58 | J. Butterworth et al. | PDF4LHC recommendations for LHC Run II | JPG 43 (2016) 023001 | 1510.03865 |
| 59 | CMS Collaboration | HEPData record for this analysis | link | |
|
|
Compact Muon Solenoid LHC, CERN |
|

|

|

|

|

|