

Compact Muon Solenoid
LHC, CERN
| CMS-SUS-21-006 ; CERN-EP-2023-209 | ||
| Search for supersymmetry in final states with disappearing tracks in proton-proton collisions at $ \sqrt{s} = $ 13 TeV | ||
| CMS Collaboration | ||
| 28 September 2023 | ||
| Phys. Rev. D 109 (2024) 072007 | ||
| Abstract: A search is presented for charged, long-lived supersymmetric particles in final states with one or more disappearing tracks. The search is based on data from proton-proton collisions at a center-of-mass energy of 13 TeV collected with the CMS detector at the CERN LHC between 2016 and 2018, corresponding to an integrated luminosity of 137 fb$ ^{-1} $. The search is performed over final states characterized by varying numbers of jets, b-tagged jets, electrons, and muons. The length of signal-candidate tracks in the plane perpendicular to the beam axis is used to characterize the lifetimes of wino- and higgsino-like charginos produced in the context of the minimal supersymmetric standard model. The $ \mathrm{d} E/\mathrm{d} x $ energy loss of signal-candidate tracks is used to increase the sensitivity to charginos with a large mass and thus a small Lorentz boost. The observed results are found to be statistically consistent with the background-only hypothesis. Limits on the pair production cross section of gluinos and squarks are presented in the framework of simplified models of supersymmetric particle production and decay, and for electroweakino production based on models of wino and higgsino dark matter. The limits presented are the most stringent to date for scenarios with light third-generation squarks and a wino- or higgsino-like dark matter candidate capable of explaining the known dark matter relic density. | ||
| Links: e-print arXiv:2309.16823 [hep-ex] (PDF) ; CDS record ; inSPIRE record ; HepData record ; CADI line (restricted) ; | ||
| Figures | |
png pdf |
Figure 1:
Representative diagrams for the simplified models considered in this analysis. From left to right: T6btLL, T6tbLL, and T5btbtLL (upper); and TChiWZ, TChiWW, and TChiW (lower). The shaded circles at the production vertices represent a sum over perturbative terms. |

png pdf |
Figure 1-a:
Representative diagram for the T6btLL simplified model. The shaded circle at the production vertex represents a sum over perturbative terms. |

png pdf |
Figure 1-b:
Representative diagram for the T6tbLL simplified model. The shaded circle at the production vertex represents a sum over perturbative terms. |
png pdf |
Figure 1-c:
Representative diagram for the T5btbtLL simplified model. The shaded circle at the production vertex represents a sum over perturbative terms. |
png pdf |
Figure 1-d:
Representative diagram for the TChiWZ simplified model. The shaded circle at the production vertex represents a sum over perturbative terms. |

png pdf |
Figure 1-e:
Representative diagram for the TChiWW simplified model. The shaded circle at the production vertex represents a sum over perturbative terms. |
png pdf |
Figure 1-f:
Representative diagram for the TChiW simplified model. The shaded circle at the production vertex represents a sum over perturbative terms. |

png pdf |
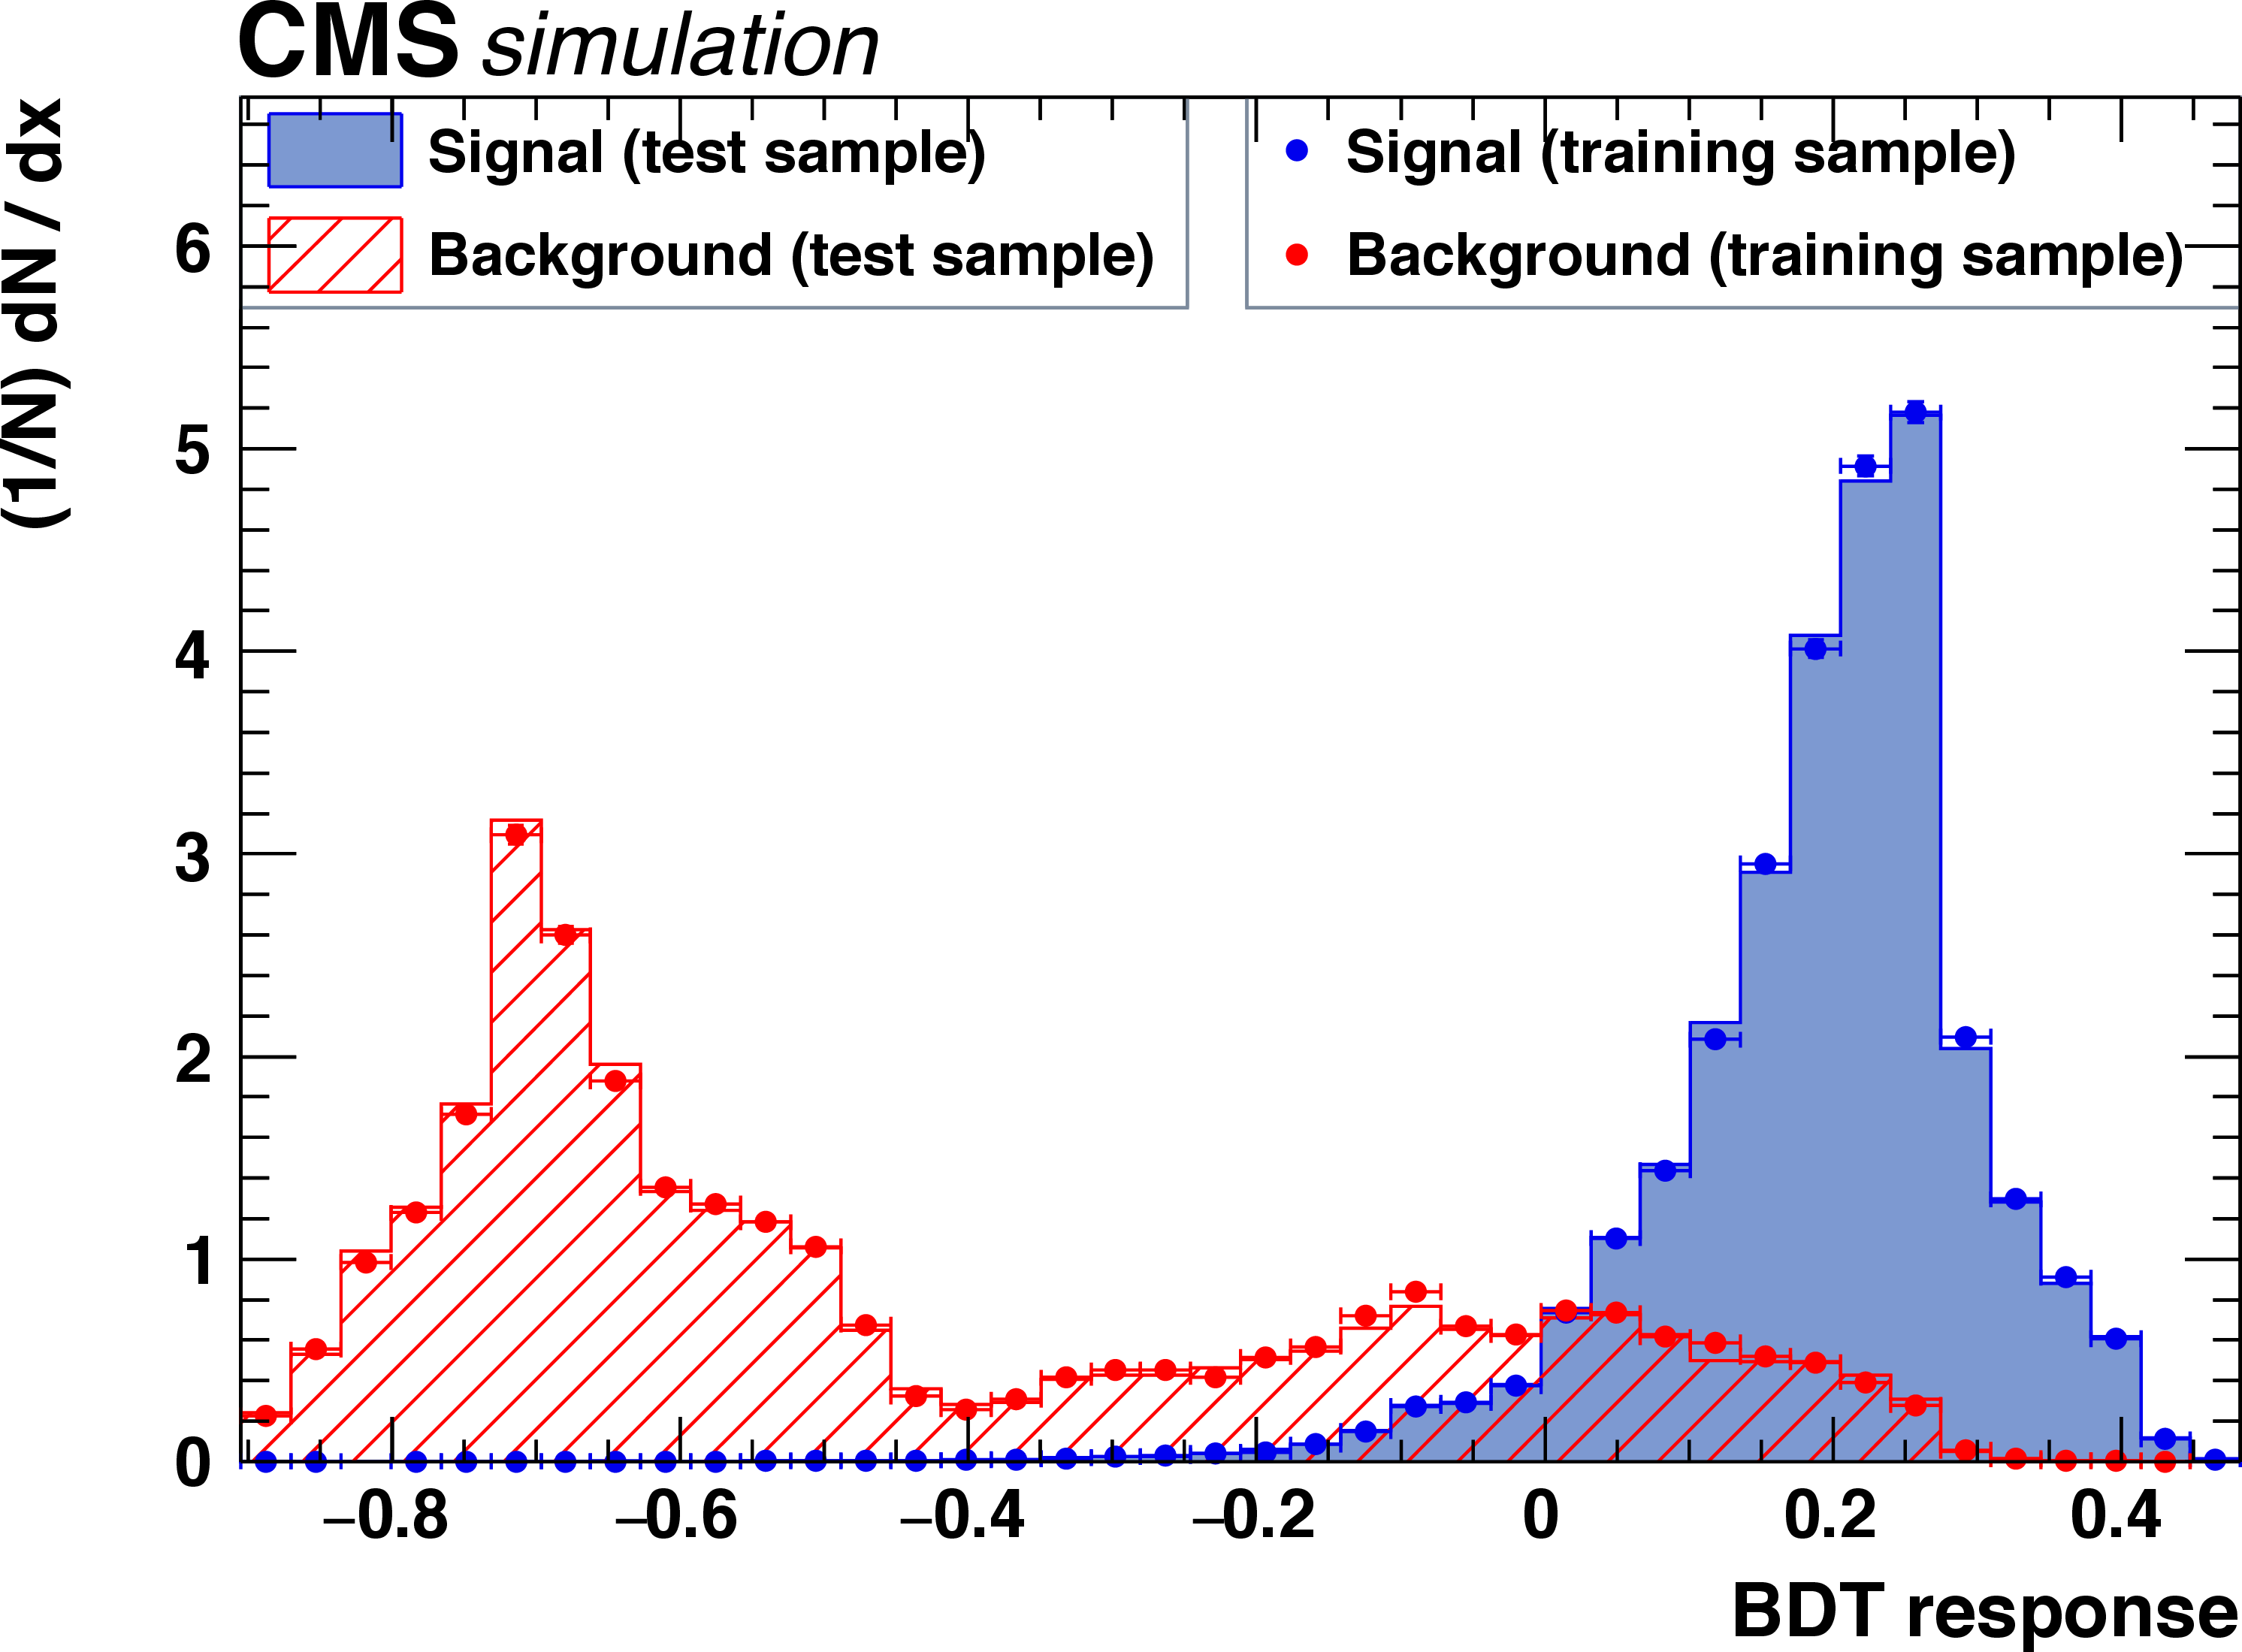
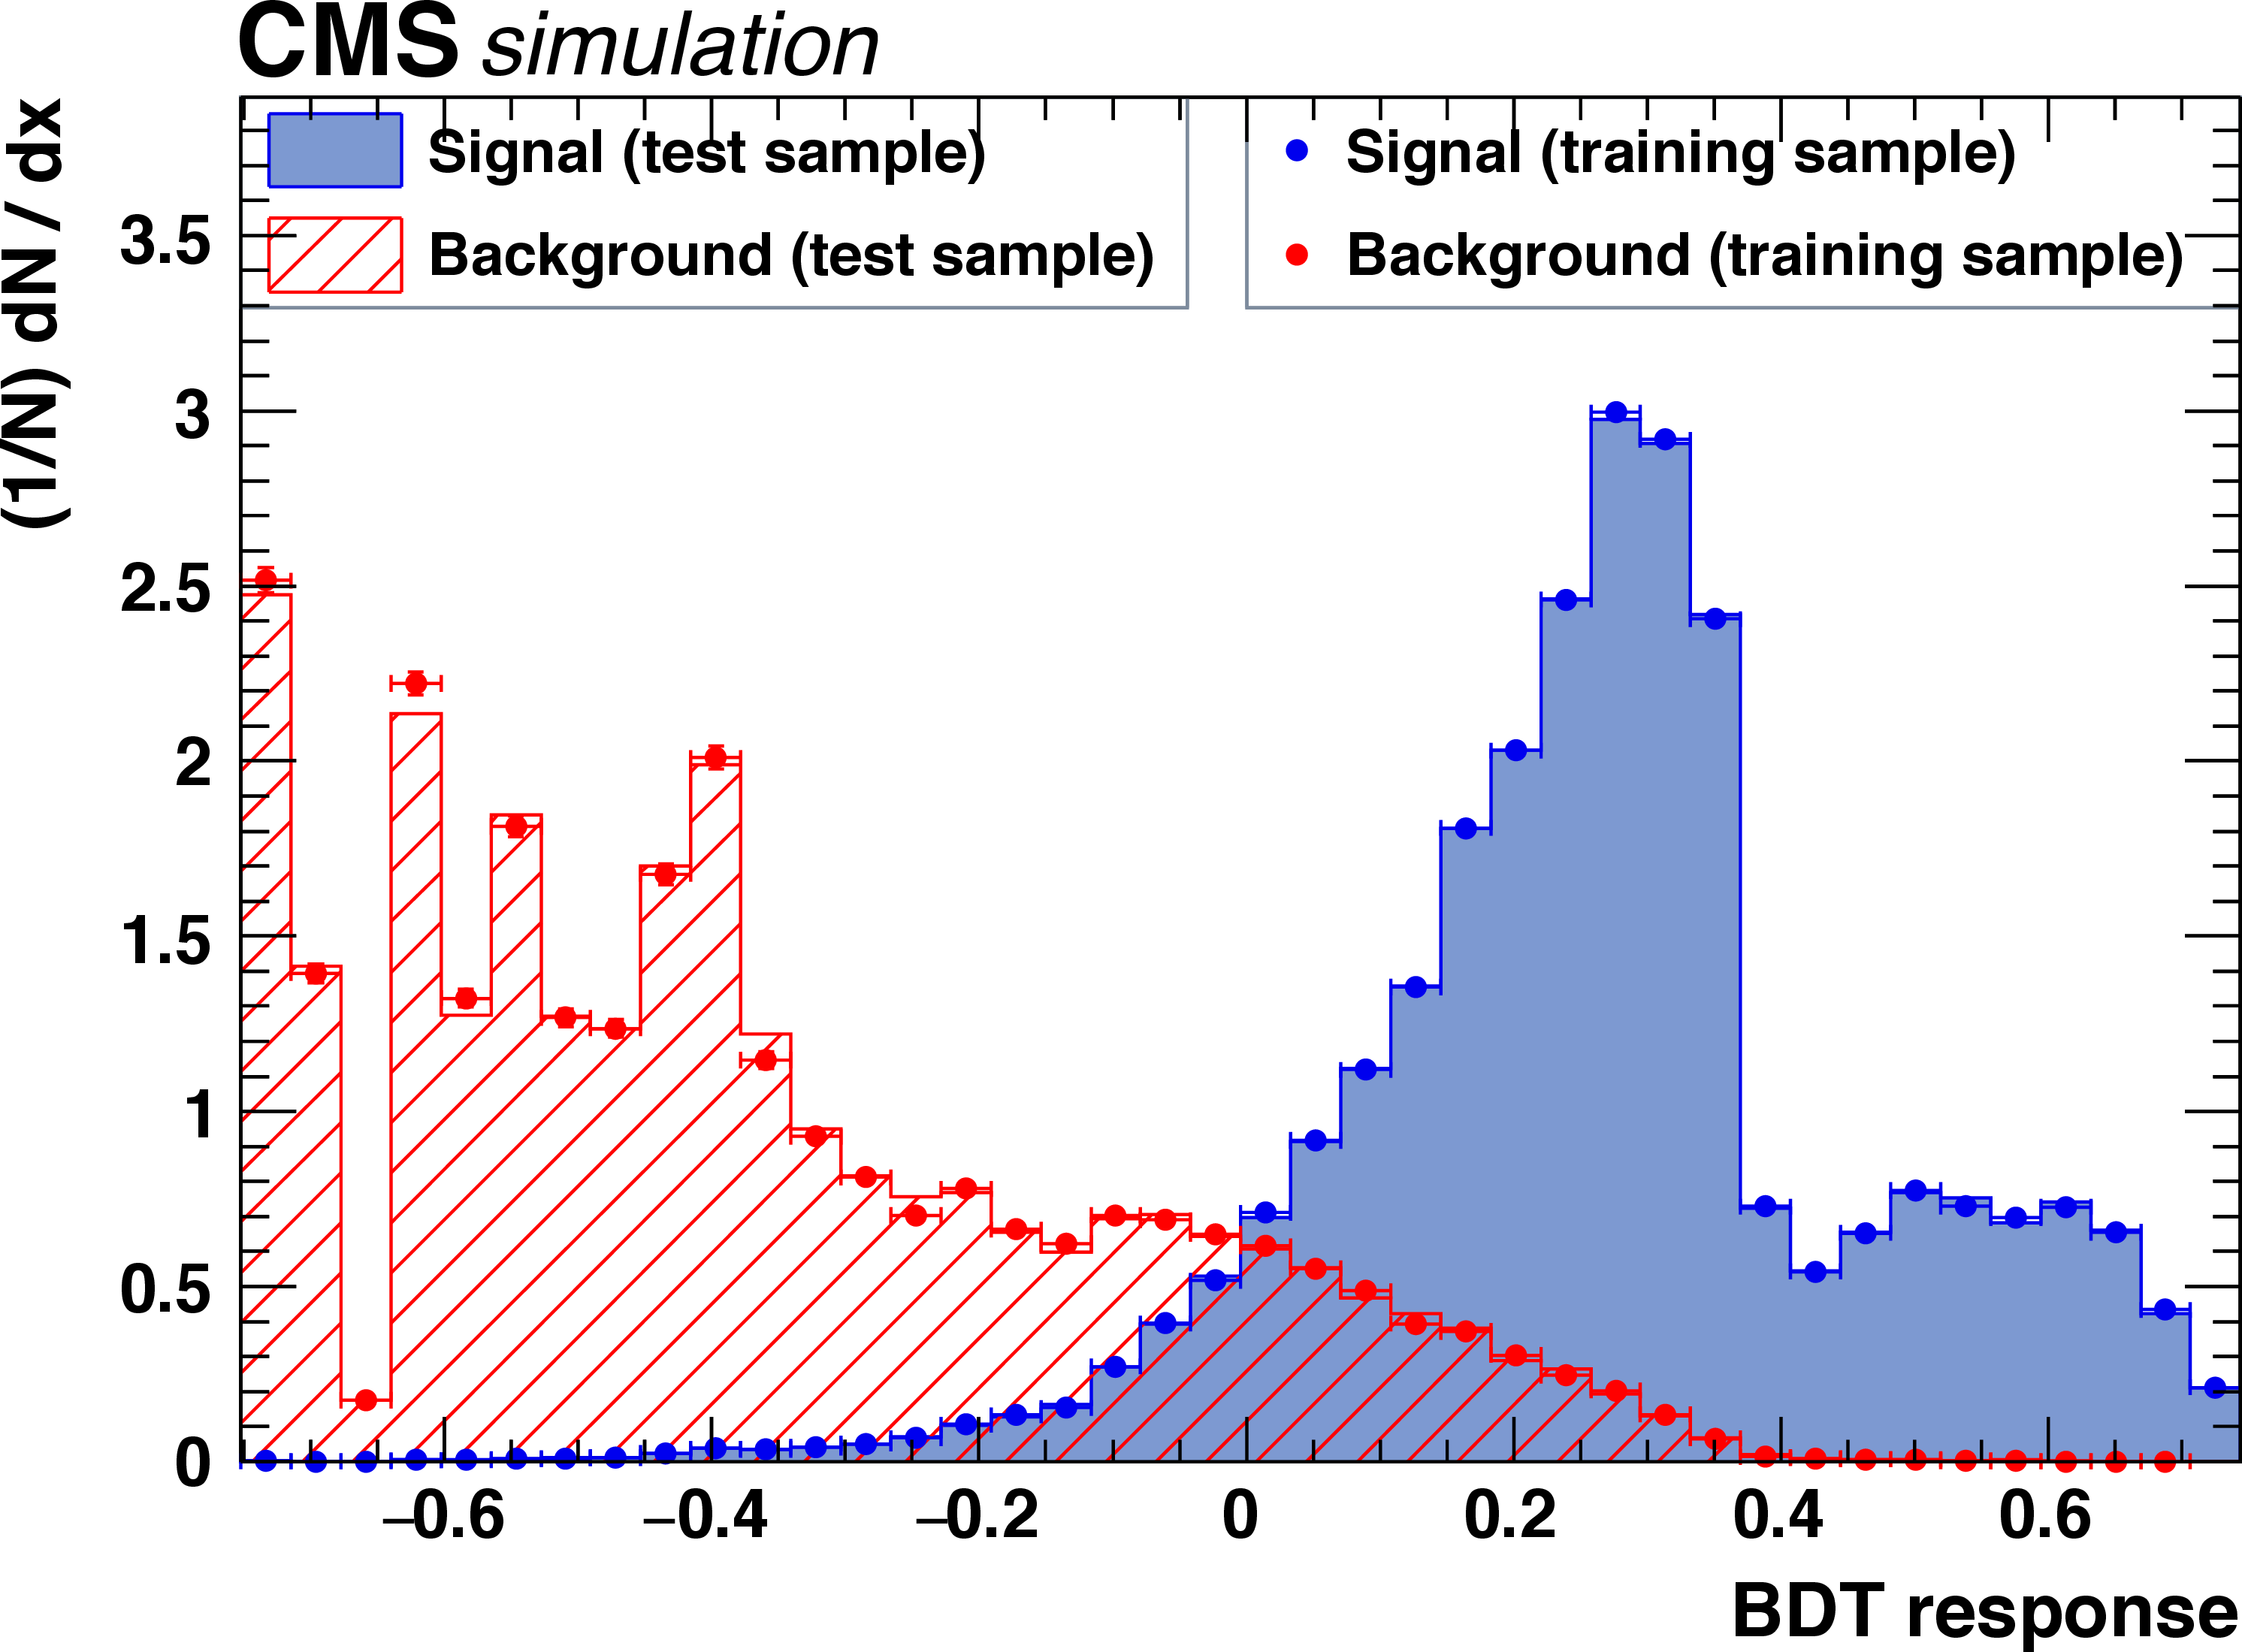
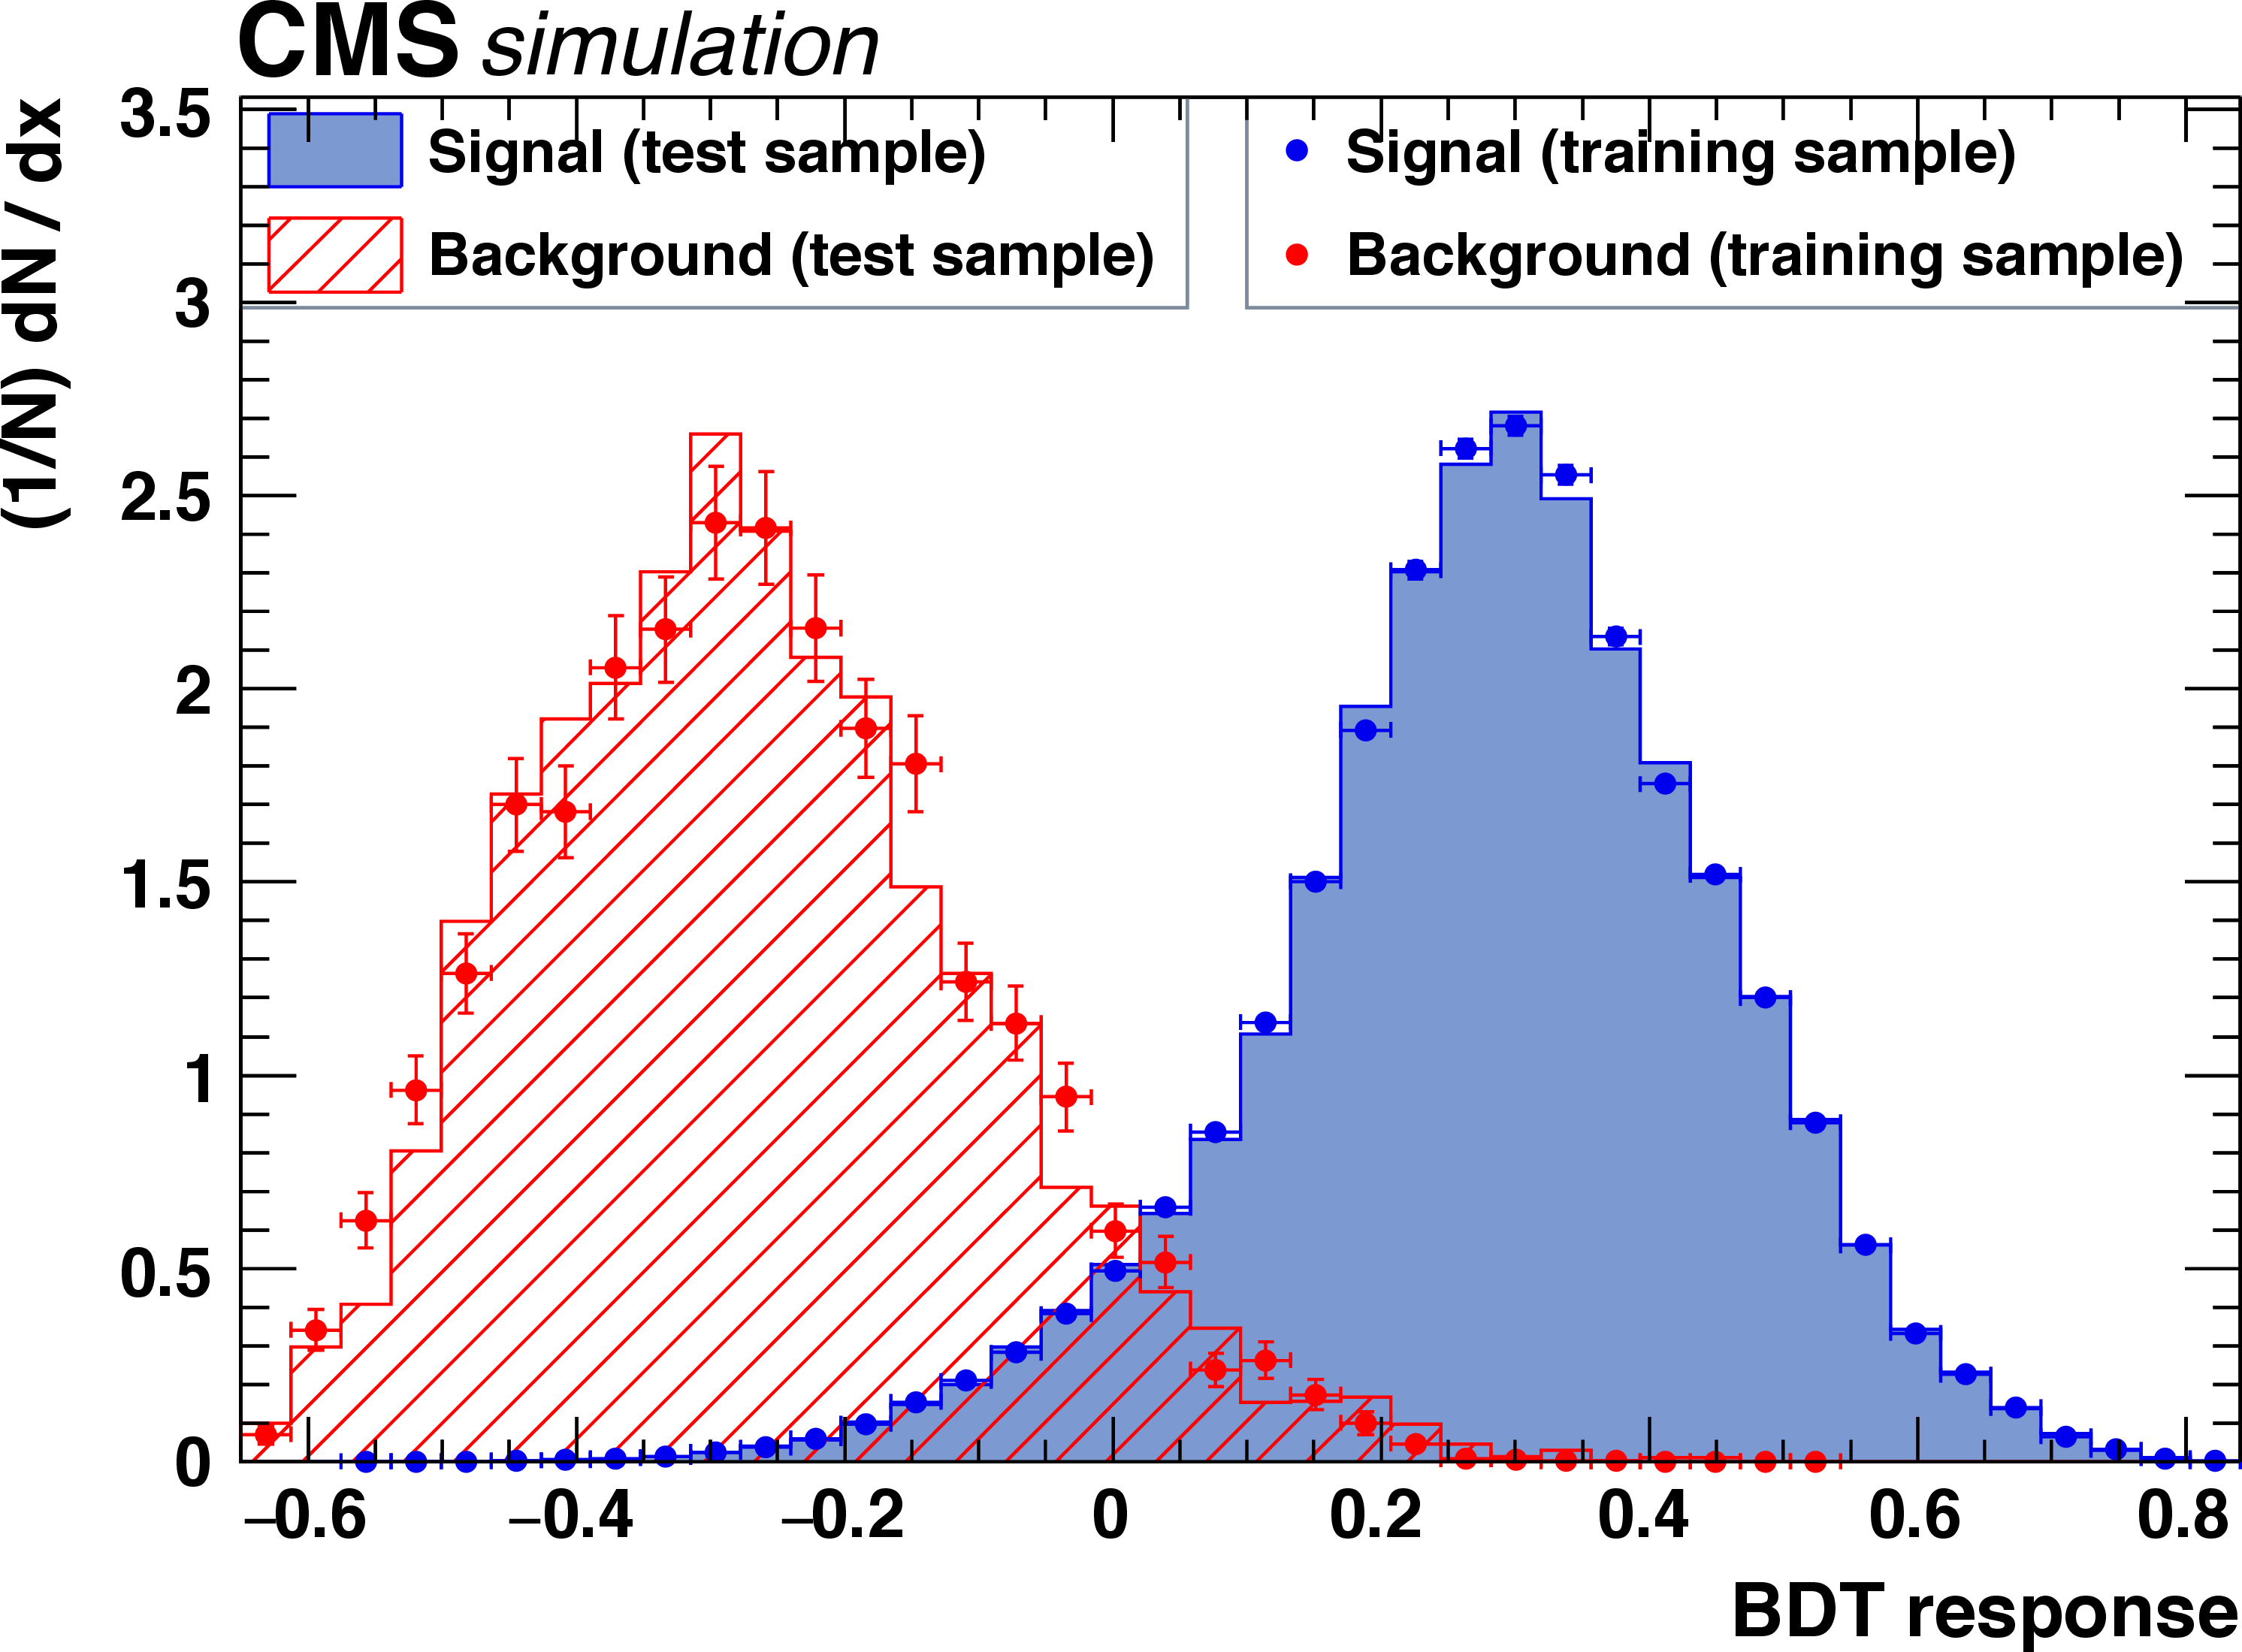
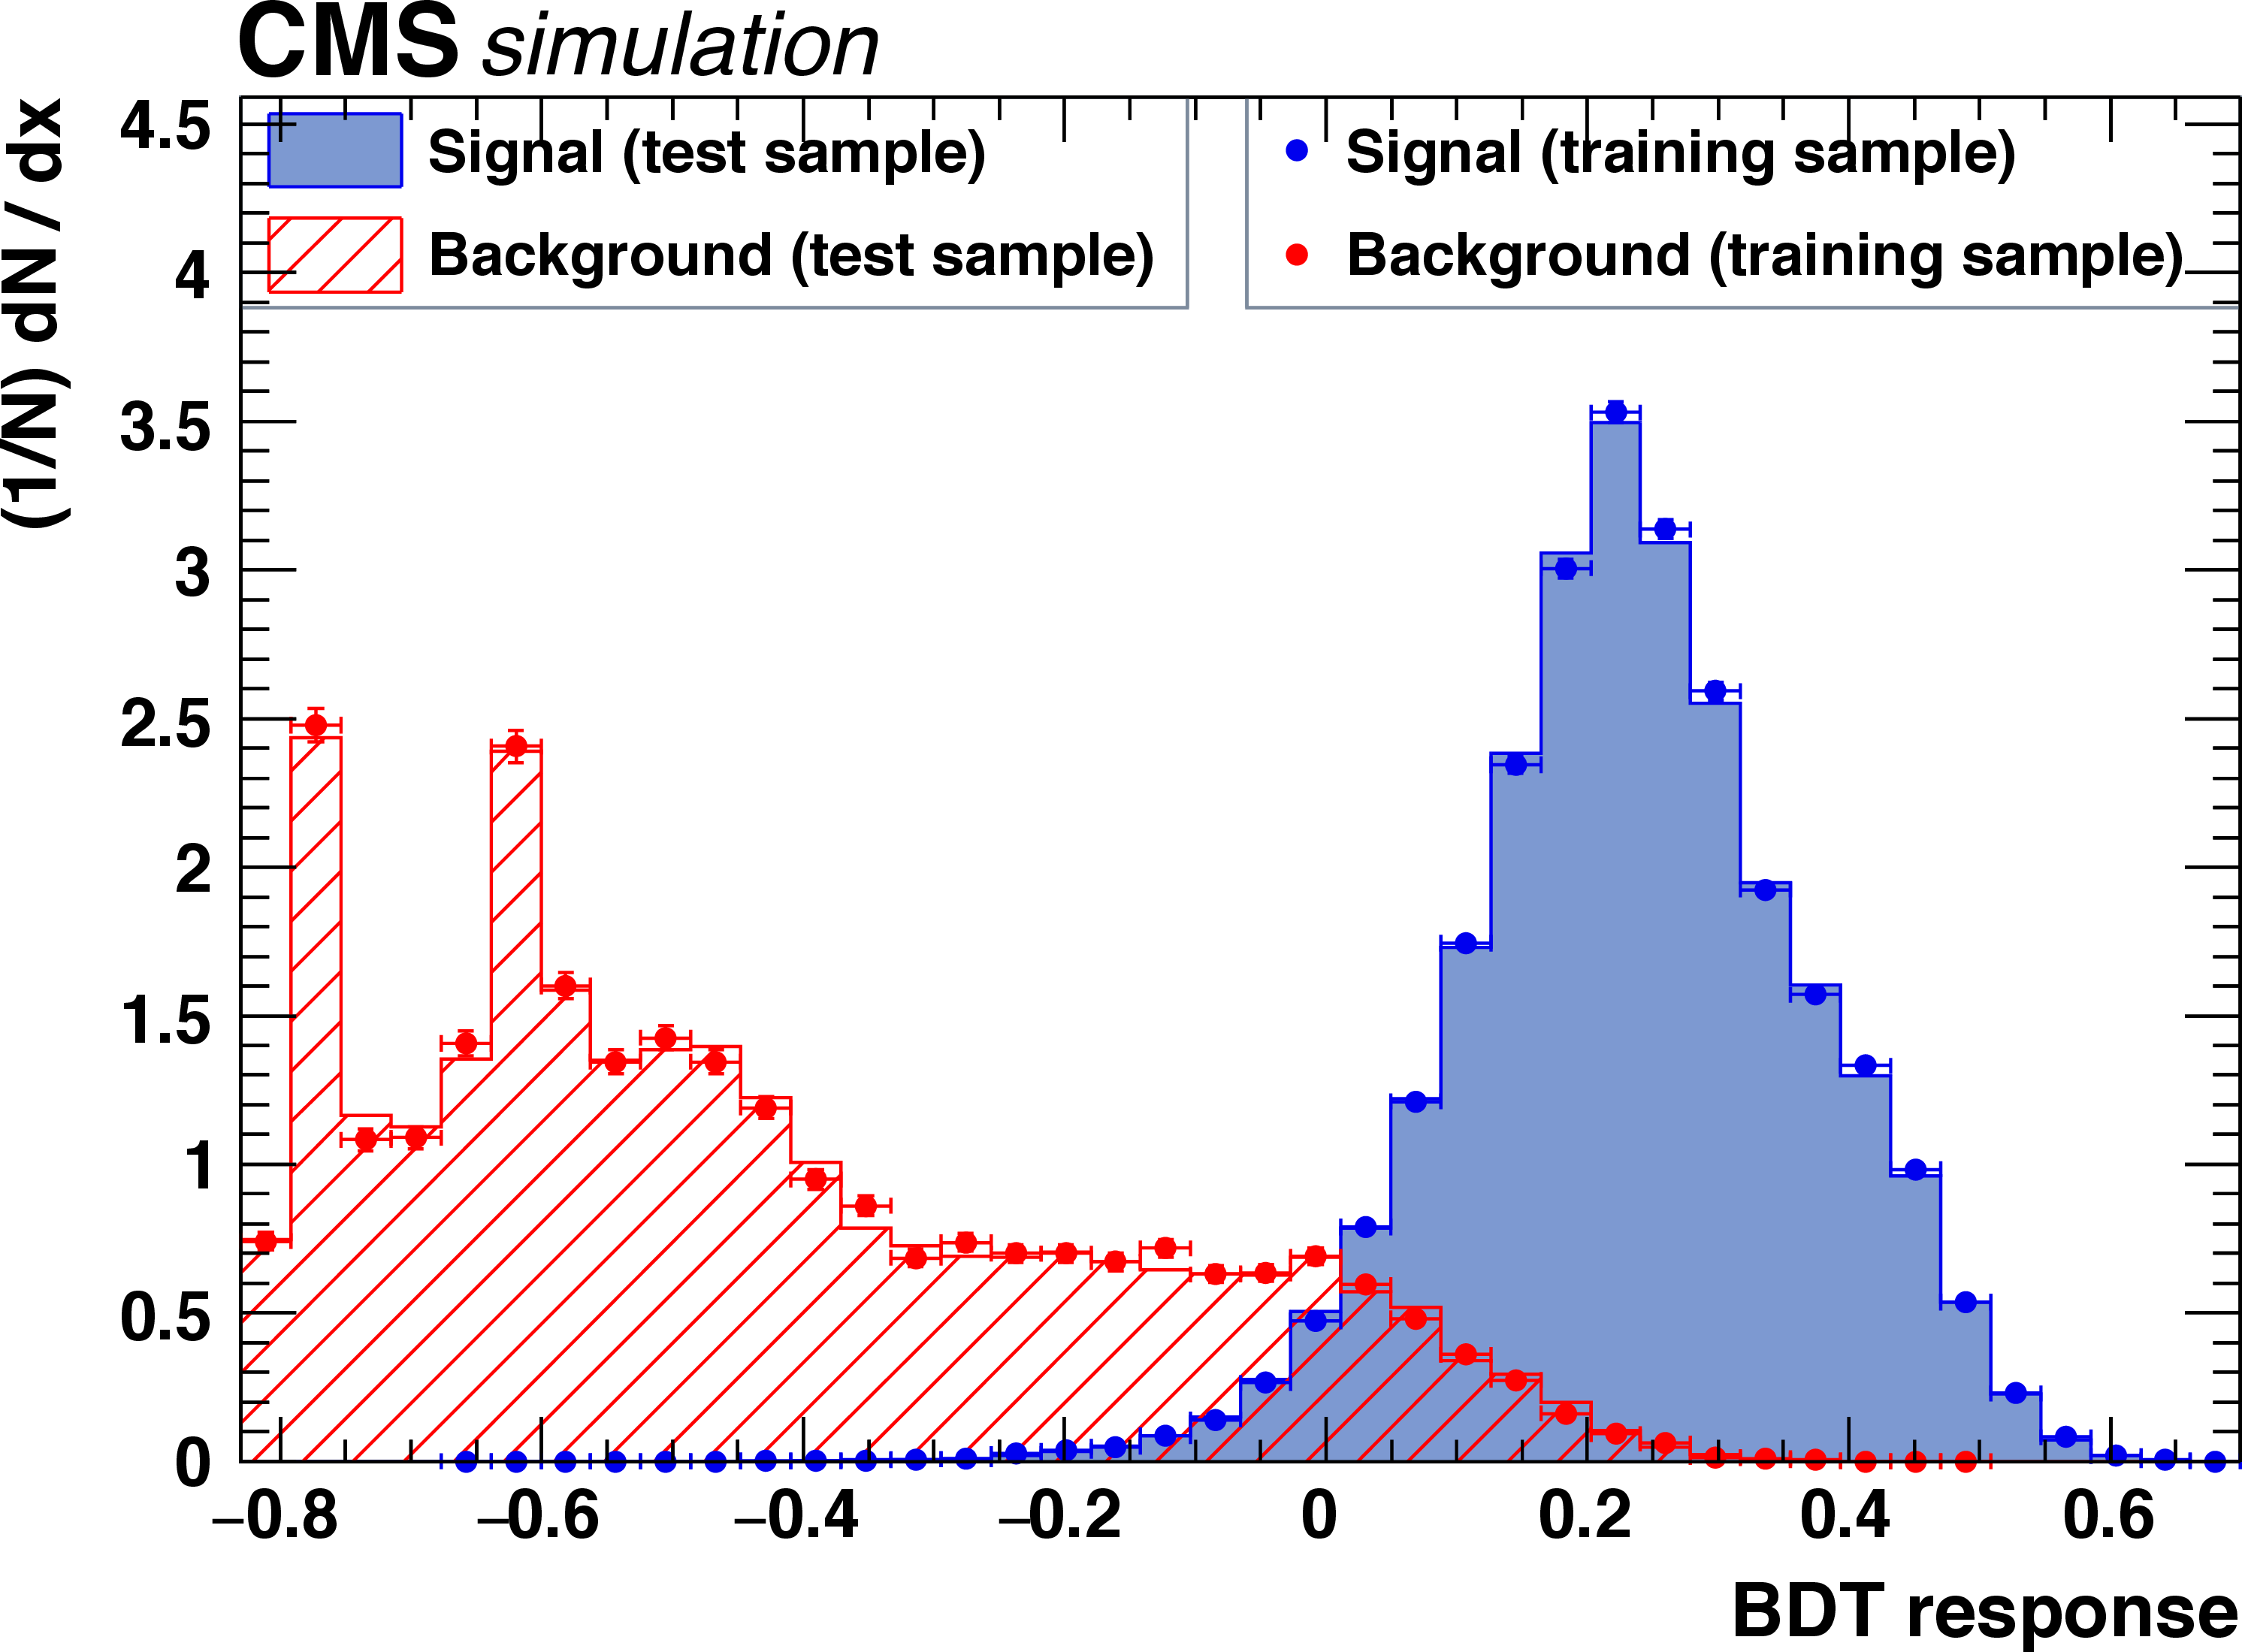
Figure 2:
The distributions of simulated events used to train and validate the BDT classifiers. The left (right) column corresponds to the Phase-0 (Phase-1) detector, and the upper (lower) row to the short (long) track category. The uncertainty bars shown for the training samples indicate the Poisson uncertainties. No events appear outside of the regions shown. |
png pdf |
Figure 2-a:
Distributions of simulated events used to train and validate the BDT classifier corresponding to the Phase-0 detector in the short track category. The uncertainty bars shown for the training sample indicate the Poisson uncertainties. No events appear outside of the regions shown. |
png pdf |
Figure 2-b:
Distributions of simulated events used to train and validate the BDT classifier corresponding to the Phase-1 detector in the short track category. The uncertainty bars shown for the training sample indicate the Poisson uncertainties. No events appear outside of the regions shown. |
png pdf |
Figure 2-c:
Distributions of simulated events used to train and validate the BDT classifier corresponding to the Phase-0 detector in the long track category. The uncertainty bars shown for the training sample indicate the Poisson uncertainties. No events appear outside of the regions shown. |
png pdf |
Figure 2-d:
Distributions of simulated events used to train and validate the BDT classifier corresponding to the Phase-1 detector in the long track category. The uncertainty bars shown for the training sample indicate the Poisson uncertainties. No events appear outside of the regions shown. |
png pdf |
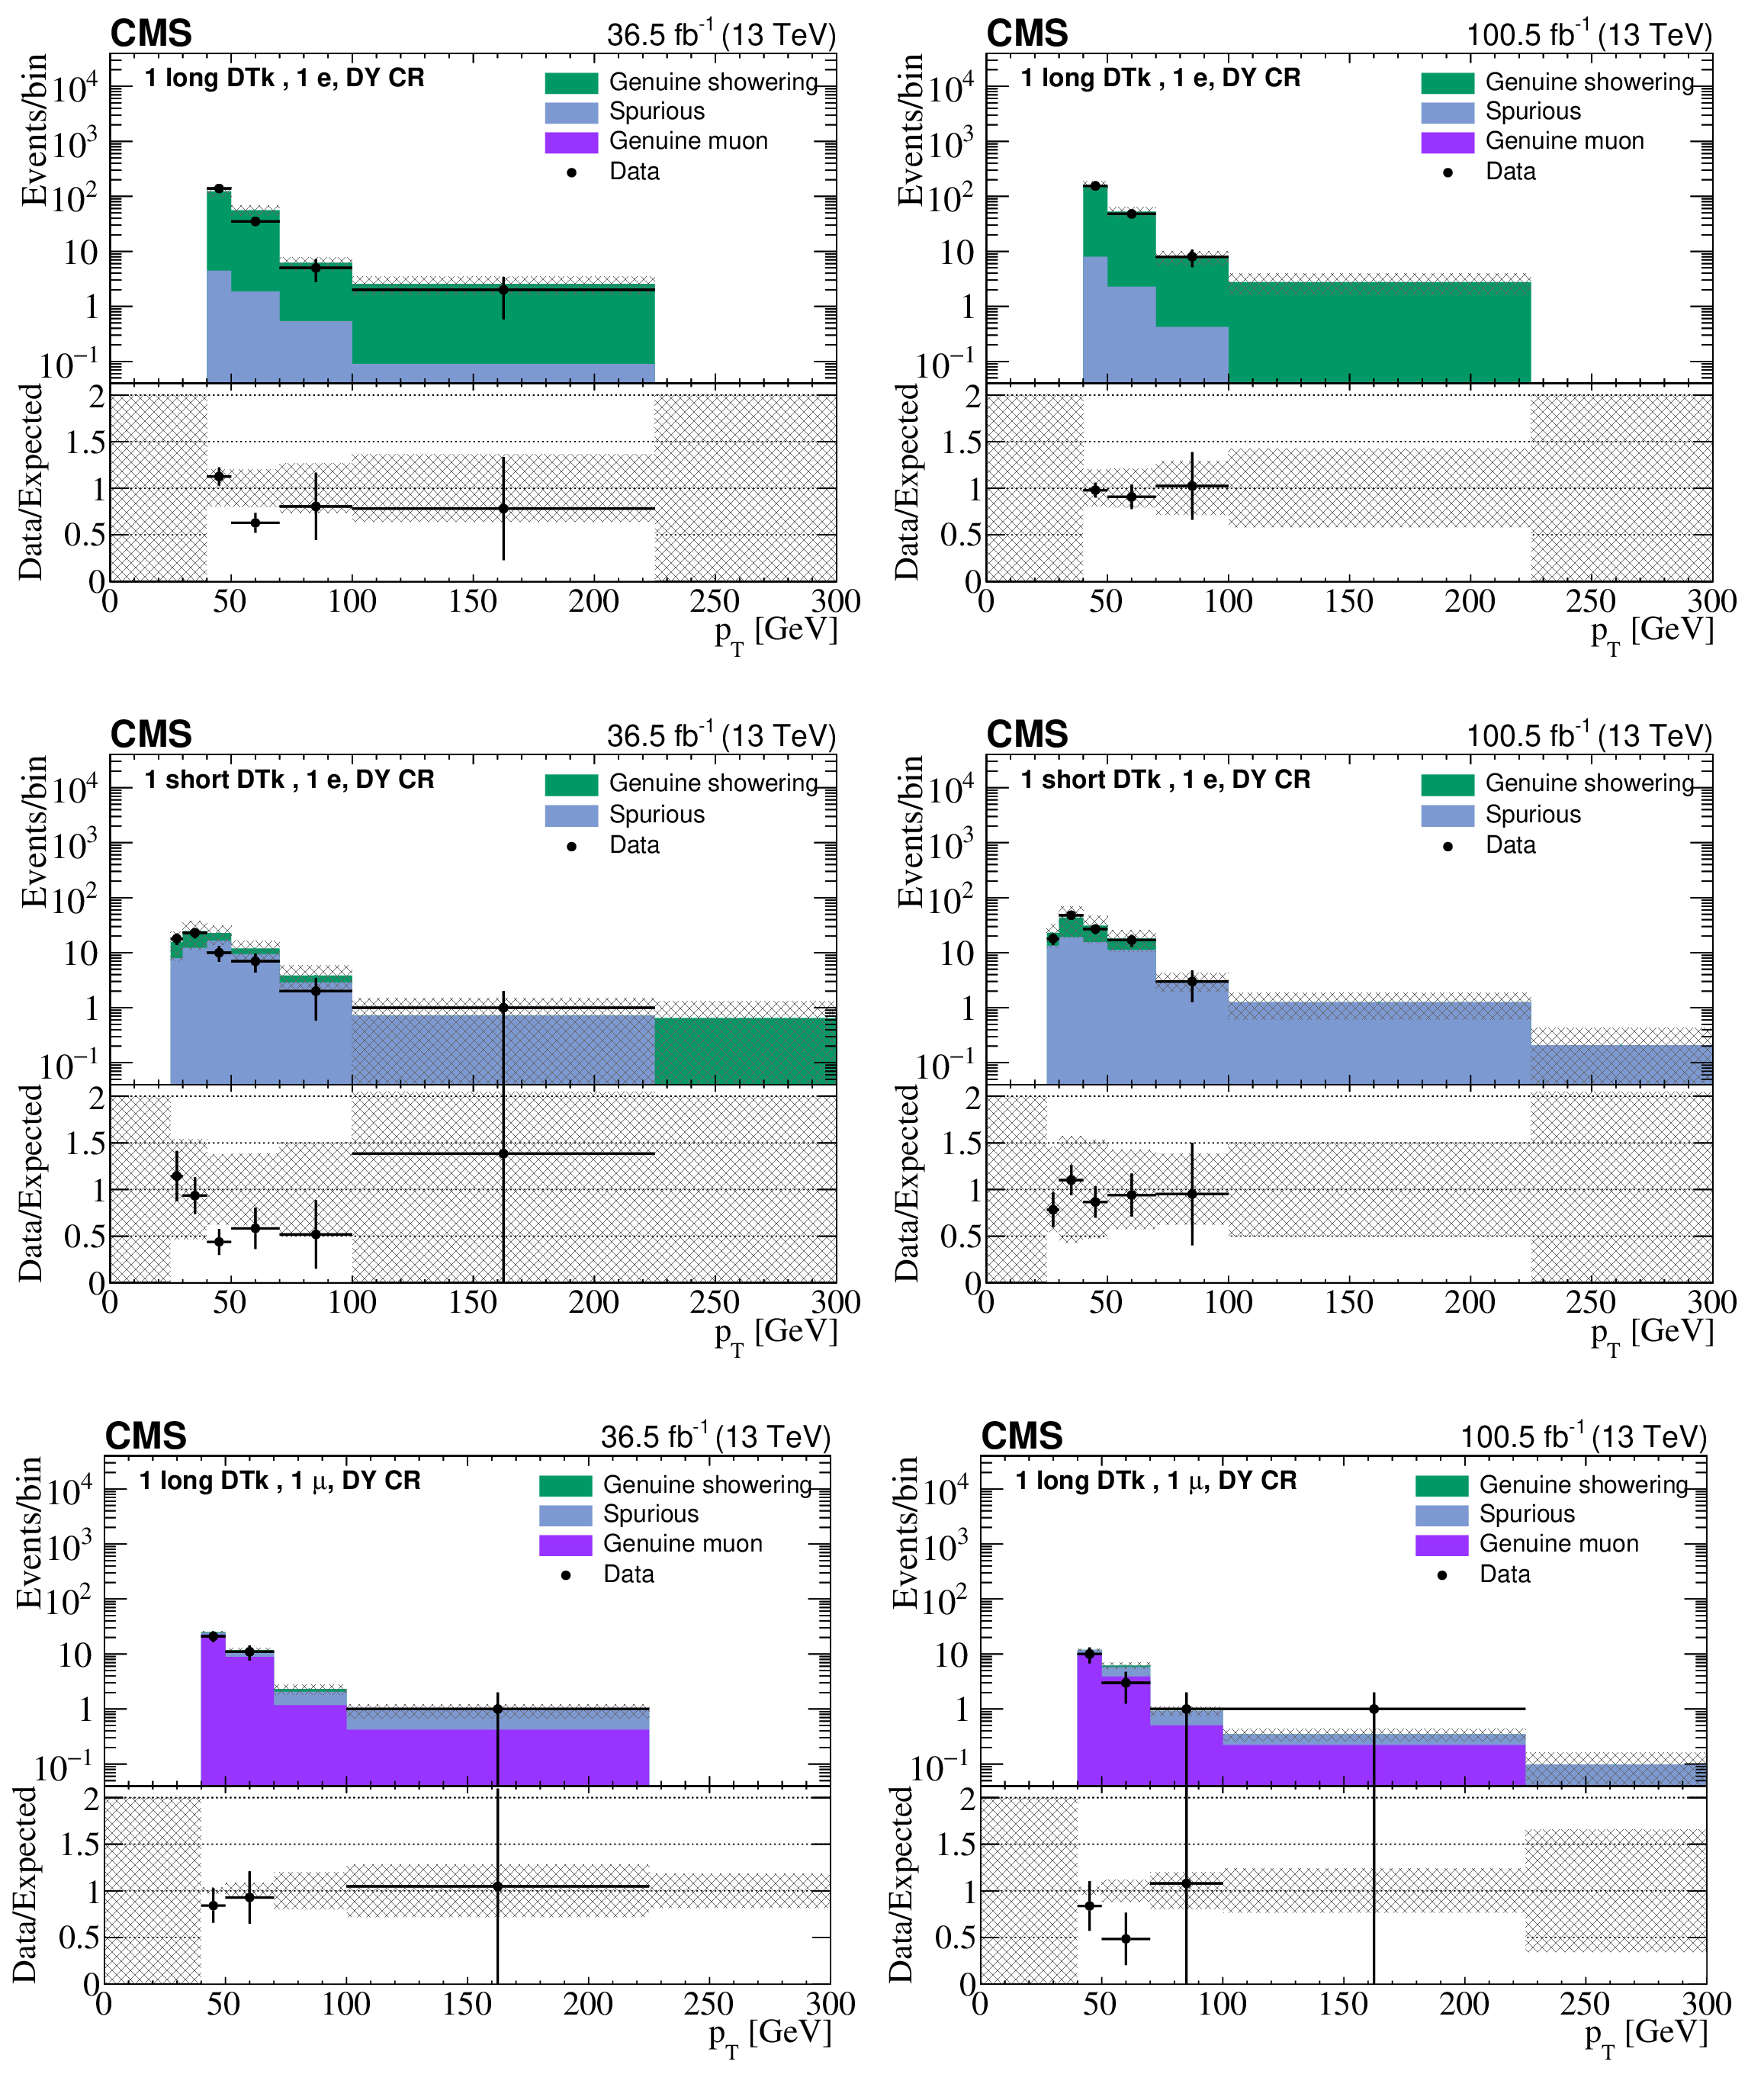
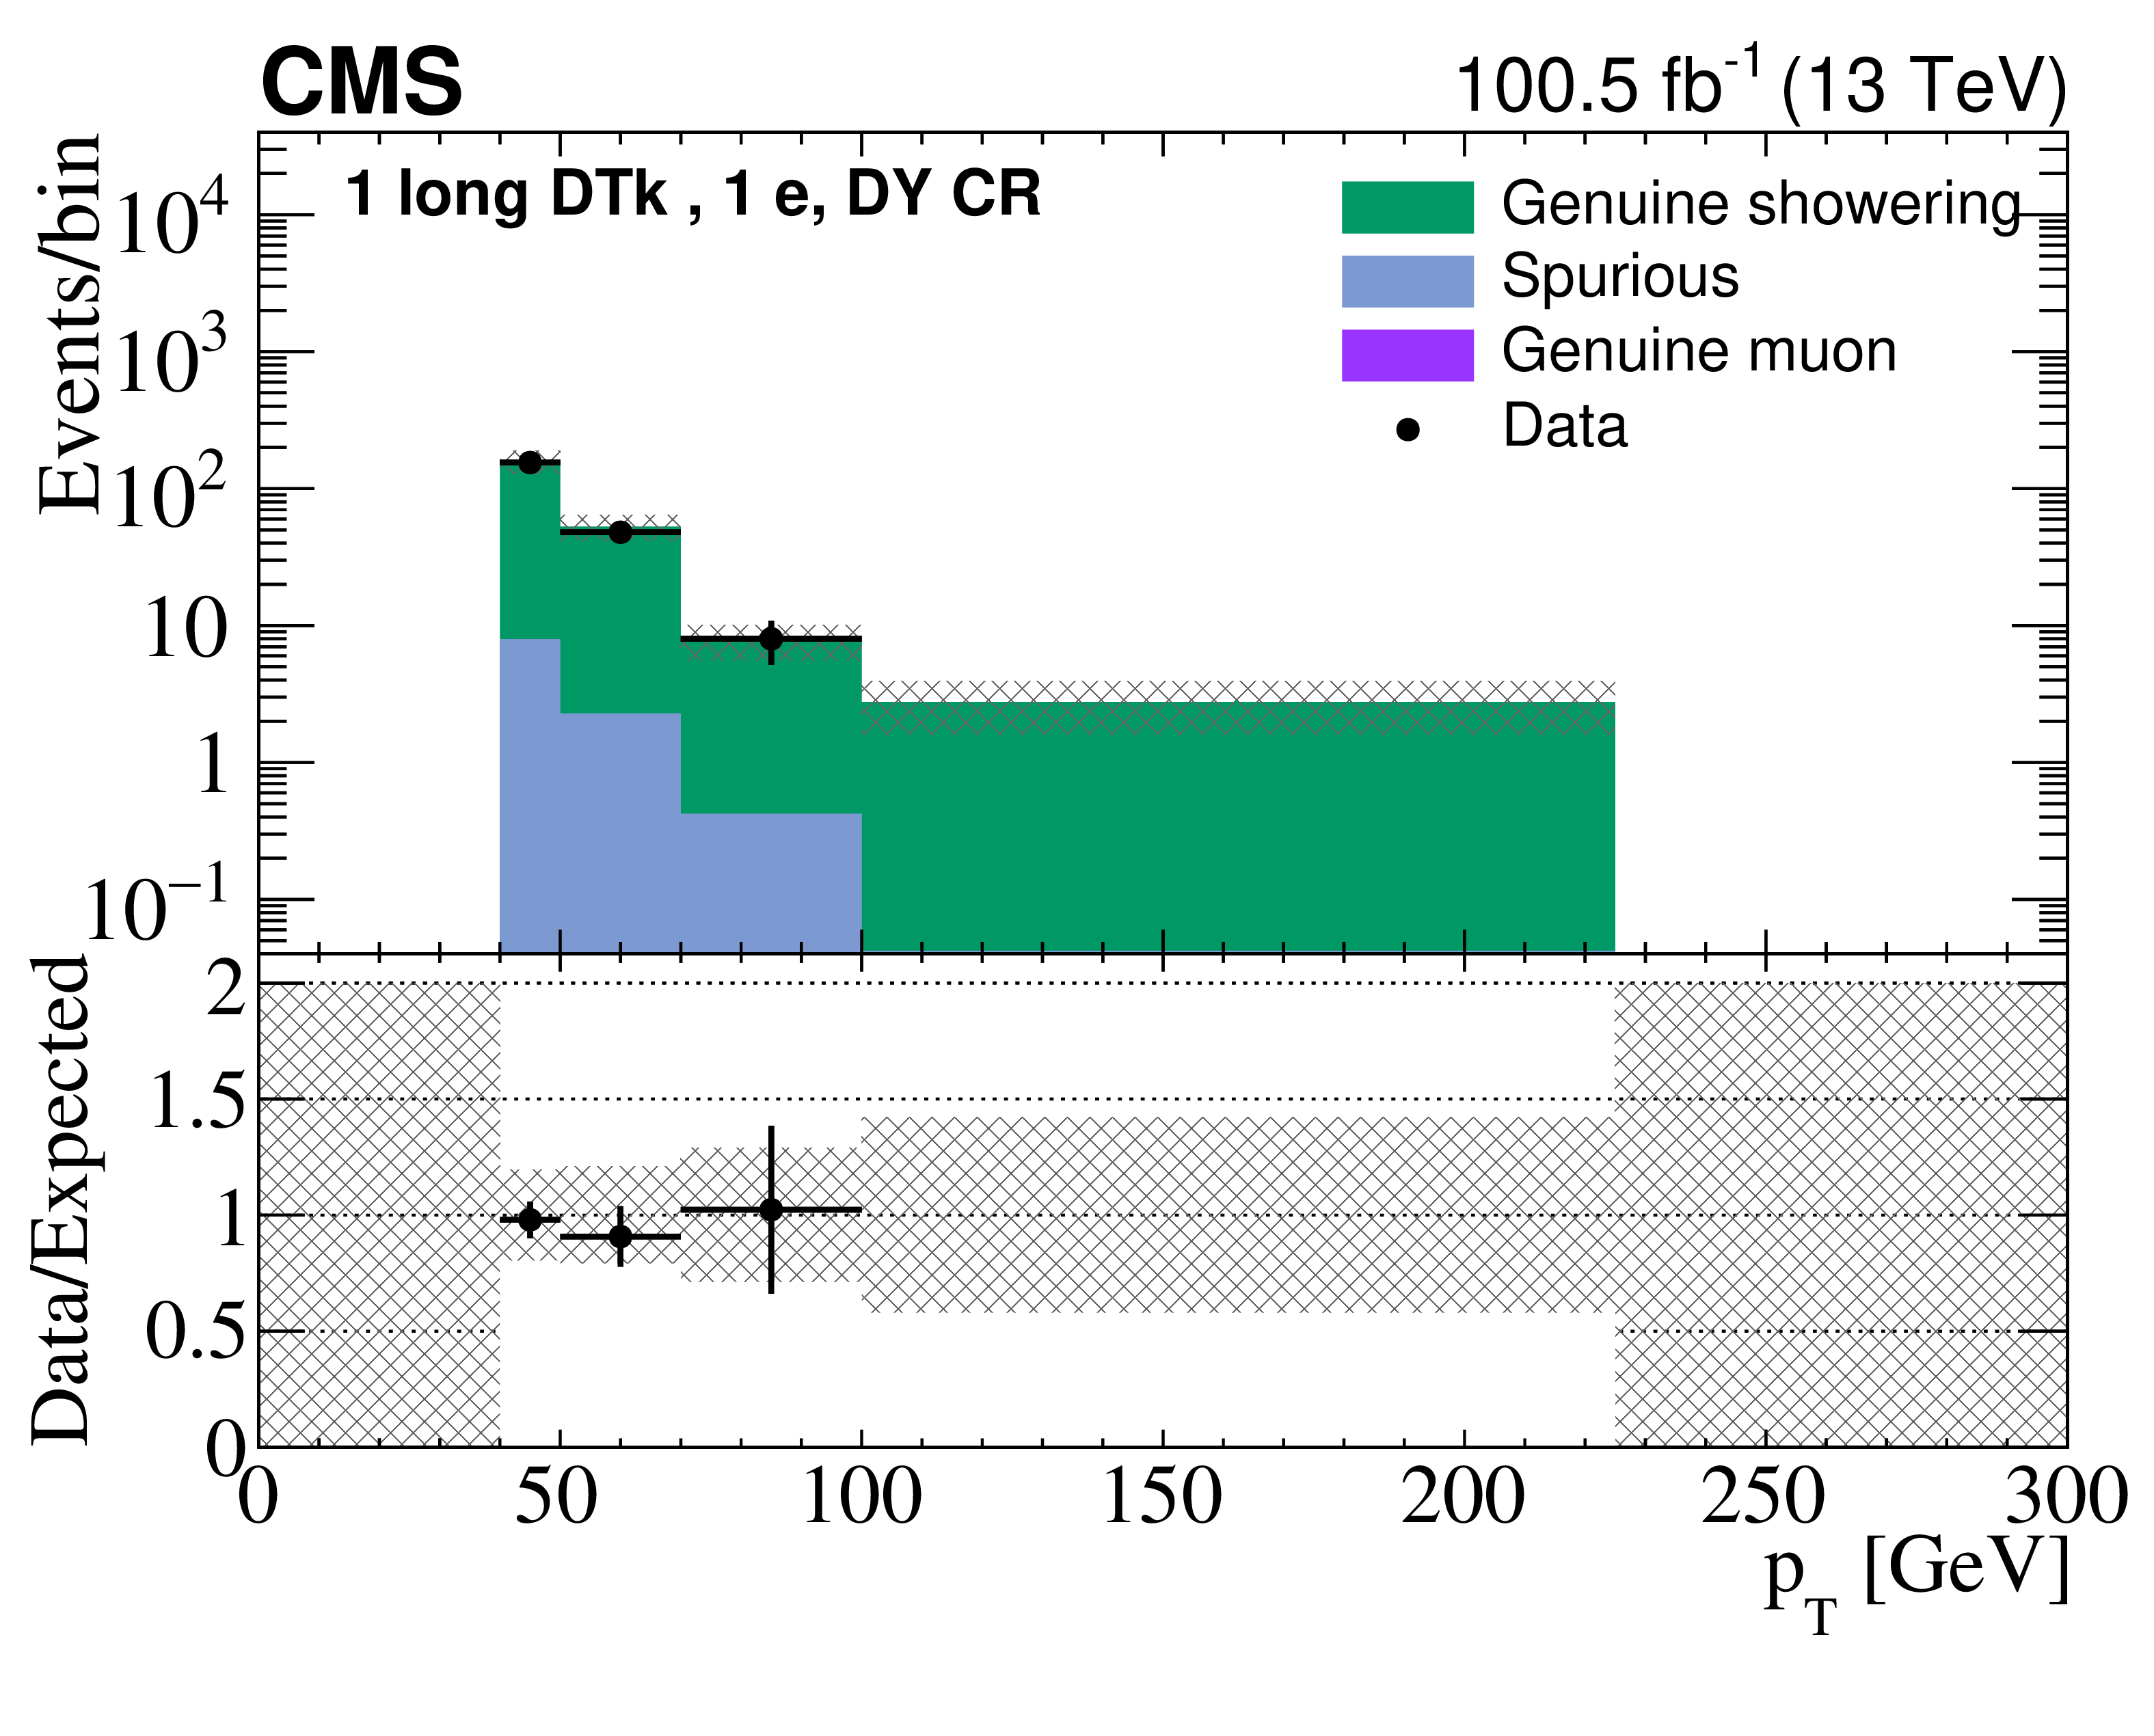
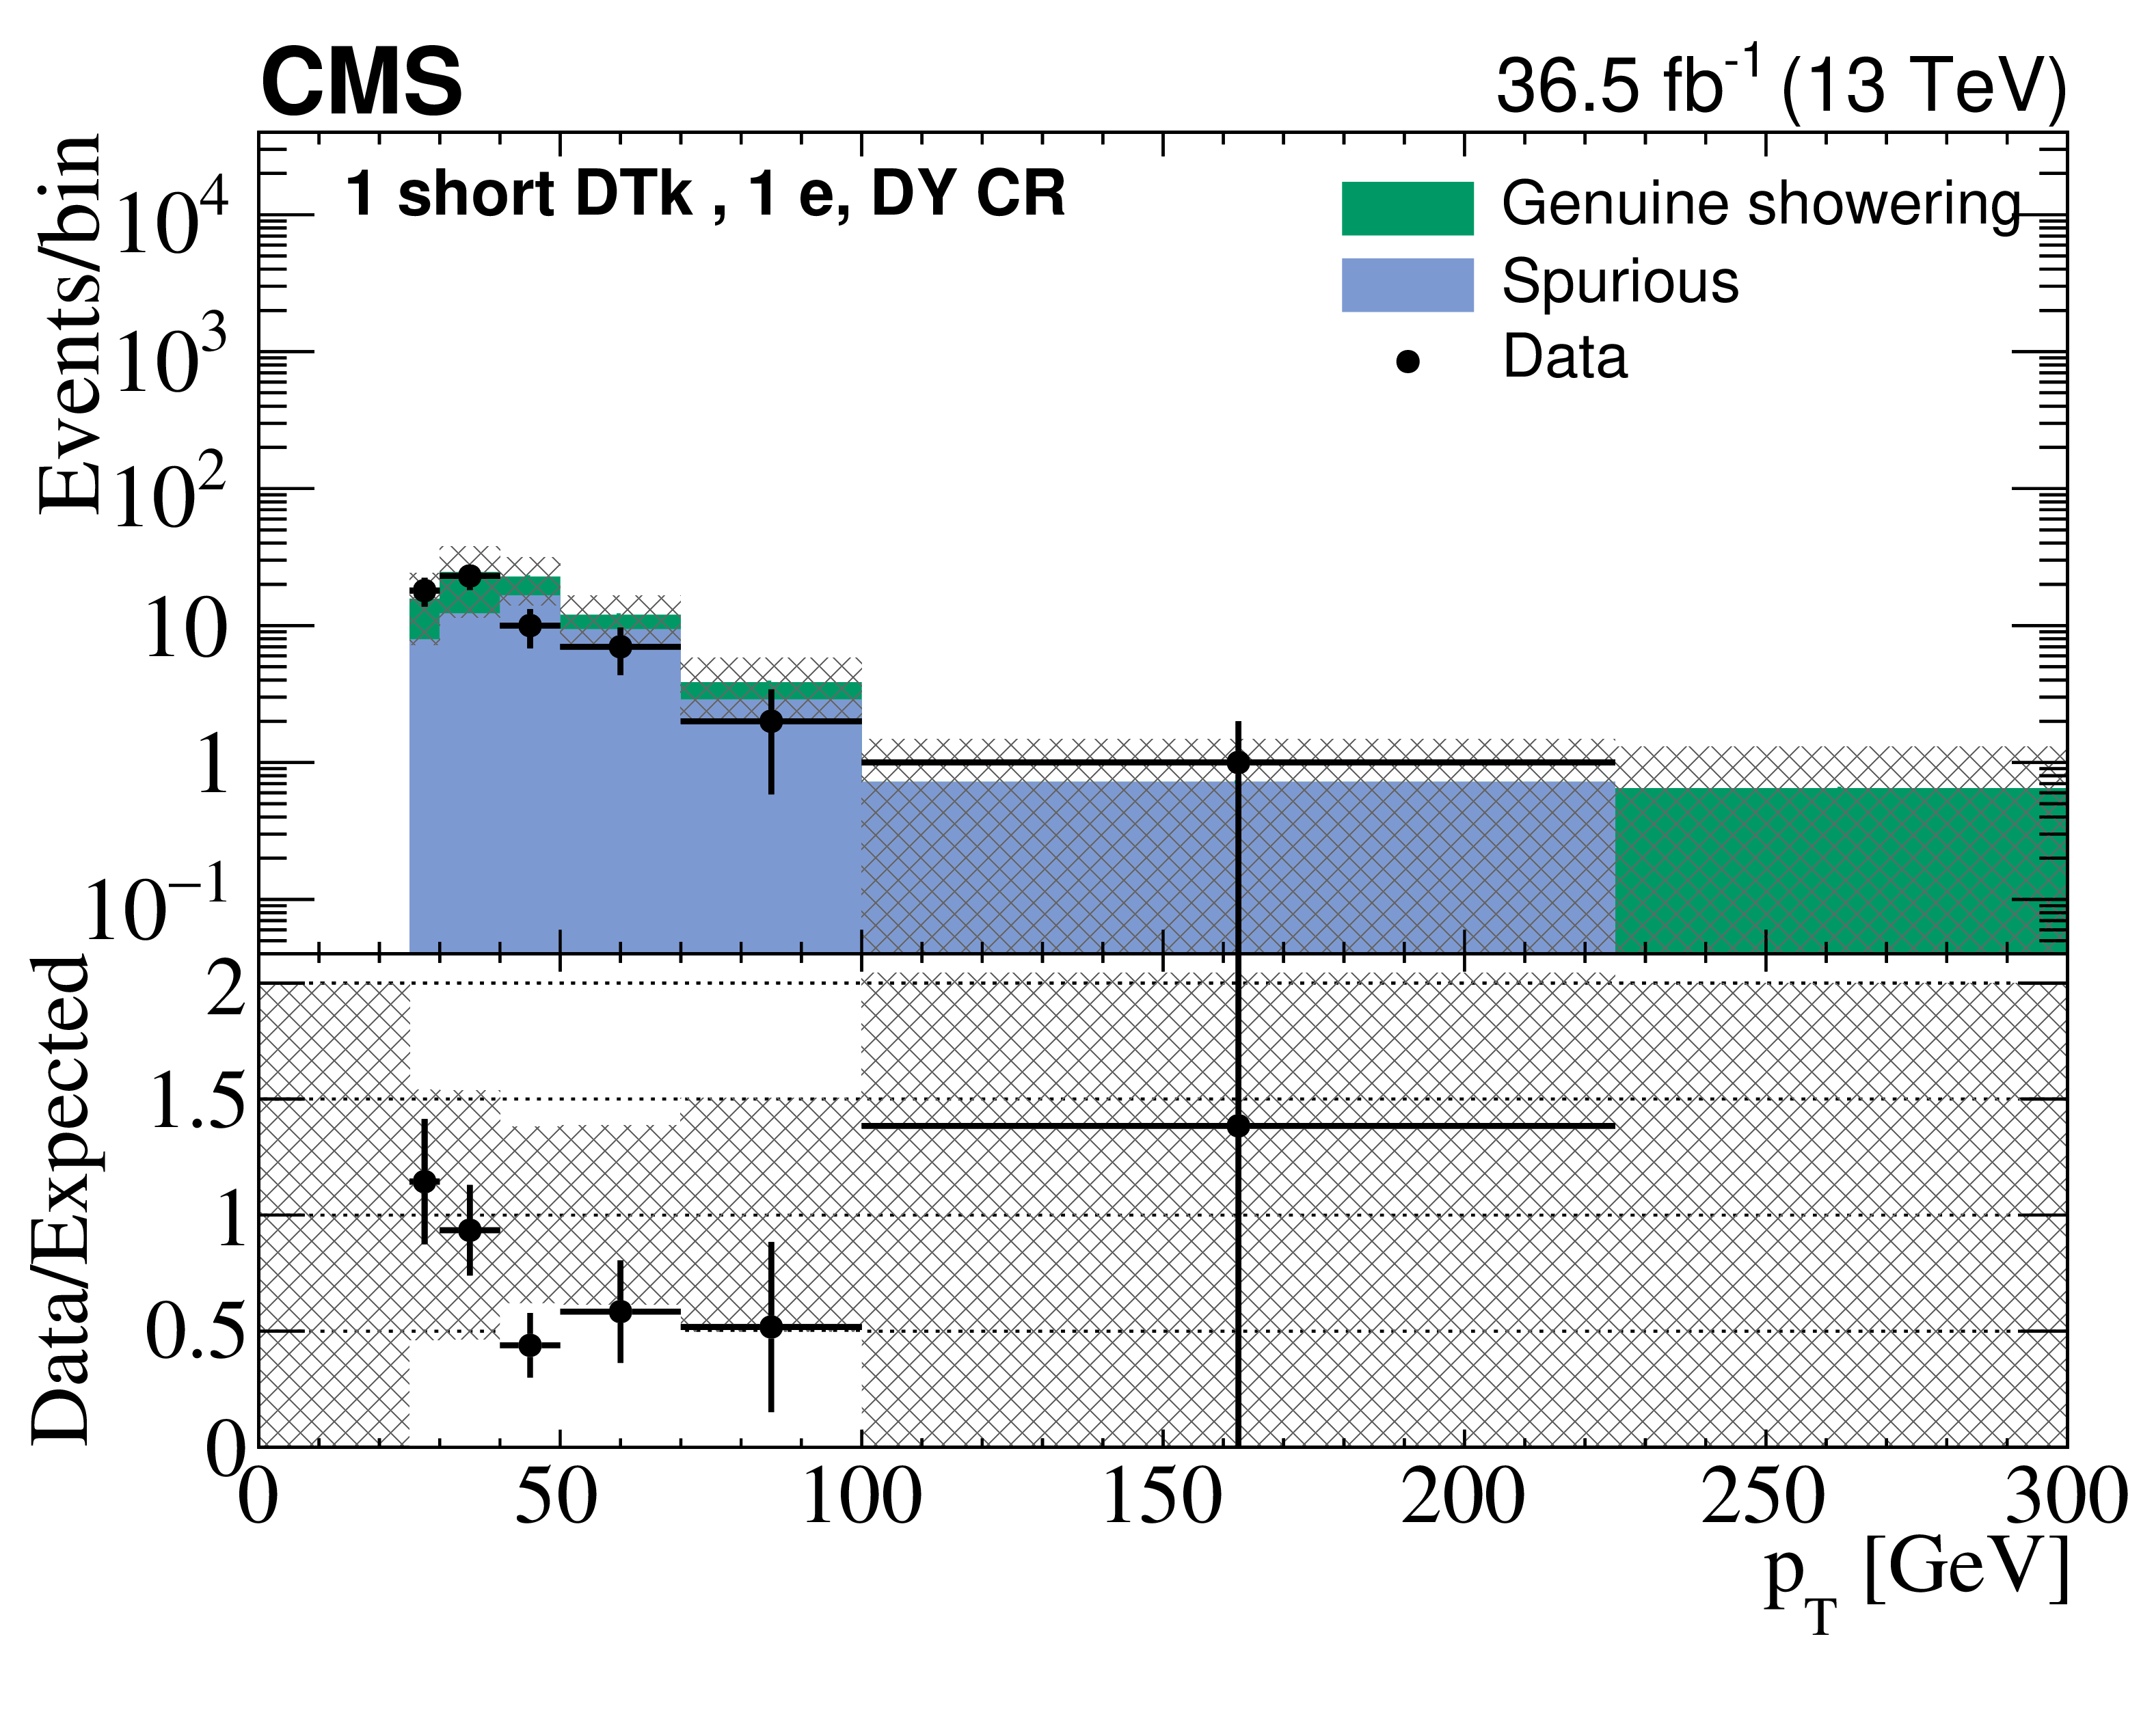
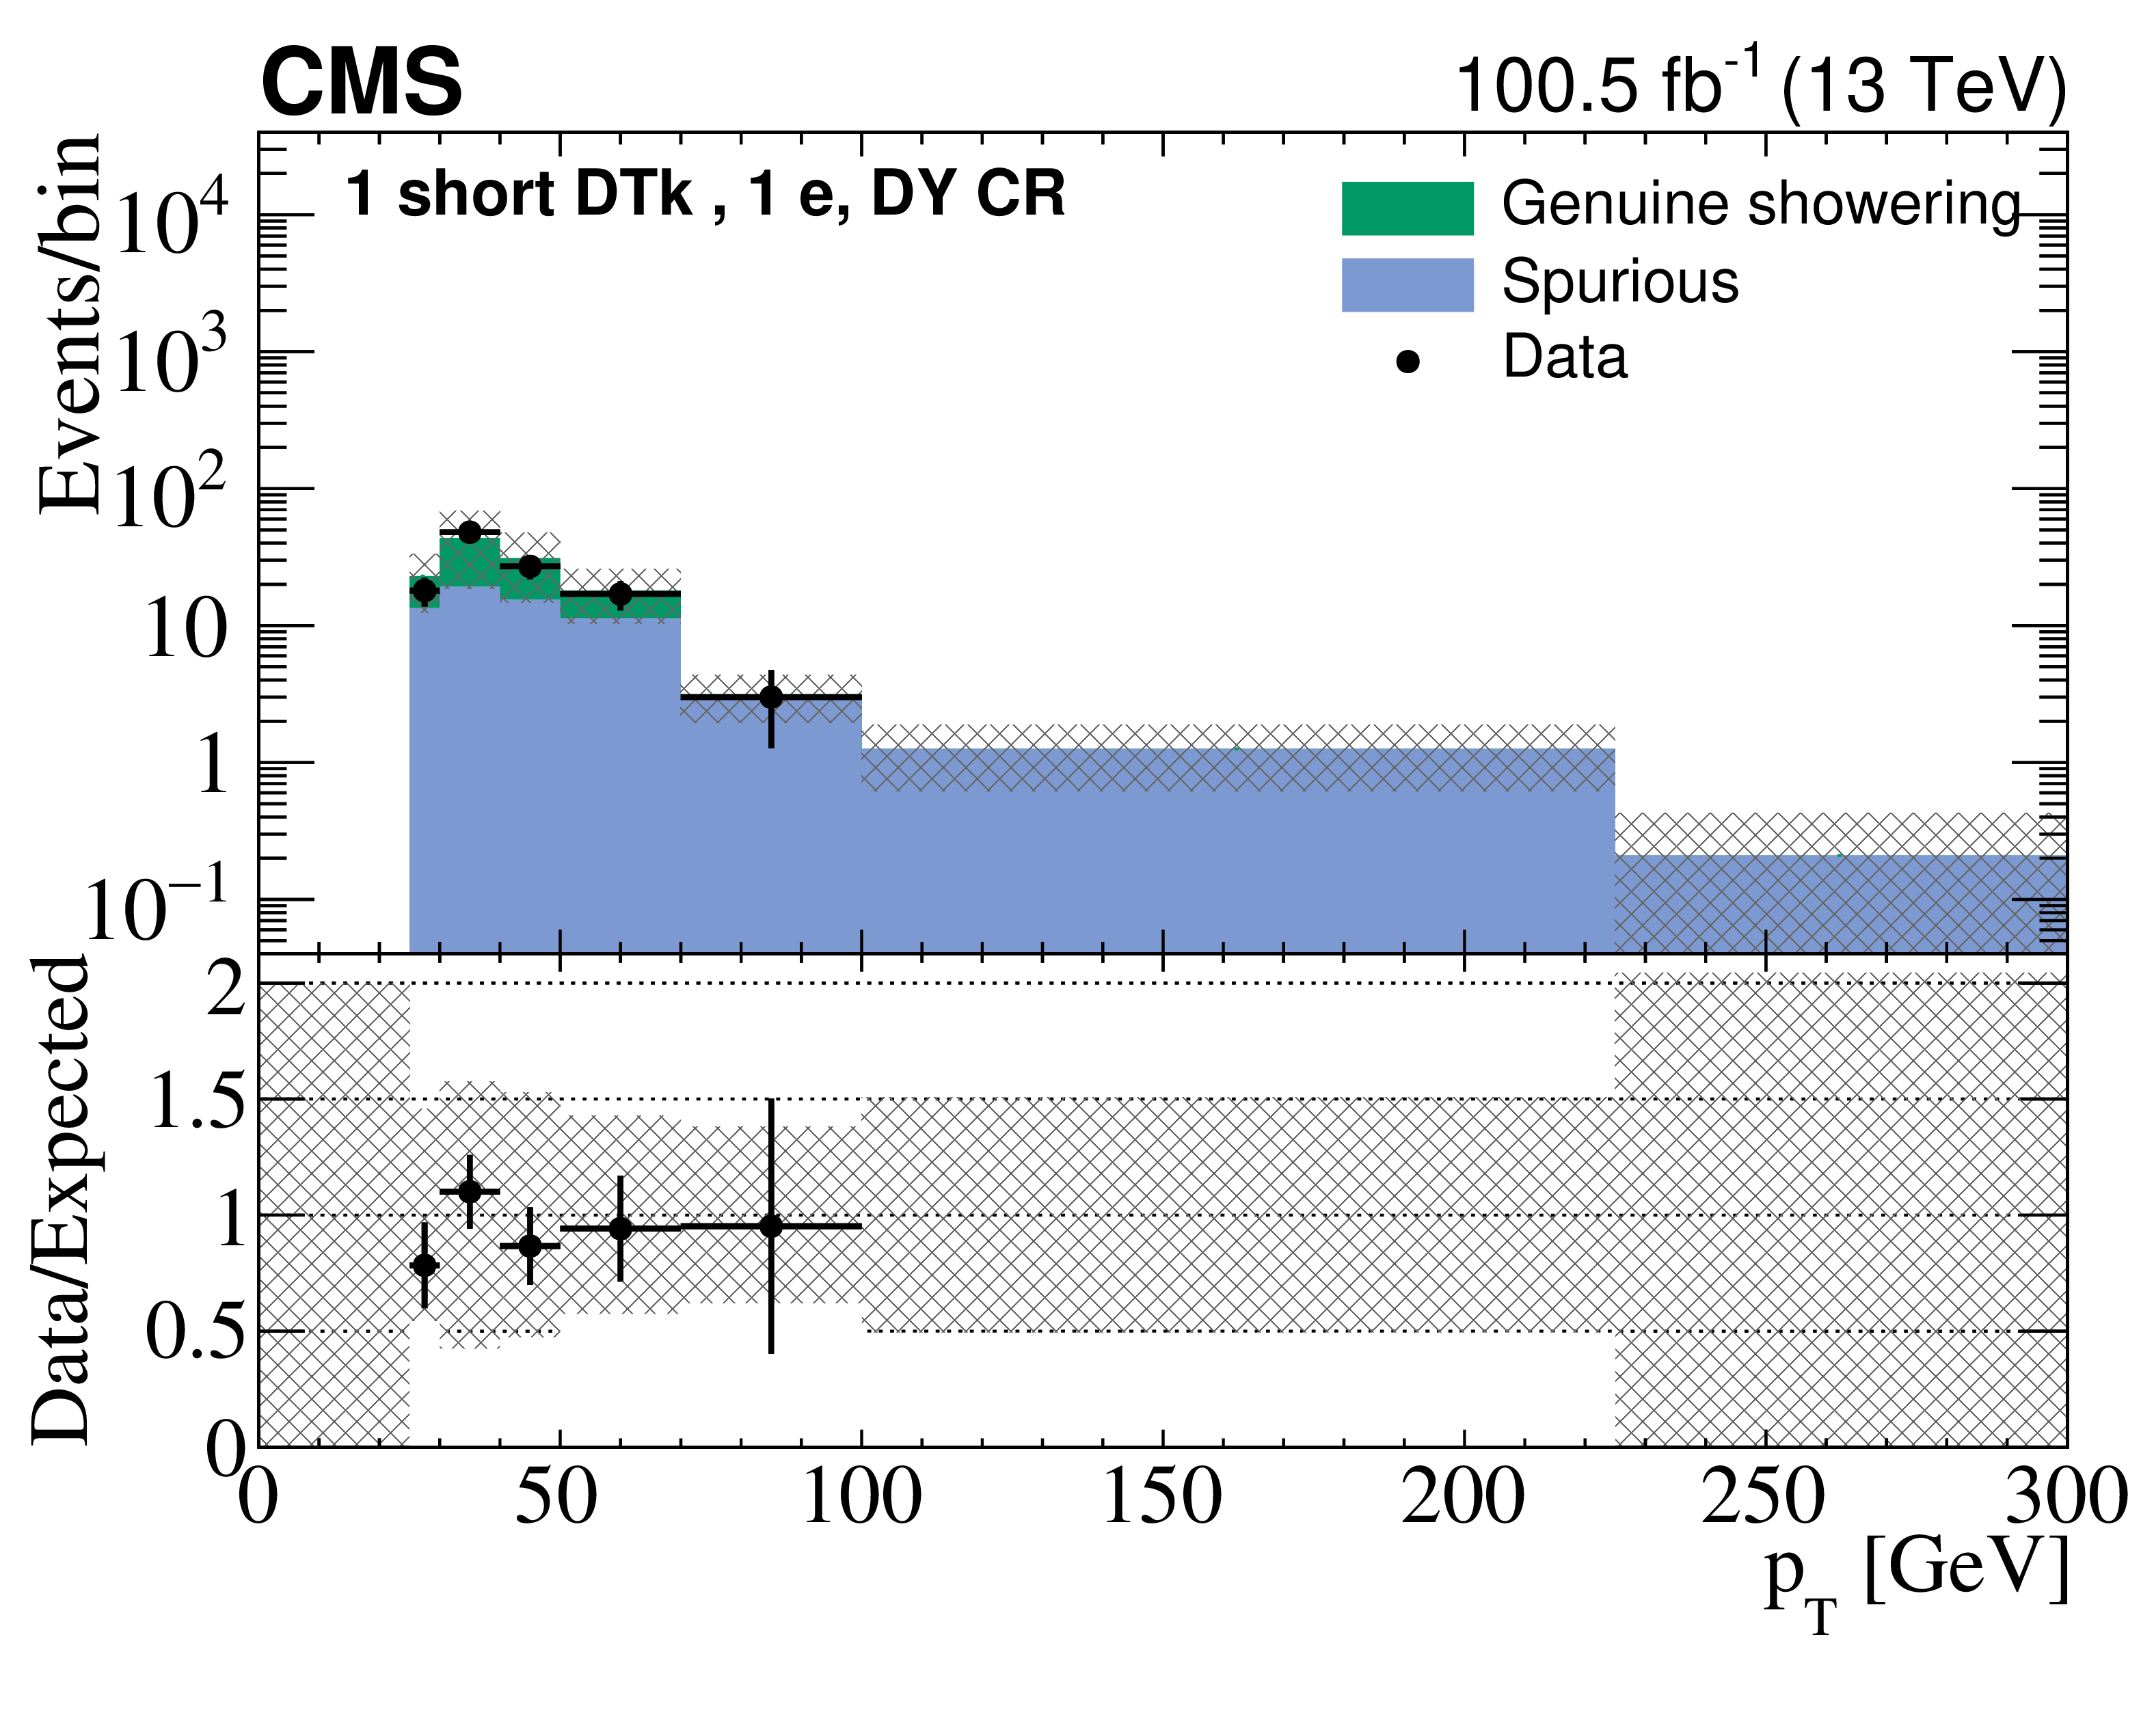
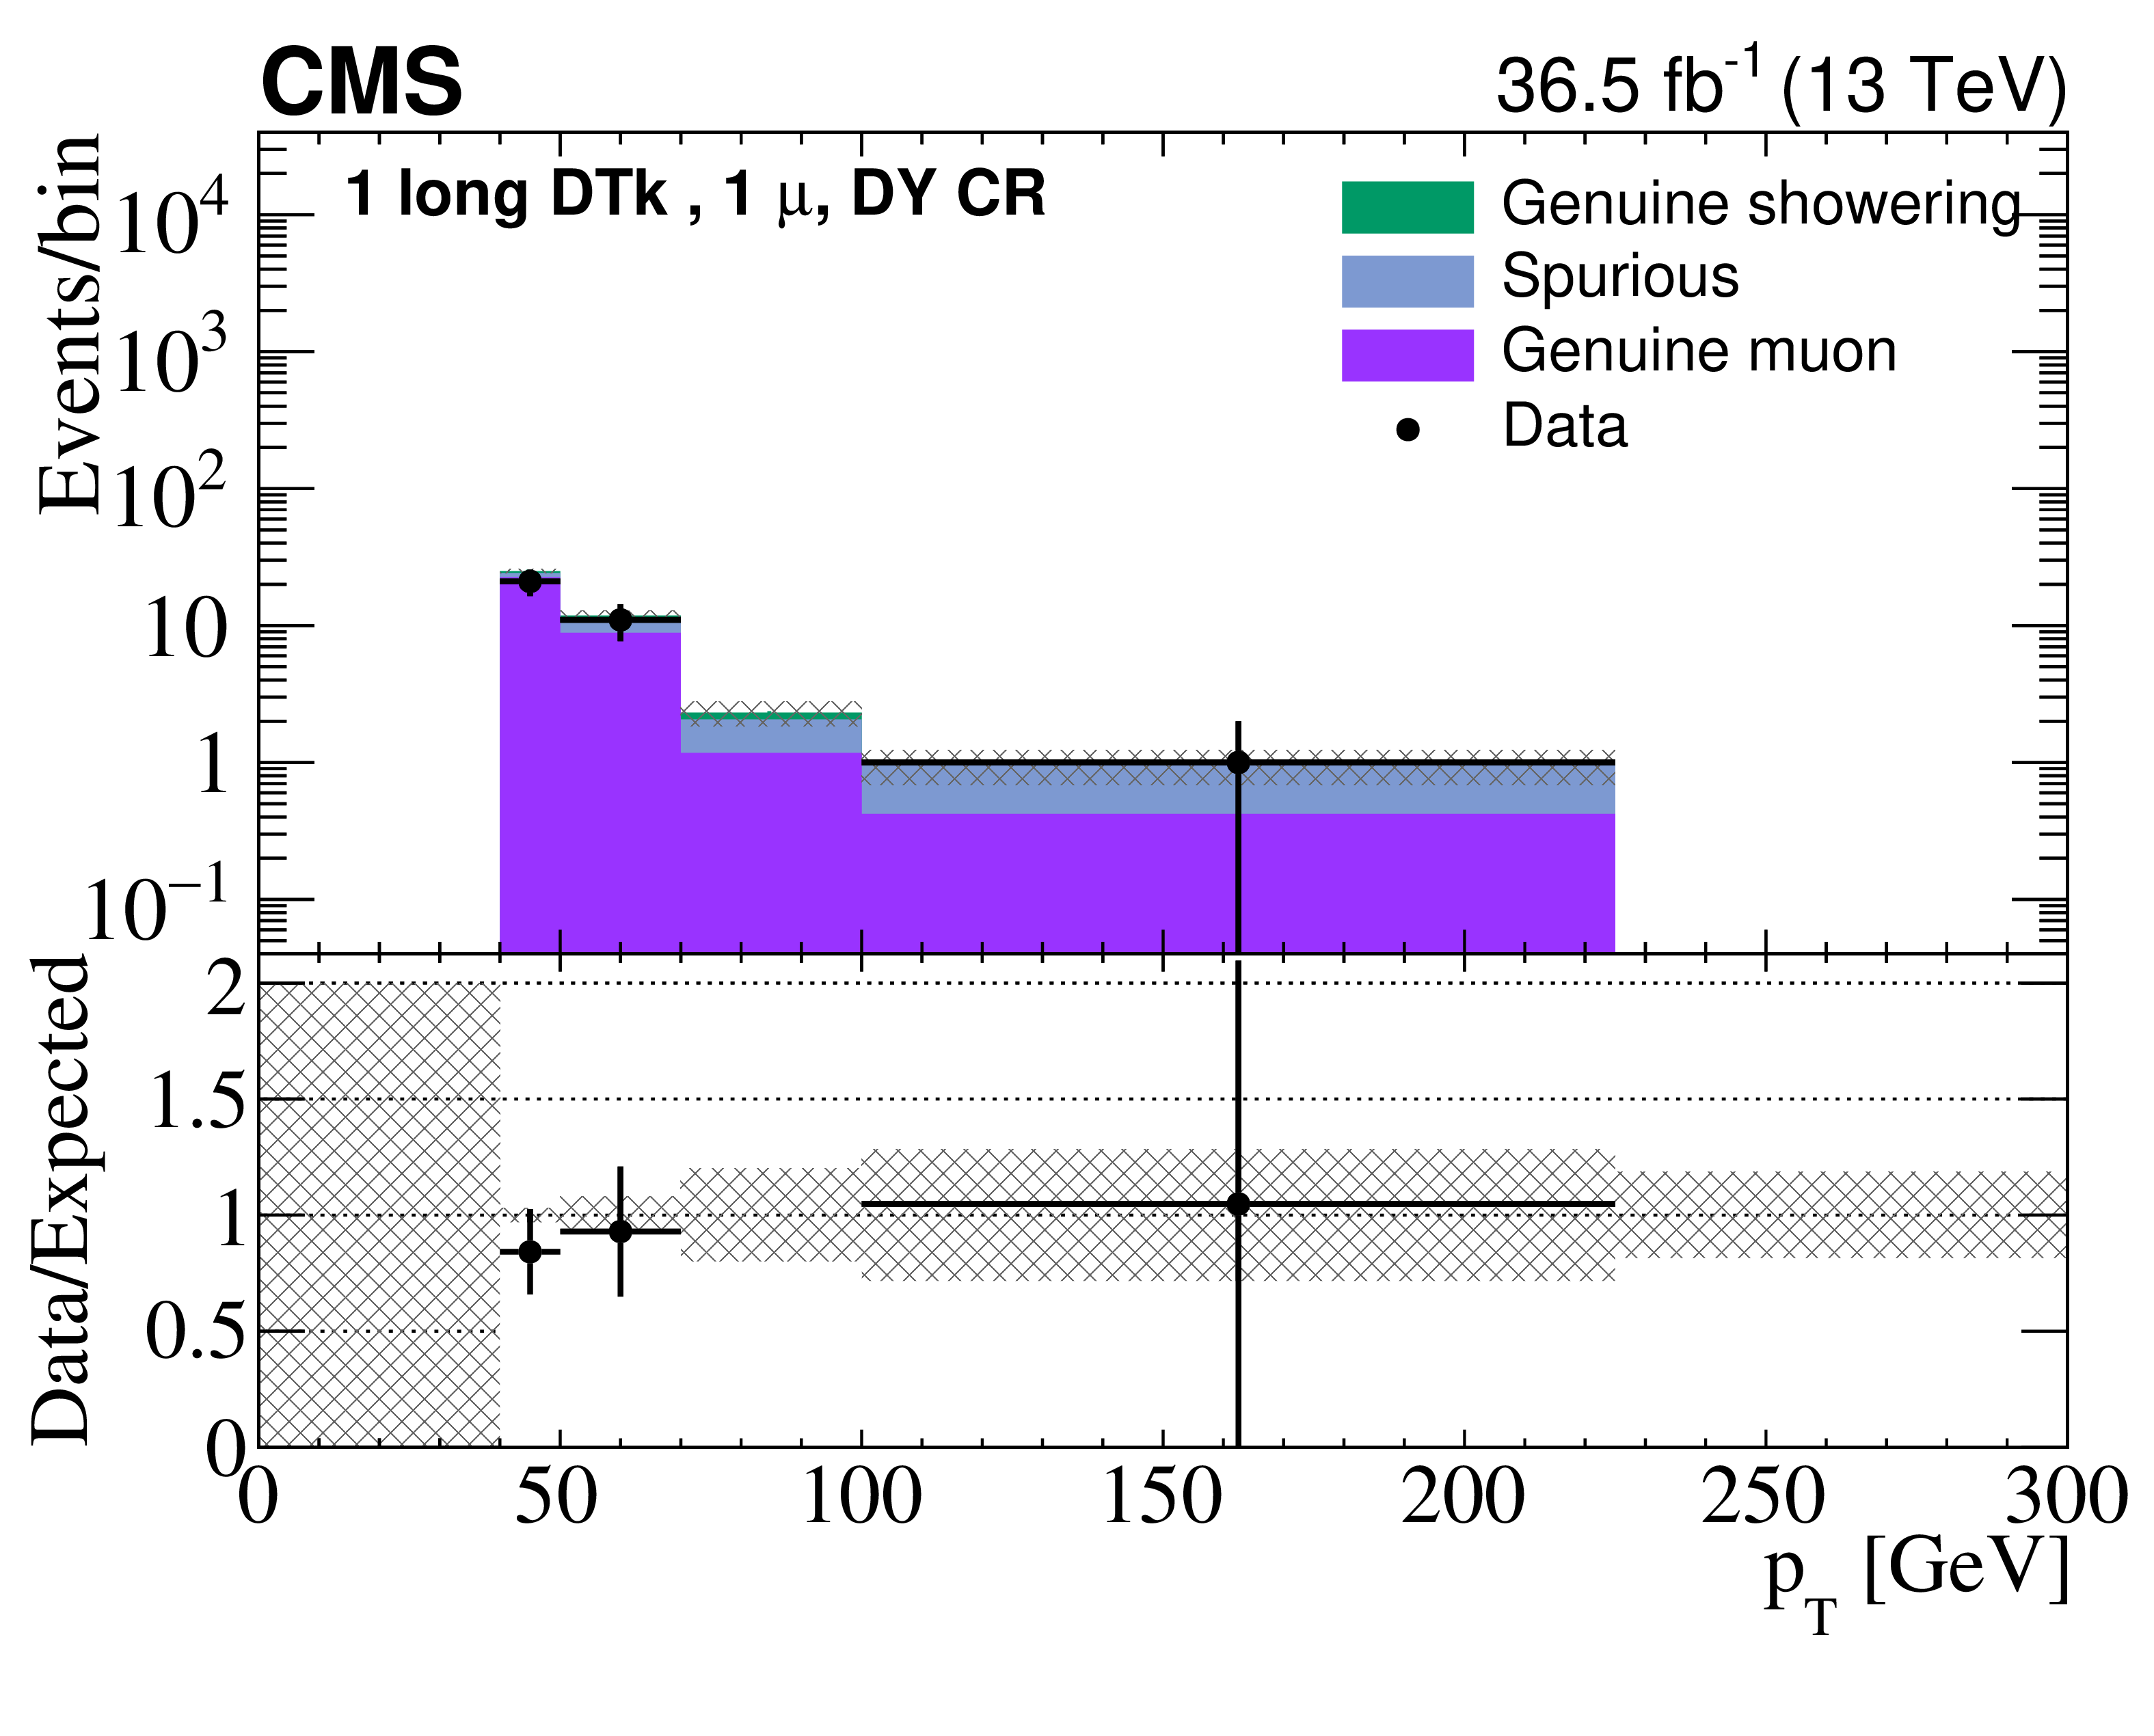
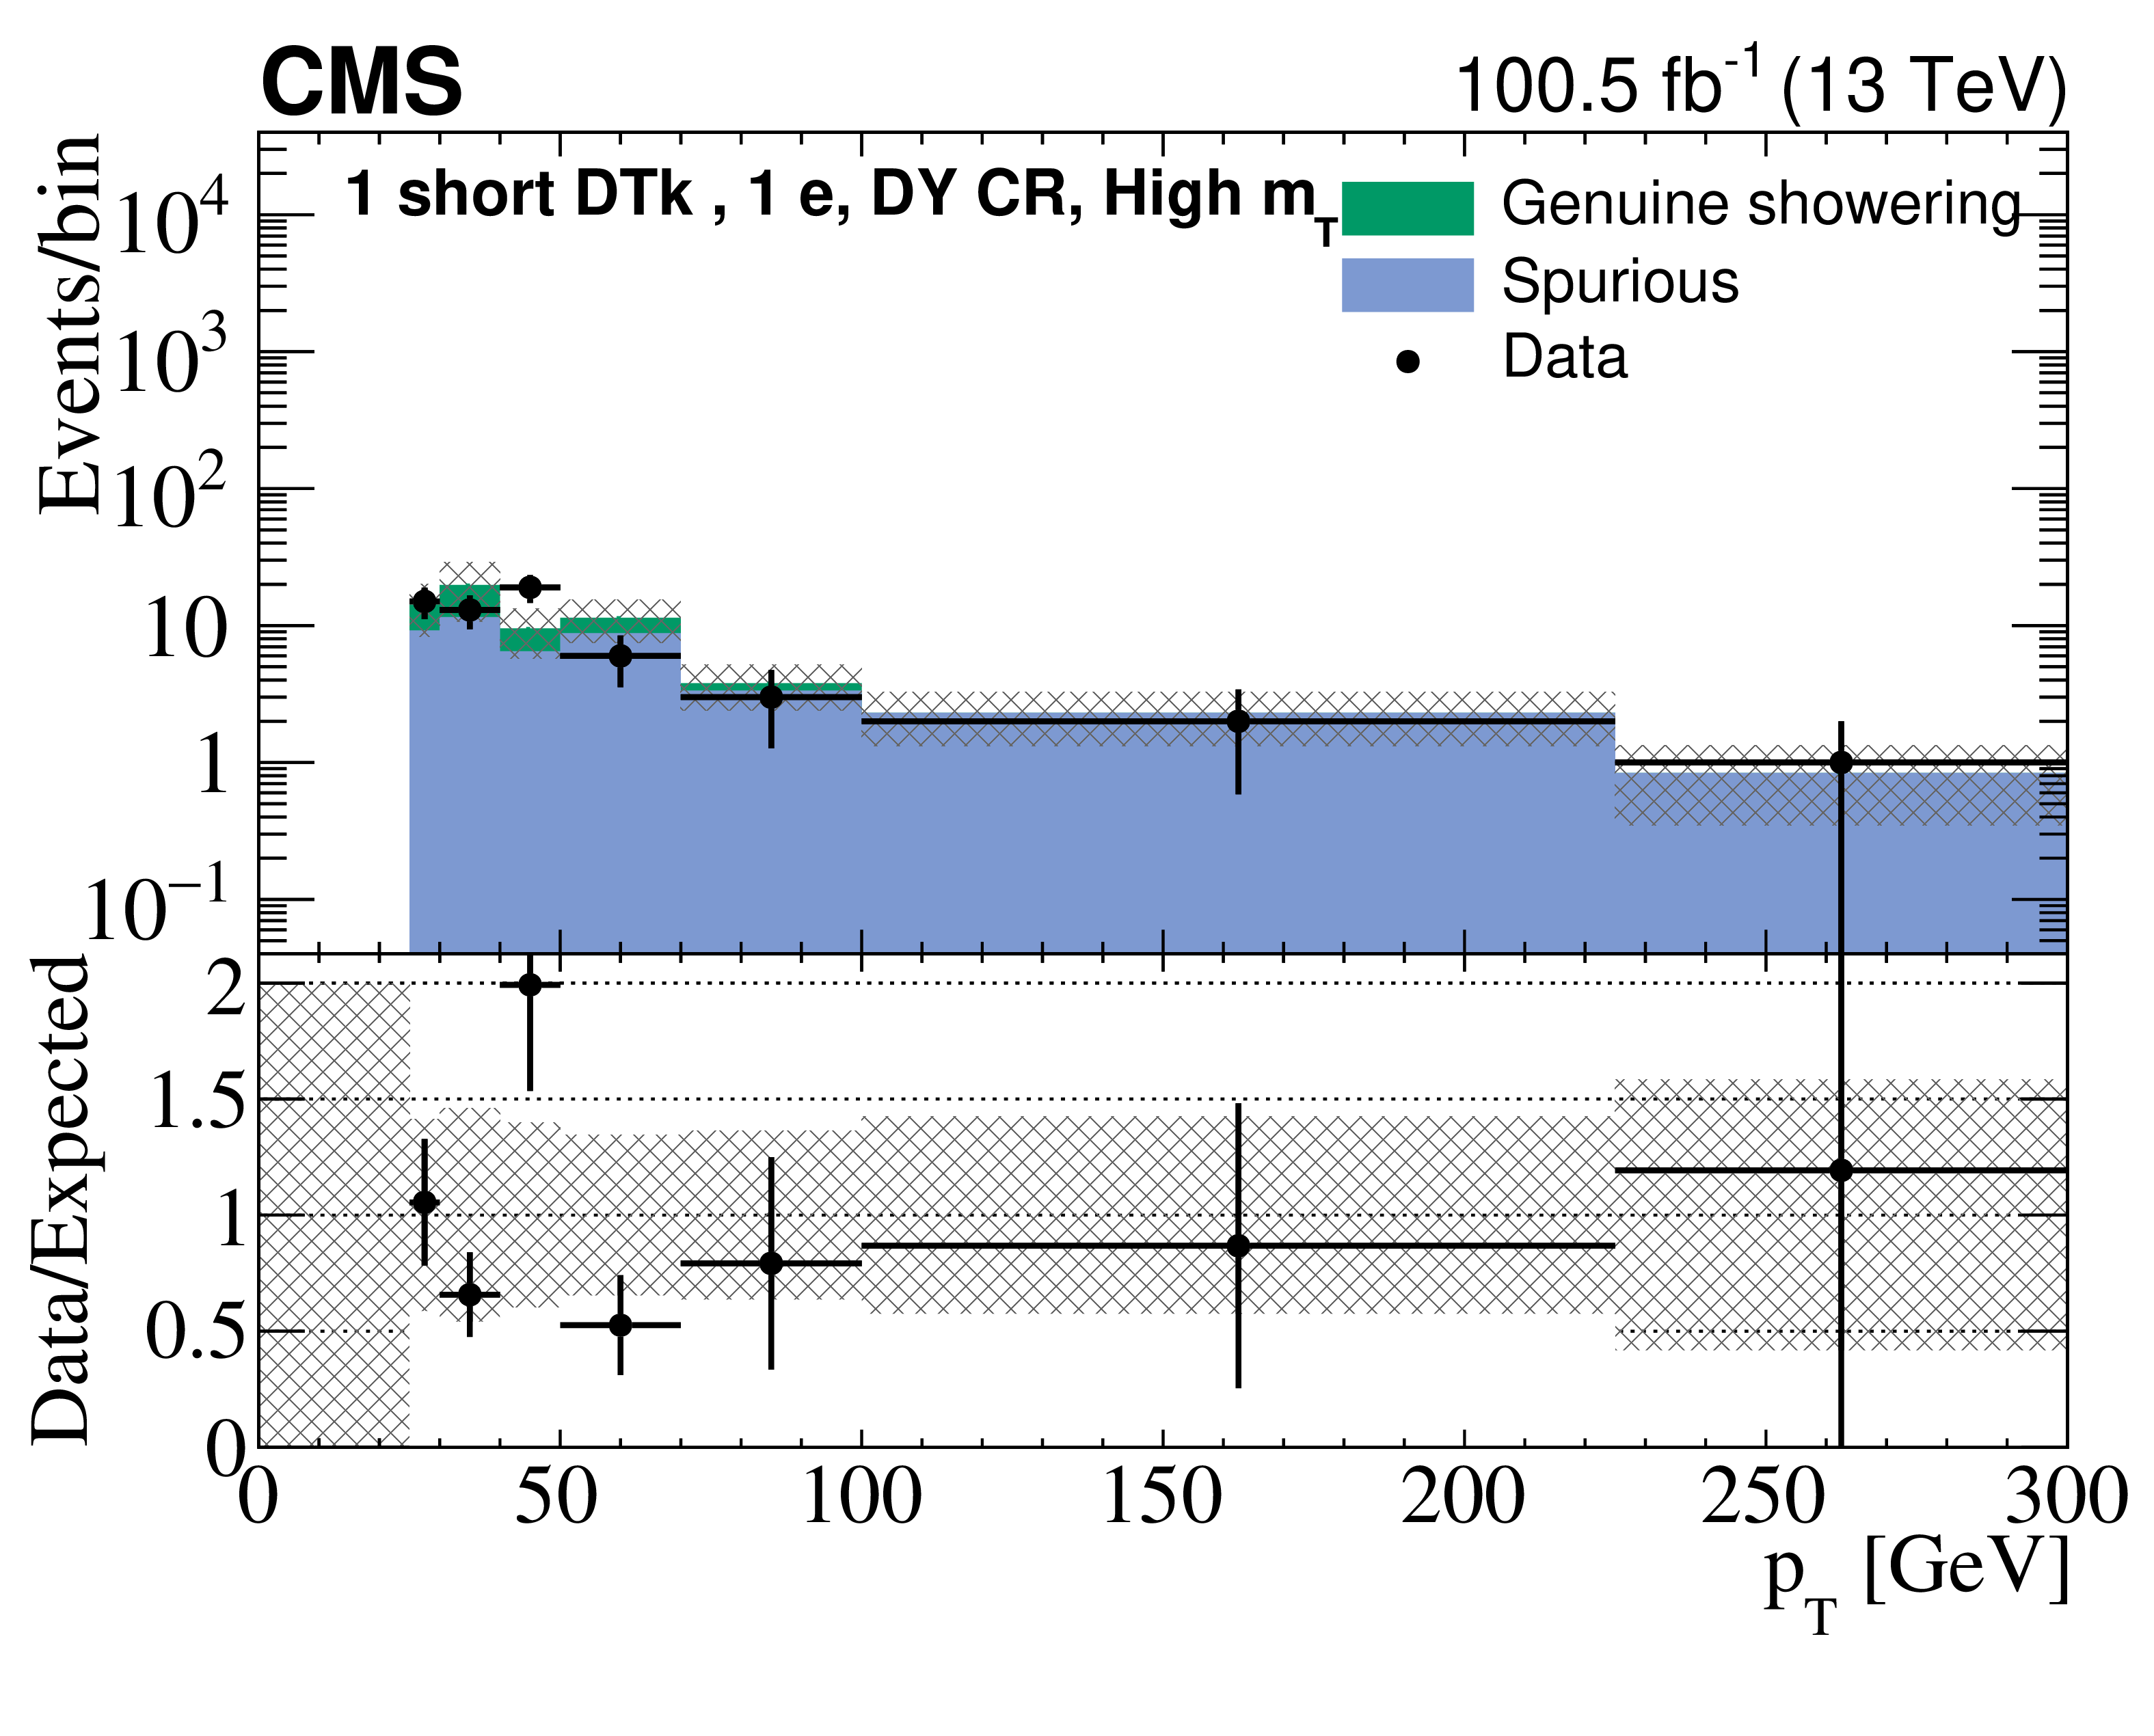
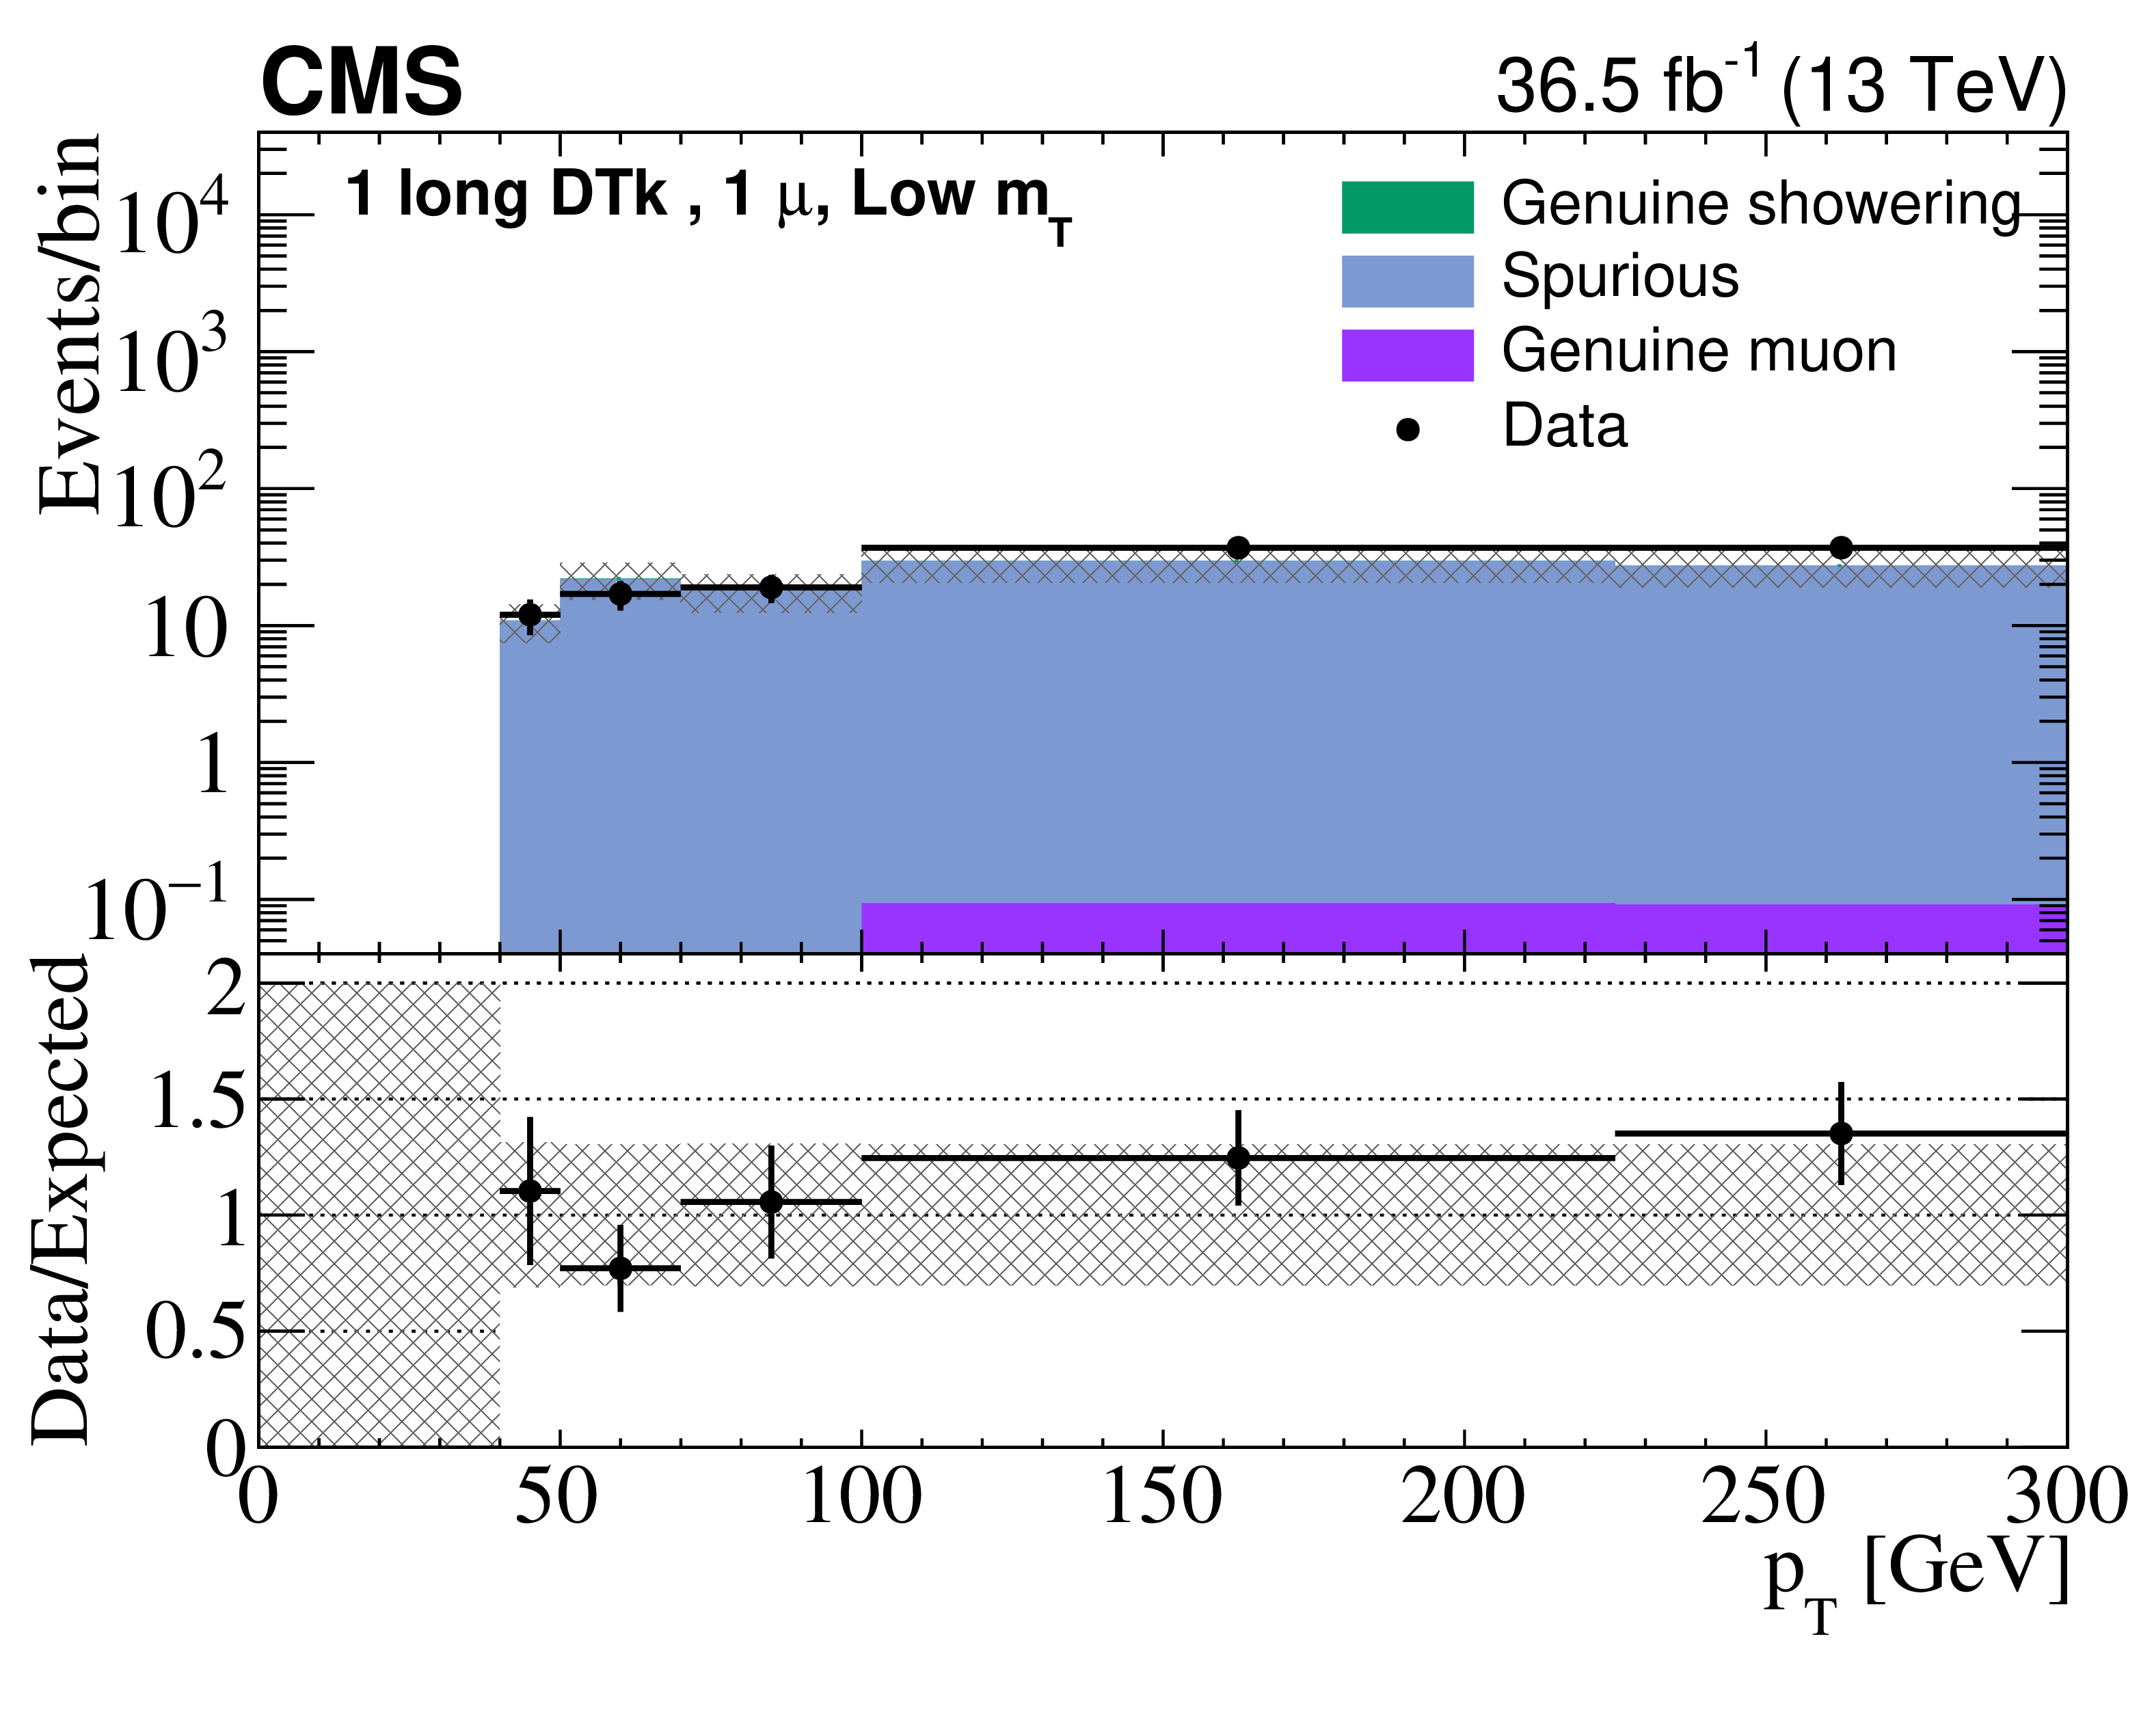
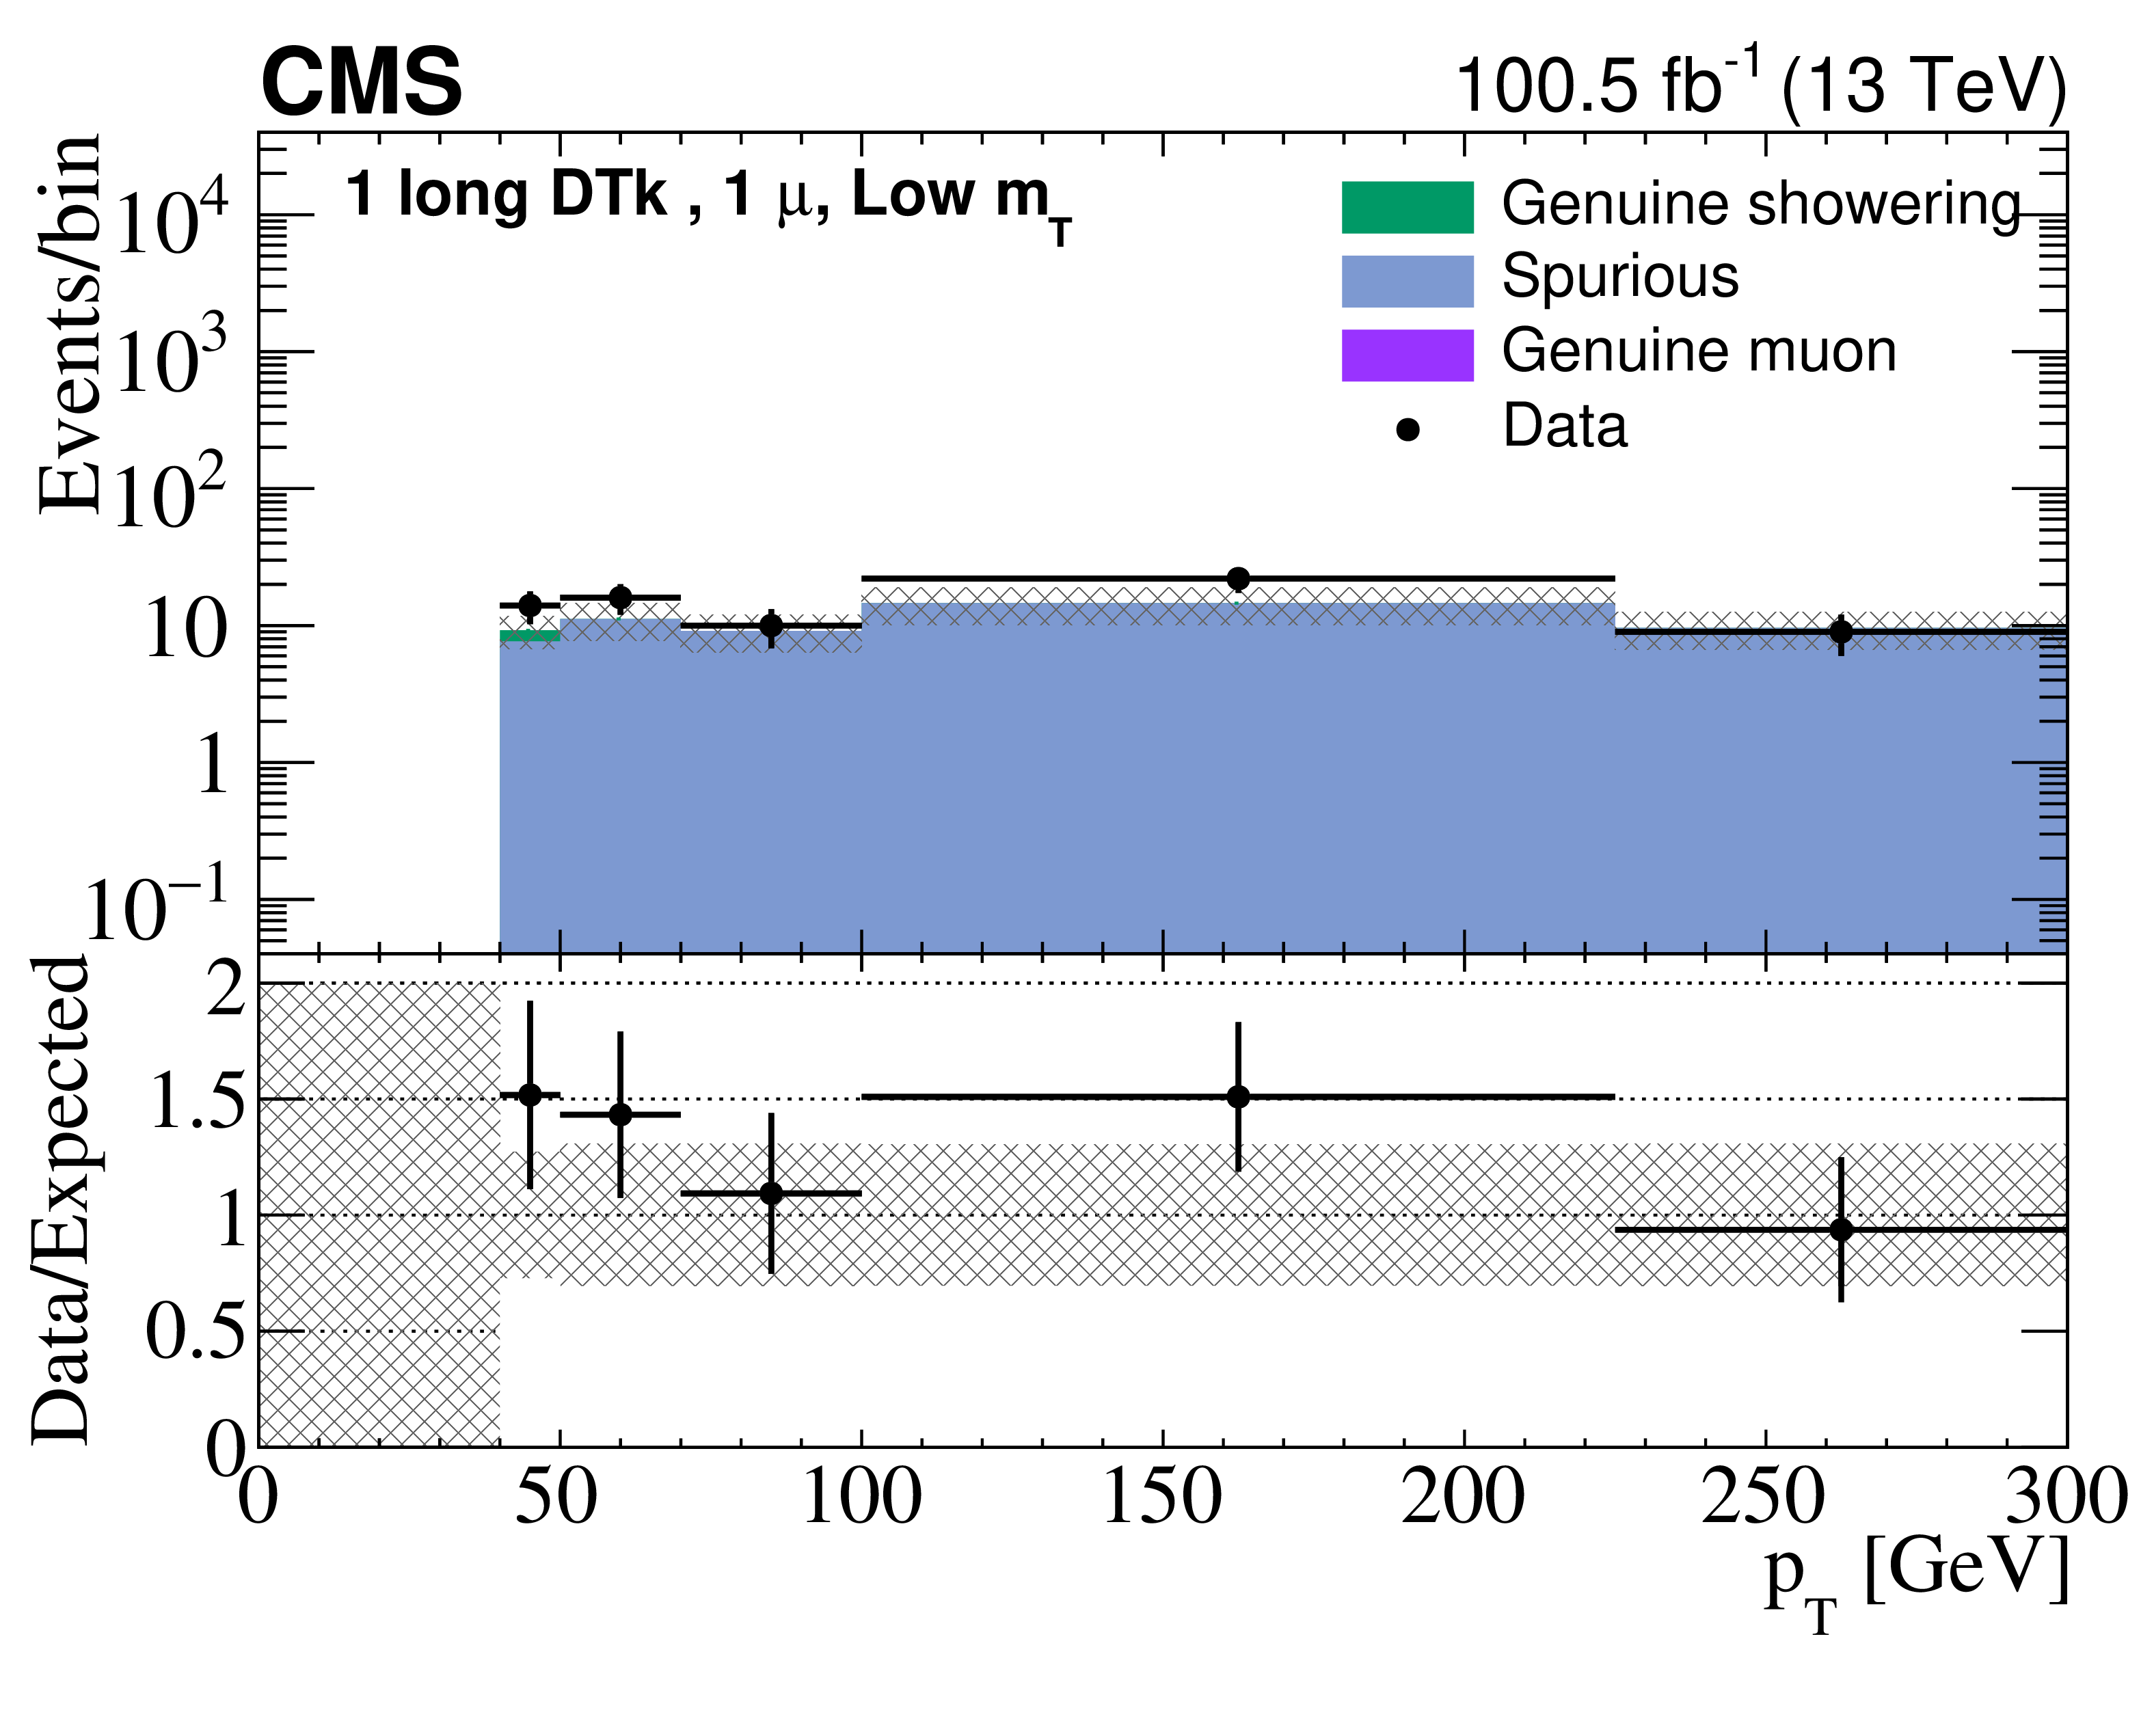
Figure 3:
Comparison of the $ p_{\mathrm{T}} $ distributions of DTks in the $ \kappa^{\text{low}}_{\text{high}} $ DY measurement control region for the data and background prediction for long (upper) and short (middle) showering tracks, and in the $ \kappa^{\mu\,\text{veto}}_{\mu\,\text{match}} $ DY measurement control region for long muon tracks (lower). The left (right) column corresponds to the Phase-0 (Phase-1) detector. The uncertainty bars on the ratios in the lower panels indicate the fractional Poisson uncertainties in the observed counts. The gray bands show the fractional Poisson uncertainties in the sideband region counts, added in quadrature with the systematic uncertainties. The leftmost (rightmost) bin includes underflow (overflow). |

png pdf |
Figure 3-a:
Comparison of the $ p_{\mathrm{T}} $ distributions of DTks in the $ \kappa^{\text{low}}_{\text{high}} $ DY measurement control region for the data and background prediction for long showering tracks, corresponding to the Phase-0 detector. The uncertainty bars on the ratios in the lower panel indicate the fractional Poisson uncertainties in the observed counts. The gray bands show the fractional Poisson uncertainties in the sideband region counts, added in quadrature with the systematic uncertainties. The leftmost (rightmost) bin includes underflow (overflow). |
png pdf |
Figure 3-b:
Comparison of the $ p_{\mathrm{T}} $ distributions of DTks in the $ \kappa^{\text{low}}_{\text{high}} $ DY measurement control region for the data and background prediction for long showering tracks, corresponding to the Phase-1 detector. The uncertainty bars on the ratios in the lower panel indicate the fractional Poisson uncertainties in the observed counts. The gray bands show the fractional Poisson uncertainties in the sideband region counts, added in quadrature with the systematic uncertainties. The leftmost (rightmost) bin includes underflow (overflow). |
png pdf |
Figure 3-c:
Comparison of the $ p_{\mathrm{T}} $ distributions of DTks in the $ \kappa^{\text{low}}_{\text{high}} $ DY measurement control region for the data and background prediction for short showering tracks, corresponding to the Phase-0 detector. The uncertainty bars on the ratios in the lower panel indicate the fractional Poisson uncertainties in the observed counts. The gray bands show the fractional Poisson uncertainties in the sideband region counts, added in quadrature with the systematic uncertainties. The leftmost (rightmost) bin includes underflow (overflow). |
png pdf |
Figure 3-d:
Comparison of the $ p_{\mathrm{T}} $ distributions of DTks in the $ \kappa^{\text{low}}_{\text{high}} $ DY measurement control region for the data and background prediction for short showering tracks, corresponding to the Phase-1 detector. The uncertainty bars on the ratios in the lower panel indicate the fractional Poisson uncertainties in the observed counts. The gray bands show the fractional Poisson uncertainties in the sideband region counts, added in quadrature with the systematic uncertainties. The leftmost (rightmost) bin includes underflow (overflow). |
png pdf |
Figure 3-e:
Comparison of the $ p_{\mathrm{T}} $ distributions of DTks in the $ \kappa^{\text{low}}_{\text{high}} $ DY measurement control region for the data and background prediction in the $ \kappa^{\mu\,\text{veto}}_{\mu\,\text{match}} $ DY measurement control region for long muon tracks, corresponding to the Phase-0 detector. The uncertainty bars on the ratios in the lower panel indicate the fractional Poisson uncertainties in the observed counts. The gray bands show the fractional Poisson uncertainties in the sideband region counts, added in quadrature with the systematic uncertainties. The leftmost (rightmost) bin includes underflow (overflow). |

png pdf |
Figure 3-f:
Comparison of the $ p_{\mathrm{T}} $ distributions of DTks in the $ \kappa^{\text{low}}_{\text{high}} $ DY measurement control region for the data and background prediction in the $ \kappa^{\mu\,\text{veto}}_{\mu\,\text{match}} $ DY measurement control region for long muon tracks, corresponding to the Phase-1 detector. The uncertainty bars on the ratios in the lower panel indicate the fractional Poisson uncertainties in the observed counts. The gray bands show the fractional Poisson uncertainties in the sideband region counts, added in quadrature with the systematic uncertainties. The leftmost (rightmost) bin includes underflow (overflow). |
png pdf |
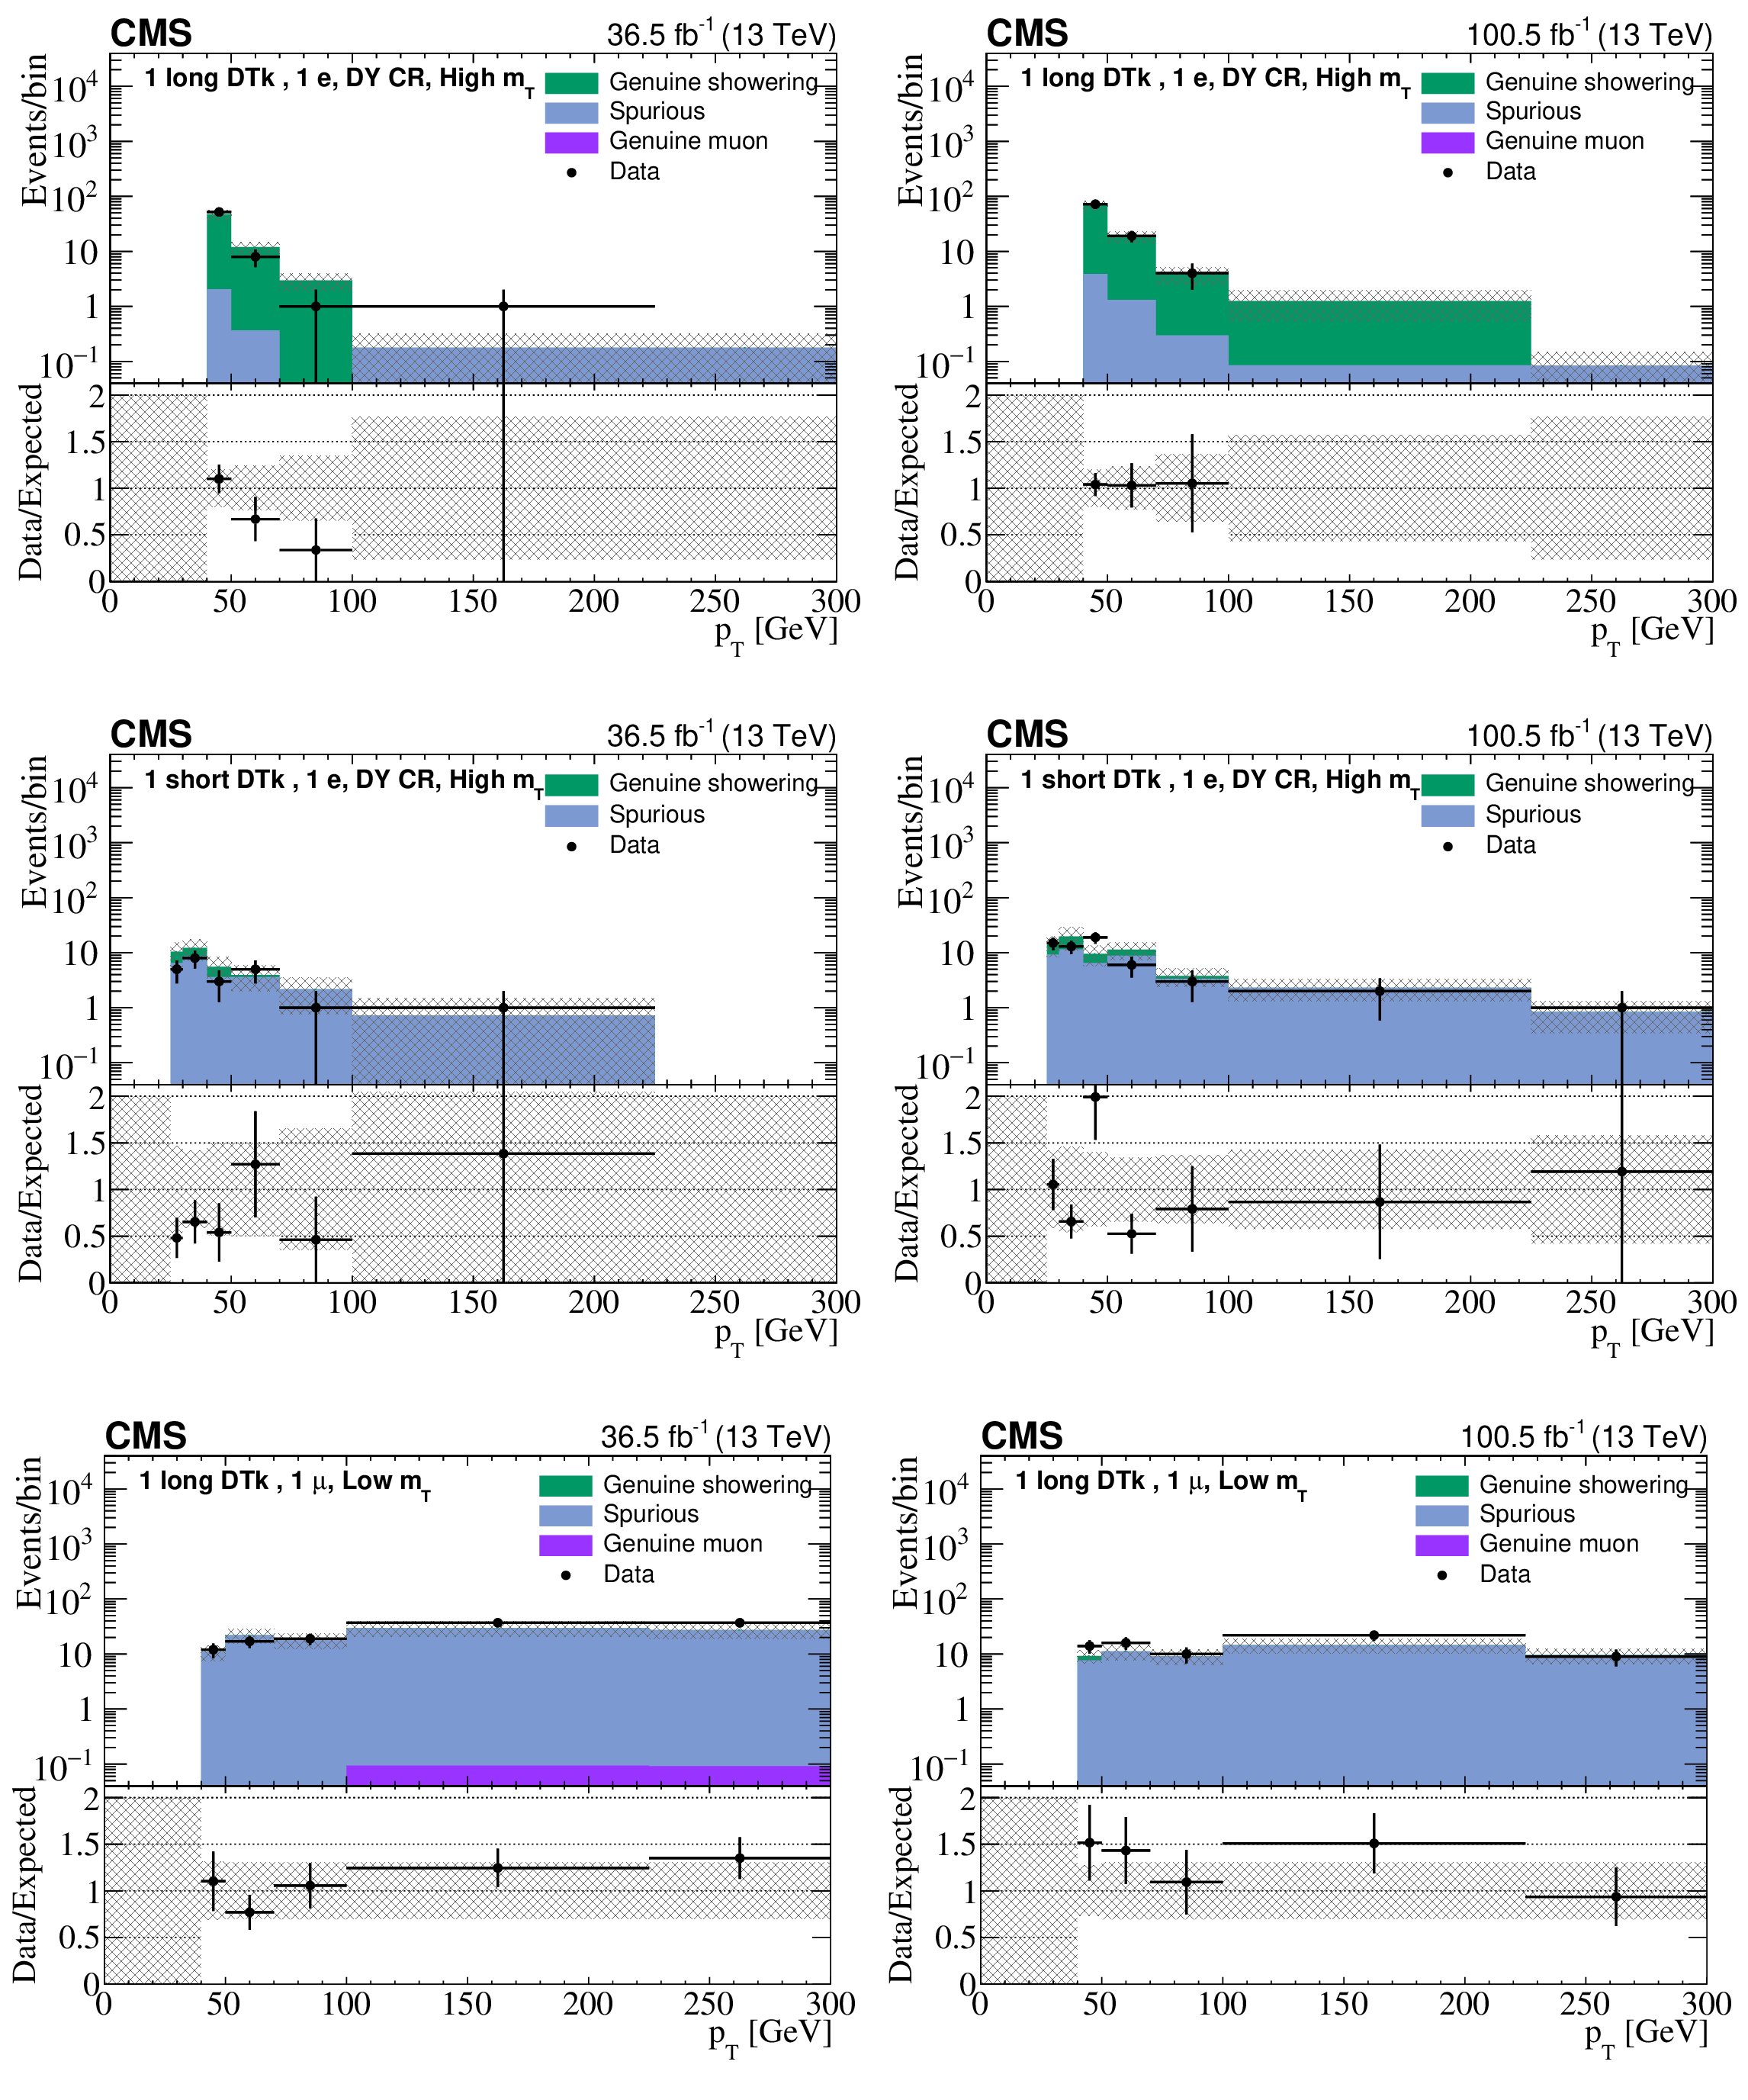
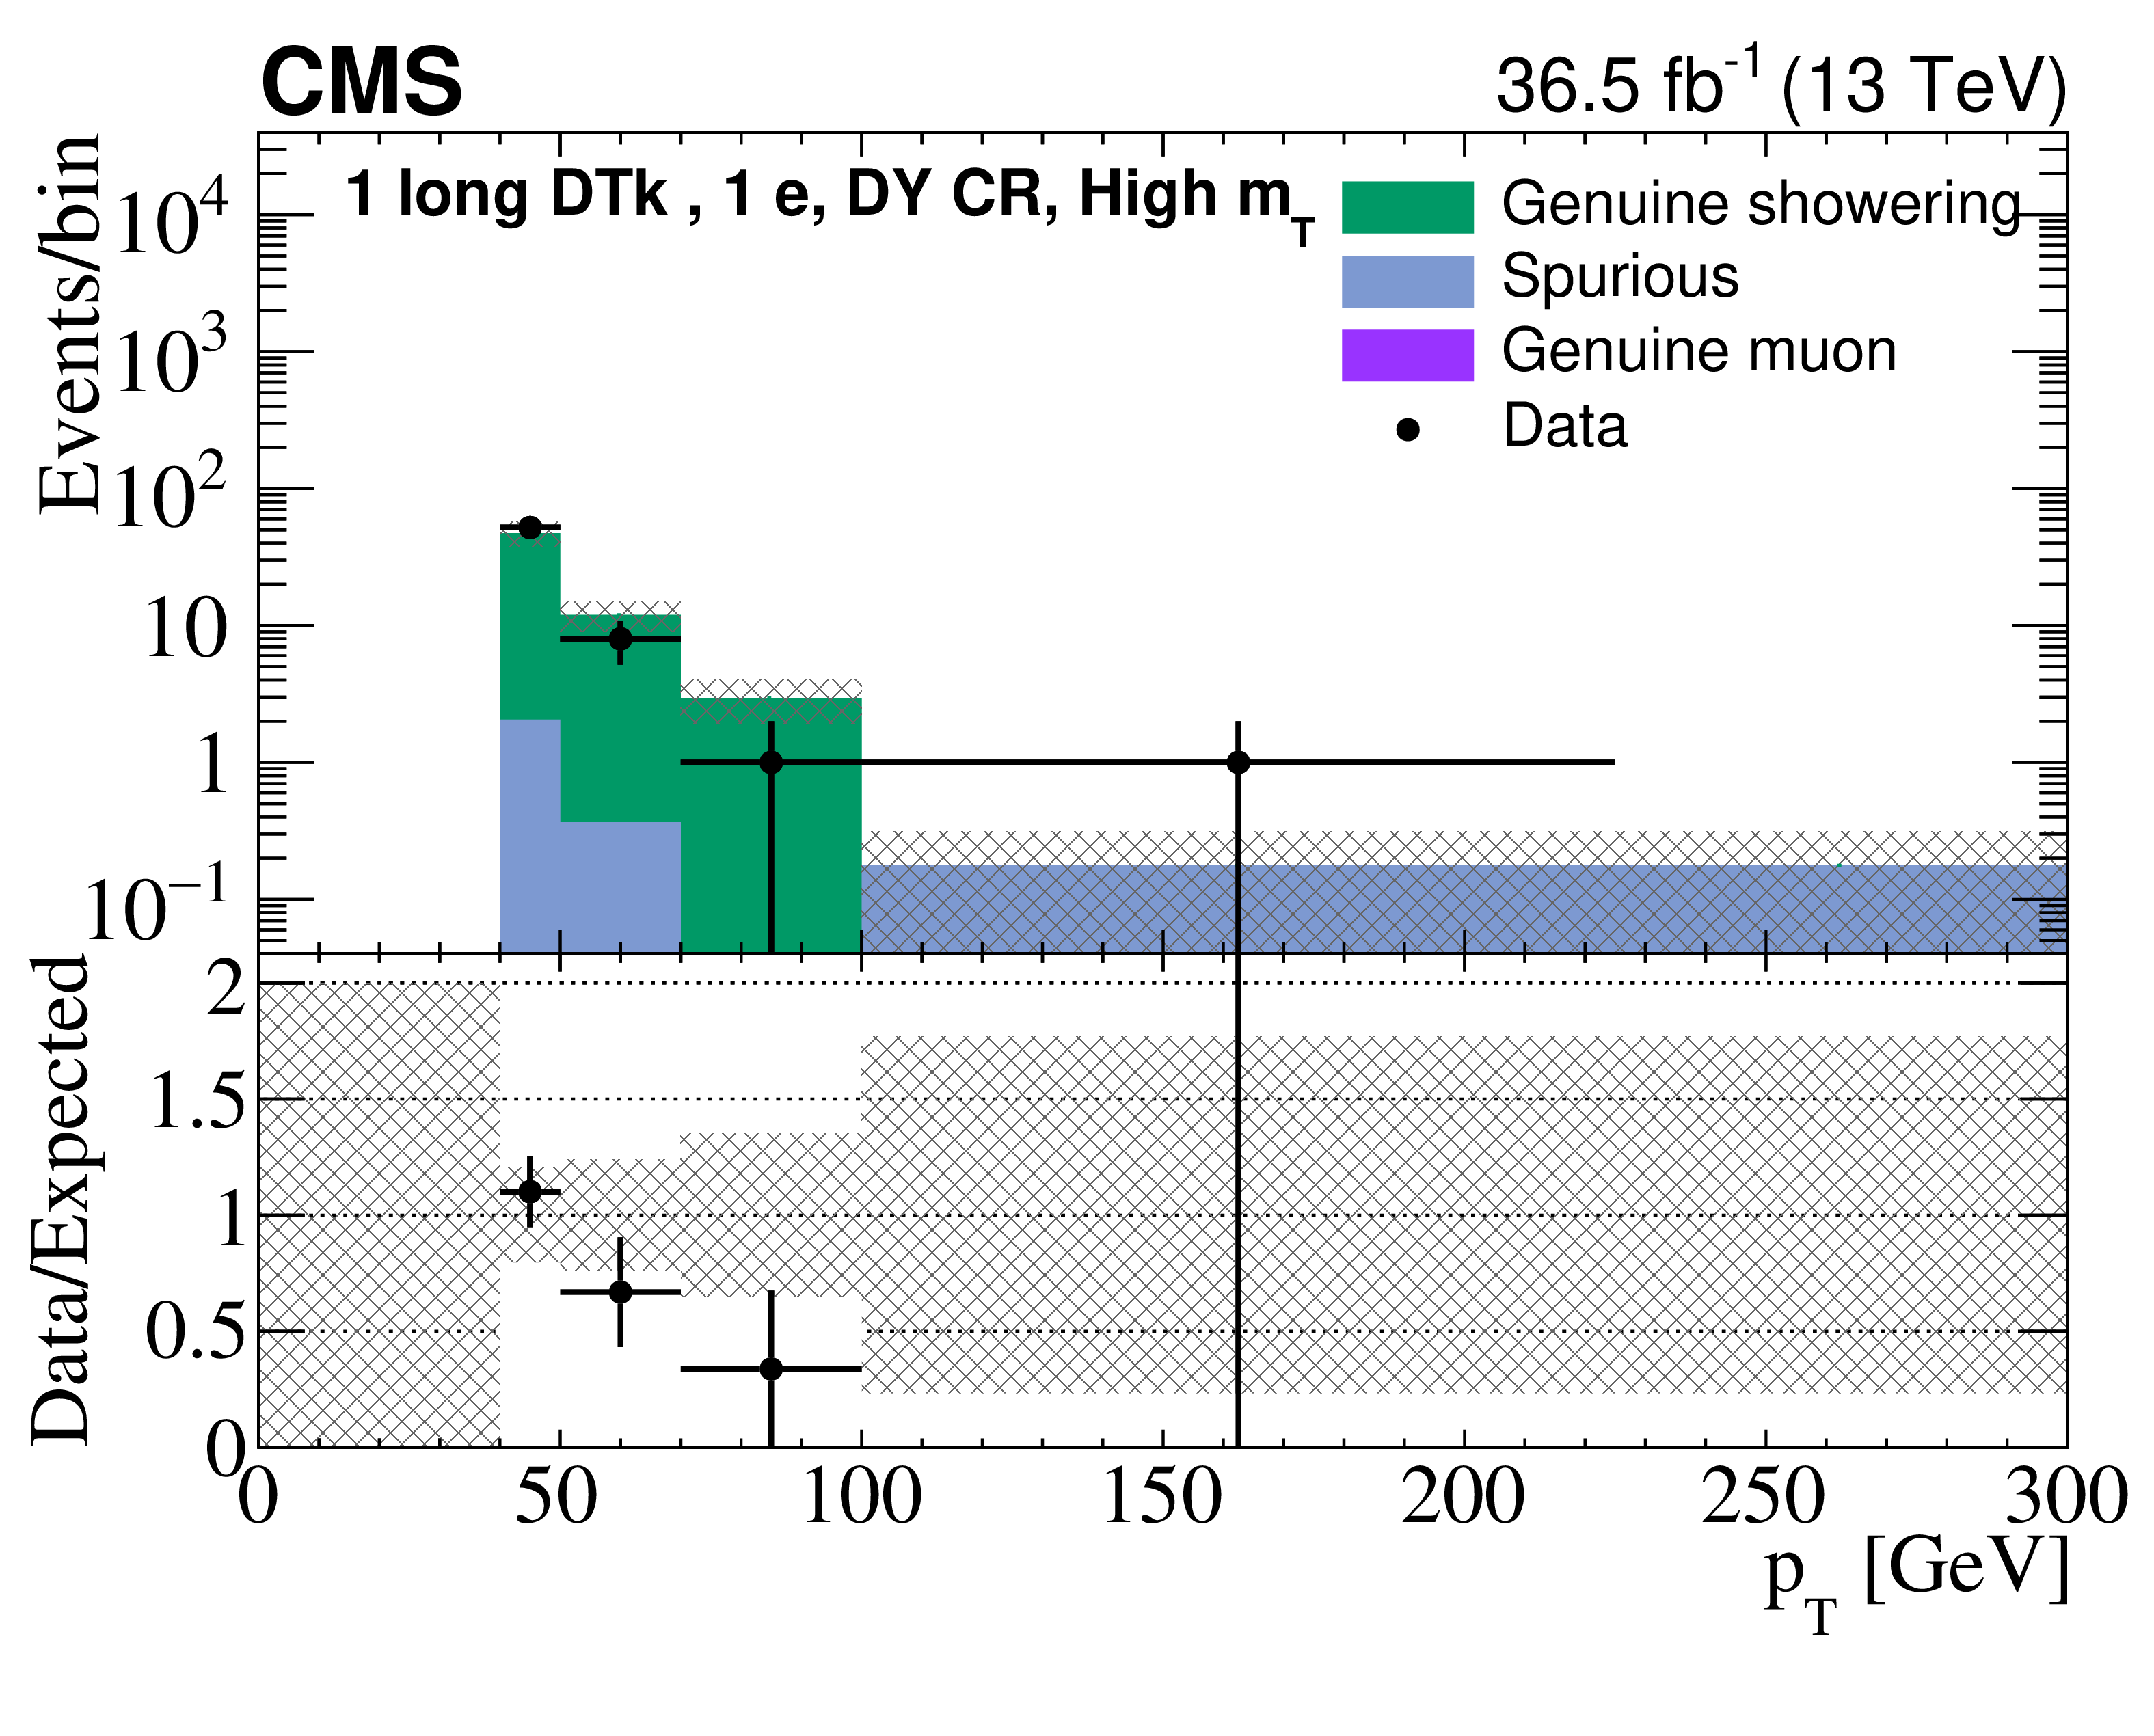
Figure 4:
Comparison of the $ p_{\mathrm{T}} $ distributions of DTks in the high-$ m_{\mathrm{T}} $ validation region for the data and background prediction for long (upper) and short (middle) showering tracks, and for long muon tracks (lower). The left (right) column corresponds to the Phase-0 (Phase-1) detector. The uncertainty bars on the ratios in the lower panels indicate the fractional Poisson uncertainties in the observed counts. The gray bands show the fractional Poisson uncertainties in the sideband region counts, added in quadrature with the systematic uncertainties. The leftmost (rightmost) bin includes underflow (overflow). |
png pdf |
Figure 4-a:
Comparison of the $ p_{\mathrm{T}} $ distributions of DTks in the high-$ m_{\mathrm{T}} $ validation region for the data and background prediction for long showering tracks, corresponding to the Phase-0 detector. The uncertainty bars on the ratio in the lower panel indicate the fractional Poisson uncertainties in the observed counts. The gray bands show the fractional Poisson uncertainties in the sideband region counts, added in quadrature with the systematic uncertainties. The leftmost (rightmost) bin includes underflow (overflow). |

png pdf |
Figure 4-b:
Comparison of the $ p_{\mathrm{T}} $ distributions of DTks in the high-$ m_{\mathrm{T}} $ validation region for the data and background prediction for long showering tracks, corresponding to the Phase-1 detector. The uncertainty bars on the ratio in the lower panel indicate the fractional Poisson uncertainties in the observed counts. The gray bands show the fractional Poisson uncertainties in the sideband region counts, added in quadrature with the systematic uncertainties. The leftmost (rightmost) bin includes underflow (overflow). |
png pdf |
Figure 4-c:
Comparison of the $ p_{\mathrm{T}} $ distributions of DTks in the high-$ m_{\mathrm{T}} $ validation region for the data and background prediction for short showering tracks, corresponding to the Phase-0 detector. The uncertainty bars on the ratio in the lower panel indicate the fractional Poisson uncertainties in the observed counts. The gray bands show the fractional Poisson uncertainties in the sideband region counts, added in quadrature with the systematic uncertainties. The leftmost (rightmost) bin includes underflow (overflow). |
png pdf |
Figure 4-d:
Comparison of the $ p_{\mathrm{T}} $ distributions of DTks in the high-$ m_{\mathrm{T}} $ validation region for the data and background prediction for short showering tracks, corresponding to the Phase-1 detector. The uncertainty bars on the ratio in the lower panel indicate the fractional Poisson uncertainties in the observed counts. The gray bands show the fractional Poisson uncertainties in the sideband region counts, added in quadrature with the systematic uncertainties. The leftmost (rightmost) bin includes underflow (overflow). |
png pdf |
Figure 4-e:
Comparison of the $ p_{\mathrm{T}} $ distributions of DTks in the high-$ m_{\mathrm{T}} $ validation region for the data and background prediction for long muon tracks, corresponding to the Phase-0 detector. The uncertainty bars on the ratio in the lower panel indicate the fractional Poisson uncertainties in the observed counts. The gray bands show the fractional Poisson uncertainties in the sideband region counts, added in quadrature with the systematic uncertainties. The leftmost (rightmost) bin includes underflow (overflow). |
png pdf |
Figure 4-f:
Comparison of the $ p_{\mathrm{T}} $ distributions of DTks in the high-$ m_{\mathrm{T}} $ validation region for the data and background prediction for long muon tracks, corresponding to the Phase-1 detector. The uncertainty bars on the ratio in the lower panel indicate the fractional Poisson uncertainties in the observed counts. The gray bands show the fractional Poisson uncertainties in the sideband region counts, added in quadrature with the systematic uncertainties. The leftmost (rightmost) bin includes underflow (overflow). |
png pdf |
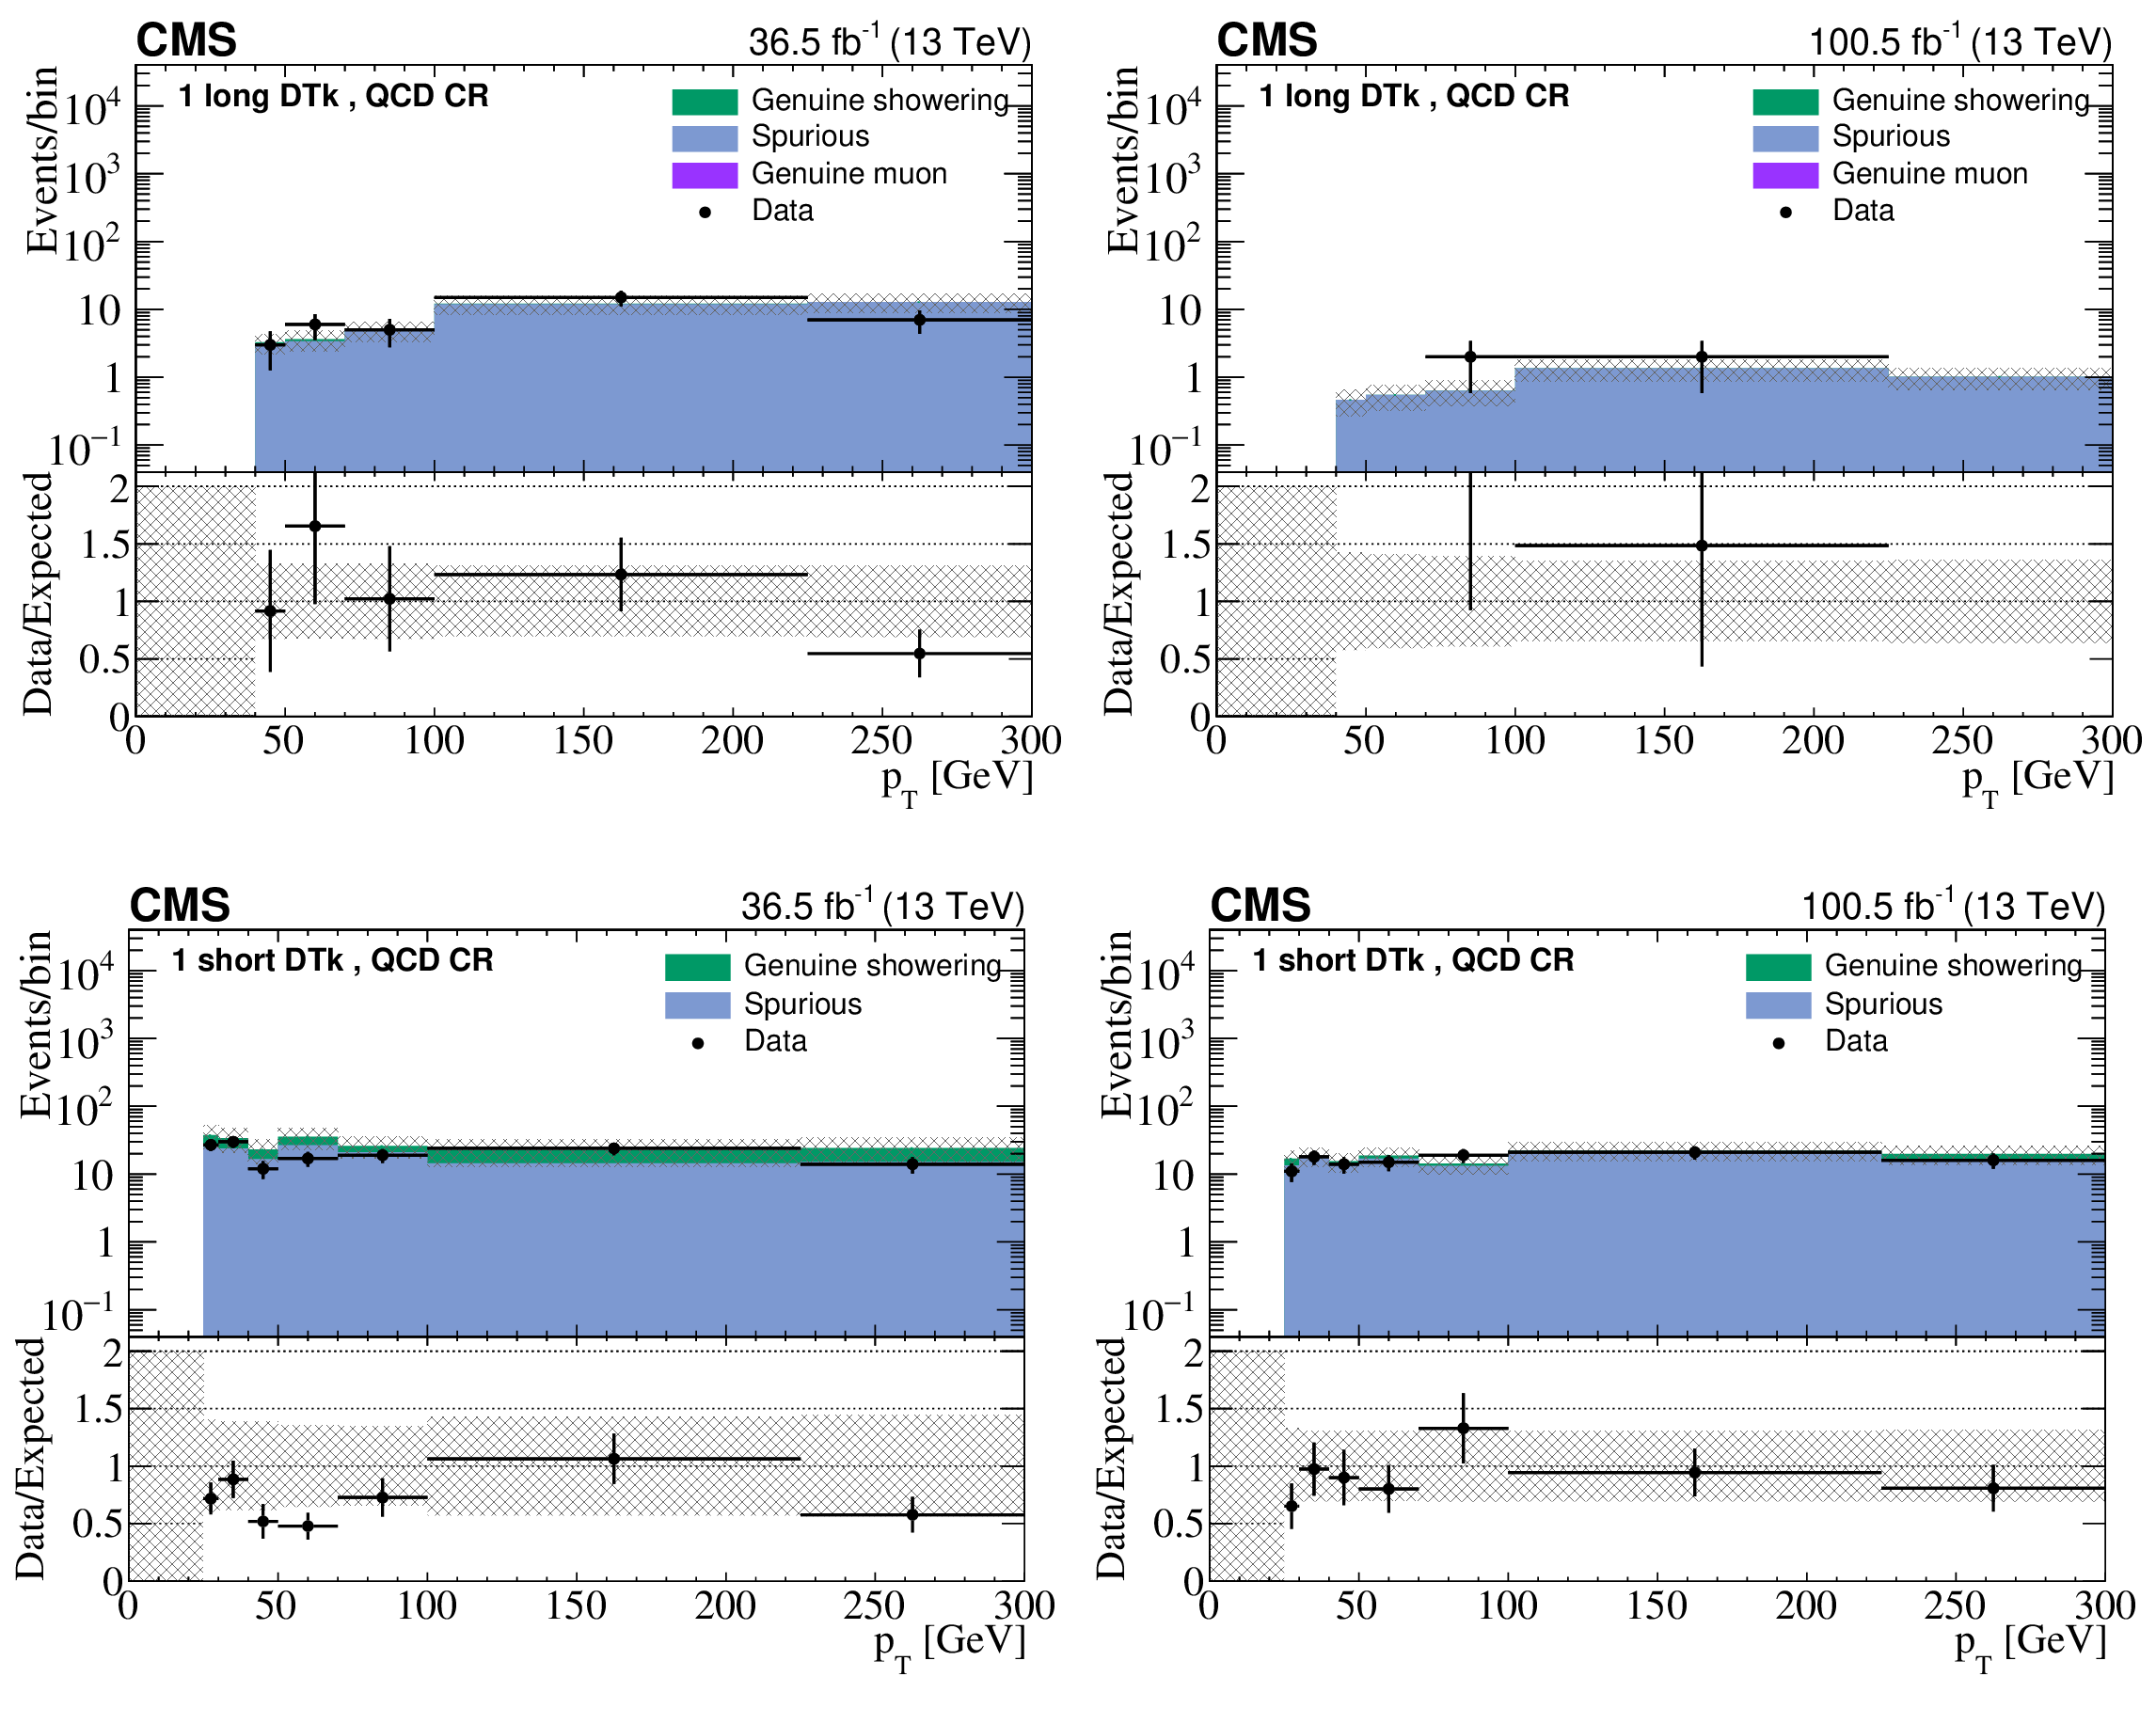
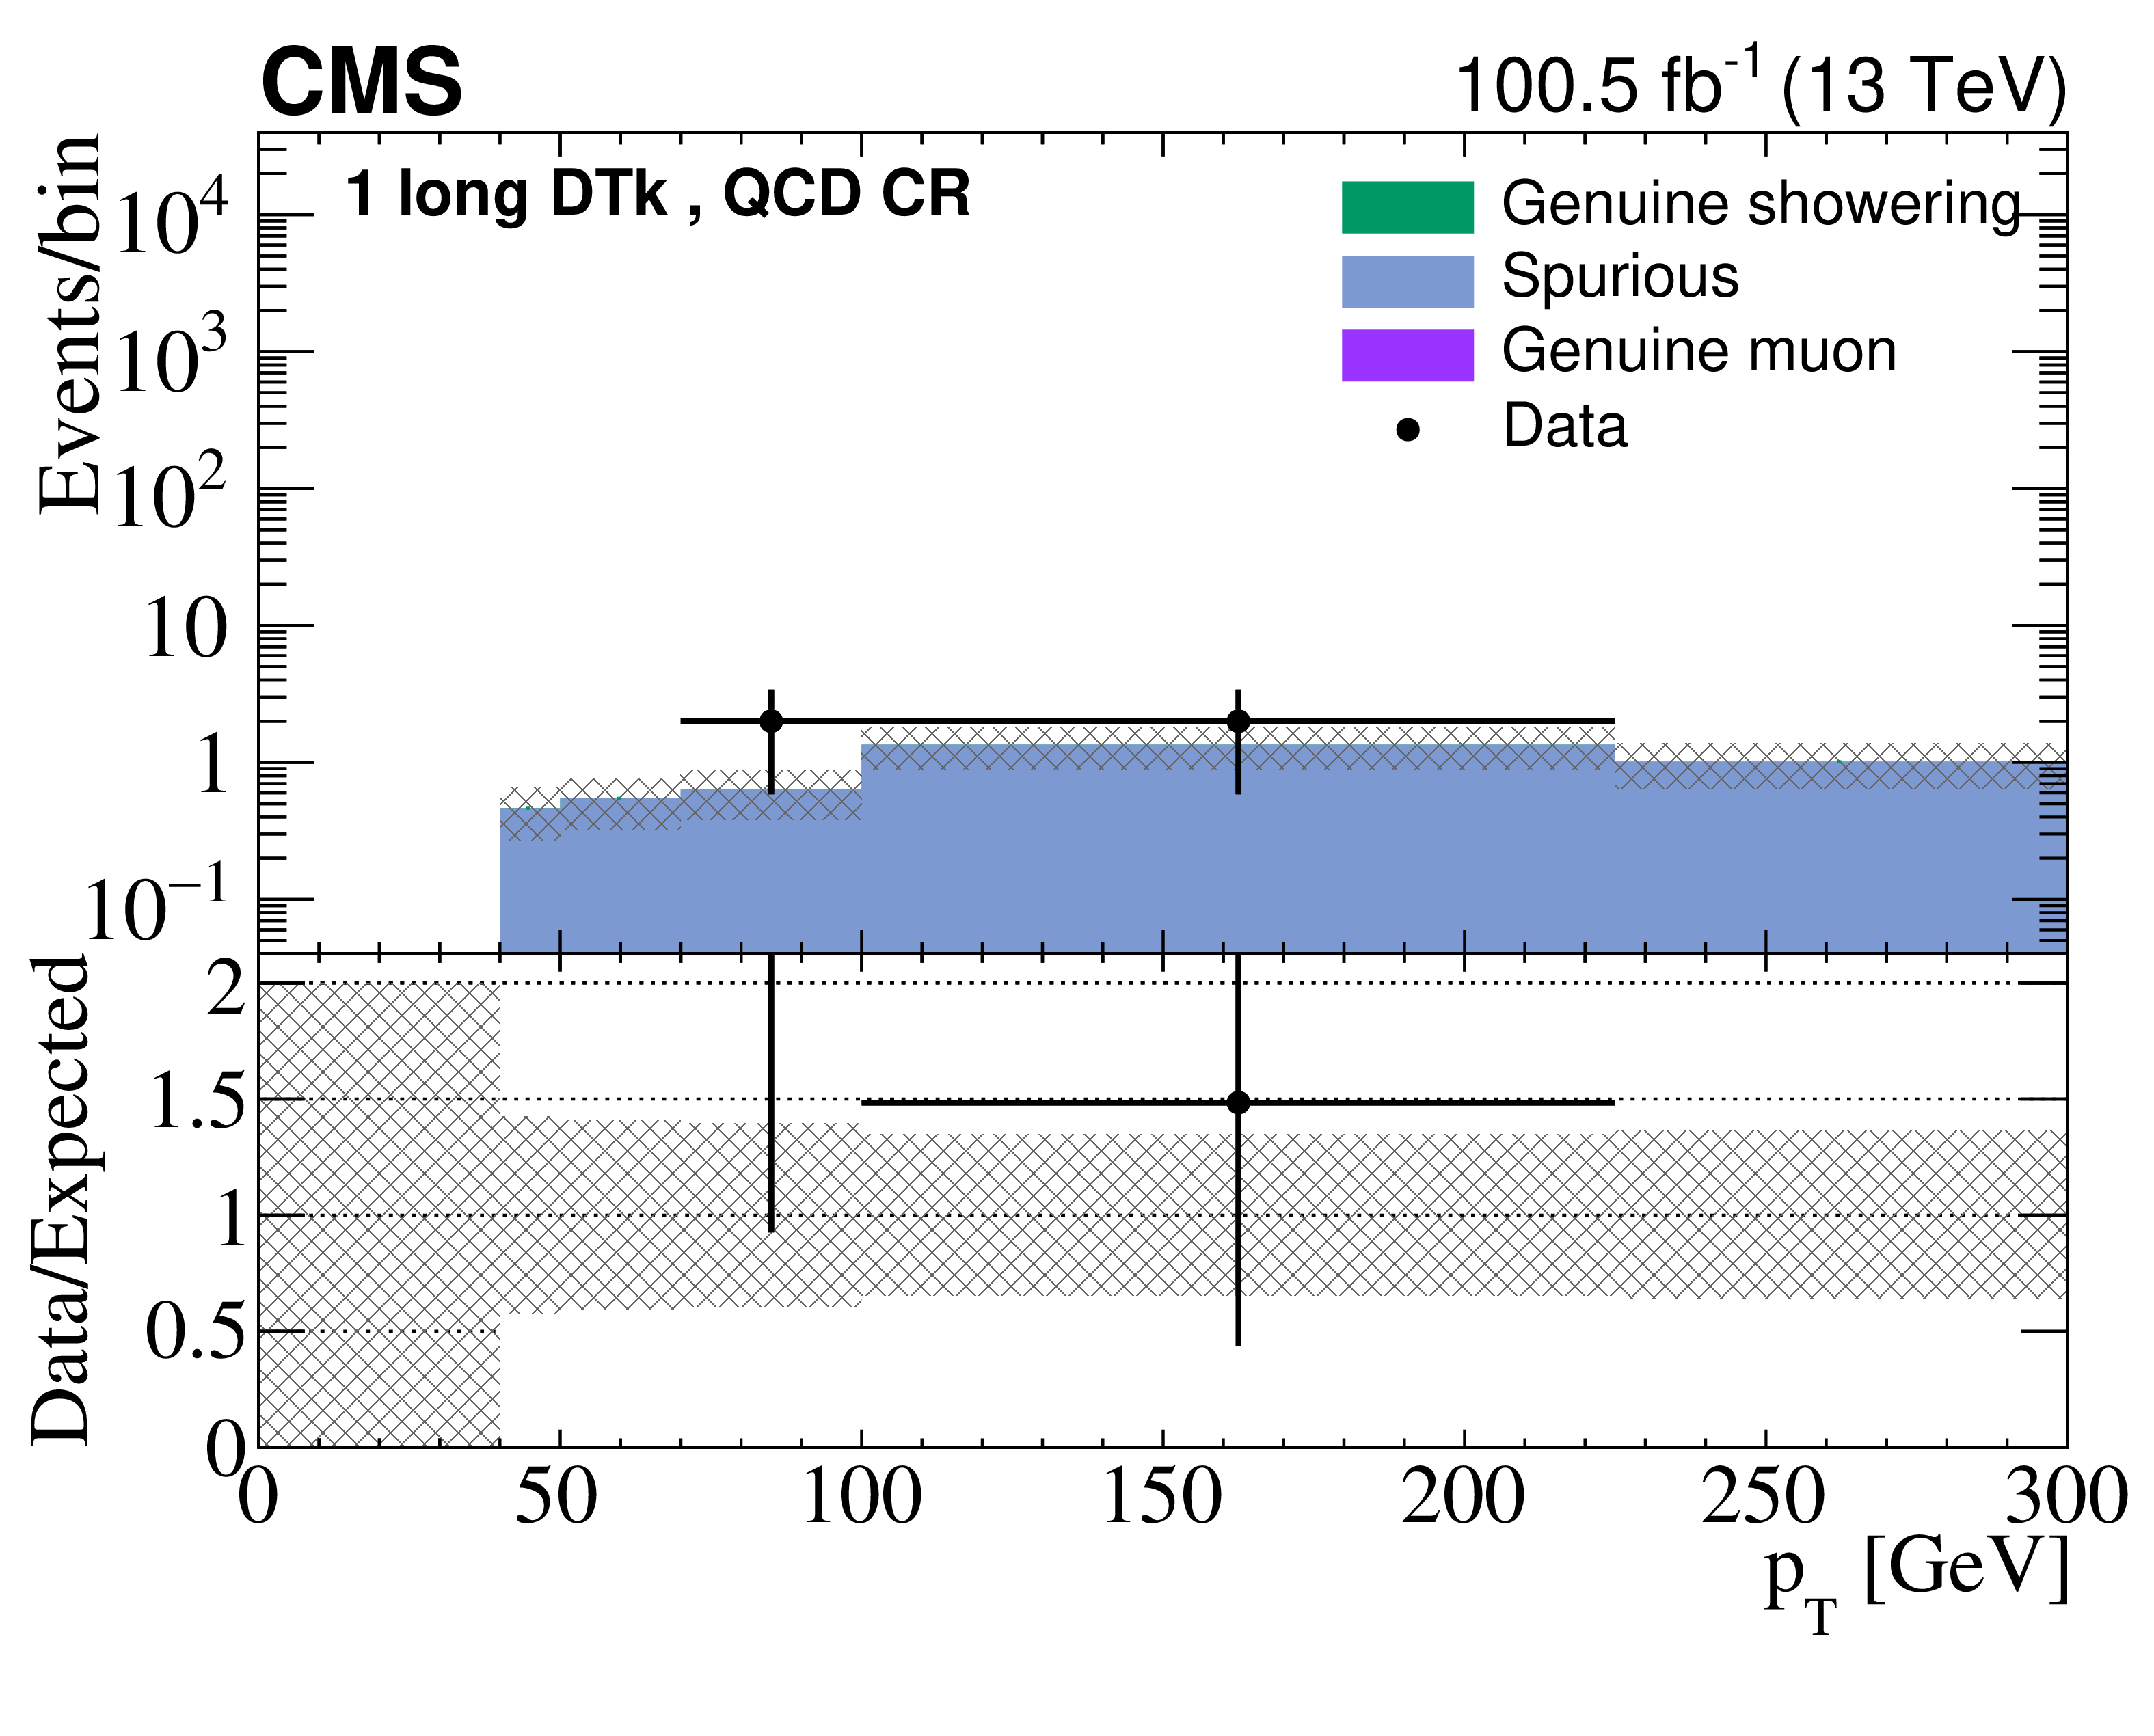
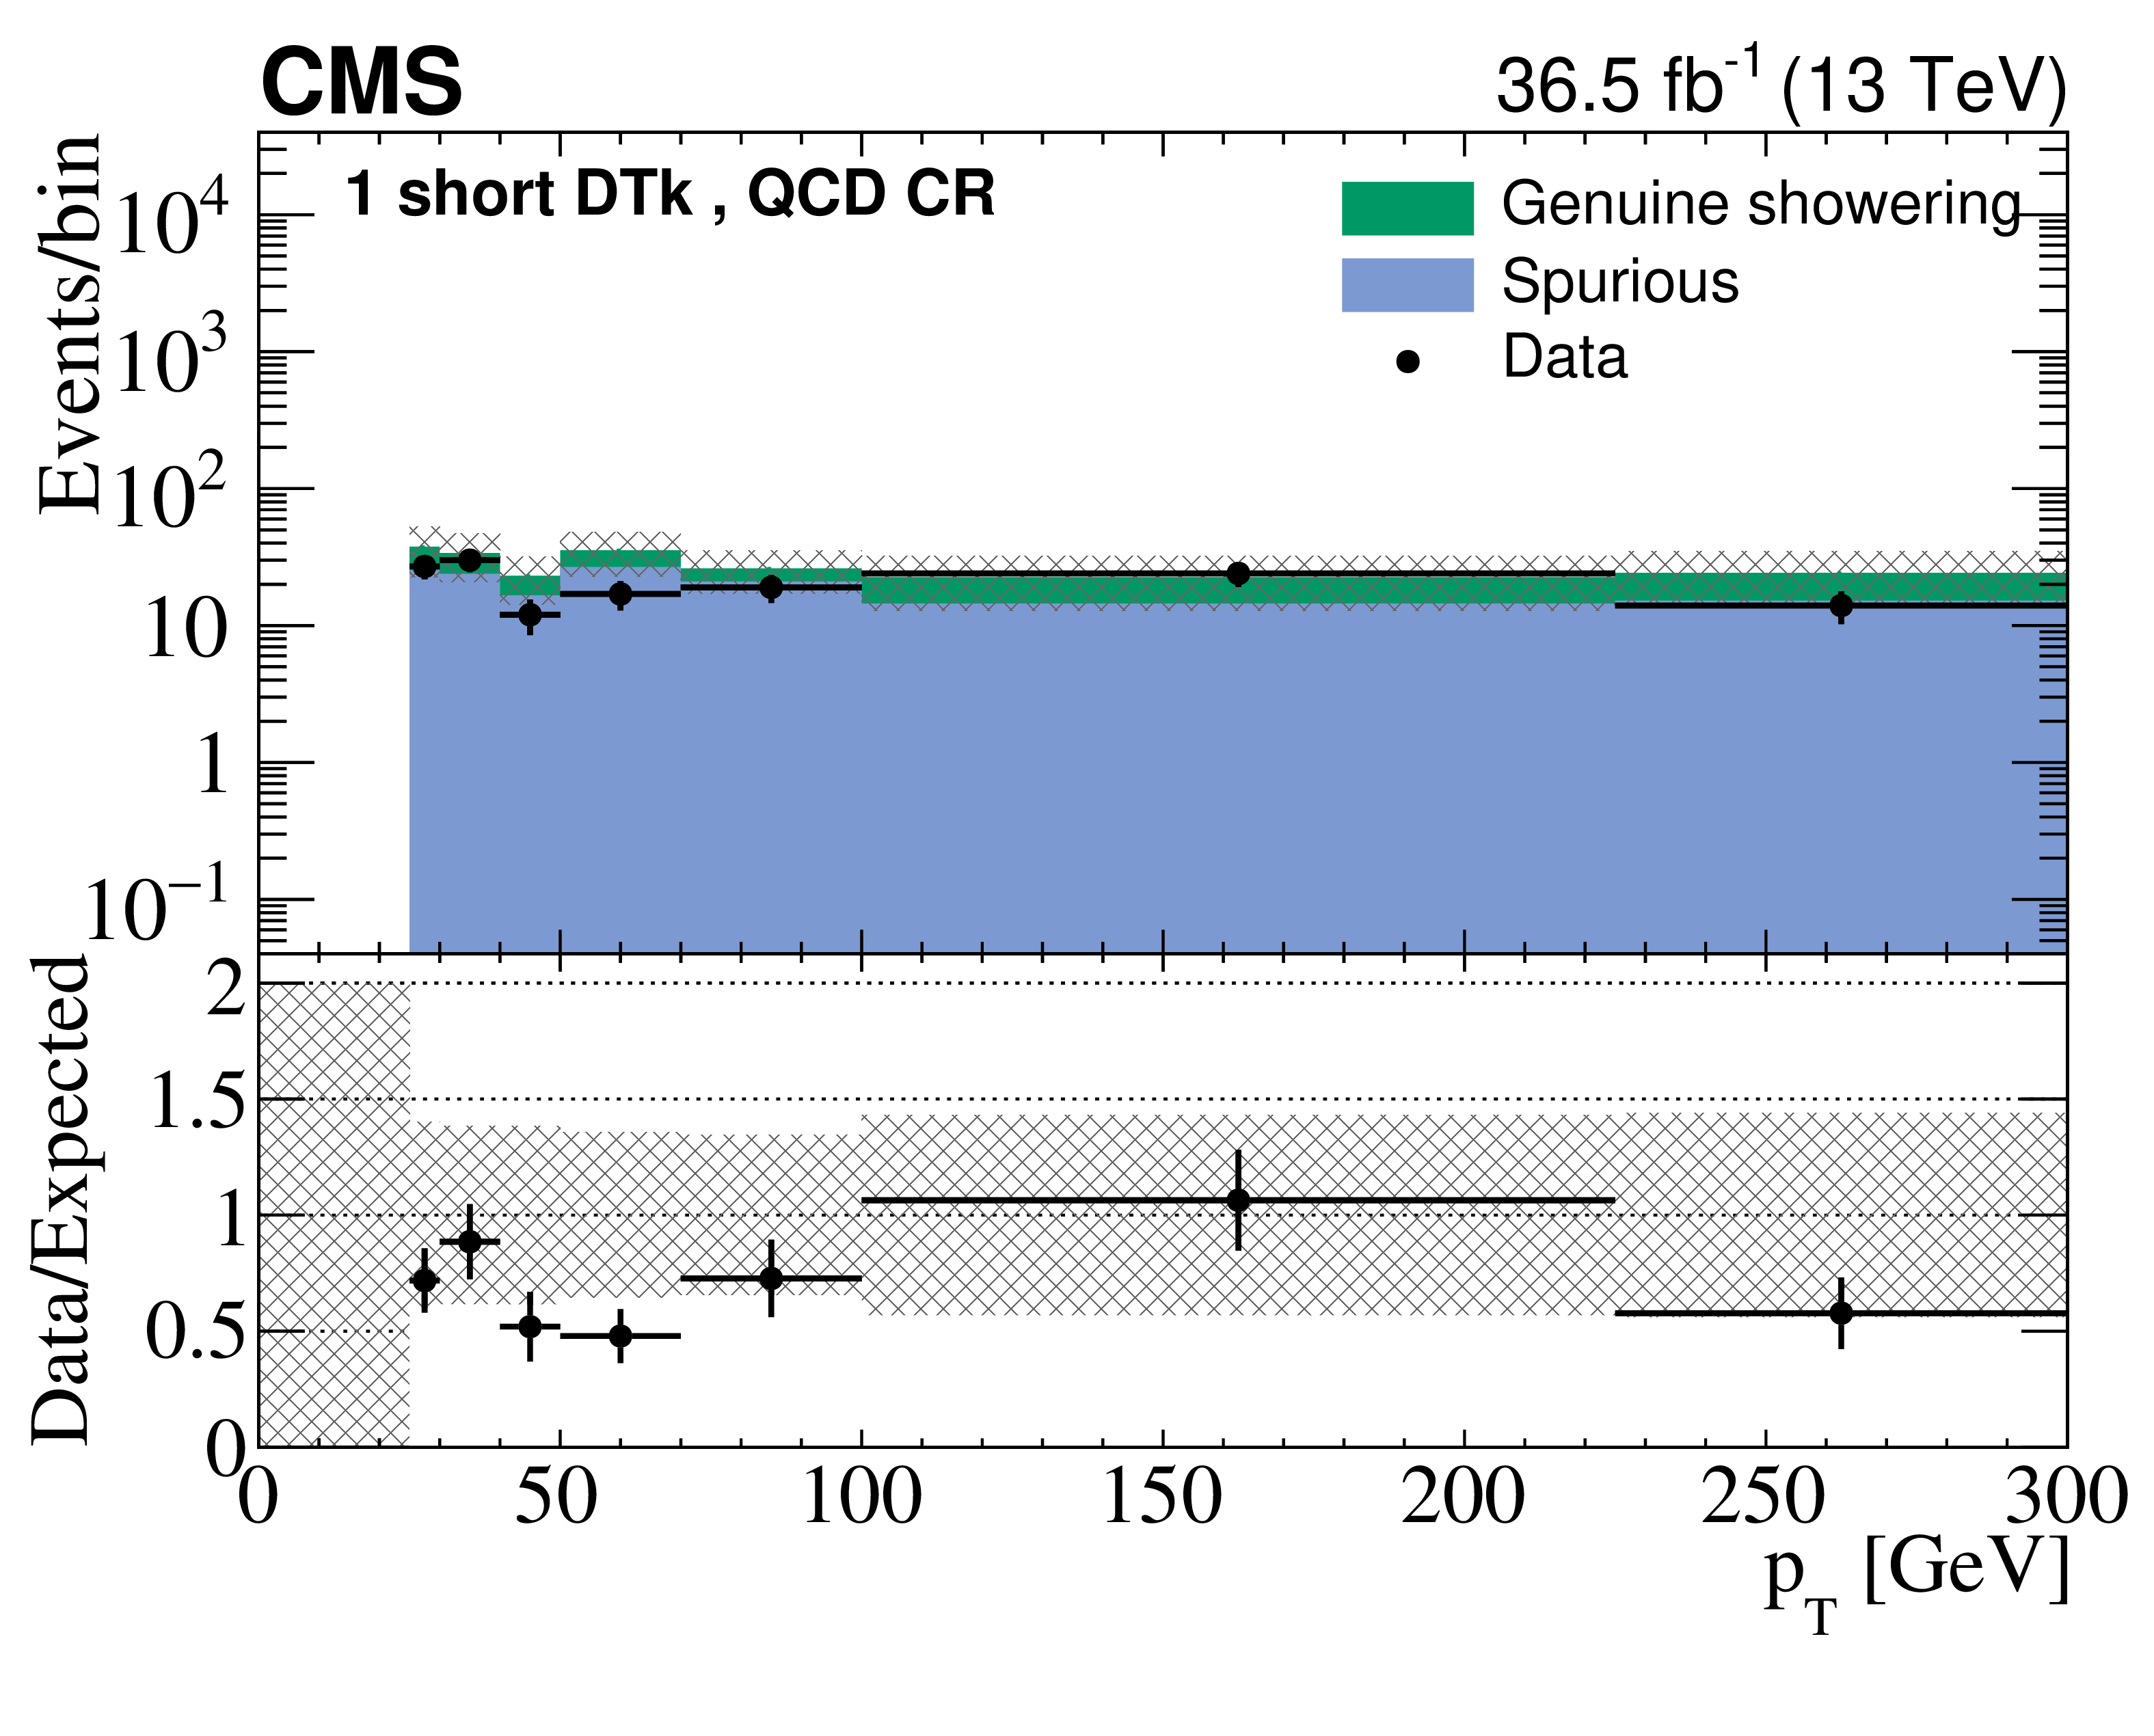
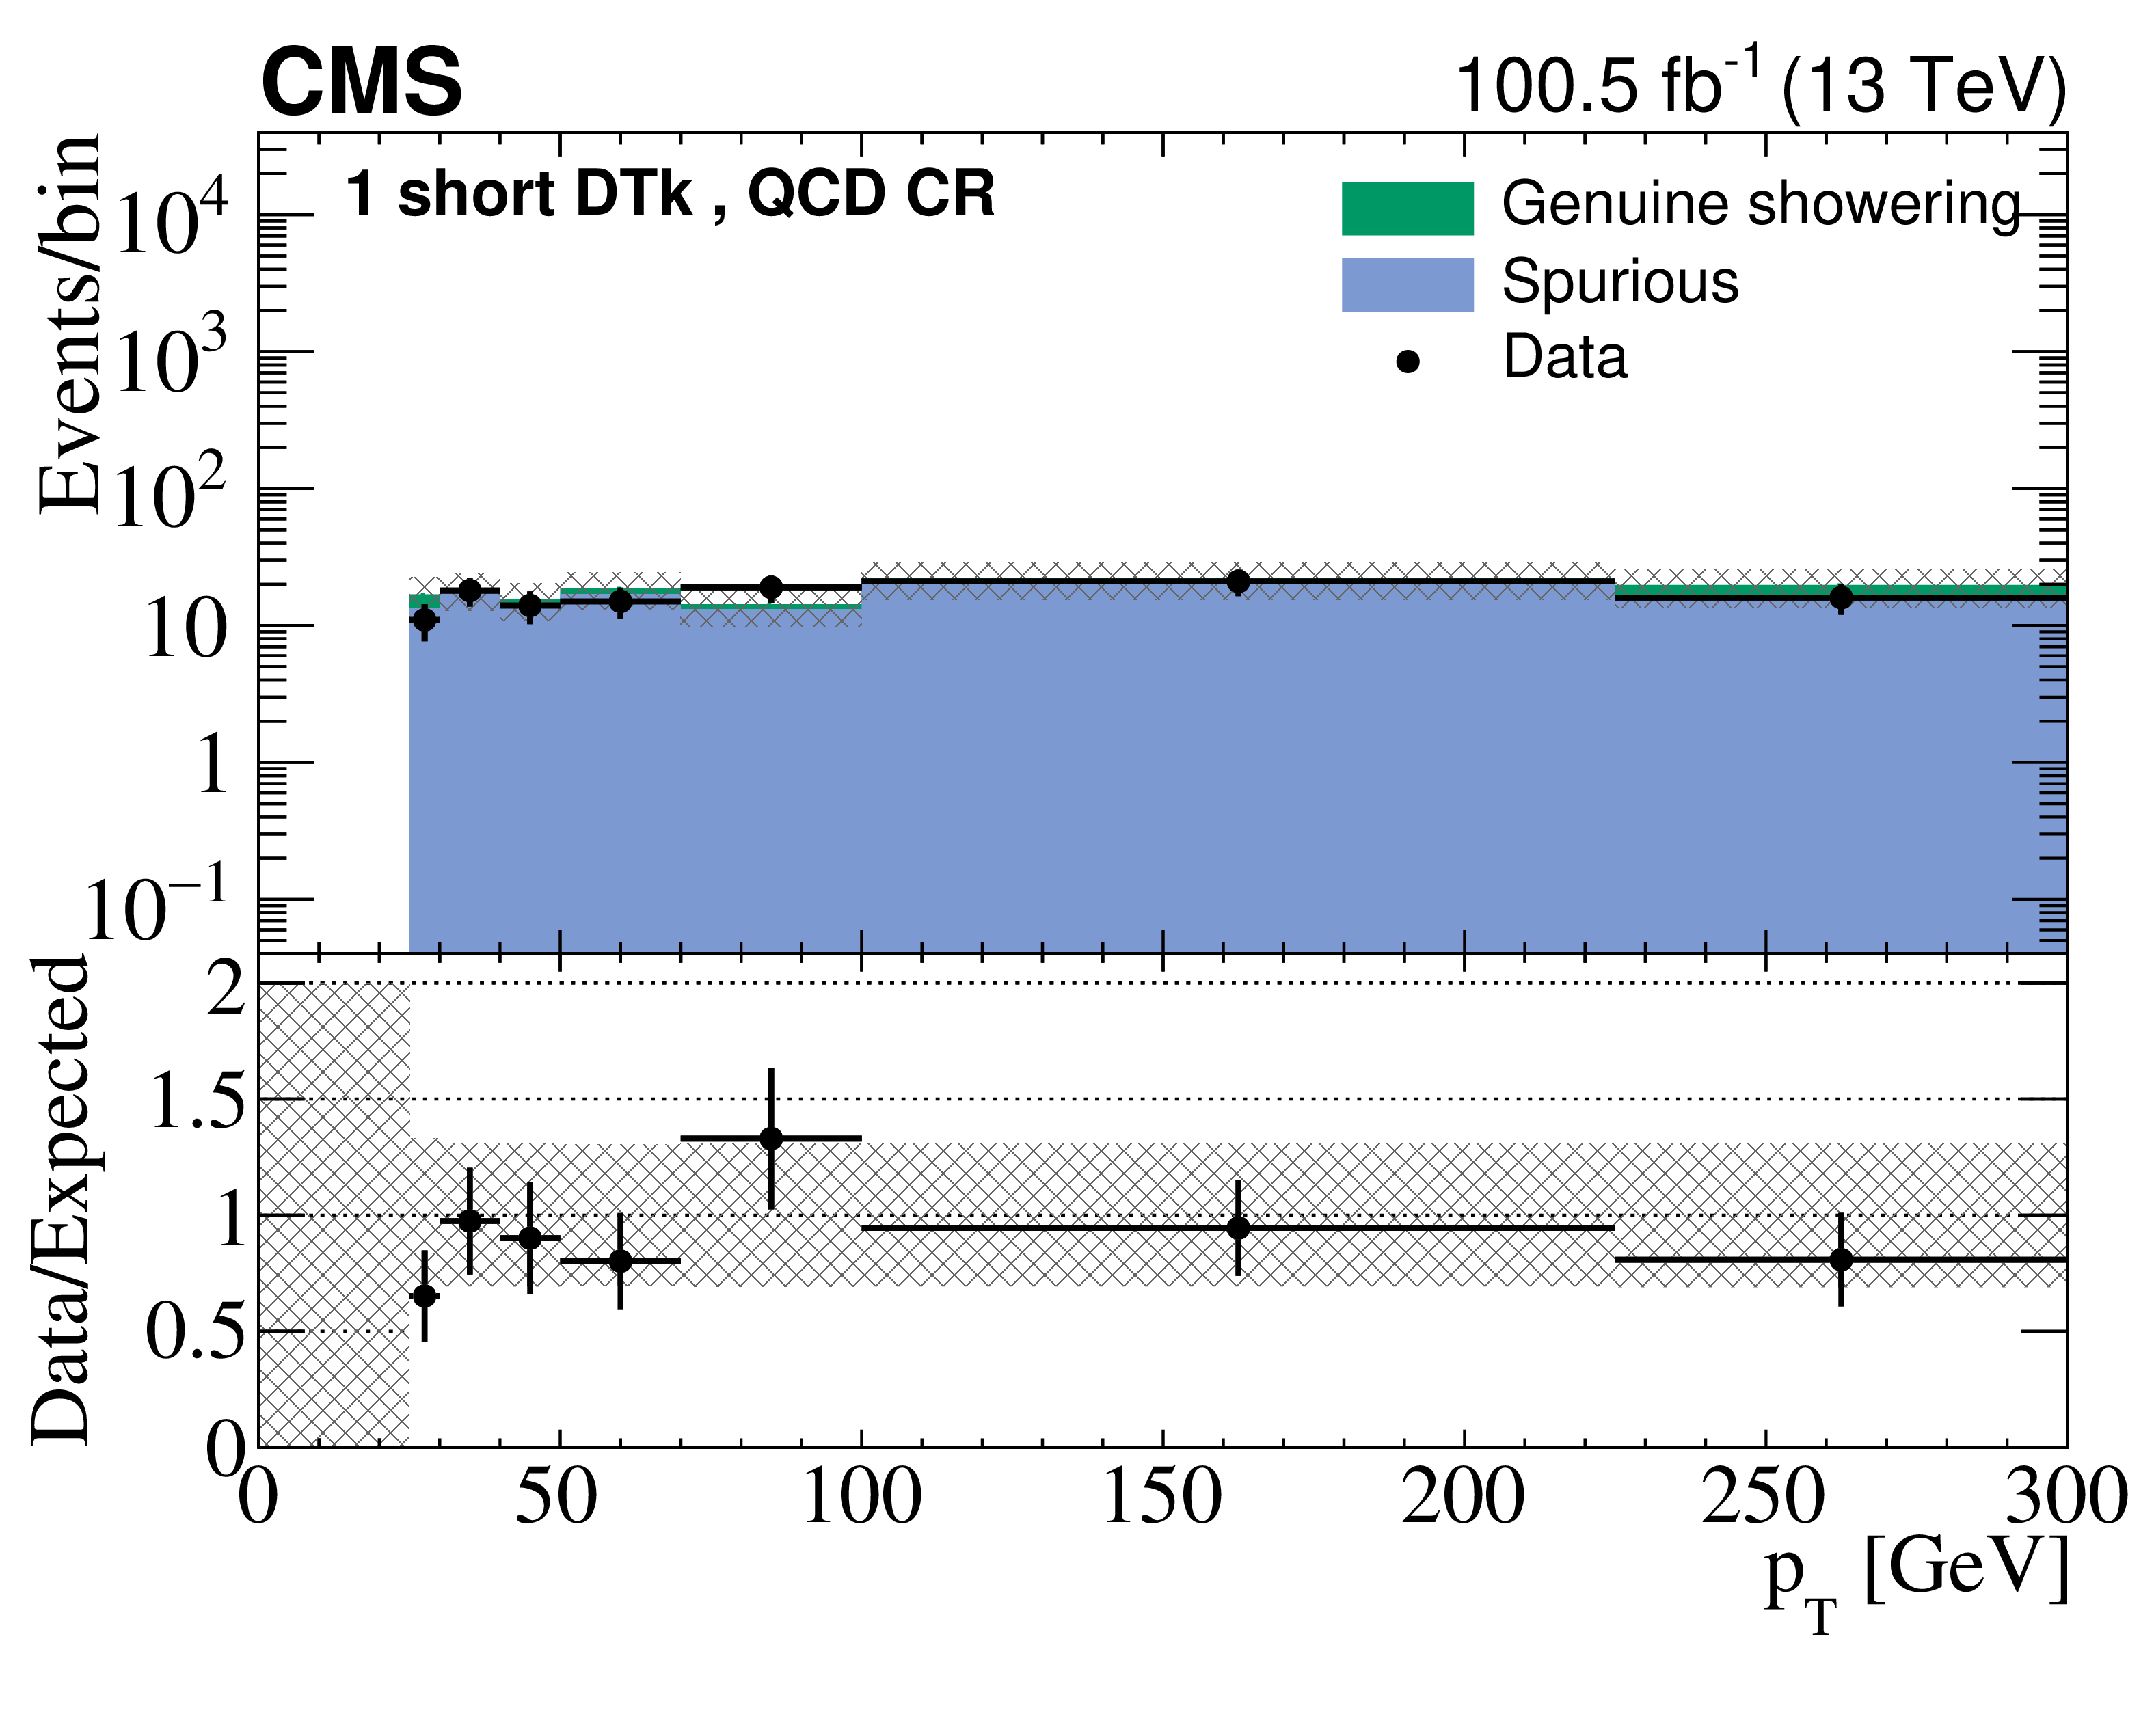
Figure 5:
Comparison of the $ p_{\mathrm{T}} $ distributions of DTks in the $ \theta^{\text{high}}_{\text{low}} $ QCD measurement control region for the data and background prediction for long (upper) and short (lower) tracks. The left (right) column corresponds to the Phase-0 (Phase-1) detector. The uncertainty bars on the ratios in the lower panels indicate the fractional Poisson uncertainties in the observed counts. The gray bands show the fractional Poisson uncertainties in the control region counts, added in quadrature with the systematic uncertainties. The leftmost (rightmost) bin includes underflow (overflow). |

png pdf |
Figure 5-a:
Comparison of the $ p_{\mathrm{T}} $ distributions of DTks in the $ \theta^{\text{high}}_{\text{low}} $ QCD measurement control region for the data and background prediction for long tracks, corresponding to the Phase-0 detector. The uncertainty bars on the ratio in the lower panel indicate the fractional Poisson uncertainties in the observed counts. The gray bands show the fractional Poisson uncertainties in the control region counts, added in quadrature with the systematic uncertainties. The leftmost (rightmost) bin includes underflow (overflow). |
png pdf |
Figure 5-b:
Comparison of the $ p_{\mathrm{T}} $ distributions of DTks in the $ \theta^{\text{high}}_{\text{low}} $ QCD measurement control region for the data and background prediction for long tracks, corresponding to the Phase-1 detector. The uncertainty bars on the ratio in the lower panel indicate the fractional Poisson uncertainties in the observed counts. The gray bands show the fractional Poisson uncertainties in the control region counts, added in quadrature with the systematic uncertainties. The leftmost (rightmost) bin includes underflow (overflow). |
png pdf |
Figure 5-c:
Comparison of the $ p_{\mathrm{T}} $ distributions of DTks in the $ \theta^{\text{high}}_{\text{low}} $ QCD measurement control region for the data and background prediction for short tracks, corresponding to the Phase-0 detector. The uncertainty bars on the ratio in the lower panel indicate the fractional Poisson uncertainties in the observed counts. The gray bands show the fractional Poisson uncertainties in the control region counts, added in quadrature with the systematic uncertainties. The leftmost (rightmost) bin includes underflow (overflow). |
png pdf |
Figure 5-d:
Comparison of the $ p_{\mathrm{T}} $ distributions of DTks in the $ \theta^{\text{high}}_{\text{low}} $ QCD measurement control region for the data and background prediction for short tracks, corresponding to the Phase-1 detector. The uncertainty bars on the ratio in the lower panel indicate the fractional Poisson uncertainties in the observed counts. The gray bands show the fractional Poisson uncertainties in the control region counts, added in quadrature with the systematic uncertainties. The leftmost (rightmost) bin includes underflow (overflow). |
png pdf |
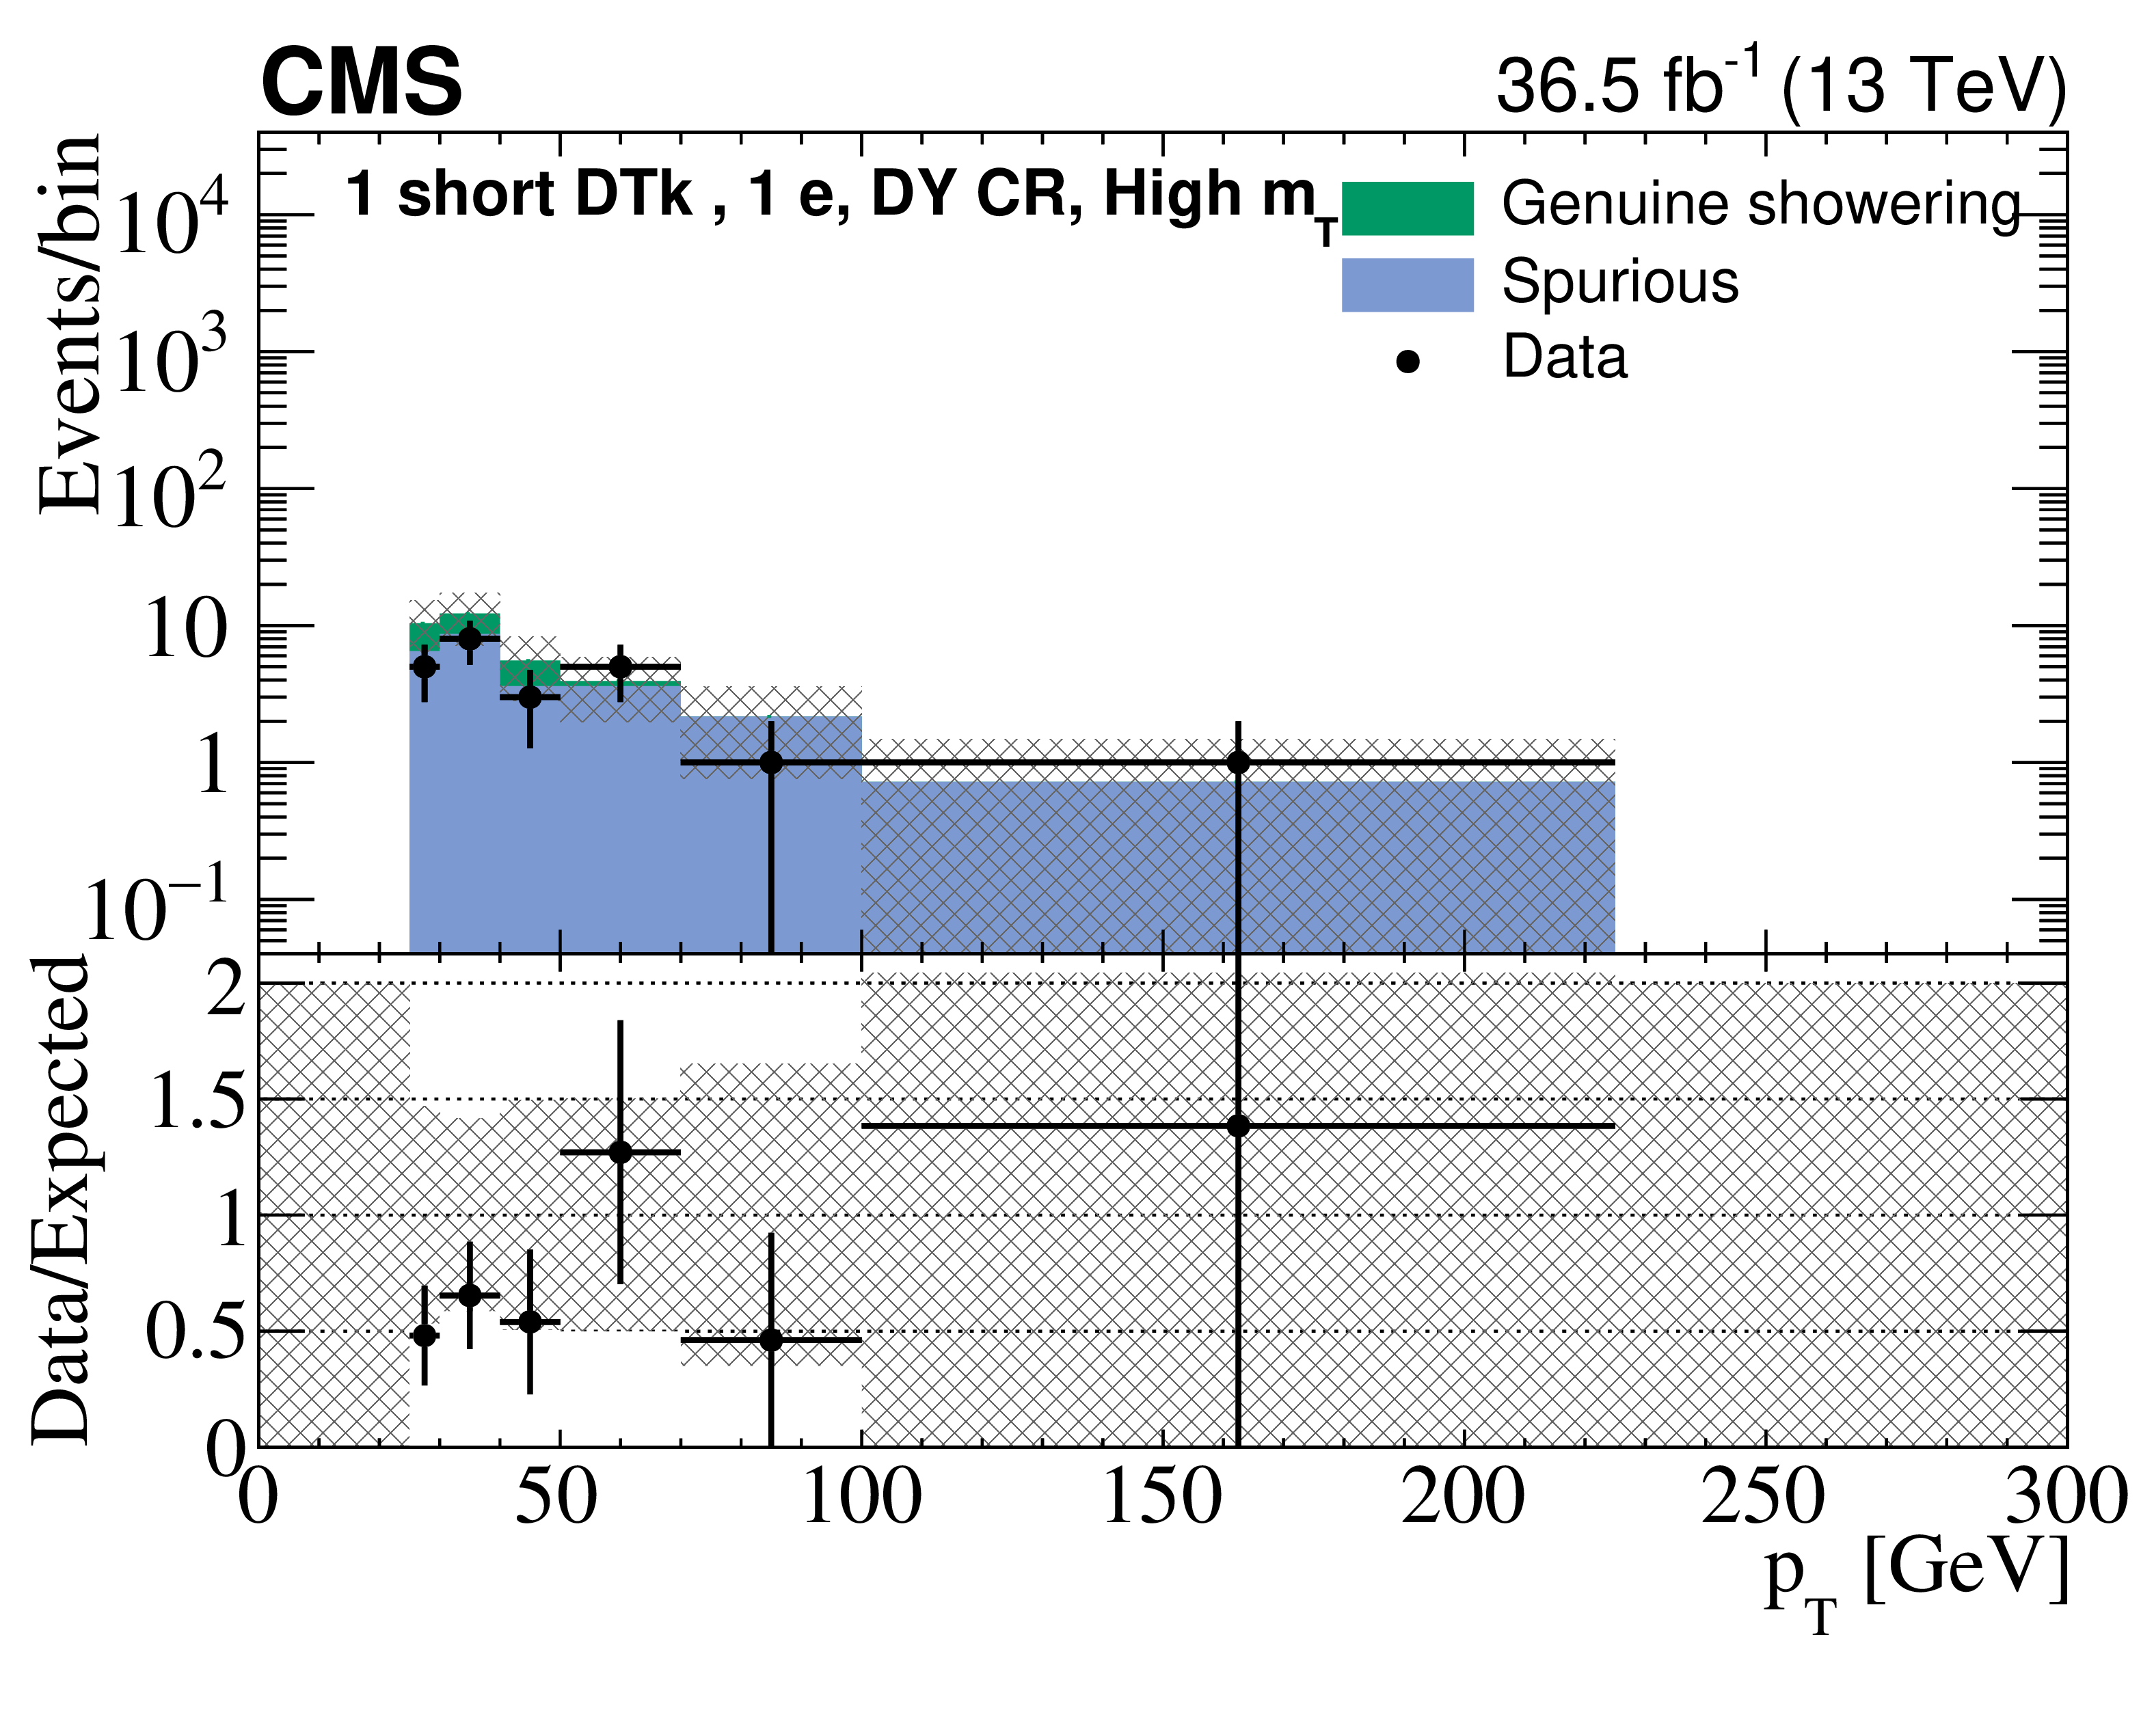
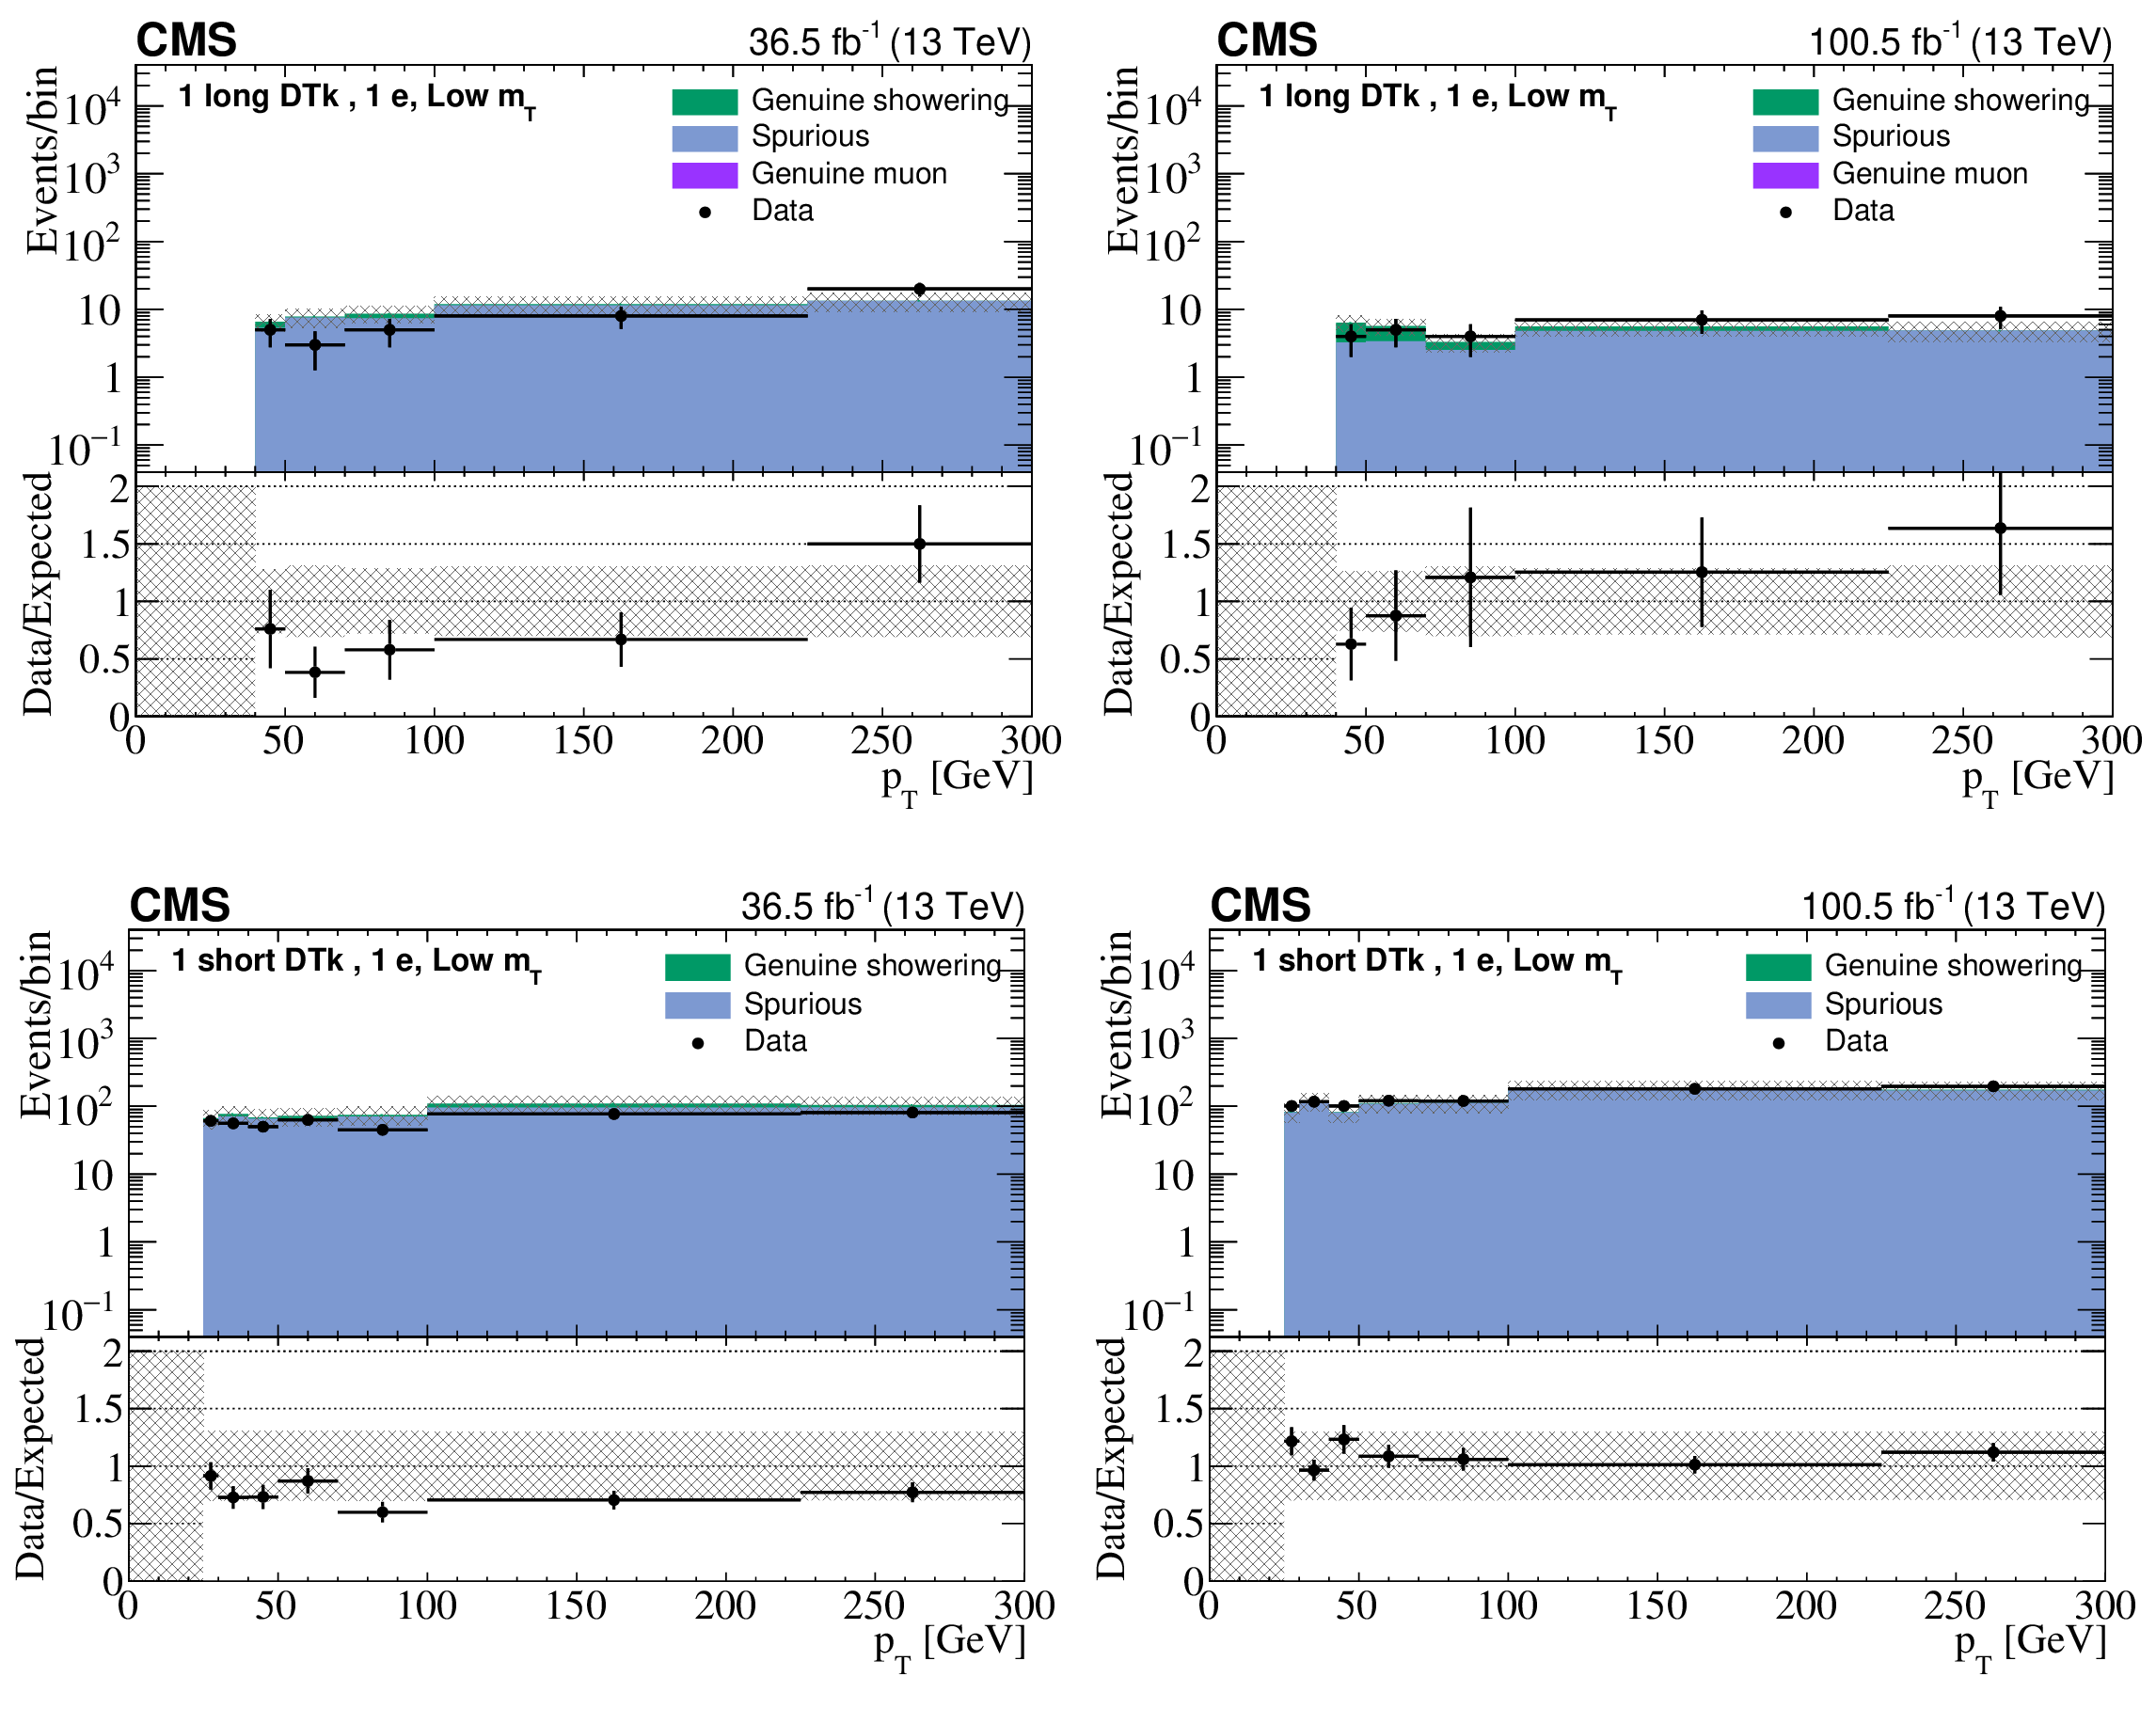
Figure 6:
Comparison of the $ p_{\mathrm{T}} $ distributions of DTks in events with one electron and one DTk, in a validation region with $ m_{\mathrm{T}} < $ 110 GeV and $ m_{\text{DTk},\ell} \not\in [65,110] $ GeV, for the data and background prediction for long (upper) and short (lower) tracks. The left (right) column corresponds to the Phase-0 (Phase-1) detector. The uncertainty bars on the ratios in the lower panels indicate the fractional Poisson uncertainties in the observed counts. The gray bands show the fractional Poisson uncertainties in the control region counts, added in quadrature with the systematic uncertainties. The leftmost (rightmost) bin includes underflow (overflow). |
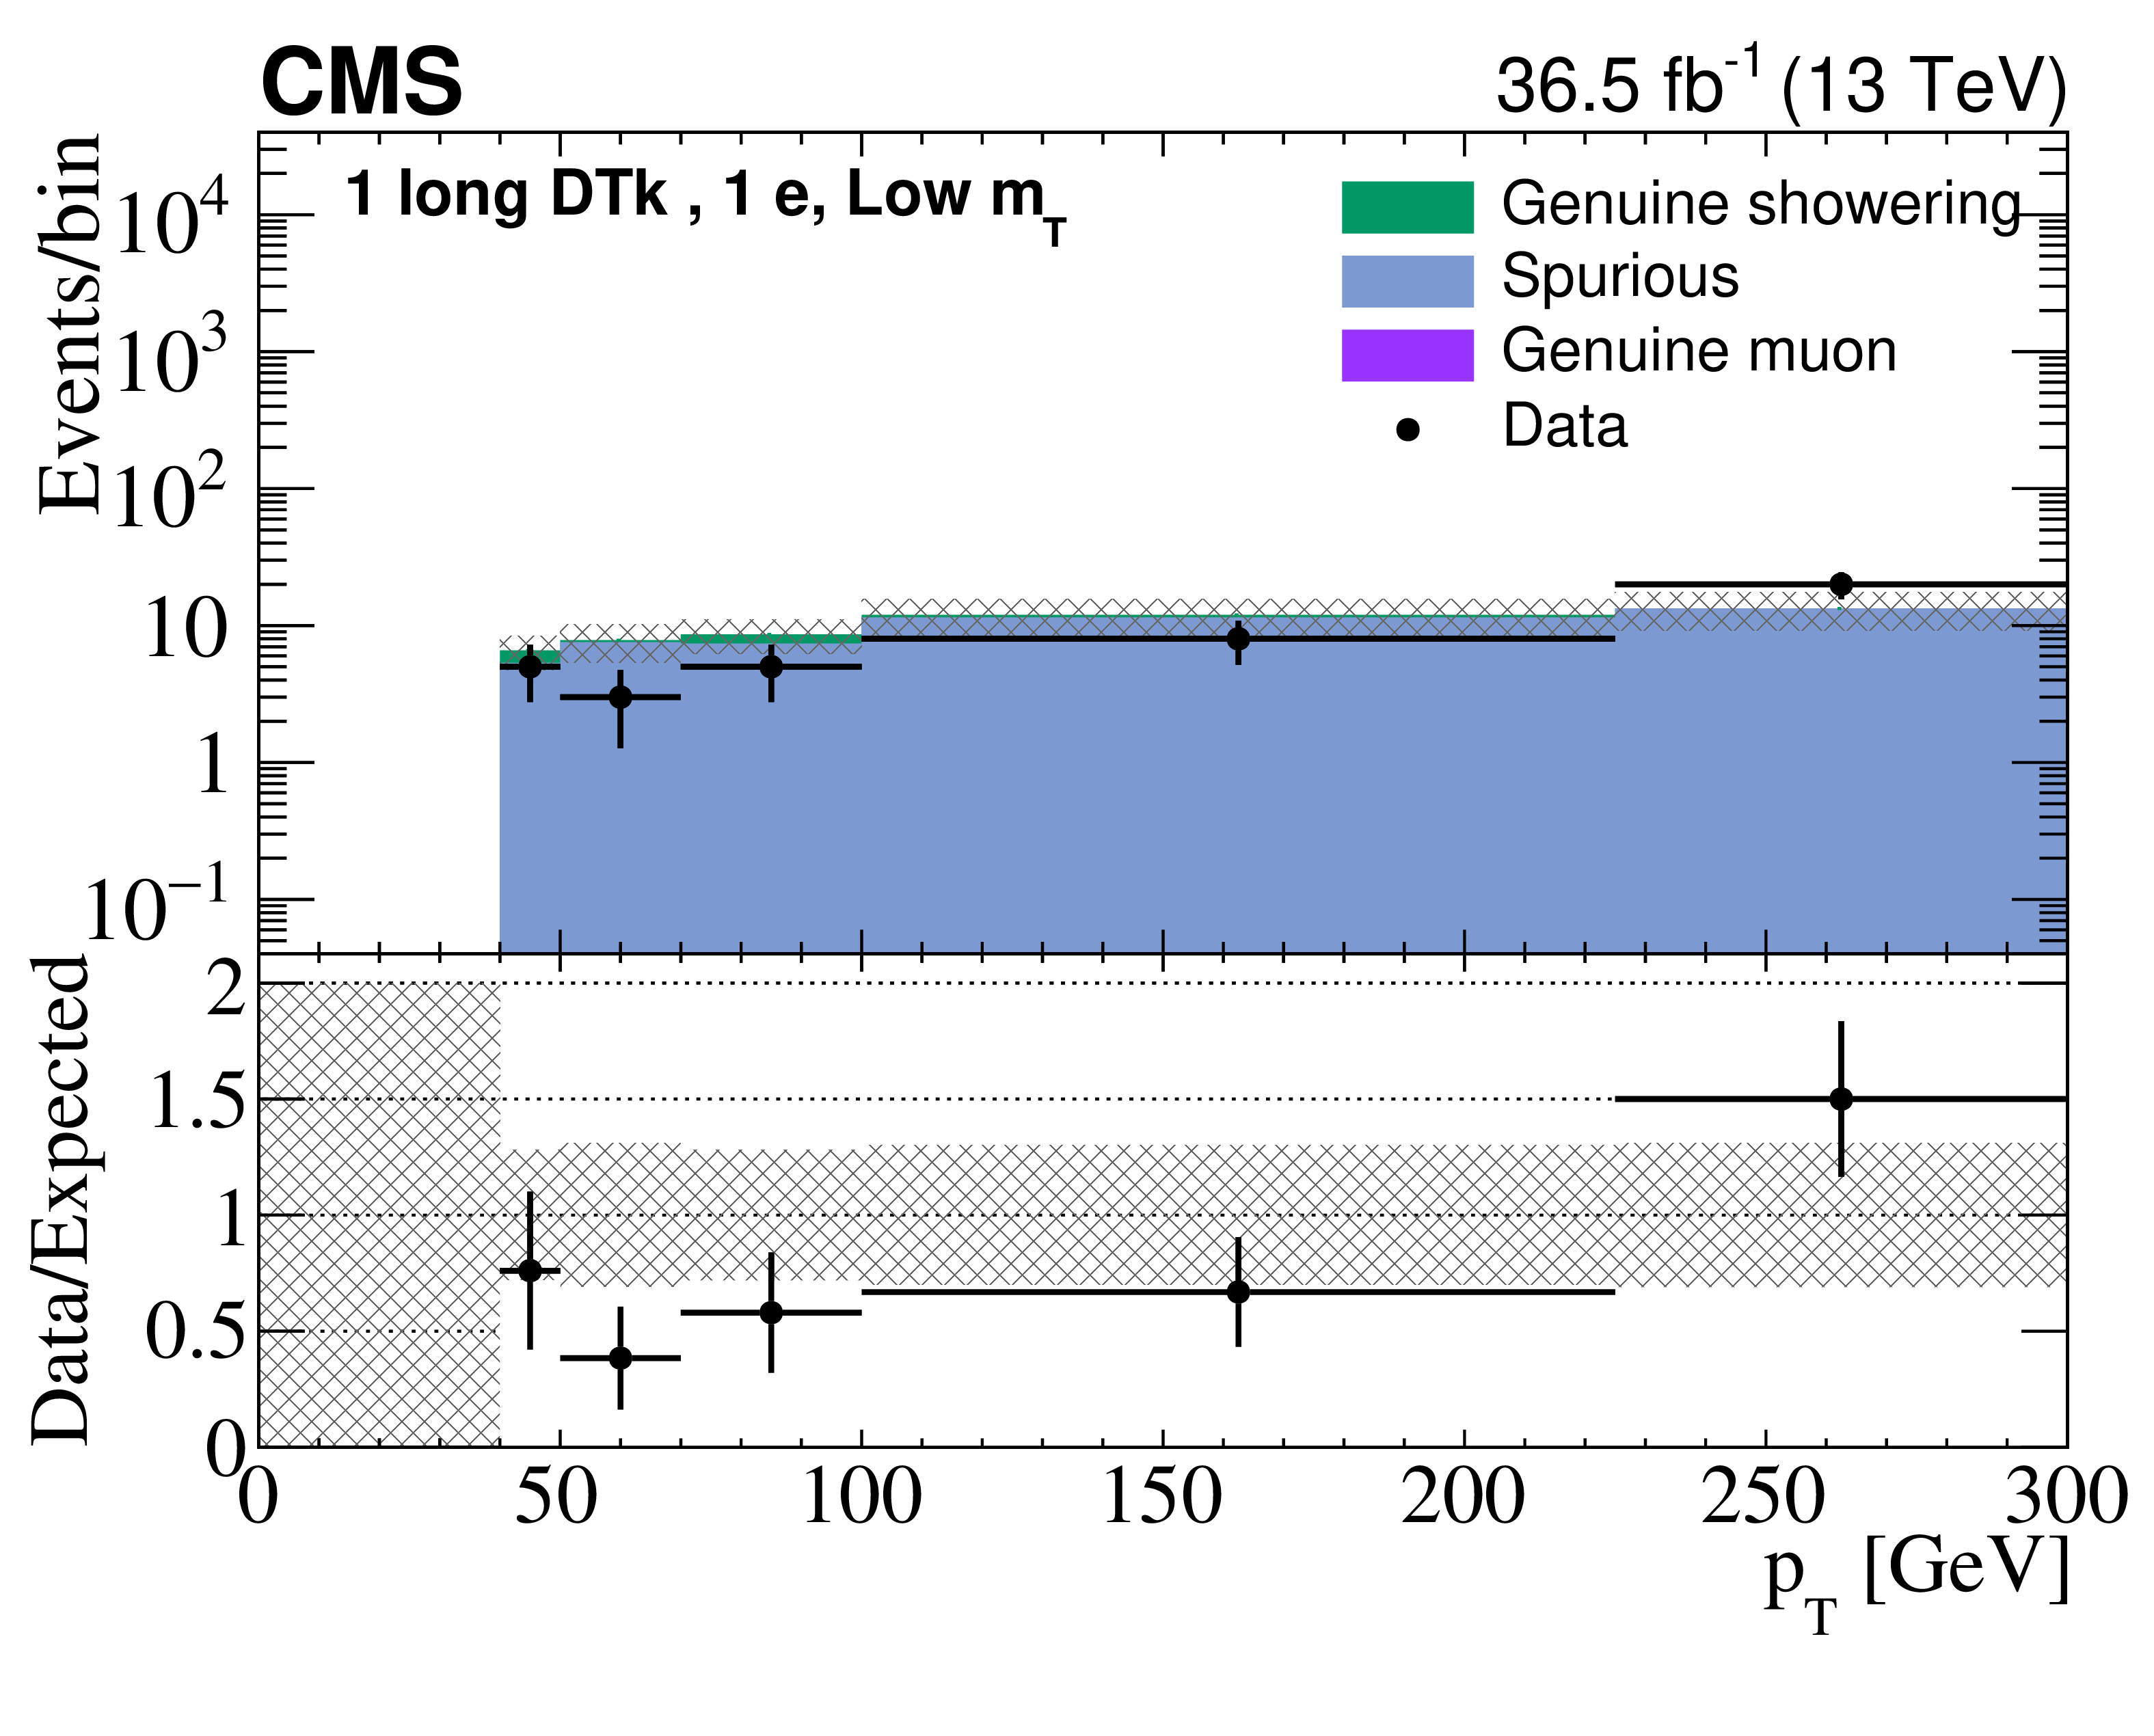
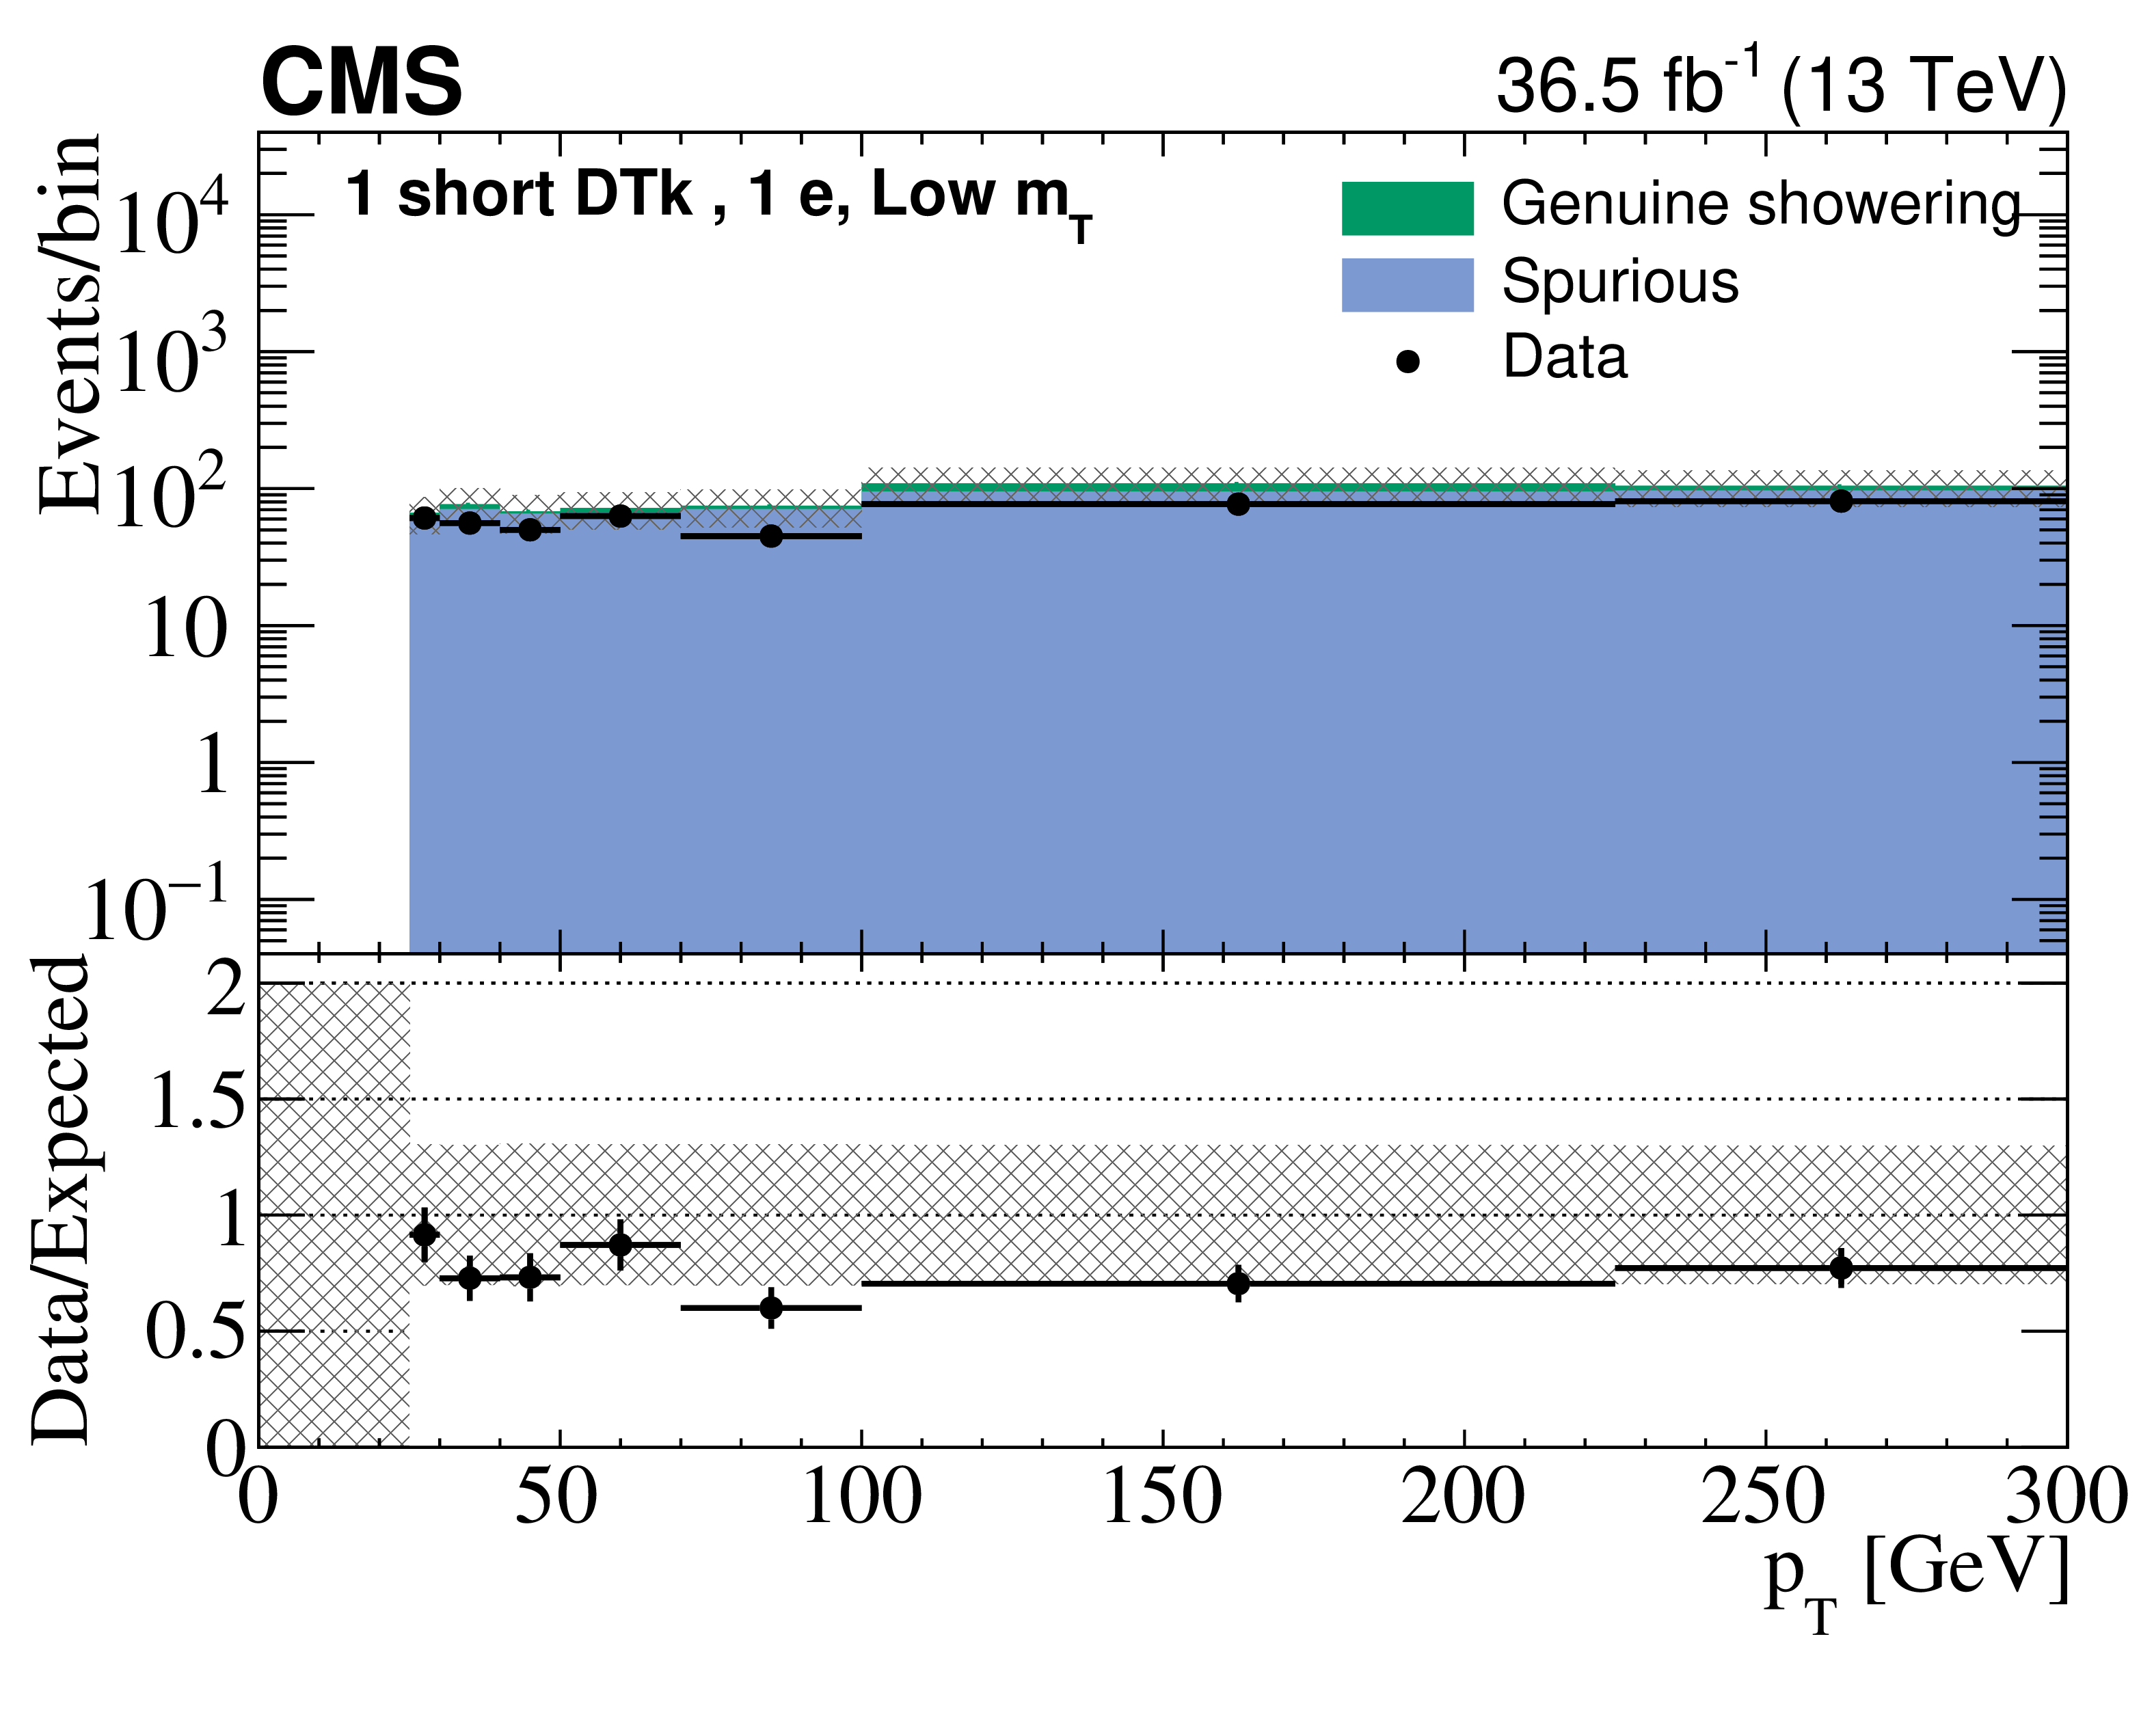
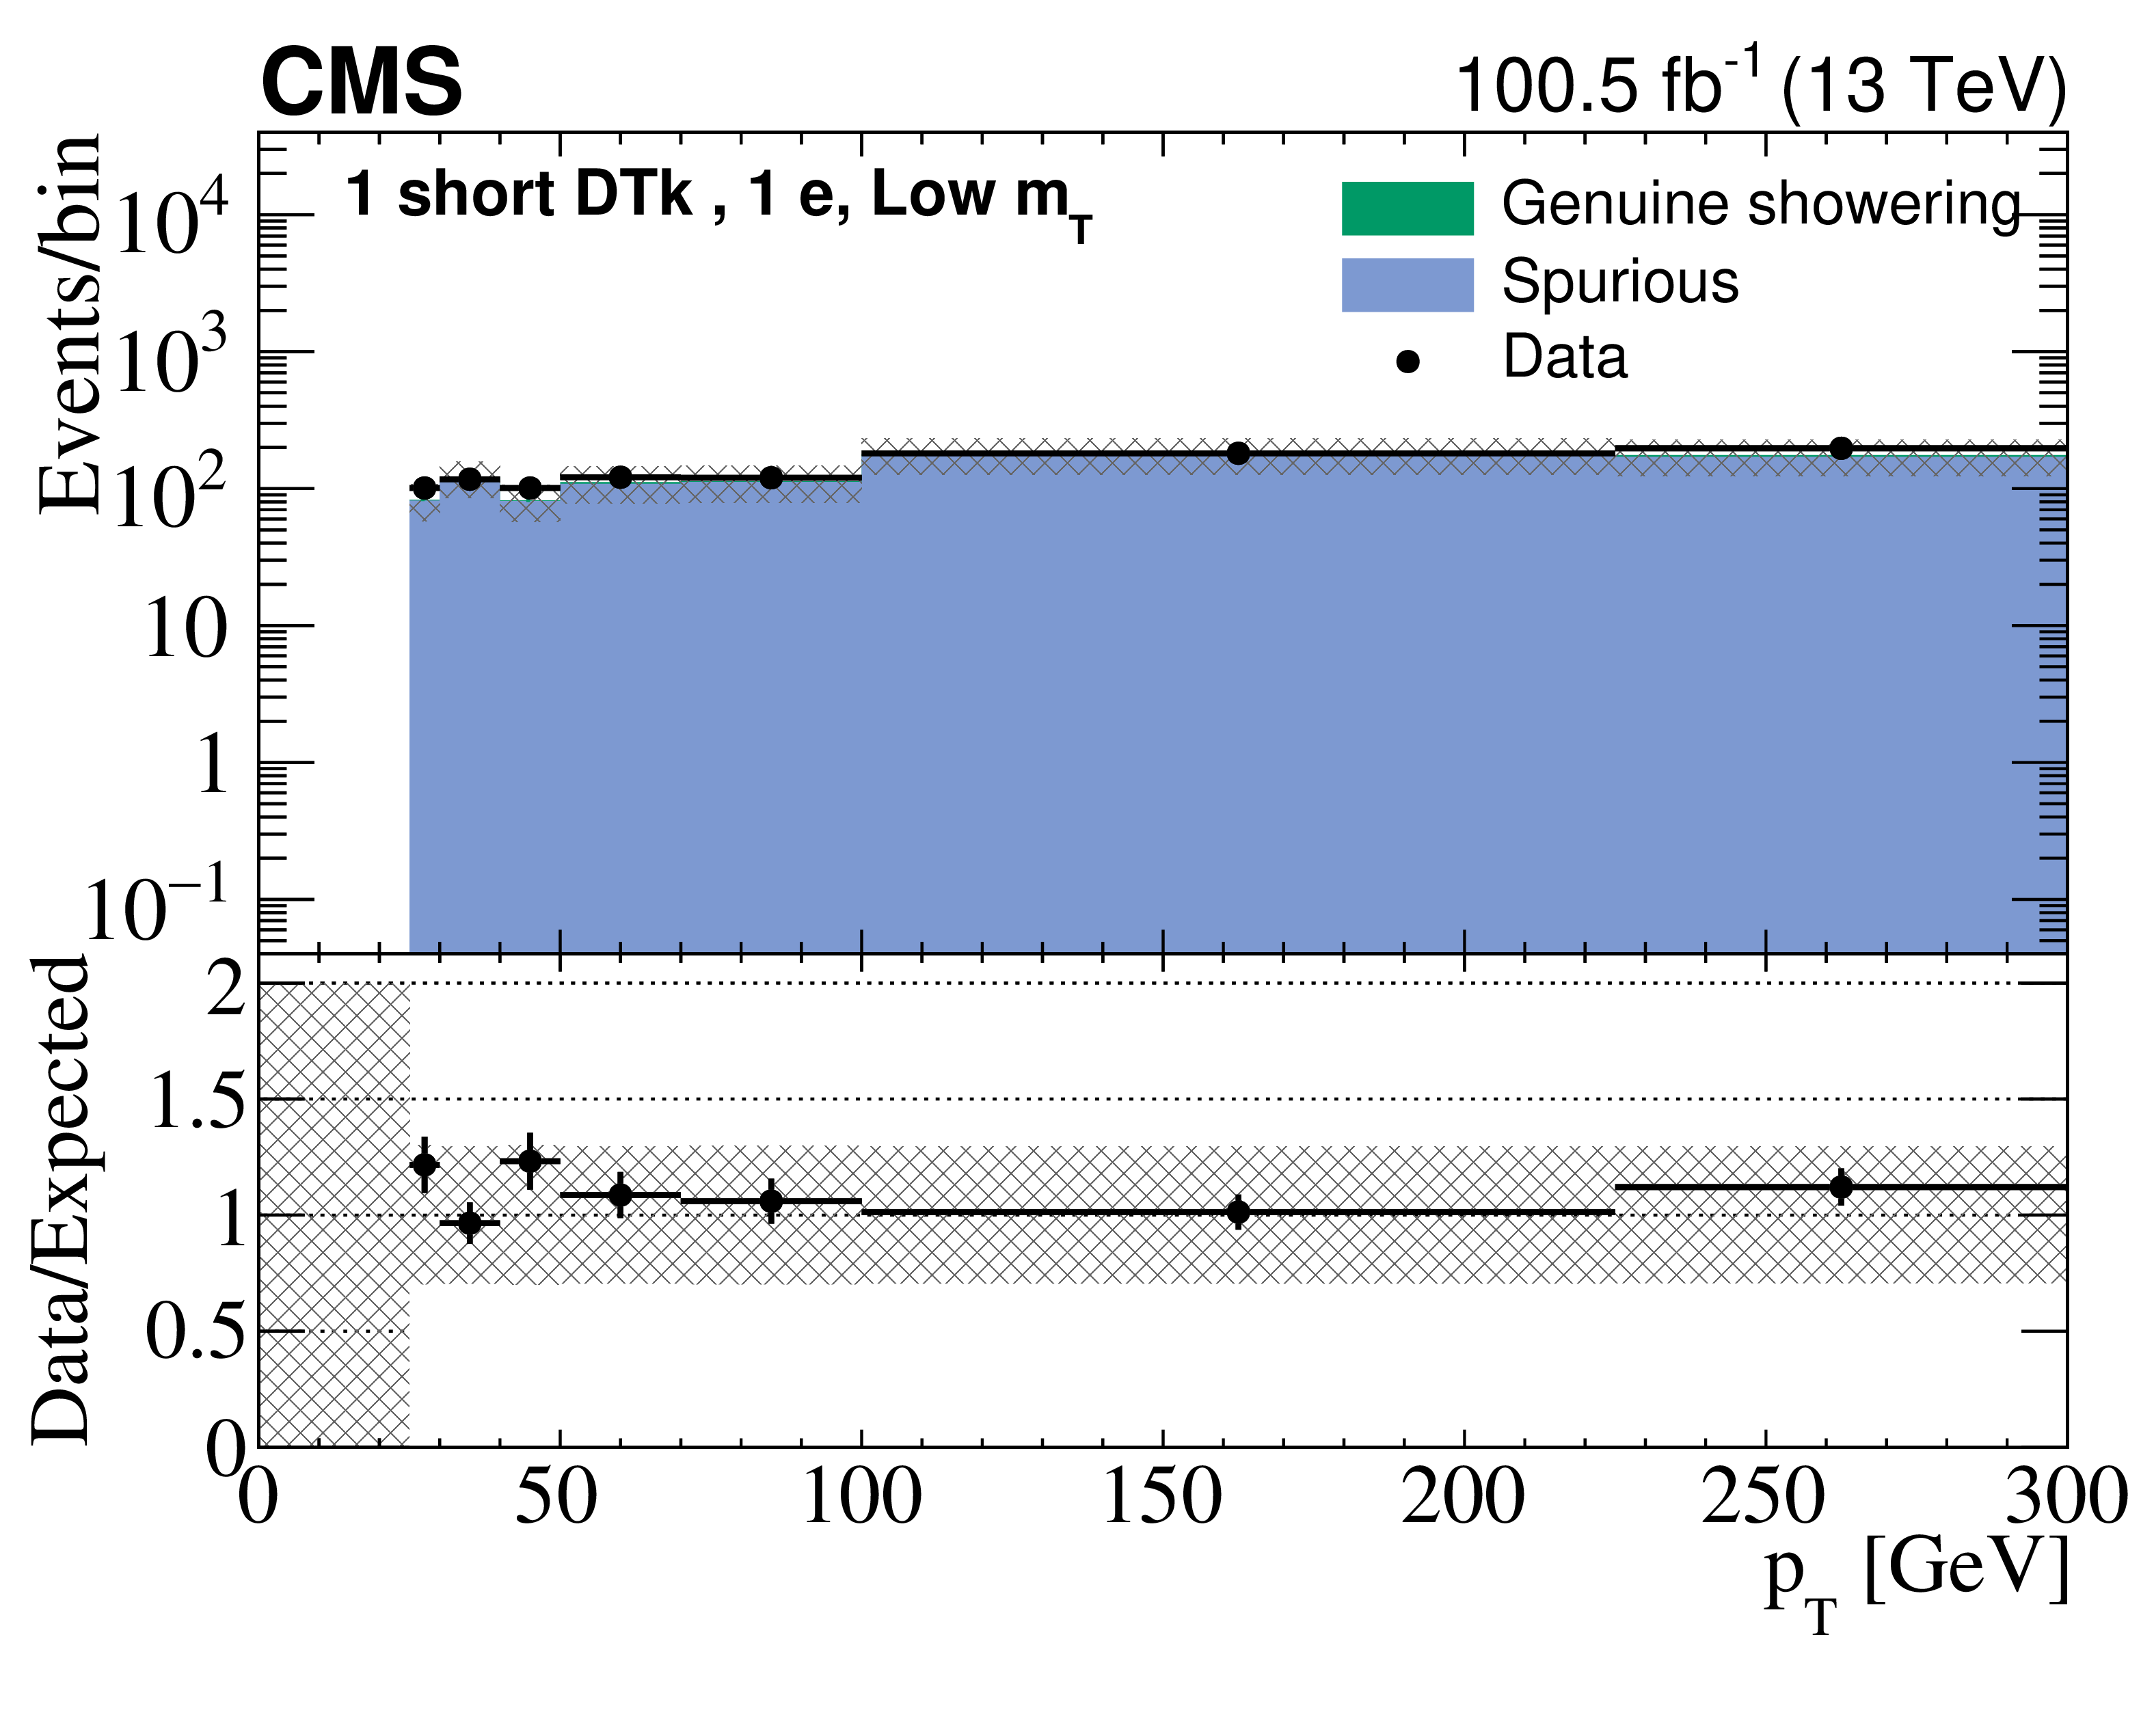
png pdf |
Figure 6-a:
Comparison of the $ p_{\mathrm{T}} $ distributions of DTks in events with one electron and one DTk, in a validation region with $ m_{\mathrm{T}} < $ 110 GeV and $ m_{\text{DTk},\ell} \not\in [65,110] $ GeV, for the data and background prediction for long tracks, corresponding to the Phase-0 detector. The uncertainty bars on the ratio in the lower panel indicate the fractional Poisson uncertainties in the observed counts. The gray bands show the fractional Poisson uncertainties in the control region counts, added in quadrature with the systematic uncertainties. The leftmost (rightmost) bin includes underflow (overflow). |

png pdf |
Figure 6-b:
Comparison of the $ p_{\mathrm{T}} $ distributions of DTks in events with one electron and one DTk, in a validation region with $ m_{\mathrm{T}} < $ 110 GeV and $ m_{\text{DTk},\ell} \not\in [65,110] $ GeV, for the data and background prediction for long tracks, corresponding to the Phase-1 detector. The uncertainty bars on the ratio in the lower panel indicate the fractional Poisson uncertainties in the observed counts. The gray bands show the fractional Poisson uncertainties in the control region counts, added in quadrature with the systematic uncertainties. The leftmost (rightmost) bin includes underflow (overflow). |
png pdf |
Figure 6-c:
Comparison of the $ p_{\mathrm{T}} $ distributions of DTks in events with one electron and one DTk, in a validation region with $ m_{\mathrm{T}} < $ 110 GeV and $ m_{\text{DTk},\ell} \not\in [65,110] $ GeV, for the data and background prediction for short tracks, corresponding to the Phase-0 detector. The uncertainty bars on the ratio in the lower panel indicate the fractional Poisson uncertainties in the observed counts. The gray bands show the fractional Poisson uncertainties in the control region counts, added in quadrature with the systematic uncertainties. The leftmost (rightmost) bin includes underflow (overflow). |
png pdf |
Figure 6-d:
Comparison of the $ p_{\mathrm{T}} $ distributions of DTks in events with one electron and one DTk, in a validation region with $ m_{\mathrm{T}} < $ 110 GeV and $ m_{\text{DTk},\ell} \not\in [65,110] $ GeV, for the data and background prediction for short tracks, corresponding to the Phase-1 detector. The uncertainty bars on the ratio in the lower panel indicate the fractional Poisson uncertainties in the observed counts. The gray bands show the fractional Poisson uncertainties in the control region counts, added in quadrature with the systematic uncertainties. The leftmost (rightmost) bin includes underflow (overflow). |
png pdf |
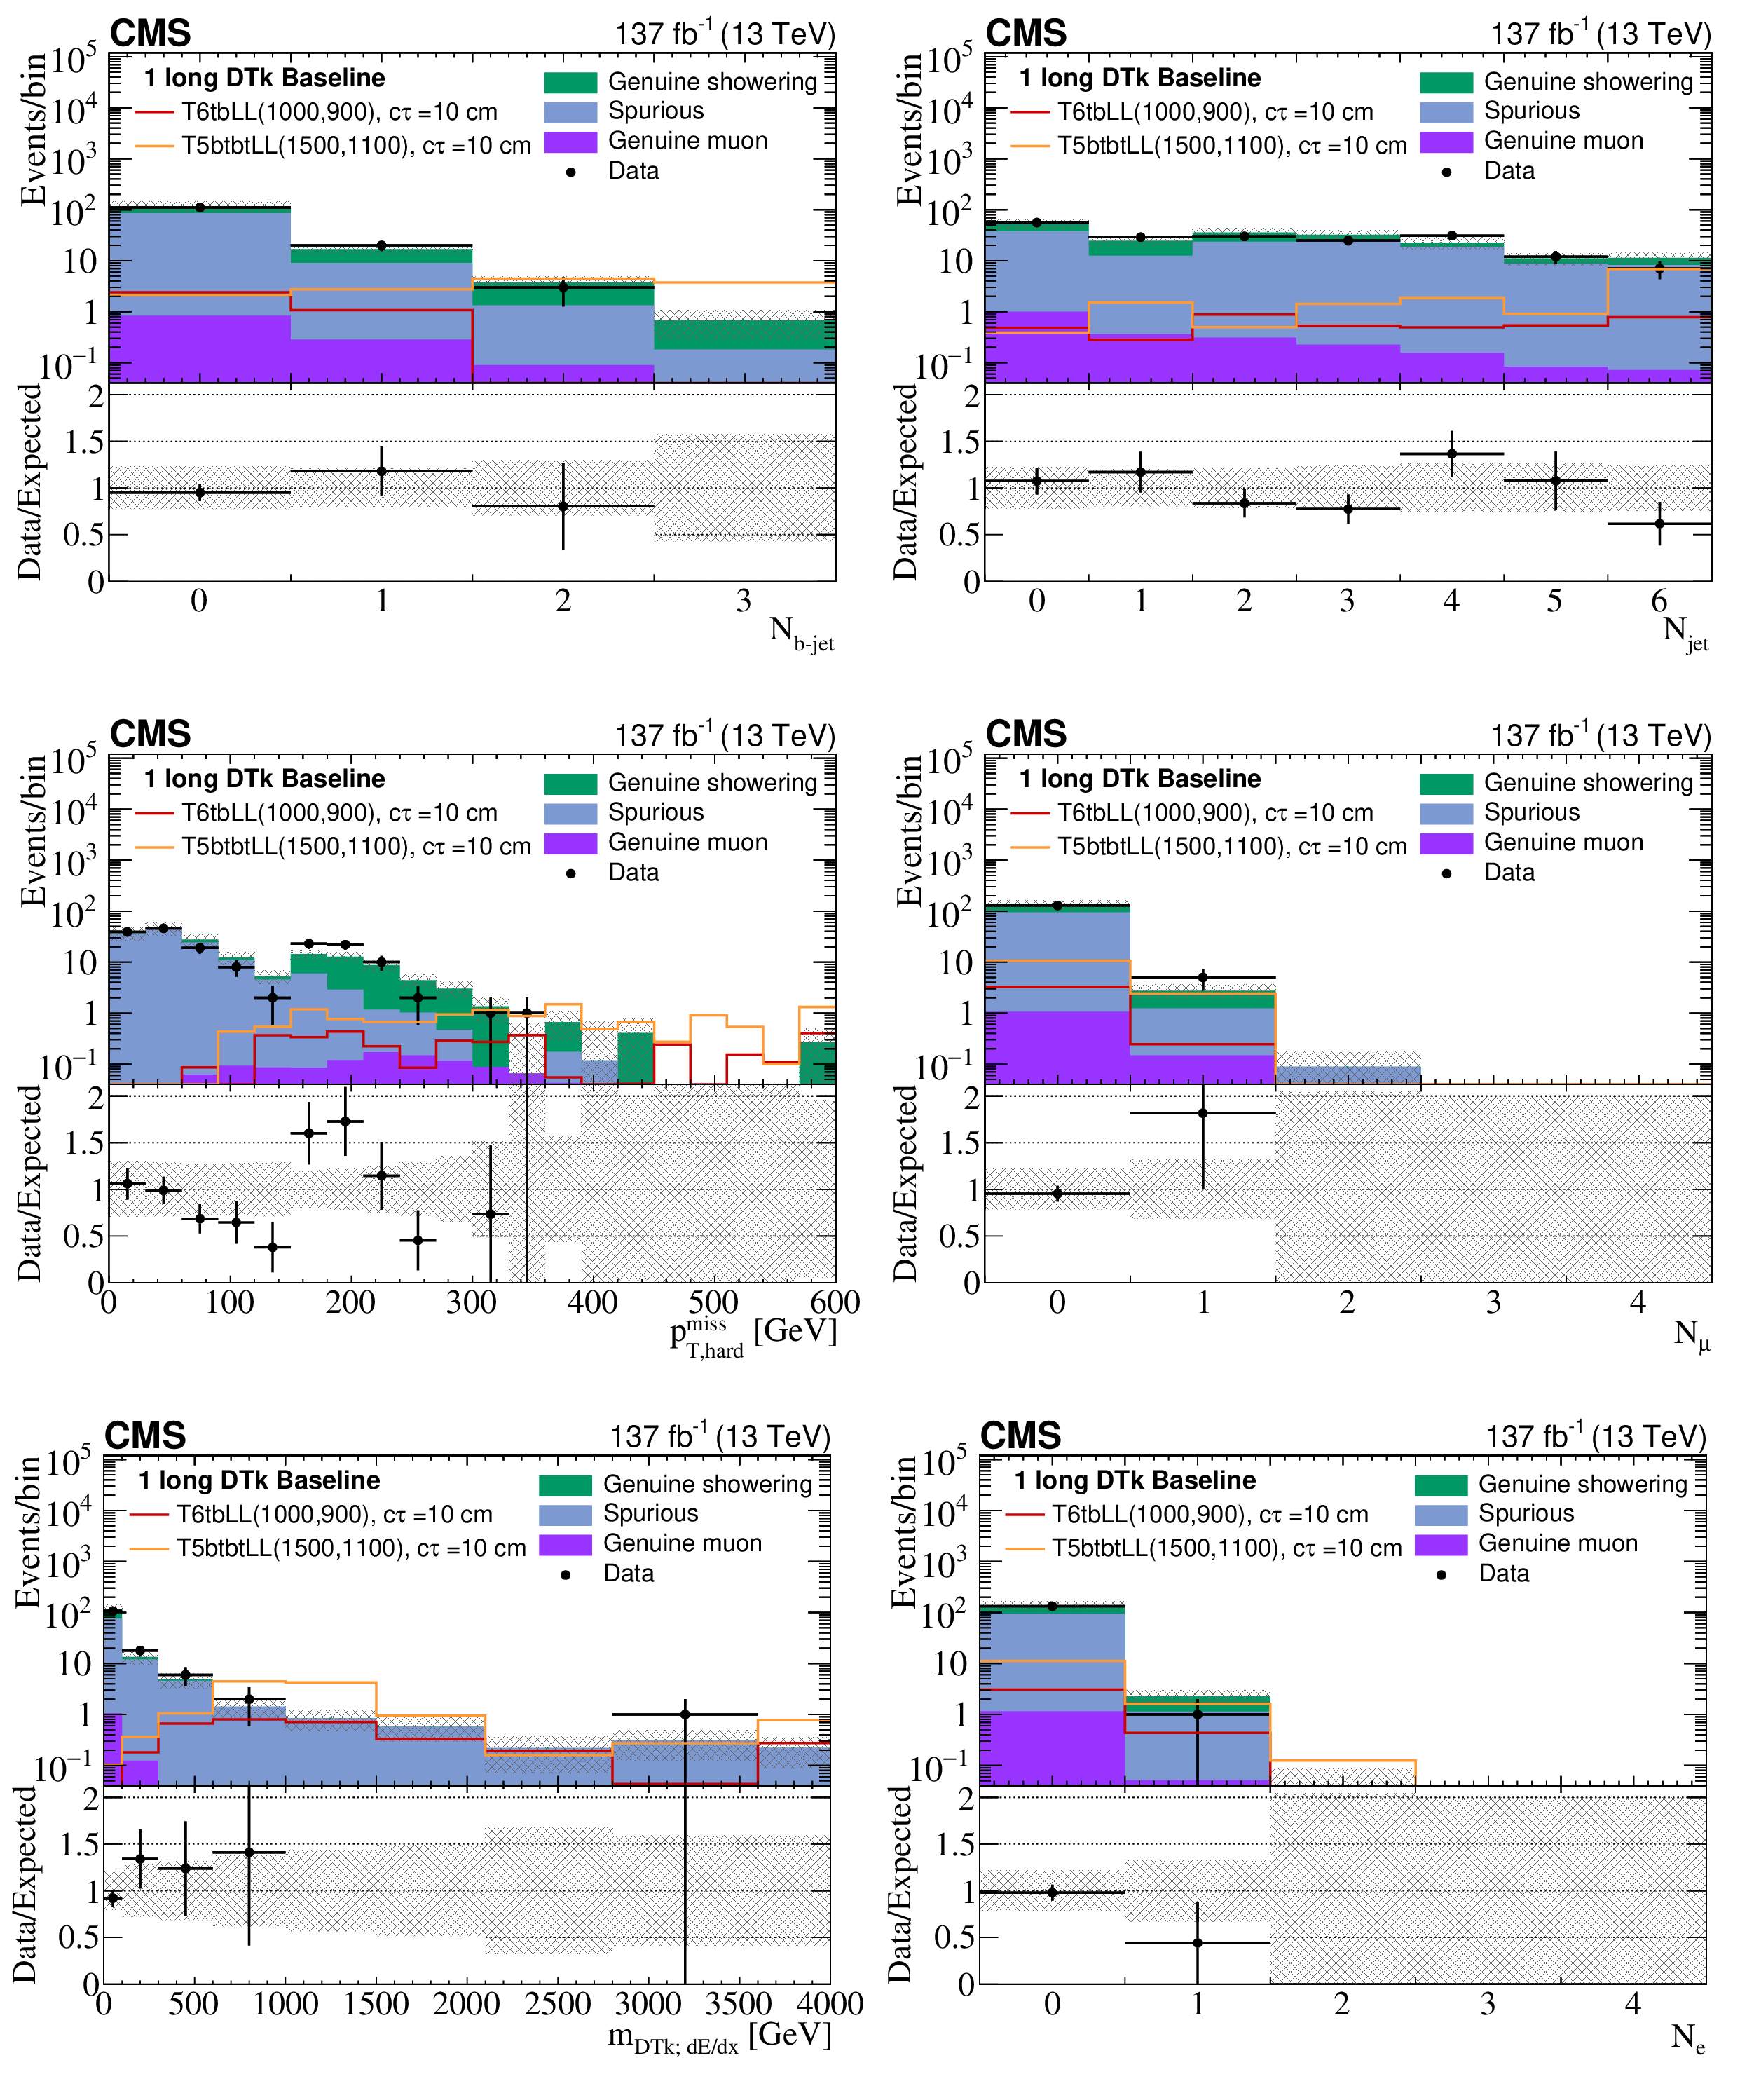
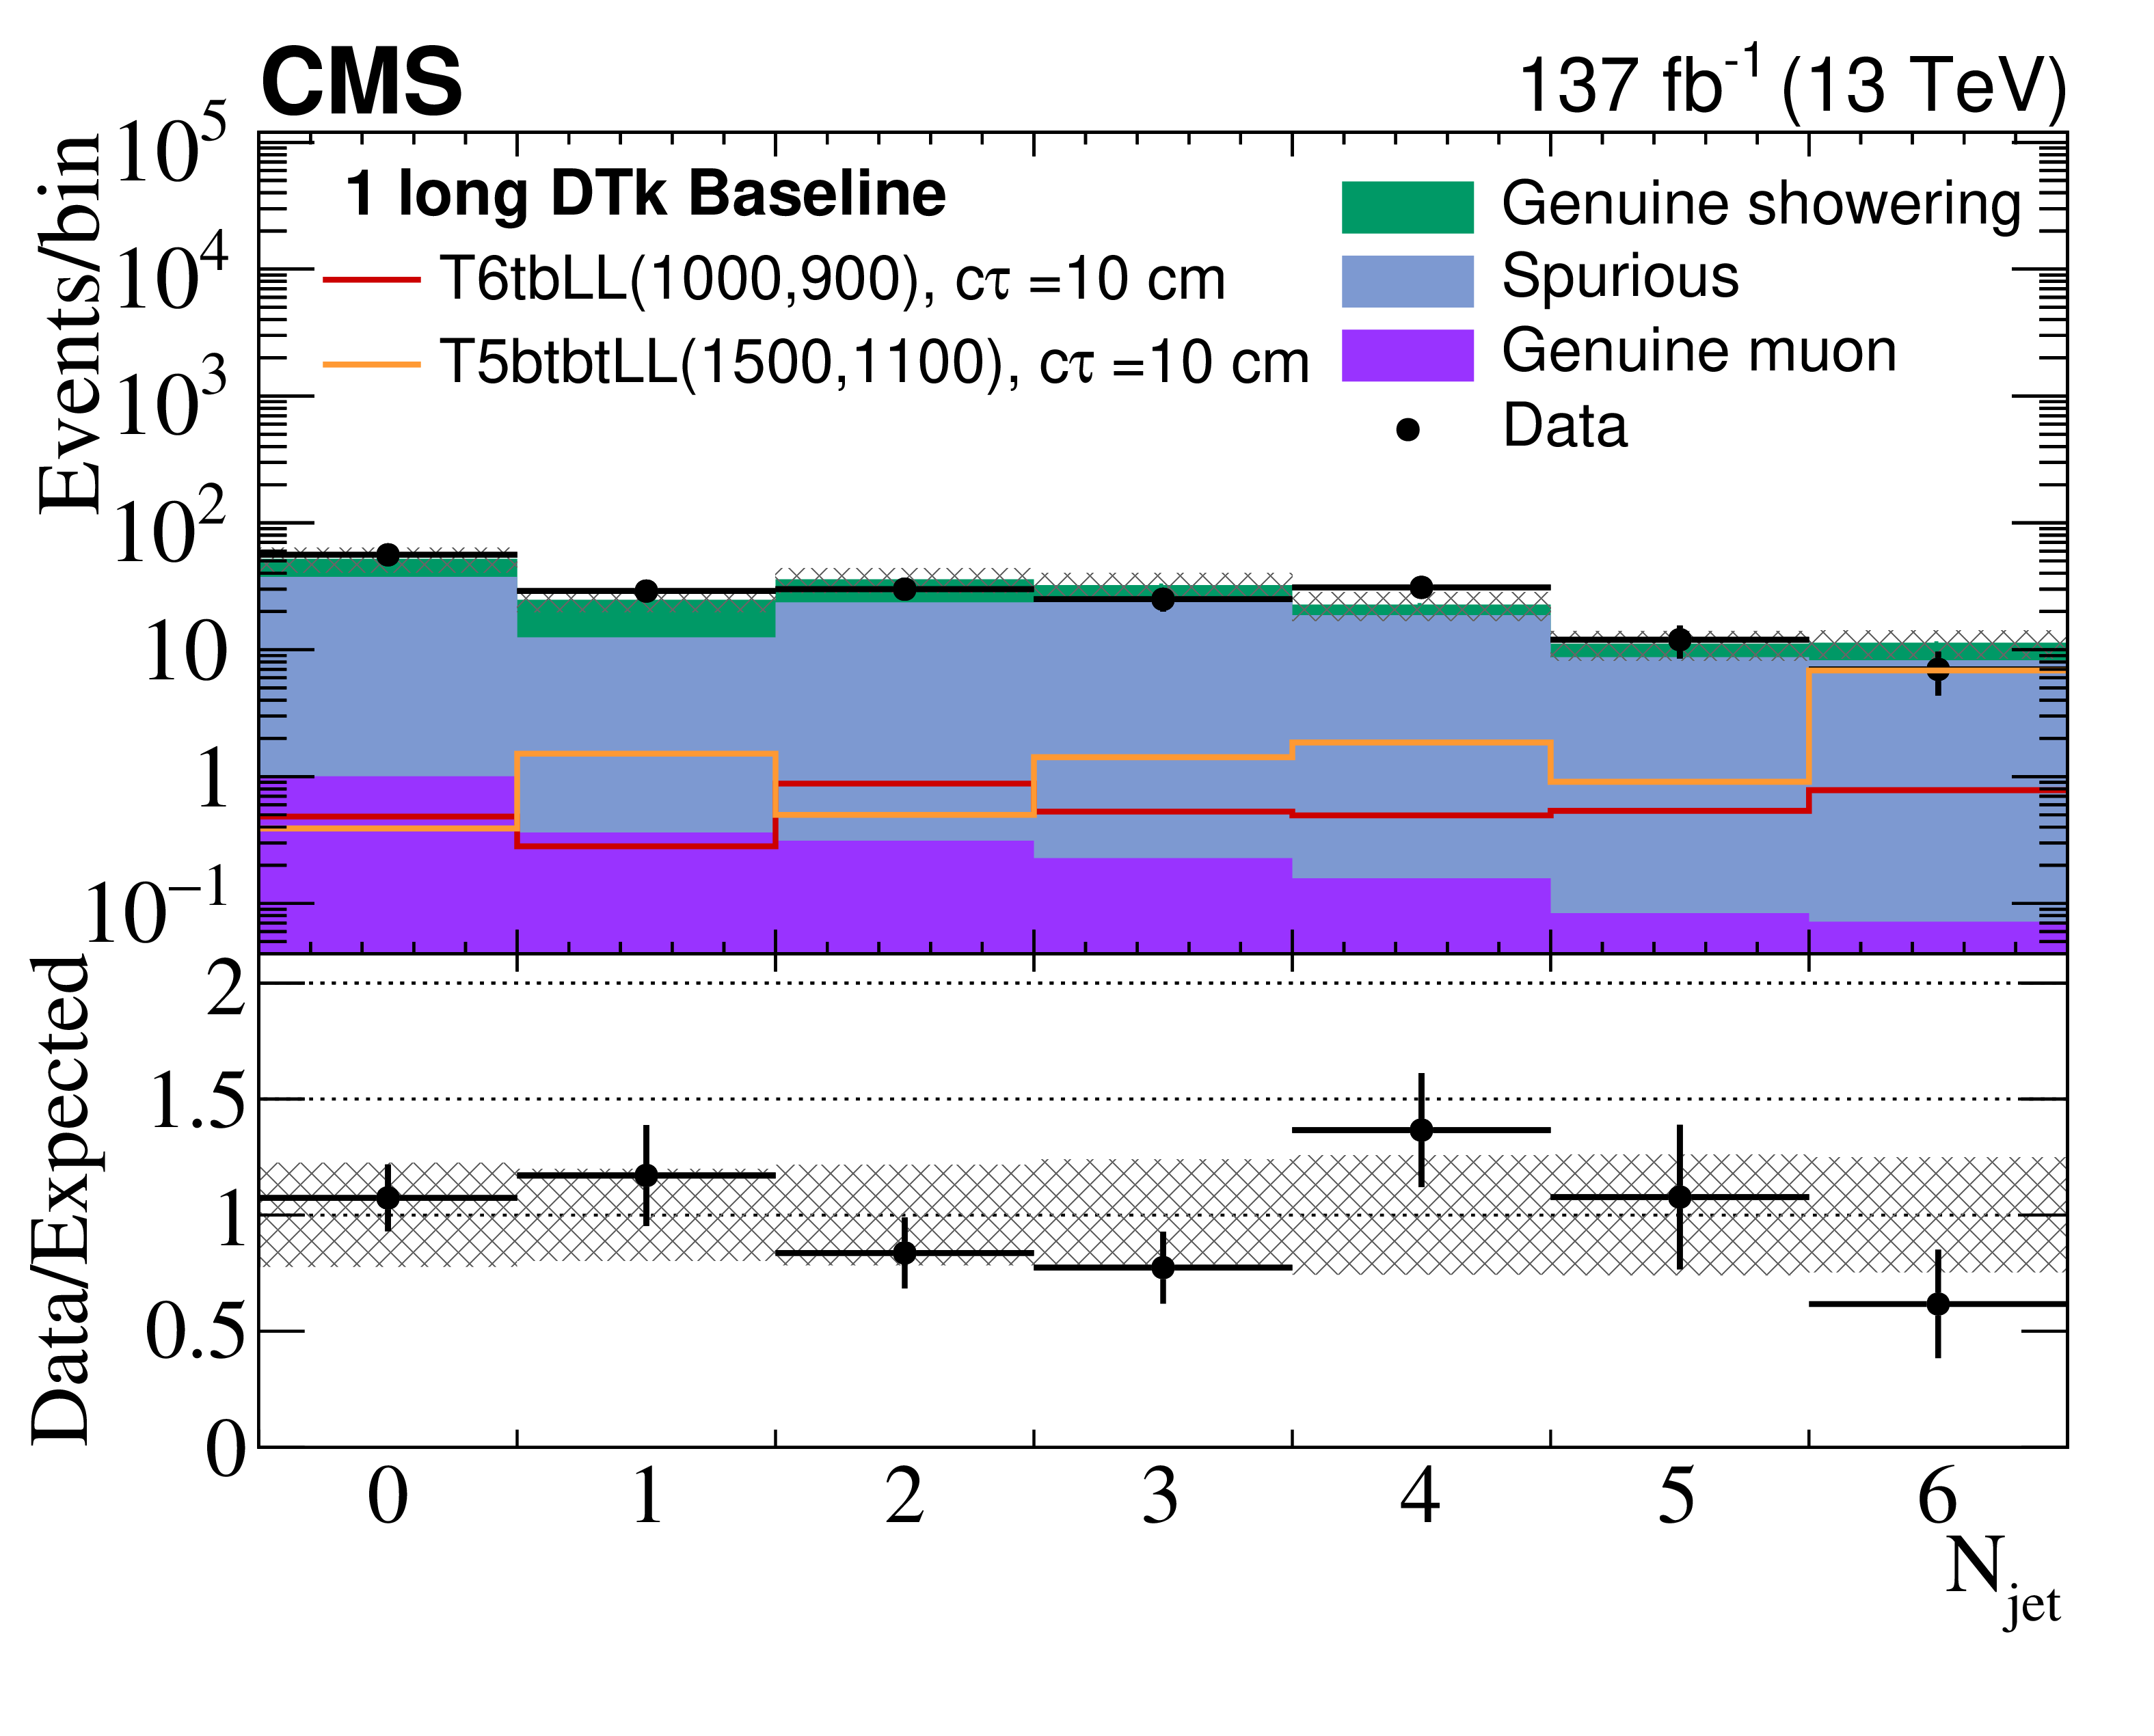
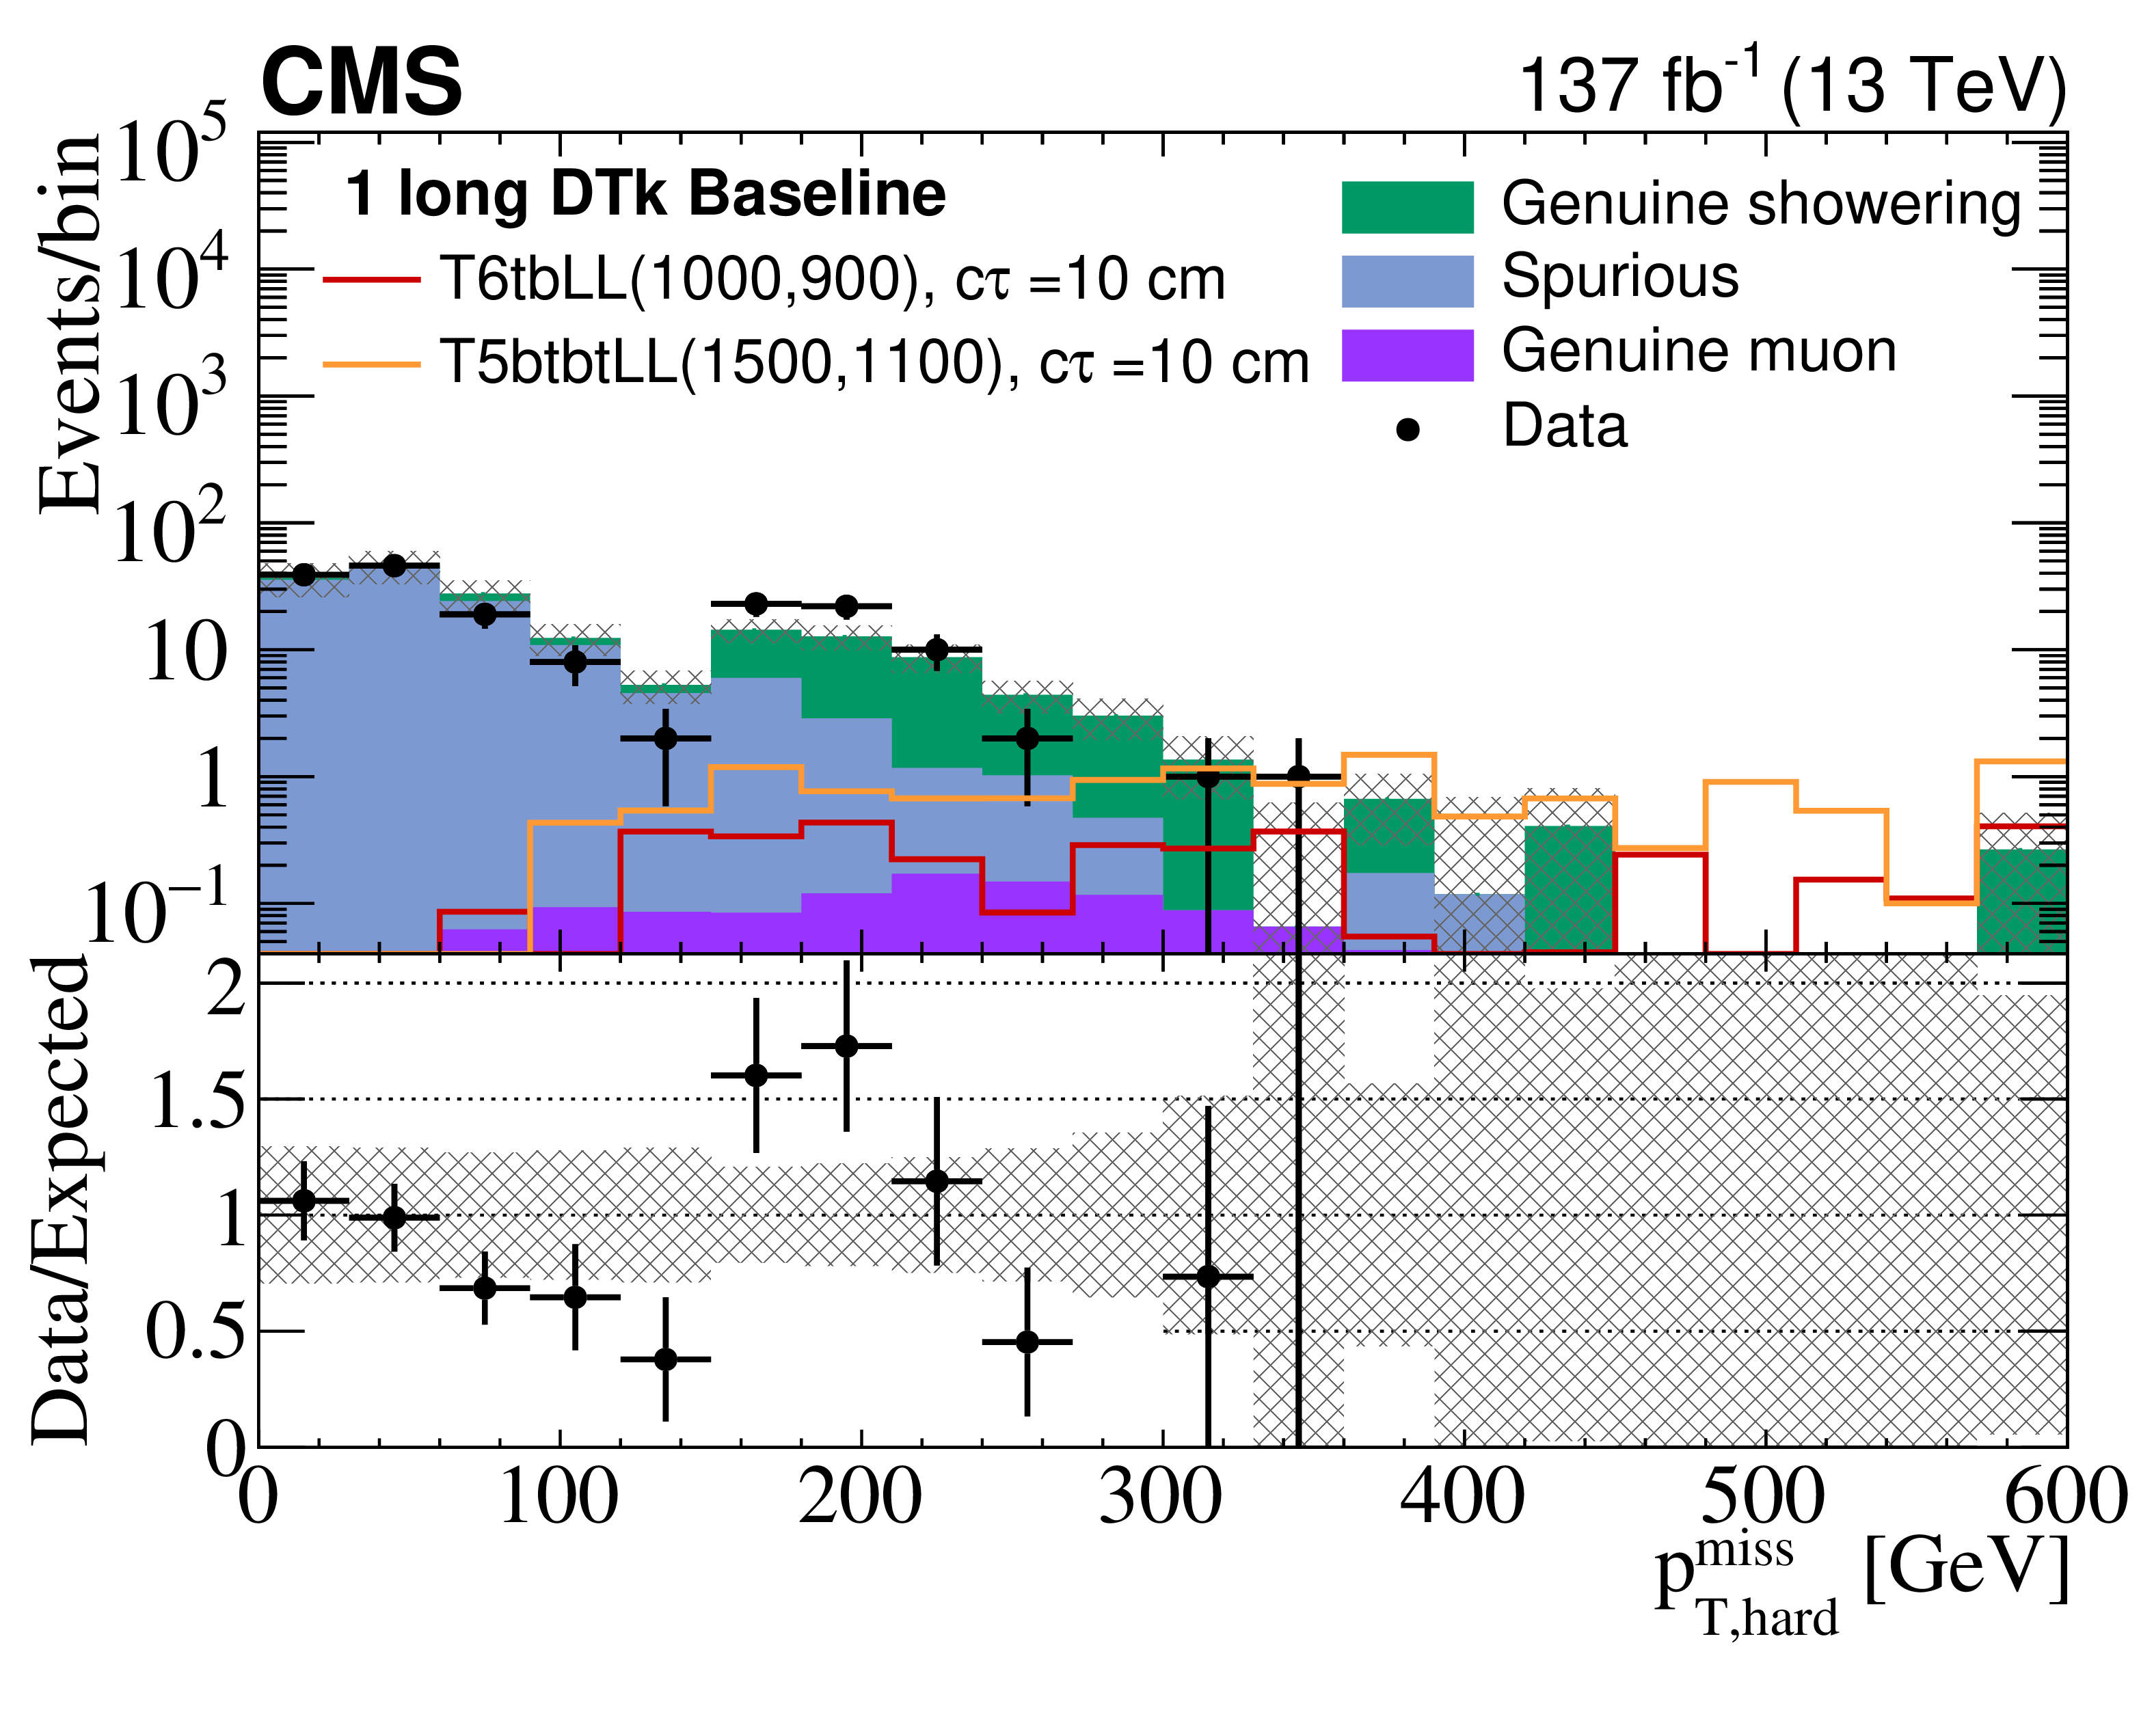
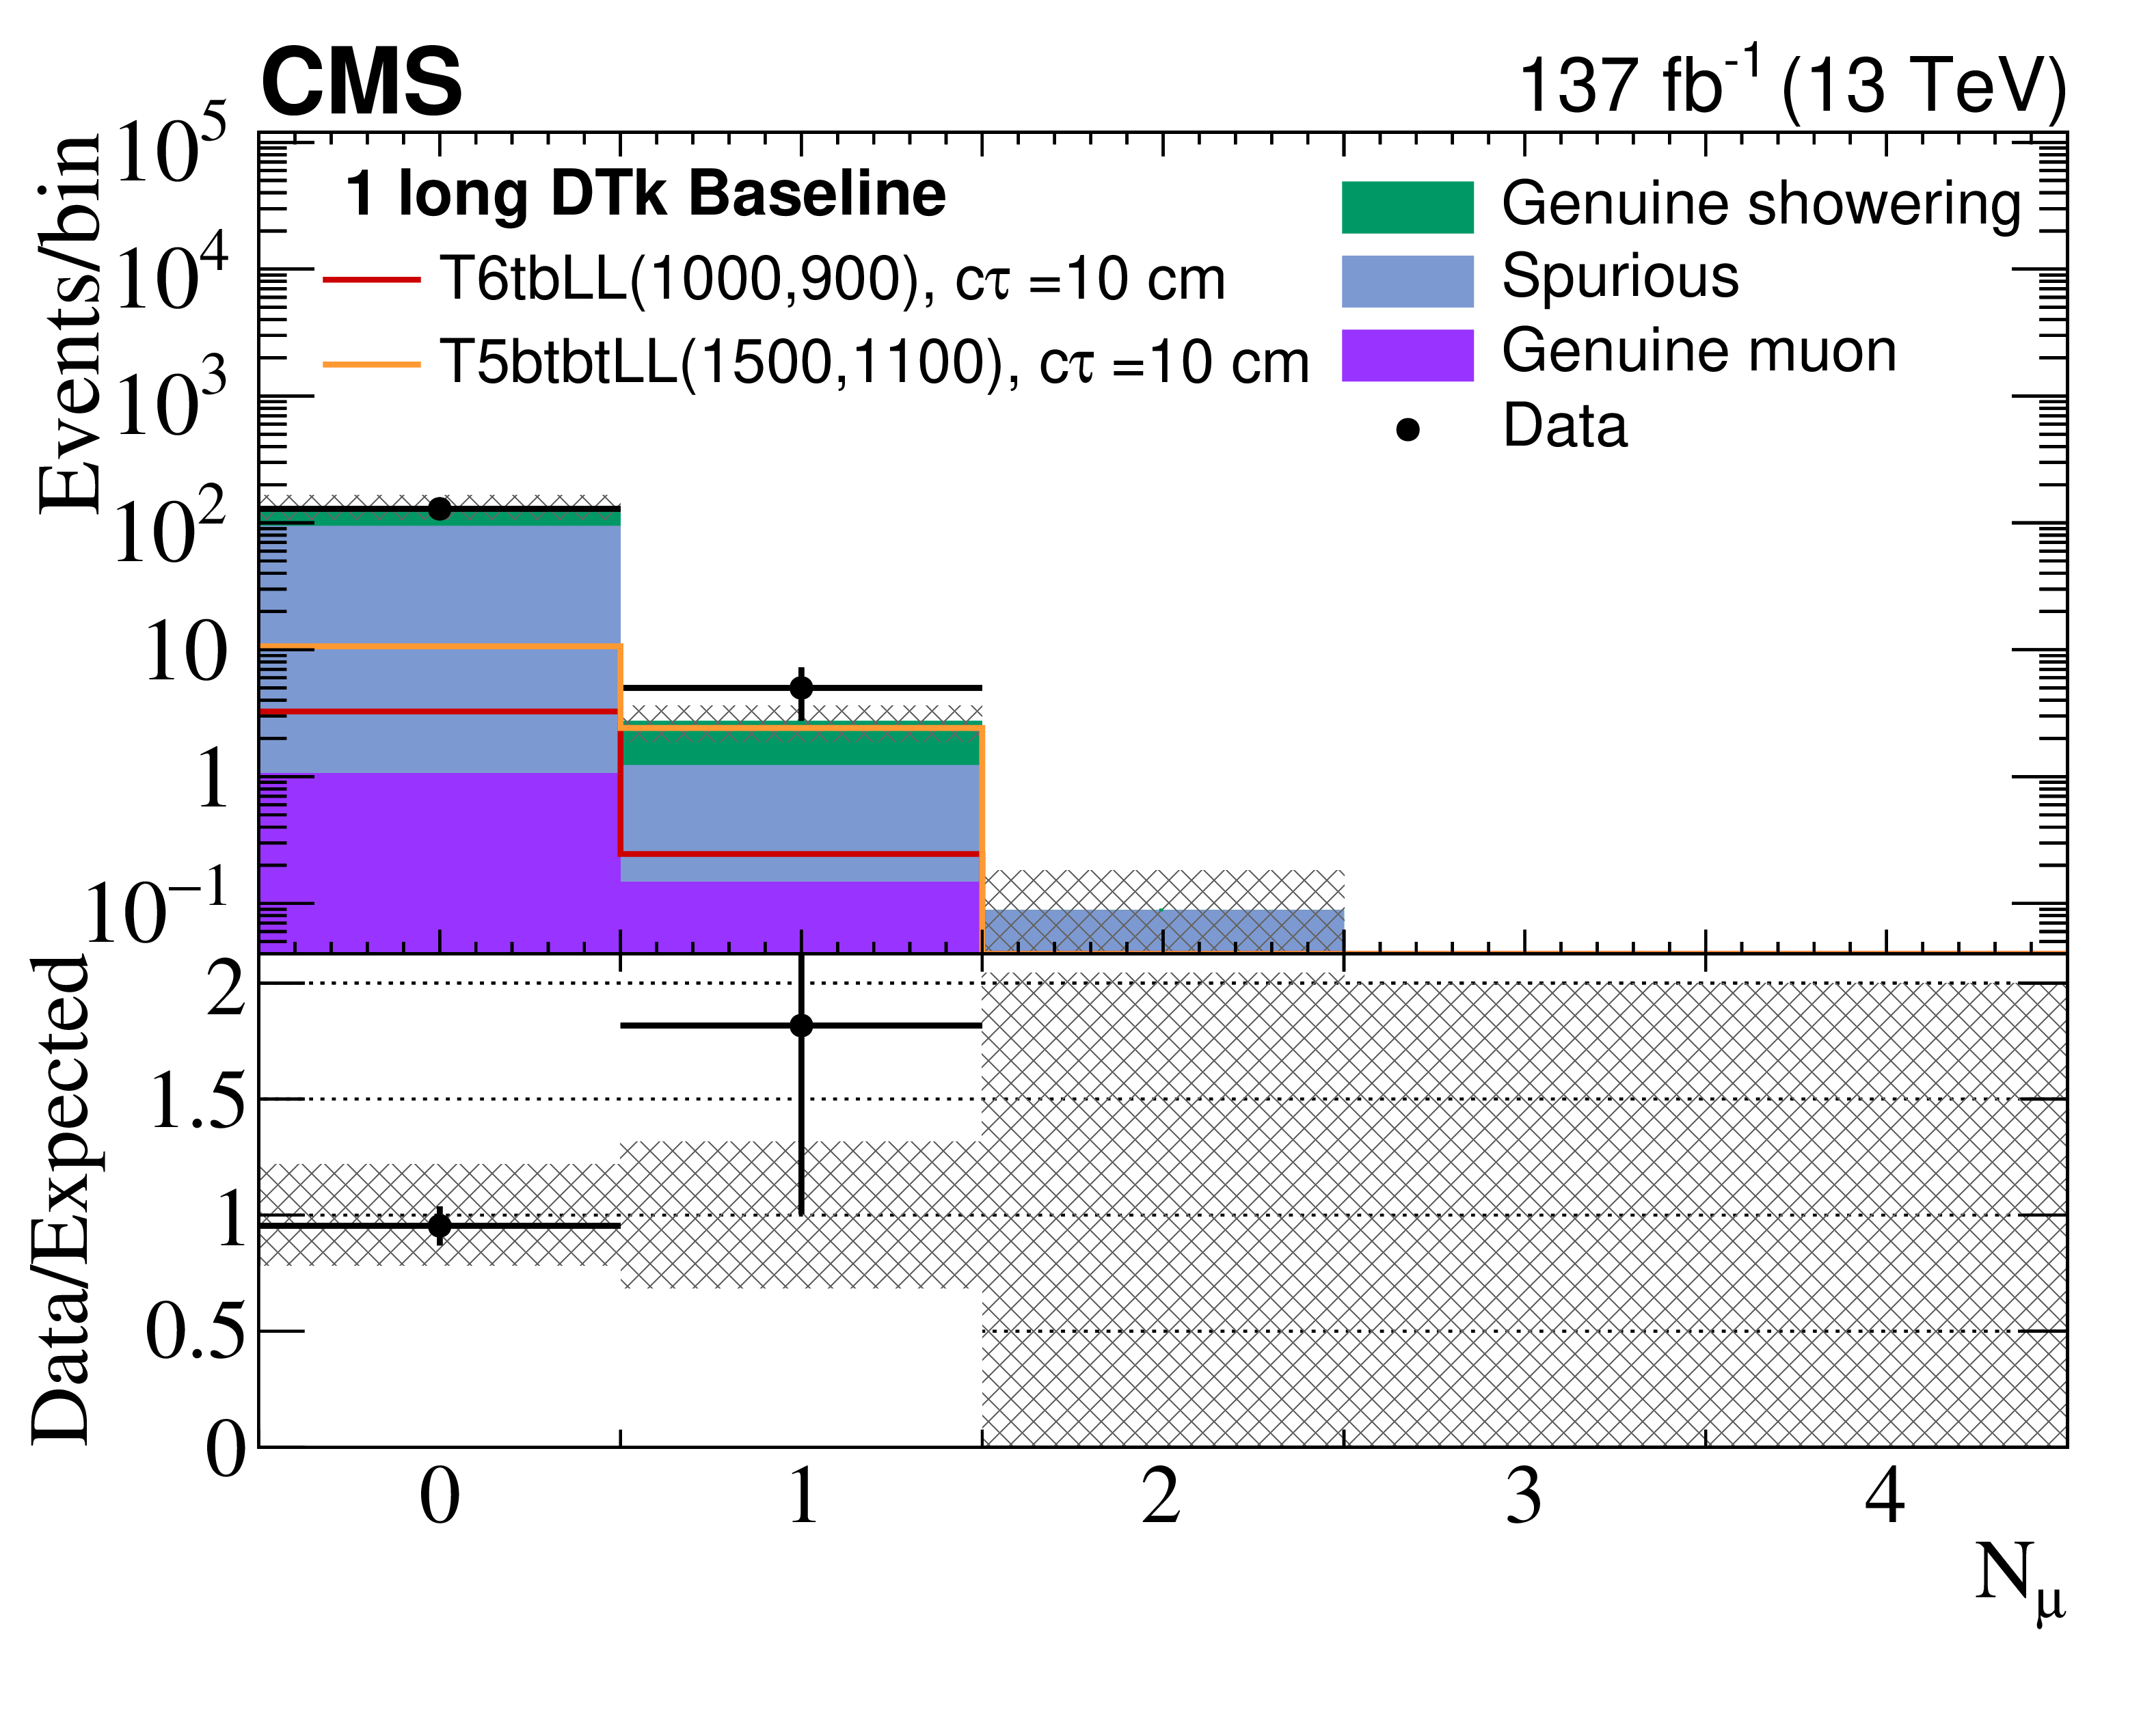
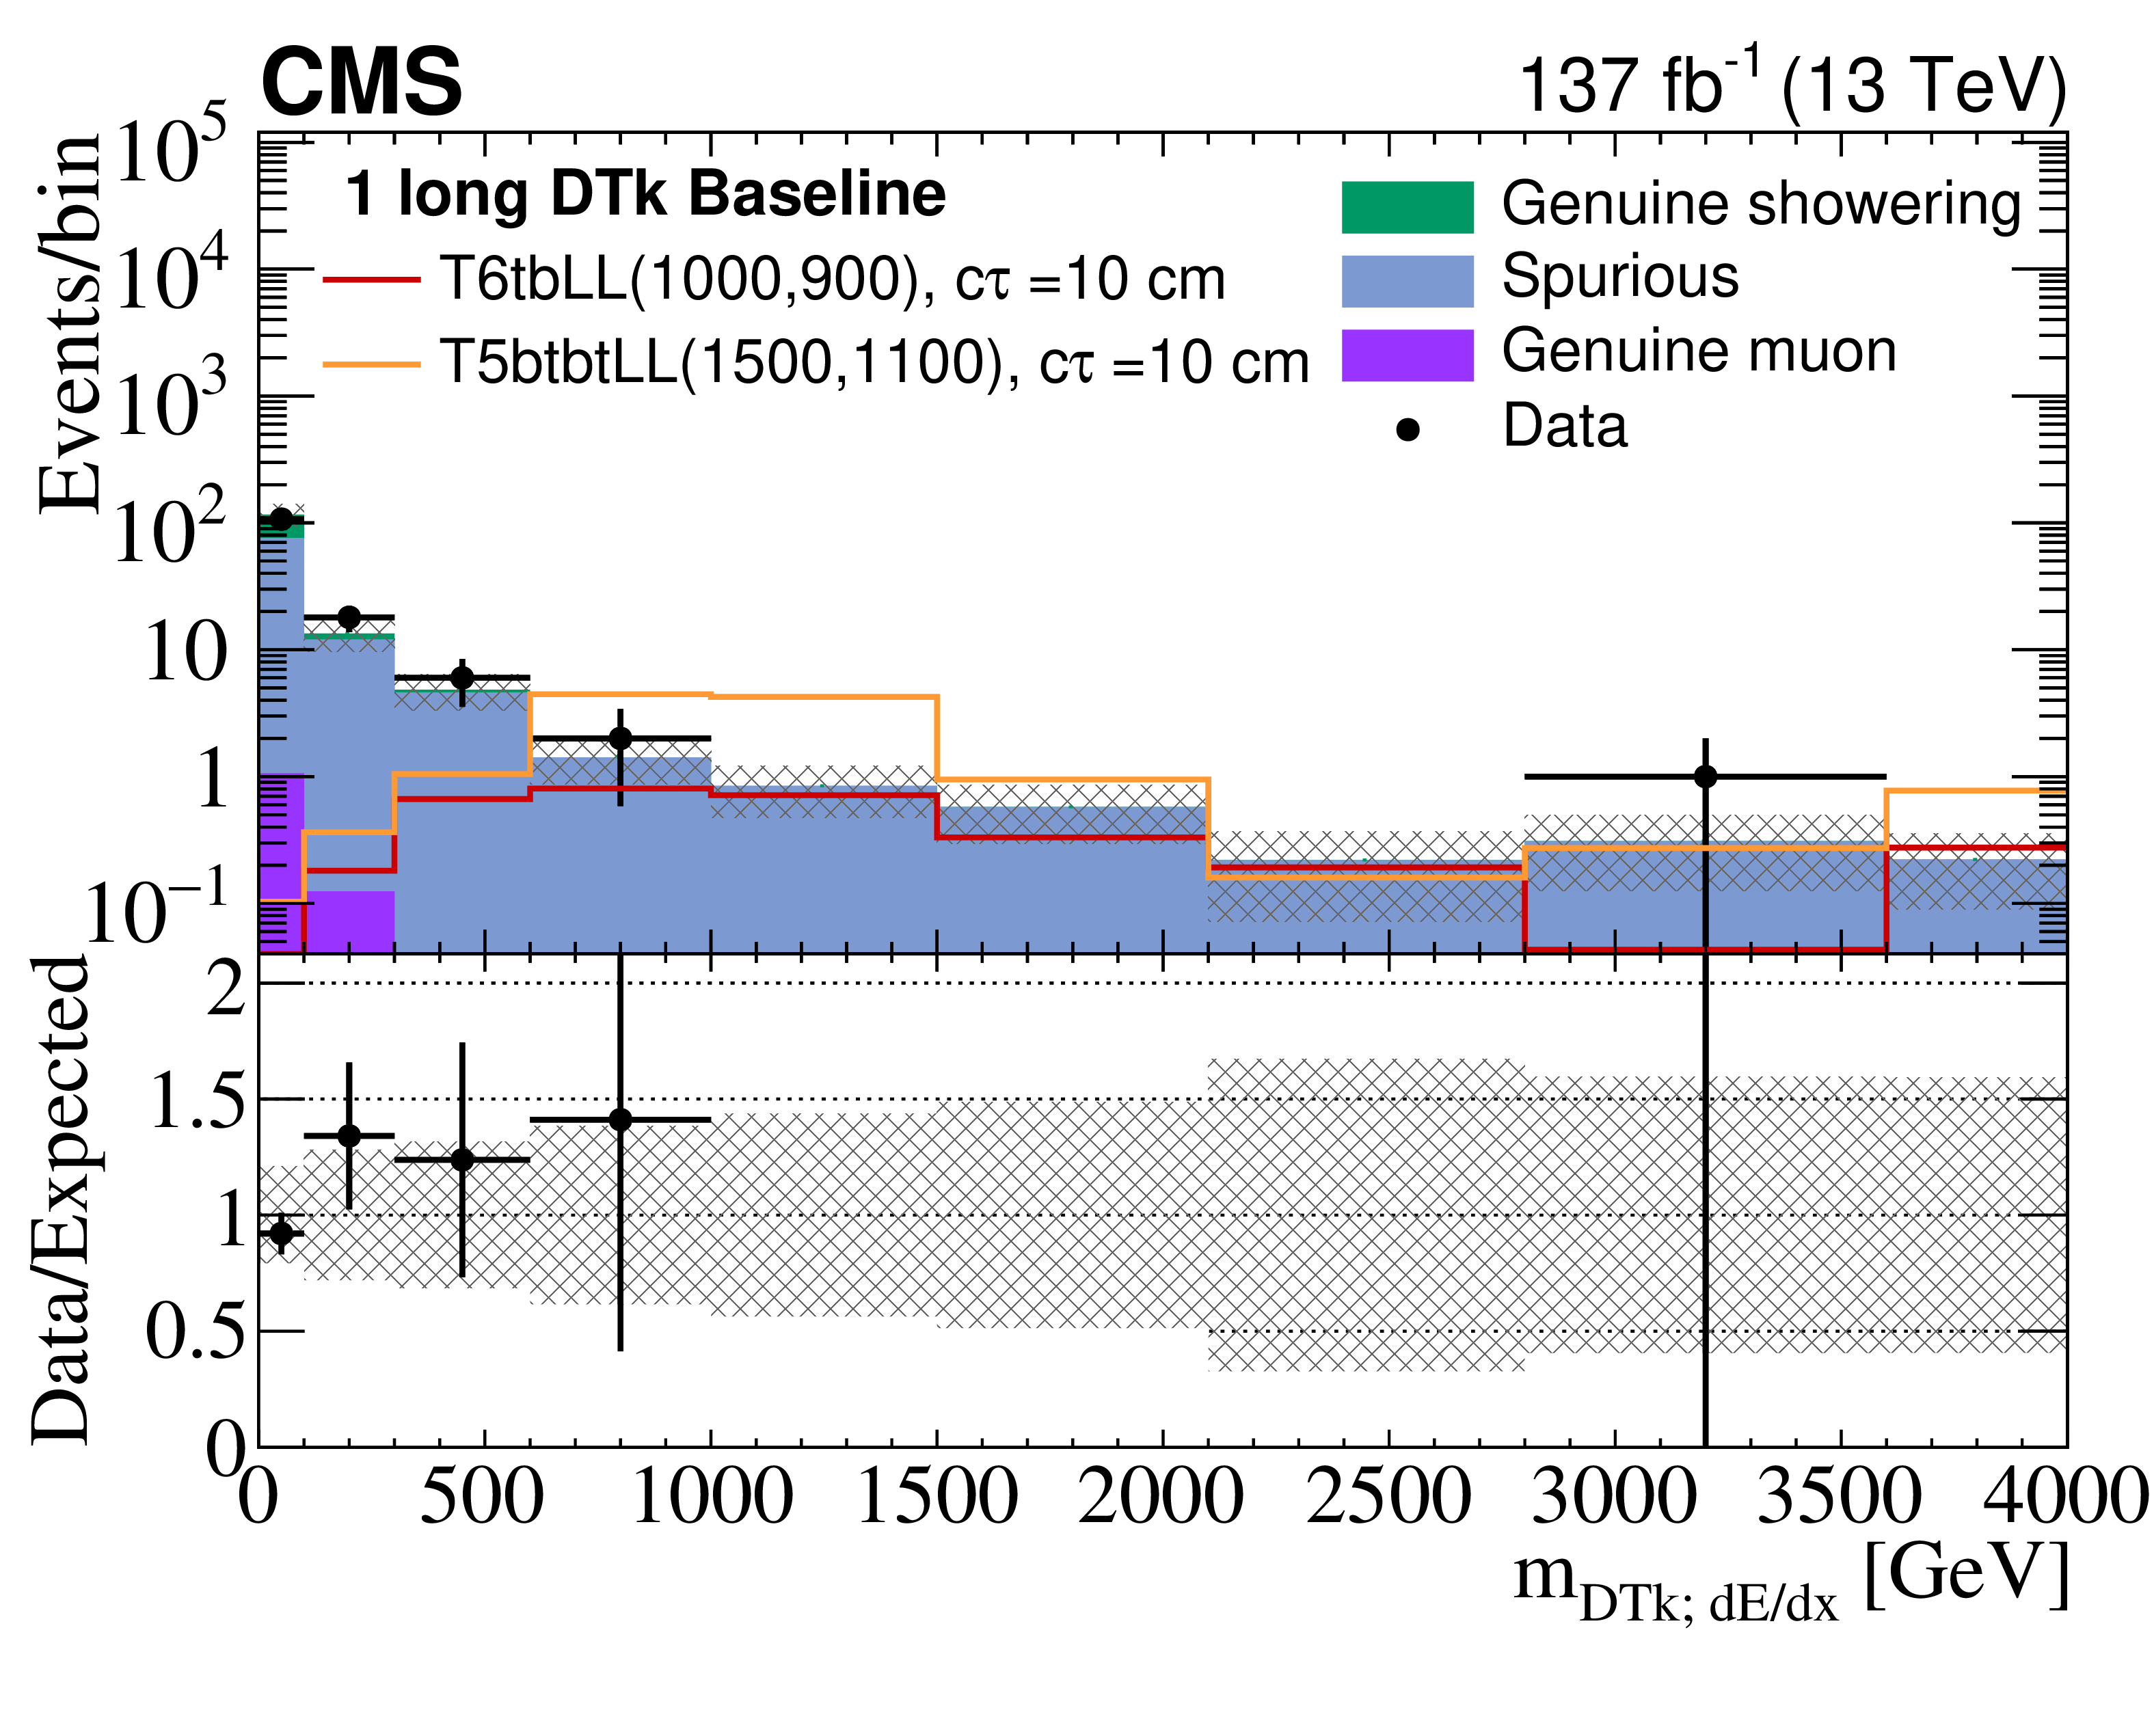
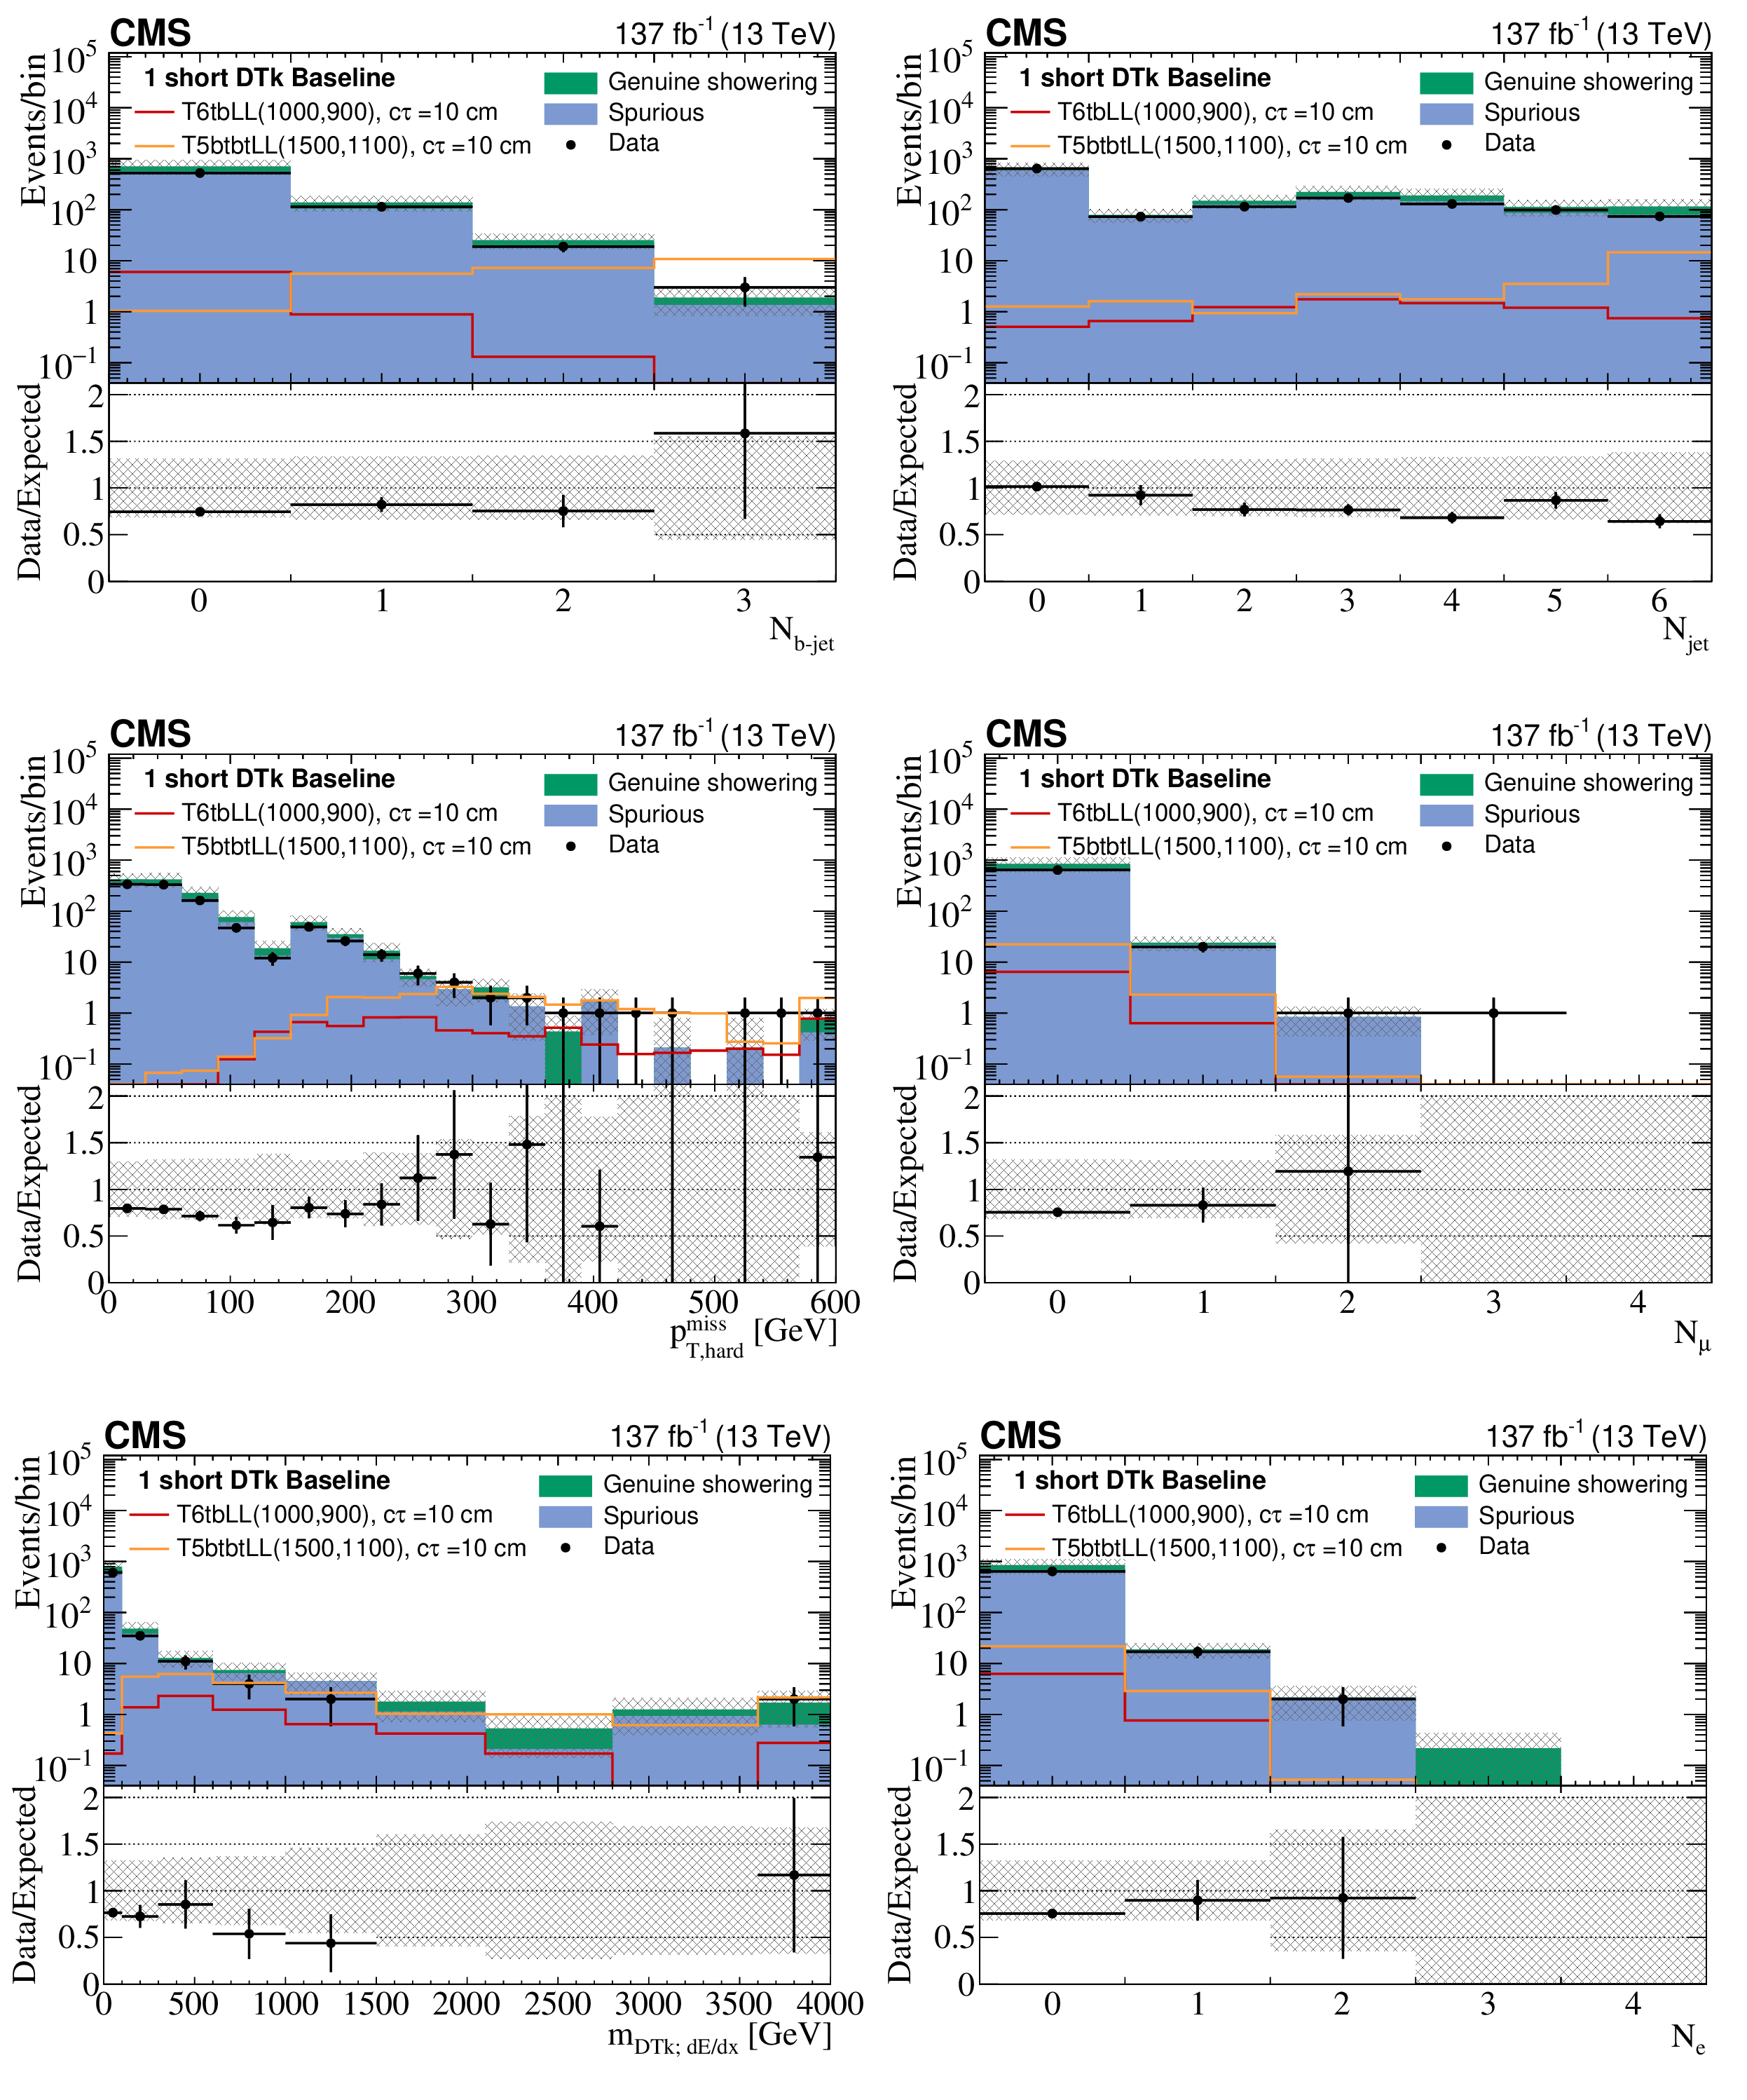
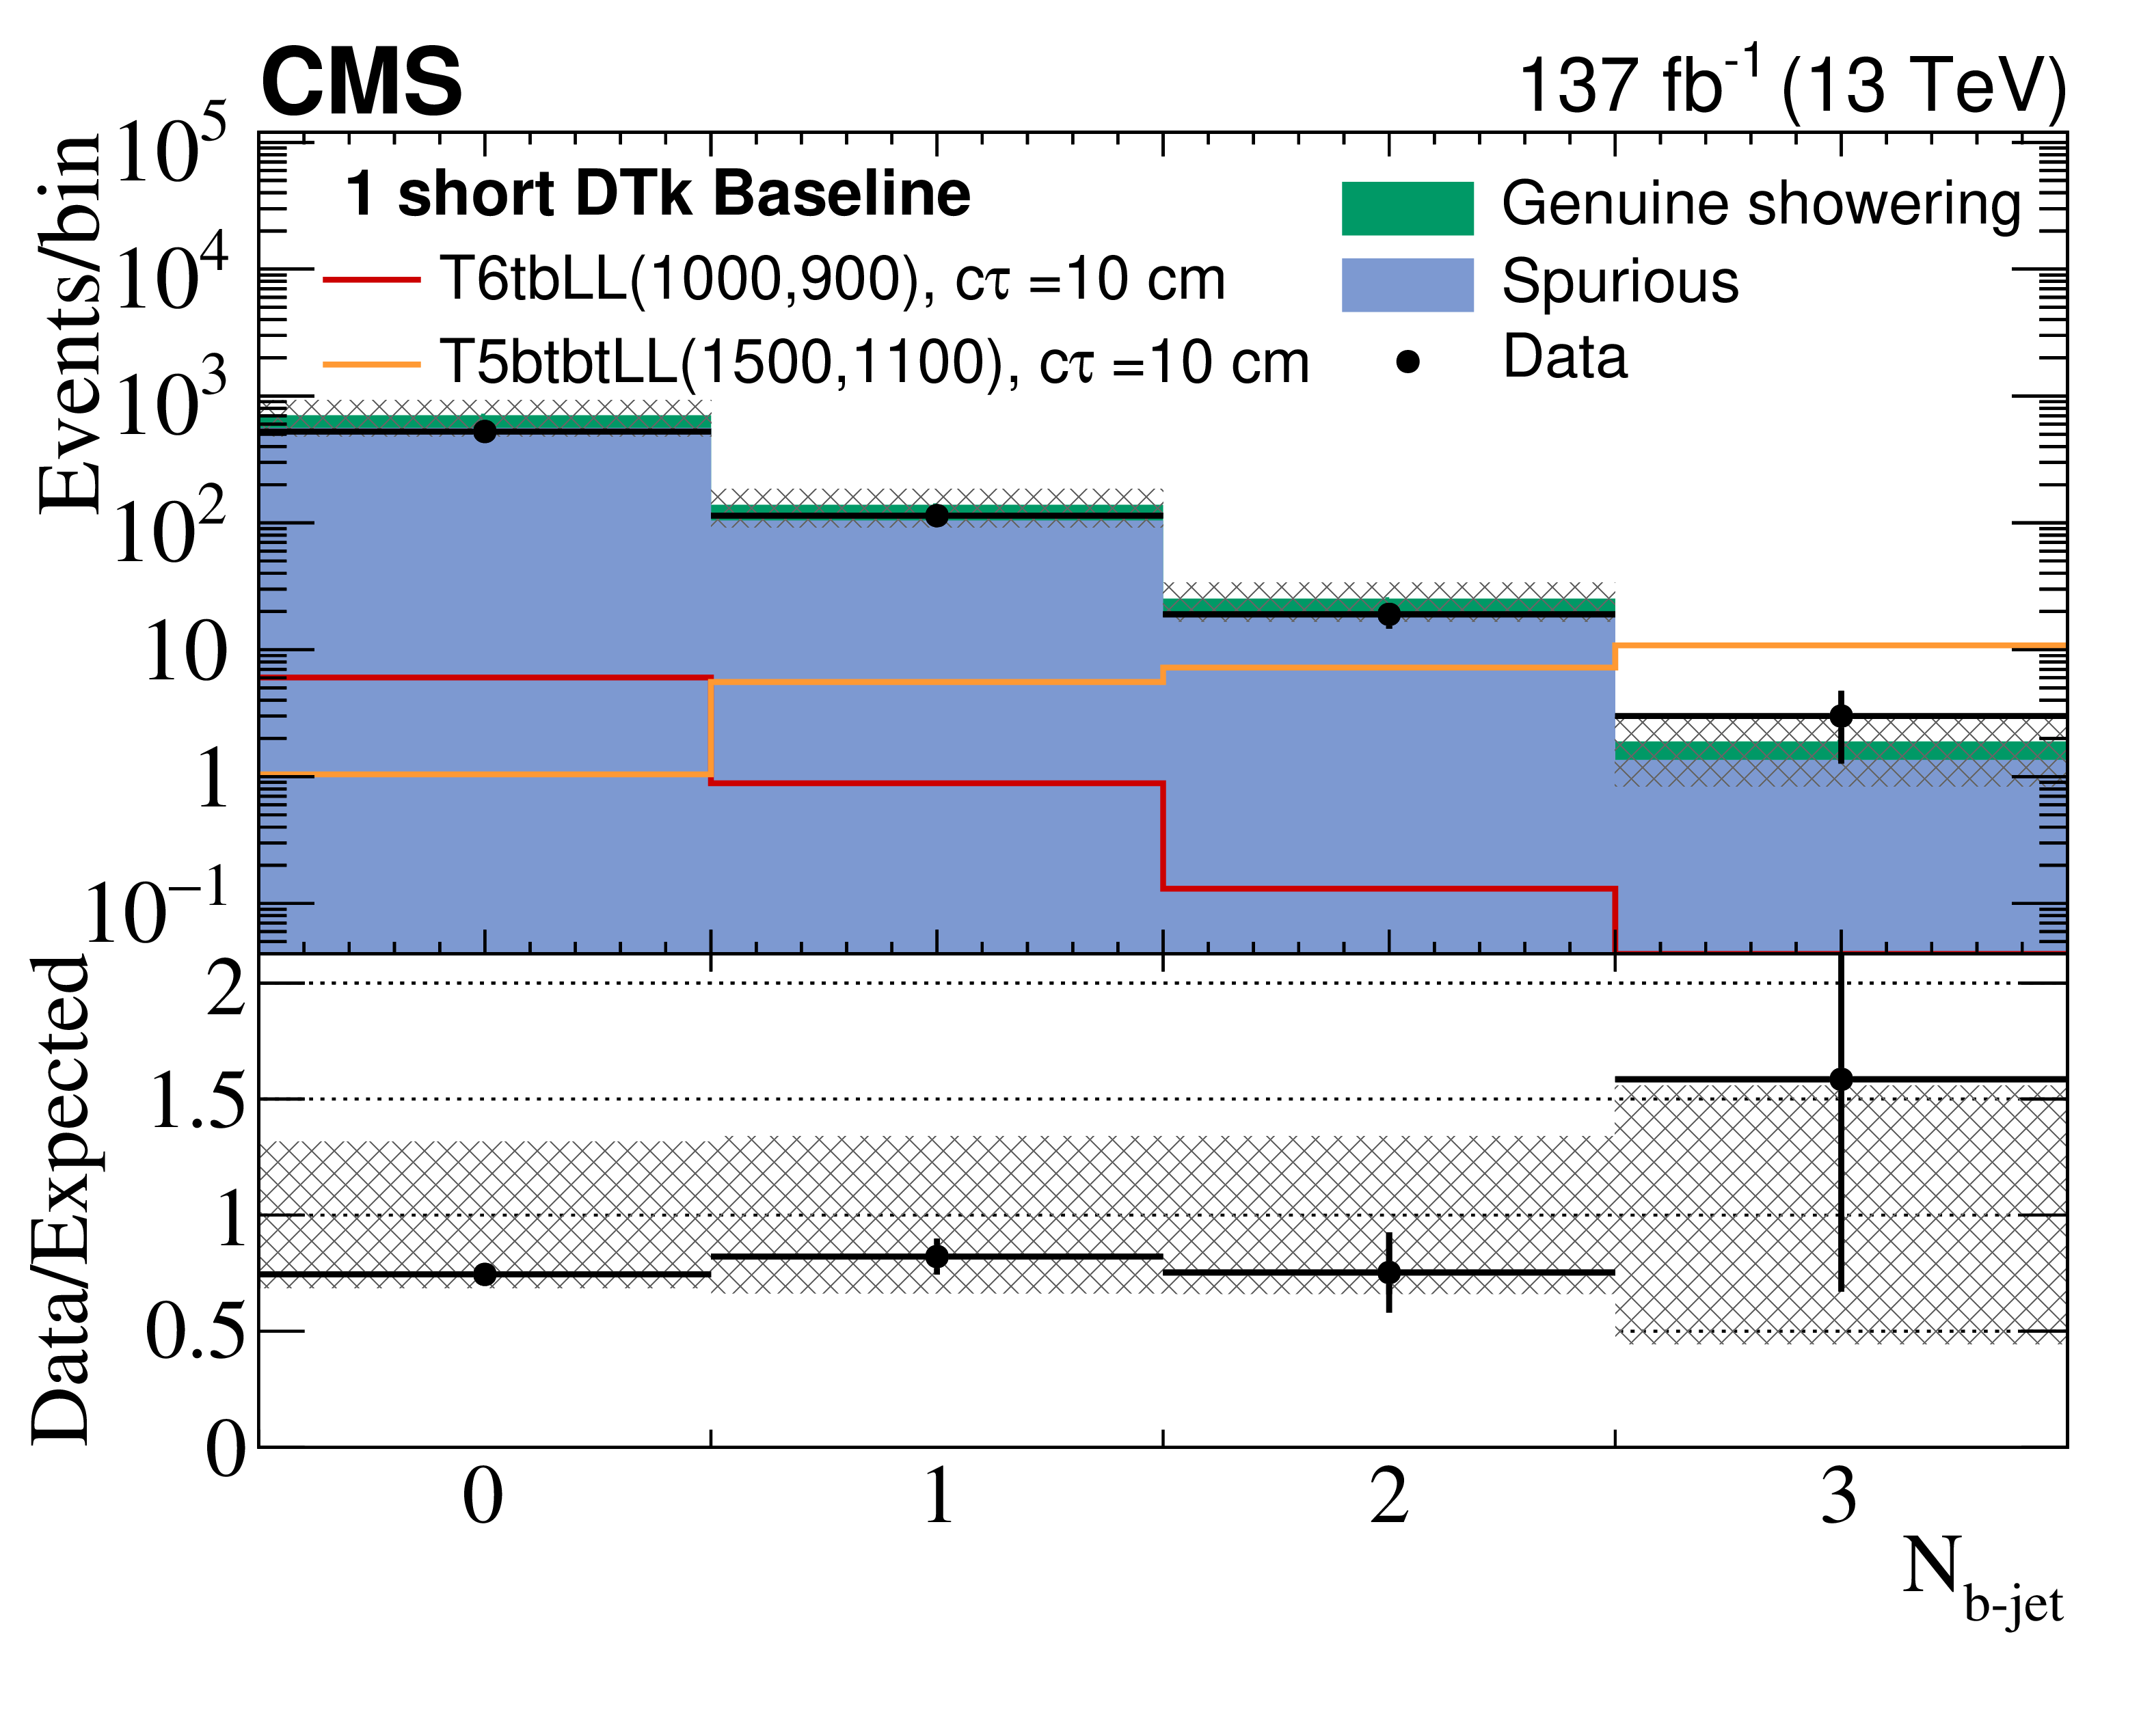
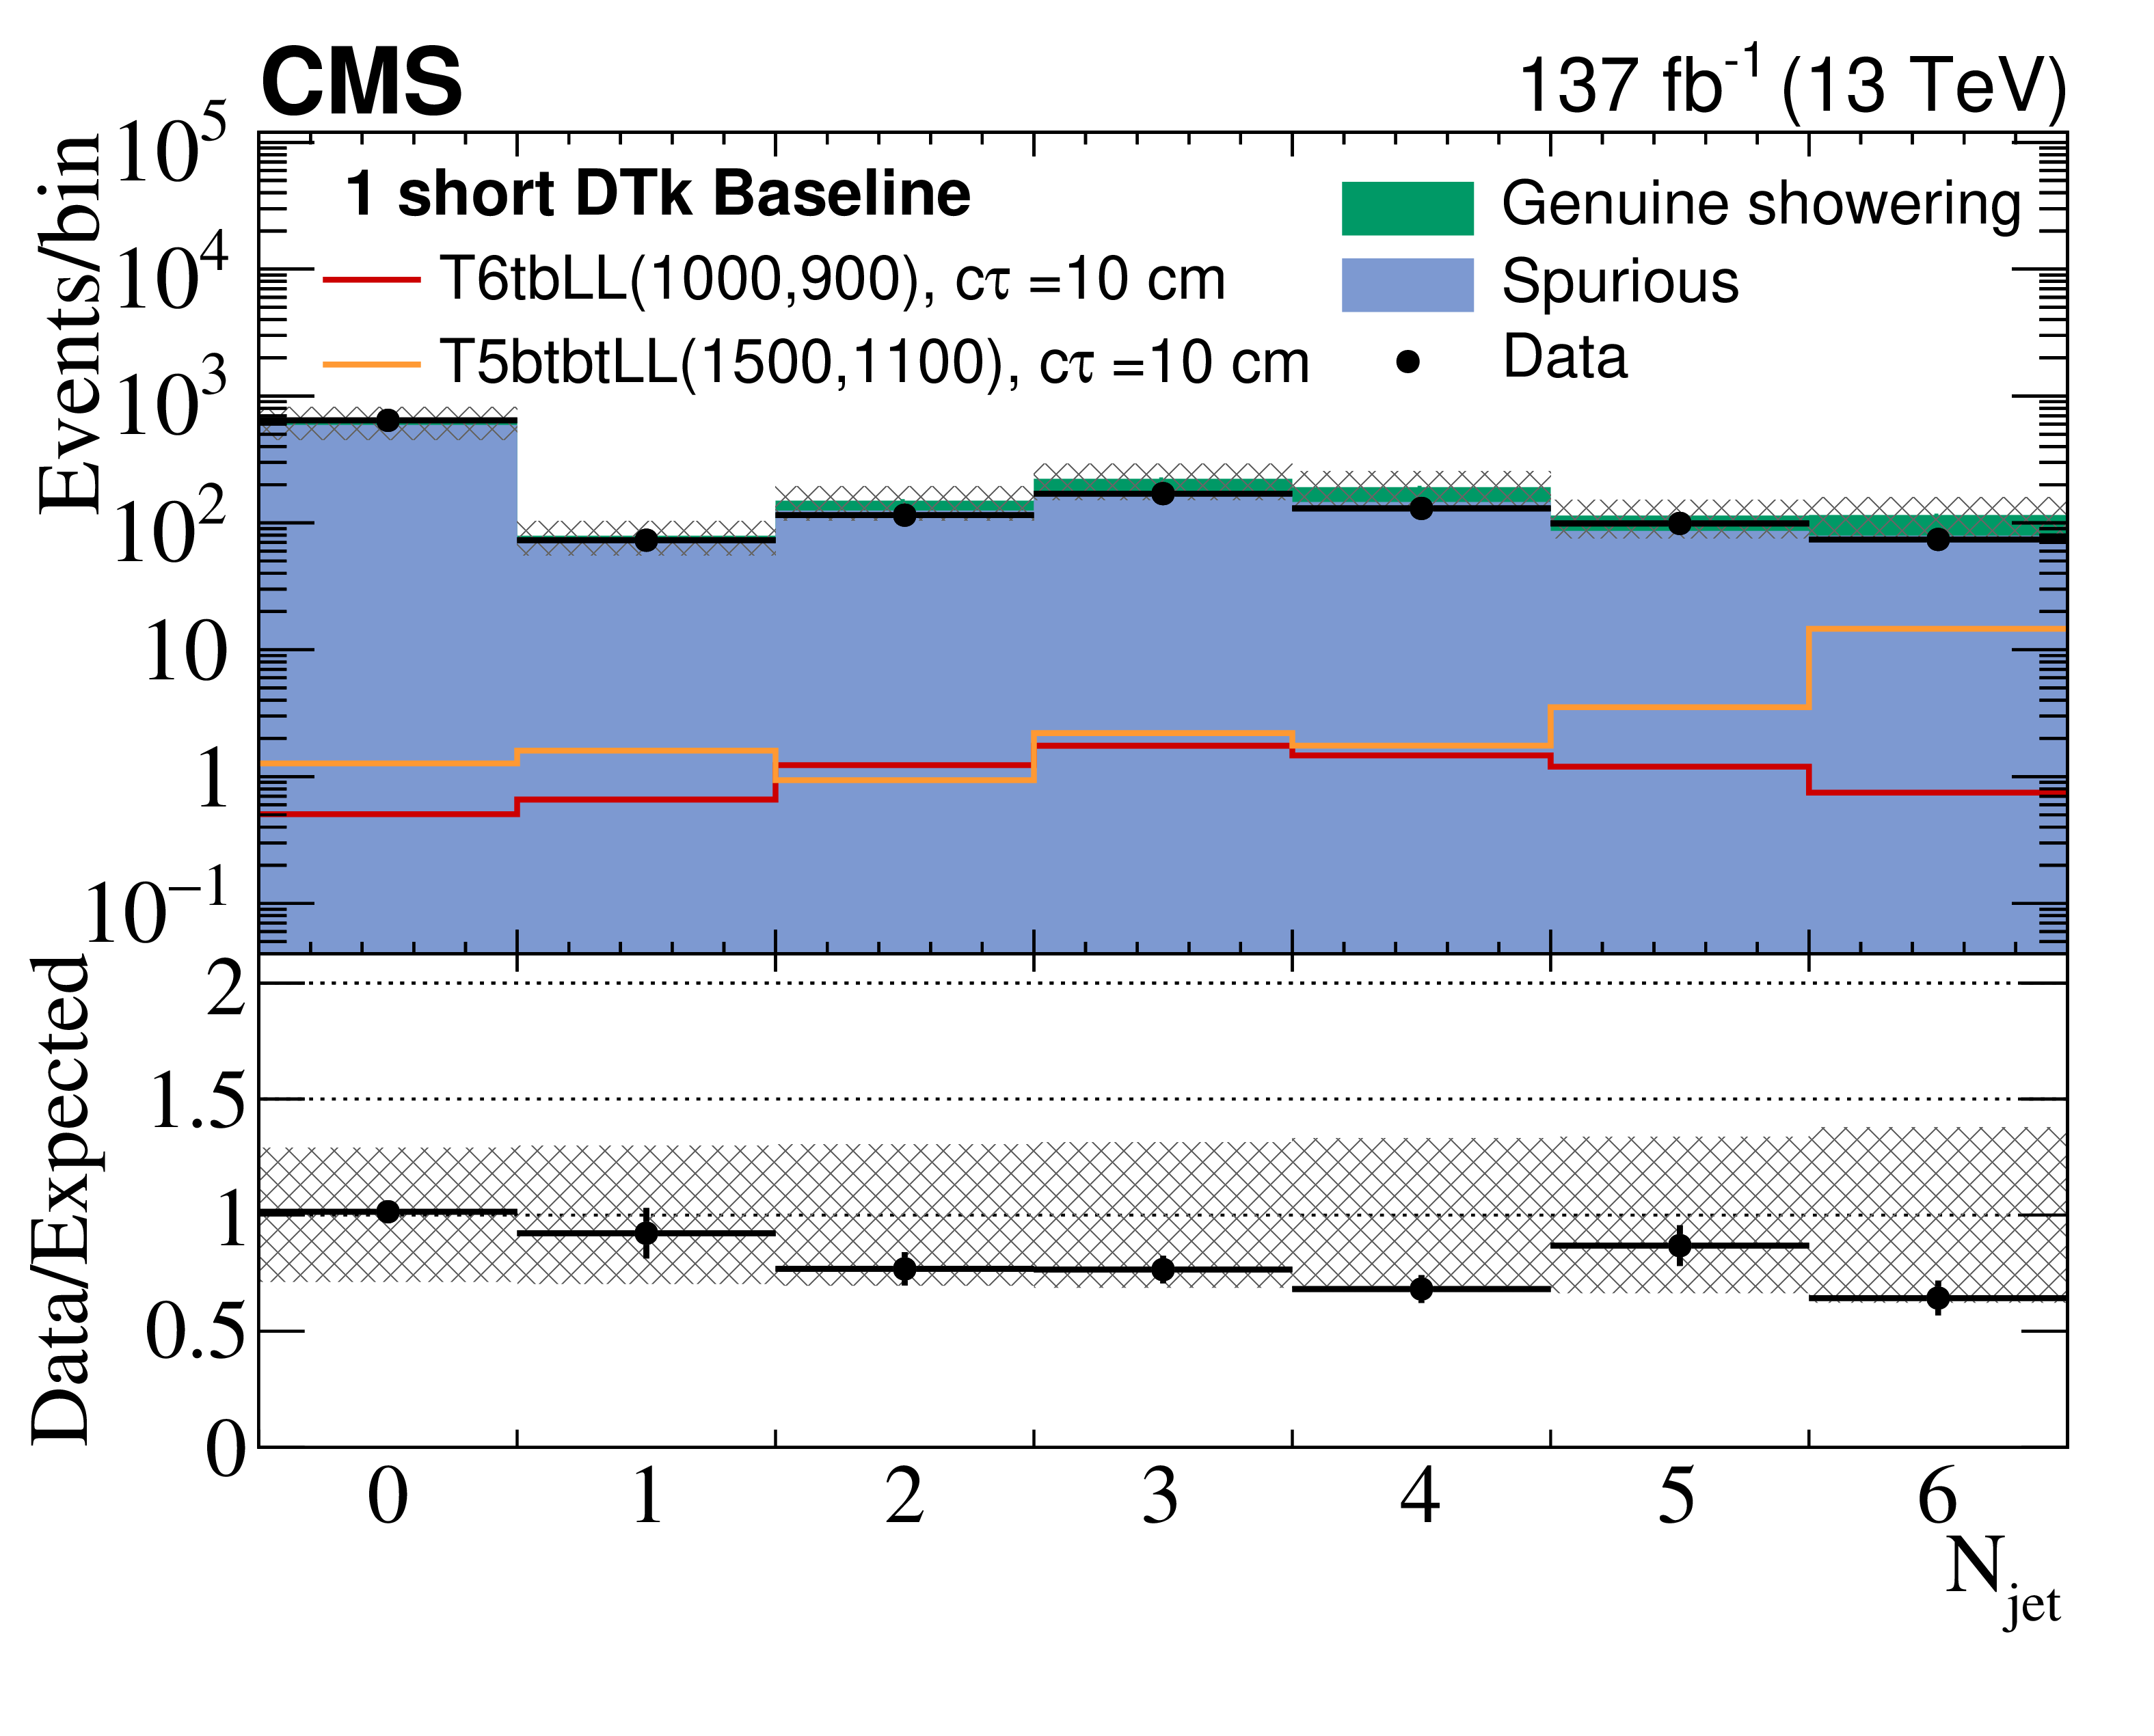
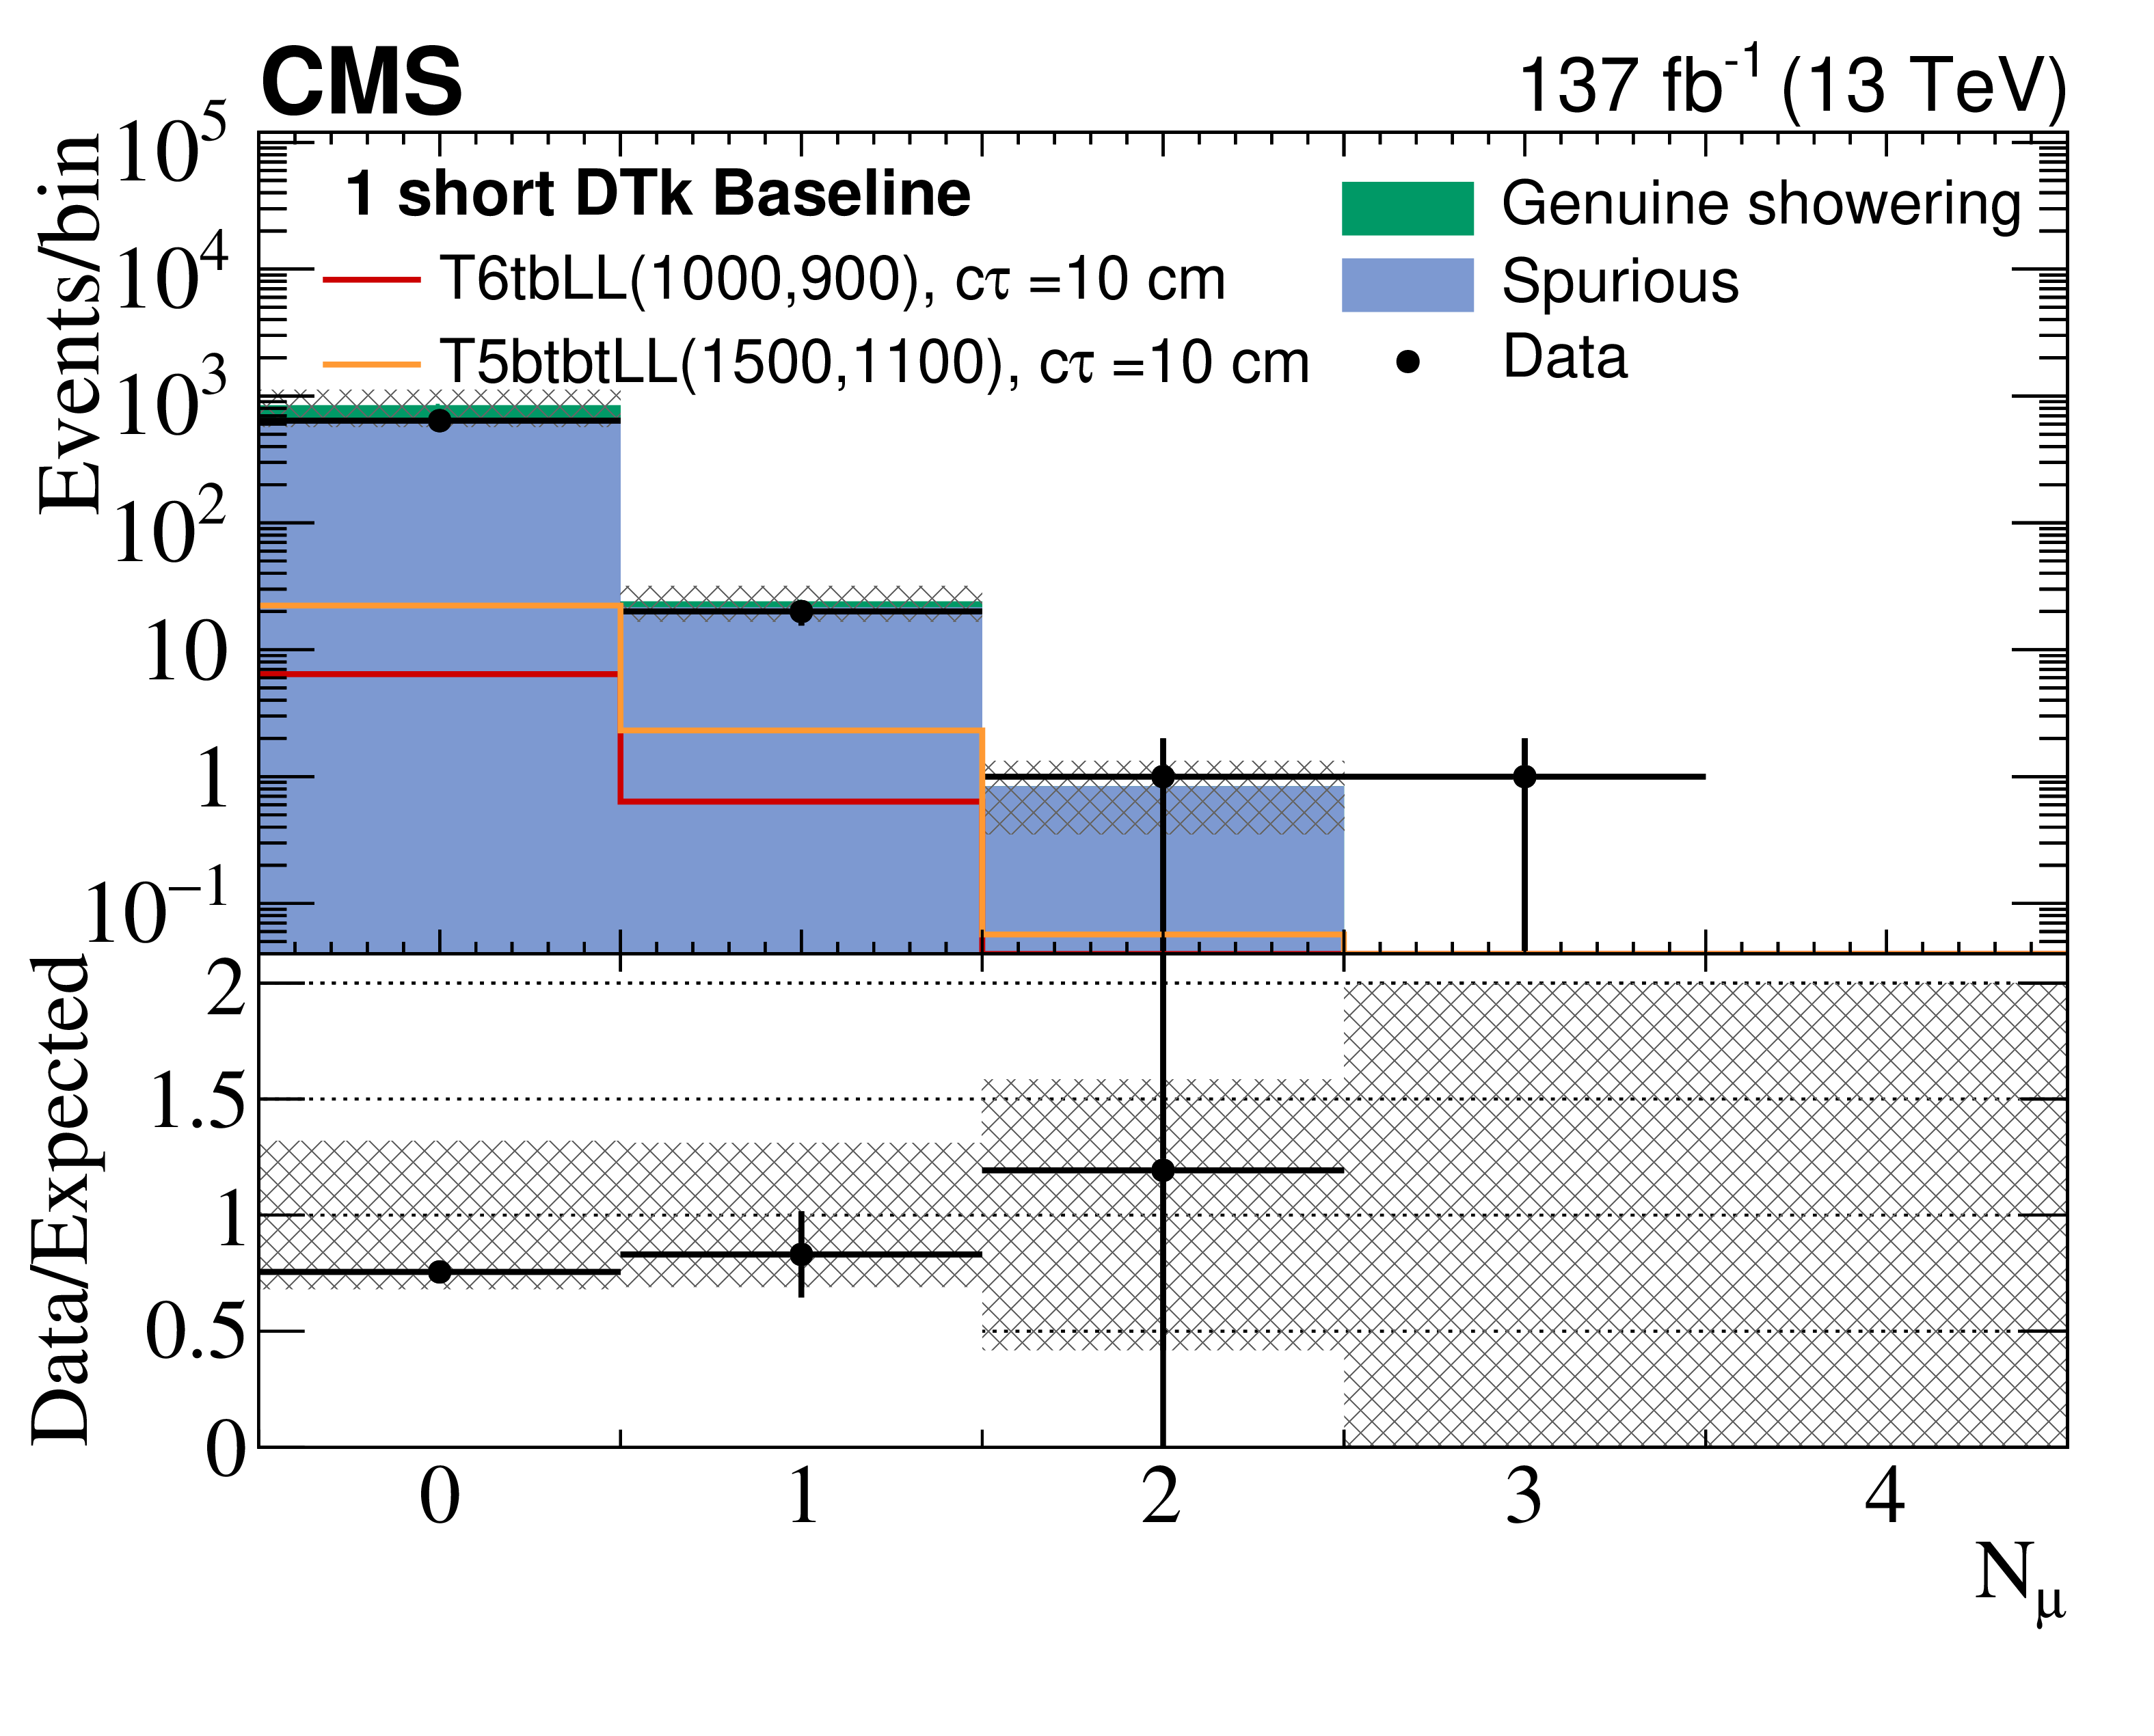
Figure 7:
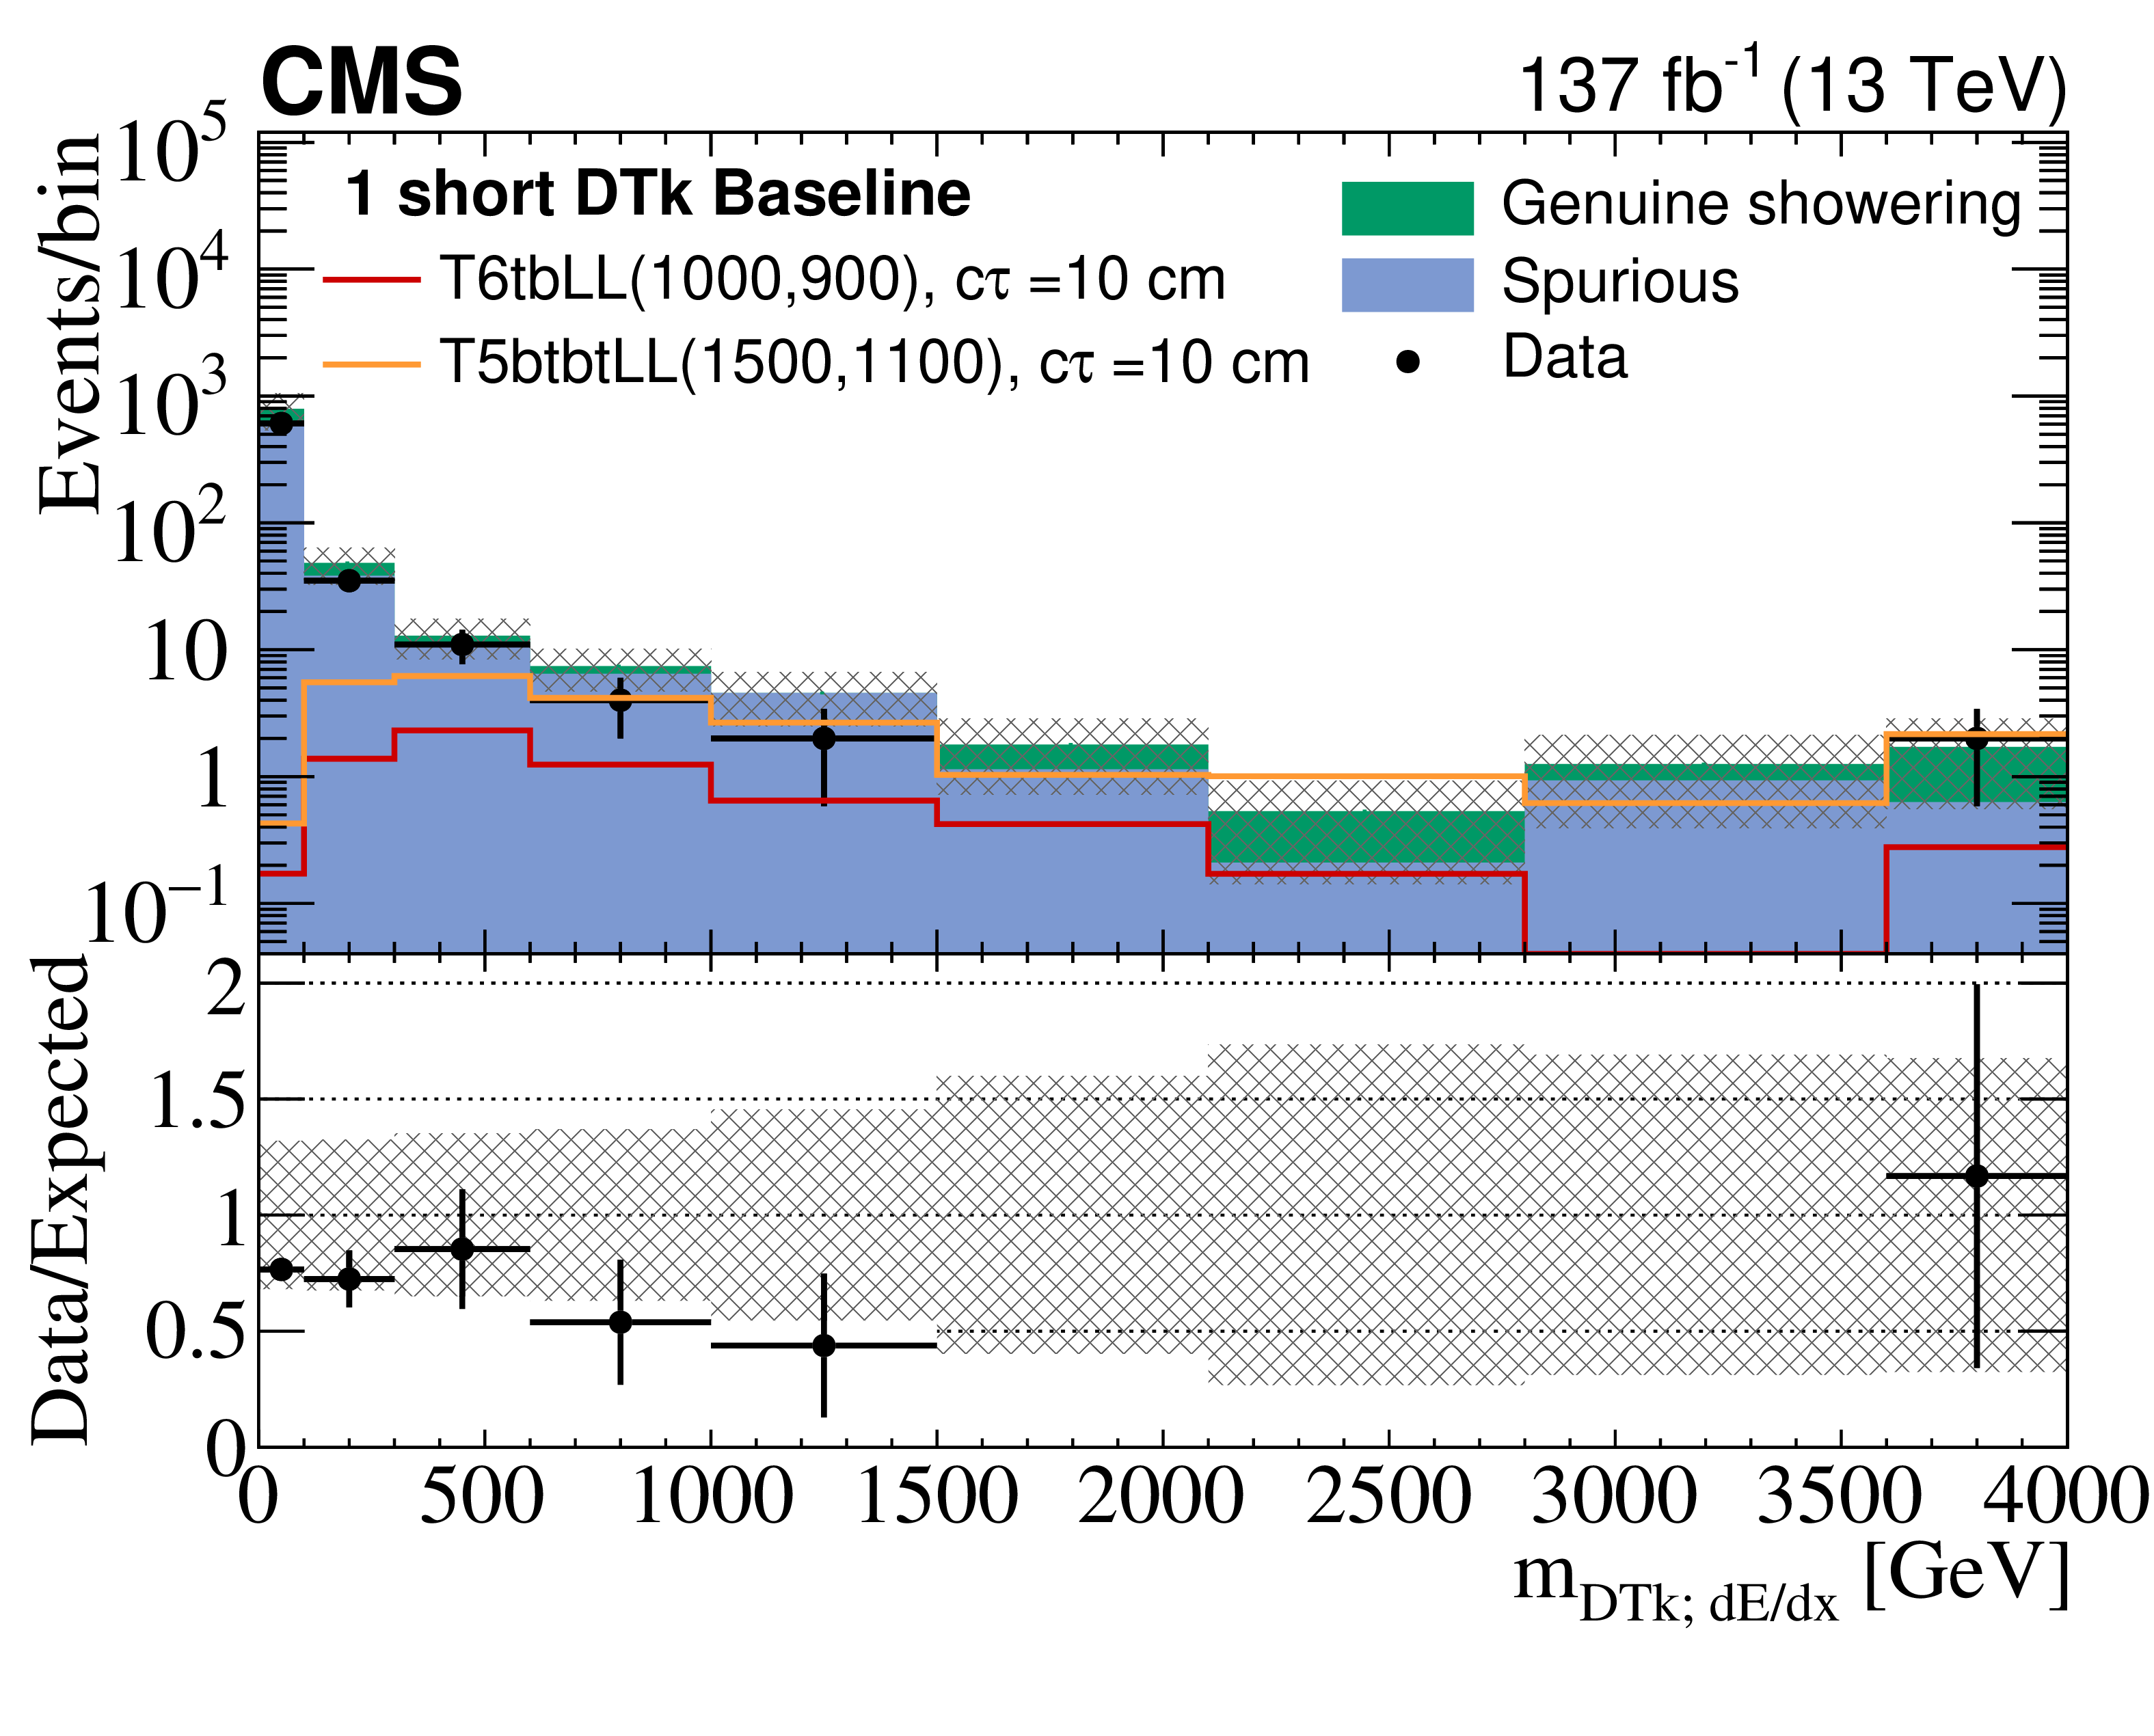
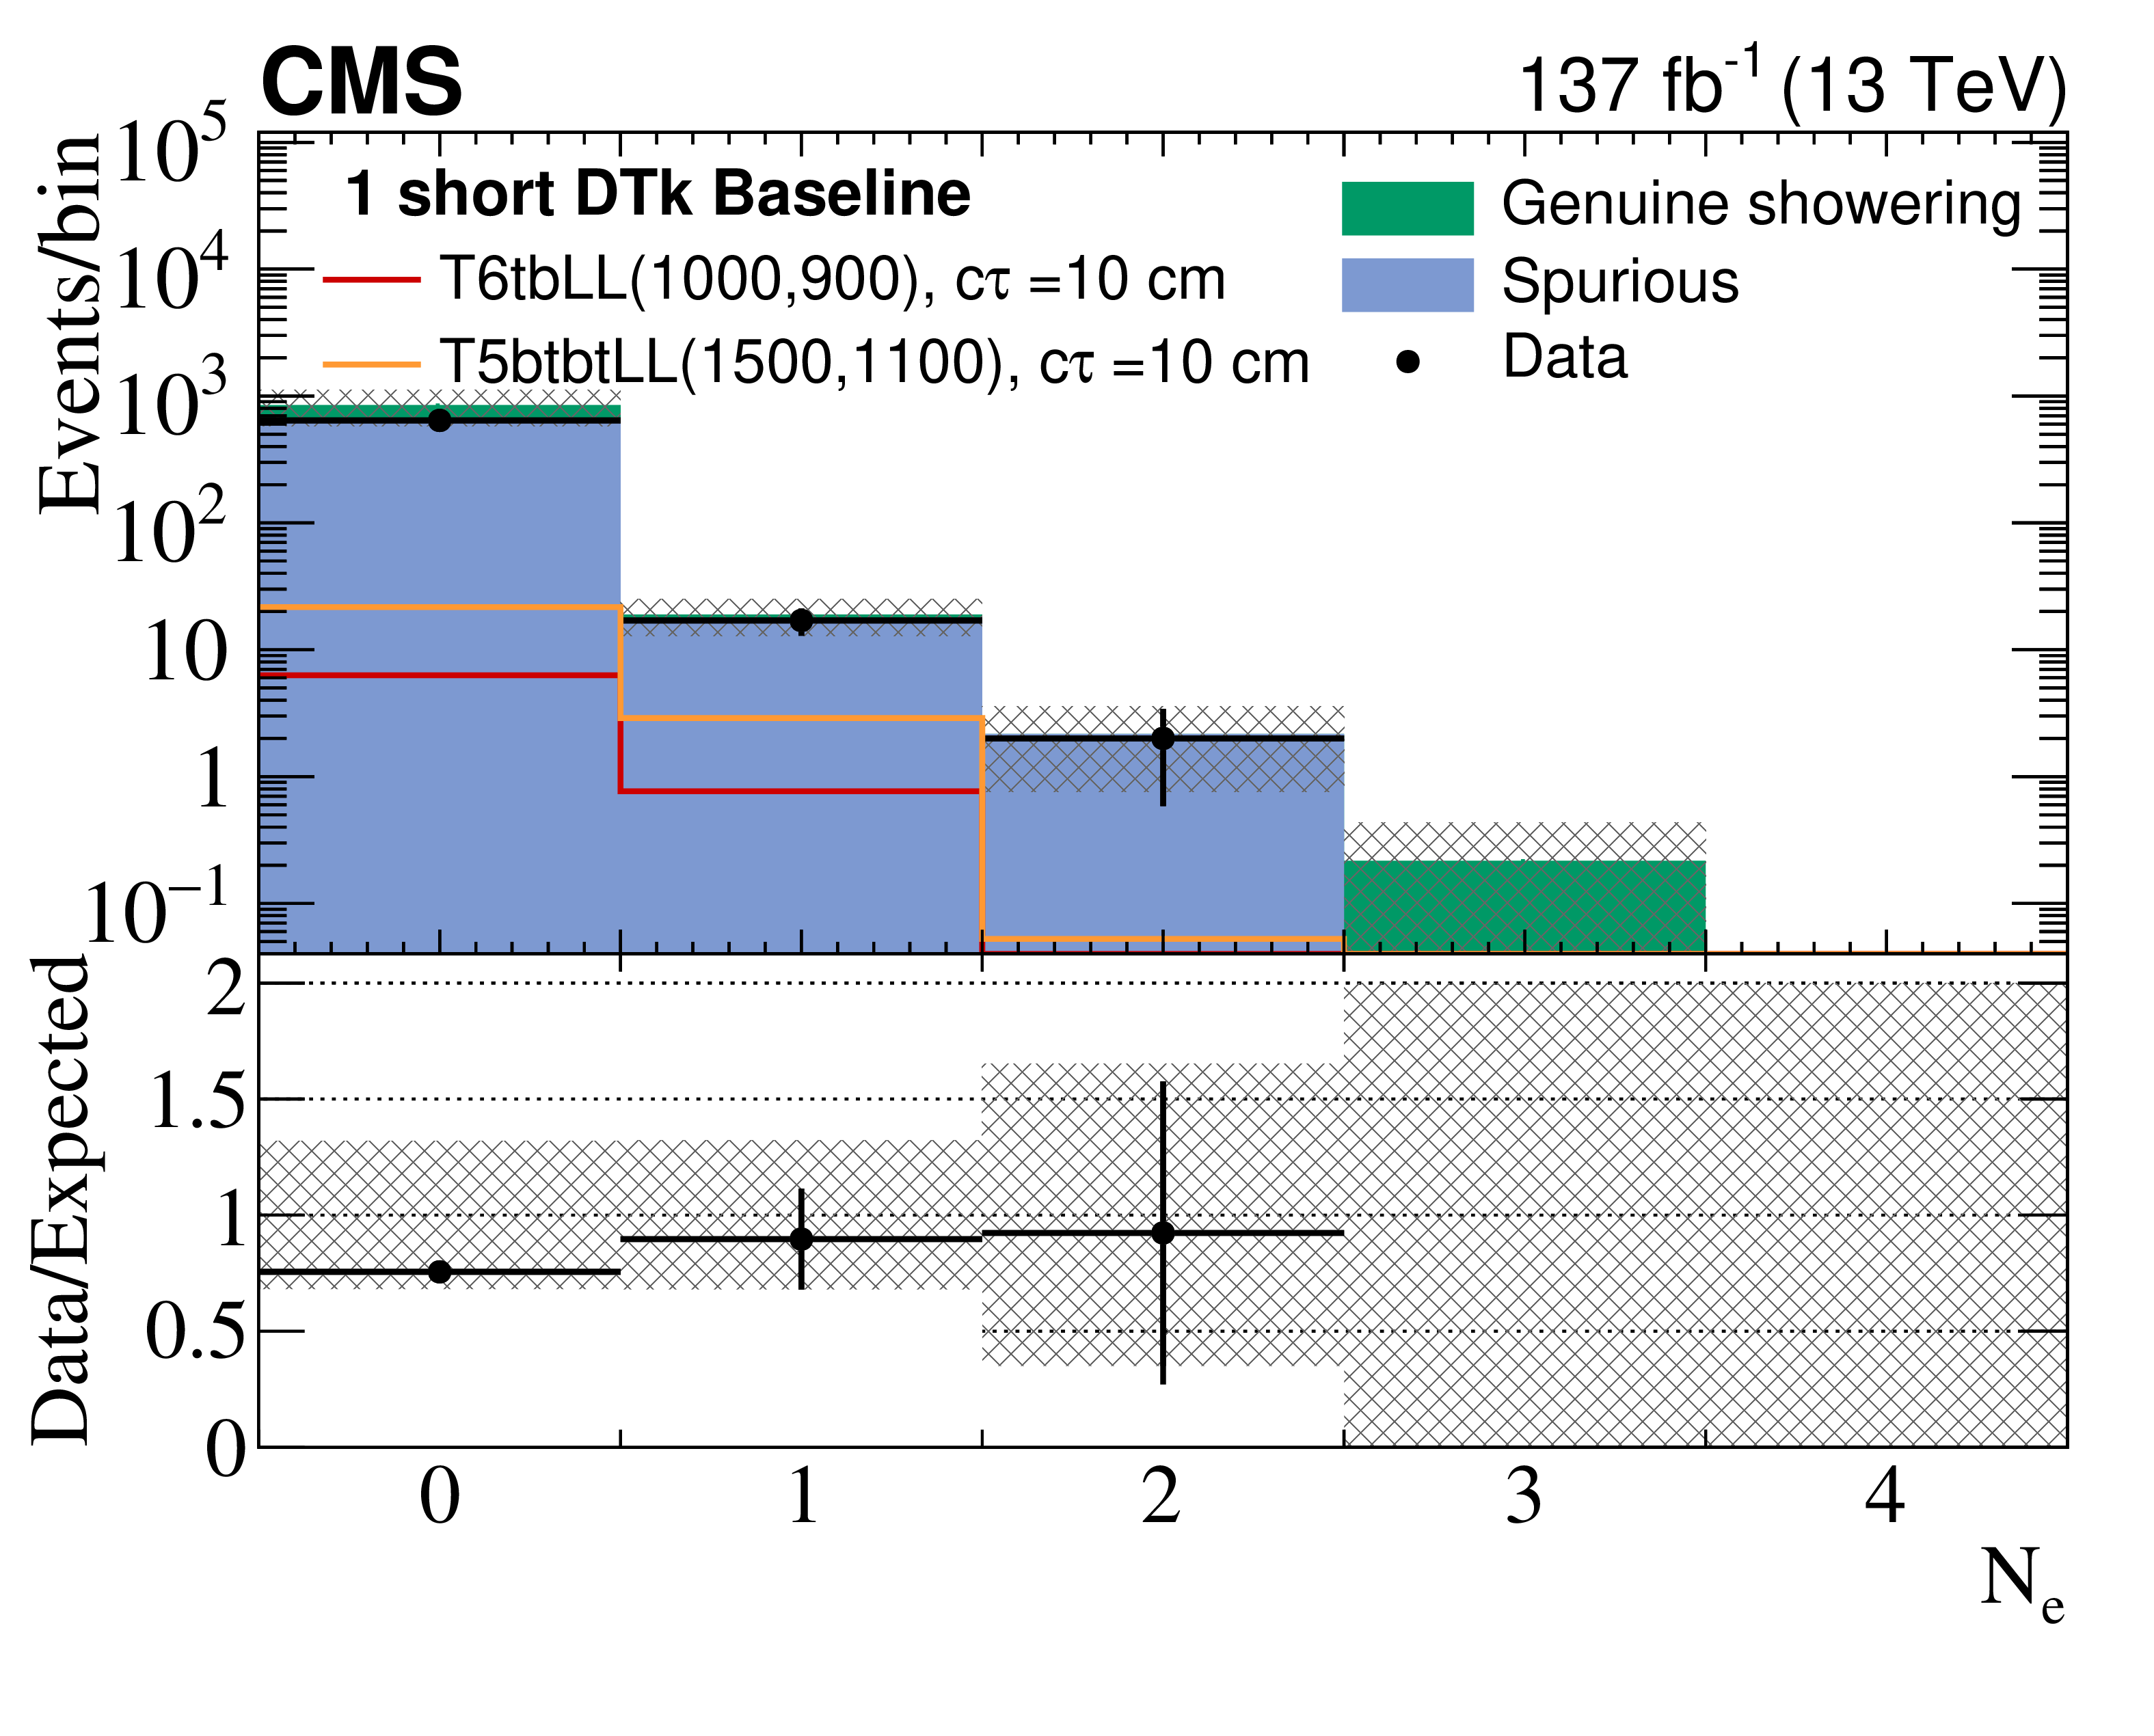
Comparison in the baseline region for the long-track DTk category between the data and pre-fit predicted SM background for the $ N_{\text{jet}} $ (upper left), $ N_{\mathrm{b}\text{-jet}} $ (upper right), $ p_{\mathrm{T,hard}}^{\mathrm{miss}} $ (middle left), $ N_{\mathrm{e}} $ (middle right), $ N_{\mu} $ (lower left), and $ m_{\text{DTk};\,\mathrm{d} E/\mathrm{d} x} $ (lower right) distributions. The uncertainty bars on the ratios in the lower panels indicate the fractional Poisson uncertainties in the observed counts. The gray bands show the fractional Poisson uncertainties in the control region counts, added in quadrature with the systematic uncertainties. The leftmost (rightmost) bin includes underflow (overflow). For purposes of illustration, results from the T6tbLL and T5btbtLL models are shown, where the first and second numbers in parentheses indicate the squark (or gluino) mass and the LSP mass, respectively, in GeV. |

png pdf |
Figure 7-a:
Comparison in the baseline region for the long-track DTk category between the data and pre-fit predicted SM background for the $ N_{\text{jet}} $ distribution. The uncertainty bars on the ratio in the lower panel indicate the fractional Poisson uncertainties in the observed counts. The gray bands show the fractional Poisson uncertainties in the control region counts, added in quadrature with the systematic uncertainties. The leftmost (rightmost) bin includes underflow (overflow). For purposes of illustration, results from the T6tbLL and T5btbtLL models are shown, where the first and second numbers in parentheses indicate the squark (or gluino) mass and the LSP mass, respectively, in GeV. |
png pdf |
Figure 7-b:
Comparison in the baseline region for the long-track DTk category between the data and pre-fit predicted SM background for the $ N_{\mathrm{b}\text{-jet}} $ distribution. The uncertainty bars on the ratio in the lower panel indicate the fractional Poisson uncertainties in the observed counts. The gray bands show the fractional Poisson uncertainties in the control region counts, added in quadrature with the systematic uncertainties. The leftmost (rightmost) bin includes underflow (overflow). For purposes of illustration, results from the T6tbLL and T5btbtLL models are shown, where the first and second numbers in parentheses indicate the squark (or gluino) mass and the LSP mass, respectively, in GeV. |
png pdf |
Figure 7-c:
Comparison in the baseline region for the long-track DTk category between the data and pre-fit predicted SM background for the $ p_{\mathrm{T,hard}}^{\mathrm{miss}} $ distribution. The uncertainty bars on the ratio in the lower panel indicate the fractional Poisson uncertainties in the observed counts. The gray bands show the fractional Poisson uncertainties in the control region counts, added in quadrature with the systematic uncertainties. The leftmost (rightmost) bin includes underflow (overflow). For purposes of illustration, results from the T6tbLL and T5btbtLL models are shown, where the first and second numbers in parentheses indicate the squark (or gluino) mass and the LSP mass, respectively, in GeV. |
png pdf |
Figure 7-d:
Comparison in the baseline region for the long-track DTk category between the data and pre-fit predicted SM background for the $ N_{\mathrm{e}} $ distribution. The uncertainty bars on the ratio in the lower panel indicate the fractional Poisson uncertainties in the observed counts. The gray bands show the fractional Poisson uncertainties in the control region counts, added in quadrature with the systematic uncertainties. The leftmost (rightmost) bin includes underflow (overflow). For purposes of illustration, results from the T6tbLL and T5btbtLL models are shown, where the first and second numbers in parentheses indicate the squark (or gluino) mass and the LSP mass, respectively, in GeV. |
png pdf |
Figure 7-e:
Comparison in the baseline region for the long-track DTk category between the data and pre-fit predicted SM background for the $ N_{\mu} $ distribution. The uncertainty bars on the ratio in the lower panel indicate the fractional Poisson uncertainties in the observed counts. The gray bands show the fractional Poisson uncertainties in the control region counts, added in quadrature with the systematic uncertainties. The leftmost (rightmost) bin includes underflow (overflow). For purposes of illustration, results from the T6tbLL and T5btbtLL models are shown, where the first and second numbers in parentheses indicate the squark (or gluino) mass and the LSP mass, respectively, in GeV. |

png pdf |
Figure 7-f:
Comparison in the baseline region for the long-track DTk category between the data and pre-fit predicted SM background for the $ m_{\text{DTk};\,\mathrm{d} E/\mathrm{d} x} $ distribution. The uncertainty bars on the ratio in the lower panel indicate the fractional Poisson uncertainties in the observed counts. The gray bands show the fractional Poisson uncertainties in the control region counts, added in quadrature with the systematic uncertainties. The leftmost (rightmost) bin includes underflow (overflow). For purposes of illustration, results from the T6tbLL and T5btbtLL models are shown, where the first and second numbers in parentheses indicate the squark (or gluino) mass and the LSP mass, respectively, in GeV. |
png pdf |
Figure 8:
Comparison in the baseline region for the short-track DTk category between the data and pre-fit predicted SM background for the $ N_{\text{jet}} $ (upper left), $ N_{\mathrm{b}\text{-jet}} $ (upper right), $ p_{\mathrm{T,hard}}^{\mathrm{miss}} $ (middle left), $ N_{\mathrm{e}} $ (middle right), $ N_{\mu} $ (lower left), and $ m_{\text{DTk};\,\mathrm{d} E/\mathrm{d} x} $ (lower right) distributions. The uncertainty bars on the ratios in the lower panels indicate the fractional Poisson uncertainties in the observed counts. The gray bands show the fractional Poisson uncertainties in the control region counts, added in quadrature with the systematic uncertainties. The leftmost (rightmost) bin includes underflow (overflow). For purposes of illustration, results from the T6tbLL and T5btbtLL models are shown, where the first and second numbers in parentheses indicate the squark (or gluino) mass and the LSP mass, respectively, in GeV. |
png pdf |
Figure 8-a:
Comparison in the baseline region for the short-track DTk category between the data and pre-fit predicted SM background for the $ N_{\text{jet}} $ distribution. The uncertainty bars on the ratio in the lower panel indicate the fractional Poisson uncertainties in the observed counts. The gray bands show the fractional Poisson uncertainties in the control region counts, added in quadrature with the systematic uncertainties. The leftmost (rightmost) bin includes underflow (overflow). For purposes of illustration, results from the T6tbLL and T5btbtLL models are shown, where the first and second numbers in parentheses indicate the squark (or gluino) mass and the LSP mass, respectively, in GeV. |
png pdf |
Figure 8-b:
Comparison in the baseline region for the short-track DTk category between the data and pre-fit predicted SM background for the $ N_{\mathrm{b}\text{-jet}} $ distribution. The uncertainty bars on the ratio in the lower panel indicate the fractional Poisson uncertainties in the observed counts. The gray bands show the fractional Poisson uncertainties in the control region counts, added in quadrature with the systematic uncertainties. The leftmost (rightmost) bin includes underflow (overflow). For purposes of illustration, results from the T6tbLL and T5btbtLL models are shown, where the first and second numbers in parentheses indicate the squark (or gluino) mass and the LSP mass, respectively, in GeV. |

png pdf |
Figure 8-c:
Comparison in the baseline region for the short-track DTk category between the data and pre-fit predicted SM background for the $ p_{\mathrm{T,hard}}^{\mathrm{miss}} $ distribution. The uncertainty bars on the ratio in the lower panel indicate the fractional Poisson uncertainties in the observed counts. The gray bands show the fractional Poisson uncertainties in the control region counts, added in quadrature with the systematic uncertainties. The leftmost (rightmost) bin includes underflow (overflow). For purposes of illustration, results from the T6tbLL and T5btbtLL models are shown, where the first and second numbers in parentheses indicate the squark (or gluino) mass and the LSP mass, respectively, in GeV. |
png pdf |
Figure 8-d:
Comparison in the baseline region for the short-track DTk category between the data and pre-fit predicted SM background for the $ N_{\mathrm{e}} $ distribution. The uncertainty bars on the ratio in the lower panel indicate the fractional Poisson uncertainties in the observed counts. The gray bands show the fractional Poisson uncertainties in the control region counts, added in quadrature with the systematic uncertainties. The leftmost (rightmost) bin includes underflow (overflow). For purposes of illustration, results from the T6tbLL and T5btbtLL models are shown, where the first and second numbers in parentheses indicate the squark (or gluino) mass and the LSP mass, respectively, in GeV. |
png pdf |
Figure 8-e:
Comparison in the baseline region for the short-track DTk category between the data and pre-fit predicted SM background for the $ N_{\mu} $ distribution. The uncertainty bars on the ratio in the lower panel indicate the fractional Poisson uncertainties in the observed counts. The gray bands show the fractional Poisson uncertainties in the control region counts, added in quadrature with the systematic uncertainties. The leftmost (rightmost) bin includes underflow (overflow). For purposes of illustration, results from the T6tbLL and T5btbtLL models are shown, where the first and second numbers in parentheses indicate the squark (or gluino) mass and the LSP mass, respectively, in GeV. |
png pdf |
Figure 8-f:
Comparison in the baseline region for the short-track DTk category between the data and pre-fit predicted SM background for the $ m_{\text{DTk};\,\mathrm{d} E/\mathrm{d} x} $ distribution. The uncertainty bars on the ratio in the lower panel indicate the fractional Poisson uncertainties in the observed counts. The gray bands show the fractional Poisson uncertainties in the control region counts, added in quadrature with the systematic uncertainties. The leftmost (rightmost) bin includes underflow (overflow). For purposes of illustration, results from the T6tbLL and T5btbtLL models are shown, where the first and second numbers in parentheses indicate the squark (or gluino) mass and the LSP mass, respectively, in GeV. |
png pdf |
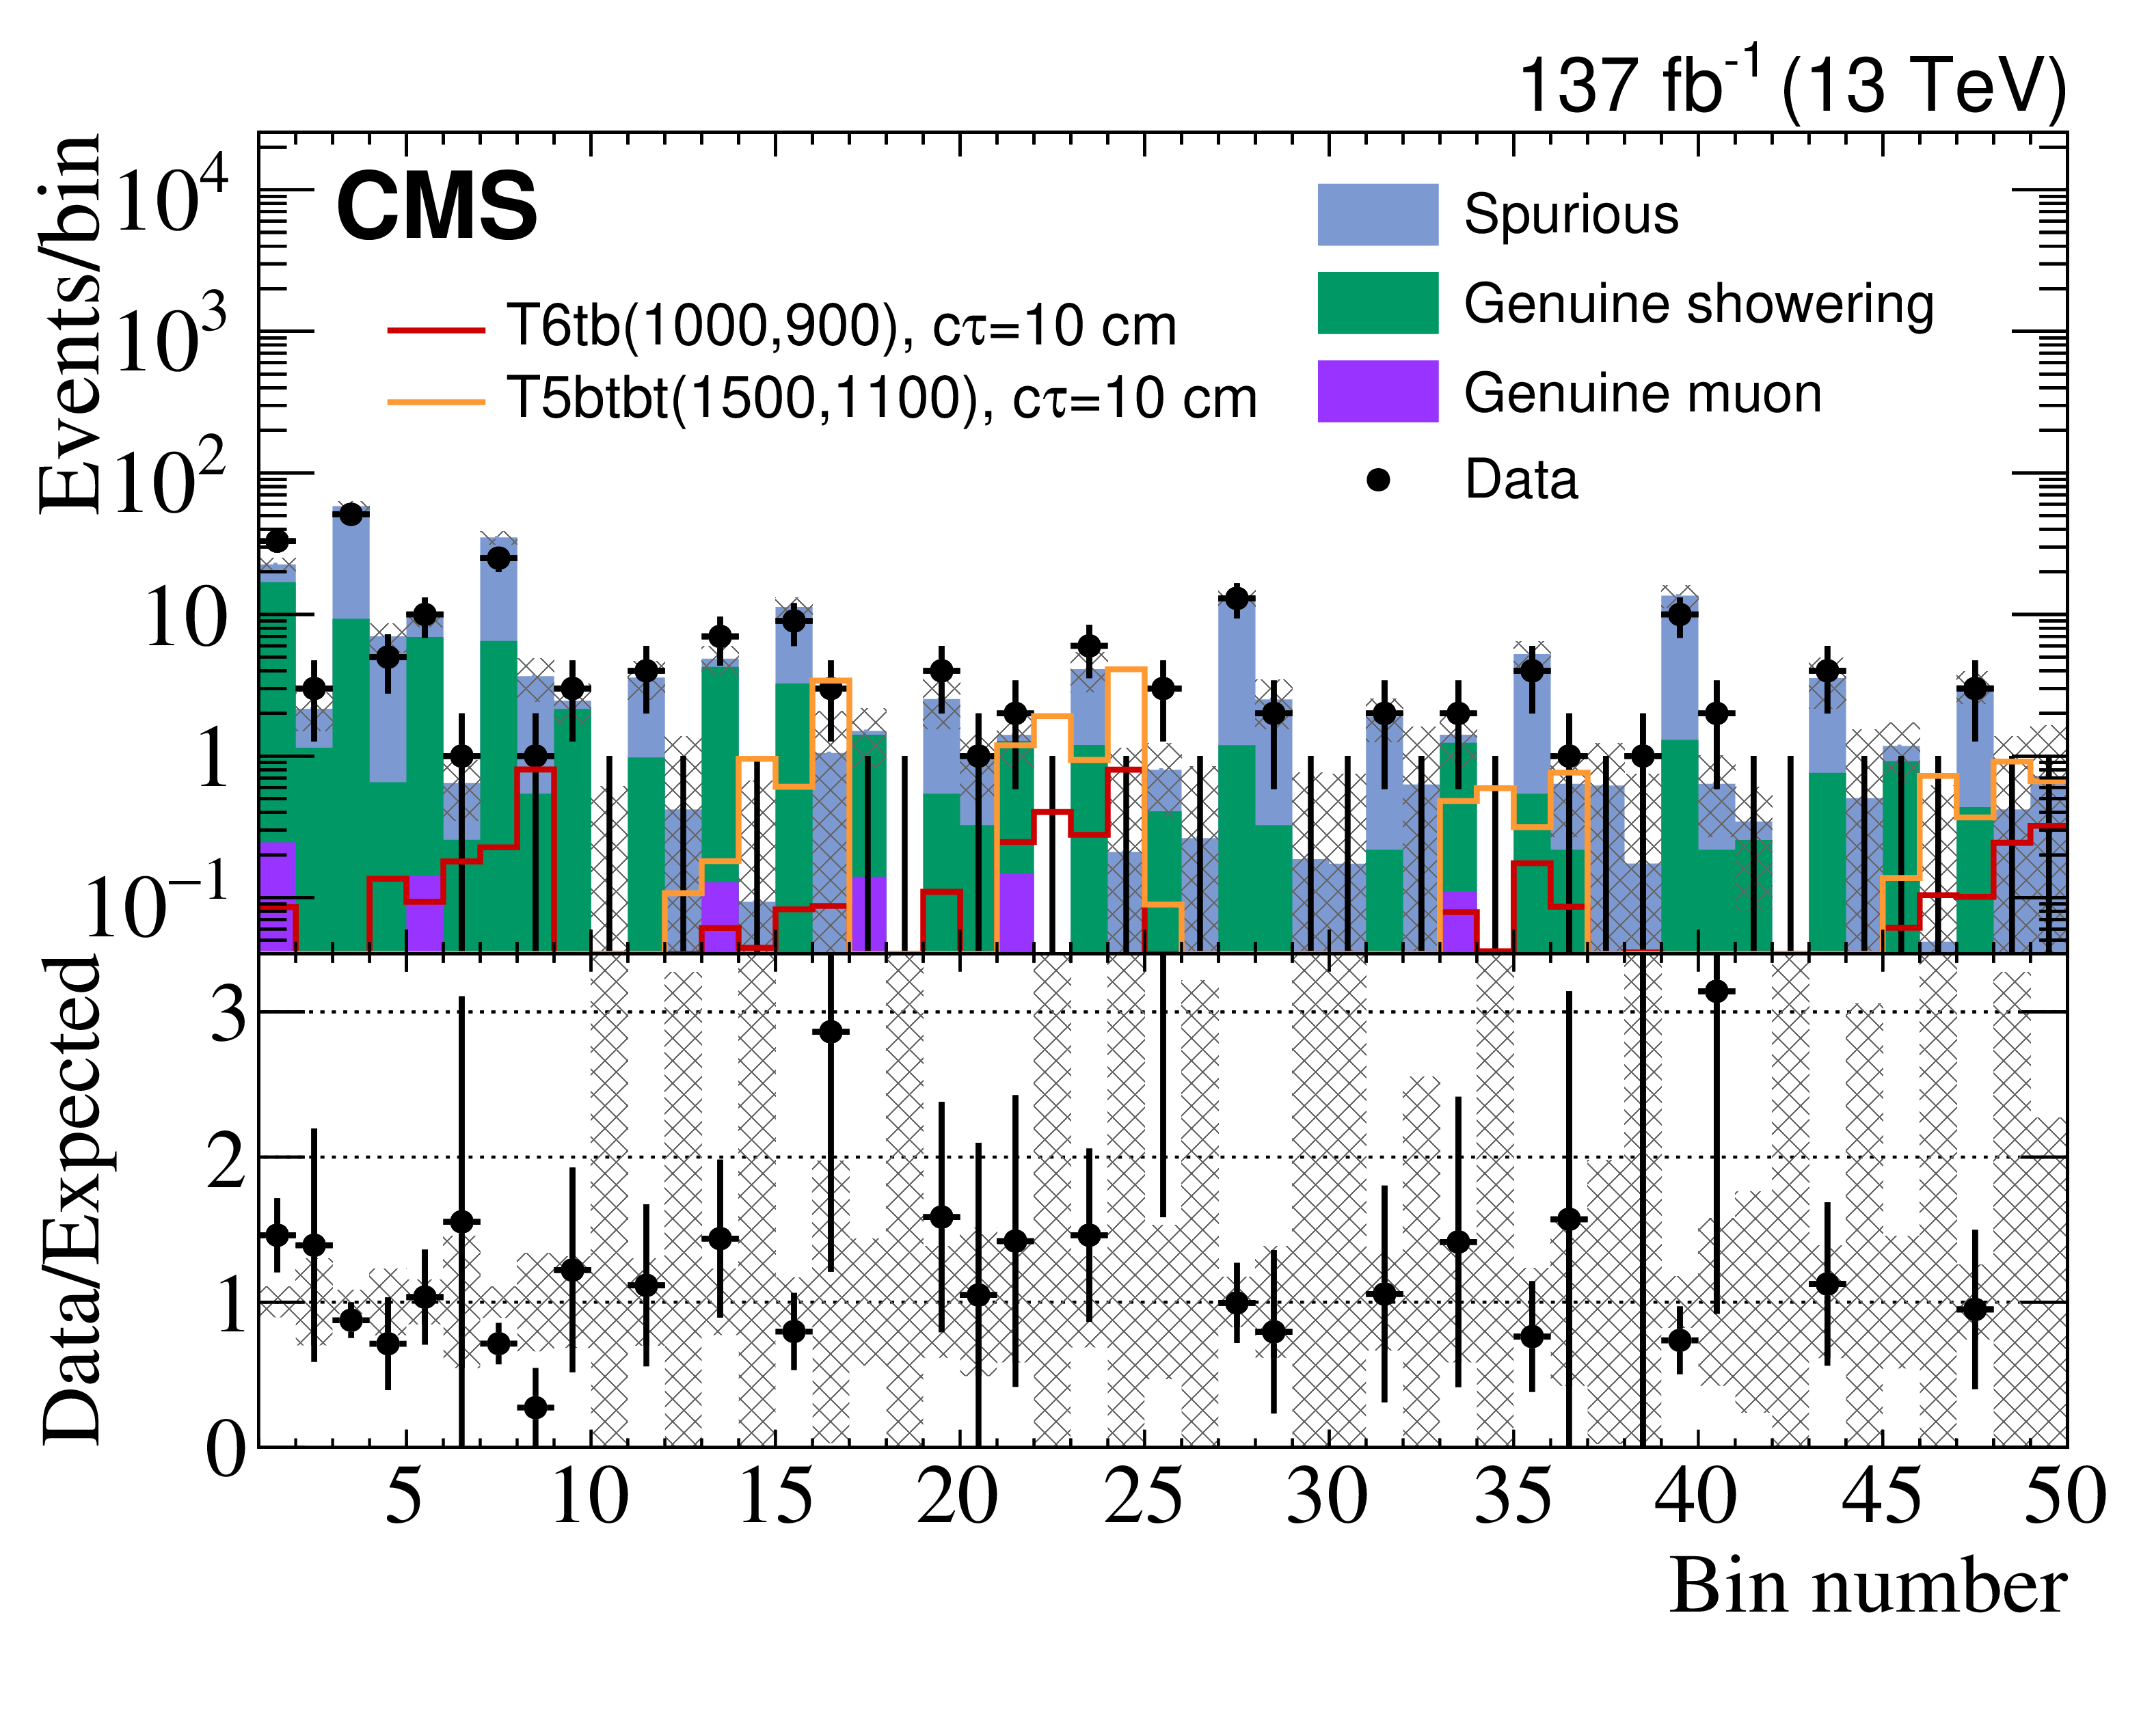
Figure 9:
Comparison between the data and SM background predictions for the 49 search regions. The uncertainty bars on the ratios in the lower panels, shown for bins with nonzero entries, indicate the fractional Poisson uncertainties in the observed counts. The gray bands show the fractional Poisson uncertainties in the control region counts, added in quadrature with the systematic uncertainties. For purposes of illustration, results from the T6tbLL and T5btbtLL models are shown, where the first and second numbers in parentheses indicate the squark (or gluino) mass and the LSP mass, respectively, in GeV. |
png pdf |
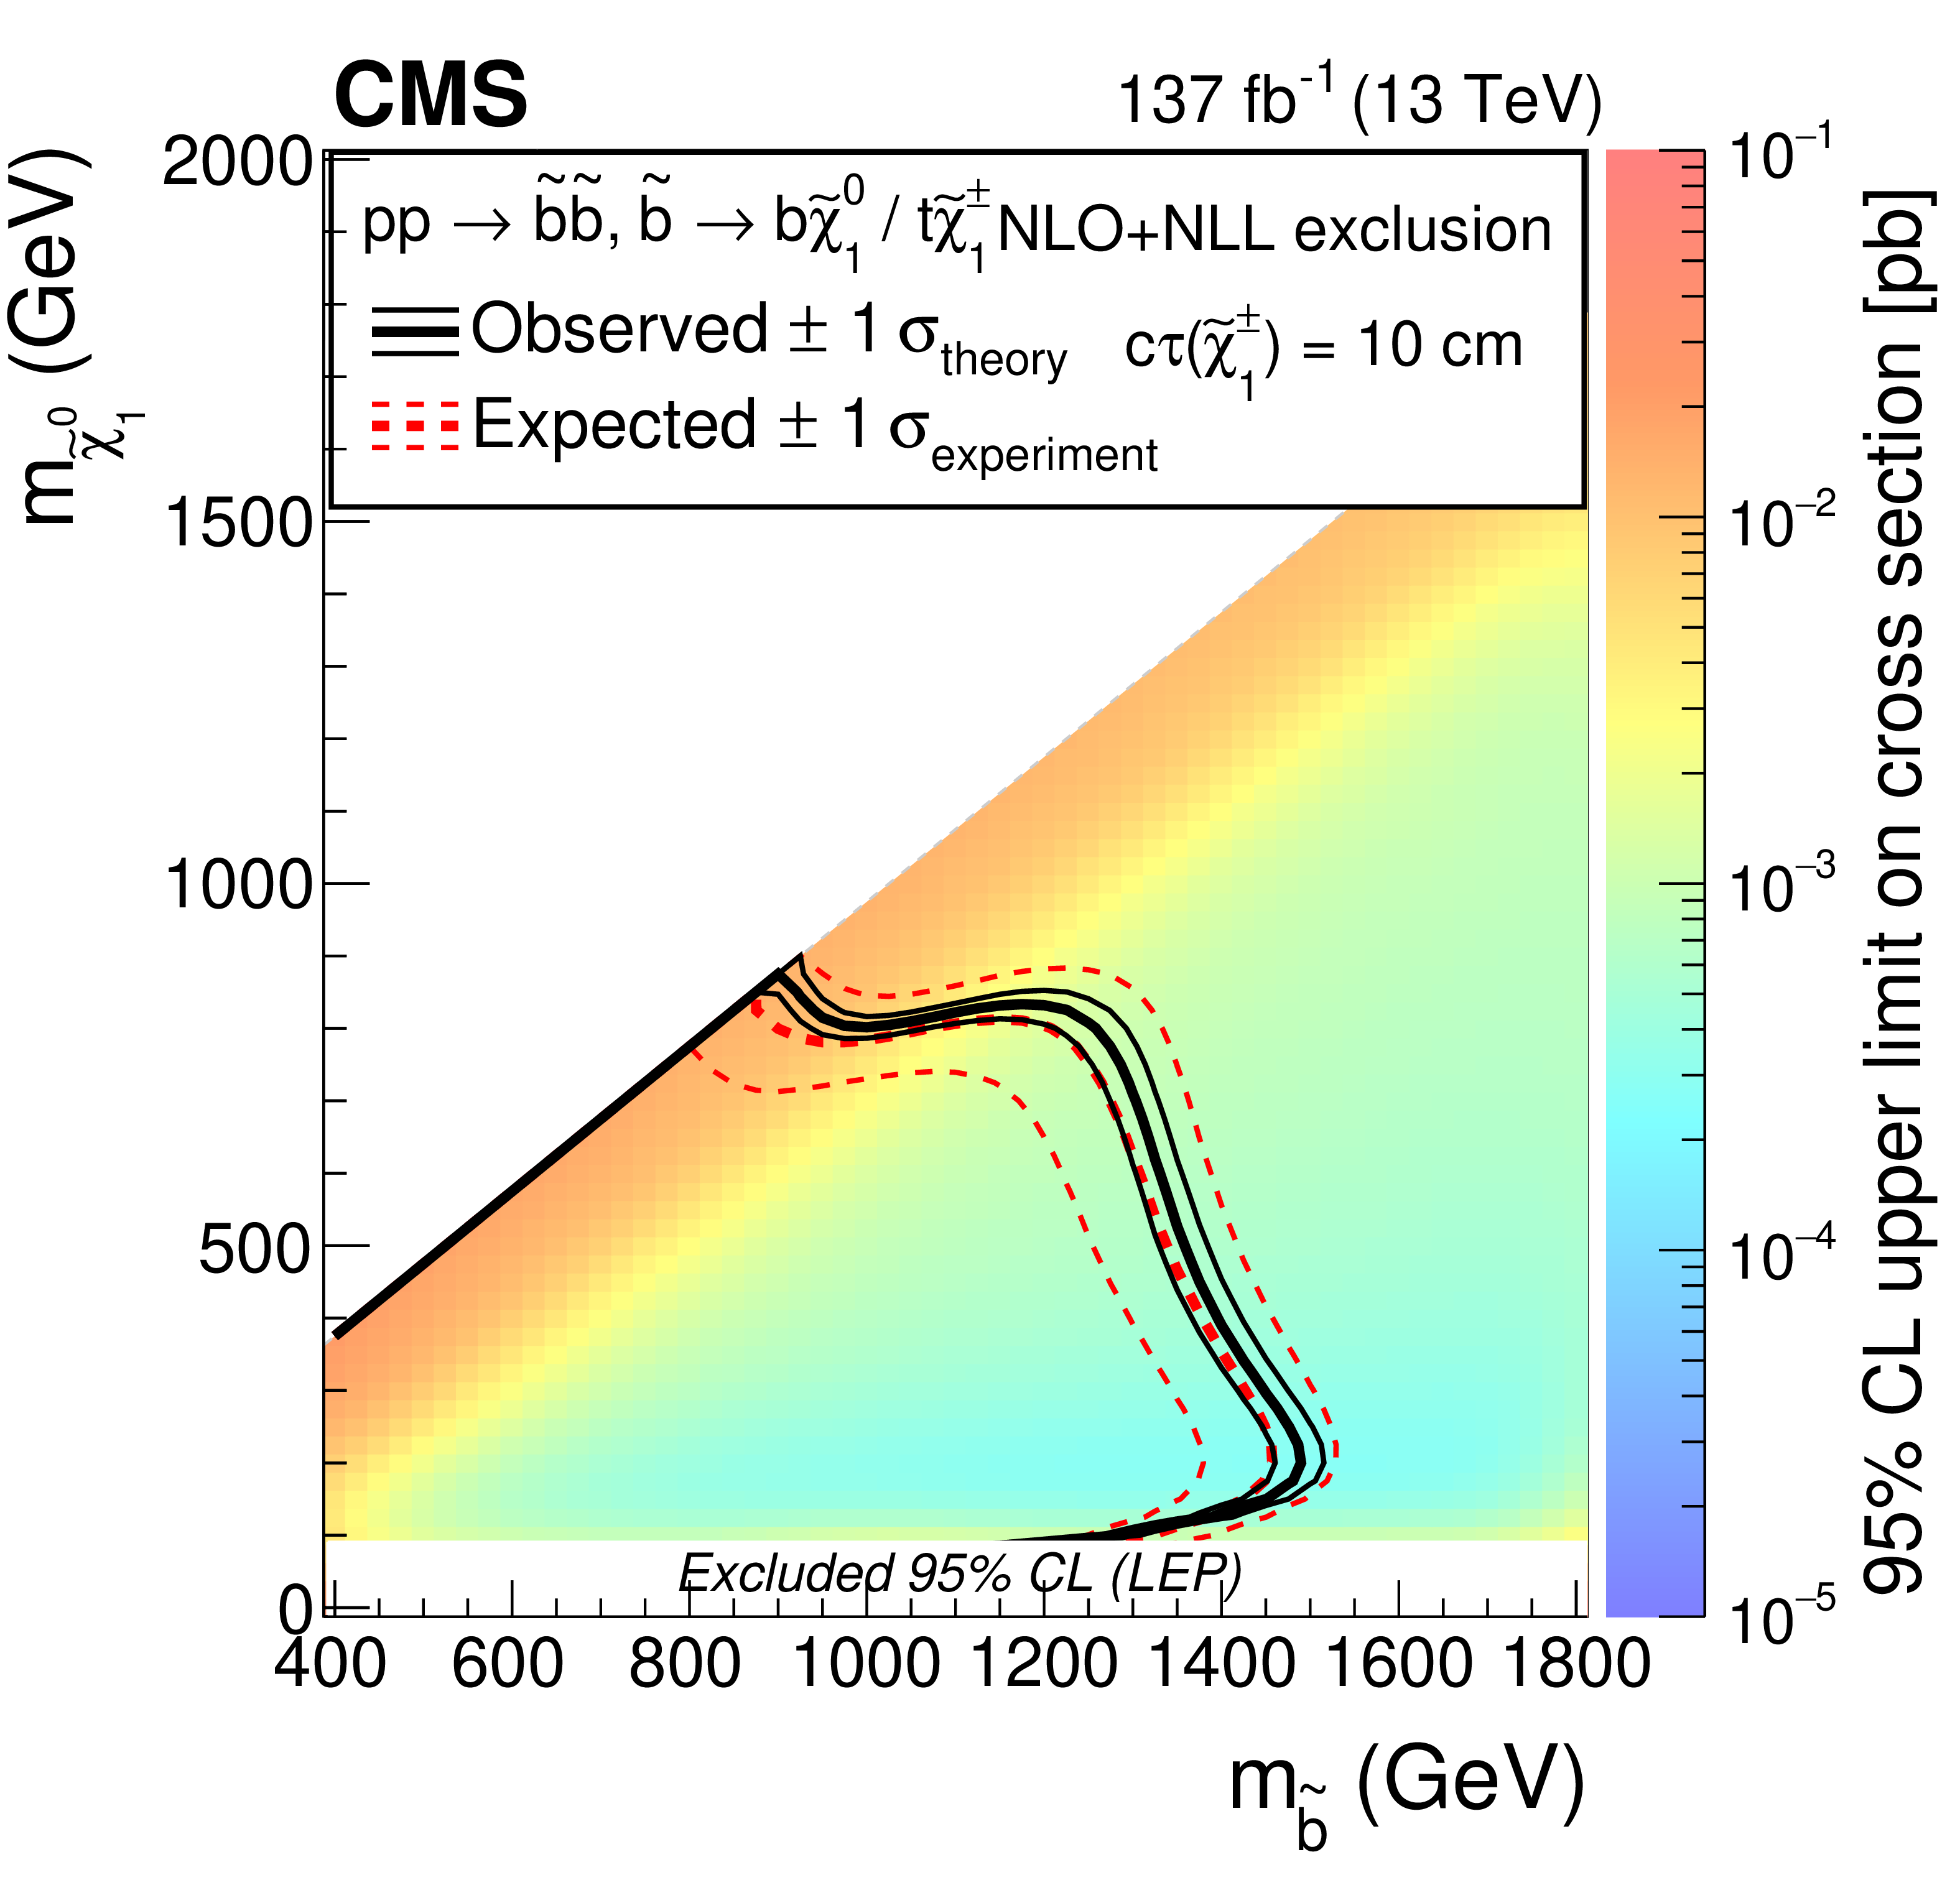
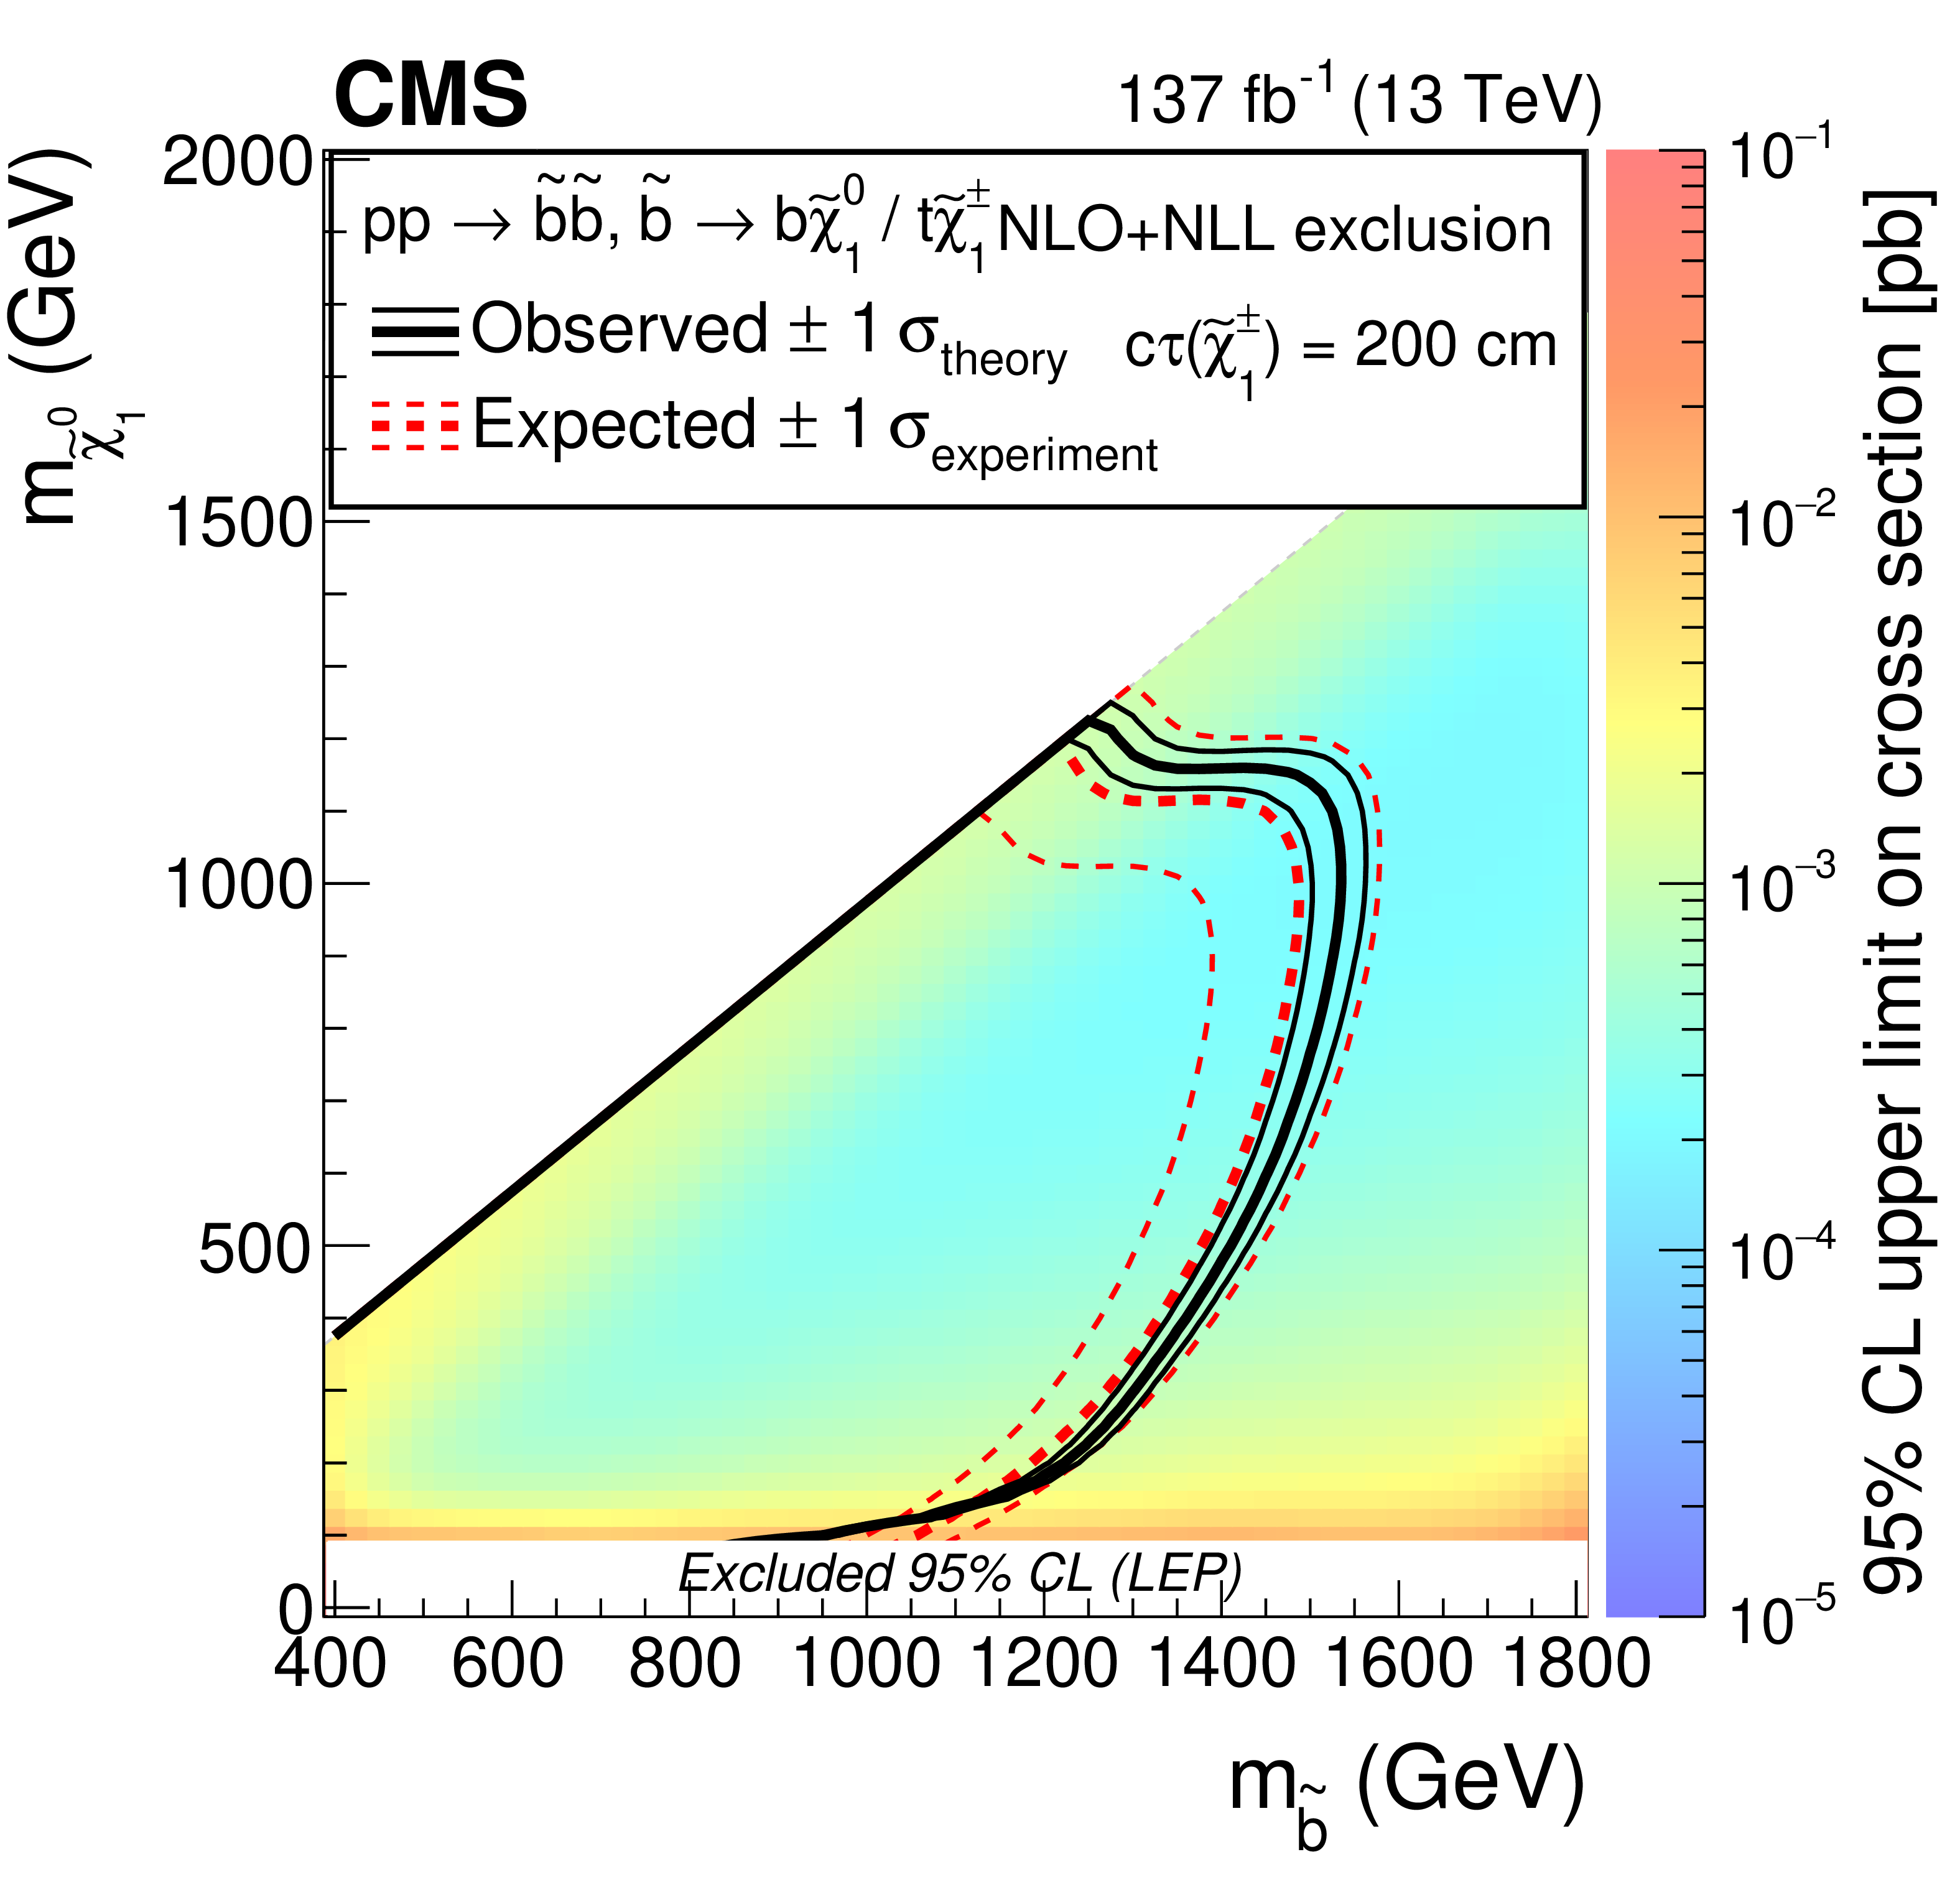
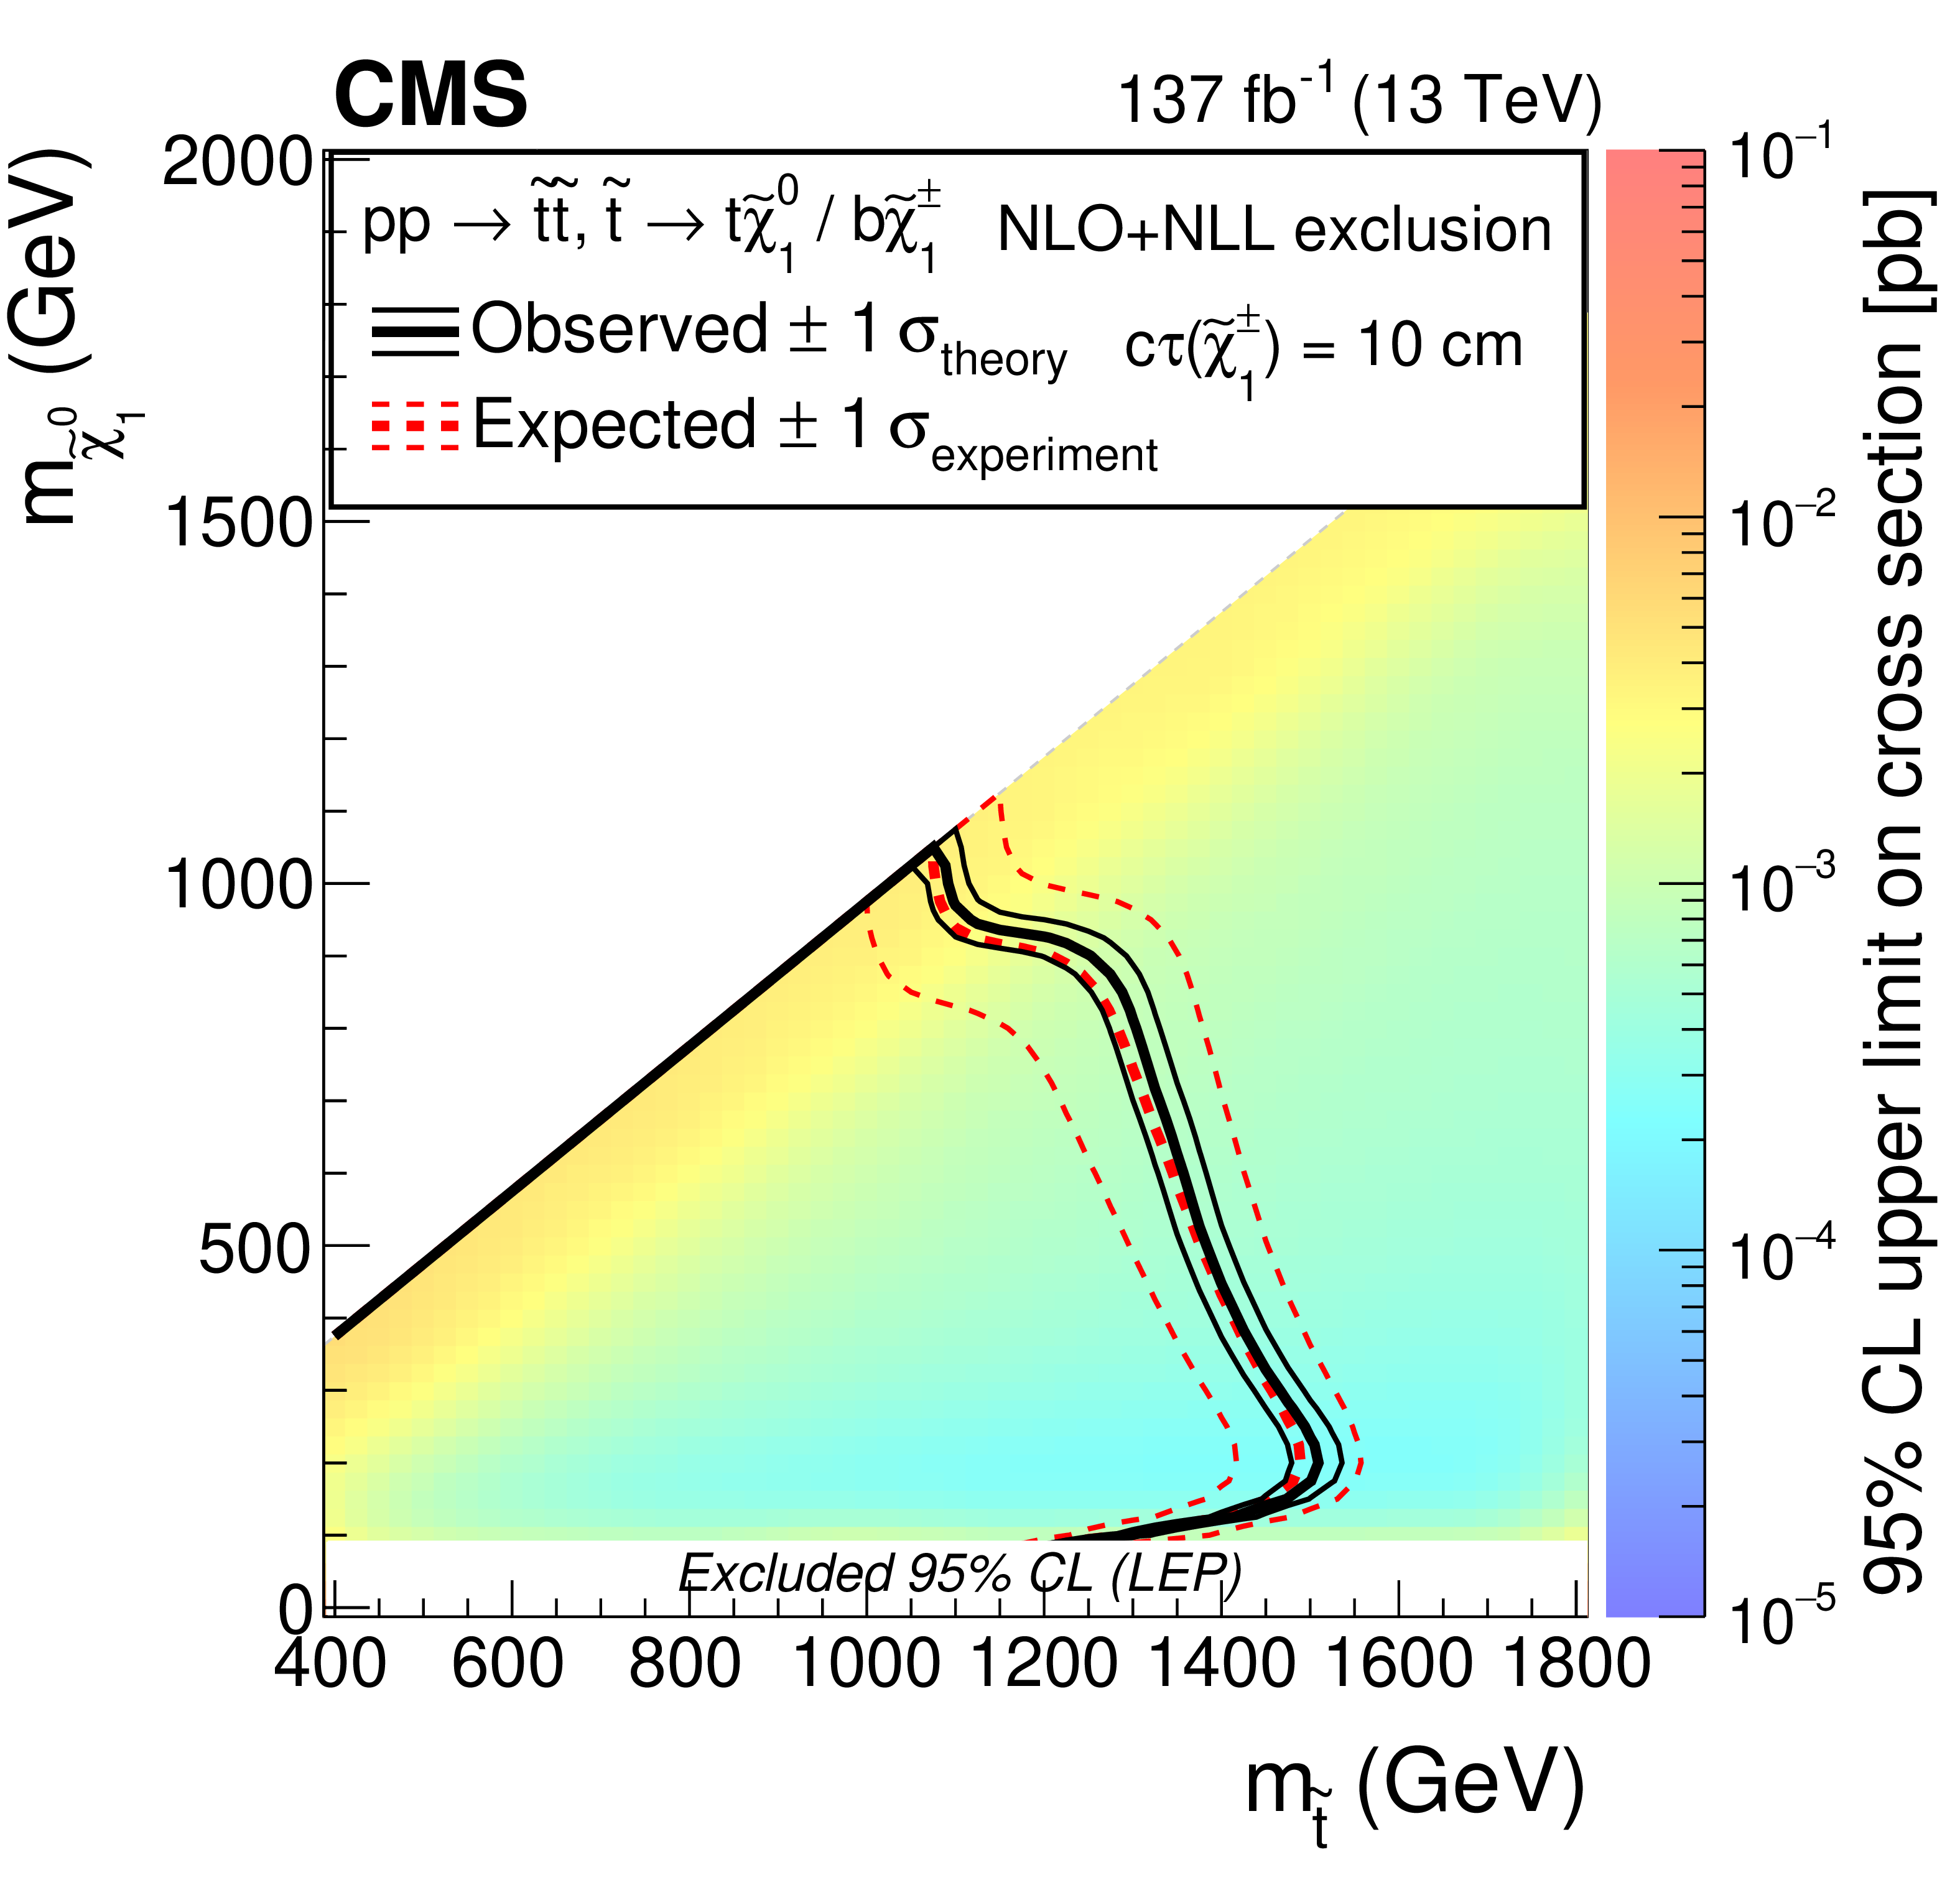
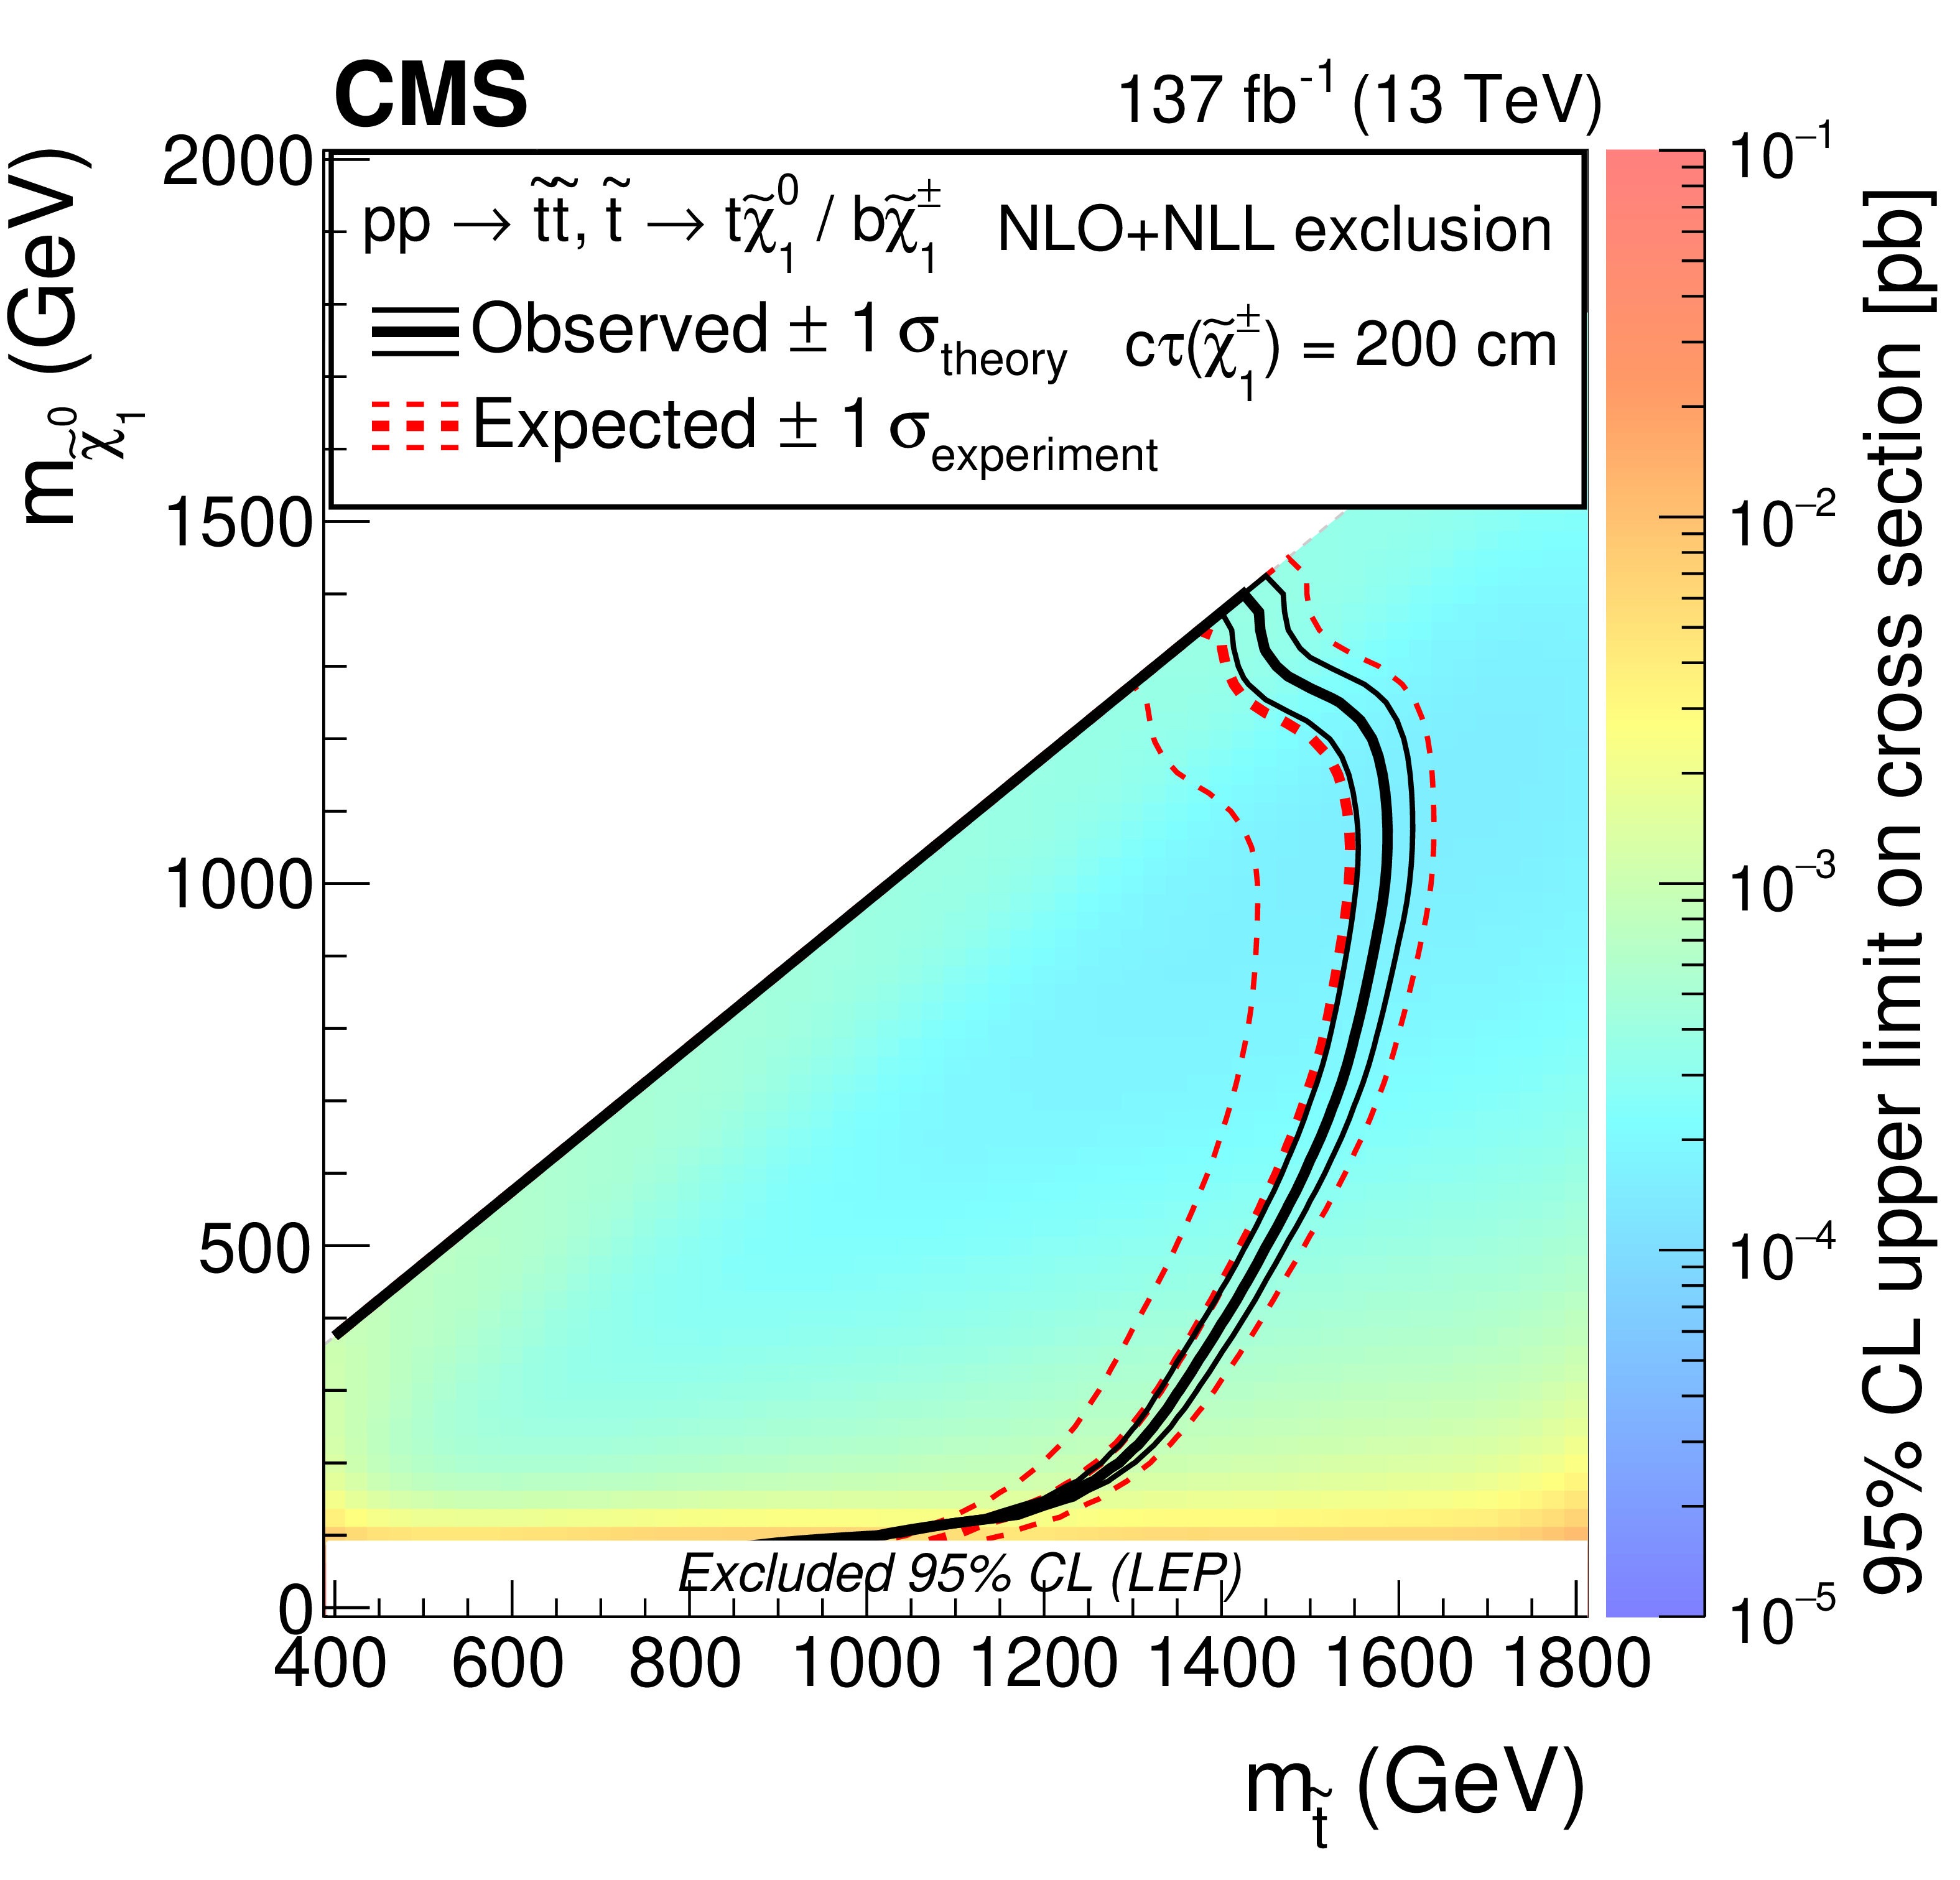
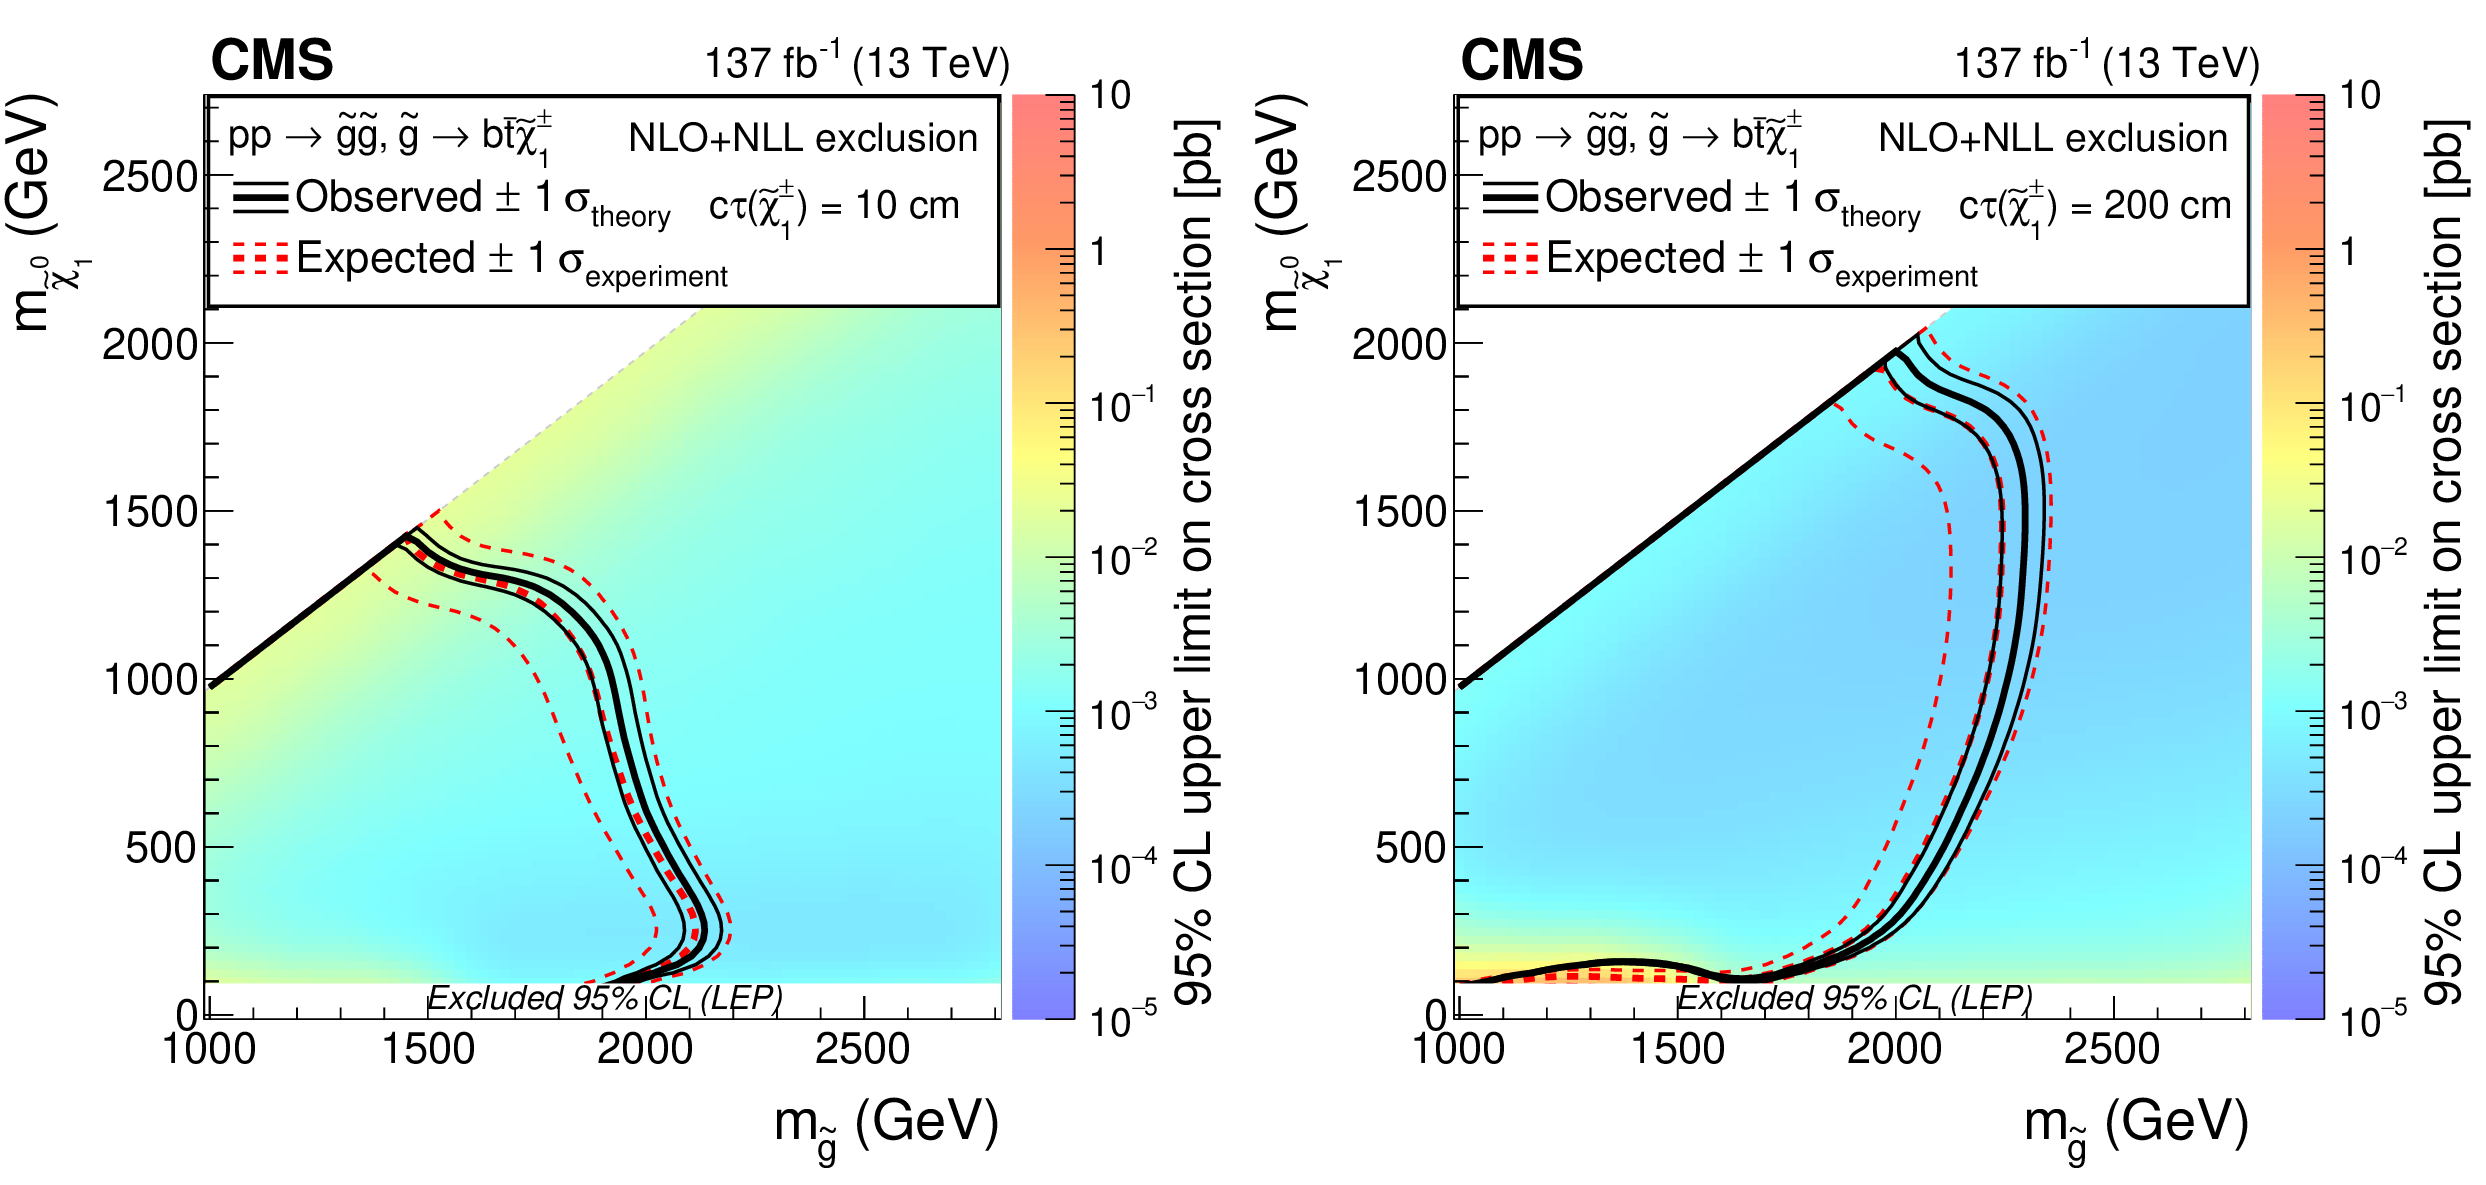
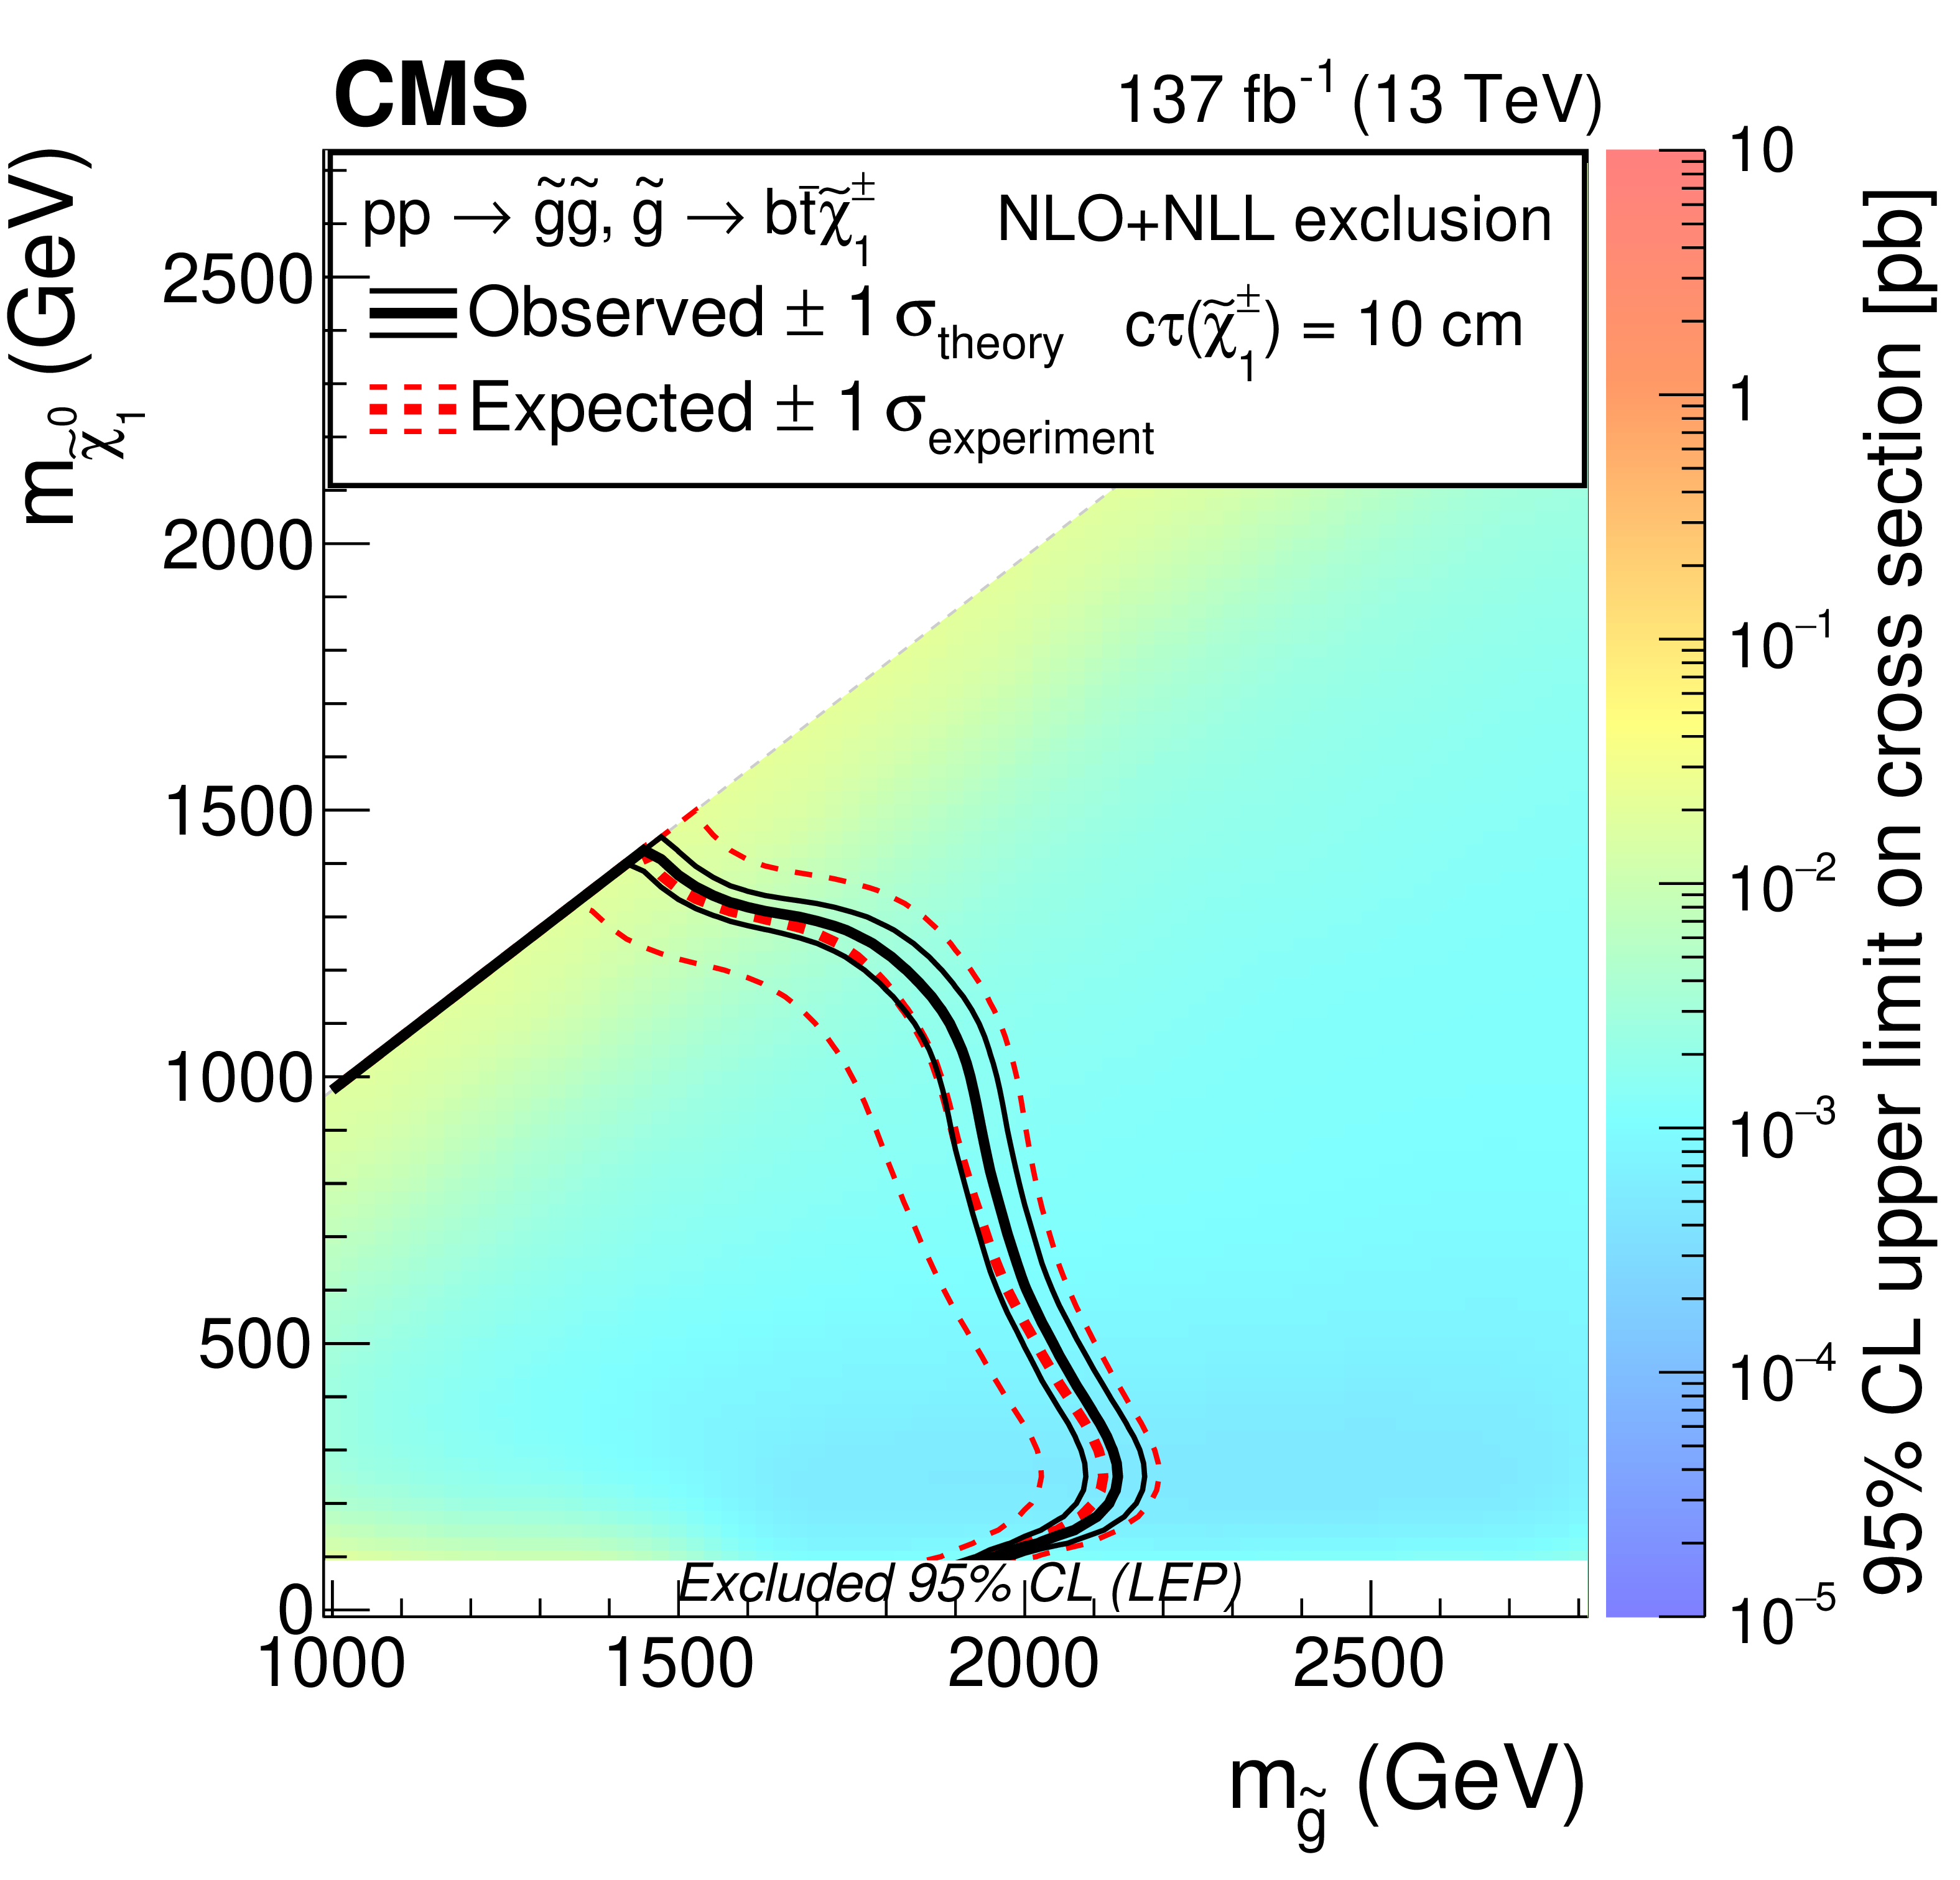
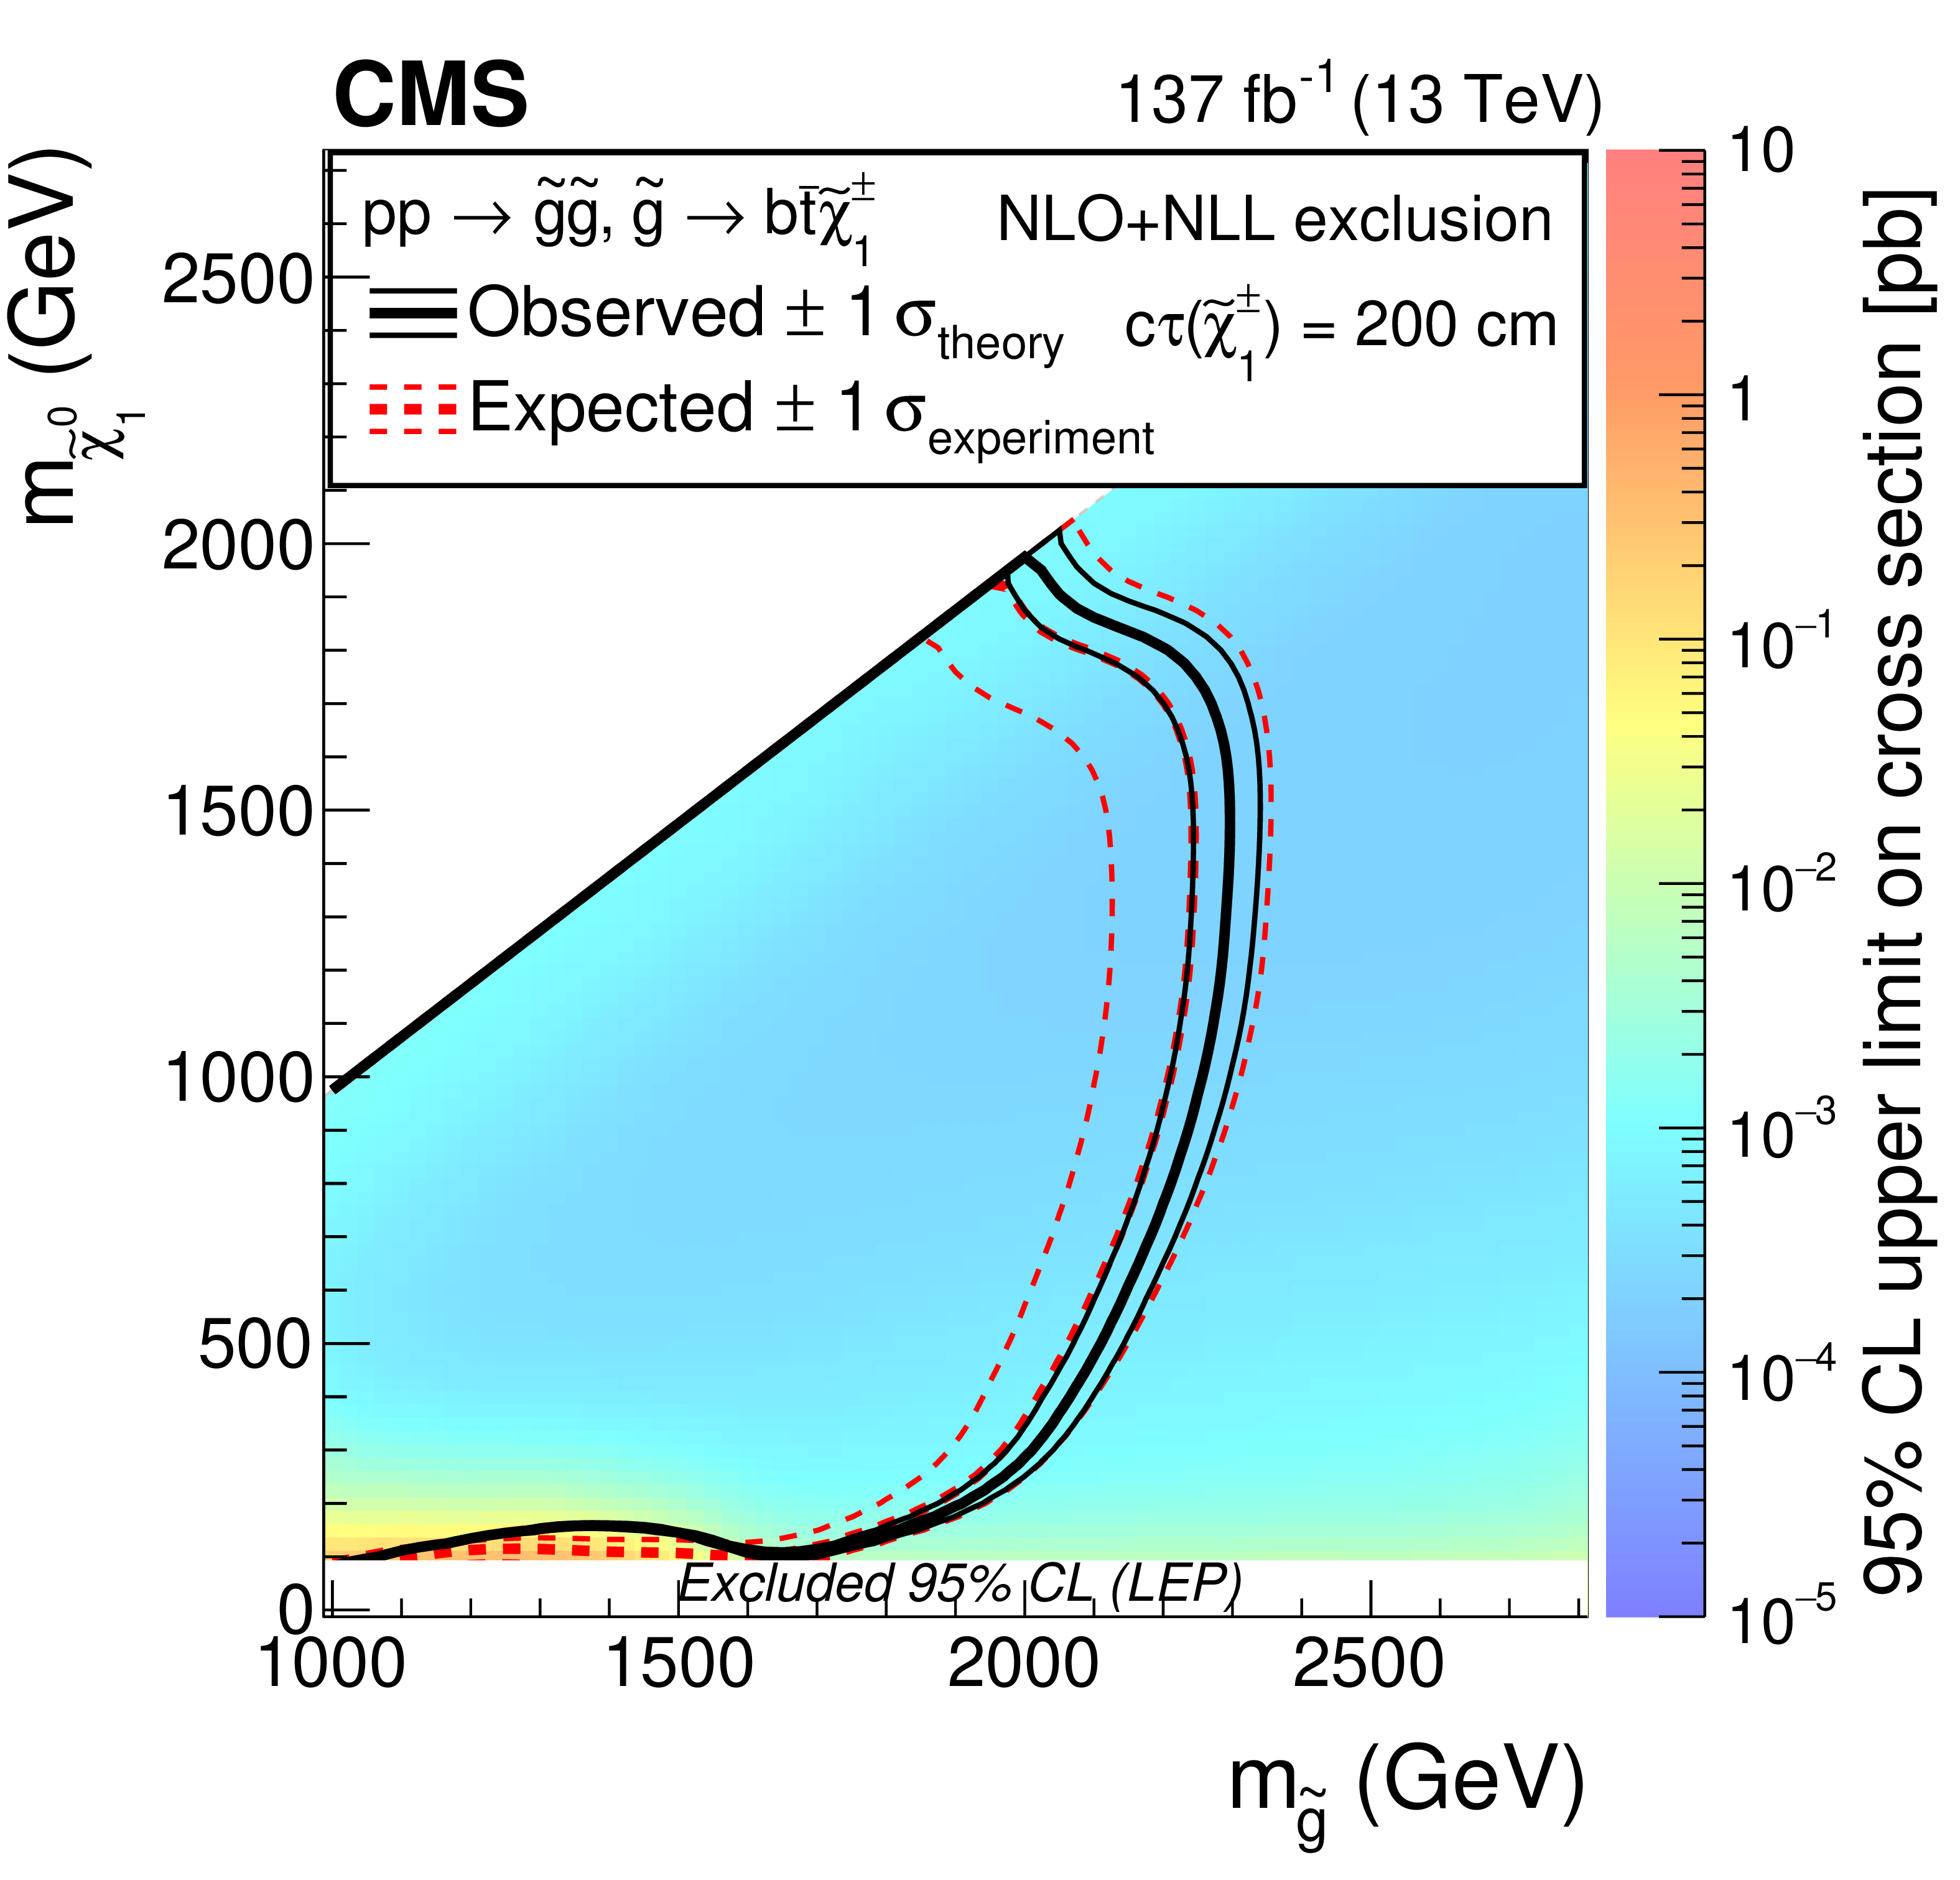
Figure 10:
Observed 95% CL upper limits on the signal cross sections (colored area) versus the bottom or top squark and neutralino mass for the T6tbLL (upper) and T6btLL (lower) model for a chargino proper decay length $ c\tau $ of 10 (left column) or 200 (right column) cm. Also shown are black (red) contours corresponding to the observed (expected) lower limits, including their uncertainties, on the squark and neutralino masses. |
png pdf |
Figure 10-a:
Observed 95% CL upper limits on the signal cross sections (colored area) versus the bottom or top squark and neutralino mass for the T6tbLL model for a chargino proper decay length $ c\tau $ of 10 cm. Also shown are black (red) contours corresponding to the observed (expected) lower limits, including their uncertainties, on the squark and neutralino masses. |
png pdf |
Figure 10-b:
Observed 95% CL upper limits on the signal cross sections (colored area) versus the bottom or top squark and neutralino mass for the T6tbLL model for a chargino proper decay length $ c\tau $ of 200 cm. Also shown are black (red) contours corresponding to the observed (expected) lower limits, including their uncertainties, on the squark and neutralino masses. |
png pdf |
Figure 10-c:
Observed 95% CL upper limits on the signal cross sections (colored area) versus the bottom or top squark and neutralino mass for the T6btLL model for a chargino proper decay length $ c\tau $ of 10 cm. Also shown are black (red) contours corresponding to the observed (expected) lower limits, including their uncertainties, on the squark and neutralino masses. |
png pdf |
Figure 10-d:
Observed 95% CL upper limits on the signal cross sections (colored area) versus the bottom or top squark and neutralino mass for the T6btLL model for a chargino proper decay length $ c\tau $ of 200 cm. Also shown are black (red) contours corresponding to the observed (expected) lower limits, including their uncertainties, on the squark and neutralino masses. |
png pdf |
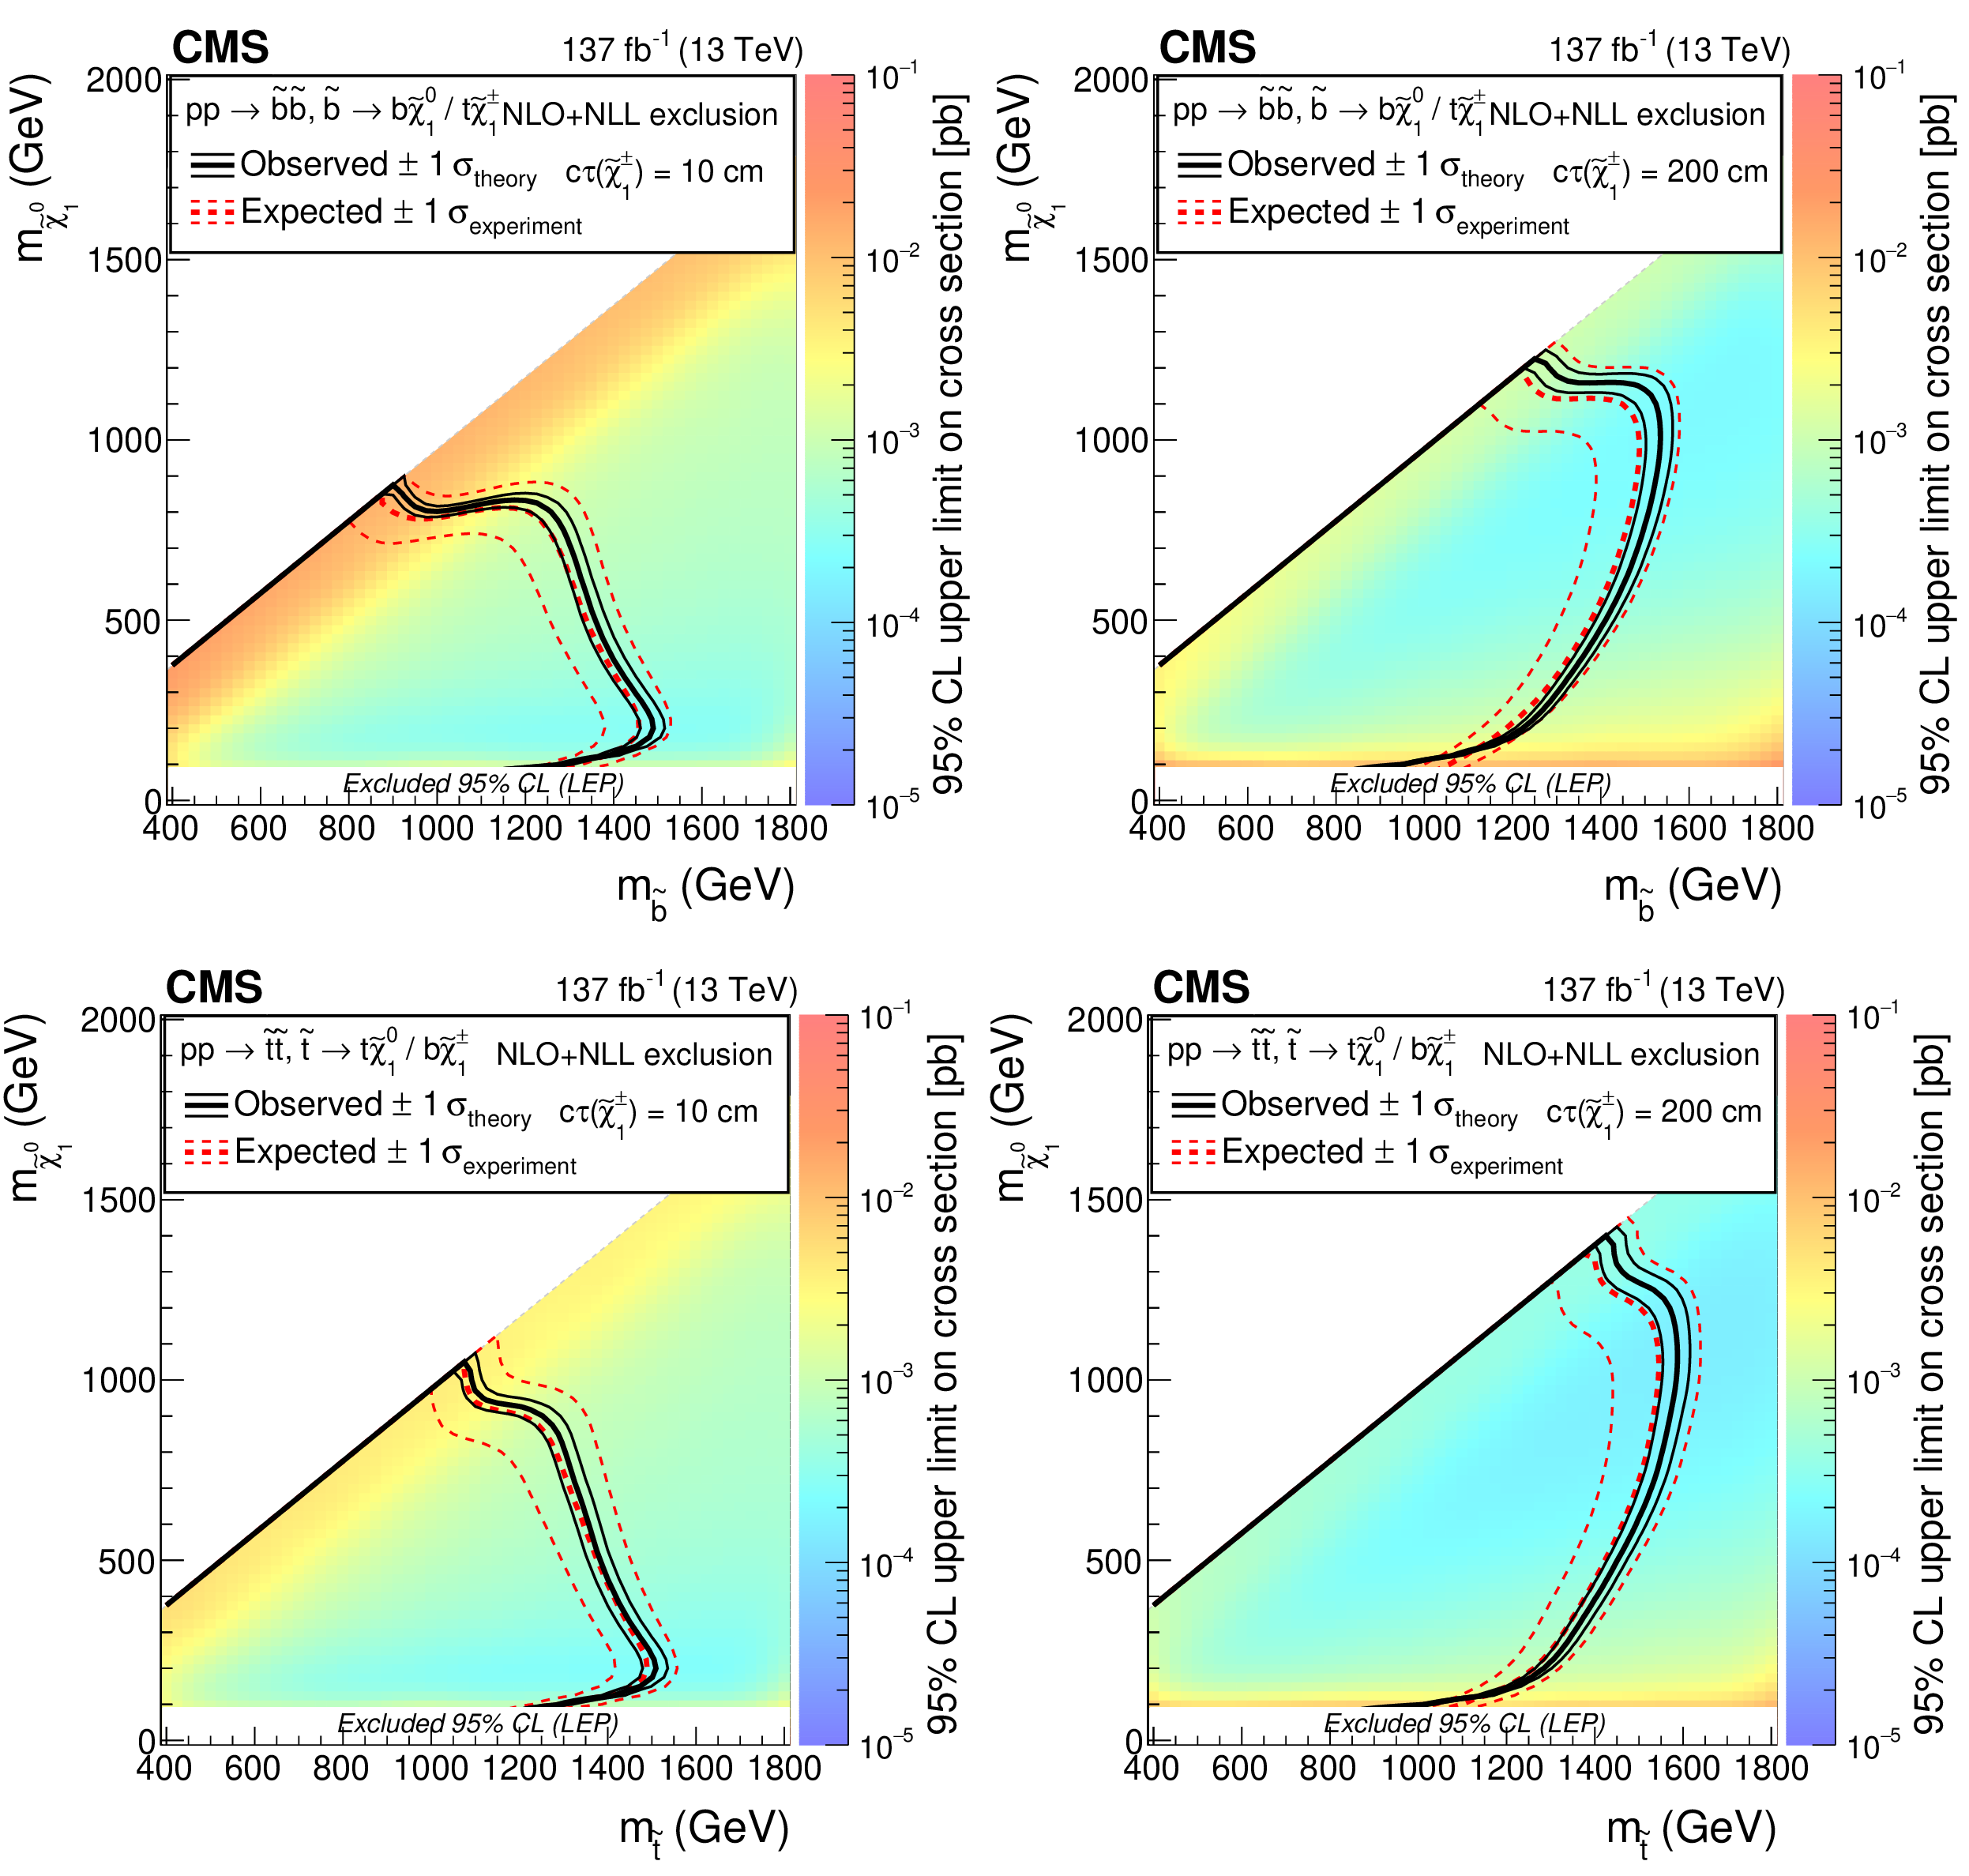
Figure 11:
Observed 95% CL upper limits on the signal cross sections (colored area) versus the gluino and neutralino mass for the T5btbtLL model for a chargino proper decay length $ c\tau $ of 10 (left column) and 200 (right column) cm. Also shown are black (red) contours corresponding to the observed (expected) lower limits, including their uncertainties, on the gluino and neutralino masses. |
png pdf |
Figure 11-a:
Observed 95% CL upper limits on the signal cross sections (colored area) versus the gluino and neutralino mass for the T5btbtLL model for a chargino proper decay length $ c\tau $ of 10 cm. Also shown are black (red) contours corresponding to the observed (expected) lower limits, including their uncertainties, on the gluino and neutralino masses. |
png pdf |
Figure 11-b:
Observed 95% CL upper limits on the signal cross sections (colored area) versus the gluino and neutralino mass for the T5btbtLL model for a chargino proper decay length $ c\tau $ of 200 cm. Also shown are black (red) contours corresponding to the observed (expected) lower limits, including their uncertainties, on the gluino and neutralino masses. |
png pdf |
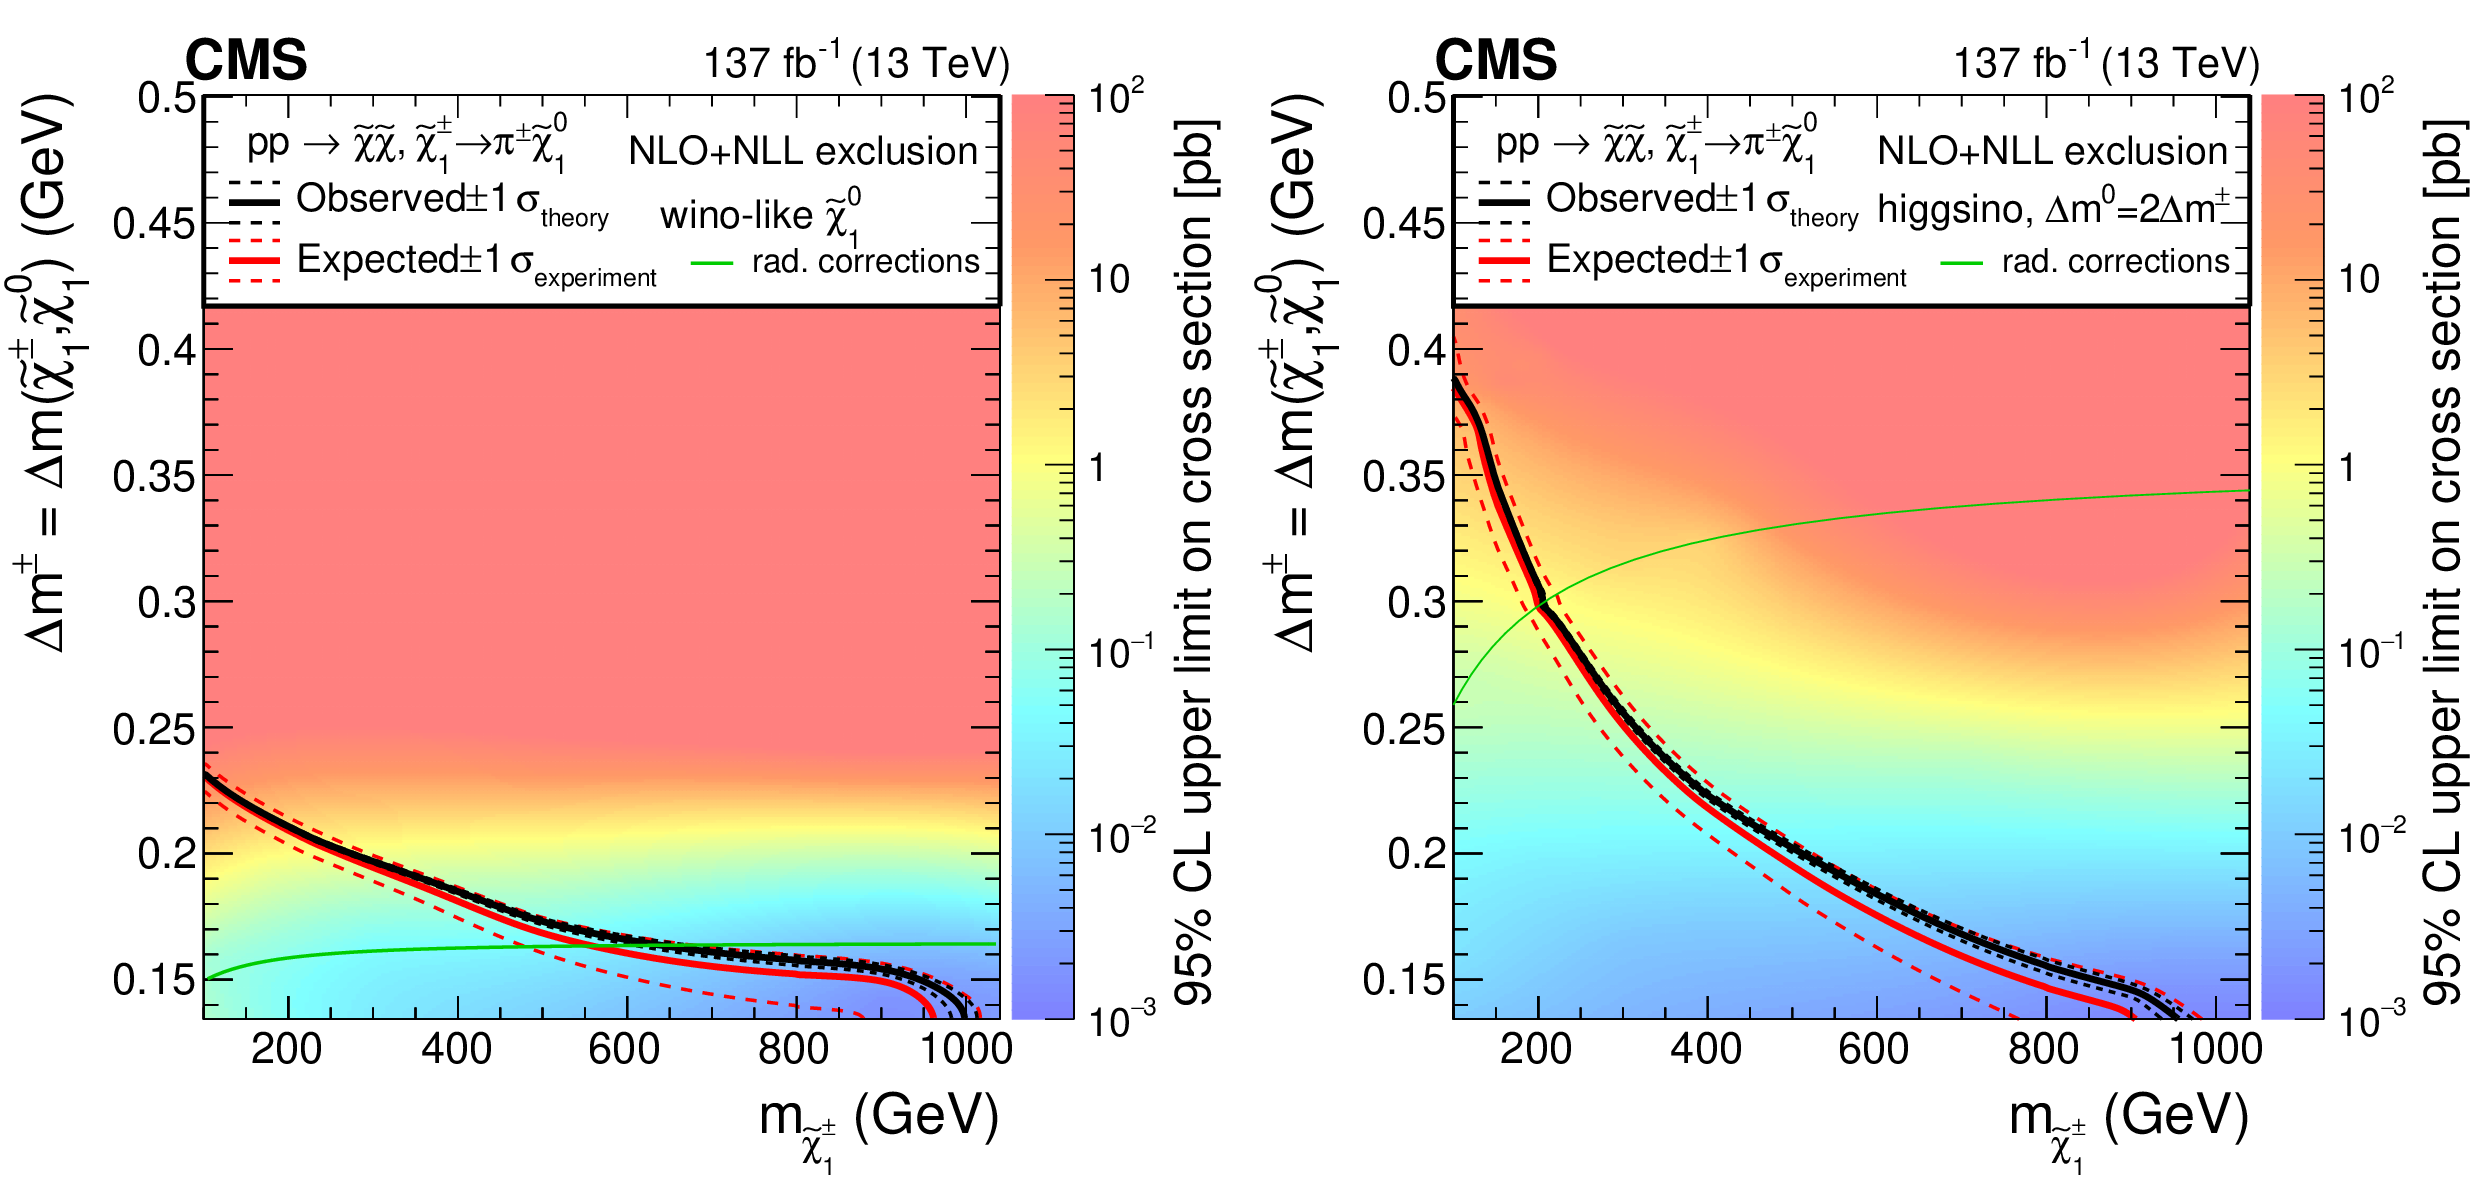
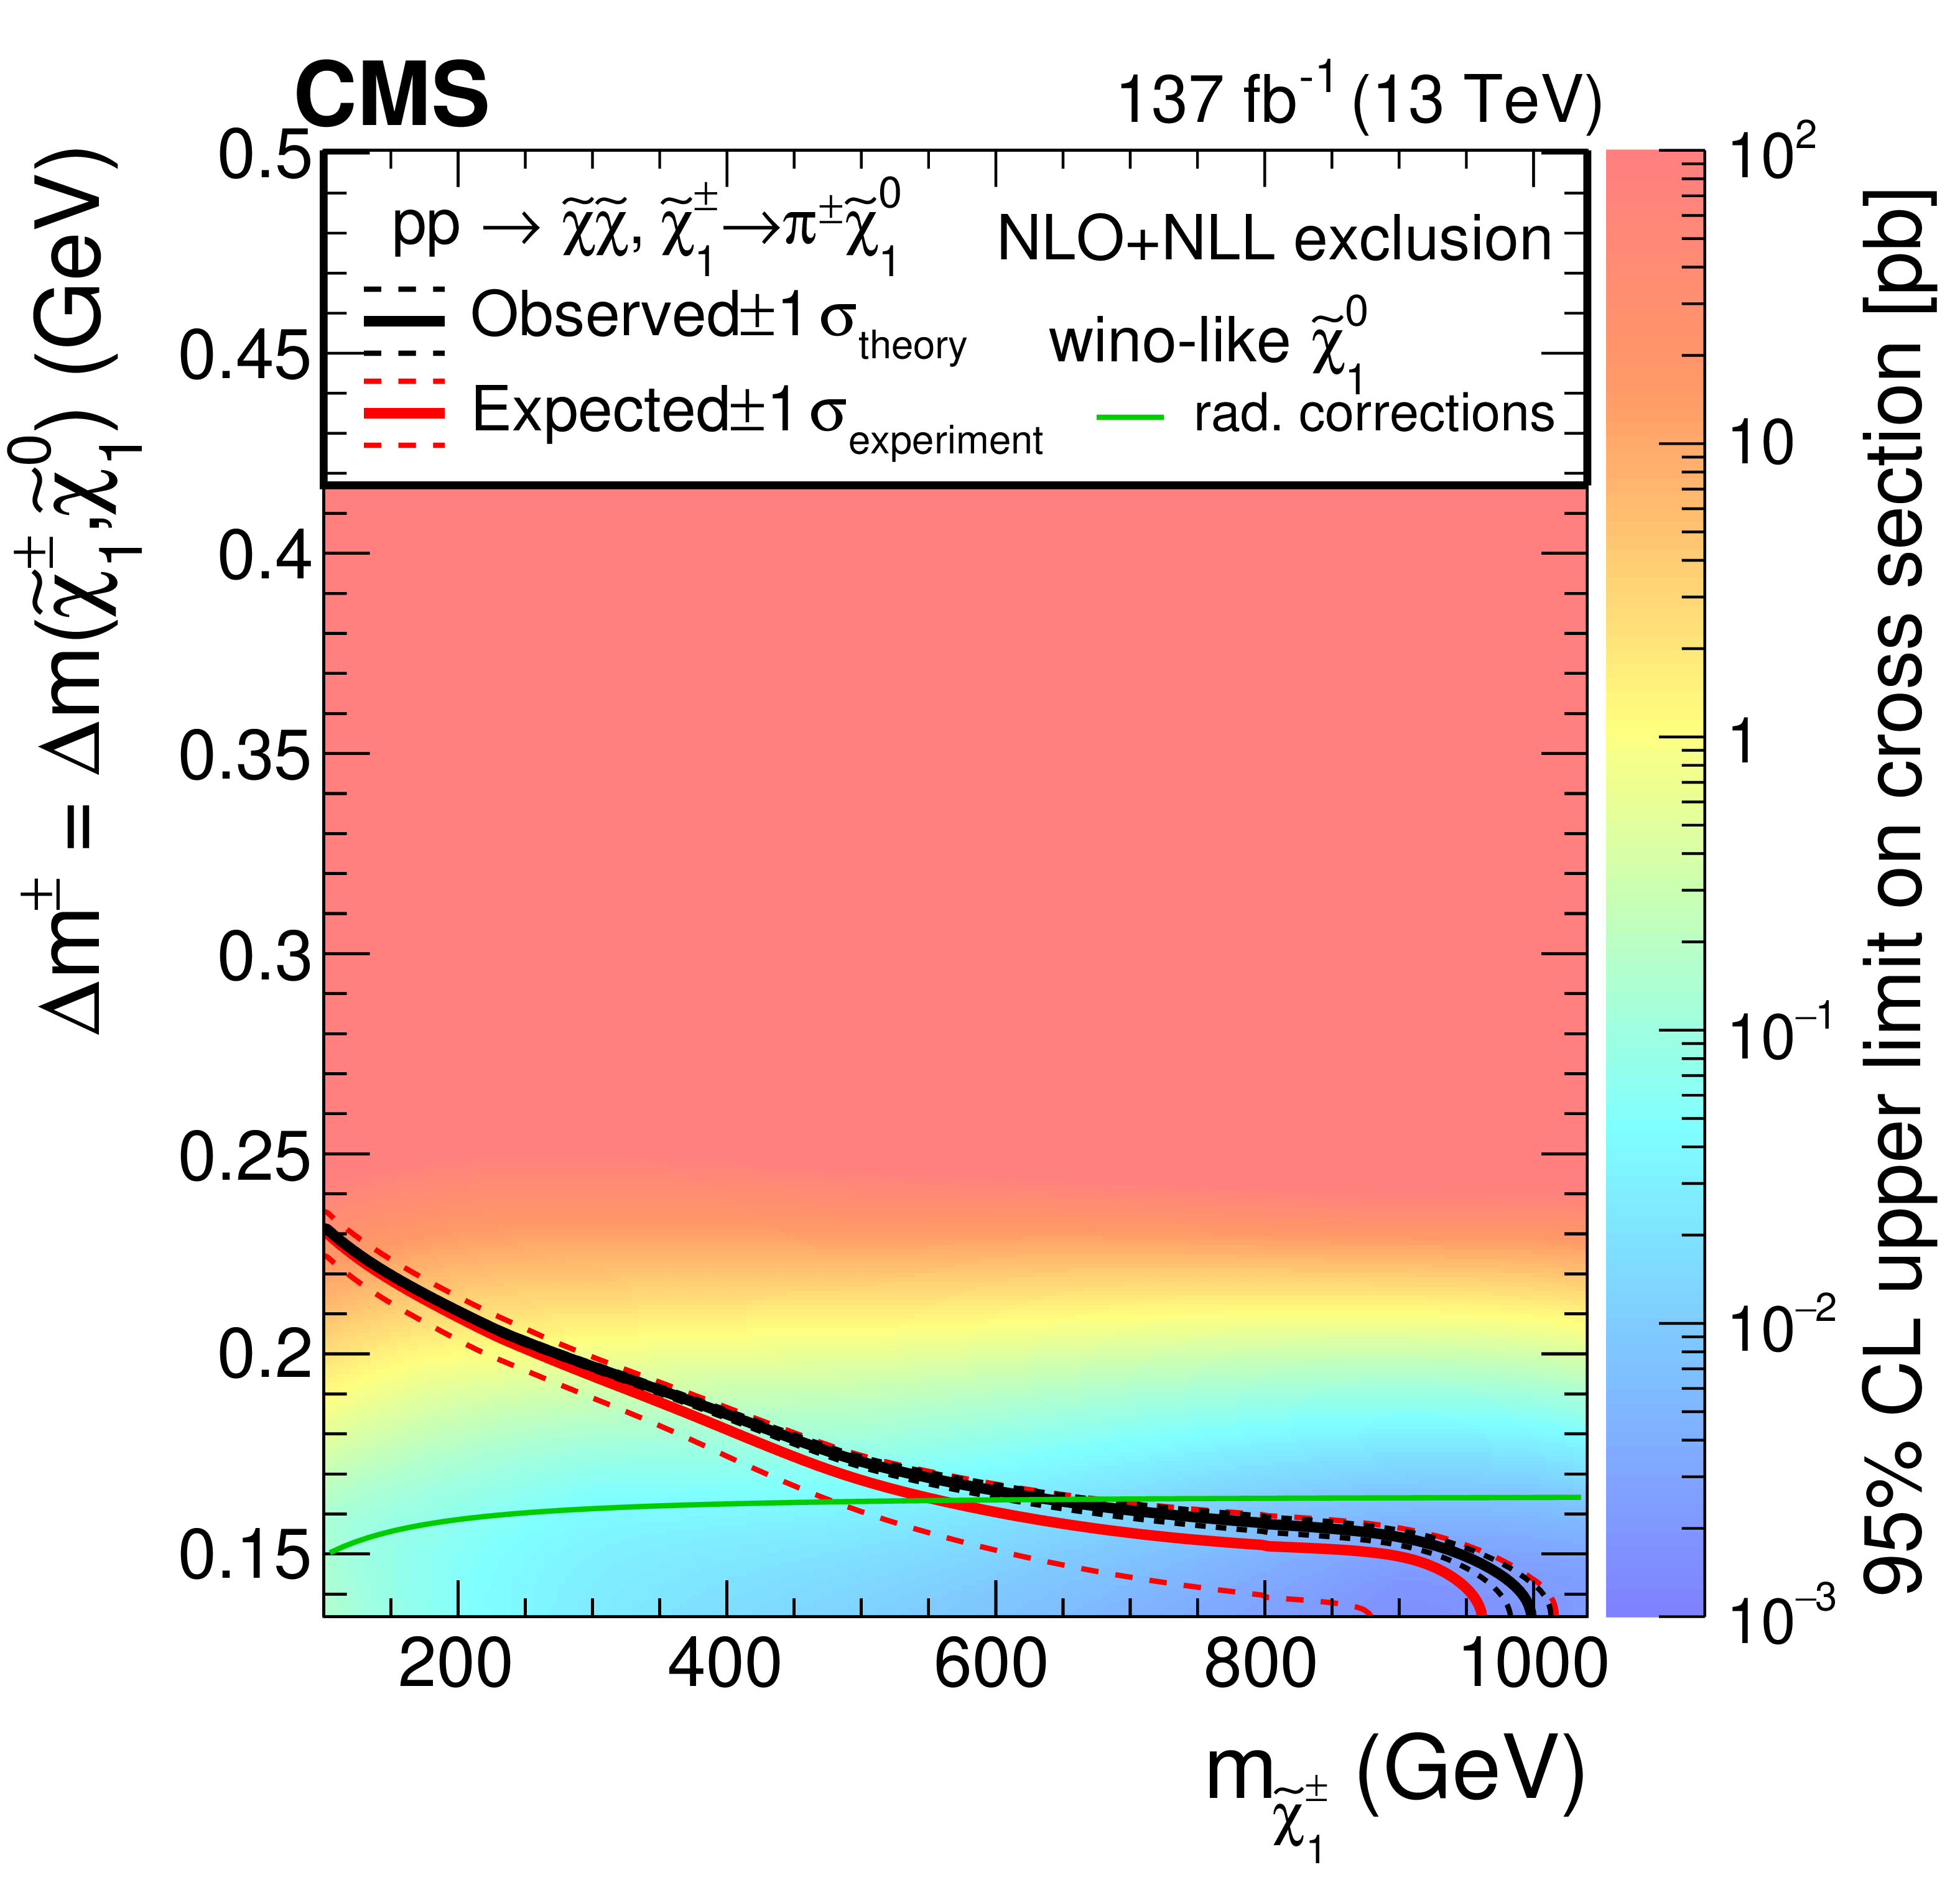
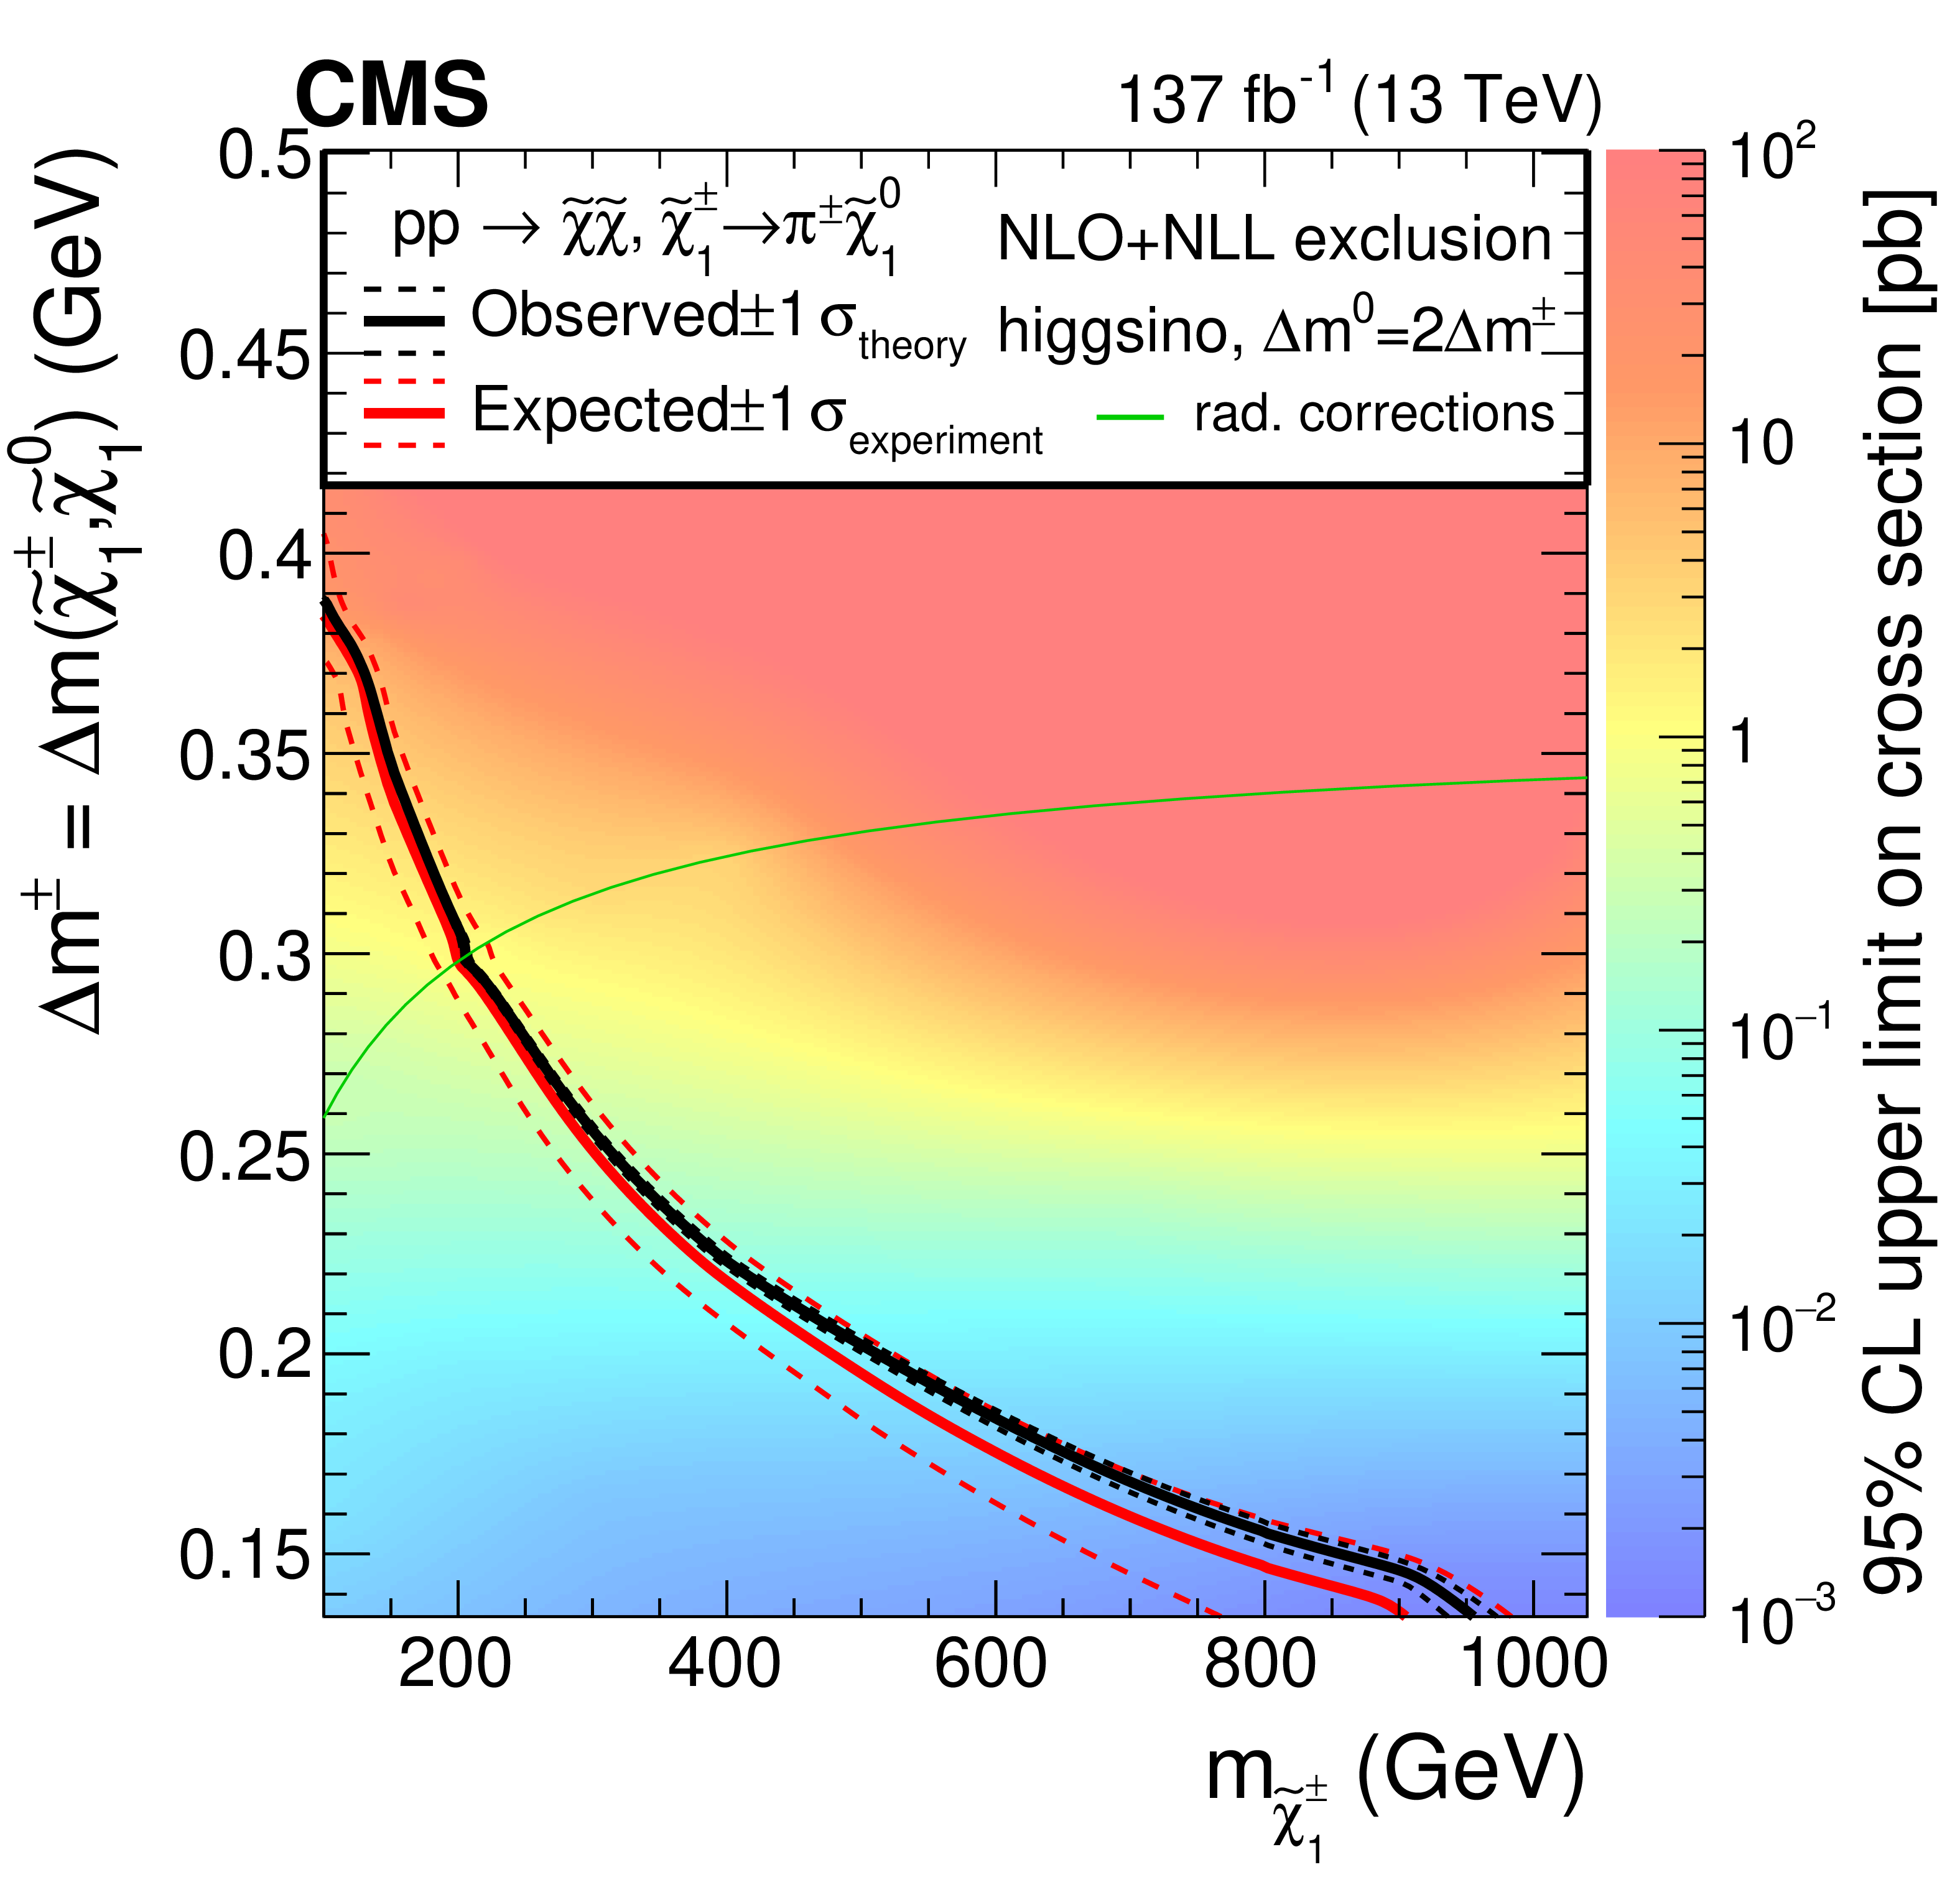
Figure 12:
Observed 95% CL upper limits on the signal cross sections (colored area) versus the chargino-LSP mass difference and the mass of the chargino for the wino (left) and higgsino (right) DM models. The black contours indicate the boundary where the observed upper limit equals the cross section of fully degenerate electroweakino production. The corresponding expected limits are shown by the red contours. The green lines represent the set of model points corresponding to the pure wino and pure higgsino models where only radiative corrections to the mass splitting are assumed. Chargino lifetimes are based on two-loop calculations. |
png pdf |
Figure 12-a:
Observed 95% CL upper limits on the signal cross sections (colored area) versus the chargino-LSP mass difference and the mass of the chargino for the wino DM model. The black contour indicates the boundary where the observed upper limit equals the cross section of fully degenerate electroweakino production. The corresponding expected limits are shown by the red contour. The green line represents the set of model points corresponding to the pure wino model where only radiative corrections to the mass splitting are assumed. Chargino lifetimes are based on two-loop calculations. |
png pdf |
Figure 12-b:
Observed 95% CL upper limits on the signal cross sections (colored area) versus the chargino-LSP mass difference and the mass of the chargino for the higgsino DM model. The black contour indicates the boundary where the observed upper limit equals the cross section of fully degenerate electroweakino production. The corresponding expected limits are shown by the red contour. The green line represents the set of model points corresponding to the pure higgsino model where only radiative corrections to the mass splitting are assumed. Chargino lifetimes are based on two-loop calculations. |
| Tables | |
png pdf |
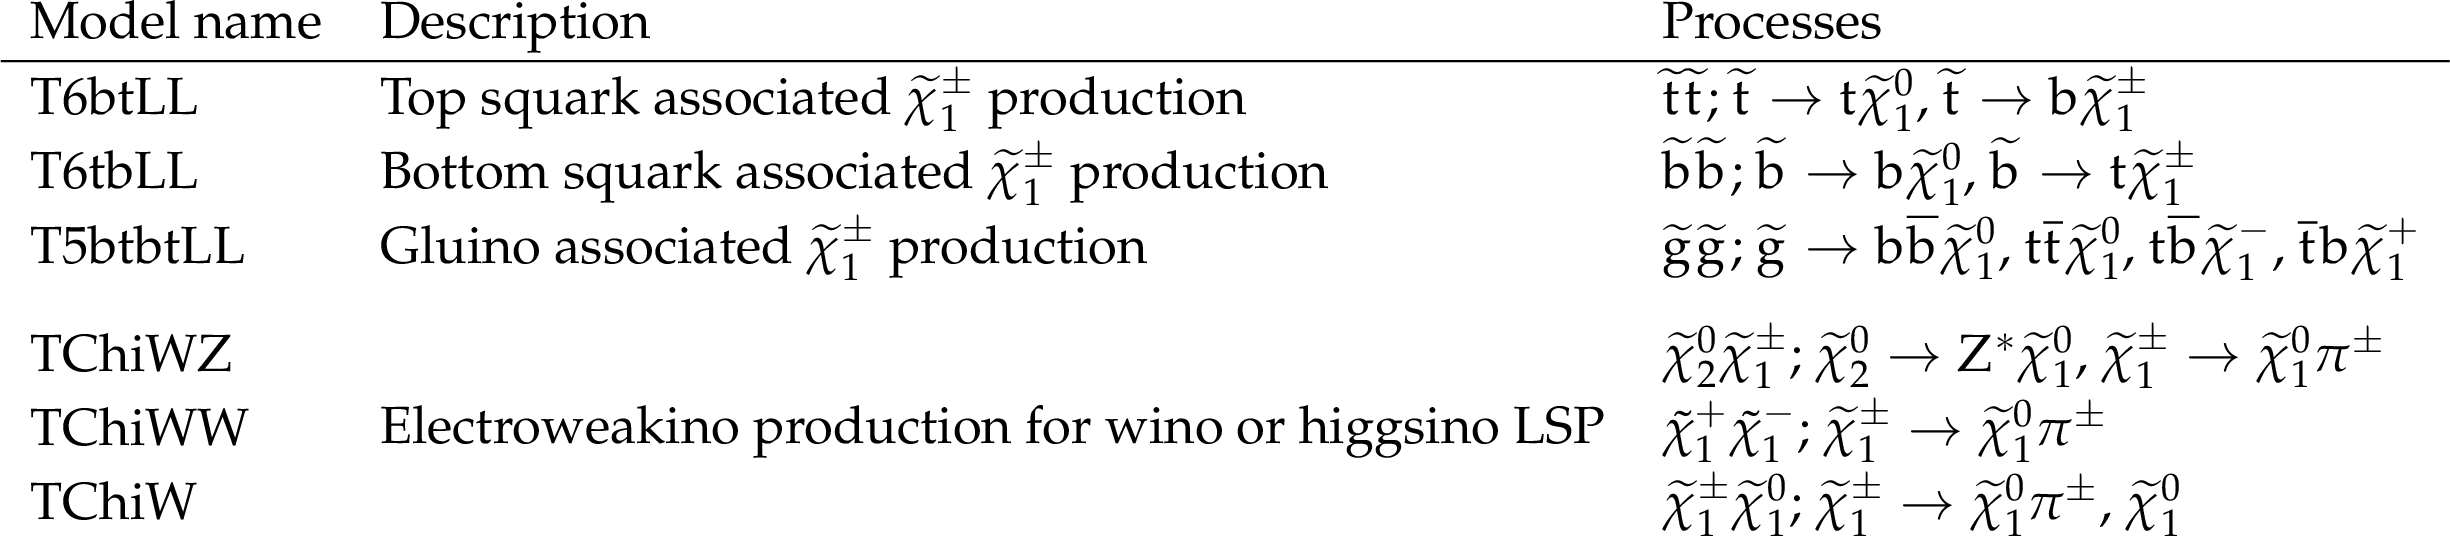
Table 1:
Overview of the simplified models of supersymmetry considered in this analysis. |
png pdf |
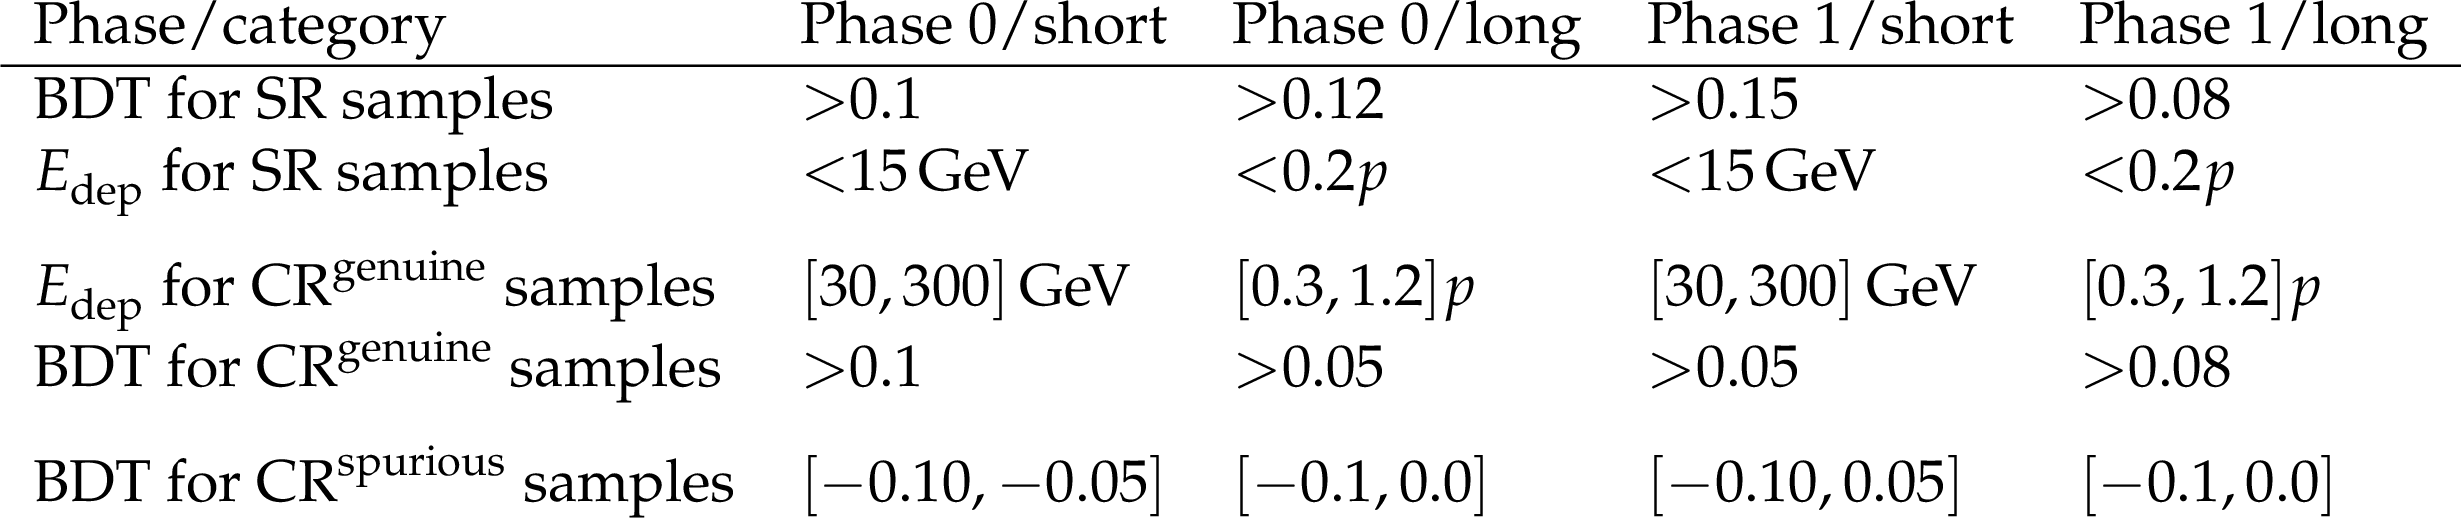
Table 2:
Selection criteria on the BDT classifier score and on the calorimetric energy $ E_{\text{dep}} $ associated with a disappearing track candidate for the search region (SR) and control region (CR) samples discussed in Section 8. |
png pdf |
Table 3:
Definition of the search regions (SRs) for the hadronic channel. |
png pdf |
Table 4:
Definition of the search regions (SRs) for the muon, electron, and $ N_{\mathrm{DTk}}\geq $ 2 channels. |

png pdf |
Table 5:
The transfer factors $ \kappa^{\text{low}}_{\text{high}} $ and $ \kappa^{\mu\,\text{veto}}_{\mu\,\text{match}} $ used for the evaluation of the genuine-particle backgrounds. The ``Genuine shower'' columns refer to the $ \kappa^{\text{low}}_{\text{high}} $ factors while the ``Genuine muon'' columns refer to the $ \kappa^{\mu\,\text{veto}}_{\mu\,\text{match}} $ factors. The genuine-particle muon background is negligible for the short category of DTks. The uncertainties are statistical only. |
png pdf |
Table 6:
The transfer factor $ \theta^{\text{high}}_{\text{low}} $ used for the evaluation of the spurious-particle background. The uncertainties are statistical only. |
png pdf |
Table 7:
Upper: The considered sources of systematic uncertainty in the predicted signal yield and the corresponding range of values over the 49 search regions. A value of 0 is reported when the relative uncertainty is determined to be less than 0.5%. Lower: The ranges for the total pre-fit uncertainty in the predicted background counts with respect to the respective background contribution. |
png pdf |
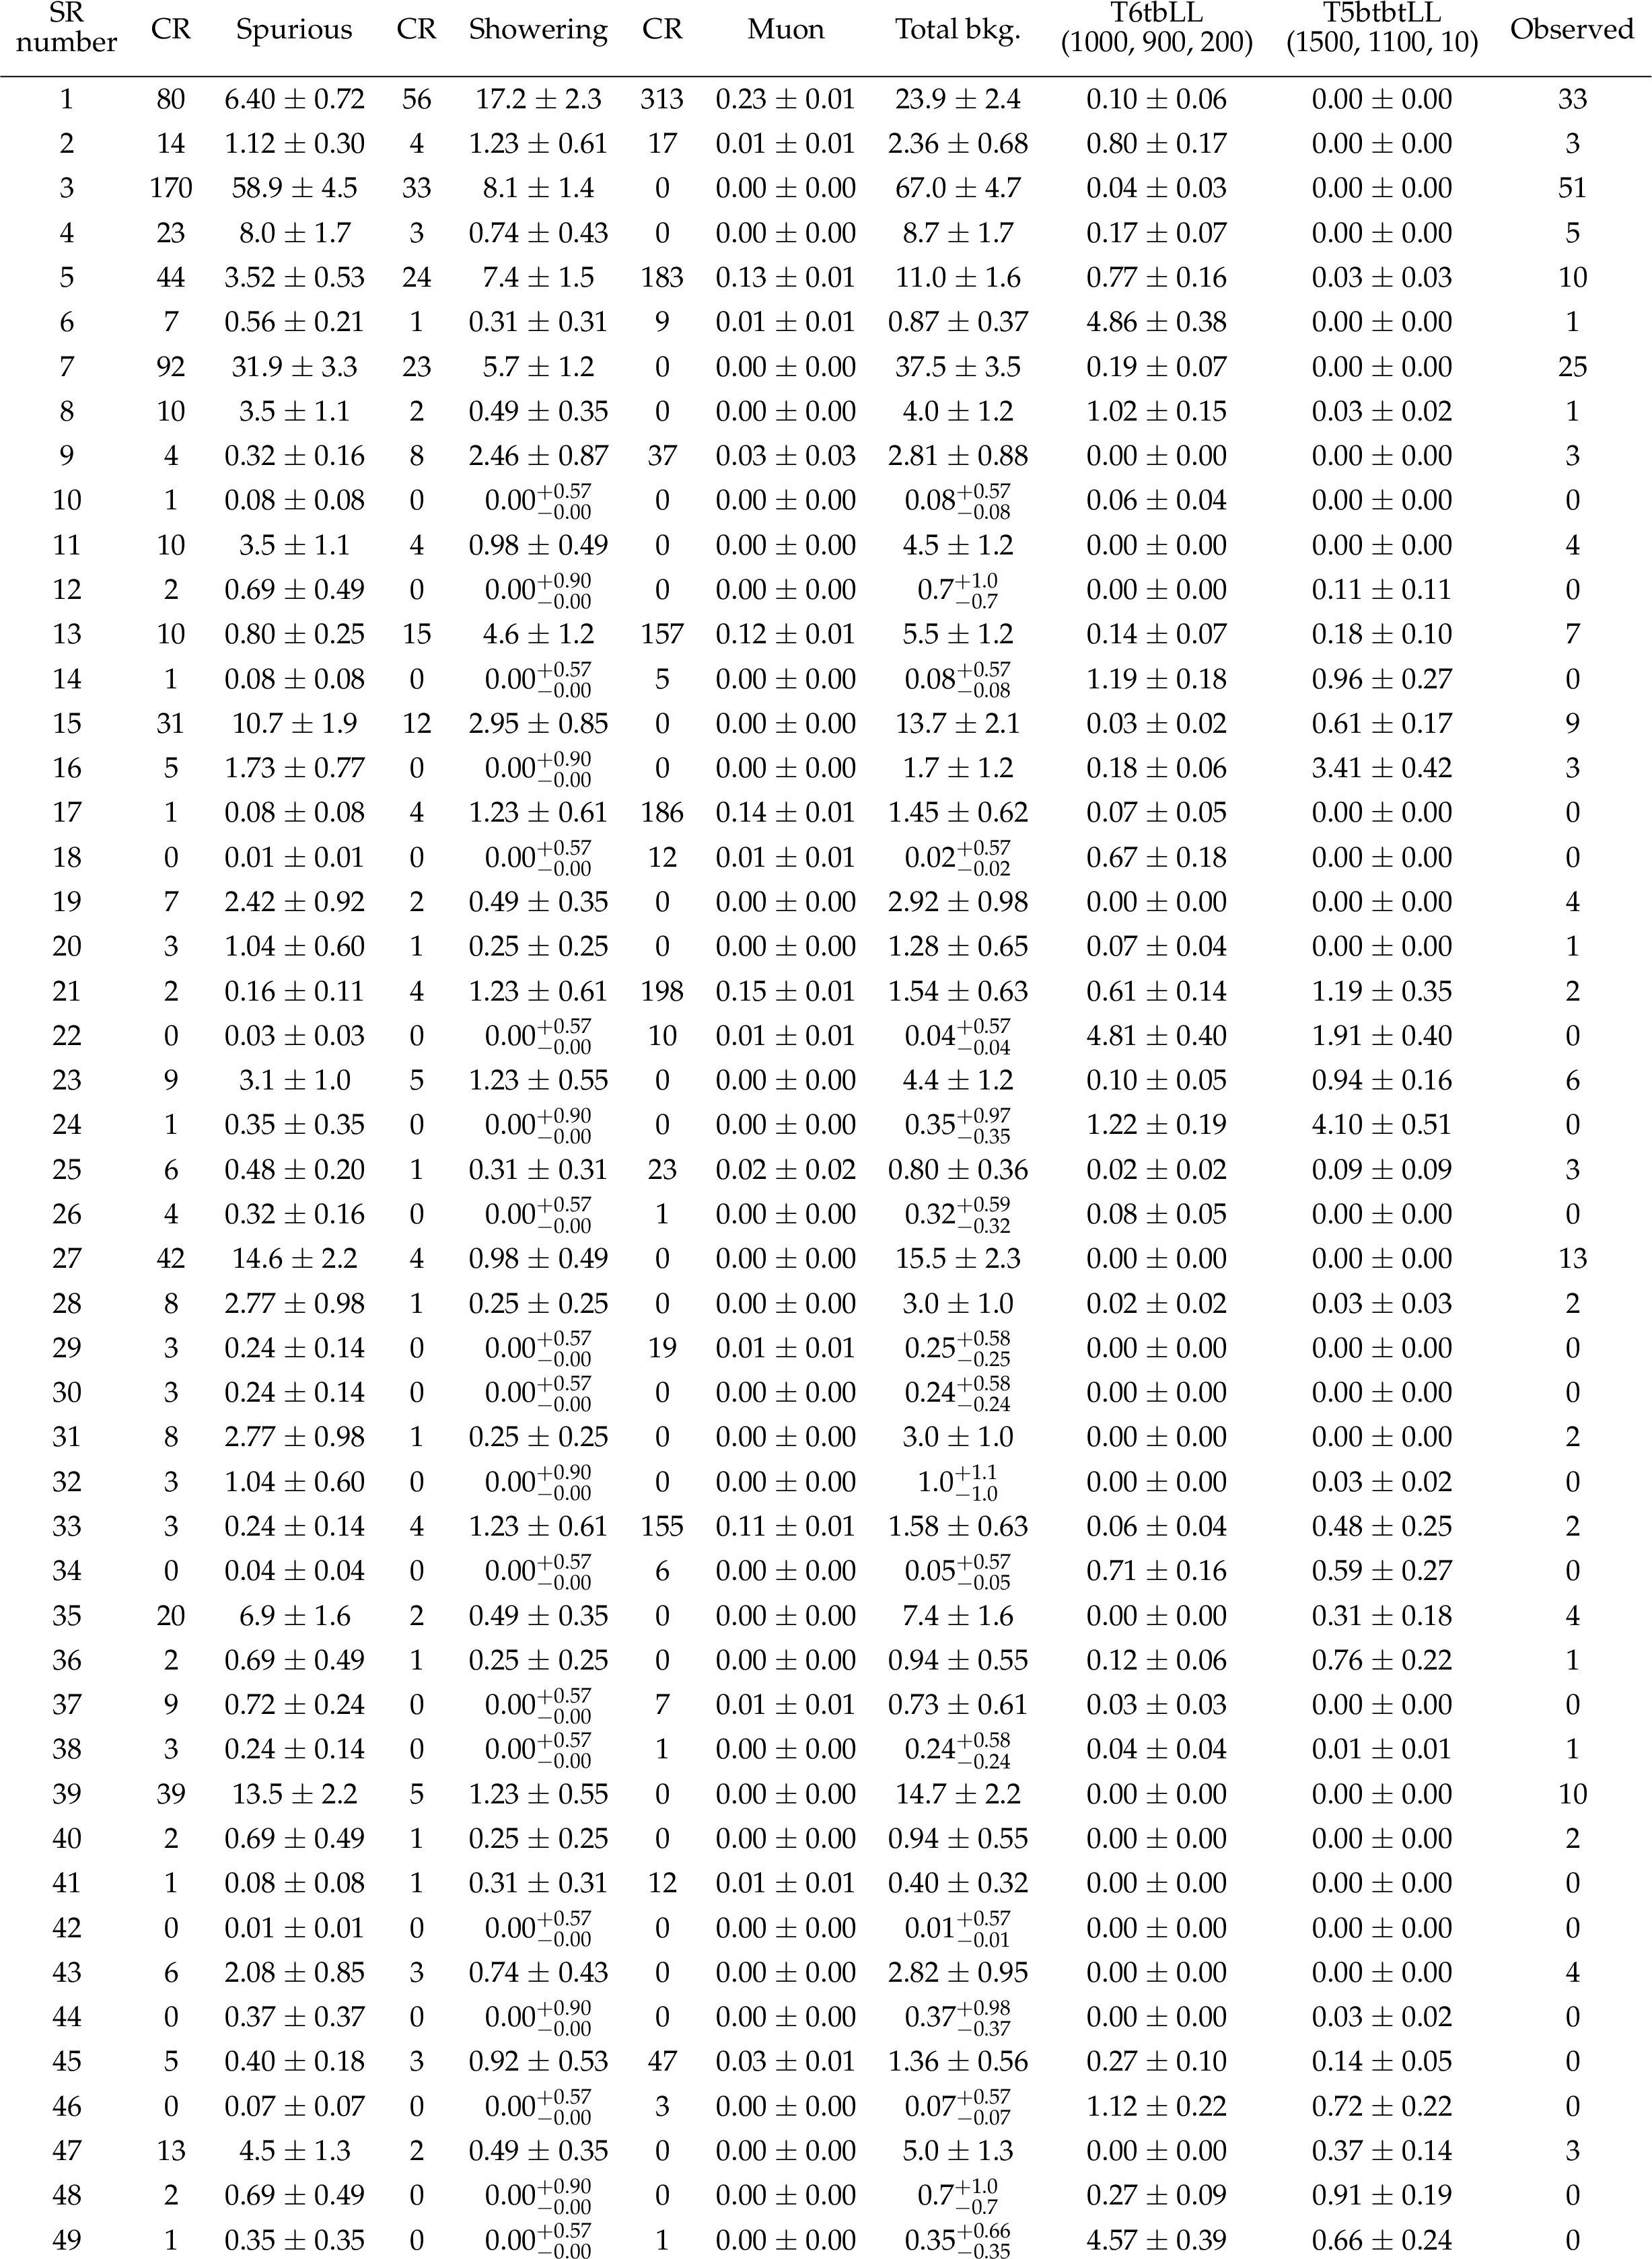
Table 8:
Predicted pre-fit background counts and uncertainties in the 49 search regions (SRs). Statistical and bin-wise systematic uncertainties are added in quadrature. The control region (CR) counts corresponding to each background category are given in the column to the left of the respective column. The numbers in parentheses for the signal points indicate the squark (or gluino) mass in GeV, the LSP mass in GeV, and $ c\tau $ for the chargino in cm, respectively. |
| Summary |
| A search for long-lived charginos based on data collected in proton-proton collisions at $ \sqrt{s}= $ 13 TeV, corresponding to an integrated luminosity of 137 fb$ ^{-1} $, is presented. Event yields are studied in 49 nonoverlapping search regions (SRs) defined by the number of electrons, muons, jets, and b-tagged jets, and by the hard missing transverse momentum, in final states with at least one identified disappearing track. Further categorization of the SRs is based on the approximate length of the track and on its $ \mathrm{d} E/\mathrm{d} x $ energy loss in the inner tracking detector. The analysis targets a wide variety of possible production modes appearing in simplified models of $ R $-parity conserving supersymmetry, including gluino, top squark, bottom squark, and electroweakino pair production. A machine-learning-based classifier is employed to optimally select disappearing tracks, while rejecting tracks originating from failures in the reconstruction or from combinatorial effects. Background contributions to the SRs are evaluated based on the observed yields in data control regions. The observed yields in the SRs are found to be consistent with the background-only predictions, and thus no evidence for supersymmetry is found. In the context of the examined models, bottom squarks, top squarks, and gluinos with masses as large as 1540, 1590, and 2300 GeV, respectively, are excluded. For bottom squark pair production, charginos and the lightest supersymmetric particle (LSP), considered to be essentially mass degenerate in our study, are excluded up to a mass of 850 (1210) GeV for a chargino proper decay length $ c\tau $ of 10 (200) cm. For top squark pair production, the corresponding limit on the chargino and LSP mass is 1050 (1400) GeV. These results extend the maximum limit on the LSP mass in the compressed phase space scenario by hundreds of GeV compared to the previous study [22], and extend the reach of sensitivity into mass regions where a pure wino- or pure higgsino-like LSP can account for the observed dark matter relic density. Limits are also determined for a pure wino dark matter model [29] and a pure higgsino dark matter model [32]. In the context of these two models, charginos and LSPs are excluded up to 650 GeV for the wino model and up to 210 GeV for the higgsino model. |
| References | ||||
| 1 | P. Ramond | Dual theory for free fermions | PRD 3 (1971) 2415 | |
| 2 | Y. A. Golfand and E. P. Likhtman | Extension of the algebra of Poincaré group generators and violation of P invariance | JETP Lett. 13 (1971) 323 | |
| 3 | A. Neveu and J. H. Schwarz | Factorizable dual model of pions | NPB 31 (1971) 86 | |
| 4 | D. V. Volkov and V. P. Akulov | Possible universal neutrino interaction | JETP Lett. 16 (1972) 438 | |
| 5 | J. Wess and B. Zumino | A Lagrangian model invariant under supergauge transformations | PLB 49 (1974) 52 | |
| 6 | J. Wess and B. Zumino | Supergauge transformations in four dimensions | NPB 70 (1974) 39 | |
| 7 | P. Fayet | Supergauge invariant extension of the Higgs mechanism and a model for the electron and its neutrino | NPB 90 (1975) 104 | |
| 8 | P. Fayet and S. Ferrara | Supersymmetry | Phys. Rept. 32 (1977) 249 | |
| 9 | H. P. Nilles | Supersymmetry, supergravity and particle physics | Phys. Rep. 110 (1984) 1 | |
| 10 | F. Zwicky | On the masses of nebulae and of clusters of nebulae | Astrophys. J. 86 (1937) 217 | |
| 11 | V. C. Rubin and W. K. Ford, Jr. | Rotation of the Andromeda nebula from a spectroscopic survey of emission regions | Astrophys. J. 159 (1970) 379 | |
| 12 | L. Susskind | Dynamics of spontaneous symmetry breaking in the Weinberg-Salam theory | PRD 20 (1979) 2619 | |
| 13 | G. 't Hooft | Naturalness, chiral symmetry, and spontaneous chiral symmetry breaking | NATO Sci. Ser. B 59 (1980) 135 | |
| 14 | M. J. G. Veltman | The infrared-ultraviolet connection | Acta Phys. Polon. B 12 (1981) 437 | |
| 15 | ATLAS Collaboration | The ATLAS experiment at the CERN Large Hadron Collider | JINST 3 (2008) S08003 | |
| 16 | CMS Collaboration | The CMS experiment at the CERN LHC | JINST 3 (2008) S08004 | |
| 17 | Planck Collaboration | Planck 2018 results. VI. Cosmological parameters | Astron. Astrophys. 641 (2020) A6 | 1807.06209 |
| 18 | G. R. Farrar and P. Fayet | Phenomenology of the production, decay, and detection of new hadronic states associated with supersymmetry | PLB 76 (1978) 575 | |
| 19 | A. Delgado and M. Quirós | Higgsino dark matter in the MSSM | PRD 103 (2021) 015024 | 2008.00954 |
| 20 | K. Griest and D. Seckel | Three exceptions in the calculation of relic abundances | PRD 43 (1991) 3191 | |
| 21 | G. Jungman, M. Kamionkowski, and K. Griest | Supersymmetric dark matter | Phys. Rept. 267 (1996) 195 | hep-ph/9506380 |
| 22 | CMS Collaboration | Searches for physics beyond the standard model with the $ M_\mathrm{T2} $ variable in hadronic final states with and without disappearing tracks in proton-proton collisions at $ \sqrt{s}= $ 13 TeV | EPJC 80 (2020) 3 | CMS-SUS-19-005 1909.03460 |
| 23 | CMS Collaboration | Search for disappearing tracks in proton-proton collisions at $ \sqrt{s} = $ 13 TeV | PLB 806 (2020) 135502 | CMS-EXO-19-010 2004.05153 |
| 24 | ATLAS Collaboration | Search for long-lived charginos based on a disappearing-track signature using 136 fb$ ^{-1} $ of pp collisions at $ \sqrt{s} $ = 13 TeV with the ATLAS detector | EPJC 82 (2022) 606 | 2201.02472 |
| 25 | CMS Collaboration | HEPData record for this analysis | link | |
| 26 | J. Alwall, P. C. Schuster, and N. Toro | Simplified models for a first characterization of new physics at the LHC | PRD 79 (2009) 075020 | 0810.3921 |
| 27 | D. Alves et al. | Simplified models for LHC new physics searches | JPG 39 (2012) 105005 | 1105.2838 |
| 28 | CMS Collaboration | Interpretation of searches for supersymmetry with simplified models | PRD 88 (2013) 052017 | CMS-SUS-11-016 1301.2175 |
| 29 | M. Ibe, S. Matsumoto, and R. Sato | Mass splitting between charged and neutral winos at two-loop level | PLB 721 (2013) 252 | 1212.5989 |
| 30 | M. Ibe, M. Mishima, Y. Nakayama, and S. Shirai | Precise estimate of charged wino decay rate | JHEP 01 (2023) 017 | 2210.16035 |
| 31 | N. Nagata and S. Shirai | Higgsino dark matter in high-scale supersymmetry | JHEP 01 (2015) 029 | 1410.4549 |
| 32 | H. Fukuda, N. Nagata, H. Otono, and S. Shirai | Higgsino dark matter or not: role of disappearing track searches at the LHC and future colliders | PLB 781 (2018) 306 | 1703.09675 |
| 33 | S. P. Martin | A supersymmetry primer | Adv. Ser. Direct. High Energy Phys. 18 (1998) 1 | hep-ph/9709356 |
| 34 | B. C. Allanach | SOFTSUSY: a program for calculating supersymmetric spectra | Comput. Phys. Commun. 143 (2002) 305 | hep-ph/0104145 |
| 35 | CMS Tracker Group Collaboration | The CMS phase-1 pixel detector upgrade | JINST 16 (2021) P02027 | 2012.14304 |
| 36 | CMS Collaboration | The CMS trigger system | JINST 12 (2017) P01020 | CMS-TRG-12-001 1609.02366 |
| 37 | CMS Collaboration | Performance of the CMS Level-1 trigger in proton-proton collisions at $ \sqrt{s} = $ 13\,TeV | JINST 15 (2020) P10017 | CMS-TRG-17-001 2006.10165 |
| 38 | CMS Collaboration | Particle-flow reconstruction and global event description with the CMS detector | JINST 12 (2017) P10003 | CMS-PRF-14-001 1706.04965 |
| 39 | CMS Collaboration | Electron and photon reconstruction and identification with the CMS experiment at the CERN LHC | JINST 16 (2021) P05014 | CMS-EGM-17-001 2012.06888 |
| 40 | CMS Collaboration | Performance of the CMS muon detector and muon reconstruction with proton-proton collisions at $ \sqrt{s} = $ 13 TeV | JINST 13 (2018) P06015 | CMS-MUO-16-001 1804.04528 |
| 41 | CMS Collaboration | Technical proposal for the Phase-II upgrade of the Compact Muon Solenoid | CMS Technical Proposal CERN-LHCC-2015-010, CMS-TDR-15-02, 2015 CDS |
|
| 42 | M. Cacciari, G. P. Salam, and G. Soyez | The anti-$ k_{\mathrm{T}} $ jet clustering algorithm | JHEP 04 (2008) 063 | 0802.1189 |
| 43 | M. Cacciari, G. P. Salam, and G. Soyez | FastJet user manual | EPJC 72 (2012) 1896 | 1111.6097 |
| 44 | CMS Collaboration | Jet performance in pp collisions at $ \sqrt{s}= $ 7 TeV | CMS Physics Analysis Summary, 2010 link |
|
| 45 | CMS Collaboration | Jet algorithms performance in 13 TeV data | CMS Physics Analysis Summary, 2017 CMS-PAS-JME-16-003 |
CMS-PAS-JME-16-003 |
| 46 | CMS Collaboration | Jet energy scale and resolution in the CMS experiment in pp collisions at 8 TeV | JINST 12 (2017) P02014 | CMS-JME-13-004 1607.03663 |
| 47 | M. Cacciari and G. P. Salam | Pileup subtraction using jet areas | PLB 659 (2008) 119 | 0707.1378 |
| 48 | CMS Collaboration | Identification of heavy-flavour jets with the CMS detector in pp collisions at 13 TeV | JINST 13 (2018) P05011 | CMS-BTV-16-002 1712.07158 |
| 49 | K. Rehermann and B. Tweedie | Efficient identification of boosted semileptonic top quarks at the LHC | JHEP 03 (2011) 059 | 1007.2221 |
| 50 | J. Alwall et al. | The automated computation of tree-level and next-to-leading order differential cross sections, and their matching to parton shower simulations | JHEP 07 (2014) 079 | 1405.0301 |
| 51 | J. Alwall et al. | Comparative study of various algorithms for the merging of parton showers and matrix elements in hadronic collisions | EPJC 53 (2008) 473 | 0706.2569 |
| 52 | R. Frederix and S. Frixione | Merging meets matching in MC@NLO | JHEP 12 (2012) 061 | 1209.6215 |
| 53 | P. Nason | A new method for combining NLO QCD with shower Monte Carlo algorithms | JHEP 11 (2004) 040 | hep-ph/0409146 |
| 54 | S. Frixione, P. Nason, and C. Oleari | Matching NLO QCD computations with parton shower simulations: the POWHEG method | JHEP 11 (2007) 070 | 0709.2092 |
| 55 | S. Alioli, P. Nason, C. Oleari, and E. Re | A general framework for implementing NLO calculations in shower Monte Carlo programs: the POWHEG BOX | JHEP 06 (2010) 043 | 1002.2581 |
| 56 | S. Alioli, P. Nason, C. Oleari, and E. Re | NLO single-top production matched with shower in POWHEG: $ s $- and $ t $-channel contributions | JHEP 09 (2009) 111 | 0907.4076 |
| 57 | E. Re | Single-top Wt-channel production matched with parton showers using the POWHEG method | EPJC 71 (2011) 1547 | 1009.2450 |
| 58 | T. Melia, P. Nason, R. Rontsch, and G. Zanderighi | W$ ^+ $W$ ^- $, WZ and ZZ production in the POWHEG BOX | JHEP 11 (2011) 078 | 1107.5051 |
| 59 | M. Beneke, P. Falgari, S. Klein, and C. Schwinn | Hadronic top-quark pair production with NNLL threshold resummation | NPB 855 (2012) 695 | 1109.1536 |
| 60 | M. Cacciari et al. | Top-pair production at hadron colliders with next-to-next-to-leading logarithmic soft-gluon resummation | PLB 710 (2012) 612 | 1111.5869 |
| 61 | P. Bärnreuther, M. Czakon, and A. Mitov | Percent level precision physics at the Tevatron: first genuine NNLO QCD corrections to $ \mathrm{q}\overline{\mathrm{q}}\to{\mathrm{t}\overline{\mathrm{t}}} +X $ | PRL 109 (2012) 132001 | 1204.5201 |
| 62 | M. Czakon and A. Mitov | NNLO corrections to top-pair production at hadron colliders: the all-fermionic scattering channels | JHEP 12 (2012) 054 | 1207.0236 |
| 63 | M. Czakon and A. Mitov | NNLO corrections to top pair production at hadron colliders: the quark-gluon reaction | JHEP 01 (2013) 080 | 1210.6832 |
| 64 | M. Czakon, P. Fiedler, and A. Mitov | Total top-quark pair-production cross section at hadron colliders through $ O(\alpha_\mathrm{S}^4) $ | PRL 110 (2013) 252004 | 1303.6254 |
| 65 | R. Gavin, Y. Li, F. Petriello, and S. Quackenbush | W physics at the LHC with FEWZ 2.1 | Comput. Phys. Commun. 184 (2013) 208 | 1201.5896 |
| 66 | R. Gavin, Y. Li, F. Petriello, and S. Quackenbush | FEWZ 2.0: A code for hadronic Z production at next-to-next-to-leading order | Comput. Phys. Commun. 182 (2011) 2388 | 1011.3540 |
| 67 | GEANT4 Collaboration | GEANT4---a simulation toolkit | NIM A 506 (2003) 250 | |
| 68 | W. Beenakker, R. Höpker, M. Spira, and P. M. Zerwas | Squark and gluino production at hadron colliders | NPB 492 (1997) 51 | hep-ph/9610490 |
| 69 | A. Kulesza and L. Motyka | Threshold resummation for squark-antisquark and gluino-pair production at the LHC | PRL 102 (2009) 111802 | 0807.2405 |
| 70 | A. Kulesza and L. Motyka | Soft gluon resummation for the production of gluino-gluino and squark-antisquark pairs at the LHC | PRD 80 (2009) 095004 | 0905.4749 |
| 71 | W. Beenakker et al. | Soft-gluon resummation for squark and gluino hadroproduction | JHEP 12 (2009) 041 | 0909.4418 |
| 72 | W. Beenakker et al. | Squark and gluino hadroproduction | Int. J. Mod. Phys. A 26 (2011) 2637 | 1105.1110 |
| 73 | W. Beenakker et al. | NNLL-fast: predictions for coloured supersymmetric particle production at the LHC with threshold and Coulomb resummation | JHEP 12 (2016) 133 | 1607.07741 |
| 74 | W. Beenakker et al. | NNLL resummation for squark-antisquark pair production at the LHC | JHEP 01 (2012) 076 | 1110.2446 |
| 75 | W. Beenakker et al. | Towards NNLL resummation: hard matching coefficients for squark and gluino hadroproduction | JHEP 10 (2013) 120 | 1304.6354 |
| 76 | W. Beenakker et al. | NNLL resummation for squark and gluino production at the LHC | JHEP 12 (2014) 023 | 1404.3134 |
| 77 | W. Beenakker et al. | Stop production at hadron colliders | NPB 515 (1998) 3 | hep-ph/9710451 |
| 78 | W. Beenakker et al. | Supersymmetric top and bottom squark production at hadron colliders | JHEP 08 (2010) 098 | 1006.4771 |
| 79 | W. Beenakker et al. | NNLL resummation for stop pair-production at the LHC | JHEP 05 (2016) 153 | 1601.02954 |
| 80 | T. Sjöstrand et al. | An Introduction to PYTHIA 8.2 | Comput. Phys. Commun. 191 (2015) 159 | 1410.3012 |
| 81 | S. Abdullin et al. | The fast simulation of the CMS detector at LHC | J. Phys. Conf. Ser. 331 (2011) 032049 | |
| 82 | A. Giammanco | The fast simulation of the CMS experiment | J. Phys. Conf. Ser. 513 (2014) 022012 | |
| 83 | CMS Collaboration | Event generator tunes obtained from underlying event and multiparton scattering measurements | EPJC 76 (2016) 155 | CMS-GEN-14-001 1512.00815 |
| 84 | CMS Collaboration | Extraction and validation of a new set of CMS PYTHIA8 tunes from underlying-event measurements | EPJC 80 (2020) 4 | CMS-GEN-17-001 1903.12179 |
| 85 | NNPDF Collaboration | Parton distributions with QED corrections | NPB 877 (2013) 290 | 1308.0598 |
| 86 | NNPDF Collaboration | Parton distributions from high-precision collider data | EPJC 77 (2017) 663 | 1706.00428 |
| 87 | CMS Collaboration | Search for supersymmetry in multijet events with missing transverse momentum in proton-proton collisions at 13 TeV | PRD 96 (2017) 032003 | CMS-SUS-16-033 1704.07781 |
| 88 | CMS Collaboration | Search for new phenomena with the $ M_{\mathrm {T2}} $ variable in the all-hadronic final state produced in proton-proton collisions at $ \sqrt{s} = $ 13 TeV | EPJC 77 (2017) 710 | CMS-SUS-16-036 1705.04650 |
| 89 | CMS Collaboration | Search for heavy stable charged particles in pp collisions at $ \sqrt{s}= $ 7 TeV | JHEP 03 (2011) 024 | CMS-EXO-10-011 1101.1645 |
| 90 | CMS Collaboration | Search for long-lived charged particles in proton-proton collisions at $ \sqrt s= $ 13 TeV | PRD 94 (2016) 112004 | CMS-EXO-15-010 1609.08382 |
| 91 | UA1 Collaboration | Experimental observation of isolated large transverse energy electrons with associated missing energy at $ \sqrt{s}= $ 540 GeV | PLB 122 (1983) 103 | |
| 92 | G. Kasieczka, B. Nachman, M. D. Schwartz, and D. Shih | Automating the ABCD method with machine learning | PRD 103 (2021) 035021 | 2007.14400 |
| 93 | CMS Collaboration | Precision luminosity measurement in proton-proton collisions at $ \sqrt{s}= $ 13 TeV in 2015 and 2016 at CMS | EPJC 81 (2021) 800 | CMS-LUM-17-003 2104.01927 |
| 94 | CMS Collaboration | CMS luminosity measurement for the 2017 data-taking period at $ \sqrt{s} = $ 13 TeV | CMS Physics Analysis Summary, 2018 CMS-PAS-LUM-17-004 |
CMS-PAS-LUM-17-004 |
| 95 | CMS Collaboration | CMS luminosity measurement for the 2018 data-taking period at $ \sqrt{s} = $ 13 TeV | CMS Physics Analysis Summary, 2019 CMS-PAS-LUM-18-002 |
CMS-PAS-LUM-18-002 |
| 96 | A. Giraldi | Precision luminosity measurement with proton-proton collisions at the CMS experiment in Run 2 | in Proc. 41st Int. Conf. on High Energy Physics (ICHEP), 2002 [PoS(ICHEP)638] |
2208.08214 |
| 97 | CMS Collaboration | Performance of missing transverse momentum reconstruction in proton-proton collisions at $ \sqrt{s} = $ 13 TeV using the CMS detector | JINST 14 (2019) P07004 | CMS-JME-17-001 1903.06078 |
| 98 | A. Kalogeropoulos and J. Alwall | The SysCalc code: A tool to derive theoretical systematic uncertainties | 1801.08401 | |
| 99 | S. Catani, D. de Florian, M. Grazzini, and P. Nason | Soft gluon resummation for Higgs boson production at hadron colliders | JHEP 07 (2003) 028 | hep-ph/0306211 |
| 100 | M. Cacciari et al. | The $ \mathrm{t} \overline{\mathrm{t}} $ cross-section at 1.8 and 1.96 TeV: A study of the systematics due to parton densities and scale dependence | JHEP 04 (2004) 068 | hep-ph/0303085 |
| 101 | CMS Collaboration | Pileup mitigation at CMS in 13 TeV data | JINST 15 (2020) P09018 | CMS-JME-18-001 2003.00503 |
| 102 | G. Cowan, K. Cranmer, E. Gross, and O. Vitells | Asymptotic formulae for likelihood-based tests of new physics | EPJC 71 (2011) 1554 | 1007.1727 |
| 103 | T. Junk | Confidence level computation for combining searches with small statistics | NIM A 434 (1999) 435 | hep-ex/9902006 |
| 104 | A. L. Read | Presentation of search results: The $ \text{CL}_\text{s} $ technique | JPG 28 (2002) 2693 | |
| 105 | LEP2 SUSY Working Group, ALEPH, DELPHI, L3 and OPAL Collaborations | Combined LEP chargino results, up to 208 GeV for low $ \Delta m $ | (2002) link |
|
|
|
Compact Muon Solenoid LHC, CERN |
|

|

|

|

|

|