

Compact Muon Solenoid
LHC, CERN
| CMS-B2G-18-003 ; CERN-EP-2019-174 | ||
| Search for electroweak production of a vector-like T quark using fully hadronic final states | ||
| CMS Collaboration | ||
| 10 September 2019 | ||
| JHEP 01 (2020) 036 | ||
| Abstract: A search is performed for electroweak production of a vector-like top quark partner T of charge 2/3 in association with a top or bottom quark, using proton-proton collision data at $\sqrt{s} = $ 13 TeV collected by the CMS experiment at the LHC in 2016. The data sample corresponds to an integrated luminosity of 35.9 fb$^{-1}$. The search targets T quarks over a wide range of masses and fractional widths, decaying to a top quark and either a Higgs boson or a Z boson in fully hadronic final states. The search is performed using two experimentally distinct signatures that depend on whether or not each quark from the decays of the top quark, Higgs boson, or Z boson produces an individual resolved jet. Jet substructure, b tagging, and kinematic variables are used to identify the top quark and boson jets, and also to suppress the standard model backgrounds. The data are found to be consistent with the expected backgrounds. Upper limits at 95% confidence level are set on the cross sections for T quark-mediated production of $\mathrm{t}\mathrm{H}\mathrm{Q}\mathrm{q}$, $\mathrm{t}\mathrm{Z}\mathrm{Q}\mathrm{q}$, and their sum, where Q is the associated top or bottom heavy quark and q is another associated quark. The limits are given for each search signature for various T quark widths up to 30% of the T quark mass, and are between 2 pb and 20 fb for T quark masses in the range 0.6-2.6 TeV. These results are significantly more sensitive than prior searches for electroweak single production of ${\mathrm{T}\to\mathrm{t}\mathrm{H}}$ and represent the first constraints on ${\mathrm{T}\to\mathrm{t}\mathrm{Z}}$ using hadronic decays of the Z boson with this production mode. | ||
| Links: e-print arXiv:1909.04721 [hep-ex] (PDF) ; CDS record ; inSPIRE record ; CADI line (restricted) ; | ||
| Figures | |
png pdf |
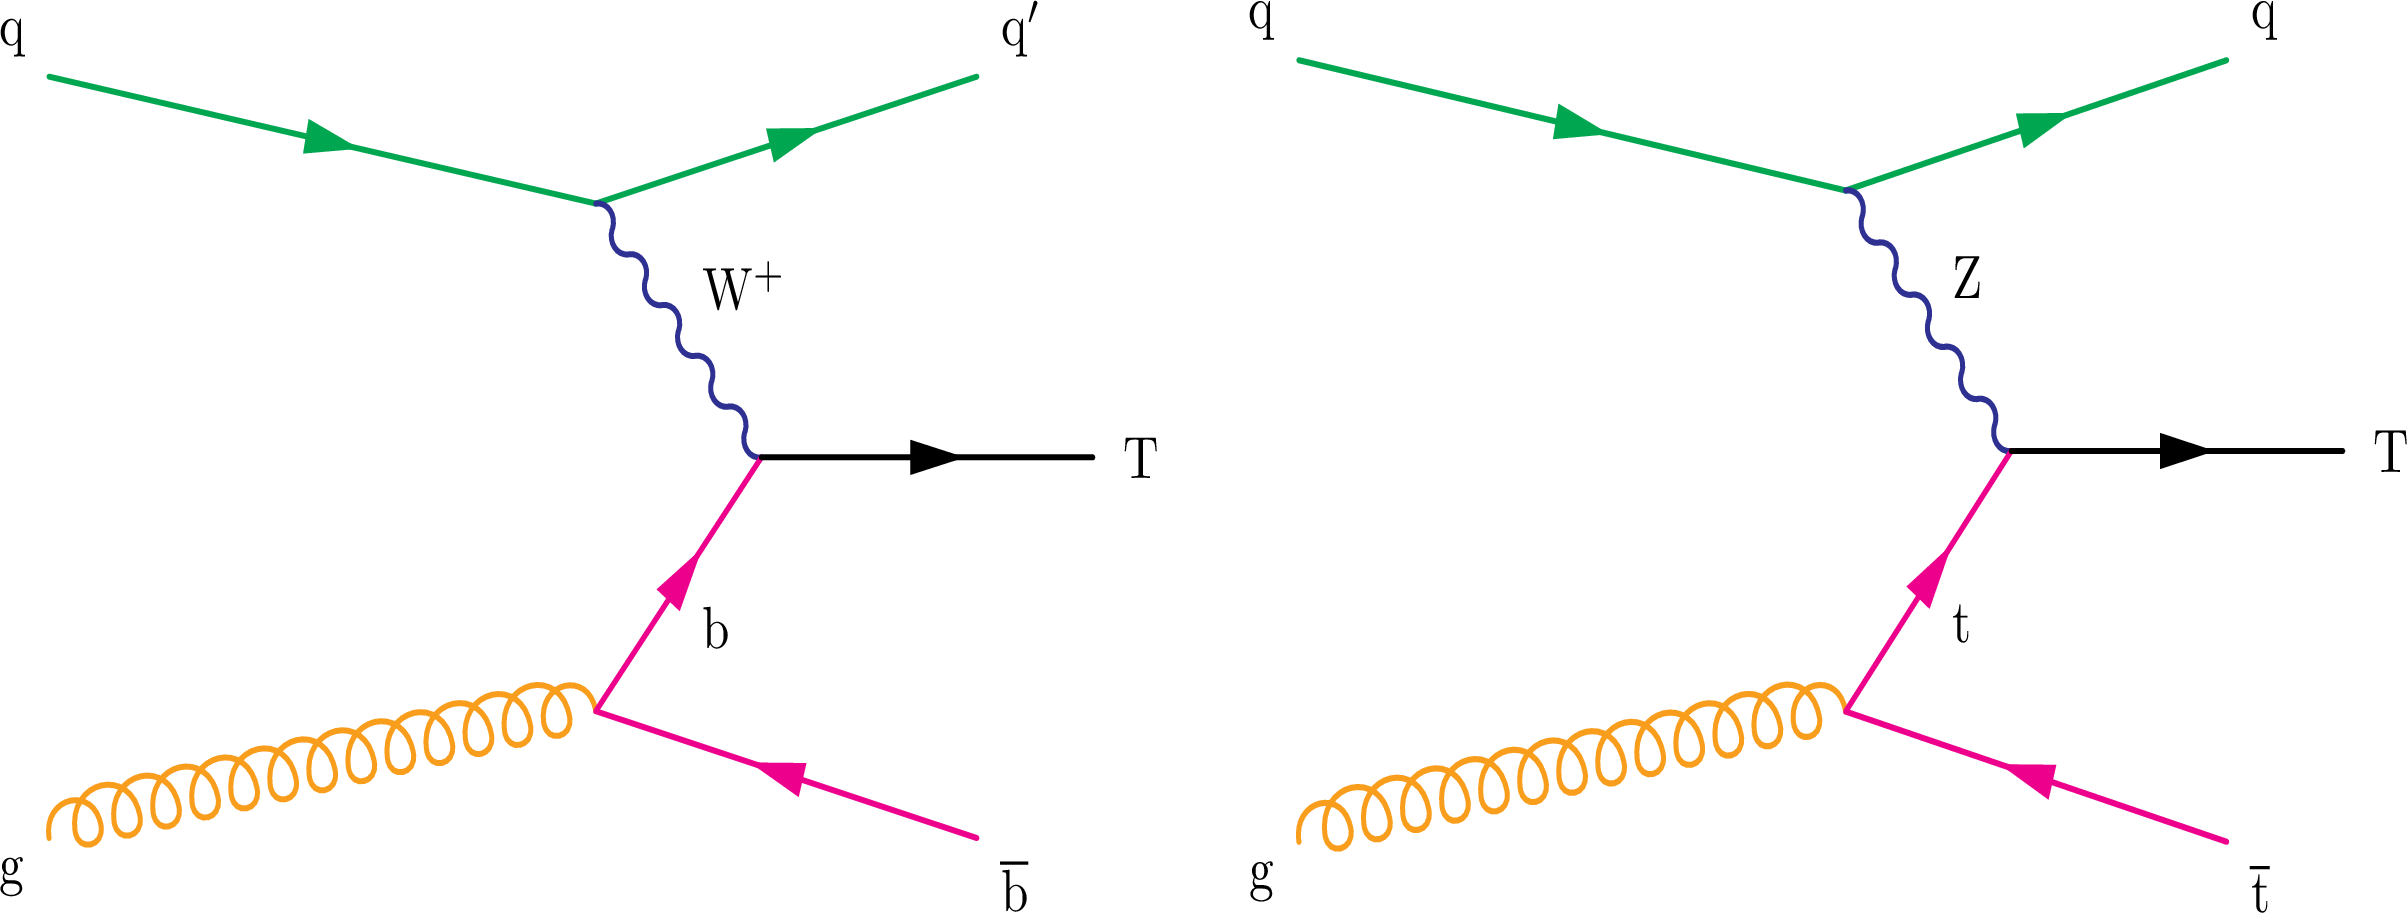
Figure 1:
Example Feynman diagrams for electroweak production of vector-like T quarks. Charged-current (left) and neutral-current (right). |

png pdf |
Figure 1-a:
Example Feynman diagram for the electroweak production of vector-like T quarks via charged-current. |
png pdf |
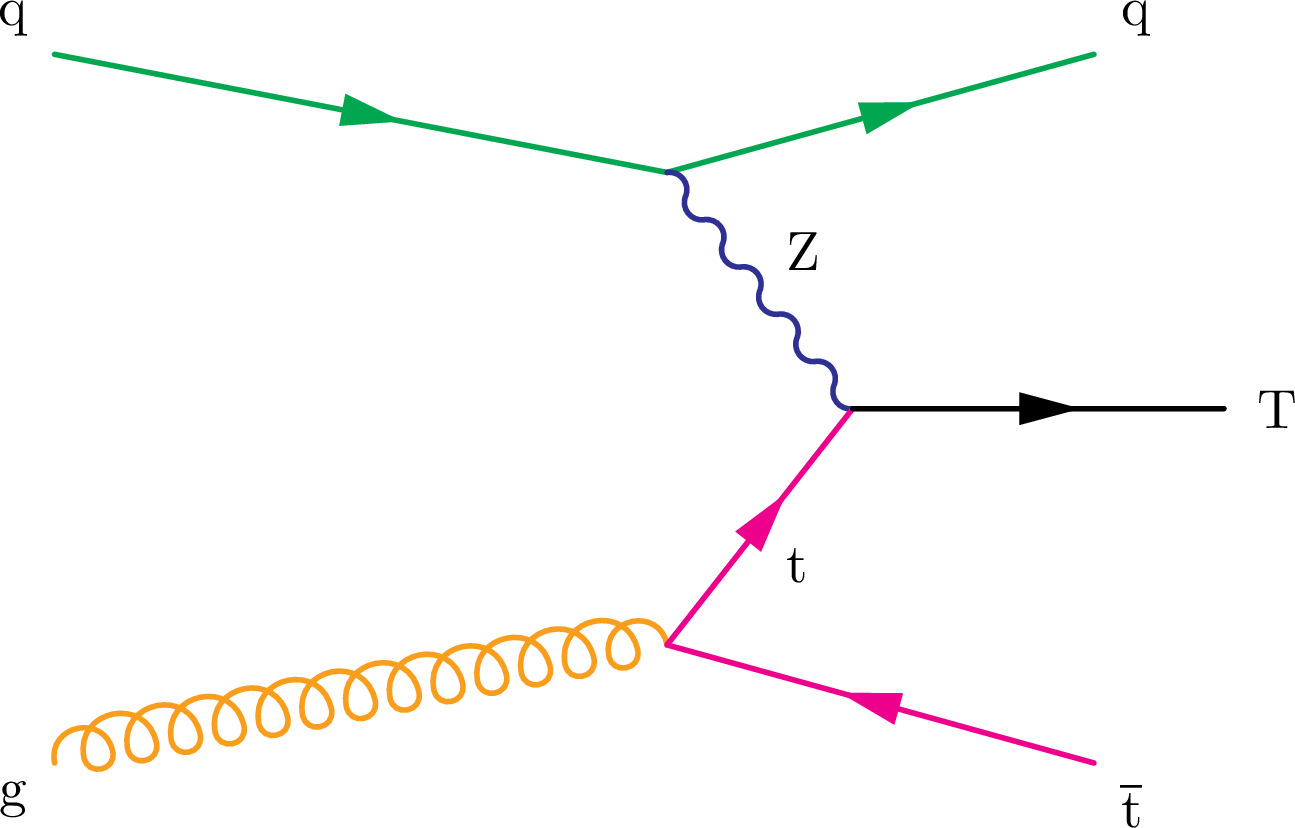
Figure 1-b:
Example Feynman diagram for the electroweak production of vector-like T quarks via neutral-current. |

png pdf |
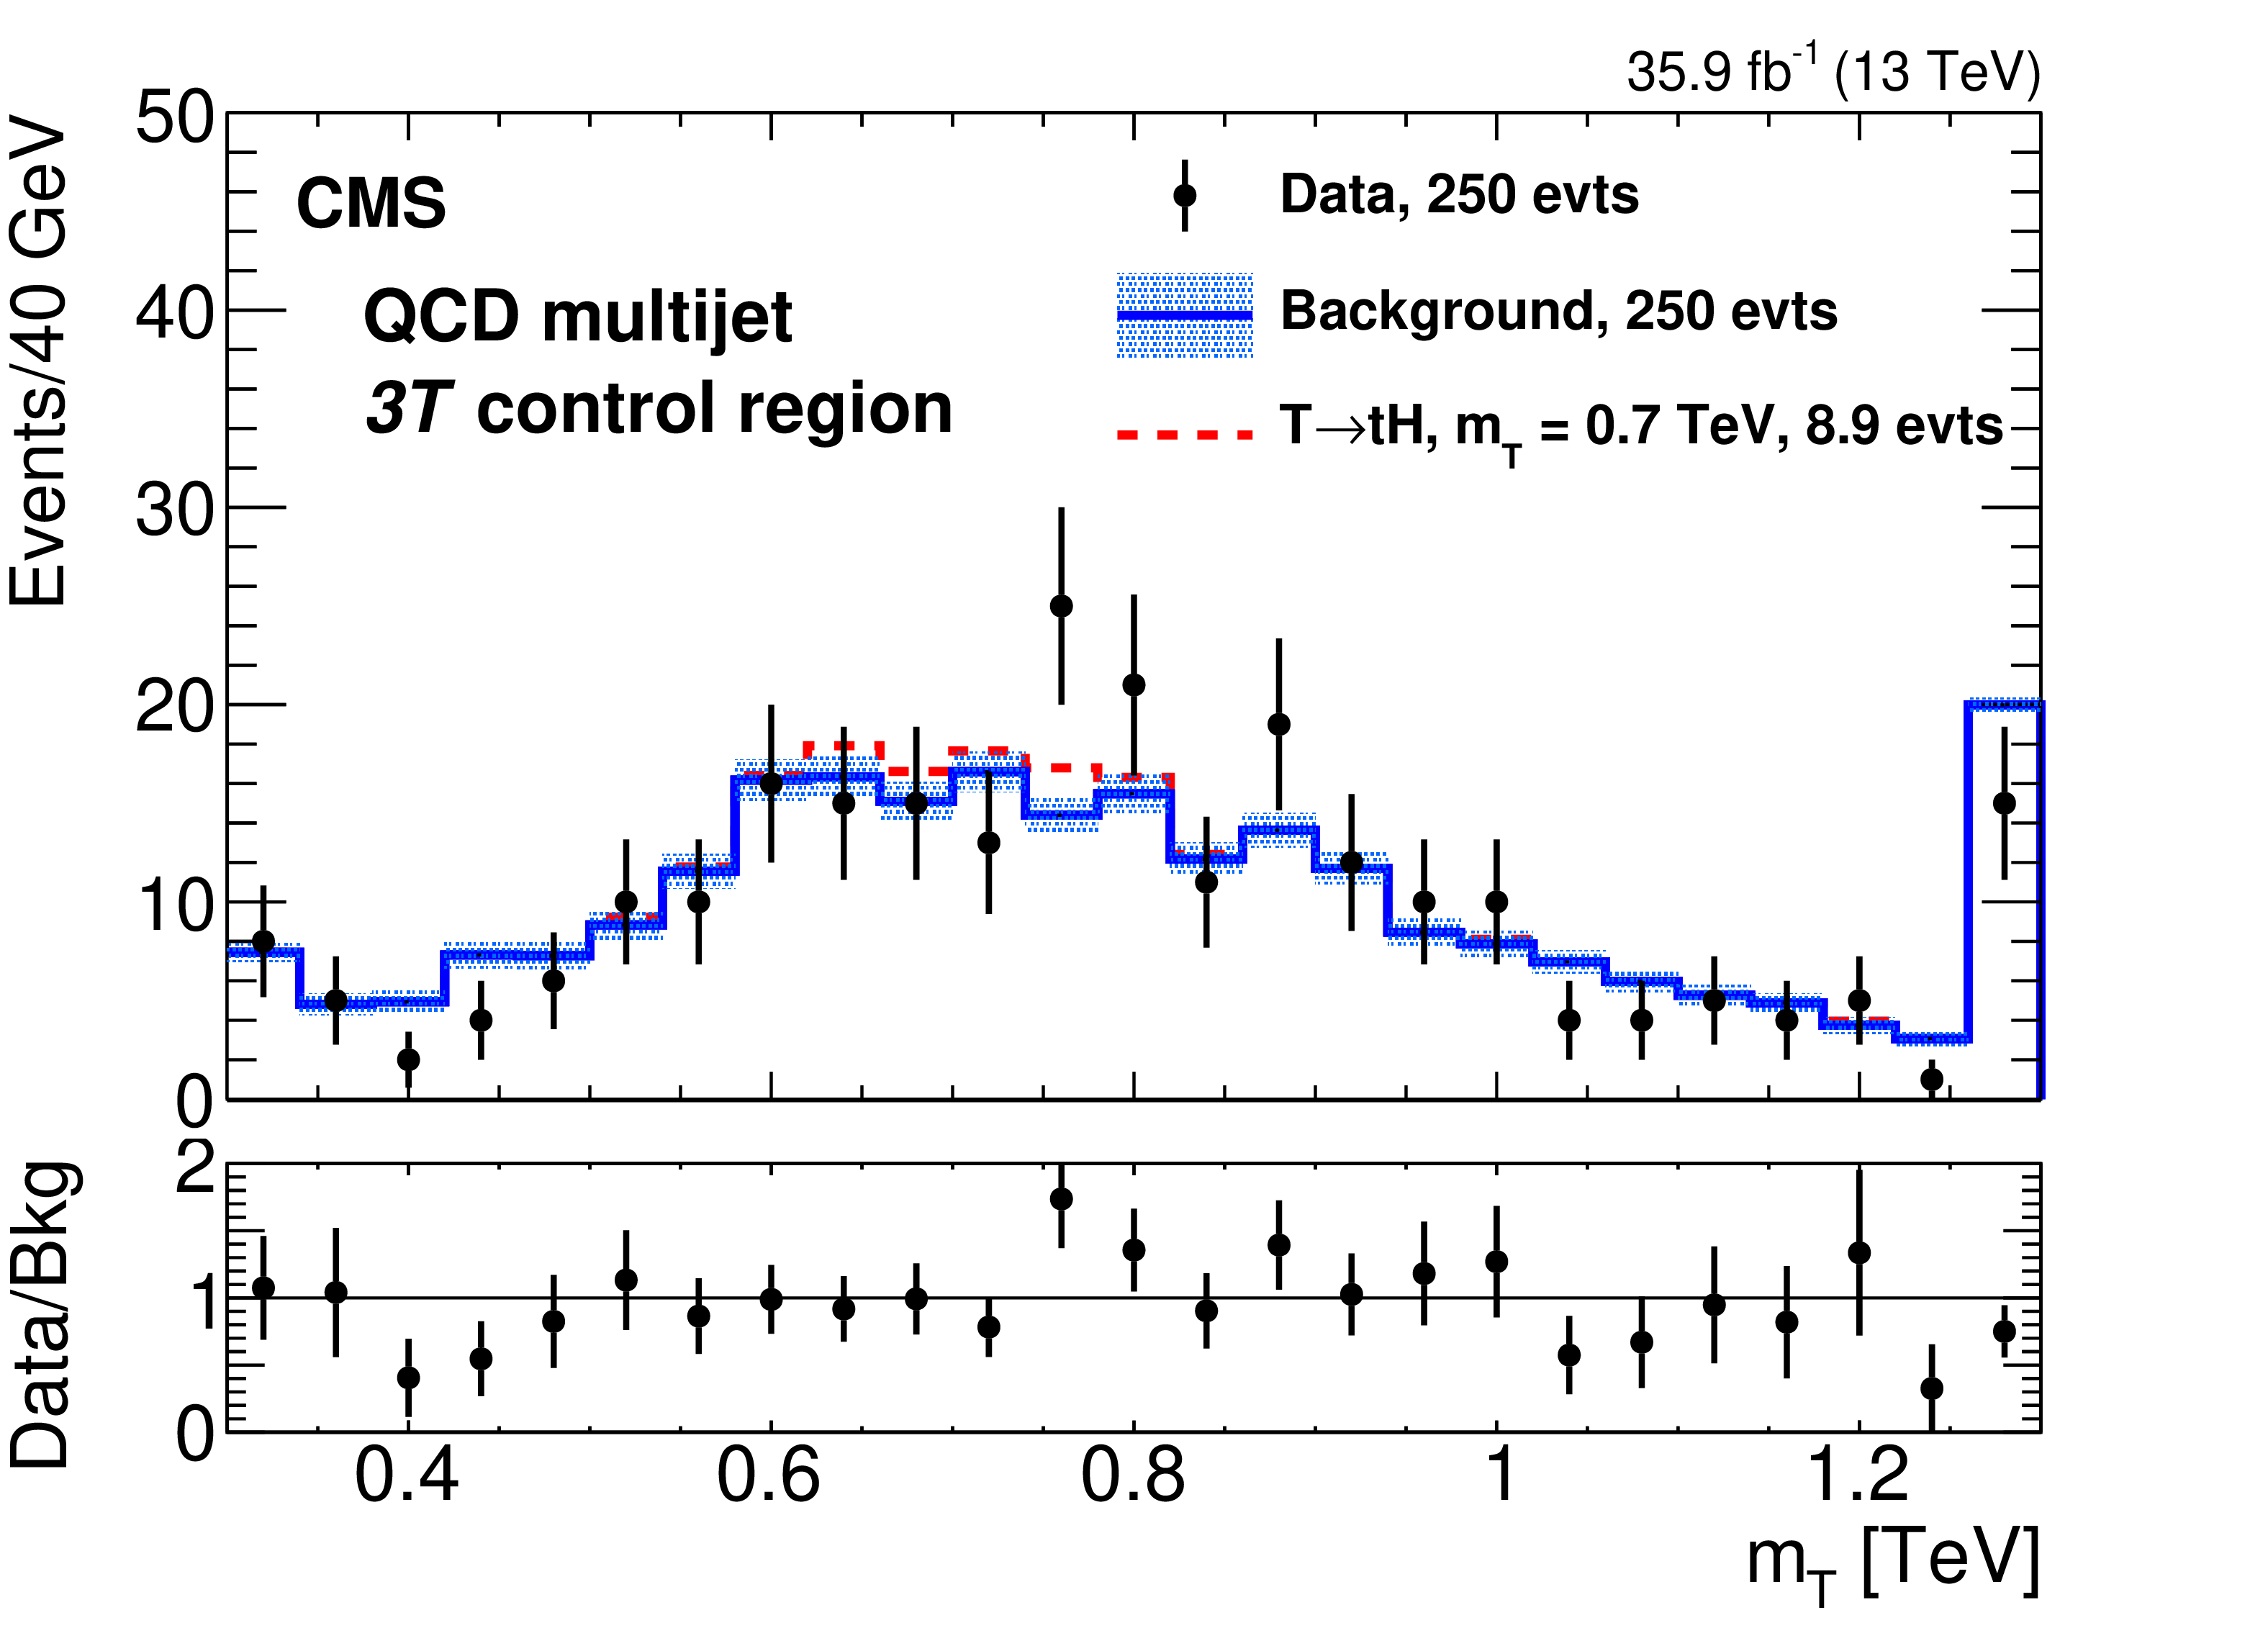
Figure 2:
The five-jet invariant mass distribution (black points with error bars) for the ${\mathrm{t} \mathrm{H} \mathrm{b} \mathrm{q}}$ channel after the full selection in the QCD multijet 3T control region (upper), the ${\mathrm{t} \mathrm{\bar{t}}}$ {2T1L} control region (middle), and the 3M signal region (lower). The superimposed blue histogram, labeled "background'', is the reweighted 2M1L region distribution, used as an estimate of the background shape, with its normalization adjusted to match the number of entries observed in each region. A potential narrow-width signal (dashed red histogram) is added on top of the blue histogram for ${{m_{{\mathrm {T}}}}} =$ 0.7 TeV and $ {\Gamma /{{m_{{\mathrm {T}}}}}} =$ 0.01, for a product of signal cross section and branching fraction of 600 fb. The light blue shaded area corresponds to the statistical uncertainties in the corresponding 2M1L region. The last bin in each distribution also contains events with masses exceeding 1.3 TeV. |
png pdf |
Figure 2-a:
The five-jet invariant mass distribution (black points with error bars) for the ${\mathrm{t} \mathrm{H} \mathrm{b} \mathrm{q}}$ channel after the full selection in the QCD multijet 3T control region. The superimposed blue histogram, labeled "background'', is the reweighted 2M1L region distribution, used as an estimate of the background shape, with its normalization adjusted to match the number of entries observed in each region. A potential narrow-width signal (dashed red histogram) is added on top of the blue histogram for ${{m_{{\mathrm {T}}}}} =$ 0.7 TeV and $ {\Gamma /{{m_{{\mathrm {T}}}}}} =$ 0.01, for a product of signal cross section and branching fraction of 600 fb. The light blue shaded area corresponds to the statistical uncertainties in the corresponding 2M1L region. The last bin also contains events with masses exceeding 1.3 TeV. |
png pdf |
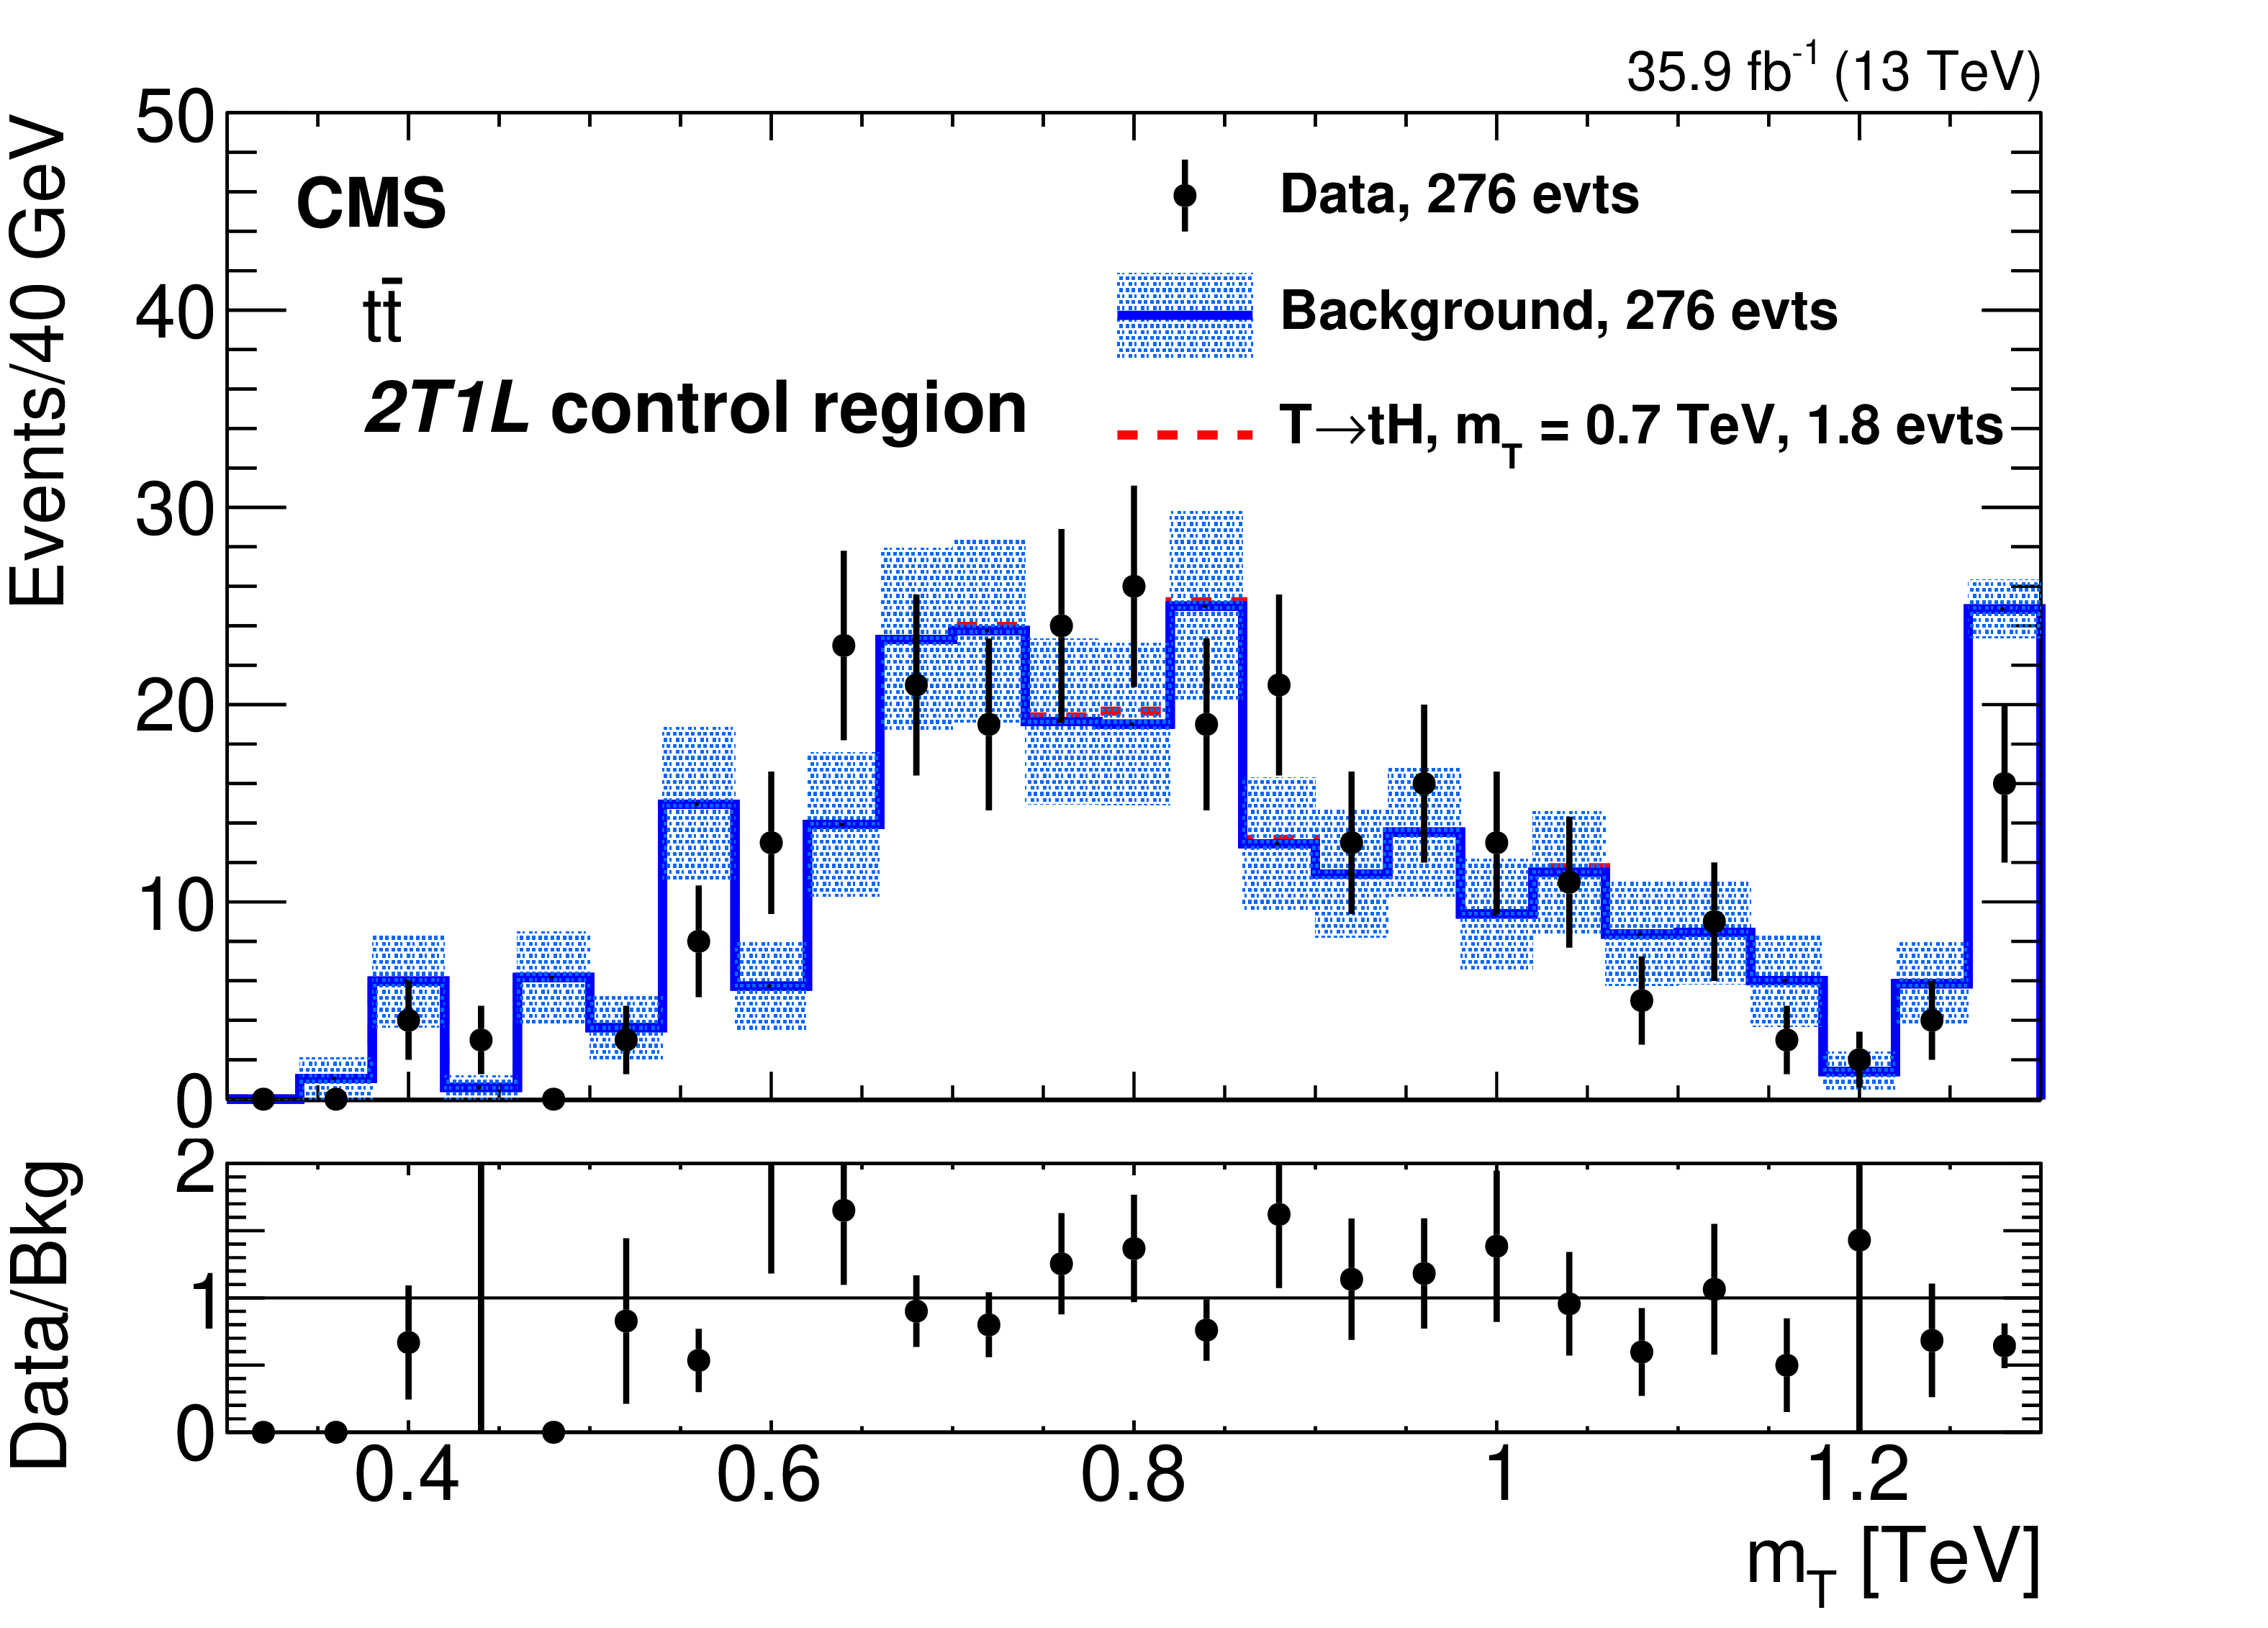
Figure 2-b:
The five-jet invariant mass distribution (black points with error bars) for the ${\mathrm{t} \mathrm{H} \mathrm{b} \mathrm{q}}$ channel after the full selection in the ${\mathrm{t} \mathrm{\bar{t}}}$ {2T1L} control region. The superimposed blue histogram, labeled "background'', is the reweighted 2M1L region distribution, used as an estimate of the background shape, with its normalization adjusted to match the number of entries observed in each region. A potential narrow-width signal (dashed red histogram) is added on top of the blue histogram for ${{m_{{\mathrm {T}}}}} =$ 0.7 TeV and $ {\Gamma /{{m_{{\mathrm {T}}}}}} =$ 0.01, for a product of signal cross section and branching fraction of 600 fb. The light blue shaded area corresponds to the statistical uncertainties in the corresponding 2M1L region. The last bin also contains events with masses exceeding 1.3 TeV. |
png pdf |
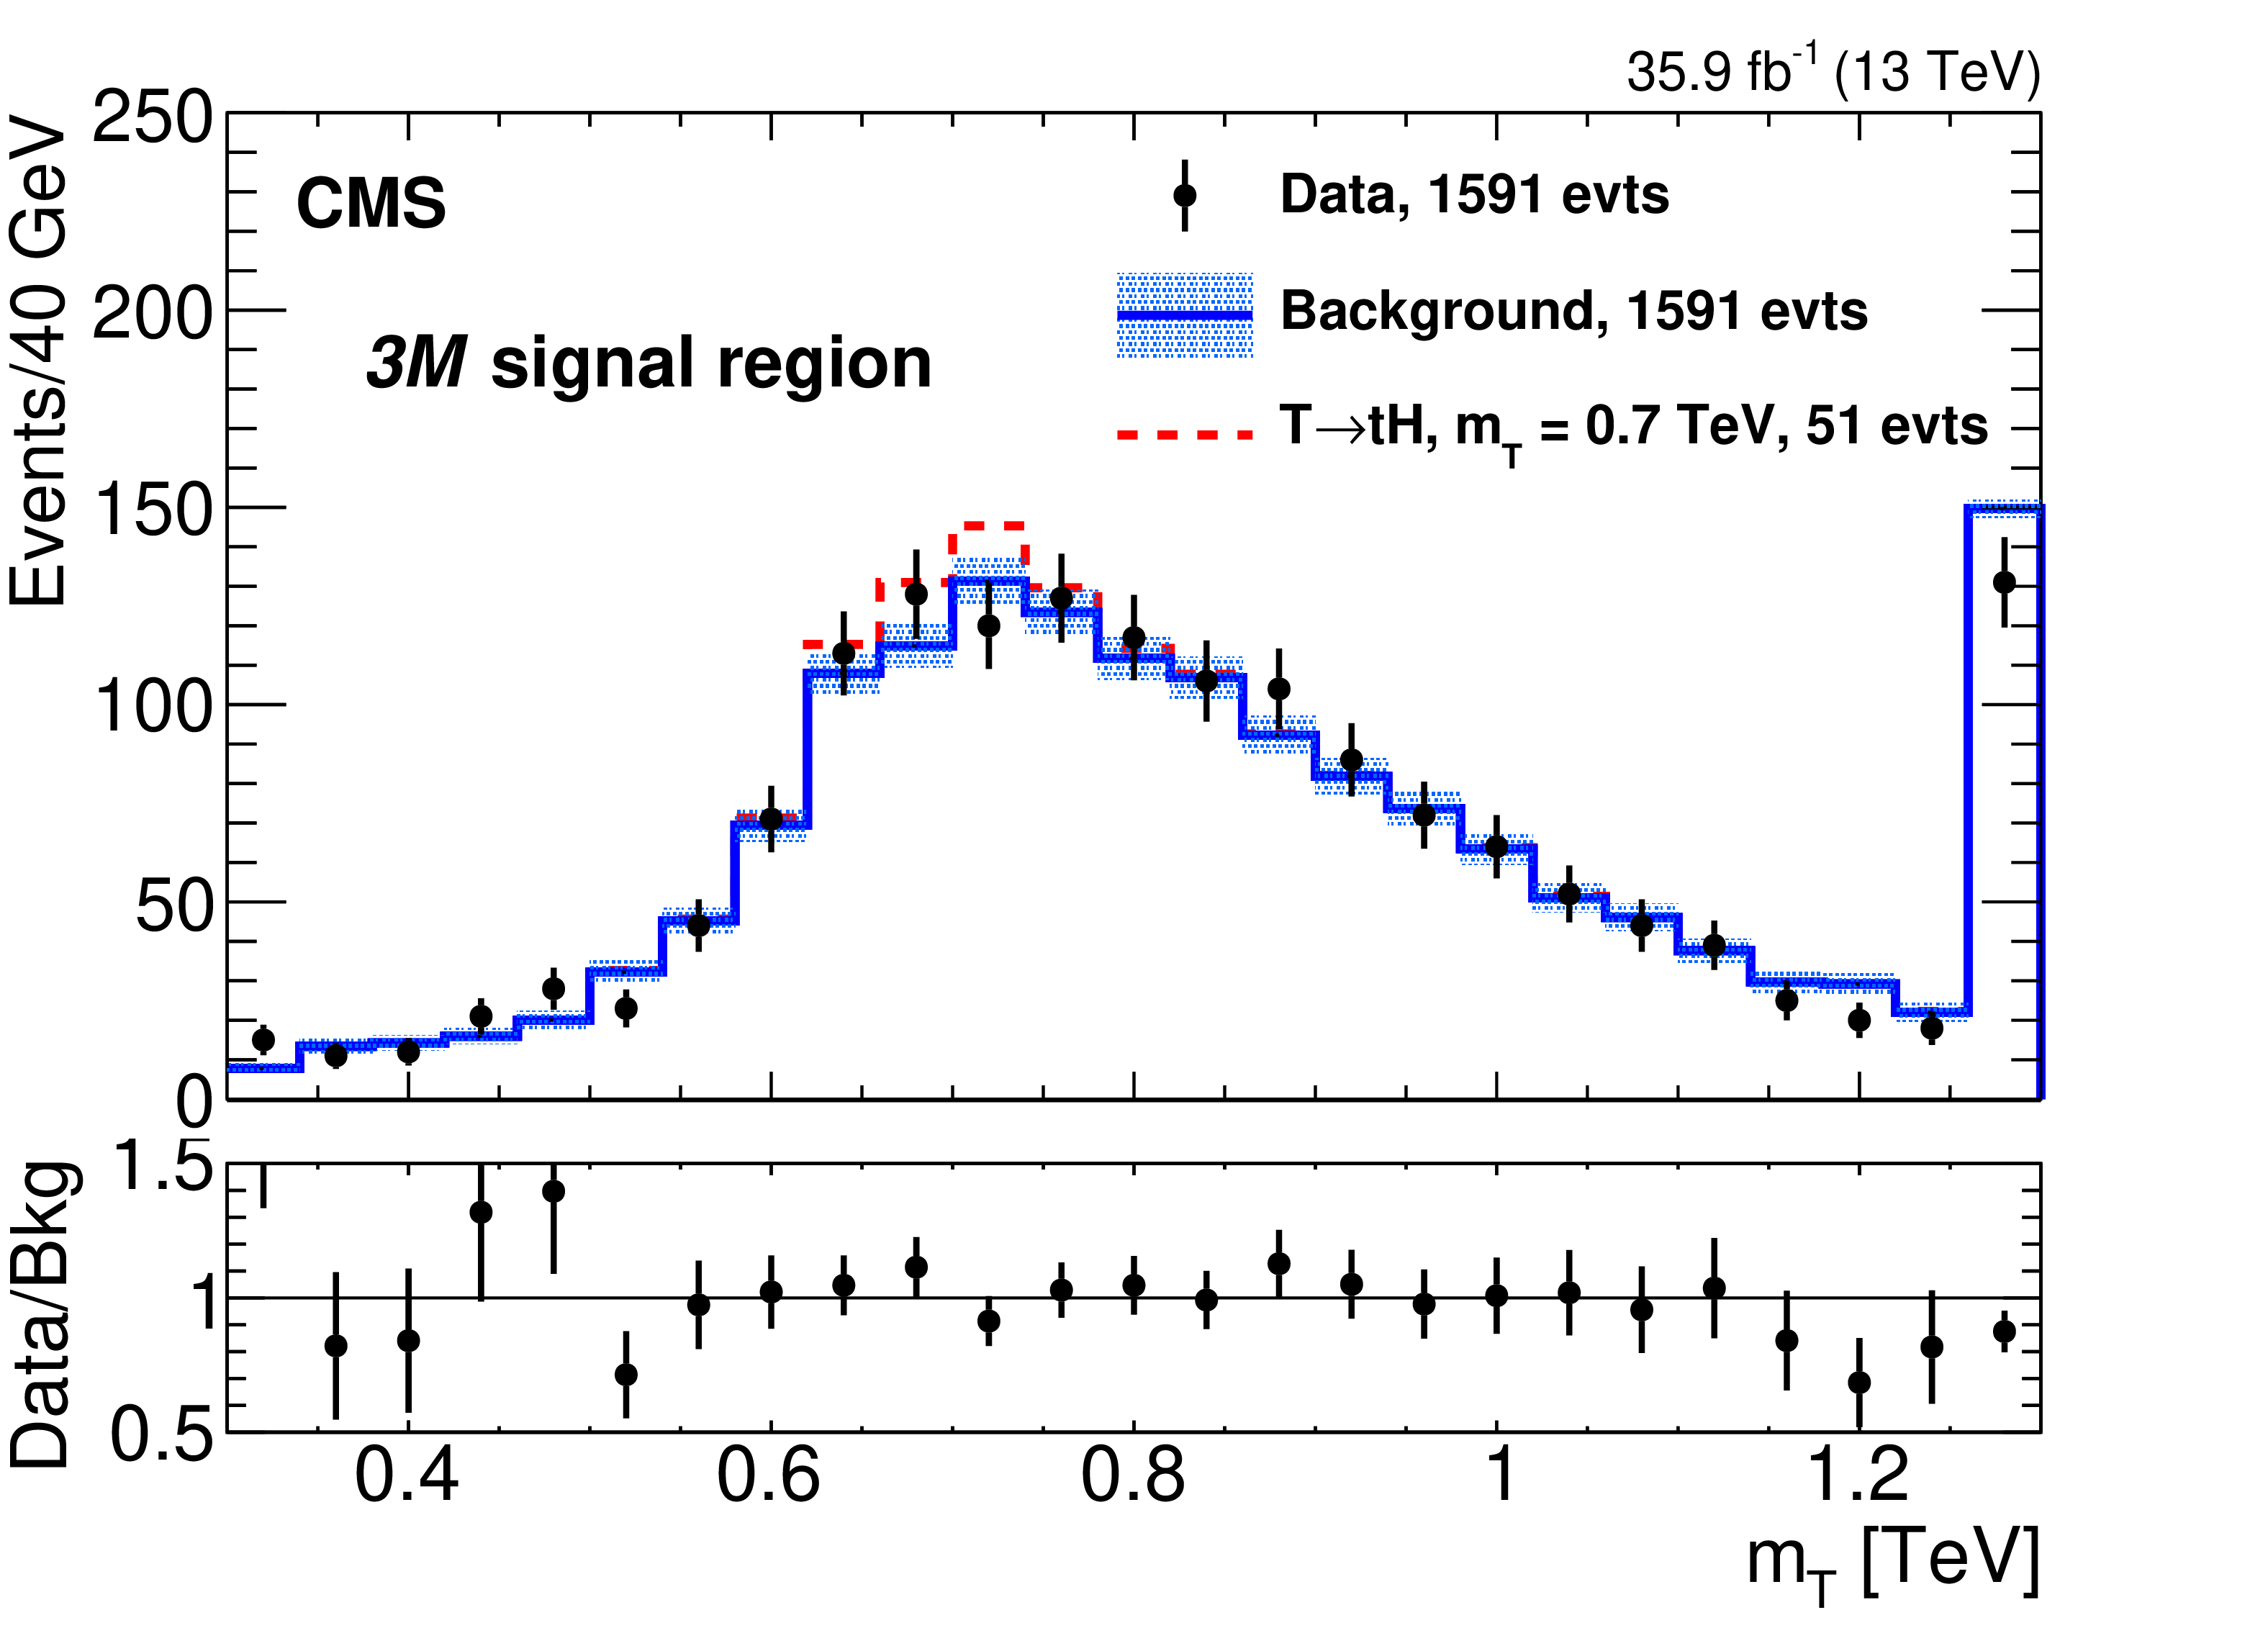
Figure 2-c:
The five-jet invariant mass distribution (black points with error bars) for the ${\mathrm{t} \mathrm{H} \mathrm{b} \mathrm{q}}$ channel after the full selection in the 3M signal region. The superimposed blue histogram, labeled "background'', is the reweighted 2M1L region distribution, used as an estimate of the background shape, with its normalization adjusted to match the number of entries observed in each region. A potential narrow-width signal (dashed red histogram) is added on top of the blue histogram for ${{m_{{\mathrm {T}}}}} =$ 0.7 TeV and $ {\Gamma /{{m_{{\mathrm {T}}}}}} =$ 0.01, for a product of signal cross section and branching fraction of 600 fb. The light blue shaded area corresponds to the statistical uncertainties in the corresponding 2M1L region. The last bin also contains events with masses exceeding 1.3 TeV. |

png pdf |
Figure 3:
Dependence of the reweighting values (product of all b tagging weights) on the five-jet invariant mass for the 2M1L region (left) and for the 3M region (right), in the case of the ${\mathrm{t} \mathrm{H}}$ channel (upper) and the ${\mathrm{t} \mathrm{Z}}$ channel (lower). These variations are fitted to obtain the transfer functions (in red) using either a 3-parameter function with a constant term and a slope, or a 2-parameter straight line. The light red shaded regions represent the central 68% CL interval for each fit. |

png pdf |
Figure 3-a:
Dependence of the reweighting values (product of all b tagging weights) on the five-jet invariant mass for the 2M1L region, in the case of the ${\mathrm{t} \mathrm{H}}$ channel. These variations are fitted to obtain the transfer functions (in red) using either a 3-parameter function with a constant term and a slope, or a 2-parameter straight line. The light red shaded regions represent the central 68% CL interval for each fit. |

png pdf |
Figure 3-b:
Dependence of the reweighting values (product of all b tagging weights) on the five-jet invariant mass for the 3M region, in the case of the ${\mathrm{t} \mathrm{H}}$ channel. These variations are fitted to obtain the transfer functions (in red) using either a 3-parameter function with a constant term and a slope, or a 2-parameter straight line. The light red shaded regions represent the central 68% CL interval for each fit. |
png pdf |
Figure 3-c:
Dependence of the reweighting values (product of all b tagging weights) on the five-jet invariant mass for the 2M1L region, in the case of the ${\mathrm{t} \mathrm{Z}}$ channel. These variations are fitted to obtain the transfer functions (in red) using either a 3-parameter function with a constant term and a slope, or a 2-parameter straight line. The light red shaded regions represent the central 68% CL interval for each fit. |
png pdf |
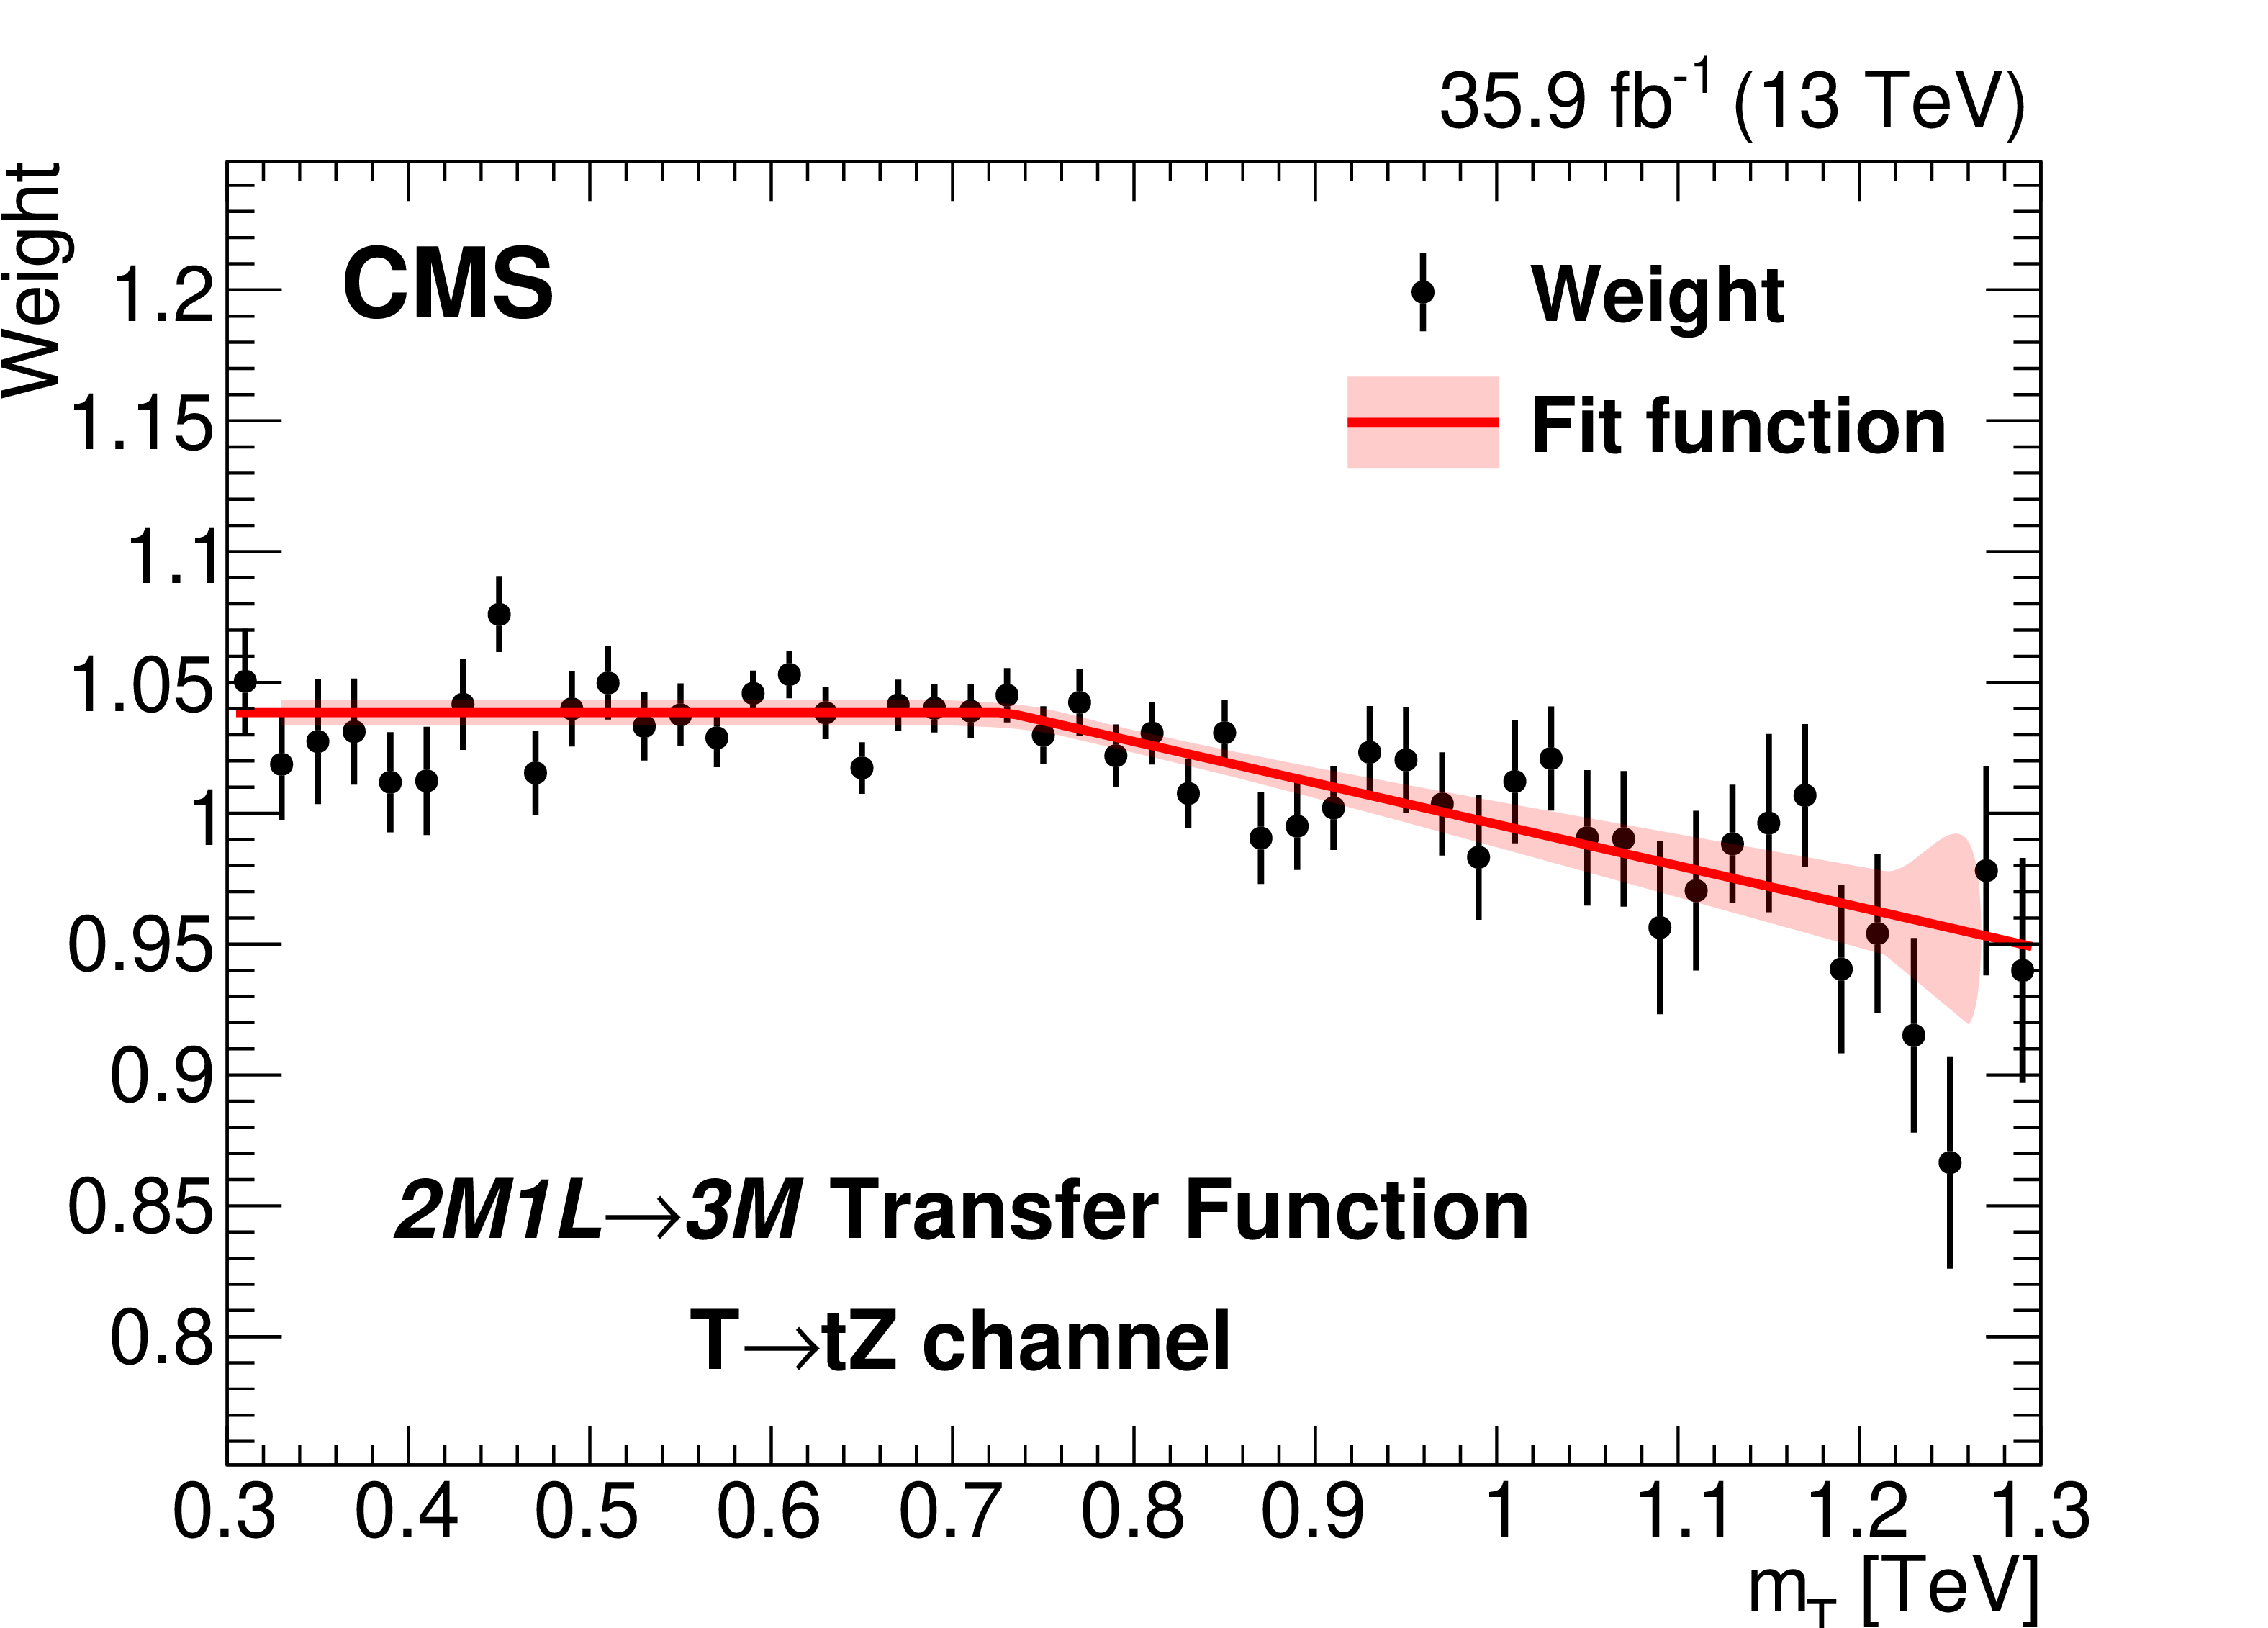
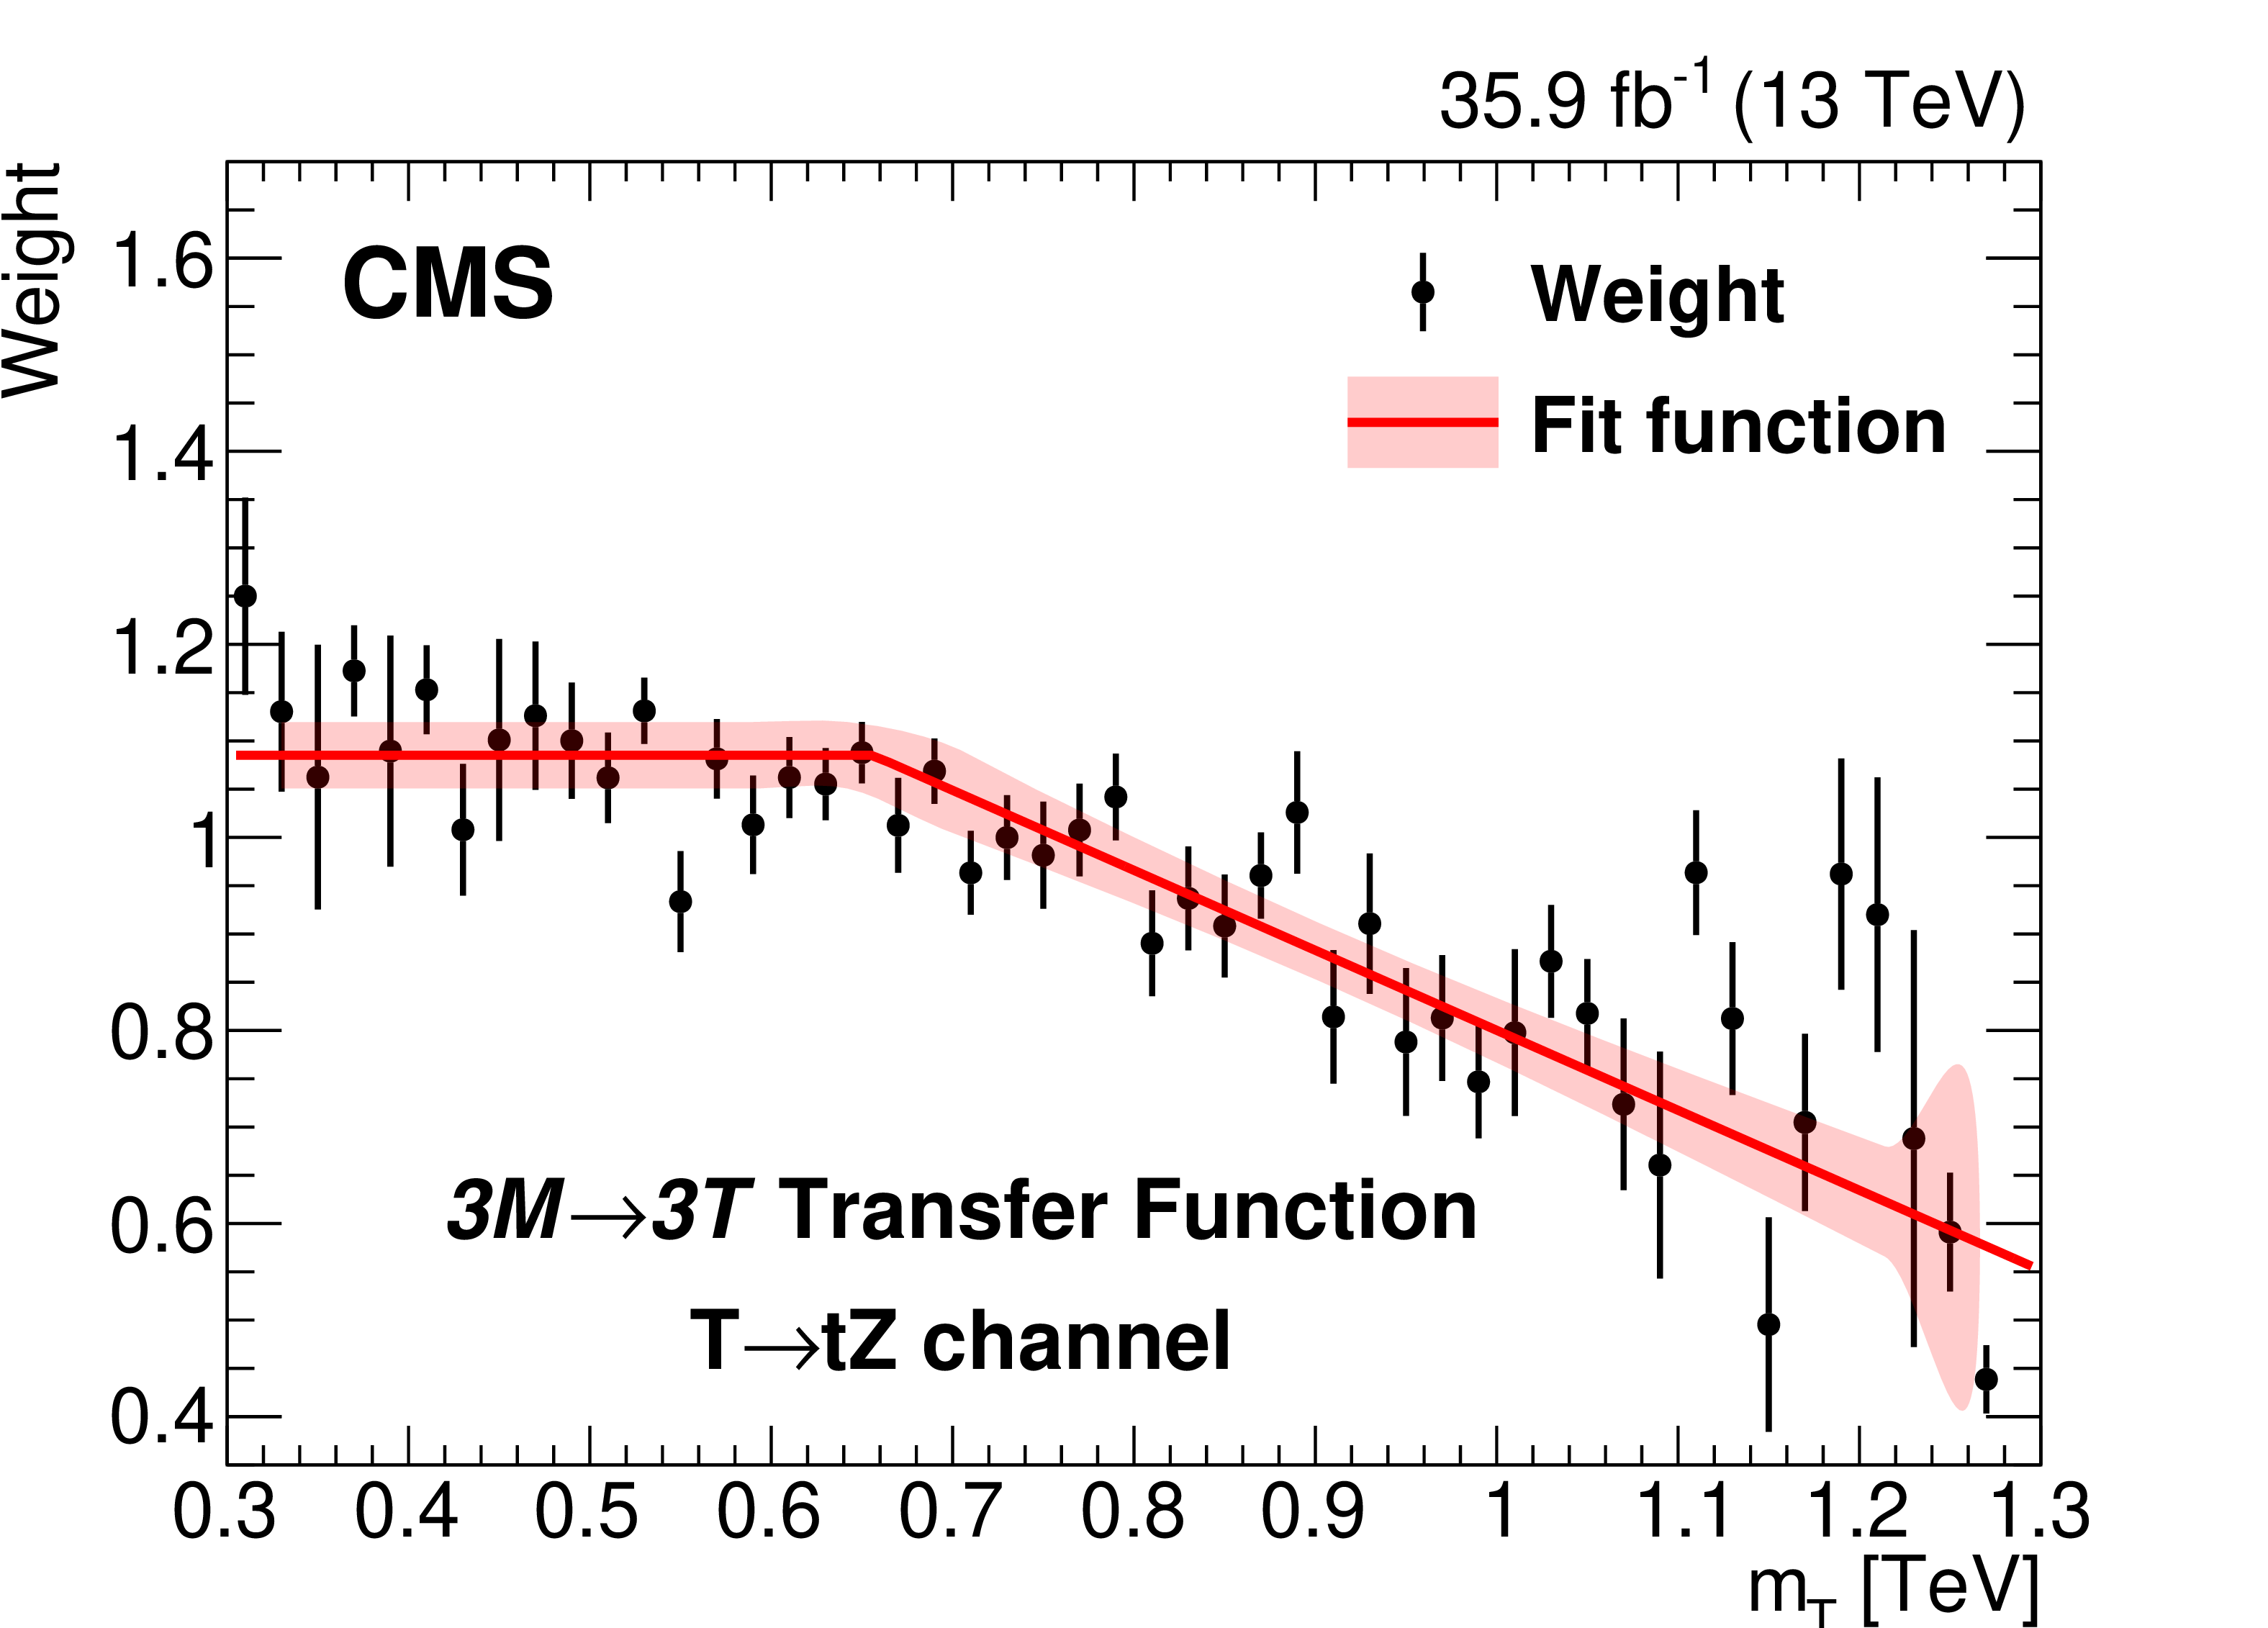
Figure 3-d:
Dependence of the reweighting values (product of all b tagging weights) on the five-jet invariant mass for the 3M region, in the case of the ${\mathrm{t} \mathrm{Z}}$ channel. These variations are fitted to obtain the transfer functions (in red) using either a 3-parameter function with a constant term and a slope, or a 2-parameter straight line. The light red shaded regions represent the central 68% CL interval for each fit. |
png pdf |
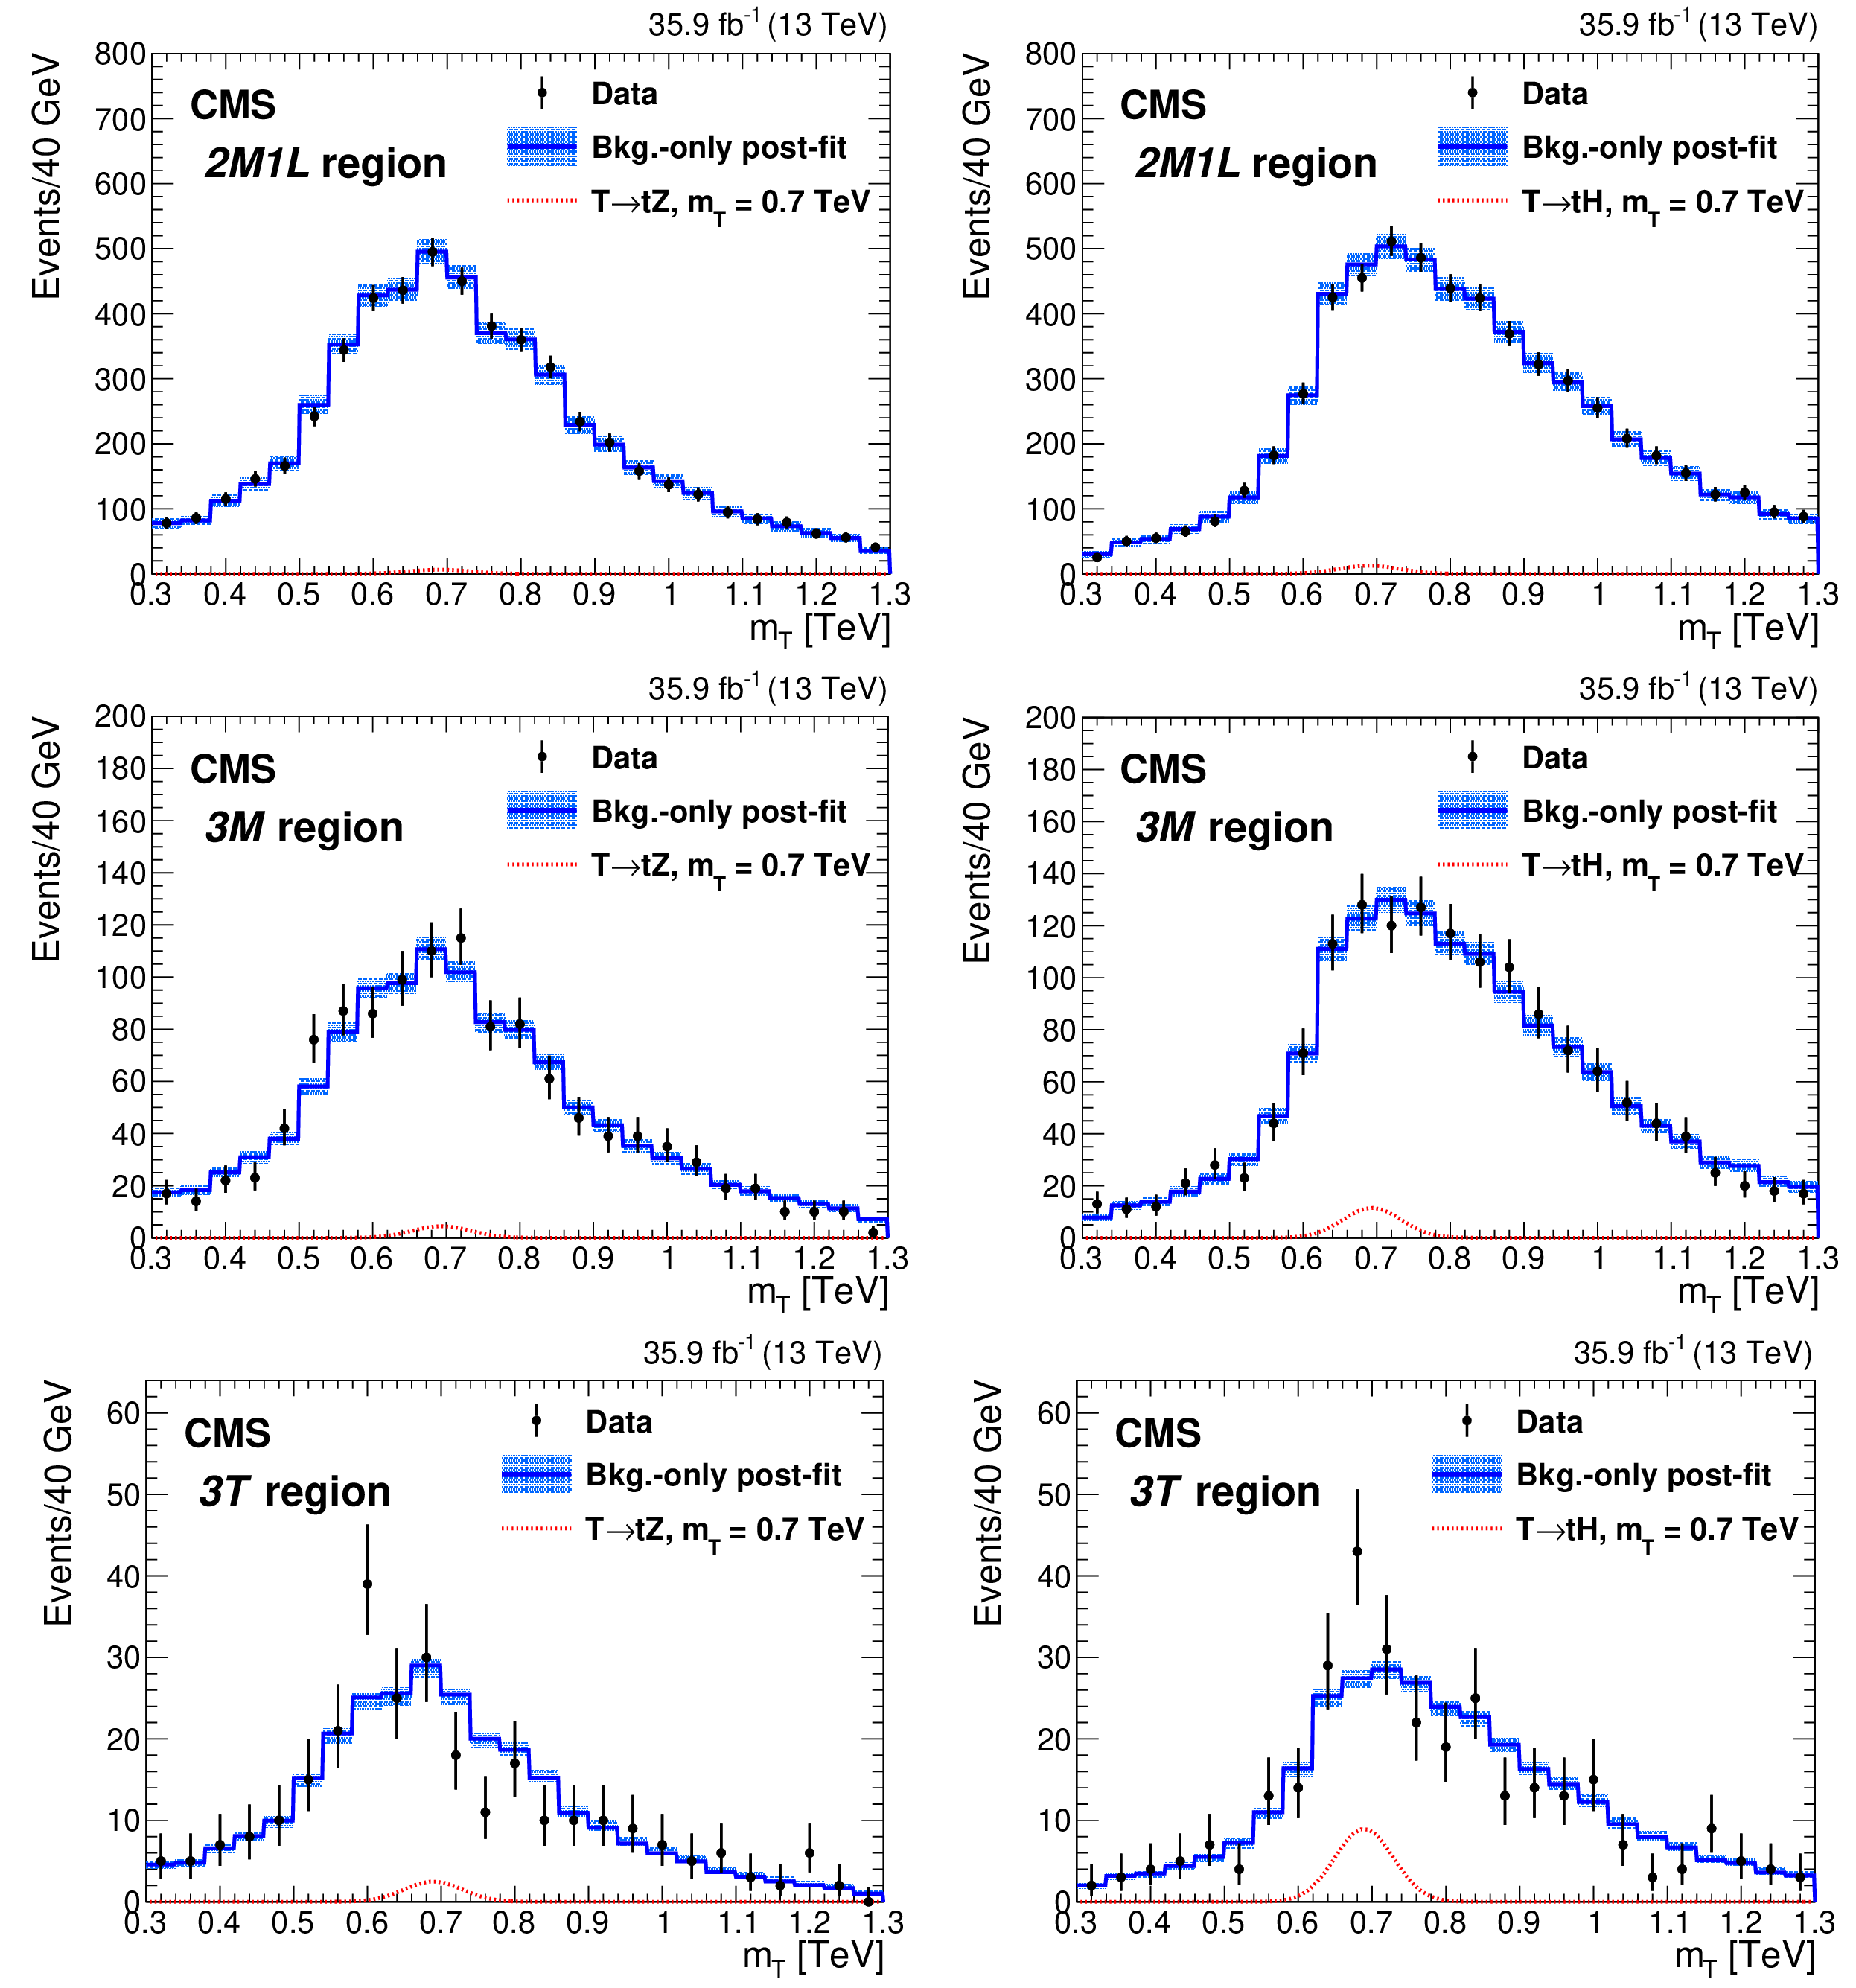
Figure 4:
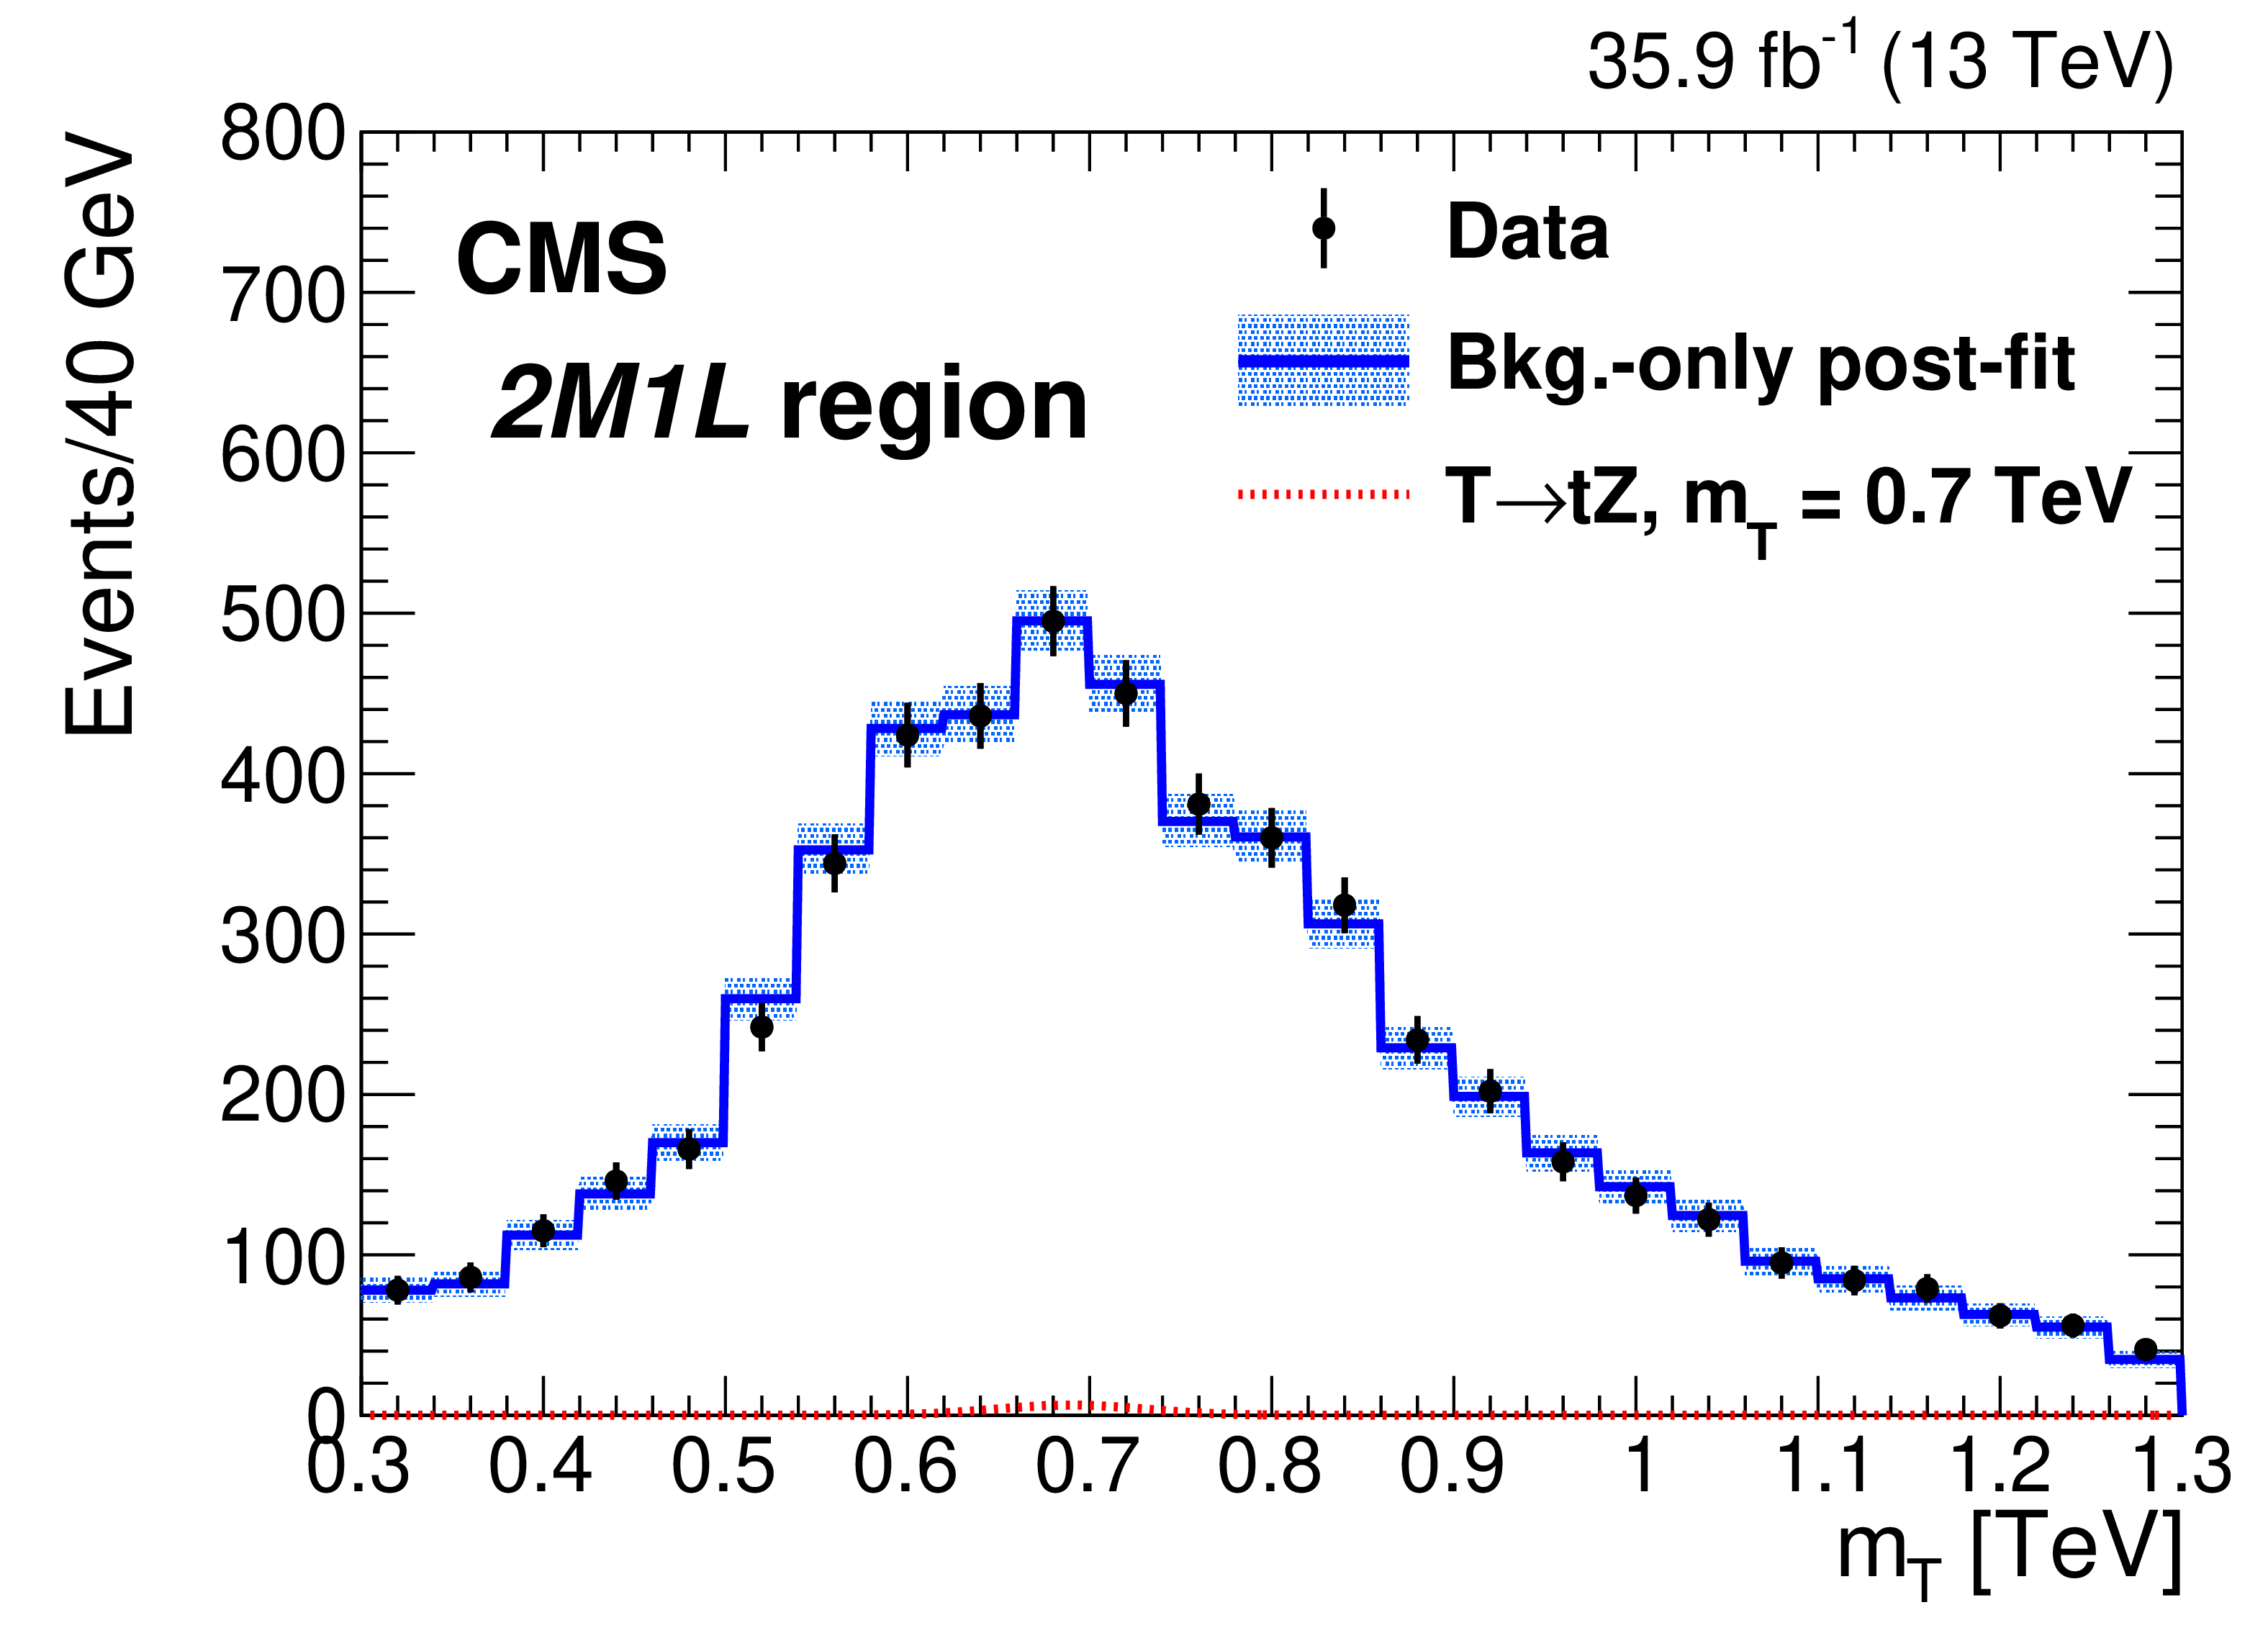
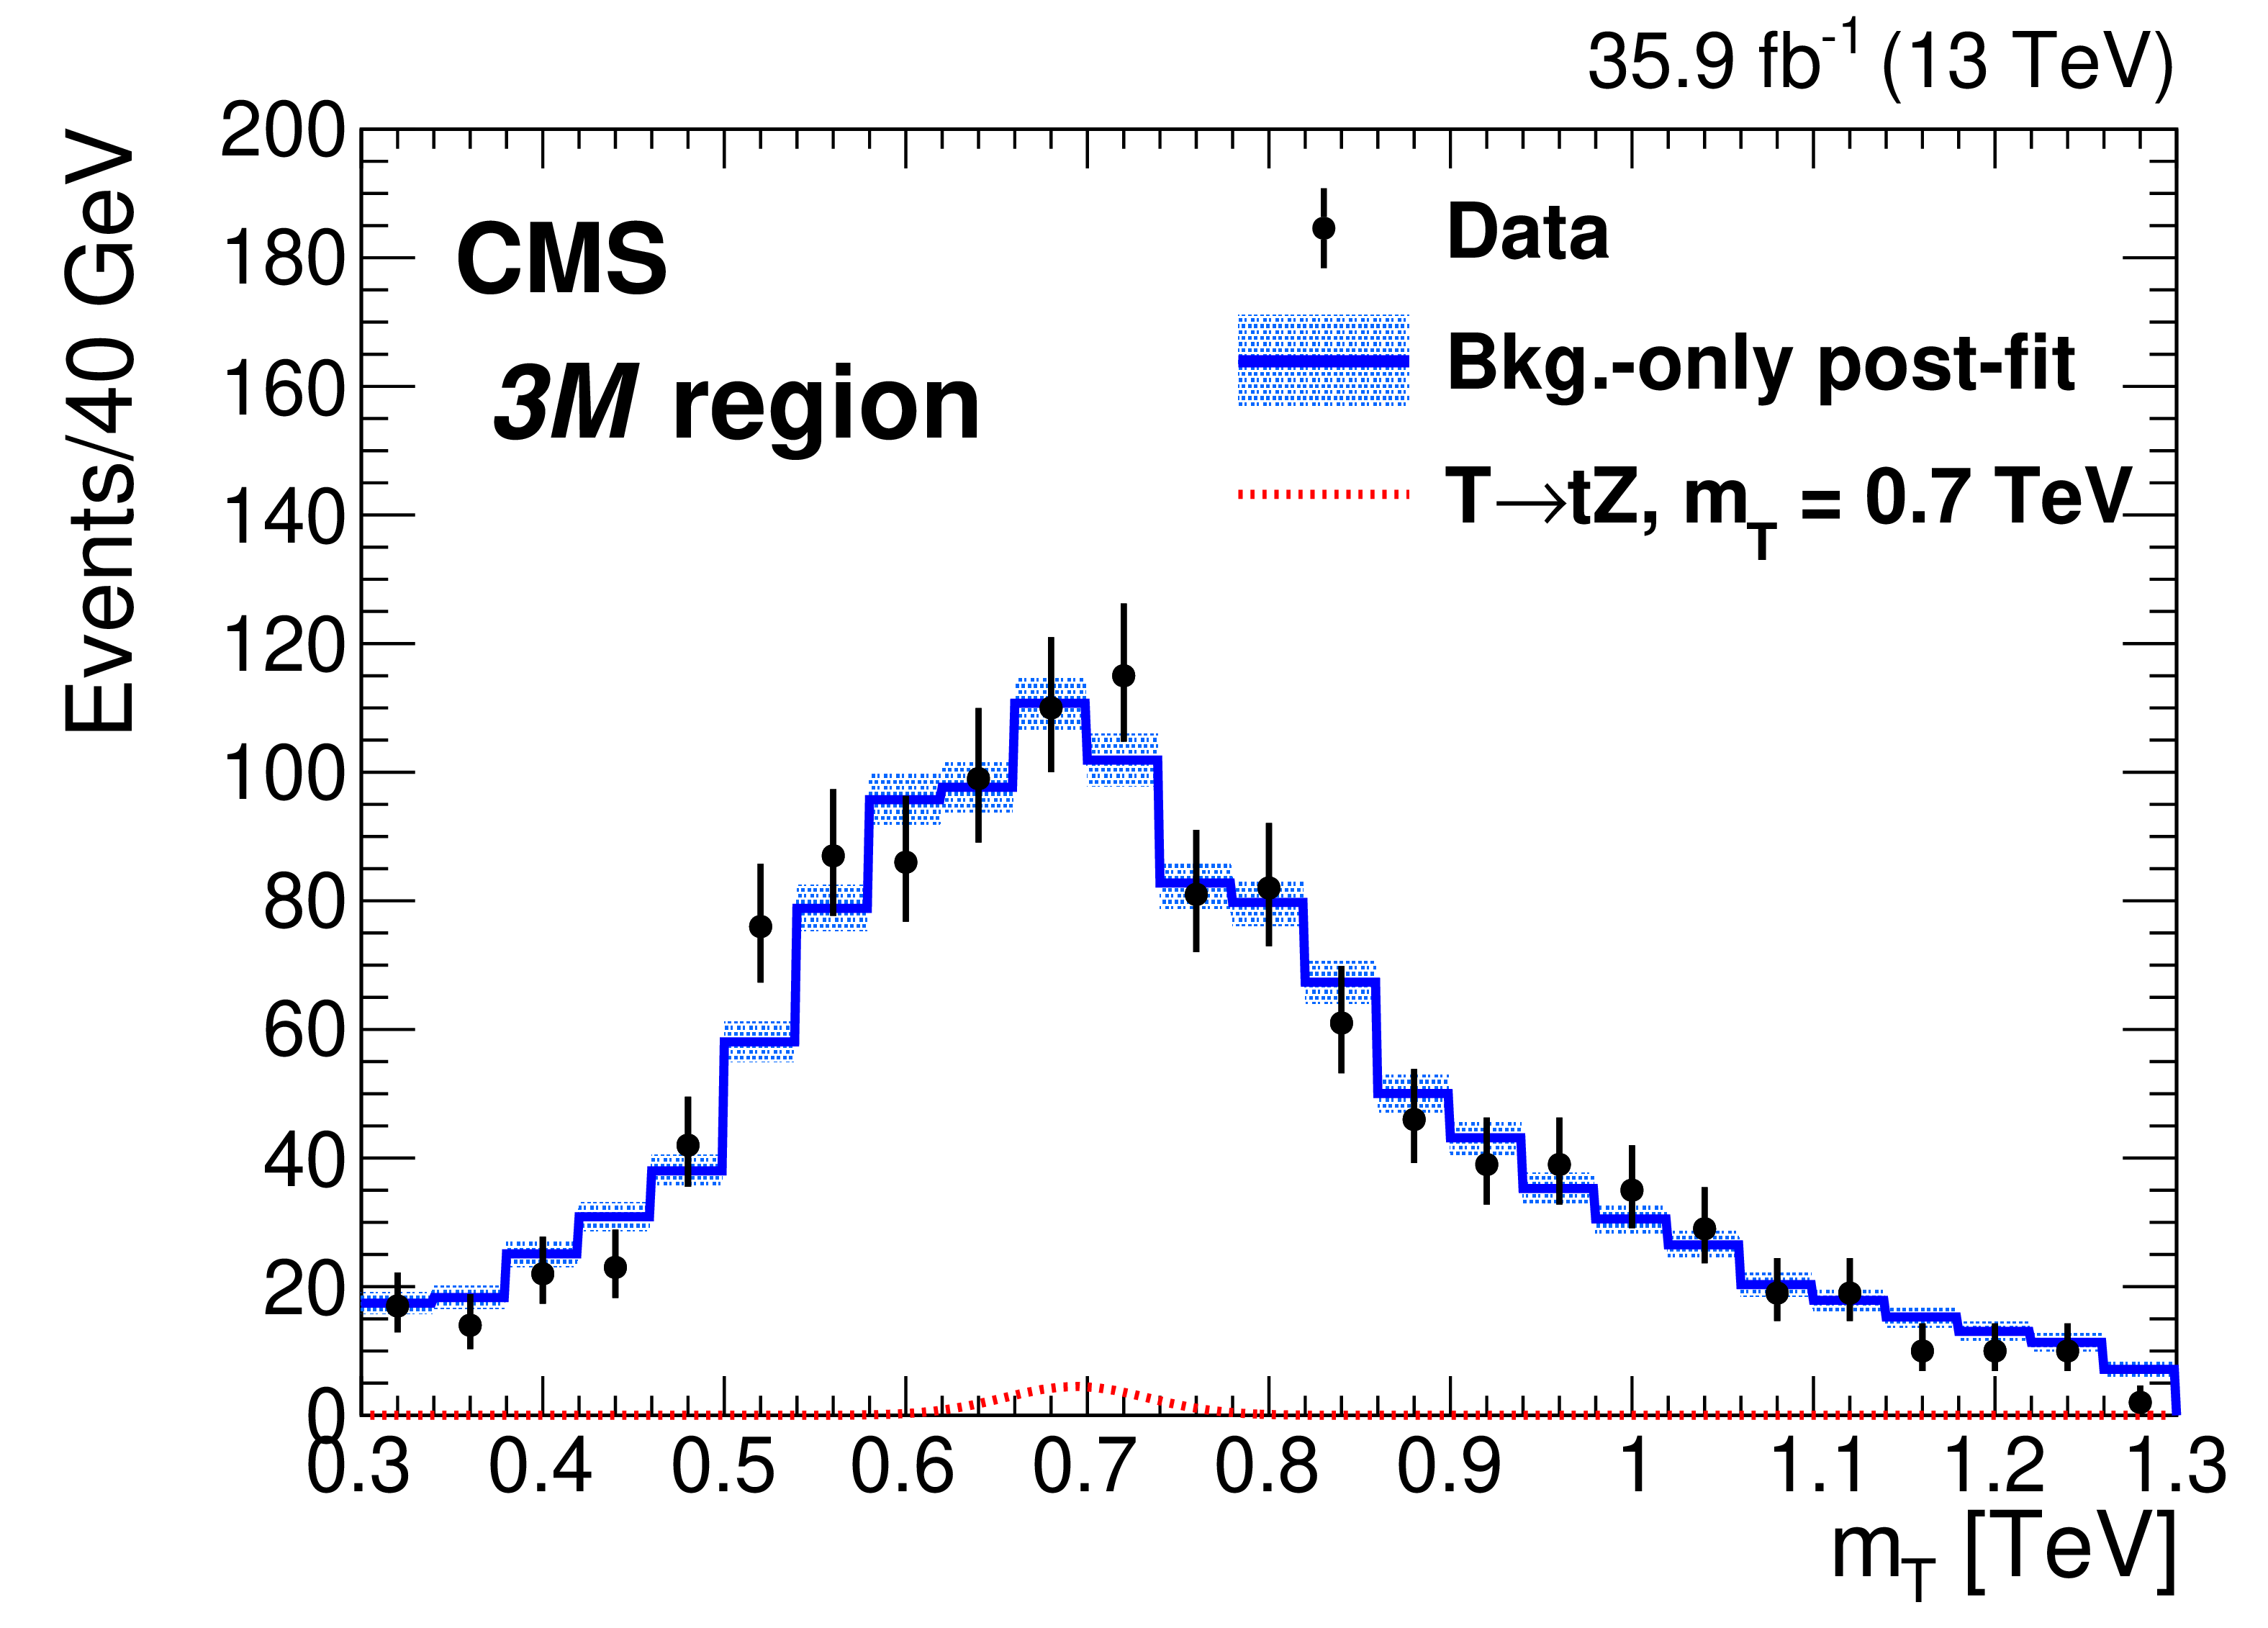
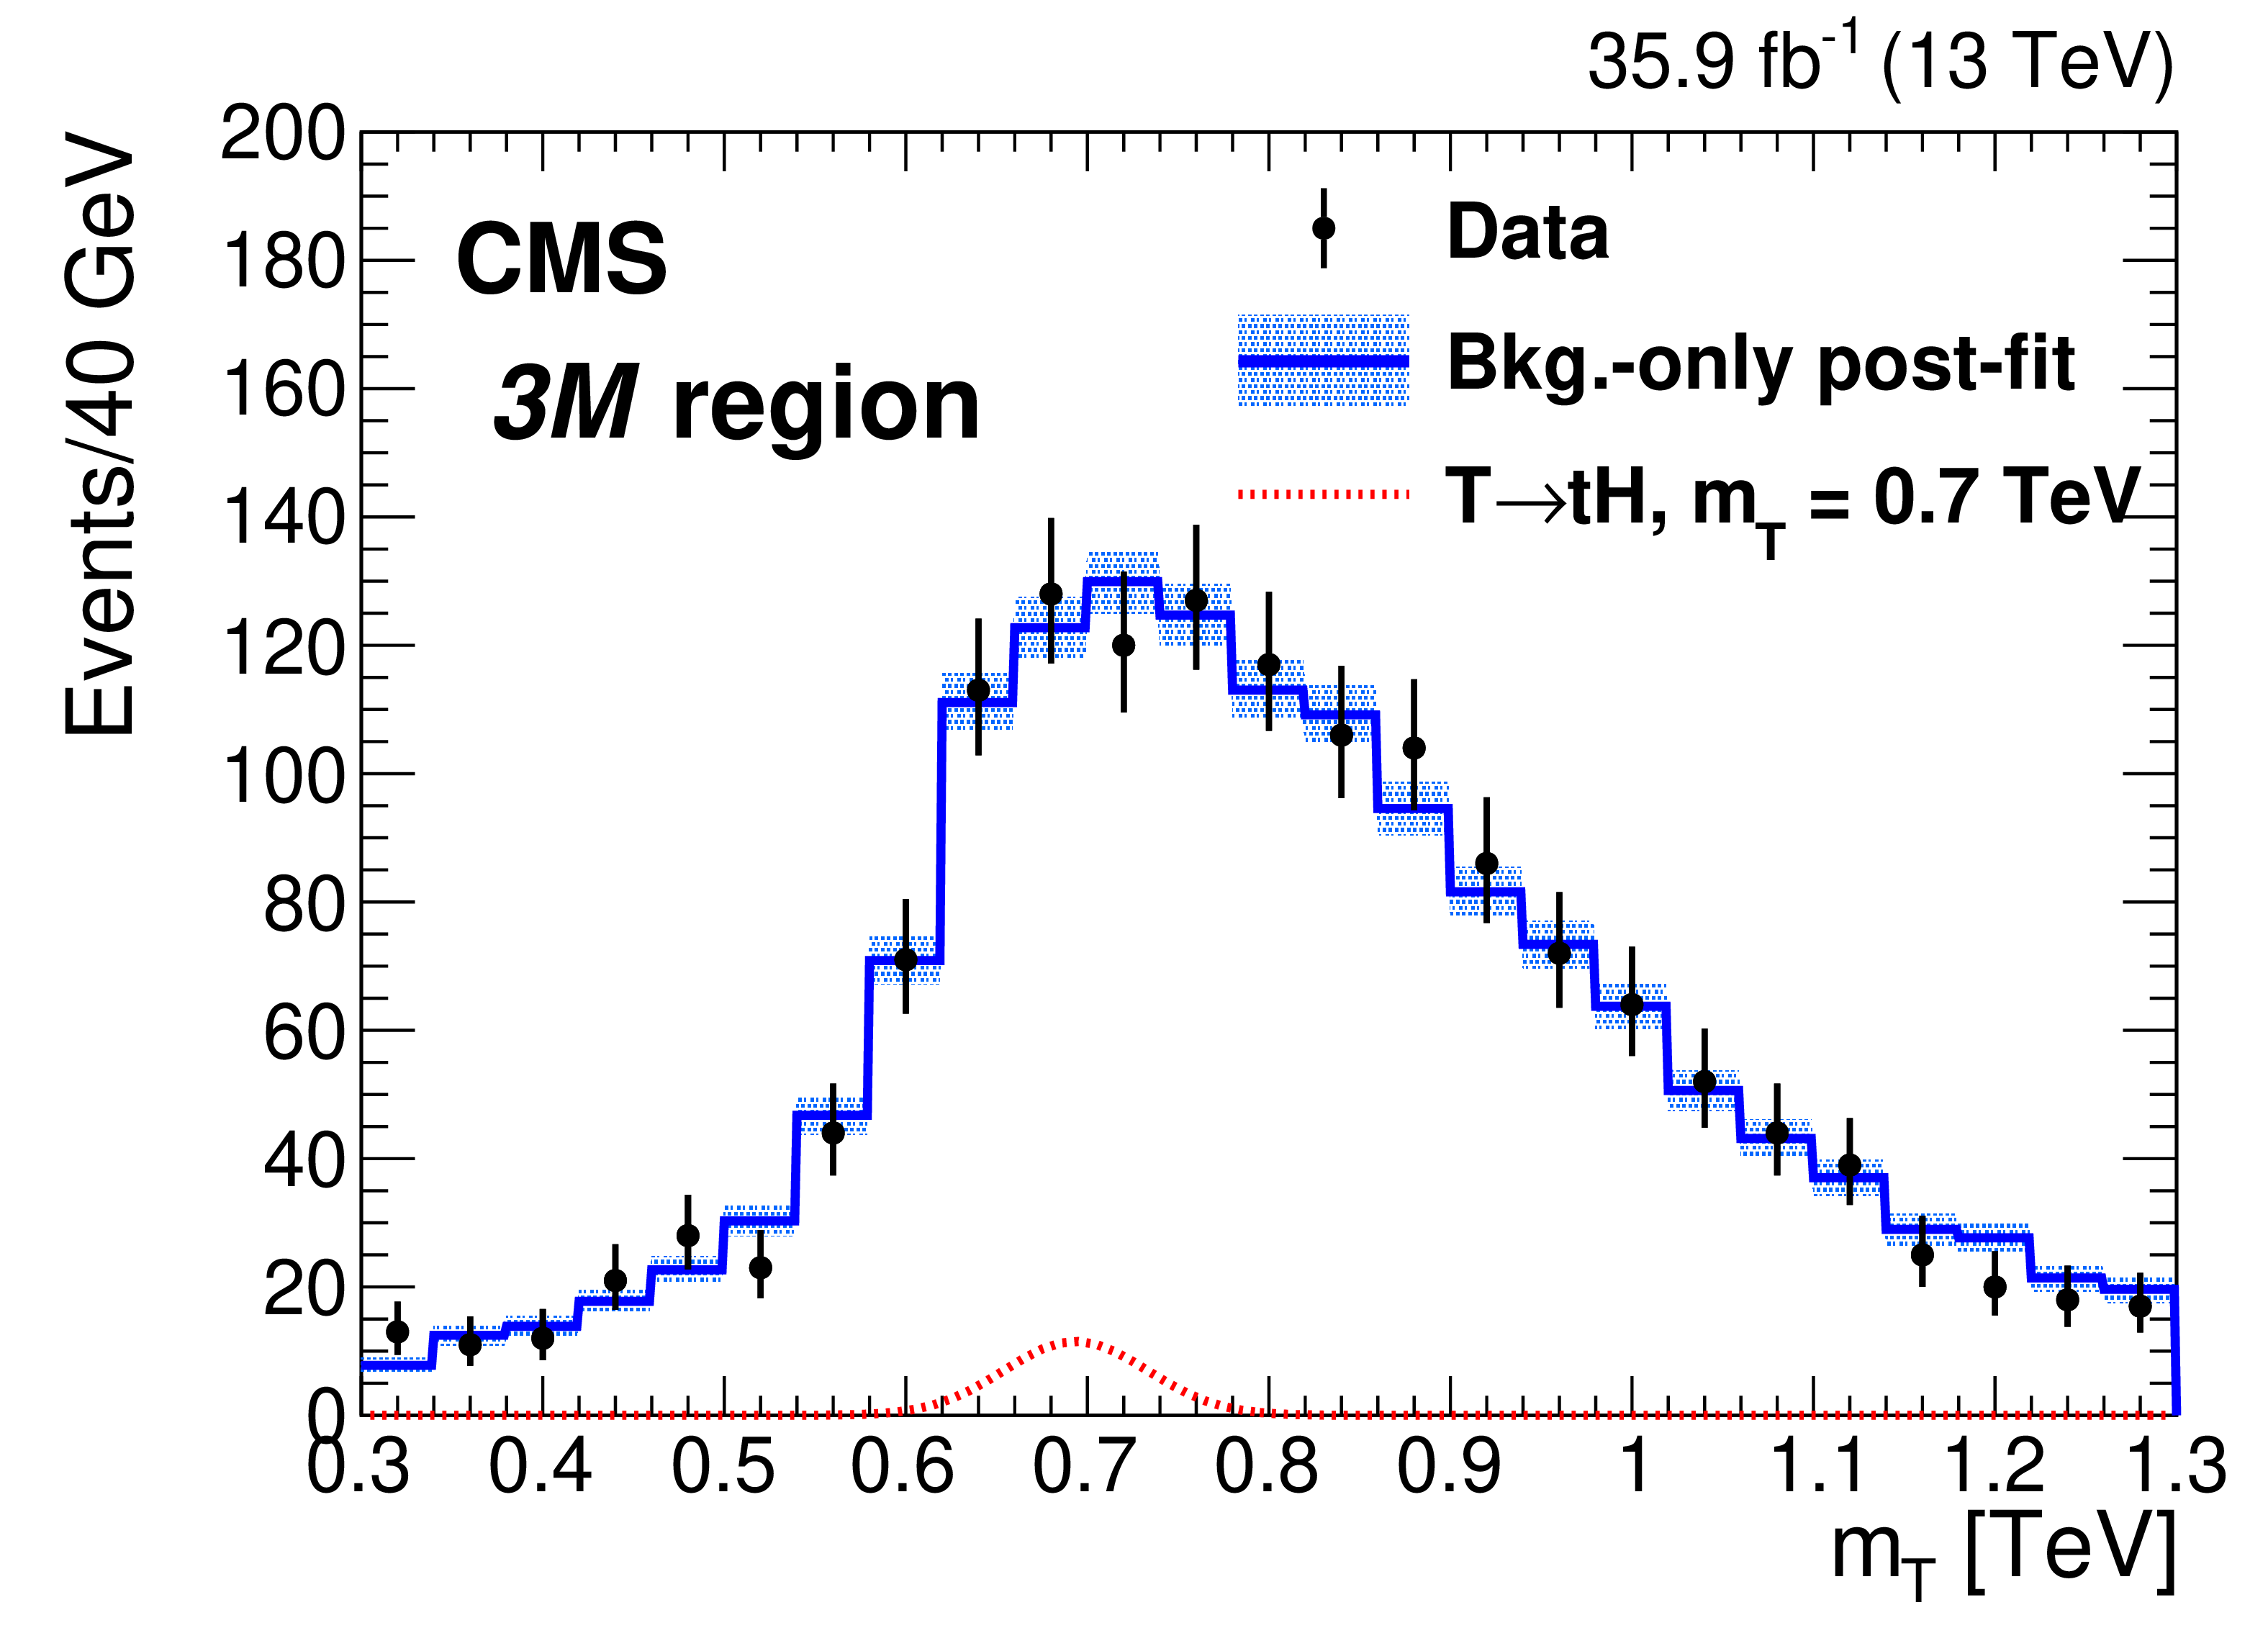
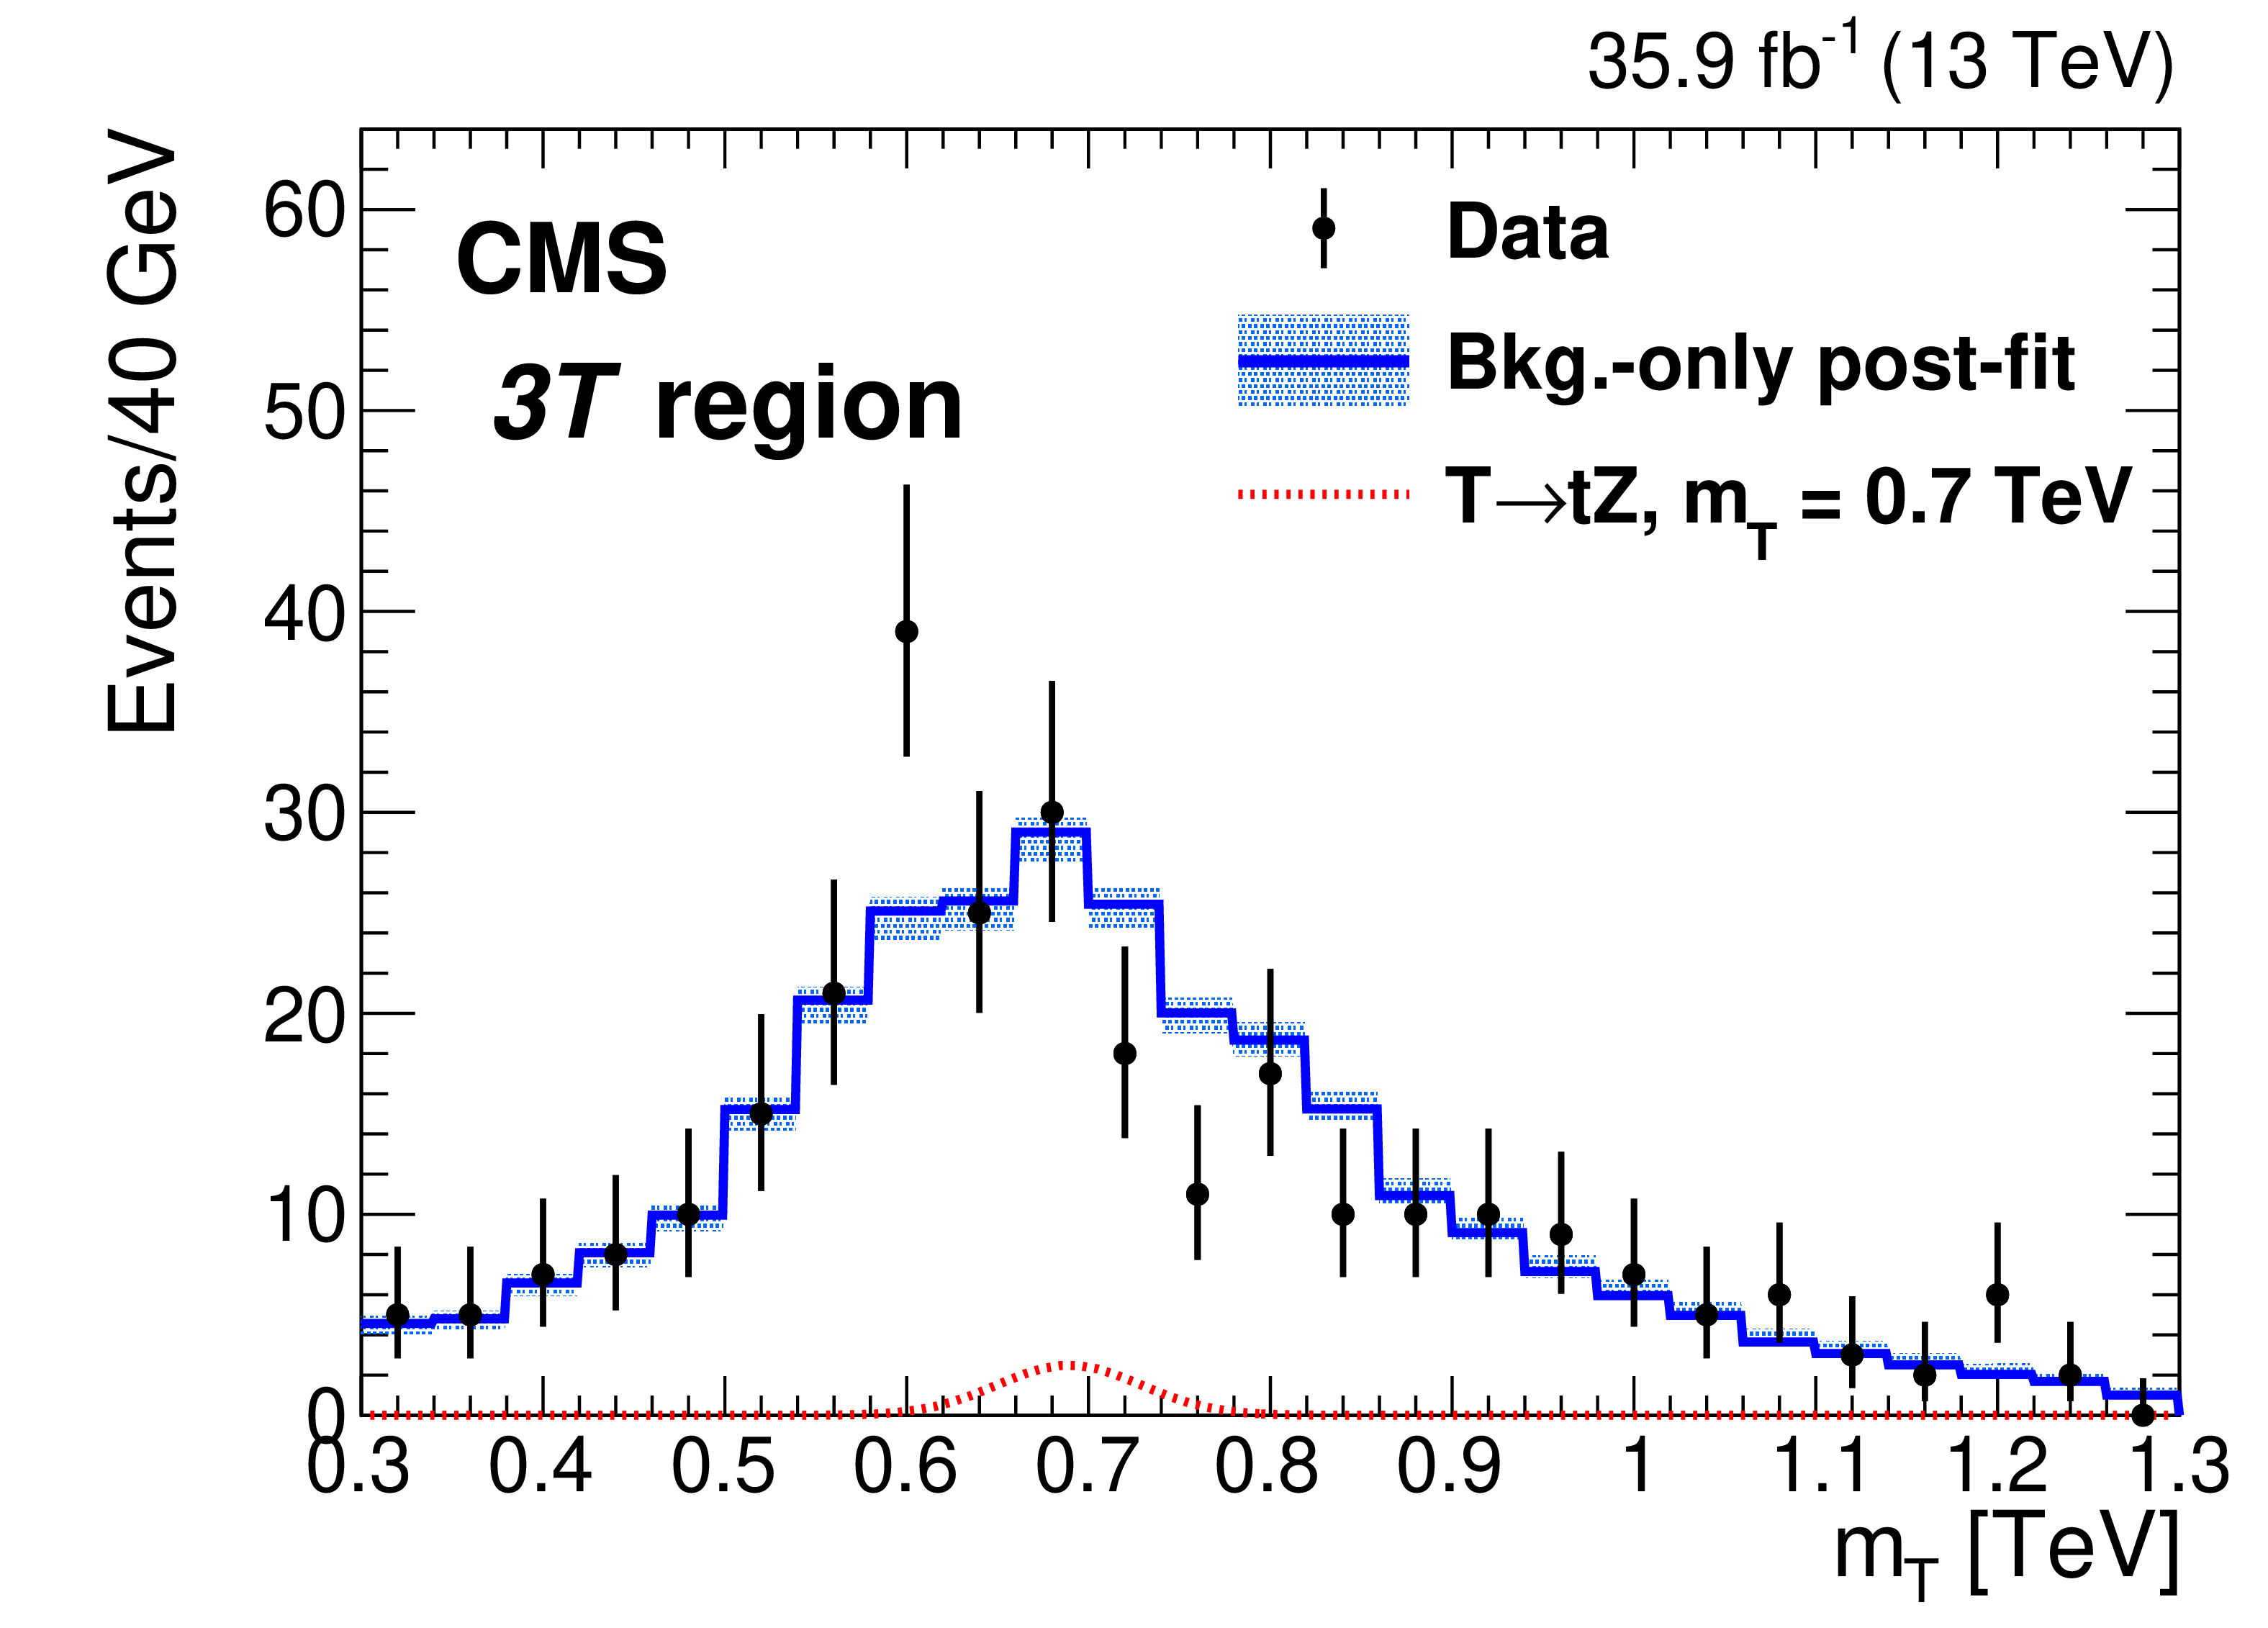
The background-only post-fit invariant mass distributions for the ${\mathrm{t} \mathrm{Z}}$ candidates (left) and ${\mathrm{t} \mathrm{H}}$ candidates (right) for each region fitted: 2M1L (upper row), 3M (middle row), and 3T (lower row). The signal hypothesis shown is a T with a mass of 0.7 TeV, narrow width, and a product of the cross section and branching fraction of 600 fb for the ${\mathrm{t} \mathrm{Z} \mathrm{b} \mathrm{q}}$ and ${\mathrm{t} \mathrm{H} \mathrm{b} \mathrm{q}}$ channels. The data are represented by the black points with error bars, the signal hypothesis is represented by the red dashed line, the blue histogram gives the fitted background, and the light blue band represents the uncertainty in the background fit. |
png pdf |
Figure 4-a:
The background-only post-fit invariant mass distributions for the ${\mathrm{t} \mathrm{Z}}$ candidates for the 2M1L region. The signal hypothesis shown is a T with a mass of 0.7 TeV, narrow width, and a product of the cross section and branching fraction of 600 fb for the ${\mathrm{t} \mathrm{Z} \mathrm{b} \mathrm{q}}$ and ${\mathrm{t} \mathrm{H} \mathrm{b} \mathrm{q}}$ channels. The data are represented by the black points with error bars, the signal hypothesis is represented by the red dashed line, the blue histogram gives the fitted background, and the light blue band represents the uncertainty in the background fit. |

png pdf |
Figure 4-b:
The background-only post-fit invariant mass distributions for the ${\mathrm{t} \mathrm{H}}$ candidates for the 2M1L region. The signal hypothesis shown is a T with a mass of 0.7 TeV, narrow width, and a product of the cross section and branching fraction of 600 fb for the ${\mathrm{t} \mathrm{Z} \mathrm{b} \mathrm{q}}$ and ${\mathrm{t} \mathrm{H} \mathrm{b} \mathrm{q}}$ channels. The data are represented by the black points with error bars, the signal hypothesis is represented by the red dashed line, the blue histogram gives the fitted background, and the light blue band represents the uncertainty in the background fit. |
png pdf |
Figure 4-c:
The background-only post-fit invariant mass distributions for the ${\mathrm{t} \mathrm{Z}}$ candidates for the 3M region. The signal hypothesis shown is a T with a mass of 0.7 TeV, narrow width, and a product of the cross section and branching fraction of 600 fb for the ${\mathrm{t} \mathrm{Z} \mathrm{b} \mathrm{q}}$ and ${\mathrm{t} \mathrm{H} \mathrm{b} \mathrm{q}}$ channels. The data are represented by the black points with error bars, the signal hypothesis is represented by the red dashed line, the blue histogram gives the fitted background, and the light blue band represents the uncertainty in the background fit. |
png pdf |
Figure 4-d:
The background-only post-fit invariant mass distributions for the ${\mathrm{t} \mathrm{H}}$ candidates for the 3M region. The signal hypothesis shown is a T with a mass of 0.7 TeV, narrow width, and a product of the cross section and branching fraction of 600 fb for the ${\mathrm{t} \mathrm{Z} \mathrm{b} \mathrm{q}}$ and ${\mathrm{t} \mathrm{H} \mathrm{b} \mathrm{q}}$ channels. The data are represented by the black points with error bars, the signal hypothesis is represented by the red dashed line, the blue histogram gives the fitted background, and the light blue band represents the uncertainty in the background fit. |
png pdf |
Figure 4-e:
The background-only post-fit invariant mass distributions for the ${\mathrm{t} \mathrm{Z}}$ candidates for the 3T region. The signal hypothesis shown is a T with a mass of 0.7 TeV, narrow width, and a product of the cross section and branching fraction of 600 fb for the ${\mathrm{t} \mathrm{Z} \mathrm{b} \mathrm{q}}$ and ${\mathrm{t} \mathrm{H} \mathrm{b} \mathrm{q}}$ channels. The data are represented by the black points with error bars, the signal hypothesis is represented by the red dashed line, the blue histogram gives the fitted background, and the light blue band represents the uncertainty in the background fit. |
png pdf |
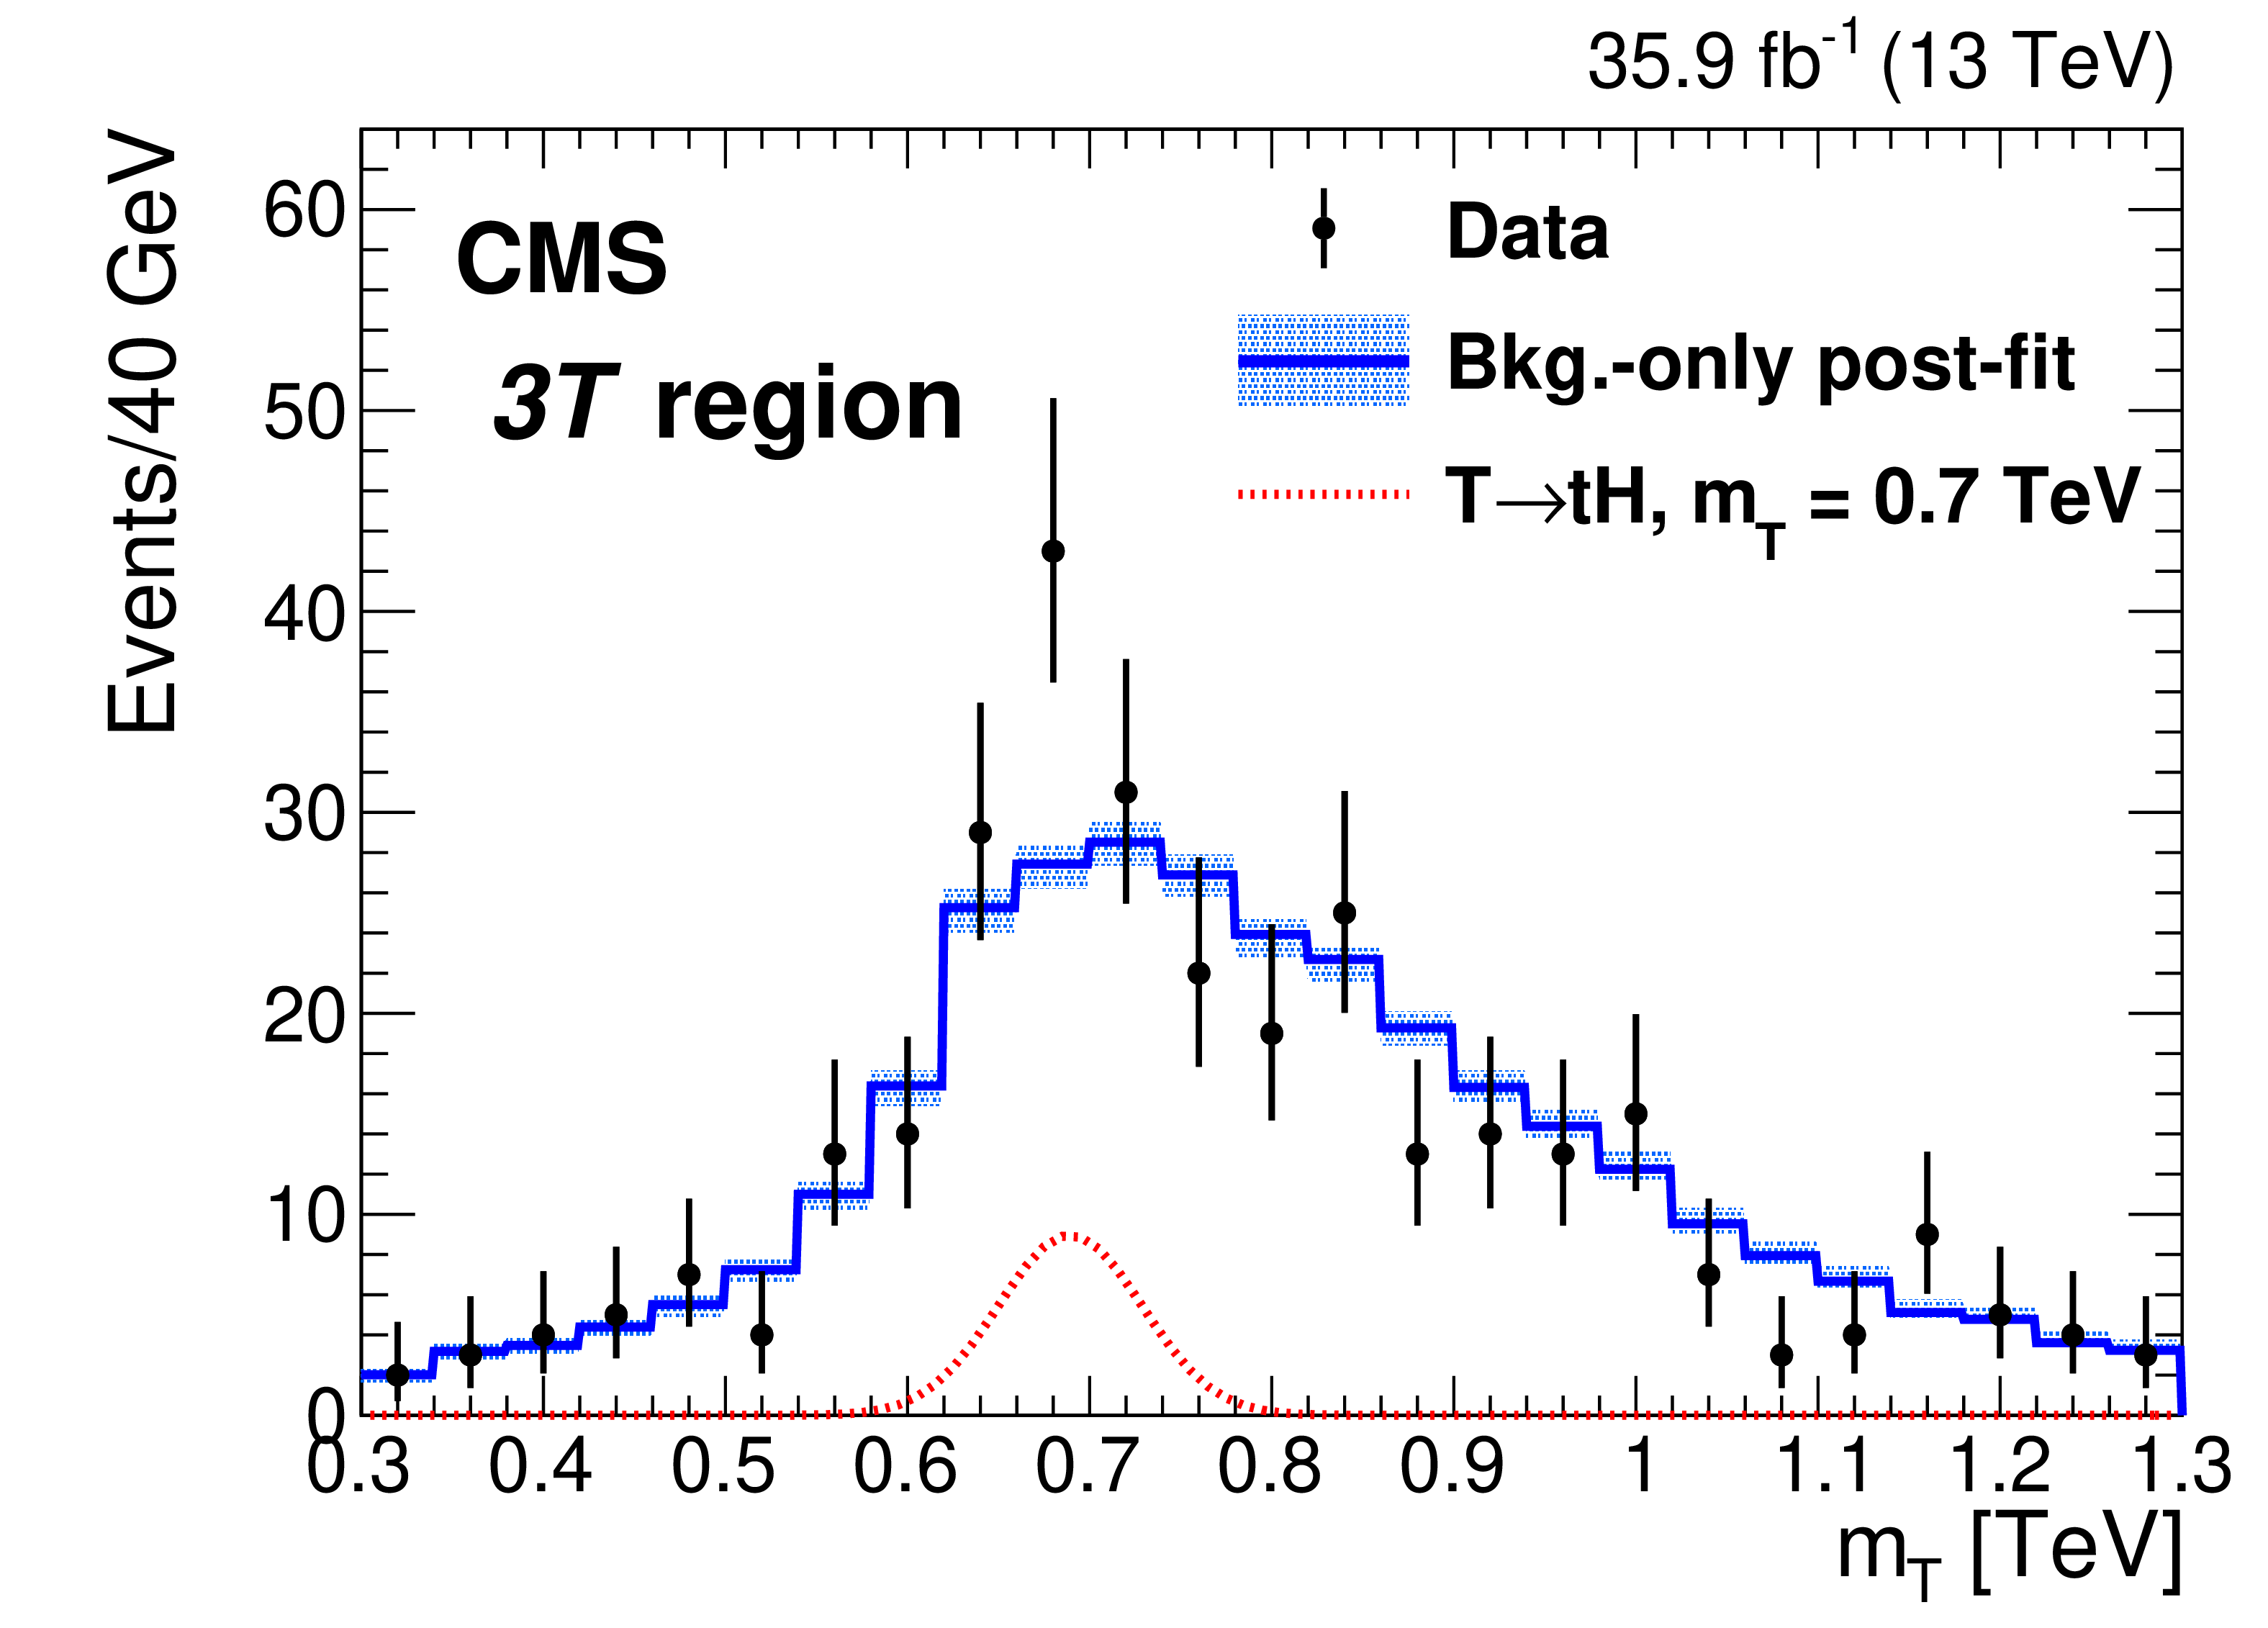
Figure 4-f:
The background-only post-fit invariant mass distributions for the ${\mathrm{t} \mathrm{H}}$ candidates for the 3T region. The signal hypothesis shown is a T with a mass of 0.7 TeV, narrow width, and a product of the cross section and branching fraction of 600 fb for the ${\mathrm{t} \mathrm{Z} \mathrm{b} \mathrm{q}}$ and ${\mathrm{t} \mathrm{H} \mathrm{b} \mathrm{q}}$ channels. The data are represented by the black points with error bars, the signal hypothesis is represented by the red dashed line, the blue histogram gives the fitted background, and the light blue band represents the uncertainty in the background fit. |
png pdf |
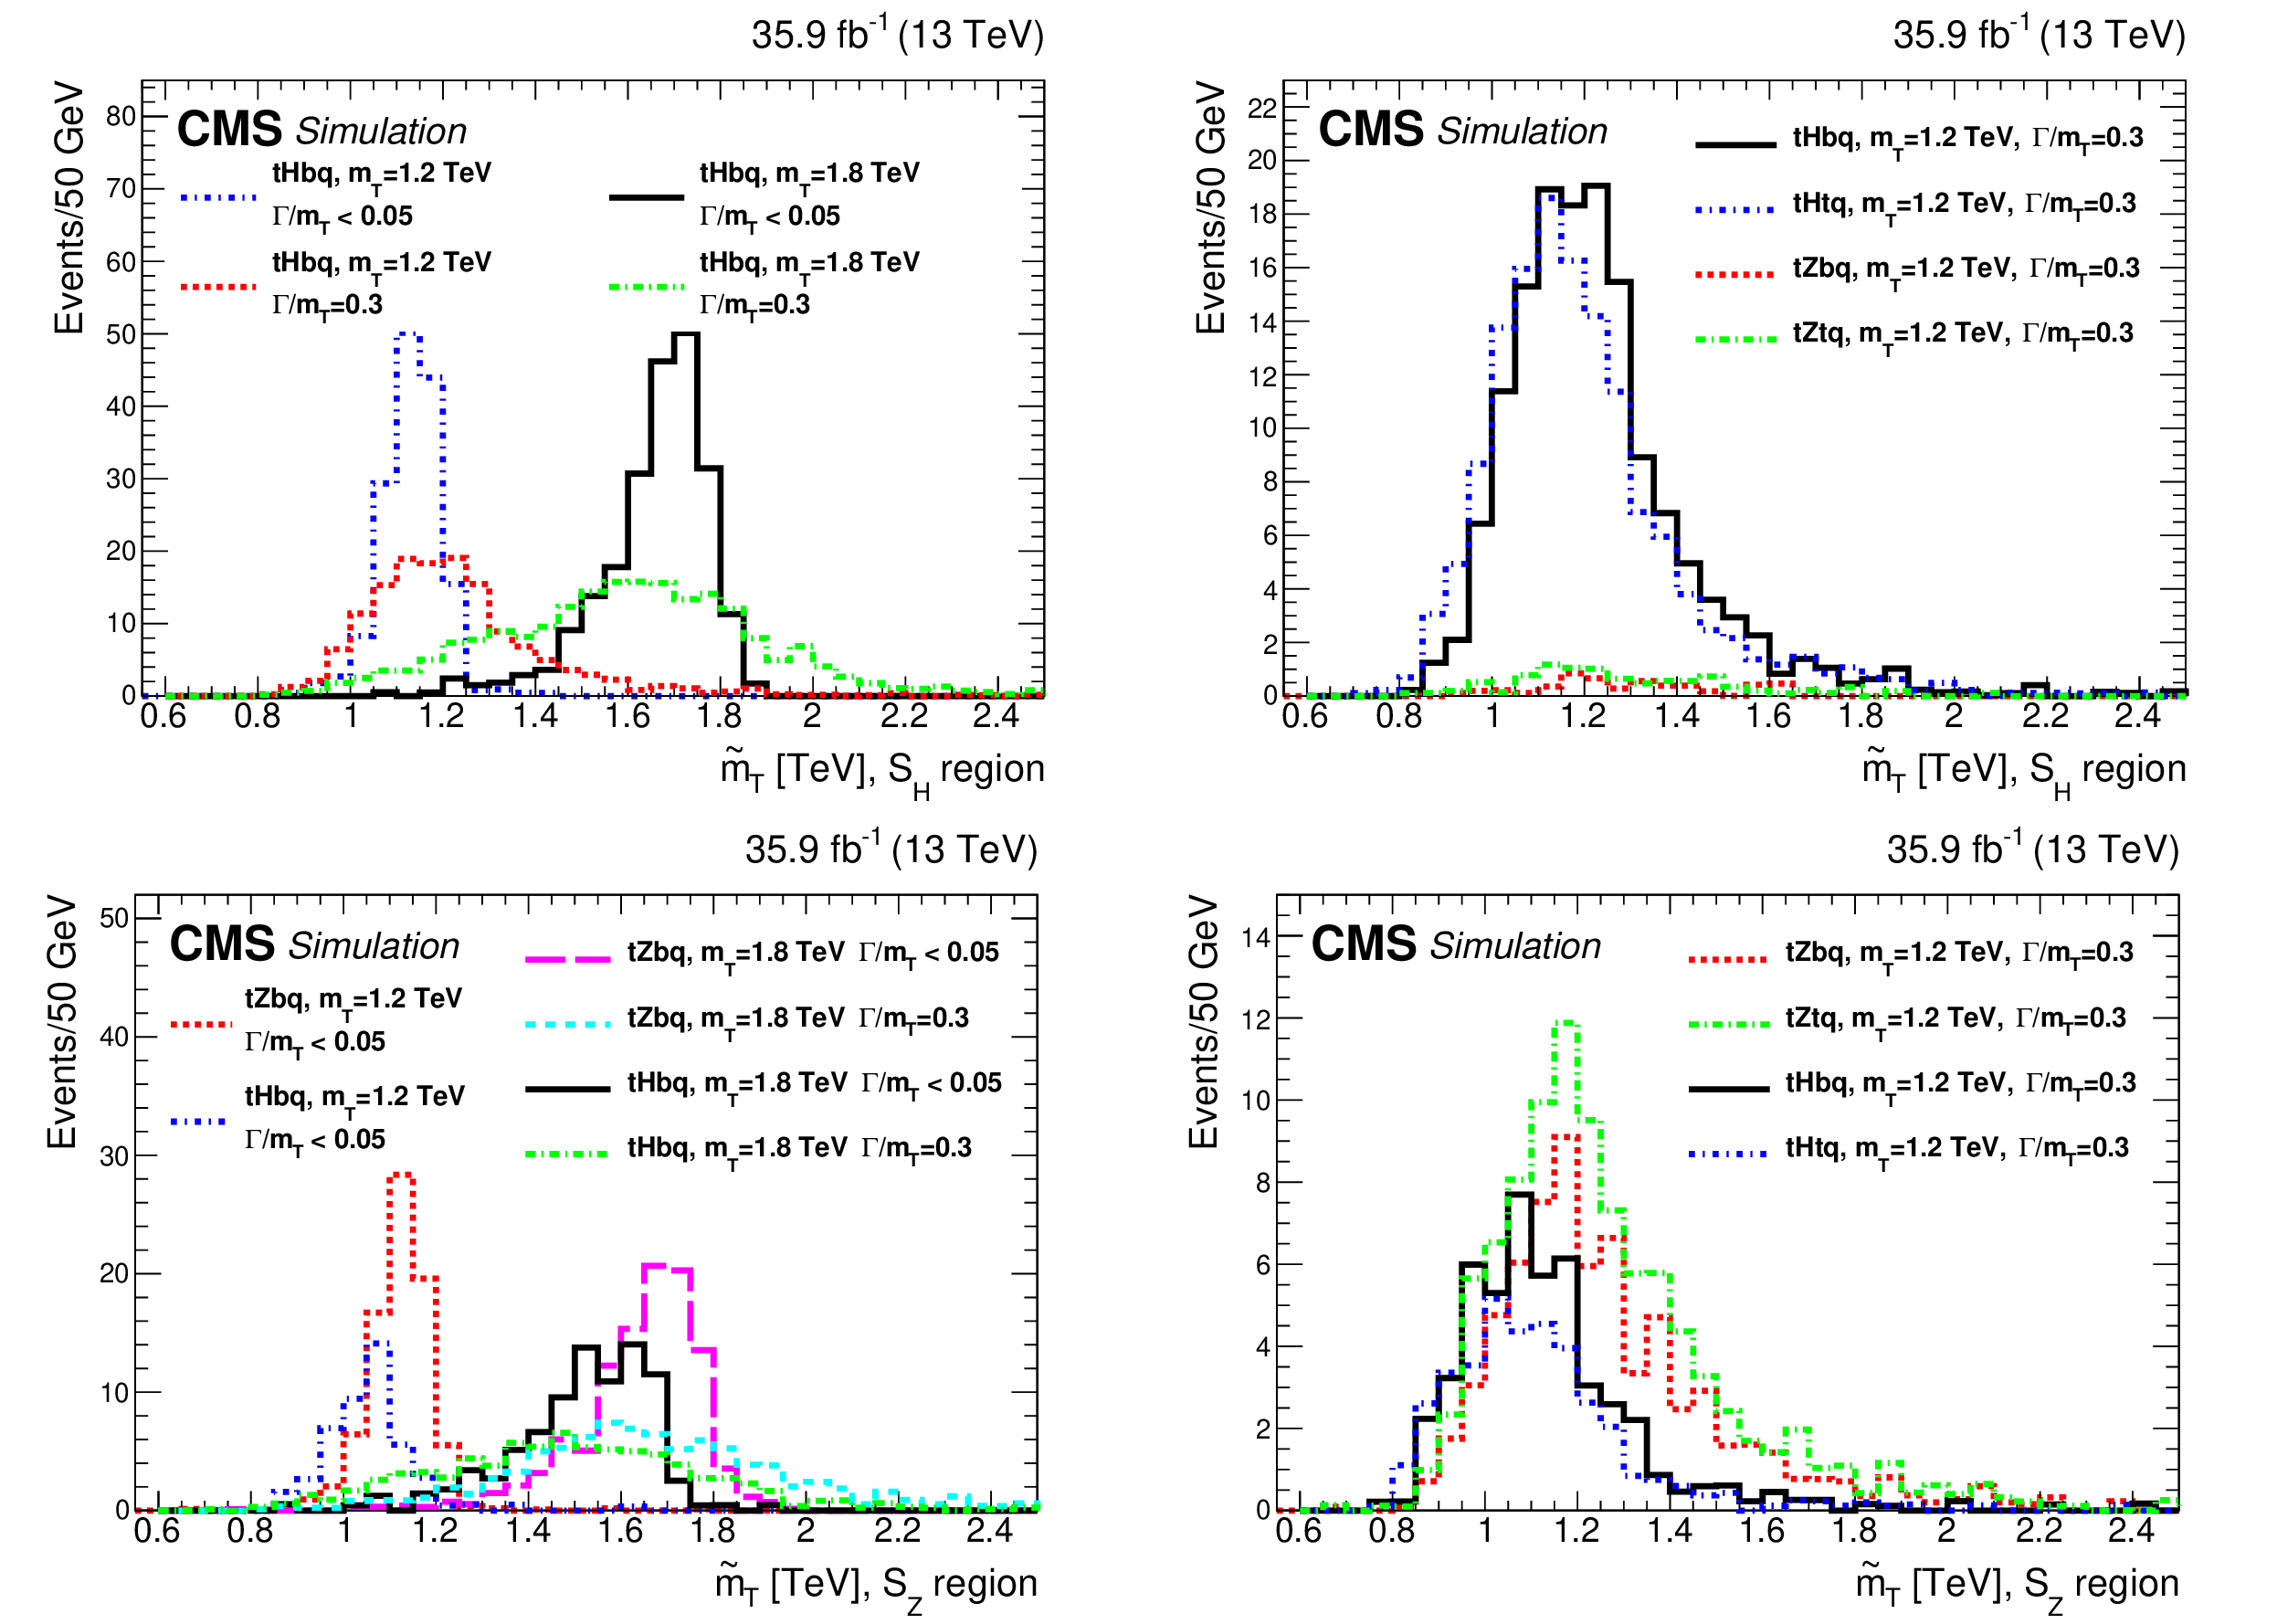
Figure 5:
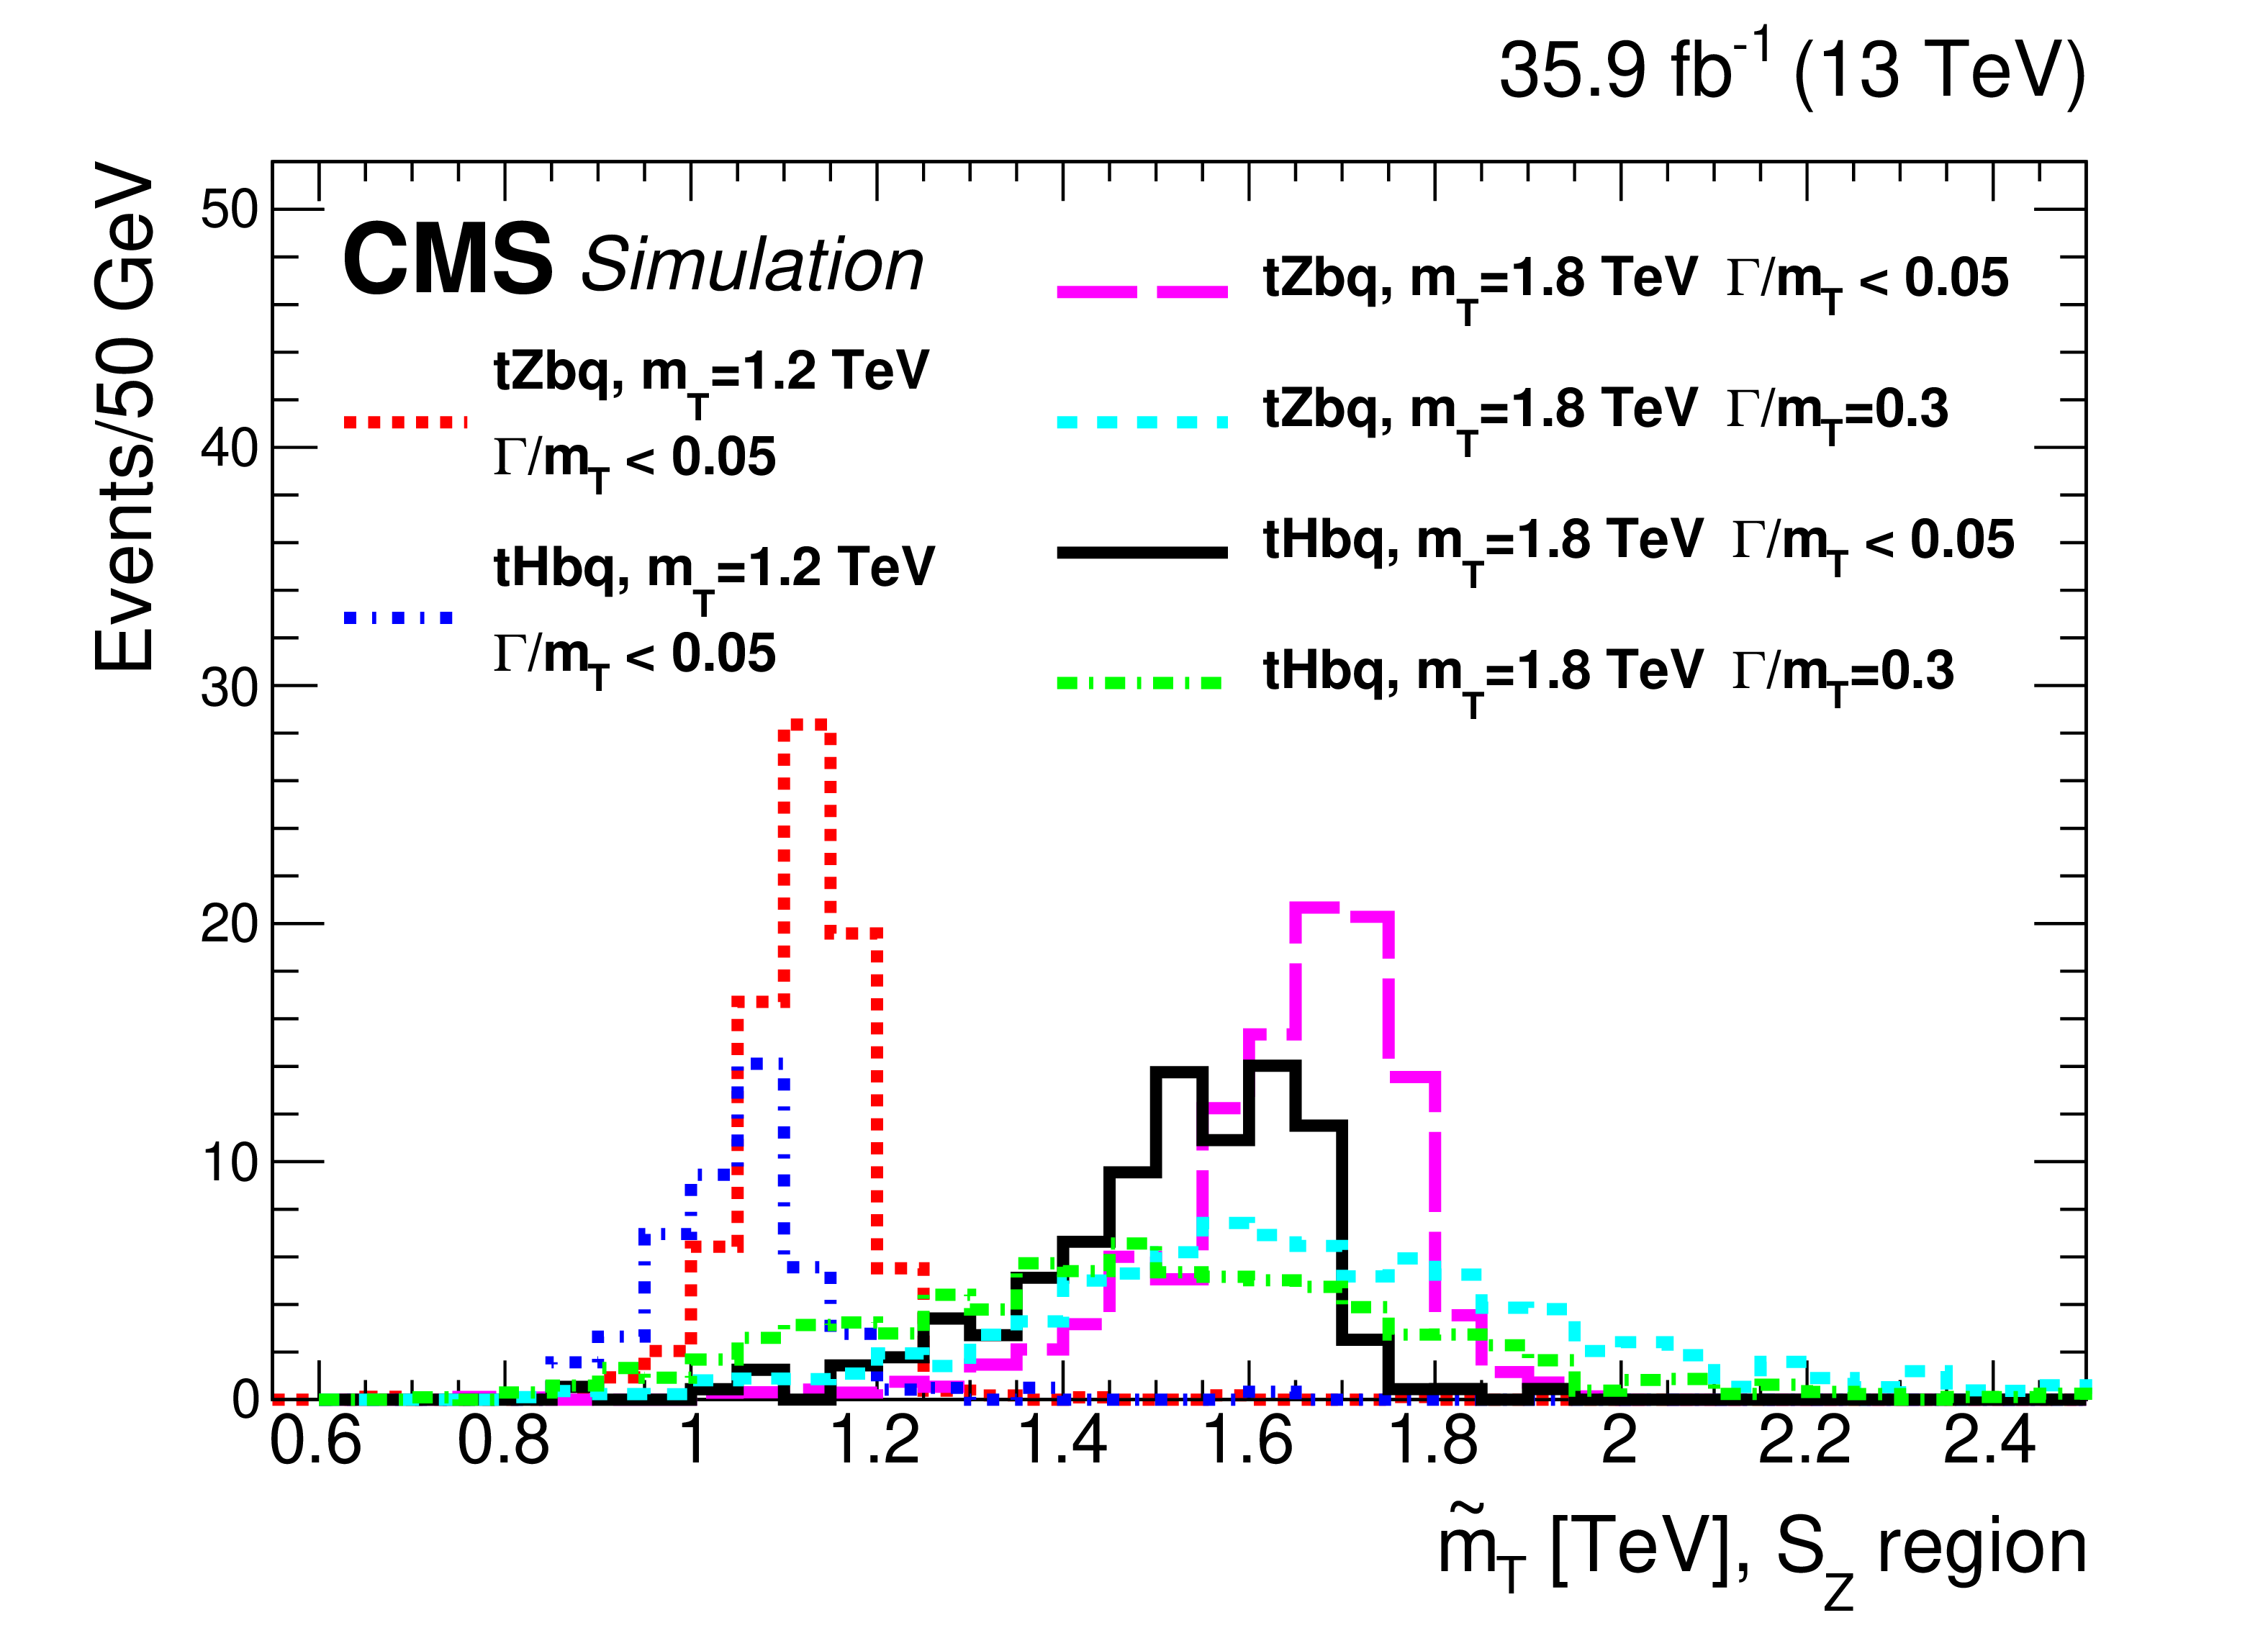
Example ${\tilde{m}_{{\mathrm {T}}}}$ distributions in the signal regions, ${\mathrm {S}_{\mathrm{H}}}$ (upper row), and ${\mathrm {S}_{\mathrm{Z}}} $ (lower row). For presentation purposes, the cross sections for ${\mathrm{t} \mathrm{H} \mathrm{b} \mathrm{q}}$, ${\mathrm{t} \mathrm{Z} \mathrm{b} \mathrm{q}}$, ${\mathrm{t} \mathrm{H} \mathrm{t} \mathrm{q}}$ and ${\mathrm{t} \mathrm{Z} \mathrm{t} \mathrm{q}}$ are set equal to 1 pb for all masses and fractional widths and normalized to the integrated luminosity of the data set. The left column illustrates potential signals with a range of masses and widths for the ${\mathrm{t} \mathrm{H} \mathrm{b} \mathrm{q}}$ and ${\mathrm{t} \mathrm{Z} \mathrm{b} \mathrm{q}}$ channels. The right column illustrates potential signals for one mass and a large width for all four processes including also ${\mathrm{t} \mathrm{H} \mathrm{t} \mathrm{q}}$ and ${\mathrm{t} \mathrm{Z} \mathrm{t} \mathrm{q}}$. |
png pdf |
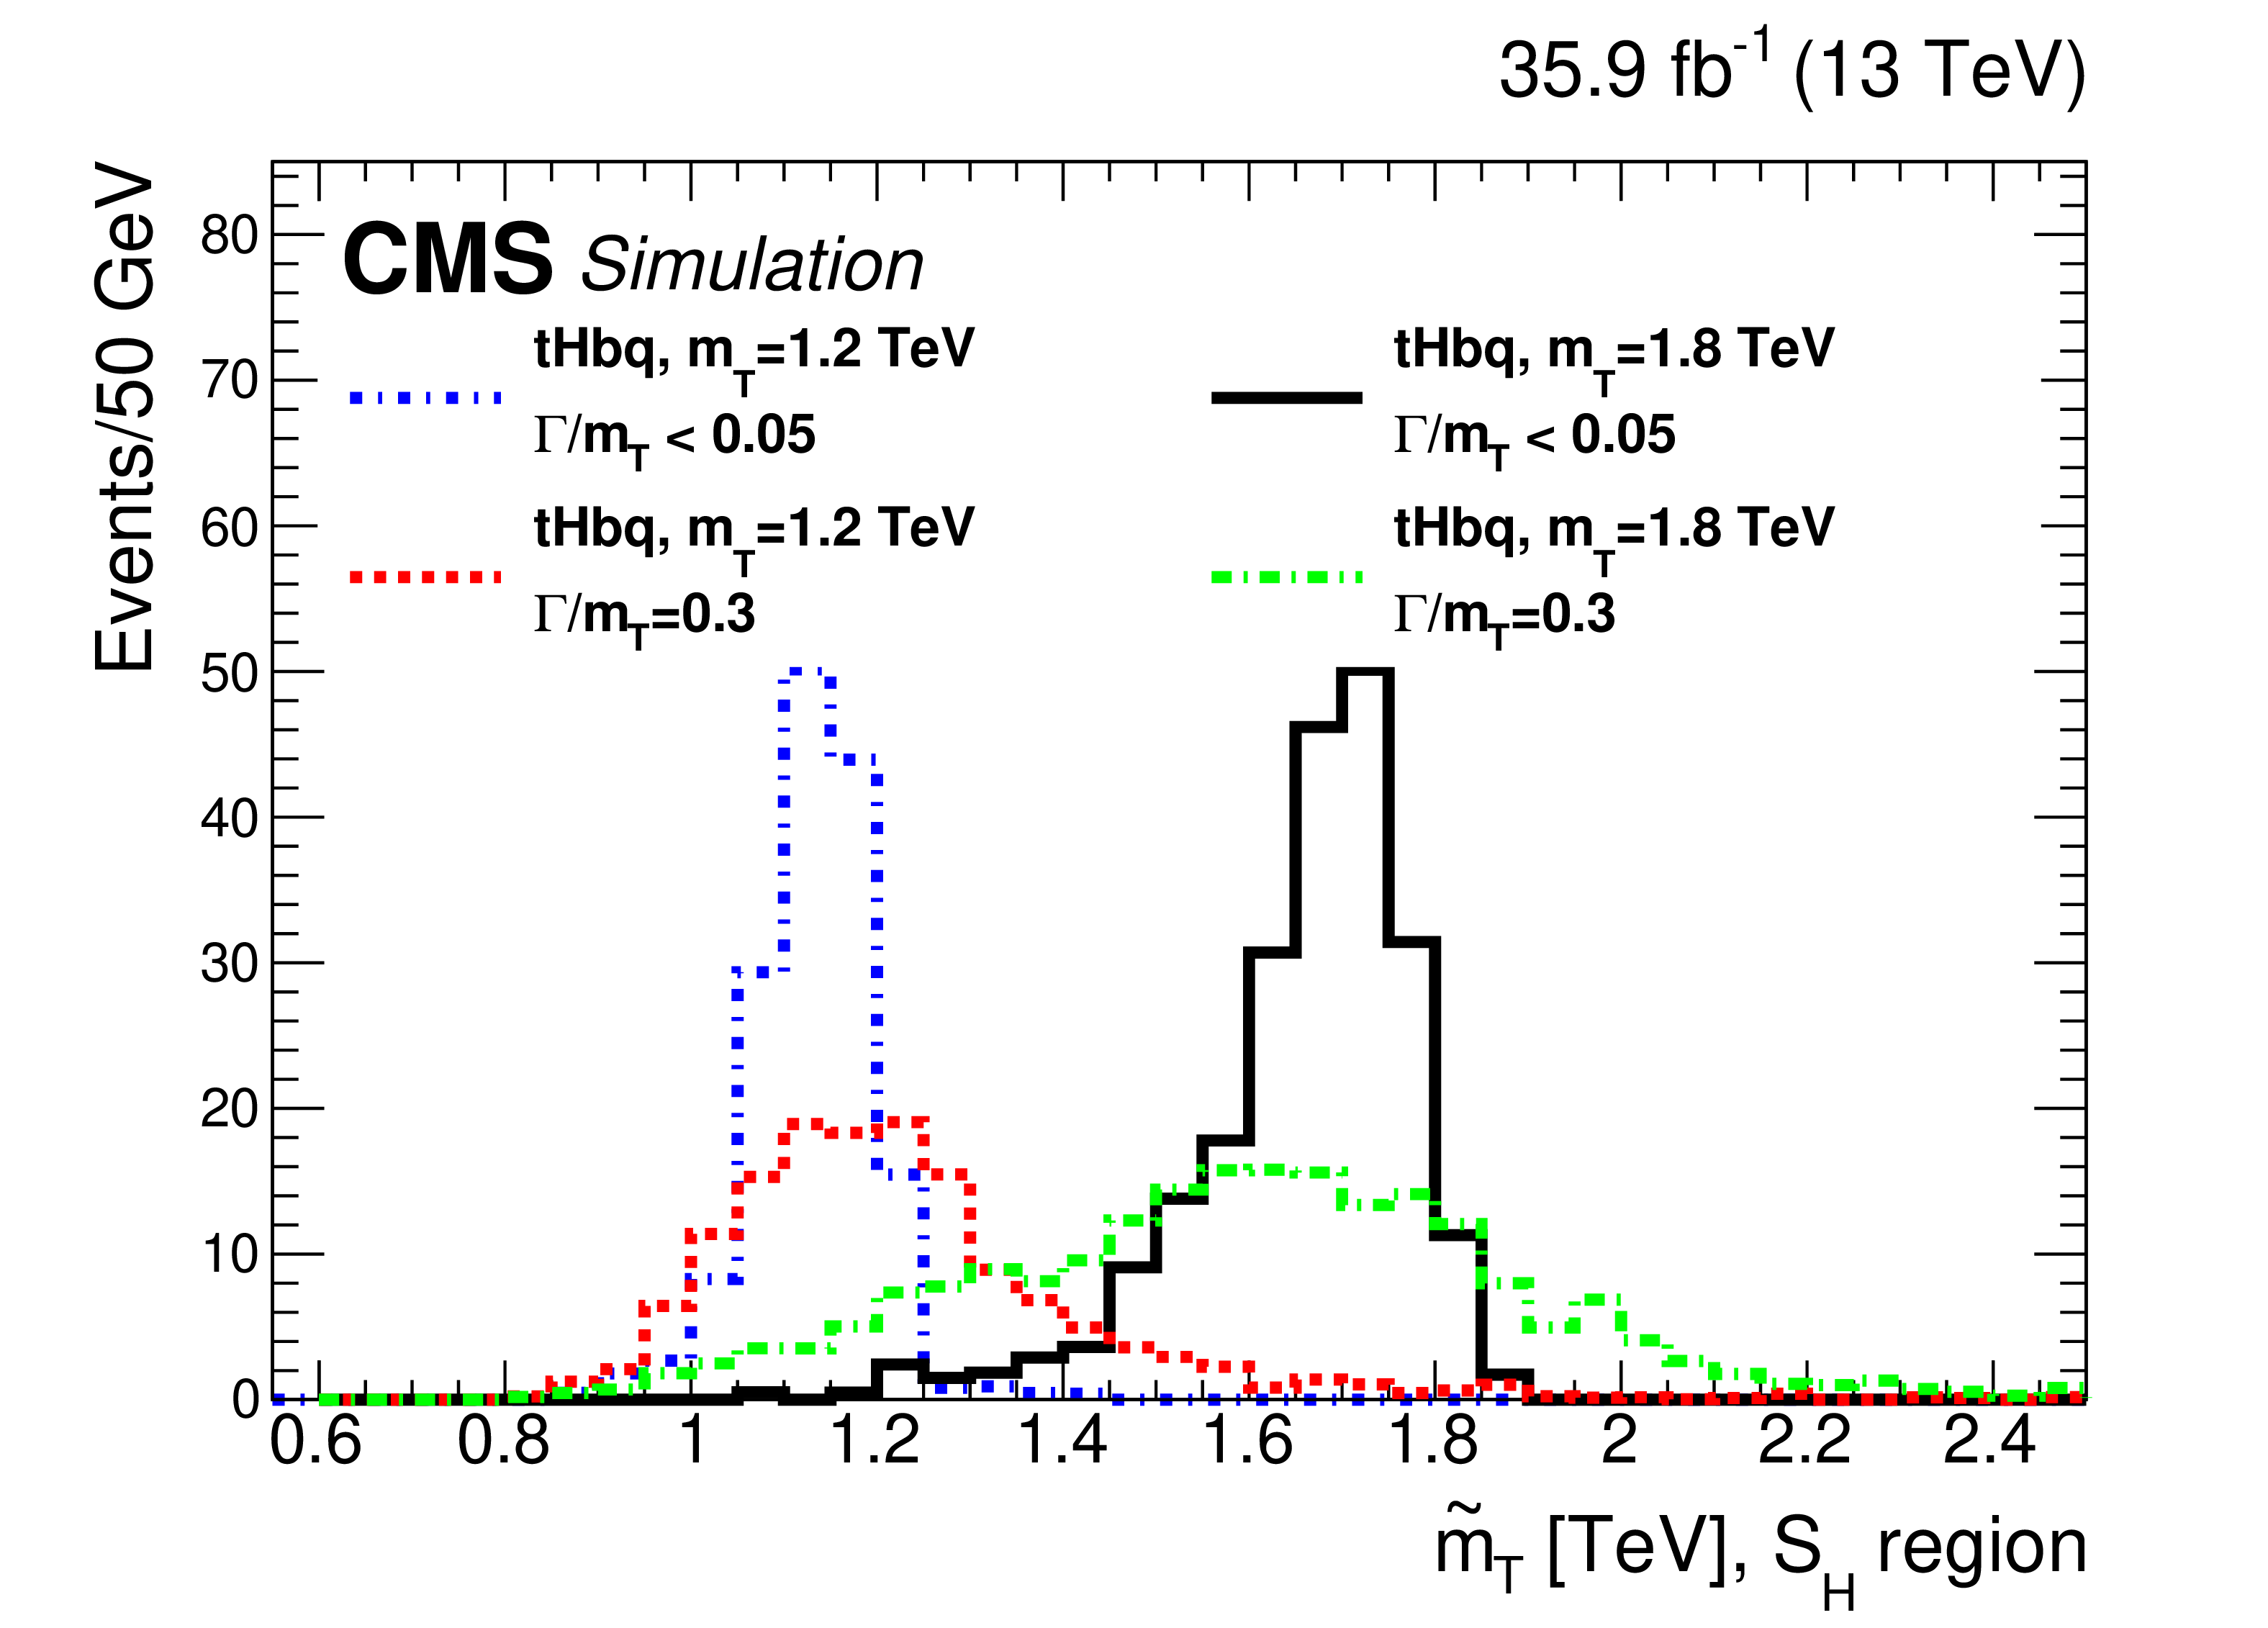
Figure 5-a:
Example ${\tilde{m}_{{\mathrm {T}}}}$ distributions in the signal regions, ${\mathrm {S}_{\mathrm{H}}}$ (upper row), and ${\mathrm {S}_{\mathrm{Z}}} $ (lower row). For presentation purposes, the cross sections for ${\mathrm{t} \mathrm{H} \mathrm{b} \mathrm{q}}$, ${\mathrm{t} \mathrm{Z} \mathrm{b} \mathrm{q}}$, ${\mathrm{t} \mathrm{H} \mathrm{t} \mathrm{q}}$ and ${\mathrm{t} \mathrm{Z} \mathrm{t} \mathrm{q}}$ are set equal to 1 pb for all masses and fractional widths and normalized to the integrated luminosity of the data set. The left column illustrates potential signals with a range of masses and widths for the ${\mathrm{t} \mathrm{H} \mathrm{b} \mathrm{q}}$ and ${\mathrm{t} \mathrm{Z} \mathrm{b} \mathrm{q}}$ channels. The right column illustrates potential signals for one mass and a large width for all four processes including also ${\mathrm{t} \mathrm{H} \mathrm{t} \mathrm{q}}$ and ${\mathrm{t} \mathrm{Z} \mathrm{t} \mathrm{q}}$. |
png pdf |
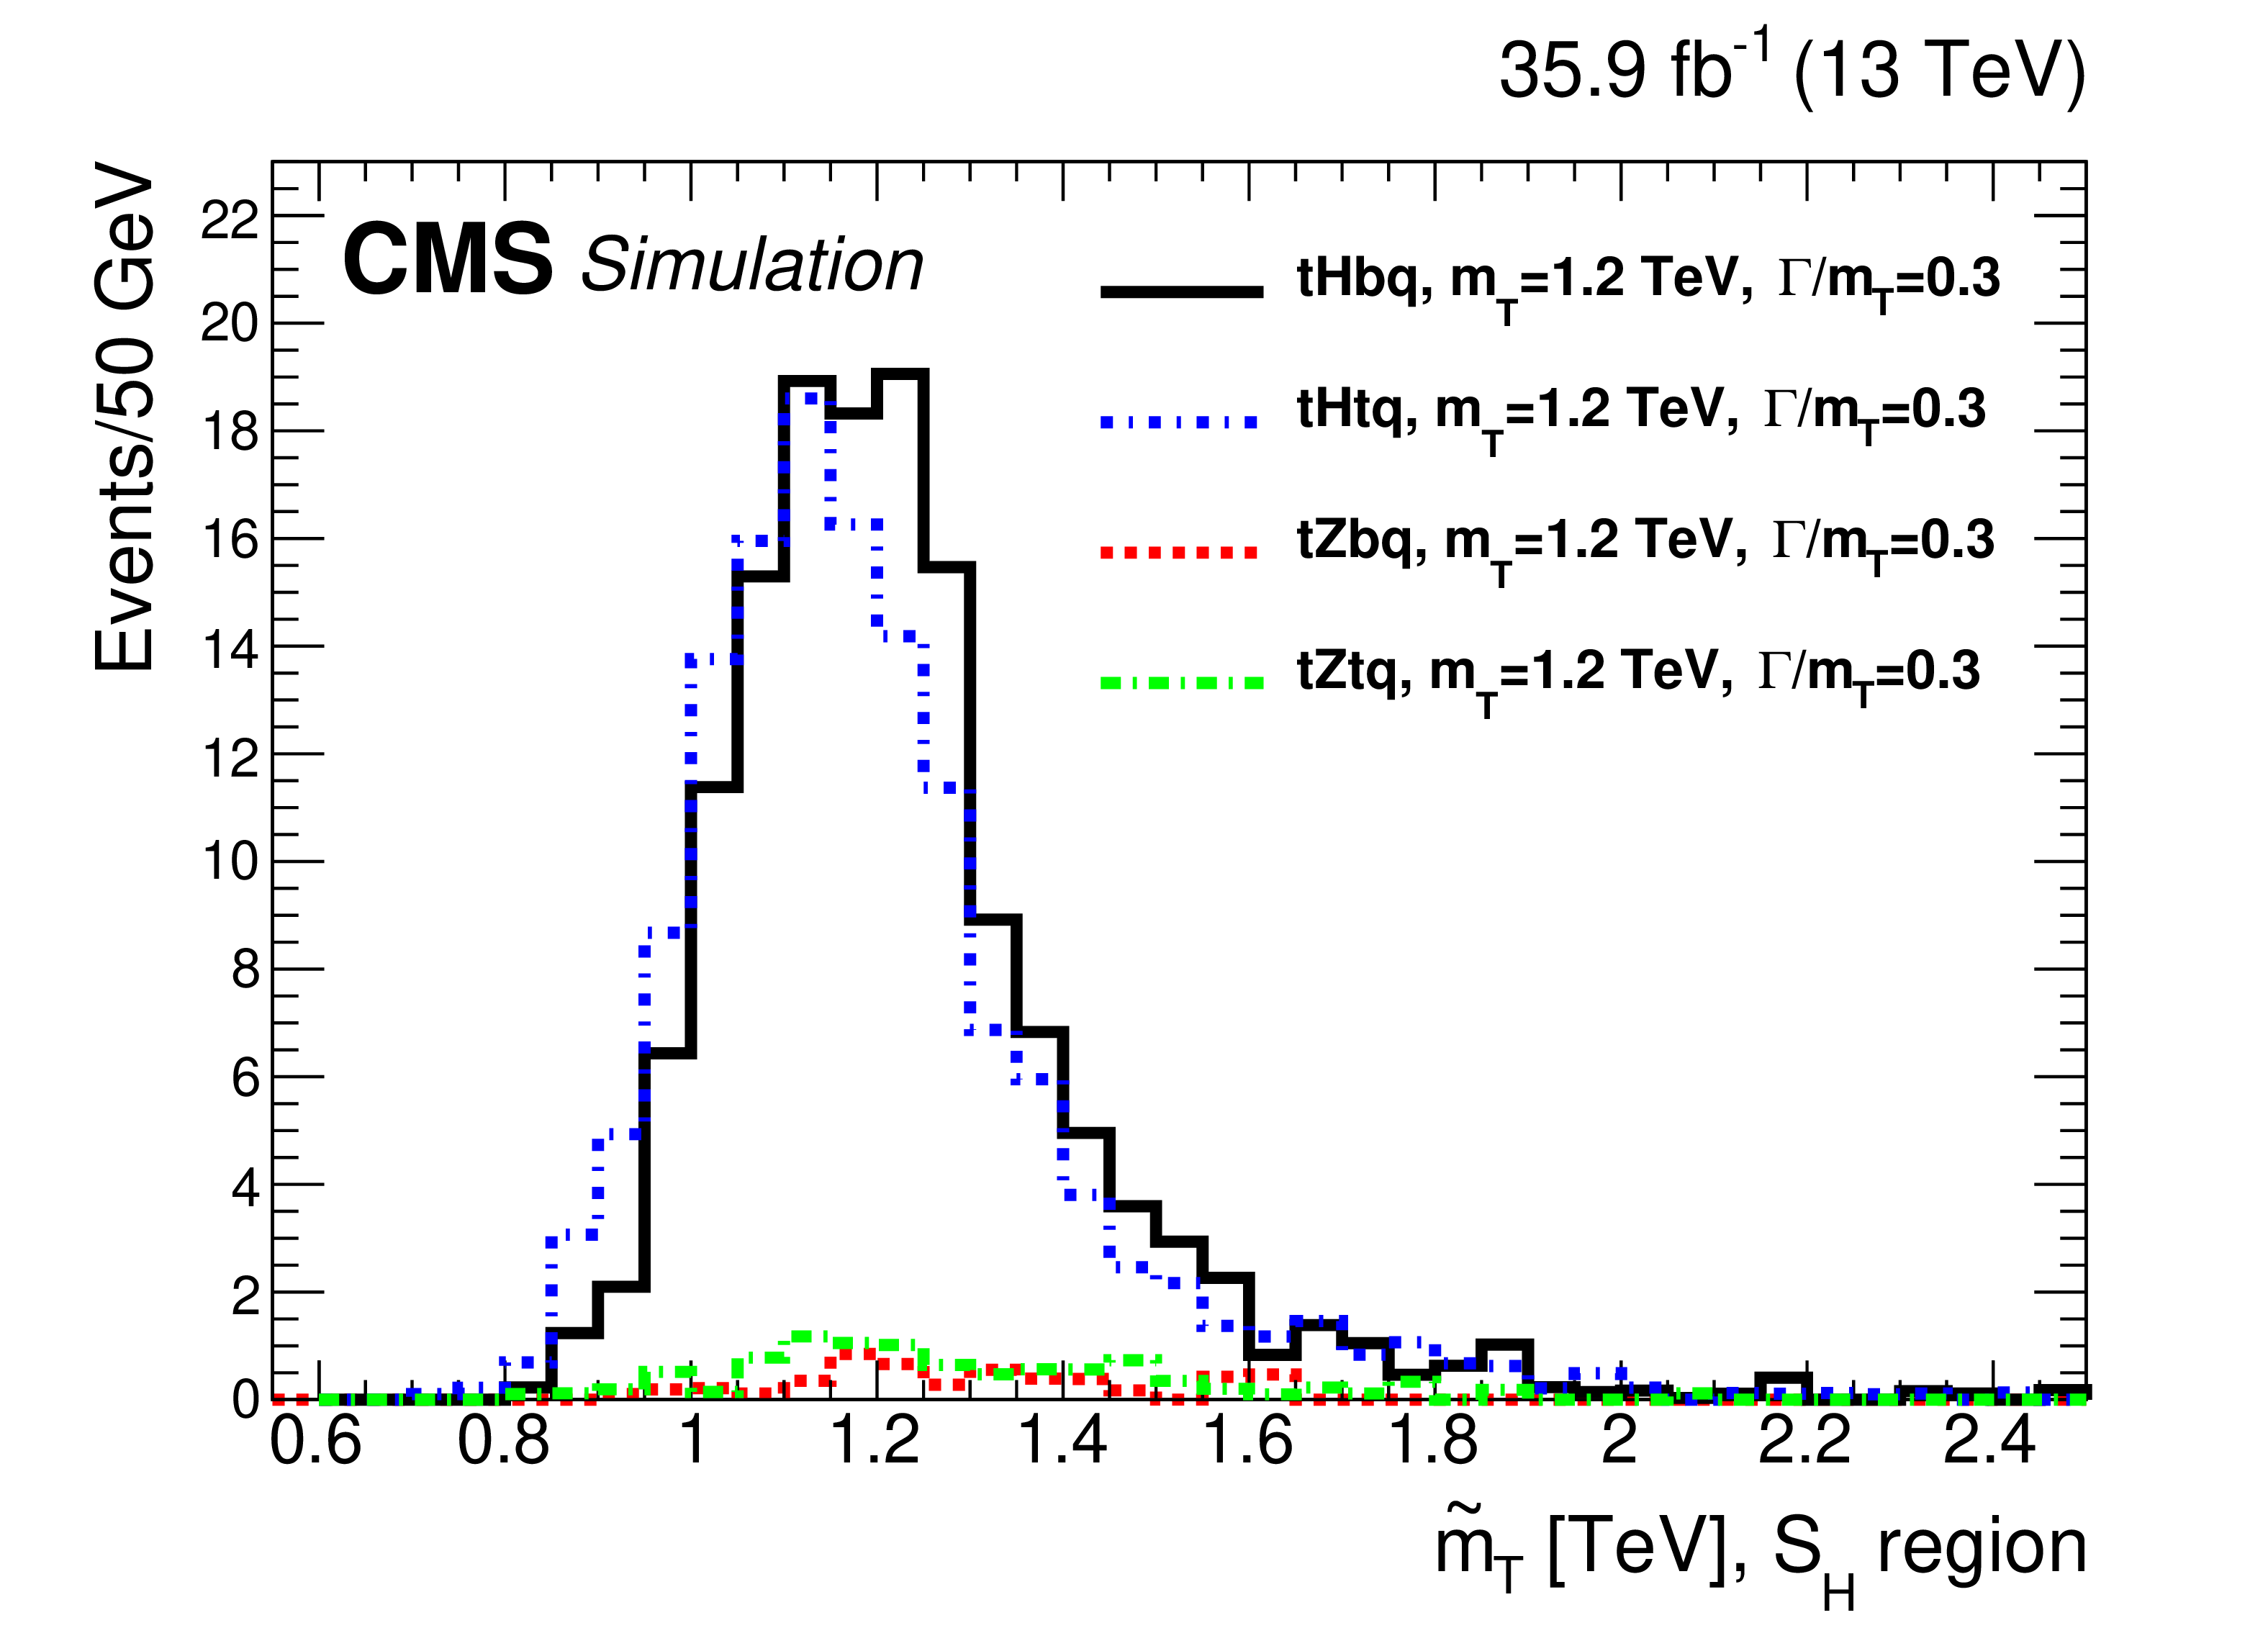
Figure 5-b:
Example ${\tilde{m}_{{\mathrm {T}}}}$ distributions in the signal regions, ${\mathrm {S}_{\mathrm{H}}}$ (upper row), and ${\mathrm {S}_{\mathrm{Z}}} $ (lower row). For presentation purposes, the cross sections for ${\mathrm{t} \mathrm{H} \mathrm{b} \mathrm{q}}$, ${\mathrm{t} \mathrm{Z} \mathrm{b} \mathrm{q}}$, ${\mathrm{t} \mathrm{H} \mathrm{t} \mathrm{q}}$ and ${\mathrm{t} \mathrm{Z} \mathrm{t} \mathrm{q}}$ are set equal to 1 pb for all masses and fractional widths and normalized to the integrated luminosity of the data set. The left column illustrates potential signals with a range of masses and widths for the ${\mathrm{t} \mathrm{H} \mathrm{b} \mathrm{q}}$ and ${\mathrm{t} \mathrm{Z} \mathrm{b} \mathrm{q}}$ channels. The right column illustrates potential signals for one mass and a large width for all four processes including also ${\mathrm{t} \mathrm{H} \mathrm{t} \mathrm{q}}$ and ${\mathrm{t} \mathrm{Z} \mathrm{t} \mathrm{q}}$. |
png pdf |
Figure 5-c:
Example ${\tilde{m}_{{\mathrm {T}}}}$ distributions in the signal regions, ${\mathrm {S}_{\mathrm{H}}}$ (upper row), and ${\mathrm {S}_{\mathrm{Z}}} $ (lower row). For presentation purposes, the cross sections for ${\mathrm{t} \mathrm{H} \mathrm{b} \mathrm{q}}$, ${\mathrm{t} \mathrm{Z} \mathrm{b} \mathrm{q}}$, ${\mathrm{t} \mathrm{H} \mathrm{t} \mathrm{q}}$ and ${\mathrm{t} \mathrm{Z} \mathrm{t} \mathrm{q}}$ are set equal to 1 pb for all masses and fractional widths and normalized to the integrated luminosity of the data set. The left column illustrates potential signals with a range of masses and widths for the ${\mathrm{t} \mathrm{H} \mathrm{b} \mathrm{q}}$ and ${\mathrm{t} \mathrm{Z} \mathrm{b} \mathrm{q}}$ channels. The right column illustrates potential signals for one mass and a large width for all four processes including also ${\mathrm{t} \mathrm{H} \mathrm{t} \mathrm{q}}$ and ${\mathrm{t} \mathrm{Z} \mathrm{t} \mathrm{q}}$. |
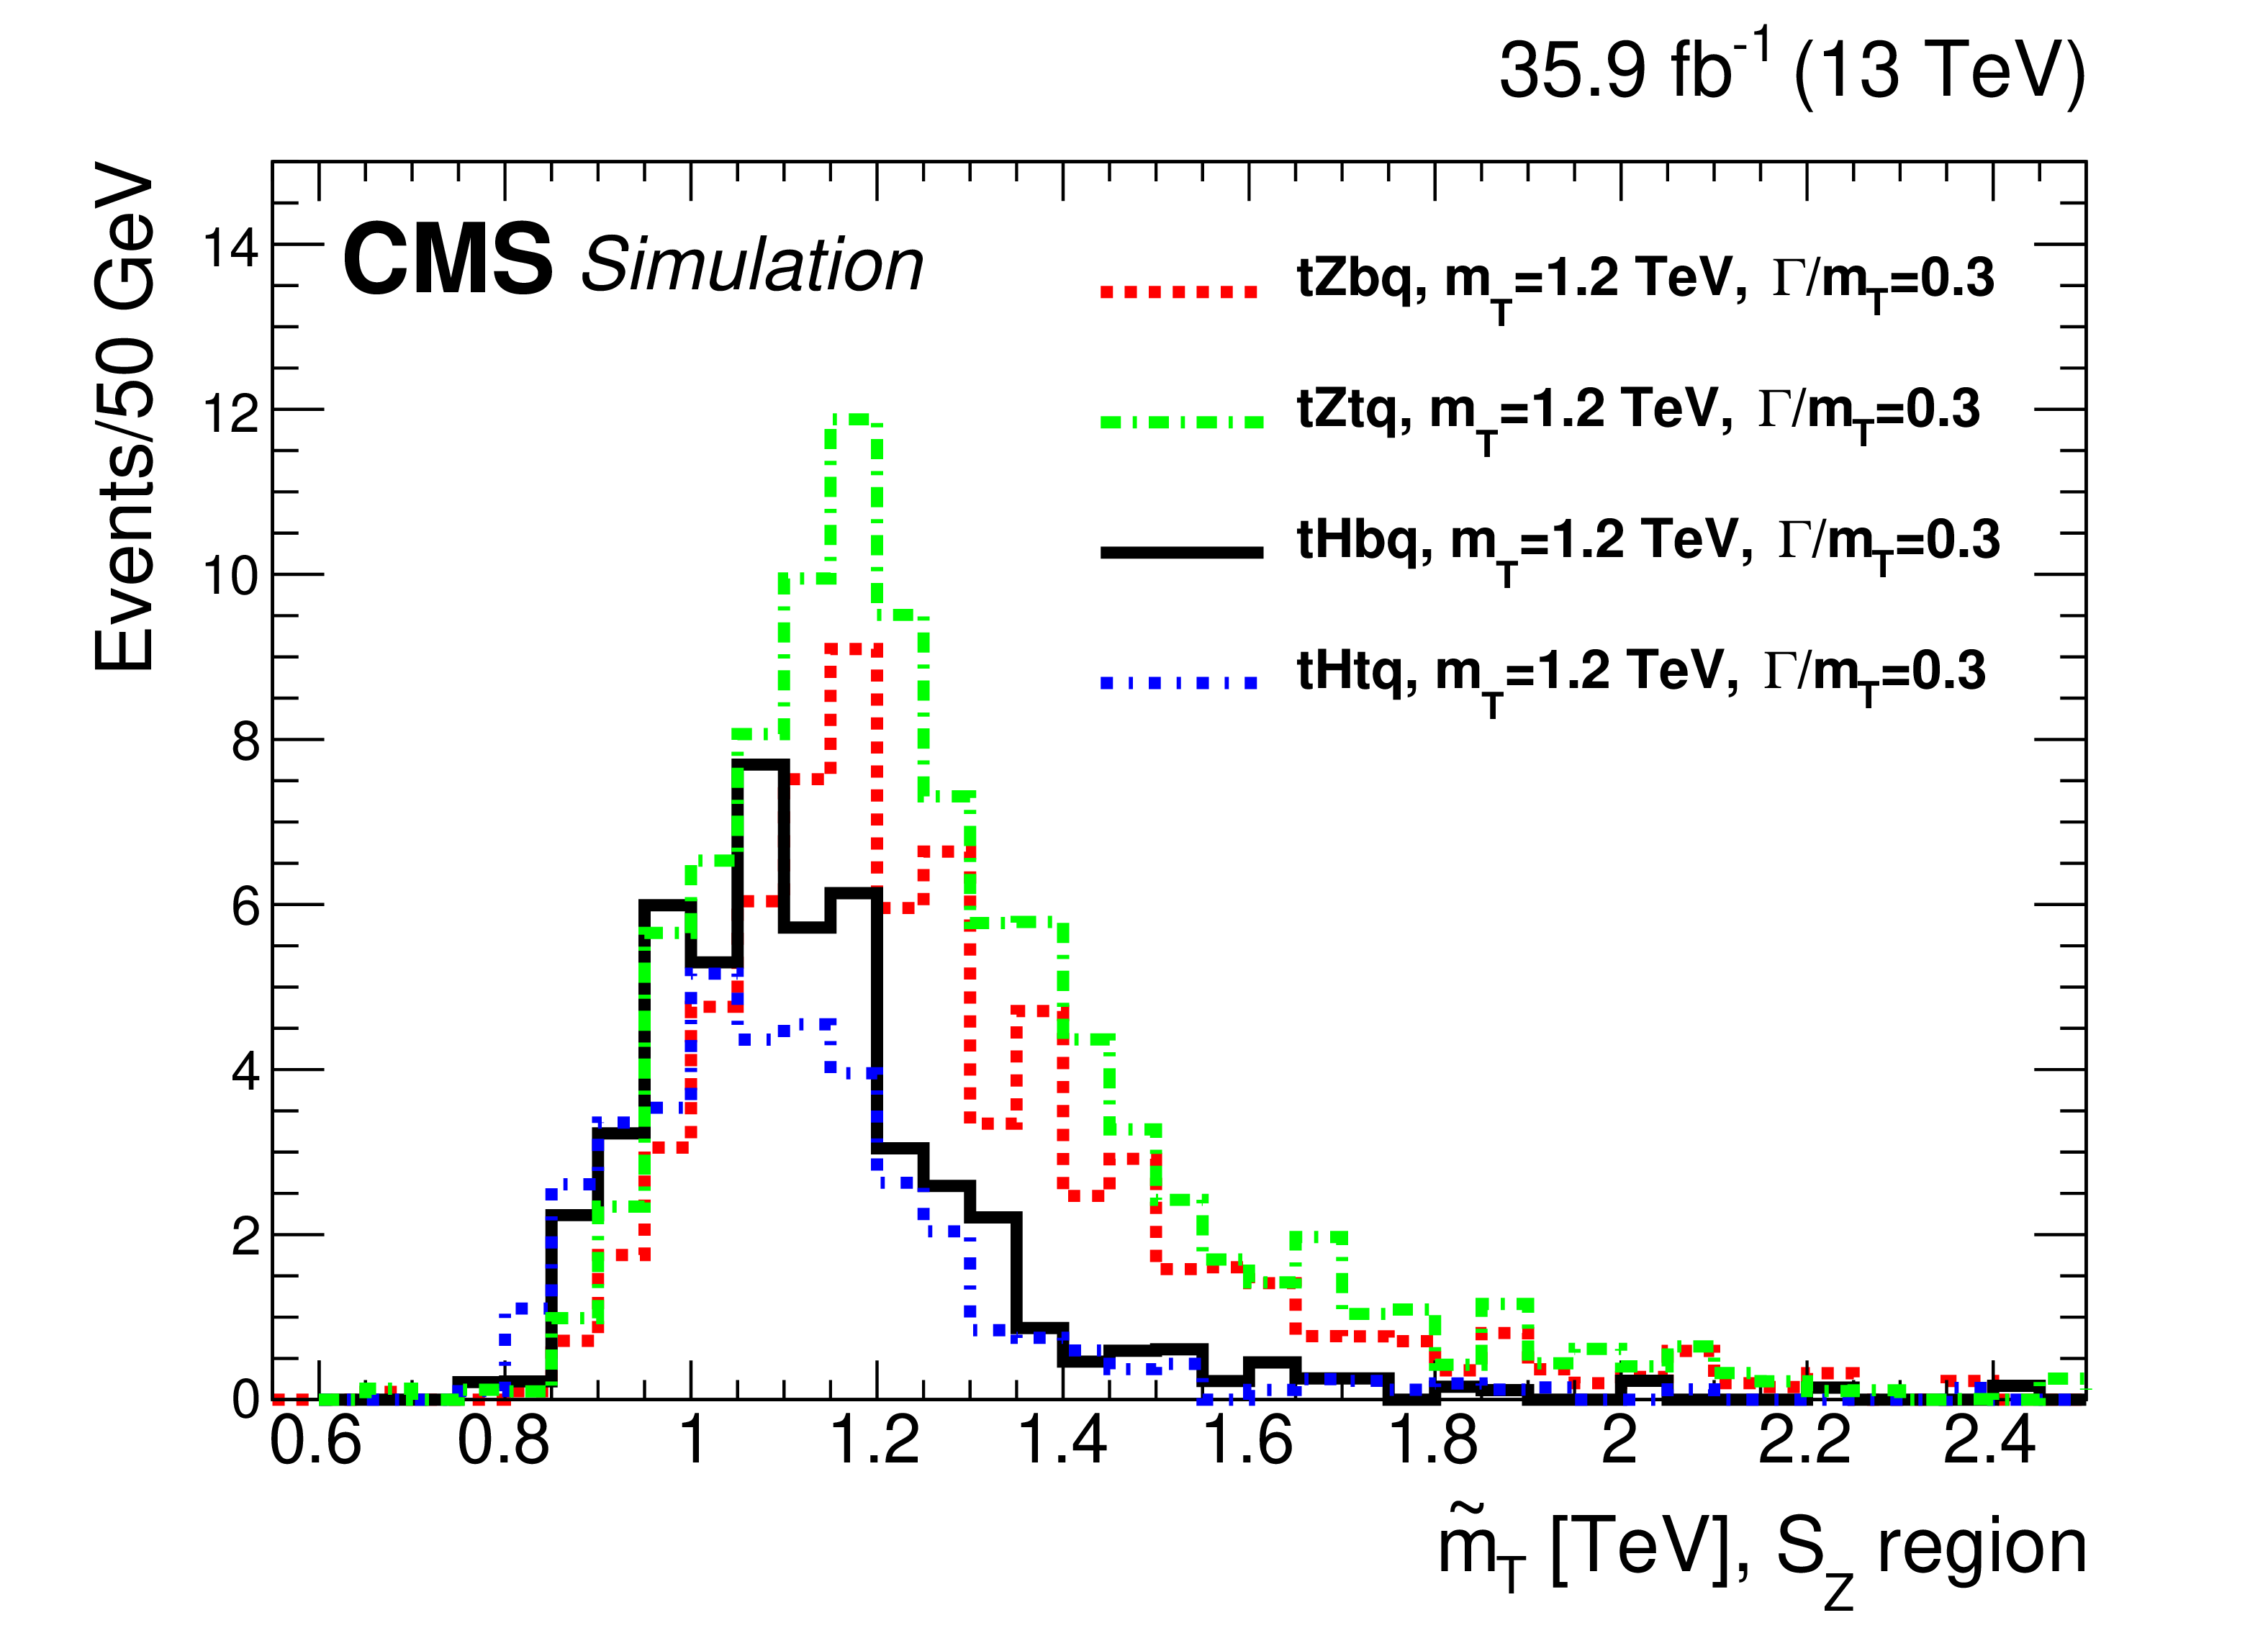
png pdf |
Figure 5-d:
Example ${\tilde{m}_{{\mathrm {T}}}}$ distributions in the signal regions, ${\mathrm {S}_{\mathrm{H}}}$ (upper row), and ${\mathrm {S}_{\mathrm{Z}}} $ (lower row). For presentation purposes, the cross sections for ${\mathrm{t} \mathrm{H} \mathrm{b} \mathrm{q}}$, ${\mathrm{t} \mathrm{Z} \mathrm{b} \mathrm{q}}$, ${\mathrm{t} \mathrm{H} \mathrm{t} \mathrm{q}}$ and ${\mathrm{t} \mathrm{Z} \mathrm{t} \mathrm{q}}$ are set equal to 1 pb for all masses and fractional widths and normalized to the integrated luminosity of the data set. The left column illustrates potential signals with a range of masses and widths for the ${\mathrm{t} \mathrm{H} \mathrm{b} \mathrm{q}}$ and ${\mathrm{t} \mathrm{Z} \mathrm{b} \mathrm{q}}$ channels. The right column illustrates potential signals for one mass and a large width for all four processes including also ${\mathrm{t} \mathrm{H} \mathrm{t} \mathrm{q}}$ and ${\mathrm{t} \mathrm{Z} \mathrm{t} \mathrm{q}}$. |
png pdf |
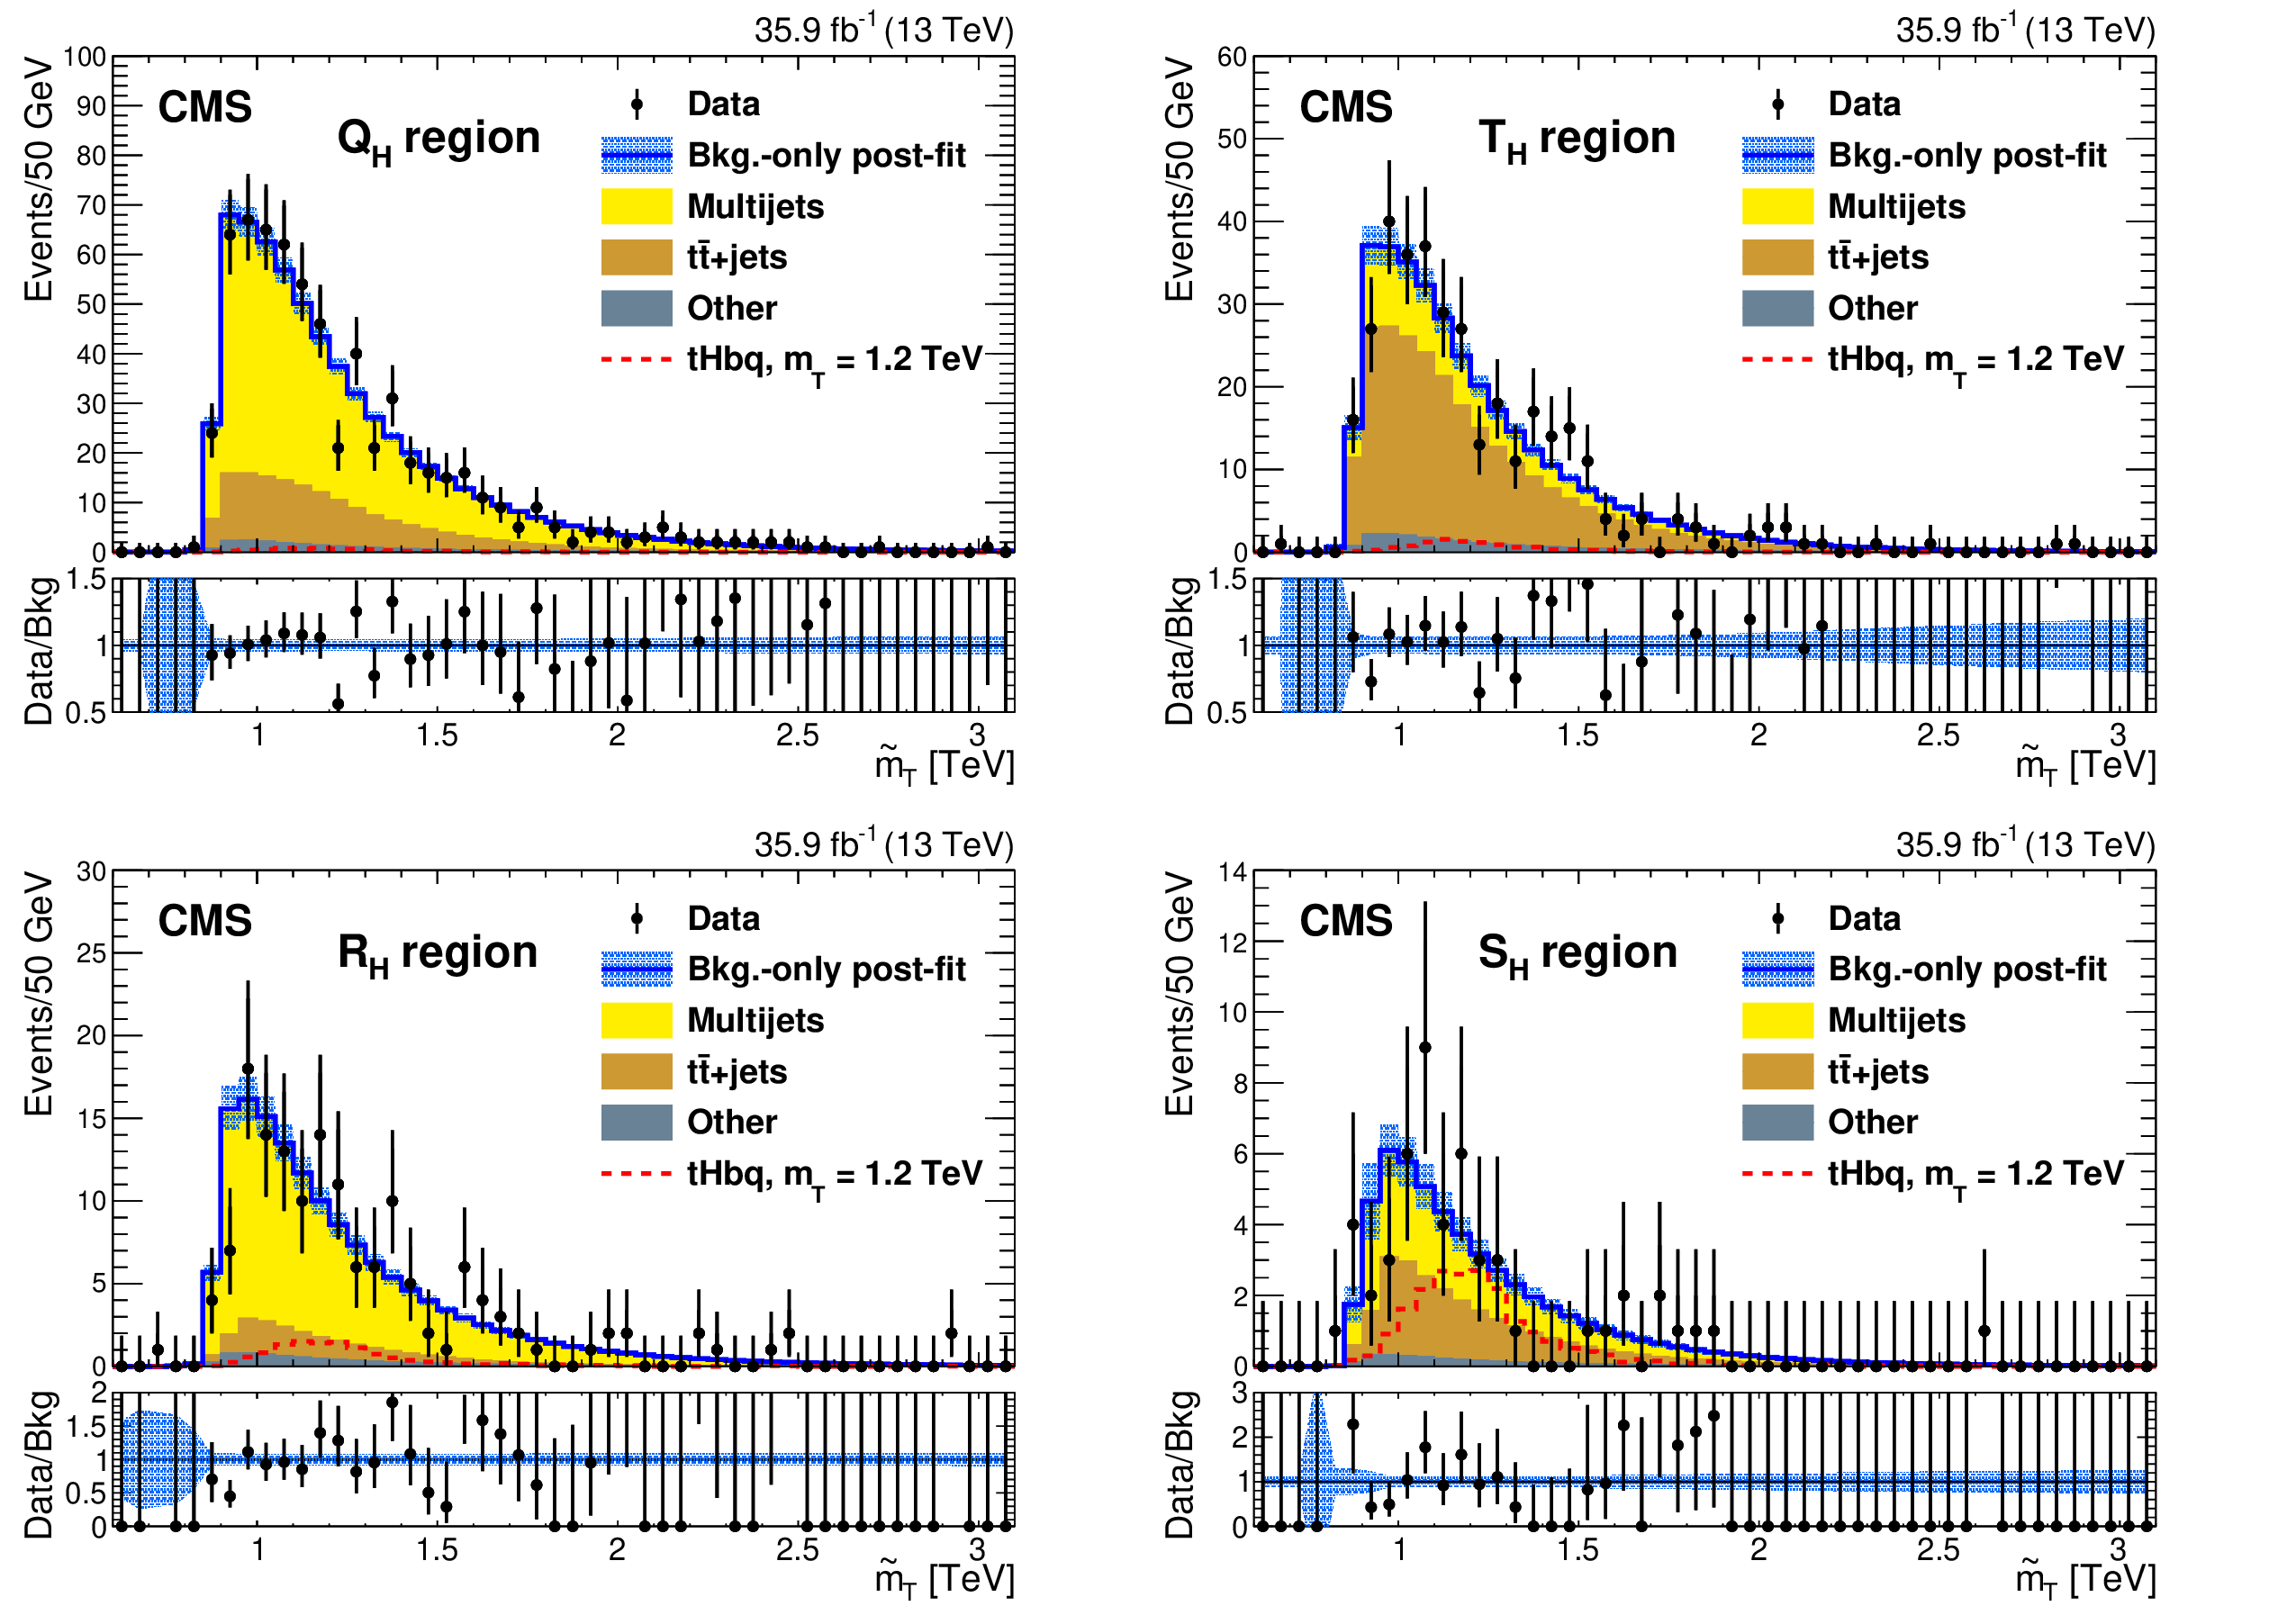
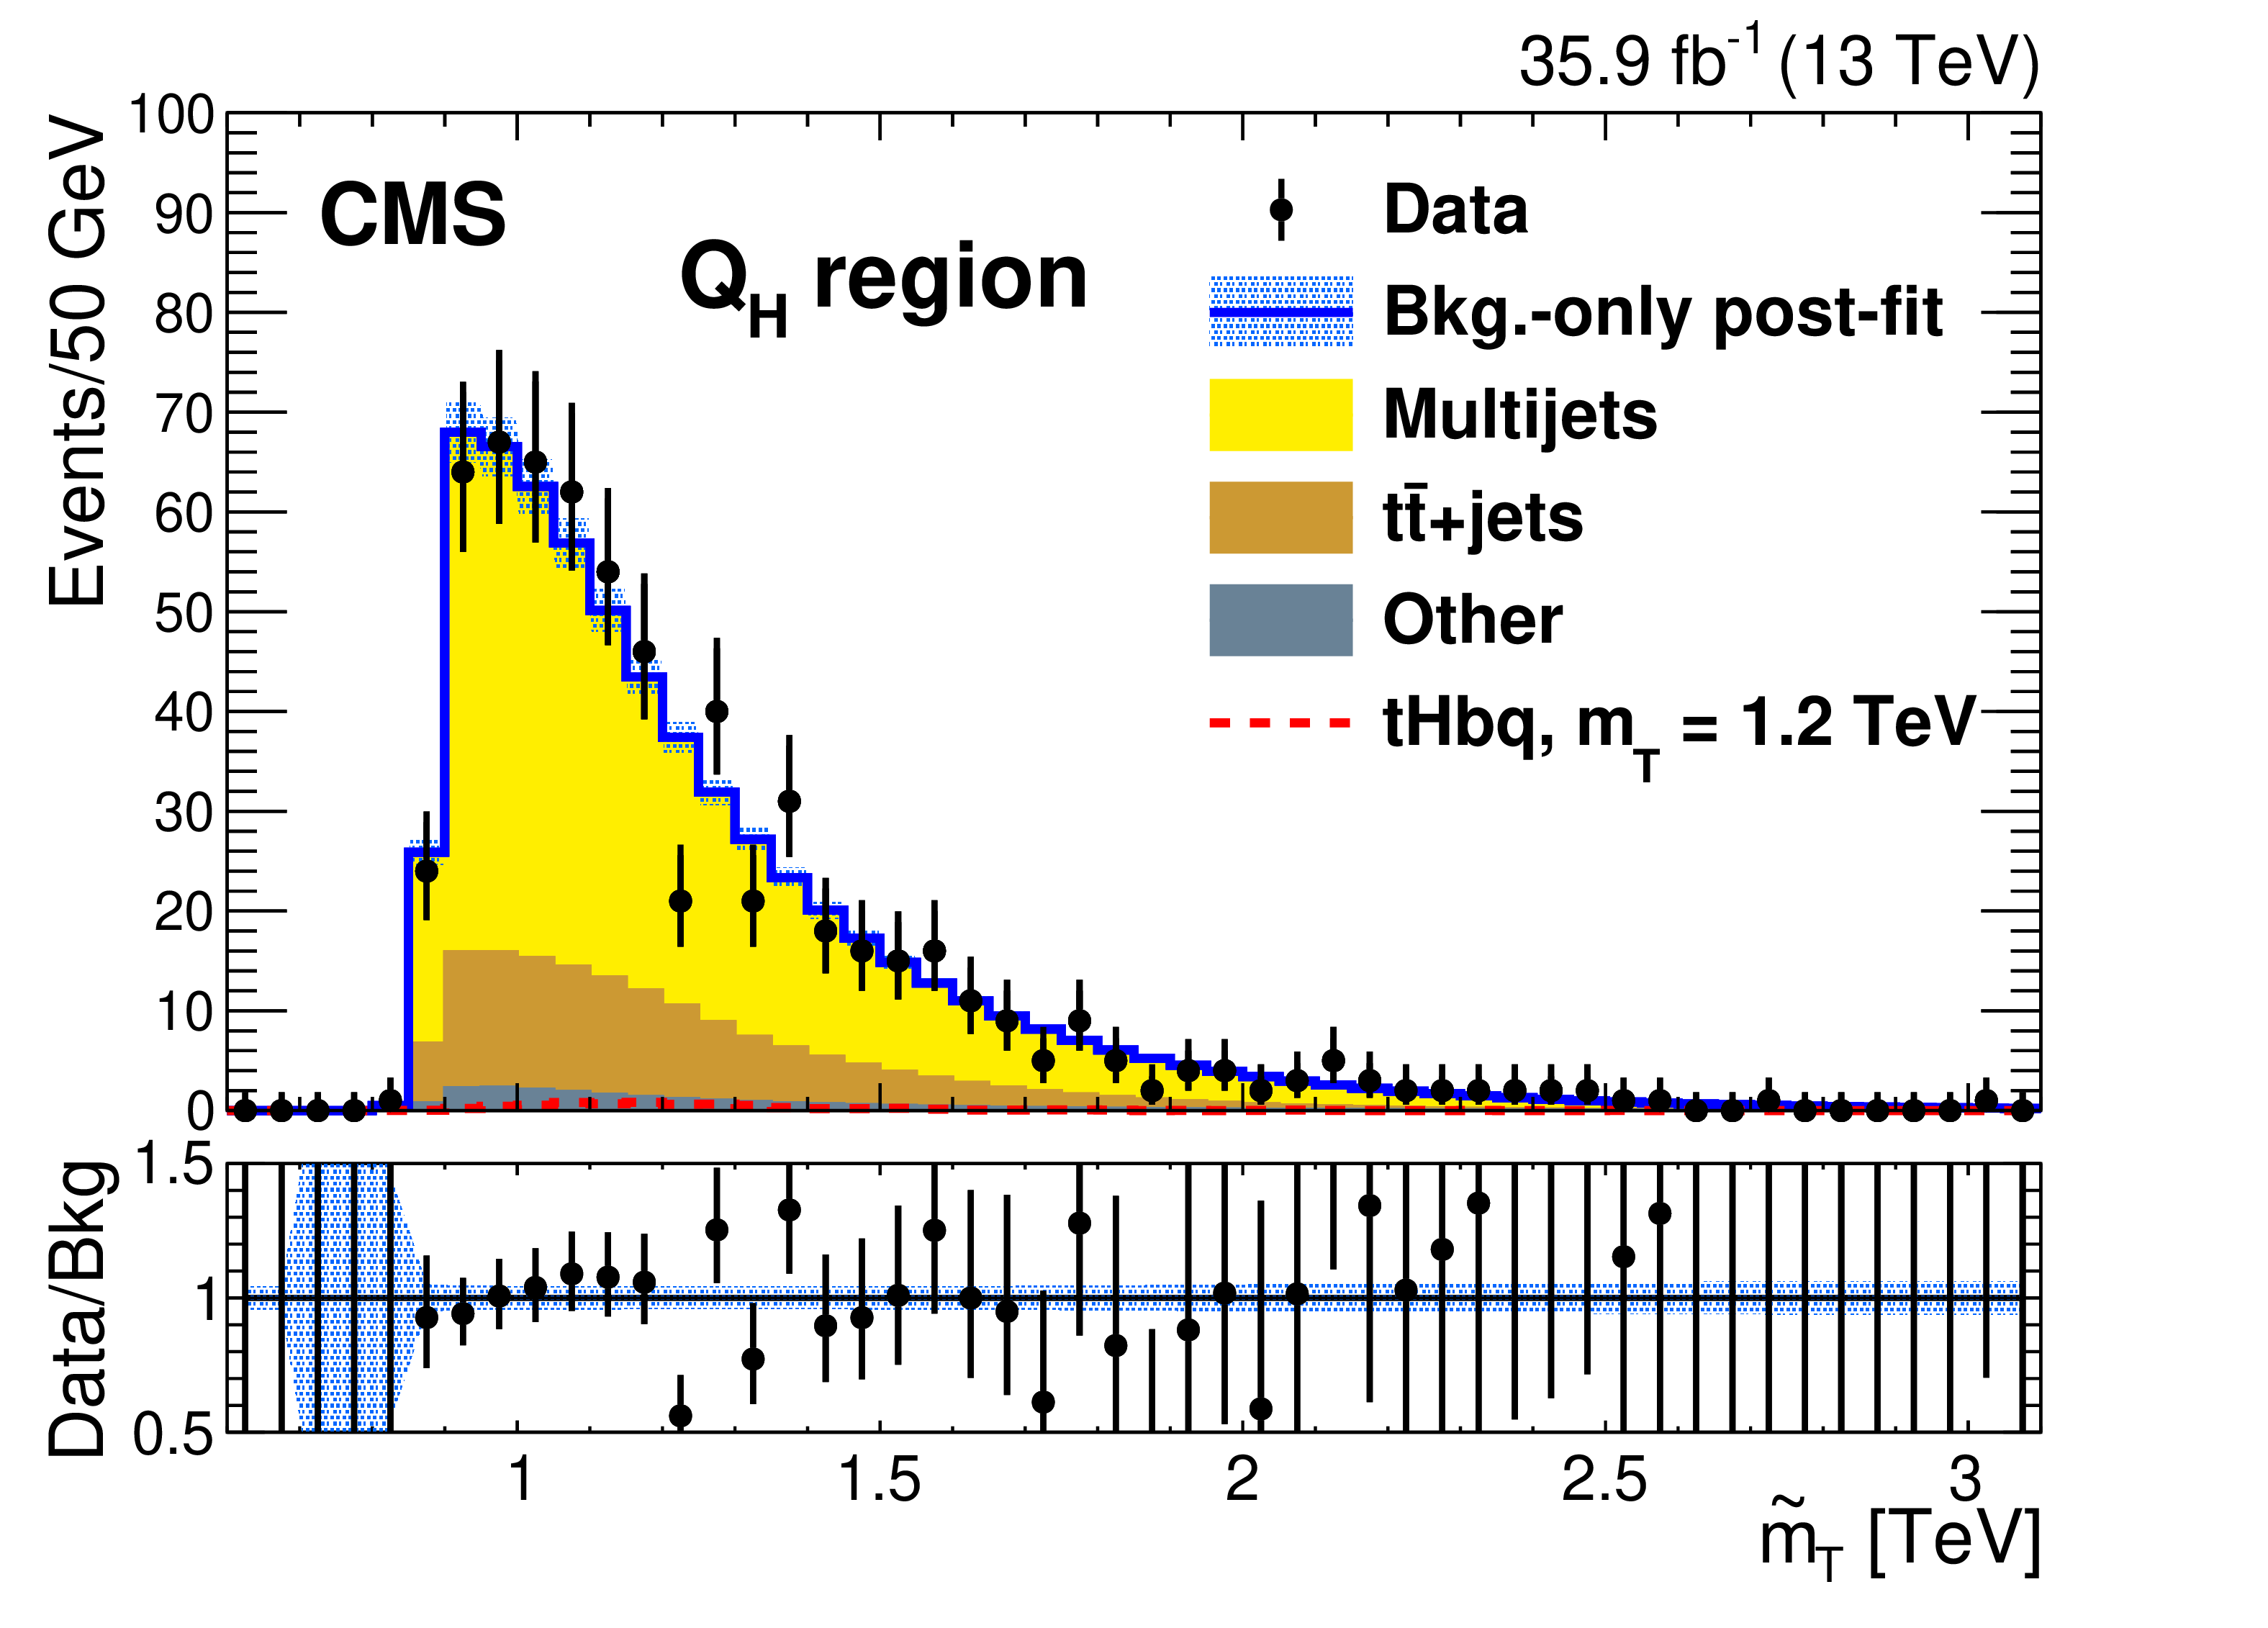
Figure 6:
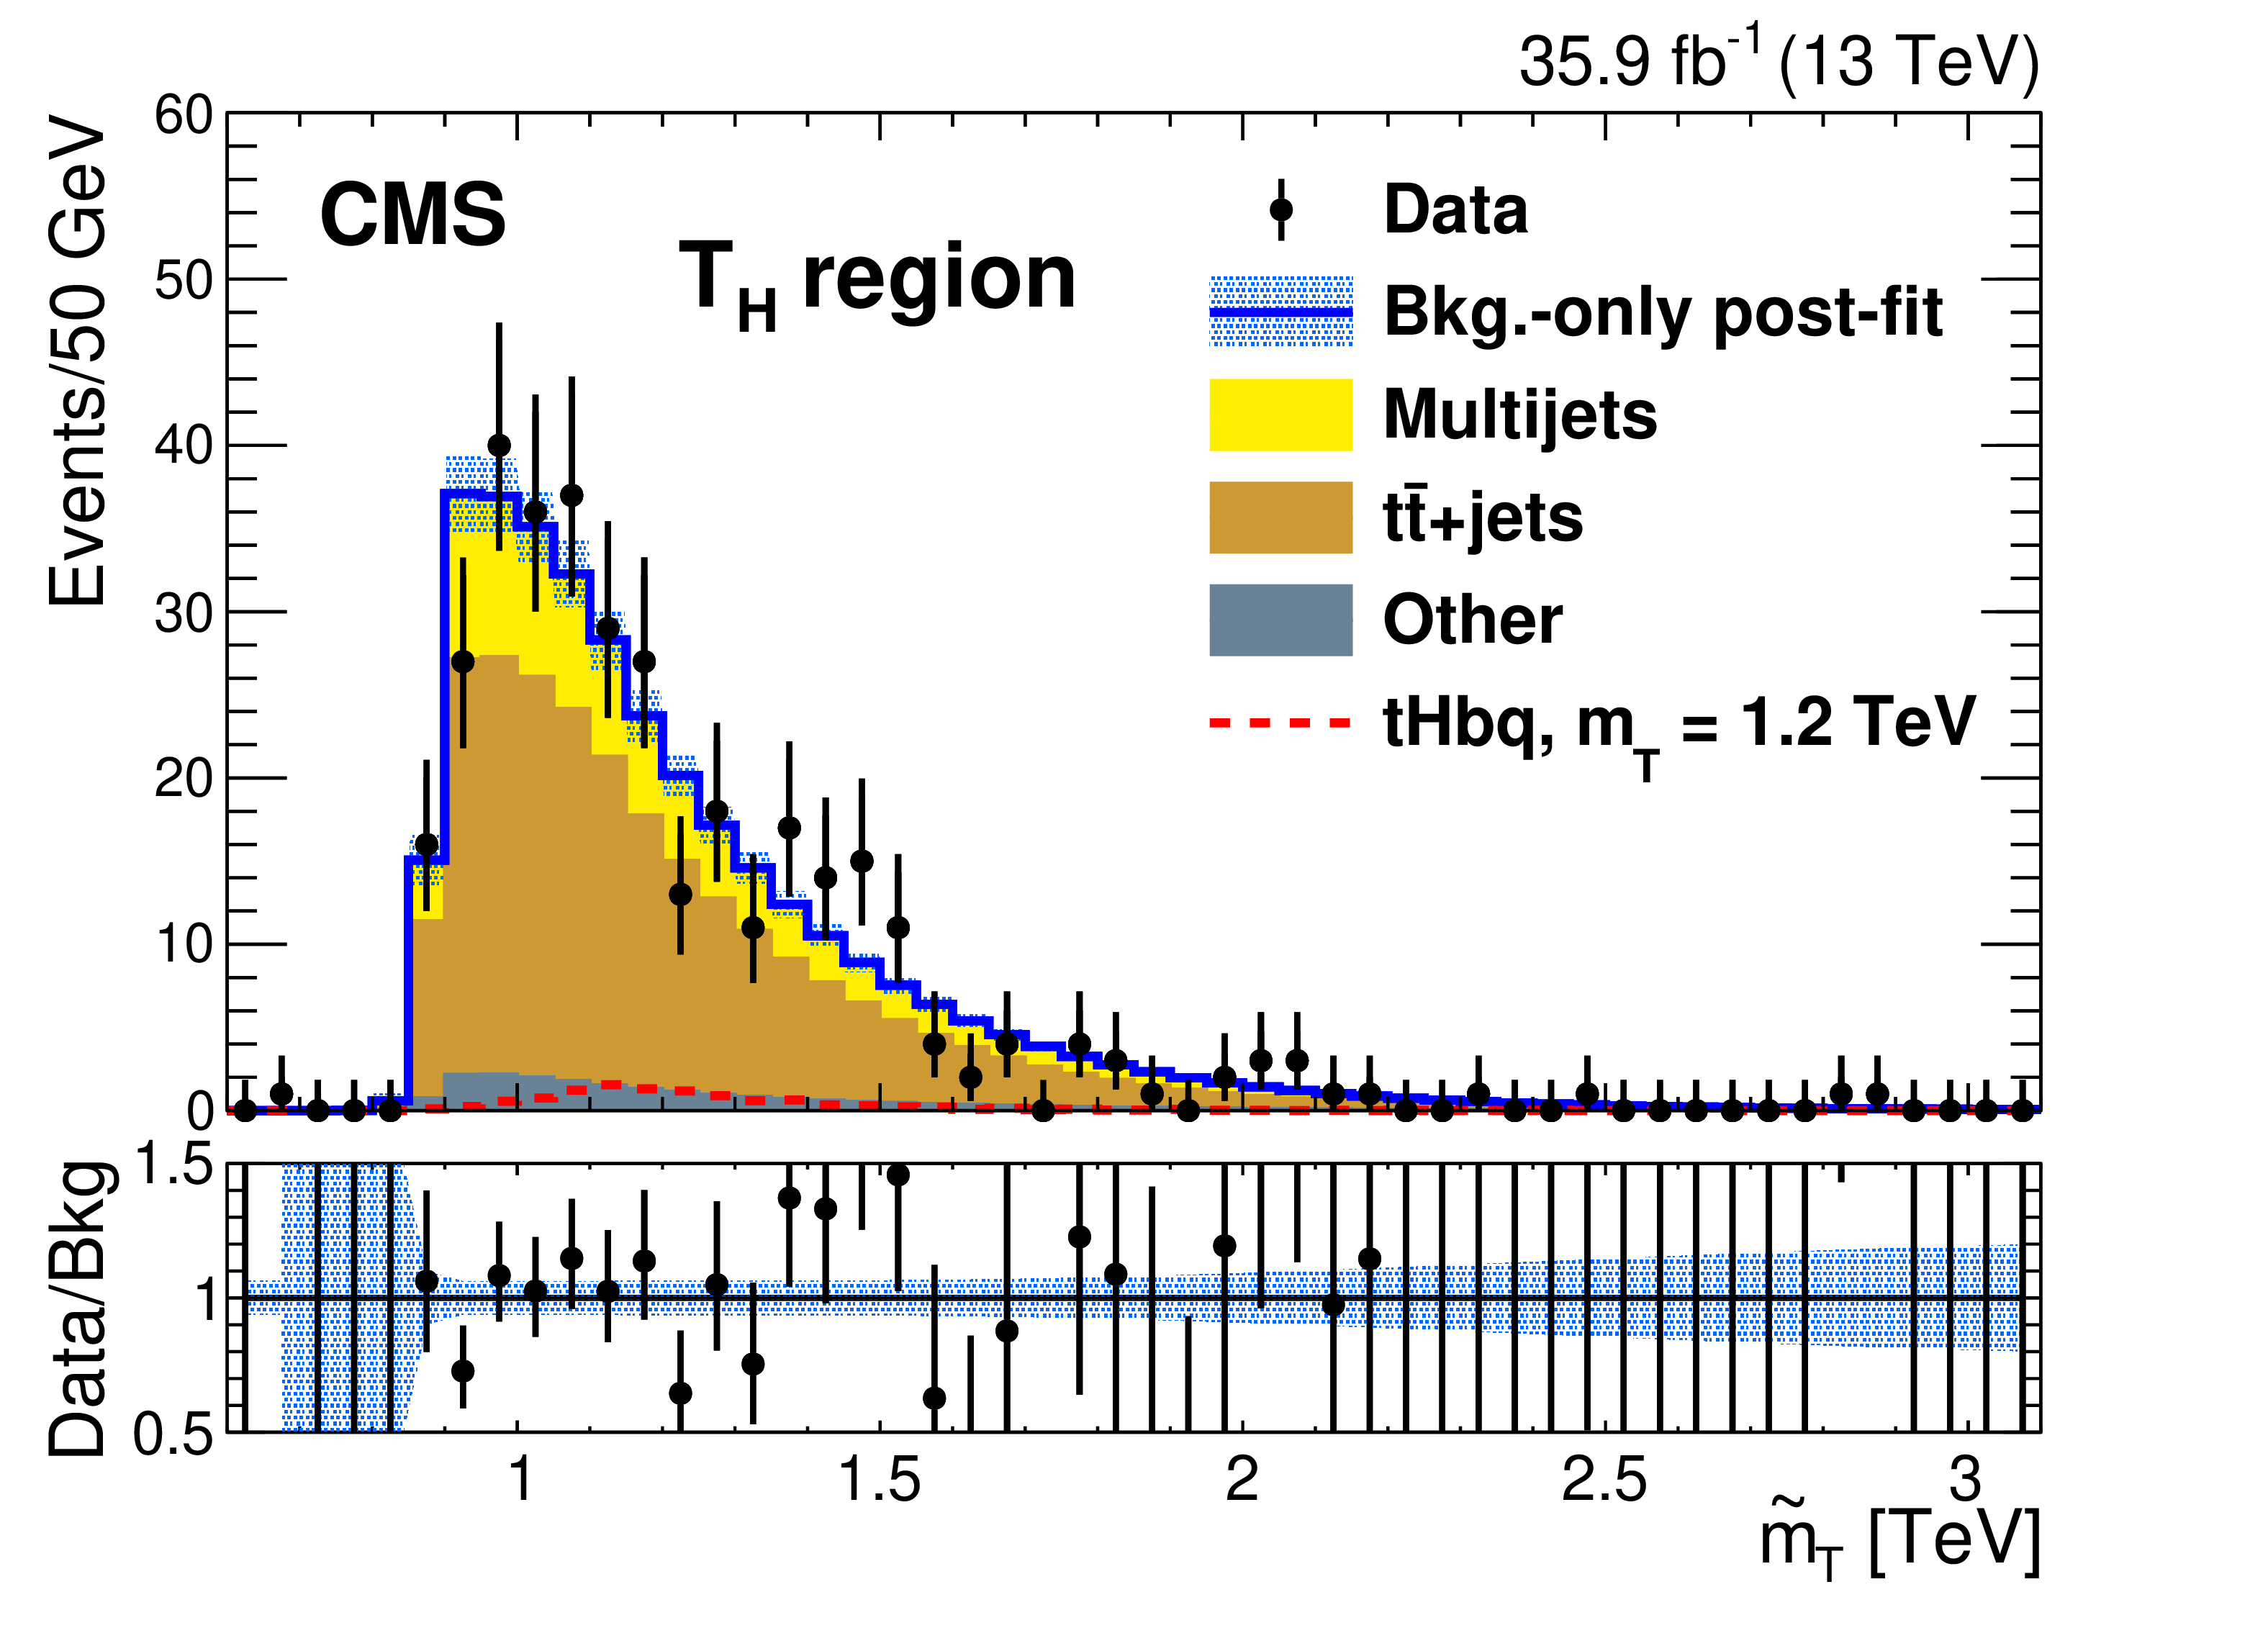
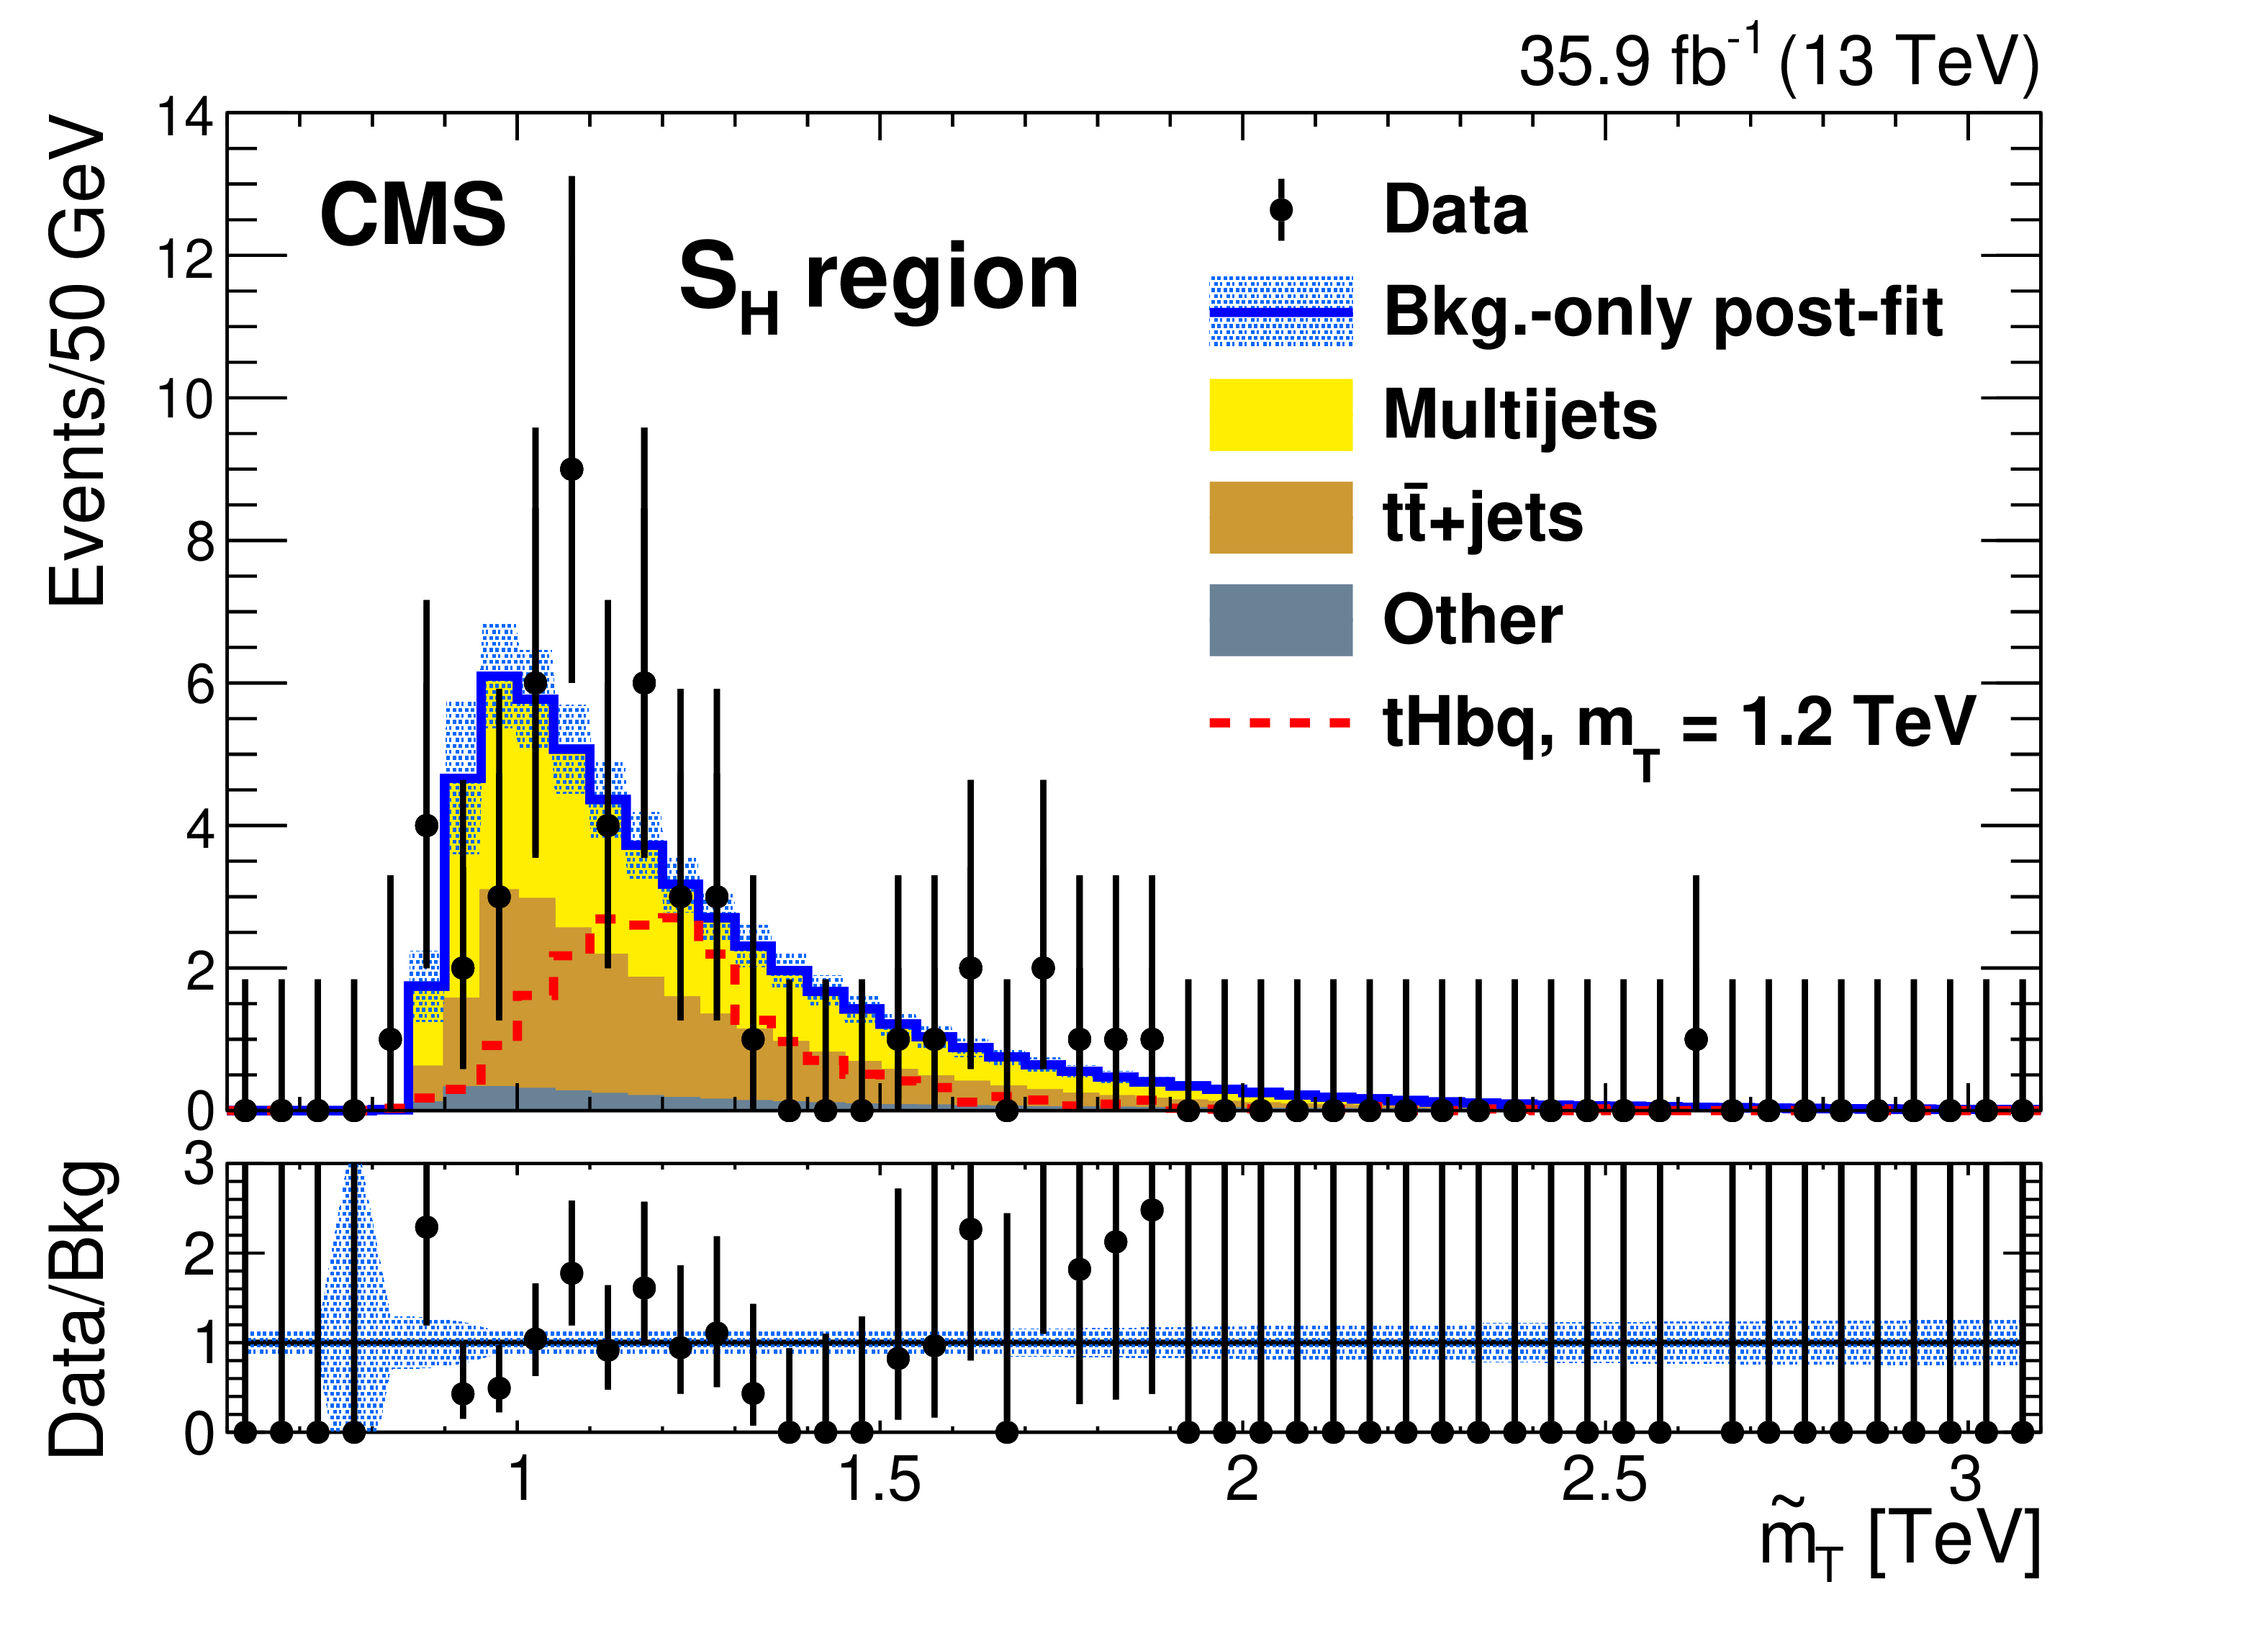
The background-only post-fit distributions in data for the ${\mathrm {Q}_{\mathrm{H}}}$, ${\mathrm {T}_{\mathrm{H}}}$, ${\mathrm {R}_{\mathrm{H}}}$, and ${\mathrm {S}_{\mathrm{H}}}$ regions that are used as signal and control regions primarily for the ${{\mathrm {T}} \to \mathrm{t} \mathrm{H}}$ channel. The upper plots show regions ${\mathrm {Q}_{\mathrm{H}}}$ (left) and ${\mathrm {T}_{\mathrm{H}}}$ (right), while the lower plots show regions ${\mathrm {R}_{\mathrm{H}}}$ (left) and ${\mathrm {S}_{\mathrm{H}}}$ (right). The dashed red histogram is an example ${{\mathrm {T}} \to \mathrm{t} \mathrm{H}}$ signal for the ${\mathrm{t} \mathrm{H} \mathrm{b} \mathrm{q}}$ process with a 1.2 TeV T quark mass and a fractional width of 30% with a cross section from the singlet model of 142 fb. The lower panels show the ratio of observed data to fitted background per bin. The error bars on the data represent 68% CL Poisson intervals. The light blue band in each ratio panel shows the fractional uncertainties in the fitted background. |
png pdf |
Figure 6-a:
The background-only post-fit distributions in data for the ${\mathrm {Q}_{\mathrm{H}}}$, ${\mathrm {T}_{\mathrm{H}}}$, ${\mathrm {R}_{\mathrm{H}}}$, and ${\mathrm {S}_{\mathrm{H}}}$ regions that are used as signal and control regions primarily for the ${{\mathrm {T}} \to \mathrm{t} \mathrm{H}}$ channel. The upper plots show regions ${\mathrm {Q}_{\mathrm{H}}}$ (left) and ${\mathrm {T}_{\mathrm{H}}}$ (right), while the lower plots show regions ${\mathrm {R}_{\mathrm{H}}}$ (left) and ${\mathrm {S}_{\mathrm{H}}}$ (right). The dashed red histogram is an example ${{\mathrm {T}} \to \mathrm{t} \mathrm{H}}$ signal for the ${\mathrm{t} \mathrm{H} \mathrm{b} \mathrm{q}}$ process with a 1.2 TeV T quark mass and a fractional width of 30% with a cross section from the singlet model of 142 fb. The lower panels show the ratio of observed data to fitted background per bin. The error bars on the data represent 68% CL Poisson intervals. The light blue band in each ratio panel shows the fractional uncertainties in the fitted background. |
png pdf |
Figure 6-b:
The background-only post-fit distributions in data for the ${\mathrm {Q}_{\mathrm{H}}}$, ${\mathrm {T}_{\mathrm{H}}}$, ${\mathrm {R}_{\mathrm{H}}}$, and ${\mathrm {S}_{\mathrm{H}}}$ regions that are used as signal and control regions primarily for the ${{\mathrm {T}} \to \mathrm{t} \mathrm{H}}$ channel. The upper plots show regions ${\mathrm {Q}_{\mathrm{H}}}$ (left) and ${\mathrm {T}_{\mathrm{H}}}$ (right), while the lower plots show regions ${\mathrm {R}_{\mathrm{H}}}$ (left) and ${\mathrm {S}_{\mathrm{H}}}$ (right). The dashed red histogram is an example ${{\mathrm {T}} \to \mathrm{t} \mathrm{H}}$ signal for the ${\mathrm{t} \mathrm{H} \mathrm{b} \mathrm{q}}$ process with a 1.2 TeV T quark mass and a fractional width of 30% with a cross section from the singlet model of 142 fb. The lower panels show the ratio of observed data to fitted background per bin. The error bars on the data represent 68% CL Poisson intervals. The light blue band in each ratio panel shows the fractional uncertainties in the fitted background. |
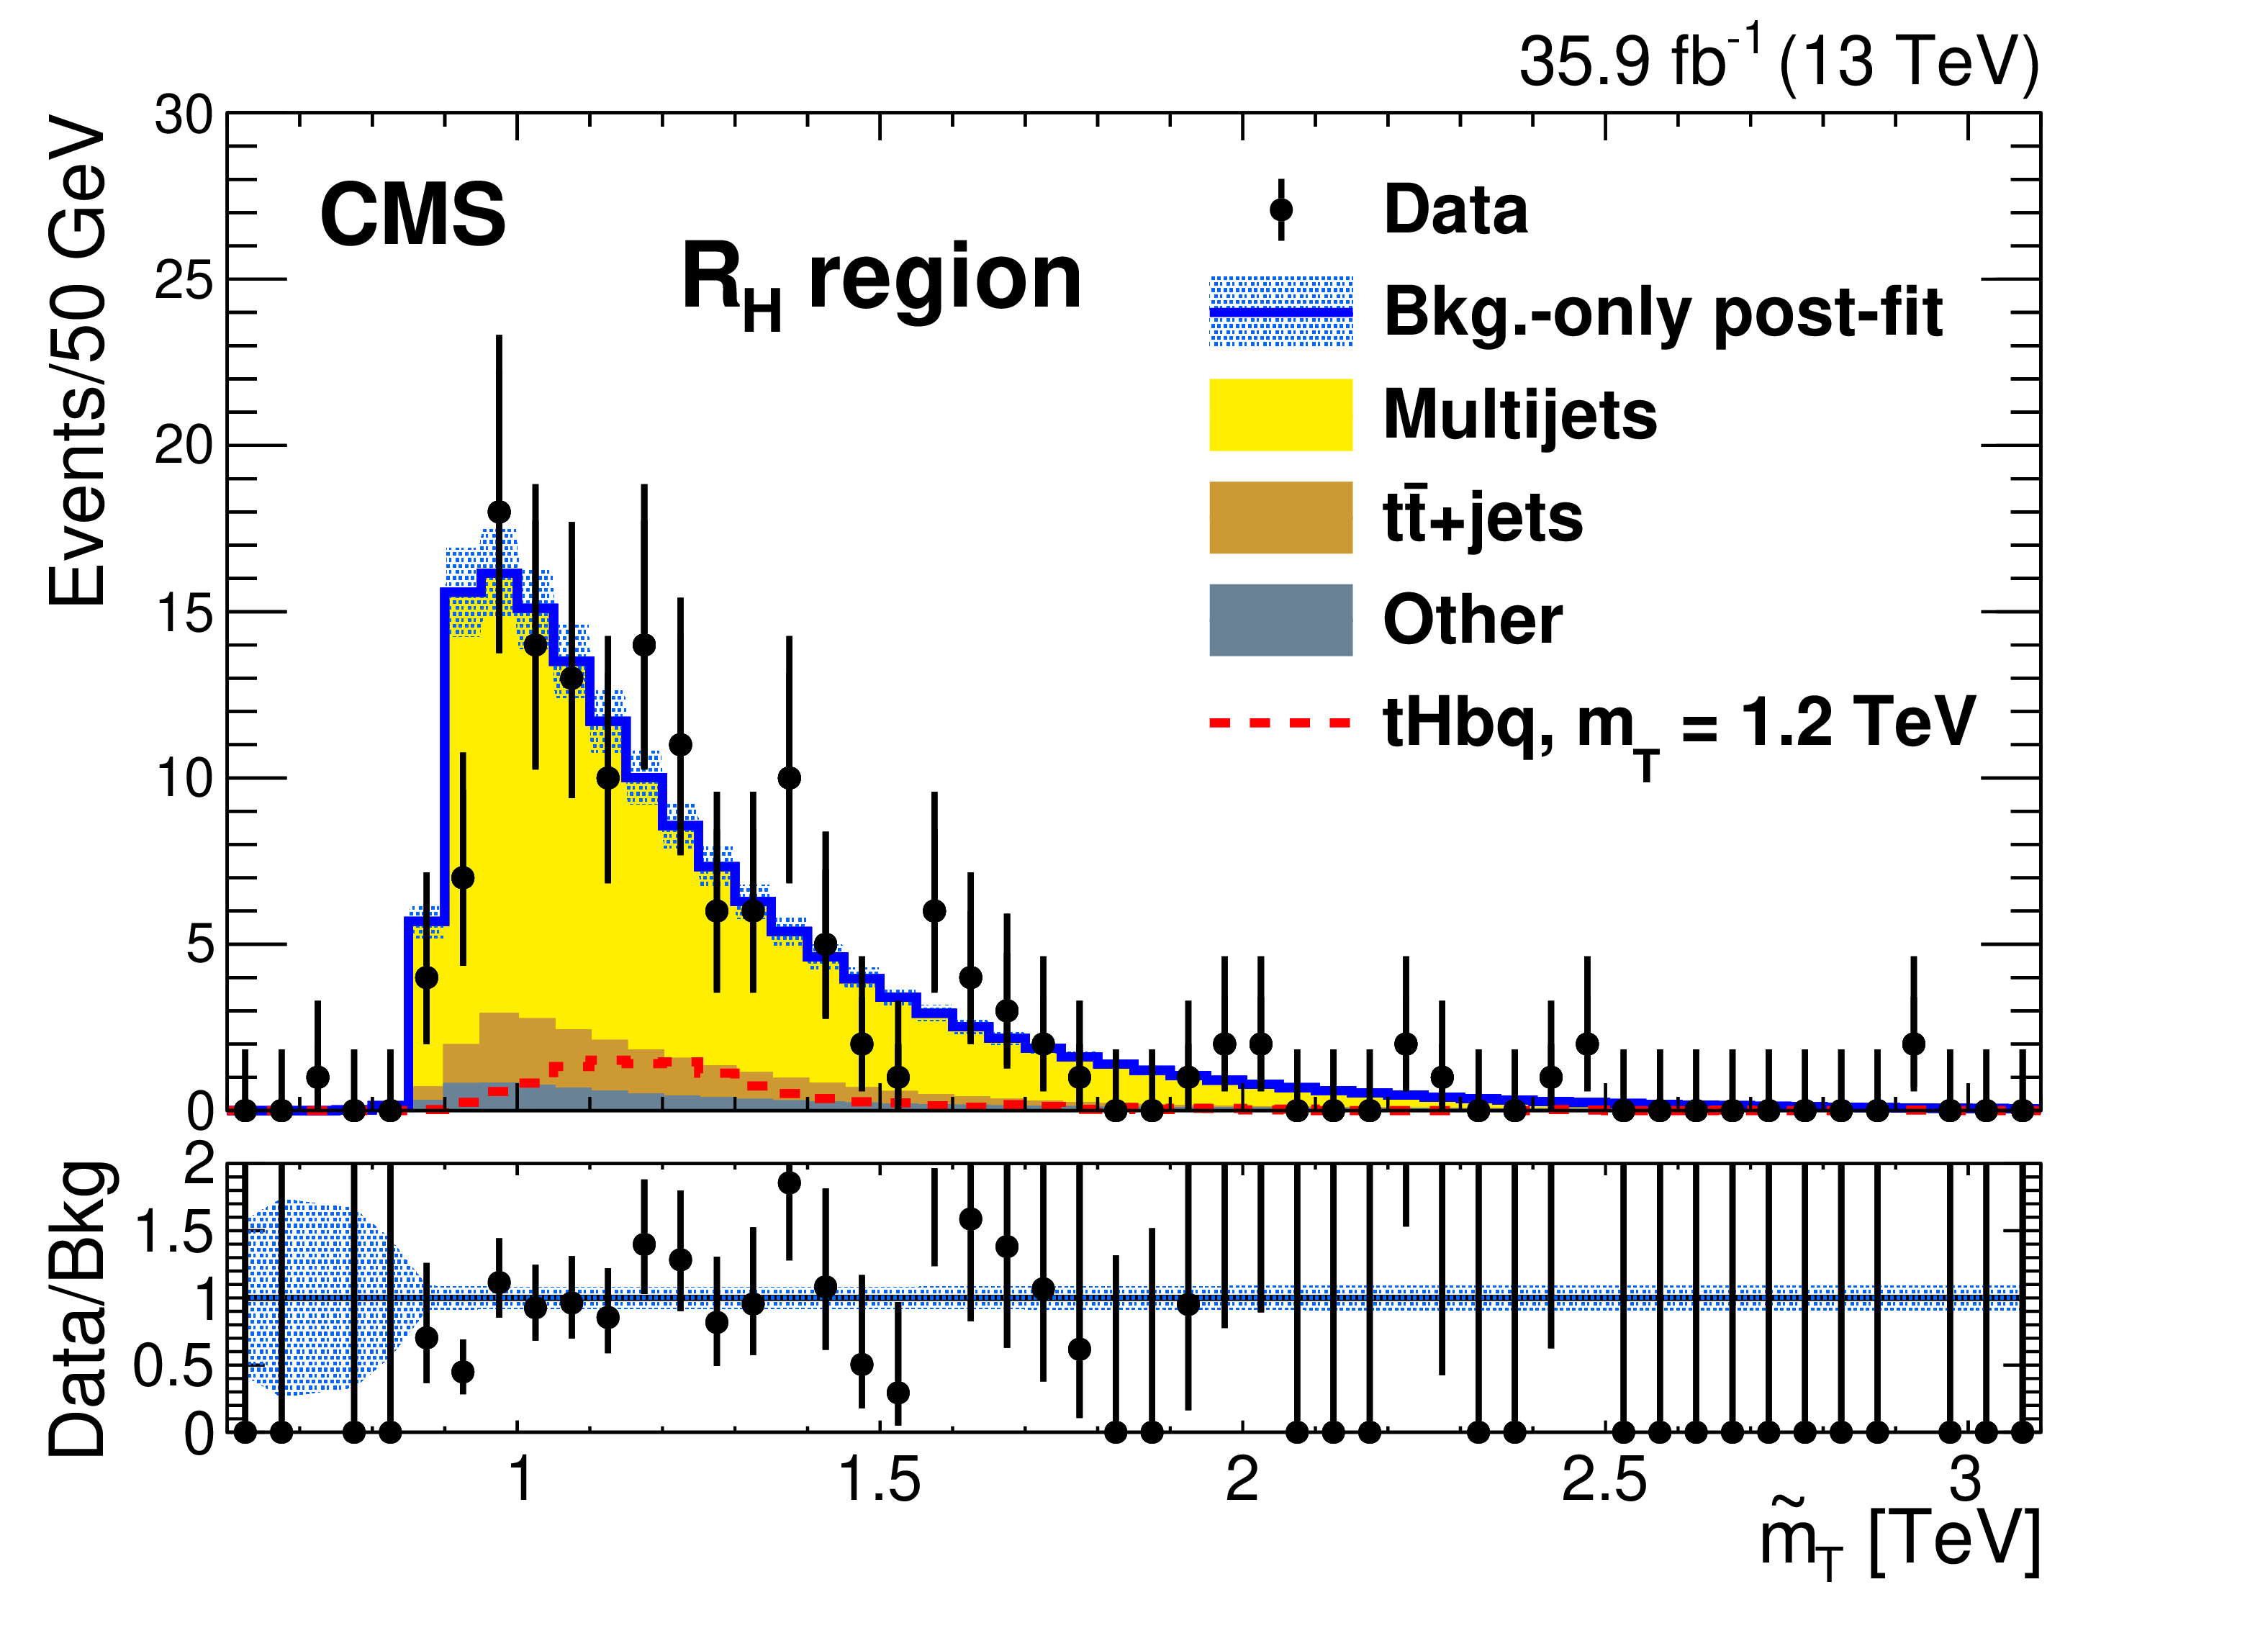
png pdf |
Figure 6-c:
The background-only post-fit distributions in data for the ${\mathrm {Q}_{\mathrm{H}}}$, ${\mathrm {T}_{\mathrm{H}}}$, ${\mathrm {R}_{\mathrm{H}}}$, and ${\mathrm {S}_{\mathrm{H}}}$ regions that are used as signal and control regions primarily for the ${{\mathrm {T}} \to \mathrm{t} \mathrm{H}}$ channel. The upper plots show regions ${\mathrm {Q}_{\mathrm{H}}}$ (left) and ${\mathrm {T}_{\mathrm{H}}}$ (right), while the lower plots show regions ${\mathrm {R}_{\mathrm{H}}}$ (left) and ${\mathrm {S}_{\mathrm{H}}}$ (right). The dashed red histogram is an example ${{\mathrm {T}} \to \mathrm{t} \mathrm{H}}$ signal for the ${\mathrm{t} \mathrm{H} \mathrm{b} \mathrm{q}}$ process with a 1.2 TeV T quark mass and a fractional width of 30% with a cross section from the singlet model of 142 fb. The lower panels show the ratio of observed data to fitted background per bin. The error bars on the data represent 68% CL Poisson intervals. The light blue band in each ratio panel shows the fractional uncertainties in the fitted background. |
png pdf |
Figure 6-d:
The background-only post-fit distributions in data for the ${\mathrm {Q}_{\mathrm{H}}}$, ${\mathrm {T}_{\mathrm{H}}}$, ${\mathrm {R}_{\mathrm{H}}}$, and ${\mathrm {S}_{\mathrm{H}}}$ regions that are used as signal and control regions primarily for the ${{\mathrm {T}} \to \mathrm{t} \mathrm{H}}$ channel. The upper plots show regions ${\mathrm {Q}_{\mathrm{H}}}$ (left) and ${\mathrm {T}_{\mathrm{H}}}$ (right), while the lower plots show regions ${\mathrm {R}_{\mathrm{H}}}$ (left) and ${\mathrm {S}_{\mathrm{H}}}$ (right). The dashed red histogram is an example ${{\mathrm {T}} \to \mathrm{t} \mathrm{H}}$ signal for the ${\mathrm{t} \mathrm{H} \mathrm{b} \mathrm{q}}$ process with a 1.2 TeV T quark mass and a fractional width of 30% with a cross section from the singlet model of 142 fb. The lower panels show the ratio of observed data to fitted background per bin. The error bars on the data represent 68% CL Poisson intervals. The light blue band in each ratio panel shows the fractional uncertainties in the fitted background. |

png pdf |
Figure 7:
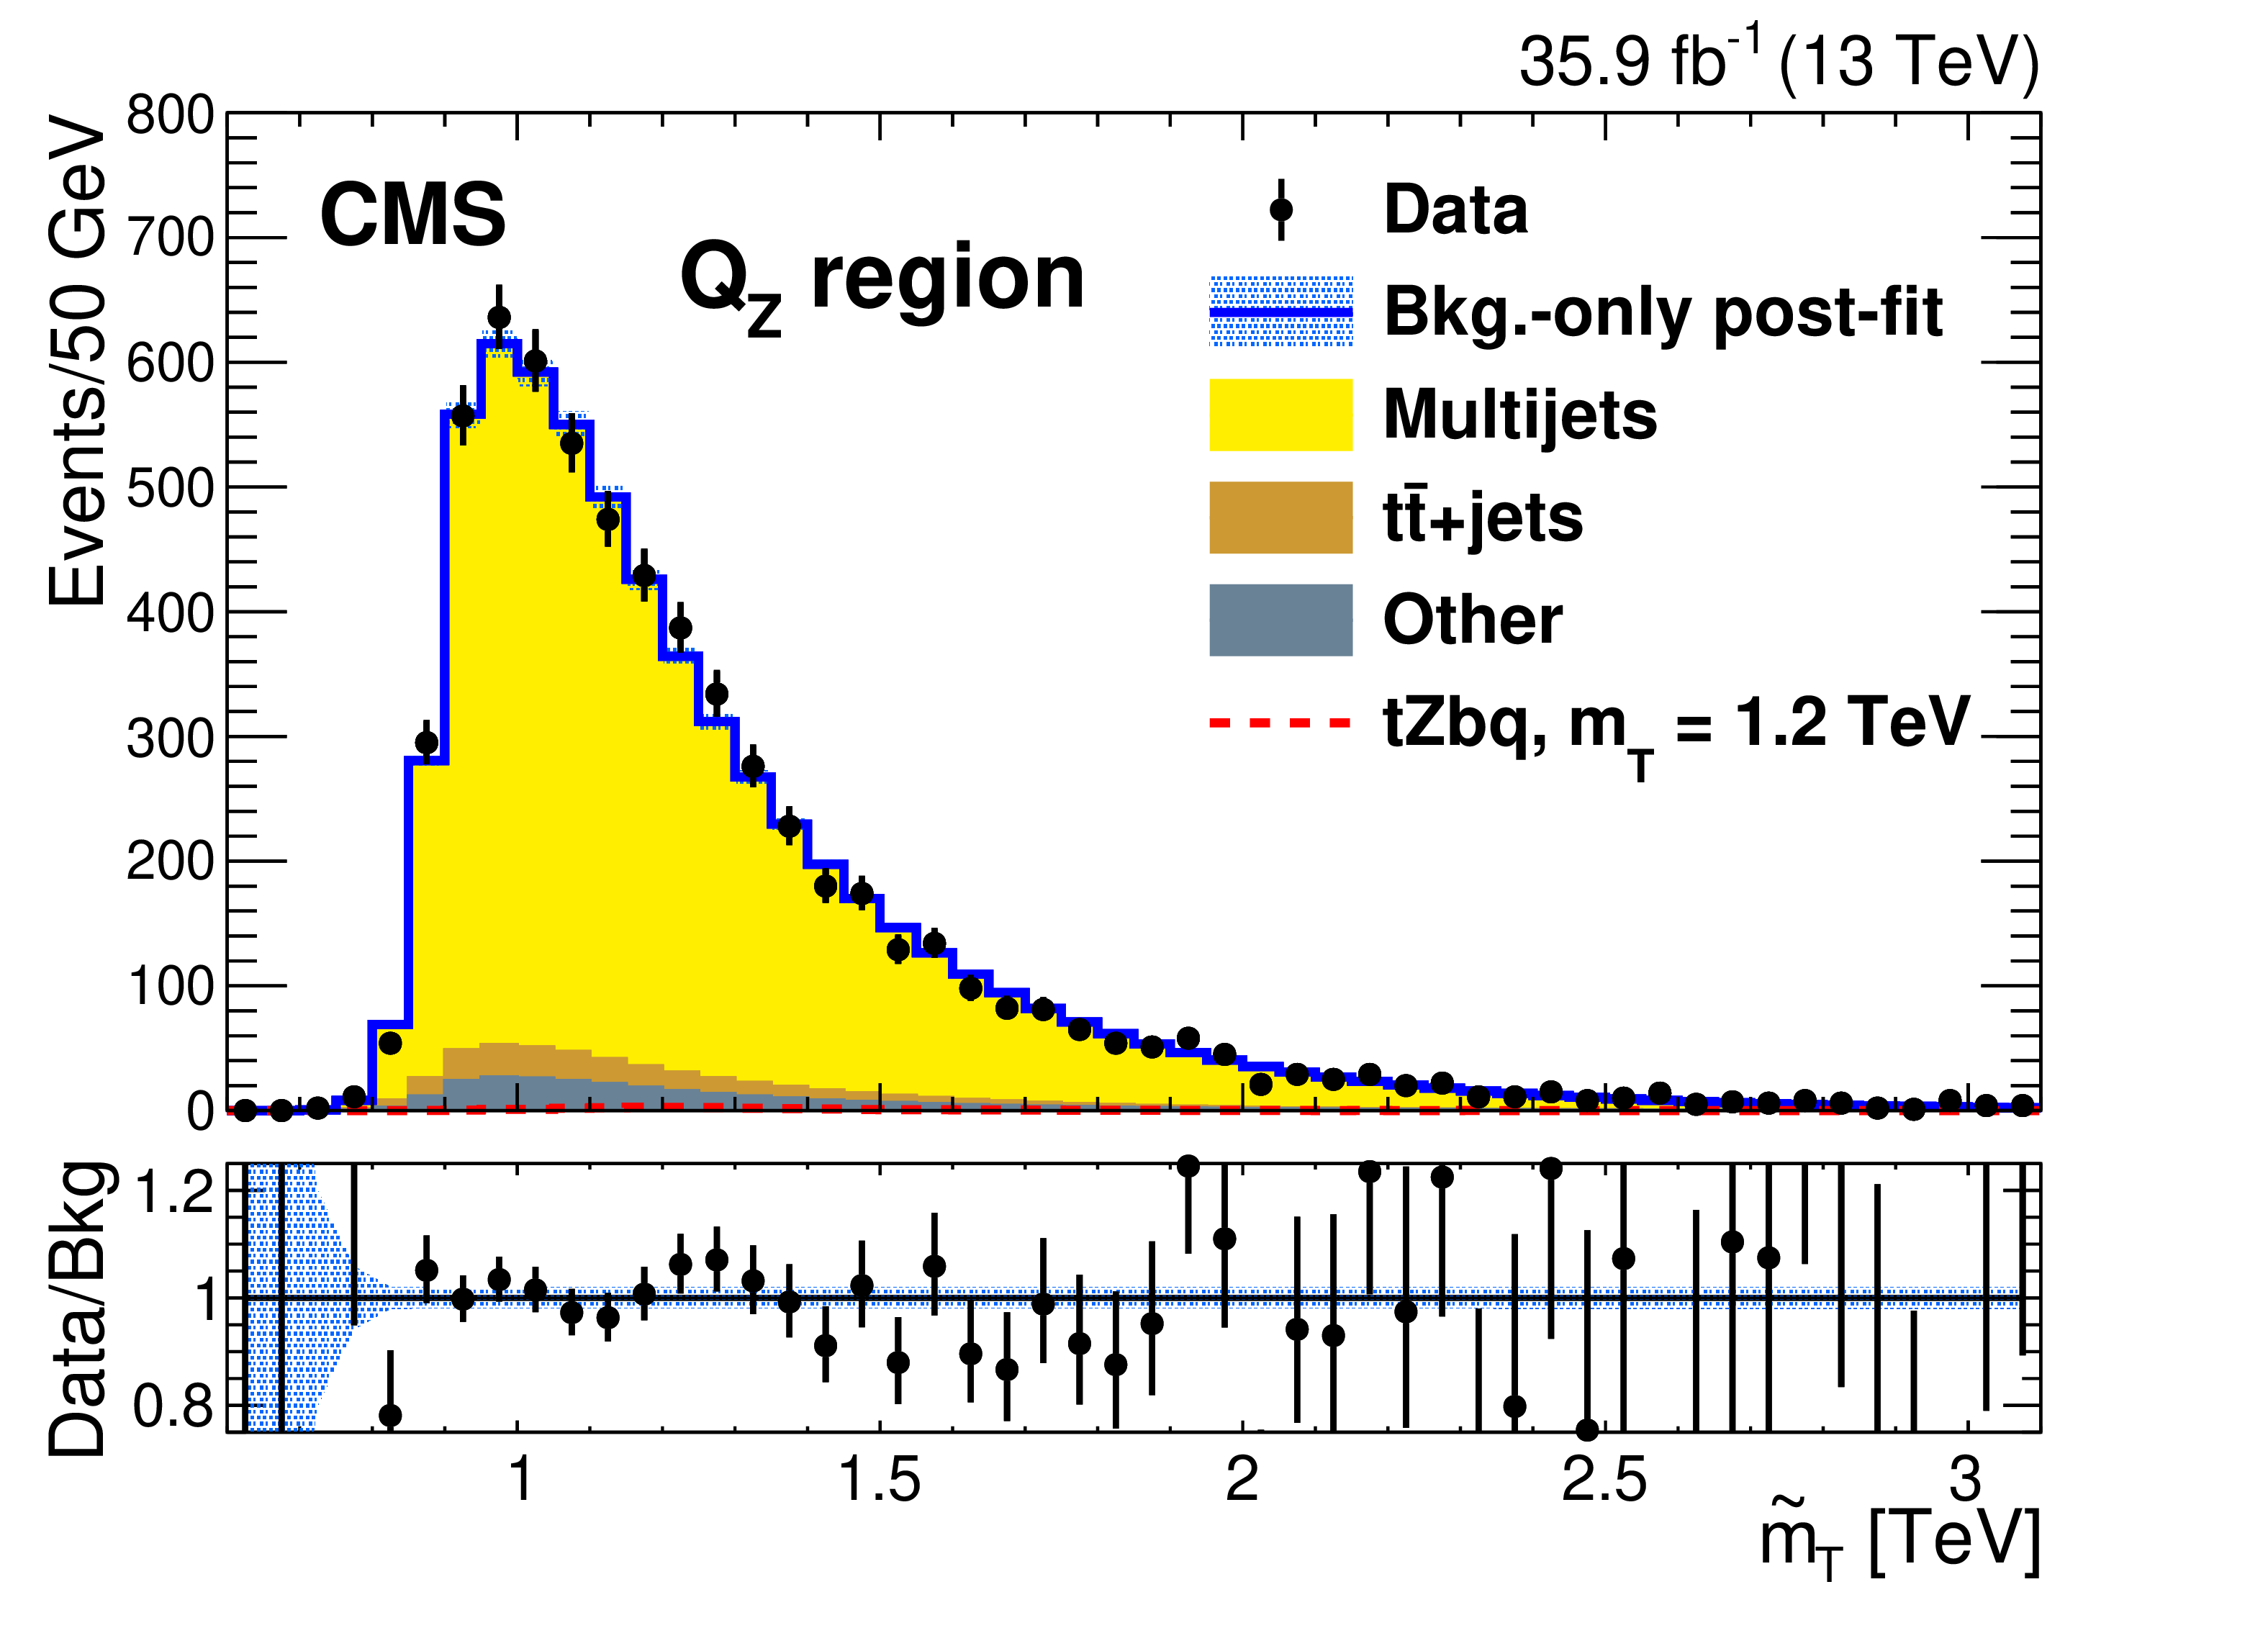
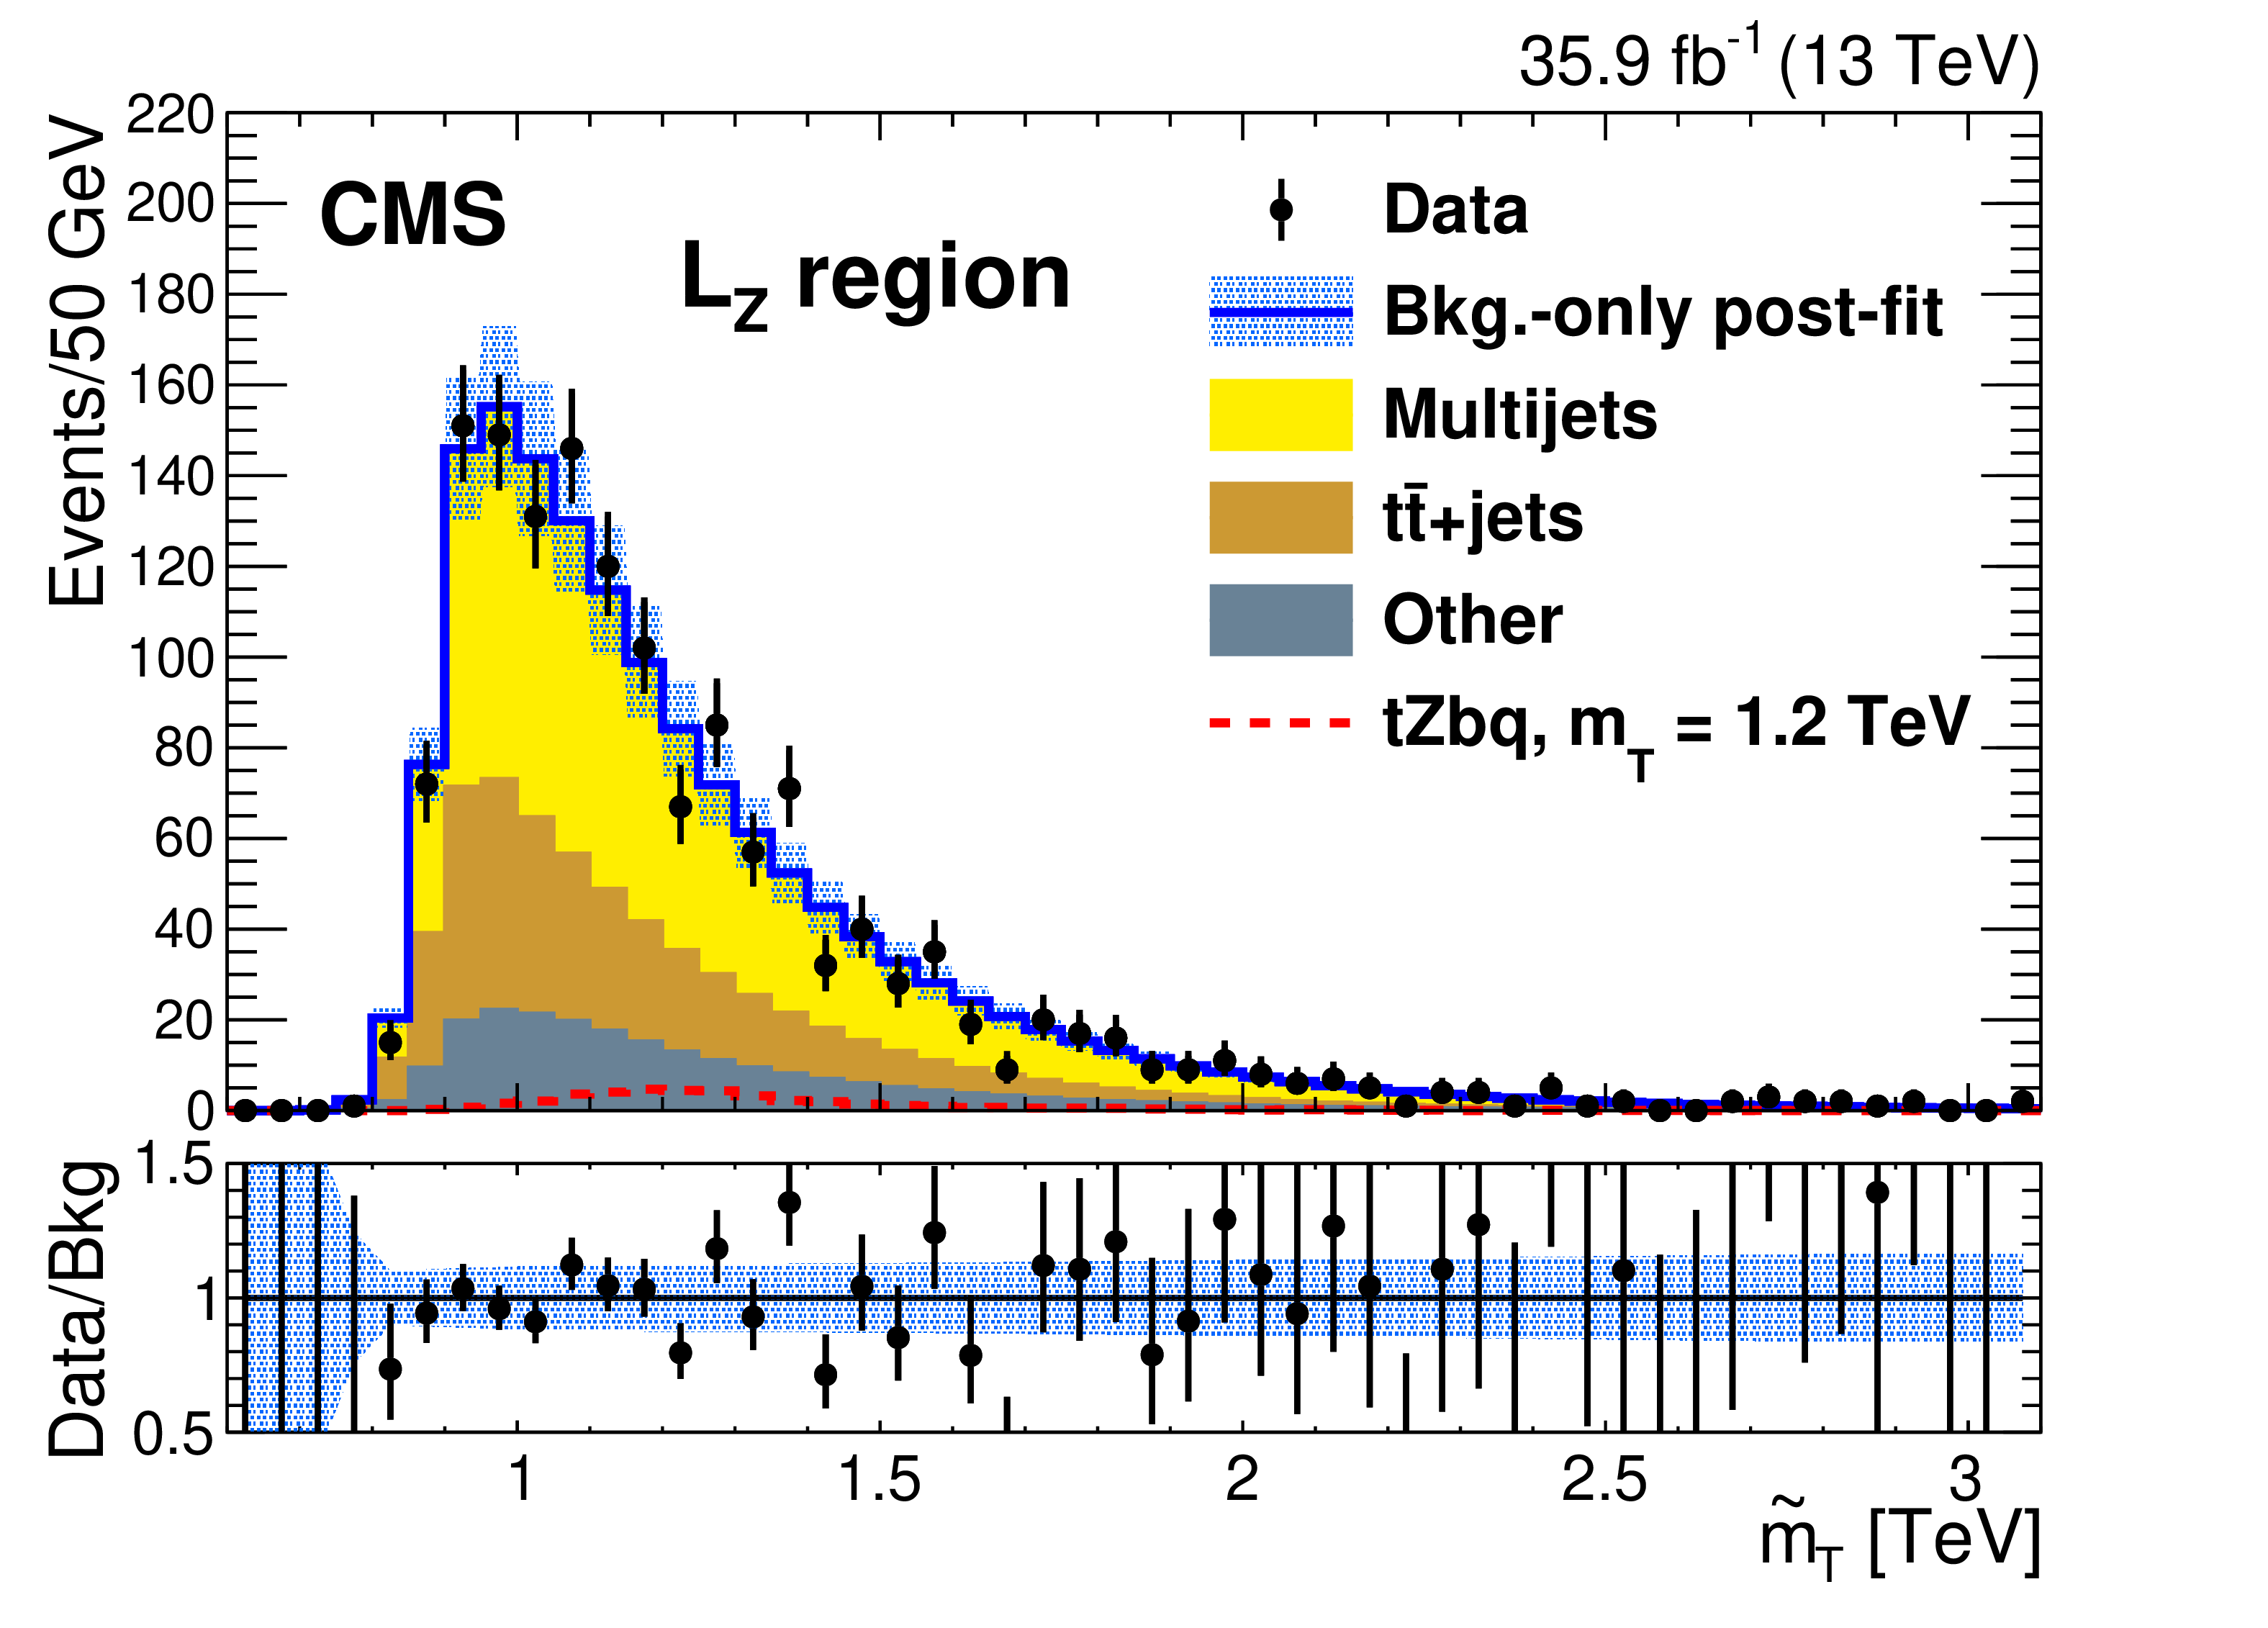
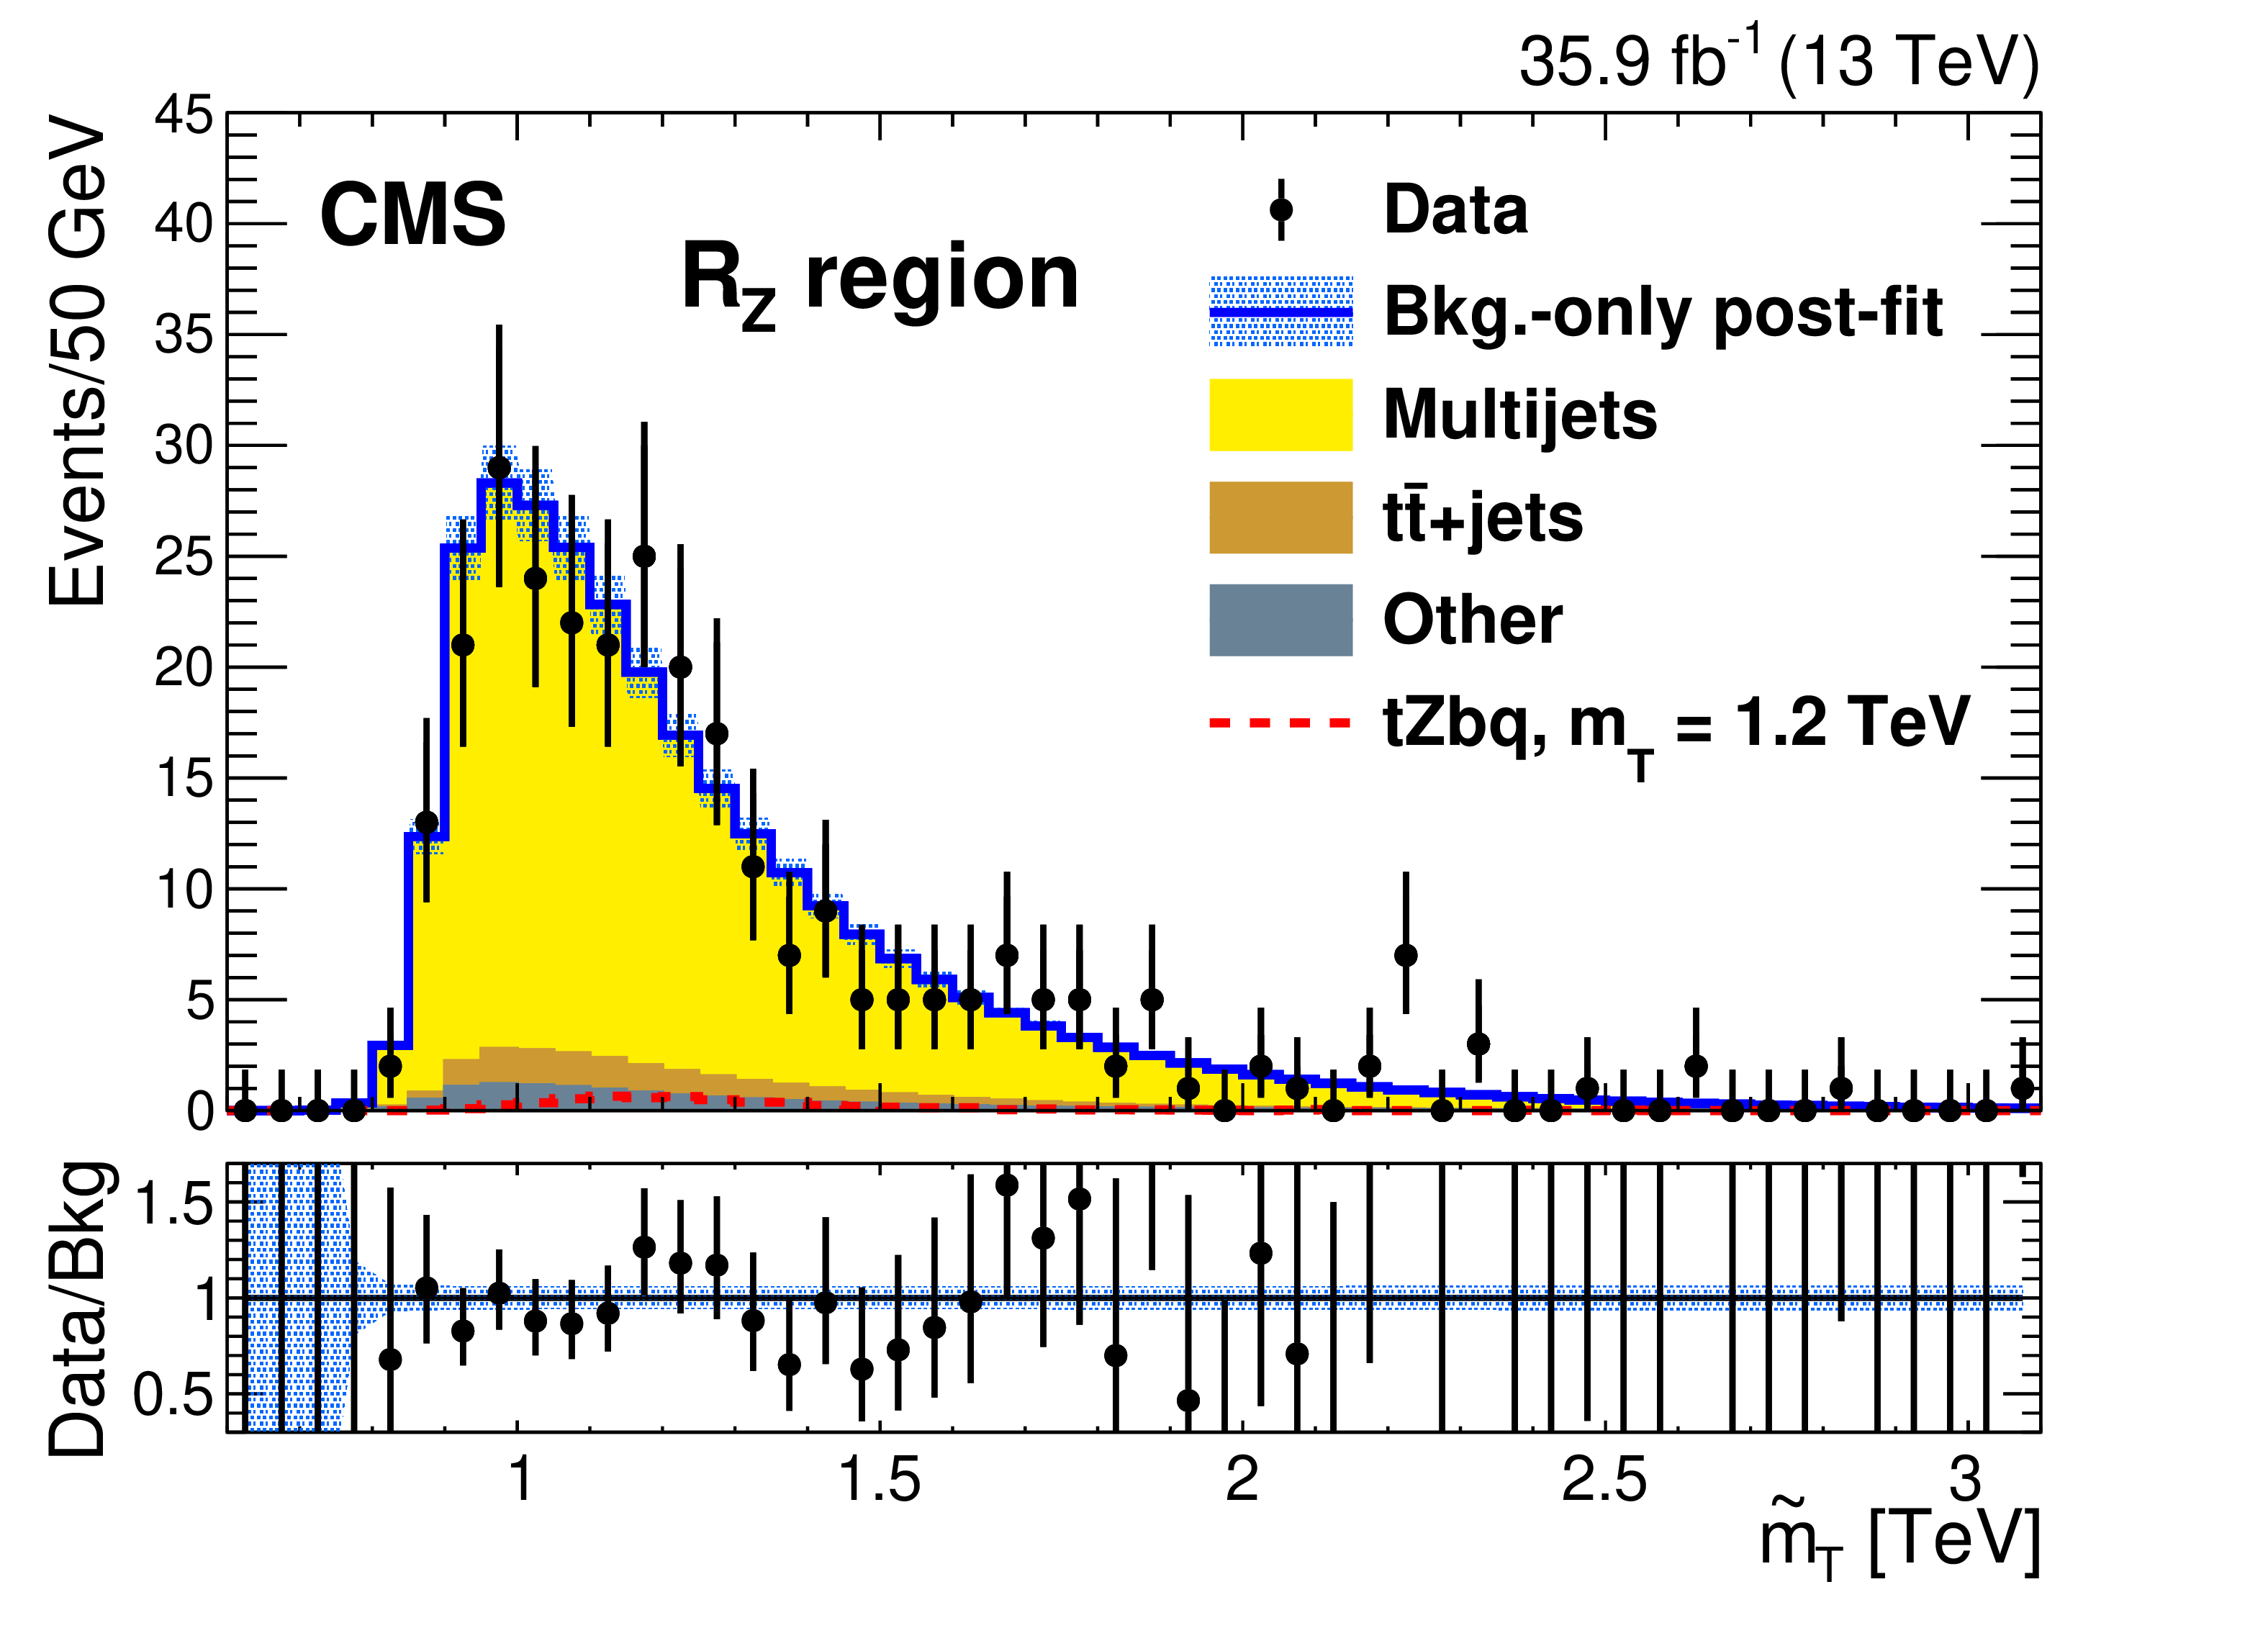
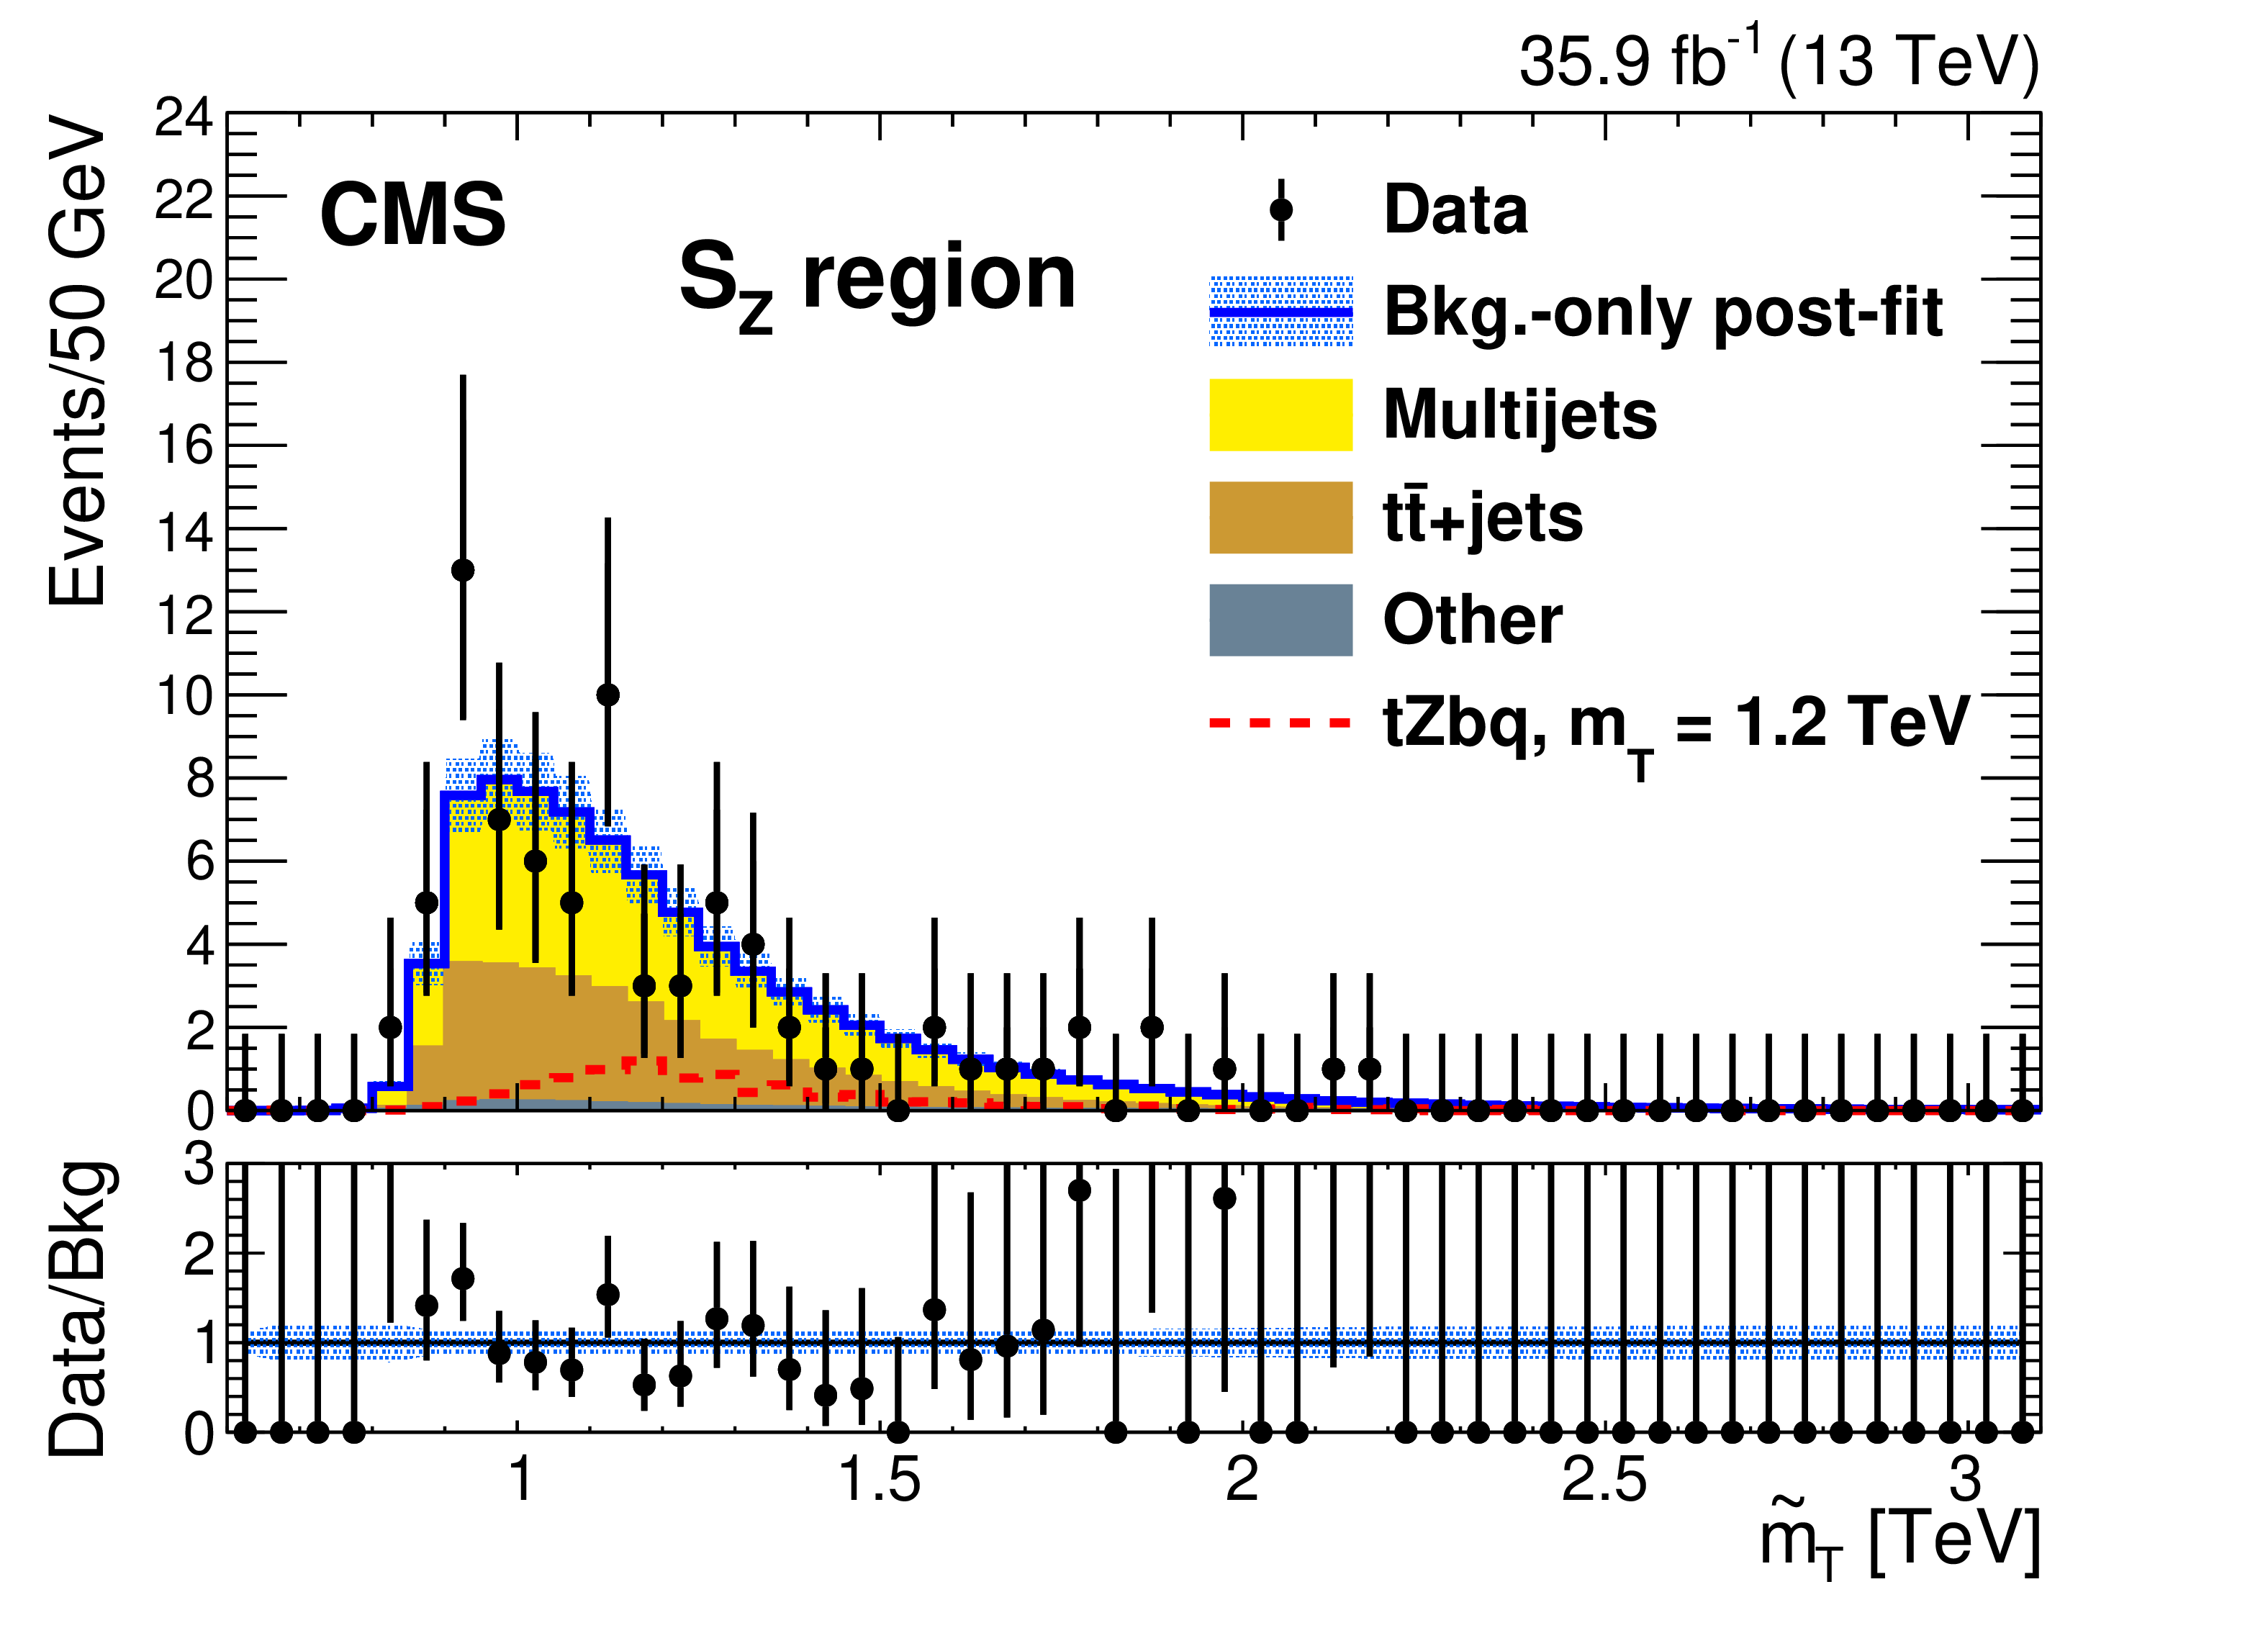
The background-only post-fit distributions in data for the ${\mathrm {Q}_{\mathrm{Z}}}$, ${\mathrm {L}_{\mathrm{Z}}}$, ${\mathrm {R}_{\mathrm{Z}}}$, and ${\mathrm {S}_{\mathrm{Z}}} $ regions that are used as signal and control regions primarily for the ${{\mathrm {T}} \to \mathrm{t} \mathrm{Z}}$ channel. The upper plots show regions ${\mathrm {Q}_{\mathrm{Z}}}$ (left) and ${\mathrm {L}_{\mathrm{Z}}}$ (right), while the lower plots show regions ${\mathrm {R}_{\mathrm{Z}}}$ (left) and ${\mathrm {S}_{\mathrm{Z}}} $ (right). The dashed red histogram is an example ${{\mathrm {T}} \to \mathrm{t} \mathrm{Z}}$ signal for the ${\mathrm{t} \mathrm{Z} \mathrm{b} \mathrm{q}}$ process with a 1.2 TeV T quark mass and a fractional width of 30% with a cross section from the singlet model of 131 fb. The lower panels show the ratio of observed data to fitted background per bin. The error bars on the data represent 68% CL Poisson intervals. The light blue band in each ratio panel shows the fractional uncertainties in the fitted background. |
png pdf |
Figure 7-a:
The background-only post-fit distributions in data for the ${\mathrm {Q}_{\mathrm{Z}}}$, ${\mathrm {L}_{\mathrm{Z}}}$, ${\mathrm {R}_{\mathrm{Z}}}$, and ${\mathrm {S}_{\mathrm{Z}}} $ regions that are used as signal and control regions primarily for the ${{\mathrm {T}} \to \mathrm{t} \mathrm{Z}}$ channel. The upper plots show regions ${\mathrm {Q}_{\mathrm{Z}}}$ (left) and ${\mathrm {L}_{\mathrm{Z}}}$ (right), while the lower plots show regions ${\mathrm {R}_{\mathrm{Z}}}$ (left) and ${\mathrm {S}_{\mathrm{Z}}} $ (right). The dashed red histogram is an example ${{\mathrm {T}} \to \mathrm{t} \mathrm{Z}}$ signal for the ${\mathrm{t} \mathrm{Z} \mathrm{b} \mathrm{q}}$ process with a 1.2 TeV T quark mass and a fractional width of 30% with a cross section from the singlet model of 131 fb. The lower panels show the ratio of observed data to fitted background per bin. The error bars on the data represent 68% CL Poisson intervals. The light blue band in each ratio panel shows the fractional uncertainties in the fitted background. |
png pdf |
Figure 7-b:
The background-only post-fit distributions in data for the ${\mathrm {Q}_{\mathrm{Z}}}$, ${\mathrm {L}_{\mathrm{Z}}}$, ${\mathrm {R}_{\mathrm{Z}}}$, and ${\mathrm {S}_{\mathrm{Z}}} $ regions that are used as signal and control regions primarily for the ${{\mathrm {T}} \to \mathrm{t} \mathrm{Z}}$ channel. The upper plots show regions ${\mathrm {Q}_{\mathrm{Z}}}$ (left) and ${\mathrm {L}_{\mathrm{Z}}}$ (right), while the lower plots show regions ${\mathrm {R}_{\mathrm{Z}}}$ (left) and ${\mathrm {S}_{\mathrm{Z}}} $ (right). The dashed red histogram is an example ${{\mathrm {T}} \to \mathrm{t} \mathrm{Z}}$ signal for the ${\mathrm{t} \mathrm{Z} \mathrm{b} \mathrm{q}}$ process with a 1.2 TeV T quark mass and a fractional width of 30% with a cross section from the singlet model of 131 fb. The lower panels show the ratio of observed data to fitted background per bin. The error bars on the data represent 68% CL Poisson intervals. The light blue band in each ratio panel shows the fractional uncertainties in the fitted background. |
png pdf |
Figure 7-c:
The background-only post-fit distributions in data for the ${\mathrm {Q}_{\mathrm{Z}}}$, ${\mathrm {L}_{\mathrm{Z}}}$, ${\mathrm {R}_{\mathrm{Z}}}$, and ${\mathrm {S}_{\mathrm{Z}}} $ regions that are used as signal and control regions primarily for the ${{\mathrm {T}} \to \mathrm{t} \mathrm{Z}}$ channel. The upper plots show regions ${\mathrm {Q}_{\mathrm{Z}}}$ (left) and ${\mathrm {L}_{\mathrm{Z}}}$ (right), while the lower plots show regions ${\mathrm {R}_{\mathrm{Z}}}$ (left) and ${\mathrm {S}_{\mathrm{Z}}} $ (right). The dashed red histogram is an example ${{\mathrm {T}} \to \mathrm{t} \mathrm{Z}}$ signal for the ${\mathrm{t} \mathrm{Z} \mathrm{b} \mathrm{q}}$ process with a 1.2 TeV T quark mass and a fractional width of 30% with a cross section from the singlet model of 131 fb. The lower panels show the ratio of observed data to fitted background per bin. The error bars on the data represent 68% CL Poisson intervals. The light blue band in each ratio panel shows the fractional uncertainties in the fitted background. |
png pdf |
Figure 7-d:
The background-only post-fit distributions in data for the ${\mathrm {Q}_{\mathrm{Z}}}$, ${\mathrm {L}_{\mathrm{Z}}}$, ${\mathrm {R}_{\mathrm{Z}}}$, and ${\mathrm {S}_{\mathrm{Z}}} $ regions that are used as signal and control regions primarily for the ${{\mathrm {T}} \to \mathrm{t} \mathrm{Z}}$ channel. The upper plots show regions ${\mathrm {Q}_{\mathrm{Z}}}$ (left) and ${\mathrm {L}_{\mathrm{Z}}}$ (right), while the lower plots show regions ${\mathrm {R}_{\mathrm{Z}}}$ (left) and ${\mathrm {S}_{\mathrm{Z}}} $ (right). The dashed red histogram is an example ${{\mathrm {T}} \to \mathrm{t} \mathrm{Z}}$ signal for the ${\mathrm{t} \mathrm{Z} \mathrm{b} \mathrm{q}}$ process with a 1.2 TeV T quark mass and a fractional width of 30% with a cross section from the singlet model of 131 fb. The lower panels show the ratio of observed data to fitted background per bin. The error bars on the data represent 68% CL Poisson intervals. The light blue band in each ratio panel shows the fractional uncertainties in the fitted background. |

png pdf |
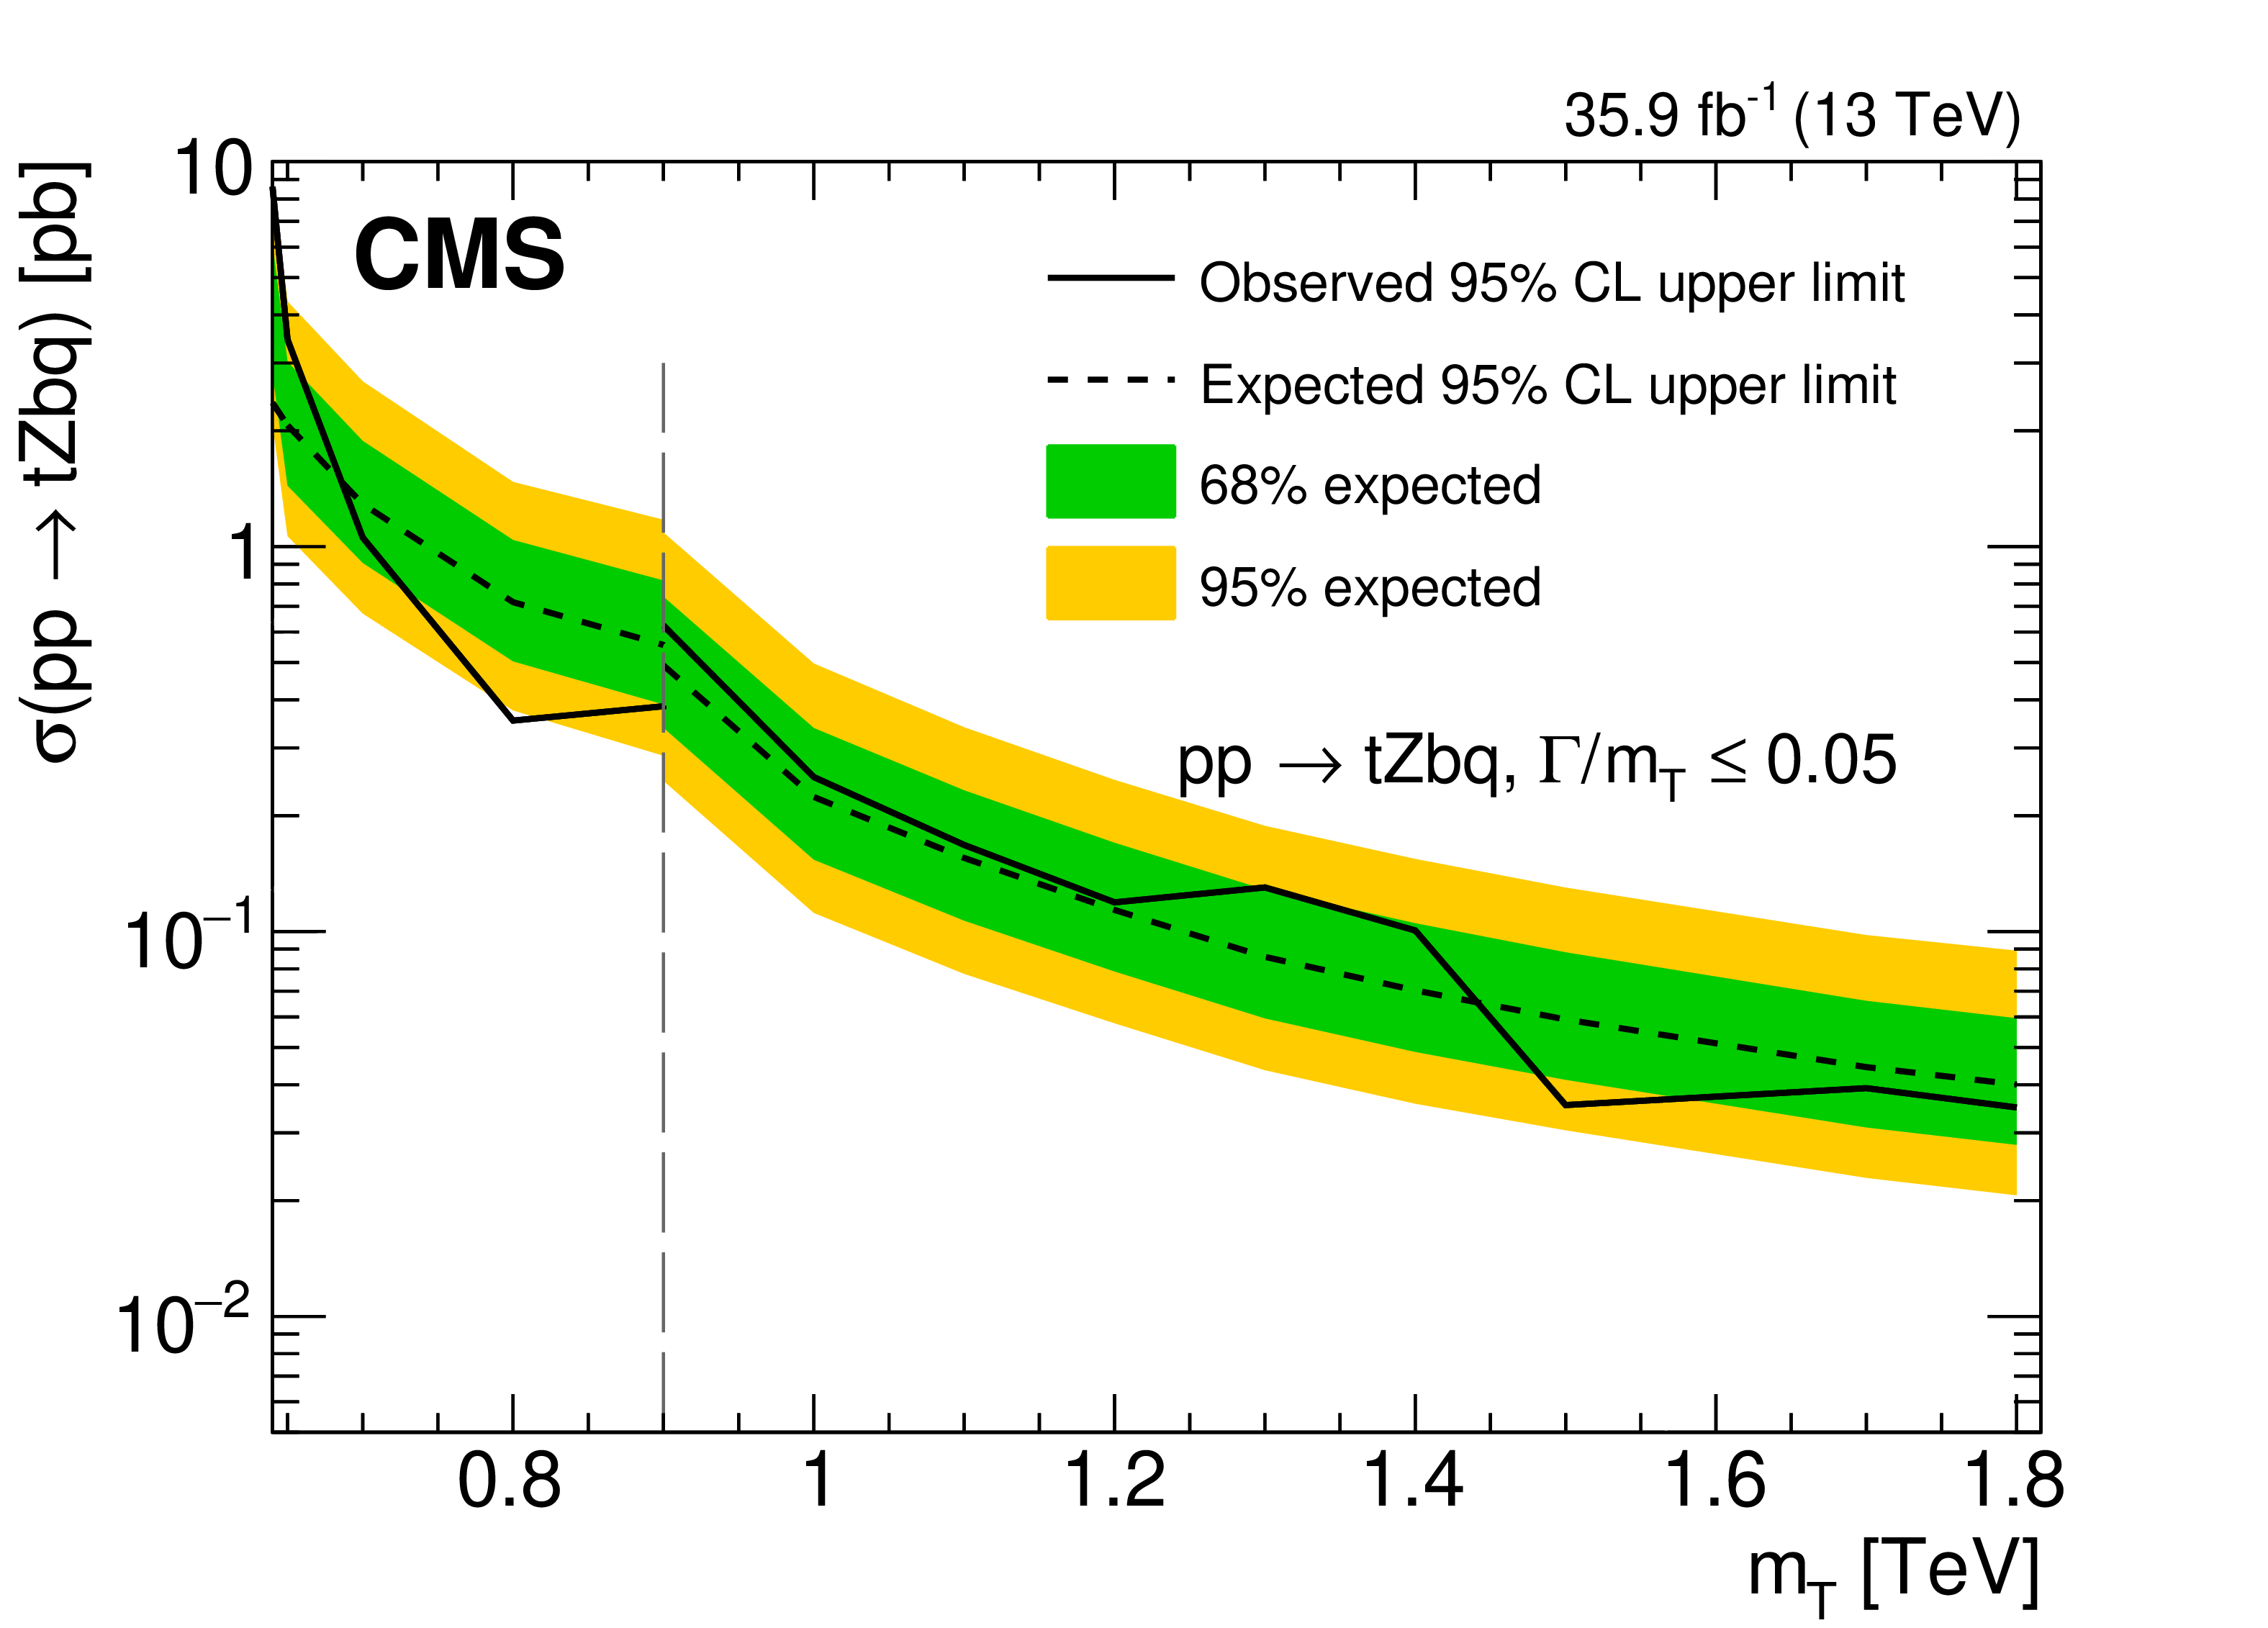
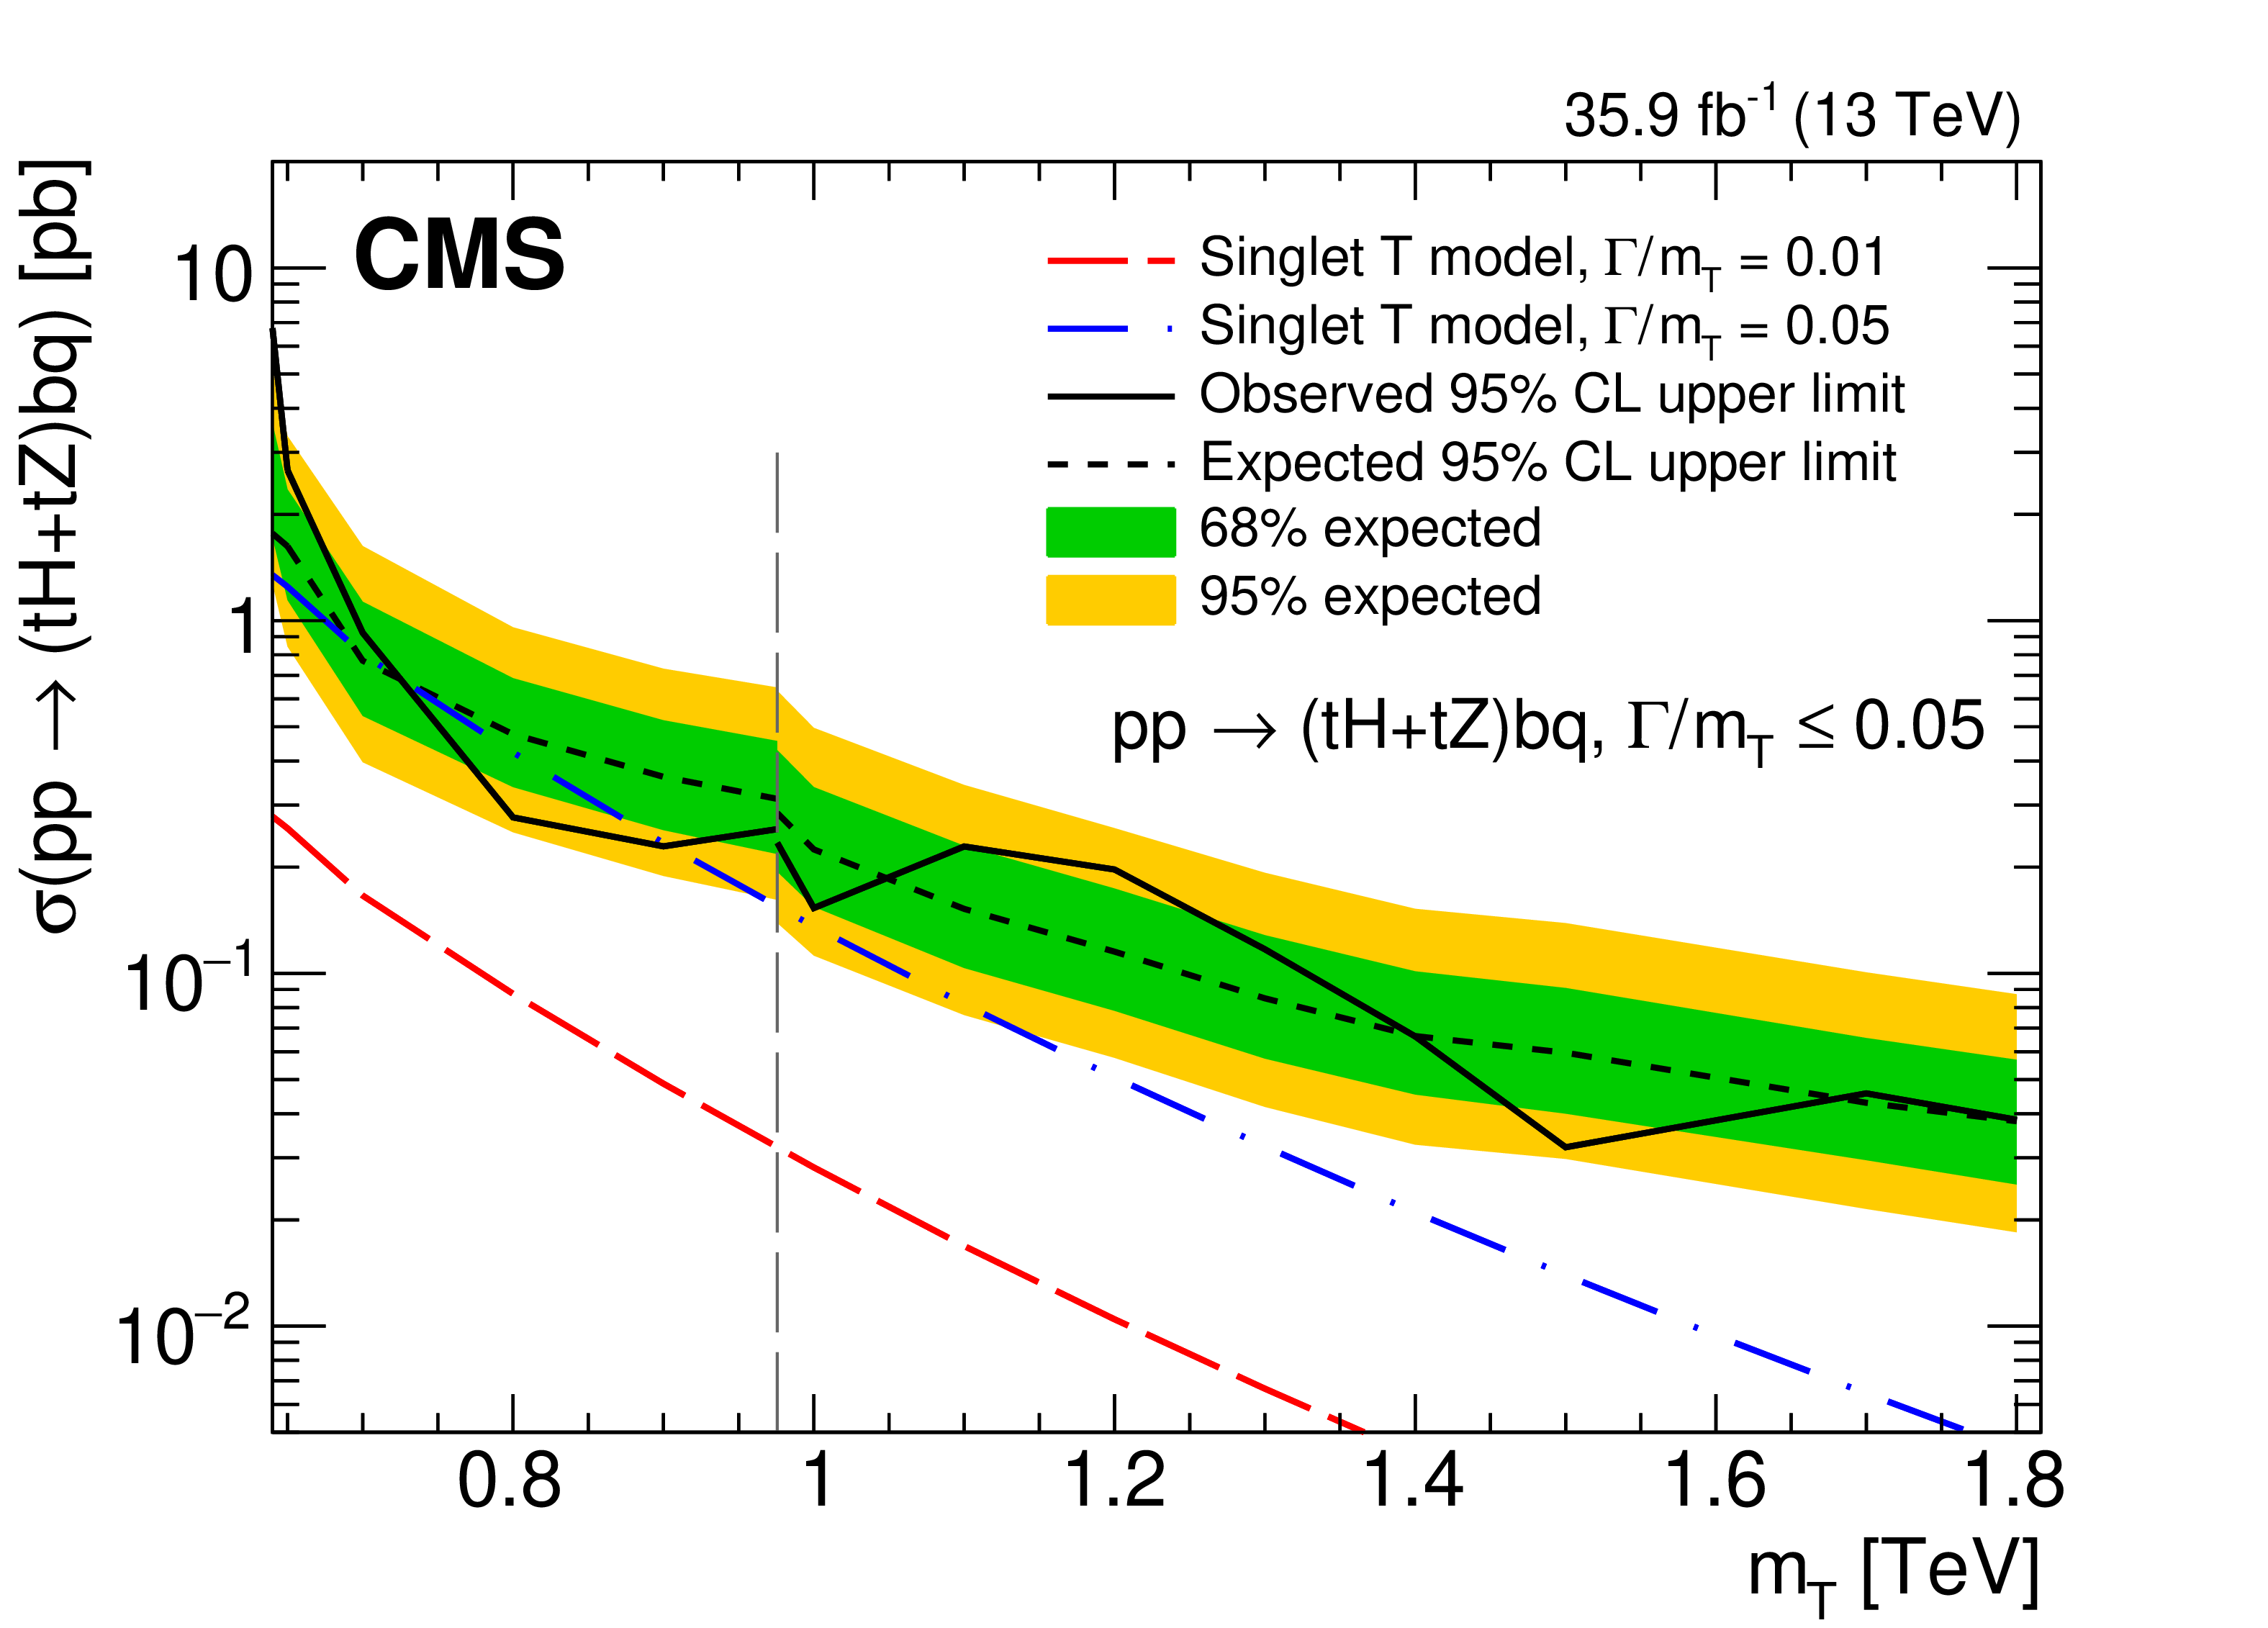
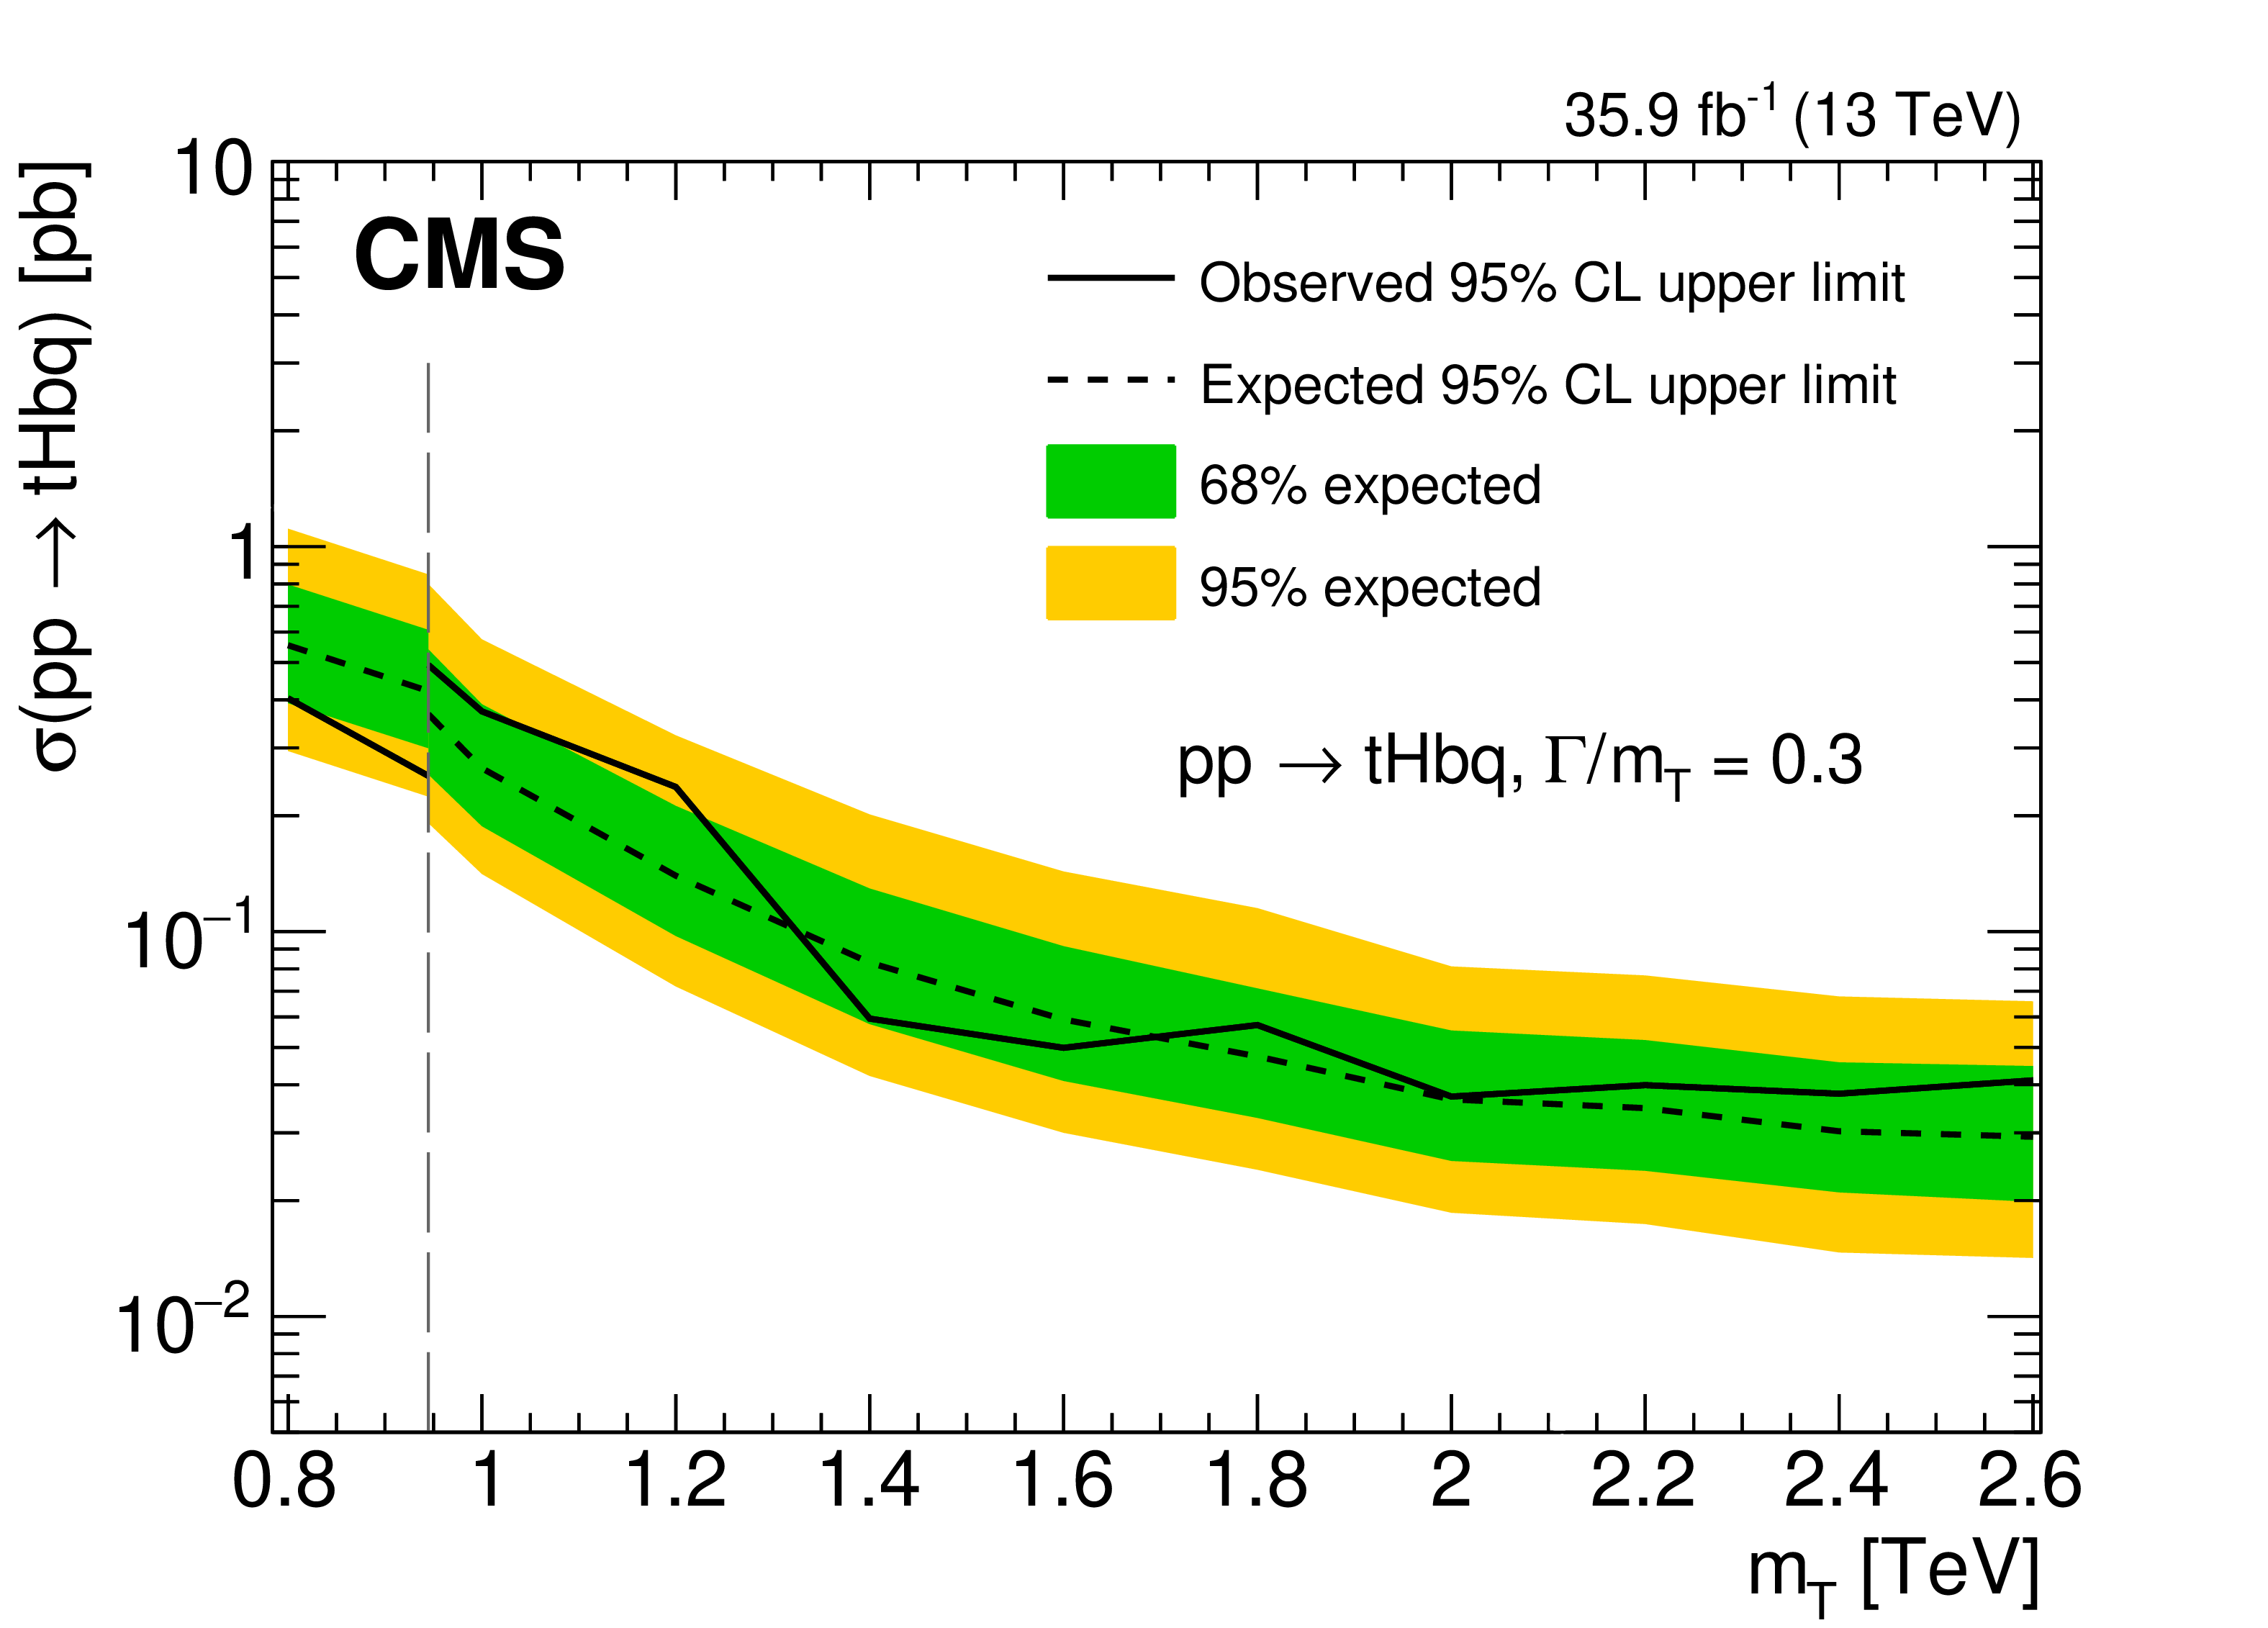
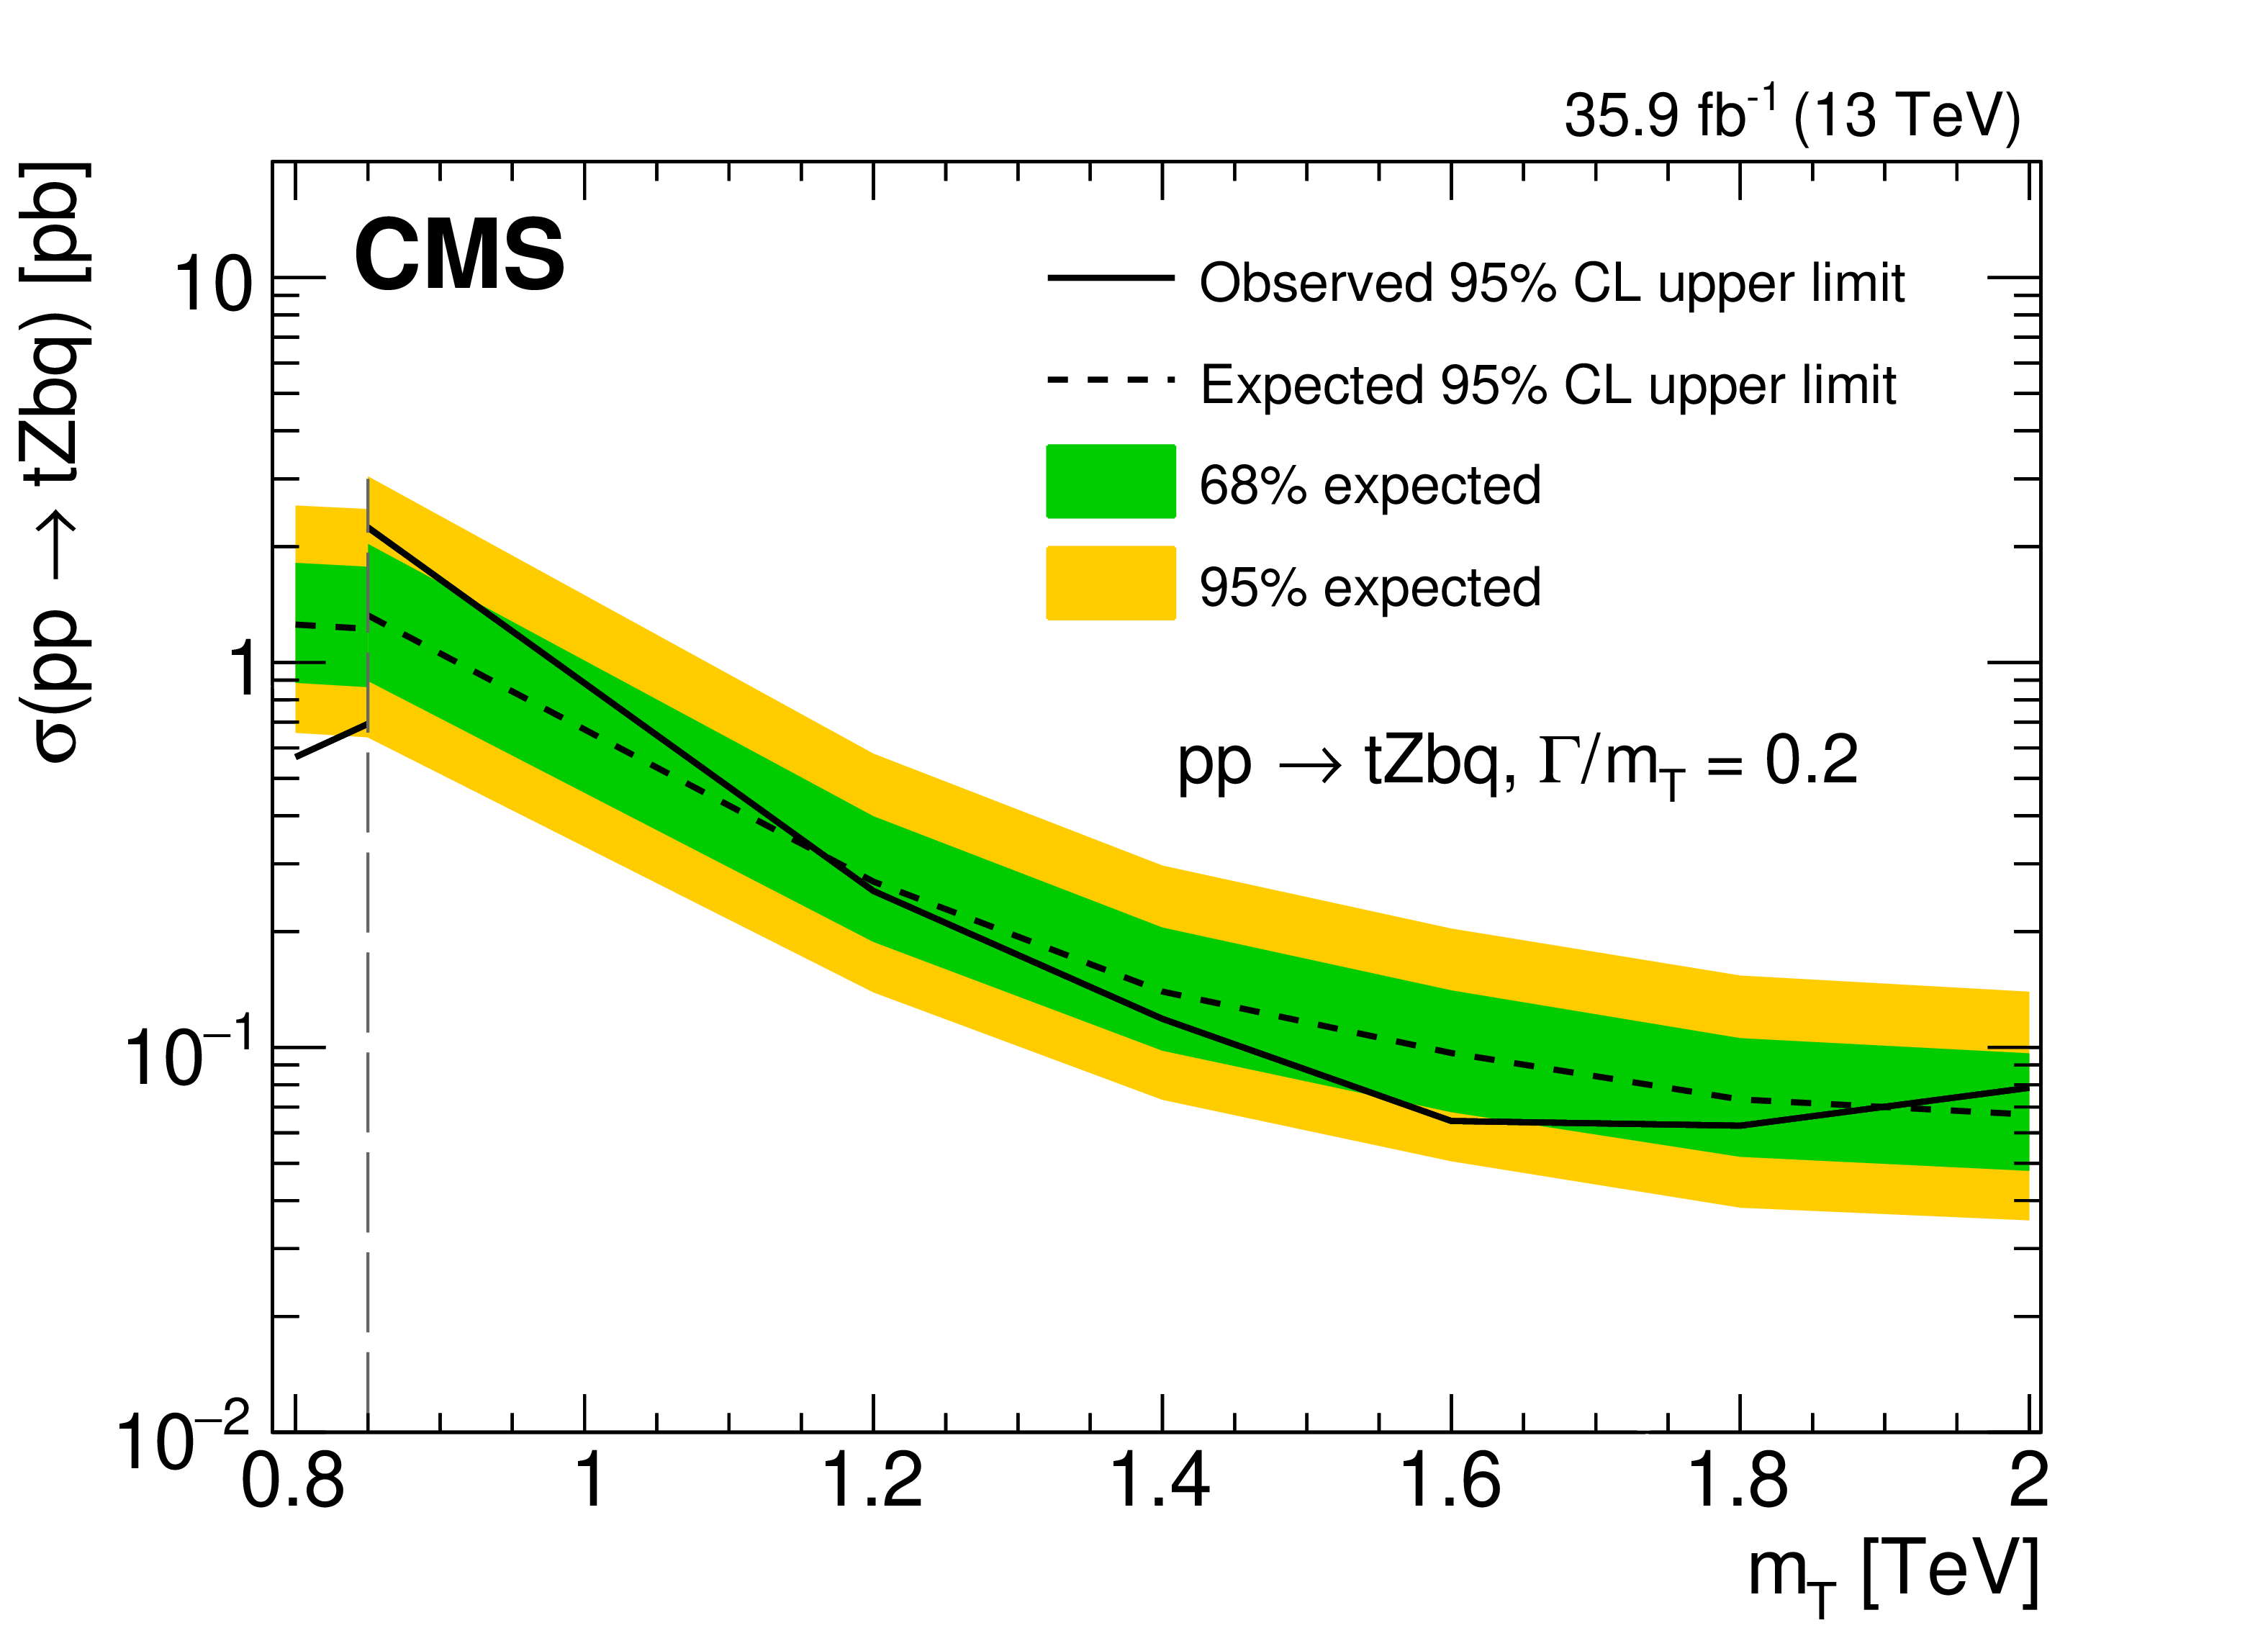
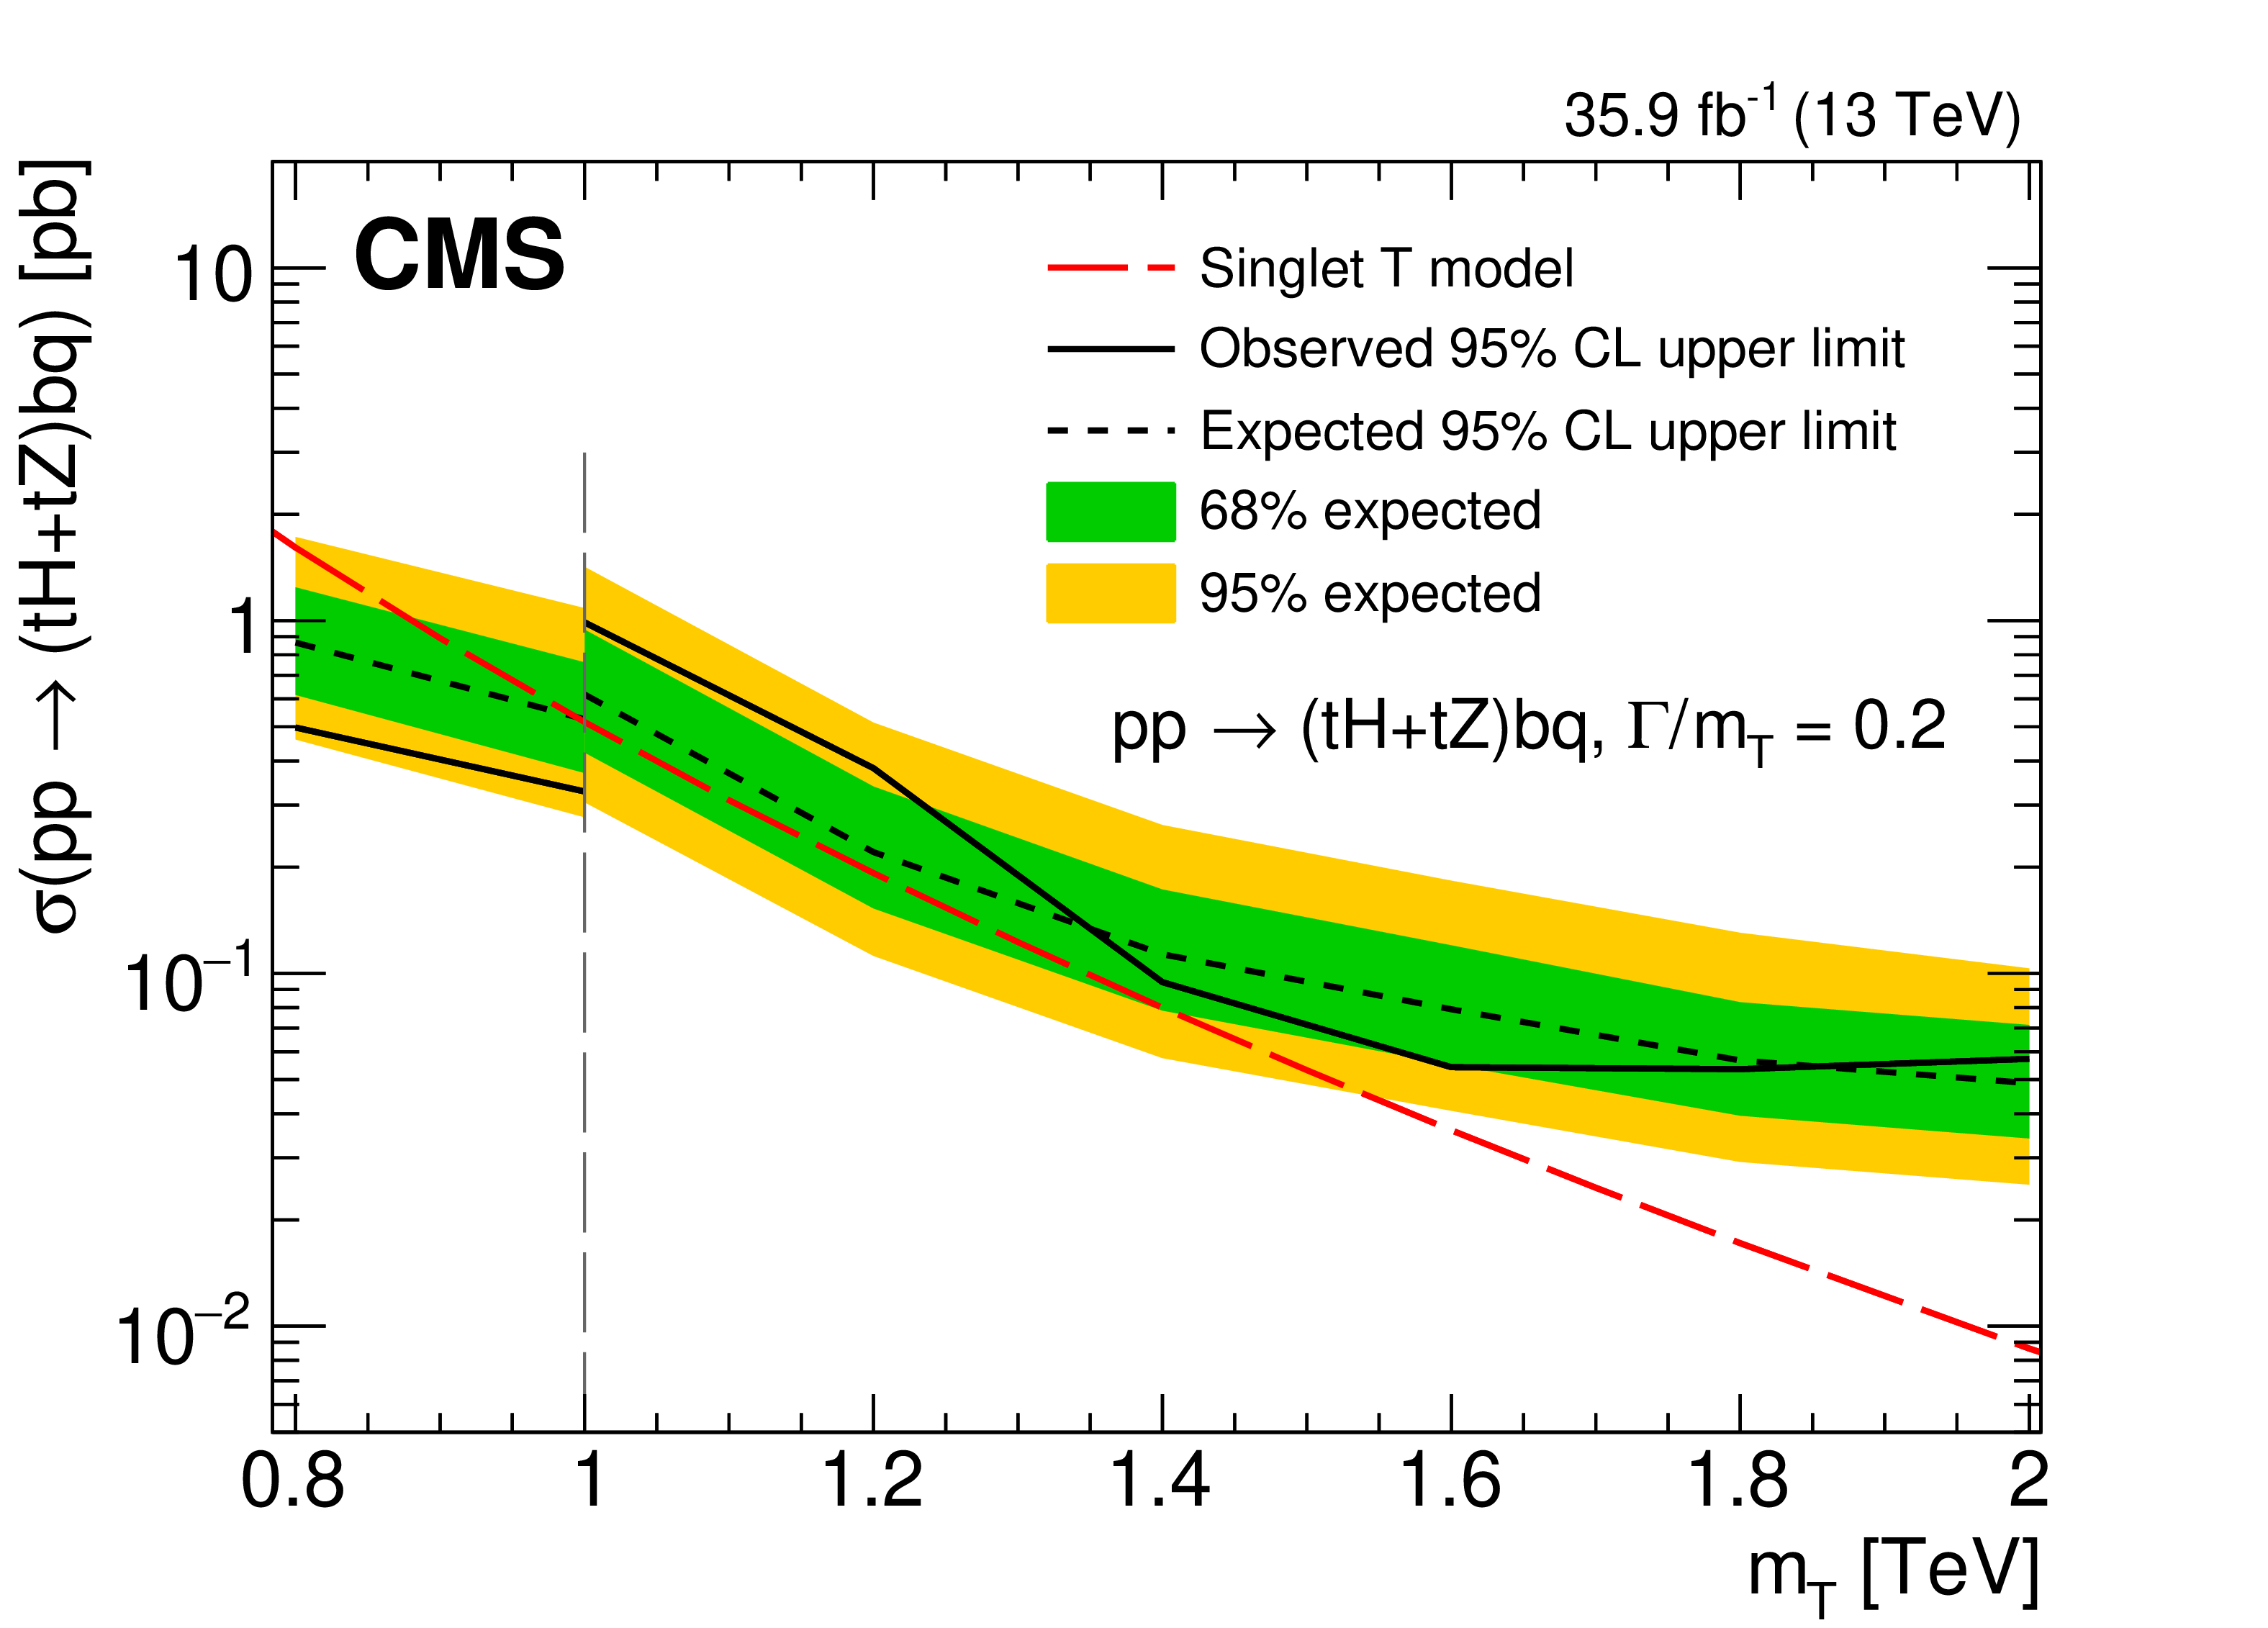
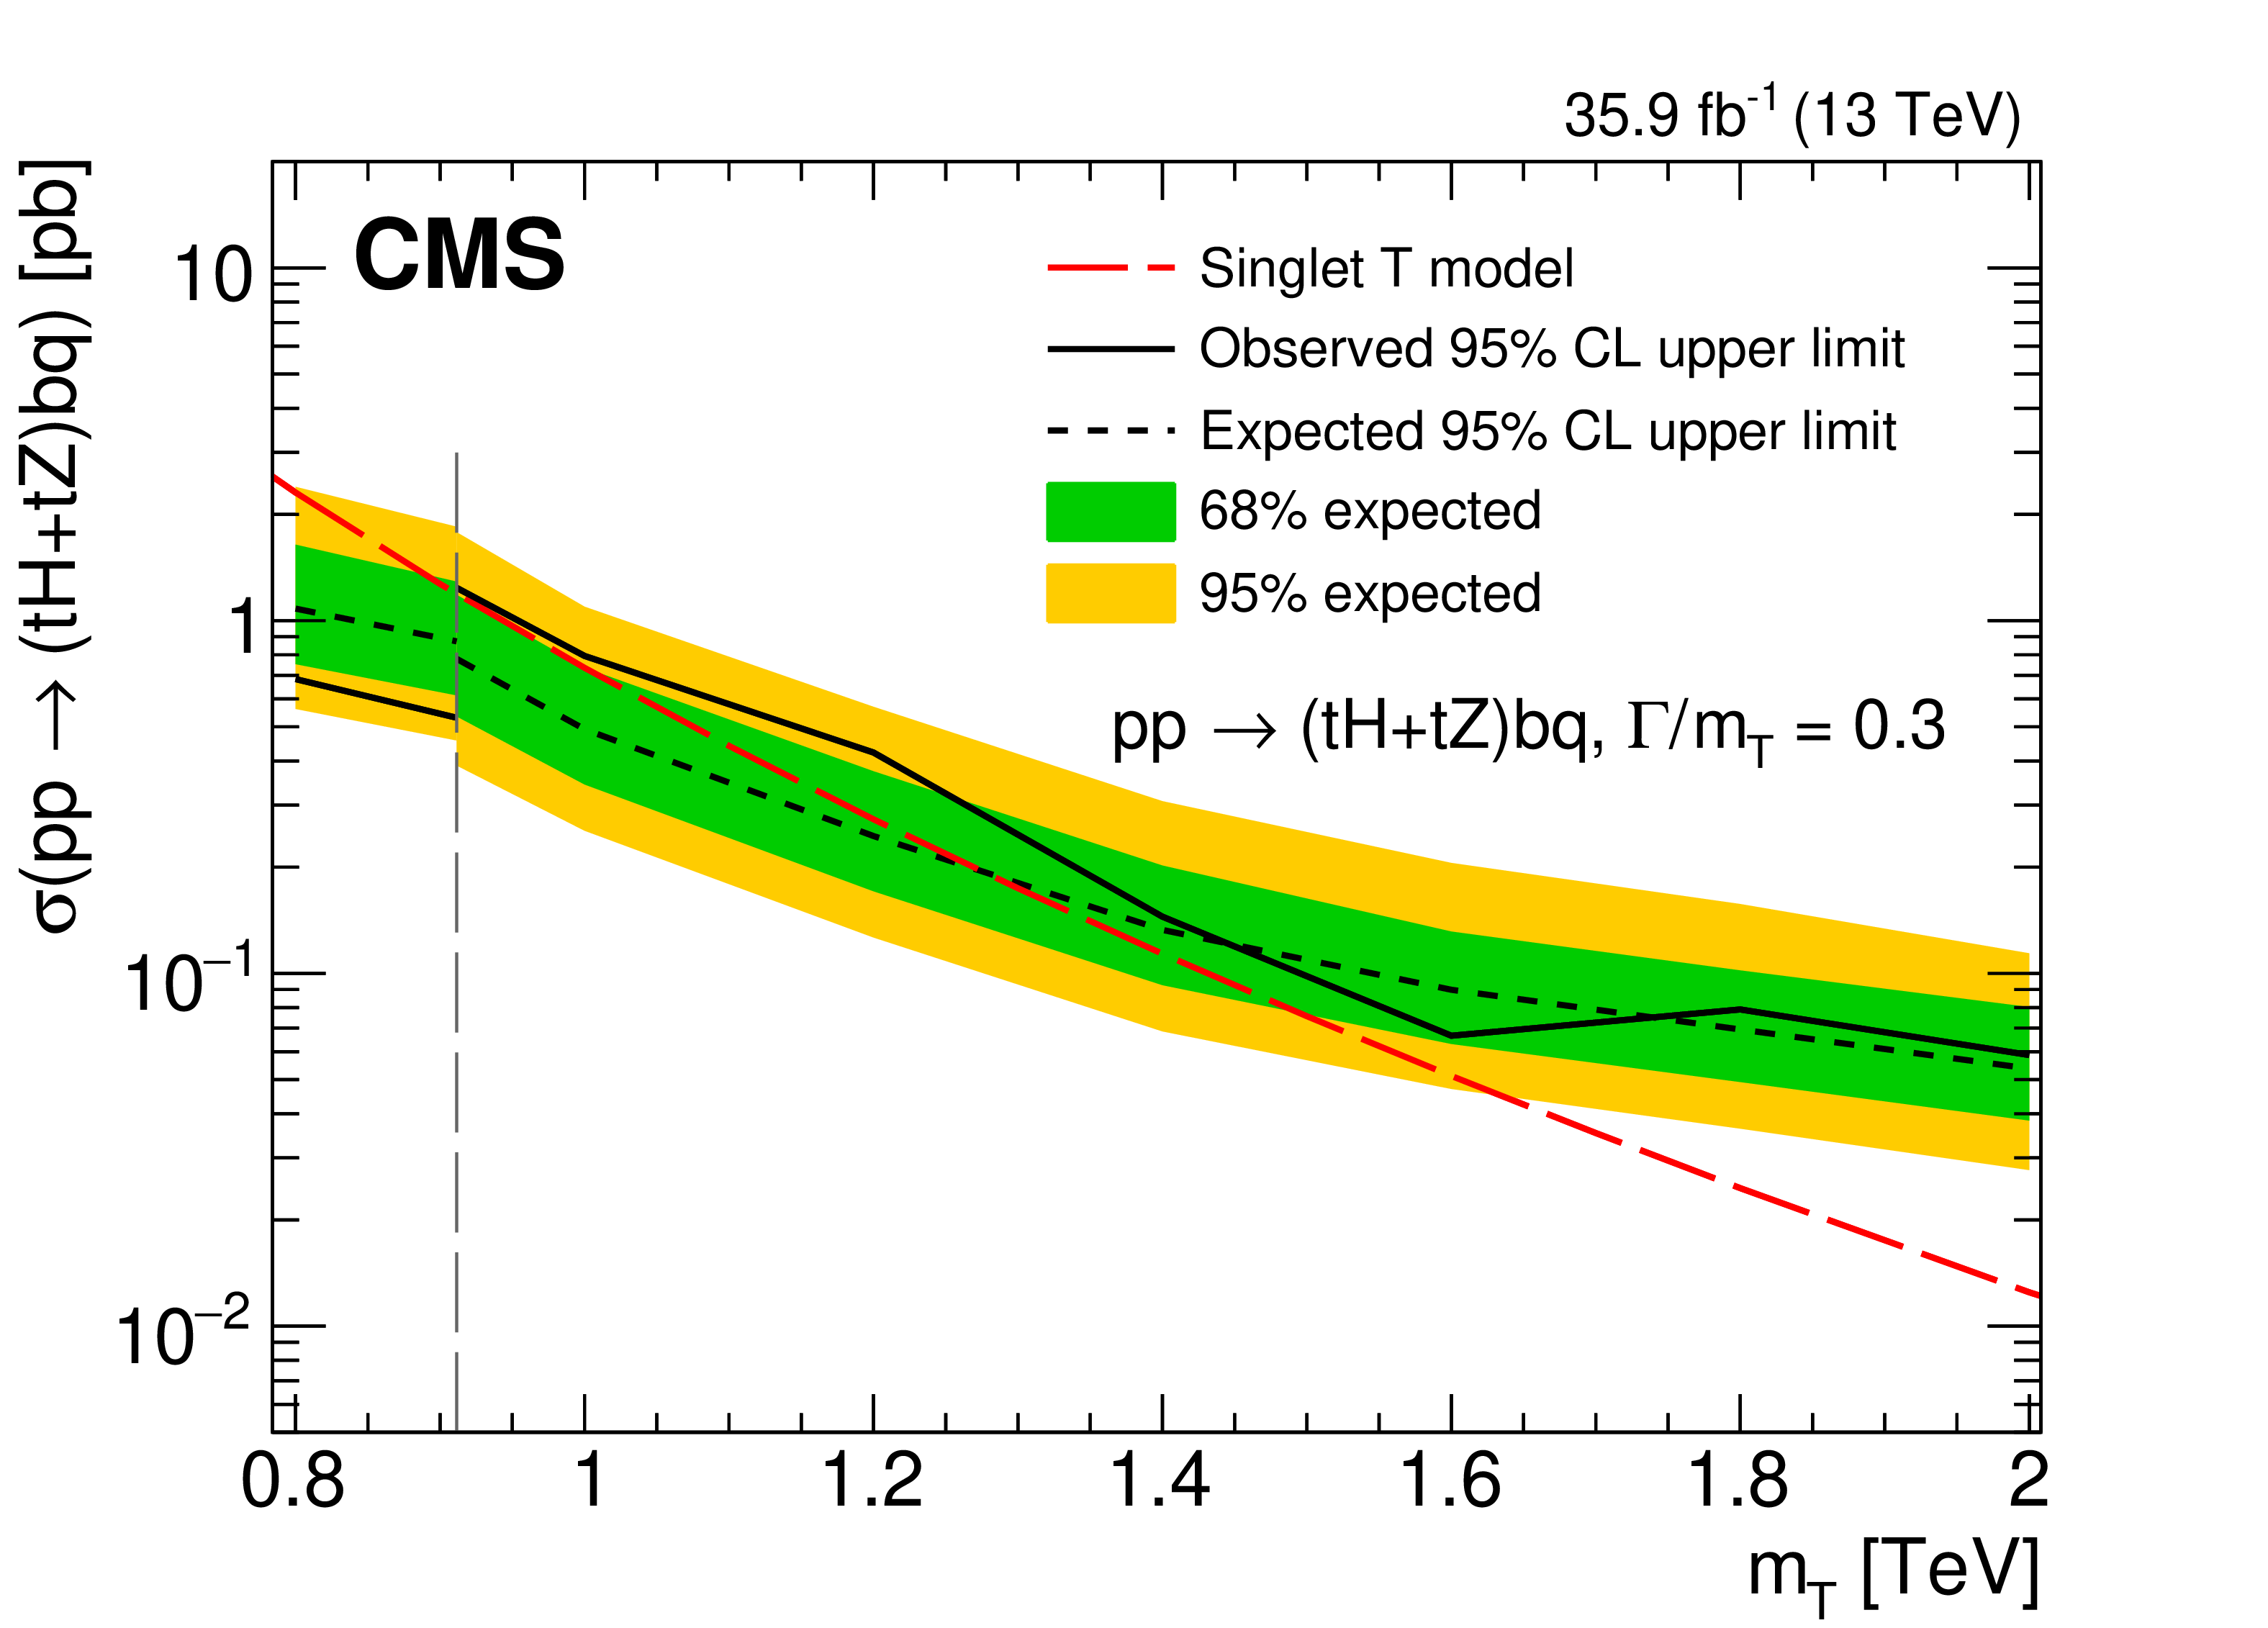
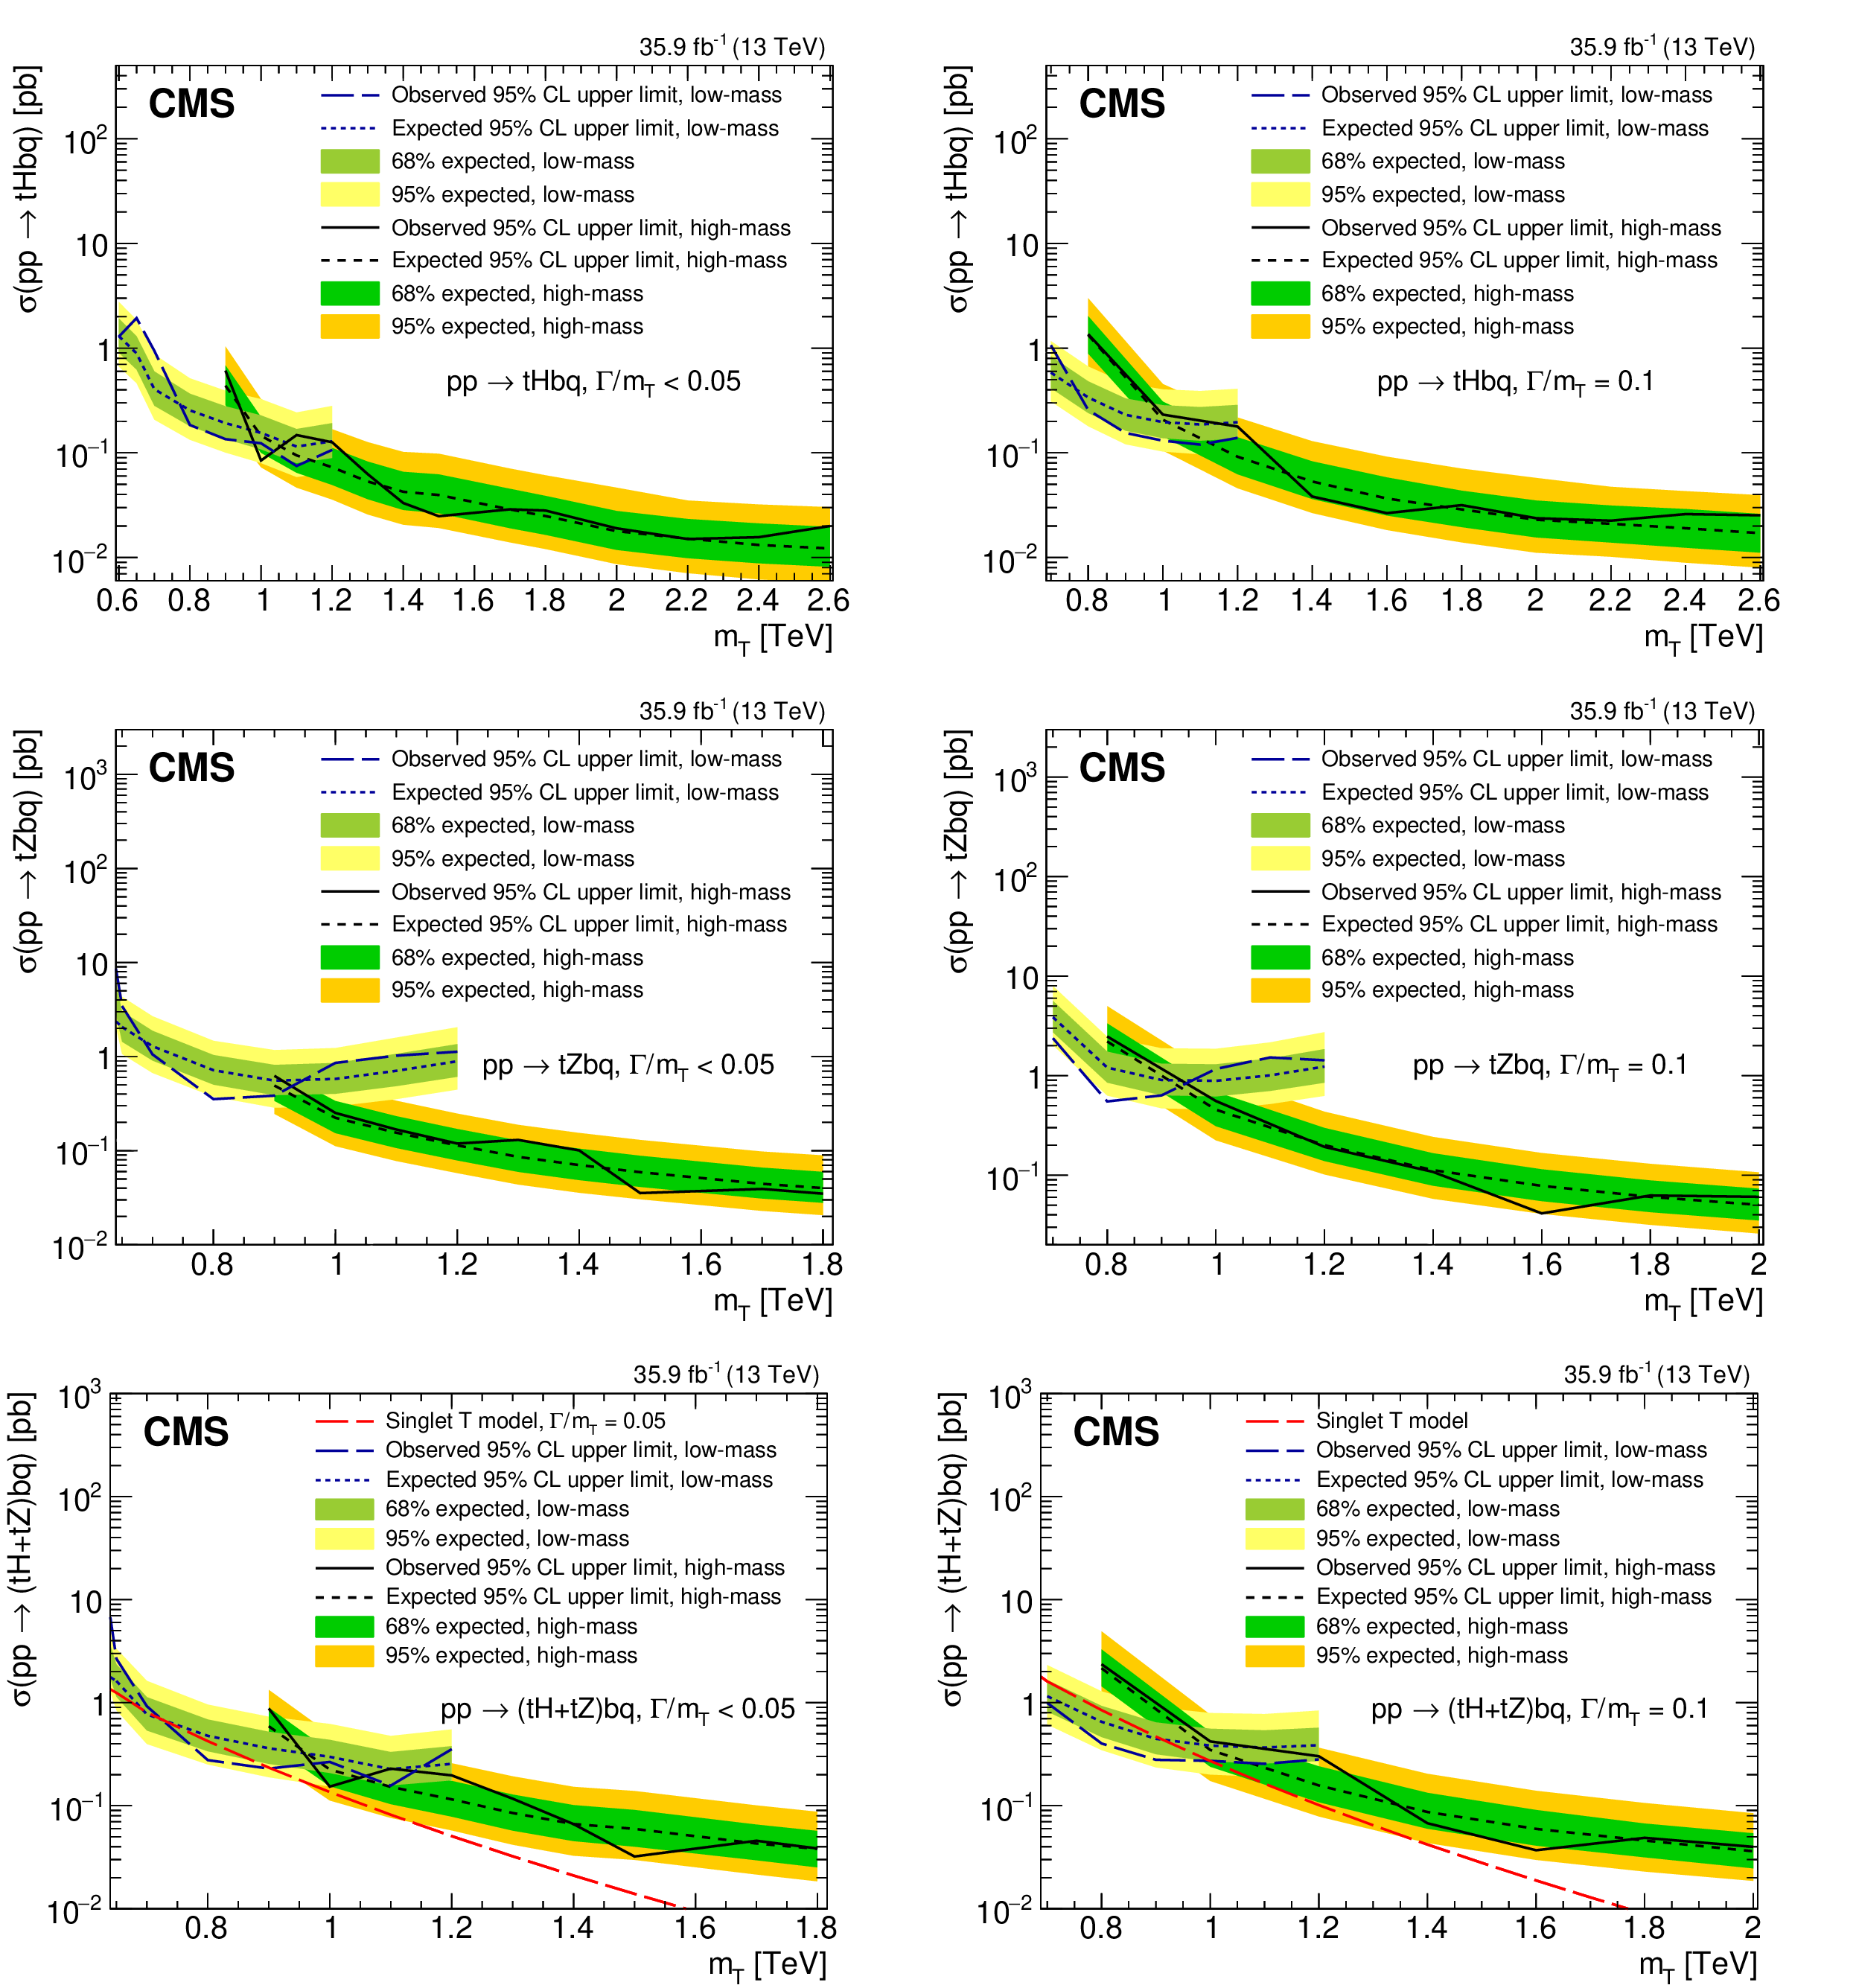
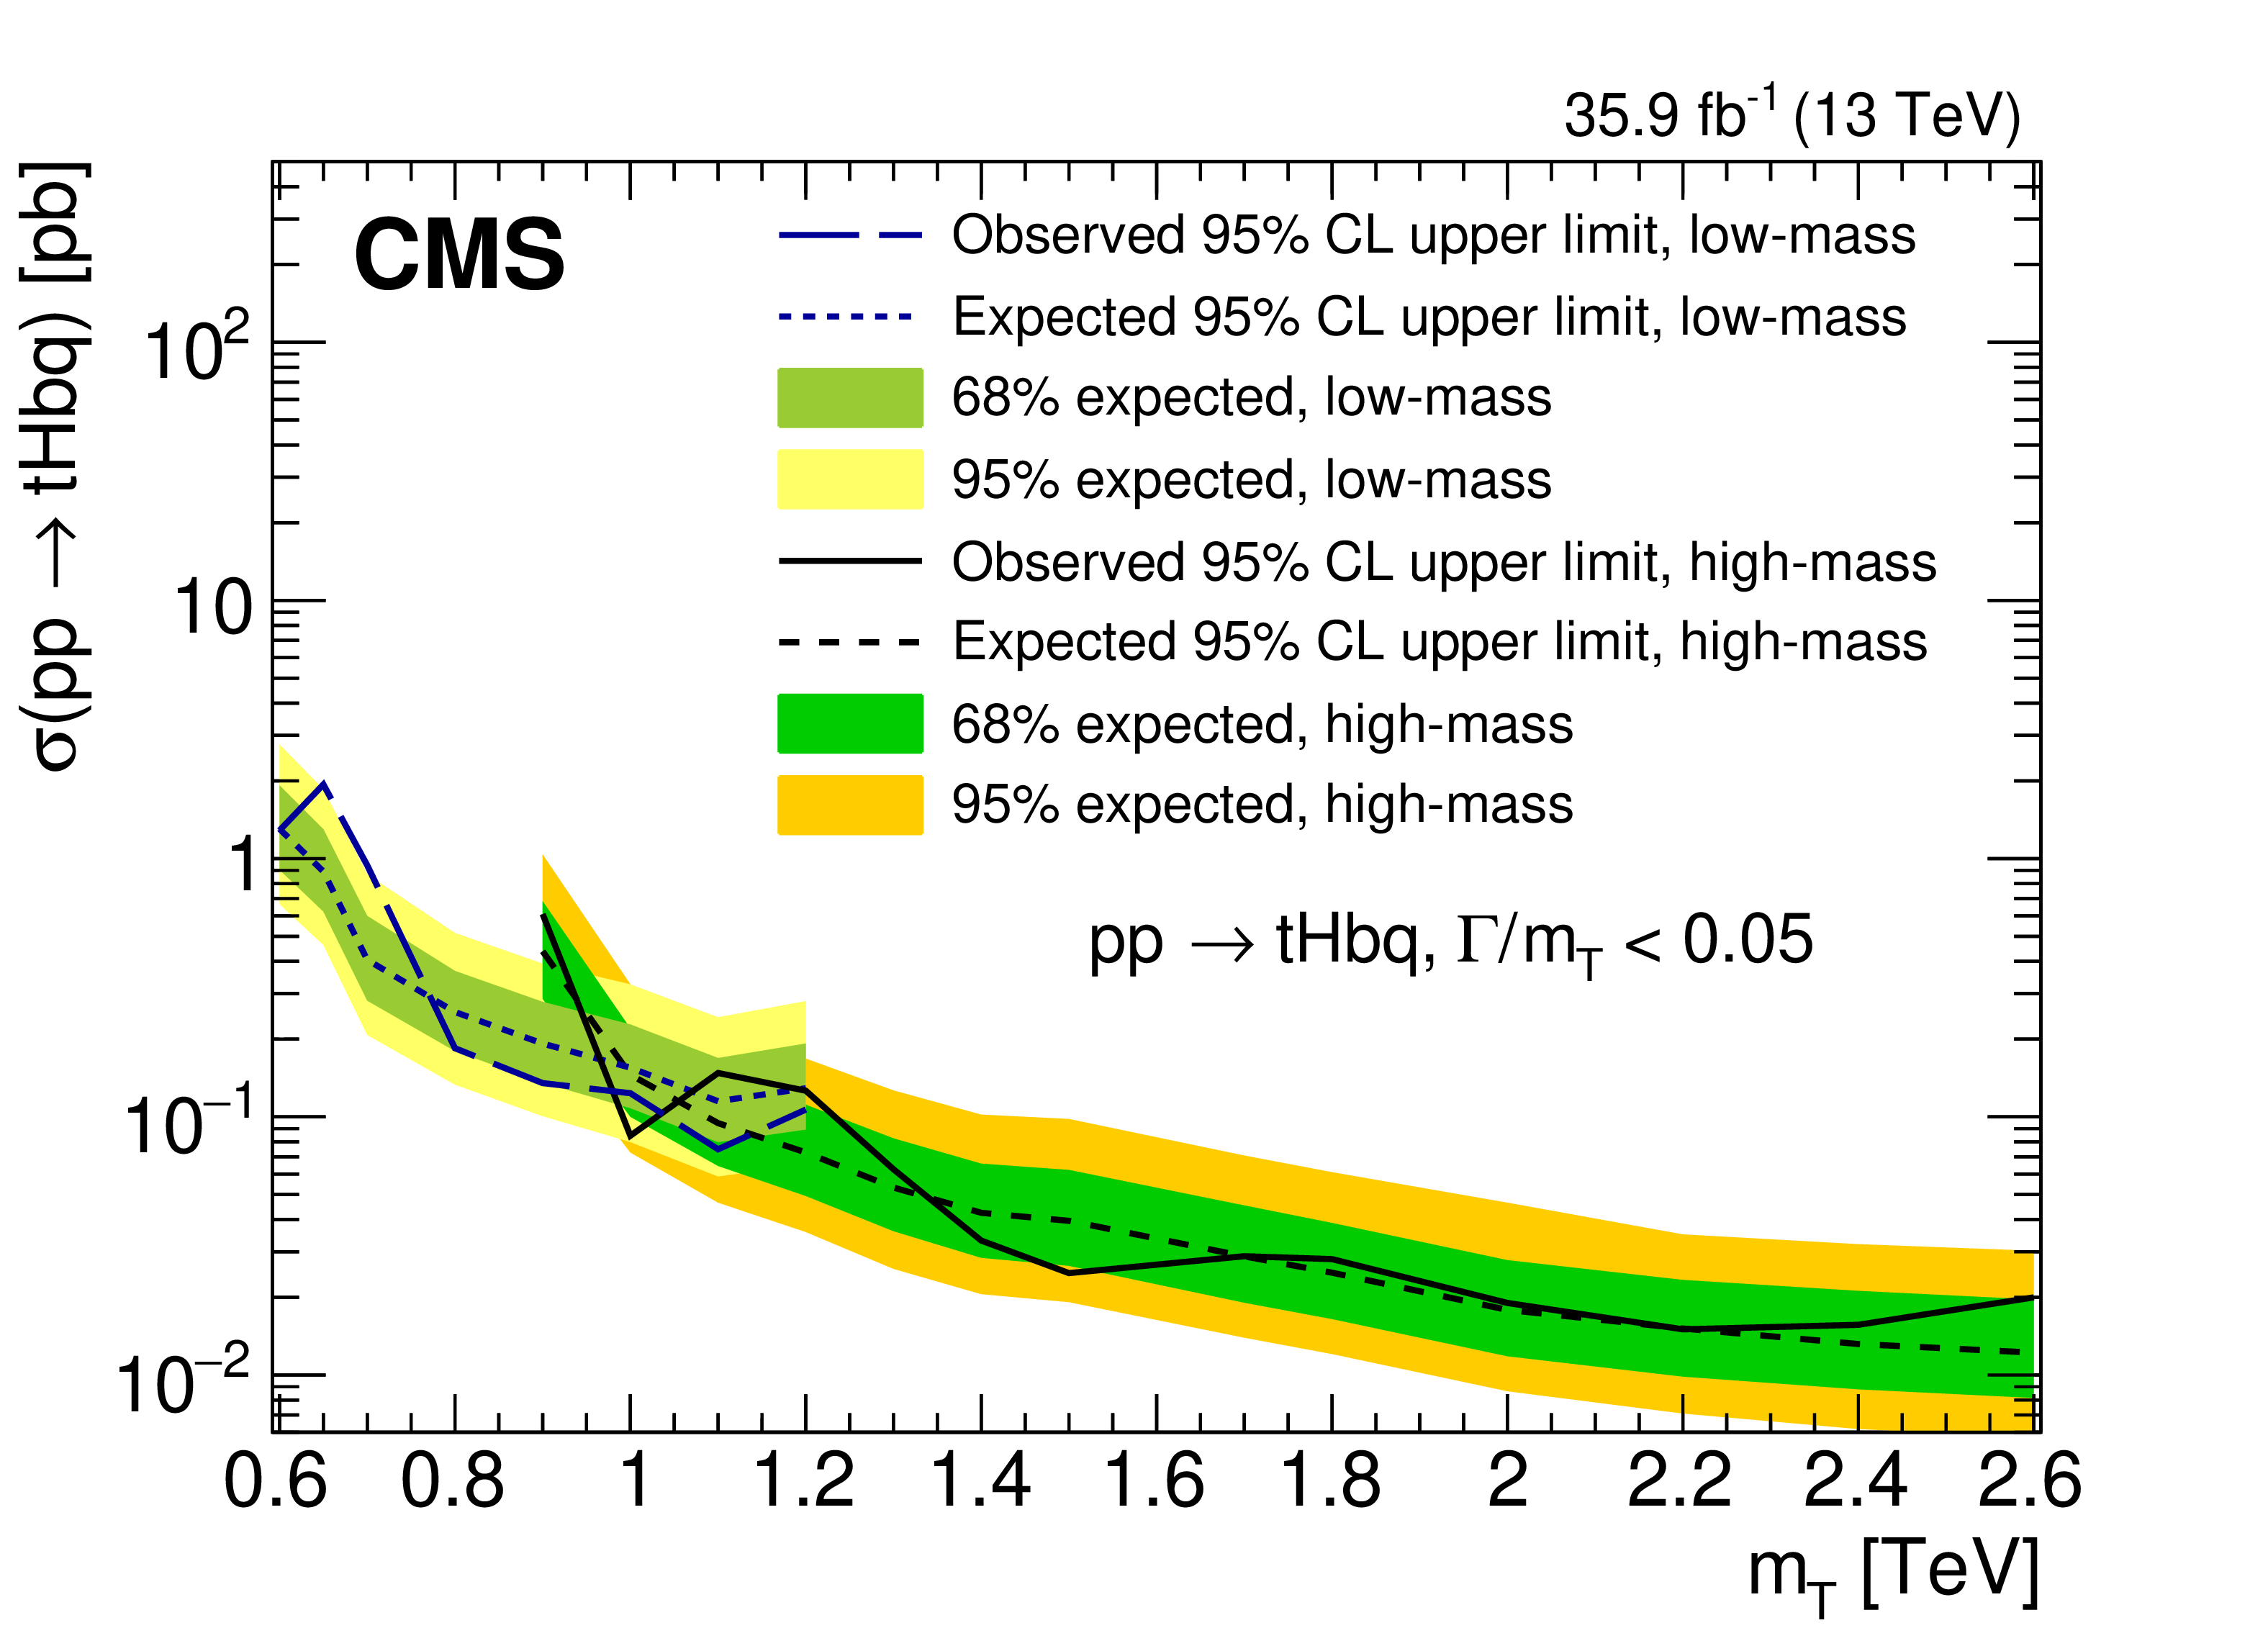
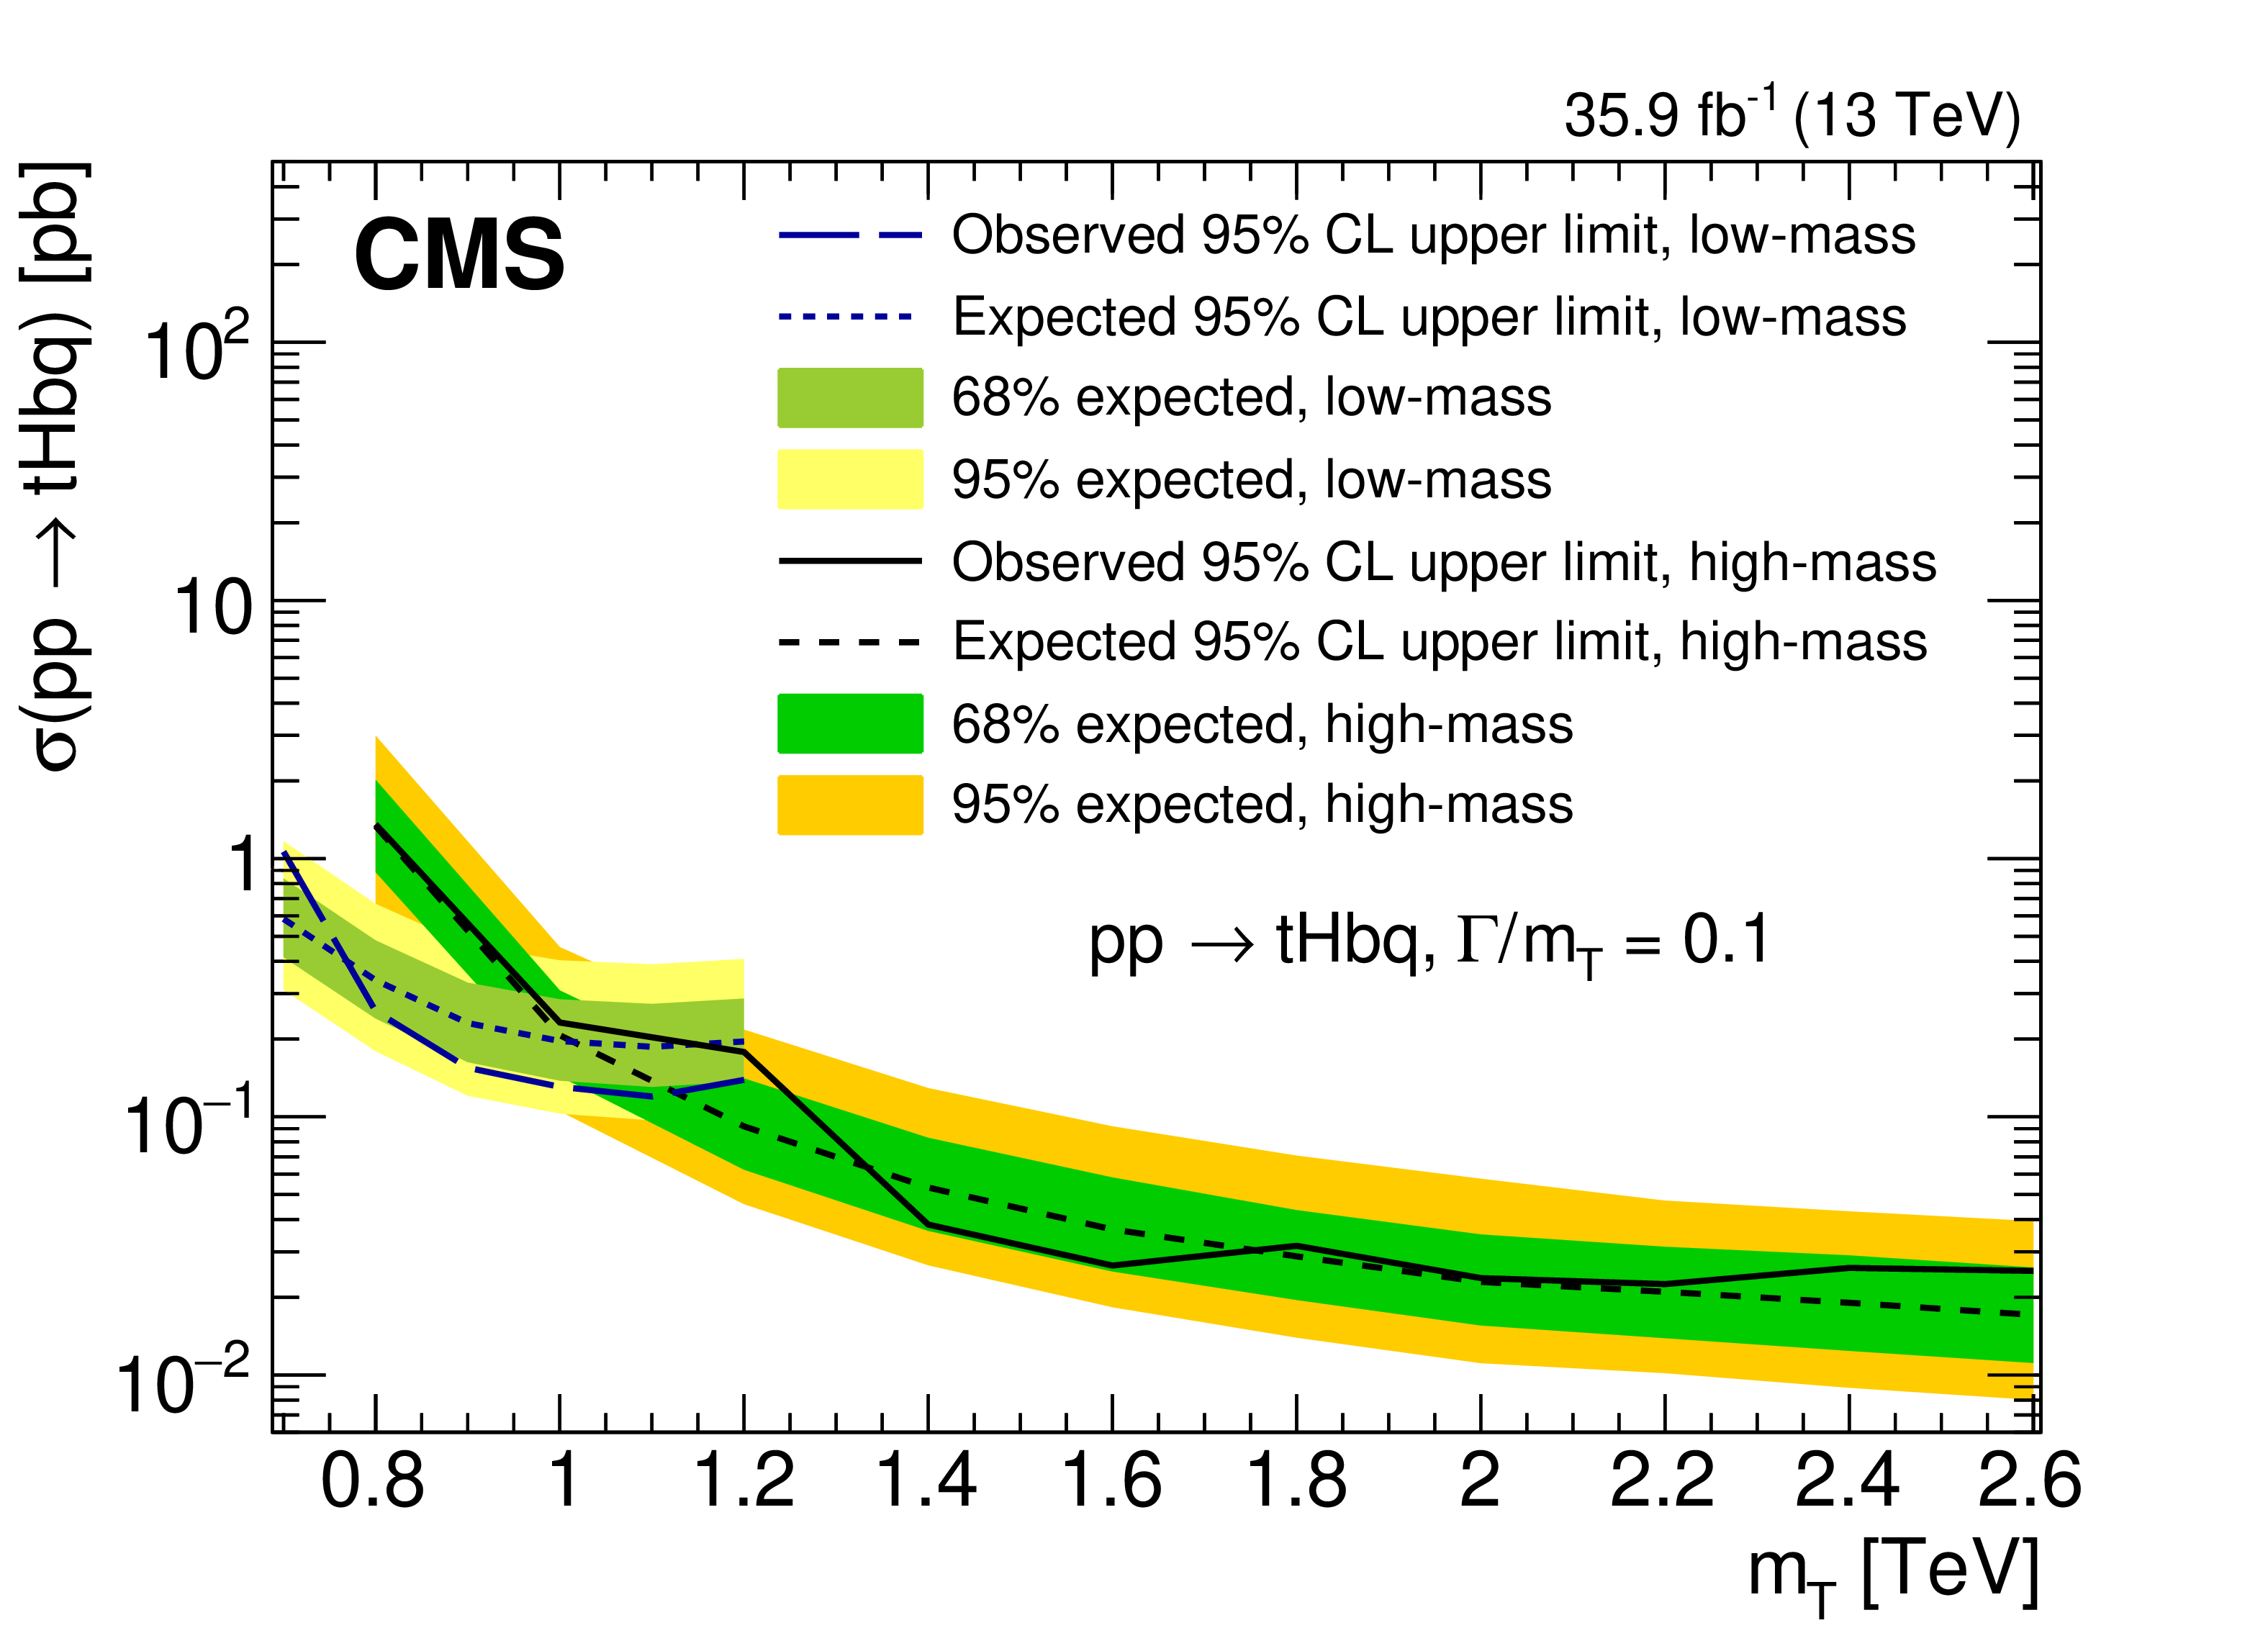
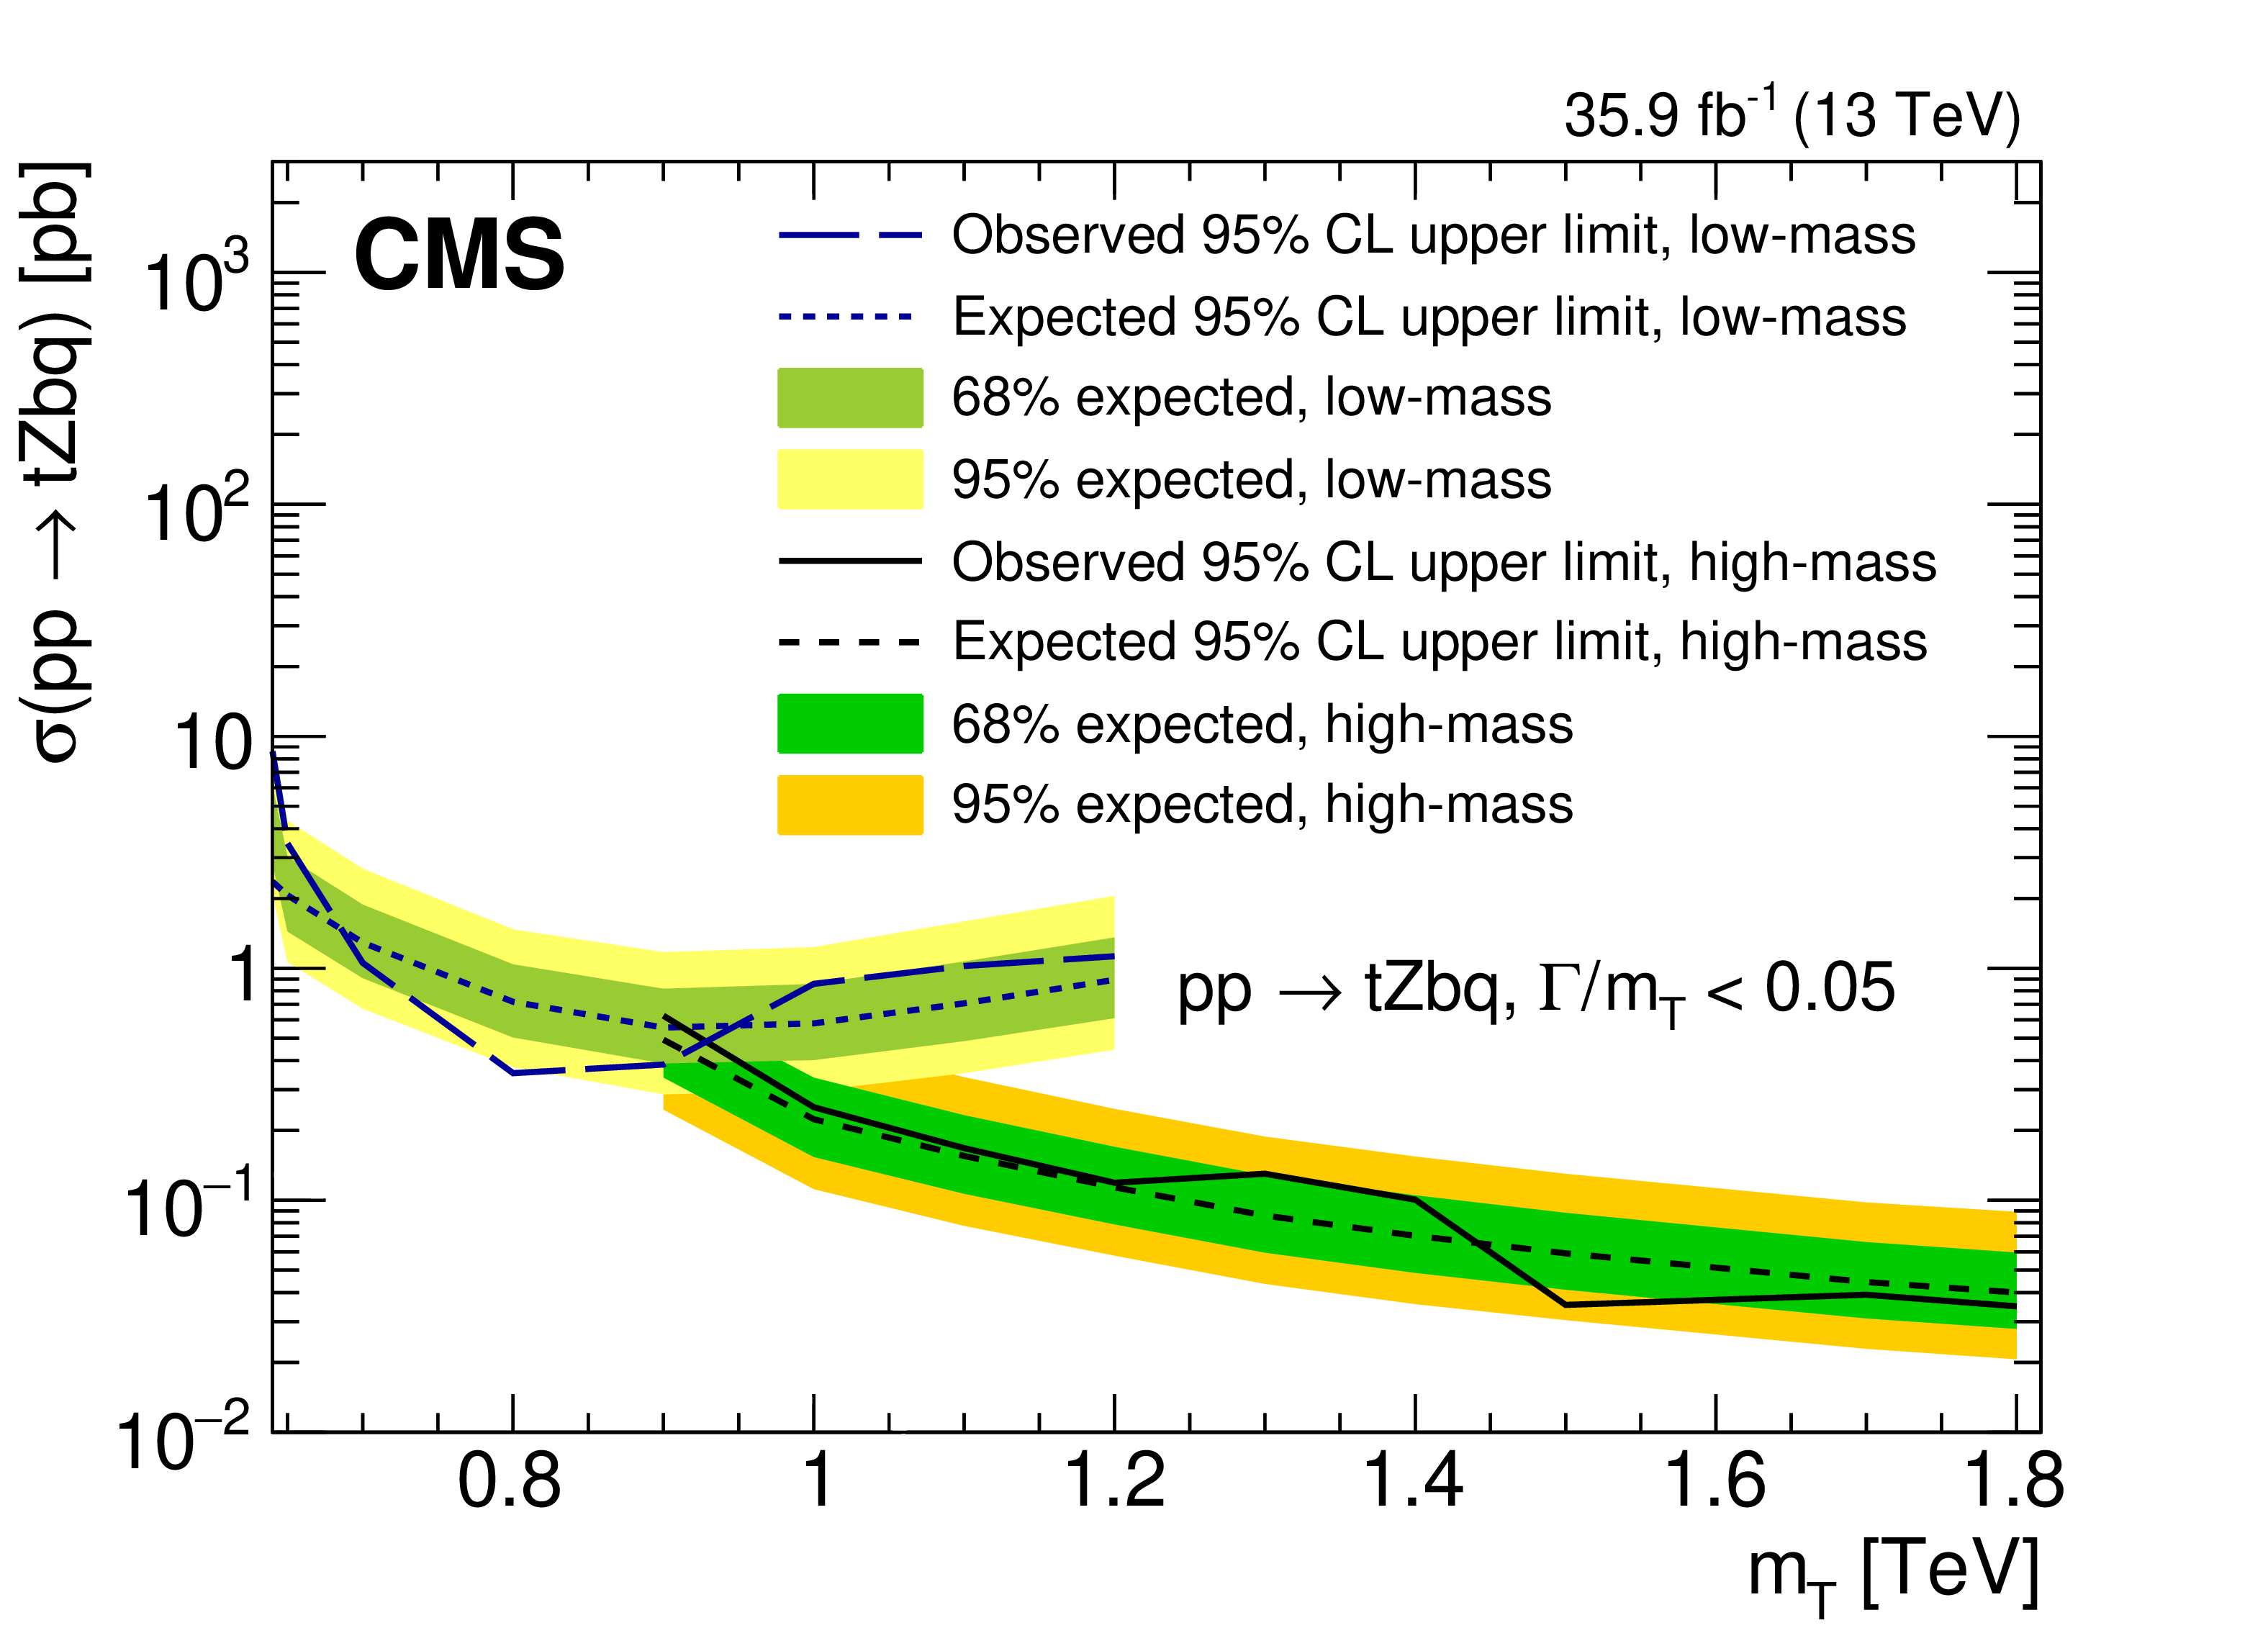
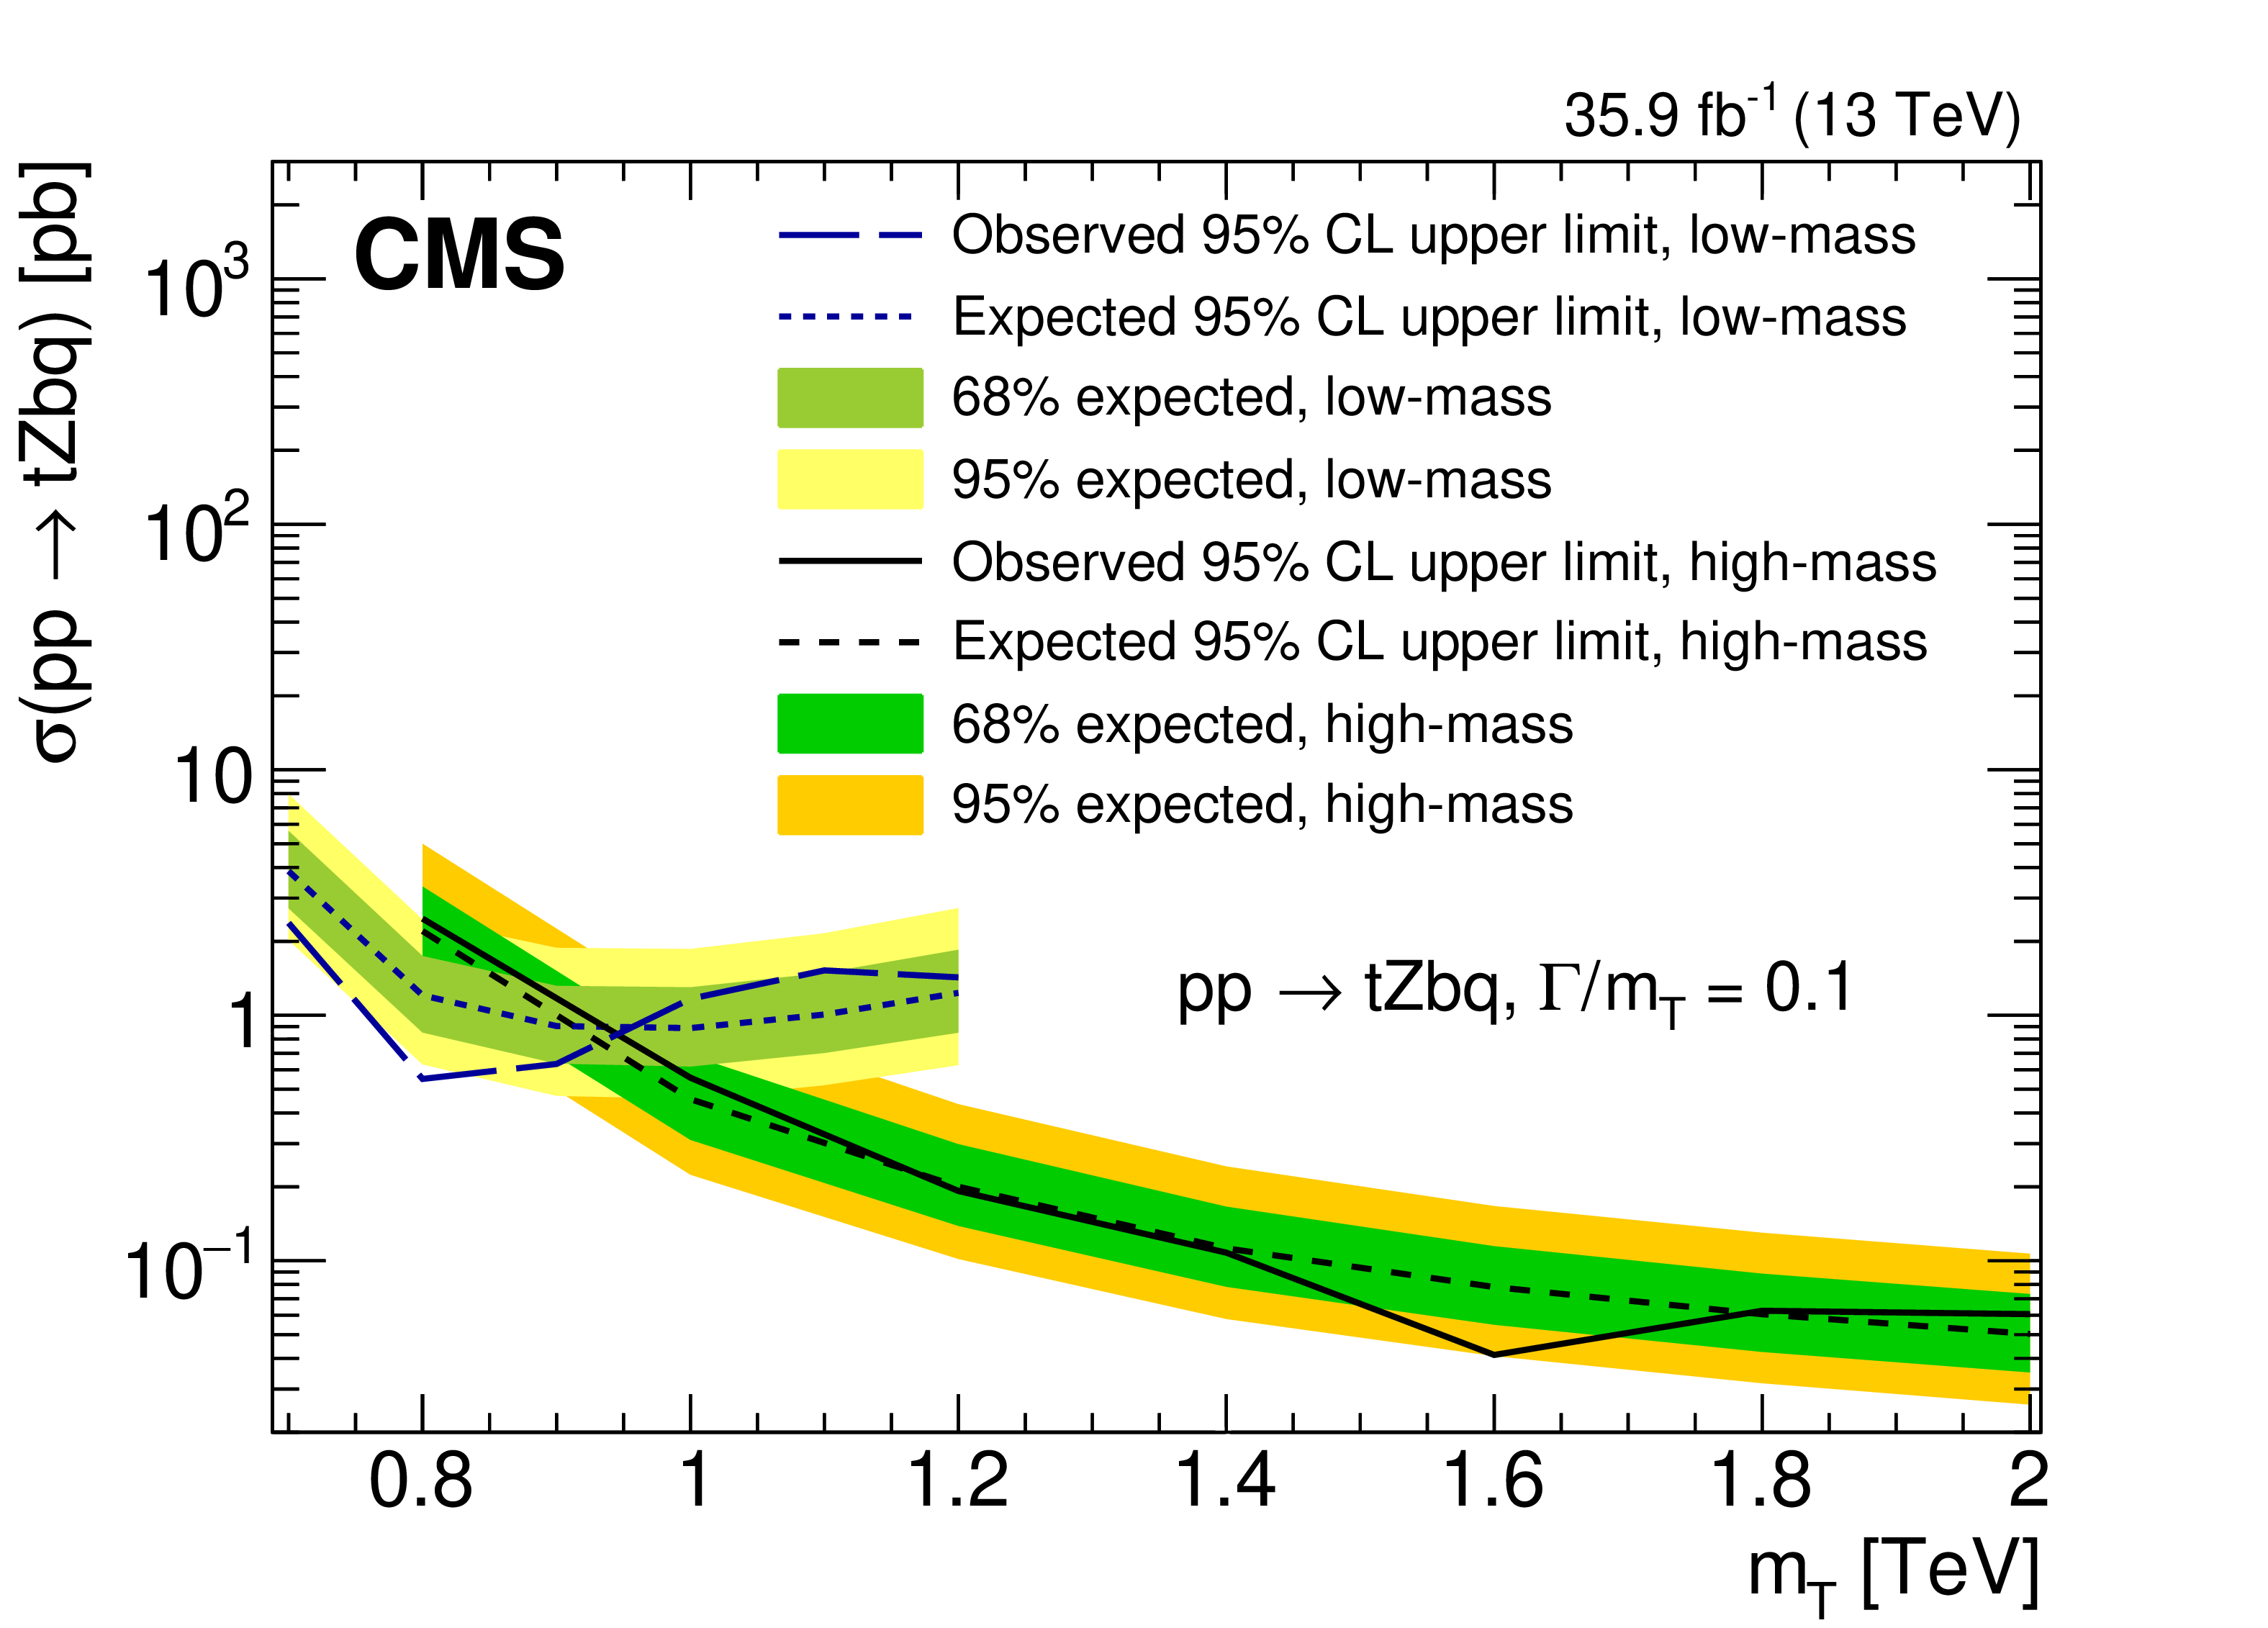
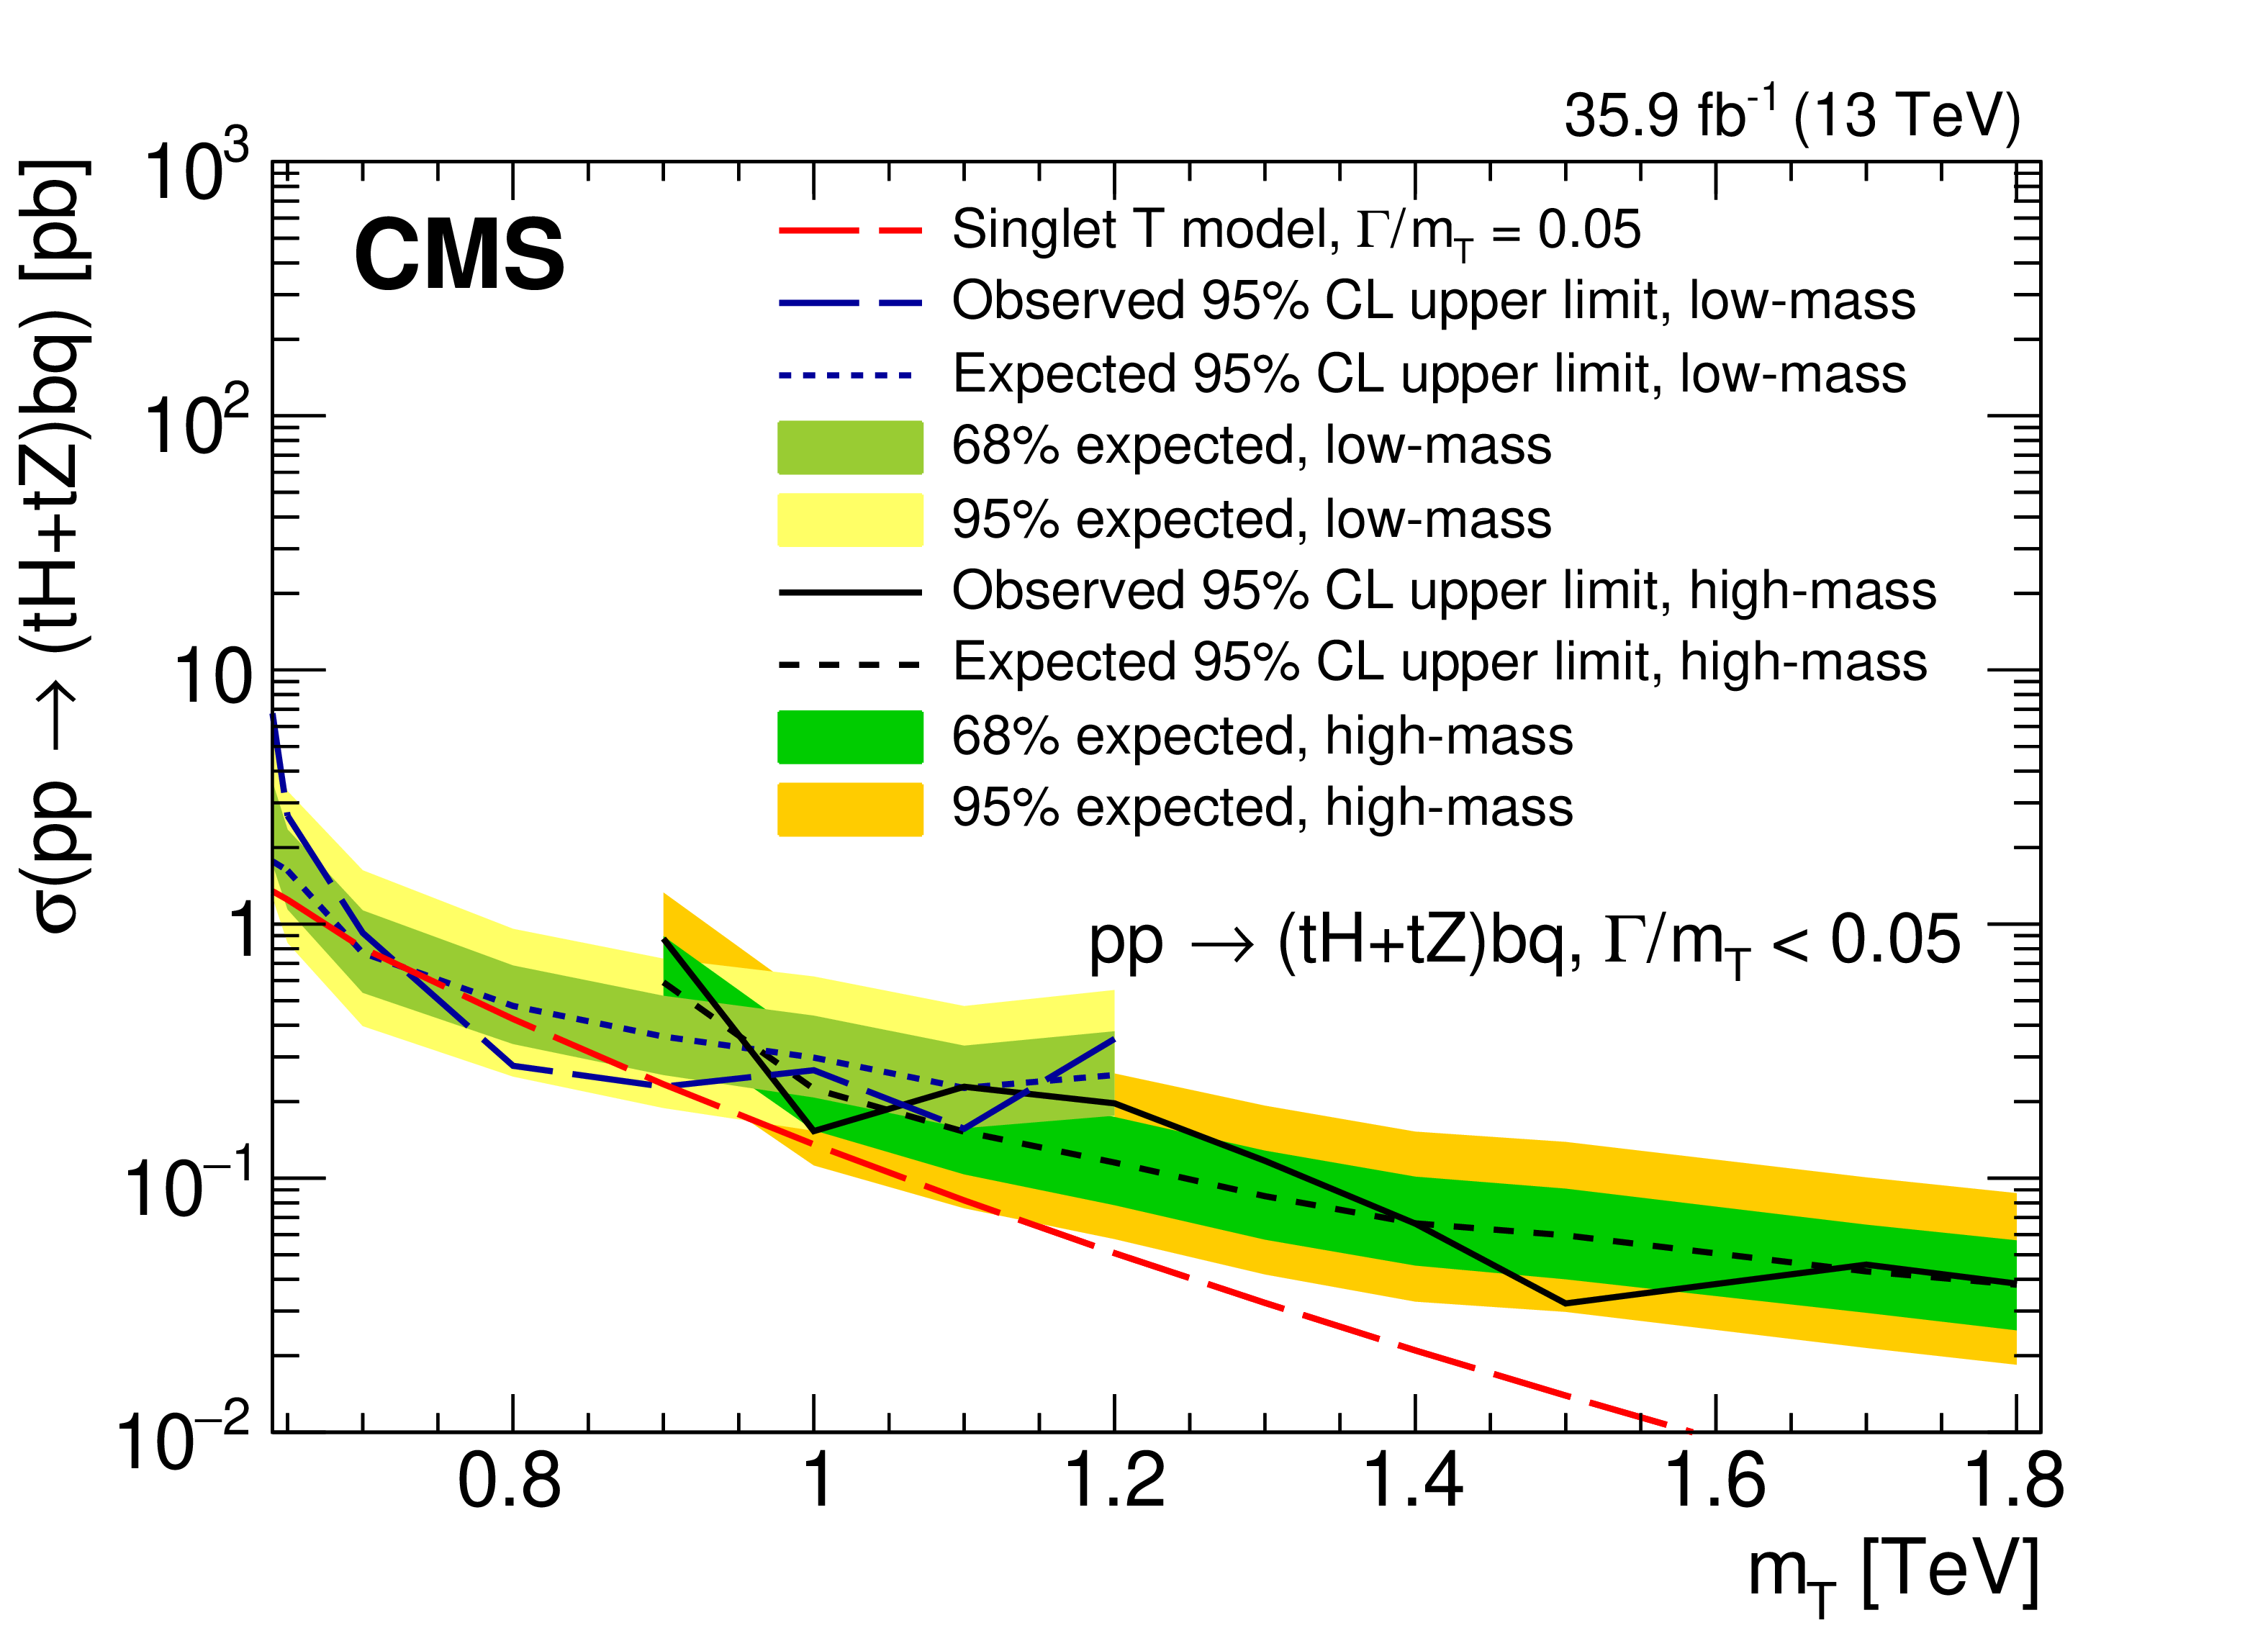
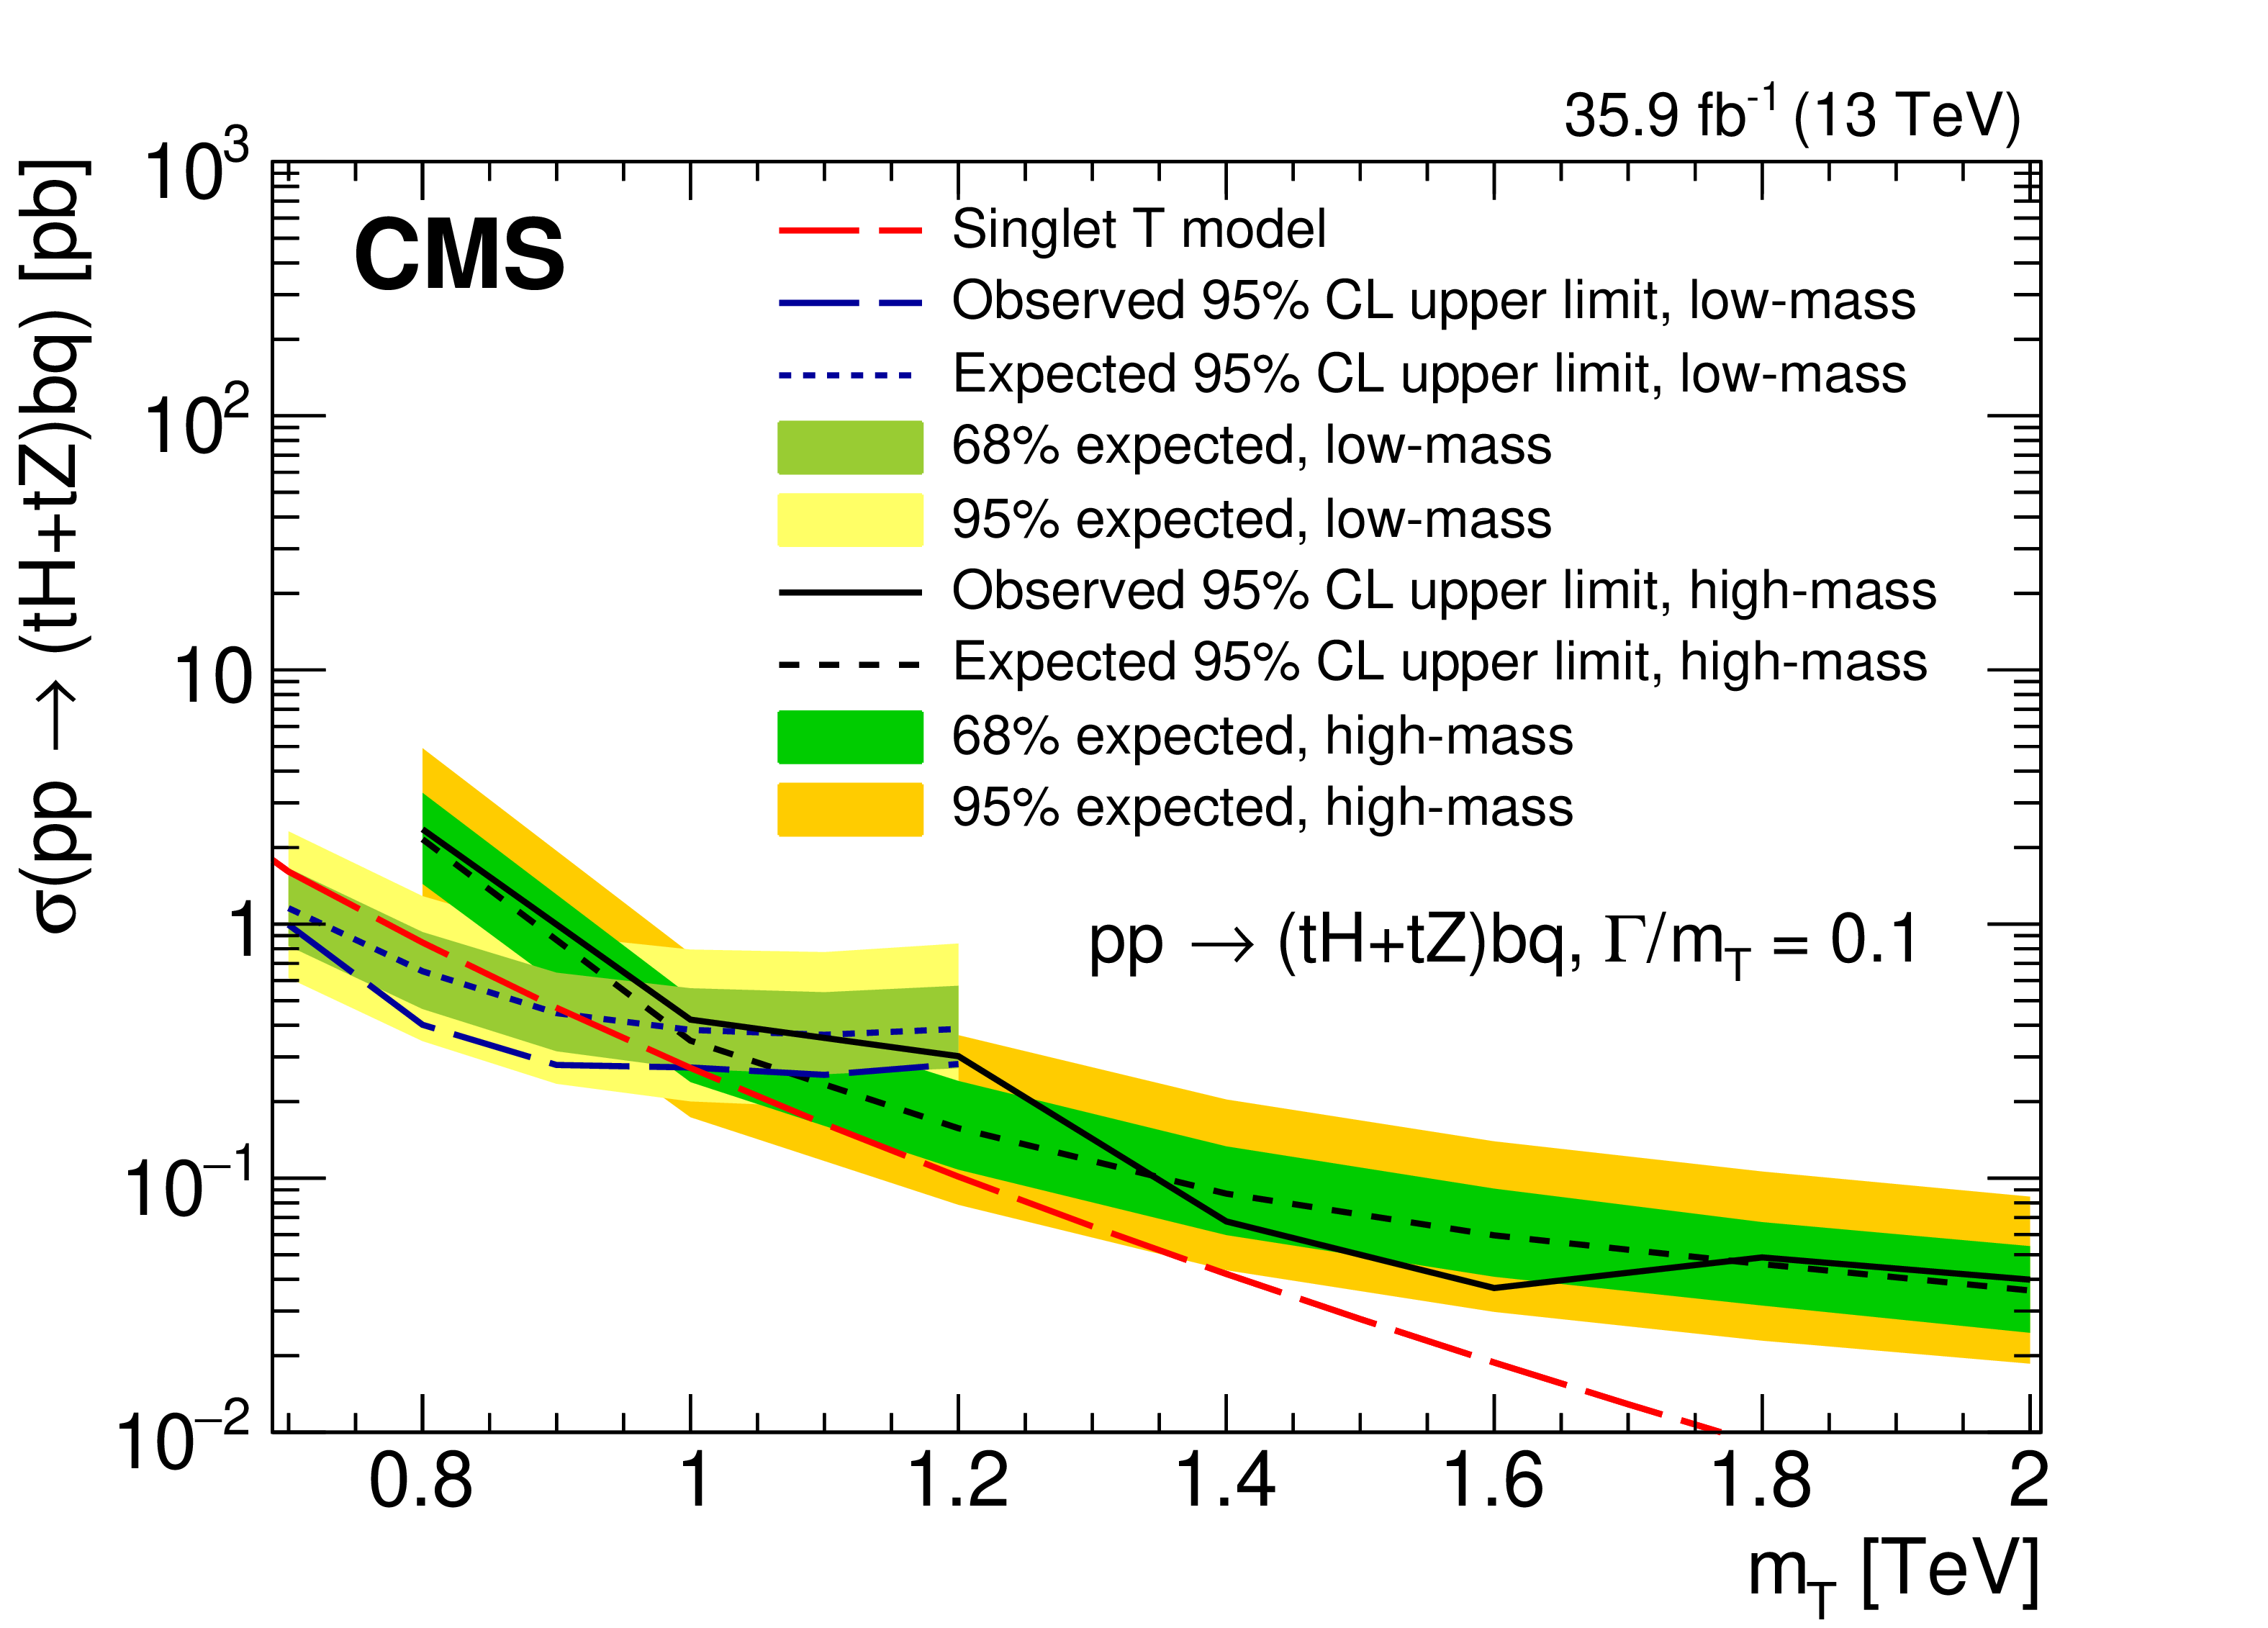
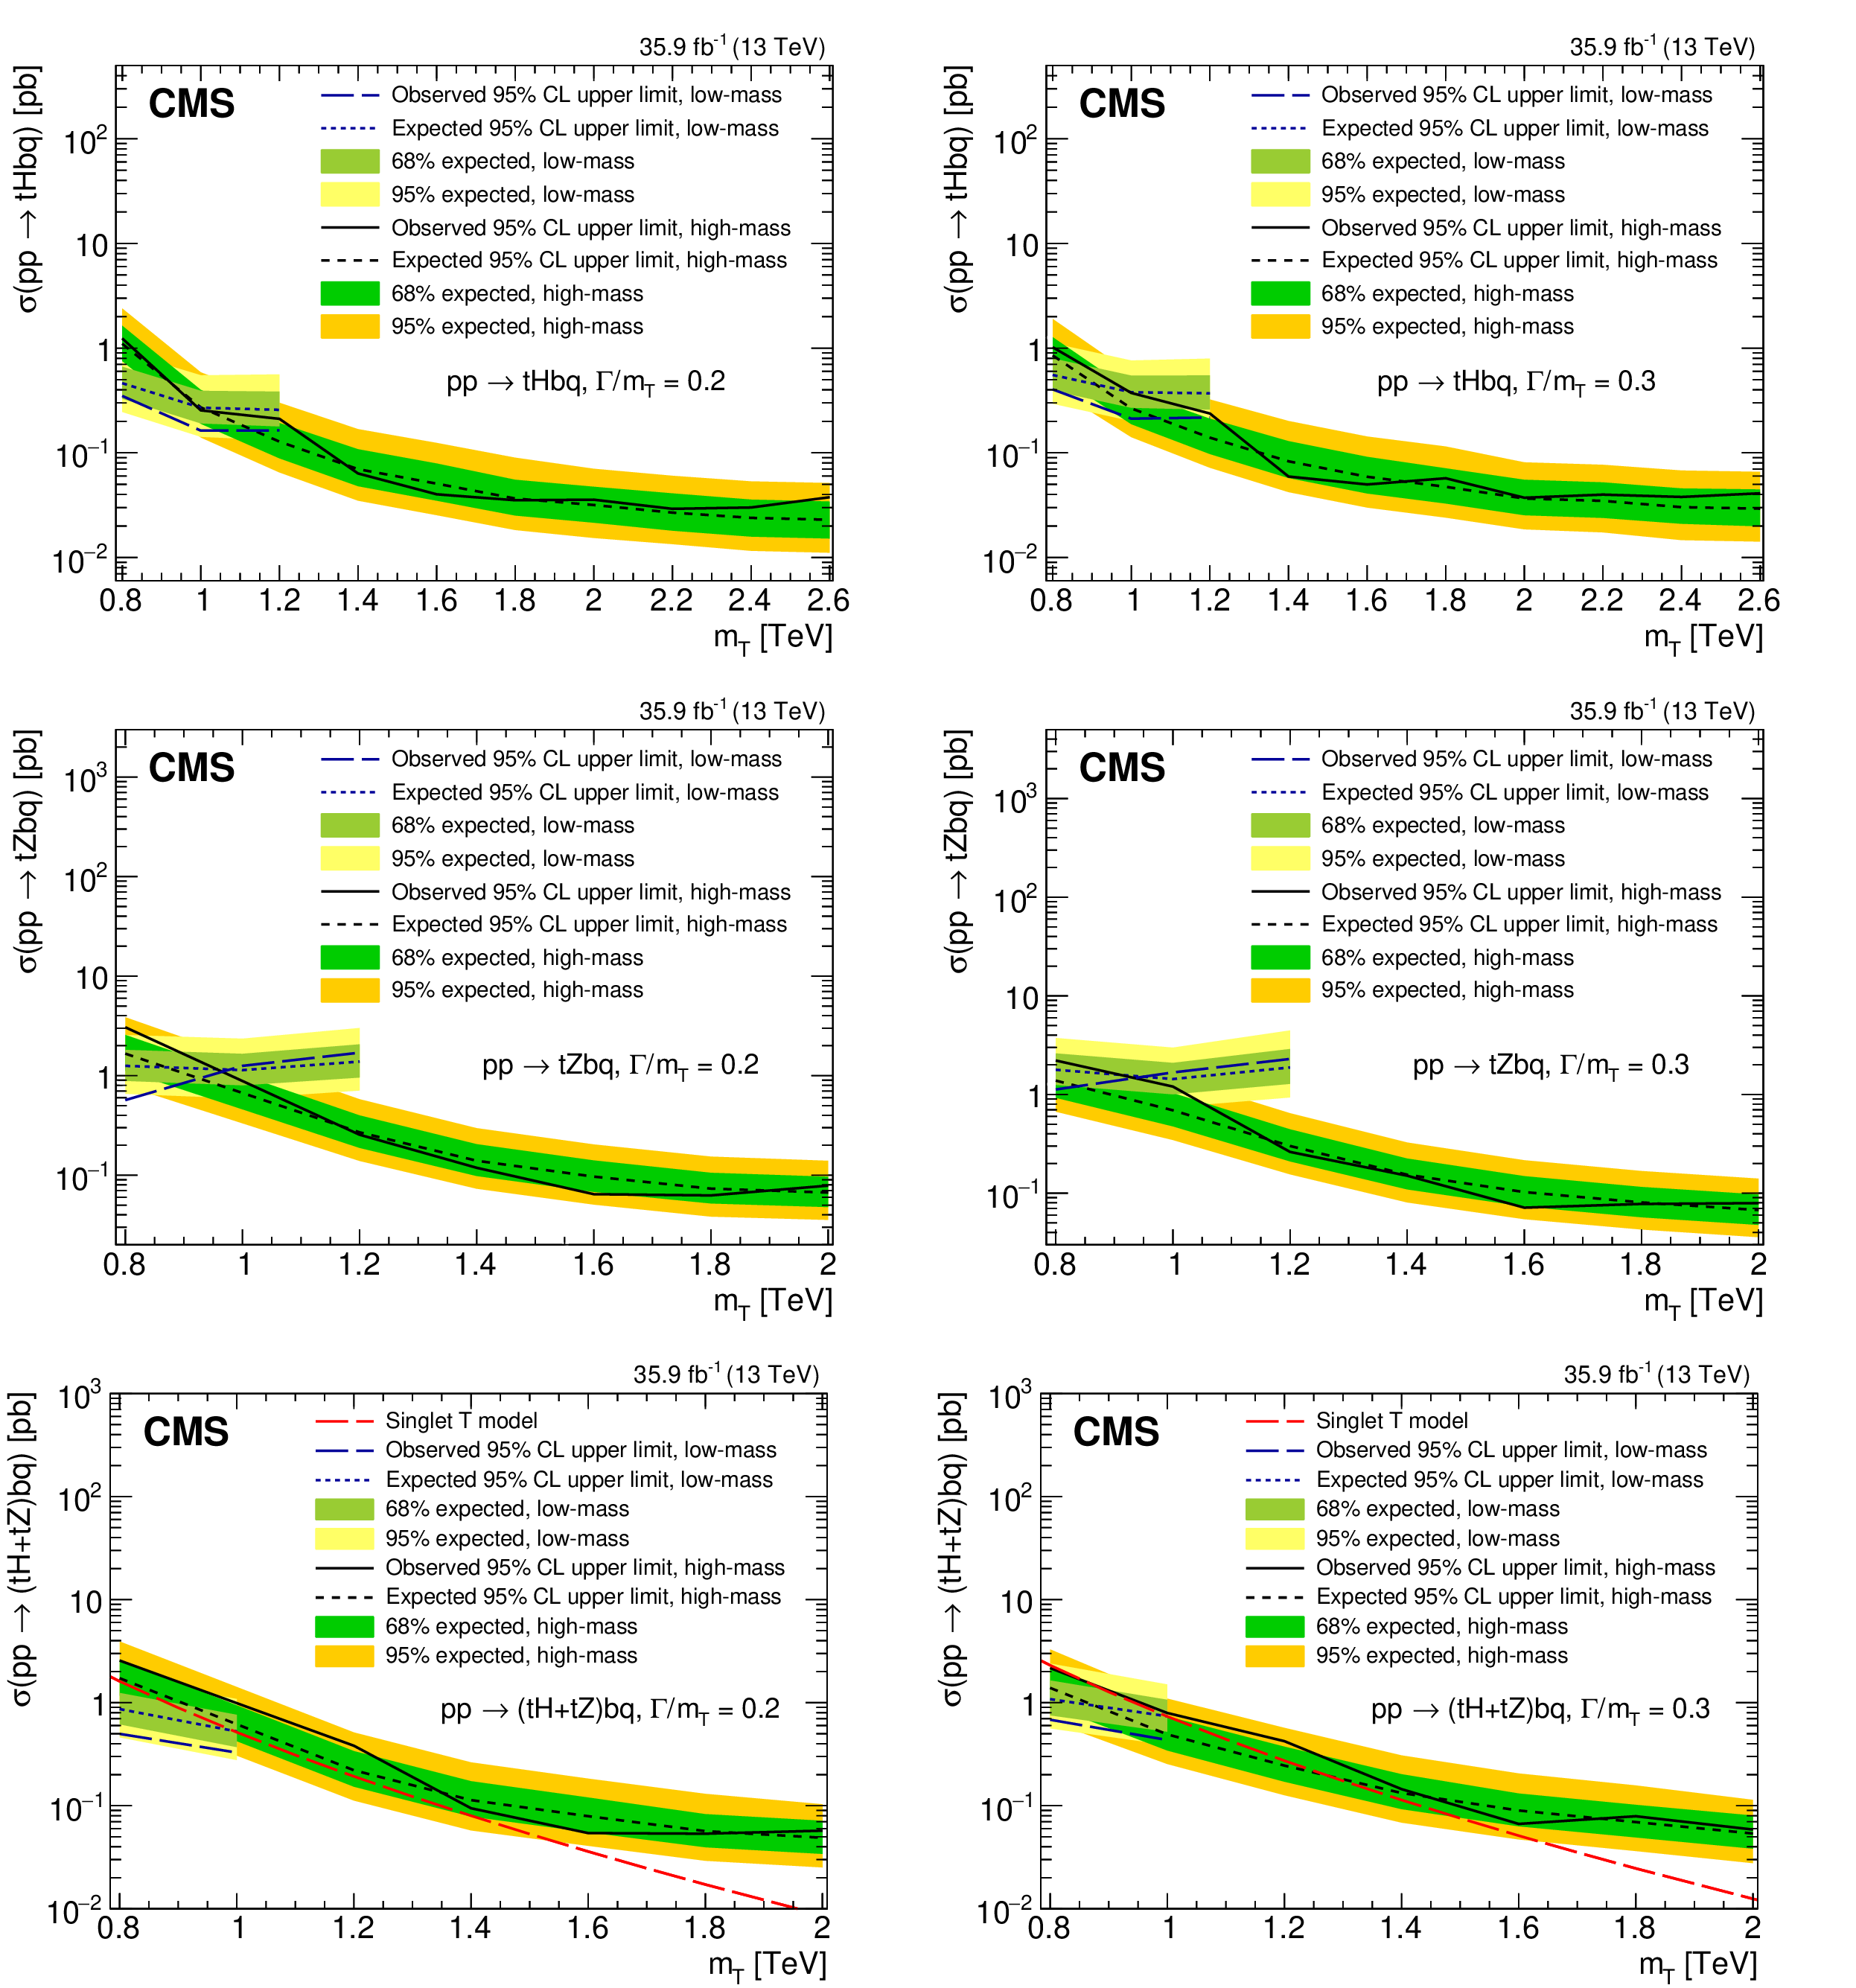
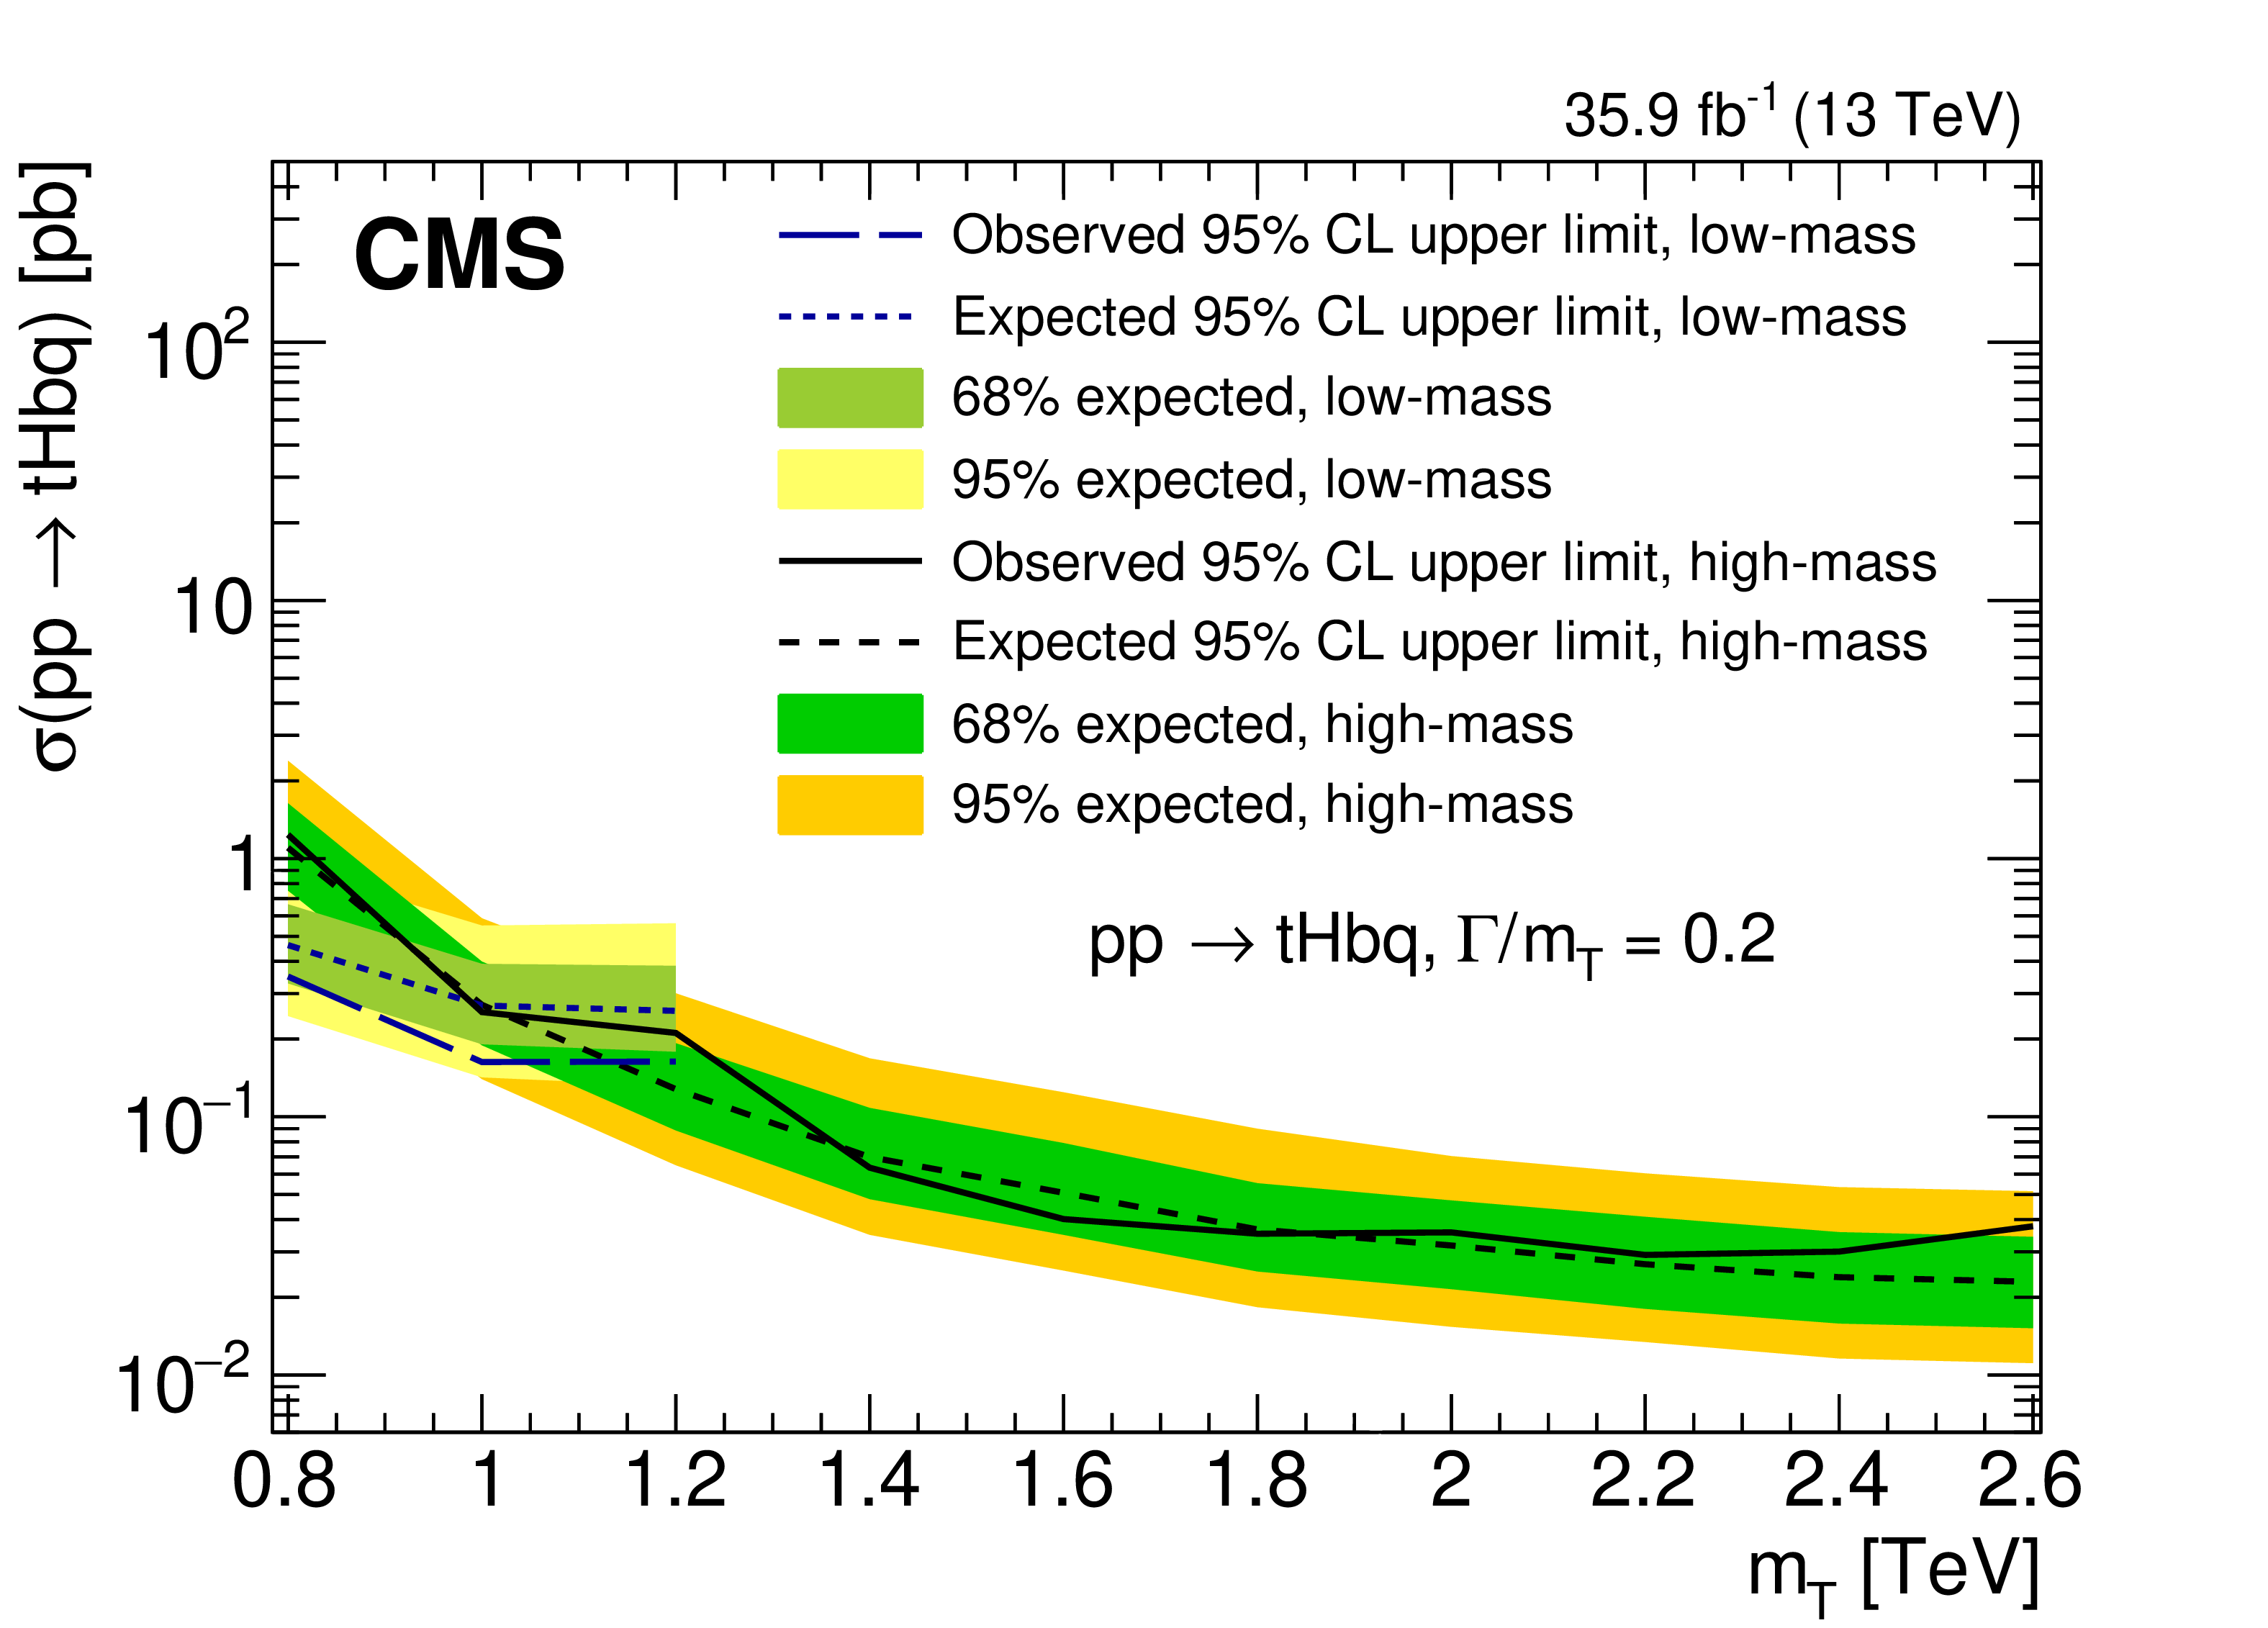
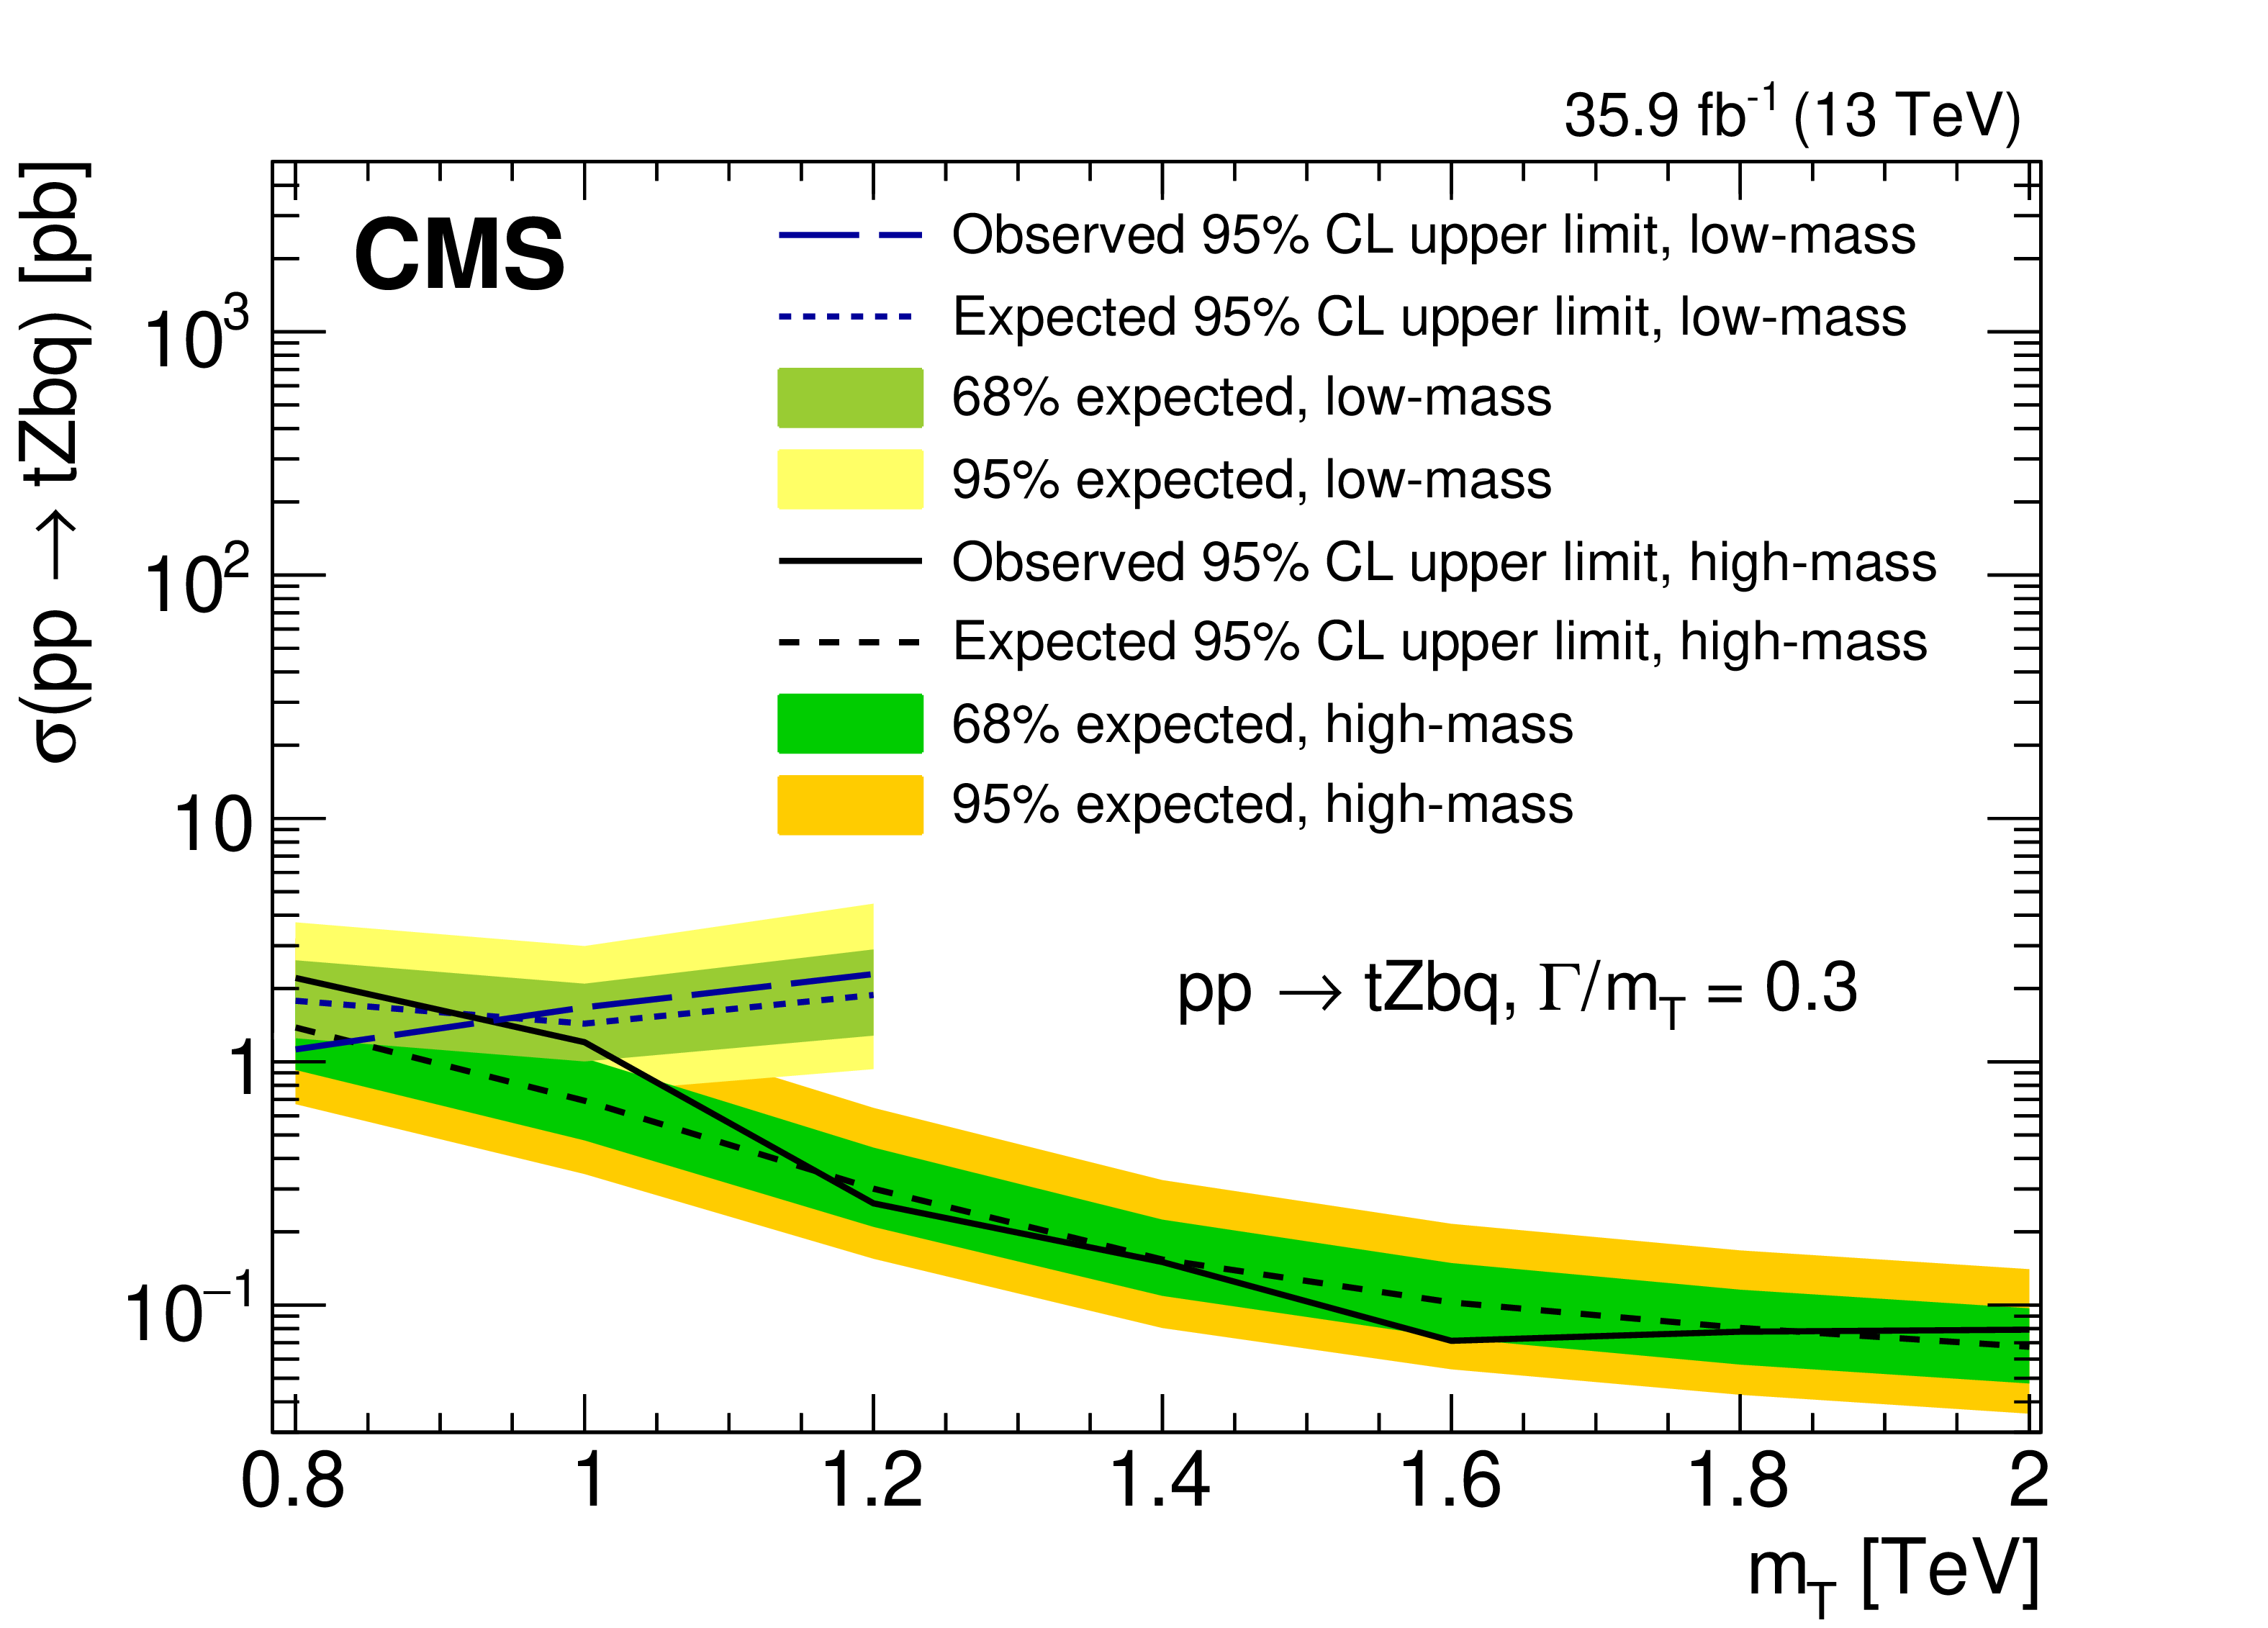
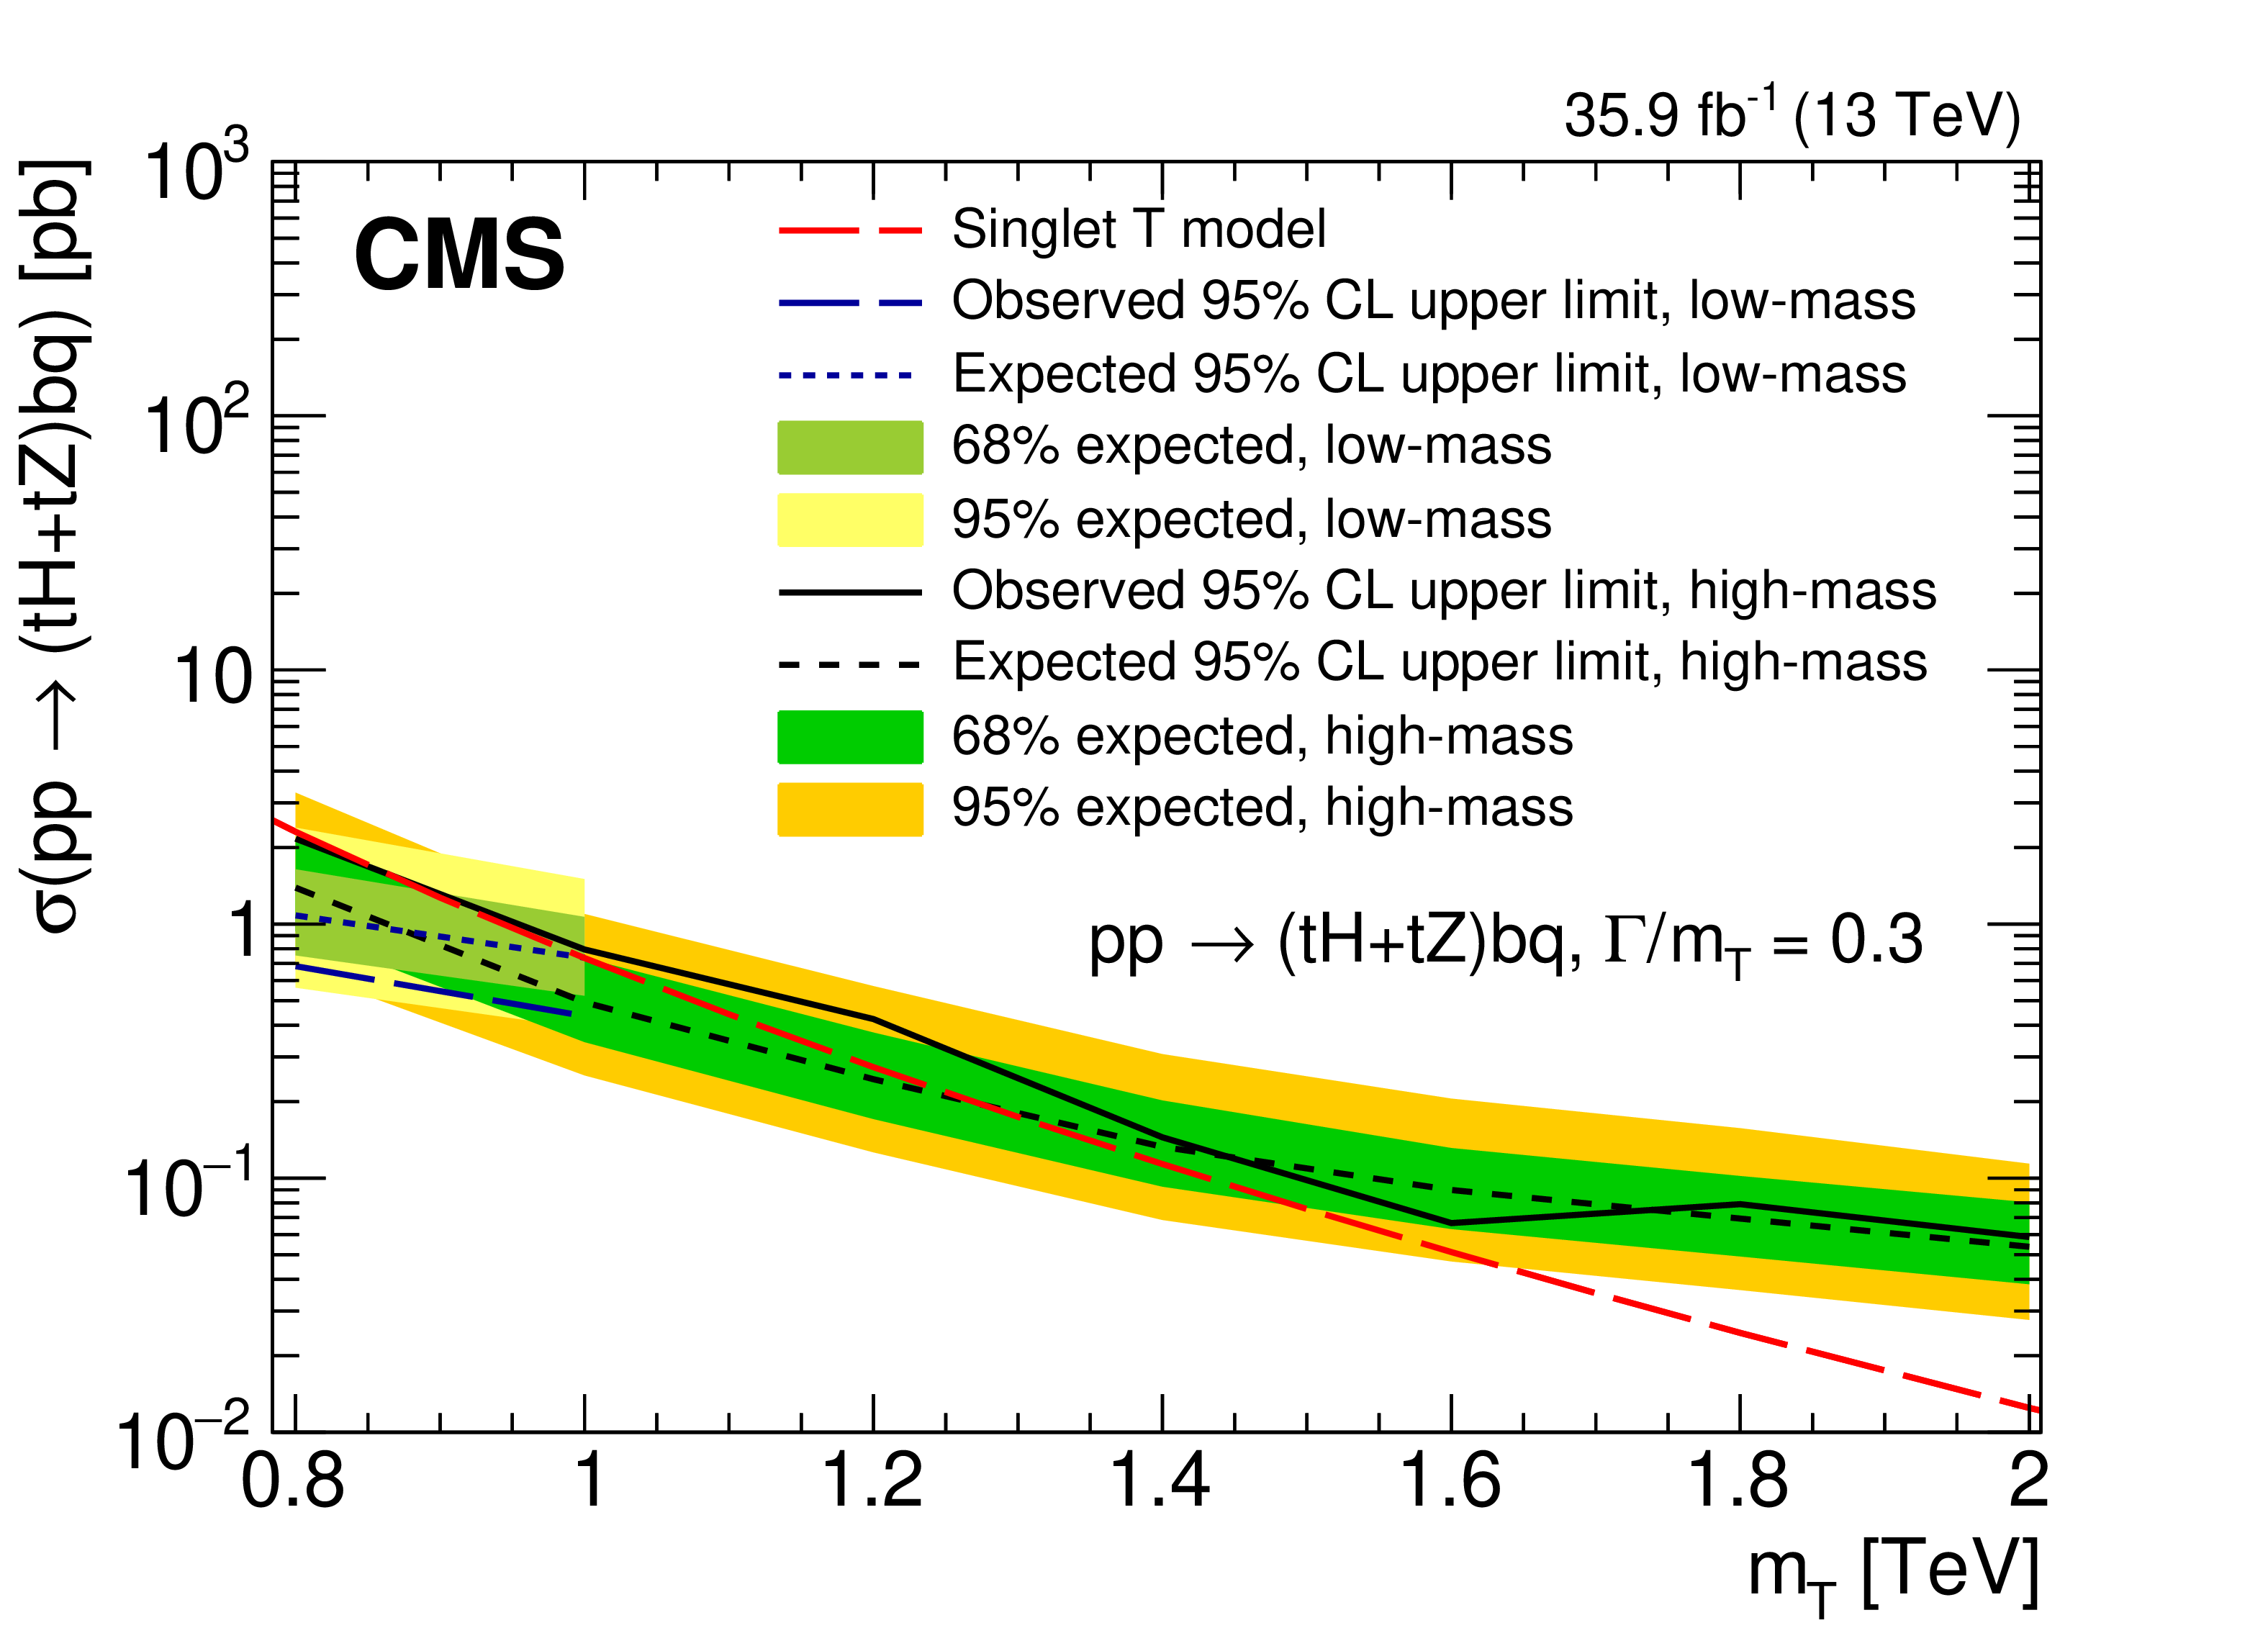
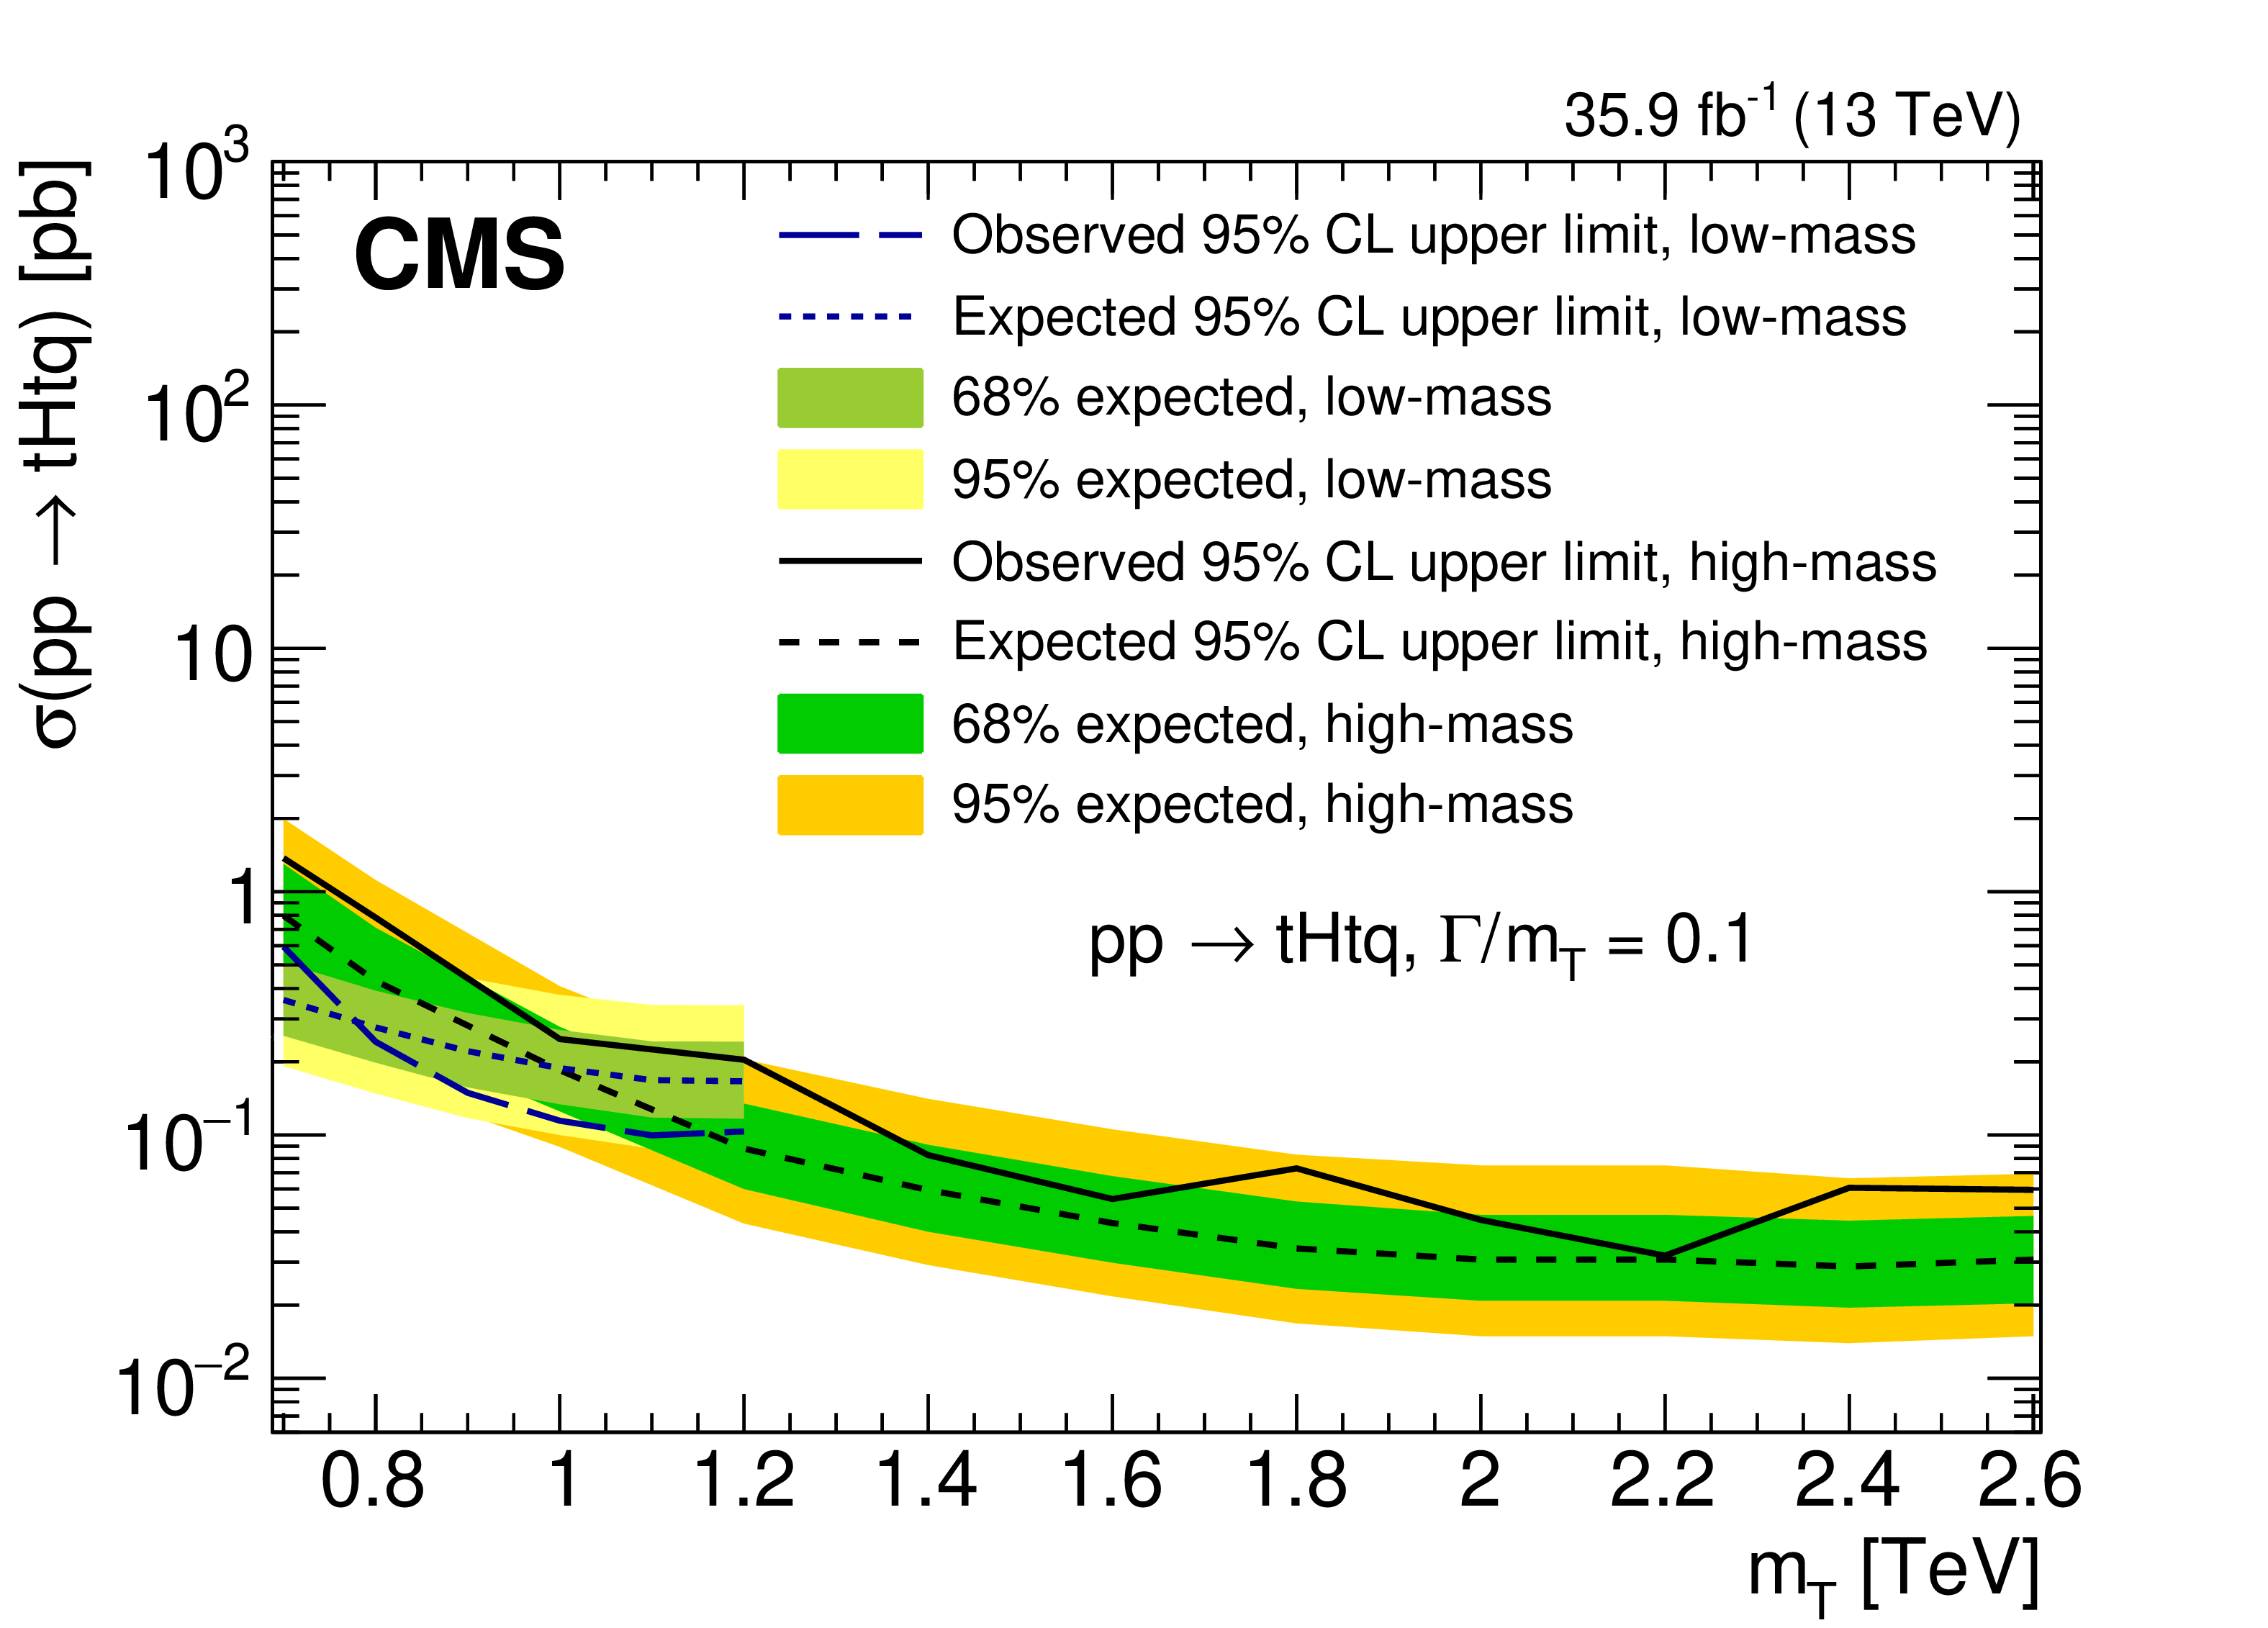
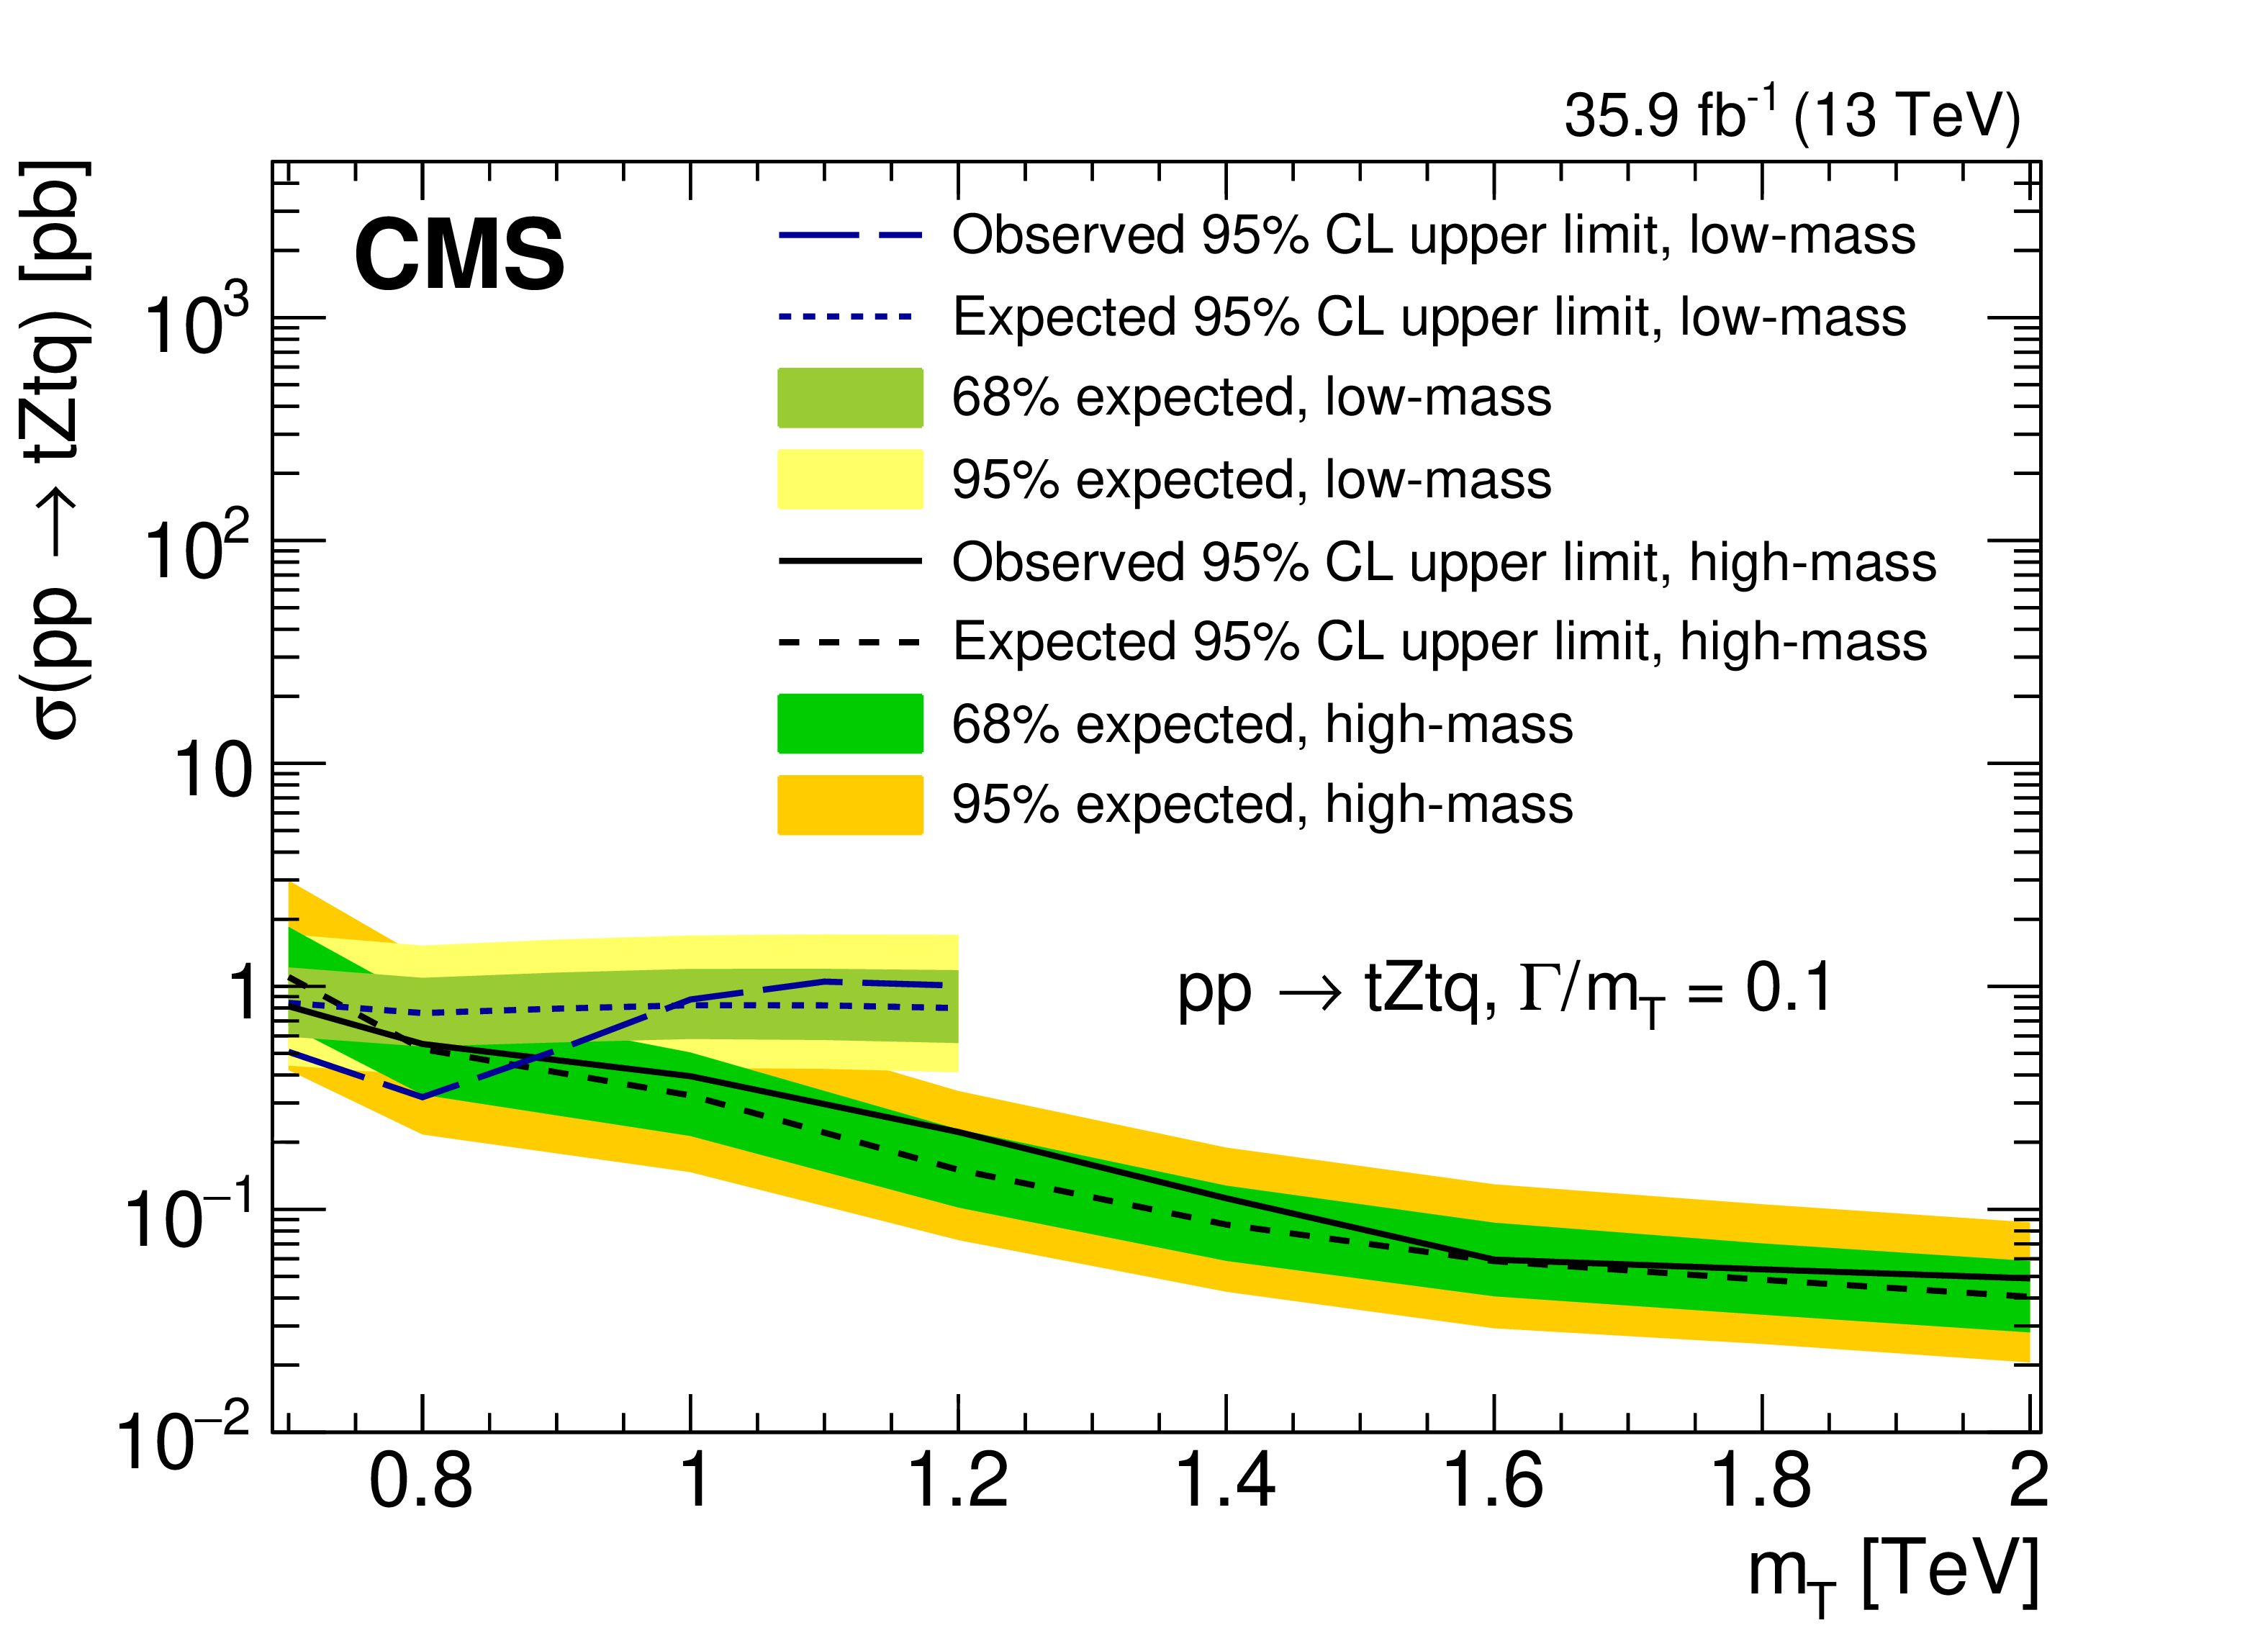
Figure 8:
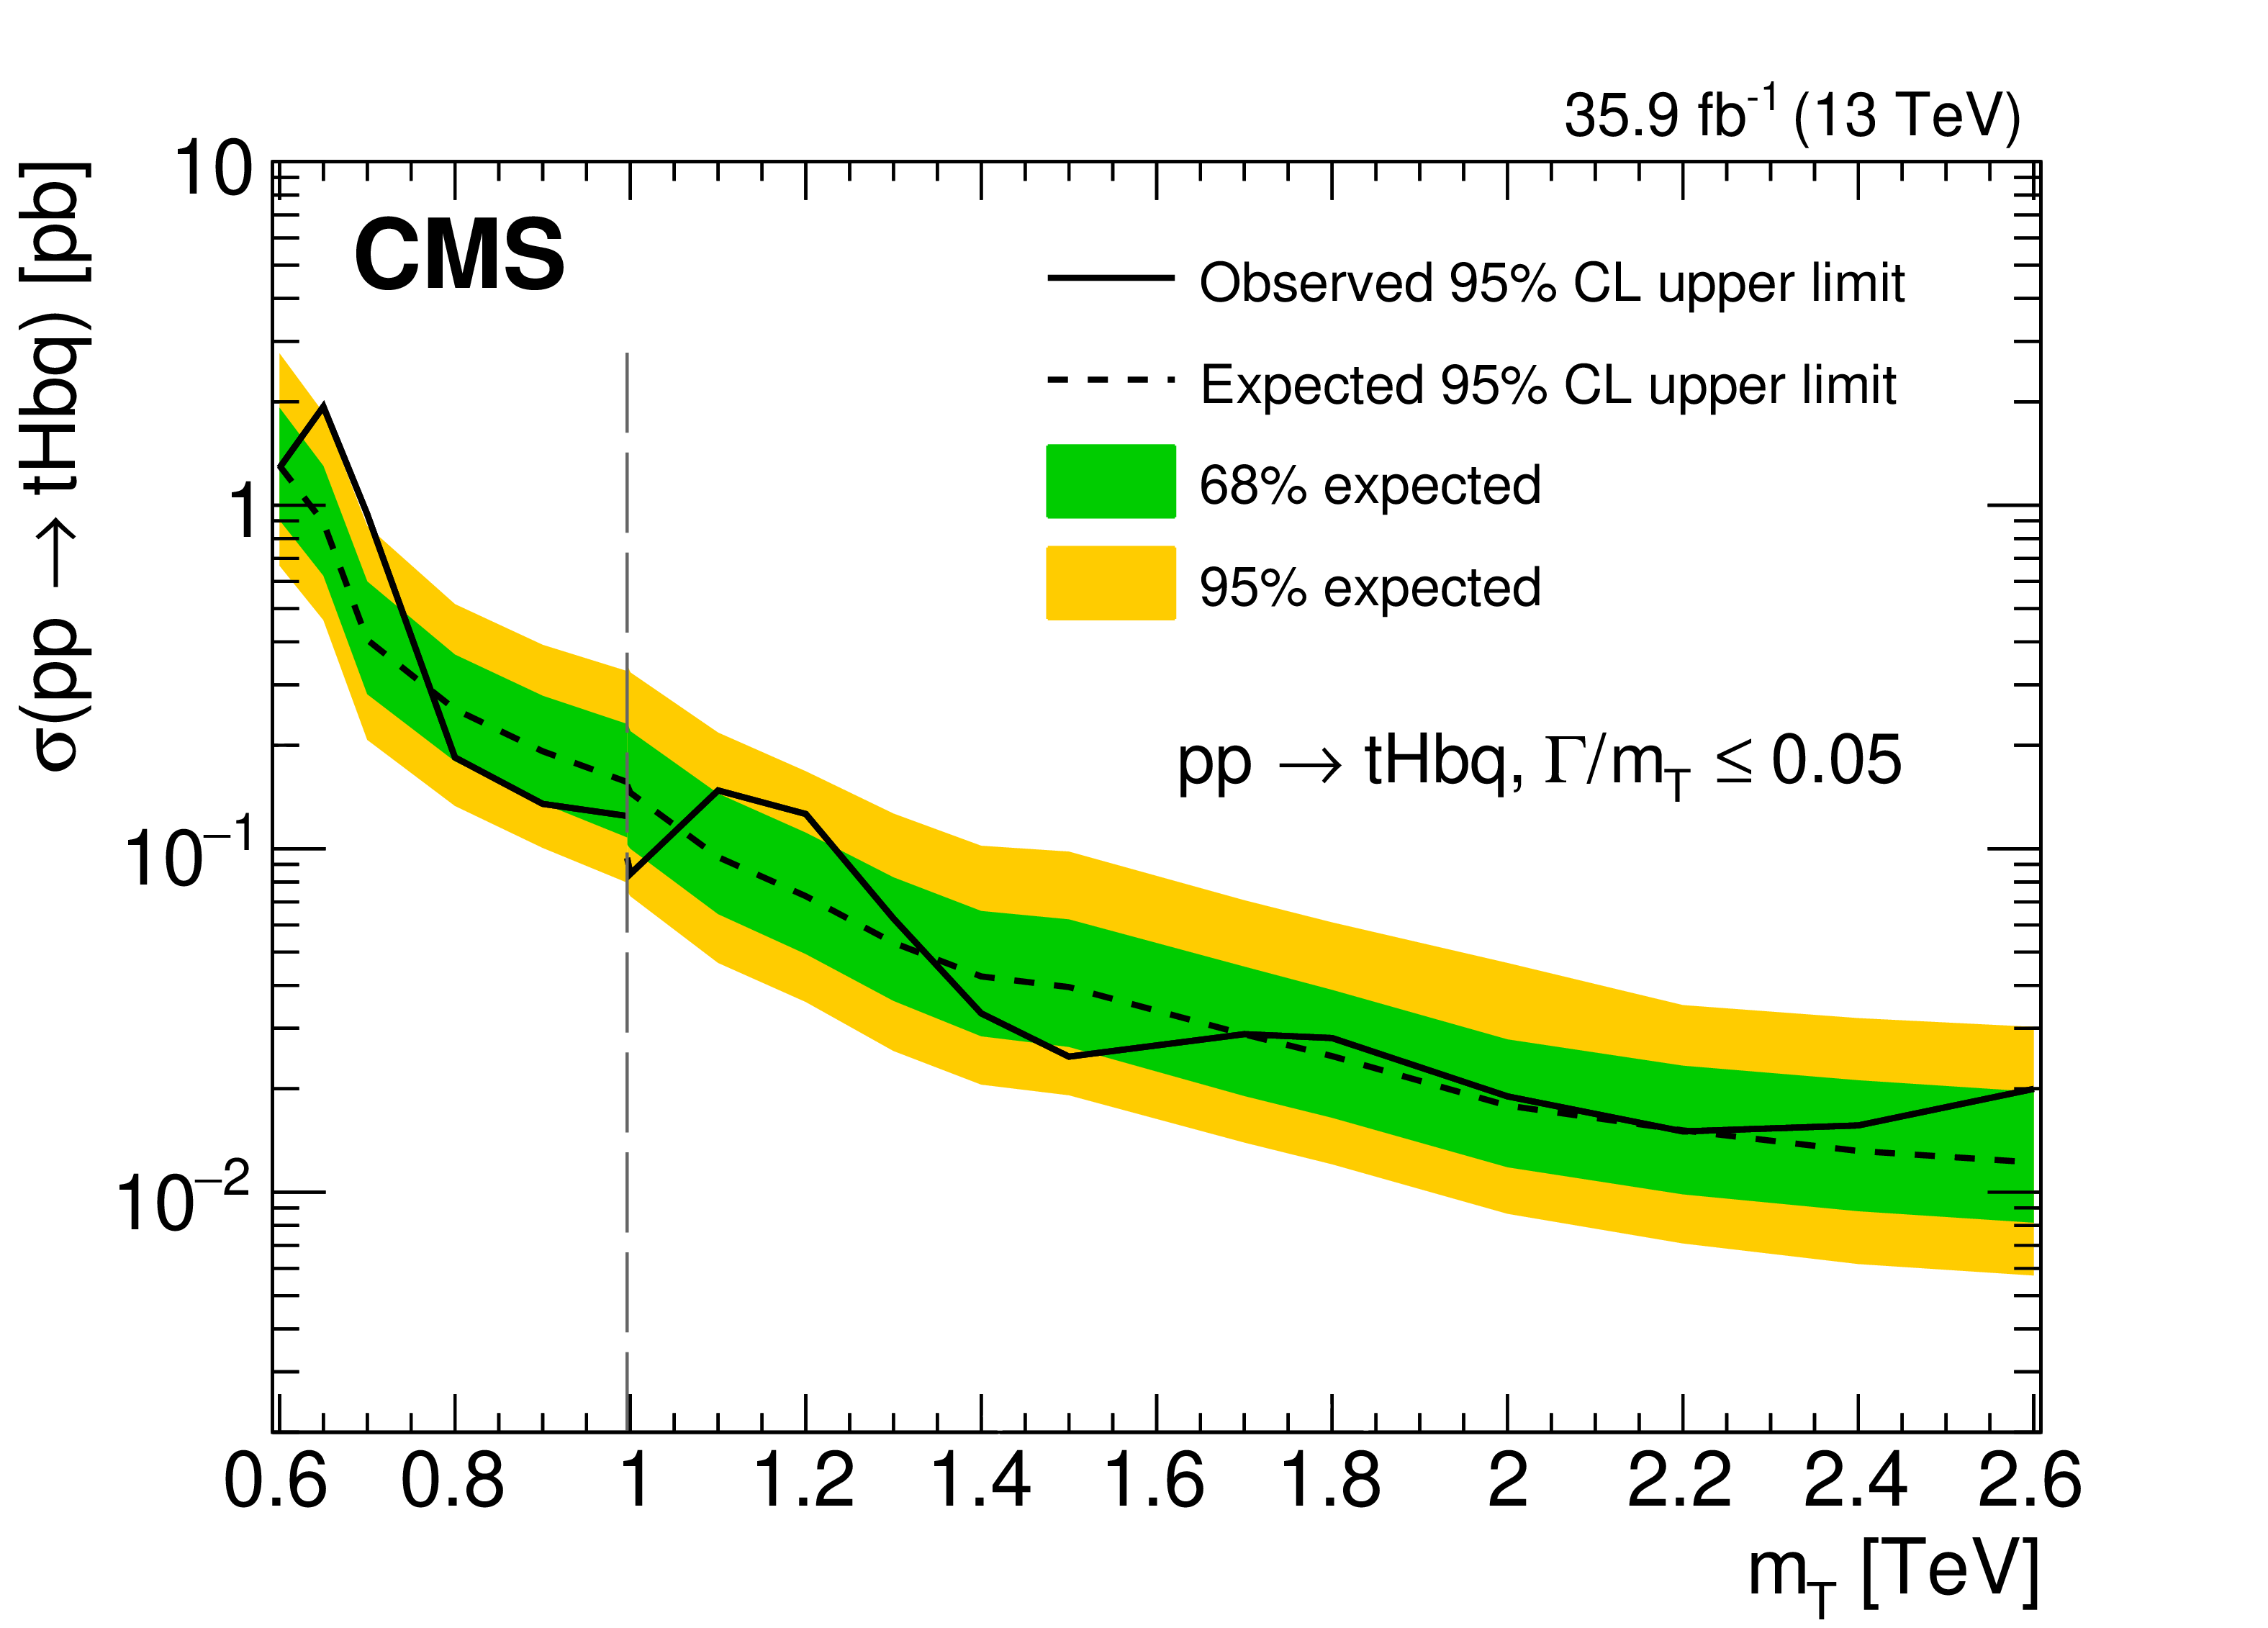
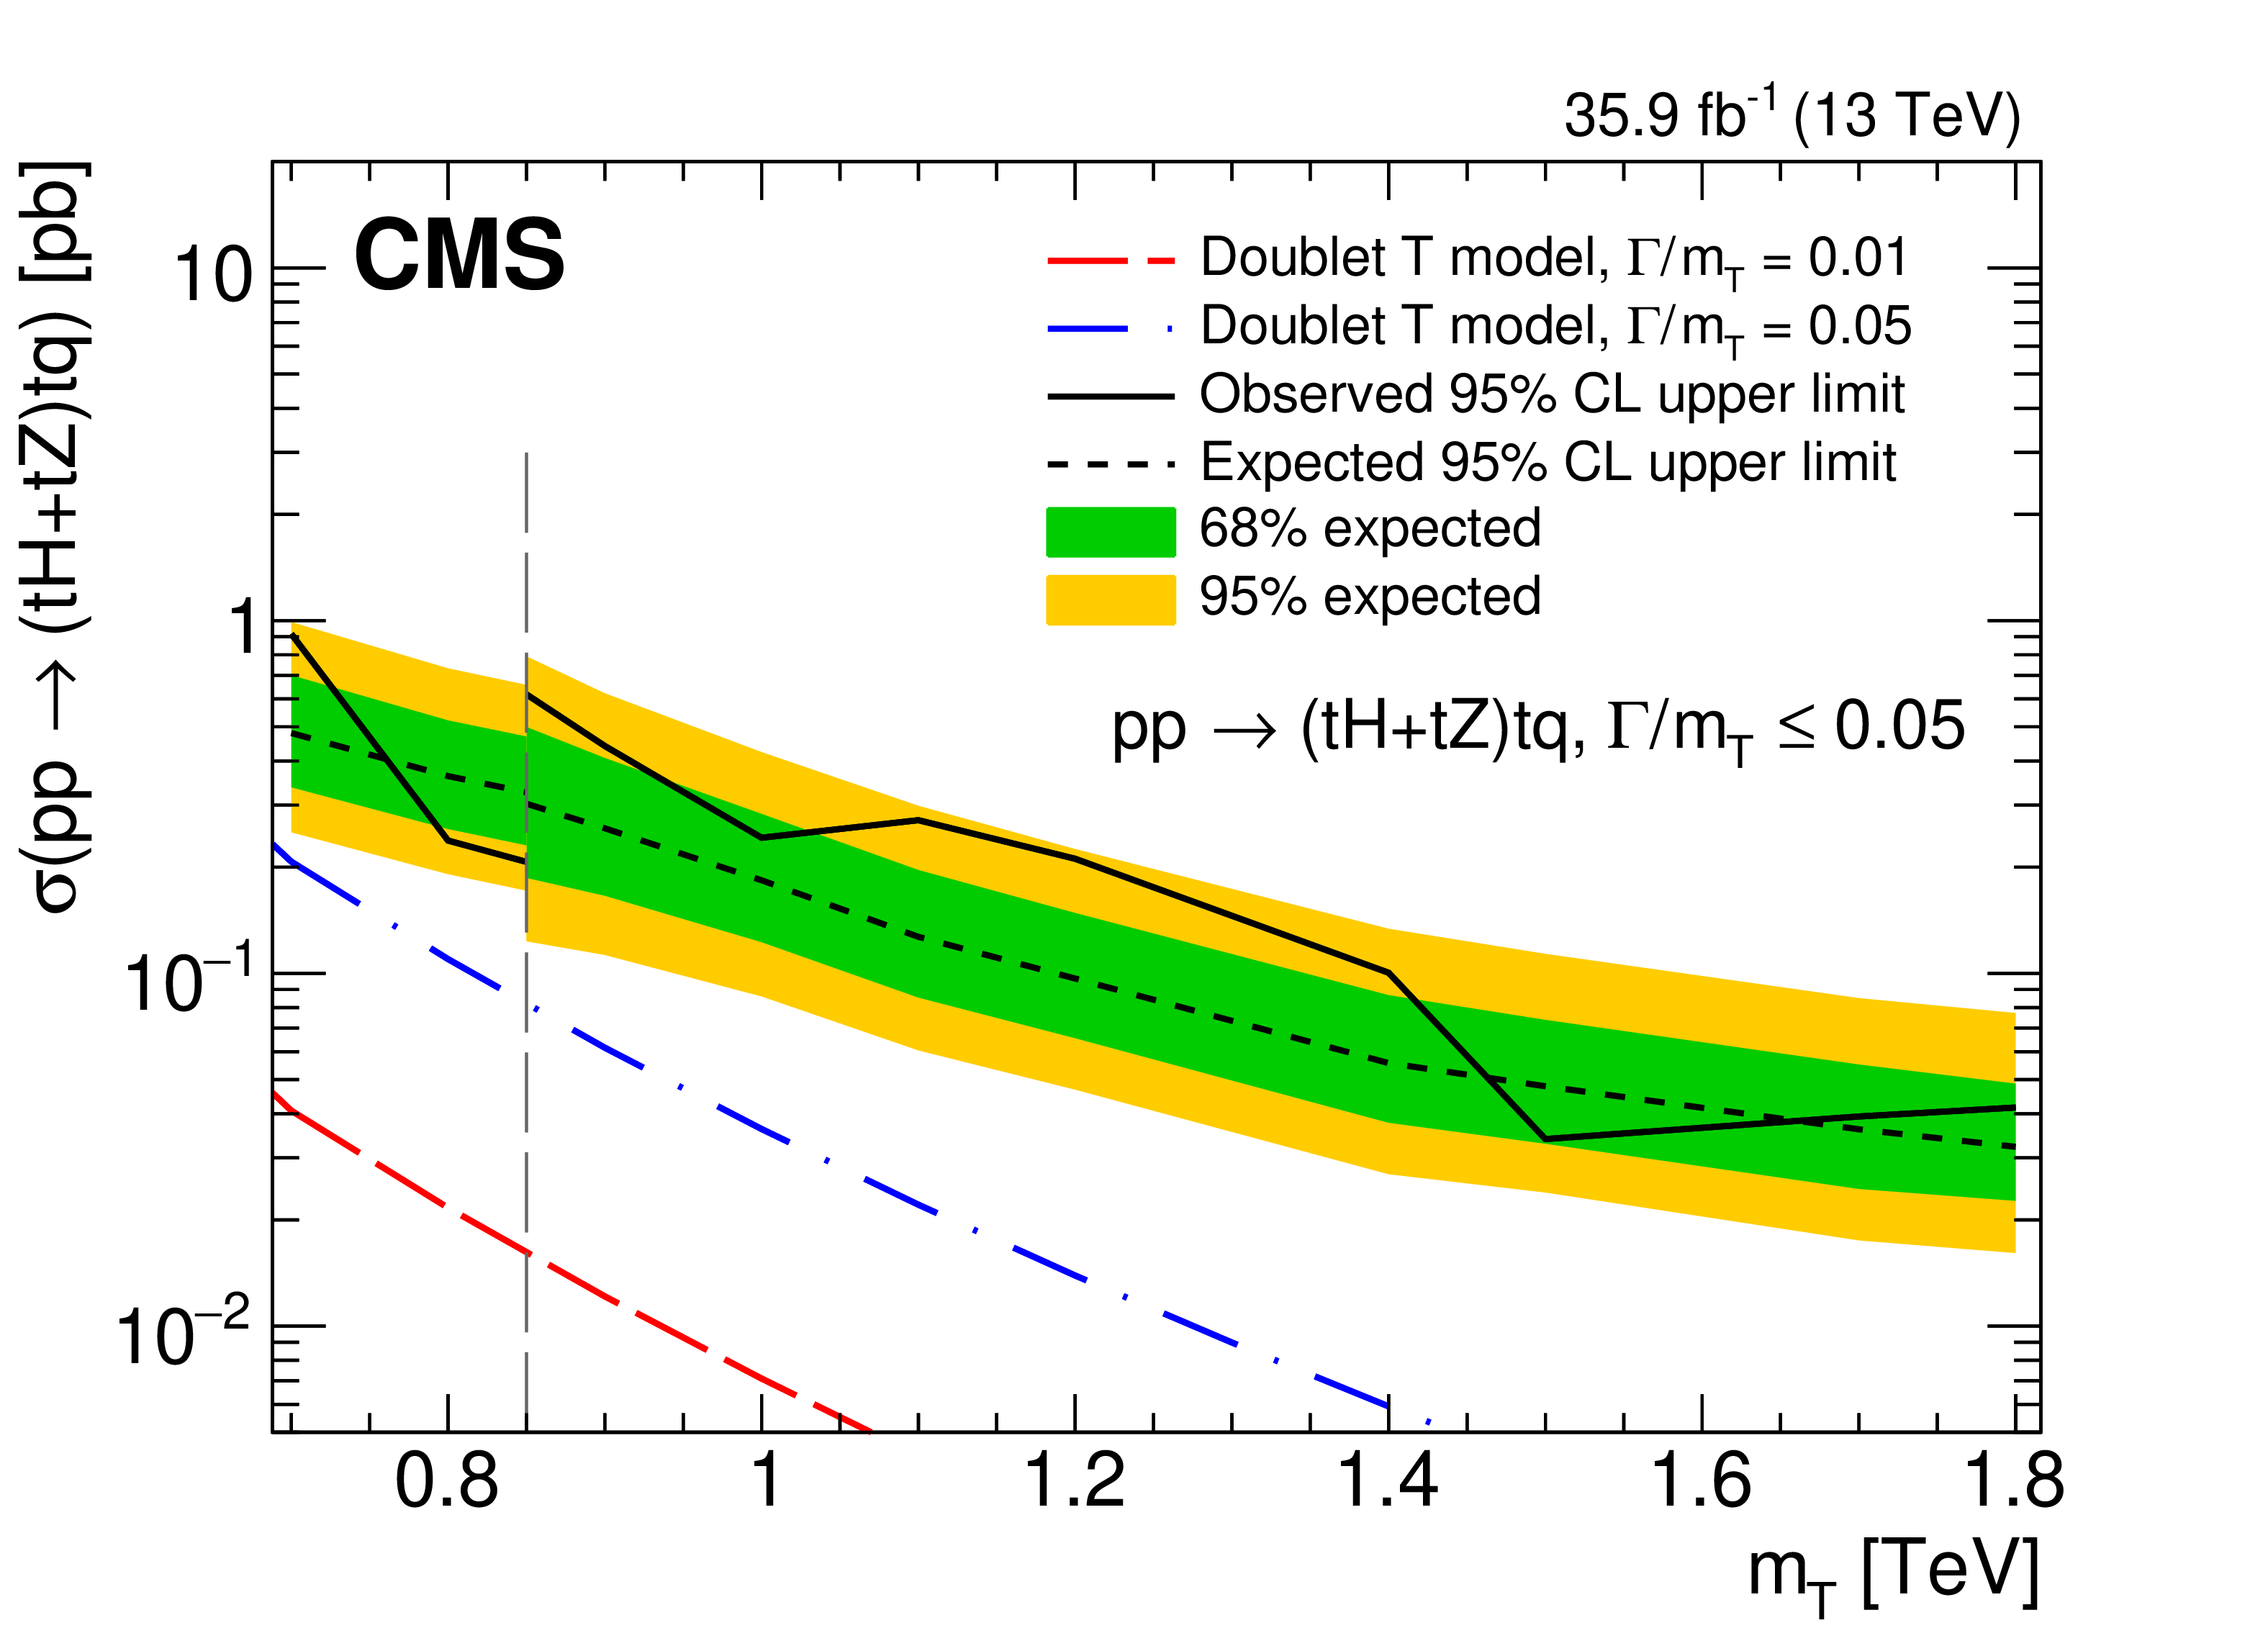
The observed and median expected upper limits at 95% CL on the cross sections for production associated with a bottom quark for the ${\mathrm{t} \mathrm{H} \mathrm{b} \mathrm{q}}$ (upper row) and ${\mathrm{t} \mathrm{Z} \mathrm{b} \mathrm{q}}$ (middle row) channels, and their sum, ${\mathrm{t} \mathrm{H} \mathrm{b} \mathrm{q} +\mathrm{t} \mathrm{Z} \mathrm{b} \mathrm{q}}$ (lower row), for different assumed values of the T quark mass. The inner (green) band and the outer (yellow) band indicate the regions containing 68 and 95%, respectively, of the distribution of limits expected under the background-only hypothesis. The left column is for a narrow fractional width ($ {\Gamma /{{m_{{\mathrm {T}}}}}} \le $ 0.05) and the right column is for a fractional width of $ {\Gamma /{{m_{{\mathrm {T}}}}}} = $ 0.1. The vertical dashed lines are the crossover points in sensitivity that indicate the mass intervals used for presenting the low-mass and high-mass search results. The dashed red and dot-dashed blue curves are for the T singlet model. Given the specified width, the couplings are implicit in the model. Two curves corresponding to $ {\Gamma /{{m_{{\mathrm {T}}}}}} = $ 0.05 (dot-dashed blue) and $ {\Gamma /{{m_{{\mathrm {T}}}}}} = $ 0.01 (dashed red) are shown for the narrow fractional width. |
png pdf |
Figure 8-a:
The observed and median expected upper limits at 95% CL on the cross sections for production associated with a bottom quark for the ${\mathrm{t} \mathrm{H} \mathrm{b} \mathrm{q}}$ (upper row) and ${\mathrm{t} \mathrm{Z} \mathrm{b} \mathrm{q}}$ (middle row) channels, and their sum, ${\mathrm{t} \mathrm{H} \mathrm{b} \mathrm{q} +\mathrm{t} \mathrm{Z} \mathrm{b} \mathrm{q}}$ (lower row), for different assumed values of the T quark mass. The inner (green) band and the outer (yellow) band indicate the regions containing 68 and 95%, respectively, of the distribution of limits expected under the background-only hypothesis. The left column is for a narrow fractional width ($ {\Gamma /{{m_{{\mathrm {T}}}}}} \le $ 0.05) and the right column is for a fractional width of $ {\Gamma /{{m_{{\mathrm {T}}}}}} = $ 0.1. The vertical dashed lines are the crossover points in sensitivity that indicate the mass intervals used for presenting the low-mass and high-mass search results. The dashed red and dot-dashed blue curves are for the T singlet model. Given the specified width, the couplings are implicit in the model. Two curves corresponding to $ {\Gamma /{{m_{{\mathrm {T}}}}}} = $ 0.05 (dot-dashed blue) and $ {\Gamma /{{m_{{\mathrm {T}}}}}} = $ 0.01 (dashed red) are shown for the narrow fractional width. |

png pdf |
Figure 8-b:
The observed and median expected upper limits at 95% CL on the cross sections for production associated with a bottom quark for the ${\mathrm{t} \mathrm{H} \mathrm{b} \mathrm{q}}$ (upper row) and ${\mathrm{t} \mathrm{Z} \mathrm{b} \mathrm{q}}$ (middle row) channels, and their sum, ${\mathrm{t} \mathrm{H} \mathrm{b} \mathrm{q} +\mathrm{t} \mathrm{Z} \mathrm{b} \mathrm{q}}$ (lower row), for different assumed values of the T quark mass. The inner (green) band and the outer (yellow) band indicate the regions containing 68 and 95%, respectively, of the distribution of limits expected under the background-only hypothesis. The left column is for a narrow fractional width ($ {\Gamma /{{m_{{\mathrm {T}}}}}} \le $ 0.05) and the right column is for a fractional width of $ {\Gamma /{{m_{{\mathrm {T}}}}}} = $ 0.1. The vertical dashed lines are the crossover points in sensitivity that indicate the mass intervals used for presenting the low-mass and high-mass search results. The dashed red and dot-dashed blue curves are for the T singlet model. Given the specified width, the couplings are implicit in the model. Two curves corresponding to $ {\Gamma /{{m_{{\mathrm {T}}}}}} = $ 0.05 (dot-dashed blue) and $ {\Gamma /{{m_{{\mathrm {T}}}}}} = $ 0.01 (dashed red) are shown for the narrow fractional width. |
png pdf |
Figure 8-c:
The observed and median expected upper limits at 95% CL on the cross sections for production associated with a bottom quark for the ${\mathrm{t} \mathrm{H} \mathrm{b} \mathrm{q}}$ (upper row) and ${\mathrm{t} \mathrm{Z} \mathrm{b} \mathrm{q}}$ (middle row) channels, and their sum, ${\mathrm{t} \mathrm{H} \mathrm{b} \mathrm{q} +\mathrm{t} \mathrm{Z} \mathrm{b} \mathrm{q}}$ (lower row), for different assumed values of the T quark mass. The inner (green) band and the outer (yellow) band indicate the regions containing 68 and 95%, respectively, of the distribution of limits expected under the background-only hypothesis. The left column is for a narrow fractional width ($ {\Gamma /{{m_{{\mathrm {T}}}}}} \le $ 0.05) and the right column is for a fractional width of $ {\Gamma /{{m_{{\mathrm {T}}}}}} = $ 0.1. The vertical dashed lines are the crossover points in sensitivity that indicate the mass intervals used for presenting the low-mass and high-mass search results. The dashed red and dot-dashed blue curves are for the T singlet model. Given the specified width, the couplings are implicit in the model. Two curves corresponding to $ {\Gamma /{{m_{{\mathrm {T}}}}}} = $ 0.05 (dot-dashed blue) and $ {\Gamma /{{m_{{\mathrm {T}}}}}} = $ 0.01 (dashed red) are shown for the narrow fractional width. |

png pdf |
Figure 8-d:
The observed and median expected upper limits at 95% CL on the cross sections for production associated with a bottom quark for the ${\mathrm{t} \mathrm{H} \mathrm{b} \mathrm{q}}$ (upper row) and ${\mathrm{t} \mathrm{Z} \mathrm{b} \mathrm{q}}$ (middle row) channels, and their sum, ${\mathrm{t} \mathrm{H} \mathrm{b} \mathrm{q} +\mathrm{t} \mathrm{Z} \mathrm{b} \mathrm{q}}$ (lower row), for different assumed values of the T quark mass. The inner (green) band and the outer (yellow) band indicate the regions containing 68 and 95%, respectively, of the distribution of limits expected under the background-only hypothesis. The left column is for a narrow fractional width ($ {\Gamma /{{m_{{\mathrm {T}}}}}} \le $ 0.05) and the right column is for a fractional width of $ {\Gamma /{{m_{{\mathrm {T}}}}}} = $ 0.1. The vertical dashed lines are the crossover points in sensitivity that indicate the mass intervals used for presenting the low-mass and high-mass search results. The dashed red and dot-dashed blue curves are for the T singlet model. Given the specified width, the couplings are implicit in the model. Two curves corresponding to $ {\Gamma /{{m_{{\mathrm {T}}}}}} = $ 0.05 (dot-dashed blue) and $ {\Gamma /{{m_{{\mathrm {T}}}}}} = $ 0.01 (dashed red) are shown for the narrow fractional width. |
png pdf |
Figure 8-e:
The observed and median expected upper limits at 95% CL on the cross sections for production associated with a bottom quark for the ${\mathrm{t} \mathrm{H} \mathrm{b} \mathrm{q}}$ (upper row) and ${\mathrm{t} \mathrm{Z} \mathrm{b} \mathrm{q}}$ (middle row) channels, and their sum, ${\mathrm{t} \mathrm{H} \mathrm{b} \mathrm{q} +\mathrm{t} \mathrm{Z} \mathrm{b} \mathrm{q}}$ (lower row), for different assumed values of the T quark mass. The inner (green) band and the outer (yellow) band indicate the regions containing 68 and 95%, respectively, of the distribution of limits expected under the background-only hypothesis. The left column is for a narrow fractional width ($ {\Gamma /{{m_{{\mathrm {T}}}}}} \le $ 0.05) and the right column is for a fractional width of $ {\Gamma /{{m_{{\mathrm {T}}}}}} = $ 0.1. The vertical dashed lines are the crossover points in sensitivity that indicate the mass intervals used for presenting the low-mass and high-mass search results. The dashed red and dot-dashed blue curves are for the T singlet model. Given the specified width, the couplings are implicit in the model. Two curves corresponding to $ {\Gamma /{{m_{{\mathrm {T}}}}}} = $ 0.05 (dot-dashed blue) and $ {\Gamma /{{m_{{\mathrm {T}}}}}} = $ 0.01 (dashed red) are shown for the narrow fractional width. |

png pdf |
Figure 8-f:
The observed and median expected upper limits at 95% CL on the cross sections for production associated with a bottom quark for the ${\mathrm{t} \mathrm{H} \mathrm{b} \mathrm{q}}$ (upper row) and ${\mathrm{t} \mathrm{Z} \mathrm{b} \mathrm{q}}$ (middle row) channels, and their sum, ${\mathrm{t} \mathrm{H} \mathrm{b} \mathrm{q} +\mathrm{t} \mathrm{Z} \mathrm{b} \mathrm{q}}$ (lower row), for different assumed values of the T quark mass. The inner (green) band and the outer (yellow) band indicate the regions containing 68 and 95%, respectively, of the distribution of limits expected under the background-only hypothesis. The left column is for a narrow fractional width ($ {\Gamma /{{m_{{\mathrm {T}}}}}} \le $ 0.05) and the right column is for a fractional width of $ {\Gamma /{{m_{{\mathrm {T}}}}}} = $ 0.1. The vertical dashed lines are the crossover points in sensitivity that indicate the mass intervals used for presenting the low-mass and high-mass search results. The dashed red and dot-dashed blue curves are for the T singlet model. Given the specified width, the couplings are implicit in the model. Two curves corresponding to $ {\Gamma /{{m_{{\mathrm {T}}}}}} = $ 0.05 (dot-dashed blue) and $ {\Gamma /{{m_{{\mathrm {T}}}}}} = $ 0.01 (dashed red) are shown for the narrow fractional width. |
png pdf |
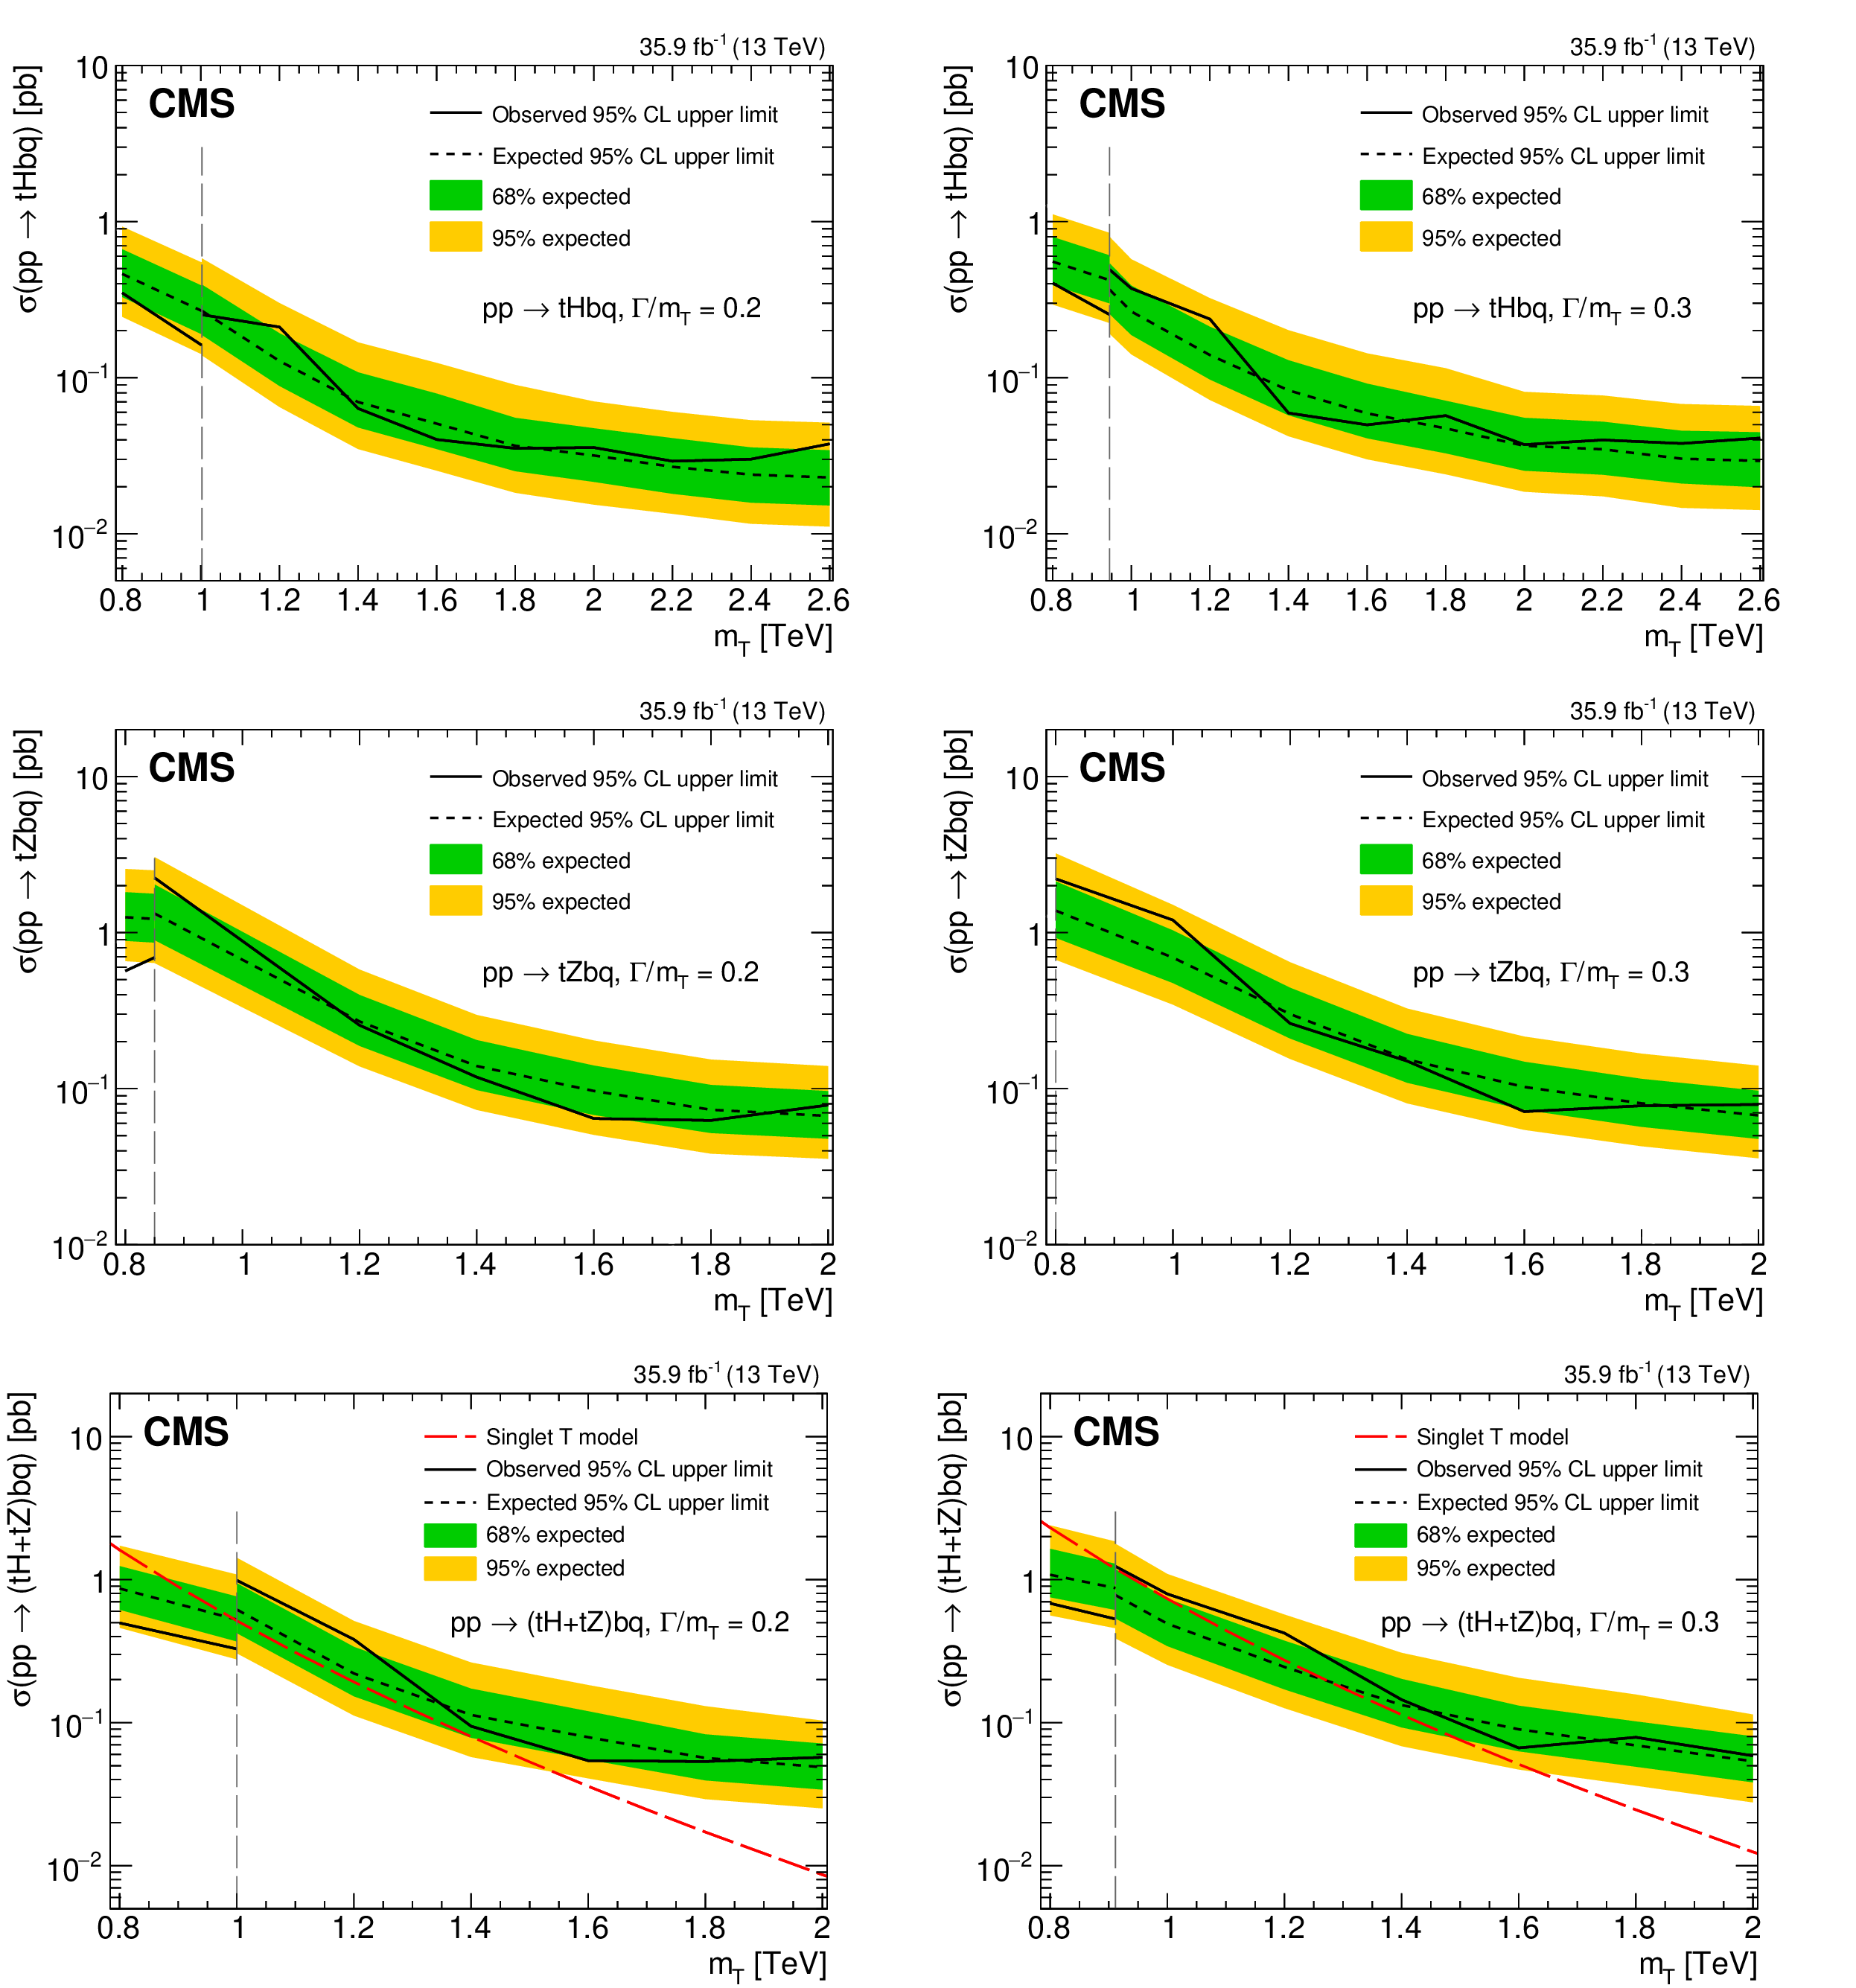
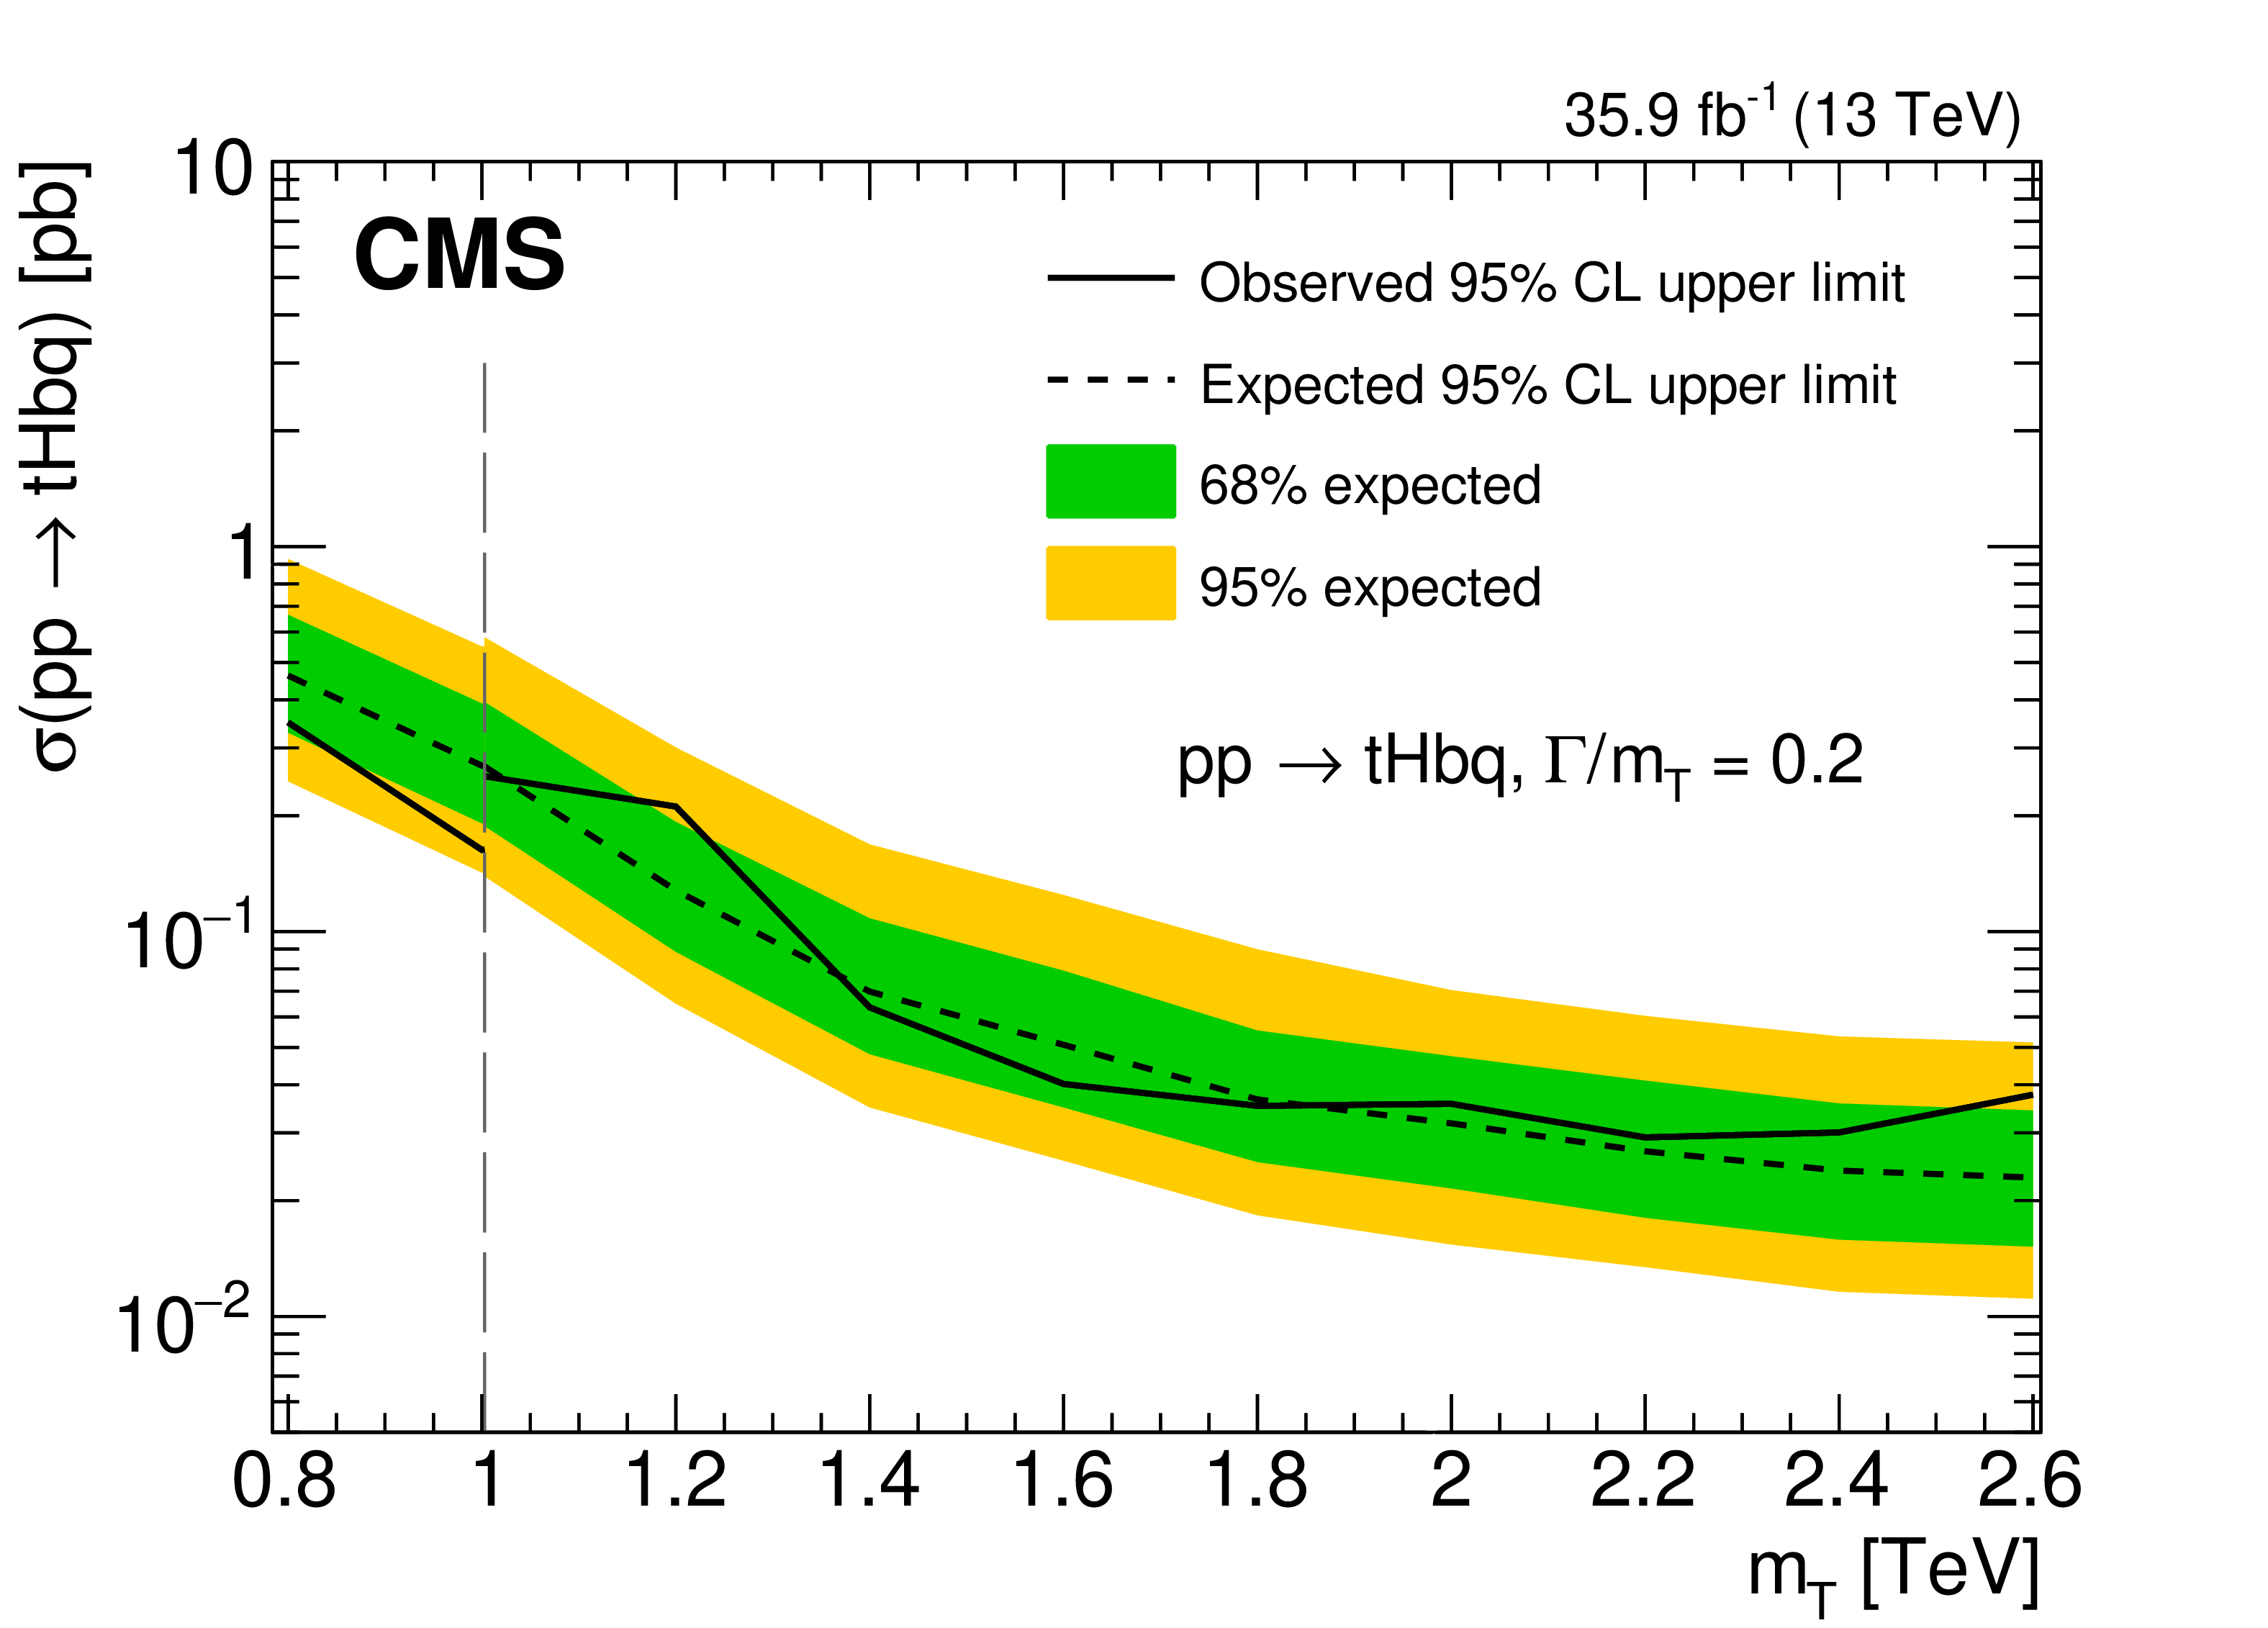
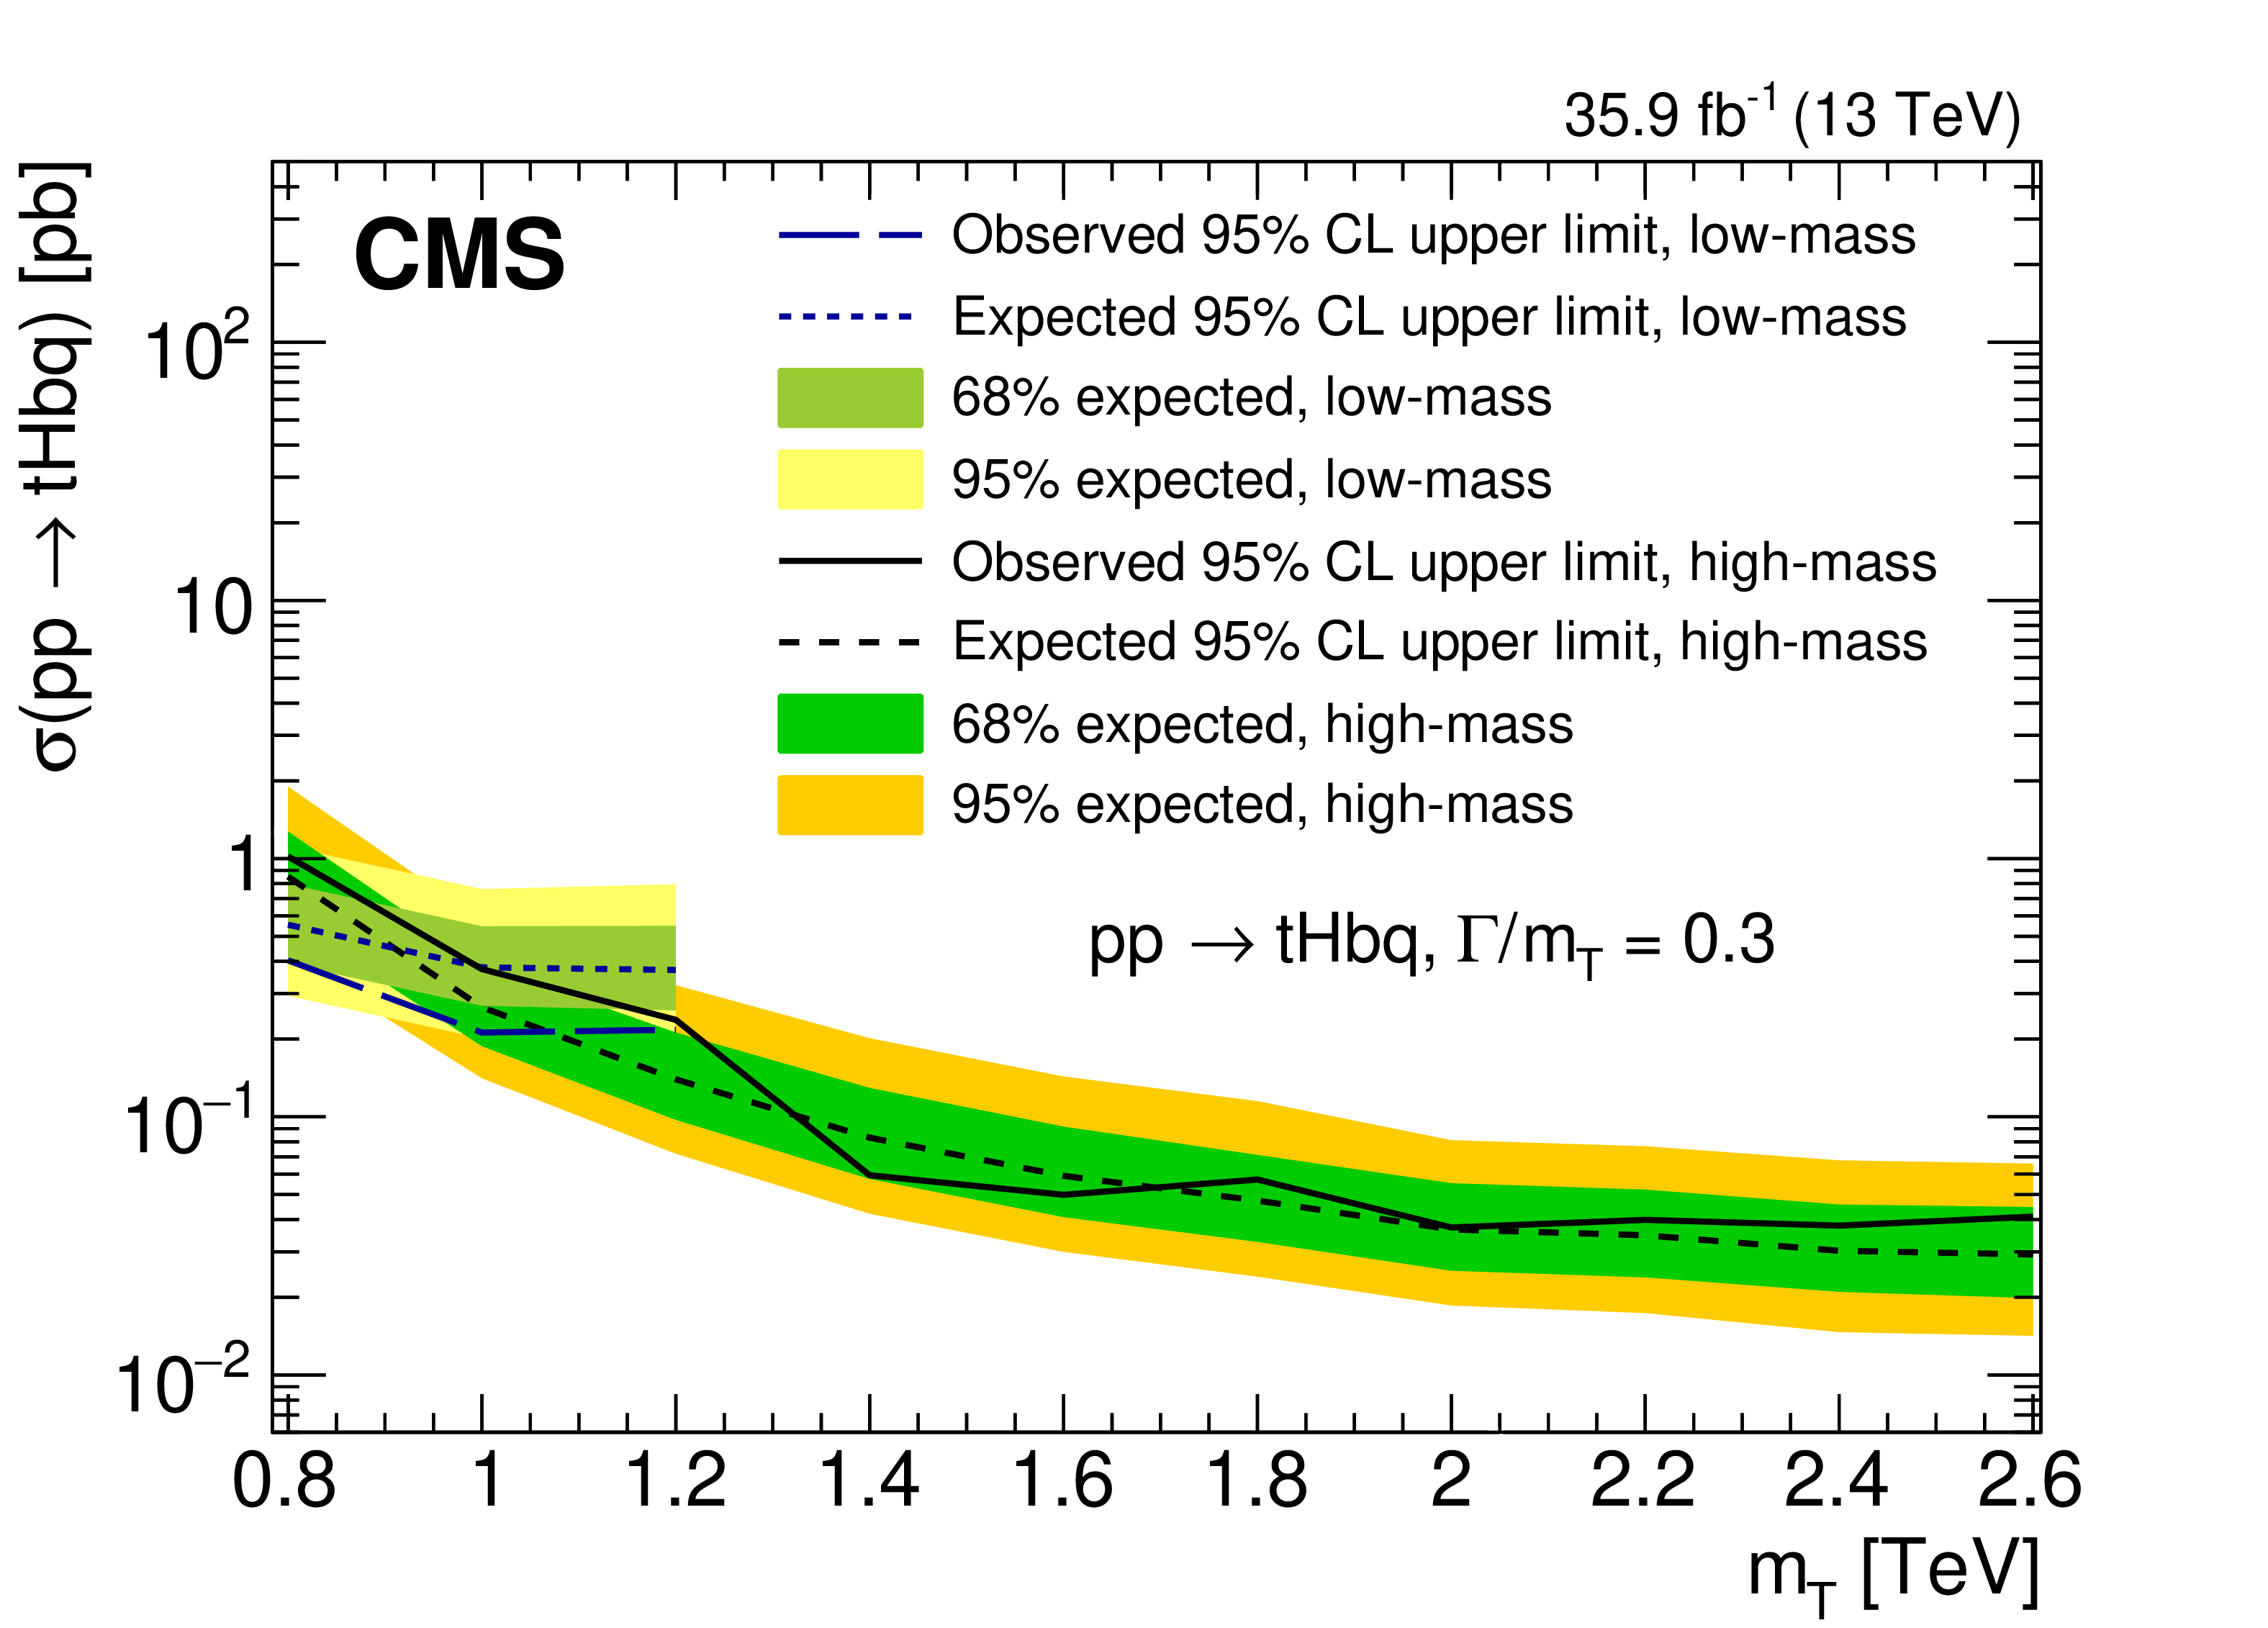
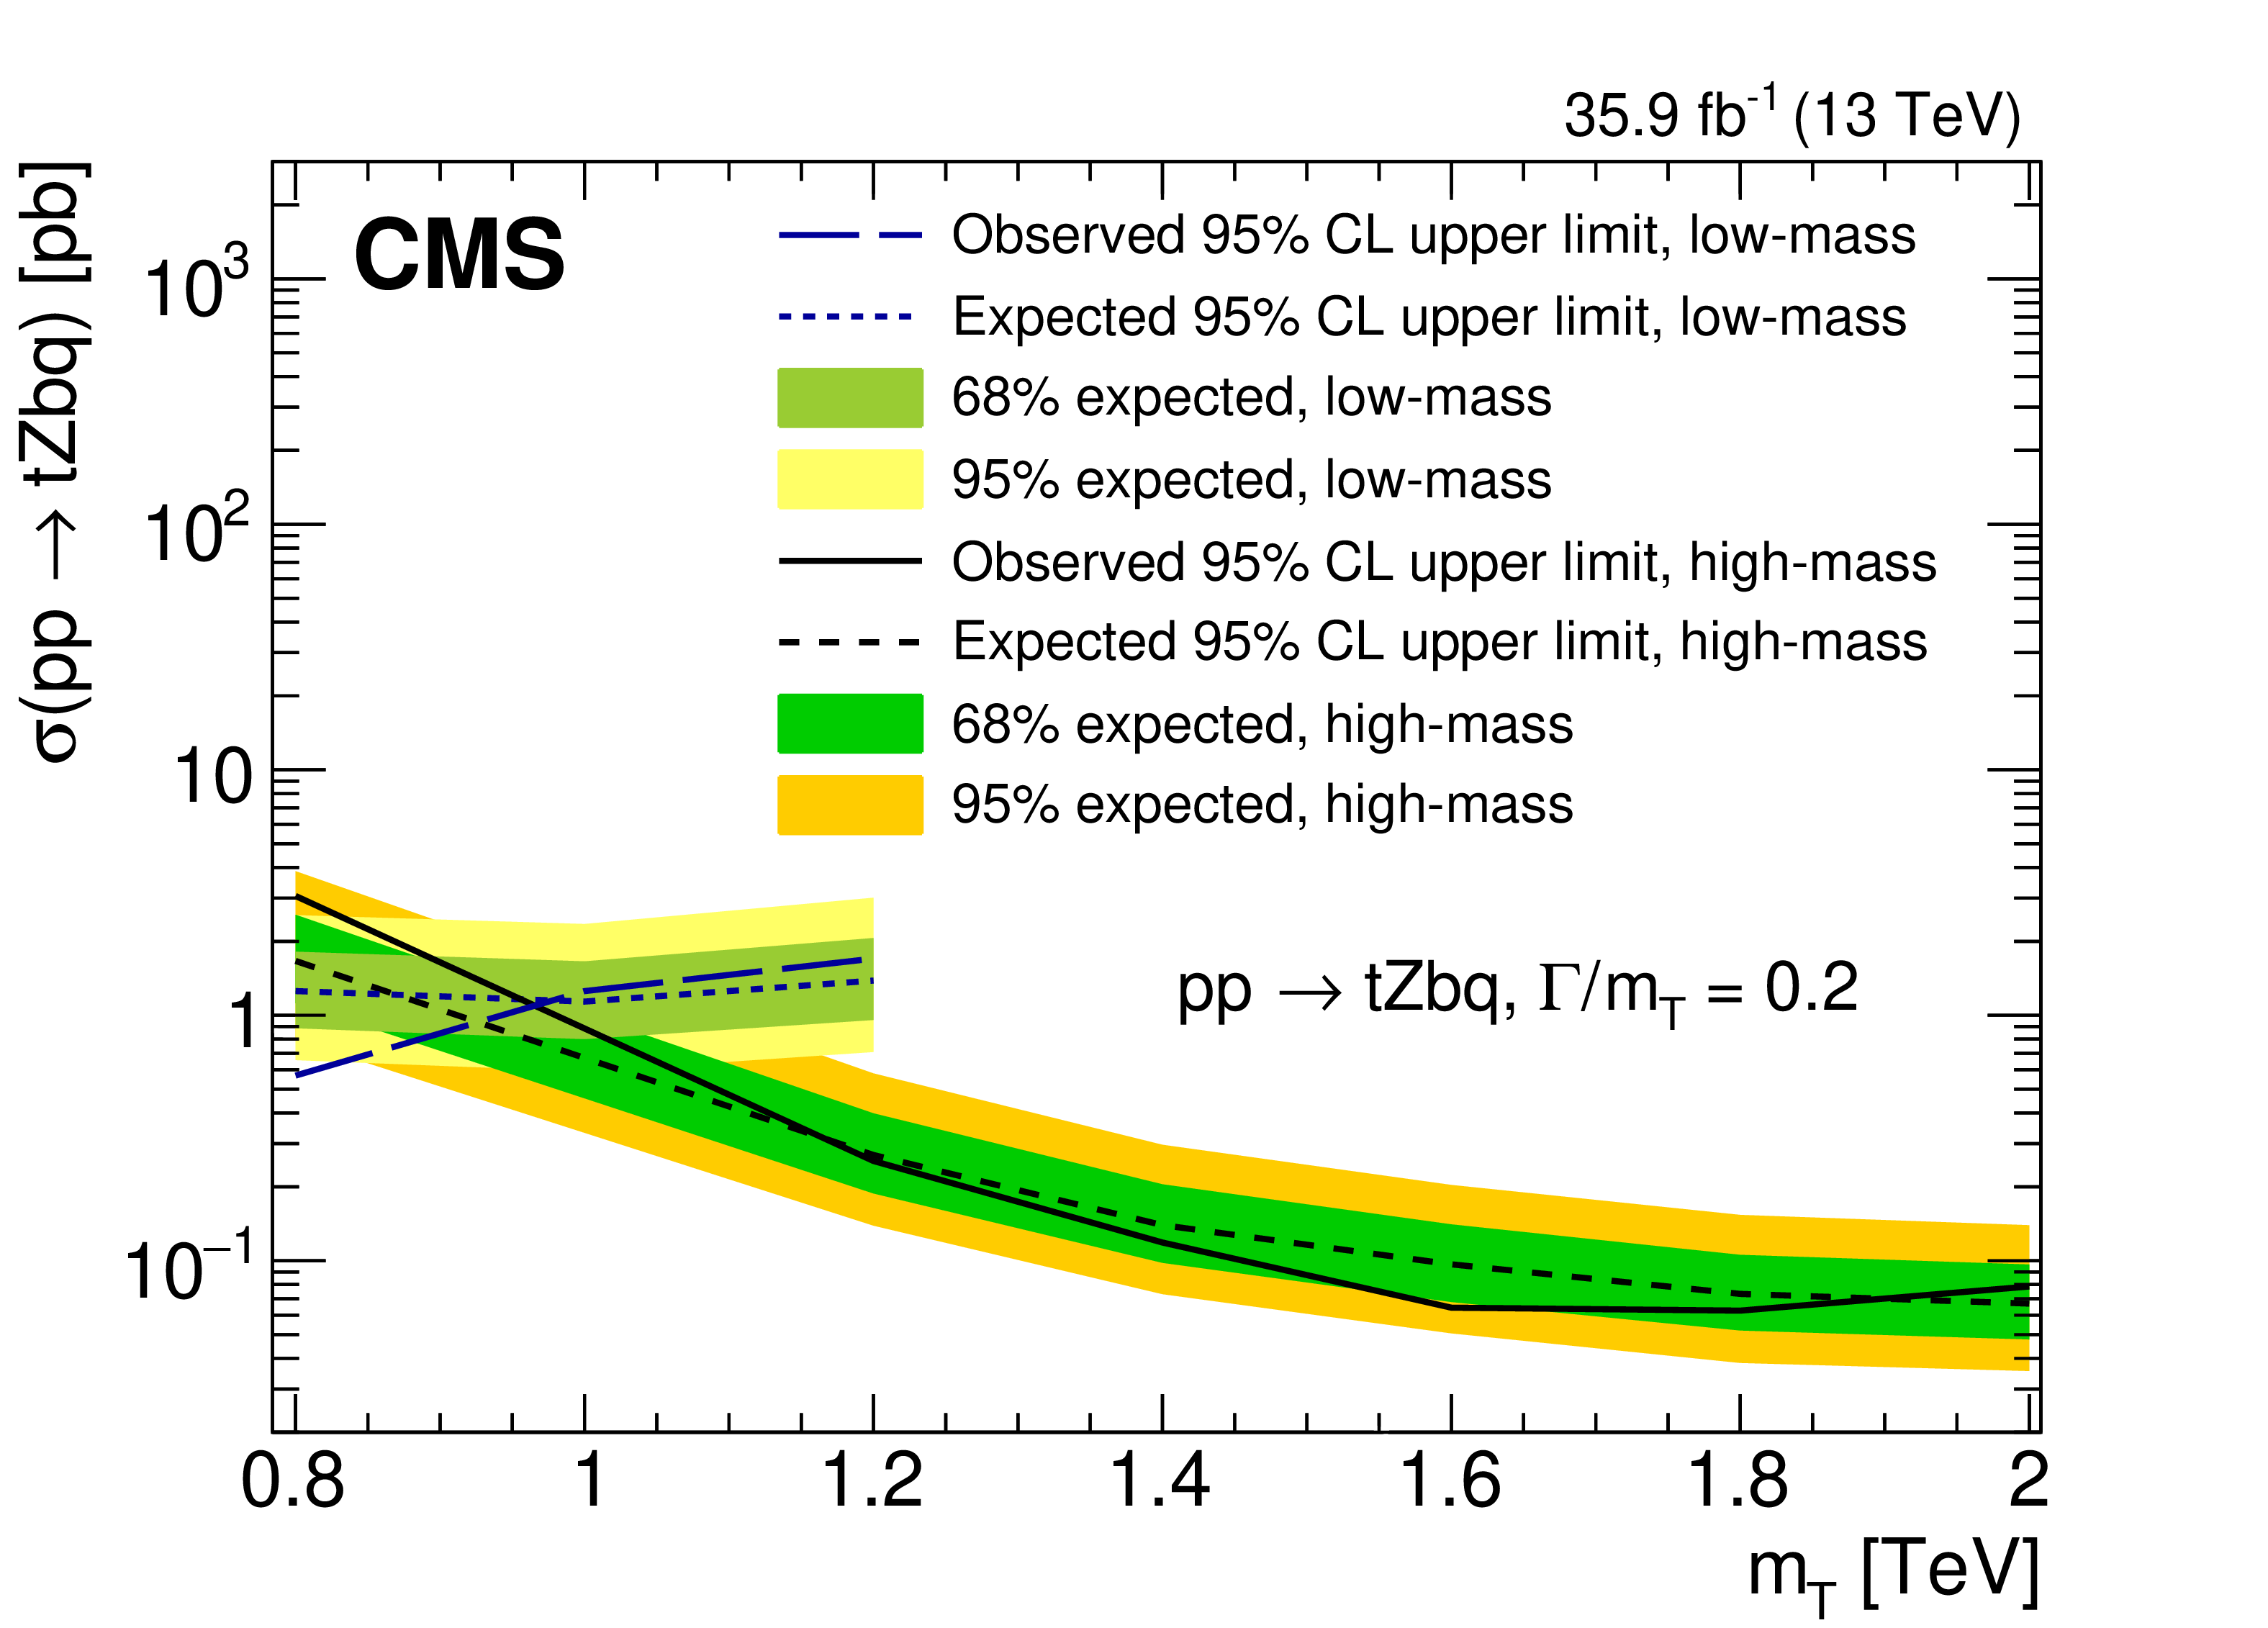
Figure 9:
The observed and median expected upper limits at 95% CL on the cross sections for production associated with a bottom quark for the ${\mathrm{t} \mathrm{H} \mathrm{b} \mathrm{q}}$ (upper row) and ${\mathrm{t} \mathrm{Z} \mathrm{b} \mathrm{q}}$ (middle row) channels, and their sum, ${\mathrm{t} \mathrm{H} \mathrm{b} \mathrm{q} +\mathrm{t} \mathrm{Z} \mathrm{b} \mathrm{q}}$ (lower row), for different assumed values of the T quark mass. The inner (green) band and the outer (yellow) band indicate the regions containing 68 and 95%, respectively, of the distribution of limits expected under the background-only hypothesis. The left column is for a fractional width of 20% and the right column is for a fractional width of 30%. The vertical dashed lines are the crossover points in sensitivity that indicate the mass intervals used for presenting the low-mass and high-mass search results. The dashed red curves are for the T singlet model. Given the specified width, the couplings are implicit in the model. |
png pdf |
Figure 9-a:
The observed and median expected upper limits at 95% CL on the cross sections for production associated with a bottom quark for the ${\mathrm{t} \mathrm{H} \mathrm{b} \mathrm{q}}$ (upper row) and ${\mathrm{t} \mathrm{Z} \mathrm{b} \mathrm{q}}$ (middle row) channels, and their sum, ${\mathrm{t} \mathrm{H} \mathrm{b} \mathrm{q} +\mathrm{t} \mathrm{Z} \mathrm{b} \mathrm{q}}$ (lower row), for different assumed values of the T quark mass. The inner (green) band and the outer (yellow) band indicate the regions containing 68 and 95%, respectively, of the distribution of limits expected under the background-only hypothesis. The left column is for a fractional width of 20% and the right column is for a fractional width of 30%. The vertical dashed lines are the crossover points in sensitivity that indicate the mass intervals used for presenting the low-mass and high-mass search results. The dashed red curves are for the T singlet model. Given the specified width, the couplings are implicit in the model. |
png pdf |
Figure 9-b:
The observed and median expected upper limits at 95% CL on the cross sections for production associated with a bottom quark for the ${\mathrm{t} \mathrm{H} \mathrm{b} \mathrm{q}}$ (upper row) and ${\mathrm{t} \mathrm{Z} \mathrm{b} \mathrm{q}}$ (middle row) channels, and their sum, ${\mathrm{t} \mathrm{H} \mathrm{b} \mathrm{q} +\mathrm{t} \mathrm{Z} \mathrm{b} \mathrm{q}}$ (lower row), for different assumed values of the T quark mass. The inner (green) band and the outer (yellow) band indicate the regions containing 68 and 95%, respectively, of the distribution of limits expected under the background-only hypothesis. The left column is for a fractional width of 20% and the right column is for a fractional width of 30%. The vertical dashed lines are the crossover points in sensitivity that indicate the mass intervals used for presenting the low-mass and high-mass search results. The dashed red curves are for the T singlet model. Given the specified width, the couplings are implicit in the model. |
png pdf |
Figure 9-c:
The observed and median expected upper limits at 95% CL on the cross sections for production associated with a bottom quark for the ${\mathrm{t} \mathrm{H} \mathrm{b} \mathrm{q}}$ (upper row) and ${\mathrm{t} \mathrm{Z} \mathrm{b} \mathrm{q}}$ (middle row) channels, and their sum, ${\mathrm{t} \mathrm{H} \mathrm{b} \mathrm{q} +\mathrm{t} \mathrm{Z} \mathrm{b} \mathrm{q}}$ (lower row), for different assumed values of the T quark mass. The inner (green) band and the outer (yellow) band indicate the regions containing 68 and 95%, respectively, of the distribution of limits expected under the background-only hypothesis. The left column is for a fractional width of 20% and the right column is for a fractional width of 30%. The vertical dashed lines are the crossover points in sensitivity that indicate the mass intervals used for presenting the low-mass and high-mass search results. The dashed red curves are for the T singlet model. Given the specified width, the couplings are implicit in the model. |

png pdf |
Figure 9-d:
The observed and median expected upper limits at 95% CL on the cross sections for production associated with a bottom quark for the ${\mathrm{t} \mathrm{H} \mathrm{b} \mathrm{q}}$ (upper row) and ${\mathrm{t} \mathrm{Z} \mathrm{b} \mathrm{q}}$ (middle row) channels, and their sum, ${\mathrm{t} \mathrm{H} \mathrm{b} \mathrm{q} +\mathrm{t} \mathrm{Z} \mathrm{b} \mathrm{q}}$ (lower row), for different assumed values of the T quark mass. The inner (green) band and the outer (yellow) band indicate the regions containing 68 and 95%, respectively, of the distribution of limits expected under the background-only hypothesis. The left column is for a fractional width of 20% and the right column is for a fractional width of 30%. The vertical dashed lines are the crossover points in sensitivity that indicate the mass intervals used for presenting the low-mass and high-mass search results. The dashed red curves are for the T singlet model. Given the specified width, the couplings are implicit in the model. |
png pdf |
Figure 9-e:
The observed and median expected upper limits at 95% CL on the cross sections for production associated with a bottom quark for the ${\mathrm{t} \mathrm{H} \mathrm{b} \mathrm{q}}$ (upper row) and ${\mathrm{t} \mathrm{Z} \mathrm{b} \mathrm{q}}$ (middle row) channels, and their sum, ${\mathrm{t} \mathrm{H} \mathrm{b} \mathrm{q} +\mathrm{t} \mathrm{Z} \mathrm{b} \mathrm{q}}$ (lower row), for different assumed values of the T quark mass. The inner (green) band and the outer (yellow) band indicate the regions containing 68 and 95%, respectively, of the distribution of limits expected under the background-only hypothesis. The left column is for a fractional width of 20% and the right column is for a fractional width of 30%. The vertical dashed lines are the crossover points in sensitivity that indicate the mass intervals used for presenting the low-mass and high-mass search results. The dashed red curves are for the T singlet model. Given the specified width, the couplings are implicit in the model. |
png pdf |
Figure 9-f:
The observed and median expected upper limits at 95% CL on the cross sections for production associated with a bottom quark for the ${\mathrm{t} \mathrm{H} \mathrm{b} \mathrm{q}}$ (upper row) and ${\mathrm{t} \mathrm{Z} \mathrm{b} \mathrm{q}}$ (middle row) channels, and their sum, ${\mathrm{t} \mathrm{H} \mathrm{b} \mathrm{q} +\mathrm{t} \mathrm{Z} \mathrm{b} \mathrm{q}}$ (lower row), for different assumed values of the T quark mass. The inner (green) band and the outer (yellow) band indicate the regions containing 68 and 95%, respectively, of the distribution of limits expected under the background-only hypothesis. The left column is for a fractional width of 20% and the right column is for a fractional width of 30%. The vertical dashed lines are the crossover points in sensitivity that indicate the mass intervals used for presenting the low-mass and high-mass search results. The dashed red curves are for the T singlet model. Given the specified width, the couplings are implicit in the model. |
png pdf |
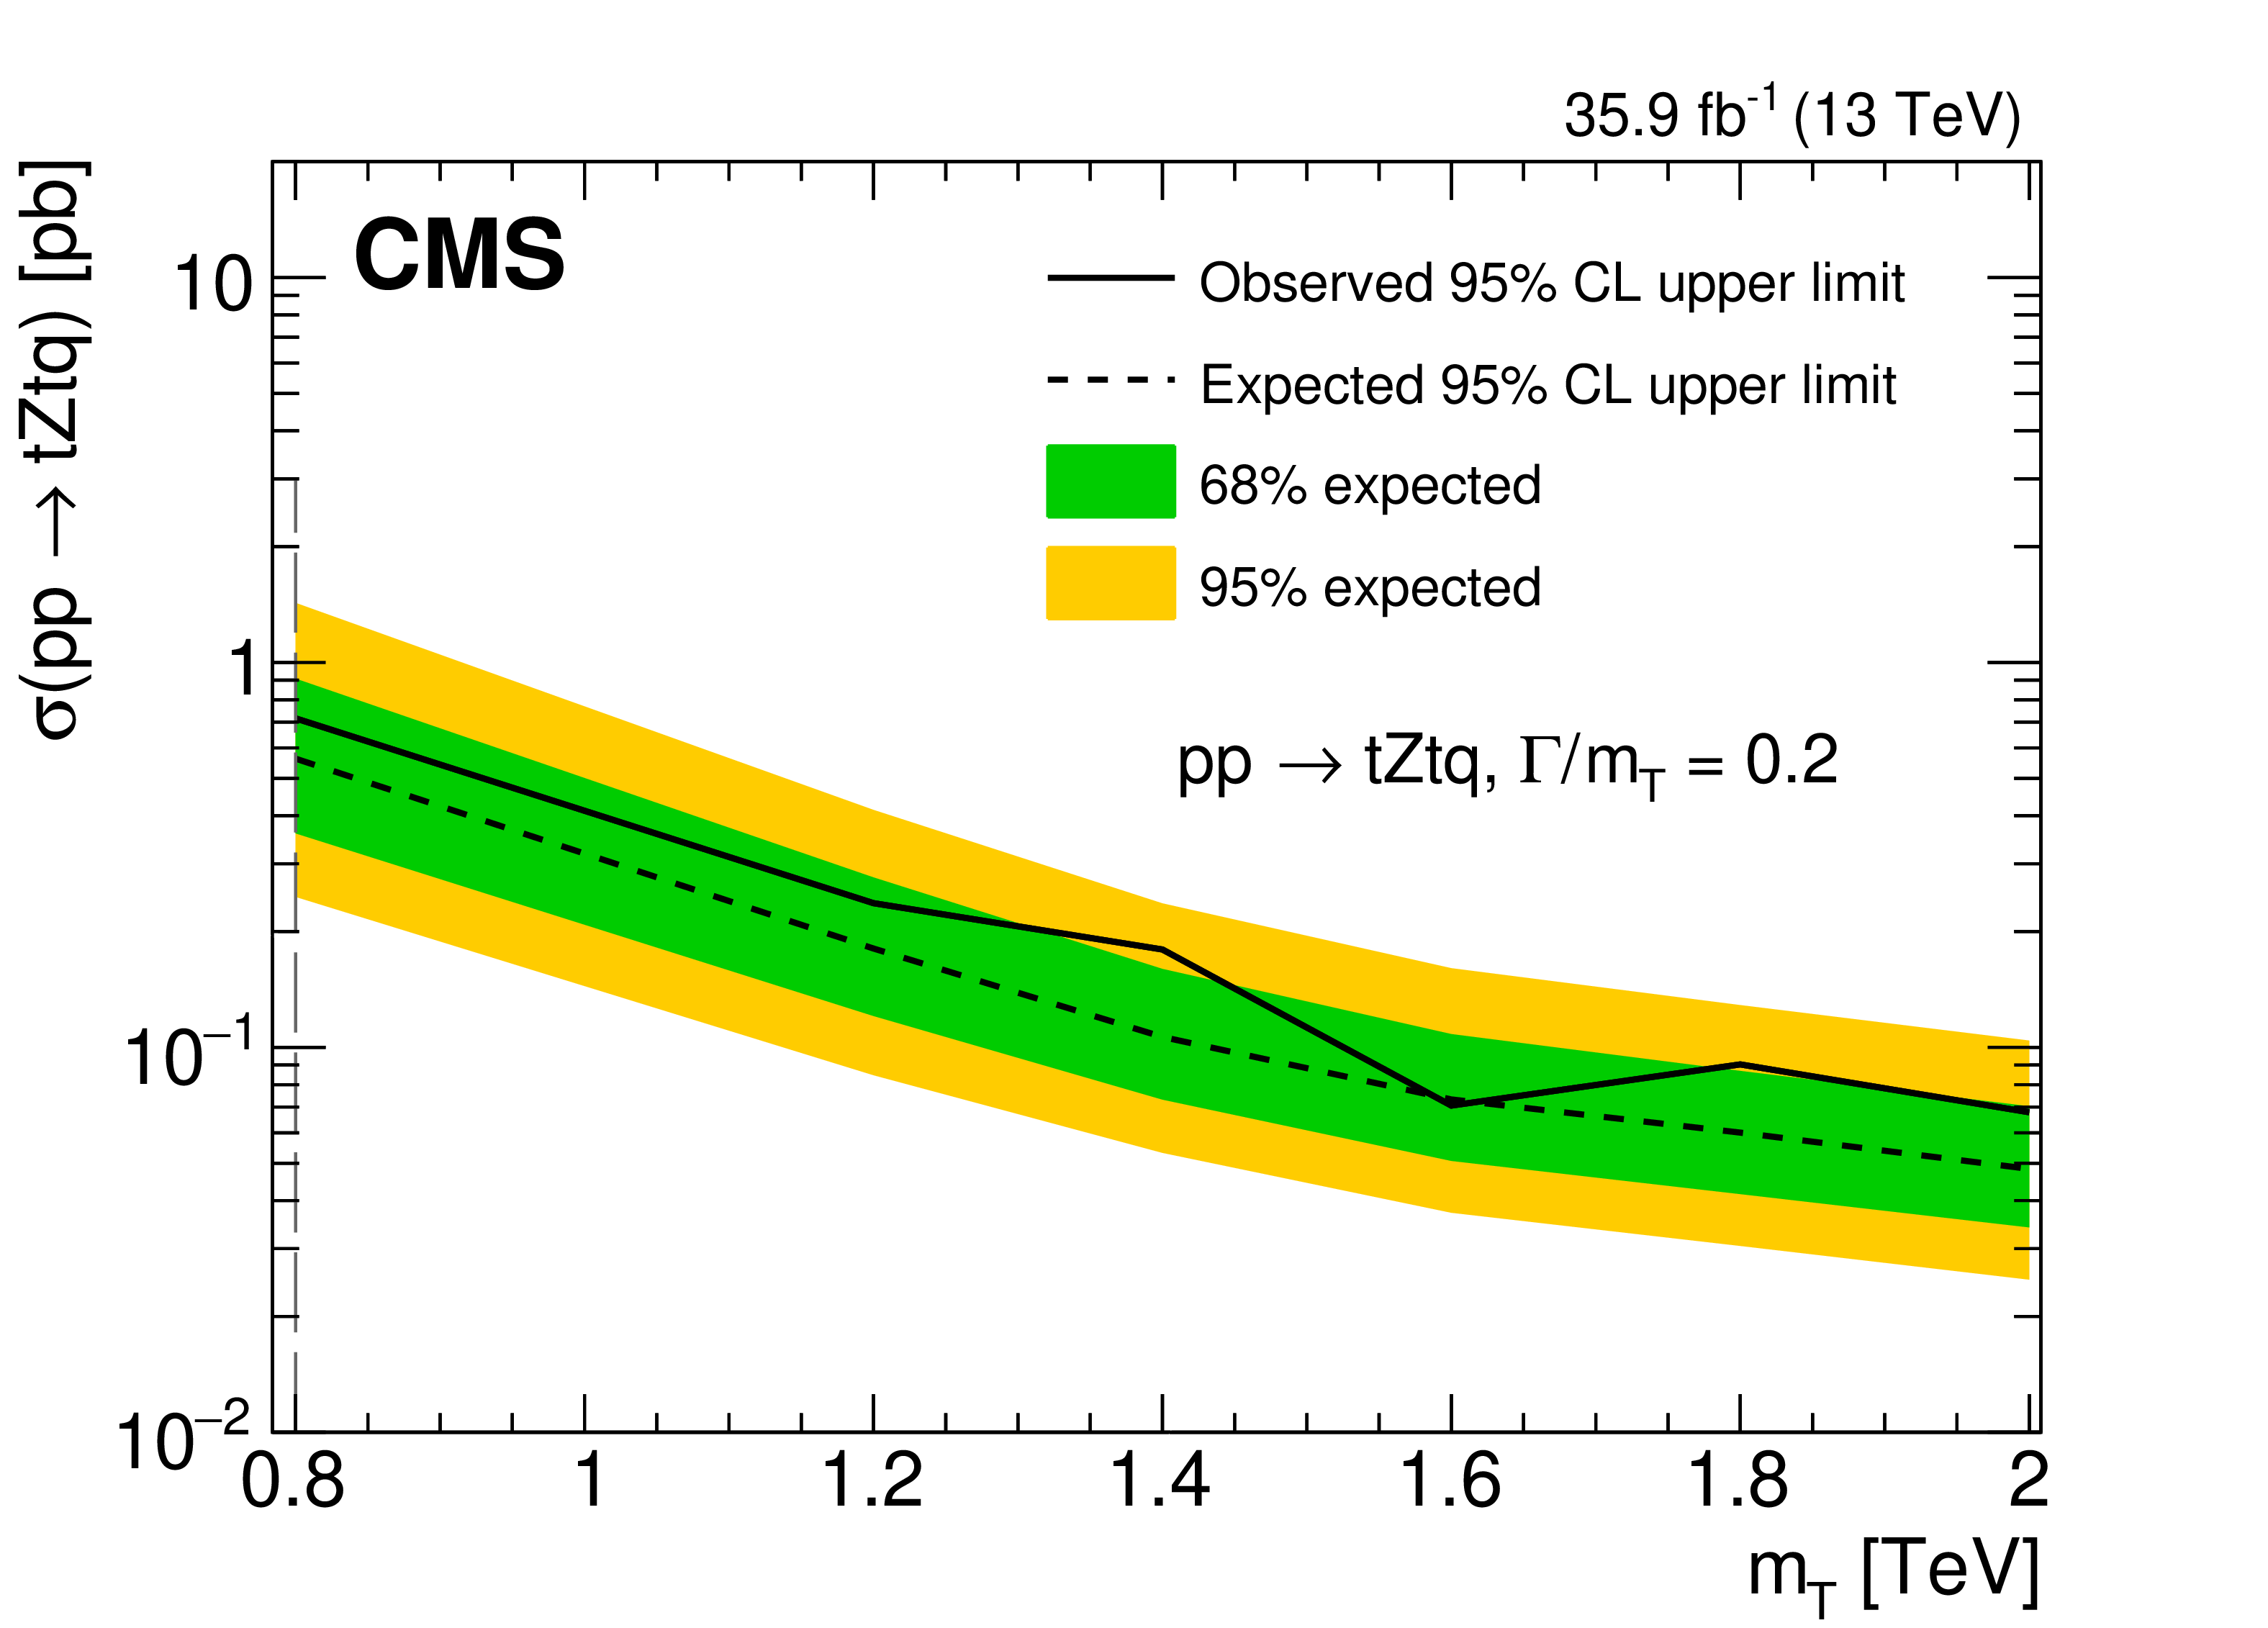
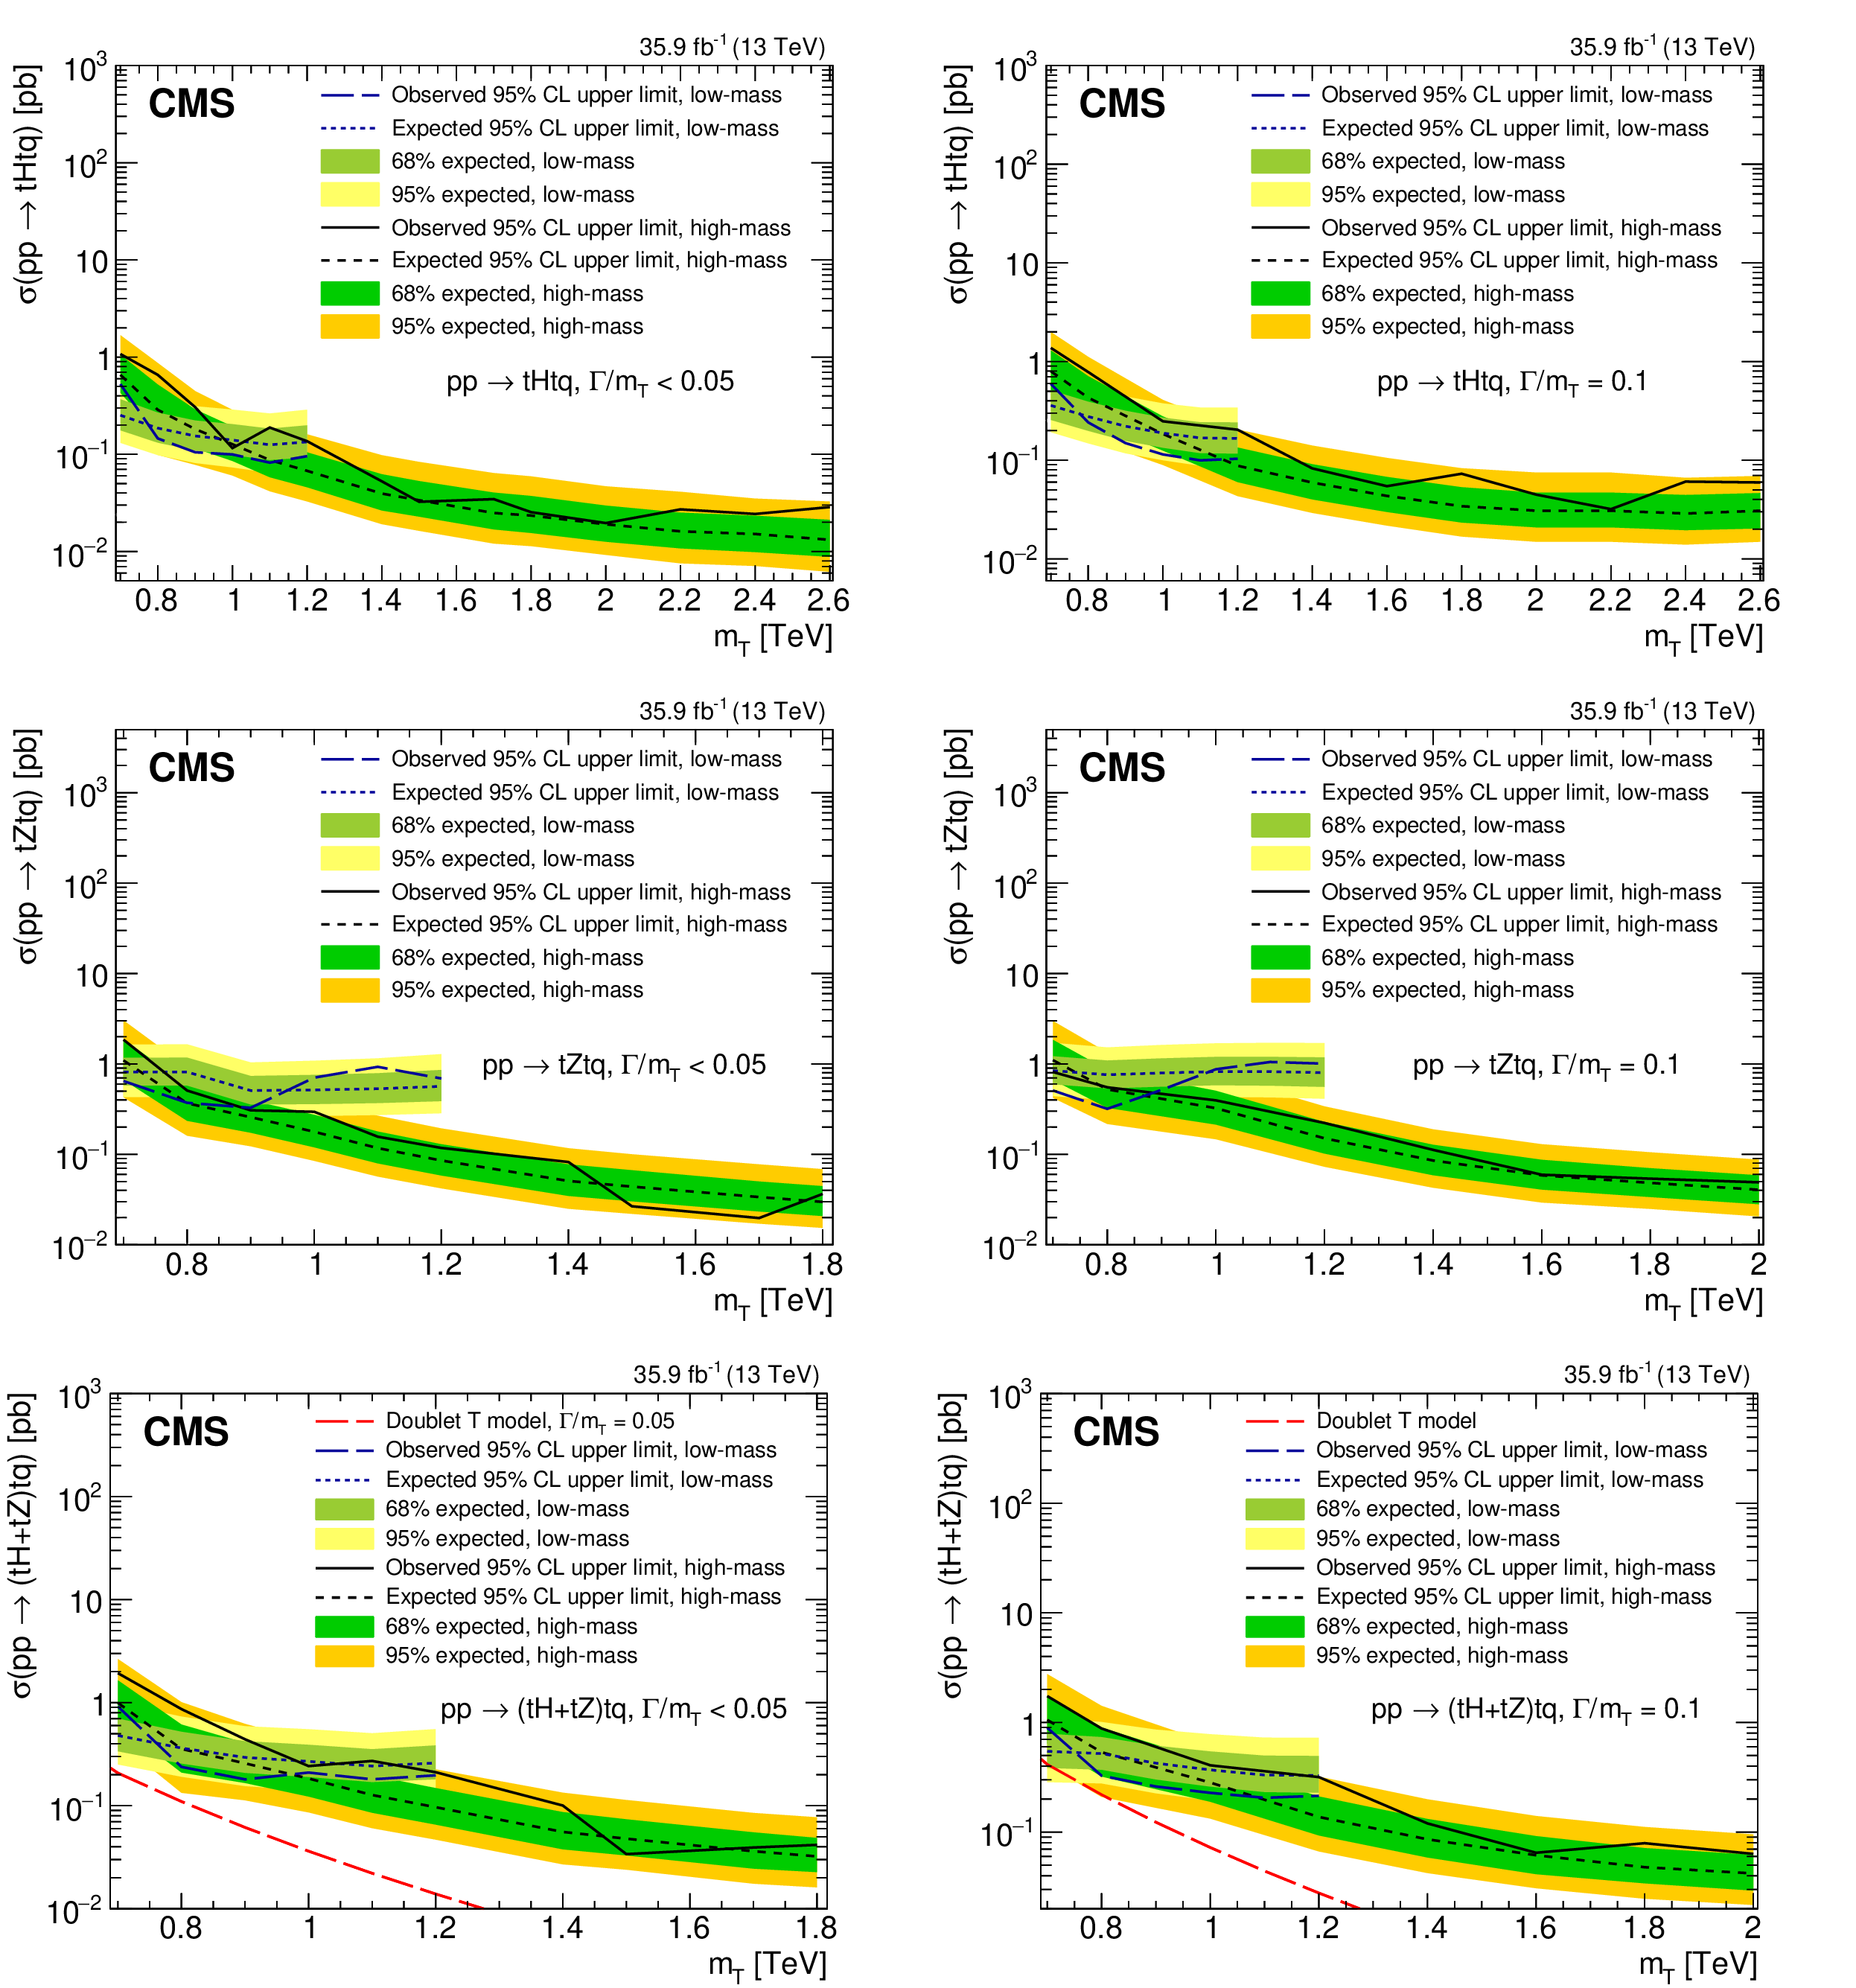
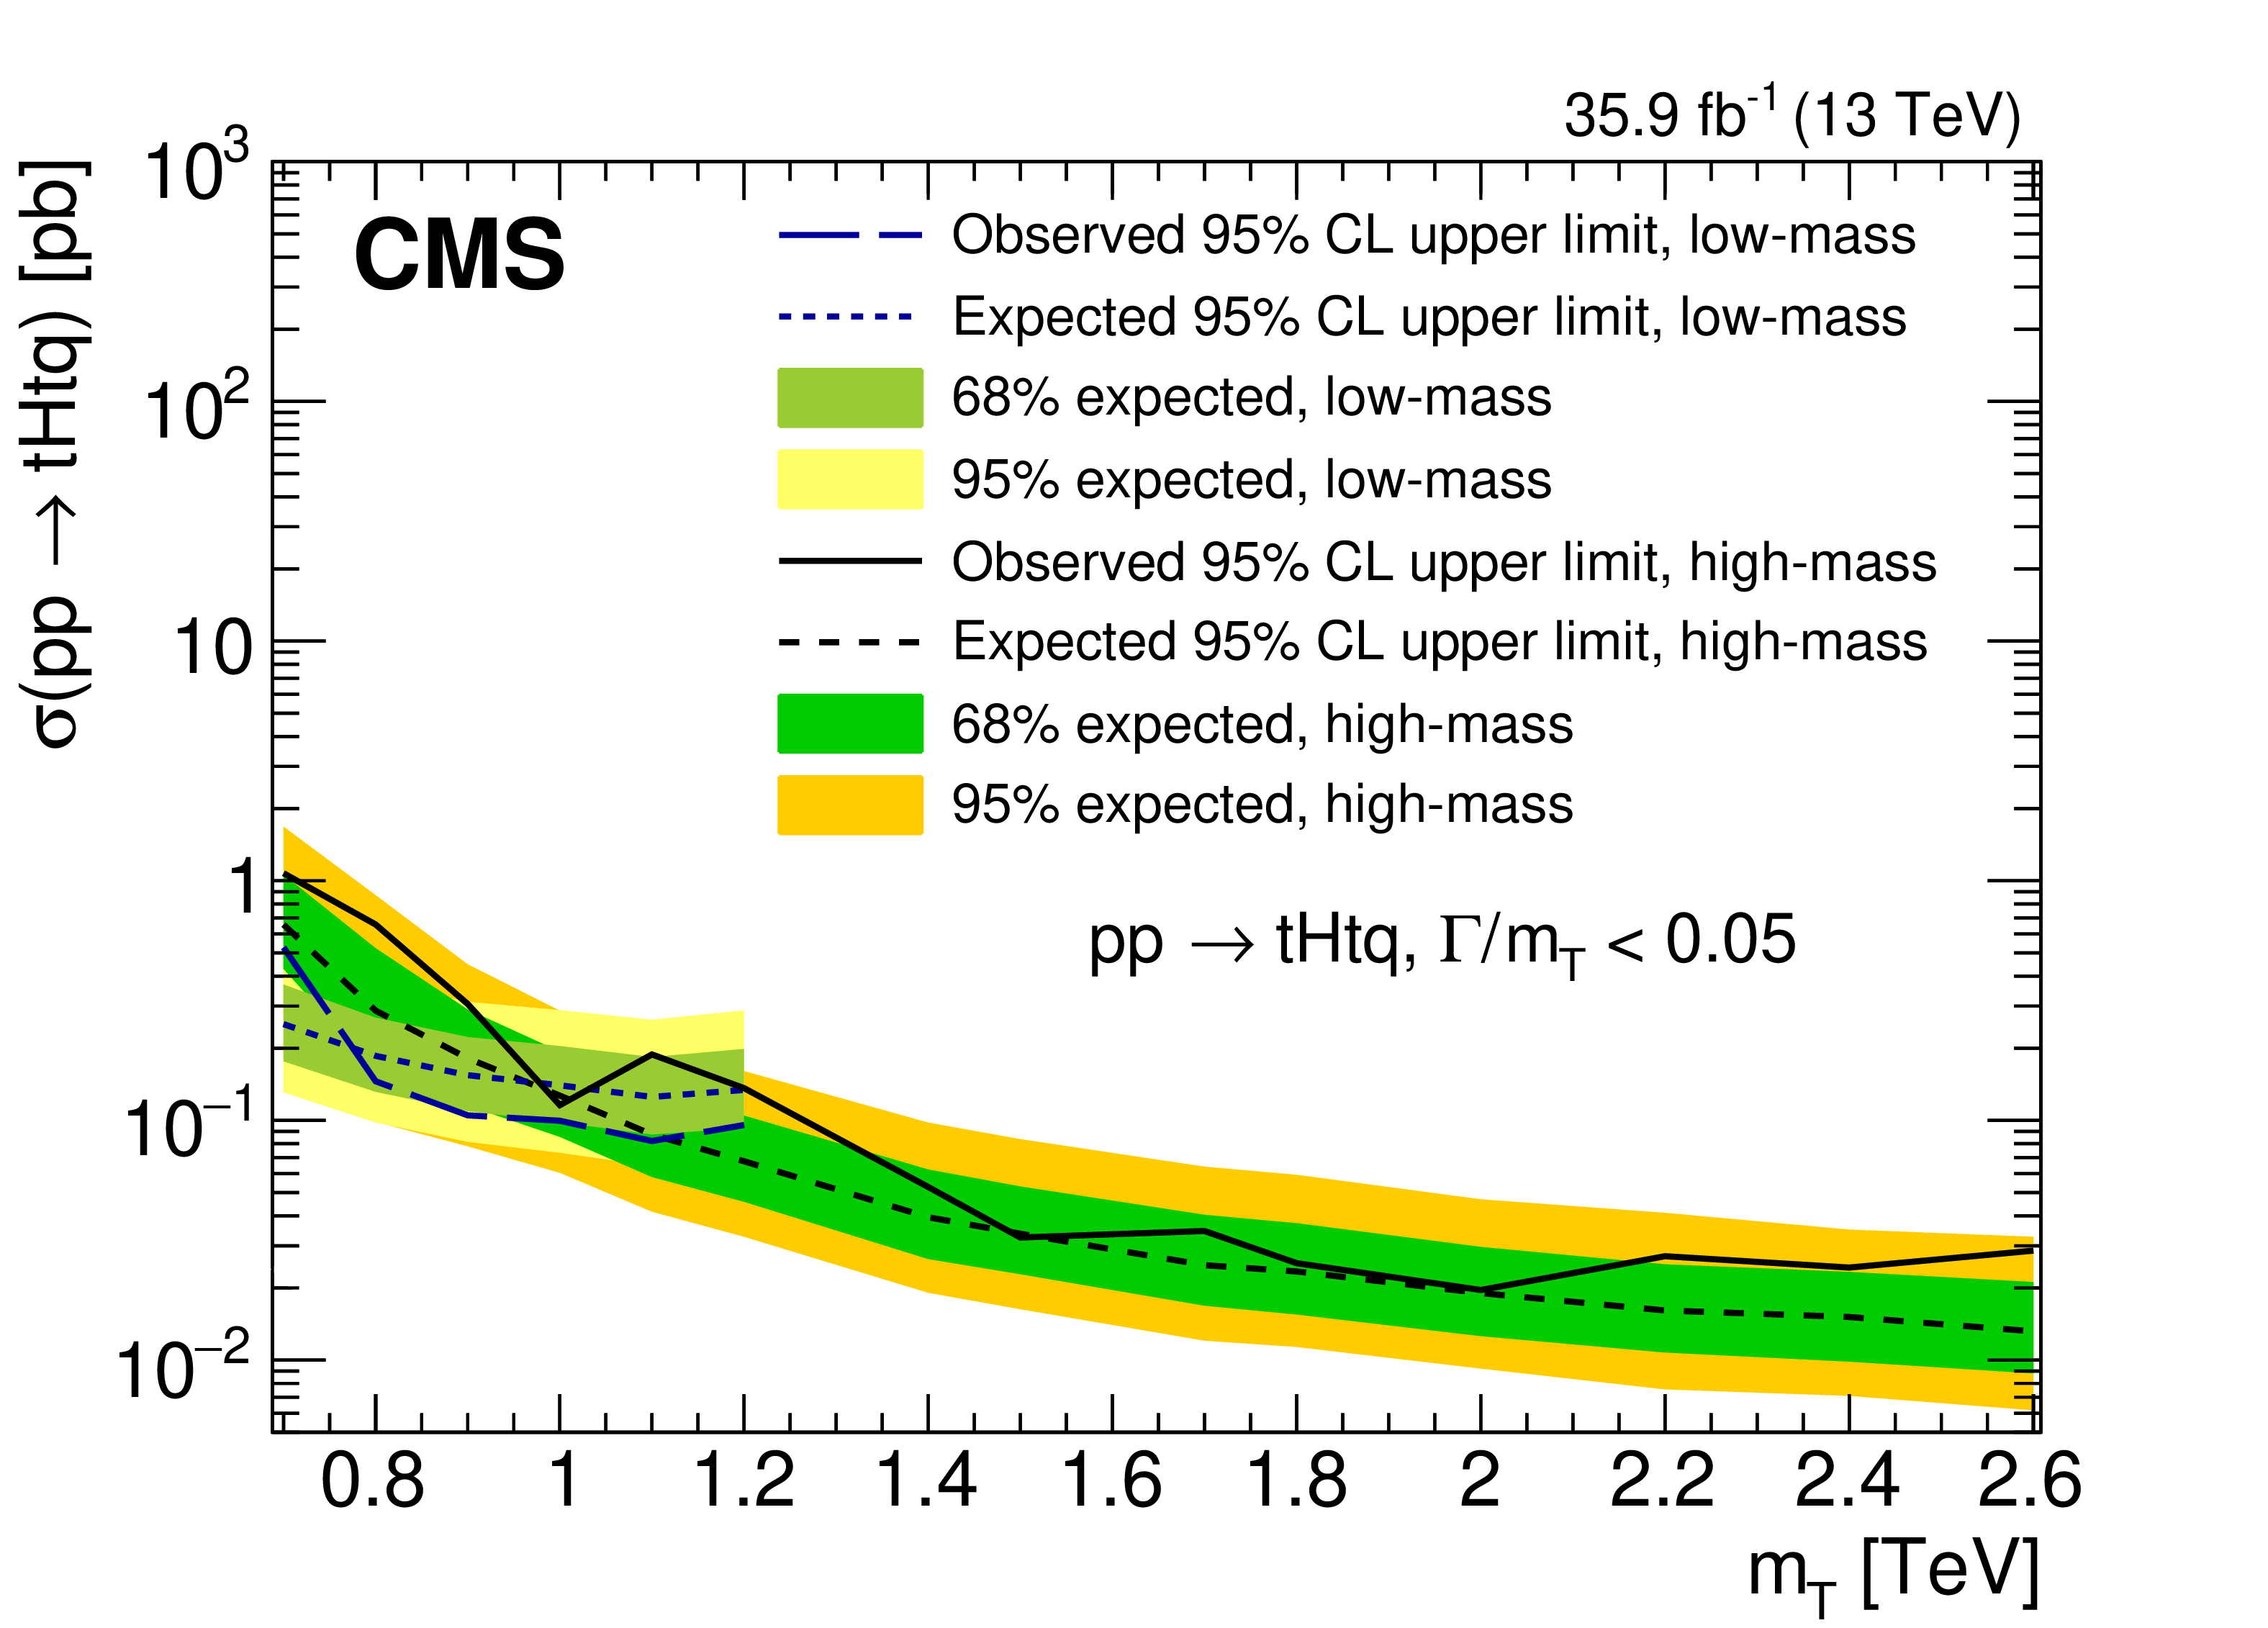
Figure 10:
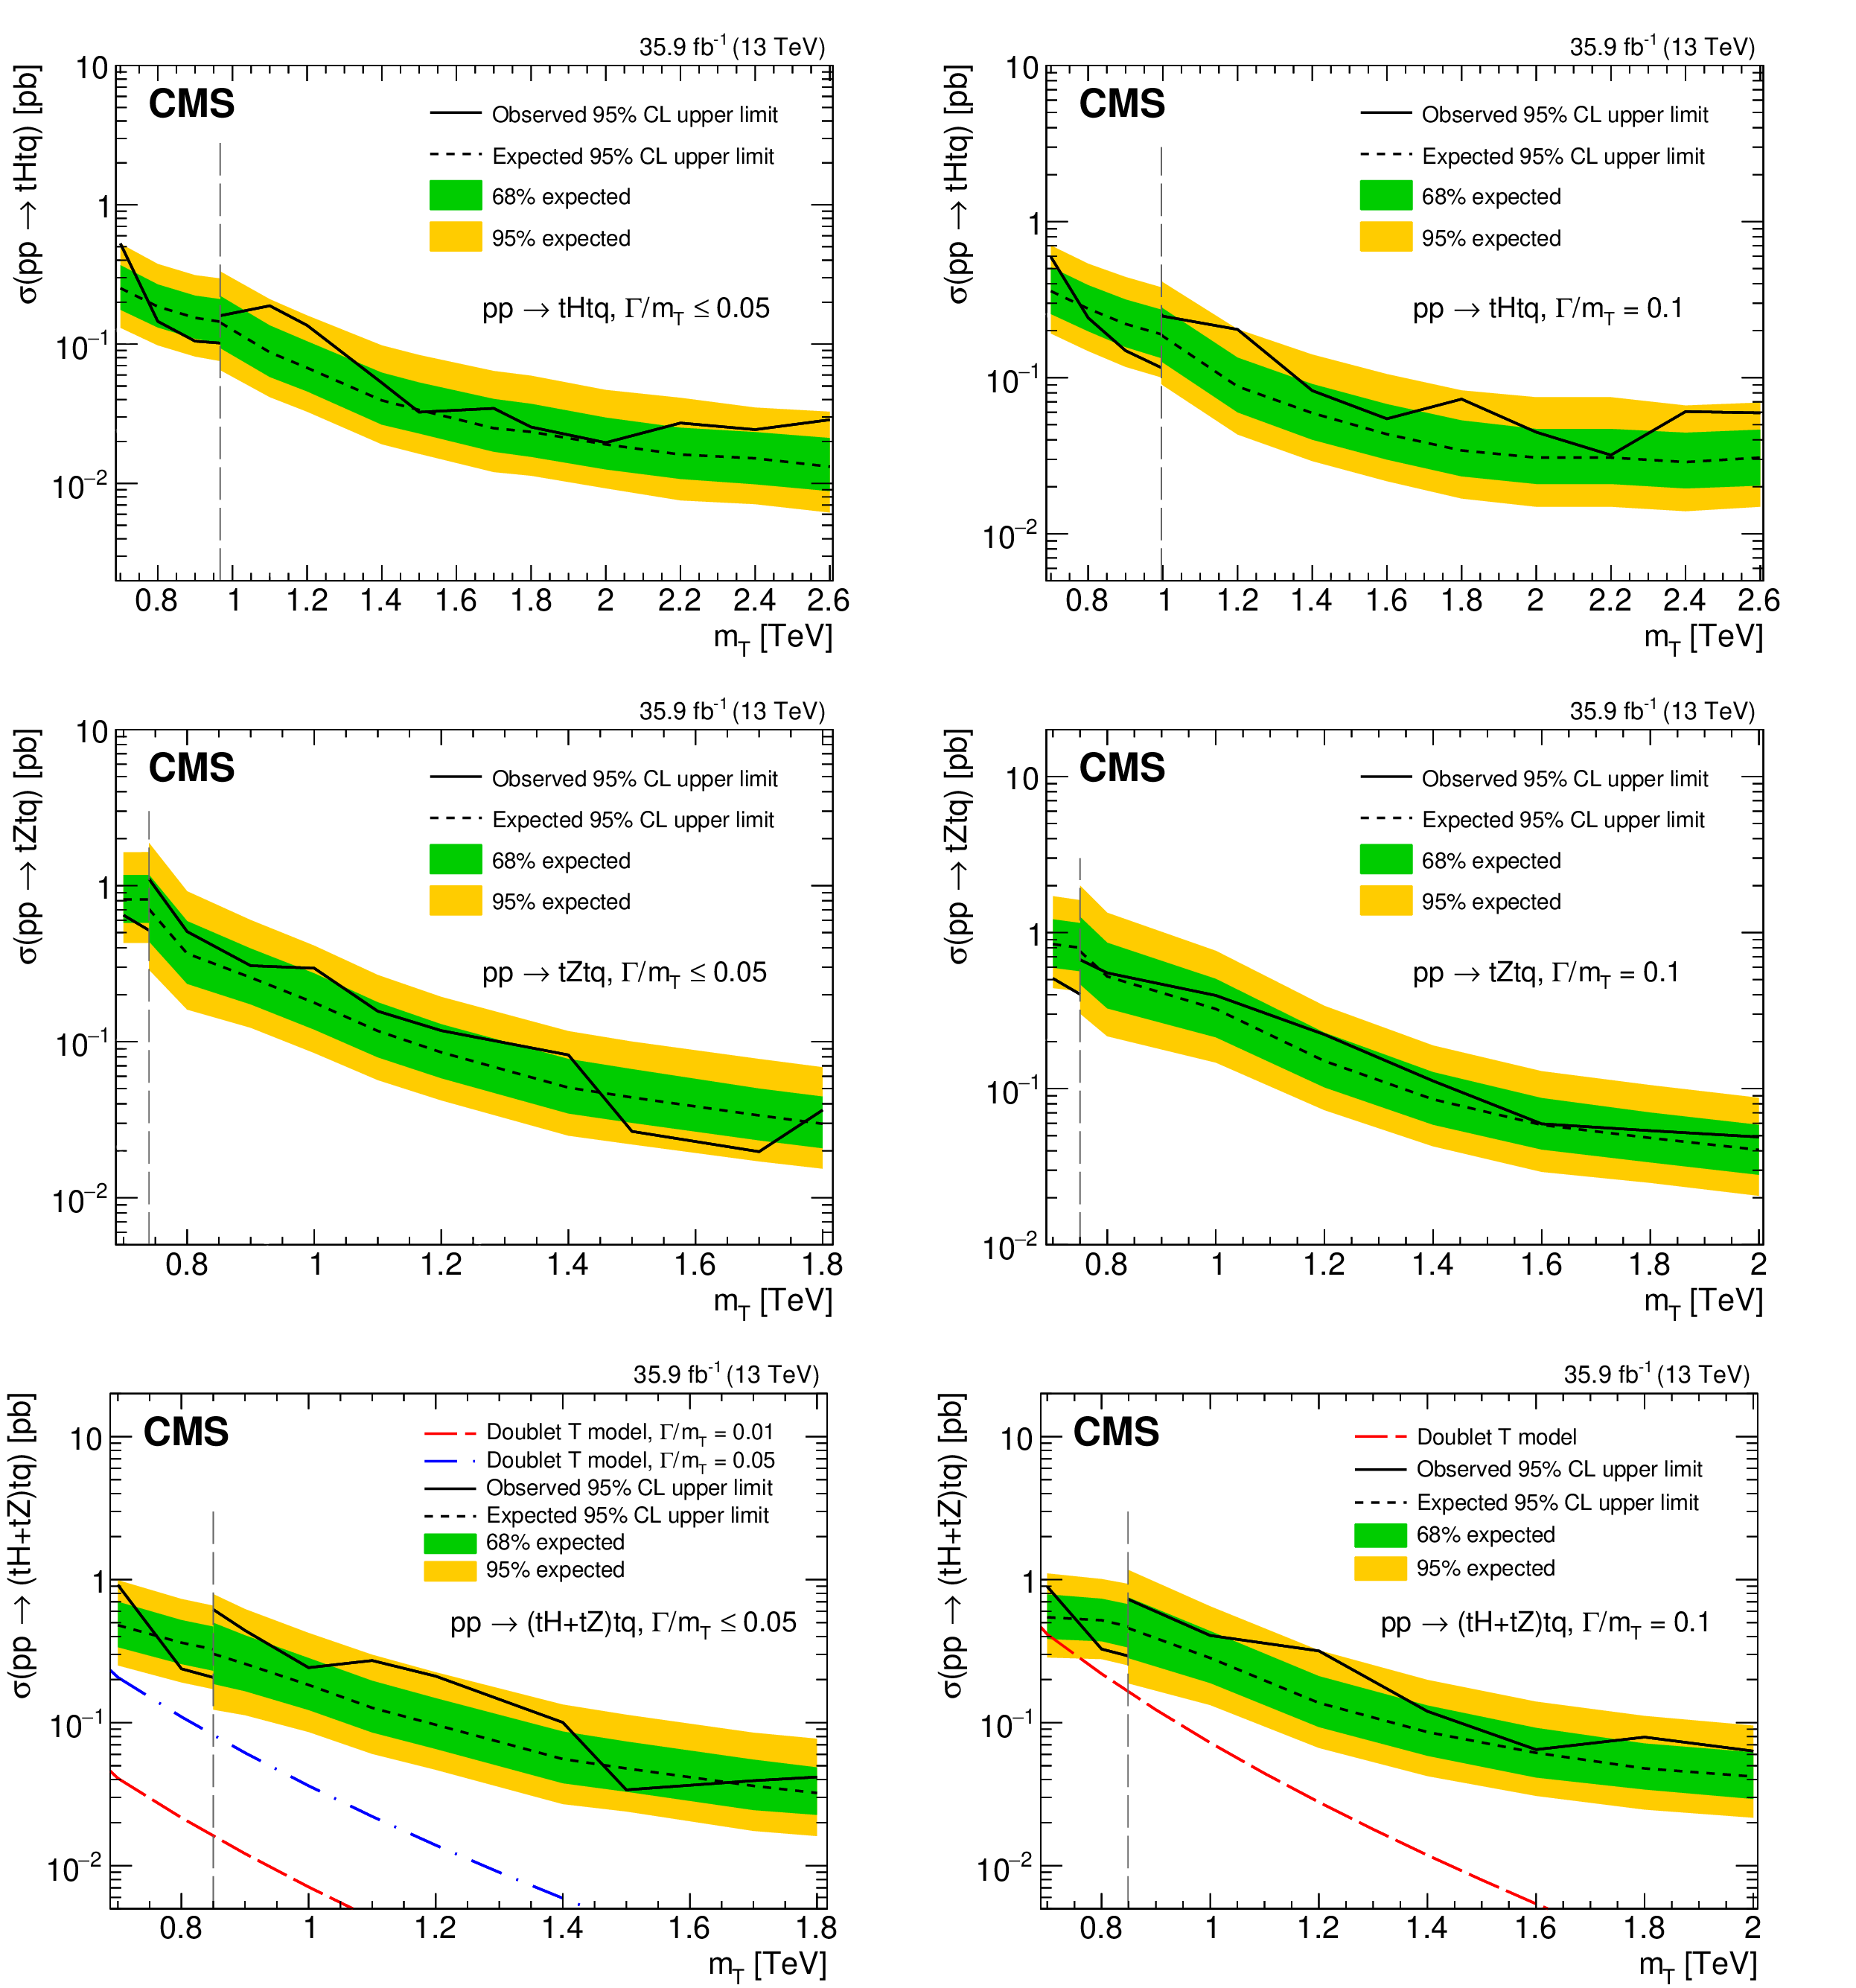
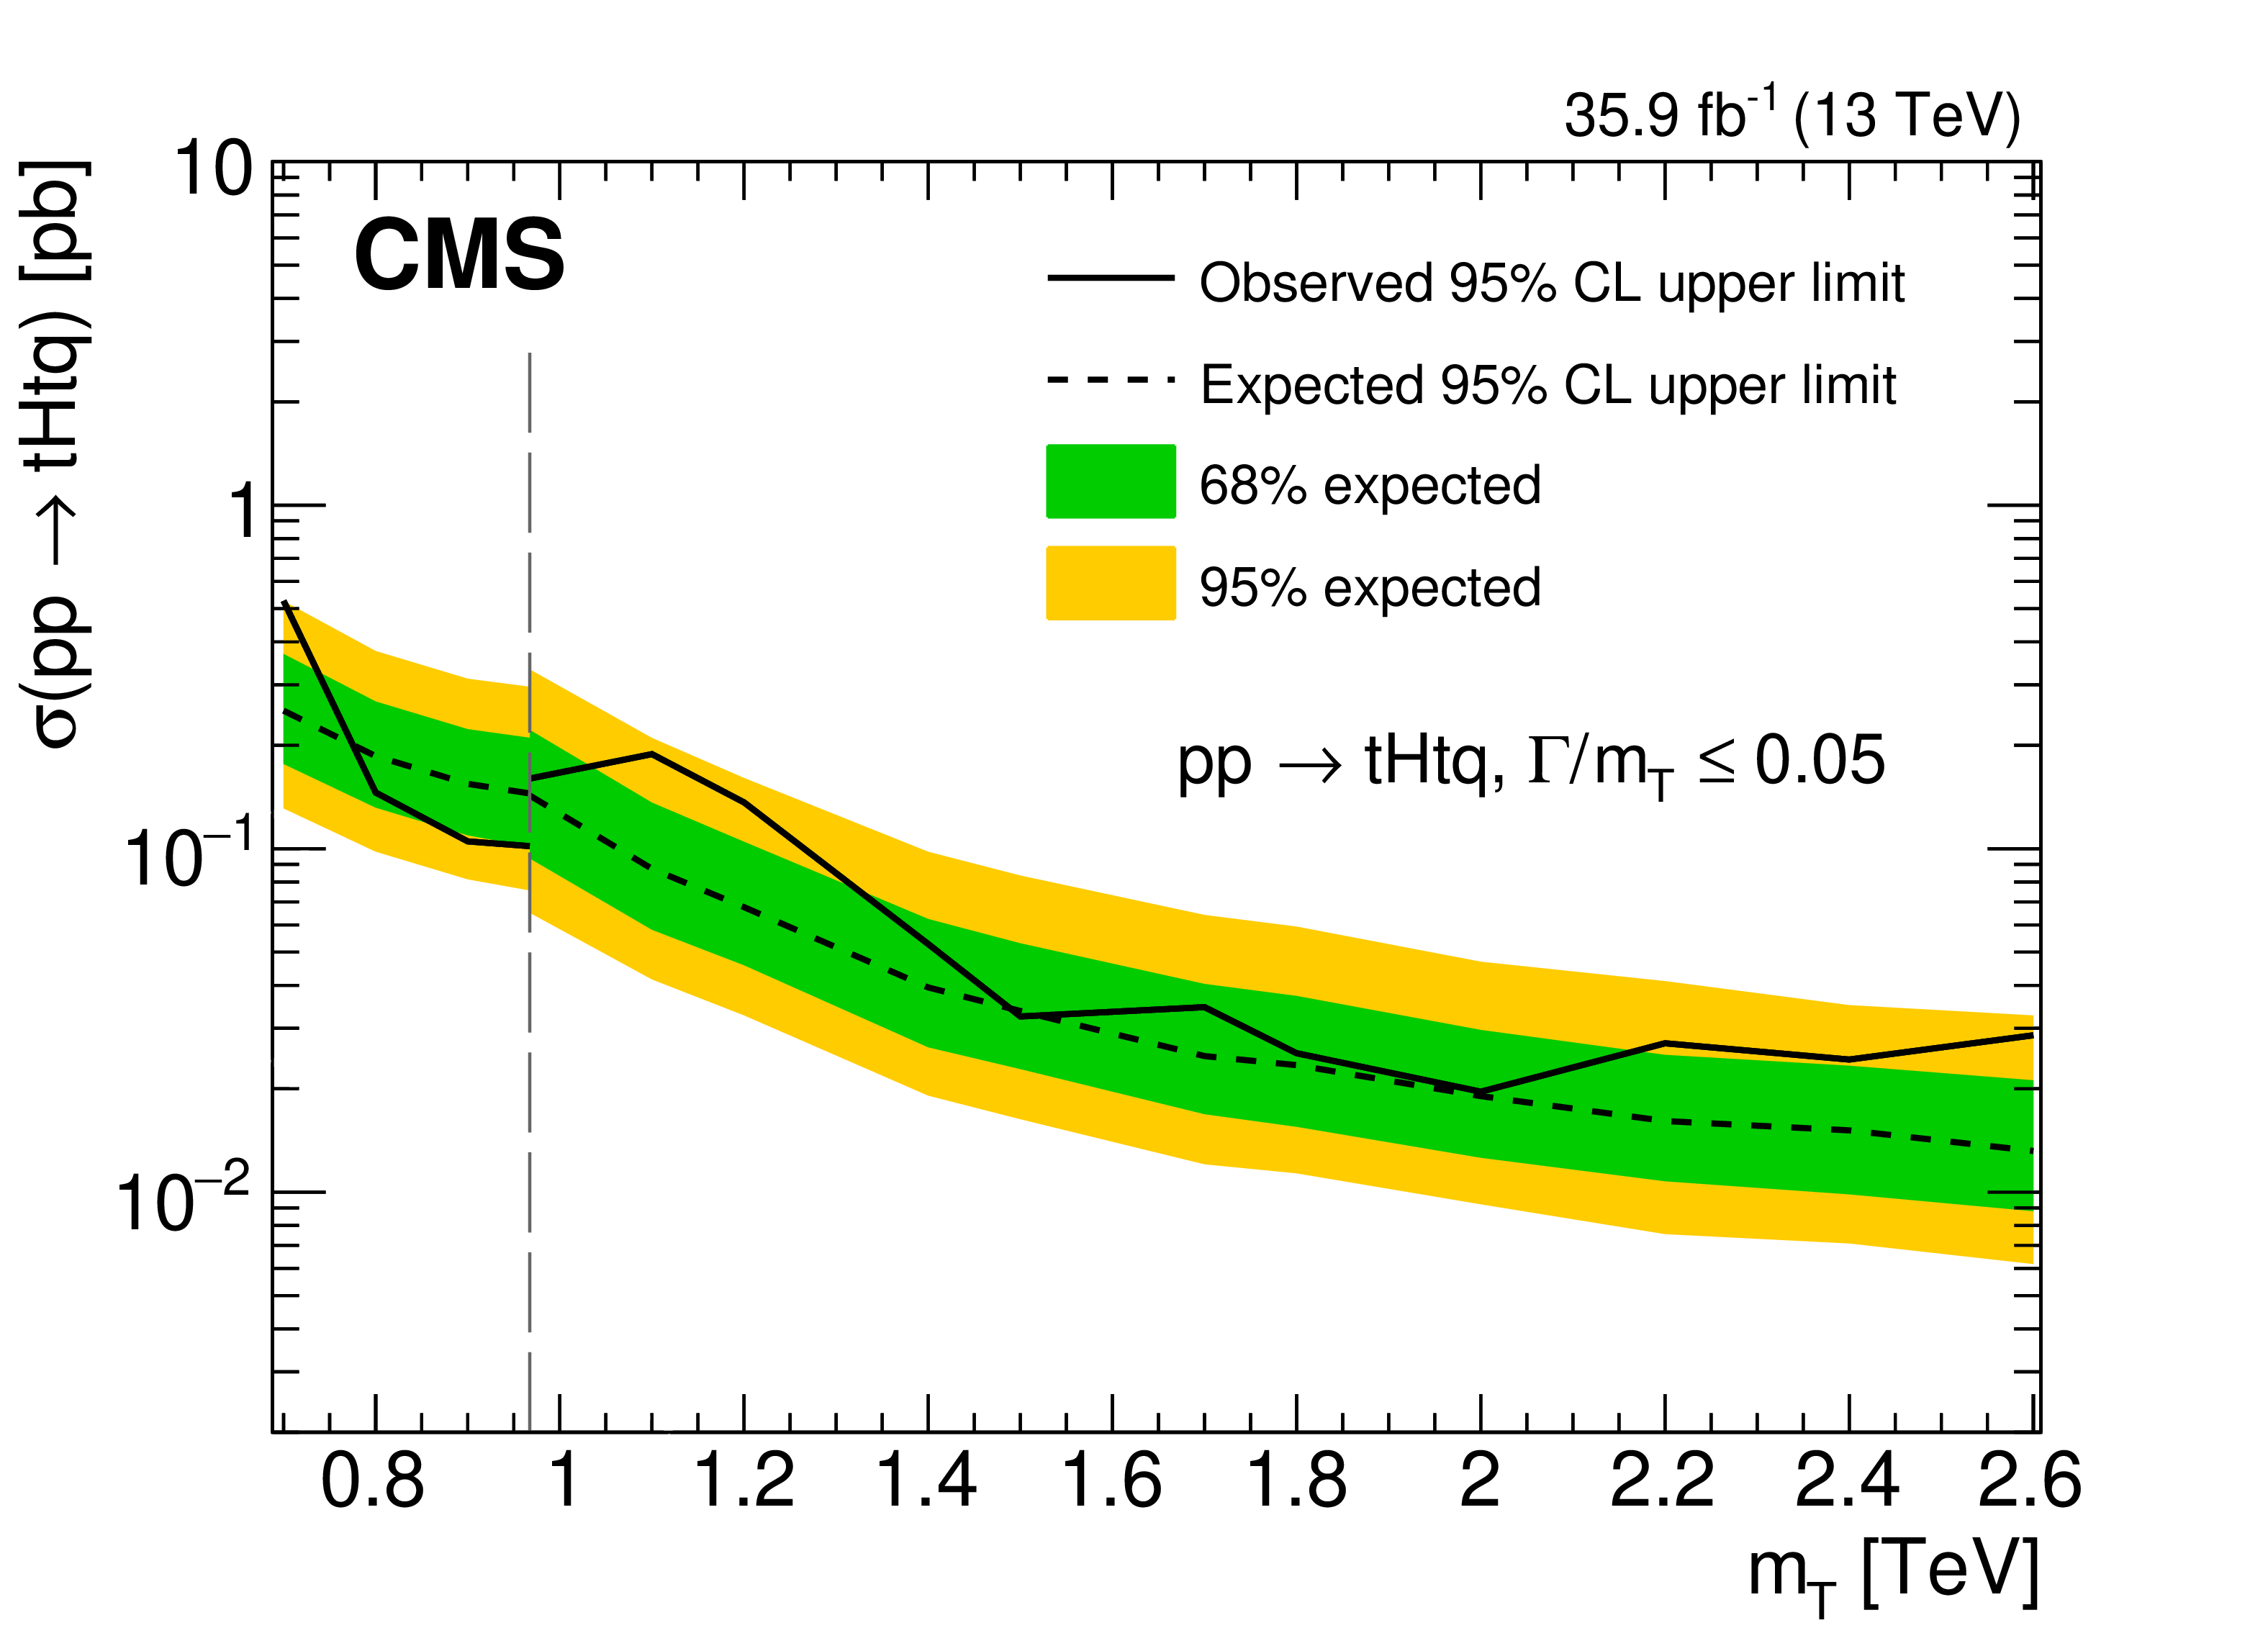
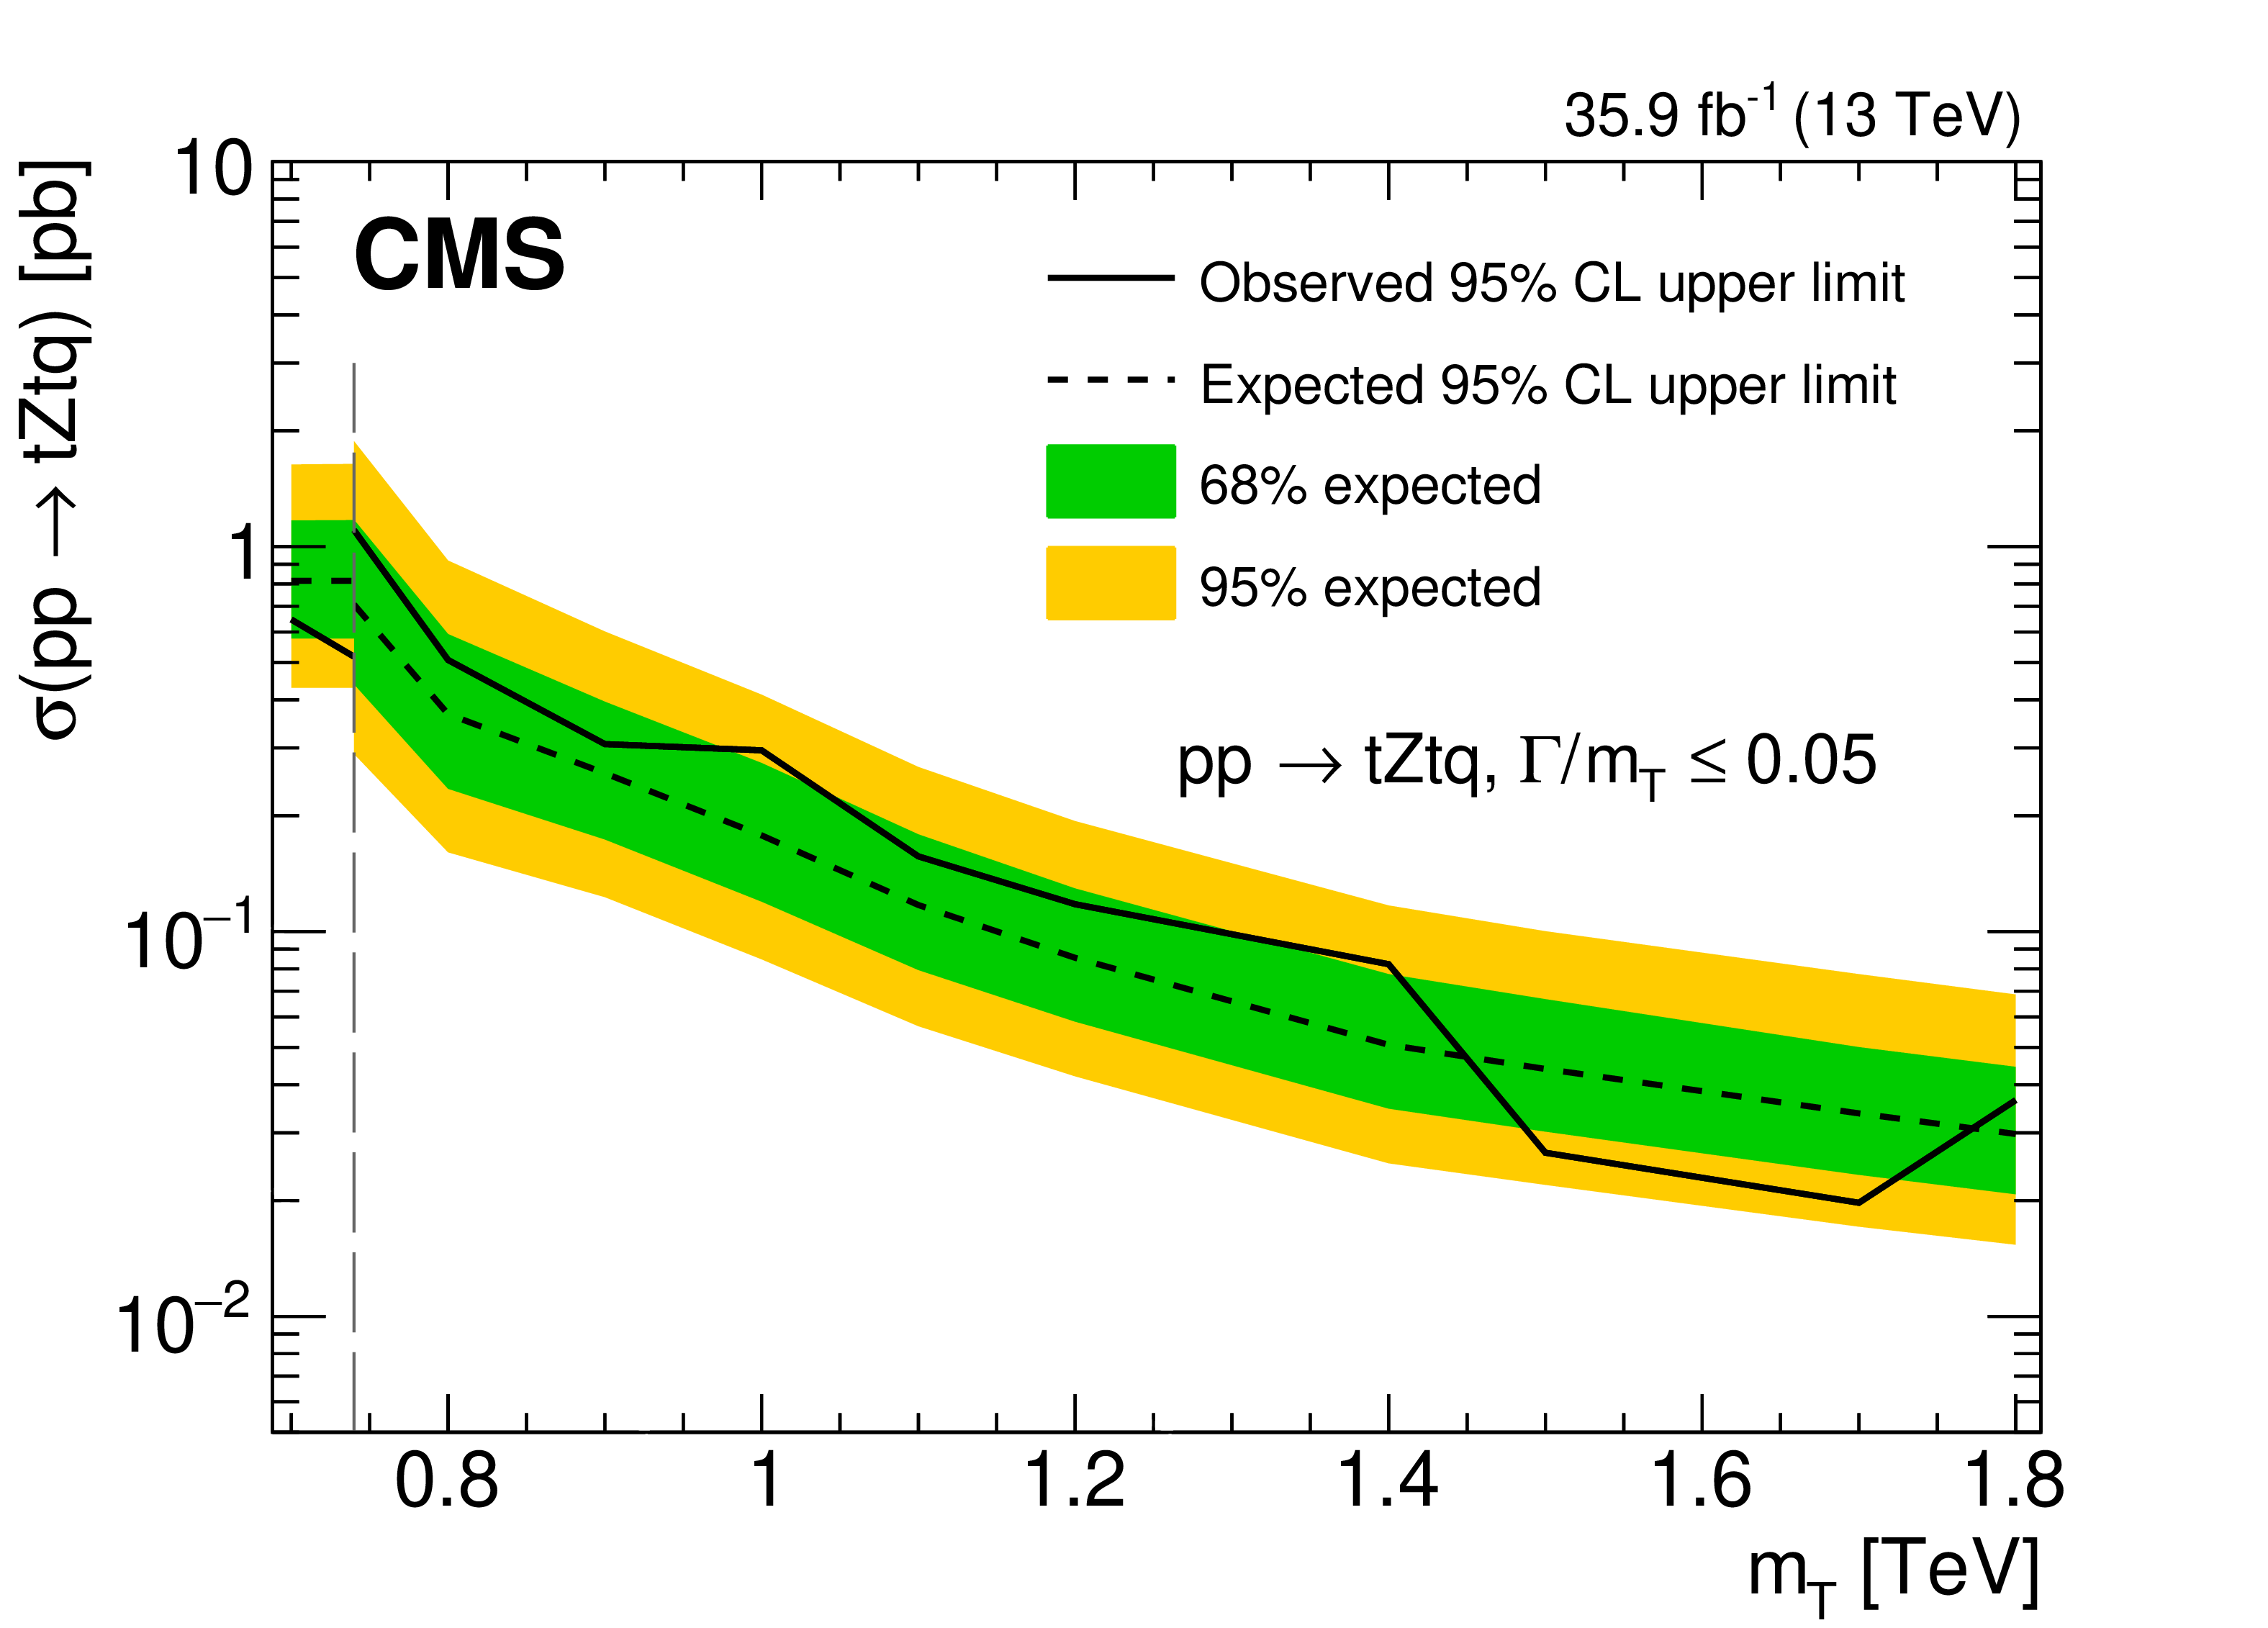
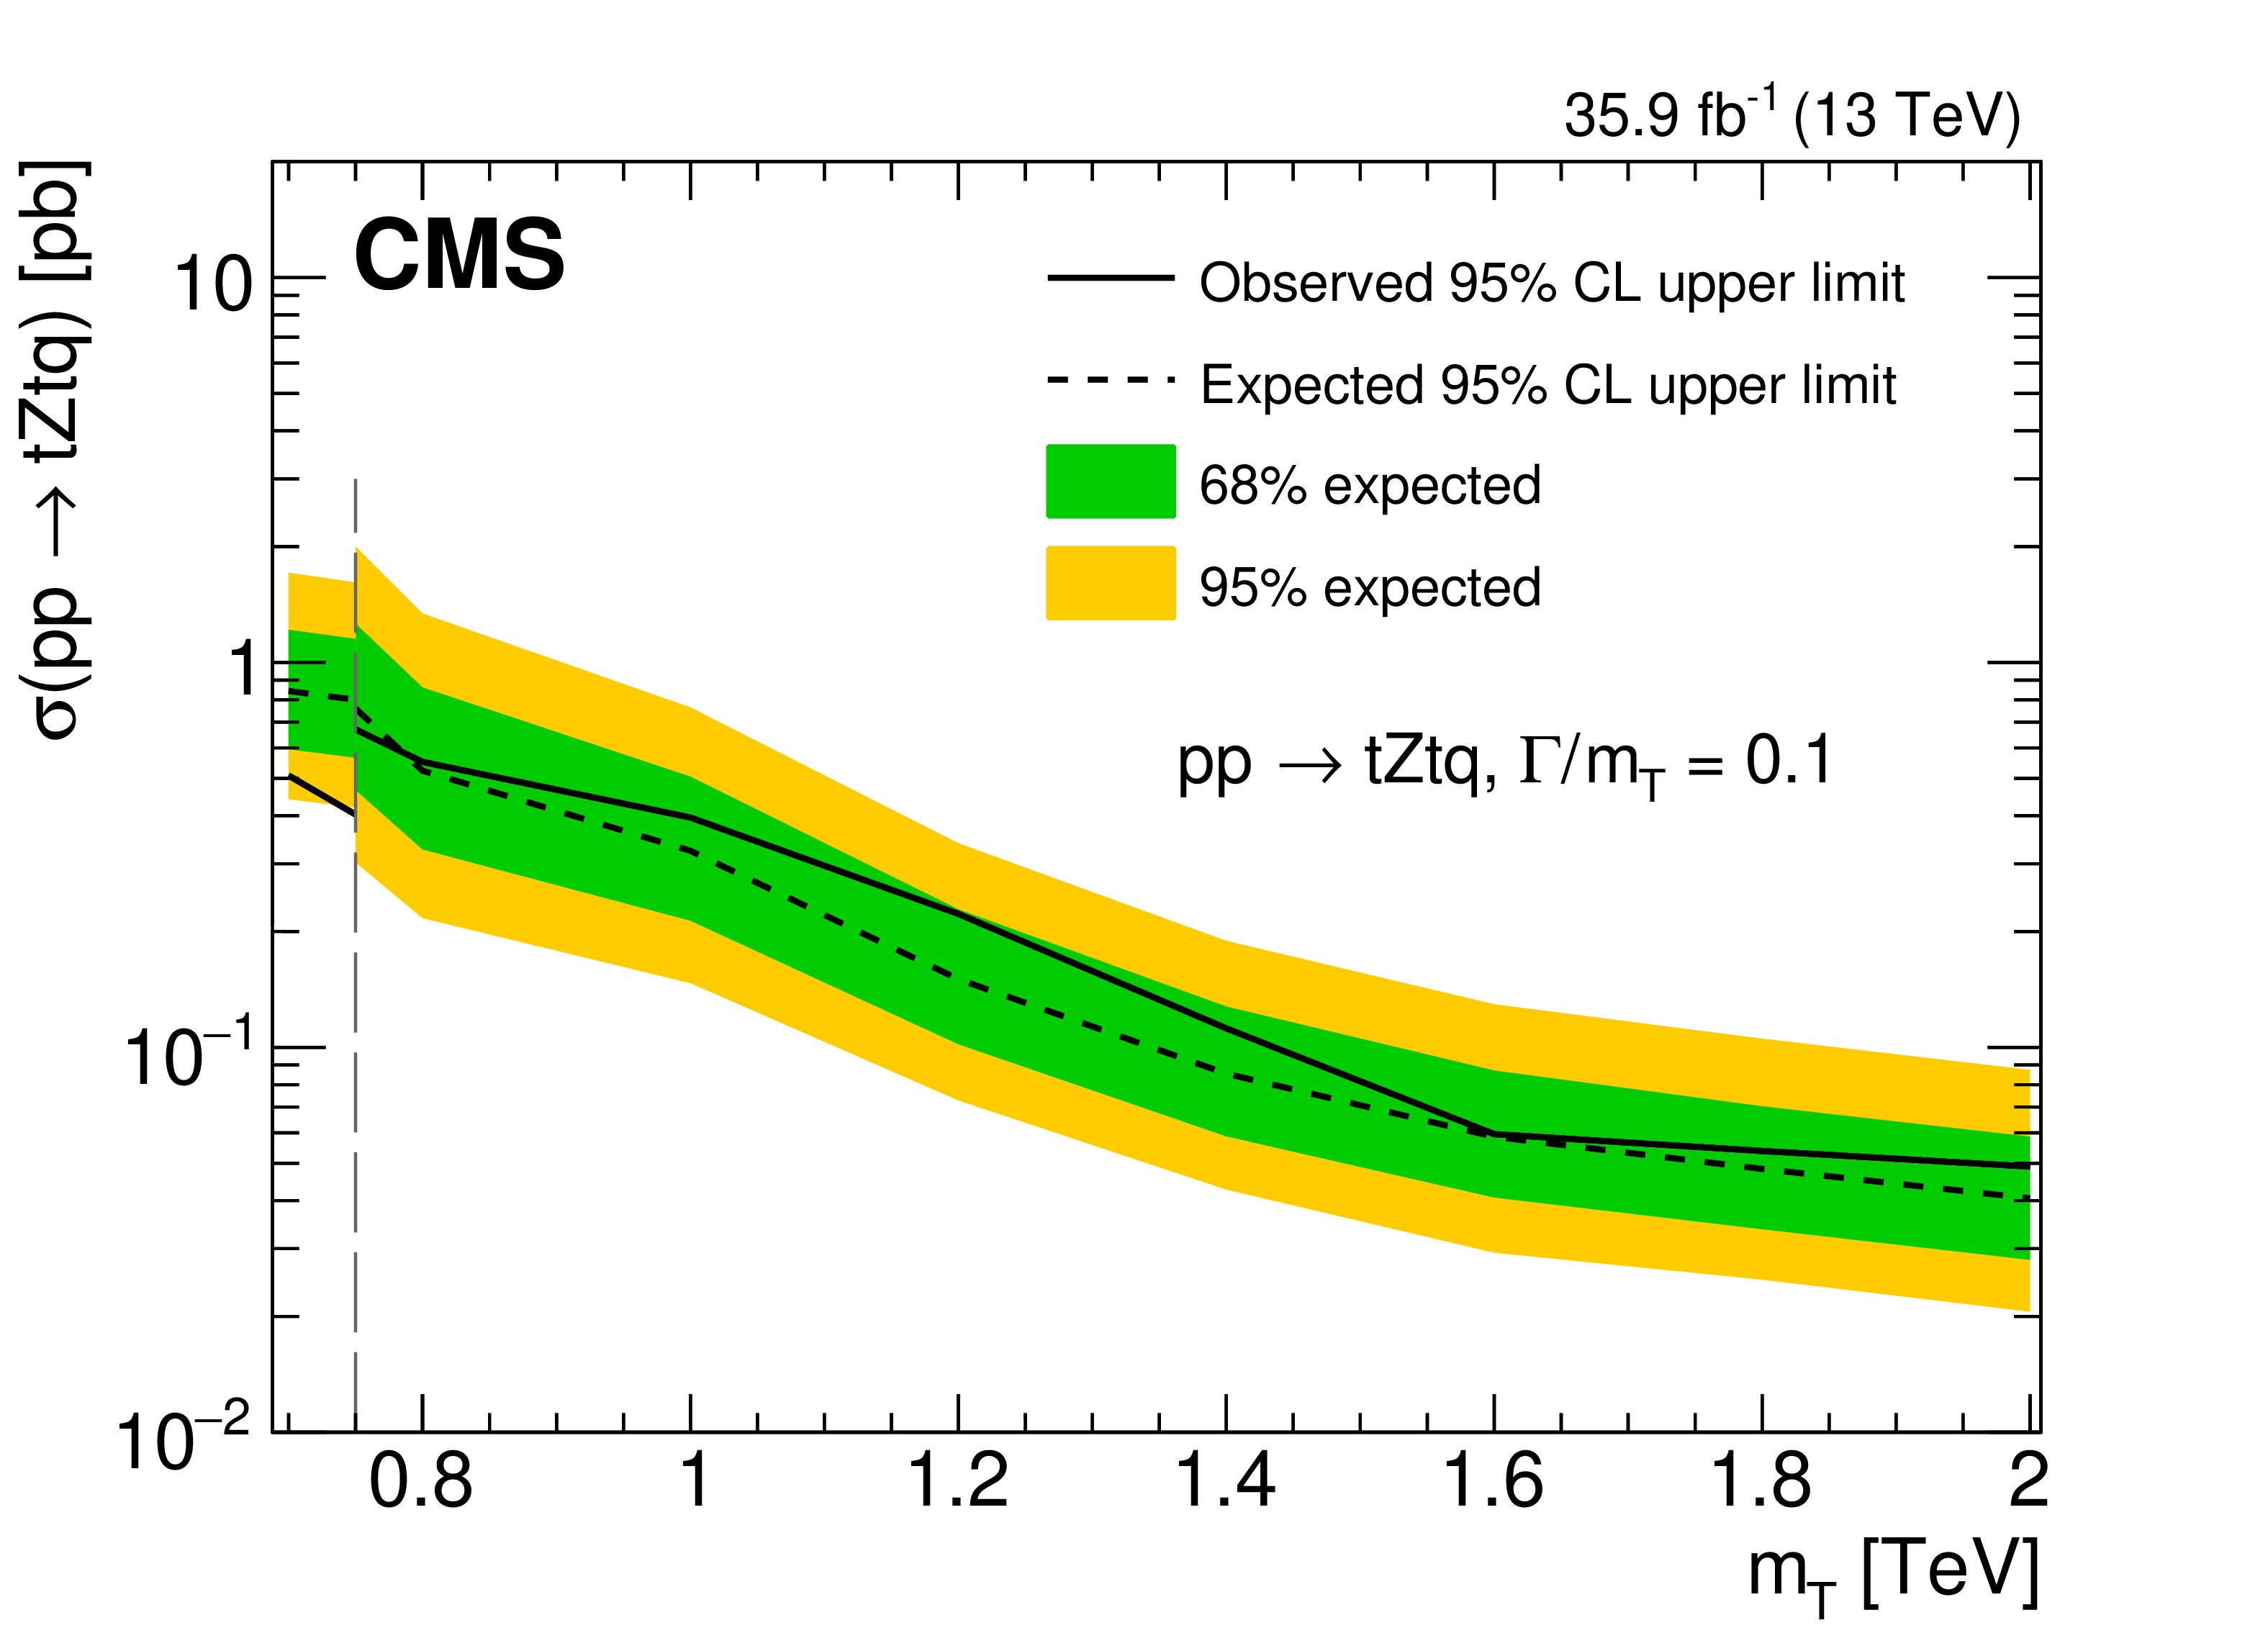
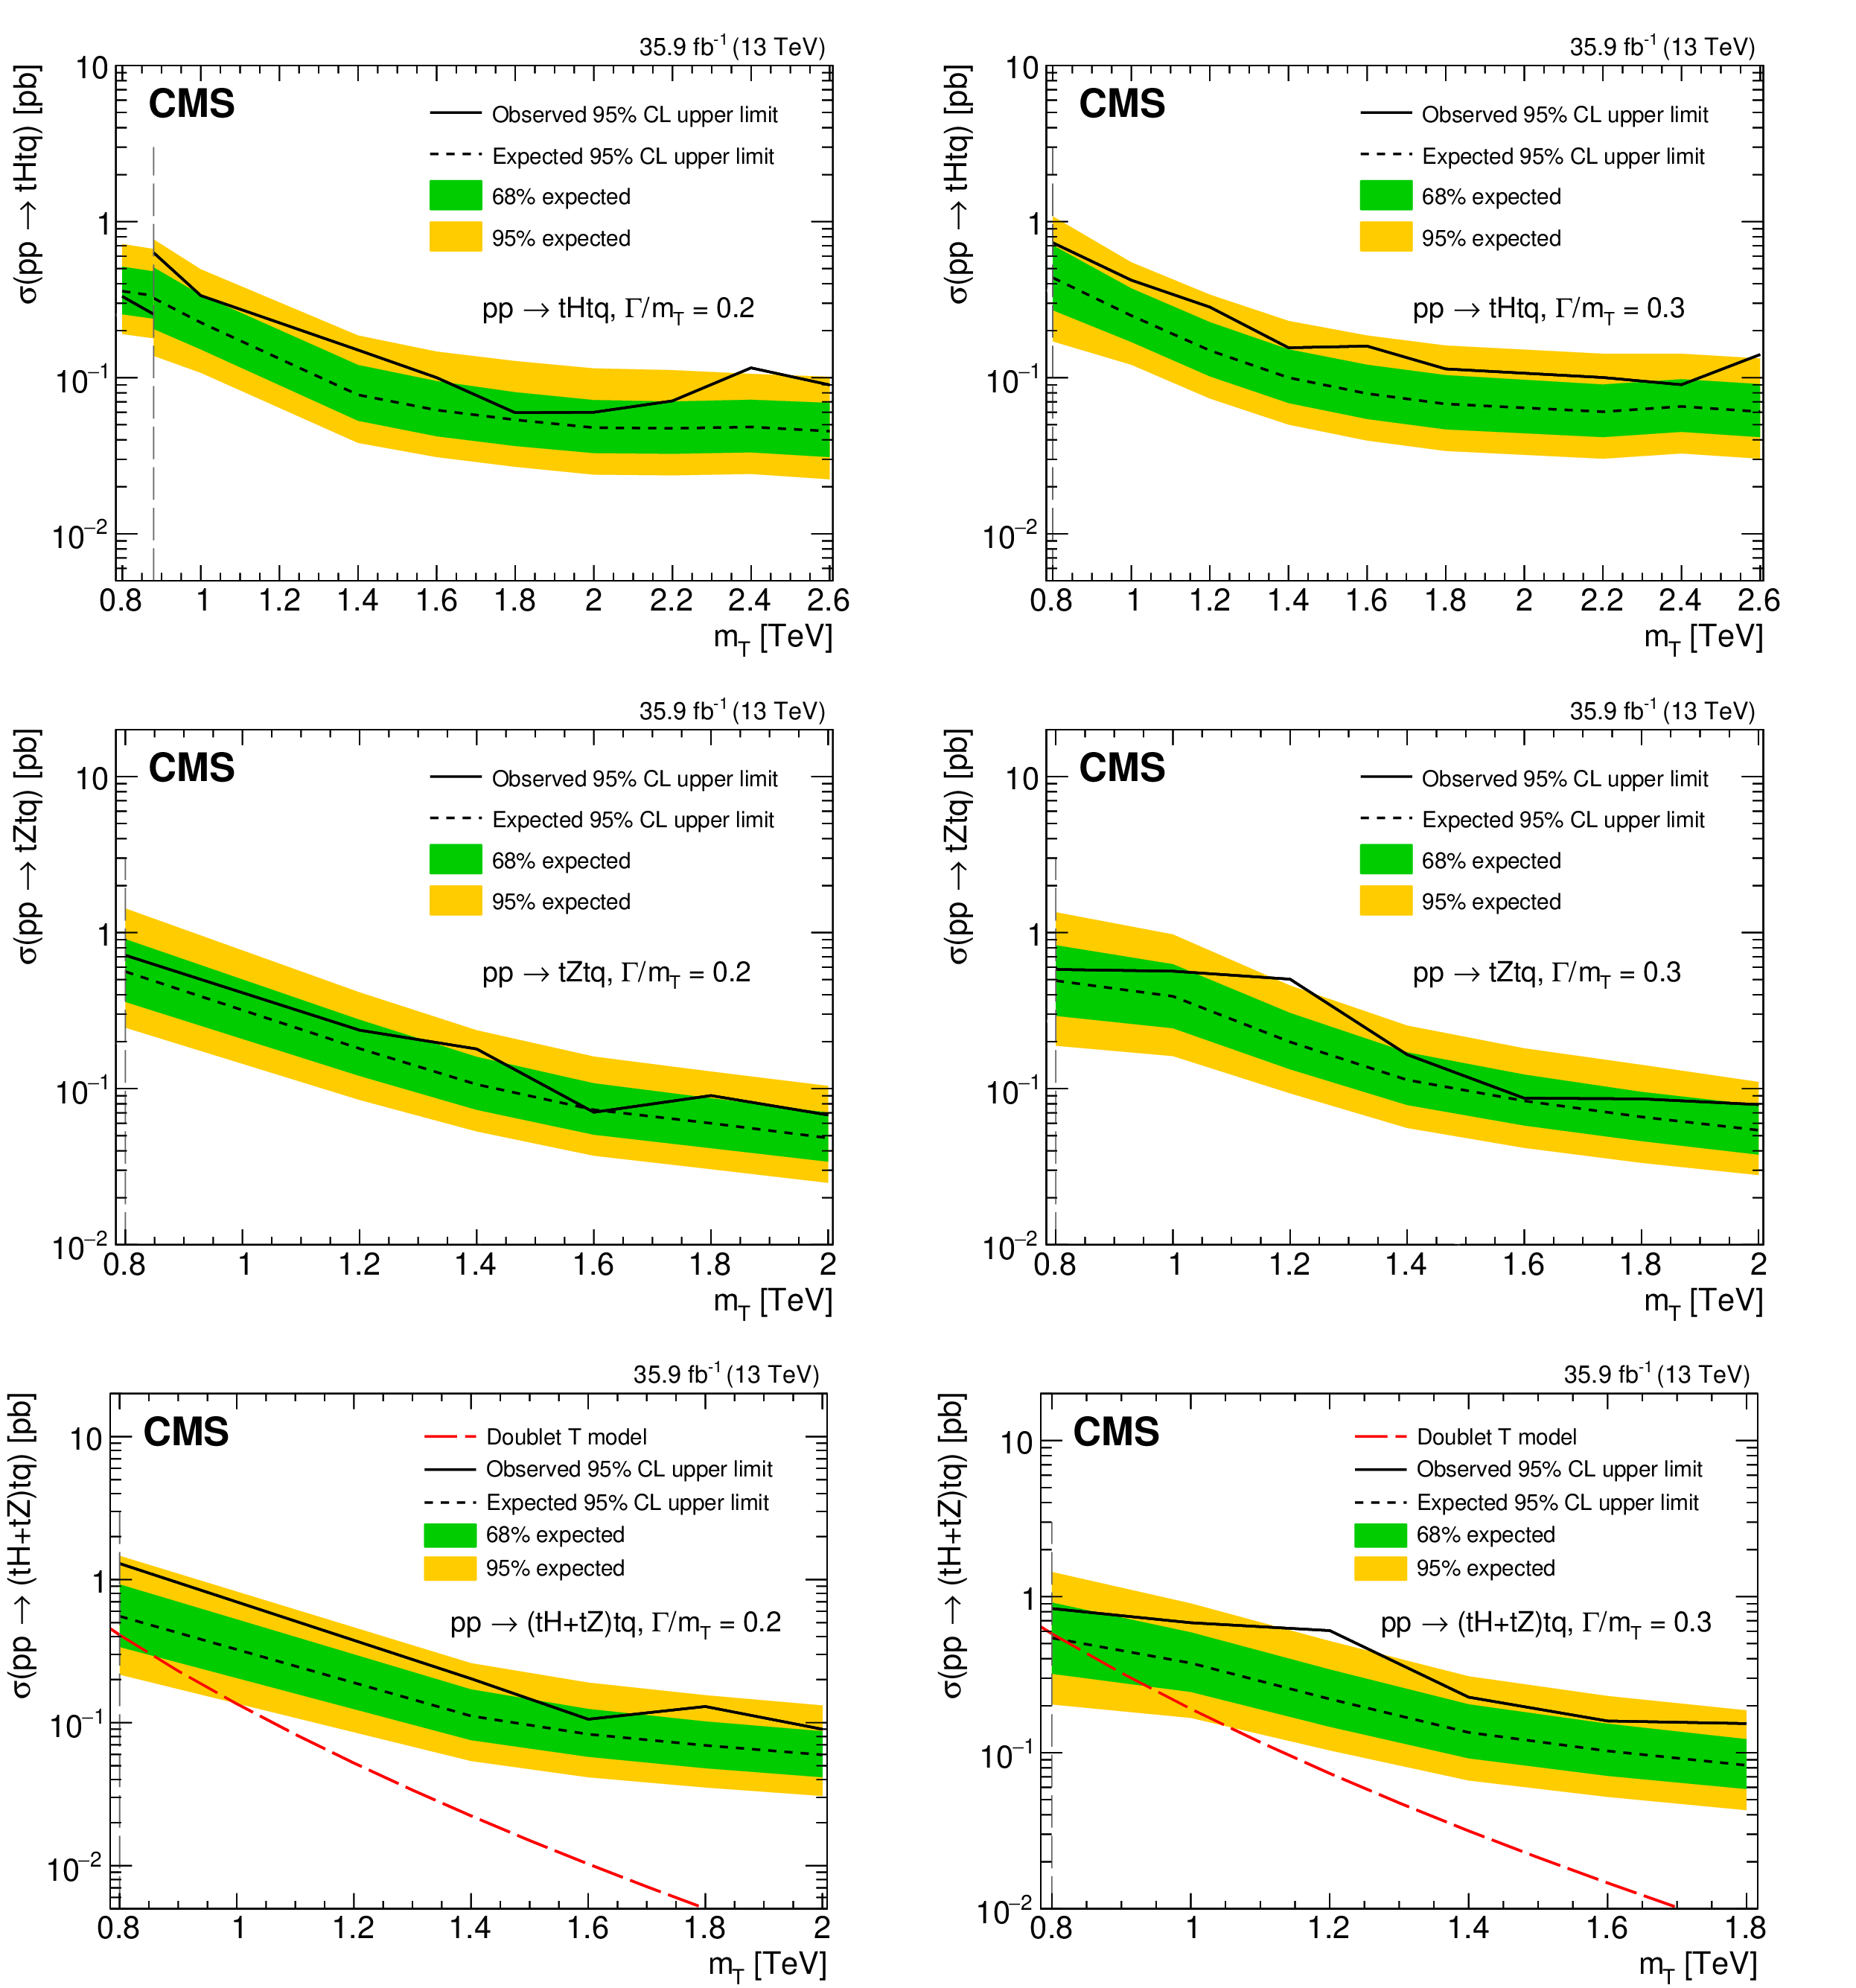
The observed and median expected upper limits at 95% CL on the cross sections for production associated with a top quark for the ${\mathrm{t} \mathrm{H} \mathrm{t} \mathrm{q}}$ (upper row) and ${\mathrm{t} \mathrm{Z} \mathrm{t} \mathrm{q}}$ (middle row) channels, and their sum, ${\mathrm{t} \mathrm{H} \mathrm{t} \mathrm{q} +\mathrm{t} \mathrm{Z} \mathrm{t} \mathrm{q}}$ (lower row), for different assumed values of the T quark mass. The inner (green) band and the outer (yellow) band indicate the regions containing 68 and 95%, respectively, of the distribution of limits expected under the background-only hypothesis. The left column is for a narrow fractional width ($ {\Gamma /{{m_{{\mathrm {T}}}}}} \le $ 0.05) and the right column is for a fractional width of $ {\Gamma /{{m_{{\mathrm {T}}}}}} = $ 0.1. The vertical dashed lines are the crossover points in sensitivity that indicate the mass intervals used for presenting the low-mass and high-mass search results. The dashed red and dot-dashed blue curves are for the (TB) doublet model. Given the specified width, the couplings are implicit in the model. Two curves corresponding to $ {\Gamma /{{m_{{\mathrm {T}}}}}} = $ 0.05 (dot-dashed blue) and $ {\Gamma /{{m_{{\mathrm {T}}}}}} = $ 0.01 (dashed red) are shown for the narrow fractional width. |
png pdf |
Figure 10-a:
The observed and median expected upper limits at 95% CL on the cross sections for production associated with a top quark for the ${\mathrm{t} \mathrm{H} \mathrm{t} \mathrm{q}}$ (upper row) and ${\mathrm{t} \mathrm{Z} \mathrm{t} \mathrm{q}}$ (middle row) channels, and their sum, ${\mathrm{t} \mathrm{H} \mathrm{t} \mathrm{q} +\mathrm{t} \mathrm{Z} \mathrm{t} \mathrm{q}}$ (lower row), for different assumed values of the T quark mass. The inner (green) band and the outer (yellow) band indicate the regions containing 68 and 95%, respectively, of the distribution of limits expected under the background-only hypothesis. The left column is for a narrow fractional width ($ {\Gamma /{{m_{{\mathrm {T}}}}}} \le $ 0.05) and the right column is for a fractional width of $ {\Gamma /{{m_{{\mathrm {T}}}}}} = $ 0.1. The vertical dashed lines are the crossover points in sensitivity that indicate the mass intervals used for presenting the low-mass and high-mass search results. The dashed red and dot-dashed blue curves are for the (TB) doublet model. Given the specified width, the couplings are implicit in the model. Two curves corresponding to $ {\Gamma /{{m_{{\mathrm {T}}}}}} = $ 0.05 (dot-dashed blue) and $ {\Gamma /{{m_{{\mathrm {T}}}}}} = $ 0.01 (dashed red) are shown for the narrow fractional width. |

png pdf |
Figure 10-b:
The observed and median expected upper limits at 95% CL on the cross sections for production associated with a top quark for the ${\mathrm{t} \mathrm{H} \mathrm{t} \mathrm{q}}$ (upper row) and ${\mathrm{t} \mathrm{Z} \mathrm{t} \mathrm{q}}$ (middle row) channels, and their sum, ${\mathrm{t} \mathrm{H} \mathrm{t} \mathrm{q} +\mathrm{t} \mathrm{Z} \mathrm{t} \mathrm{q}}$ (lower row), for different assumed values of the T quark mass. The inner (green) band and the outer (yellow) band indicate the regions containing 68 and 95%, respectively, of the distribution of limits expected under the background-only hypothesis. The left column is for a narrow fractional width ($ {\Gamma /{{m_{{\mathrm {T}}}}}} \le $ 0.05) and the right column is for a fractional width of $ {\Gamma /{{m_{{\mathrm {T}}}}}} = $ 0.1. The vertical dashed lines are the crossover points in sensitivity that indicate the mass intervals used for presenting the low-mass and high-mass search results. The dashed red and dot-dashed blue curves are for the (TB) doublet model. Given the specified width, the couplings are implicit in the model. Two curves corresponding to $ {\Gamma /{{m_{{\mathrm {T}}}}}} = $ 0.05 (dot-dashed blue) and $ {\Gamma /{{m_{{\mathrm {T}}}}}} = $ 0.01 (dashed red) are shown for the narrow fractional width. |
png pdf |
Figure 10-c:
The observed and median expected upper limits at 95% CL on the cross sections for production associated with a top quark for the ${\mathrm{t} \mathrm{H} \mathrm{t} \mathrm{q}}$ (upper row) and ${\mathrm{t} \mathrm{Z} \mathrm{t} \mathrm{q}}$ (middle row) channels, and their sum, ${\mathrm{t} \mathrm{H} \mathrm{t} \mathrm{q} +\mathrm{t} \mathrm{Z} \mathrm{t} \mathrm{q}}$ (lower row), for different assumed values of the T quark mass. The inner (green) band and the outer (yellow) band indicate the regions containing 68 and 95%, respectively, of the distribution of limits expected under the background-only hypothesis. The left column is for a narrow fractional width ($ {\Gamma /{{m_{{\mathrm {T}}}}}} \le $ 0.05) and the right column is for a fractional width of $ {\Gamma /{{m_{{\mathrm {T}}}}}} = $ 0.1. The vertical dashed lines are the crossover points in sensitivity that indicate the mass intervals used for presenting the low-mass and high-mass search results. The dashed red and dot-dashed blue curves are for the (TB) doublet model. Given the specified width, the couplings are implicit in the model. Two curves corresponding to $ {\Gamma /{{m_{{\mathrm {T}}}}}} = $ 0.05 (dot-dashed blue) and $ {\Gamma /{{m_{{\mathrm {T}}}}}} = $ 0.01 (dashed red) are shown for the narrow fractional width. |
png pdf |
Figure 10-d:
The observed and median expected upper limits at 95% CL on the cross sections for production associated with a top quark for the ${\mathrm{t} \mathrm{H} \mathrm{t} \mathrm{q}}$ (upper row) and ${\mathrm{t} \mathrm{Z} \mathrm{t} \mathrm{q}}$ (middle row) channels, and their sum, ${\mathrm{t} \mathrm{H} \mathrm{t} \mathrm{q} +\mathrm{t} \mathrm{Z} \mathrm{t} \mathrm{q}}$ (lower row), for different assumed values of the T quark mass. The inner (green) band and the outer (yellow) band indicate the regions containing 68 and 95%, respectively, of the distribution of limits expected under the background-only hypothesis. The left column is for a narrow fractional width ($ {\Gamma /{{m_{{\mathrm {T}}}}}} \le $ 0.05) and the right column is for a fractional width of $ {\Gamma /{{m_{{\mathrm {T}}}}}} = $ 0.1. The vertical dashed lines are the crossover points in sensitivity that indicate the mass intervals used for presenting the low-mass and high-mass search results. The dashed red and dot-dashed blue curves are for the (TB) doublet model. Given the specified width, the couplings are implicit in the model. Two curves corresponding to $ {\Gamma /{{m_{{\mathrm {T}}}}}} = $ 0.05 (dot-dashed blue) and $ {\Gamma /{{m_{{\mathrm {T}}}}}} = $ 0.01 (dashed red) are shown for the narrow fractional width. |
png pdf |
Figure 10-e:
The observed and median expected upper limits at 95% CL on the cross sections for production associated with a top quark for the ${\mathrm{t} \mathrm{H} \mathrm{t} \mathrm{q}}$ (upper row) and ${\mathrm{t} \mathrm{Z} \mathrm{t} \mathrm{q}}$ (middle row) channels, and their sum, ${\mathrm{t} \mathrm{H} \mathrm{t} \mathrm{q} +\mathrm{t} \mathrm{Z} \mathrm{t} \mathrm{q}}$ (lower row), for different assumed values of the T quark mass. The inner (green) band and the outer (yellow) band indicate the regions containing 68 and 95%, respectively, of the distribution of limits expected under the background-only hypothesis. The left column is for a narrow fractional width ($ {\Gamma /{{m_{{\mathrm {T}}}}}} \le $ 0.05) and the right column is for a fractional width of $ {\Gamma /{{m_{{\mathrm {T}}}}}} = $ 0.1. The vertical dashed lines are the crossover points in sensitivity that indicate the mass intervals used for presenting the low-mass and high-mass search results. The dashed red and dot-dashed blue curves are for the (TB) doublet model. Given the specified width, the couplings are implicit in the model. Two curves corresponding to $ {\Gamma /{{m_{{\mathrm {T}}}}}} = $ 0.05 (dot-dashed blue) and $ {\Gamma /{{m_{{\mathrm {T}}}}}} = $ 0.01 (dashed red) are shown for the narrow fractional width. |

png pdf |
Figure 10-f:
The observed and median expected upper limits at 95% CL on the cross sections for production associated with a top quark for the ${\mathrm{t} \mathrm{H} \mathrm{t} \mathrm{q}}$ (upper row) and ${\mathrm{t} \mathrm{Z} \mathrm{t} \mathrm{q}}$ (middle row) channels, and their sum, ${\mathrm{t} \mathrm{H} \mathrm{t} \mathrm{q} +\mathrm{t} \mathrm{Z} \mathrm{t} \mathrm{q}}$ (lower row), for different assumed values of the T quark mass. The inner (green) band and the outer (yellow) band indicate the regions containing 68 and 95%, respectively, of the distribution of limits expected under the background-only hypothesis. The left column is for a narrow fractional width ($ {\Gamma /{{m_{{\mathrm {T}}}}}} \le $ 0.05) and the right column is for a fractional width of $ {\Gamma /{{m_{{\mathrm {T}}}}}} = $ 0.1. The vertical dashed lines are the crossover points in sensitivity that indicate the mass intervals used for presenting the low-mass and high-mass search results. The dashed red and dot-dashed blue curves are for the (TB) doublet model. Given the specified width, the couplings are implicit in the model. Two curves corresponding to $ {\Gamma /{{m_{{\mathrm {T}}}}}} = $ 0.05 (dot-dashed blue) and $ {\Gamma /{{m_{{\mathrm {T}}}}}} = $ 0.01 (dashed red) are shown for the narrow fractional width. |
png pdf |
Figure 11:
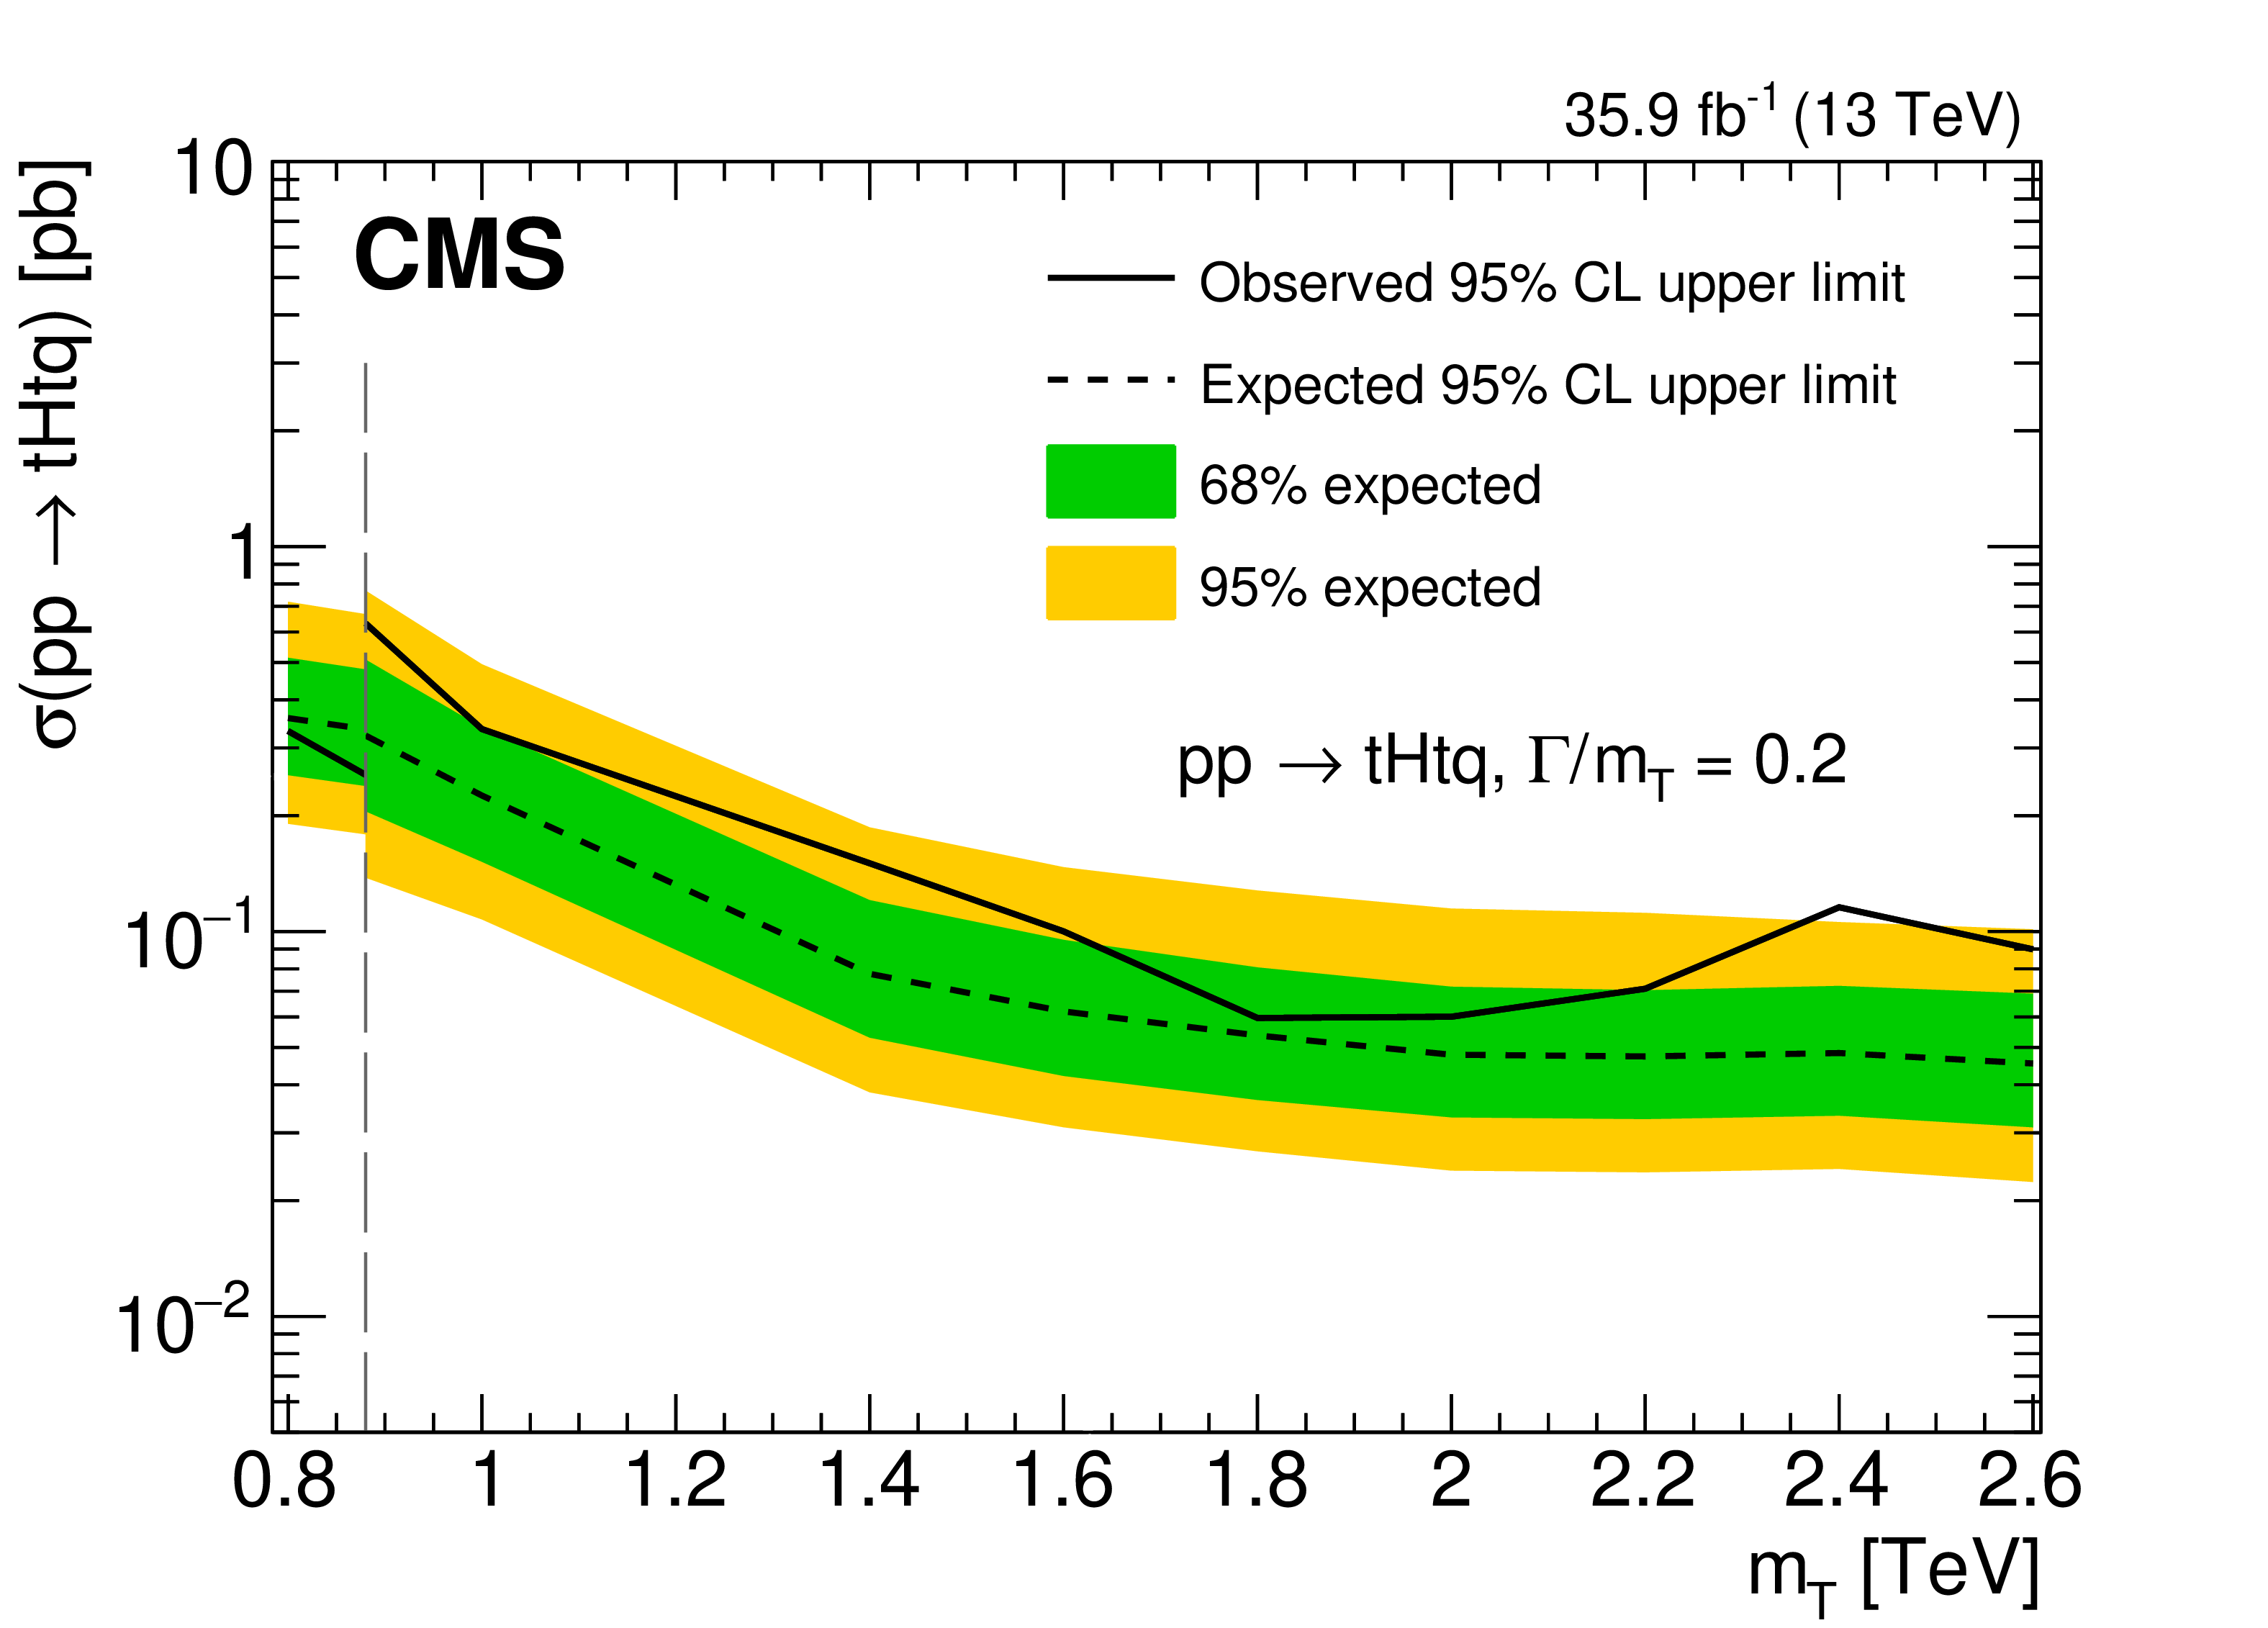
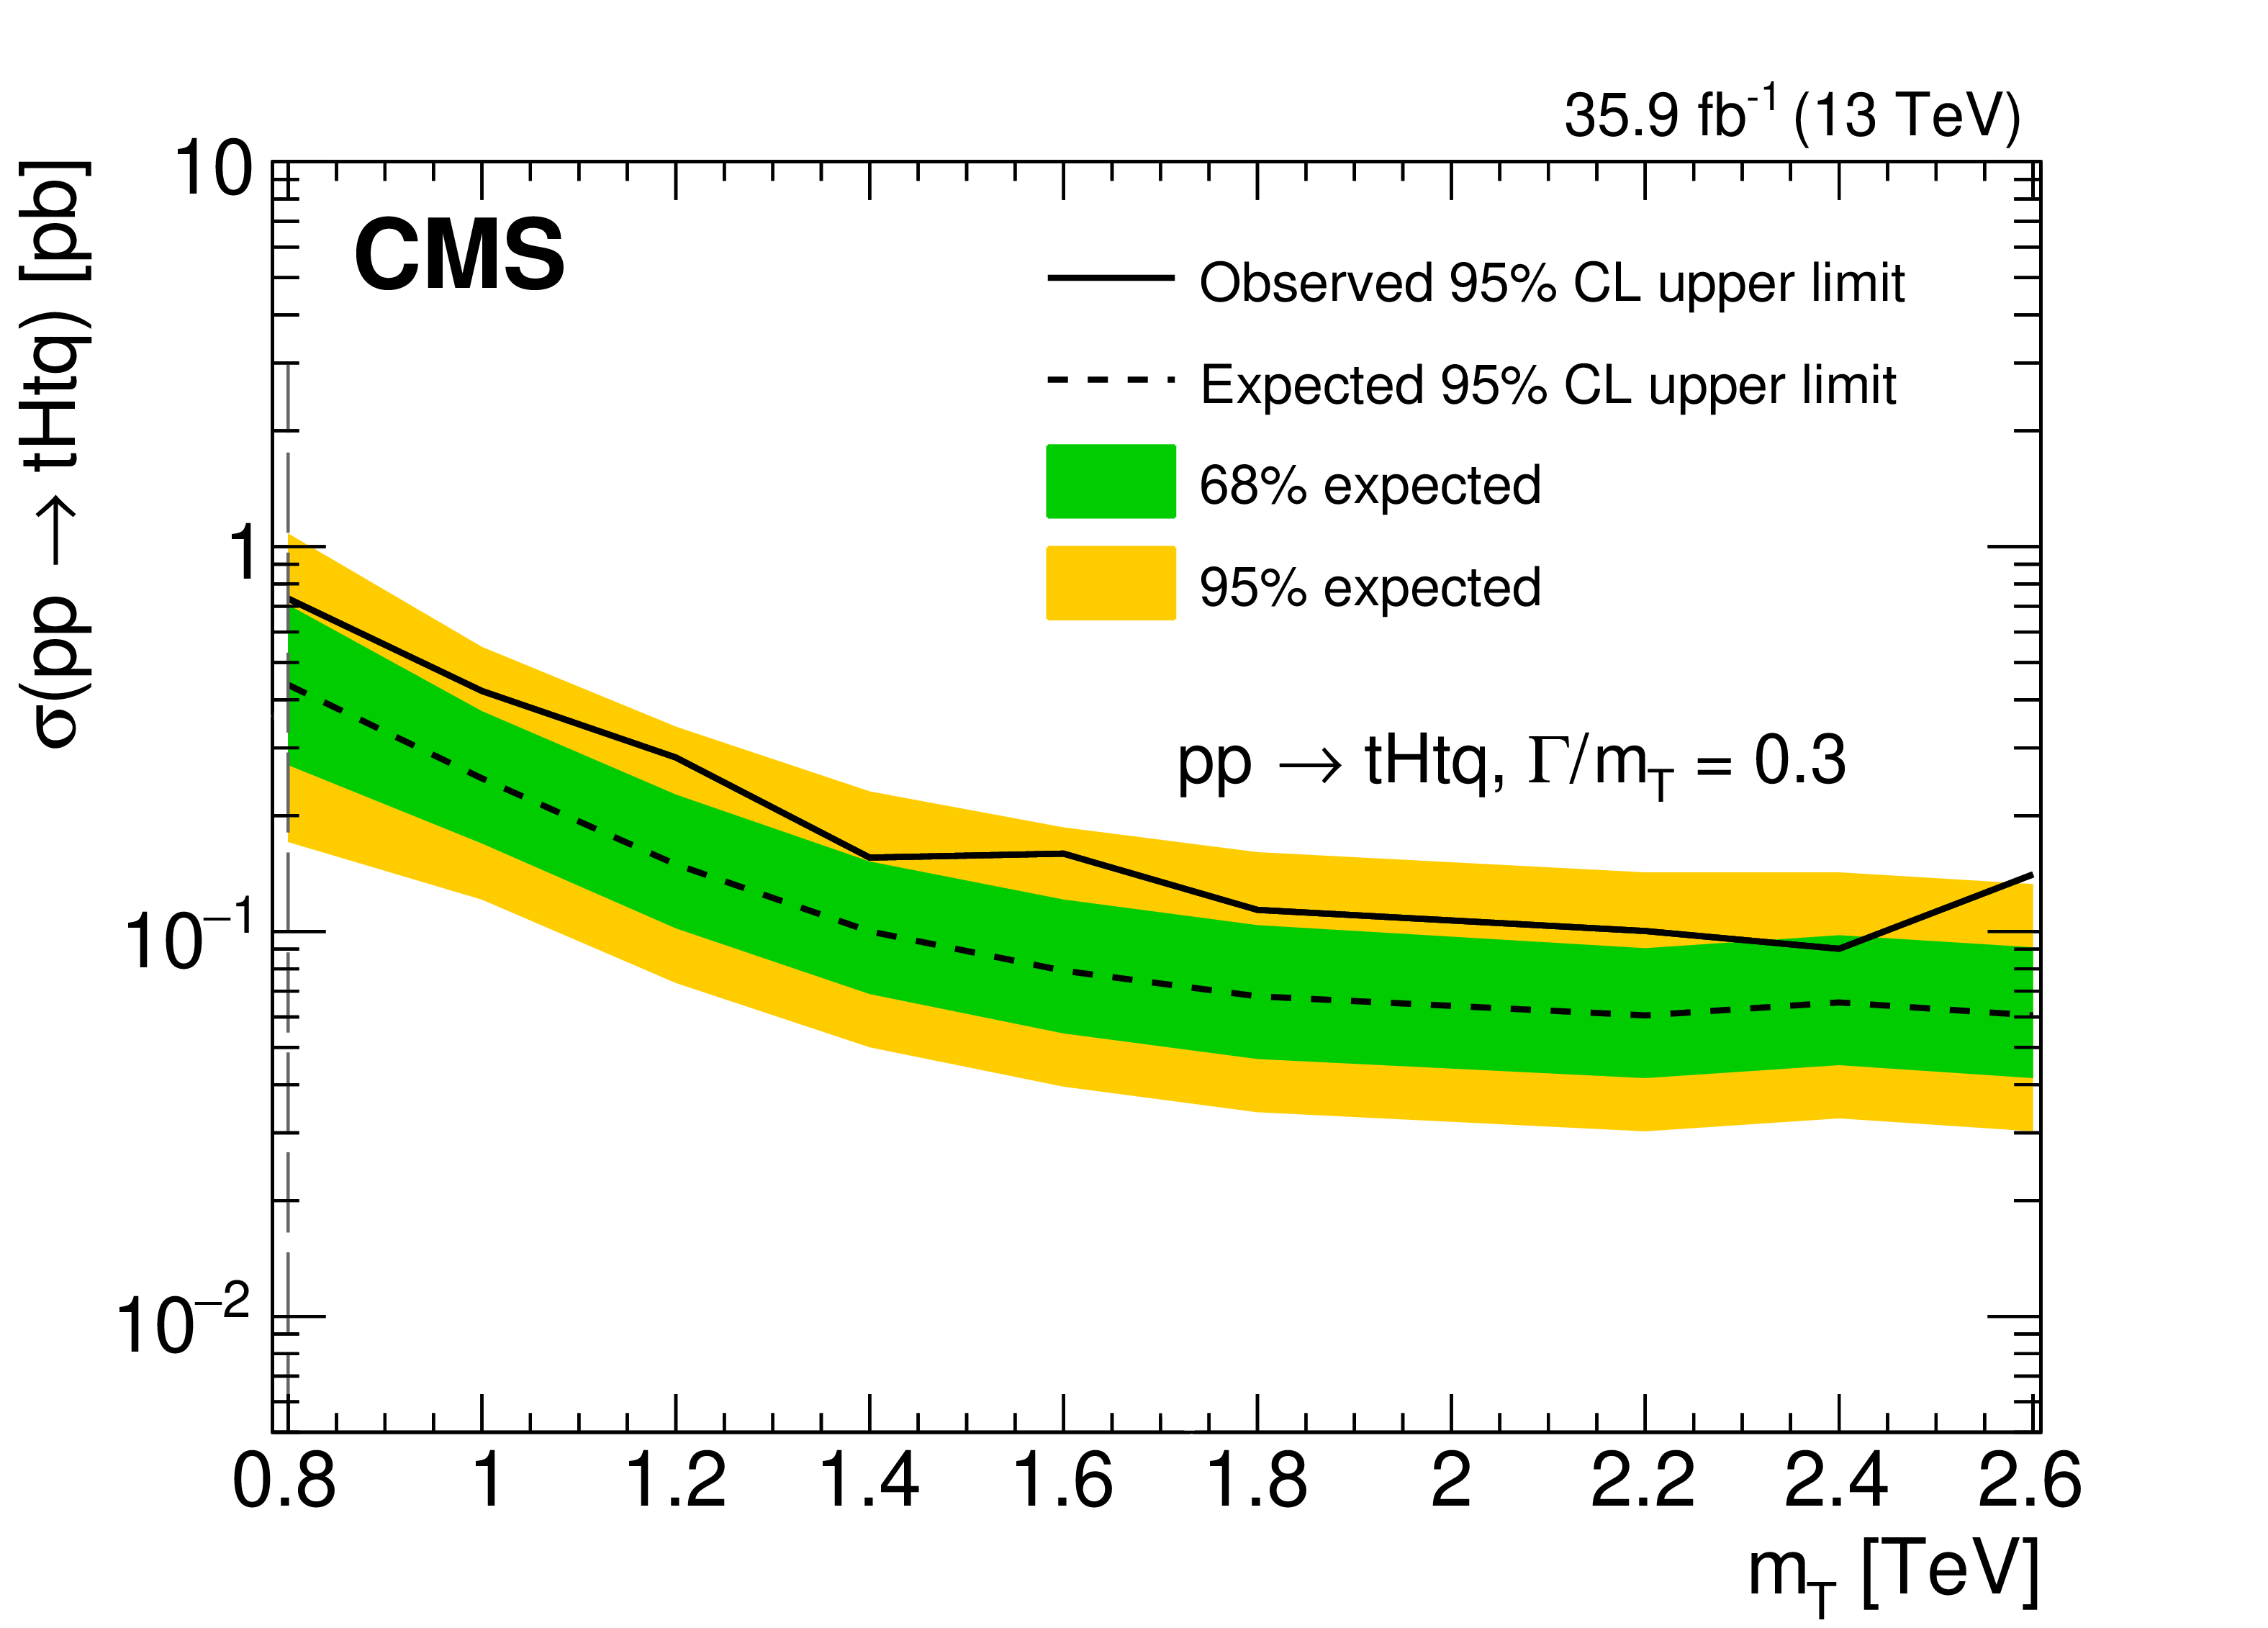
The observed and median expected upper limits at 95% CL on the cross sections for production associated with a top quark for the ${\mathrm{t} \mathrm{H} \mathrm{t} \mathrm{q}}$ (upper row) and ${\mathrm{t} \mathrm{Z} \mathrm{t} \mathrm{q}}$ (middle row) channels, and their sum, ${\mathrm{t} \mathrm{H} \mathrm{t} \mathrm{q} +\mathrm{t} \mathrm{Z} \mathrm{t} \mathrm{q}}$ (lower row), for different assumed values of the T quark mass. The inner (green) band and the outer (yellow) band indicate the regions containing 68 and 95%, respectively, of the distribution of limits expected under the background-only hypothesis. The left column is for a fractional width of 20% and the right column is for a fractional width of 30%. The vertical dashed lines are the crossover points in sensitivity that indicate the mass intervals used for presenting the low-mass and high-mass search results. The dashed red curves are for the (TB) doublet model. Given the specified width, the couplings are implicit in the model. |
png pdf |
Figure 11-a:
The observed and median expected upper limits at 95% CL on the cross sections for production associated with a top quark for the ${\mathrm{t} \mathrm{H} \mathrm{t} \mathrm{q}}$ (upper row) and ${\mathrm{t} \mathrm{Z} \mathrm{t} \mathrm{q}}$ (middle row) channels, and their sum, ${\mathrm{t} \mathrm{H} \mathrm{t} \mathrm{q} +\mathrm{t} \mathrm{Z} \mathrm{t} \mathrm{q}}$ (lower row), for different assumed values of the T quark mass. The inner (green) band and the outer (yellow) band indicate the regions containing 68 and 95%, respectively, of the distribution of limits expected under the background-only hypothesis. The left column is for a fractional width of 20% and the right column is for a fractional width of 30%. The vertical dashed lines are the crossover points in sensitivity that indicate the mass intervals used for presenting the low-mass and high-mass search results. The dashed red curves are for the (TB) doublet model. Given the specified width, the couplings are implicit in the model. |
png pdf |
Figure 11-b:
The observed and median expected upper limits at 95% CL on the cross sections for production associated with a top quark for the ${\mathrm{t} \mathrm{H} \mathrm{t} \mathrm{q}}$ (upper row) and ${\mathrm{t} \mathrm{Z} \mathrm{t} \mathrm{q}}$ (middle row) channels, and their sum, ${\mathrm{t} \mathrm{H} \mathrm{t} \mathrm{q} +\mathrm{t} \mathrm{Z} \mathrm{t} \mathrm{q}}$ (lower row), for different assumed values of the T quark mass. The inner (green) band and the outer (yellow) band indicate the regions containing 68 and 95%, respectively, of the distribution of limits expected under the background-only hypothesis. The left column is for a fractional width of 20% and the right column is for a fractional width of 30%. The vertical dashed lines are the crossover points in sensitivity that indicate the mass intervals used for presenting the low-mass and high-mass search results. The dashed red curves are for the (TB) doublet model. Given the specified width, the couplings are implicit in the model. |
png pdf |
Figure 11-c:
The observed and median expected upper limits at 95% CL on the cross sections for production associated with a top quark for the ${\mathrm{t} \mathrm{H} \mathrm{t} \mathrm{q}}$ (upper row) and ${\mathrm{t} \mathrm{Z} \mathrm{t} \mathrm{q}}$ (middle row) channels, and their sum, ${\mathrm{t} \mathrm{H} \mathrm{t} \mathrm{q} +\mathrm{t} \mathrm{Z} \mathrm{t} \mathrm{q}}$ (lower row), for different assumed values of the T quark mass. The inner (green) band and the outer (yellow) band indicate the regions containing 68 and 95%, respectively, of the distribution of limits expected under the background-only hypothesis. The left column is for a fractional width of 20% and the right column is for a fractional width of 30%. The vertical dashed lines are the crossover points in sensitivity that indicate the mass intervals used for presenting the low-mass and high-mass search results. The dashed red curves are for the (TB) doublet model. Given the specified width, the couplings are implicit in the model. |

png pdf |
Figure 11-d:
The observed and median expected upper limits at 95% CL on the cross sections for production associated with a top quark for the ${\mathrm{t} \mathrm{H} \mathrm{t} \mathrm{q}}$ (upper row) and ${\mathrm{t} \mathrm{Z} \mathrm{t} \mathrm{q}}$ (middle row) channels, and their sum, ${\mathrm{t} \mathrm{H} \mathrm{t} \mathrm{q} +\mathrm{t} \mathrm{Z} \mathrm{t} \mathrm{q}}$ (lower row), for different assumed values of the T quark mass. The inner (green) band and the outer (yellow) band indicate the regions containing 68 and 95%, respectively, of the distribution of limits expected under the background-only hypothesis. The left column is for a fractional width of 20% and the right column is for a fractional width of 30%. The vertical dashed lines are the crossover points in sensitivity that indicate the mass intervals used for presenting the low-mass and high-mass search results. The dashed red curves are for the (TB) doublet model. Given the specified width, the couplings are implicit in the model. |

png pdf |
Figure 11-e:
The observed and median expected upper limits at 95% CL on the cross sections for production associated with a top quark for the ${\mathrm{t} \mathrm{H} \mathrm{t} \mathrm{q}}$ (upper row) and ${\mathrm{t} \mathrm{Z} \mathrm{t} \mathrm{q}}$ (middle row) channels, and their sum, ${\mathrm{t} \mathrm{H} \mathrm{t} \mathrm{q} +\mathrm{t} \mathrm{Z} \mathrm{t} \mathrm{q}}$ (lower row), for different assumed values of the T quark mass. The inner (green) band and the outer (yellow) band indicate the regions containing 68 and 95%, respectively, of the distribution of limits expected under the background-only hypothesis. The left column is for a fractional width of 20% and the right column is for a fractional width of 30%. The vertical dashed lines are the crossover points in sensitivity that indicate the mass intervals used for presenting the low-mass and high-mass search results. The dashed red curves are for the (TB) doublet model. Given the specified width, the couplings are implicit in the model. |

png pdf |
Figure 11-f:
The observed and median expected upper limits at 95% CL on the cross sections for production associated with a top quark for the ${\mathrm{t} \mathrm{H} \mathrm{t} \mathrm{q}}$ (upper row) and ${\mathrm{t} \mathrm{Z} \mathrm{t} \mathrm{q}}$ (middle row) channels, and their sum, ${\mathrm{t} \mathrm{H} \mathrm{t} \mathrm{q} +\mathrm{t} \mathrm{Z} \mathrm{t} \mathrm{q}}$ (lower row), for different assumed values of the T quark mass. The inner (green) band and the outer (yellow) band indicate the regions containing 68 and 95%, respectively, of the distribution of limits expected under the background-only hypothesis. The left column is for a fractional width of 20% and the right column is for a fractional width of 30%. The vertical dashed lines are the crossover points in sensitivity that indicate the mass intervals used for presenting the low-mass and high-mass search results. The dashed red curves are for the (TB) doublet model. Given the specified width, the couplings are implicit in the model. |
png pdf |
Figure 12:
The observed and median expected upper limits at 95% CL on the cross sections for production associated with a bottom quark for the ${\mathrm{t} \mathrm{H} \mathrm{b} \mathrm{q}}$ (upper row) and ${\mathrm{t} \mathrm{Z} \mathrm{b} \mathrm{q}}$ (middle row) channels, and their sum, ${\mathrm{t} \mathrm{H} \mathrm{b} \mathrm{q} +\mathrm{t} \mathrm{Z} \mathrm{b} \mathrm{q}}$ (lower row), for different assumed values of the T quark mass. The inner (green) bands and the outer (yellow) bands indicate the regions containing 68 and 95%, respectively, of the distribution of limits expected under the background-only hypothesis. The left column is for a narrow fractional width ($ {\Gamma /{{m_{{\mathrm {T}}}}}} \le $ 0.05) and the right column is for a fractional width of $ {\Gamma /{{m_{{\mathrm {T}}}}}} = $ 0.1. The dashed red curves are for the T singlet model. Given the specified width, the couplings are implicit in the model. |
png pdf |
Figure 12-a:
The observed and median expected upper limits at 95% CL on the cross sections for production associated with a bottom quark for the ${\mathrm{t} \mathrm{H} \mathrm{b} \mathrm{q}}$ (upper row) and ${\mathrm{t} \mathrm{Z} \mathrm{b} \mathrm{q}}$ (middle row) channels, and their sum, ${\mathrm{t} \mathrm{H} \mathrm{b} \mathrm{q} +\mathrm{t} \mathrm{Z} \mathrm{b} \mathrm{q}}$ (lower row), for different assumed values of the T quark mass. The inner (green) bands and the outer (yellow) bands indicate the regions containing 68 and 95%, respectively, of the distribution of limits expected under the background-only hypothesis. The left column is for a narrow fractional width ($ {\Gamma /{{m_{{\mathrm {T}}}}}} \le $ 0.05) and the right column is for a fractional width of $ {\Gamma /{{m_{{\mathrm {T}}}}}} = $ 0.1. The dashed red curves are for the T singlet model. Given the specified width, the couplings are implicit in the model. |
png pdf |
Figure 12-b:
The observed and median expected upper limits at 95% CL on the cross sections for production associated with a bottom quark for the ${\mathrm{t} \mathrm{H} \mathrm{b} \mathrm{q}}$ (upper row) and ${\mathrm{t} \mathrm{Z} \mathrm{b} \mathrm{q}}$ (middle row) channels, and their sum, ${\mathrm{t} \mathrm{H} \mathrm{b} \mathrm{q} +\mathrm{t} \mathrm{Z} \mathrm{b} \mathrm{q}}$ (lower row), for different assumed values of the T quark mass. The inner (green) bands and the outer (yellow) bands indicate the regions containing 68 and 95%, respectively, of the distribution of limits expected under the background-only hypothesis. The left column is for a narrow fractional width ($ {\Gamma /{{m_{{\mathrm {T}}}}}} \le $ 0.05) and the right column is for a fractional width of $ {\Gamma /{{m_{{\mathrm {T}}}}}} = $ 0.1. The dashed red curves are for the T singlet model. Given the specified width, the couplings are implicit in the model. |
png pdf |
Figure 12-c:
The observed and median expected upper limits at 95% CL on the cross sections for production associated with a bottom quark for the ${\mathrm{t} \mathrm{H} \mathrm{b} \mathrm{q}}$ (upper row) and ${\mathrm{t} \mathrm{Z} \mathrm{b} \mathrm{q}}$ (middle row) channels, and their sum, ${\mathrm{t} \mathrm{H} \mathrm{b} \mathrm{q} +\mathrm{t} \mathrm{Z} \mathrm{b} \mathrm{q}}$ (lower row), for different assumed values of the T quark mass. The inner (green) bands and the outer (yellow) bands indicate the regions containing 68 and 95%, respectively, of the distribution of limits expected under the background-only hypothesis. The left column is for a narrow fractional width ($ {\Gamma /{{m_{{\mathrm {T}}}}}} \le $ 0.05) and the right column is for a fractional width of $ {\Gamma /{{m_{{\mathrm {T}}}}}} = $ 0.1. The dashed red curves are for the T singlet model. Given the specified width, the couplings are implicit in the model. |
png pdf |
Figure 12-d:
The observed and median expected upper limits at 95% CL on the cross sections for production associated with a bottom quark for the ${\mathrm{t} \mathrm{H} \mathrm{b} \mathrm{q}}$ (upper row) and ${\mathrm{t} \mathrm{Z} \mathrm{b} \mathrm{q}}$ (middle row) channels, and their sum, ${\mathrm{t} \mathrm{H} \mathrm{b} \mathrm{q} +\mathrm{t} \mathrm{Z} \mathrm{b} \mathrm{q}}$ (lower row), for different assumed values of the T quark mass. The inner (green) bands and the outer (yellow) bands indicate the regions containing 68 and 95%, respectively, of the distribution of limits expected under the background-only hypothesis. The left column is for a narrow fractional width ($ {\Gamma /{{m_{{\mathrm {T}}}}}} \le $ 0.05) and the right column is for a fractional width of $ {\Gamma /{{m_{{\mathrm {T}}}}}} = $ 0.1. The dashed red curves are for the T singlet model. Given the specified width, the couplings are implicit in the model. |
png pdf |
Figure 12-e:
The observed and median expected upper limits at 95% CL on the cross sections for production associated with a bottom quark for the ${\mathrm{t} \mathrm{H} \mathrm{b} \mathrm{q}}$ (upper row) and ${\mathrm{t} \mathrm{Z} \mathrm{b} \mathrm{q}}$ (middle row) channels, and their sum, ${\mathrm{t} \mathrm{H} \mathrm{b} \mathrm{q} +\mathrm{t} \mathrm{Z} \mathrm{b} \mathrm{q}}$ (lower row), for different assumed values of the T quark mass. The inner (green) bands and the outer (yellow) bands indicate the regions containing 68 and 95%, respectively, of the distribution of limits expected under the background-only hypothesis. The left column is for a narrow fractional width ($ {\Gamma /{{m_{{\mathrm {T}}}}}} \le $ 0.05) and the right column is for a fractional width of $ {\Gamma /{{m_{{\mathrm {T}}}}}} = $ 0.1. The dashed red curves are for the T singlet model. Given the specified width, the couplings are implicit in the model. |
png pdf |
Figure 12-f:
The observed and median expected upper limits at 95% CL on the cross sections for production associated with a bottom quark for the ${\mathrm{t} \mathrm{H} \mathrm{b} \mathrm{q}}$ (upper row) and ${\mathrm{t} \mathrm{Z} \mathrm{b} \mathrm{q}}$ (middle row) channels, and their sum, ${\mathrm{t} \mathrm{H} \mathrm{b} \mathrm{q} +\mathrm{t} \mathrm{Z} \mathrm{b} \mathrm{q}}$ (lower row), for different assumed values of the T quark mass. The inner (green) bands and the outer (yellow) bands indicate the regions containing 68 and 95%, respectively, of the distribution of limits expected under the background-only hypothesis. The left column is for a narrow fractional width ($ {\Gamma /{{m_{{\mathrm {T}}}}}} \le $ 0.05) and the right column is for a fractional width of $ {\Gamma /{{m_{{\mathrm {T}}}}}} = $ 0.1. The dashed red curves are for the T singlet model. Given the specified width, the couplings are implicit in the model. |
png pdf |
Figure 13:
The observed and median expected upper limits at 95% CL on the cross sections for production associated with a bottom quark for the ${\mathrm{t} \mathrm{H} \mathrm{b} \mathrm{q}}$ (upper row) and ${\mathrm{t} \mathrm{Z} \mathrm{b} \mathrm{q}}$ (middle row) channels, and their sum, ${\mathrm{t} \mathrm{H} \mathrm{b} \mathrm{q} +\mathrm{t} \mathrm{Z} \mathrm{b} \mathrm{q}}$ (lower row), for different assumed values of the T quark mass. The inner (green) bands and the outer (yellow) bands indicate the regions containing 68 and 95%, respectively, of the distribution of limits expected under the background-only hypothesis. The left column is for a fractional width of 20% and the right column is for a fractional width of 30%. The dashed red curves are for the T singlet model. Given the specified width, the couplings are implicit in the model. |
png pdf |
Figure 13-a:
The observed and median expected upper limits at 95% CL on the cross sections for production associated with a bottom quark for the ${\mathrm{t} \mathrm{H} \mathrm{b} \mathrm{q}}$ (upper row) and ${\mathrm{t} \mathrm{Z} \mathrm{b} \mathrm{q}}$ (middle row) channels, and their sum, ${\mathrm{t} \mathrm{H} \mathrm{b} \mathrm{q} +\mathrm{t} \mathrm{Z} \mathrm{b} \mathrm{q}}$ (lower row), for different assumed values of the T quark mass. The inner (green) bands and the outer (yellow) bands indicate the regions containing 68 and 95%, respectively, of the distribution of limits expected under the background-only hypothesis. The left column is for a fractional width of 20% and the right column is for a fractional width of 30%. The dashed red curves are for the T singlet model. Given the specified width, the couplings are implicit in the model. |
png pdf |
Figure 13-b:
The observed and median expected upper limits at 95% CL on the cross sections for production associated with a bottom quark for the ${\mathrm{t} \mathrm{H} \mathrm{b} \mathrm{q}}$ (upper row) and ${\mathrm{t} \mathrm{Z} \mathrm{b} \mathrm{q}}$ (middle row) channels, and their sum, ${\mathrm{t} \mathrm{H} \mathrm{b} \mathrm{q} +\mathrm{t} \mathrm{Z} \mathrm{b} \mathrm{q}}$ (lower row), for different assumed values of the T quark mass. The inner (green) bands and the outer (yellow) bands indicate the regions containing 68 and 95%, respectively, of the distribution of limits expected under the background-only hypothesis. The left column is for a fractional width of 20% and the right column is for a fractional width of 30%. The dashed red curves are for the T singlet model. Given the specified width, the couplings are implicit in the model. |
png pdf |
Figure 13-c:
The observed and median expected upper limits at 95% CL on the cross sections for production associated with a bottom quark for the ${\mathrm{t} \mathrm{H} \mathrm{b} \mathrm{q}}$ (upper row) and ${\mathrm{t} \mathrm{Z} \mathrm{b} \mathrm{q}}$ (middle row) channels, and their sum, ${\mathrm{t} \mathrm{H} \mathrm{b} \mathrm{q} +\mathrm{t} \mathrm{Z} \mathrm{b} \mathrm{q}}$ (lower row), for different assumed values of the T quark mass. The inner (green) bands and the outer (yellow) bands indicate the regions containing 68 and 95%, respectively, of the distribution of limits expected under the background-only hypothesis. The left column is for a fractional width of 20% and the right column is for a fractional width of 30%. The dashed red curves are for the T singlet model. Given the specified width, the couplings are implicit in the model. |
png pdf |
Figure 13-d:
The observed and median expected upper limits at 95% CL on the cross sections for production associated with a bottom quark for the ${\mathrm{t} \mathrm{H} \mathrm{b} \mathrm{q}}$ (upper row) and ${\mathrm{t} \mathrm{Z} \mathrm{b} \mathrm{q}}$ (middle row) channels, and their sum, ${\mathrm{t} \mathrm{H} \mathrm{b} \mathrm{q} +\mathrm{t} \mathrm{Z} \mathrm{b} \mathrm{q}}$ (lower row), for different assumed values of the T quark mass. The inner (green) bands and the outer (yellow) bands indicate the regions containing 68 and 95%, respectively, of the distribution of limits expected under the background-only hypothesis. The left column is for a fractional width of 20% and the right column is for a fractional width of 30%. The dashed red curves are for the T singlet model. Given the specified width, the couplings are implicit in the model. |

png pdf |
Figure 13-e:
The observed and median expected upper limits at 95% CL on the cross sections for production associated with a bottom quark for the ${\mathrm{t} \mathrm{H} \mathrm{b} \mathrm{q}}$ (upper row) and ${\mathrm{t} \mathrm{Z} \mathrm{b} \mathrm{q}}$ (middle row) channels, and their sum, ${\mathrm{t} \mathrm{H} \mathrm{b} \mathrm{q} +\mathrm{t} \mathrm{Z} \mathrm{b} \mathrm{q}}$ (lower row), for different assumed values of the T quark mass. The inner (green) bands and the outer (yellow) bands indicate the regions containing 68 and 95%, respectively, of the distribution of limits expected under the background-only hypothesis. The left column is for a fractional width of 20% and the right column is for a fractional width of 30%. The dashed red curves are for the T singlet model. Given the specified width, the couplings are implicit in the model. |
png pdf |
Figure 13-f:
The observed and median expected upper limits at 95% CL on the cross sections for production associated with a bottom quark for the ${\mathrm{t} \mathrm{H} \mathrm{b} \mathrm{q}}$ (upper row) and ${\mathrm{t} \mathrm{Z} \mathrm{b} \mathrm{q}}$ (middle row) channels, and their sum, ${\mathrm{t} \mathrm{H} \mathrm{b} \mathrm{q} +\mathrm{t} \mathrm{Z} \mathrm{b} \mathrm{q}}$ (lower row), for different assumed values of the T quark mass. The inner (green) bands and the outer (yellow) bands indicate the regions containing 68 and 95%, respectively, of the distribution of limits expected under the background-only hypothesis. The left column is for a fractional width of 20% and the right column is for a fractional width of 30%. The dashed red curves are for the T singlet model. Given the specified width, the couplings are implicit in the model. |
png pdf |
Figure 14:
The observed and median expected upper limits at 95% CL on the cross sections for production associated with a top quark for the ${\mathrm{t} \mathrm{H} \mathrm{t} \mathrm{q}}$ (upper row) and ${\mathrm{t} \mathrm{Z} \mathrm{t} \mathrm{q}}$ (middle row) channels, and their sum, ${\mathrm{t} \mathrm{H} \mathrm{t} \mathrm{q} +\mathrm{t} \mathrm{Z} \mathrm{t} \mathrm{q}}$ (lower row), for different assumed values of the T quark mass. The inner (green) bands and the outer (yellow) bands indicate the regions containing 68 and 95%, respectively, of the distribution of limits expected under the background-only hypothesis. The left column is for a narrow fractional width ($ {\Gamma /{{m_{{\mathrm {T}}}}}} \le $ 0.05) and the right column is for a fractional width of $ {\Gamma /{{m_{{\mathrm {T}}}}}} = $ 0.1. The dashed red curves are for the (TB) doublet model. Given the specified width, the couplings are implicit in the model. |
png pdf |
Figure 14-a:
The observed and median expected upper limits at 95% CL on the cross sections for production associated with a top quark for the ${\mathrm{t} \mathrm{H} \mathrm{t} \mathrm{q}}$ (upper row) and ${\mathrm{t} \mathrm{Z} \mathrm{t} \mathrm{q}}$ (middle row) channels, and their sum, ${\mathrm{t} \mathrm{H} \mathrm{t} \mathrm{q} +\mathrm{t} \mathrm{Z} \mathrm{t} \mathrm{q}}$ (lower row), for different assumed values of the T quark mass. The inner (green) bands and the outer (yellow) bands indicate the regions containing 68 and 95%, respectively, of the distribution of limits expected under the background-only hypothesis. The left column is for a narrow fractional width ($ {\Gamma /{{m_{{\mathrm {T}}}}}} \le $ 0.05) and the right column is for a fractional width of $ {\Gamma /{{m_{{\mathrm {T}}}}}} = $ 0.1. The dashed red curves are for the (TB) doublet model. Given the specified width, the couplings are implicit in the model. |
png pdf |
Figure 14-b:
The observed and median expected upper limits at 95% CL on the cross sections for production associated with a top quark for the ${\mathrm{t} \mathrm{H} \mathrm{t} \mathrm{q}}$ (upper row) and ${\mathrm{t} \mathrm{Z} \mathrm{t} \mathrm{q}}$ (middle row) channels, and their sum, ${\mathrm{t} \mathrm{H} \mathrm{t} \mathrm{q} +\mathrm{t} \mathrm{Z} \mathrm{t} \mathrm{q}}$ (lower row), for different assumed values of the T quark mass. The inner (green) bands and the outer (yellow) bands indicate the regions containing 68 and 95%, respectively, of the distribution of limits expected under the background-only hypothesis. The left column is for a narrow fractional width ($ {\Gamma /{{m_{{\mathrm {T}}}}}} \le $ 0.05) and the right column is for a fractional width of $ {\Gamma /{{m_{{\mathrm {T}}}}}} = $ 0.1. The dashed red curves are for the (TB) doublet model. Given the specified width, the couplings are implicit in the model. |

png pdf |
Figure 14-c:
The observed and median expected upper limits at 95% CL on the cross sections for production associated with a top quark for the ${\mathrm{t} \mathrm{H} \mathrm{t} \mathrm{q}}$ (upper row) and ${\mathrm{t} \mathrm{Z} \mathrm{t} \mathrm{q}}$ (middle row) channels, and their sum, ${\mathrm{t} \mathrm{H} \mathrm{t} \mathrm{q} +\mathrm{t} \mathrm{Z} \mathrm{t} \mathrm{q}}$ (lower row), for different assumed values of the T quark mass. The inner (green) bands and the outer (yellow) bands indicate the regions containing 68 and 95%, respectively, of the distribution of limits expected under the background-only hypothesis. The left column is for a narrow fractional width ($ {\Gamma /{{m_{{\mathrm {T}}}}}} \le $ 0.05) and the right column is for a fractional width of $ {\Gamma /{{m_{{\mathrm {T}}}}}} = $ 0.1. The dashed red curves are for the (TB) doublet model. Given the specified width, the couplings are implicit in the model. |
png pdf |
Figure 14-d:
The observed and median expected upper limits at 95% CL on the cross sections for production associated with a top quark for the ${\mathrm{t} \mathrm{H} \mathrm{t} \mathrm{q}}$ (upper row) and ${\mathrm{t} \mathrm{Z} \mathrm{t} \mathrm{q}}$ (middle row) channels, and their sum, ${\mathrm{t} \mathrm{H} \mathrm{t} \mathrm{q} +\mathrm{t} \mathrm{Z} \mathrm{t} \mathrm{q}}$ (lower row), for different assumed values of the T quark mass. The inner (green) bands and the outer (yellow) bands indicate the regions containing 68 and 95%, respectively, of the distribution of limits expected under the background-only hypothesis. The left column is for a narrow fractional width ($ {\Gamma /{{m_{{\mathrm {T}}}}}} \le $ 0.05) and the right column is for a fractional width of $ {\Gamma /{{m_{{\mathrm {T}}}}}} = $ 0.1. The dashed red curves are for the (TB) doublet model. Given the specified width, the couplings are implicit in the model. |

png pdf |
Figure 14-e:
The observed and median expected upper limits at 95% CL on the cross sections for production associated with a top quark for the ${\mathrm{t} \mathrm{H} \mathrm{t} \mathrm{q}}$ (upper row) and ${\mathrm{t} \mathrm{Z} \mathrm{t} \mathrm{q}}$ (middle row) channels, and their sum, ${\mathrm{t} \mathrm{H} \mathrm{t} \mathrm{q} +\mathrm{t} \mathrm{Z} \mathrm{t} \mathrm{q}}$ (lower row), for different assumed values of the T quark mass. The inner (green) bands and the outer (yellow) bands indicate the regions containing 68 and 95%, respectively, of the distribution of limits expected under the background-only hypothesis. The left column is for a narrow fractional width ($ {\Gamma /{{m_{{\mathrm {T}}}}}} \le $ 0.05) and the right column is for a fractional width of $ {\Gamma /{{m_{{\mathrm {T}}}}}} = $ 0.1. The dashed red curves are for the (TB) doublet model. Given the specified width, the couplings are implicit in the model. |
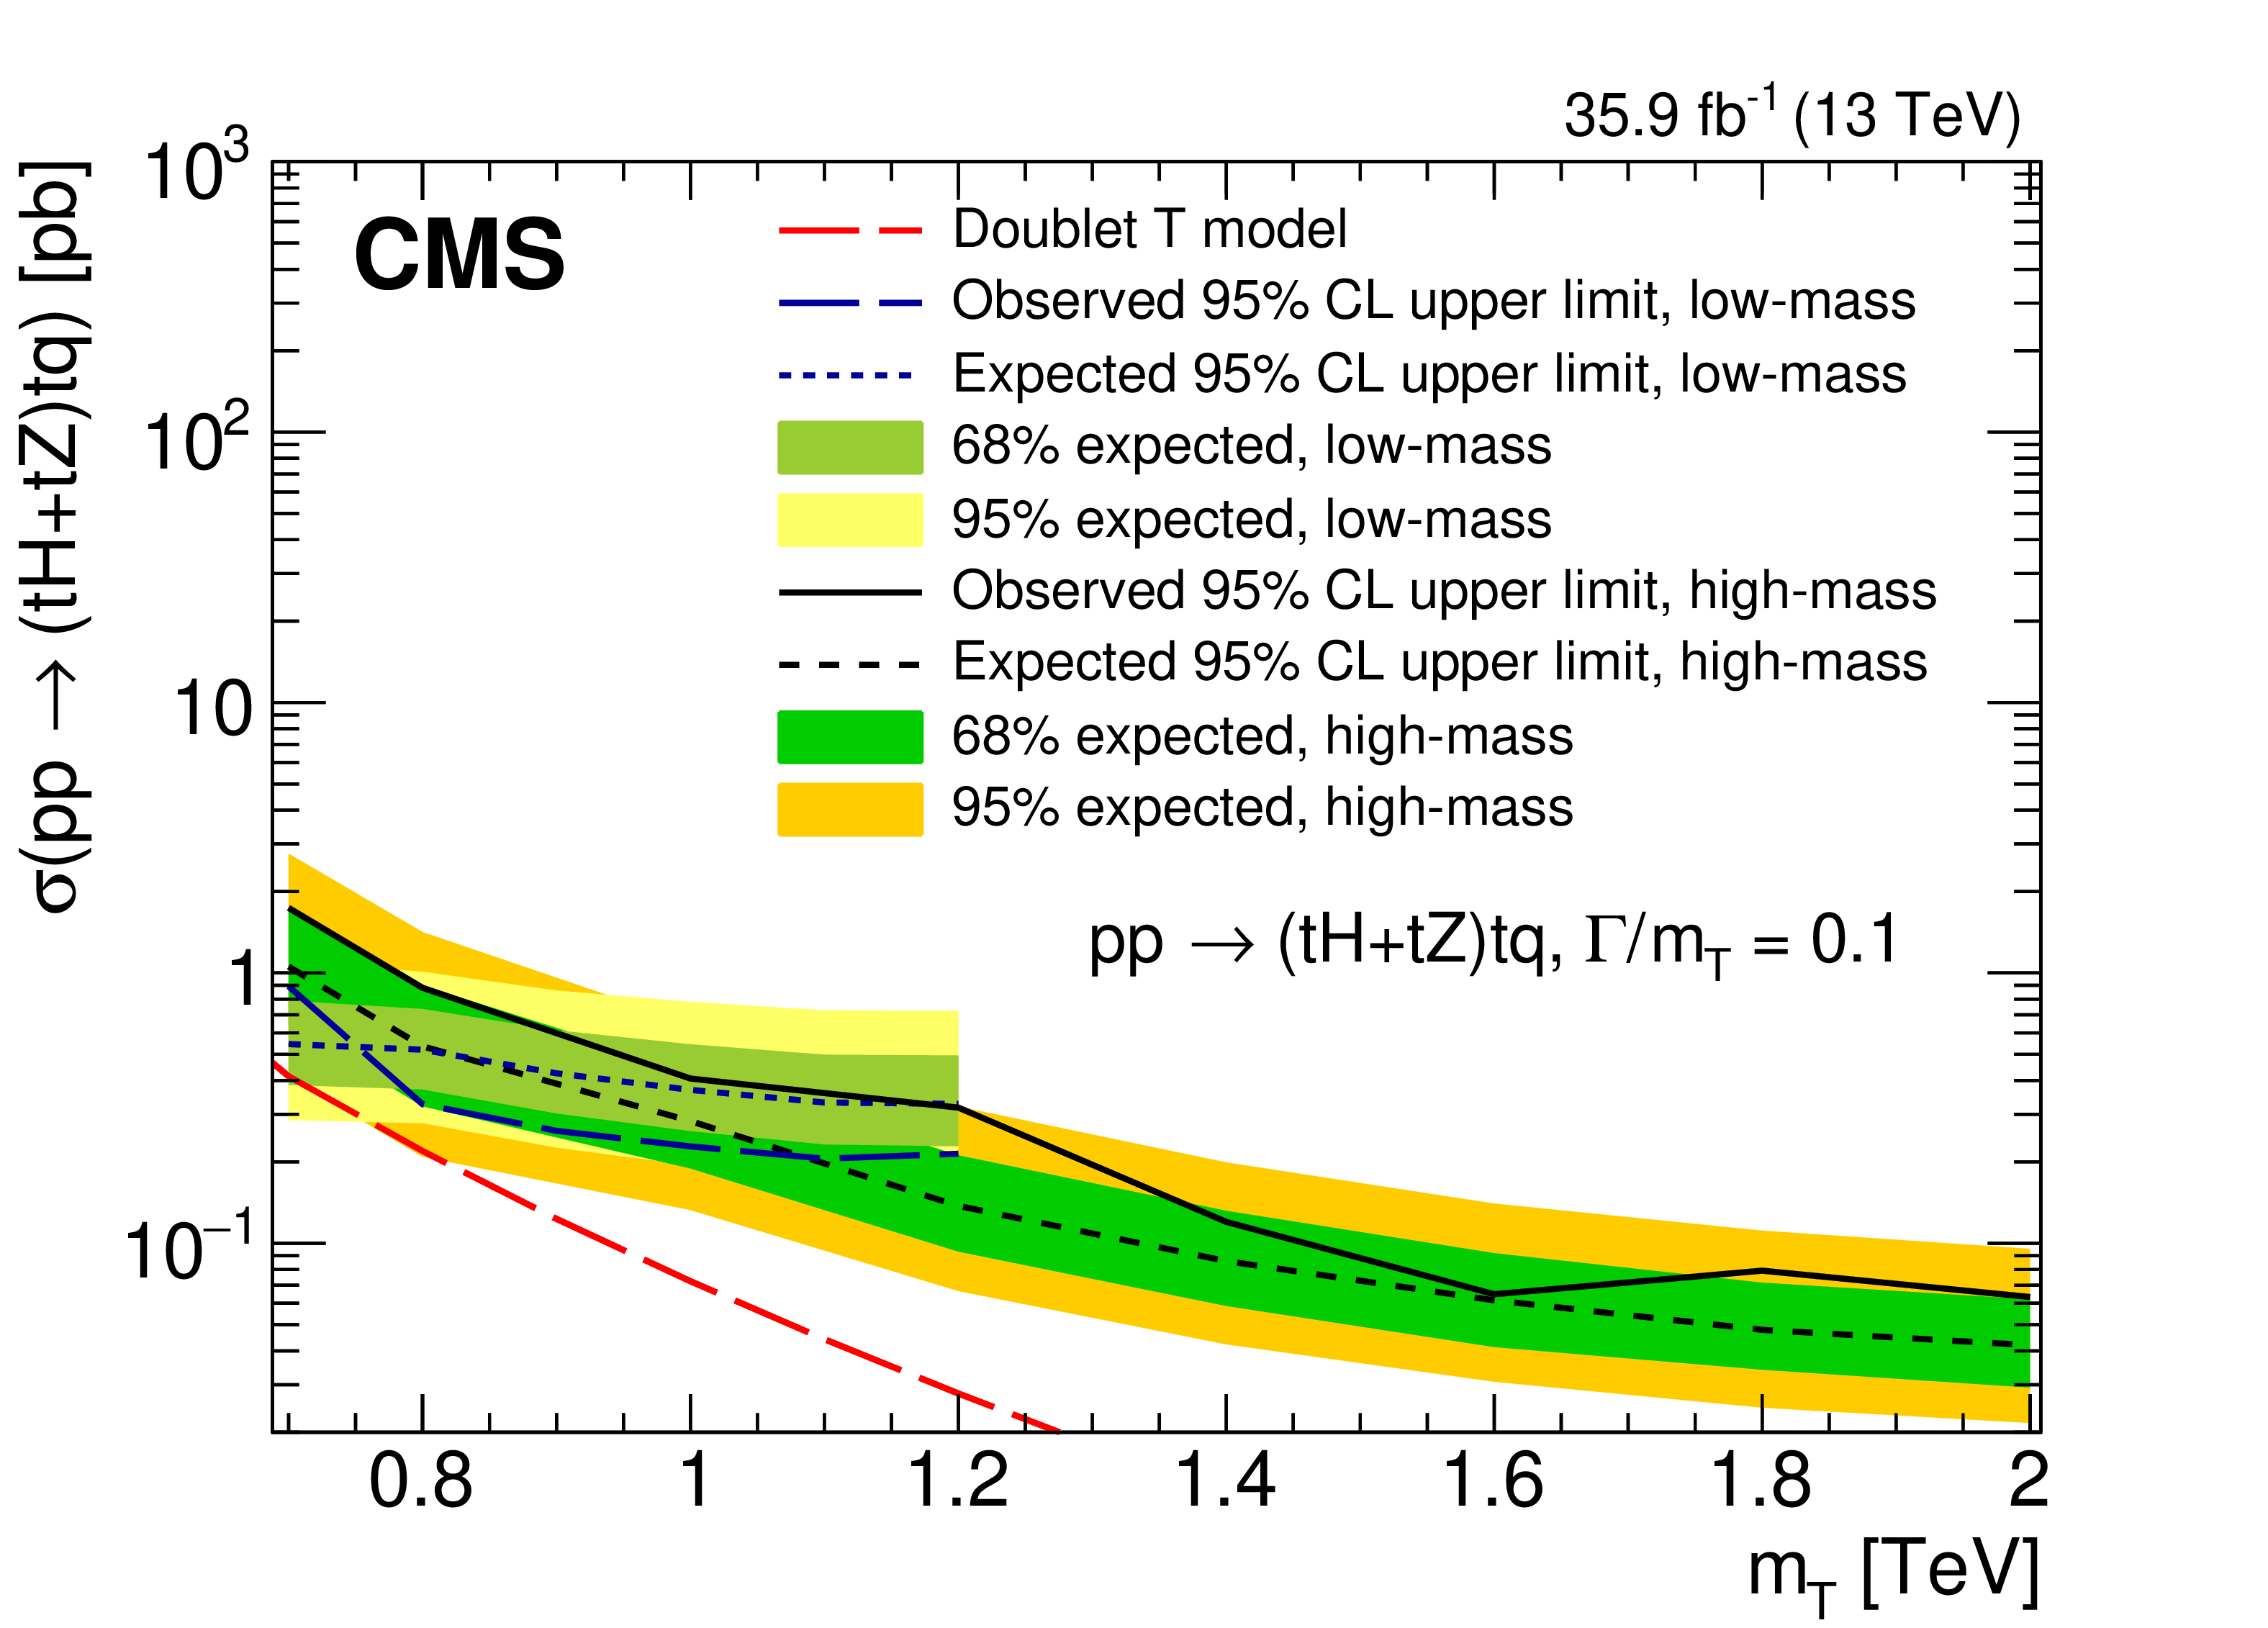
png pdf |
Figure 14-f:
The observed and median expected upper limits at 95% CL on the cross sections for production associated with a top quark for the ${\mathrm{t} \mathrm{H} \mathrm{t} \mathrm{q}}$ (upper row) and ${\mathrm{t} \mathrm{Z} \mathrm{t} \mathrm{q}}$ (middle row) channels, and their sum, ${\mathrm{t} \mathrm{H} \mathrm{t} \mathrm{q} +\mathrm{t} \mathrm{Z} \mathrm{t} \mathrm{q}}$ (lower row), for different assumed values of the T quark mass. The inner (green) bands and the outer (yellow) bands indicate the regions containing 68 and 95%, respectively, of the distribution of limits expected under the background-only hypothesis. The left column is for a narrow fractional width ($ {\Gamma /{{m_{{\mathrm {T}}}}}} \le $ 0.05) and the right column is for a fractional width of $ {\Gamma /{{m_{{\mathrm {T}}}}}} = $ 0.1. The dashed red curves are for the (TB) doublet model. Given the specified width, the couplings are implicit in the model. |
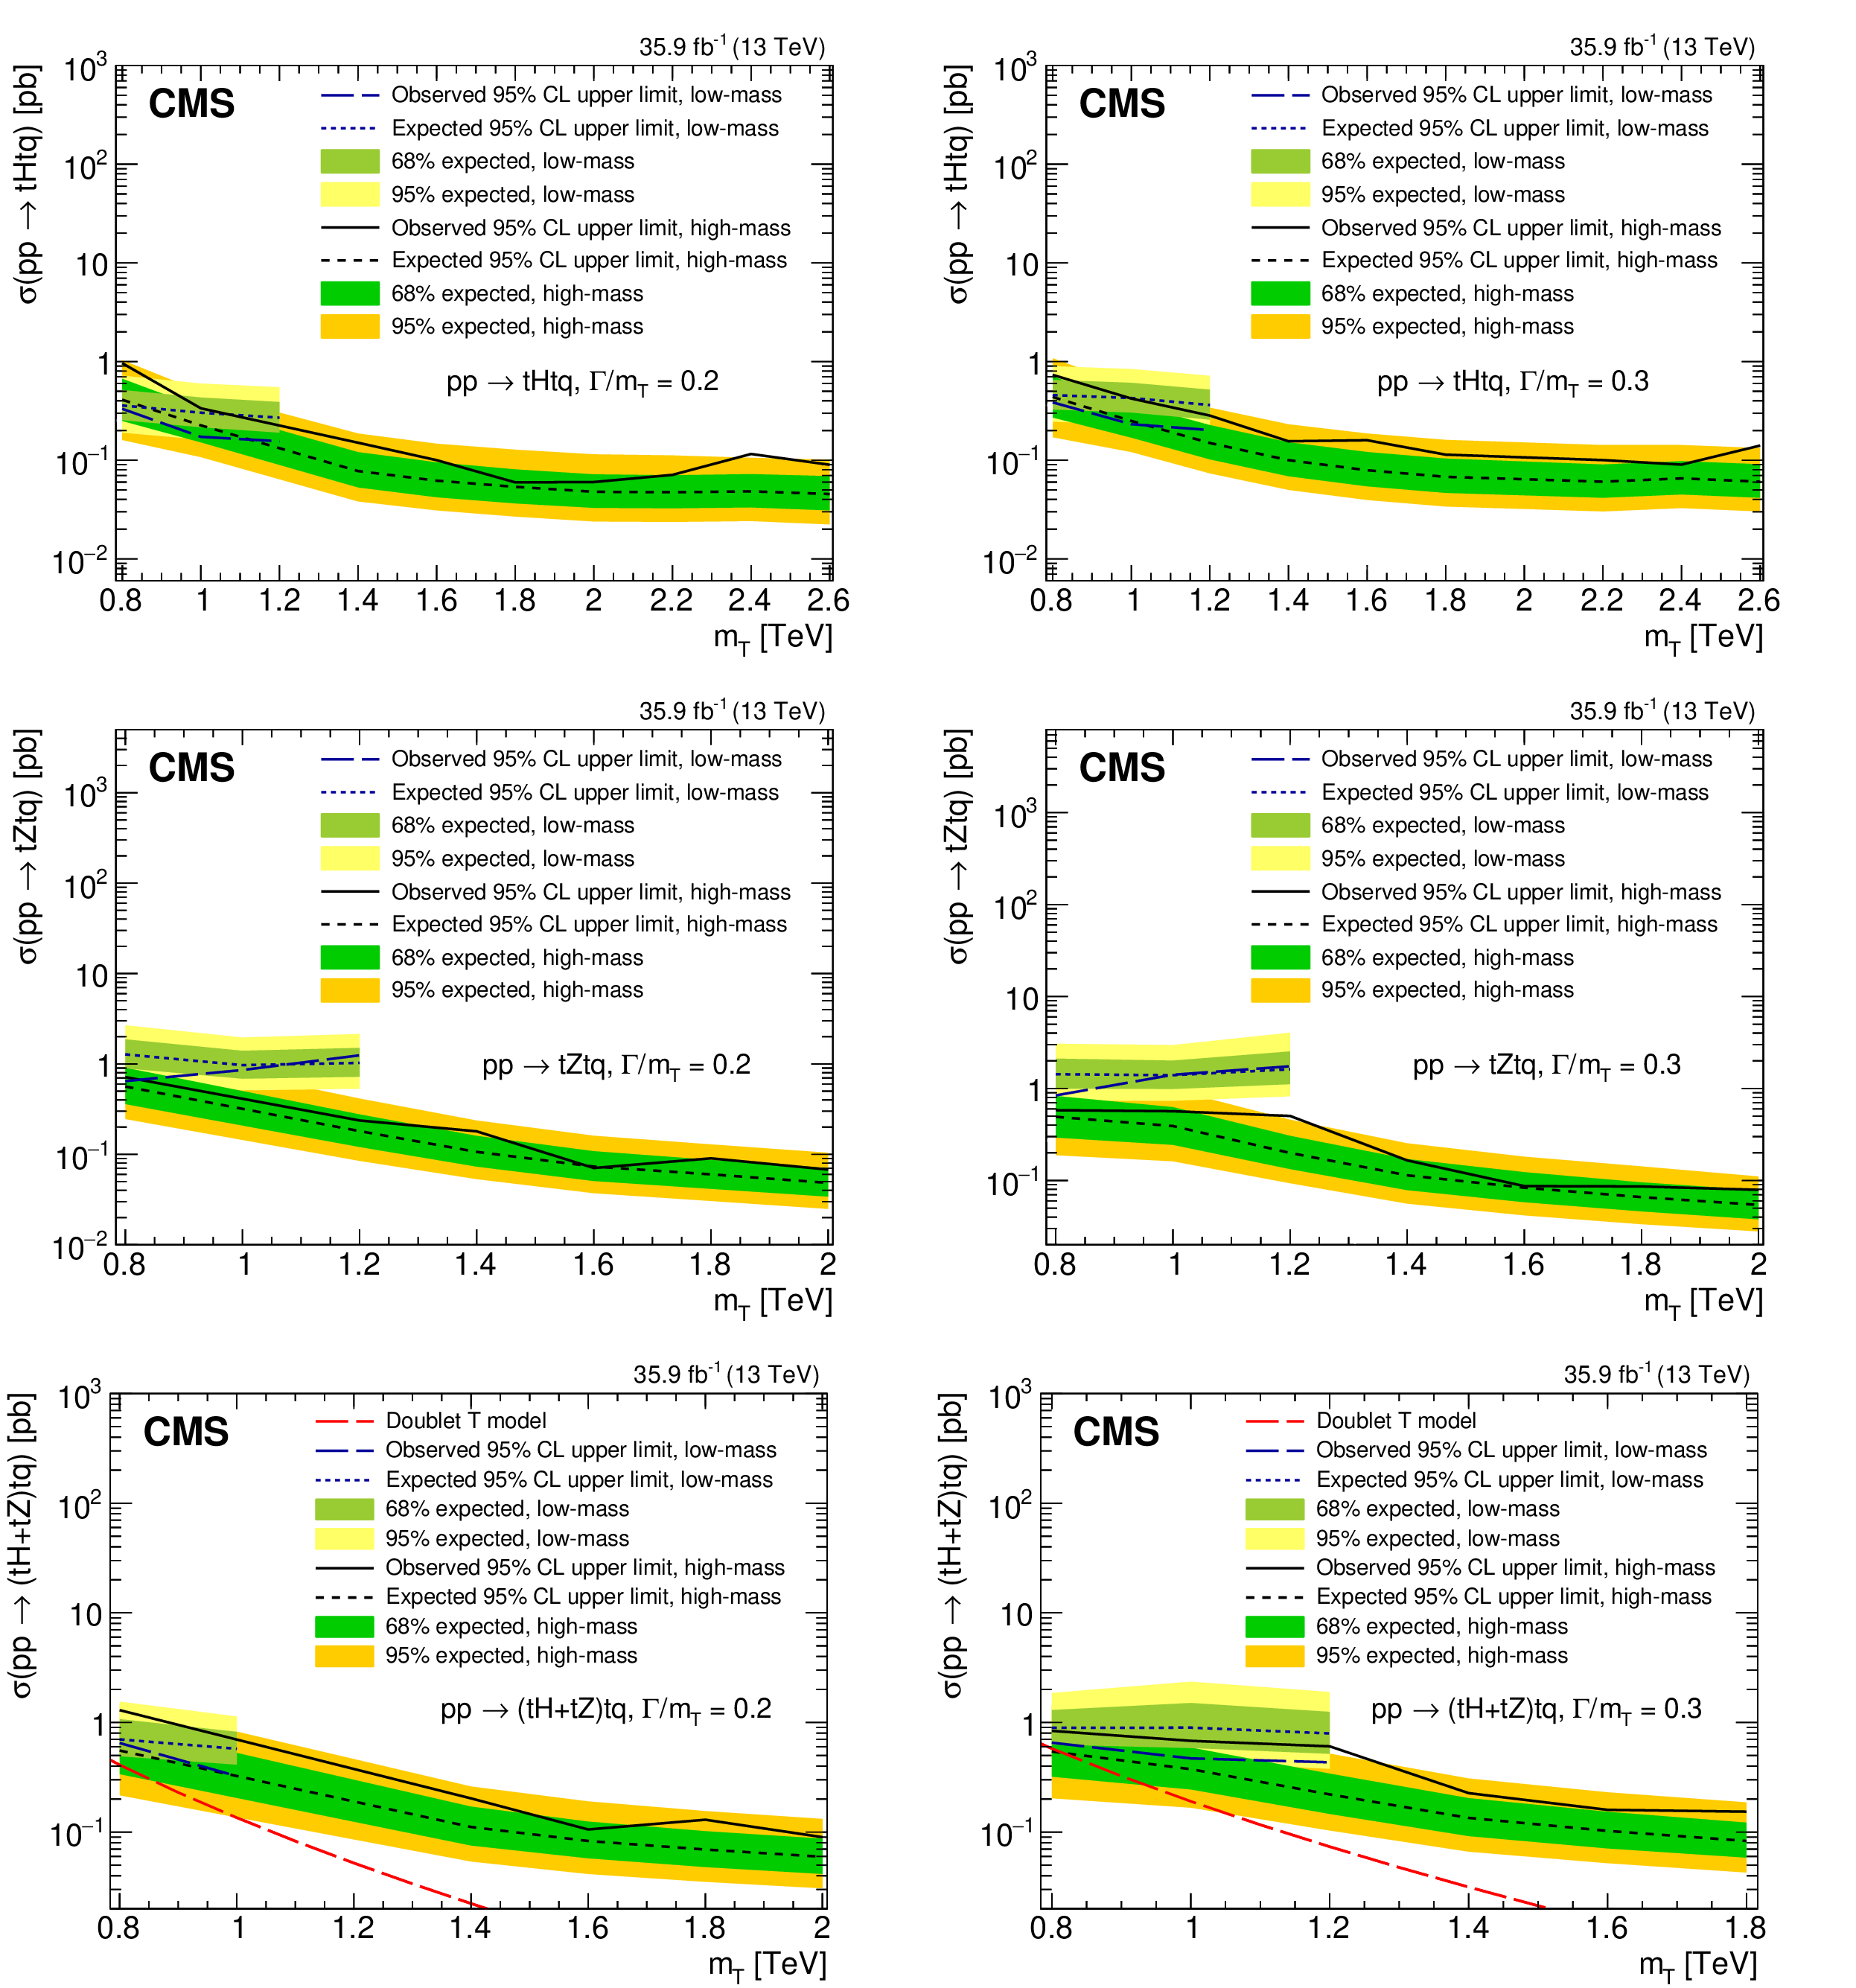
png pdf |
Figure 15:
The observed and median expected upper limits at 95% CL on the cross sections for production associated with a top quark for the ${\mathrm{t} \mathrm{H} \mathrm{t} \mathrm{q}}$ (upper row) and ${\mathrm{t} \mathrm{Z} \mathrm{t} \mathrm{q}}$ (middle row) channels, and their sum, ${\mathrm{t} \mathrm{H} \mathrm{t} \mathrm{q} +\mathrm{t} \mathrm{Z} \mathrm{t} \mathrm{q}}$ (lower row), for different assumed values of the T quark mass. The inner (green) bands and the outer (yellow) bands indicate the regions containing 68 and 95%, respectively, of the distribution of limits expected under the background-only hypothesis. The left column is for a fractional width of 20% and the right column is for a fractional width of 30%. The dashed red curves are for the (TB) doublet model. Given the specified width, the couplings are implicit in the model. |

png pdf |
Figure 15-a:
The observed and median expected upper limits at 95% CL on the cross sections for production associated with a top quark for the ${\mathrm{t} \mathrm{H} \mathrm{t} \mathrm{q}}$ (upper row) and ${\mathrm{t} \mathrm{Z} \mathrm{t} \mathrm{q}}$ (middle row) channels, and their sum, ${\mathrm{t} \mathrm{H} \mathrm{t} \mathrm{q} +\mathrm{t} \mathrm{Z} \mathrm{t} \mathrm{q}}$ (lower row), for different assumed values of the T quark mass. The inner (green) bands and the outer (yellow) bands indicate the regions containing 68 and 95%, respectively, of the distribution of limits expected under the background-only hypothesis. The left column is for a fractional width of 20% and the right column is for a fractional width of 30%. The dashed red curves are for the (TB) doublet model. Given the specified width, the couplings are implicit in the model. |
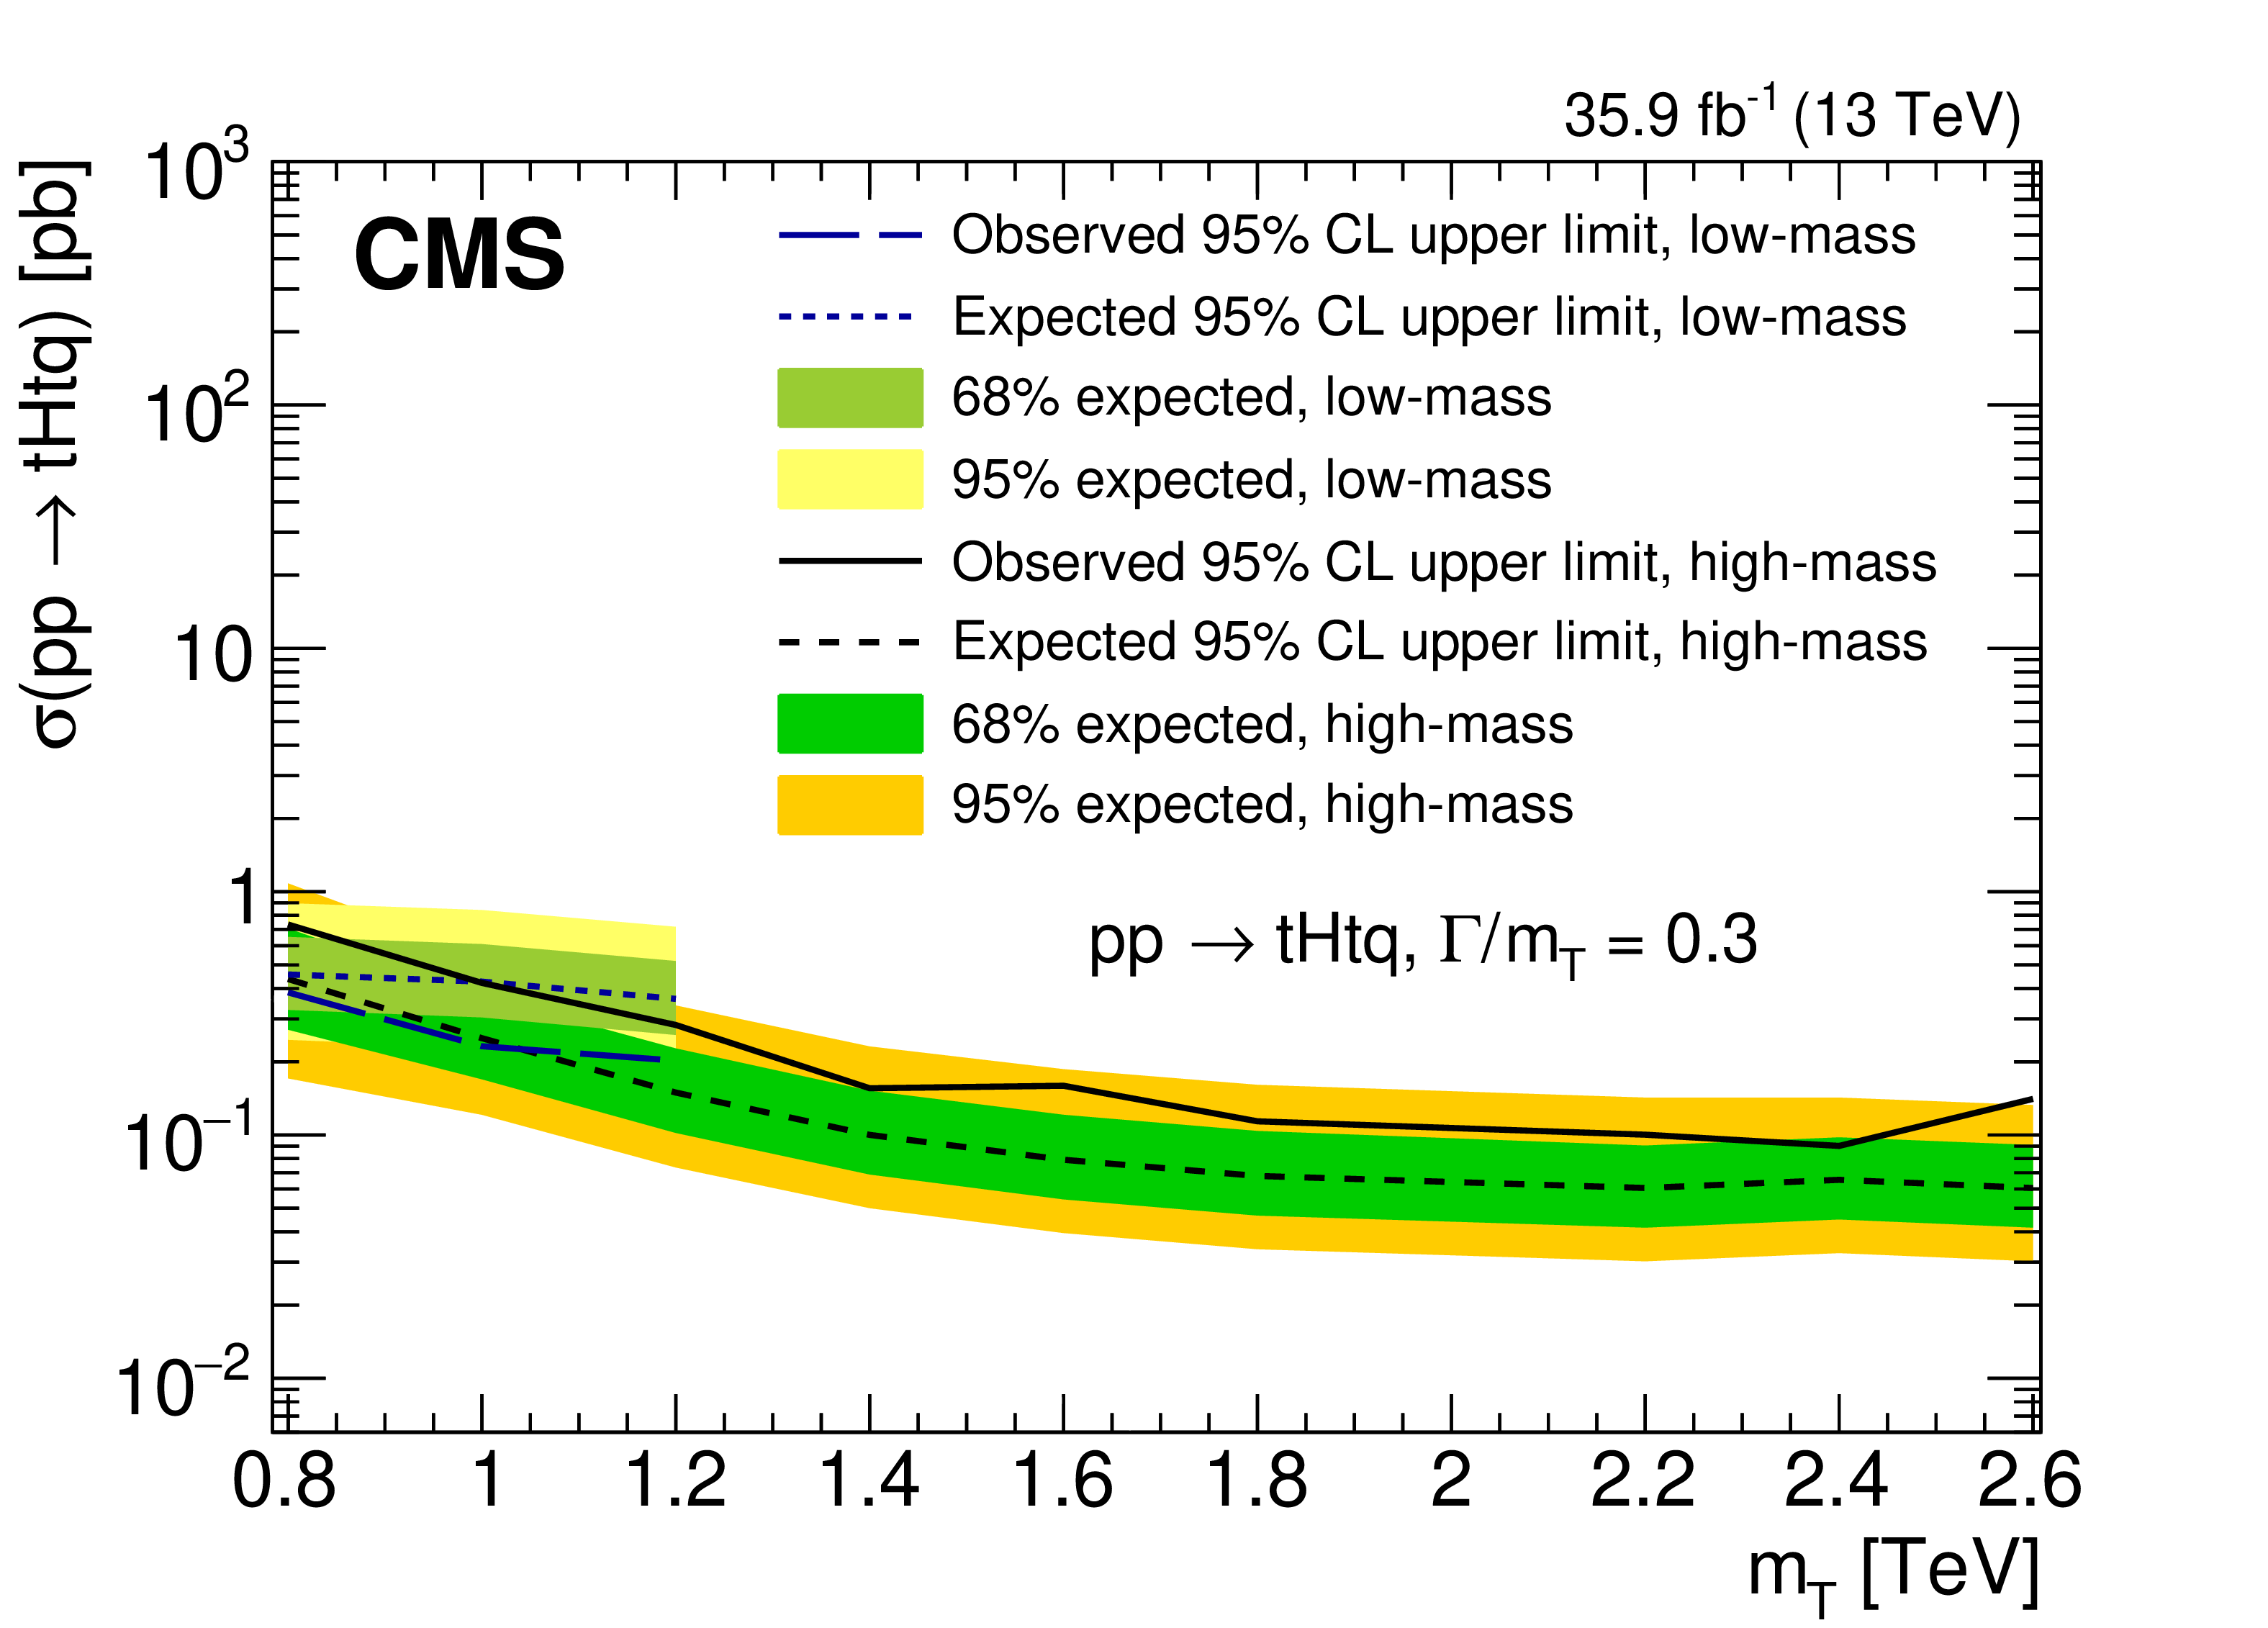
png pdf |
Figure 15-b:
The observed and median expected upper limits at 95% CL on the cross sections for production associated with a top quark for the ${\mathrm{t} \mathrm{H} \mathrm{t} \mathrm{q}}$ (upper row) and ${\mathrm{t} \mathrm{Z} \mathrm{t} \mathrm{q}}$ (middle row) channels, and their sum, ${\mathrm{t} \mathrm{H} \mathrm{t} \mathrm{q} +\mathrm{t} \mathrm{Z} \mathrm{t} \mathrm{q}}$ (lower row), for different assumed values of the T quark mass. The inner (green) bands and the outer (yellow) bands indicate the regions containing 68 and 95%, respectively, of the distribution of limits expected under the background-only hypothesis. The left column is for a fractional width of 20% and the right column is for a fractional width of 30%. The dashed red curves are for the (TB) doublet model. Given the specified width, the couplings are implicit in the model. |
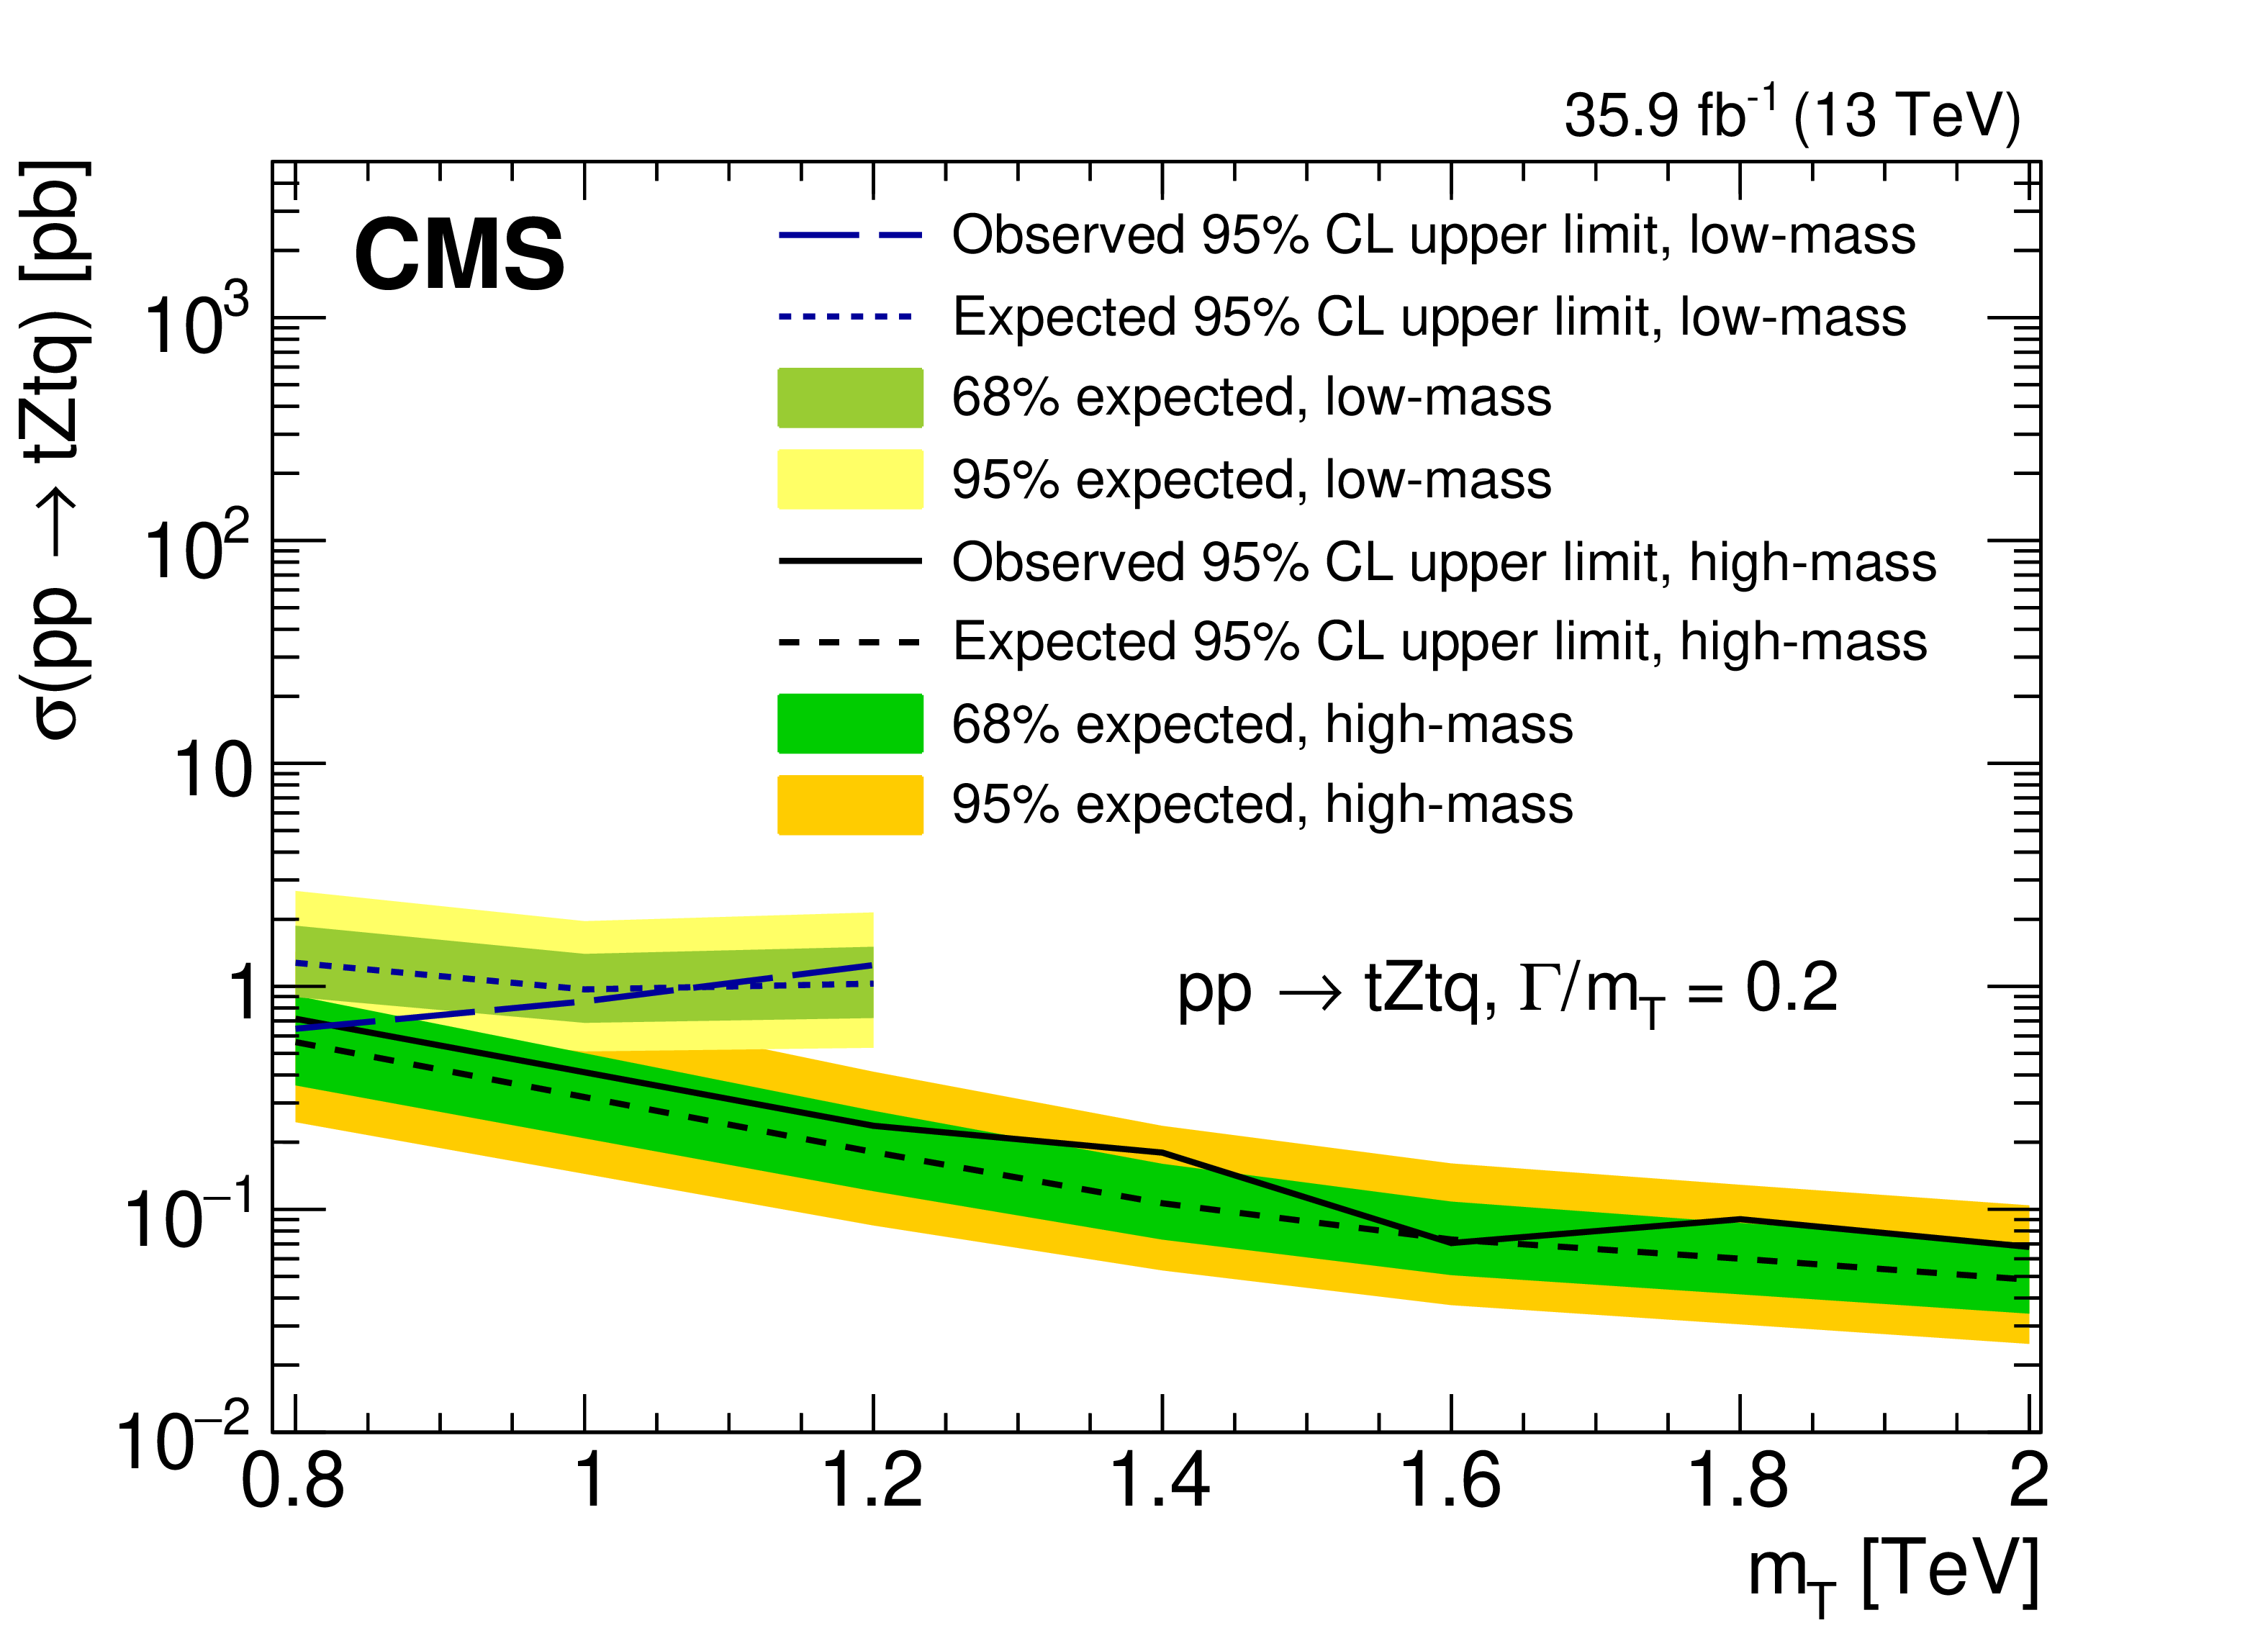
png pdf |
Figure 15-c:
The observed and median expected upper limits at 95% CL on the cross sections for production associated with a top quark for the ${\mathrm{t} \mathrm{H} \mathrm{t} \mathrm{q}}$ (upper row) and ${\mathrm{t} \mathrm{Z} \mathrm{t} \mathrm{q}}$ (middle row) channels, and their sum, ${\mathrm{t} \mathrm{H} \mathrm{t} \mathrm{q} +\mathrm{t} \mathrm{Z} \mathrm{t} \mathrm{q}}$ (lower row), for different assumed values of the T quark mass. The inner (green) bands and the outer (yellow) bands indicate the regions containing 68 and 95%, respectively, of the distribution of limits expected under the background-only hypothesis. The left column is for a fractional width of 20% and the right column is for a fractional width of 30%. The dashed red curves are for the (TB) doublet model. Given the specified width, the couplings are implicit in the model. |

png pdf |
Figure 15-d:
The observed and median expected upper limits at 95% CL on the cross sections for production associated with a top quark for the ${\mathrm{t} \mathrm{H} \mathrm{t} \mathrm{q}}$ (upper row) and ${\mathrm{t} \mathrm{Z} \mathrm{t} \mathrm{q}}$ (middle row) channels, and their sum, ${\mathrm{t} \mathrm{H} \mathrm{t} \mathrm{q} +\mathrm{t} \mathrm{Z} \mathrm{t} \mathrm{q}}$ (lower row), for different assumed values of the T quark mass. The inner (green) bands and the outer (yellow) bands indicate the regions containing 68 and 95%, respectively, of the distribution of limits expected under the background-only hypothesis. The left column is for a fractional width of 20% and the right column is for a fractional width of 30%. The dashed red curves are for the (TB) doublet model. Given the specified width, the couplings are implicit in the model. |
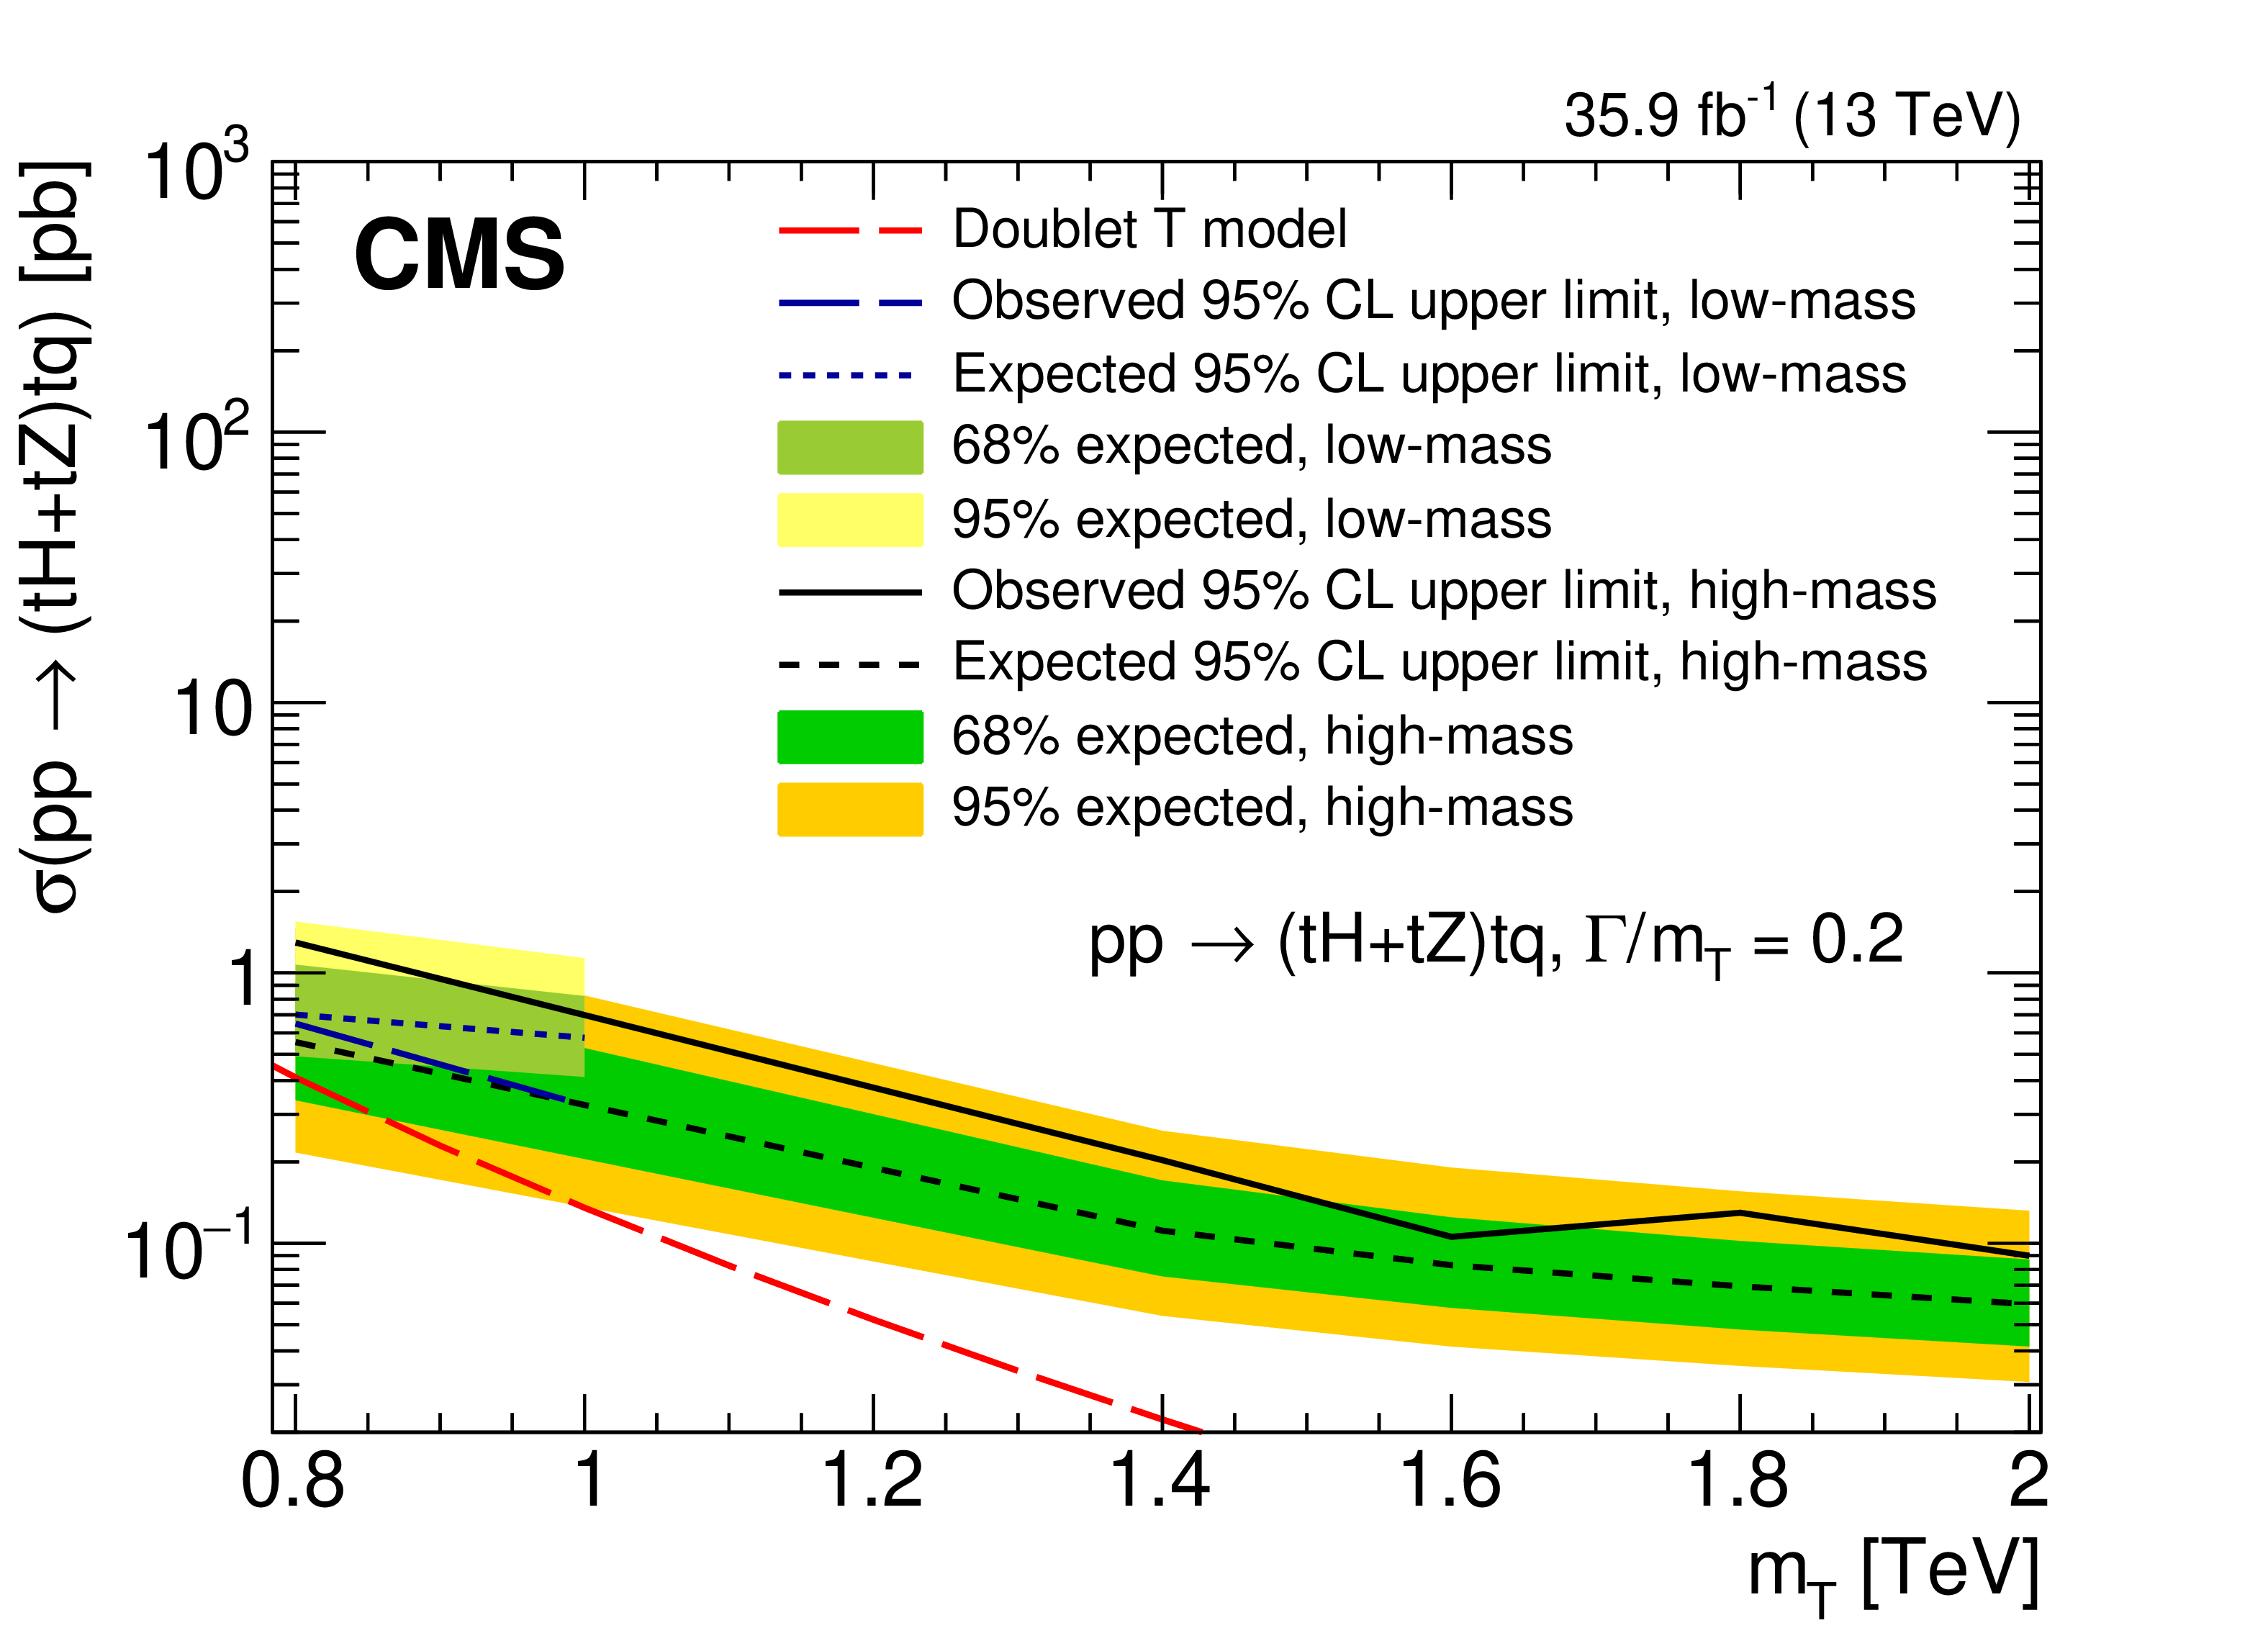
png pdf |
Figure 15-e:
The observed and median expected upper limits at 95% CL on the cross sections for production associated with a top quark for the ${\mathrm{t} \mathrm{H} \mathrm{t} \mathrm{q}}$ (upper row) and ${\mathrm{t} \mathrm{Z} \mathrm{t} \mathrm{q}}$ (middle row) channels, and their sum, ${\mathrm{t} \mathrm{H} \mathrm{t} \mathrm{q} +\mathrm{t} \mathrm{Z} \mathrm{t} \mathrm{q}}$ (lower row), for different assumed values of the T quark mass. The inner (green) bands and the outer (yellow) bands indicate the regions containing 68 and 95%, respectively, of the distribution of limits expected under the background-only hypothesis. The left column is for a fractional width of 20% and the right column is for a fractional width of 30%. The dashed red curves are for the (TB) doublet model. Given the specified width, the couplings are implicit in the model. |
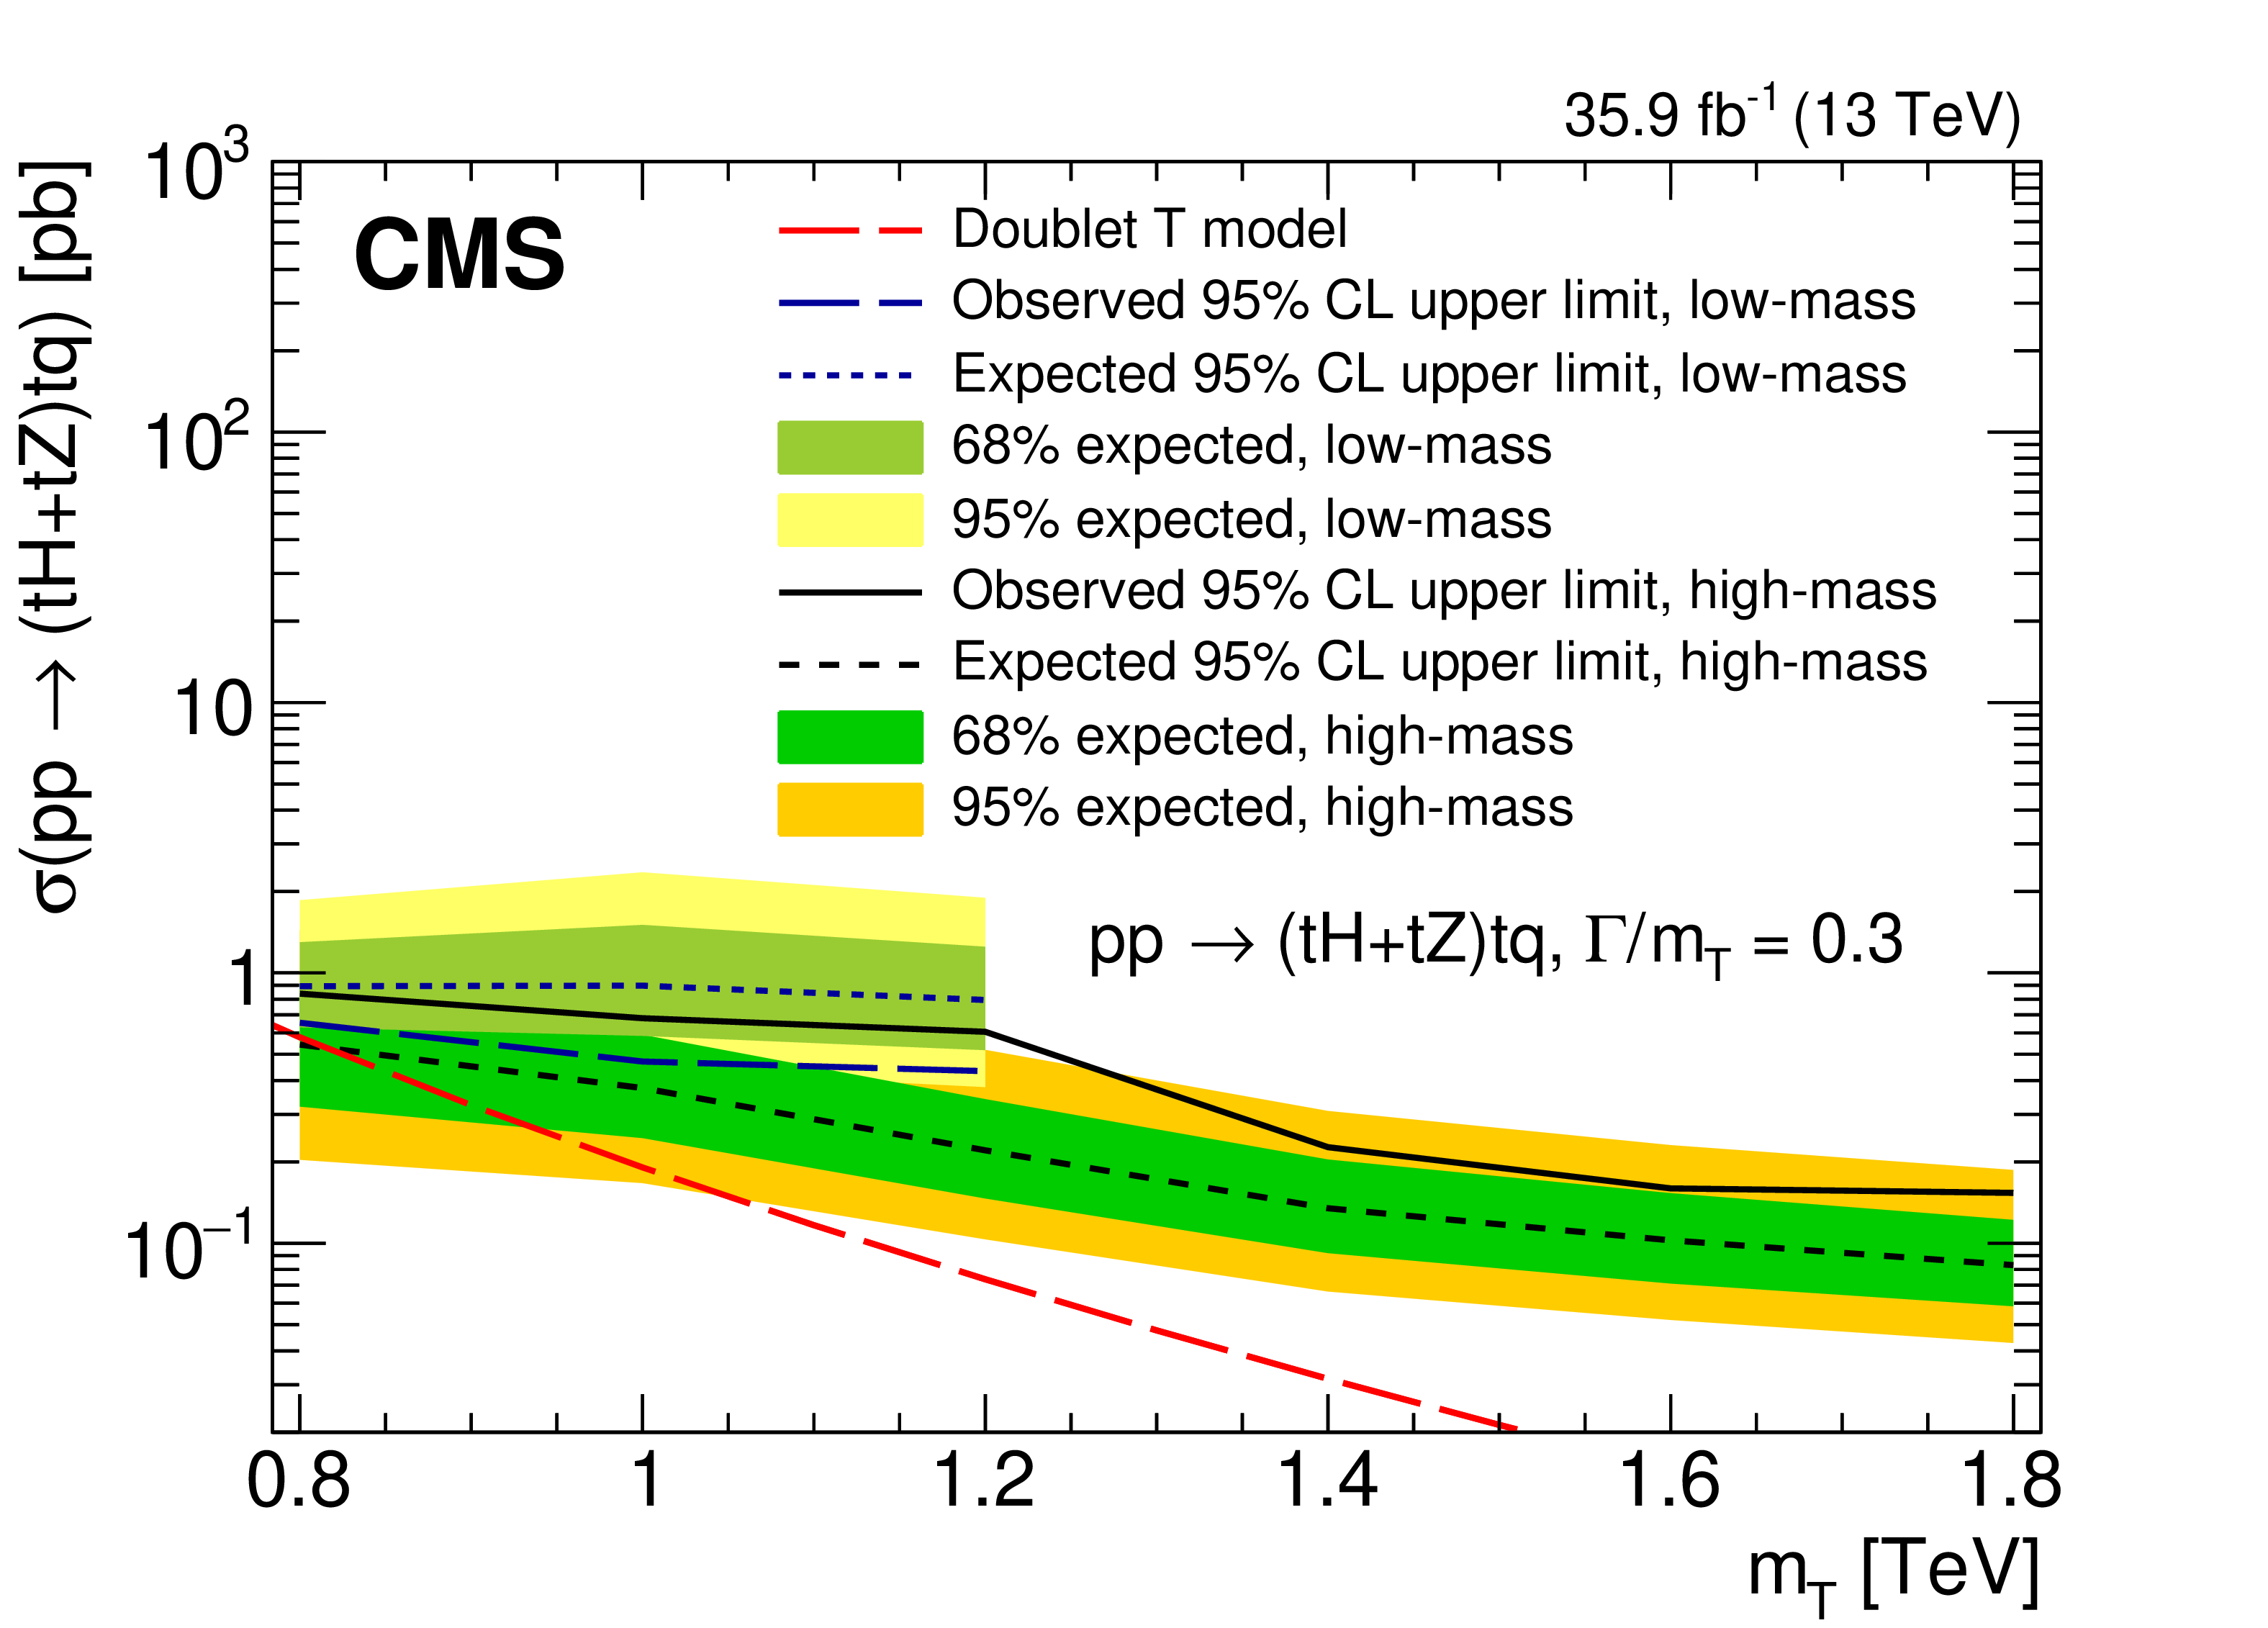
png pdf |
Figure 15-f:
The observed and median expected upper limits at 95% CL on the cross sections for production associated with a top quark for the ${\mathrm{t} \mathrm{H} \mathrm{t} \mathrm{q}}$ (upper row) and ${\mathrm{t} \mathrm{Z} \mathrm{t} \mathrm{q}}$ (middle row) channels, and their sum, ${\mathrm{t} \mathrm{H} \mathrm{t} \mathrm{q} +\mathrm{t} \mathrm{Z} \mathrm{t} \mathrm{q}}$ (lower row), for different assumed values of the T quark mass. The inner (green) bands and the outer (yellow) bands indicate the regions containing 68 and 95%, respectively, of the distribution of limits expected under the background-only hypothesis. The left column is for a fractional width of 20% and the right column is for a fractional width of 30%. The dashed red curves are for the (TB) doublet model. Given the specified width, the couplings are implicit in the model. |
| Tables | |

png pdf |
Table 1:
Cumulative efficiencies for the low-mass search after applying event selections for the signal and main backgrounds in the Higgs boson decay channel (upper half) and the Z boson decay channel (lower half). The first and last rows of each section give the expected numbers of events normalized to the integrated luminosity of 35.9 fb$^{-1}$. Uncertainties are statistical only. The signal values are for a mass of 0.7 TeV, $ {\Gamma /{{m_{{\mathrm {T}}}}}} = $ 0.01, left-handed chirality, and a T quark produced in association with a bottom quark with a product of cross section and branching fraction of 89 fb for each channel. The "Other backgrounds'' column includes W+jets, Z+jets, single top quark, and ${{\mathrm{t} \mathrm{\bar{t}}} \mathrm{H}}$ processes. It has been checked that the ${{\mathrm{t} \mathrm{\bar{t}}} \mathrm{H}}$ process does not present a resonance in the ${\mathrm{t} \mathrm{H}}$ channel. The number of expected ${{\mathrm{t} \mathrm{\bar{t}}} \mathrm{H}}$ events is comparable to the expected T signal. |
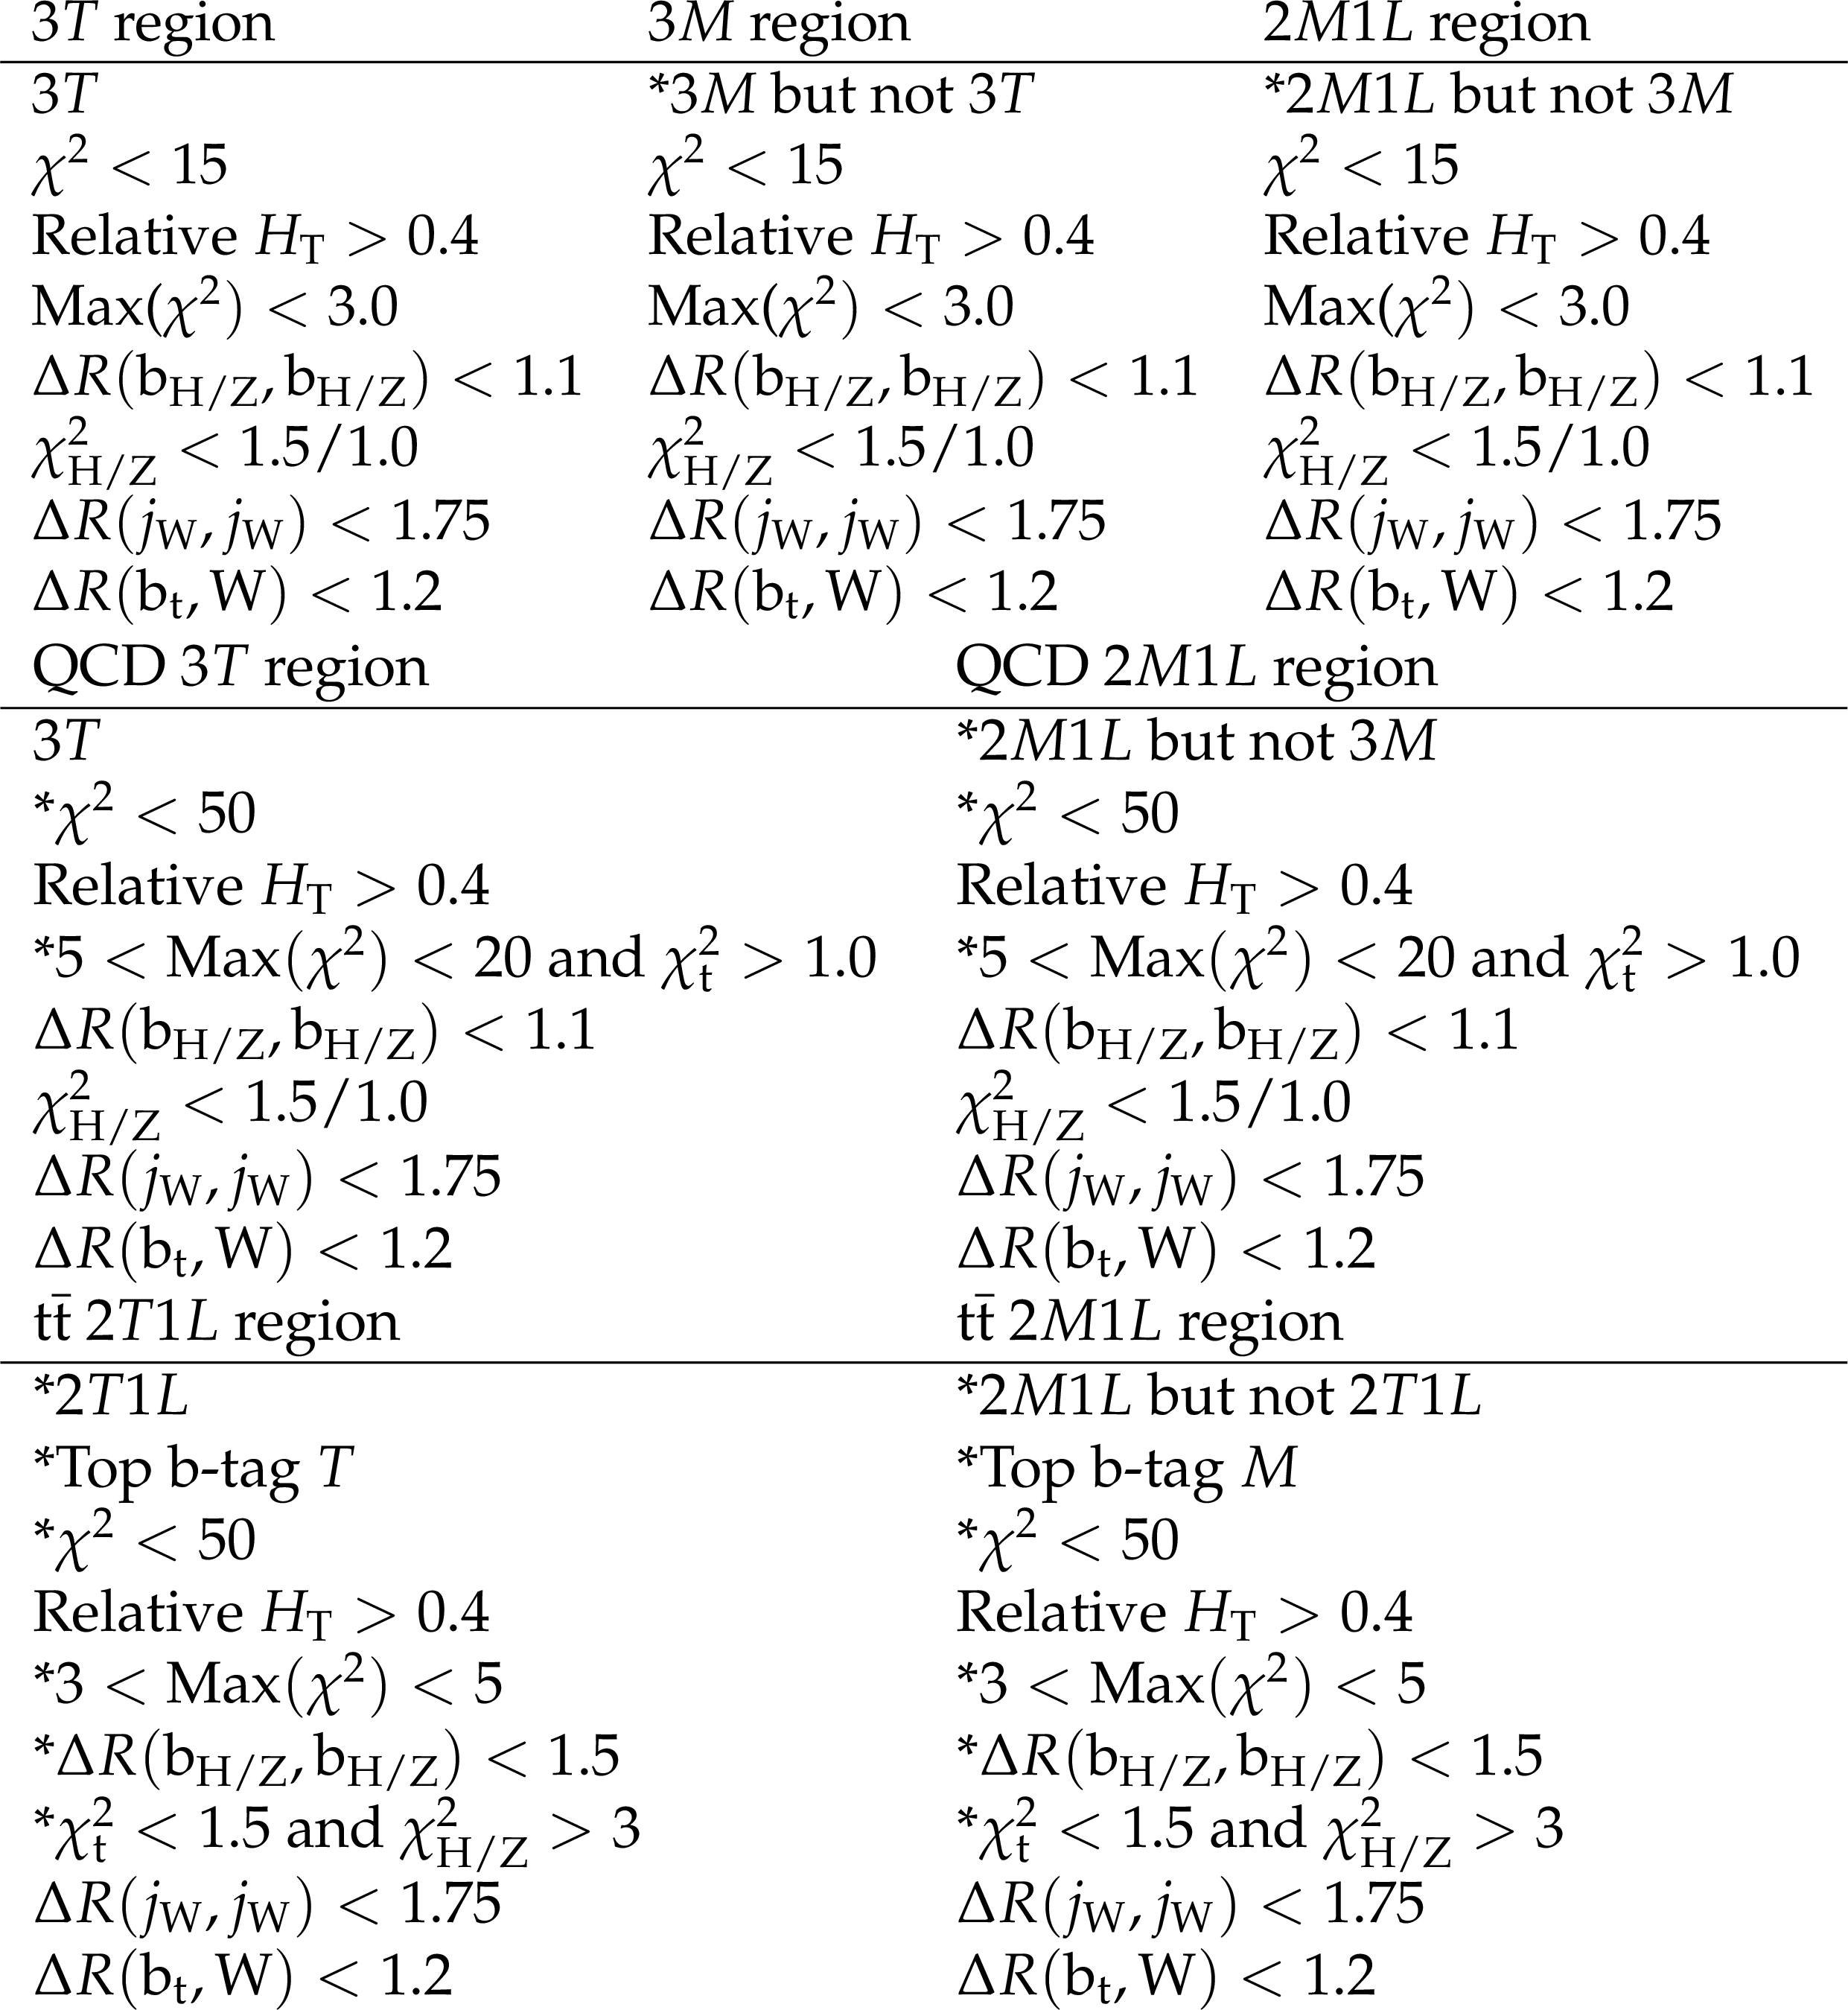
png pdf |
Table 2:
Criteria defining the various signal and control regions. The first line of each section gives the b tagging requirements. The criteria that differ are preceded by an asterisk "*". The ${\mathrm{b} \mathrm{\bar{b}}}$ mass requirements are different for the H ($m_{\mathrm{b} \mathrm{\bar{b}}} > $ 100 GeV) and Z channels ($m_{\mathrm{b} \mathrm{\bar{b}}} < $ 100 GeV). |
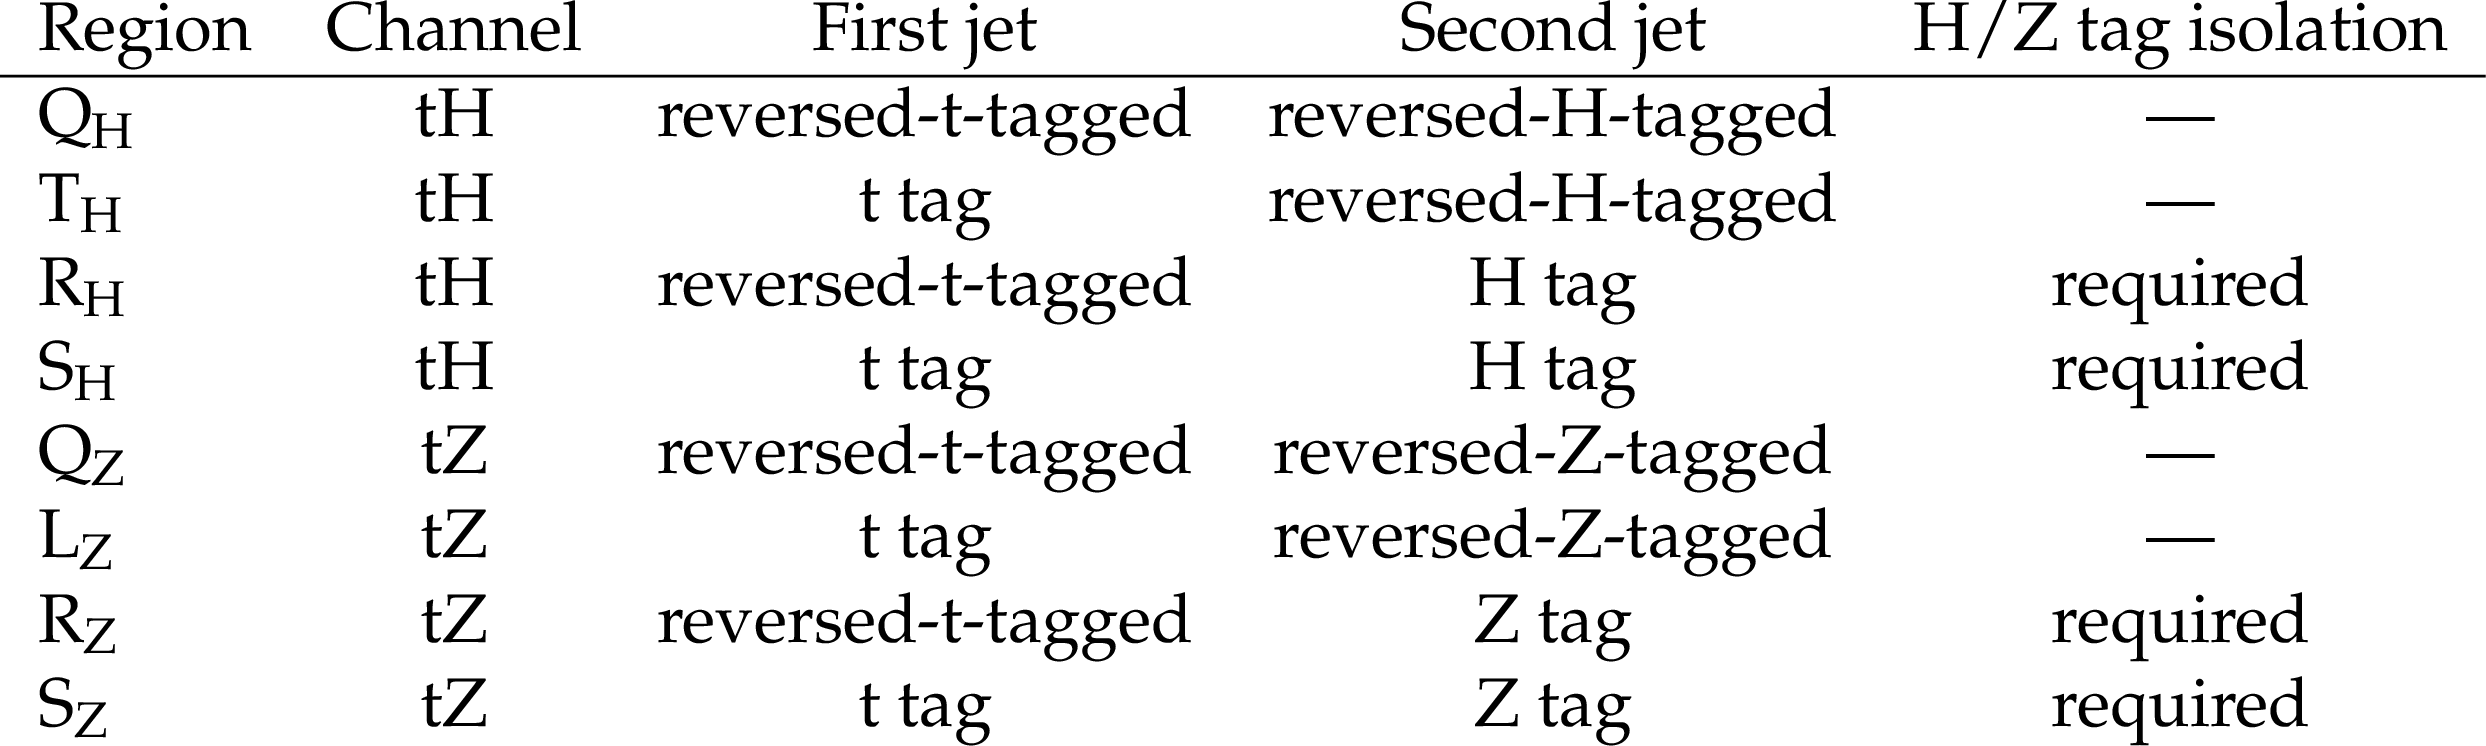
png pdf |
Table 3:
Overview of the criteria used to define the mutually exclusive ${\mathrm {Q}_{\mathrm{H}}}$, ${\mathrm {T}_{\mathrm{H}}}$, ${\mathrm {R}_{\mathrm{H}}}$, ${\mathrm {S}_{\mathrm{H}}}$, ${\mathrm {Q}_{\mathrm{Z}}}$, ${\mathrm {L}_{\mathrm{Z}}}$, ${\mathrm {R}_{\mathrm{Z}}}$, and ${\mathrm {S}_{\mathrm{Z}}} $ regions. These are based on the particle tagging criteria for t, H, and Z jets and for the reversed-t-tagged, reversed-H-tagged, and reversed-Z-tagged jets using the two highest ${p_{\mathrm {T}}}$ AK8 jets. |
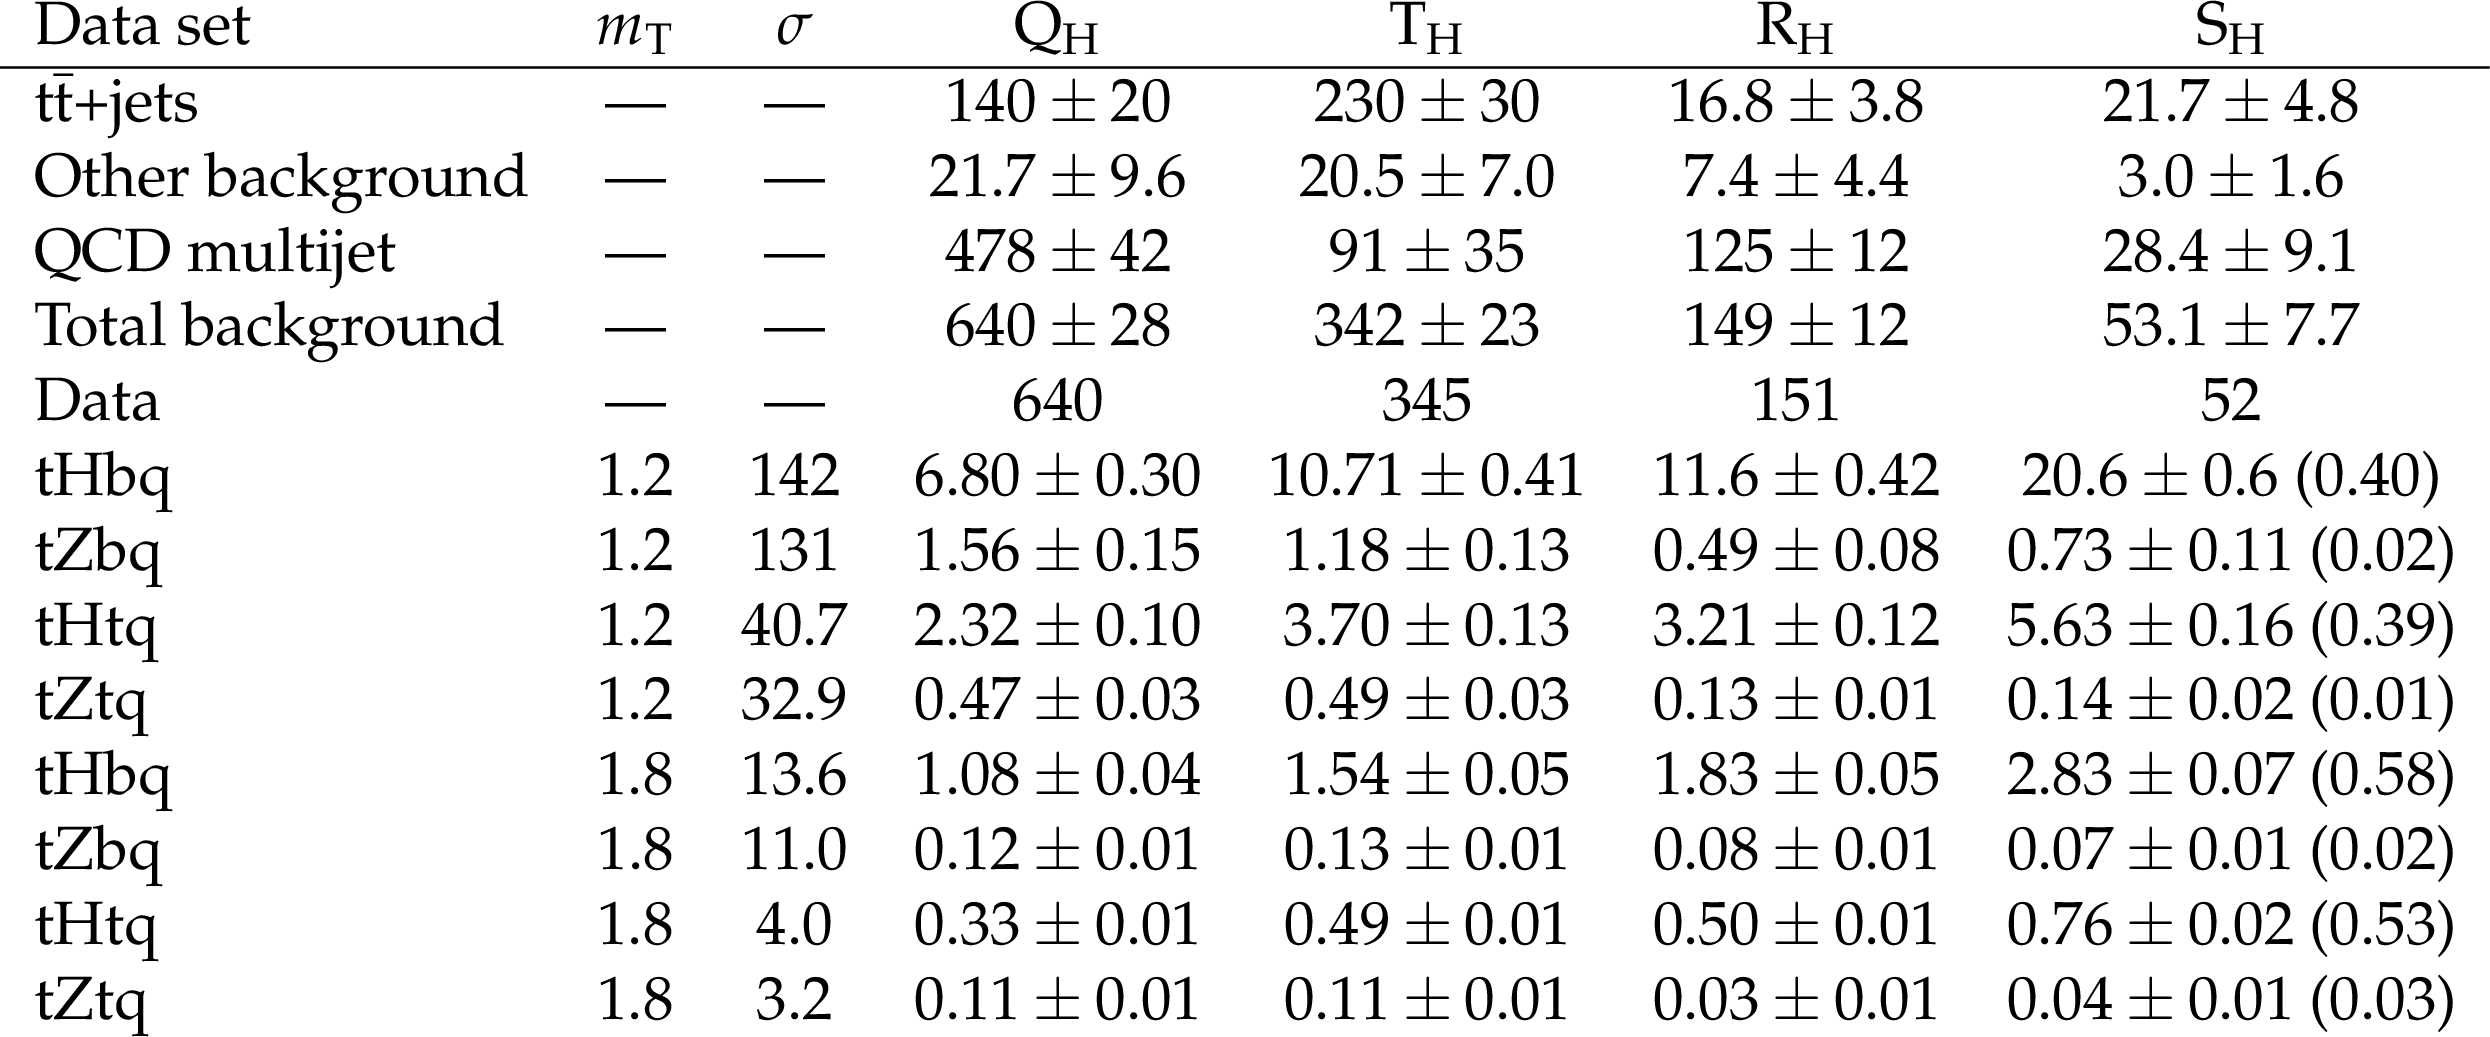
png pdf |
Table 4:
Post-fit numbers of events for the ${\mathrm {Q}_{\mathrm{H}}}$, ${\mathrm {T}_{\mathrm{H}}}$, ${\mathrm {R}_{\mathrm{H}}}$, and ${\mathrm {S}_{\mathrm{H}}}$ regions for the data and specified background sources, for the overall eight-region background-only fit. The uncertainties include both the statistical and systematic components. The fitted background sums depend on the data. The expected event yields for various signal samples are also listed with statistical uncertainties only, along with the corresponding masses (TeV) and cross sections (fb). The fractional width considered is 30%. The percent efficiency in region ${\mathrm {S}_{\mathrm{H}}}$ is also noted in parentheses, alongside the event yield. |
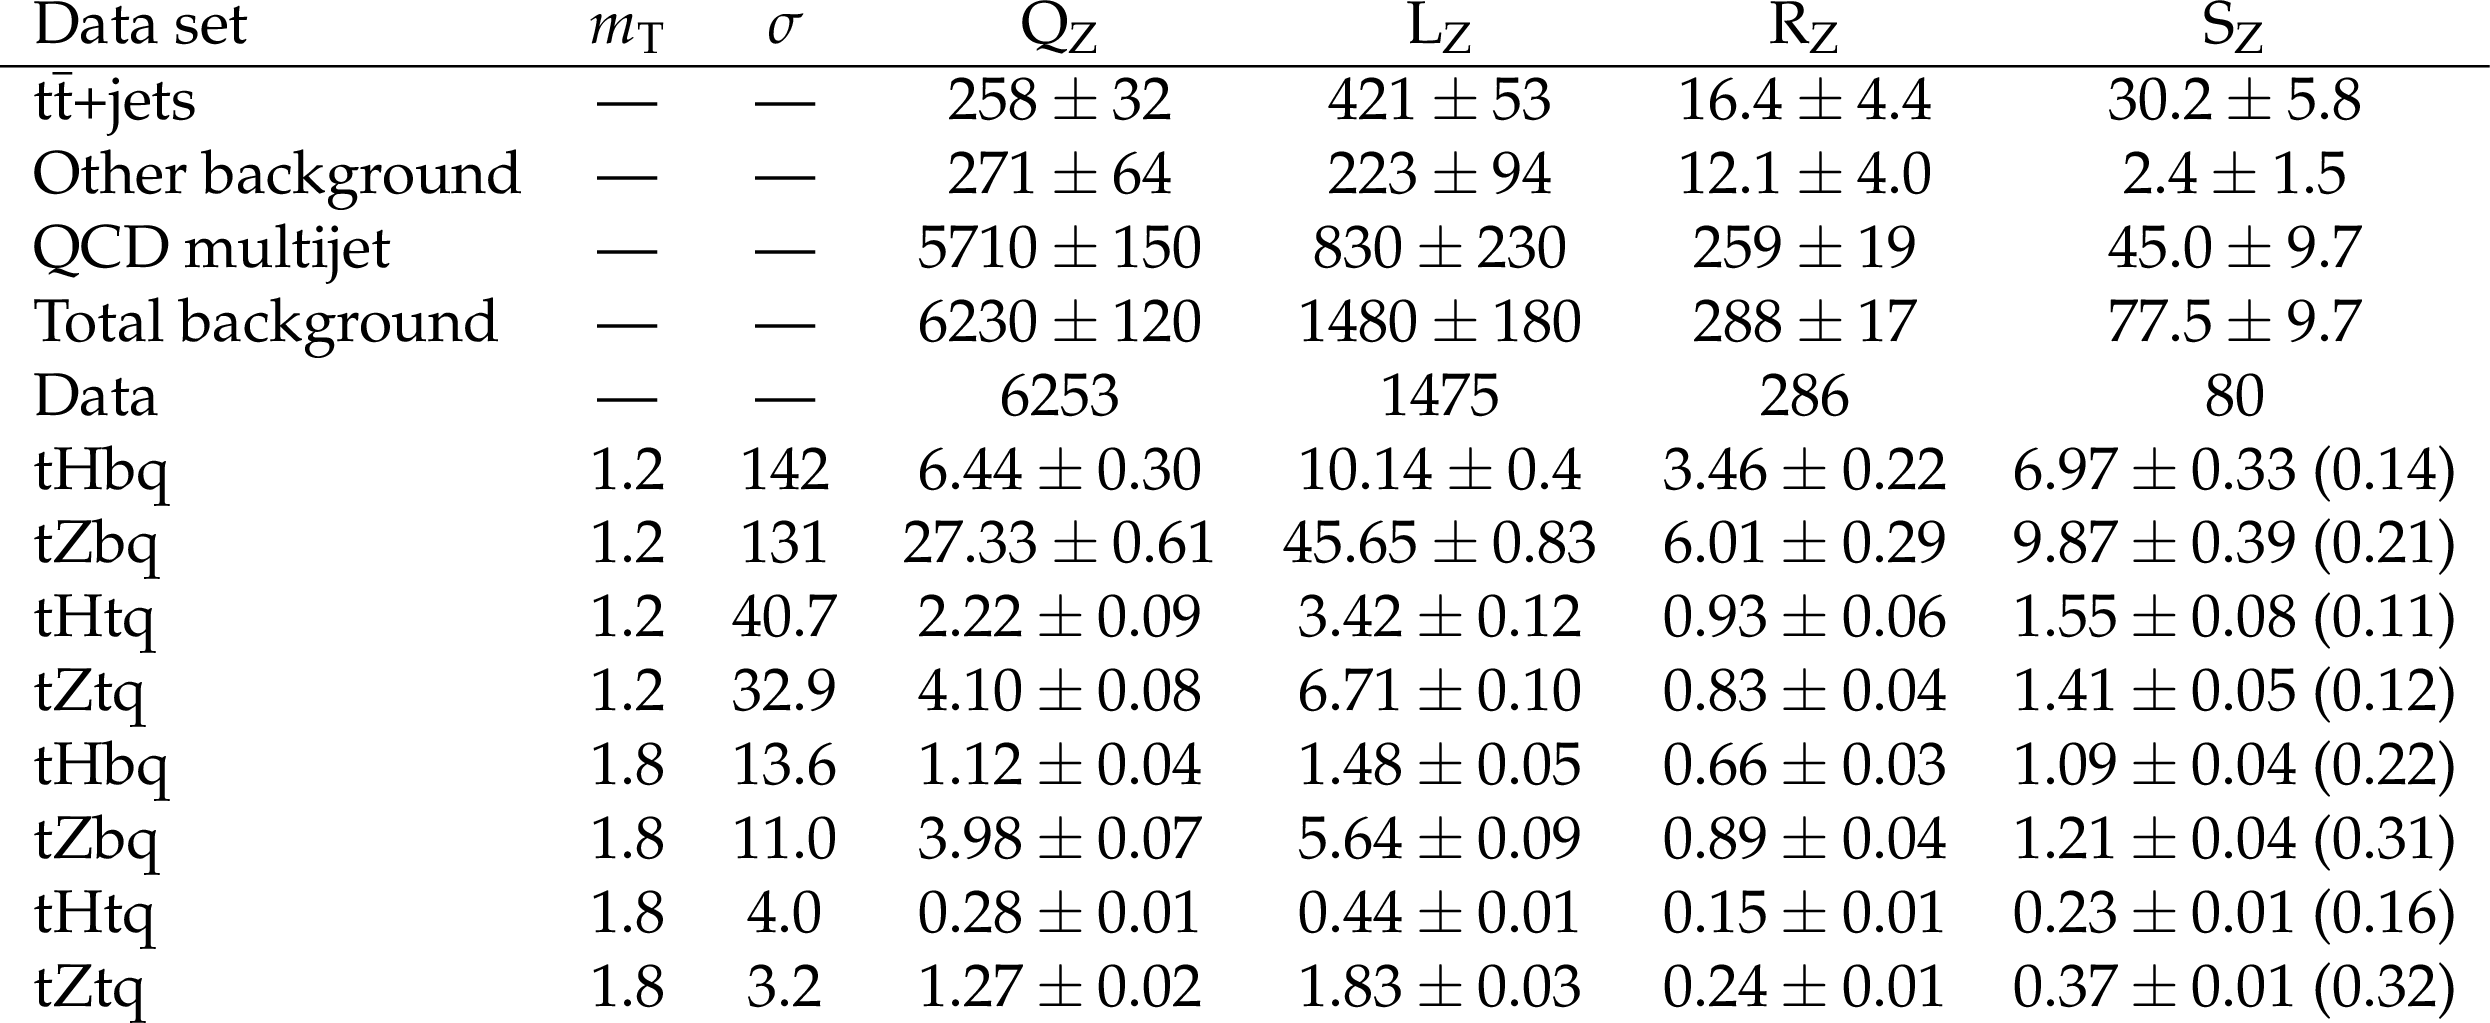
png pdf |
Table 5:
Post-fit numbers of events for the ${\mathrm {Q}_{\mathrm{Z}}}$, ${\mathrm {L}_{\mathrm{Z}}}$, ${\mathrm {R}_{\mathrm{Z}}}$, and ${\mathrm {S}_{\mathrm{Z}}} $ regions for the data and specified background sources, for the overall eight-region background-only fit. The uncertainties include both the statistical and systematic components. The fitted background sums depend on the data. The expected event yields for various signal samples are also listed with statistical uncertainties only, along with the corresponding masses (TeV) and cross sections (fb). The fractional width considered is 30%. The percent efficiency in region ${\mathrm {S}_{\mathrm{Z}}} $ is also noted in parentheses, alongside the event yield. |
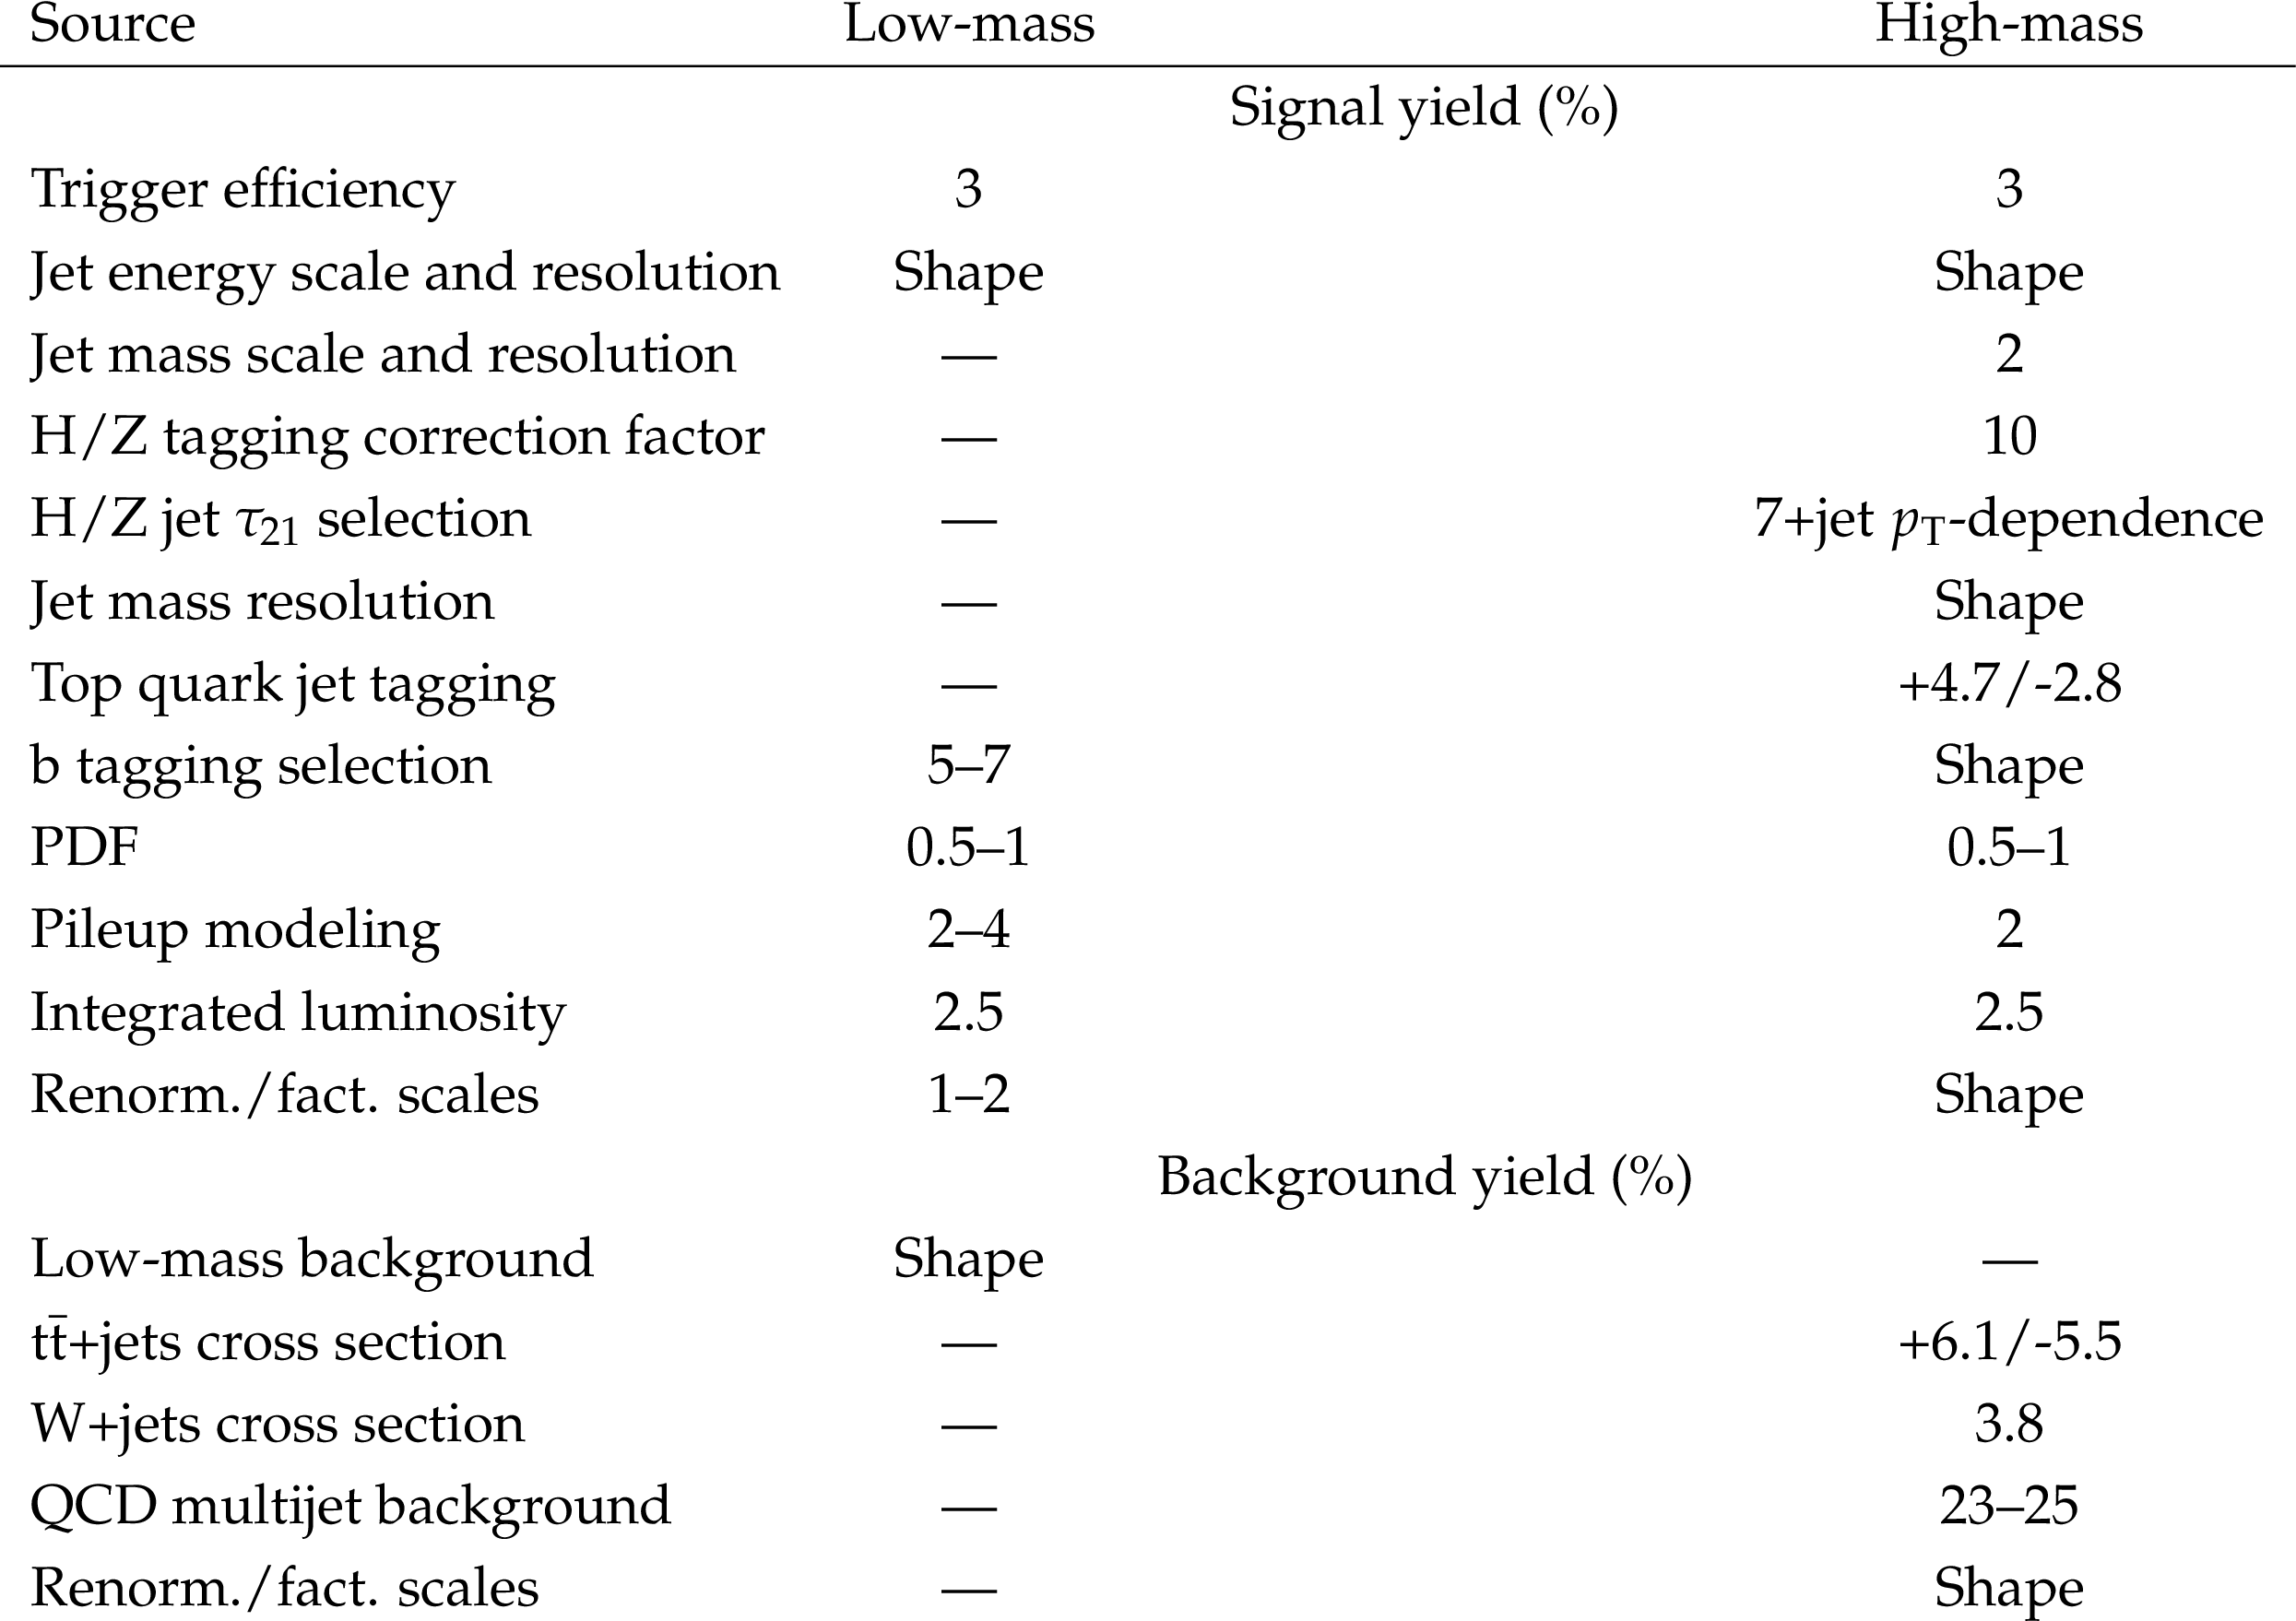
png pdf |
Table 6:
The systematic uncertainties in the signal and background yields for each search. The uncertainties marked "Shape'' affect both the event yields and the distributions. |
| Summary |
| A search for a vector-like top quark partner T in the electroweak single production mode with fully hadronic final states has been performed using ${\mathrm{p}}{\mathrm{p}}$ collision events at $\sqrt{s} = $ 13 TeV collected by the CMS experiment in 2016. The data sample corresponds to an integrated luminosity of 35.9 fb$^{-1}$. The T quarks are assumed to couple only to the standard model third-generation quarks. The decay channels exploited are ${\mathrm{T}\to\mathrm{t}\mathrm{H}}$ and ${\mathrm{T}\to\mathrm{t}\mathrm{Z}}$ with the hadronic decay of the top quark and primarily the $\mathrm{b\bar{b}}$ decay of the Higgs and Z bosons. This search is designed to be sensitive to T quark fractional widths of up to 30% and a wide range of masses. The background is mostly due to standard model ${\mathrm{t}\mathrm{\bar{t}}}$+jets and QCD multijet events with some contributions from W+jets processes. No significant excess of data above the standard model background is observed and upper limits at 95% confidence level are set on $\sigma \,\mathcal{B}({\mathrm{T}\to\mathrm{t}\mathrm{H}} )$ and $\sigma \,\mathcal{B}({\mathrm{T}\to\mathrm{t}\mathrm{Z}} )$, which vary between 2 pb and 20 fb for T masses ranging from 0.6 to 2.6 TeV in the ${\mathrm{T}\mathrm{b}\mathrm{q}}$ and ${{\mathrm{p}}{\mathrm{p}}\to\mathrm{T}\mathrm{t}\mathrm{q}}$ only production channels. Limits are reported for T quark fractional widths ranging from narrow to 30%. Results from combining the two decay channels assuming equal couplings are also reported. Compared with prior electroweak single production searches, this search is significantly more sensitive for ${\mathrm{T}\to\mathrm{t}\mathrm{H}}$. The search gives the first constraints using this production mode on ${\mathrm{T}\to\mathrm{t}\mathrm{Z}}$ for hadronic decays of the Z boson. These results are competitive with those from searches for ${\mathrm{T}\to\mathrm{t}\mathrm{Z}}$ using other Z decay modes. The combined ${\mathrm{T}\to\mathrm{t}\mathrm{H}}$ and ${\mathrm{T}\to\mathrm{t}\mathrm{Z}}$ results for associated production with a bottom quark lead to constraints on T quarks in the T singlet model for masses below 1.00 TeV. The expected sensitivity for this model extends to 1.28 TeV (for 30% fractional width), which is comparable to the mass reach of the most stringent pair production searches. |
| References | ||||
| 1 | Y. Okada and L. Panizzi | LHC signatures of vector-like quarks | Adv. High Energy Phys. 2013 (2013) 364936 | 1207.5607 |
| 2 | J. A. Aguilar-Saavedra, R. Benbrik, S. Heinemeyer, and M. P\'erez-Victoria | Handbook of vectorlike quarks: Mixing and single production | PRD 88 (2013) 094010 | 1306.0572 |
| 3 | A. De Simone, O. Matsedonskyi, R. Rattazzi, and A. Wulzer | A first top partner hunter's guide | JHEP 04 (2013) 004 | 1211.5663 |
| 4 | M. Buchkremer, G. Cacciapaglia, A. Deandrea, and L. Panizzi | Model independent framework for searches of top partners | NPB 876 (2013) 376 | 1305.4172 |
| 5 | J. A. Aguilar-Saavedra | Identifying top partners at LHC | JHEP 11 (2009) 030 | 0907.3155 |
| 6 | B. A. Dobrescu, K. Kong, and R. Mahbubani | Prospects for top-prime quark discovery at the Tevatron | JHEP 06 (2009) 001 | 0902.0792 |
| 7 | N. Vignaroli | Early discovery of top partners and test of the Higgs nature | PRD 86 (2012) 075017 | 1207.0830 |
| 8 | T. Han, H. E. Logan, B. McElrath, and L.-T. Wang | Phenomenology of the little Higgs model | PRD 67 (2003) 095004 | hep-ph/0301040 |
| 9 | ATLAS Collaboration | Search for pair production of vector-like top quarks in events with one lepton, jets, and missing transverse momentum in $ \sqrt{s}=$ 13 TeV pp collisions with the ATLAS detector | JHEP 08 (2017) 052 | 1705.10751 |
| 10 | CMS Collaboration | Search for pair production of vector-like T and B quarks in single-lepton final states using boosted jet substructure in proton-proton collisions at $ \sqrt{s}= $ 13 TeV | JHEP 11 (2017) 085 | CMS-B2G-16-024 1706.03408 |
| 11 | ATLAS Collaboration | Search for pair production of heavy vector-like quarks decaying to high-$ {p_{\mathrm{T}}} $ W bosons and b quarks in the lepton-plus-jets final state in pp collisions at $ \sqrt{s}= $ 13 TeV with the ATLAS detector | JHEP 10 (2017) 141 | 1707.03347 |
| 12 | CMS Collaboration | Search for pair production of vector-like quarks in the bW$ \overline{\mathrm{b}} $W channel from proton-proton collisions at $ \sqrt{s} = $ 13 TeV | PLB 779 (2018) 82 | CMS-B2G-17-003 1710.01539 |
| 13 | CMS Collaboration | Search for vector-like T and B quark pairs in final states with leptons at $ \sqrt{s} = $ 13 TeV | JHEP 08 (2018) 177 | CMS-B2G-17-011 1805.04758 |
| 14 | ATLAS Collaboration | Search for pair- and single-production of vector-like quarks in final states with at least one $ Z $ boson decaying into a pair of electrons or muons in $ pp $ collision data collected with the ATLAS detector at $ \sqrt{s} = $ 13 TeV | PRD 98 (2018) 112010 | 1806.10555 |
| 15 | ATLAS Collaboration | Combination of the searches for pair-produced vector-like partners of the third-generation quarks at $ \sqrt{s} = $ 13 TeV with the ATLAS detector | PRL 121 (2018) 211801 | 1808.02343 |
| 16 | CMS Collaboration | Search for vector-like quarks in events with two oppositely charged leptons and jets in proton-proton collisions at $ \sqrt{s} = $ 13 TeV | EPJC 79 (2019) 364 | CMS-B2G-17-012 1812.09768 |
| 17 | CMS Collaboration | Search for pair production of vector-like quarks in the fully hadronic final state | Submitted to PRD | CMS-B2G-18-005 1906.11903 |
| 18 | ATLAS Collaboration | Search for pair and single production of new heavy quarks that decay to a $ Z $ boson and a third-generation quark in $ pp $ collisions at $ \sqrt{s}= $ 8 TeV with the ATLAS detector | JHEP 11 (2014) 104 | 1409.5500 |
| 19 | CMS Collaboration | Search for single production of a heavy vector-like T quark decaying to a Higgs boson and a top quark with a lepton and jets in the final state | PLB 771 (2017) 80 | CMS-B2G-15-008 1612.00999 |
| 20 | CMS Collaboration | Search for electroweak production of a vector-like quark decaying to a top quark and a Higgs boson using boosted topologies in fully hadronic final states | JHEP 04 (2017) 136 | CMS-B2G-16-005 1612.05336 |
| 21 | CMS Collaboration | Search for single production of vector-like quarks decaying into a b quark and a W boson in proton-proton collisions at $ \sqrt s = $ 13 TeV | PLB 772 (2017) 634 | CMS-B2G-16-006 1701.08328 |
| 22 | ATLAS Collaboration | Search for single production of vector-like quarks decaying into $ Wb $ in $ pp $ collisions at $ \sqrt{s} = $ 13 TeV with the ATLAS detector | JHEP 05 (2019) 164 | 1812.07343 |
| 23 | CMS Collaboration | Search for single production of vector-like quarks decaying to a Z boson and a top or a bottom quark in proton-proton collisions at $ \sqrt{s}= $ 13 TeV | JHEP 05 (2017) 029 | CMS-B2G-16-001 1701.07409 |
| 24 | CMS Collaboration | Search for single production of a vector-like T quark decaying to a Z boson and a top quark in proton-proton collisions at $ \sqrt s = $ 13 TeV | PLB 781 (2018) 574 | CMS-B2G-17-007 1708.01062 |
| 25 | ATLAS Collaboration | Search for large missing transverse momentum in association with one top-quark in proton-proton collisions at $ \sqrt{s} = $ 13 TeV with the ATLAS detector | JHEP 05 (2019) 041 | 1812.09743 |
| 26 | CMS Collaboration | Description and performance of track and primary-vertex reconstruction with the CMS tracker | JINST 9 (2014) P10009 | CMS-TRK-11-001 1405.6569 |
| 27 | CMS Collaboration | The CMS trigger system | JINST 12 (2017) P01020 | CMS-TRG-12-001 1609.02366 |
| 28 | M. Cacciari, G. P. Salam, and G. Soyez | The anti-$ {k_{\mathrm{T}}} $ jet clustering algorithm | JHEP 04 (2008) 063 | 0802.1189 |
| 29 | M. Cacciari, G. P. Salam, and G. Soyez | FastJet user manual | EPJC 72 (2012) 1896 | 1111.6097 |
| 30 | CMS Collaboration | Particle-flow reconstruction and global event description with the CMS detector | JINST 12 (2017) P10003 | CMS-PRF-14-001 1706.04965 |
| 31 | CMS Collaboration | Jet energy scale and resolution in the CMS experiment in pp collisions at 8 TeV | JINST 12 (2017) P02014 | CMS-JME-13-004 1607.03663 |
| 32 | CMS Collaboration | The CMS experiment at the CERN LHC | JINST 3 (2008) S08004 | CMS-00-001 |
| 33 | J. Alwall et al. | The automated computation of tree-level and next-to-leading order differential cross sections, and their matching to parton shower simulations | JHEP 07 (2014) 079 | 1405.0301 |
| 34 | NNPDF Collaboration | Parton distributions for the LHC Run II | JHEP 04 (2015) 040 | 1410.8849 |
| 35 | T. Sjostrand, S. Mrenna, and P. Z. Skands | A brief introduction to PYTHIA 8.1 | CPC 178 (2008) 852 | 0710.3820 |
| 36 | CMS Collaboration | Investigations of the impact of the parton shower tuning in Pythia 8 in the modelling of $ \mathrm{t\overline{t}} $ at $ \sqrt{s}= $ 8 and 13 TeV | CMS-PAS-TOP-16-021 | CMS-PAS-TOP-16-021 |
| 37 | CMS Collaboration | Event generator tunes obtained from underlying event and multiparton scattering measurements | EPJC 76 (2016) 155 | CMS-GEN-14-001 1512.00815 |
| 38 | P. Nason | A new method for combining NLO QCD with shower Monte Carlo algorithms | JHEP 11 (2004) 040 | hep-ph/0409146 |
| 39 | S. Frixione, P. Nason, and C. Oleari | Matching NLO QCD computations with parton shower simulations: the POWHEG method | JHEP 11 (2007) 070 | 0709.2092 |
| 40 | S. Alioli, P. Nason, C. Oleari, and E. Re | A general framework for implementing NLO calculations in shower Monte Carlo programs: the POWHEG BOX | JHEP 06 (2010) 043 | 1002.2581 |
| 41 | S. Frixione, P. Nason, and G. Ridolfi | A positive-weight next-to-leading-order Monte Carlo for heavy flavour hadroproduction | JHEP 09 (2007) 126 | 0707.3088 |
| 42 | P. Artoisenet, R. Frederix, O. Mattelaer, and R. Rietkerk | Automatic spin-entangled decays of heavy resonances in Monte Carlo simulations | JHEP 03 (2013) 015 | 1212.3460 |
| 43 | R. Frederix and S. Frixione | Merging meets matching in MC@NLO | JHEP 12 (2012) 061 | 1209.6215 |
| 44 | J. Alwall et al. | Comparative study of various algorithms for the merging of parton showers and matrix elements in hadronic collisions | EPJC 53 (2008) 473 | 0706.2569 |
| 45 | R. D. Ball et al. | Parton distributions with LHC data | NPB 867 (2013) 244 | 1207.1303 |
| 46 | CMS Collaboration | Identification of heavy-flavour jets with the CMS detector in pp collisions at 13 TeV | JINST 13 (2018) P05011 | CMS-BTV-16-002 1712.07158 |
| 47 | A. J. Larkoski, S. Marzani, G. Soyez, and J. Thaler | Soft drop | JHEP 05 (2014) 146 | 1402.2657 |
| 48 | Particle Data Group, M. Tanabashi et al. | Review of particle physics | PRD 98 (2018) 030001 | |
| 49 | T. Junk | Confidence level computation for combining searches with small statistics | NIMA 434 (1999) 435 | hep-ex/9902006 |
| 50 | A. L. Read | Presentation of search results: The CL$ _{\text{s}} $ technique | JPG 28 (2002) 2693 | |
| 51 | G. Cowan, K. Cranmer, E. Gross, and O. Vitells | Asymptotic formulae for likelihood-based tests of new physics | EPJC 71 (2011) 1554 | 1007.1727 |
| 52 | G. P. Salam | Towards jetography | EPJC 67 (2010) 637 | 0906.1833 |
| 53 | M. Dasgupta, A. Fregoso, S. Marzani, and G. P. Salam | Towards an understanding of jet substructure | JHEP 09 (2013) 029 | 1307.0007 |
| 54 | S. D. Ellis, C. K. Vermilion, and J. R. Walsh | Recombination algorithms and jet substructure: Pruning as a tool for heavy particle searches | PRD 81 (2010) 094023 | 0912.0033 |
| 55 | J. Thaler and K. Van Tilburg | Identifying boosted objects with subjettiness | JHEP 03 (2011) 015 | 1011.2268 |
| 56 | CMS Collaboration | Top tagging with new approaches | CMS-PAS-JME-15-002 | CMS-PAS-JME-15-002 |
| 57 | CMS Collaboration | Search for Higgs boson pair production in the $ \gamma\gamma\mathrm{b\overline{b}} $ final state in pp collisions at $ \sqrt{s}= $ 13 TeV | PLB 788 (2019) 7 | CMS-HIG-17-008 1806.00408 |
| 58 | N. Kumar and S. P. Martin | LHC search for di-Higgs decays of stoponium and other scalars in events with two photons and two bottom jets | PRD 90 (2014) 055007 | 1404.0996 |
| 59 | CMS Collaboration | Jet algorithms performance in 13 TeV data | CMS-PAS-JME-16-003 | CMS-PAS-JME-16-003 |
| 60 | M. Bahr et al. | Herwig++ physics and manual | EPJC 58 (2008) 639 | 0803.0883 |
| 61 | S. Gieseke, C. Rohr, and A. Siodmok | Colour reconnections in Herwig++ | EPJC 72 (2012) 2225 | 1206.0041 |
| 62 | J. Butterworth et al. | PDF4LHC recommendations for LHC Run II | JPG 43 (2016) 023001 | 1510.03865 |
| 63 | CMS Collaboration | CMS luminosity measurements for the 2016 data taking period | CMS-PAS-LUM-17-001 | CMS-PAS-LUM-17-001 |
| 64 | CMS Collaboration | Measurement of the inelastic proton-proton cross section at $ \sqrt{s}= $ 13 TeV | JHEP 07 (2018) 161 | CMS-FSQ-15-005 1802.02613 |
| 65 | M. Czakon, P. Fiedler, and A. Mitov | Total top-quark pair-production cross section at hadron colliders through $ O(\alpha^{4}_{S}) $ | PRL 110 (2013) 252004 | 1303.6254 |
| 66 | K. Melnikov and F. Petriello | Electroweak gauge boson production at hadron colliders through $ O(\alpha^{2}_{S}) $ | PRD 74 (2006) 114017 | hep-ph/0609070 |
| 67 | Y. Li and F. Petriello | Combining QCD and electroweak corrections to dilepton production in FEWZ | PRD 86 (2012) 094034 | 1208.5967 |
| 68 | A. Carvalho et al. | Single production of vectorlike quarks with large width at the Large Hadron Collider | PRD 98 (2018) 015029 | 1805.06402 |
|
|
Compact Muon Solenoid LHC, CERN |
|

|

|

|

|

|