

Compact Muon Solenoid
LHC, CERN
| CMS-EXO-19-017 ; CERN-EP-2021-142 | ||
| Search for new physics in the lepton plus missing transverse momentum final state in proton-proton collisions at $\sqrt{s} = $ 13 TeV | ||
| CMS Collaboration | ||
| 12 February 2022 | ||
| JHEP 07 (2022) 067 | ||
| Abstract: A search for physics beyond the standard model (SM) in final states with an electron or muon and missing transverse momentum is presented. The analysis uses data from proton-proton collisions at a centre-of-mass energy of 13 TeV, collected with the CMS detector at the LHC in 2016-2018 and corresponding to an integrated luminosity of 138 fb$^{-1}$. No significant deviation from the SM prediction is observed. Model-independent limits are set on the production cross section of W' bosons decaying into lepton-plus-neutrino final states. Within the framework of the sequential standard model, with the combined results from the electron and muon decay channels a W' boson with mass less than 5.7 TeV is excluded at 95% confidence level. Results on a SM precision test, the determination of the oblique electroweak $W$ parameter, are presented using LHC data for the first time. These results together with those from the direct W' resonance search are used to extend existing constraints on composite Higgs scenarios. This is the first experimental exclusion on compositeness parameters using results from LHC data other than Higgs boson measurements. | ||
| Links: e-print arXiv:2202.06075 [hep-ex] (PDF) ; CDS record ; inSPIRE record ; HepData record ; CADI line (restricted) ; | ||
| Figures | |
png pdf |
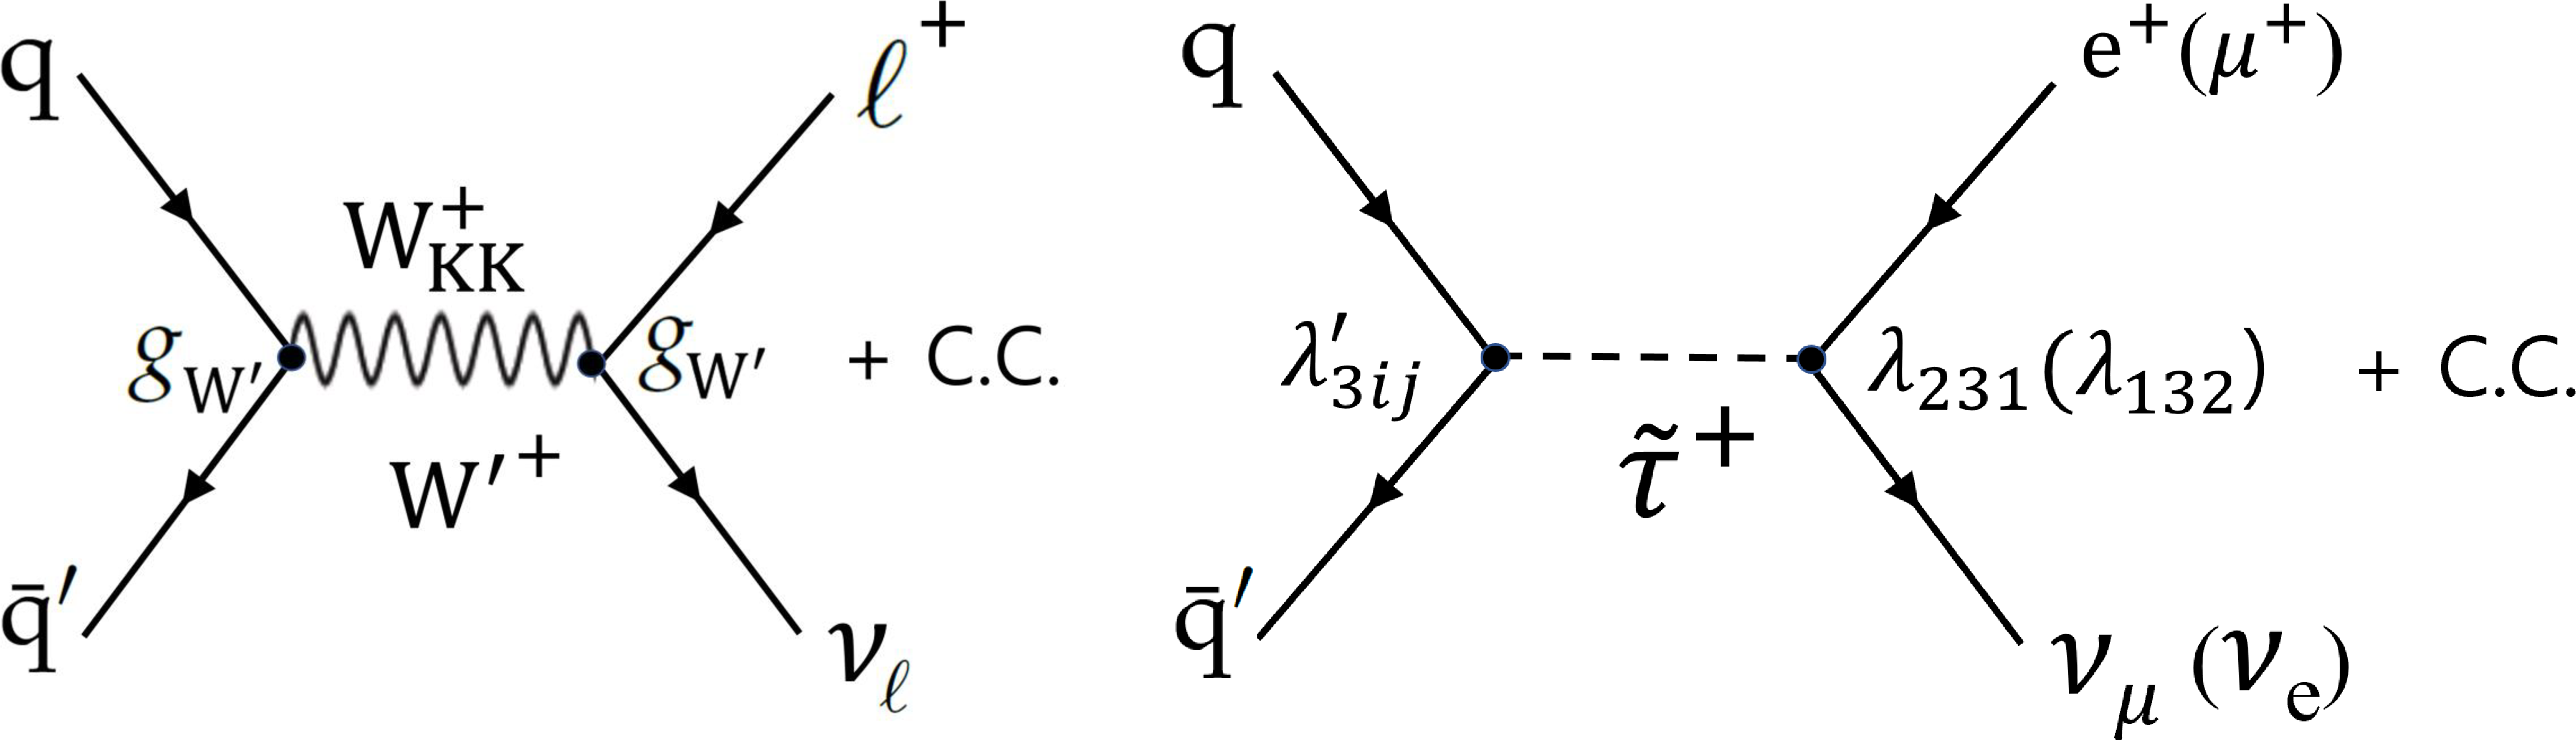
Figure 1:
Feynman diagram for the production and decay of a new heavy boson, an SSM W' or a Kaluza-Klein excitation mode of W ($\mathrm{W} _{\mathrm {KK}}$) (left). The coupling strength, $g_{\mathrm{W'}}$, is allowed to vary. In RPV SUSY, a $\tau$ slepton ($\tilde{\tau}$) could also act as a mediator (right) with the corresponding coupling strength, ${\lambda}$, for the decay. This coupling strength is allowed to be different between the two final states, denoted by $ {\lambda} _{231}$ and $ {\lambda} _{132}$ for the electron and muon final states, respectively. Here, C.C. stands for charge conjugation. |
png pdf |
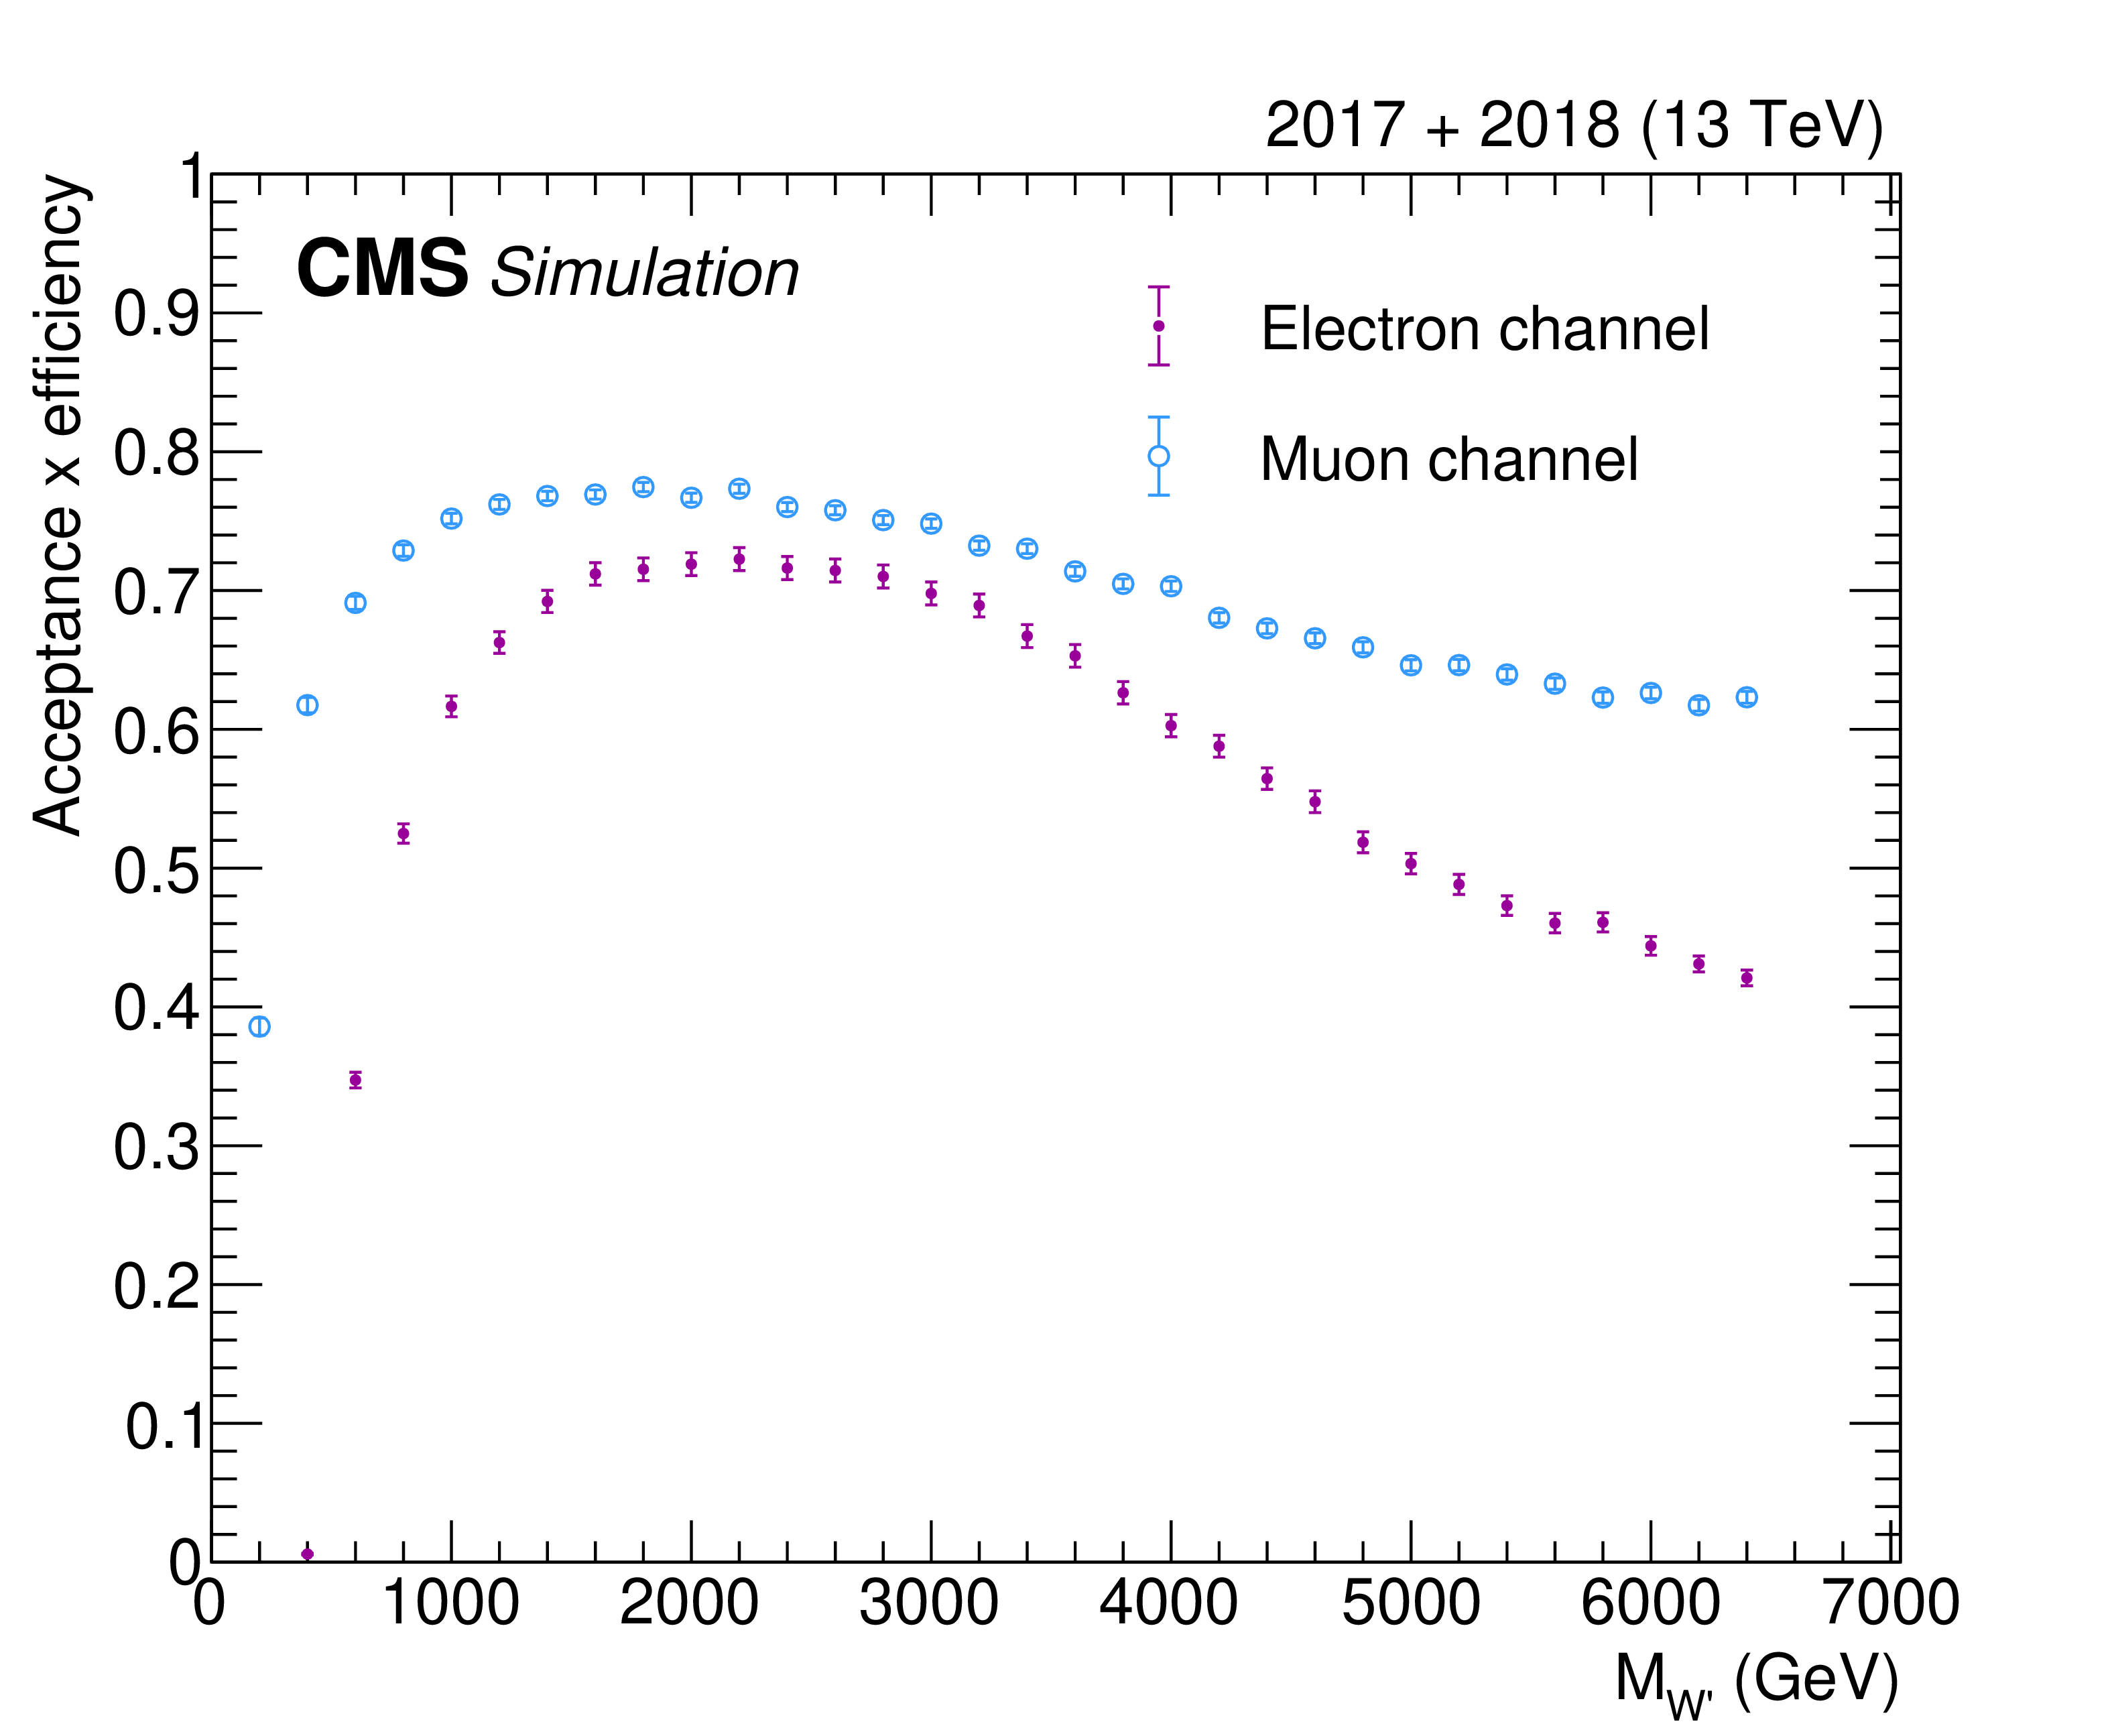
Figure 2:
Product of acceptance and efficiency for the SSM W' signal, as a function of the W' mass, after all selection criteria are applied for the electron (filled purple markers) and the muon (open blue markers) channels. |

png pdf |
Figure 3:
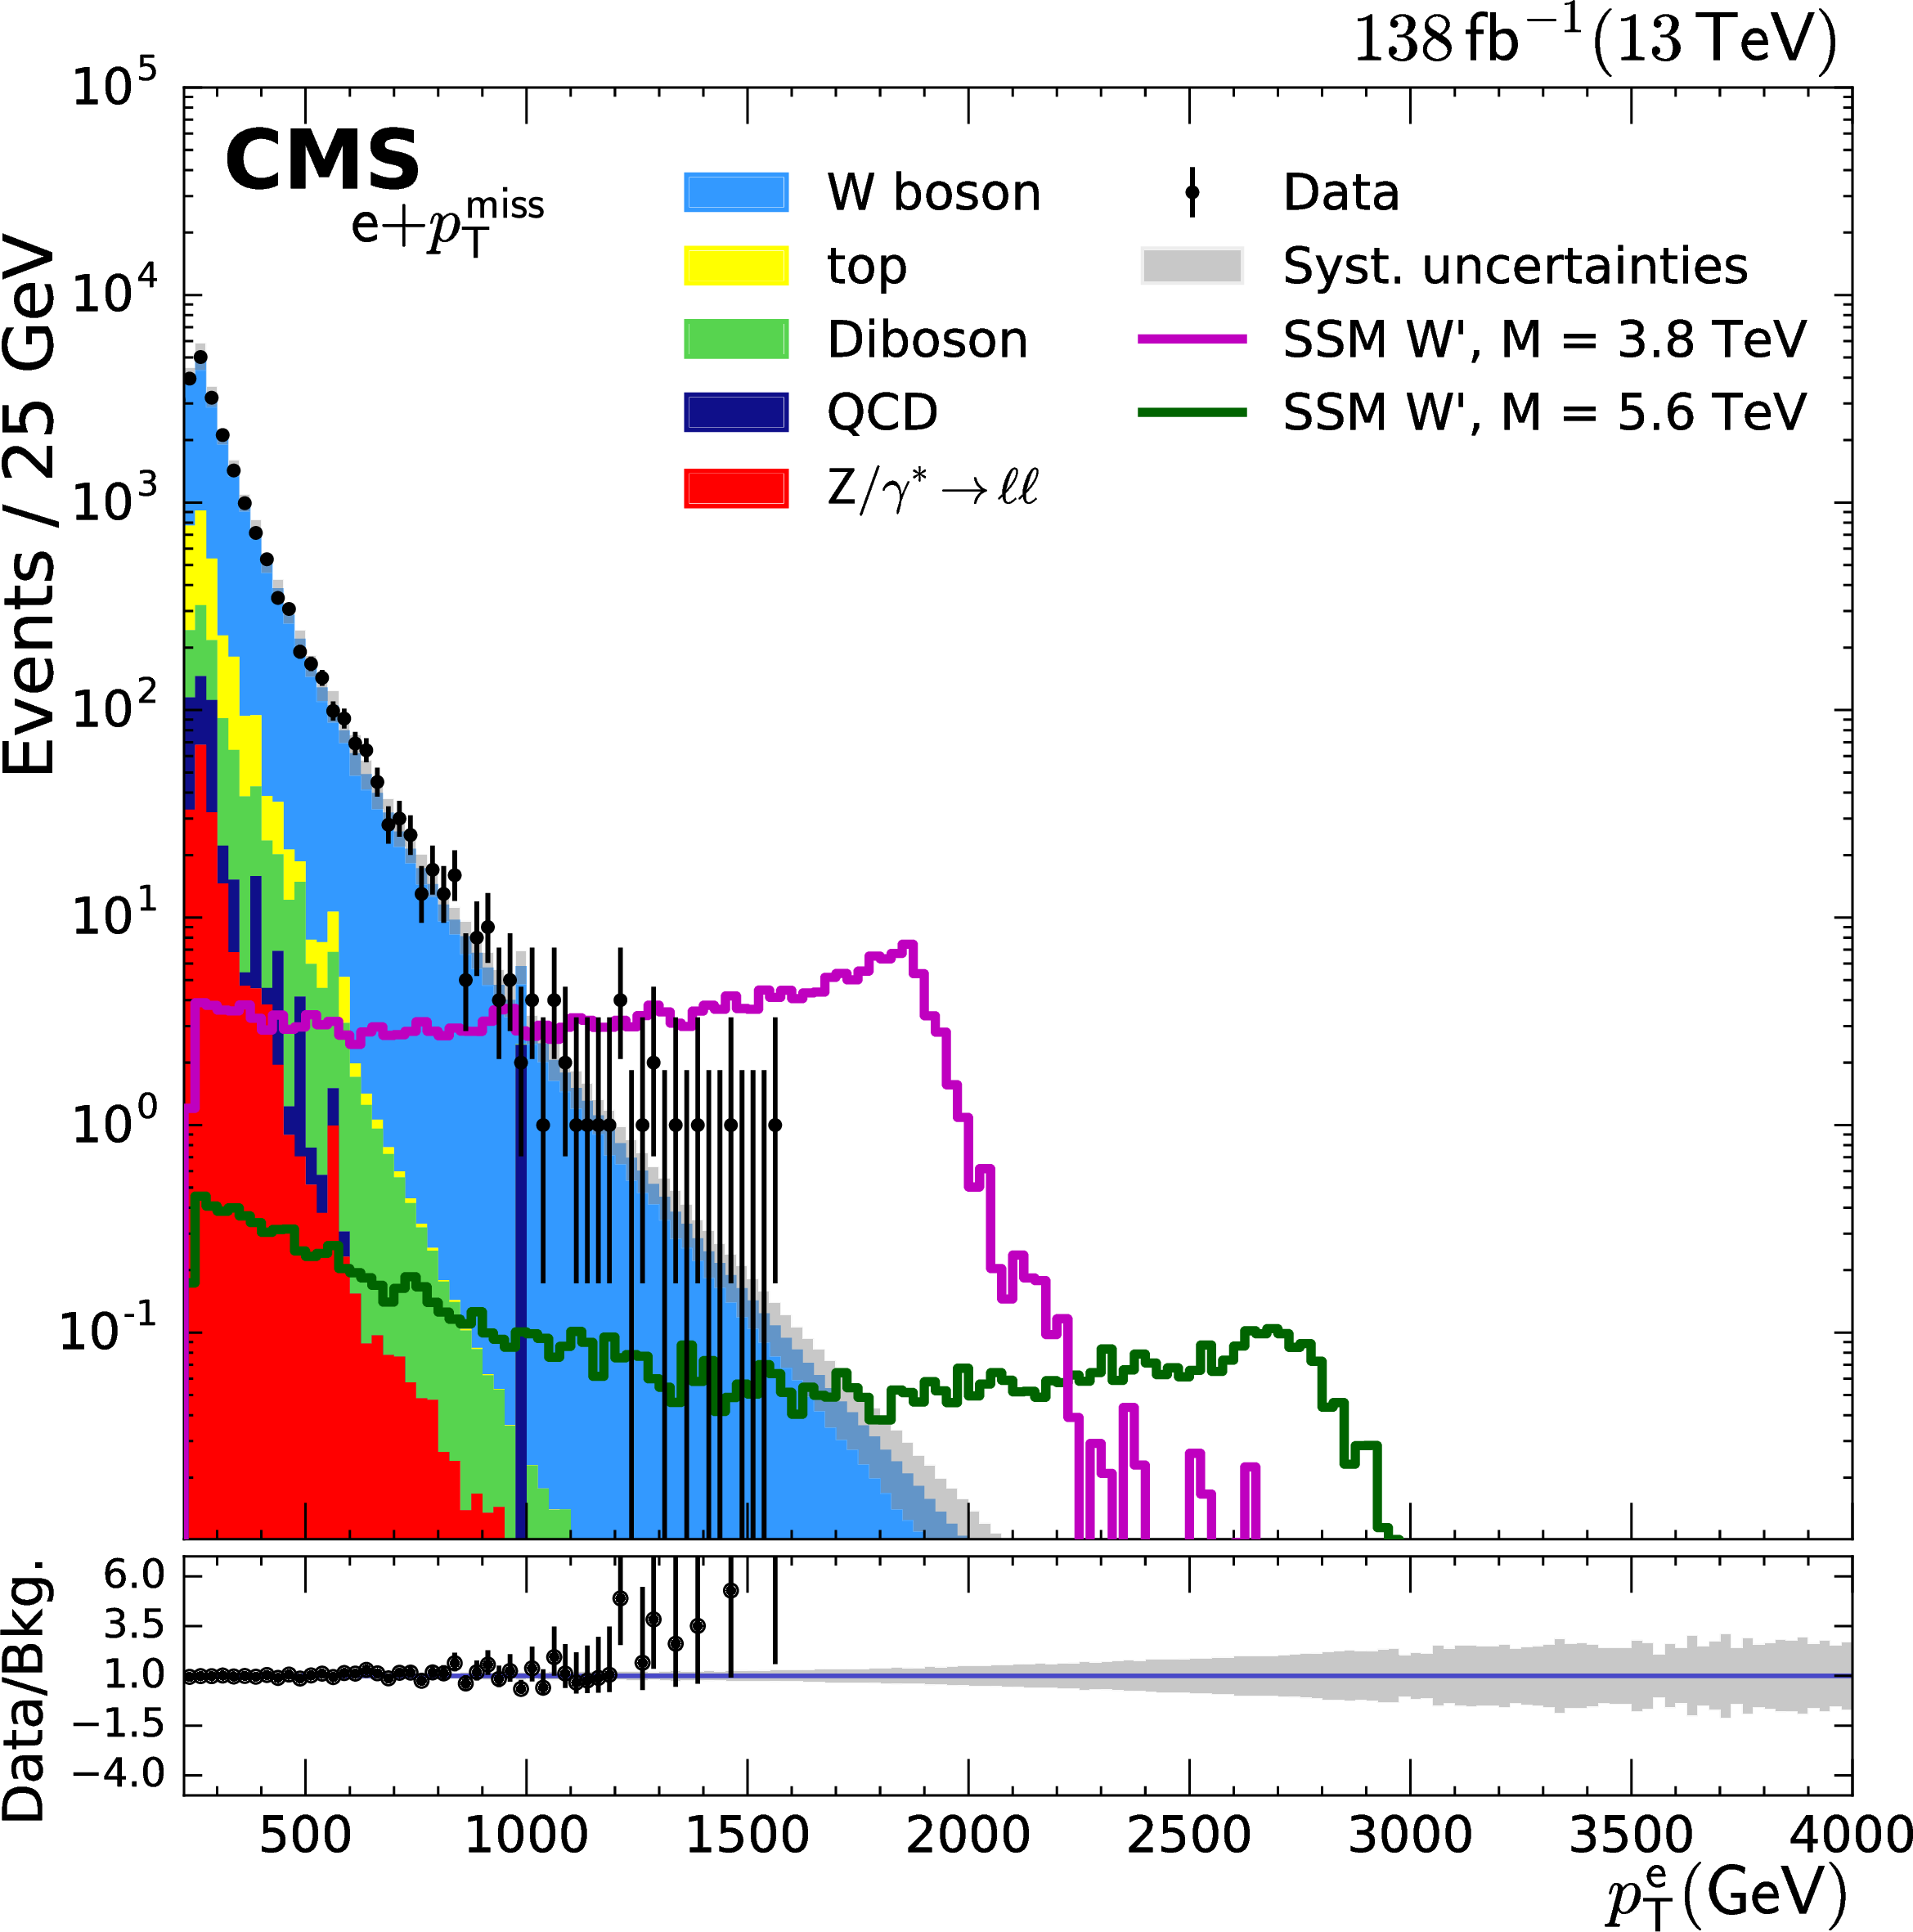
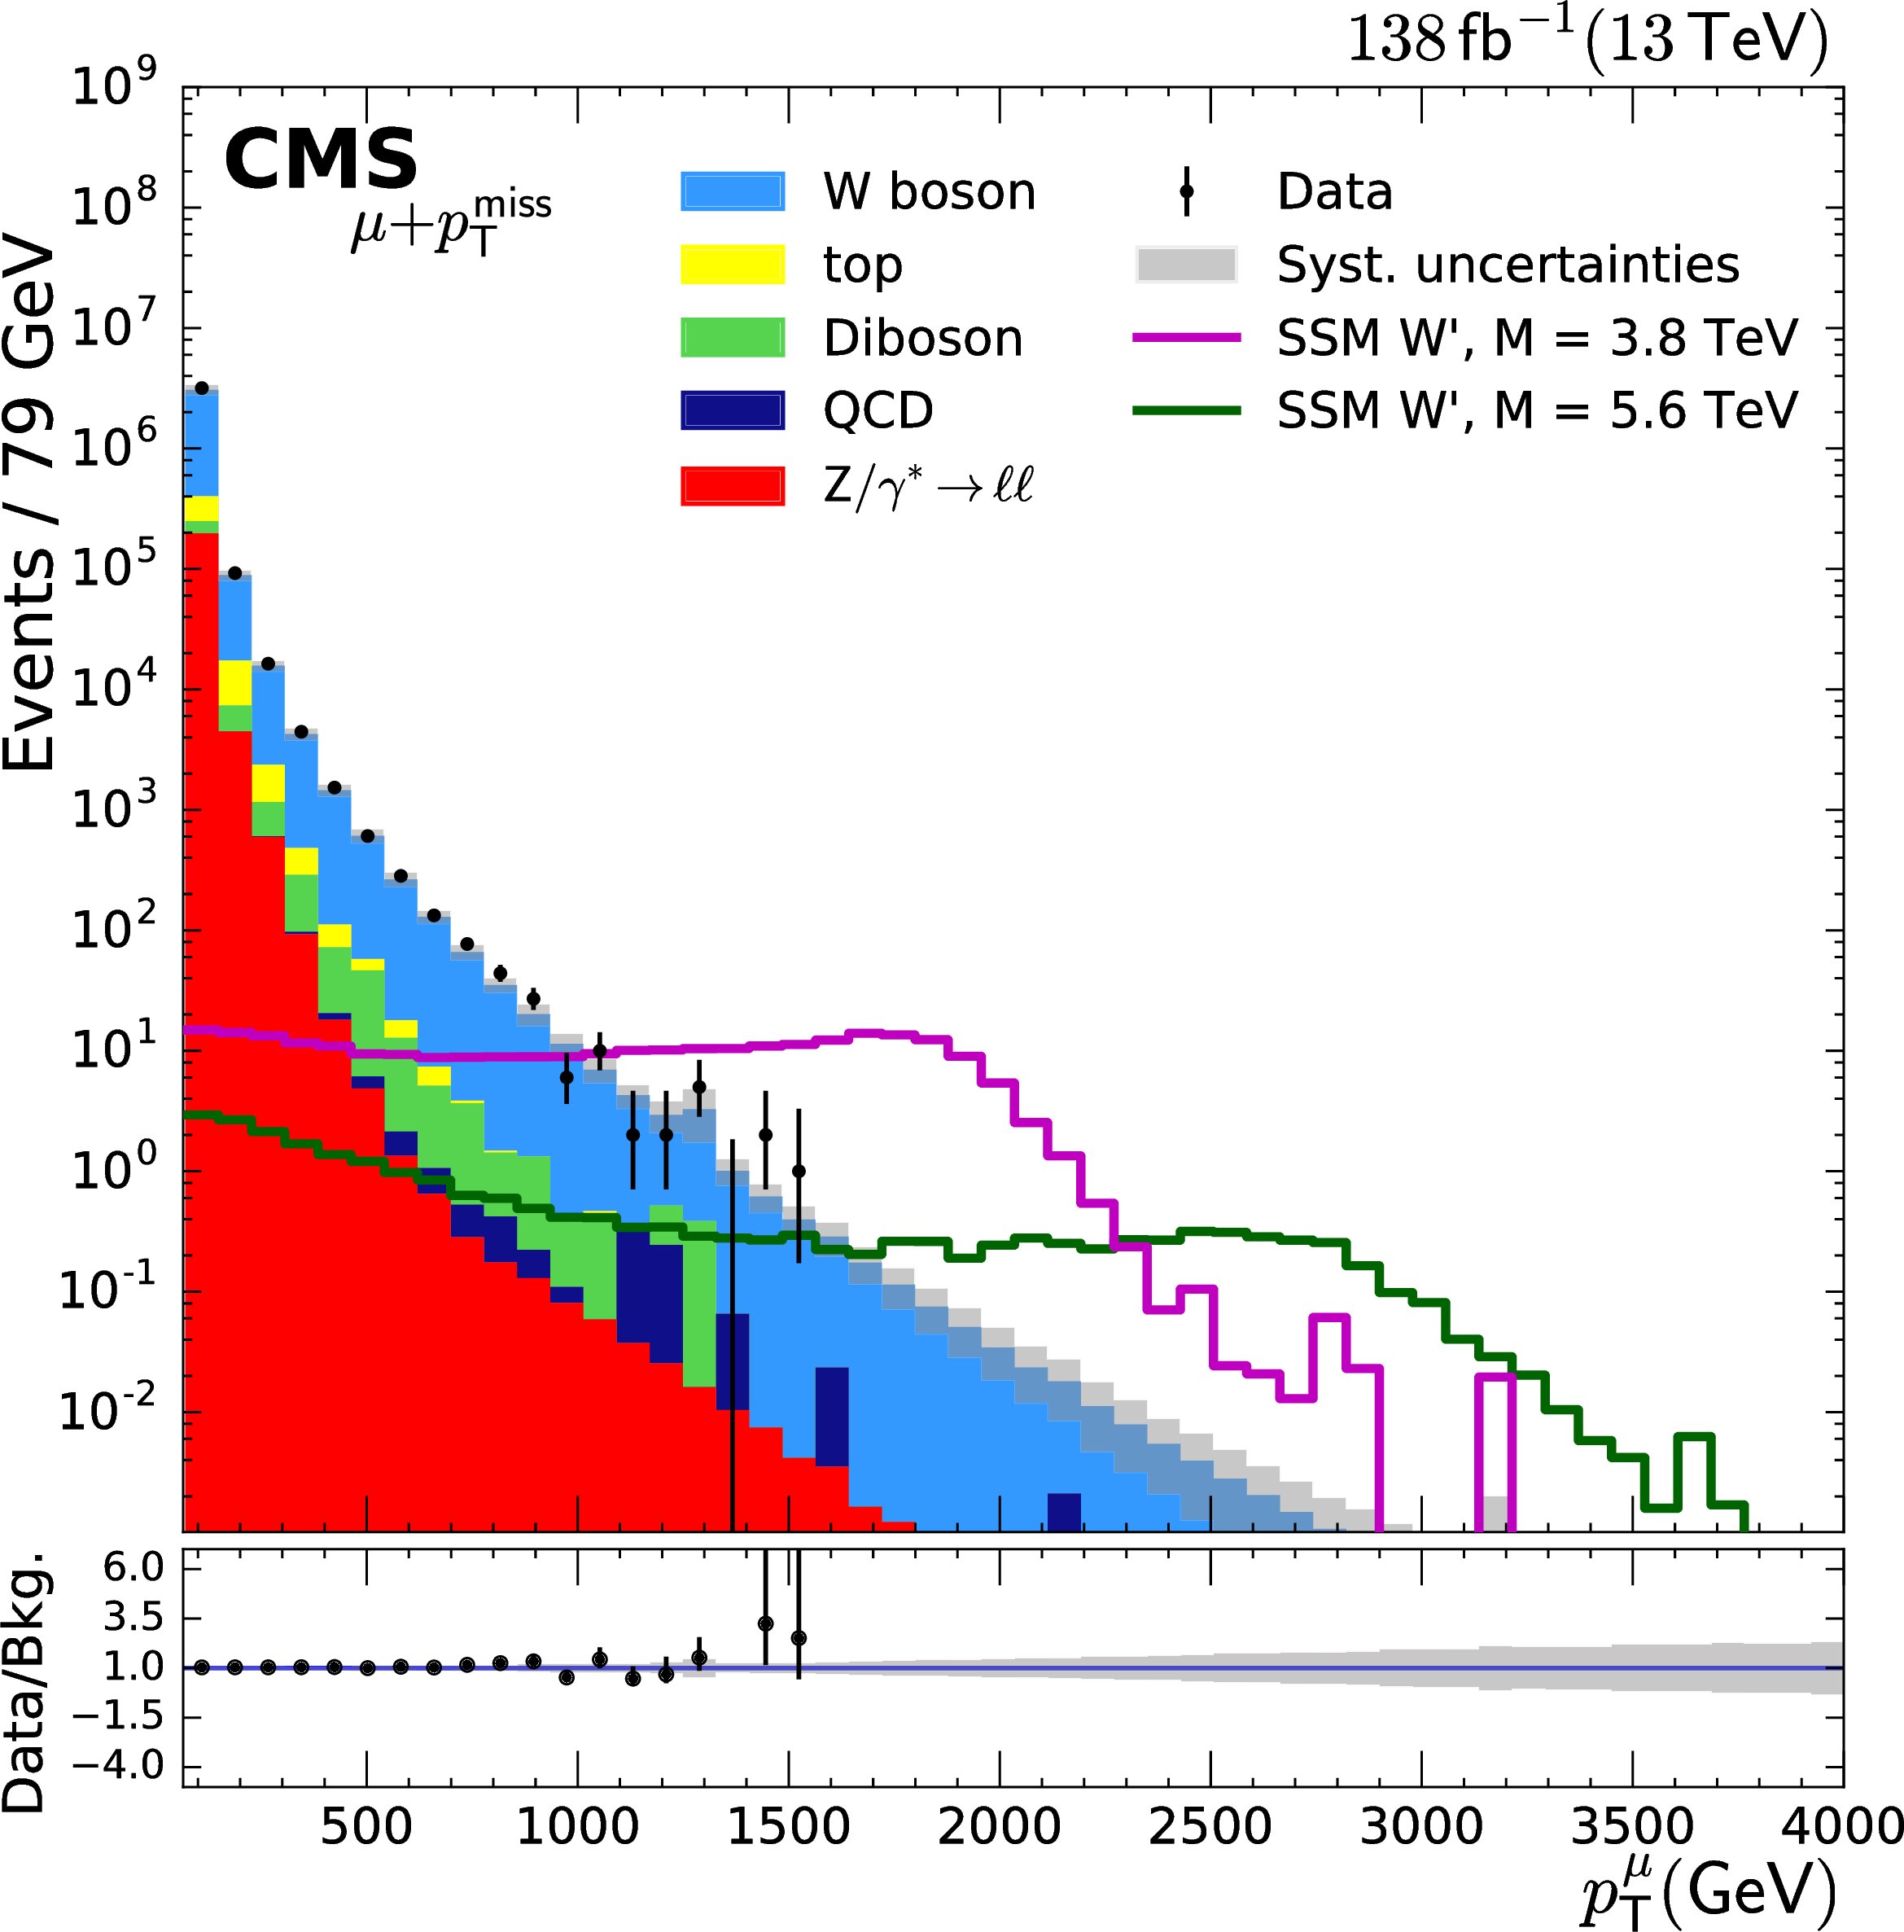
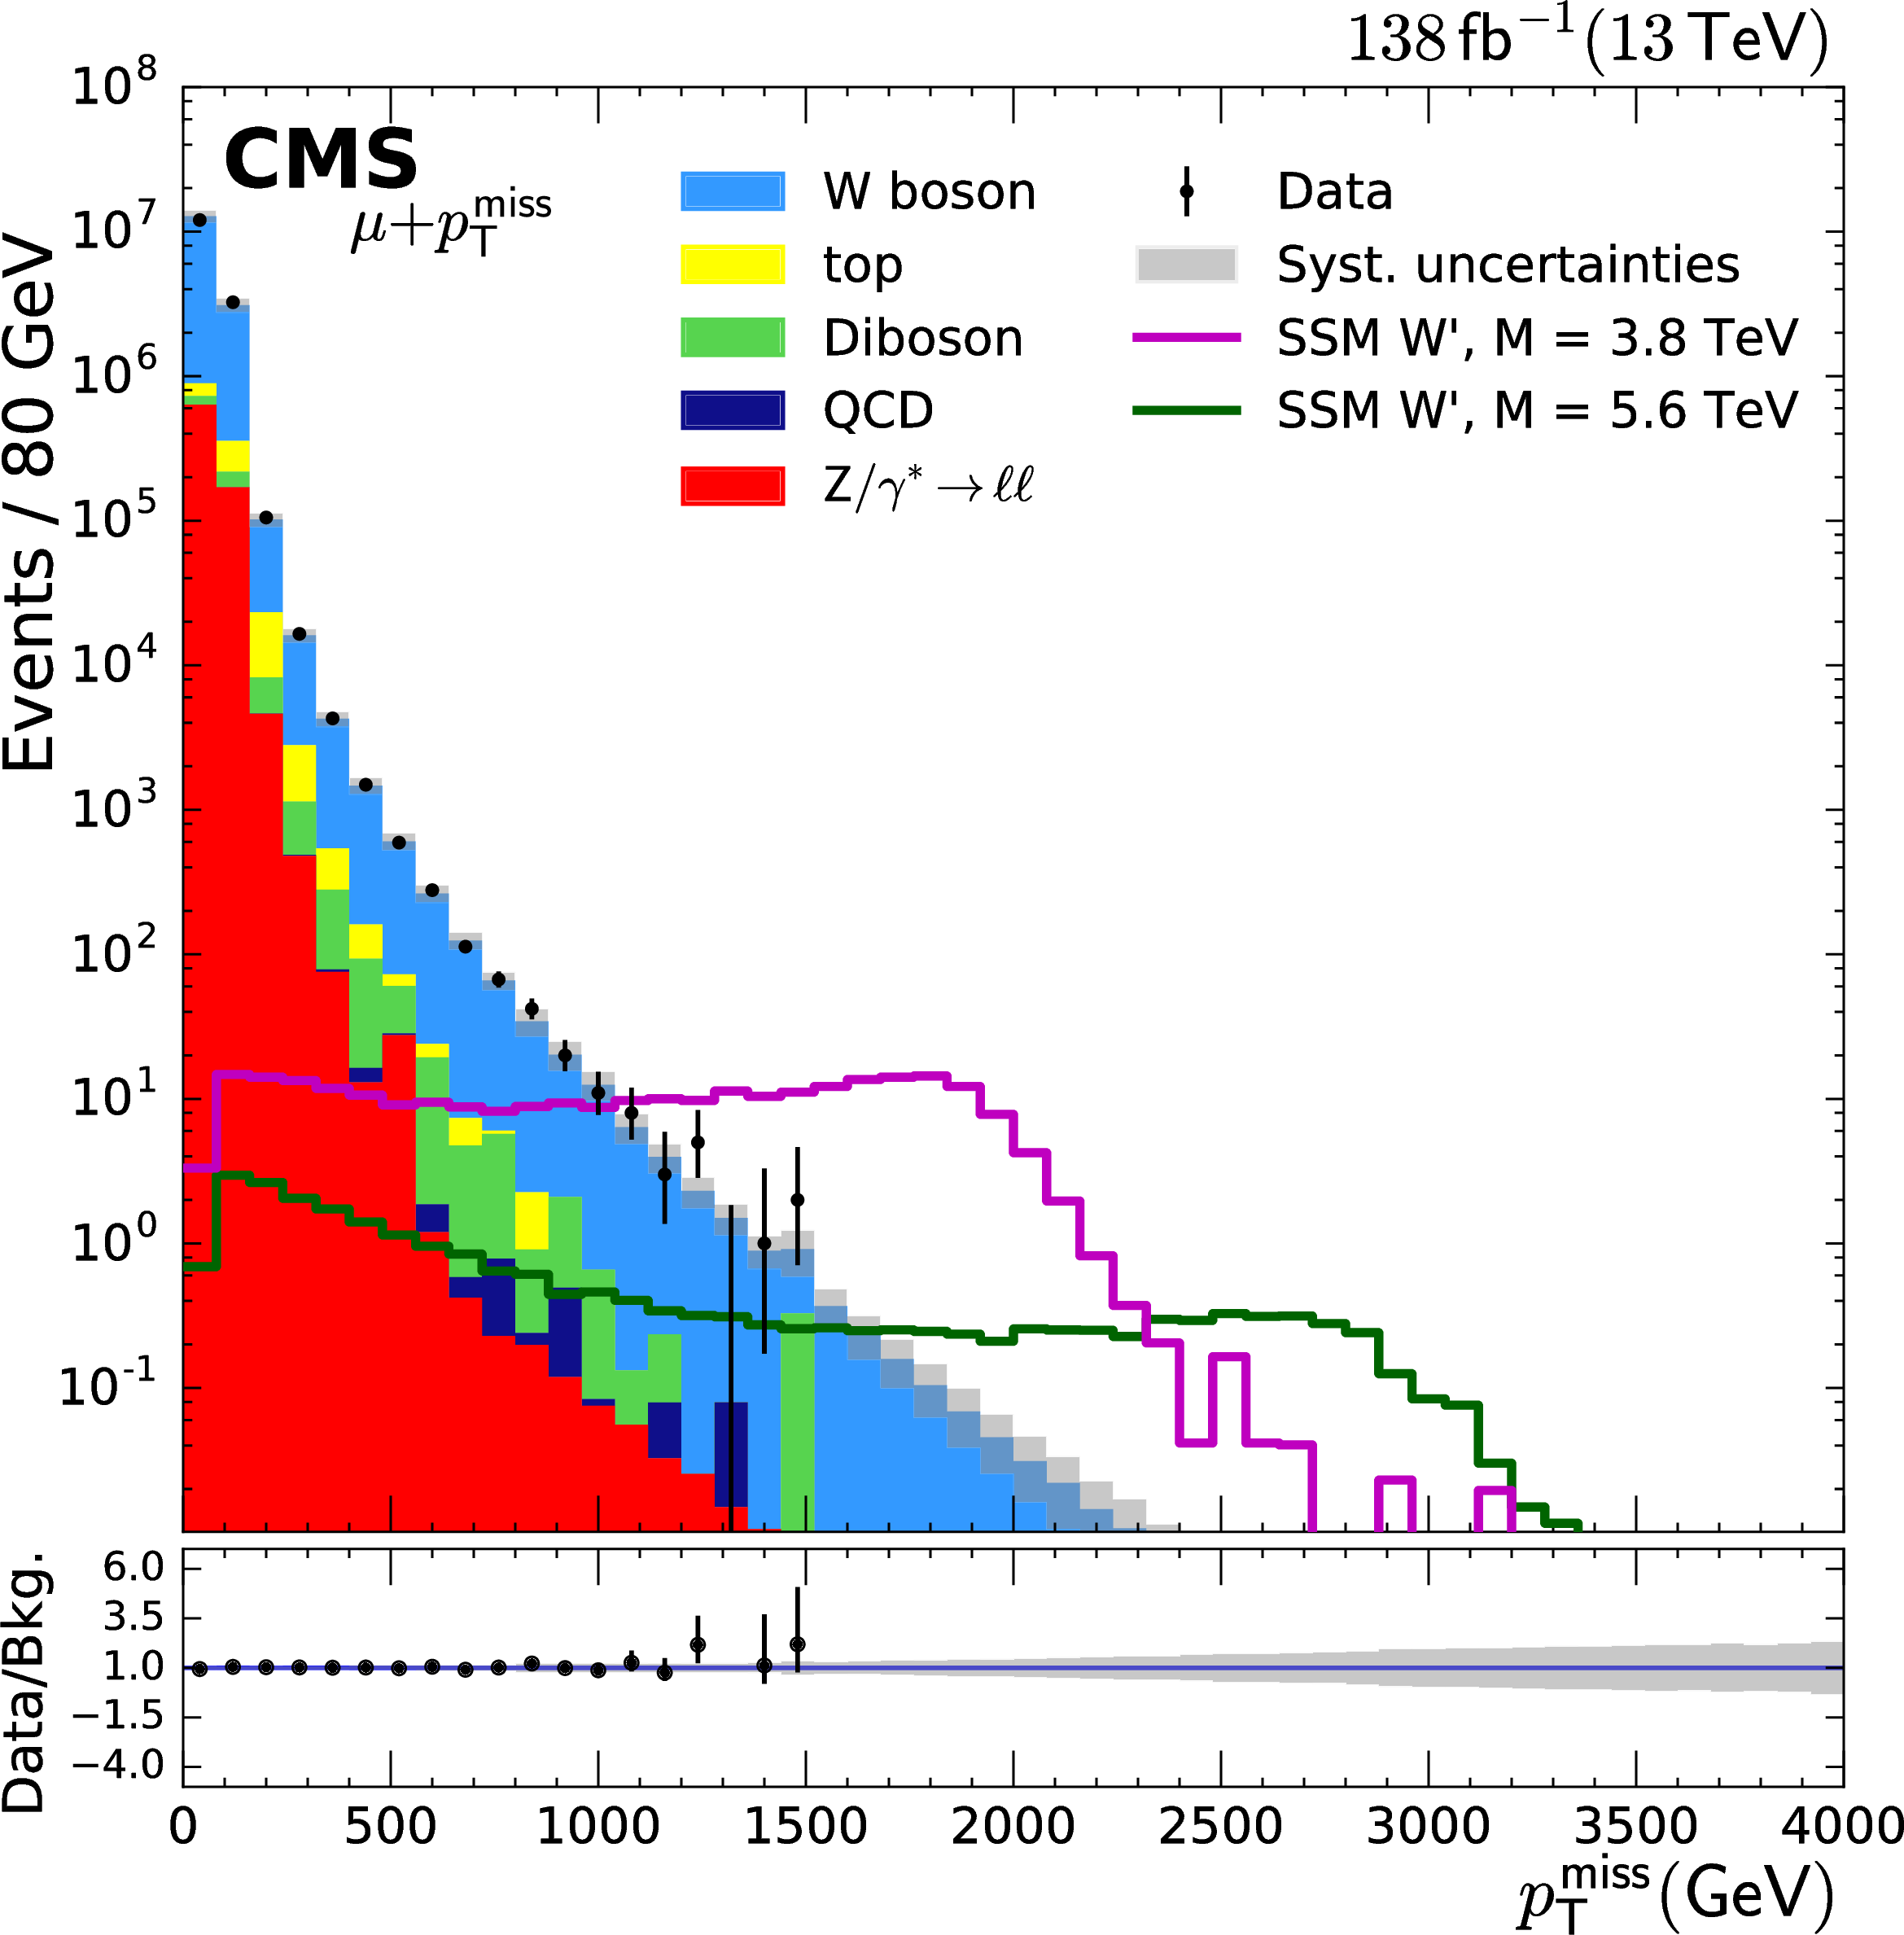
The distributions for lepton ${p_{\mathrm {T}}}$ (left) and ${{p_{\mathrm {T}}} ^\text {miss}}$ (right) for the electron (upper) and muon (lower) channels after applying the full selection criteria, for the combined 2016-2018 data sets. Two signal distributions are presented, corresponding to SSM W' boson masses of 3.8 and 5.6 TeV. The lower panels show the ratios of data to the SM prediction, and the shaded bands represents the systematic uncertainty. |
png pdf |
Figure 3-a:
The distributions for lepton ${p_{\mathrm {T}}}$ (left) and ${{p_{\mathrm {T}}} ^\text {miss}}$ (right) for the electron (upper) and muon (lower) channels after applying the full selection criteria, for the combined 2016-2018 data sets. Two signal distributions are presented, corresponding to SSM W' boson masses of 3.8 and 5.6 TeV. The lower panels show the ratios of data to the SM prediction, and the shaded bands represents the systematic uncertainty. |

png pdf |
Figure 3-b:
The distributions for lepton ${p_{\mathrm {T}}}$ (left) and ${{p_{\mathrm {T}}} ^\text {miss}}$ (right) for the electron (upper) and muon (lower) channels after applying the full selection criteria, for the combined 2016-2018 data sets. Two signal distributions are presented, corresponding to SSM W' boson masses of 3.8 and 5.6 TeV. The lower panels show the ratios of data to the SM prediction, and the shaded bands represents the systematic uncertainty. |
png pdf |
Figure 3-c:
The distributions for lepton ${p_{\mathrm {T}}}$ (left) and ${{p_{\mathrm {T}}} ^\text {miss}}$ (right) for the electron (upper) and muon (lower) channels after applying the full selection criteria, for the combined 2016-2018 data sets. Two signal distributions are presented, corresponding to SSM W' boson masses of 3.8 and 5.6 TeV. The lower panels show the ratios of data to the SM prediction, and the shaded bands represents the systematic uncertainty. |
png pdf |
Figure 3-d:
The distributions for lepton ${p_{\mathrm {T}}}$ (left) and ${{p_{\mathrm {T}}} ^\text {miss}}$ (right) for the electron (upper) and muon (lower) channels after applying the full selection criteria, for the combined 2016-2018 data sets. Two signal distributions are presented, corresponding to SSM W' boson masses of 3.8 and 5.6 TeV. The lower panels show the ratios of data to the SM prediction, and the shaded bands represents the systematic uncertainty. |
png pdf |
Figure 4:
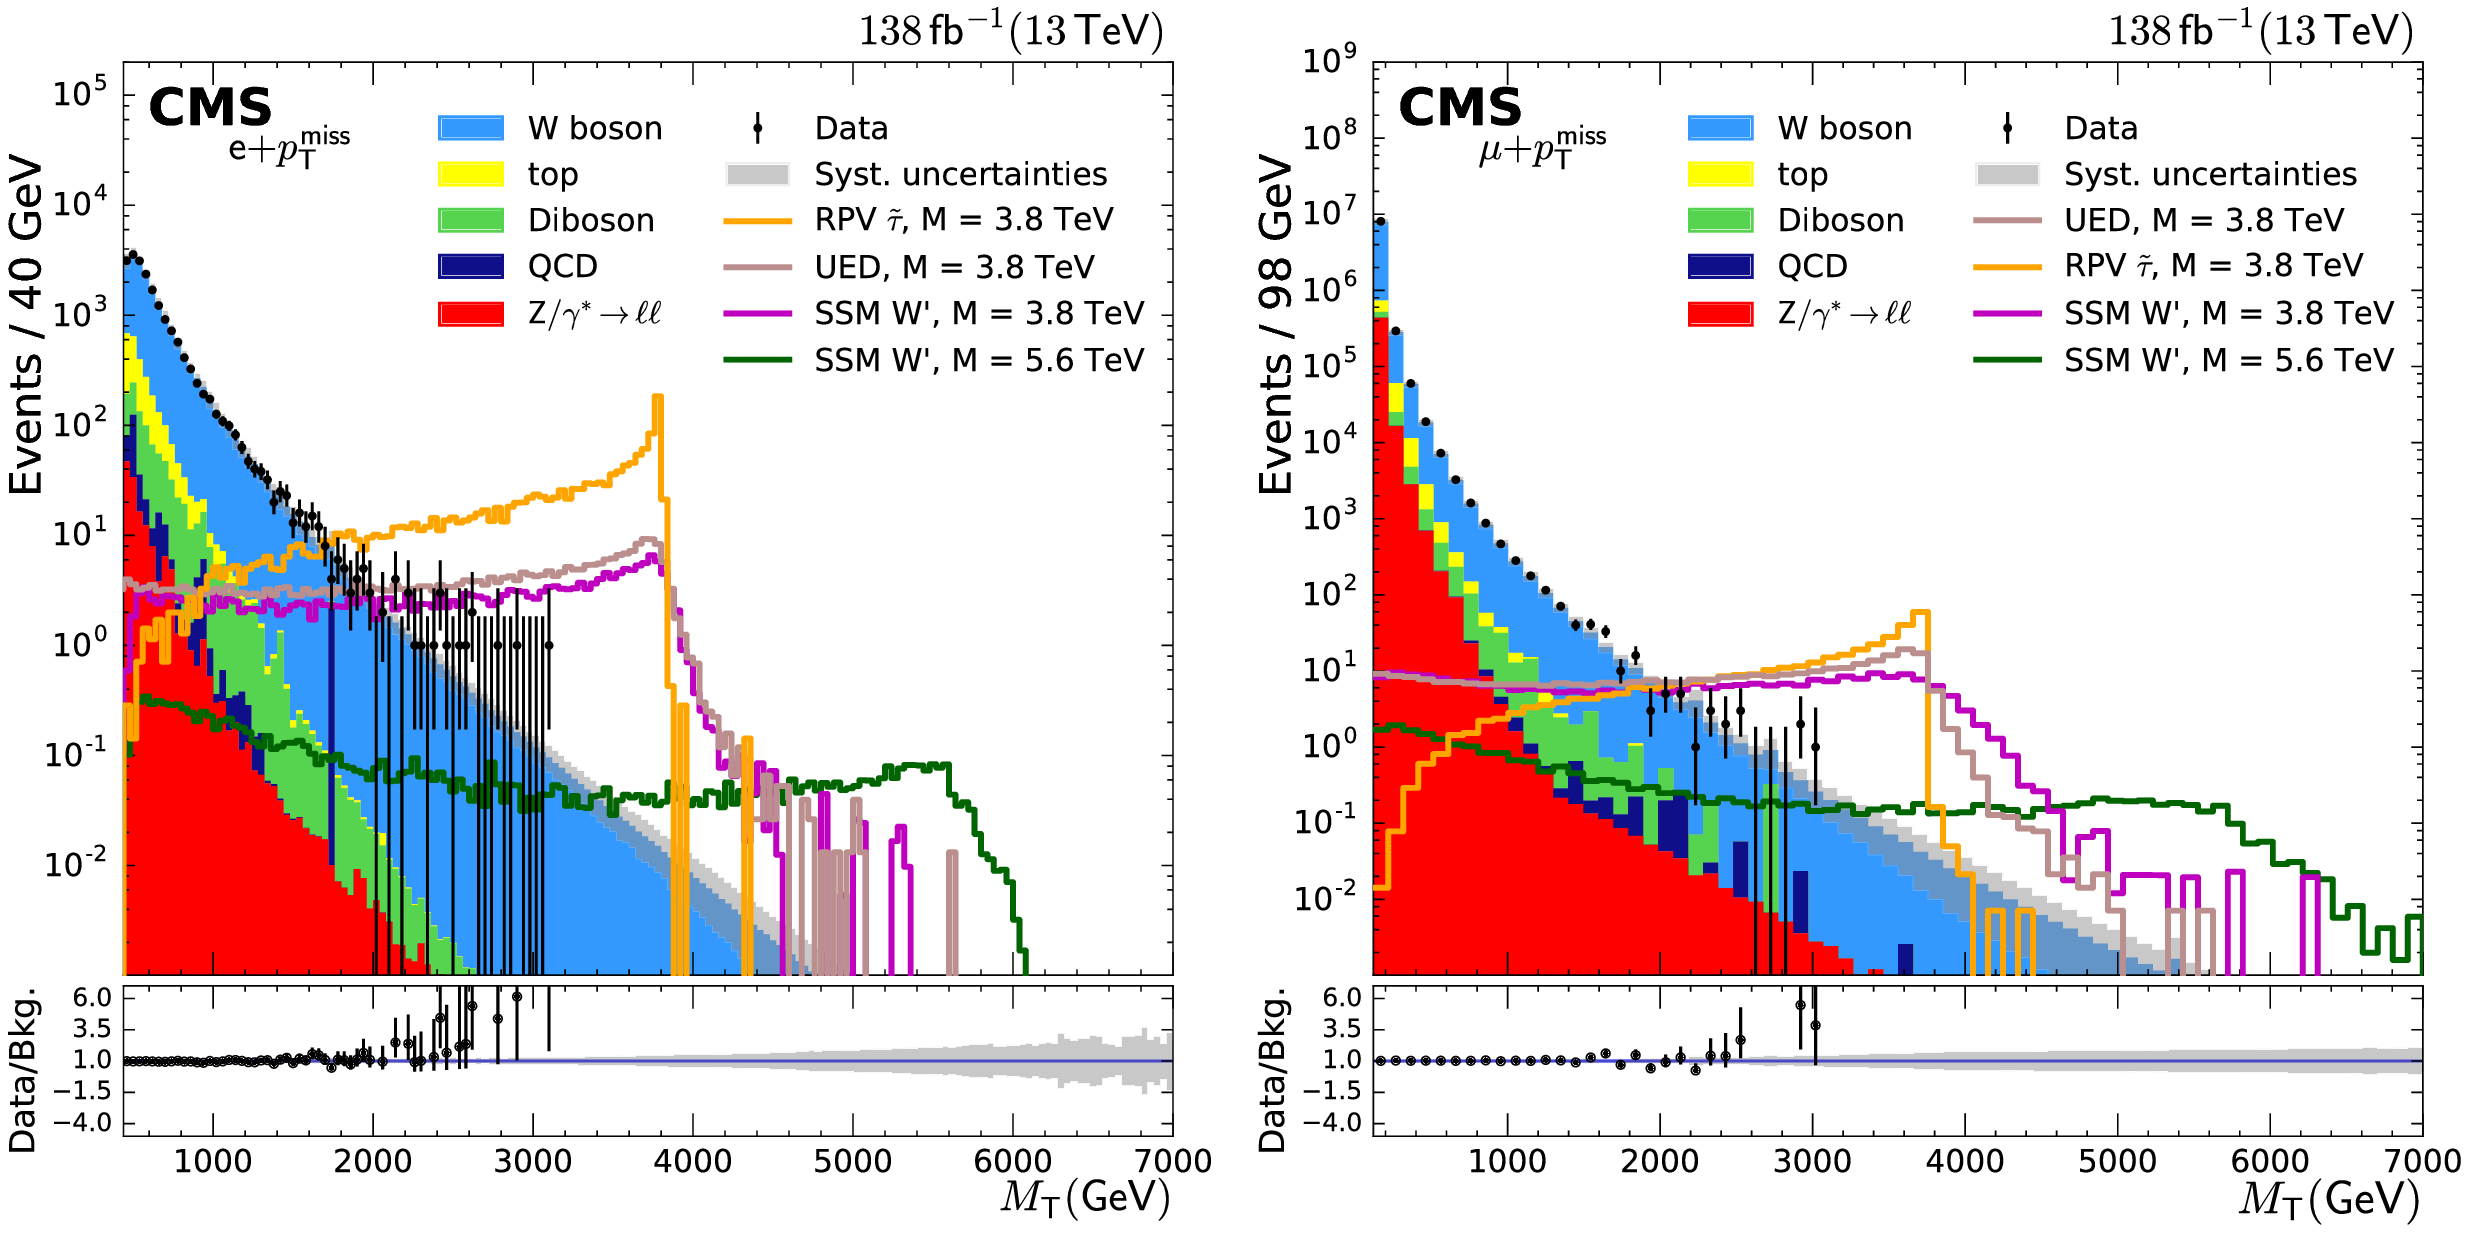
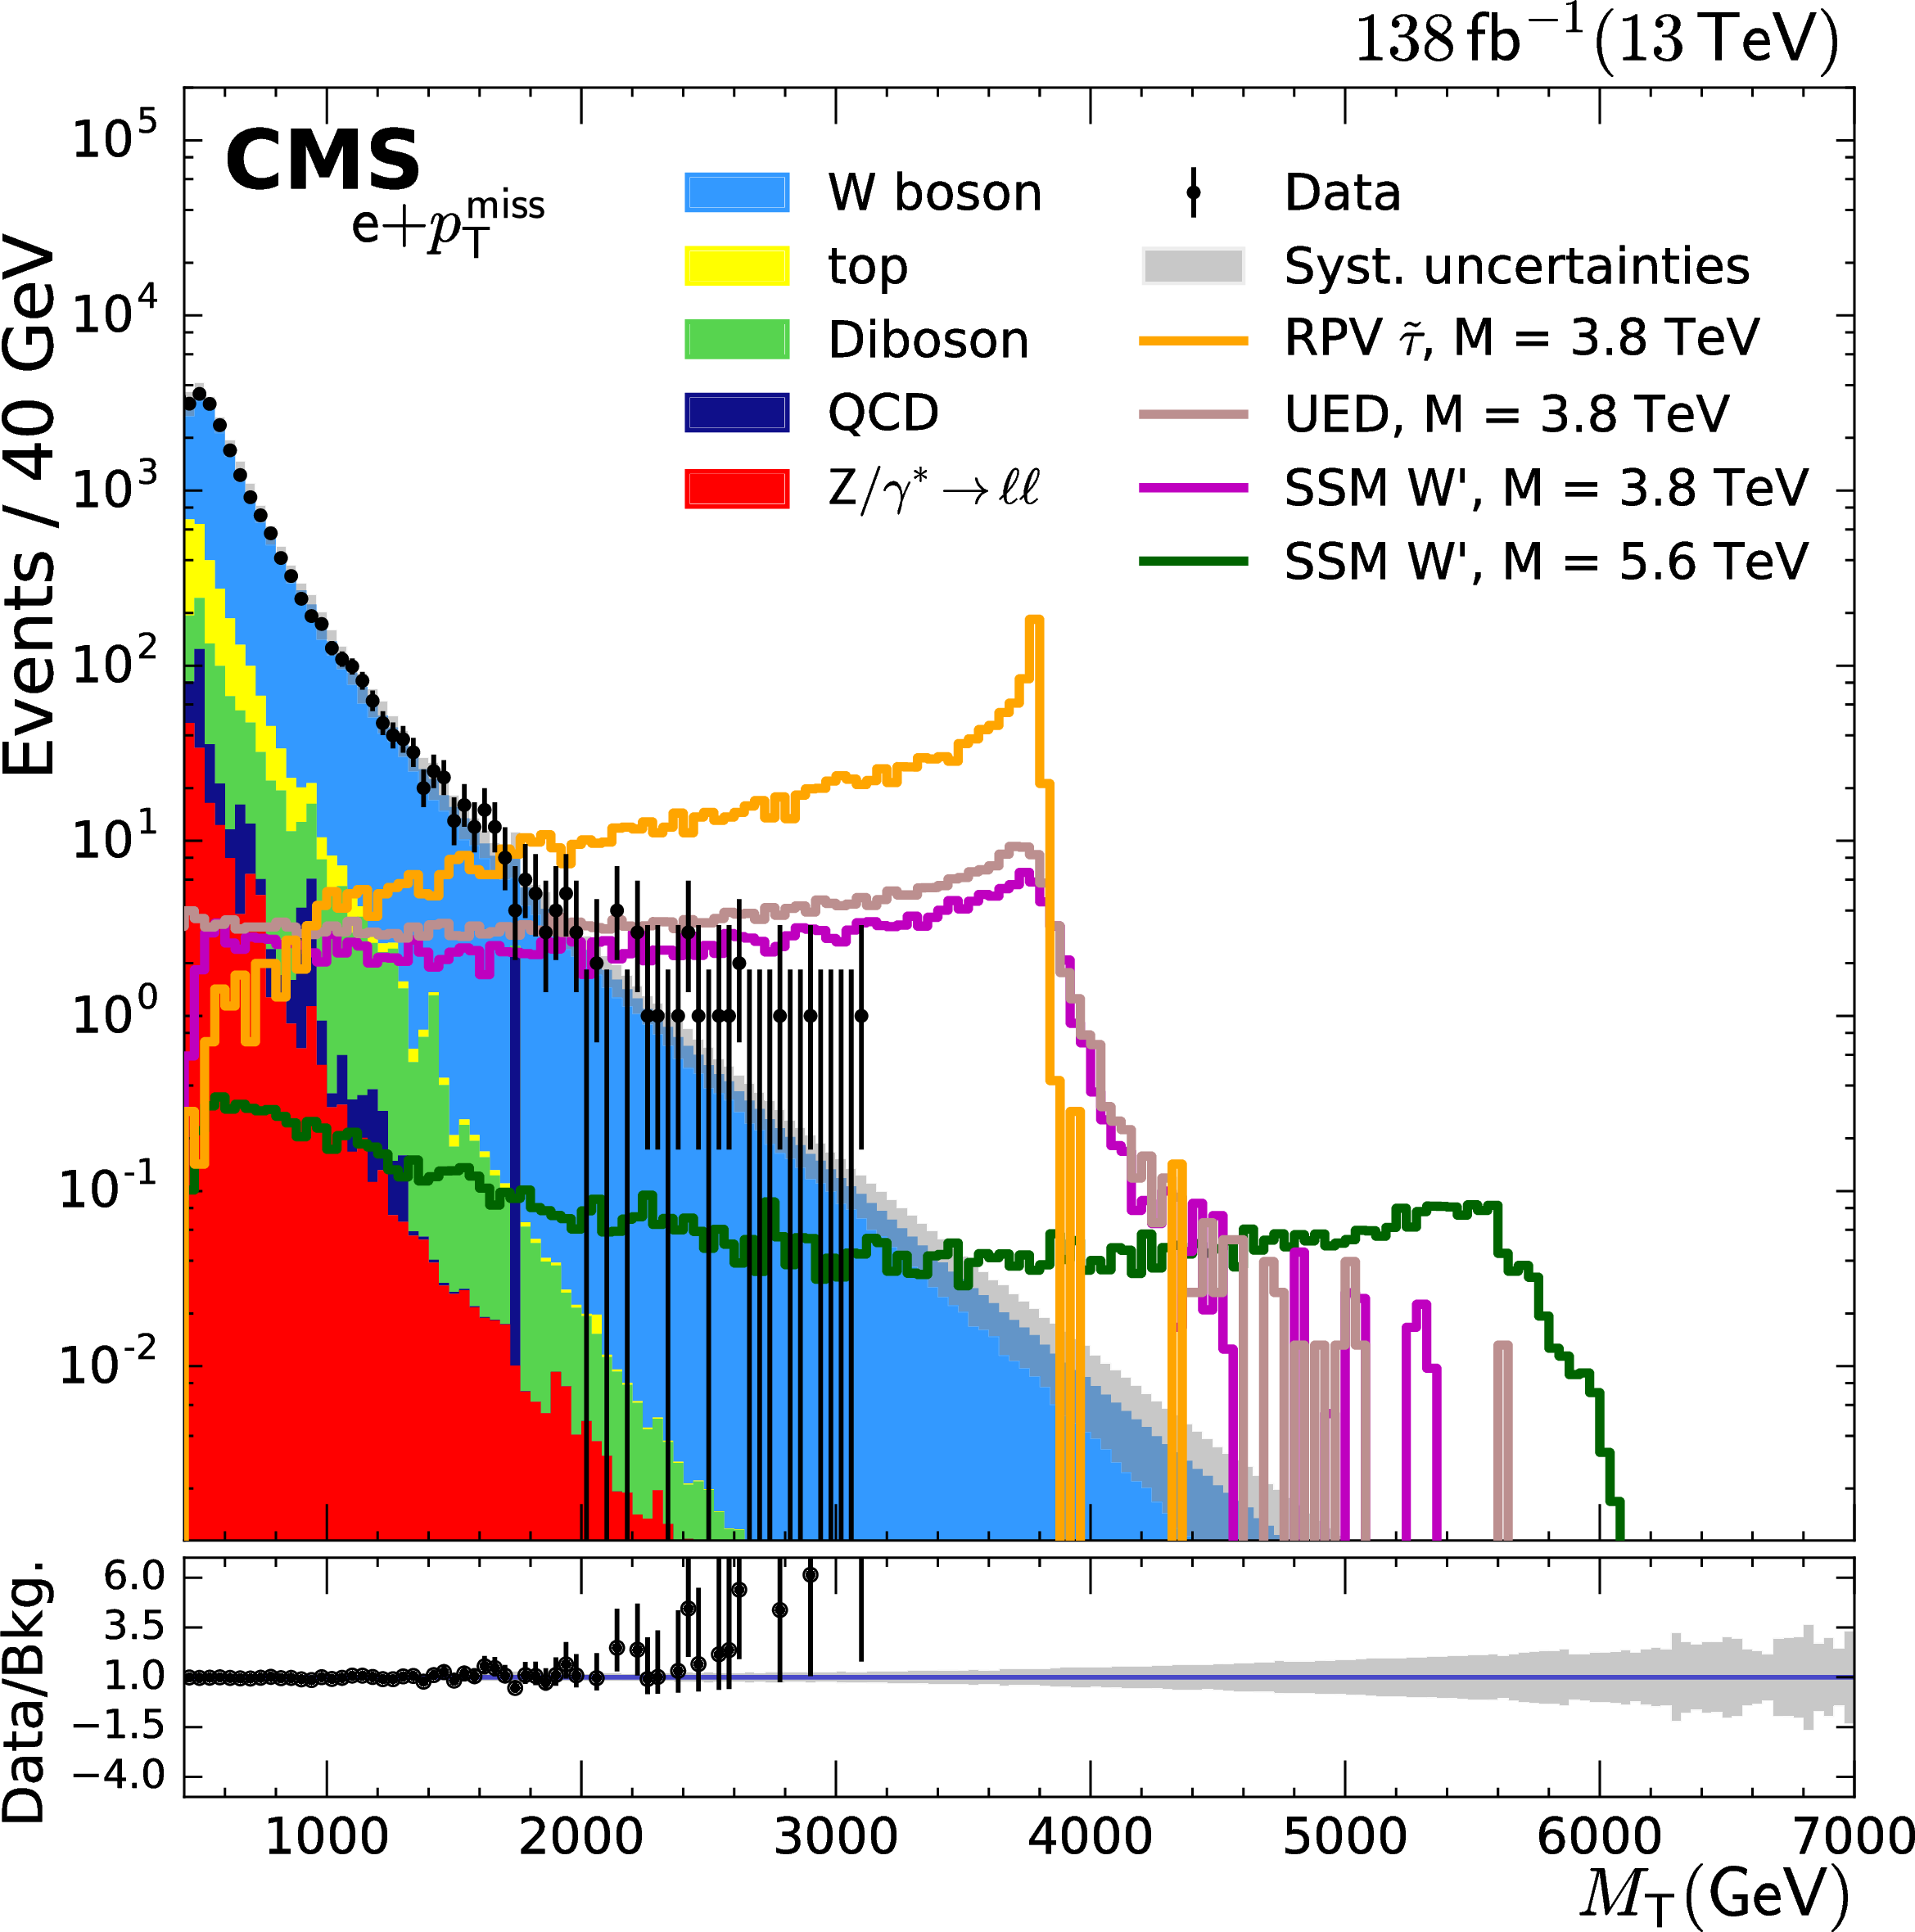
The distributions for ${M_\mathrm {T}}$ for the electron (left) and muon (right) channels after applying the full selection criteria, for the combined 2016-2018 data sets. Two signal distributions are presented, corresponding to SSM W' boson masses of 3.8 and 5.6 TeV. The lower panels show the ratios of data to the SM prediction, and the shaded bands represents the systematic uncertainty. |
png pdf |
Figure 4-a:
The distributions for ${M_\mathrm {T}}$ for the electron (left) and muon (right) channels after applying the full selection criteria, for the combined 2016-2018 data sets. Two signal distributions are presented, corresponding to SSM W' boson masses of 3.8 and 5.6 TeV. The lower panels show the ratios of data to the SM prediction, and the shaded bands represents the systematic uncertainty. |

png pdf |
Figure 4-b:
The distributions for ${M_\mathrm {T}}$ for the electron (left) and muon (right) channels after applying the full selection criteria, for the combined 2016-2018 data sets. Two signal distributions are presented, corresponding to SSM W' boson masses of 3.8 and 5.6 TeV. The lower panels show the ratios of data to the SM prediction, and the shaded bands represents the systematic uncertainty. |
png pdf |
Figure 5:
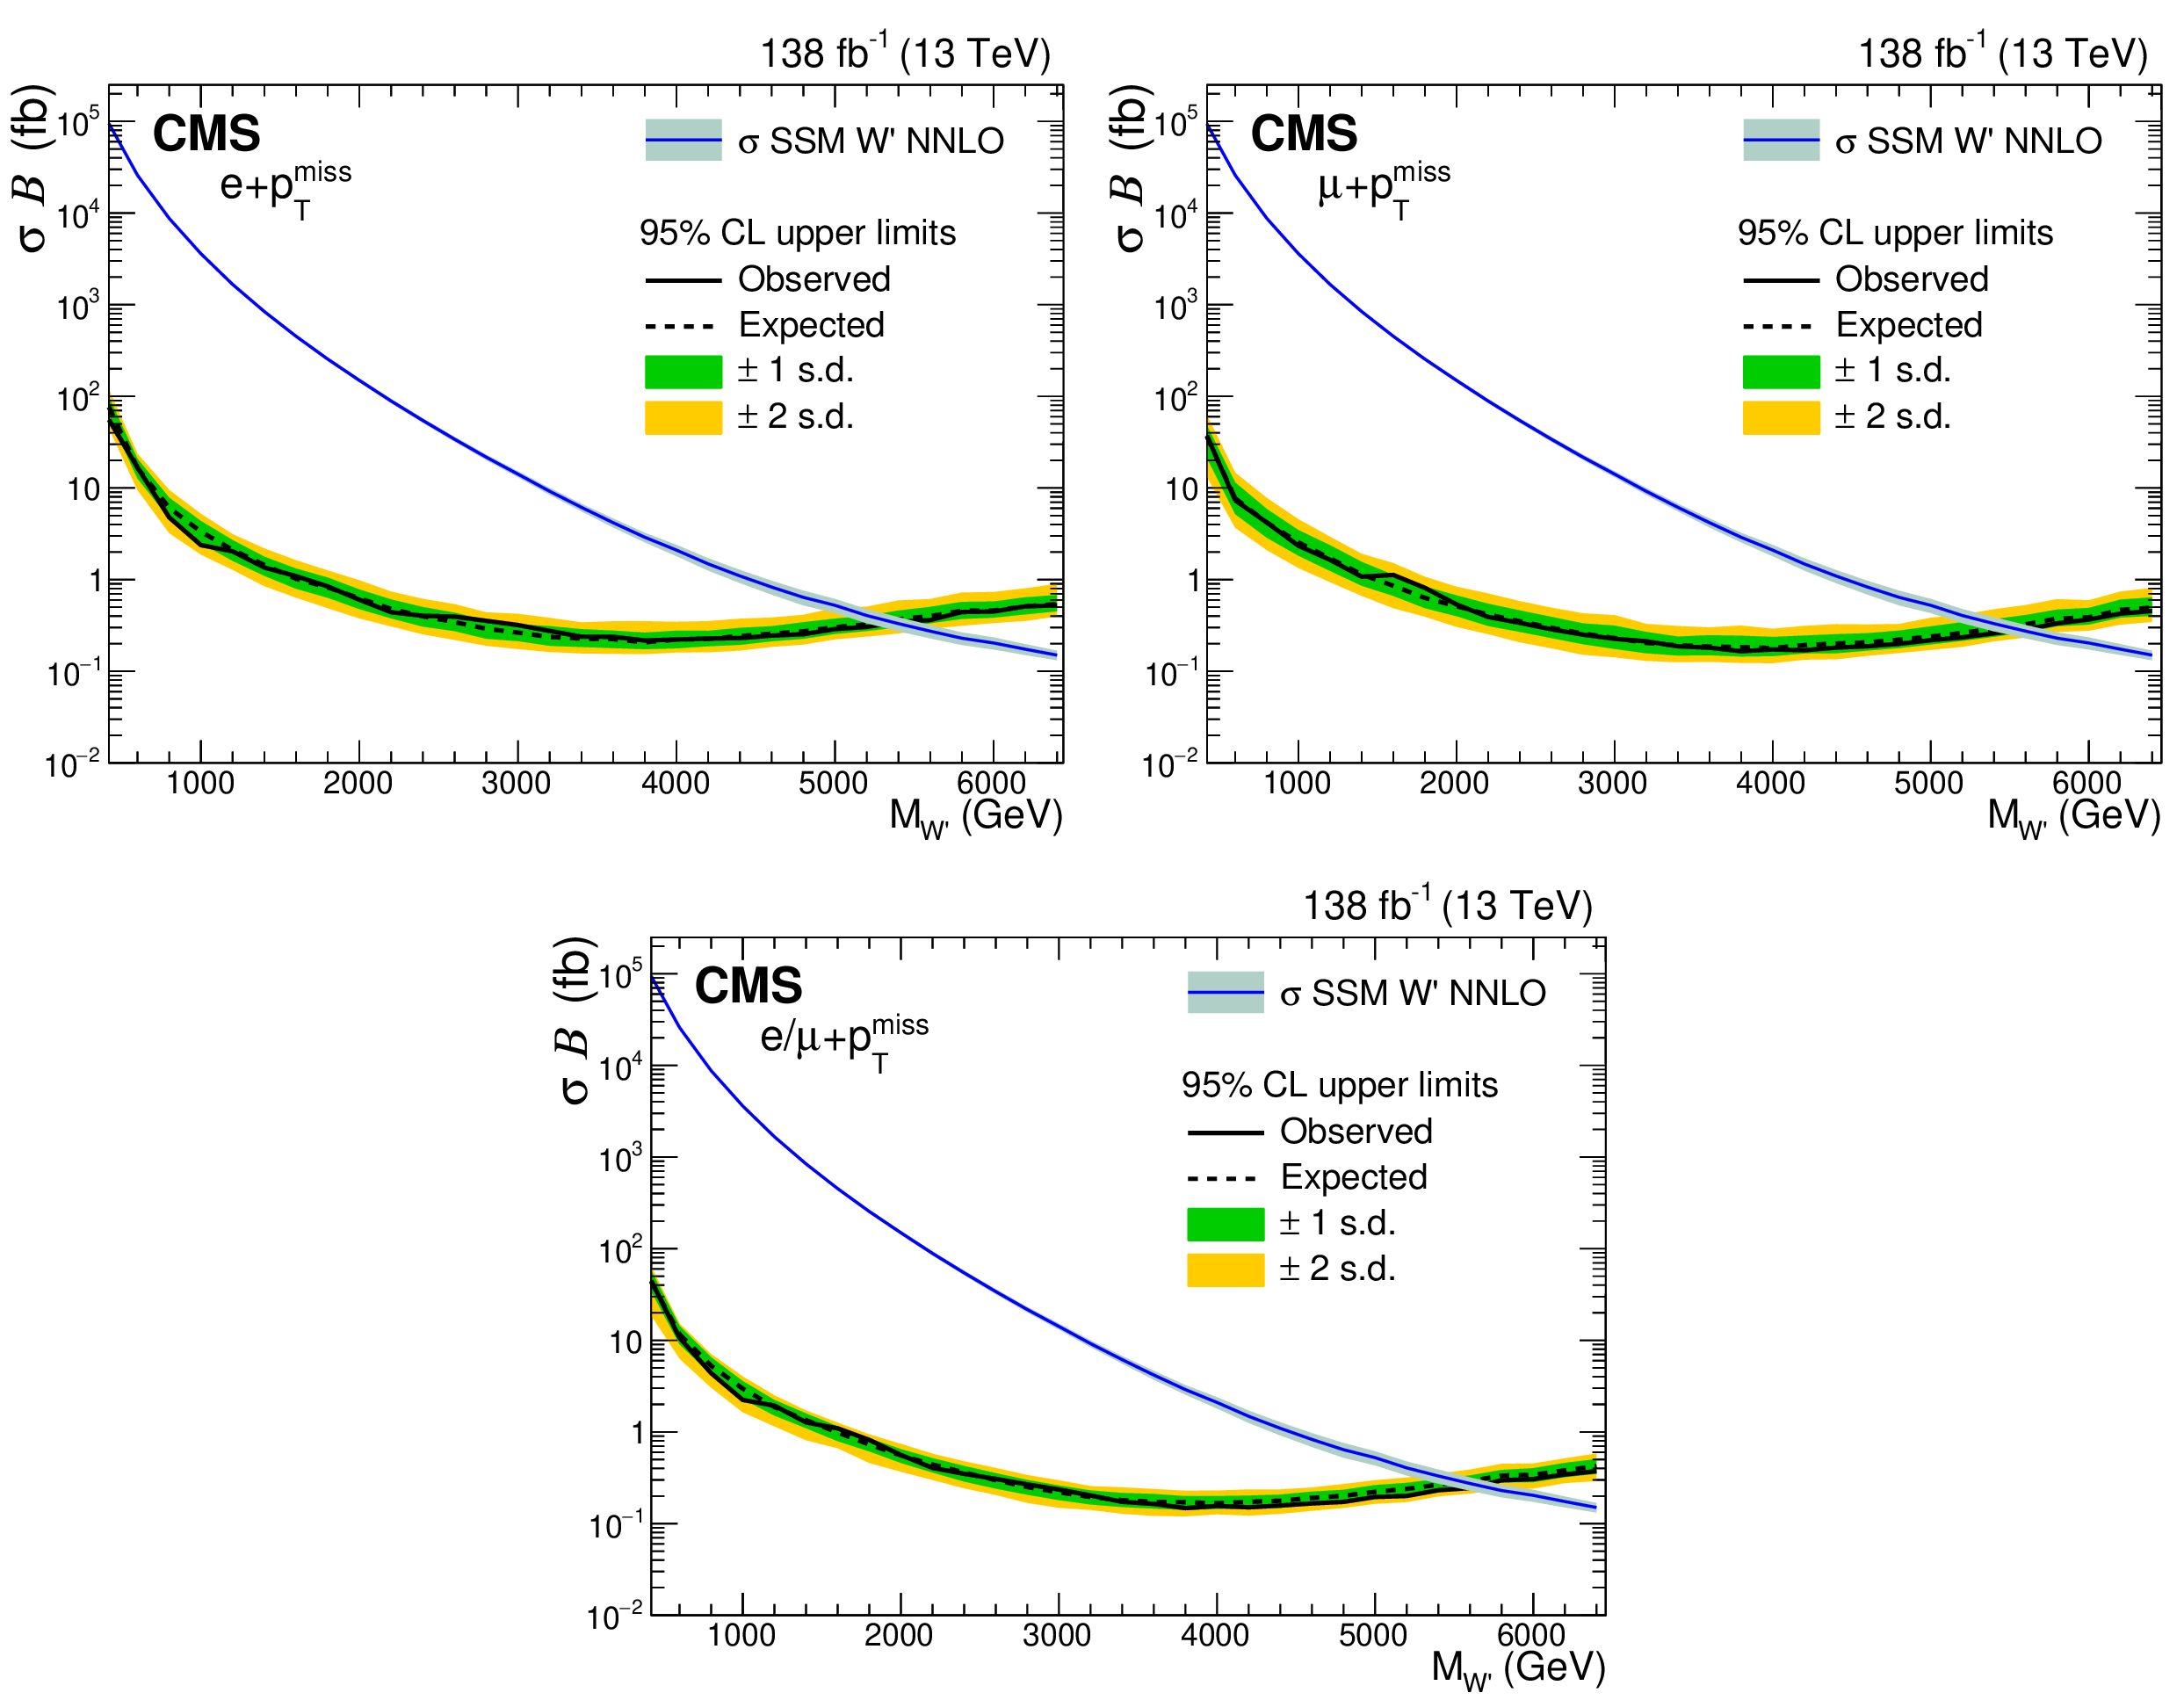
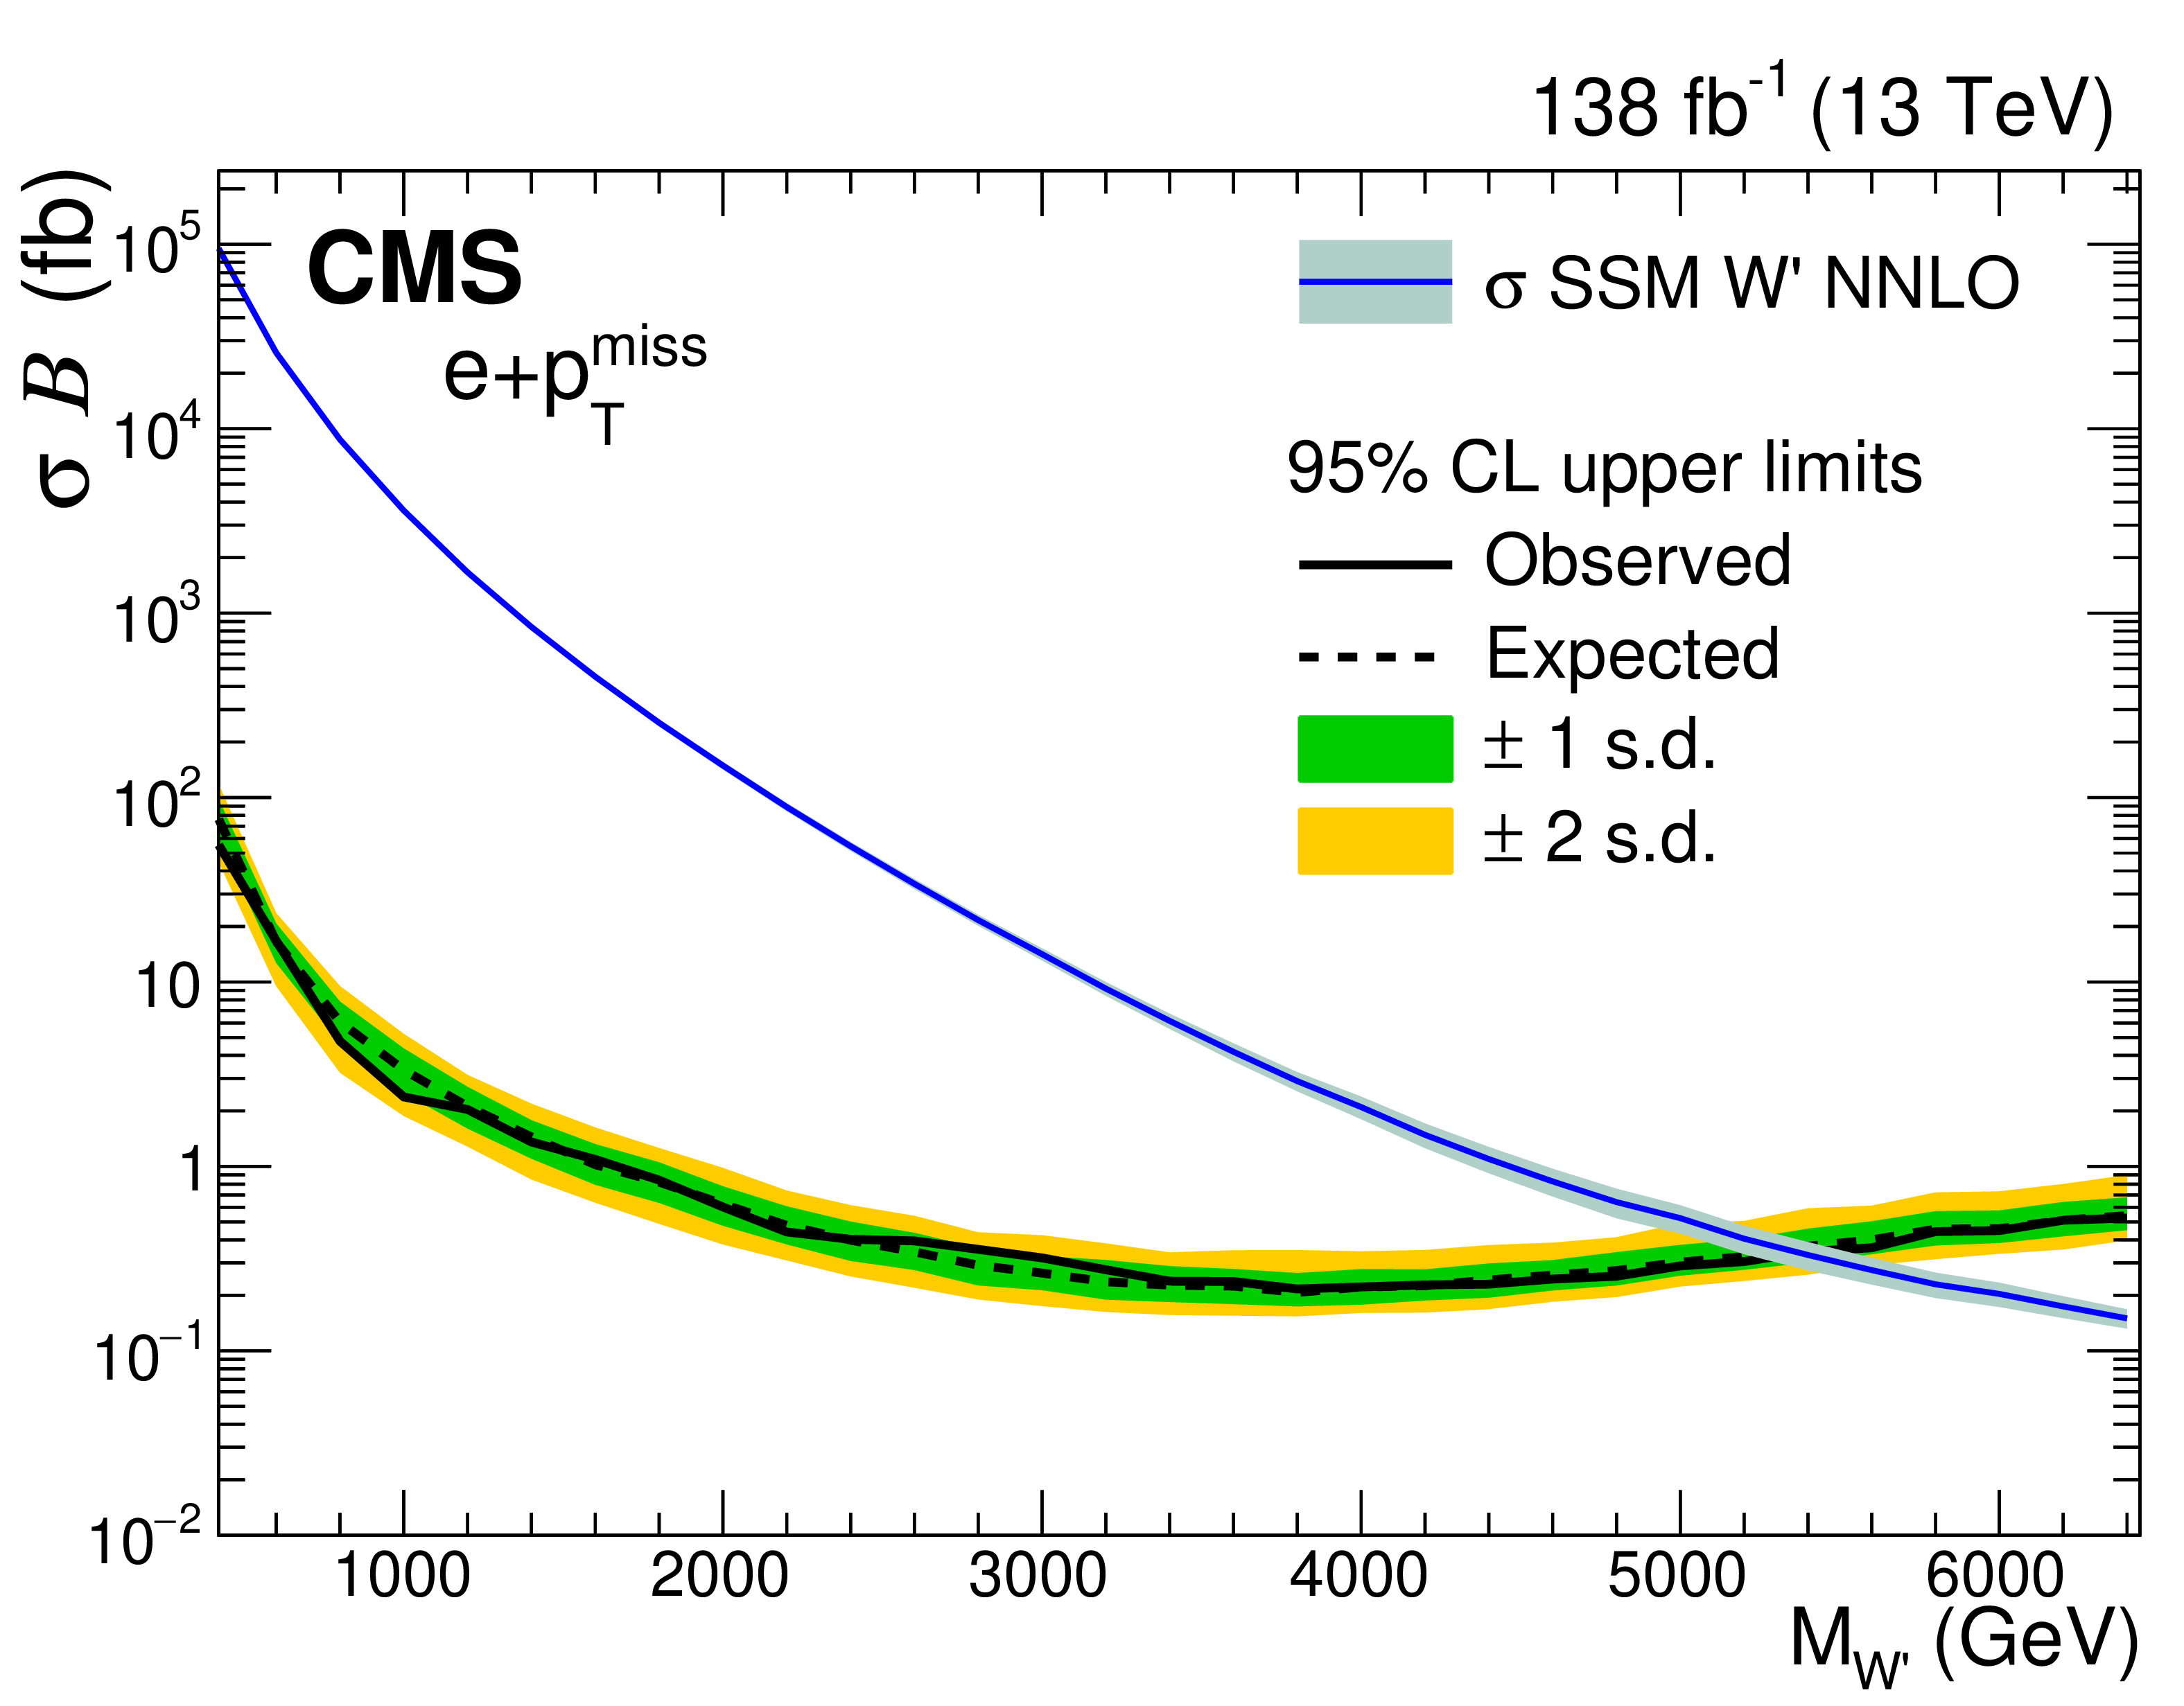
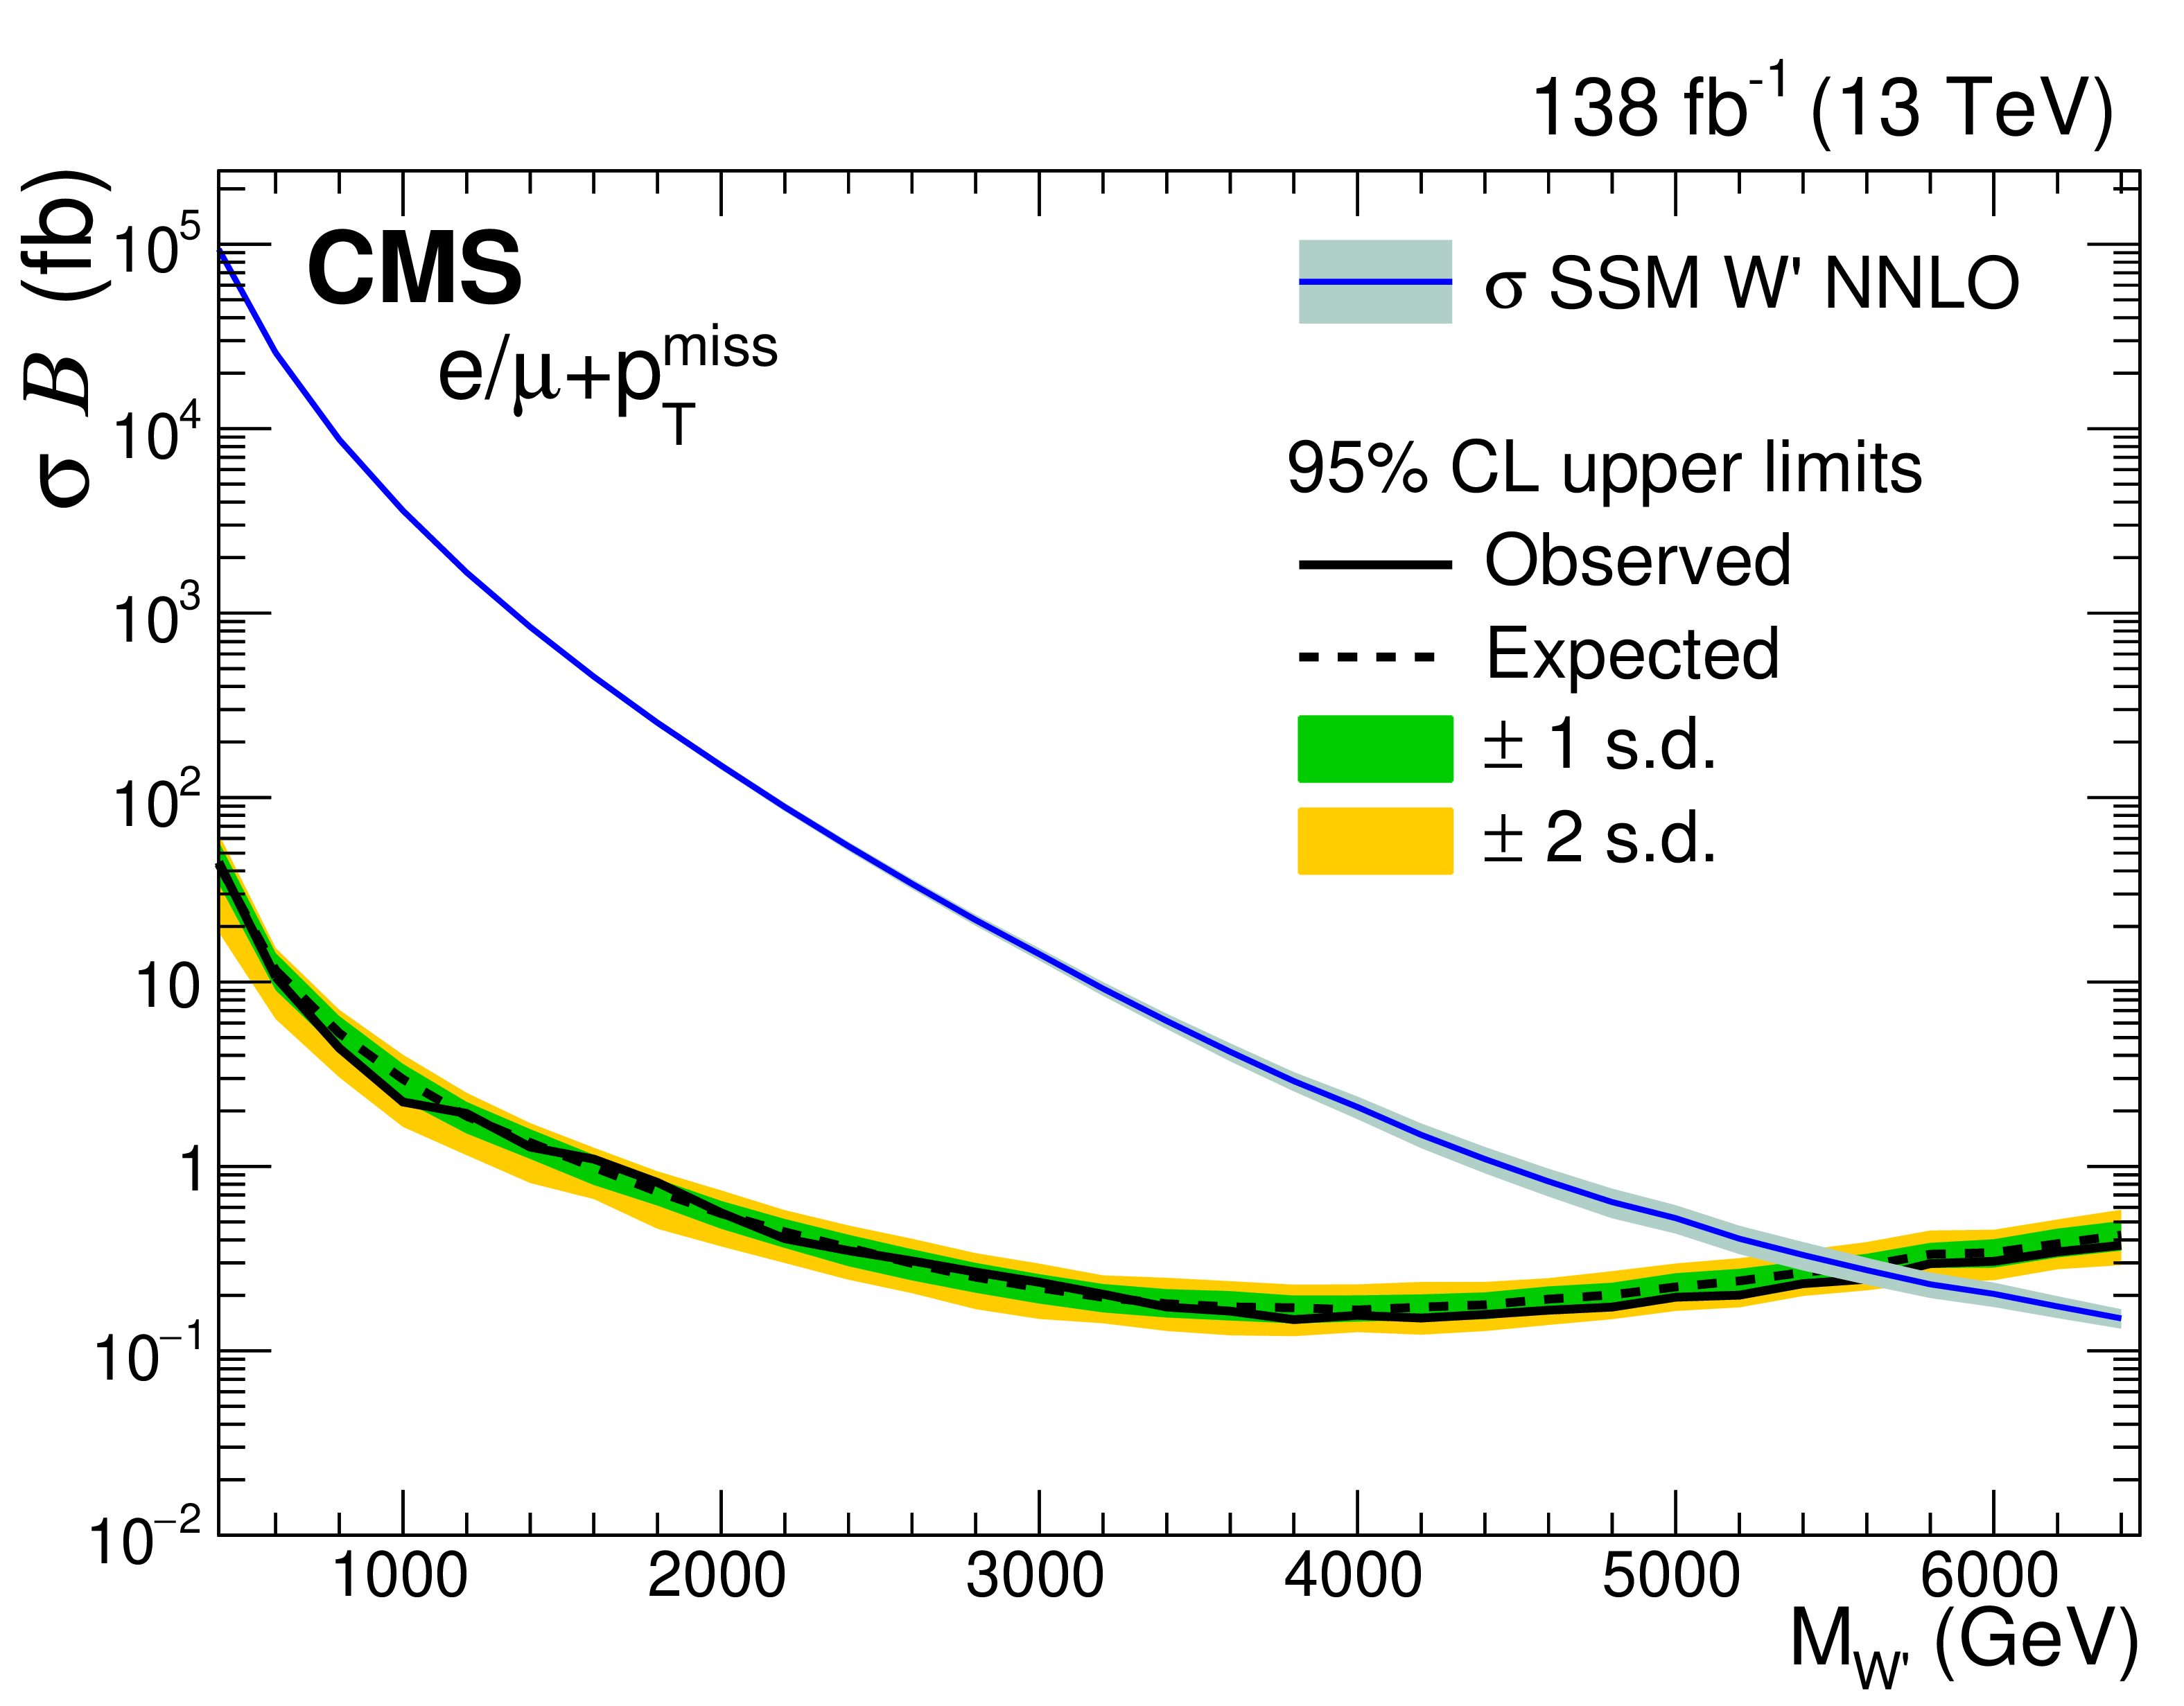
The observed (solid line) and expected (dashed line) upper limits at 95% CL on $\sigma _{\mathrm{W'}}\mathcal {B}(\mathrm{W'} \to \ell \nu)$ for an SSM W' boson model, as a function of the W' boson mass, for the electron (upper left), muon (upper right) channels, and the combination of both channels (lower). The shaded bands represent the one and two standard deviation uncertainty bands for the expected limits. The theoretical predictions for the SSM at QCD NNLO precision are shown, with the narrow grey bands indicating the uncertainty associated with the choice of PDFs and ${\alpha _\mathrm {S}}$. |
png pdf |
Figure 5-a:
The observed (solid line) and expected (dashed line) upper limits at 95% CL on $\sigma _{\mathrm{W'}}\mathcal {B}(\mathrm{W'} \to \ell \nu)$ for an SSM W' boson model, as a function of the W' boson mass, for the electron (upper left), muon (upper right) channels, and the combination of both channels (lower). The shaded bands represent the one and two standard deviation uncertainty bands for the expected limits. The theoretical predictions for the SSM at QCD NNLO precision are shown, with the narrow grey bands indicating the uncertainty associated with the choice of PDFs and ${\alpha _\mathrm {S}}$. |

png pdf |
Figure 5-b:
The observed (solid line) and expected (dashed line) upper limits at 95% CL on $\sigma _{\mathrm{W'}}\mathcal {B}(\mathrm{W'} \to \ell \nu)$ for an SSM W' boson model, as a function of the W' boson mass, for the electron (upper left), muon (upper right) channels, and the combination of both channels (lower). The shaded bands represent the one and two standard deviation uncertainty bands for the expected limits. The theoretical predictions for the SSM at QCD NNLO precision are shown, with the narrow grey bands indicating the uncertainty associated with the choice of PDFs and ${\alpha _\mathrm {S}}$. |
png pdf |
Figure 5-c:
The observed (solid line) and expected (dashed line) upper limits at 95% CL on $\sigma _{\mathrm{W'}}\mathcal {B}(\mathrm{W'} \to \ell \nu)$ for an SSM W' boson model, as a function of the W' boson mass, for the electron (upper left), muon (upper right) channels, and the combination of both channels (lower). The shaded bands represent the one and two standard deviation uncertainty bands for the expected limits. The theoretical predictions for the SSM at QCD NNLO precision are shown, with the narrow grey bands indicating the uncertainty associated with the choice of PDFs and ${\alpha _\mathrm {S}}$. |
png pdf |
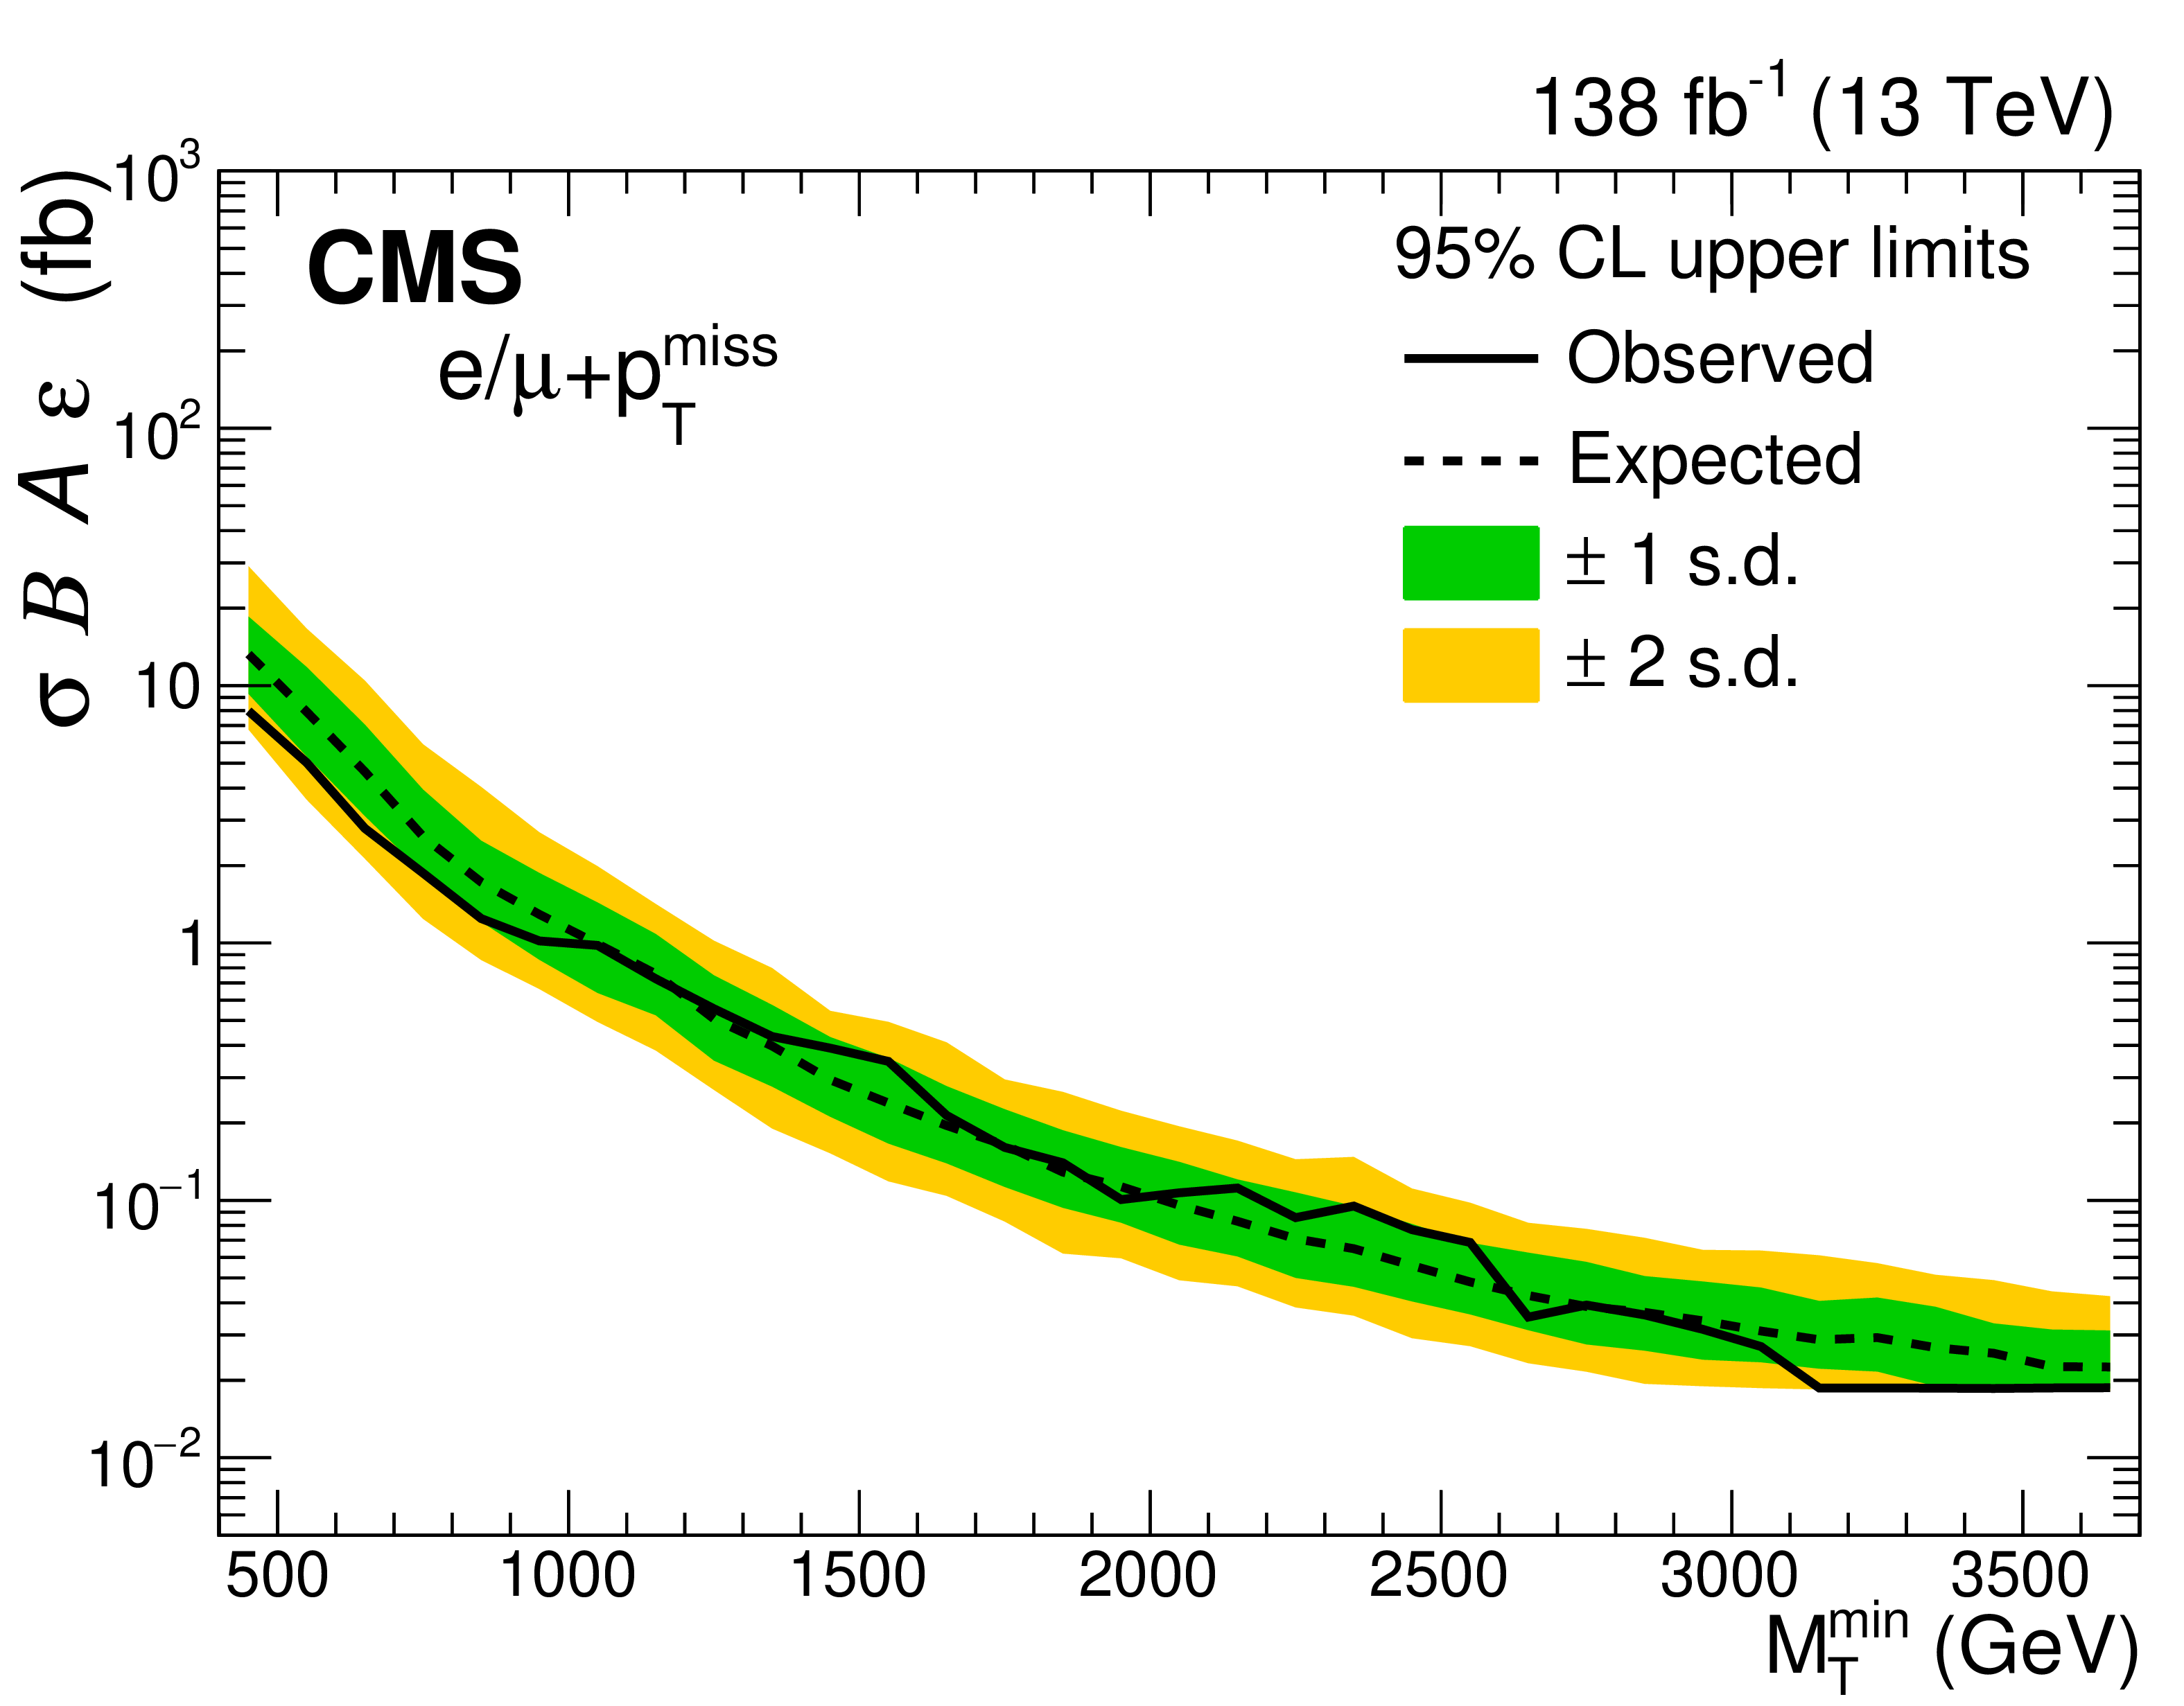
Figure 6:
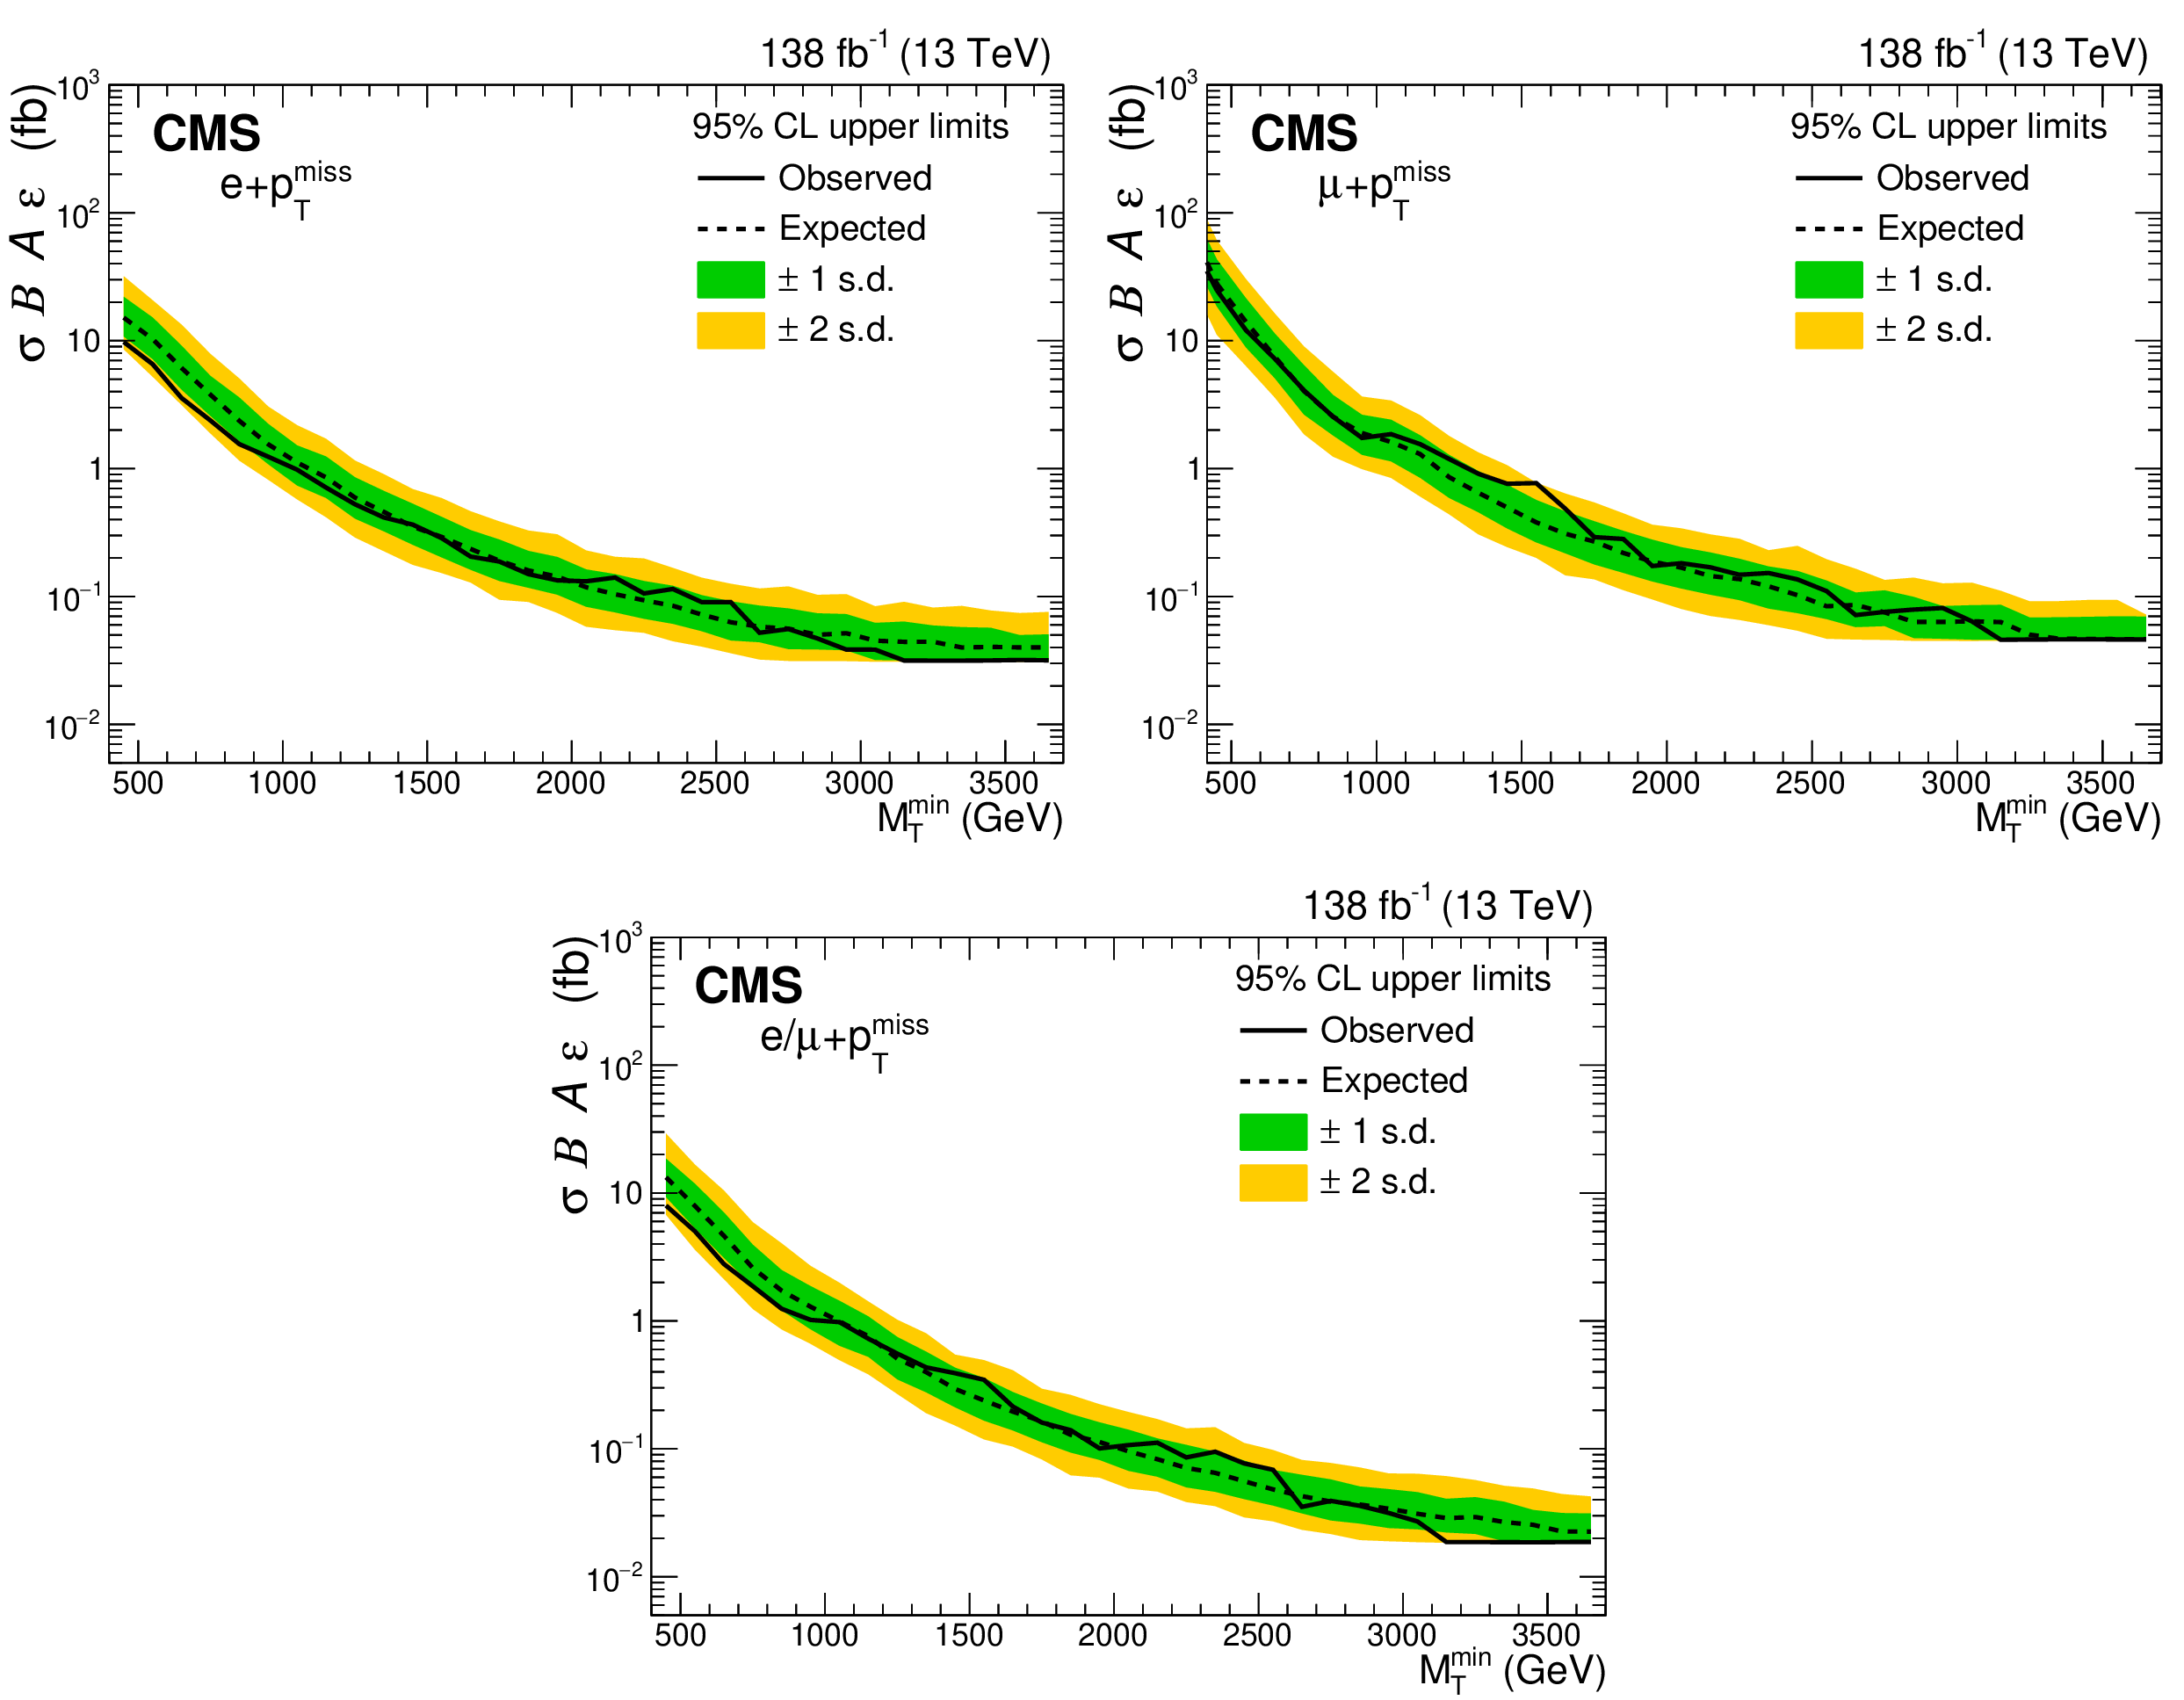
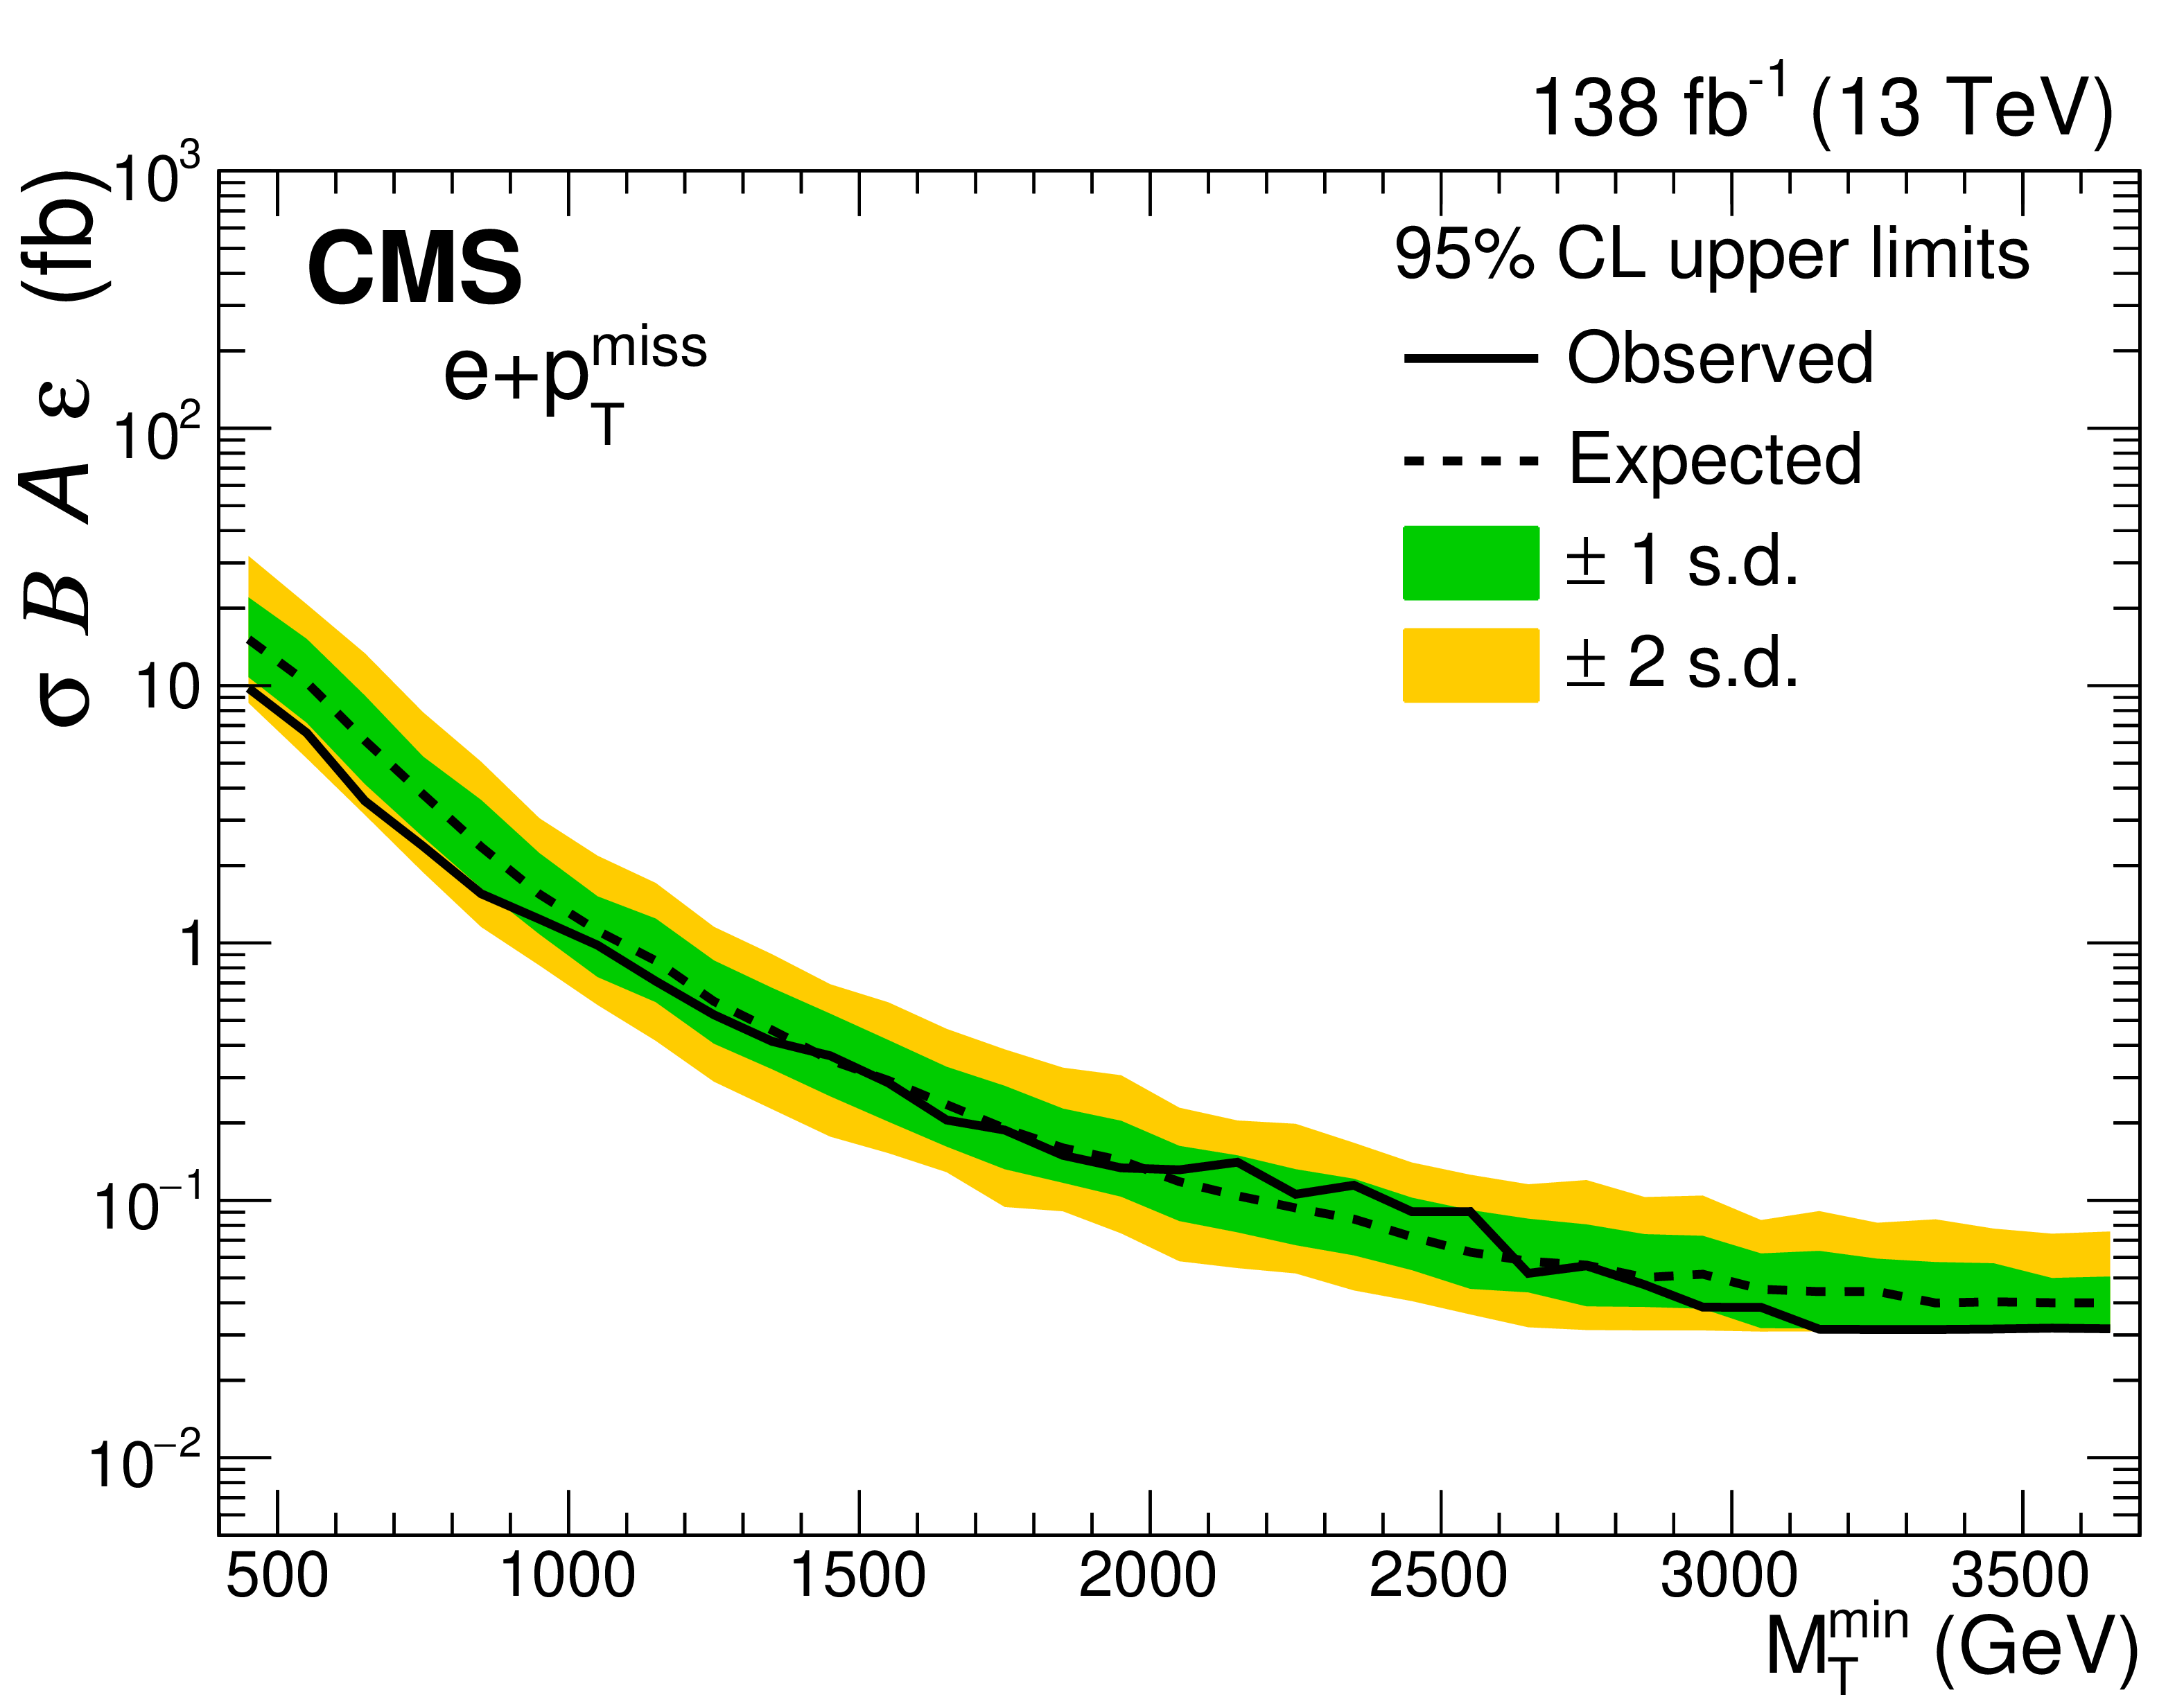
The 95% CL observed (solid line) and expected (dashed line) model-independent cross section limits as functions of the $ {M_\mathrm {T}^\mathrm {min}} $ threshold. These are shown for the electron (upper left) and muon (upper right) channels and their combination (lower). The one and two standard deviation uncertainty bands for the expected limits are shown. |
png pdf |
Figure 6-a:
The 95% CL observed (solid line) and expected (dashed line) model-independent cross section limits as functions of the $ {M_\mathrm {T}^\mathrm {min}} $ threshold. These are shown for the electron (upper left) and muon (upper right) channels and their combination (lower). The one and two standard deviation uncertainty bands for the expected limits are shown. |

png pdf |
Figure 6-b:
The 95% CL observed (solid line) and expected (dashed line) model-independent cross section limits as functions of the $ {M_\mathrm {T}^\mathrm {min}} $ threshold. These are shown for the electron (upper left) and muon (upper right) channels and their combination (lower). The one and two standard deviation uncertainty bands for the expected limits are shown. |
png pdf |
Figure 6-c:
The 95% CL observed (solid line) and expected (dashed line) model-independent cross section limits as functions of the $ {M_\mathrm {T}^\mathrm {min}} $ threshold. These are shown for the electron (upper left) and muon (upper right) channels and their combination (lower). The one and two standard deviation uncertainty bands for the expected limits are shown. |
png pdf |
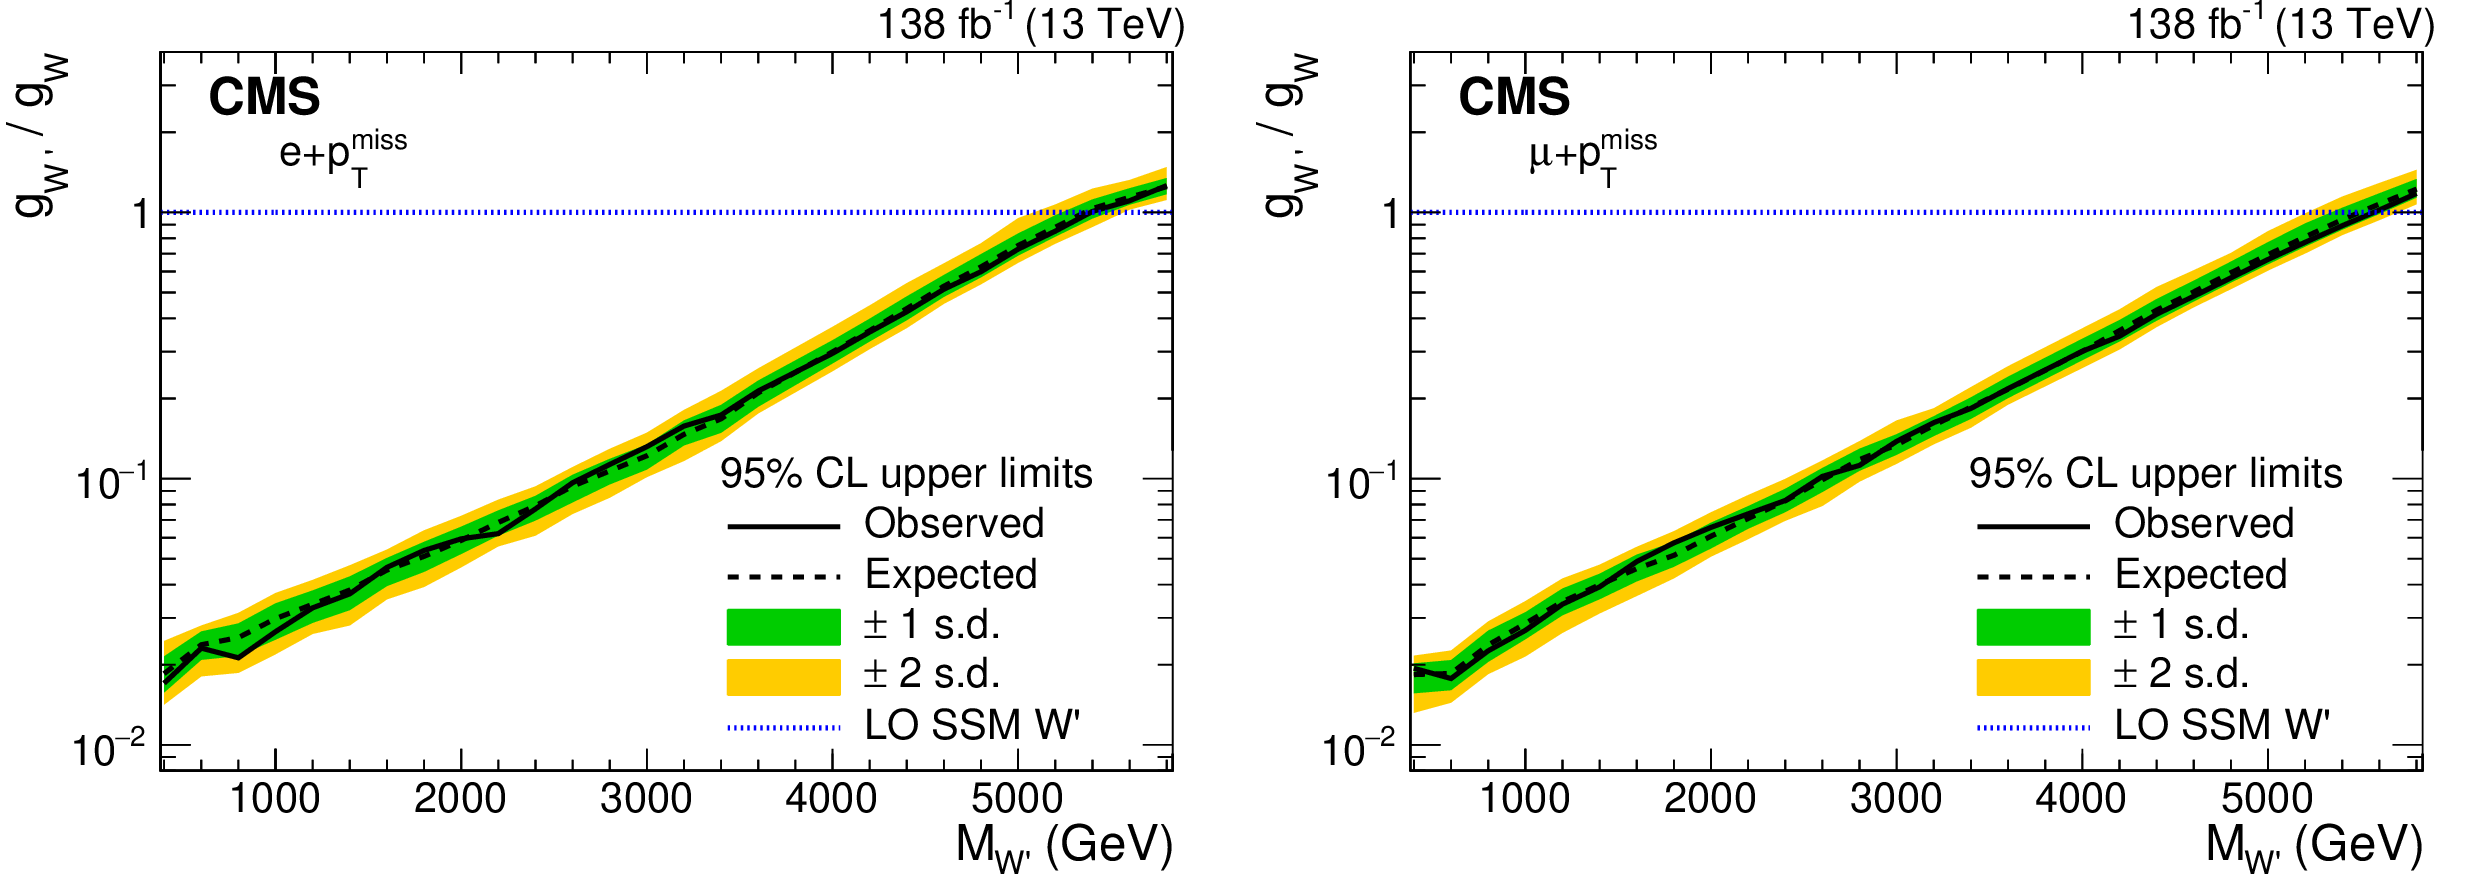
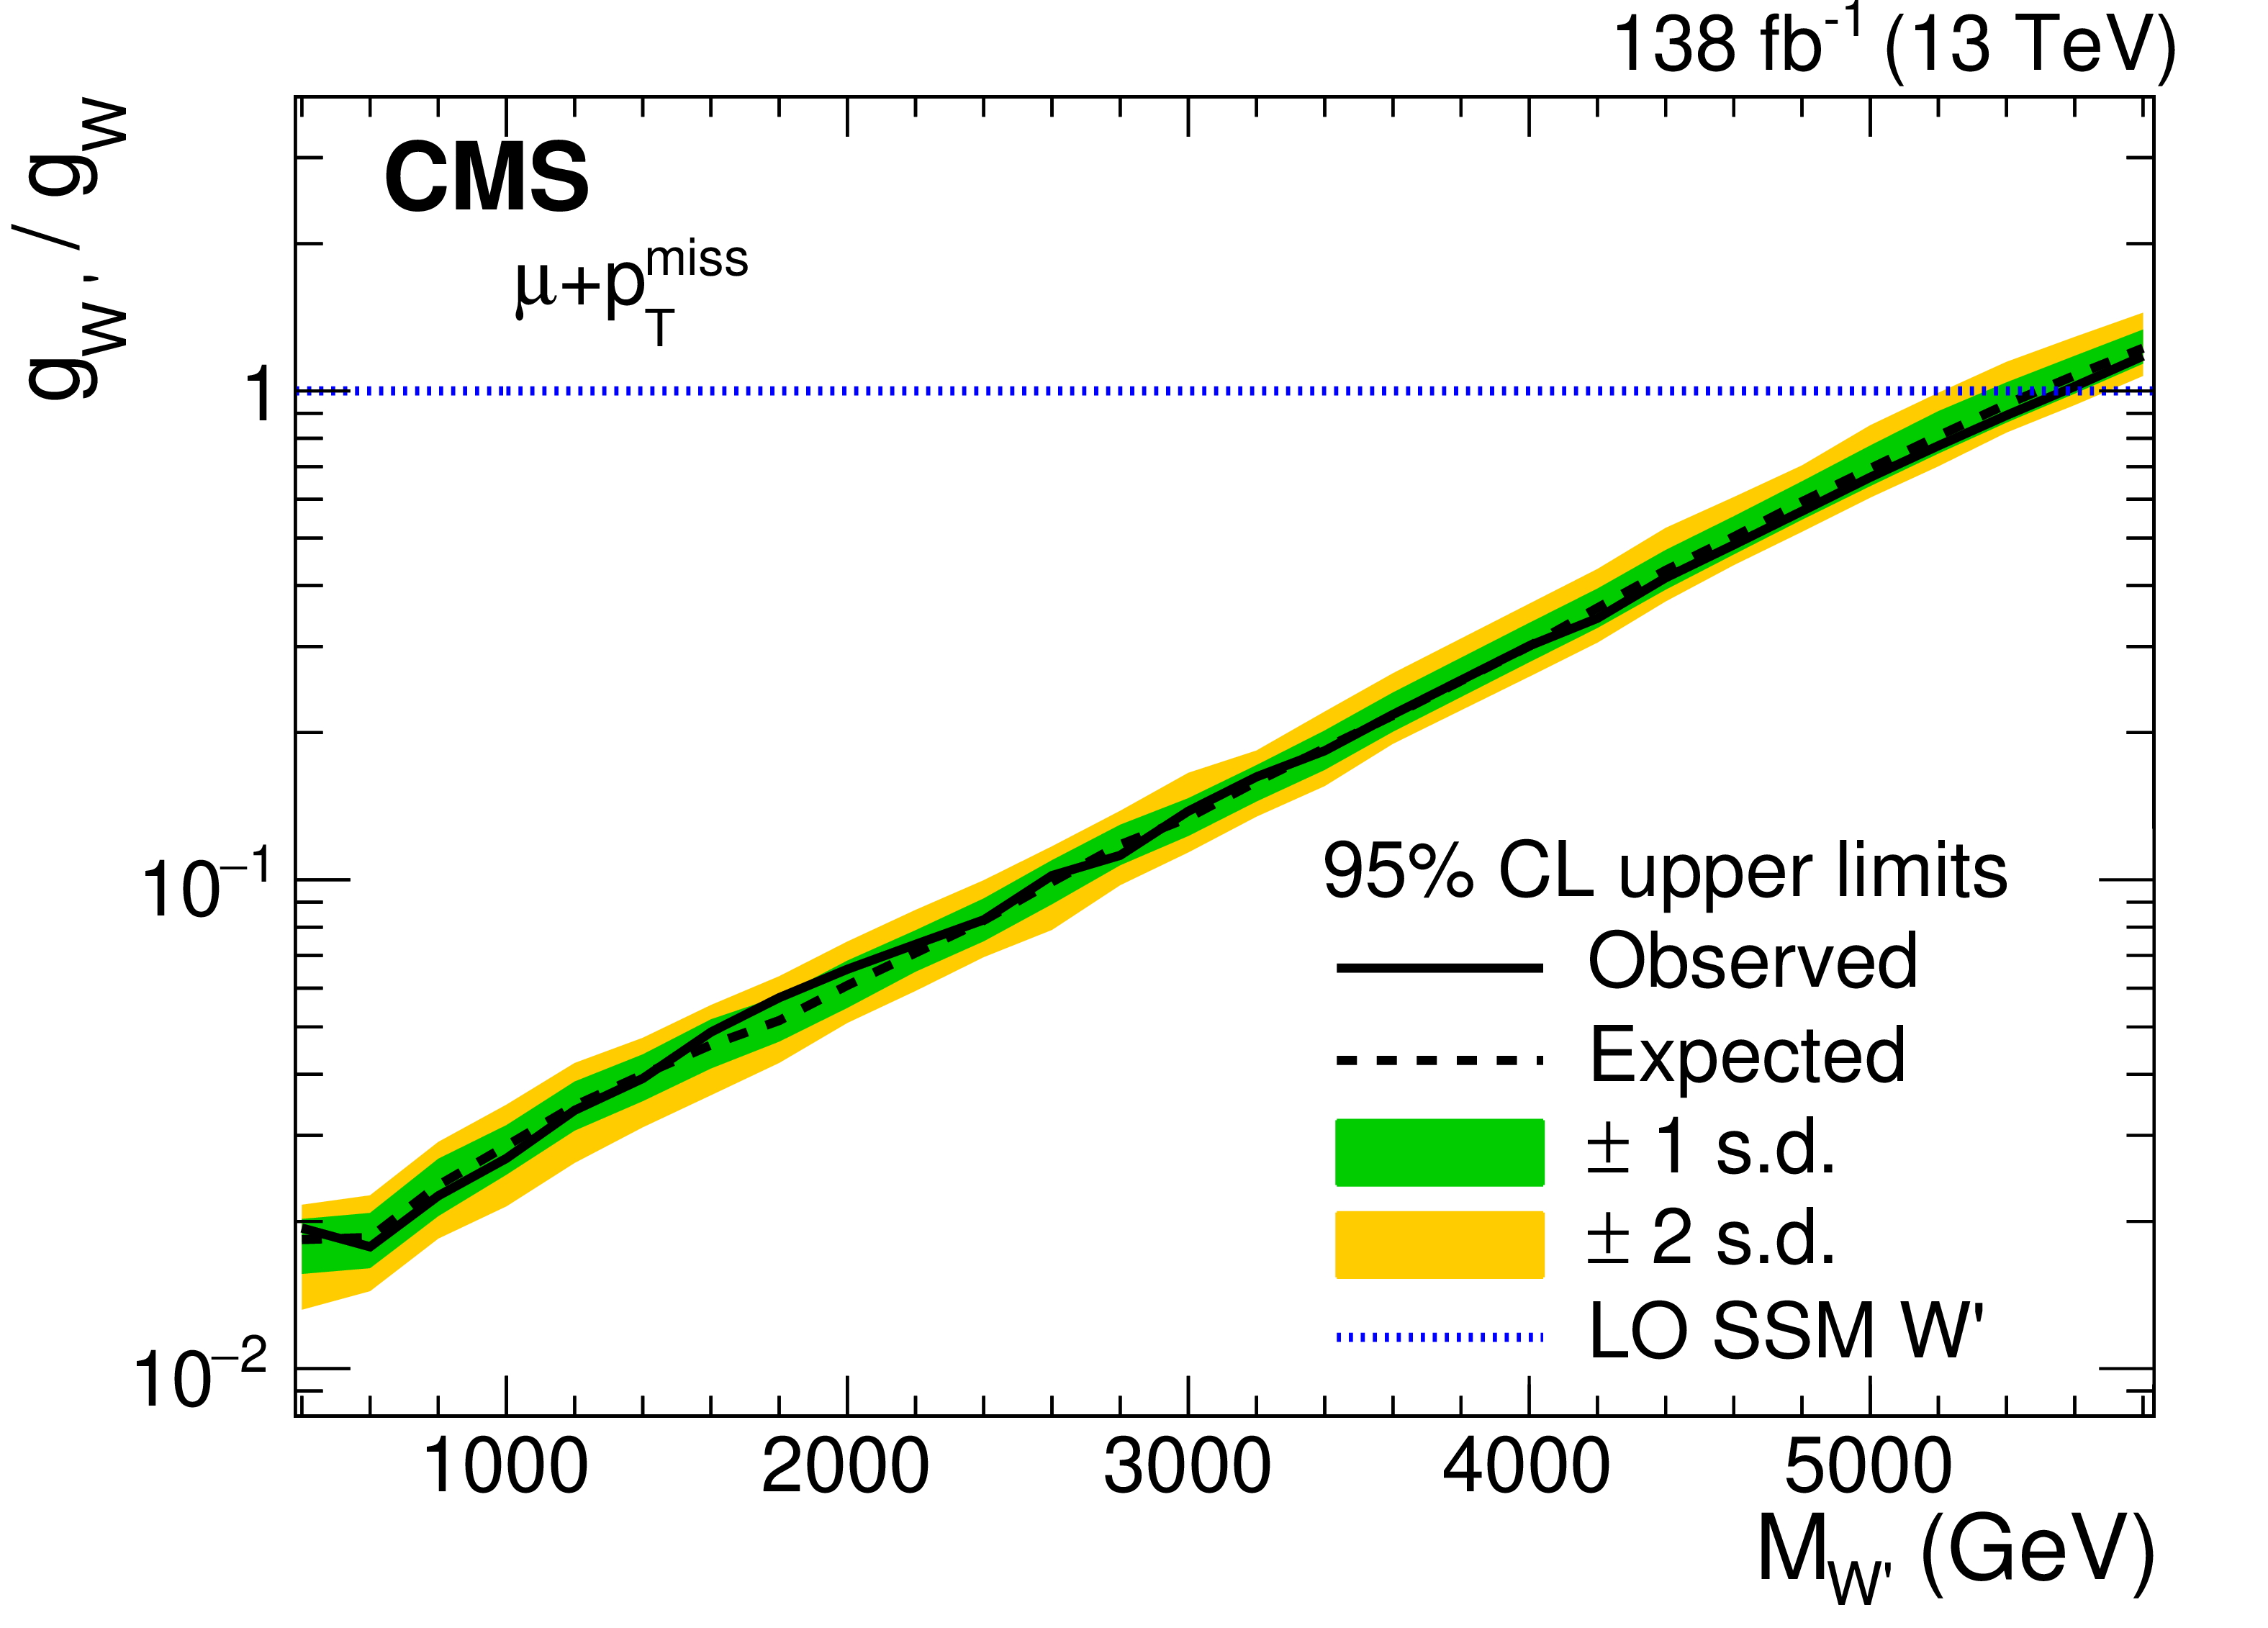
Figure 7:
The observed (solid line) and expected (dashed line) upper limits at 95% CL on the coupling strength ratio, $g_{\mathrm{W'}}/g_{\mathrm{W}}$ as functions of the mass of the W' boson. These are shown for the electron (left) and muon (right) channels. The one and two standard deviation uncertainty bands for the expected limits are shown. The area above the limit curve is excluded. The dotted line represents the case of SSM couplings, $g_{\mathrm{W'}}$, being equal to $g_{\mathrm{W}}$, the SM coupling. |

png pdf |
Figure 7-a:
The observed (solid line) and expected (dashed line) upper limits at 95% CL on the coupling strength ratio, $g_{\mathrm{W'}}/g_{\mathrm{W}}$ as functions of the mass of the W' boson. These are shown for the electron (left) and muon (right) channels. The one and two standard deviation uncertainty bands for the expected limits are shown. The area above the limit curve is excluded. The dotted line represents the case of SSM couplings, $g_{\mathrm{W'}}$, being equal to $g_{\mathrm{W}}$, the SM coupling. |
png pdf |
Figure 7-b:
The observed (solid line) and expected (dashed line) upper limits at 95% CL on the coupling strength ratio, $g_{\mathrm{W'}}/g_{\mathrm{W}}$ as functions of the mass of the W' boson. These are shown for the electron (left) and muon (right) channels. The one and two standard deviation uncertainty bands for the expected limits are shown. The area above the limit curve is excluded. The dotted line represents the case of SSM couplings, $g_{\mathrm{W'}}$, being equal to $g_{\mathrm{W}}$, the SM coupling. |
png pdf |
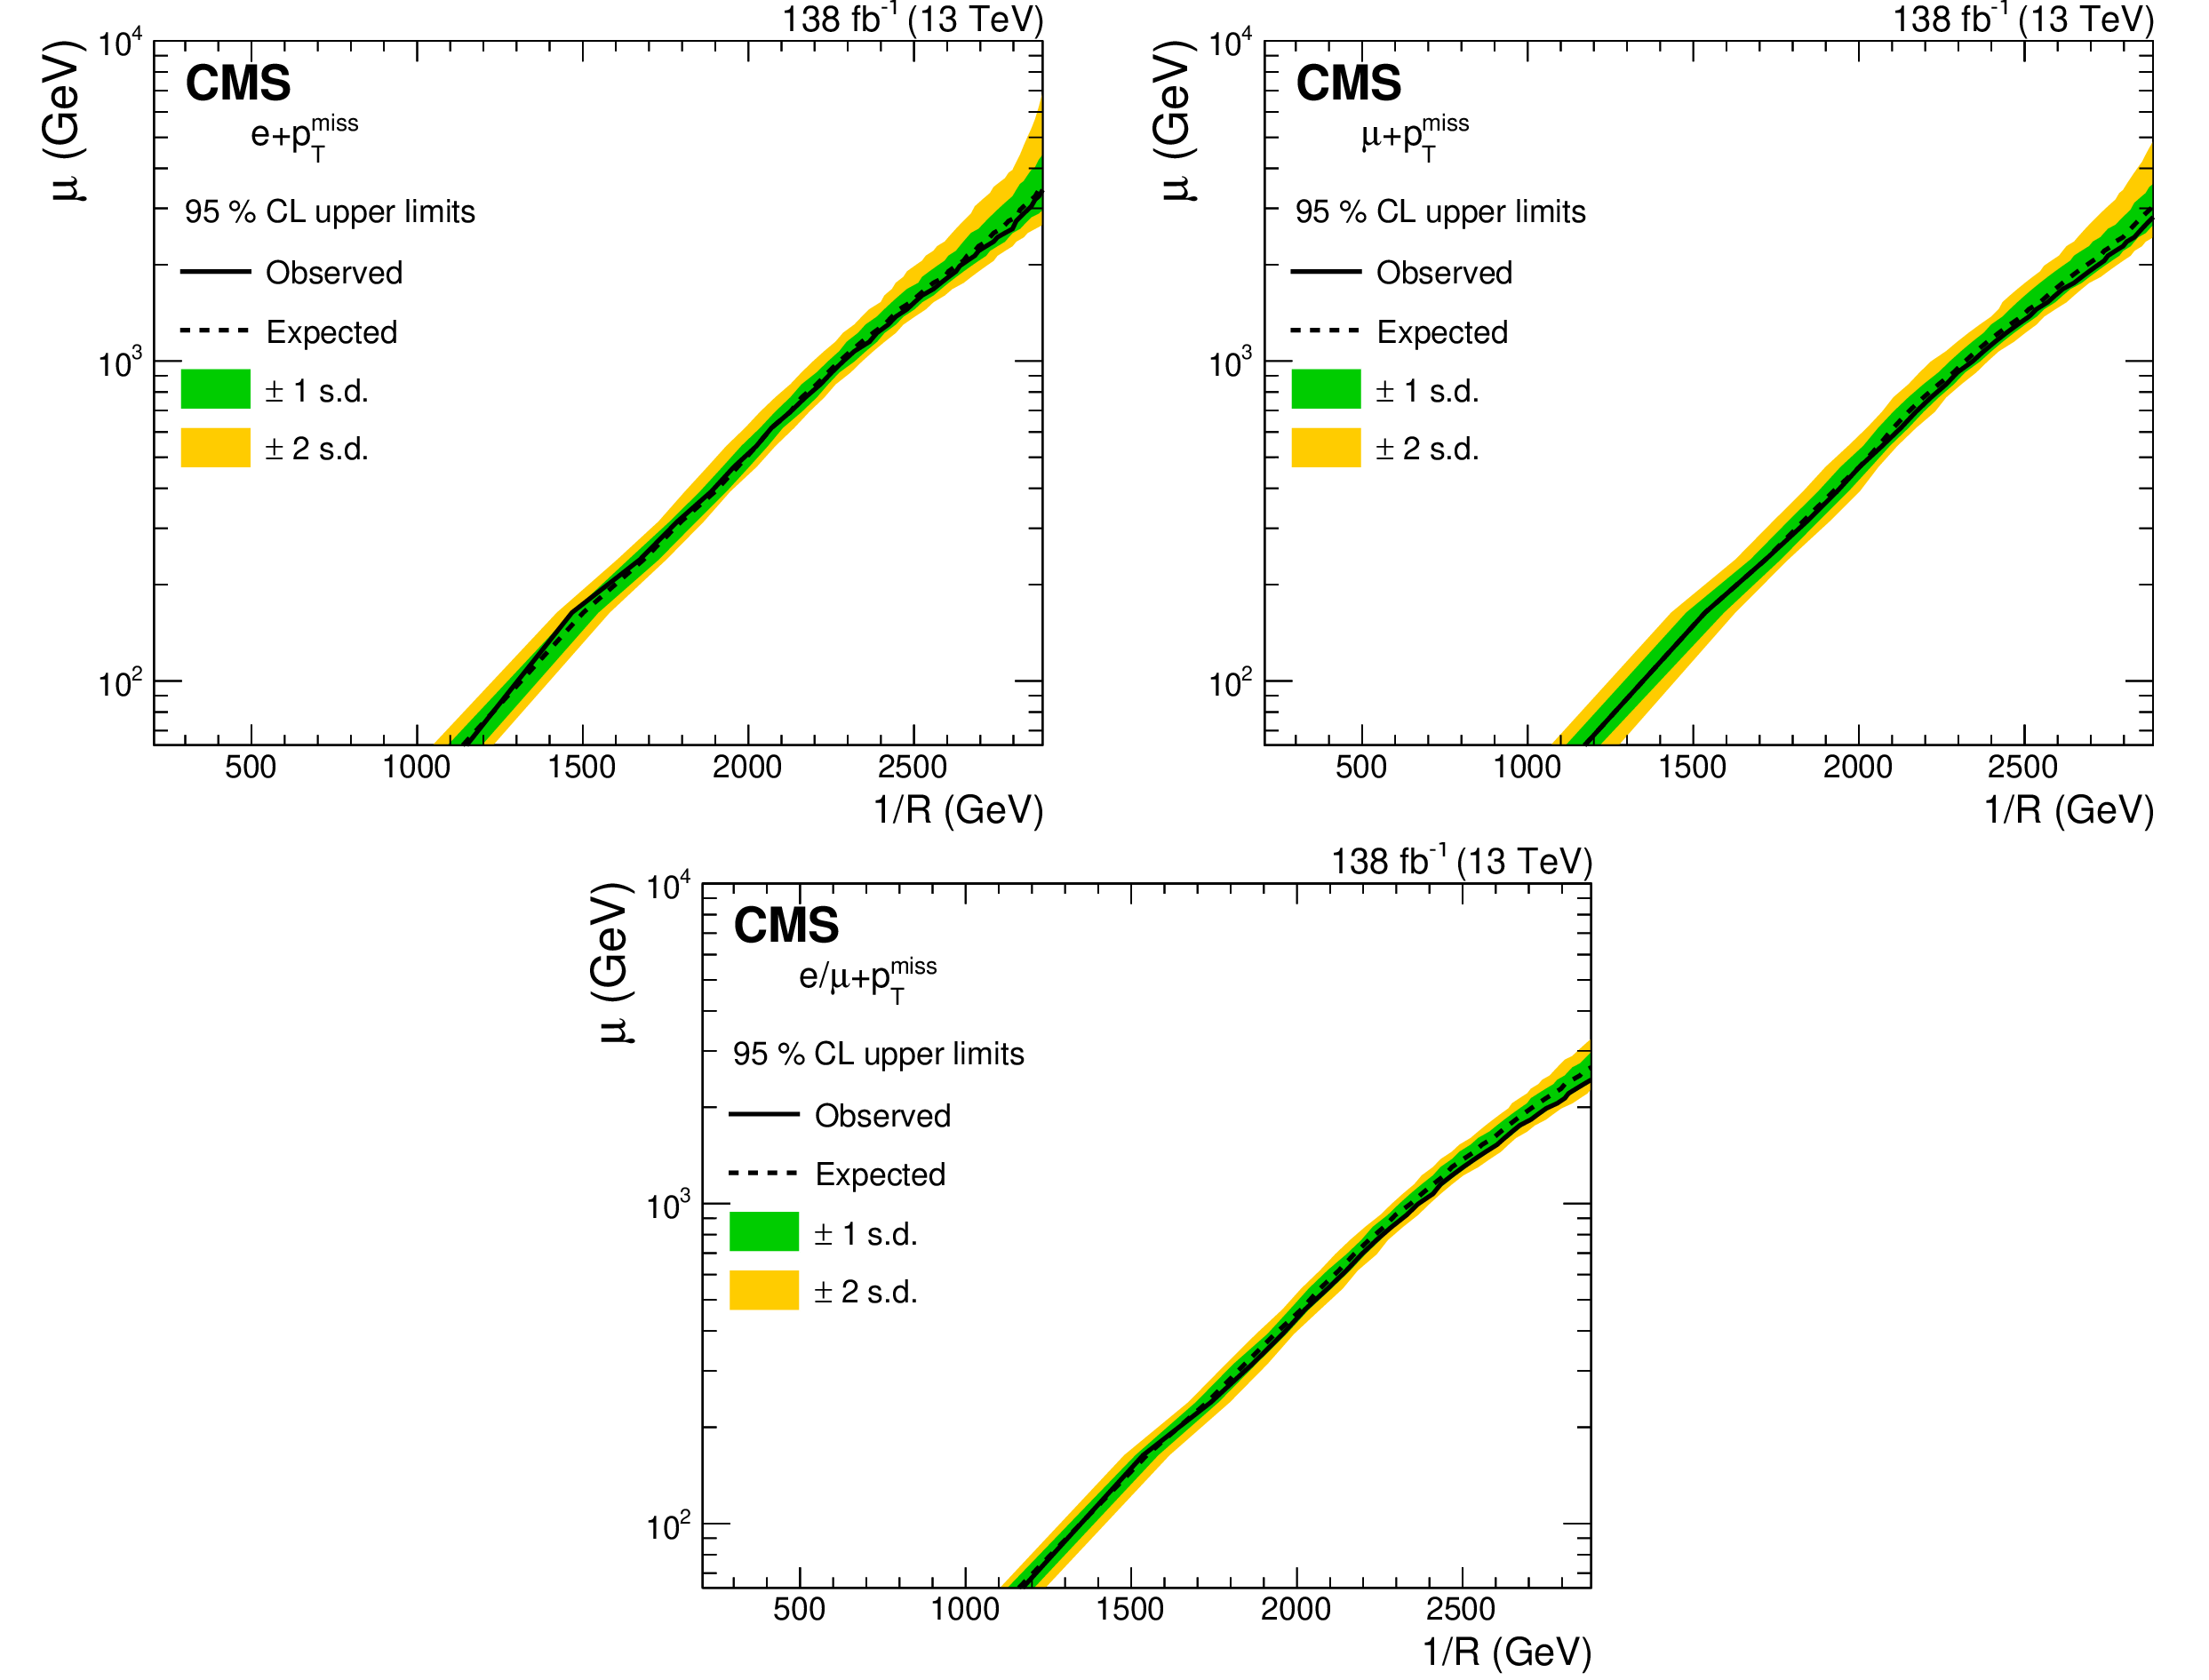
Figure 8:
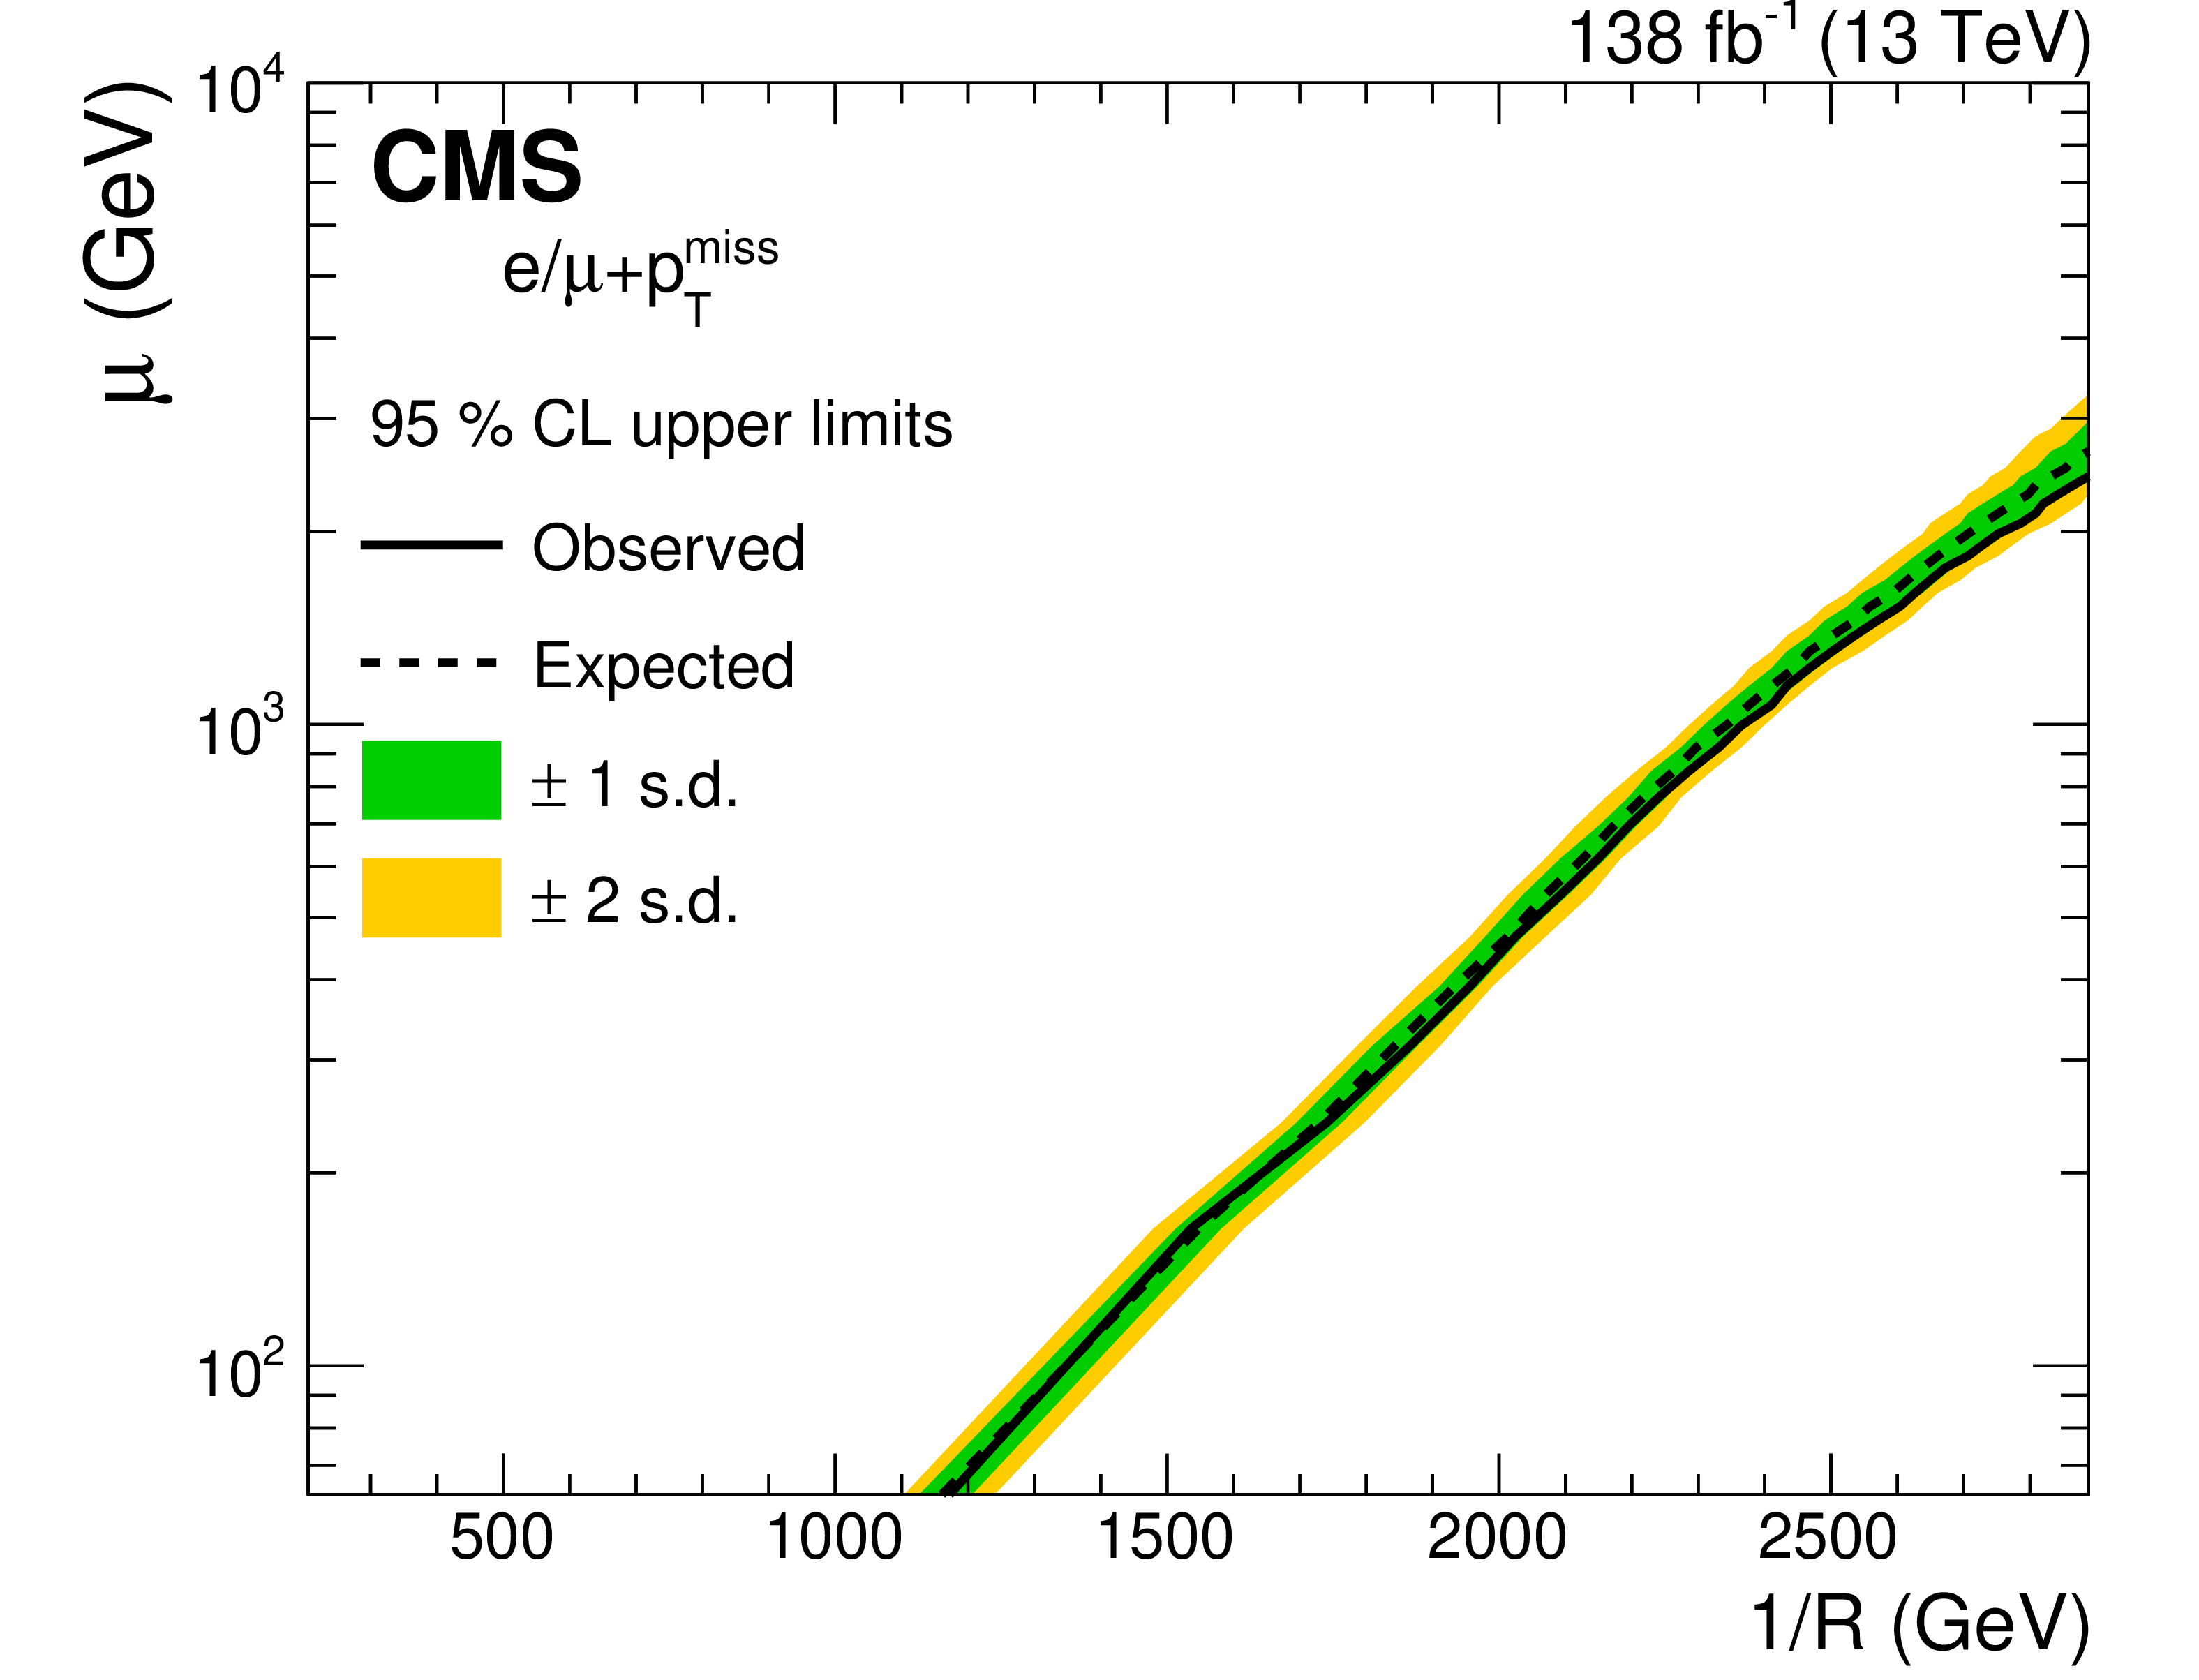
Exclusion limits in the 2D plane (1/$R$,$\mu $) for the split-UED interpretation for the $n = $ 2 case. These are shown for the electron (upper left), muon (upper right), and the combination of both (lower) channels for the 2016-2018 data sets. The expected limit is depicted as a black dashed line. The one and two standard deviation uncertainty bands for the expected limits are shown. The experimentally excluded region is the entire area to the left of the solid black line. |

png pdf |
Figure 8-a:
Exclusion limits in the 2D plane (1/$R$,$\mu $) for the split-UED interpretation for the $n = $ 2 case. These are shown for the electron (upper left), muon (upper right), and the combination of both (lower) channels for the 2016-2018 data sets. The expected limit is depicted as a black dashed line. The one and two standard deviation uncertainty bands for the expected limits are shown. The experimentally excluded region is the entire area to the left of the solid black line. |

png pdf |
Figure 8-b:
Exclusion limits in the 2D plane (1/$R$,$\mu $) for the split-UED interpretation for the $n = $ 2 case. These are shown for the electron (upper left), muon (upper right), and the combination of both (lower) channels for the 2016-2018 data sets. The expected limit is depicted as a black dashed line. The one and two standard deviation uncertainty bands for the expected limits are shown. The experimentally excluded region is the entire area to the left of the solid black line. |
png pdf |
Figure 8-c:
Exclusion limits in the 2D plane (1/$R$,$\mu $) for the split-UED interpretation for the $n = $ 2 case. These are shown for the electron (upper left), muon (upper right), and the combination of both (lower) channels for the 2016-2018 data sets. The expected limit is depicted as a black dashed line. The one and two standard deviation uncertainty bands for the expected limits are shown. The experimentally excluded region is the entire area to the left of the solid black line. |
png pdf |
Figure 9:
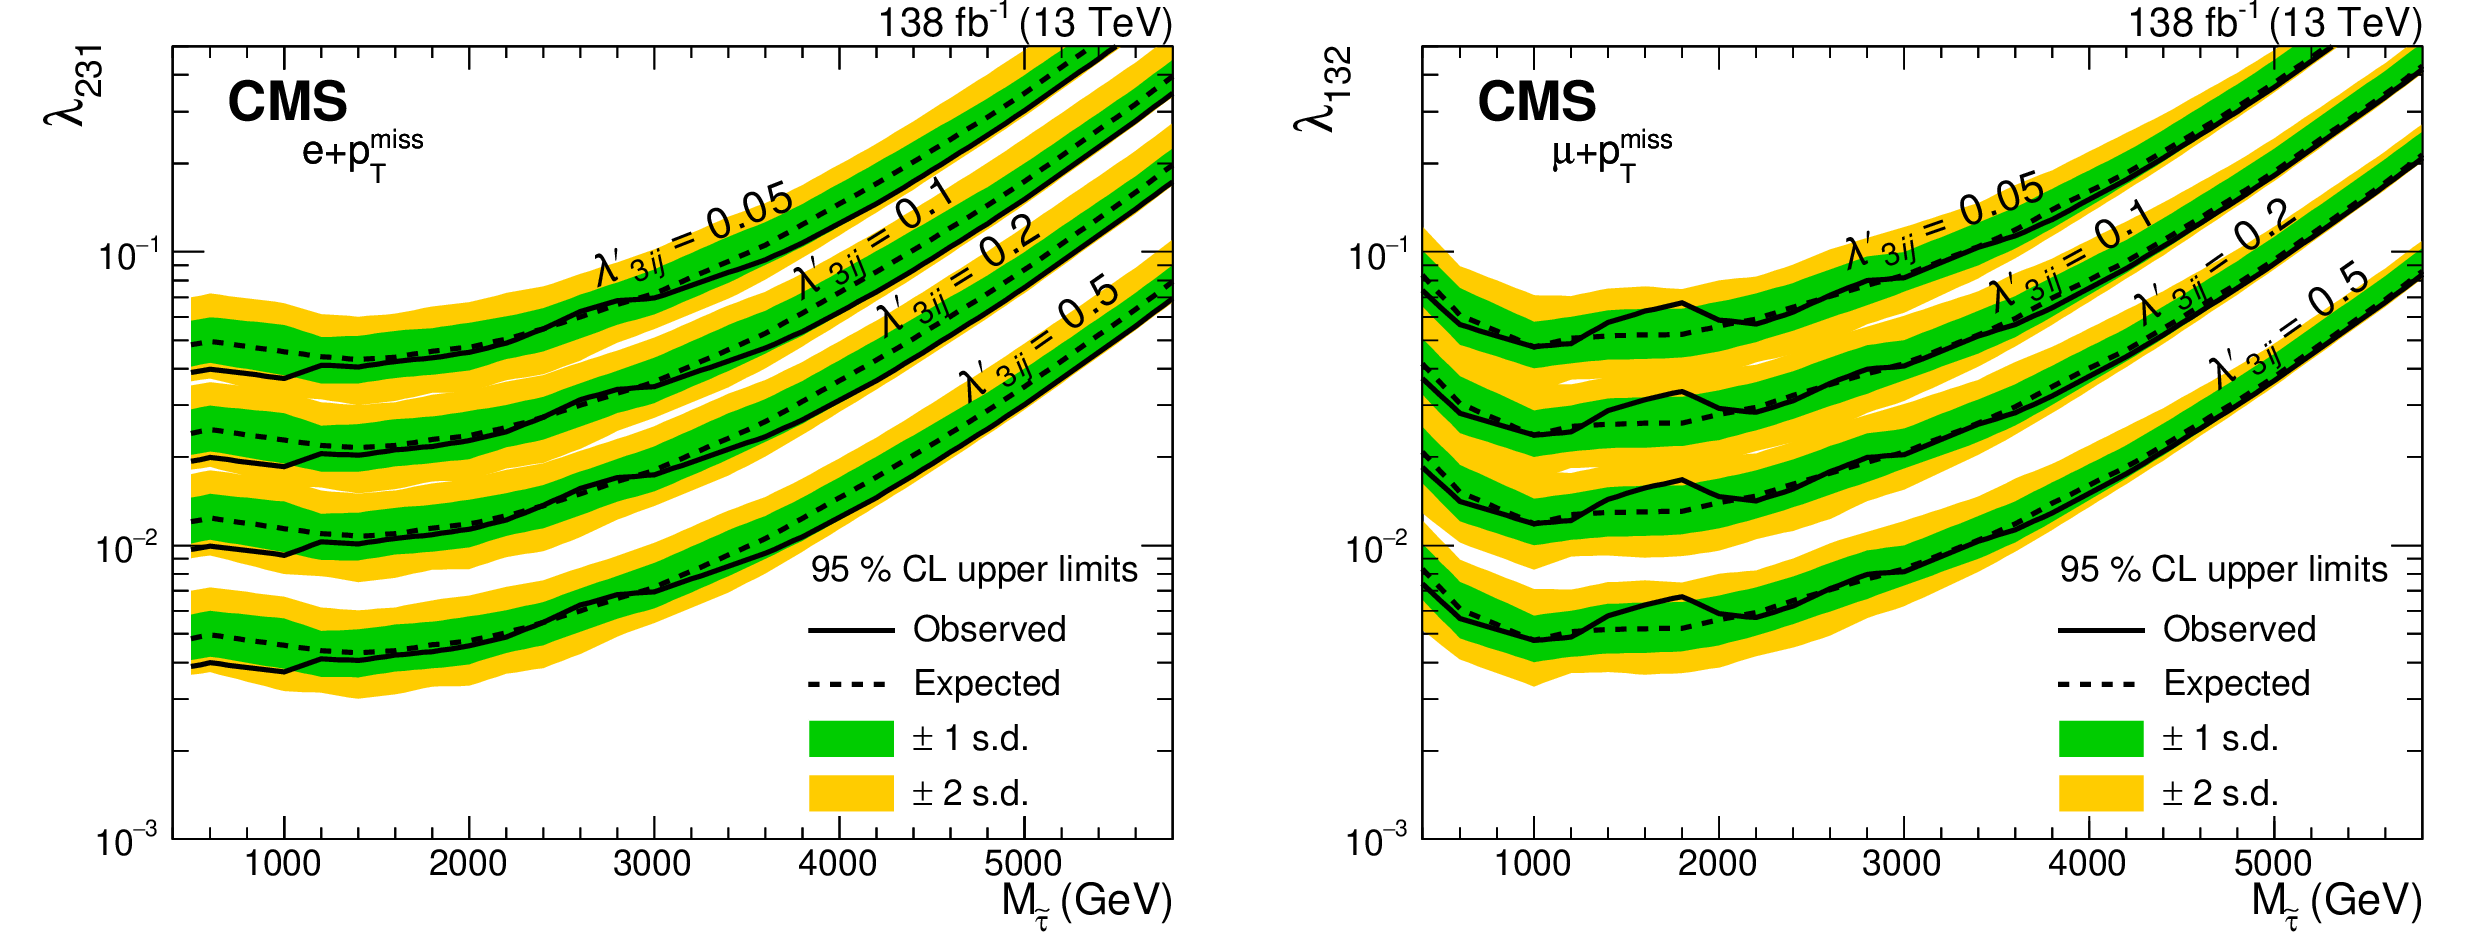
The observed (solid line) and expected (dashed line) upper limits at 95% CL on the couplings $ {\lambda} _{231}$ (left) and $ {\lambda} _{132}$ (right), for several values of $ {\lambda '} _{3ij}$ ($i, j$ = 1, 2, 3), as a function of the mass of the mediator $\tilde{\tau}$ in the RPV SUSY model. The one and two standard deviation uncertainty bands for the expected limits are shown. The areas above the limit curves are excluded. |

png pdf |
Figure 9-a:
The observed (solid line) and expected (dashed line) upper limits at 95% CL on the couplings $ {\lambda} _{231}$ (left) and $ {\lambda} _{132}$ (right), for several values of $ {\lambda '} _{3ij}$ ($i, j$ = 1, 2, 3), as a function of the mass of the mediator $\tilde{\tau}$ in the RPV SUSY model. The one and two standard deviation uncertainty bands for the expected limits are shown. The areas above the limit curves are excluded. |

png pdf |
Figure 9-b:
The observed (solid line) and expected (dashed line) upper limits at 95% CL on the couplings $ {\lambda} _{231}$ (left) and $ {\lambda} _{132}$ (right), for several values of $ {\lambda '} _{3ij}$ ($i, j$ = 1, 2, 3), as a function of the mass of the mediator $\tilde{\tau}$ in the RPV SUSY model. The one and two standard deviation uncertainty bands for the expected limits are shown. The areas above the limit curves are excluded. |
png pdf |
Figure 10:
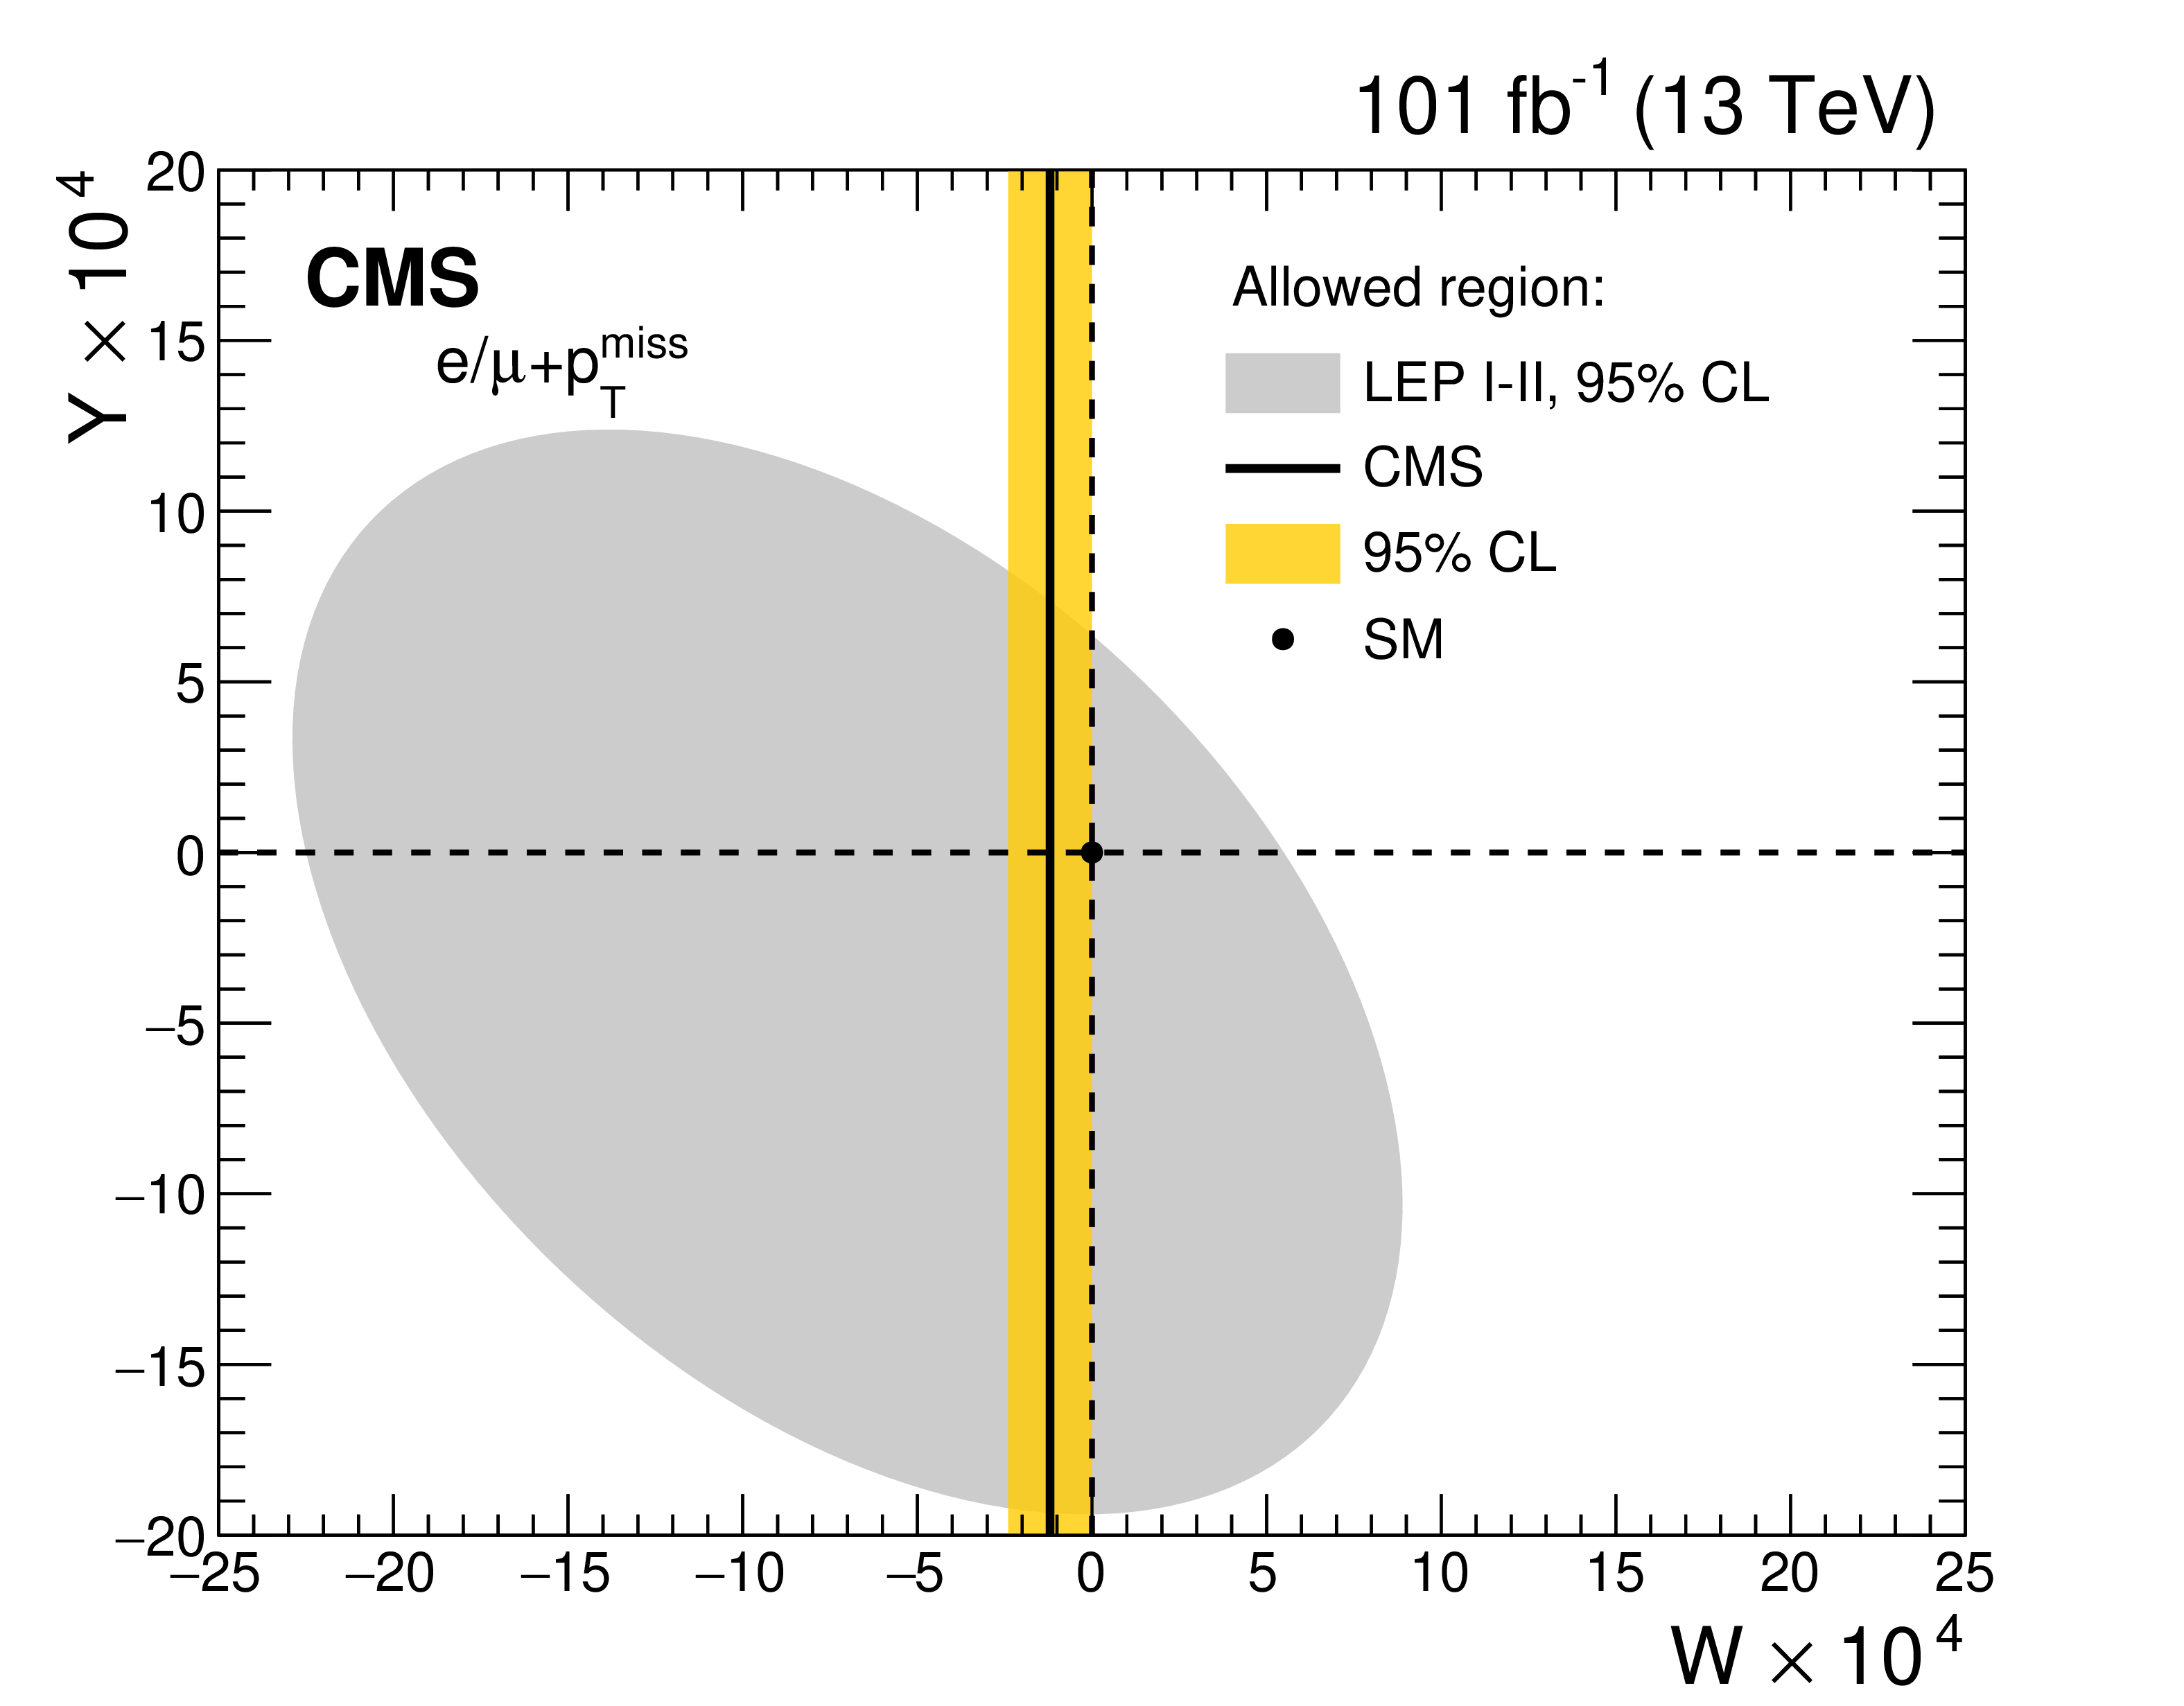
Region in the oblique $(W, Y)$ parameter phase space allowed by the current analysis at 95% CL, obtained by combining electron and muon channel distributions. Comparison of the result from the current analysis with the area derived from LEP experiments (grey-shaded area) is presented. |
png pdf |
Figure 11:
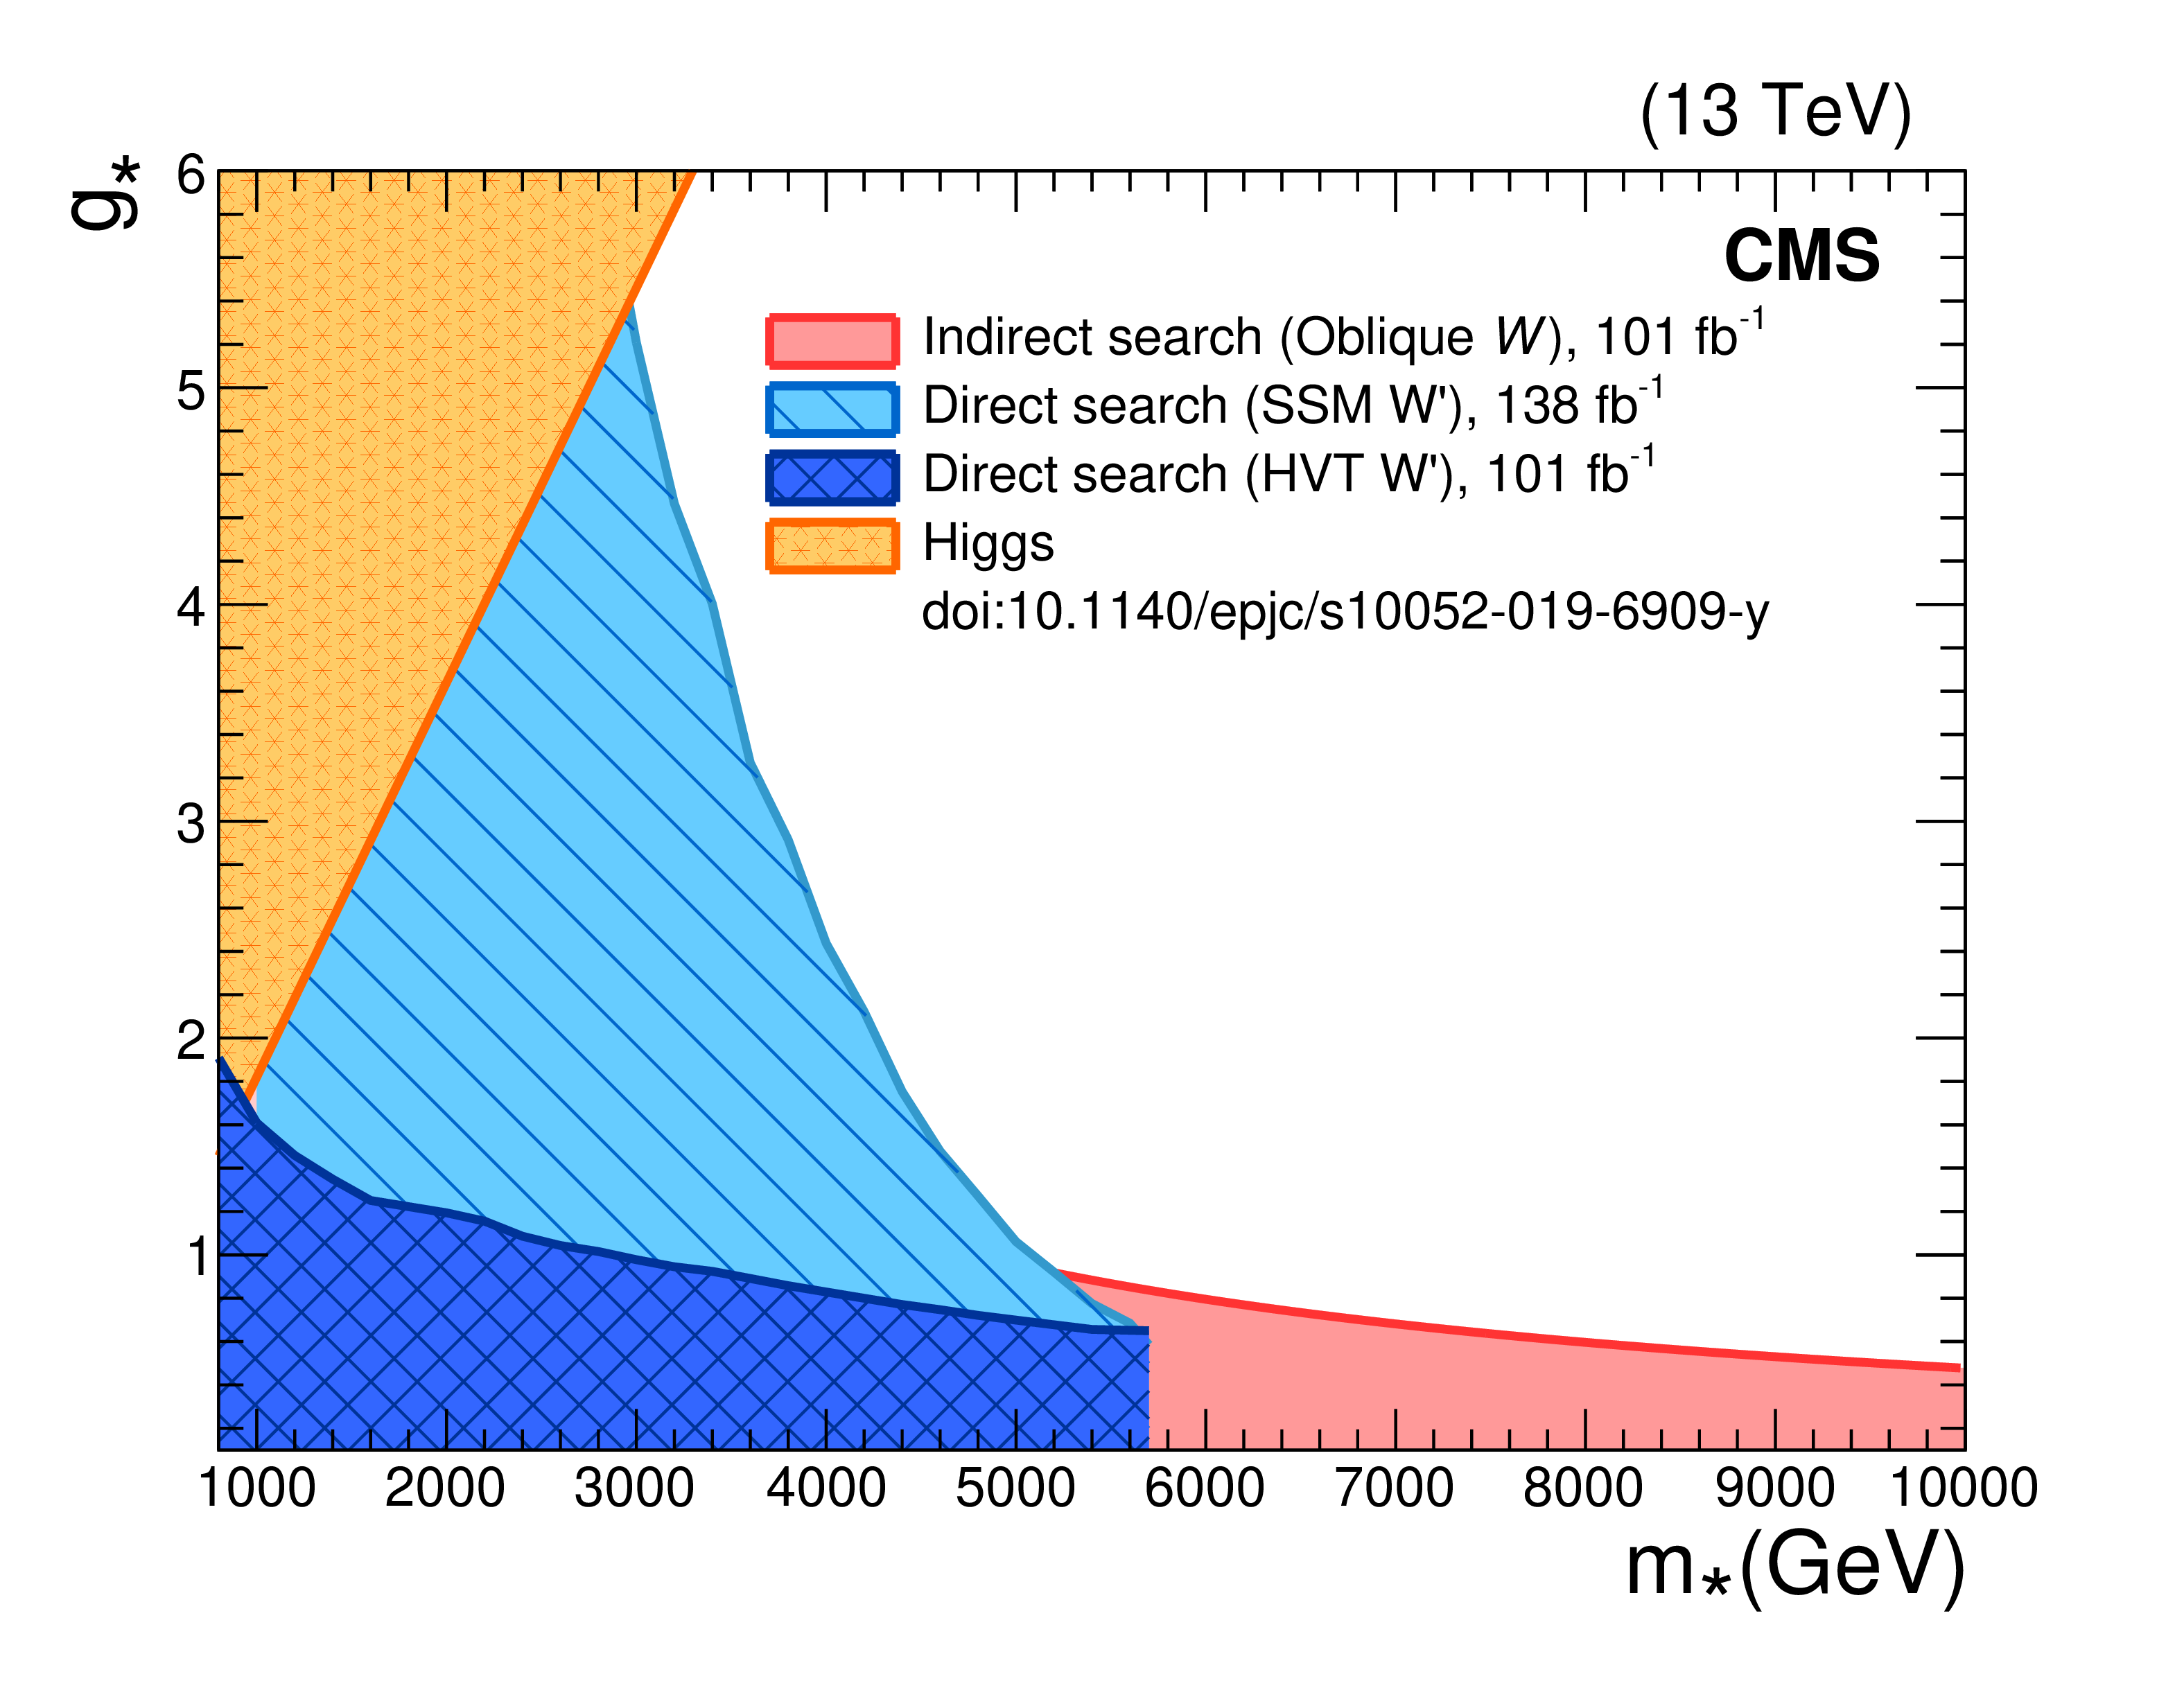
Regions in the $m_{*}$-$g_{*}$ plane excluded at 95% CL by the results derived in the framework of the different models considered in the current analysis. Constraints from the limit on the oblique $W$ parameter are shown in red. Constraints from the limit on the W' boson coupling strength are shown in light blue for the SSM W' hypothesis (only coupling to fermions), and in dark blue for the HVT W' hypothesis (coupling to bosons as well). In addition, the exclusion coming from current CMS constraints on the Higgs boson cross section is shown as a orange shaded area. |
| Tables | |
png pdf |
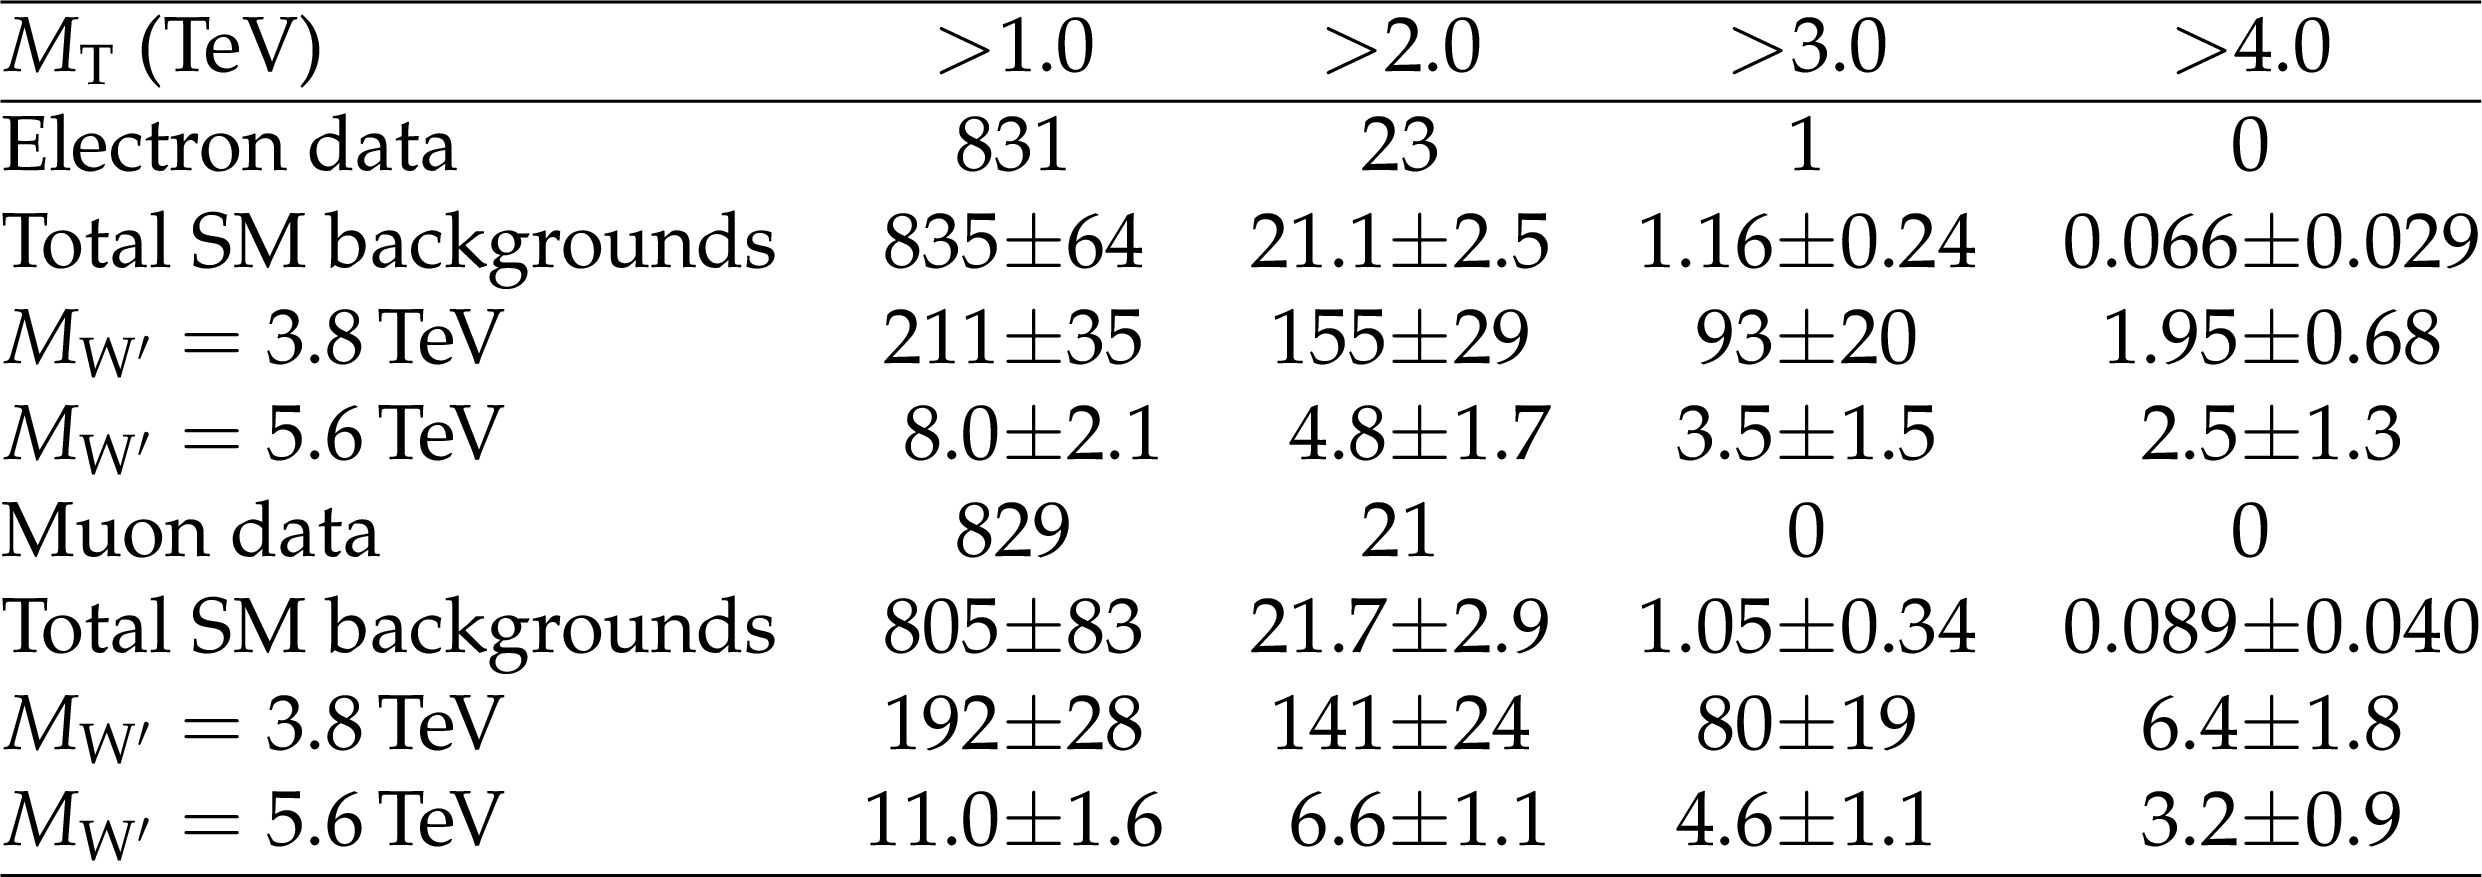
Table 1:
The observed and expected number of events in the electron (upper) and muon (lower) channels, collected during three years (2016-2018), for selected values of ${M_\mathrm {T}}$ threshold. Predicted numbers of SSM W' events are given, for $M_{\mathrm{W'}}= $ 3.8 and 5.6 TeV. The statistical and systematic uncertainties are added in quadrature to provide the total uncertainty. |

png pdf |
Table 2:
Observed and expected lower limits at 95% CL on the SSM W' boson mass for the electron and muon channels and for the combination of the two. |
png pdf |
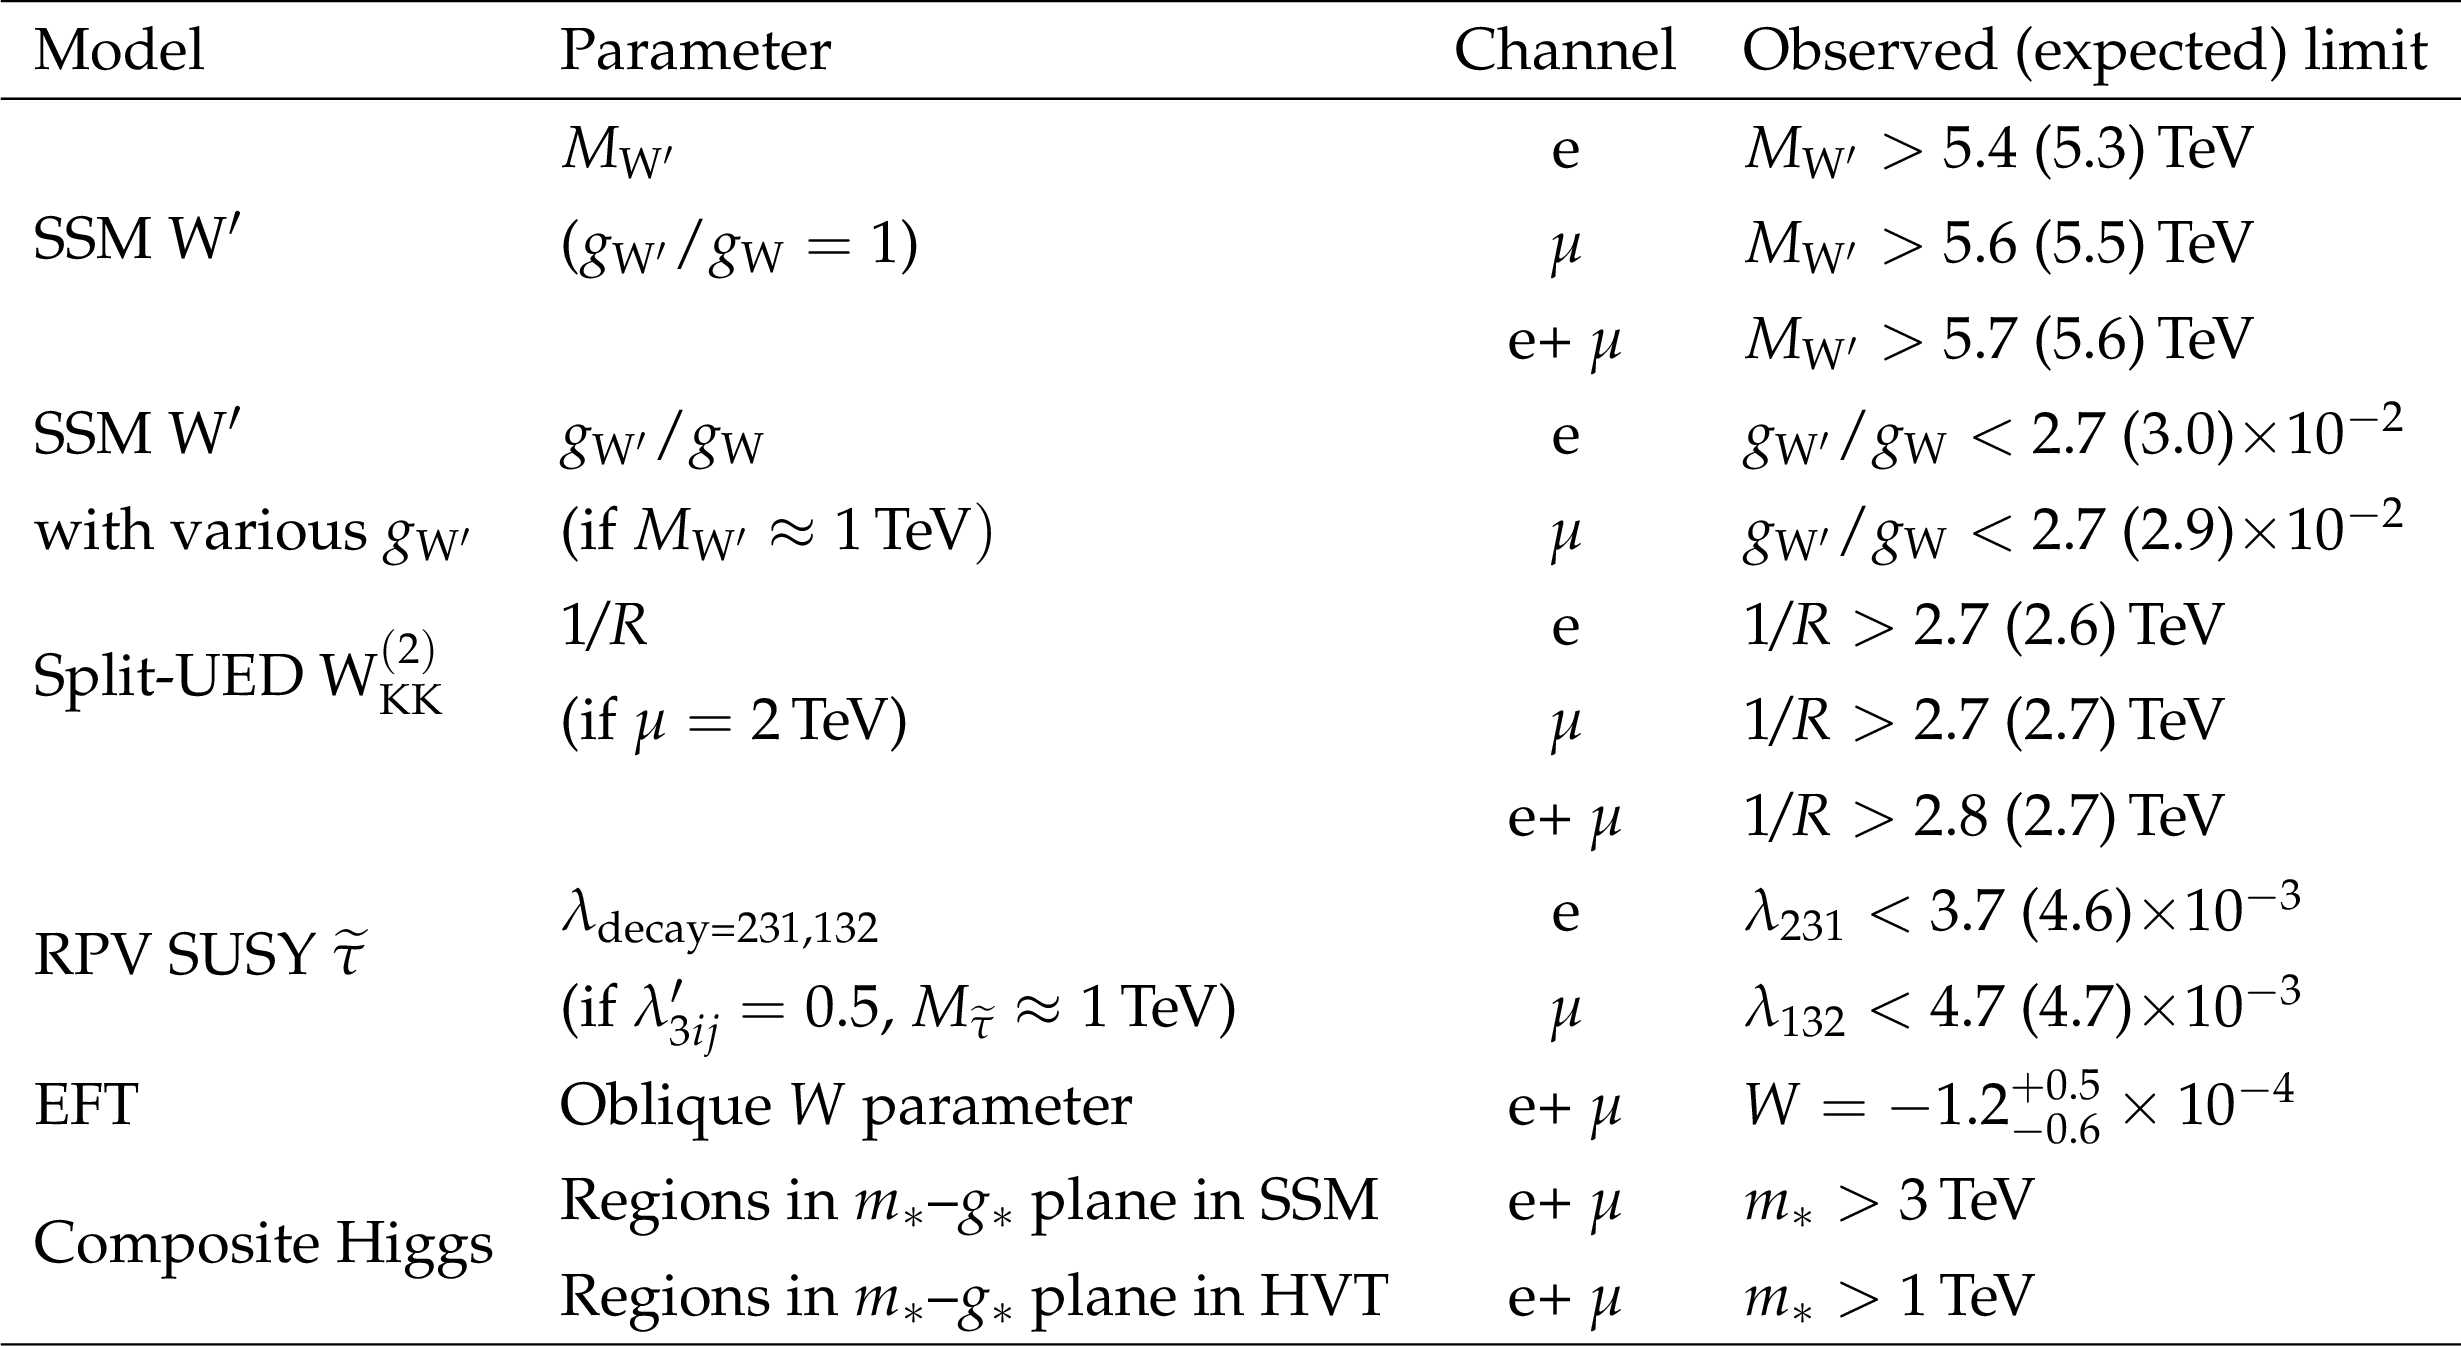
Table 3:
Summary of all 95% CL exclusion limit results with various theoretical model interpretations in the electron and muon channels, and the combination of both channels. The results in EFT and the composite Higgs boson model are obtained using 2017-2018 data sets only. The final allowed ranges for the model parameters are in the last column, except for the oblique $W$ parameter, where a measurement is provided, and the Composite Higgs scenario, as explained in the text. |
| Summary |
|
A search for a deviation relative to standard model (SM) expectations in events with a final state consisting of a lepton (electron or muon) and missing transverse momentum in proton-proton collisions at a centre-of-mass energy of 13 TeV has been performed. The analysis strategy is similar to that of the previous study using data corresponding to an integrated luminosity of 36 fb$^{-1}$ [19]. This search uses data collected by the CMS detector in 2016-2018 corresponding to 138 fb$^{-1}$ of total integrated luminosity. In addition to employing four times larger data set, this search considers two new interpretations. No evidence for new physics is observed when examining the transverse mass distributions. These observations are interpreted as limits on the parameters of several models. The exclusion limits at 95% confidence level (CL) on the mass of a Sequential Standard Model (SSM) W' boson are found to be 5.4 and 5.6 TeV for the electron and muon channels, respectively. The 95% CL exclusion limit from the combination of both channels is 5.7 TeV. Variations in the coupling strength of the SSM W' boson are also examined. Models for which the ratio of the coupling strength of the W' boson to the SM W boson is at the level of 2$\times $10$^{-2}$ are excluded for W' masses up to 0.5 TeV. For higher masses the constraint on the coupling weakens, approaching $g_{\mathrm{W'}}/g_{\mathrm{W}} = $ 1 at the value of $M_{\mathrm{W'}}$ corresponding to the exclusion limit obtained in the SSM analysis. The result is also interpreted in the split universal extra dimensions model. The inverse radius of the extra dimension, 1/$R$, is constrained to be larger than 2.8 TeV if the bulk mass parameter of the five-dimensional fermion field, $\mu = $ 2 TeV. Model-independent limits are also provided. These can be used to constrain parameters of several models through reinterpretations. As an example, the limits have been interpreted in the context of an $R$-parity violating supersymmetric model. This interpretation provides limits on the coupling strengths at the decay vertex as a function of the mediator $\tilde{\tau}$ mass, for various coupling values, $\lambda'_{3ij}$, at the production vertex. In addition to these results, new interpretations of an ${\ell} \nu$ final state analysis using LHC data are considered for the first time. One is the measurement of the oblique $W$ parameter, using the combined electron and muon channels. The oblique $W$ parameter fitted value is $W = -$1.2$^{+0.5}_{-0.6}\times $10$^{-4}$, in agreement within uncertainties with the SM value. This is the most precise measurement to date of the oblique $W$ parameter, reducing its allowed range by more than an order of magnitude relative to previous bounds derived from LEP results. Another new interpretation is made within the framework of composite Higgs boson models. The 95% CL exclusion limit for the combined channels is set in the $m_{*}$-$g_{*}$ plane, where $m_{*}$ indicates the mass scale of compositeness and $g_{*}$ the coupling strength of the new composite sector. In this case, interpretations of several of the presented results have been used in a complementary way, as different inputs for setting the limit. Each of the inputs is sensitive to a different region in the $m_{*}$-$g_{*}$ plane. Constraints coming from the limit on the W' coupling strength dominate the low-$m_{*}$ region and are kinematically limited by the collider energy. The high-$m_{*}$ region is probed by the indirect oblique $W$ parameter interpretation. Finally, we set a lower limit of 3 (1) TeV for the mass scale of such a composite Higgs boson, when an SSM (Heavy Vector Triplet) W' boson is assumed, extending existing constraints from previous measurements. |
| References | ||||
| 1 | Particle Data Group, P. A. Zyla et al. | Review of particle physics | Prog. Theor. Exp. Phys. 2020 (2020) 083C01 | |
| 2 | R. N. Mohapatra and J. C. Pati | ``Natural'' left-right symmetry | PRD 11 (1975) 2558 | |
| 3 | R. N. Mohapatra and J. C. Pati | Left-right gauge symmetry and an ``isoconjugate'' model of $ \mathrm{CP} $ violation | PRD 11 (1975) 566 | |
| 4 | K. Hsieh, K. Schmitz, J.-H. Yu, and C.-P. Yuan | Global analysis of general SU(2)$ \times $SU(2)$ \times $U(1) models with precision data | PRD 82 (2010) 035011 | 1003.3482 |
| 5 | N. Arkani-Hamed, S. Dimopoulos, and G. Dvali | The hierarchy problem and new dimensions at a millimeter | PLB 429 (1998) 263 | hep-ph/9803315 |
| 6 | T. Appelquist, H.-C. Cheng, and B. A. Dobrescu | Bounds on universal extra dimensions | PRD 64 (2001) 035002 | hep-ph/0012100 |
| 7 | CMS Collaboration | Performance of missing transverse momentum reconstruction in proton-proton collisions at $ \sqrt{s}= $ 13 TeV using the CMS detector | JINST 14 (2019) P07004 | CMS-JME-17-001 1903.06078 |
| 8 | G. Altarelli, B. Mele, and M. Ruiz-Altaba | Searching for new heavy vector bosons in $ {\mathrm{p}}\mathrm{\bar{p}} $ colliders | Z. Phys. C 45 (1989) 109, . [Erratum: \DOI10.1007/BF01552335] | |
| 9 | K. Kong, S. C. Park, and T. G. Rizzo | Collider phenomenology with split-UED | JHEP 04 (2010) 081 | 1002.0602 |
| 10 | C.-R. Chen et al. | Dark matter and collider phenomenology of split-UED | JHEP 09 (2009) 078 | 0903.1971 |
| 11 | G. R. Farrar and P. Fayet | Phenomenology of the production, decay, and detection of new hadronic states associated with supersymmetry | PLB 76 (1978) 575 | |
| 12 | H. K. Dreiner and T. Stefaniak | Bounds on R-parity violation from resonant slepton production at the LHC | PRD 86 (2012) 055010 | 1201.5014 |
| 13 | ATLAS Collaboration | ATLAS search for a heavy gauge boson decaying to a charged lepton and a neutrino in pp collisions at $ \sqrt{s}= $ 7 TeV | EPJC 72 (2012) 2241 | 1209.4446 |
| 14 | CMS Collaboration | Search for leptonic decays of $ \mathrm{W'} $ bosons in pp collisions at $ \sqrt{s}= $ 7 TeV | JHEP 08 (2012) 023 | CMS-EXO-11-024 1204.4764 |
| 15 | ATLAS Collaboration | Search for new particles in events with one lepton and missing transverse momentum in pp collisions at $ \sqrt{s}= $ 8 TeV with the ATLAS detector | JHEP 09 (2014) 037 | 1407.7494 |
| 16 | CMS Collaboration | Search for physics beyond the standard model in final states with a lepton and missing transverse energy in proton-proton collisions at $ \sqrt{s}= $ 8 TeV | PRD 91 (2015) 092005 | CMS-EXO-12-060 1408.2745 |
| 17 | ATLAS Collaboration | Search for a new heavy gauge boson resonance decaying into a lepton and missing transverse momentum in 36 fb$^{-1}$ of pp collisions at $ \sqrt{s}= $ 13 TeV with the ATLAS experiment | EPJC 78 (2018) 401 | 1706.04786 |
| 18 | CMS Collaboration | Search for heavy gauge $ \mathrm{W'} $ boson in events with an energetic lepton and large missing transverse momentum at $ \sqrt{s}= $ 13 TeV | PLB 770 (2017) 278 | CMS-EXO-15-006 1612.09274 |
| 19 | CMS Collaboration | Search for high-mass resonances in final states with a lepton and missing transverse momentum at $ \sqrt{s}= $ 13 TeV | JHEP 06 (2018) 128 | CMS-EXO-16-033 1803.11133 |
| 20 | ATLAS Collaboration | Search for a heavy charged boson in events with a charged lepton and missing transverse momentum from pp collisions at $ \sqrt{s}= $ 13 TeV with the ATLAS detector | PRD 100 (2019) 052013 | 1906.05609 |
| 21 | M. E. Peskin and T. Takeuchi | Estimation of oblique electroweak corrections | PRD 46 (1992) 381 | |
| 22 | A. Falkowski and K. Mimouni | Model independent constraints on four-lepton operators | JHEP 02 (2016) 086 | 1511.07434 |
| 23 | ALEPH, DELPHI, L3, and OPAL Collaborations, and the LEP Electroweak Working Group | Electroweak measurements in electron-positron collisions at $ \mathrm{W} $-boson-pair energies at LEP | PR 532 (2013) 119 | 1302.3415 |
| 24 | G. F. Giudice, C. Grojean, A. Pomarol, and R. Rattazzi | The strongly-interacting light Higgs | JHEP 06 (2007) 045 | hep-ph/0703164 |
| 25 | A. Thamm, R. Torre, and A. Wulzer | Future tests of Higgs compositeness: direct vs indirect | JHEP 07 (2015) 100 | 1502.01701 |
| 26 | CMS Collaboration | Combined measurements of higgs boson couplings in proton-proton collisions at $ \sqrt{s}= $ 13 TeV | EPJC 79 (2019) 421 | CMS-HIG-17-031 1809.10733 |
| 27 | CMS Collaboration | HEPData record for this analysis | link | |
| 28 | CMS Collaboration | Performance of the CMS Level-1 trigger in proton-proton collisions at $ \sqrt{s}= $ 13 TeV | JINST 15 (2020) P10017 | CMS-TRG-17-001 2006.10165 |
| 29 | CMS Collaboration | Performance of the CMS muon trigger system in proton-proton collisions at $ \sqrt{s}= $ 13 TeV | JINST 16 (2021) P07001 | CMS-MUO-19-001 2102.04790 |
| 30 | CMS Collaboration | The CMS trigger system | JINST 12 (2017) P01020 | CMS-TRG-12-001 1609.02366 |
| 31 | CMS Collaboration | The CMS experiment at the CERN LHC | JINST 3 (2008) S08004 | CMS-00-001 |
| 32 | T. Sjostrand et al. | An introduction to PYTHIA 8.2 | CPC 191 (2015) 159 | 1410.3012 |
| 33 | R. Vogt | The usage of the K factor in heavy ion physics | Acta Phys. Hung. A 17 (2003) 75 | hep-ph/0207359 |
| 34 | Y. Li and F. Petriello | Combining QCD and electroweak corrections to dilepton production in FEWZ | PRD 86 (2012) 094034 | 1208.5967 |
| 35 | J. Alwall et al. | The automated computation of tree-level and next-to-leading order differential cross sections, and their matching to parton shower simulations | JHEP 07 (2014) 079 | 1405.0301 |
| 36 | M. Farina et al. | Energy helps accuracy: Electroweak precision tests at hadron colliders | PLB 772 (2017) 210 | 1609.08157 |
| 37 | D. Pappadopulo, A. Thamm, R. Torre, and A. Wulzer | Heavy vector triplets: Bridging theory and data | JHEP 09 (2014) 060 | 1402.4431 |
| 38 | CMS Collaboration | Extraction and validation of a new set of CMS PYTHIA8 tunes from underlying-event measurements | EPJC 80 (2020) 4 | CMS-GEN-17-001 1903.12179 |
| 39 | NNPDF Collaboration | Parton distributions from high-precision collider data | EPJC 77 (2017) 663 | 1706.00428 |
| 40 | A. Arbuzov et al. | Update of the MCSANC Monte Carlo integrator, v.1.20 | JEPTL 103 (2016) 131 | 1509.03052 |
| 41 | S. Alioli et al. | Precision studies of observables in $ pp \to $ W $ \to l\nu $ and $ pp \to \gamma $,Z $ \to l^{+}l^{-} $ processes at the LHC | EPJC 77 (2017) 280 | 1606.02330 |
| 42 | V. Bertone, S. Carrazza, N. Hartland, and J. Rojo | Illuminating the photon content of the proton within a global PDF analysis | SciPost Phys. 5 (2018) 008 | 1712.07053 |
| 43 | A. Manohar, P. Nason, G. P. Salam, and G. Zanderighi | How bright is the proton? A precise determination of the photon parton distribution function | PRL 117 (2016) 24 | 1607.04266 |
| 44 | J. Butterworth et al. | PDF4LHC recommendations for LHC Run II | JPG 43 (2016) 023001 | 1510.03865 |
| 45 | R. Frederix and S. Frixione | Merging meets matching in MC@NLO | JHEP 12 (2012) 061 | 1209.6215 |
| 46 | J. Alwall et al. | Comparative study of various algorithms for the merging of parton showers and matrix elements in hadronic collisions | EPJC 53 (2008) 473 | 0706.2569 |
| 47 | P. Nason | A new method for combining NLO QCD with shower Monte Carlo algorithms | JHEP 11 (2004) 040 | hep-ph/0409146 |
| 48 | S. Frixione, P. Nason, and C. Oleari | Matching NLO QCD computations with parton shower simulations: the POWHEG method | JHEP 11 (2007) 070 | 0709.2092 |
| 49 | S. Alioli, P. Nason, C. Oleari, and E. Re | A general framework for implementing NLO calculations in shower Monte Carlo programs: the POWHEG BOX | JHEP 06 (2010) 043 | 1002.2581 |
| 50 | M. Czakon, P. Fiedler, and A. Mitov | Total top-quark pair-production cross section at hadron colliders through $ \mathcal{O}({{\alpha}}_{S}^{4}) $ | PRL 110 (2013) 252004 | 1303.6254 |
| 51 | M. Czakon et al. | Top-pair production at the LHC through NNLO QCD and NLO EW | JHEP 10 (2017) 186 | 1705.04105 |
| 52 | T. Gehrmann et al. | $ {\mathrm{W}^{+}\mathrm{W}^{{-}}} $ production at hadron colliders in Next-to-next-to-leading order QCD | PRL 113 (2014) 212001 | 1408.5243 |
| 53 | J. M. Campbell, R. K. Ellis, and C. Williams | Vector boson pair production at the LHC | JHEP 07 (2011) 018 | 1105.0020 |
| 54 | F. Cascioli et al. | ZZ production at hadron colliders in NNLO QCD | PLB 735 (2014) 311 | |
| 55 | GEANT4 Collaboration | GEANT4--a simulation toolkit | NIMA 506 (2003) 250 | |
| 56 | J. Allison et al. | Recent developments in GEANT4 | NIMA 835 (2016) 186 | |
| 57 | CMS Collaboration | Measurement of the inelastic proton-proton cross section at $ \sqrt{s}= $ 13 TeV | JHEP 07 (2018) 161 | CMS-FSQ-15-005 1802.02613 |
| 58 | M. Cacciari, G. P. Salam, and G. Soyez | The anti-$ {k_{\mathrm{T}}} $ jet clustering algorithm | JHEP 04 (2008) 063 | 0802.1189 |
| 59 | M. Cacciari, G. P. Salam, and G. Soyez | FastJet user manual | EPJC 72 (2012) 1896 | 1111.6097 |
| 60 | CMS Collaboration | Particle-flow reconstruction and global event description with the cms detector | JINST 12 (2017) P10003 | CMS-PRF-14-001 1706.04965 |
| 61 | CMS Collaboration | Search for narrow resonances in dilepton mass spectra in proton-proton collisions at $ \sqrt{s}= $ 13 TeV and combination with 8 TeV data | PLB 768 (2017) 57 | CMS-EXO-15-005 1609.05391 |
| 62 | CMS Collaboration | Electron and photon reconstruction and identification with the CMS experiment at the CERN LHC | JINST 16 (2021) P05014 | CMS-EGM-17-001 2012.06888 |
| 63 | CMS Collaboration | Performance of the CMS muon detector and muon reconstruction with proton-proton collisions at $ \sqrt{s}= $ 13 TeV | JINST 13 (2018) P06015 | CMS-MUO-16-001 1804.04528 |
| 64 | CMS Collaboration | Performance of the reconstruction and identification of high-momentum muons in proton-proton collisions at $ \sqrt{s}= $ 13 TeV | JINST 15 (2020) P02027 | CMS-MUO-17-001 1912.03516 |
| 65 | CMS Collaboration | Jet energy scale and resolution in the CMS experiment in pp collisions at 8 TeV | JINST 12 (2017) P02014 | CMS-JME-13-004 1607.03663 |
| 66 | CMS Collaboration | Identification of heavy-flavour jets with the CMS detector in pp collisions at 13 TeV | JINST 13 (2018) P05011 | CMS-BTV-16-002 1712.07158 |
| 67 | CMS Collaboration | Determination of jet energy calibration and transverse momentum resolution in CMS | JINST 6 (2011) P11002 | CMS-JME-10-011 1107.4277 |
| 68 | CMS Collaboration | Measurement of the inclusive $ \mathrm{W} $ and $ \mathrm{Z} $ production cross sections in pp collisions at $ \sqrt{s}= $ 7 TeV | JHEP 10 (2011) 132 | CMS-EWK-10-005 1107.4789 |
| 69 | CMS Collaboration | Precision luminosity measurement in proton-proton collisions at $ \sqrt{s}= $ 13 TeV in 2015 and 2016 at CMS | EPJC 81 (2021) 800 | CMS-LUM-17-003 2104.01927 |
| 70 | CMS Collaboration | CMS luminosity measurement for the 2017 data-taking period at $ \sqrt{s}= $ 13 TeV | CMS-PAS-LUM-17-004 | CMS-PAS-LUM-17-004 |
| 71 | CMS Collaboration | CMS luminosity measurement for the 2018 data-taking period at $ \sqrt{s}= $ 13 TeV | CMS-PAS-LUM-18-002 | CMS-PAS-LUM-18-002 |
| 72 | J. S. Conway | Incorporating nuisance parameters in likelihoods for multisource spectra | 2011 | 1103.0354 |
| 73 | R. Barlow and C. Beeston | Fitting using finite Monte Carlo samples | CPC 77 (1993) 219 | |
| 74 | F. James | MINUIT: function minimization and error analysis reference manual | CERN-D-506 | |
| 75 | CMS Collaboration | Precise determination of the mass of the Higgs boson and tests of compatibility of its couplings with the standard model predictions using proton collisions at 7 and 8 TeV | EPJC 75 (2015) 212 | CMS-HIG-14-009 1412.8662 |
|
|
Compact Muon Solenoid LHC, CERN |
|

|

|

|

|

|