

Compact Muon Solenoid
LHC, CERN
| CMS-TOP-22-012 ; CERN-EP-2023-021 | ||
| First measurement of the top quark pair production cross section in proton-proton collisions at $\sqrt{s} = $ 13.6 TeV | ||
| CMS Collaboration | ||
| 19 March 2023 | ||
| JHEP 08 (2023) 204 | ||
| Abstract: The first measurement of the top quark pair ( $ \mathrm{t} \overline{\mathrm{t}} $) production cross section in proton-proton collisions at $\sqrt{s} = $ 13.6 TeV is presented. Data recorded with the CMS detector at the CERN LHC in Summer 2022, corresponding to an integrated luminosity of 1.21 fb$^{-1}$, are analyzed. Events are selected with one or two charged leptons (electrons or muons) and additional jets. A maximum likelihood fit is performed in event categories defined by the number and flavors of the leptons, the number of jets, and the number of jets identified as originating from b quarks. An inclusive $ \mathrm{t} \overline{\mathrm{t}} $ production cross section of 881 $ \pm $ 23 (stat+syst) $ \pm $ 20 (lumi) pb is measured, in agreement with the standard model prediction of 924 $^{+32}_{-40} $ pb. | ||
| Links: e-print arXiv:2303.10680 [hep-ex] (PDF) ; CDS record ; inSPIRE record ; HepData record ; Physics Briefing ; CADI line (restricted) ; | ||
| Figures & Tables | Summary | Additional Figures | References | CMS Publications |
|---|
| Figures | |

png pdf |
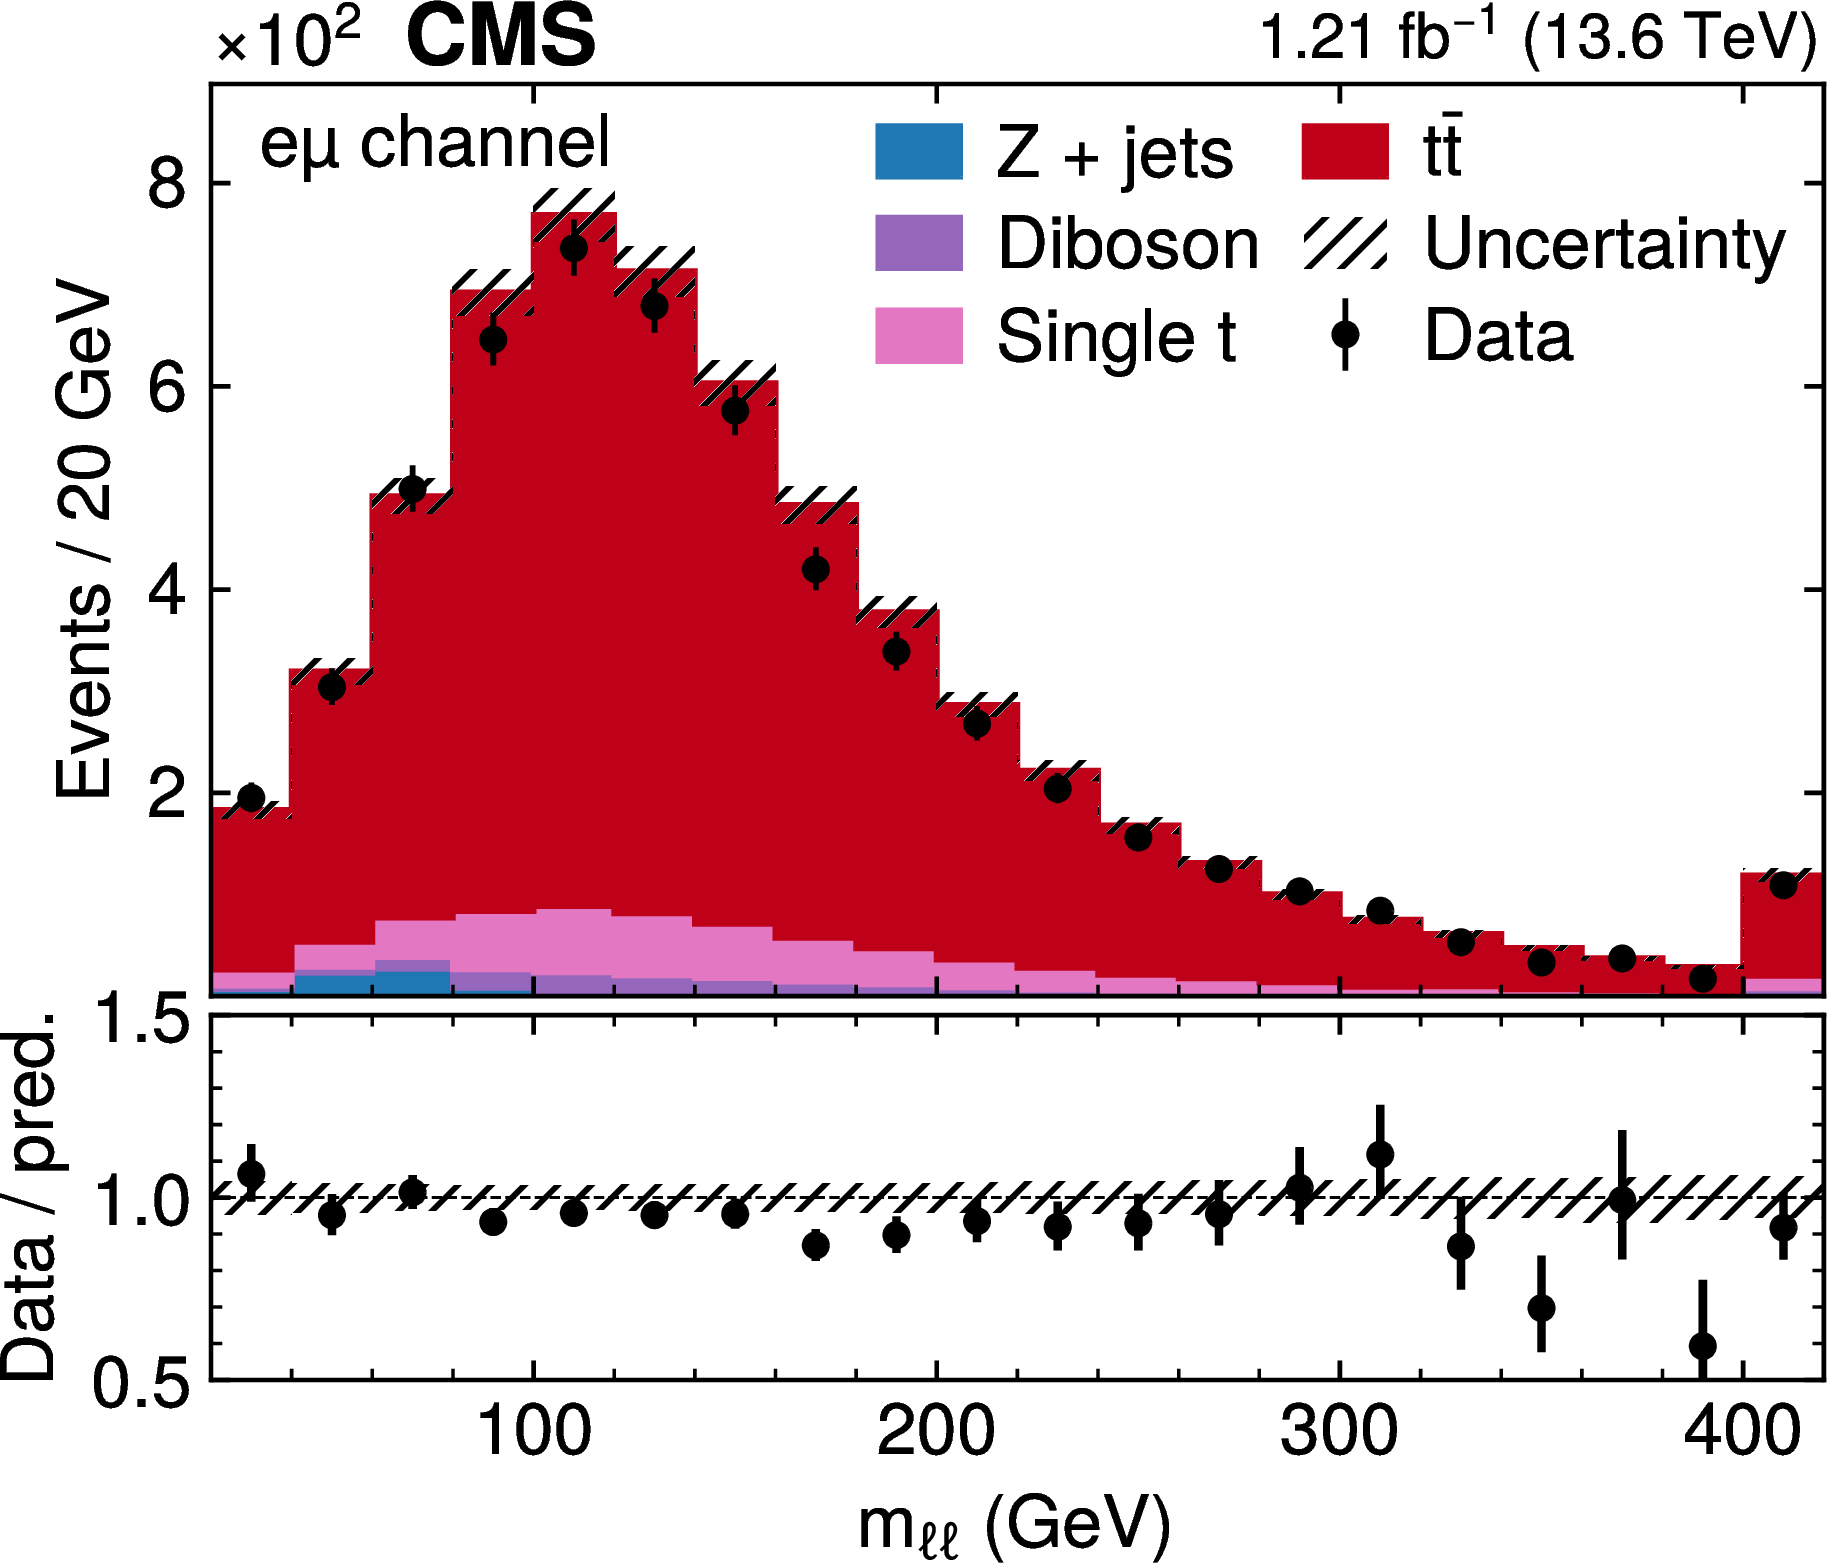
Figure 1:
Comparison of the number of observed (points) and predicted (filled histograms) events in the $ \mathrm{e}^\pm\mu^\mp $ channel. The distributions of the $ p_{\mathrm{T}} $ (upper left) and $ \eta $ (upper right) of both leptons, the leading jet $ p_{\mathrm{T}} $ (middle left), $ m_{\ell\ell} $ (middle right), and the number of jets (lower left) and b jets (lower right) are displayed. The predictions are normalized using the measured integrated luminosity and predicted cross sections, and are scaled by the b jet scale factors as obtained from the fit. The vertical bars on the points represent the statistical uncertainties in the data, and the hatched bands the systematic uncertainty in the predictions, including the integrated luminosity. The last bins include the overflow contributions. In the lower panels, the ratio of the event yields in data to the sum of predicted signal and background yields is presented. |

png pdf |
Figure 1-a:
Comparison of the number of observed (points) and predicted (filled histograms) events in the $ \mathrm{e}^\pm\mu^\mp $ channel for the distribution of the $ p_{\mathrm{T}} $ of both leptons. The predictions are normalized using the measured integrated luminosity and predicted cross sections, and are scaled by the b jet scale factors as obtained from the fit. The vertical bars on the points represent the statistical uncertainties in the data, and the hatched bands the systematic uncertainty in the predictions, including the integrated luminosity. The last bin includes the overflow contributions. In the lower panel, the ratio of the event yields in data to the sum of predicted signal and background yields is presented. |

png pdf |
Figure 1-b:
Comparison of the number of observed (points) and predicted (filled histograms) events in the $ \mathrm{e}^\pm\mu^\mp $ channel for the distribution of the $ \eta $ of both leptons. The predictions are normalized using the measured integrated luminosity and predicted cross sections, and are scaled by the b jet scale factors as obtained from the fit. The vertical bars on the points represent the statistical uncertainties in the data, and the hatched bands the systematic uncertainty in the predictions, including the integrated luminosity. The last bin includes the overflow contributions. In the lower panel, the ratio of the event yields in data to the sum of predicted signal and background yields is presented. |

png pdf |
Figure 1-c:
Comparison of the number of observed (points) and predicted (filled histograms) events in the $ \mathrm{e}^\pm\mu^\mp $ channel for the distribution of the leading jet $ p_{\mathrm{T}} $. The predictions are normalized using the measured integrated luminosity and predicted cross sections, and are scaled by the b jet scale factors as obtained from the fit. The vertical bars on the points represent the statistical uncertainties in the data, and the hatched bands the systematic uncertainty in the predictions, including the integrated luminosity. The last bin includes the overflow contributions. In the lower panel, the ratio of the event yields in data to the sum of predicted signal and background yields is presented. |
png pdf |
Figure 1-d:
Comparison of the number of observed (points) and predicted (filled histograms) events in the $ \mathrm{e}^\pm\mu^\mp $ channel for the distribution of $ m_{\ell\ell} $. The predictions are normalized using the measured integrated luminosity and predicted cross sections, and are scaled by the b jet scale factors as obtained from the fit. The vertical bars on the points represent the statistical uncertainties in the data, and the hatched bands the systematic uncertainty in the predictions, including the integrated luminosity. The last bin includes the overflow contributions. In the lower panel, the ratio of the event yields in data to the sum of predicted signal and background yields is presented. |
png pdf |
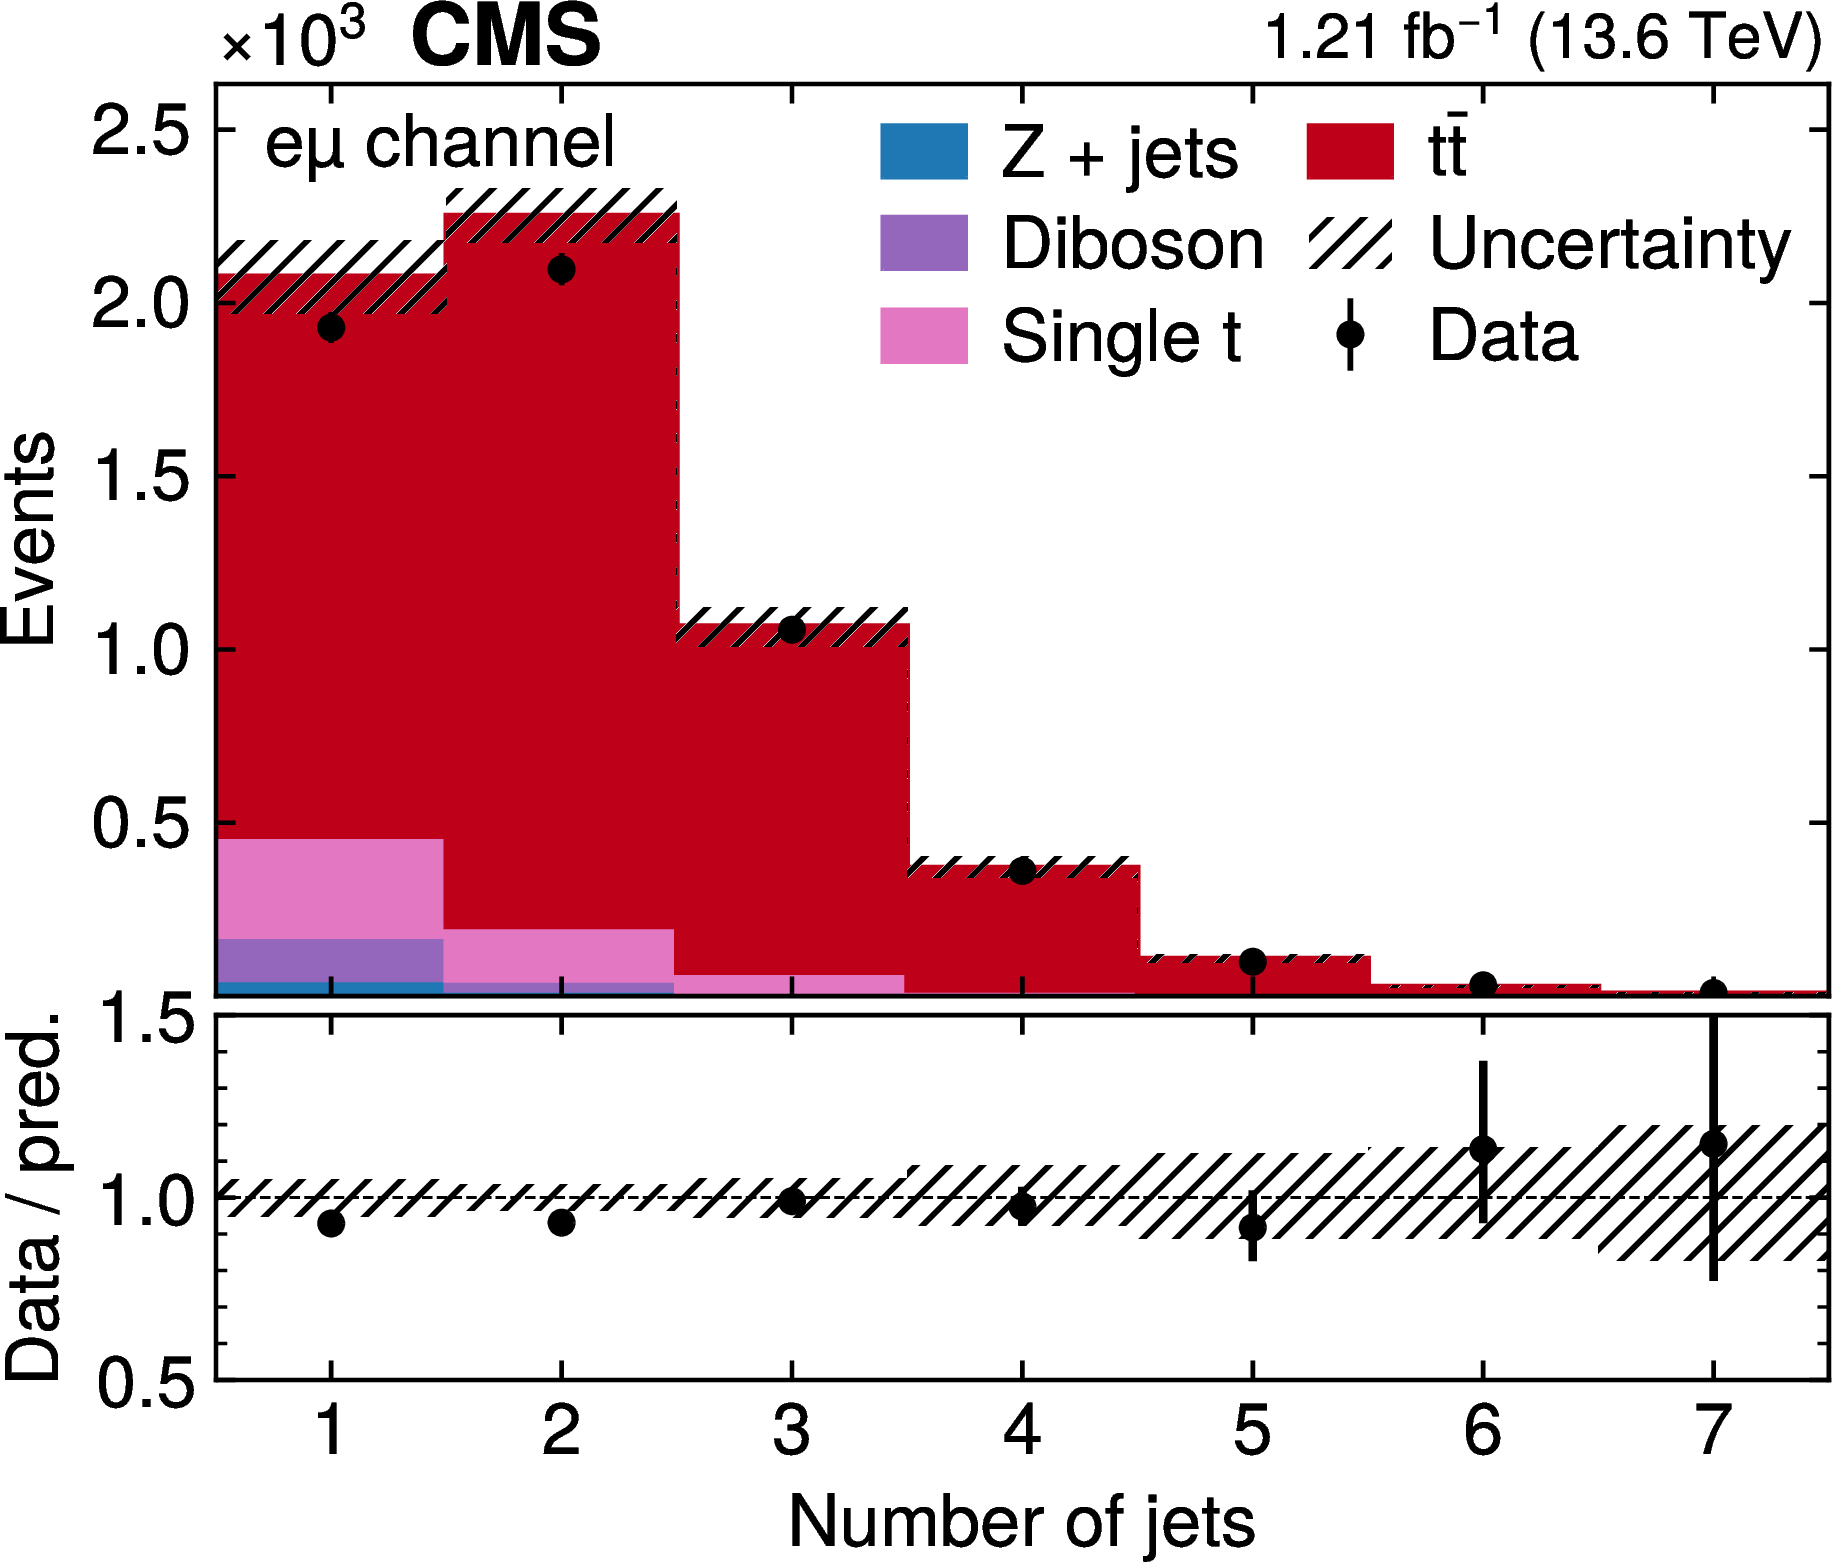
Figure 1-e:
Comparison of the number of observed (points) and predicted (filled histograms) events in the $ \mathrm{e}^\pm\mu^\mp $ channel for the distribution of the number of jets. The predictions are normalized using the measured integrated luminosity and predicted cross sections, and are scaled by the b jet scale factors as obtained from the fit. The vertical bars on the points represent the statistical uncertainties in the data, and the hatched bands the systematic uncertainty in the predictions, including the integrated luminosity. The last bin includes the overflow contributions. In the lower panel, the ratio of the event yields in data to the sum of predicted signal and background yields is presented. |
png pdf |
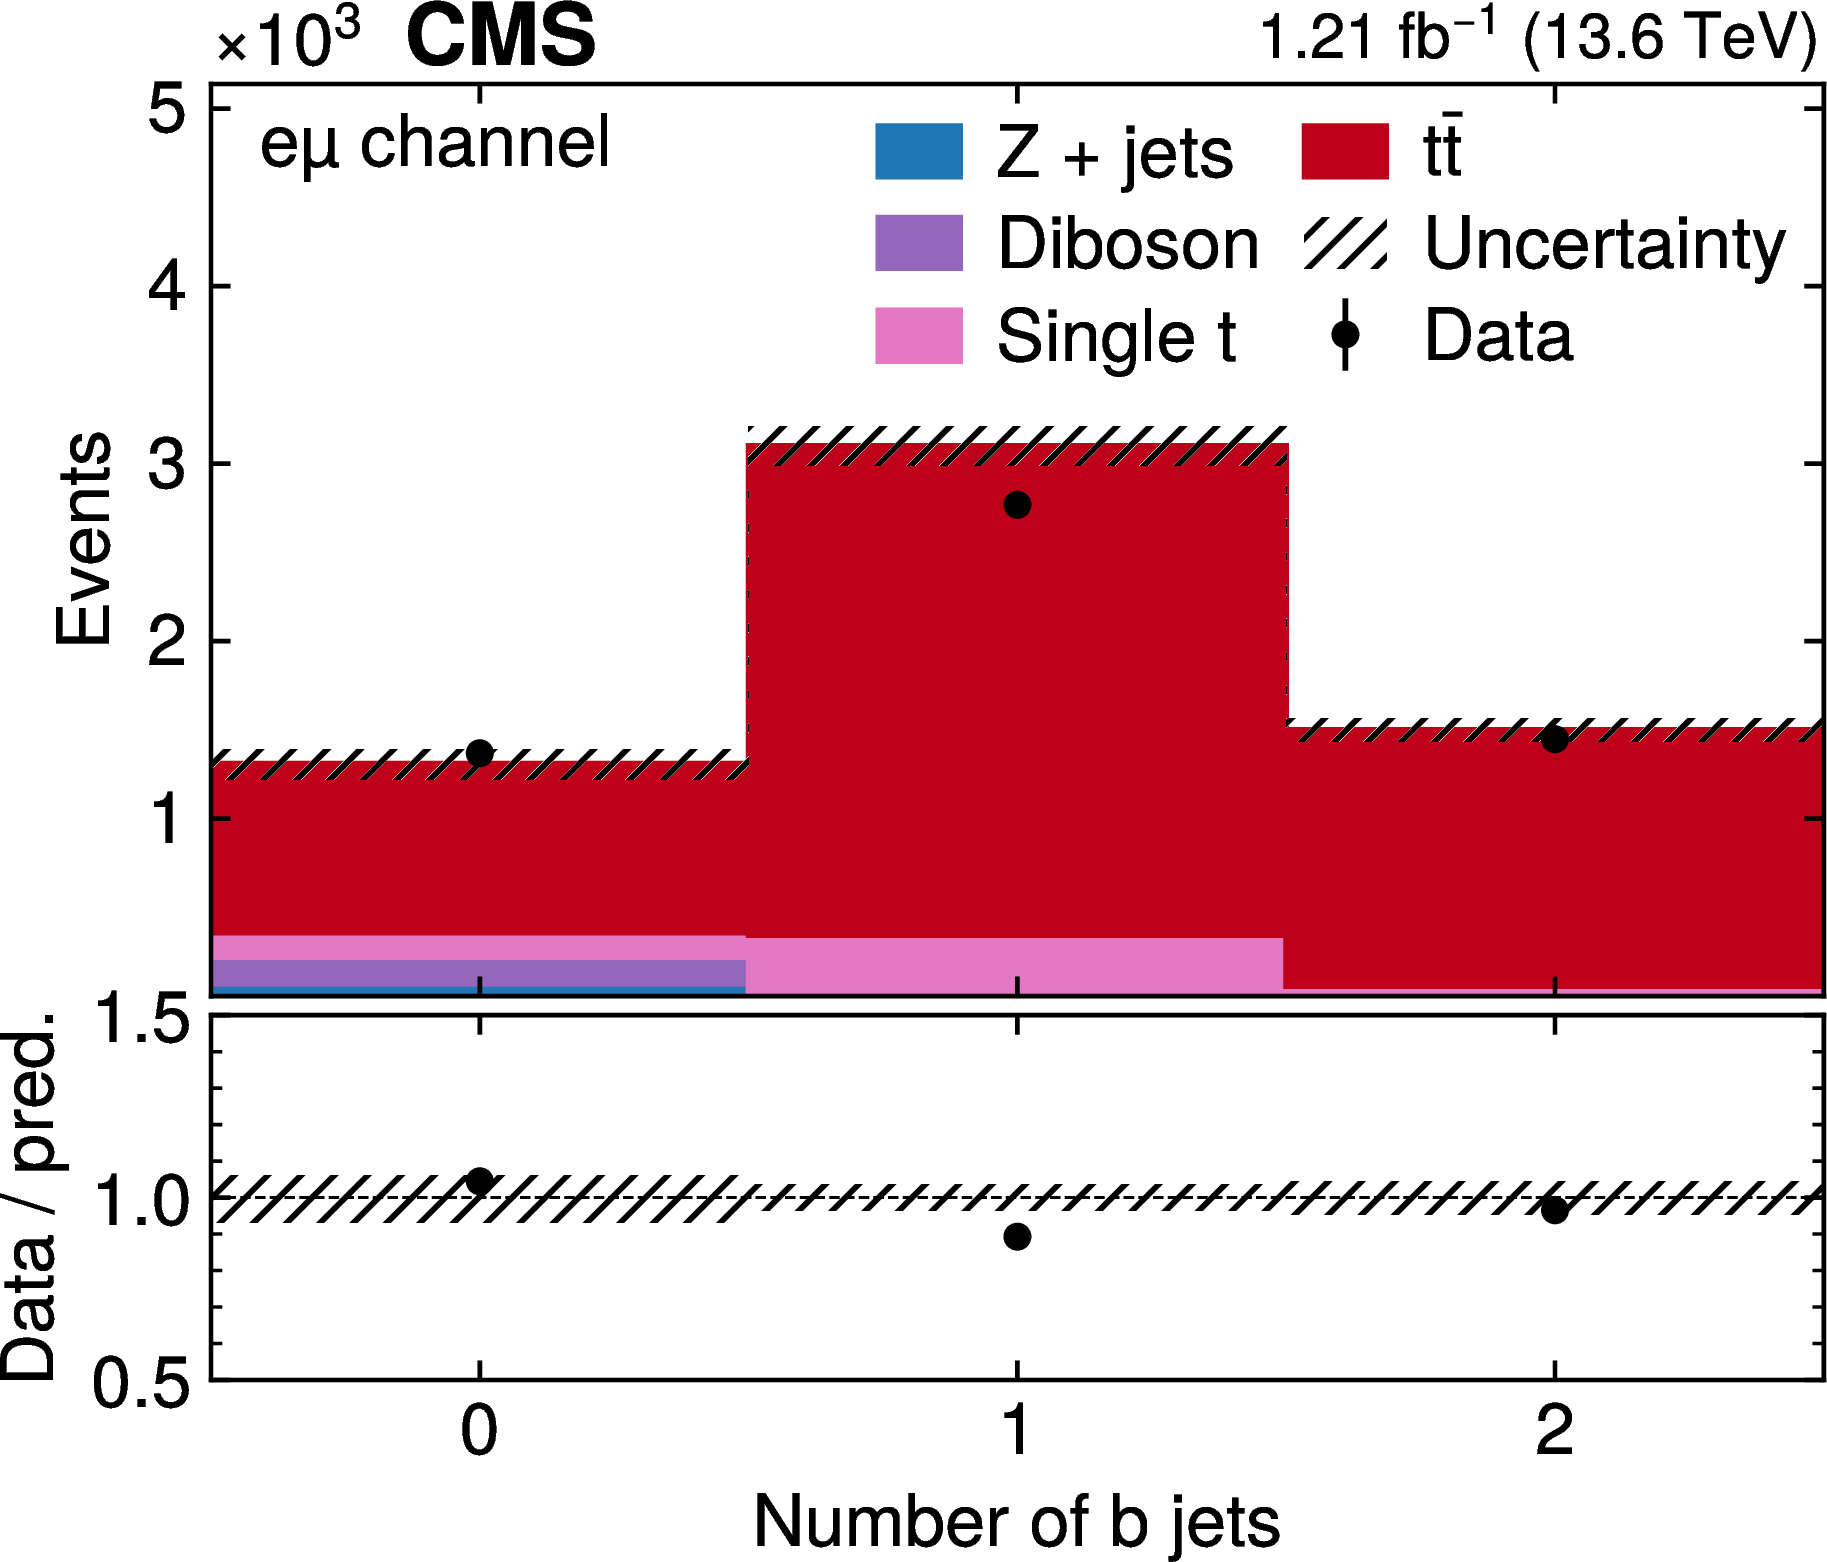
Figure 1-f:
Comparison of the number of observed (points) and predicted (filled histograms) events in the $ \mathrm{e}^\pm\mu^\mp $ channel for the distribution of the number of b jets. The predictions are normalized using the measured integrated luminosity and predicted cross sections, and are scaled by the b jet scale factors as obtained from the fit. The vertical bars on the points represent the statistical uncertainties in the data, and the hatched bands the systematic uncertainty in the predictions, including the integrated luminosity. The last bin includes the overflow contributions. In the lower panel, the ratio of the event yields in data to the sum of predicted signal and background yields is presented. |

png pdf |
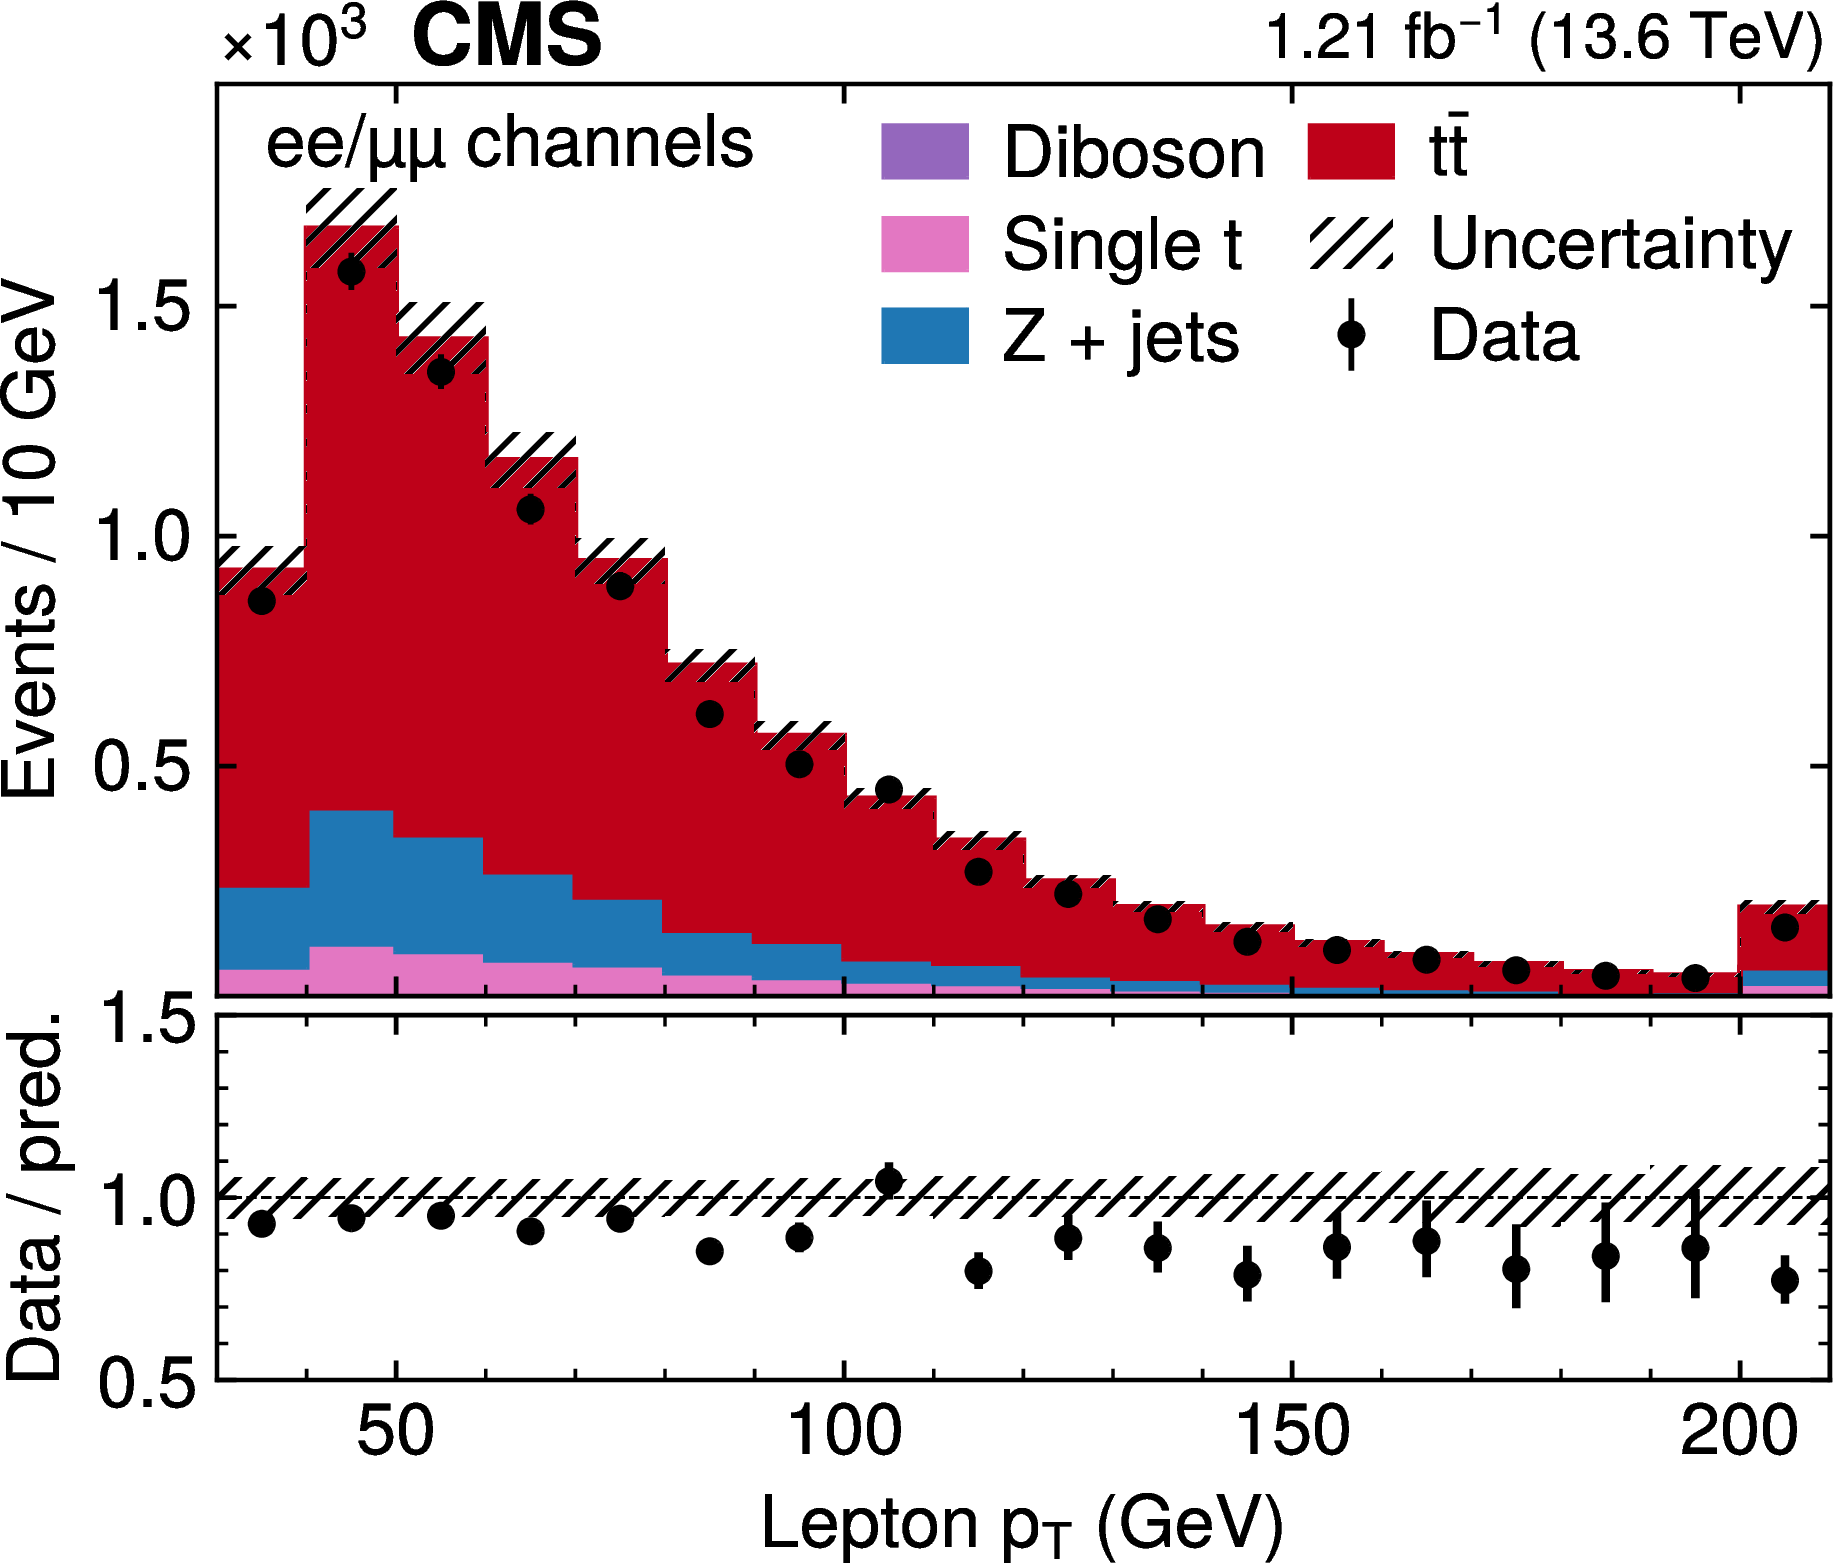
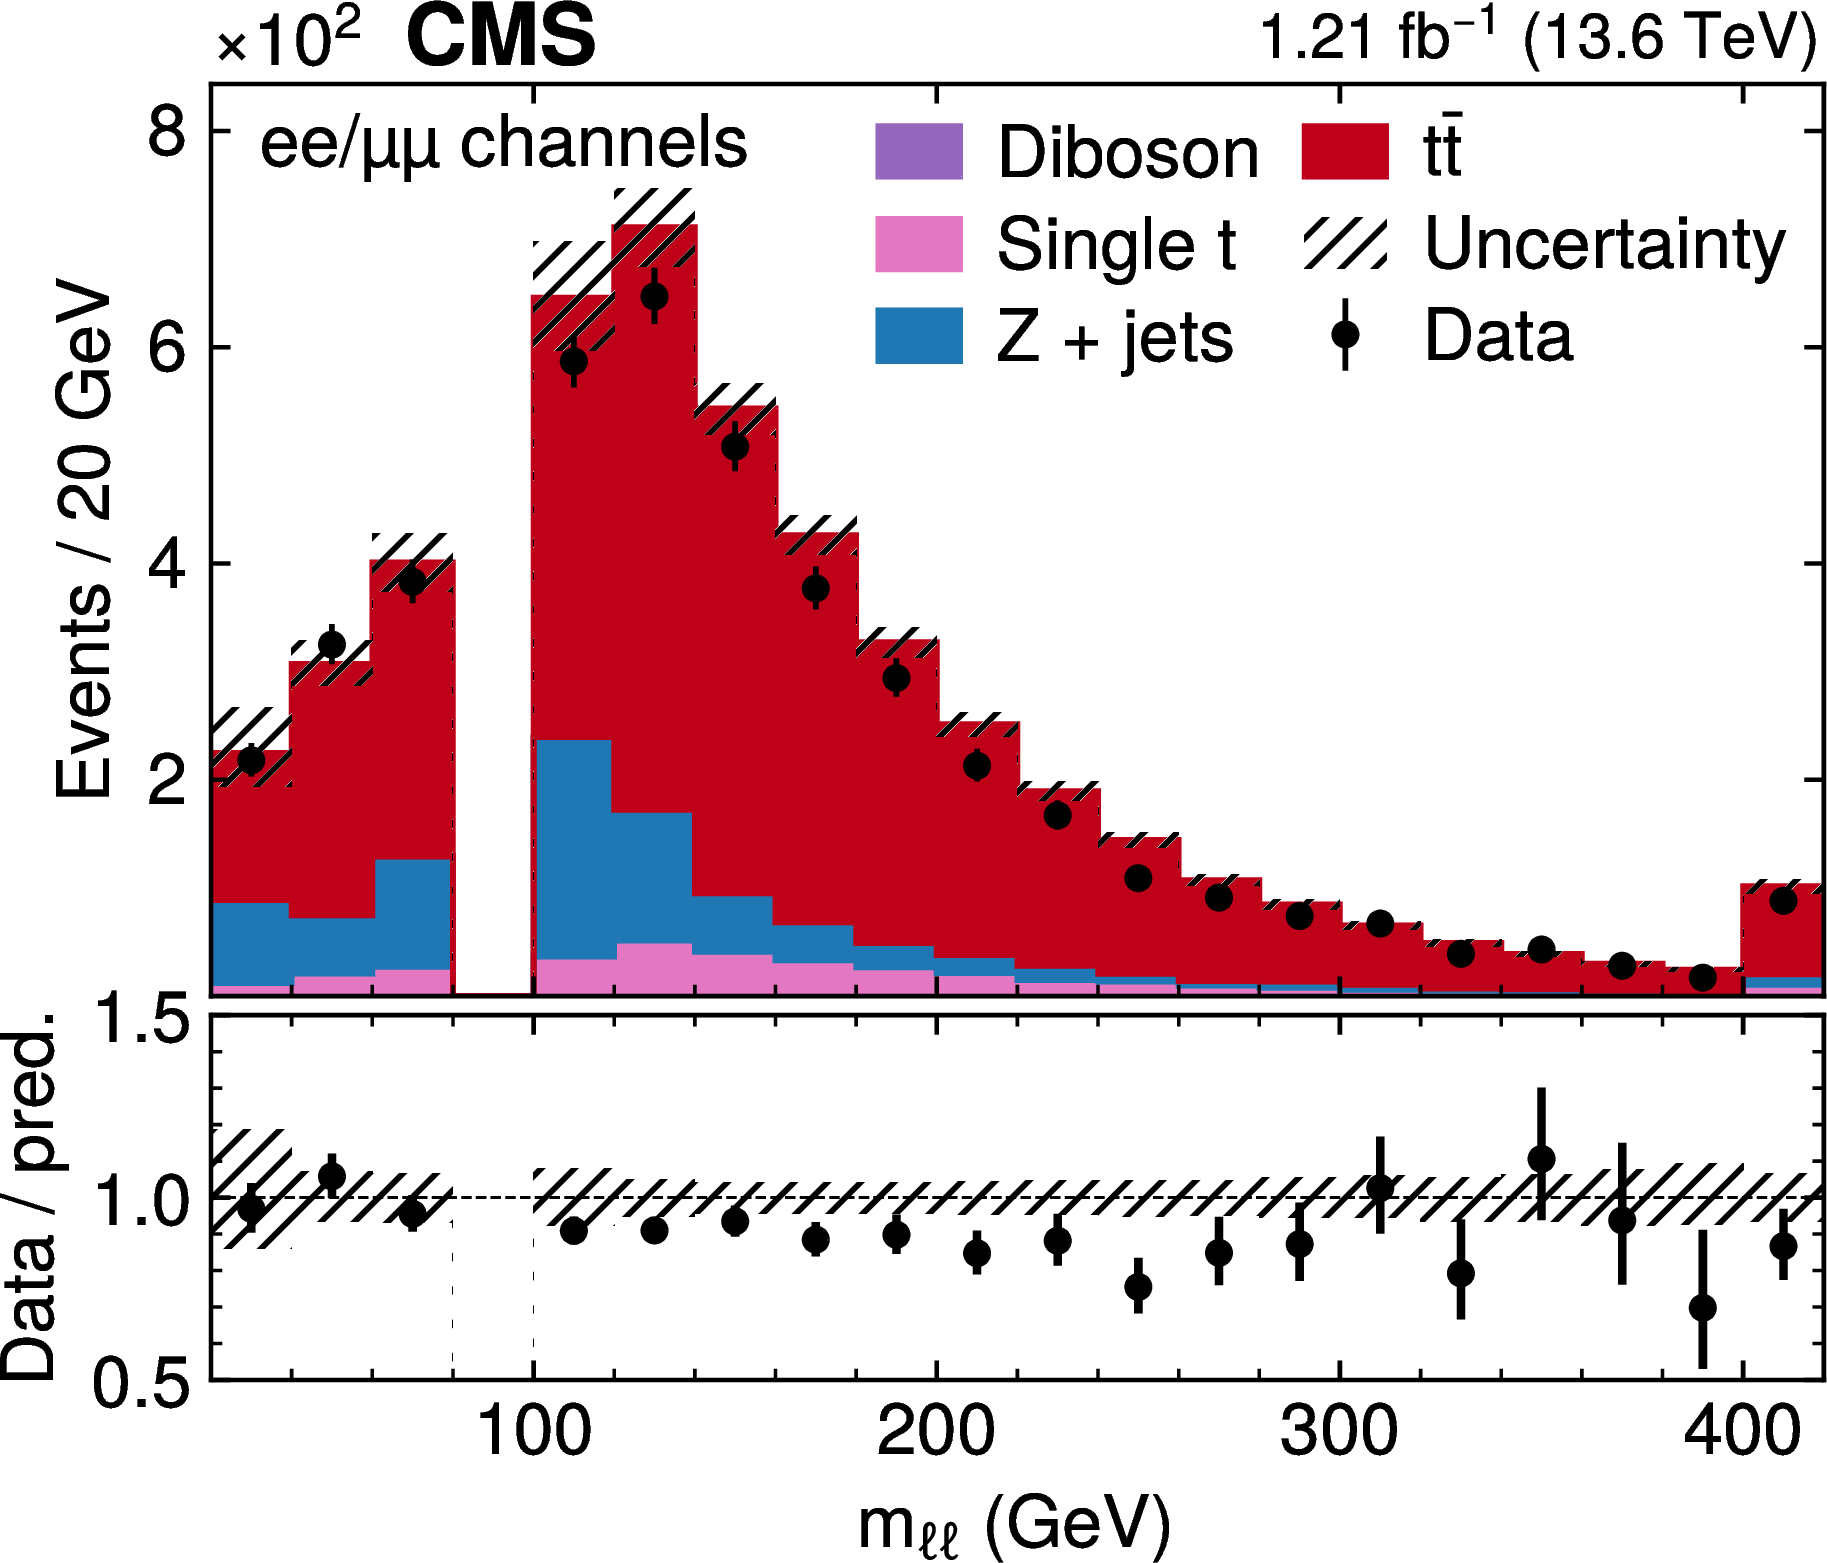
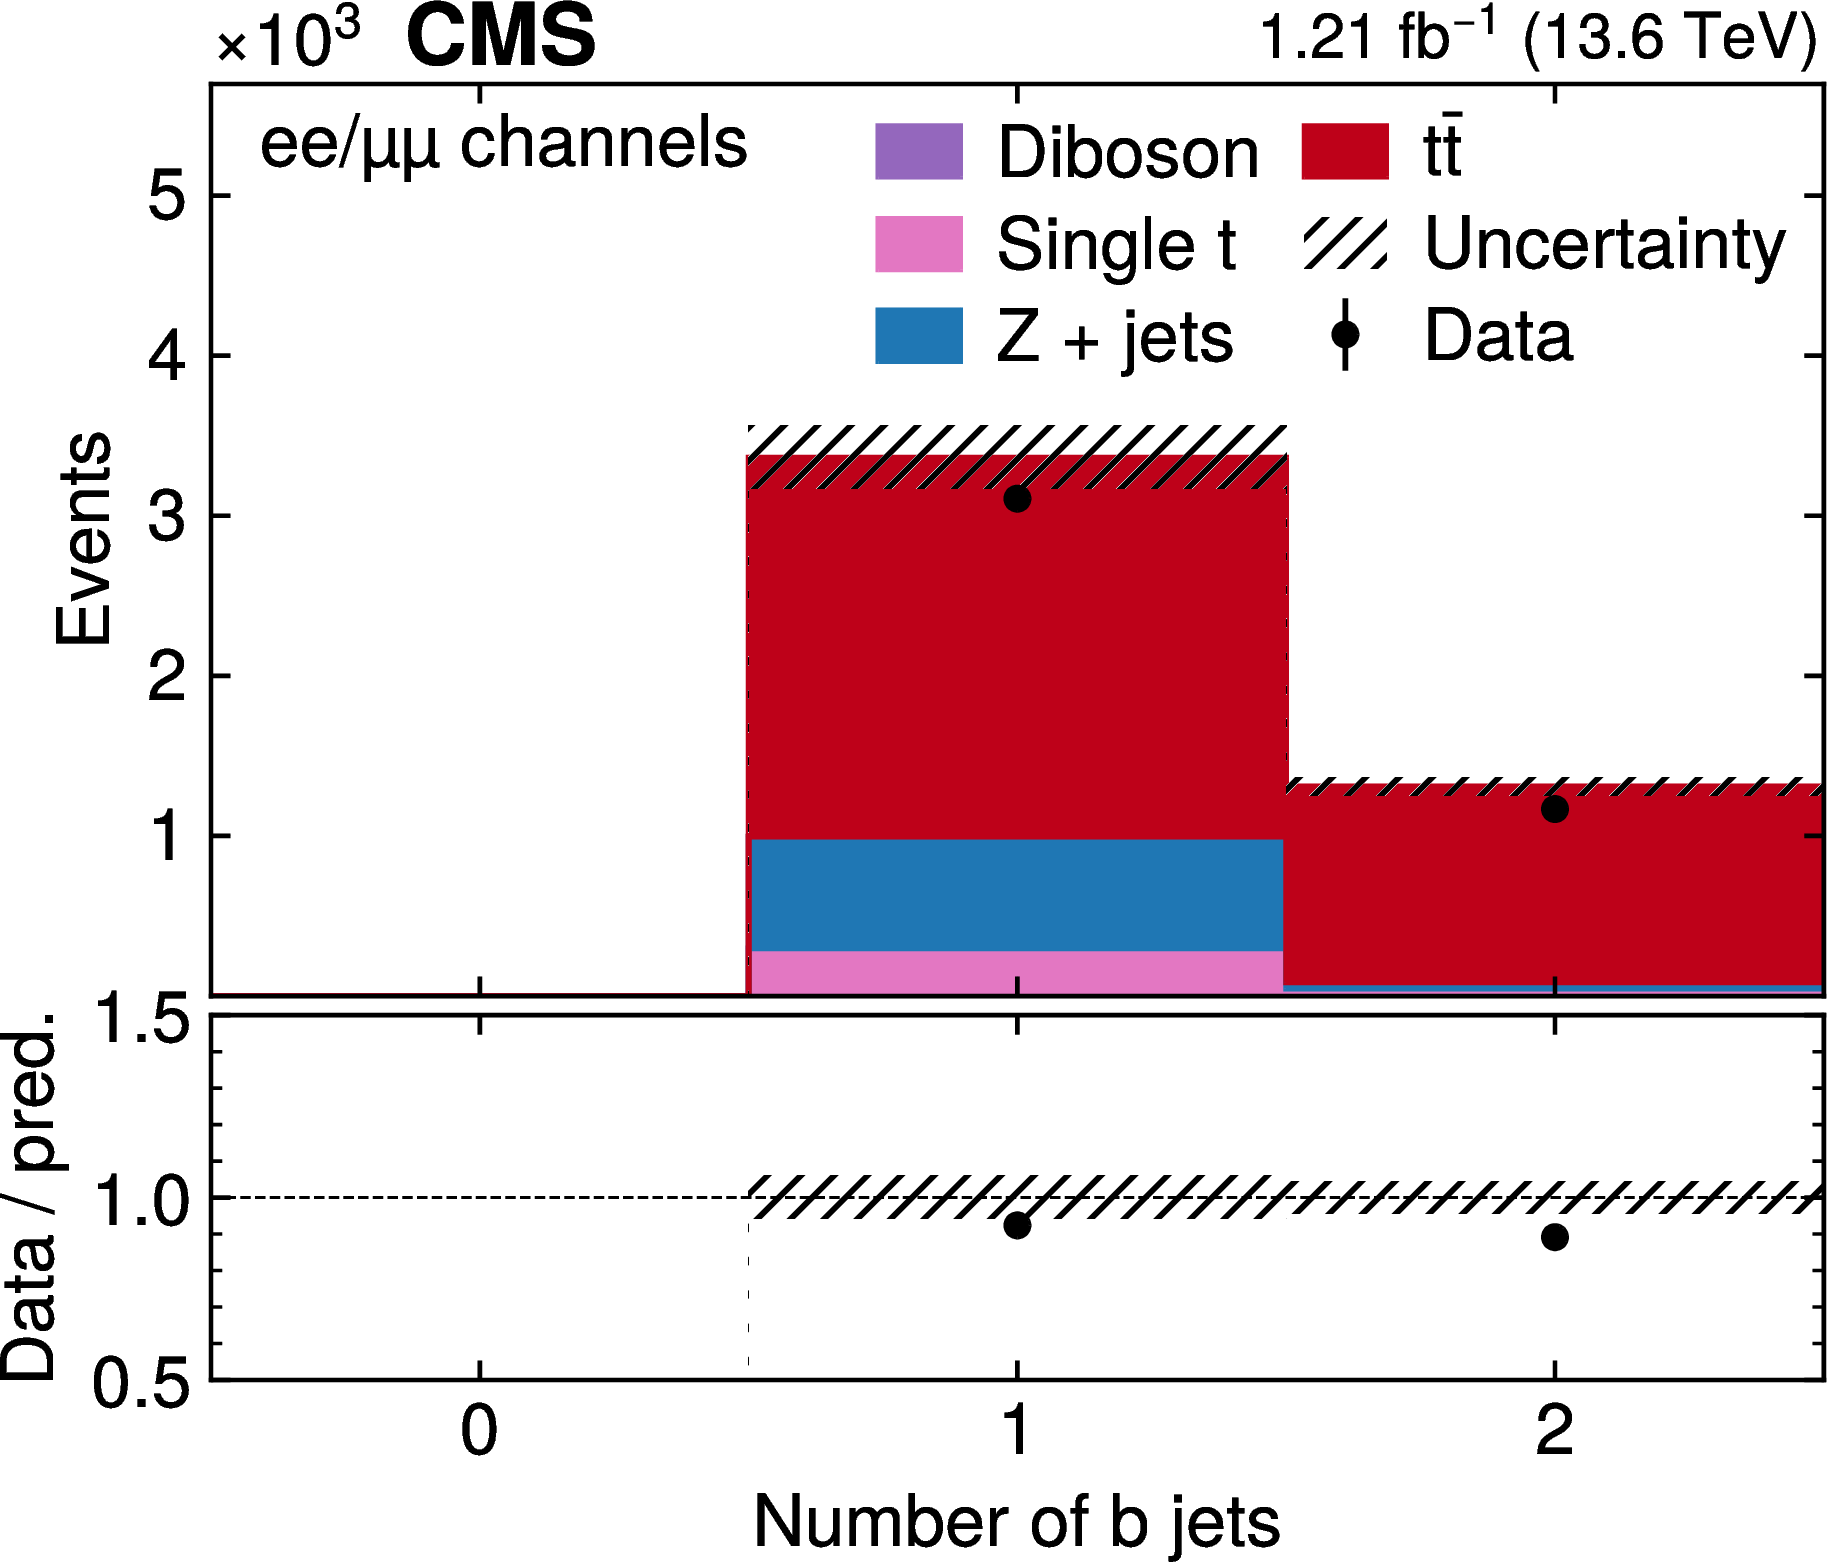
Figure 2:
The number of observed and predicted events in the $ \mathrm{e}^+\mathrm{e}^- $ and $ \mu^{+}\mu^{-} $ channel are presented in the same manner as Fig.1. |
png pdf |
Figure 2-a:
The number of observed and predicted events in the $ \mathrm{e}^+\mathrm{e}^- $ and $ \mu^{+}\mu^{-} $ channel are presented in the same manner as Fig.1-a. |

png pdf |
Figure 2-b:
The number of observed and predicted events in the $ \mathrm{e}^+\mathrm{e}^- $ and $ \mu^{+}\mu^{-} $ channel are presented in the same manner as Fig.1-b. |

png pdf |
Figure 2-c:
The number of observed and predicted events in the $ \mathrm{e}^+\mathrm{e}^- $ and $ \mu^{+}\mu^{-} $ channel are presented in the same manner as Fig.1-c. |
png pdf |
Figure 2-d:
The number of observed and predicted events in the $ \mathrm{e}^+\mathrm{e}^- $ and $ \mu^{+}\mu^{-} $ channel are presented in the same manner as Fig.1-d. |

png pdf |
Figure 2-e:
The number of observed and predicted events in the $ \mathrm{e}^+\mathrm{e}^- $ and $ \mu^{+}\mu^{-} $ channel are presented in the same manner as Fig.1-e. |
png pdf |
Figure 2-f:
The number of observed and predicted events in the $ \mathrm{e}^+\mathrm{e}^- $ and $ \mu^{+}\mu^{-} $ channel are presented in the same manner as Fig.1-f. |
png pdf |
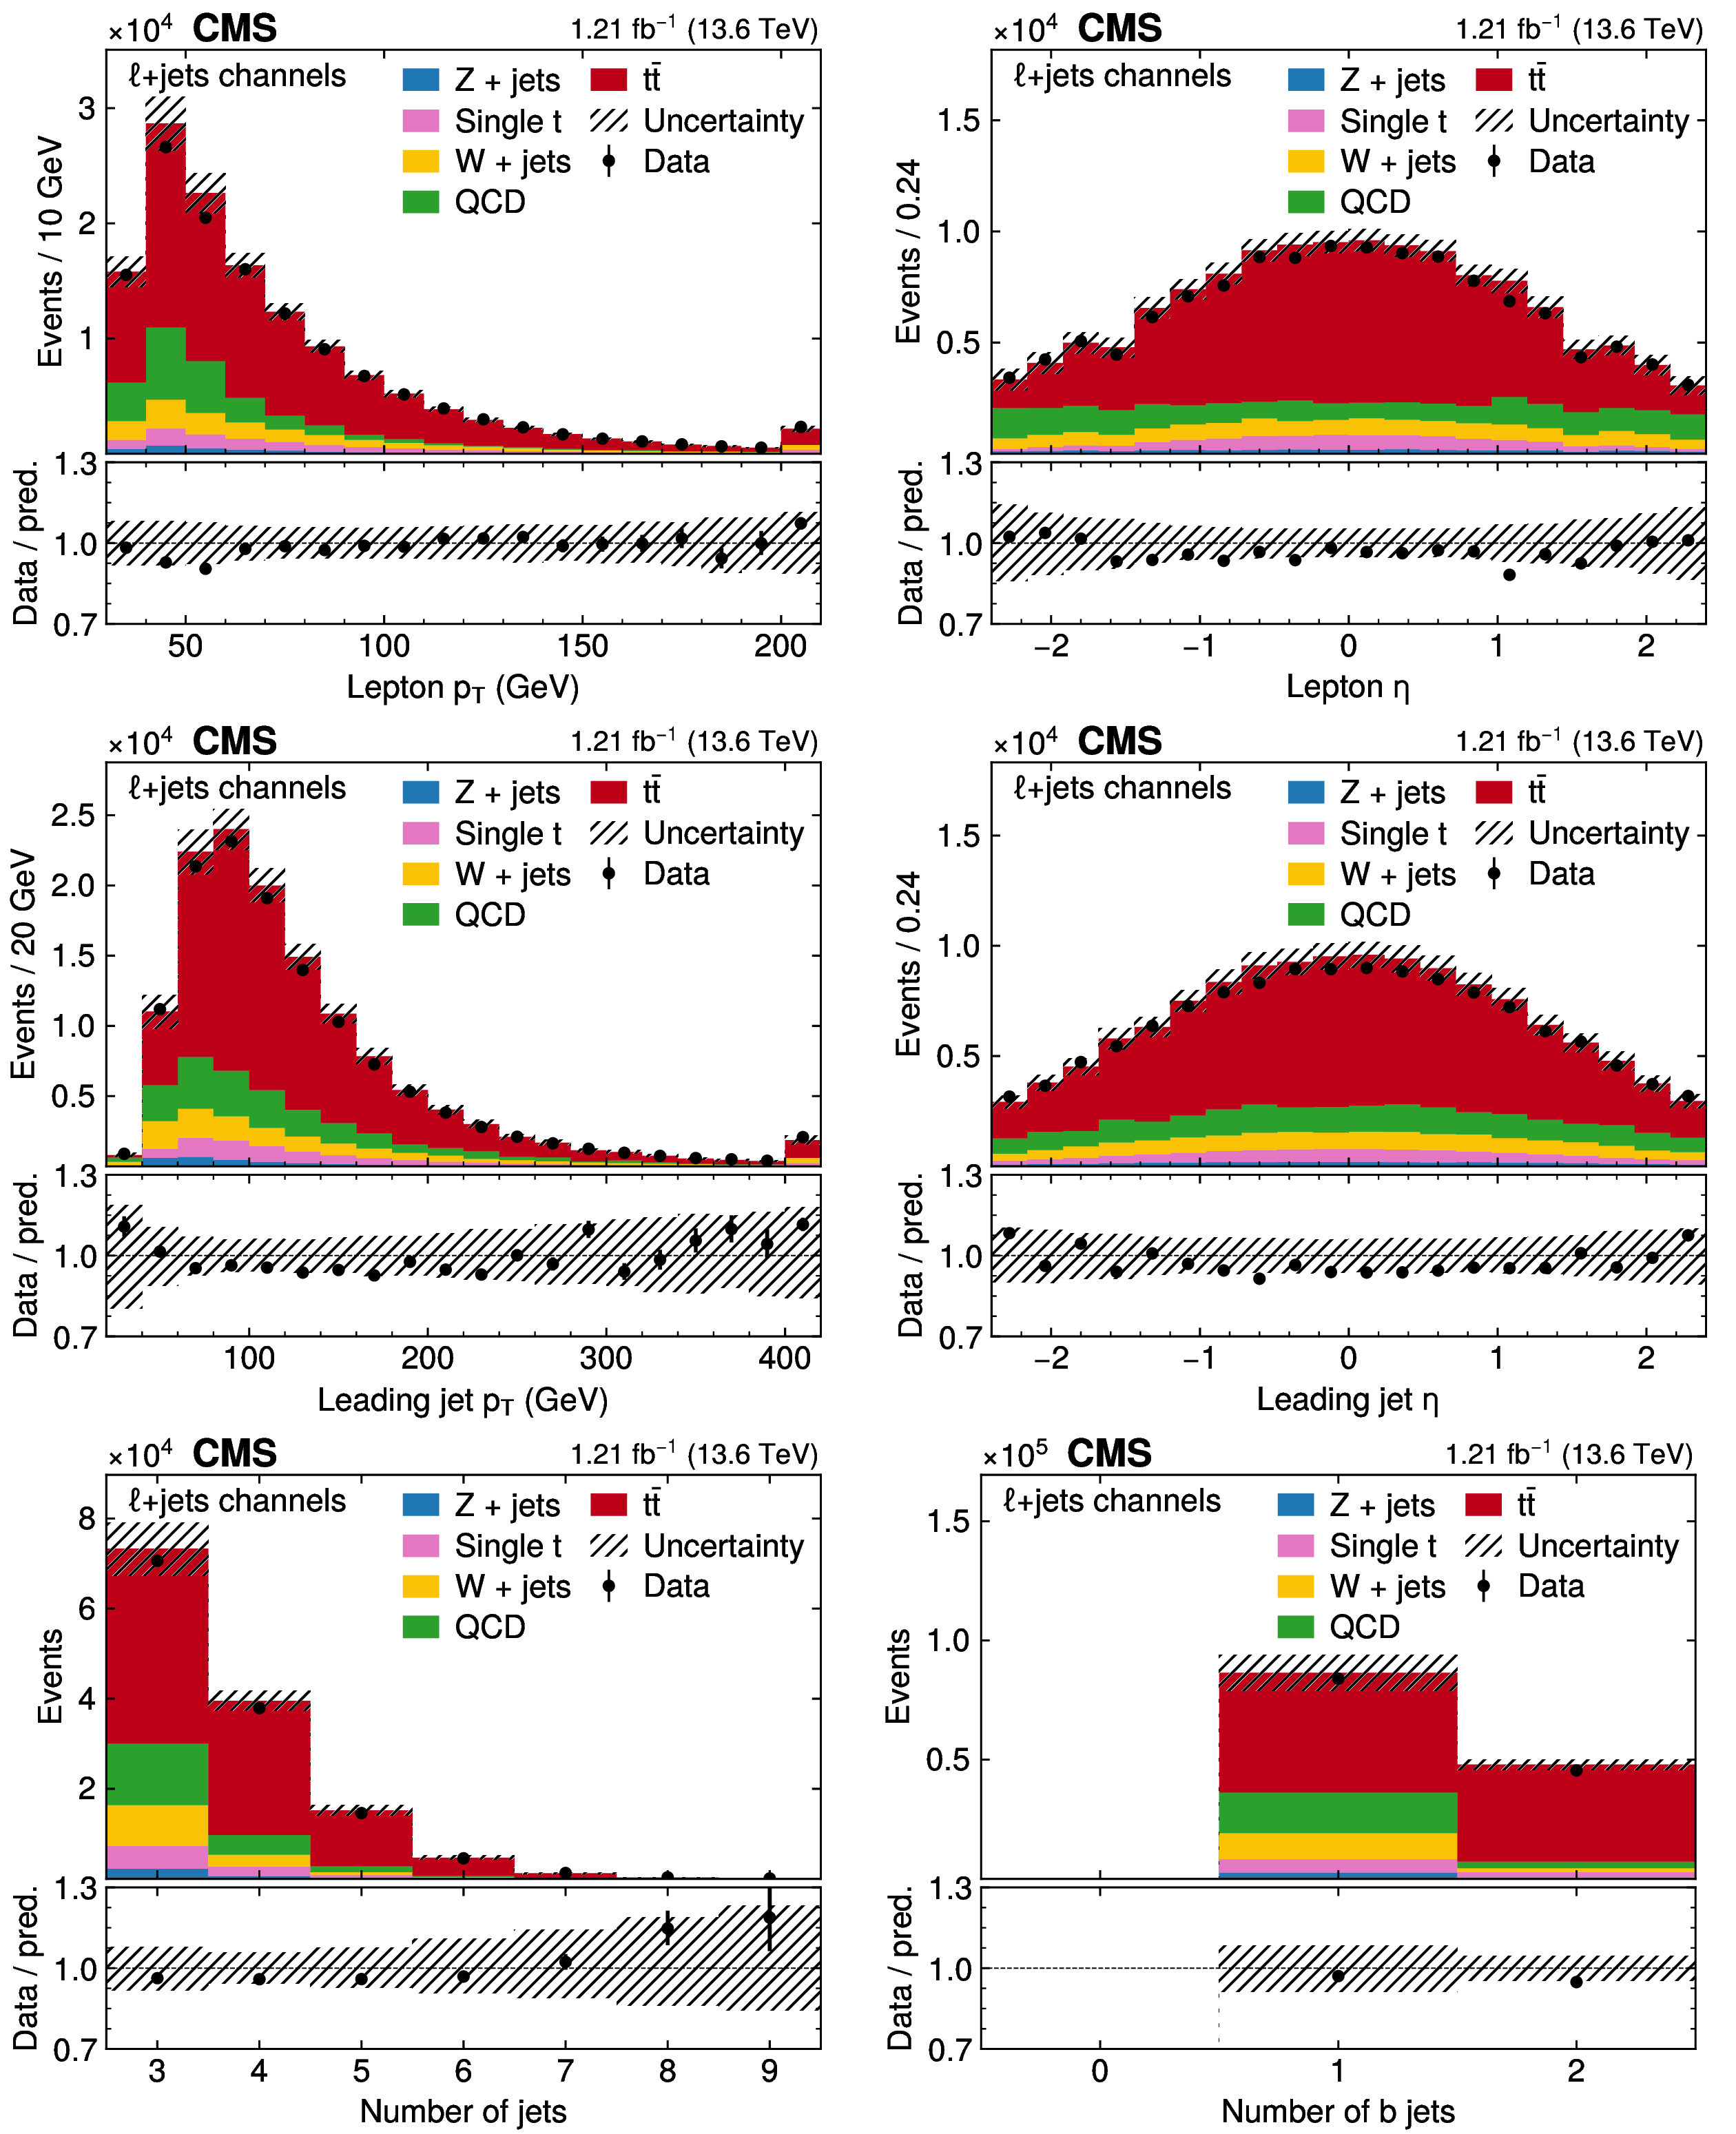
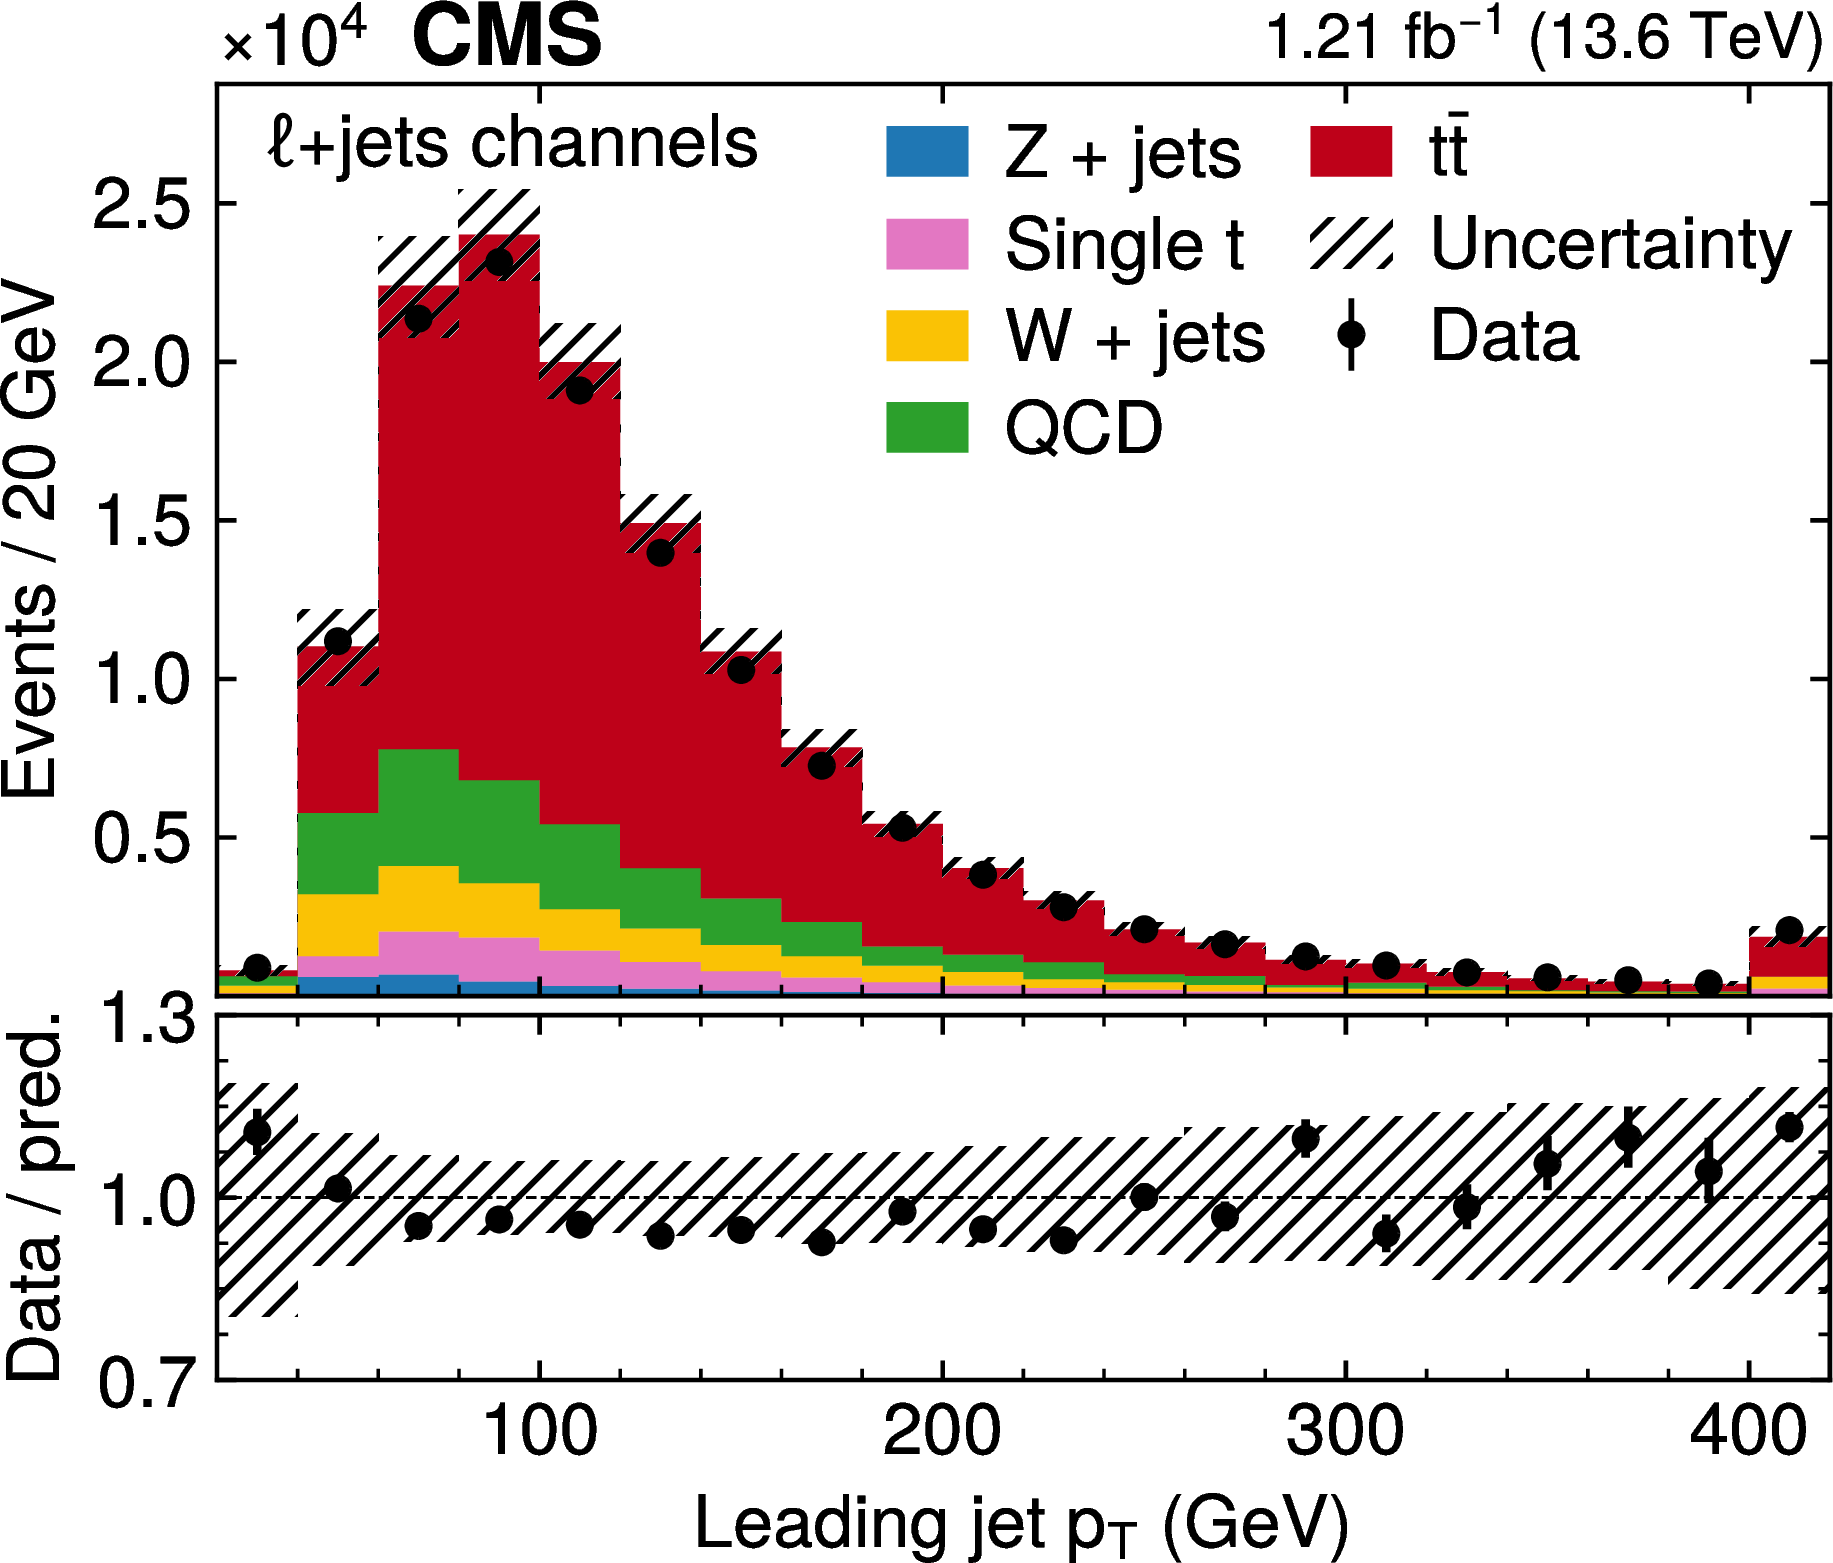
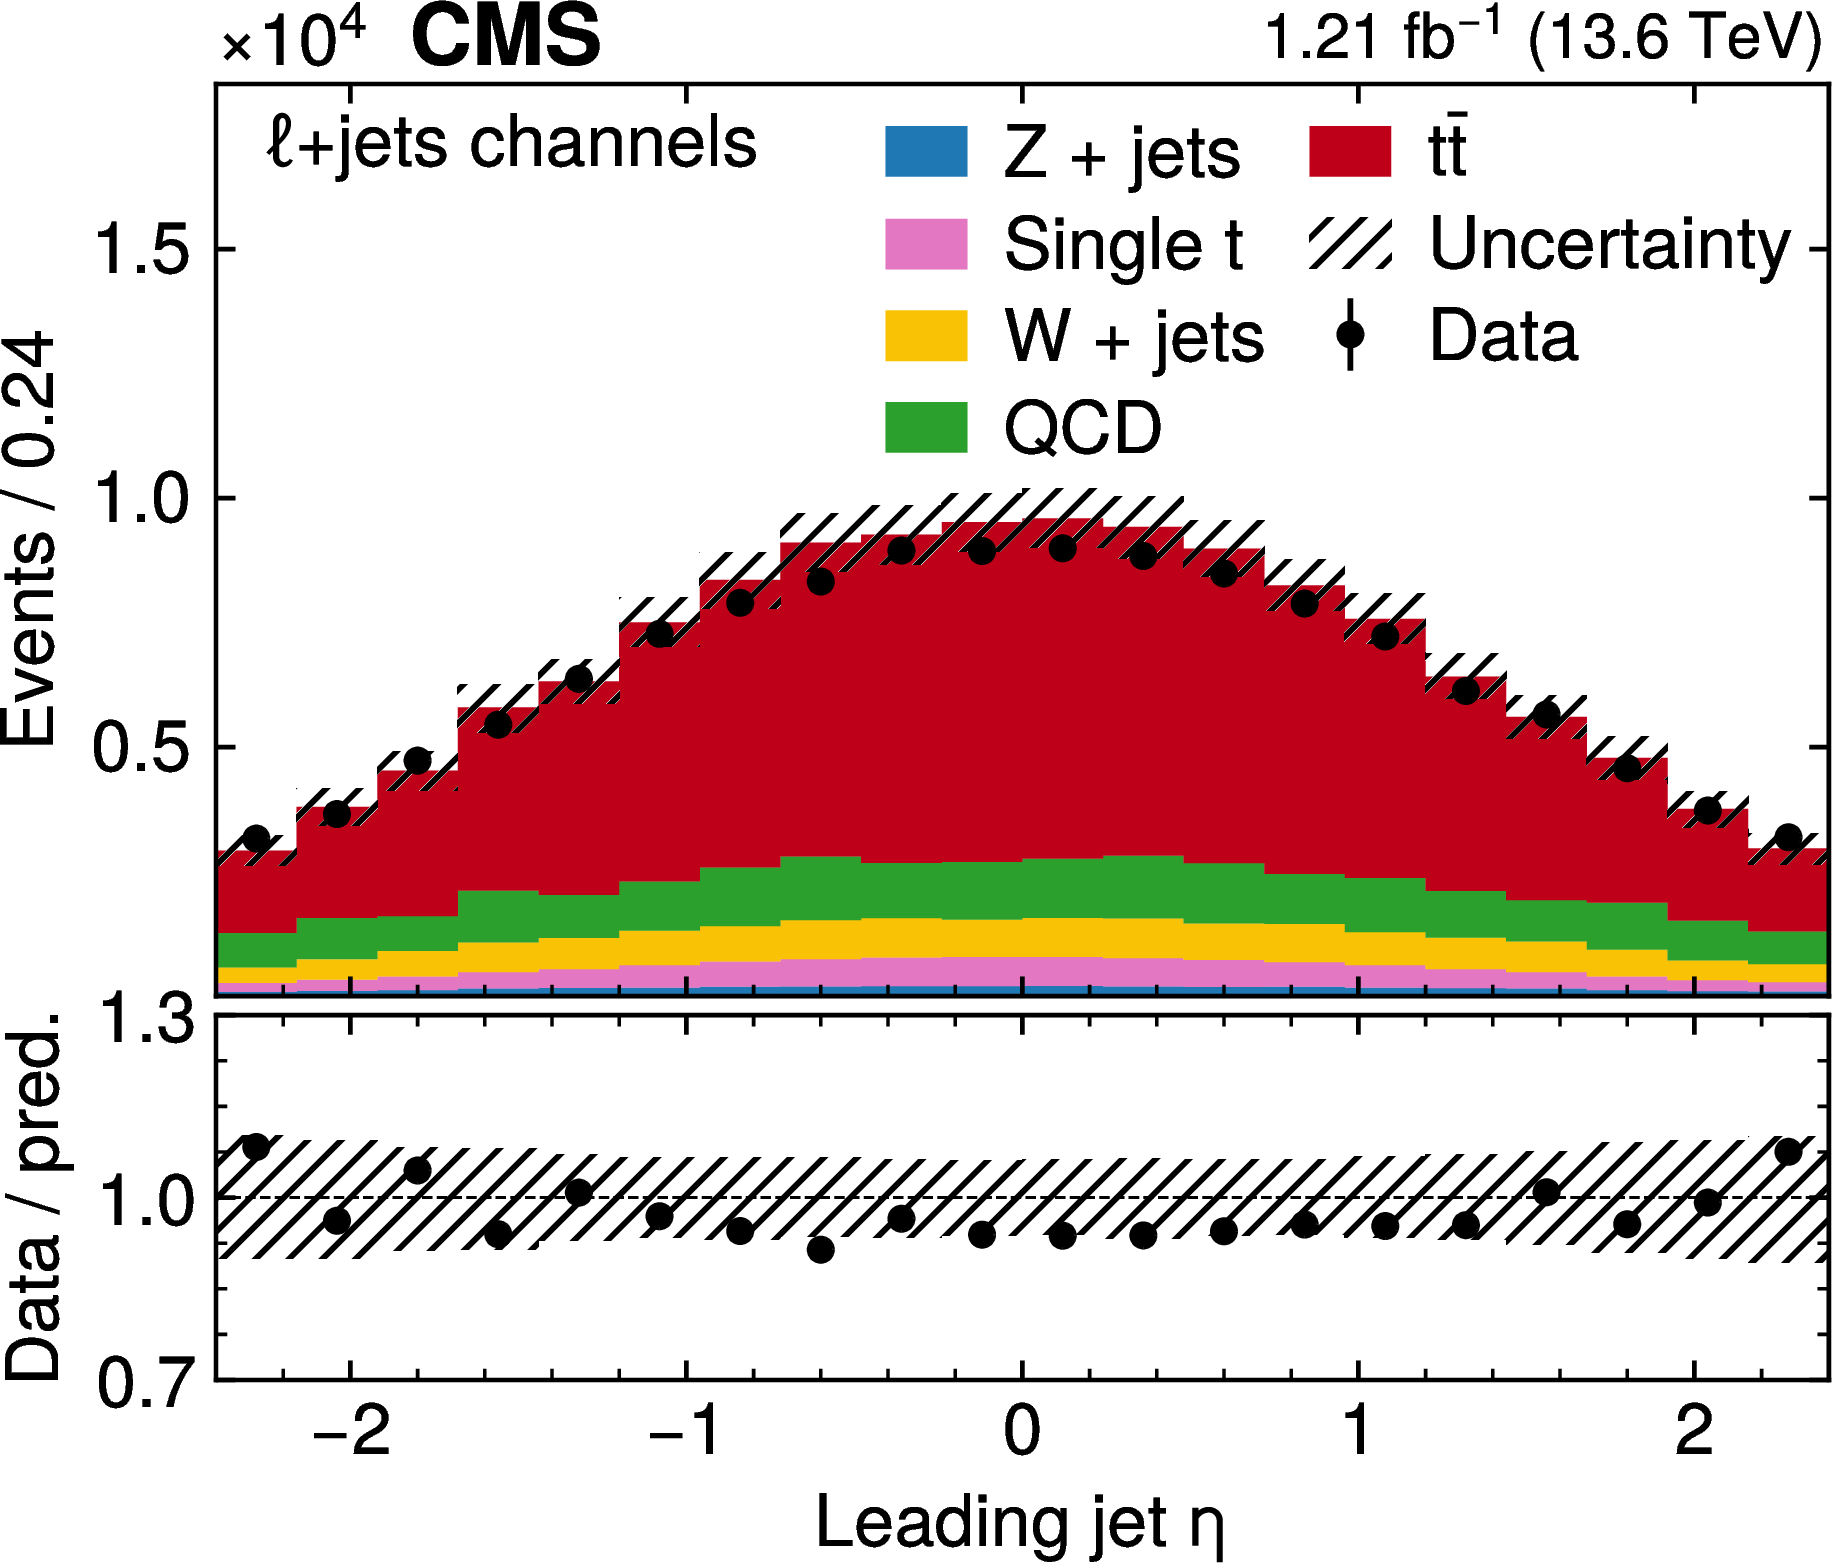
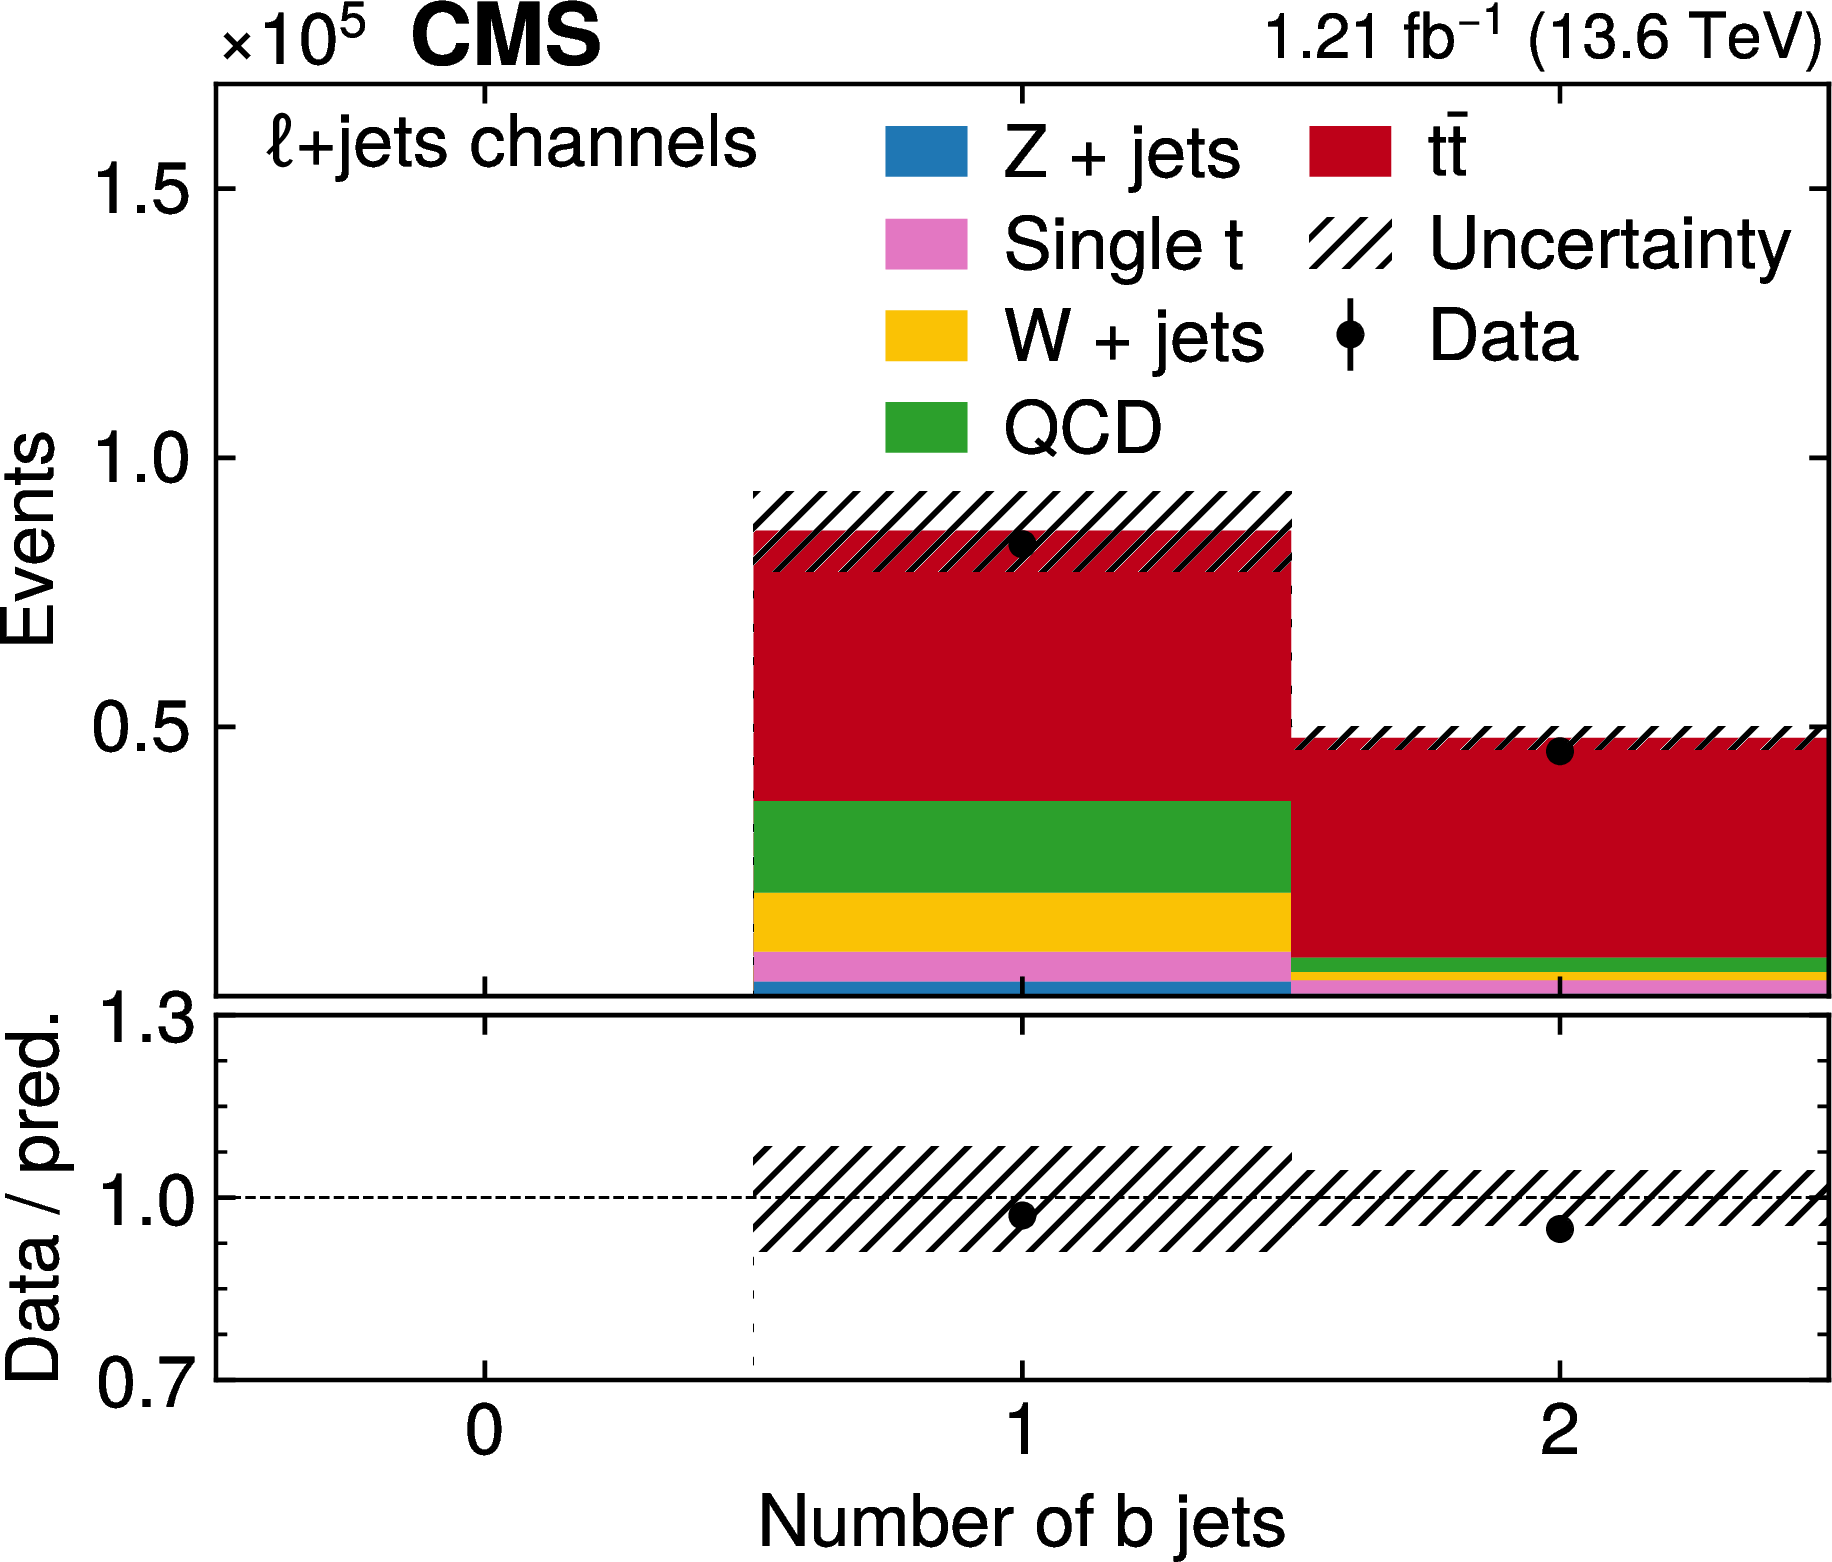
Figure 3:
The number of observed and predicted events in the $ \ell $+jets channel are presented in the same manner as Fig.1, except that the middle-right plot shows the $ \eta $ of the leading jet instead. |

png pdf |
Figure 3-a:
The number of observed and predicted events in the $ \ell $+jets channel are presented in the same manner as Fig.1-a. |
png pdf |
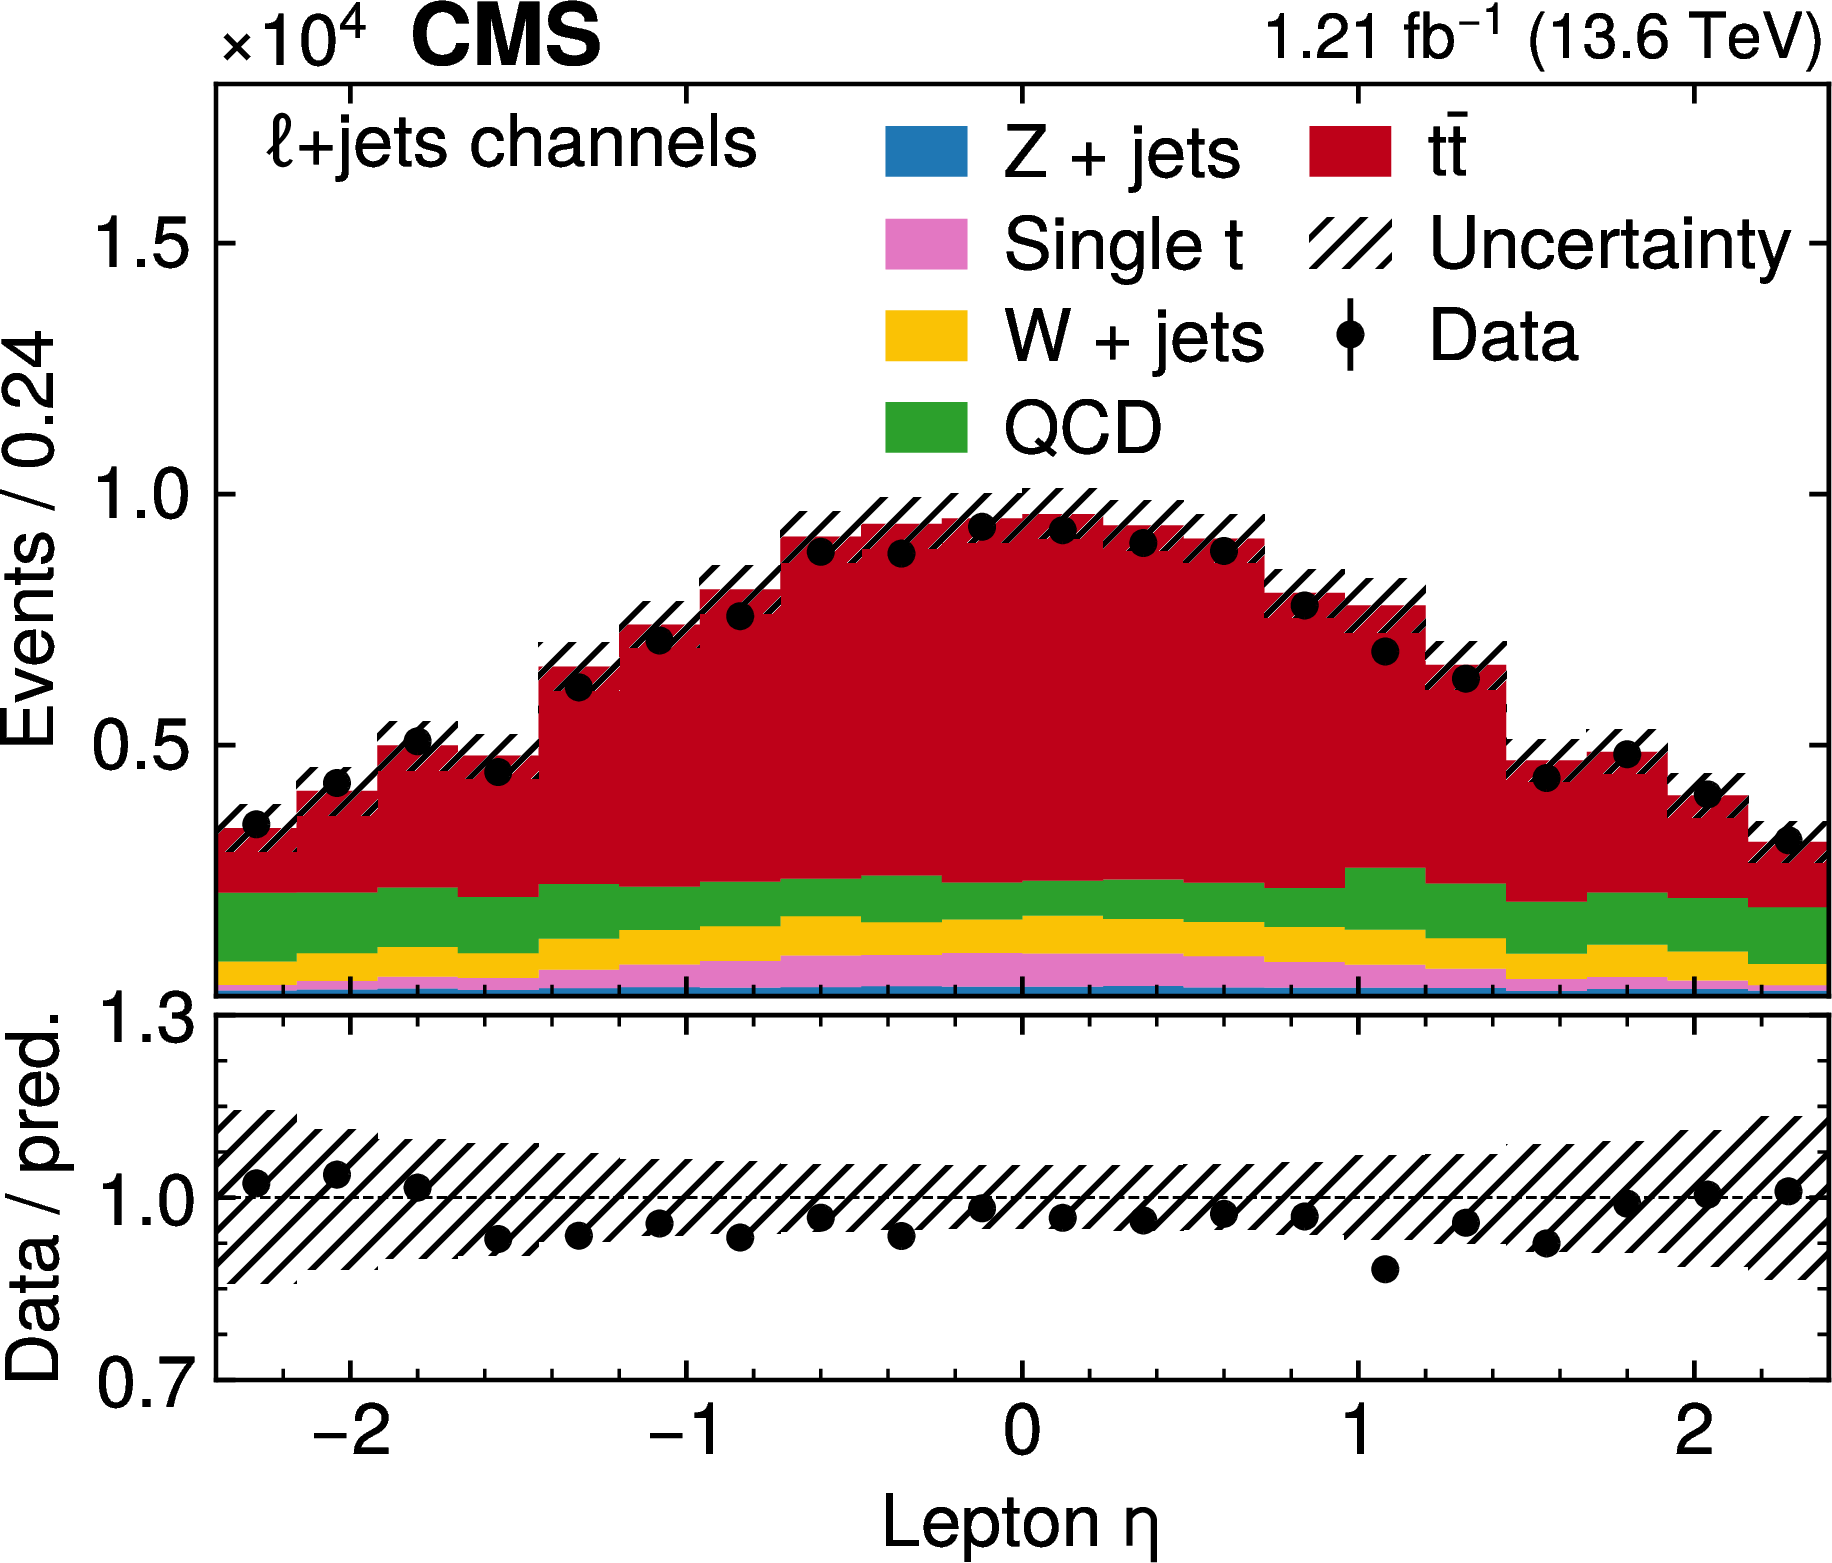
Figure 3-b:
The number of observed and predicted events in the $ \ell $+jets channel are presented in the same manner as Fig.1-b. |
png pdf |
Figure 3-c:
The number of observed and predicted events in the $ \ell $+jets channel are presented in the same manner as Fig.1-c. |
png pdf |
Figure 3-d:
The number of observed and predicted events in the $ \ell $+jets channel are presented in the same manner as Fig.1. The plot shows the $ \eta $ of the leading jet. |

png pdf |
Figure 3-e:
The number of observed and predicted events in the $ \ell $+jets channel are presented in the same manner as Fig.1-e. |
png pdf |
Figure 3-f:
The number of observed and predicted events in the $ \ell $+jets channel are presented in the same manner as Fig.1-f. |

png pdf |
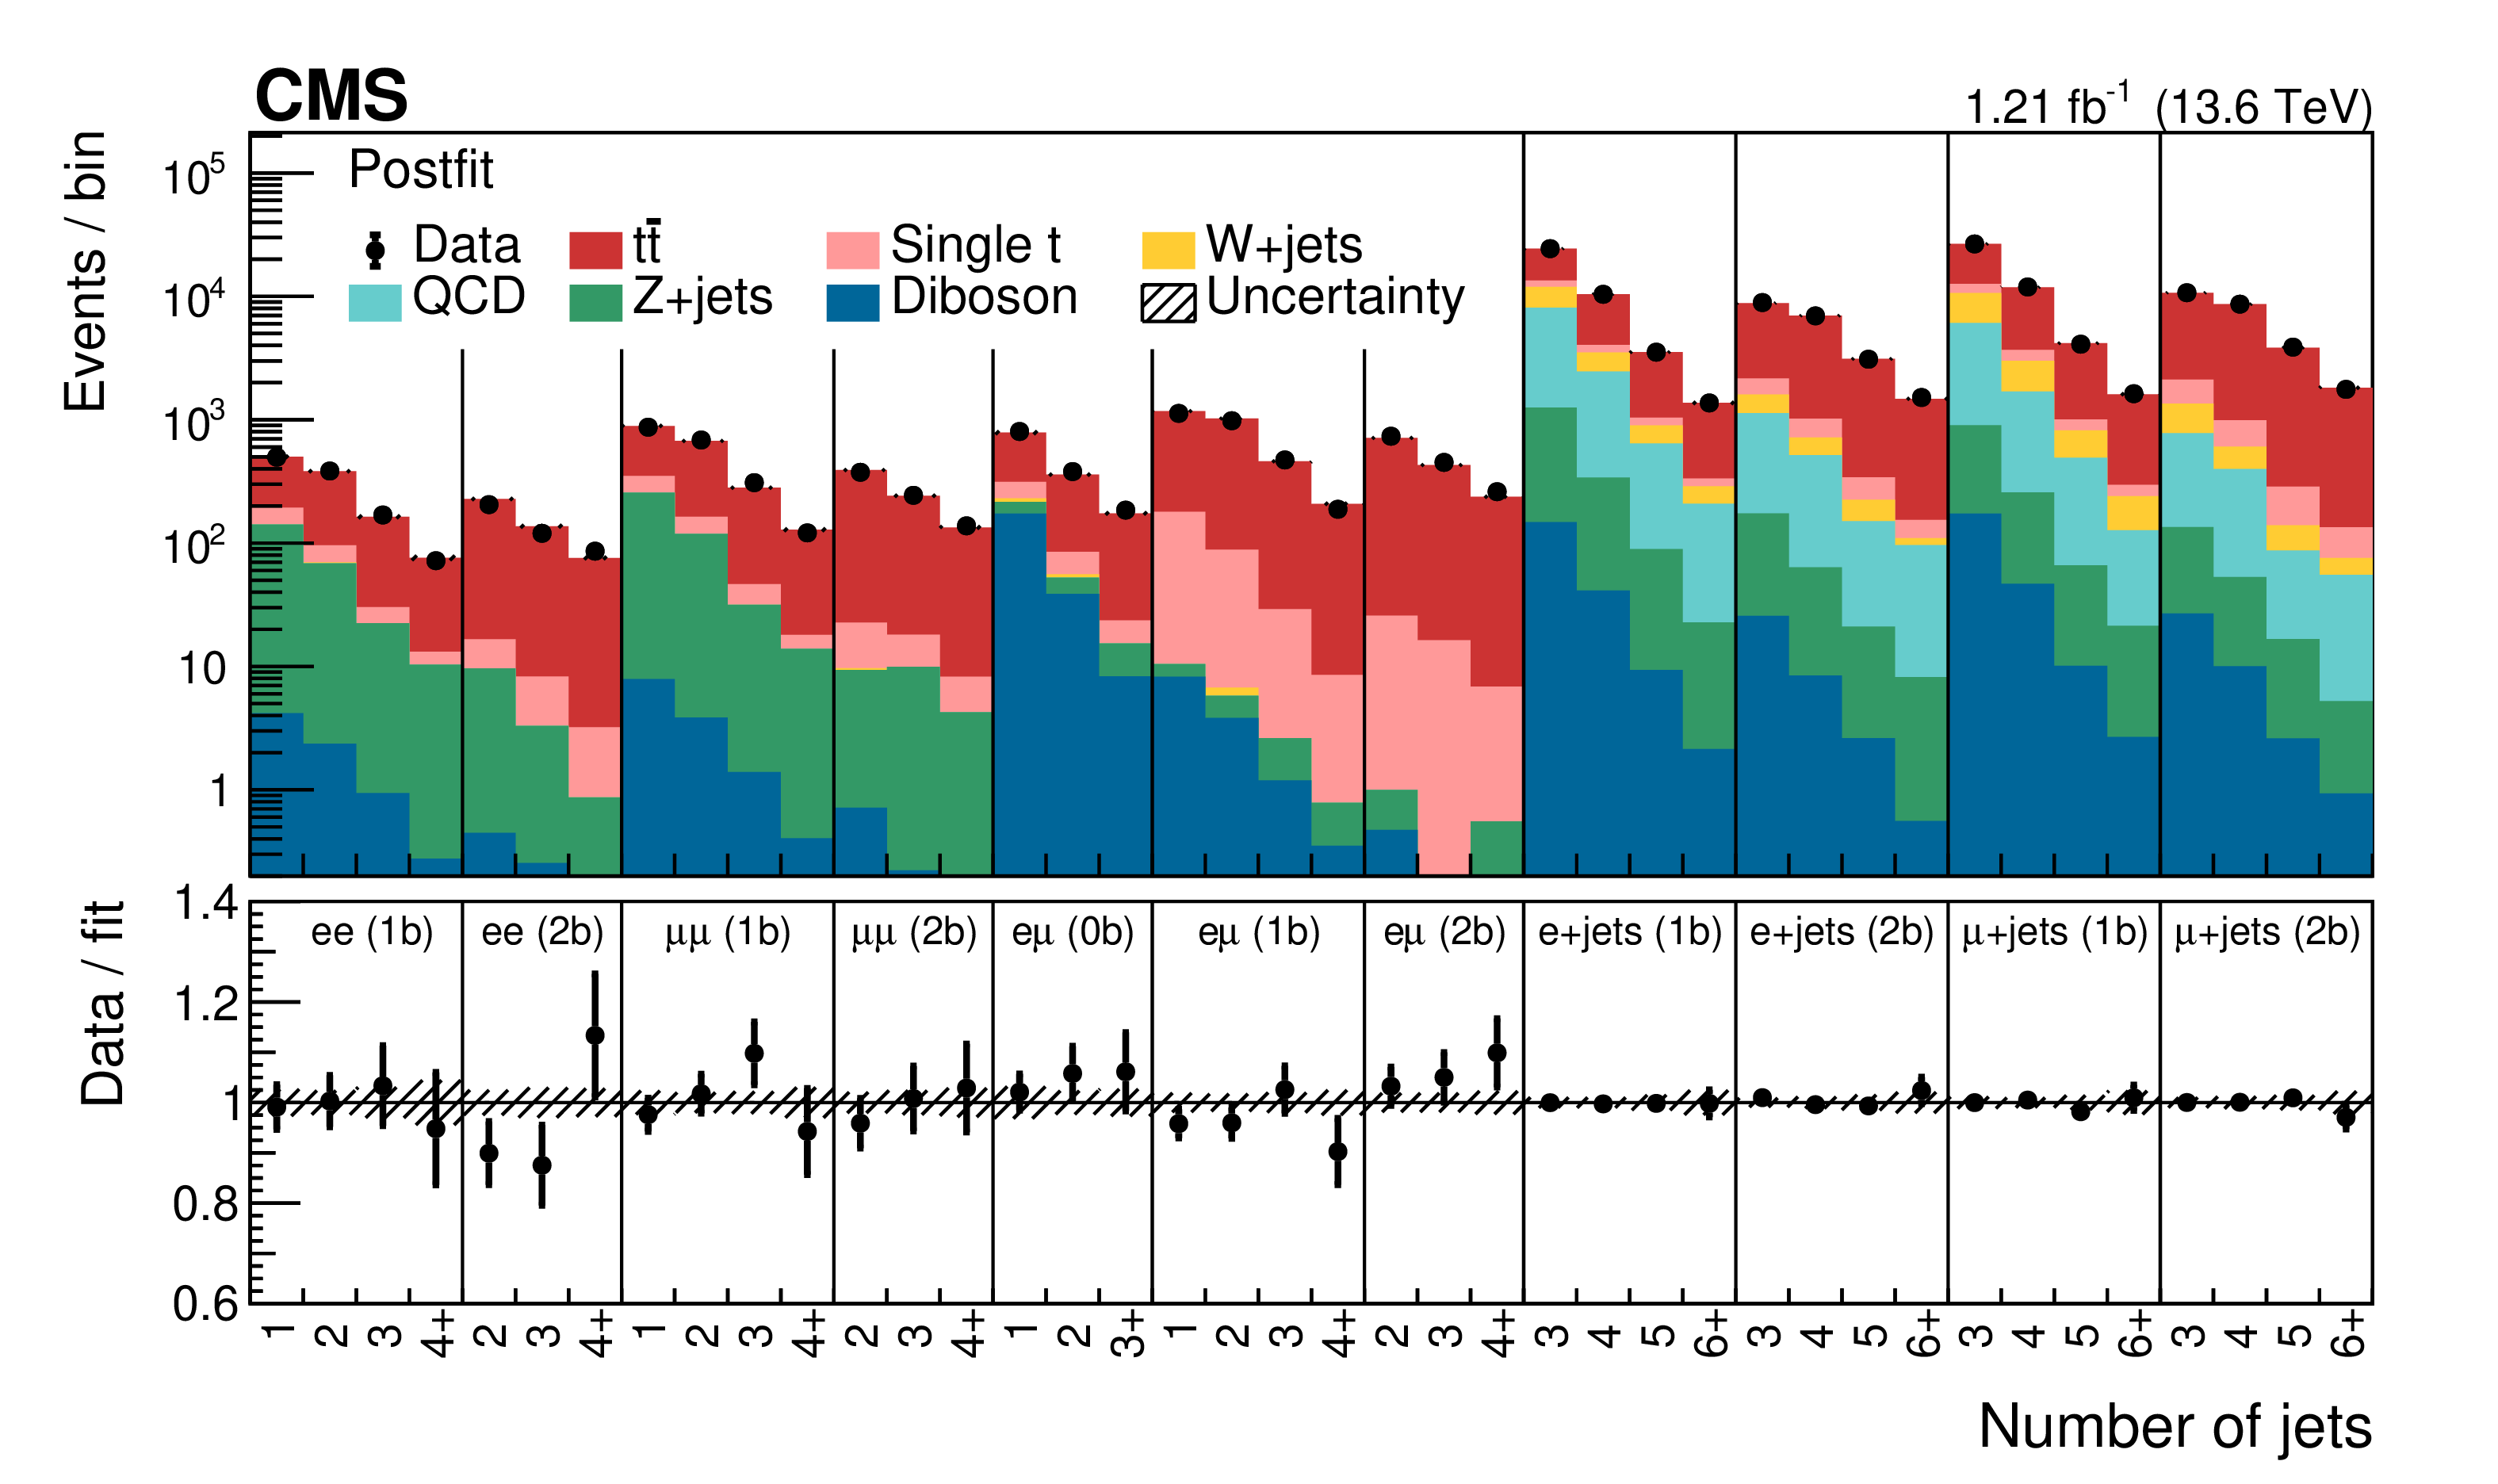
Figure 4:
Comparison of the number of observed (points) and predicted (filled histograms) events in the final analysis binning. The predictions are shown before (upper) and after (lower) fitting the model to the data. The lower panel of each plot displays the ratio of the event yields in data to the sum of predicted signal and background yields. The vertical bars on the points represent the statistical uncertainties in the data, while the hatched bands represent the systematic uncertainty in the predictions, excluding the integrated luminosity. In the lower plot, the hatched bands are greatly reduced due to additional constraint of the nuisances parameters as well as correlations between them. No b jet efficiency scale factors are applied in the upper plot, and no systematic uncertainty entering into the hatched bands is intended to cover these factors, which are free parameters in the fit. |

png pdf |
Figure 4-a:
Comparison of the number of observed (points) and predicted (filled histograms) events in the final analysis binning. The predictions are shown before after fitting the model to the data. The lower panel displays the ratio of the event yields in data to the sum of predicted signal and background yields. The vertical bars on the points represent the statistical uncertainties in the data, while the hatched bands represent the systematic uncertainty in the predictions, excluding the integrated luminosity. No b jet efficiency scale factors are applied, and no systematic uncertainty entering into the hatched bands is intended to cover these factors, which are free parameters in the fit. |
png pdf |
Figure 4-b:
Comparison of the number of observed (points) and predicted (filled histograms) events in the final analysis binning. The predictions are shown before after fitting the model to the data. The lower panel displays the ratio of the event yields in data to the sum of predicted signal and background yields. The vertical bars on the points represent the statistical uncertainties in the data, while the hatched bands represent the systematic uncertainty in the predictions, excluding the integrated luminosity. The hatched bands are greatly reduced due to additional constraint of the nuisances parameters as well as correlations between them. |

png pdf |
Figure 5:
The $ \mathrm{t} \bar{\mathrm{t}} $ cross section as a function of $ \sqrt{s} $, as obtained in this analysis (red filled circle) and in previous measurements by the CMS experiment [1,2,3,4,5,7,10,11] (blue markers), with vertical bars on the markers indicating the total uncertainty in the measurements. Points corresponding to measurements at the same $ \sqrt{s} $ are horizontally shifted for better visibility. The SM prediction at NNLO+NNLL precision [18] using the NNPDF3.0 NNLO PDF sets [68] and values of $ m_{\mathrm{t}}= $ 172.5 GeV and $ \alpha_\mathrm{S}(m_{\mathrm{Z}})= $ 0.118 is shown with a black line and green uncertainty bands. An enlarged inset is included to highlight the difference between 13 and 13.6 TeV predictions and results. |
| Tables | |

png pdf |
Table 1:
Summary of the sources of uncertainty in the $ \sigma_{{\mathrm{t}\bar{\mathrm{t}}} } $ measurement. The relative uncertainty values are approximate and given without their correlations. The statistical uncertainty includes contributions from both the signal and control regions. The combined uncertainty includes correlations between sources. The integrated luminosity uncertainty is listed separately. |
| Summary |
| The first measurement of the top quark pair ( $ \mathrm{t} \overline{\mathrm{t}} $) production cross section in proton-proton collisions at $\sqrt{s} = $ 13.6 TeV is presented. Data recorded with the CMS detector in Summer 2022, corresponding to an integrated luminosity of1.21 fb$^{-1}$, are analyzed. Events are selected with one or two charged leptons (electrons or muons) and additional jets. A profile maximum likelihood fit is performed on categories defined by the number and flavors of the leptons, the total number of jets, and the number of jets identified as originating from b quarks. The fit is used to constrain the uncertainties in the b tagging efficiencies and lepton selection efficiencies. Novel cross-checks are performed on the selected $ \mathrm{t} \overline{\mathrm{t}} $ data sample to verify the lepton selection efficiencies, as well as the jet energy scale, while the cross section result itself is verified by an independent event counting approach in the $ \mathrm{e}^\pm\mu^\mp $ channel. An inclusive $ \mathrm{t} \overline{\mathrm{t}} $ production cross section of 881 $ \pm $ 23 (stat+syst) $ \pm $ 20 (lumi) pb is measured, in agreement with the standard model prediction of 924 $^{+32}_{-40} $ pb. |
| Additional Figures | |

png pdf |
Additional Figure 1:
For the nuisance parameters listed in the left column, the pulls $ (\hat{\theta}-\theta_0)/\Delta\theta $ (middle column) and impacts $ \Delta\hat{r} $ (right column) are displayed. The 20 nuisance parameters with the largest impacts in the fit used to determine the $ \mathrm{t} \overline{\mathrm{t}} $ cross section are shown. The impact $ \Delta\hat{r} $ is obtained from varying the nuisance parameter $ \theta $ by $ \pm $ 1 standard deviation ($ \sigma $) and evaluating the induced shift in the $ \mathrm{t} \overline{\mathrm{t}} $ signal strength $ r $. The pull $ (\hat\theta-\theta_0)/\Delta\theta $ is calculated from the values $ \hat{\theta} $ and $ \theta_0 $ after and before the fit of $ \theta $, respectively, and from its uncertainty $ \Delta\theta $ before the fit. The nuisance parameters labeled ``BG model stat.''\refer to the per-bin statistical uncertainties in the predicted yields. The uncertainty associated with the top $ p_{\mathrm{T}} $ correction corresponds to a one-sided variation of the nominal template before the fit, and thus a one-sided impact after the fit is expected. |
| References | ||||
| 1 | CMS Collaboration | Measurement of the $ \mathrm{t} \overline{\mathrm{t}} $ production cross section in the all-jet final state in $ {\mathrm{p}\mathrm{p}} $ collisions at $ \sqrt{s}= $ 7 TeV | JHEP 05 (2013) 065 | CMS-TOP-11-007 1302.0508 |
| 2 | ATLAS Collaboration | Measurement of the $ \mathrm{t} \overline{\mathrm{t}} $ production cross-section using $ {\mathrm{e}\mu} $ events with b-tagged jets in pp collisions at $ \sqrt{s}= $ 7 and 8 TeV with the ATLAS detector | [Addendum: \DOI10.1140/epjc/s2-016-4501-2], 2014 EPJC 74 (2014) 3109 |
1406.5375 |
| 3 | CMS Collaboration | Measurement of the $ \mathrm{t} \overline{\mathrm{t}} $ production cross section in the all-jets final state in $ {\mathrm{p}\mathrm{p}} $ collisions at $ \sqrt{s}= $ 8 TeV | EPJC 76 (2016) 128 | CMS-TOP-14-018 1509.06076 |
| 4 | CMS Collaboration | Measurements of the $ \mathrm{t} \overline{\mathrm{t}} $ production cross section in lepton+jets final states in $ {\mathrm{p}\mathrm{p}} $ collisions at 8 TeV and ratio of 8 to 7 TeV cross sections | EPJC 77 (2017) 15 | CMS-TOP-12-006 1602.09024 |
| 5 | CMS Collaboration | Measurement of the $ \mathrm{t} \overline{\mathrm{t}} $ production cross section in the $ {\mathrm{e}\mu} $ channel in proton-proton collisions at $ \sqrt{s}= $ 7 and 8 TeV | JHEP 08 (2016) 029 | CMS-TOP-13-004 1603.02303 |
| 6 | ATLAS Collaboration | Measurement of the $ \mathrm{t} \overline{\mathrm{t}} $ production cross section in the $ \tau $+jets final state in pp collisions at $ \sqrt{s}= $ 8 TeV using the ATLAS detector | PRD 95 (2017) 072003 | 1702.08839 |
| 7 | ATLAS Collaboration | Measurement of the inclusive and fiducial $ \mathrm{t} \overline{\mathrm{t}} $ production cross-sections in the lepton+jets channel in pp collisions at $ \sqrt{s}= $ 8 TeV with the ATLAS detector | EPJC 78 (2018) 487 | 1712.06857 |
| 8 | LHCb Collaboration | Measurement of forward top pair production in the dilepton channel in pp collisions at $ \sqrt{s}= $ 13 TeV | JHEP 08 (2018) 174 | 1803.05188 |
| 9 | CMS Collaboration | Measurement of the $ \mathrm{t} \overline{\mathrm{t}} $ production cross section, the top quark mass, and the strong coupling constant using dilepton events in $ {\mathrm{p}\mathrm{p}} $ collisions at $ \sqrt{s}= $ 13 TeV | EPJC 79 (2019) 368 | CMS-TOP-17-001 1812.10505 |
| 10 | CMS Collaboration | Measurement of the top quark pair production cross section in dilepton final states containing one $ \tau $ lepton in $ {\mathrm{p}\mathrm{p}} $ collisions at $ \sqrt{s}= $ 13 TeV | JHEP 02 (2020) 191 | CMS-TOP-18-005 1911.13204 |
| 11 | ATLAS Collaboration | Measurements of top-quark pair single- and double-differential cross-sections in the all-hadronic channel in pp collisions at \sqrts[13] using the ATLAS detector | JHEP 01 (2021) 033 | 2006.09274 |
| 12 | ATLAS Collaboration | Measurement of the $ \mathrm{t} \overline{\mathrm{t}} $ production cross-section in the lepton+jets channel at \sqrts[13] with the ATLAS experiment | PLB 810 (2020) 135797 | 2006.13076 |
| 13 | CMS Collaboration | Measurement of differential $ \mathrm{t} \overline{\mathrm{t}} $ production cross sections in the full kinematic range using lepton+jets events from proton-proton collisions at $ \sqrt{s}= $ 13 TeV | PRD 104 (2021) 092013 | CMS-TOP-20-001 2108.02803 |
| 14 | CMS Collaboration | Measurement of the inclusive $ \mathrm{t} \overline{\mathrm{t}} $ production cross section in proton-proton collisions at $ \sqrt{s}= $ 5.02 TeV | JHEP 04 (2022) 144 | CMS-TOP-20-004 2112.09114 |
| 15 | ATLAS and CMS Collaborations | Combination of inclusive top-quark pair production cross-section measurements using ATLAS and CMS data at $ \sqrt{s}= $ 7 and 8 TeV | JHEP 07 (2023) 213 | 2205.13830 |
| 16 | ATLAS Collaboration | Measurement of the $ \mathrm{t} \overline{\mathrm{t}} $ production cross-section in pp collisions at \sqrts[5.02] with the ATLAS detector | JHEP 06 (2023) 138 | 2207.01354 |
| 17 | ATLAS Collaboration | Measurement of the inclusive $ \mathrm{t} \overline{\mathrm{t}} $ production cross section in the lepton+jets channel in pp collisions at $ \sqrt{s}= $ 7 TeV with the ATLAS detector using support vector machines | Accepted by Phys. Rev. D, 2022 | 2212.00571 |
| 18 | ATLAS Collaboration | Inclusive and differential cross-sections for dilepton $ \mathrm{t} \overline{\mathrm{t}} $ production measured in $ \sqrt{s}= $ 13 TeV pp collisions with the ATLAS detector | JHEP 07 (2023) 141 | 2303.15340 |
| 19 | M. Cacciari et al. | Top-pair production at hadron colliders with next-to-next-to-leading logarithmic soft-gluon resummation | PLB 710 (2012) 612 | 1111.5869 |
| 20 | P. B ä rnreuther, M. Czakon, and A. Mitov | Percent level precision physics at the Tevatron: Next-to-next-to-leading order QCD corrections to $ \mathrm{q}\overline{\mathrm{q}}\to{\mathrm{t}\overline{\mathrm{t}}} +{\mathrm{X}} $ | PRL 109 (2012) 132001 | 1204.5201 |
| 21 | M. Czakon and A. Mitov | NNLO corrections to top-pair production at hadron colliders: the all-fermionic scattering channels | JHEP 12 (2012) 054 | 1207.0236 |
| 22 | M. Czakon and A. Mitov | NNLO corrections to top pair production at hadron colliders: the quark-gluon reaction | JHEP 01 (2013) 080 | 1210.6832 |
| 23 | M. Czakon, P. Fiedler, and A. Mitov | Total top-quark pair-production cross section at hadron colliders through $ \mathcal{O}({\alpha_\mathrm{S}}^4) $ | PRL 110 (2013) 252004 | 1303.6254 |
| 24 | S. Catani et al. | Top-quark pair hadroproduction at next-to-next-to-leading order in QCD | PRD 99 (2019) 051501 | 1901.04005 |
| 25 | M. Czakon and A. Mitov | \textsctop++: a program for the calculation of the top-pair cross-section at hadron colliders | Comput. Phys. Commun. 185 (2014) 2930 | 1112.5675 |
| 26 | PDF4LHC Working Group , R. D. Ball et al. | The PDF4LHC21 combination of global PDF fits for the LHC Run III | JPG 49 (2022) 080501 | 2203.05506 |
| 27 | CMS Collaboration | HEPData record for this analysis | link | |
| 28 | CMS Collaboration | The CMS experiment at the CERN LHC | JINST 3 (2008) S08004 | |
| 29 | CMS Collaboration | Performance of the CMS Level-1 trigger in proton-proton collisions at $ \sqrt{s}= $ 13 TeV | JINST 15 (2020) P10017 | CMS-TRG-17-001 2006.10165 |
| 30 | CMS Collaboration | The CMS trigger system | JINST 12 (2017) P01020 | CMS-TRG-12-001 1609.02366 |
| 31 | CMS Collaboration | CMS technical design report for the Phase 1 upgrade of the hadron calorimeter | CMS Technical Proposal CERN-LHCC-2012-015, CMS-TDR-010, 2012 CDS |
|
| 32 | CMS Collaboration | Performance of the CMS phase-1 pixel detector with Run 3 data | CMS Detector Performance Note CMS-DP-2022-047, 2022 CDS |
|
| 33 | CMS Collaboration | Commissioning CMS online reconstruction with GPUs | CMS Detector Performance Note CMS-DP-2023-004, 2023 CDS |
|
| 34 | CMS BRIL Collaboration | The Pixel Luminosity Telescope: a detector for luminosity measurement at CMS using silicon pixel sensors | EPJC 83 (2023) 673 | 2206.08870 |
| 35 | N. Karunarathna | Run 3 luminosity measurements with the Pixel Luminosity Telescope | CMS Collaboration, in 41st Int. Conf. on High Energy Phys. (ICHEP ): Bologna, Italy, 2022 [PoS (ICHEP) 936] |
|
| 36 | J. Wańczyk | Upgraded CMS Fast Beam Condition Monitor for LHC Run 3 online luminosity and beam-induced background measurements | CMS Collaboration, in 11th Int. Beam Instrumentation Conf. (IBIC ): Krakow, Poland, 2022 [JACoW (IBIC) 540] |
|
| 37 | CMS Collaboration | Particle-flow reconstruction and global event description with the CMS detector | JINST 12 (2017) P10003 | CMS-PRF-14-001 1706.04965 |
| 38 | CMS Collaboration | Technical proposal for the Phase-II upgrade of the Compact Muon Solenoid | CMS Technical Proposal CERN-LHCC-2015-010, CMS-TDR-15-02, 2015 CDS |
|
| 39 | M. Cacciari, G. P. Salam, and G. Soyez | The anti-$ k_{\mathrm{T}} $ jet clustering algorithm | JHEP 04 (2008) 063 | 0802.1189 |
| 40 | M. Cacciari, G. P. Salam, and G. Soyez | FASTJET user manual | EPJC 72 (2012) 1896 | 1111.6097 |
| 41 | CMS Collaboration | Jet energy scale and resolution in the CMS experiment in $ {\mathrm{p}\mathrm{p}} $ collisions at 8 TeV | JINST 12 (2017) P02014 | CMS-JME-13-004 1607.03663 |
| 42 | CMS Collaboration | Pileup mitigation at CMS in 13 TeV data | JINST 15 (2020) P09018 | CMS-JME-18-001 2003.00503 |
| 43 | D. Bertolini, P. Harris, M. Low, and N. Tran | Pileup per particle identification | JHEP 10 (2014) 059 | 1407.6013 |
| 44 | CMS Collaboration | Jet energy scale and resolution measurements using prompt Run 3 data collected by CMS in the first months of 2022 at 13.6 TeV | CMS Detector Performance Note CMS-DP-2022-054, 2022 CDS |
|
| 45 | CMS Collaboration | Jet algorithms performance in 13 TeV data | CMS Physics Analysis Summary, 2017 CMS-PAS-JME-16-003 |
CMS-PAS-JME-16-003 |
| 46 | CMS Collaboration | Measurements of inclusive W and Z cross sections in $ {\mathrm{p}\mathrm{p}} $ collisions at $ \sqrt{s}= $ 7 TeV | JHEP 01 (2011) 080 | CMS-EWK-10-002 1012.2466 |
| 47 | S. van der Meer | Calibration of the effective beam height in the ISR | ISR Report CERN-ISR-PO-68-31, 1968 | |
| 48 | P. Grafström and W. Kozanecki | Luminosity determination at proton colliders | Prog. Part. Nucl. Phys. 81 (2015) 97 | |
| 49 | CMS Collaboration | Precision luminosity measurement in proton-proton collisions at $ \sqrt{s}= $ 13 TeV in 2015 and 2016 at CMS | EPJC 81 (2021) 800 | CMS-LUM-17-003 2104.01927 |
| 50 | S. Frixione, G. Ridolfi, and P. Nason | A positive-weight next-to-leading-order Monte Carlo for heavy flavour hadroproduction | JHEP 09 (2007) 126 | 0707.3088 |
| 51 | S. Frixione, P. Nason, and C. Oleari | Matching NLO QCD computations with parton shower simulations: the POWHEG method | JHEP 11 (2007) 070 | 0709.2092 |
| 52 | S. Alioli, P. Nason, C. Oleari, and E. Re | A general framework for implementing NLO calculations in shower Monte Carlo programs: the POWHEG \textscbox | JHEP 06 (2010) 043 | 1002.2581 |
| 53 | P. Artoisenet, R. Frederix, O. Mattelaer, and R. Rietkerk | Automatic spin-entangled decays of heavy resonances in Monte Carlo simulations | JHEP 03 (2013) 015 | 1212.3460 |
| 54 | J. Alwall et al. | The automated computation of tree-level and next-to-leading order differential cross sections, and their matching to parton shower simulations | JHEP 07 (2014) 079 | 1405.0301 |
| 55 | T. Sjöstrand et al. | An introduction to PYTHIA8.2 | Comput. Phys. Commun. 191 (2015) 159 | 1410.3012 |
| 56 | NNPDF Collaboration | Parton distributions from high-precision collider data | EPJC 77 (2017) 663 | 1706.00428 |
| 57 | CMS Collaboration | Extraction and validation of a new set of CMS PYTHIA8 tunes from underlying-event measurements | EPJC 80 (2020) 4 | CMS-GEN-17-001 1903.12179 |
| 58 | J. Alwall et al. | Comparative study of various algorithms for the merging of parton showers and matrix elements in hadronic collisions | EPJC 53 (2008) 473 | 0706.2569 |
| 59 | GEANT4 Collaboration | GEANT 4---a simulation toolkit | NIM A 506 (2003) 250 | |
| 60 | J. Campbell, T. Neumann, and Z. Sullivan | Single-top-quark production in the $ t $-channel at NNLO | JHEP 02 (2021) 040 | 2012.01574 |
| 61 | N. Kidonakis and N. Yamanaka | Higher-order corrections for $ \mathrm{t}\mathrm{W} $ production at high-energy hadron colliders | JHEP 05 (2021) 278 | 2102.11300 |
| 62 | S. Camarda et al. | \textscDYTurbo: Fast predictions for Drell--Yan processes | EPJC 80 (2020) 251 | 1910.07049 |
| 63 | M. Grazzini, S. Kallweit, and M. Wiesemann | Fully differential NNLO computations with \textscmatrix | EPJC 78 (2018) 537 | 1711.06631 |
| 64 | CMS Collaboration | Electron and photon reconstruction and identification with the CMS experiment at the CERN LHC | JINST 16 (2021) P05014 | CMS-EGM-17-001 2012.06888 |
| 65 | CMS Collaboration | Performance of the CMS muon detector and muon reconstruction with proton-proton collisions at $ \sqrt{s}= $ 13 TeV | JINST 13 (2018) P06015 | CMS-MUO-16-001 1804.04528 |
| 66 | CMS Collaboration | Identification of heavy-flavour jets with the CMS detector in $ {\mathrm{p}\mathrm{p}} $ collisions at 13 TeV | JINST 13 (2018) P05011 | CMS-BTV-16-002 1712.07158 |
| 67 | CMS Collaboration | Performance of the DeepJet b tagging algorithm using 41.9 fb$ ^{-1} $ of data from proton-proton collisions at 13 TeV with Phase 1 CMS detector | CMS Detector Performance Note CMS-DP-2018-058, 2018 CDS |
|
| 68 | E. Bols et al. | Jet flavour classification using DeepJet | JINST 15 (2020) P12012 | 2008.10519 |
| 69 | Particle Data Group , R. L. Workman et al. | Review of particle physics | Prog. Theor. Exp. Phys. 2022 (2022) 083C01 | |
| 70 | CMS Collaboration | Search for dark matter particles produced in association with a top quark pair at $ \sqrt{s}= $ 13 TeV | PRL 122 (2019) 011803 | CMS-EXO-16-049 1807.06522 |
| 71 | CMS Collaboration | Luminosity monitoring with Z counting in early 2022 data | CMS Detector Performance Note CMS-DP-2023-003, 2023 CDS |
|
| 72 | M. Cacciari et al. | The $ \mathrm{t} \overline{\mathrm{t}} $ cross-section at 1.8 and 1.96 TeV: a study of the systematics due to parton densities and scale dependence | JHEP 04 (2004) 068 | hep-ph/0303085 |
| 73 | CMS Collaboration | Investigations of the impact of the parton shower tuning in \mboxPYTHIA8 in the modelling of $ \mathrm{t} \overline{\mathrm{t}} $ at $ \sqrt{s}= $ 8 and 13 TeV | CMS Physics Analysis Summary, 2016 CMS-PAS-TOP-16-021 |
CMS-PAS-TOP-16-021 |
| 74 | J. Butterworth et al. | PDF4LHC recommendations for LHC Run II | JPG 43 (2016) 023001 | 1510.03865 |
| 75 | CMS Collaboration | Measurements of $ \mathrm{t} \overline{\mathrm{t}} $ differential cross sections in proton-proton collisions at $ \sqrt{s}= $ 13 TeV using events containing two leptons | JHEP 02 (2019) 149 | CMS-TOP-17-014 1811.06625 |
| 76 | CMS Collaboration | Measurement of normalized differential $ \mathrm{t} \overline{\mathrm{t}} $ cross sections in the dilepton channel from $ {\mathrm{p}\mathrm{p}} $ collisions at $ \sqrt{s}= $ 13 TeV | JHEP 04 (2018) 060 | CMS-TOP-16-007 1708.07638 |
| 77 | CMS Collaboration | Measurement of differential cross sections for top quark pair production using the lepton+jets final state in proton-proton collisions at 13 TeV | PRD 95 (2017) 092001 | CMS-TOP-16-008 1610.04191 |
| 78 | M. Czakon et al. | Top-pair production at the LHC through NNLO QCD and NLO EW | JHEP 10 (2017) 186 | 1705.04105 |
| 79 | CMS Collaboration | Measurement of the production cross section of a W boson in association with two b jets in $ {\mathrm{p}\mathrm{p}} $ collisions at $ \sqrt{s}= $ 8 TeV | EPJC 77 (2017) 92 | CMS-SMP-14-020 1608.07561 |
| 80 | CMS Collaboration | Measurement of the single top quark and antiquark production cross sections in the $ t $ channel and their ratio in proton-proton collisions at $ \sqrt{s}= $ 13 TeV | PLB 800 (2019) 135042 | CMS-TOP-17-011 1812.10514 |
| 81 | CMS Collaboration | $ {\mathrm{W^+}\mathrm{W^-}} $ boson pair production in proton-proton collisions at $ \sqrt{s}= $ 13 TeV | PRD 102 (2020) 092001 | CMS-SMP-18-004 2009.00119 |
| 82 | CMS Collaboration | Observation of $ {\mathrm{t}\mathrm{W}} $ production in the single-lepton channel in $ {\mathrm{p}\mathrm{p}} $ collisions at $ \sqrt{s}= $ 13 TeV | JHEP 11 (2021) 111 | CMS-TOP-20-002 2109.01706 |
| 83 | CMS Collaboration | Measurement of the inclusive and differential $ {\mathrm{W}\mathrm{Z}} $ production cross sections, polarization angles, and triple gauge couplings in $ {\mathrm{p}\mathrm{p}} $ collisions at $ \sqrt{s}= $ 13 TeV | JHEP 07 (2022) 032 | CMS-SMP-20-014 2110.11231 |
| 84 | CMS Collaboration | Measurement of the production cross section for $ {\mathrm{Z}+\mathrm{b}} $ jets in proton-proton collisions at $ \sqrt{s}= $ 13 TeV | PRD 105 (2022) 092014 | CMS-SMP-20-015 2112.09659 |
| 85 | CMS Collaboration | Measurement of inclusive and differential cross sections for single top quark production in association with a W boson in proton-proton collisions at $ \sqrt{s}= $ 13 TeV | JHEP 07 (2023) 046 | CMS-TOP-21-010 2208.00924 |
| 86 | CMS Collaboration | Measurement of the top quark pair production cross section in proton-proton collisions at $ \sqrt{s}= $ 13 TeV | PRL 116 (2016) 052002 | CMS-TOP-15-003 1510.05302 |
| 87 | CMS Collaboration | Measurement of the $ \mathrm{t} \overline{\mathrm{t}} $ production cross section using events in the $ {\mathrm{e}\mu} $ final state in $ {\mathrm{p}\mathrm{p}} $ collisions at $ \sqrt{s}= $ 13 TeV | EPJC 77 (2017) 172 | CMS-TOP-16-005 1611.04040 |
| 88 | R. Barlow and C. Beeston | Fitting using finite Monte Carlo samples | Comput. Phys. Commun. 77 (1993) 219 | |
| 89 | CMS Collaboration | Precise determination of the mass of the Higgs boson and tests of compatibility of its couplings with the standard model predictions using proton collisions at 7 and 8 TeV | EPJC 75 (2015) 212 | CMS-HIG-14-009 1412.8662 |
|
|
Compact Muon Solenoid LHC, CERN |
|

|

|

|

|

|