

Compact Muon Solenoid
LHC, CERN
| CMS-SMP-20-009 ; CERN-EP-2021-091 | ||
| Measurements of Z bosons plus jets using variables sensitive to double parton scattering in pp collisions at 13 TeV | ||
| CMS Collaboration | ||
| 30 May 2021 | ||
| JHEP 10 (2021) 176 | ||
| Abstract: Double parton scattering is investigated using events with a Z boson and jets. The measurements are performed with proton-proton collision data recorded by the CMS experiment at the LHC at $\sqrt{s} = $ 13 TeV, corresponding to an integrated luminosity of 35.9 fb$^{-1}$ collected in the year 2016. Differential cross sections of Z+$\geq $ 1 jet and Z+$\geq $ 2 jets are measured with transverse momentum of the jets above 20 GeV and pseudorapidity $|{\eta}| < $ 2.4. Several distributions with sensitivity to double parton scattering effects are measured as functions of the angle and the transverse momentum imbalance between the Z boson and the jets. The measured distributions are compared with predictions from several event generators with different hadronization models and different parameter settings for multiparton interactions. The measured distributions show a dependence on the hadronization and multiparton interaction simulation parameters, and are important input for future improvements of the simulations. | ||
| Links: e-print arXiv:2105.14511 [hep-ex] (PDF) ; CDS record ; inSPIRE record ; HepData record ; CADI line (restricted) ; | ||
| Figures | |

png pdf |
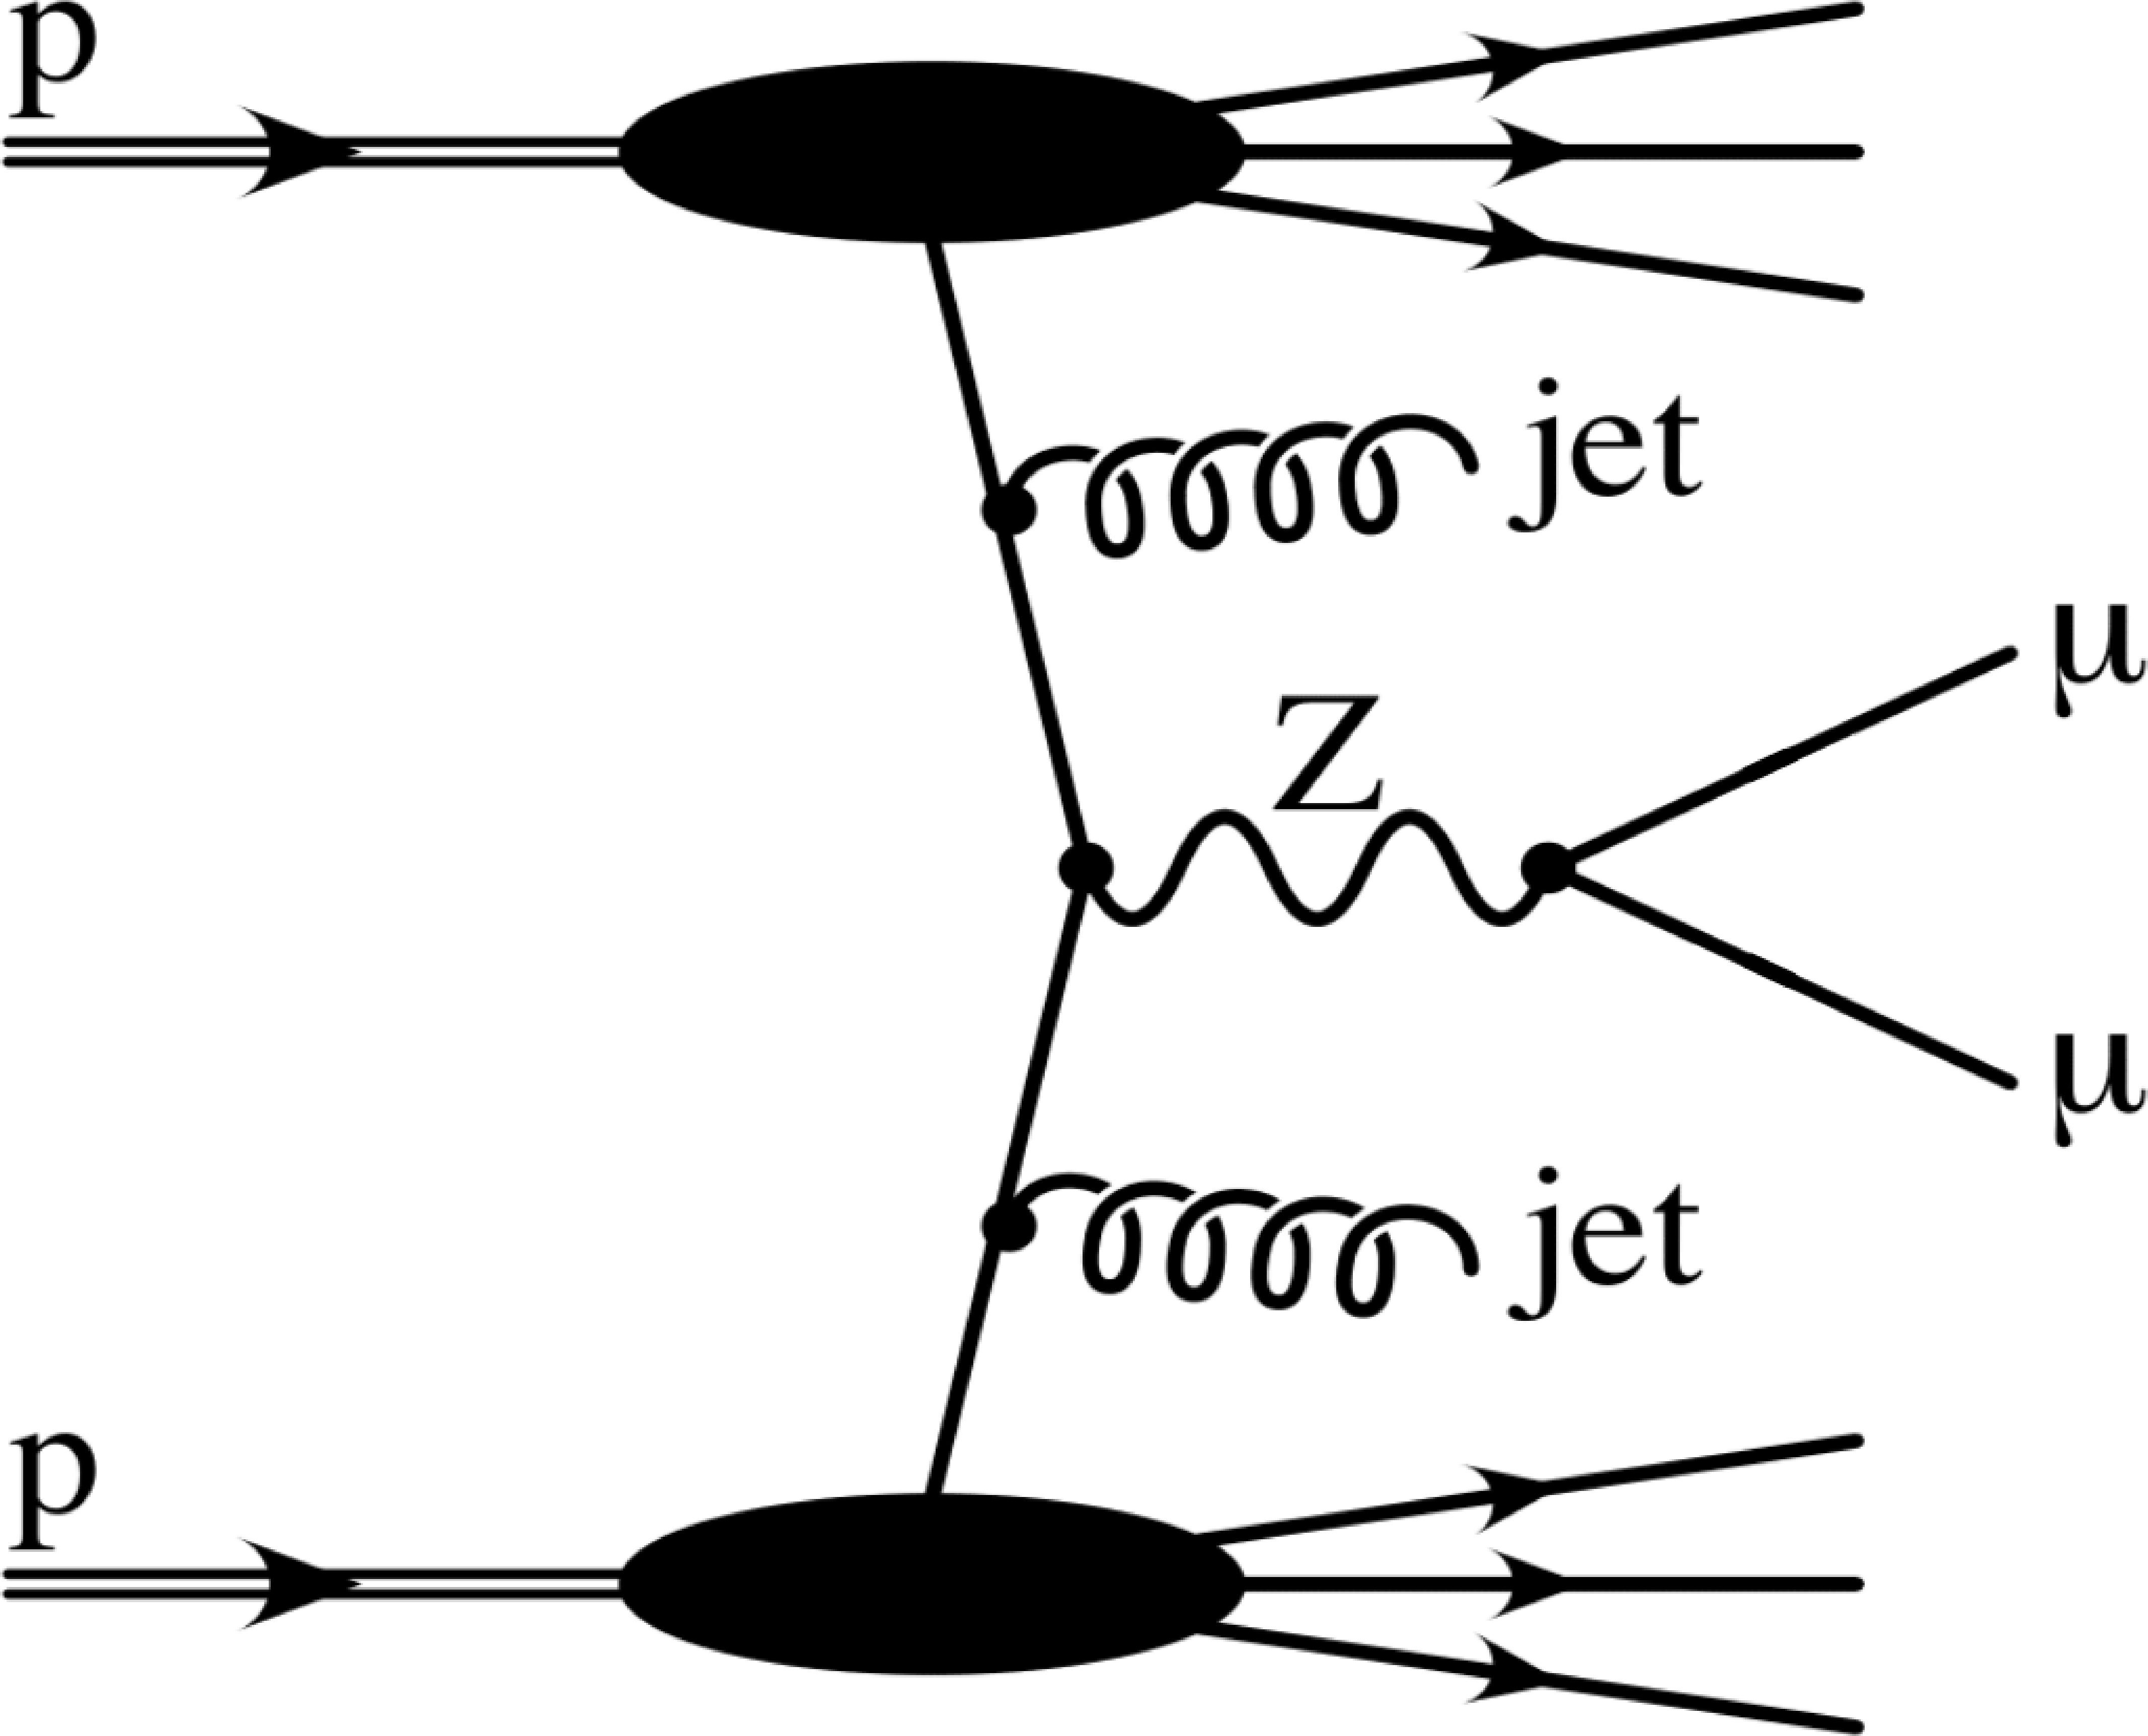
Figure 1:
Typical diagrams for Z+2 jets production in a single (left) and double parton (right) scattering process. |
png pdf |
Figure 1-a:
Typical diagram for Z+2 jets production in a single parton scattering process. |

png pdf |
Figure 1-b:
Typical diagram for Z+2 jets production in a double parton scattering process. |

png pdf |
Figure 2:
Differential cross sections (left) and area-normalized distributions (right) as functions of $\Delta \phi $ between the Z boson and the leading jet for Z+$\geq $1 jet events. The uncertainties in the predictions are shown as coloured bands around the theoretical predictions including statistical, PDF, and scale uncertainties for the NLO MG5_aMC + PYTHIA8 (with CP5 tune) and the statistical uncertainty only for the LO MG5_aMC + PYTHIA8 (with CP5 tune), NLO MG5_aMC + PYTHIA8 (with CDPSTP8S1-WJ tune, CP5 tune with MPI-OFF), NLO MG5_aMC + HERWIG7 (with tune CH3), and SHERPA predictions. In the top panel, the vertical bars on the data points represent statistical uncertainties, whereas in the bottom panels, the total uncertainty in data is indicated by the solid yellow band centred at 1. In the legend, the $\chi ^{2}$ per degree of freedom is given to quantify the goodness of fit of the model to the data. |

png pdf |
Figure 2-a:
Differential cross sections as functions of $\Delta \phi $ between the Z boson and the leading jet for Z+$\geq $1 jet events. The uncertainties in the predictions are shown as coloured bands around the theoretical predictions including statistical, PDF, and scale uncertainties for the NLO MG5_aMC + PYTHIA8 (with CP5 tune) and the statistical uncertainty only for the LO MG5_aMC + PYTHIA8 (with CP5 tune), NLO MG5_aMC + PYTHIA8 (with CDPSTP8S1-WJ tune, CP5 tune with MPI-OFF), NLO MG5_aMC + HERWIG7 (with tune CH3), and SHERPA predictions. In the top panel, the vertical bars on the data points represent statistical uncertainties, whereas in the bottom panels, the total uncertainty in data is indicated by the solid yellow band centred at 1. In the legend, the $\chi ^{2}$ per degree of freedom is given to quantify the goodness of fit of the model to the data. |

png pdf |
Figure 2-b:
Area-normalized distributions as functions of $\Delta \phi $ between the Z boson and the leading jet for Z+$\geq $1 jet events. The uncertainties in the predictions are shown as coloured bands around the theoretical predictions including statistical, PDF, and scale uncertainties for the NLO MG5_aMC + PYTHIA8 (with CP5 tune) and the statistical uncertainty only for the LO MG5_aMC + PYTHIA8 (with CP5 tune), NLO MG5_aMC + PYTHIA8 (with CDPSTP8S1-WJ tune, CP5 tune with MPI-OFF), NLO MG5_aMC + HERWIG7 (with tune CH3), and SHERPA predictions. In the top panel, the vertical bars on the data points represent statistical uncertainties, whereas in the bottom panels, the total uncertainty in data is indicated by the solid yellow band centred at 1. In the legend, the $\chi ^{2}$ per degree of freedom is given to quantify the goodness of fit of the model to the data. |

png pdf |
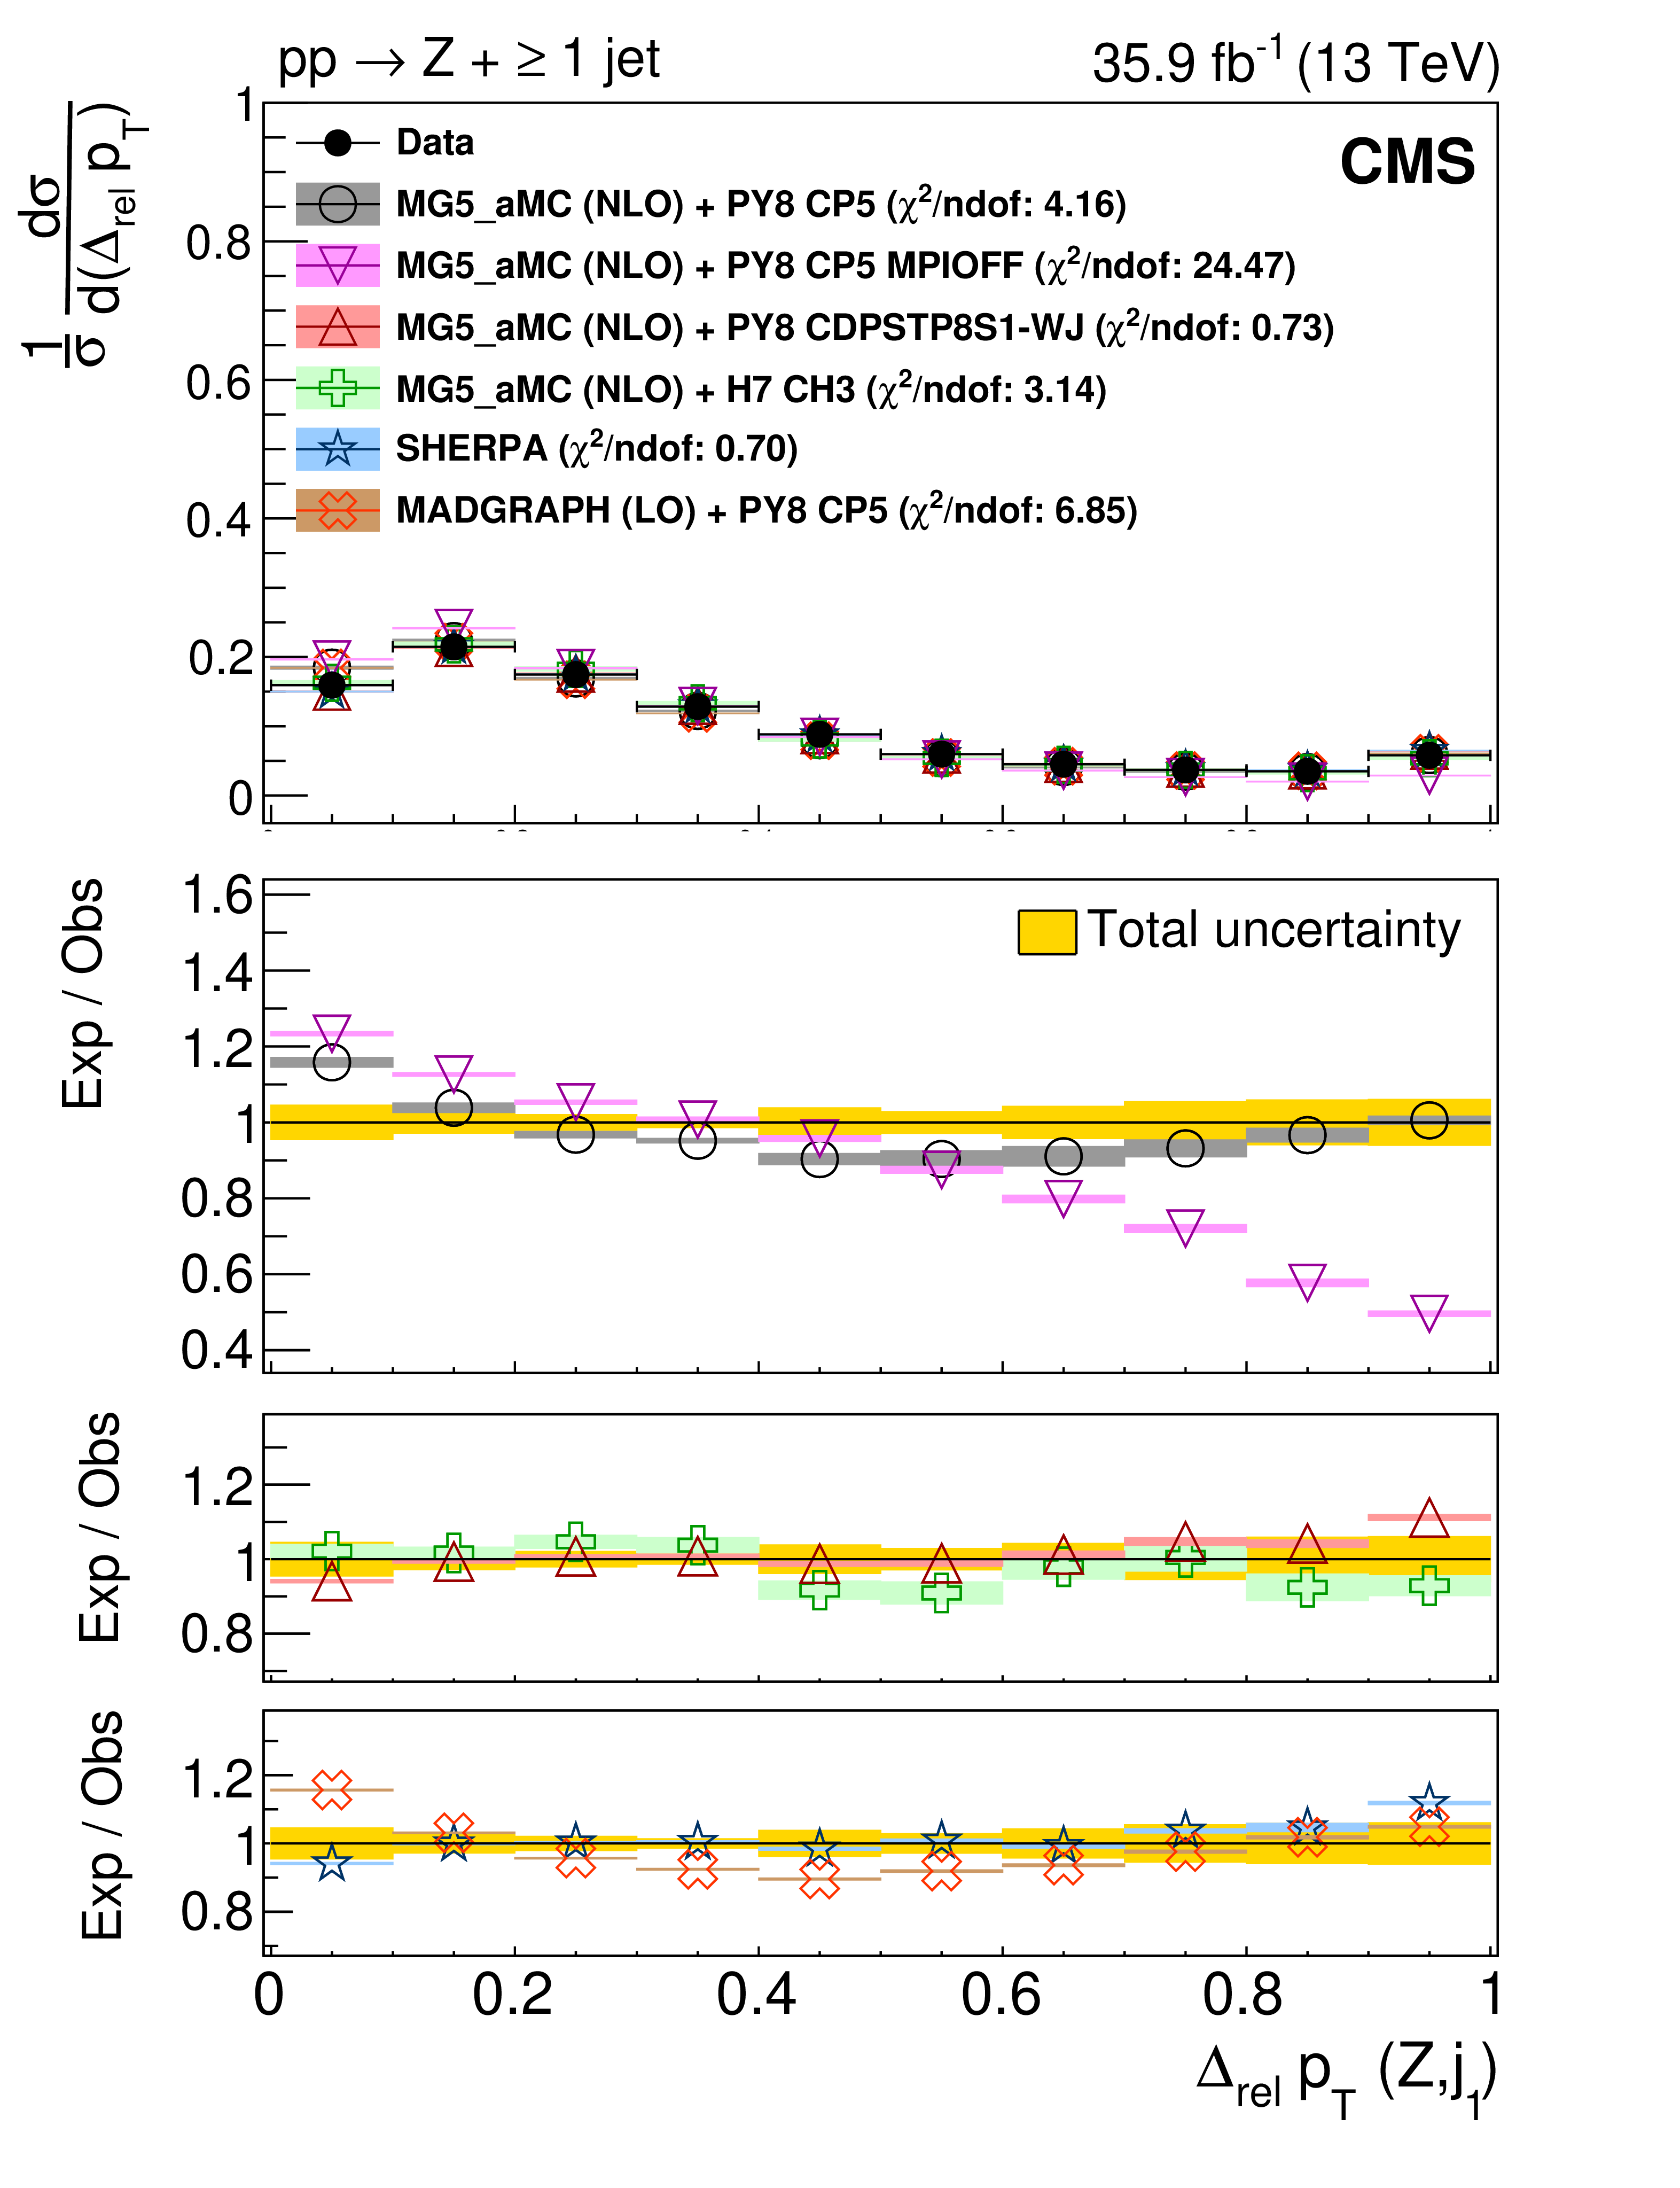
Figure 3:
Differential cross sections (left) and area-normalized distributions (right) as functions of the ${p_{\mathrm {T}}}$ imbalance between the Z boson and the leading jet for Z+$\geq $1 jet events. The uncertainties in the predictions are shown as coloured bands around the theoretical predictions including statistical, PDF, and scale uncertainties for the NLO MG5_aMC + PYTHIA8 (with CP5 tune) and the statistical uncertainty only for the LO MG5_aMC + PYTHIA8 (with CP5 tune), NLO MG5_aMC + PYTHIA8 (with CDPSTP8S1-WJ tune, CP5 tune with MPI-OFF), NLO MG5_aMC + HERWIG7 (with tune CH3), and SHERPA predictions. In the top panel, the vertical bars on the data points represent statistical uncertainties, whereas in the bottom panels, the total uncertainty in data is indicated by the solid yellow band centred at 1. In the legend, the $\chi ^{2}$ per degree of freedom is given to quantify the goodness of fit of the model to the data. |

png pdf |
Figure 3-a:
Differential cross sections as functions of the ${p_{\mathrm {T}}}$ imbalance between the Z boson and the leading jet for Z+$\geq $1 jet events. The uncertainties in the predictions are shown as coloured bands around the theoretical predictions including statistical, PDF, and scale uncertainties for the NLO MG5_aMC + PYTHIA8 (with CP5 tune) and the statistical uncertainty only for the LO MG5_aMC + PYTHIA8 (with CP5 tune), NLO MG5_aMC + PYTHIA8 (with CDPSTP8S1-WJ tune, CP5 tune with MPI-OFF), NLO MG5_aMC + HERWIG7 (with tune CH3), and SHERPA predictions. In the top panel, the vertical bars on the data points represent statistical uncertainties, whereas in the bottom panels, the total uncertainty in data is indicated by the solid yellow band centred at 1. In the legend, the $\chi ^{2}$ per degree of freedom is given to quantify the goodness of fit of the model to the data. |
png pdf |
Figure 3-b:
Area-normalized distributions as functions of the ${p_{\mathrm {T}}}$ imbalance between the Z boson and the leading jet for Z+$\geq $1 jet events. The uncertainties in the predictions are shown as coloured bands around the theoretical predictions including statistical, PDF, and scale uncertainties for the NLO MG5_aMC + PYTHIA8 (with CP5 tune) and the statistical uncertainty only for the LO MG5_aMC + PYTHIA8 (with CP5 tune), NLO MG5_aMC + PYTHIA8 (with CDPSTP8S1-WJ tune, CP5 tune with MPI-OFF), NLO MG5_aMC + HERWIG7 (with tune CH3), and SHERPA predictions. In the top panel, the vertical bars on the data points represent statistical uncertainties, whereas in the bottom panels, the total uncertainty in data is indicated by the solid yellow band centred at 1. In the legend, the $\chi ^{2}$ per degree of freedom is given to quantify the goodness of fit of the model to the data. |
png pdf |
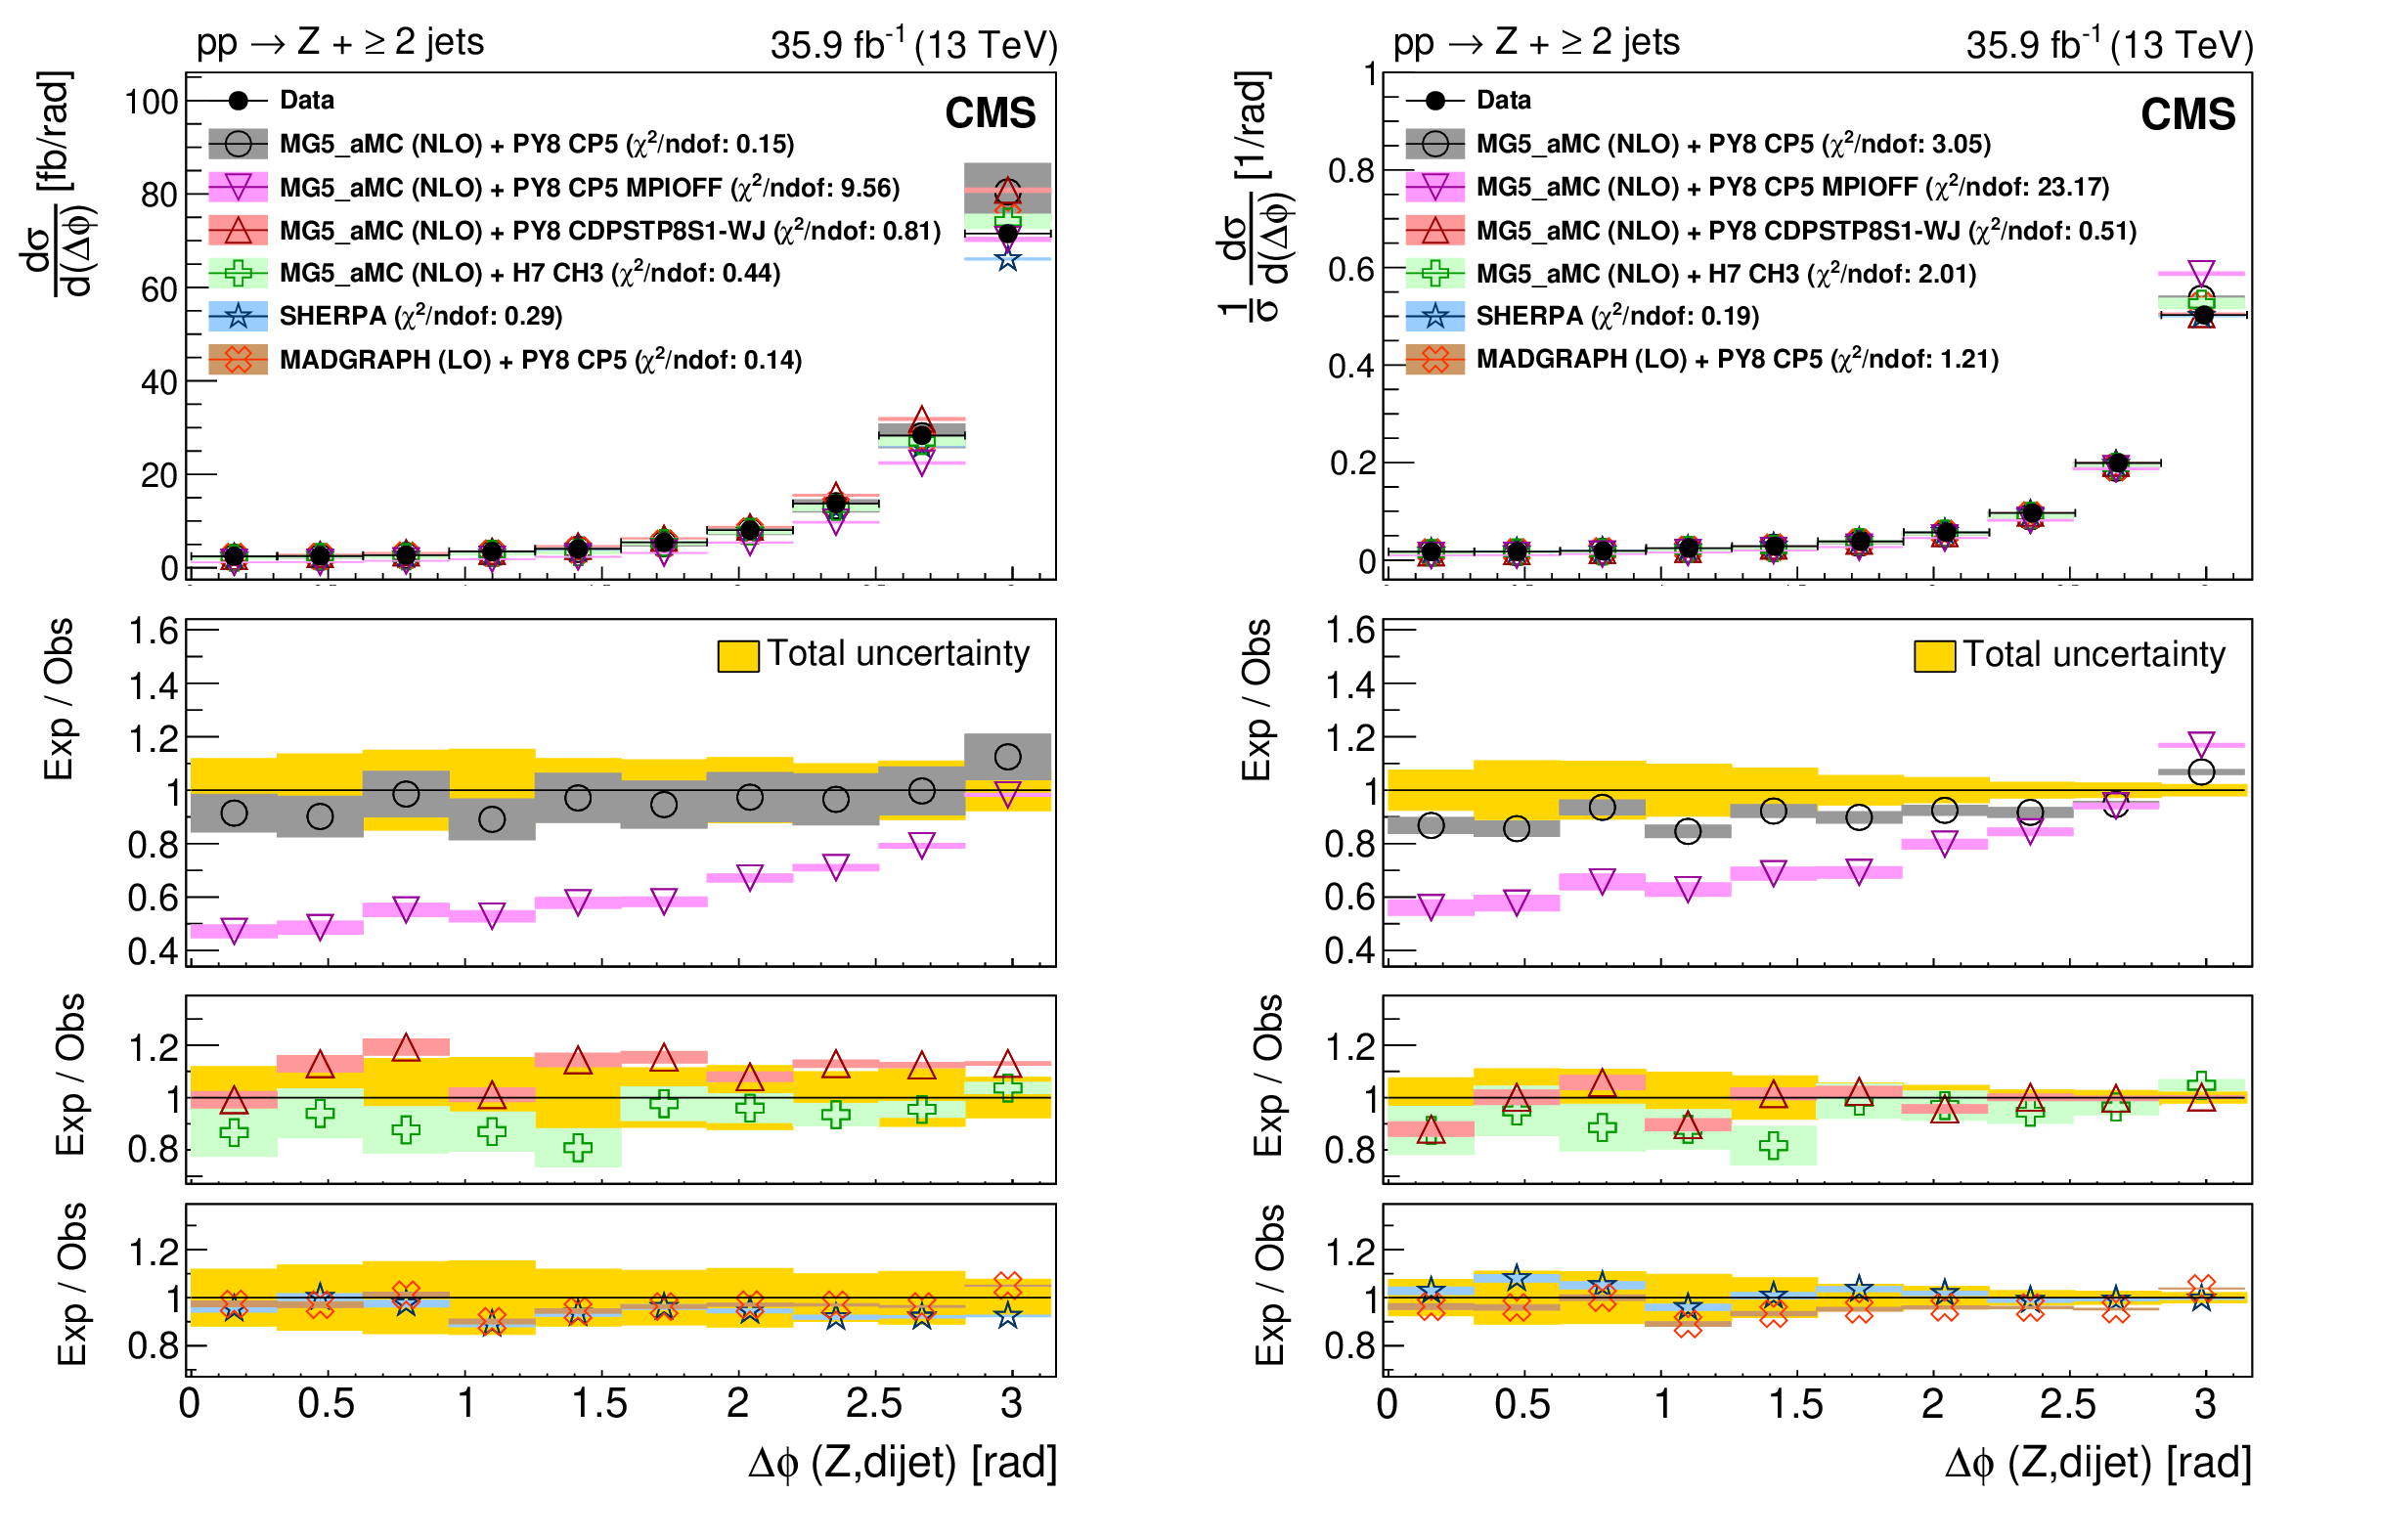
Figure 4:
Differential cross sections (left) and area-normalized distributions (right) as functions of $\Delta \phi $ between the Z boson and the dijet for Z+$\geq $2 jet events. The uncertainties in the predictions are shown as coloured bands around the theoretical predictions including statistical, PDF, and scale uncertainties for the NLO MG5_aMC + PYTHIA8 (with CP5 tune) and the statistical uncertainty only for the LO MG5_aMC + PYTHIA8 (with CP5 tune), NLO MG5_aMC + PYTHIA8 (with CDPSTP8S1-WJ tune, CP5 tune with MPI-OFF), NLO MG5_aMC + HERWIG7 (with tune CH3), and SHERPA predictions. In the top panel, the vertical bars on the data points represent statistical uncertainties, whereas in the bottom panels, the total uncertainty in data is indicated by the solid yellow band centred at 1. In the legend, the $\chi ^{2}$ per degree of freedom is given to quantify the goodness of fit of the model to the data. |

png pdf |
Figure 4-a:
Differential cross sections as functions of $\Delta \phi $ between the Z boson and the dijet for Z+$\geq $2 jet events. The uncertainties in the predictions are shown as coloured bands around the theoretical predictions including statistical, PDF, and scale uncertainties for the NLO MG5_aMC + PYTHIA8 (with CP5 tune) and the statistical uncertainty only for the LO MG5_aMC + PYTHIA8 (with CP5 tune), NLO MG5_aMC + PYTHIA8 (with CDPSTP8S1-WJ tune, CP5 tune with MPI-OFF), NLO MG5_aMC + HERWIG7 (with tune CH3), and SHERPA predictions. In the top panel, the vertical bars on the data points represent statistical uncertainties, whereas in the bottom panels, the total uncertainty in data is indicated by the solid yellow band centred at 1. In the legend, the $\chi ^{2}$ per degree of freedom is given to quantify the goodness of fit of the model to the data. |

png pdf |
Figure 4-b:
Area-normalized distributions as functions of $\Delta \phi $ between the Z boson and the dijet for Z+$\geq $2 jet events. The uncertainties in the predictions are shown as coloured bands around the theoretical predictions including statistical, PDF, and scale uncertainties for the NLO MG5_aMC + PYTHIA8 (with CP5 tune) and the statistical uncertainty only for the LO MG5_aMC + PYTHIA8 (with CP5 tune), NLO MG5_aMC + PYTHIA8 (with CDPSTP8S1-WJ tune, CP5 tune with MPI-OFF), NLO MG5_aMC + HERWIG7 (with tune CH3), and SHERPA predictions. In the top panel, the vertical bars on the data points represent statistical uncertainties, whereas in the bottom panels, the total uncertainty in data is indicated by the solid yellow band centred at 1. In the legend, the $\chi ^{2}$ per degree of freedom is given to quantify the goodness of fit of the model to the data. |

png pdf |
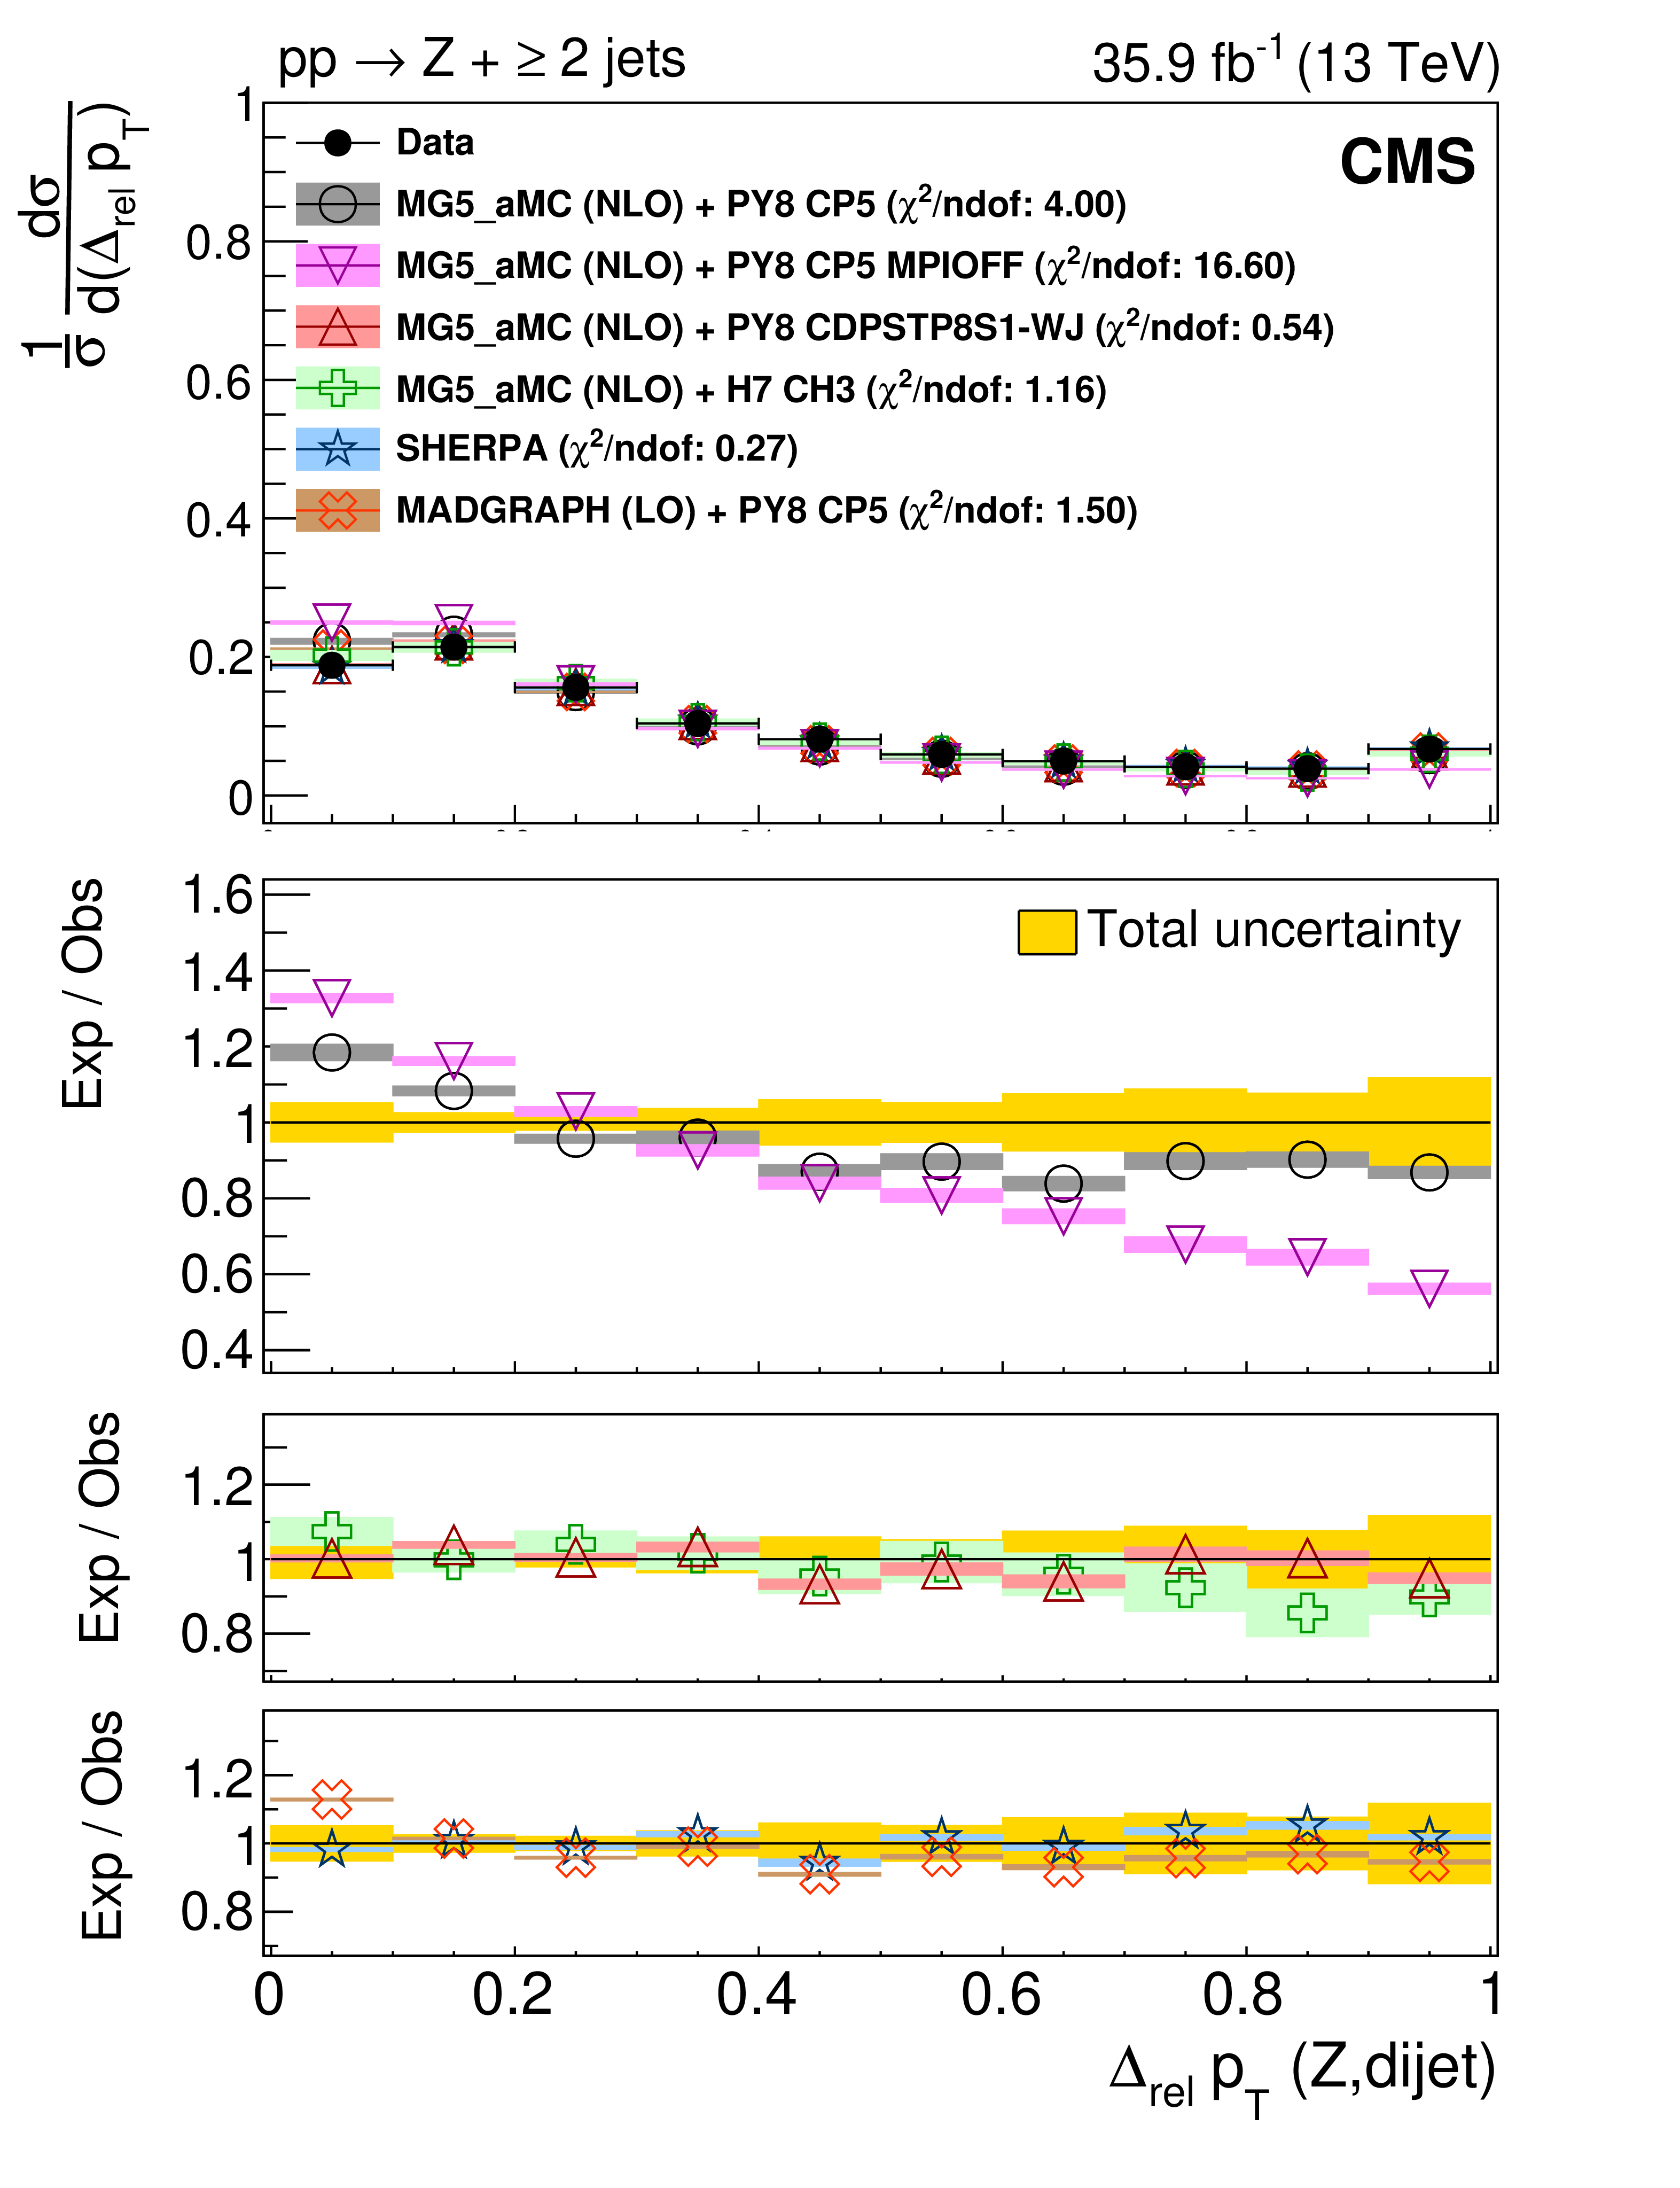
Figure 5:
Differential cross sections (left) and area-normalized distributions (right) as functions of the ${p_{\mathrm {T}}}$ imbalance between the Z boson and the dijet for Z+$\geq $2 jet events. The uncertainties in the predictions are shown as coloured bands around the theoretical predictions including statistical, PDF, and scale uncertainties for the NLO MG5_aMC + PYTHIA8 (with CP5 tune) and the statistical uncertainty only for the LO MG5_aMC + PYTHIA8 (with CP5 tune), NLO MG5_aMC + PYTHIA8 (with CDPSTP8S1-WJ tune, CP5 tune with MPI-OFF), NLO MG5_aMC + HERWIG7 (with tune CH3), and SHERPA predictions. In the top panel, the vertical bars on the data points represent statistical uncertainties, whereas in the bottom panels, the total uncertainty in data is indicated by the solid yellow band centred at 1. In the legend, the $\chi ^{2}$ per degree of freedom is given to quantify the goodness of fit of the model to the data. |

png pdf |
Figure 5-a:
Differential cross sections as functions of the ${p_{\mathrm {T}}}$ imbalance between the Z boson and the dijet for Z+$\geq $2 jet events. The uncertainties in the predictions are shown as coloured bands around the theoretical predictions including statistical, PDF, and scale uncertainties for the NLO MG5_aMC + PYTHIA8 (with CP5 tune) and the statistical uncertainty only for the LO MG5_aMC + PYTHIA8 (with CP5 tune), NLO MG5_aMC + PYTHIA8 (with CDPSTP8S1-WJ tune, CP5 tune with MPI-OFF), NLO MG5_aMC + HERWIG7 (with tune CH3), and SHERPA predictions. In the top panel, the vertical bars on the data points represent statistical uncertainties, whereas in the bottom panels, the total uncertainty in data is indicated by the solid yellow band centred at 1. In the legend, the $\chi ^{2}$ per degree of freedom is given to quantify the goodness of fit of the model to the data. |
png pdf |
Figure 5-b:
Area-normalized distributions as functions of the ${p_{\mathrm {T}}}$ imbalance between the Z boson and the dijet for Z+$\geq $2 jet events. The uncertainties in the predictions are shown as coloured bands around the theoretical predictions including statistical, PDF, and scale uncertainties for the NLO MG5_aMC + PYTHIA8 (with CP5 tune) and the statistical uncertainty only for the LO MG5_aMC + PYTHIA8 (with CP5 tune), NLO MG5_aMC + PYTHIA8 (with CDPSTP8S1-WJ tune, CP5 tune with MPI-OFF), NLO MG5_aMC + HERWIG7 (with tune CH3), and SHERPA predictions. In the top panel, the vertical bars on the data points represent statistical uncertainties, whereas in the bottom panels, the total uncertainty in data is indicated by the solid yellow band centred at 1. In the legend, the $\chi ^{2}$ per degree of freedom is given to quantify the goodness of fit of the model to the data. |

png pdf |
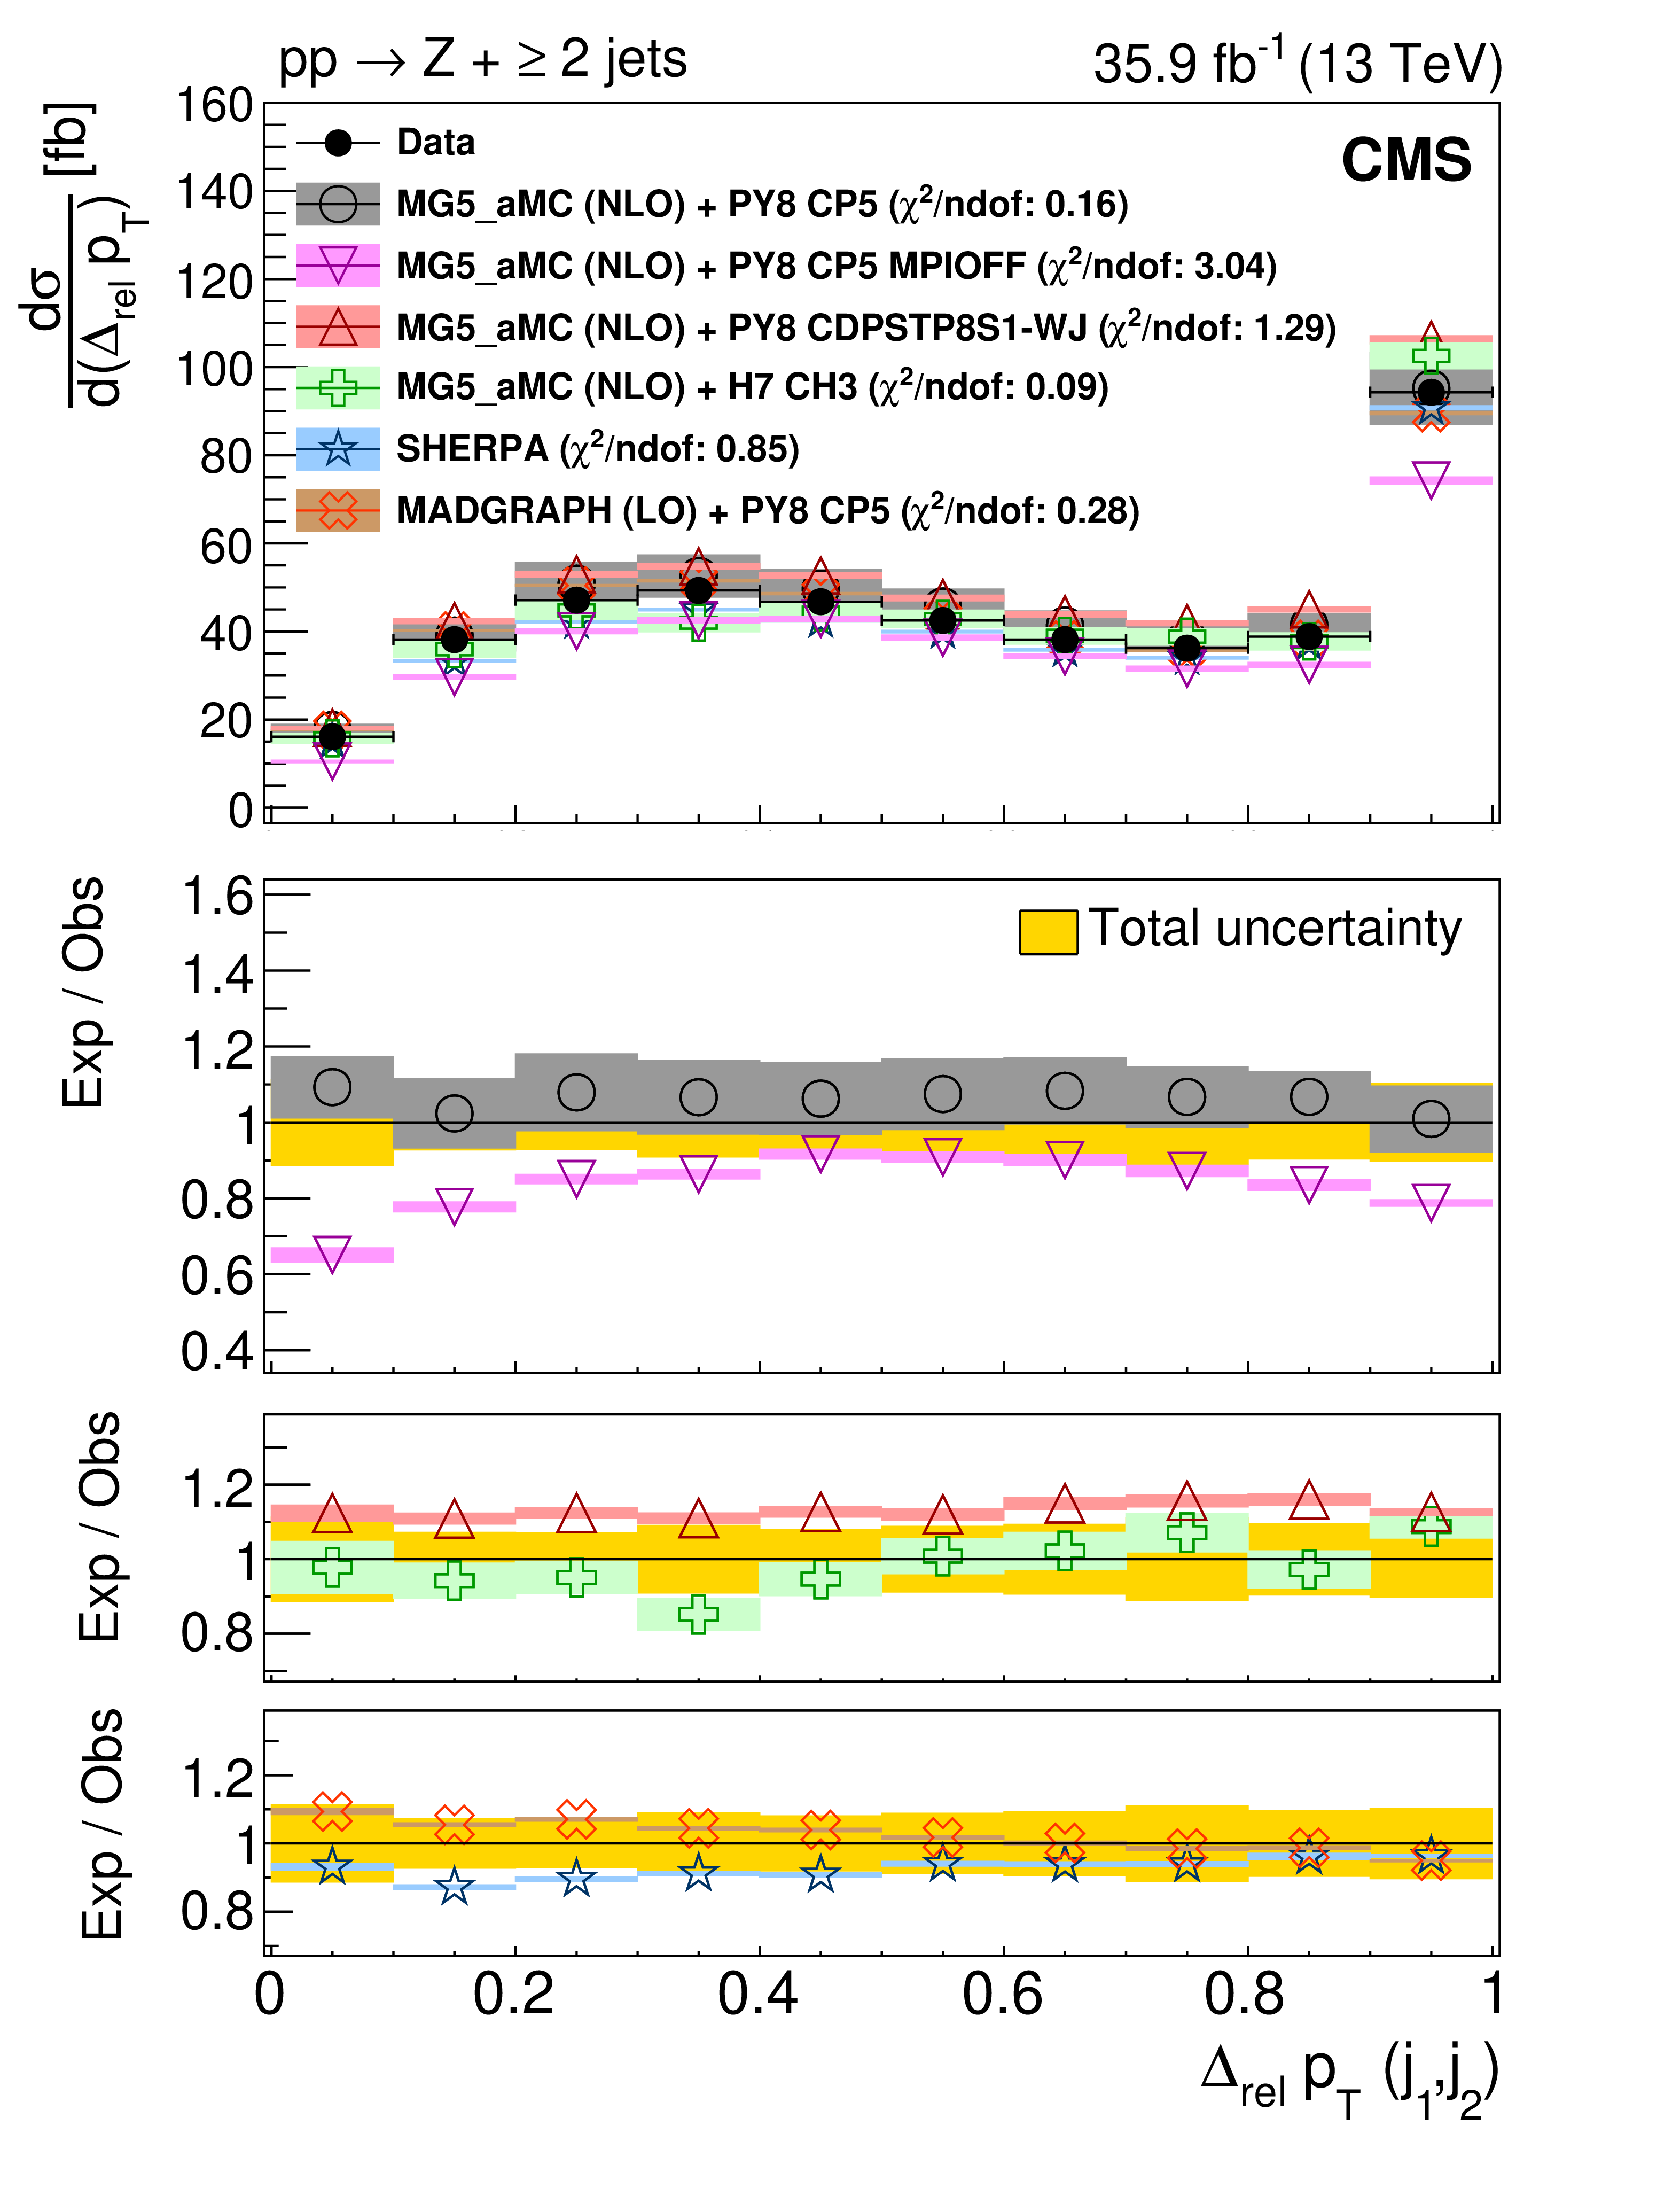
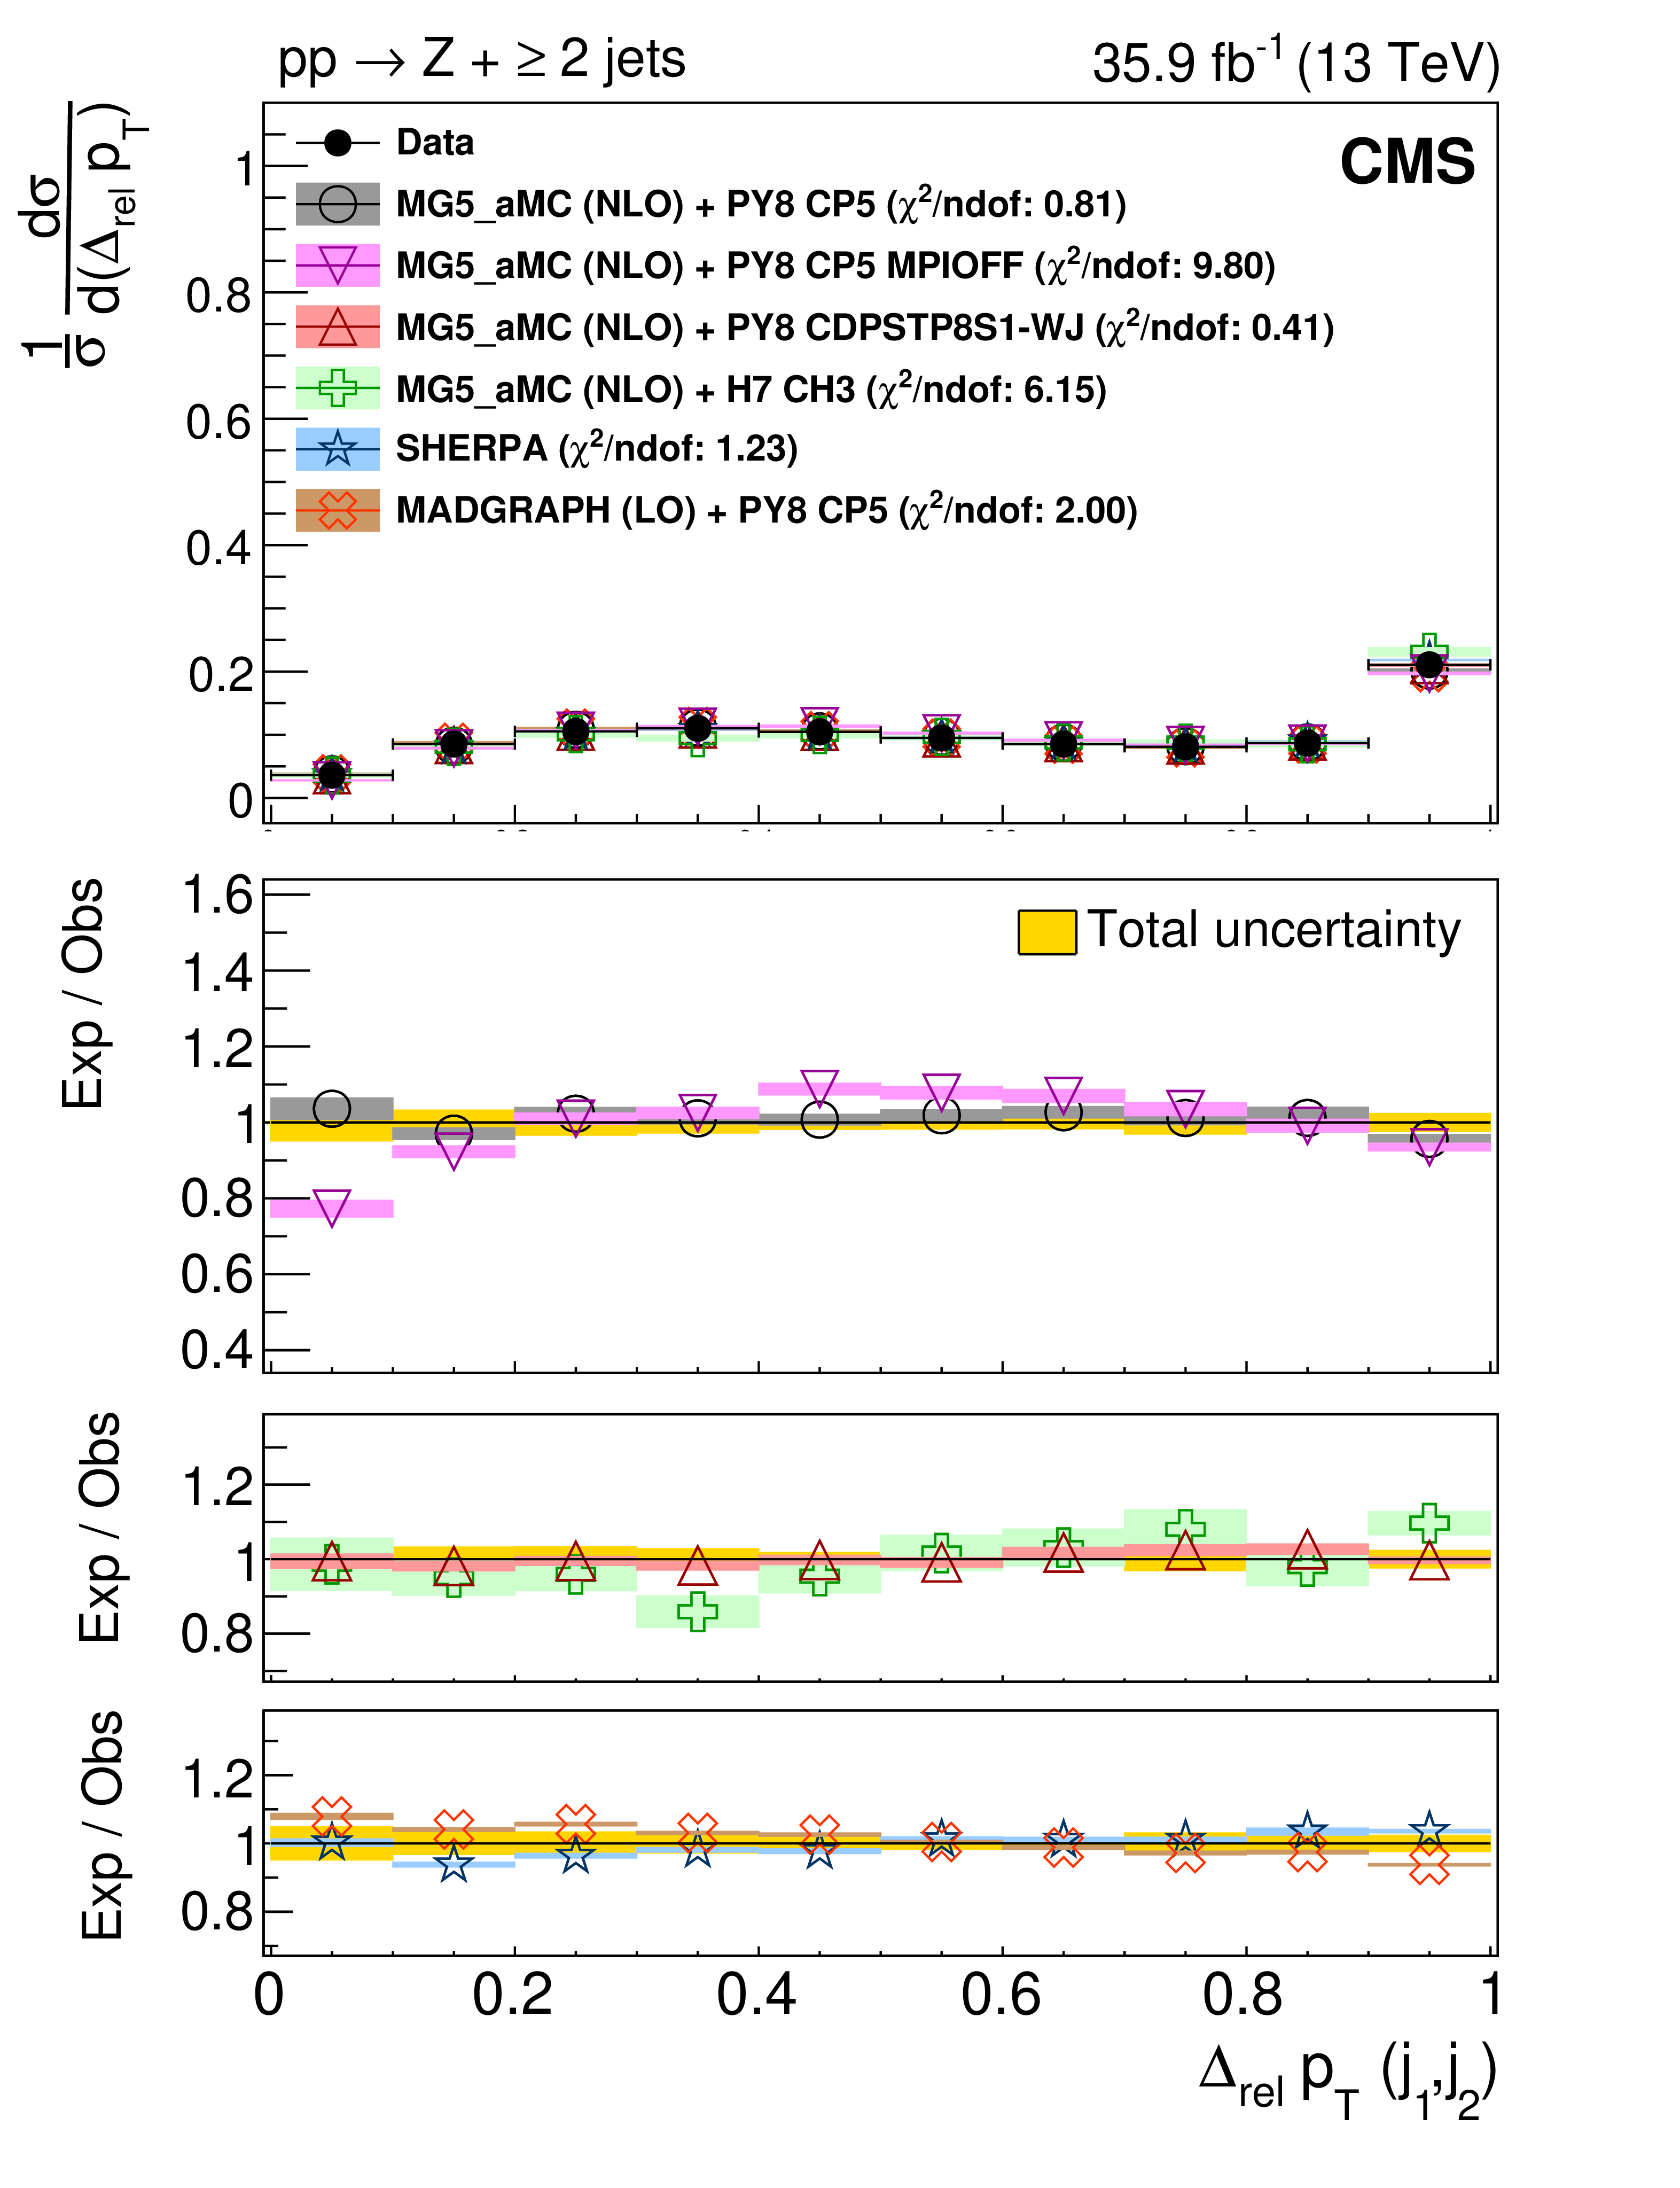
Figure 6:
Differential cross sections (left) and area-normalized distributions (right) as functions of the ${p_{\mathrm {T}}}$ imbalance between leading and subleading jets for Z+$\geq $2 jet events. The uncertainties in the predictions are shown as coloured bands around the theoretical predictions including statistical, PDF, and scale uncertainties for the NLO MG5_aMC + PYTHIA8 (with CP5 tune) and the statistical uncertainty only for the LO MG5_aMC + PYTHIA8 (with CP5 tune), NLO MG5_aMC + PYTHIA8 (with CDPSTP8S1-WJ tune, CP5 tune with MPI-OFF), NLO MG5_aMC + HERWIG7 (with tune CH3), and SHERPA predictions. In the top panel, the vertical bars on the data points represent statistical uncertainties, whereas in the bottom panels, the total uncertainty in data is indicated by the solid yellow band centred at 1. In the legend, the $\chi ^{2}$ per degree of freedom is given to quantify the goodness of fit of the model to the data. |
png pdf |
Figure 6-a:
Differential cross sections as functions of the ${p_{\mathrm {T}}}$ imbalance between leading and subleading jets for Z+$\geq $2 jet events. The uncertainties in the predictions are shown as coloured bands around the theoretical predictions including statistical, PDF, and scale uncertainties for the NLO MG5_aMC + PYTHIA8 (with CP5 tune) and the statistical uncertainty only for the LO MG5_aMC + PYTHIA8 (with CP5 tune), NLO MG5_aMC + PYTHIA8 (with CDPSTP8S1-WJ tune, CP5 tune with MPI-OFF), NLO MG5_aMC + HERWIG7 (with tune CH3), and SHERPA predictions. In the top panel, the vertical bars on the data points represent statistical uncertainties, whereas in the bottom panels, the total uncertainty in data is indicated by the solid yellow band centred at 1. In the legend, the $\chi ^{2}$ per degree of freedom is given to quantify the goodness of fit of the model to the data. |
png pdf |
Figure 6-b:
Area-normalized distributions as functions of the ${p_{\mathrm {T}}}$ imbalance between leading and subleading jets for Z+$\geq $2 jet events. The uncertainties in the predictions are shown as coloured bands around the theoretical predictions including statistical, PDF, and scale uncertainties for the NLO MG5_aMC + PYTHIA8 (with CP5 tune) and the statistical uncertainty only for the LO MG5_aMC + PYTHIA8 (with CP5 tune), NLO MG5_aMC + PYTHIA8 (with CDPSTP8S1-WJ tune, CP5 tune with MPI-OFF), NLO MG5_aMC + HERWIG7 (with tune CH3), and SHERPA predictions. In the top panel, the vertical bars on the data points represent statistical uncertainties, whereas in the bottom panels, the total uncertainty in data is indicated by the solid yellow band centred at 1. In the legend, the $\chi ^{2}$ per degree of freedom is given to quantify the goodness of fit of the model to the data. |
| Tables | |
png pdf |
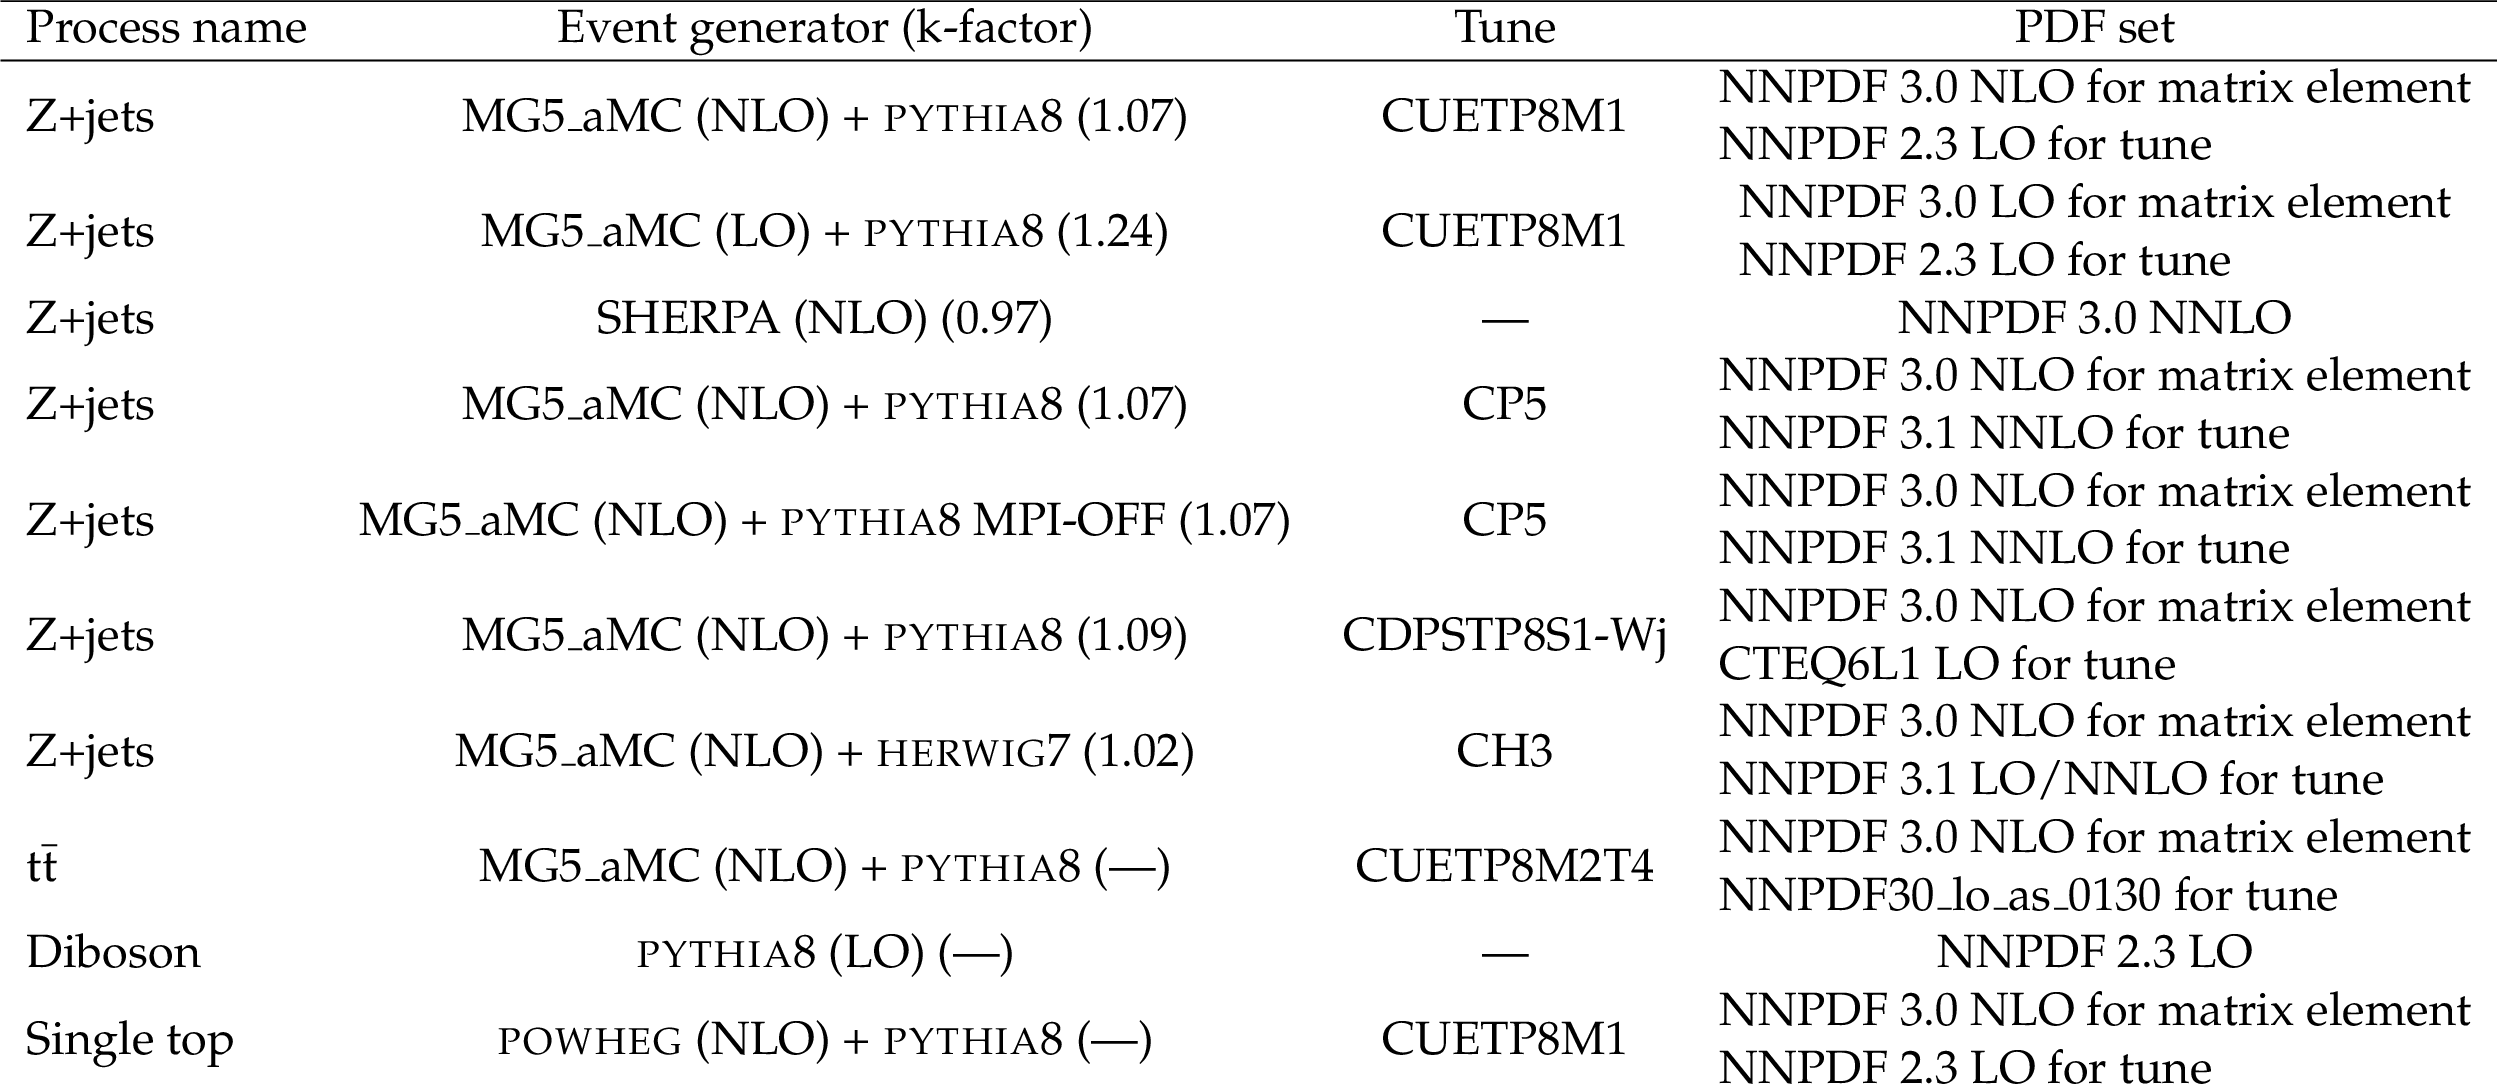
Table 1:
Summary of event generators with their k-factors (ratio of NNLO to NLO/LO cross section), PDF sets, and tunes used to produce both the signal and background event samples. |
png pdf |
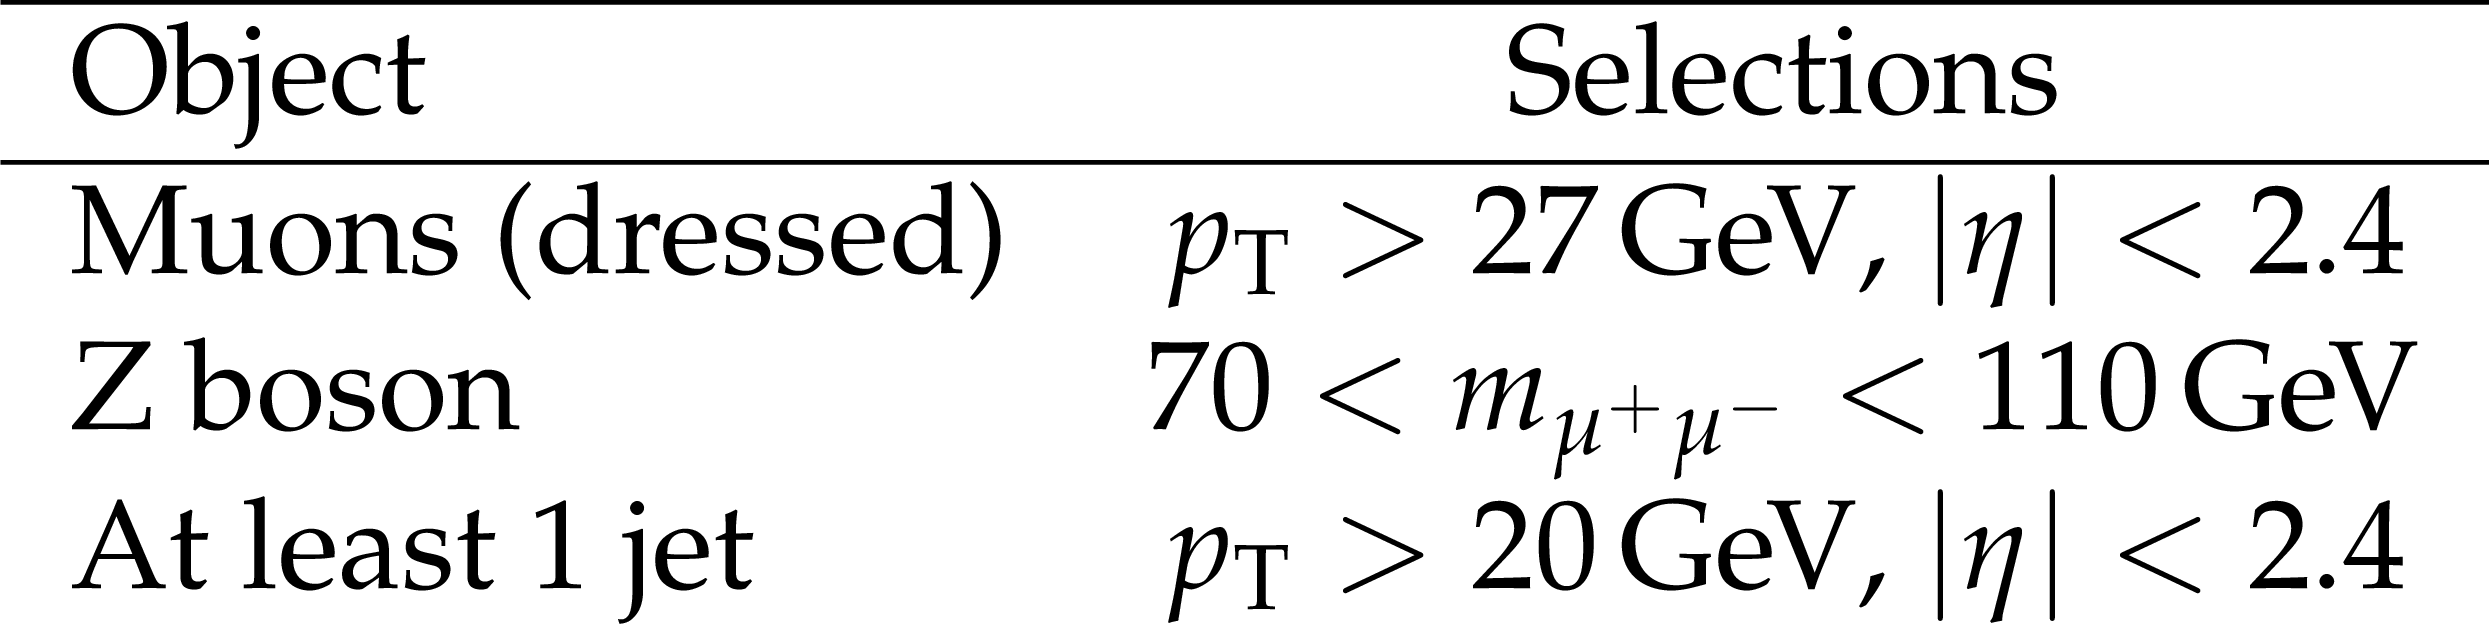
Table 2:
Fiducial selections at particle level. |
png pdf |
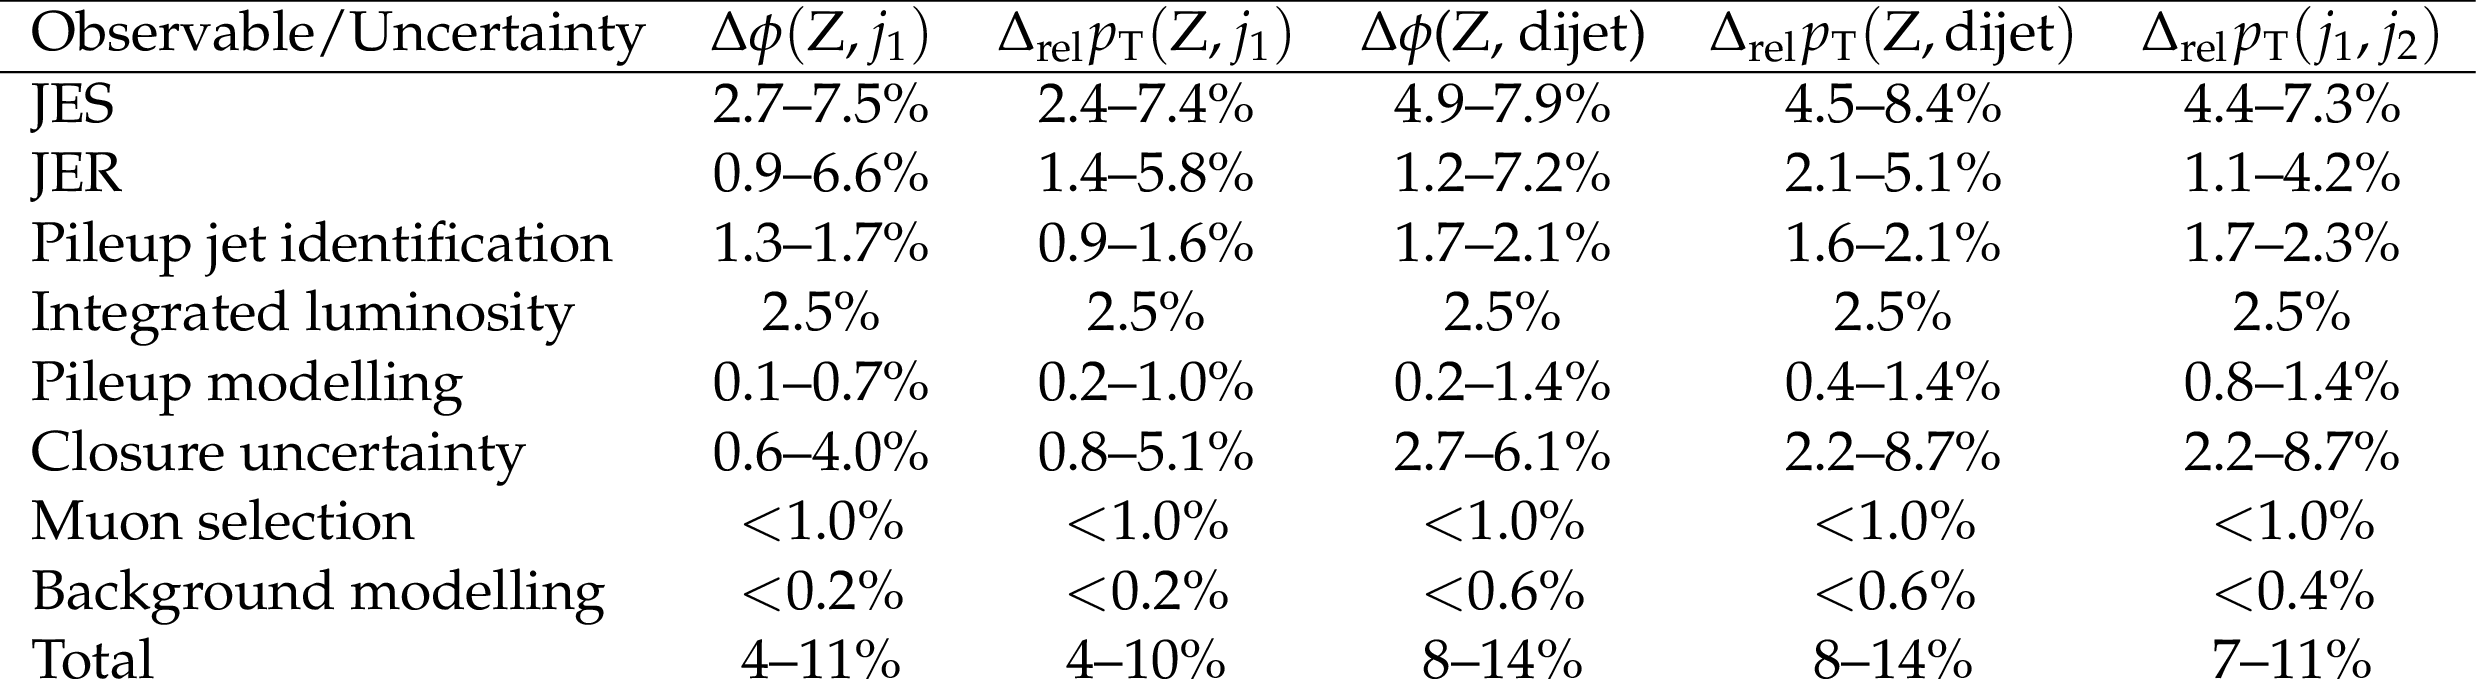
Table 3:
Uncertainty sources and their effect on the differential cross section distributions. |

png pdf |
Table 4:
Uncertainty sources and their effect on the area-normalized distributions. |
png pdf |
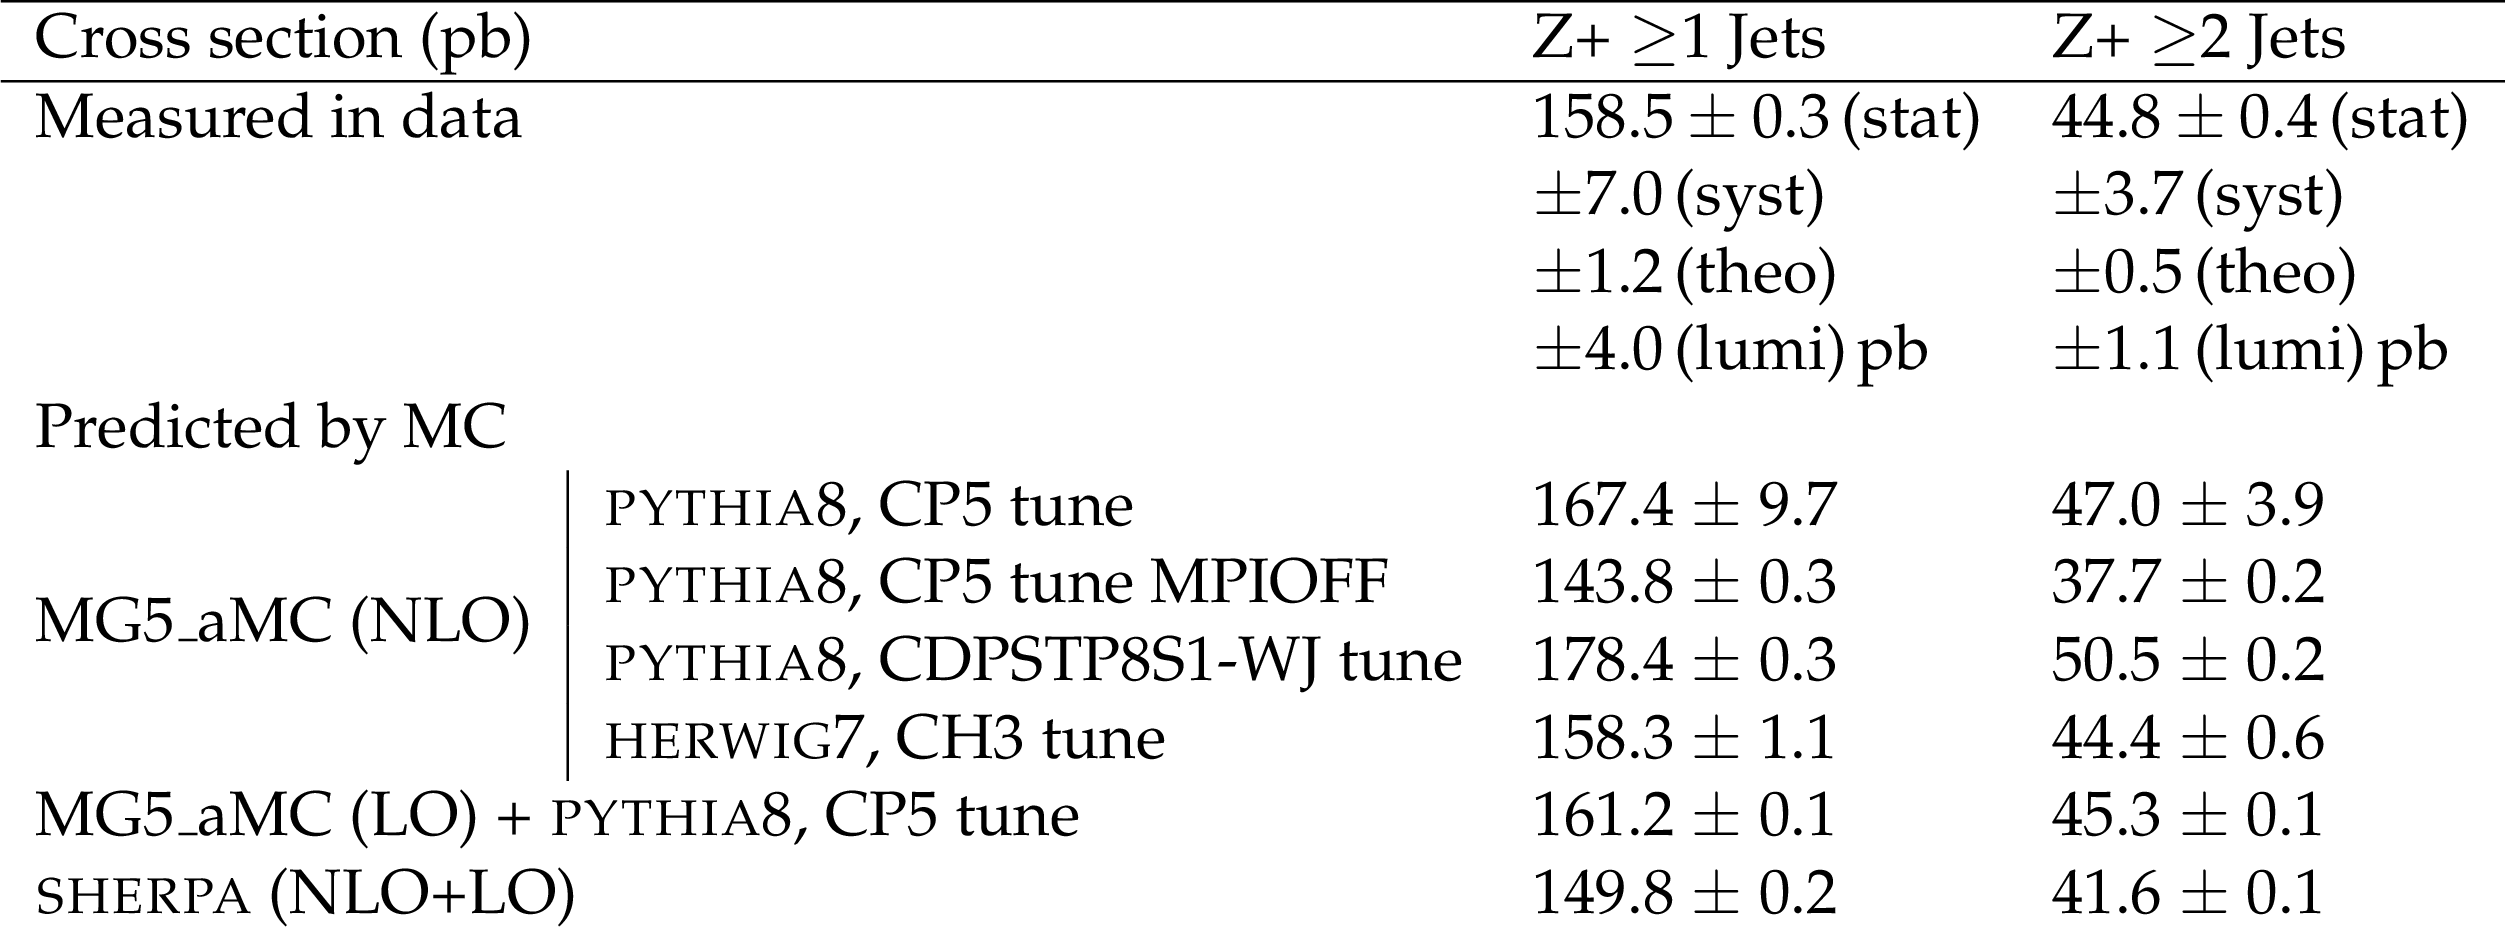
Table 5:
Measured and predicted cross section for Z+$\geq $1 jet and Z+$\geq $2 jet production. Simulations are normalized to NNLO calculations (from FEWZ) and reported cross section values are extracted by applying fiducial selections. Predicted cross sections include statistical and theoretical uncertainties added in quadrature for MG5_aMC + PYTHIA8 with CP5 tune, whereas the other predicted cross sections are reported with only statistical uncertainties. |
| Summary |
| The CMS Collaboration has measured the differential cross sections for Z+$\geq $1 jet and Z+$\geq $2 jet events using proton-proton collision data at $\sqrt{s} $ = 13 TeV, corresponding to an integrated luminosity of 35.9 fb$^{-1}$ collected in the year 2016. The Z boson is reconstructed using the dimuon channel. This is the first measurement performed to explore observables sensitive to the presence of multi-parton interaction (MPI) using the Z+jets process at 13 TeV. Within the fiducial region, the production cross sections of Z+$\geq $1 jet and Z+$\geq $2 jet events are measured to be 158.5 $\pm$ 0.3 (stat) $\pm$ 7.0 (syst) $\pm$ 1.2 (theo) $\pm$ 4.0 (lumi) pb and 44.8 $\pm$ 0.4 (stat) $\pm$ 3.7 (syst) $\pm$ 0.5 (theo) $\pm$ 1.1 (lumi) pb, respectively. The measured integrated cross section in the fiducial region with jets is well described by the event generators SHERPA, MG5_aMC + PYTHIA8, and MG5_aMC + {HERWIG}7 predictions. The prediction obtained with MG5_aMC + PYTHIA8 with the double parton scattering (DPS) specific tune CDPSTP8S1-WJ overestimates the measurements by 10-15%, but correctly describes the shape of all the observables. The prediction from MG5_aMC + PYTHIA8 with the CP5 tune, derived by fitting soft quantum chromodynamics (QCD) measurements, describes the differential cross section and area-normalized distributions. However, there are parts of the distributions that are not well described, such as single parton scattering that dominates lower regions of transverse momentum imbalance $\Delta_\mathrm{rel}{p_{\mathrm{T}}}$ distributions. Predictions with other MPI models describe the measurements well (SHERPA) or reasonably well (MG5_aMC + HERWIG7) except a few deviations in describing the shapes of the $\Delta \phi (\mathrm{Z}, j_1)$ and $\Delta_{\mathrm{rel}}{p_{\mathrm{T}}}(j_1,j_2)$ distributions. The measured distributions show a significant sensitivity to MPI. A proper simulation of MPI is essential to describe the shape of the measured distributions and hence these results are a useful input to further improve DPS-specific tunes and a global tune in combination with other soft QCD measurements. |
| References | ||||
| 1 | ATLAS Collaboration | Measurement of the production cross section of jets in association with a Z boson in pp collisions at $ \sqrt{s} = $ 7 TeV with the ATLAS detector | JHEP 07 (2013) 032 | 1304.7098 |
| 2 | ATLAS Collaboration | Measurement of the production cross section for $ Z/\gamma^* $ in association with jets in pp collisions at $ \sqrt{s} = $ 7 TeV with the ATLAS detector. | PRD 85 (2011) 032009 | 1111.2690 |
| 3 | CMS Collaboration | Jet production rates in association with $ W $ and $ Z $ bosons in pp collisions at $ \sqrt{s}= $ 7 TeV | JHEP 01 (2012) 010 | CMS-EWK-10-012 1110.3226 |
| 4 | CMS Collaboration | Measurements of jet multiplicity and differential production cross sections of Z+jets events in proton-proton collisions at $ \sqrt{s} = $ 7 TeV | PRD 91 (2015) 052008 | CMS-SMP-12-017 1408.3104 |
| 5 | CMS Collaboration | Event shapes and azimuthal correlations in Z+jets events in $ {\mathrm{p}}{\mathrm{p}} $ collisions at $ \sqrt{s}= $ 7 TeV | PLB 722 (2013) 238 | CMS-EWK-11-021 1301.1646 |
| 6 | CMS Collaboration | Comparison of the Z/$ \gamma ^{*} $ + jets to $ \gamma $ + jets cross sections in pp collisions at $ \sqrt{s}= $ 8 TeV | JHEP 10 (2015) 128 | CMS-SMP-14-005 1505.06520 |
| 7 | CMS Collaboration | Measurements of differential production cross sections for a Z boson in association with jets in pp collisions at $ \sqrt{s}= $ 8 TeV | JHEP 04 (2017) 022 | CMS-SMP-14-013 1611.03844 |
| 8 | CMS Collaboration | Measurement of differential cross sections for Z boson production in association with jets in proton-proton collisions at $ \sqrt{s} = $ 13 TeV | EPJC 78 (2018) 965 | CMS-SMP-16-015 1804.05252 |
| 9 | ATLAS Collaboration | Measurements of the production cross-section for a $ Z $ boson in association with b-jets in proton-proton collisions at $ \sqrt{s} = $ 13 TeV with the ATLAS detector | JHEP 07 (2020) 044 | 2003.11960 |
| 10 | CMS Collaboration | Constraints on the double-parton scattering cross section from same-sign W boson pair production in proton-proton collisions at $ \sqrt{s}= $ 8 TeV | JHEP 02 (2018) 032 | CMS-FSQ-16-005 1712.02280 |
| 11 | ATLAS Collaboration | Measurement of hard double-parton interactions in W$ (\to {l\nu}) $+ 2 jet events at $ \sqrt{s} = $ 7 TeV with the ATLAS detector | New J. Phys. 15 (2013) 033038 | 1301.6872 |
| 12 | CMS Collaboration | Study of double parton scattering using W + 2-jet events in proton-proton collisions at $ \sqrt{s} = $ 7 TeV | JHEP 03 (2014) 032 | CMS-FSQ-12-028 1312.5729 |
| 13 | ATLAS Collaboration | Study of the hard double-parton scattering contribution to inclusive four-lepton production in pp collisions at $ \sqrt s= $ 8 TeV with the ATLAS detector | PLB 790 (2019) 595 | 1811.11094 |
| 14 | ATLAS Collaboration | Observation and measurements of the production of prompt and non-prompt J/$ \psi $ mesons in association with a $ Z $ boson in pp collisions at $ \sqrt{s} = $ 8 TeV with the ATLAS detector | EPJC 75 (2015) 229 | 1412.6428 |
| 15 | D0 Collaboration | Double parton interactions in $ \gamma $+3 jet events in p$ \overline{\mbox{p}} $ collisions $ \sqrt{s}= $ 1.96 TeV. | PRD 81 (2010) 052012 | 0912.5104 |
| 16 | CMS Collaboration | Extraction and validation of a new set of CMS PYTHIA8 tunes from underlying-event measurements | EPJC 80 (2020) 4 | CMS-GEN-17-001 1903.12179 |
| 17 | CMS Collaboration | Event generator tunes obtained from underlying event and multiparton scattering measurements | EPJC 76 (2016) 155 | CMS-GEN-14-001 1512.00815 |
| 18 | CMS Collaboration | Performance of the CMS muon detector and muon reconstruction with proton-proton collisions at $ \sqrt{s} = $ 13 TeV | JINST 13 (2018) P06015 | CMS-MUO-16-001 1804.04528 |
| 19 | CMS Collaboration | Performance of the CMS Level-1 trigger in proton-proton collisions at $ \sqrt{s} = $ 13 TeV | JINST 15 (2020) P10017 | CMS-TRG-17-001 2006.10165 |
| 20 | CMS Collaboration | The CMS trigger system | JINST 12 (2017) P01020 | CMS-TRG-12-001 1609.02366 |
| 21 | CMS Collaboration | The CMS experiment at the CERN LHC | JINST 3 (2008) S08004 | CMS-00-001 |
| 22 | J. Alwall et al. | Comparative study of various algorithms for the merging of parton showers and matrix elements in hadronic collisions | EPJC 53 (2008) 473 | 0706.2569 |
| 23 | NNPDF Collaboration | Parton distributions for the LHC Run II | JHEP 04 (2015) 040 | 1410.8849 |
| 24 | Sherpa Collaboration | Event generation with Sherpa 2.2 | SciPost Phys. 7 (2019) 034 | 1905.09127 |
| 25 | S. Hoeche, F. Krauss, M. Schonherr, and F. Siegert | QCD matrix elements + parton showers: The NLO case | JHEP 04 (2013) 027 | 1207.5030 |
| 26 | T. Gehrmann et al. | NLO QCD matrix elements + parton showers in e$ ^{+} $e$ ^{-} \to $ hadrons | JHEP 01 (2013) 144 | 1207.5031 |
| 27 | S. Hoeche et al. | Triple vector boson production through Higgs-Strahlung with NLO multijet merging | PRD 89 (2014) 093015 | 1403.7516 |
| 28 | T. Sjostrand et al. | An introduction to PYTHIA 8.2 | CPC 191 (2015) 159 | 1410.3012 |
| 29 | M. Czakon, P. Fiedler, and A. Mitov | Total top-quark pair-production cross section at hadron colliders through $ O(\alpha^4_S) $ | PRL 110 (2013) 252004 | 1303.6254 |
| 30 | P. Barnreuther, M. Czakon, and A. Mitov | Percent level precision physics at the Tevatron: first genuine NNLO QCD corrections to $ \mathrm{q} \overline{\mathrm{q}} \to \mathrm{t\overline{t}} + \mathrm{X} $ | PRL 109 (2012) 132001 | 1204.5201 |
| 31 | M. Beneke, P. Falgari, S. Klein, and C. Schwinn | Hadronic top-quark pair production with NNLL threshold resummation | NPB 855 (2012) 695 | 1109.1536 |
| 32 | M. Cacciari et al. | Top-pair production at hadron colliders with next-to-next-to-leading logarithmic soft-gluon resummation | PLB 710 (2012) 612 | 1111.5869 |
| 33 | M. Czakon and A. Mitov | NNLO corrections to top-pair production at hadron colliders: the all-fermionic scattering channels | JHEP 12 (2012) 054 | 1207.0236 |
| 34 | M. Czakon and A. Mitov | NNLO corrections to top pair production at hadron colliders: the quark-gluon reaction | JHEP 01 (2013) 080 | 1210.6832 |
| 35 | M. Czakon and A. Mitov | Top++: A program for the calculation of the top-pair cross-section at hadron colliders | CPC 185 (2014) 2930 | 1112.5675 |
| 36 | J. M. Campbell, R. K. Ellis, and C. Williams | Vector boson pair production at the LHC | JHEP 07 (2011) 018 | 1105.0020 |
| 37 | N. Kidonakis | Top Quark Production | in Proceedings, Helmholtz International Summer School on Physics of Heavy Quarks and Hadrons (HQ 2013): JINR, Dubna, Russia, July 15-28, 2013, p. 139 (2014) | 1311.0283 |
| 38 | CMS Collaboration | Investigations of the impact of the parton shower tuning in PYTHIA 8 in the modelling of $ \mathrm{t\overline{t}} $ at $ \sqrt{s}= $ 8 and 13 TeV | CMS-PAS-TOP-16-021 | CMS-PAS-TOP-16-021 |
| 39 | R. D. Ball et al. | Parton distributions with LHC data | NPB 867 (2013) 244 | 1207.1303 |
| 40 | J. Alwall et al. | MadGraph 5: going beyond | JHEP 06 (2011) 128 | 1106.0522 |
| 41 | J. Alwall, S. de Visscher, and F. Maltoni | QCD radiation in the production of heavy colored particles at the LHC | JHEP 02 (2009) 017 | 0810.5350 |
| 42 | R. Frederix and S. Frixione | Merging meets matching in MC@NLO | JHEP 12 (2012) 061 | 1209.6215 |
| 43 | GEANT4 Collaboration | GEANT4--a simulation toolkit | NIMA 506 (2003) 250 | |
| 44 | T. Sjostrand and M. van Zijl | A multiple interaction model for the event structure in hadron collisions | PRD 36 (1987) 2019 | |
| 45 | M. Bahr et al. | Herwig++ physics and manual | EPJC 58 (2008) 639 | 0803.0883 |
| 46 | J. Bellm et al. | Herwig 7.0/Herwig++ 3.0 release note | EPJC 76 (2016) 196 | 1512.01178 |
| 47 | J. Bellm et al. | Herwig 7.1 release note | CERN theory preprint CERN-PH-TH-2017-109 | 1705.06919 |
| 48 | CMS Collaboration | Development and validation of HERWIG 7 tunes from CMS underlying-event measurements | EPJC 81 (2021) 312 | CMS-GEN-19-001 2011.03422 |
| 49 | K. Melnikov and F. Petriello | Electroweak gauge boson production at hadron colliders through O($ \alpha_{s}^{2} $) | PRD 74 (2006) 114017 | hep-ph/0609070 |
| 50 | CMS Collaboration | Particle-flow reconstruction and global event description with the CMS detector | JINST 12 (2017) P10003 | CMS-PRF-14-001 1706.04965 |
| 51 | M. Cacciari, G. P. Salam, and G. Soyez | The anti-$ {k_{\mathrm{T}}} $ jet clustering algorithm | JHEP 04 (2008) 063 | 0802.1189 |
| 52 | M. Cacciari, G. P. Salam, and G. Soyez | FastJet user manual | EPJC 72 (2012) 1896 | 1111.6097 |
| 53 | CMS Collaboration | Measurement of the inclusive $ W $ and $ Z $ production cross sections in pp collisions at $ \sqrt{s}= $ 7 TeV | JHEP 10 (2011) 132 | CMS-EWK-10-005 1107.4789 |
| 54 | M. Cacciari and G. P. Salam | Pileup subtraction using jet areas | PLB 659 (2008) 119 | 0707.1378 |
| 55 | CMS Collaboration | Jet energy scale and resolution in the CMS experiment in pp collisions at 8 TeV | JINST 12 (2017) P02014 | CMS-JME-13-004 1607.03663 |
| 56 | CMS Collaboration | Jet energy scale and resolution performance with 13 TeV data collected by CMS in 2016 | CDS | |
| 57 | CMS Collaboration | Jet performance in pp collisions at 7 TeV | CDS | |
| 58 | CMS Collaboration | Pileup jet identification | CMS-PAS-JME-13-005 | CMS-PAS-JME-13-005 |
| 59 | CMS Collaboration | Pileup mitigation at CMS in 13 TeV data | JINST 15 (2020) P09018 | CMS-JME-18-001 2003.00503 |
| 60 | CMS Collaboration | Electron and photon reconstruction and identification with the CMS experiment at the CERN LHC | JINST 16 (2021) P05014 | CMS-EGM-17-001 2012.06888 |
| 61 | S. Schmitt | TUnfold: an algorithm for correcting migration effects in high energy physics | JINST 7 (2012) T10003 | 1205.6201 |
| 62 | A. N. Tikhonov | Solution of incorrectly formulated problems and the regularization method | Soviet Math. Dokl. 4 (1963) 1035 | |
| 63 | CMS Collaboration | Object definitions for top quark analyses at the particle level | CDS | |
| 64 | J. Butterworth et al. | PDF4LHC recommendations for LHC Run II | JPG 43 (2016) 023001 | 1510.03865 |
| 65 | CMS Collaboration | Precision luminosity measurement in proton-proton collisions at $ \sqrt{s} = $ 13 TeV in 2015 and 2016 at CMS | Submitted to EPJC | CMS-LUM-17-003 2104.01927 |
| 66 | CMS Collaboration | Measurement of the inelastic proton-proton cross section at $ \sqrt{s}= $ 13 TeV | JHEP 07 (2018) 161 | CMS-FSQ-15-005 1802.02613 |
|
|
Compact Muon Solenoid LHC, CERN |
|

|

|

|

|

|