

Compact Muon Solenoid
LHC, CERN
| CMS-SMP-21-001 ; CERN-EP-2022-038 | ||
| Observation of electroweak W$^{+}$W$^{-}$ pair production in association with two jets in proton-proton collisions at $ \sqrt{s} = $ 13 TeV | ||
| CMS Collaboration | ||
| 11 May 2022 | ||
| PLB 841 (2023) 137495 | ||
| Abstract: An observation is reported of the electroweak production of a W$^{+}$W$^{-}$ pair in association with two jets, with both W bosons decaying leptonically. The data sample corresponds to an integrated luminosity of 138 fb$ ^{-1} $ of proton-proton collisions at $ \sqrt{s}= $ 13 TeV, collected by the CMS detector at the CERN LHC. Events are selected by requiring exactly two opposite-sign leptons (electrons or muons) and two jets with large pseudorapidity separation and high dijet invariant mass. Events are categorized based on the flavor of the final-state leptons. A signal is observed with a significance of 5.6 standard deviations (5.2 expected) with respect to the background-only hypothesis. The measured fiducial cross section is 10.2 $ \pm $ 2.0 fb and this value is consistent with the standard model prediction of 9.1 $ \pm $ 0.6 fb. | ||
| Links: e-print arXiv:2205.05711 [hep-ex] (PDF) ; CDS record ; inSPIRE record ; HepData record ; CADI line (restricted) ; | ||
| Figures | |
png pdf |
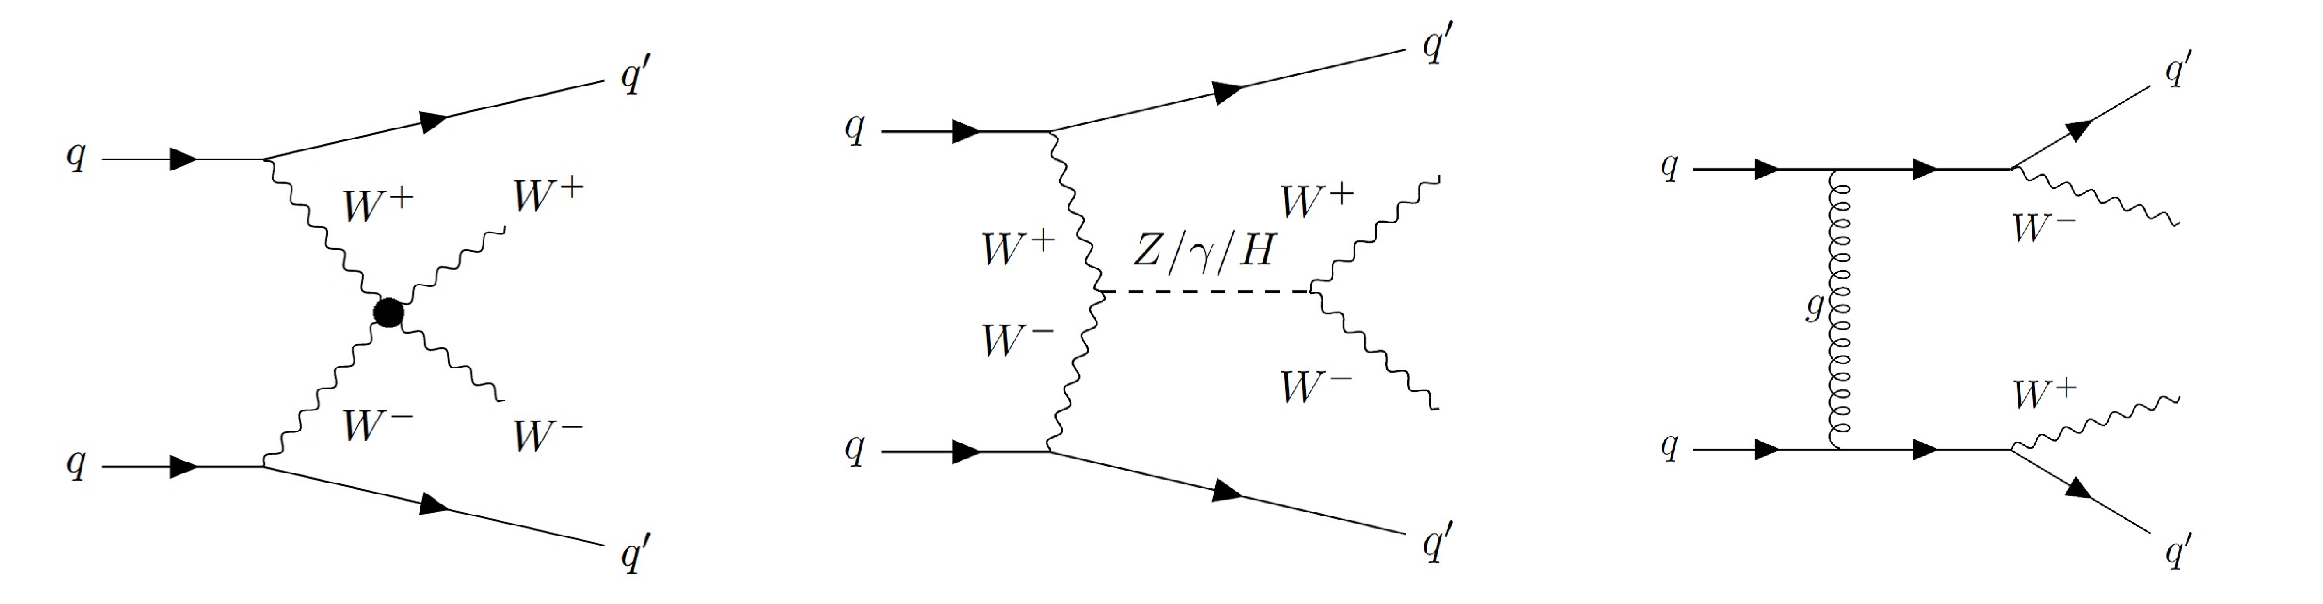
Figure 1:
Examples of Feynman diagrams for the EW (left, center) and QCD-induced (right) production of W$^{+}$W$^{-}$ bosons in association with two quarks. |
png pdf |
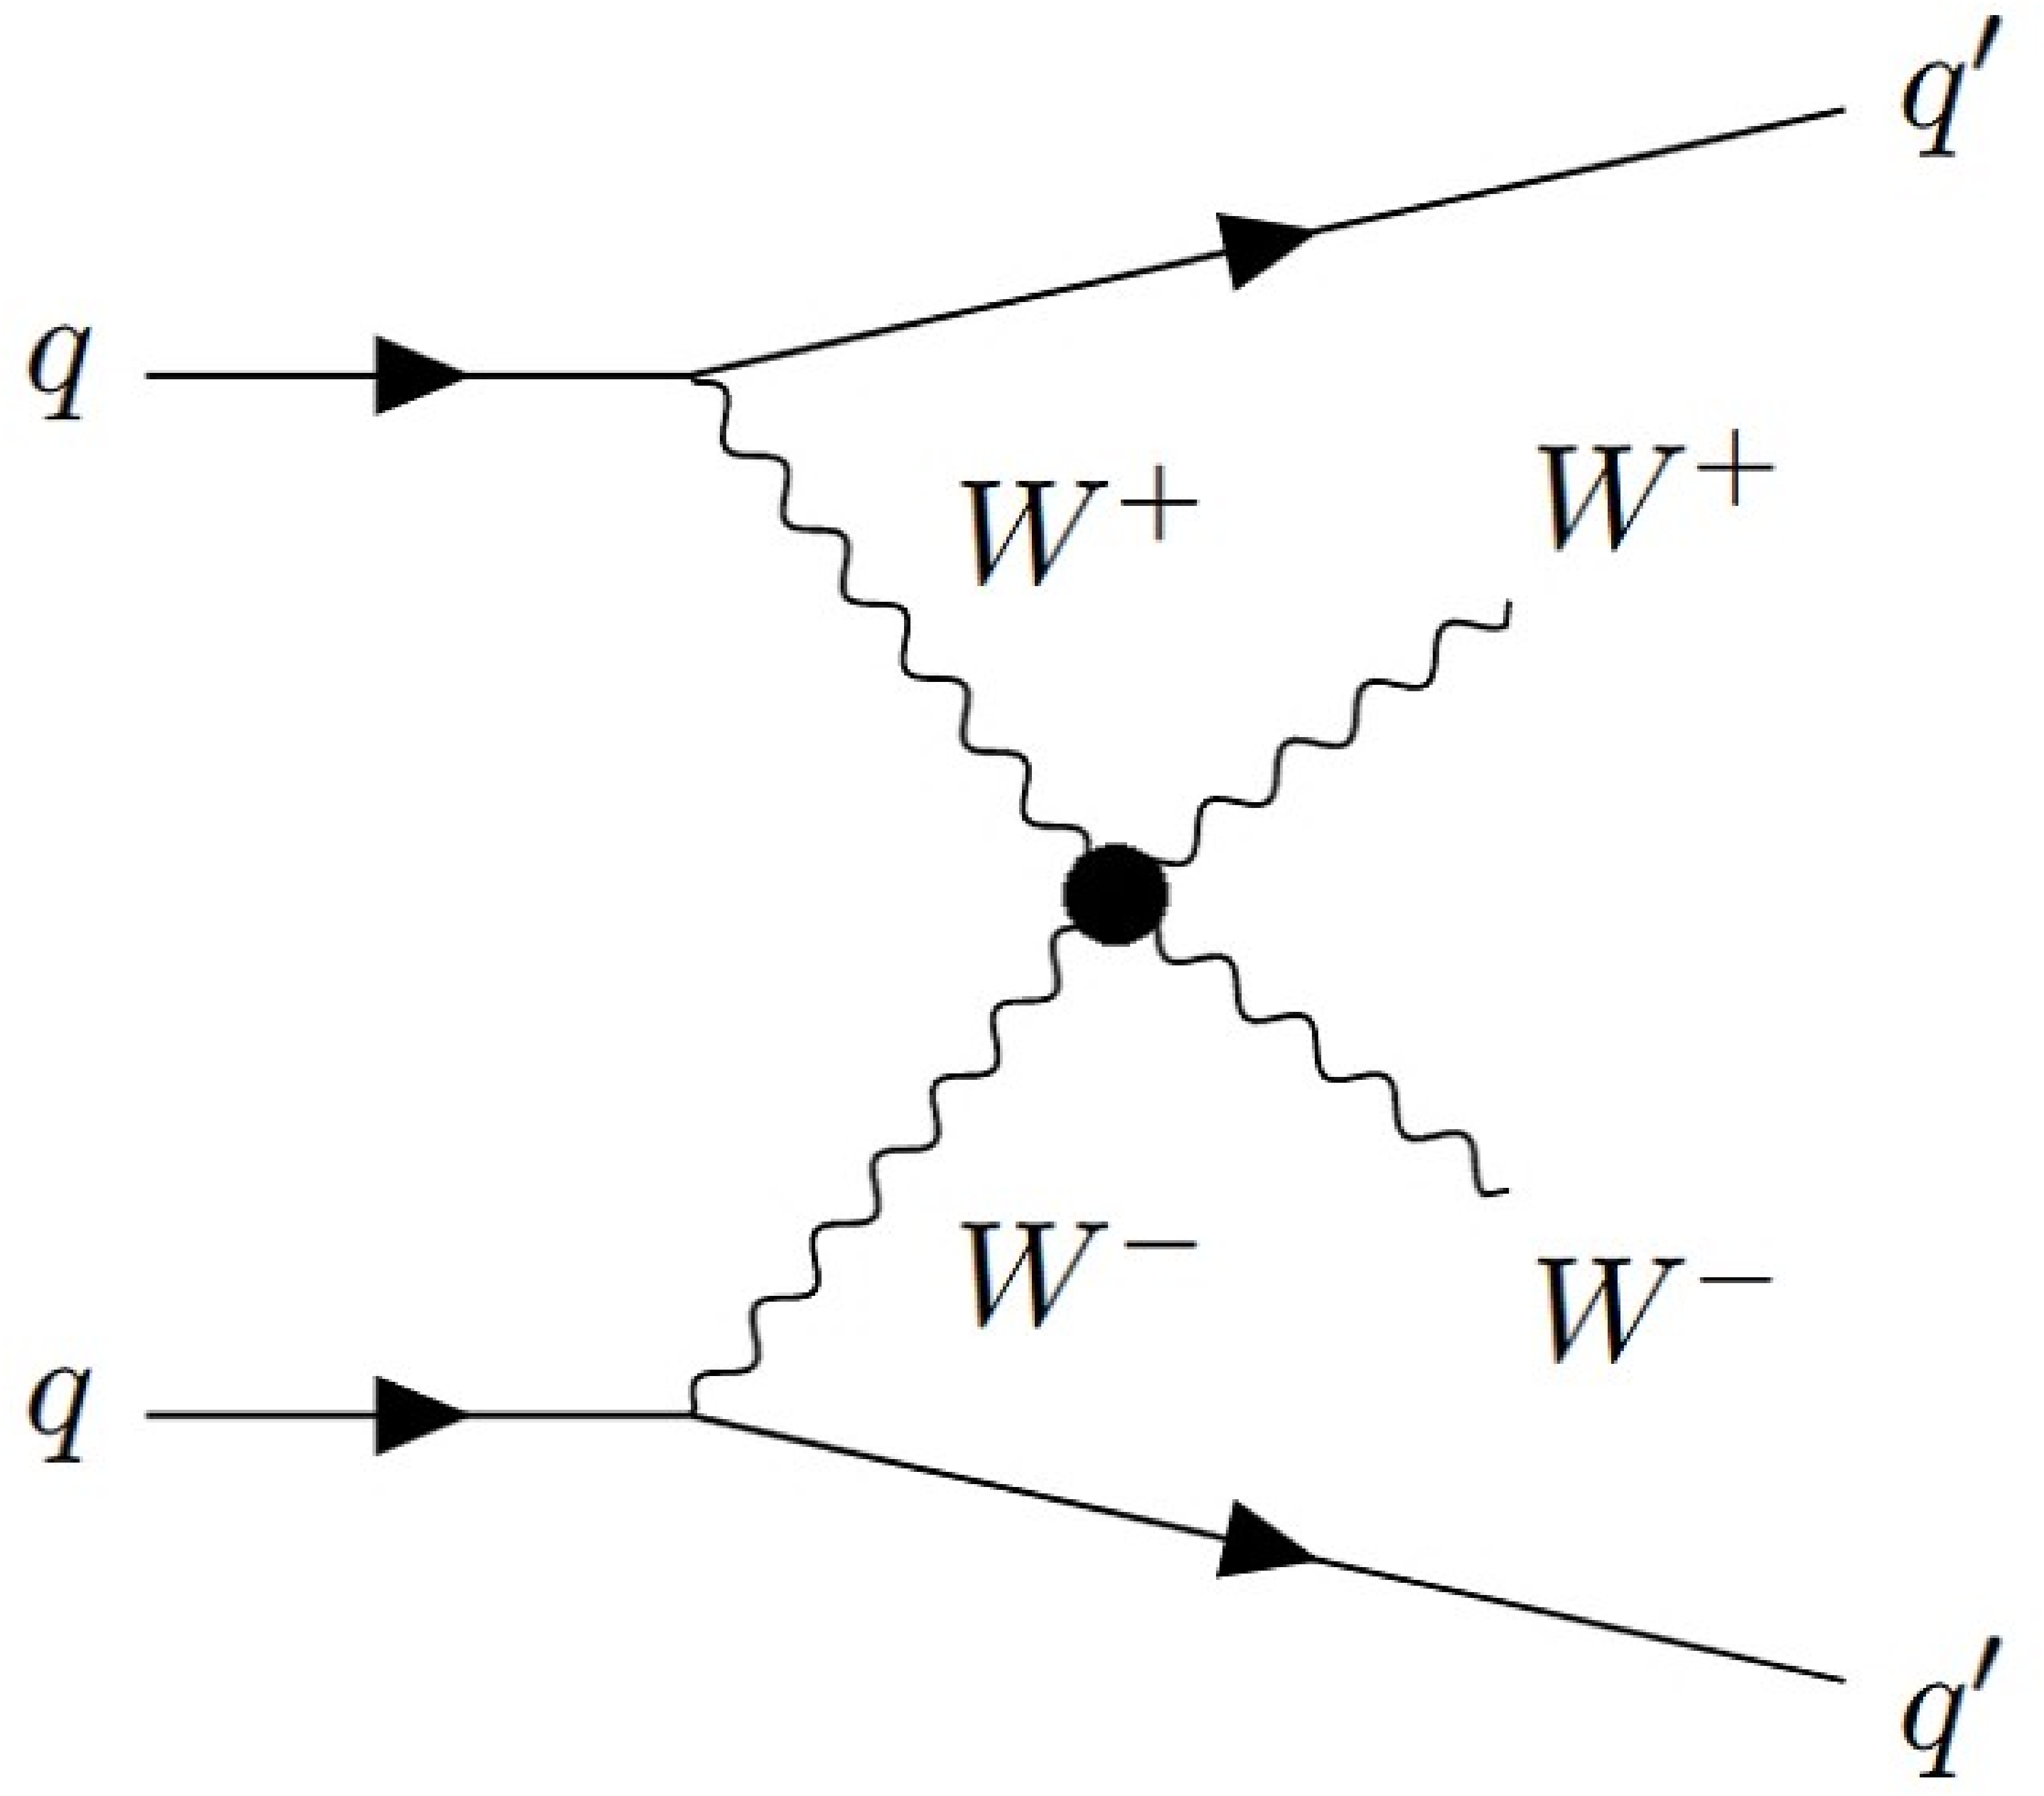
Figure 1-a:
Example of Feynman diagram for the EW production of W$^{+}$W$^{-}$ bosons in association with two quarks. |
png pdf |
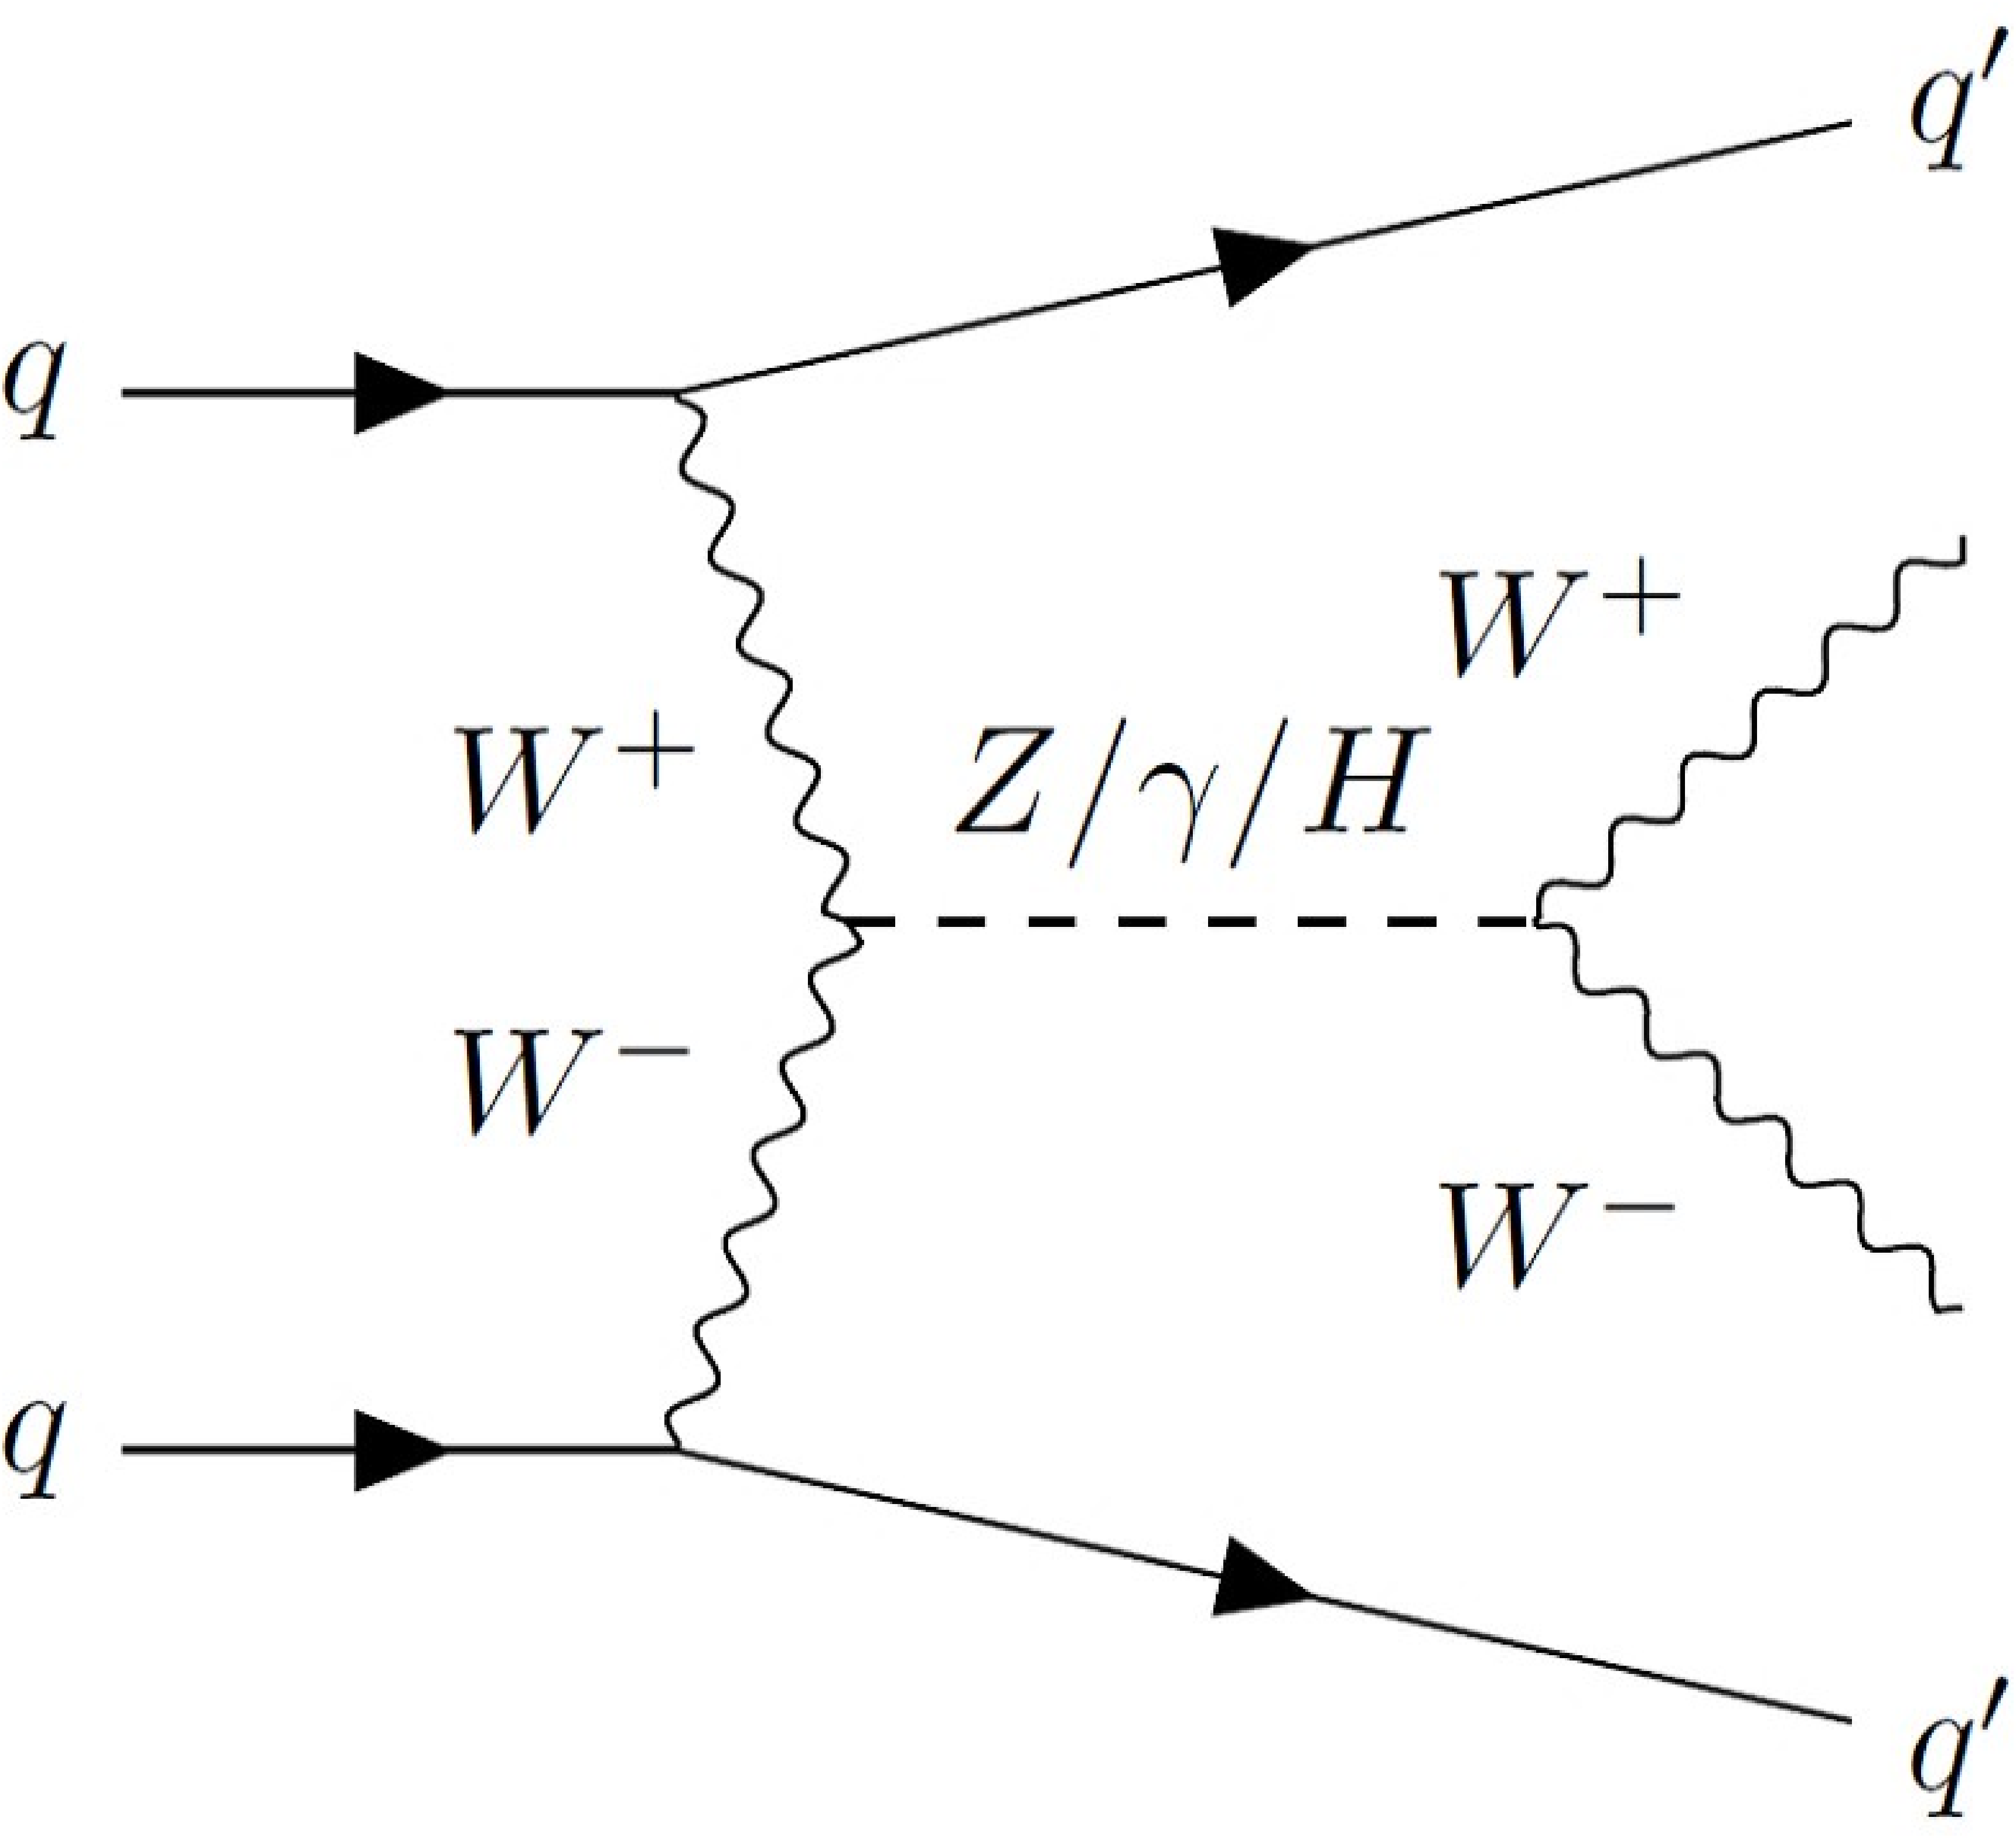
Figure 1-b:
Example of Feynman diagram for the EW production of W$^{+}$W$^{-}$ bosons in association with two quarks. |
png pdf |
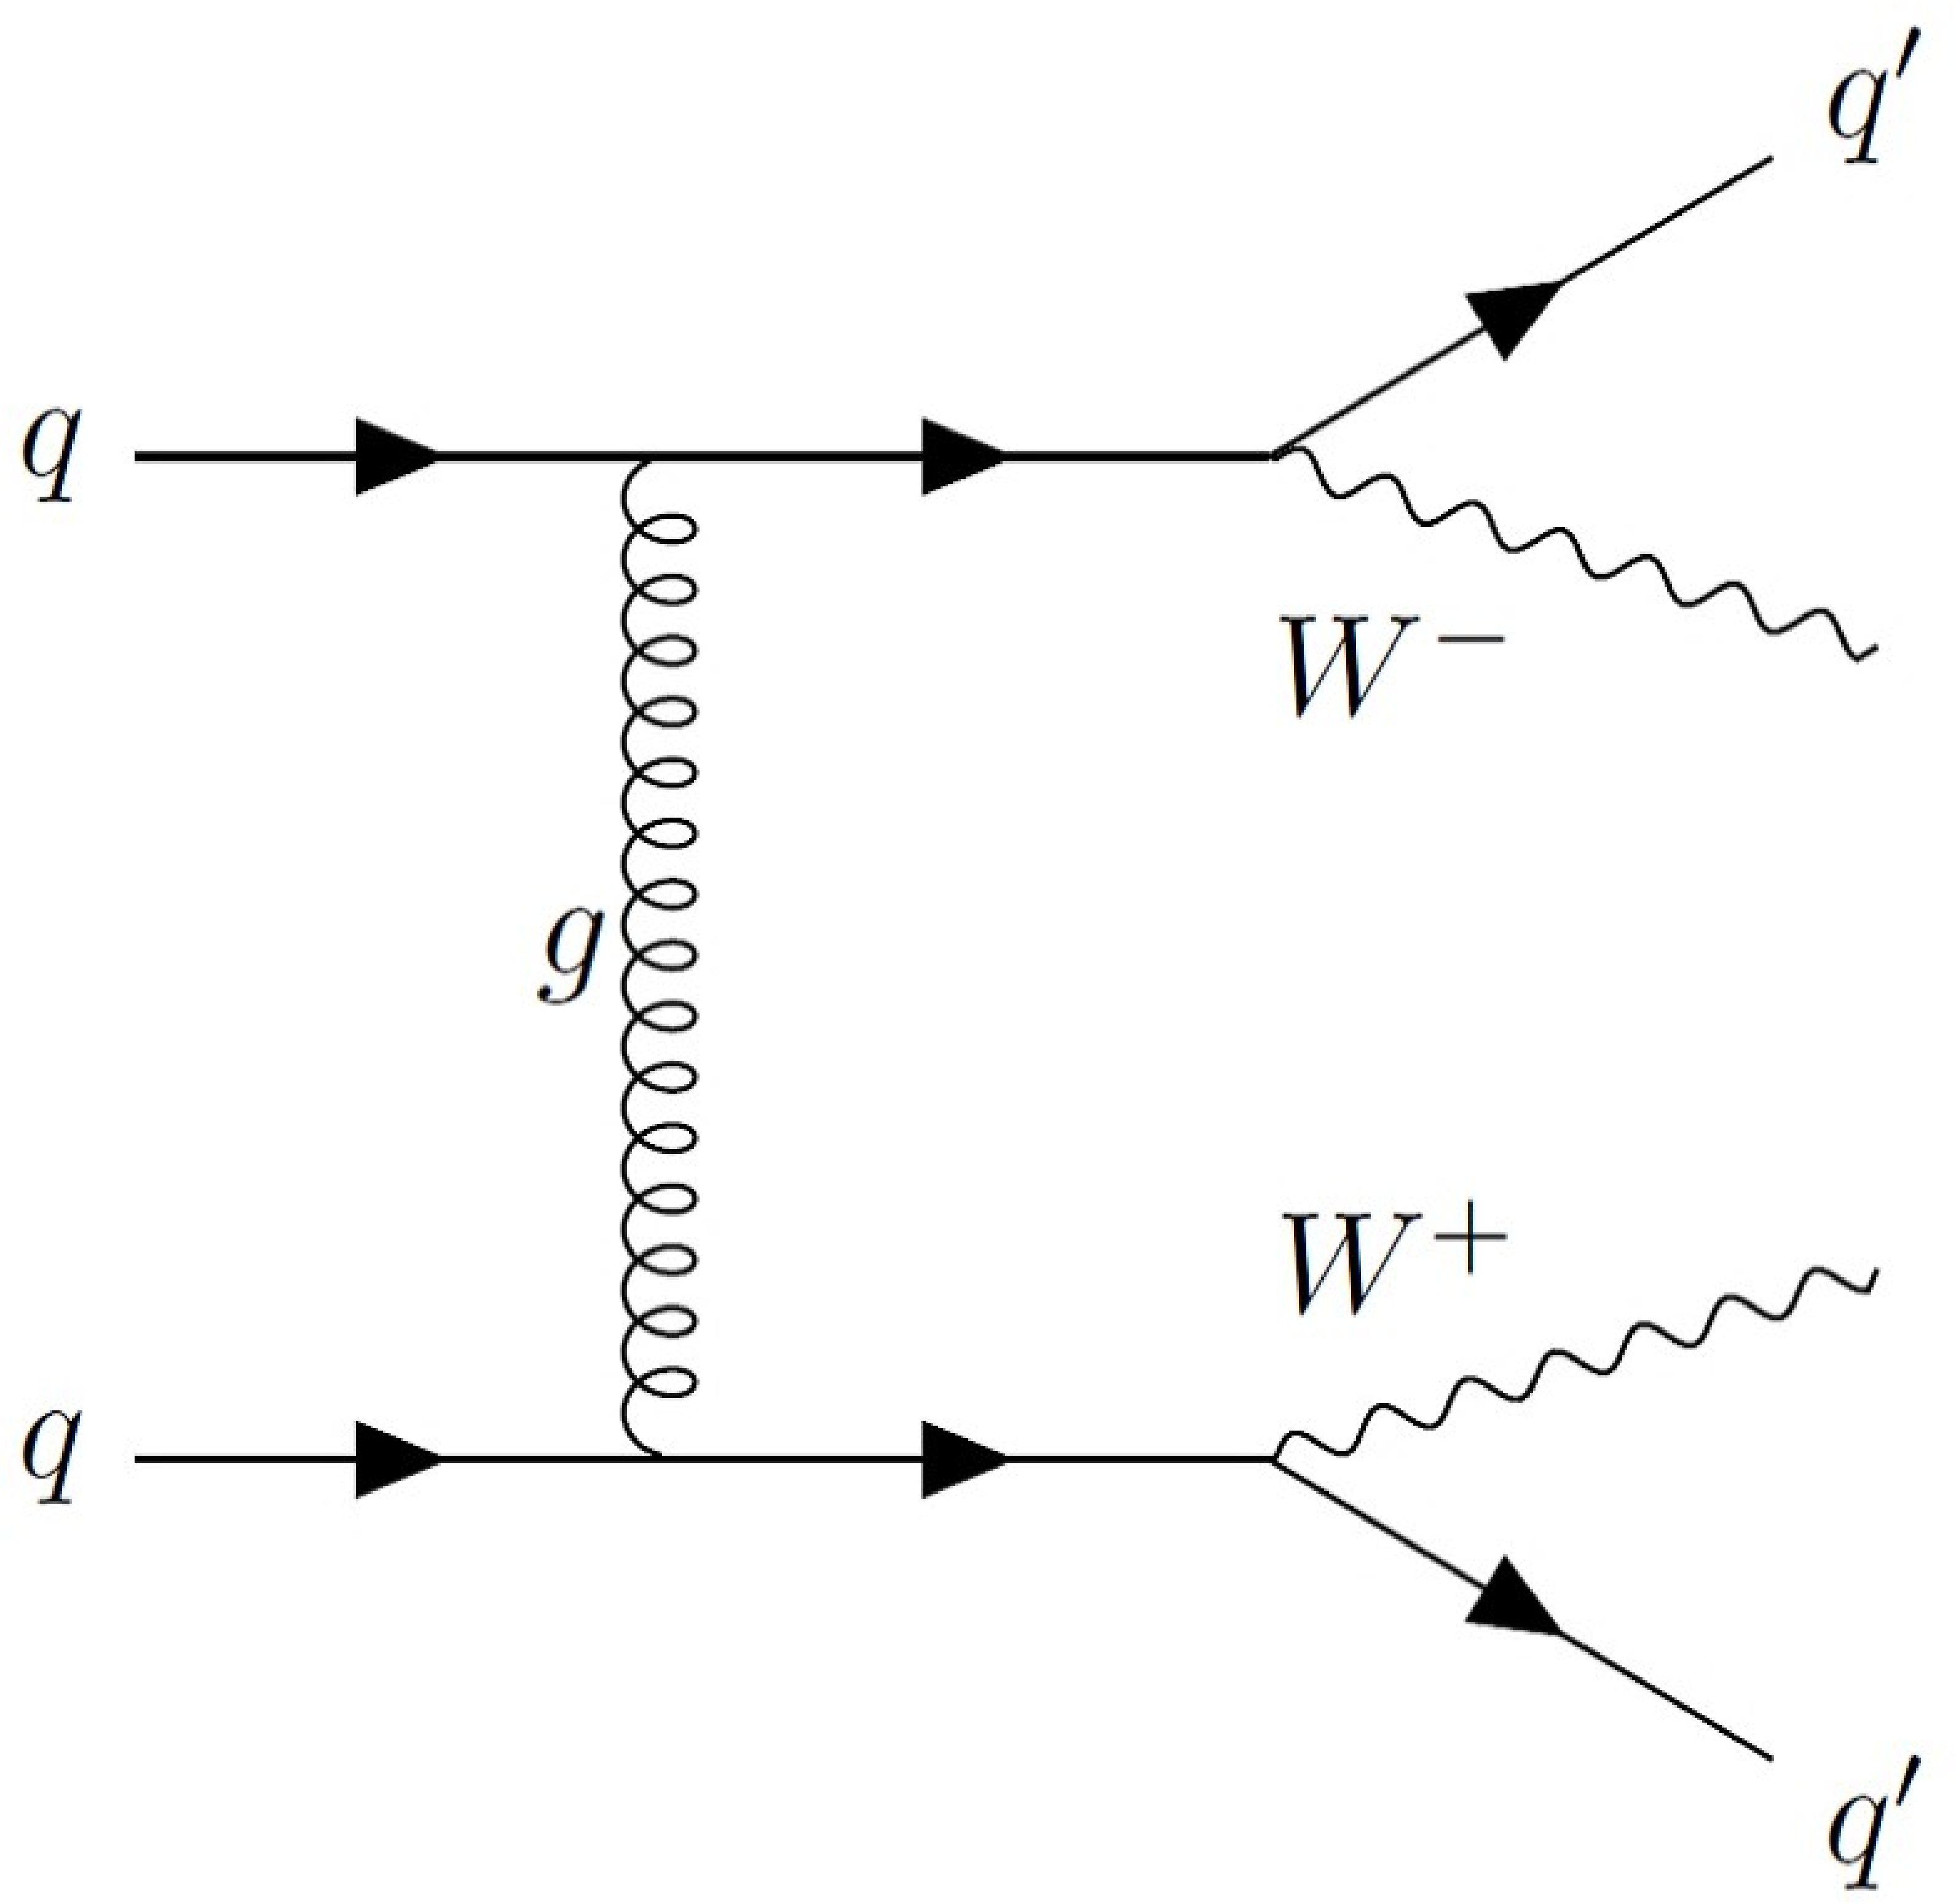
Figure 1-c:
Example of Feynman diagram for the QCD-induced production of W$^{+}$W$^{-}$ bosons in association with two quarks. |
png pdf |
Figure 2:
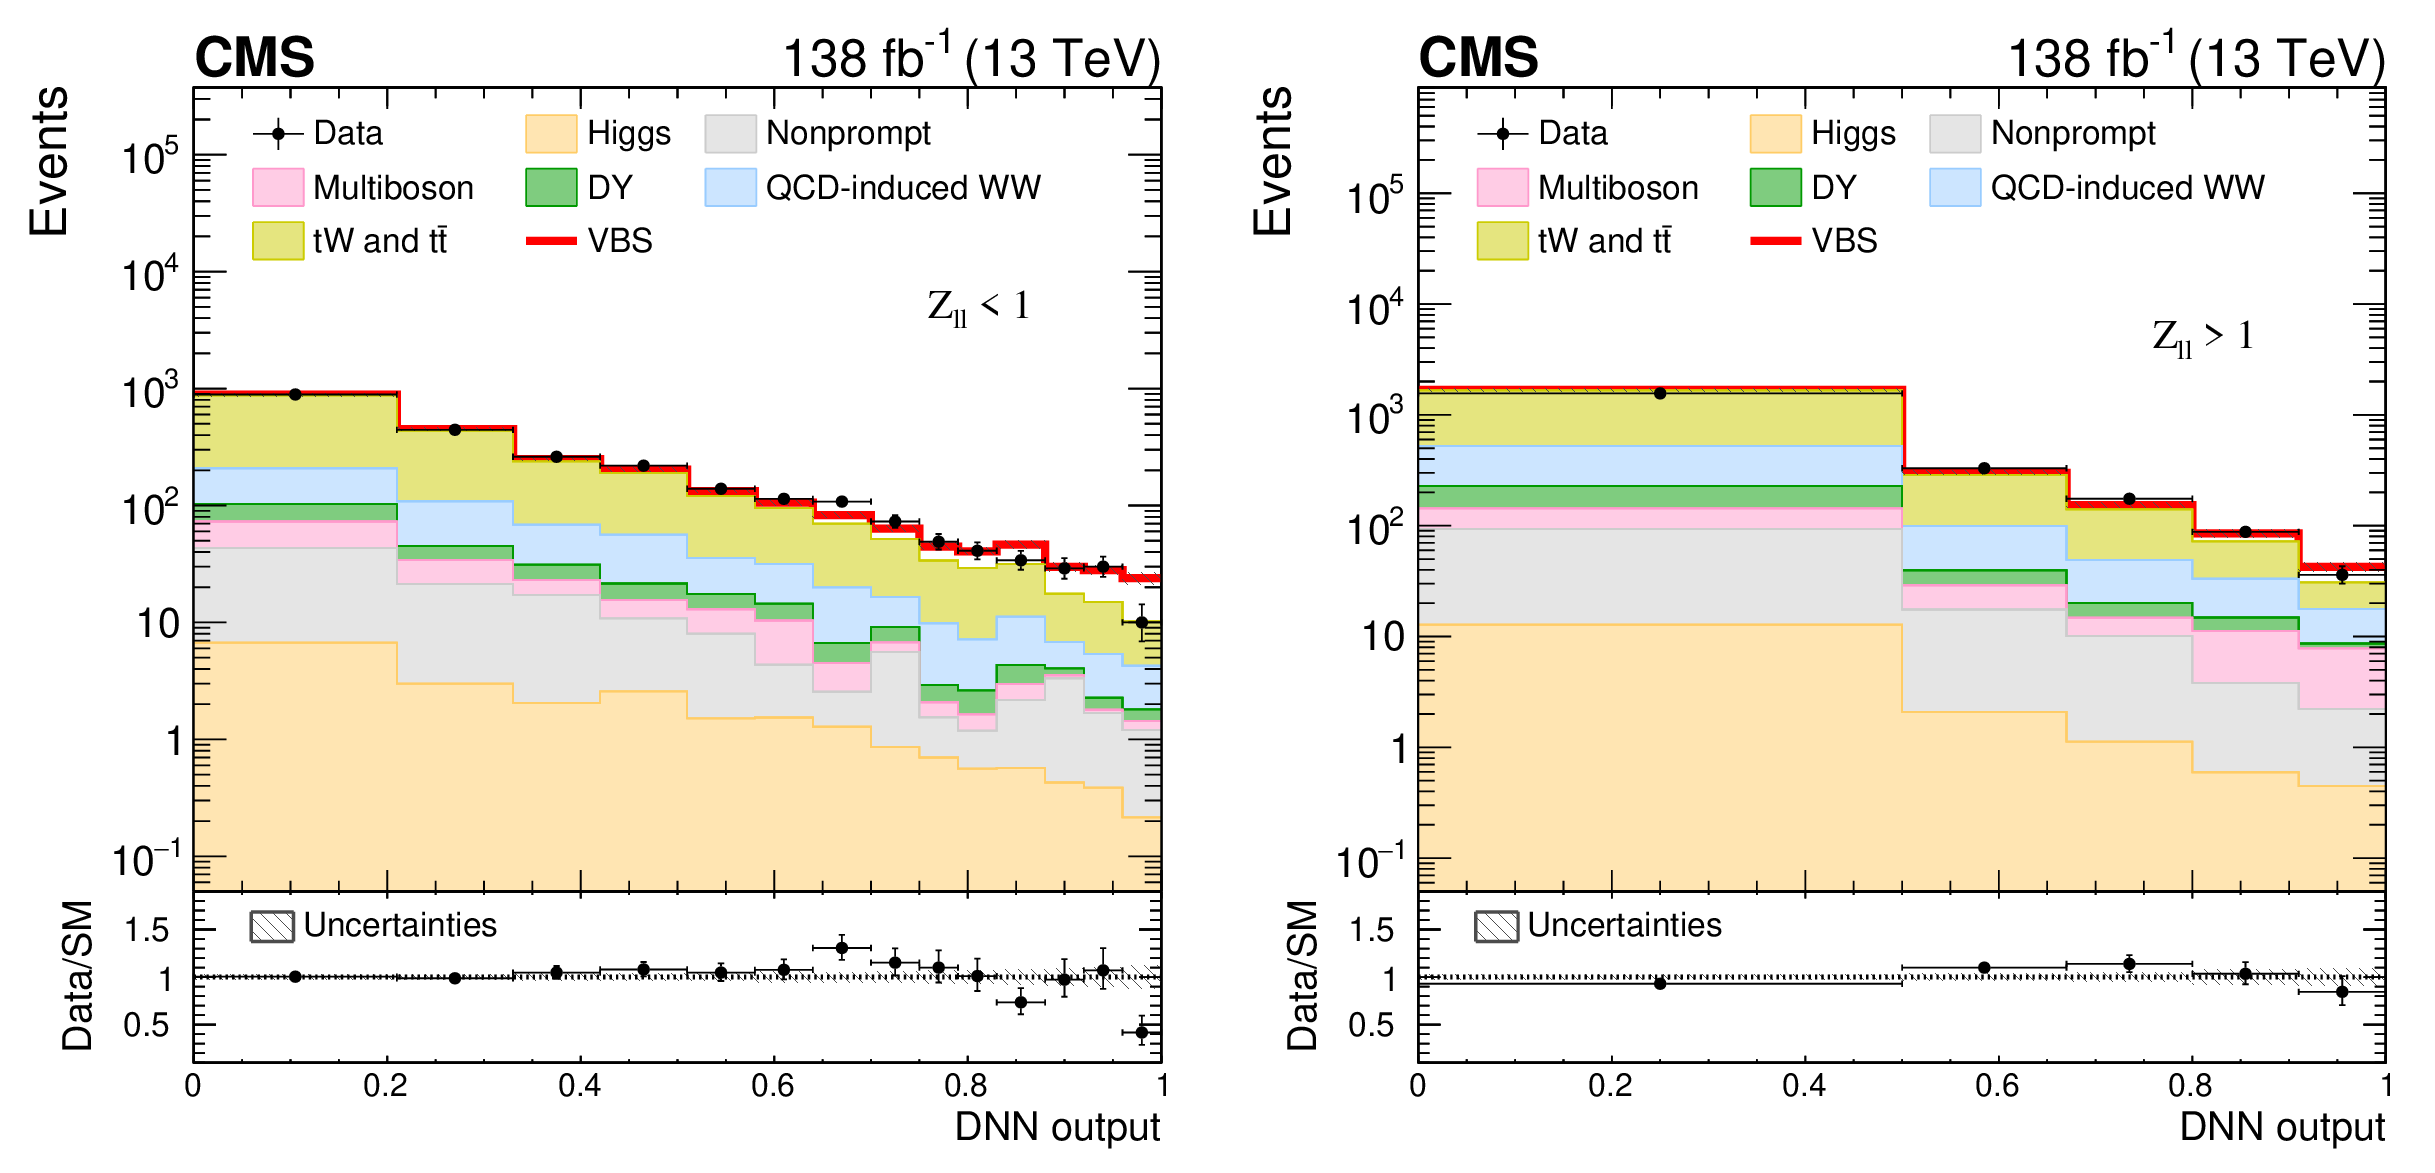
Post-fit DNN output distribution in different-flavor SRs for $ Z_{\ell\ell} < $ 1 (left) and $ Z_{\ell\ell} > $ 1 (right) categories. This variable quantifies how likely each event is signal. The contributions from background and signal (red line) processes are shown as stacked histograms; systematic uncertainties are plotted as dashed gray bands. Data points are displayed with asymmetric Poisson vertical bars to ensure a correct statistical coverage all over the spectrum. |
png pdf |
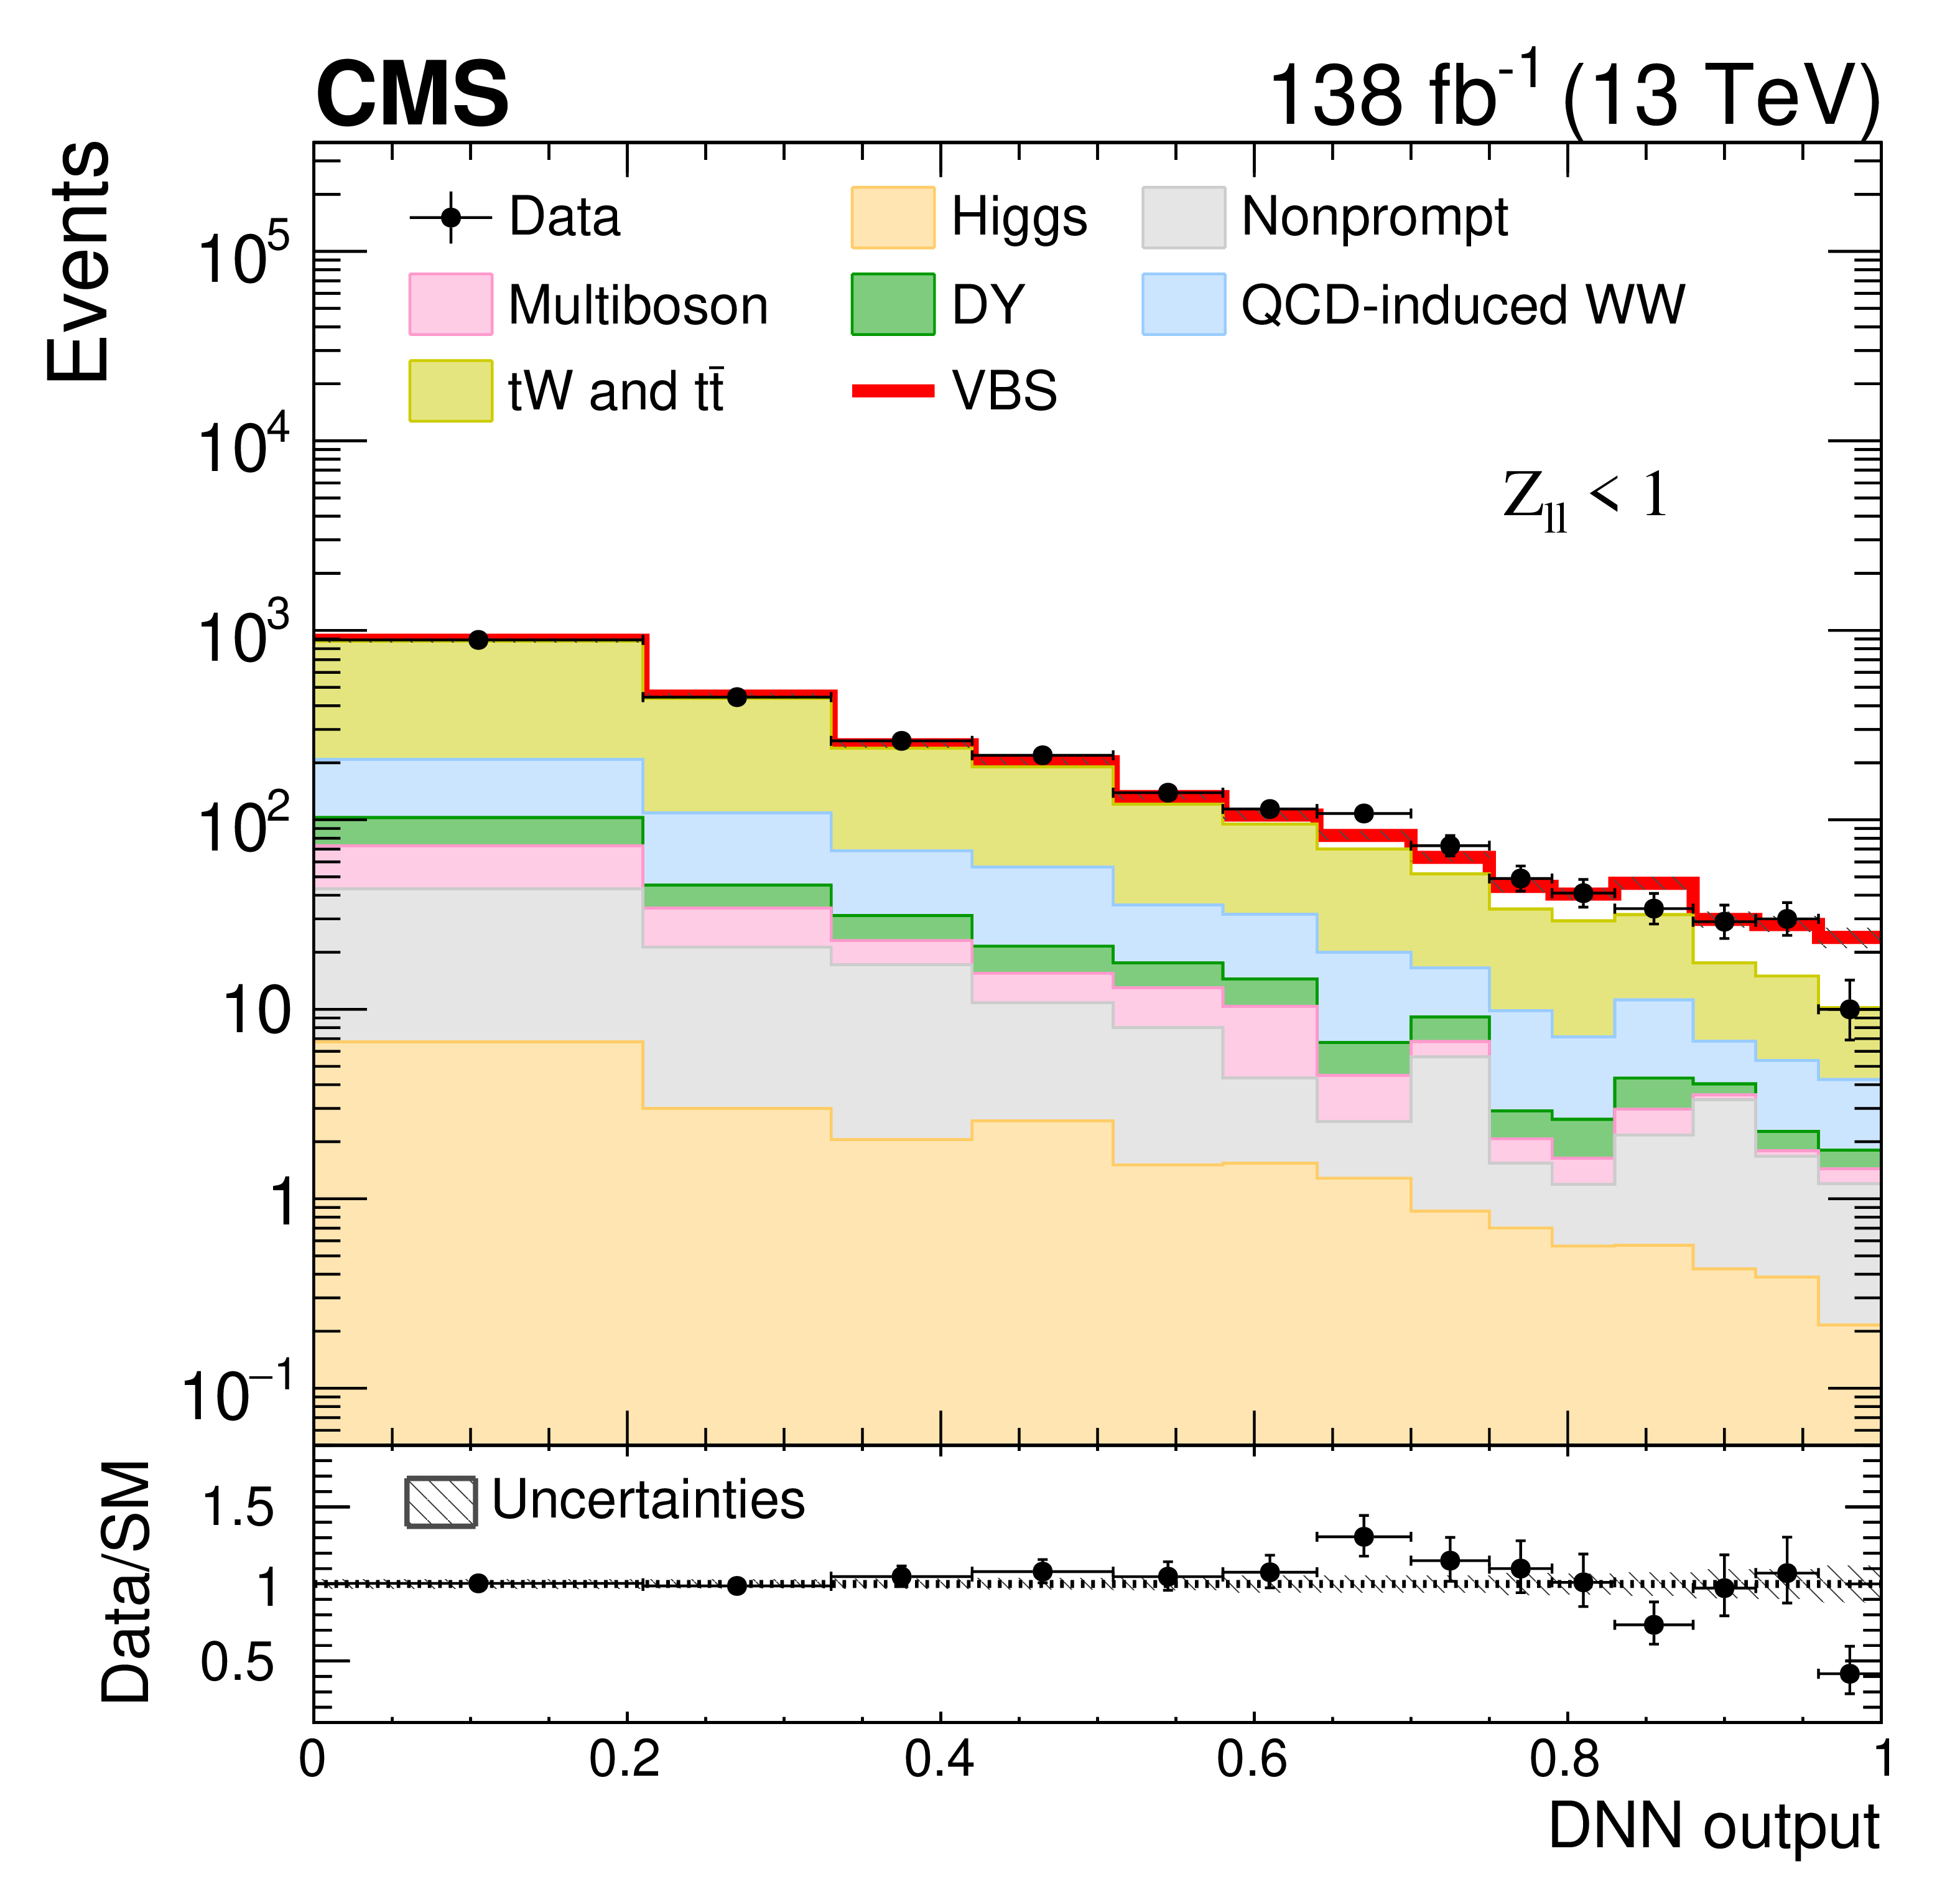
Figure 2-a:
Post-fit DNN output distribution in different-flavor SRs for the $ Z_{\ell\ell} < $ 1 category. This variable quantifies how likely each event is signal. The contributions from background and signal (red line) processes are shown as stacked histograms; systematic uncertainties are plotted as dashed gray bands. Data points are displayed with asymmetric Poisson vertical bars to ensure a correct statistical coverage all over the spectrum. |
png pdf |
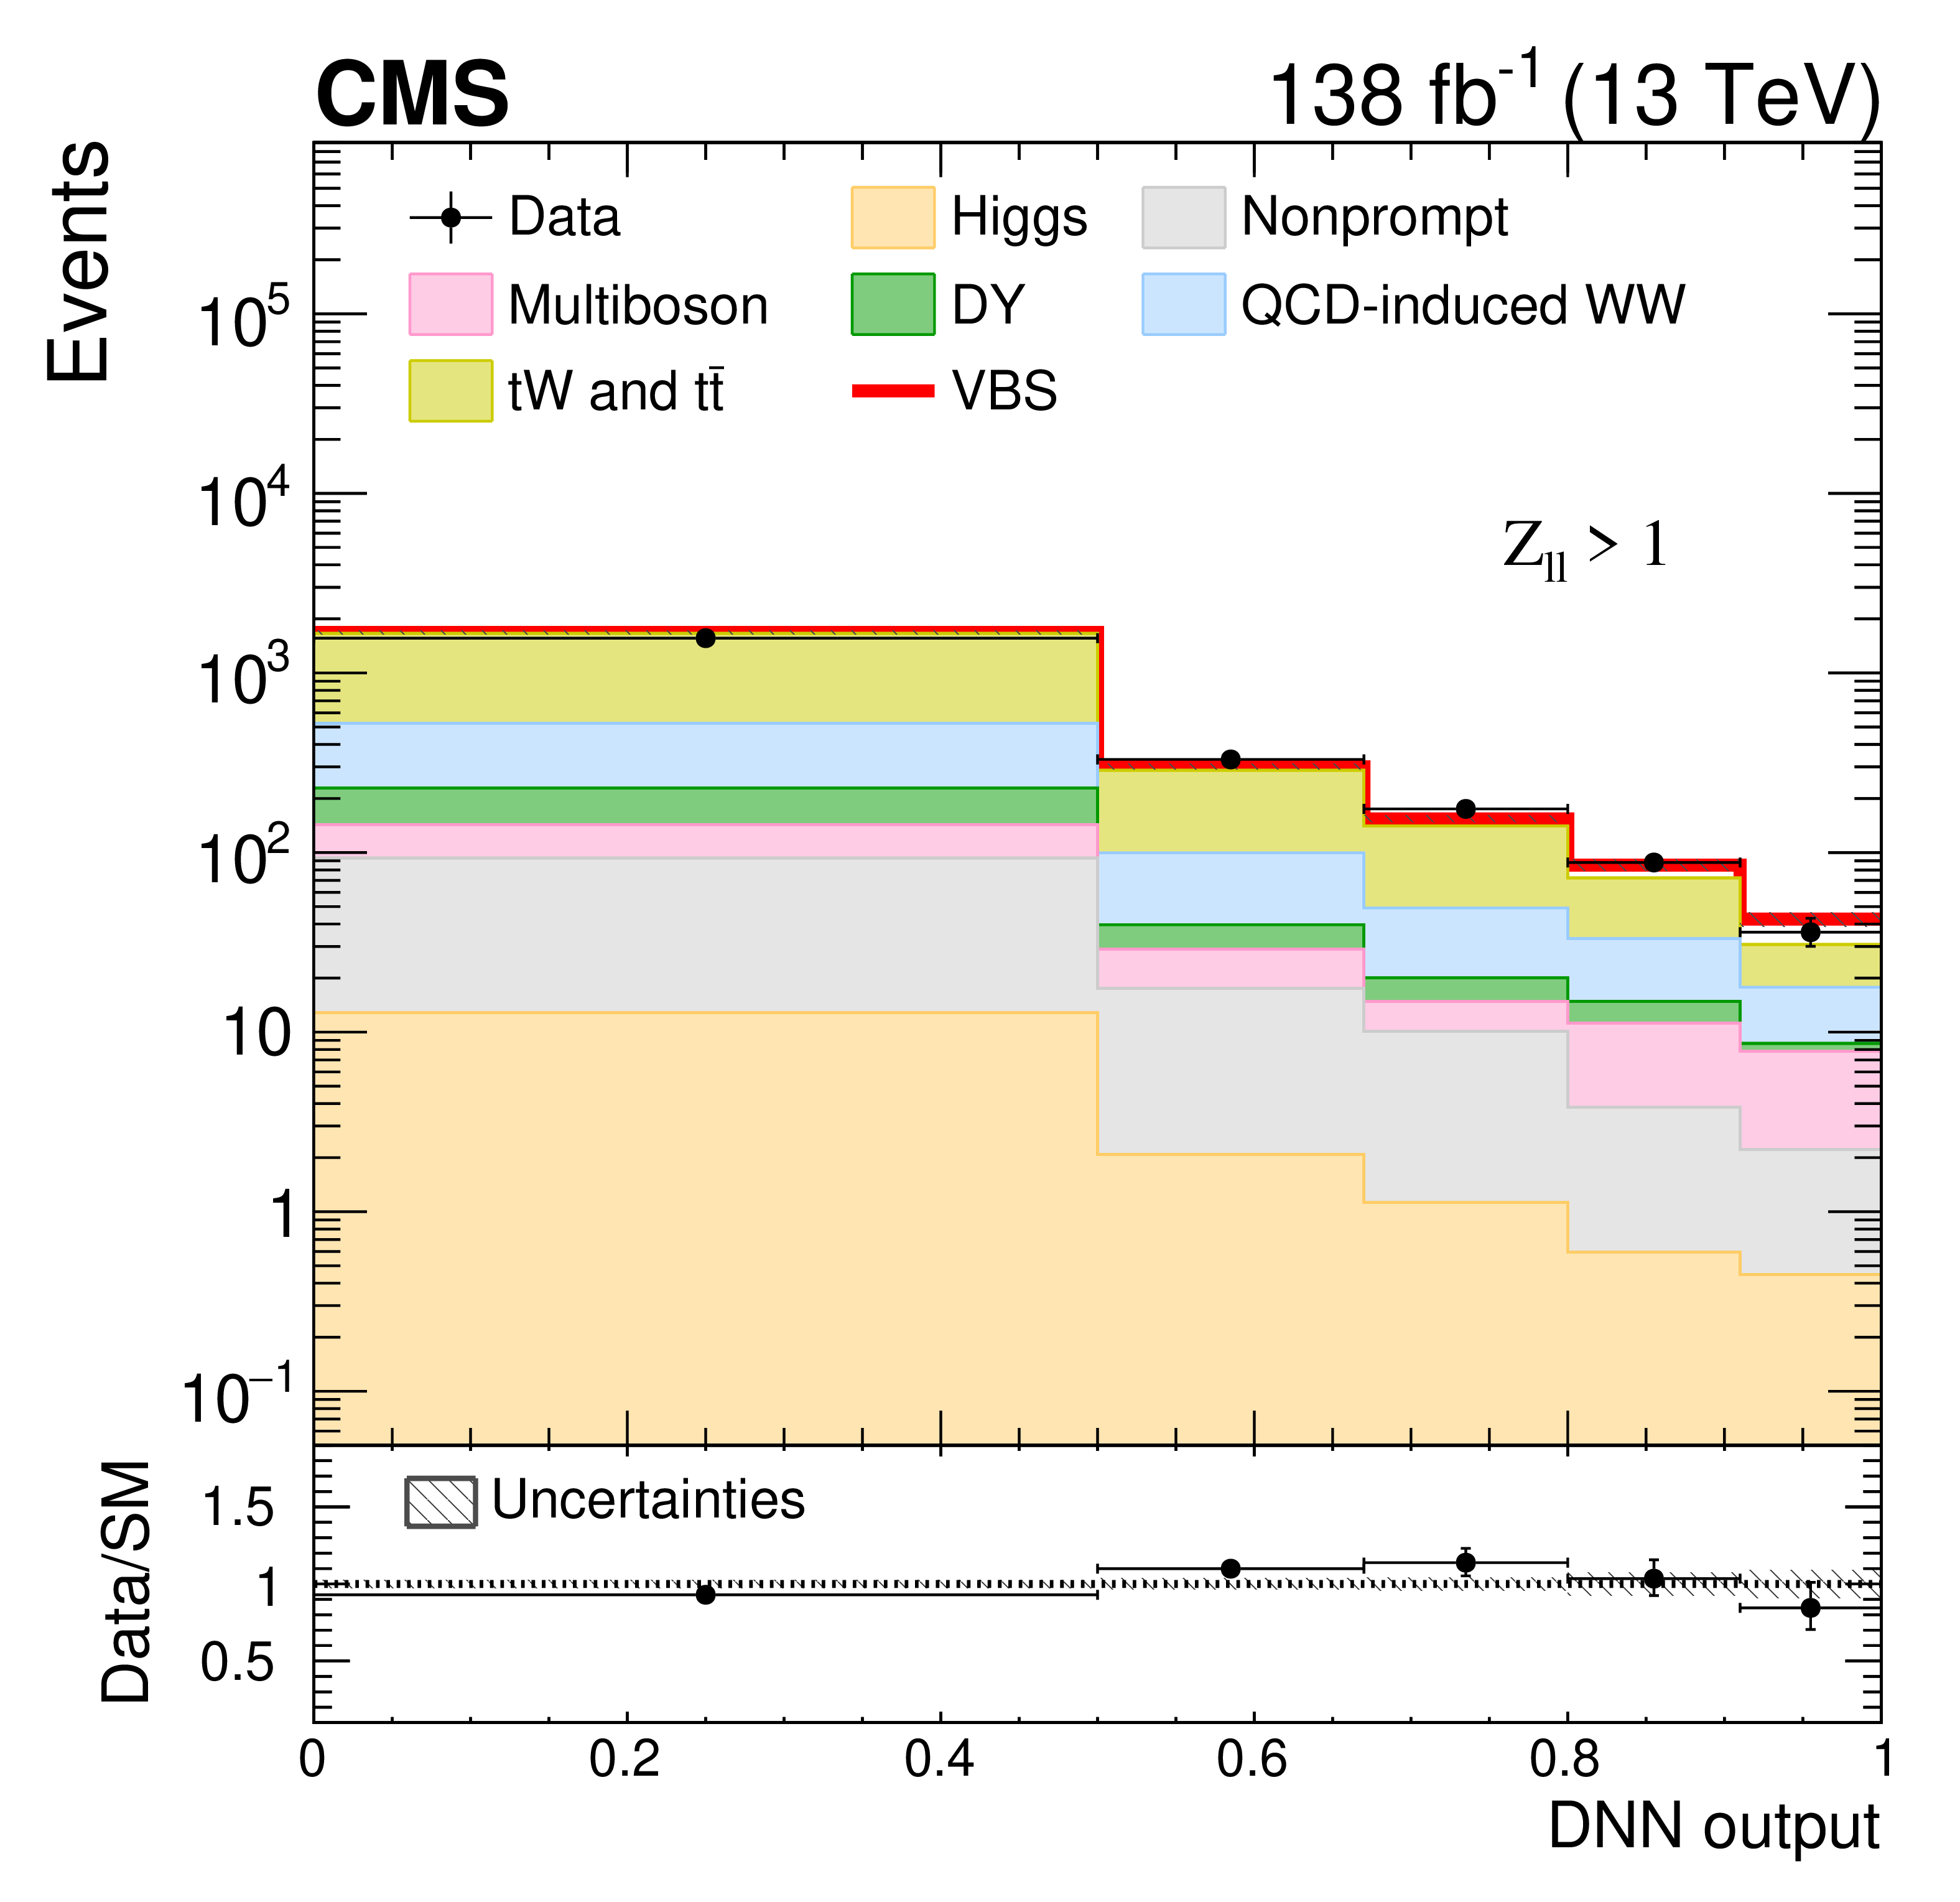
Figure 2-b:
Post-fit DNN output distribution in different-flavor SRs for the $ Z_{\ell\ell} > $ 1 category. This variable quantifies how likely each event is signal. The contributions from background and signal (red line) processes are shown as stacked histograms; systematic uncertainties are plotted as dashed gray bands. Data points are displayed with asymmetric Poisson vertical bars to ensure a correct statistical coverage all over the spectrum. |
png pdf |
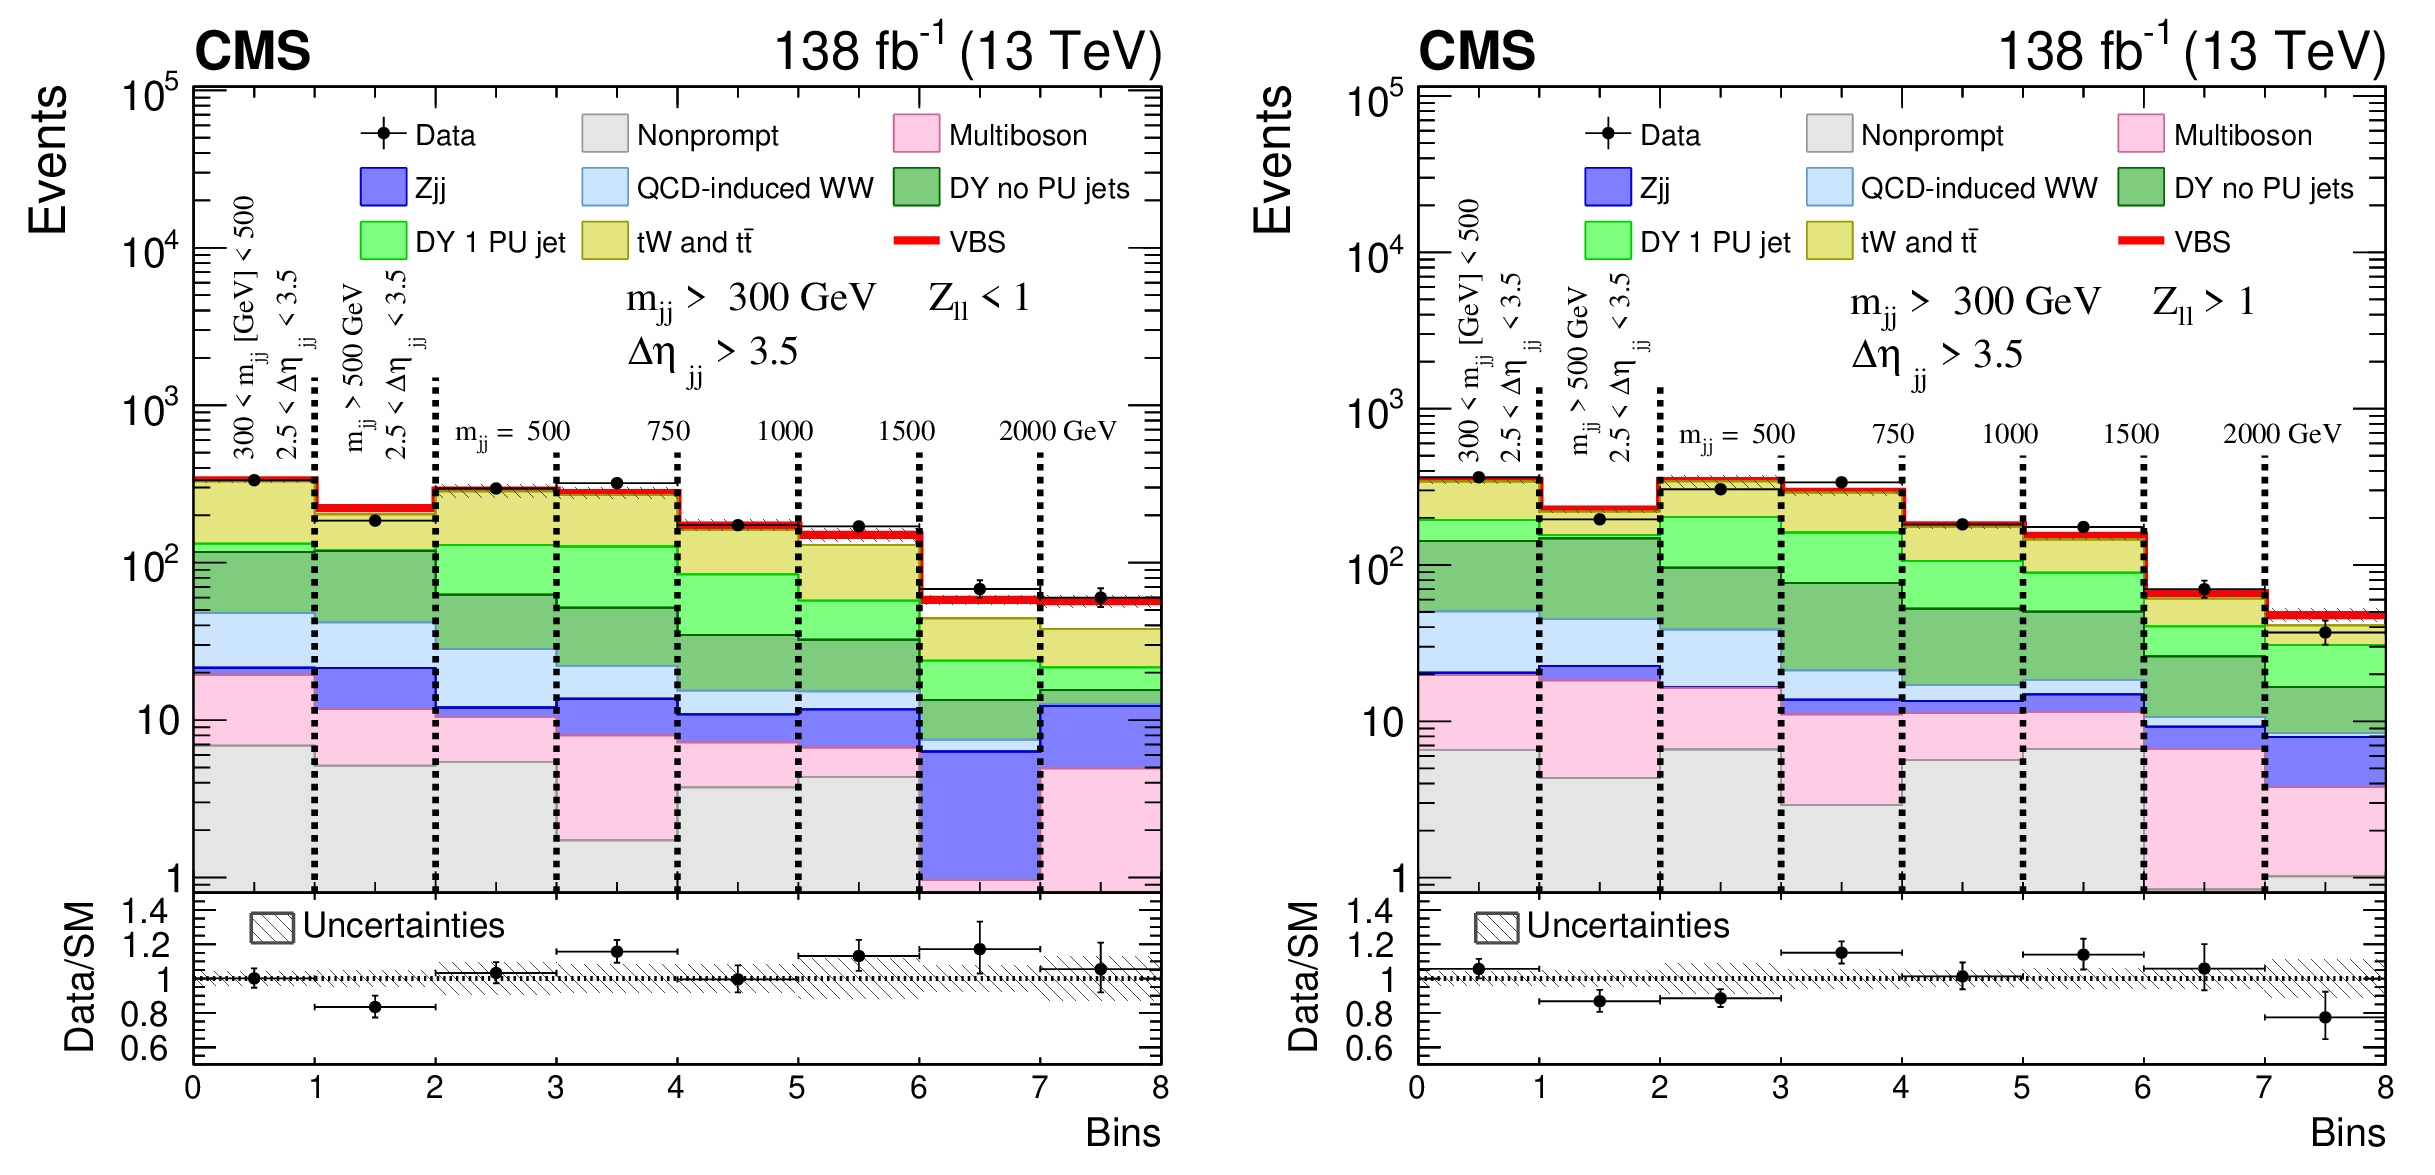
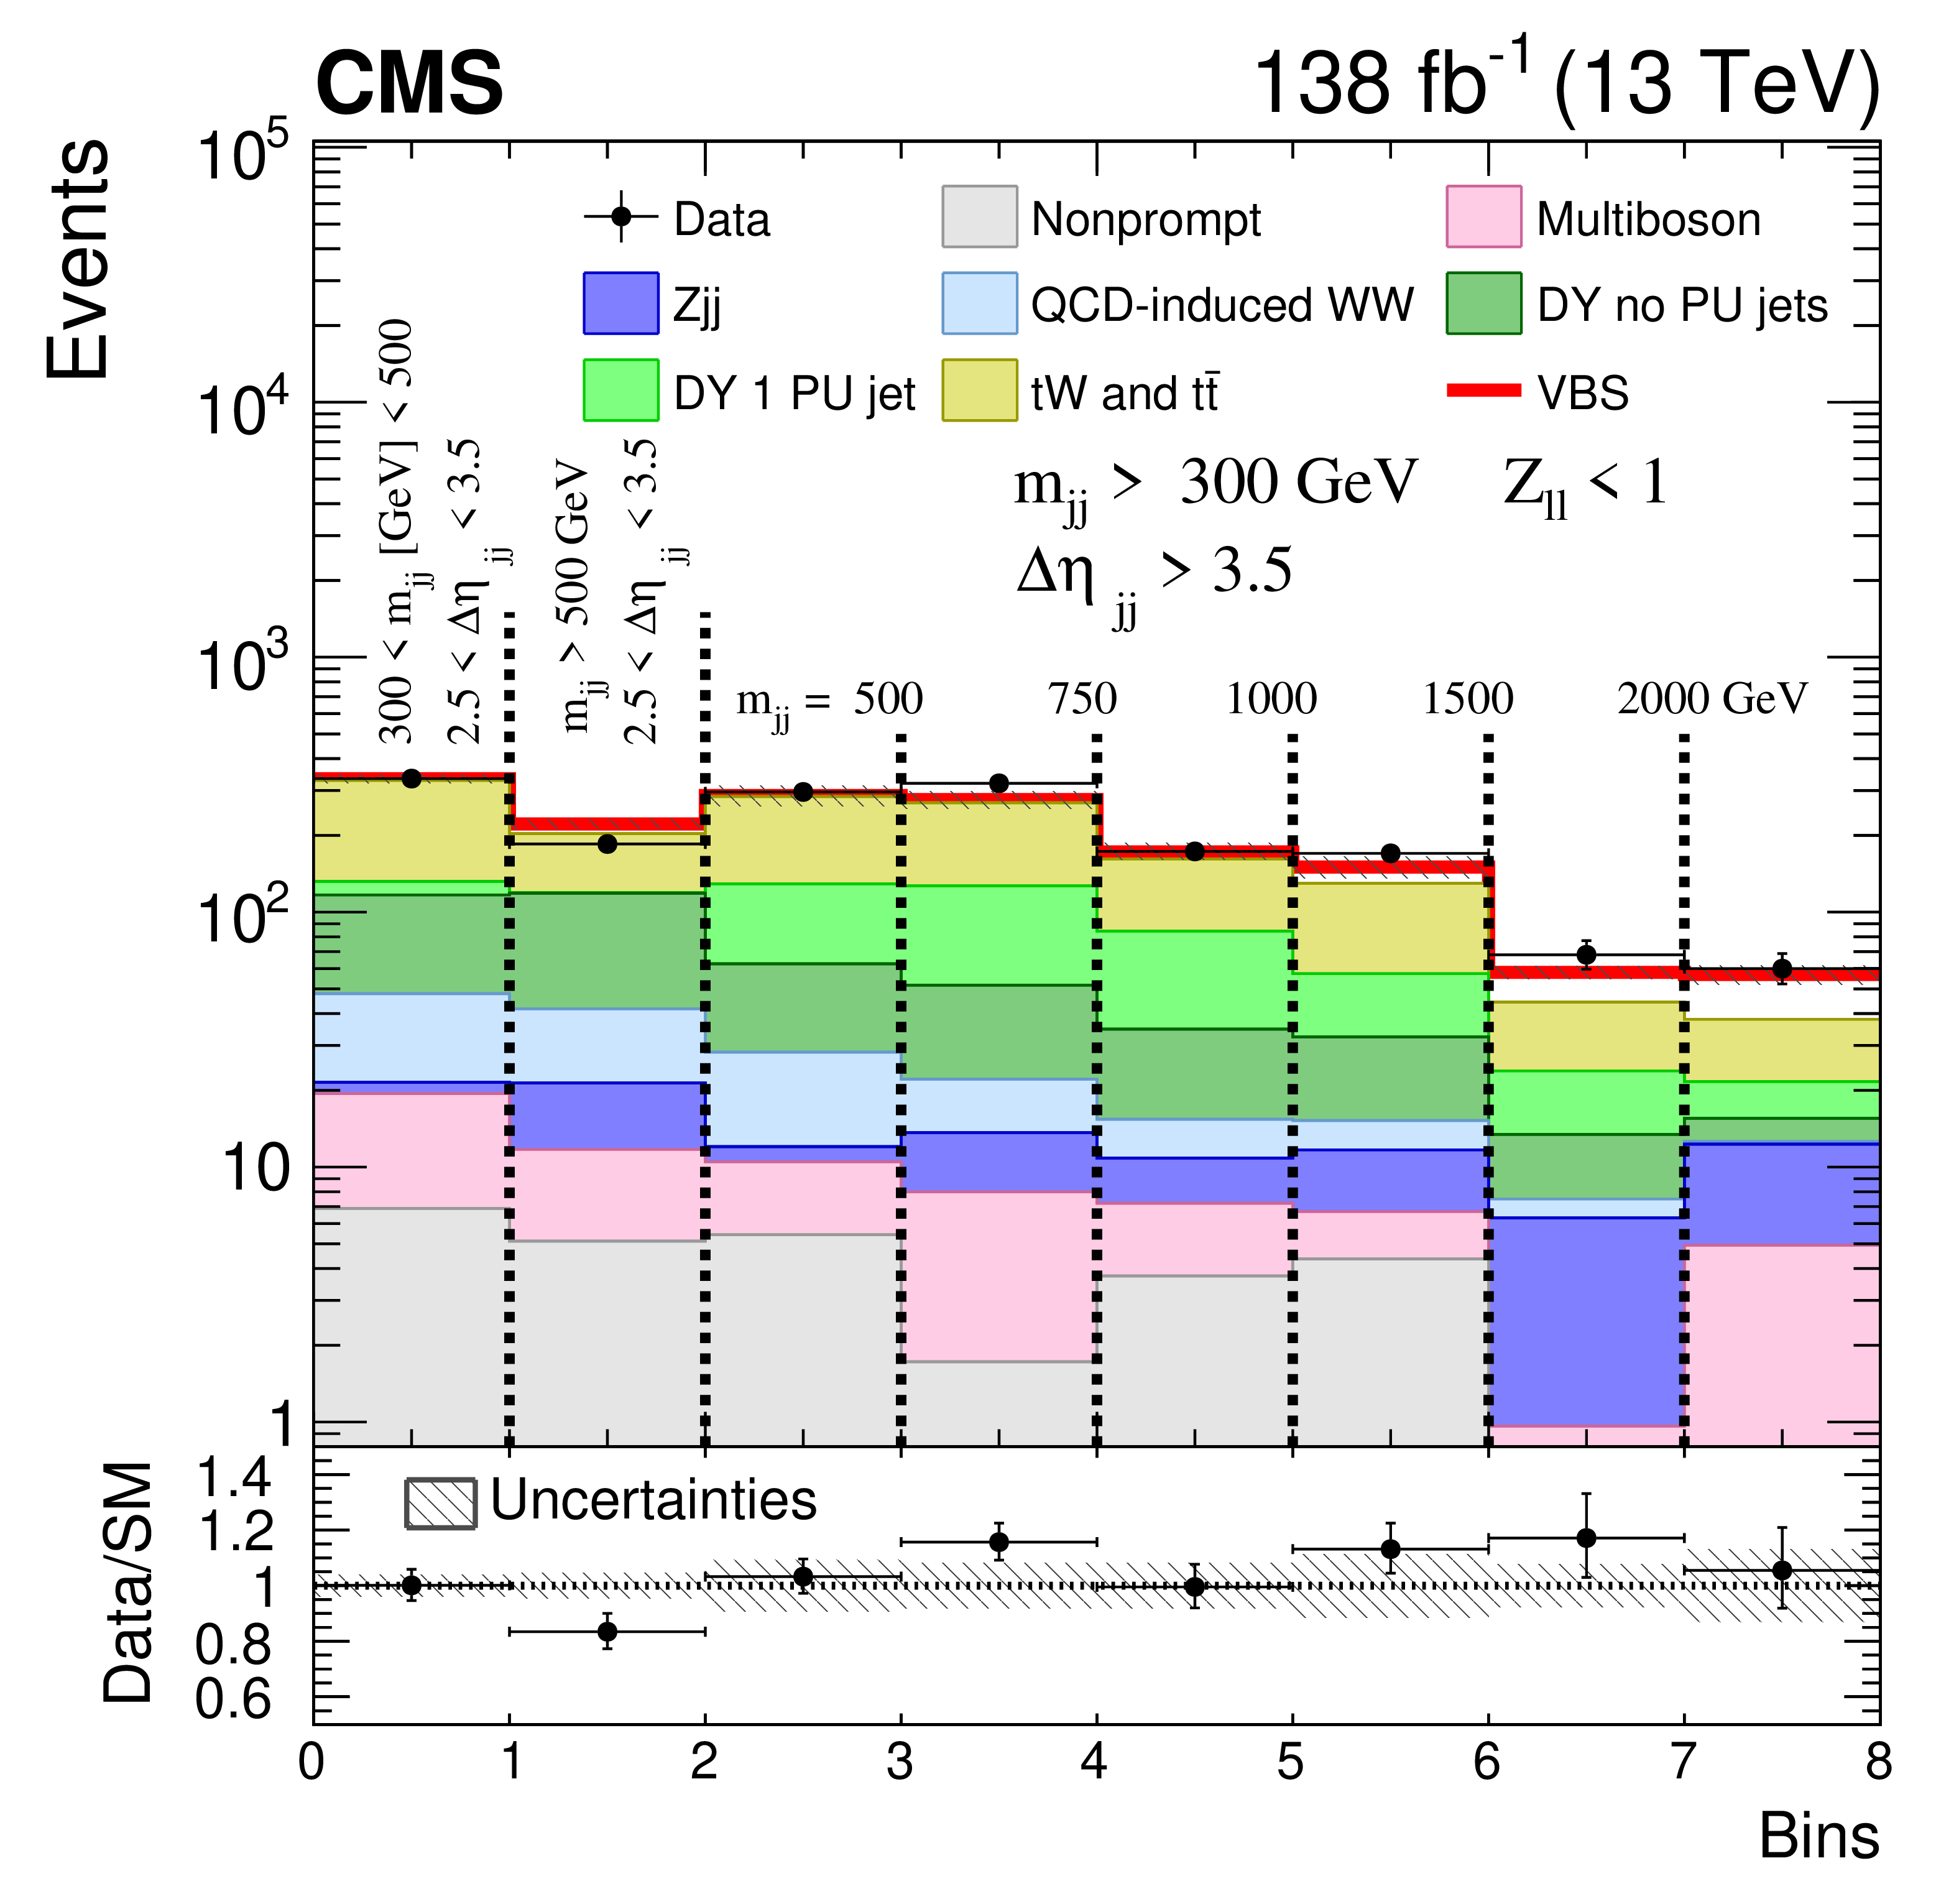
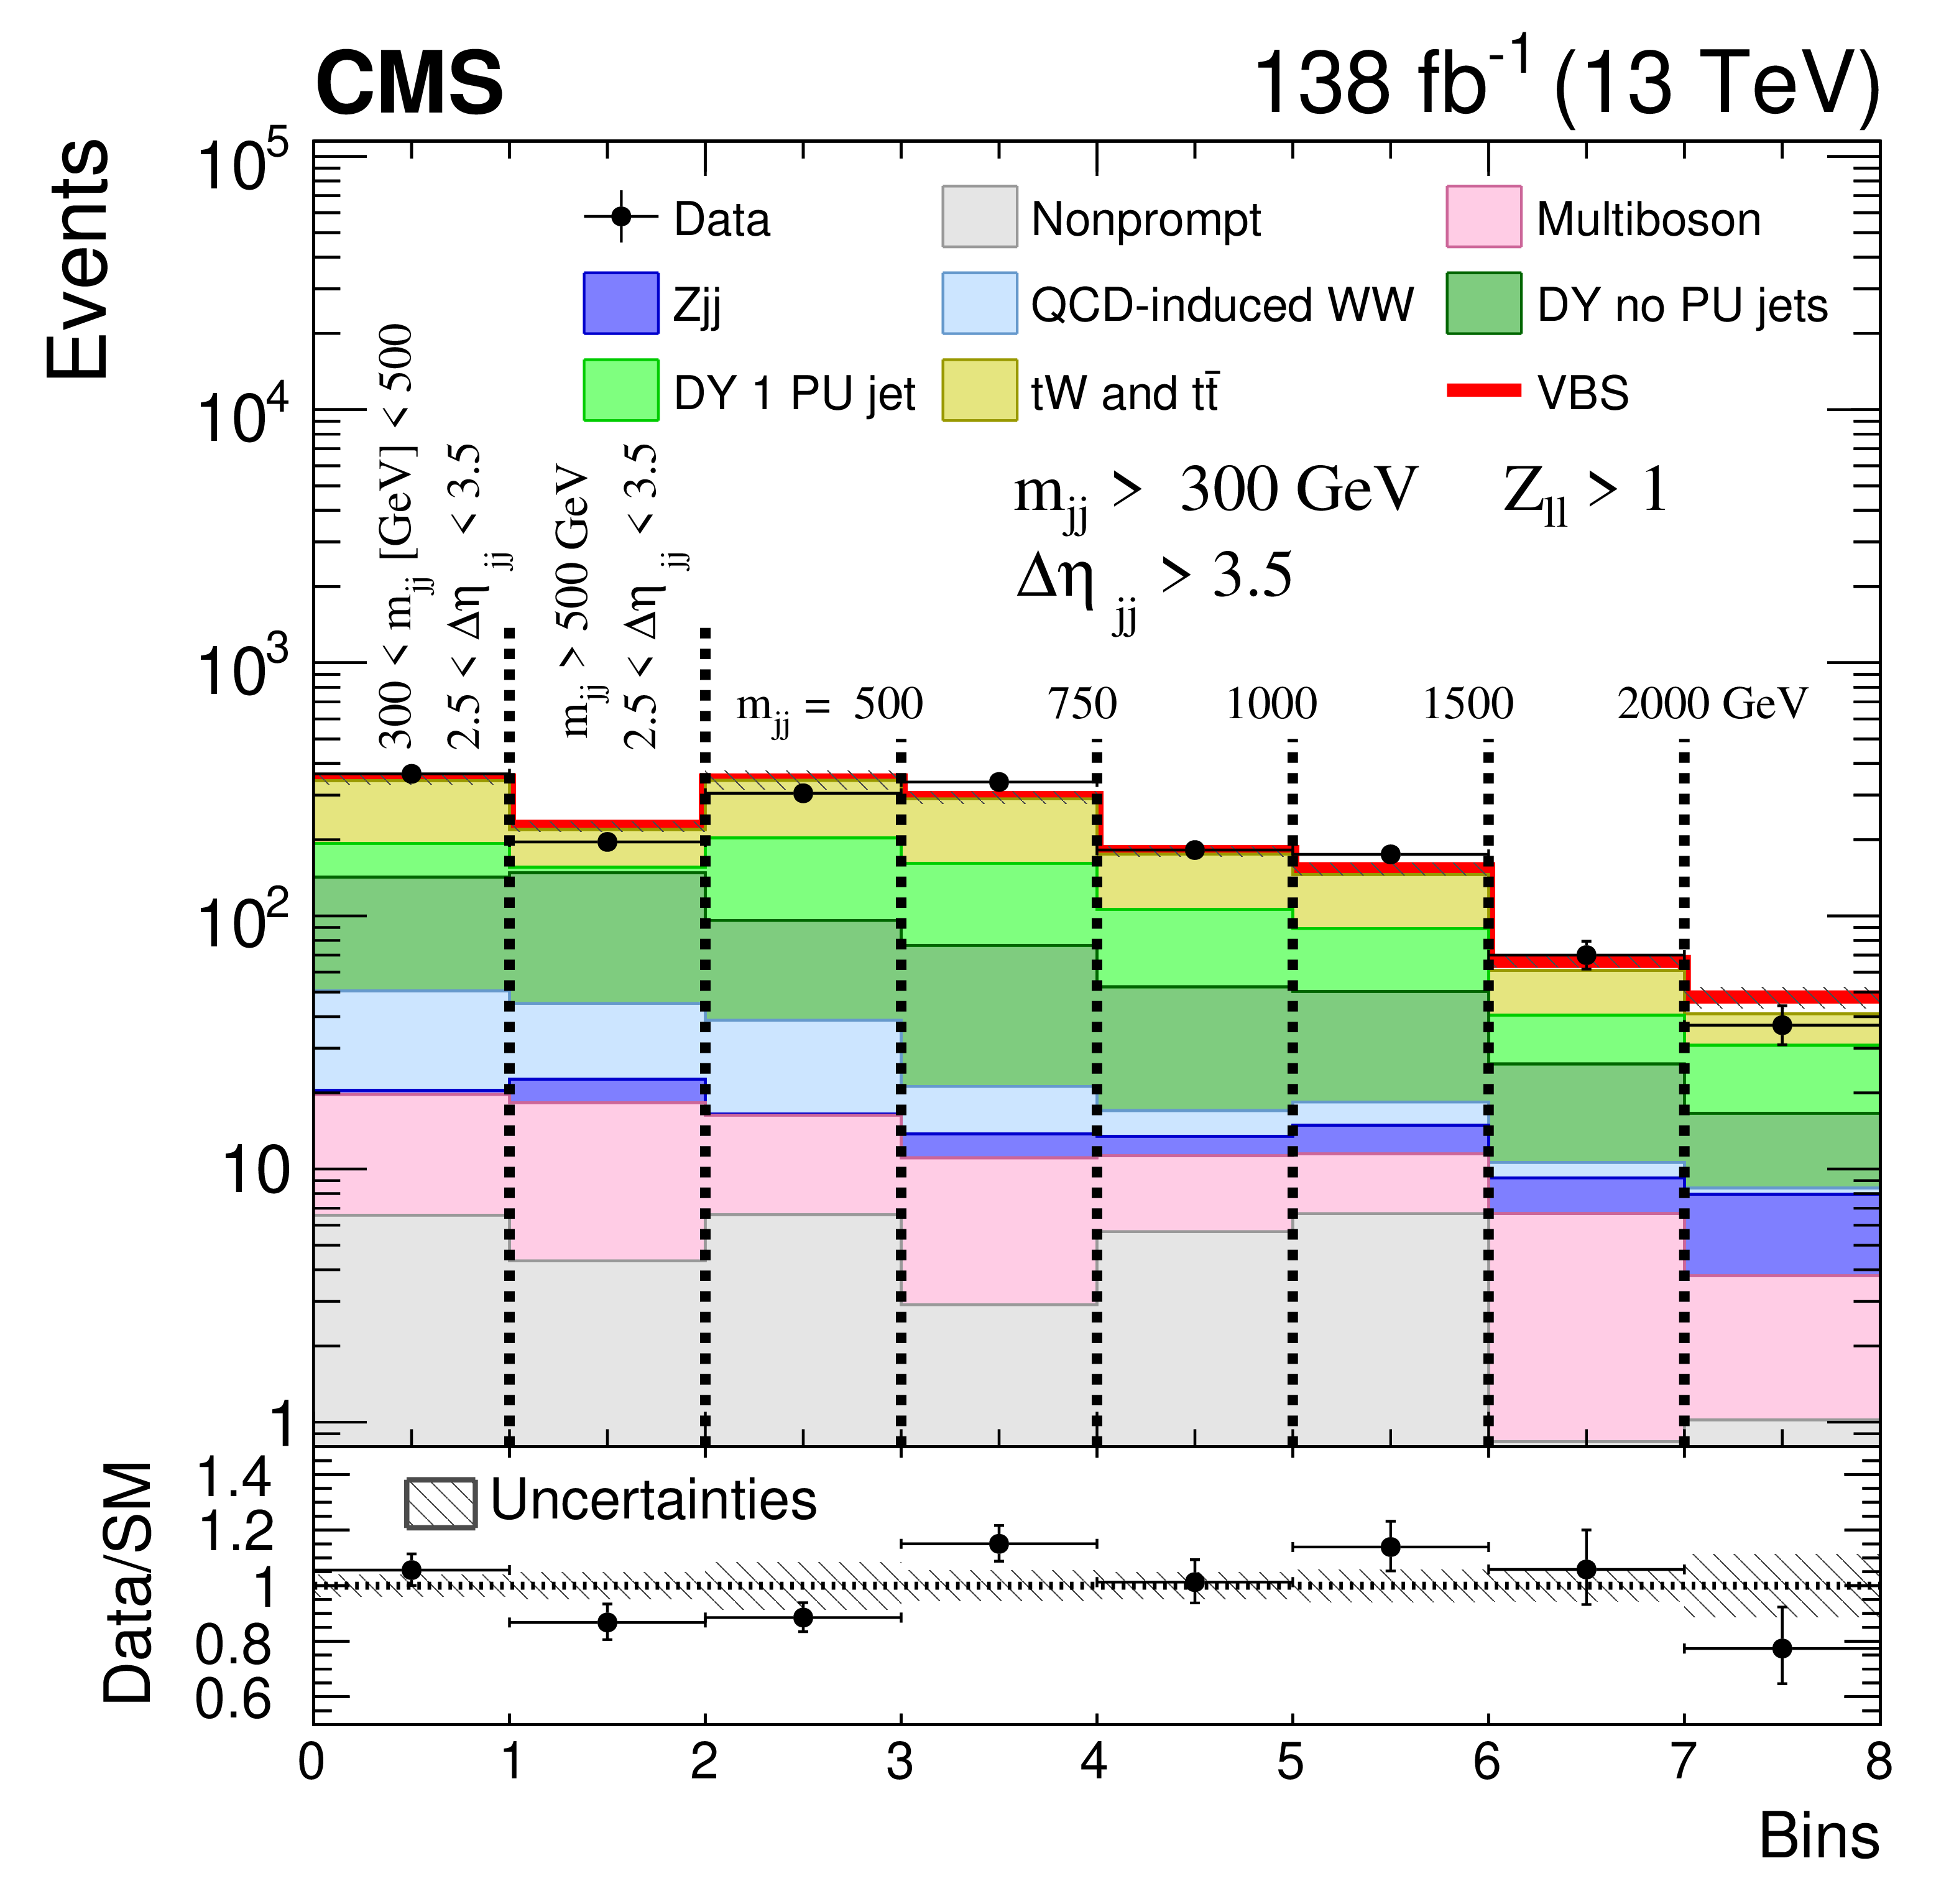
Figure 3:
Post-fit $ m_{\mathrm{jj}} $ distribution and number of events in same-flavor ($ \mathrm{e}\mathrm{e} $ and $ \mu\mu $ combined) SRs for $ Z_{\ell\ell} < $ 1 (left) and $ Z_{\ell\ell} > $ 1 (right) categories. The first two bins contain the number of events in the selected region (as reported in the plots themselves). The third bin contains the number of events in the 300 $ < m_{\mathrm{jj}} $ [GeV] $ < $ 500 and $ |\Delta\eta_{\mathrm{jj}}| > $ 3.5 regions and, for display purposes, is included in the $ m_{\mathrm{jj}} $ distribution, shown in the last five bins. The contributions from background and signal (red line) processes are shown as stacked histograms; systematic uncertainties are plotted as dashed gray bands. Data points are displayed with asymmetric Poisson vertical bars to ensure a correct statistical coverage all over the spectrum. |
png pdf |
Figure 3-a:
Post-fit $ m_{\mathrm{jj}} $ distribution and number of events in same-flavor ($ \mathrm{e}\mathrm{e} $ and $ \mu\mu $ combined) SRs for the $ Z_{\ell\ell} < $ 1 and $ Z_{\ell\ell} > $ 1 category. The first two bins contain the number of events in the selected region (as reported in the plot). The third bin contains the number of events in the 300 $ < m_{\mathrm{jj}} $ [GeV] $ < $ 500 and $ |\Delta\eta_{\mathrm{jj}}| > $ 3.5 regions and, for display purposes, is included in the $ m_{\mathrm{jj}} $ distribution, shown in the last five bins. The contributions from background and signal (red line) processes are shown as stacked histograms; systematic uncertainties are plotted as dashed gray bands. Data points are displayed with asymmetric Poisson vertical bars to ensure a correct statistical coverage all over the spectrum. |
png pdf |
Figure 3-b:
Post-fit $ m_{\mathrm{jj}} $ distribution and number of events in same-flavor ($ \mathrm{e}\mathrm{e} $ and $ \mu\mu $ combined) SRs for the $ Z_{\ell\ell} > $ 1 and $ Z_{\ell\ell} > $ 1 category. The first two bins contain the number of events in the selected region (as reported in the plot). The third bin contains the number of events in the 300 $ < m_{\mathrm{jj}} $ [GeV] $ < $ 500 and $ |\Delta\eta_{\mathrm{jj}}| > $ 3.5 regions and, for display purposes, is included in the $ m_{\mathrm{jj}} $ distribution, shown in the last five bins. The contributions from background and signal (red line) processes are shown as stacked histograms; systematic uncertainties are plotted as dashed gray bands. Data points are displayed with asymmetric Poisson vertical bars to ensure a correct statistical coverage all over the spectrum. |
png pdf |
Figure 4:
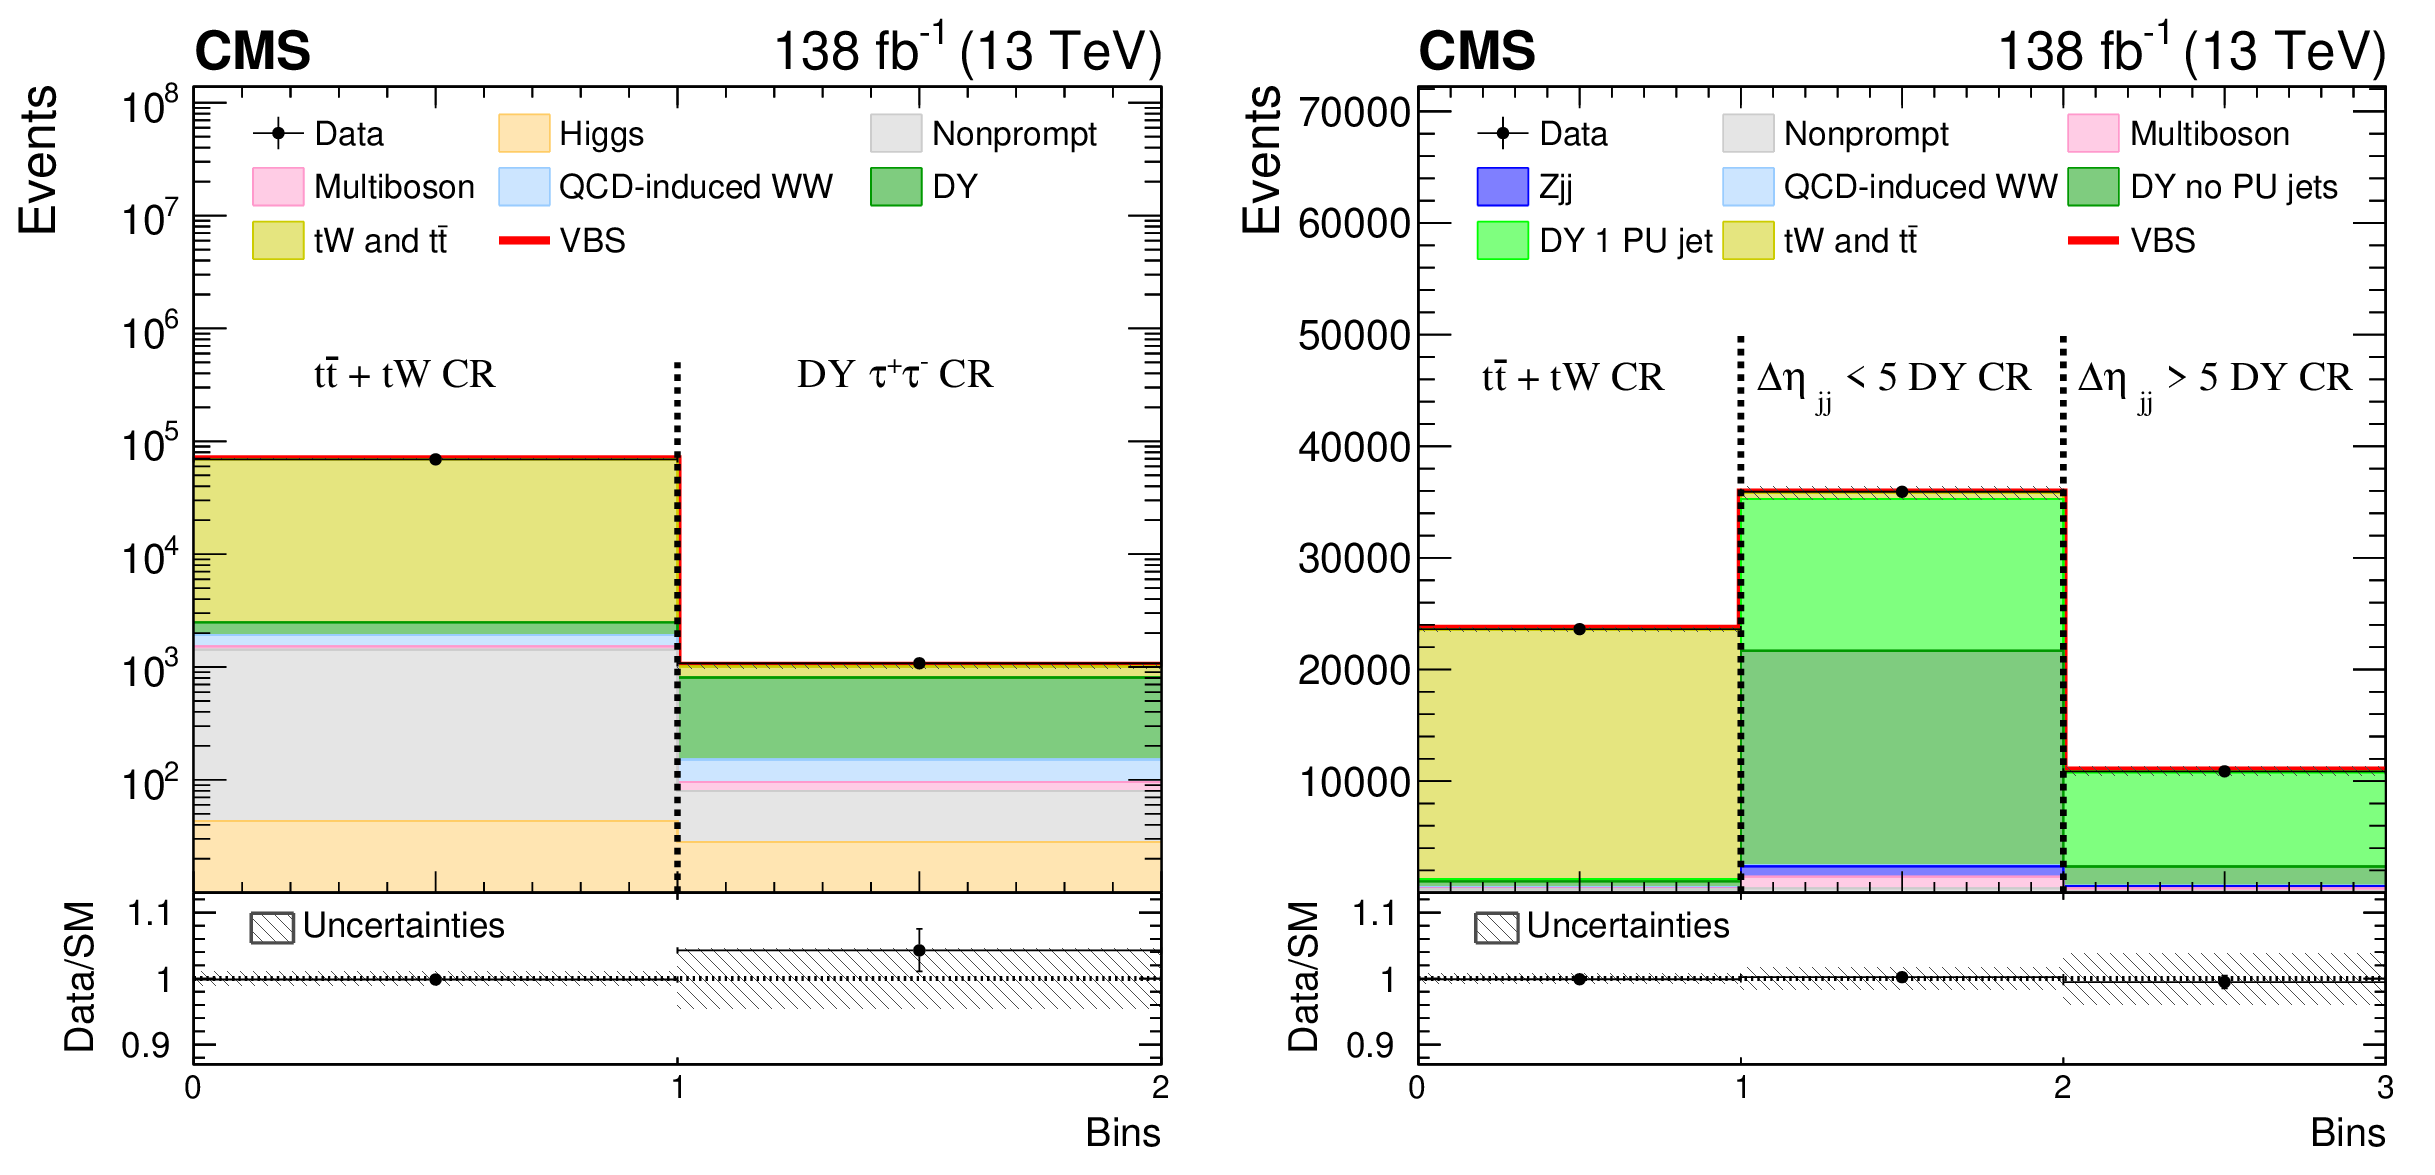
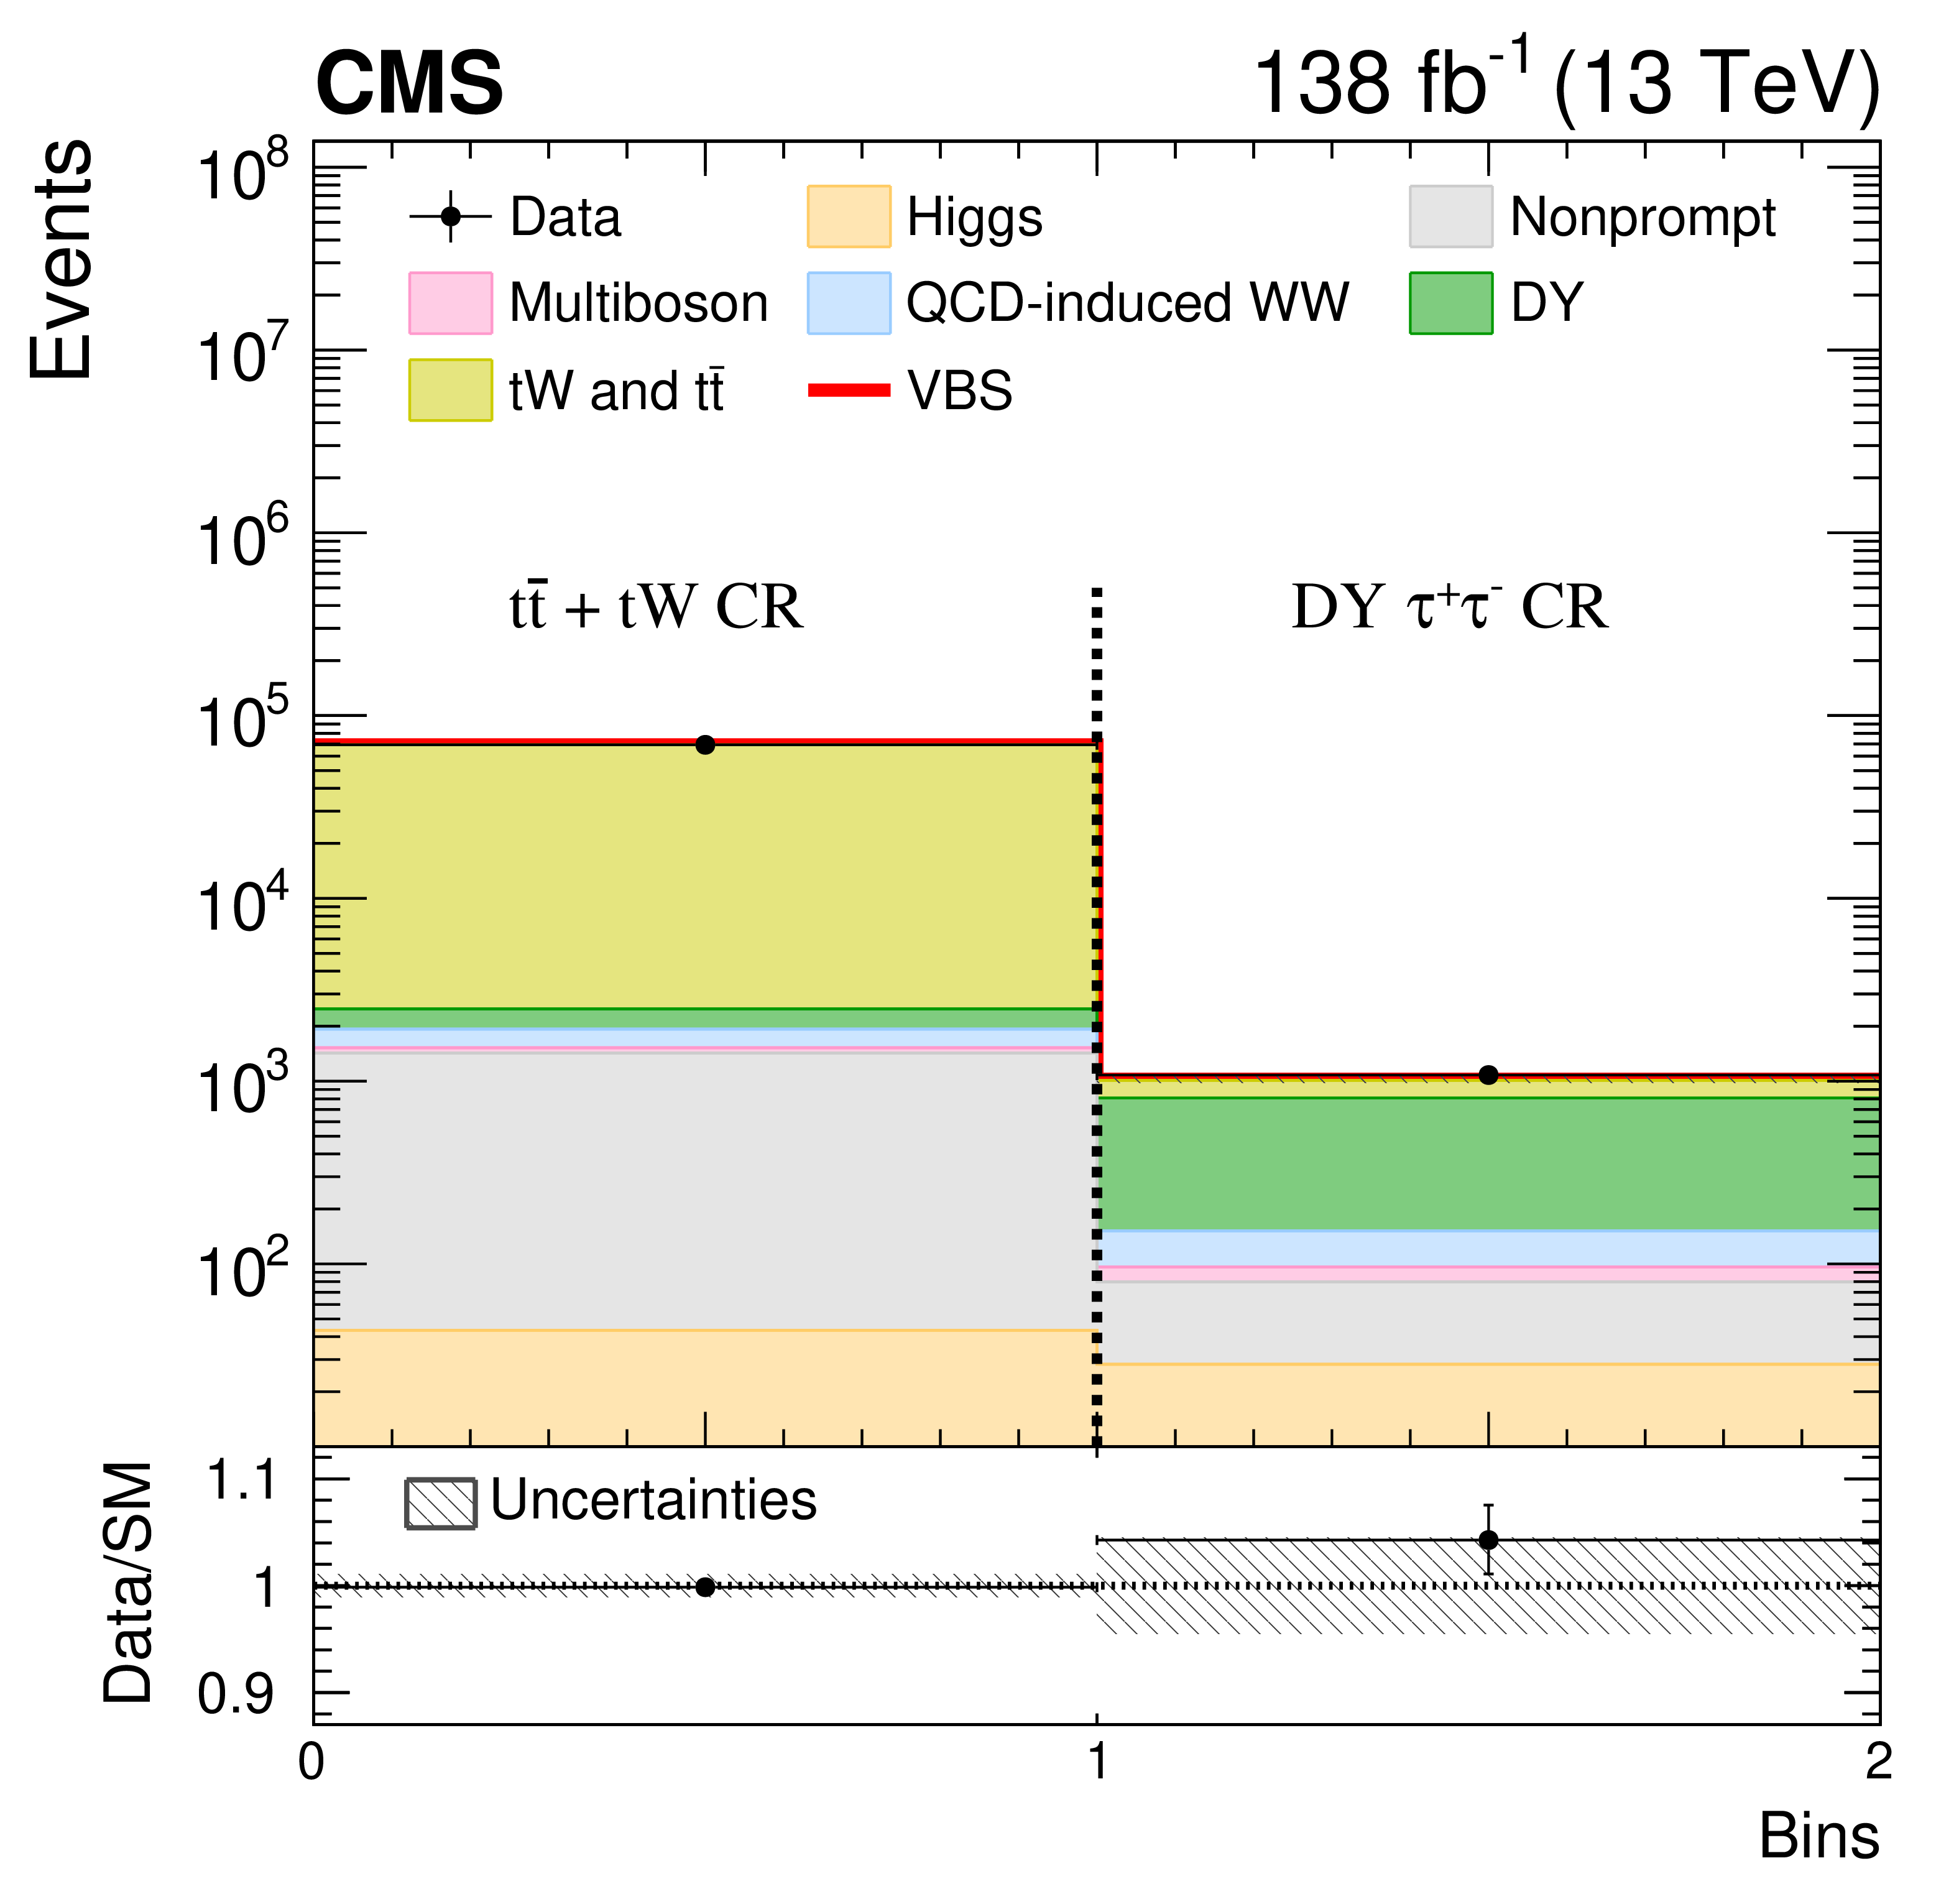
Post-fit number of events in different-flavor (left) and same-flavor (right, with $ \mathrm{e}\mathrm{e} $ and $ \mu\mu $ combined) CRs. In the left plot, the first bin contains the number of events in the $ {\mathrm{t}\overline{\mathrm{t}}} + \mathrm{t}\mathrm{W} $ different-flavor CR, and the second bin those in the DY $ \tau\tau $ CR. In the right plot, the first bin contains the number of events in the $ {\mathrm{t}\overline{\mathrm{t}}} + \mathrm{t}\mathrm{W} $ same-flavor CR, the second bin those in the $ |\Delta\eta_{\mathrm{jj}}| < $ 5 DY CR, and the third bin those in the $ |\Delta\eta_{\mathrm{jj}}| > $ 5 DY CR. The contributions from background and signal processes (red line) are shown as stacked histograms; systematic uncertainties are plotted as dashed gray bands. Data points are displayed with asymmetric Poisson vertical bars to ensure a correct statistical coverage all over the spectrum. |
png pdf |
Figure 4-a:
Post-fit number of events in the different-flavor CR. The first bin contains the number of events in the $ {\mathrm{t}\overline{\mathrm{t}}} + \mathrm{t}\mathrm{W} $ different-flavor CR, and the second bin those in the DY $ \tau\tau $ CR. The contributions from background and signal processes (red line) are shown as stacked histograms; systematic uncertainties are plotted as dashed gray bands. Data points are displayed with asymmetric Poisson vertical bars to ensure a correct statistical coverage all over the spectrum. |

png pdf |
Figure 4-b:
Post-fit number of events in the same-flavor (with $ \mathrm{e}\mathrm{e} $ and $ \mu\mu $ combined) CR. The first bin contains the number of events in the $ {\mathrm{t}\overline{\mathrm{t}}} + \mathrm{t}\mathrm{W} $ same-flavor CR, the second bin those in the $ |\Delta\eta_{\mathrm{jj}}| < $ 5 DY CR, and the third bin those in the $ |\Delta\eta_{\mathrm{jj}}| > $ 5 DY CR. The contributions from background and signal processes (red line) are shown as stacked histograms; systematic uncertainties are plotted as dashed gray bands. Data points are displayed with asymmetric Poisson vertical bars to ensure a correct statistical coverage all over the spectrum. |
png pdf |
Figure A1:
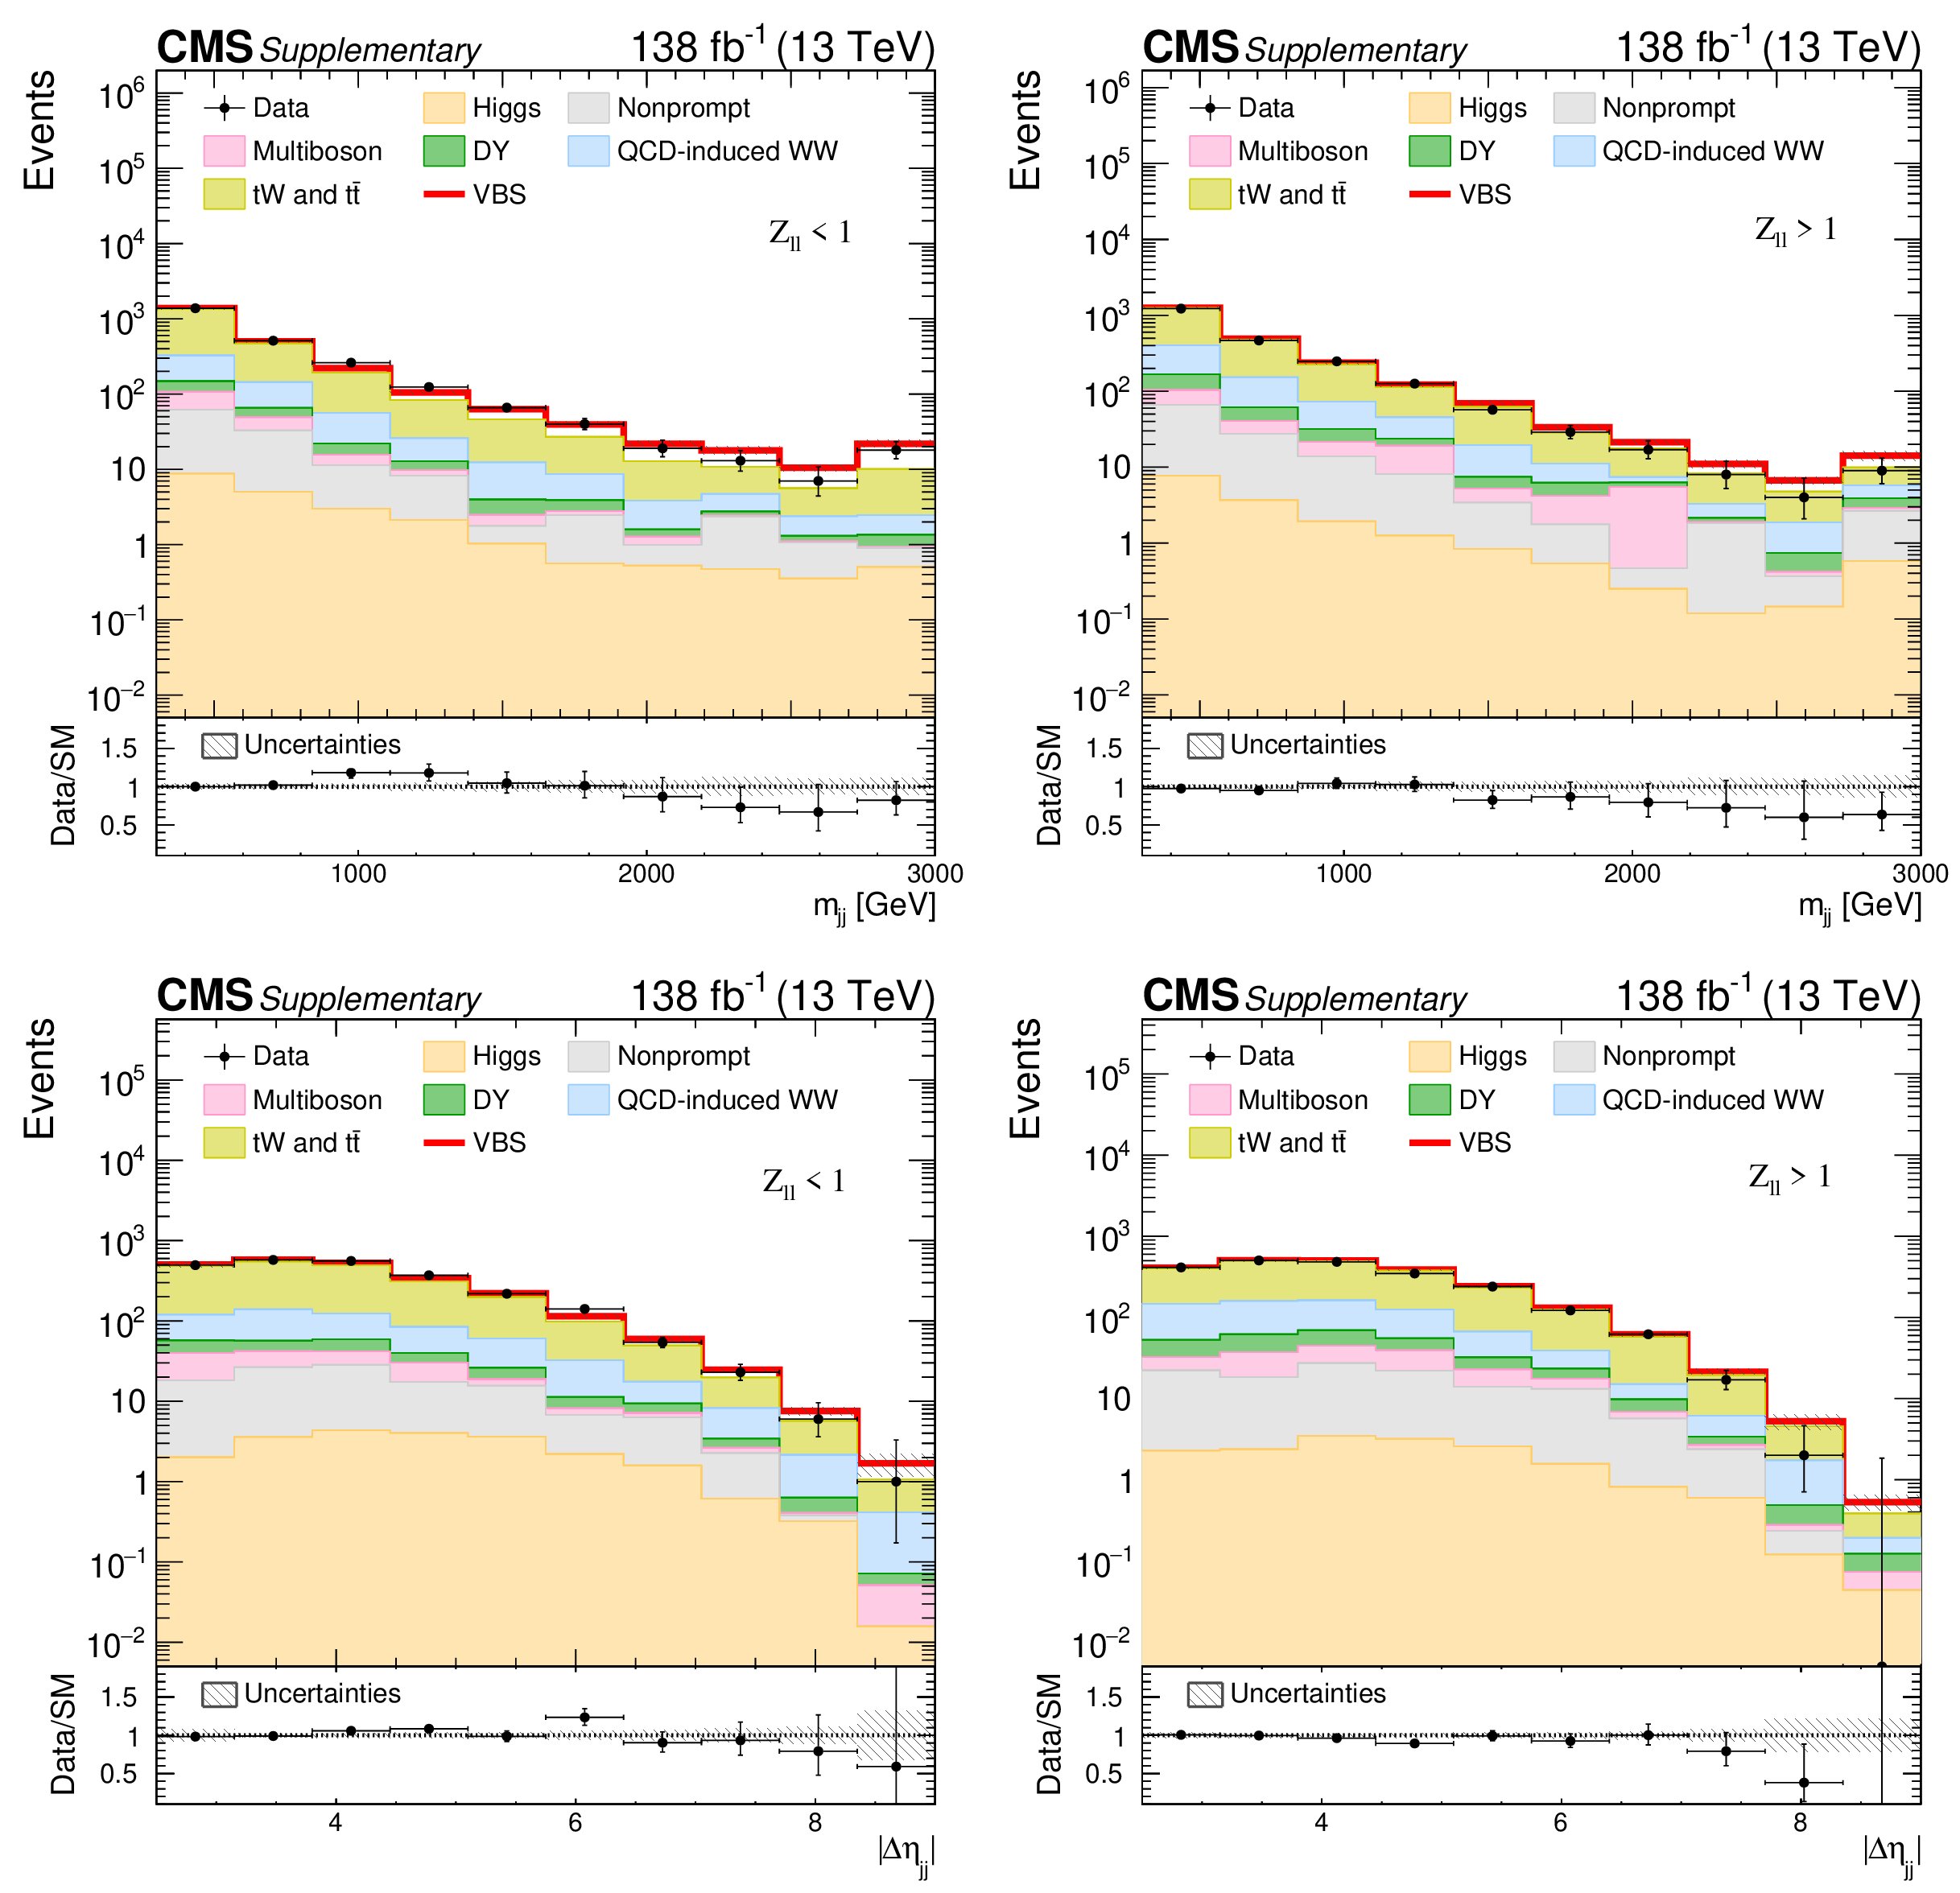
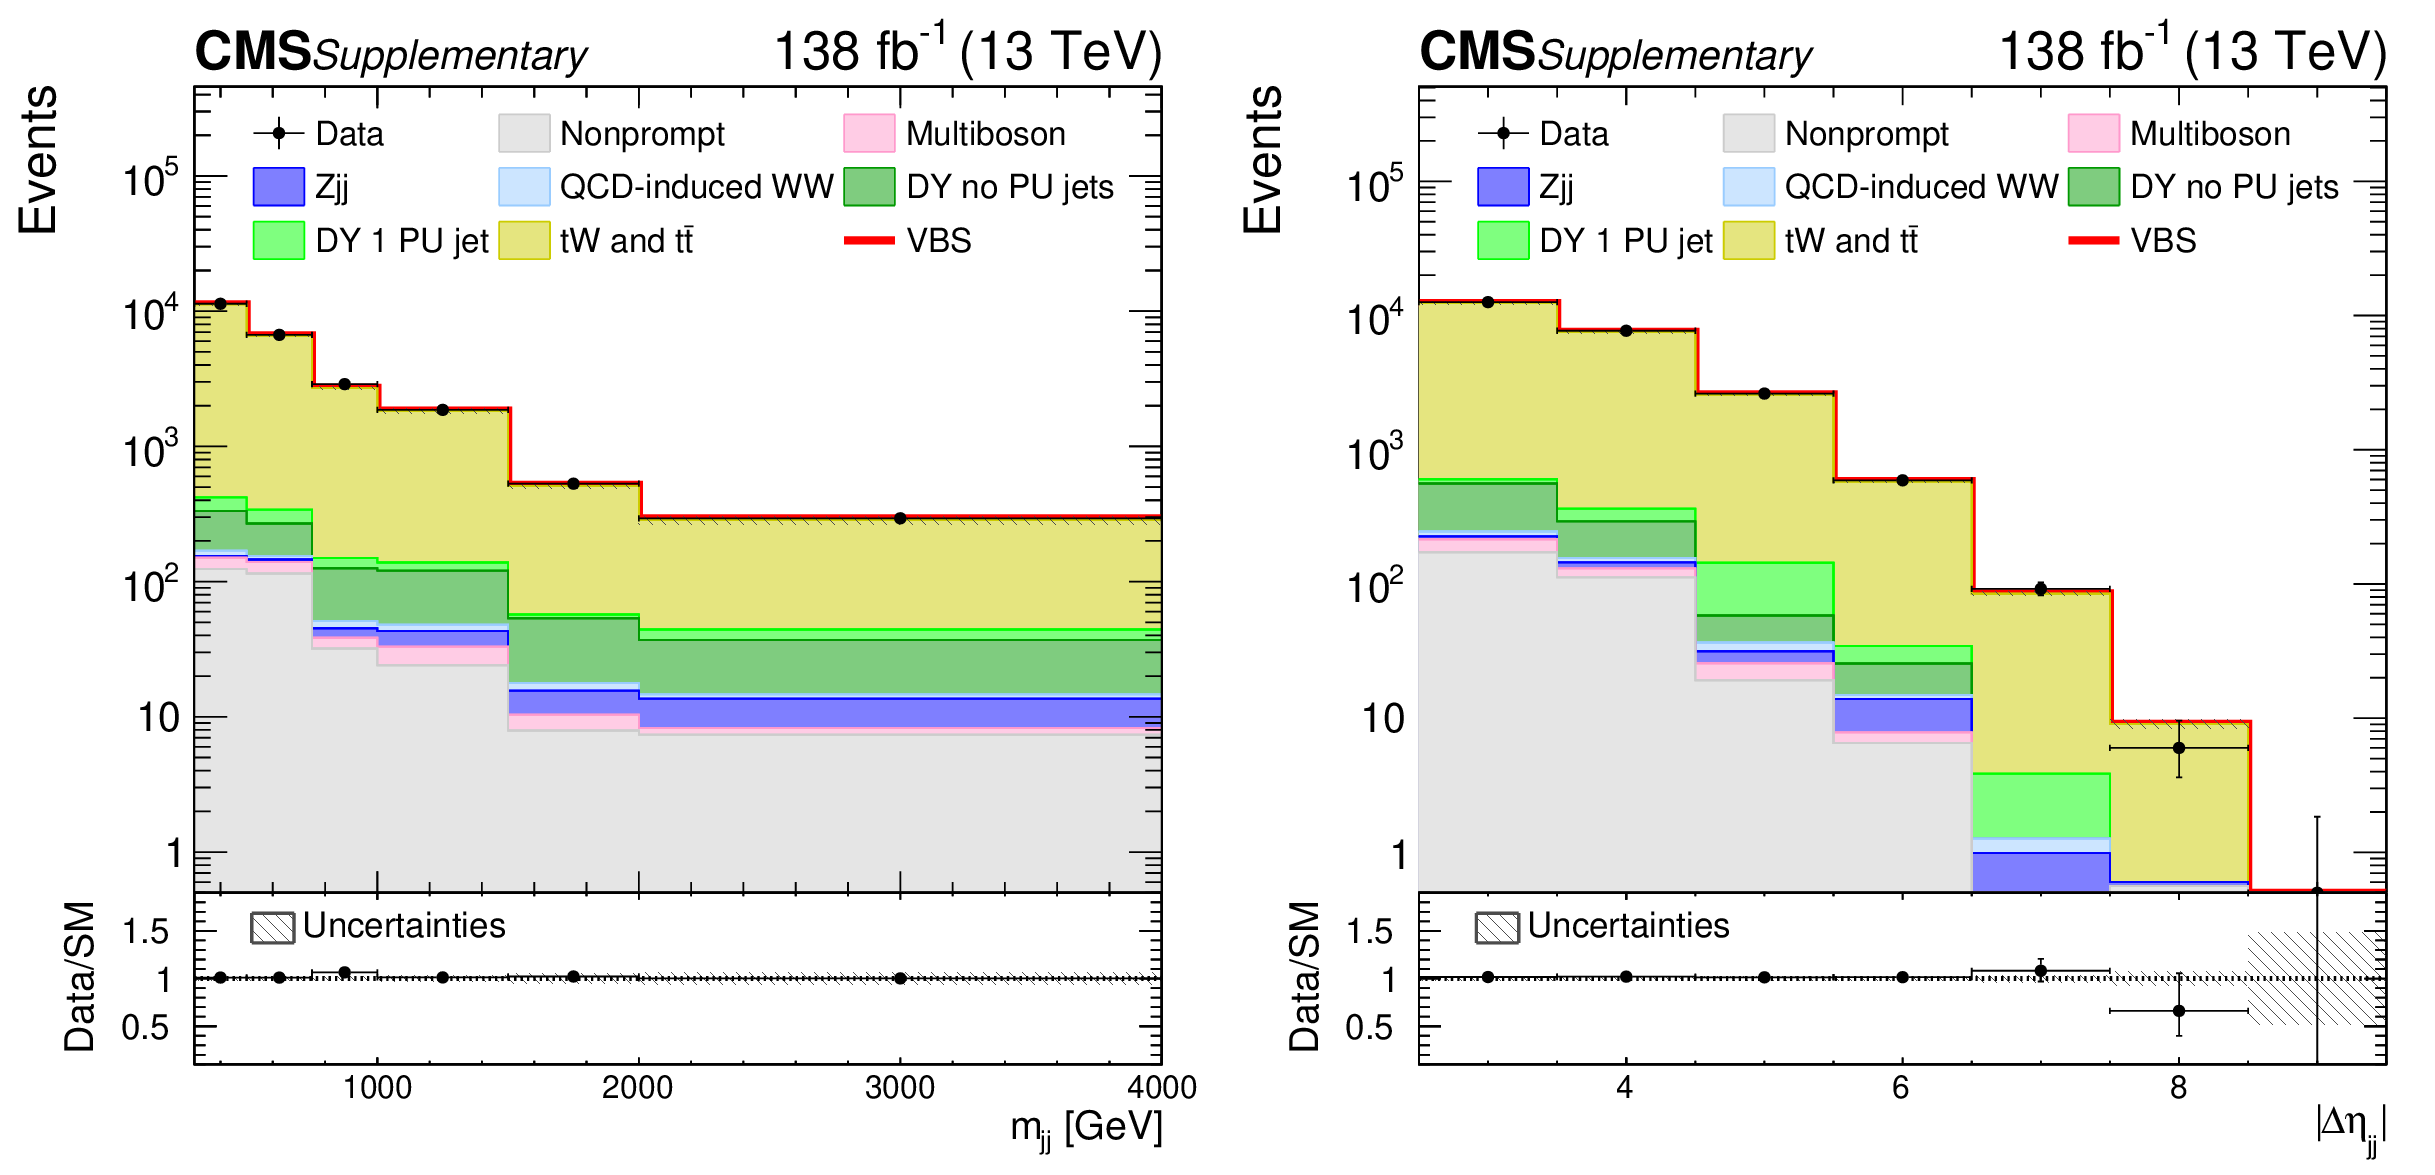
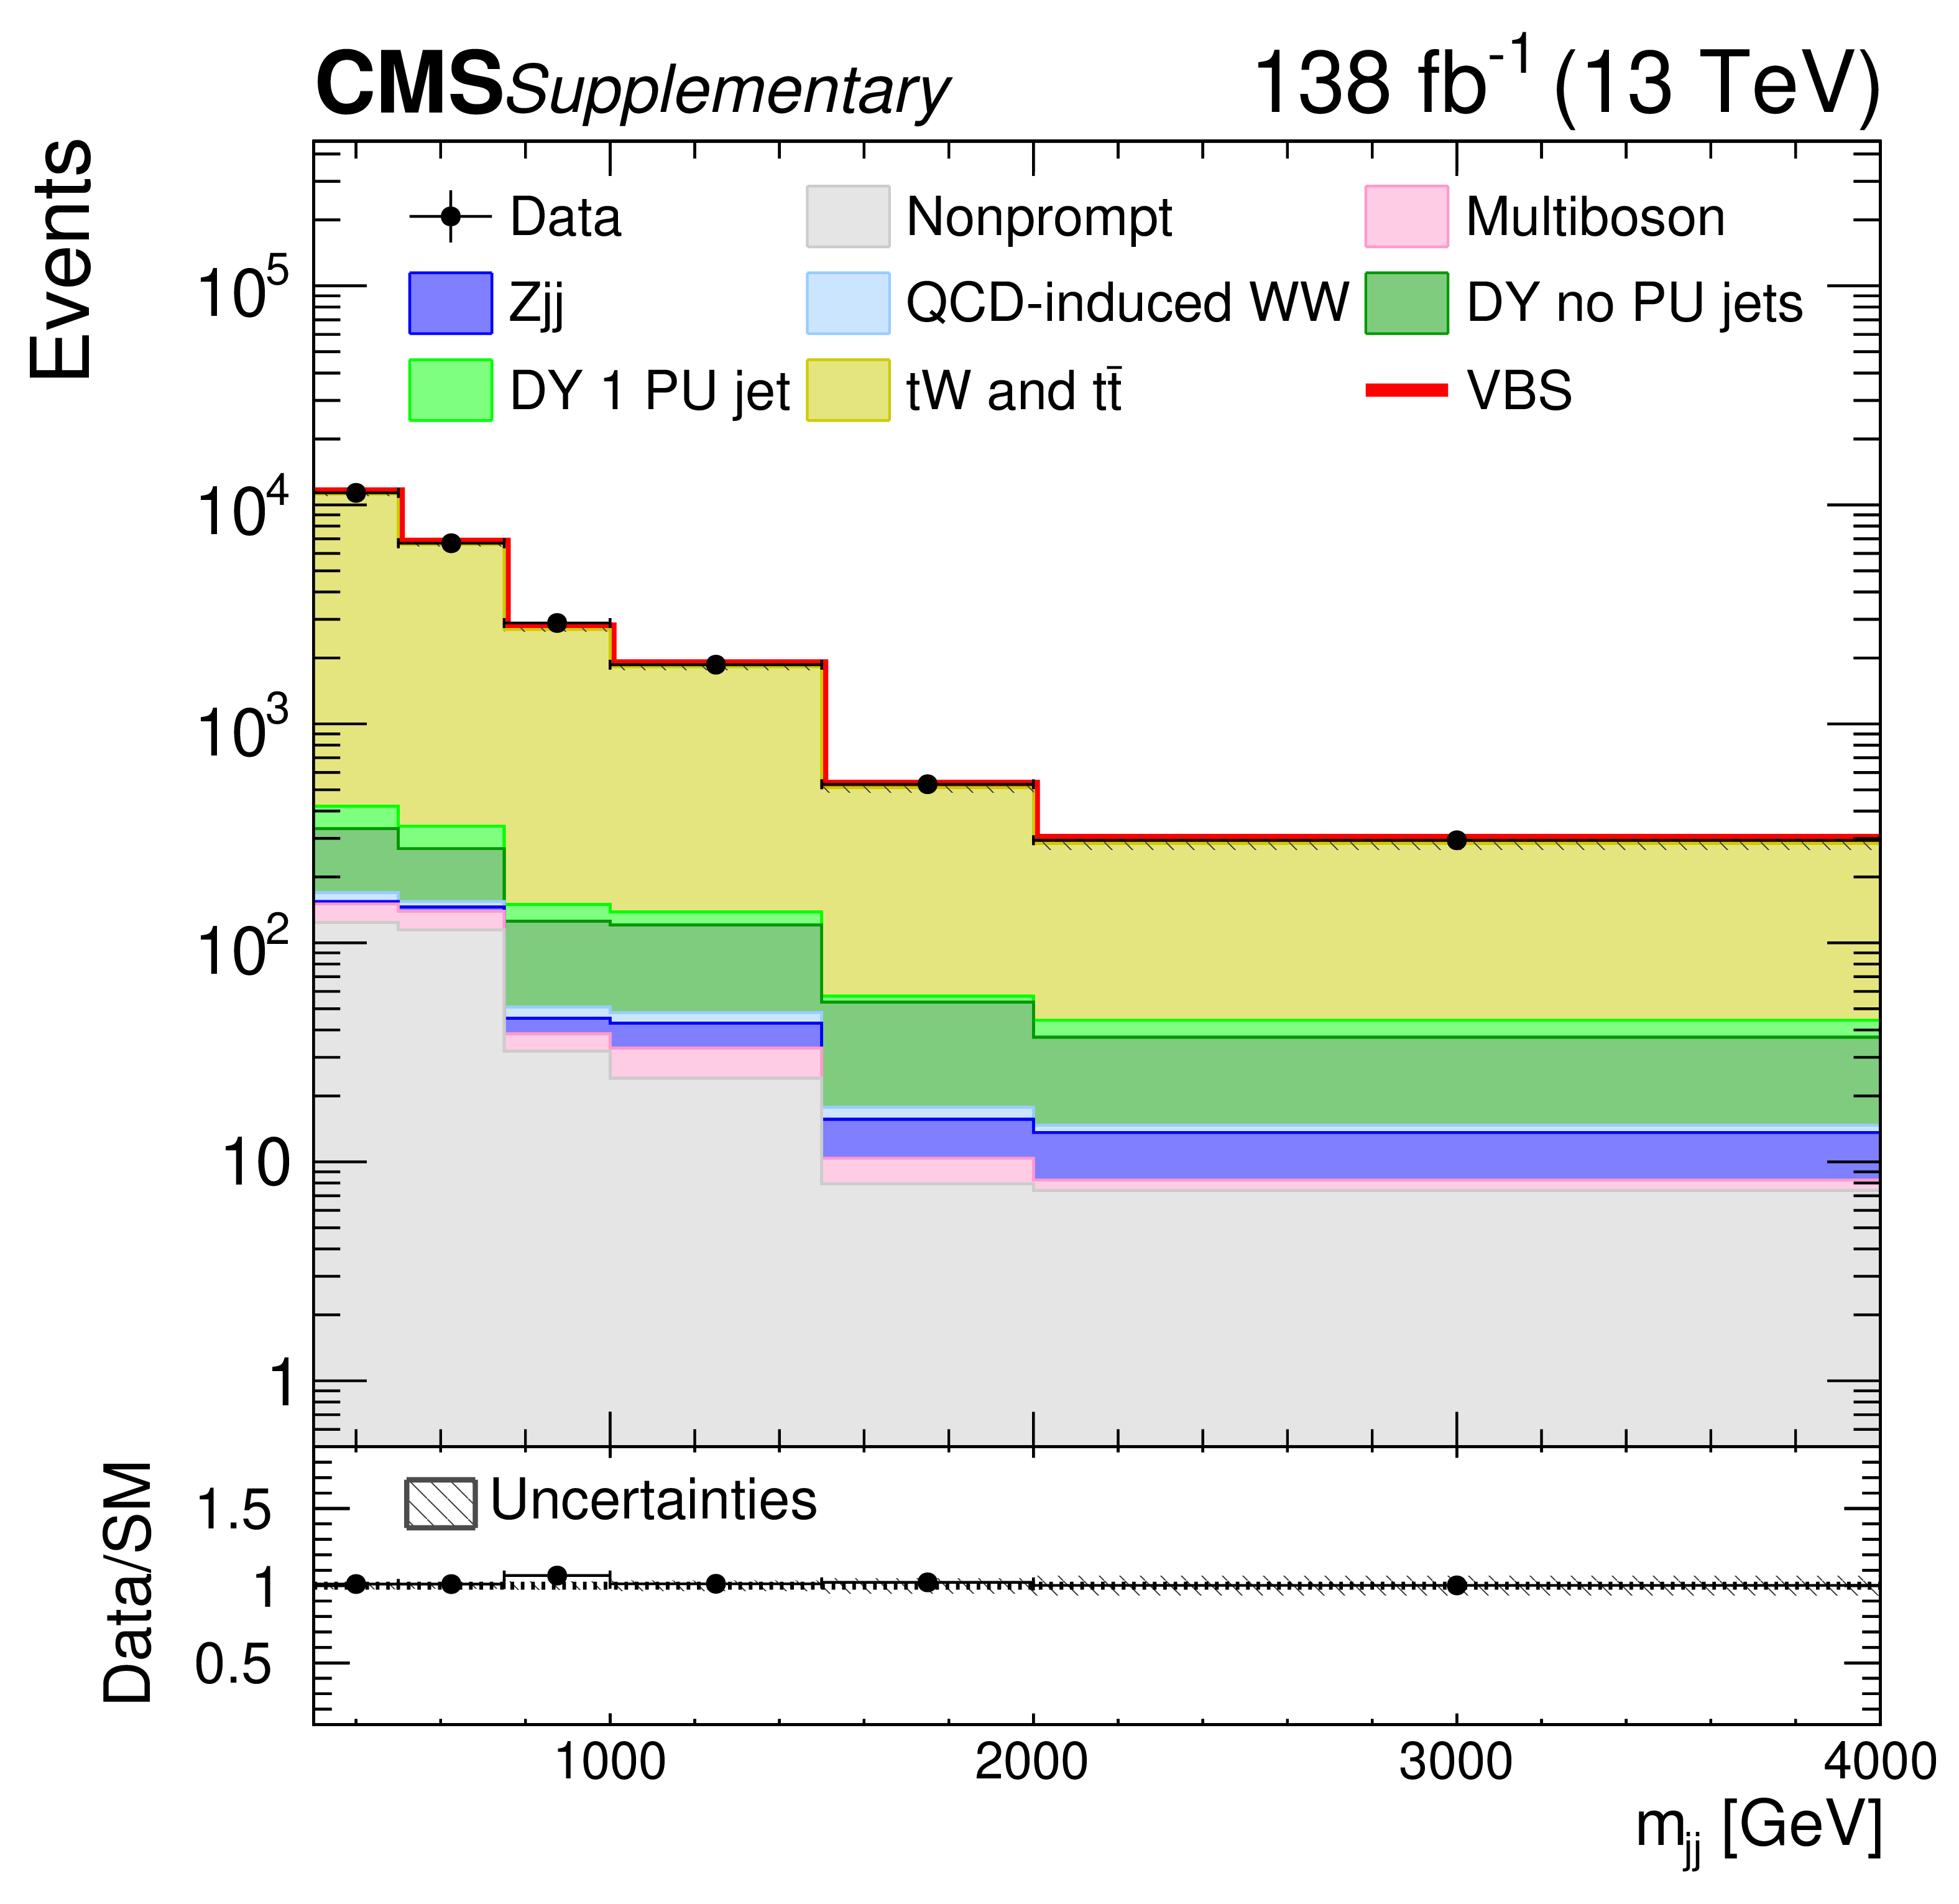
Post-fit distributions of $ m_{\mathrm{jj}} $ (upper row) and $ |\Delta\eta_{\mathrm{jj}}| $ (lower row) variables in different-flavor SRs for $ Z_{\ell\ell} < $ 1 (left column) and $ Z_{\ell\ell} > $ 1 (right column) categories. These variables are among the nine observables used as inputs for the DNN, as listed in Table 2. The contributions from background and signal (red line) processes are shown as stacked histograms; systematic uncertainties are plotted as dashed gray bands. Data points are displayed with asymmetric Poisson vertical bars to ensure a correct statistical coverage all over the spectrum. |
png pdf |
Figure A1-a:
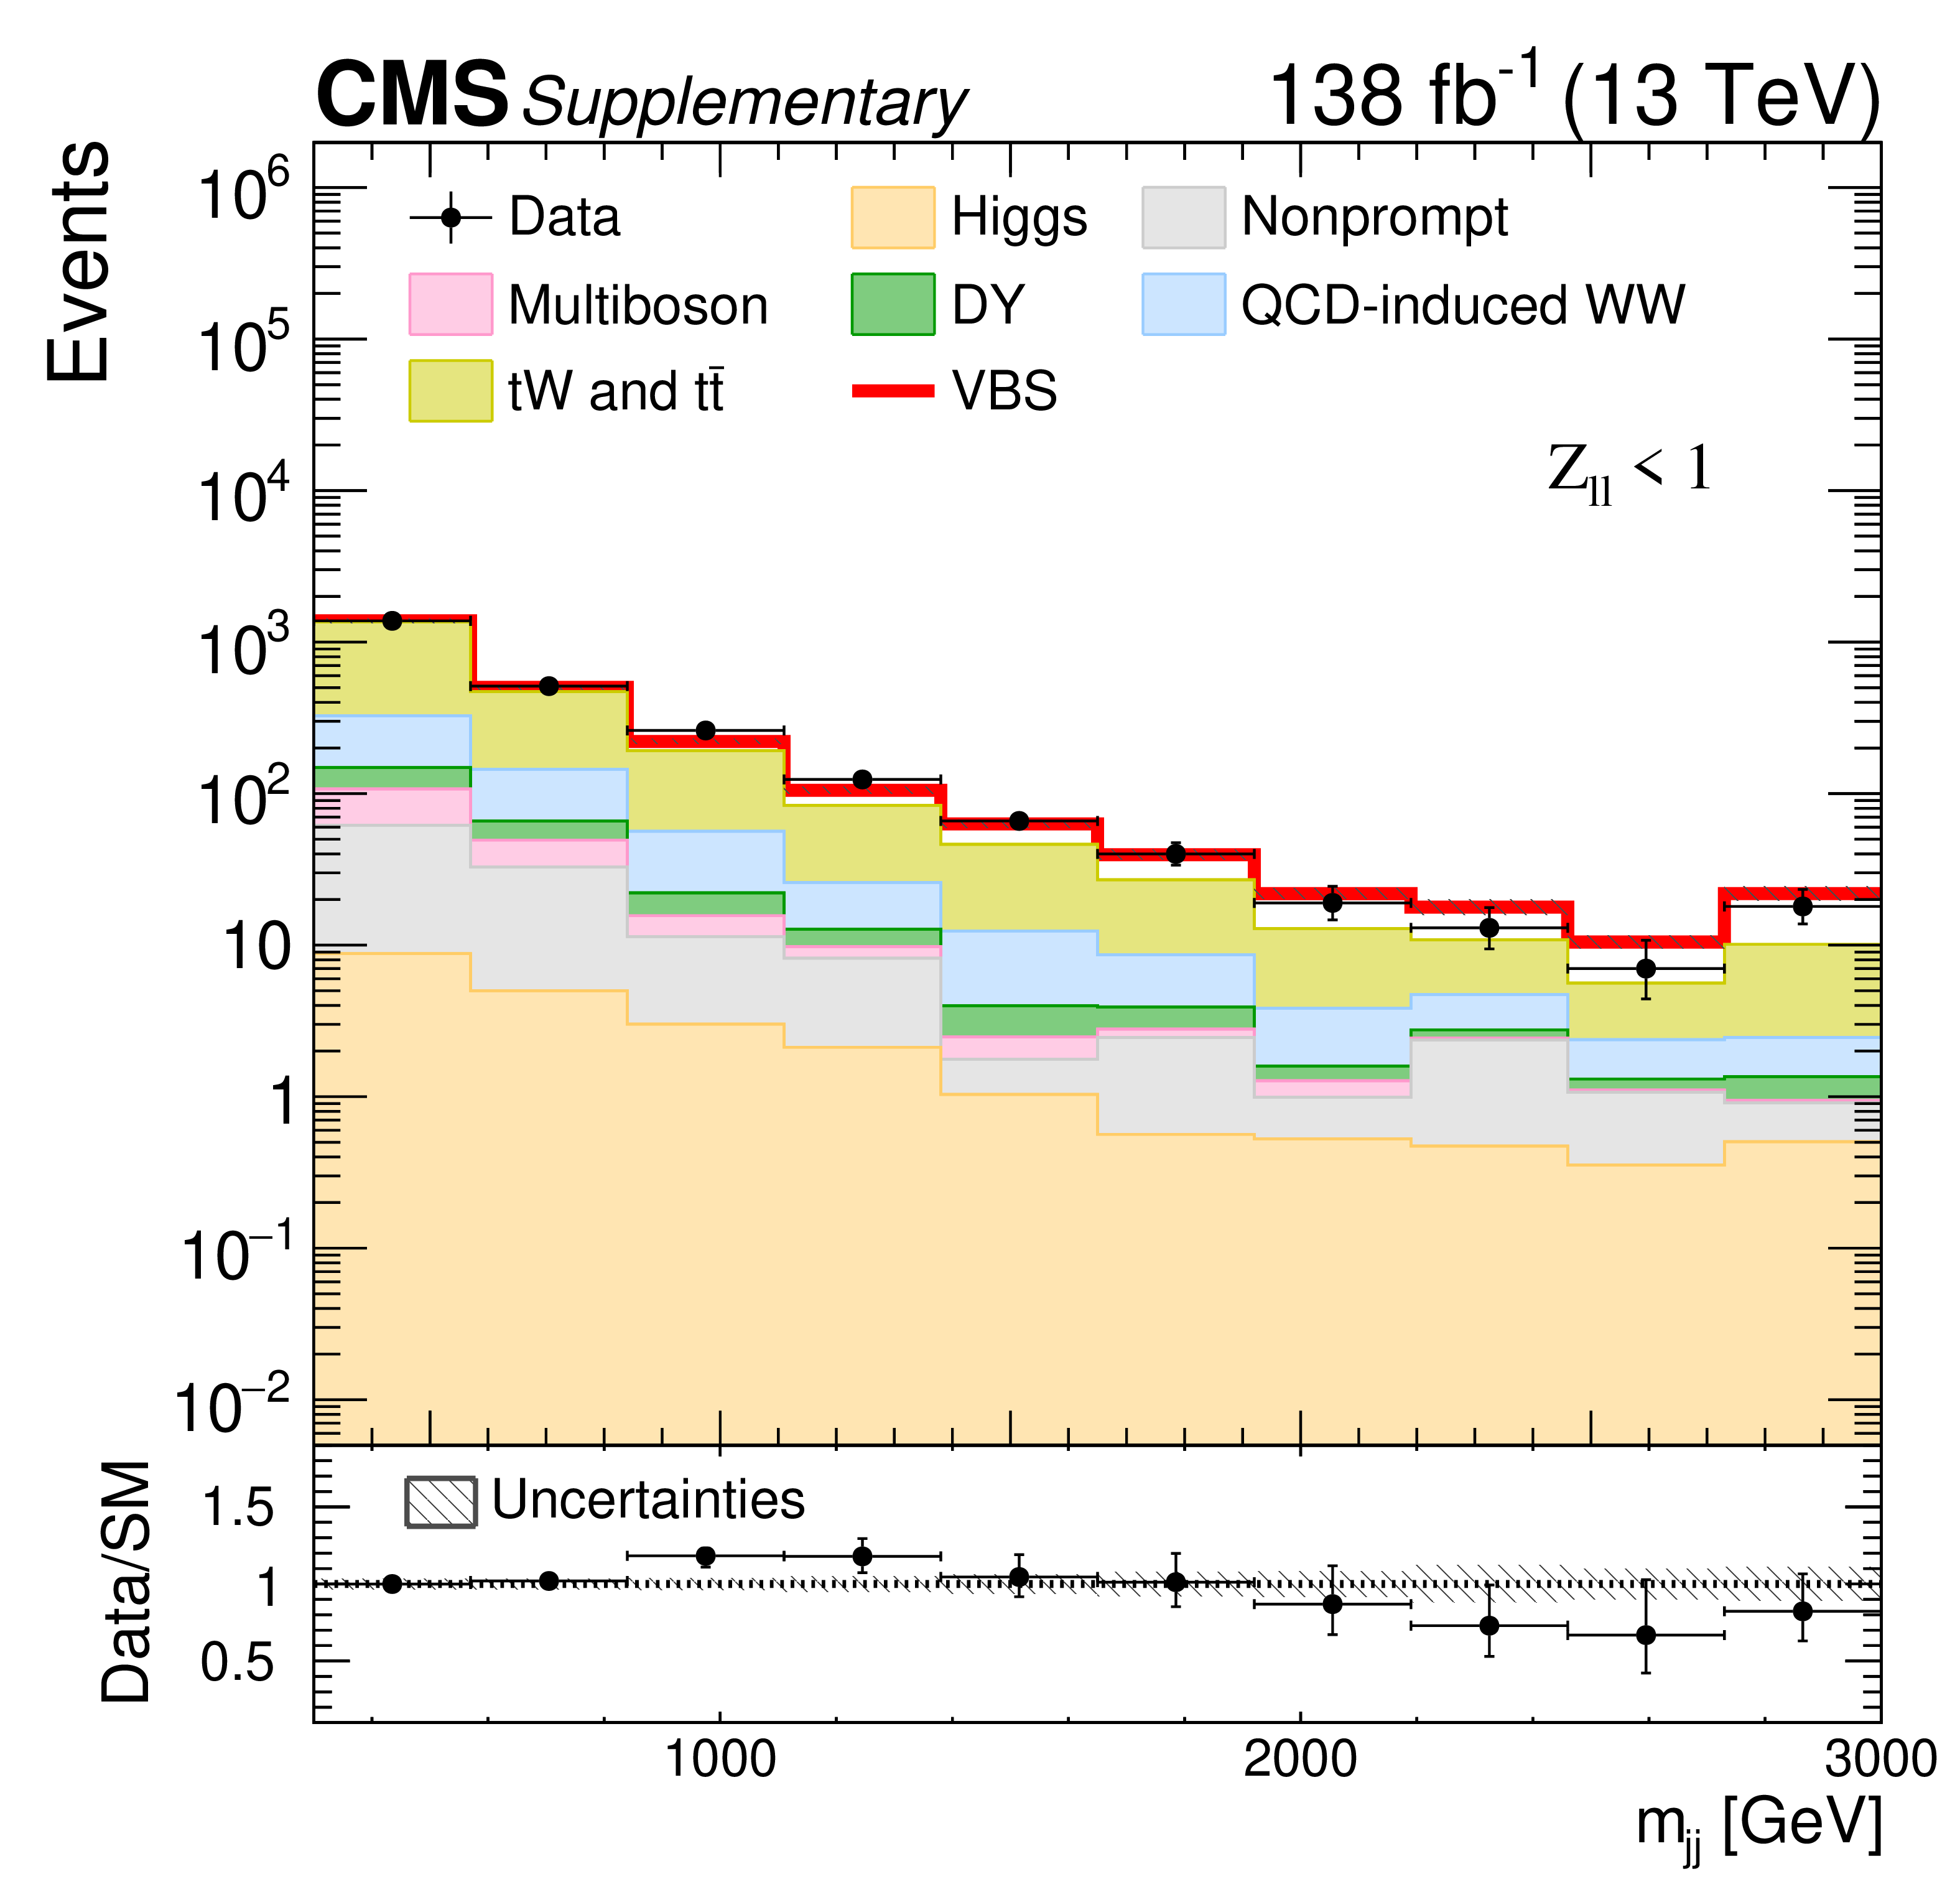
Post-fit distribution of the $ m_{\mathrm{jj}} $ variable in different-flavor SRs for the $ Z_{\ell\ell} < $ 1 category. This variable is among the nine observables used as inputs for the DNN, as listed in Table 2. The contributions from background and signal (red line) processes are shown as stacked histograms; systematic uncertainties are plotted as dashed gray bands. Data points are displayed with asymmetric Poisson vertical bars to ensure a correct statistical coverage all over the spectrum. |
png pdf |
Figure A1-b:
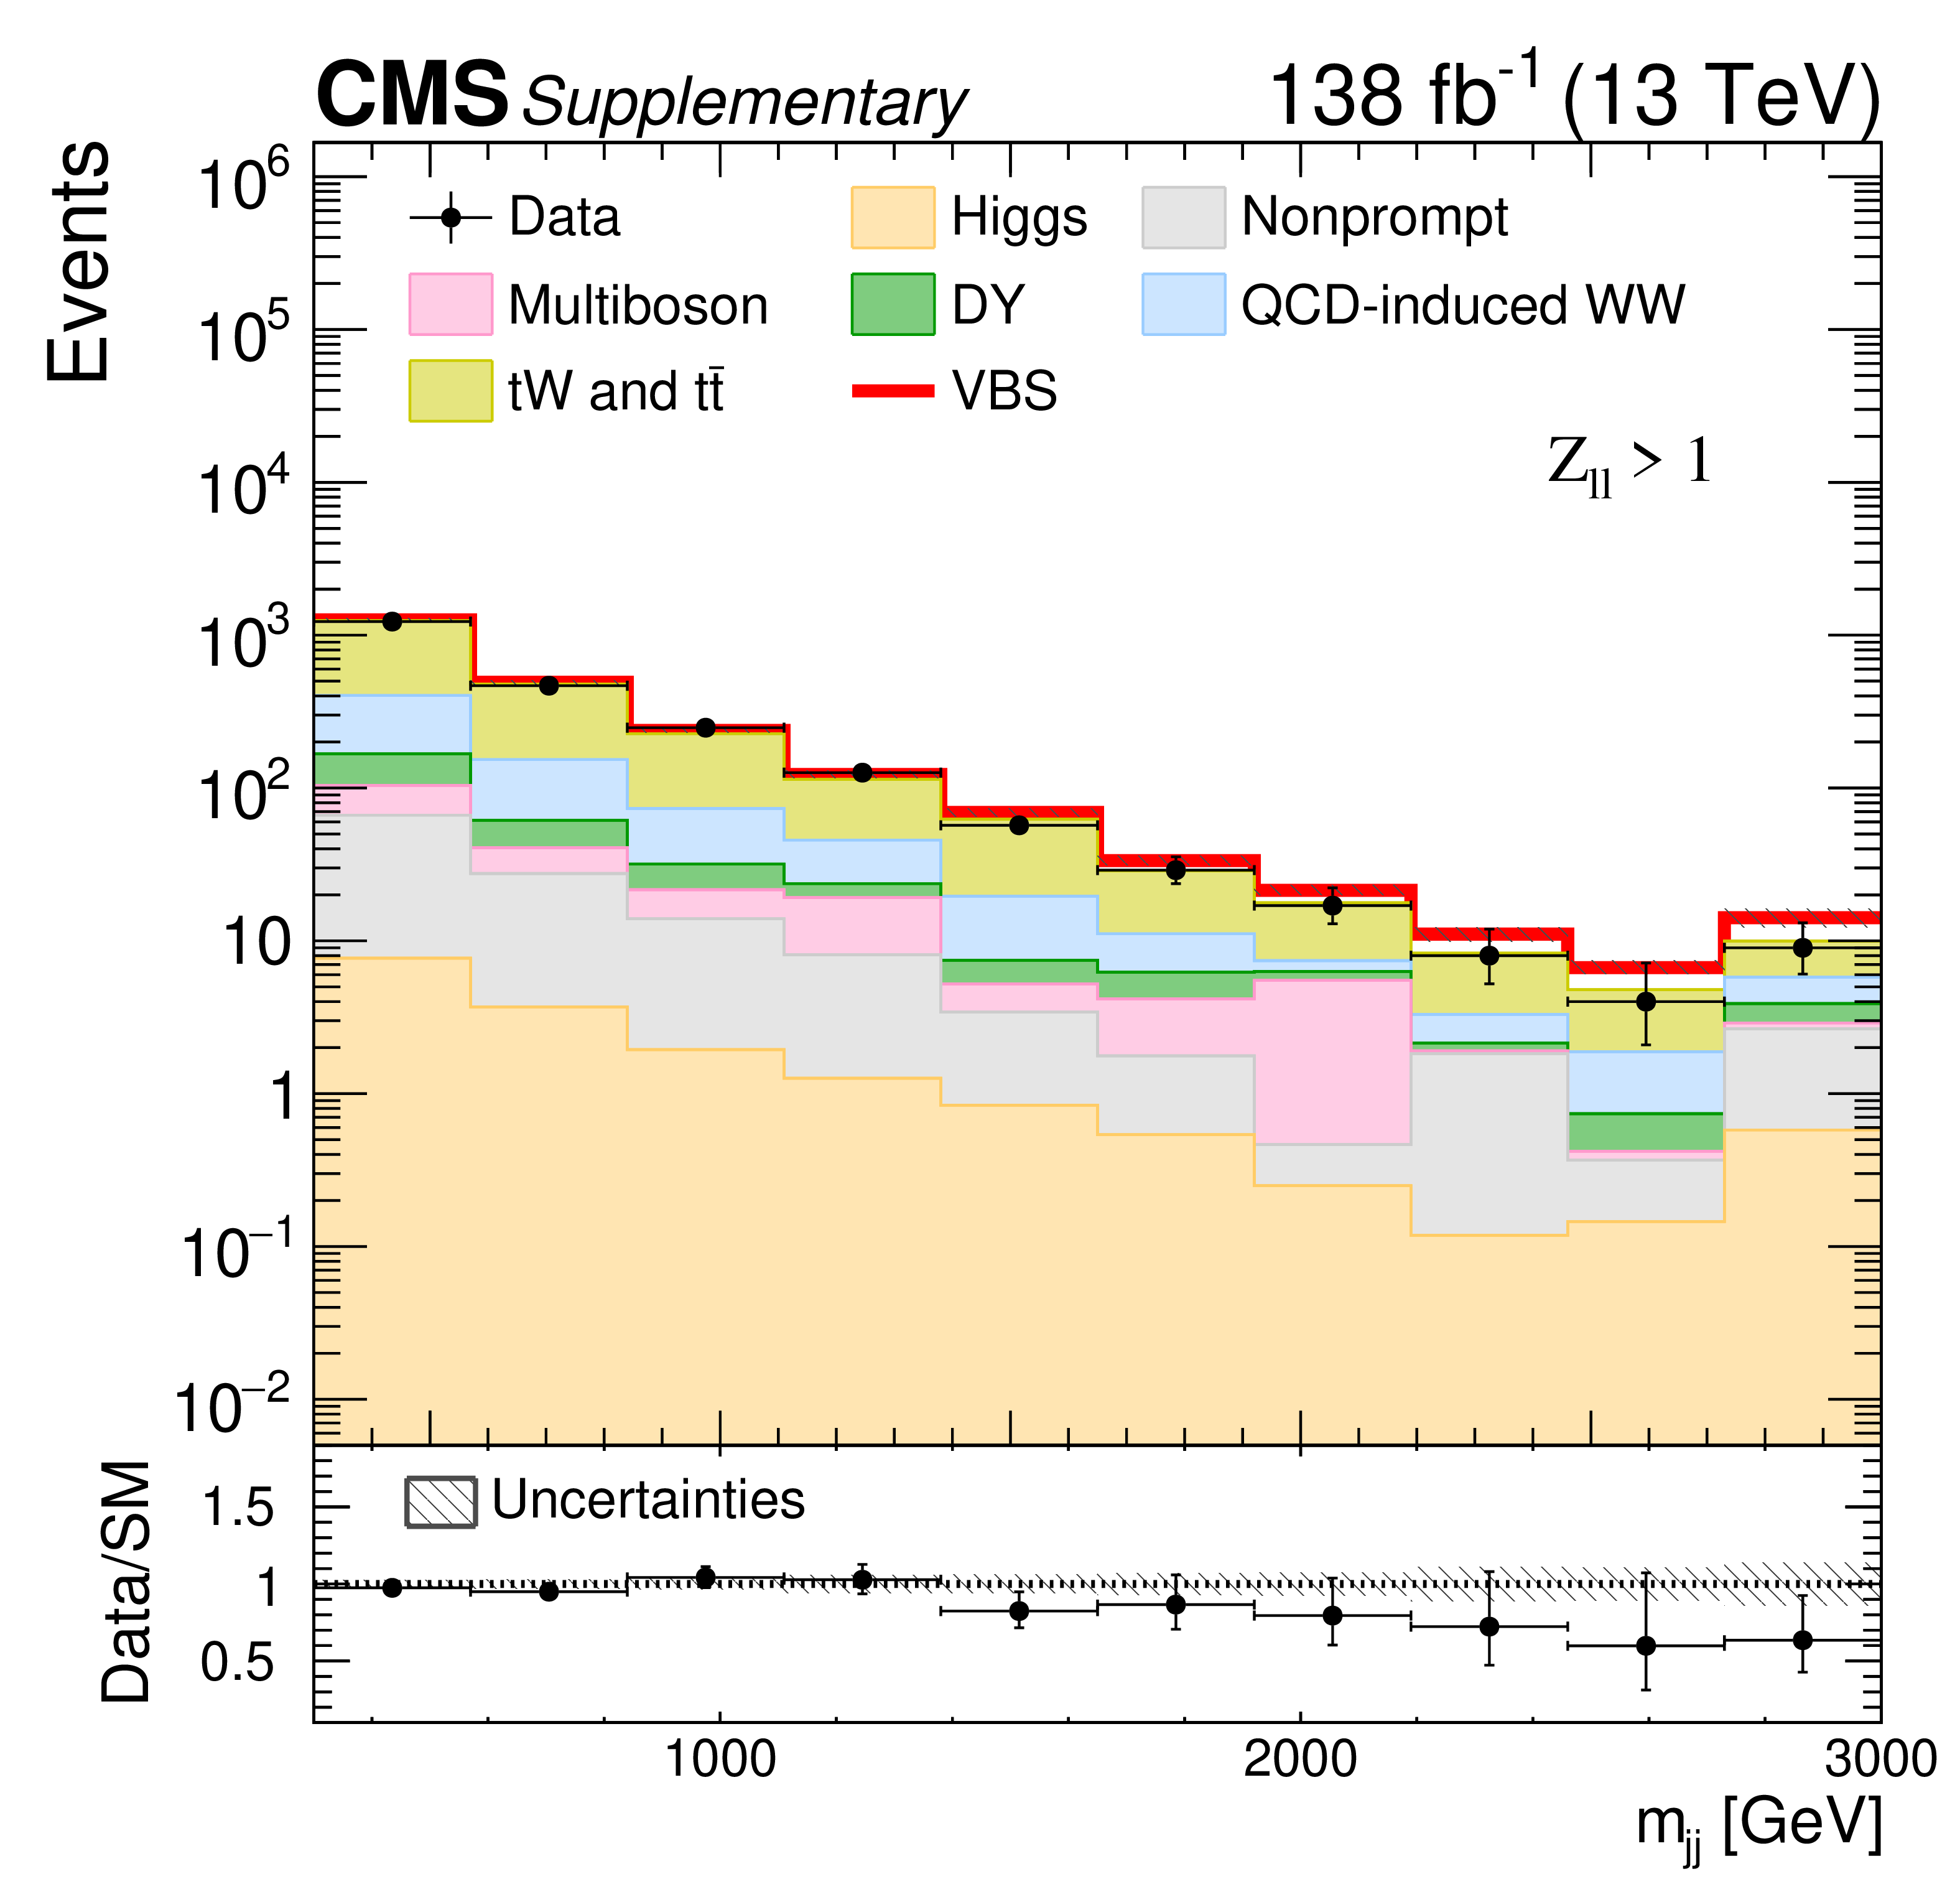
Post-fit distribution of the $ m_{\mathrm{jj}} $ variable in different-flavor SRs for the $ Z_{\ell\ell} > $ 1 category. This variable is among the nine observables used as inputs for the DNN, as listed in Table 2. The contributions from background and signal (red line) processes are shown as stacked histograms; systematic uncertainties are plotted as dashed gray bands. Data points are displayed with asymmetric Poisson vertical bars to ensure a correct statistical coverage all over the spectrum. |

png pdf |
Figure A1-c:
Post-fit distribution of the $ |\Delta\eta_{\mathrm{jj}}| $ variable in different-flavor SRs for the $ Z_{\ell\ell} < $ 1 category. This variable is among the nine observables used as inputs for the DNN, as listed in Table 2. The contributions from background and signal (red line) processes are shown as stacked histograms; systematic uncertainties are plotted as dashed gray bands. Data points are displayed with asymmetric Poisson vertical bars to ensure a correct statistical coverage all over the spectrum. |
png pdf |
Figure A1-d:
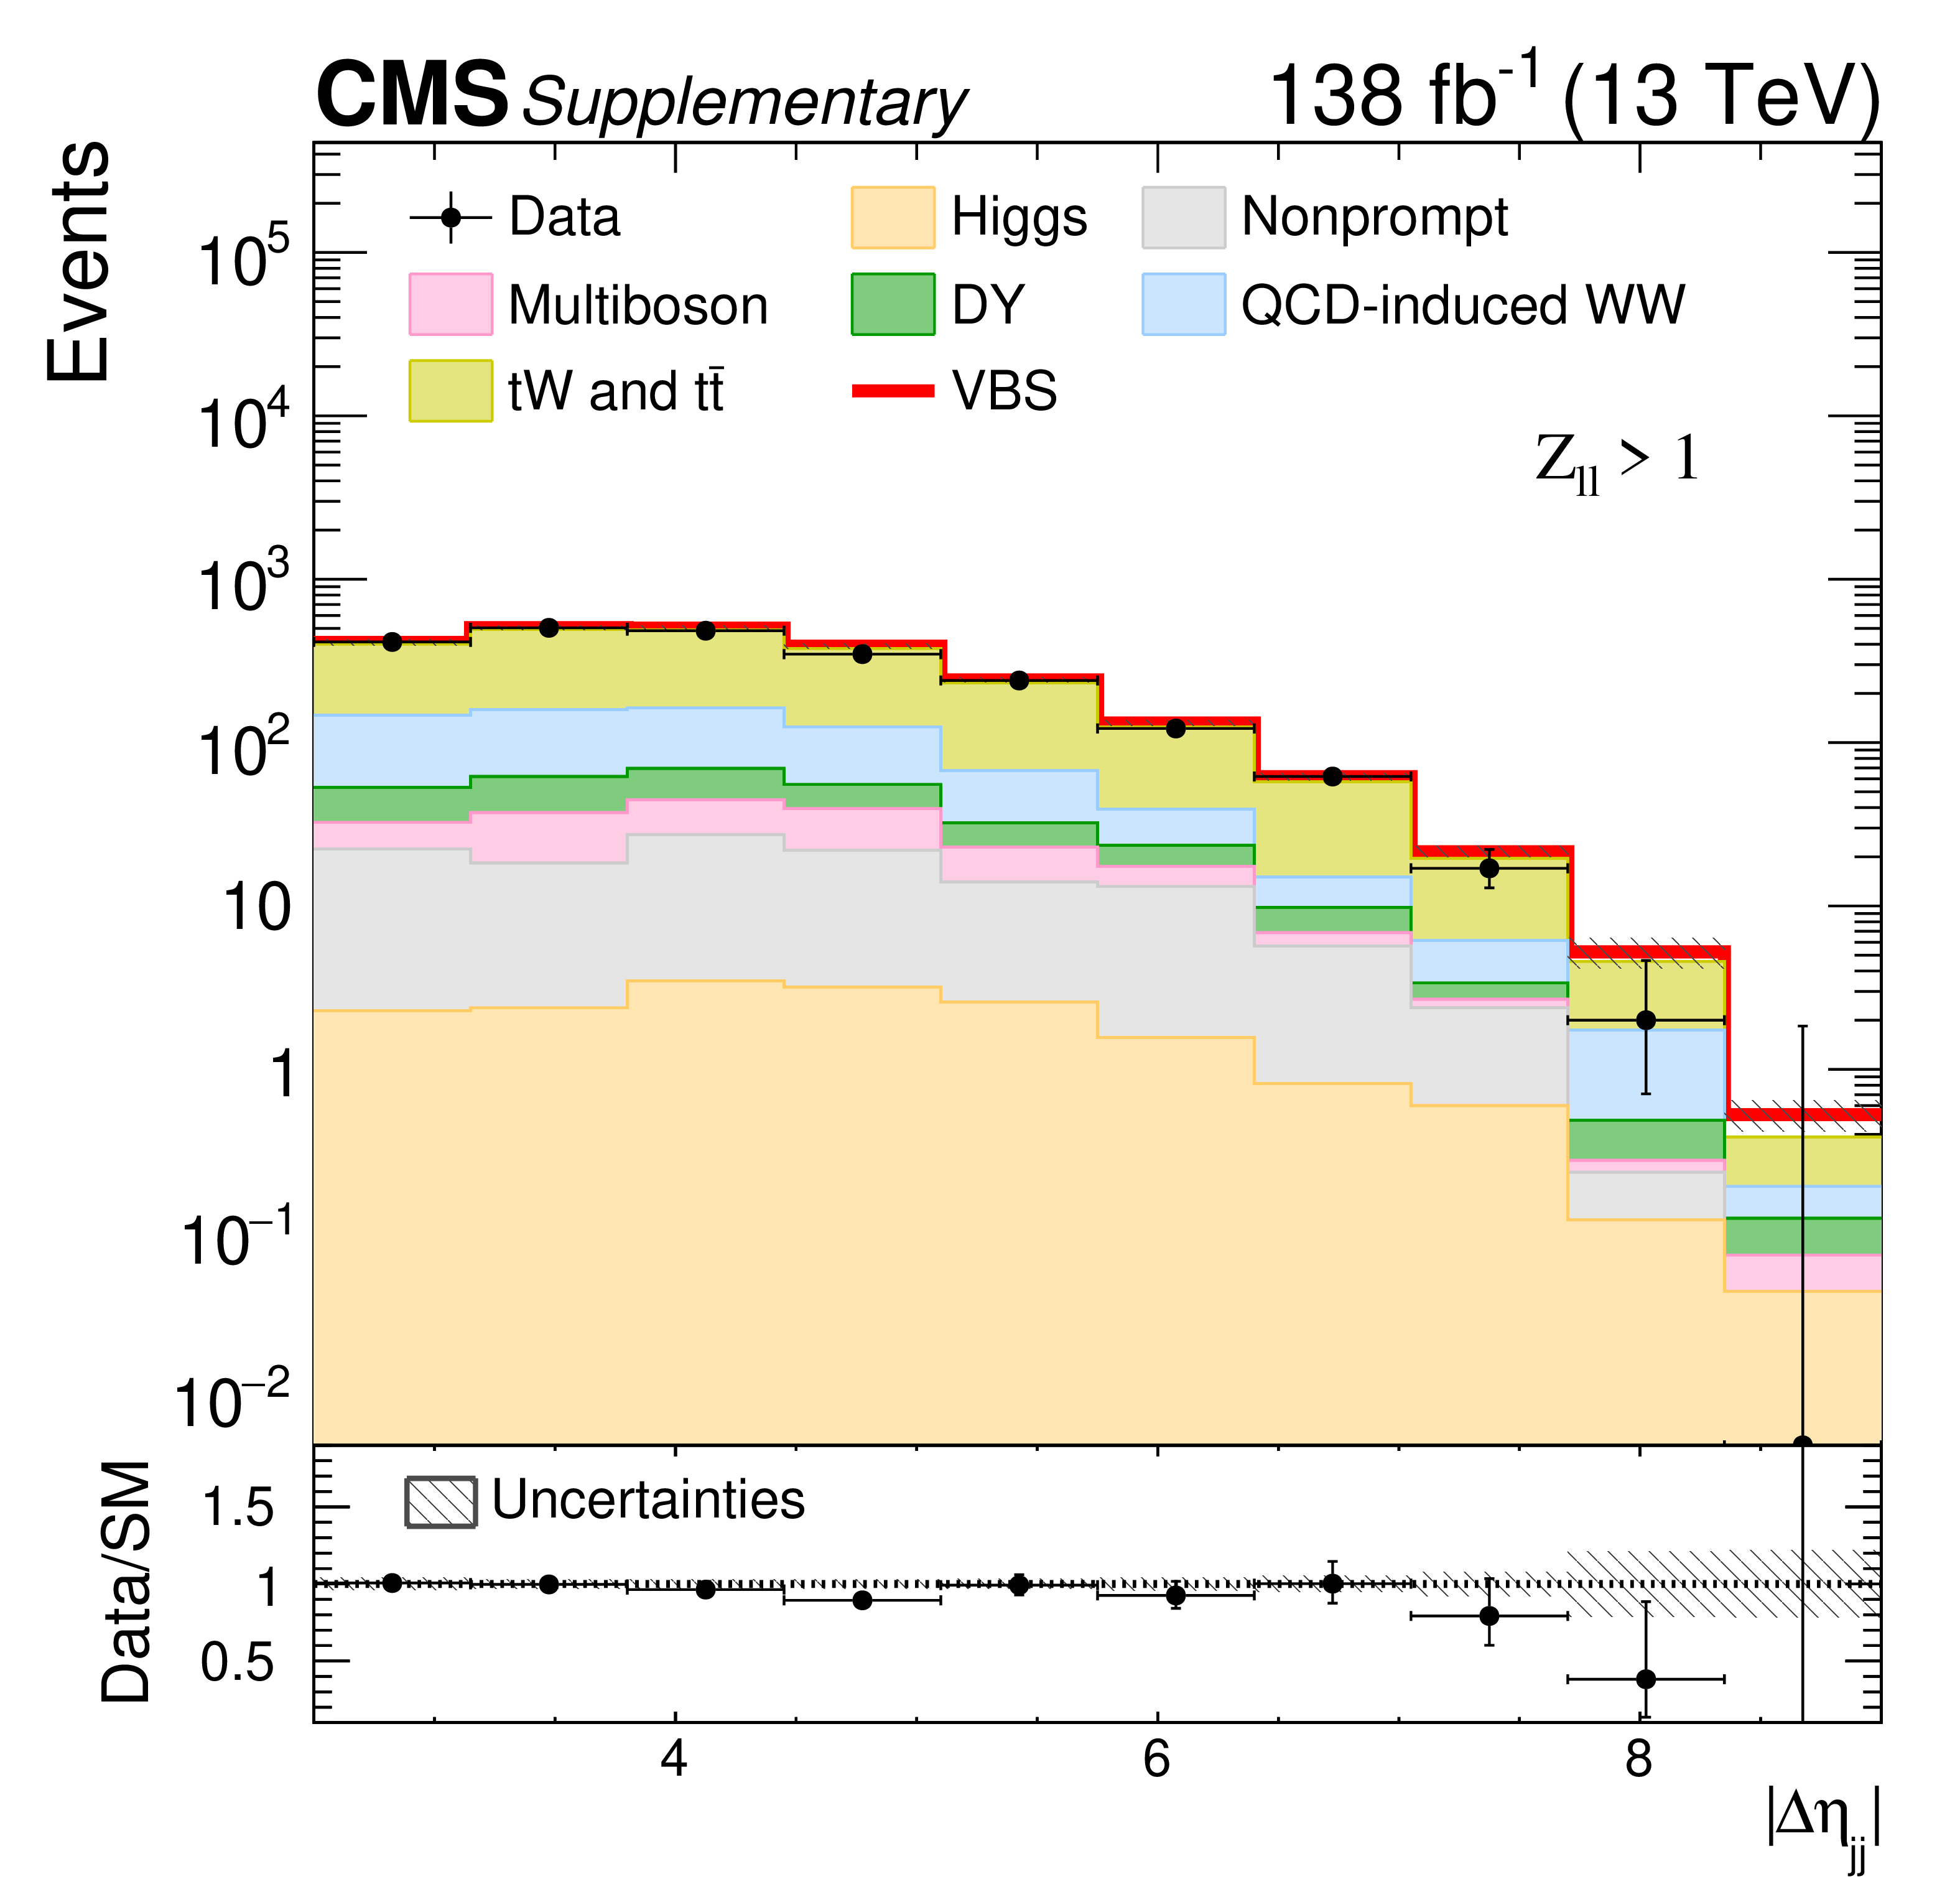
Post-fit distribution of the $ |\Delta\eta_{\mathrm{jj}}| $ variable in different-flavor SRs for the $ Z_{\ell\ell} > $ 1 category. This variable is among the nine observables used as inputs for the DNN, as listed in Table 2. The contributions from background and signal (red line) processes are shown as stacked histograms; systematic uncertainties are plotted as dashed gray bands. Data points are displayed with asymmetric Poisson vertical bars to ensure a correct statistical coverage all over the spectrum. |

png pdf |
Figure A2:
Post-fit distribution of the DNN output in different-flavor top CR. Data to SM expectation ratio has some residual shape dependence (less than 5% across the full spectrum), which however was found to not affect the analysis. The contributions from background and signal (red line) processes are shown as stacked histograms; systematic uncertainties are plotted as dashed gray bands. Data points are displayed with asymmetric Poisson vertical bars to ensure a correct statistical coverage all over the spectrum. |
png pdf |
Figure A3:
Post-fit distributions of $ m_{\mathrm{jj}} $ (left) and $ |\Delta\eta_{\mathrm{jj}}| $ (right) variables in same-flavor top CR ($ \mathrm{e}\mathrm{e} $ and $ \mu\mu $ final states combined). The ratio between data and SM expectation is in excellent agreement with 1 within post-fit uncertainties in both spectra. The contributions from background and signal (red line) processes are shown as stacked histograms; systematic uncertainties are plotted as dashed gray bands. Data points are displayed with asymmetric Poisson vertical bars to ensure a correct statistical coverage all over the spectrum. |
png pdf |
Figure A3-a:
Post-fit distributions of the $ m_{\mathrm{jj}} $ variable in same-flavor top CR ($ \mathrm{e}\mathrm{e} $ and $ \mu\mu $ final states combined). The ratio between data and SM expectation is in excellent agreement with 1 within post-fit uncertainties. The contributions from background and signal (red line) processes are shown as stacked histograms; systematic uncertainties are plotted as dashed gray bands. Data points are displayed with asymmetric Poisson vertical bars to ensure a correct statistical coverage all over the spectrum. |

png pdf |
Figure A3-b:
Post-fit distributions of the $ |\Delta\eta_{\mathrm{jj}}| $ variable in same-flavor top CR ($ \mathrm{e}\mathrm{e} $ and $ \mu\mu $ final states combined). The ratio between data and SM expectation is in excellent agreement with 1 within post-fit uncertainties. The contributions from background and signal (red line) processes are shown as stacked histograms; systematic uncertainties are plotted as dashed gray bands. Data points are displayed with asymmetric Poisson vertical bars to ensure a correct statistical coverage all over the spectrum. |
| Tables | |

png pdf |
Table 1:
Post-fit process yields and uncertainties in each SR ($ \mathrm{e}\mathrm{e} $ and $ \mu\mu $ final states combined). |
png pdf |
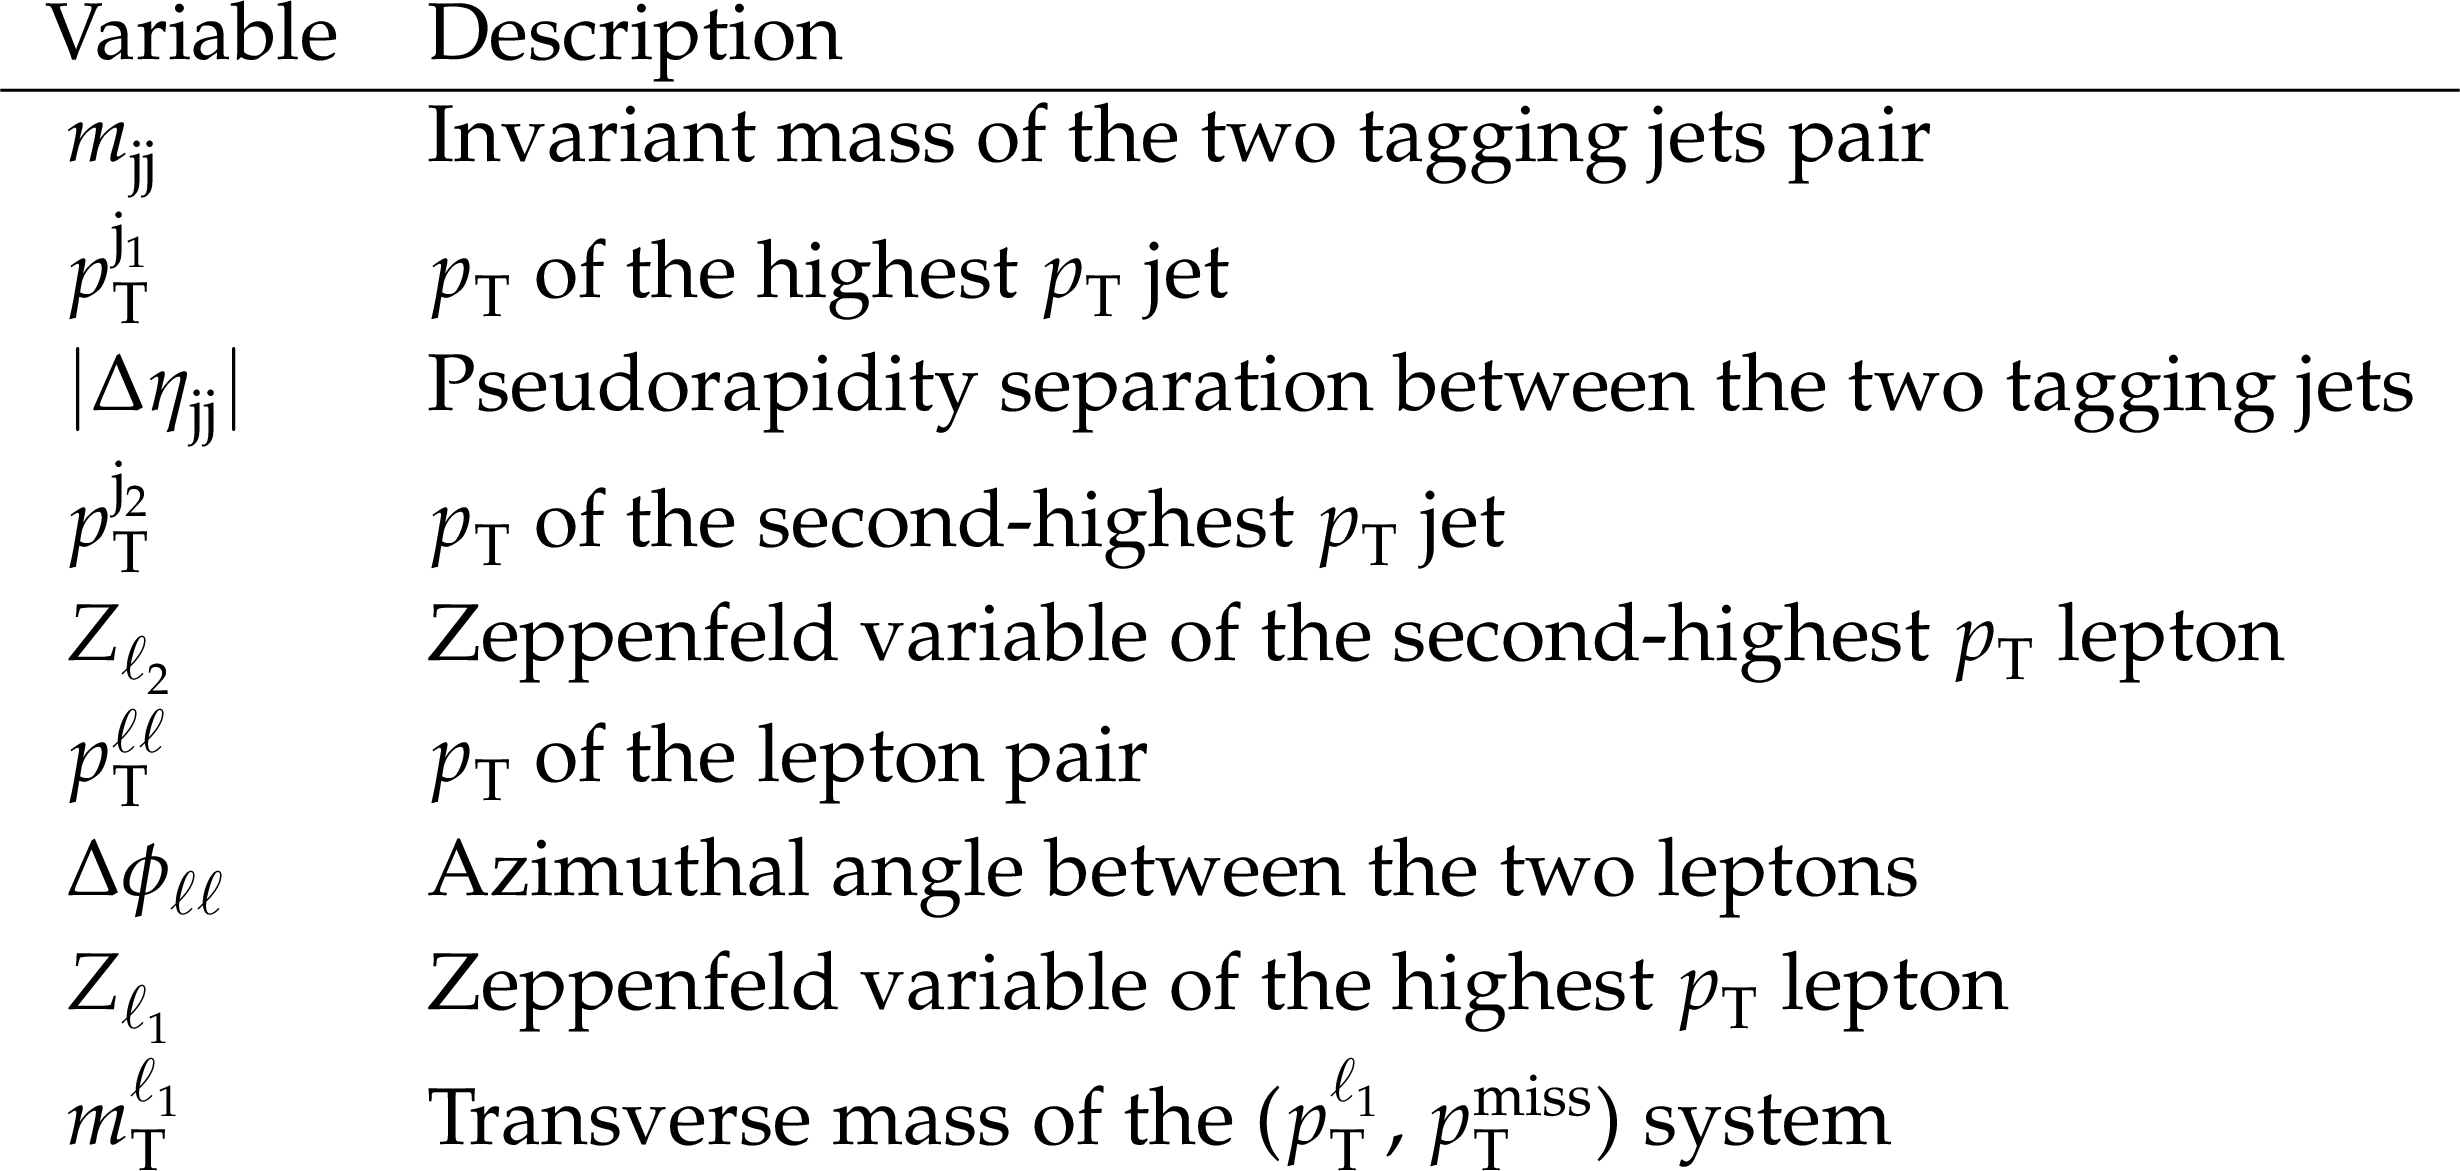
Table 2:
Set of variables used as inputs to the DNN for both $ Z_{\ell\ell} < $ 1 and $ Z_{\ell\ell} > $ 1 models. The order in the table corresponds to the importance of the discriminating variable for the $ Z_{\ell\ell} < $ 1 model, as obtained through the SHAP method [57,58]. |

png pdf |
Table 3:
Sources of systematic uncertainty affecting the cross section measurement by more than 1%. The total uncertainty is also reported, as well as the total systematic and statistical contributions. |
png pdf |
Table 4:
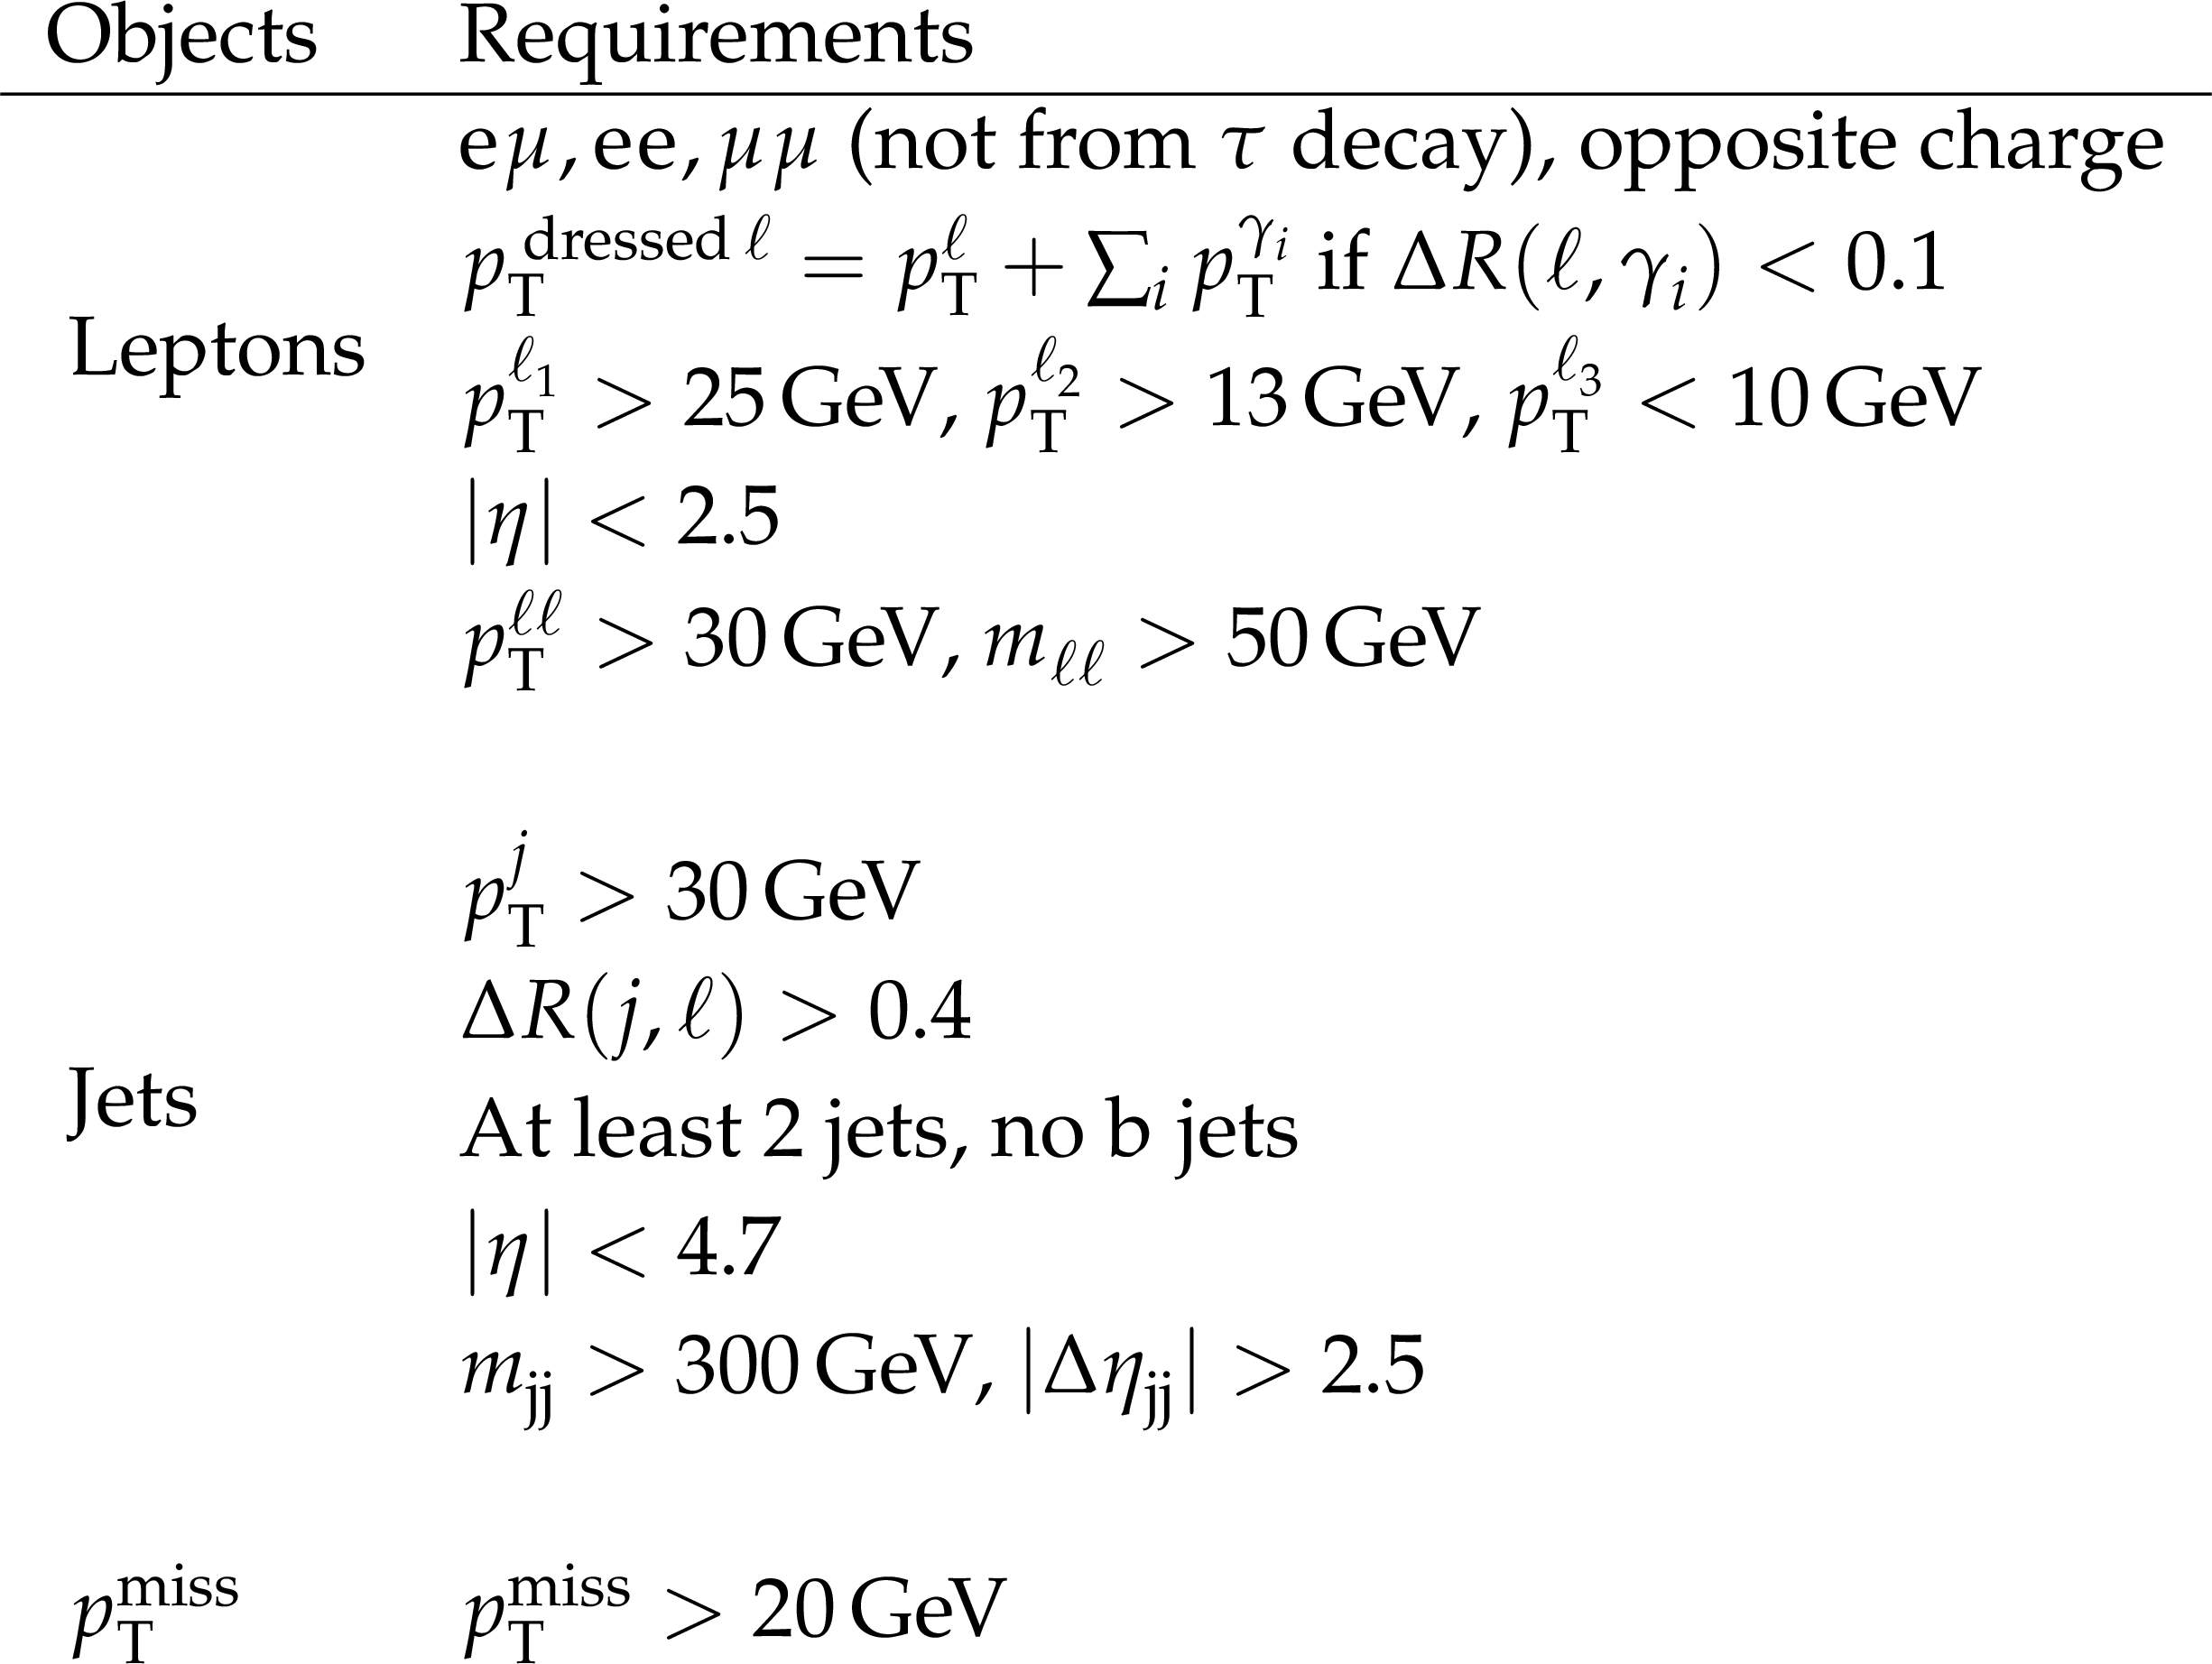
Definition of the fiducial volume similar to the reconstructed SR. |
png pdf |
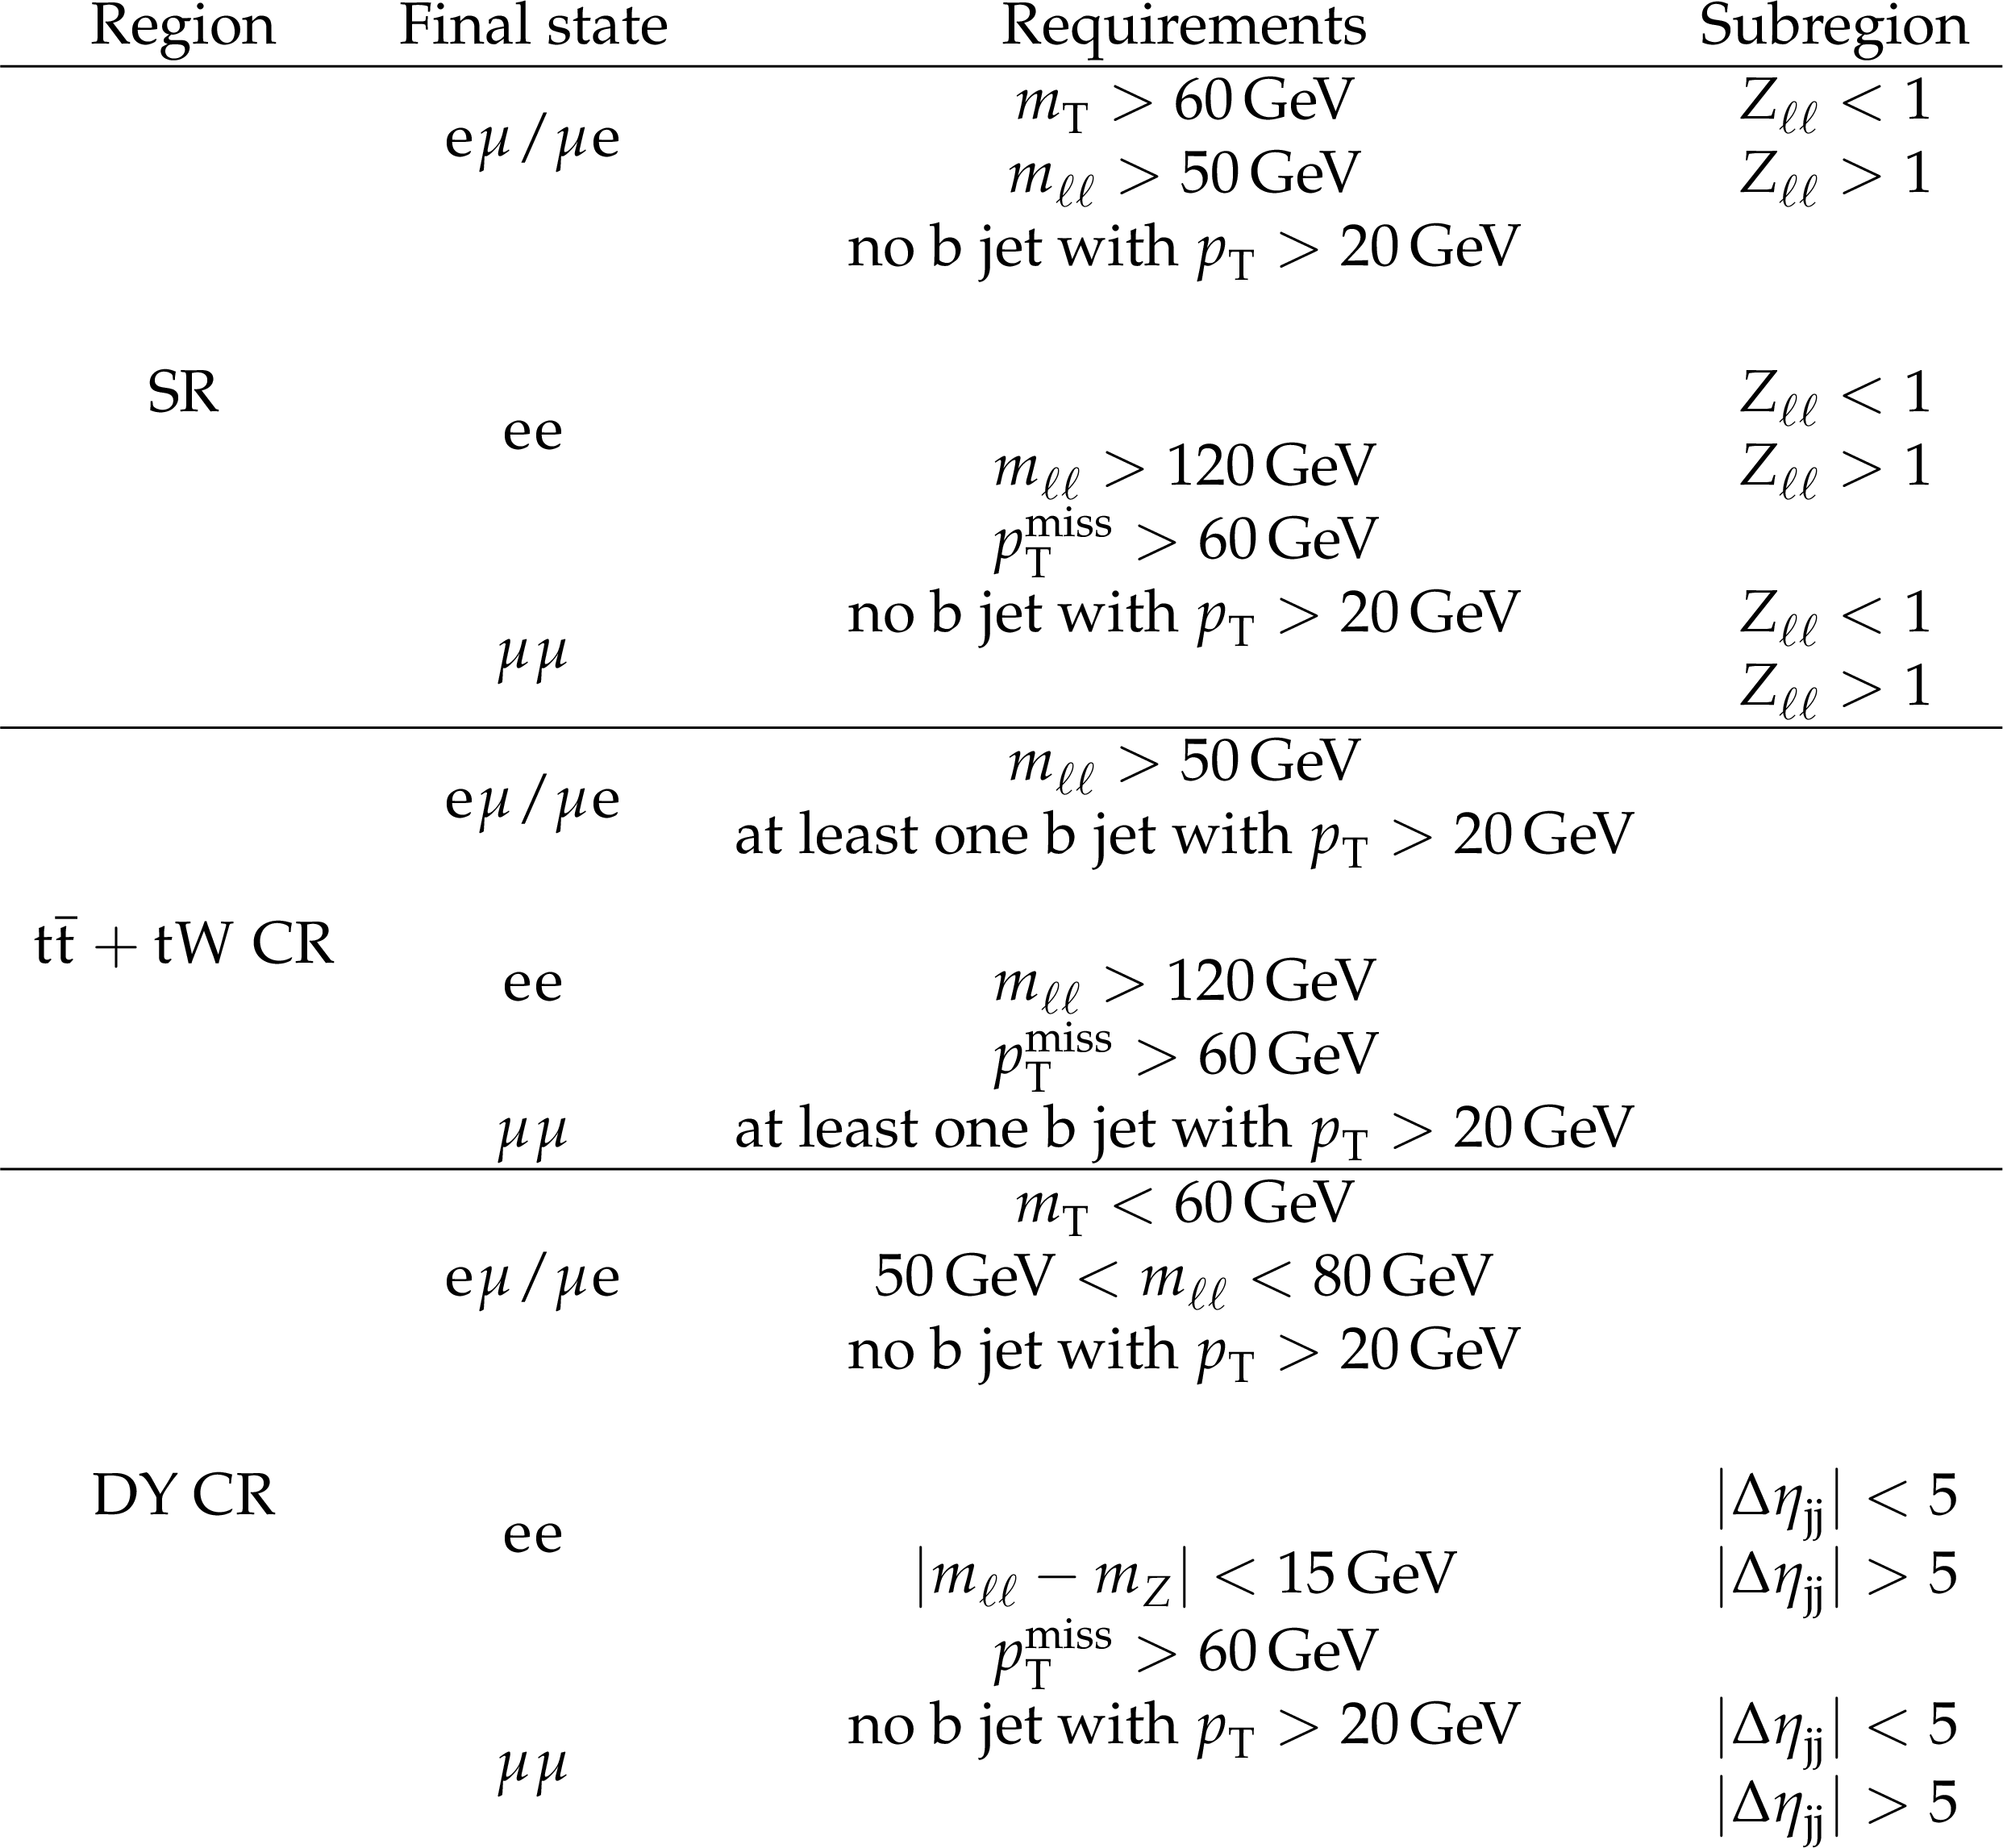
Table A1:
Summary of the event categorization on top of signal candidates preselection. In each region, same-flavor final states share the same kinematic requirements. |
| Summary |
| The EW production of a pair of opposite-sign W bosons in association with two jets has been observed in a data set corresponding to an integrated luminosity of 138 fb$ ^{-1} $ collected with the CMS detector at the CERN LHC in proton-proton collisions at $ \sqrt{s} = $ 13 TeV. Tabulated results are provided in the HEPData record for this analysis [65]. Events containing two opposite-sign leptons (electrons or muons), missing transverse momentum, and two jets with large separation in pseudorapidity and high dijet invariant mass were selected. A deep neural network was employed to deal with the irreducible background from the QCD-induced production of W boson pairs, and the dominant background from the production of $ \mathrm{t} \overline{\mathrm{t}} $ quark pairs. The measured signal corresponds to an observed (expected) significance of 5.6\,(5.2) standard deviations with respect to the background-only hypothesis. The EW W$^{+}$W$^{-}$ production cross section has been measured in two fiducial volumes. In the more inclusive one, the cross section is 99 $ \pm $ 20 fb ( 89 $ \pm $ 5 fb expected), whereas in that comparable with the experimental phase space the measured cross section is 10.2 $ \pm $ 2.0 fb ( 9.1 $ \pm $ 0.6 fb expected). These results are compatible with standard model predictions within one standard deviation. |
| References | ||||
| 1 | D. Espriu and B. Yencho | Longitudinal WW scattering in light of the \textquotedblleftHiggs boson\textquotedblright discovery | PRD 87 (2013) 055017 | 1212.4158 |
| 2 | J. Chang, K. Cheung, C.-T. Lu, and T.-C. Yuan | Ww scattering in the era of post-higgs-boson discovery | PRD 87 (2013) 093005 | 1303.6335 |
| 3 | ATLAS Collaboration | Observation of a new particle in the search for the Standard Model Higgs boson with the ATLAS detector at the LHC | PLB 716 (2012) 1 | 1207.7214 |
| 4 | CMS Collaboration | Observation of a new boson at a mass of 125 GeV with the CMS experiment at the LHC | PLB 716 (2012) 30 | CMS-HIG-12-028 1207.7235 |
| 5 | CMS Collaboration | Observation of a new boson with mass near 125 GeV in pp collisions at $ \sqrt{s}= $ 7 and 8 TeV | JHEP 06 (2013) 081 | CMS-HIG-12-036 1303.4571 |
| 6 | B. W. Lee, C. Quigg, and H. B. Thacker | Weak interactions at very high energies: The role of the Higgs-boson mass | PRD 16 (1977) 1519 | |
| 7 | ATLAS Collaboration | Evidence for Electroweak Production of $ W^{\pm}W^{\pm}jj $ in pp Collisions at $ \sqrt{s}= $ 8 TeV with the ATLAS Detector | PRL 113 (2014) 141803 | 1405.6241 |
| 8 | CMS Collaboration | Study of vector boson scattering and search for new physics in events with two same-sign leptons and two jets | PRL 114 (2014) 051801 | CMS-SMP-13-015 1410.6315 |
| 9 | ATLAS Collaboration | Observation of electroweak production of a same-sign W boson pair in association with two jets in pp collisions at $ \sqrt{s}= $ 13 TeV with the ATLAS detector | PRL 123 (2019) 161801 | 1906.03203 |
| 10 | CMS Collaboration | Observation of electroweak production of same-sign W boson pairs in the two jet and two same-sign lepton final state in proton-proton collisions at $ \sqrt{s} = $ 13 TeV | PRL 120 (2018) 081801 | CMS-SMP-17-004 1709.05822 |
| 11 | CMS Collaboration | Measurements of production cross sections of WZ and same-sign WW boson pairs in association with two jets in proton-proton collisions at $ \sqrt{s} = $ 13 TeV | PLB 809 (2020) 135710 | CMS-SMP-19-012 2005.01173 |
| 12 | CMS Collaboration | Measurements of production cross sections of polarized same-sign W boson pairs in association with two jets in proton-proton collisions at $ \sqrt{s} = $ 13 TeV | PLB 812 (2021) 136018 | CMS-SMP-20-006 2009.09429 |
| 13 | R. Bellan et al. | A sensitivity study of VBS and diboson WW to dimension-6 EFT operators at the LHC | JHEP 05 (2022) 039 | 2108.03199 |
| 14 | CMS Collaboration | The CMS experiment at the CERN LHC | JINST 3 (2008) S08004 | |
| 15 | CMS Collaboration | Performance of the CMS Level-1 trigger in proton-proton collisions at $ \sqrt{s} = $ 13 TeV | JINST 15 (2020) P10017 | CMS-TRG-17-001 2006.10165 |
| 16 | CMS Collaboration | The CMS trigger system | JINST 12 (2017) P01020 | CMS-TRG-12-001 1609.02366 |
| 17 | CMS Collaboration | Particle-flow reconstruction and global event description with the CMS detector | JINST 12 (2017) P10003 | CMS-PRF-14-001 1706.04965 |
| 18 | CMS Collaboration | Technical proposal for the Phase-II upgrade of the Compact Muon Solenoid | CMS Technical Proposal CERN-LHCC-2015-010, CMS-TDR-15-02, 2015 CDS |
|
| 19 | M. Cacciari, G. P. Salam, and G. Soyez | The anti-$ k_{\mathrm{T}} $ jet clustering algorithm | JHEP 04 (2008) 063 | 0802.1189 |
| 20 | M. Cacciari, G. P. Salam, and G. Soyez | FastJet user manual | EPJC 72 (2012) 1896 | 1111.6097 |
| 21 | CMS Collaboration | Pileup mitigation at CMS in 13 TeV data | JINST 15 (2020) P09018 | CMS-JME-18-001 2003.00503 |
| 22 | CMS Collaboration | Jet energy scale and resolution in the CMS experiment in pp collisions at 8 TeV | JINST 12 (2017) P02014 | CMS-JME-13-004 1607.03663 |
| 23 | CMS Collaboration | Performance of missing transverse momentum reconstruction in proton-proton collisions at $ \sqrt{s} = $ 13 TeV using the CMS detector | JINST 14 (2019) P07004 | CMS-JME-17-001 1903.06078 |
| 24 | D. Bertolini, P. Harris, M. Low, and N. Tran | Pileup per particle identification | JHEP 10 (2014) 059 | 1407.6013 |
| 25 | CMS Collaboration | Precision luminosity measurement in proton-proton collisions at $ \sqrt{s} = $ 13 TeV in 2015 and 2016 at CMS | EPJC 81 (2021) 800 | CMS-LUM-17-003 2104.01927 |
| 26 | CMS Collaboration | CMS luminosity measurement for the 2017 data-taking period at $ \sqrt{s} = $ 13 TeV | CMS Physics Analysis Summary, 2017 CMS-PAS-LUM-17-004 |
CMS-PAS-LUM-17-004 |
| 27 | CMS Collaboration | CMS luminosity measurement for the 2018 data-taking period at $ \sqrt{s} = $ 13 TeV | CMS Physics Analysis Summary, 2019 CMS-PAS-LUM-18-002 |
CMS-PAS-LUM-18-002 |
| 28 | CMS Collaboration | Measurements of inclusive W and Z cross sections in pp collisions at $ \sqrt {s} = $ 7 TeV | JHEP 01 (2011) 080 | CMS-EWK-10-002 1012.2466 |
| 29 | E. Bols et al. | Jet flavour classification using DeepJet | JINST 15 (2020) P12012 | 2008.10519 |
| 30 | J. Alwall et al. | The automated computation of tree-level and next-to-leading order differential cross sections, and their matching to parton shower simulations | JHEP 07 (2014) 079 | 1405.0301 |
| 31 | T. Sjöstrand et al. | An introduction to PYTHIA 8.2 | Comput. Phys. Commun. 191 (2015) 159 | 1410.3012 |
| 32 | B. Cabouat and T. Sjöstrand | Some dipole shower studies | EPJC 78 (2018) 226 | 1710.00391 |
| 33 | B. Jager et al. | Parton-shower effects in Higgs production via vector-boson fusion | EPJC 80 (2020) 756 | 2003.12435 |
| 34 | S. Alioli, P. Nason, C. Oleari, and E. Re | A general framework for implementing NLO calculations in shower Monte Carlo programs: the POWHEG BOX | JHEP 06 (2010) 043 | 1002.2581 |
| 35 | E. Re, M. Wiesemann, and G. Zanderighi | NNLOPS accurate predictions for W$ ^+ $W$ ^- $ production | JHEP 12 (2018) 121 | 1805.09857 |
| 36 | K. Hamilton, P. Nason, and G. Zanderighi | Finite quark-mass effects in the NNLOPS POWHEG+MiNLO Higgs generator | JHEP 05 (2015) 140 | 1501.04637 |
| 37 | S. Bolognesi et al. | Spin and parity of a single-produced resonance at the lhc | PRD 8 (2012) 095031 | |
| 38 | CMS Collaboration | Measurements of properties of the higgs boson in the W boson pair decay channel in proton-proton collisions at $ \sqrt{s}= $ 13 TeV | CMS Physics Analysis Summary, 2022 CMS-PAS-HIG-20-013 |
CMS-PAS-HIG-20-013 |
| 39 | J. M. Campbell and R. K. Ellis | An update on vector boson pair production at hadron colliders | PRD 60 (1999) 113006 | hep-ph/9905386 |
| 40 | J. M. Campbell, R. K. Ellis, and C. Williams | Vector boson pair production at the LHC | JHEP 07 (2011) 017 | 1105.0020 |
| 41 | J. M. Campbell, R. K. Ellis, and W. T. Giele | A multi-threaded version of MCFM | EPJC 75 (2015) 246 | 1503.06182 |
| 42 | CMS Collaboration | Measurement of differential cross sections for top quark pair production using the lepton+jets final state in proton-proton collisions at 13 TeV | PRD 95 (2017) 092001 | CMS-TOP-16-008 1610.04191 |
| 43 | CMS Collaboration | Measurements of differential Z boson production cross sections in proton-proton collisions at $ \sqrt{s}= $ 13 TeV | JHEP 12 (2019) 061 | CMS-SMP-17-010 1909.04133 |
| 44 | NNPDF Collaboration | Parton distributions with QED corrections | NPB 877 (2013) 290 | 1308.0598 |
| 45 | NNPDF Collaboration | Unbiased global determination of parton distributions and their uncertainties at NNLO and at LO | NPB 855 (2012) 153 | 1107.2652 |
| 46 | NNPDF Collaboration | Parton distributions from high-precision collider data | EPJC 77 (2017) 663 | 1706.00428 |
| 47 | CMS Collaboration | Event generator tunes obtained from underlying event and multiparton scattering measurements | EPJC 76 (2016) 155 | CMS-GEN-14-001 1512.00815 |
| 48 | CMS Collaboration | Extraction and validation of a new set of CMS PYTHIA8 tunes from underlying-event measurements | EPJC 80 (2020) 4 | CMS-GEN-17-001 1903.12179 |
| 49 | GEANT 4 Collaboration | GEANT 4 -- a simulation toolkit | NIM A 506 (2003) 250 | |
| 50 | CMS Collaboration | Electron and photon reconstruction and identification with the CMS experiment at the CERN LHC | JINST 16 (2021) P05014 | CMS-EGM-17-001 2012.06888 |
| 51 | CMS Collaboration | Performance of the CMS muon detector and muon reconstruction with proton-proton collisions at $ \sqrt{s}= $ 13 TeV | JINST 13 (2018) P06015 | CMS-MUO-16-001 1804.04528 |
| 52 | D. L. Rainwater, R. Szalapski, and D. Zeppenfeld | Probing color singlet exchange in Z + two jet events at the CERN LHC | PRD 54 (1996) 6680 | hep-ph/9605444 |
| 53 | CMS Collaboration | Measurements of properties of the Higgs boson decaying to a W boson pair in pp collisions at $ \sqrt{s}= $ 13 TeV | PLB 791 (2019) 96 | CMS-HIG-16-042 1806.05246 |
| 54 | D. P. Kingma and J. Ba | Adam: A method for stochastic optimization | in 3rd International Conference on Learning Representations, San Diego, 2015 ICLR 201 (2015) 5 |
1412.6980 |
| 55 | D. R. Cox | The regression analysis of binary sequences | J R Stat Soc Series B 20 (1958) 215 | |
| 56 | I. Goodfellow, Y. Bengio, and A. Courville | Deep learning | MIT Press, 2016 link |
|
| 57 | S. M. Lundberg and S.-I. Lee | A unified approach to interpreting model predictions | in 31st International Conference on Neural Information Processing Systems, NIPS'17, Red Hook NY, USA, 2017 Proceedings of the 3 (2017) 4768 |
1705.07874 |
| 58 | L. S. Shapley | A value for n-person games | Contributions to the Theory of Games, 1953 link |
|
| 59 | CMS Collaboration | Performance of electron reconstruction and selection with the CMS detector in proton-proton collisions at $ \sqrt{s} = $ 8 TeV | JINST 10 (2015) P06005 | CMS-EGM-13-001 1502.02701 |
| 60 | S. Catani, D. de Florian, M. Grazzini, and P. Nason | Soft gluon resummation for Higgs boson production at hadron colliders | JHEP 07 (2003) 028 | hep-ph/0306211 |
| 61 | M. Cacciari et al. | The $ {\mathrm{t}\overline{\mathrm{t}}} $ cross-section at 1.8 TeV and 1.96 TeV: a study of the systematics due to parton densities and scale dependence | JHEP 04 (2004) 068 | hep-ph/0303085 |
| 62 | J. Rojo | PDF4LHC recommendations for Run II | PoS DIS 018, 2016 link |
1606.08243 |
| 63 | G. Cowan, K. Cranmer, E. Gross, and O. Vitells | Asymptotic formulae for likelihood-based tests of new physics | EPJC 71 (2011) 1554 | 1007.1727 |
| 64 | E. Gross and O. Vitells | Trial factors for the look elsewhere effect in high energy physics | EPJC 70 (2010) 525 | 1005.1891 |
| 65 | CMS Collaboration | HEPData record for this analysis | link | |
|
|
Compact Muon Solenoid LHC, CERN |
|

|

|

|

|

|