

Compact Muon Solenoid
LHC, CERN
| CMS-GEN-17-002 ; CERN-EP-2022-005 | ||
| CMS PYTHIA 8 colour reconnection tunes based on underlying-event data | ||
| CMS Collaboration | ||
| 5 May 2022 | ||
| Eur. Phys. J. C 83 (2023) 571 | ||
| Abstract: New sets of parameter tunes for two of the colour reconnection models, quantum chromodynamics-inspired and gluon-move, implemented in the PYTHIA 8 event generator, are obtained based on the default CMS PYTHIA 8 underlying-event tune, CP5. Measurements sensitive to the underlying event performed by the CMS experiment at centre-of-mass energies $ \sqrt{s}= $ 7 and 13 TeV, and by the CDF experiment at 1.96 TeV are used to constrain the parameters of colour reconnection models and multiple-parton interactions simultaneously. The new colour reconnection tunes are compared with various measurements at 1.96, 7, 8, and 13 TeV including measurements of the underlying-event, strange-particle multiplicities, jet substructure observables, jet shapes, and colour flow in top quark pair ( $ \mathrm{t} \overline{\mathrm{t}} $) events. The new tunes are also used to estimate the uncertainty related to colour reconnection modelling in the top quark mass measurement using the decay products of $ \mathrm{t} \overline{\mathrm{t}} $ events in the semileptonic channel at 13 TeV. | ||
| Links: e-print arXiv:2205.02905 [hep-ex] (PDF) ; CDS record ; inSPIRE record ; CADI line (restricted) ; | ||
| Figures | |

png pdf |
Figure 1:
Rules for colour flow for quark-gluon vertices. Figure is taken from Ref. [5]. Quark-gluon vertices are shown in black with Feynman diagrams and colour connection lines are shown with coloured lines. |

png pdf |
Figure 2:
The schematic description of the result of a typical hadron-hadron collision. The ``toward'' region contains the ``toward-side'' jet, whereas the ``away'' region may contain an ``away-side'' jet. |
png pdf |
Figure 3:
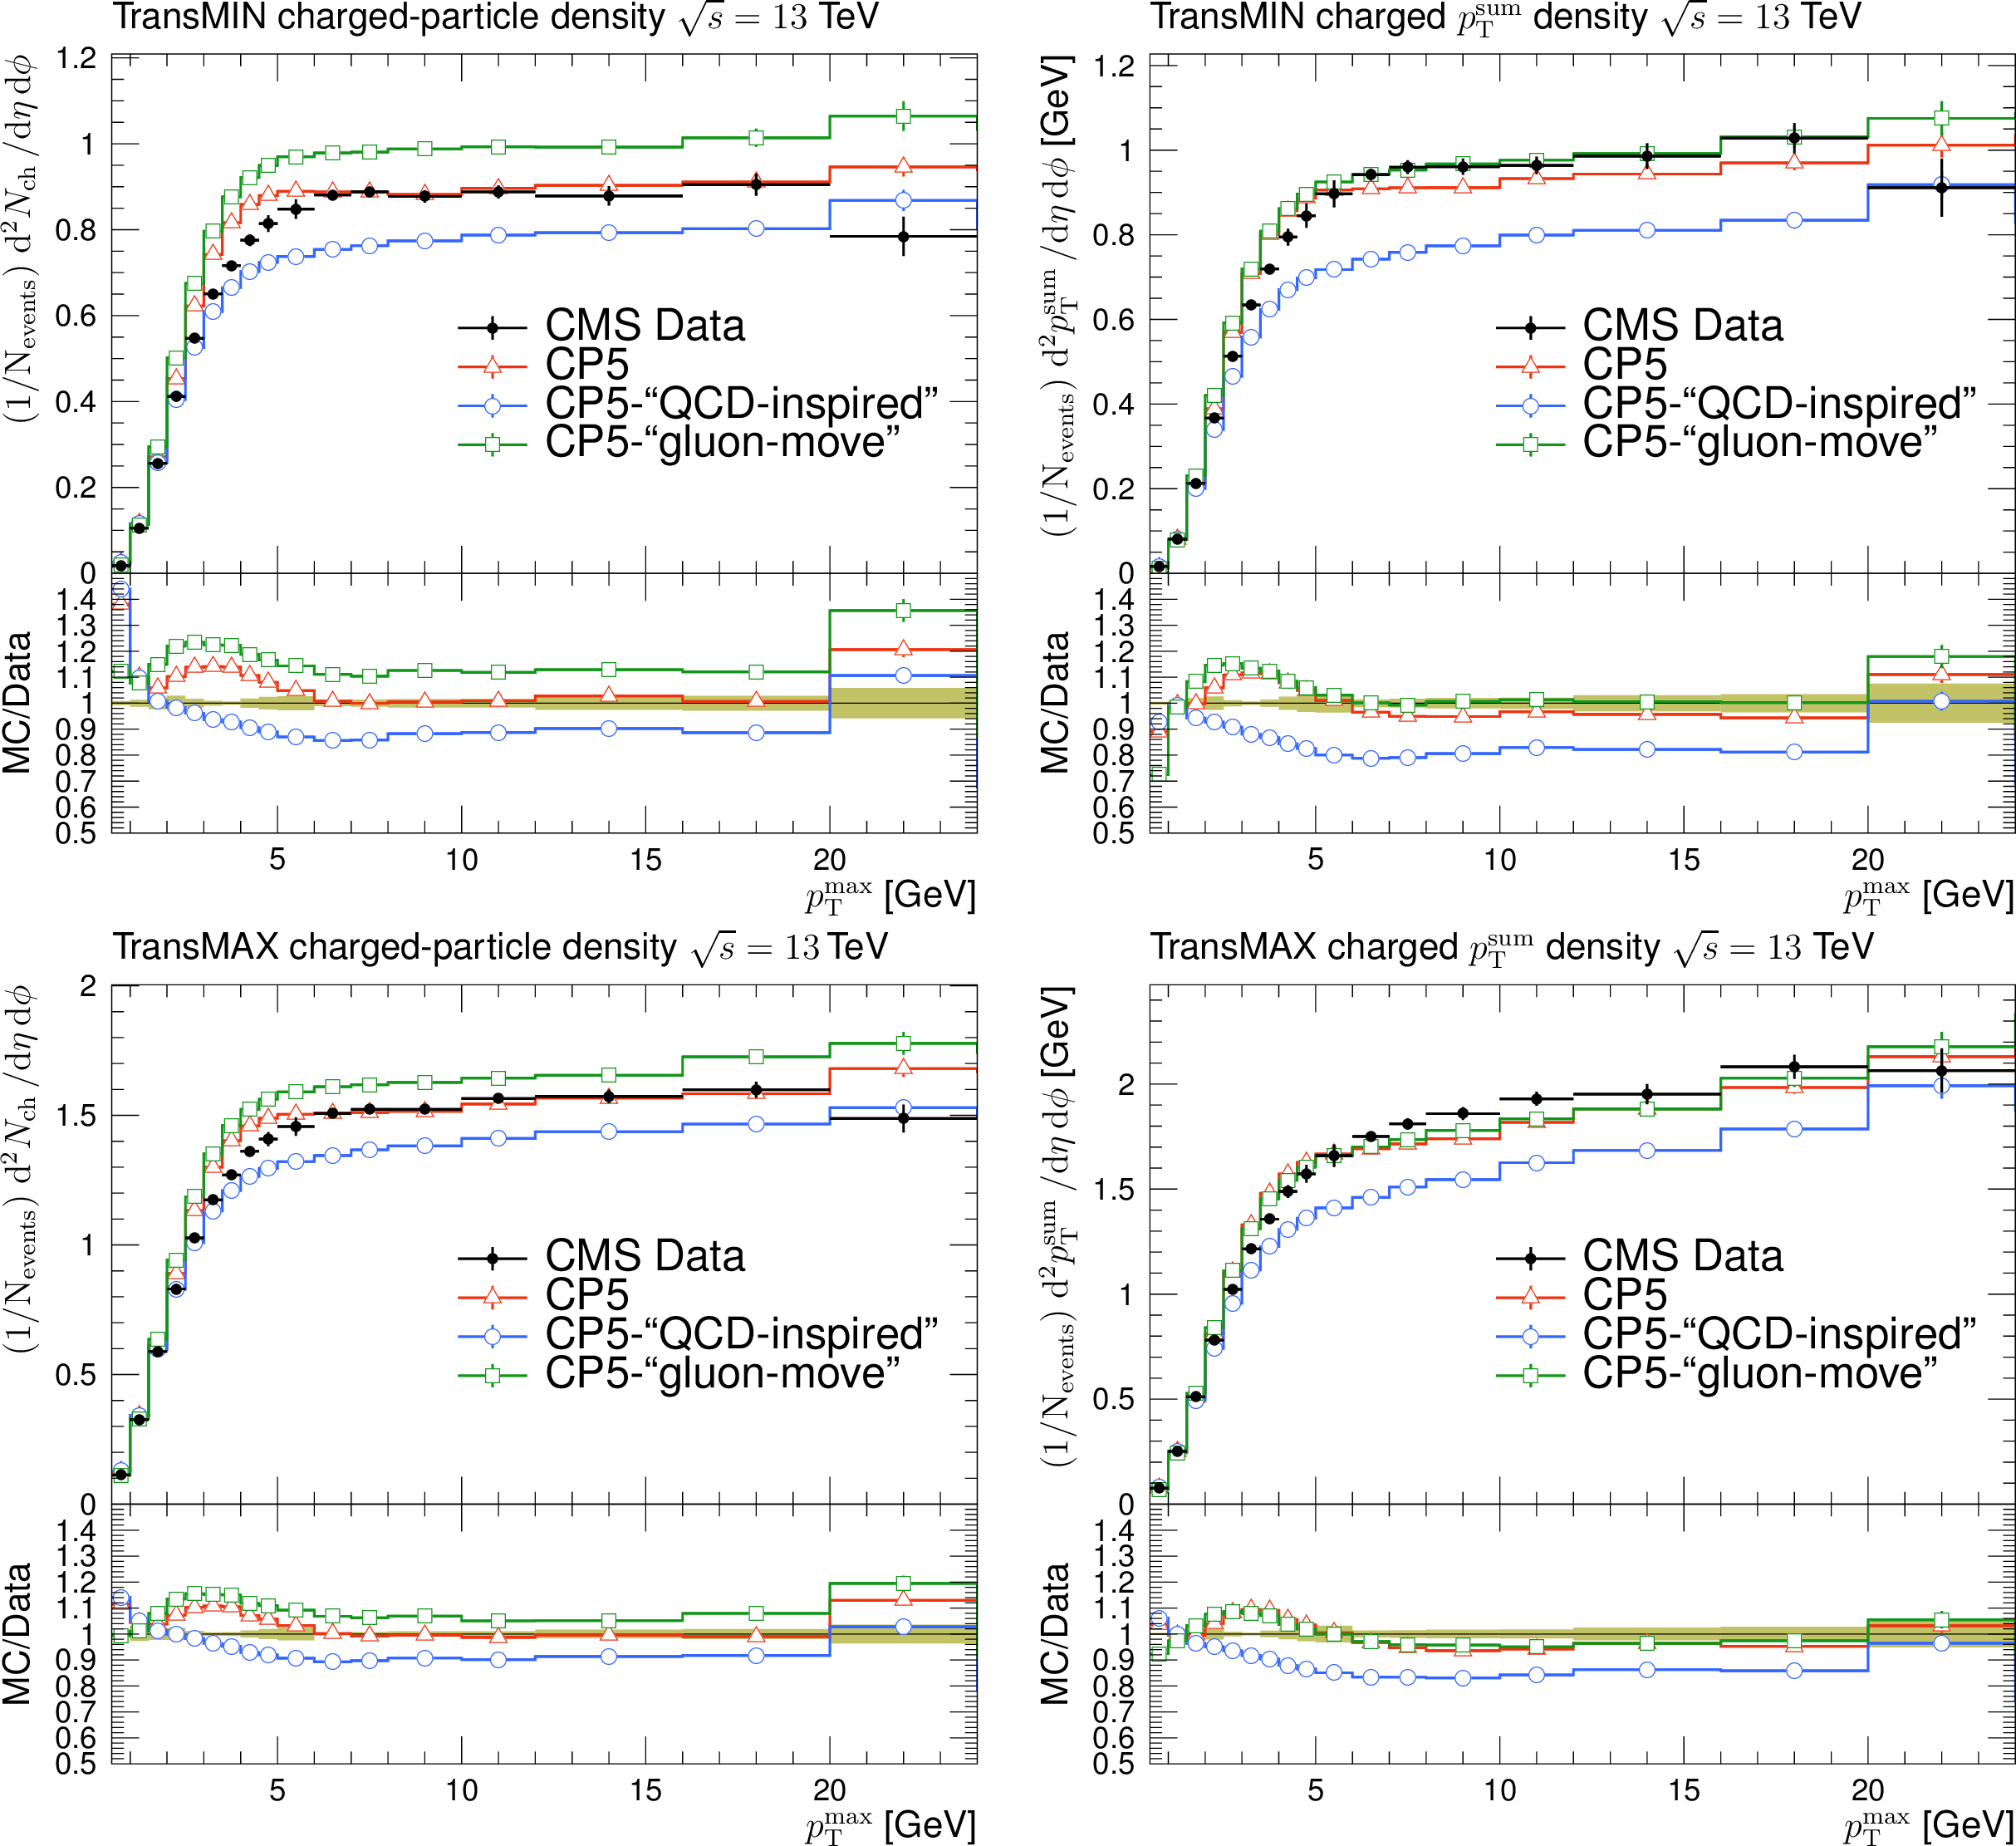
The charged-particle (left) and $ p_{\mathrm{T}}^{\text{sum}} $ densities (right) in the transMIN (upper) and transMAX (lower) regions as functions of the $ p_{\mathrm{T}} $ of the leading charged particle, $ p_{\mathrm{T}}^{\text{max}} $, measured by the CMS experiment at $ \sqrt{s}= $ 13 TeV [17]. The predictions of the tunes CP5, CP5-``QCD-inspired'', and CP5-``gluon-move'' using their default parameter settings in Refs. [14,9], are compared with data. The coloured band and error bars on the data points represent the total experimental uncertainty in the data where the model uncertainty is also included. The comparisons show that the models do not describe the data and need to be retuned. |
png pdf |
Figure 3-a:
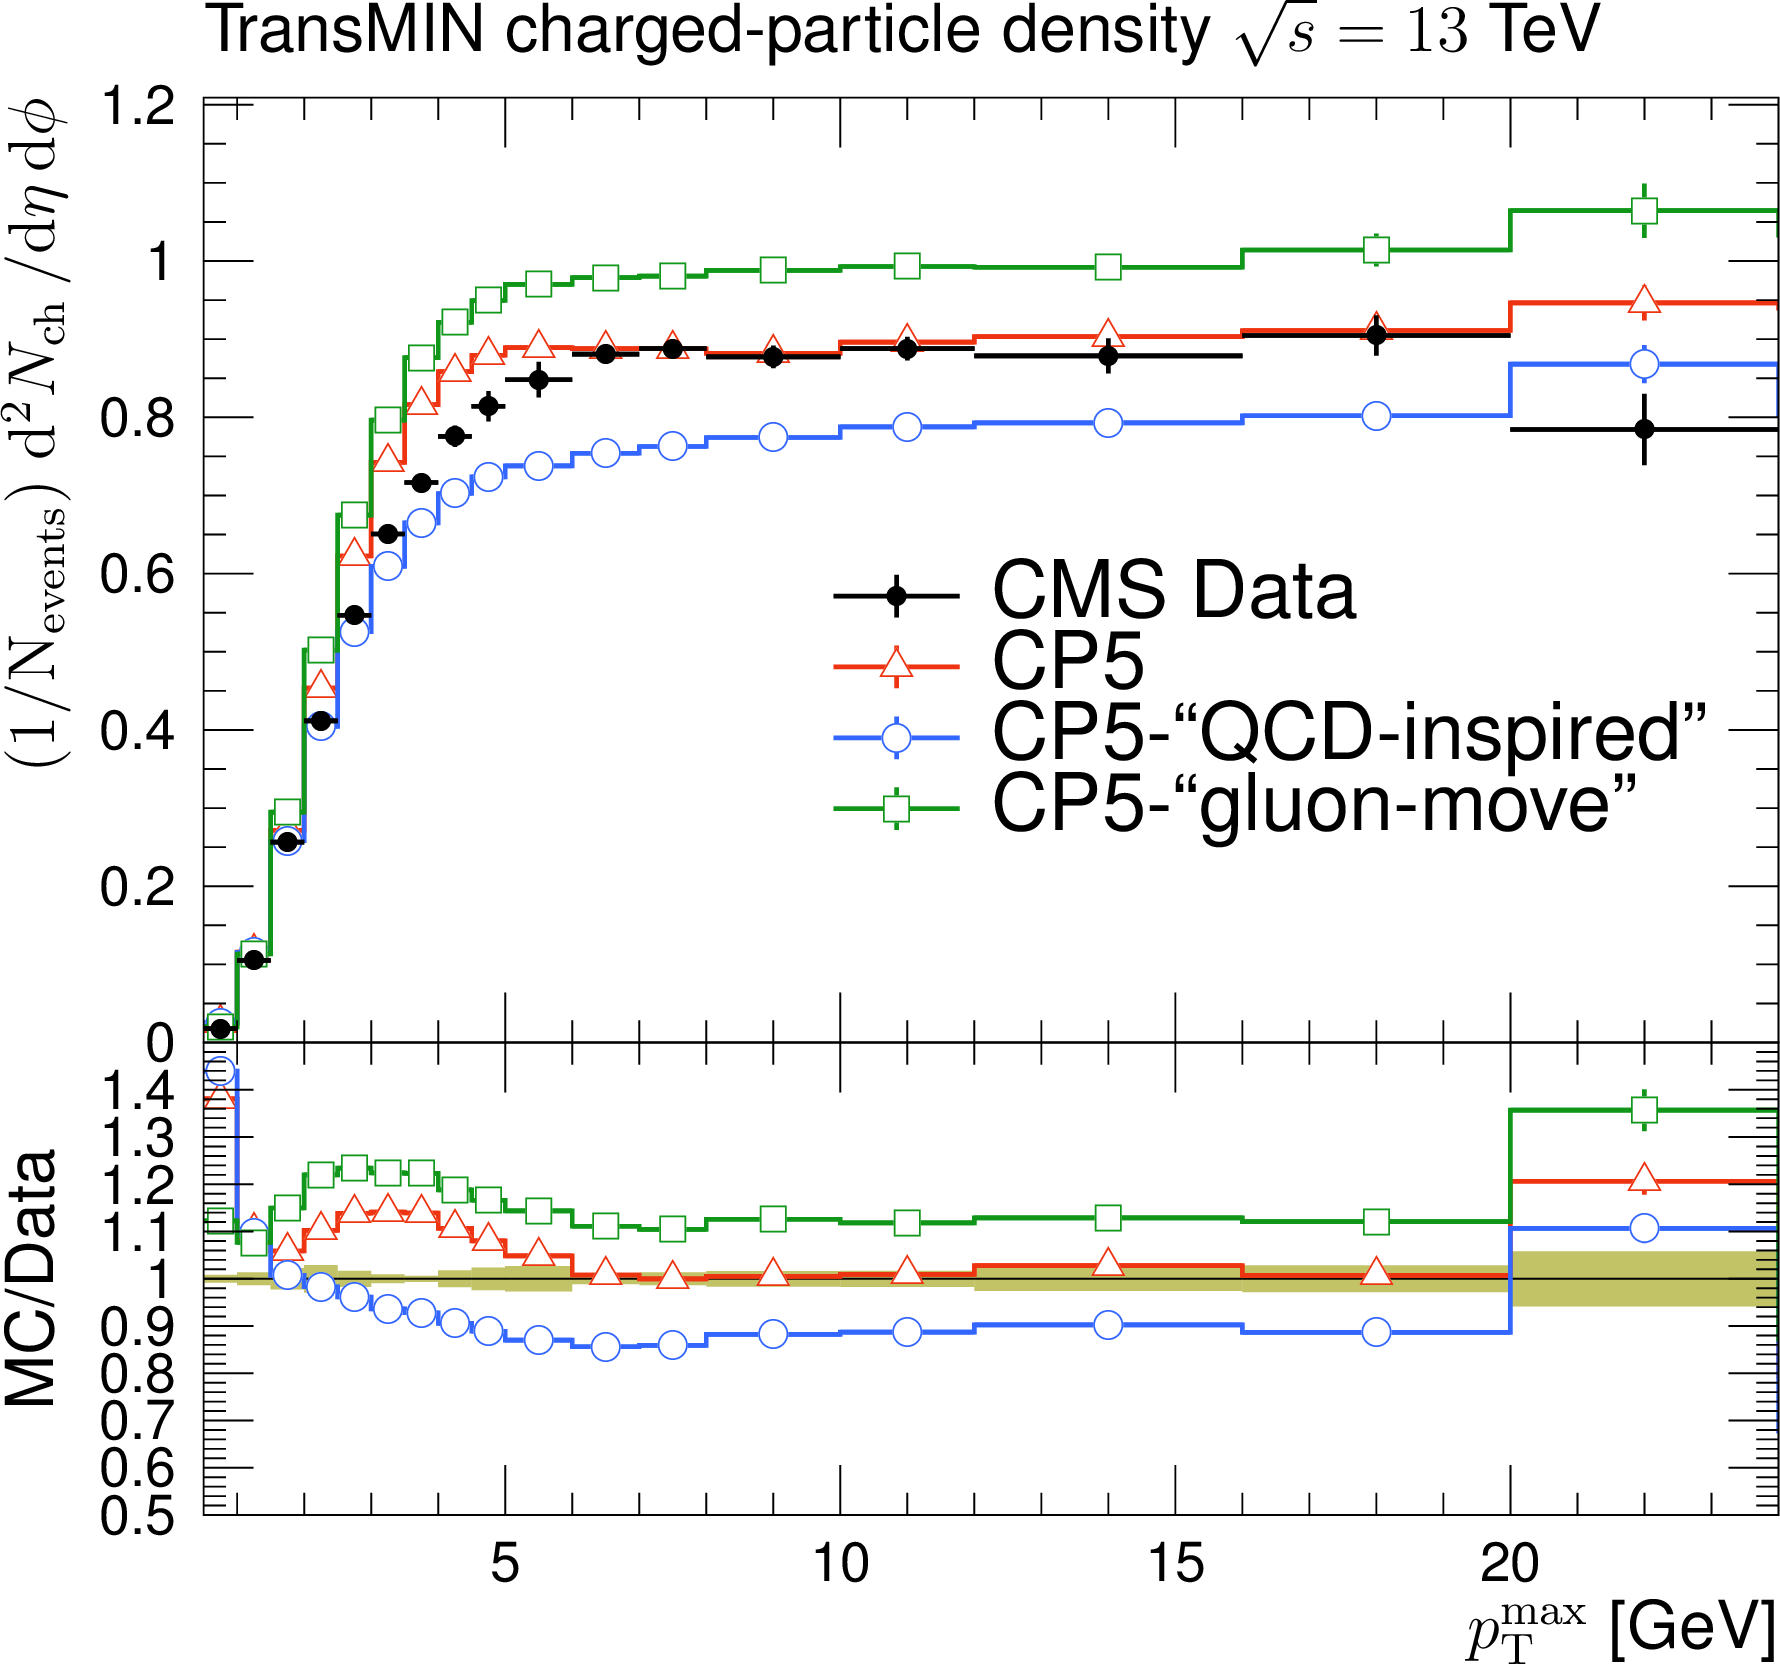
The charged-particle (left) and $ p_{\mathrm{T}}^{\text{sum}} $ densities (right) in the transMIN (upper) and transMAX (lower) regions as functions of the $ p_{\mathrm{T}} $ of the leading charged particle, $ p_{\mathrm{T}}^{\text{max}} $, measured by the CMS experiment at $ \sqrt{s}= $ 13 TeV [17]. The predictions of the tunes CP5, CP5-``QCD-inspired'', and CP5-``gluon-move'' using their default parameter settings in Refs. [14,9], are compared with data. The coloured band and error bars on the data points represent the total experimental uncertainty in the data where the model uncertainty is also included. The comparisons show that the models do not describe the data and need to be retuned. |
png pdf |
Figure 3-b:
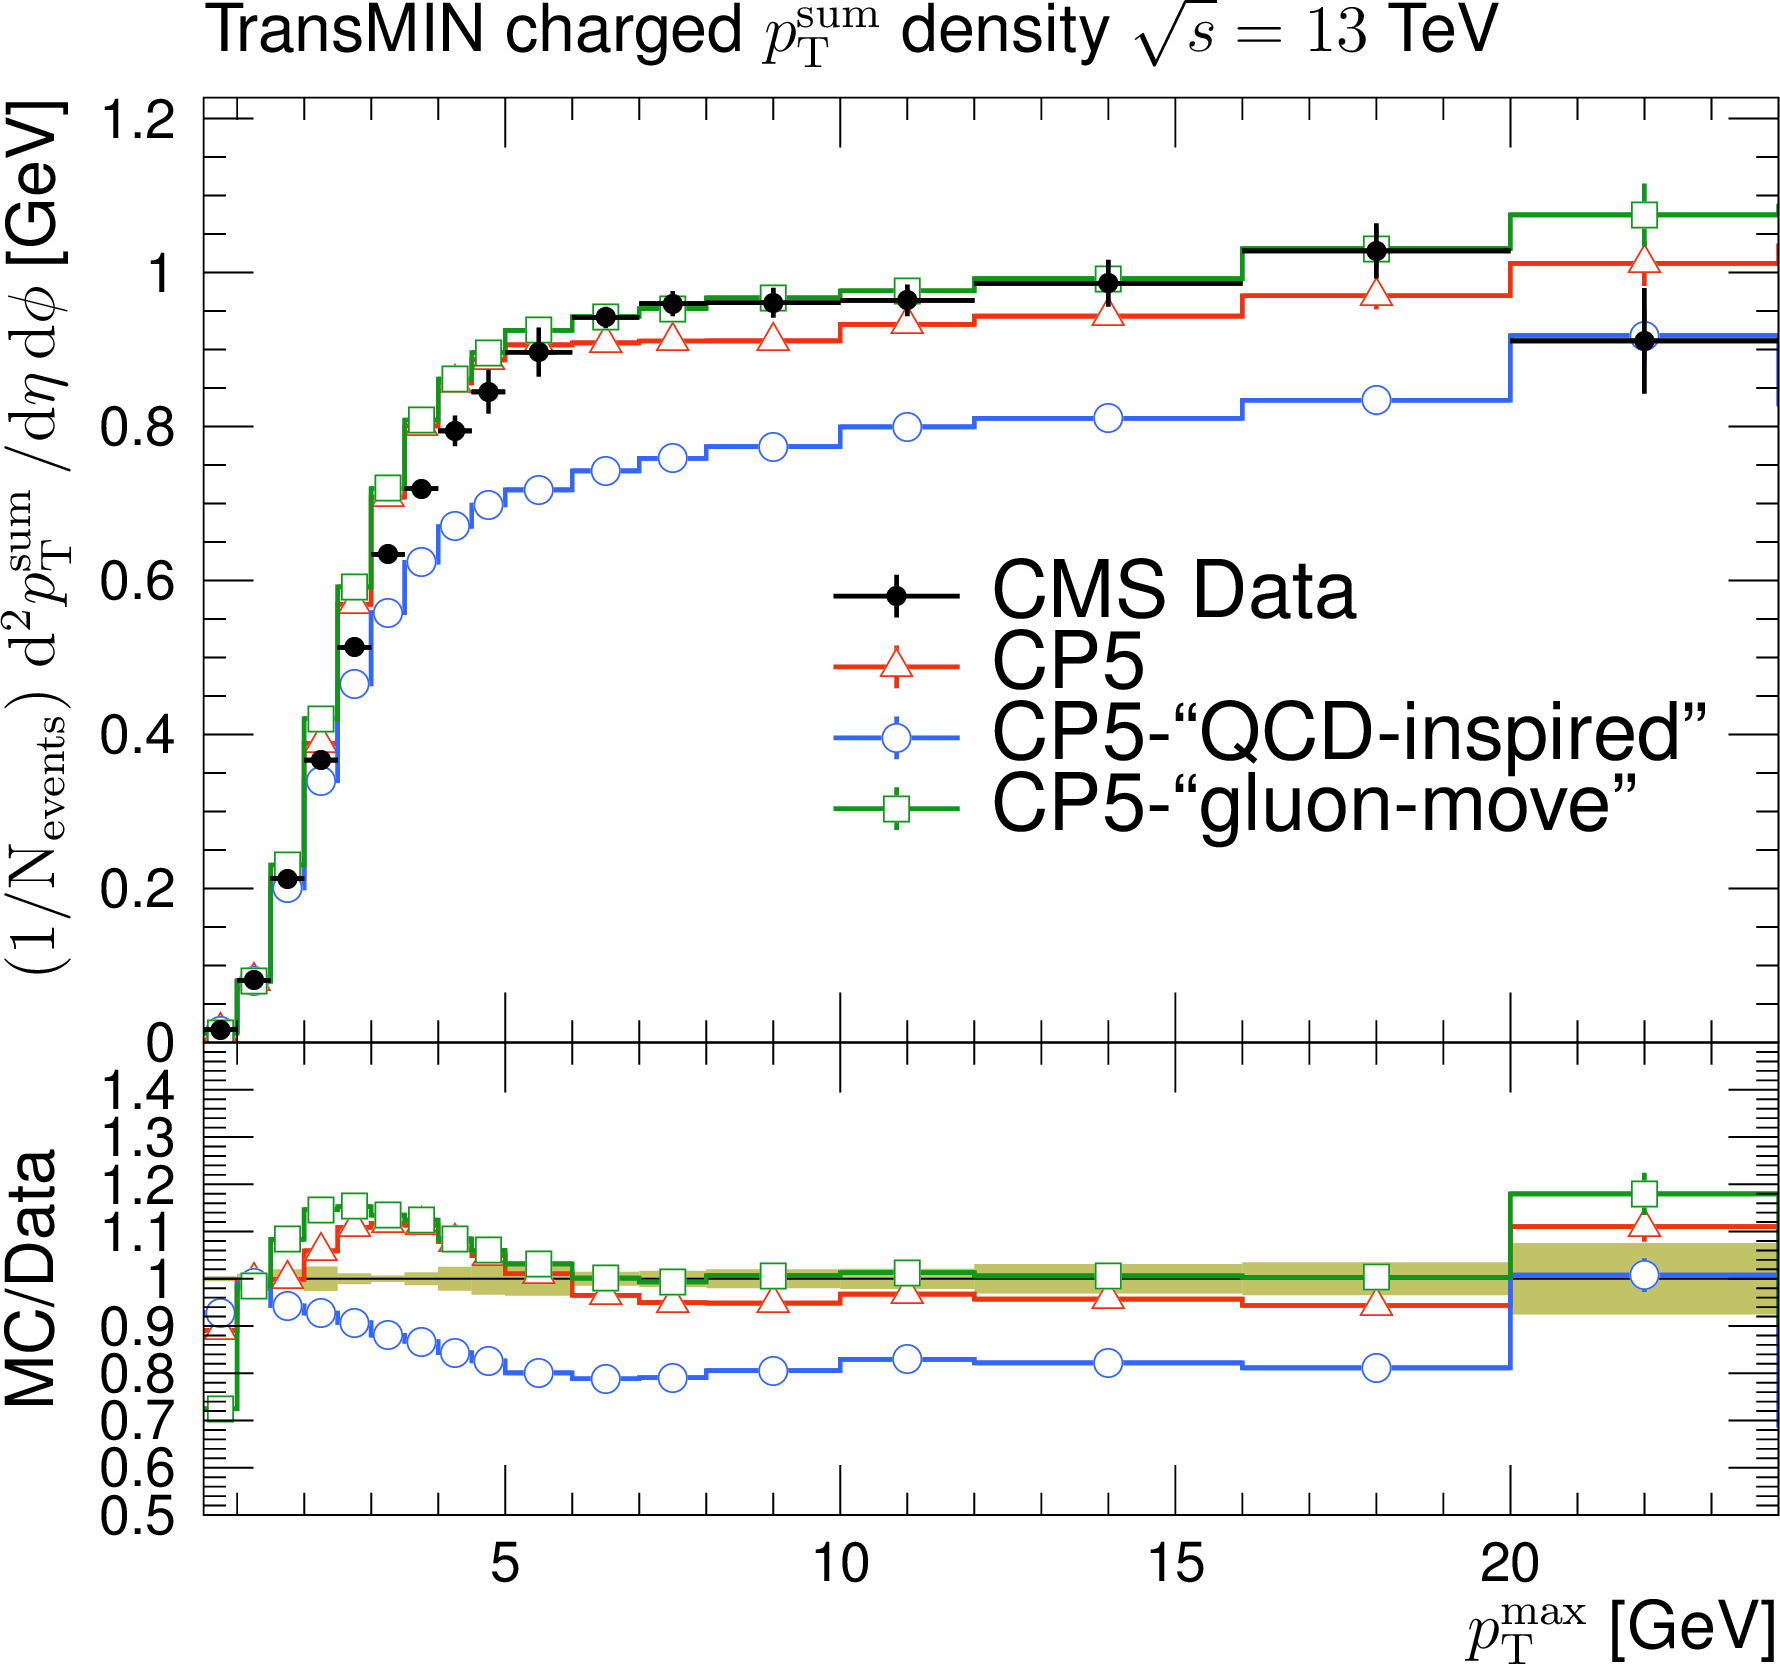
The charged-particle (left) and $ p_{\mathrm{T}}^{\text{sum}} $ densities (right) in the transMIN (upper) and transMAX (lower) regions as functions of the $ p_{\mathrm{T}} $ of the leading charged particle, $ p_{\mathrm{T}}^{\text{max}} $, measured by the CMS experiment at $ \sqrt{s}= $ 13 TeV [17]. The predictions of the tunes CP5, CP5-``QCD-inspired'', and CP5-``gluon-move'' using their default parameter settings in Refs. [14,9], are compared with data. The coloured band and error bars on the data points represent the total experimental uncertainty in the data where the model uncertainty is also included. The comparisons show that the models do not describe the data and need to be retuned. |
png pdf |
Figure 3-c:
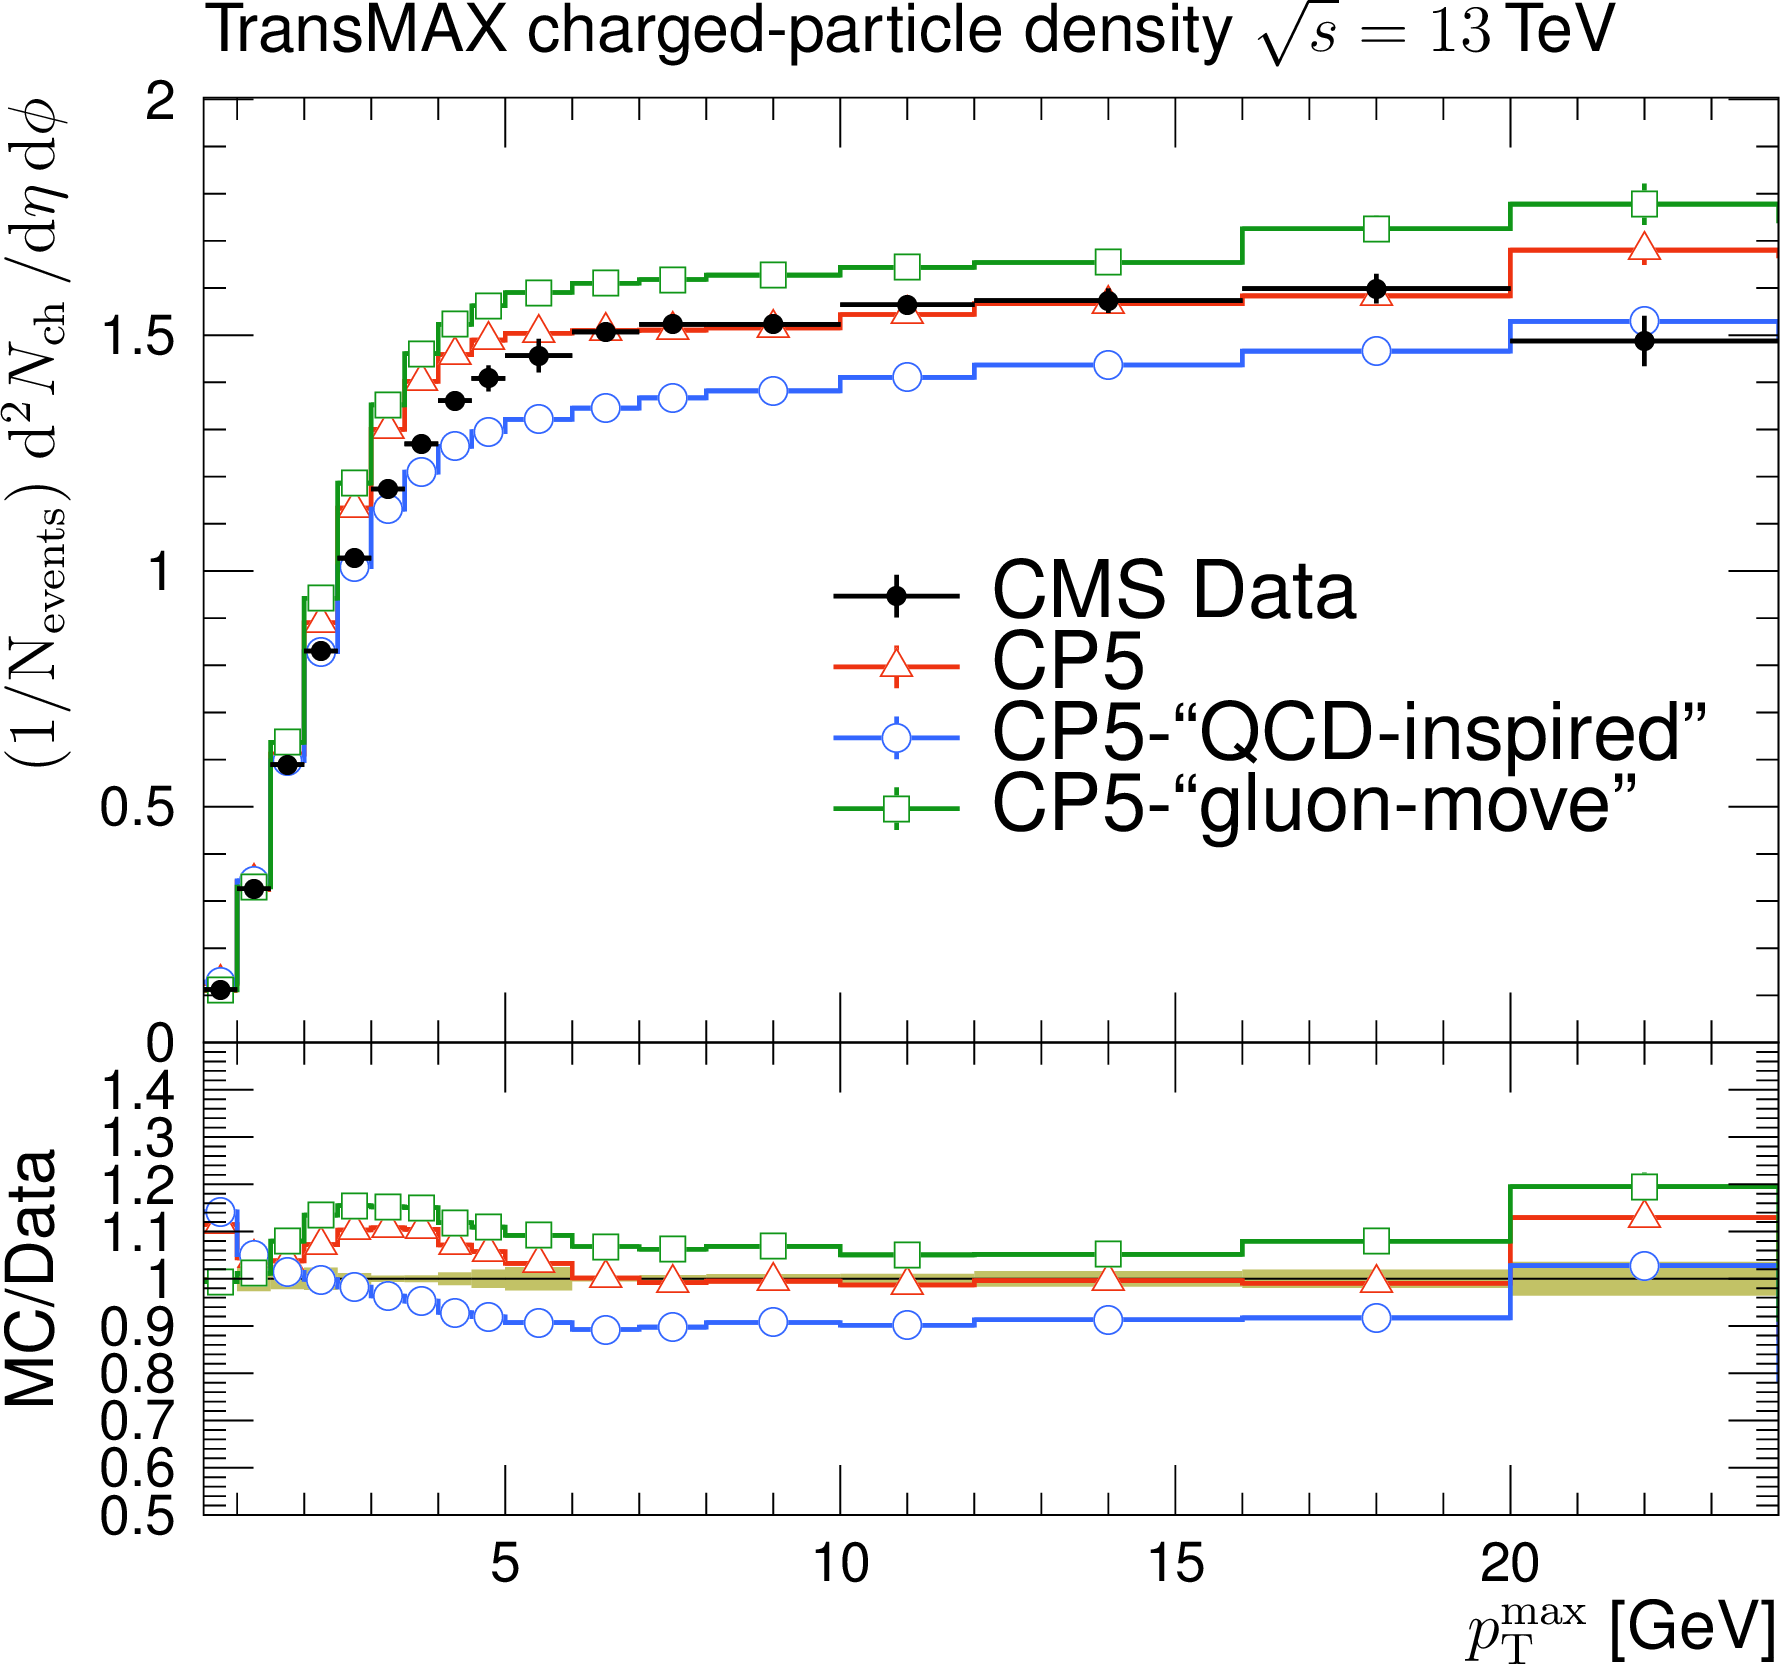
The charged-particle (left) and $ p_{\mathrm{T}}^{\text{sum}} $ densities (right) in the transMIN (upper) and transMAX (lower) regions as functions of the $ p_{\mathrm{T}} $ of the leading charged particle, $ p_{\mathrm{T}}^{\text{max}} $, measured by the CMS experiment at $ \sqrt{s}= $ 13 TeV [17]. The predictions of the tunes CP5, CP5-``QCD-inspired'', and CP5-``gluon-move'' using their default parameter settings in Refs. [14,9], are compared with data. The coloured band and error bars on the data points represent the total experimental uncertainty in the data where the model uncertainty is also included. The comparisons show that the models do not describe the data and need to be retuned. |

png pdf |
Figure 3-d:
The charged-particle (left) and $ p_{\mathrm{T}}^{\text{sum}} $ densities (right) in the transMIN (upper) and transMAX (lower) regions as functions of the $ p_{\mathrm{T}} $ of the leading charged particle, $ p_{\mathrm{T}}^{\text{max}} $, measured by the CMS experiment at $ \sqrt{s}= $ 13 TeV [17]. The predictions of the tunes CP5, CP5-``QCD-inspired'', and CP5-``gluon-move'' using their default parameter settings in Refs. [14,9], are compared with data. The coloured band and error bars on the data points represent the total experimental uncertainty in the data where the model uncertainty is also included. The comparisons show that the models do not describe the data and need to be retuned. |
png pdf |
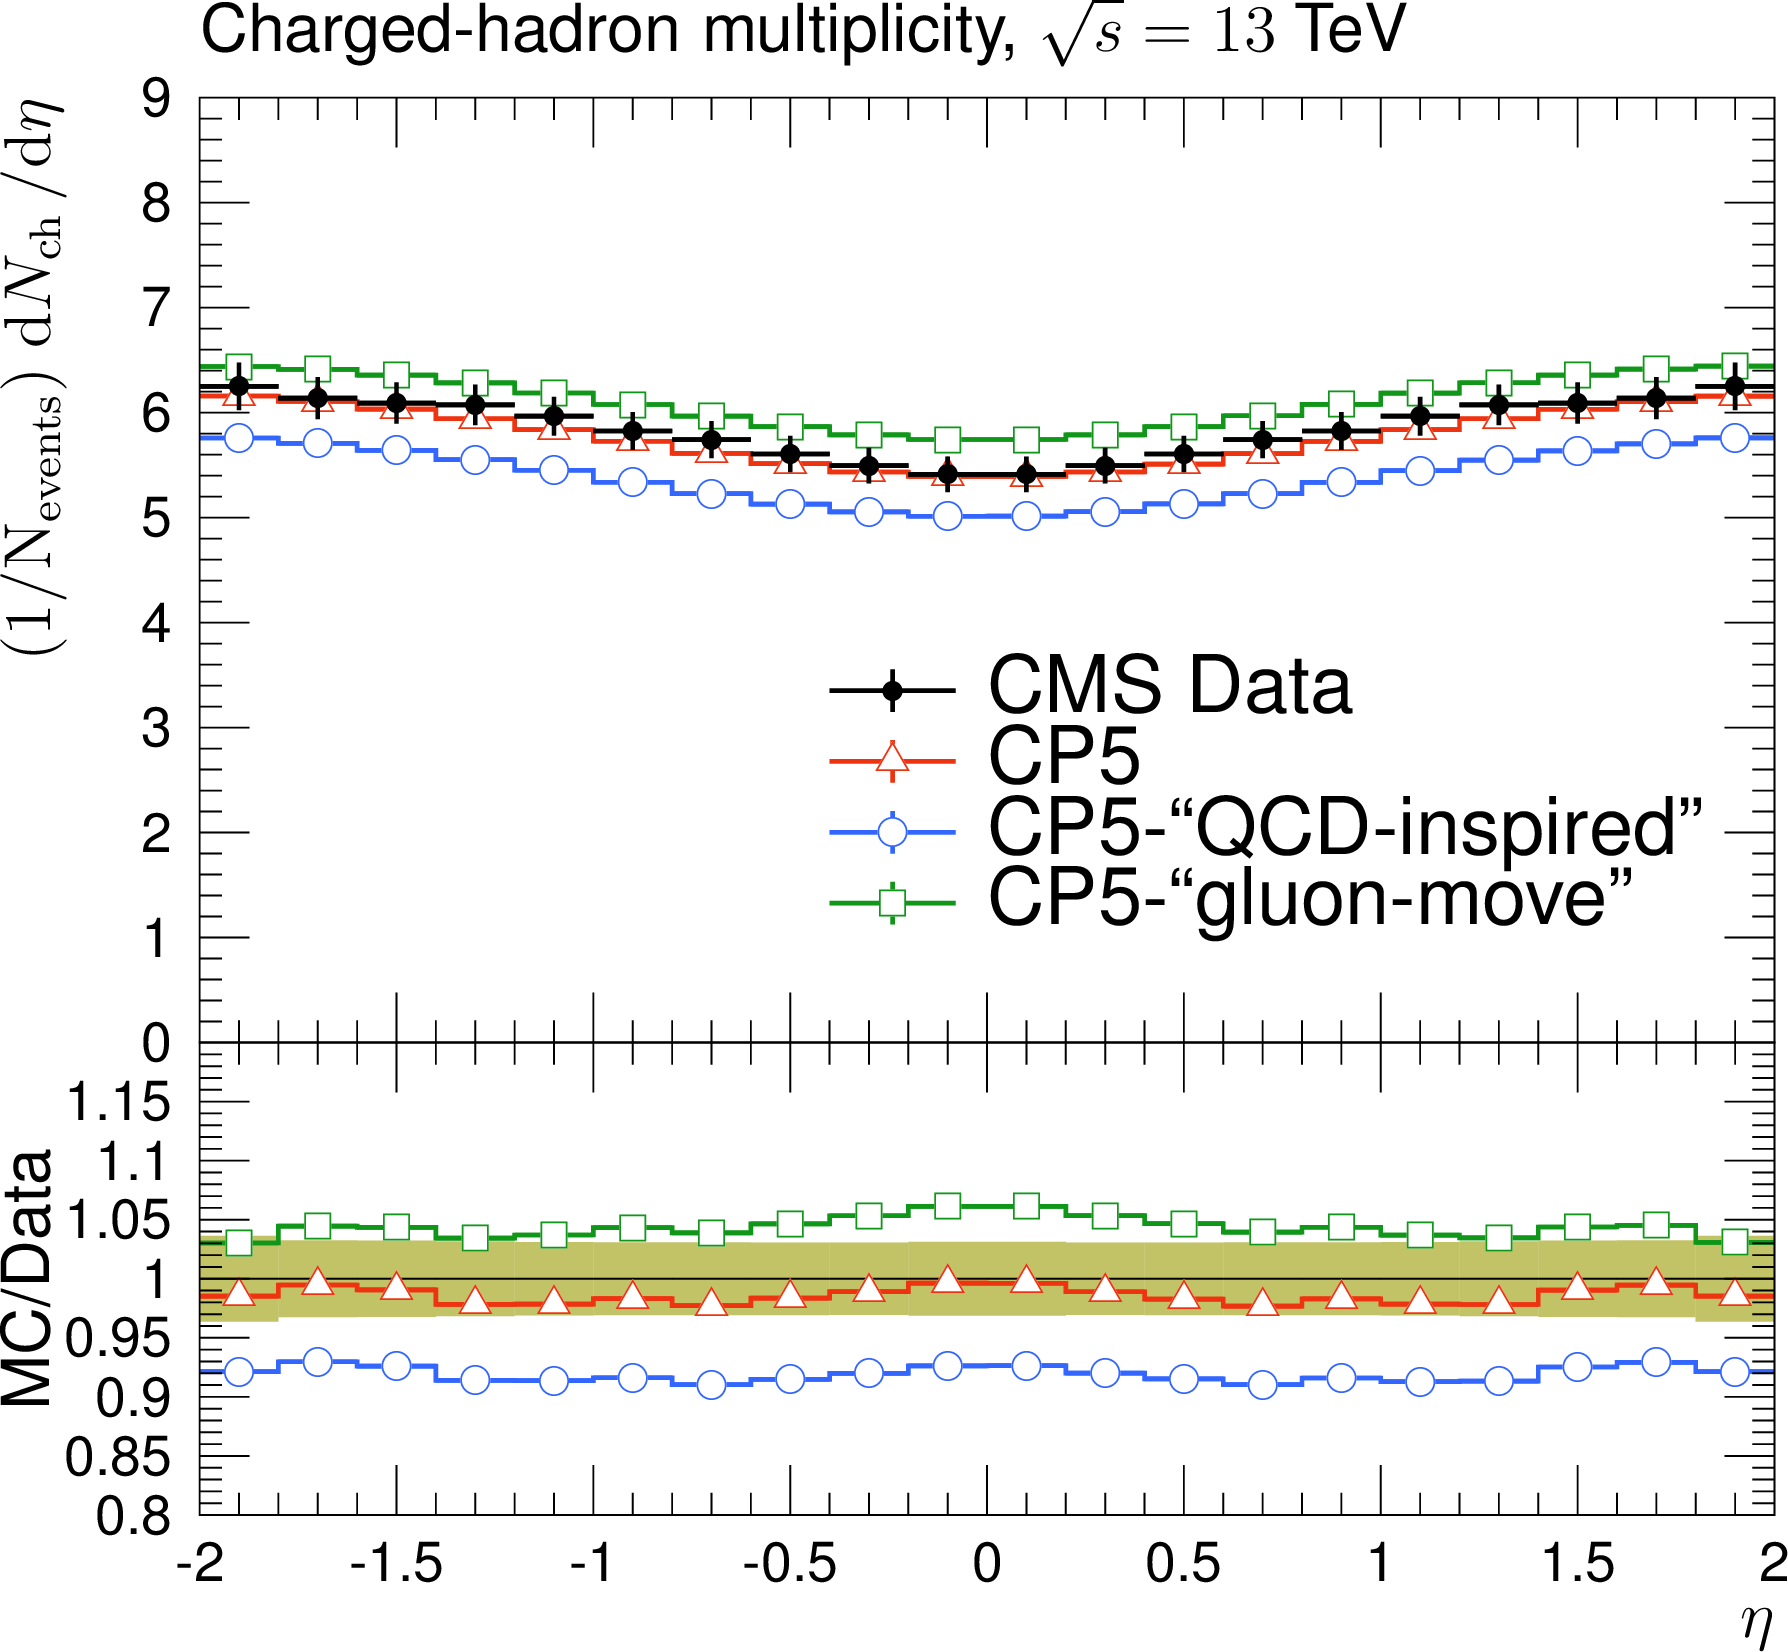
Figure 4:
The pseudorapidity of charged hadrons, $ \mathrm{d}N_{\mathrm{ch}}/\mathrm{d}\eta $, measured in $ |\eta| < $ 2 by the CMS experiment at $ \sqrt{s}= $ 13 TeV [23]. The predictions of the tunes CP5, CP5-``QCD-inspired'', and CP5-``gluon-move'' using their default parameter settings in Refs. [14,9], are compared with data. The coloured band and error bars on the data points represent the total experimental uncertainty in the data where model uncertainty is also included. The comparisons show that the models need to be retuned in order to have a better agreement with the data. |
png pdf |
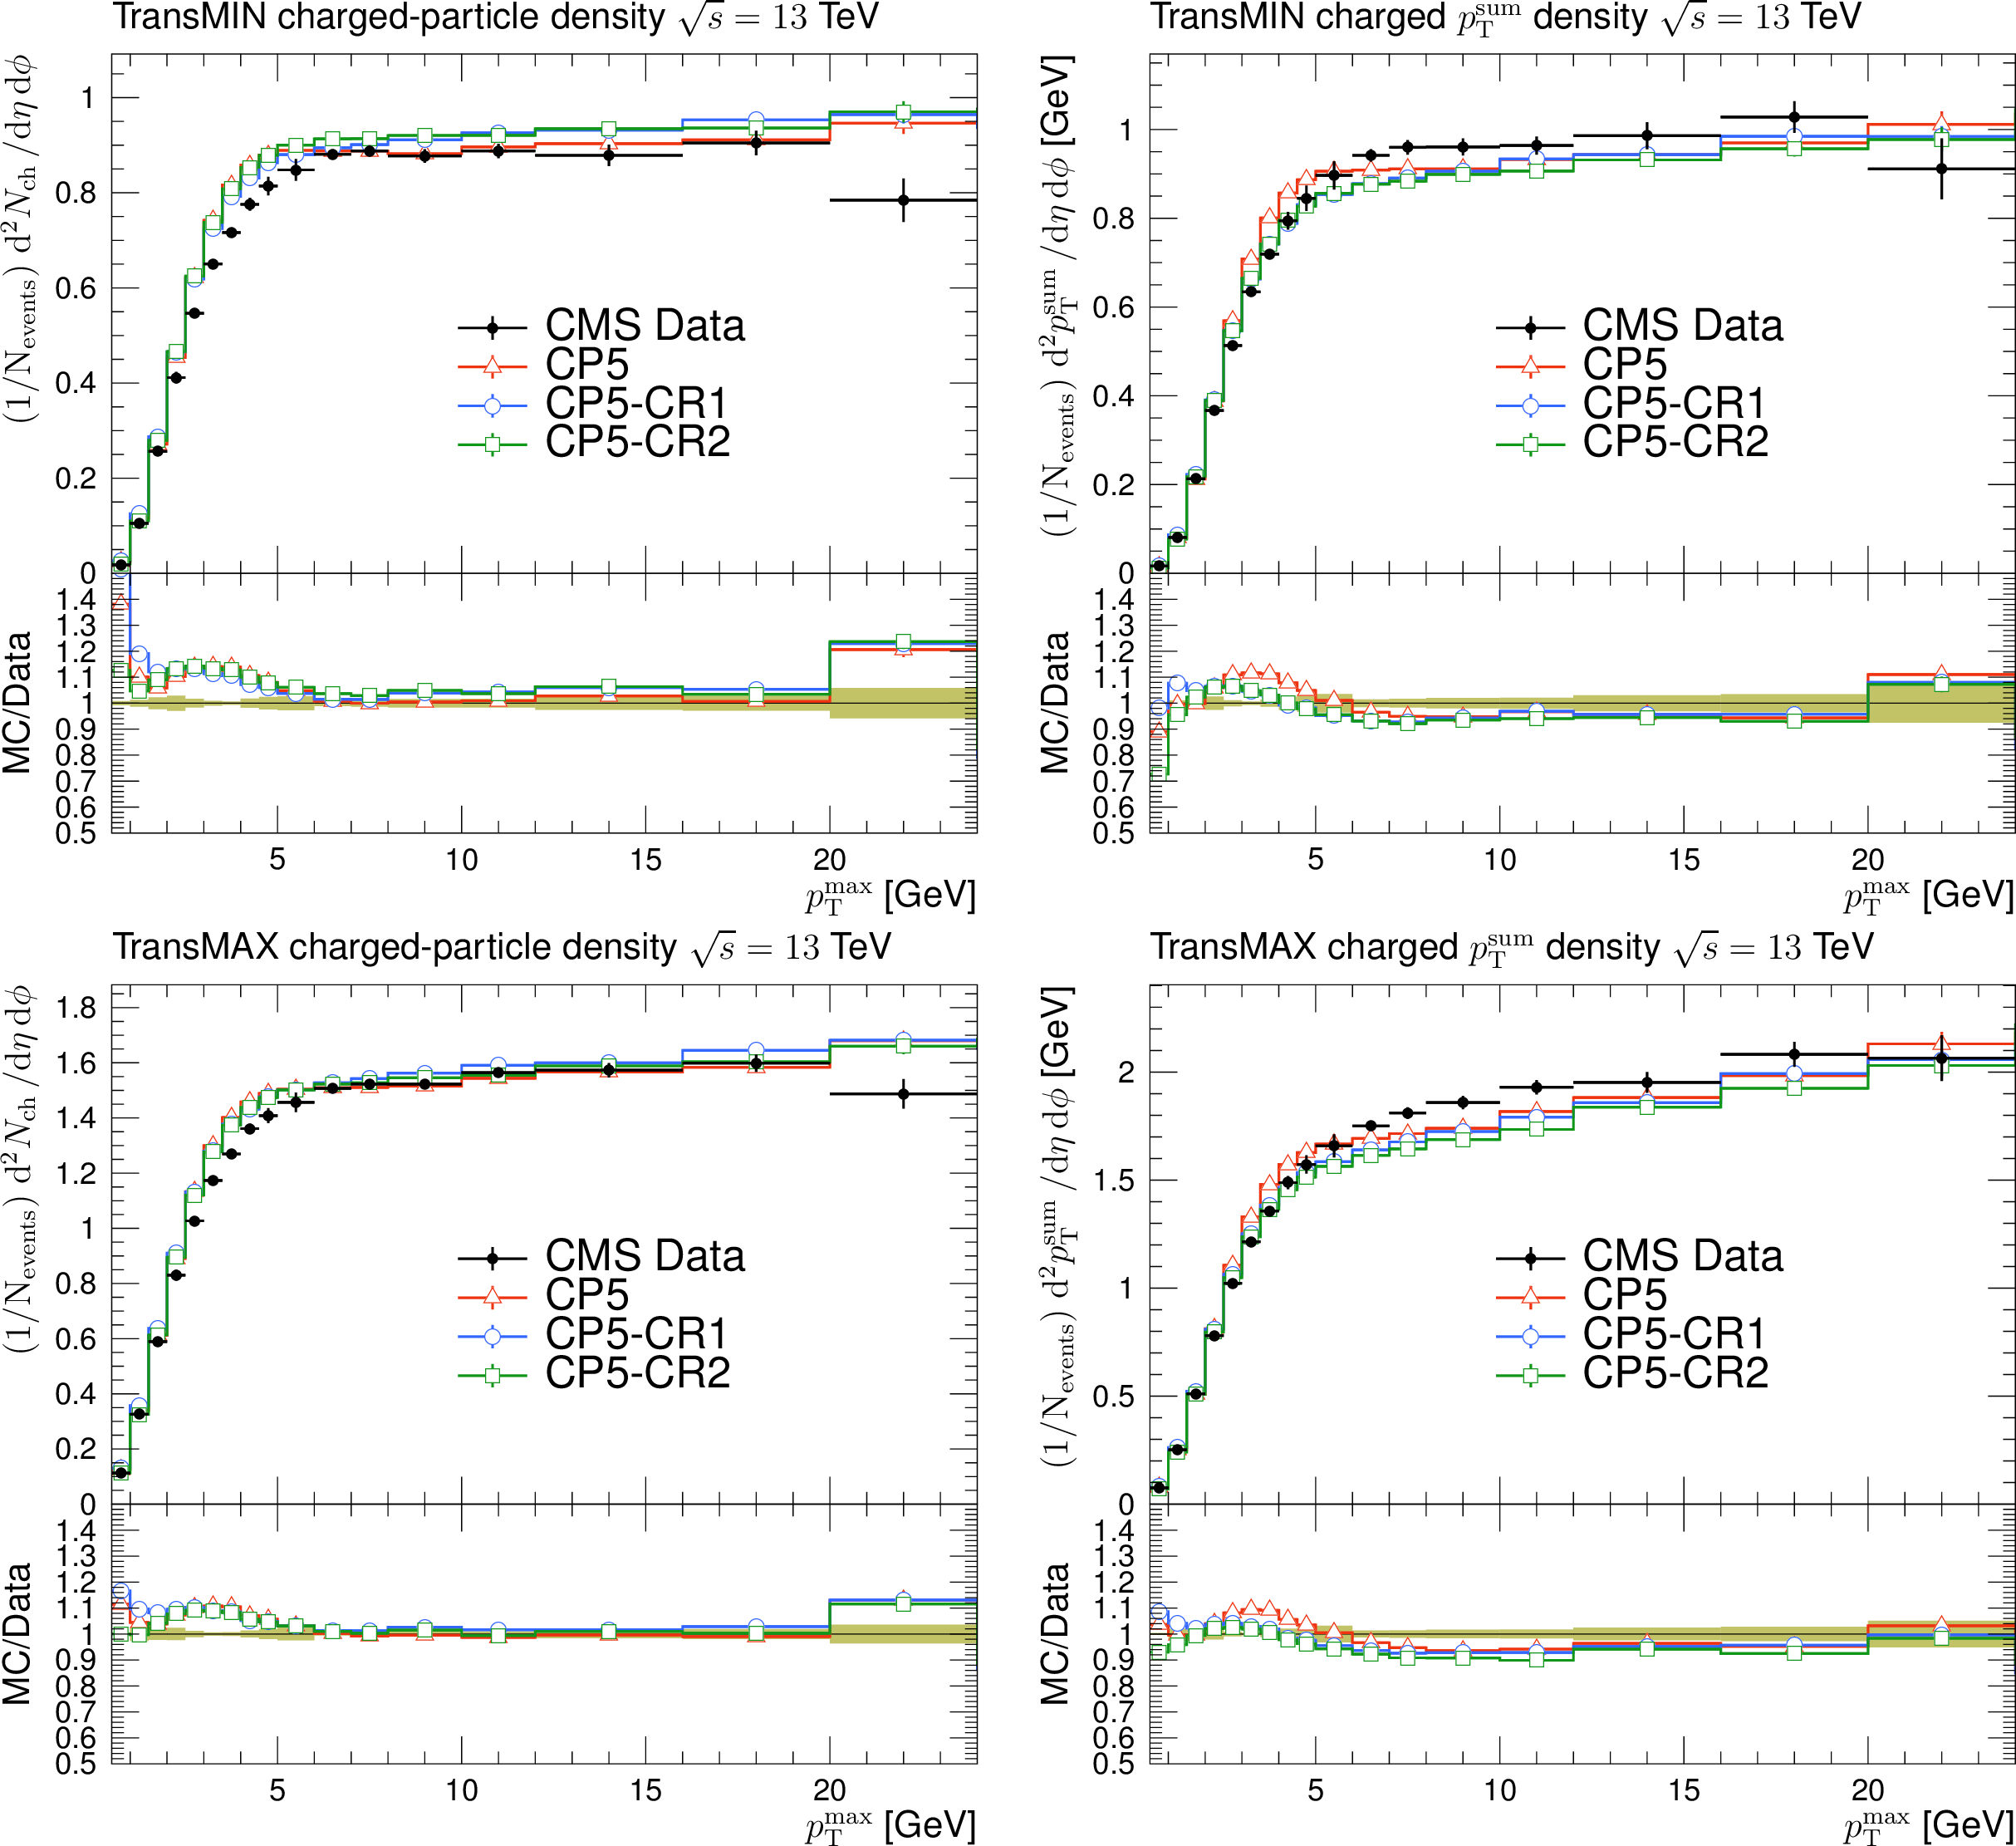
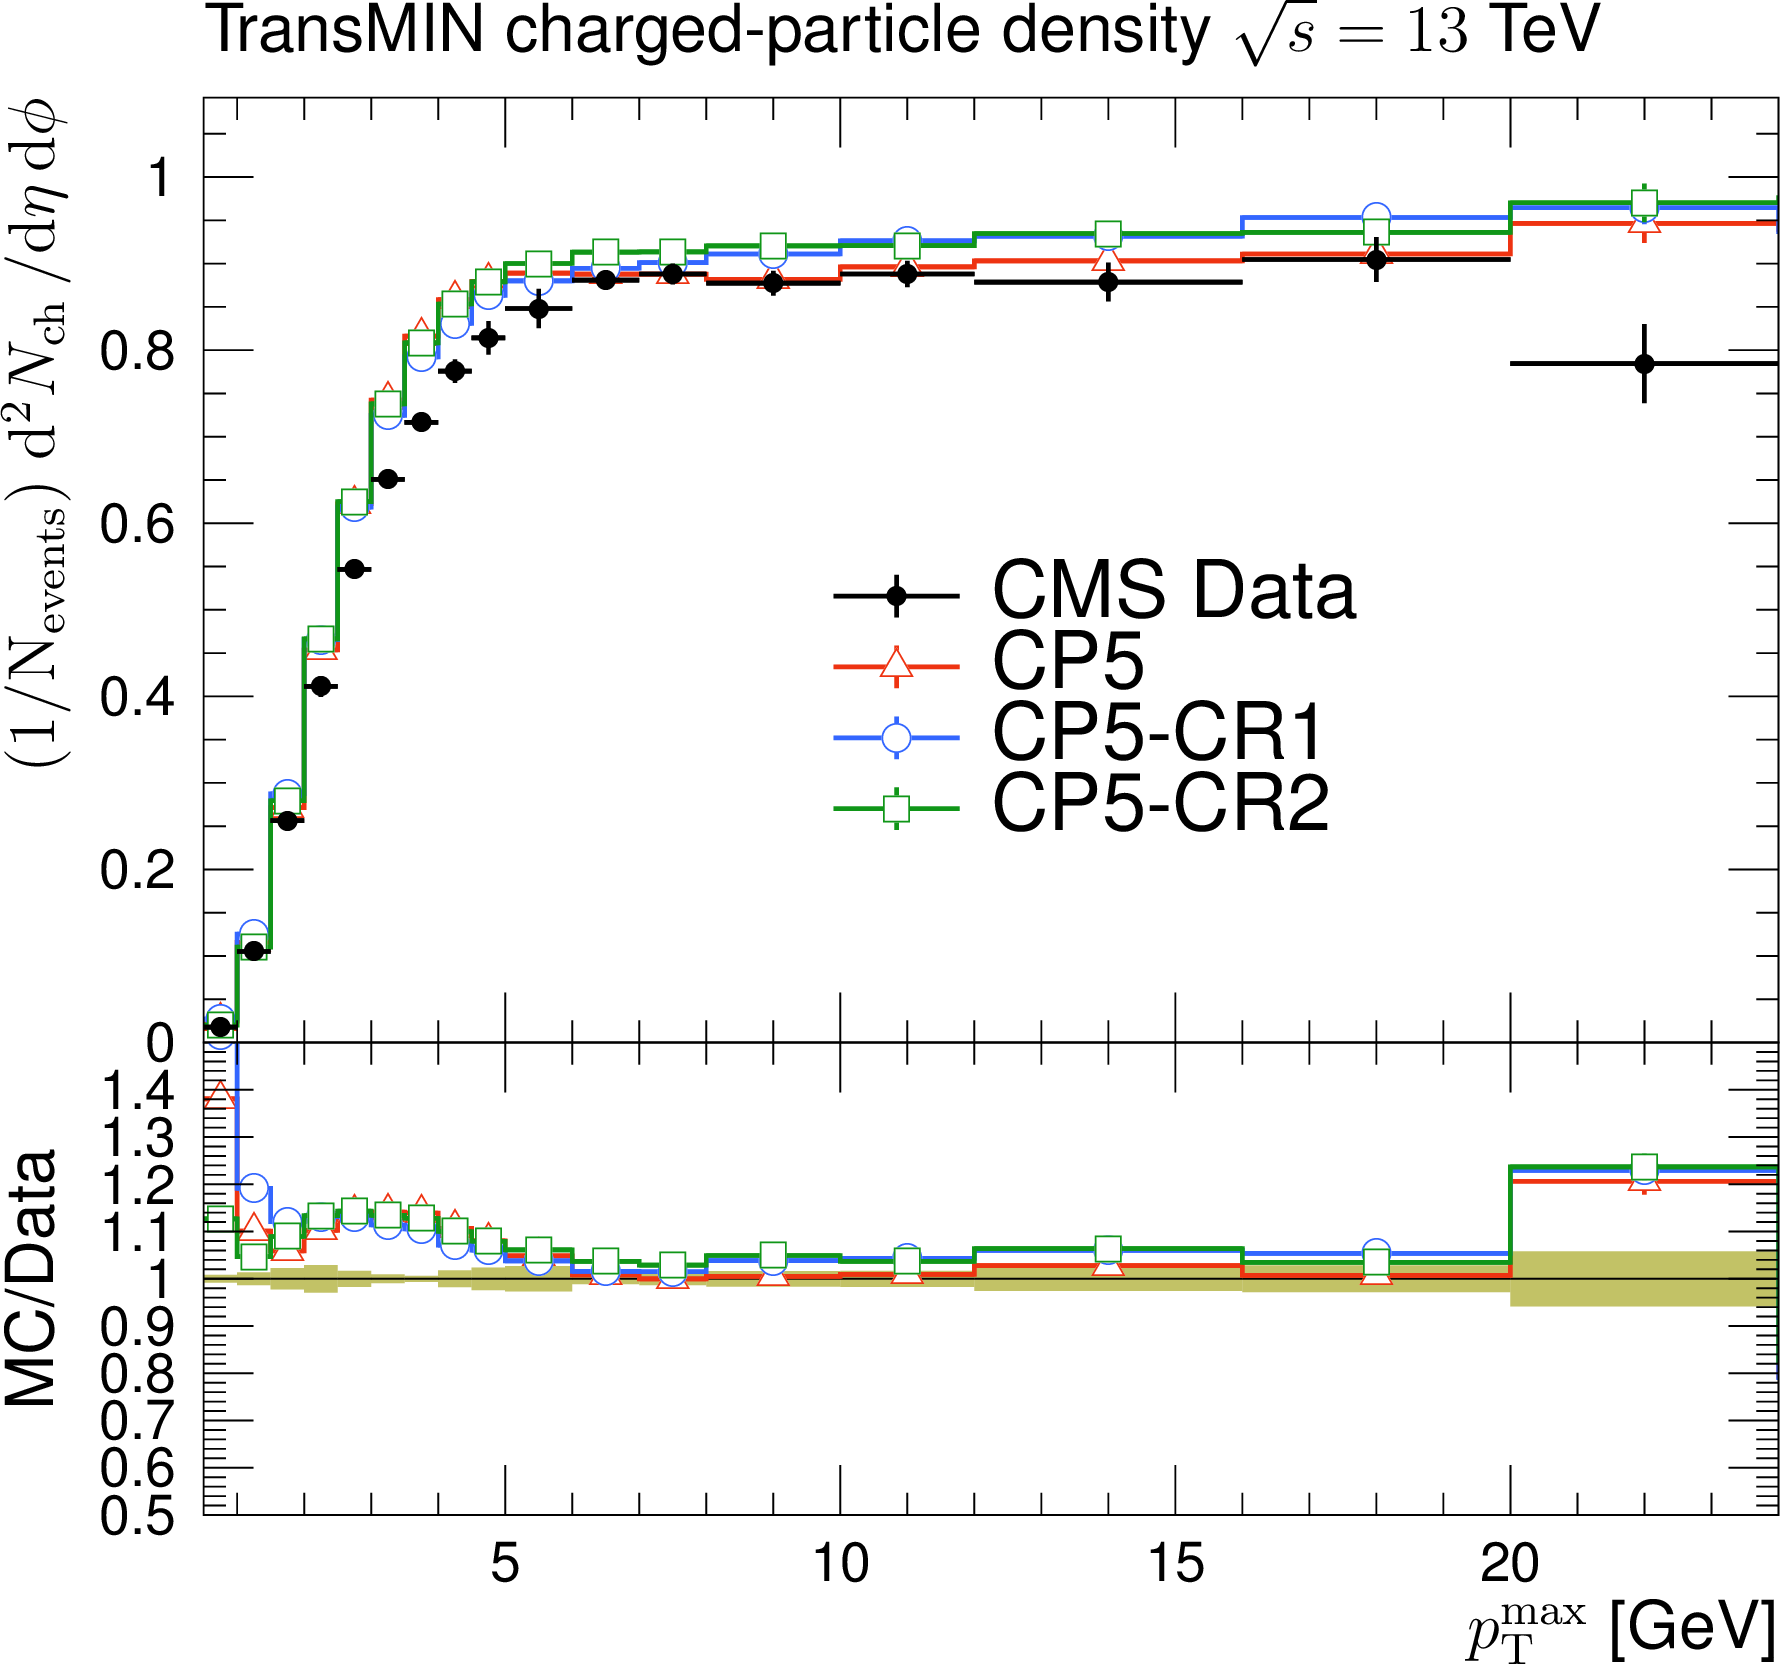
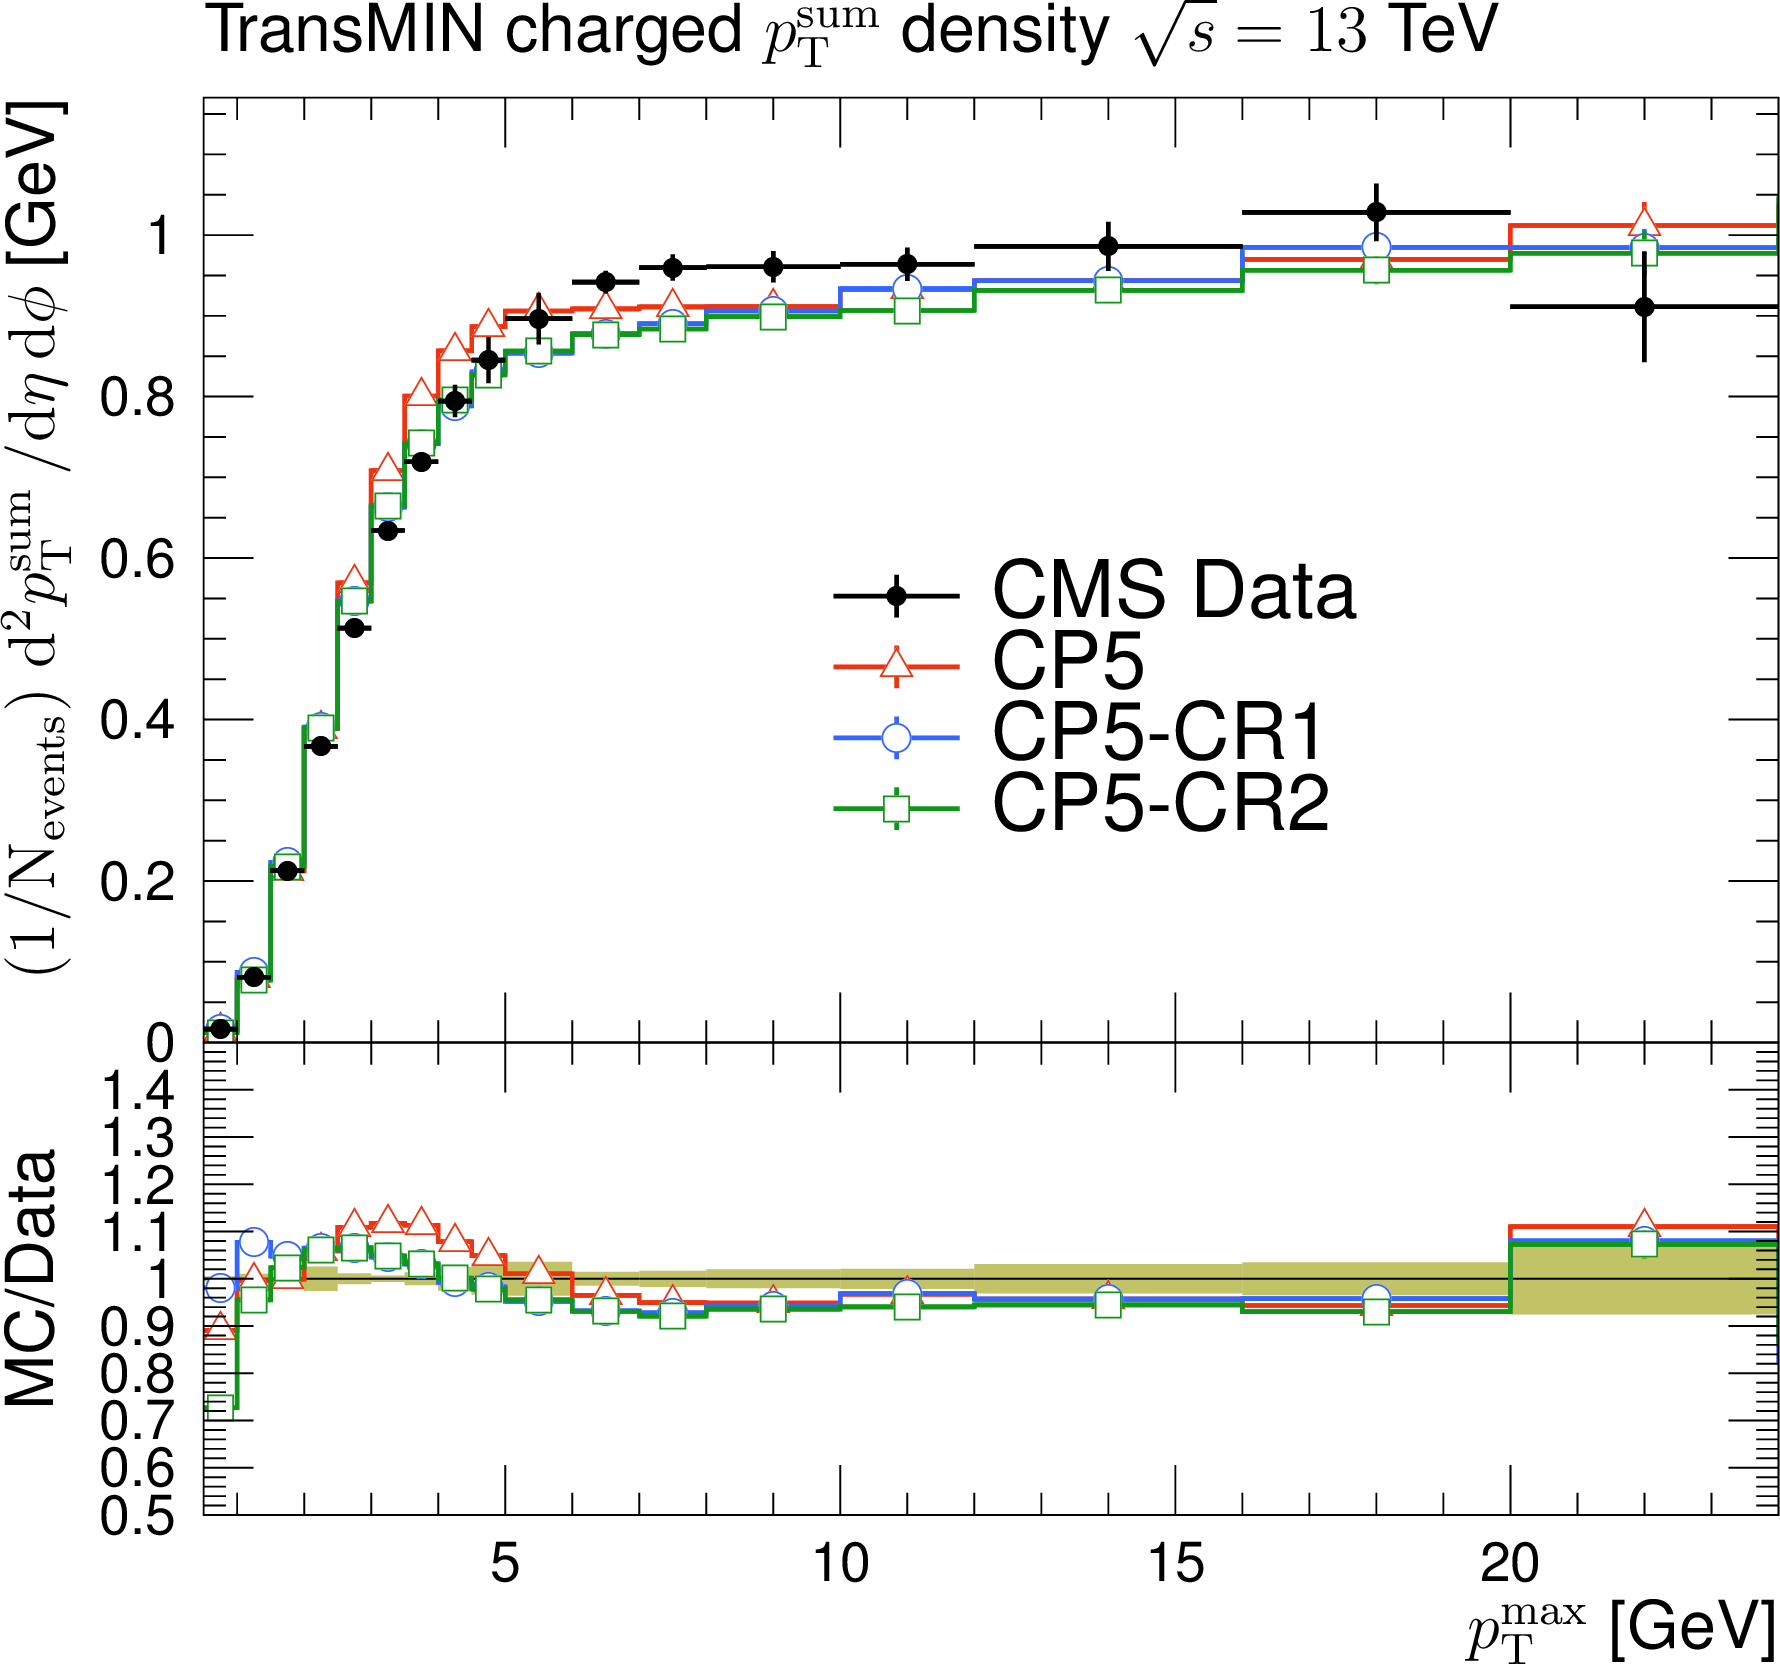
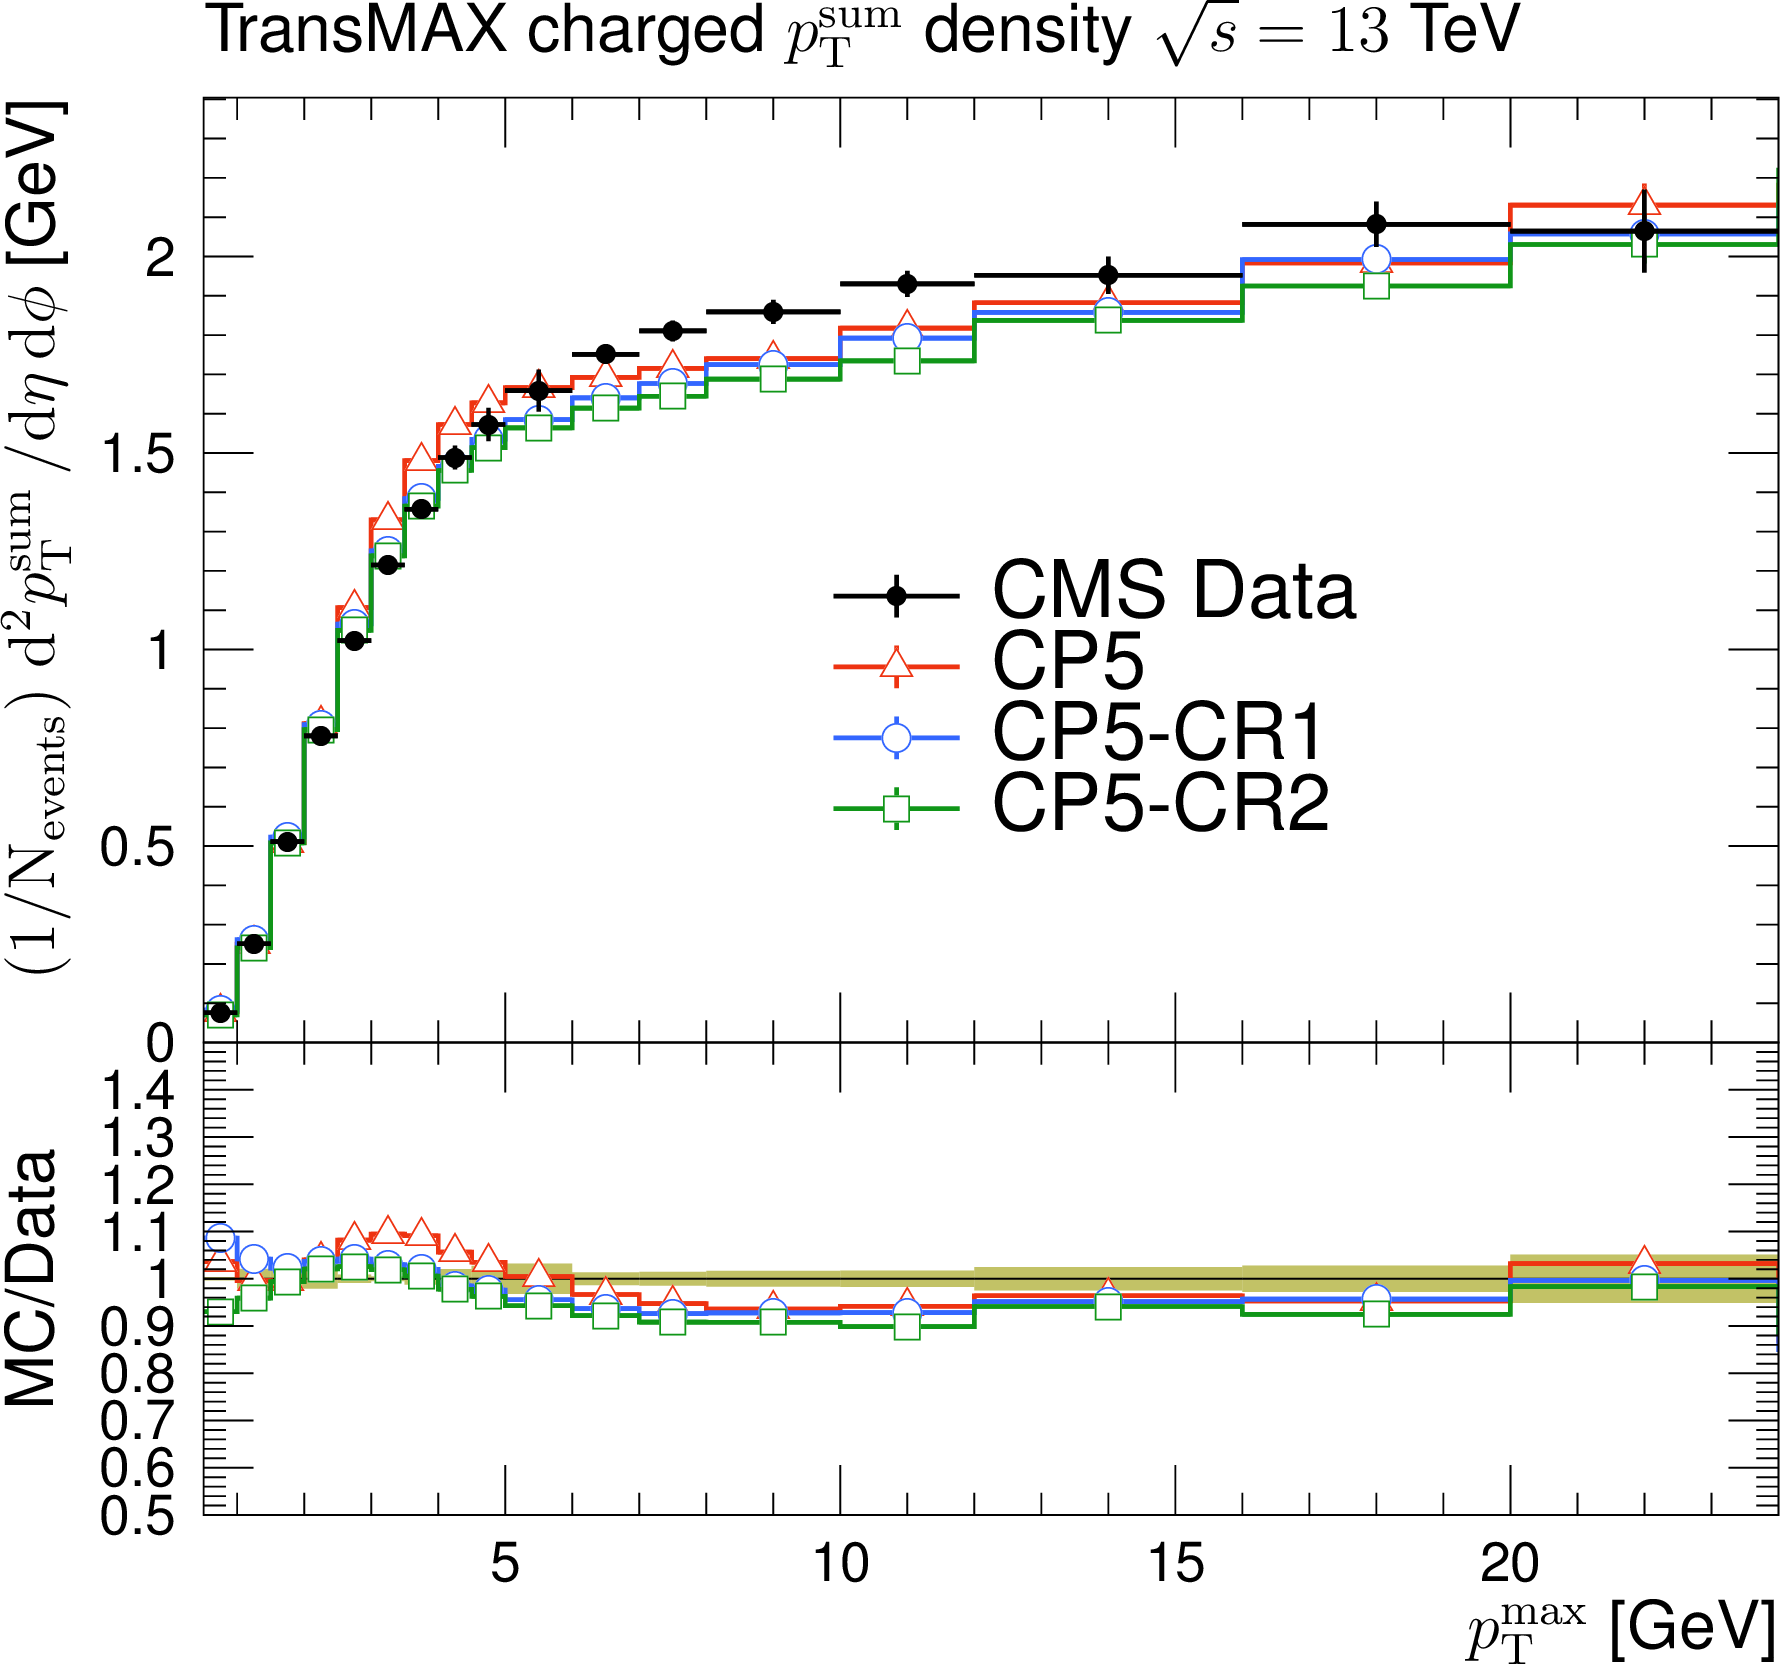
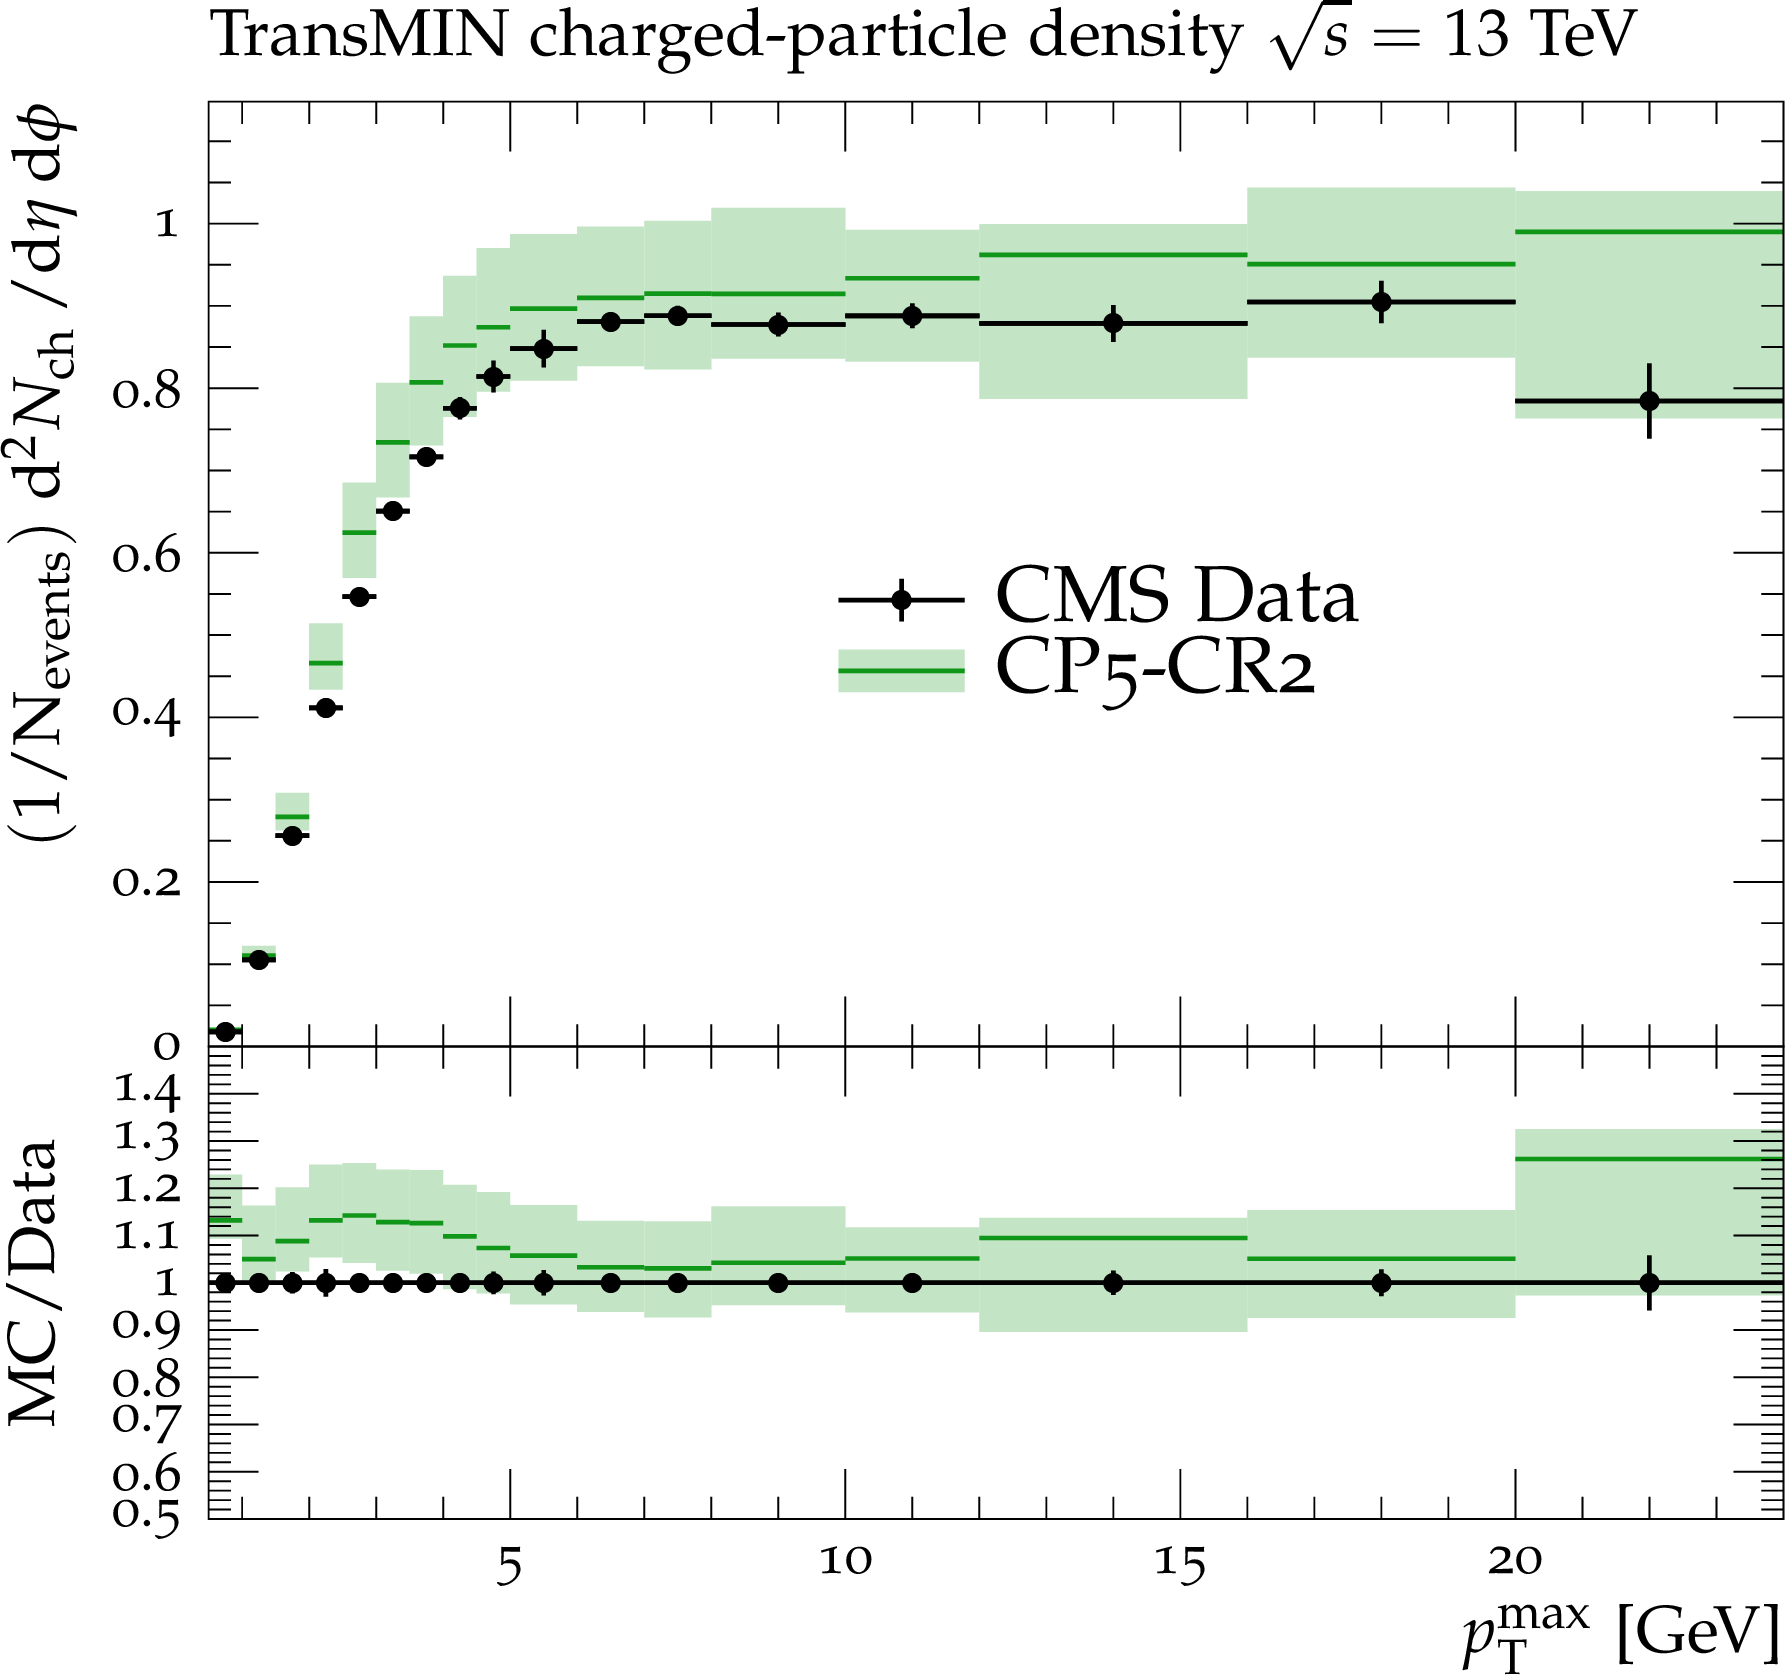
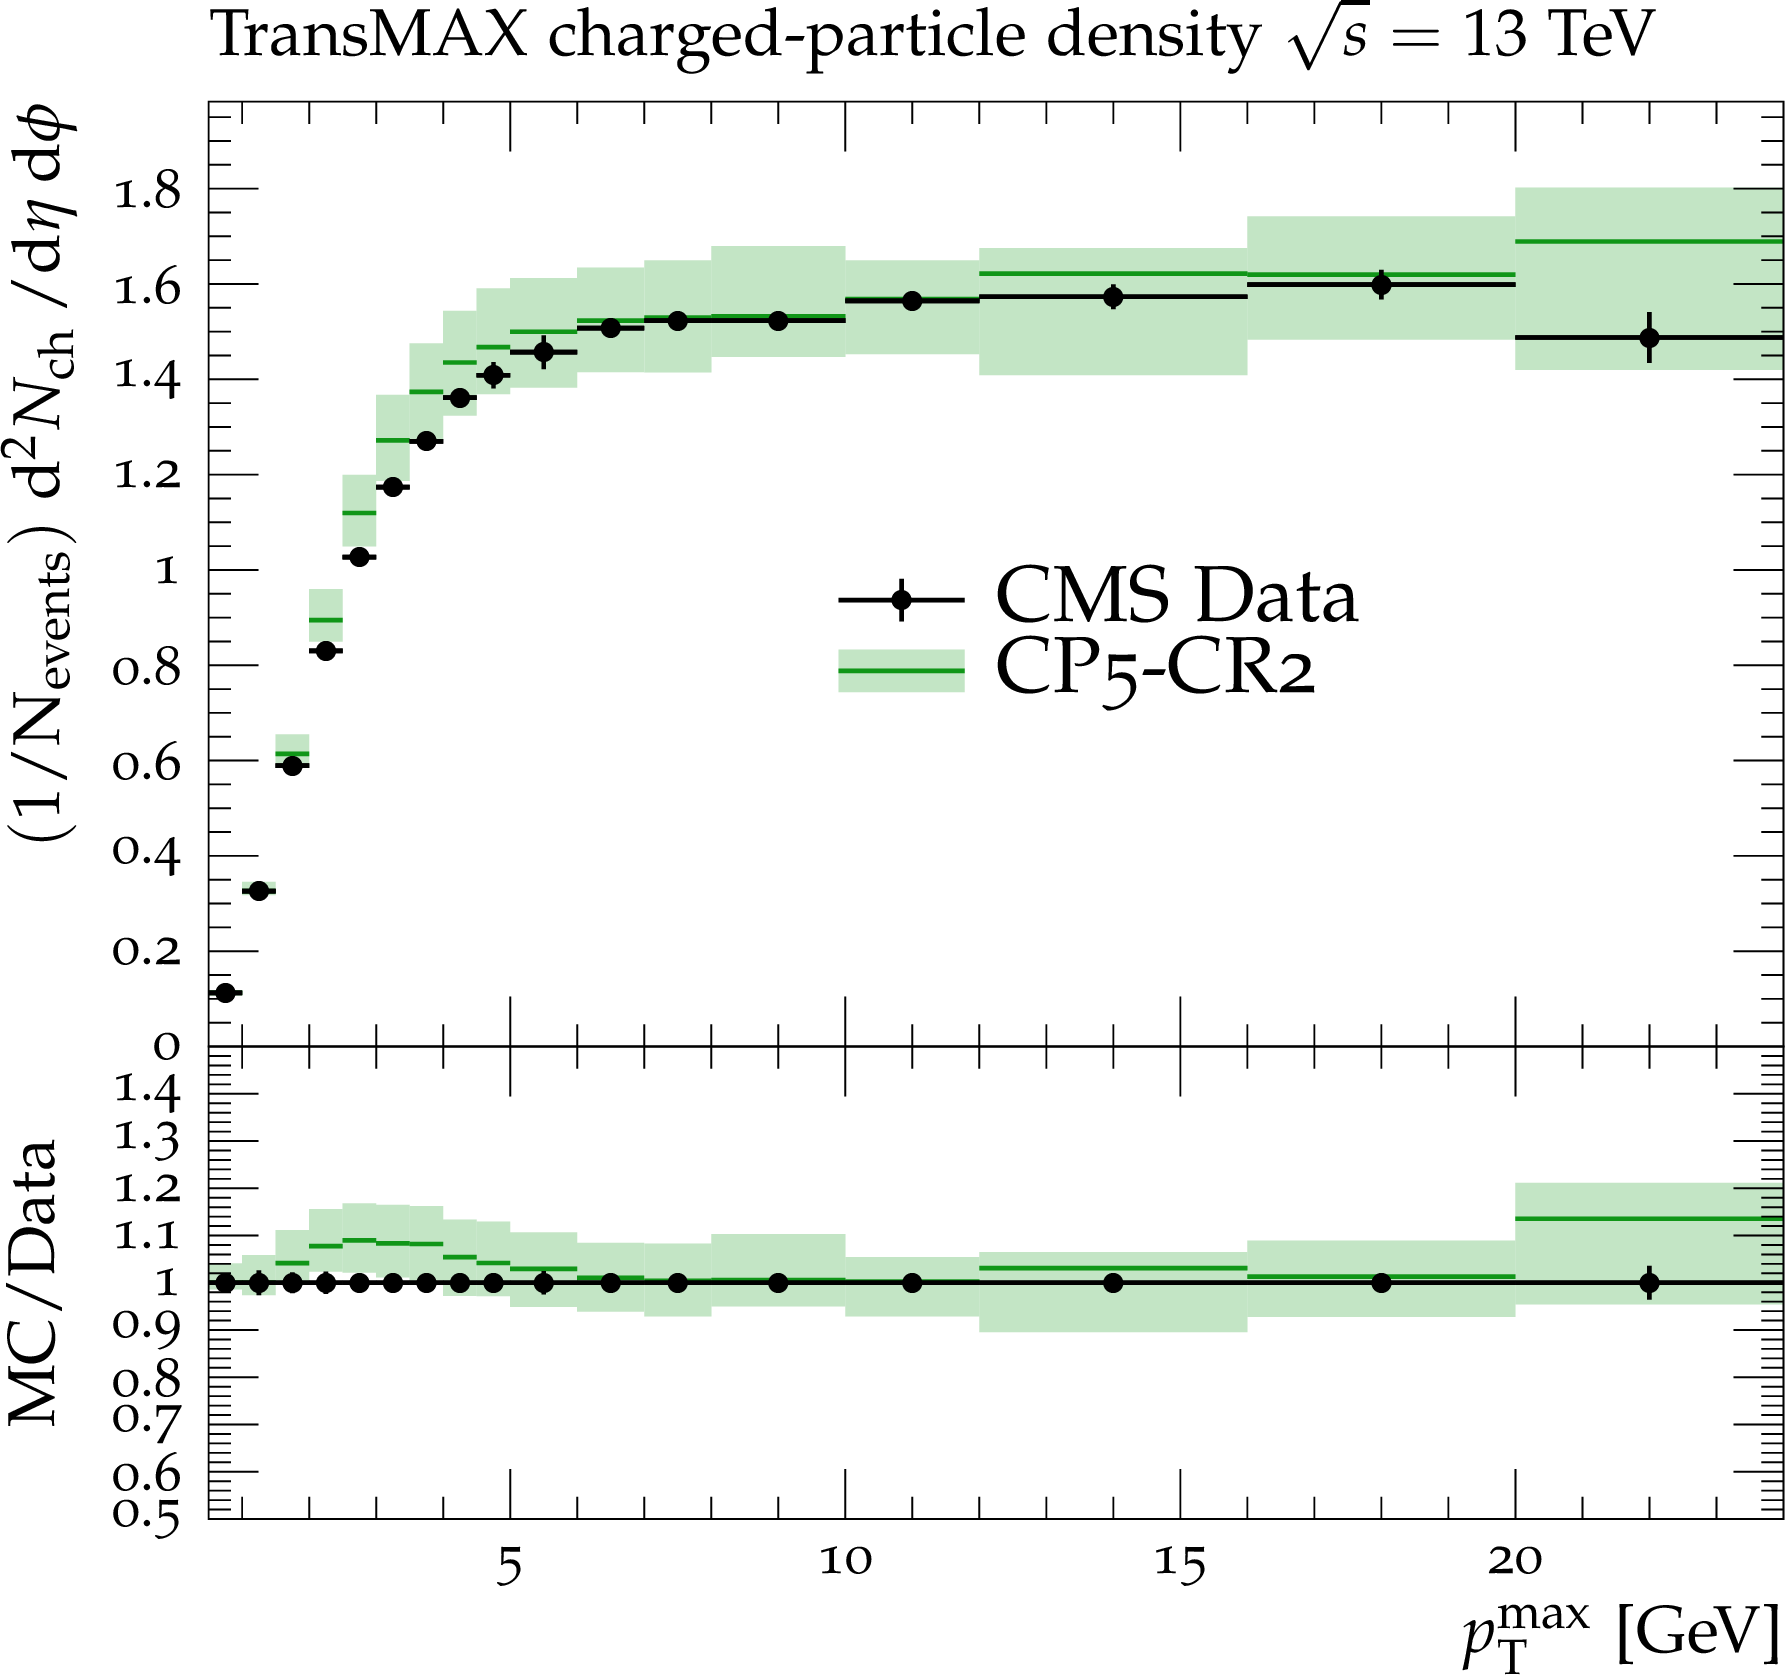
Figure 5:
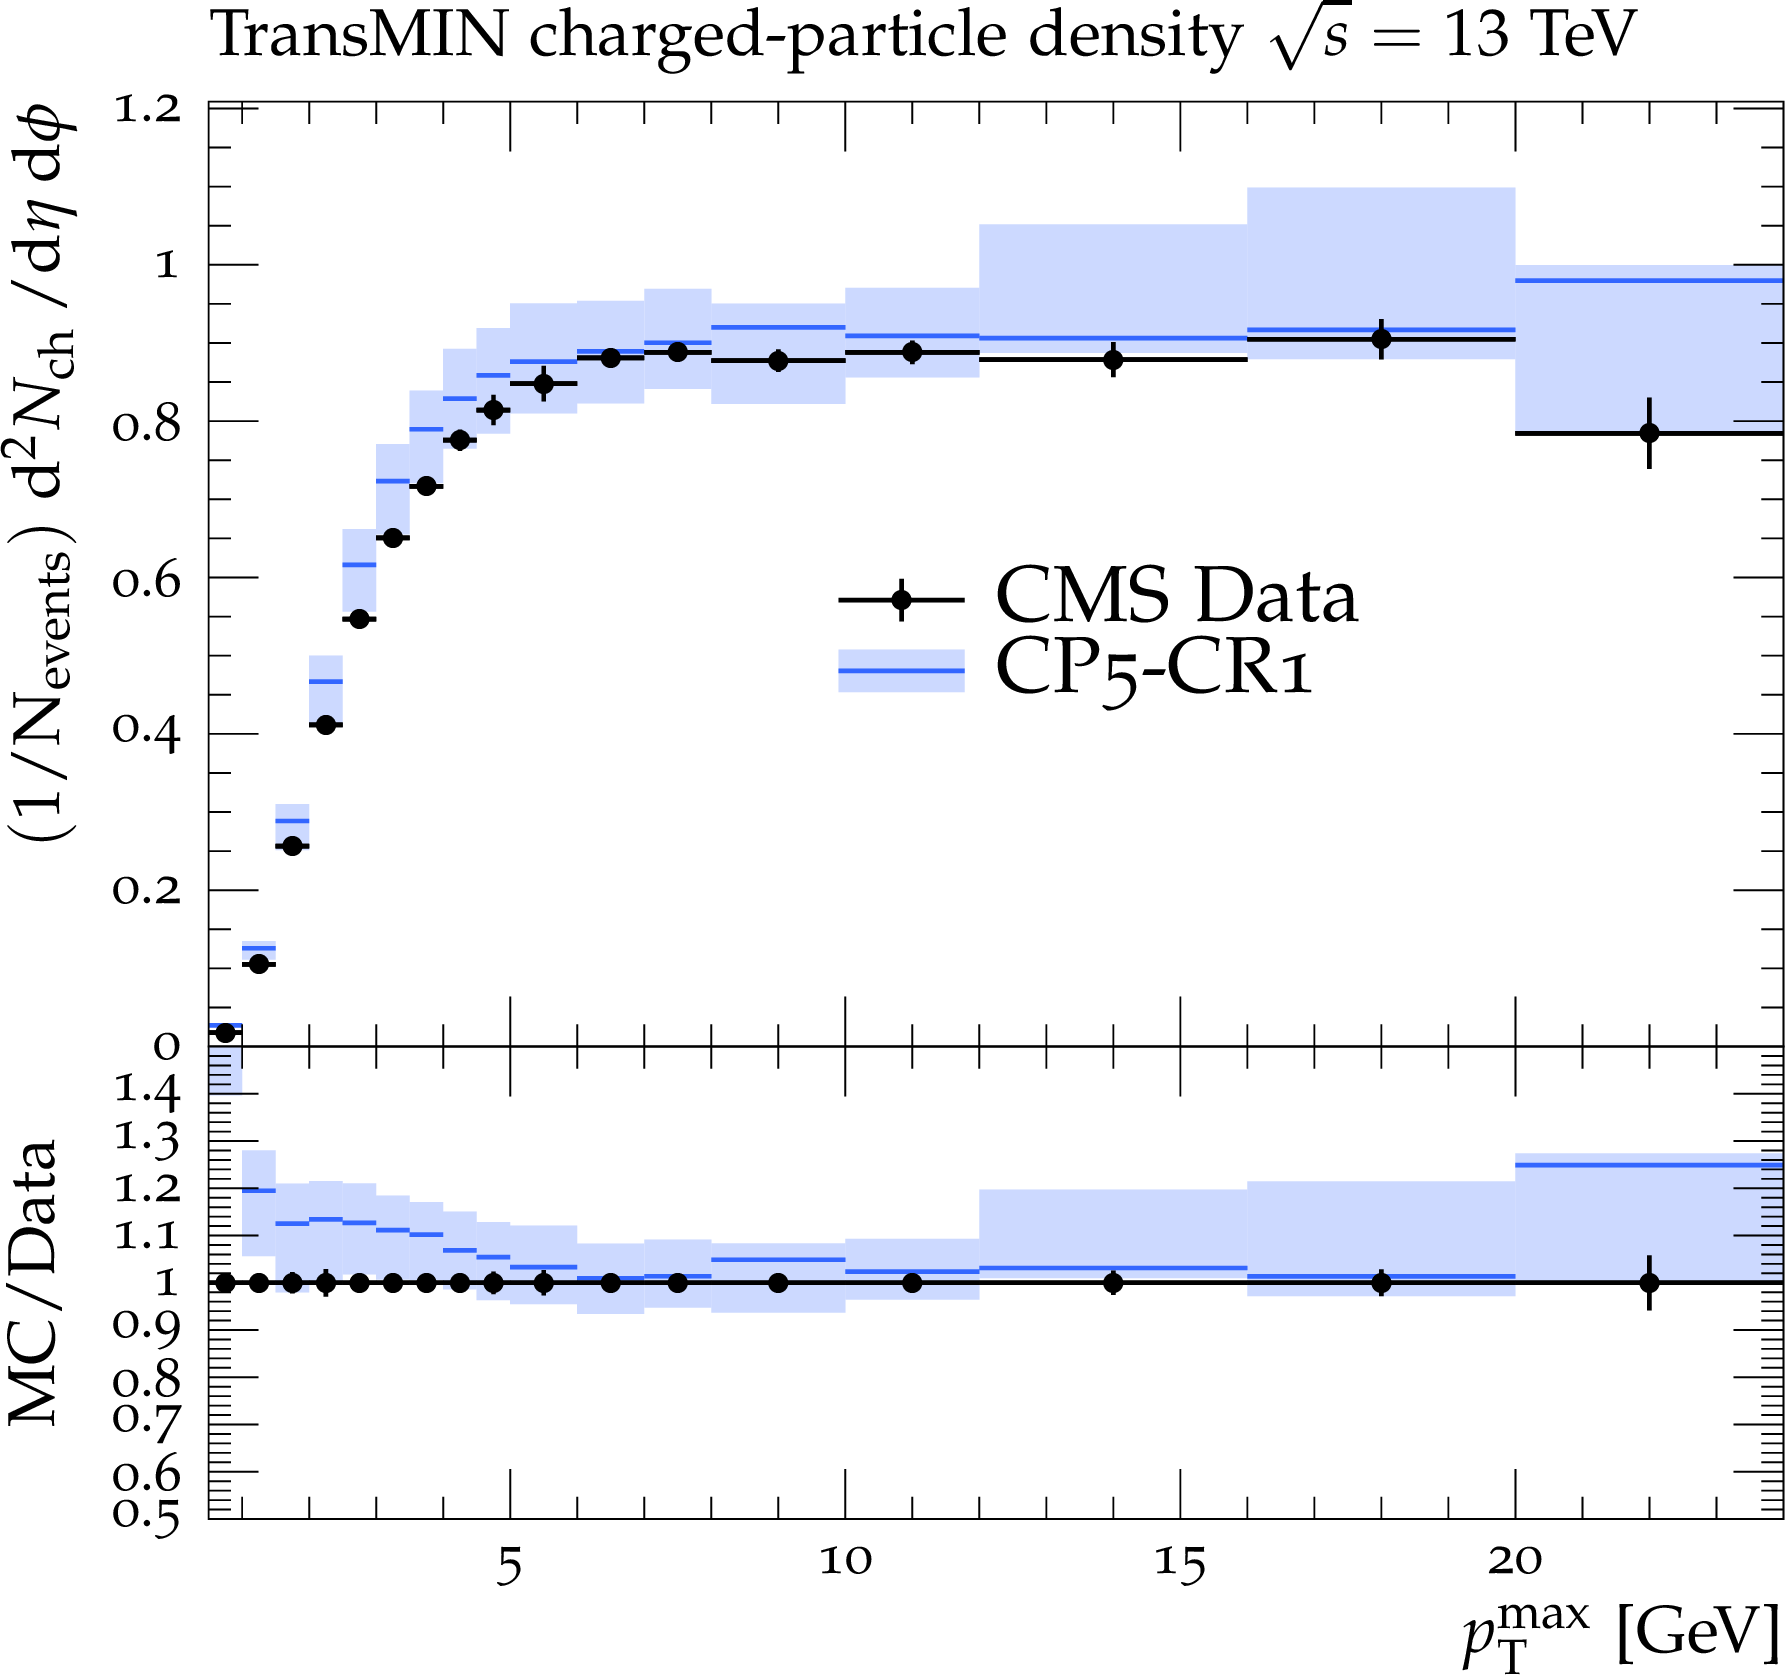
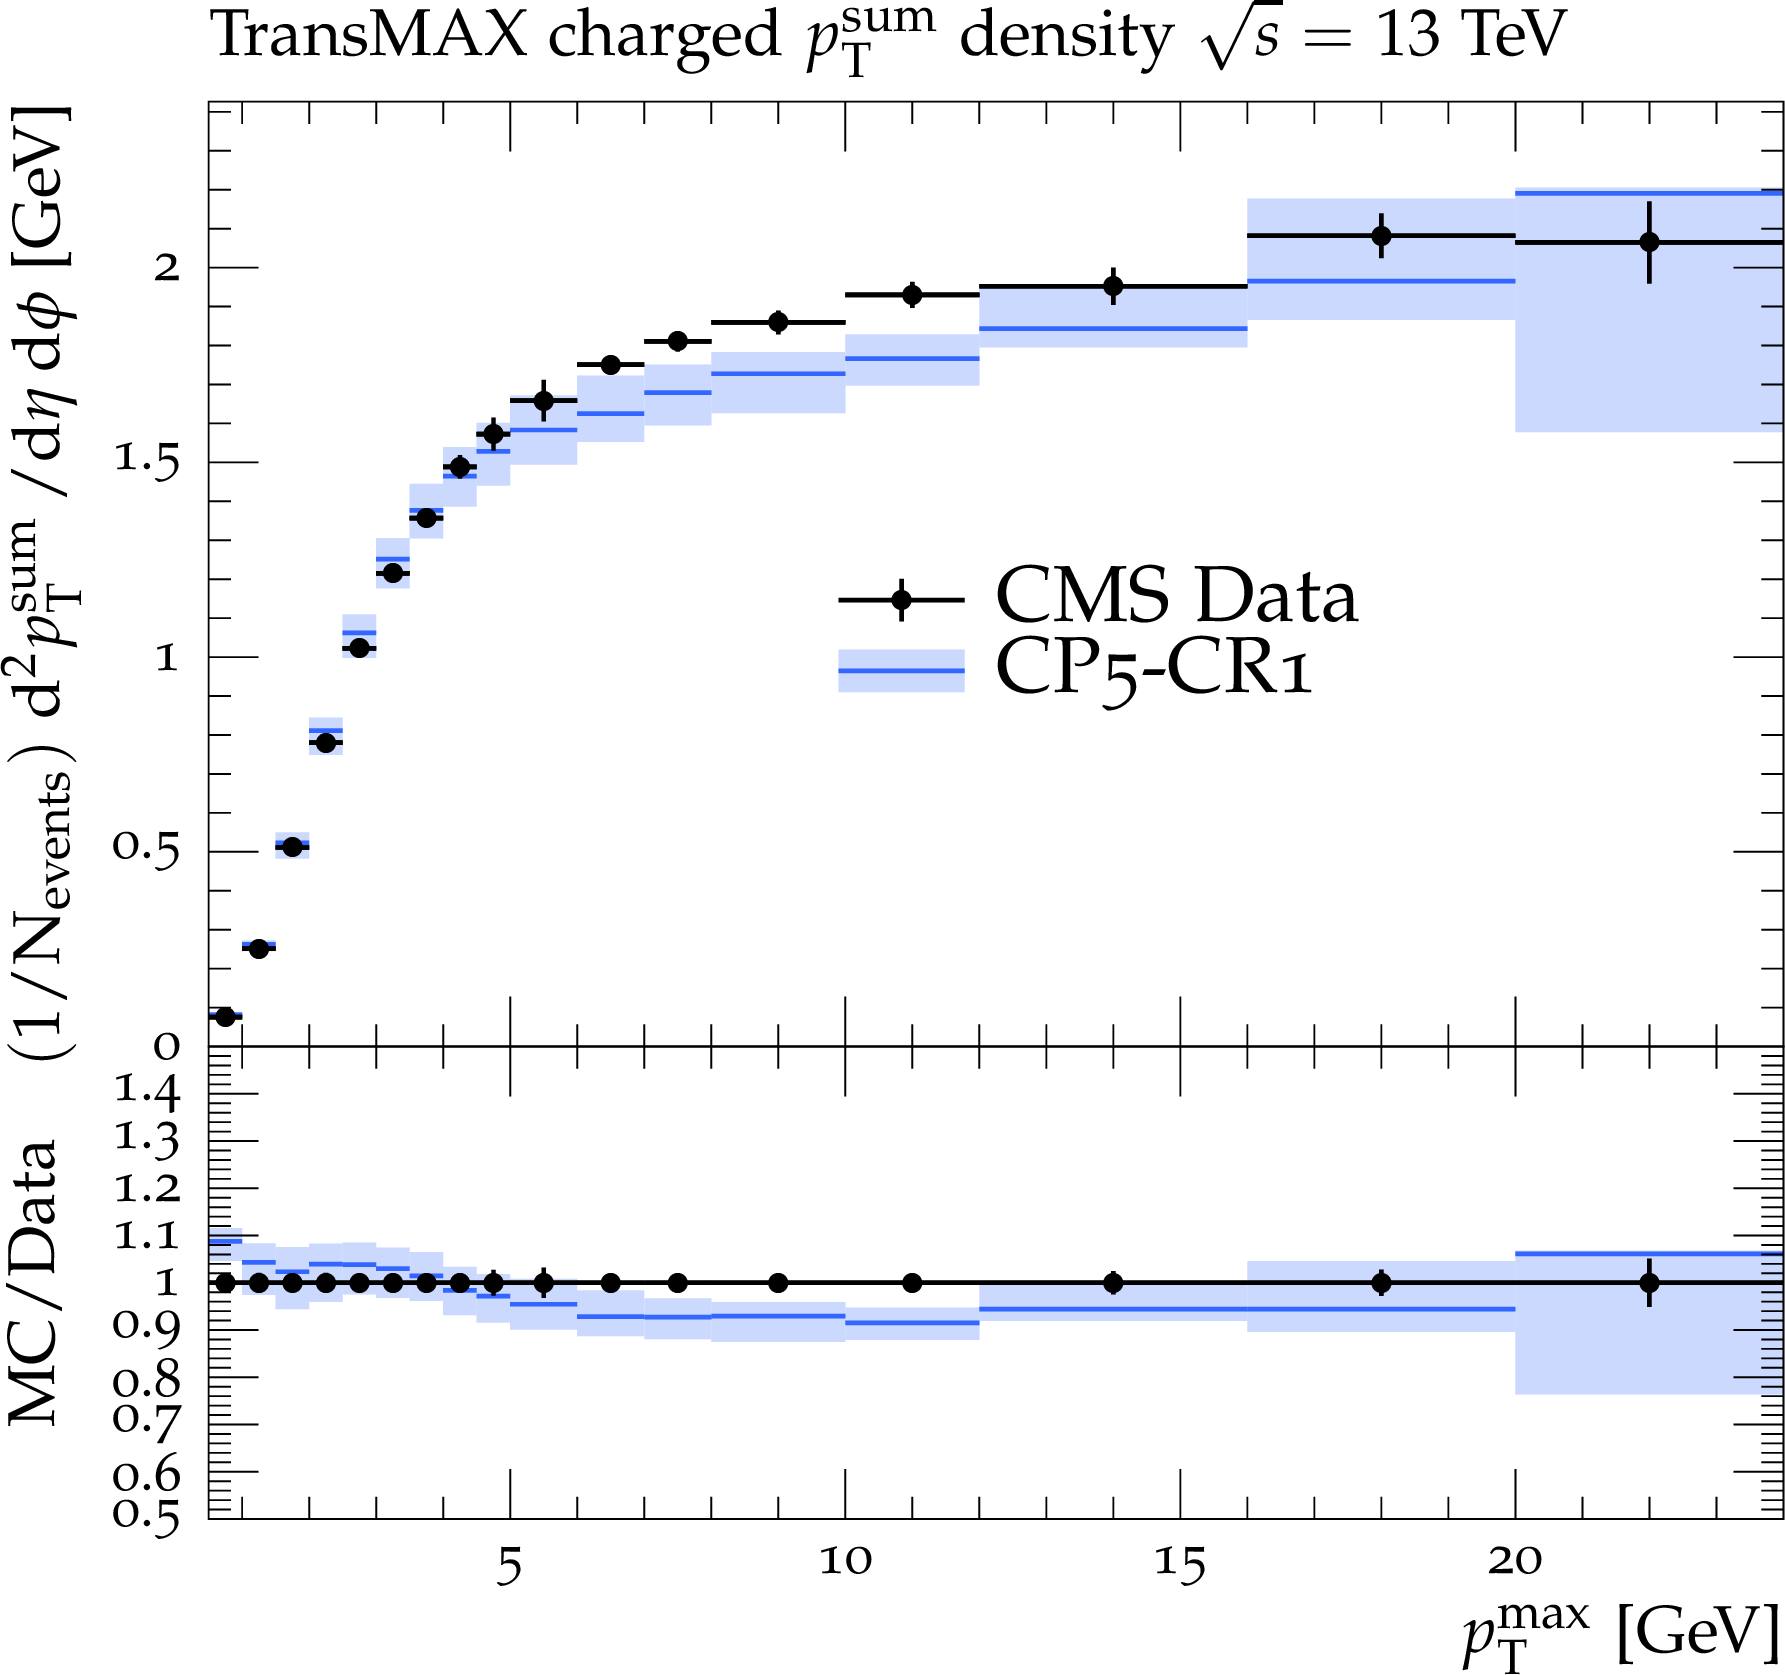
The charged-particle (left) and $ p_{\mathrm{T}}^{\text{sum}} $ (right) densities in the transMIN (upper) and transMAX (lower) regions, as functions of the $ p_{\mathrm{T}} $ of the leading charged particle, $ p_{\mathrm{T}}^{\text{max}} $, measured by the CMS experiment at $ \sqrt{s}= $ 13 TeV [17]. The predictions of the CP5 and CP5-CR tunes are compared with data. The coloured band and error bars on the data points represent the total experimental uncertainty in the data. |
png pdf |
Figure 5-a:
The charged-particle (left) and $ p_{\mathrm{T}}^{\text{sum}} $ (right) densities in the transMIN (upper) and transMAX (lower) regions, as functions of the $ p_{\mathrm{T}} $ of the leading charged particle, $ p_{\mathrm{T}}^{\text{max}} $, measured by the CMS experiment at $ \sqrt{s}= $ 13 TeV [17]. The predictions of the CP5 and CP5-CR tunes are compared with data. The coloured band and error bars on the data points represent the total experimental uncertainty in the data. |
png pdf |
Figure 5-b:
The charged-particle (left) and $ p_{\mathrm{T}}^{\text{sum}} $ (right) densities in the transMIN (upper) and transMAX (lower) regions, as functions of the $ p_{\mathrm{T}} $ of the leading charged particle, $ p_{\mathrm{T}}^{\text{max}} $, measured by the CMS experiment at $ \sqrt{s}= $ 13 TeV [17]. The predictions of the CP5 and CP5-CR tunes are compared with data. The coloured band and error bars on the data points represent the total experimental uncertainty in the data. |

png pdf |
Figure 5-c:
The charged-particle (left) and $ p_{\mathrm{T}}^{\text{sum}} $ (right) densities in the transMIN (upper) and transMAX (lower) regions, as functions of the $ p_{\mathrm{T}} $ of the leading charged particle, $ p_{\mathrm{T}}^{\text{max}} $, measured by the CMS experiment at $ \sqrt{s}= $ 13 TeV [17]. The predictions of the CP5 and CP5-CR tunes are compared with data. The coloured band and error bars on the data points represent the total experimental uncertainty in the data. |
png pdf |
Figure 5-d:
The charged-particle (left) and $ p_{\mathrm{T}}^{\text{sum}} $ (right) densities in the transMIN (upper) and transMAX (lower) regions, as functions of the $ p_{\mathrm{T}} $ of the leading charged particle, $ p_{\mathrm{T}}^{\text{max}} $, measured by the CMS experiment at $ \sqrt{s}= $ 13 TeV [17]. The predictions of the CP5 and CP5-CR tunes are compared with data. The coloured band and error bars on the data points represent the total experimental uncertainty in the data. |
png pdf |
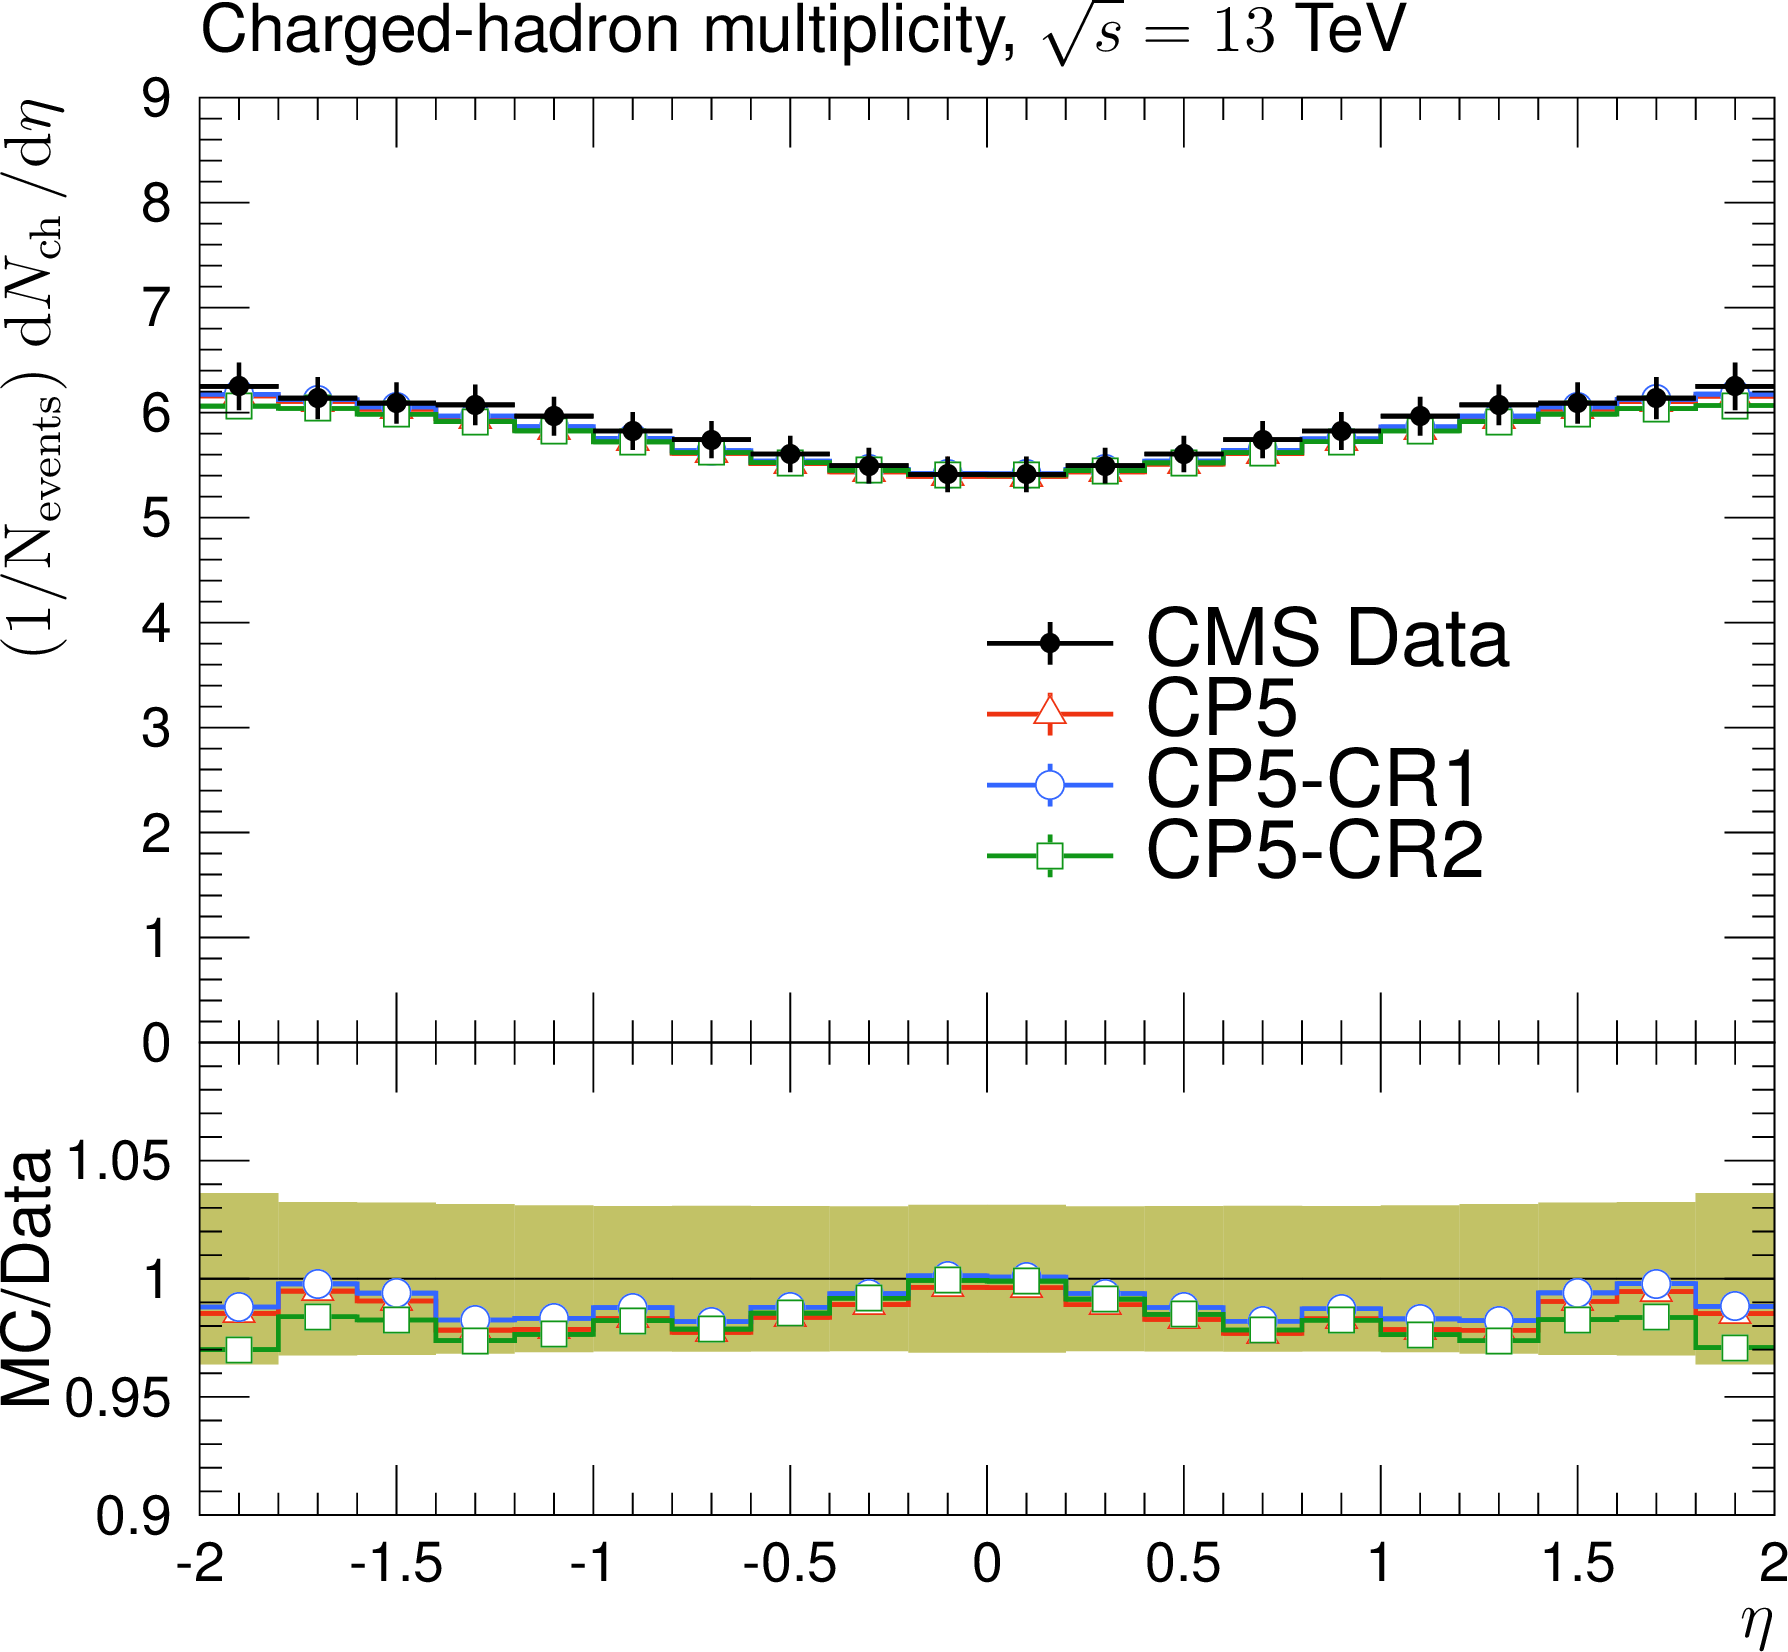
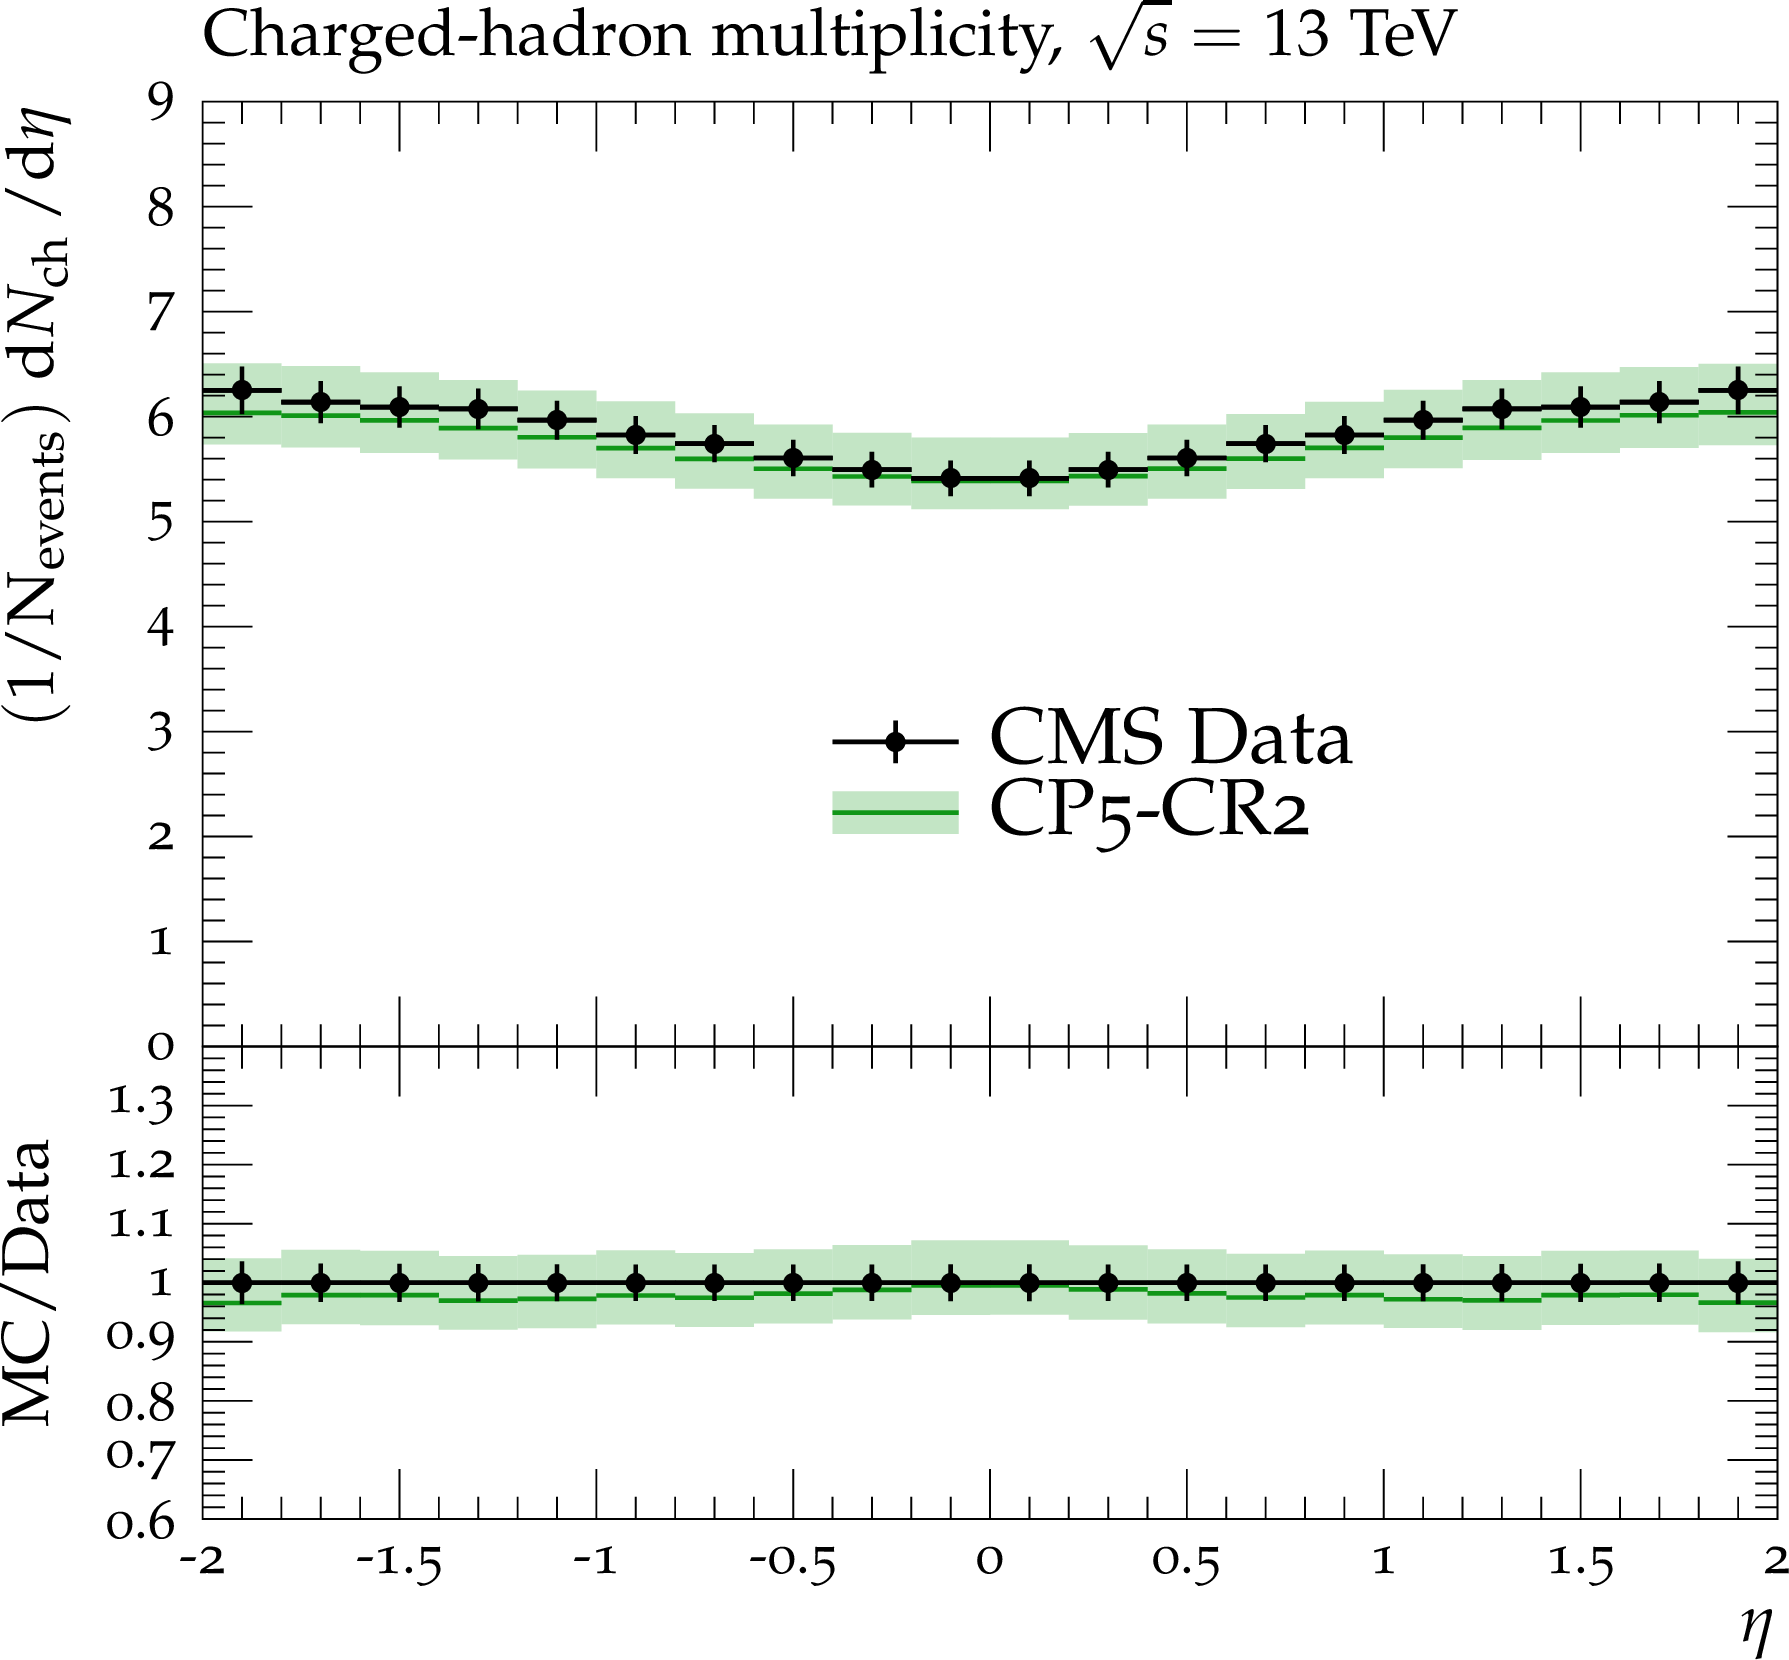
Figure 6:
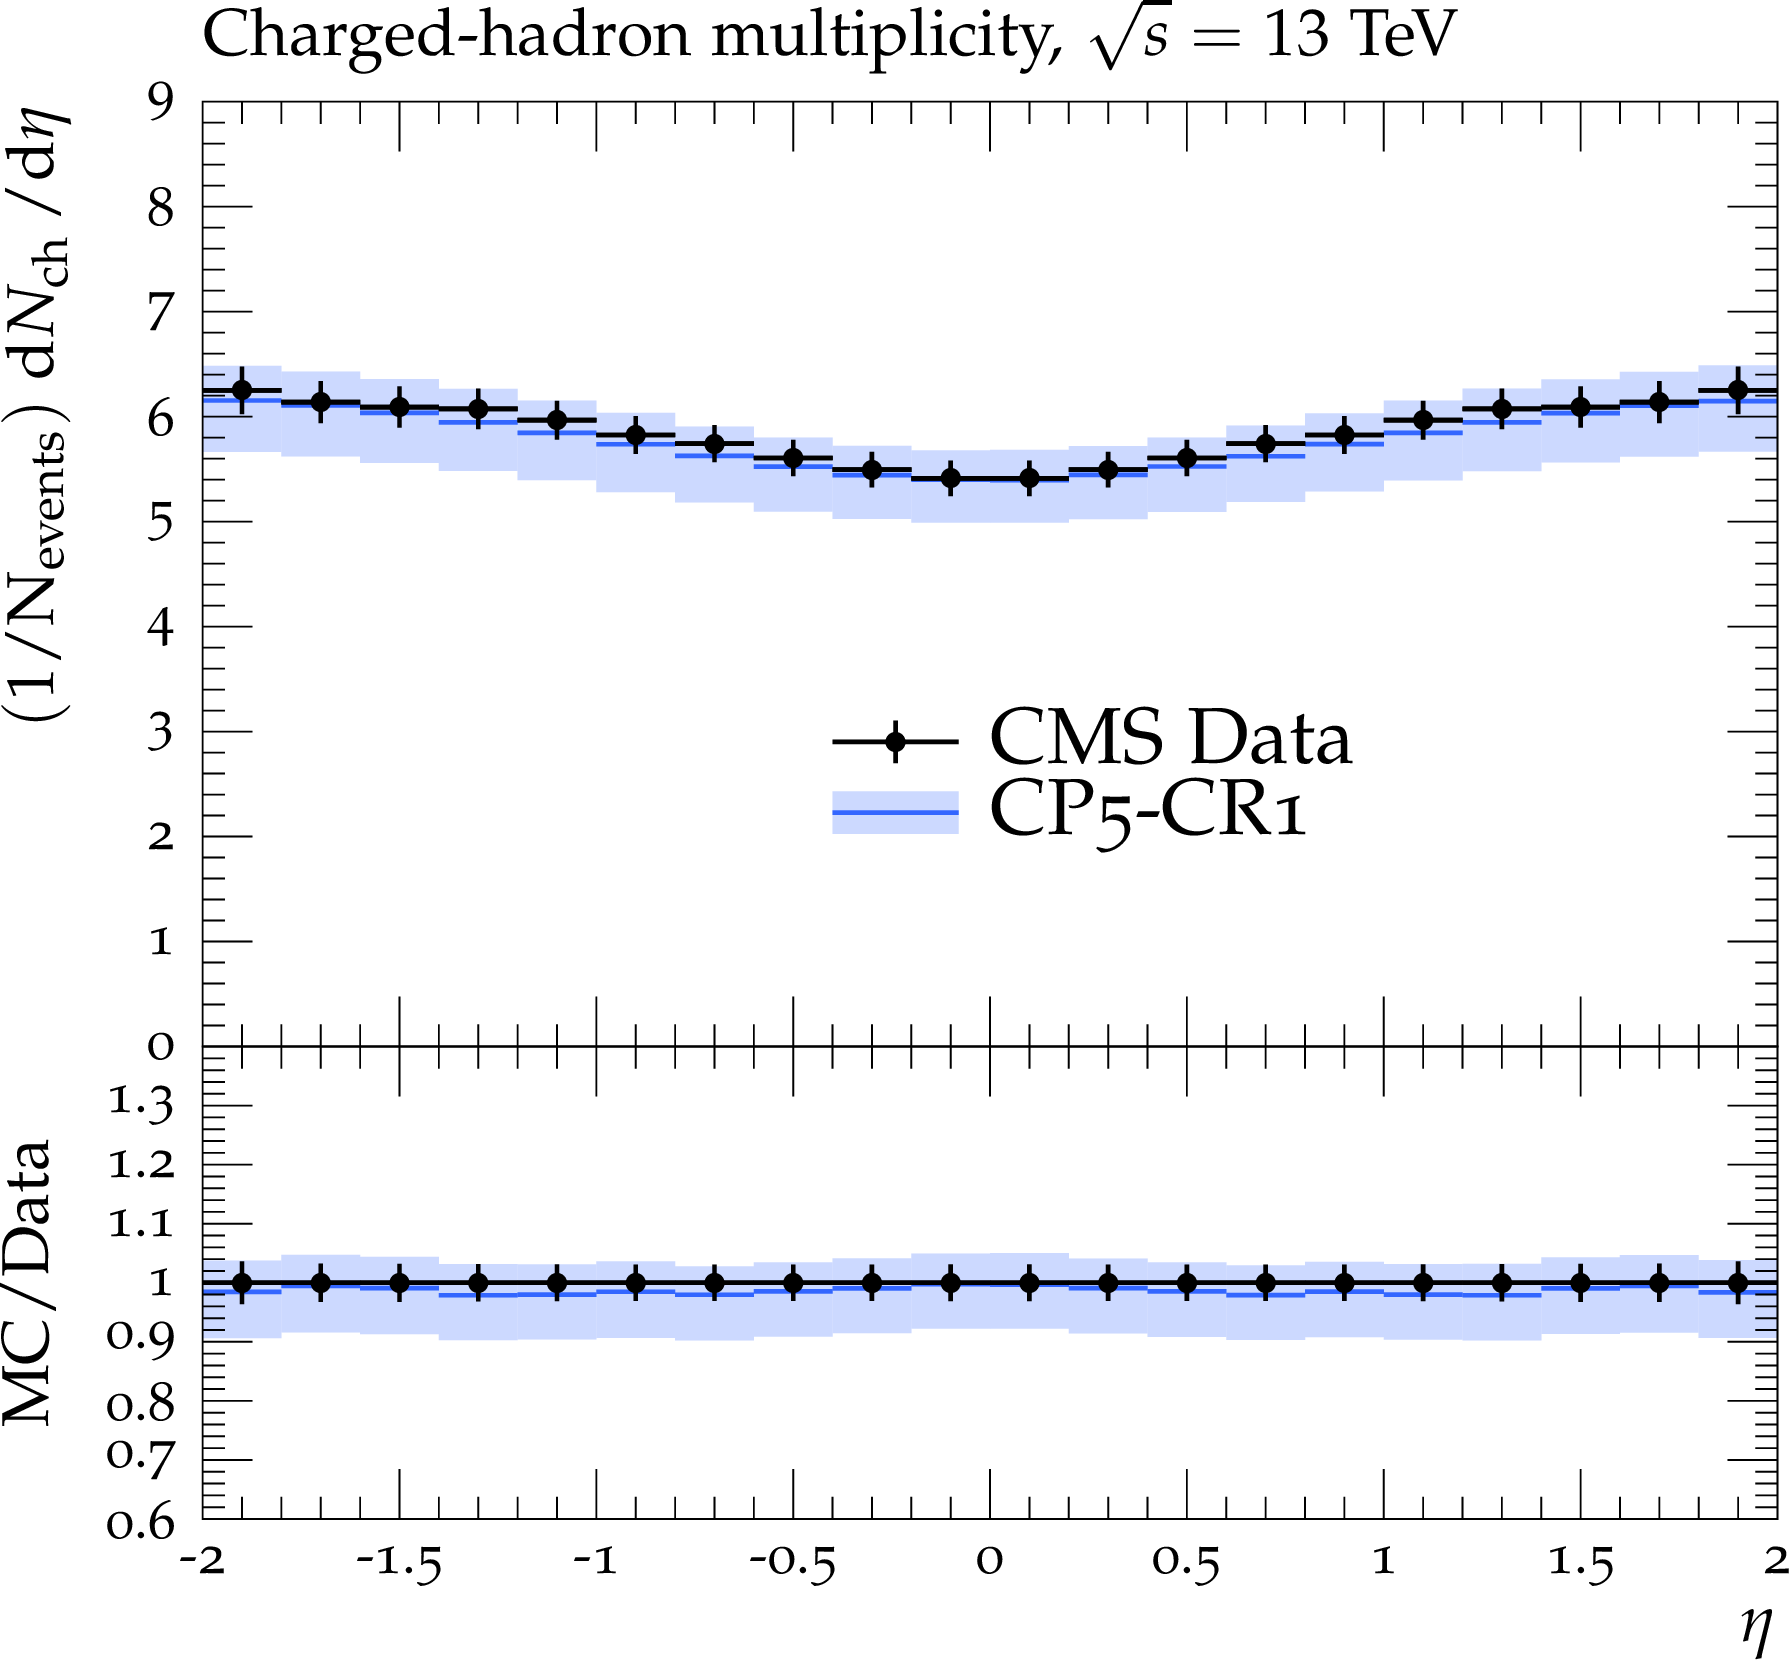
The pseudorapidity of charged hadrons, $ \mathrm{d}N_{\mathrm{ch}}/\mathrm{d}\eta $, measured by the CMS experiment at $ \sqrt{s}= $ 13 TeV [22]. The predictions of the CP5 and CP5-CR tunes are compared with data. The coloured band and error bars on the data points represent the total experimental uncertainty in the data. |
png pdf |
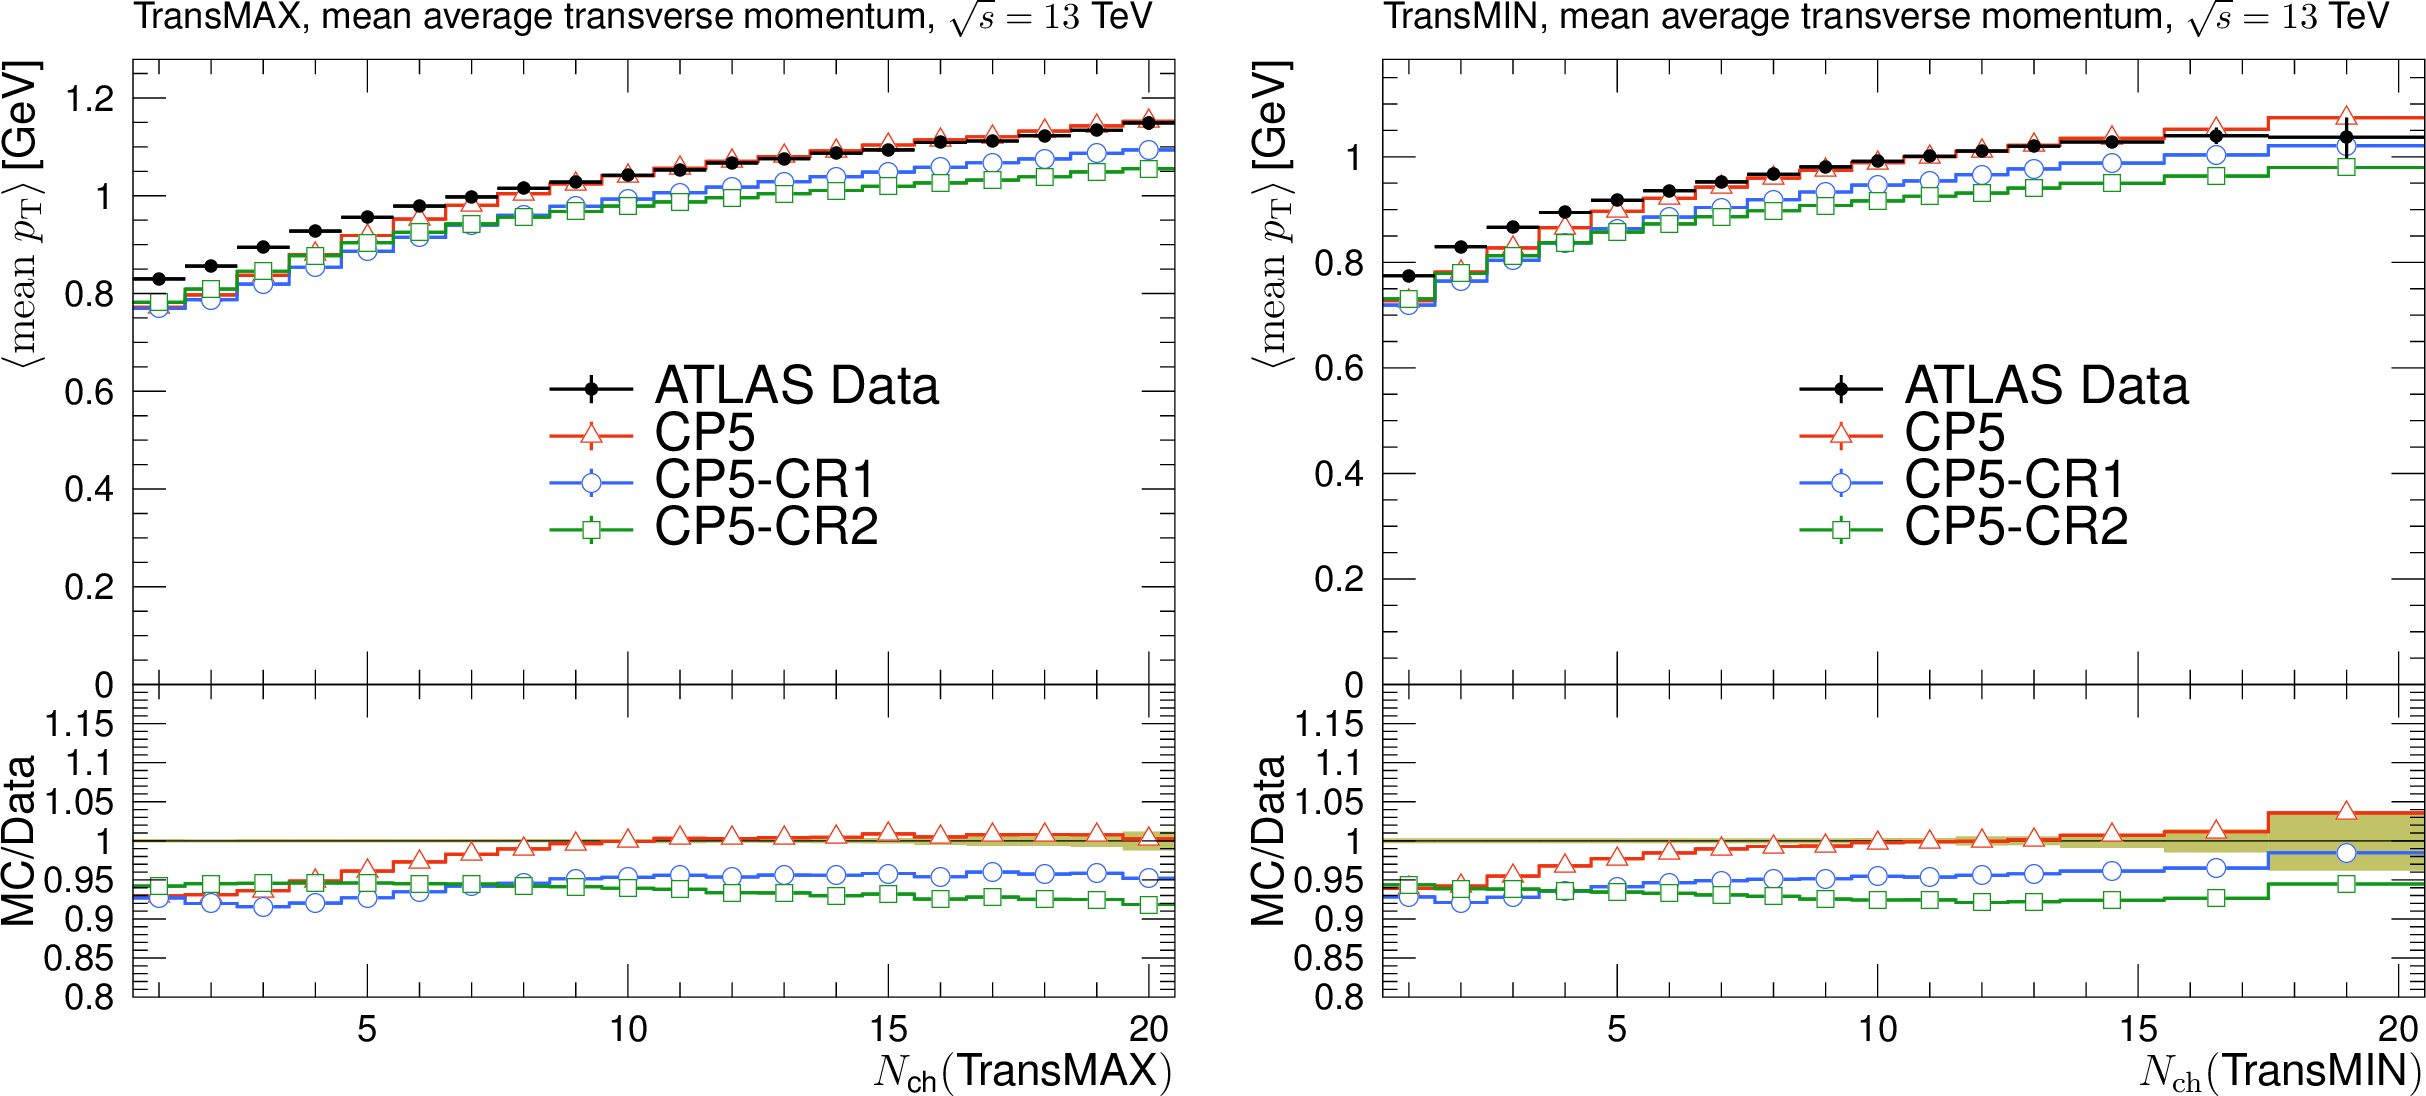
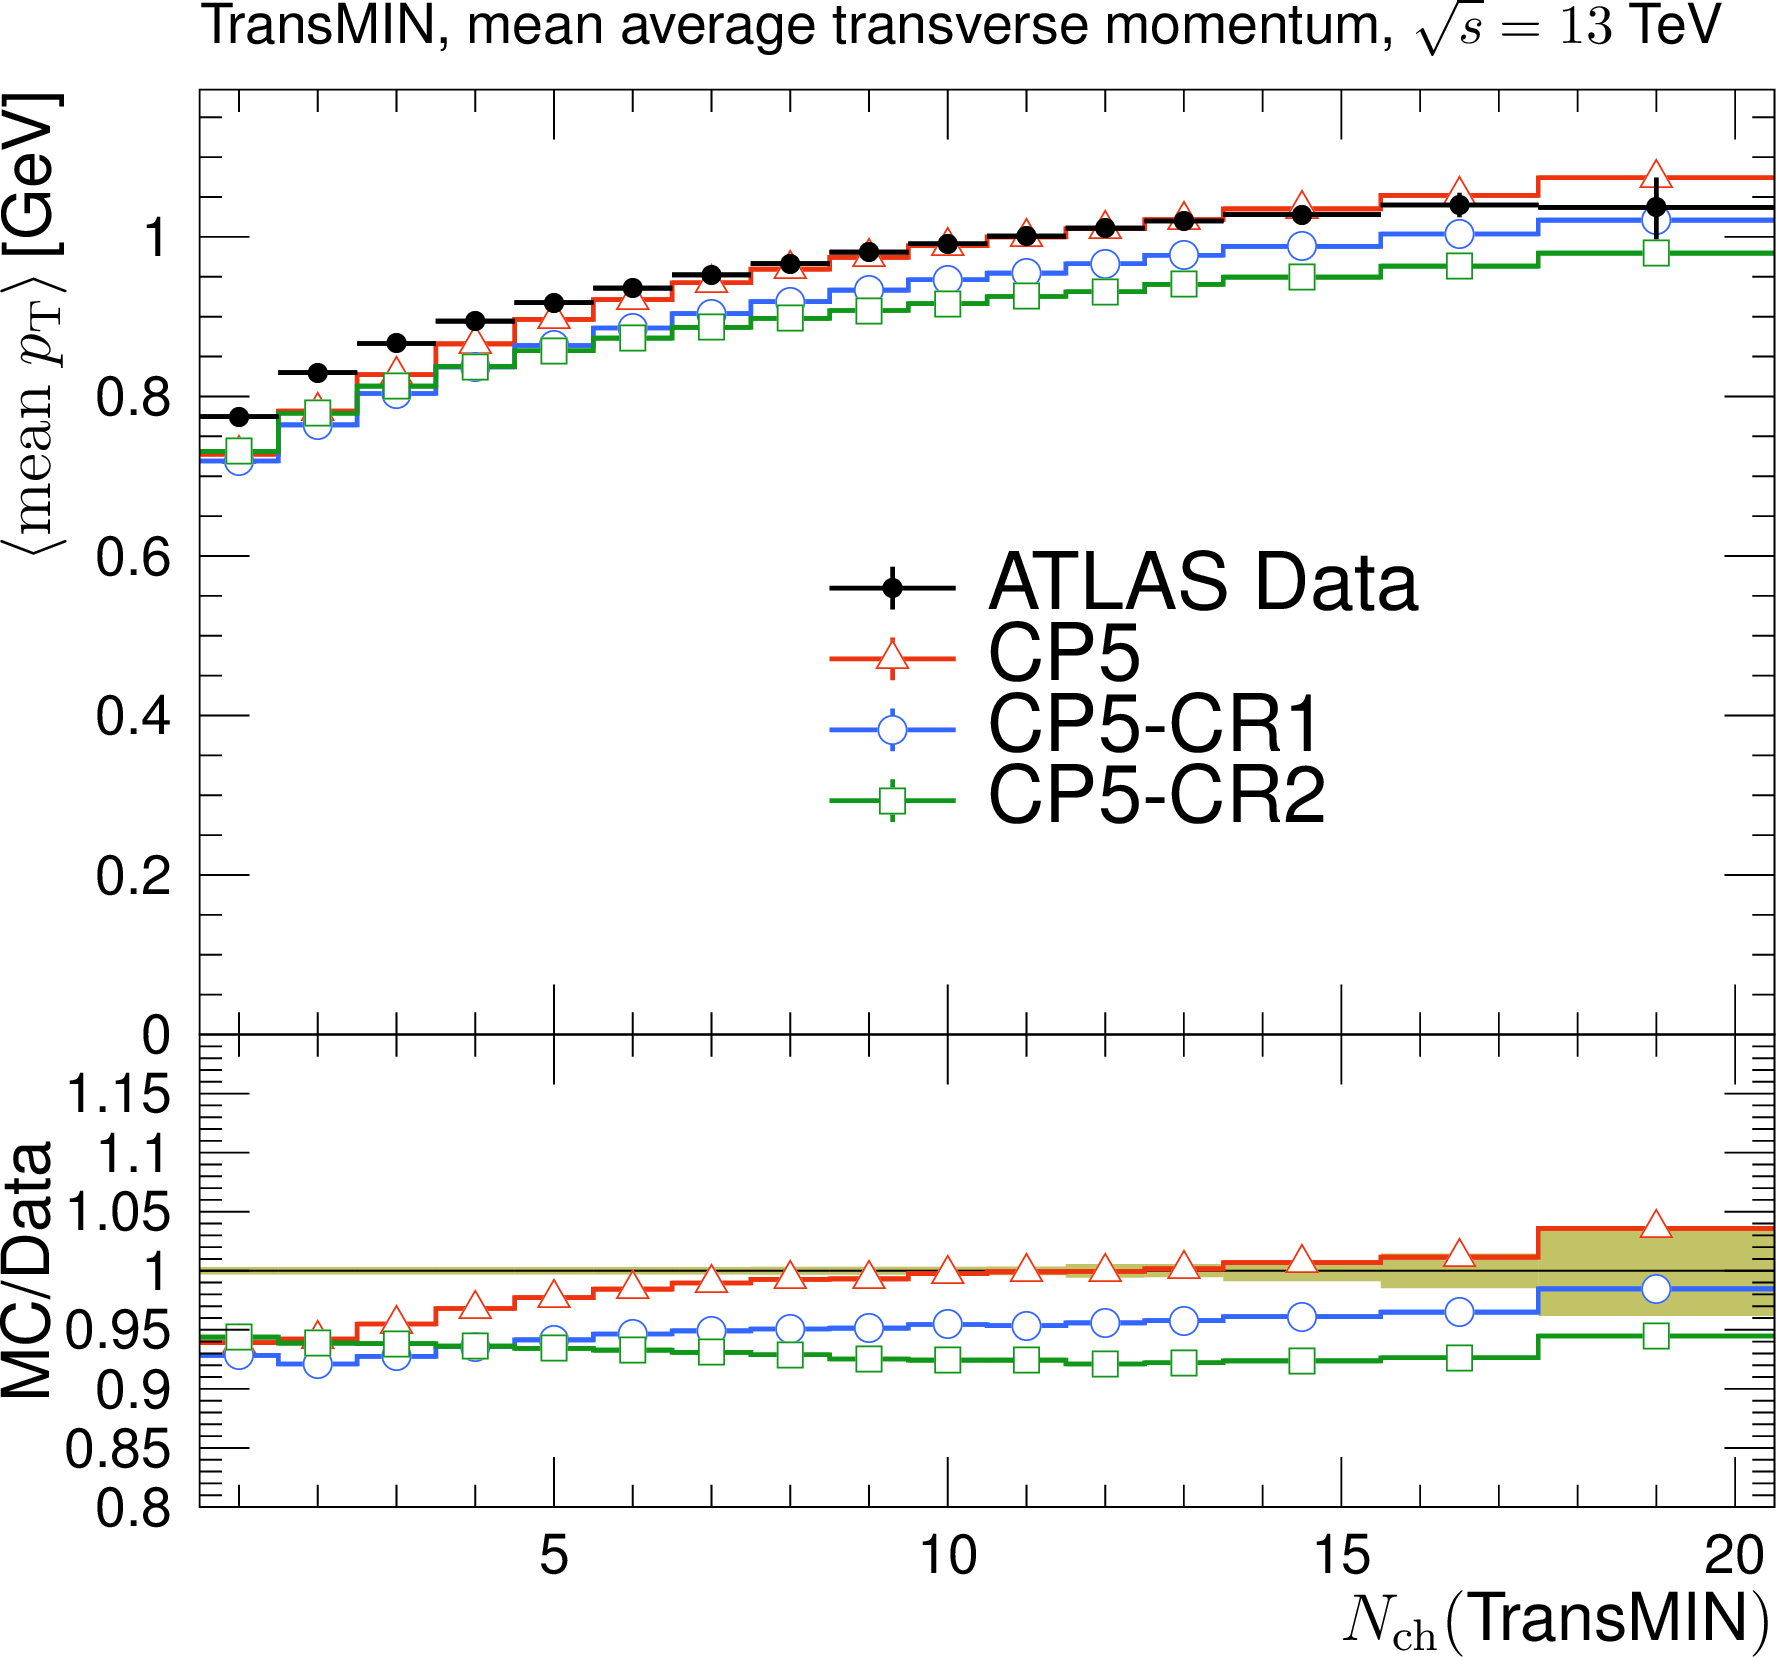
Figure 7:
The mean charged-particle average transverse momentum as functions of charged-particle multiplicity in the transMAX (left) and transMIN (right) regions, measured by the ATLAS experiment at $ \sqrt{s}= $ 13 TeV [18]. The predictions of the CP5 and CP5-CR tunes are compared with data. The coloured band and error bars on the data points represent the total experimental uncertainty in the data. |

png pdf |
Figure 7-a:
The mean charged-particle average transverse momentum as functions of charged-particle multiplicity in the transMAX (left) and transMIN (right) regions, measured by the ATLAS experiment at $ \sqrt{s}= $ 13 TeV [18]. The predictions of the CP5 and CP5-CR tunes are compared with data. The coloured band and error bars on the data points represent the total experimental uncertainty in the data. |
png pdf |
Figure 7-b:
The mean charged-particle average transverse momentum as functions of charged-particle multiplicity in the transMAX (left) and transMIN (right) regions, measured by the ATLAS experiment at $ \sqrt{s}= $ 13 TeV [18]. The predictions of the CP5 and CP5-CR tunes are compared with data. The coloured band and error bars on the data points represent the total experimental uncertainty in the data. |
png pdf |
Figure 8:
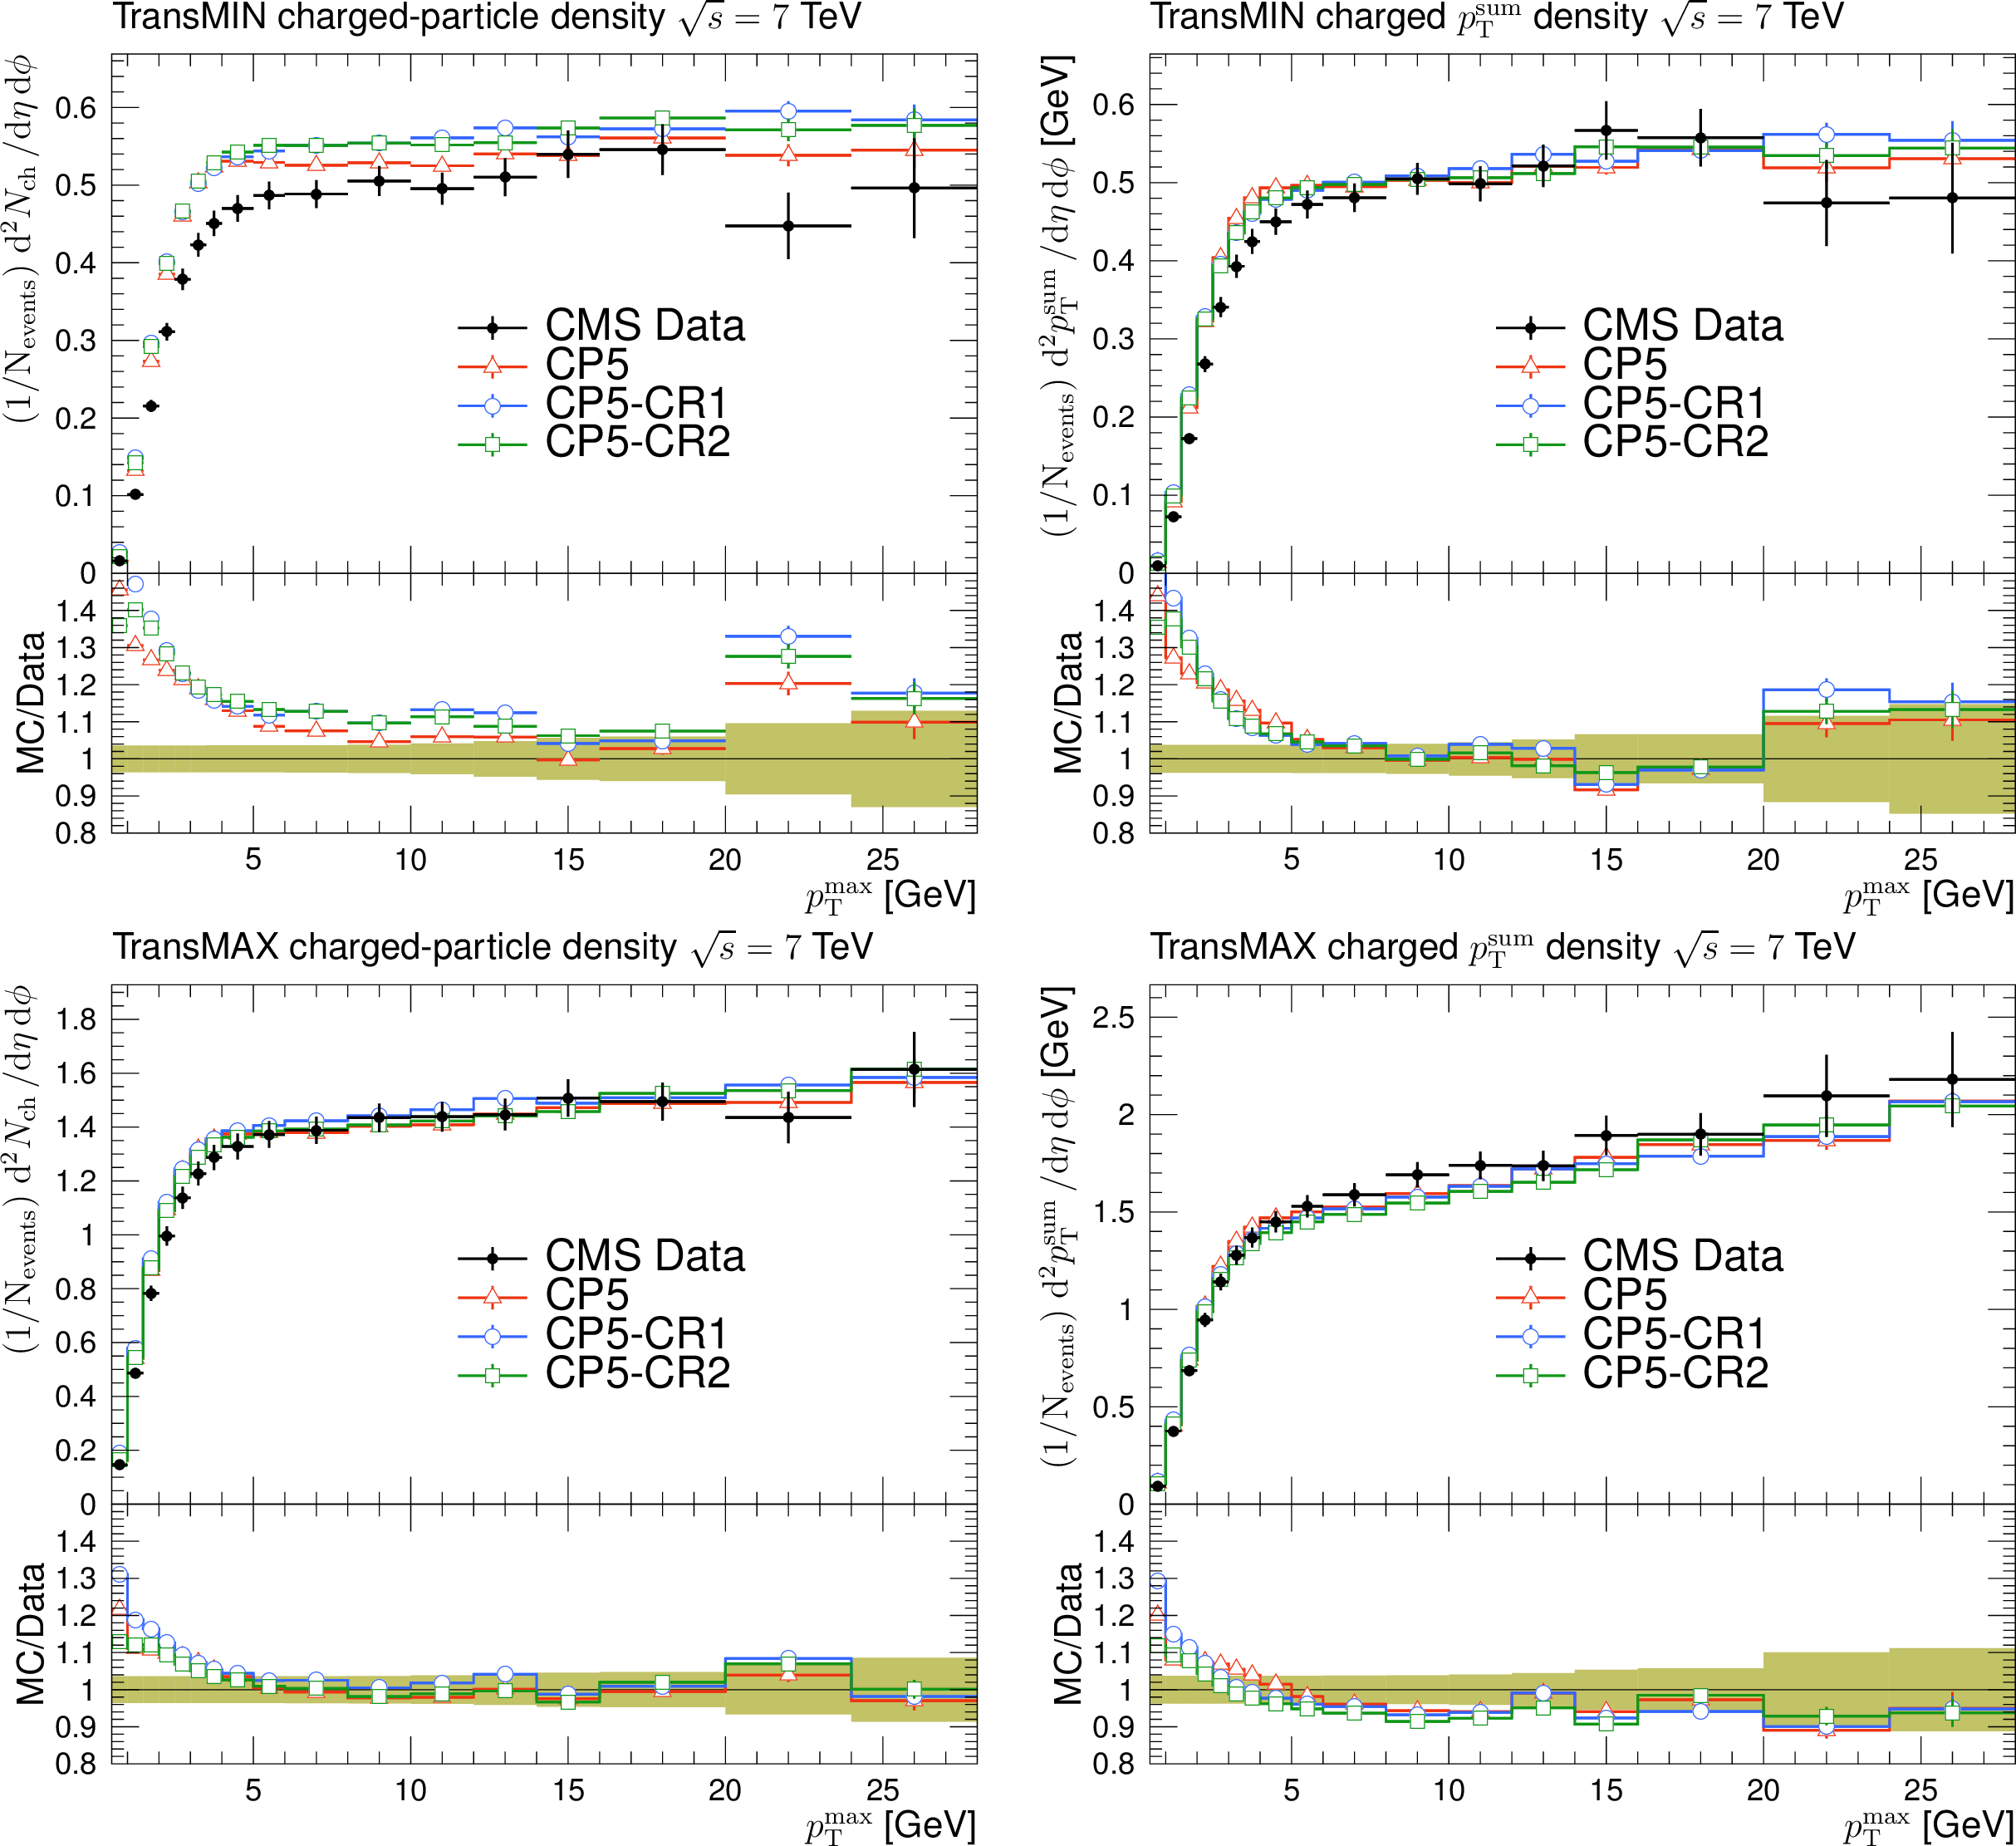
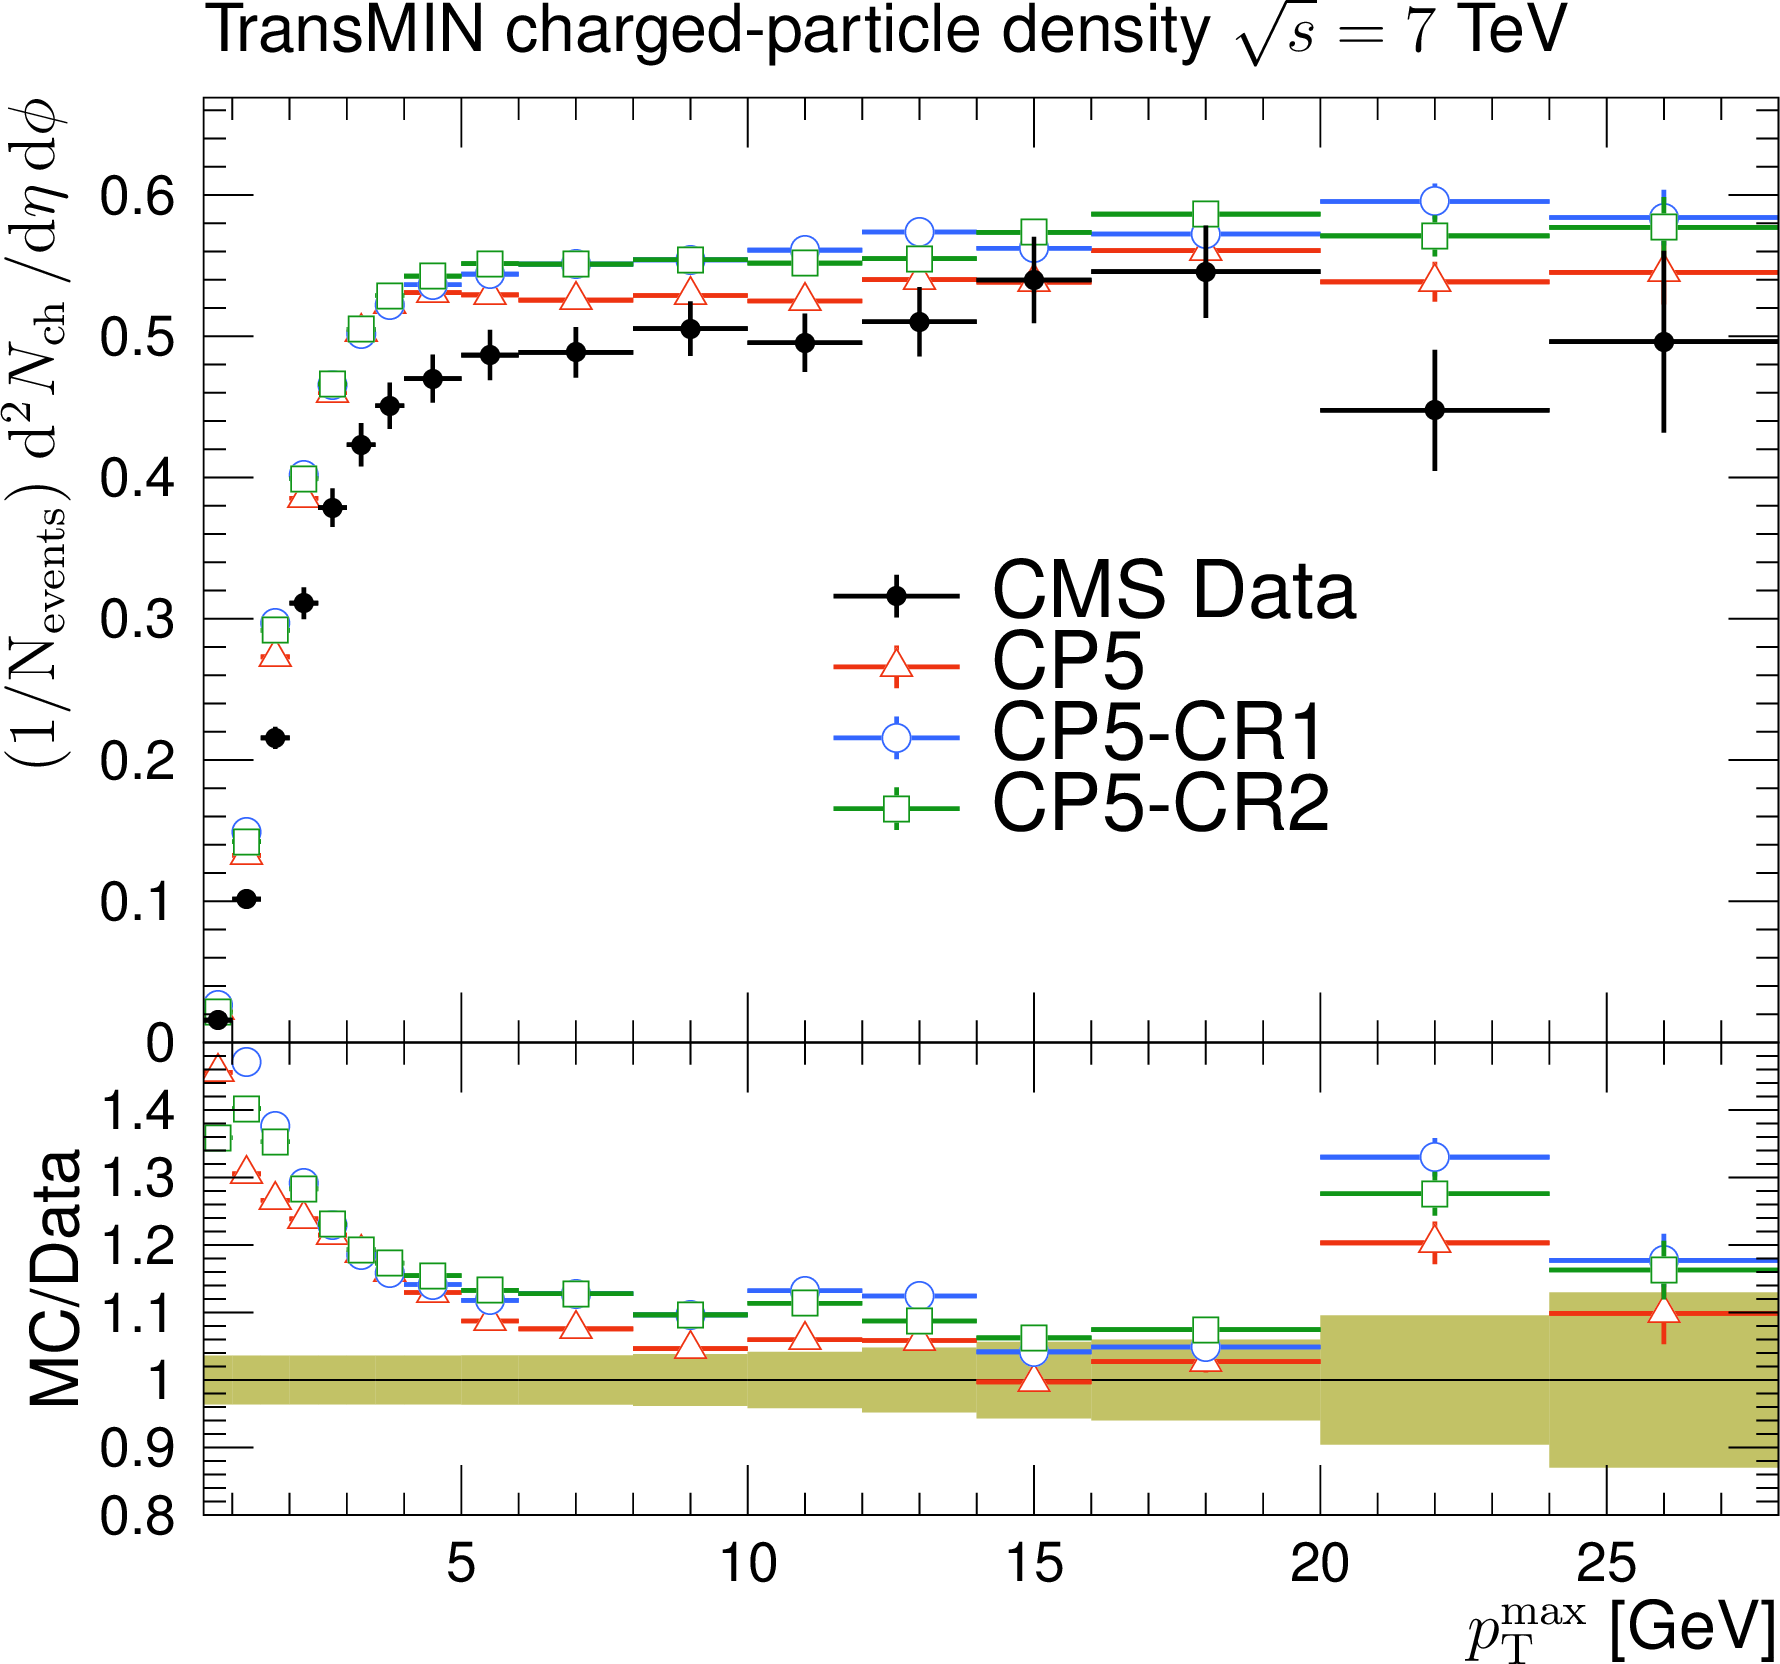
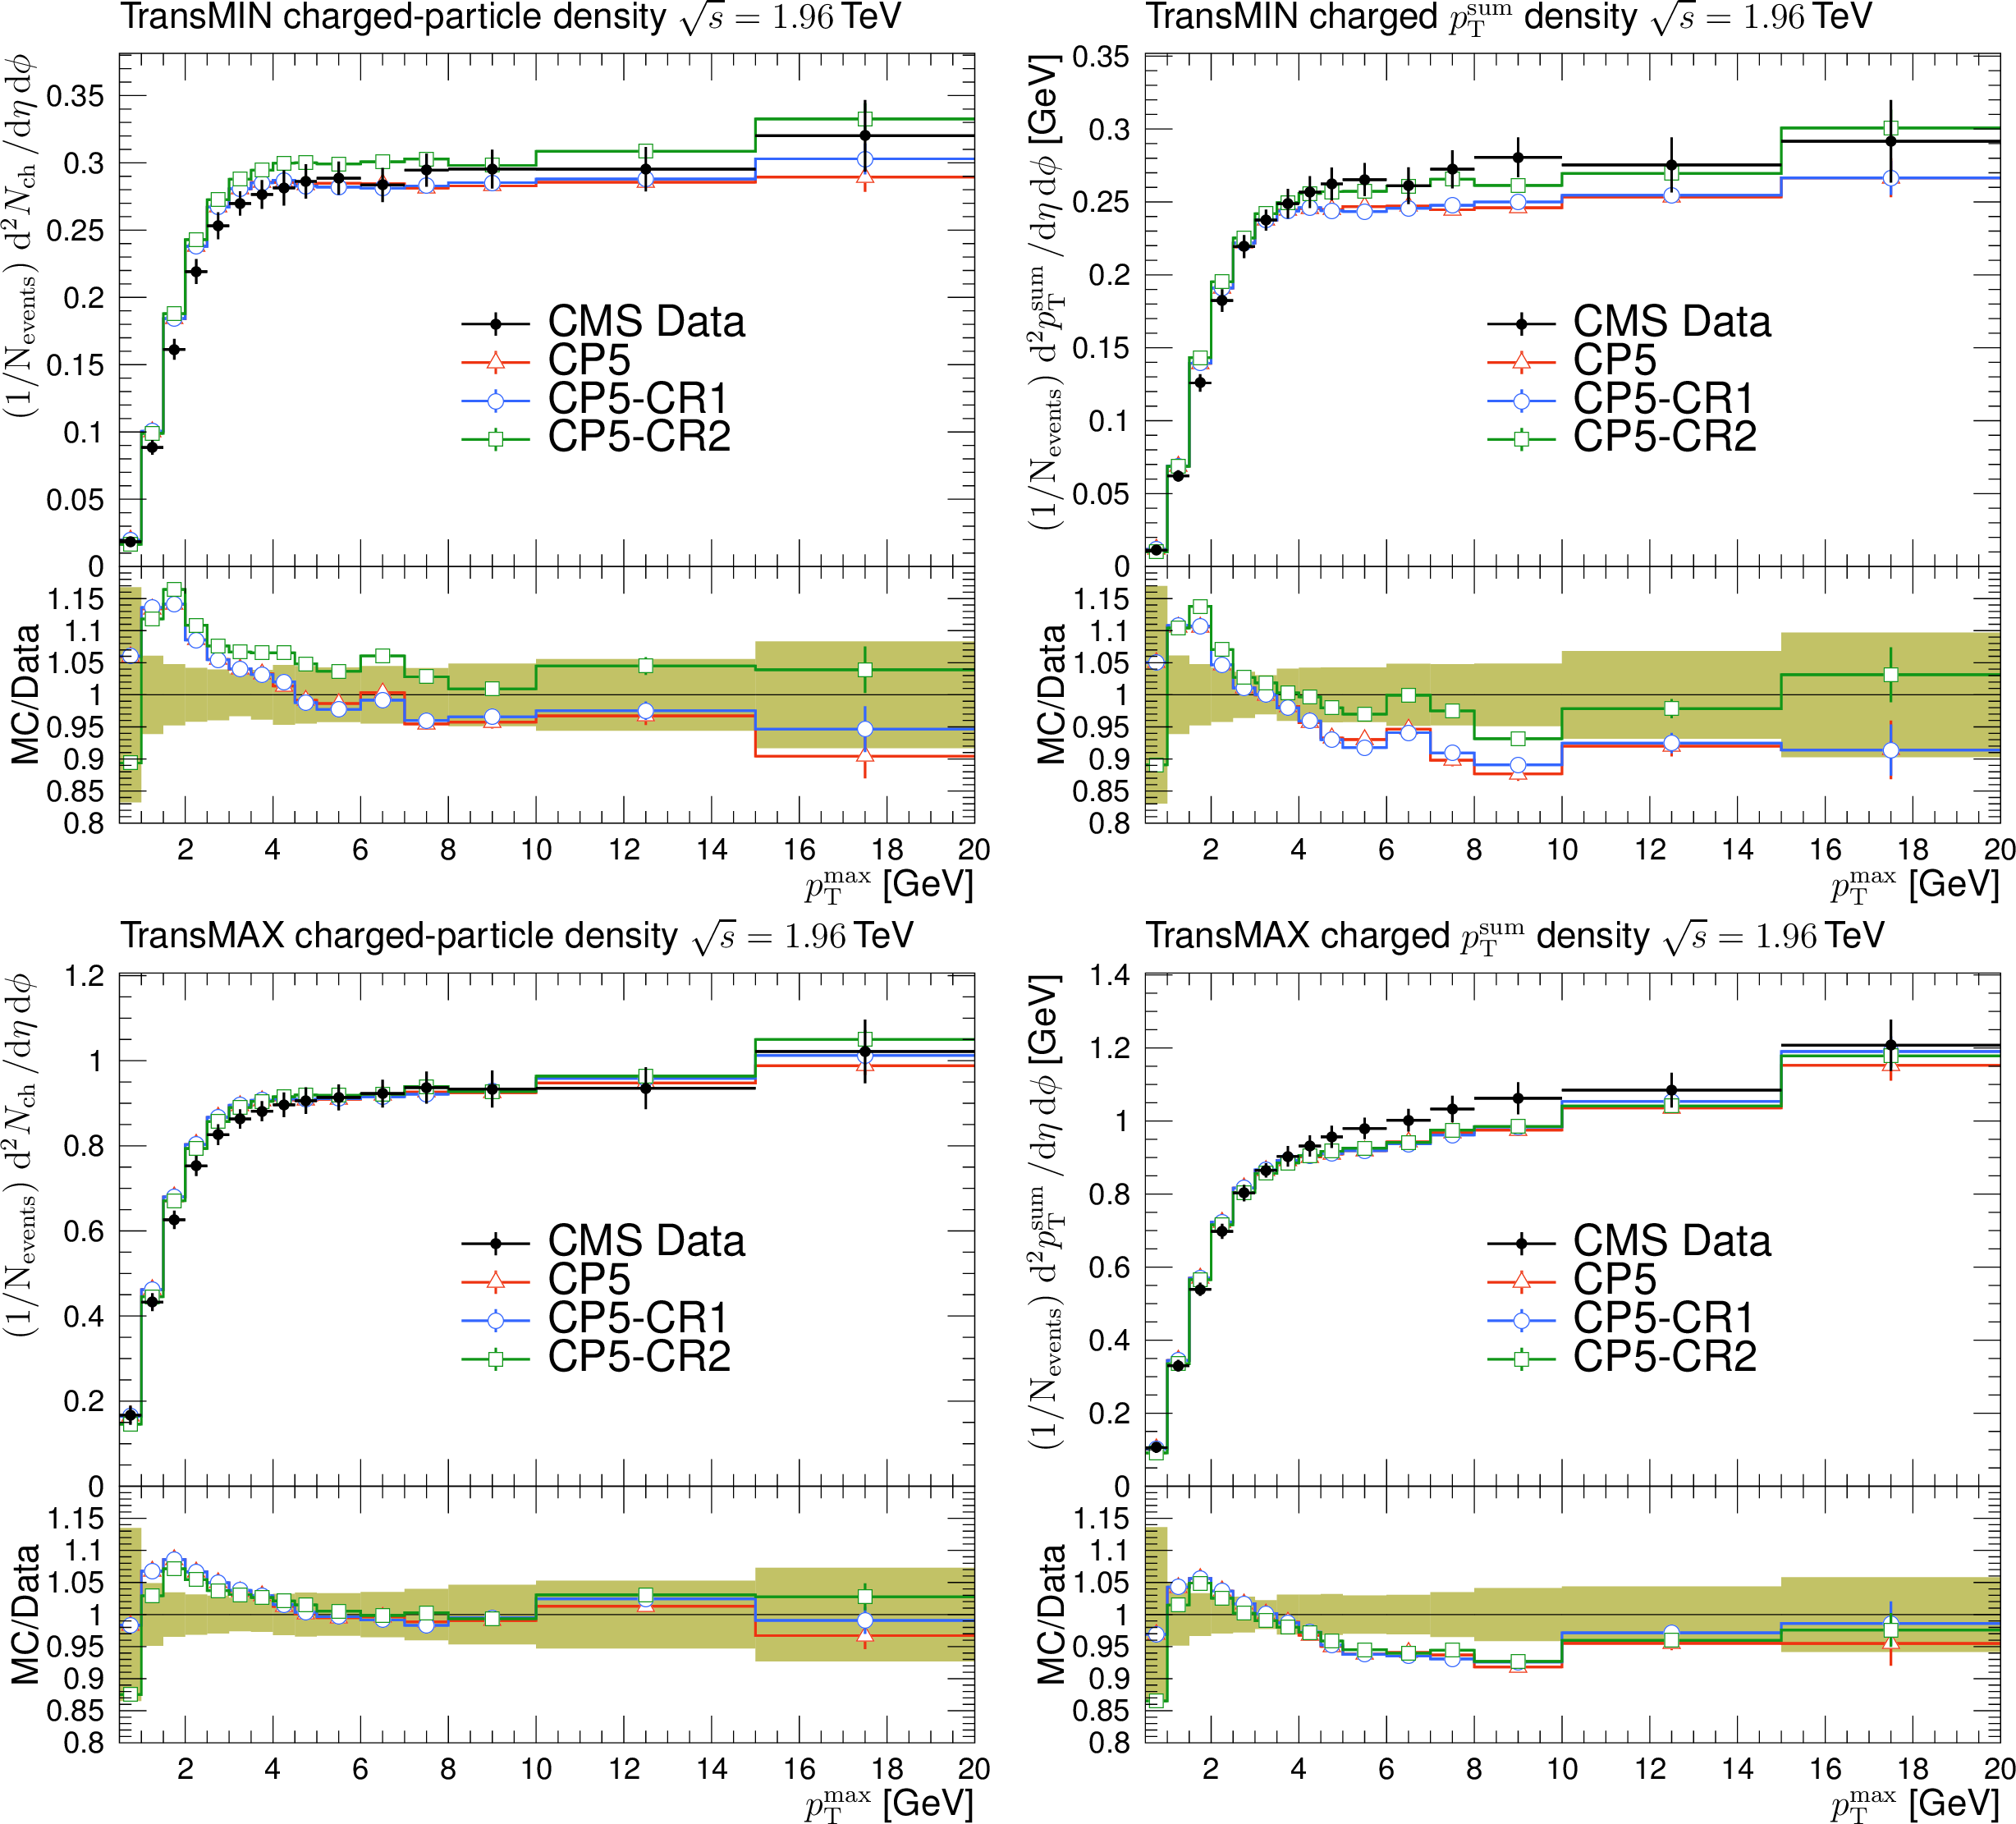
The charged-particle (left) and $ p_{\mathrm{T}}^{\text{sum}} $ (right) densities in the transMIN (upper) and transMAX (lower) regions, as functions of the $ p_{\mathrm{T}} $ of the leading charged particle, $ p_{\mathrm{T}}^{\text{max}} $, measured by the CMS experiment at $ \sqrt{s}= $ 7 TeV [19]. The predictions of the CP5 and CP5-CR tunes are compared with data. The coloured band and error bars on the data points represent the total experimental uncertainty in the data. |
png pdf |
Figure 8-a:
The charged-particle (left) and $ p_{\mathrm{T}}^{\text{sum}} $ (right) densities in the transMIN (upper) and transMAX (lower) regions, as functions of the $ p_{\mathrm{T}} $ of the leading charged particle, $ p_{\mathrm{T}}^{\text{max}} $, measured by the CMS experiment at $ \sqrt{s}= $ 7 TeV [19]. The predictions of the CP5 and CP5-CR tunes are compared with data. The coloured band and error bars on the data points represent the total experimental uncertainty in the data. |

png pdf |
Figure 8-b:
The charged-particle (left) and $ p_{\mathrm{T}}^{\text{sum}} $ (right) densities in the transMIN (upper) and transMAX (lower) regions, as functions of the $ p_{\mathrm{T}} $ of the leading charged particle, $ p_{\mathrm{T}}^{\text{max}} $, measured by the CMS experiment at $ \sqrt{s}= $ 7 TeV [19]. The predictions of the CP5 and CP5-CR tunes are compared with data. The coloured band and error bars on the data points represent the total experimental uncertainty in the data. |

png pdf |
Figure 8-c:
The charged-particle (left) and $ p_{\mathrm{T}}^{\text{sum}} $ (right) densities in the transMIN (upper) and transMAX (lower) regions, as functions of the $ p_{\mathrm{T}} $ of the leading charged particle, $ p_{\mathrm{T}}^{\text{max}} $, measured by the CMS experiment at $ \sqrt{s}= $ 7 TeV [19]. The predictions of the CP5 and CP5-CR tunes are compared with data. The coloured band and error bars on the data points represent the total experimental uncertainty in the data. |

png pdf |
Figure 8-d:
The charged-particle (left) and $ p_{\mathrm{T}}^{\text{sum}} $ (right) densities in the transMIN (upper) and transMAX (lower) regions, as functions of the $ p_{\mathrm{T}} $ of the leading charged particle, $ p_{\mathrm{T}}^{\text{max}} $, measured by the CMS experiment at $ \sqrt{s}= $ 7 TeV [19]. The predictions of the CP5 and CP5-CR tunes are compared with data. The coloured band and error bars on the data points represent the total experimental uncertainty in the data. |

png pdf |
Figure 9:
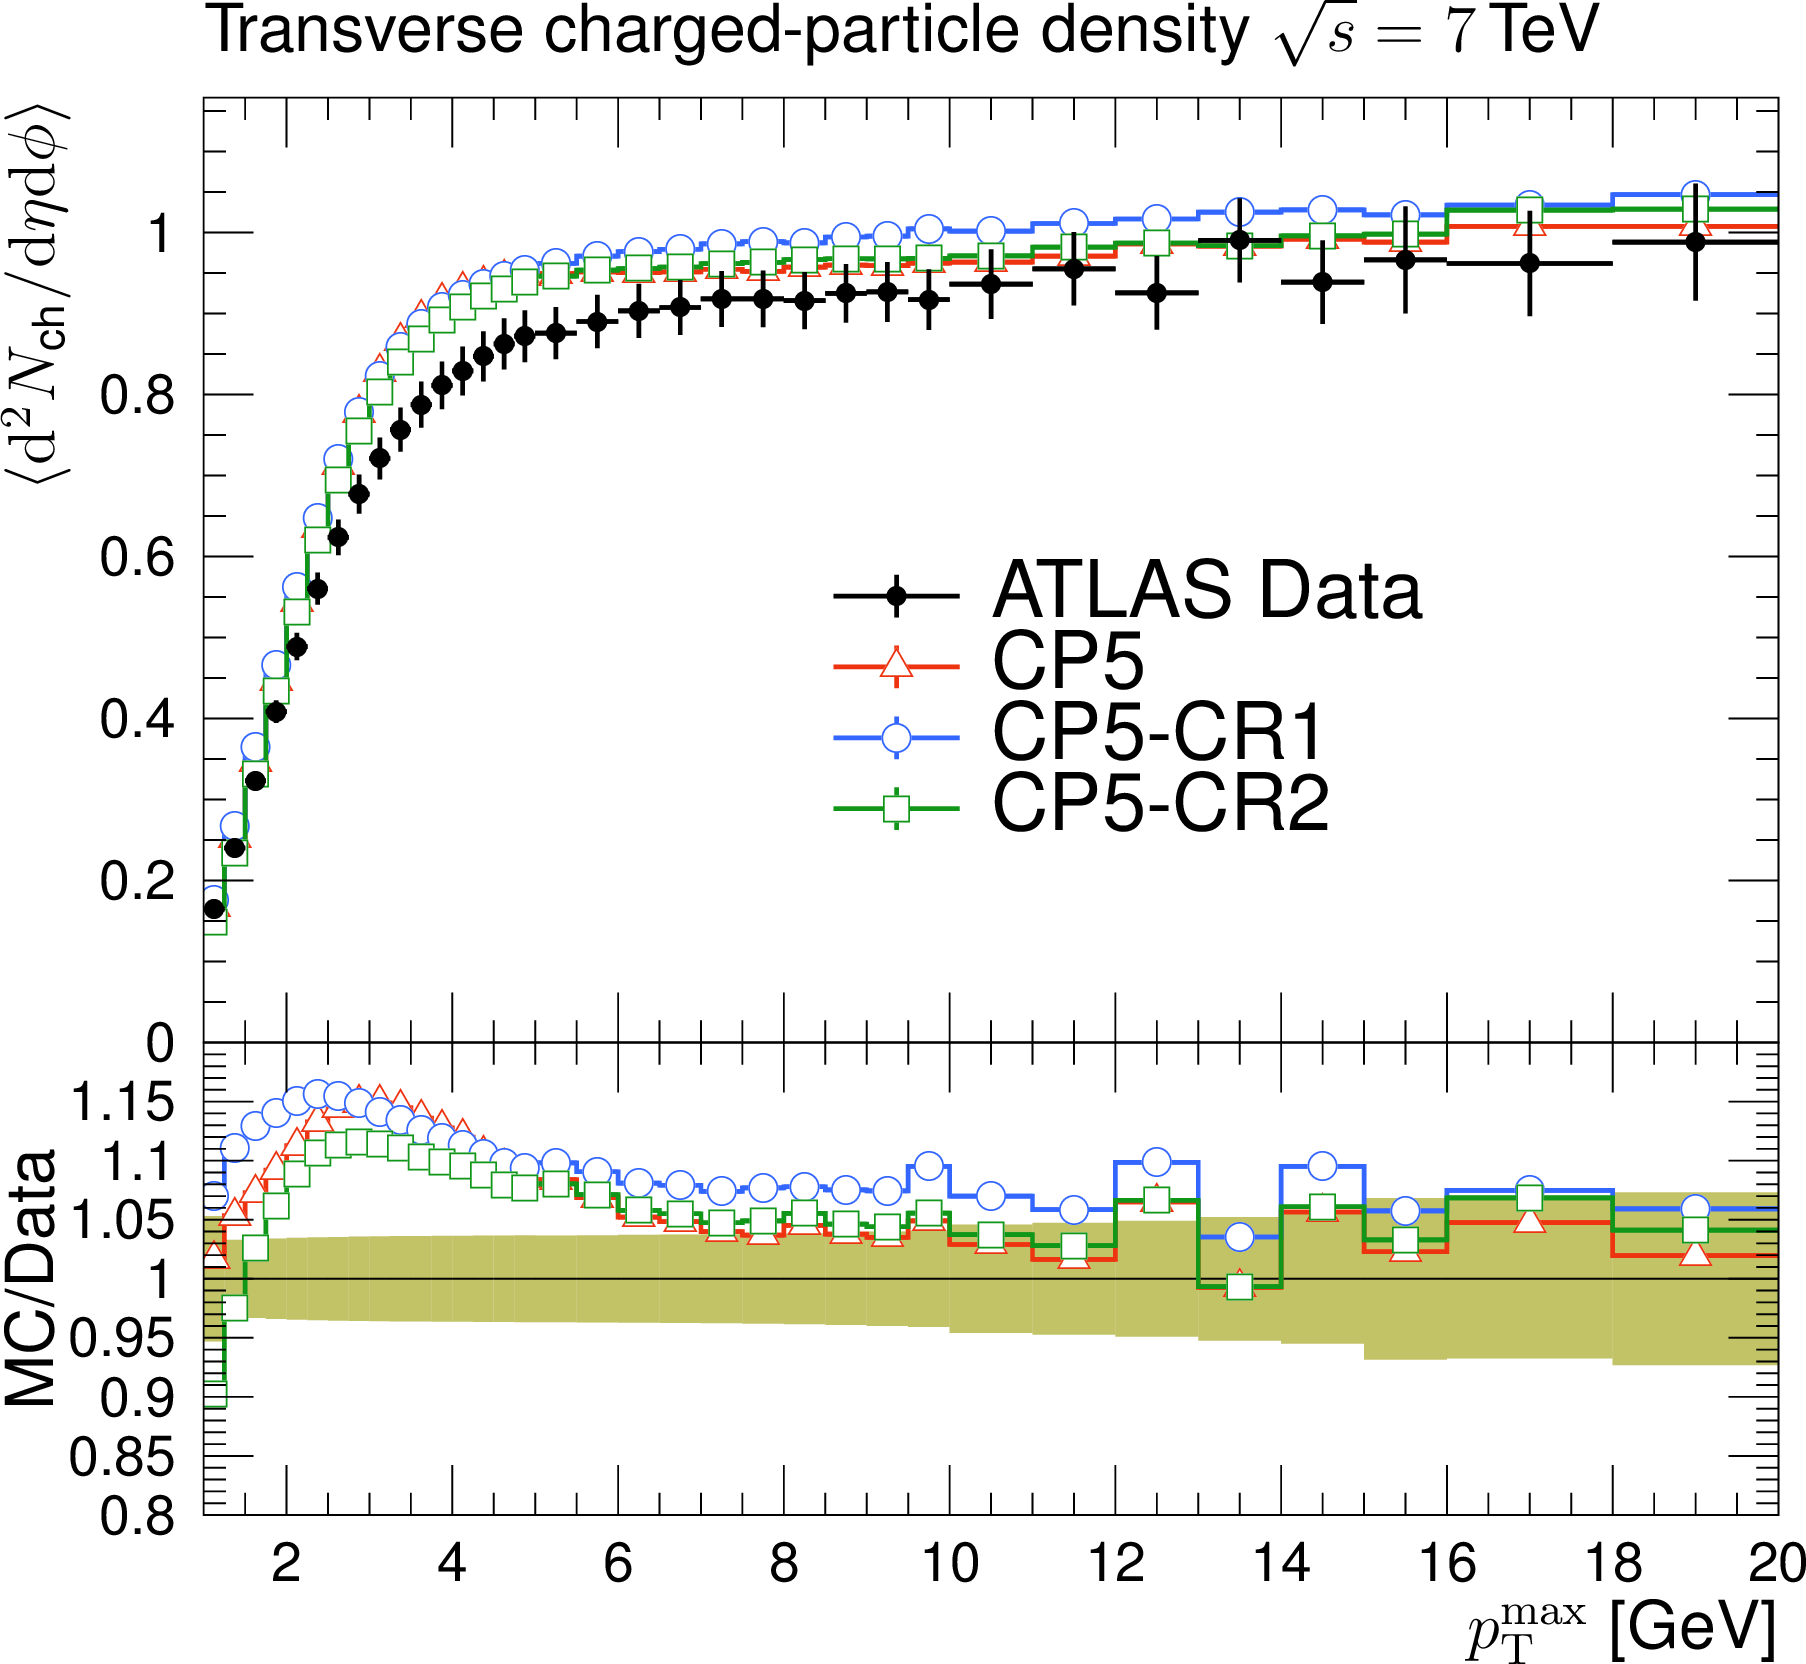
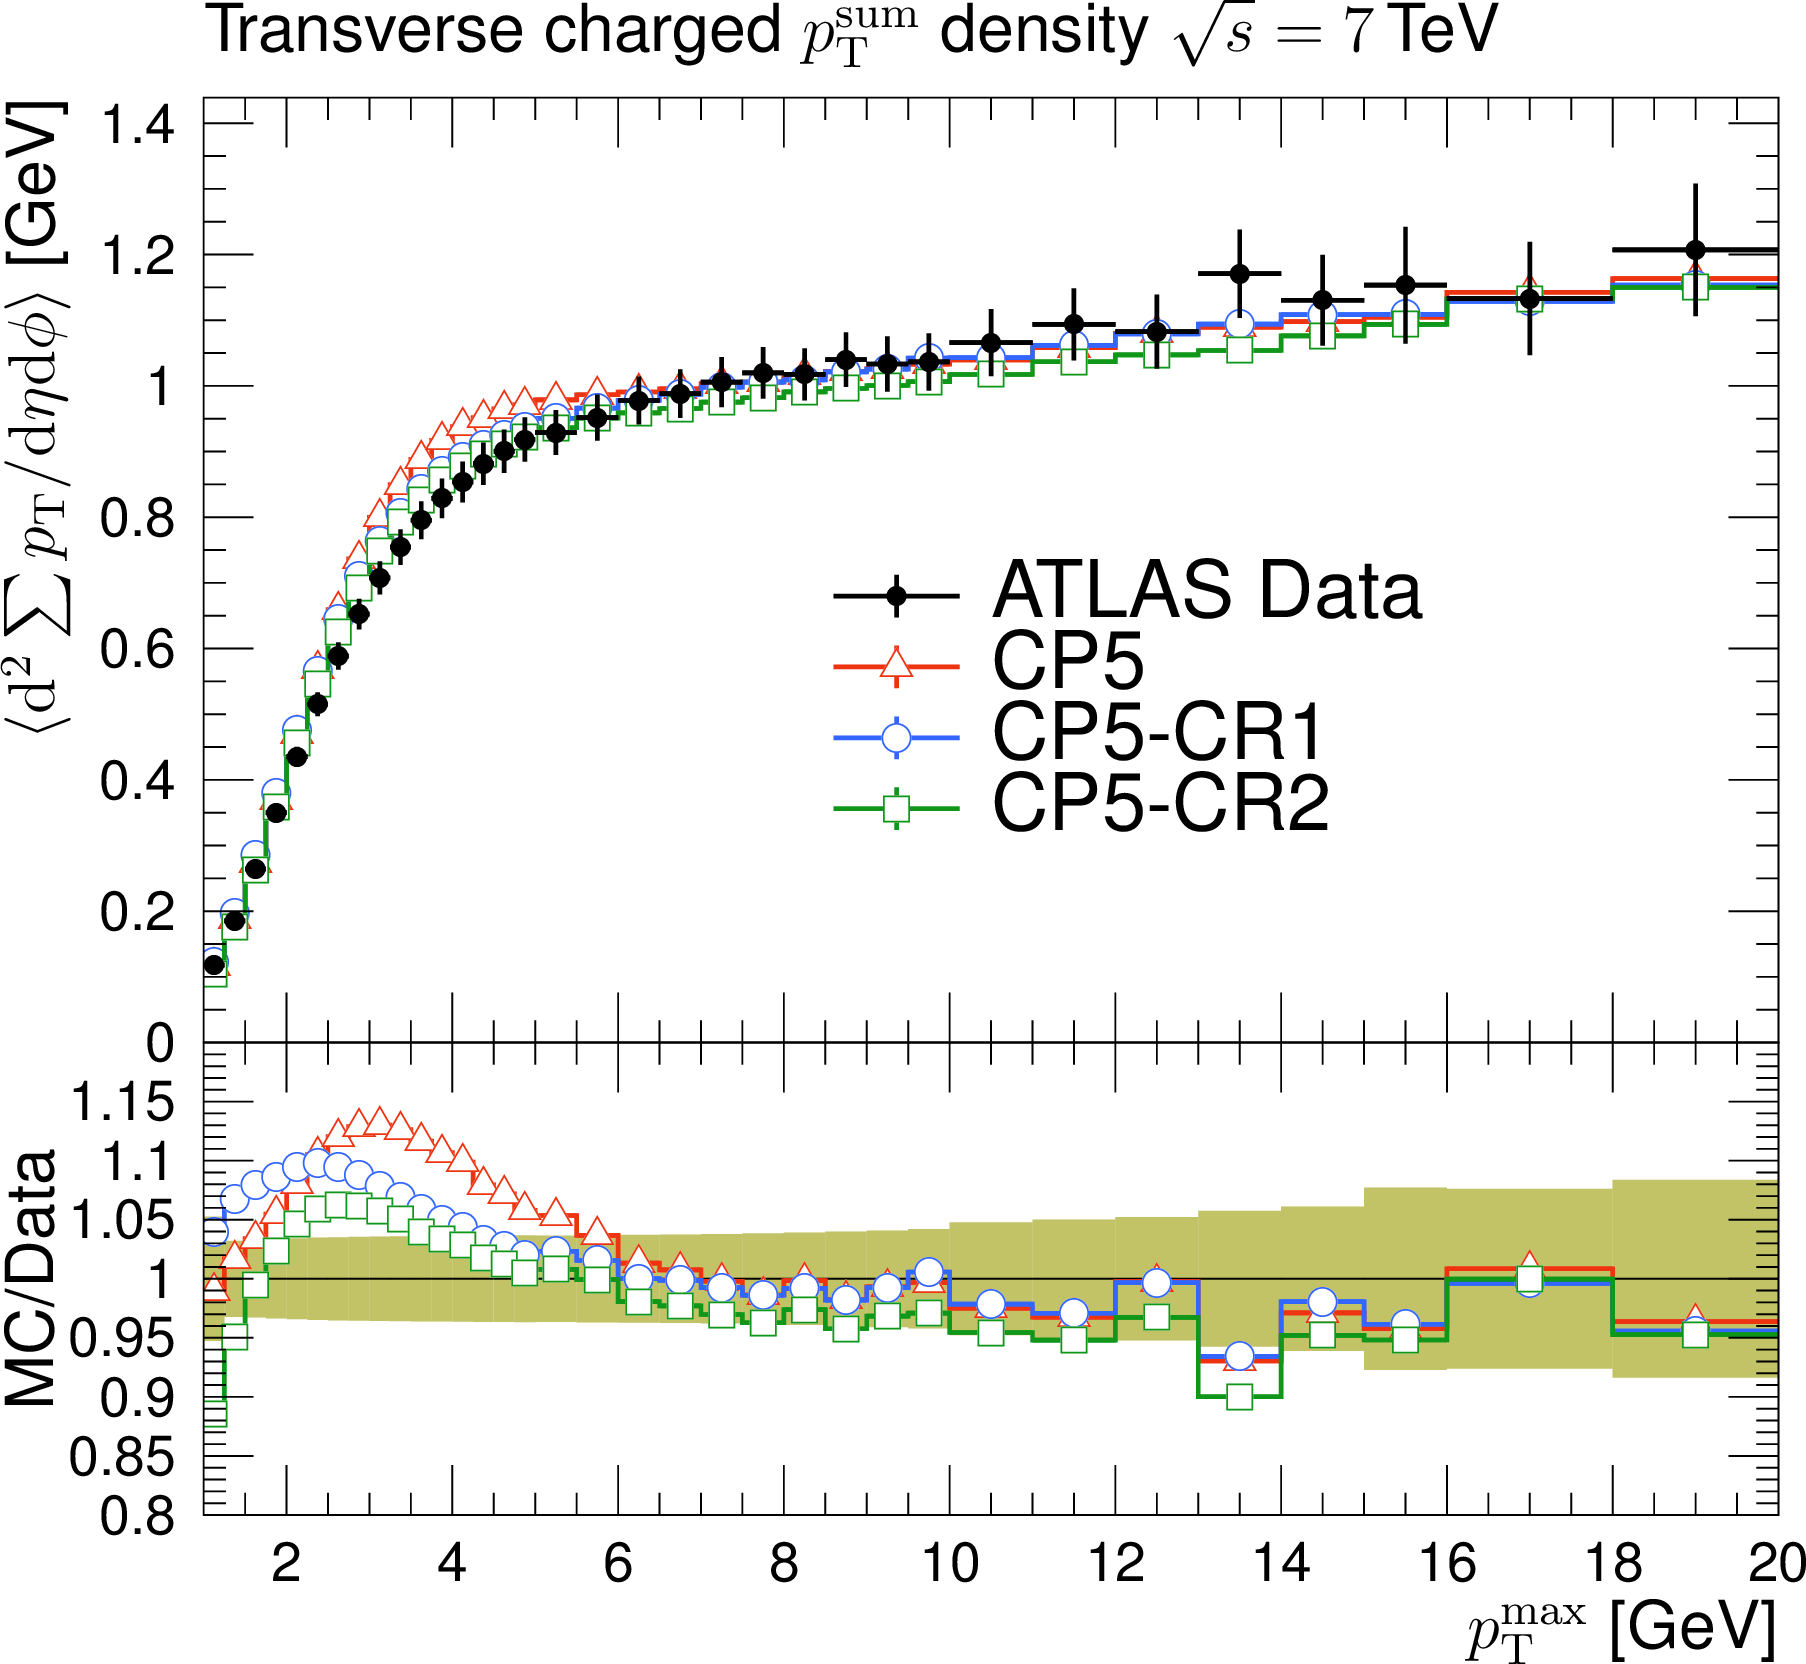
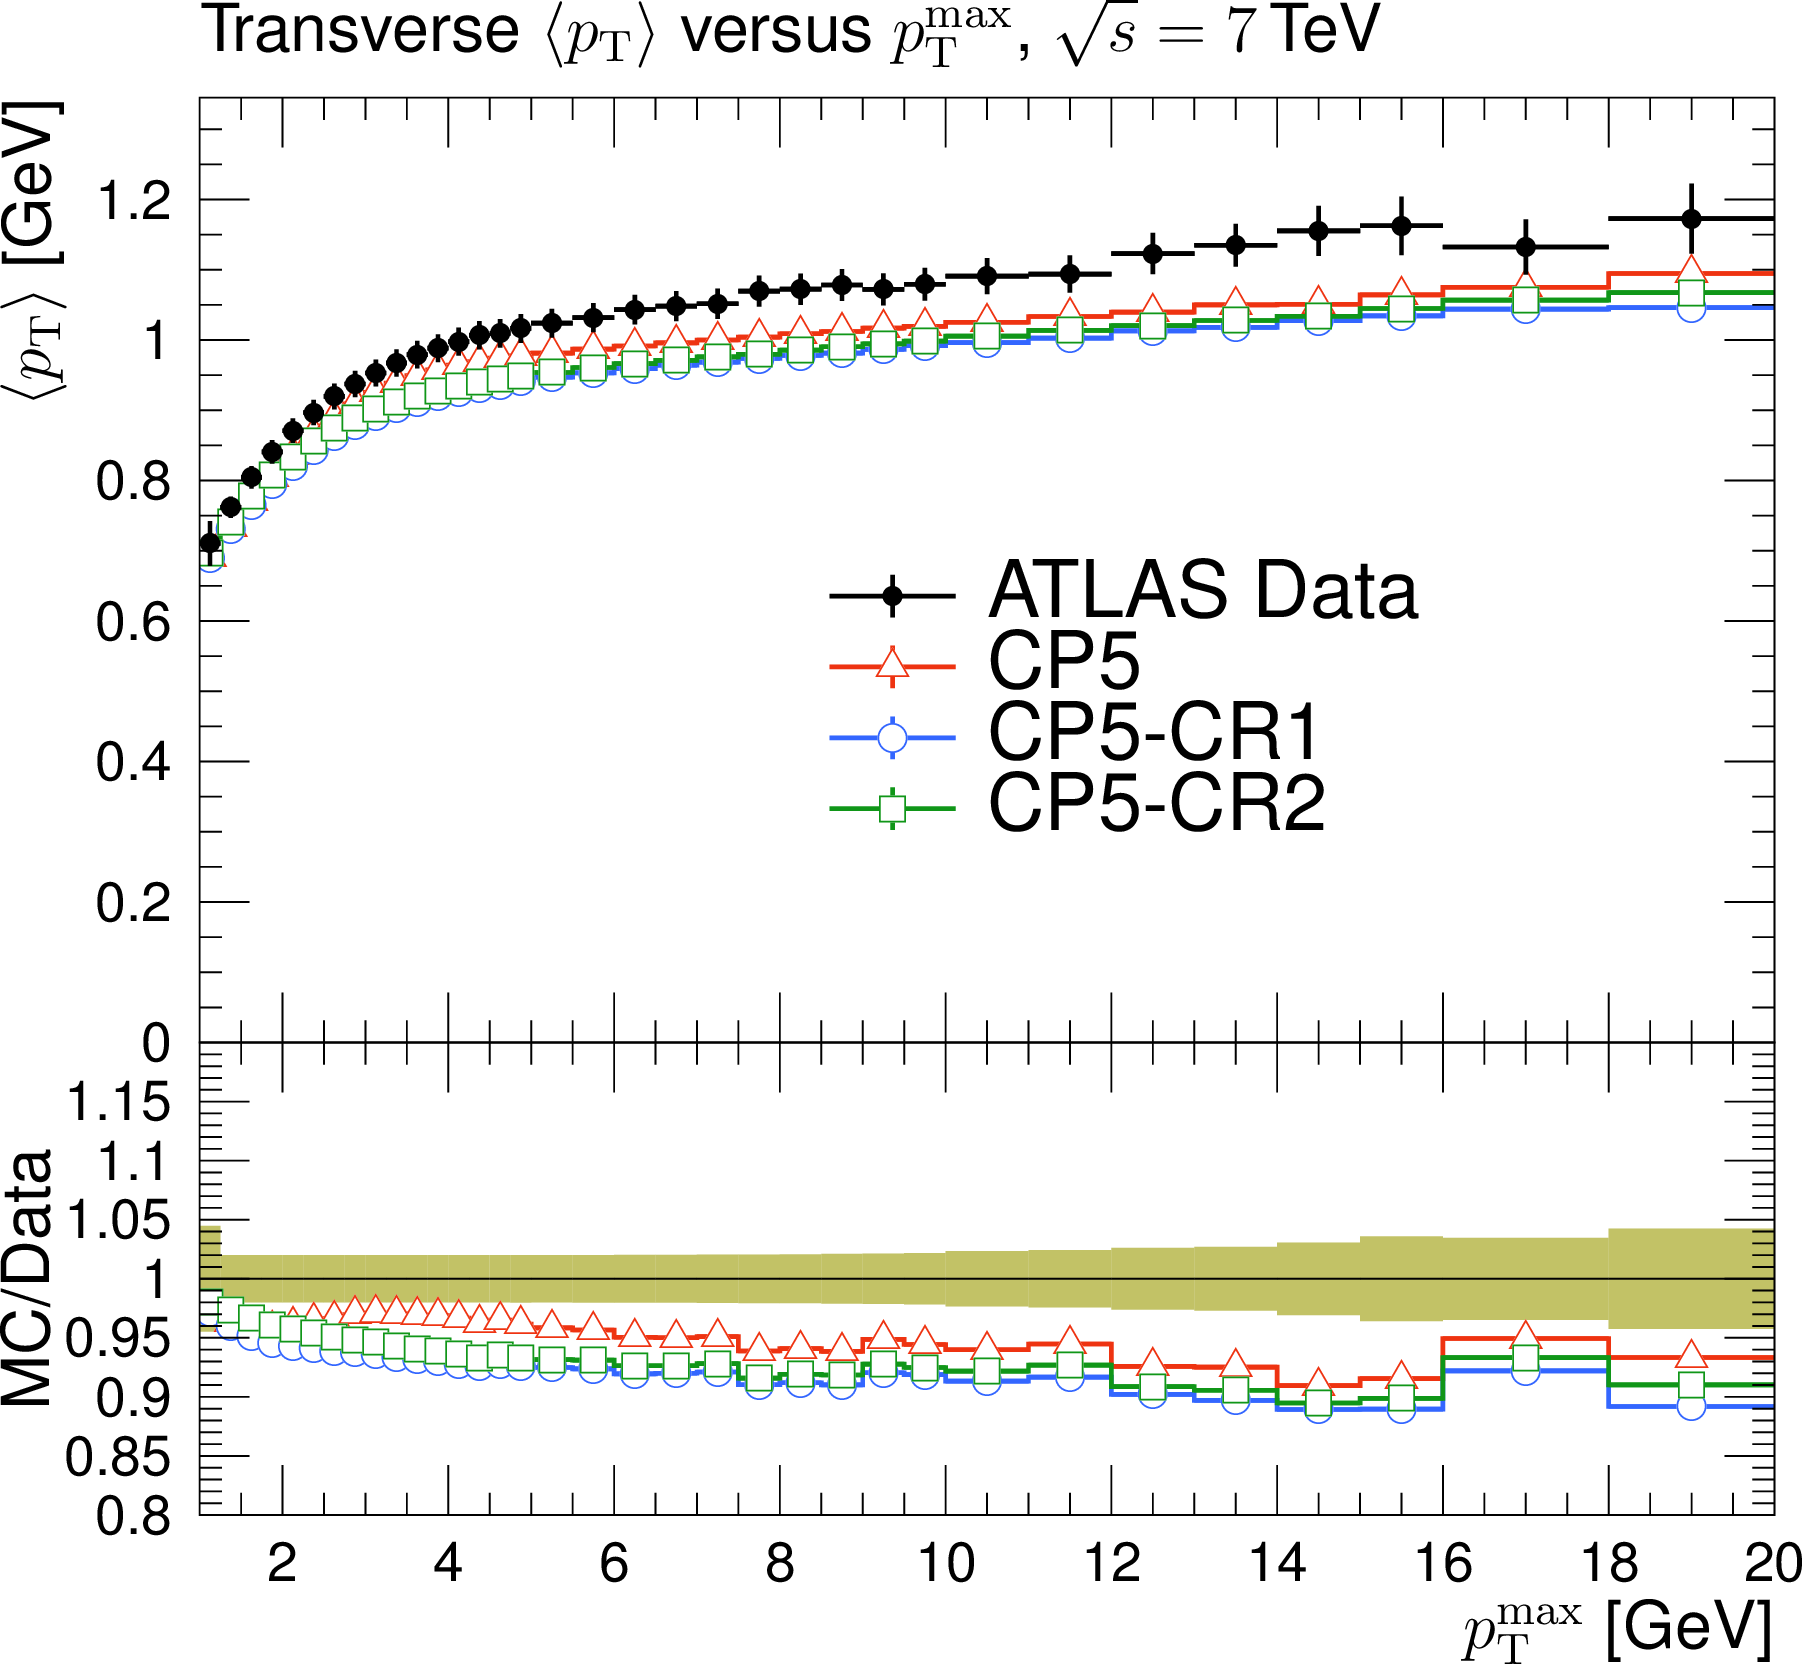
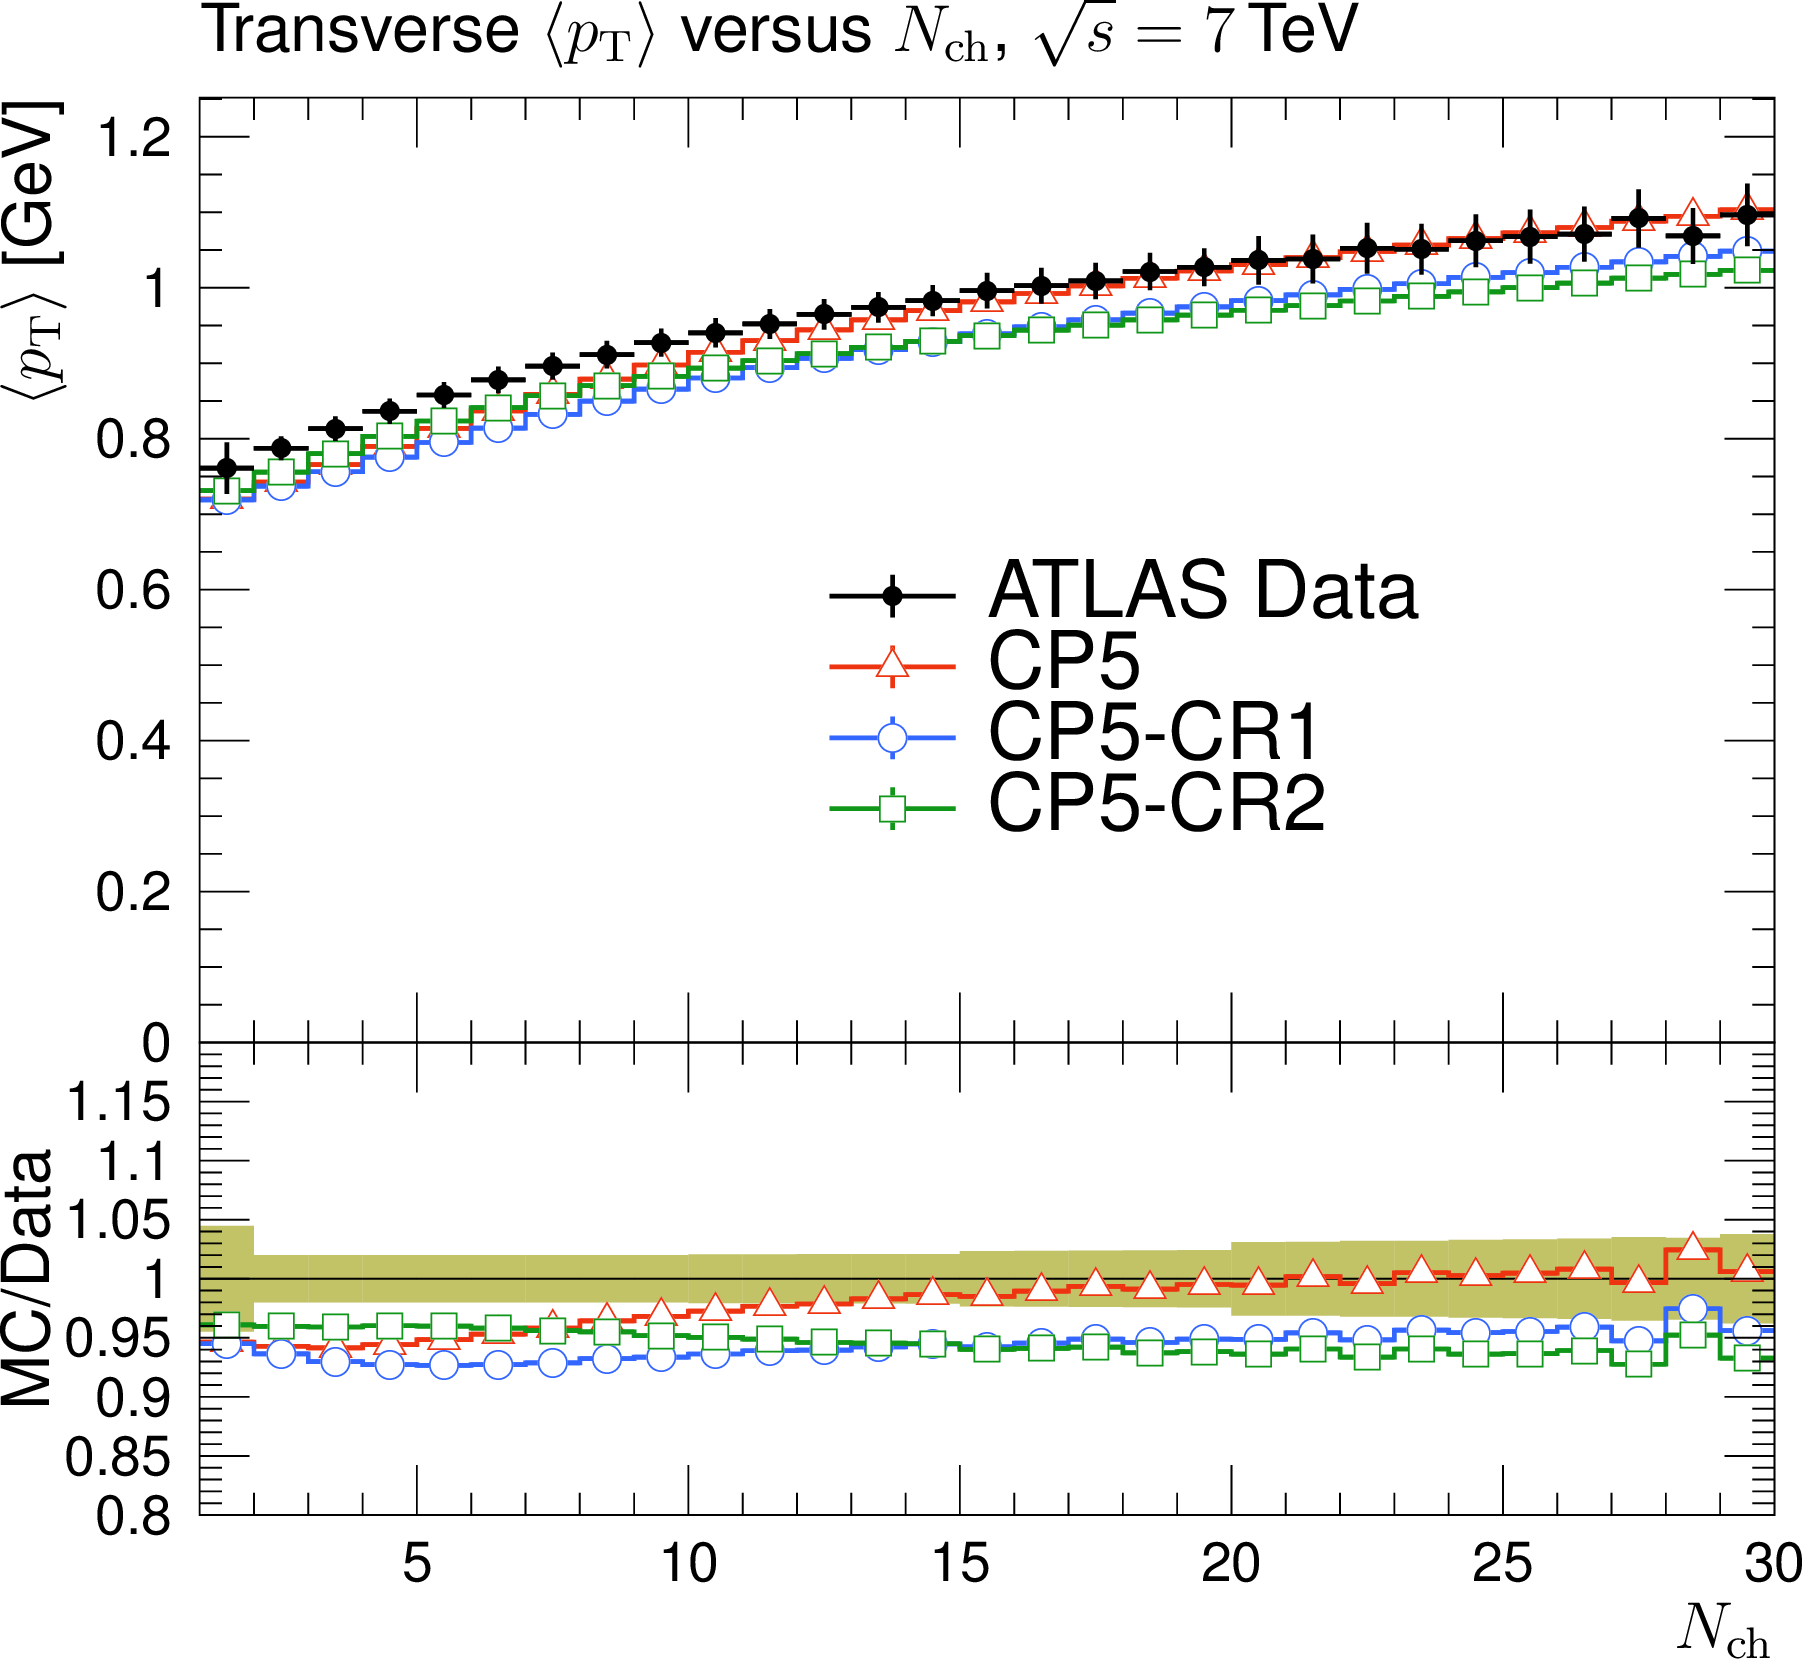
The charged-particle (upper left) and $ p_{\mathrm{T}}^{\text{sum}} $ densities (upper right) in the transverse region, as functions of the $ p_{\mathrm{T}} $ of the leading charged particle, and average transverse momentum in the transverse region as functions of the leading charged particle $ p_{\mathrm{T}} $ (lower left) and of the charged particle multiplicity (lower right), measured by the ATLAS experiment at $ \sqrt{s}= $ 7 TeV [20]. The predictions of the CP5 and CP5-CR tunes are compared with data. The coloured band and error bars on the data points represent the total experimental uncertainty in the data. |
png pdf |
Figure 9-a:
The charged-particle (upper left) and $ p_{\mathrm{T}}^{\text{sum}} $ densities (upper right) in the transverse region, as functions of the $ p_{\mathrm{T}} $ of the leading charged particle, and average transverse momentum in the transverse region as functions of the leading charged particle $ p_{\mathrm{T}} $ (lower left) and of the charged particle multiplicity (lower right), measured by the ATLAS experiment at $ \sqrt{s}= $ 7 TeV [20]. The predictions of the CP5 and CP5-CR tunes are compared with data. The coloured band and error bars on the data points represent the total experimental uncertainty in the data. |
png pdf |
Figure 9-b:
The charged-particle (upper left) and $ p_{\mathrm{T}}^{\text{sum}} $ densities (upper right) in the transverse region, as functions of the $ p_{\mathrm{T}} $ of the leading charged particle, and average transverse momentum in the transverse region as functions of the leading charged particle $ p_{\mathrm{T}} $ (lower left) and of the charged particle multiplicity (lower right), measured by the ATLAS experiment at $ \sqrt{s}= $ 7 TeV [20]. The predictions of the CP5 and CP5-CR tunes are compared with data. The coloured band and error bars on the data points represent the total experimental uncertainty in the data. |
png pdf |
Figure 9-c:
The charged-particle (upper left) and $ p_{\mathrm{T}}^{\text{sum}} $ densities (upper right) in the transverse region, as functions of the $ p_{\mathrm{T}} $ of the leading charged particle, and average transverse momentum in the transverse region as functions of the leading charged particle $ p_{\mathrm{T}} $ (lower left) and of the charged particle multiplicity (lower right), measured by the ATLAS experiment at $ \sqrt{s}= $ 7 TeV [20]. The predictions of the CP5 and CP5-CR tunes are compared with data. The coloured band and error bars on the data points represent the total experimental uncertainty in the data. |
png pdf |
Figure 9-d:
The charged-particle (upper left) and $ p_{\mathrm{T}}^{\text{sum}} $ densities (upper right) in the transverse region, as functions of the $ p_{\mathrm{T}} $ of the leading charged particle, and average transverse momentum in the transverse region as functions of the leading charged particle $ p_{\mathrm{T}} $ (lower left) and of the charged particle multiplicity (lower right), measured by the ATLAS experiment at $ \sqrt{s}= $ 7 TeV [20]. The predictions of the CP5 and CP5-CR tunes are compared with data. The coloured band and error bars on the data points represent the total experimental uncertainty in the data. |

png pdf |
Figure 10:
The pseudorapidity of charged particles, $ \mathrm{d}N_{\mathrm{ch}}/\mathrm{d}\eta $, with at least one charged particle in $ |\eta| < $ 2.4, measured by the CMS experiment at $ \sqrt{s}= $ 7 TeV [31]. The predictions of the CP5 and CP5-CR tunes are compared with data. The coloured band and error bars on the data points represent the total experimental uncertainty in the data. |
png pdf |
Figure 11:
The charged-particle (left) and $ p_{\mathrm{T}}^{\text{sum}} $ densities (right) in the transMIN (upper) and transMAX (lower) regions, as functions of the $ p_{\mathrm{T}} $ of the leading charged particle, $ p_{\mathrm{T}}^{\text{max}} $, measured by the CDF experiment at $ \sqrt{s}= $ 1.96 TeV [21]. The predictions of the CP5 and CP5-CR tunes are compared with data. The coloured band and error bars on the data points represent the total experimental uncertainty in the data. |

png pdf |
Figure 11-a:
The charged-particle (left) and $ p_{\mathrm{T}}^{\text{sum}} $ densities (right) in the transMIN (upper) and transMAX (lower) regions, as functions of the $ p_{\mathrm{T}} $ of the leading charged particle, $ p_{\mathrm{T}}^{\text{max}} $, measured by the CDF experiment at $ \sqrt{s}= $ 1.96 TeV [21]. The predictions of the CP5 and CP5-CR tunes are compared with data. The coloured band and error bars on the data points represent the total experimental uncertainty in the data. |

png pdf |
Figure 11-b:
The charged-particle (left) and $ p_{\mathrm{T}}^{\text{sum}} $ densities (right) in the transMIN (upper) and transMAX (lower) regions, as functions of the $ p_{\mathrm{T}} $ of the leading charged particle, $ p_{\mathrm{T}}^{\text{max}} $, measured by the CDF experiment at $ \sqrt{s}= $ 1.96 TeV [21]. The predictions of the CP5 and CP5-CR tunes are compared with data. The coloured band and error bars on the data points represent the total experimental uncertainty in the data. |

png pdf |
Figure 11-c:
The charged-particle (left) and $ p_{\mathrm{T}}^{\text{sum}} $ densities (right) in the transMIN (upper) and transMAX (lower) regions, as functions of the $ p_{\mathrm{T}} $ of the leading charged particle, $ p_{\mathrm{T}}^{\text{max}} $, measured by the CDF experiment at $ \sqrt{s}= $ 1.96 TeV [21]. The predictions of the CP5 and CP5-CR tunes are compared with data. The coloured band and error bars on the data points represent the total experimental uncertainty in the data. |

png pdf |
Figure 11-d:
The charged-particle (left) and $ p_{\mathrm{T}}^{\text{sum}} $ densities (right) in the transMIN (upper) and transMAX (lower) regions, as functions of the $ p_{\mathrm{T}} $ of the leading charged particle, $ p_{\mathrm{T}}^{\text{max}} $, measured by the CDF experiment at $ \sqrt{s}= $ 1.96 TeV [21]. The predictions of the CP5 and CP5-CR tunes are compared with data. The coloured band and error bars on the data points represent the total experimental uncertainty in the data. |

png pdf |
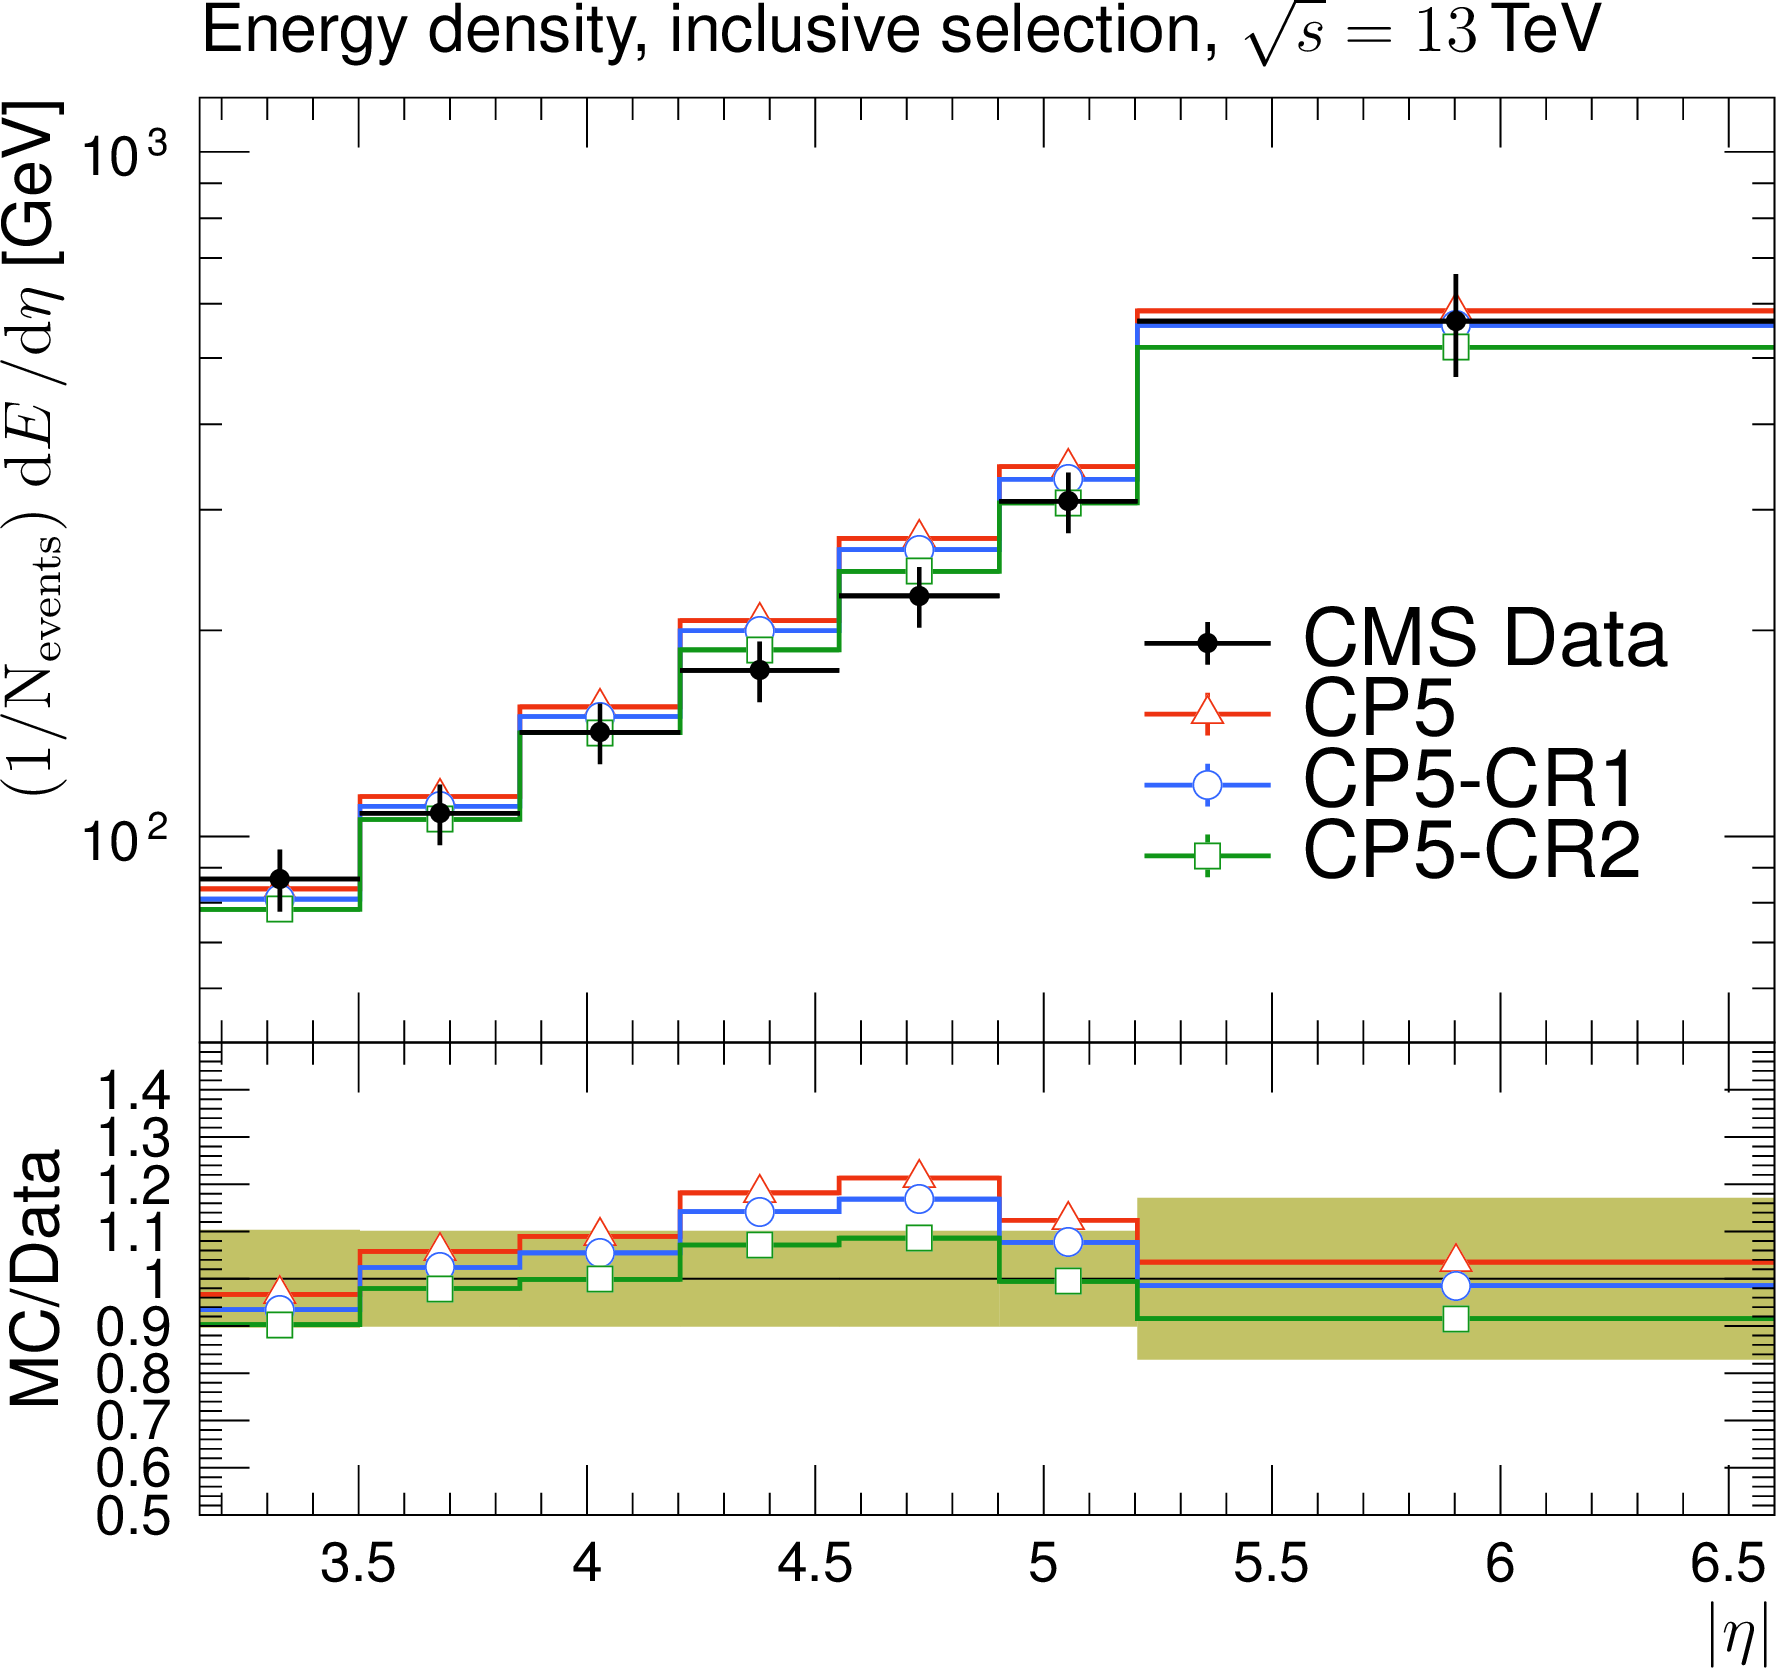
Figure 12:
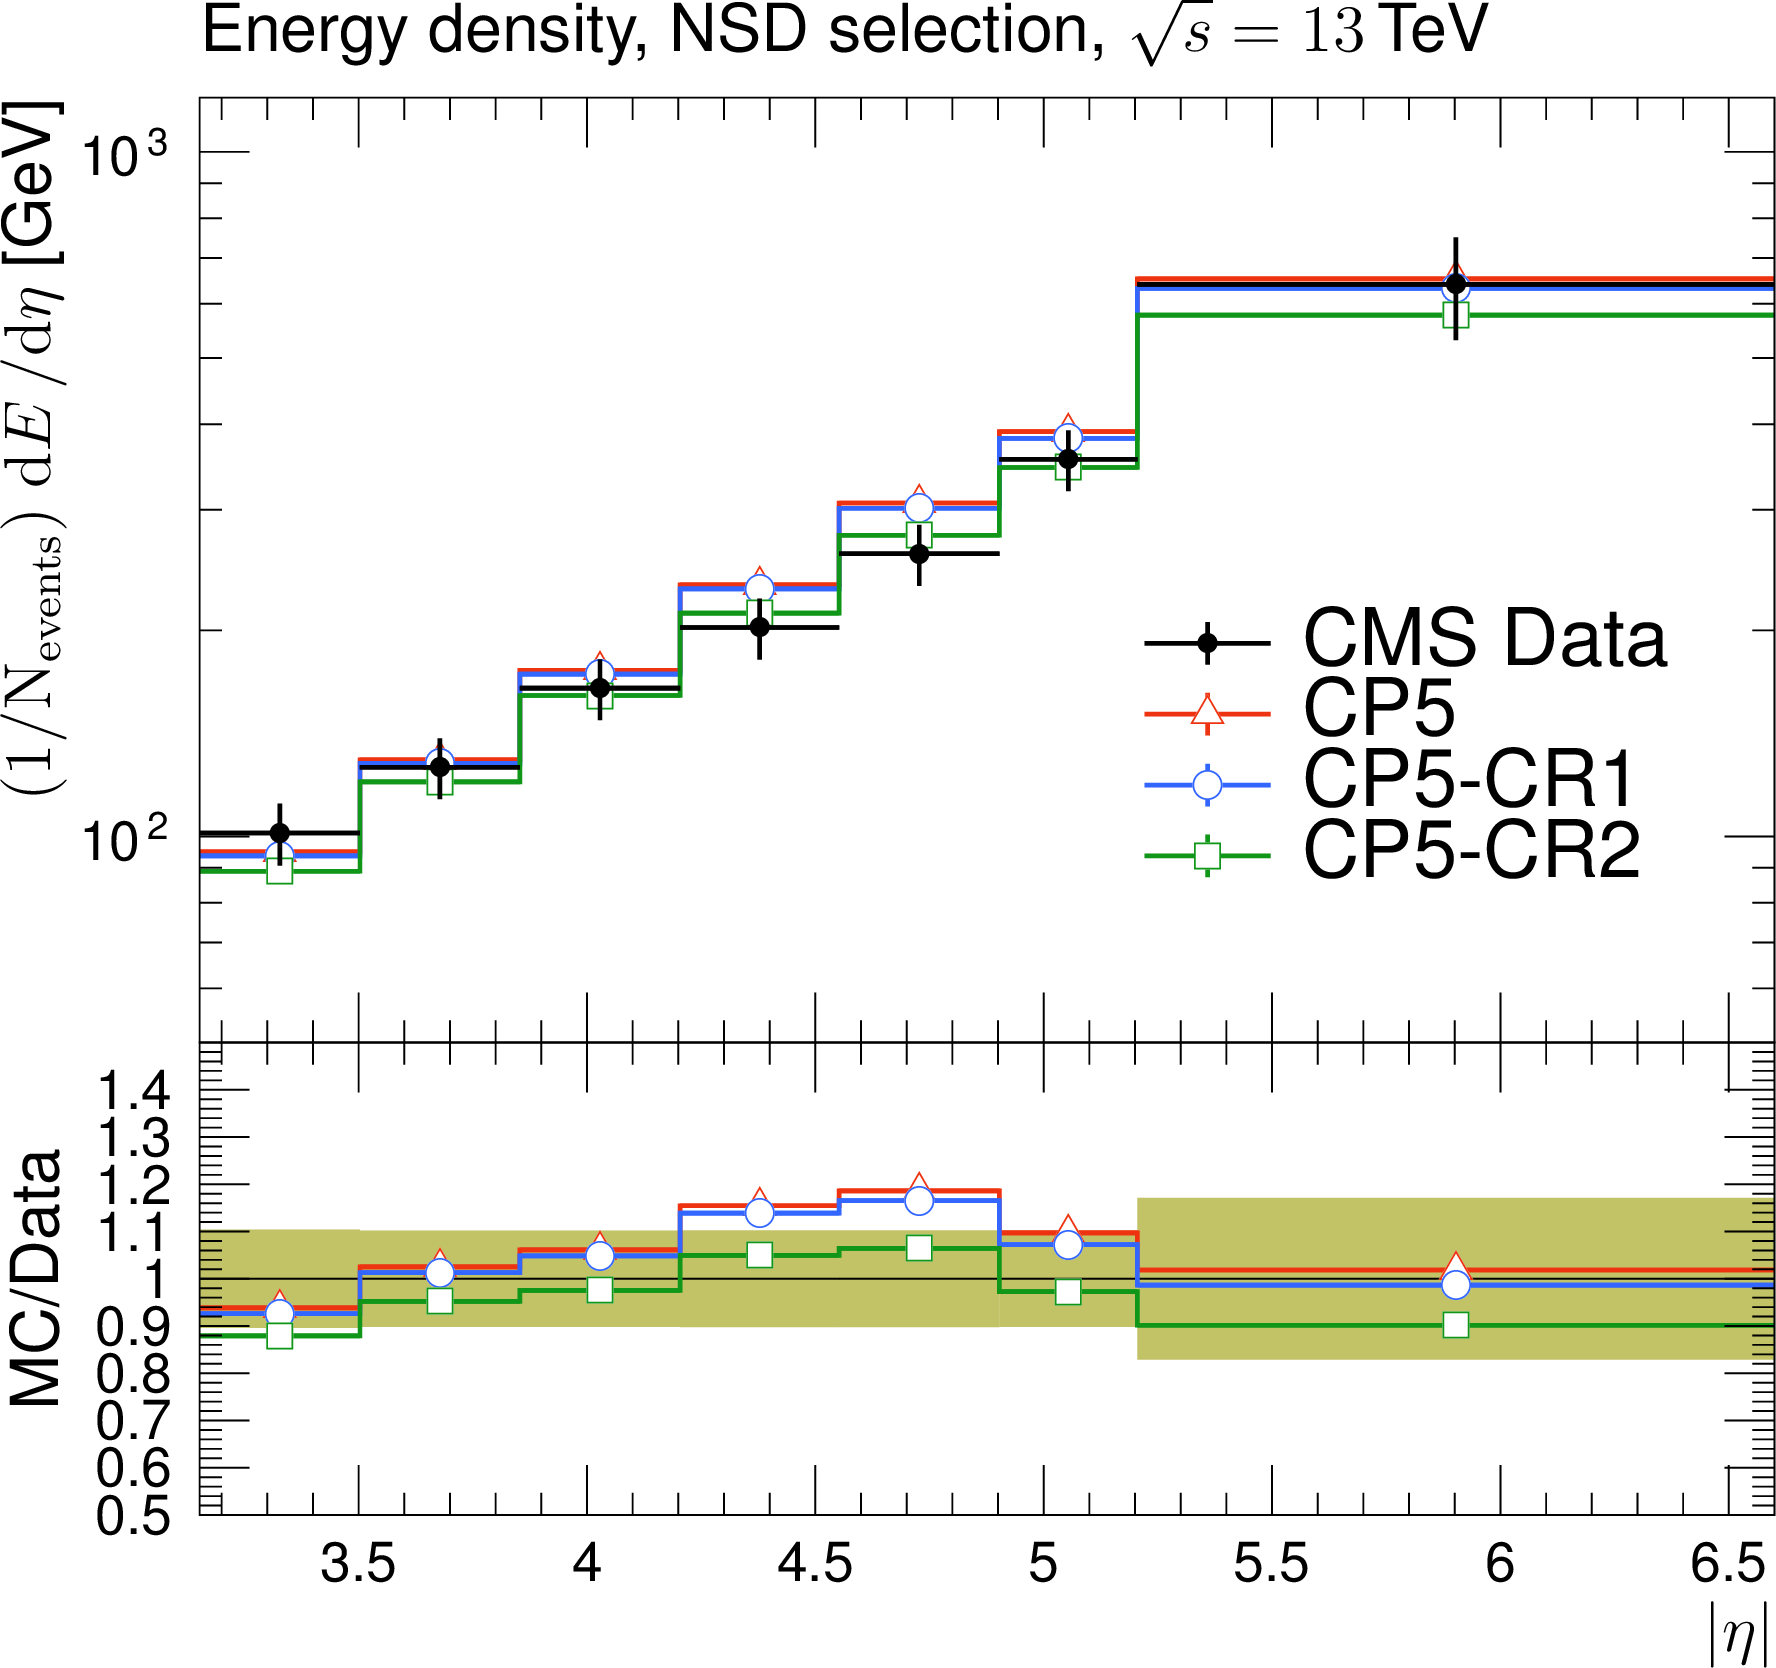
The energy density as a function of pseudorapidity, in two different selections, in MB events (left) and in events with a presence of a hard dijet system (right), measured by the CMS experiment at $ \sqrt{s}= $ 13 TeV [34]. The predictions of the CP5 and CP5-CR tunes are compared with data. The coloured band and error bars on the data points represent the total experimental uncertainty in the data. |
png pdf |
Figure 12-a:
The energy density as a function of pseudorapidity, in two different selections, in MB events (left) and in events with a presence of a hard dijet system (right), measured by the CMS experiment at $ \sqrt{s}= $ 13 TeV [34]. The predictions of the CP5 and CP5-CR tunes are compared with data. The coloured band and error bars on the data points represent the total experimental uncertainty in the data. |
png pdf |
Figure 12-b:
The energy density as a function of pseudorapidity, in two different selections, in MB events (left) and in events with a presence of a hard dijet system (right), measured by the CMS experiment at $ \sqrt{s}= $ 13 TeV [34]. The predictions of the CP5 and CP5-CR tunes are compared with data. The coloured band and error bars on the data points represent the total experimental uncertainty in the data. |

png pdf |
Figure 13:
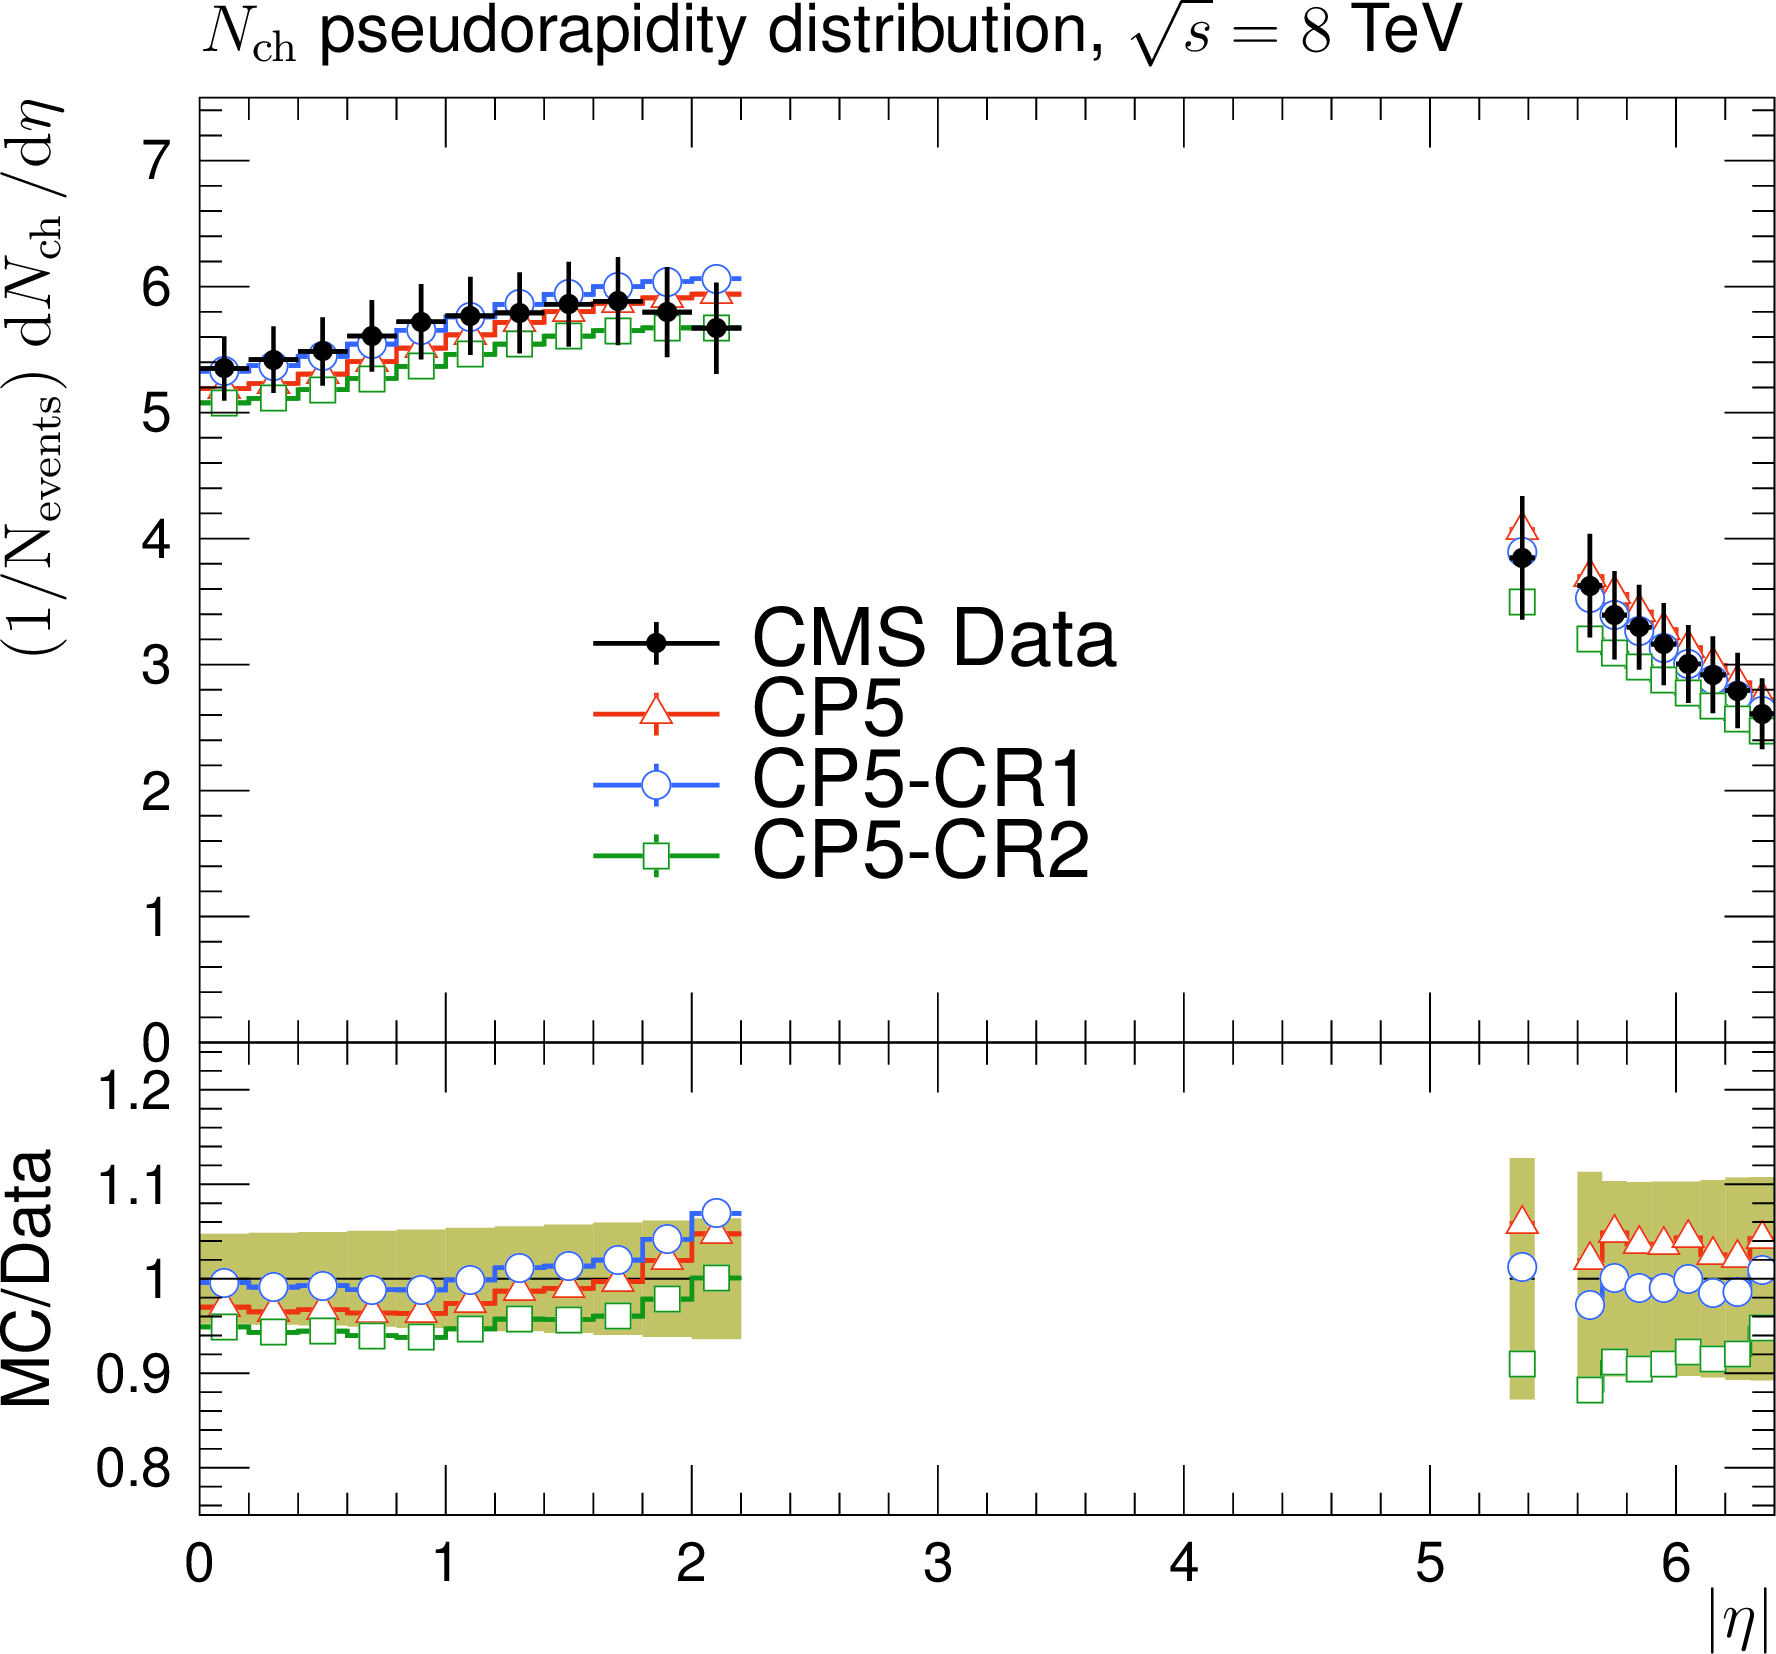
The pseudorapidity of charged particles, $ \mathrm{d}N_{\mathrm{ch}}/\mathrm{d}\eta $, measured by the CMS and TOTEM collaborations at $ \sqrt{s}= $ 8 TeV [32] (left) and measured by the TOTEM collaboration at $ \sqrt{s}= $ 7 TeV [33] (right). The predictions of the CP5 and CP5-CR tunes are compared with data. The coloured band and error bars on the data points represent the total experimental uncertainty in the data. For the CMS-TOTEM measurement, at least one charged particle with $ p_{\mathrm{T}} > $ 0 is required in 5.3 $ < \eta < $ 6.5 or $ -$6.5 $ < \eta < $ $-$5.3. For the TOTEM measurement, at least one charged particle with $ p_{\mathrm{T}} > $ 40 MeV is required in 5.3 $ < |\eta| < $ 6.4. |
png pdf |
Figure 13-a:
The pseudorapidity of charged particles, $ \mathrm{d}N_{\mathrm{ch}}/\mathrm{d}\eta $, measured by the CMS and TOTEM collaborations at $ \sqrt{s}= $ 8 TeV [32] (left) and measured by the TOTEM collaboration at $ \sqrt{s}= $ 7 TeV [33] (right). The predictions of the CP5 and CP5-CR tunes are compared with data. The coloured band and error bars on the data points represent the total experimental uncertainty in the data. For the CMS-TOTEM measurement, at least one charged particle with $ p_{\mathrm{T}} > $ 0 is required in 5.3 $ < \eta < $ 6.5 or $ -$6.5 $ < \eta < $ $-$5.3. For the TOTEM measurement, at least one charged particle with $ p_{\mathrm{T}} > $ 40 MeV is required in 5.3 $ < |\eta| < $ 6.4. |

png pdf |
Figure 13-b:
The pseudorapidity of charged particles, $ \mathrm{d}N_{\mathrm{ch}}/\mathrm{d}\eta $, measured by the CMS and TOTEM collaborations at $ \sqrt{s}= $ 8 TeV [32] (left) and measured by the TOTEM collaboration at $ \sqrt{s}= $ 7 TeV [33] (right). The predictions of the CP5 and CP5-CR tunes are compared with data. The coloured band and error bars on the data points represent the total experimental uncertainty in the data. For the CMS-TOTEM measurement, at least one charged particle with $ p_{\mathrm{T}} > $ 0 is required in 5.3 $ < \eta < $ 6.5 or $ -$6.5 $ < \eta < $ $-$5.3. For the TOTEM measurement, at least one charged particle with $ p_{\mathrm{T}} > $ 40 MeV is required in 5.3 $ < |\eta| < $ 6.4. |

png pdf |
Figure 14:
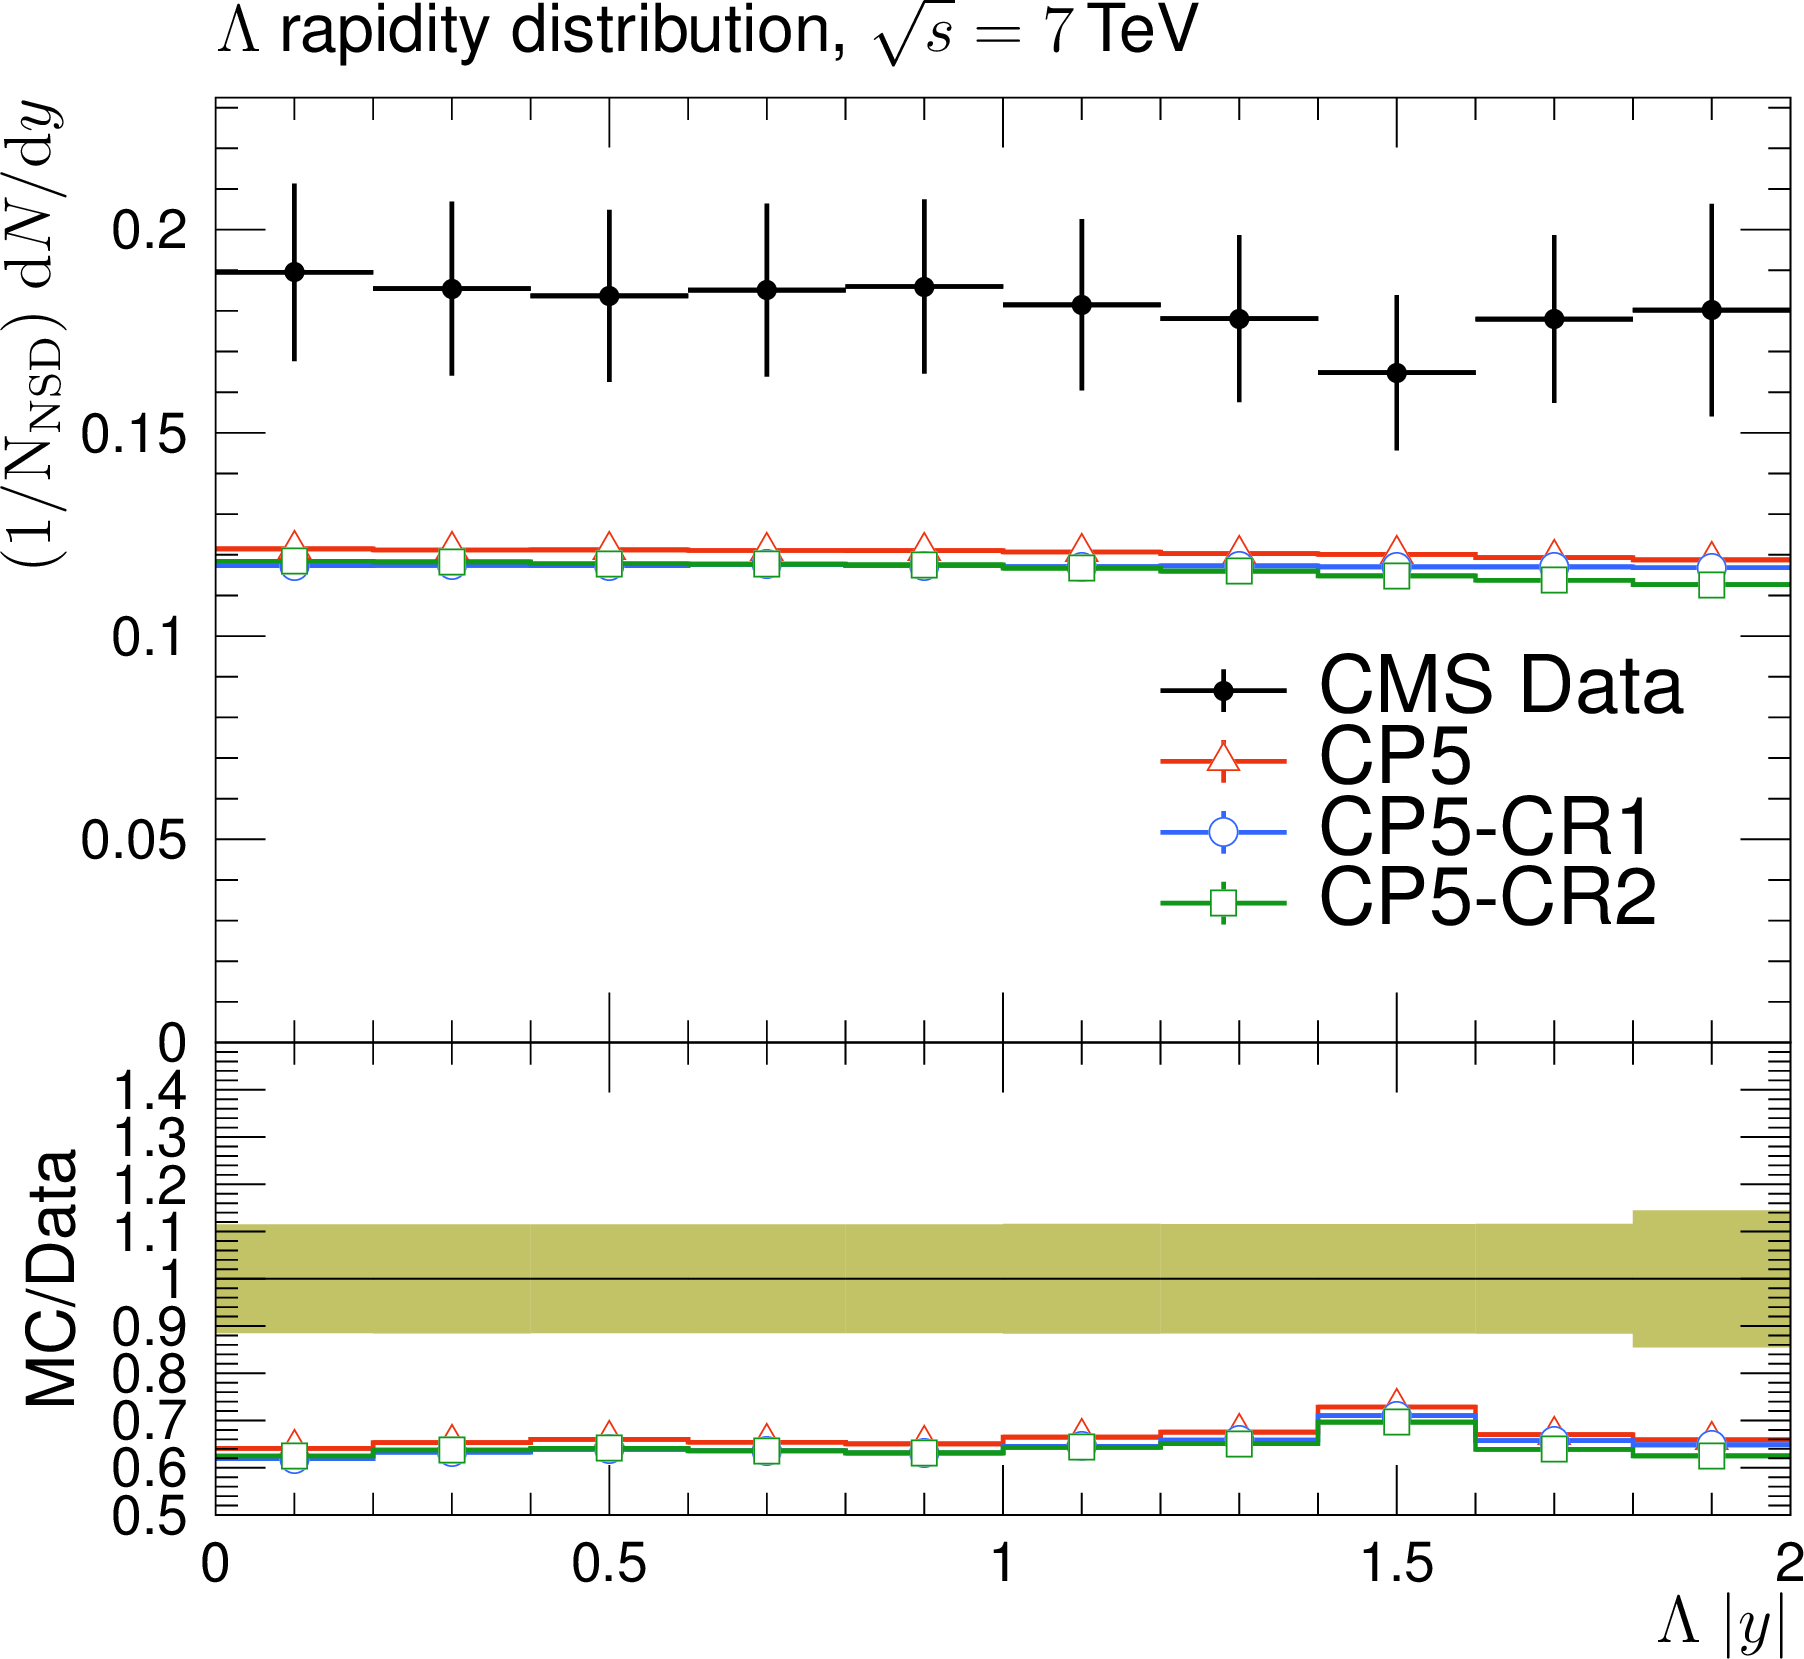
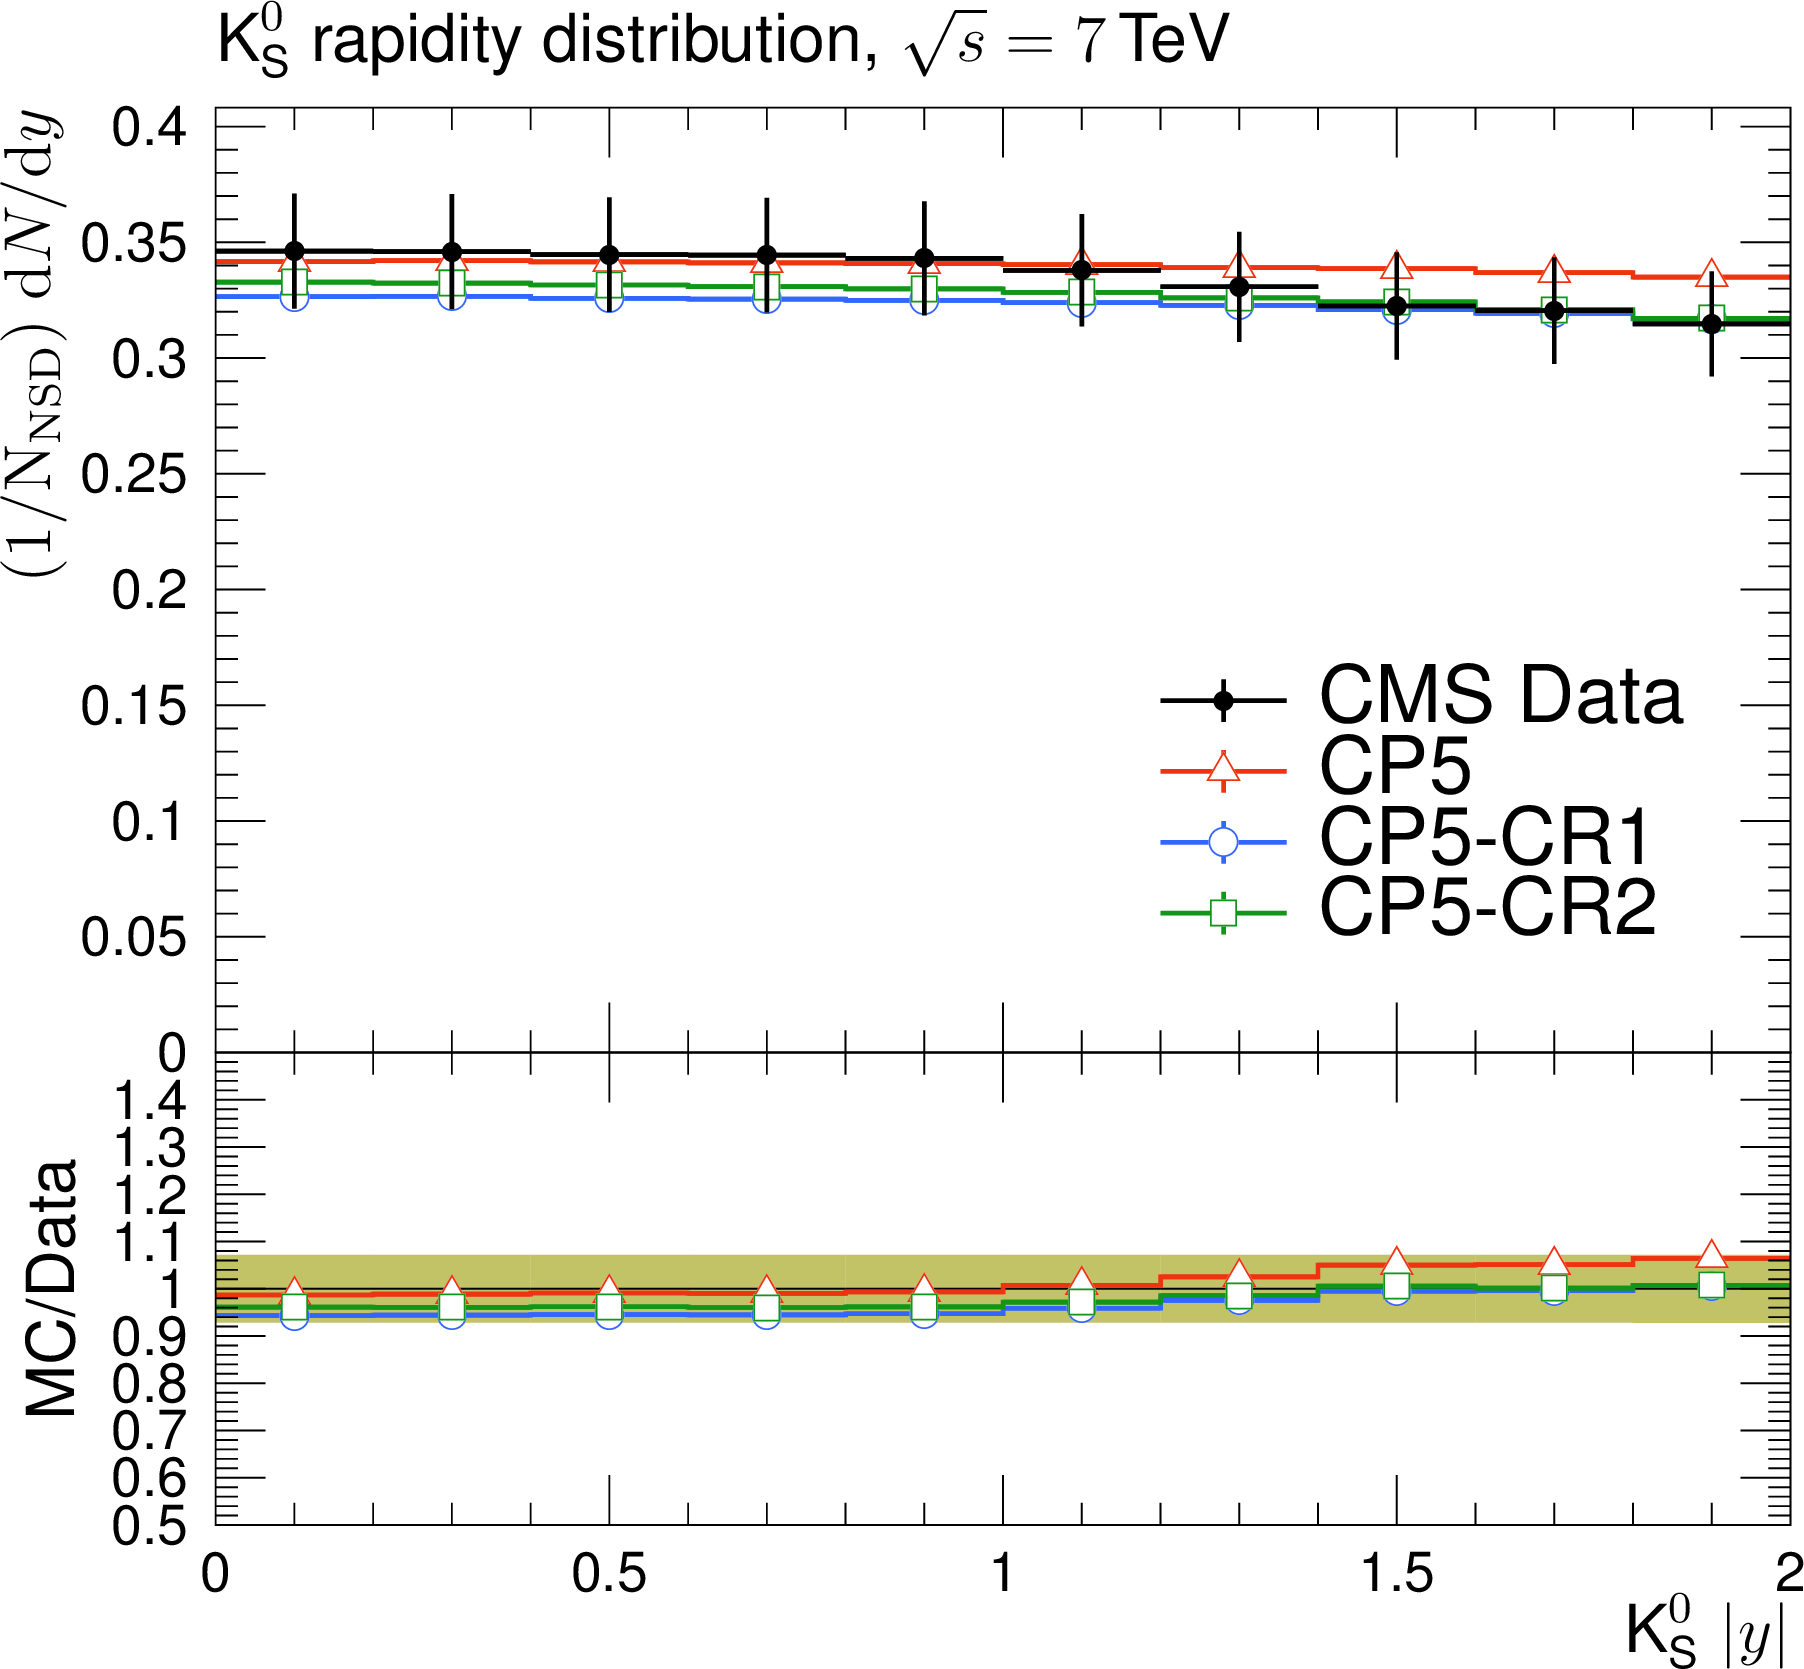
The strange particle production, $ \Lambda $ baryons (left) and $ \mathrm{K^0_S} $ mesons (right), as a function of rapidity, measured by the CMS experiment at $ \sqrt{s}= $ 7 TeV [16]. The predictions of the CP5 and CP5-CR tunes are compared with data. The coloured band and error bars on the data points represent the total experimental uncertainty in the data. |
png pdf |
Figure 14-a:
The strange particle production, $ \Lambda $ baryons (left) and $ \mathrm{K^0_S} $ mesons (right), as a function of rapidity, measured by the CMS experiment at $ \sqrt{s}= $ 7 TeV [16]. The predictions of the CP5 and CP5-CR tunes are compared with data. The coloured band and error bars on the data points represent the total experimental uncertainty in the data. |
png pdf |
Figure 14-b:
The strange particle production, $ \Lambda $ baryons (left) and $ \mathrm{K^0_S} $ mesons (right), as a function of rapidity, measured by the CMS experiment at $ \sqrt{s}= $ 7 TeV [16]. The predictions of the CP5 and CP5-CR tunes are compared with data. The coloured band and error bars on the data points represent the total experimental uncertainty in the data. |
png pdf |
Figure 15:
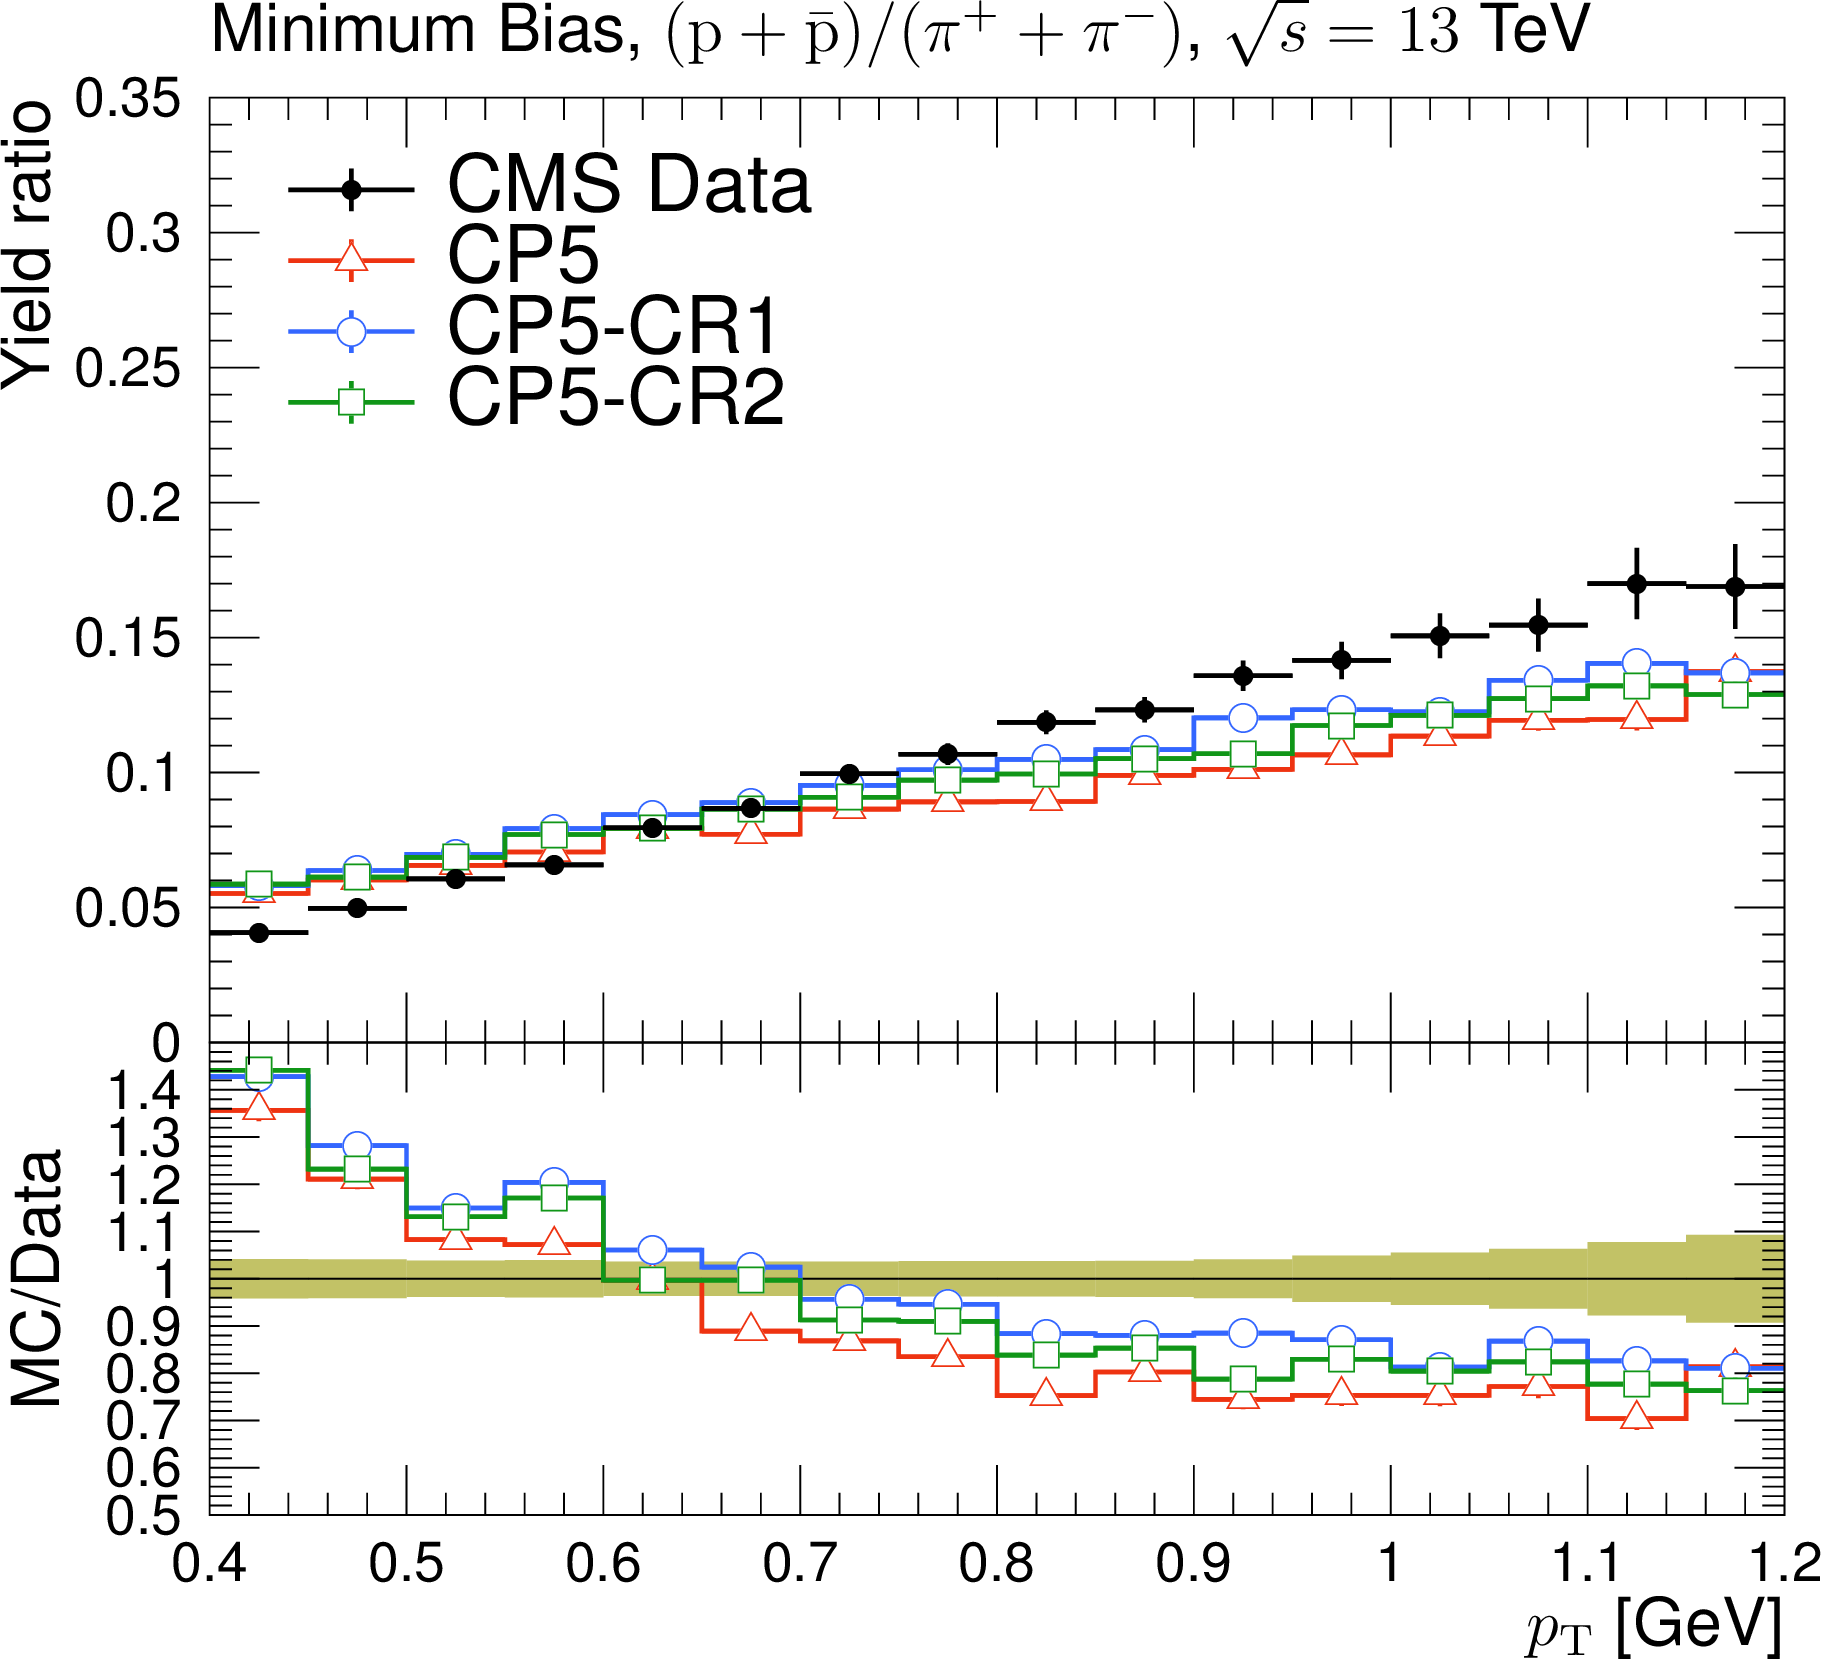
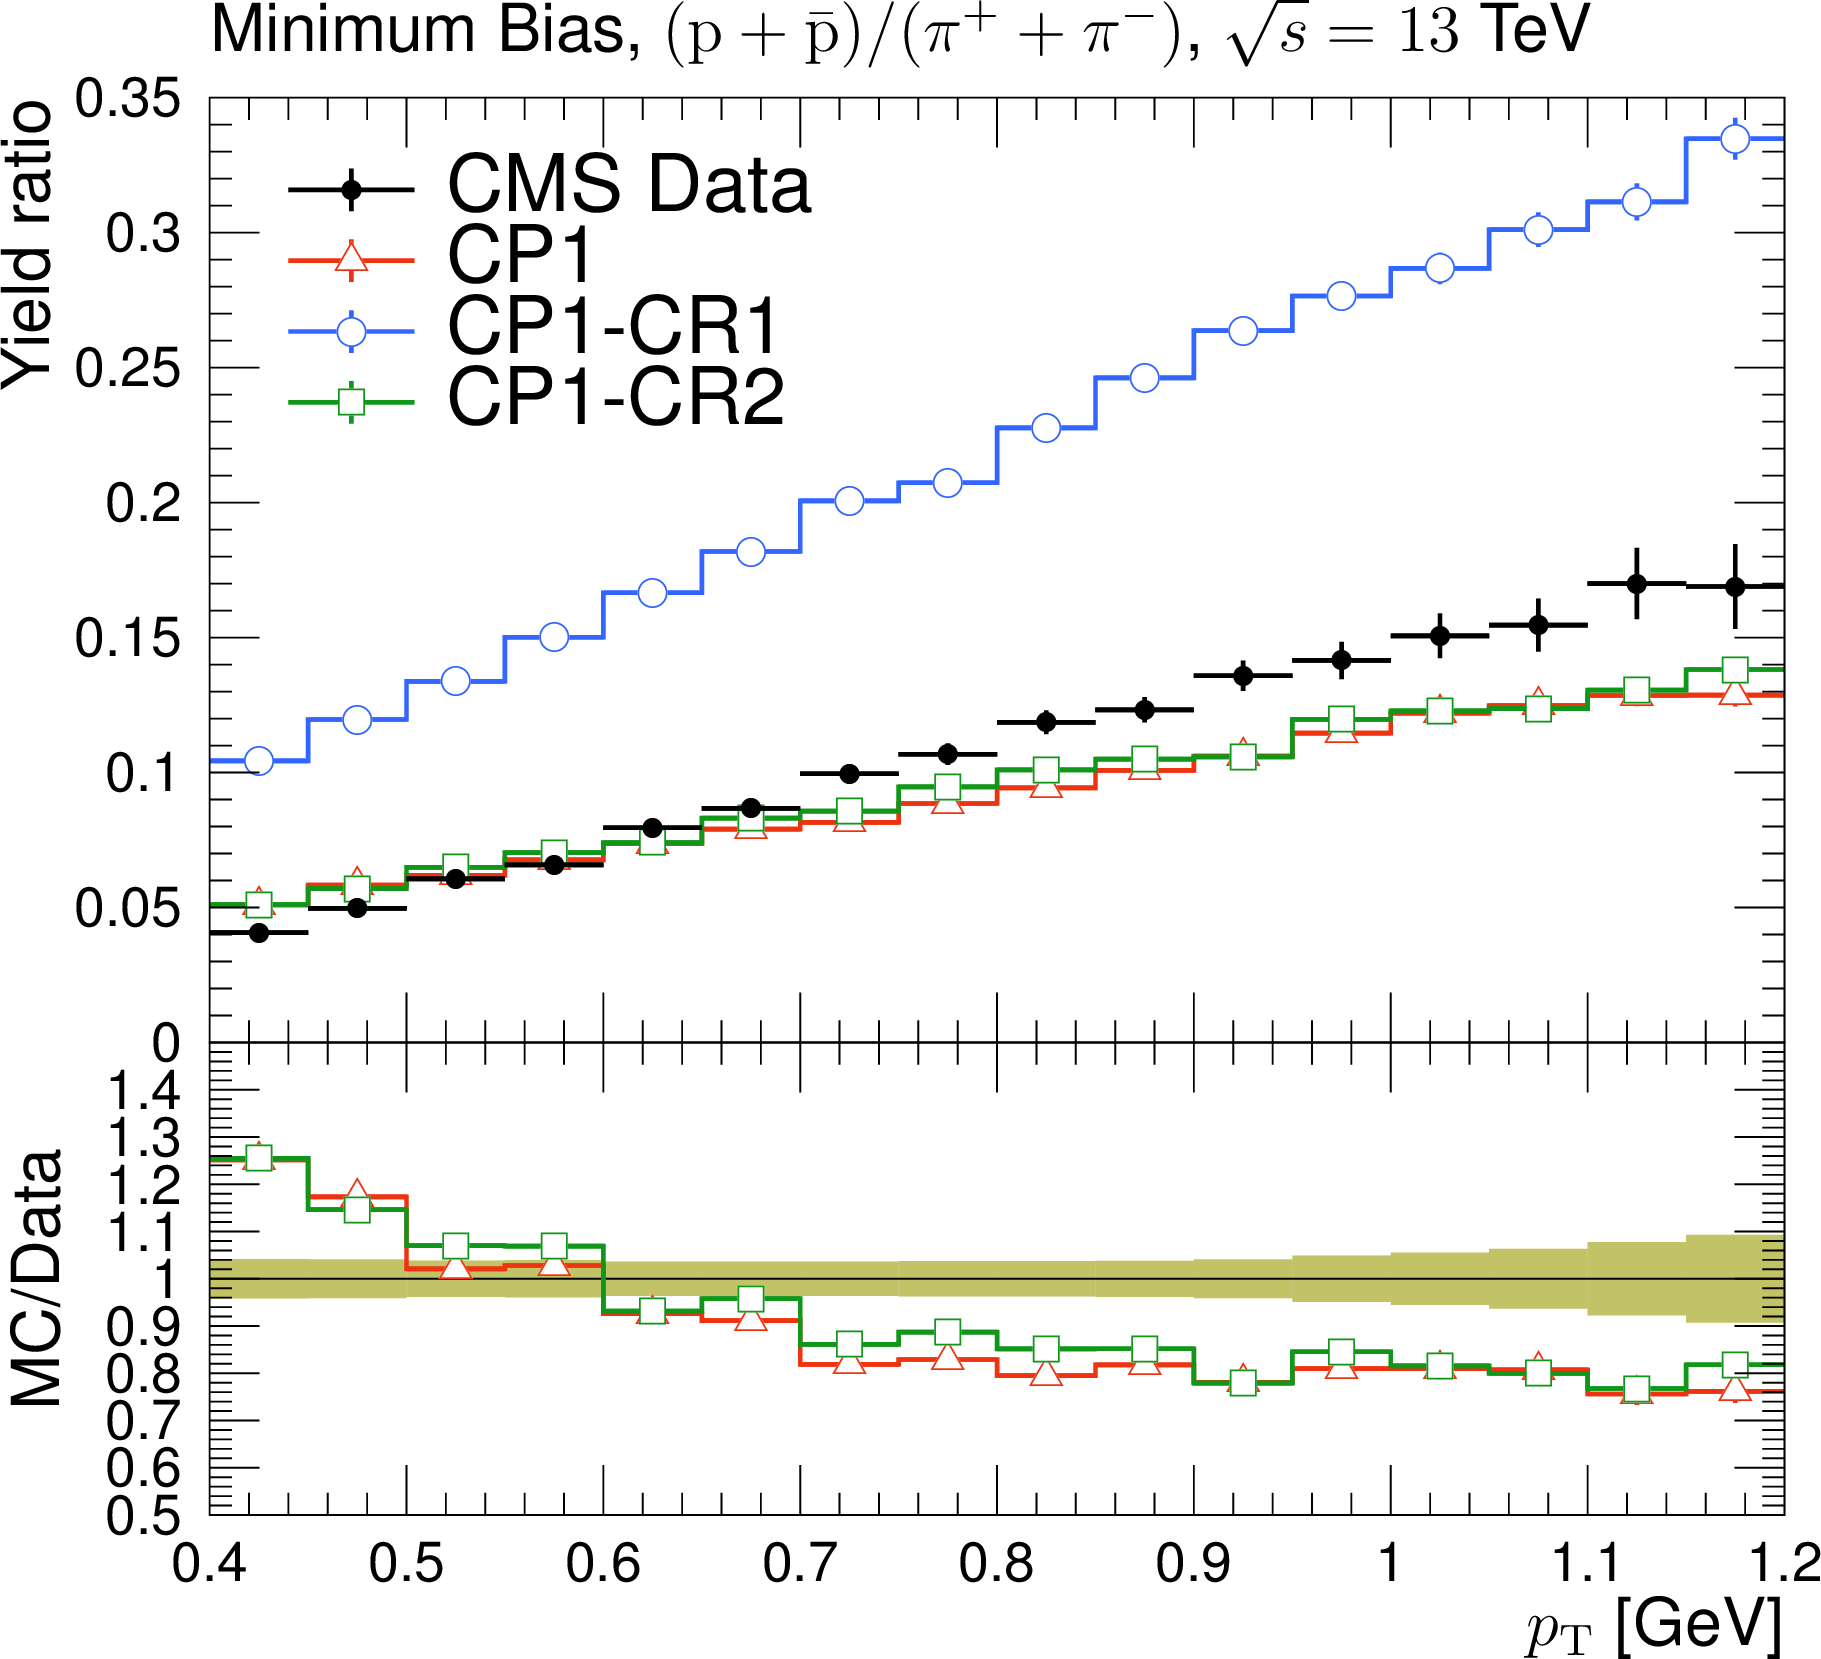
Ratios of particle yields, $ \text{p}/\pi $, as a function of transverse momentum in mininum-bias events, measured by the CMS experiment at $ \sqrt{s}= $ 13 TeV [39]. The predictions of the CP5 and CP5-CR tunes are compared with CMS data. The coloured band and error bars on the data points represent the total experimental uncertainty in the data. |

png pdf |
Figure 16:
Average charged-hadron multiplicity, as a function of the jet $ p_{\mathrm{T}} $, for jets with rapidity $ |y| < $ 1, measured by the CMS experiment at $ \sqrt{s}= $ 7 TeV [27]. The predictions of the CP5 and CP5-CR tunes are compared with data. The coloured band and error bars on the data points represent the total experimental uncertainty in the data. |

png pdf |
Figure 17:
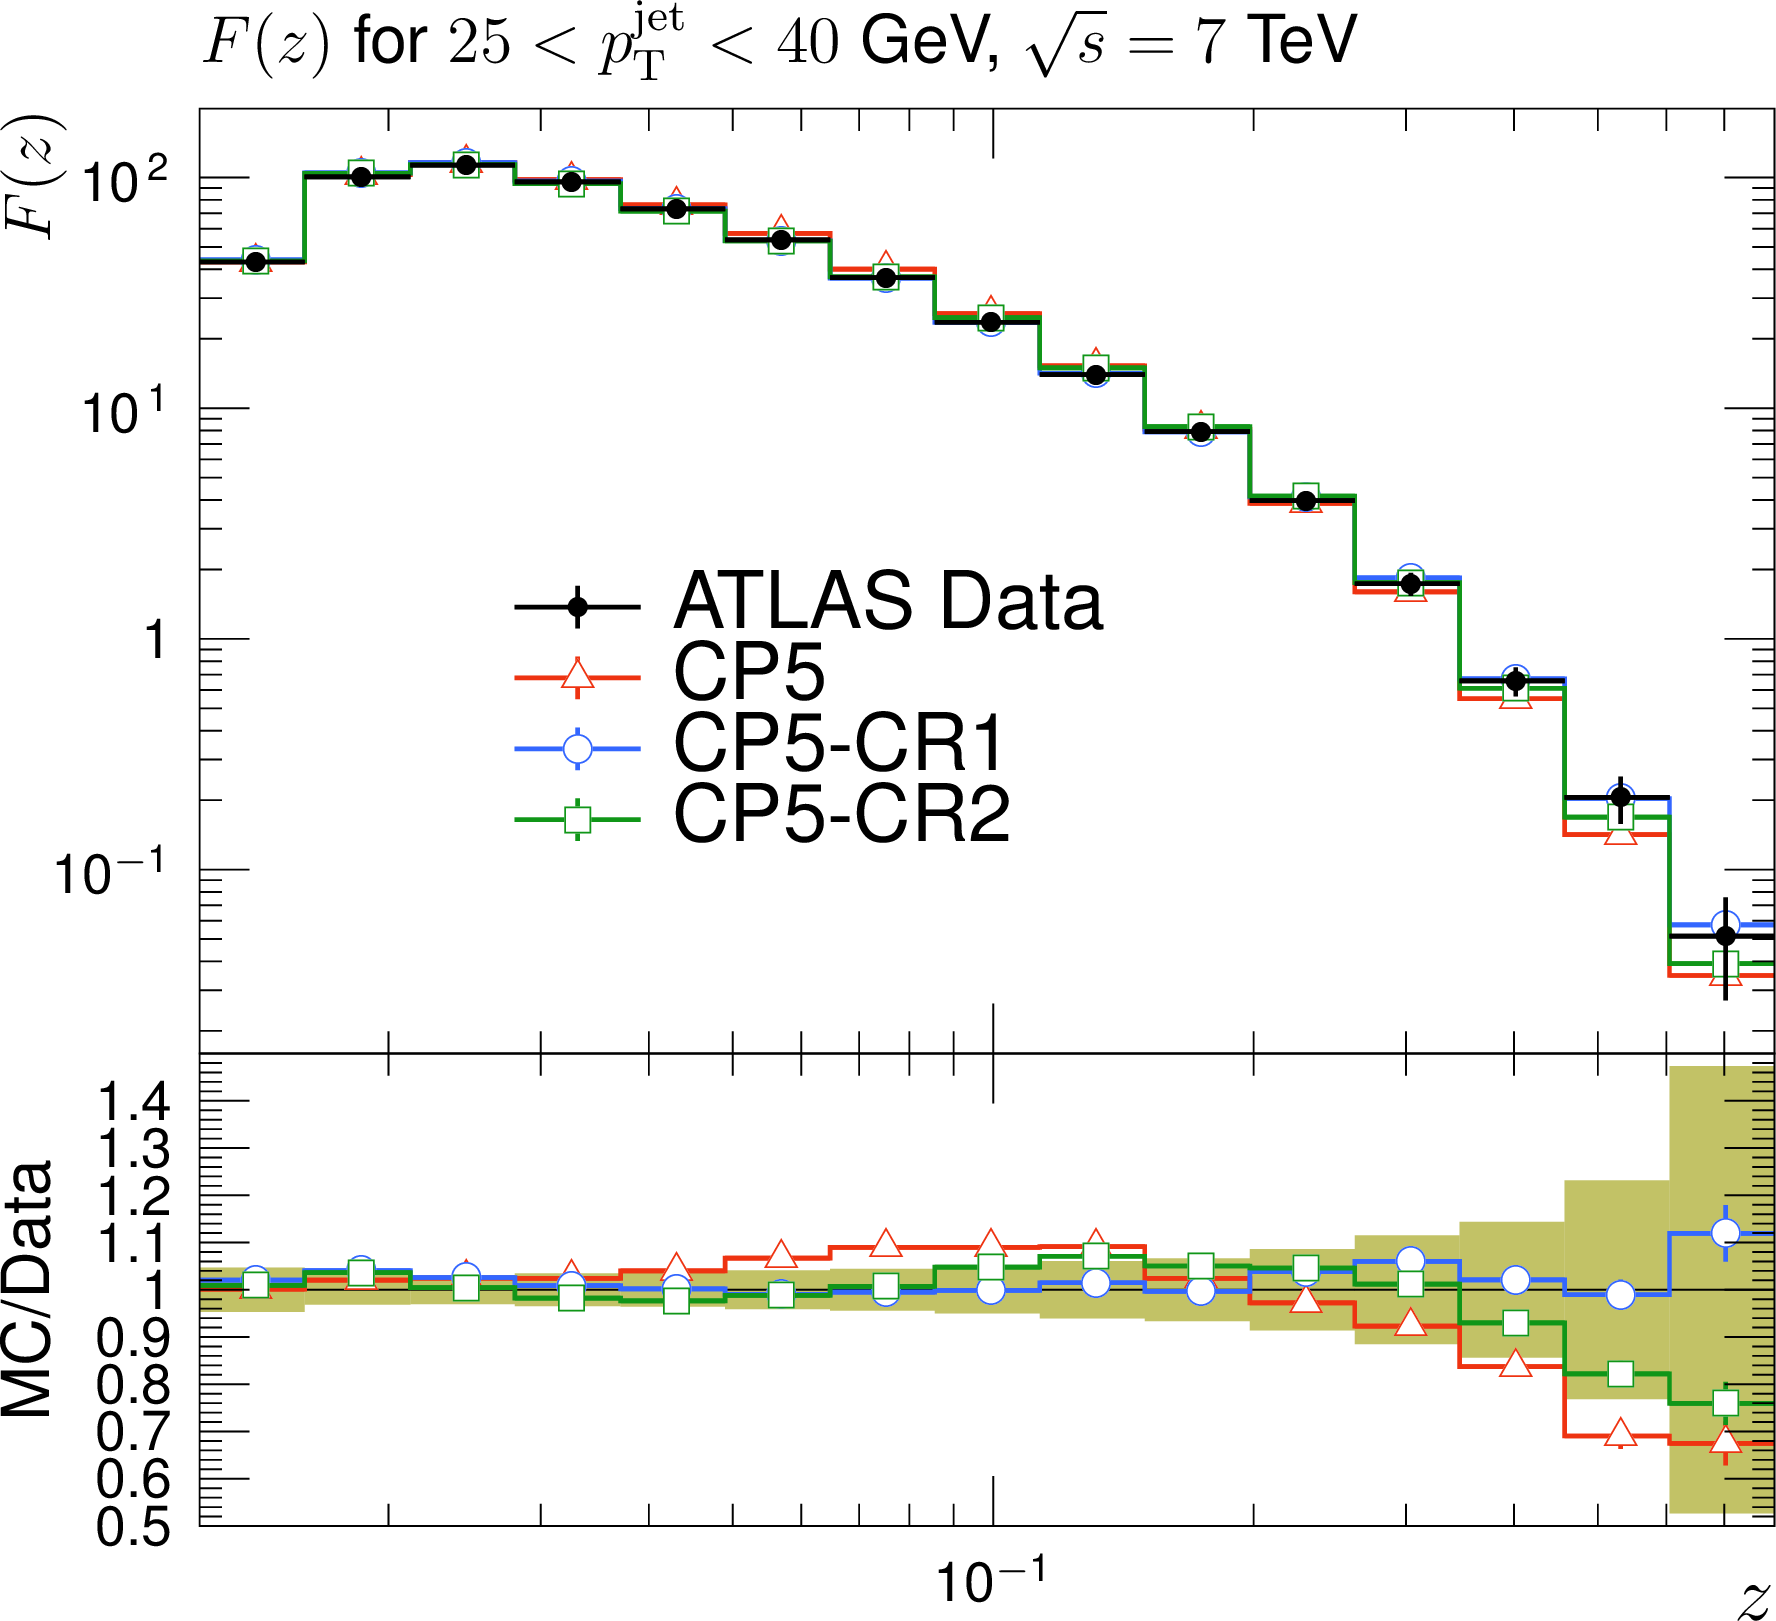
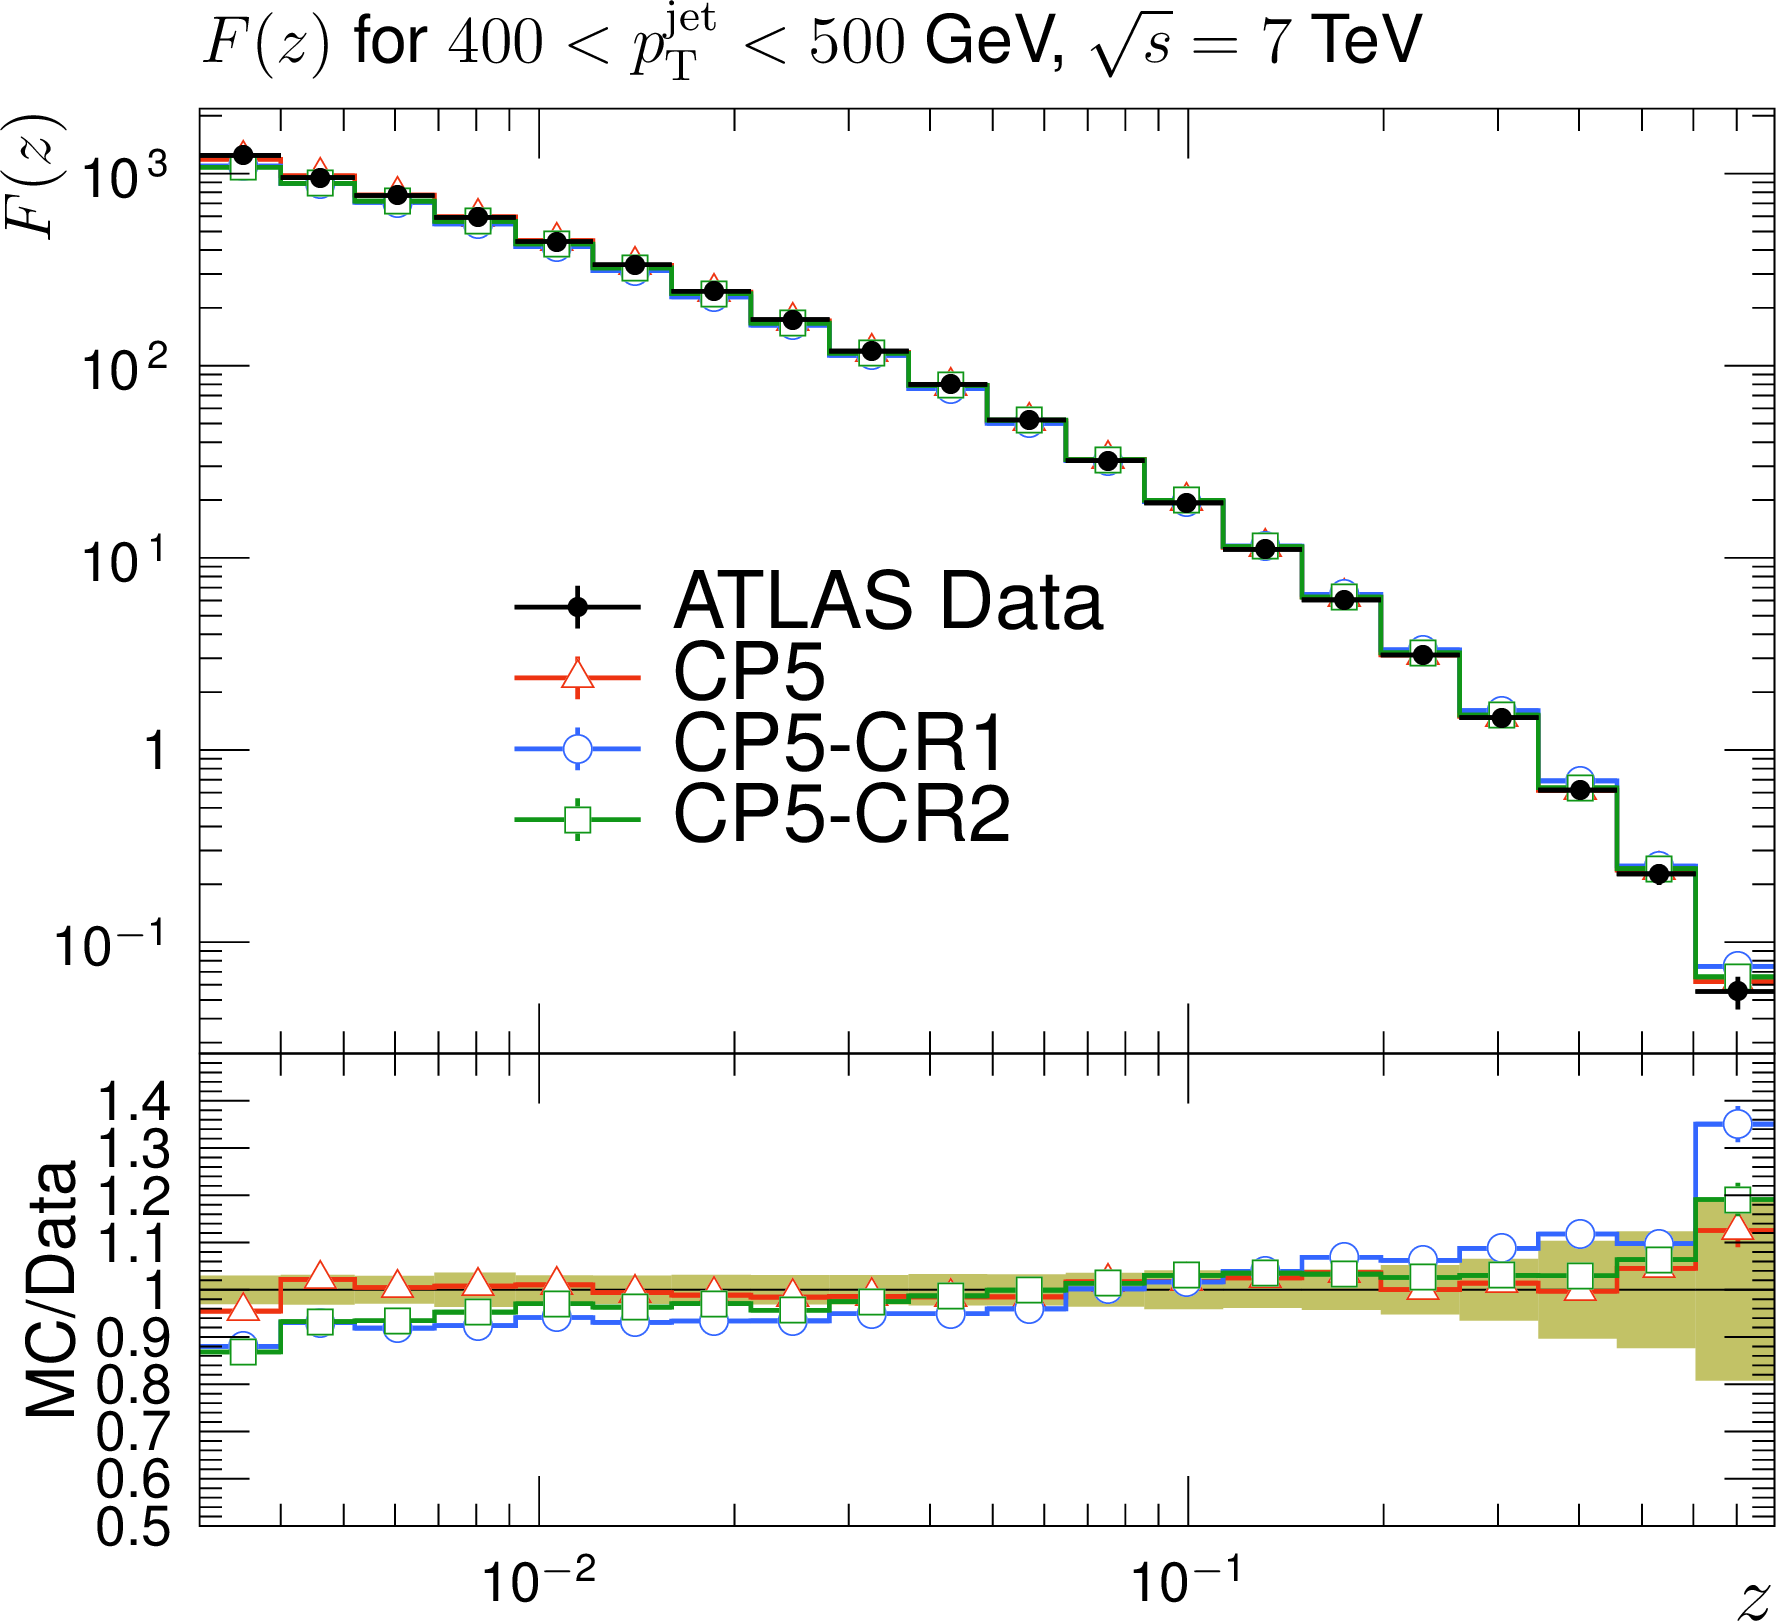
Distributions of $ F(z) $ for 25 $ < p_{\mathrm{T}}^{\text{jet}} < $ 40 GeV (left) and 400 $ < p_{\mathrm{T}}^{\text{jet}} < $ 500 GeV (right) for jets with pseudorapidity $ |\eta_\text{jet}| < $ 1.2, measured by the ATLAS experiment at $ \sqrt{s}= $ 7 TeV [28]. The predictions of the CP5 and CP5-CR tunes are compared with data. The coloured band and error bars on the data points represent the total experimental uncertainty in the data. |
png pdf |
Figure 17-a:
Distributions of $ F(z) $ for 25 $ < p_{\mathrm{T}}^{\text{jet}} < $ 40 GeV (left) and 400 $ < p_{\mathrm{T}}^{\text{jet}} < $ 500 GeV (right) for jets with pseudorapidity $ |\eta_\text{jet}| < $ 1.2, measured by the ATLAS experiment at $ \sqrt{s}= $ 7 TeV [28]. The predictions of the CP5 and CP5-CR tunes are compared with data. The coloured band and error bars on the data points represent the total experimental uncertainty in the data. |
png pdf |
Figure 17-b:
Distributions of $ F(z) $ for 25 $ < p_{\mathrm{T}}^{\text{jet}} < $ 40 GeV (left) and 400 $ < p_{\mathrm{T}}^{\text{jet}} < $ 500 GeV (right) for jets with pseudorapidity $ |\eta_\text{jet}| < $ 1.2, measured by the ATLAS experiment at $ \sqrt{s}= $ 7 TeV [28]. The predictions of the CP5 and CP5-CR tunes are compared with data. The coloured band and error bars on the data points represent the total experimental uncertainty in the data. |

png pdf |
Figure 18:
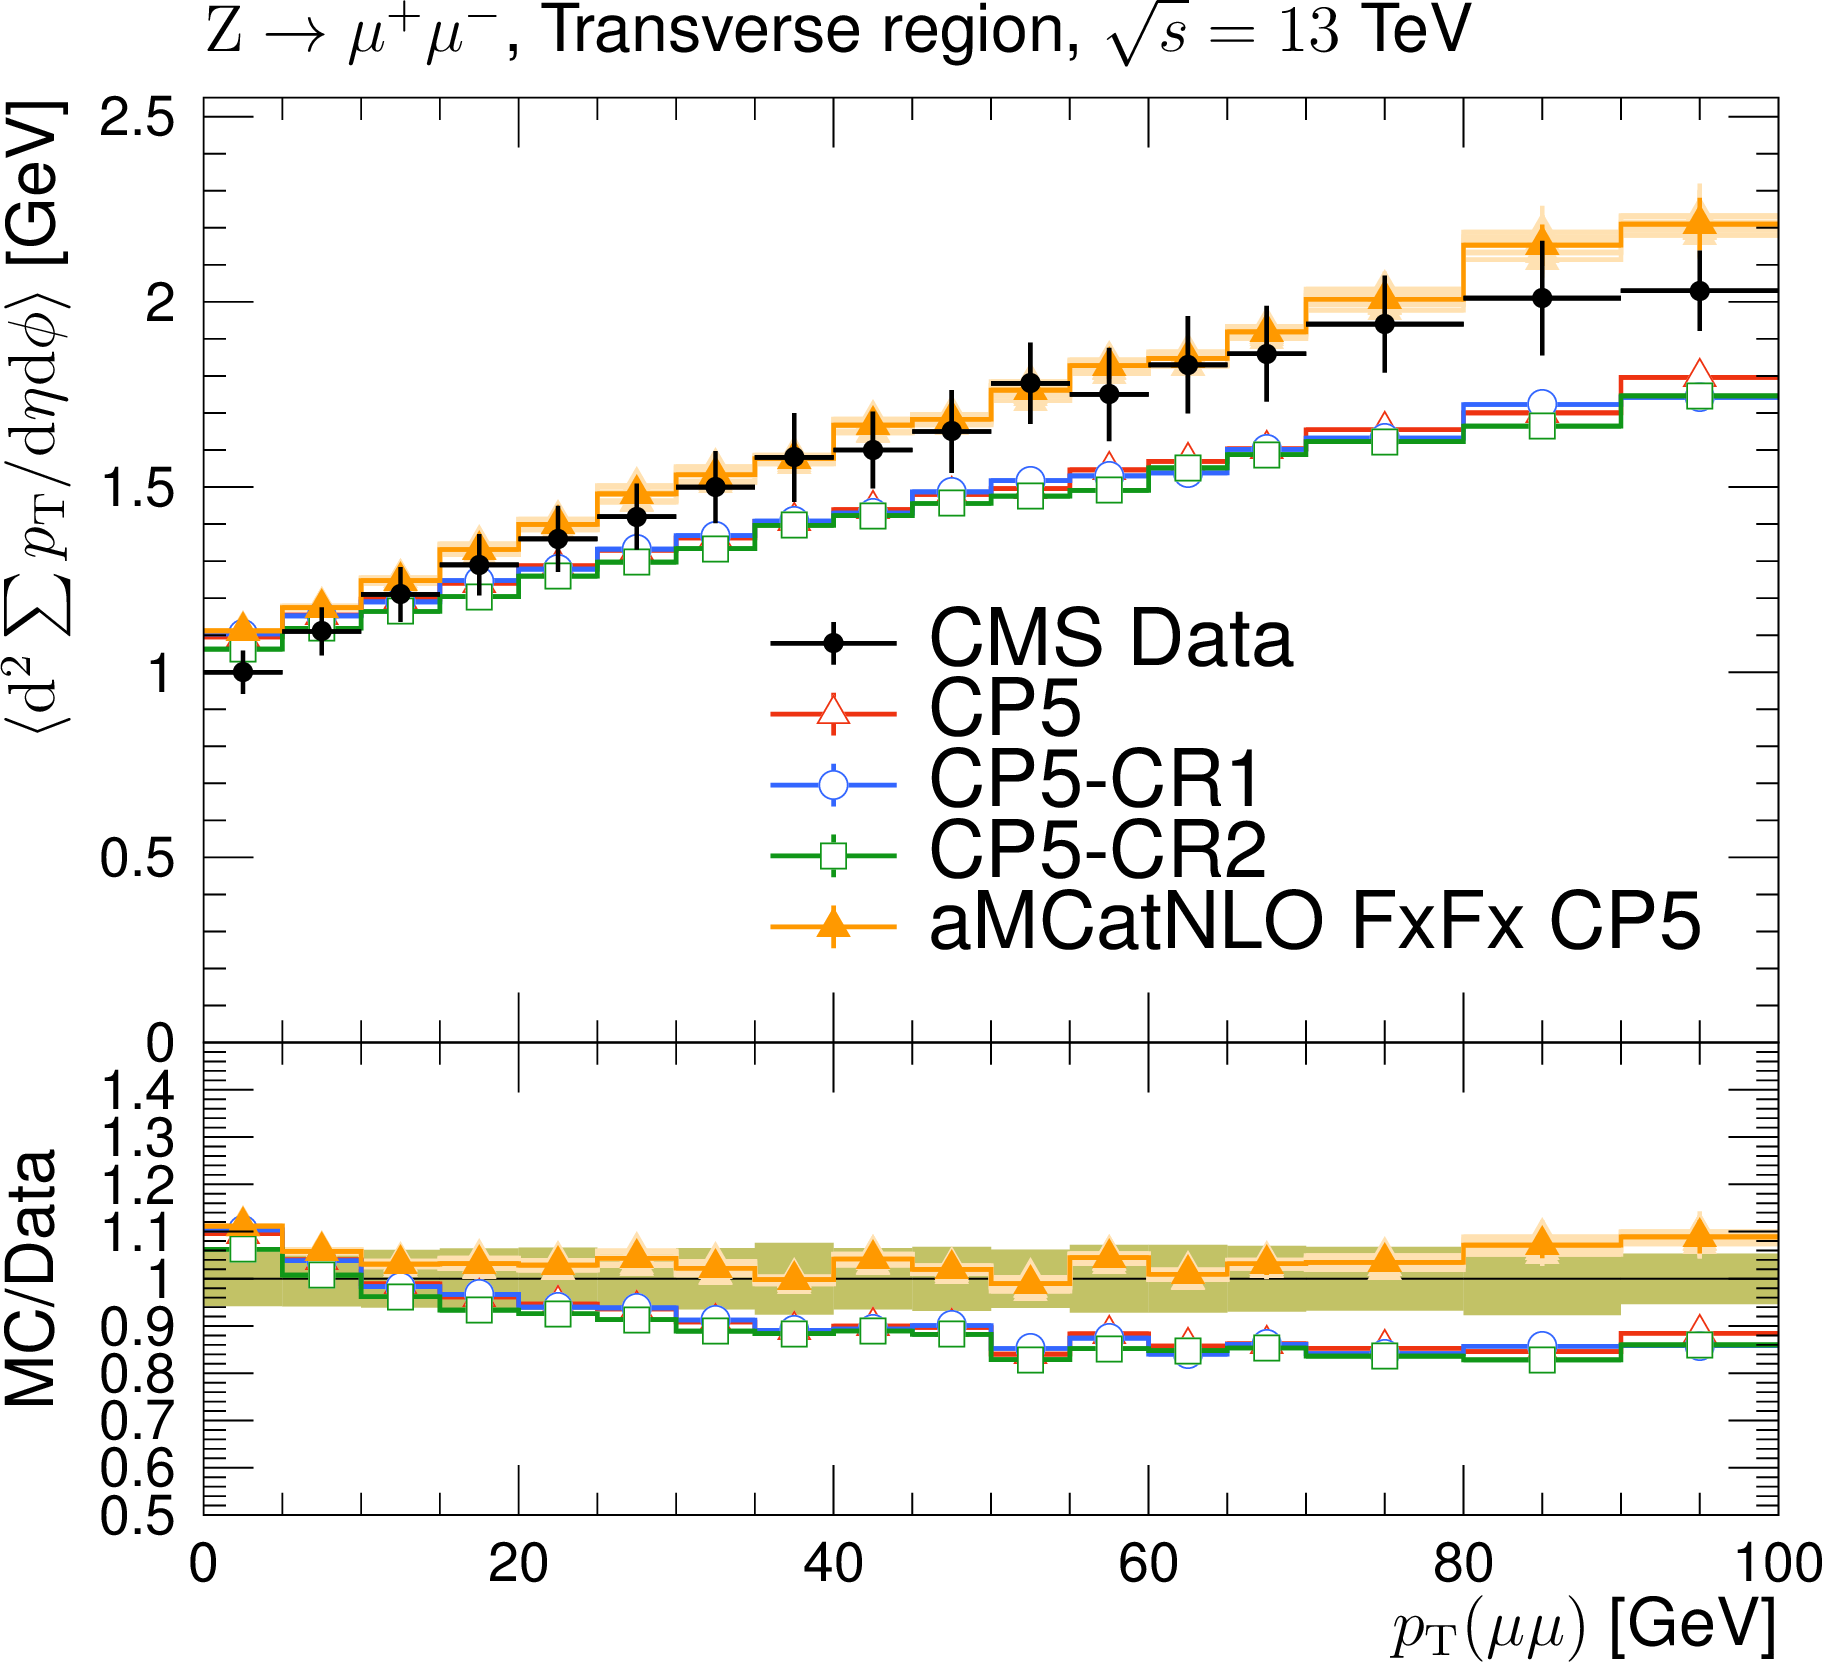
Number of charged particles and $ p_{\mathrm{T}} $ flow in the transverse region of DY events, measured by the CMS experiment at $ \sqrt{s}= $ 13 TeV in bins of Z boson $ p_{\mathrm{T}} $ [44]. The plots show the predictions of PYTHIA 8 with the CP5 and CP5-CR tunes, as well as MadGraph-5_aMC@NLO with the CP5 tune compared with data. The coloured band and error bars on the data points represent the total experimental uncertainty in the data. |

png pdf |
Figure 18-a:
Number of charged particles and $ p_{\mathrm{T}} $ flow in the transverse region of DY events, measured by the CMS experiment at $ \sqrt{s}= $ 13 TeV in bins of Z boson $ p_{\mathrm{T}} $ [44]. The plots show the predictions of PYTHIA 8 with the CP5 and CP5-CR tunes, as well as MadGraph-5_aMC@NLO with the CP5 tune compared with data. The coloured band and error bars on the data points represent the total experimental uncertainty in the data. |
png pdf |
Figure 18-b:
Number of charged particles and $ p_{\mathrm{T}} $ flow in the transverse region of DY events, measured by the CMS experiment at $ \sqrt{s}= $ 13 TeV in bins of Z boson $ p_{\mathrm{T}} $ [44]. The plots show the predictions of PYTHIA 8 with the CP5 and CP5-CR tunes, as well as MadGraph-5_aMC@NLO with the CP5 tune compared with data. The coloured band and error bars on the data points represent the total experimental uncertainty in the data. |
png pdf |
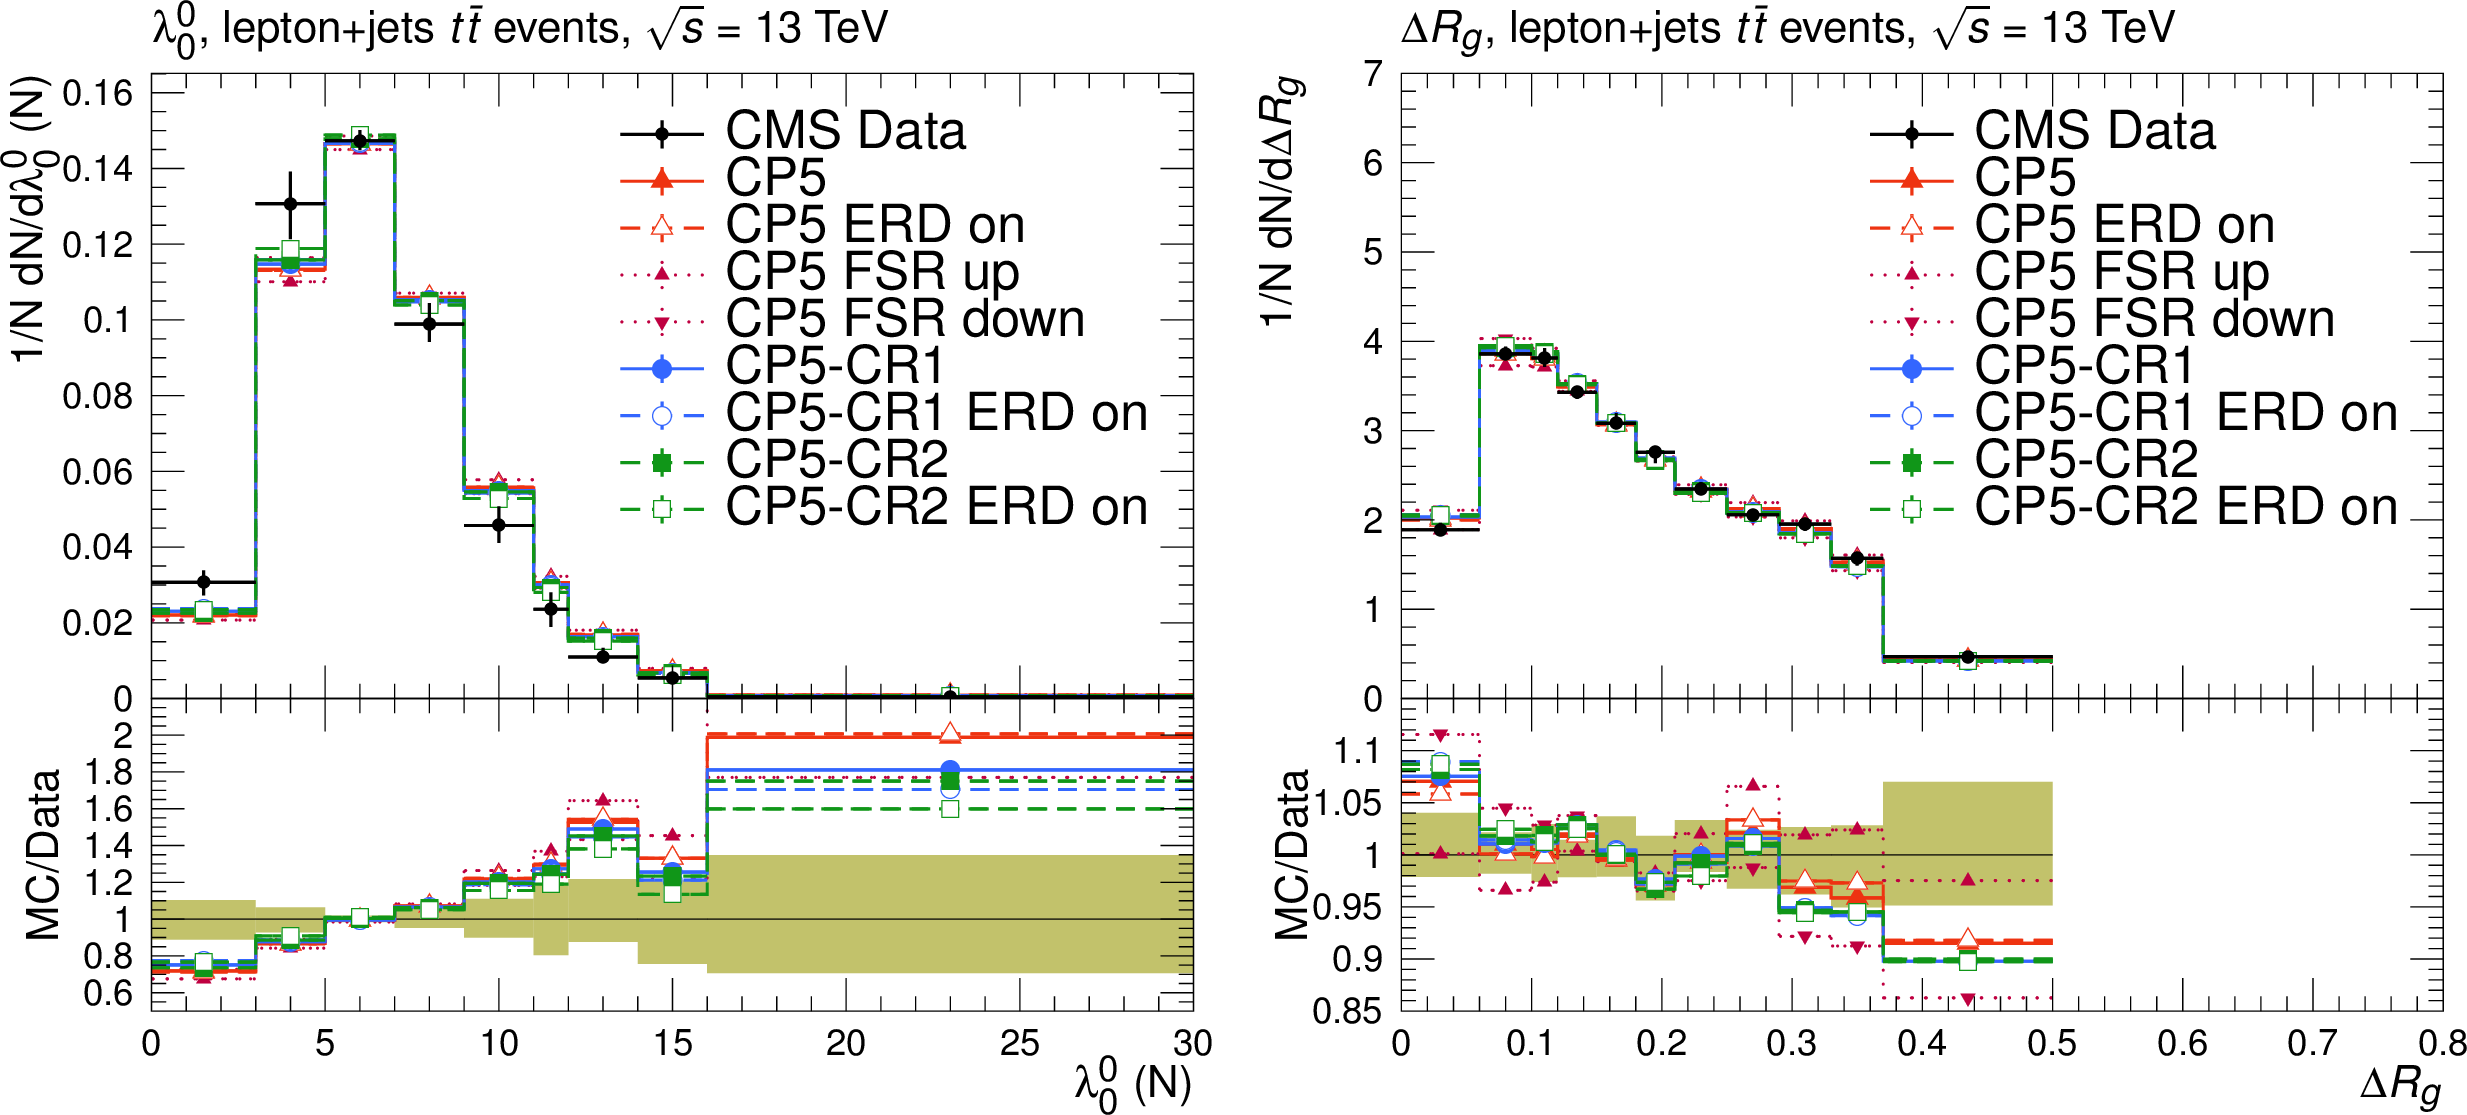
Figure 19:
Distributions of the particle multiplicity in gluon jets (left) and the angle $ \Delta R_g $ between two groomed subjets in inclusive jets (right) measured by the CMS experiment in $ {\mathrm{t}\overline{\mathrm{t}}} $ events at $ \sqrt{s}= $ 13 TeV [53]. The coloured band and error bars on the data points represent the total experimental uncertainty in the data. |
png pdf |
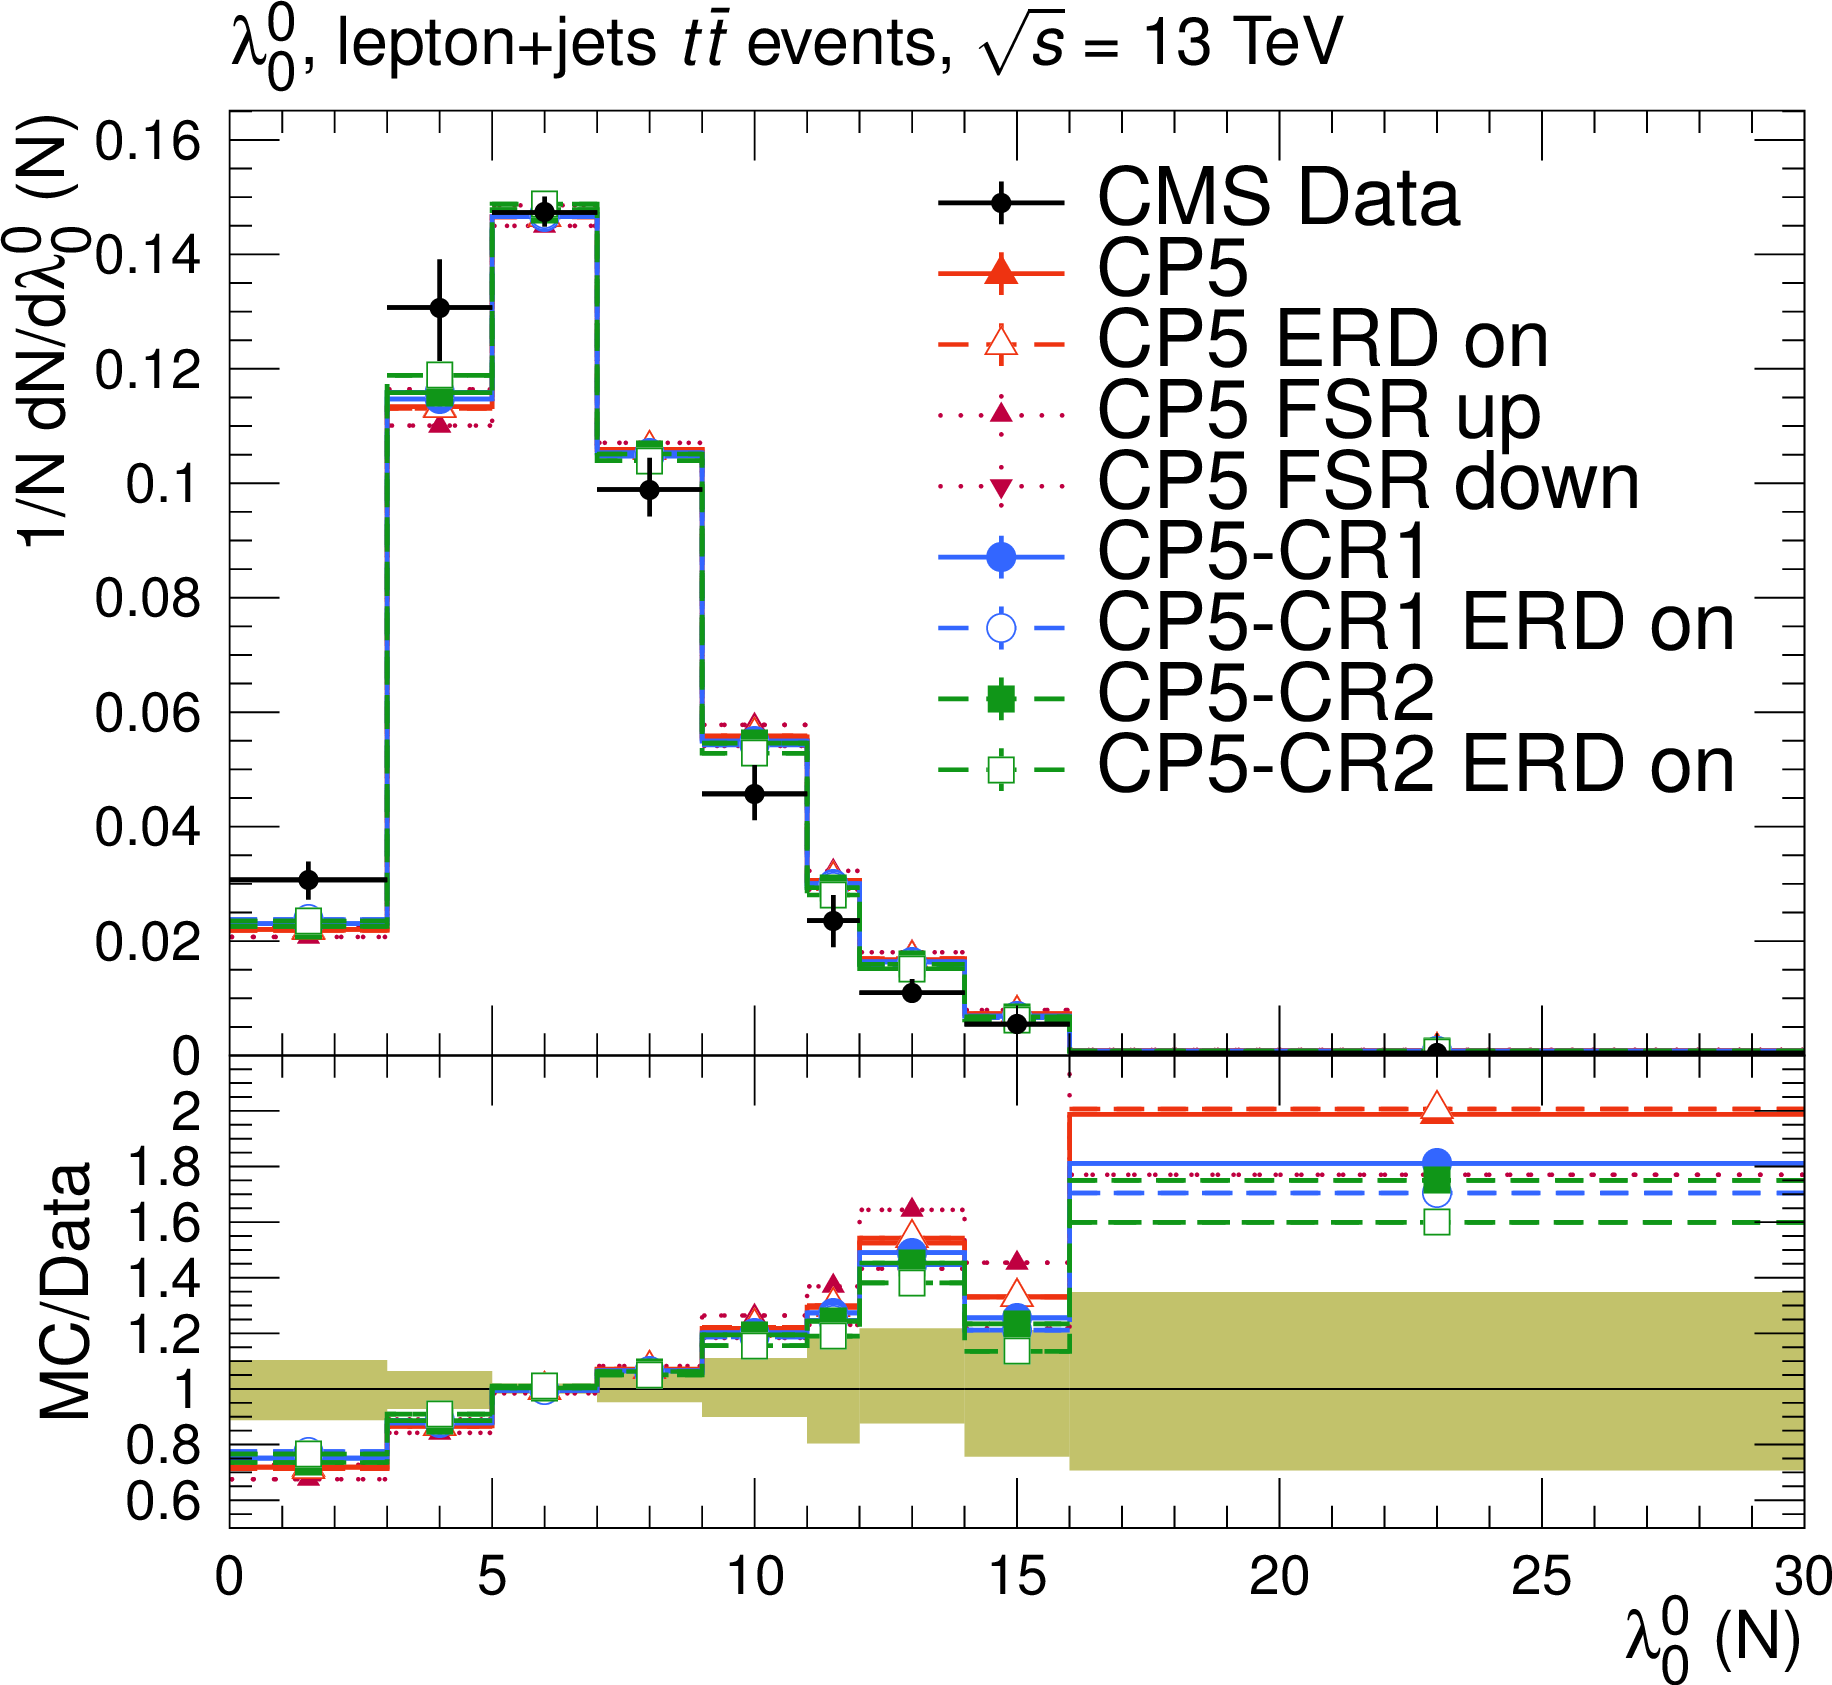
Figure 19-a:
Distributions of the particle multiplicity in gluon jets (left) and the angle $ \Delta R_g $ between two groomed subjets in inclusive jets (right) measured by the CMS experiment in $ {\mathrm{t}\overline{\mathrm{t}}} $ events at $ \sqrt{s}= $ 13 TeV [53]. The coloured band and error bars on the data points represent the total experimental uncertainty in the data. |
png pdf |
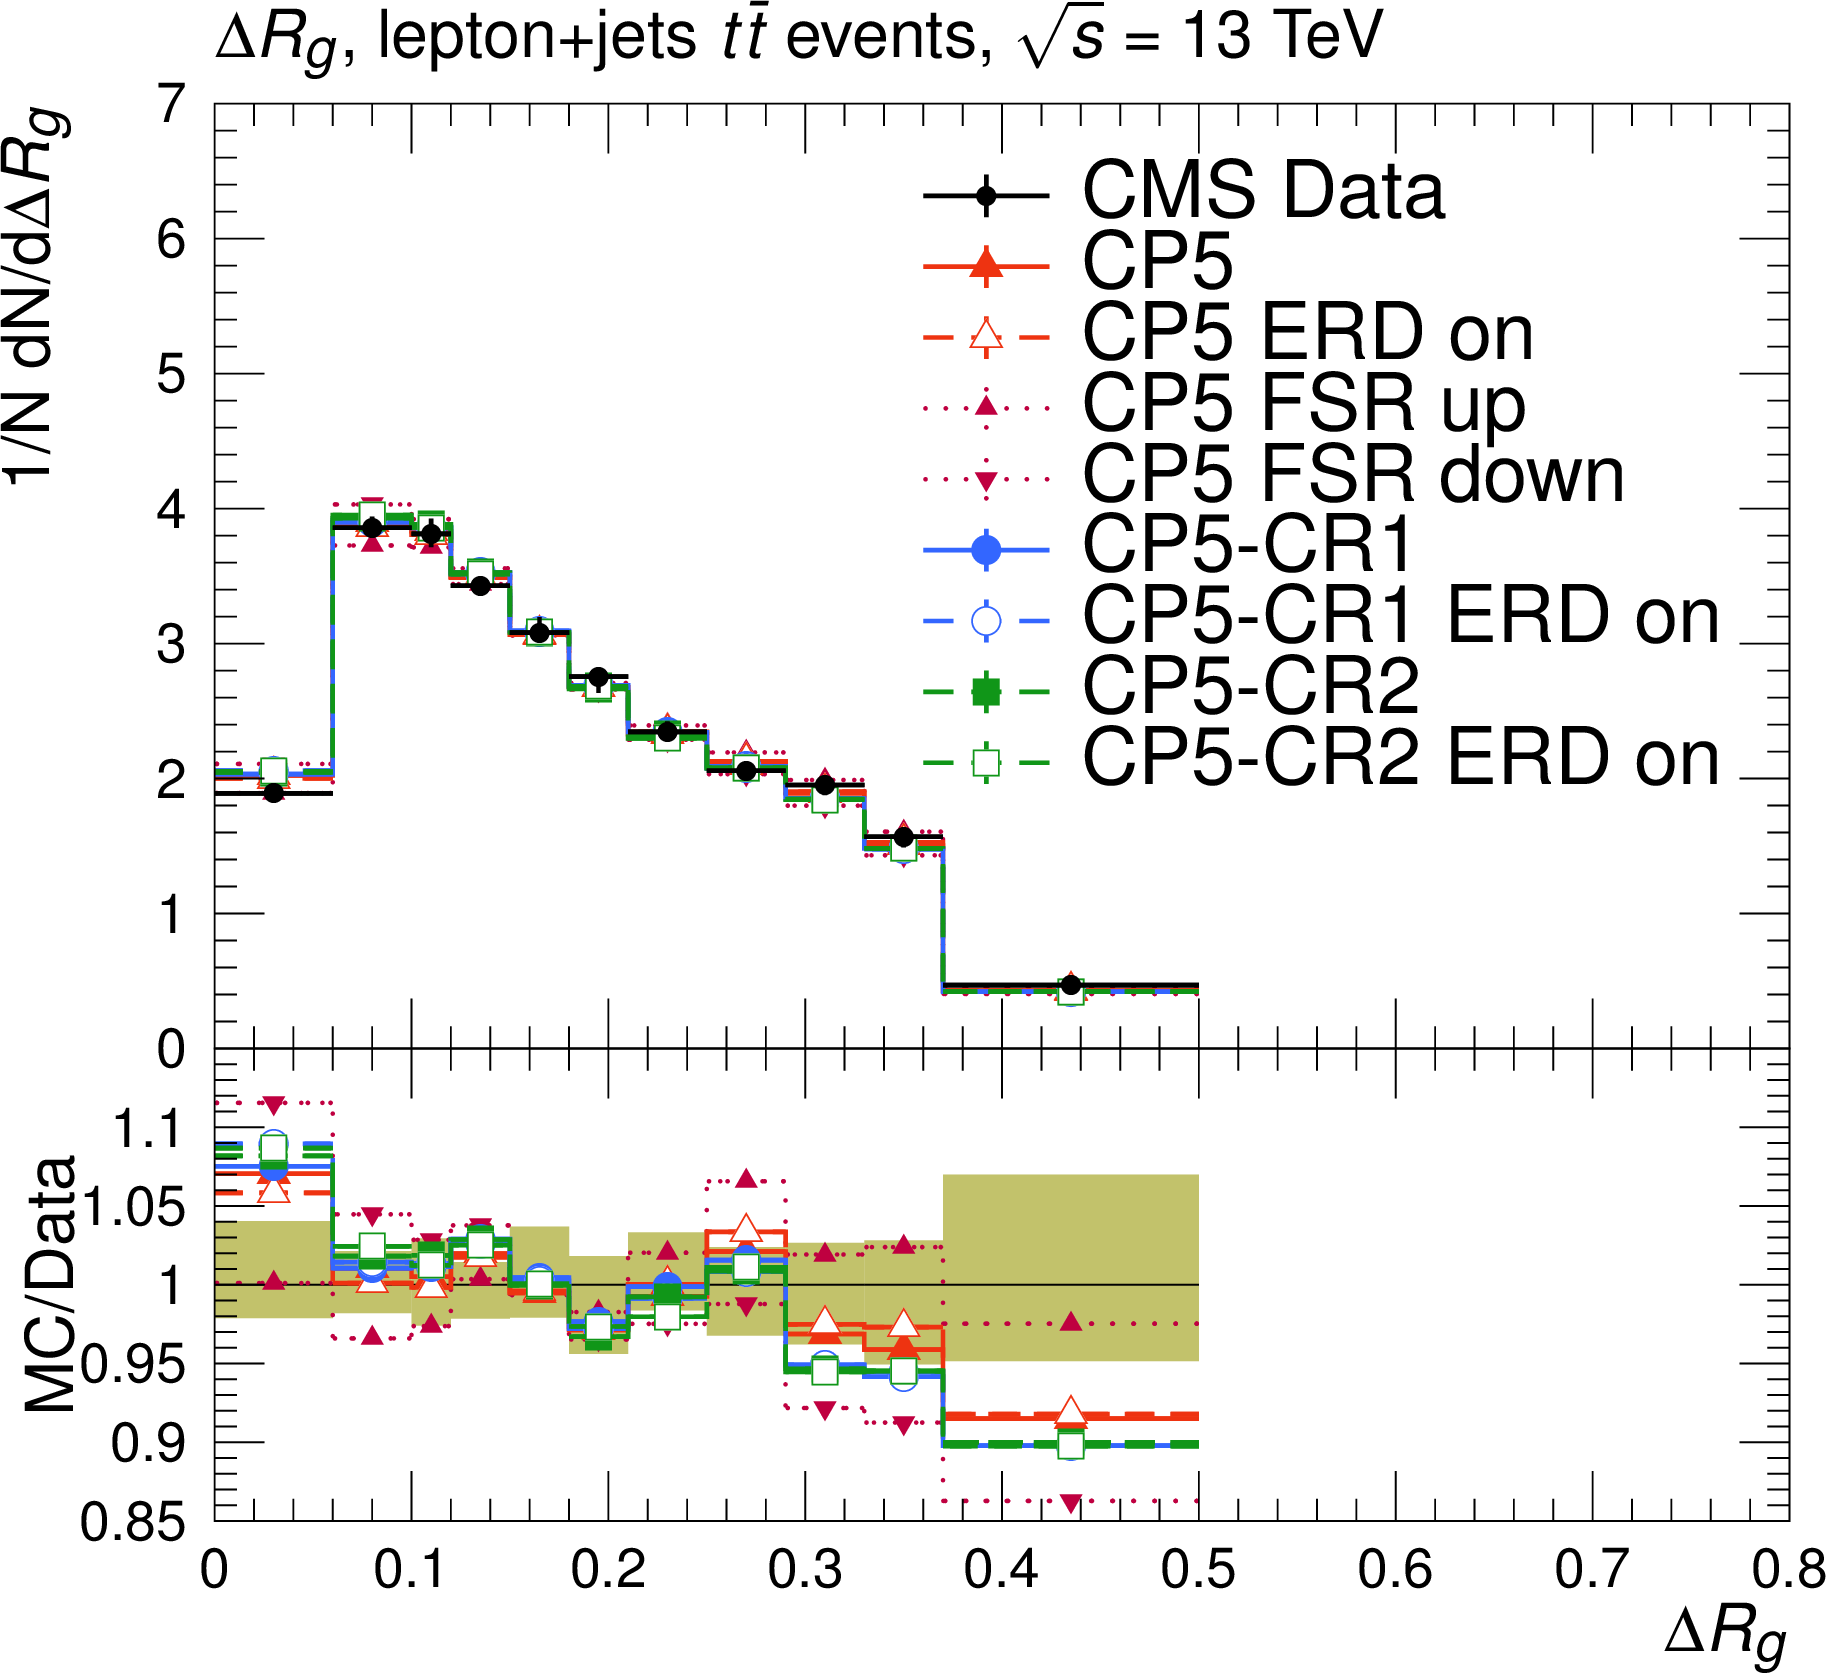
Figure 19-b:
Distributions of the particle multiplicity in gluon jets (left) and the angle $ \Delta R_g $ between two groomed subjets in inclusive jets (right) measured by the CMS experiment in $ {\mathrm{t}\overline{\mathrm{t}}} $ events at $ \sqrt{s}= $ 13 TeV [53]. The coloured band and error bars on the data points represent the total experimental uncertainty in the data. |

png pdf |
Figure 20:
Normalised $ \mathrm{t} \overline{\mathrm{t}} $ differential cross section for the pull angle between jets from the W boson in top quark decays, calculated from the charged constituents of the jets, measured by the ATLAS experiment using $ \sqrt{s}= $ 8 TeV data [58] to investigate colour flow. The coloured band and error bars on the data points represent the total experimental uncertainty in the data. |

png pdf |
Figure 21:
The invariant mass of hadronically decaying top quark candidates for different tune configurations. The coloured band and vertical bars represent the statistical uncertainty in the predictions. |
png pdf |
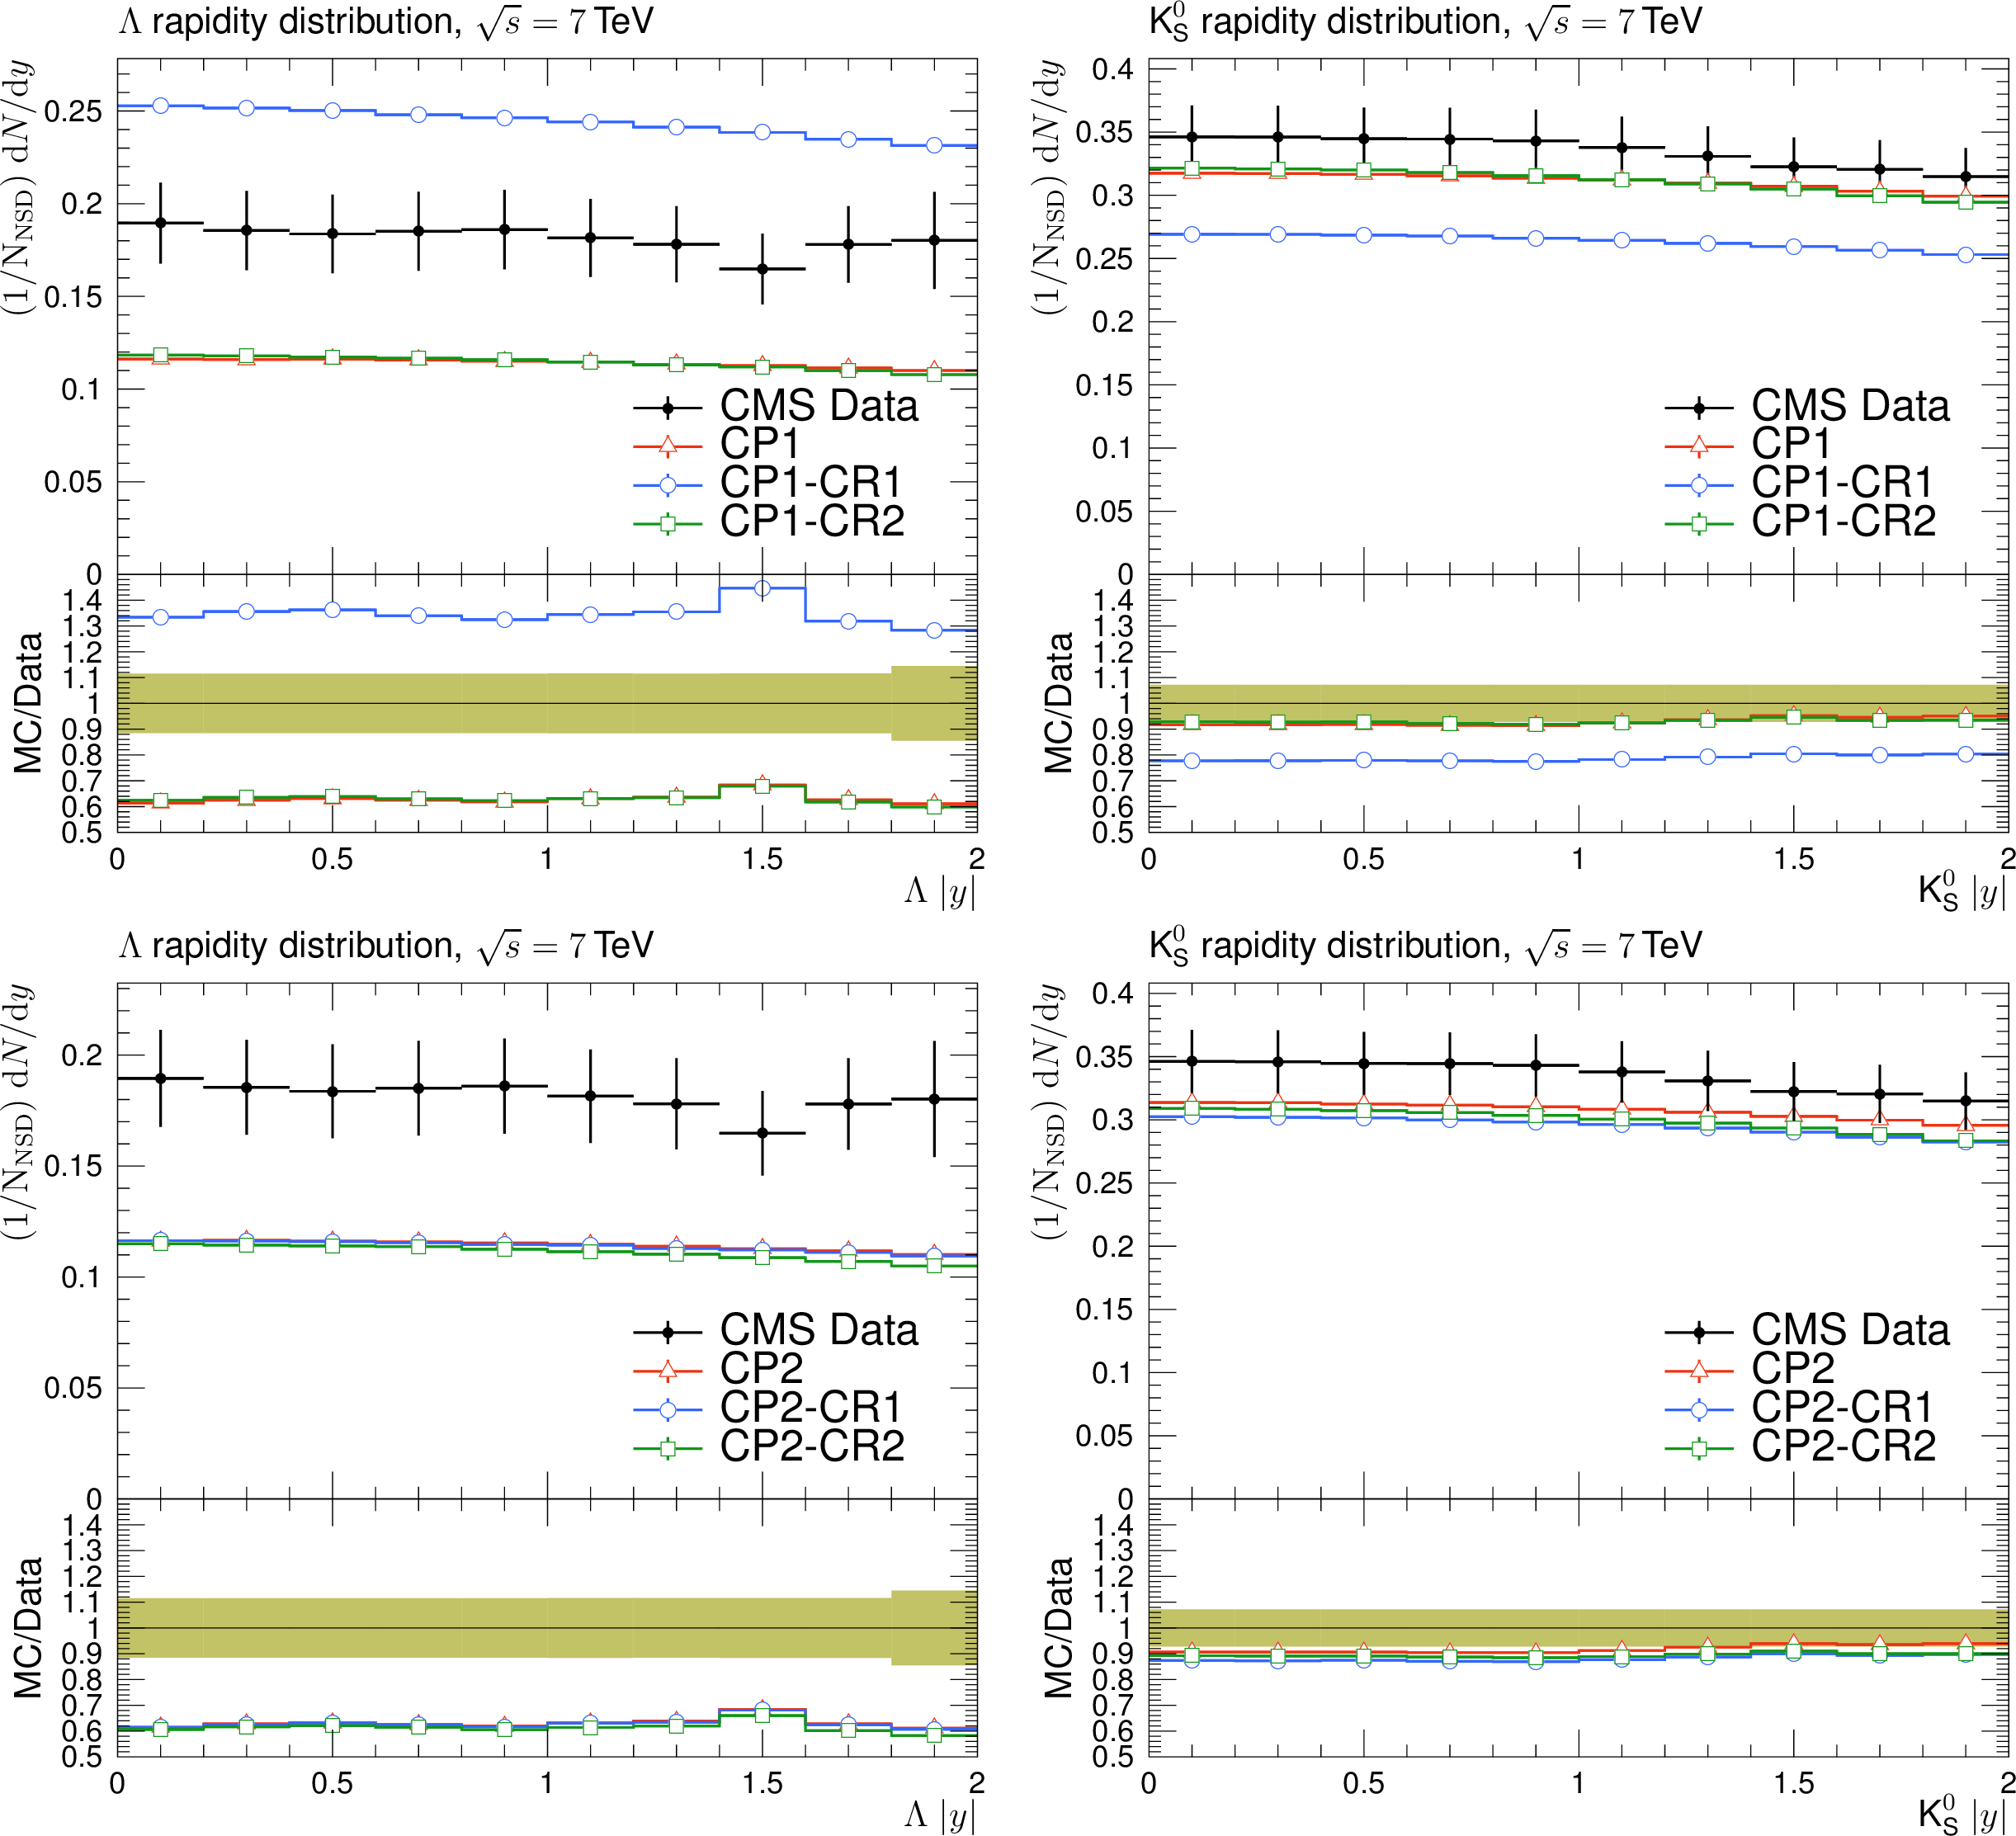
Figure A1:
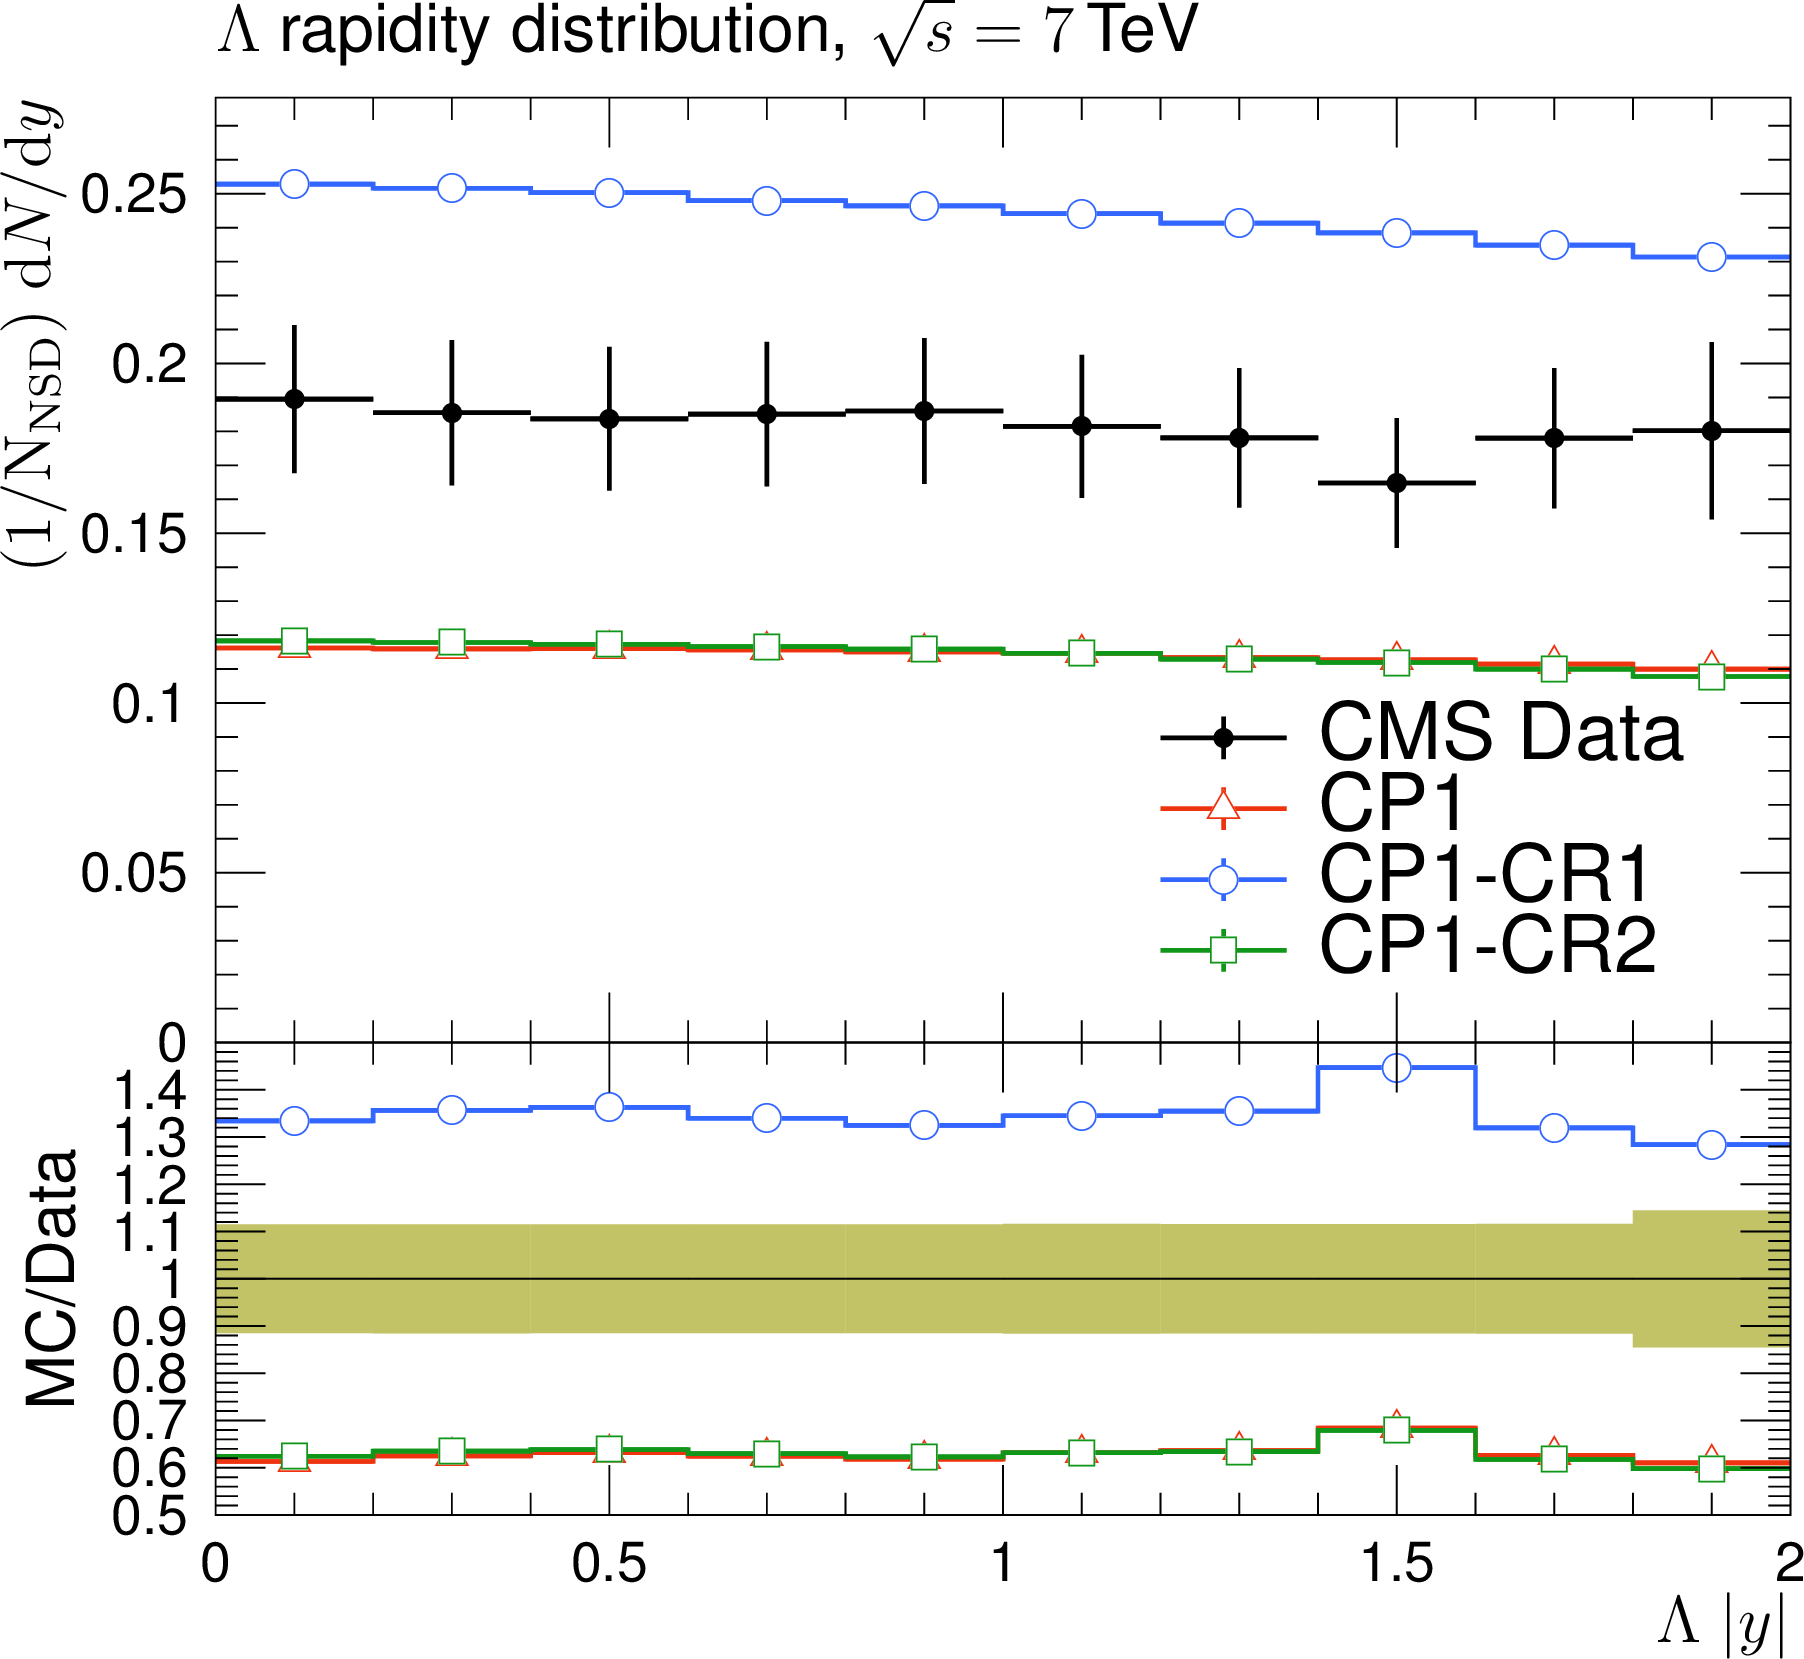
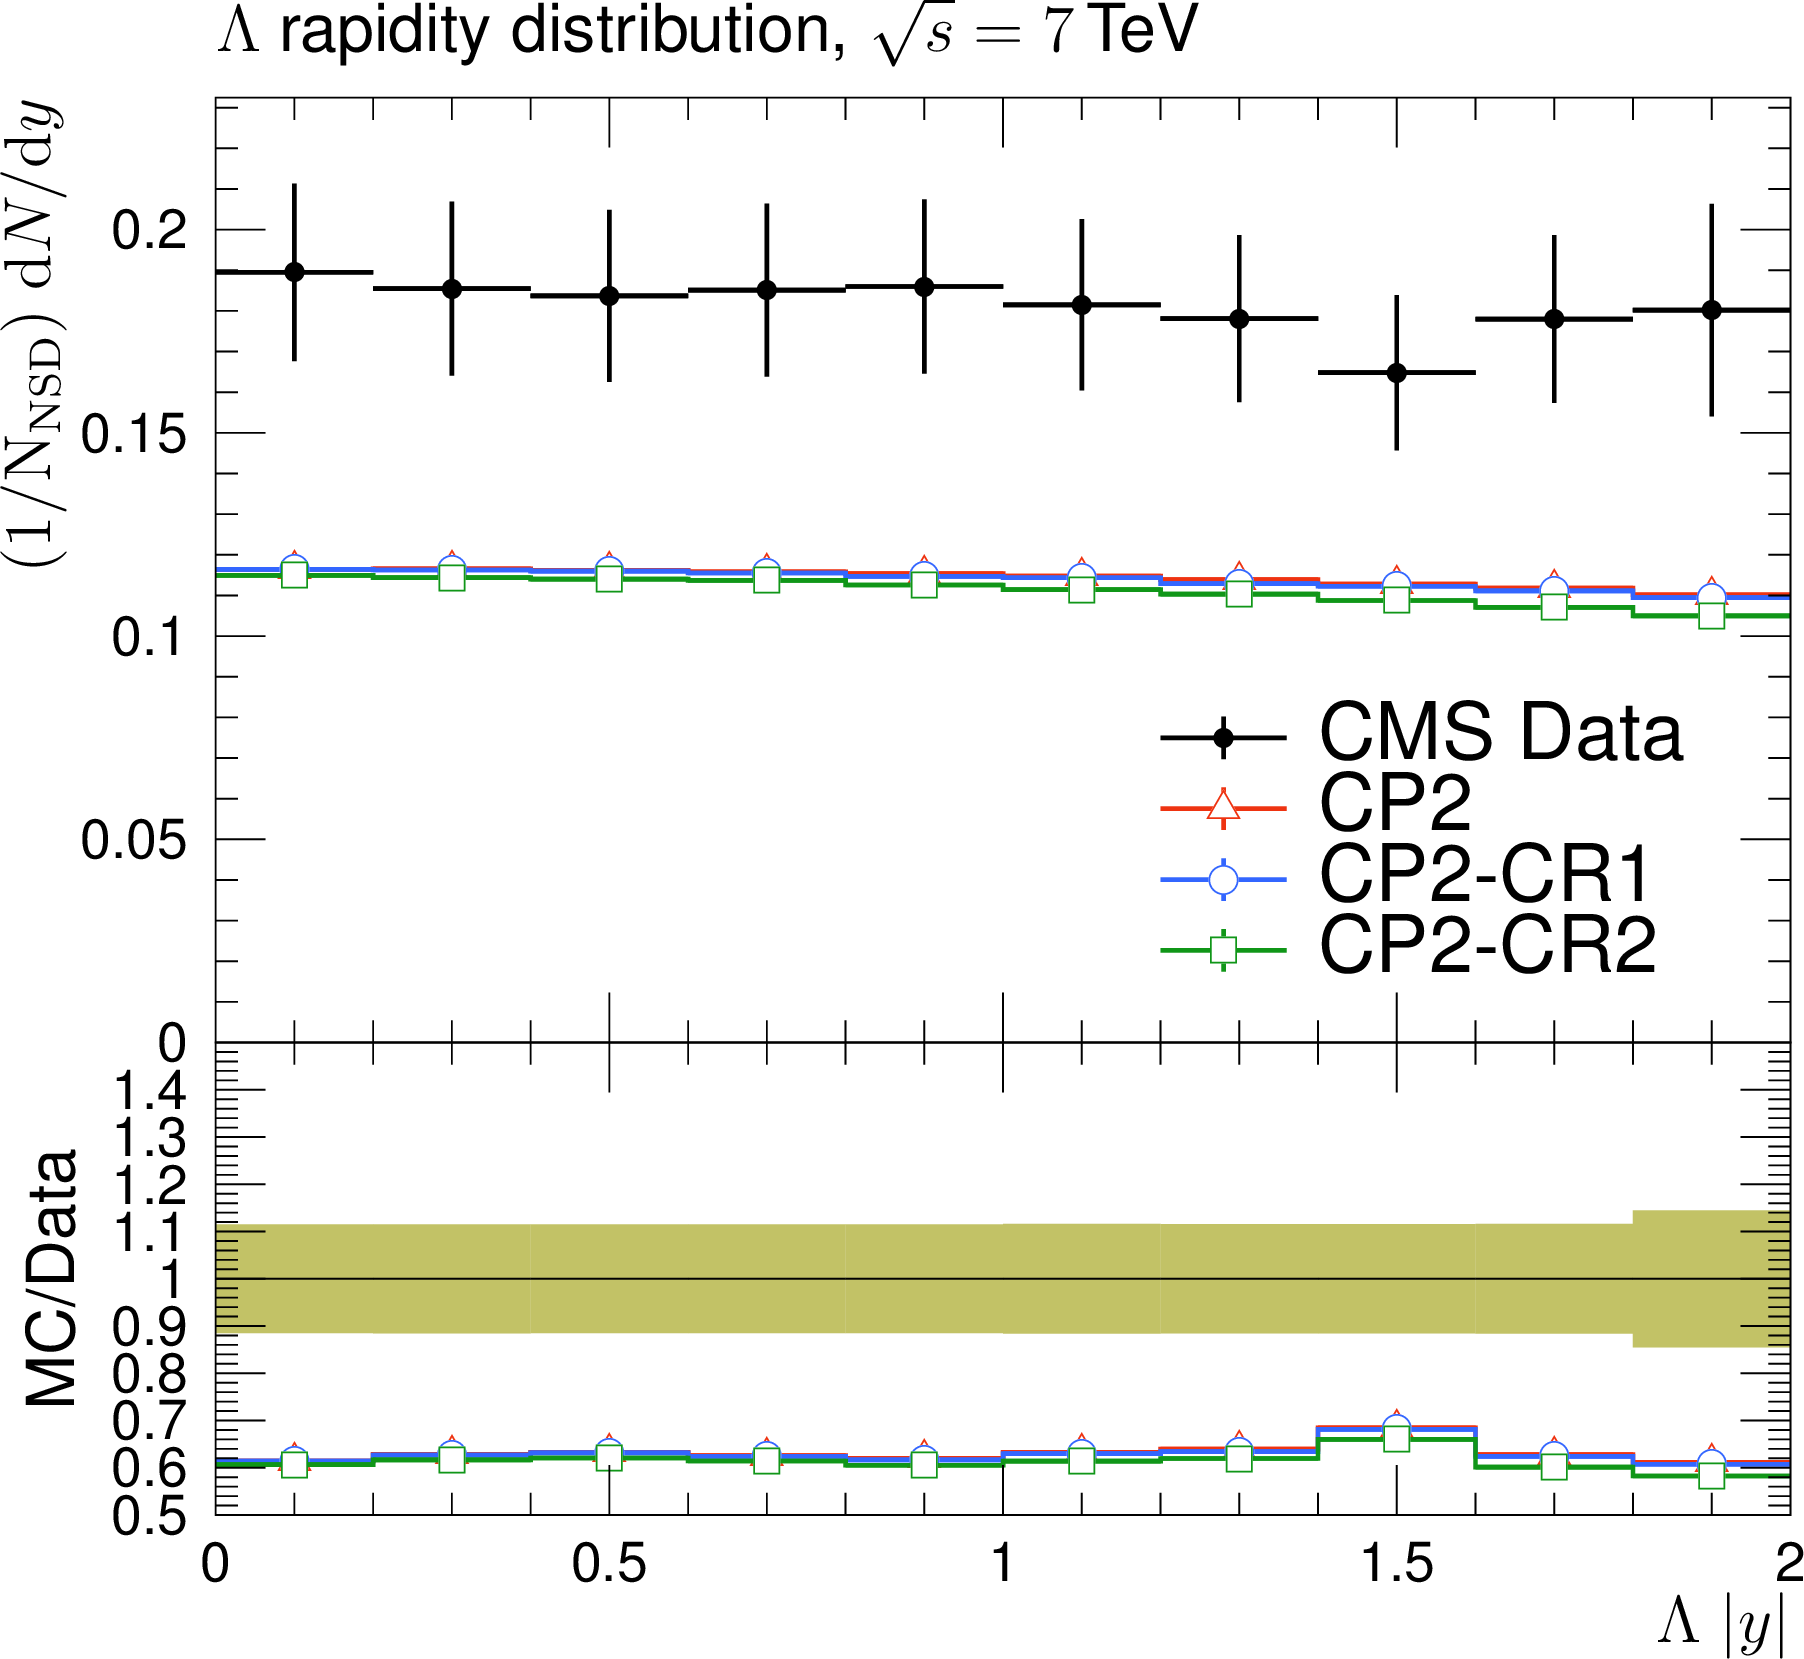
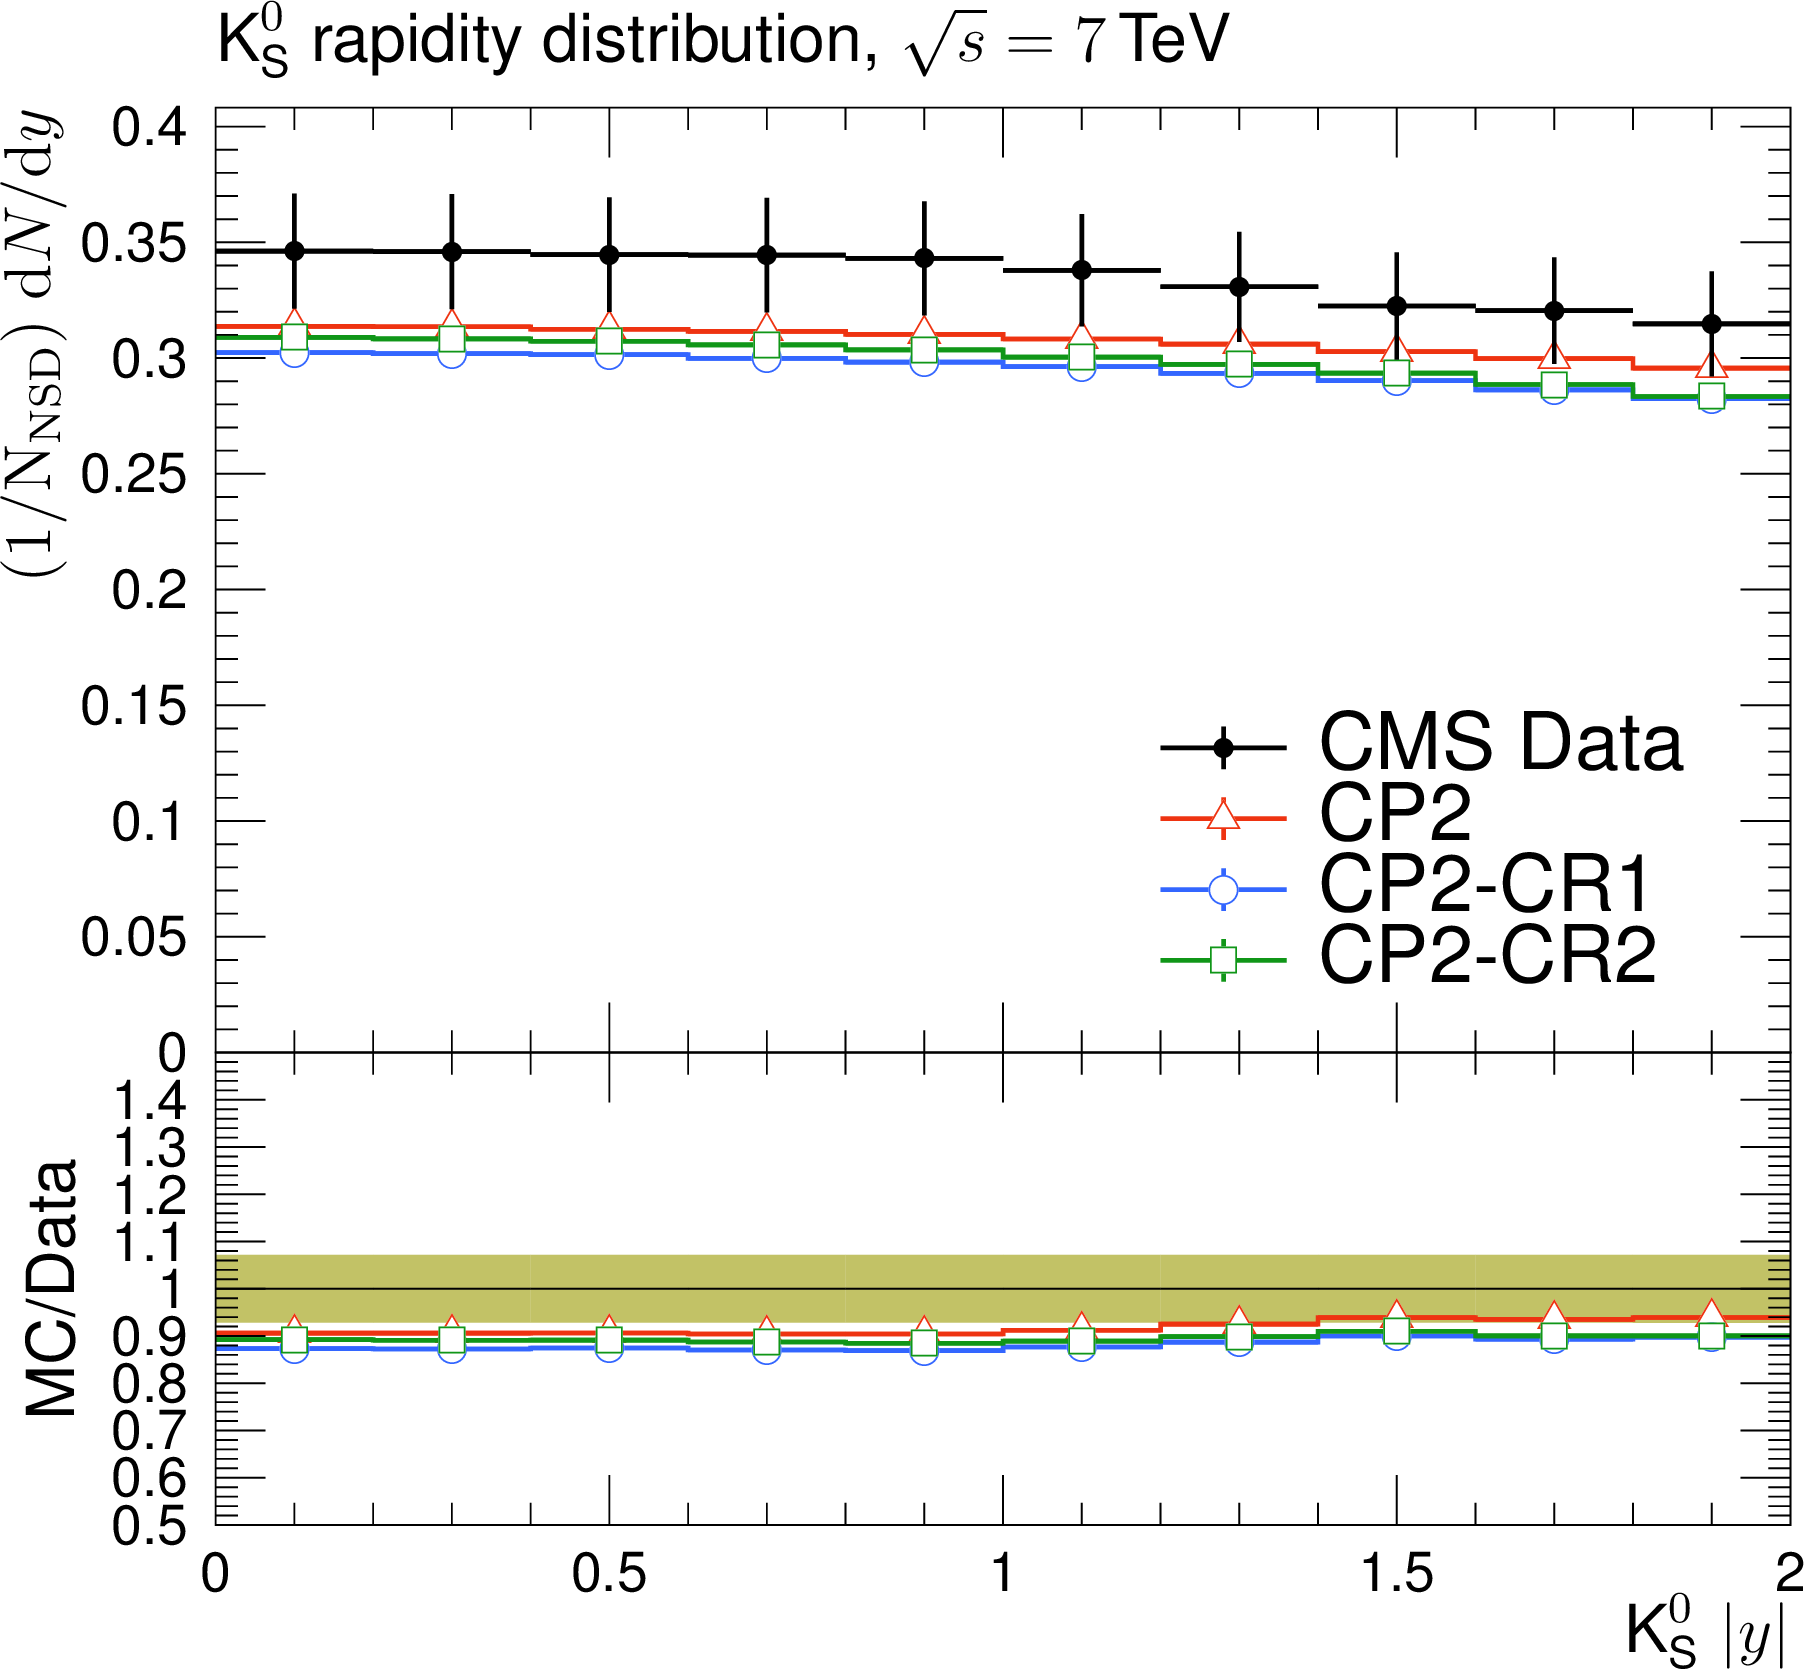
The strange particle production, $ \Lambda $ baryons (left) and $ \mathrm{K^0_S} $ mesons (right), as a function of rapidity, measured by the CMS experiment at $ \sqrt{s}= $ 7 TeV [16]. The predictions of the CP1 and CP1-CR tunes (upper) and CP2 and CP2-CR tunes (lower) are compared with data. The coloured band and error bars on the data points represent the total experimental uncertainty in the data. |
png pdf |
Figure A1-a:
The strange particle production, $ \Lambda $ baryons (left) and $ \mathrm{K^0_S} $ mesons (right), as a function of rapidity, measured by the CMS experiment at $ \sqrt{s}= $ 7 TeV [16]. The predictions of the CP1 and CP1-CR tunes (upper) and CP2 and CP2-CR tunes (lower) are compared with data. The coloured band and error bars on the data points represent the total experimental uncertainty in the data. |

png pdf |
Figure A1-b:
The strange particle production, $ \Lambda $ baryons (left) and $ \mathrm{K^0_S} $ mesons (right), as a function of rapidity, measured by the CMS experiment at $ \sqrt{s}= $ 7 TeV [16]. The predictions of the CP1 and CP1-CR tunes (upper) and CP2 and CP2-CR tunes (lower) are compared with data. The coloured band and error bars on the data points represent the total experimental uncertainty in the data. |
png pdf |
Figure A1-c:
The strange particle production, $ \Lambda $ baryons (left) and $ \mathrm{K^0_S} $ mesons (right), as a function of rapidity, measured by the CMS experiment at $ \sqrt{s}= $ 7 TeV [16]. The predictions of the CP1 and CP1-CR tunes (upper) and CP2 and CP2-CR tunes (lower) are compared with data. The coloured band and error bars on the data points represent the total experimental uncertainty in the data. |
png pdf |
Figure A1-d:
The strange particle production, $ \Lambda $ baryons (left) and $ \mathrm{K^0_S} $ mesons (right), as a function of rapidity, measured by the CMS experiment at $ \sqrt{s}= $ 7 TeV [16]. The predictions of the CP1 and CP1-CR tunes (upper) and CP2 and CP2-CR tunes (lower) are compared with data. The coloured band and error bars on the data points represent the total experimental uncertainty in the data. |
png pdf |
Figure A2:
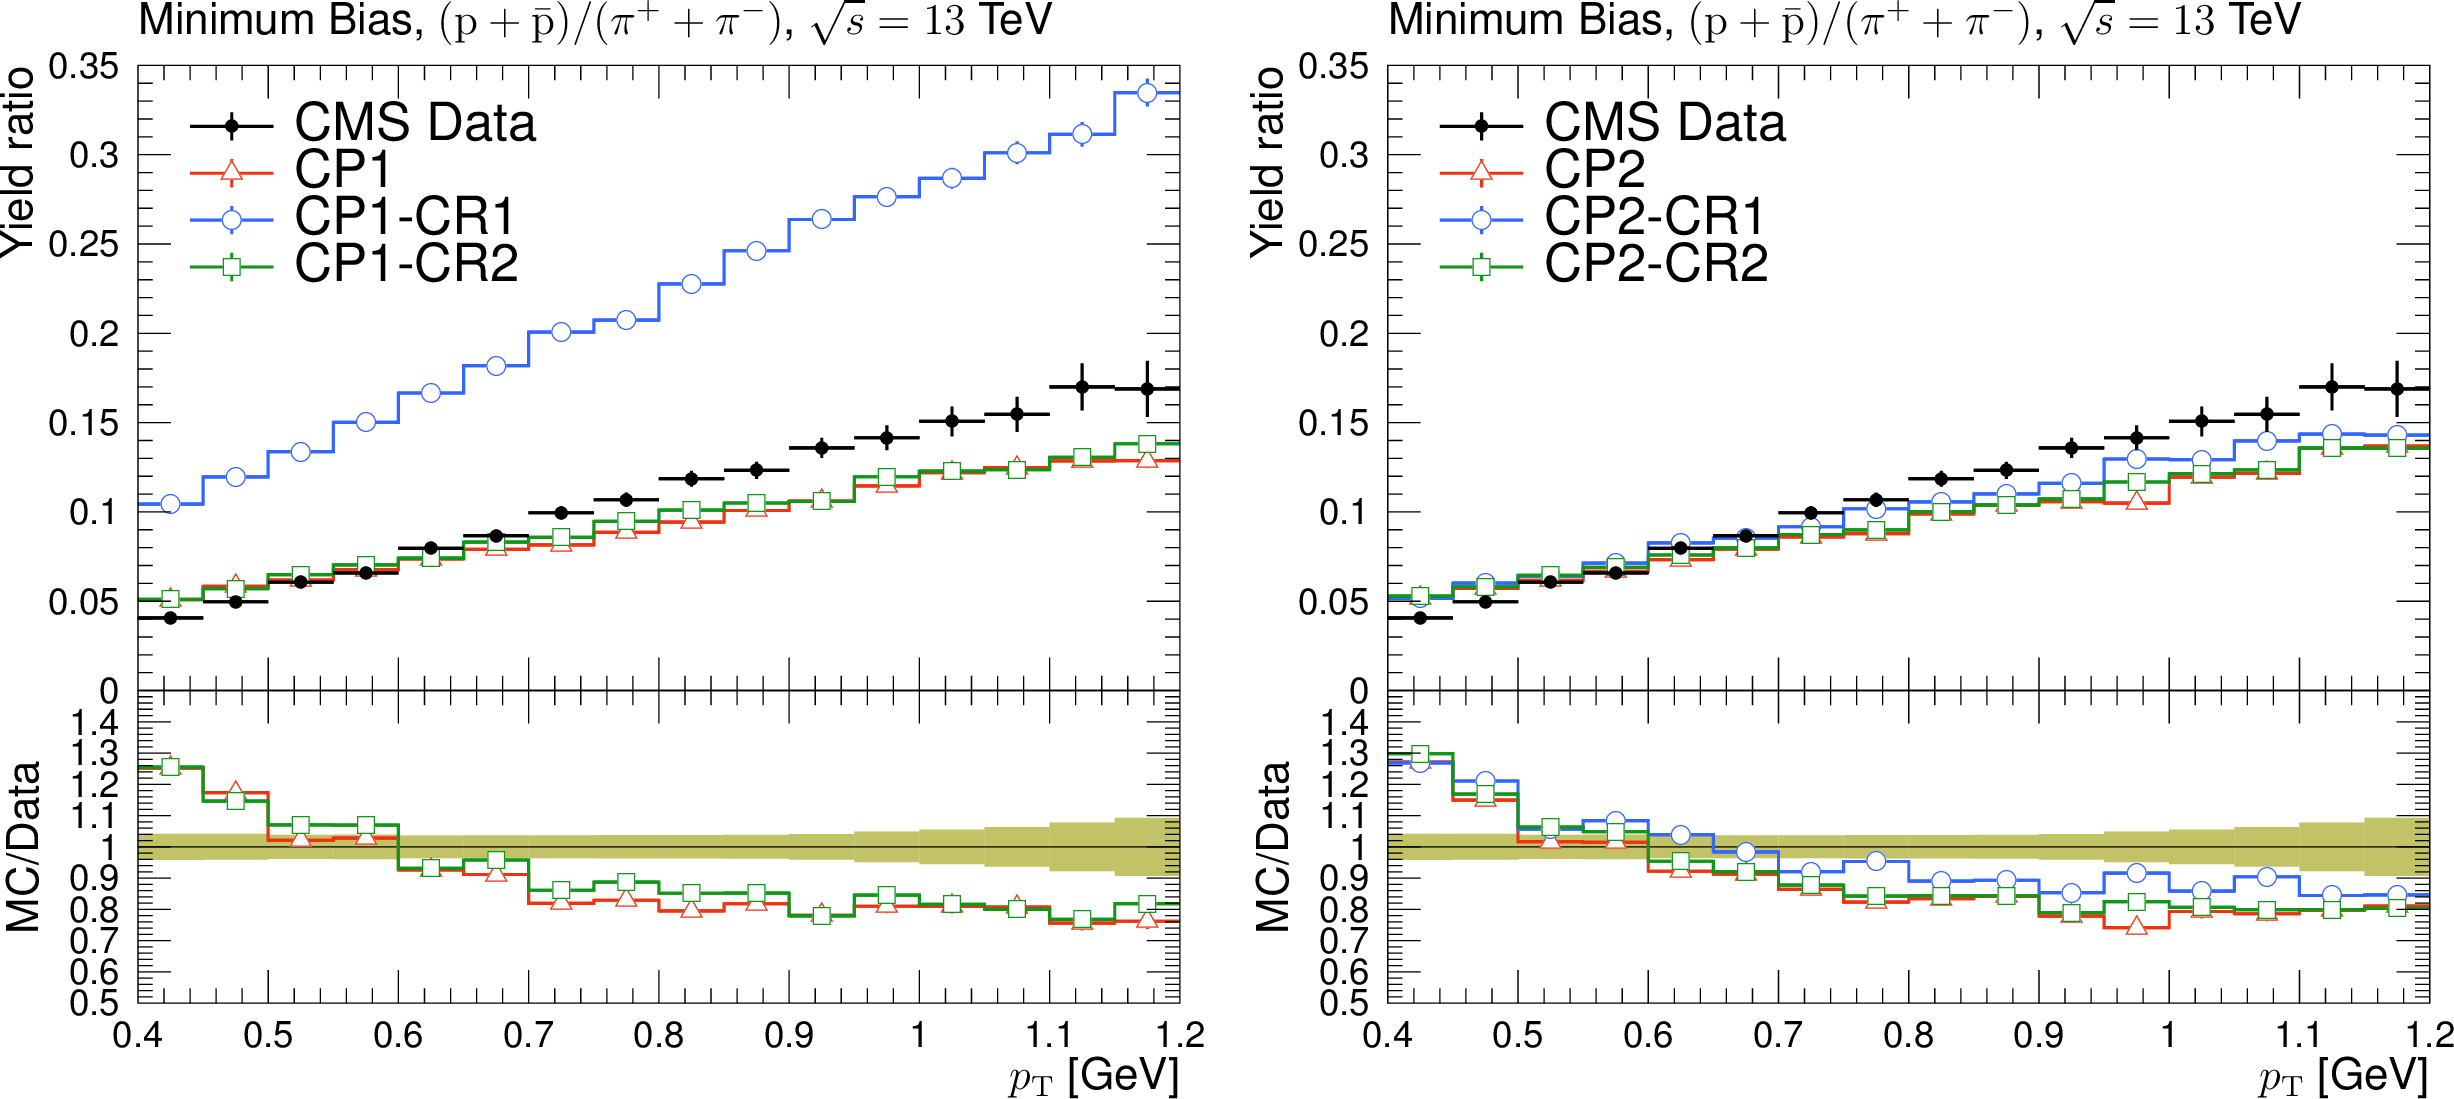
Ratios of particle yields, $ p/\pi $, as a function of transverse momentum in MB events, measured by the CMS experiment at $ \sqrt{s}= $ 13 TeV [39]. The predictions of the CP1 and CP1-CR tunes (upper) and CP2 and CP2-CR tunes (lower) are compared with data. The coloured band and error bars on the data points represent the total experimental uncertainty in the data. |
png pdf |
Figure A2-a:
Ratios of particle yields, $ p/\pi $, as a function of transverse momentum in MB events, measured by the CMS experiment at $ \sqrt{s}= $ 13 TeV [39]. The predictions of the CP1 and CP1-CR tunes (upper) and CP2 and CP2-CR tunes (lower) are compared with data. The coloured band and error bars on the data points represent the total experimental uncertainty in the data. |

png pdf |
Figure A2-b:
Ratios of particle yields, $ p/\pi $, as a function of transverse momentum in MB events, measured by the CMS experiment at $ \sqrt{s}= $ 13 TeV [39]. The predictions of the CP1 and CP1-CR tunes (upper) and CP2 and CP2-CR tunes (lower) are compared with data. The coloured band and error bars on the data points represent the total experimental uncertainty in the data. |

png pdf |
Figure B1:
Sample histograms showing the range of variation available on the observable histograms are given for CP5-CR1. |

png pdf |
Figure B1-a:
Sample histograms showing the range of variation available on the observable histograms are given for CP5-CR1. |

png pdf |
Figure B1-b:
Sample histograms showing the range of variation available on the observable histograms are given for CP5-CR1. |

png pdf |
Figure B1-c:
Sample histograms showing the range of variation available on the observable histograms are given for CP5-CR1. |

png pdf |
Figure B1-d:
Sample histograms showing the range of variation available on the observable histograms are given for CP5-CR1. |
png pdf |
Figure B2:
The pseudorapidity of charged hadrons, $ \mathrm{d}N_{\mathrm{ch}}/\mathrm{d}\eta $, measured by the CMS experiment at $ \sqrt{s}= $ 13 TeV [22]. The prediction of the CP5-CR1 tune is compared with data. The coloured band represents the tune uncertainties. |

png pdf |
Figure B3:
The charged-particle (left) and $ p_{\mathrm{T}}^{\text{sum}} $ densities (right) in the transMIN (upper) and transMAX (lower) regions as functions of the $ p_{\mathrm{T}} $ of the leading charged particle, $ p_{\mathrm{T}}^{\text{max}} $, measured by the CMS experiment at $ \sqrt{s}= $ 13 TeV [17]. The predictions of the tunes CP5-CR1 are compared with data. The coloured band represents the tune uncertainties. |
png pdf |
Figure B3-a:
The charged-particle (left) and $ p_{\mathrm{T}}^{\text{sum}} $ densities (right) in the transMIN (upper) and transMAX (lower) regions as functions of the $ p_{\mathrm{T}} $ of the leading charged particle, $ p_{\mathrm{T}}^{\text{max}} $, measured by the CMS experiment at $ \sqrt{s}= $ 13 TeV [17]. The predictions of the tunes CP5-CR1 are compared with data. The coloured band represents the tune uncertainties. |

png pdf |
Figure B3-b:
The charged-particle (left) and $ p_{\mathrm{T}}^{\text{sum}} $ densities (right) in the transMIN (upper) and transMAX (lower) regions as functions of the $ p_{\mathrm{T}} $ of the leading charged particle, $ p_{\mathrm{T}}^{\text{max}} $, measured by the CMS experiment at $ \sqrt{s}= $ 13 TeV [17]. The predictions of the tunes CP5-CR1 are compared with data. The coloured band represents the tune uncertainties. |

png pdf |
Figure B3-c:
The charged-particle (left) and $ p_{\mathrm{T}}^{\text{sum}} $ densities (right) in the transMIN (upper) and transMAX (lower) regions as functions of the $ p_{\mathrm{T}} $ of the leading charged particle, $ p_{\mathrm{T}}^{\text{max}} $, measured by the CMS experiment at $ \sqrt{s}= $ 13 TeV [17]. The predictions of the tunes CP5-CR1 are compared with data. The coloured band represents the tune uncertainties. |
png pdf |
Figure B3-d:
The charged-particle (left) and $ p_{\mathrm{T}}^{\text{sum}} $ densities (right) in the transMIN (upper) and transMAX (lower) regions as functions of the $ p_{\mathrm{T}} $ of the leading charged particle, $ p_{\mathrm{T}}^{\text{max}} $, measured by the CMS experiment at $ \sqrt{s}= $ 13 TeV [17]. The predictions of the tunes CP5-CR1 are compared with data. The coloured band represents the tune uncertainties. |
png pdf |
Figure B4:
The pseudorapidity of charged hadrons, $ \mathrm{d}N_{\mathrm{ch}}/\mathrm{d}\eta $, measured by the CMS experiment at $ \sqrt{s}= $ 13 TeV [22]. The prediction of the CP5-CR2 tune is compared with data. The coloured band represents the tune uncertainties. |

png pdf |
Figure B5:
The charged-particle (left) and $ p_{\mathrm{T}}^{\text{sum}} $ densities (right) in the transMIN (upper) and transMAX (lower) regions as functions of the $ p_{\mathrm{T}} $ of the leading charged particle, $ p_{\mathrm{T}}^{\text{max}} $, measured by the CMS experiment at $ \sqrt{s}= $ 13 TeV [17]. The predictions of the tunes CP5-CR2 are compared with data. The coloured band represents the tune uncertainties. |
png pdf |
Figure B5-a:
The charged-particle (left) and $ p_{\mathrm{T}}^{\text{sum}} $ densities (right) in the transMIN (upper) and transMAX (lower) regions as functions of the $ p_{\mathrm{T}} $ of the leading charged particle, $ p_{\mathrm{T}}^{\text{max}} $, measured by the CMS experiment at $ \sqrt{s}= $ 13 TeV [17]. The predictions of the tunes CP5-CR2 are compared with data. The coloured band represents the tune uncertainties. |

png pdf |
Figure B5-b:
The charged-particle (left) and $ p_{\mathrm{T}}^{\text{sum}} $ densities (right) in the transMIN (upper) and transMAX (lower) regions as functions of the $ p_{\mathrm{T}} $ of the leading charged particle, $ p_{\mathrm{T}}^{\text{max}} $, measured by the CMS experiment at $ \sqrt{s}= $ 13 TeV [17]. The predictions of the tunes CP5-CR2 are compared with data. The coloured band represents the tune uncertainties. |
png pdf |
Figure B5-c:
The charged-particle (left) and $ p_{\mathrm{T}}^{\text{sum}} $ densities (right) in the transMIN (upper) and transMAX (lower) regions as functions of the $ p_{\mathrm{T}} $ of the leading charged particle, $ p_{\mathrm{T}}^{\text{max}} $, measured by the CMS experiment at $ \sqrt{s}= $ 13 TeV [17]. The predictions of the tunes CP5-CR2 are compared with data. The coloured band represents the tune uncertainties. |

png pdf |
Figure B5-d:
The charged-particle (left) and $ p_{\mathrm{T}}^{\text{sum}} $ densities (right) in the transMIN (upper) and transMAX (lower) regions as functions of the $ p_{\mathrm{T}} $ of the leading charged particle, $ p_{\mathrm{T}}^{\text{max}} $, measured by the CMS experiment at $ \sqrt{s}= $ 13 TeV [17]. The predictions of the tunes CP5-CR2 are compared with data. The coloured band represents the tune uncertainties. |

png pdf |
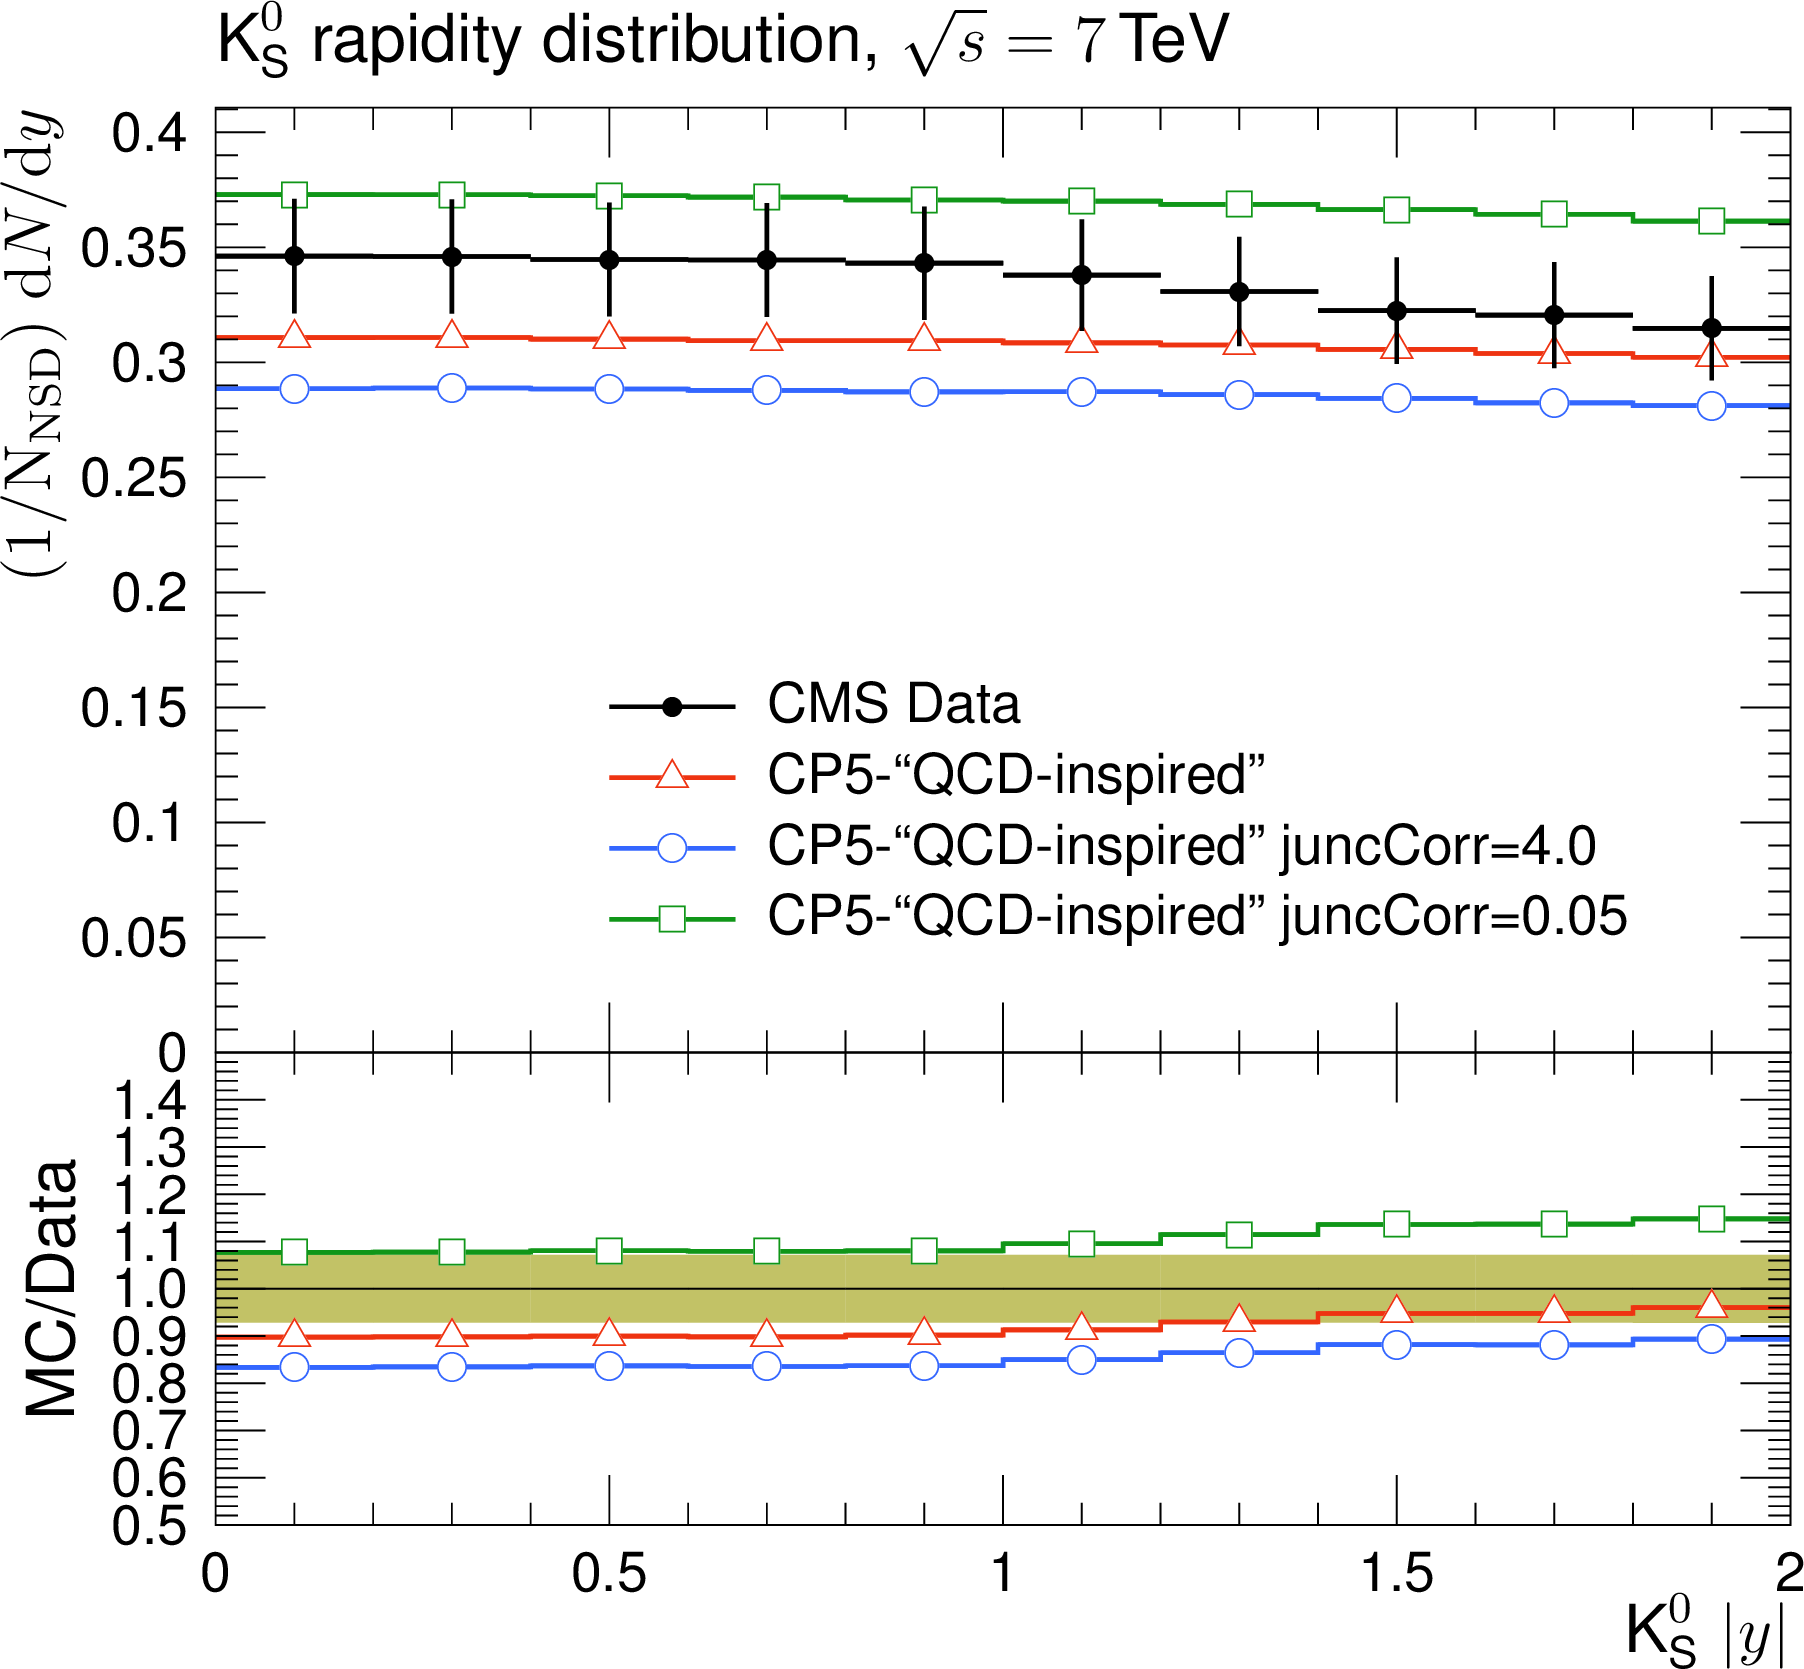
Figure C1:
The pseudorapidity of charged hadrons, $ \mathrm{d}N_{\mathrm{ch}}/\mathrm{d}\eta $, measured in $ |\eta| < $ 2 by the CMS experiment at $ \sqrt{s}= $ 13 TeV [23]. The red line shows the prediction of CP5-``QCD-inspired,'' where the default value of the ColourReconnection:junctionCorrection parameter is 1.2. The predictions shown with the blue and green lines use 4.0 and 0.05 for the ColourReconnection:junctionCorrection parameter, respectively. These comparisons demonstrate the sensitivity of the ColourReconnection:junctionCorrection parameter to this observable. |

png pdf |
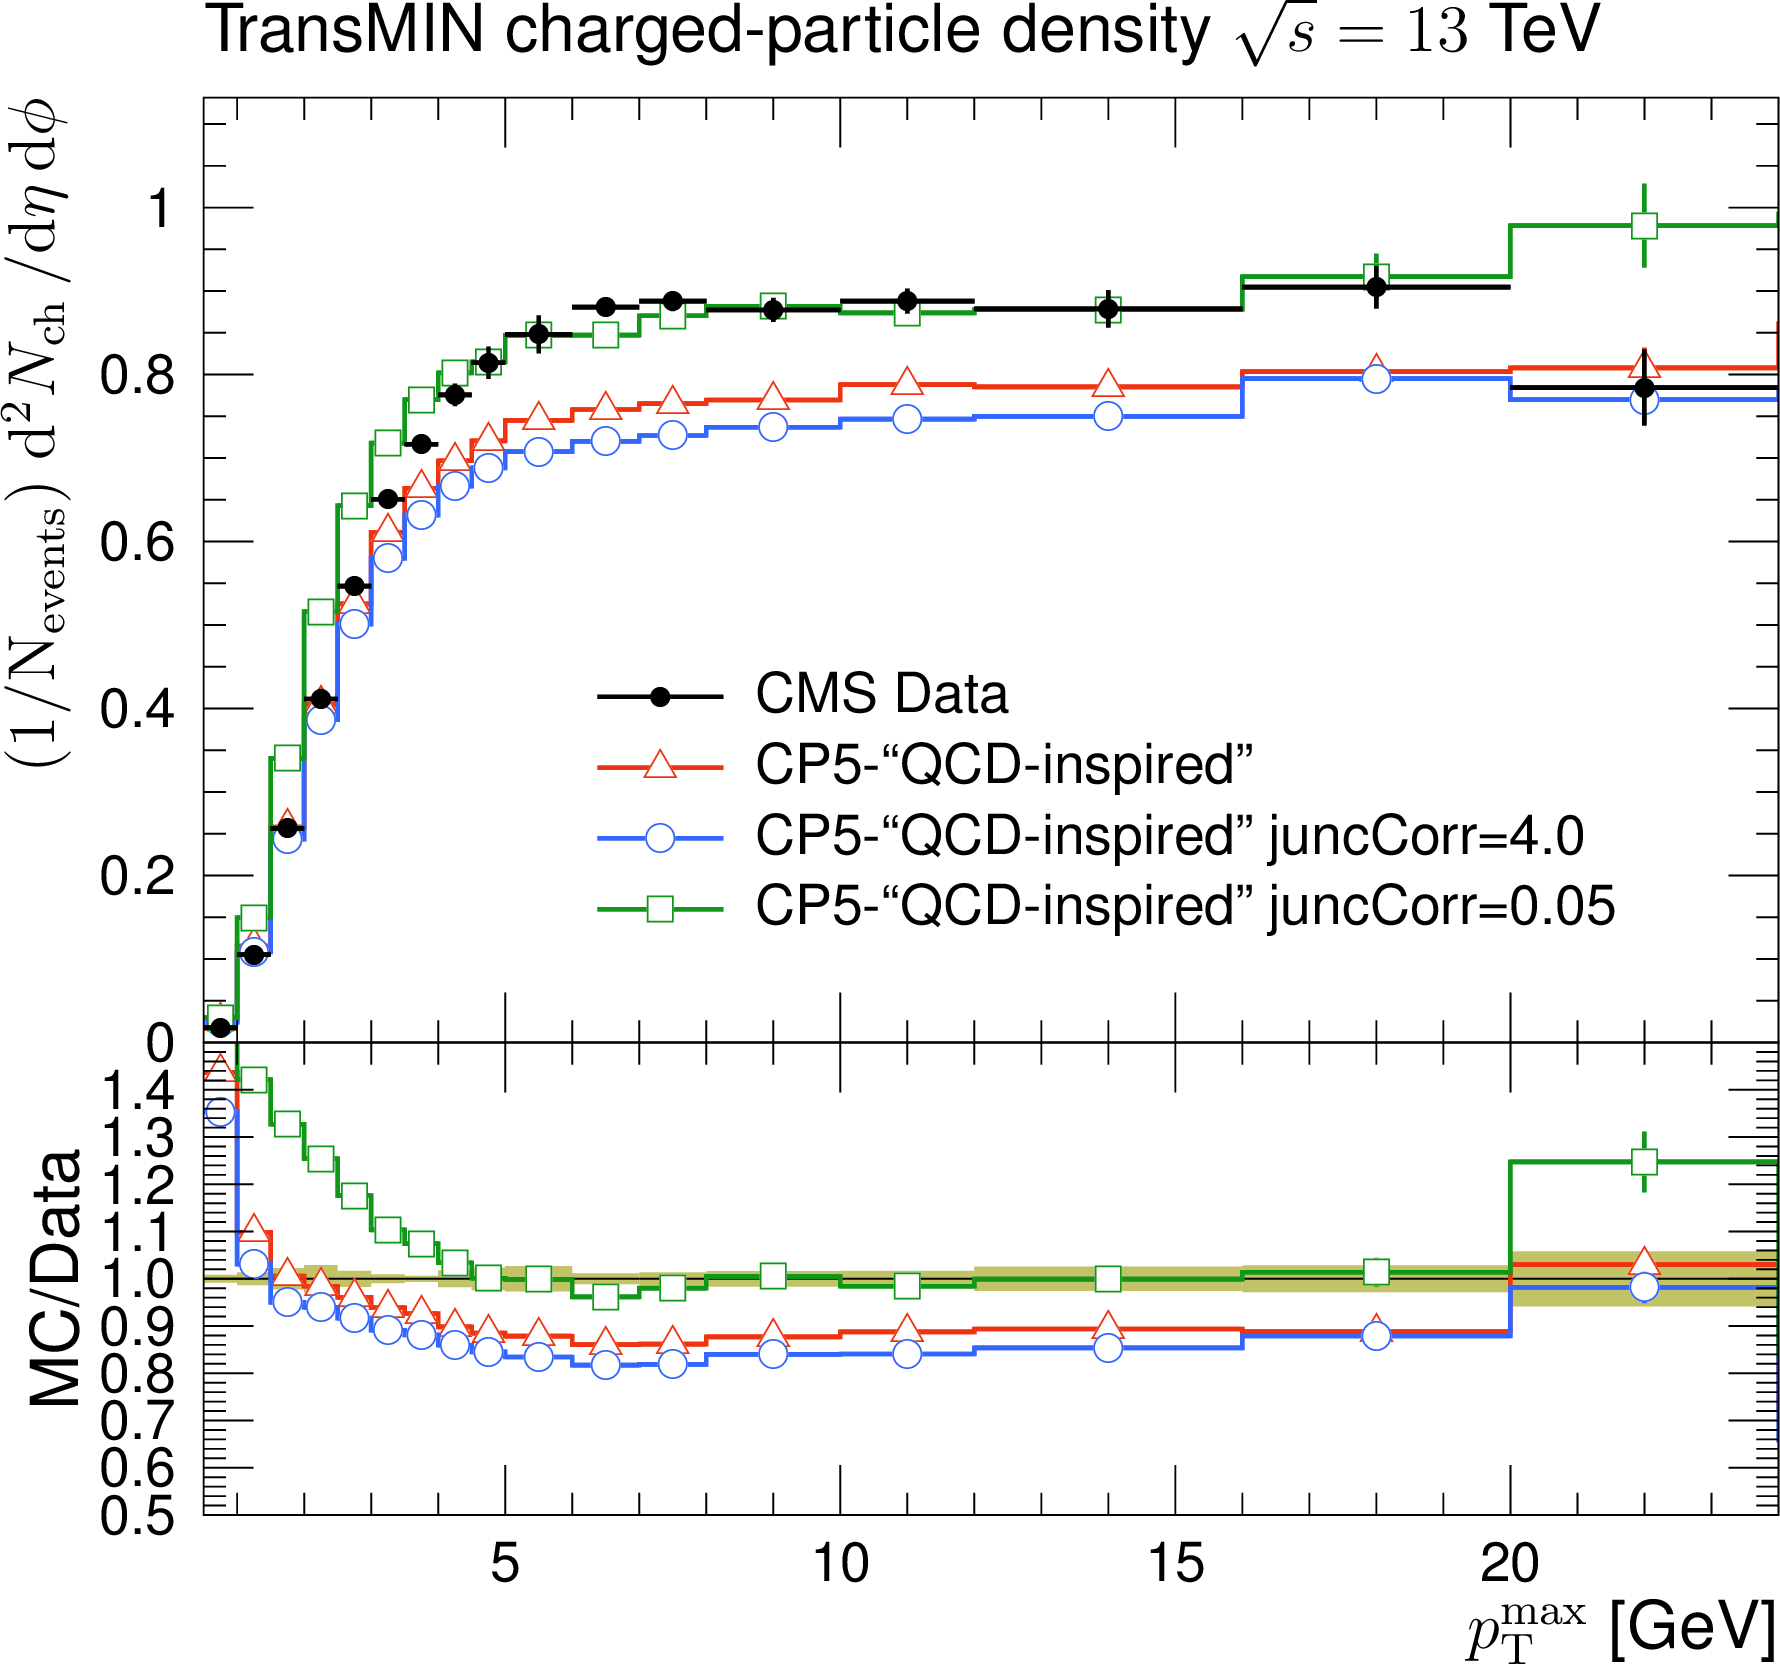
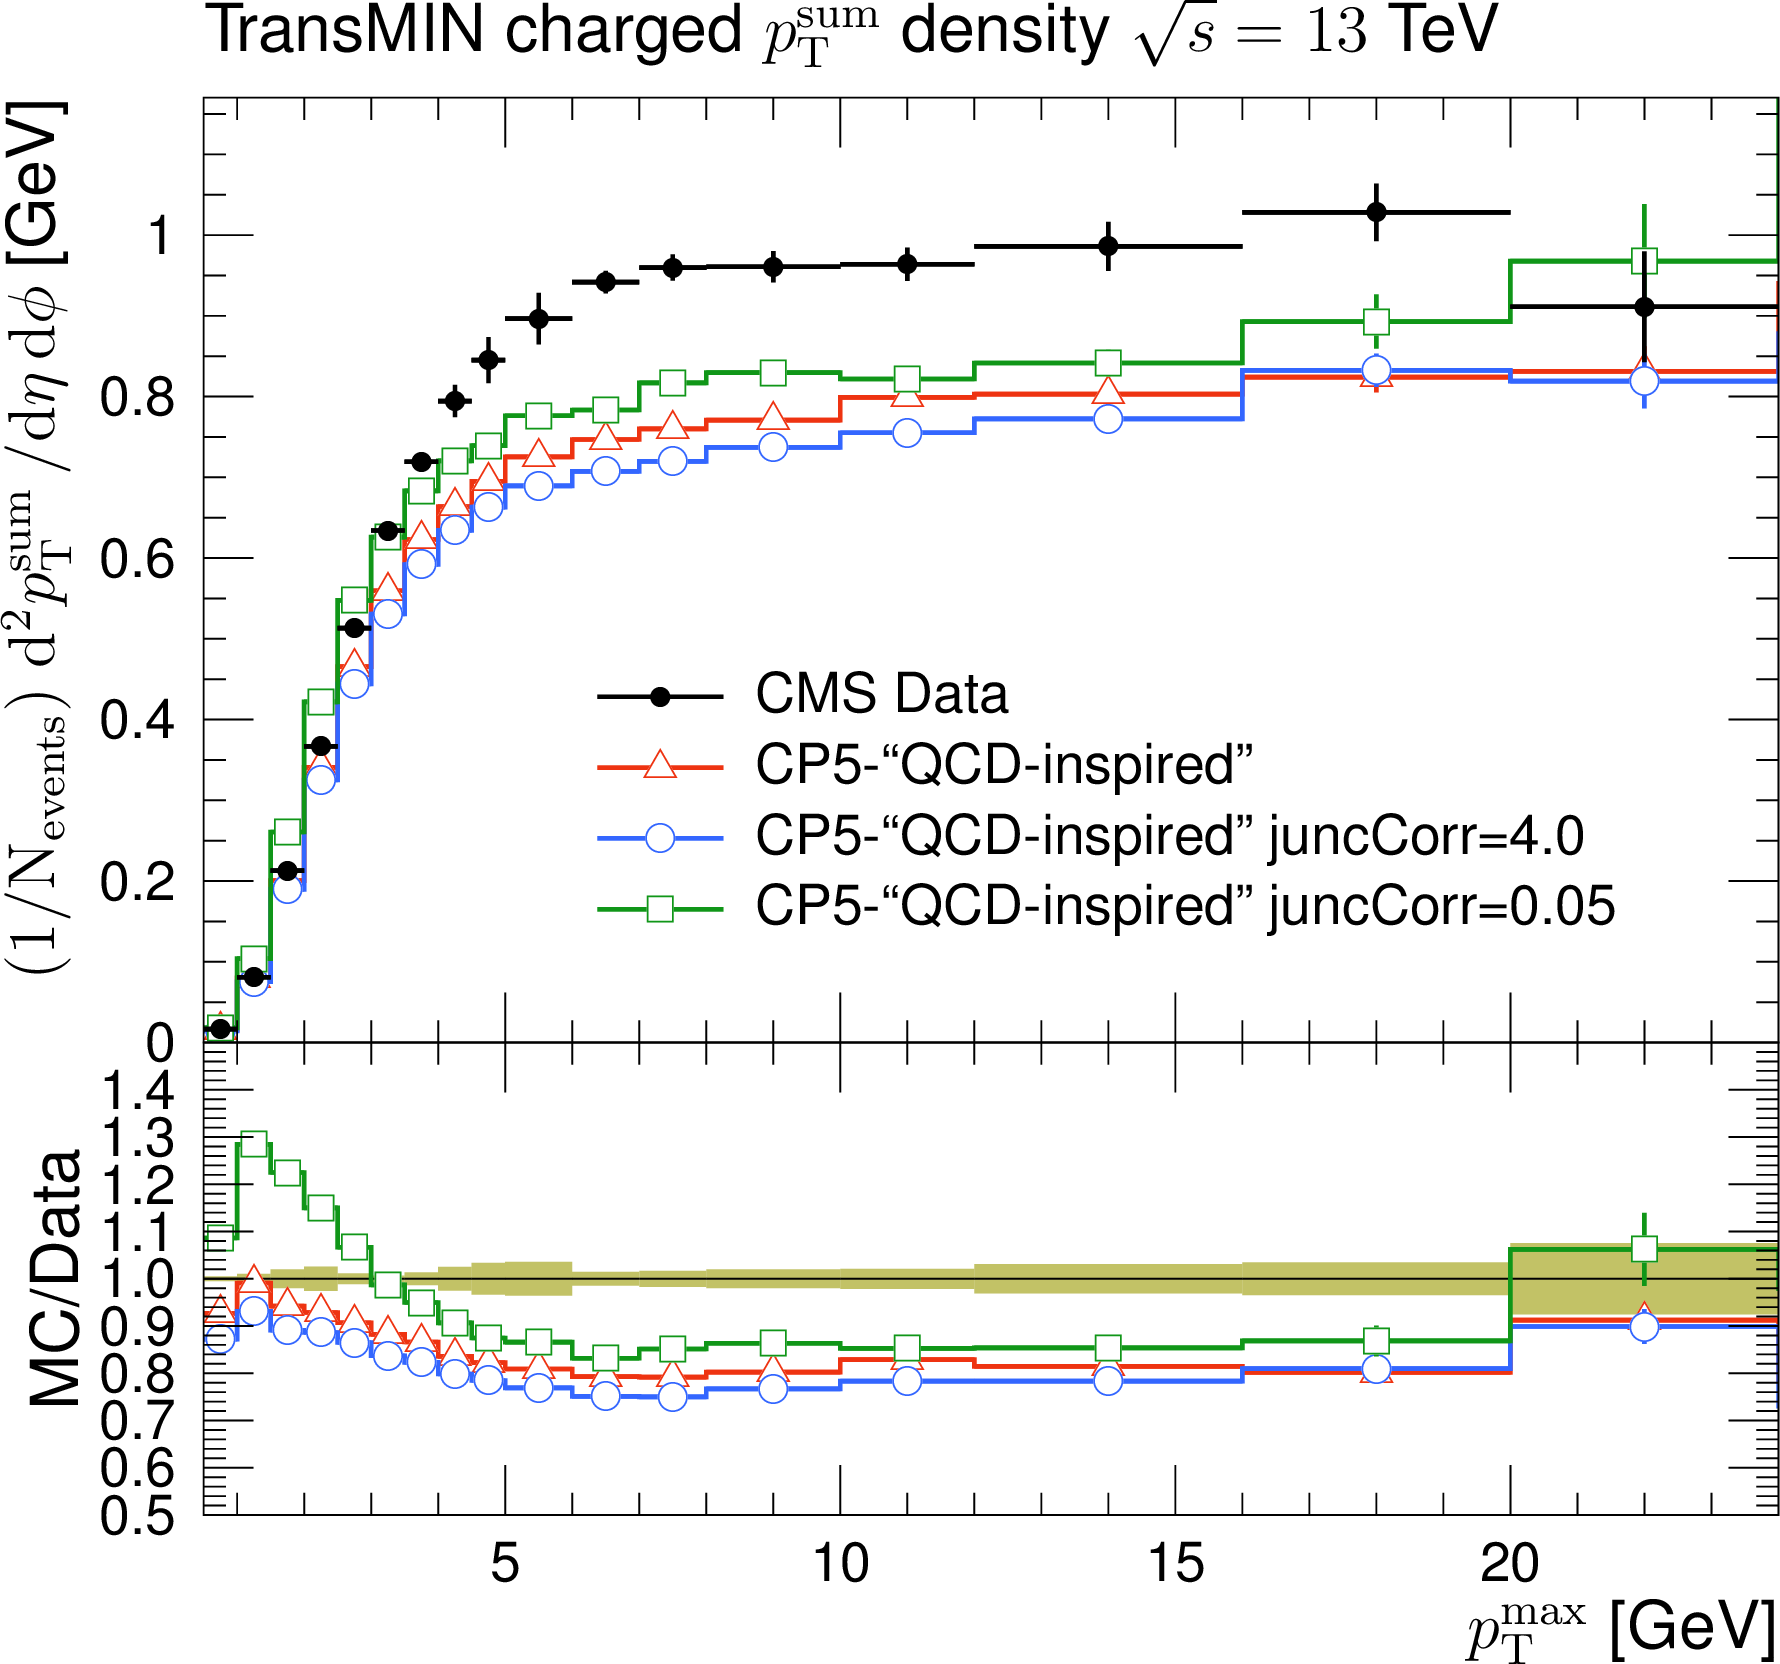
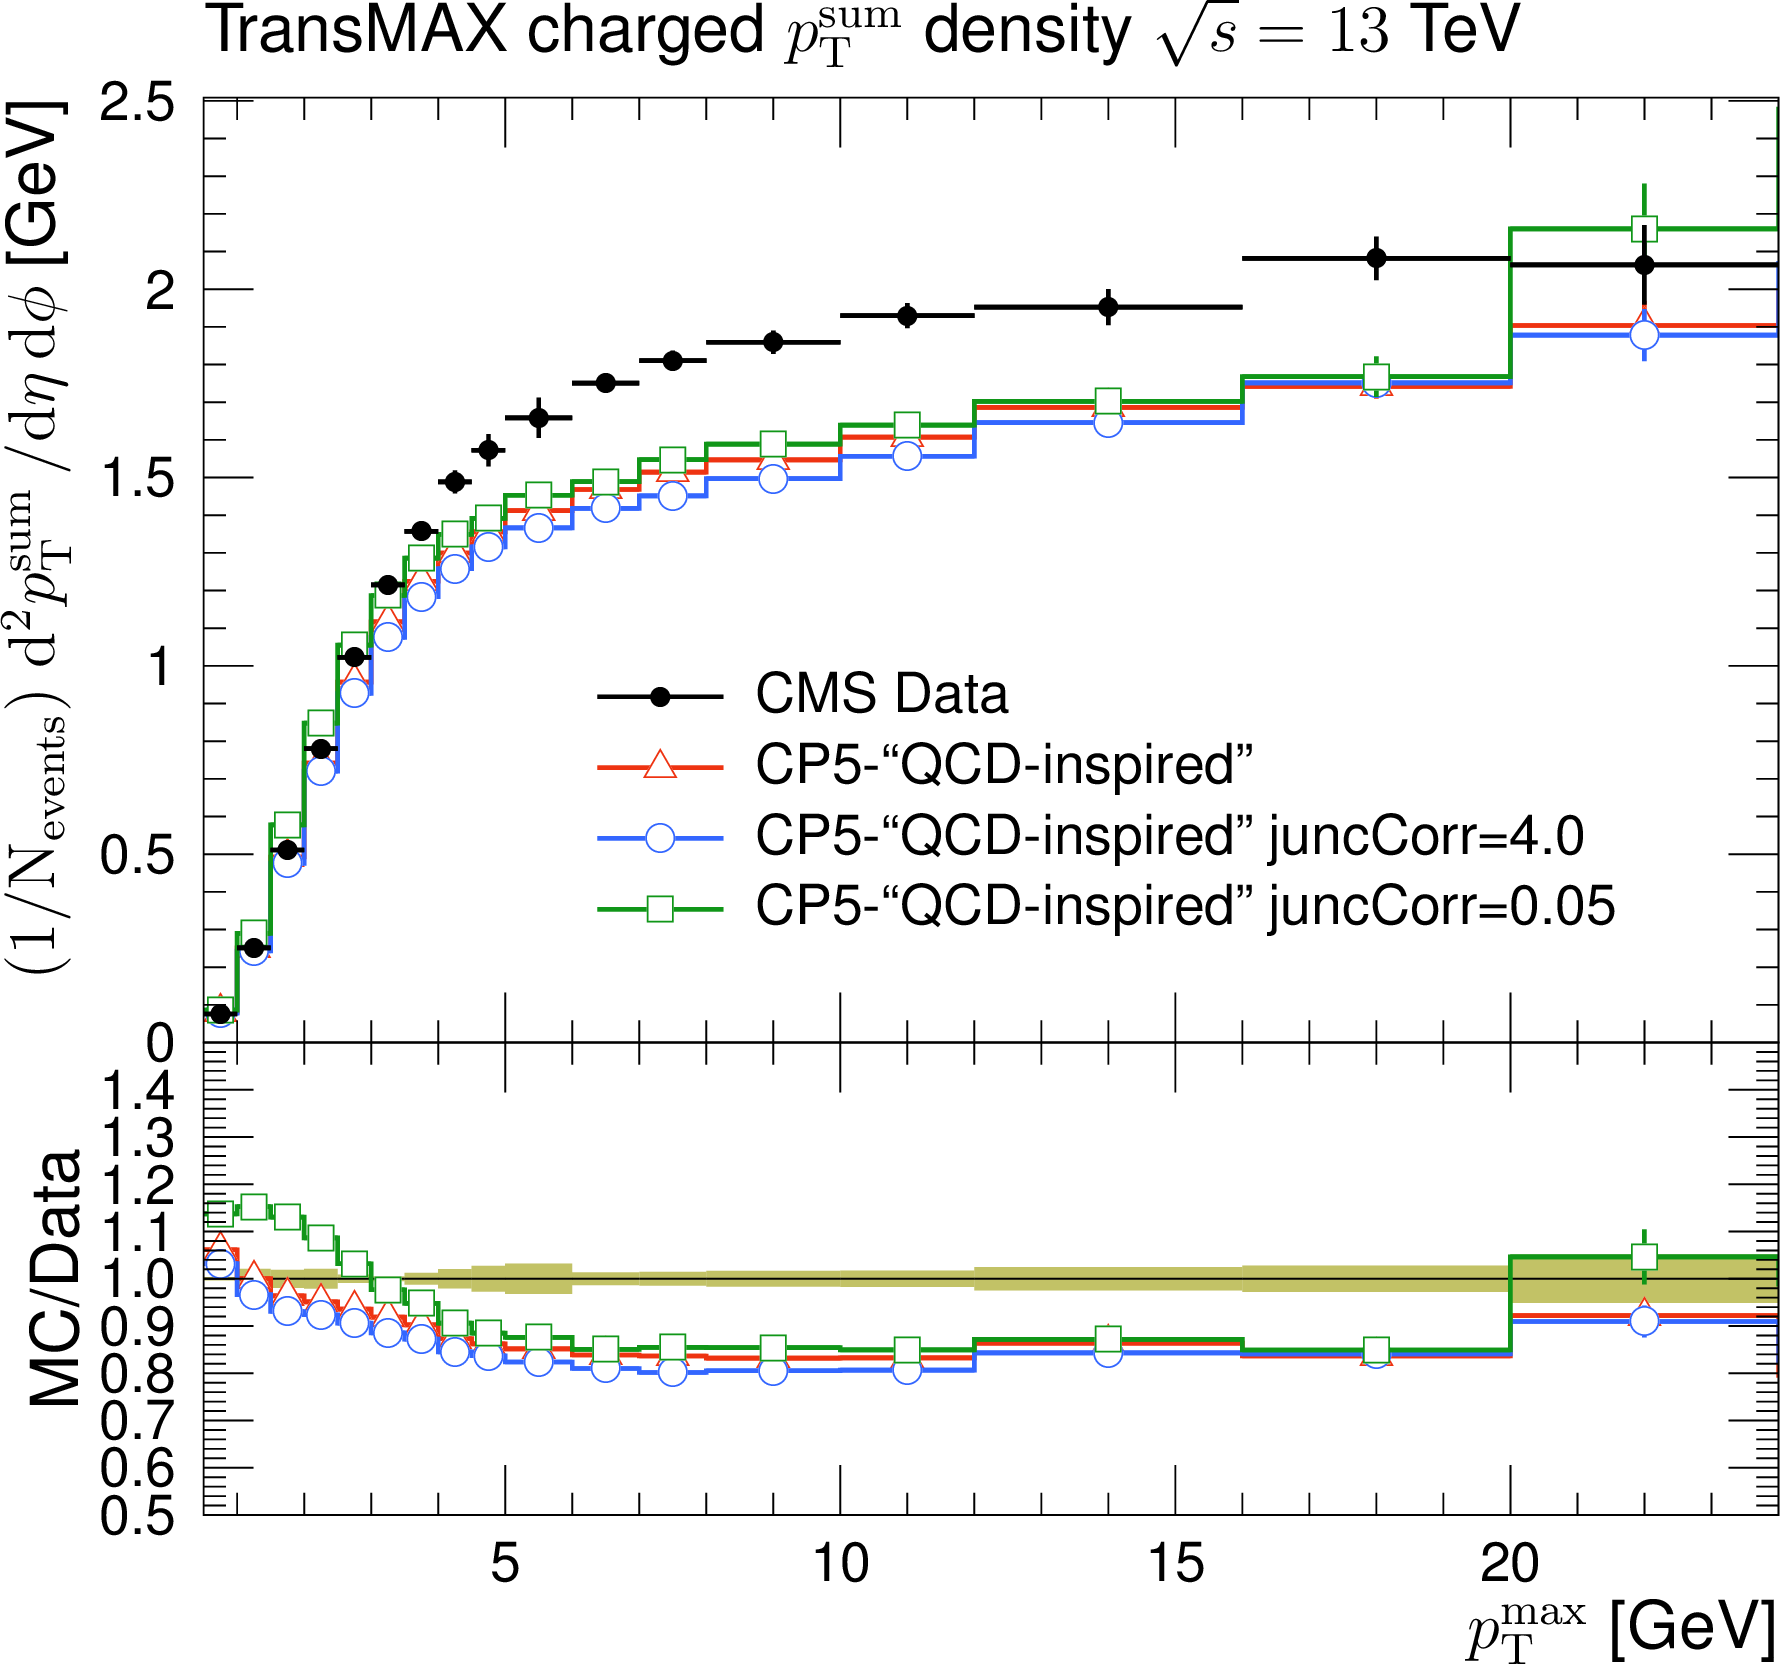
Figure C2:
The charged-particle (left) and $ p_{\mathrm{T}}^{\text{sum}} $ densities (right) in the transMIN (upper) and transMAX (lower) regions as functions of the $ p_{\mathrm{T}} $ of the leading charged particle, $ p_{\mathrm{T}}^{\text{max}} $, measured by the CMS experiment at $ \sqrt{s}= $ 13 TeV [17]. The red line shows the prediction of CP5-``QCD-inspired,'' where the default value of the ColourReconnection:junctionCorrection parameter is 1.2. The predictions shown with the blue and green lines use 4.0 and 0.05 for the ColourReconnection:junctionCorrection parameter, respectively. These comparisons demonstrate the sensitivity of the ColourReconnection:junctionCorrection parameter to these observables. |
png pdf |
Figure C2-a:
The charged-particle (left) and $ p_{\mathrm{T}}^{\text{sum}} $ densities (right) in the transMIN (upper) and transMAX (lower) regions as functions of the $ p_{\mathrm{T}} $ of the leading charged particle, $ p_{\mathrm{T}}^{\text{max}} $, measured by the CMS experiment at $ \sqrt{s}= $ 13 TeV [17]. The red line shows the prediction of CP5-``QCD-inspired,'' where the default value of the ColourReconnection:junctionCorrection parameter is 1.2. The predictions shown with the blue and green lines use 4.0 and 0.05 for the ColourReconnection:junctionCorrection parameter, respectively. These comparisons demonstrate the sensitivity of the ColourReconnection:junctionCorrection parameter to these observables. |
png pdf |
Figure C2-b:
The charged-particle (left) and $ p_{\mathrm{T}}^{\text{sum}} $ densities (right) in the transMIN (upper) and transMAX (lower) regions as functions of the $ p_{\mathrm{T}} $ of the leading charged particle, $ p_{\mathrm{T}}^{\text{max}} $, measured by the CMS experiment at $ \sqrt{s}= $ 13 TeV [17]. The red line shows the prediction of CP5-``QCD-inspired,'' where the default value of the ColourReconnection:junctionCorrection parameter is 1.2. The predictions shown with the blue and green lines use 4.0 and 0.05 for the ColourReconnection:junctionCorrection parameter, respectively. These comparisons demonstrate the sensitivity of the ColourReconnection:junctionCorrection parameter to these observables. |

png pdf |
Figure C2-c:
The charged-particle (left) and $ p_{\mathrm{T}}^{\text{sum}} $ densities (right) in the transMIN (upper) and transMAX (lower) regions as functions of the $ p_{\mathrm{T}} $ of the leading charged particle, $ p_{\mathrm{T}}^{\text{max}} $, measured by the CMS experiment at $ \sqrt{s}= $ 13 TeV [17]. The red line shows the prediction of CP5-``QCD-inspired,'' where the default value of the ColourReconnection:junctionCorrection parameter is 1.2. The predictions shown with the blue and green lines use 4.0 and 0.05 for the ColourReconnection:junctionCorrection parameter, respectively. These comparisons demonstrate the sensitivity of the ColourReconnection:junctionCorrection parameter to these observables. |
png pdf |
Figure C2-d:
The charged-particle (left) and $ p_{\mathrm{T}}^{\text{sum}} $ densities (right) in the transMIN (upper) and transMAX (lower) regions as functions of the $ p_{\mathrm{T}} $ of the leading charged particle, $ p_{\mathrm{T}}^{\text{max}} $, measured by the CMS experiment at $ \sqrt{s}= $ 13 TeV [17]. The red line shows the prediction of CP5-``QCD-inspired,'' where the default value of the ColourReconnection:junctionCorrection parameter is 1.2. The predictions shown with the blue and green lines use 4.0 and 0.05 for the ColourReconnection:junctionCorrection parameter, respectively. These comparisons demonstrate the sensitivity of the ColourReconnection:junctionCorrection parameter to these observables. |
png pdf |
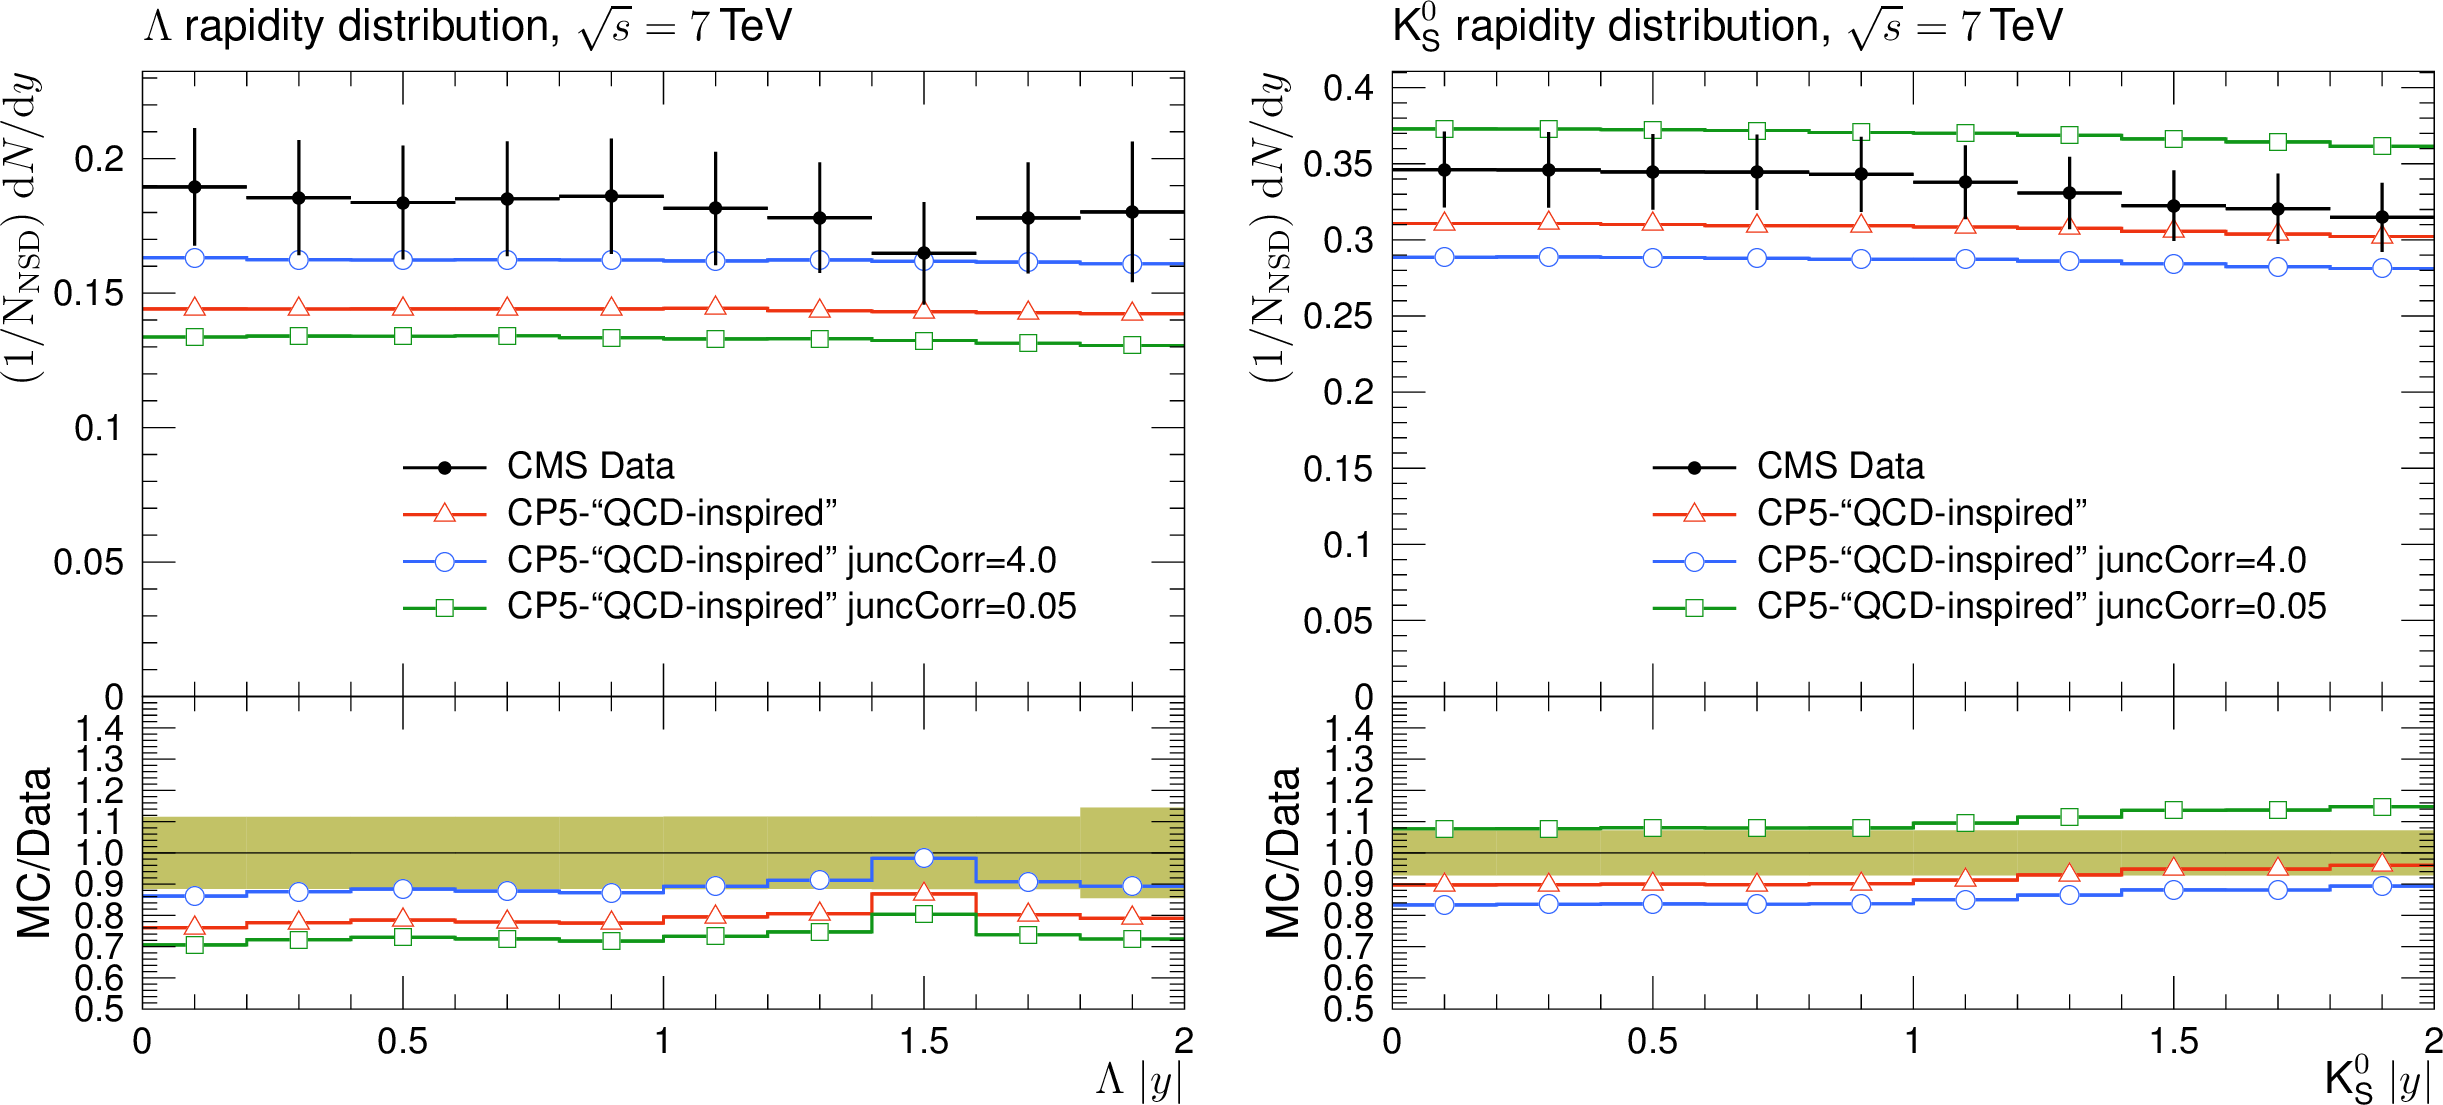
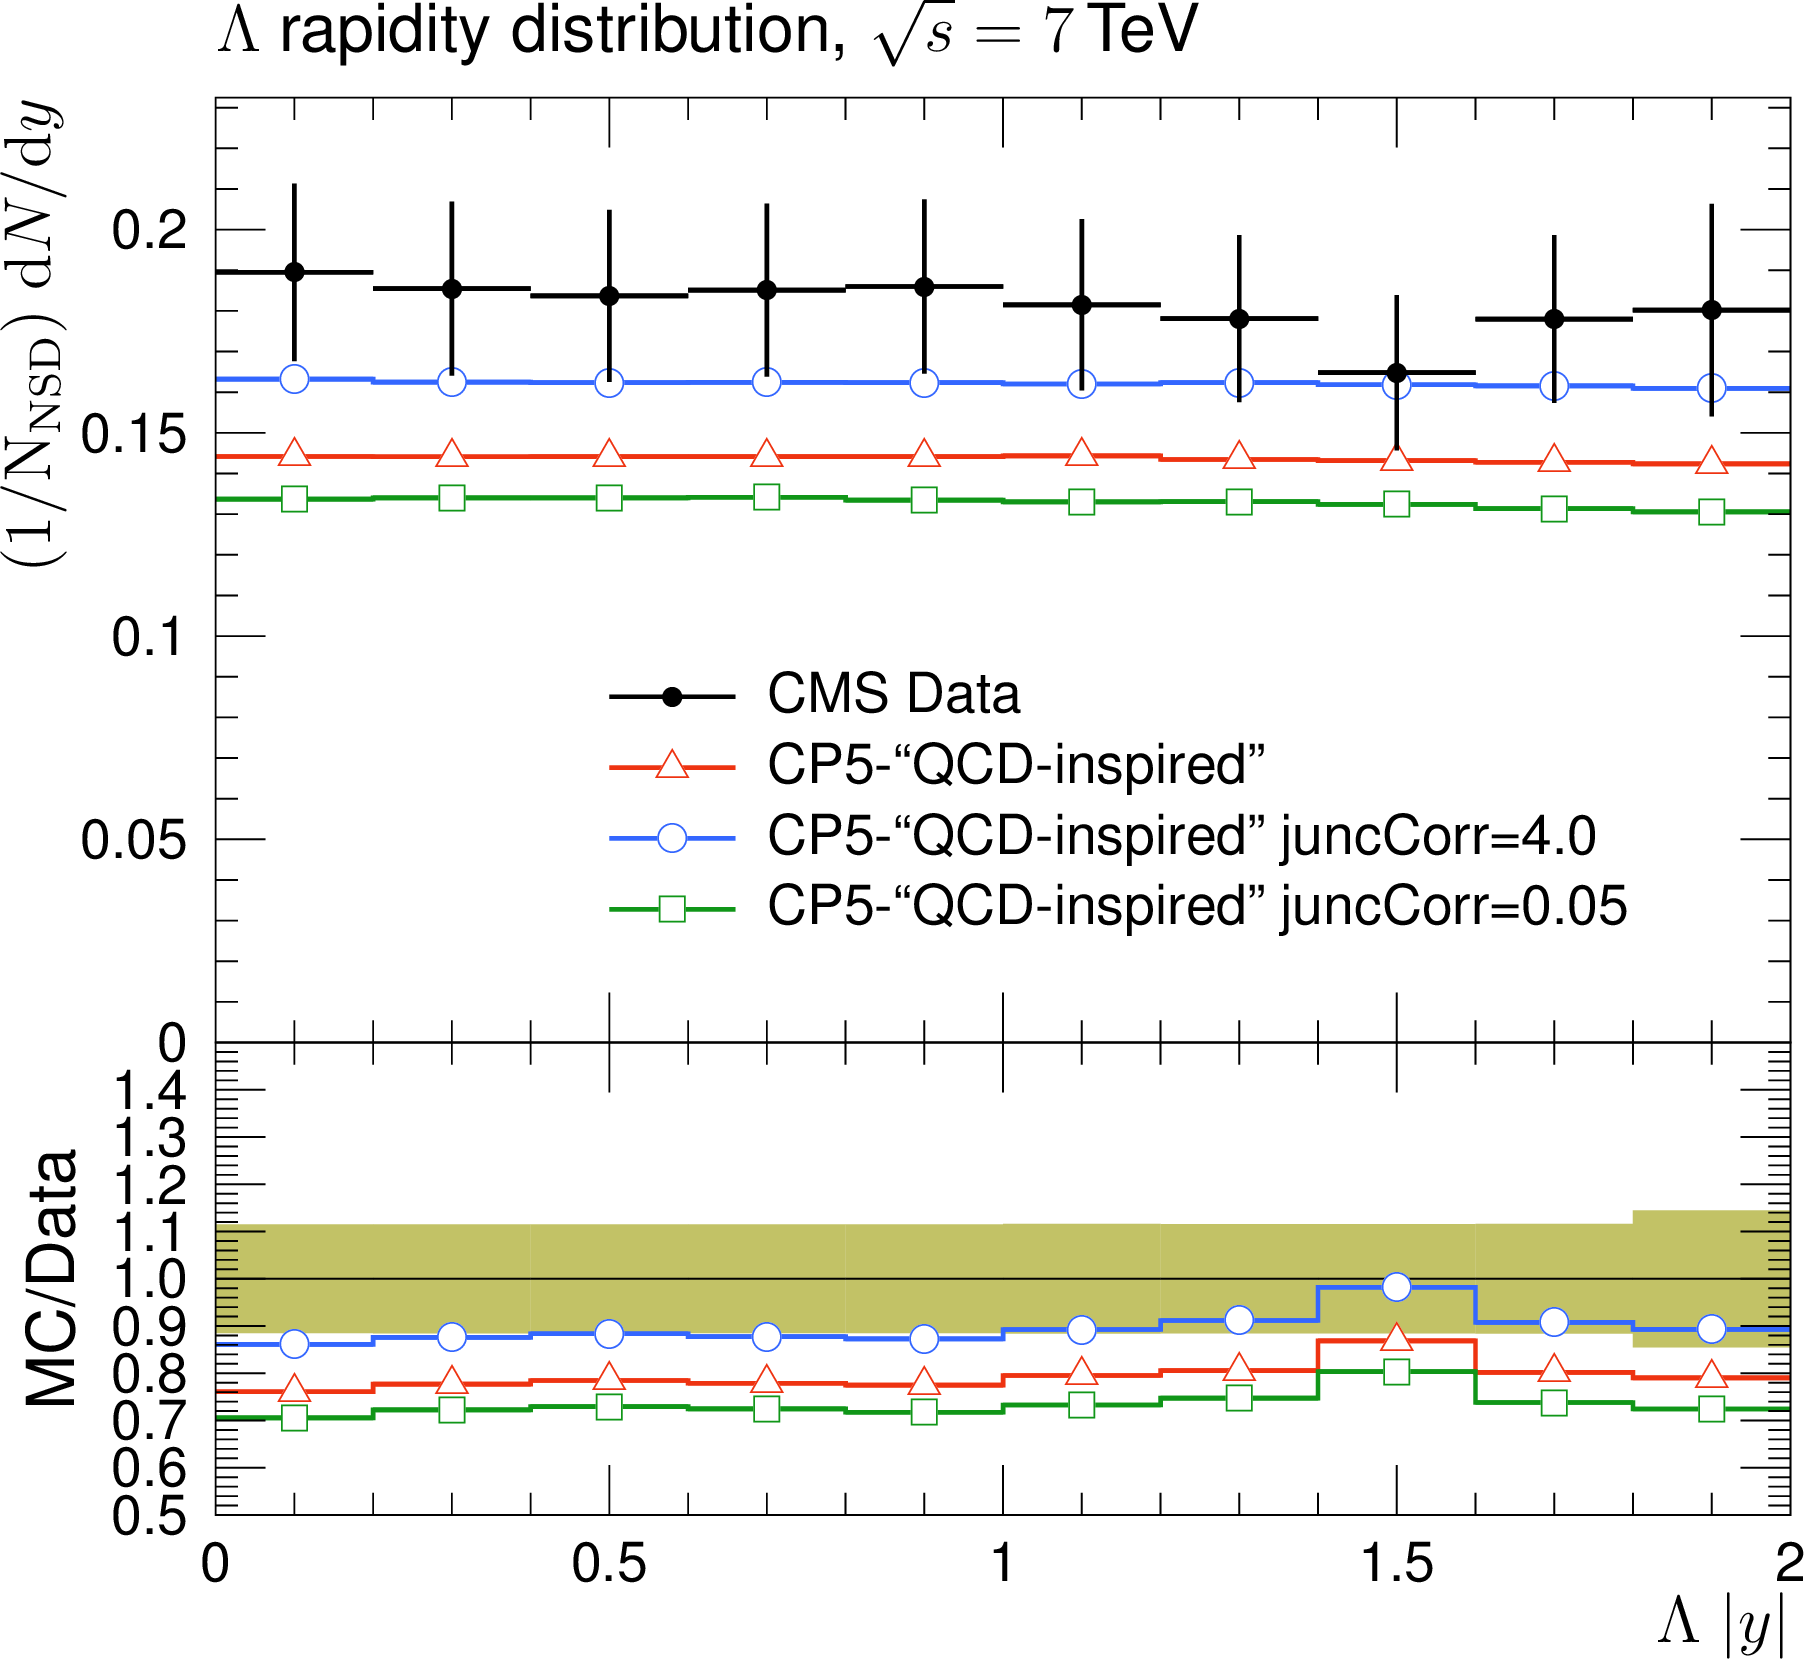
Figure C3:
The strange particle production, $ \Lambda $ baryons (upper) and $ \mathrm{K^0_S} $ mesons (lower), as a function of rapidity, measured by the CMS experiment at $ \sqrt{s}= $ 7 TeV [16]. The red line shows the prediction of CP5-``QCD-inspired,'' where the default value of the ColourReconnection:junctionCorrection parameter is 1.2. The predictions shown with the blue and green lines use 4.0 and 0.05 for the ColourReconnection:junctionCorrection parameter, respectively. These comparisons demonstrate the sensitivity of the ColourReconnection:junctionCorrection parameter to these observables. |
png pdf |
Figure C3-a:
The strange particle production, $ \Lambda $ baryons (upper) and $ \mathrm{K^0_S} $ mesons (lower), as a function of rapidity, measured by the CMS experiment at $ \sqrt{s}= $ 7 TeV [16]. The red line shows the prediction of CP5-``QCD-inspired,'' where the default value of the ColourReconnection:junctionCorrection parameter is 1.2. The predictions shown with the blue and green lines use 4.0 and 0.05 for the ColourReconnection:junctionCorrection parameter, respectively. These comparisons demonstrate the sensitivity of the ColourReconnection:junctionCorrection parameter to these observables. |
png pdf |
Figure C3-b:
The strange particle production, $ \Lambda $ baryons (upper) and $ \mathrm{K^0_S} $ mesons (lower), as a function of rapidity, measured by the CMS experiment at $ \sqrt{s}= $ 7 TeV [16]. The red line shows the prediction of CP5-``QCD-inspired,'' where the default value of the ColourReconnection:junctionCorrection parameter is 1.2. The predictions shown with the blue and green lines use 4.0 and 0.05 for the ColourReconnection:junctionCorrection parameter, respectively. These comparisons demonstrate the sensitivity of the ColourReconnection:junctionCorrection parameter to these observables. |
| Tables | |
png pdf |
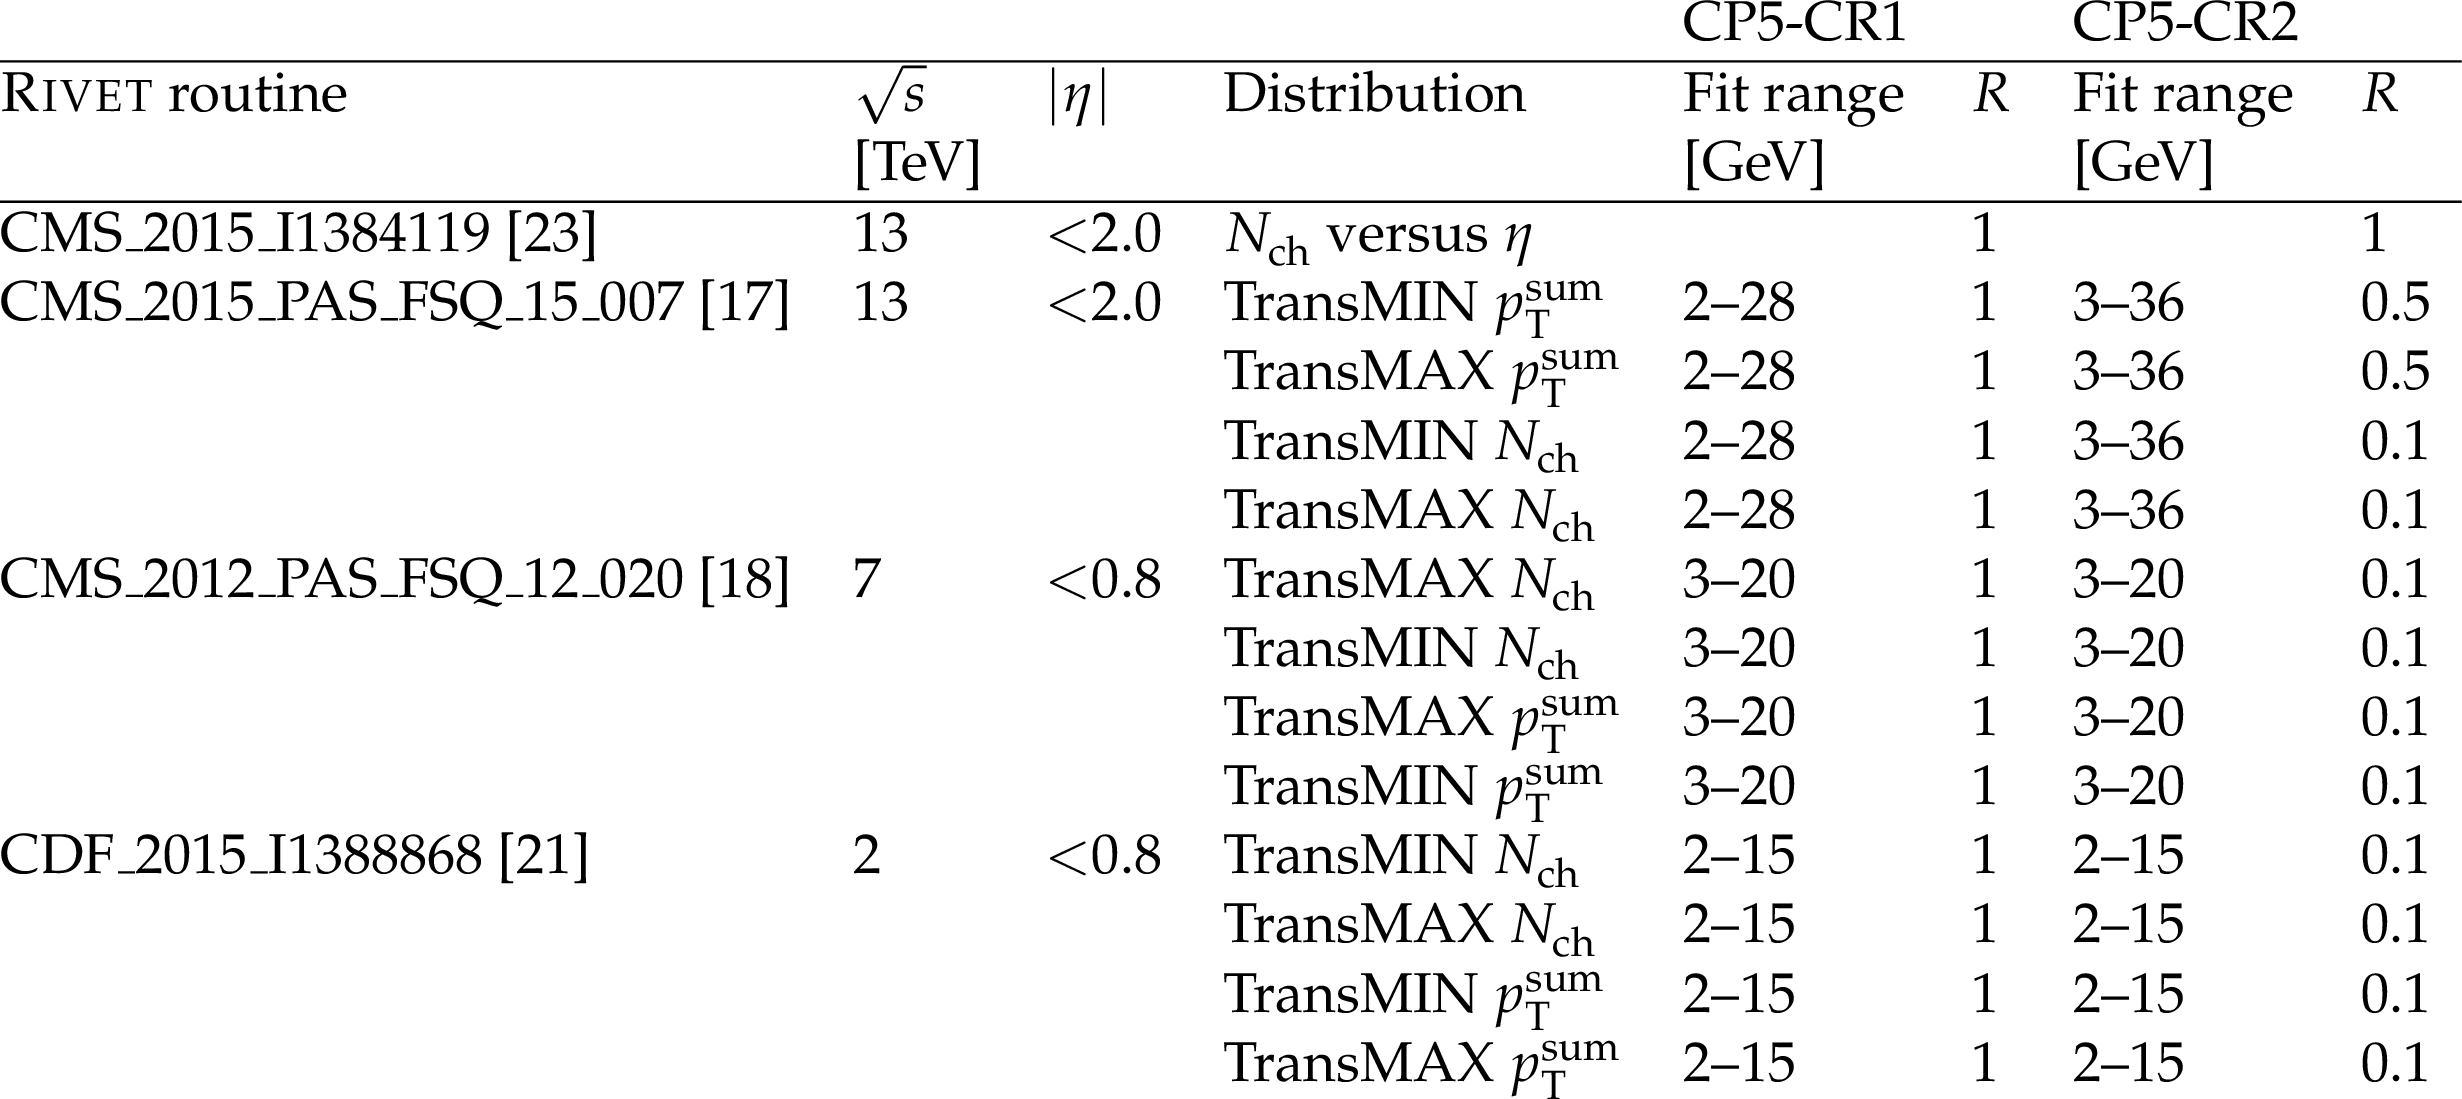
Table 1:
List of input RIVET routines, centre-of-mass energy values, $ \eta $ ranges, names of distributions, fit ranges, and relative importance of the distributions used in the fits to derive the tunes CP5-CR1 and CP5-CR2. |

png pdf |
Table 2:
The MPI and CR parameter ranges used in the tuning procedure. |
png pdf |
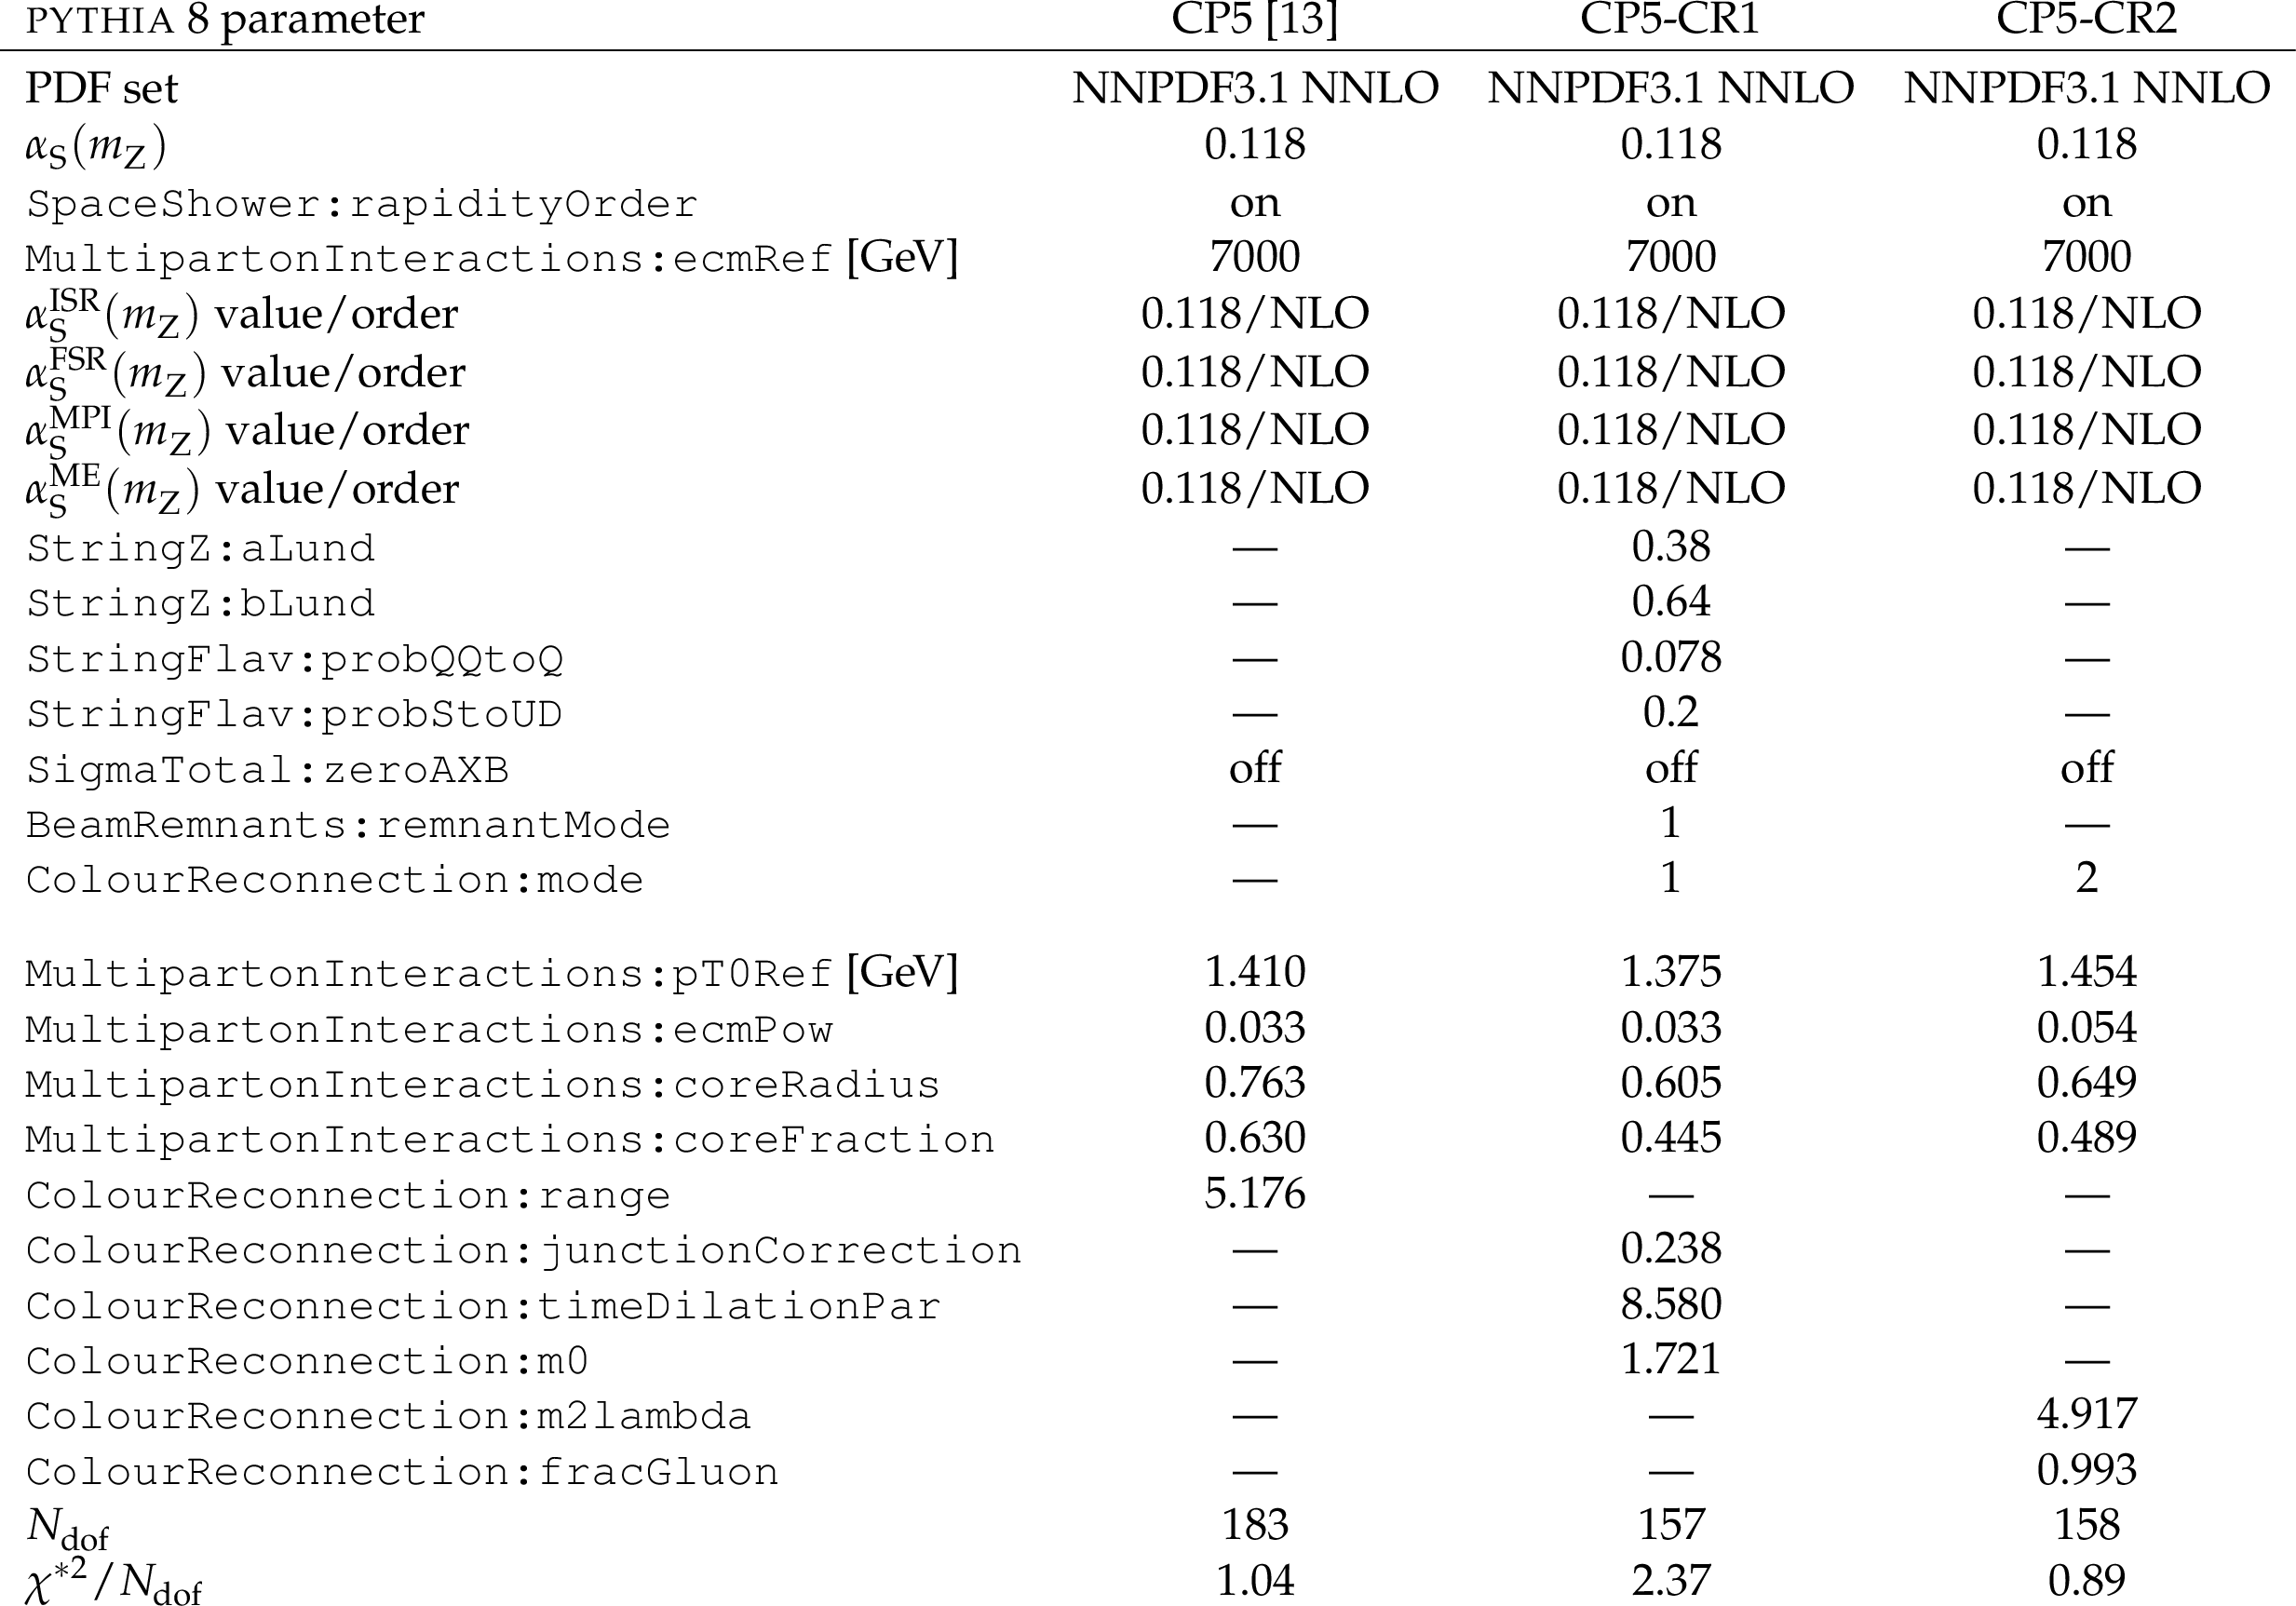
Table 3:
The parameters obtained in the fits of the CP5-CR1 and CP5-CR2 tunes, compared with that of the CP5 tune. The upper part of the table displays the fixed input parameters of the tune, whereas the lower part shows the fitted tune parameters. The number of degrees of freedom ($ N_\mathrm{dof} $) and the goodness of fit divided by $ N_\mathrm{dof} $ are also shown. |
png pdf |
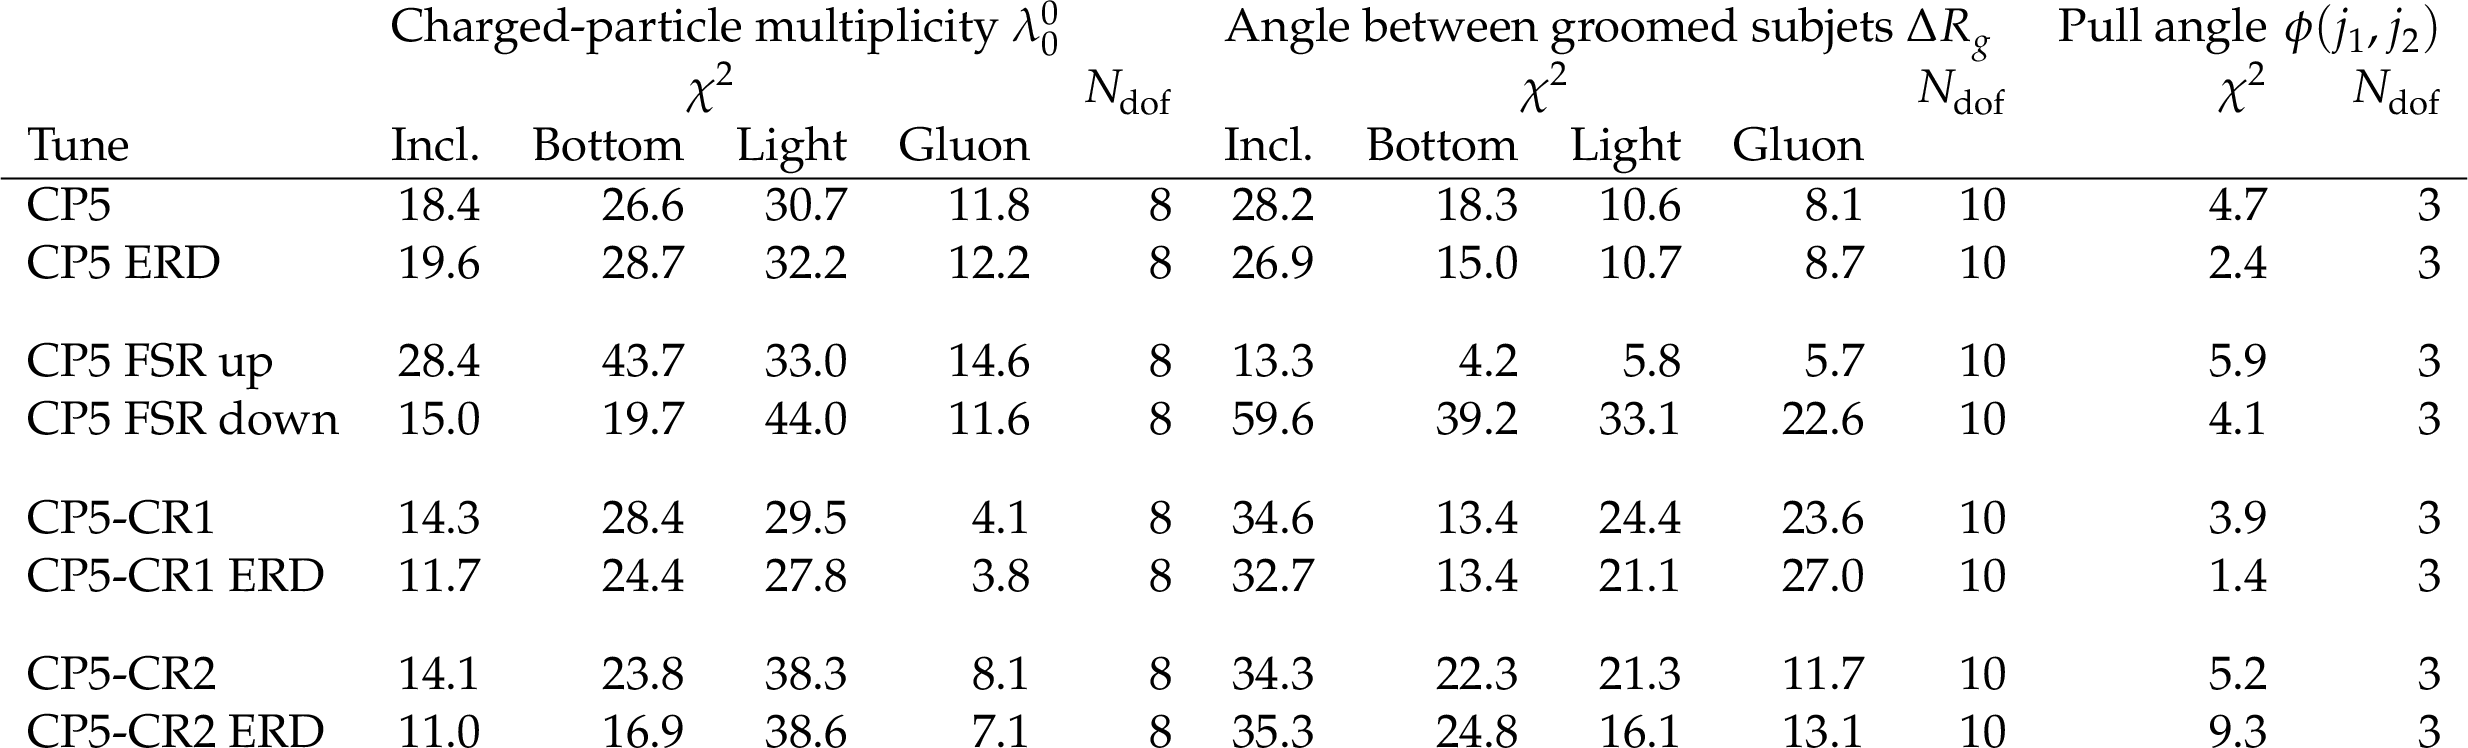
Table 4:
The $ \chi^2 $ values and the numbers of degrees of freedom ($ N_\mathrm{dof} $) for the comparison of $ \mathrm{t} \overline{\mathrm{t}} $ data with the predictions of the different PYTHIA 8 tunes, for the distributions of the charged-particle multiplicity $ \lambda_0^0 $, the angle between the groomed subjets $ \Delta R_g $ at $ \sqrt{s} $ = 13 TeV [53], and the pull angle measured in the ATLAS analysis of the colour flow at 8 TeV [58]. The FSR up and down entries denote variations of the renormalisation scale in the $ \alpha_\mathrm{S}^\mathrm{FSR}(m_\mathrm{Z}) $ by factors of 0.5 and 2, respectively. |
png pdf |
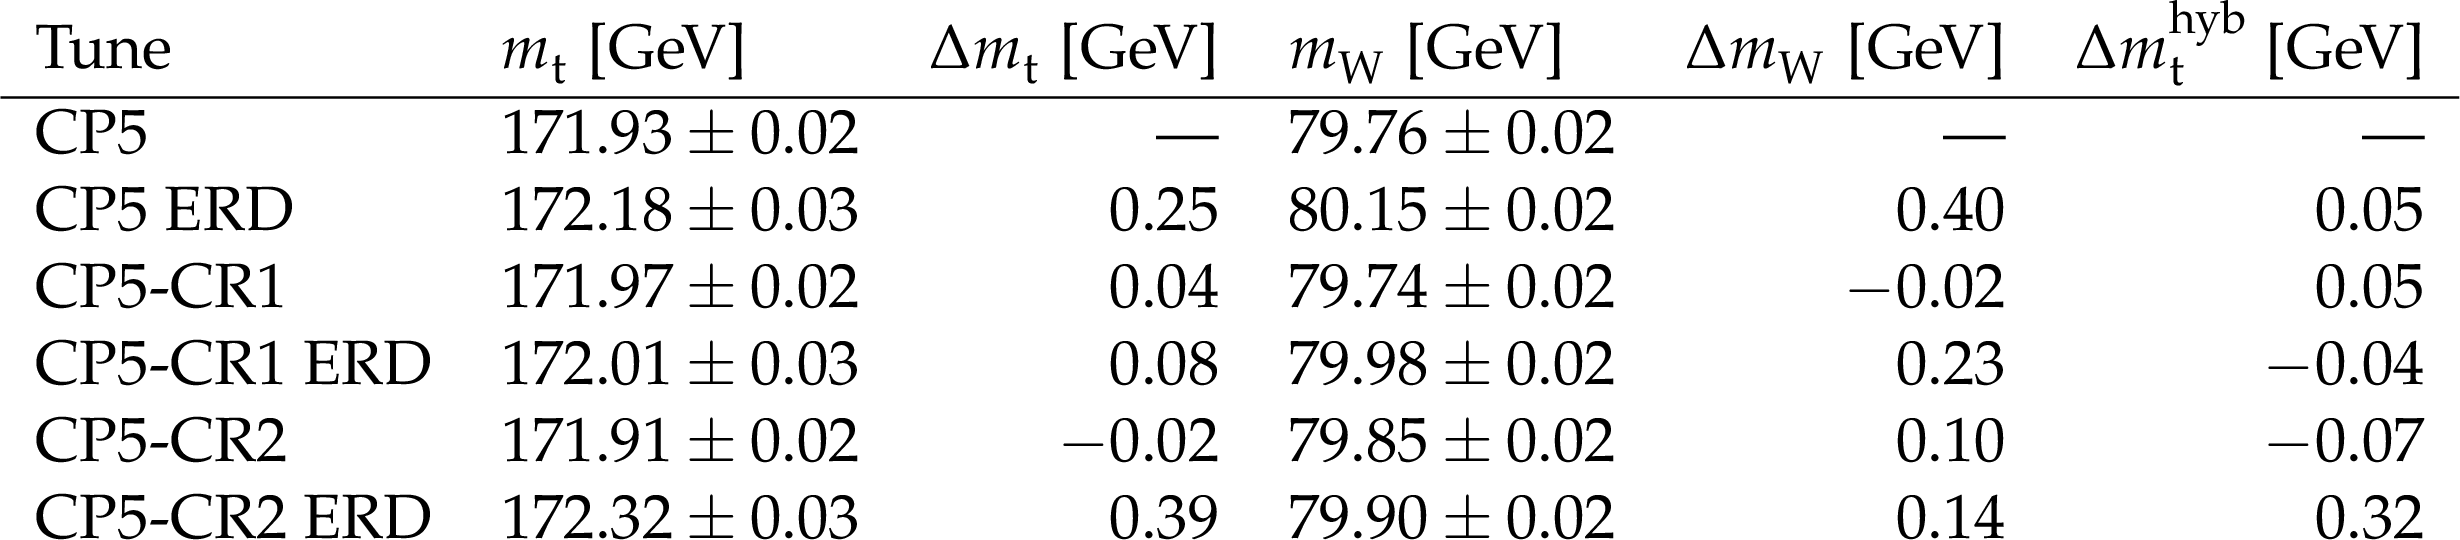
Table 5:
The top quark mass ($ m_{\mathrm{t}} $) and W mass ($ m_{\mathrm{W}} $) extracted by a fit to the predictions of the different PYTHIA 8 tunes, along with the differences from the nominal $ m_{\mathrm{t}} $ value ($ \Delta m_{\mathrm{t}} $), $ m_{\mathrm{W}} $ value ($ \Delta m_{\mathrm{W}} $), and $ \Delta m_{\mathrm{t}}^\text{hyb} $ which represents an estimation of the $ m_{\mathrm{t}} $ uncertainty considering the shift in $ m_{\mathrm{W}} $ included with a weight of 0.5. The uncertainties in the $ m_{\mathrm{t}} $ and $ m_{\mathrm{W}} $ values correspond to the uncertainty in the fitted $ m_{\mathrm{t}} $ and $ m_{\mathrm{W}} $. |
png pdf |
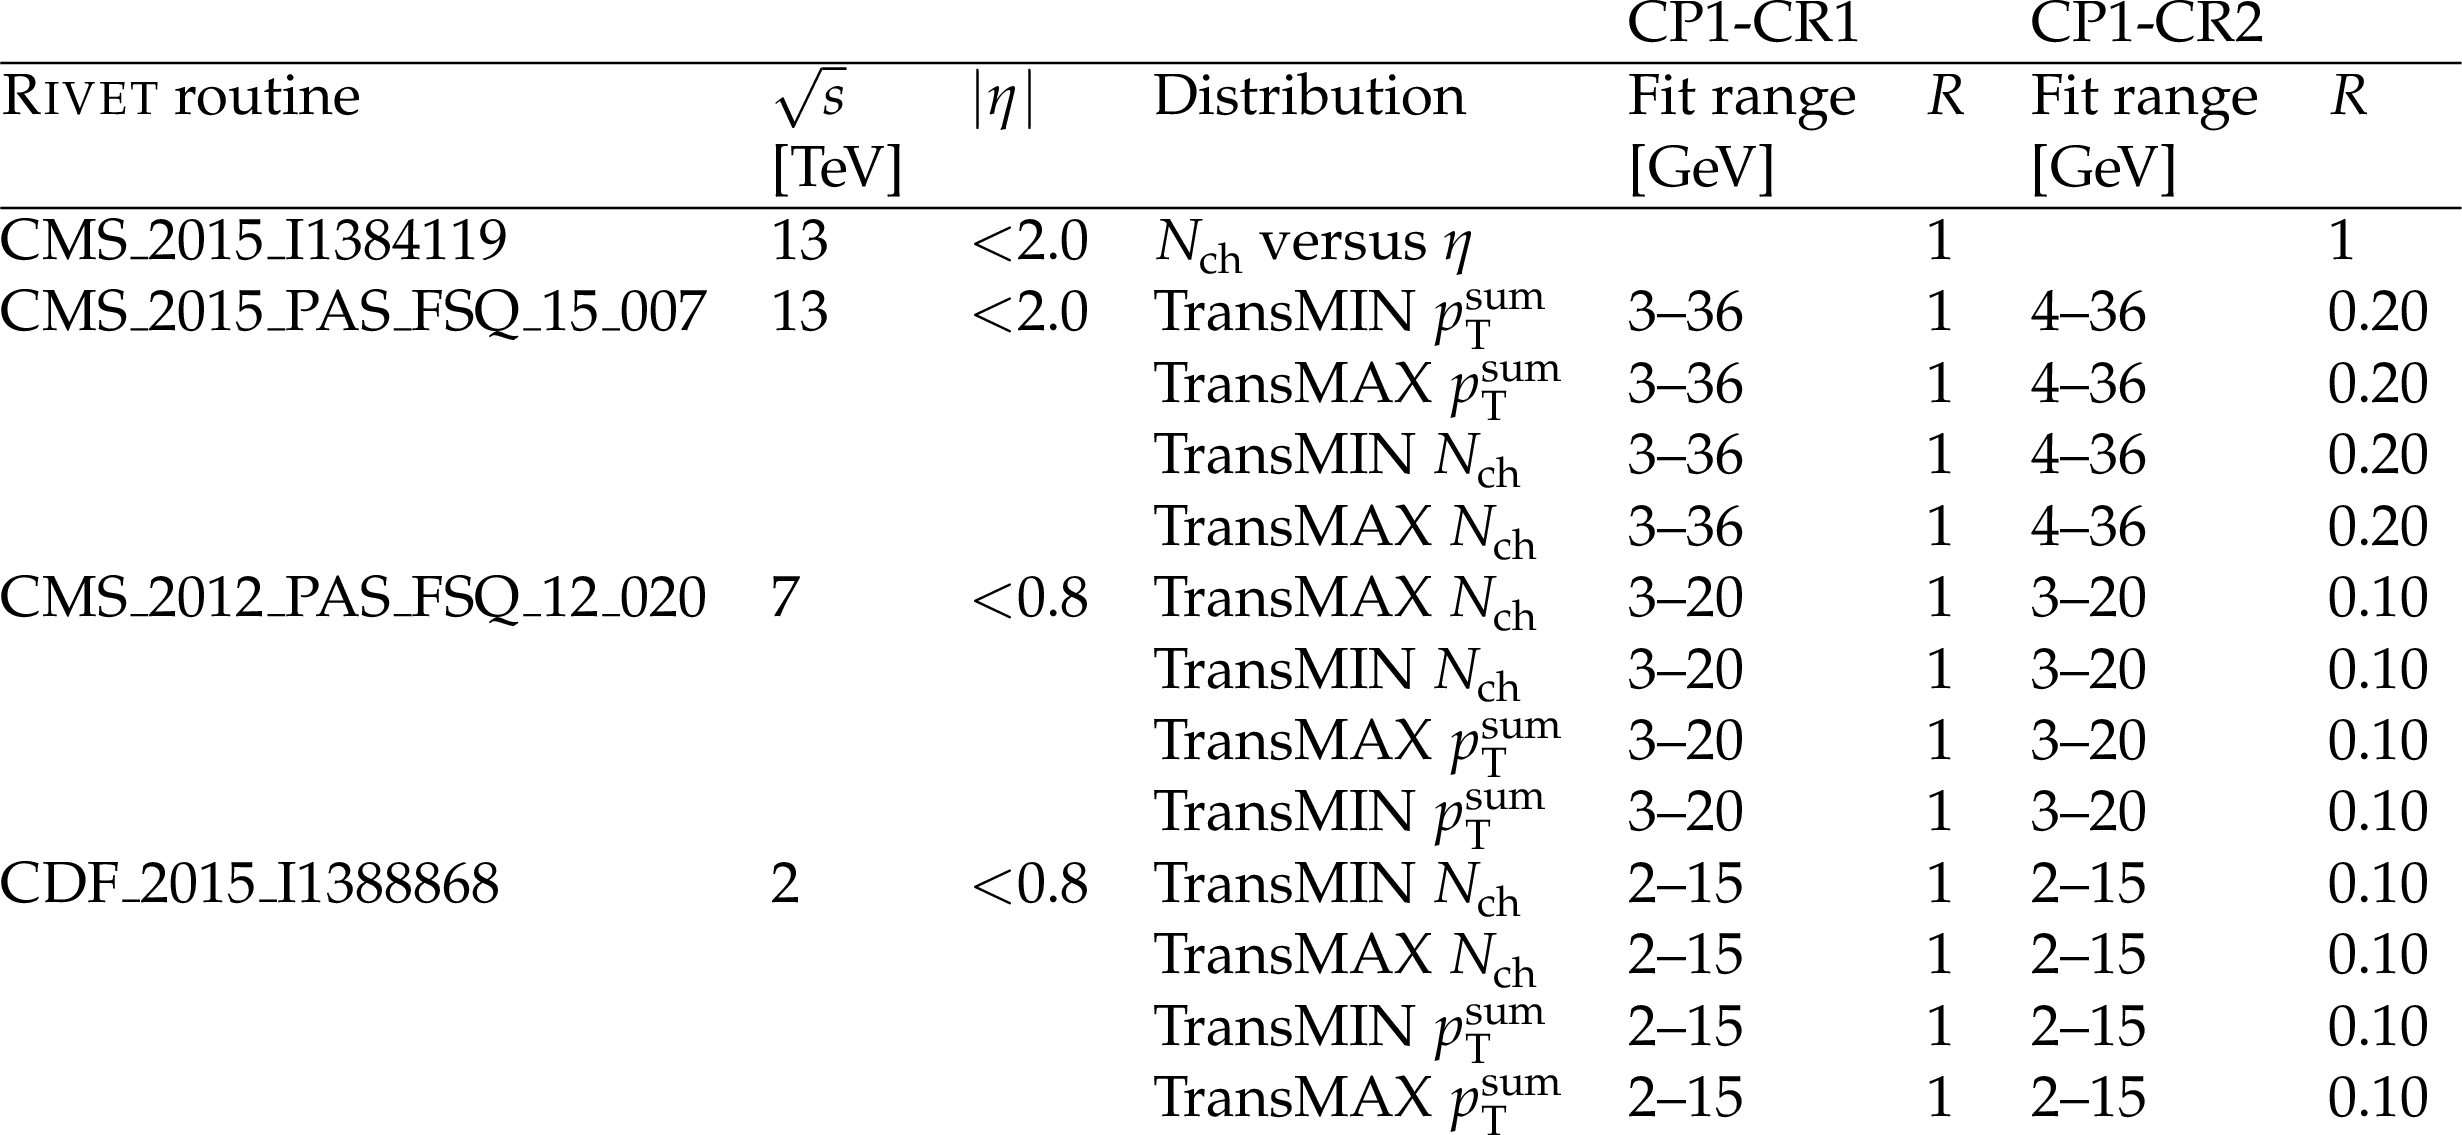
Table A1:
List of input RIVET routines, centre-of-mass energy values, $ \eta $ ranges, names of distributions, fit ranges, and relative importance of the distributions used in the fits to derive the tunes CP1-CR1 and CP1-CR2. |
png pdf |
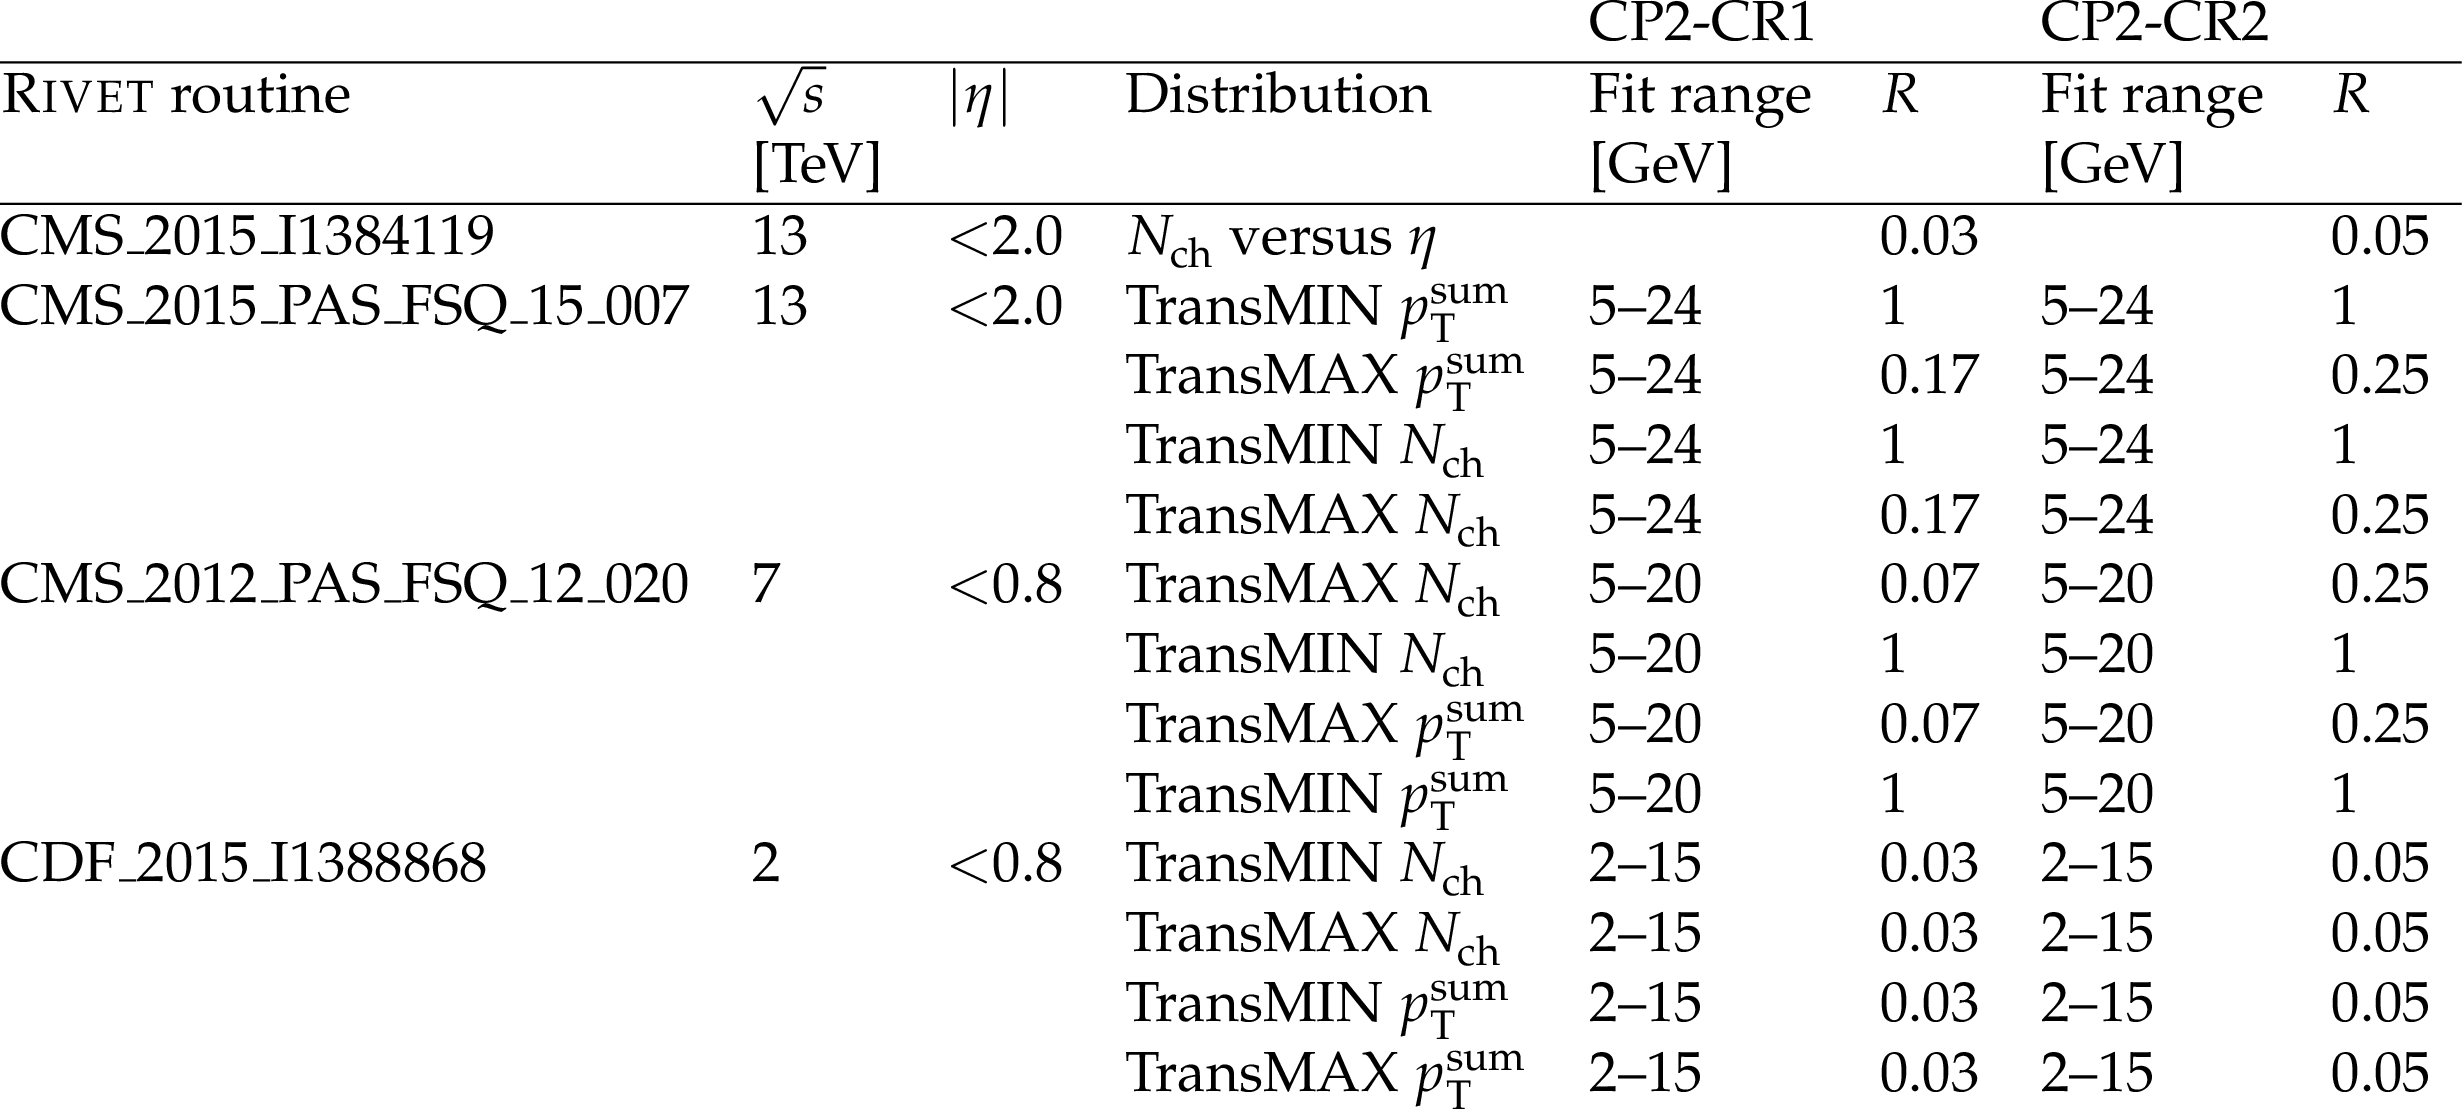
Table A2:
List of input RIVET routines, centre-of-mass energy values, $ \eta $ ranges, names of distributions, fit ranges, and relative importance of the distributions used in the fits to derive the tunes CP2-CR1 and CP2-CR2. |
png pdf |
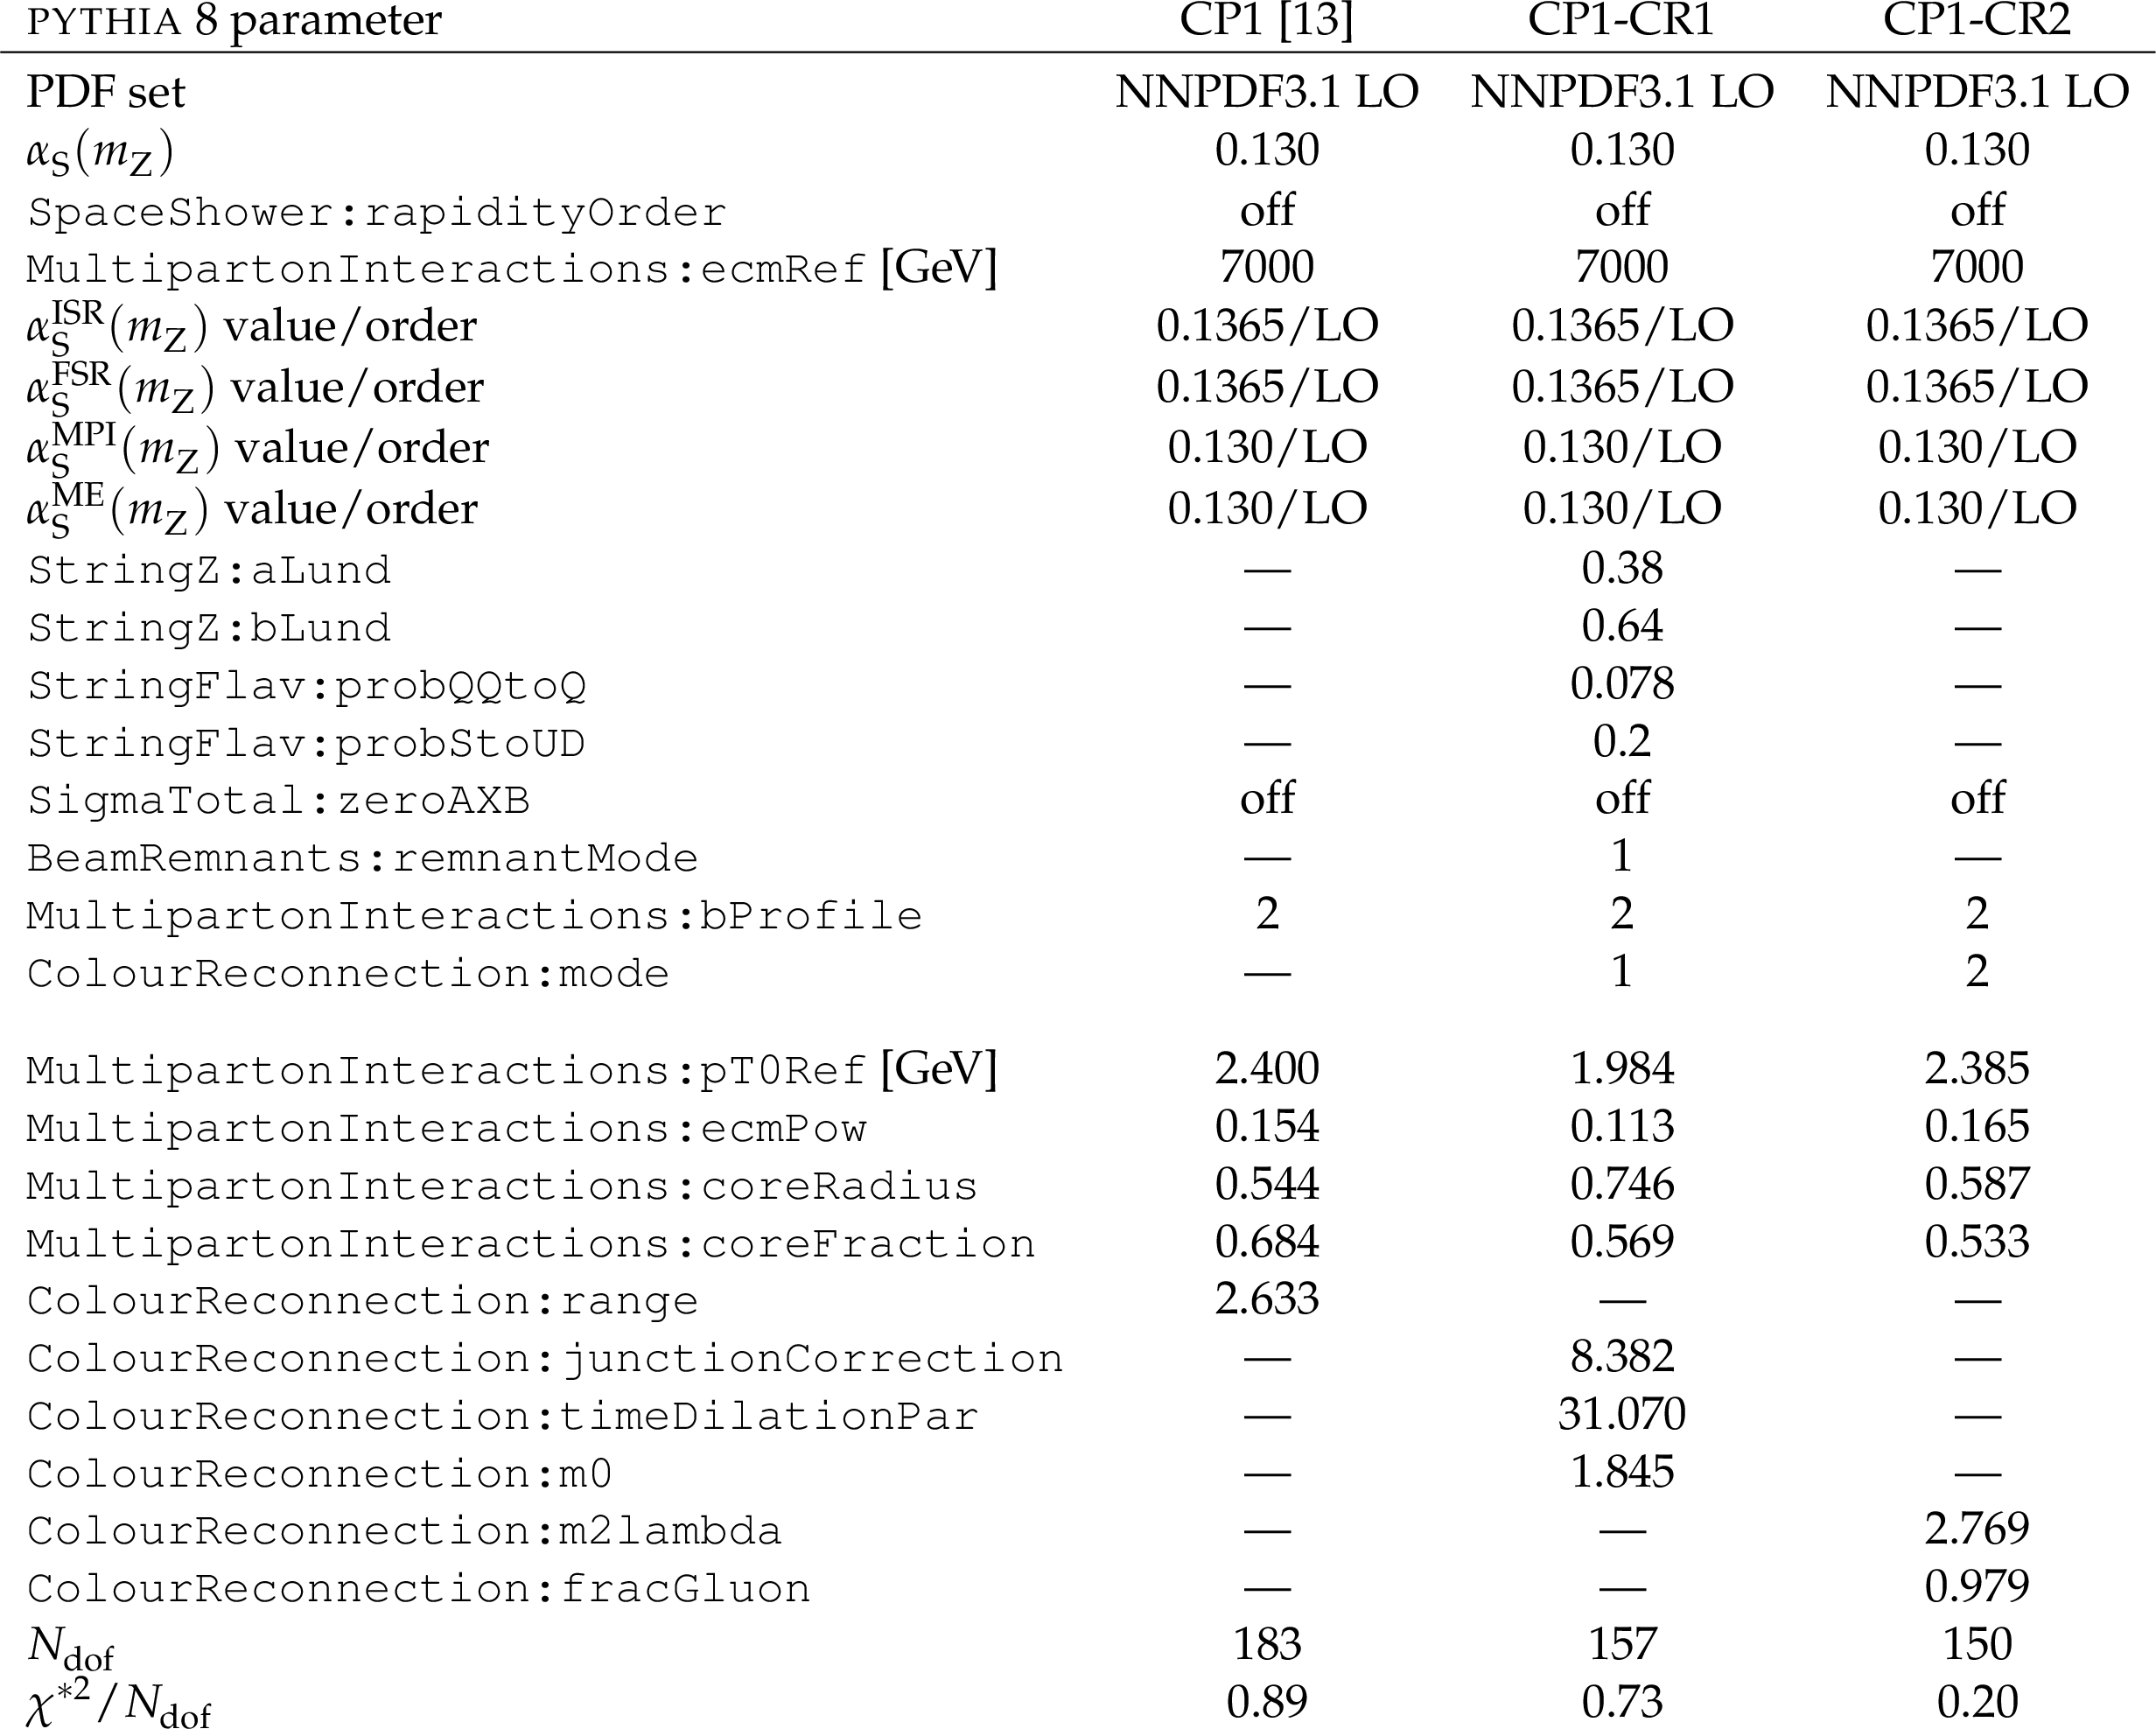
Table A3:
The parameters obtained in the fits of the CP1-CR1 and CP1-CR2 tunes, compared with the ones of the tune CP1. The upper part of the table displays the fixed input parameters of the tune, while the lower part shows the fitted tune parameters. The number of degrees of freedom ($ N_\mathrm{dof} $) and the goodness of fit divided by the number of degrees of freedom are also shown. |

png pdf |
Table A4:
The parameters obtained in the fits of the CP2-CR1 and CP2-CR2 tunes, compared with the ones of the tune CP2. The upper part of the table displays the fixed input parameters of the tune, while the lower part shows the fitted tune parameters. The number of degrees of freedom ($ N_\mathrm{dof} $) and the goodness of fit divided by the number of degrees of freedom are also shown. |

png pdf |
Table B1:
Parameters of the ``up'' and ``down'' variations of the CP5-CR1 tune. |
png pdf |
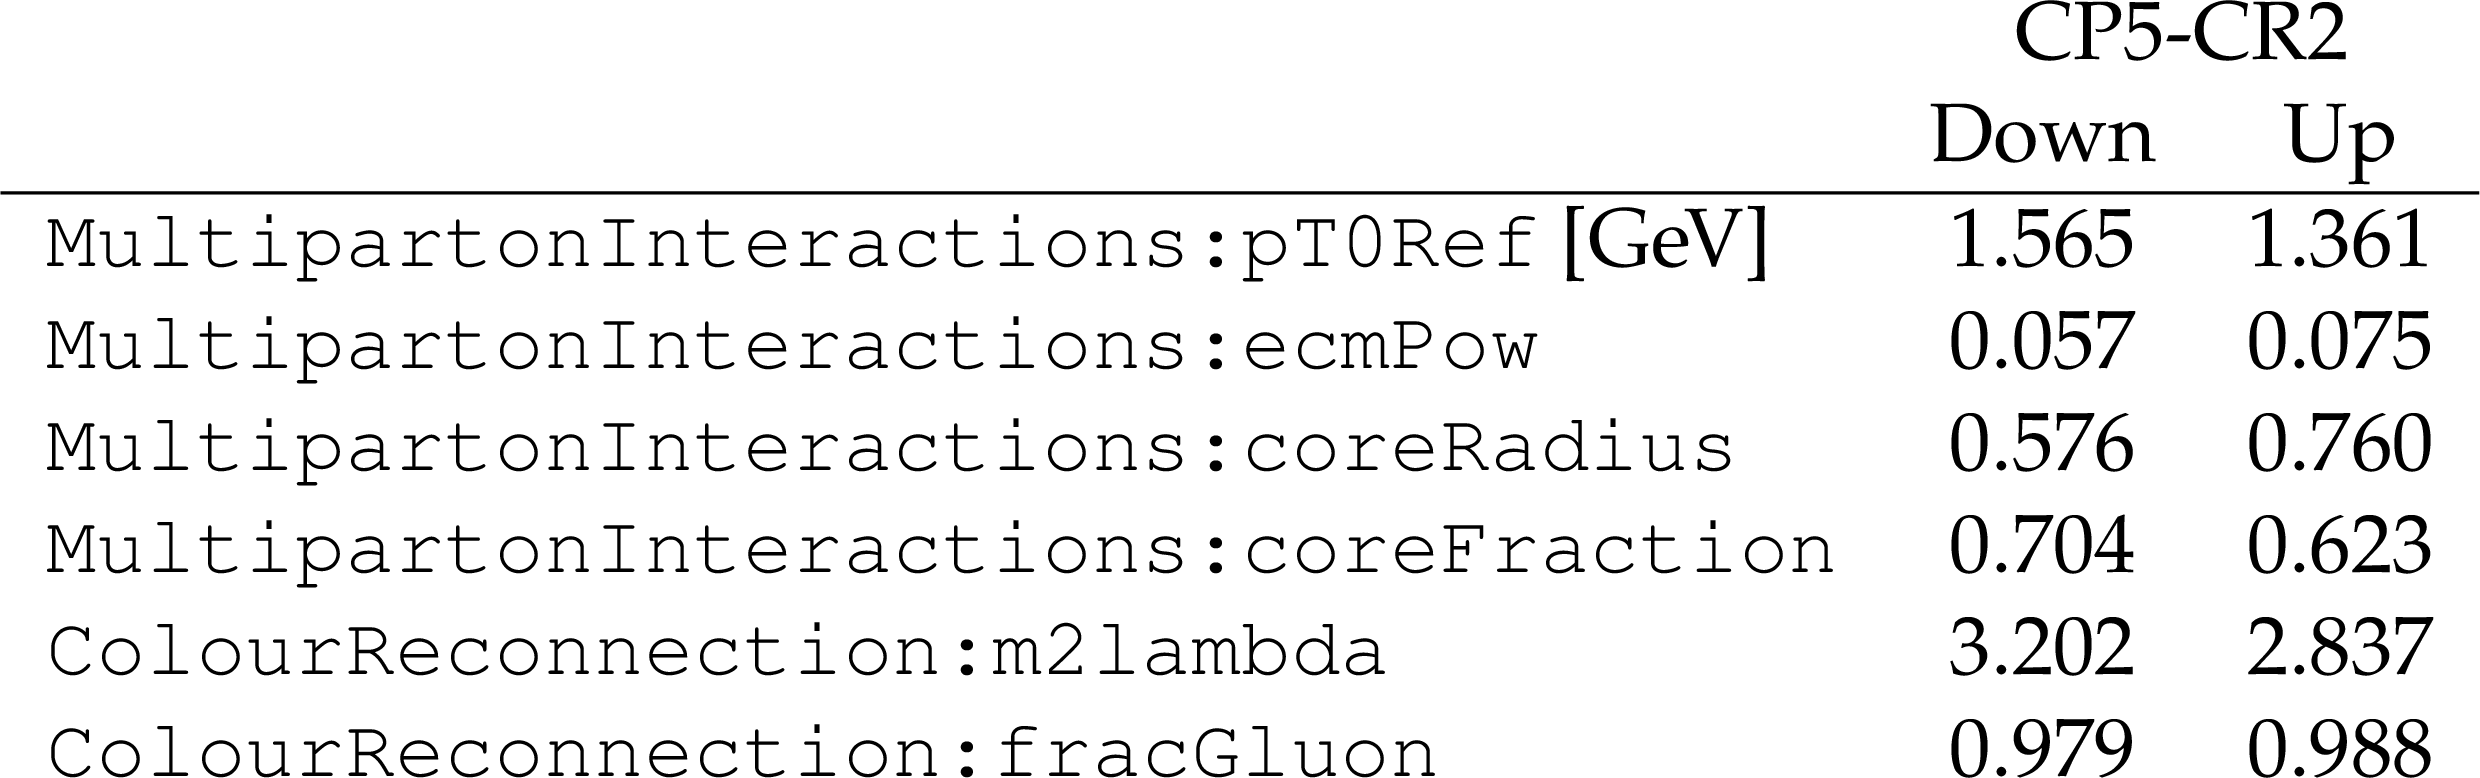
Table B2:
Parameters of the ``up'' and ``down'' variations of the CP5-CR2 tune. |
png pdf |
Table C1:
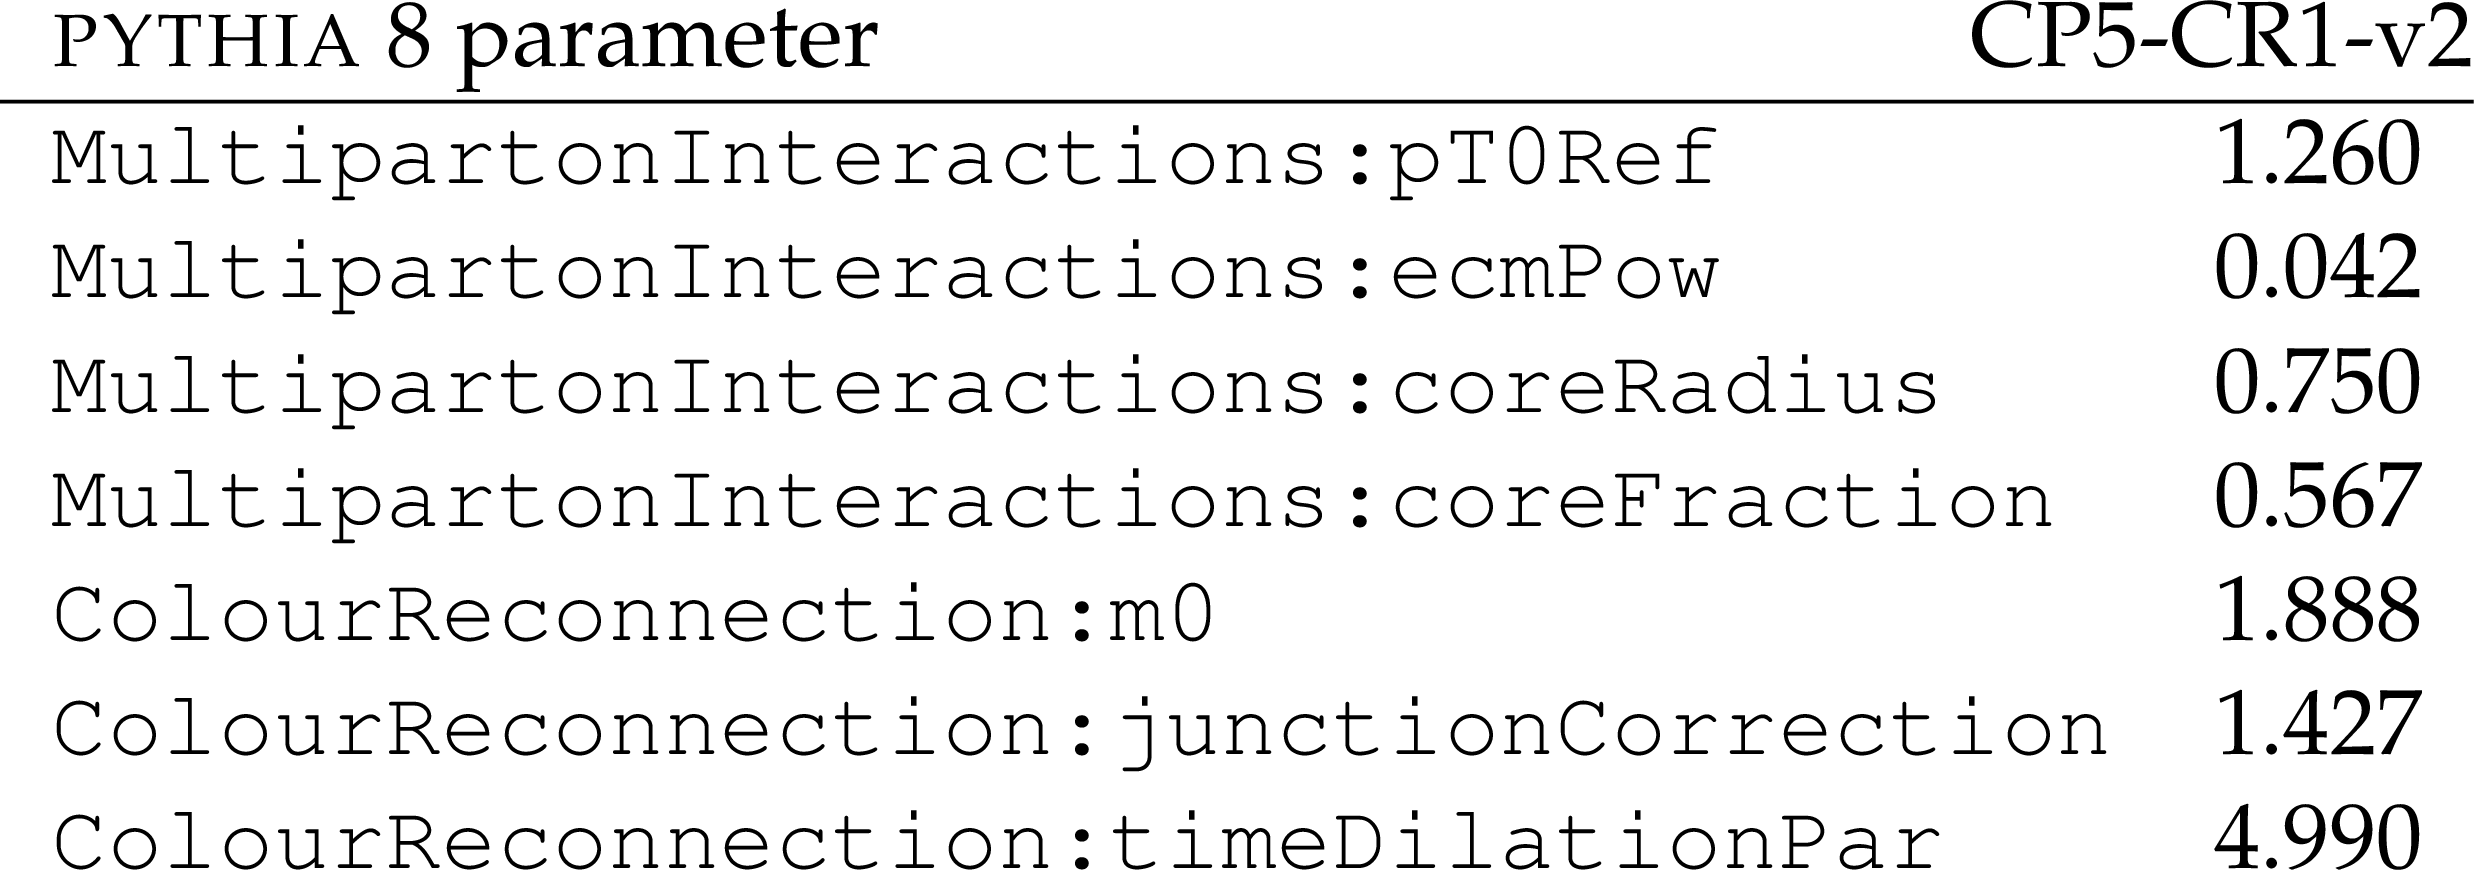
The values of the parameters obtained in the fits of the CP5-CR1-v2. |
| Summary |
| New sets of parameters for two of the colour reconnection (CR) models implemented in the PYTHIA 8 event generator, QCD-inspired and gluon-move, are obtained, based on the default CMS PYTHIA 8 tune CP5. Measurements sensitive to underlying-event (UE) contributions performed at hadron-colliders at $ \sqrt{s}= $ 1.96, 7, and 13 TeV are used to constrain the parameters for the CR and for the multiple-parton interactions simultaneously. Various measurements at 1.96, 7, 8, and 13 TeV are used to evaluate the performance of the new tunes. The central values predicted by the new CR tunes for the UE and minimum-bias events describe the data significantly better than the CR models with their default parameters before tuning. The predictions of the new tunes achieve a reasonable agreement in many UE observables, including the ones measured at forward pseudorapidities. However, the models after tuning do not generally perform better than the CP5 tune for the observables presented in this study. Although the new CR tunes presented in this work are not intended to improve the description of the measurements of strange particle multiplicities for $ \Lambda $ baryons and $ \mathrm{K^0_S} $ mesons, we test the new tunes against them. We find that the new CR models, when tuned using only measurements that are sensitive to the UE, do not provide a better description of the distribution of strange particle production as a function of rapidity for $ \Lambda $ baryons. However, we observe that all CP5 tunes, irrespective of the CR model, describe particle production for $ \mathrm{K^0_S} $ as a function of rapidity well. Including these observables in the fits, along with the latest measurements of baryon/meson production, could be beneficial for future tune derivations. The predictions of the new tunes for jet shapes and colour flow measurements done with top quark pair events are also compared with data. All tunes give similar predictions, but none of the tunes describe the jet shape distributions well. Some differences are also observed with respect to the colour flow data, which is particularly sensitive to the early resonance decay option in the CR models. The differences between the predictions using the different tunes observed here indicate that the inclusion of observables, such as the jet pull angle and other jet substructure observables, could be beneficial in tuning studies. A study of the uncertainty in the top quark mass measurement due to CR effects is also presented. The new CR tunes will play a role in the evaluation of systematic uncertainties associated with the modelling of colour reconnection. |
| References | ||||
| 1 | T. Sjöstrand et al. | An introduction to PYTHIA 8.2 | Comput. Phys. Commun. 191 (2015) 159 | 1410.3012 |
| 2 | R. Corke and T. Sjöstrand | Multiparton interactions with an x-dependent proton size | JHEP 05 (2011) 009 | 1101.5953 |
| 3 | A. Buckley et al. | General-purpose event generators for LHC physics | Phys. Rept. 504 (2011) 145 | 1101.2599 |
| 4 | G. Gustafson | Dual description of a confined color field | PLB 175 (1986) 453 | |
| 5 | Particle Data Group Collaboration | Review of Particle Physics | PTEP 2020 (2020) 083C01 | |
| 6 | T. Sjöstrand and M. van Zijl | A multiple interaction model for the event structure in hadron collisions | PRD 36 (1987) 2019 | |
| 7 | T. Sjöstrand | Colour reconnection and its effects on precise measurements at the LHC | 1310.8073 | |
| 8 | CMS Collaboration | Study of the underlying event in top quark pair production in pp collisions at 13 TeV | EPJC 79 (2019) 123 | CMS-TOP-17-015 1807.02810 |
| 9 | S. Argyropoulos and T. Sjöstrand | Effects of color reconnection on $ \rm{t\bar{t}} $ final states at the LHC | JHEP 11 (2014) 043 | 1407.6653 |
| 10 | CMS Collaboration | Measurement of the top quark mass with lepton+jets final states using pp collisions at $ \sqrt{s}= $ 13 TeV | EPJC 78 (2018) 891 | CMS-TOP-17-007 1805.01428 |
| 11 | B. Andersson, G. Gustafson, G. Ingelman, and T. Sjöstrand | Parton Fragmentation and String Dynamics | Phys. Rept. 97 (1983) 31 | |
| 12 | CMS Collaboration | Event generator tunes obtained from underlying event and multiparton scattering measurements | EPJC 76 (2016) 155 | CMS-GEN-14-001 1512.00815 |
| 13 | CMS Collaboration | Extraction and validation of a new set of CMS PYTHIA8 tunes from underlying-event measurements | EPJC 80 (2020) 4 | CMS-GEN-17-001 1903.12179 |
| 14 | J. R. Christiansen and P. Z. Skands | String formation beyond leading colour | JHEP 08 (2015) 003 | 1505.01681 |
| 15 | T. Sjöstrand and P. Z. Skands | Multiple interactions and the structure of beam remnants | JHEP 03 (2004) 053 | hep-ph/0402078 |
| 16 | CMS Collaboration | Strange particle production in pp collisions at $ \sqrt{s}= $ 0.9 and 7 TeV | JHEP 05 (2011) 064 | CMS-QCD-10-007 1102.4282 |
| 17 | CMS Collaboration | Underlying event measurements with leading particles and jets in pp collisions at $ \sqrt{s}= $ 13 TeV | CMS Physics Analysis Summary, 2015 CMS-PAS-FSQ-15-007 |
CMS-PAS-FSQ-15-007 |
| 18 | ATLAS Collaboration | Measurement of charged-particle distributions sensitive to the underlying event in $ \sqrt{s}= $ 13 TeV proton-proton collisions with the ATLAS detector at the LHC | JHEP 03 (2017) 157 | 1701.05390 |
| 19 | CMS Collaboration | Measurement of the underlying event activity in pp collisions at the LHC at 7 TeV and comparison with 0.9 TeV | CMS Physics Analysis Summary, 2012 CMS-PAS-FSQ-12-020 |
|
| 20 | ATLAS Collaboration | Measurement of underlying event characteristics using charged particles in pp collisions at $ \sqrt{s}= $ 900 GeV and 7 TeV with the ATLAS detector | PRD 83 (2011) 112001 | 1012.0791 |
| 21 | CDF Collaboration | Study of the energy dependence of the underlying event in proton-antiproton collisions | PRD 92 (2015) 092009 | 1508.05340 |
| 22 | CMS Collaboration | Pseudorapidity distribution of charged hadrons in proton-proton collisions at $ \sqrt{s}= $ 13 TeV | PLB 751 (2015) 143 | CMS-FSQ-15-001 1507.05915 |
| 23 | CMS Collaboration | Measurement of pseudorapidity distributions of charged particles in proton-proton collisions at $ \sqrt{s}= $ 13 TeV by the CMS experiment | CMS Physics Analysis Summary, 2016 CMS-PAS-FSQ-15-008 |
CMS-PAS-FSQ-15-008 |
| 24 | A. Buckley et al. | Rivet user manual | Comput. Phys. Commun. 184 (2013) 2803 | 1003.0694 |
| 25 | A. Buckley et al. | Systematic event generator tuning for the LHC | EPJC 65 (2010) 331 | 0907.2973 |
| 26 | NNPDF Collaboration | Parton distributions from high-precision collider data | EPJC 77 (2017) 663 | 1706.00428 |
| 27 | CMS Collaboration | Shape, transverse size, and charged hadron multiplicity of jets in pp collisions at 7 TeV | JHEP 06 (2012) 160 | CMS-QCD-10-029 1204.3170 |
| 28 | ATLAS Collaboration | Measurement of the jet fragmentation function and transverse profile in proton-proton collisions at a center-of-mass energy of 7 TeV with the ATLAS detector | EPJC 71 (2011) 1795 | 1109.5816 |
| 29 | ATLAS Collaboration | Measurement of the charged-particle multiplicity inside jets from $ \sqrt{s}= $ 8 TeV pp collisions with the ATLAS detector | EPJC 76 (2016) 322 | 1602.00988 |
| 30 | CMS and TOTEM Collaborations | Measurement of single-diffractive dijet production in proton-proton collisions at $ \sqrt{s}= $ 8 TeV with the CMS and TOTEM experiments | EPJC 80 (2020) 1164 | CMS-FSQ-12-033 2002.12146 |
| 31 | CMS Collaboration | Pseudorapidity distributions of charged particles in pp collisions at $ \sqrt{s}= $ 7 TeV with at least one central charged particle | CMS Physics Analysis Summary, 2010 CMS-PAS-QCD-10-024 |
|
| 32 | CMS and TOTEM Collaborations | Measurement of pseudorapidity distributions of charged particles in proton-proton collisions at $ \sqrt{s} $ = 8 TeV by the CMS and TOTEM experiments | EPJC 74 (2014) 3053 | CMS-FSQ-12-026 1405.0722 |
| 33 | TOTEM Collaboration | Measurement of the forward charged particle pseudorapidity density in $ pp $ collisions at $ \sqrt{s} = $ 7 TeV with the TOTEM experiment | Europhysics Letters 98 (2012) 3 | 1205.4105 |
| 34 | CMS Collaboration | Measurement of the energy density as a function of pseudorapidity in proton-proton collisions at $ \sqrt{s}= $ 13 TeV | EPJC 79 (2019) 391 | CMS-FSQ-15-006 1812.04095 |
| 35 | C. Bierlich, G. Gustafson, and L. Lönnblad | A shoving model for collectivity in hadronic collisions | 1612.05132 | |
| 36 | C. Bierlich | Rope hadronization and strange particle production | Eur. Phys. J. Web Conf. 171 (2018) 14003 | 1710.04464 |
| 37 | ALICE Collaboration | Measurement of prompt D$ ^{0} $, $ \Lambda_{c}^{+} $, and $ \Sigma_{c}^{0,++} $(2455) production in proton-proton collisions at $ \sqrt{s}= $ 13 TeV | PRL 128 (2022) 012001 | 2106.08278 |
| 38 | LHCb Collaboration | Measurement of $ b $ hadron fractions in 13 TeV pp collisions | PRD 100 (2019) 031102 | 1902.06794 |
| 39 | CMS Collaboration | Measurement of charged pion, kaon, and proton production in proton-proton collisions at $ \sqrt{s}= $ 13 TeV | PRD 96 (2017) 112003 | CMS-FSQ-16-004 1706.10194 |
| 40 | CMS Collaboration | Study of the inclusive production of charged pions, kaons, and protons in pp collisions at $ \sqrt{s}= $ 0.9, 2.76, and 7 TeV | EPJC 72 (2012) 2164 | CMS-FSQ-12-014 1207.4724 |
| 41 | CMS Collaboration | Study of the production of charged pions, kaons, and protons in pPb collisions at $ \sqrt {\smash [b]{s_{_{\mathrm {NN}}}}}= $ 5.02 TeV | EPJC 74 (2014) 2847 | CMS-HIN-12-016 1307.3442 |
| 42 | S. D. Drell and T.-M. Yan | Massive Lepton Pair Production in Hadron-Hadron Collisions at High-Energies | [Erratum: PRL 25, 902] PRL 25 (1970) 316 |
|
| 43 | J. H. Christenson et al. | Observation of massive muon pairs in hadron collisions | PRL 25 (1970) 1523 | |
| 44 | CMS Collaboration | Measurement of the underlying event activity in inclusive Z boson production in proton-proton collisions at $ \sqrt{s}= $ 13 TeV | JHEP 07 (2018) 032 | CMS-FSQ-16-008 1711.04299 |
| 45 | J. Alwall et al. | The automated computation of tree-level and next-to-leading order differential cross sections, and their matching to parton shower simulations | JHEP 07 (2014) 079 | 1405.0301 |
| 46 | R. Frederix and S. Frixione | Merging meets matching in MC@NLO | JHEP 12 (2012) 061 | 1209.6215 |
| 47 | C. Bierlich, G. Gustafson, L. Lönnblad, and A. Tarasov | Effects of Overlapping Strings in pp Collisions | JHEP 03 (2015) 148 | 1412.6259 |
| 48 | C. Bierlich and J. R. Christiansen | Effects of color reconnection on hadron flavor observables | PRD 92 (2015) 094010 | 1507.02091 |
| 49 | C. Bierlich, G. Gustafson, and L. Lönnblad | Collectivity without plasma in hadronic collisions | PLB 779 (2018) 58 | 1710.09725 |
| 50 | V. A. Abramovsky, E. V. Gedalin, E. G. Gurvich, and O. V. Kancheli | Long Range Azimuthal Correlations in Multiple Production Processes at High-energies | JETP Lett. 47 (1988) 337 | |
| 51 | I. Altsybeev | Mean transverse momenta correlations in hadron-hadron collisions in MC toy model with repulsing strings | AIP Conf. Proc. 1701 (2016) 100002 | 1502.03608 |
| 52 | P. Cea, L. Cosmai, F. Cuteri, and A. Papa | Flux tubes in the SU(3) vacuum: London penetration depth and coherence length | PRD 89 (2014) 094505 | 1404.1172 |
| 53 | CMS Collaboration | Measurement of jet substructure observables in $ \mathrm{t\overline{t}} $ events from proton-proton collisions at $ \sqrt{s}= $ 13 TeV | PRD 98 (2018) 092014 | CMS-TOP-17-013 1808.07340 |
| 54 | M. Cacciari, G. P. Salam, and G. Soyez | The anti-$ k_{\mathrm{T}} $ jet clustering algorithm | JHEP 04 (2008) 063 | 0802.1189 |
| 55 | M. Cacciari, G. P. Salam, and G. Soyez | FastJet user manual | EPJC 72 (2012) 1896 | 1111.6097 |
| 56 | M. Dasgupta, A. Fregoso, S. Marzani, and G. P. Salam | Towards an understanding of jet substructure | JHEP 09 (2013) 029 | 1307.0007 |
| 57 | A. J. Larkoski, S. Marzani, G. Soyez, and J. Thaler | Soft drop | JHEP 05 (2014) 146 | 1402.2657 |
| 58 | ATLAS Collaboration | Measurement of colour flow with the jet pull angle in $ {\rm t\bar{t}} $ events using the ATLAS detector at $ \sqrt{s}= $ 8 TeV | PLB 750 (2015) 475 | 1506.05629 |
| 59 | J. Gallicchio and M. D. Schwartz | Seeing in color: jet superstructure | PRL 105 (2010) 022001 | 1001.5027 |
| 60 | S. Frixione, P. Nason, and G. Ridolfi | A positive-weight next-to-leading-order Monte Carlo for heavy flavour hadroproduction | JHEP 09 (2007) 126 | 0707.3088 |
| 61 | ATLAS, CDF, CMS, and D0 Collaborations | First combination of Tevatron and LHC measurements of the top-quark mass | Technical Reports ATLAS-CONF-2014-008, CDF-NOTE-1, , D0-NOTE-6416, FERMILAB-TM-2582-E, 1071 | 1403.4427 |
| 62 | ATLAS Collaboration | Measurement of the top-quark mass in the fully hadronic decay channel from ATLAS data at $ \sqrt{s}= $ 7 TeV | EPJC 75 (2015) 158 | 1409.0832 |
| 63 | ATLAS Collaboration | Measurement of the top quark mass in the $ {\rm t\bar{t}}\rightarrow $ lepton+jets and $ {\rm t\bar{t}}\rightarrow $ dilepton channels using $ \sqrt{s}= $ 7 TeV ATLAS data | EPJC 75 (2015) 330 | 1503.05427 |
| 64 | ATLAS Collaboration | Measurement of the top quark mass in the $ {\rm t\bar{t}}\to $ dilepton channel from $ \sqrt{s}= $ 8 TeV ATLAS data | PLB 761 (2016) 350 | 1606.02179 |
| 65 | ATLAS Collaboration | Top-quark mass measurement in the all-hadronic $ {\rm t\overline{t} } $ decay channel at $ \sqrt{s}= $ 8 TeV with the ATLAS detector | JHEP 09 (2017) 118 | 1702.07546 |
| 66 | ATLAS Collaboration | Measurement of the top quark mass in the $ {\rm t\bar{t}}\rightarrow $ lepton+jets channel from $ \sqrt{s}= $ 8 TeV ATLAS data and combination with previous results | EPJC 79 (2019) 290 | 1810.01772 |
| 67 | CMS Collaboration | Measurement of the top quark mass using proton-proton data at $ \sqrt{s}= $ 7 and 8 TeV | PRD 93 (2016) 072004 | CMS-TOP-14-022 1509.04044 |
| 68 | CMS Collaboration | Measurement of the top-quark mass in $ {\rm t\bar{t}} $ events with lepton+jets final states in pp collisions at $ \sqrt{s}= $ 7 TeV | JHEP 12 (2012) 105 | CMS-TOP-11-015 1209.2319 |
| 69 | CMS Collaboration | Measurement of the top-quark mass in $ {\rm t\bar{t}} $ events with dilepton final states in pp collisions at $ \sqrt{s}= $ 7 TeV | EPJC 72 (2012) 2202 | CMS-TOP-11-016 1209.2393 |
| 70 | CMS Collaboration | Measurement of the top-quark mass in all-jets $ {\rm t\bar{t}} $ events in pp collisions at $ \sqrt{s}= $ 7 TeV | EPJC 74 (2014) 2758 | CMS-TOP-11-017 1307.4617 |
| 71 | CMS Collaboration | Measurement of the top quark mass using single top quark events in proton-proton collisions at $ \sqrt{s}= $ 8 TeV | EPJC 77 (2017) 354 | CMS-TOP-15-001 1703.02530 |
| 72 | CMS Collaboration | Measurement of the $ \mathrm{t}\overline{\mathrm{t}} $ production cross section, the top quark mass, and the strong coupling constant using dilepton events in pp collisions at $ \sqrt{s}= $ 13 TeV | EPJC 79 (2019) 368 | CMS-TOP-17-001 1812.10505 |
| 73 | CMS Collaboration | Measurement of the top quark mass in the all-jets final state at $ \sqrt{s}= $ 13 TeV and combination with the lepton+jets channel | EPJC 79 (2019) 313 | CMS-TOP-17-008 1812.10534 |
| 74 | P. Z. Skands | Tuning Monte Carlo Generators: The Perugia Tunes | PRD 82 (2010) 074018 | 1005.3457 |
| 75 | CMS Collaboration | Investigations of the impact of the parton shower tuning in PYTHIA8 in the modelling of $ \mathrm{t\overline{t}} $ at $ \sqrt{s}= $ 8 and 13 TeV | CMS Physics Analysis Summary, 2016 CMS-PAS-TOP-16-021 |
CMS-PAS-TOP-16-021 |
| 76 | CMS Collaboration | Measurement of the top quark mass using events with a single reconstructed top quark in pp collisions at $ \sqrt{s}= $ 13 TeV | JHEP 12 (2021) 161 | CMS-TOP-19-009 2108.10407 |
|
|
Compact Muon Solenoid LHC, CERN |
|

|

|

|

|

|