

Compact Muon Solenoid
LHC, CERN
| CMS-TOP-19-009 ; CERN-EP-2021-124 | ||
| Measurement of the top quark mass using events with a single reconstructed top quark in pp collisions at $\sqrt{s} = $ 13 TeV | ||
| CMS Collaboration | ||
| 24 August 2021 | ||
| JHEP 12 (2021) 161 | ||
| Abstract: A measurement of the top quark mass is performed using a data sample enriched with single top quark events produced in the $t$ channel. The study is based on proton-proton collision data, corresponding to an integrated luminosity of 35.9 fb$^{-1}$, recorded at $\sqrt{s} = $ 13 TeV by the CMS experiment at the LHC in 2016. Candidate events are selected by requiring an isolated high-momentum lepton (muon or electron) and exactly two jets, of which one is identified as originating from a bottom quark. Multivariate discriminants are designed to separate the signal from the background. Optimized thresholds are placed on the discriminant outputs to obtain an event sample with high signal purity. The top quark mass is found to be 172.13$^{+0.76}_{-0.77}$ GeV, where the uncertainty includes both the statistical and systematic components, reaching sub-GeV precision for the first time in this event topology. The masses of the top quark and antiquark are also determined separately using the lepton charge in the final state, from which the mass ratio and difference are determined to be 0.9952$^{+0.0079}_{-0.0104}$ and 0.83$^{+1.79}_{-1.35}$ GeV, respectively. The results are consistent with CPT invariance. | ||
| Links: e-print arXiv:2108.10407 [hep-ex] (PDF) ; CDS record ; inSPIRE record ; HepData record ; CADI line (restricted) ; | ||
| Figures | |

png pdf |
Figure 1:
Feynman diagrams of the $t$-channel single top quark production at LO corresponding to four- (left) and five-flavor (right) schemes. At NLO in perturbative QCD, the left diagram is also part of the five-flavor scheme. |

png pdf |
Figure 1-a:
Feynman diagram of the $t$-channel single top quark production at LO corresponding to four-flavor scheme. At NLO in perturbative QCD, the diagram is also part of the five-flavor scheme. |

png pdf |
Figure 1-b:
Feynman diagram of the $t$-channel single top quark production at LO corresponding to five-flavor scheme. |

png pdf |
Figure 2:
Event yields corresponding to positively and negatively charged muons (left) and electrons (right) in the final states obtained for the 2J1T category from data (points) and from simulated signal and background processes (colored histograms). The vertical bars on the points show the statistical uncertainty in the data, and the cross-hatched bands denote the quadrature sum of the statistical and systematic uncertainties in the predictions. The lower panels show the ratio of the data to the predictions. |

png pdf |
Figure 2-a:
Event yields corresponding to positively and negatively charged muons in the final states obtained for the 2J1T category from data (points) and from simulated signal and background processes (colored histograms). The vertical bars on the points show the statistical uncertainty in the data, and the cross-hatched bands denote the quadrature sum of the statistical and systematic uncertainties in the predictions. The lower panel shows the ratio of the data to the predictions. |

png pdf |
Figure 2-b:
Event yields corresponding to positively and negatively charged electrons in the final states obtained for the 2J1T category from data (points) and from simulated signal and background processes (colored histograms). The vertical bars on the points show the statistical uncertainty in the data, and the cross-hatched bands denote the quadrature sum of the statistical and systematic uncertainties in the predictions. The lower panel shows the ratio of the data to the predictions. |

png pdf |
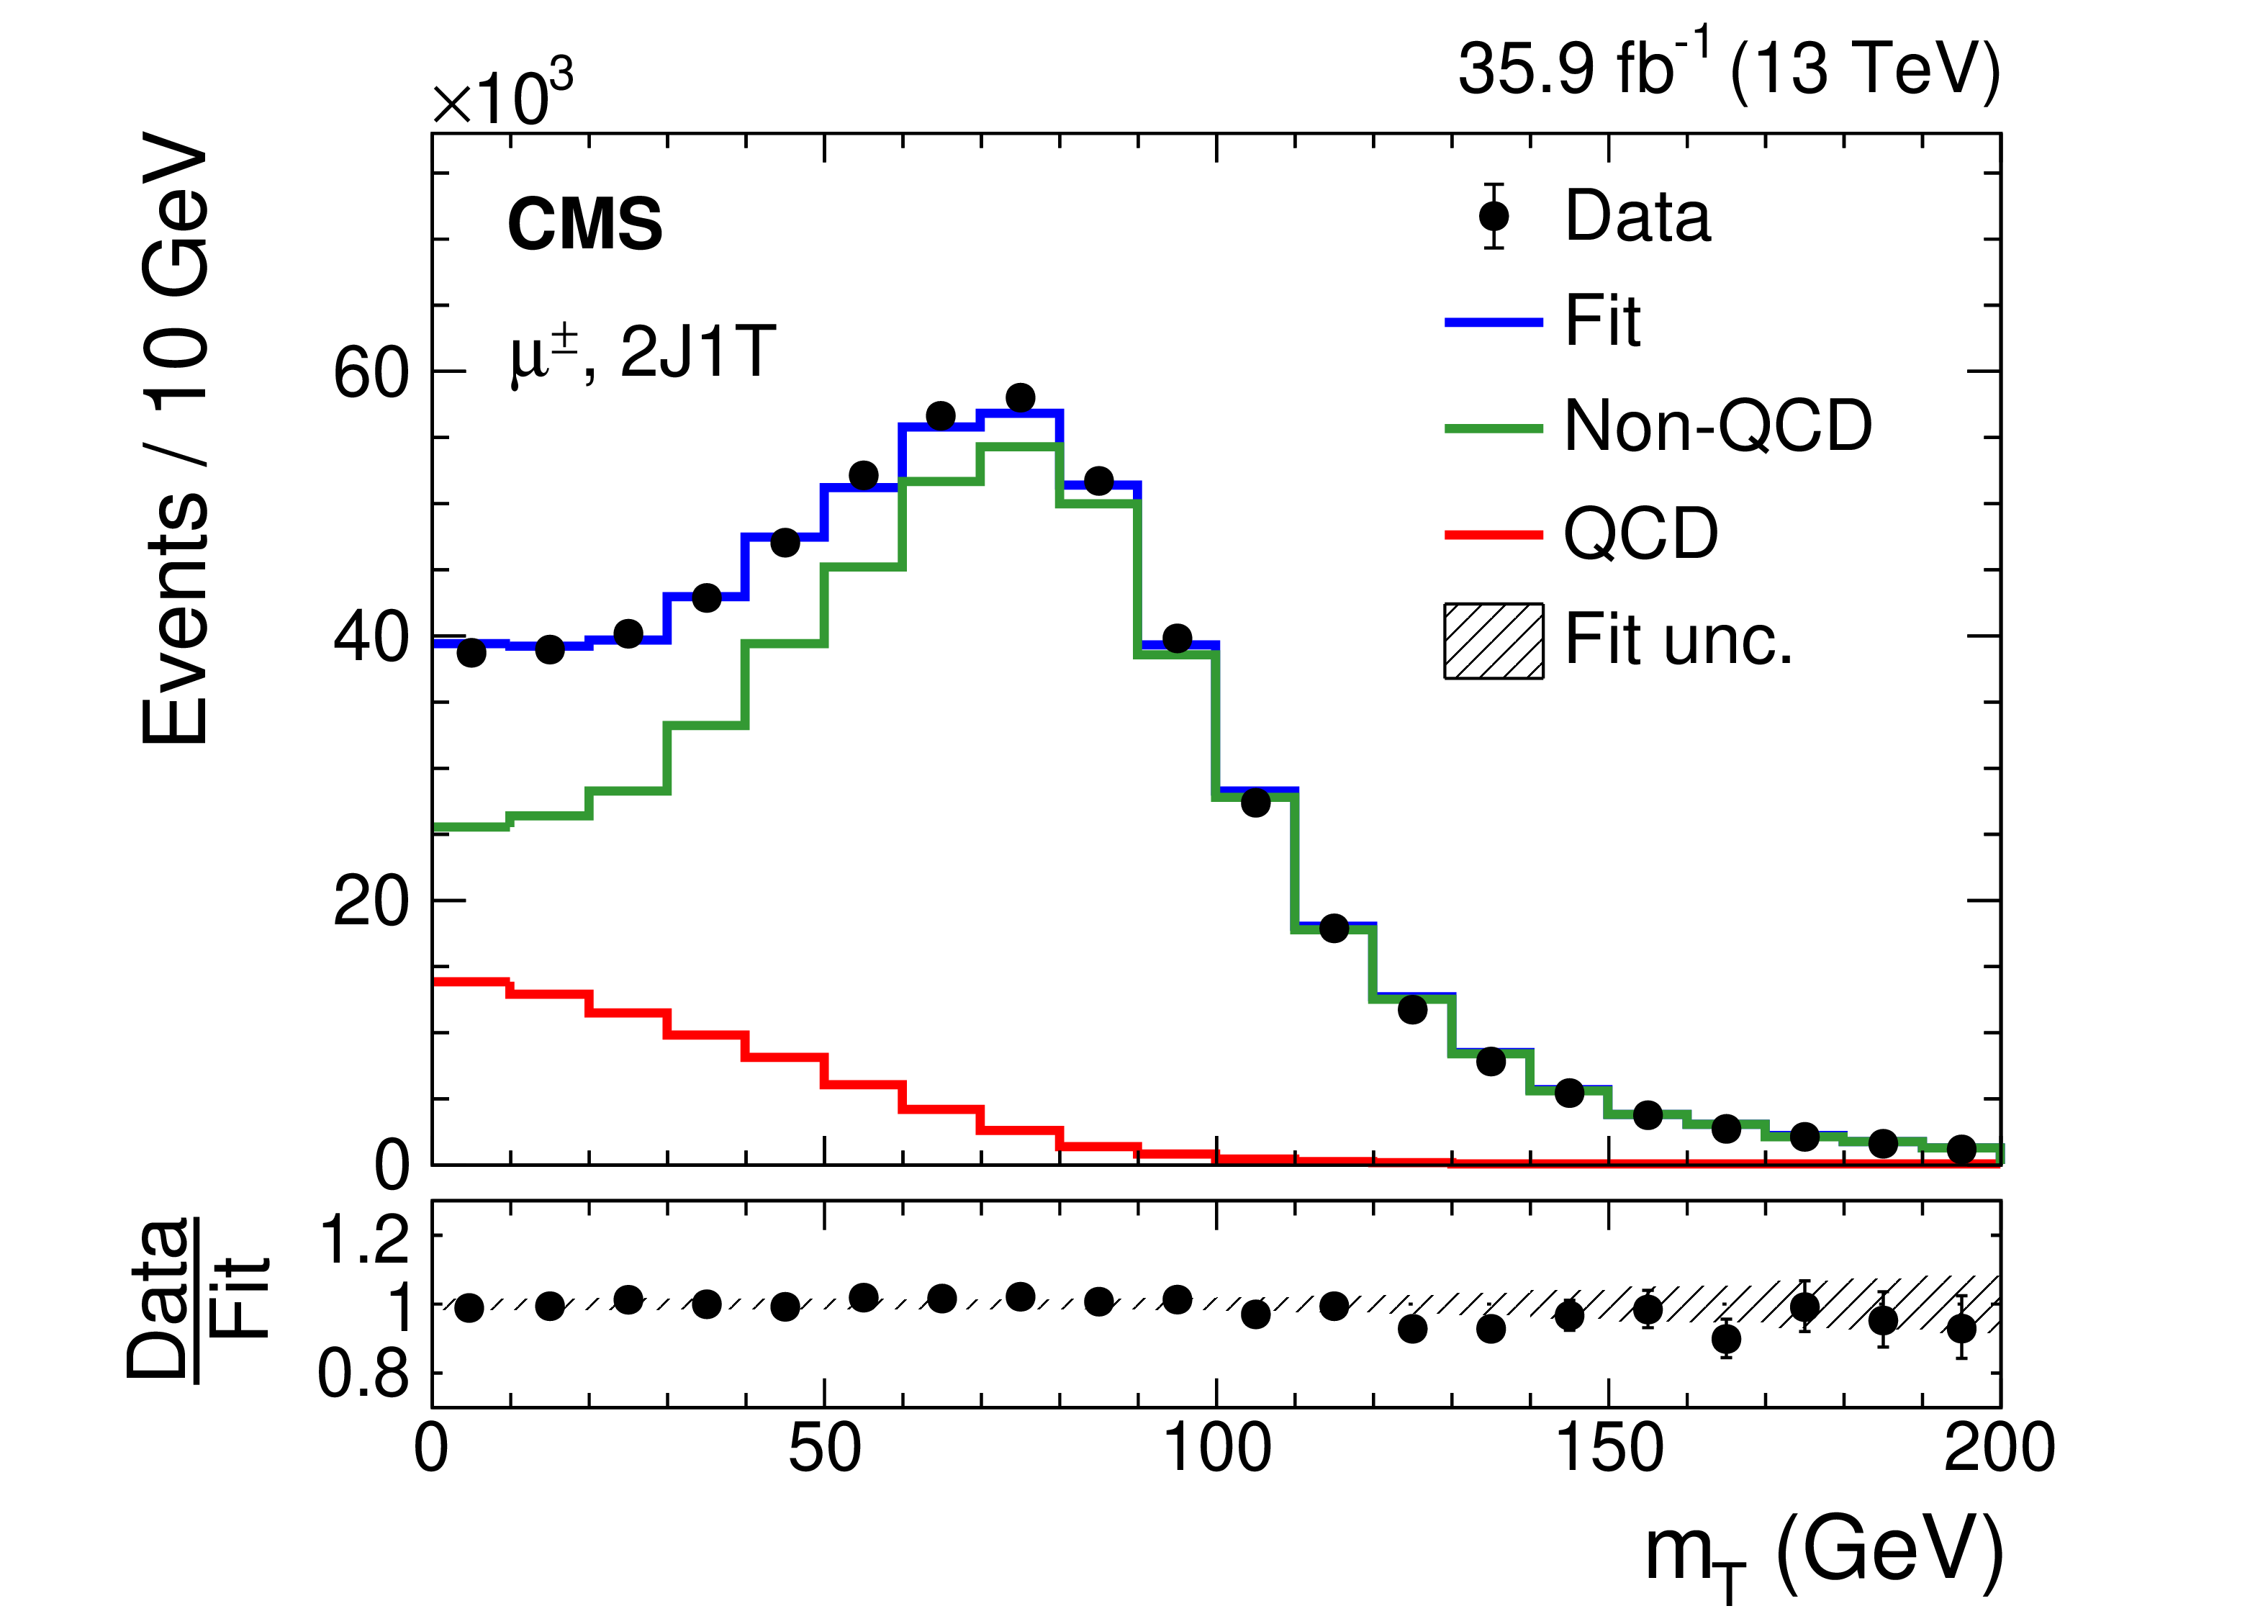
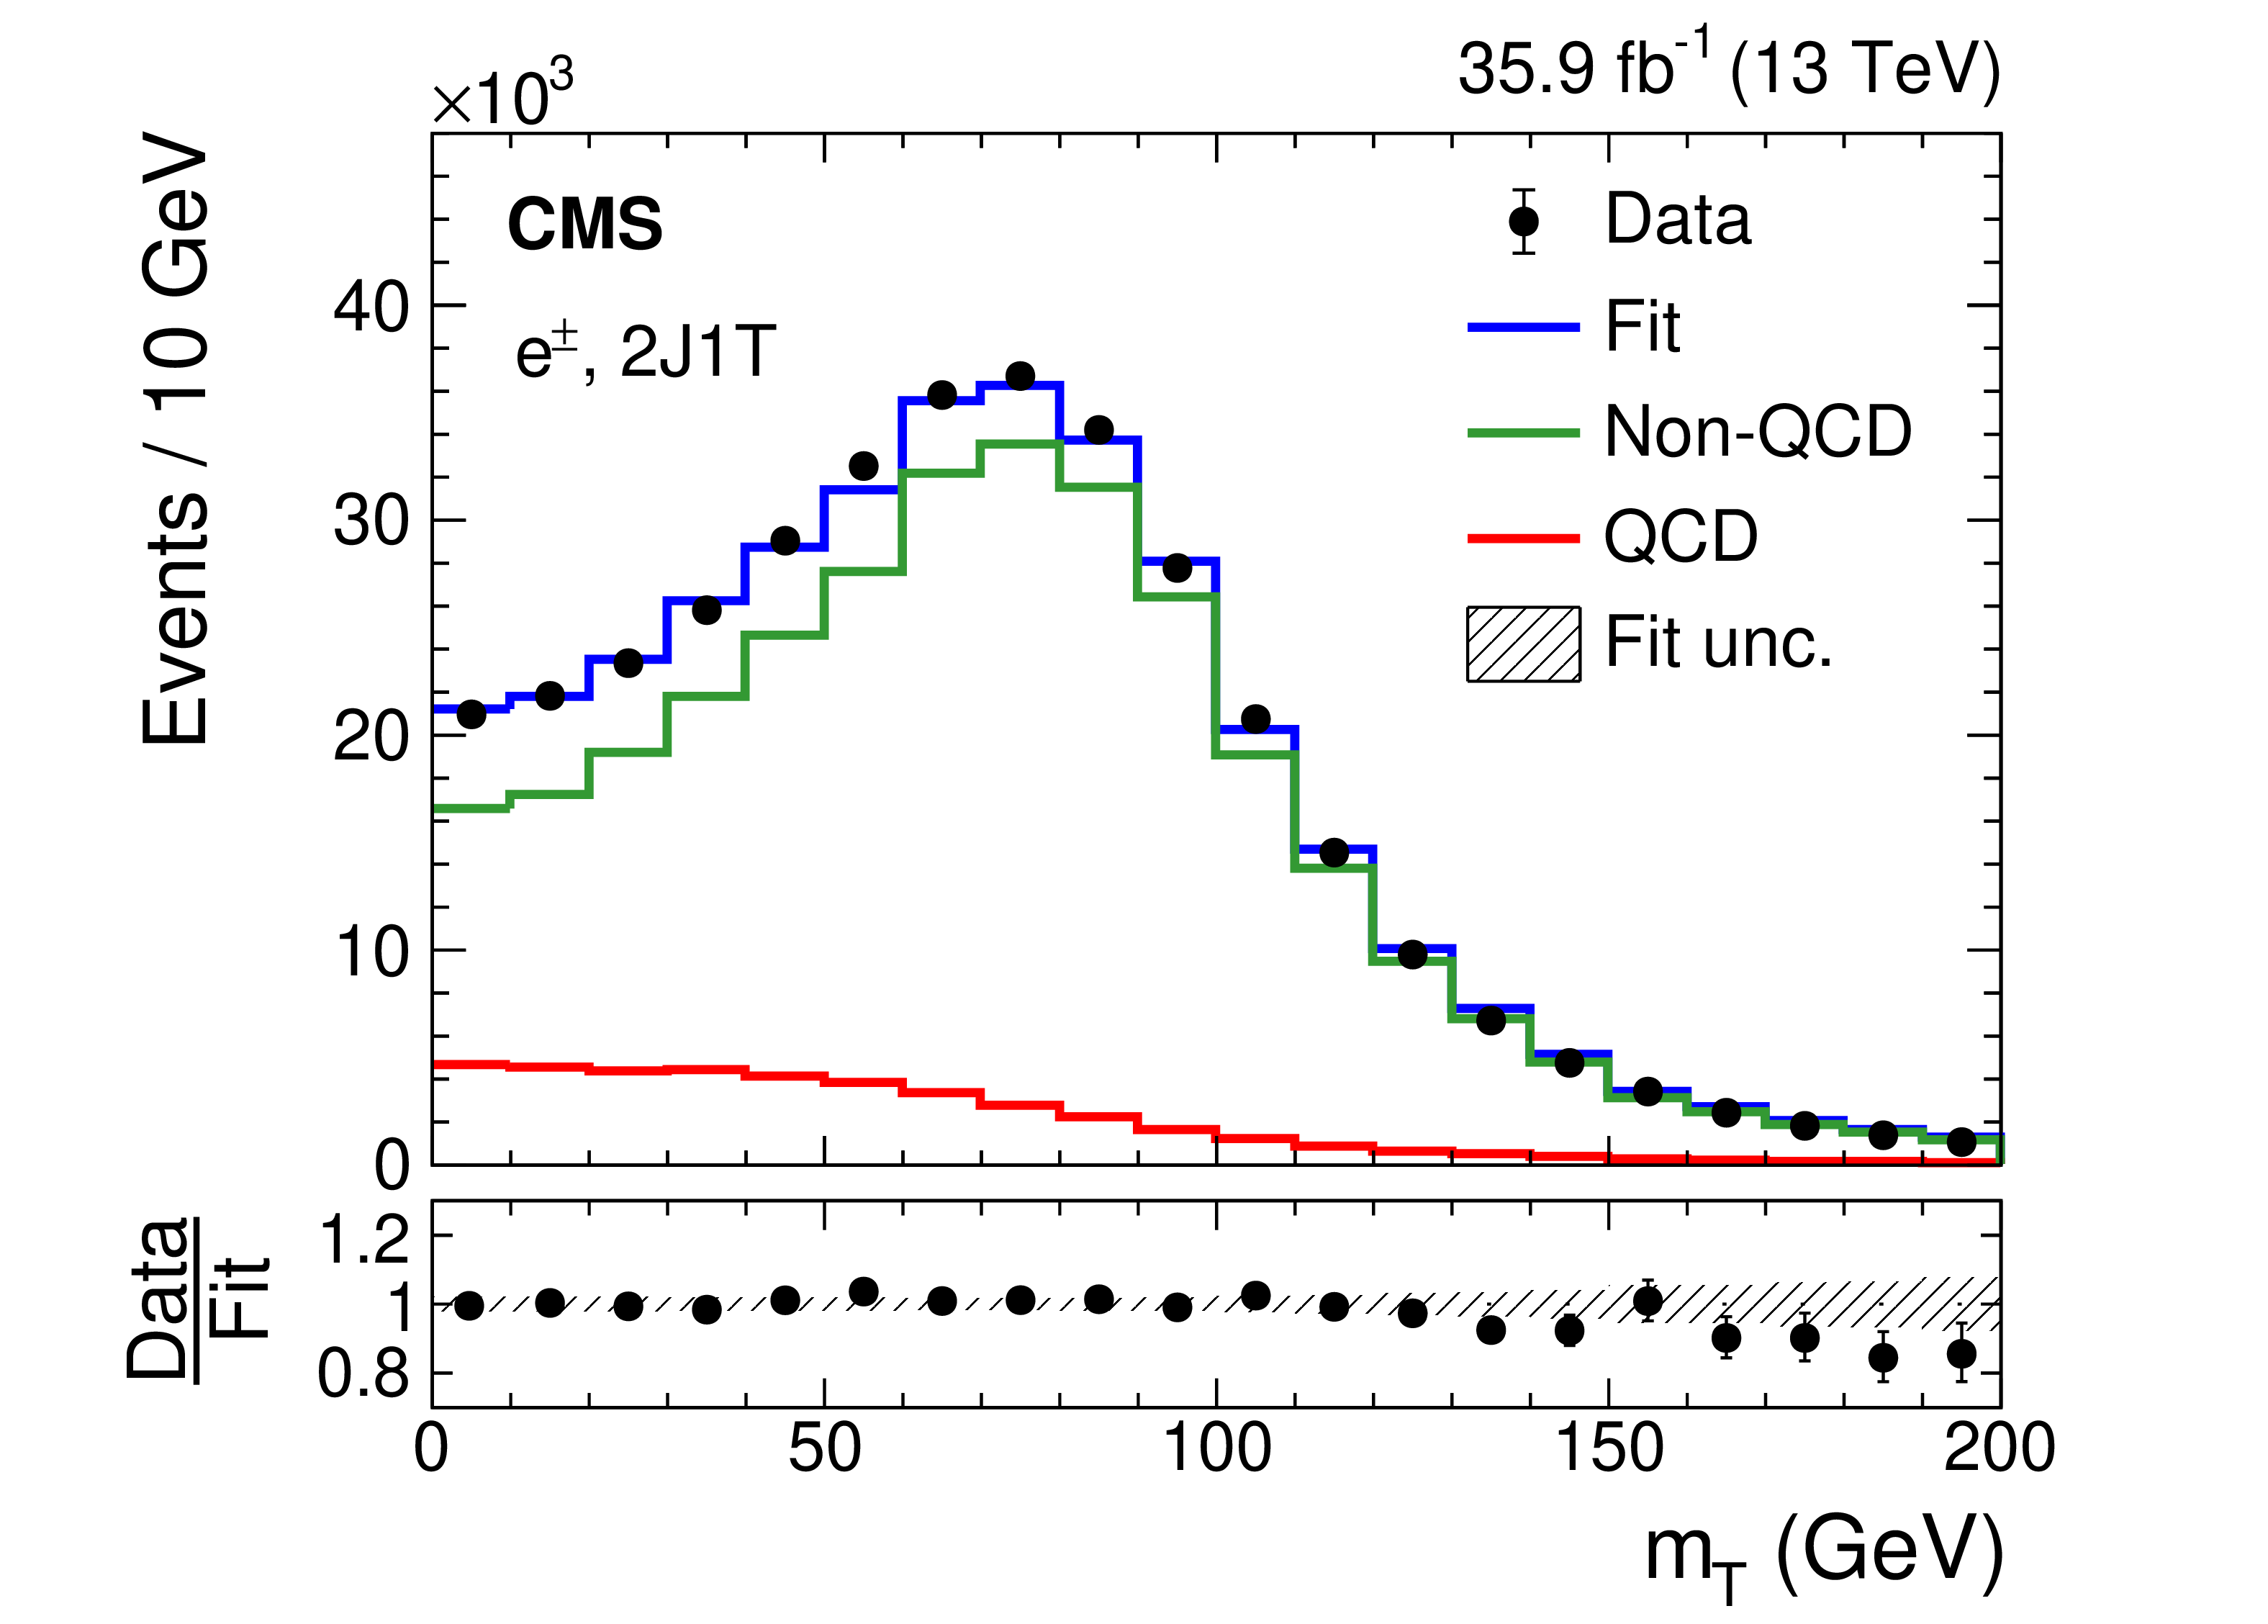
Figure 3:
Postfit distributions of ${m_{\mathrm {T}}}$ for the muon (left) and electron (right) final states in the 2J0T (upper) and 2J1T (lower) categories for the data (points) and the various components of the fit (colored lines). The lower panels show the ratio of the data to the fit predictions. The bands represent the postfit uncertainty in the ${m_{\mathrm {T}}}$ distribution predicted by the fit. |

png pdf |
Figure 3-a:
Postfit distribution of ${m_{\mathrm {T}}}$ for the muon final state in the 2J0T category for the data (points) and the various components of the fit (colored lines). The lower panel shows the ratio of the data to the fit predictions. The bands represent the postfit uncertainty in the ${m_{\mathrm {T}}}$ distribution predicted by the fit. |

png pdf |
Figure 3-b:
Postfit distribution of ${m_{\mathrm {T}}}$ for the electron final state in the 2J0T category for the data (points) and the various components of the fit (colored lines). The lower panel shows the ratio of the data to the fit predictions. The bands represent the postfit uncertainty in the ${m_{\mathrm {T}}}$ distribution predicted by the fit. |
png pdf |
Figure 3-c:
Postfit distribution of ${m_{\mathrm {T}}}$ for the muon final state in the 2J1T category for the data (points) and the various components of the fit (colored lines). The lower panel shows the ratio of the data to the fit predictions. The bands represent the postfit uncertainty in the ${m_{\mathrm {T}}}$ distribution predicted by the fit. |
png pdf |
Figure 3-d:
Postfit distribution of ${m_{\mathrm {T}}}$ for the electron final state in the 2J1T category for the data (points) and the various components of the fit (colored lines). The lower panel shows the ratio of the data to the fit predictions. The bands represent the postfit uncertainty in the ${m_{\mathrm {T}}}$ distribution predicted by the fit. |

png pdf |
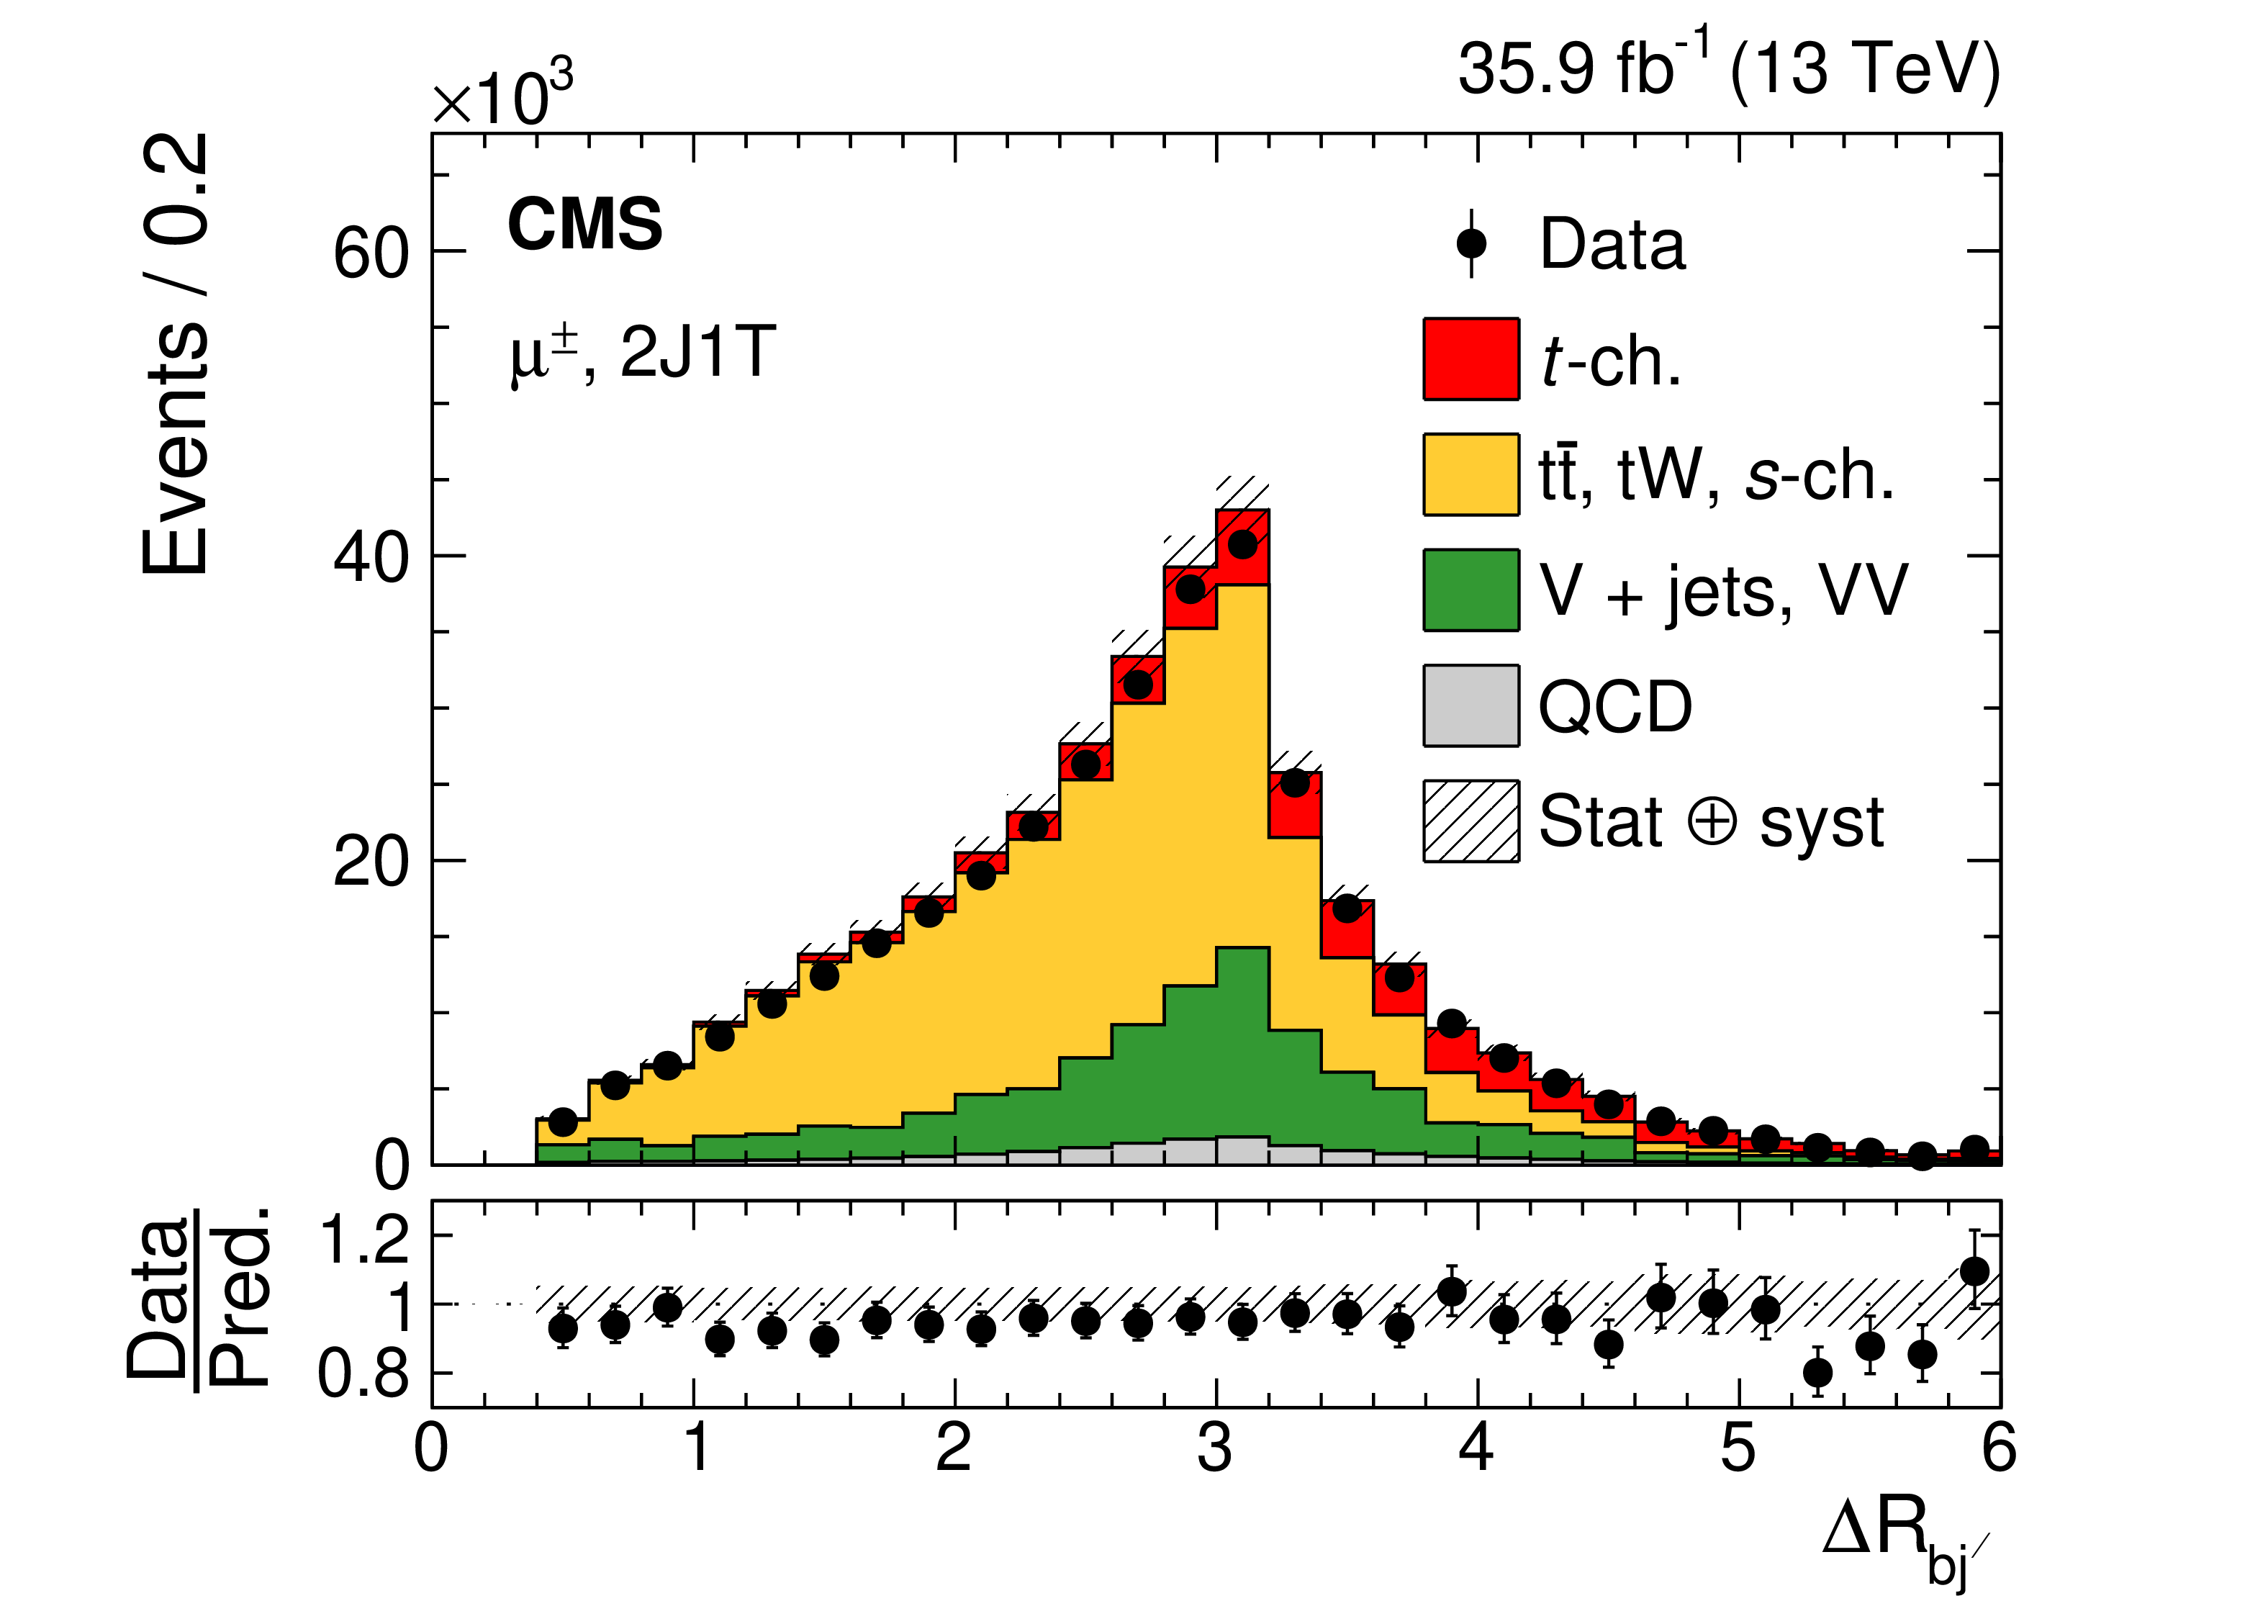
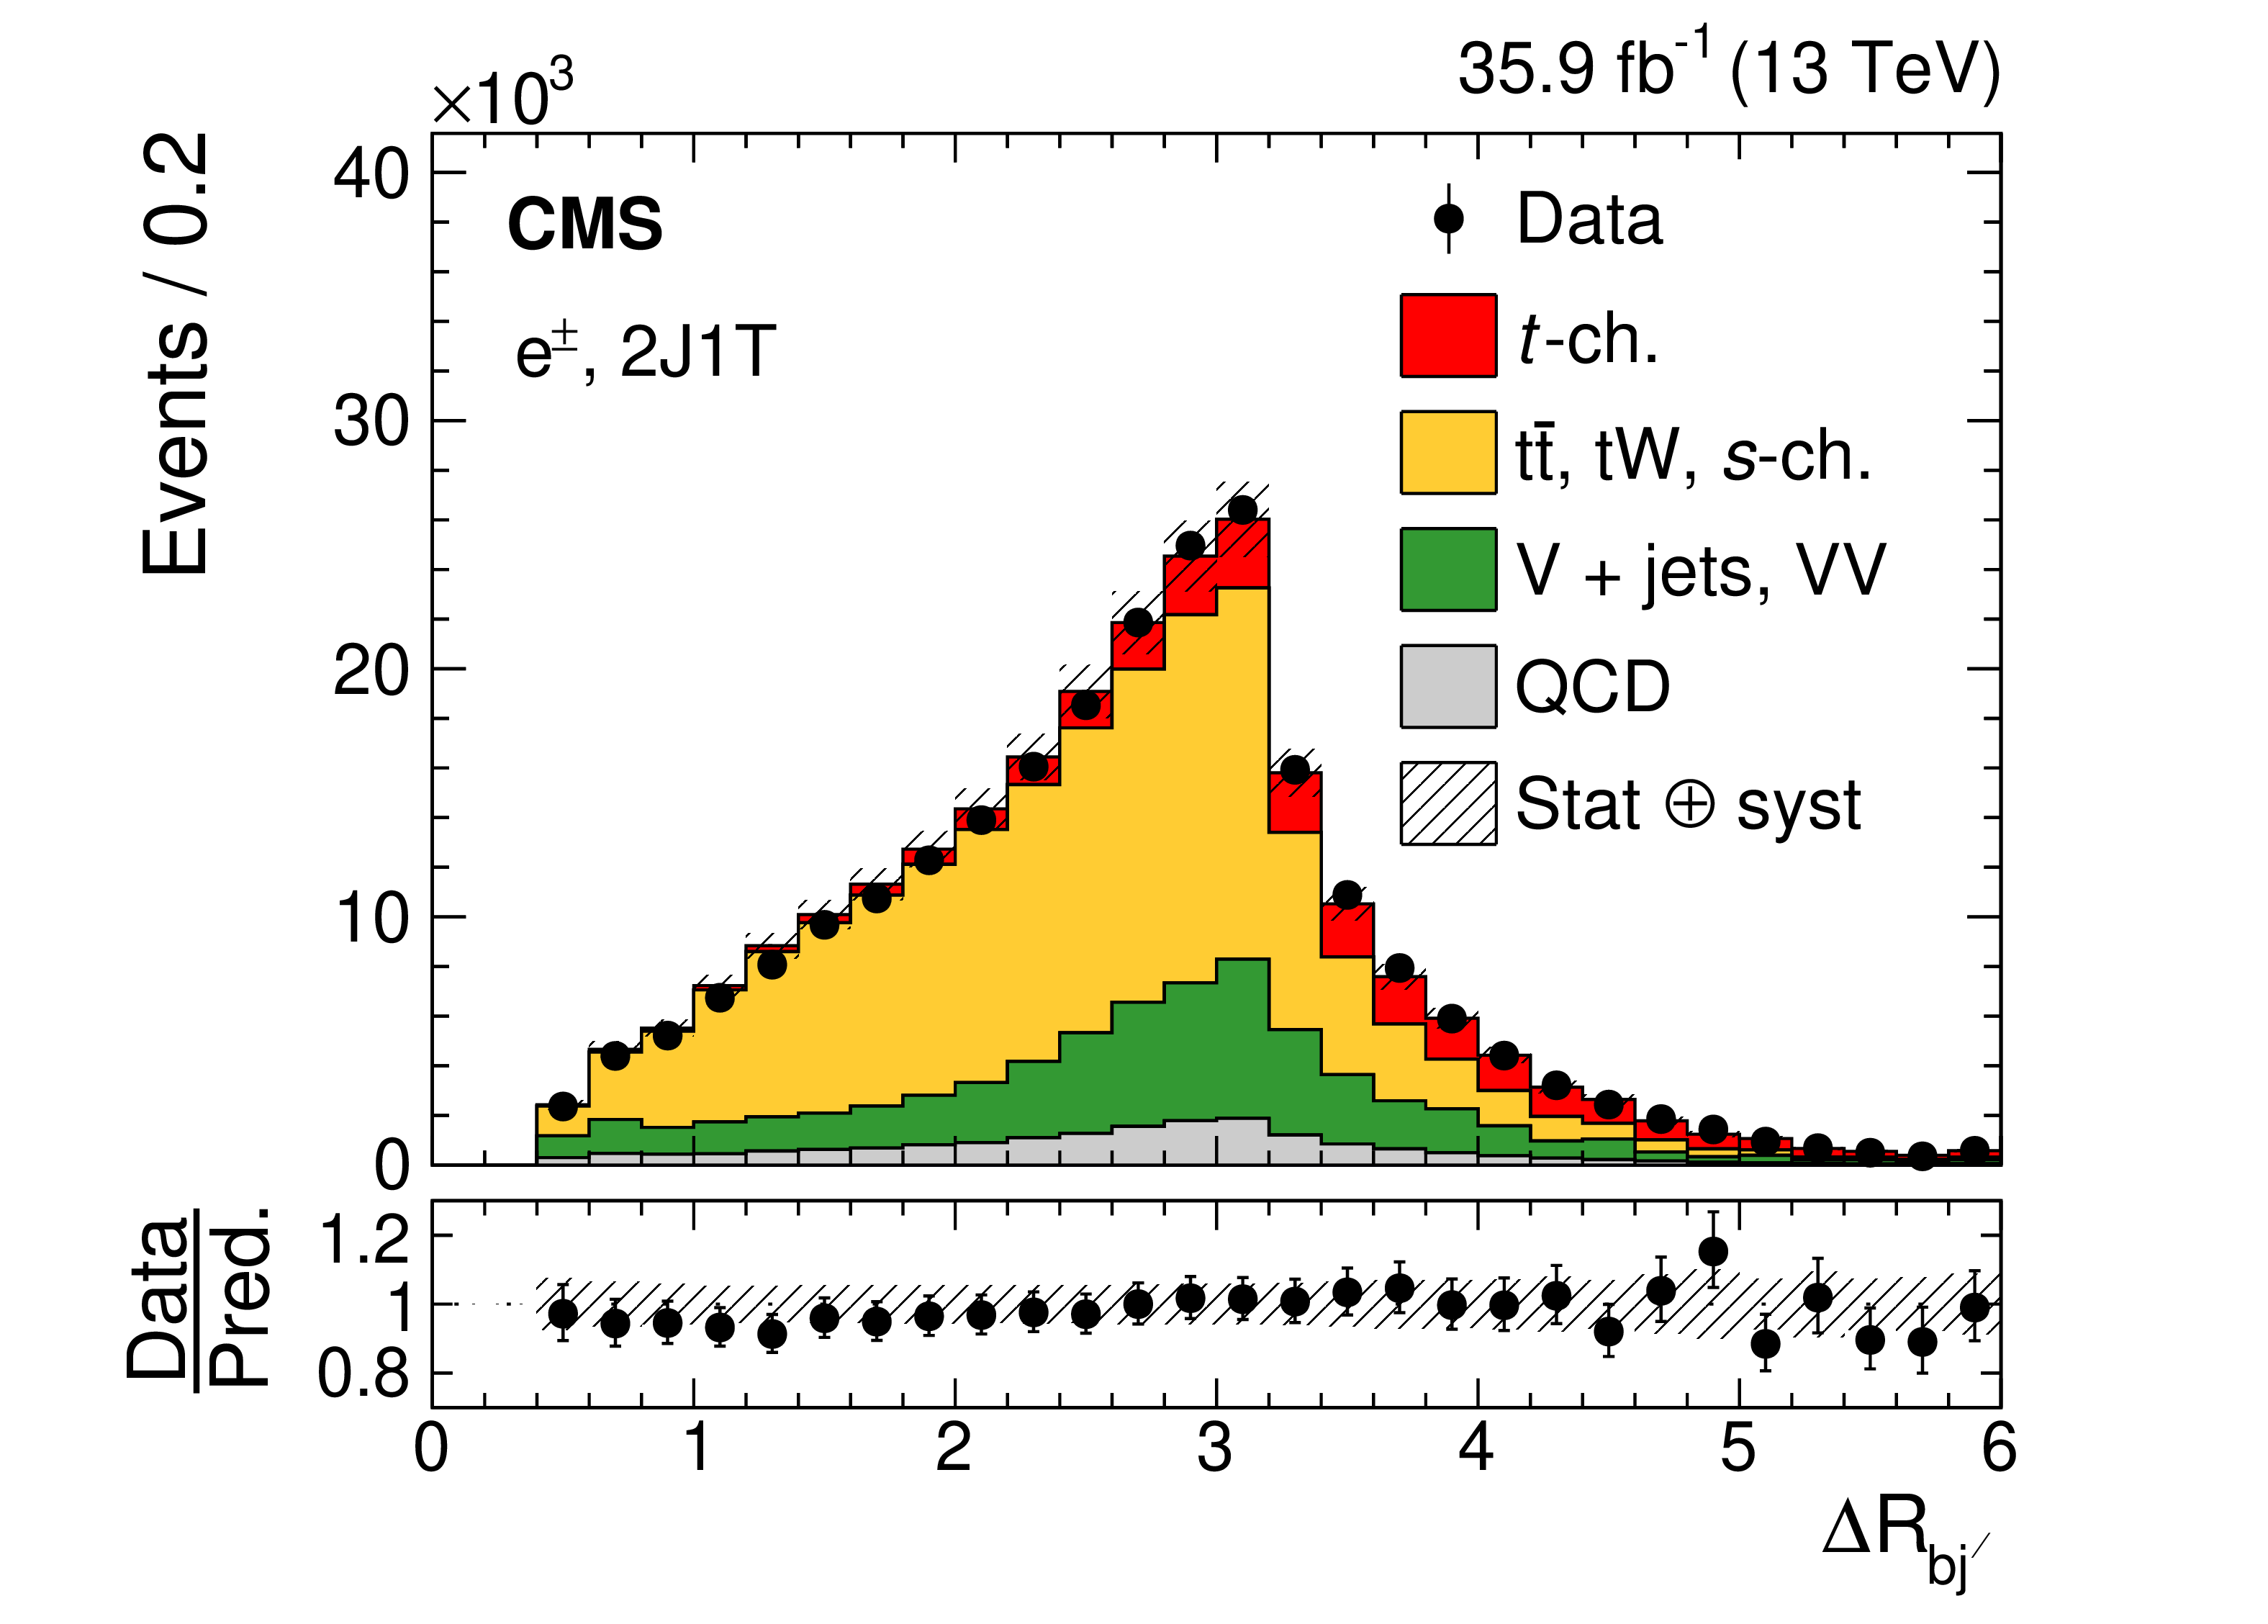
Figure 4:
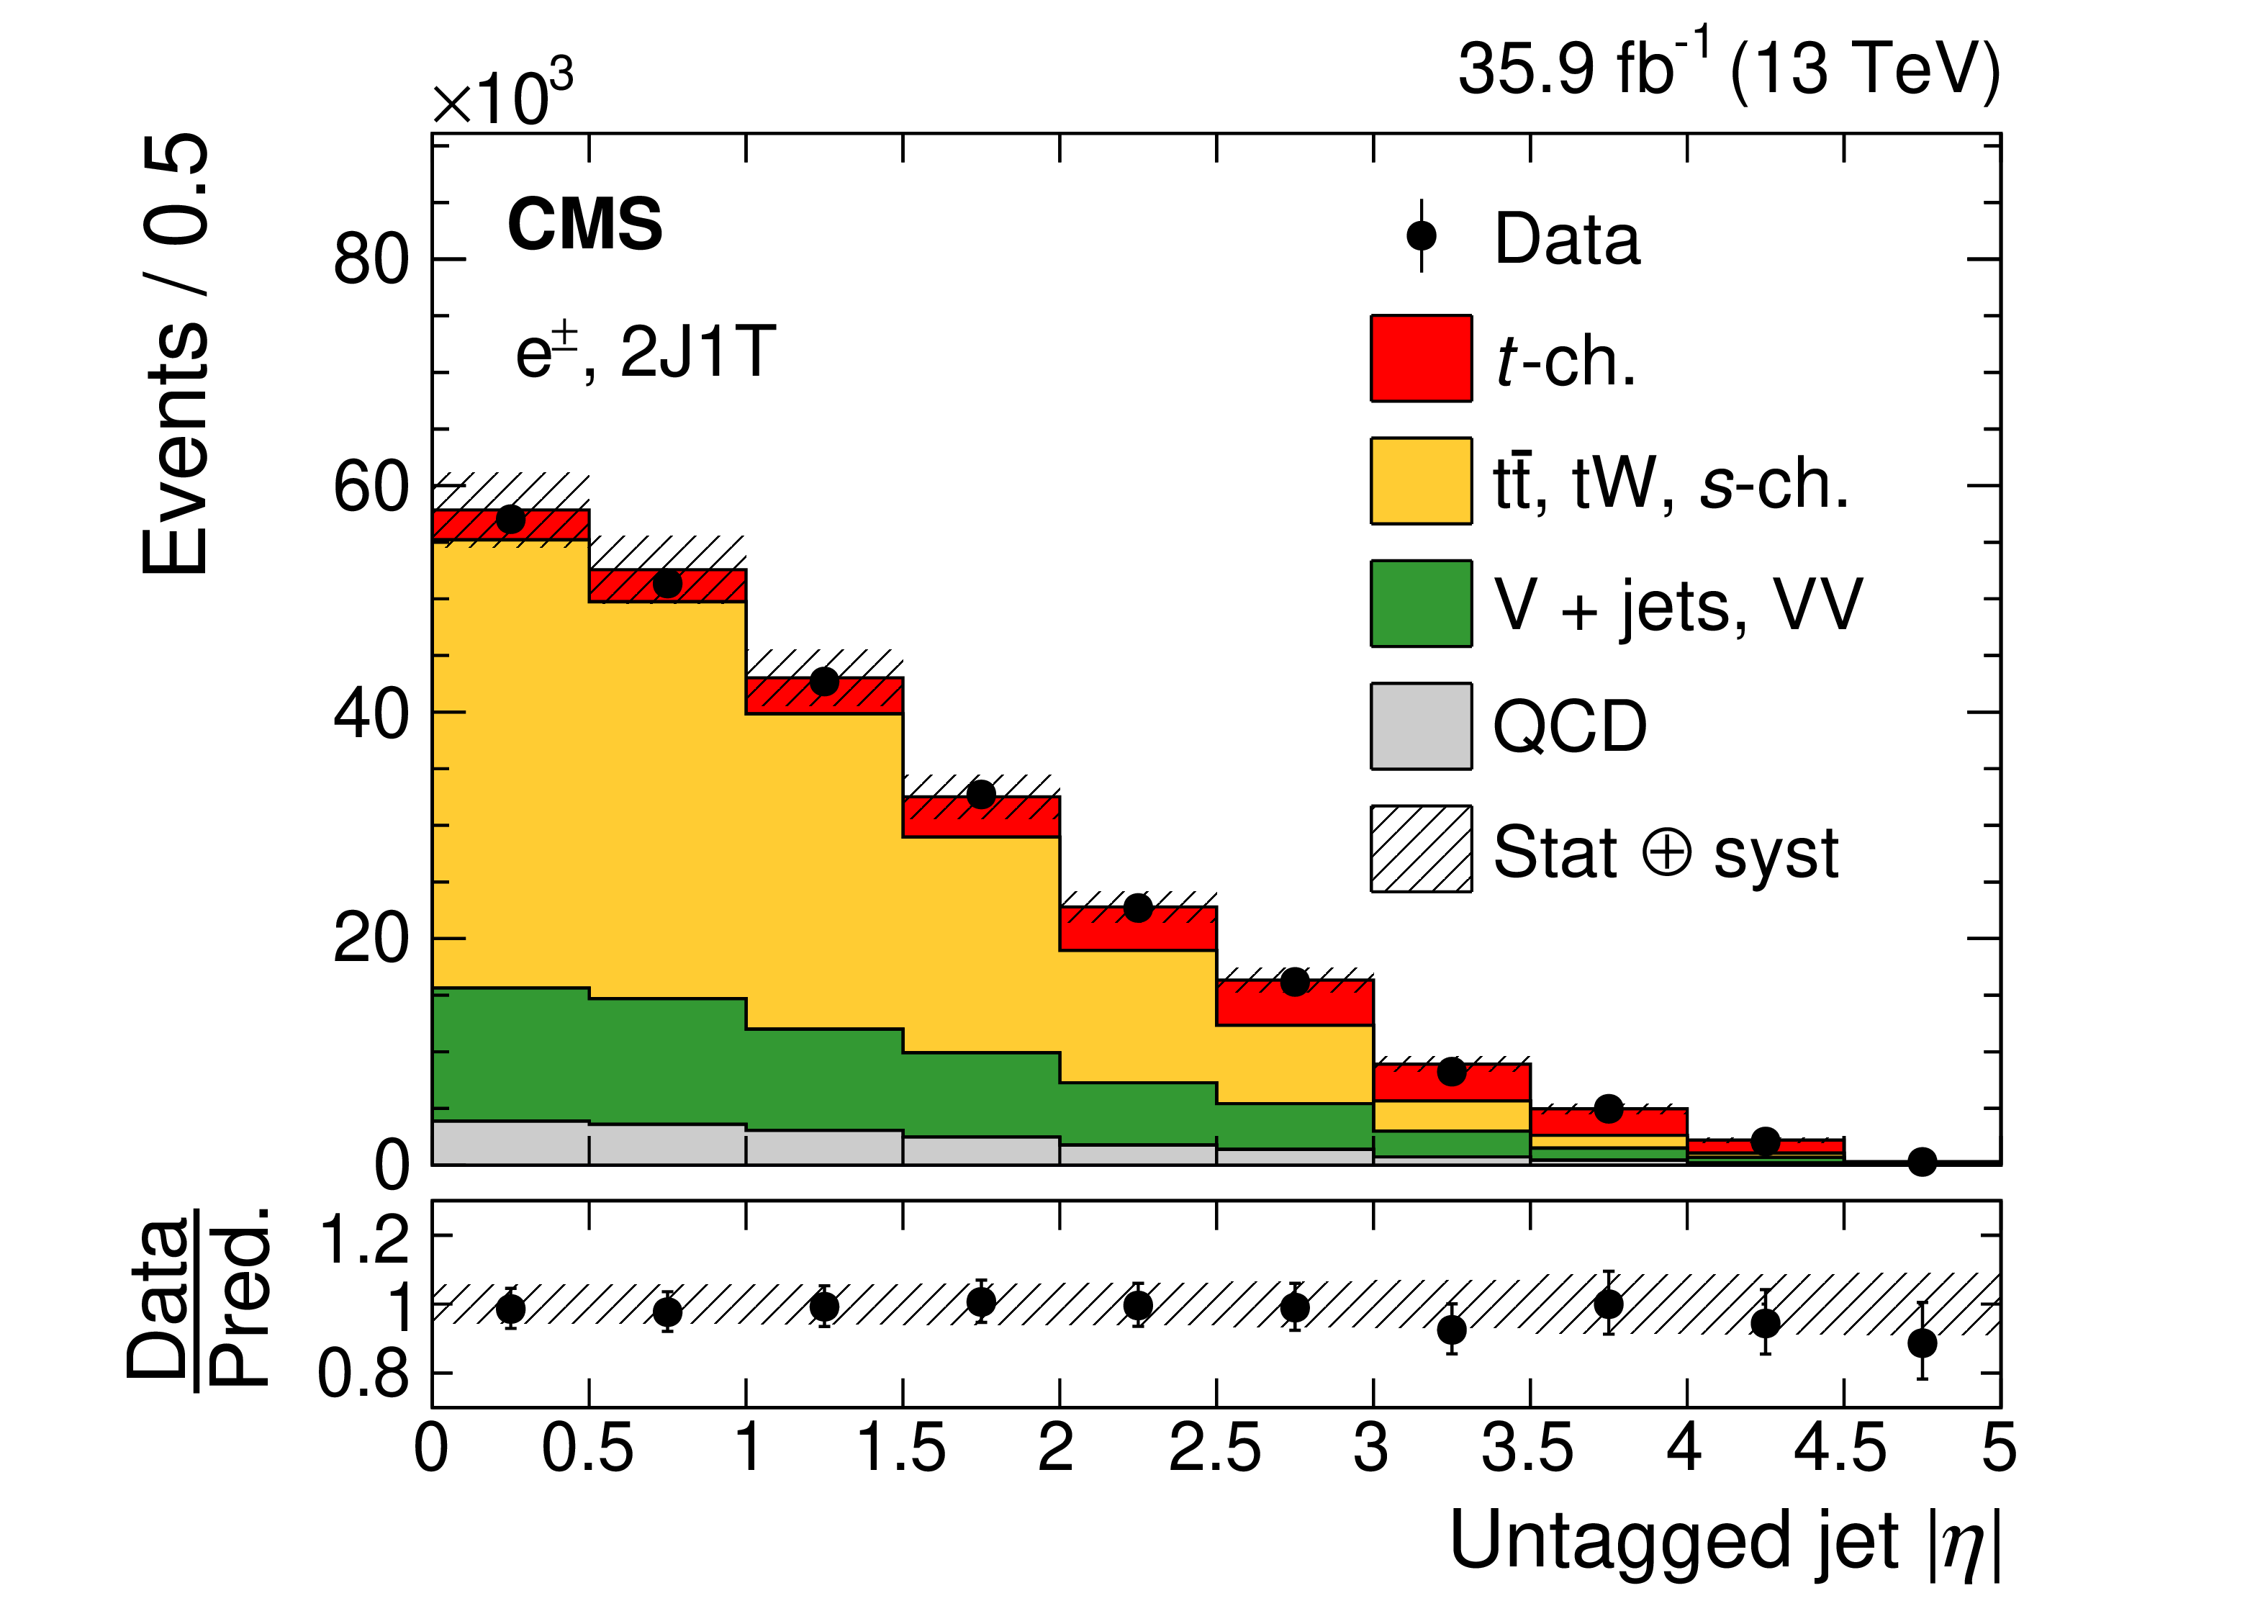
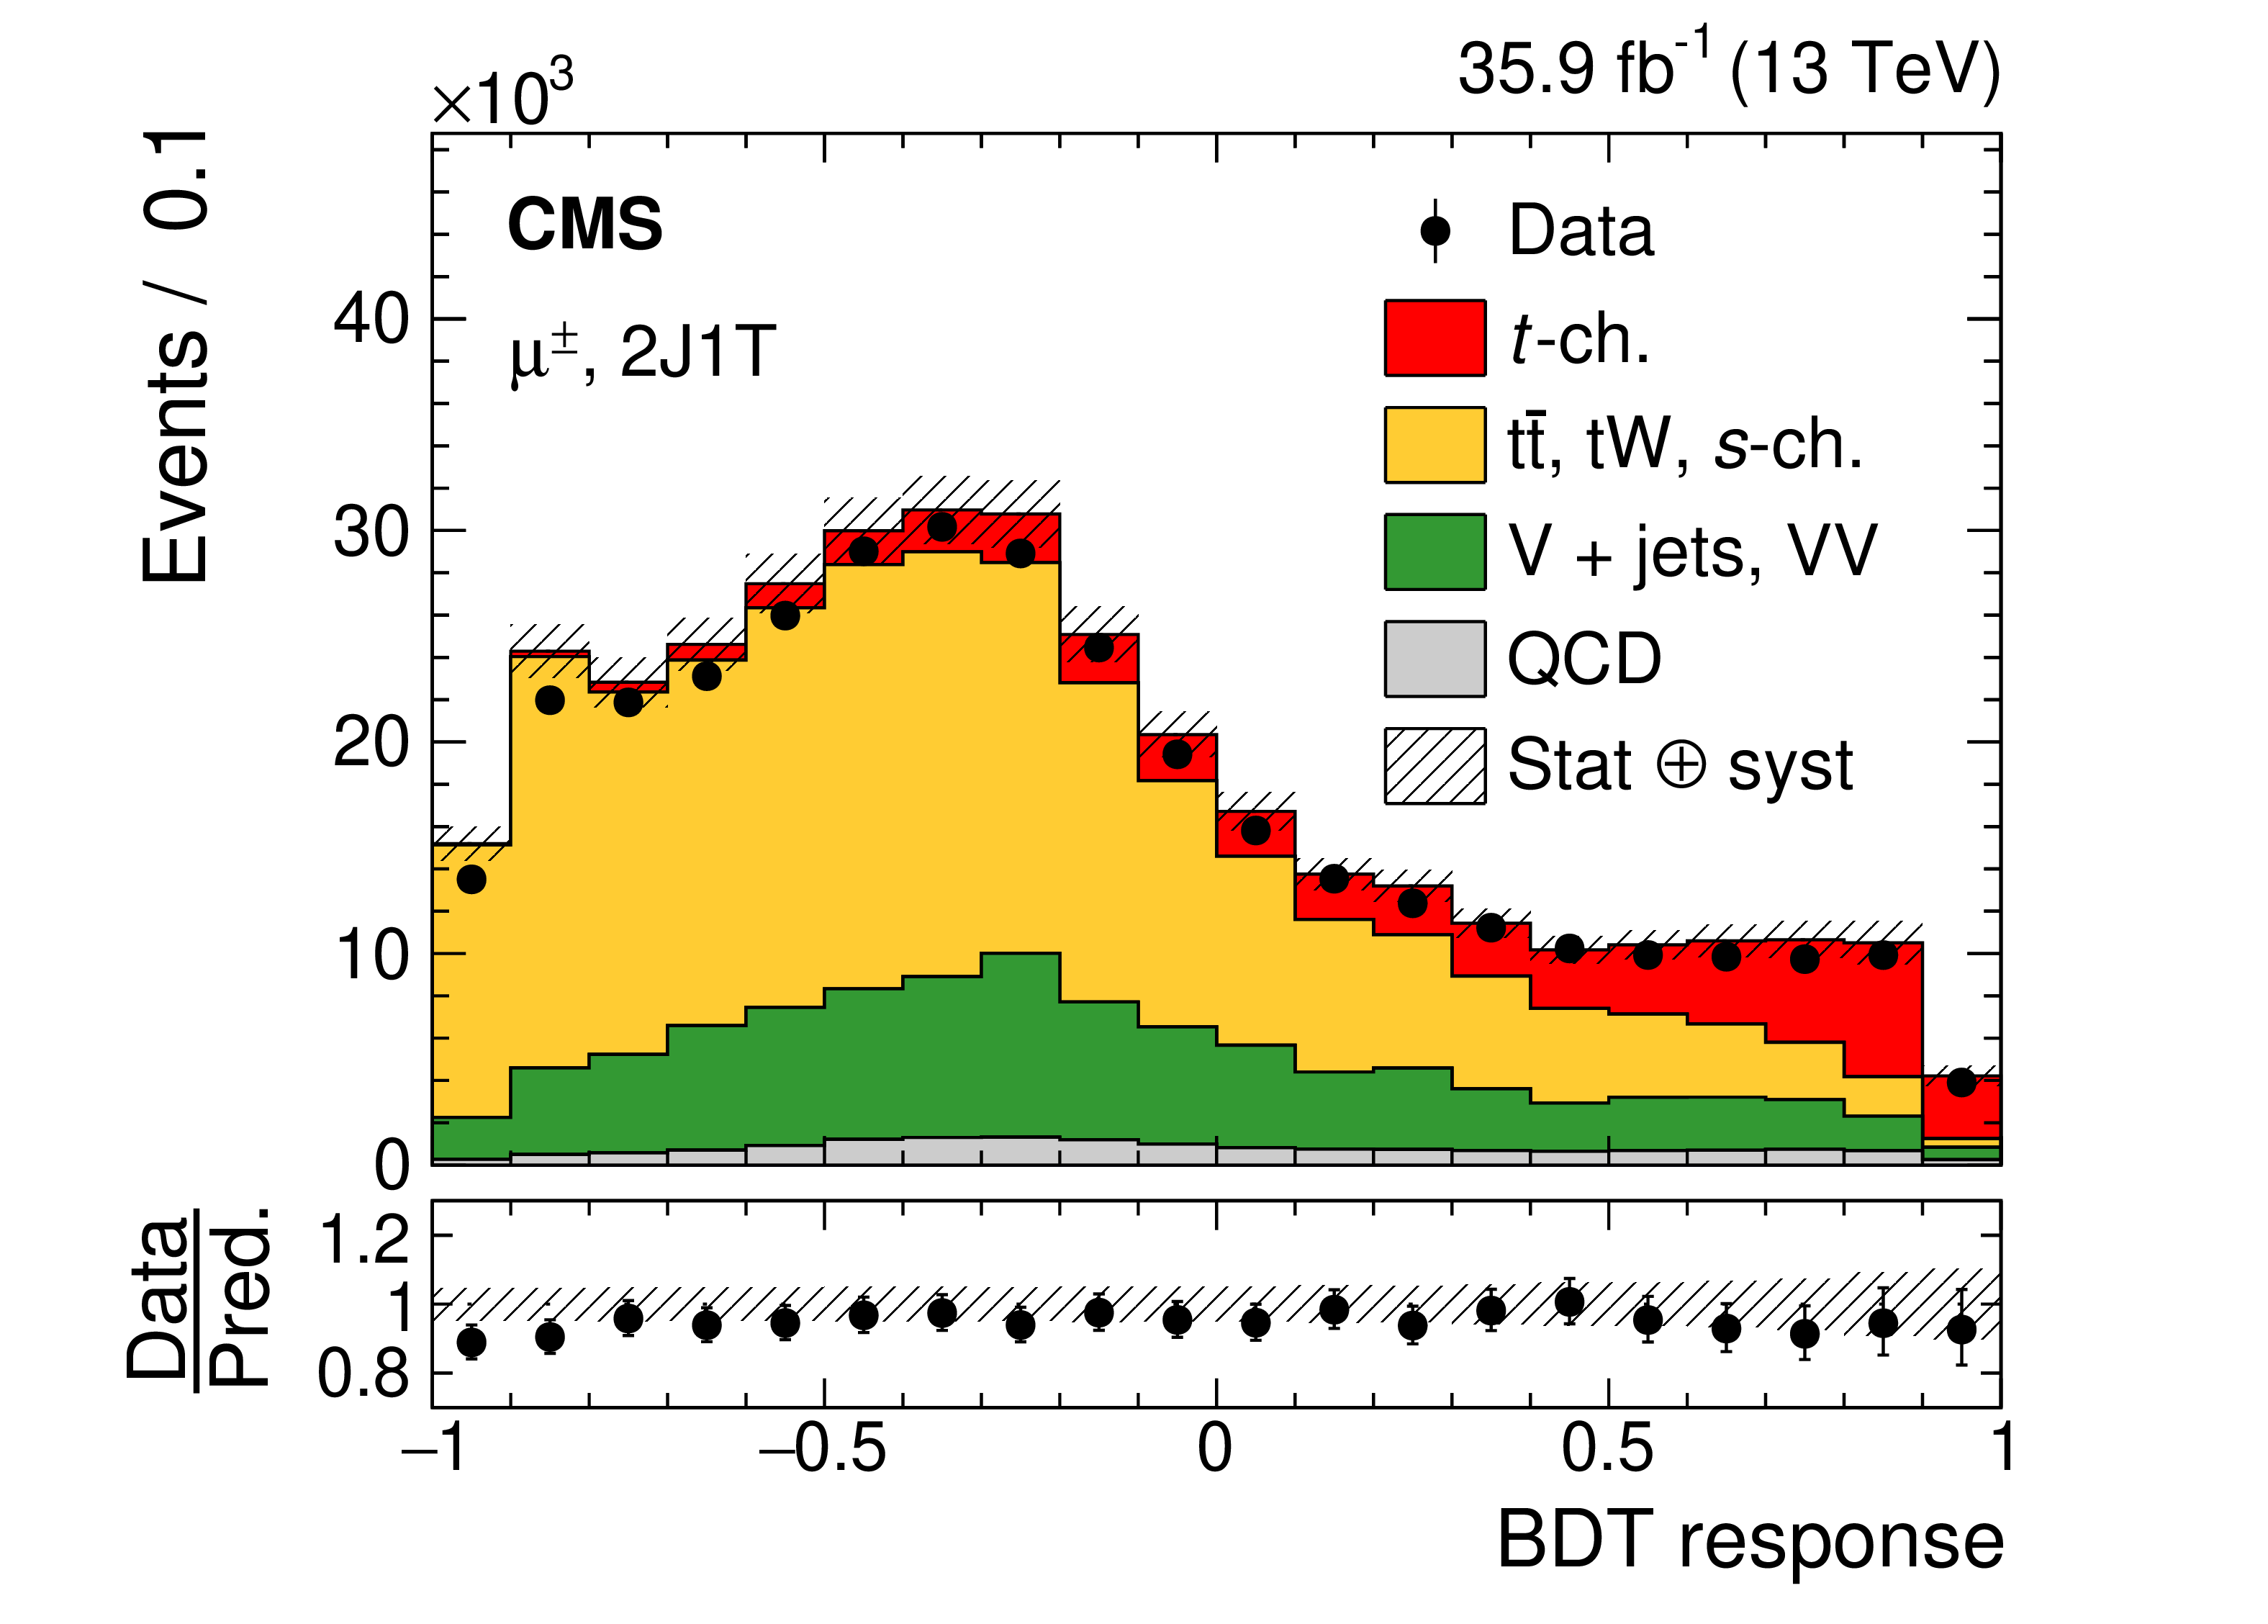
Data and simulation comparison for $\Delta R_{\mathrm{b} \mathrm {j^{\prime}}}$ (upper row), untagged jet $ {| \eta |}$ (middle row), and BDT response (lower row) in the 2J1T category for the muon (left) and electron (right) final states. The lower panels show the ratio of the data to simulation predictions. The bands indicate the prefit statistical and systematic uncertainties added in quadrature. The last bin in each of the upper-row plots includes the overflow. |
png pdf |
Figure 4-a:
Data and simulation comparison for $\Delta R_{\mathrm{b} \mathrm {j^{\prime}}}$ in the 2J1T category for the muon final state. The lower panel shows the ratio of the data to simulation predictions. The bands indicate the prefit statistical and systematic uncertainties added in quadrature. |
png pdf |
Figure 4-b:
Data and simulation comparison for $\Delta R_{\mathrm{b} \mathrm {j^{\prime}}}$ in the 2J1T category for the electron final state. The lower panel shows the ratio of the data to simulation predictions. The bands indicate the prefit statistical and systematic uncertainties added in quadrature. |

png pdf |
Figure 4-c:
Data and simulation comparison for the untagged jet $ {| \eta |}$ in the 2J1T category for the muon final state. The lower panel shows the ratio of the data to simulation predictions. The bands indicate the prefit statistical and systematic uncertainties added in quadrature. |
png pdf |
Figure 4-d:
Data and simulation comparison for the untagged jet $ {| \eta |}$ in the 2J1T category for the electron final state. The lower panel shows the ratio of the data to simulation predictions. The bands indicate the prefit statistical and systematic uncertainties added in quadrature. |
png pdf |
Figure 4-e:
Data and simulation comparison for the BDT response in the 2J1T category for the muon final state. The lower panel shows the ratio of the data to simulation predictions. The bands indicate the prefit statistical and systematic uncertainties added in quadrature. |

png pdf |
Figure 4-f:
Data and simulation comparison for the BDT response in the 2J1T category for the electron final state. The lower panel shows the ratio of the data to simulation predictions. The bands indicate the prefit statistical and systematic uncertainties added in quadrature. |
png pdf |
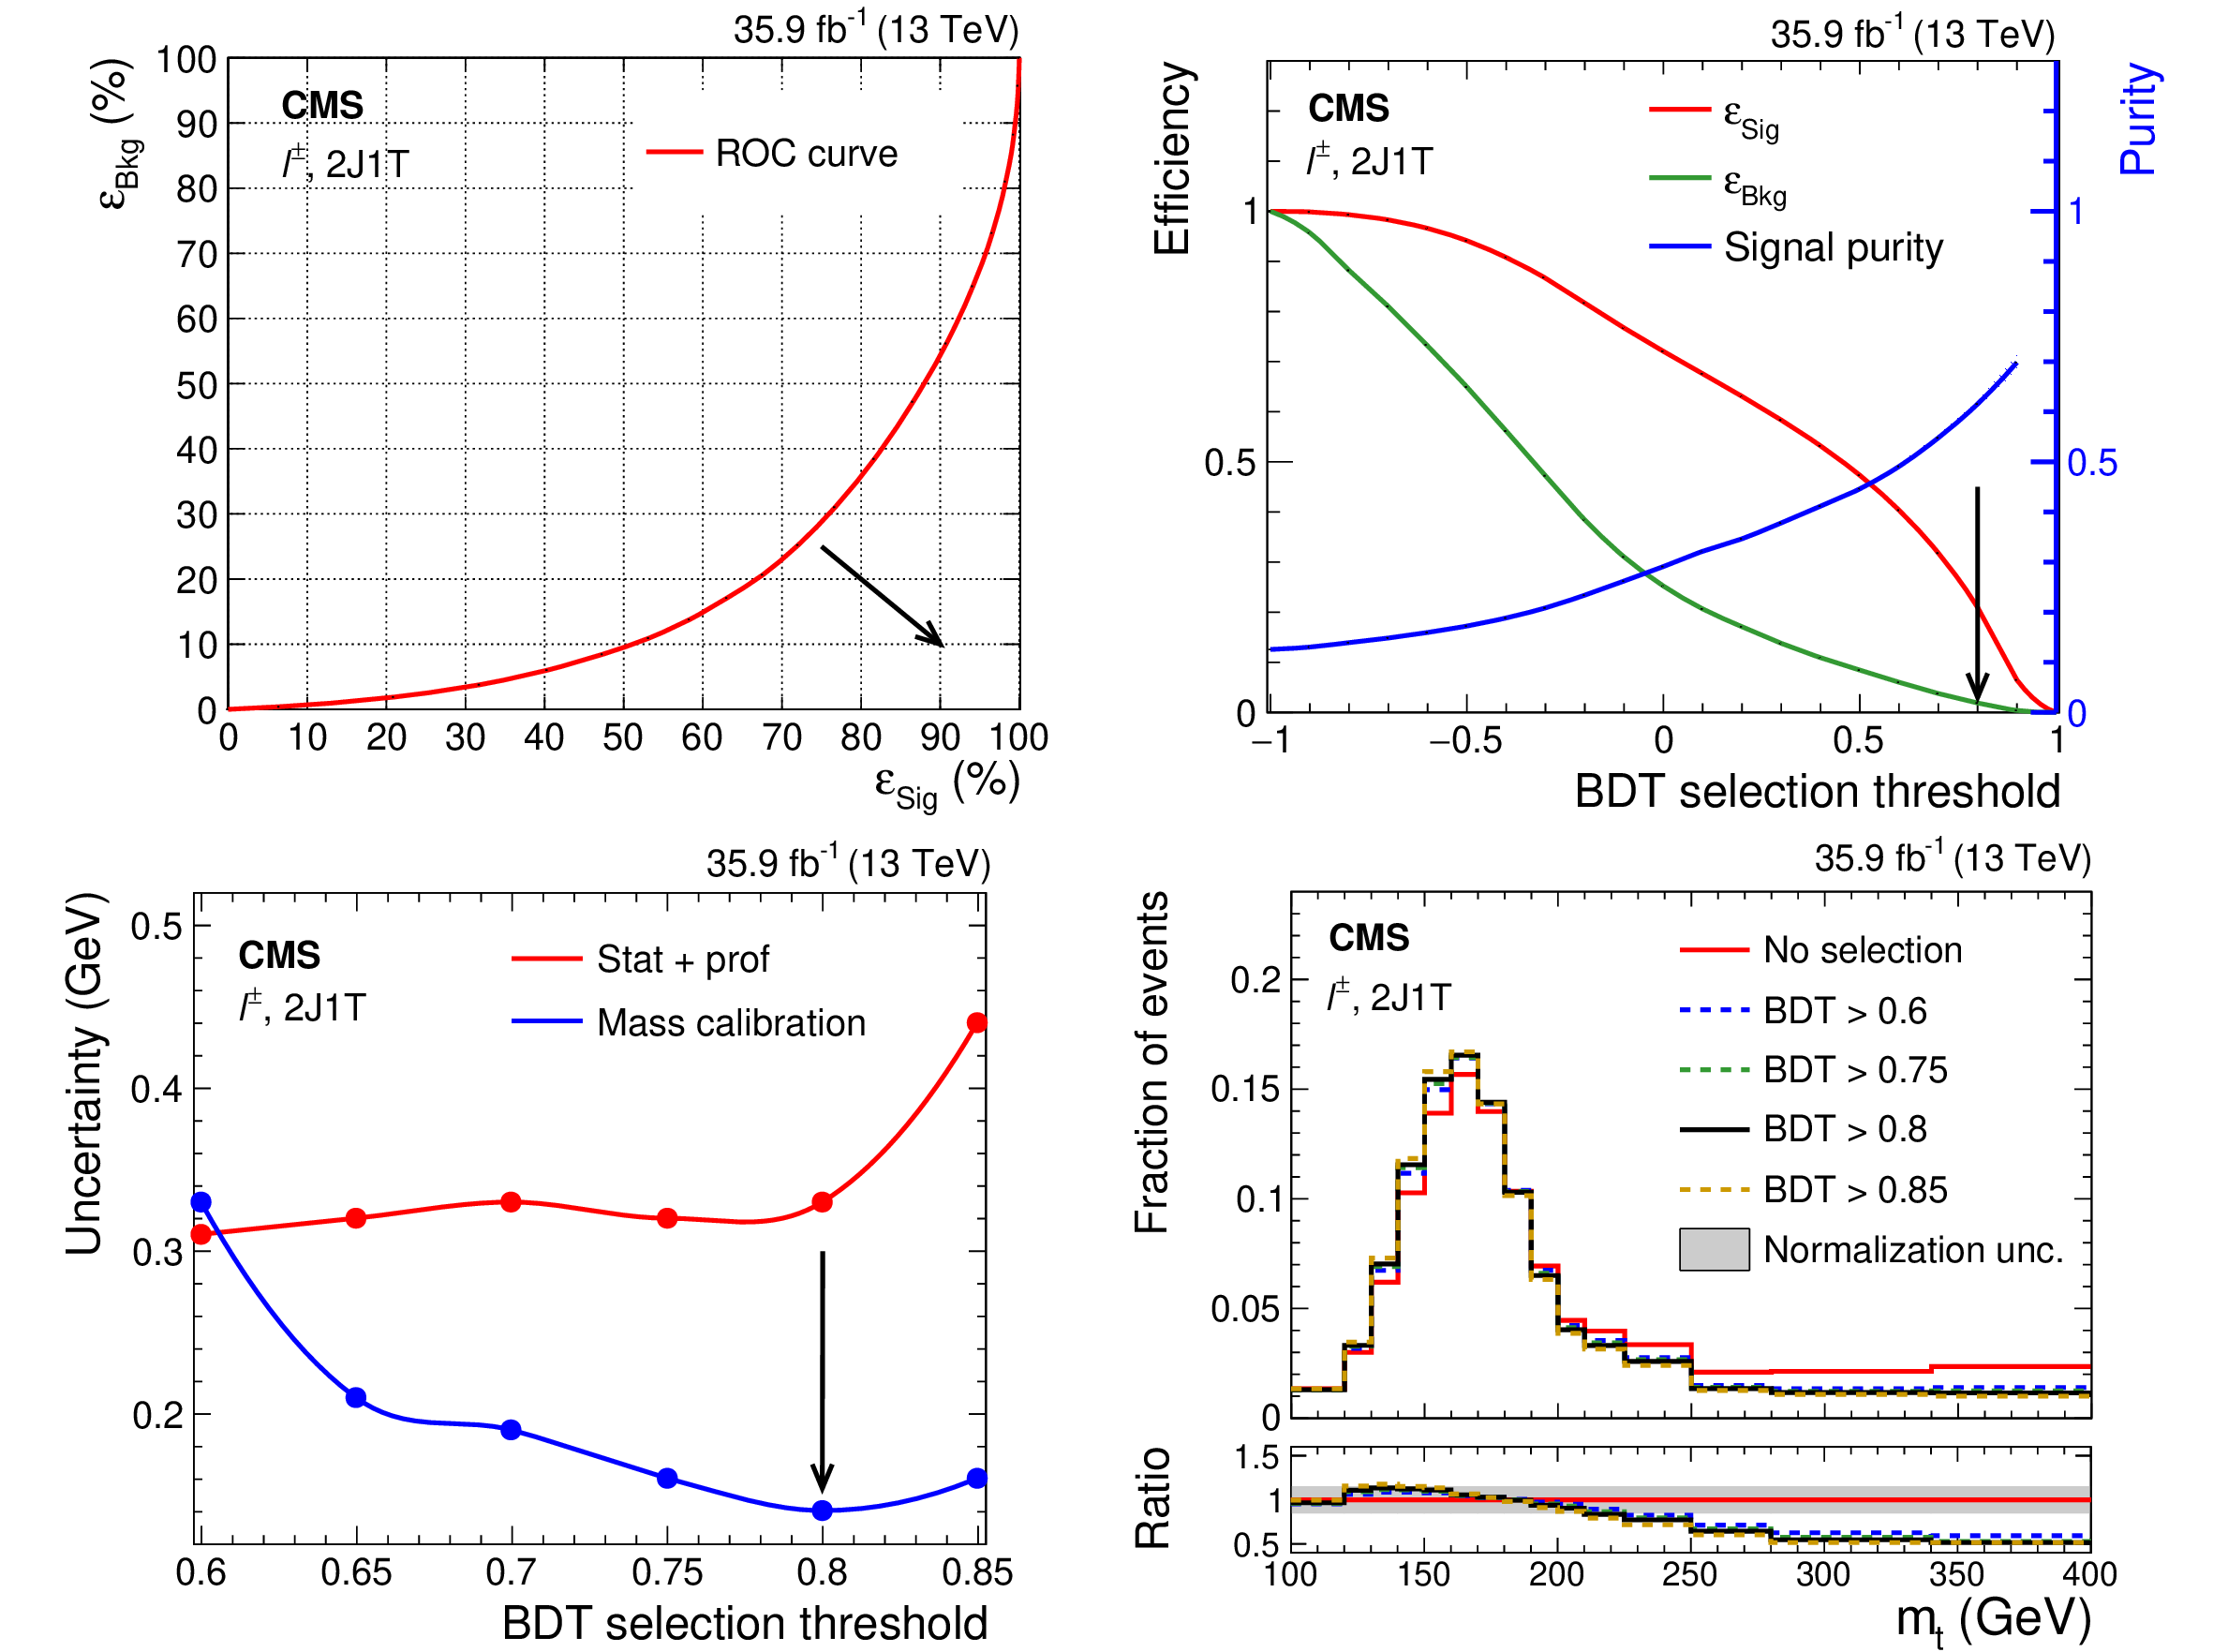
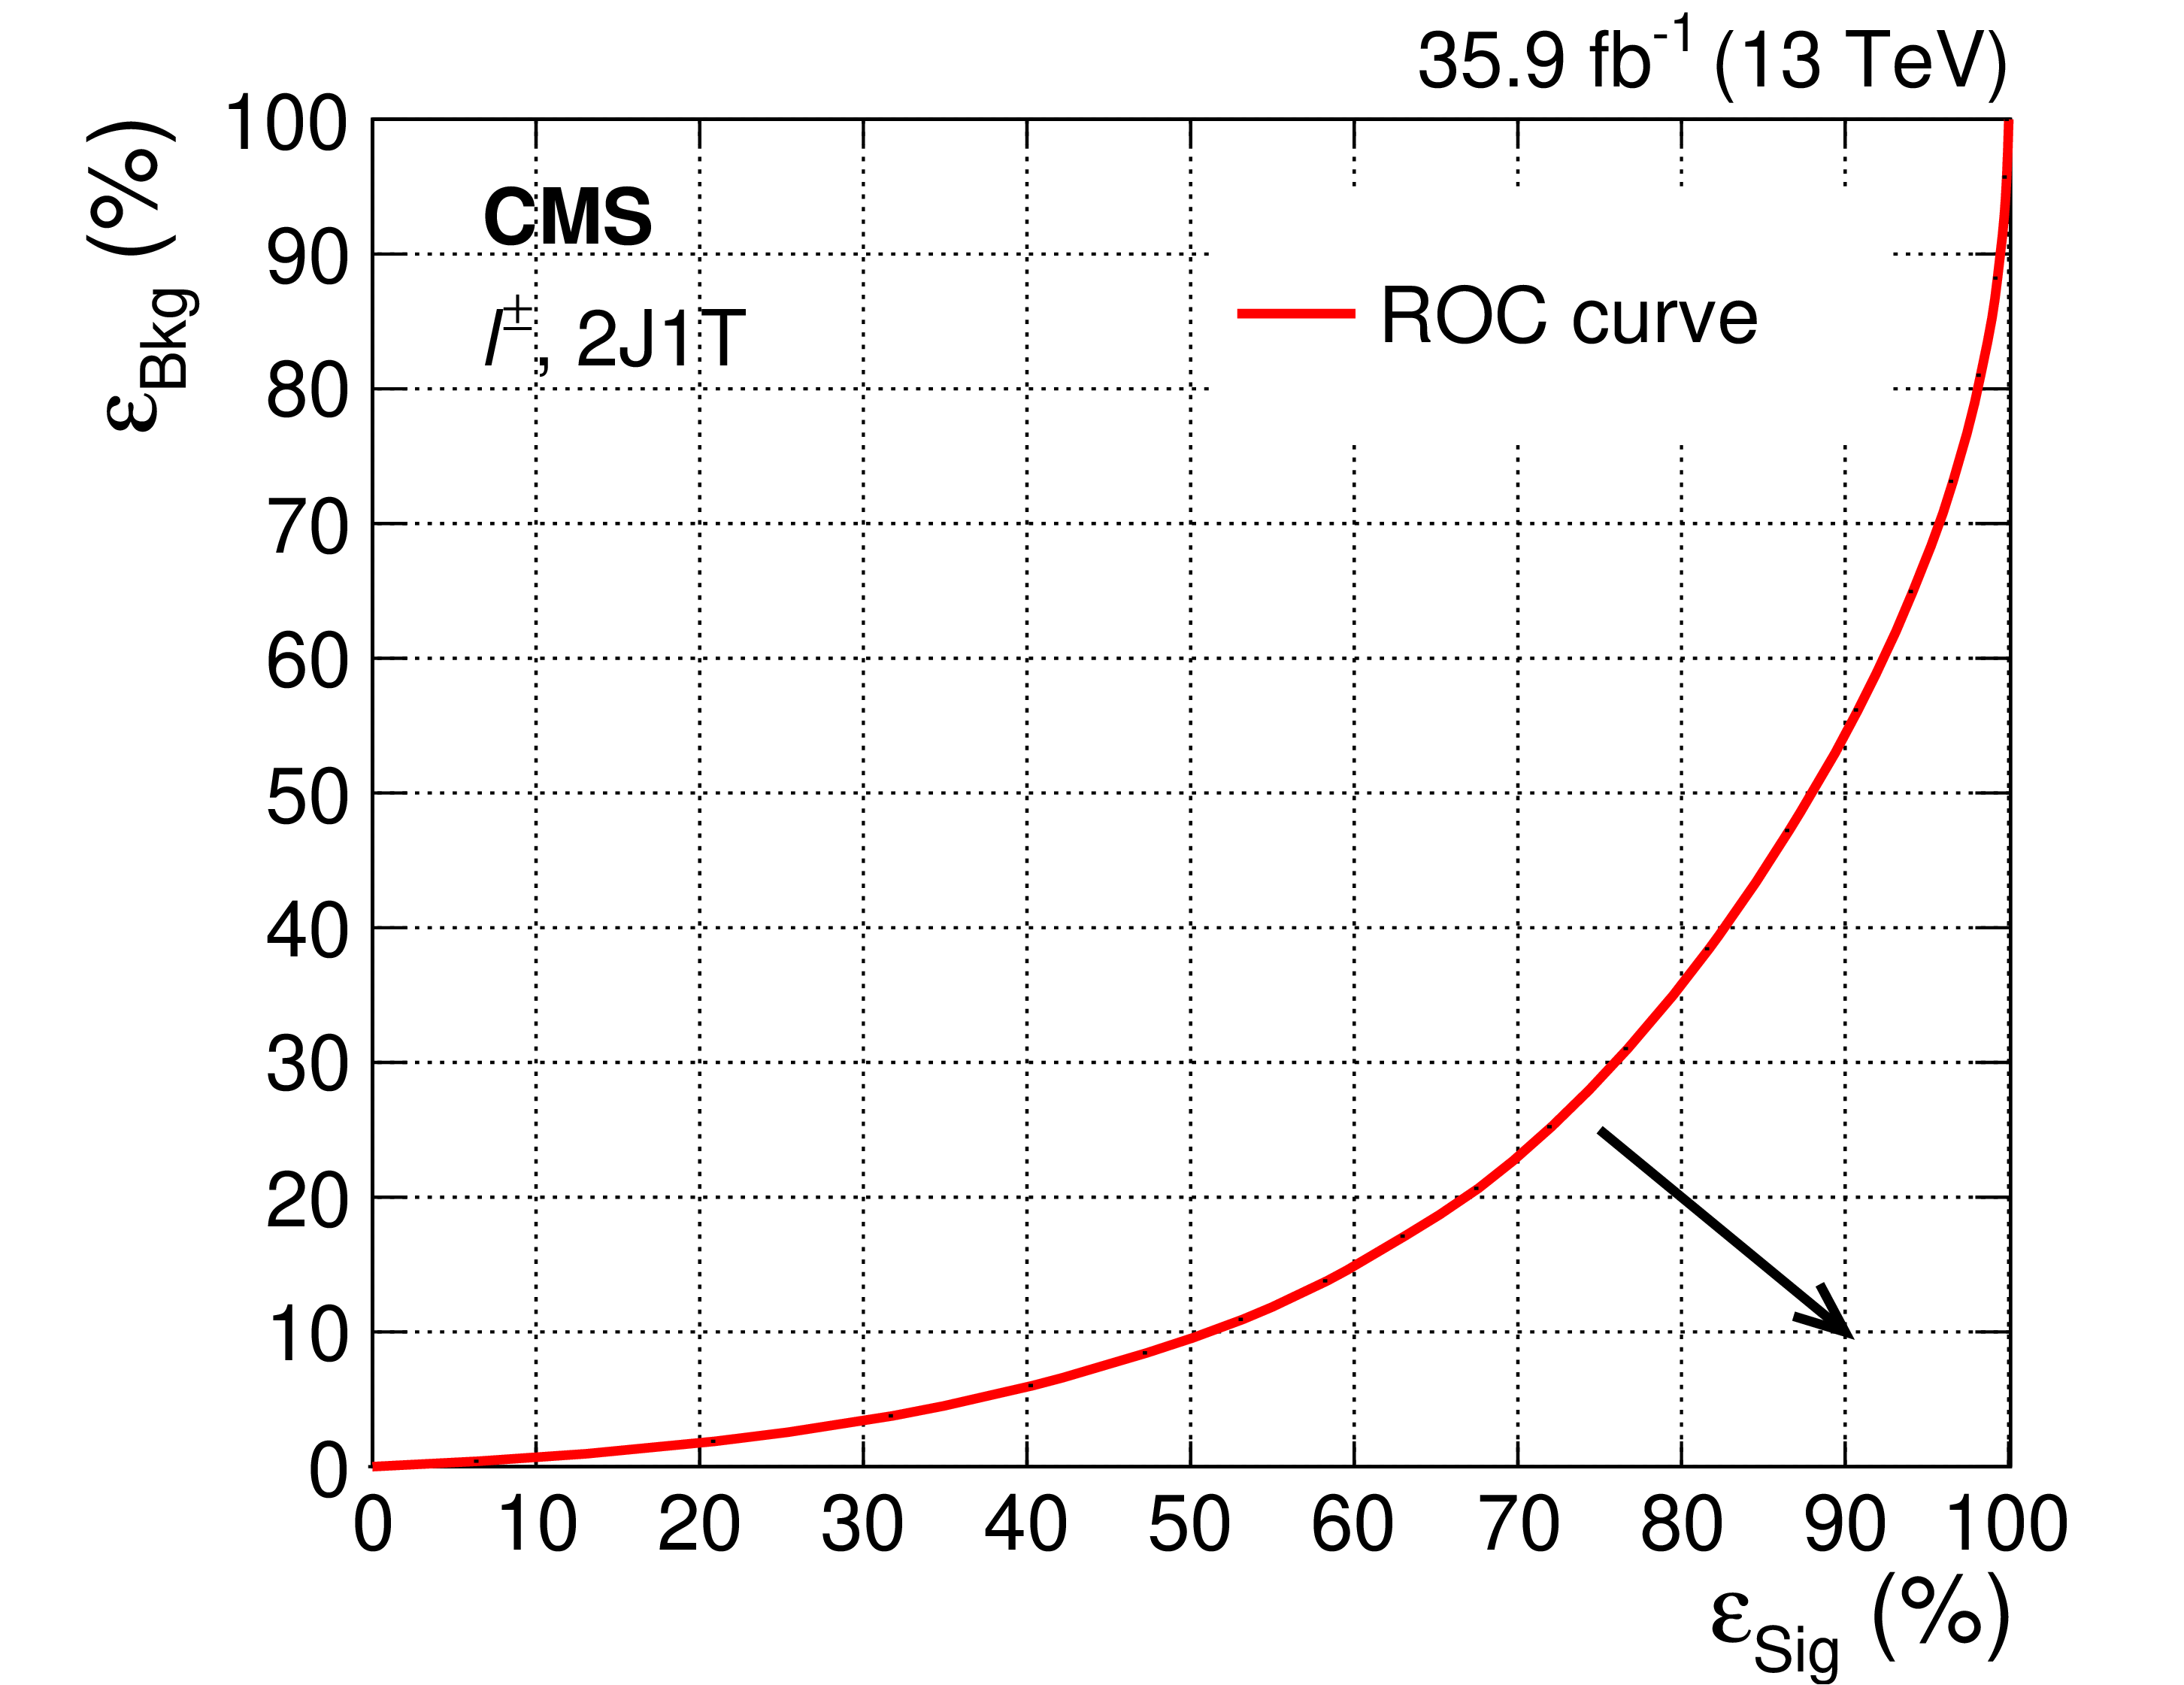
Figure 5:
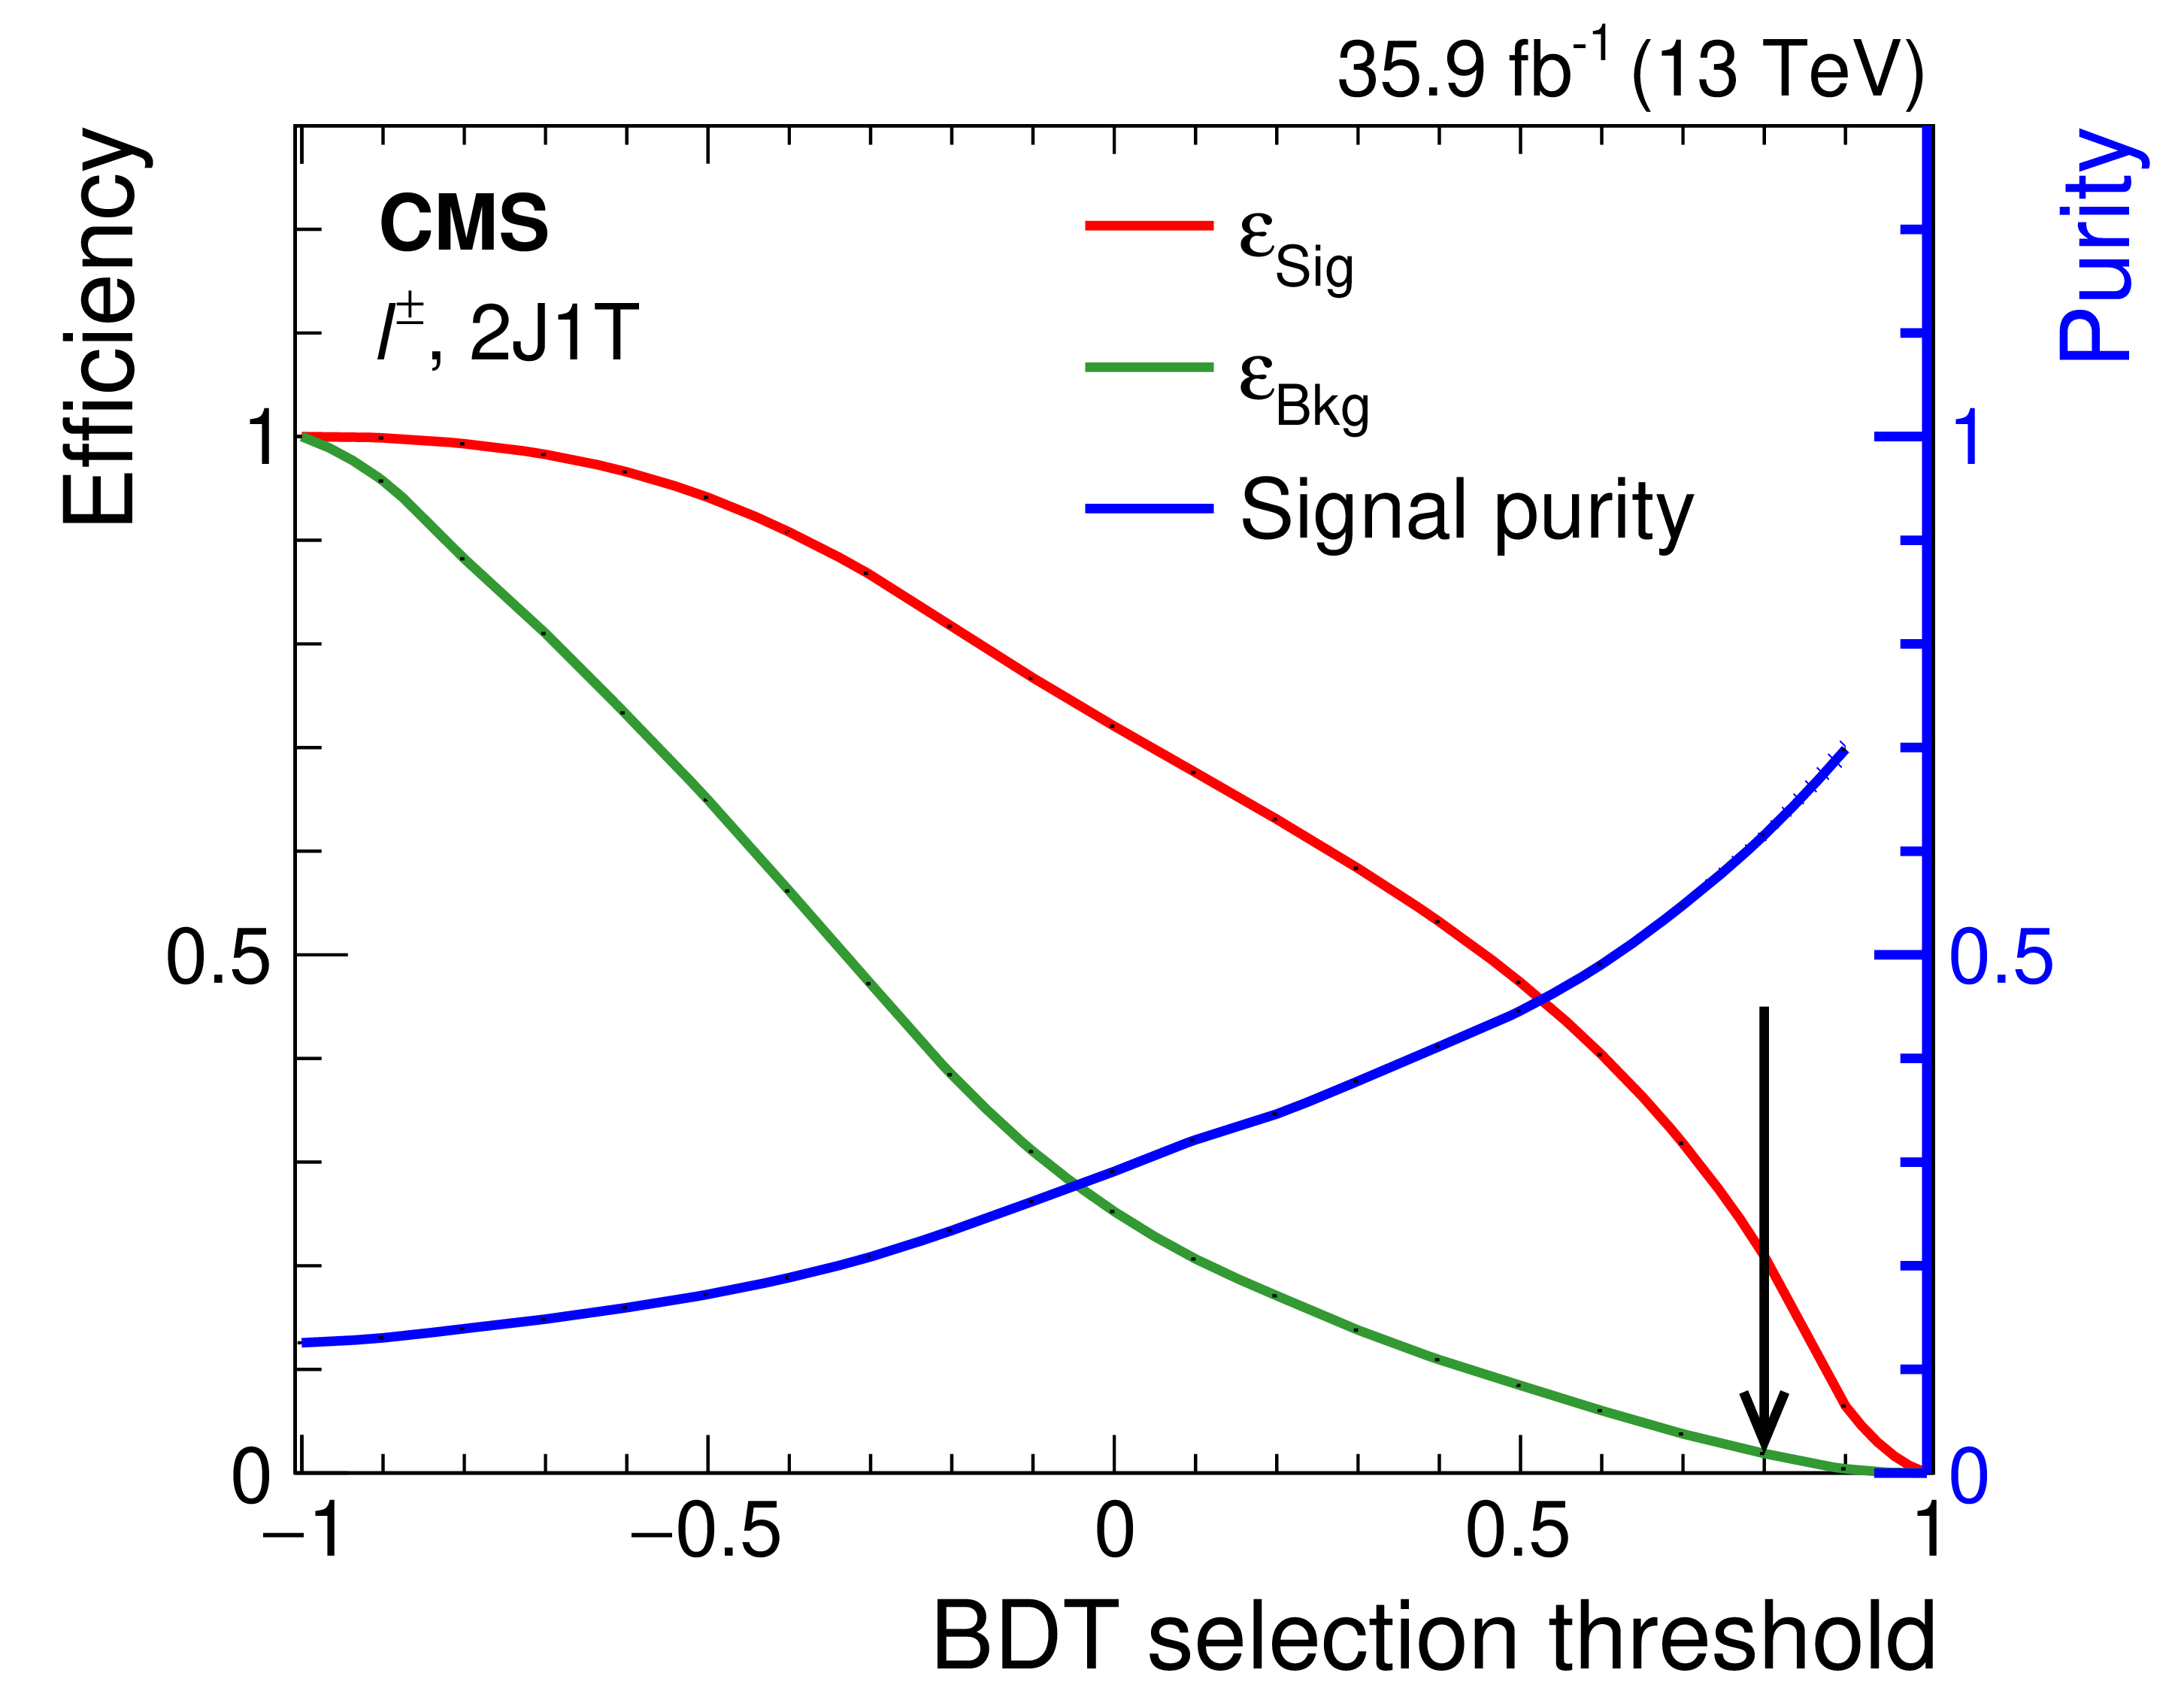
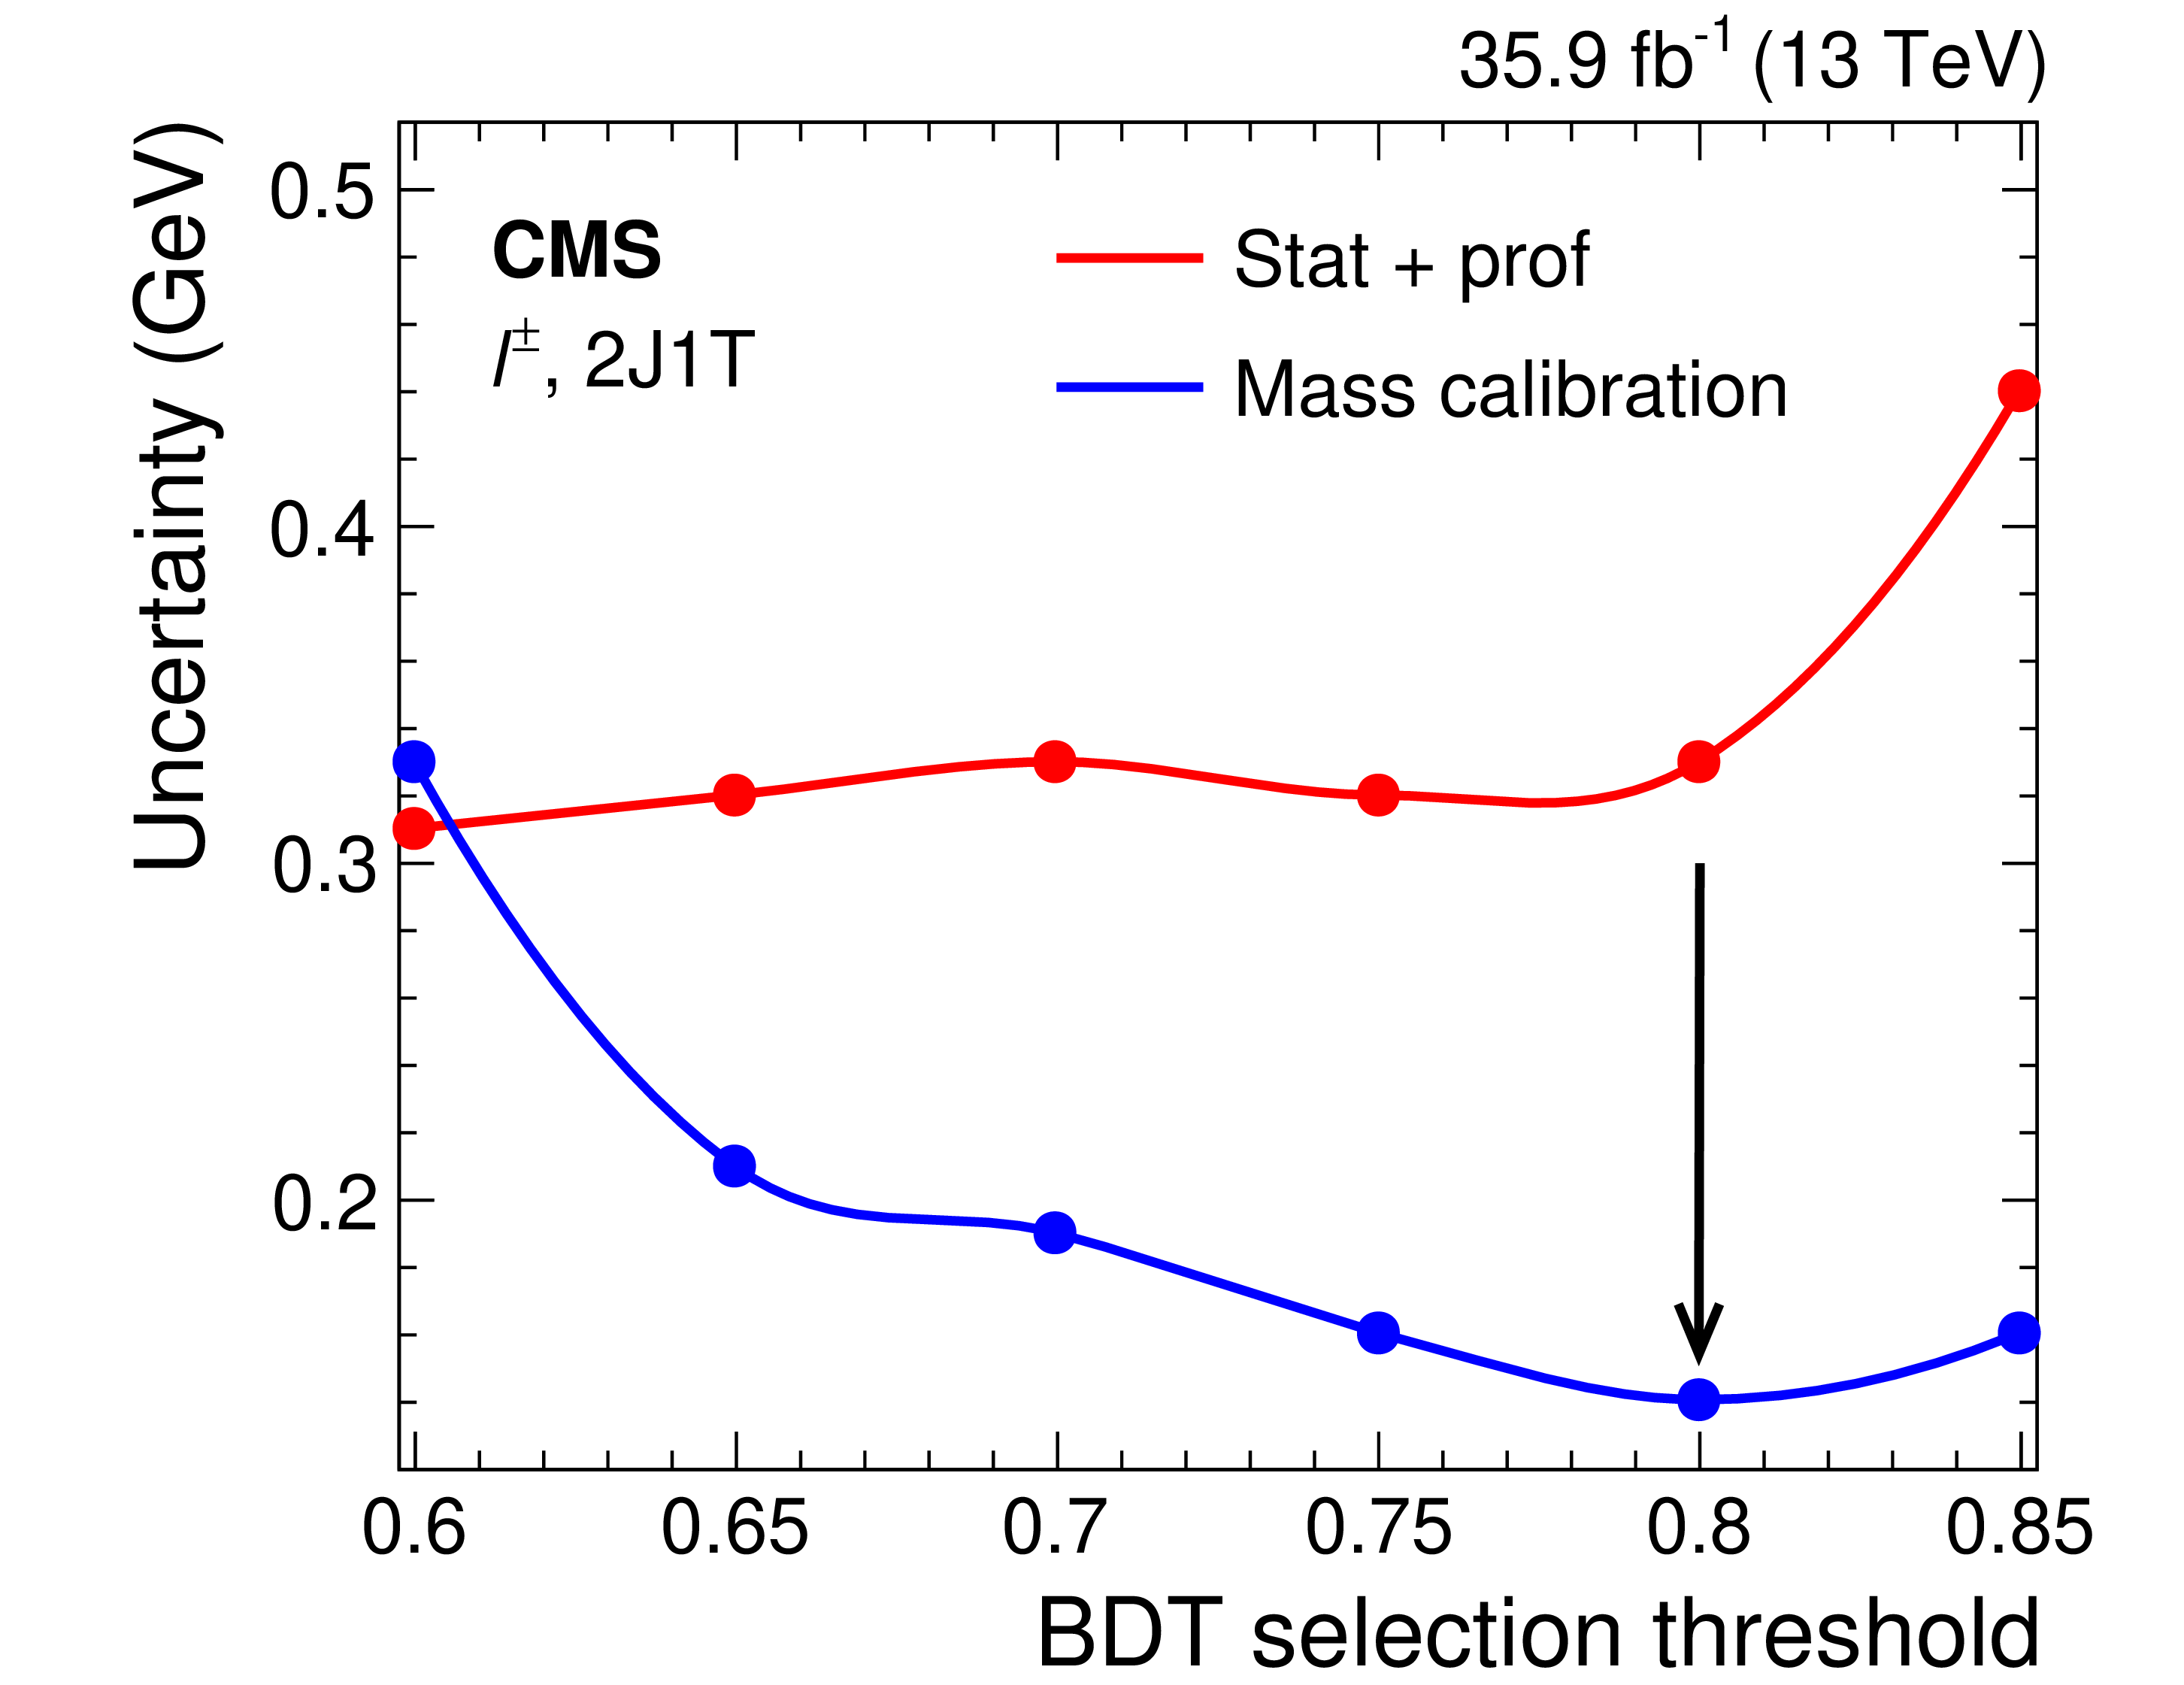
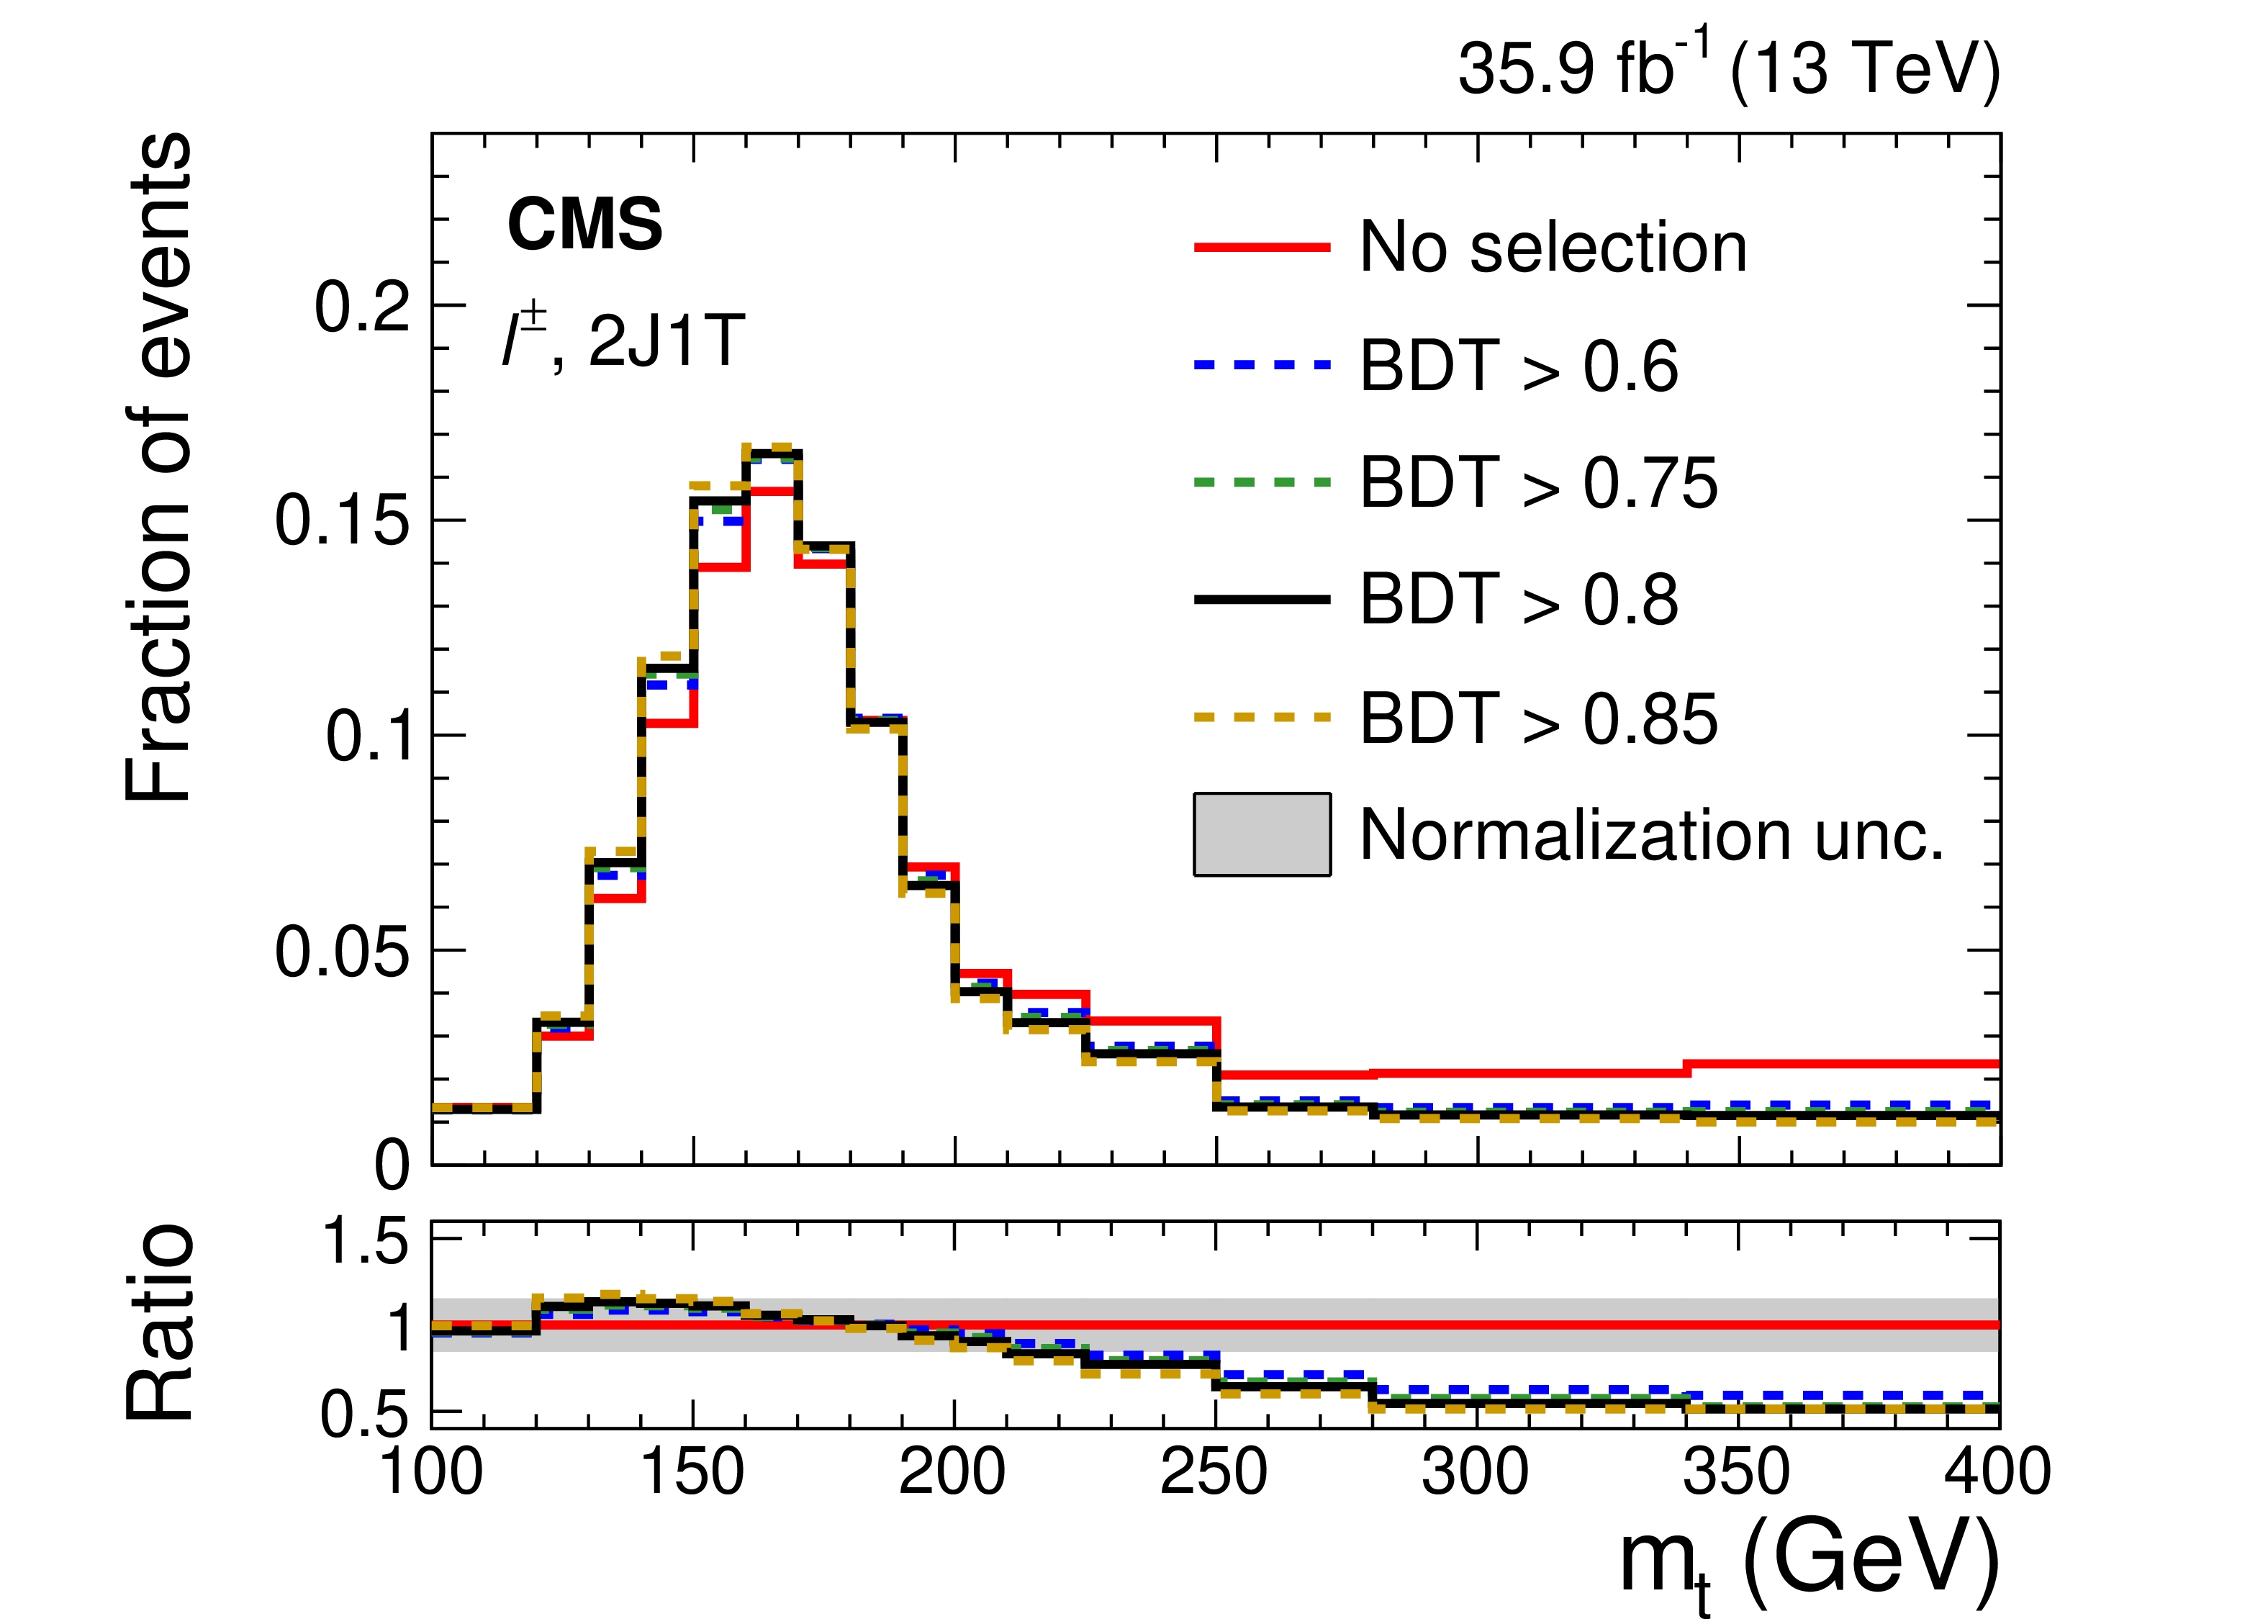
Combined BDT performance in terms of the ROC curve (upper left), and the signal and background efficiencies and signal purity as functions of the BDT selection threshold (upper right) in the muon and electron final states. The uncertainty in ${m_{\mathrm{t}}}$ from the combined statistical and profiled systematic components (red curve), and from the mass calibration (blue curve) as a function of the BDT selection threshold (lower left). Arrows on the plots indicate the region of better separation (upper left) and optimized selection criteria (upper right and lower left). A comparison of the reconstructed ${m_{\mathrm{t}}}$ shapes from simulated signal events for different selection thresholds on the BDT response is shown on the lower right. The lower panel shows the ratio relative to the case where no selection (red) is applied, with the grey band denoting the prefit rate uncertainty around the red curve. |
png pdf |
Figure 5-a:
Combined BDT performance in terms of the ROC curve in the muon and electron final states. The arrow indicates the region of better separation. |
png pdf |
Figure 5-b:
The signal and background efficiencies and signal purity as functions of the BDT selection threshold in the muon and electron final states. The arrow indicates the region of optimized selection criteria. |
png pdf |
Figure 5-c:
The uncertainty in ${m_{\mathrm{t}}}$ from the combined statistical and profiled systematic components (red curve), and from the mass calibration (blue curve) as a function of the BDT selection threshold. The arrow indicates the region of optimized selection criteria. |
png pdf |
Figure 5-d:
A comparison of the reconstructed ${m_{\mathrm{t}}}$ shapes from simulated signal events for different selection thresholds on the BDT response. The lower panel shows the ratio relative to the case where no selection (red) is applied, with the grey band denoting the prefit rate uncertainty around the red curve. |
png pdf |
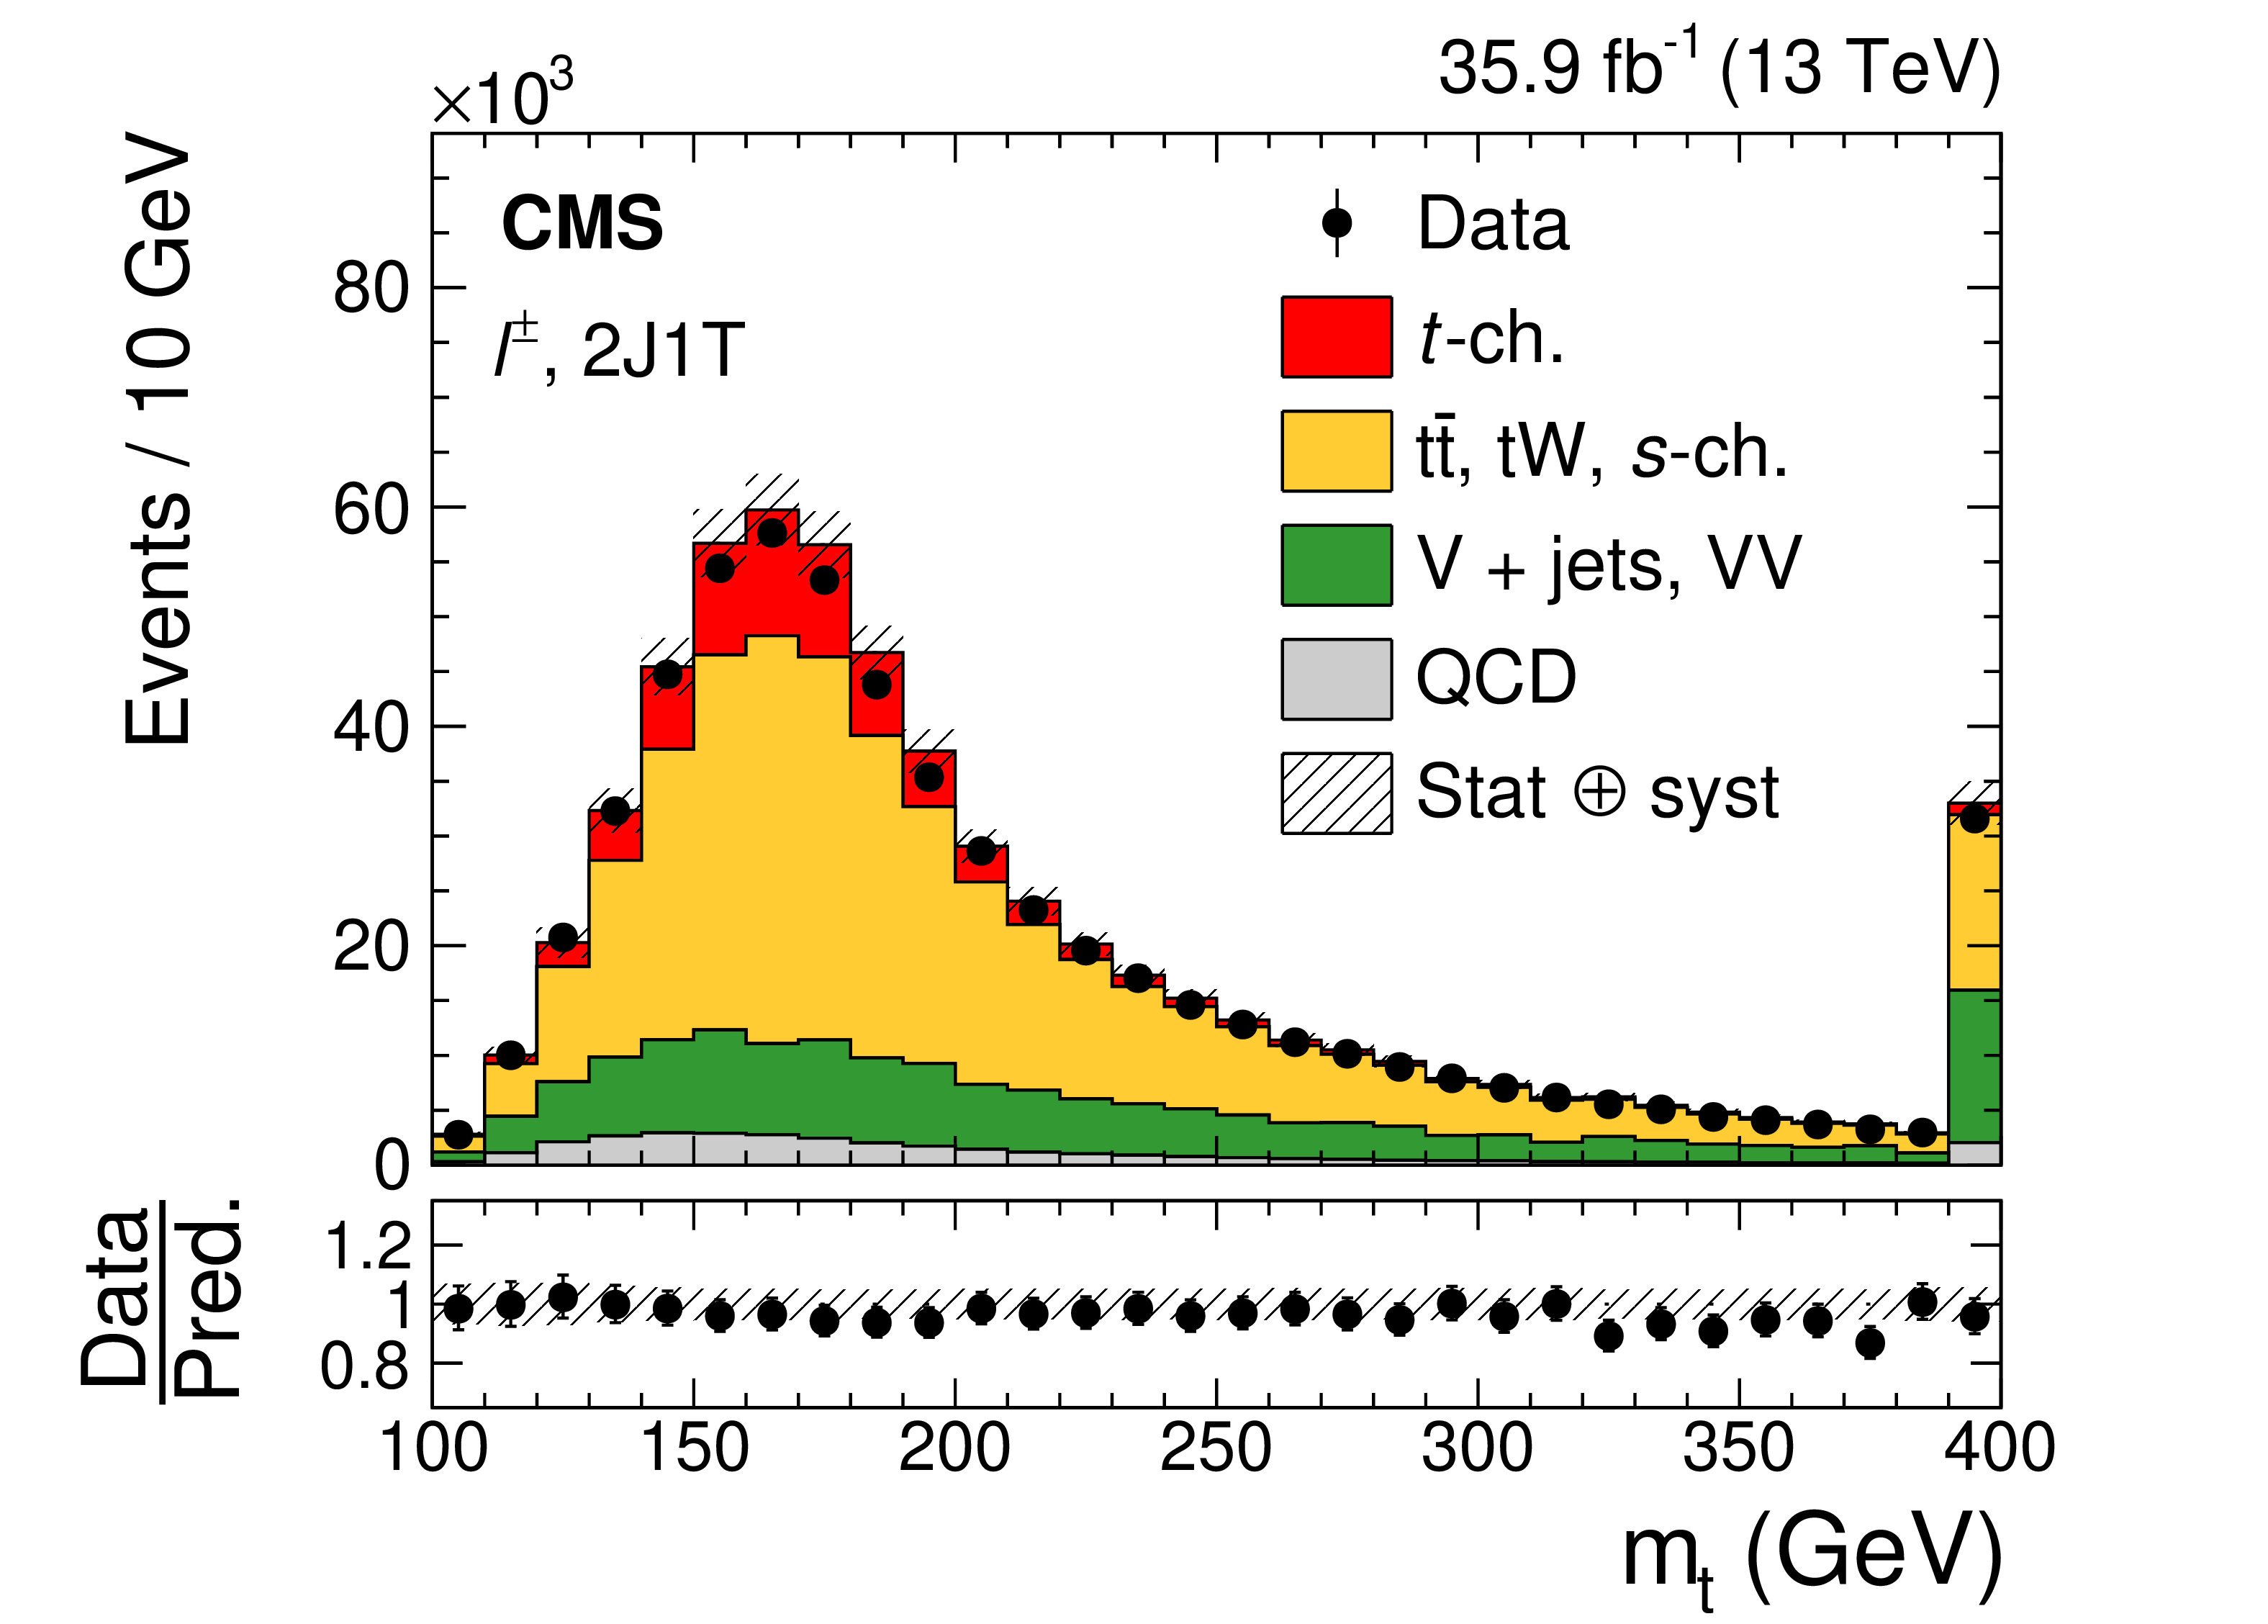
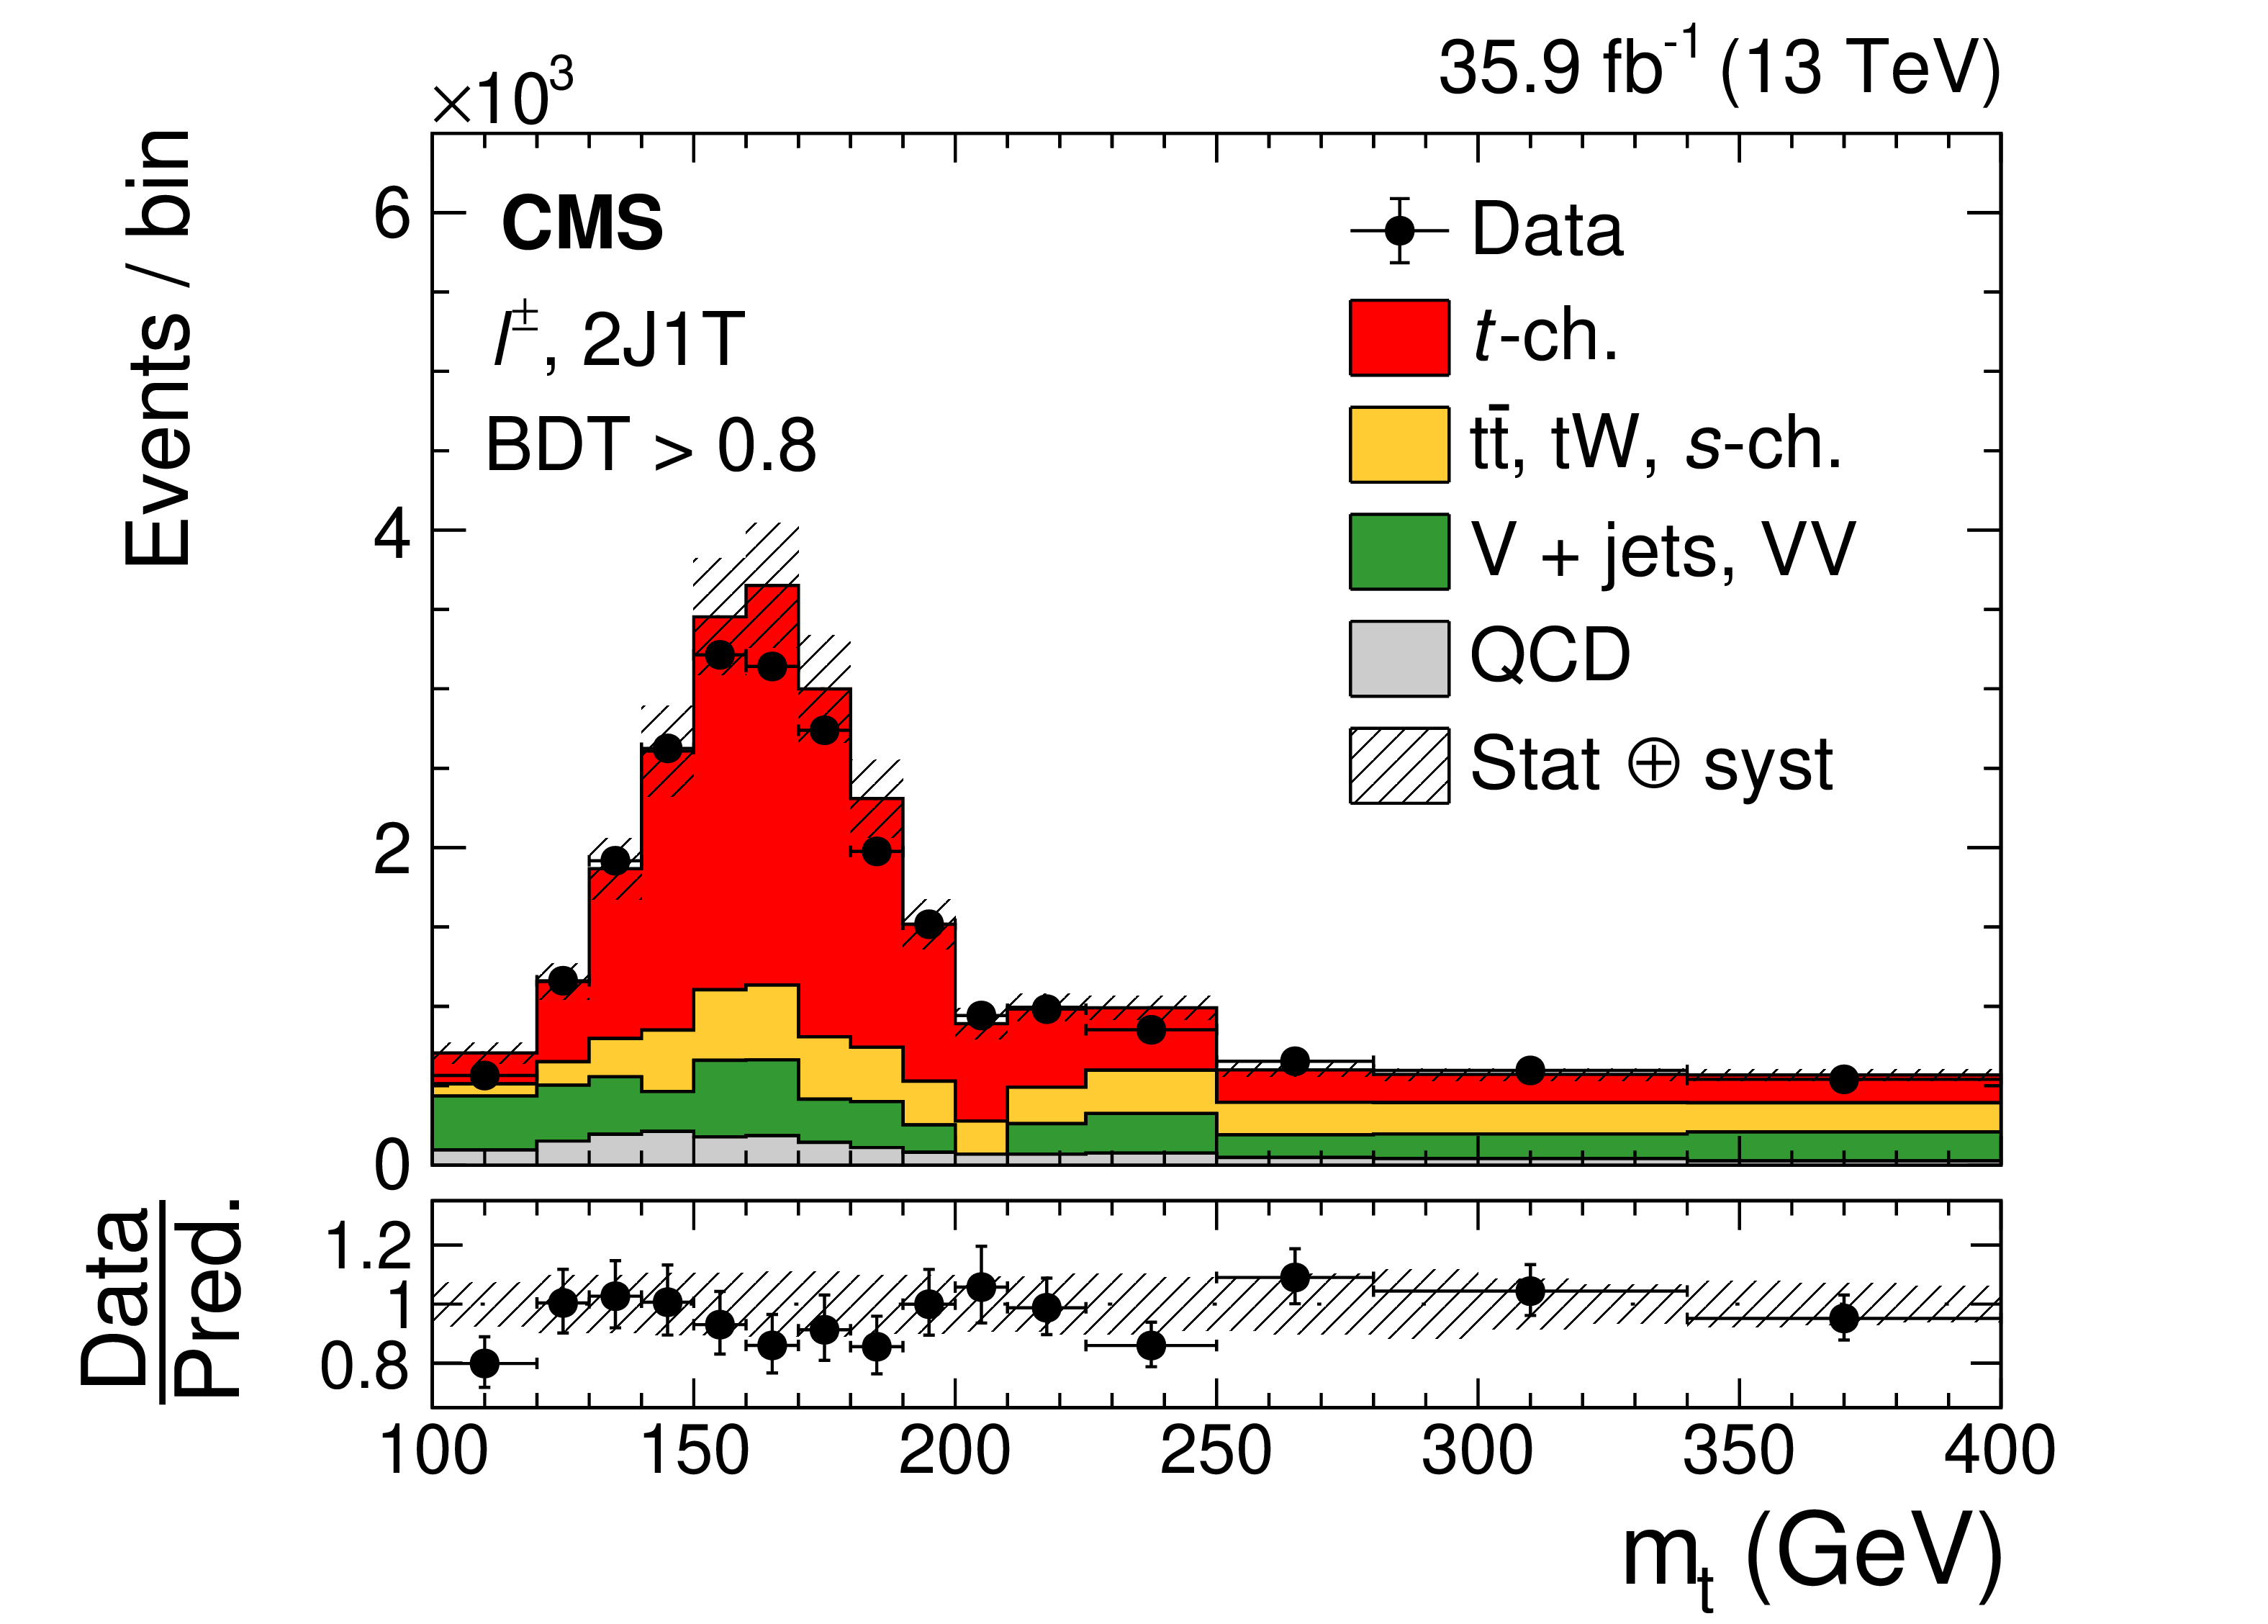
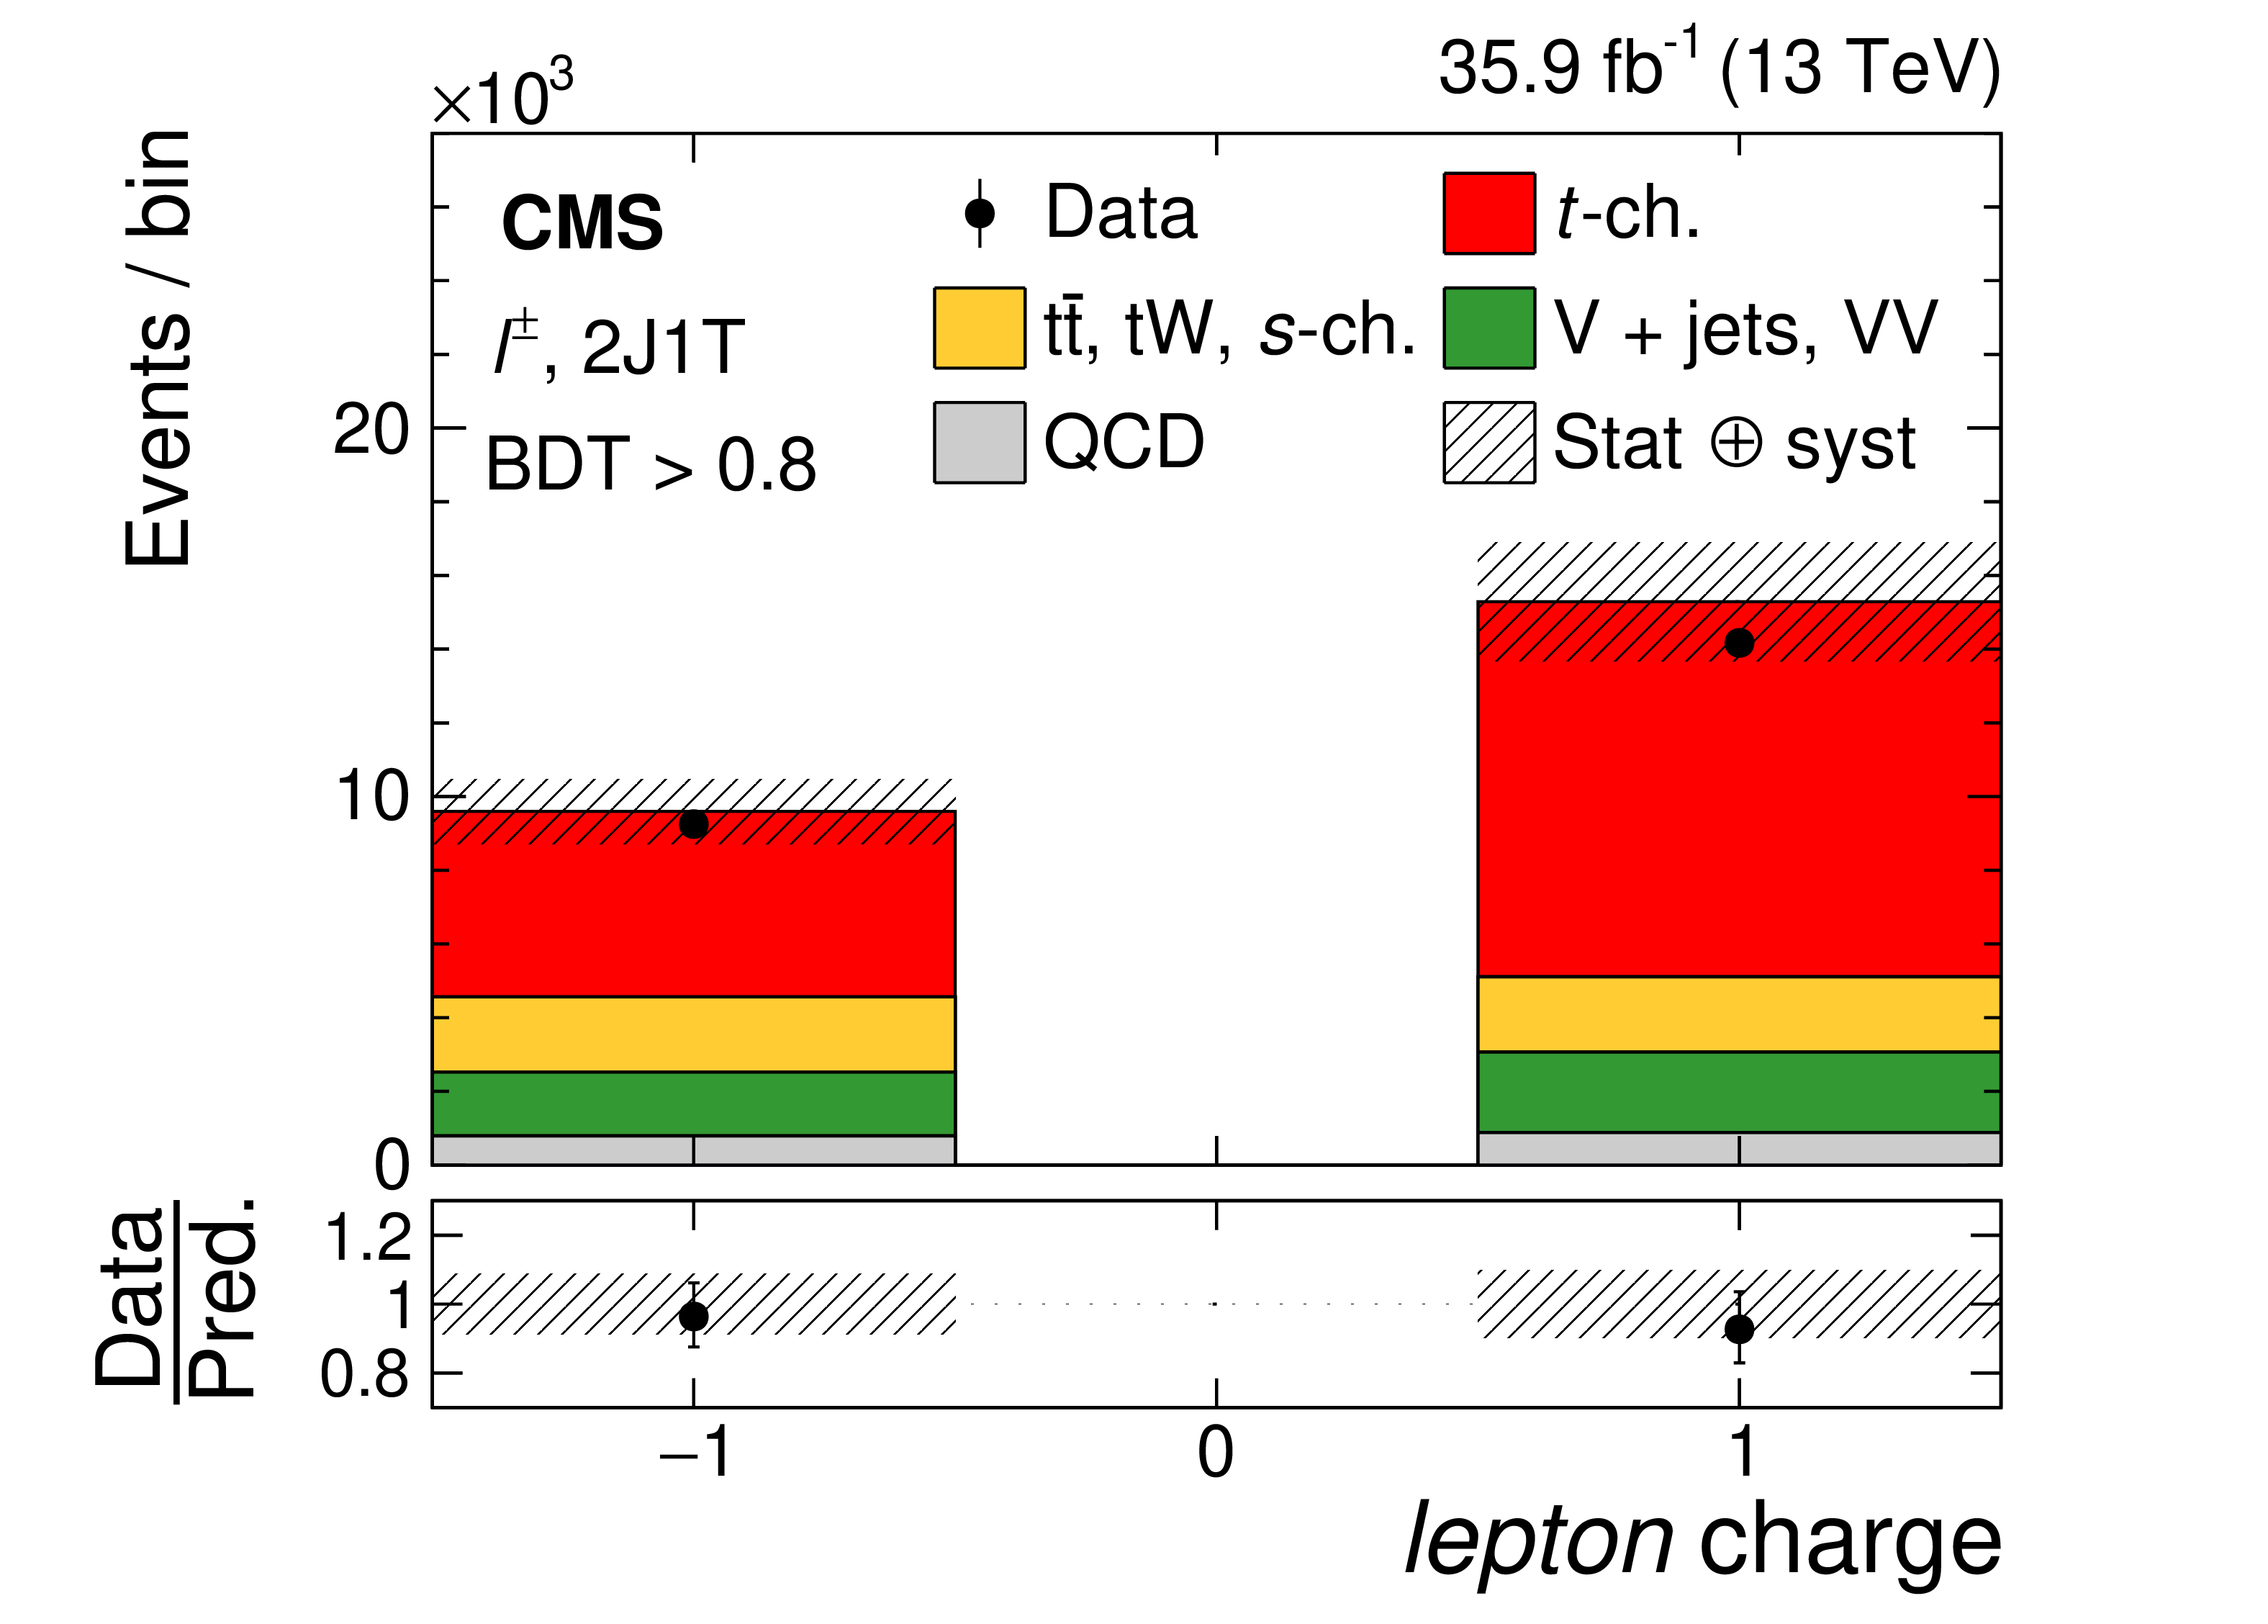
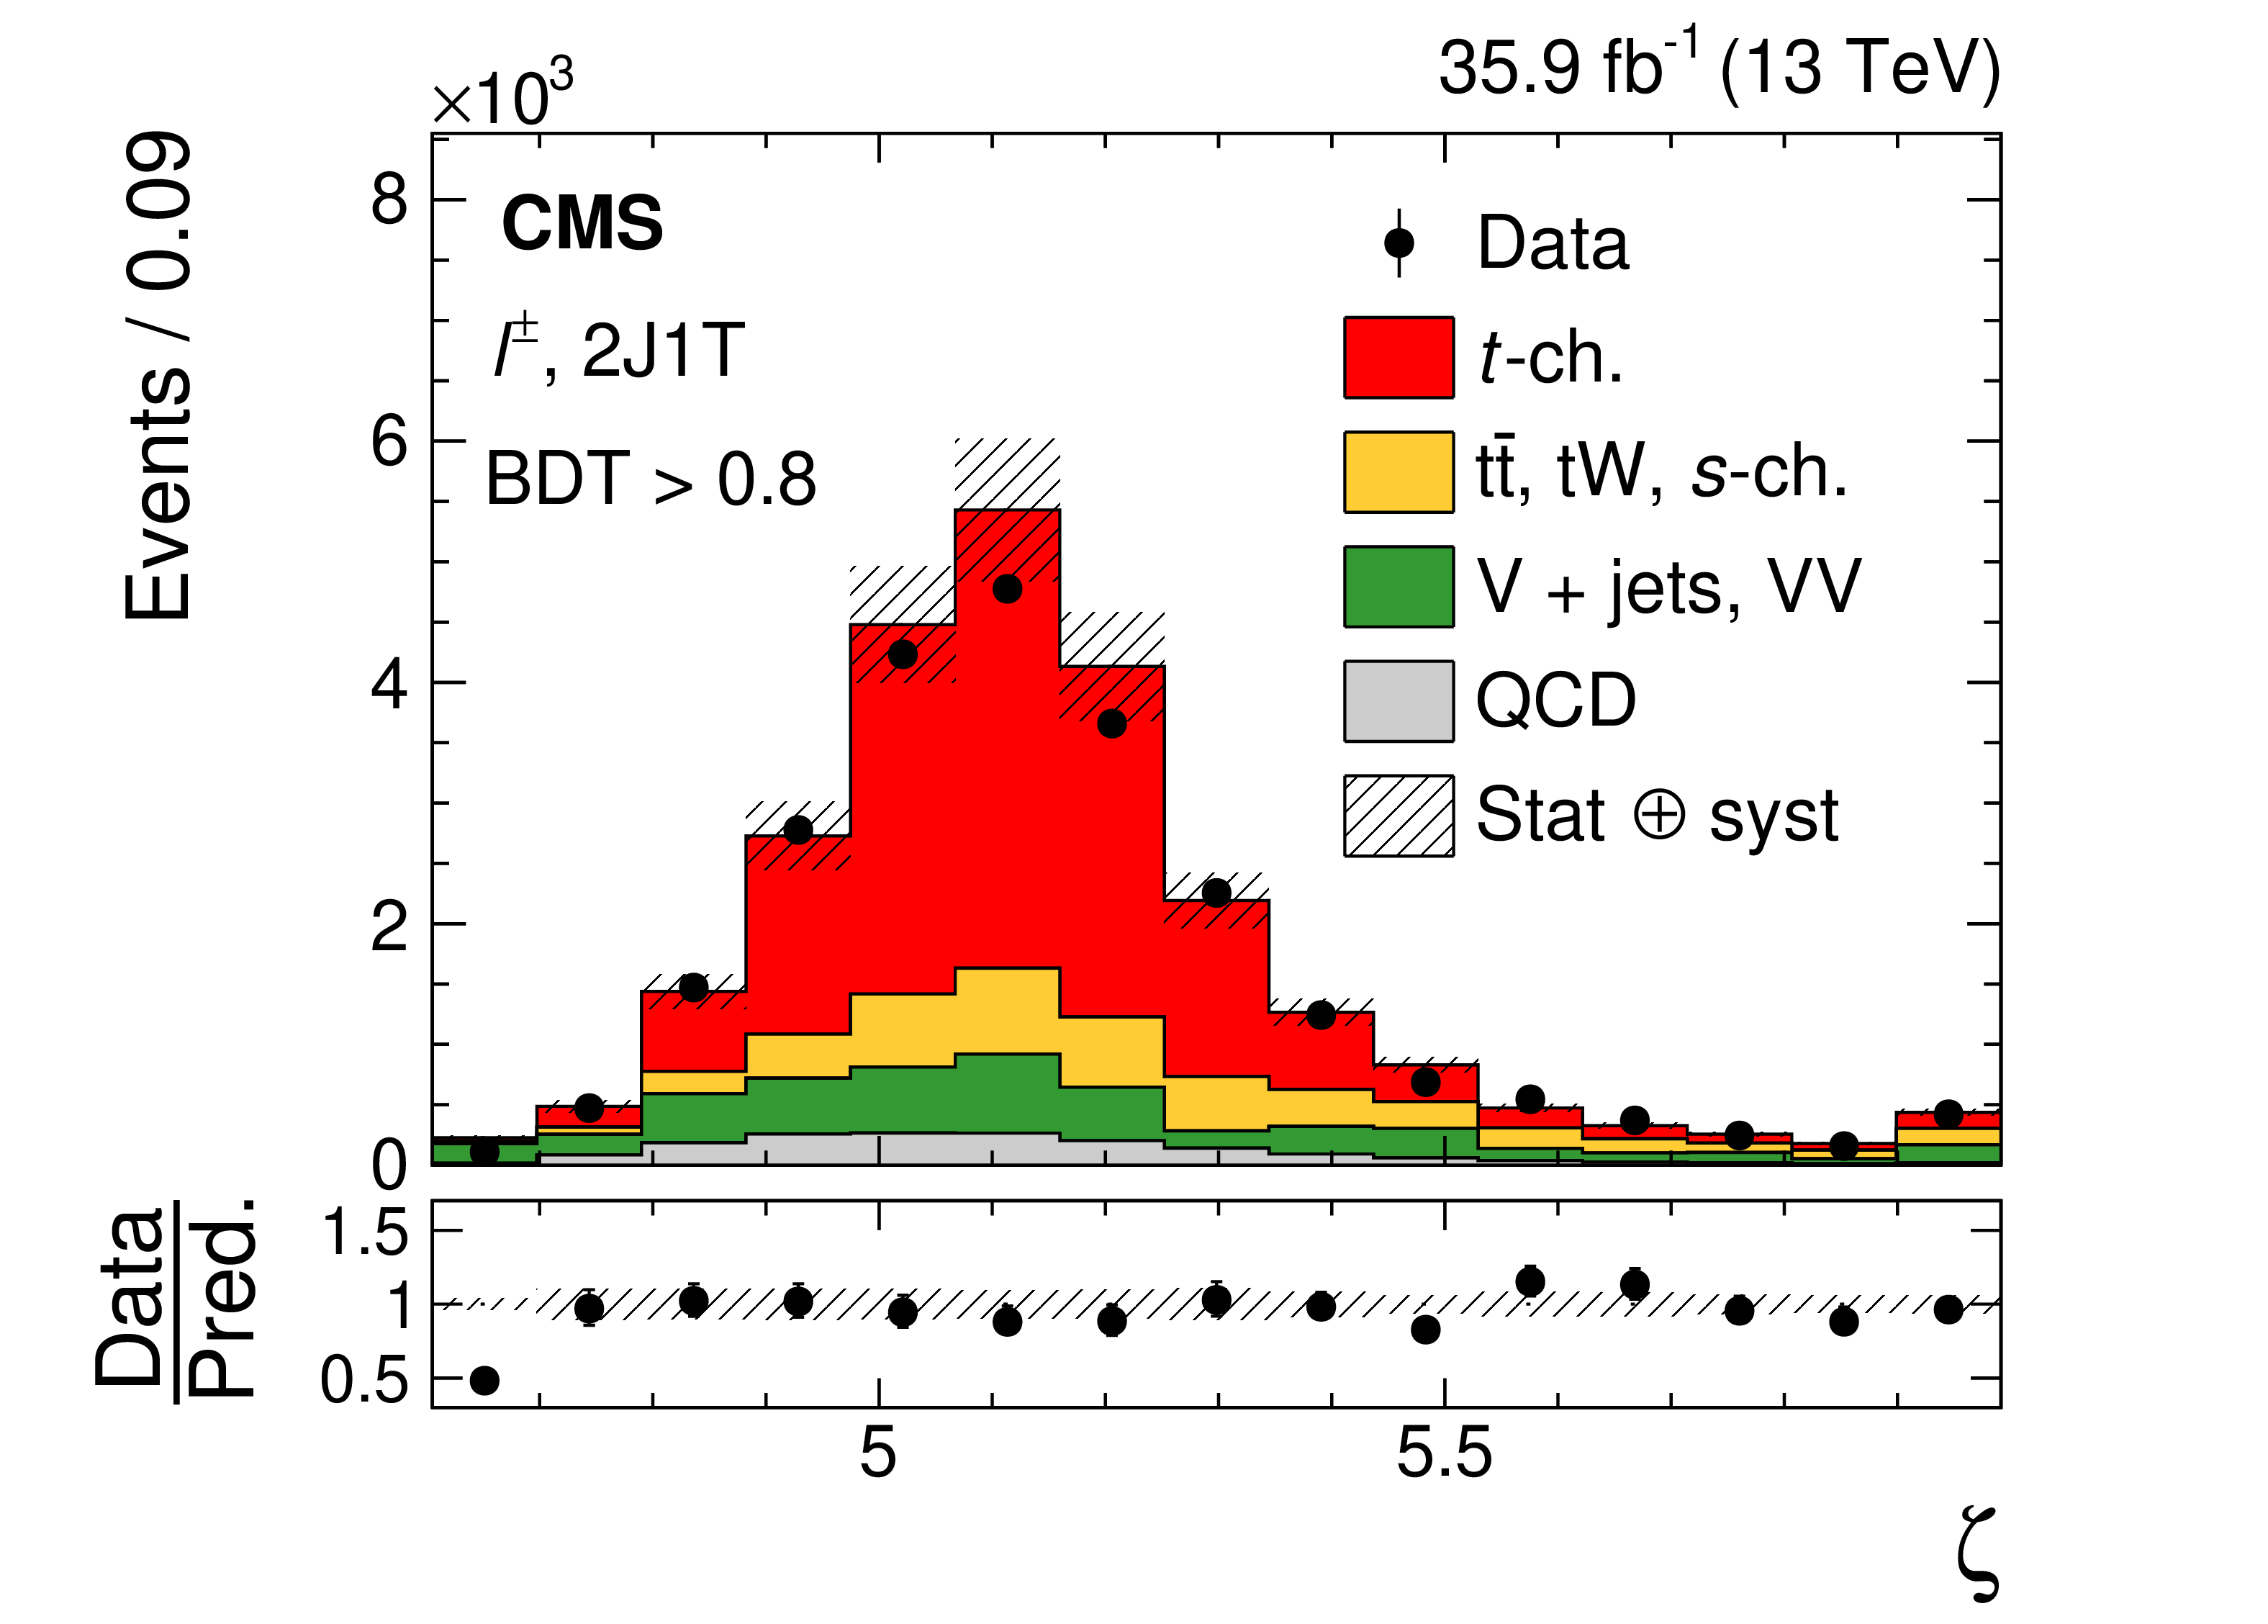
Figure 6:
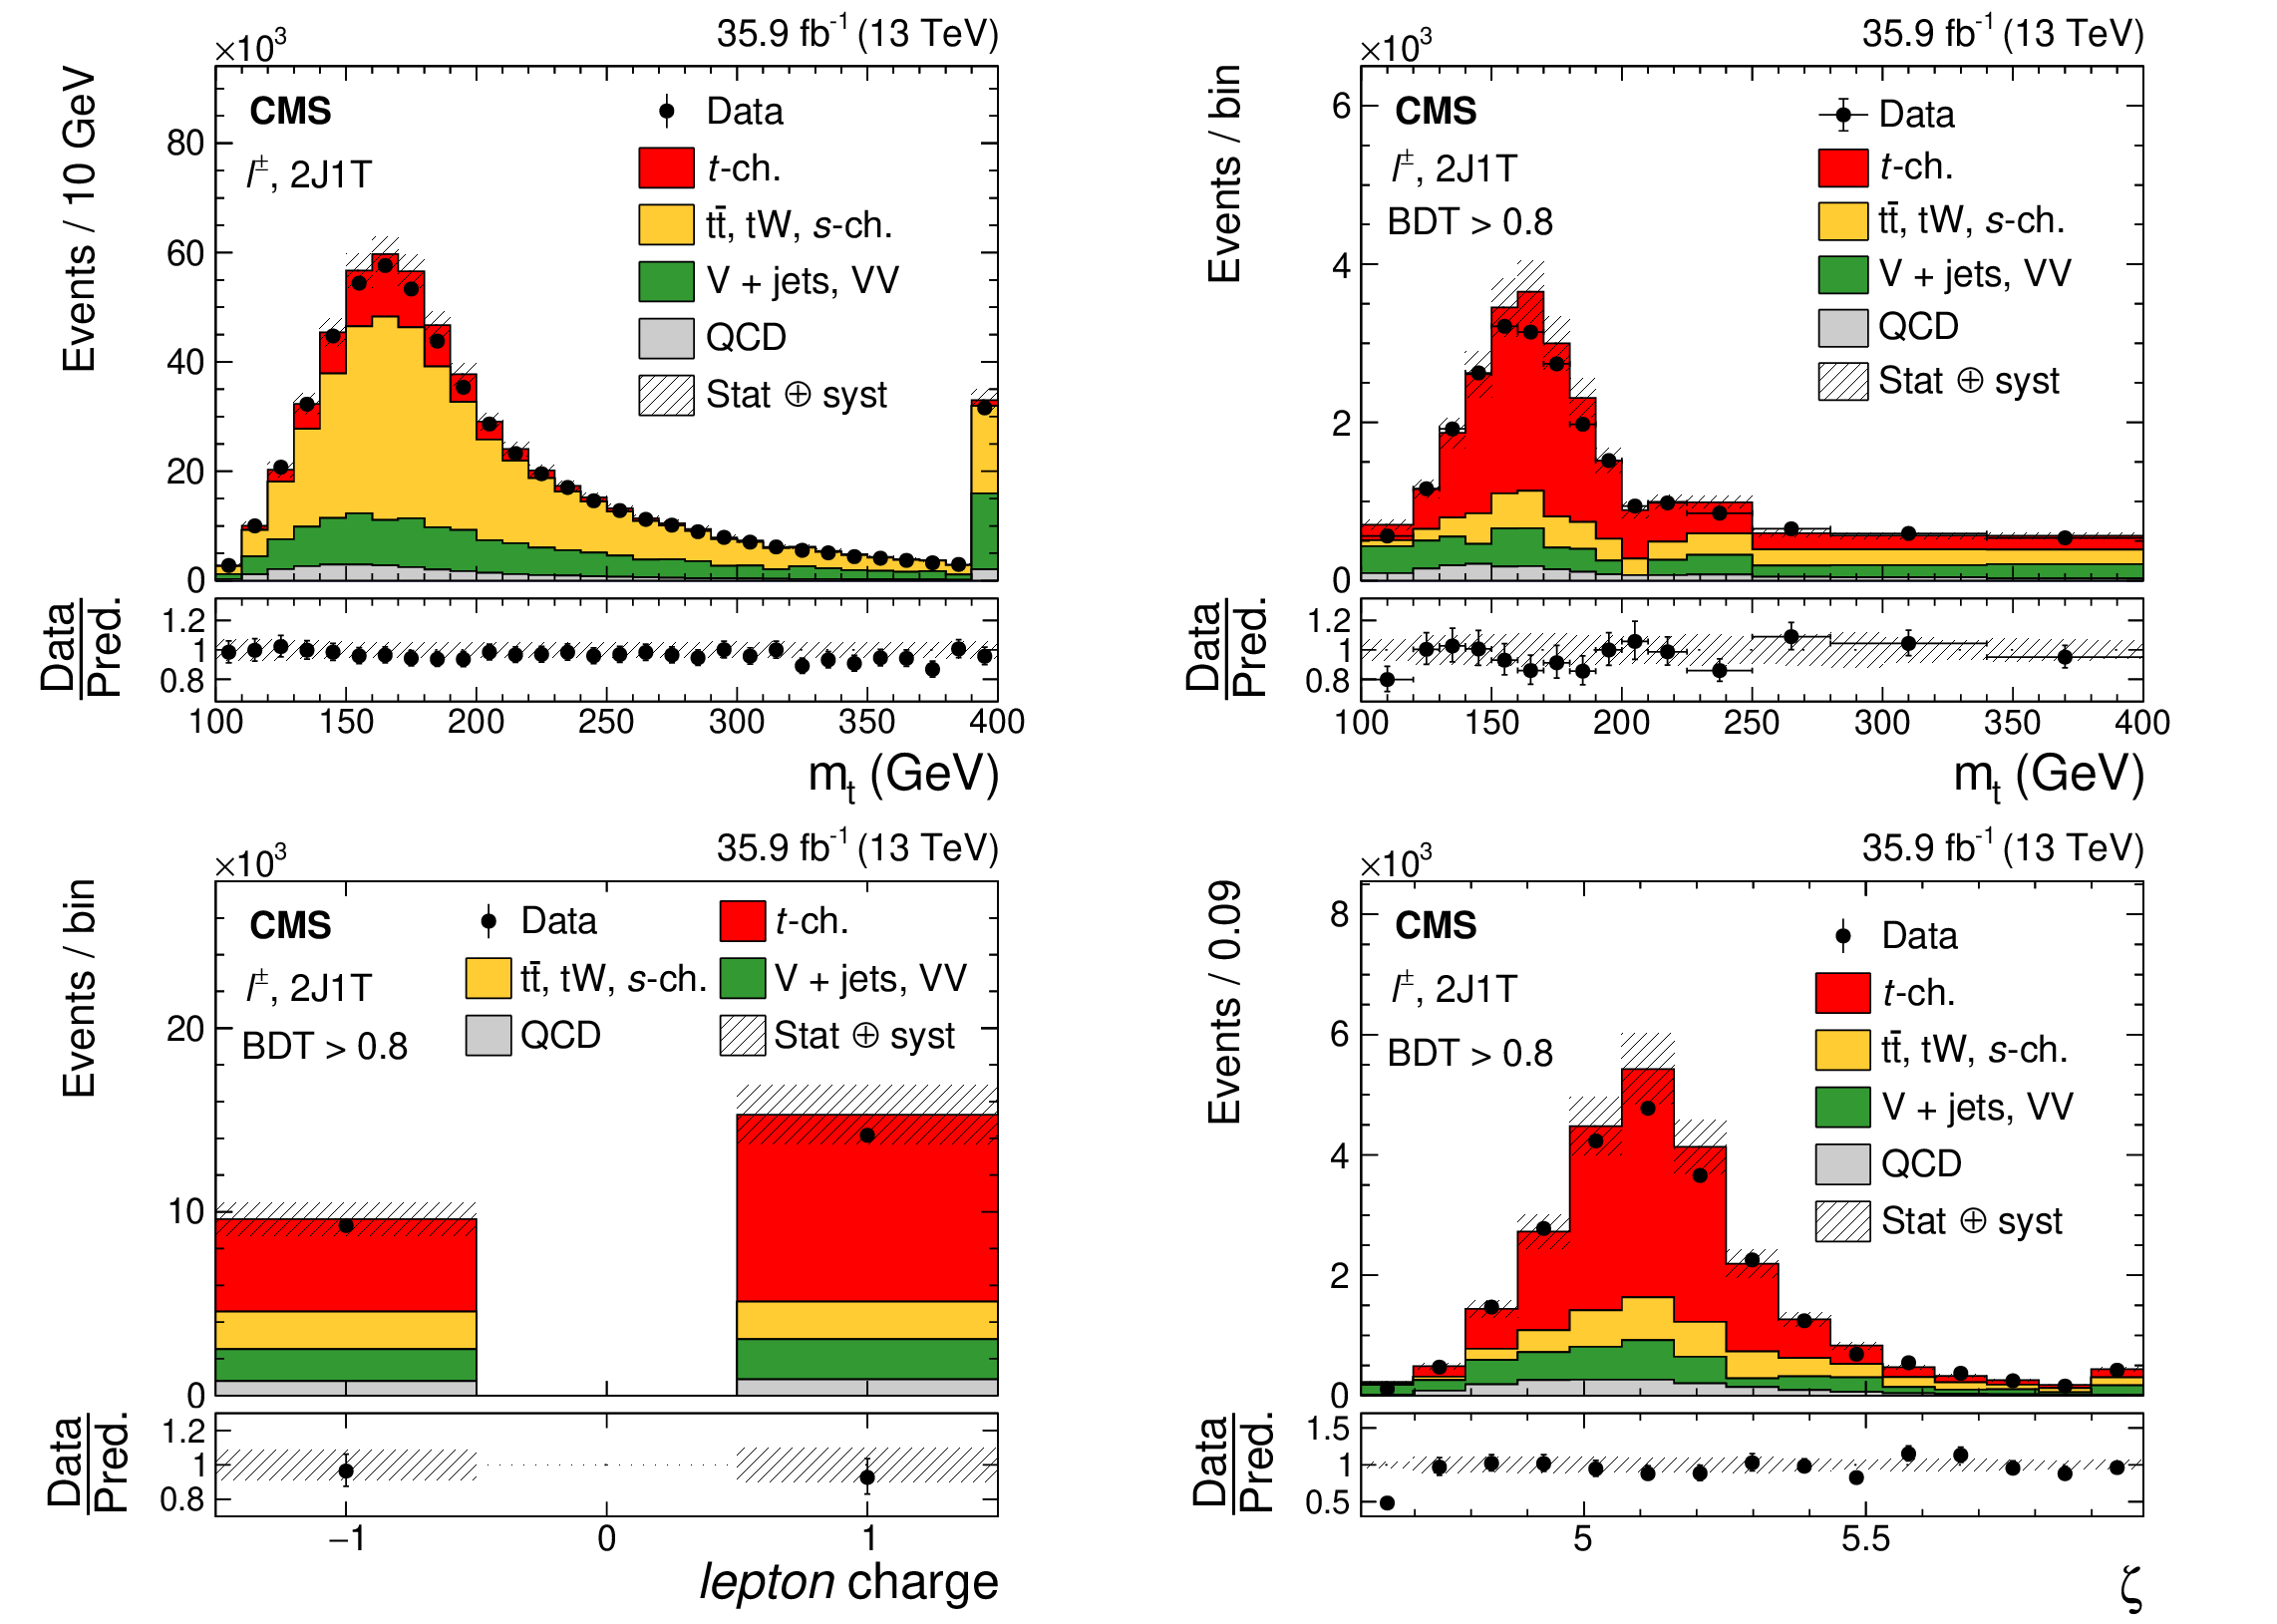
Reconstructed ${m_{\mathrm{t}}}$ distributions before (upper-left) and after (upper-right) applying the optimized BDT selection from data (points) and simulation (colored histograms) are shown in the upper row. The lower-left plot shows the event yields per lepton charge in data and simulation after optimized BDT selection. Data-to-simulation comparison of the fit variable $\zeta \ = \ \ln({m_{\mathrm{t}}} /\text{1 GeV})$ inclusive of lepton charge after optimized BDT selection is presented in the lower right plot. The horizontal bars in the upper-right plot indicate the variable bin width. The first and last bins include the underflow and overflow, respectively, for each plot. The bands denote a quadrature sum of the statistical and systematic uncertainties in the prediction. The lower panels show the ratio of the data to the prediction. The deviation from unity seen in the first bins of the upper-right and lower-right ratio plots arises because of significantly less underflow events in the data compared to the simulation. |
png pdf |
Figure 6-a:
Reconstructed ${m_{\mathrm{t}}}$ distributions before applying the optimized BDT selection from data (points) and simulation (colored histograms). The first and last bins include the underflow and overflow, respectively. The bands denote a quadrature sum of the statistical and systematic uncertainties in the prediction. The lower panel shows the ratio of the data to the prediction. |
png pdf |
Figure 6-b:
Reconstructed ${m_{\mathrm{t}}}$ distributions after applying the optimized BDT selection from data (points) and simulation (colored histograms). The horizontal bars indicate the variable bin width. The first and last bins include the underflow and overflow, respectively. The bands denote a quadrature sum of the statistical and systematic uncertainties in the prediction. The lower panel shows the ratio of the data to the prediction. The deviation from unity seen in the first bin arises because of significantly less underflow events in the data compared to the simulation. |
png pdf |
Figure 6-c:
The plot shows the event yields per lepton charge in data and simulation after optimized BDT selection. The bands denote a quadrature sum of the statistical and systematic uncertainties in the prediction. The lower panel shows the ratio of the data to the prediction. |
png pdf |
Figure 6-d:
Data-to-simulation comparison of the fit variable $\zeta \ =\ \ln({m_{\mathrm{t}}} /\text{1 GeV})$ inclusive of lepton charge after optimized BDT selection. The first and last bins include the underflow and overflow, respectively. The bands denote a quadrature sum of the statistical and systematic uncertainties in the prediction. The lower panel shows the ratio of the data to the prediction. The deviation from unity seen in the first bin arises because of significantly less underflow events in the data compared to the simulation. |
png pdf |
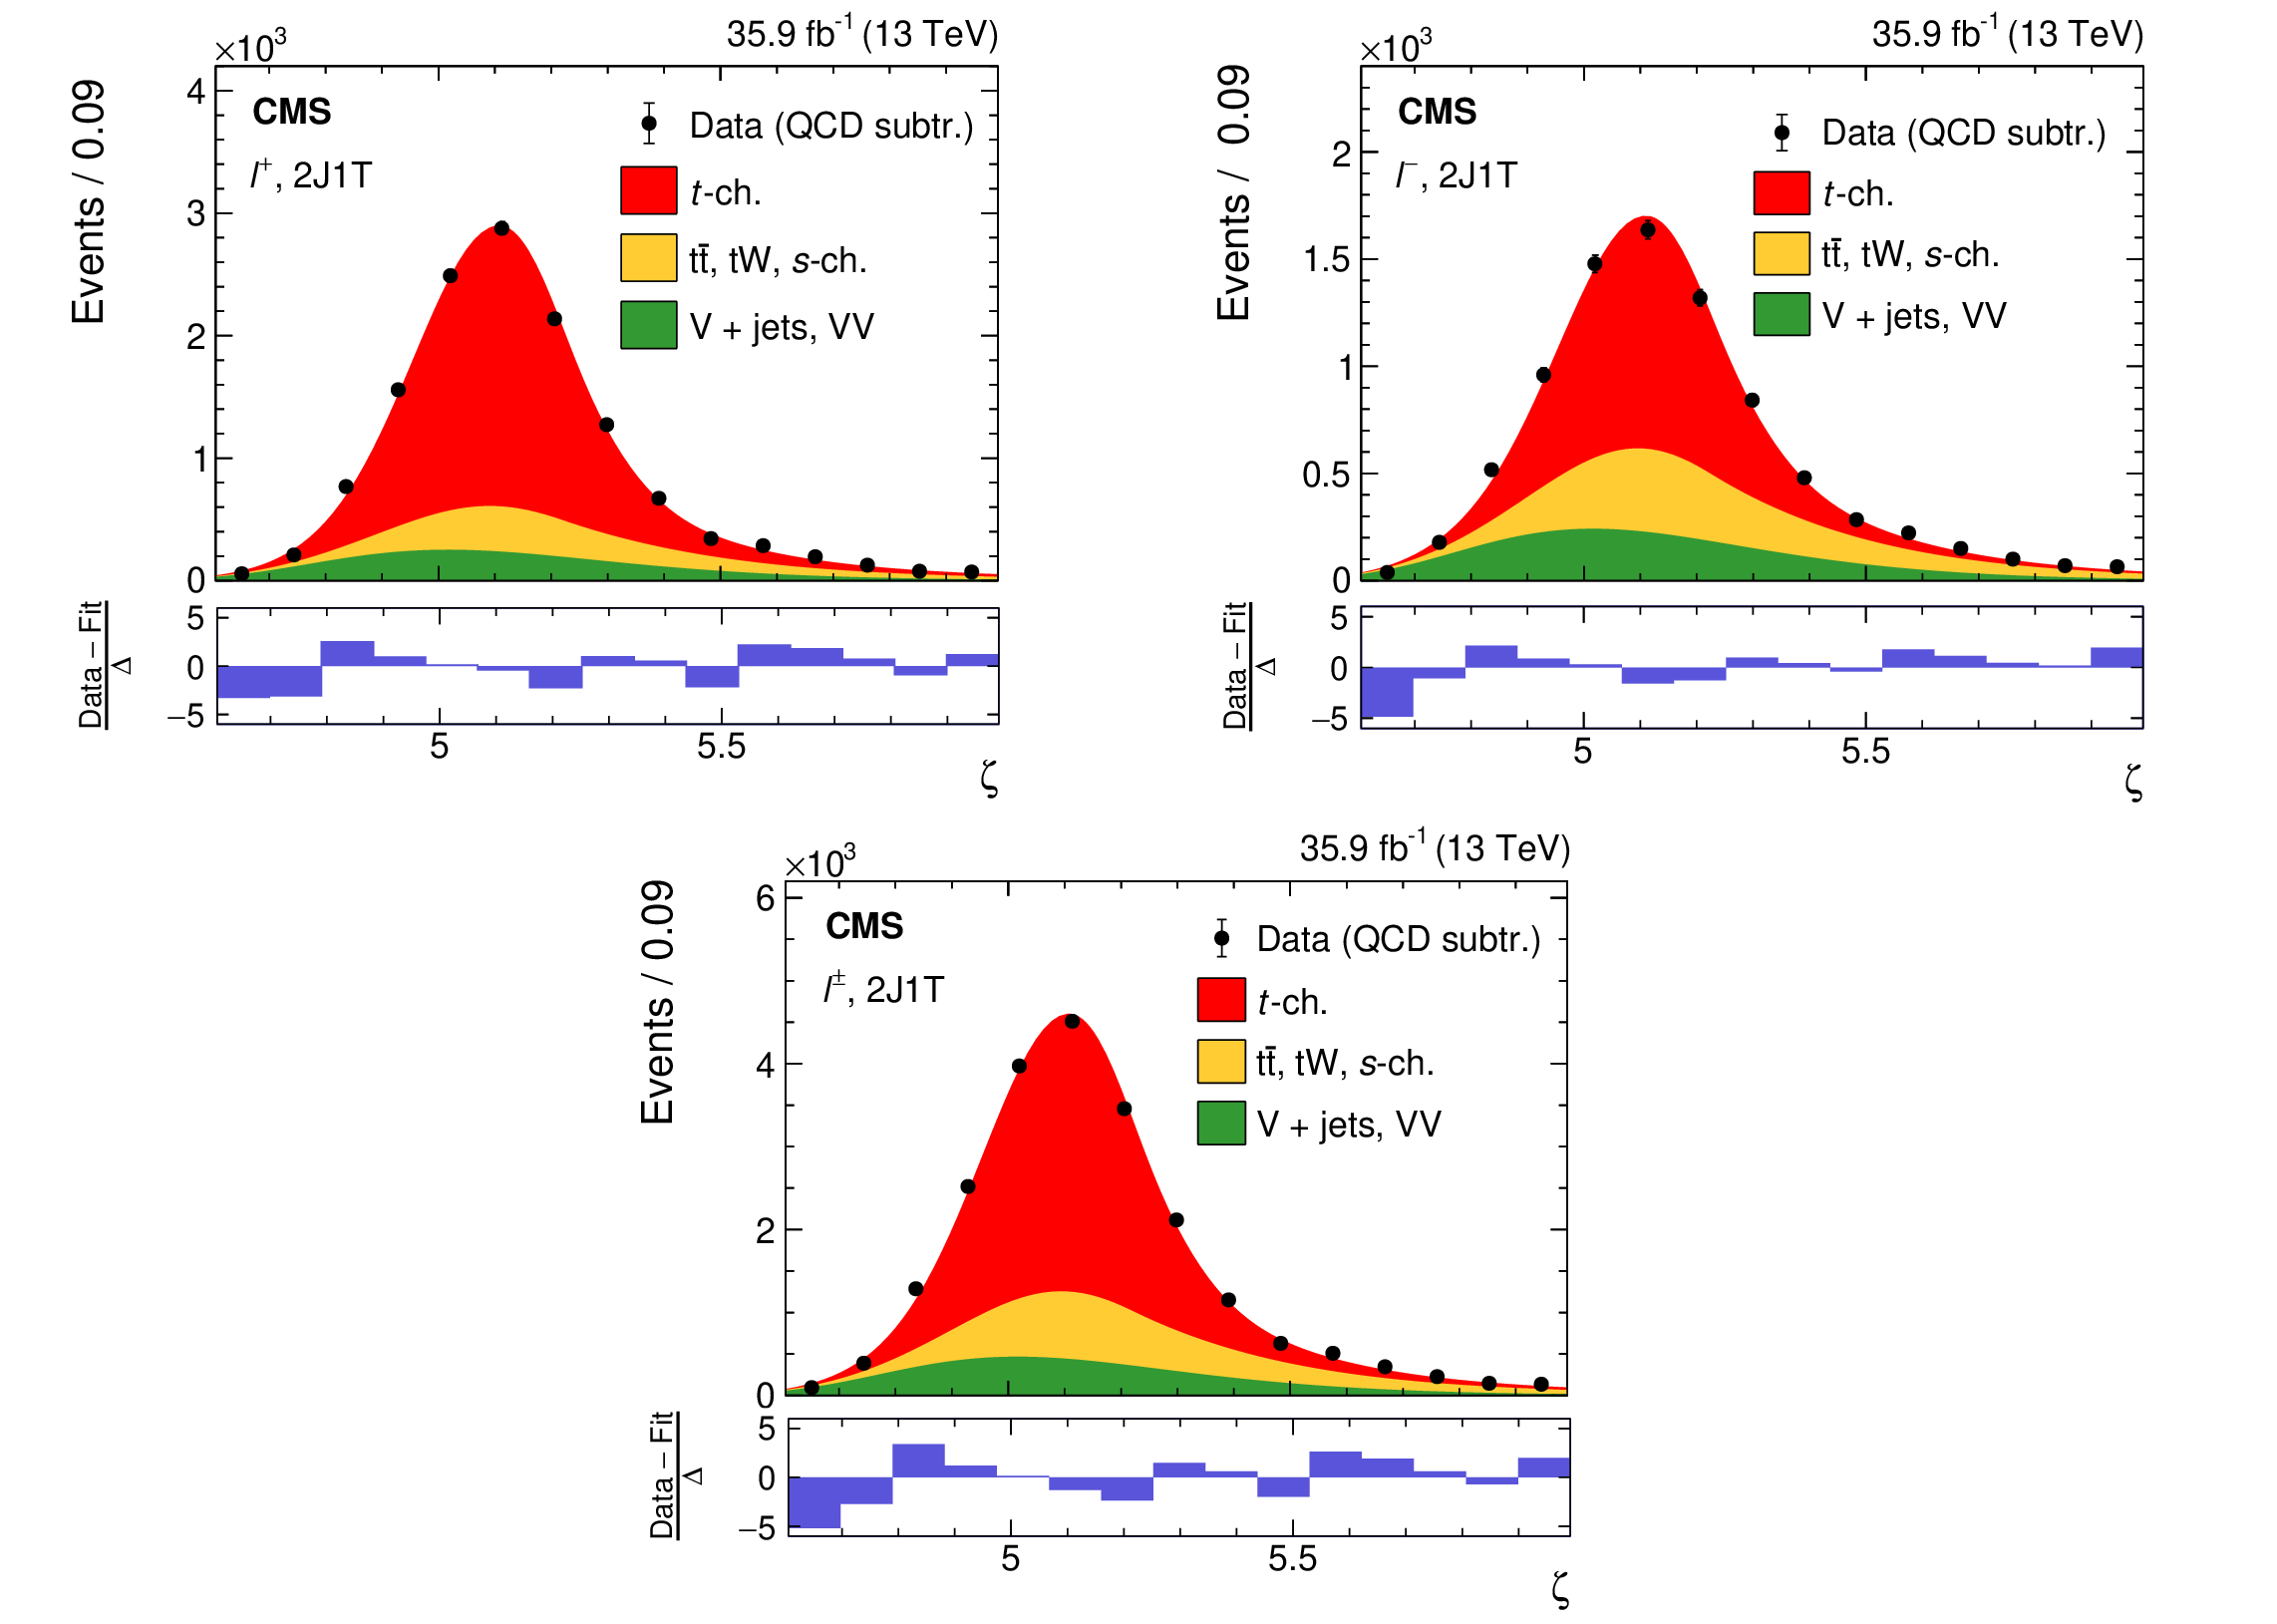
Figure 7:
Postfit distributions of $\zeta \ =\ \ln({m_{\mathrm{t}}} /\text{1 GeV})$ for the $\ell^{+}$ (upper left), $\ell^{-}$ (upper right), and $\ell^{\pm}$ (lower row) final states for signal and background processes compared to data in the 2J1T category. The lower panels show the pulls. The postfit signal and background shapes for each lepton flavor are combined in these plots for a comparison with data for the three different cases based on the lepton charge. |

png pdf |
Figure 7-a:
Postfit distribution of $\zeta \ =\ \ln({m_{\mathrm{t}}} /\text{1 GeV})$ for the $\ell^{+}$ final state for signal and background processes compared to data in the 2J1T category. The lower panel shows the pulls. The postfit signal and background shapes for each lepton flavor are combined for a comparison with data for the three different cases based on the lepton charge. |

png pdf |
Figure 7-b:
Postfit distribution of $\zeta \ =\ \ln({m_{\mathrm{t}}} /\text{1 GeV})$ for the $\ell^{-}$ final state for signal and background processes compared to data in the 2J1T category. The lower panel shows the pulls. The postfit signal and background shapes for each lepton flavor are combined for a comparison with data for the three different cases based on the lepton charge. |

png pdf |
Figure 7-c:
Postfit distribution of $\zeta \ =\ \ln({m_{\mathrm{t}}} /\text{1 GeV})$ for the $\ell^{\pm}$ final state for signal and background processes compared to data in the 2J1T category. The lower panel shows the pulls. The postfit signal and background shapes for each lepton flavor are combined for a comparison with data for the three different cases based on the lepton charge. |
png pdf |
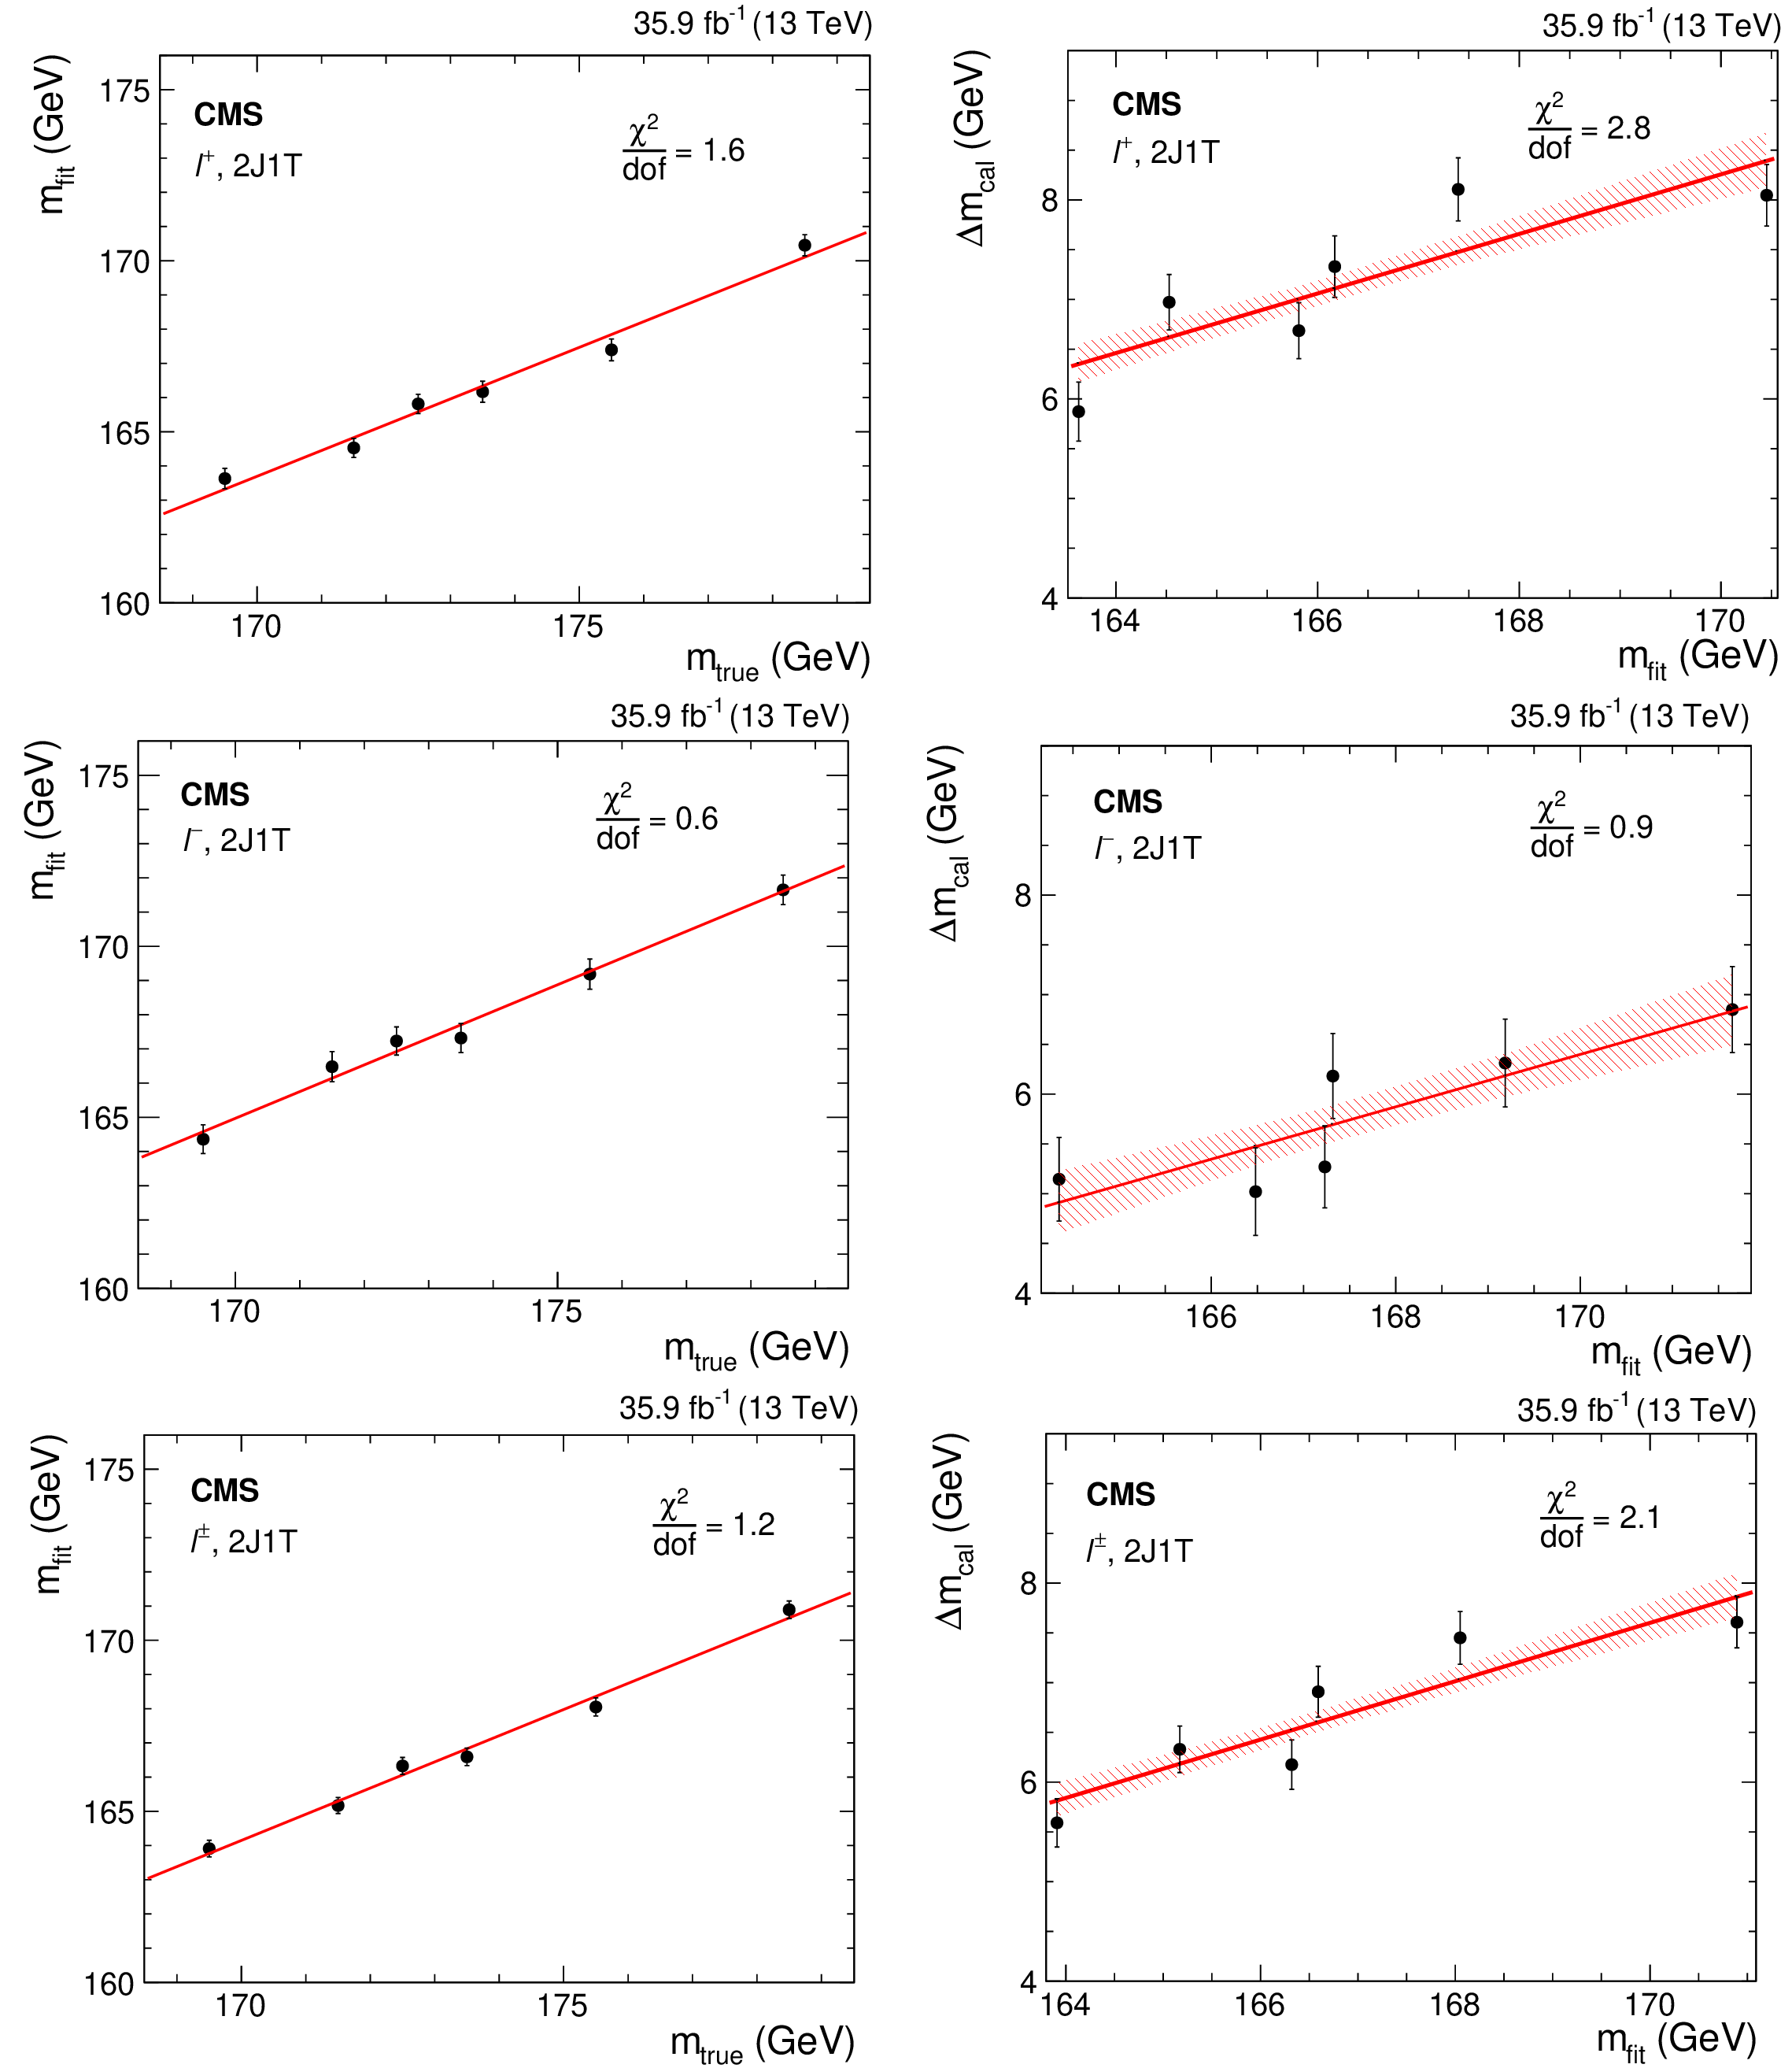
Figure 8:
Test of the linearity of the postfit top quark mass $m_{\text {fit}}$ for different values of true mass $m_{\text {true}}$ (left), and the resulting mass calibration $\Delta m_{\mathrm {cal}}$ as a function of $m_{\text {fit}}$ (right) for events in the 2J1T category for the $\ell^{+}$ (upper), $\ell^{-}$ (middle), and $\ell^{\pm}$ (lower) cases. The shaded regions indicate $\pm $1 standard deviations about the central values defined by the red line. The value of the $\chi ^{2}$ per degrees of freedom (dof) from the linear fit is shown in each plot. |
png pdf |
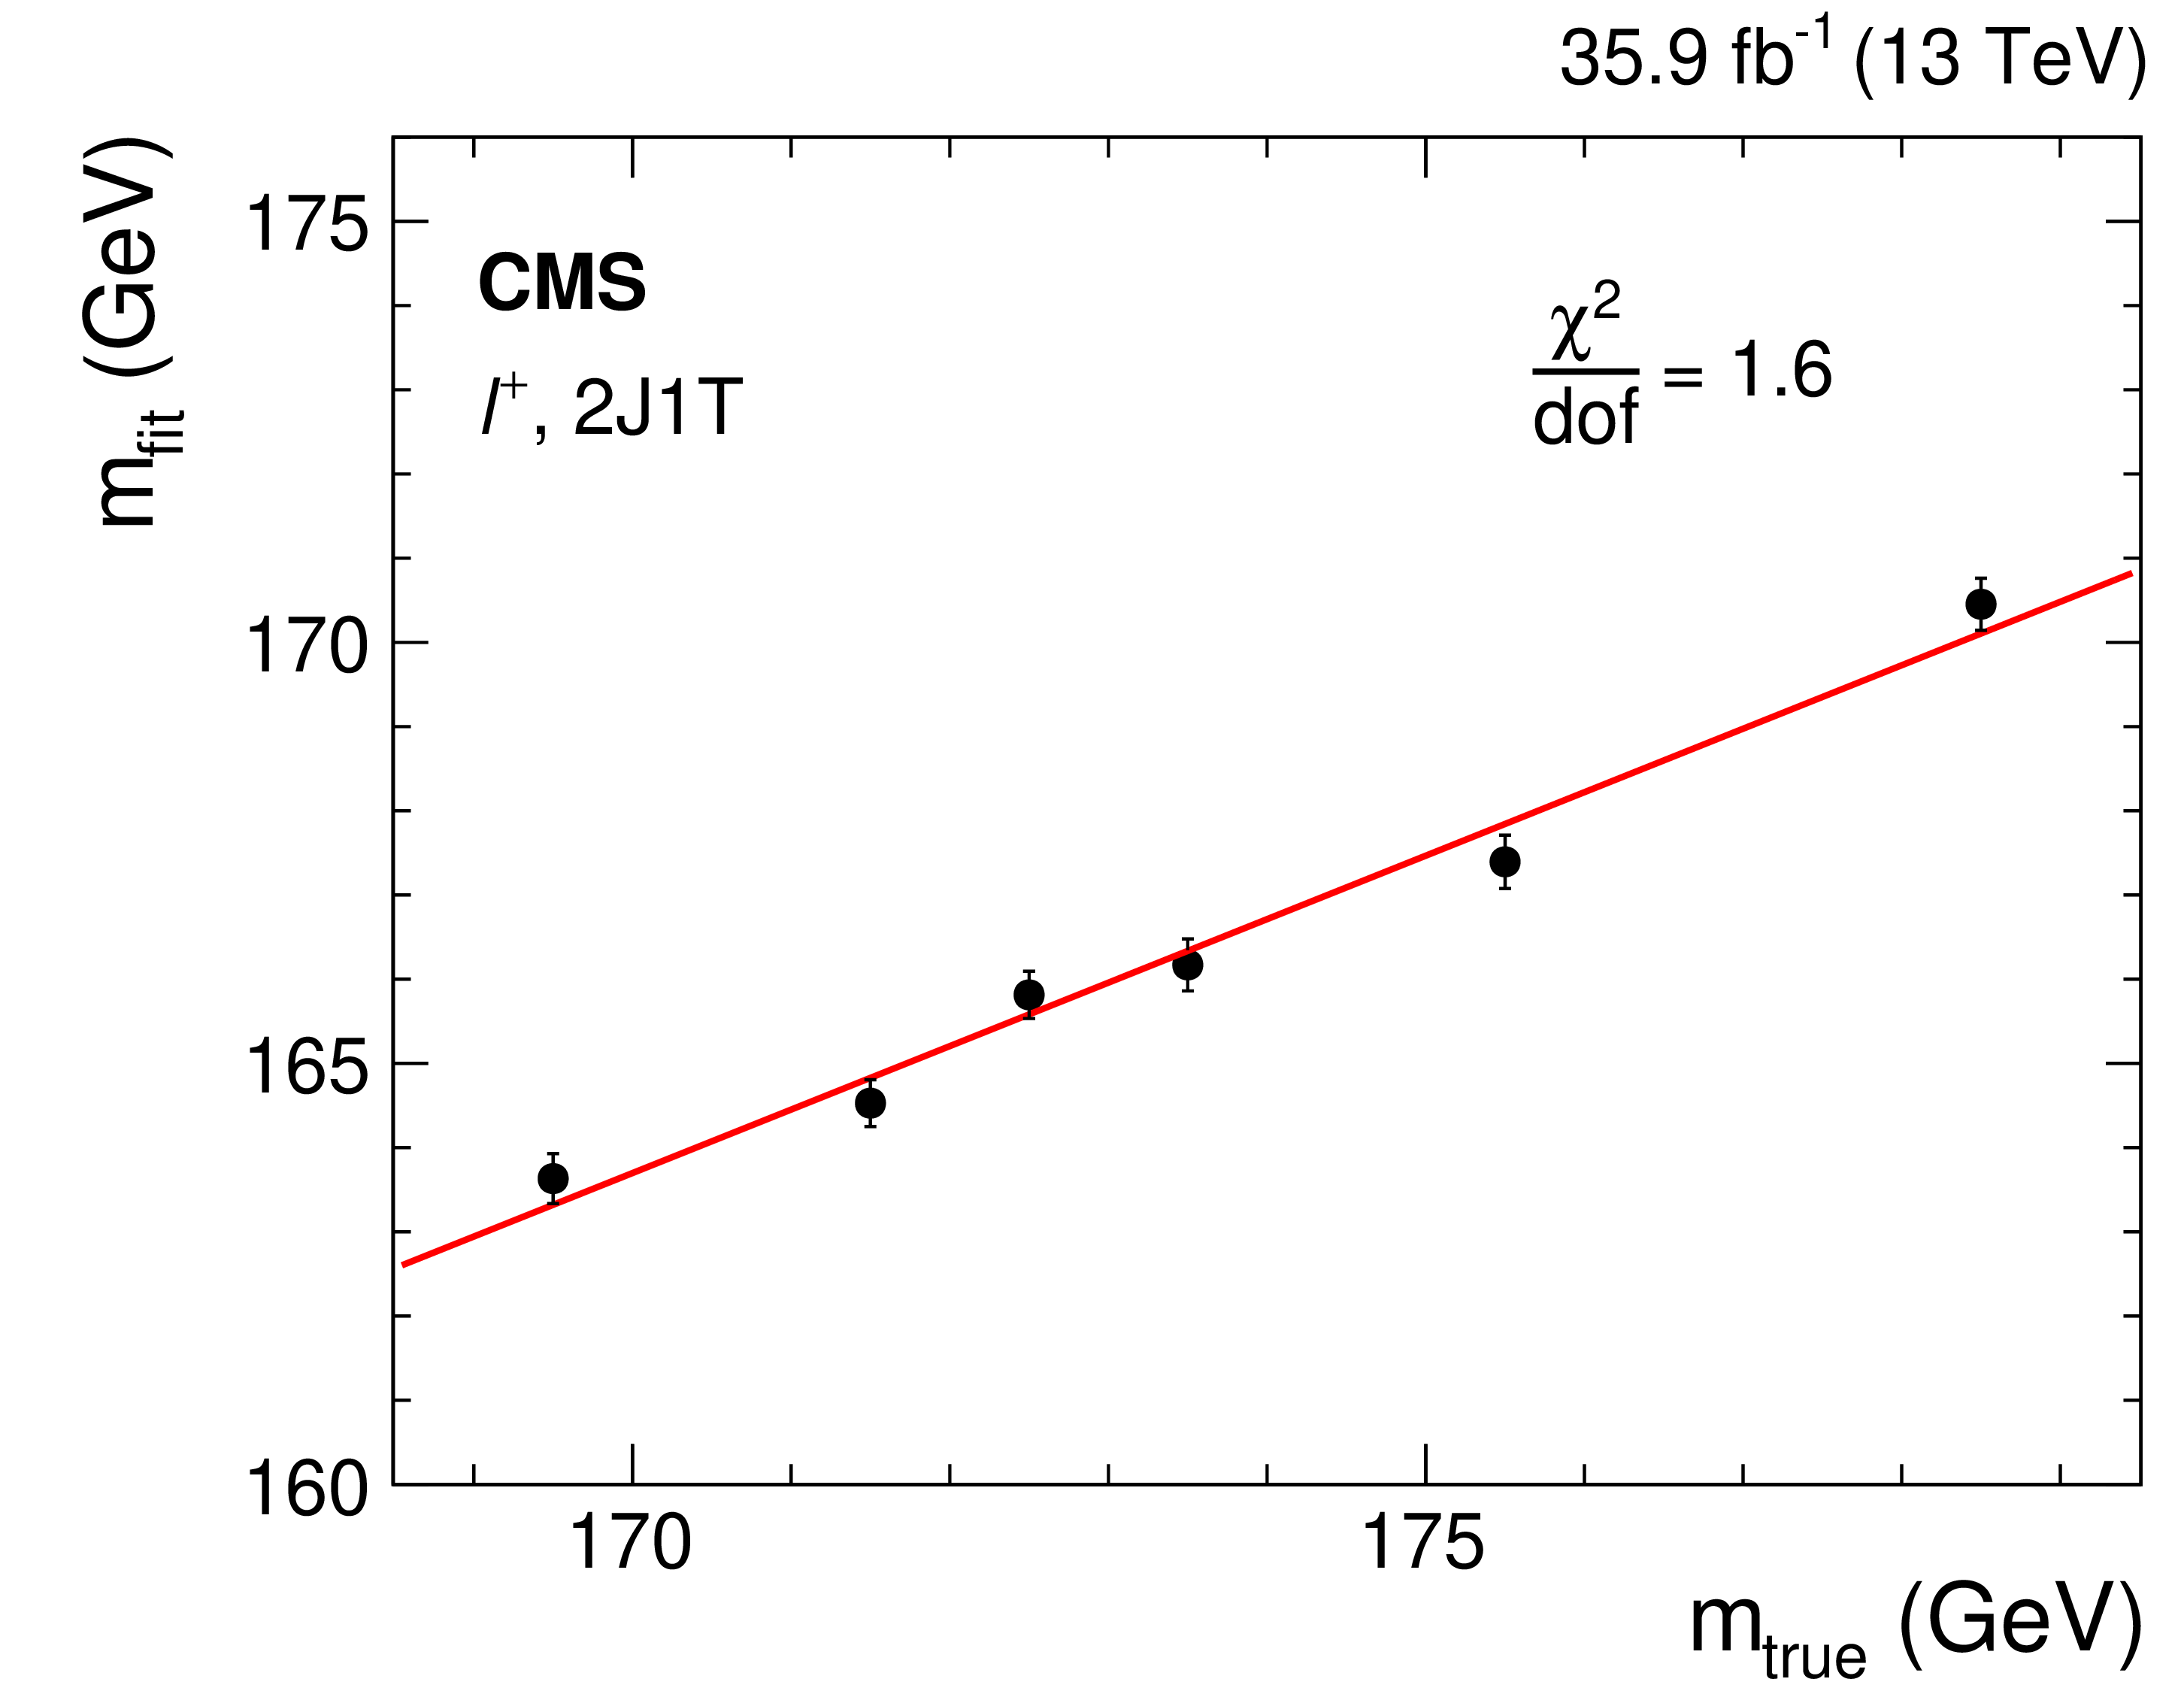
Figure 8-a:
Test of the linearity of the postfit top quark mass $m_{\text {fit}}$ for different values of true mass $m_{\text {true}}$ for events in the 2J1T category for the $\ell^{+}$ case. The shaded region indicates $\pm $1 standard deviations about the central values defined by the red line. The value of the $\chi ^{2}$ per degrees of freedom (dof) from the linear fit is shown. |

png pdf |
Figure 8-b:
Mass calibration $\Delta m_{\mathrm {cal}}$ as a function of $m_{\text {fit}}$ for events in the 2J1T category for the |

png pdf |
Figure 8-c:
Test of the linearity of the postfit top quark mass $m_{\text {fit}}$ for different values of true mass $m_{\text {true}}$ for events in the 2J1T category for the $\ell^{-}$ case. The shaded region indicates $\pm $1 standard deviations about the central values defined by the red line. The value of the $\chi ^{2}$ per degrees of freedom (dof) from the linear fit is shown. |

png pdf |
Figure 8-d:
Mass calibration $\Delta m_{\mathrm {cal}}$ as a function of $m_{\text {fit}}$ for events in the 2J1T category for the |

png pdf |
Figure 8-e:
Test of the linearity of the postfit top quark mass $m_{\text {fit}}$ for different values of true mass $m_{\text {true}}$ for events in the 2J1T category for the $\ell^{\pm}$ case. The shaded region indicates $\pm $1 standard deviations about the central values defined by the red line. The value of the $\chi ^{2}$ per degrees of freedom (dof) from the linear fit is shown. |
png pdf |
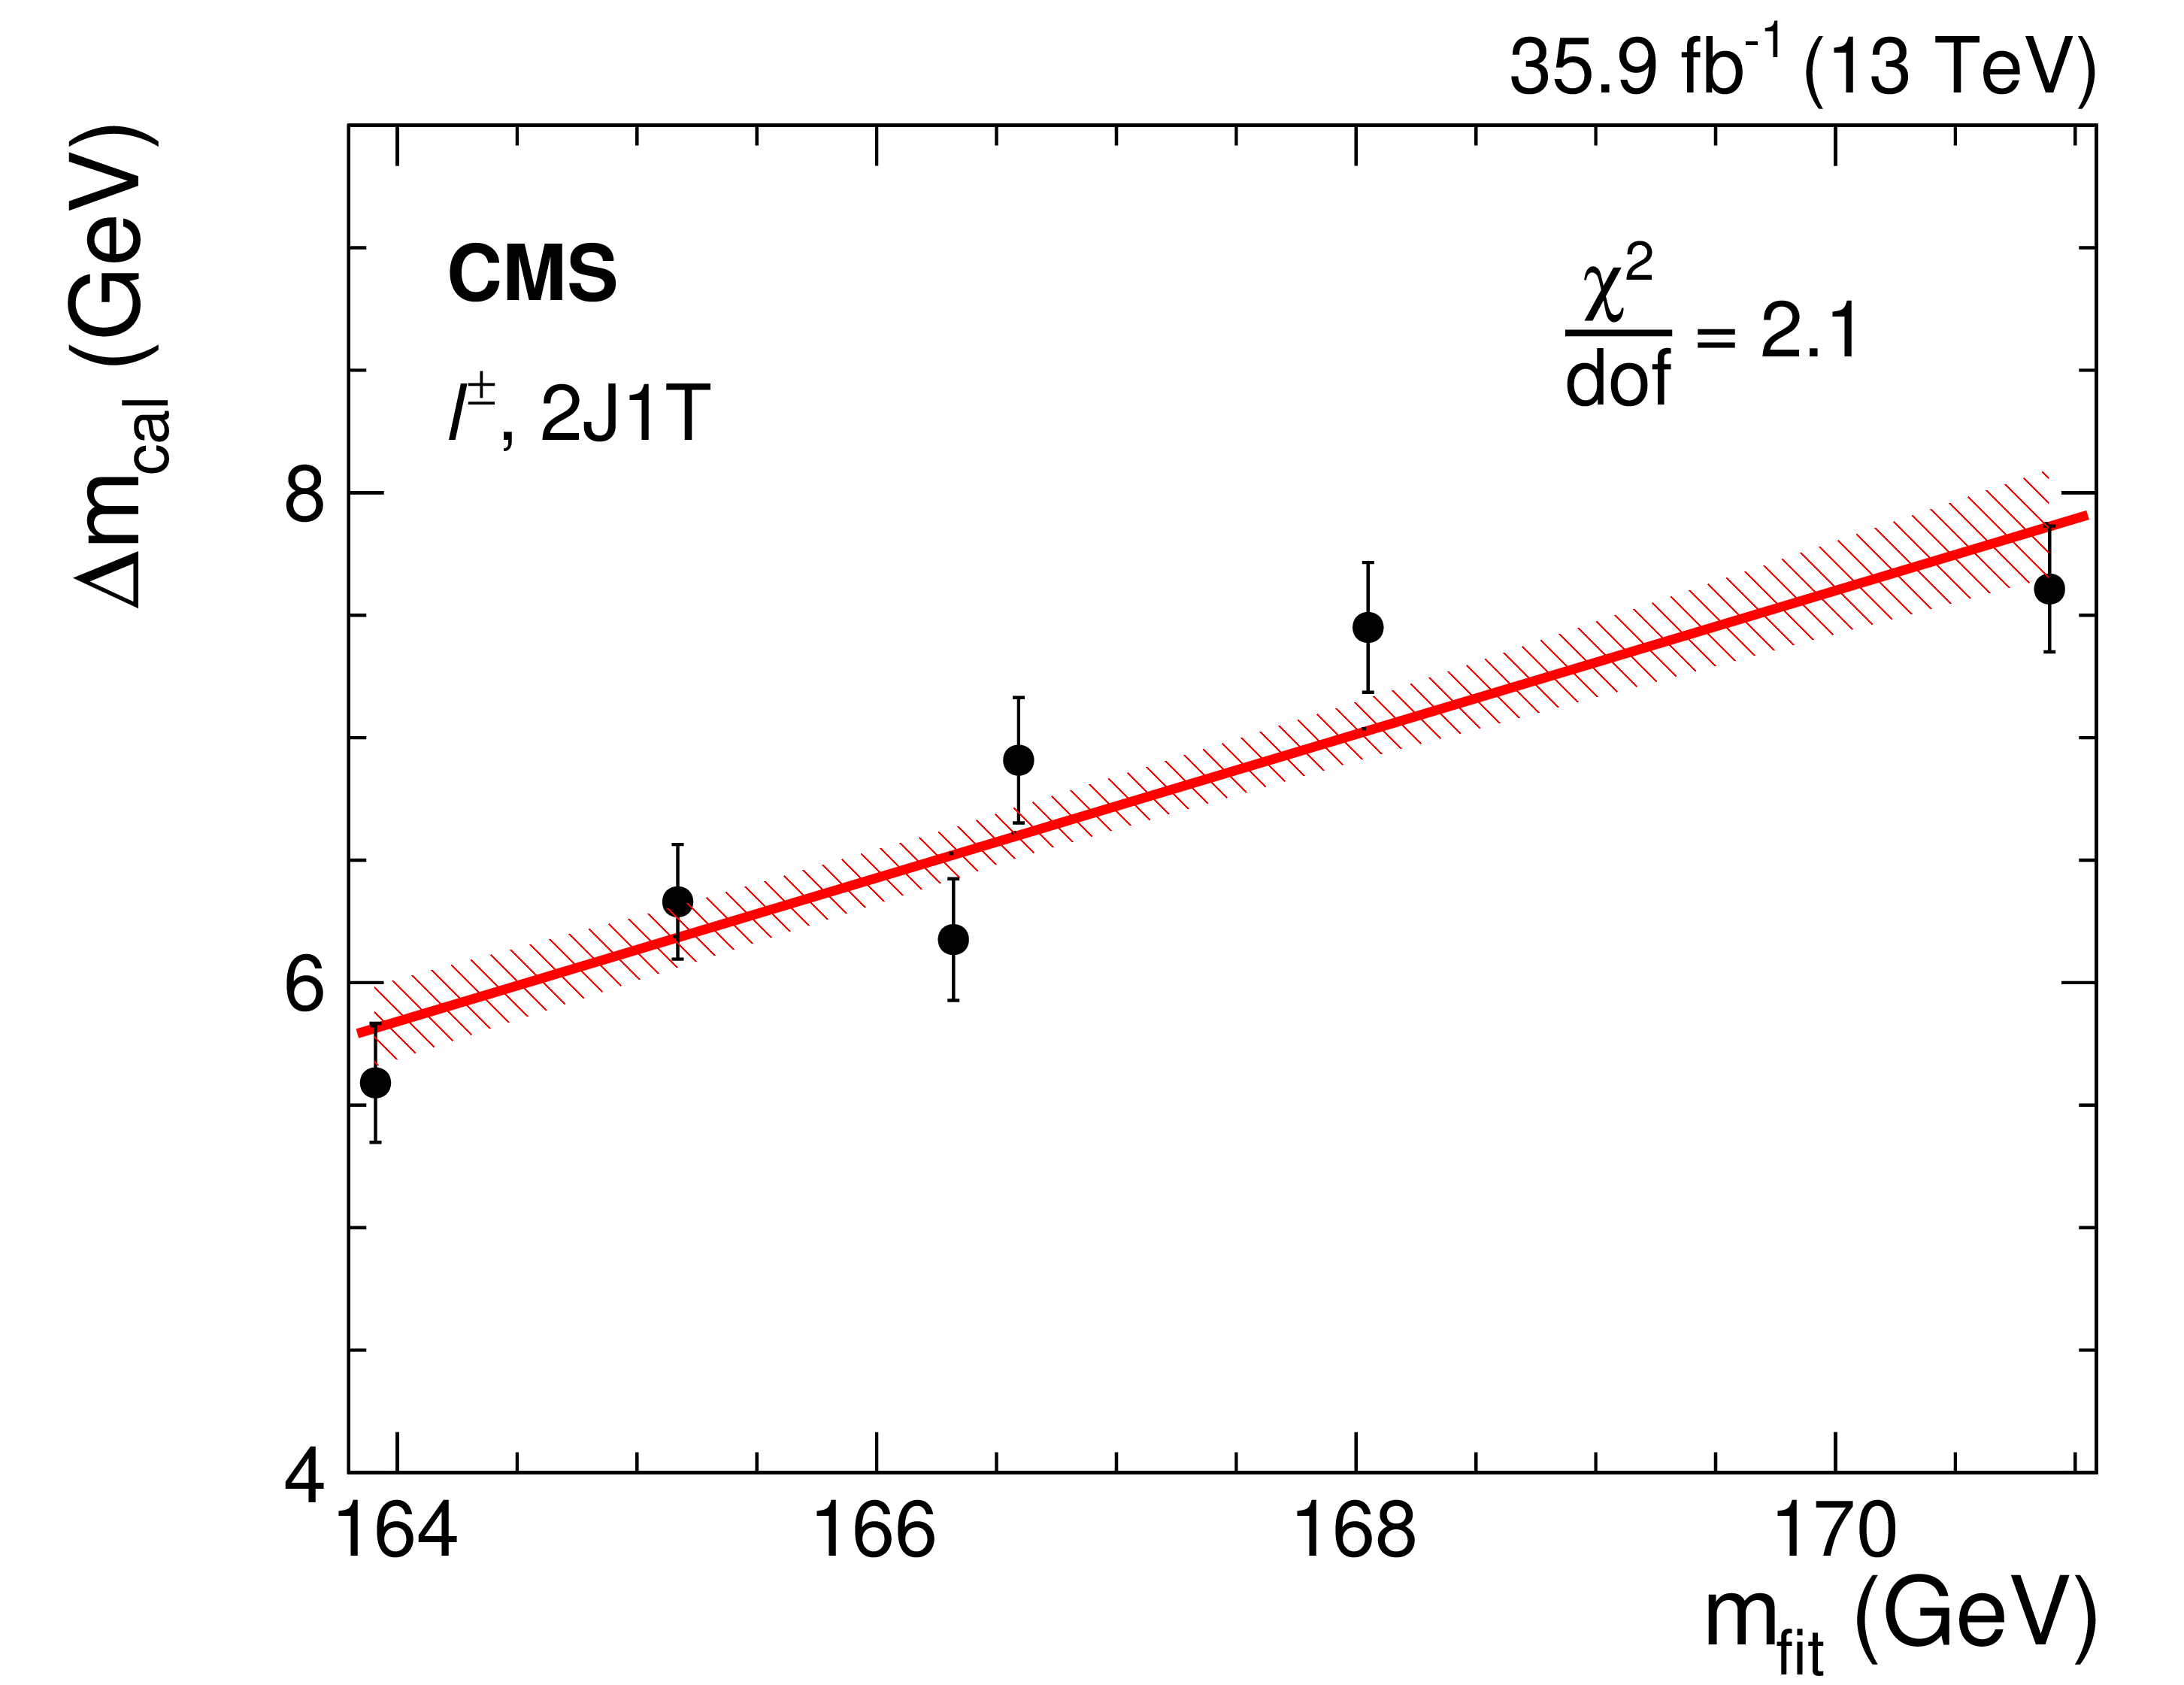
Figure 8-f:
Mass calibration $\Delta m_{\mathrm {cal}}$ as a function of $m_{\text {fit}}$ for events in the 2J1T category for the |
png pdf |
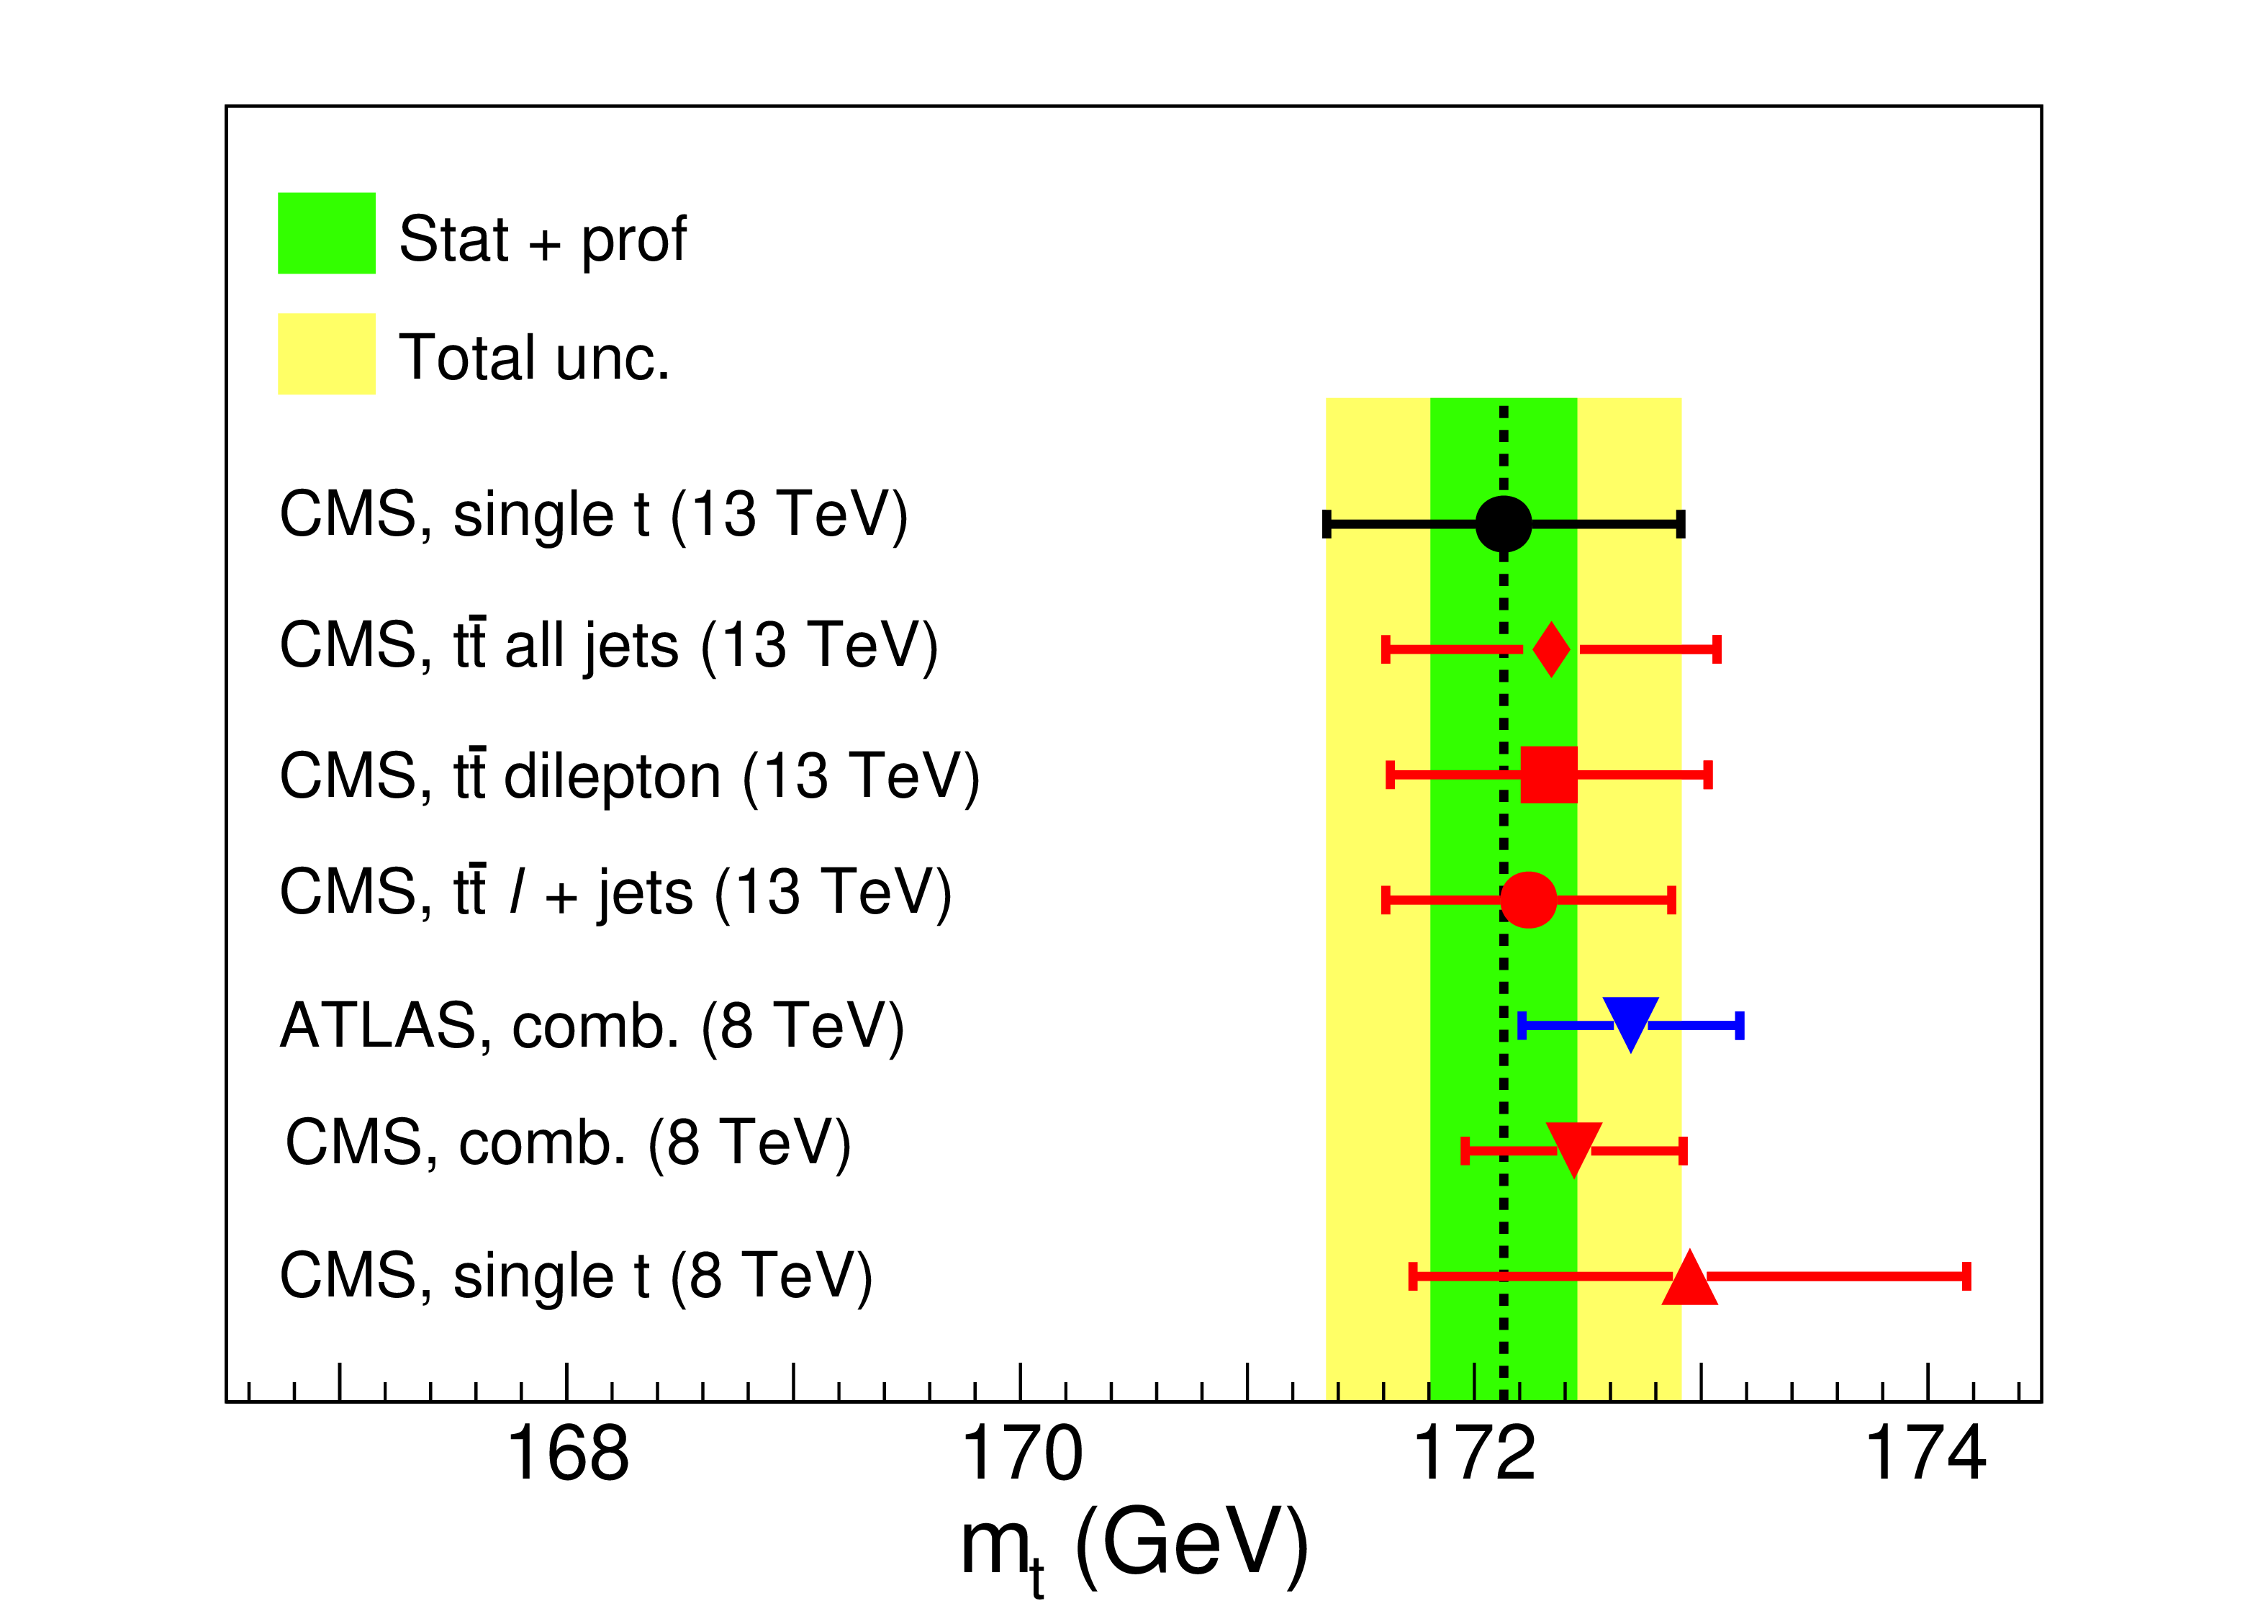
Figure 9:
A comparison of measured ${m_{\mathrm{t}}}$ values from this analysis (black circle), from previous CMS results in ${\mathrm{t} {}\mathrm{\bar{t}}}$ events at $\sqrt {s} = $ 13 TeV for fully hadronic [10], dileptonic [14], and semileptonic [9] final states, and from ATLAS [7] and CMS [8,22] analyses at $\sqrt {s} = $ 8 TeV. The horizontal bars on the points show the combined statistical and systematic uncertainties in each measurement. The vertical dashed black line indicates the central value obtained from this measurement in the $\ell^{\pm}$ final state. The green band represents the combined statistical and profiled systematic uncertainties in the present result, whereas the yellow band shows the total uncertainty. |
png pdf |
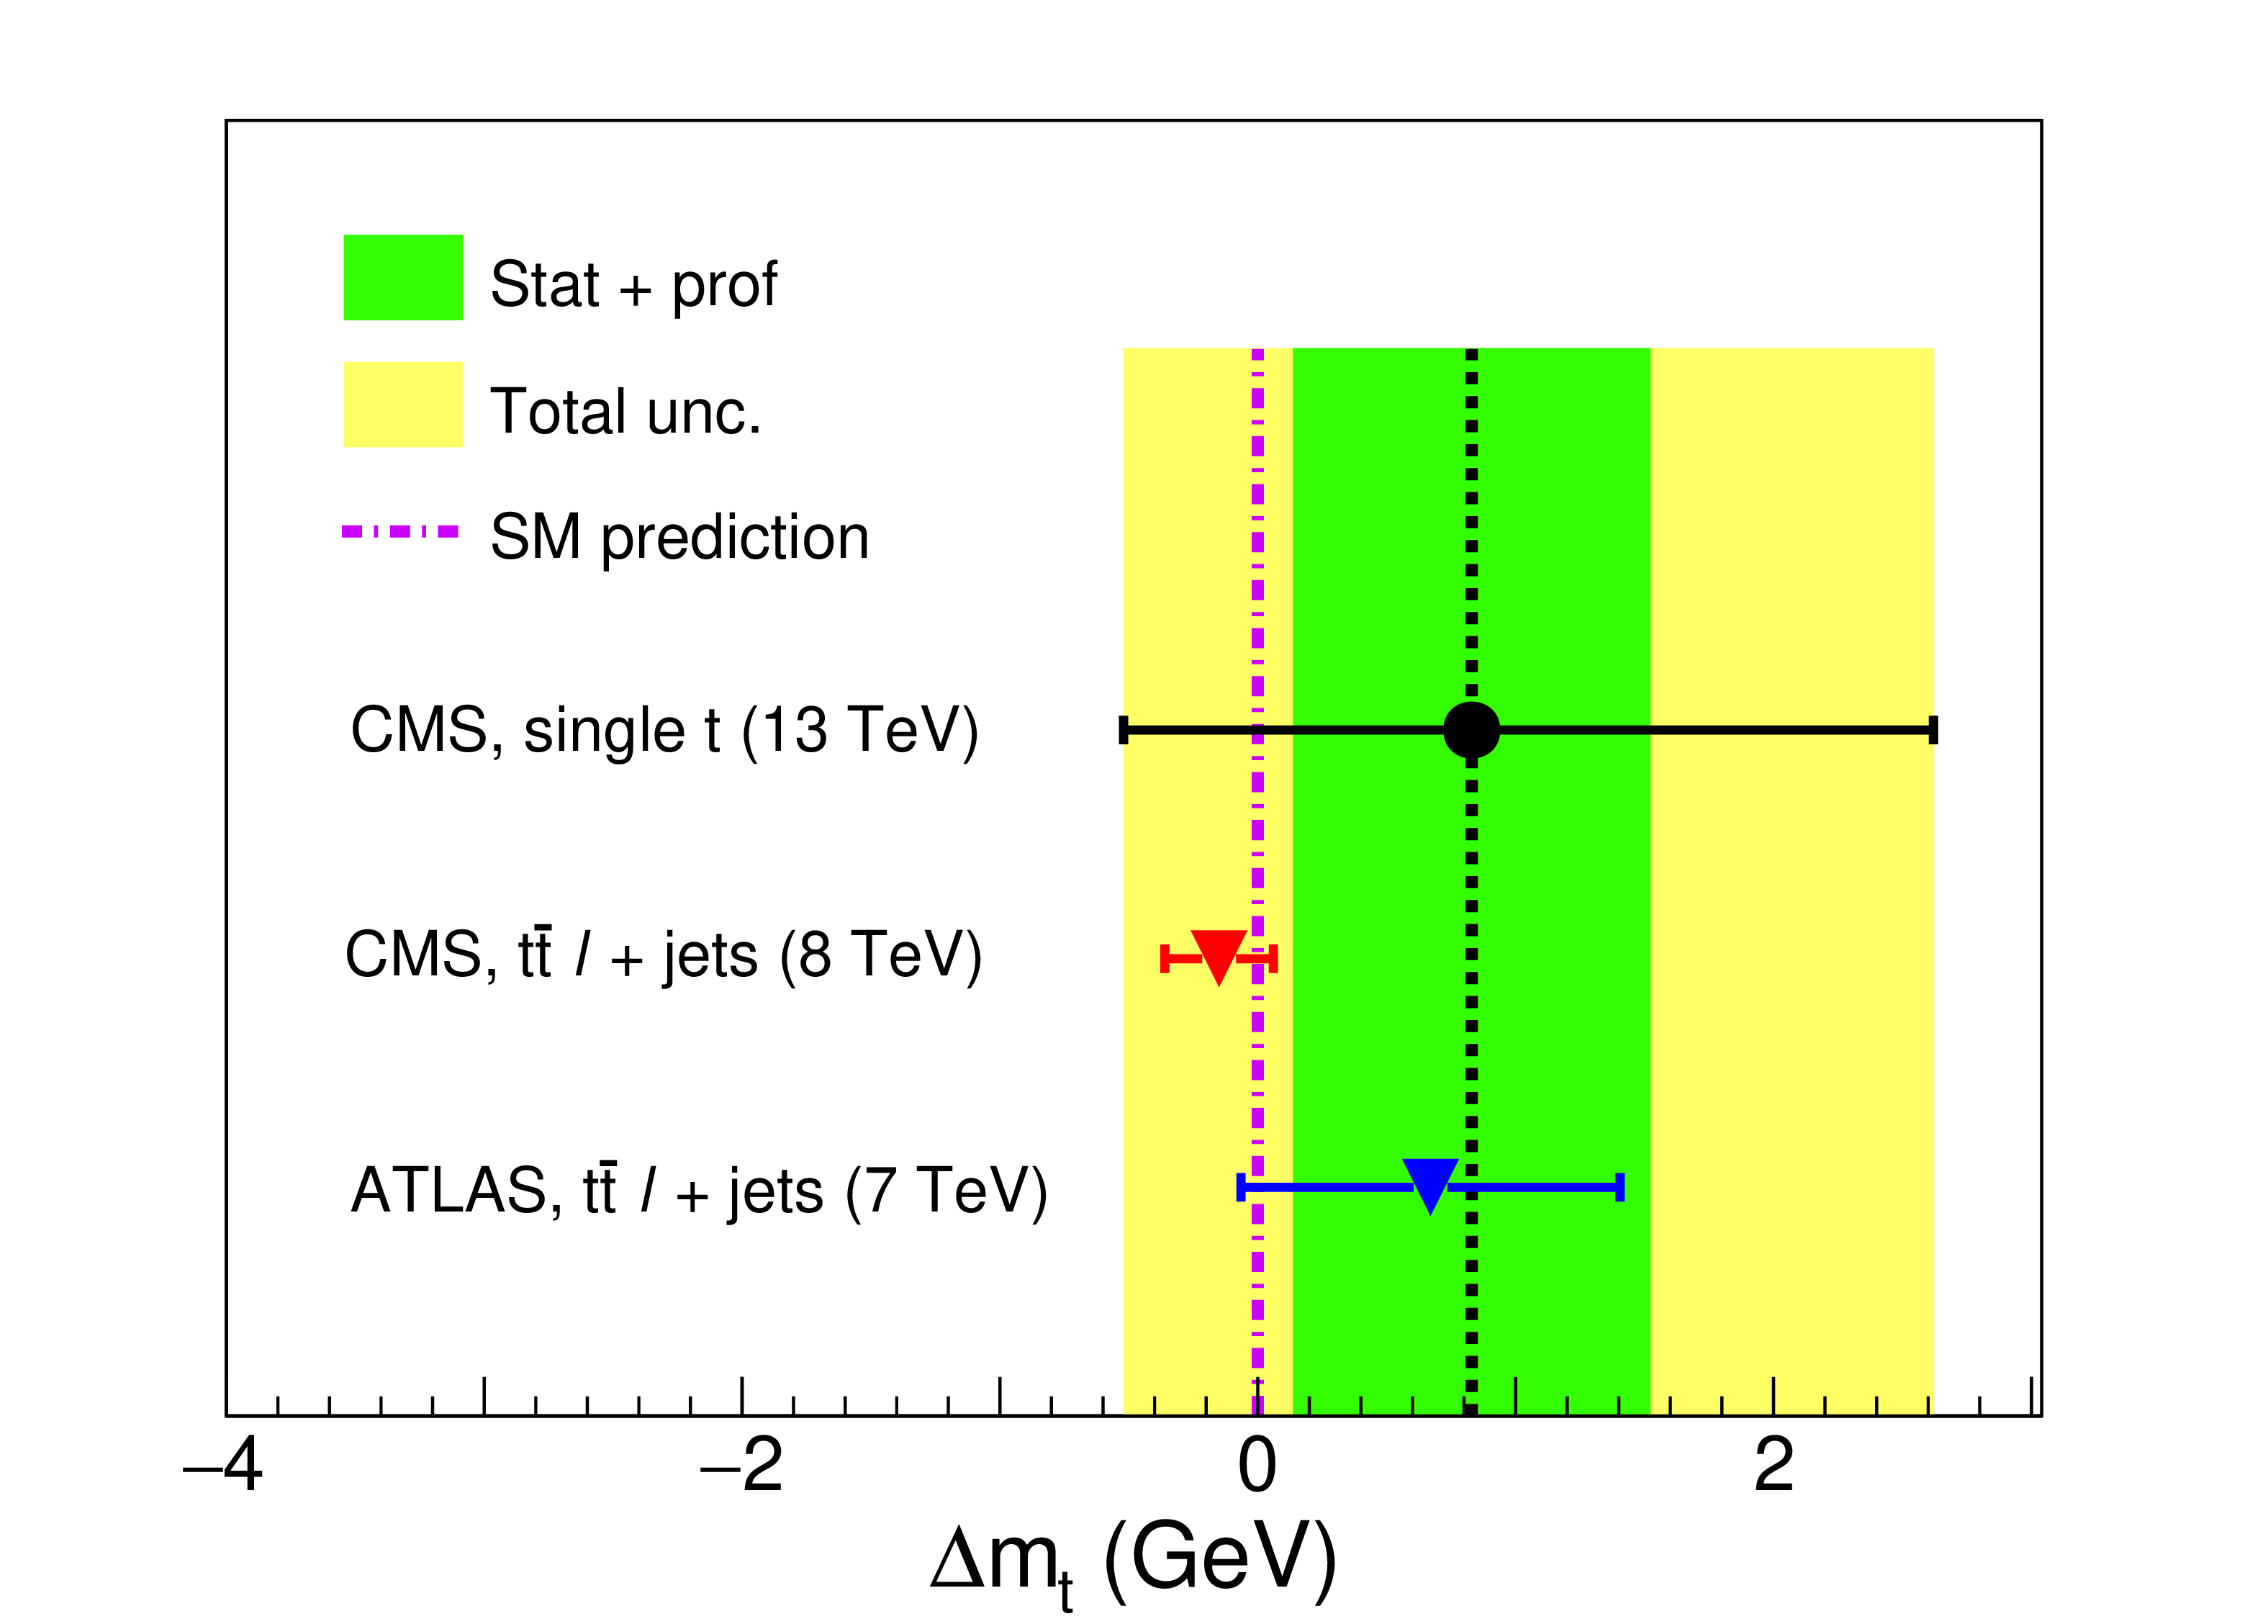
Figure 10:
A comparison of the $\Delta {m_{\mathrm{t}}} $ measurement from this analysis (black circle) with the previous ATLAS [90] and CMS [91] results in ${\mathrm{t} {}\mathrm{\bar{t}}}$ events at 7 and 8 TeV, respectively. The horizontal bars on the points show the combined statistical and systematic uncertainties in each measurement. The vertical dashed black line indicates the central value obtained from this measurement, and the vertical dash-dotted magenta line is the SM prediction. The green band represents the combined statistical and profiled systematic uncertainties in the present result, whereas the yellow band shows the total uncertainty. |

png pdf |
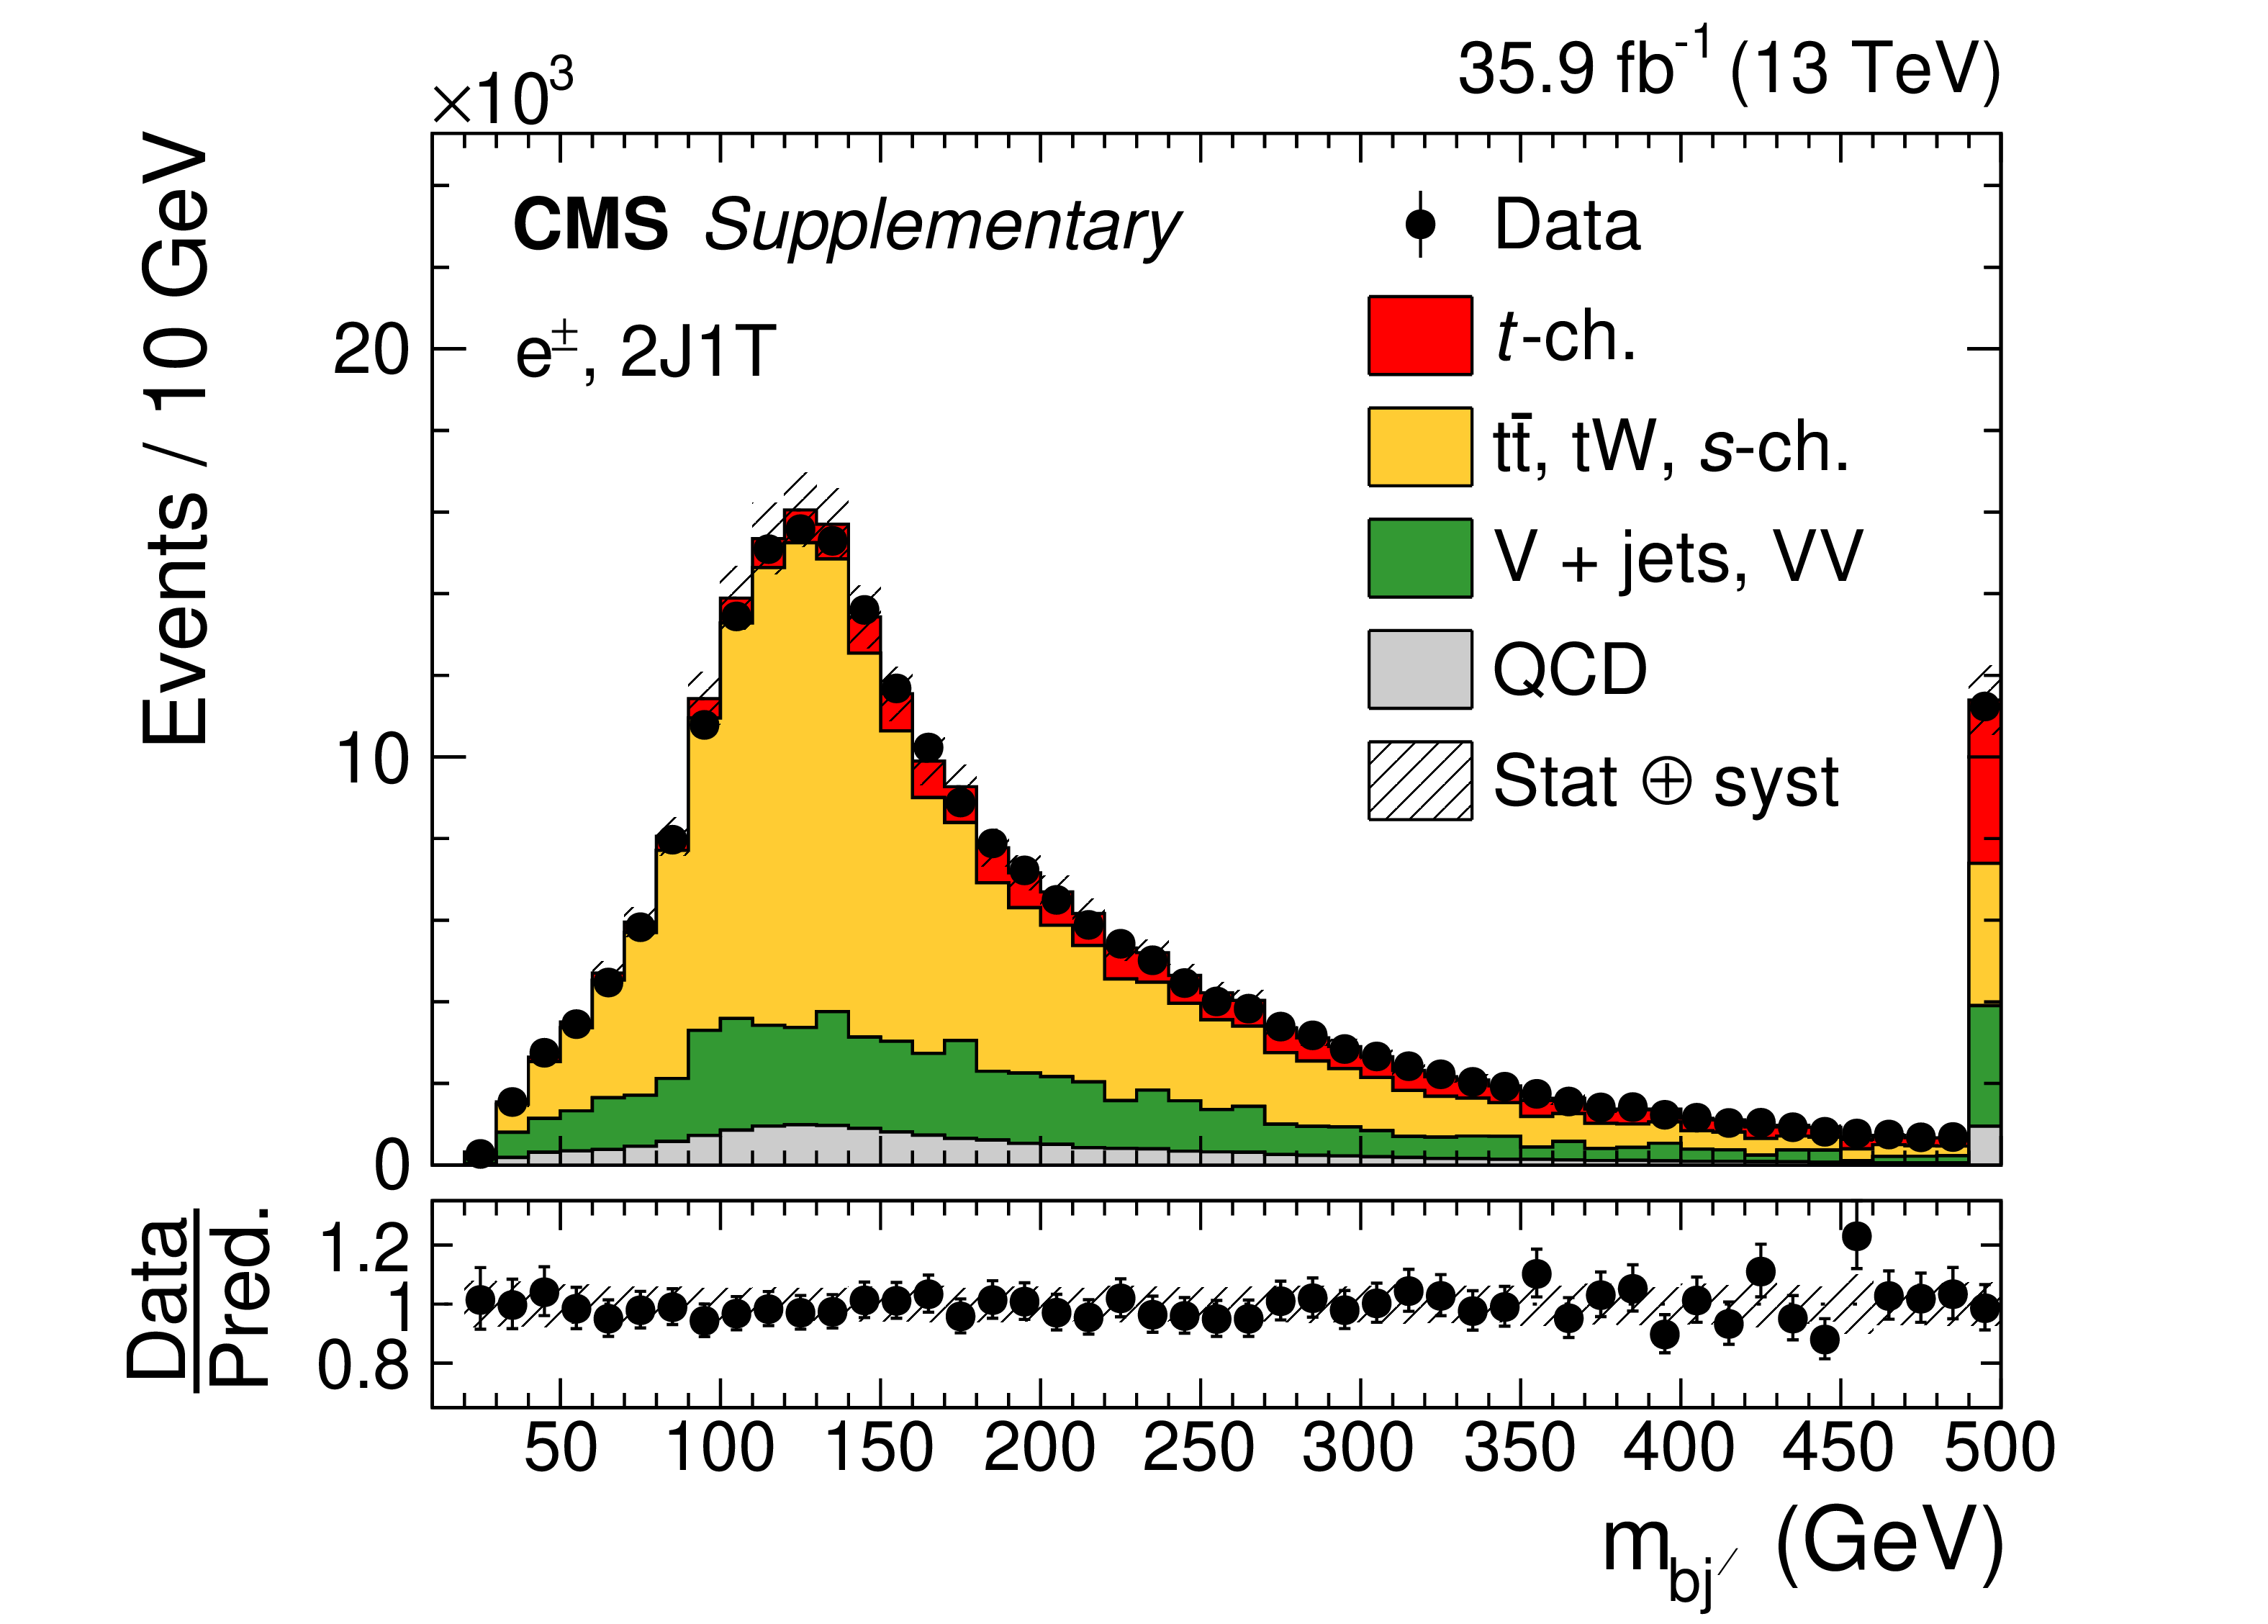
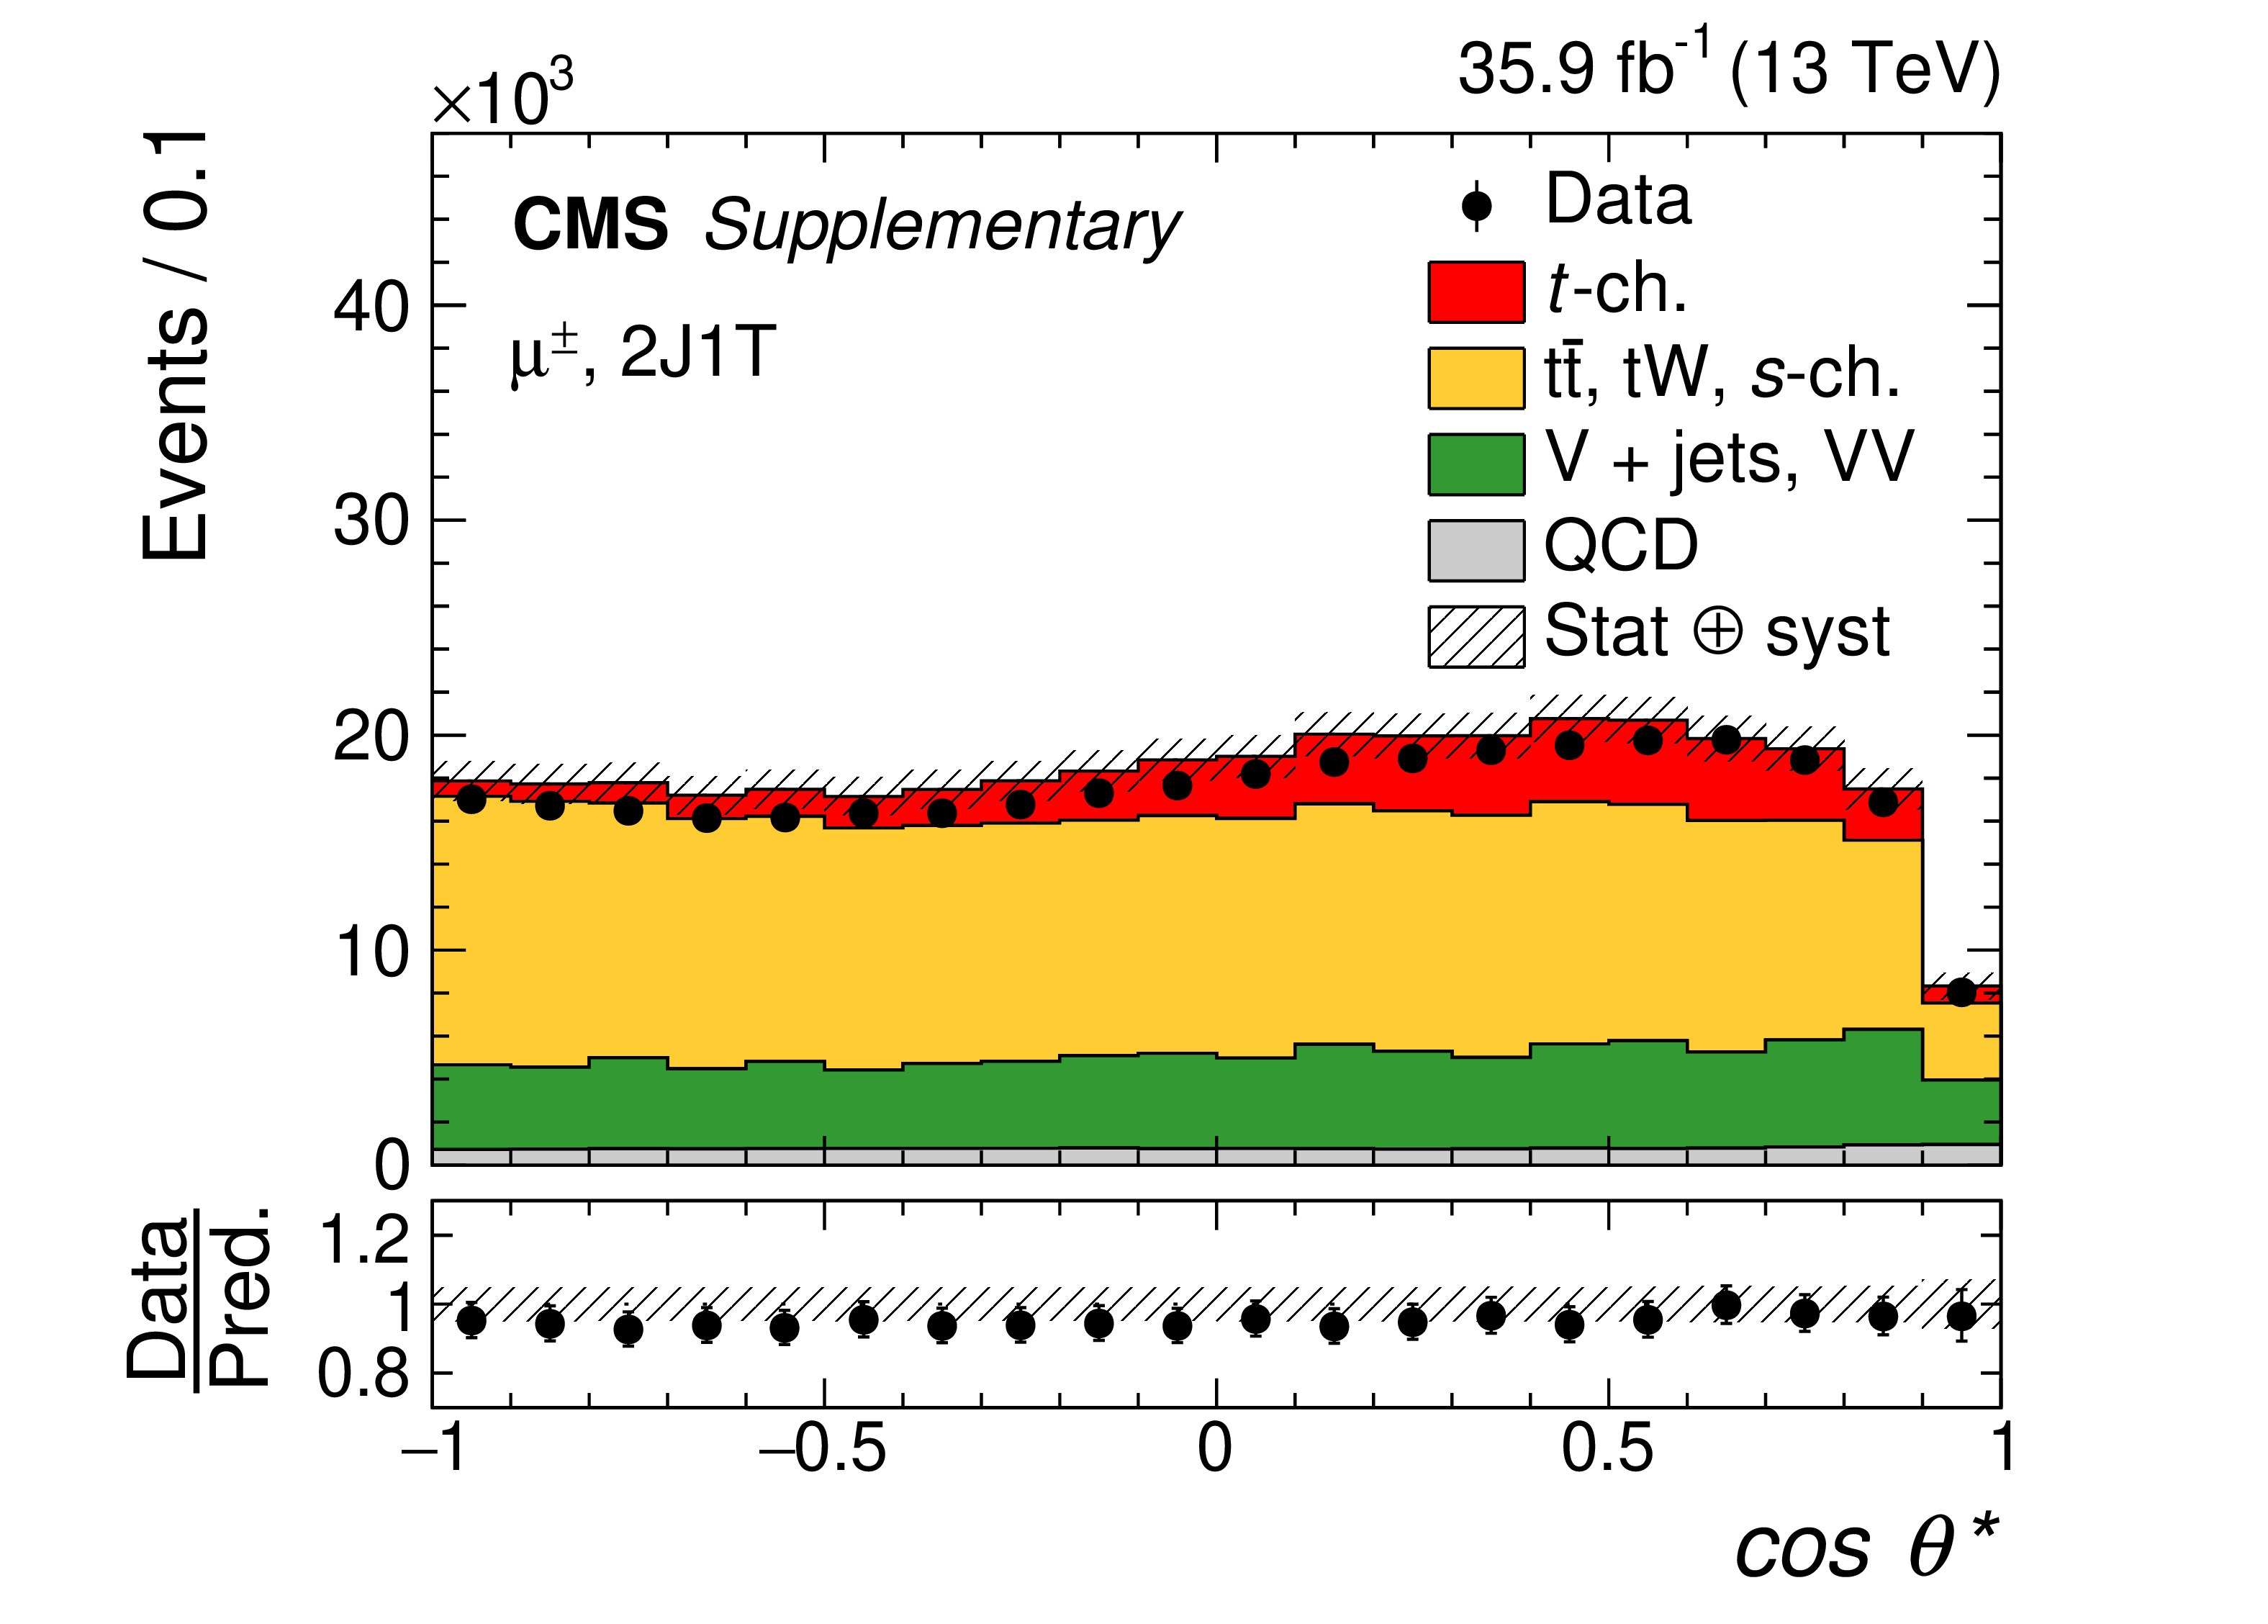
Figure A1:
Distributions of $m_{\mathrm{b} \mathrm {j^{\prime}}}$ (upper row), $\cos{\theta ^{*}}$ (middle row), and ${m_{\mathrm {T}}}$ (lower row) for the muon (left) and electron (right) final states in the 2J1T category for data (points) and simulation (colored histograms). The lower panel in each plot shows the ratio of the data to the predictions. The bands indicate the prefit statistical and systematic uncertainties added in quadrature. The last bin in each of the upper- and lower-row plots includes the overflow. |

png pdf |
Figure A1-a:
Distribution of $m_{\mathrm{b} \mathrm {j^{\prime}}}$ the muon final state in the 2J1T category for data (points) and simulation (colored histograms). The lower panel shows the ratio of the data to the predictions. The bands indicate the prefit statistical and systematic uncertainties added in quadrature. The last bin includes the overflow. |
png pdf |
Figure A1-b:
Distribution of $m_{\mathrm{b} \mathrm {j^{\prime}}}$ the electron final state in the 2J1T category for data (points) and simulation (colored histograms). The lower panel shows the ratio of the data to the predictions. The bands indicate the prefit statistical and systematic uncertainties added in quadrature. The last bin includes the overflow. |
png pdf |
Figure A1-c:
Distribution of $\cos{\theta ^{*}}$ the muon final state in the 2J1T category for data (points) and simulation (colored histograms). The lower panel shows the ratio of the data to the predictions. The bands indicate the prefit statistical and systematic uncertainties added in quadrature. |
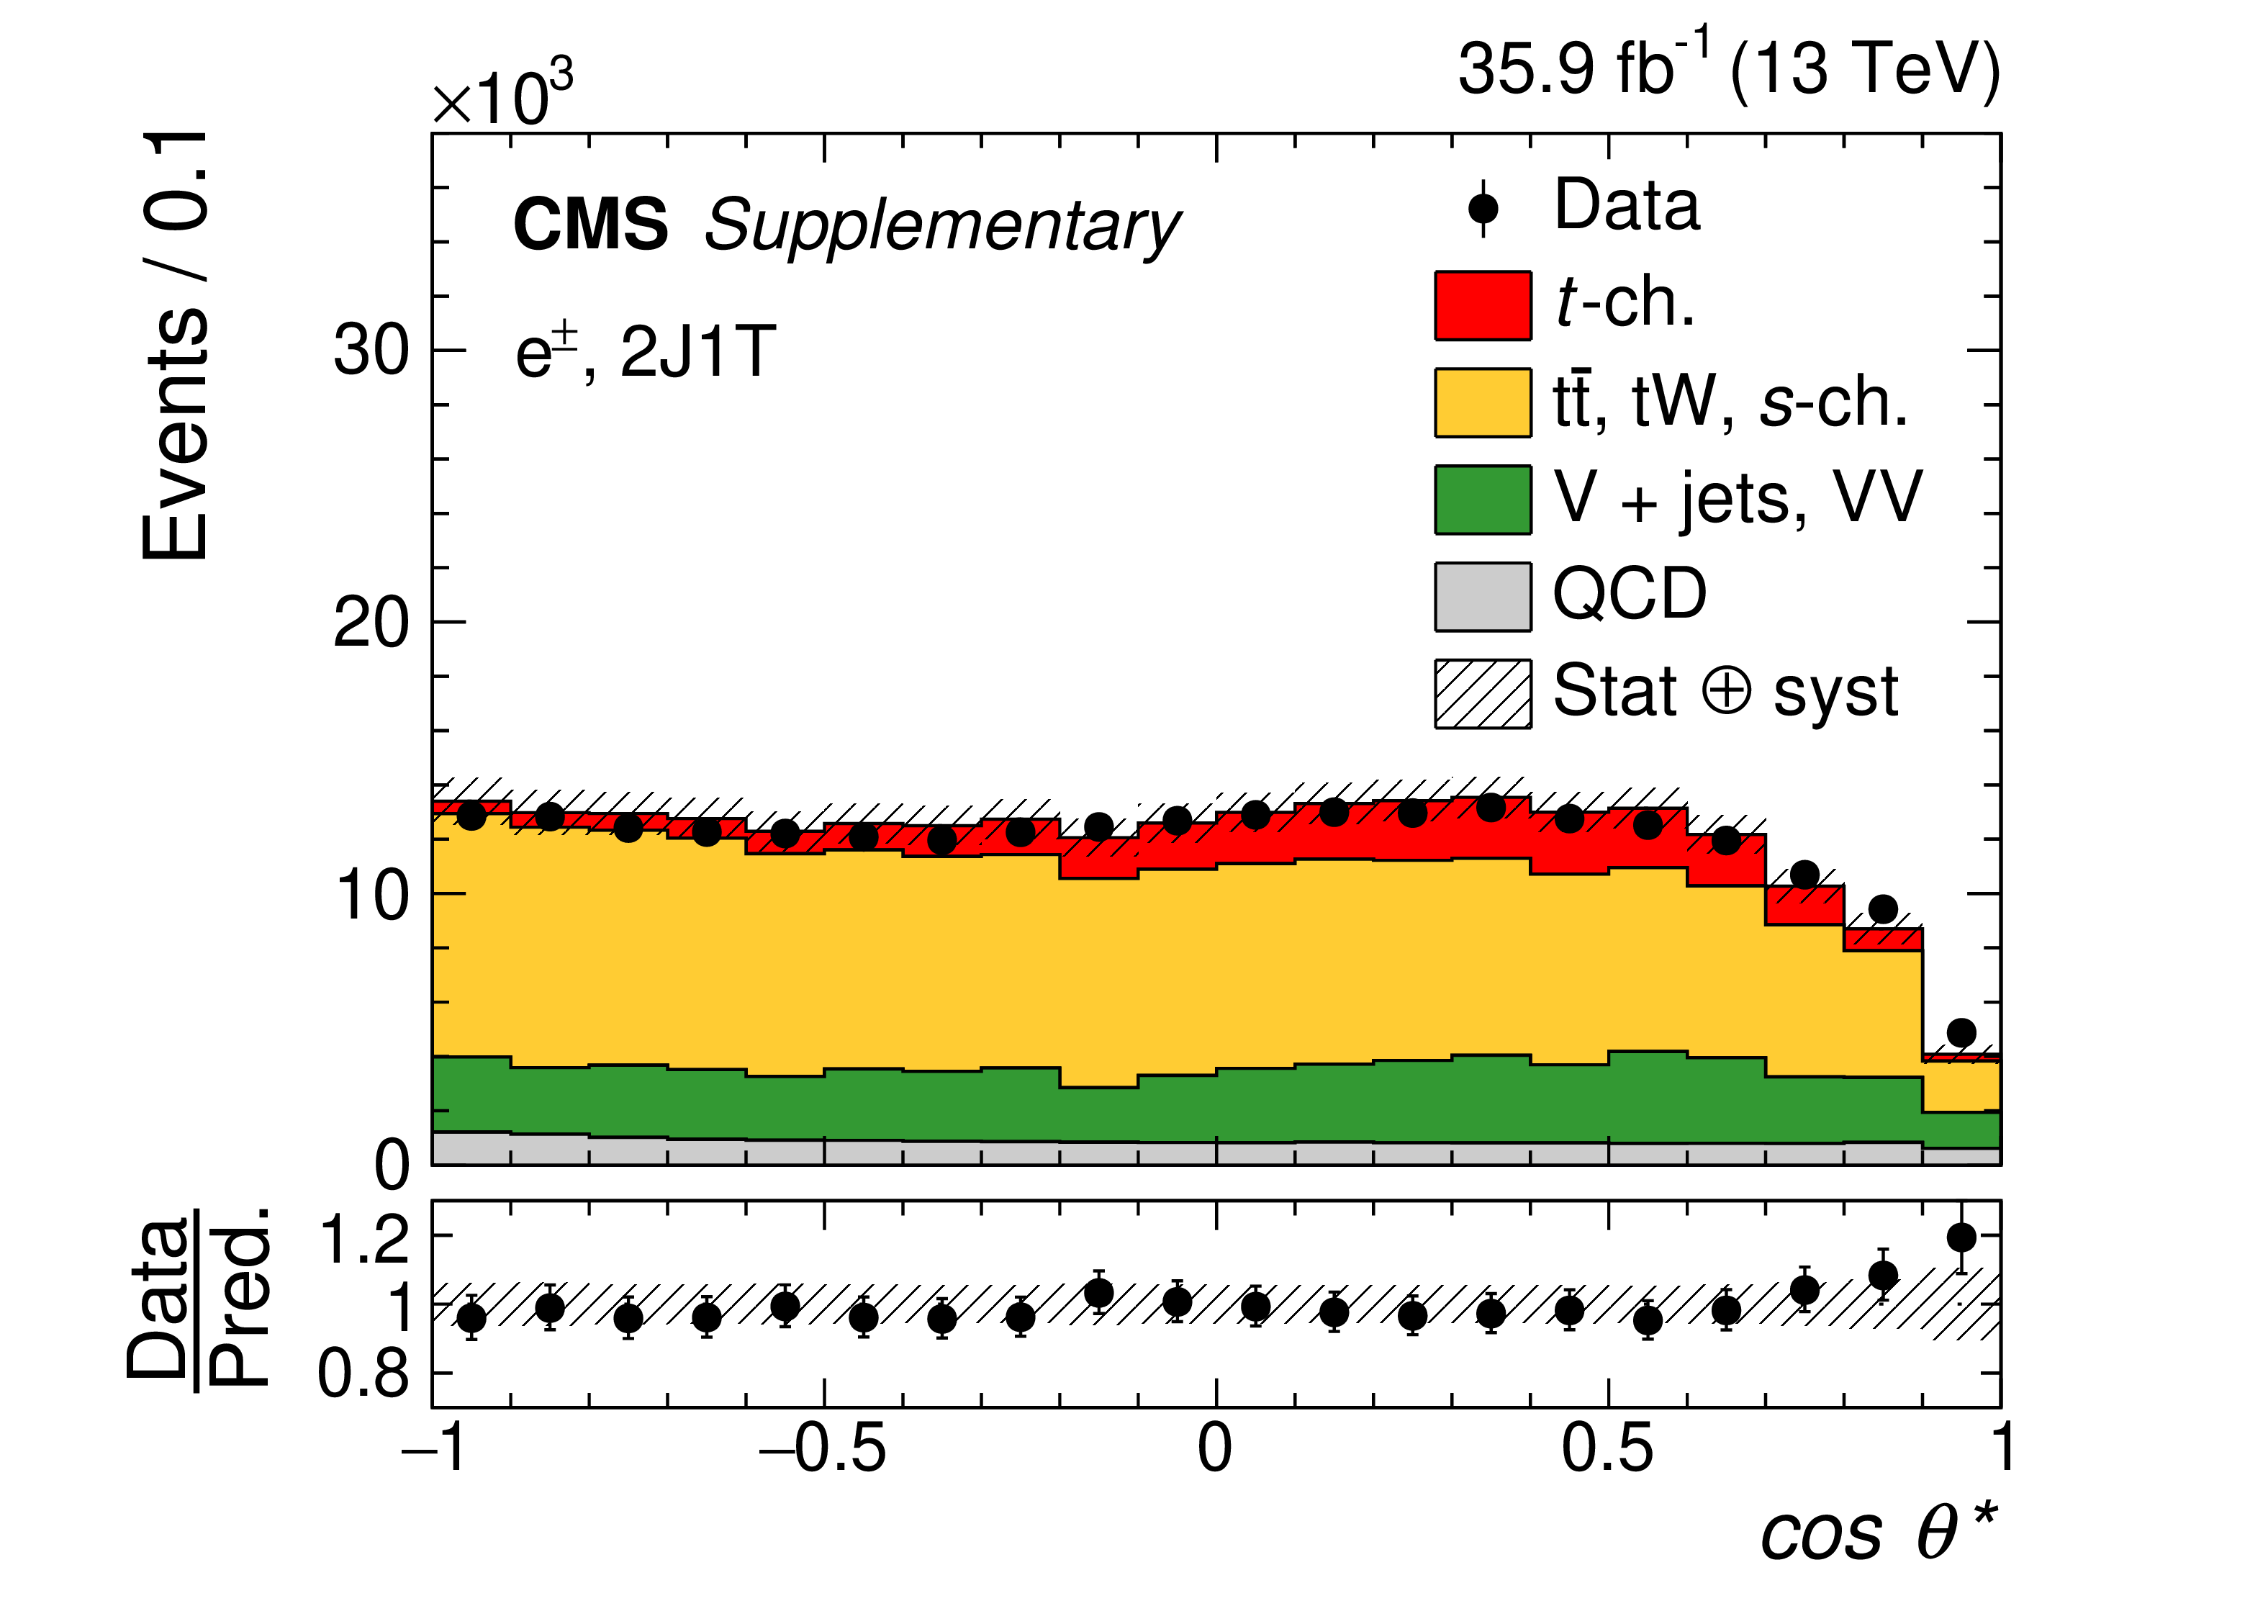
png pdf |
Figure A1-d:
Distribution of $\cos{\theta ^{*}}$ the electron final state in the 2J1T category for data (points) and simulation (colored histograms). The lower panel shows the ratio of the data to the predictions. The bands indicate the prefit statistical and systematic uncertainties added in quadrature. |
png pdf |
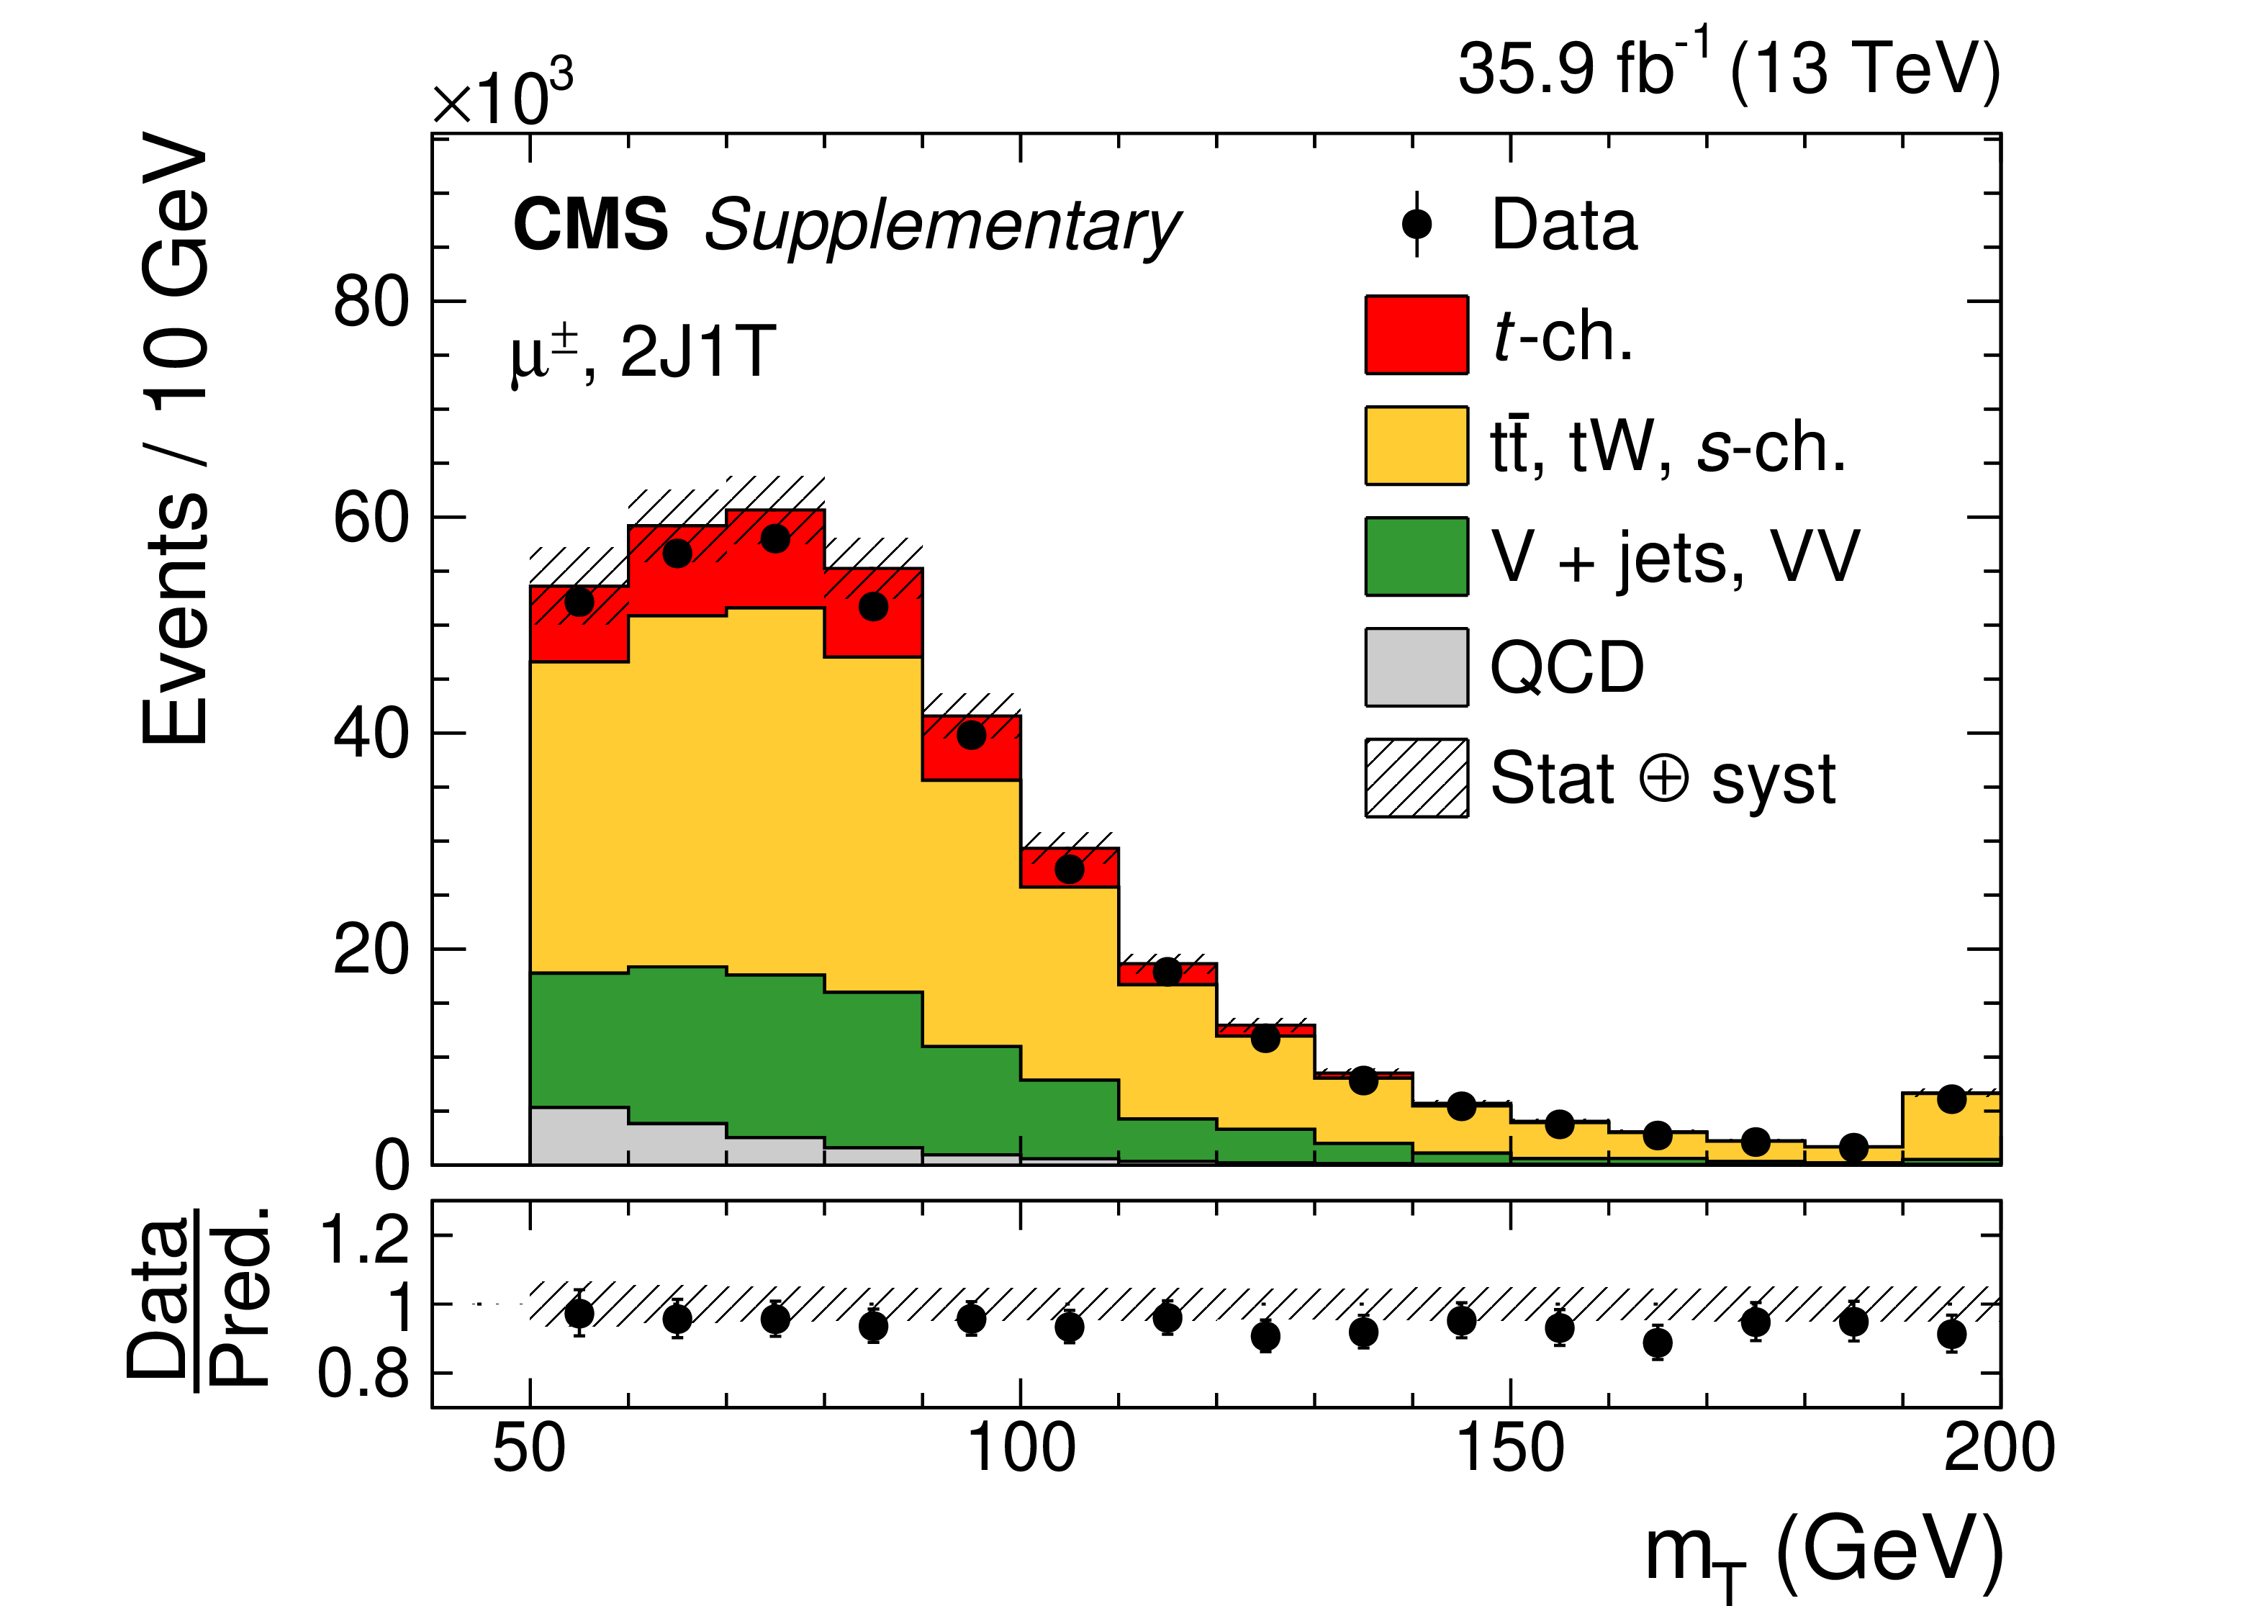
Figure A1-e:
Distribution of ${m_{\mathrm {T}}}$ the muon final state in the 2J1T category for data (points) and simulation (colored histograms). The lower panel shows the ratio of the data to the predictions. The bands indicate the prefit statistical and systematic uncertainties added in quadrature. The last bin includes the overflow. |
png pdf |
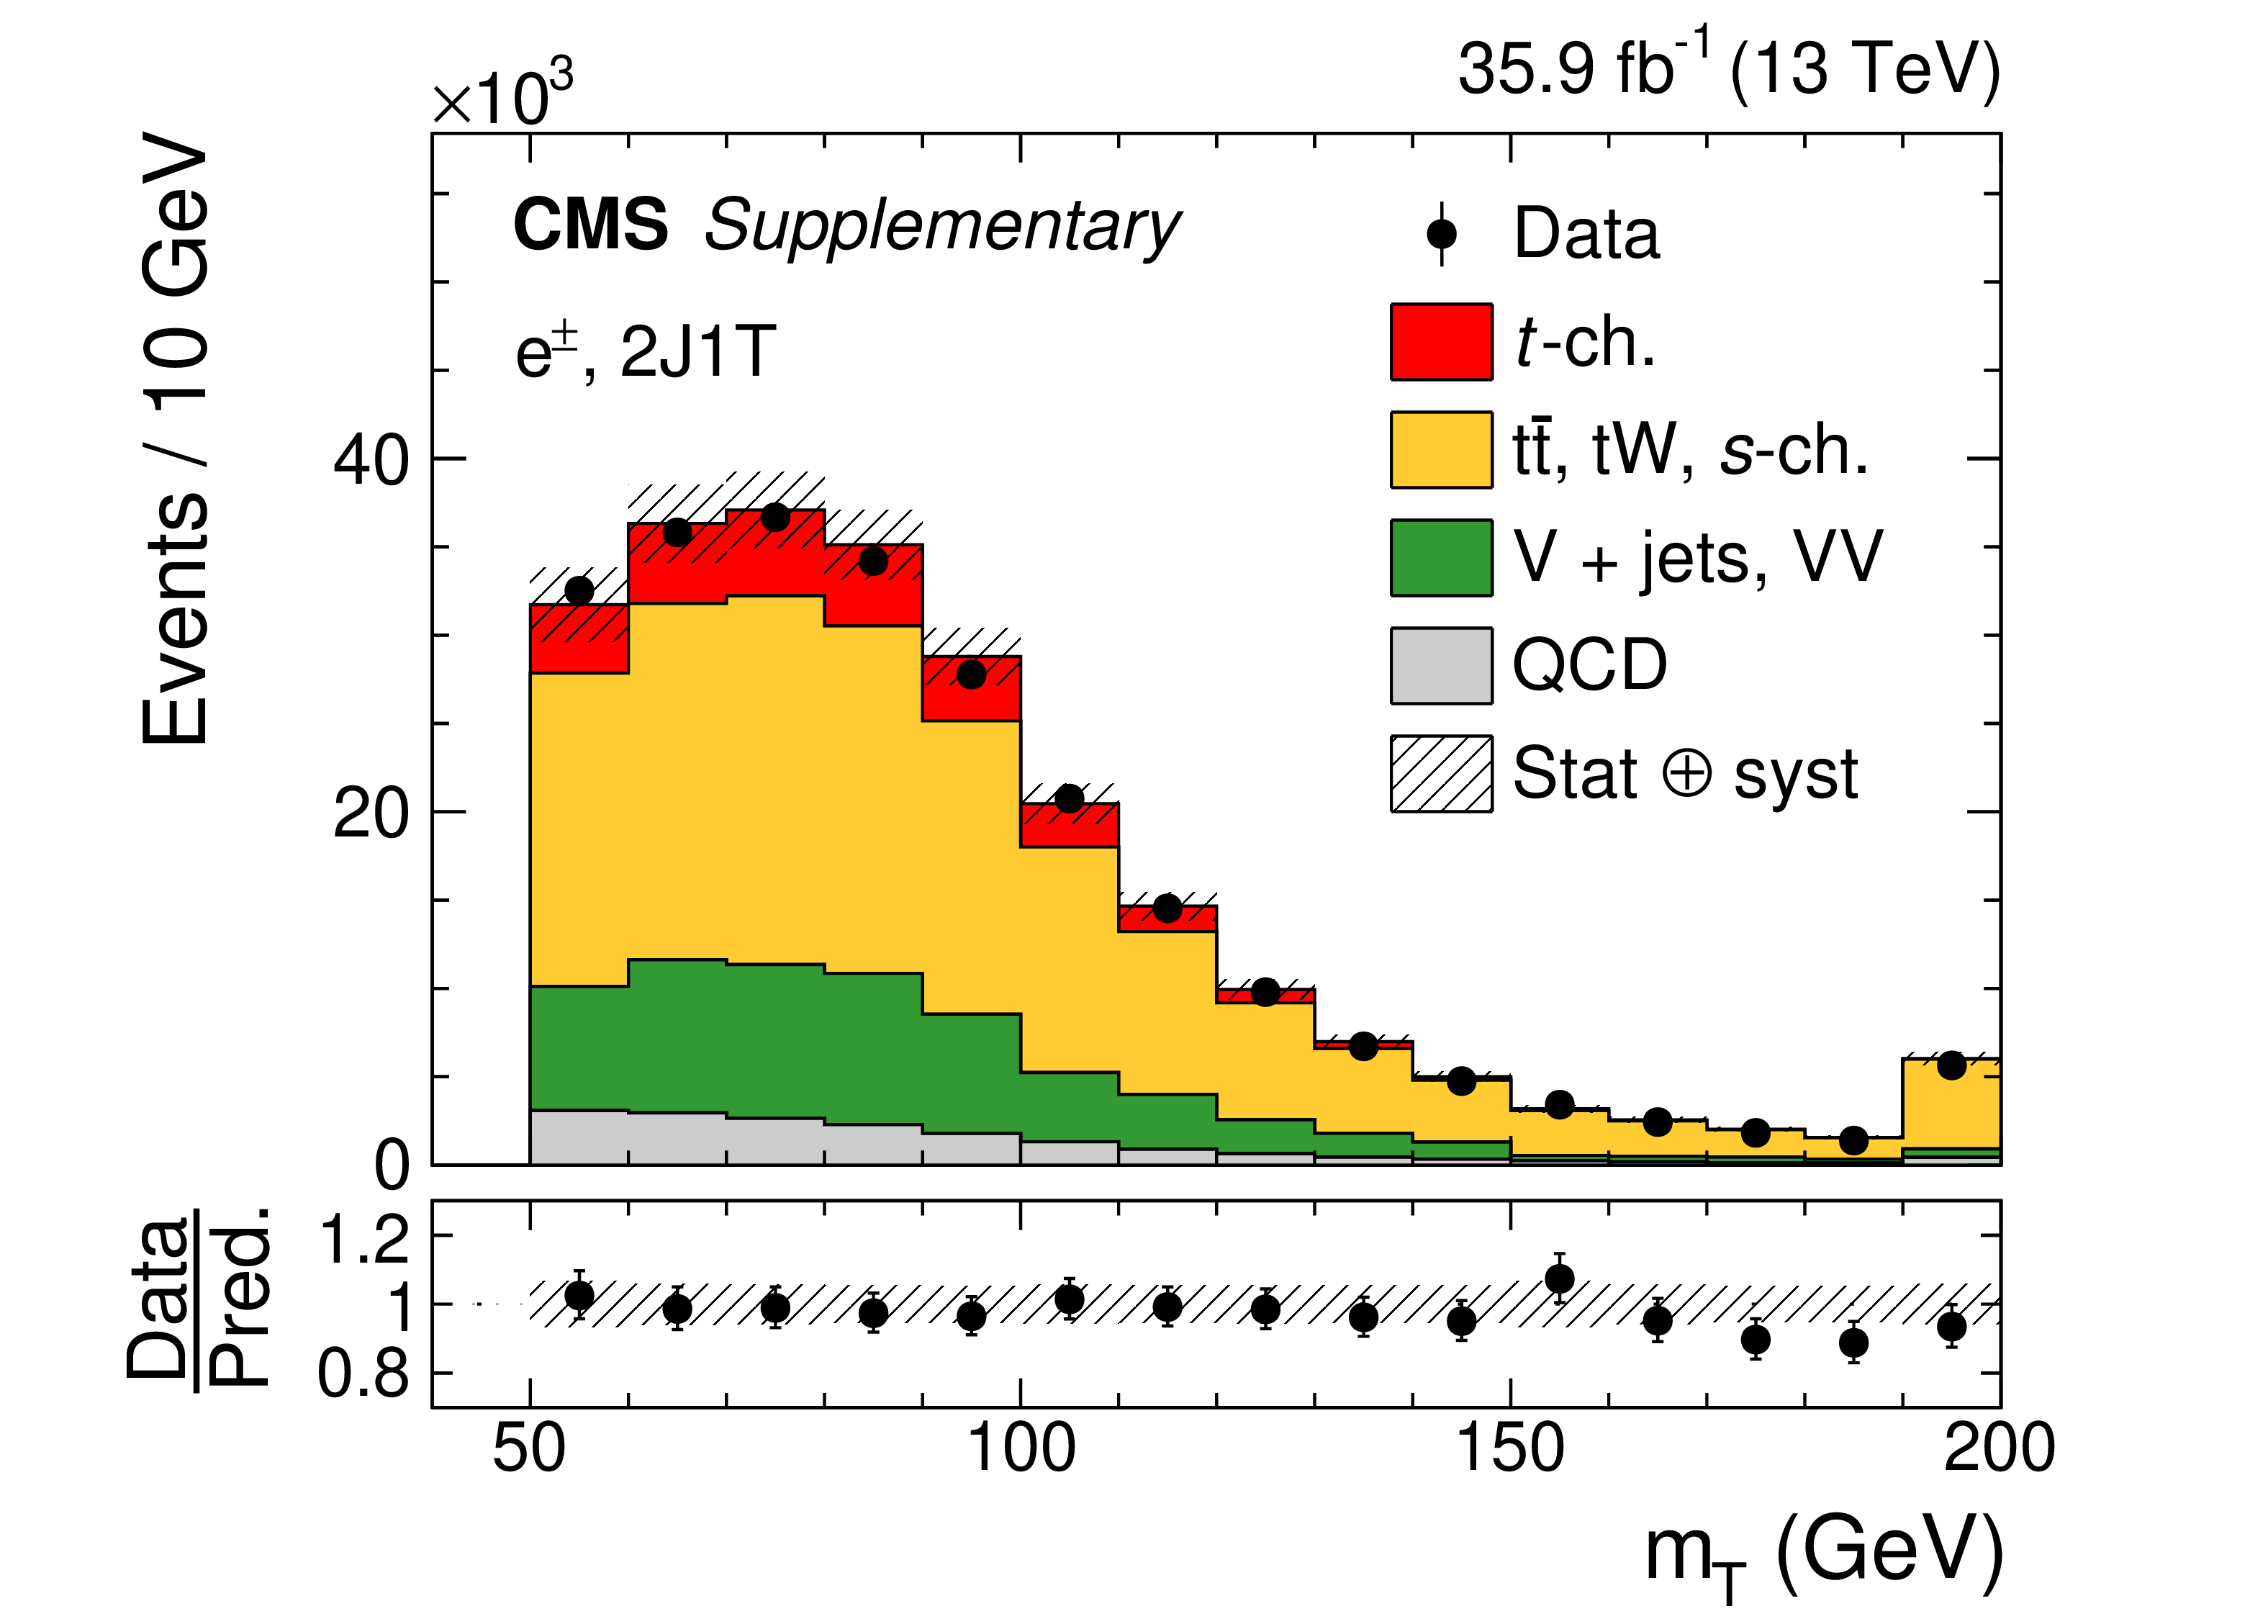
Figure A1-f:
Distribution of ${m_{\mathrm {T}}}$ the electron final state in the 2J1T category for data (points) and simulation (colored histograms). The lower panel shows the ratio of the data to the predictions. The bands indicate the prefit statistical and systematic uncertainties added in quadrature. The last bin includes the overflow. |
png pdf |
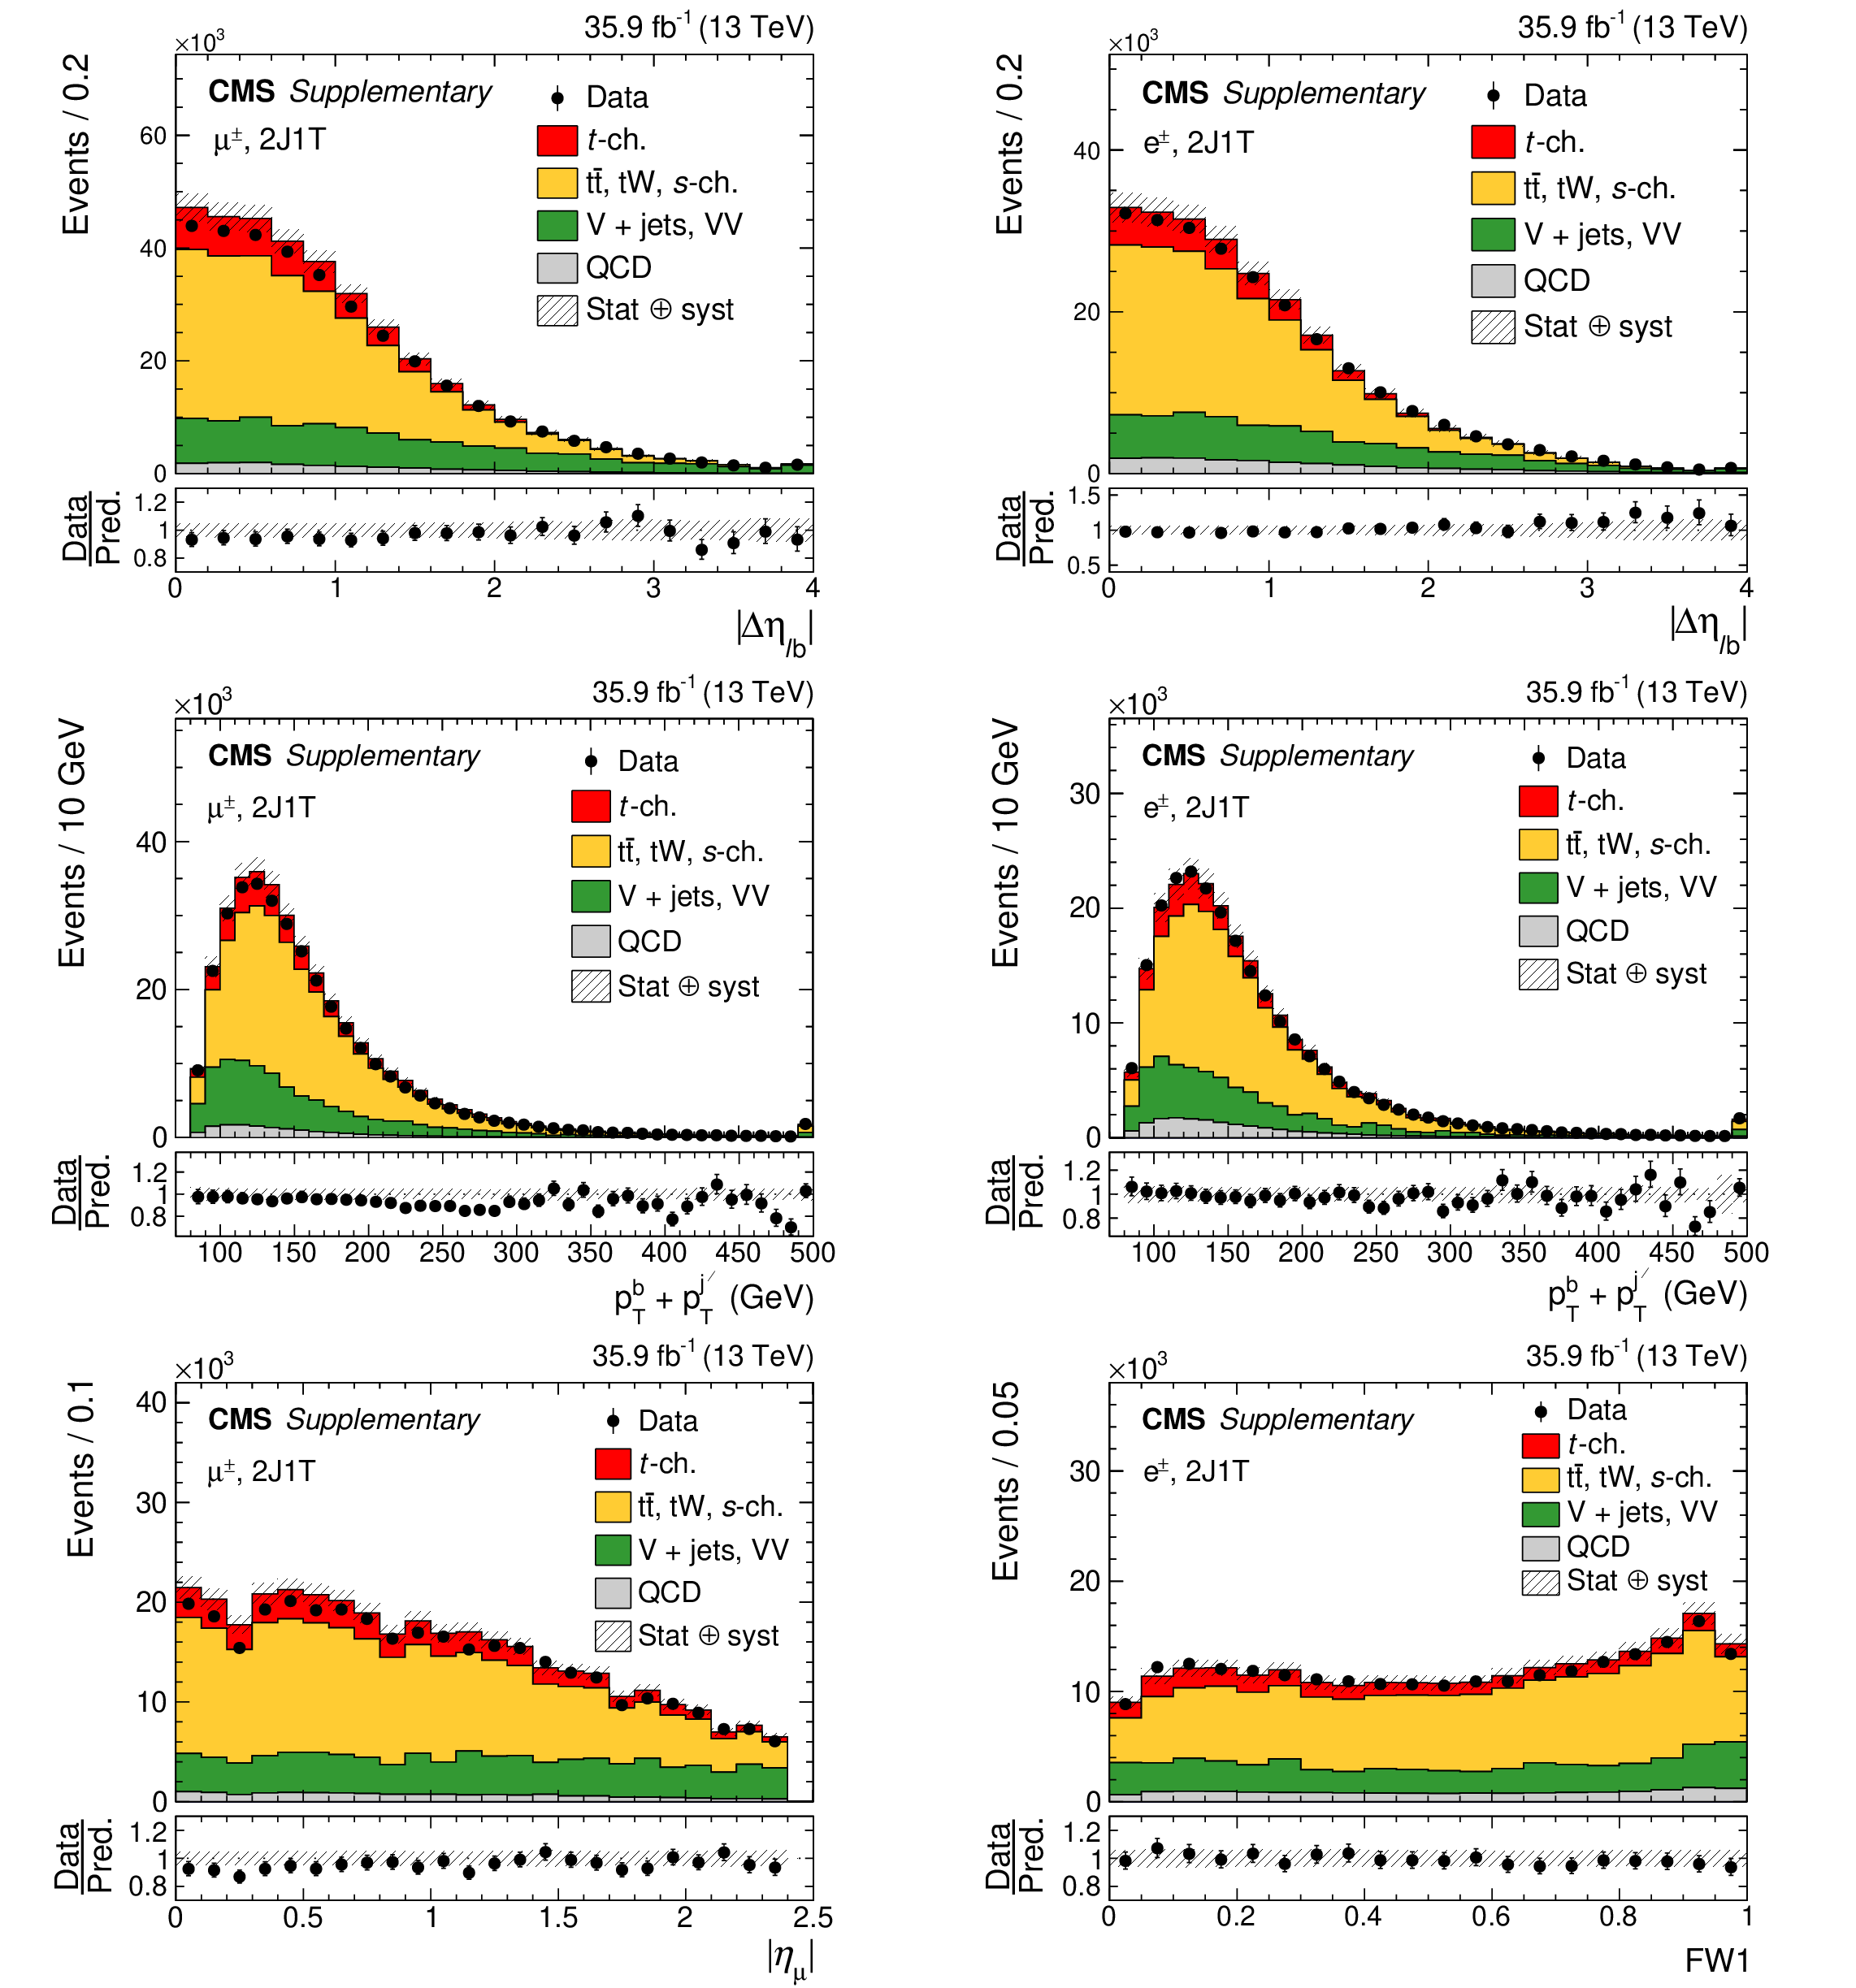
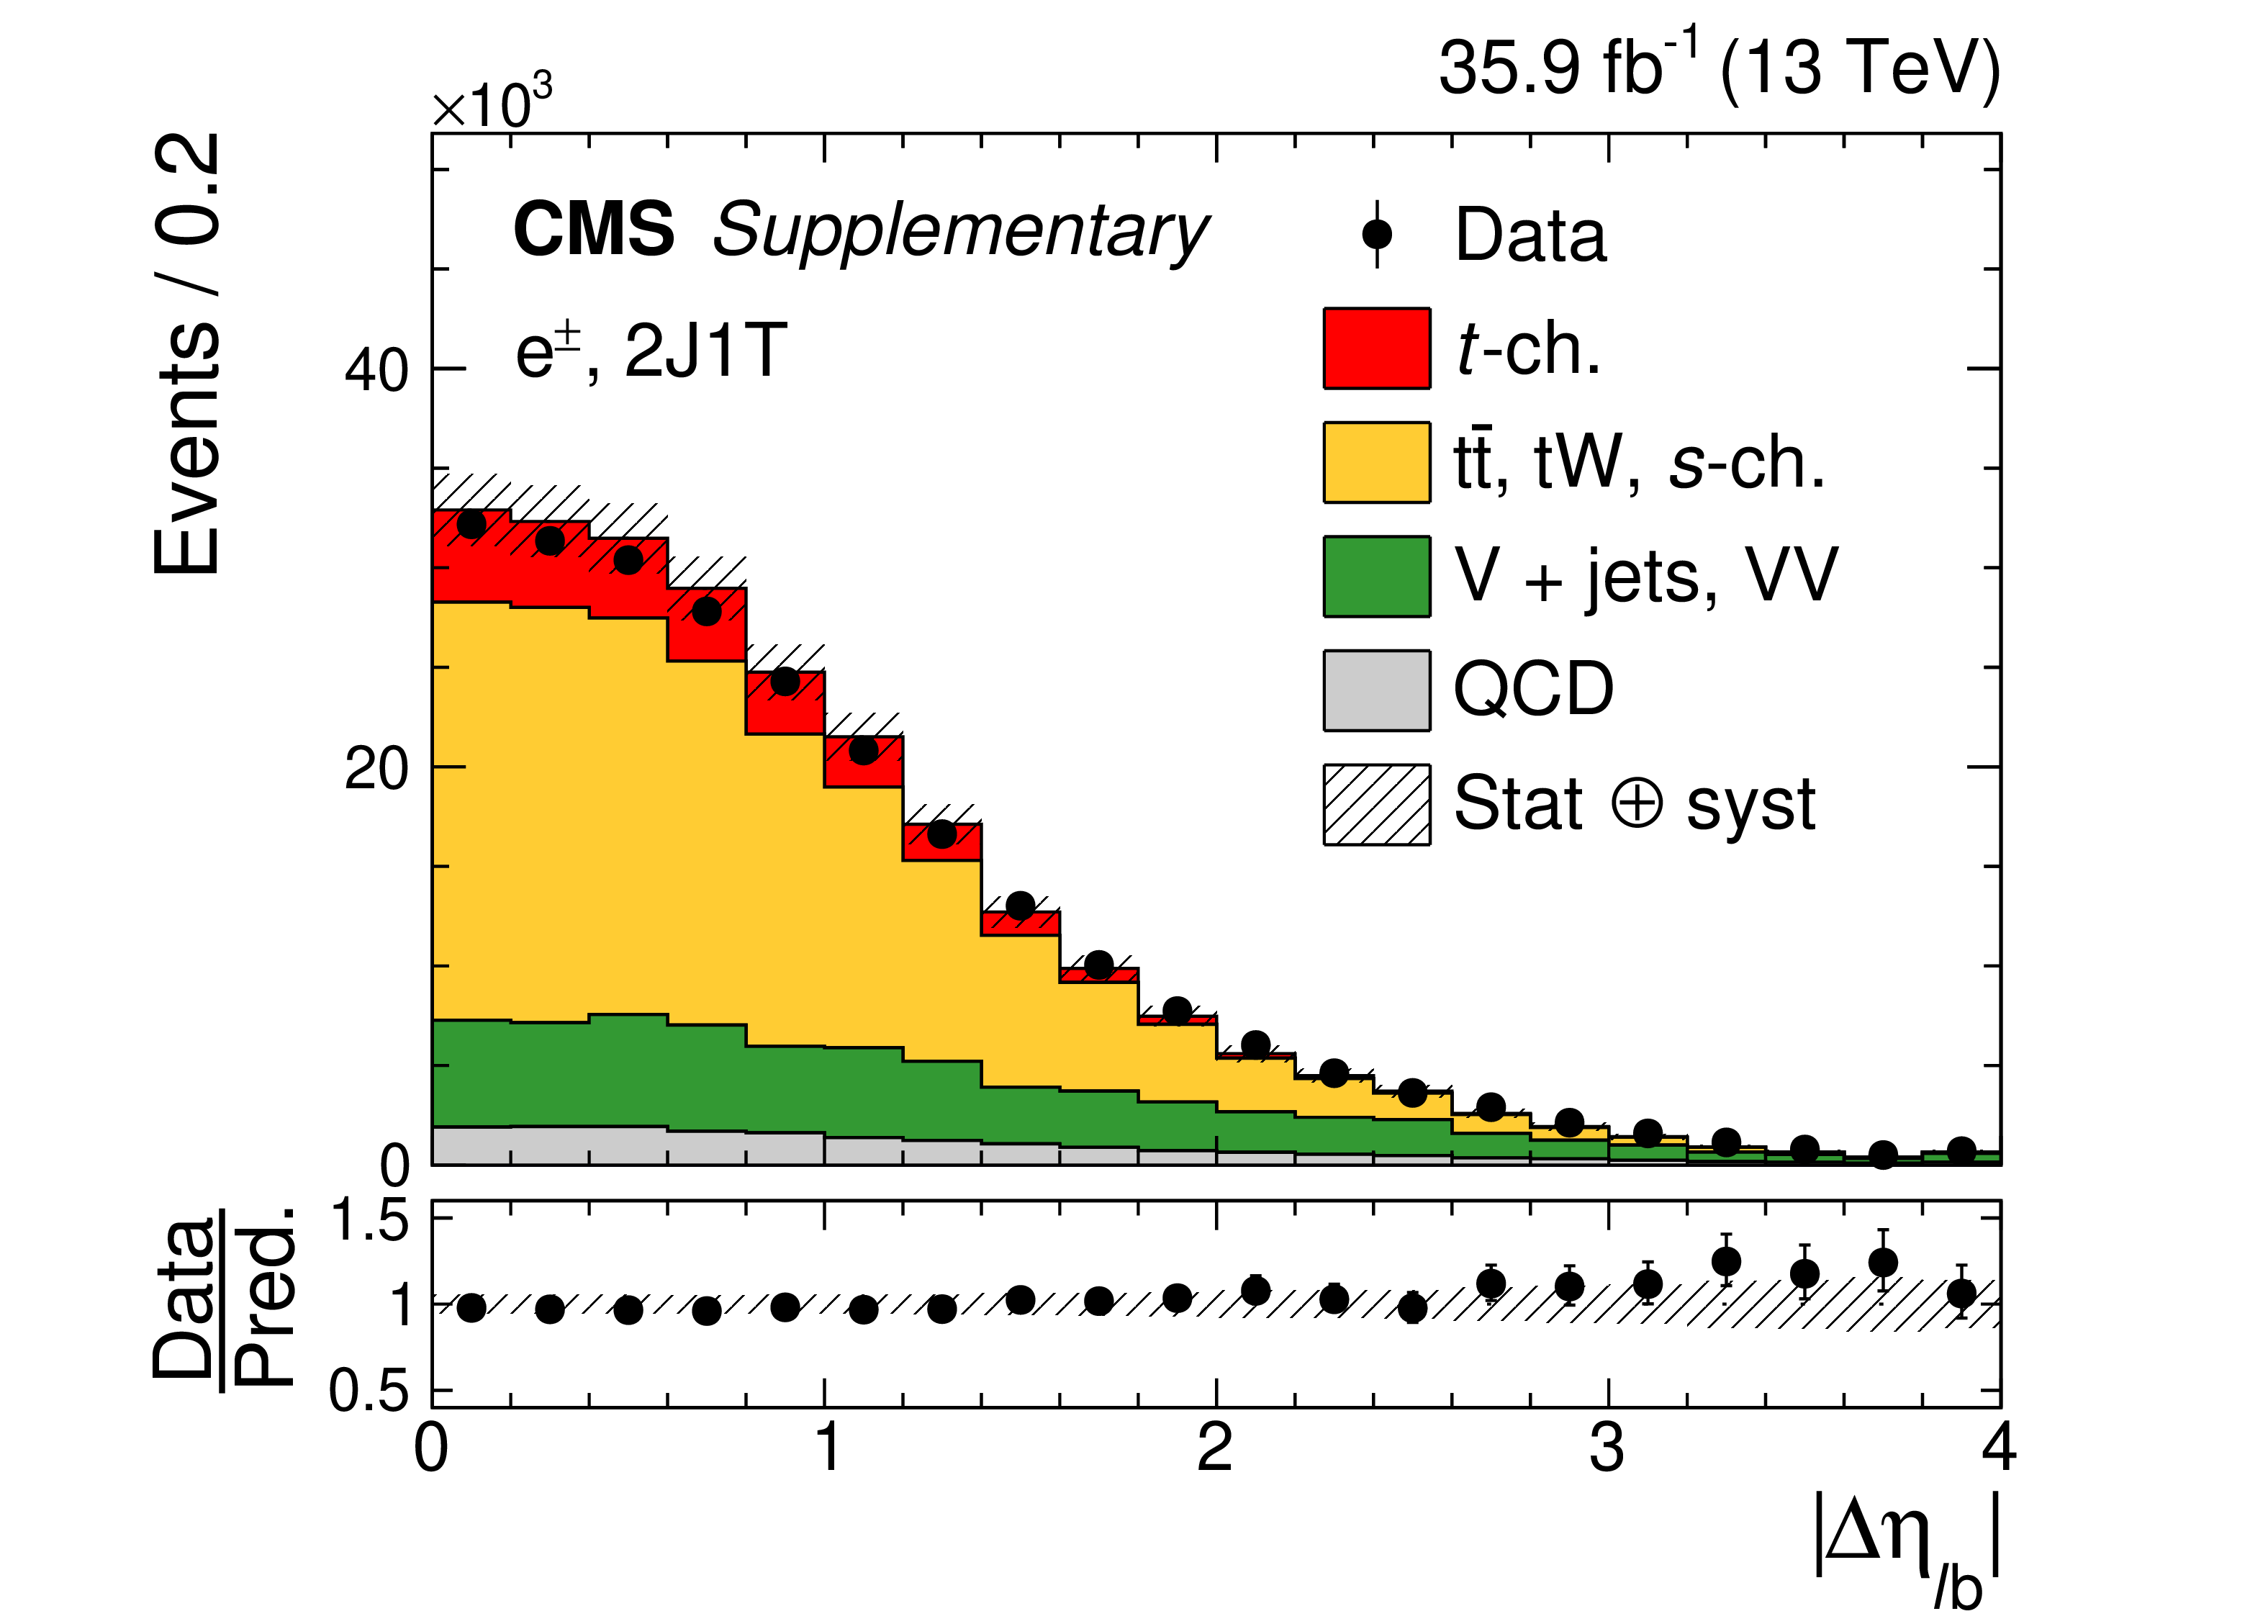
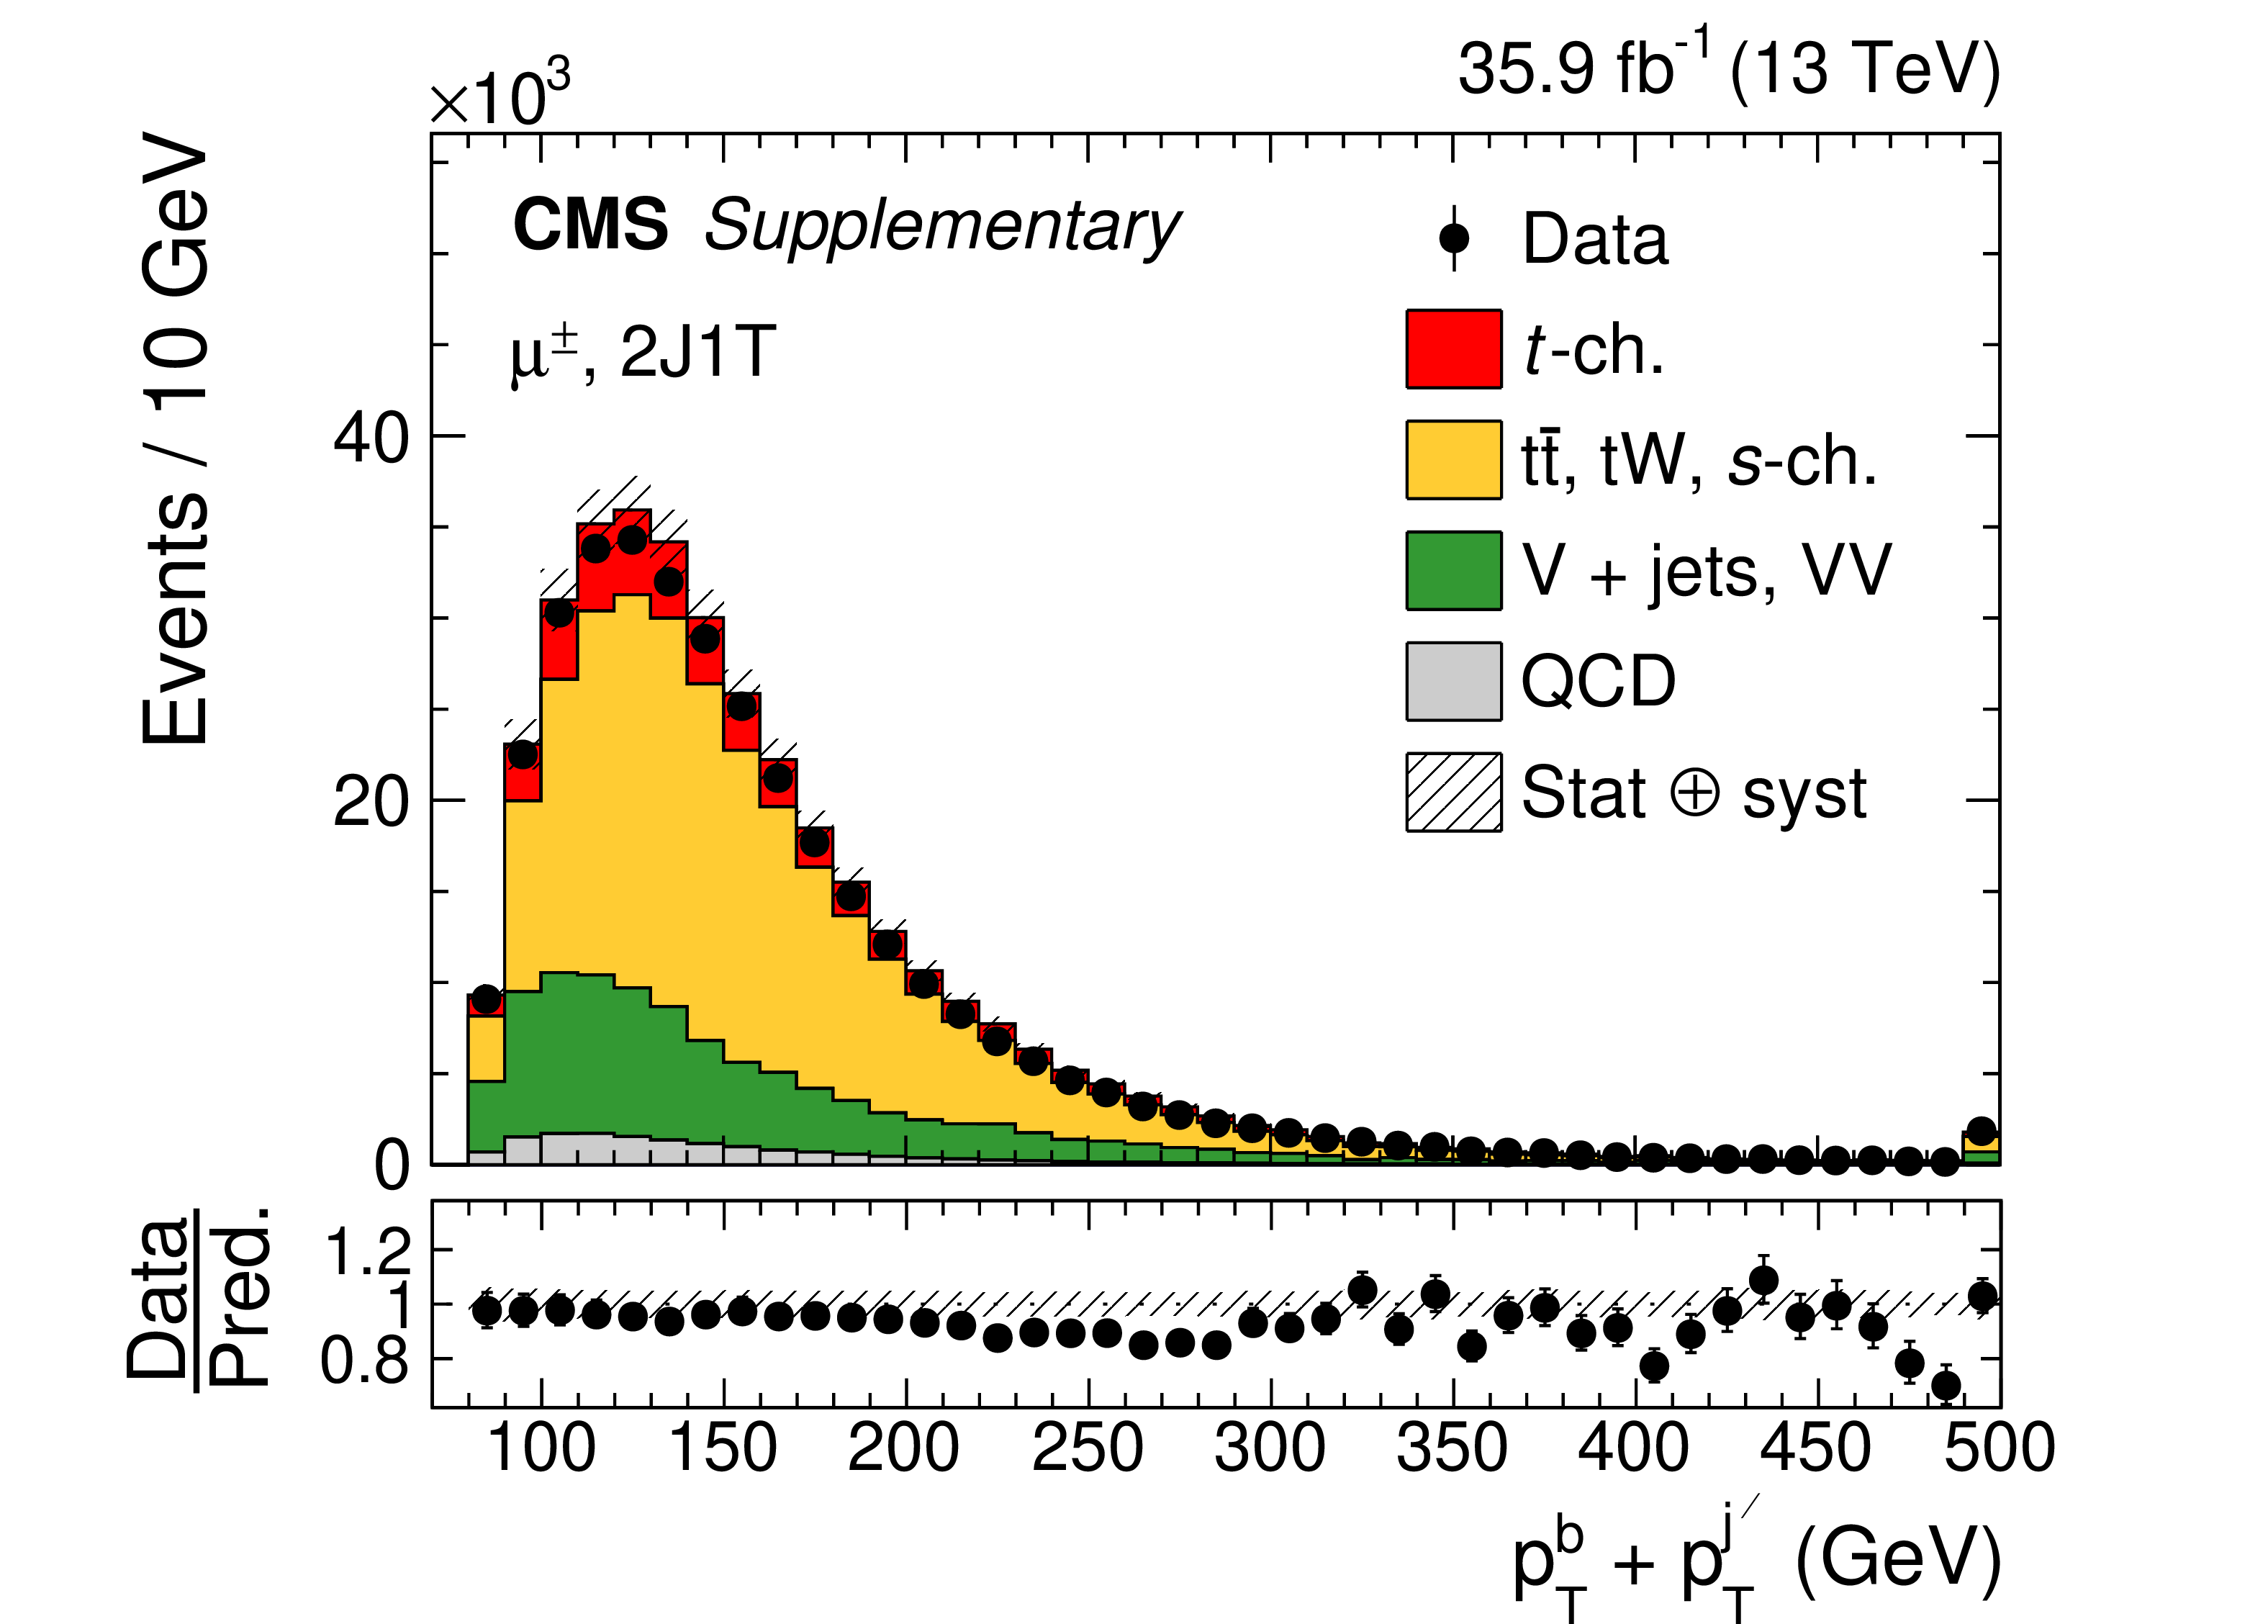
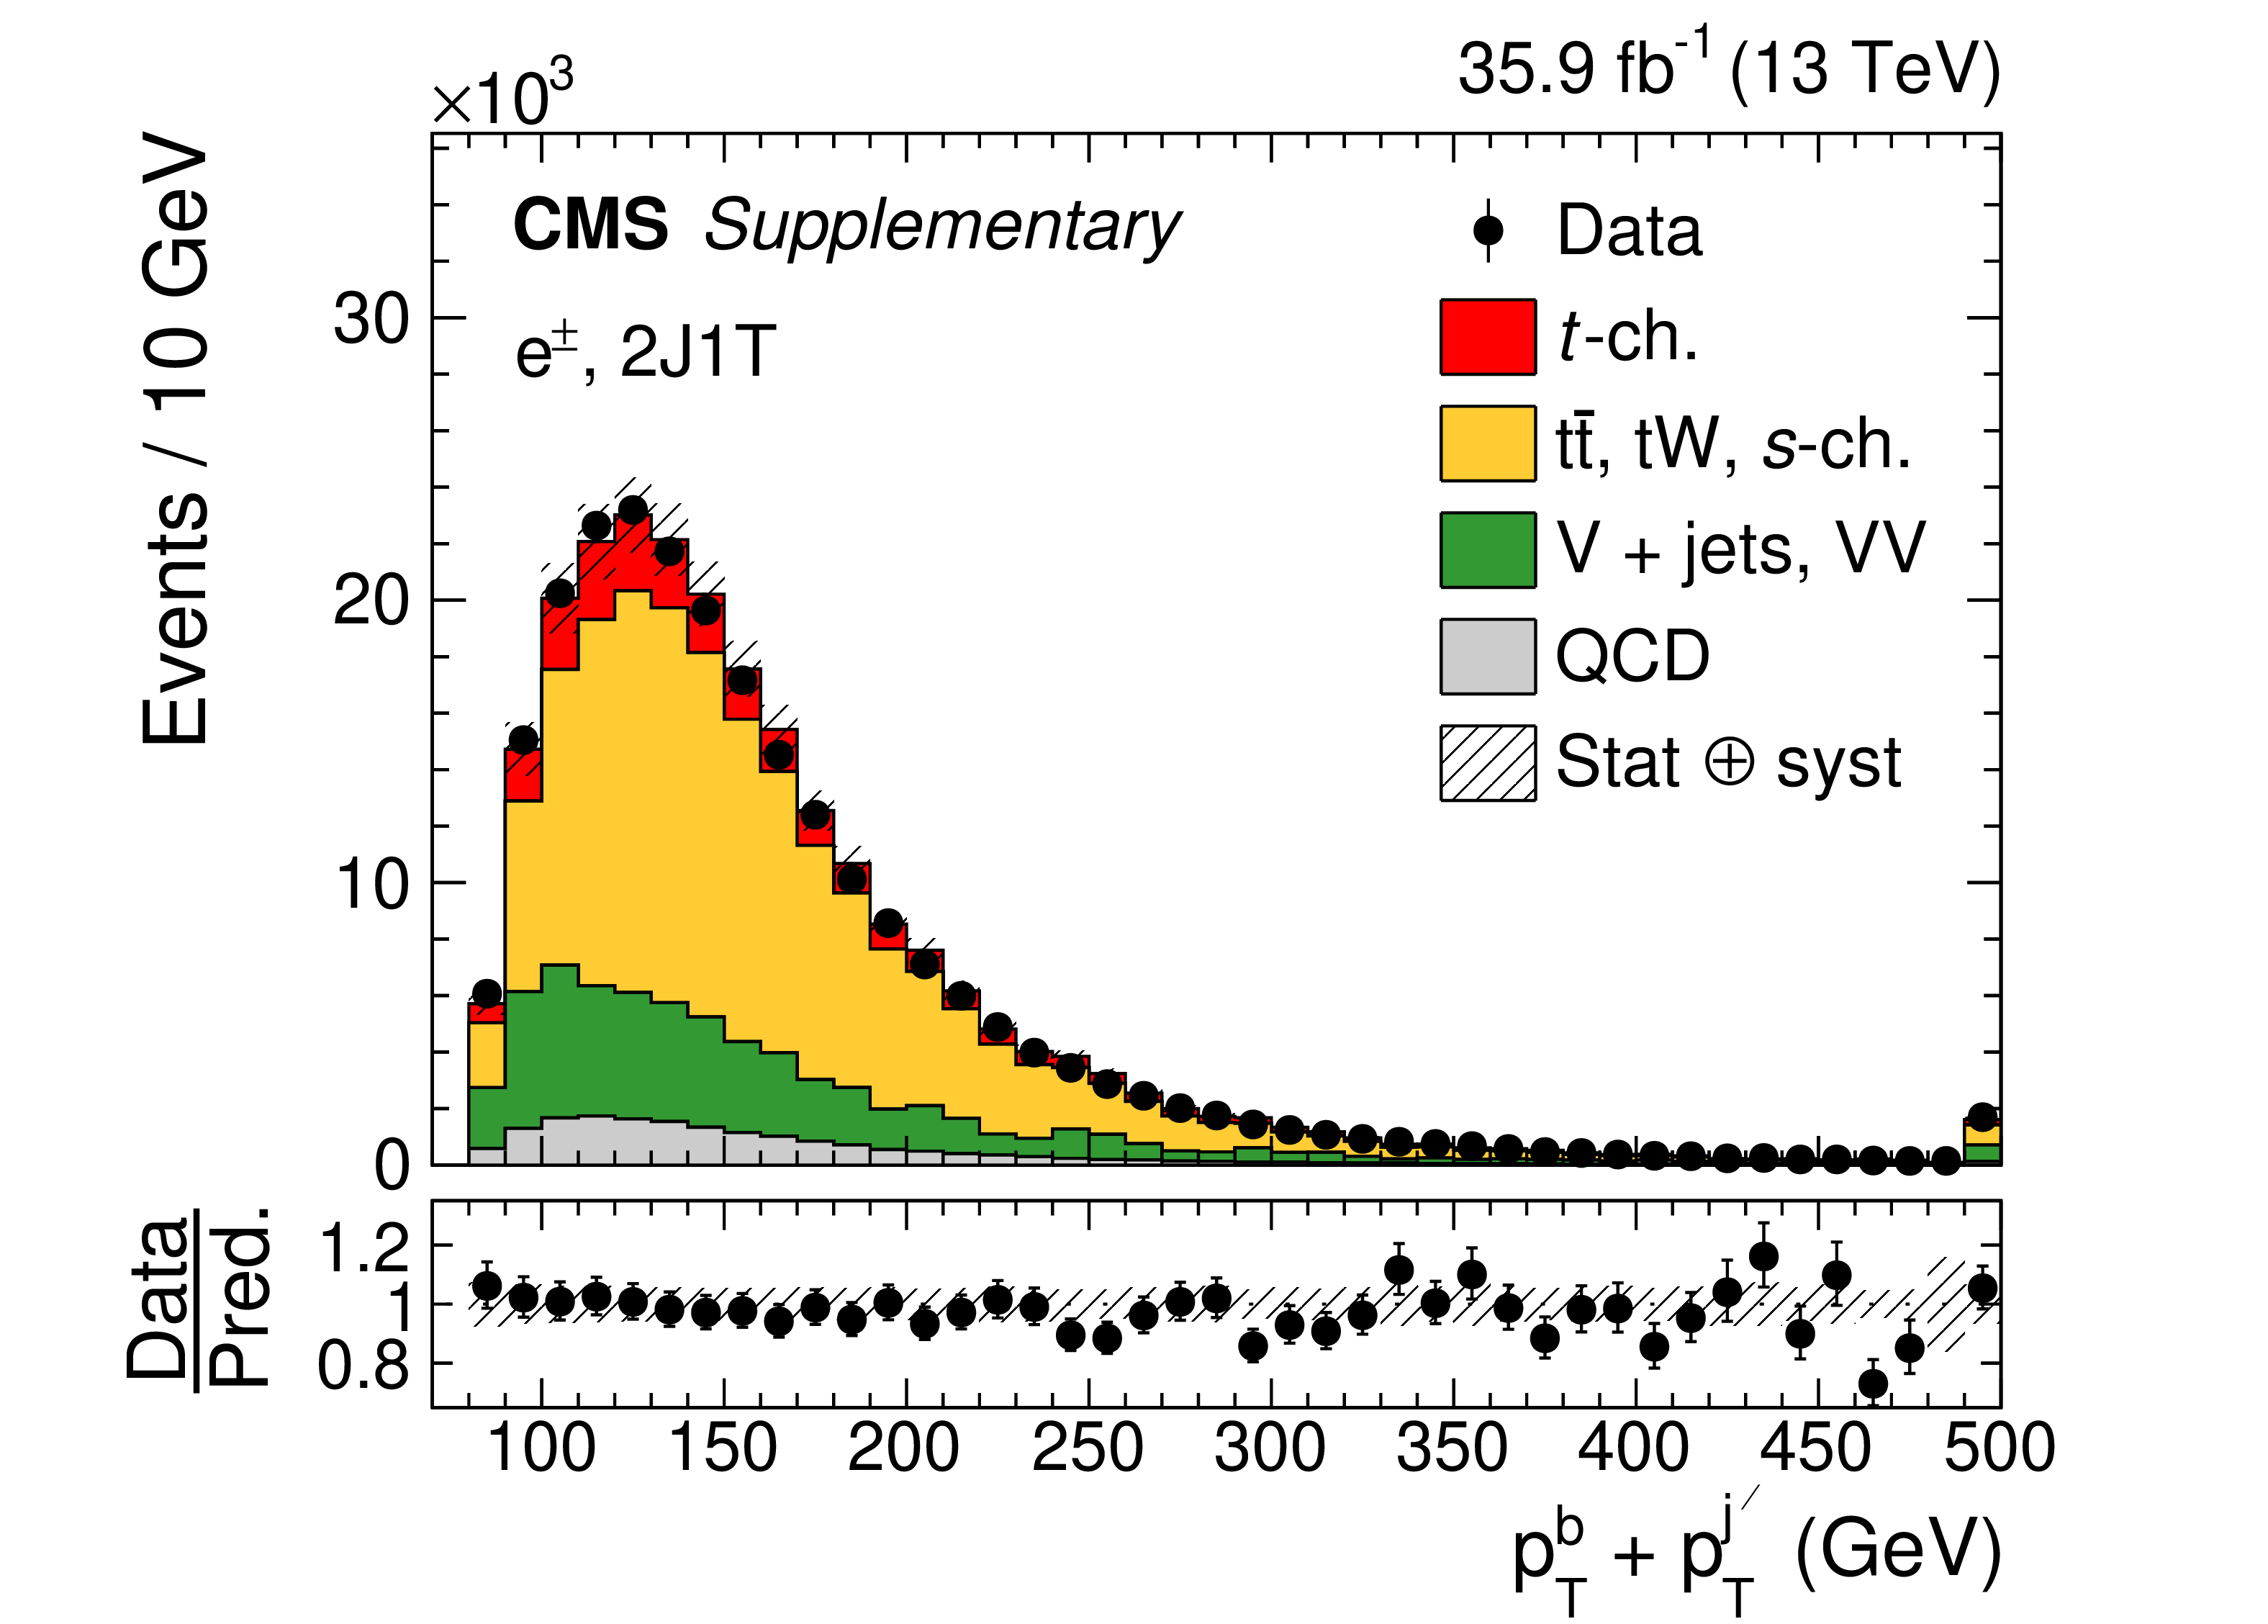
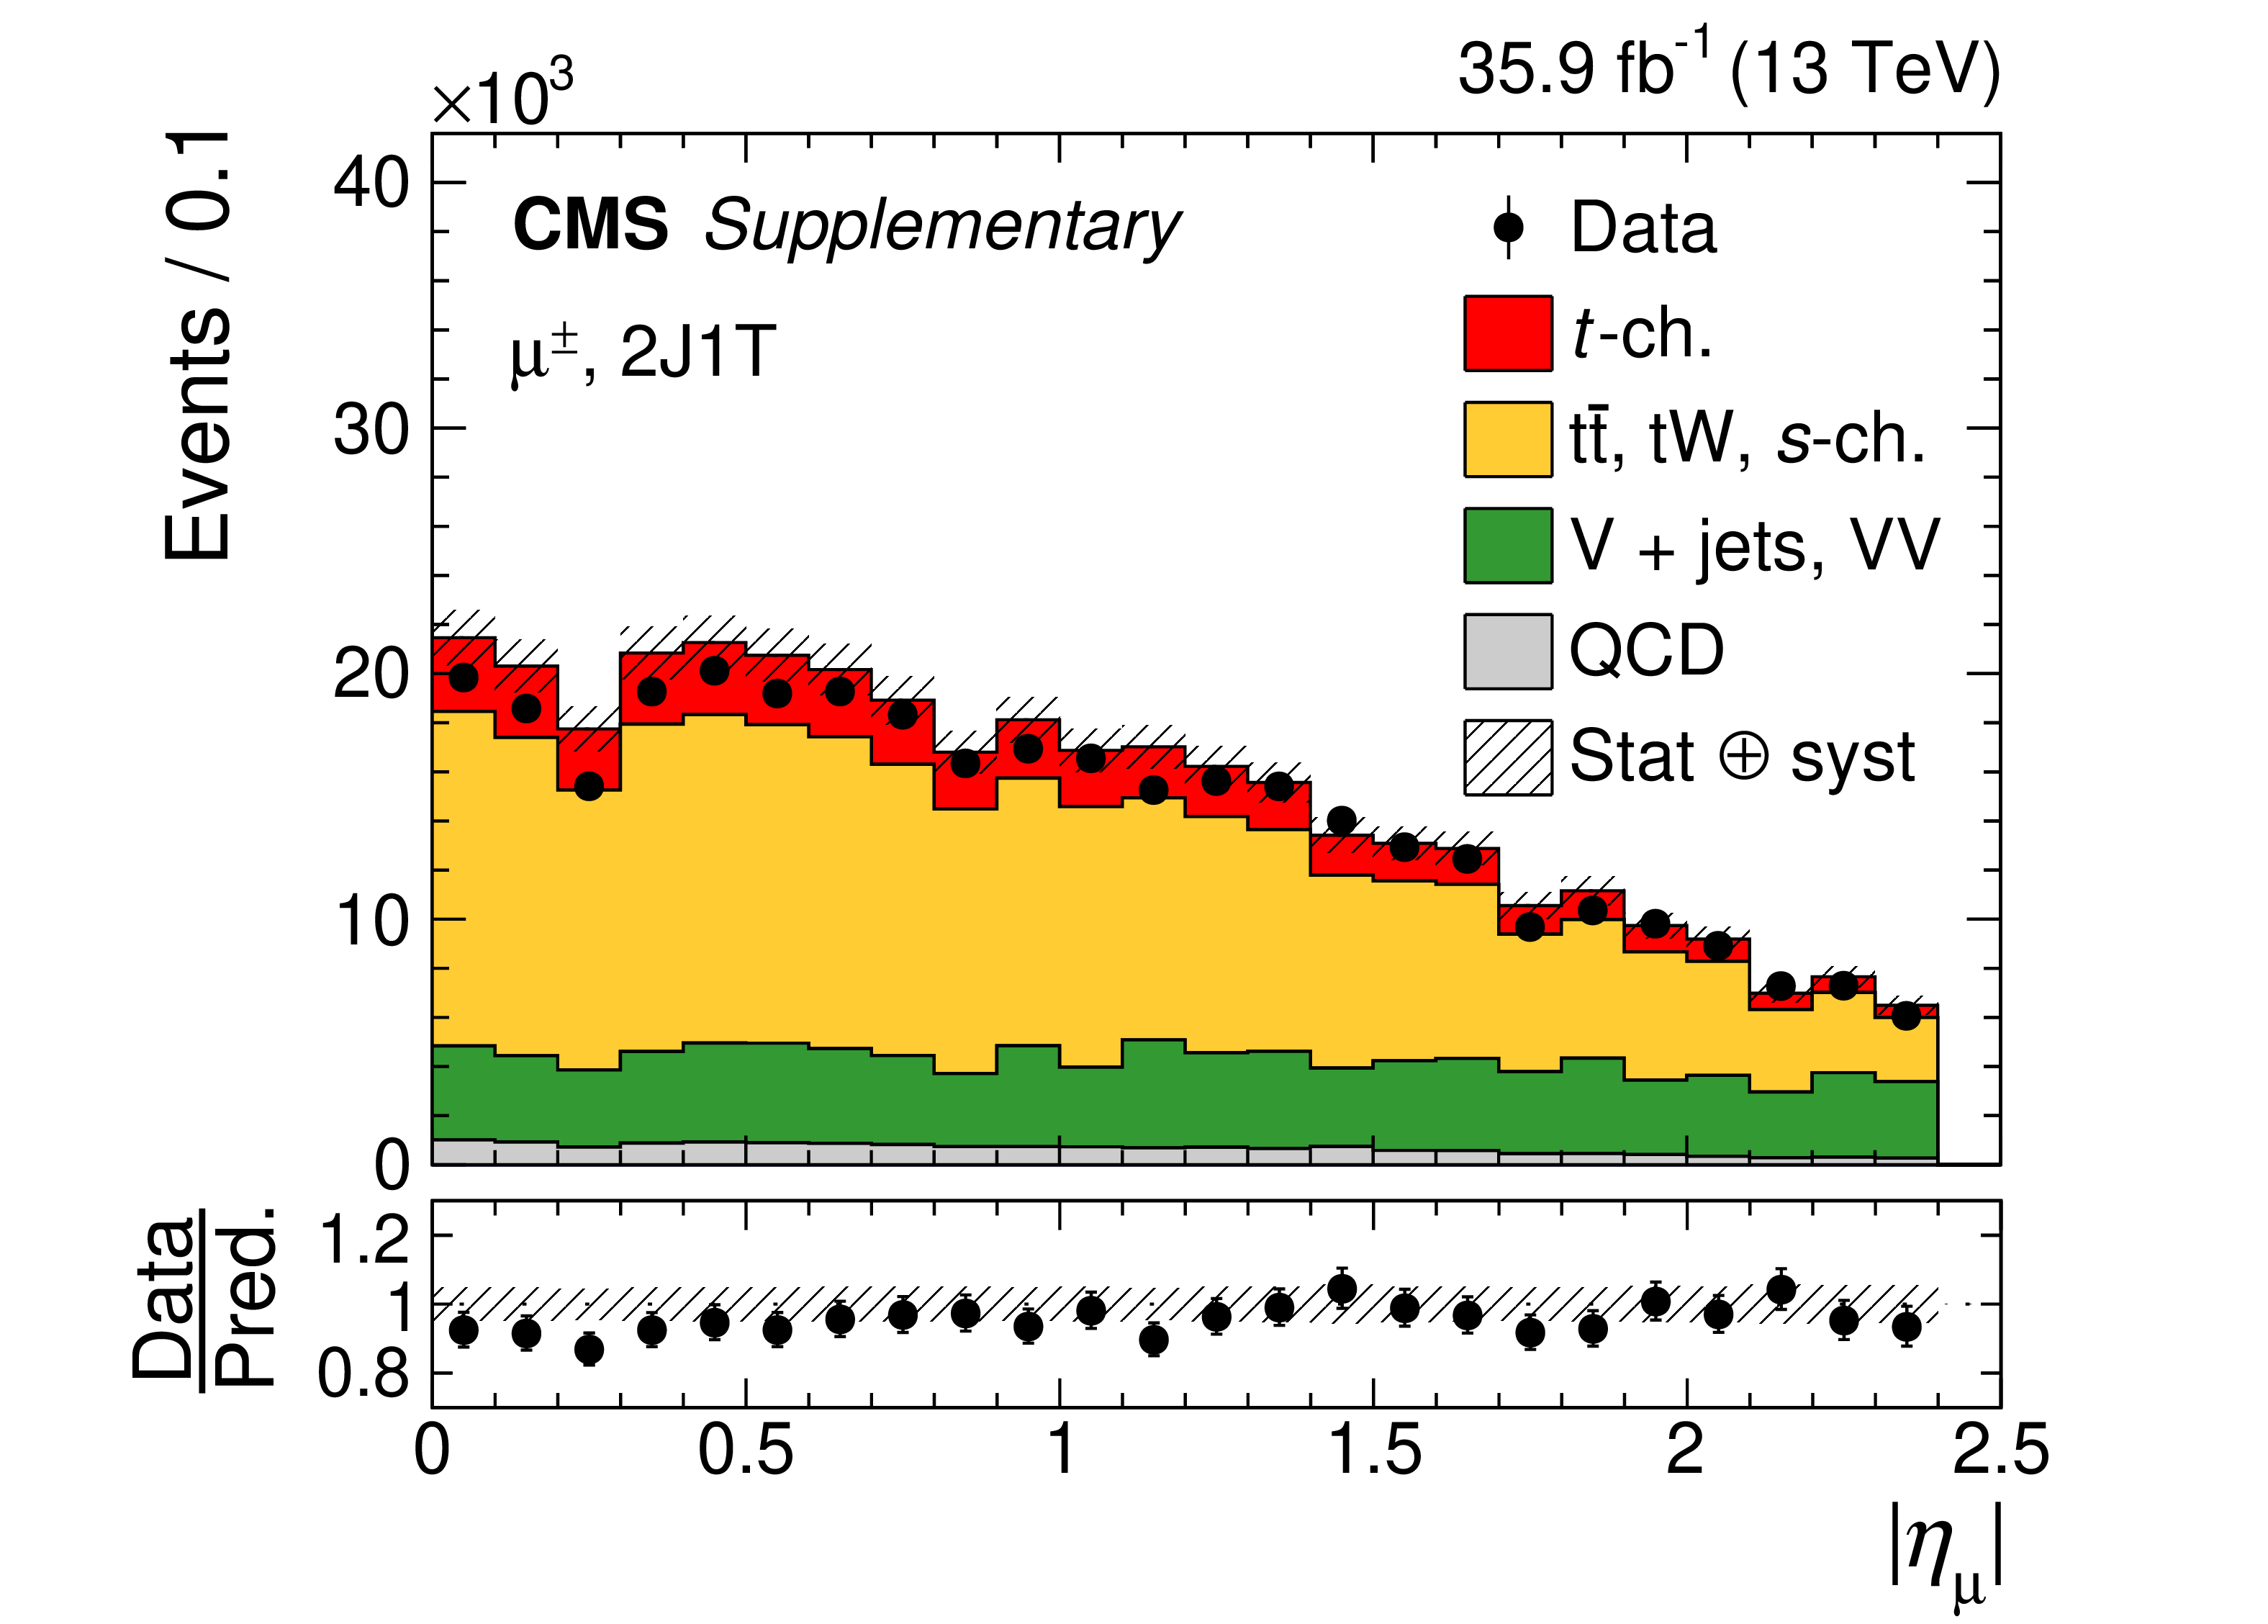
Figure A2:
Distributions of $ {| \Delta \eta _{l\mathrm{b}} |}$ (upper row) and $ {p_{\mathrm {T}}} ^{\mathrm{b}} + {p_{\mathrm {T}}} ^{\mathrm {j}^{\prime}}$ (middle row) for the muon (left) and electron (right) final states in the 2J1T category for data (points) and simulation (colored histograms). The lower row shows the similar data-to-simulation comparison for $ {| \eta _{\ell} |}$ (left) and FW1 (right) for the muon (left) and electron (right) final states in the 2J1T category. The lower panel in each plot shows the ratio of the data to the predictions. The bands indicate the prefit statistical and systematic uncertainties added in quadrature. The last bin in each plot except for the lower-right one includes the overflow. |

png pdf |
Figure A2-a:
Distribution of $ {| \Delta \eta _{l\mathrm{b}} |}$ $ {p_{\mathrm {T}}} ^{\mathrm{b}} + {p_{\mathrm {T}}} ^{\mathrm {j}^{\prime}}$ for the muon final state in the 2J1T category for data (points) and simulation (colored histograms). The lower panel shows the ratio of the data to the predictions. The bands indicate the prefit statistical and systematic uncertainties added in quadrature. The last bin includes the overflow. |
png pdf |
Figure A2-b:
Distribution of $ {| \Delta \eta _{l\mathrm{b}} |}$ $ {p_{\mathrm {T}}} ^{\mathrm{b}} + {p_{\mathrm {T}}} ^{\mathrm {j}^{\prime}}$ for the electron final state in the 2J1T category for data (points) and simulation (colored histograms). The lower panel shows the ratio of the data to the predictions. The bands indicate the prefit statistical and systematic uncertainties added in quadrature. The last bin includes the overflow. |
png pdf |
Figure A2-c:
Distribution of $ {| \Delta \eta _{l\mathrm{b}} |}$ $ {p_{\mathrm {T}}} ^{\mathrm{b}} + {p_{\mathrm {T}}} ^{\mathrm {j}^{\prime}}$ for the muon final state in the 2J1T category for data (points) and simulation (colored histograms). The lower panel shows the ratio of the data to the predictions. The bands indicate the prefit statistical and systematic uncertainties added in quadrature. The last bin includes the overflow. |
png pdf |
Figure A2-d:
Distribution of $ {| \Delta \eta _{l\mathrm{b}} |}$ $ {p_{\mathrm {T}}} ^{\mathrm{b}} + {p_{\mathrm {T}}} ^{\mathrm {j}^{\prime}}$ for the electron final state in the 2J1T category for data (points) and simulation (colored histograms). The lower panel shows the ratio of the data to the predictions. The bands indicate the prefit statistical and systematic uncertainties added in quadrature. The last bin includes the overflow. |
png pdf |
Figure A2-e:
Distribution of $ {| \eta _{\ell} |}$ for the muon final state in the 2J1T category. The lower panel shows the ratio of the data to the predictions. The bands indicate the prefit statistical and systematic uncertainties added in quadrature. The last bin includes the overflow. |

png pdf |
Figure A2-f:
Distribution of FW1 for the electron final state in the 2J1T category. The lower panel shows the ratio of the data to the predictions. The bands indicate the prefit statistical and systematic uncertainties added in quadrature. |

png pdf |
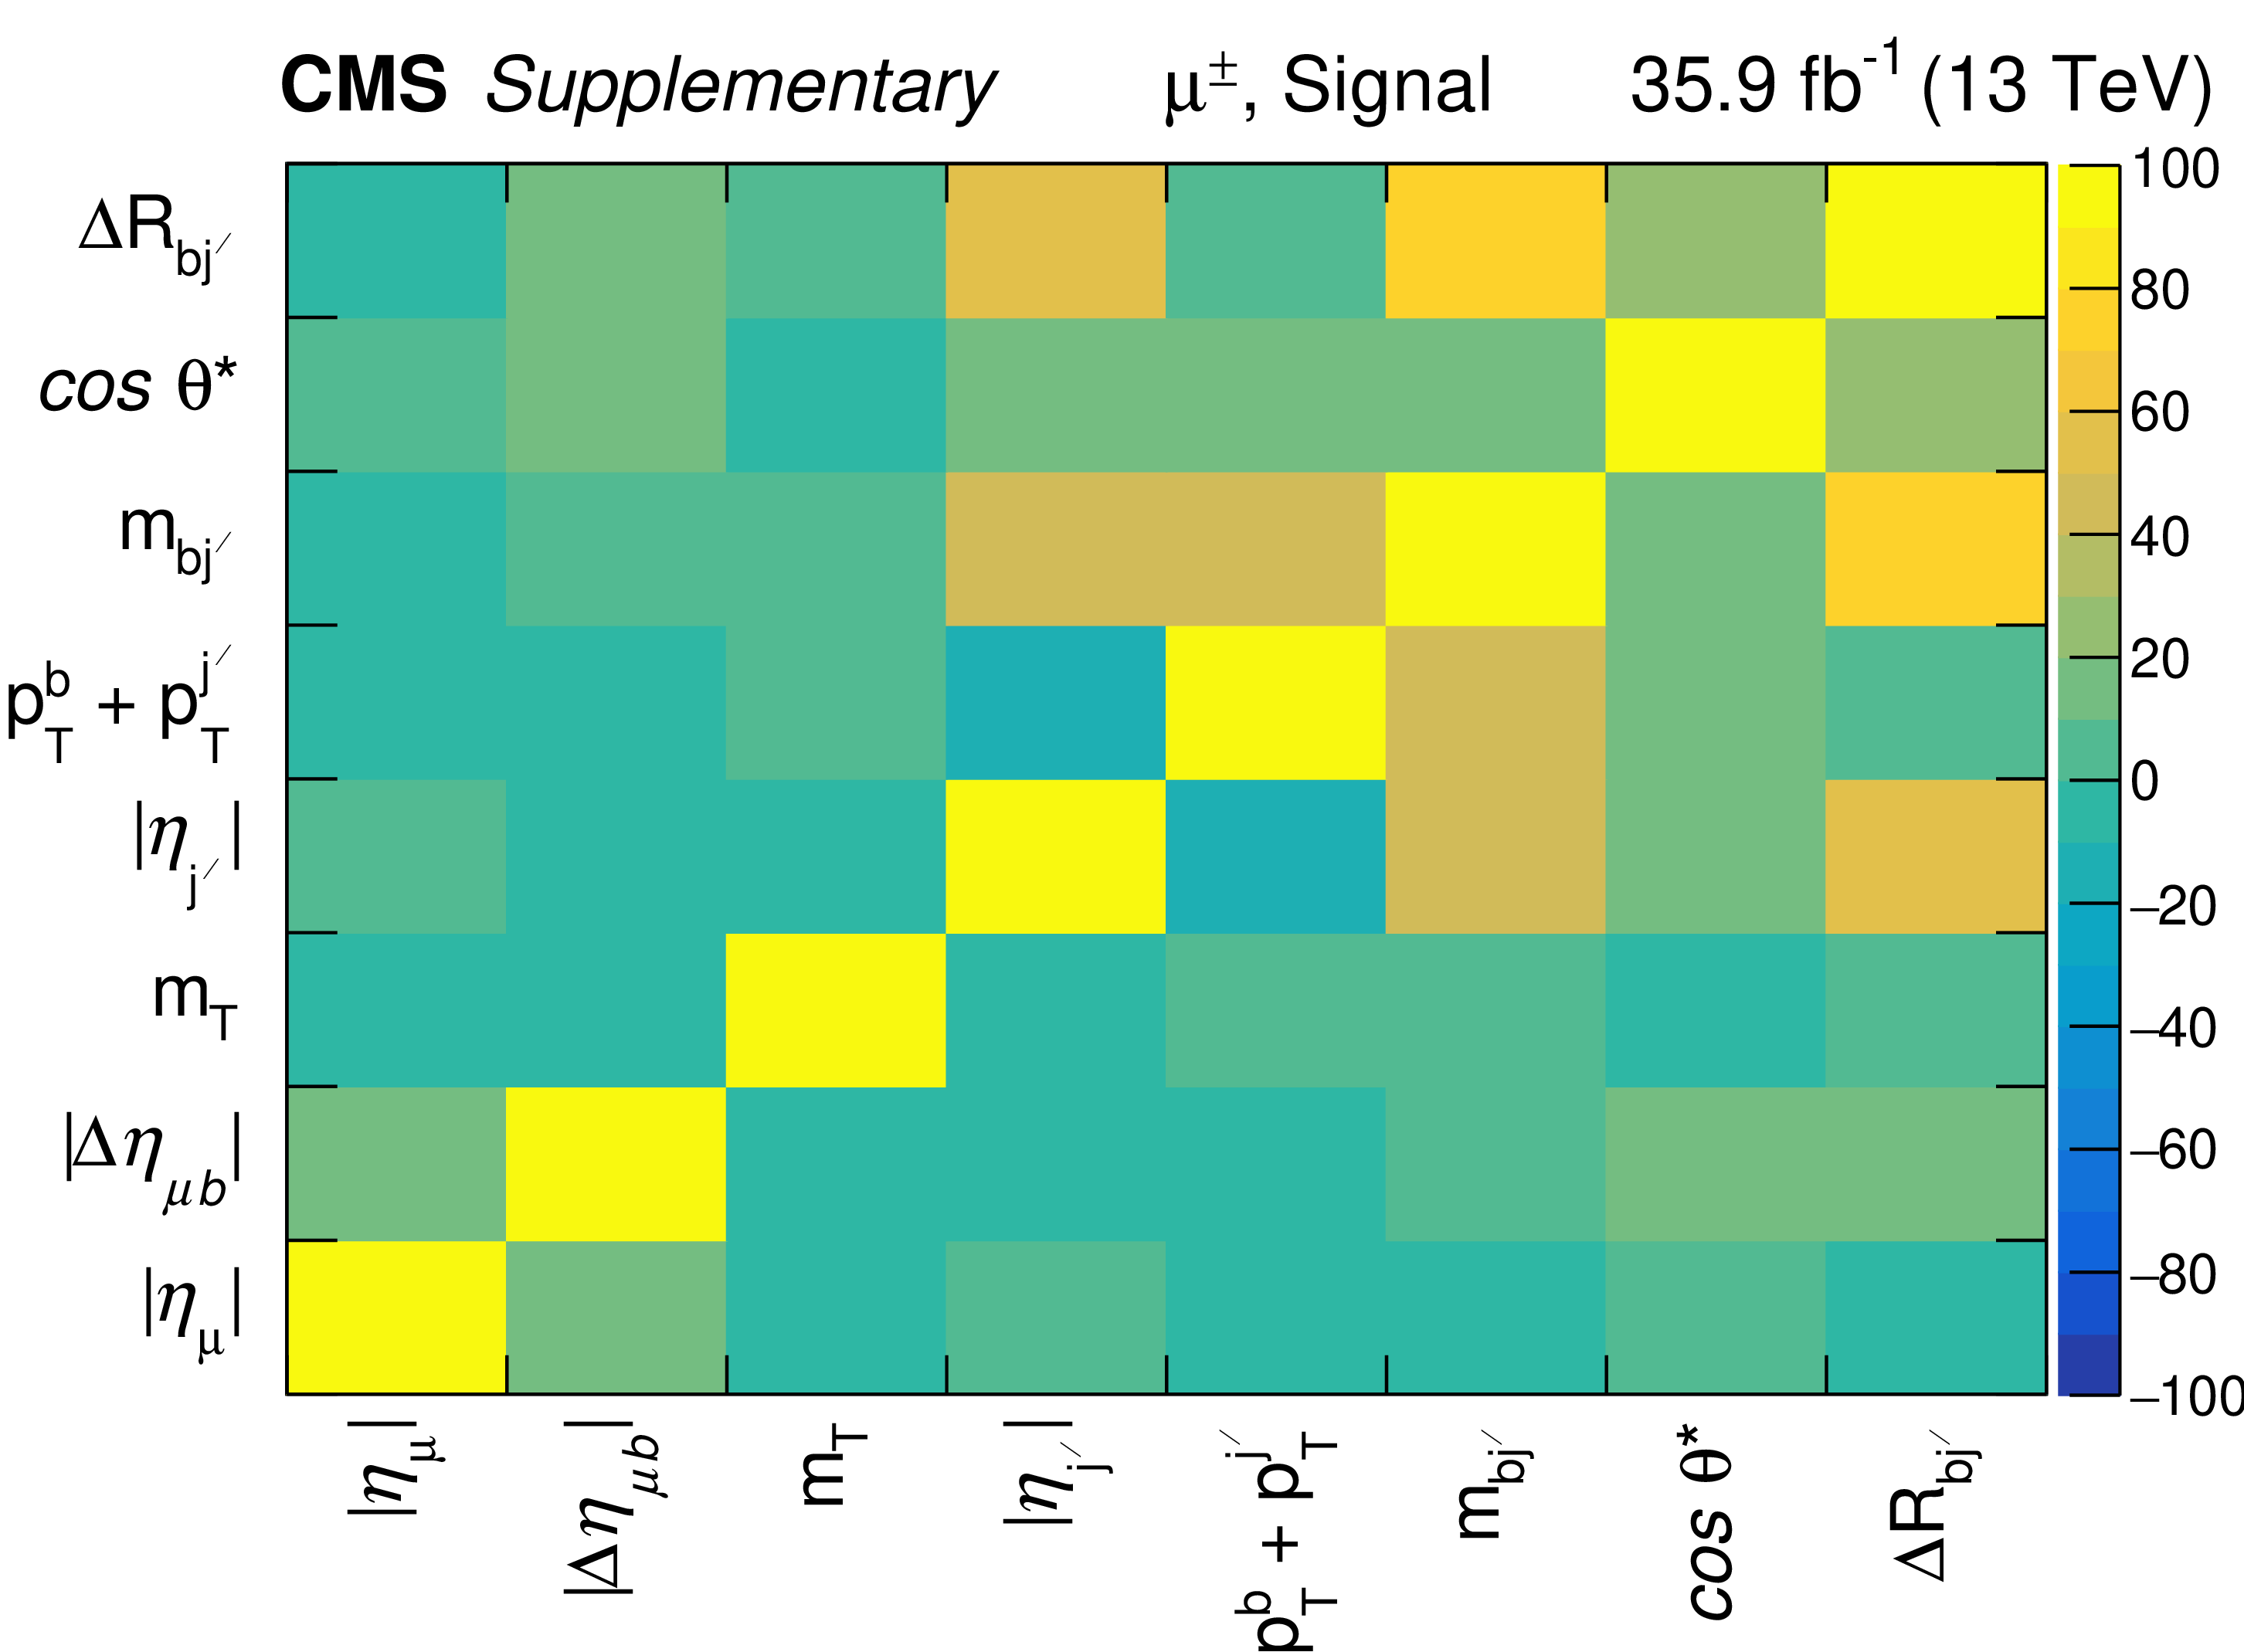
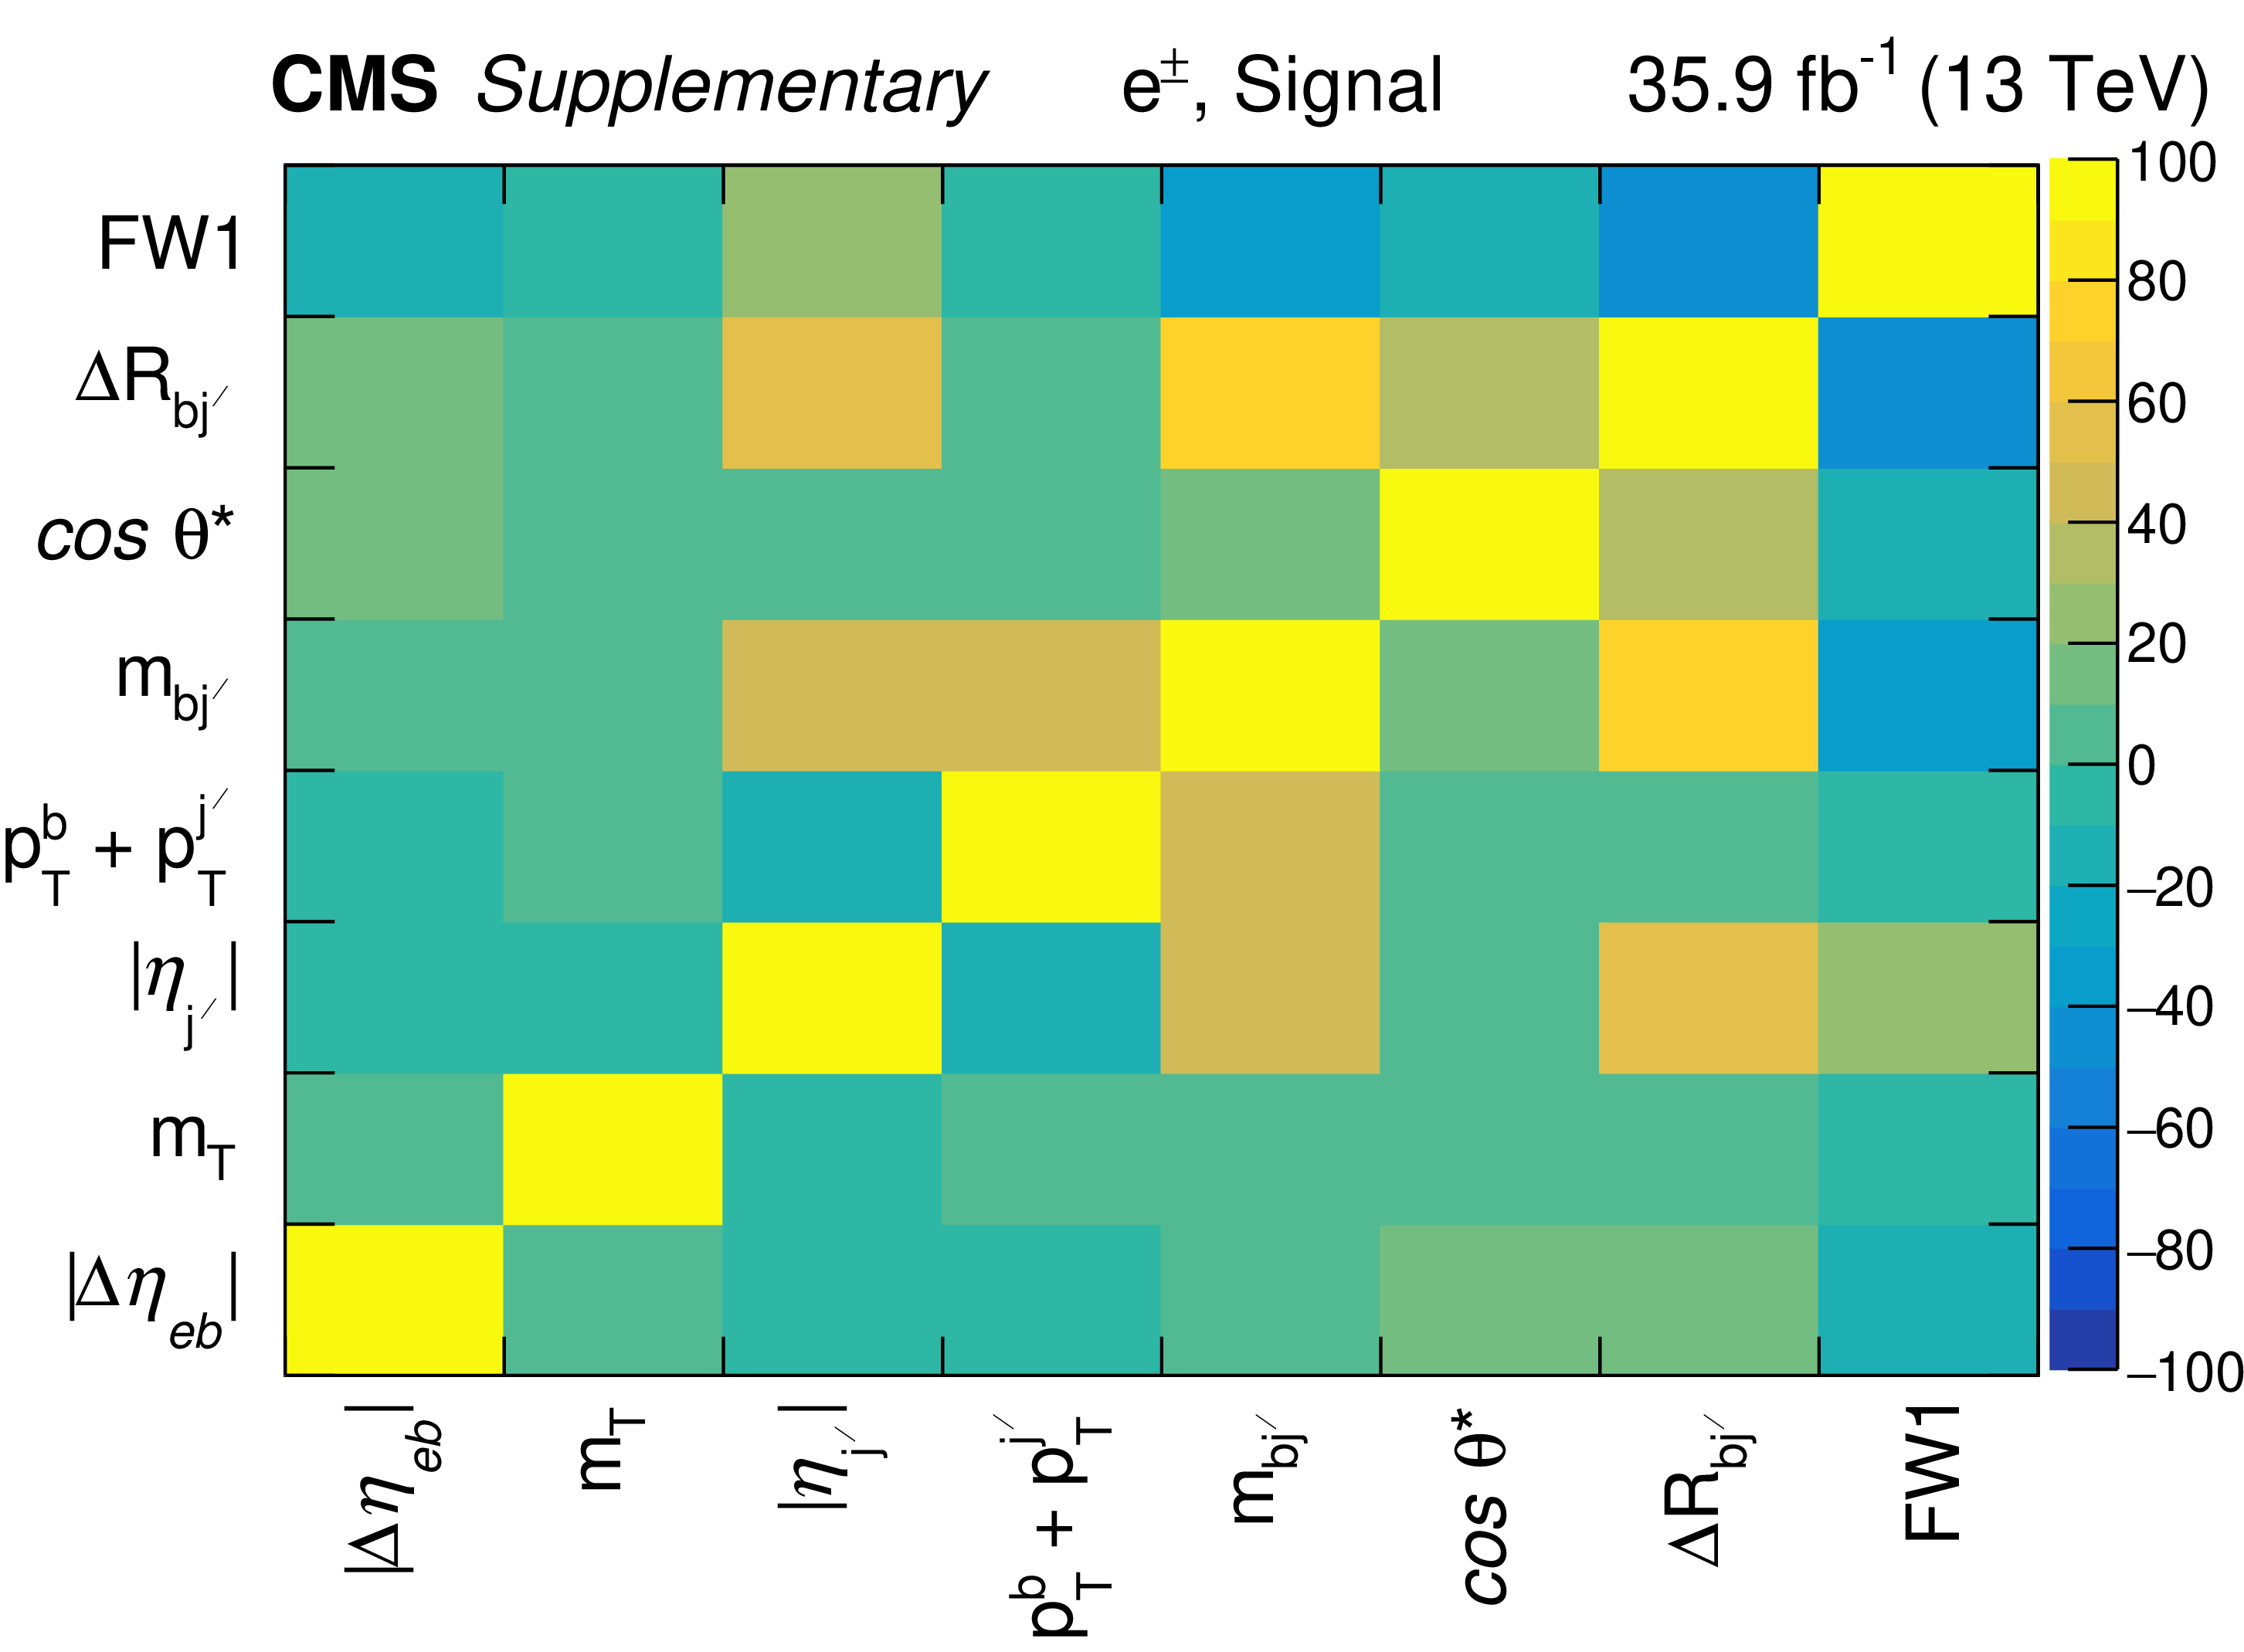
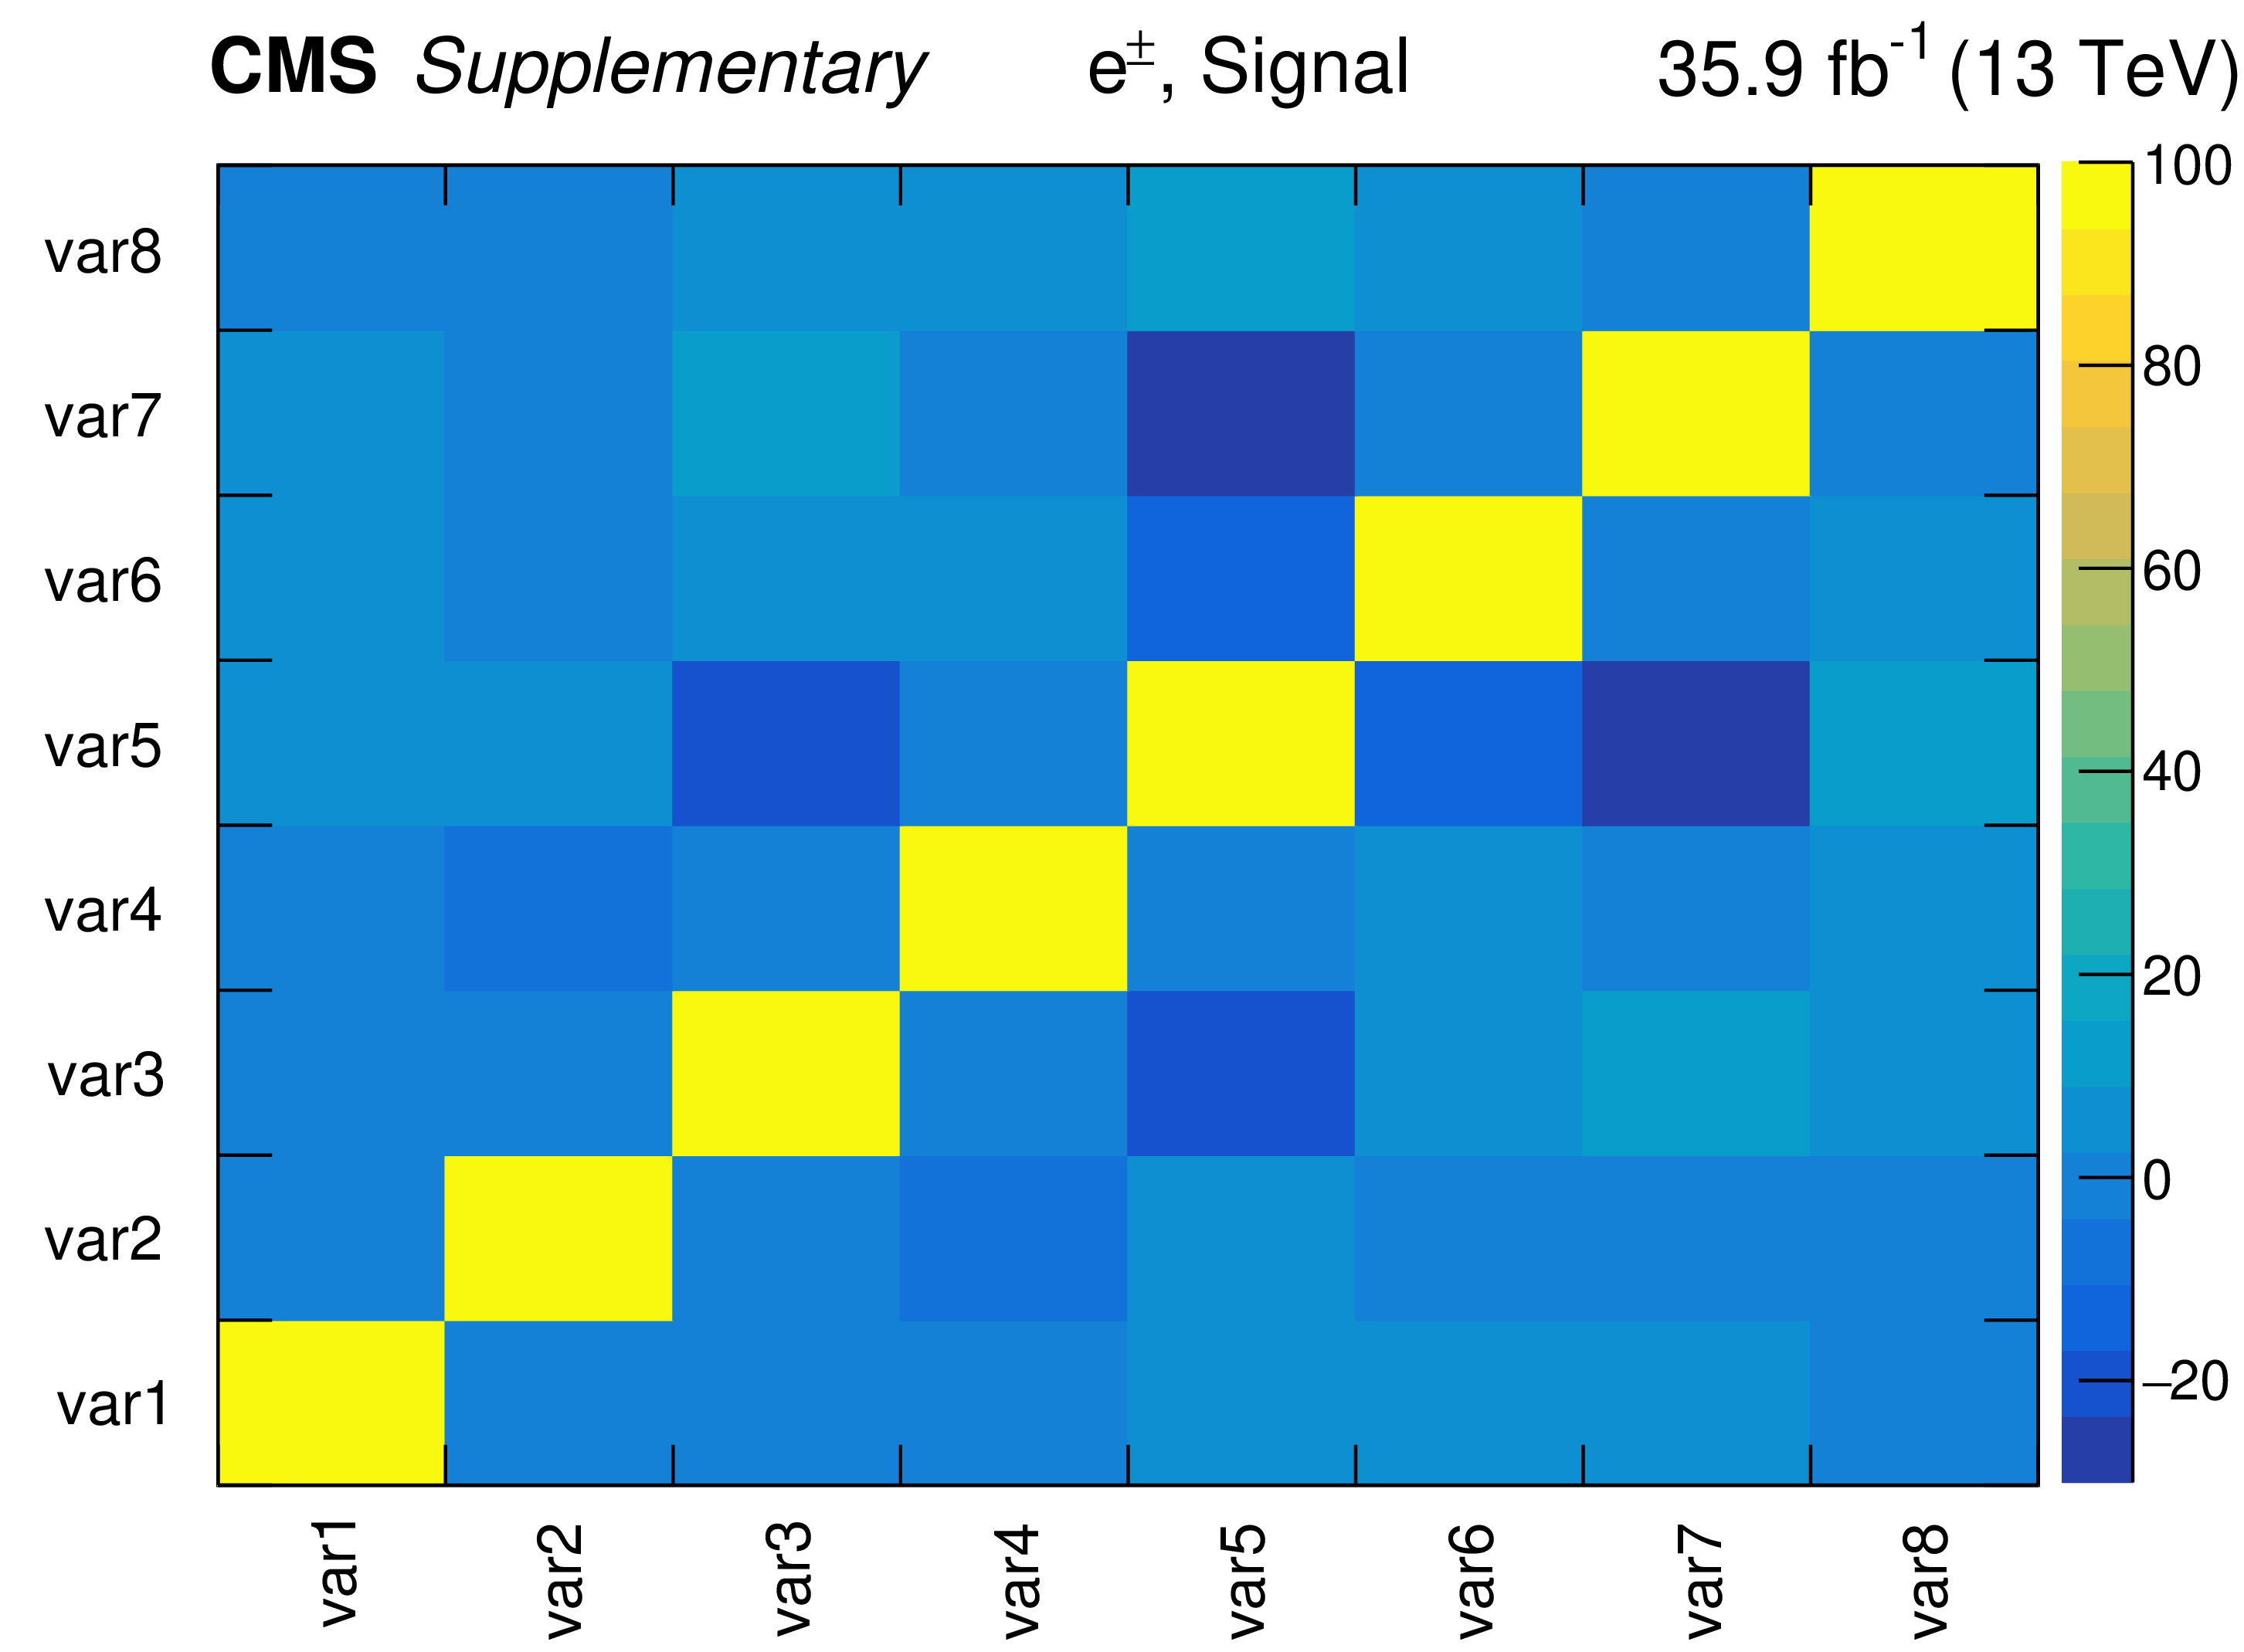
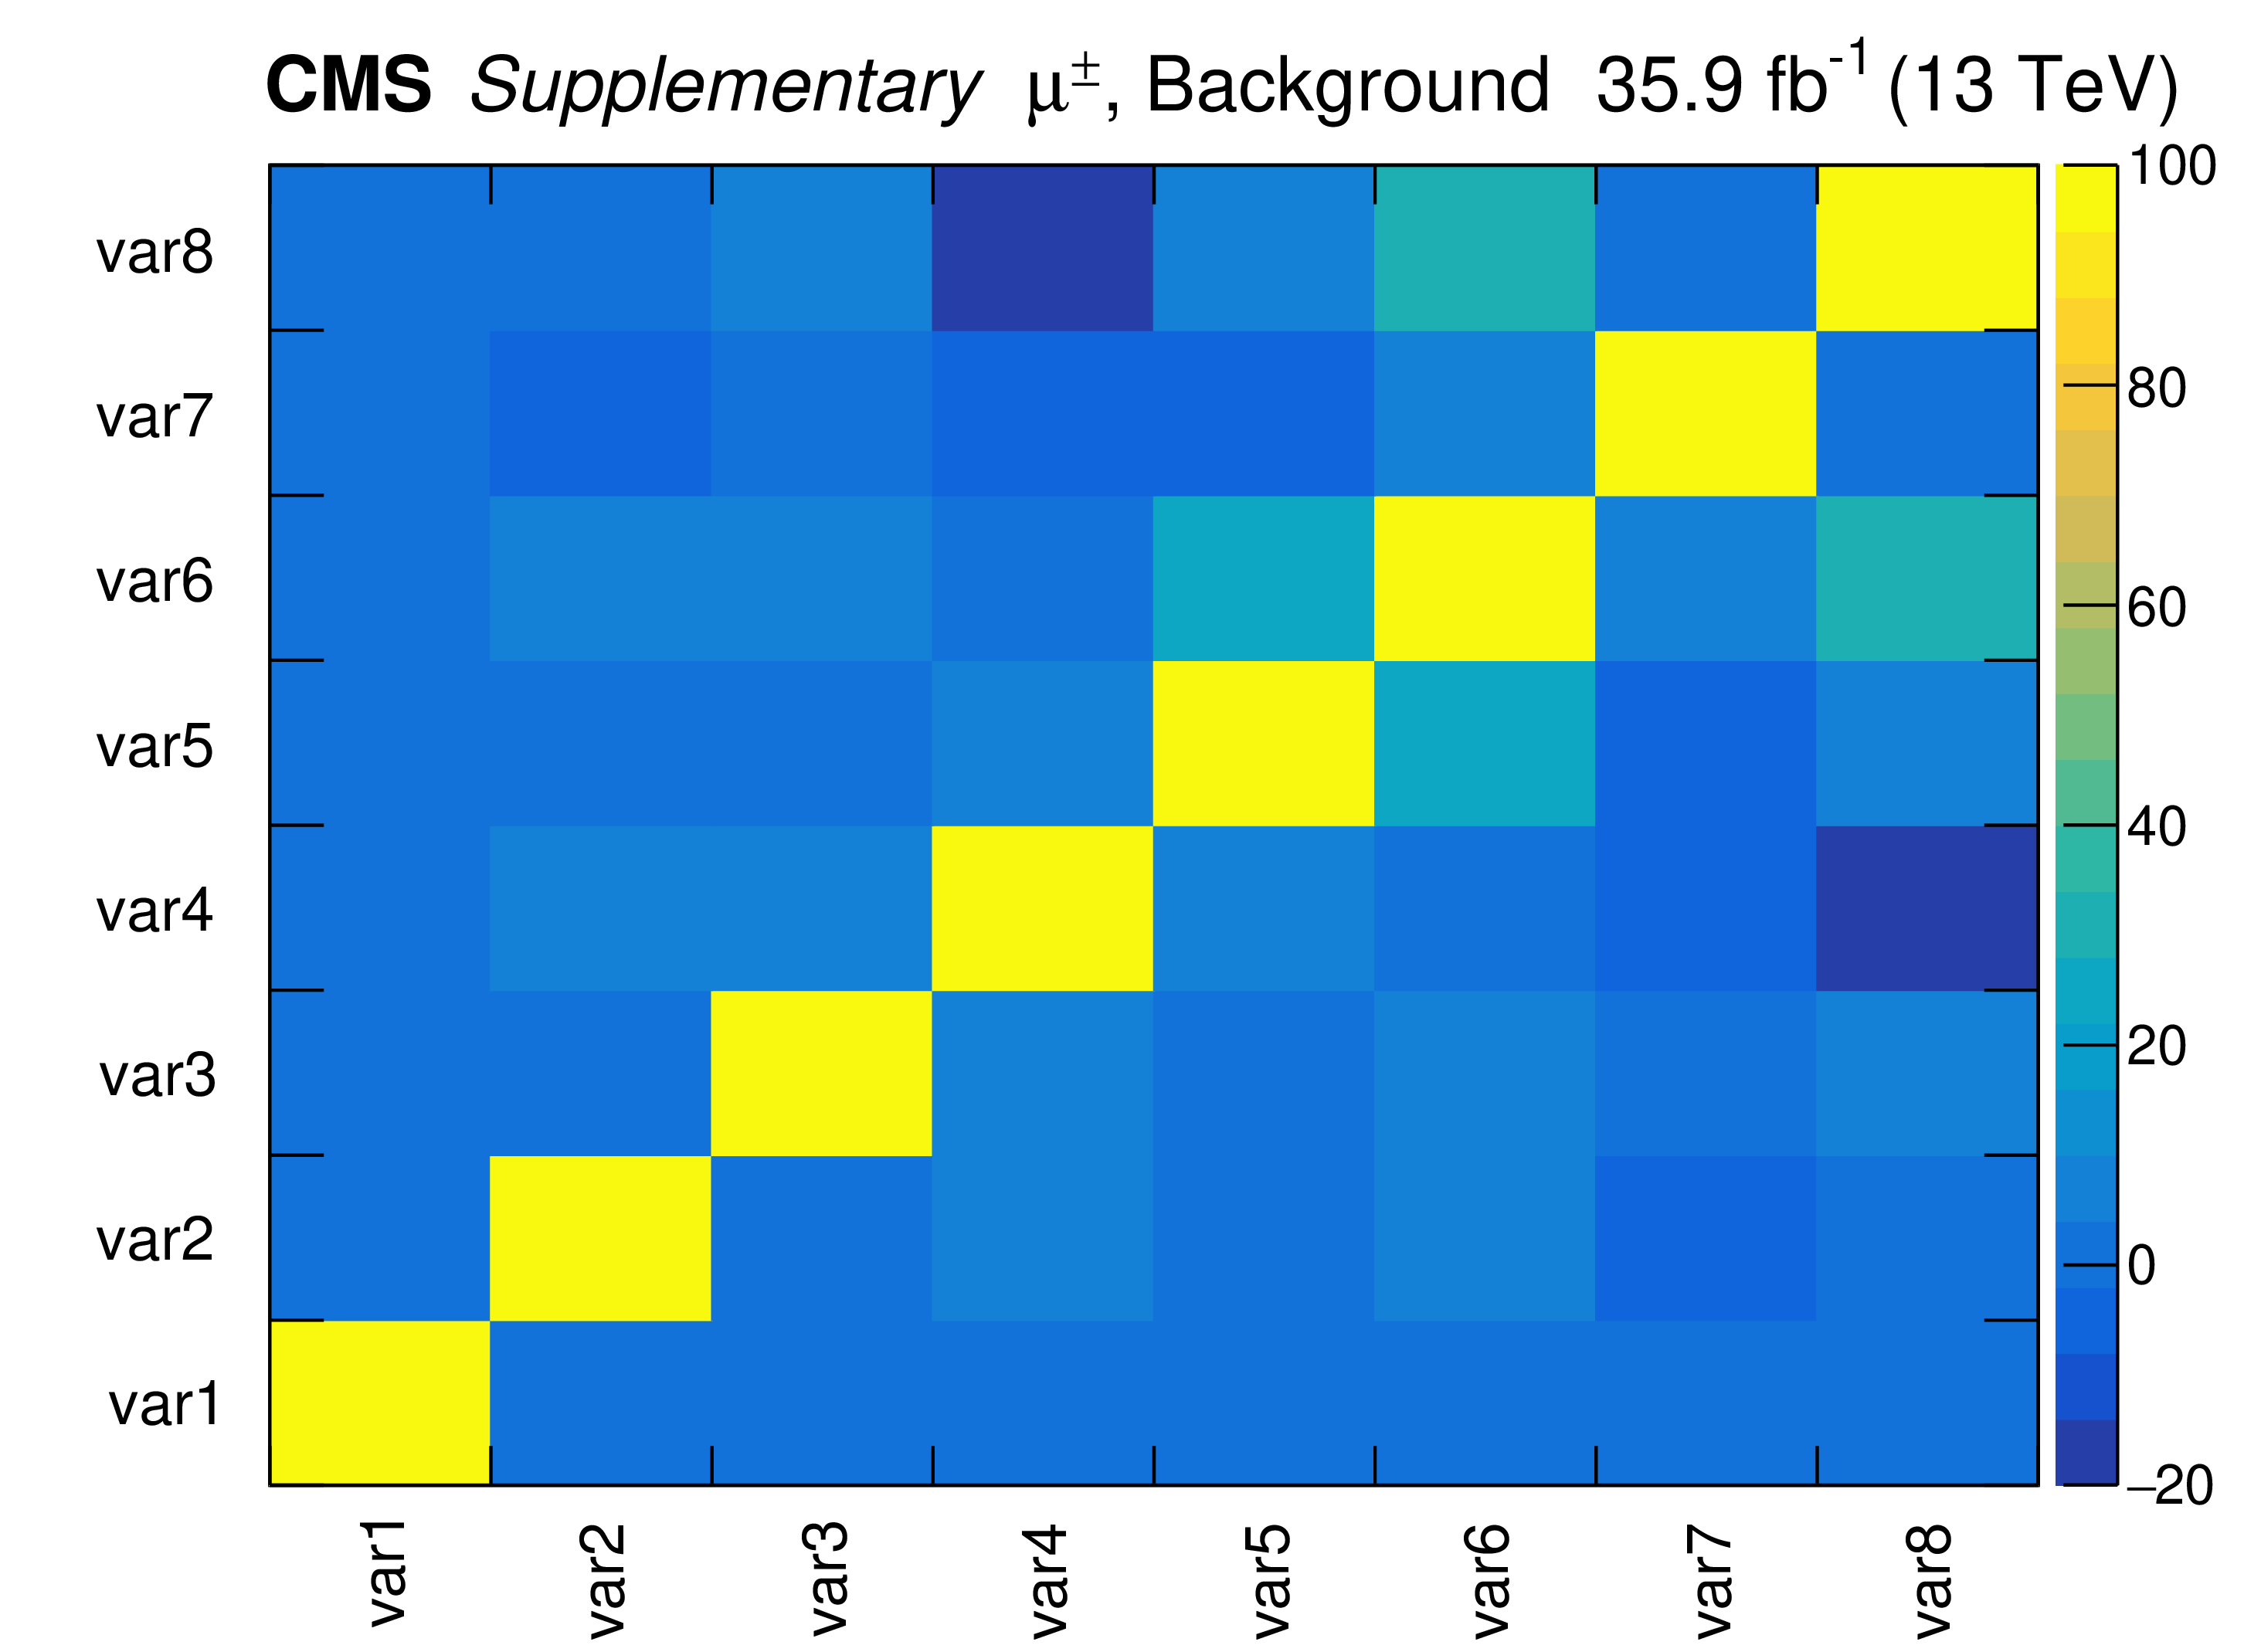
Figure A3:
Correlations in % among the BDT input variables used for the muon (left) and electron (right) final states in the signal and background events of the 2J1T category before (upper-two rows) and after (lower-two rows) decorrelation. |
png pdf |
Figure A3-a:
Correlations in % among two BDT input variables used for the muon final state in the signal and background events of the 2J1T category before decorrelation. |
png pdf |
Figure A3-b:
Correlations in % among two BDT input variables used for the electron final state in the signal and background events of the 2J1T category before decorrelation. |

png pdf |
Figure A3-c:
Correlations in % among two BDT input variables used for the muon final state in the signal and background events of the 2J1T category before decorrelation. |

png pdf |
Figure A3-d:
Correlations in % among two BDT input variables used for the electron final state in the signal and background events of the 2J1T category before decorrelation. |

png pdf |
Figure A3-e:
Correlations in % among two BDT input variables used for the muon final state in the signal and background events of the 2J1T category after decorrelation. |
png pdf |
Figure A3-f:
Correlations in % among two BDT input variables used for the electron final state in the signal and background events of the 2J1T category after decorrelation. |
png pdf |
Figure A3-g:
Correlations in % among two BDT input variables used for the muon final state in the signal and background events of the 2J1T category after decorrelation. |

png pdf |
Figure A3-h:
Correlations in % among two BDT input variables used for the electron final state in the signal and background events of the 2J1T category after decorrelation. |
png pdf |
Figure B1:
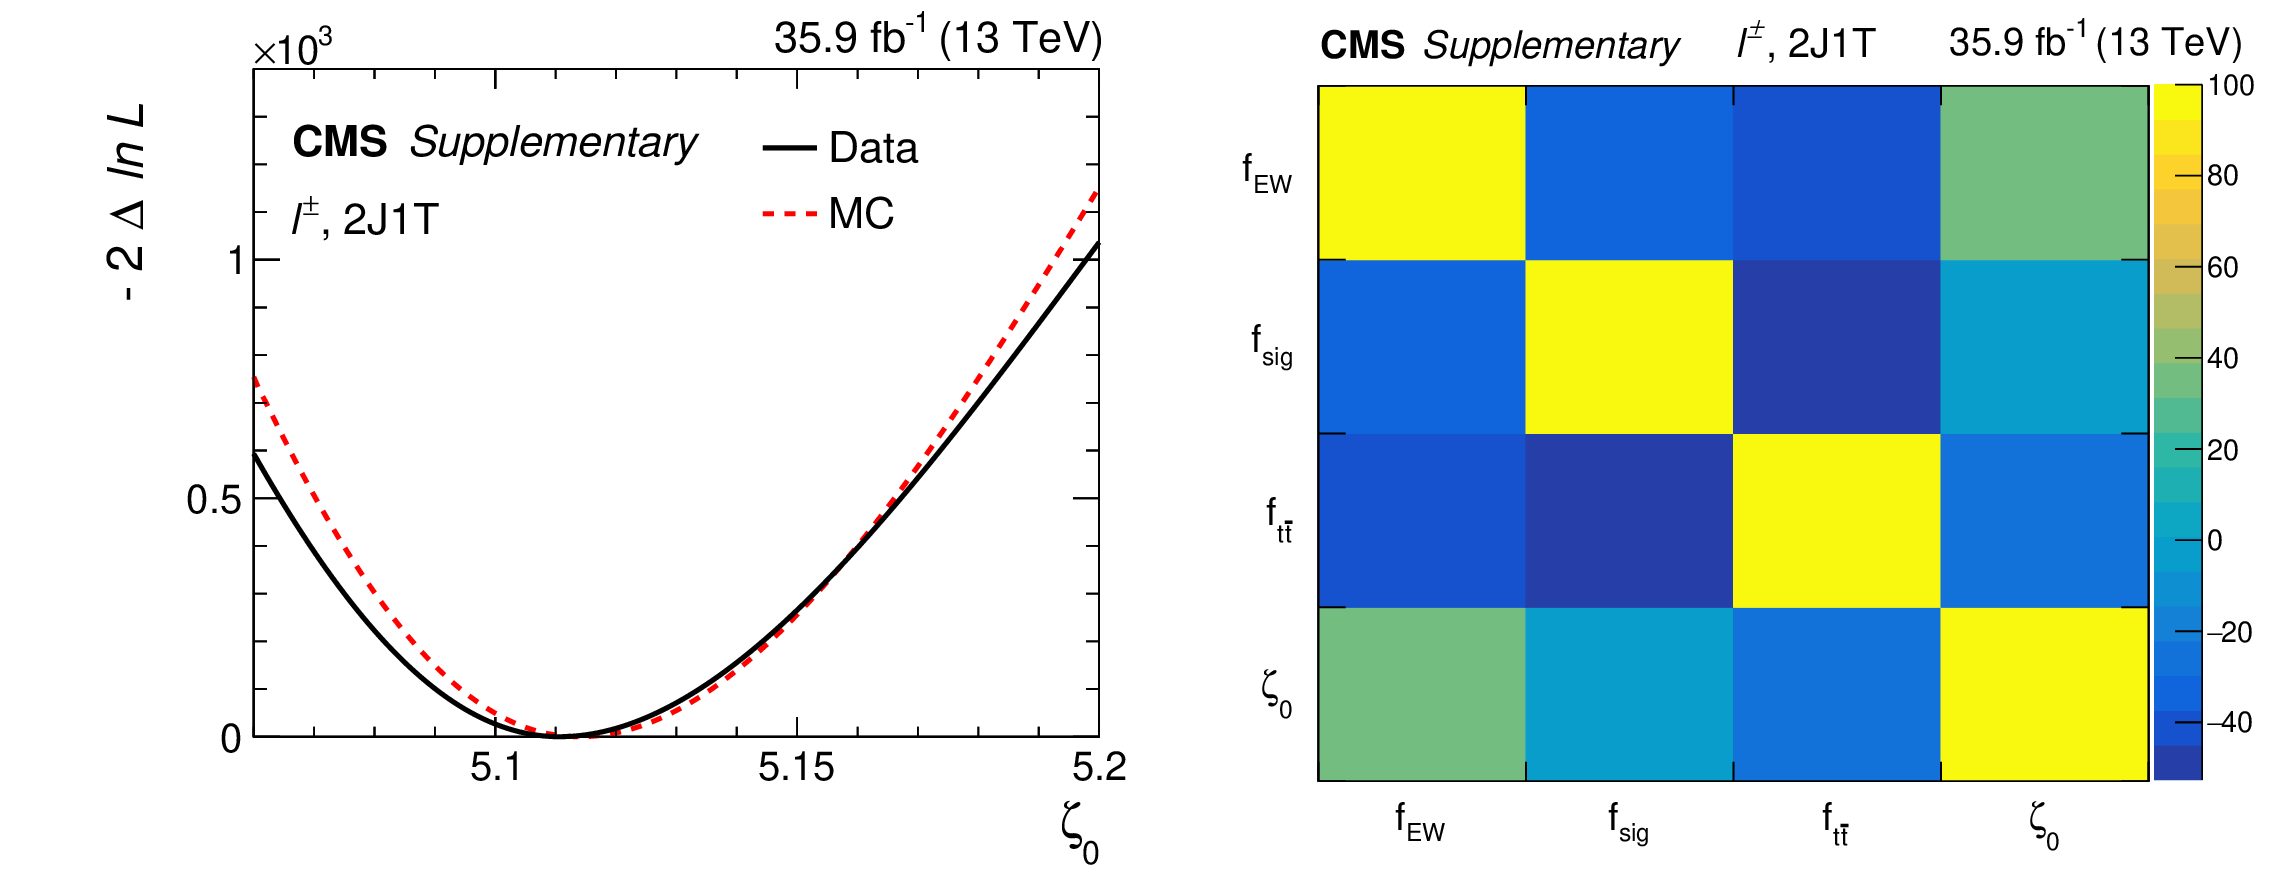
Scan of the profile likelihood ratio as a function of the POI for the parametric fit model used in the $\ell^{\pm}$ final state of the 2J1T category in data and simulated events (left). Correlations in % among the POI and nuisance parameters corresponding to the fit to data for the $\ell^{\pm}$ final state of the 2J1T category (right). |

png pdf |
Figure B1-a:
Scan of the profile likelihood ratio as a function of the POI for the parametric fit model used in the $\ell^{\pm}$ final state of the 2J1T category in data and simulated events. |
png pdf |
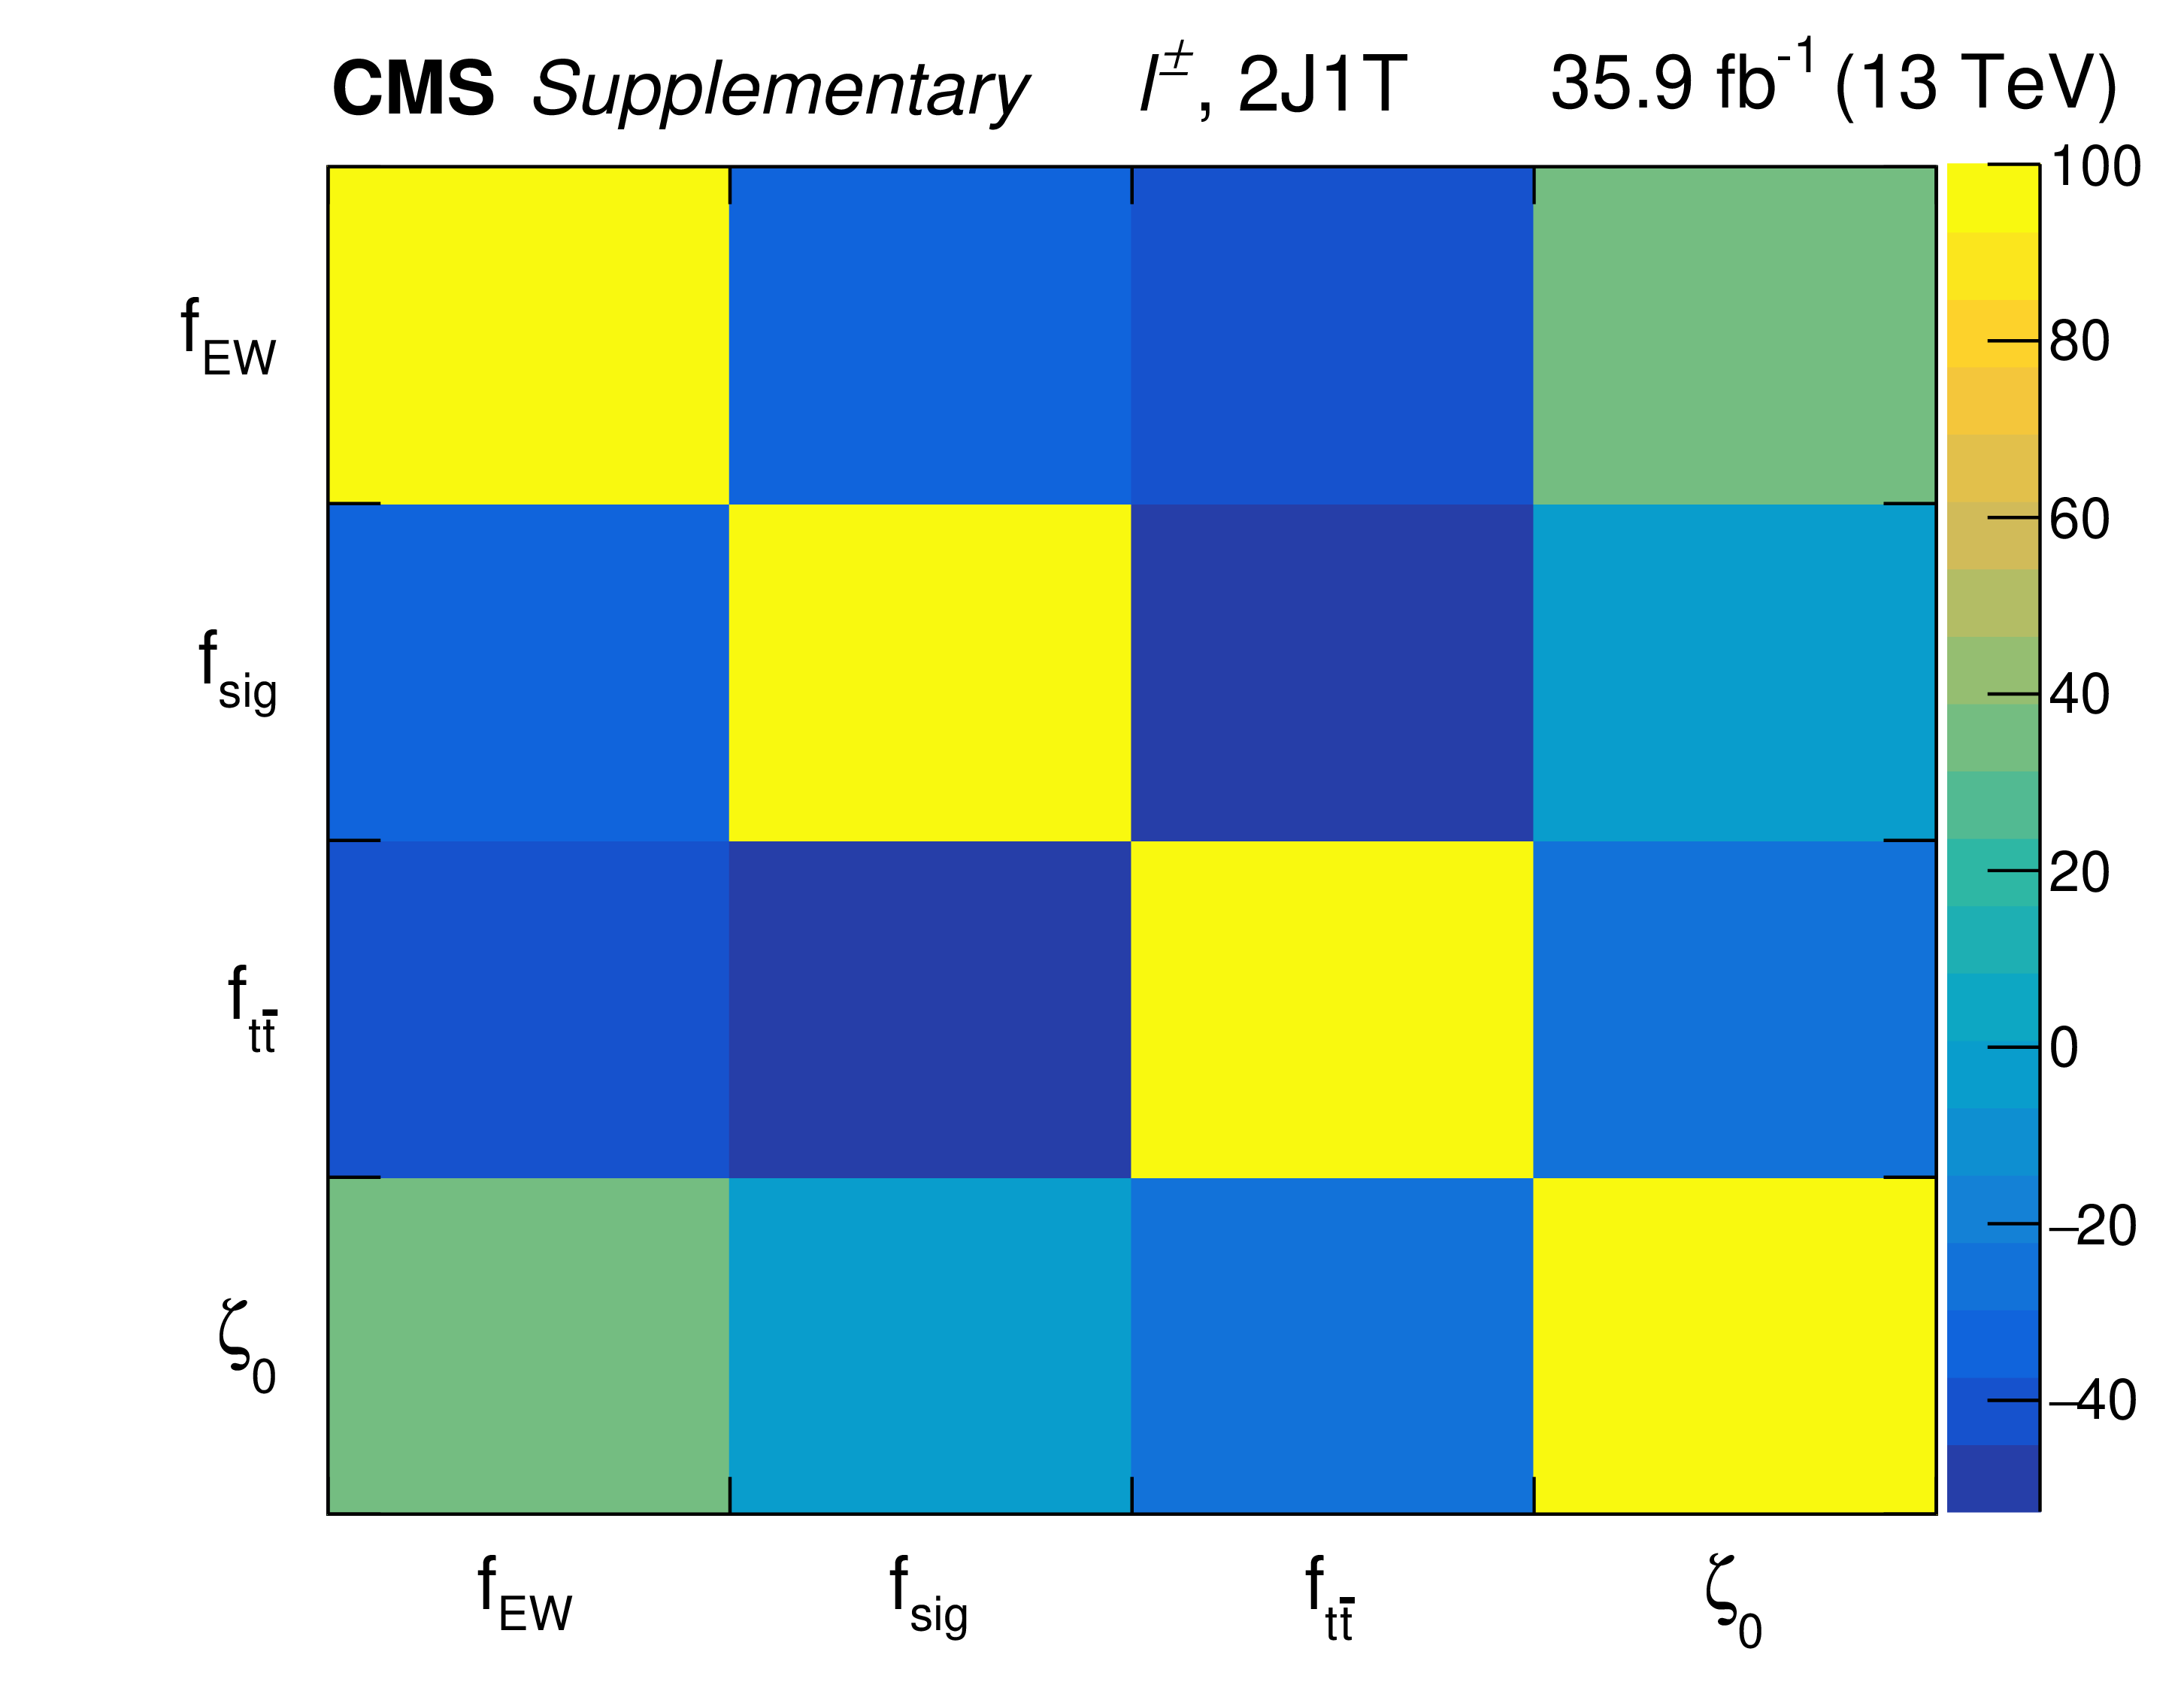
Figure B1-b:
Correlations in % among the POI and nuisance parameters corresponding to the fit to data for the $\ell^{\pm}$ final state of the 2J1T category. |
| Tables | |

png pdf |
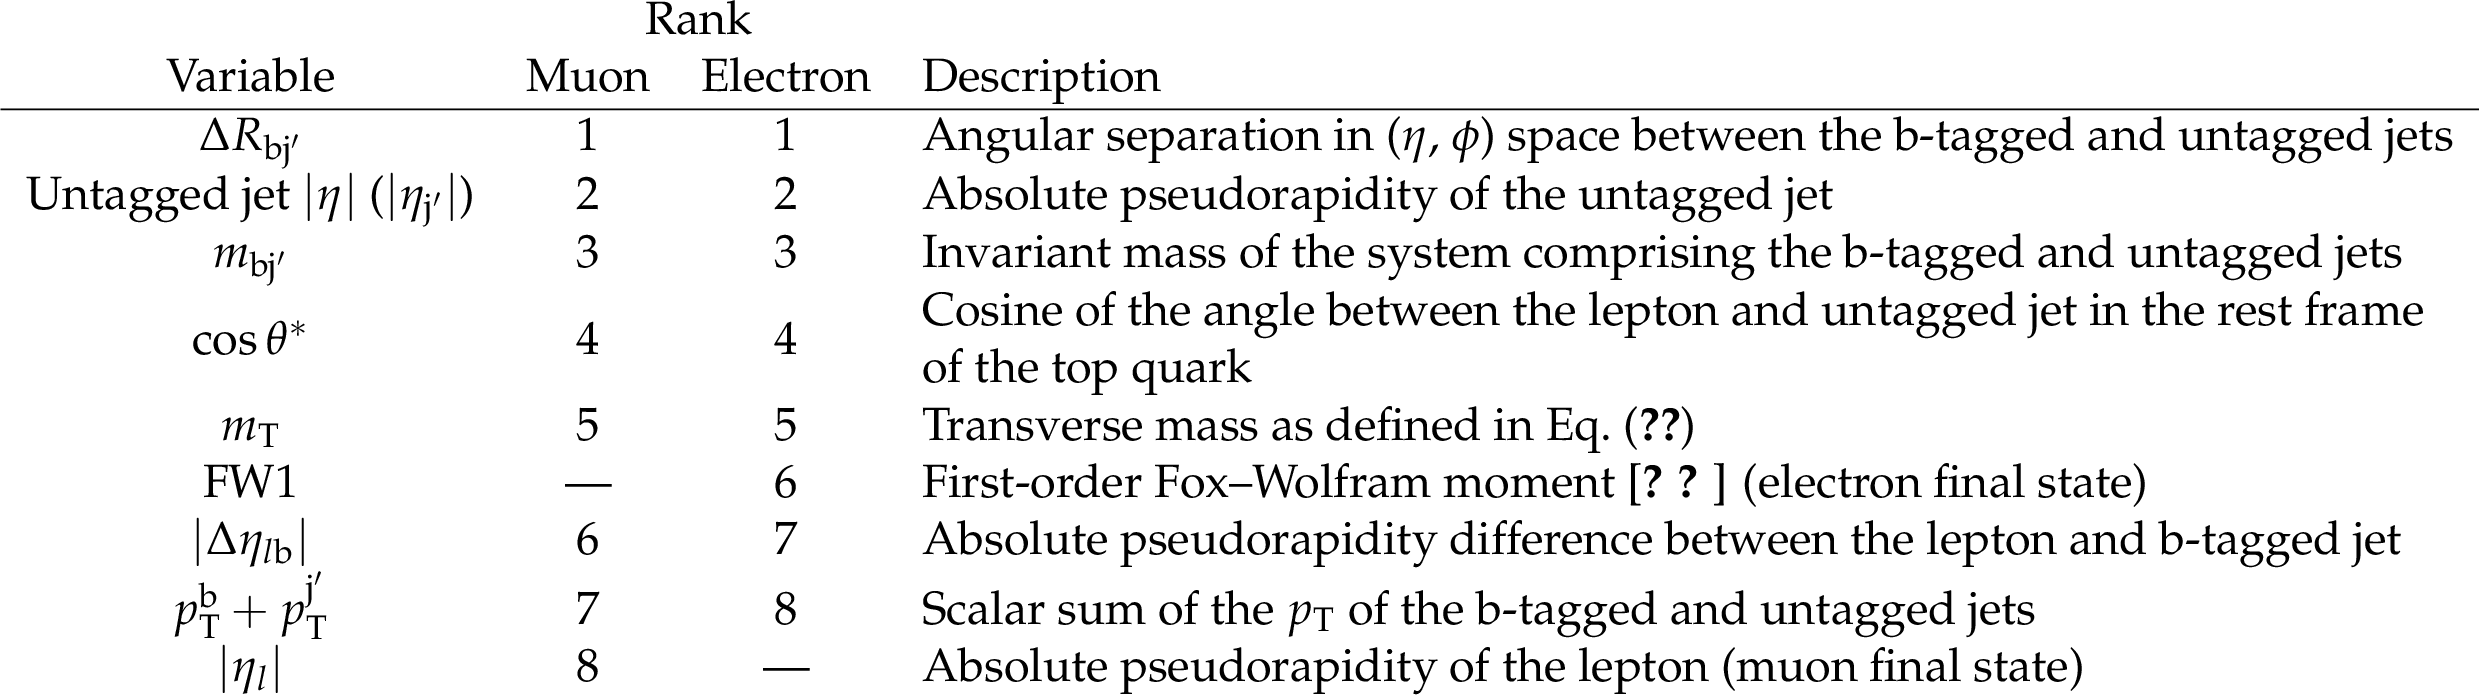
Table 1:
BDT input variables ranked in decreasing order of their \textit {SP} values for the muon and electron final states in the 2J1T category. |
png pdf |
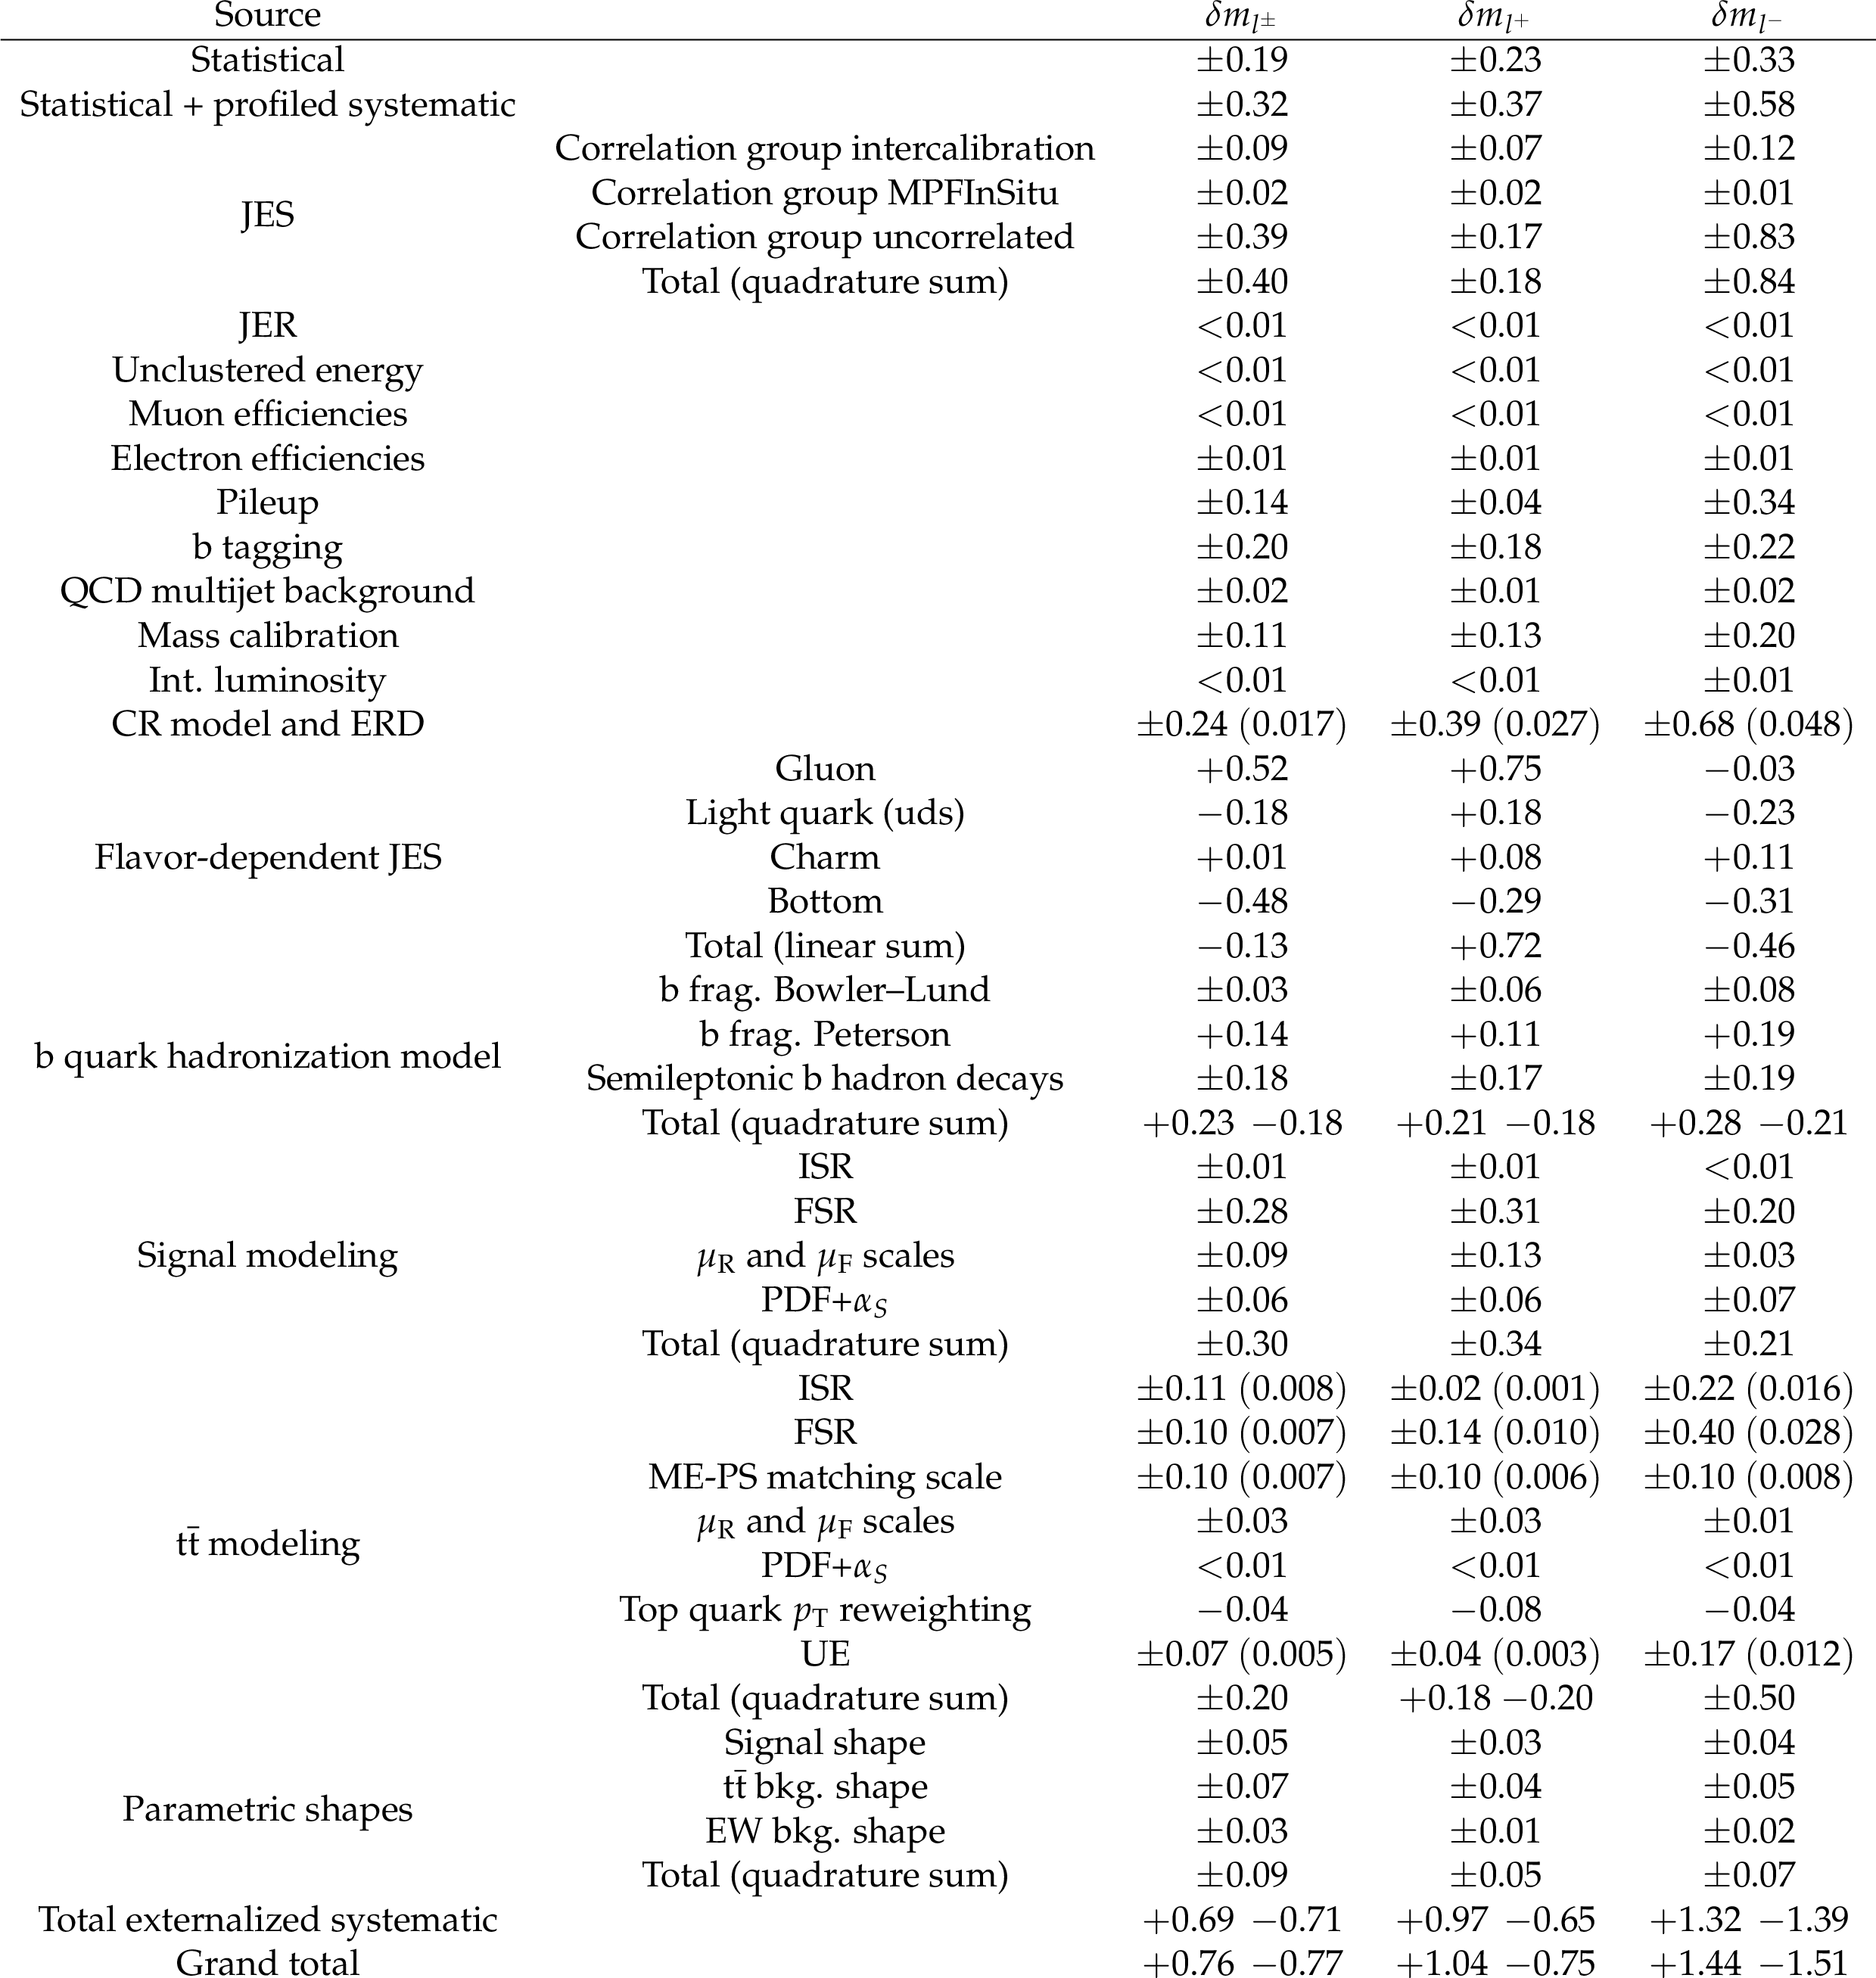
Table 2:
Summary of the ${m_{\mathrm{t}}}$ systematic uncertainties in GeV for each final-state lepton charge configuration, as discussed in Section 8. With the exception of the flavor-dependent JES sources, the total systematic uncertainty is obtained from the quadrature sum of the individual systematic sources. The statistical uncertainties in the systematic shifts are quoted within parentheses whenever alternative simulated samples with systematic variations have been used. These statistical uncertainties are determined from 1000 pseudo-experiments in each case. |
png pdf |
Table 3:
Summary of the ${m_{\mathrm{t}}}$ uncertainties in GeV for each final-state lepton charge configuration. The statistical uncertainties are obtained by performing the fits again in each case while fixing the nuisance parameters to their estimated values from data. With the exception of the flavor-dependent JES sources, the total systematic uncertainty is obtained from the quadrature sum of the individual systematic sources. The amount of statistical fluctuations in the systematic shifts are quoted within parentheses whenever alternative simulated samples with systematic variations have been used. These are determined from 1000 pseudo-experiments in each case. Entries with $<$ 0.01 denote that the magnitude of the systematic bias is less than 0.01. |
| Summary |
| Measurements of the top quark and antiquark masses, as well as their ratio and difference, are performed using a data sample enriched with single top quark events produced in proton-proton collisions at $\sqrt{s} = $ 13 TeV. The data corresponding to an integrated luminosity of 35.9 fb$^{-1}$ were recorded by the CMS experiment at the LHC. Events containing an isolated muon or electron and two jets, of which one is b tagged, in the final state are used in the study. From the inclusive measurement the top quark mass is found to be 172.13$^{+0.76}_{-0.77}$ GeV, where the uncertainty includes both the statistical and systematic components. The masses of the top quark and antiquark are separately determined as 172.62$^{+1.04}_{-0.75}$ and 171.79$^{+1.44}_{-1.51}$ GeV, respectively. These quantities are used to determine the mass ratio of the top antiquark to top quark of 0.9952$^{+0.0079}_{-0.0104}$, along with the difference between the top quark and antiquark masses of 0.83$^{+1.79}_{-1.35}$ GeV, both for the first time in single top quark production. The obtained mass ratio and difference agree with unity and zero, respectively, within the uncertainties, and are consistent with the conservation of CPT symmetry. This is the first measurement of the top quark mass in this particular final state to achieve a sub-GeV precision. |
| References | ||||
| 1 | J. Haller et al. | Update of the global electroweak fit and constraints on two-Higgs-doublet models | EPJC 78 (2018) 675 | 1803.01853 |
| 2 | G. Durieux et al. | The electroweak couplings of the top and bottom quarks Global fit and future prospects | JHEP 12 (2019) 98 | 1907.10619 |
| 3 | S. Alekhin, A. Djouadi, and S. Moch | The top quark and Higgs boson masses and the stability of the electroweak vacuum | PLB 716 (2012) 214 | 1207.0980 |
| 4 | G. Degrassi et al. | Higgs mass and vacuum stability in the standard model at NNLO | JHEP 08 (2012) 098 | 1205.6497 |
| 5 | CMS Collaboration | Identification of heavy-flavor jets with the CMS detector in pp collisions at 13 TeV | JINST 13 (2018) P05011 | CMS-BTV-16-002 1712.07158 |
| 6 | ATLAS Collaboration | Performance of top-quark and W-boson tagging with ATLAS in Run 2 of the LHC | EPJC 79 (2019) 375 | 1808.07858 |
| 7 | ATLAS Collaboration | Measurement of the top quark mass in the $ \mathrm{t}\bar{\mathrm{t}}\rightarrow $ lepton+jets channel from $ \sqrt{s}= $ 8 TeV ATLAS data and combination with previous results | EPJC 79 (2019) 290 | 1810.01772 |
| 8 | CMS Collaboration | Measurement of the top quark mass using proton-proton data at $ \sqrt{s} = $ 7 and 8 TeV | PRD 93 (2016) 072004 | CMS-TOP-14-022 1509.04044 |
| 9 | CMS Collaboration | Measurement of the top quark mass with lepton+jets final states using pp collisions at $ \sqrt{s}= $ 13 TeV | EPJC 78 (2018) 891 | CMS-TOP-17-007 1805.01428 |
| 10 | CMS Collaboration | Measurement of the top quark mass in the all-jets final state at $ \sqrt{s} = $ 13 TeV and combination with the lepton+jets channel | EPJC 79 (2019) 313 | CMS-TOP-17-008 1812.10534 |
| 11 | CMS Collaboration | Measurement of the jet mass distribution and top quark mass in hadronic decays of boosted top quarks in pp collisions at $ \sqrt{s} = $ 13 TeV | PRL 124 (2020) 202001 | CMS-TOP-19-005 1911.03800 |
| 12 | CMS Collaboration | Measurement of $ \mathrm{t\bar t} $ normalised multi-differential cross sections in pp collisions at $ \sqrt s= $ 13 TeV, and simultaneous determination of the strong coupling strength, top quark pole mass, and parton distribution functions | EPJC 80 (2020) 658 | CMS-TOP-18-004 1904.05237 |
| 13 | CMS Collaboration | Running of the top quark mass from proton-proton collisions at $ \sqrt{s} = $ 13 TeV | PLB 803 (2020) 135263 | CMS-TOP-19-007 1909.09193 |
| 14 | CMS Collaboration | Measurement of the $ \mathrm{t}\overline{\mathrm{t}} $ production cross section, the top quark mass, and the strong coupling constant using dilepton events in pp collisions at $ \sqrt{s}= $ 13 TeV | EPJC 79 (2019) 368 | CMS-TOP-17-001 1812.10505 |
| 15 | J. R. Christiansen and P. Z. Skands | String formation beyond leading colour | JHEP 08 (2015) 003 | 1505.01681 |
| 16 | S. Argyropoulos and T. Sjostrand | Effects of color reconnection on t$ \bar{\mathrm{t}} $ final states at the LHC | JHEP 11 (2014) 043 | 1407.6653 |
| 17 | M. Aliev et al. | HATHOR: HAdronic Top and Heavy quarks crOss section calculatoR | CPC 182 (2011) 1034 | 1007.1327 |
| 18 | P. Kant et al. | HATHOR for single top-quark production: Updated predictions and uncertainty estimates for single top-quark production in hadronic collisions | CPC 191 (2015) 74 | 1406.4403 |
| 19 | CMS Collaboration | Measurement of the single top quark and antiquark production cross sections in the $ t $ channel and their ratio in proton-proton collisions at $ \sqrt{s}= $ 13 TeV | PLB 800 (2020) 135042 | CMS-TOP-17-011 1812.10514 |
| 20 | M. Butenschoen et al. | Top quark mass calibration for Monte Carlo event generators | PRL 117 (2016) 232001 | 1608.01318 |
| 21 | CMS Collaboration | Precision luminosity measurement in proton-proton collisions at $ \sqrt{s} = $ 13 TeV in 2015 and 2016 at CMS | 2021. Submitted to EPJC | CMS-LUM-17-003 2104.01927 |
| 22 | CMS Collaboration | Measurement of the top quark mass using single top quark events in proton-proton collisions at $ \sqrt{s}= $ 8 TeV | EPJC 77 (2017) 354 | CMS-TOP-15-001 1703.02530 |
| 23 | O. W. Greenberg | CPT violation implies violation of Lorentz invariance | PRL 89 (2002) 231602 | hep-ph/0201258 |
| 24 | CMS Collaboration | Hepdata record for this analysis | link | |
| 25 | CMS Collaboration | The CMS experiment at the CERN LHC | JINST 3 (2008) S08004 | CMS-00-001 |
| 26 | CMS Collaboration | The CMS trigger system | JINST 12 (2017) P01020 | CMS-TRG-12-001 1609.02366 |
| 27 | CMS Collaboration | Performance of the CMS Level-1 trigger in proton-proton collisions at $ \sqrt{s} = $ 13 TeV | JINST 15 (2020) P10017 | |
| 28 | P. Nason | A new method for combining NLO QCD with shower Monte Carlo algorithms | JHEP 11 (2004) 040 | hep-ph/0409146 |
| 29 | S. Frixione, P. Nason, and C. Oleari | Matching NLO QCD computations with parton shower simulations: the POWHEG method | JHEP 11 (2007) 070 | 0709.2092 |
| 30 | S. Alioli, P. Nason, C. Oleari, and E. Re | A general framework for implementing NLO calculations in shower Monte Carlo programs: the POWHEG BOX | JHEP 06 (2010) 043 | 1002.2581 |
| 31 | J. Alwall et al. | The automated computation of tree-level and next-to-leading order differential cross sections, and their matching to parton shower simulations | JHEP 07 (2014) 079 | 1405.0301 |
| 32 | S. Alioli, P. Nason, C. Oleari, and E. Re | NLO single-top production matched with shower in POWHEG: $ s $- and $ t $-channel contributions | JHEP 09 (2009) 111 | 0907.4076 |
| 33 | R. Frederix, E. Re, and P. Torrielli | Single-top $ t $-channel hadroproduction in the four-flavors scheme with POWHEG and aMC@NLO | JHEP 09 (2012) 130 | 1207.5391 |
| 34 | ATLAS Collaboration | Fiducial, total and differential cross-section measurements of $ t $-channel single top-quark production in pp collisions at 8 TeV using data collected by the ATLAS detector | EPJC 77 (2017) 531 | 1702.02859 |
| 35 | CMS Collaboration | Measurement of differential cross sections and charge ratios for $ t $-channel single top quark production in proton-proton collisions at $ \sqrt{s}=13 \text {Te}\text {V} $ | EPJC 80 (2020) 370 | CMS-TOP-17-023 1907.08330 |
| 36 | S. Alioli, S.-O. Moch, and P. Uwer | Hadronic top-quark pair-production with one jet and parton showering | JHEP 01 (2012) 137 | 1110.5251 |
| 37 | M. Czakon and A. Mitov | TOP++: A program for the calculation of the top-pair cross-section at hadron colliders | CPC 185 (2014) 2930 | 1112.5675 |
| 38 | E. Re | Single-top Wt-channel production matched with parton showers using the POWHEG method | EPJC 71 (2011) 1547 | 1009.2450 |
| 39 | N. Kidonakis | Two-loop soft anomalous dimensions for single top quark associated production with a $ {\mathrm W}^- $ or $ {\mathrm H}^- $ | PRD 82 (2010) 054018 | 1005.4451 |
| 40 | N. Kidonakis | Top Quark Production | in Helmholtz International Summer School on Physics of Heavy Quarks and Hadrons 11 | 1311.0283 |
| 41 | R. Frederix and S. Frixione | Merging meets matching in MC@NLO | JHEP 12 (2012) 061 | 1209.6215 |
| 42 | R. Gavin, Y. Li, F. Petriello, and S. Quackenbush | FEWZ 2.0: A code for hadronic Z production at next-to-next-to-leading order | CPC 182 (2011) 2388 | 1011.3540 |
| 43 | R. Gavin, Y. Li, F. Petriello, and S. Quackenbush | W Physics at the LHC with FEWZ 2.1 | CPC 184 (2013) 208 | 1201.5896 |
| 44 | Y. Li and F. Petriello | Combining QCD and electroweak corrections to dilepton production in FEWZ | PRD 86 (2012) 094034 | 1208.5967 |
| 45 | T. Sjostrand et al. | An introduction to PYTHIA 8.2 | CPC 191 (2015) 159 | 1410.3012 |
| 46 | CMS Collaboration | Event generator tunes obtained from underlying event and multiparton scattering measurements | EPJC 76 (2016) 155 | CMS-GEN-14-001 1512.00815 |
| 47 | CMS Collaboration | Investigations of the impact of the parton shower tuning in PYTHIA 8 in the modelling of $ \mathrm{t\overline{t}} $ at $ \sqrt{s}= $ 8 and 13 TeV | CMS-PAS-TOP-16-021 | CMS-PAS-TOP-16-021 |
| 48 | NNPDF Collaboration | Parton distributions for the LHC Run II | JHEP 04 (2015) 040 | 1410.8849 |
| 49 | GEANT4 Collaboration | GEANT4---a simulation toolkit | NIMA 506 (2003) 250 | |
| 50 | CMS Collaboration | Particle-flow reconstruction and global event description with the CMS detector | JINST 12 (2017) P10003 | CMS-PRF-14-001 1706.04965 |
| 51 | W. Adam, R. Fruhwirth, A. Strandlie, and T. Todorov | Reconstruction of electrons with the Gaussian-sum filter in the CMS tracker at the LHC | JPG 31 (2005) 9 | physics/0306087 |
| 52 | CMS Collaboration | Electron and photon reconstruction and identification with the CMS experiment at the CERN LHC | JINST 16 (2021) P05014 | CMS-EGM-17-001 2012.06888 |
| 53 | CMS Collaboration | Performance of the CMS muon detector and muon reconstruction with proton-proton collisions at $ \sqrt{s} = $ 13 TeV | JINST 13 (2018) P06015 | CMS-MUO-16-001 1804.04528 |
| 54 | M. Cacciari, G. P. Salam, and G. Soyez | The anti-$ {k_{\mathrm{T}}} $ jet clustering algorithm | JHEP 04 (2008) 063 | 0802.1189 |
| 55 | M. Cacciari, G. P. Salam, and G. Soyez | FastJet user manual | EPJC 72 (2012) 1896 | 1111.6097 |
| 56 | CMS Collaboration | Jet algorithms performance in 13 TeV data | CMS-PAS-JME-16-003 | CMS-PAS-JME-16-003 |
| 57 | M. Cacciari and G. P. Salam | Pileup subtraction using jet areas | PLB 659 (2008) 119 | 0707.1378 |
| 58 | CMS Collaboration | Jet energy scale and resolution in the CMS experiment in pp collisions at 8 TeV | JINST 12 (2017) P02014 | CMS-JME-13-004 1607.03663 |
| 59 | CMS Collaboration | Performance of missing transverse momentum reconstruction in proton-proton collisions at $ \sqrt{s} = $ 13 TeV using the CMS detector | JINST 14 (2019) P07004 | CMS-JME-17-001 1903.06078 |
| 60 | Particle Data Group, P. A. Zyla et al. | Review of particle physics | Prog. Theor. Exp. Phys. 2020 (2020) 083C01 | |
| 61 | CDF Collaboration | First observation of electroweak single top quark production | PRL 103 (2009) 092002 | 0903.0885 |
| 62 | D0 Collaboration | Observation of single top quark production | PRL 103 (2009) 092001 | 0903.0850 |
| 63 | H. Voss, A. Hocker, J. Stelzer, and F. Tegenfeldt | TMVA, the toolkit for multivariate data analysis with ROOT | in XIth International Workshop on Advanced Computing and Analysis Techniques in Physics Research (ACAT) | physics/0703039 |
| 64 | G. C. Fox and S. Wolfram | Event shapes in $ \mathrm{e}^{+}\mathrm{e}^{-} $ annihilation | NPB 157 (1979) 543 | |
| 65 | C. Bernaciak, M. S. A. Buschmann, A. Butter, and T. Plehn | Fox--Wolfram moments in Higgs physics | PRD 87 (2013) 073014 | 1212.4436 |
| 66 | Y. Freund and R. E. Schapire | A decision-theoretic generalization of on-line learning and an application to boosting | J. Comput. Syst. Sci. 55 (1997) 119 | |
| 67 | Belle Collaboration | Evidence for the decay $ \mathrm{B}^{0}\to \mathrm{K}^{+} \mathrm{K}^{-} \pi^{0} $ | PRD 87 (2013) 091101 | 1304.5312 |
| 68 | W. Verkerke and D. P. Kirkby | The RooFit toolkit for data modeling | in Proceedings of the 13th International Conference for Computing in High-Energy and Nuclear Physics (CHEP03) 2003 | physics/0306116 |
| 69 | H. Fanchiotti, C. A. Garcia Canal, and M. Marucho | The Landau distribution | Int. J. Mod. Phys. C 17 (2006) 1461 | hep-ph/0305310 |
| 70 | M. J. Oreglia | A study of the reactions $\psi' \to \gamma\gamma \psi$ | PhD thesis, Stanford University, 1980 SLAC Report SLAC-R-236, see Appendix D | |
| 71 | Belle Collaboration | A detailed test of the CsI(Tl) calorimeter for BELLE with photon beams of energy between 20 MeV and 5.4 GeV | NIMA 441 (2000) 401 | |
| 72 | M. Czakon, P. Fiedler, and A. Mitov | Total top-quark pair-production cross section at hadron colliders through $ {\mathcal O}(\alpha_{S}) $ | PRL 110 (2013) 252004 | 1303.6254 |
| 73 | CMS Collaboration | Measurement of the differential cross sections for the associated production of a W boson and jets in proton-proton collisions at $ \sqrt{s}= $ 13 TeV | PRD 96 (2017) 072005 | CMS-SMP-16-005 1707.05979 |
| 74 | CMS Collaboration | Measurement of differential cross sections for Z boson production in association with jets in proton-proton collisions at $ \sqrt{s} = $ 13 TeV | EPJC 78 (2018) 965 | CMS-SMP-16-015 1804.05252 |
| 75 | CMS Collaboration | Determination of jet energy calibration and transverse momentum resolution in CMS | JINST 6 (2011) P11002 | CMS-JME-10-011 1107.4277 |
| 76 | CMS Collaboration | Jet energy scale uncertainty correlations between ATLAS and CMS at 8 TeV | CMS-PAS-JME-15-001 | CMS-PAS-JME-15-001 |
| 77 | CMS Collaboration | Performance of the CMS missing transverse momentum reconstruction in pp data at $ \sqrt{s} = $ 8 TeV | JINST 10 (2015) P02006 | CMS-JME-13-003 1411.0511 |
| 78 | CMS Collaboration | Measurements of inclusive W and Z cross sections in pp collisions at $ \sqrt{s}= $ 7 TeV | JHEP 01 (2011) 080 | CMS-EWK-10-002 1012.2466 |
| 79 | CMS Collaboration | Measurement of the inelastic proton-proton cross section at $ \sqrt{s}= $ 13 TeV | JHEP 07 (2018) 161 | CMS-FSQ-15-005 1802.02613 |
| 80 | CMS Collaboration | CMS luminosity measurements for the 2016 data taking period | CMS-PAS-LUM-17-001 | CMS-PAS-LUM-17-001 |
| 81 | CMS Collaboration | Study of the underlying event in top quark pair production in $ \mathrm {p}\mathrm {p} $ collisions at 13 TeV | EPJC 79 (2019) 123 | CMS-TOP-17-015 1807.02810 |
| 82 | M. Bahr et al. | Herwig++ physics and manual | EPJC 58 (2008) 639 | 0803.0883 |
| 83 | ALEPH Collaboration | Study of the fragmentation of b quarks into B mesons at the Z peak | PLB 512 (2001) 30 | hep-ex/0106051 |
| 84 | DELPHI Collaboration | A study of the b-quark fragmentation function with the DELPHI detector at LEP I and an averaged distribution obtained at the Z pole | EPJC 71 (2011) 1557 | 1102.4748 |
| 85 | SLD Collaboration | Measurement of the b-quark fragmentation function in $ {\mathrm Z}^{0} $ decays | PRD 65 (2002) 092006 | hep-ex/0202031 |
| 86 | M. G. Bowler | $ \mathrm{e}^{+}\mathrm{e}^{-} $ production of heavy quarks in the string model | Z. Phys. C 11 (1981) 169 | |
| 87 | C. Peterson, D. Schlatter, I. Schmitt, and P. M. Zerwas | Scaling violations in inclusive $ {\mathrm e}^{+}{\mathrm e}^{-} $ annihilation spectra | PRD 27 (1983) 105 | |
| 88 | A. Kalogeropoulos and J. Alwall | The SysCalc code: A tool to derive theoretical systematic uncertainties | 2018 | 1801.08401 |
| 89 | CMS Collaboration | Measurement of the differential cross section for top quark pair production in pp collisions at $ \sqrt{s} = $ 8 TeV | EPJC 75 (2015) 542 | CMS-TOP-12-028 1505.04480 |
| 90 | ATLAS Collaboration | Measurement of the mass difference between top and anti-top quarks in pp collisions at $ \sqrt{s} = $ 7 TeV using the ATLAS detector | PLB 728 (2014) 363 | 1310.6527 |
| 91 | CMS Collaboration | Measurement of the mass difference between top quark and antiquark in pp collisions at $ \sqrt{s} = $ 8 TeV | PLB 770 (2017) 50 | CMS-TOP-12-031 1610.09551 |
|
|
Compact Muon Solenoid LHC, CERN |
|

|

|

|

|

|