

Compact Muon Solenoid
LHC, CERN
| CMS-HIG-20-017 ; CERN-EP-2021-045 | ||
| Search for charged Higgs bosons produced in vector boson fusion processes and decaying into vector boson pairs in proton-proton collisions at $\sqrt{s} = $ 13 TeV | ||
| CMS Collaboration | ||
| 10 April 2021 | ||
| Eur. Phys. J. C 81 (2021) 723 | ||
| Abstract: A search for charged Higgs bosons produced in vector boson fusion processes and decaying into vector bosons, using proton-proton collisions at $\sqrt{s} = $ 13 TeV at the LHC, is reported. The data sample corresponds to an integrated luminosity of 137 fb$^{-1}$ collected with the CMS detector. Events are selected by requiring two or three electrons or muons, moderate missing transverse momentum, and two jets with a large rapidity separation and a large dijet mass. No excess of events with respect to the standard model background predictions is observed. Model independent upper limits at 95% confidence level are reported on the product of the cross section and branching fraction for vector boson fusion production of charged Higgs bosons as a function of mass, from 200 to 3000 GeV. The results are interpreted in the context of the Georgi-Machacek model. | ||
| Links: e-print arXiv:2104.04762 [hep-ex] (PDF) ; CDS record ; inSPIRE record ; HepData record ; CADI line (restricted) ; | ||
| Figures | |
png pdf |
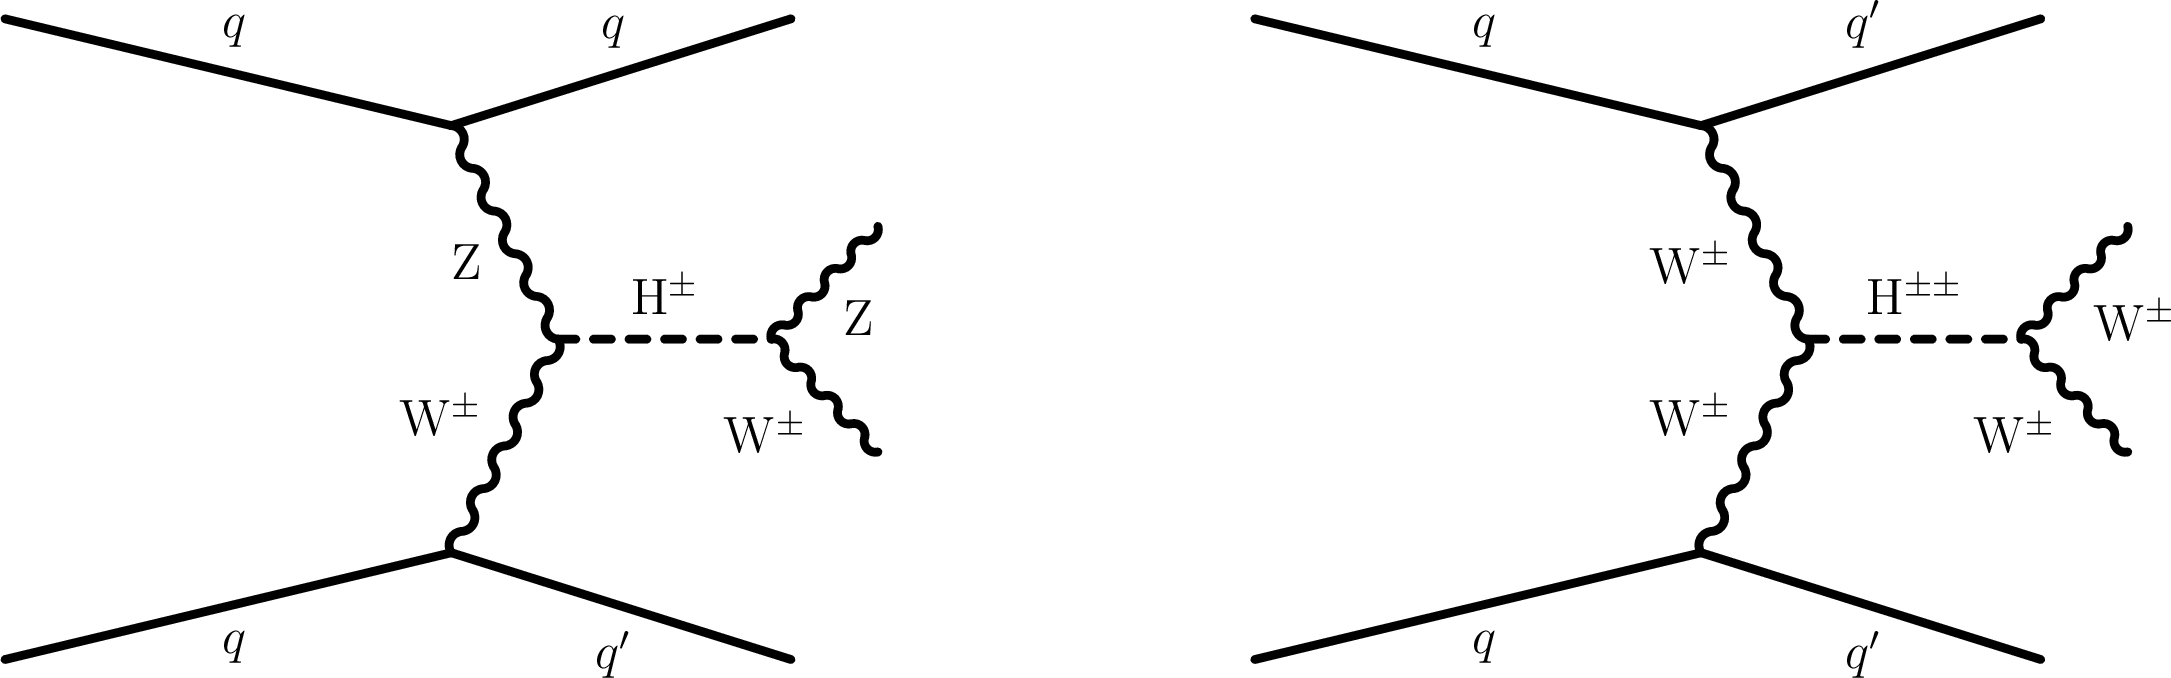
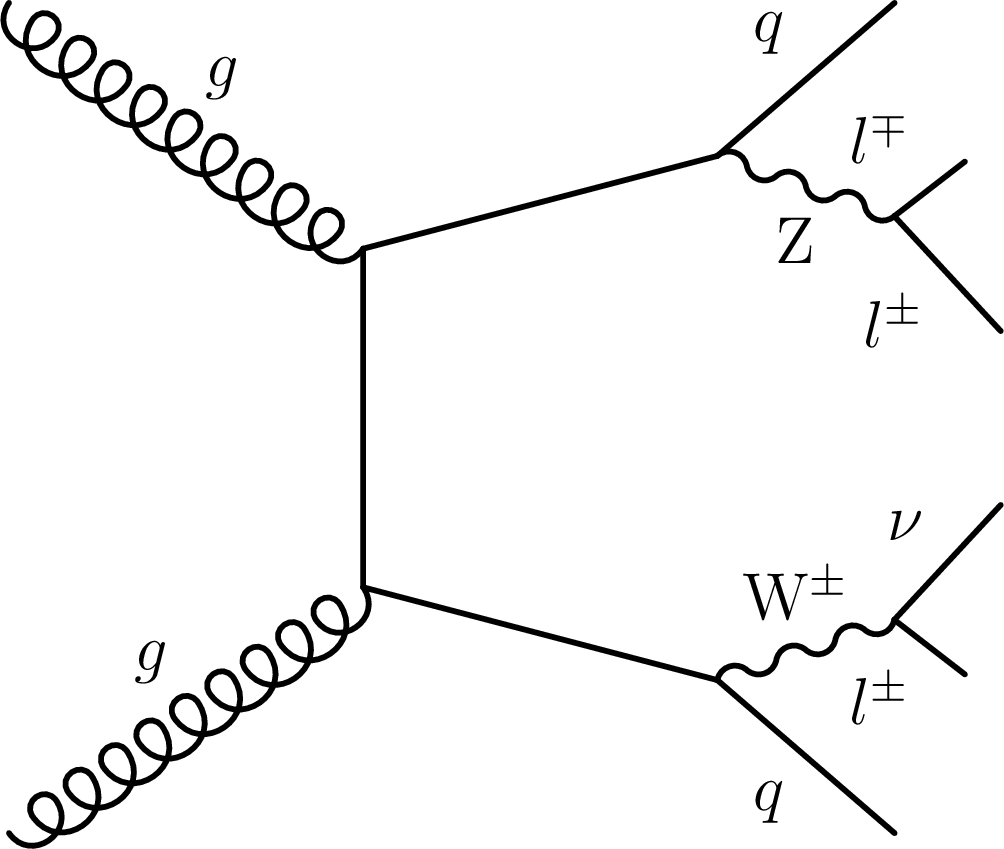
Figure 1:
Examples of Feynman diagrams showing the production of singly (left) and doubly (right) charged Higgs bosons via VBF. |
png pdf |
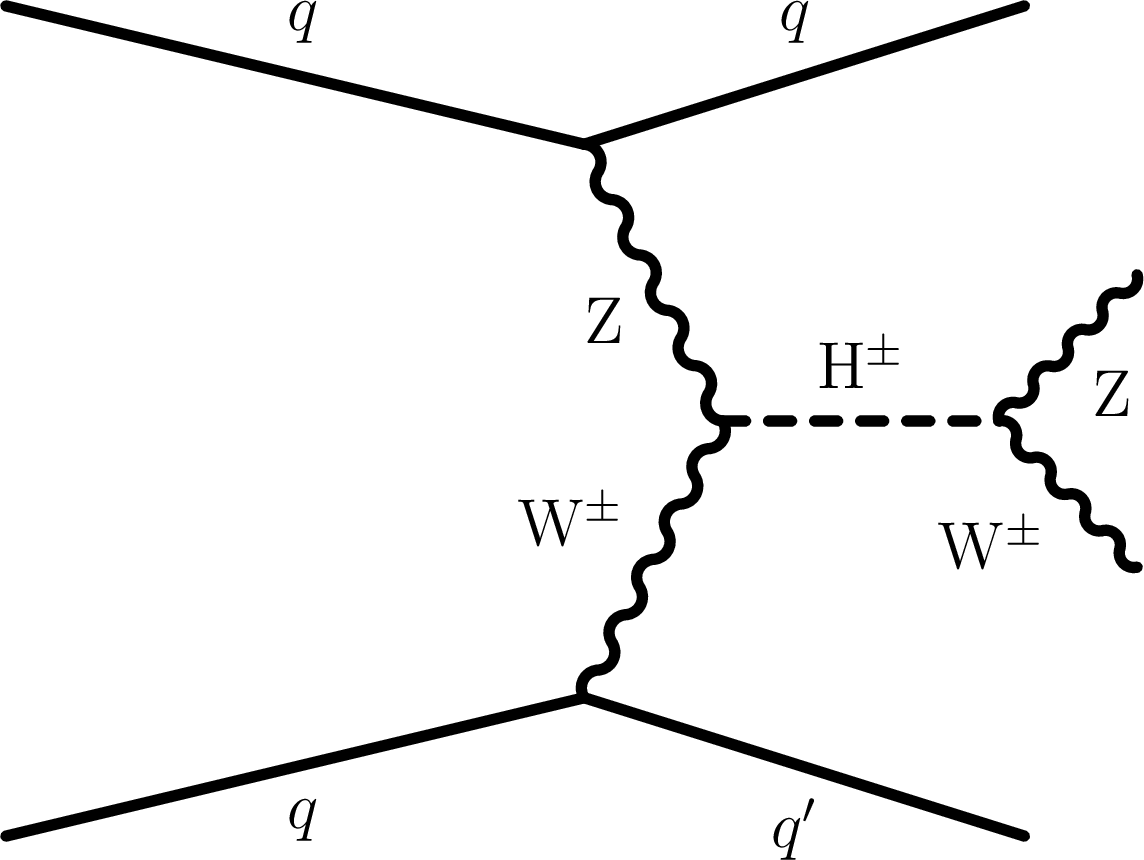
Figure 1-a:
Example of Feynman diagram showing the production of a singly charged Higgs boson via VBF. |

png pdf |
Figure 1-b:
Example of Feynman diagram showing the production of a doubly charged Higgs boson via VBF. |
png pdf |
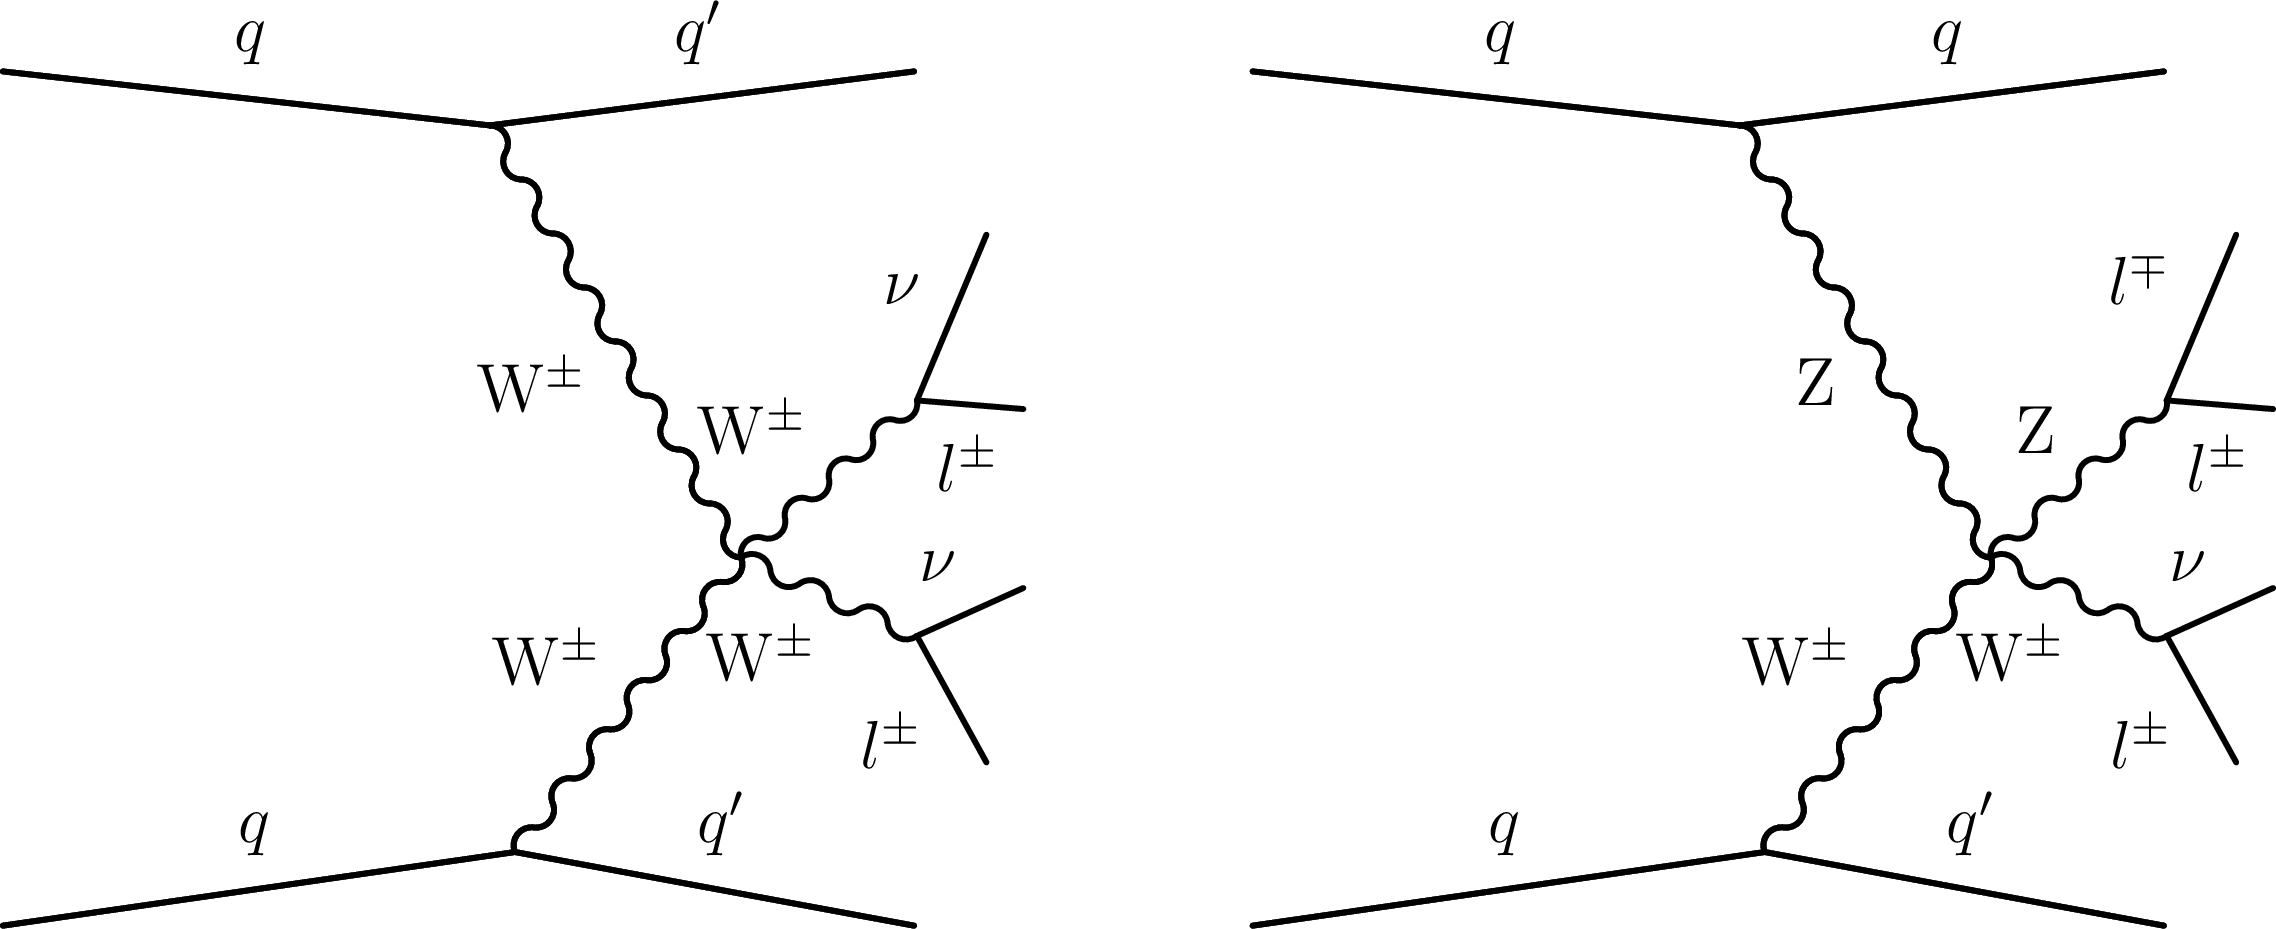
Figure 2:
Representative Feynman diagrams of a VBS process contributing to the EW-induced production of events containing $ {\mathrm{W} ^\pm \mathrm{W} ^\pm} $ (left) and WZ (right) boson pairs decaying to leptons, and two forward jets. |

png pdf |
Figure 2-a:
Representative Feynman diagram of a VBS process contributing to the EW-induced production of events containing a $ {\mathrm{W} ^\pm \mathrm{W} ^\pm} $ boson pair decaying to leptons, and two forward jets. |

png pdf |
Figure 2-b:
Representative Feynman diagram of a VBS process contributing to the EW-induced production of events containing a WZ boson pair decaying to leptons, and two forward jets. |

png pdf |
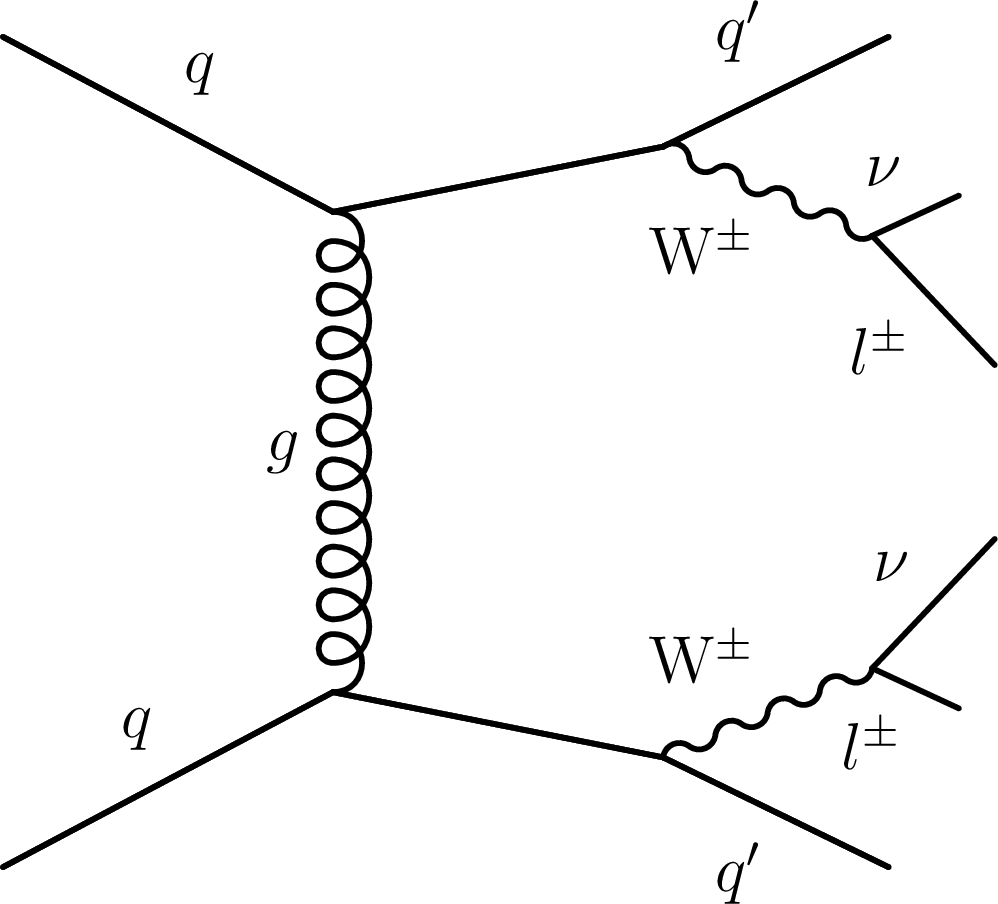
Figure 3:
Representative Feynman diagrams of the QCD-induced production of $ {\mathrm{W} ^\pm \mathrm{W} ^\pm} $ (left) and WZ (right) boson pairs decaying to leptons, and two jets. |
png pdf |
Figure 3-a:
Representative Feynman diagram of the QCD-induced production of a WZ boson pair decaying to leptons, and two jets. |
png pdf |
Figure 3-b:
Representative Feynman diagrams of the QCD-induced production of $ {\mathrm{W} ^\pm \mathrm{W} ^\pm} $ (left) and WZ (right) boson pairs decaying to leptons, and two jets. |
png pdf |
Figure 4:
The $ {m_{{\mathrm {j}} {\mathrm {j}}}} $ distributions after requiring the same selection as for the WW (left) and WZ (right) SRs, but with a requirement of 200 $ < {m_{{\mathrm {j}} {\mathrm {j}}}} < $ 500 GeV. The predicted yields are shown with their best fit normalizations from the simultaneous fit (described in Section 7) for the background-only hypothesis i.e., assuming no contributions from the ${\mathrm{\tilde{H}^{\pm_j}}} $ and $ {\mathrm{H} ^{\pm \pm}}$ processes. Vertical bars on data points represent the statistical uncertainty in the data. The histograms for $ {\mathrm{t} {\mathrm{V}} \mathrm {x}} $ backgrounds include the contributions from ${\mathrm{t} \mathrm{\bar{t}}} {\mathrm{V}} $ and $ {\mathrm{t} \mathrm{Z} \mathrm{q}} $ processes. The histograms for other backgrounds include the contributions from double parton scattering, VVV, and from oppositely charged dilepton final states from ${\mathrm{t} \mathrm{\bar{t}}} $, $\mathrm{t} \mathrm{W} $, $\mathrm{W} ^{+}\mathrm{W} ^{-}$, and Drell-Yan processes. The overflow is included in the last bin. The lower panels show the ratio of the number of events observed in data to that of the total SM prediction. The hatched gray bands represent the uncertainties in the predicted yields. The solid lines show the signal predictions for values of $s_{\mathrm{H}}=$ 1.0 and $m_{\mathrm{H} _{5}} = $ 500 GeV in the GM model. |

png pdf |
Figure 4-a:
The $ {m_{{\mathrm {j}} {\mathrm {j}}}} $ distributions after requiring the same selection as for the WW SR, but with a requirement of 200 $ < {m_{{\mathrm {j}} {\mathrm {j}}}} < $ 500 GeV. The predicted yields are shown with their best fit normalizations from the simultaneous fit (described in Section 7) for the background-only hypothesis i.e., assuming no contributions from the ${\mathrm{\tilde{H}^{\pm_j}}} $ and $ {\mathrm{H} ^{\pm \pm}}$ processes. Vertical bars on data points represent the statistical uncertainty in the data. The histograms for $ {\mathrm{t} {\mathrm{V}} \mathrm {x}} $ backgrounds include the contributions from ${\mathrm{t} \mathrm{\bar{t}}} {\mathrm{V}} $ and $ {\mathrm{t} \mathrm{Z} \mathrm{q}} $ processes. The histograms for other backgrounds include the contributions from double parton scattering, VVV, and from oppositely charged dilepton final states from ${\mathrm{t} \mathrm{\bar{t}}} $, $\mathrm{t} \mathrm{W} $, $\mathrm{W} ^{+}\mathrm{W} ^{-}$, and Drell-Yan processes. The overflow is included in the last bin. The lower panel shows the ratio of the number of events observed in data to that of the total SM prediction. The hatched gray band represents the uncertainties in the predicted yields. The solid lines show the signal predictions for values of $s_{\mathrm{H}}=$ 1.0 and $m_{\mathrm{H} _{5}} = $ 500 GeV in the GM model. |
png pdf |
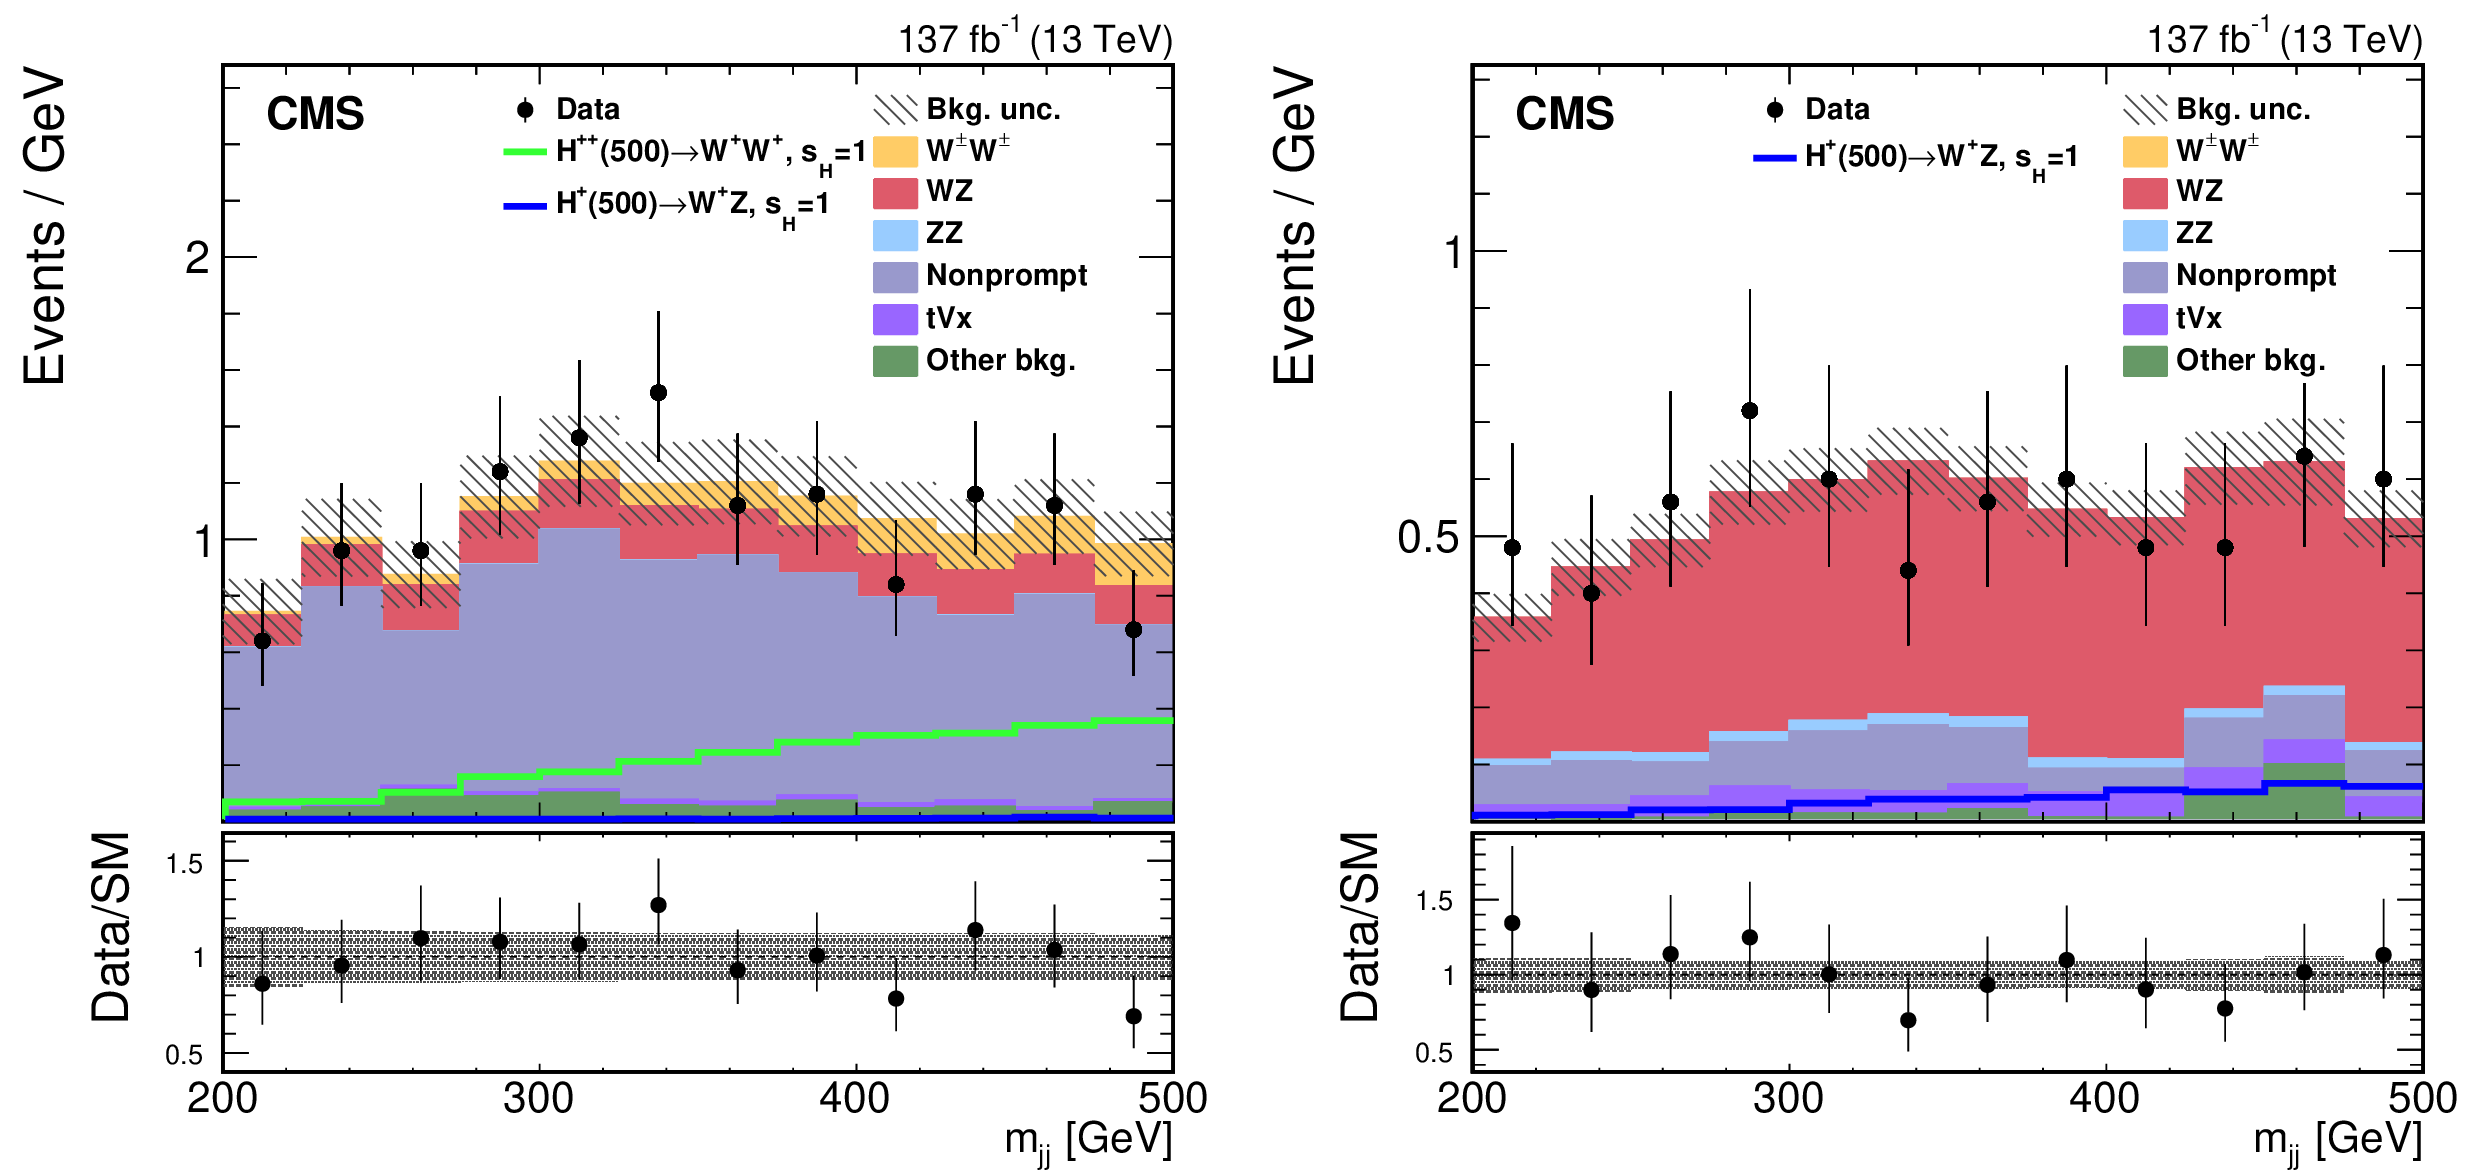
Figure 4-b:
The $ {m_{{\mathrm {j}} {\mathrm {j}}}} $ distributions after requiring the same selection as for the WZ SR, but with a requirement of 200 $ < {m_{{\mathrm {j}} {\mathrm {j}}}} < $ 500 GeV. The predicted yields are shown with their best fit normalizations from the simultaneous fit (described in Section 7) for the background-only hypothesis i.e., assuming no contributions from the ${\mathrm{\tilde{H}^{\pm_j}}} $ and $ {\mathrm{H} ^{\pm \pm}}$ processes. Vertical bars on data points represent the statistical uncertainty in the data. The histograms for $ {\mathrm{t} {\mathrm{V}} \mathrm {x}} $ backgrounds include the contributions from ${\mathrm{t} \mathrm{\bar{t}}} {\mathrm{V}} $ and $ {\mathrm{t} \mathrm{Z} \mathrm{q}} $ processes. The histograms for other backgrounds include the contributions from double parton scattering, VVV, and from oppositely charged dilepton final states from ${\mathrm{t} \mathrm{\bar{t}}} $, $\mathrm{t} \mathrm{W} $, $\mathrm{W} ^{+}\mathrm{W} ^{-}$, and Drell-Yan processes. The overflow is included in the last bin. The lower panel shows the ratio of the number of events observed in data to that of the total SM prediction. The hatched gray band represents the uncertainties in the predicted yields. The solid lines show the signal predictions for values of $s_{\mathrm{H}}=$ 1.0 and $m_{\mathrm{H} _{5}} = $ 500 GeV in the GM model. |
png pdf |
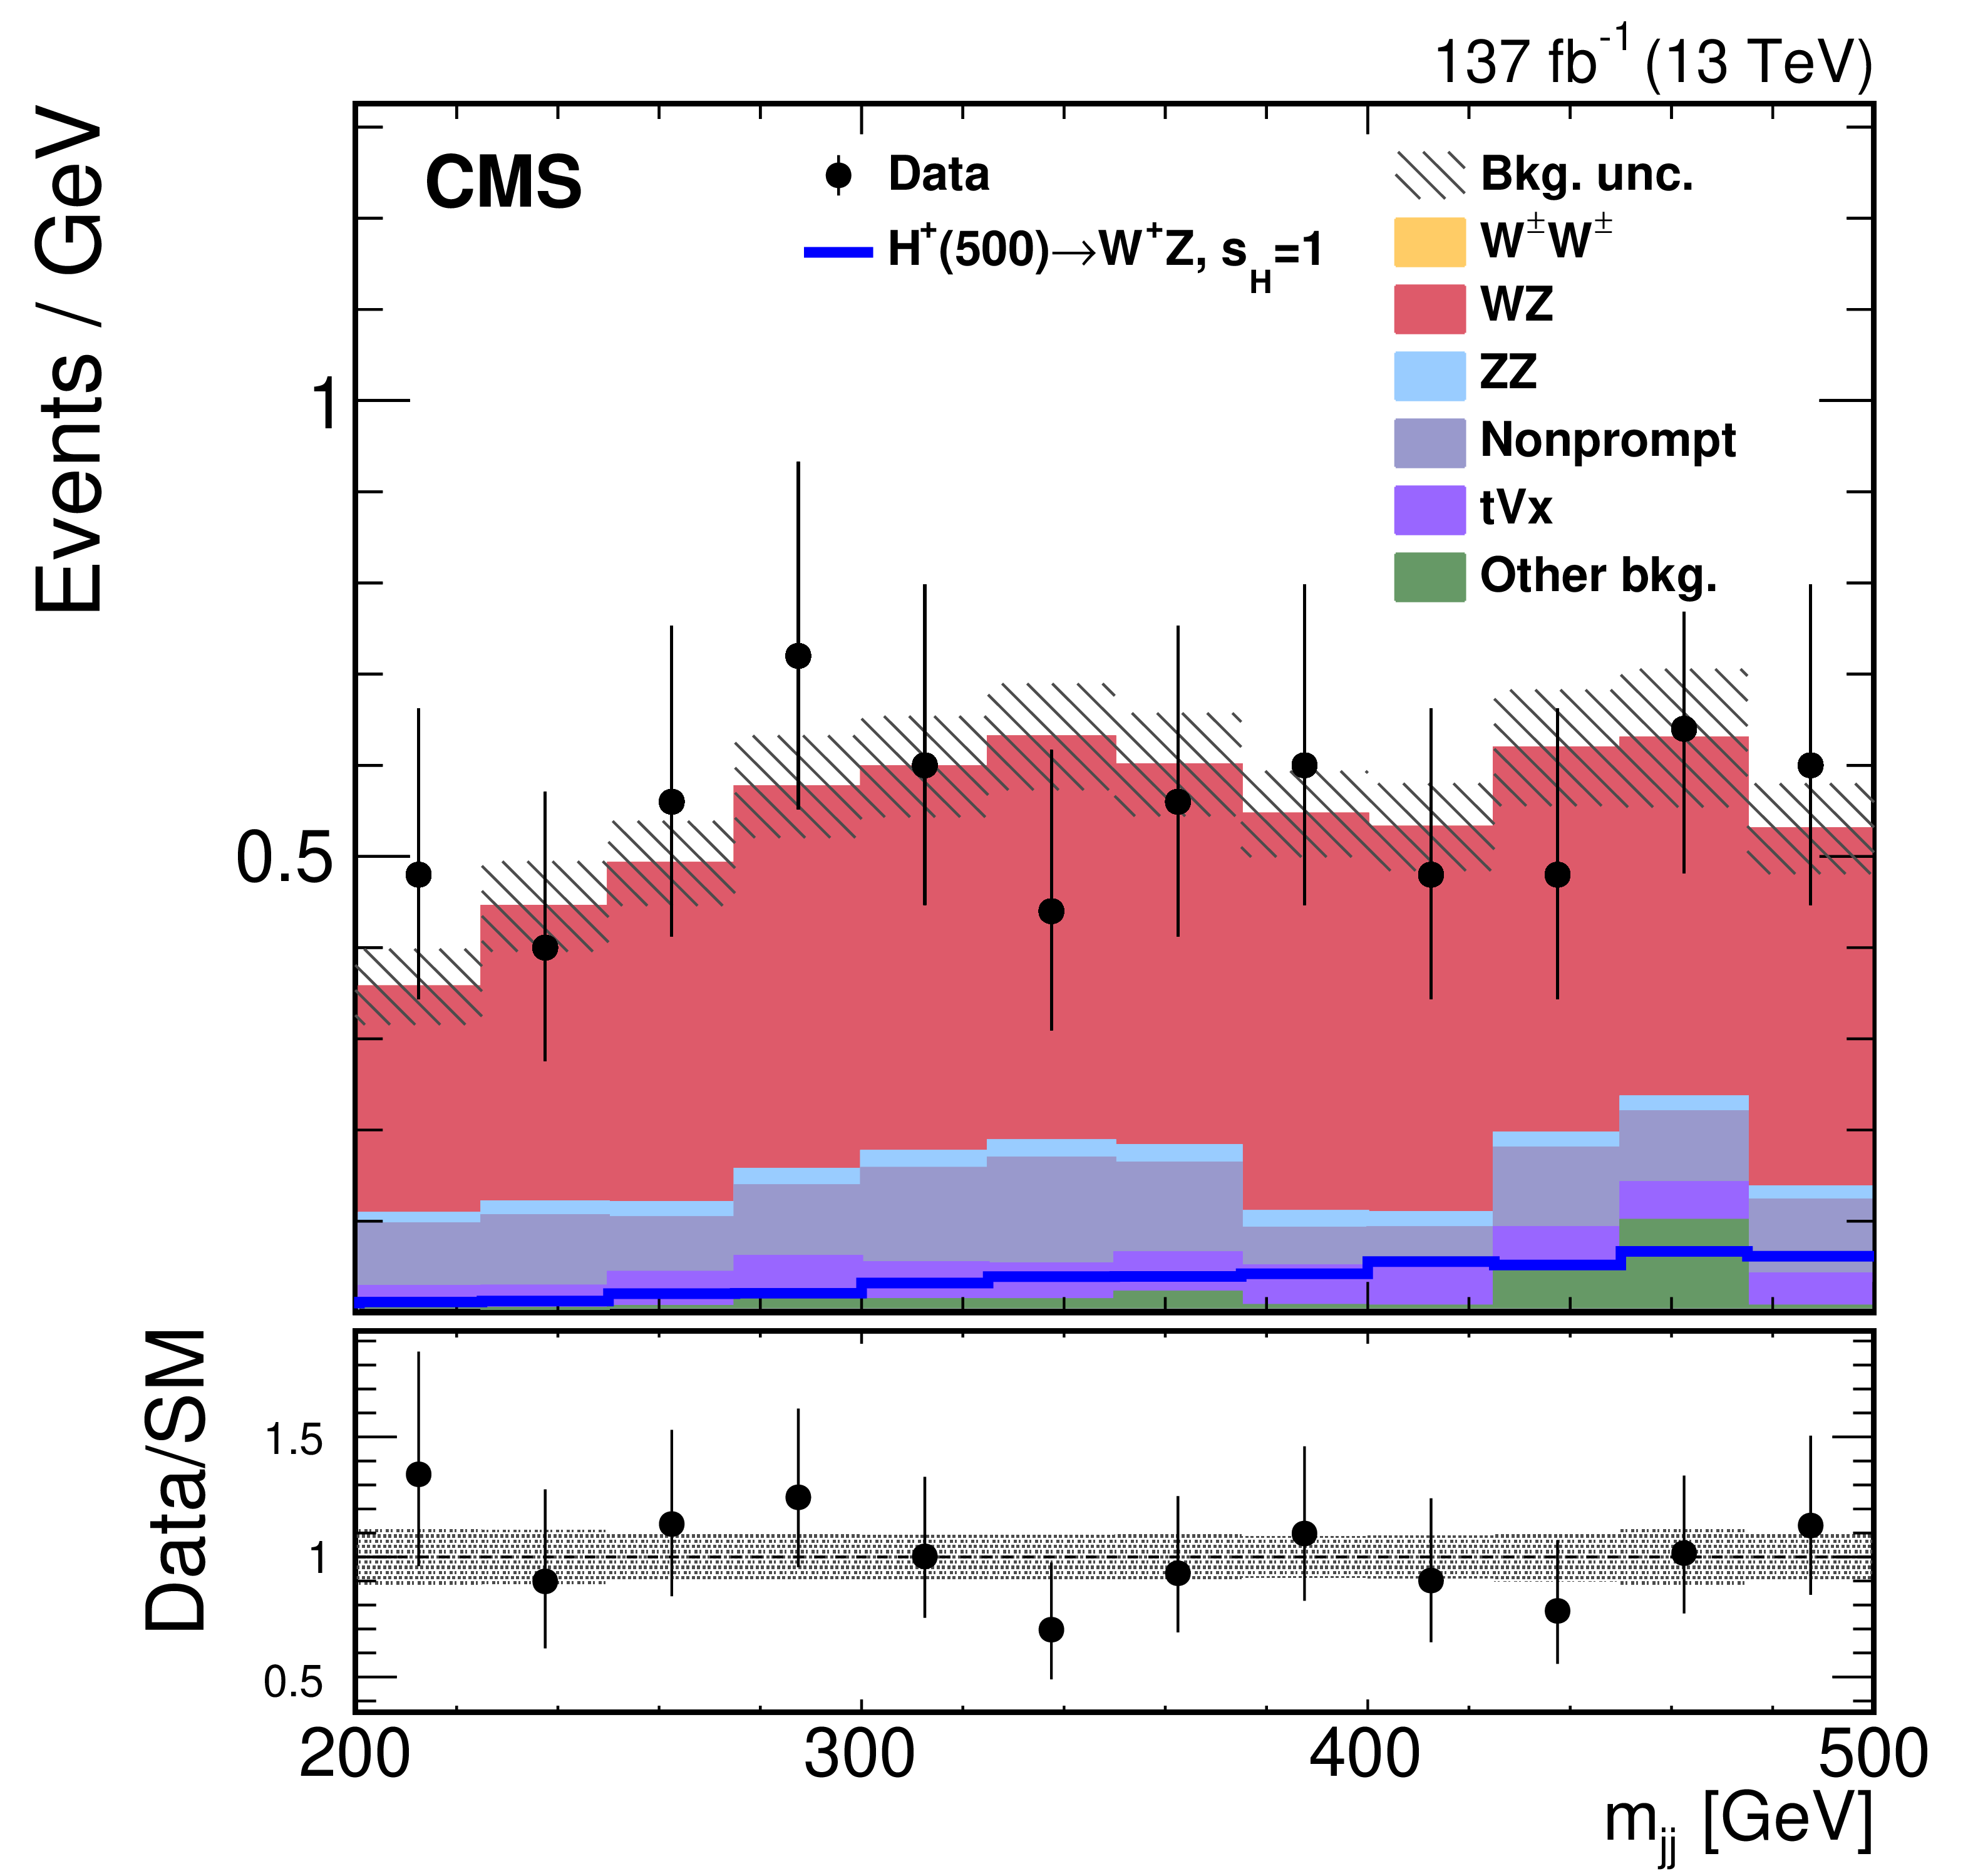
Figure 5:
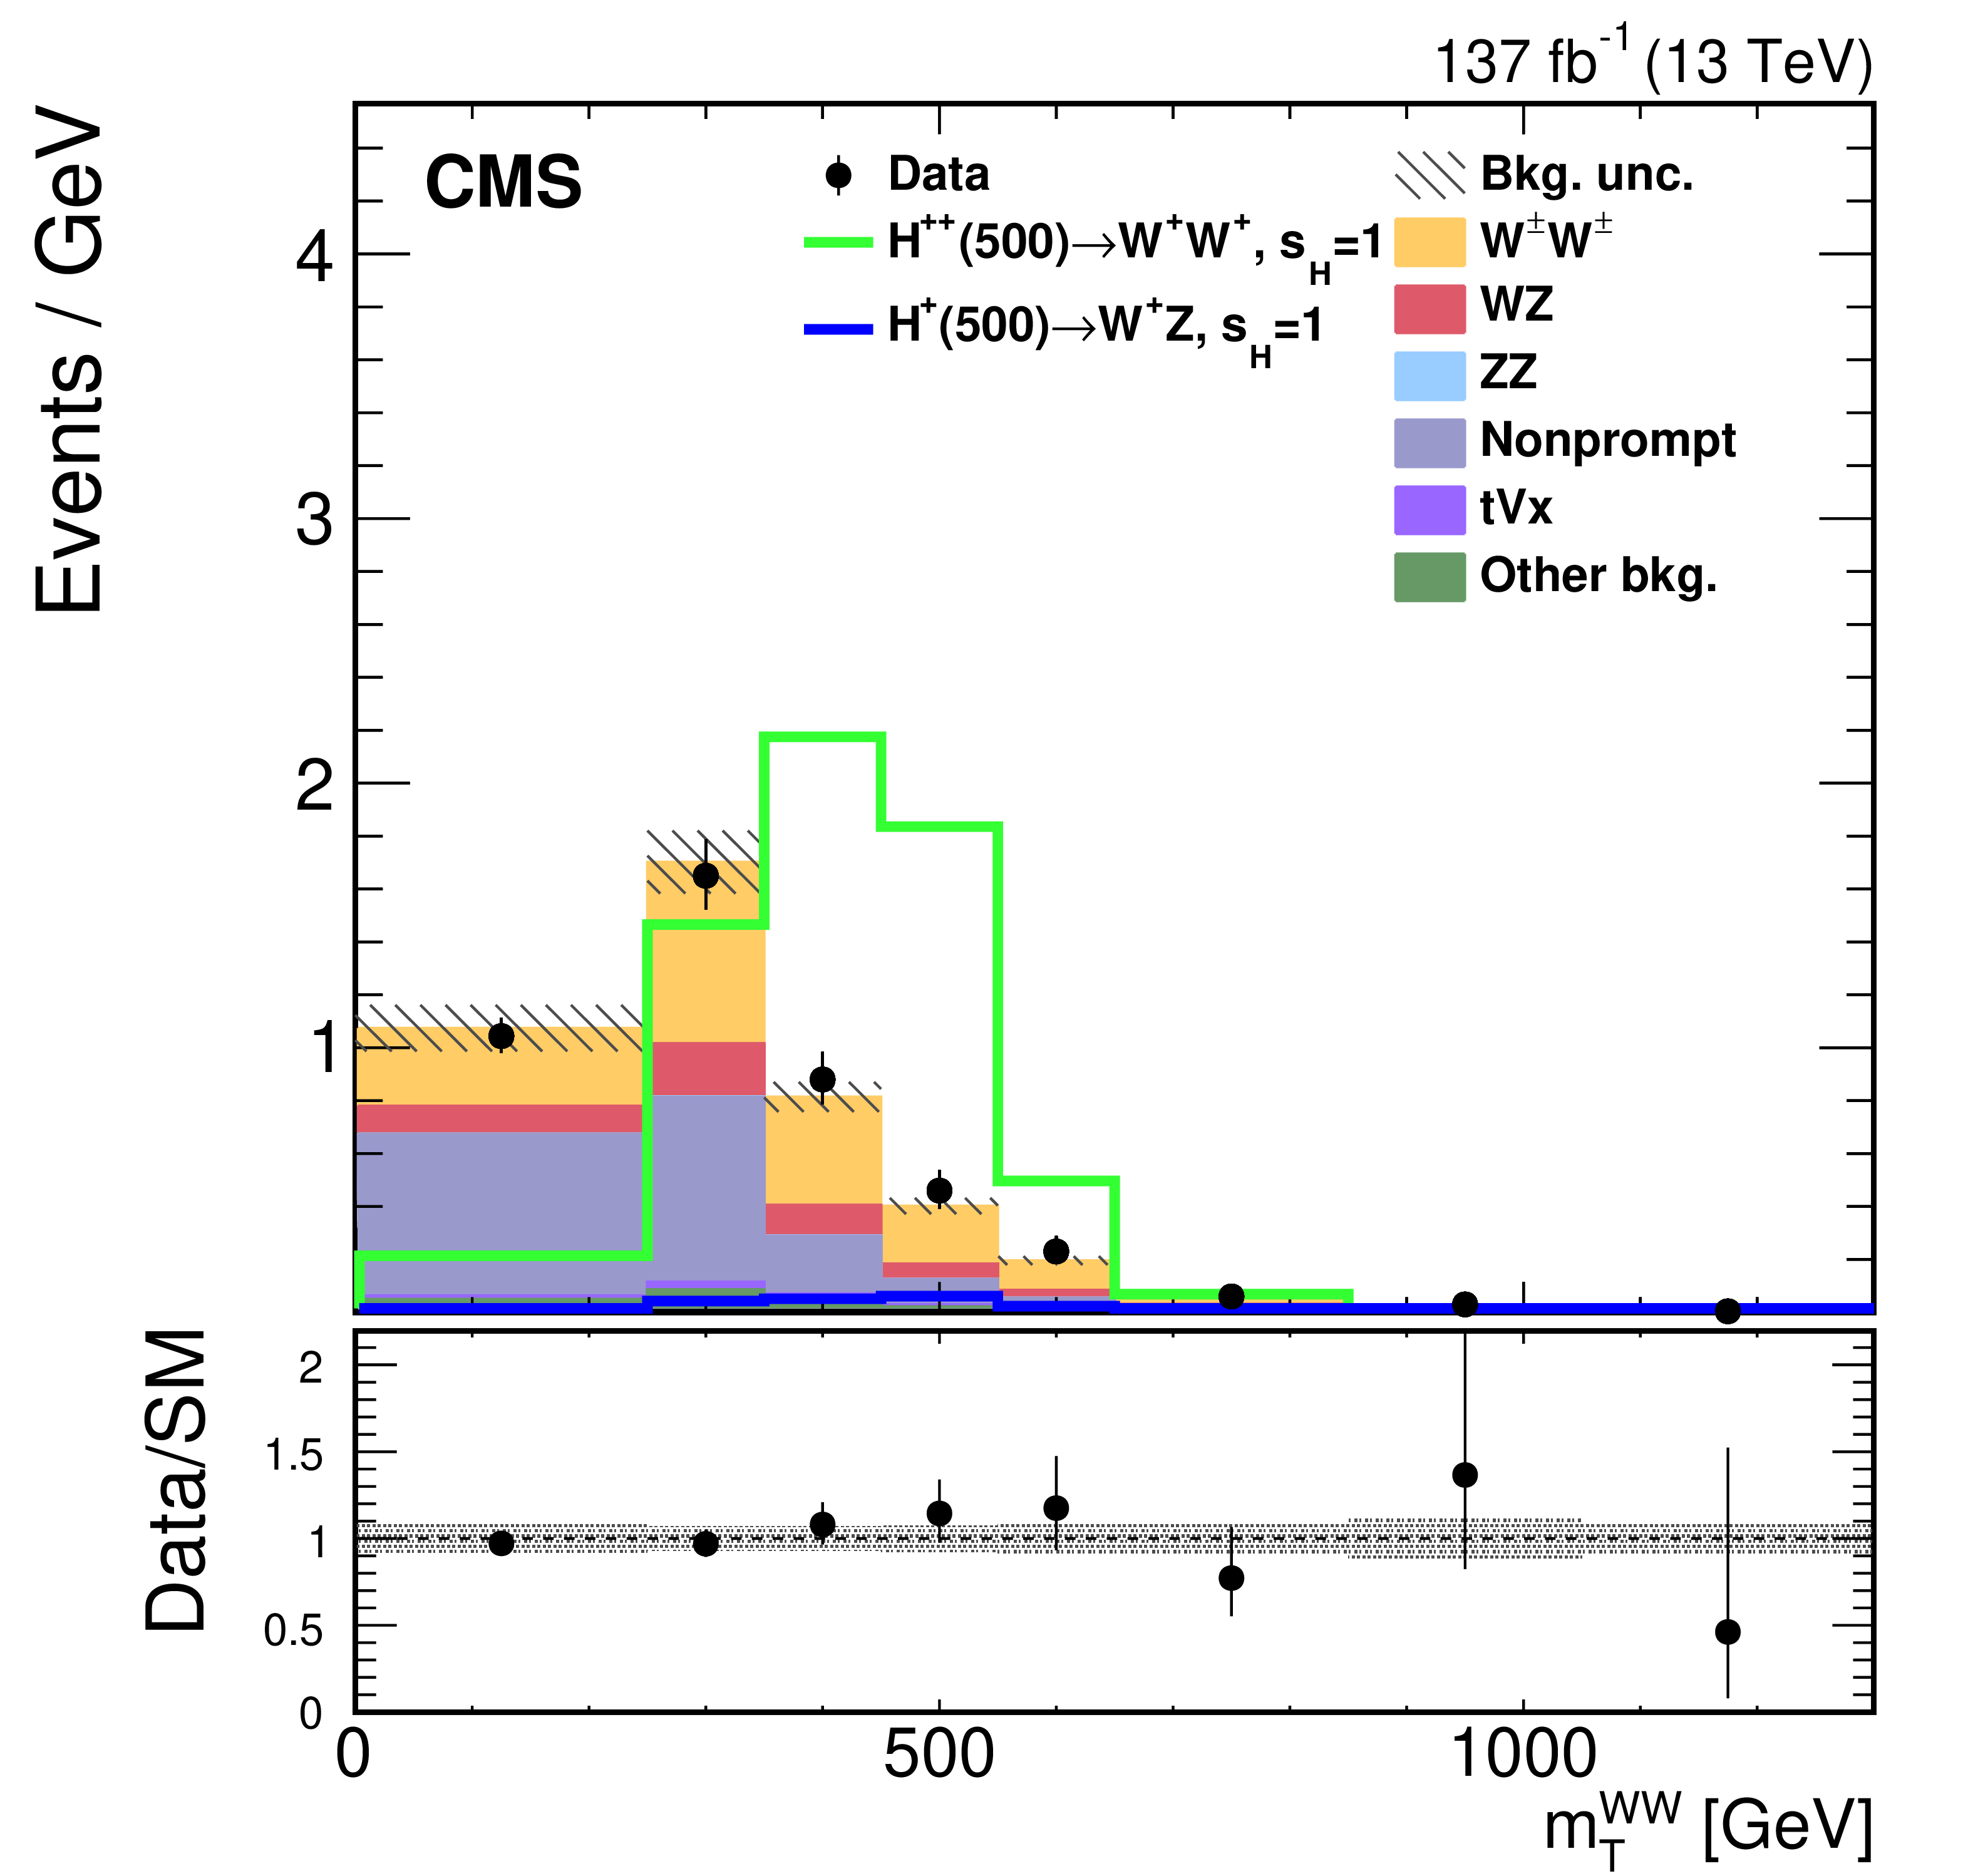
The $ {m_{{\mathrm {j}} {\mathrm {j}}}} $ (upper left) and $ {m_{\mathrm {T}}} ^{\mathrm{W} \mathrm{W}}$ (upper right) distributions in the WW SR, and the $ {m_{{\mathrm {j}} {\mathrm {j}}}} $ (lower left) and $ {m_{\mathrm {T}}} ^{\mathrm{W} \mathrm{Z}}$ (lower right) distributions in the WZ SR for signal, backgrounds, and data. The predicted yields are shown with their best fit normalizations from the simultaneous fit for the background-only hypothesis, i.e., assuming no contributions from the ${\mathrm{\tilde{H}^{\pm_j}}} $ and $ {\mathrm{H} ^{\pm \pm}}$ processes. Vertical bars on data points represent the statistical uncertainty in the data. The histograms for $ {\mathrm{t} {\mathrm{V}} \mathrm {x}} $ backgrounds include the contributions from ${\mathrm{t} \mathrm{\bar{t}}} {\mathrm{V}} $ and $ {\mathrm{t} \mathrm{Z} \mathrm{q}} $ processes. The histograms for other backgrounds include the contributions from double parton scattering, VVV, and from oppositely charged dilepton final states from ${\mathrm{t} \mathrm{\bar{t}}} $, $\mathrm{t} \mathrm{W} $, $\mathrm{W} ^{+}\mathrm{W} ^{-}$, and Drell-Yan processes. The overflow is included in the last bin. The lower panels show the ratio of the number of events observed in data to that of the total SM prediction. The hatched gray bands represent the uncertainties in the predicted yields. The solid lines show the signal predictions for values of $s_{\mathrm{H}}=$ 1.0 and $m_{\mathrm{H} _{5}} = $ 500 GeV in the GM model. |

png pdf |
Figure 5-a:
The $ {m_{{\mathrm {j}} {\mathrm {j}}}} $ distribution in the WW SR for signal, backgrounds, and data. The predicted yields are shown with their best fit normalizations from the simultaneous fit for the background-only hypothesis, i.e., assuming no contributions from the ${\mathrm{\tilde{H}^{\pm_j}}} $ and $ {\mathrm{H} ^{\pm \pm}}$ processes. Vertical bars on data points represent the statistical uncertainty in the data. The histograms for $ {\mathrm{t} {\mathrm{V}} \mathrm {x}} $ backgrounds include the contributions from ${\mathrm{t} \mathrm{\bar{t}}} {\mathrm{V}} $ and $ {\mathrm{t} \mathrm{Z} \mathrm{q}} $ processes. The histograms for other backgrounds include the contributions from double parton scattering, VVV, and from oppositely charged dilepton final states from ${\mathrm{t} \mathrm{\bar{t}}} $, $\mathrm{t} \mathrm{W} $, $\mathrm{W} ^{+}\mathrm{W} ^{-}$, and Drell-Yan processes. The overflow is included in the last bin. The lower panel shows the ratio of the number of events observed in data to that of the total SM prediction. The hatched gray band represents the uncertainties in the predicted yields. The solid lines show the signal predictions for values of $s_{\mathrm{H}}=$ 1.0 and $m_{\mathrm{H} _{5}} = $ 500 GeV in the GM model. |
png pdf |
Figure 5-b:
The $ {m_{\mathrm {T}}} ^{\mathrm{W} \mathrm{W}}$ distribution in the WW SR for signal, backgrounds, and data. The predicted yields are shown with their best fit normalizations from the simultaneous fit for the background-only hypothesis, i.e., assuming no contributions from the ${\mathrm{\tilde{H}^{\pm_j}}} $ and $ {\mathrm{H} ^{\pm \pm}}$ processes. Vertical bars on data points represent the statistical uncertainty in the data. The histograms for $ {\mathrm{t} {\mathrm{V}} \mathrm {x}} $ backgrounds include the contributions from ${\mathrm{t} \mathrm{\bar{t}}} {\mathrm{V}} $ and $ {\mathrm{t} \mathrm{Z} \mathrm{q}} $ processes. The histograms for other backgrounds include the contributions from double parton scattering, VVV, and from oppositely charged dilepton final states from ${\mathrm{t} \mathrm{\bar{t}}} $, $\mathrm{t} \mathrm{W} $, $\mathrm{W} ^{+}\mathrm{W} ^{-}$, and Drell-Yan processes. The overflow is included in the last bin. The lower panel shows the ratio of the number of events observed in data to that of the total SM prediction. The hatched gray band represents the uncertainties in the predicted yields. The solid lines show the signal predictions for values of $s_{\mathrm{H}}=$ 1.0 and $m_{\mathrm{H} _{5}} = $ 500 GeV in the GM model. |
png pdf |
Figure 5-c:
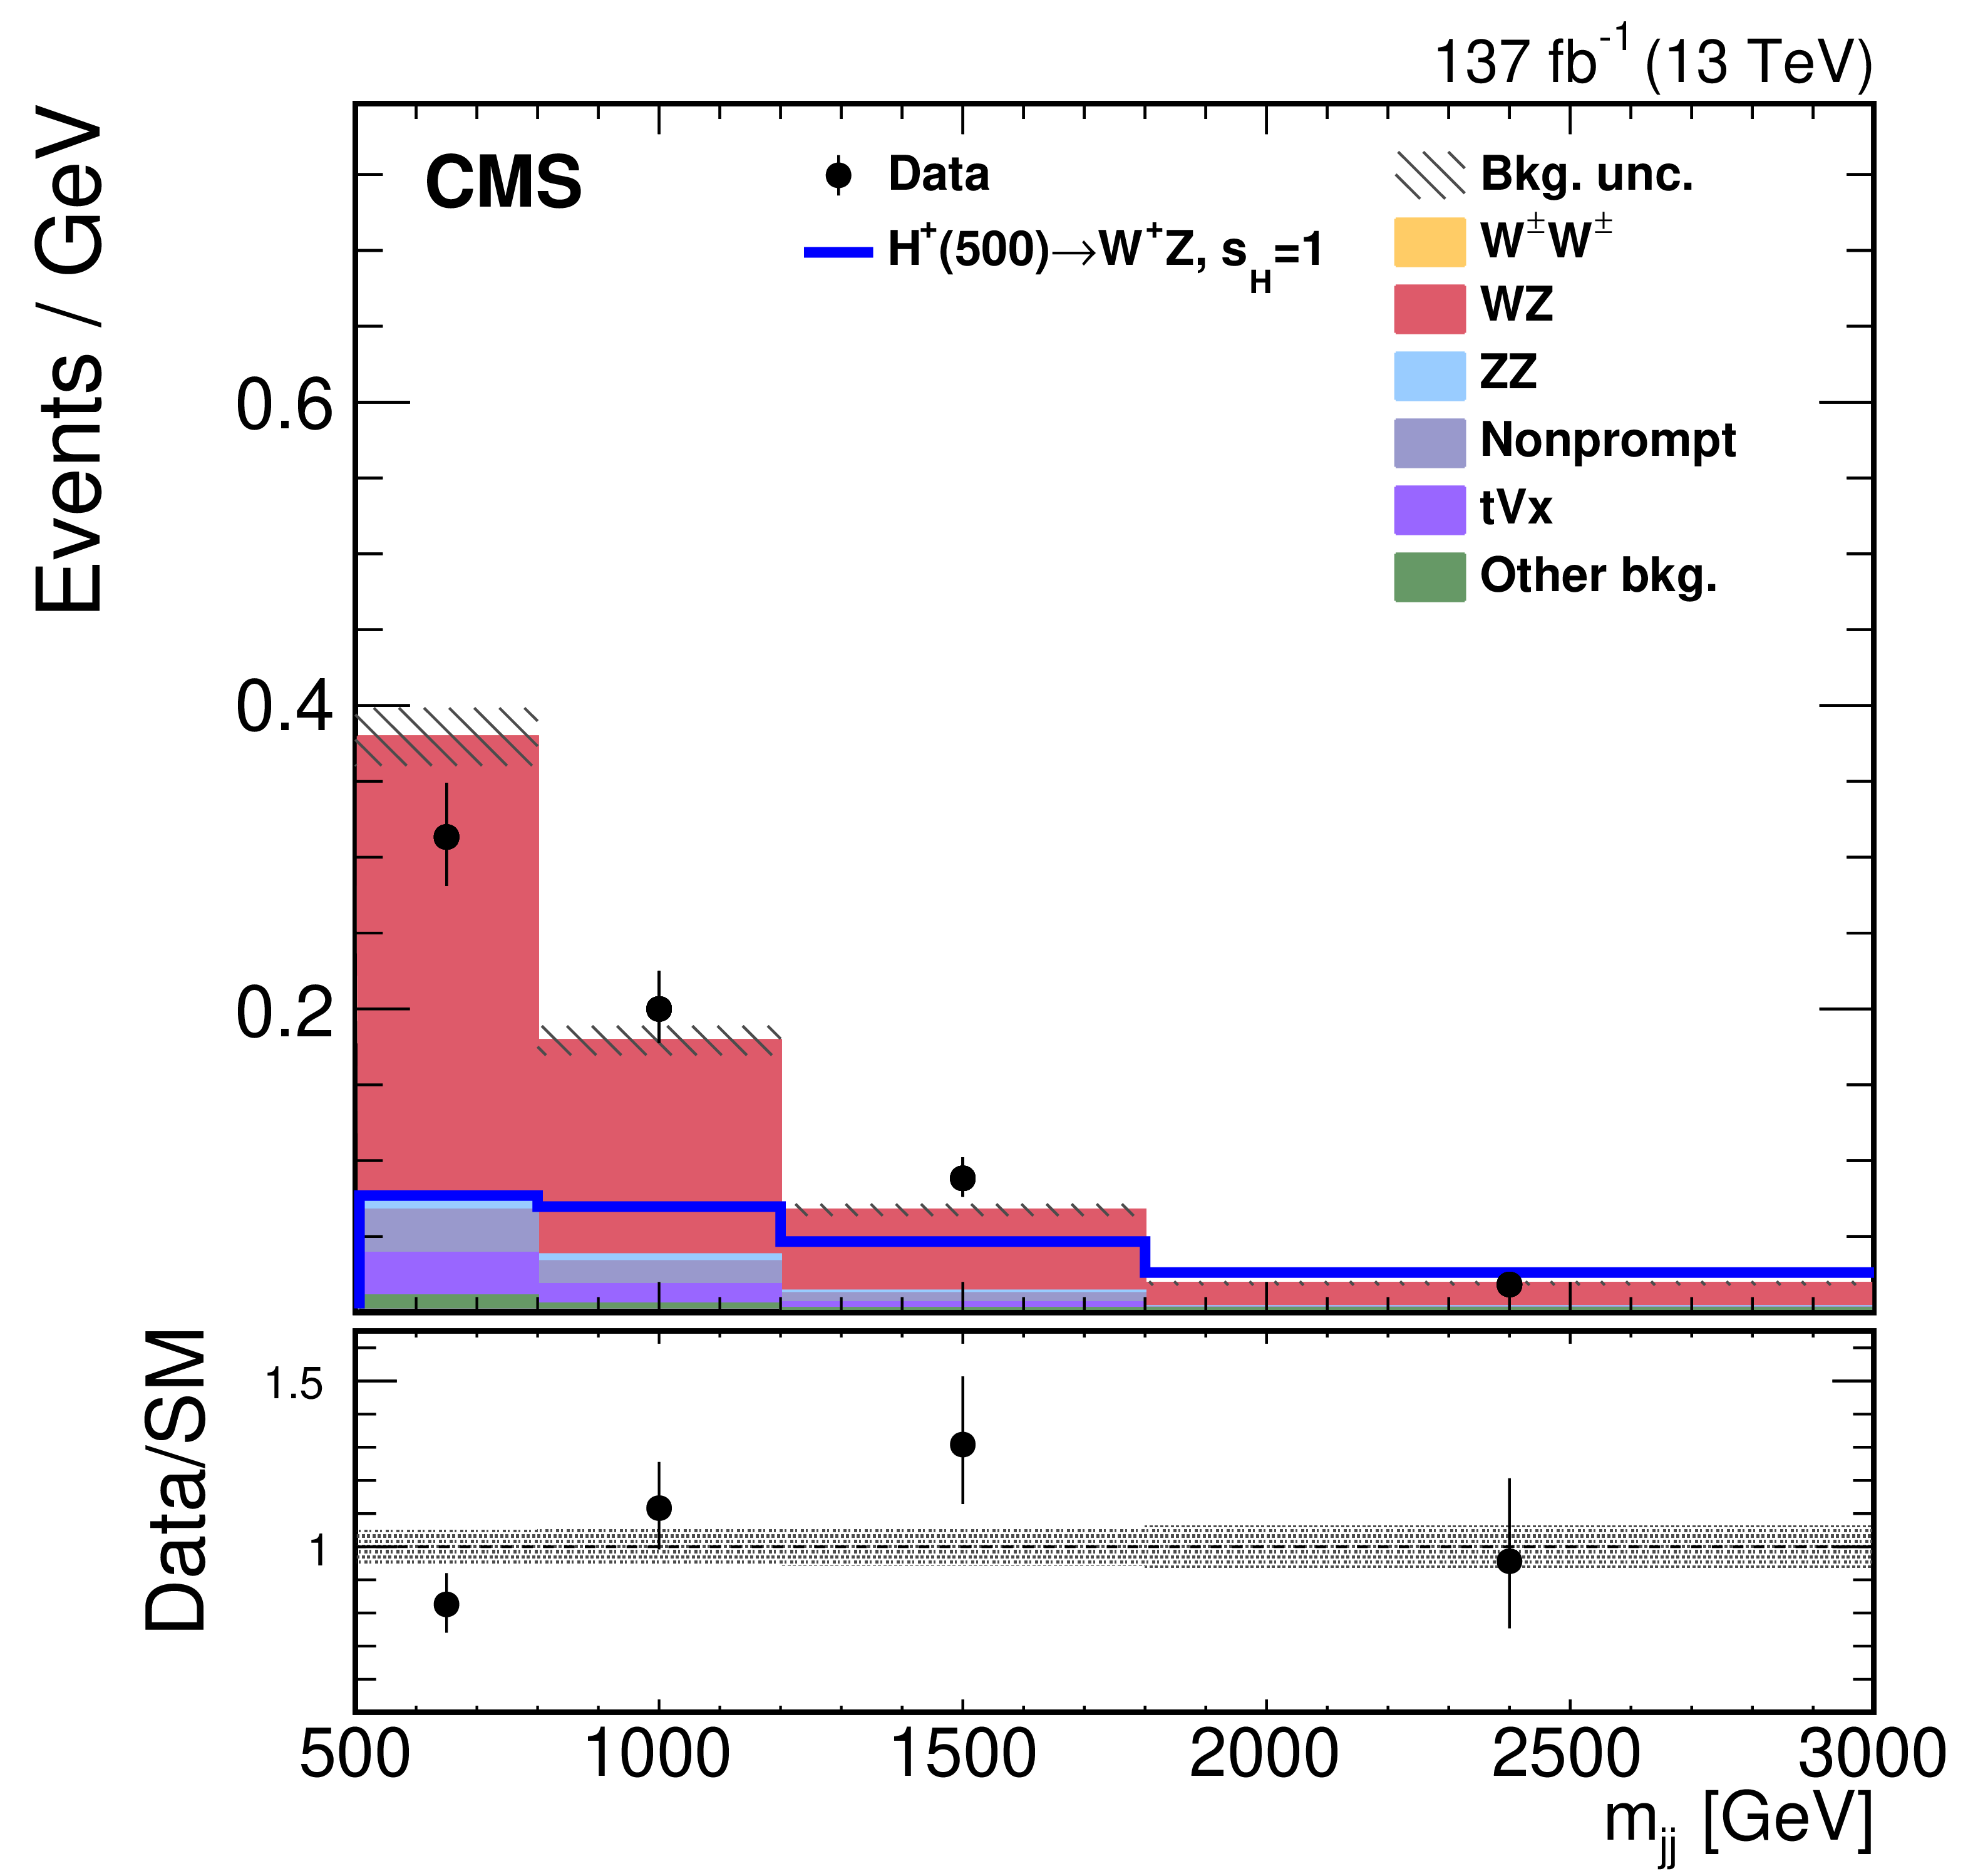
The $ {m_{{\mathrm {j}} {\mathrm {j}}}} $ distribution in the WZ SR for signal, backgrounds, and data. The predicted yields are shown with their best fit normalizations from the simultaneous fit for the background-only hypothesis, i.e., assuming no contributions from the ${\mathrm{\tilde{H}^{\pm_j}}} $ and $ {\mathrm{H} ^{\pm \pm}}$ processes. Vertical bars on data points represent the statistical uncertainty in the data. The histograms for $ {\mathrm{t} {\mathrm{V}} \mathrm {x}} $ backgrounds include the contributions from ${\mathrm{t} \mathrm{\bar{t}}} {\mathrm{V}} $ and $ {\mathrm{t} \mathrm{Z} \mathrm{q}} $ processes. The histograms for other backgrounds include the contributions from double parton scattering, VVV, and from oppositely charged dilepton final states from ${\mathrm{t} \mathrm{\bar{t}}} $, $\mathrm{t} \mathrm{W} $, $\mathrm{W} ^{+}\mathrm{W} ^{-}$, and Drell-Yan processes. The overflow is included in the last bin. The lower panel shows the ratio of the number of events observed in data to that of the total SM prediction. The hatched gray band represents the uncertainties in the predicted yields. The solid lines show the signal predictions for values of $s_{\mathrm{H}}=$ 1.0 and $m_{\mathrm{H} _{5}} = $ 500 GeV in the GM model. |

png pdf |
Figure 5-d:
The $ {m_{\mathrm {T}}} ^{\mathrm{W} \mathrm{Z}}$ distribution in the WZ SR for signal, backgrounds, and data. The predicted yields are shown with their best fit normalizations from the simultaneous fit for the background-only hypothesis, i.e., assuming no contributions from the ${\mathrm{\tilde{H}^{\pm_j}}} $ and $ {\mathrm{H} ^{\pm \pm}}$ processes. Vertical bars on data points represent the statistical uncertainty in the data. The histograms for $ {\mathrm{t} {\mathrm{V}} \mathrm {x}} $ backgrounds include the contributions from ${\mathrm{t} \mathrm{\bar{t}}} {\mathrm{V}} $ and $ {\mathrm{t} \mathrm{Z} \mathrm{q}} $ processes. The histograms for other backgrounds include the contributions from double parton scattering, VVV, and from oppositely charged dilepton final states from ${\mathrm{t} \mathrm{\bar{t}}} $, $\mathrm{t} \mathrm{W} $, $\mathrm{W} ^{+}\mathrm{W} ^{-}$, and Drell-Yan processes. The overflow is included in the last bin. The lower panel shows the ratio of the number of events observed in data to that of the total SM prediction. The hatched gray band represents the uncertainties in the predicted yields. The solid lines show the signal predictions for values of $s_{\mathrm{H}}=$ 1.0 and $m_{\mathrm{H} _{5}} = $ 500 GeV in the GM model. |

png pdf |
Figure 6:
Distributions for signal, backgrounds, and data for the bins used in the simultaneous fit. The bins 1-32 (4$\times $8) show the events in the WW SR ($ {m_{{\mathrm {j}} {\mathrm {j}}}} \times {m_{\mathrm {T}}} $), the bins 33-46 (2$\times $7) show the events in the WZ SR ($ {m_{{\mathrm {j}} {\mathrm {j}}}} \times {m_{\mathrm {T}}} $), the 4 bins 47-50 show the events in the nonprompt lepton CR ($ {m_{{\mathrm {j}} {\mathrm {j}}}} $), the 4 bins 51-54 show the events in the $ {\mathrm{t} \mathrm{Z} \mathrm{q}} $ CR ($ {m_{{\mathrm {j}} {\mathrm {j}}}} $), and the 4 bins 55-58 show the events in the $\mathrm{Z} \mathrm{Z} $ CR ($ {m_{{\mathrm {j}} {\mathrm {j}}}} $). The predicted yields are shown with their best fit normalizations from the simultaneous fit for the background-only hypothesis, i.e., assuming no contributions from the ${\mathrm{\tilde{H}^{\pm_j}}} $ and $ {\mathrm{H} ^{\pm \pm}}$ processes. Vertical bars on data points represent the statistical uncertainty in the data. The histograms for $ {\mathrm{t} {\mathrm{V}} \mathrm {x}} $ backgrounds include the contributions from ${\mathrm{t} \mathrm{\bar{t}}} {\mathrm{V}} $ and $ {\mathrm{t} \mathrm{Z} \mathrm{q}} $ processes. The histograms for other backgrounds include the contributions from double parton scattering, VVV, and from oppositely charged dilepton final states from ${\mathrm{t} \mathrm{\bar{t}}} $, $\mathrm{t} \mathrm{W} $, $\mathrm{W} ^{+}\mathrm{W} ^{-}$, and Drell-Yan processes. The overflow is included in the last bin in each corresponding region. The lower panels show the ratio of the number of events observed in data to that of the total SM prediction. The hatched gray bands represent the uncertainties in the predicted yields. The solid lines show the signal predictions for values of $s_{\mathrm{H}}=$ 1.0 and $m_{\mathrm{H} _{5}} = $ 500 GeV in the GM model. |

png pdf |
Figure 7:
The product of acceptance and selection efficiency within the fiducial region for the VBF $ {\mathrm{H} ^{\pm \pm}}\to {\mathrm{W} ^\pm \mathrm{W} ^\pm} \to 2\ell 2\nu $ and ${\mathrm{\tilde{H}^{\pm_j}}} \to {\mathrm{W} \mathrm{Z}} \to 3\ell \nu $ processes, as a function of $m_{\mathrm{H} _{5}}$. The combination of the statistical and systematic uncertainties is shown. The theoretical uncertainties in the acceptance are also included. |
png pdf |
Figure 8:
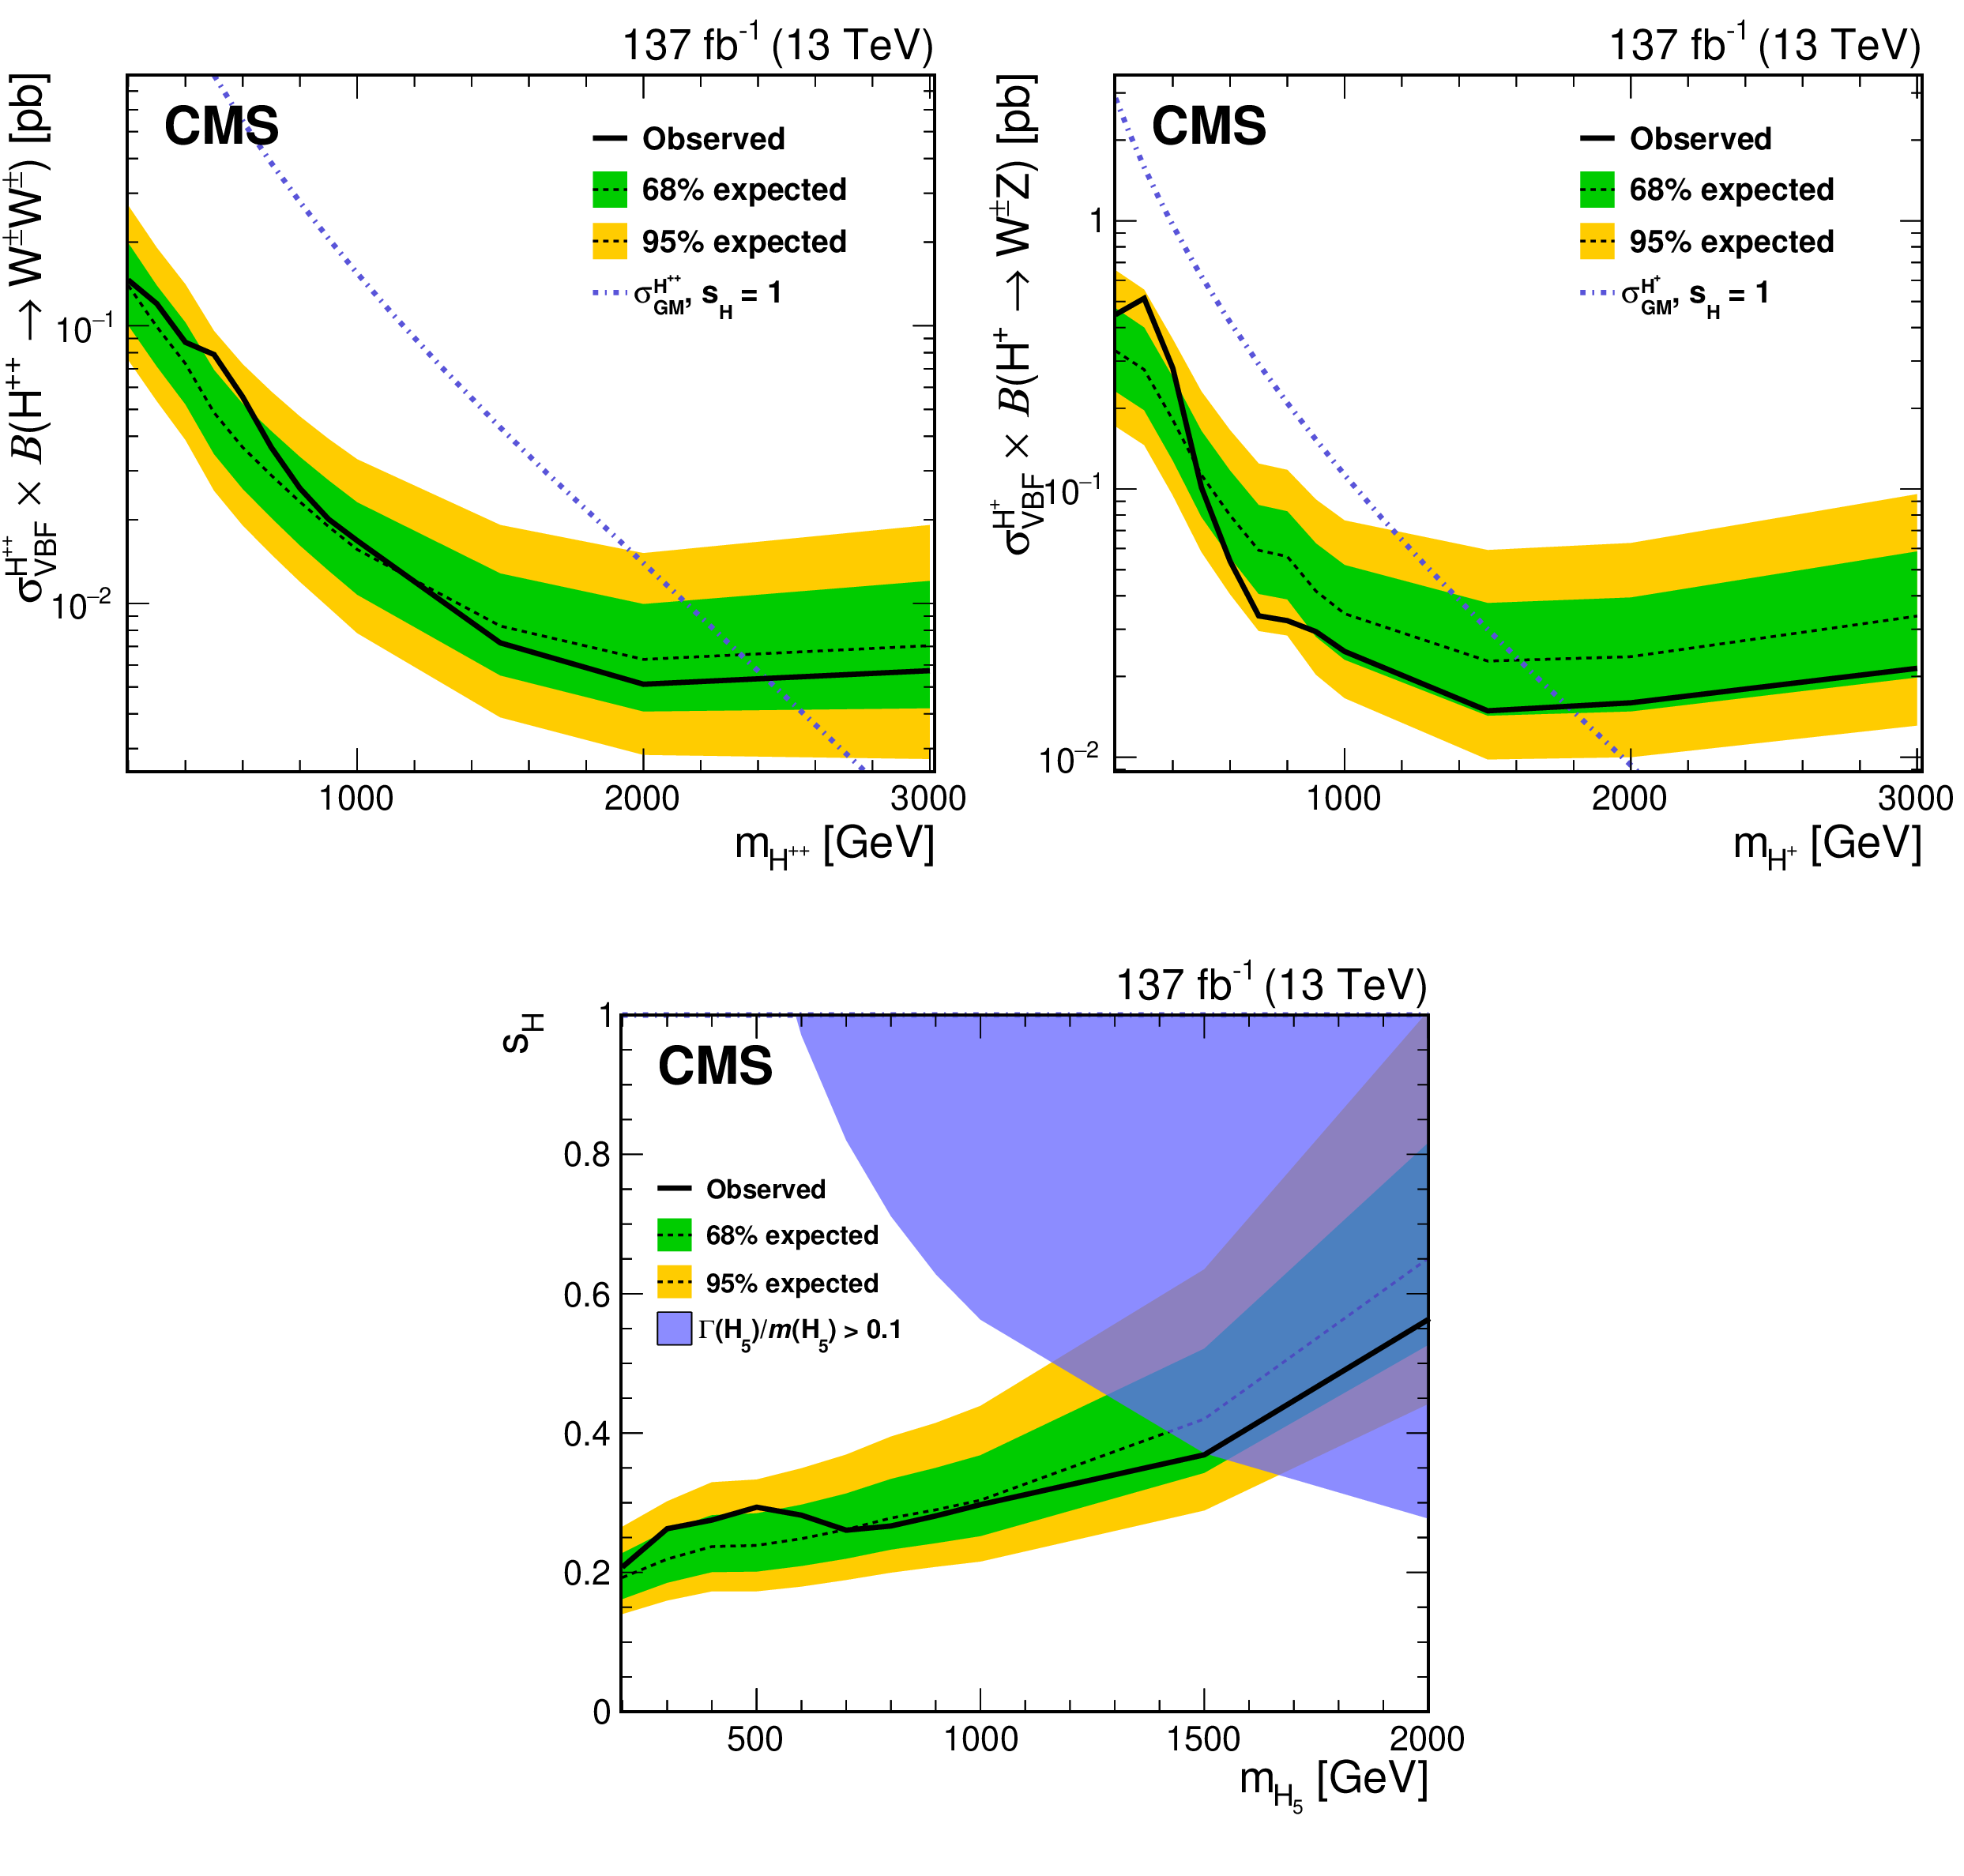
Expected and observed exclusion limits at 95% CL for $\sigma _\mathrm {VBF}({\mathrm{H} ^{\pm \pm}}) + \mathcal {B}({\mathrm{H} ^{\pm \pm}}\to {\mathrm{W} ^\pm \mathrm{W} ^\pm})$ as functions of $m_{{\mathrm{H} ^{\pm \pm}}}$ (upper left), for $\sigma _\mathrm {VBF}({\mathrm{\tilde{H}^{\pm_j}}}) + \mathcal {B}({\mathrm{\tilde{H}^{\pm_j}}} \to {\mathrm{W} \mathrm{Z}})$ as functions of $m_{{\mathrm{\tilde{H}^{\pm_j}}}}$ (upper right), and for $s_{\mathrm{H}}$ as functions of $m_{\mathrm{H} _{5}}$ in the GM model (lower). The contribution of the ${\mathrm{\tilde{H}^{\pm_j}}} $ ($ {\mathrm{H} ^{\pm \pm}}$) boson signal is set to zero for the derivation of the exclusion limits on the $\sigma _\mathrm {VBF}({\mathrm{H} ^{\pm \pm}}) + \mathcal {B}({\mathrm{H} ^{\pm \pm}}\to {\mathrm{W} ^\pm \mathrm{W} ^\pm})$ ($\sigma _\mathrm {VBF}({\mathrm{\tilde{H}^{\pm_j}}}) + \mathcal {B}({\mathrm{\tilde{H}^{\pm_j}}} \to {\mathrm{W} \mathrm{Z}})$). The exclusion limits for $s_{\mathrm{H}}$ are shown up to $m_{\mathrm{H} _{5}} = $ 2000 GeV, given the low sensitivity in the GM model for values above that mass. Values above the curves are excluded. |

png pdf |
Figure 8-a:
Expected and observed exclusion limits at 95% CL for $\sigma _\mathrm {VBF}({\mathrm{H} ^{\pm \pm}}) + \mathcal {B}({\mathrm{H} ^{\pm \pm}}\to {\mathrm{W} ^\pm \mathrm{W} ^\pm})$ as functions of $m_{{\mathrm{H} ^{\pm \pm}}}$. The contribution of the ${\mathrm{\tilde{H}^{\pm_j}}} $ ($ {\mathrm{H} ^{\pm \pm}}$) boson signal is set to zero for the derivation of the exclusion limits on the $\sigma _\mathrm {VBF}({\mathrm{H} ^{\pm \pm}}) + \mathcal {B}({\mathrm{H} ^{\pm \pm}}\to {\mathrm{W} ^\pm \mathrm{W} ^\pm})$ ($\sigma _\mathrm {VBF}({\mathrm{\tilde{H}^{\pm_j}}}) + \mathcal {B}({\mathrm{\tilde{H}^{\pm_j}}} \to {\mathrm{W} \mathrm{Z}})$). The exclusion limits for $s_{\mathrm{H}}$ are shown up to $m_{\mathrm{H} _{5}} = $ 2000 GeV, given the low sensitivity in the GM model for values above that mass. Values above the curves are excluded. |
png pdf |
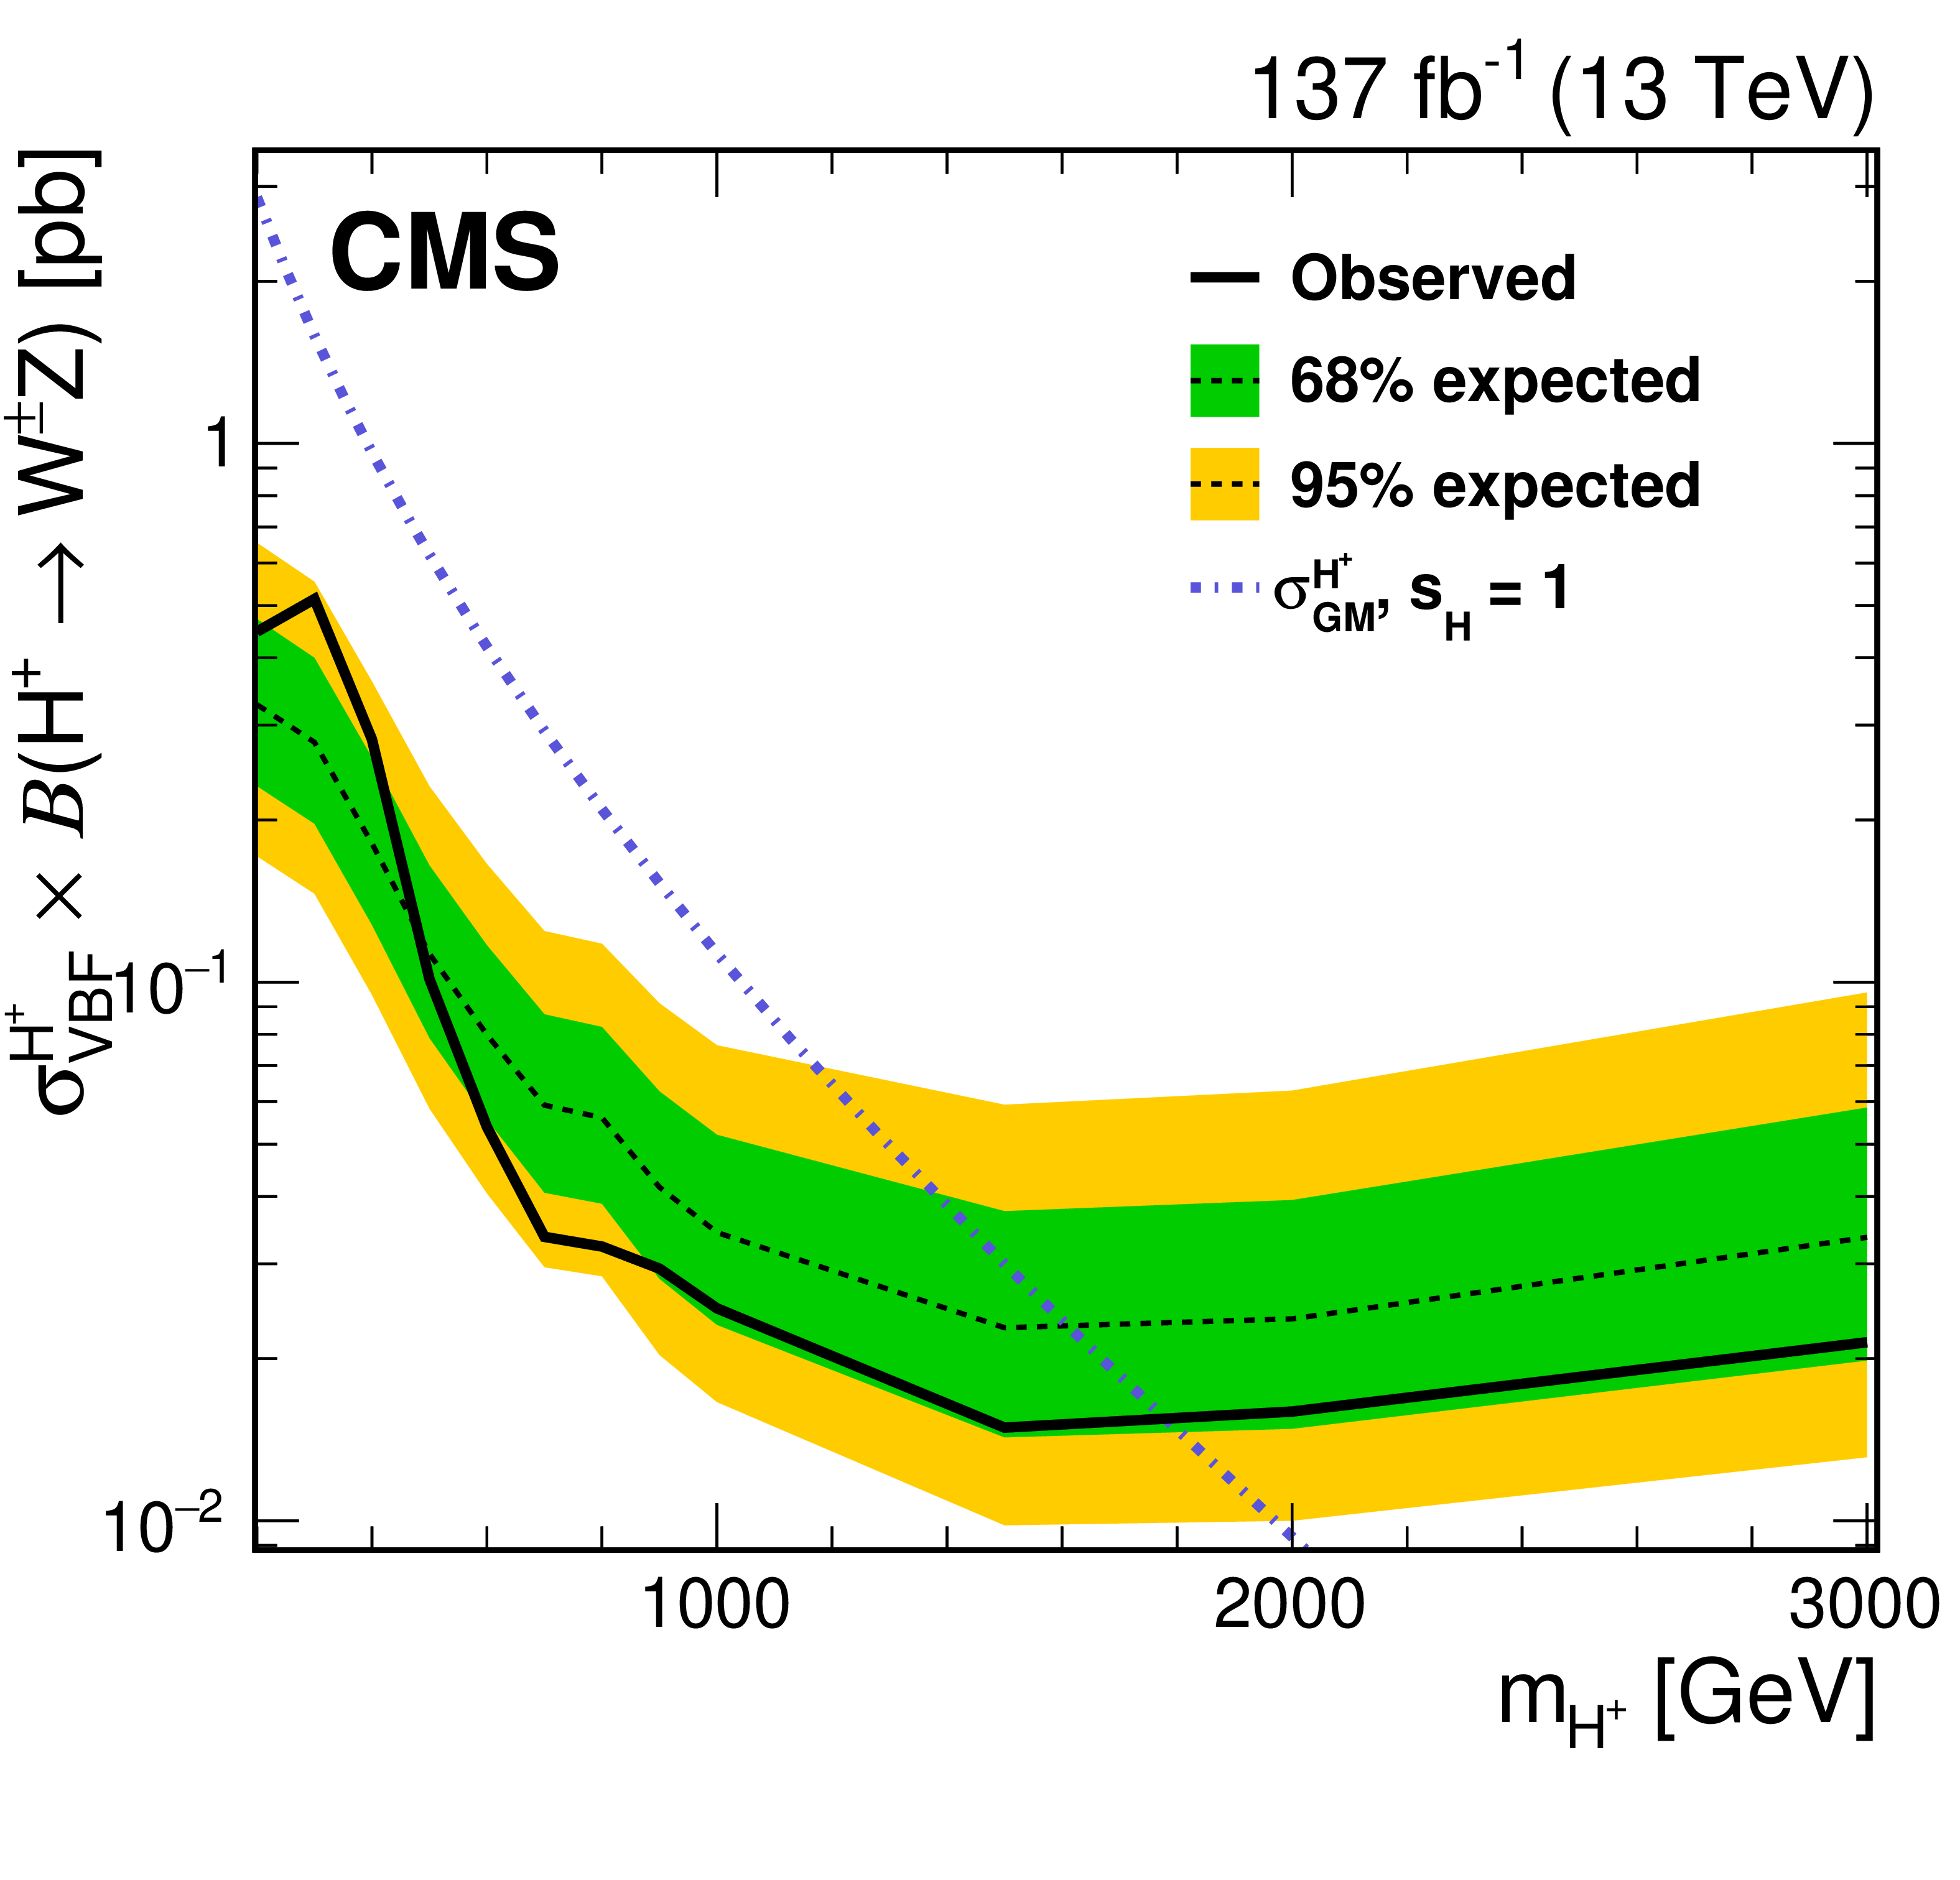
Figure 8-b:
Expected and observed exclusion limits at 95% CL for $\sigma _\mathrm {VBF}({\mathrm{\tilde{H}^{\pm_j}}}) + \mathcal {B}({\mathrm{\tilde{H}^{\pm_j}}} \to {\mathrm{W} \mathrm{Z}})$ as functions of $m_{{\mathrm{\tilde{H}^{\pm_j}}}}$. The contribution of the ${\mathrm{\tilde{H}^{\pm_j}}} $ ($ {\mathrm{H} ^{\pm \pm}}$) boson signal is set to zero for the derivation of the exclusion limits on the $\sigma _\mathrm {VBF}({\mathrm{H} ^{\pm \pm}}) + \mathcal {B}({\mathrm{H} ^{\pm \pm}}\to {\mathrm{W} ^\pm \mathrm{W} ^\pm})$ ($\sigma _\mathrm {VBF}({\mathrm{\tilde{H}^{\pm_j}}}) + \mathcal {B}({\mathrm{\tilde{H}^{\pm_j}}} \to {\mathrm{W} \mathrm{Z}})$). The exclusion limits for $s_{\mathrm{H}}$ are shown up to $m_{\mathrm{H} _{5}} = $ 2000 GeV, given the low sensitivity in the GM model for values above that mass. Values above the curves are excluded. |
png pdf |
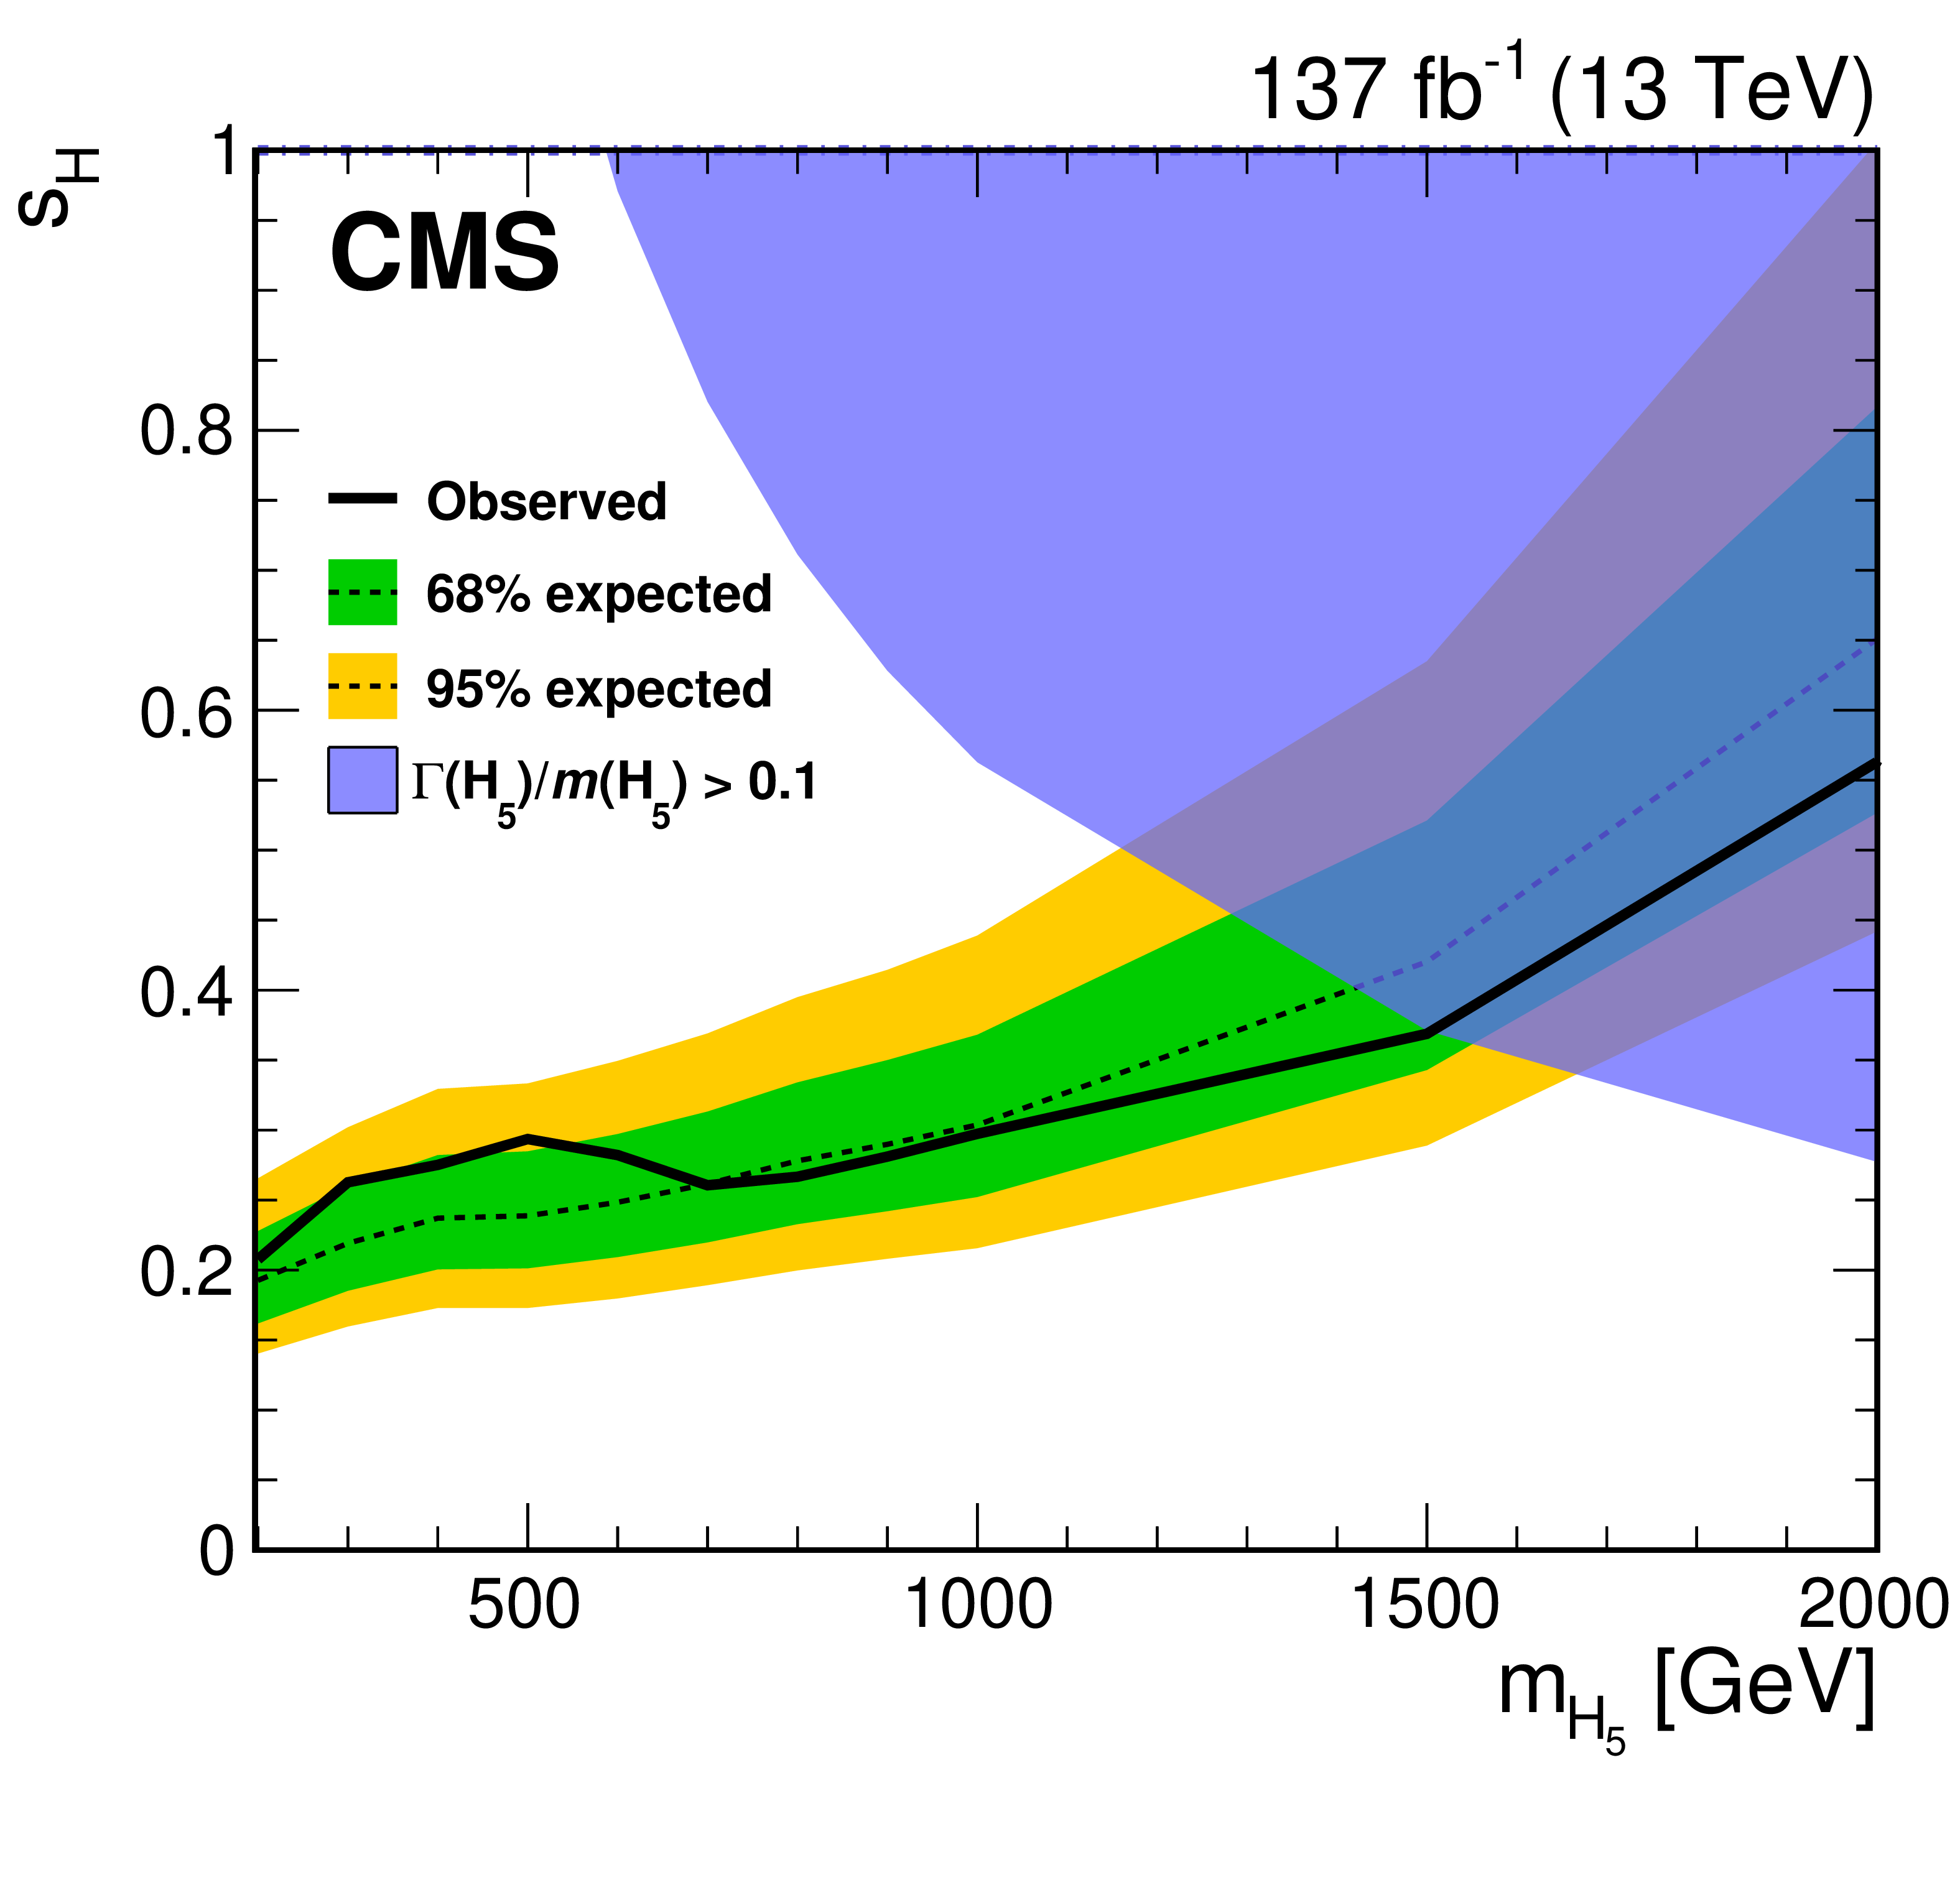
Figure 8-c:
Expected and observed exclusion limits at 95% CL for $s_{\mathrm{H}}$ as functions of $m_{\mathrm{H} _{5}}$ in the GM model. The contribution of the ${\mathrm{\tilde{H}^{\pm_j}}} $ ($ {\mathrm{H} ^{\pm \pm}}$) boson signal is set to zero for the derivation of the exclusion limits on the $\sigma _\mathrm {VBF}({\mathrm{H} ^{\pm \pm}}) + \mathcal {B}({\mathrm{H} ^{\pm \pm}}\to {\mathrm{W} ^\pm \mathrm{W} ^\pm})$ ($\sigma _\mathrm {VBF}({\mathrm{\tilde{H}^{\pm_j}}}) + \mathcal {B}({\mathrm{\tilde{H}^{\pm_j}}} \to {\mathrm{W} \mathrm{Z}})$). The exclusion limits for $s_{\mathrm{H}}$ are shown up to $m_{\mathrm{H} _{5}} = $ 2000 GeV, given the low sensitivity in the GM model for values above that mass. Values above the curves are excluded. |
| Tables | |

png pdf |
Table 1:
Summary of the selection requirements defining the $ {\mathrm{W} ^\pm \mathrm{W} ^\pm} $ and WZ SRs. The looser lepton $ {p_{\mathrm {T}}} $ requirement in the WZ selection refers to the trailing lepton from the $\mathrm{Z} $ boson decays. The $ {| {\mathrm {m}_{\ell \ell}} - m_{\mathrm{Z}} |}$ requirement is applied only to the dielectron final state in the $ {\mathrm{W} ^\pm \mathrm{W} ^\pm} $ SR. |

png pdf |
Table 2:
Summary of the impact of the systematic uncertainties on the extracted signal strength; for the case of a background-only simulated data set, i.e., assuming no contributions from the ${\mathrm{\tilde{H}^{\pm_j}}} $ and $ {\mathrm{H} ^{\pm \pm}}$ processes, and including a charged Higgs boson signal for values of $s_{\mathrm{H}}=$ 1.0 and $m_{\mathrm{H} _{5}} = $ 500 GeV in the GM model. |
png pdf |
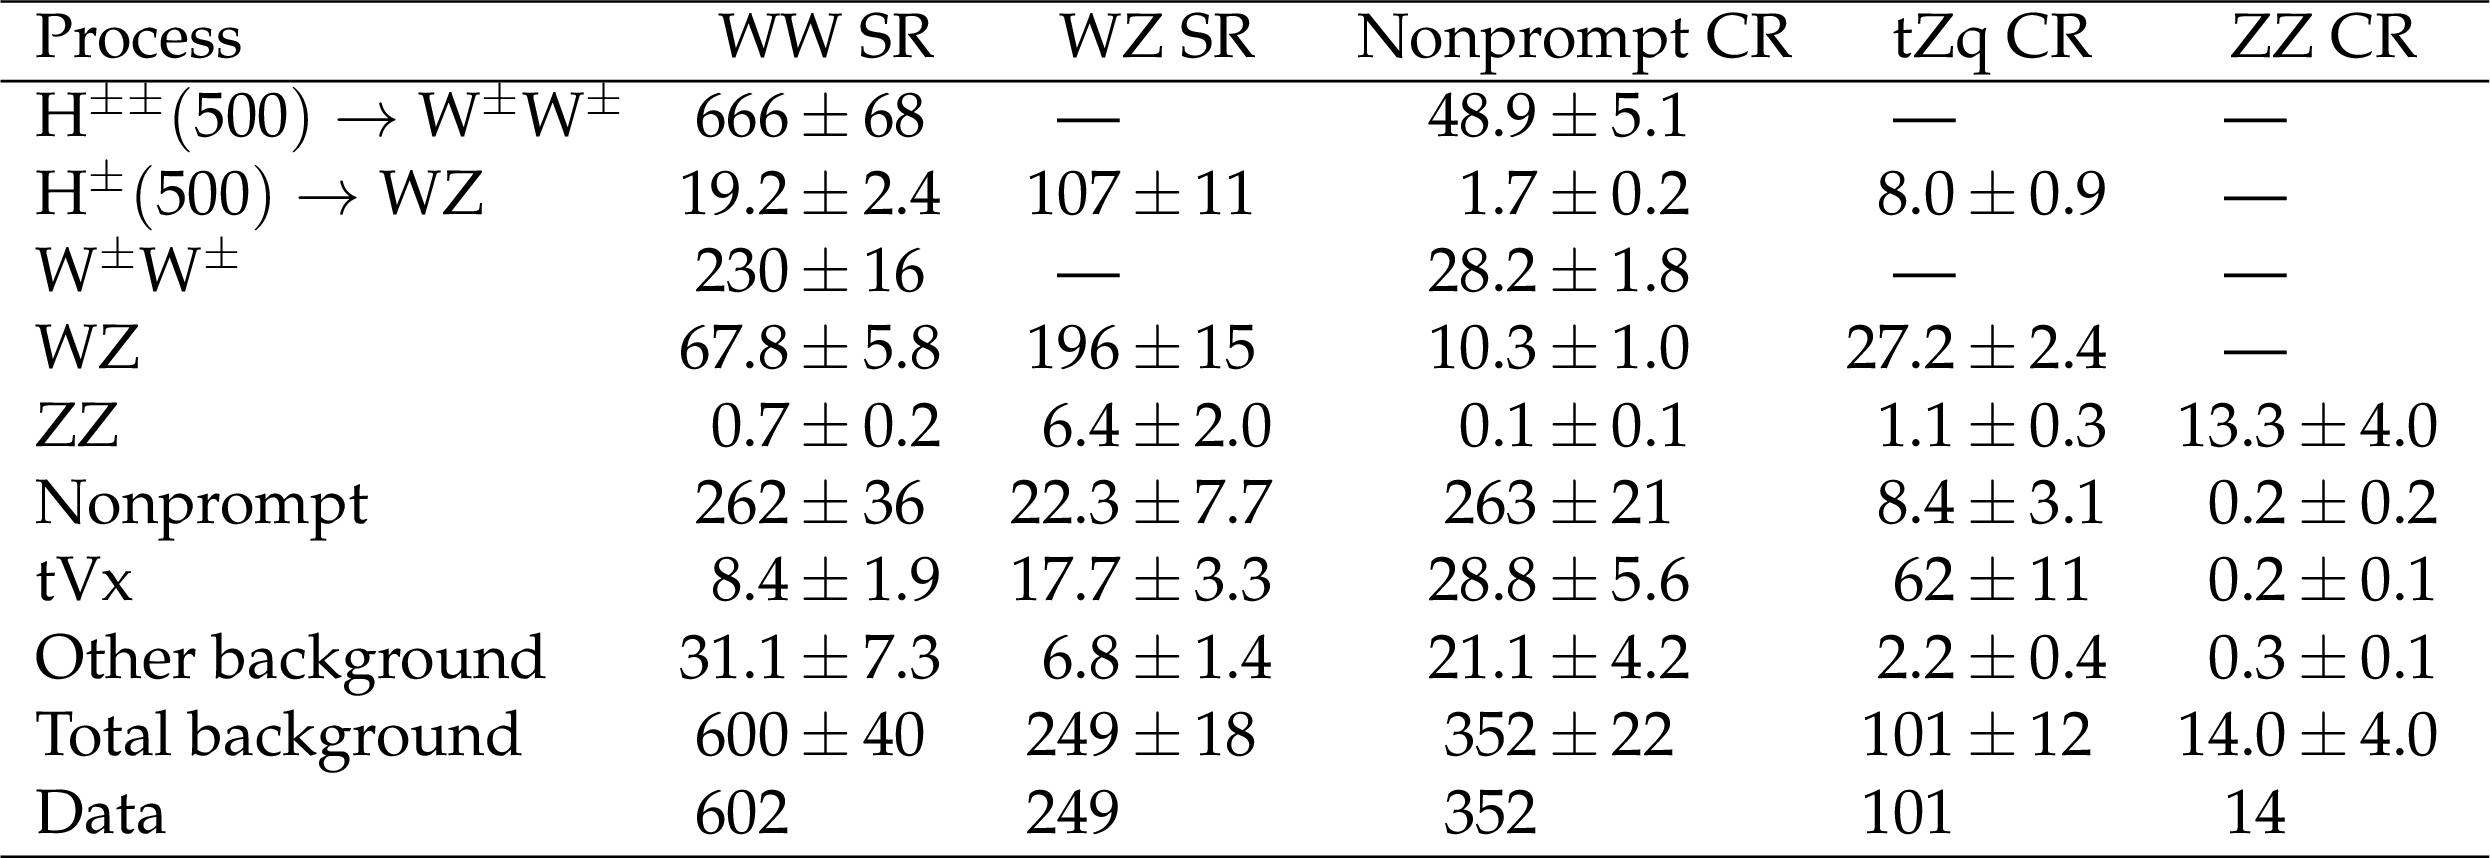
Table 3:
Expected signal and background yields from various SM processes and observed data events in all regions used in the analysis. The expected background yields are shown with their normalizations from the simultaneous fit for the background-only hypothesis, i.e., assuming no contributions from the ${\mathrm{\tilde{H}^{\pm_j}}} $ and $ {\mathrm{H} ^{\pm \pm}}$ processes. The expected signal yields are shown for $s_{\mathrm{H}}=$ 1.0 in the GM model. The combination of the statistical and systematic uncertainties is shown. |
| Summary |
| A search for charged Higgs bosons produced in vector boson fusion processes and decaying into vector bosons, using proton-proton collisions at $\sqrt{s} = $ 13 TeV at the LHC, is reported. The data sample corresponds to an integrated luminosity of 137 fb$^{-1}$, collected with the CMS detector between 2016 and 2018. The search is performed in the leptonic decay modes ${\mathrm{W}^\pm\mathrm{W}^\pm} \to \ell^\pm\nu\ell'^\pm\nu$ and $\mathrm{W}^\pm\mathrm{Z} \to \ell^\pm\nu\ell'^\pm\ell'^\mp$, where $\ell, \ell' = $ e, $\mu$. The ${\mathrm{W}^\pm\mathrm{W}^\pm} $ and ${\mathrm{W}\mathrm{Z}} $ channels are simultaneously studied by performing a binned maximum-likelihood fit using the transverse mass $m_{\mathrm{T}}$ and dijet invariant mass ${m_{{\mathrm{j}}{\mathrm{j}}}} $ distributions. No excess of events with respect to the standard model background predictions is observed. Model independent upper limits at 95% confidence level are reported on the product of the cross section and branching fraction for vector boson fusion production of charged Higgs bosons decaying into vector bosons as a function of mass from 200 to 3000 GeV. The results are interpreted in the Georgi-Machacek (GM) model for which the most stringent limits to date are derived. The observed 95% confidence level limits exclude GM $s_{\mathrm{H}}$ parameter values greater than 0.20-0.35 for the mass range from 200 to 1500 GeV. |
| References | ||||
| 1 | ATLAS Collaboration | Observation of a new particle in the search for the standard model Higgs boson with the ATLAS detector at the LHC | PLB 716 (2012) 1 | 1207.7214 |
| 2 | CMS Collaboration | Observation of a new boson at a mass of 125 GeV with the CMS experiment at the LHC | PLB 716 (2012) 30 | CMS-HIG-12-028 1207.7235 |
| 3 | CMS Collaboration | Observation of a new boson with mass near 125 GeV in pp collisions at $ \sqrt{s} = $ 7 and 8 TeV | JHEP 06 (2013) 081 | CMS-HIG-12-036 1303.4571 |
| 4 | F. Englert and R. Brout | Broken symmetry and the mass of gauge vector mesons | PRL 13 (1964) 321 | |
| 5 | P. W. Higgs | Broken symmetries, massless particles and gauge fields | PL12 (1964) 132 | |
| 6 | P. W. Higgs | Broken symmetries and the masses of gauge bosons | PRL 13 (1964) 508 | |
| 7 | G. S. Guralnik, C. R. Hagen, and T. W. B. Kibble | Global conservation laws and massless particles | PRL 13 (1964) 585 | |
| 8 | P. W. Higgs | Spontaneous symmetry breakdown without massless bosons | PR145 (1966) 1156 | |
| 9 | T. W. B. Kibble | Symmetry breaking in non-Abelian gauge theories | PR155 (1967) 1554 | |
| 10 | T. D. Lee | A theory of spontaneous $ \mathrm{T} $ violation | PRD 8 (1973) 1226 | |
| 11 | P. Fayet | A gauge theory of weak and electromagnetic interactions with spontaneous parity breaking | NPB 78 (1974) 14 | |
| 12 | N. Craig and S. Thomas | Exclusive Signals of an Extended Higgs Sector | JHEP 11 (2012) 083 | 1207.4835 |
| 13 | G. C. Branco et al. | Theory and phenomenology of two-Higgs-doublet models | PR 516 (2012) 1 | 1106.0034 |
| 14 | W. Konetschny and W. Kummer | Nonconservation of total lepton number with scalar bosons | PLB 70 (1977) 433 | |
| 15 | M. Magg and C. Wetterich | Neutrino mass problem and gauge hierarchy | PLB 94 (1980) 61 | |
| 16 | T. P. Cheng and L.-F. Li | Neutrino masses, mixings, and oscillations in SU(2)$ \times $U(1) models of electroweak interactions | PRD 22 (1980) 2860 | |
| 17 | J. Schechter and J. W. F. Valle | Neutrino masses in SU(2)$ {\bigotimes} $U(1) theories | PRD 22 (1980) 2227 | |
| 18 | C. Englert, E. Re, and M. Spannowsky | Triplet Higgs boson collider phenomenology after the LHC | PRD 87 (2013) 095014 | 1302.6505 |
| 19 | C. Englert, E. Re, and M. Spannowsky | Pinning down Higgs triplets at the LHC | PRD 88 (2013) 035024 | 1306.6228 |
| 20 | H. Georgi and M. Machacek | Doubly charged Higgs bosons | NPB 262 (1985) 463 | |
| 21 | CMS Collaboration | CMS luminosity measurement for the 2016 data-taking period | CMS-PAS-LUM-15-001 | CMS-PAS-LUM-15-001 |
| 22 | CMS Collaboration | CMS luminosity measurement for the 2017 data-taking period at $ \sqrt{s} = $ 13 TeV | CMS-PAS-LUM-17-004 | CMS-PAS-LUM-17-004 |
| 23 | CMS Collaboration | CMS luminosity measurement for the 2018 data-taking period at $ \sqrt{s} = $ 13 TeV | CMS-PAS-LUM-18-002 | CMS-PAS-LUM-18-002 |
| 24 | CMS Collaboration | The CMS Experiment at the CERN LHC | JINST 3 (2008) S08004 | CMS-00-001 |
| 25 | CMS Collaboration | Measurements of production cross sections of WZ and same-sign WW boson pairs in association with two jets in proton-proton collisions at $ \sqrt{s} = $ 13 TeV | PLB 809 (2020) | CMS-SMP-19-012 2005.01173 |
| 26 | CMS Collaboration | Search for charged Higgs bosons produced via vector boson fusion and decaying into a pair of $ \mathrm{W} $ and $ \mathrm{Z} $ bosons using $ {\mathrm{p}}{\mathrm{p}} $ collisions at $ \sqrt{s}=13\text{}\text{}\mathrm{TeV} $ | PRL 119 (2017) 141802 | CMS-HIG-16-027 1705.02942 |
| 27 | CMS Collaboration | Observation of electroweak production of same-sign W boson pairs in the two jet and two same-sign lepton final state in proton-proton collisions at $ \sqrt{s} = $ 13 TeV | PRL 120 (2018) 081801 | CMS-SMP-17-004 1709.05822 |
| 28 | CMS Collaboration | Measurement of electroweak WZ boson production and search for new physics in WZ + two jets events in pp collisions at $ \sqrt{s} = $ 13 TeV | PLB 795 (2019) 281 | CMS-SMP-18-001 1901.04060 |
| 29 | ATLAS Collaboration | Search for a charged Higgs boson produced in the vector-boson fusion mode with decay $ {\mathrm{H}}^\pm\to{\mathrm{W}}^\pm {\mathrm{Z}} $ using pp collisions at $ \sqrt{s}=8\text{}\mathrm{TeV} $ with the ATLAS experiment | PRL 114 (2015) 231801 | 1503.04233 |
| 30 | CMS Collaboration | Search for anomalous electroweak production of vector boson pairs in association with two jets in proton-proton collisions at 13 TeV | PLB 798 (2019) 134985 | CMS-SMP-18-006 1905.07445 |
| 31 | CMS Collaboration | The CMS trigger system | JINST 12 (2017) P01020 | CMS-TRG-12-001 1609.02366 |
| 32 | J. Alwall et al. | The automated computation of tree-level and next-to-leading order differential cross sections, and their matching to parton shower simulations | JHEP 07 (2014) 079 | 1405.0301 |
| 33 | R. Frederix and S. Frixione | Merging meets matching in MC@NLO | JHEP 12 (2012) 061 | 1209.6215 |
| 34 | M. Zaro and H. Logan | Recommendations for the interpretation of LHC searches for $ \mathrm{H}_5^0 $, $ \mathrm{H}_5^{\pm} $, and $ \mathrm{H}_5^{\pm\pm} $ in vector boson fusion with decays to vector boson pairs | LHCHXSWG-2015-001 | |
| 35 | J. Alwall et al. | Comparative study of various algorithms for the merging of parton showers and matrix elements in hadronic collisions | EPJC 53 (2008) 473 | 0706.2569 |
| 36 | M. Grazzini, S. Kallweit, D. Rathlev, and M. Wiesemann | $ \mathrm{W}^{\pm}\mathrm{Z} $ production at hadron colliders in NNLO QCD | PLB 761 (2016) 179 | 1604.08576 |
| 37 | B. Biedermann, A. Denner, and M. Pellen | Large electroweak corrections to vector boson scattering at the Large Hadron Collider | PRL 118 (2017) 261801 | 1611.02951 |
| 38 | B. Biedermann, A. Denner, and M. Pellen | Complete NLO corrections to W$ ^{+} $W$ ^{+} $ scattering and its irreducible background at the LHC | JHEP 10 (2017) 124 | 1708.00268 |
| 39 | A. Denner et al. | QCD and electroweak corrections to WZ scattering at the LHC | JHEP 06 (2019) 067 | 1904.00882 |
| 40 | S. Frixione and B. R. Webber | Matching NLO QCD computations and parton shower simulations | JHEP 06 (2002) 029 | hep-ph/0204244 |
| 41 | P. Nason | A new method for combining NLO QCD with shower Monte Carlo algorithms | JHEP 11 (2004) 040 | hep-ph/0409146 |
| 42 | S. Frixione, P. Nason, and C. Oleari | Matching NLO QCD computations with parton shower simulations: the POWHEG method | JHEP 11 (2007) 070 | 0709.2092 |
| 43 | S. Alioli, P. Nason, C. Oleari, and E. Re | NLO vector-boson production matched with shower in POWHEG | JHEP 07 (2008) 060 | 0805.4802 |
| 44 | S. Alioli, P. Nason, C. Oleari, and E. Re | A general framework for implementing NLO calculations in shower Monte Carlo programs: the POWHEG BOX | JHEP 06 (2010) 043 | 1002.2581 |
| 45 | T. Sjostrand et al. | An Introduction to PYTHIA 8.2 | CPC 191 (2015) 159 | 1410.3012 |
| 46 | R. D. Ball et al. | Parton distributions with LHC data | NPB 867 (2013) 244 | 1207.1303 |
| 47 | NNPDF Collaboration | Parton distributions from high-precision collider data | EPJC 77 (2017) 663 | 1706.00428 |
| 48 | NNPDF Collaboration | Parton distributions for the LHC Run II | JHEP 04 (2015) 040 | 1410.8849 |
| 49 | P. Skands, S. Carrazza, and J. Rojo | Tuning PYTHIA 8.1: the Monash 2013 tune | EPJC 74 (2014) 3024 | 1404.5630 |
| 50 | CMS Collaboration | Event generator tunes obtained from underlying event and multiparton scattering measurements | EPJC 76 (2016) 155 | CMS-GEN-14-001 1512.00815 |
| 51 | CMS Collaboration | Extraction and validation of a new set of CMS PYTHIA8 tunes from underlying-event measurements | EPJC 80 (2020) 4 | CMS-GEN-17-001 1903.12179 |
| 52 | \GEANTfour Collaboration | GEANT4 --- a simulation toolkit | NIMA 506 (2003) 250 | |
| 53 | CMS Collaboration | Particle-flow reconstruction and global event description with the CMS detector | JINST 12 (2017) P10003 | CMS-PRF-14-001 1706.04965 |
| 54 | M. Cacciari, G. P. Salam, and G. Soyez | The anti-$ {k_{\mathrm{T}}} $ jet clustering algorithm | JHEP 04 (2008) 063 | 0802.1189 |
| 55 | CMS Collaboration | Pileup mitigation at CMS in 13 TeV data | JINST 15 (2020) P09018 | CMS-JME-18-001 2003.00503 |
| 56 | CMS Collaboration | Jet energy scale and resolution in the CMS experiment in pp collisions at 8 TeV | JINST 12 (2017) P02014 | CMS-JME-13-004 1607.03663 |
| 57 | CMS Collaboration | Performance of missing transverse momentum reconstruction in proton-proton collisions at $ \sqrt{s} = $ 13 TeV using the CMS detector | JINST 14 (2019) P07004 | CMS-JME-17-001 1903.06078 |
| 58 | M. Cacciari, G. P. Salam, and G. Soyez | FastJet user manual | EPJC 72 (2012) 1896 | 1111.6097 |
| 59 | CMS Collaboration | Identification of heavy-flavour jets with the CMS detector in pp collisions at 13 TeV | JINST 13 (2018) P05011 | CMS-BTV-16-002 1712.07158 |
| 60 | CMS Collaboration | Reconstruction and identification of $ \tau $ lepton decays to hadrons and $ \nu_\tau $ at CMS | JINST 11 (2016) P01019 | CMS-TAU-14-001 1510.07488 |
| 61 | CMS Collaboration | Performance of electron reconstruction and selection with the CMS detector in proton-proton collisions at $ \sqrt{s} = $ 8 TeV | JINST 10 (2015) P06005 | CMS-EGM-13-001 1502.02701 |
| 62 | CMS Collaboration | Electron and photon reconstruction and identification with the CMS experiment at the CERN LHC | Submitted to JHEP | CMS-EGM-17-001 2012.06888 |
| 63 | CMS Collaboration | Performance of the CMS muon detector and muon reconstruction with proton-proton collisions at $ \sqrt{s} = $ 13 TeV | JINST 13 (2018) P06015 | CMS-MUO-16-001 1804.04528 |
| 64 | CMS Collaboration | Measurements of properties of the Higgs boson decaying to a W boson pair in pp collisions at $ \sqrt{s}= $ 13 TeV | PLB 791 (2019) 96 | CMS-HIG-16-042 1806.05246 |
| 65 | CMS Collaboration | Performance of CMS muon reconstruction in cosmic-ray events | JINST 5 (2010) T03022 | CMS-CFT-09-014 0911.4994 |
| 66 | CMS Collaboration | Performance of the reconstruction and identification of high-momentum muons in proton-proton collisions at $ \sqrt{s} = $ 13 TeV | JINST 15 (2020) P02027 | CMS-MUO-17-001 1912.03516 |
| 67 | CMS Collaboration | Performance of the CMS muon trigger system in proton-proton collisions at $ \sqrt{s} = $ 13 TeV | Submitted to JINST | CMS-MUO-19-001 2102.04790 |
| 68 | Particle Data Group, P. A. Zyla et al. | Review of particle physics | Progress of Theoretical and Experimental Physics 2020 (2020) 083C01 | |
| 69 | D. L. Rainwater, R. Szalapski, and D. Zeppenfeld | Probing color singlet exchange in $ Z $ + two jet events at the CERN LHC | PRD 54 (1996) 6680 | hep-ph/9605444 |
| 70 | CMS Collaboration | Study of vector boson scattering and search for new physics in events with two same-sign leptons and two jets | PRL 114 (2015) 051801 | CMS-SMP-13-015 1410.6315 |
| 71 | G. Cowan, K. Cranmer, E. Gross, and O. Vitells | Asymptotic formulae for likelihood-based tests of new physics | EPJC 71 (2011) 1554 | 1007.1727 |
| 72 | CMS Collaboration | Measurement of the inelastic proton-proton cross section at $ \sqrt{s}= $ 13 TeV | JHEP 07 (2018) 161 | CMS-FSQ-15-005 1802.02613 |
| 73 | CMS Collaboration | Measurements of differential Z boson production cross sections in proton-proton collisions at $ \sqrt{s} = $ 13 TeV | JHEP 12 (2019) 061 | CMS-SMP-17-010 1909.04133 |
| 74 | CMS Collaboration | Performance of the CMS Level-1 trigger in proton-proton collisions at $ \sqrt{s} = $ 13 TeV | JINST 15 (2020) P10017 | CMS-TRG-17-001 2006.10165 |
| 75 | CMS Collaboration | Jet energy scale and resolution performance with 13 TeV data collected by CMS in 2016-2018 | CDS | |
| 76 | S. Catani, D. de Florian, M. Grazzini, and P. Nason | Soft gluon resummation for Higgs boson production at hadron colliders | JHEP 07 (2003) 028 | hep-ph/0306211 |
| 77 | M. Cacciari et al. | The $ \mathrm{t\bar{t}} $ cross section at $ 1.8 $ TeV and $ 1.96 $ TeV: a study of the systematics due to parton densities and scale dependence | JHEP 04 (2004) 068 | hep-ph/0303085 |
| 78 | J. Butterworth et al. | PDF4LHC recommendations for LHC Run II | JPG 43 (2016) 023001 | 1510.03865 |
| 79 | T. Junk | Confidence level computation for combining searches with small statistics | NIMA 434 (1999) 435 | hep-ex/9902006 |
| 80 | A. L. Read | Presentation of search results: the CL$ _{s} $ technique | JPG 28 (2002) 2693 | |
| 81 | ATLAS and CMS Collaborations, LHC Higgs Combination Group | Procedure for the LHC Higgs boson search combination in Summer 2011 | ATL-PHYS-PUB 2011-11, CMS NOTE 2011/005 | |
| 82 | CMS Collaboration | Search for charged Higgs bosons produced in vector boson fusion processes and decaying into vector boson pairs in proton-proton collisions at $ \sqrt{s} = $ 13 TeV | 2021 HEPData record | |
|
|
Compact Muon Solenoid LHC, CERN |
|

|

|

|

|

|