

Compact Muon Solenoid
LHC, CERN
| CMS-SUS-20-003 ; CERN-EP-2021-114 | ||
| Search for chargino-neutralino production in events with Higgs and W bosons using 137 fb$^{-1}$ of proton-proton collisions at $\sqrt{s} = $ 13 TeV | ||
| CMS Collaboration | ||
| 26 July 2021 | ||
| JHEP 10 (2021) 045 | ||
| Abstract: A search for electroweak production of supersymmetric (SUSY) particles in final states with one lepton, a Higgs boson decaying to a pair of bottom quarks, and large missing transverse momentum is presented. The search uses data from proton-proton collisions at a center-of-mass energy of 13 TeV collected using the CMS detector at the LHC, corresponding to an integrated luminosity of 137 fb$^{-1}$. The observed yields are consistent with backgrounds expected from the standard model. The results are interpreted in the context of a simplified SUSY model of chargino-neutralino production, with the chargino decaying to a W boson and the lightest SUSY particle (LSP) and the neutralino decaying to a Higgs boson and the LSP. Charginos and neutralinos with masses up to 820 GeV are excluded at 95% confidence level when the LSP mass is small, and LSPs with mass up to 350 GeV are excluded when the masses of the chargino and neutralino are approximately 700 GeV. | ||
| Links: e-print arXiv:2107.12553 [hep-ex] (PDF) ; CDS record ; inSPIRE record ; CADI line (restricted) ; | ||
| Figures | |

png pdf |
Figure 1:
Diagram for a simplified SUSY model with electroweak production of the lightest chargino $\tilde{\chi}^{\pm}_1$ and next-to-lightest neutralino $\tilde{\chi}^{0}_2$. The $\tilde{\chi}^{\pm}_1$ decays to a W boson and the lightest neutralino $\tilde{\chi}^0_1$. The $\tilde{\chi}^{0}_2$ decays to a Higgs boson and a $\tilde{\chi}^0_1$. |

png pdf |
Figure 2:
Distributions of ${{p_{\mathrm {T}}} ^\text {miss}}$, ${m_{\mathrm {CT}}}$, ${m_{\mathrm{b} {}\mathrm{\bar{b}}}}$, ${m_{\mathrm {T}}}$, ${N_{\text {jets}}}$, and the $\mathrm{H} \to \mathrm{b} \mathrm{\bar{b}} $ large-$R$ jet discriminator in simulated background and signal samples. Three benchmark signal points corresponding to masses in GeV ($m_{\tilde{\chi}^{0}_2 /\tilde{\chi}^{\pm}_1}$, $m_{\tilde{\chi}^0_1}$) of (800, 100), (425, 150) and (225, 75) are shown as solid, dashed, and short-dashed lines, respectively. Events are taken from the 2-jet signal regions with $ {{p_{\mathrm {T}}} ^\text {miss}} > $ 125 GeV, with all of the requirements specified in Table 3 except for the one on the plotted variable. The shaded areas correspond to the statistical uncertainty of the simulated backgrounds. The dashed vertical lines indicate the thresholds used to define the signal regions. These indicators are not shown on the H tagging discriminator score distribution because the required values vary between 0.83 and 0.90, depending on the data-taking year. |
png pdf |
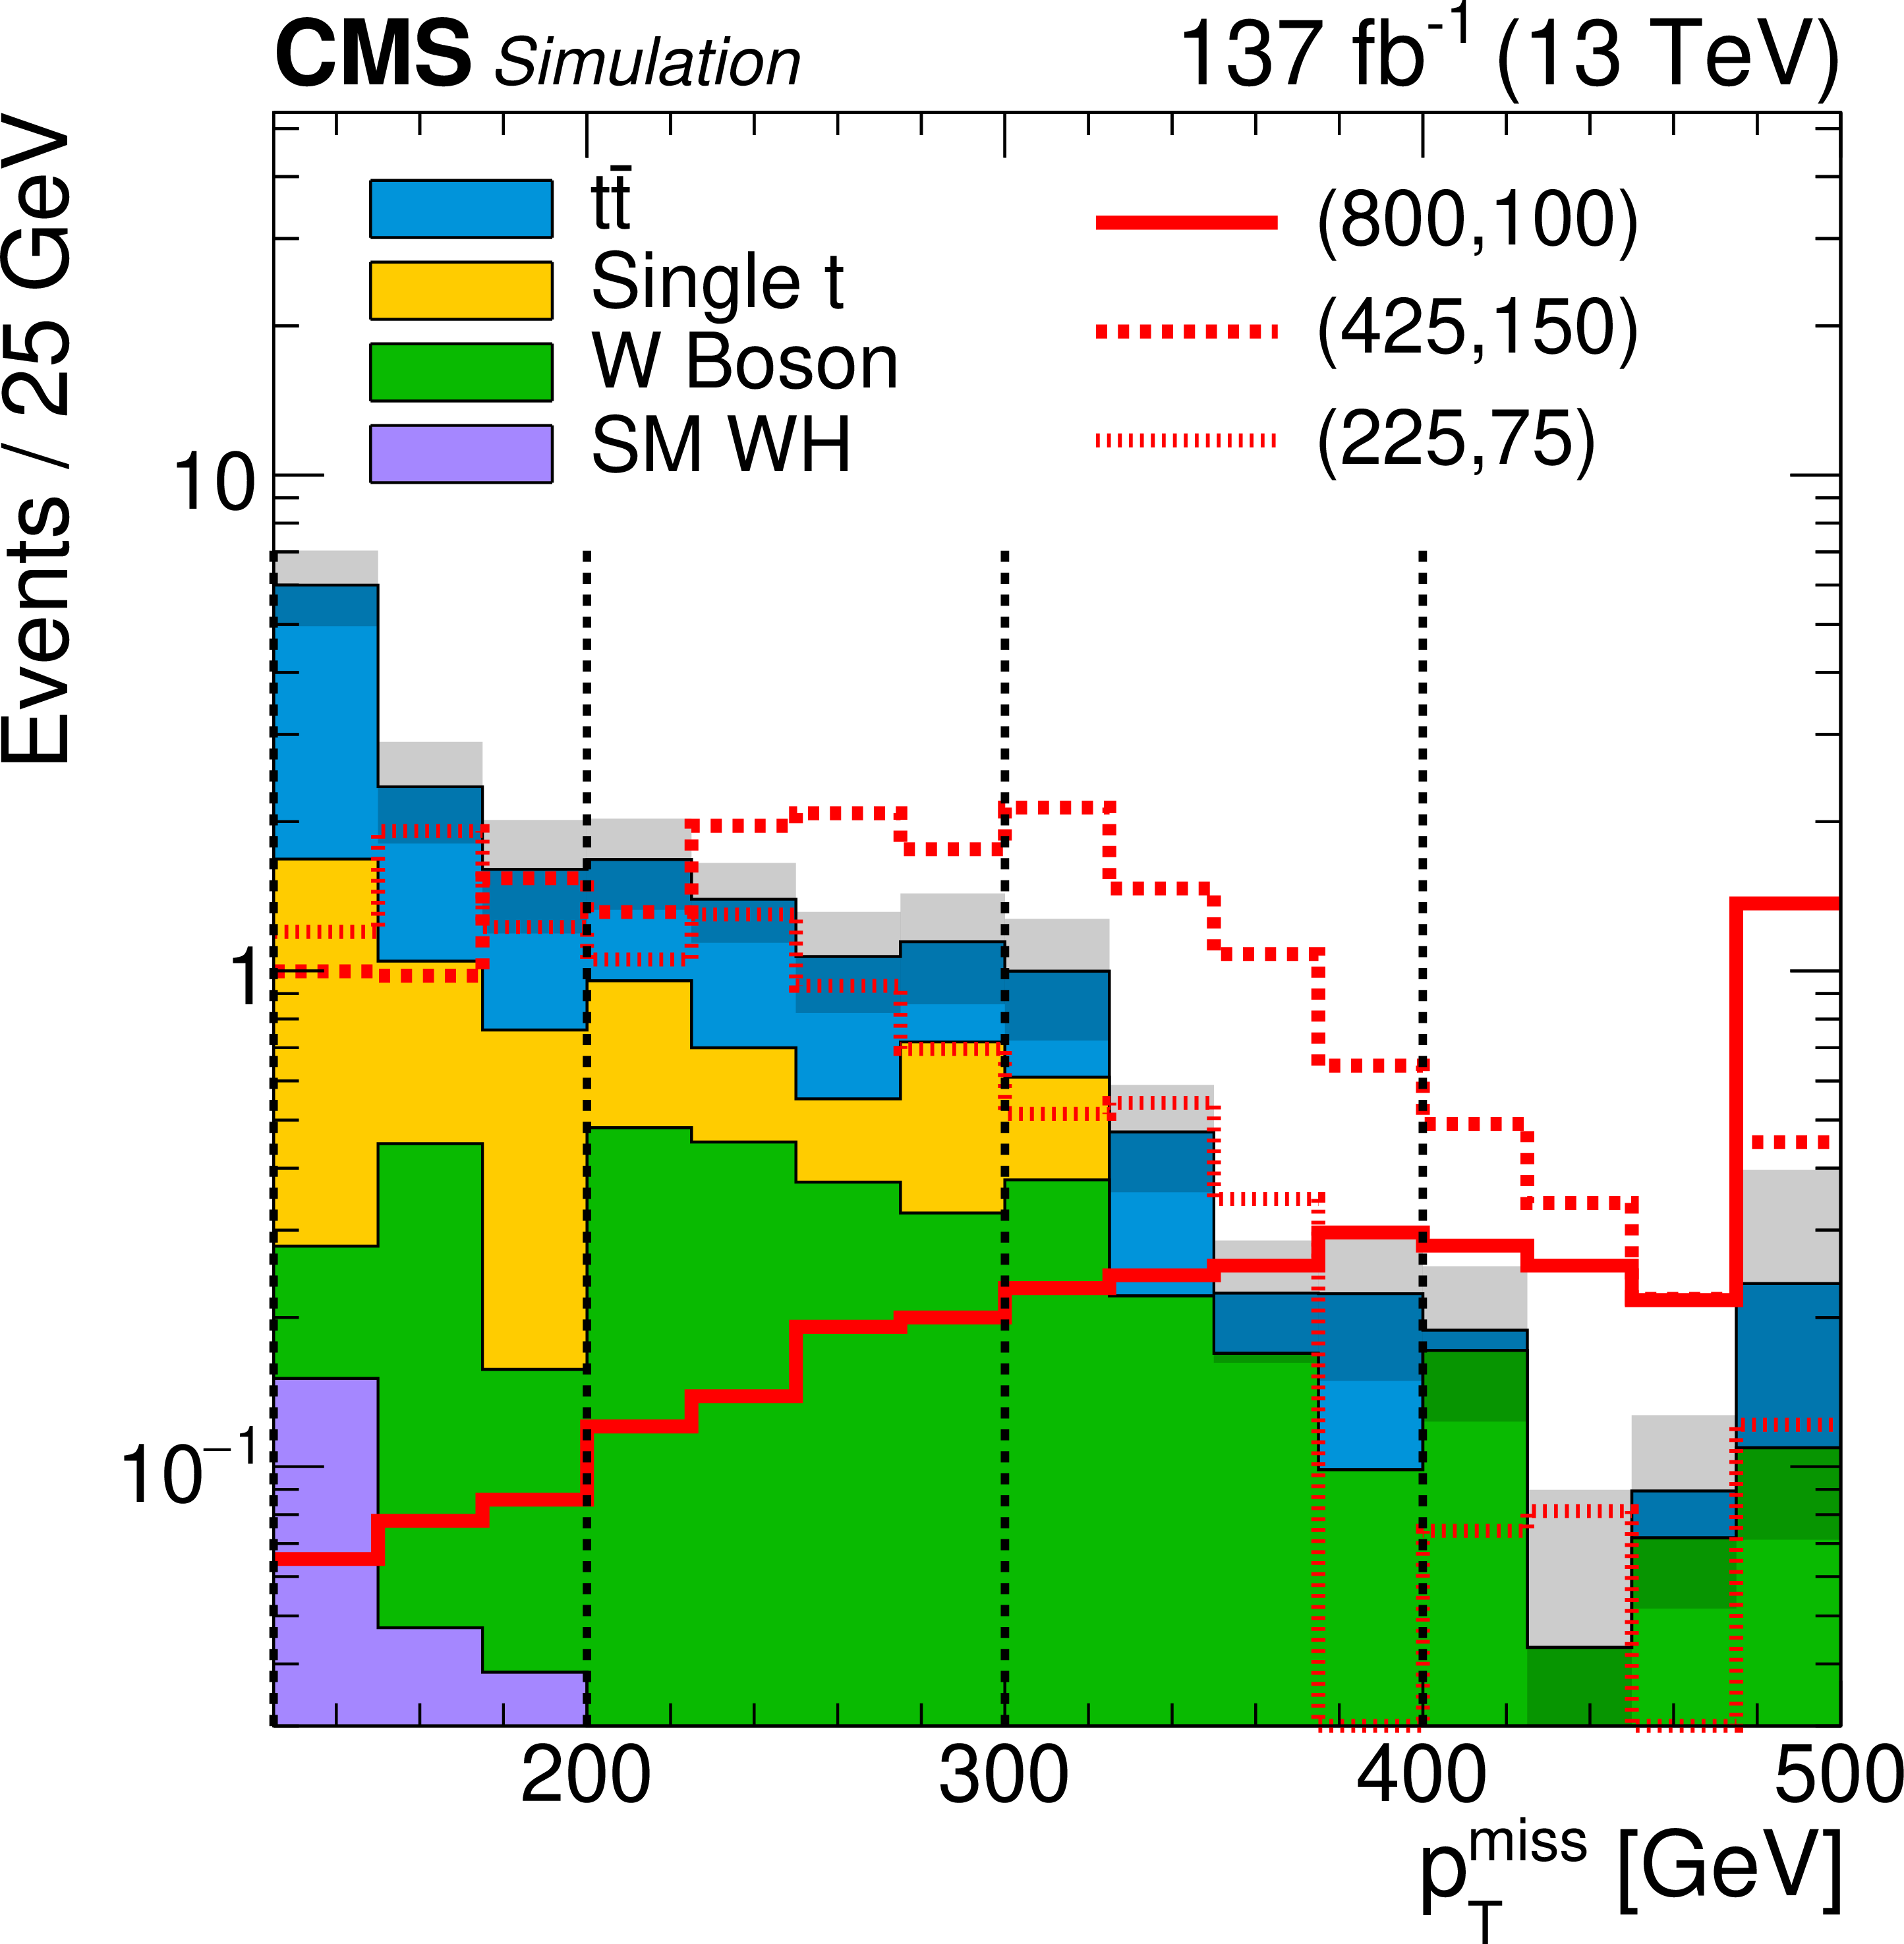
Figure 2-a:
Distribution of ${{p_{\mathrm {T}}} ^\text {miss}}$ in simulated background and signal samples. Three benchmark signal points corresponding to masses in GeV ($m_{\tilde{\chi}^{0}_2 /\tilde{\chi}^{\pm}_1}$, $m_{\tilde{\chi}^0_1}$) of (800, 100), (425, 150) and (225, 75) are shown as solid, dashed, and short-dashed lines, respectively. Events are taken from the 2-jet signal regions with $ {{p_{\mathrm {T}}} ^\text {miss}} > $ 125 GeV, with all of the requirements specified in Table 3 except for the one on the plotted variable. The shaded areas correspond to the statistical uncertainty of the simulated backgrounds. The dashed vertical lines indicate the thresholds used to define the signal regions. |

png pdf |
Figure 2-b:
Distribution of ${m_{\mathrm {CT}}}$ in simulated background and signal samples. Three benchmark signal points corresponding to masses in GeV ($m_{\tilde{\chi}^{0}_2 /\tilde{\chi}^{\pm}_1}$, $m_{\tilde{\chi}^0_1}$) of (800, 100), (425, 150) and (225, 75) are shown as solid, dashed, and short-dashed lines, respectively. Events are taken from the 2-jet signal regions with $ {{p_{\mathrm {T}}} ^\text {miss}} > $ 125 GeV, with all of the requirements specified in Table 3 except for the one on the plotted variable. The shaded areas correspond to the statistical uncertainty of the simulated backgrounds. The dashed vertical lines indicate the thresholds used to define the signal regions. |

png pdf |
Figure 2-c:
Distribution of ${m_{\mathrm{b} {}\mathrm{\bar{b}}}}$ in simulated background and signal samples. Three benchmark signal points corresponding to masses in GeV ($m_{\tilde{\chi}^{0}_2 /\tilde{\chi}^{\pm}_1}$, $m_{\tilde{\chi}^0_1}$) of (800, 100), (425, 150) and (225, 75) are shown as solid, dashed, and short-dashed lines, respectively. Events are taken from the 2-jet signal regions with $ {{p_{\mathrm {T}}} ^\text {miss}} > $ 125 GeV, with all of the requirements specified in Table 3 except for the one on the plotted variable. The shaded areas correspond to the statistical uncertainty of the simulated backgrounds. The dashed vertical lines indicate the thresholds used to define the signal regions. |

png pdf |
Figure 2-d:
Distribution of ${m_{\mathrm {T}}}$, in simulated background and signal samples. Three benchmark signal points corresponding to masses in GeV ($m_{\tilde{\chi}^{0}_2 /\tilde{\chi}^{\pm}_1}$, $m_{\tilde{\chi}^0_1}$) of (800, 100), (425, 150) and (225, 75) are shown as solid, dashed, and short-dashed lines, respectively. Events are taken from the 2-jet signal regions with $ {{p_{\mathrm {T}}} ^\text {miss}} > $ 125 GeV, with all of the requirements specified in Table 3 except for the one on the plotted variable. The shaded areas correspond to the statistical uncertainty of the simulated backgrounds. The dashed vertical lines indicate the thresholds used to define the signal regions. |

png pdf |
Figure 2-e:
Distribution of ${N_{\text {jets}}}$ in simulated background and signal samples. Three benchmark signal points corresponding to masses in GeV ($m_{\tilde{\chi}^{0}_2 /\tilde{\chi}^{\pm}_1}$, $m_{\tilde{\chi}^0_1}$) of (800, 100), (425, 150) and (225, 75) are shown as solid, dashed, and short-dashed lines, respectively. Events are taken from the 2-jet signal regions with $ {{p_{\mathrm {T}}} ^\text {miss}} > $ 125 GeV, with all of the requirements specified in Table 3 except for the one on the plotted variable. The shaded areas correspond to the statistical uncertainty of the simulated backgrounds. The dashed vertical lines indicate the thresholds used to define the signal regions. |

png pdf |
Figure 2-f:
Distribution of the $\mathrm{H} \to \mathrm{b} \mathrm{\bar{b}} $ large-$R$ jet discriminator in simulated background and signal samples. Three benchmark signal points corresponding to masses in GeV ($m_{\tilde{\chi}^{0}_2 /\tilde{\chi}^{\pm}_1}$, $m_{\tilde{\chi}^0_1}$) of (800, 100), (425, 150) and (225, 75) are shown as solid, dashed, and short-dashed lines, respectively. Events are taken from the 2-jet signal regions with $ {{p_{\mathrm {T}}} ^\text {miss}} > $ 125 GeV, with all of the requirements specified in Table 3 except for the one on the plotted variable. The shaded areas correspond to the statistical uncertainty of the simulated backgrounds. The thresholds used to define the signal regions are not shown because the required values vary between 0.83 and 0.90, depending on the data-taking year. |

png pdf |
Figure 3:
Observed and simulated ${R_{\text {top}}}$ values in the $ {m_{\mathrm{b} {}\mathrm{\bar{b}}}} > $ 150 GeV validation regions. The differences between observed and simulated ${R_{\text {top}}}$ values, divided by the total statistical uncertainties, are also listed in the figure as $\Delta {R_{\text {top}}} $. The statistical precision of each difference, $\sigma _{\mathrm {stat}}$, is taken as the systematic uncertainty on ${R_{\text {top}}}$ for the corresponding bin in the signal region. |

png pdf |
Figure 4:
Distribution of ${N_{\mathrm{b}}}$ in the low-${m_{\mathrm {T}}}$ control sample. The ${{\mathrm{t} {}\mathrm{\bar{t}}} {}\text {+jets}}$ contribution is suppressed by requiring $ {m_{\mathrm {CT}}} > $ 200 GeV. The shaded area reflects the statistical uncertainty in the simulation. |

png pdf |
Figure 5:
Predictions of the SM background after performing the signal extraction fit (filled histograms) and observed yields in the signal regions. Three signal models with different values of $m_{\tilde{\chi}^{0}_2 /\tilde{\chi}^{\pm}_1}$ and $m_{\tilde{\chi}^0_1}$ are shown as solid, short dashed, and long dashed lines. The lower panel provides the ratio between the observation and the predicted SM backgrounds. The shaded band shows the post-fit combination of the systematic and statistical uncertainties in the background prediction. |

png pdf |
Figure 6:
Cross section upper limits calculated with the background estimates and all of the background systematic uncertainties described in Sections 5.1 and 5.2. The color on the $z$ axis represents the 95% CL upper limit on the cross section calculated at each point in the $m_{\tilde{\chi}^0_1}$-$m_{\tilde{\chi}^{0}_2}$ plane. The area below the thick black curve (dashed red line) represents the observed (expected) exclusion region at this CL. The region containing 68% of the distribution of limits expected under the background-only hypothesis is bounded by thin dashed red lines. The thin black lines show the effect of the theoretical uncertainties in the signal cross section. |
| Tables | |

png pdf |
Table 1:
Summary of the requirements for the physics objects used in this analysis. |

png pdf |
Table 2:
Summary of the triggers used to select the analysis data set. Events are selected using a logical "or'' of the following triggers. |

png pdf |
Table 3:
Summary of the preselection requirements common to all signal regions. The $ {N_{\mathrm{b}}} $ is the multiplicity of b-tagged jets and $ {p_{\mathrm {T}}} ^{\text{non-b}}$ is the ${p_{\mathrm {T}}}$ of the non-b-tagged jet. |

png pdf |
Table 4:
Definition of the 12 non-overlapping signal regions categorized in ${N_{\mathrm{H}}}$, ${N_{\text {jets}}}$, and ${{p_{\mathrm {T}}} ^\text {miss}}$, where $ {N_{\mathrm{H}}} $ is the number of large-$R$ jets tagged as $\mathrm{H} \to \mathrm{b} \mathrm{\bar{b}} $. |

png pdf |
Table 5:
The values of the ${R_{\text {top}}}$ transfer factors, the observed yields in the low-${m_{\mathrm {CT}}}$ CRs, and the resulting top quark background prediction in each bin of ${{p_{\mathrm {T}}} ^\text {miss}}$, ${N_{\text {jets}}}$, and ${N_{\mathrm{H}}}$. The uncertainty shown for ${R_{\text {top}}}$ is only of statistical origin. For the top quark prediction both the statistical and systematic uncertainties are shown (discussed in the text.) |

png pdf |
Table 6:
The observed ($N_{{\mathrm {CR}}}^{\text {obs.}}$) and top quark background yield ($N_{{\mathrm {CR}}}^{\mathrm{W}}$) in the CR, together with the values of ${R_{\mathrm{W}}}$ for the extrapolation of the W boson background from the CR to the SR, and the final W boson prediction, $N^{\mathrm{W}}_{{\mathrm {SR}}}$. The uncertainties in ${R_{\mathrm{W}}}$ include the statistical uncertainty only. The W boson prediction shows both the statistical and systematic uncertainties. |

png pdf |
Table 7:
Systematic uncertainties on ${R_{\mathrm{W}}}$. |

png pdf |
Table 8:
Summary of the predicted SM background and the observed yield in the signal regions, together with the expected yields for three signal benchmark models. The total prediction, $N_{\mathrm {SR}}^{\mathrm {BG}}$, is the sum of the top quark and W boson predictions, $N_{\mathrm {SR}}^{\text {top}}$ and $N_{\mathrm {SR}}^{\mathrm {\mathrm{W}}}$, as well as small contributions from standard model WH production. The values shown are taken before the signal extraction fit to the observed yields in the signal regions is performed. The uncertainties include the statistical and systematic components. For each benchmark model column, the ordered pairs indicate the masses (in GeV) of the $\tilde{\chi}^{0}_2 /\tilde{\chi}^{\pm}_1$ and $\tilde{\chi}^0_1$, respectively. |

png pdf |
Table 9:
Sources and ranges of systematic uncertainties on the expected signal yields. The ranges reported reflect the magnitudes of the median 68% of all impacts, considering the distribution of variations in all 12 signal regions and the full range of signal mass hypotheses used. When the lower bound is very close to 0, an upper bound is shown instead. |
| Summary |
|
This paper presents the results of a search for chargino-neutralino production in a final state containing a W boson decaying to leptons, a Higgs boson decaying to a bottom quark-antiquark pair, and missing transverse momentum. Expected yields from standard model processes are estimated by extrapolating the yields observed in control regions using transfer factors obtained from simulation. The observed yields agree with those expected from the standard model. The results are interpreted as an exclusion of a simplified model of chargino-neutralino production. In the simplified model, the chargino decays to a W boson and a lightest supersymmetric particle (LSP), and the next-to-lightest neutralino decays to a Higgs boson and an LSP. Charginos with mass below 820 GeV are excluded at 95% confidence level for an LSP with mass below 200 GeV, and values of LSP mass up to approximately 350 GeV are excluded for a chargino mass near 700 GeV. Relative to the previous result from the CMS Collaboration targeting this signature [12], the sensitivity of the search has been significantly extended. The constraints on the masses of the chargino and LSP exceed those from the previous analysis by nearly 350 and 250 GeV, respectively. This represents a factor of 14 reduction in the excluded cross section for models with large mass splittings. Roughly half of this improvement is the result of the four-fold increase in integrated luminosity, with the remainder coming from analysis optimizations such as the inclusion of the H tagger and events with ${N_{\text{jets}}} = $ 3, as well as finer categorization of events based on ${{p_{\mathrm {T}}} ^\text {miss}}$ made possible by the increased size of the data set. |
| References | ||||
| 1 | P. Ramond | Dual theory for free fermions | PRD 3 (1971) 2415 | |
| 2 | J. Wess and B. Zumino | Supergauge transformations in four dimensions | NPB 70 (1974) 39 | |
| 3 | H. P. Nilles | Supersymmetry, supergravity and particle physics | PR 110 (1984) 1 | |
| 4 | B. de Carlos and J. A. Casas | One-loop analysis of the electroweak breaking in supersymmetric models and the fine tuning problem | PLB 309 (1993) 320 | hep-ph/9303291 |
| 5 | S. Dimopoulos and G. F. Giudice | Naturalness constraints in supersymmetric theories with nonuniversal soft terms | PLB 357 (1995) 573 | hep-ph/9507282 |
| 6 | G. R. Farrar and P. Fayet | Phenomenology of the production, decay, and detection of new hadronic states associated with supersymmetry | PLB 76 (1978) 575 | |
| 7 | J. Alwall, P. Schuster, and N. Toro | Simplified models for a first characterization of new physics at the LHC | PRD 79 (2009) 075020 | 0810.3921 |
| 8 | LHC New Physics Working Group | Simplified models for LHC new physics searches | JPG 39 (2012) 105005 | 1105.2838 |
| 9 | CMS Collaboration | Interpretation of searches for supersymmetry with simplified models | PRD 88 (2013) 052017 | CMS-SUS-11-016 1301.2175 |
| 10 | ATLAS Collaboration | Search for direct production of electroweakinos in final states with one lepton, missing transverse momentum and a Higgs boson decaying into two b-jets in pp collisions $ \sqrt{s}= $ 13 TeV with the ATLAS detector | EPJC 80 (2020) 691 | 1909.09226 |
| 11 | ATLAS Collaboration | Search for the electroweak production of supersymmetric particles in $ \sqrt{s} = $ 8 TeV pp collisions with the ATLAS detector | PRD 93 (2016) 052002 | 1509.07152 |
| 12 | CMS Collaboration | Search for electroweak production of charginos and neutralinos in WH events in proton-proton collisions at $ \sqrt{s}= $ 13 TeV | JHEP 11 (2017) 029 | CMS-SUS-16-043 1706.09933 |
| 13 | CMS Collaboration | Searches for electroweak neutralino and chargino production in channels with Higgs, Z, and W bosons in pp collisions at 8 TeV | PRD 90 (2014) 092007 | CMS-SUS-14-002 1409.3168 |
| 14 | CMS Collaboration | Searches for electroweak production of charginos, neutralinos, and sleptons decaying to leptons and W, Z, and Higgs bosons in pp collisions at 8 TeV | EPJC 74 (2014) 3036 | CMS-SUS-13-006 1405.7570 |
| 15 | CMS Collaboration | The CMS experiment at the CERN LHC | JINST 3 (2008) S08004 | CMS-00-001 |
| 16 | CMS Collaboration | Performance of the CMS Level-1 trigger in proton-proton collisions at $ \sqrt{s} = $ 13 TeV | JINST 15 (2020) P10017 | CMS-TRG-17-001 2006.10165 |
| 17 | CMS Collaboration | The CMS trigger system | JINST 12 (2017) P01020 | CMS-TRG-12-001 1609.02366 |
| 18 | J. Alwall et al. | The automated computation of tree-level and next-to-leading order differential cross sections, and their matching to parton shower simulations | JHEP 07 (2014) 079 | 1405.0301 |
| 19 | P. Nason | A new method for combining NLO QCD with shower Monte Carlo algorithms | JHEP 11 (2004) 040 | hep-ph/0409146 |
| 20 | S. Frixione, P. Nason, and C. Oleari | Matching NLO QCD computations with parton shower simulations: the POWHEG method | JHEP 11 (2007) 070 | 0709.2092 |
| 21 | S. Alioli, P. Nason, C. Oleari, and E. Re | A general framework for implementing NLO calculations in shower Monte Carlo programs: the POWHEG BOX | JHEP 06 (2010) 043 | 1002.2581 |
| 22 | E. Re | Single-top $ \mathrm{W}\mathrm{t} $-channel production matched with parton showers using the POWHEG method | EPJC 71 (2011) 1547 | 1009.2450 |
| 23 | NNPDF Collaboration | Unbiased global determination of parton distributions and their uncertainties at NNLO and at LO | NPB 855 (2012) 153 | 1107.2652 |
| 24 | NNPDF Collaboration | Parton distributions for the LHC Run II | JHEP 04 (2015) 040 | 1410.8849 |
| 25 | NNPDF Collaboration | Parton distributions from high-precision collider data | EPJC 77 (2017) 663 | 1706.00428 |
| 26 | T. Sjostrand et al. | An introduction to PYTHIA 8.2 | CPC 191 (2015) 159 | 1410.3012 |
| 27 | J. Alwall et al. | Comparative study of various algorithms for the merging of parton showers and matrix elements in hadronic collisions | EPJC 53 (2008) 473 | 0706.2569 |
| 28 | R. Frederix and S. Frixione | Merging meets matching in MC@NLO | JHEP 12 (2012) 061 | 1209.6215 |
| 29 | CMS Collaboration | Event generator tunes obtained from underlying event and multiparton scattering measurements | EPJC 76 (2016) 155 | CMS-GEN-14-001 1512.00815 |
| 30 | CMS Collaboration | Extraction and validation of a new set of CMS PYTHIA8 tunes from underlying-event measurements | EPJC 80 (2020) 4 | CMS-GEN-17-001 1903.12179 |
| 31 | \GEANTfour Collaboration | GEANT4 -- a simulation toolkit | NIMA 506 (2003) 250 | |
| 32 | S. Abdullin et al. | The fast simulation of the CMS detector at LHC | J. Phys. Conf. Ser. 331 (2011) 032049 | |
| 33 | A. Giammanco | The fast simulation of the CMS experiment | J. Phys. Conf. Ser. 513 (2014) 022012 | |
| 34 | Y. Li and F. Petriello | Combining QCD and electroweak corrections to dilepton production in FEWZ | PRD 86 (2012) 094034 | 1208.5967 |
| 35 | M. Aliev et al. | HATHOR: HAdronic Top and Heavy quarks crOss section calculatoR | CPC 182 (2011) 1034 | 1007.1327 |
| 36 | P. Kant et al. | HatHor for single top-quark production: Updated predictions and uncertainty estimates for single top-quark production in hadronic collisions | CPC 191 (2015) 74 | 1406.4403 |
| 37 | M. Beneke, P. Falgari, S. Klein, and C. Schwinn | Hadronic top-quark pair production with NNLL threshold resummation | NPB 855 (2012) 695 | 1109.1536 |
| 38 | M. Cacciari et al. | Top-pair production at hadron colliders with next-to-next-to-leading logarithmic soft-gluon resummation | PLB 710 (2012) 612 | 1111.5869 |
| 39 | M. Czakon and A. Mitov | Top++: A program for the calculation of the top-pair cross-section at hadron colliders | CPC 185 (2014) 2930 | 1112.5675 |
| 40 | P. Barnreuther, M. Czakon, and A. Mitov | Percent level precision physics at the Tevatron: First genuine NNLO QCD corrections to $ q \bar{q} \to t \bar{t} + X $ | PRL 109 (2012) 132001 | 1204.5201 |
| 41 | M. Czakon and A. Mitov | NNLO corrections to top-pair production at hadron colliders: the all-fermionic scattering channels | JHEP 12 (2012) 054 | 1207.0236 |
| 42 | M. Czakon and A. Mitov | NNLO corrections to top pair production at hadron colliders: the quark-gluon reaction | JHEP 01 (2013) 080 | 1210.6832 |
| 43 | M. Czakon, P. Fiedler, and A. Mitov | Total top-quark pair-production cross section at hadron colliders through $ O({\alpha_S}^4) $ | PRL 110 (2013) 252004 | 1303.6254 |
| 44 | W. Beenakker et al. | Production of charginos, neutralinos, and sleptons at hadron colliders | PRL 83 (1999) 3780 | hep-ph/9906298 |
| 45 | J. Debove, B. Fuks, and M. Klasen | Threshold resummation for gaugino pair production at hadron colliders | Nuc. Phys. B 842 (2011) | 1005.2909 |
| 46 | B. Fuks, M. Klasen, D. R. Lamprea, and M. Rothering | Precision predictions for electroweak superpartner production at hadron colliders with resummino | EPJC 73 (2013) 2480 | 1304.0790 |
| 47 | J. Fiaschi and M. Klasen | Neutralino-chargino pair production at NLO+NLL with resummation-improved parton density functions for LHC Run II | PRD 98 (2018) 055014 | 1805.11322 |
| 48 | LHC Higgs Cross Section Working Group | Handbook of LHC Higgs cross sections: 4. Deciphering the nature of the Higgs sector | CERN-2017-002-M | 1610.07922 |
| 49 | CMS Collaboration | Search for direct top squark pair production in events with one lepton, jets, and missing transverse momentum at 13 TeV with the CMS experiment | JHEP 05 (2020) 032 | CMS-SUS-19-009 1912.08887 |
| 50 | CMS Collaboration | Particle-flow reconstruction and global event description with the CMS detector | JINST 12 (2017) P10003 | CMS-PRF-14-001 1706.04965 |
| 51 | CMS Collaboration | Performance of missing transverse momentum reconstruction in proton-proton collisions at $ \sqrt{s} = $ 13 TeV using the CMS detector | JINST 14 (2019) P07004 | CMS-JME-17-001 1903.06078 |
| 52 | CMS Collaboration | Electron and photon reconstruction and identification with the CMS experiment at the CERN LHC | JINST 16 (2021) P05014 | CMS-EGM-17-001 2012.06888 |
| 53 | CMS Collaboration | Performance of the CMS muon detector and muon reconstruction with proton-proton collisions at $ \sqrt{s} = $ 13 TeV | JINST 13 (2018) P06015 | CMS-MUO-16-001 1804.04528 |
| 54 | CMS Collaboration | Reconstruction and identification of $ \tau $ lepton decays to hadrons and $ \nu _{\tau} $ at CMS | JINST 11 (2016) P01019 | CMS-TAU-14-001 1510.07488 |
| 55 | CMS Collaboration | Performance of reconstruction and identification of $ \tau $ leptons decaying to hadrons and $ \nu _{\tau} $ in pp collisions at $ \sqrt{s} = $ 13 TeV | JINST 13 (2018) P10005 | CMS-TAU-16-003 1809.02816 |
| 56 | M. Cacciari, G. P. Salam, and G. Soyez | The anti-$ {k_{\mathrm{T}}} $ jet clustering algorithm | JHEP 04 (2008) 063 | 0802.1189 |
| 57 | M. Cacciari, G. P. Salam, and G. Soyez | FastJet user manual | EPJC 72 (2012) 1896 | 1111.6097 |
| 58 | CMS Collaboration | Determination of jet energy calibration and transverse momentum resolution in CMS | JINST 6 (2011) P11002 | CMS-JME-10-011 1107.4277 |
| 59 | CMS Collaboration | Identification of heavy-flavour jets with the CMS detector in $ {\mathrm{p}}{\mathrm{p}} $ collisions at 13 TeV | JINST 13 (2018) P05011 | CMS-BTV-16-002 1712.07158 |
| 60 | CMS Collaboration | Identification of heavy, energetic, hadronically decaying particles using machine-learning techniques | JINST 15 (2020) P06005 | CMS-JME-18-002 2004.08262 |
| 61 | CMS Collaboration | Missing transverse energy performance of the CMS detector | JINST 6 (2011) P09001 | CMS-JME-10-009 1106.5048 |
| 62 | D. R. Tovey | On measuring the masses of pair-produced semi-invisibly decaying particles at hadron colliders | JHEP 04 (2008) 034 | 0802.2879 |
| 63 | CMS Collaboration | Observation of Higgs boson decay to bottom quarks | PRL 121 (2018) 121801 | CMS-HIG-18-016 1808.08242 |
| 64 | CMS Collaboration | Measurements of the pp $ \to $ WZ inclusive and differential production cross section and constraints on charged anomalous triple gauge couplings at $ \sqrt{s} = $ 13 TeV | JHEP 04 (2019) 122 | CMS-SMP-18-002 1901.03428 |
| 65 | CMS Collaboration | W$ ^+ $W$ ^- $ boson pair production in proton-proton collisions at $ \sqrt{s} = $ 13 TeV | PRD 102 (2020) 092001 | CMS-SMP-18-004 2009.00119 |
| 66 | CMS Collaboration | Measurements of $ {\mathrm{p}} {\mathrm{p}} \rightarrow {\mathrm{Z}} {\mathrm{Z}} $ production cross sections and constraints on anomalous triple gauge couplings at $ \sqrt{s} = $ 13 TeV | EPJC 81 (2021) 200 | CMS-SMP-19-001 2009.01186 |
| 67 | CMS Collaboration | Jet energy scale and resolution performance with 13 TeV data collected by CMS in 2016-2018 | CDS | |
| 68 | S. Catani, D. de Florian, M. Grazzini, and P. Nason | Soft gluon resummation for Higgs boson production at hadron colliders | JHEP 07 (2003) 028 | hep-ph/0306211 |
| 69 | M. Cacciari et al. | The $ \mathrm{t\bar{t}} $ cross-section at 1.8 TeV and 1.96 TeV: A study of the systematics due to parton densities and scale dependence | JHEP 04 (2004) 068 | hep-ph/0303085 |
| 70 | A. Kalogeropoulos and J. Alwall | The SysCalc code: A tool to derive theoretical systematic uncertainties | 1801.08401 | |
| 71 | CMS Collaboration | CMS luminosity measurements for the 2016 data-taking period | CMS-PAS-LUM-17-001 | CMS-PAS-LUM-17-001 |
| 72 | CMS Collaboration | CMS luminosity measurement for the 2017 data-taking period at $ \sqrt{s} = $ 13 TeV | CMS-PAS-LUM-17-004 | CMS-PAS-LUM-17-004 |
| 73 | CMS Collaboration | CMS luminosity measurement for the 2018 data-taking period at $ \sqrt{s} = $ 13 TeV | CMS-PAS-LUM-18-002 | CMS-PAS-LUM-18-002 |
| 74 | T. Junk | Confidence level computation for combining searches with small statistics | NIMA 434 (1999) 435 | |
| 75 | A. L. Read | Presentation of search results: the CLs technique | JPG 28 (2002) 2693 | |
| 76 | G. Cowan, K. Cranmer, E. Gross, and O. Vitells | Asymptotic formulae for likelihood-based tests of new physics | EPJC 71 (2011) 1554 | 1007.1727 |
|
|
Compact Muon Solenoid LHC, CERN |
|

|

|

|

|

|