

Compact Muon Solenoid
LHC, CERN
| CMS-TOP-21-013 ; CERN-EP-2023-214 | ||
| Search for flavor changing neutral current interactions of the top quark in final states with a photon and additional jets in proton-proton collisions at $ \sqrt{s}= $ 13 TeV | ||
| CMS Collaboration | ||
| 11 December 2023 | ||
| Phys. Rev. D 109 (2024) 072004 | ||
| Abstract: A search for the production of a top quark in association with a photon and additional jets via flavor changing neutral current interactions is presented. The analysis uses proton-proton collision data recorded by the CMS detector at a center-of-mass energy of 13 TeV, corresponding to an integrated luminosity of 138 fb$ ^{-1} $. The search is performed by looking for processes where a single top quark is produced in association with a photon, or a pair of top quarks where one of the top quarks decays into a photon and an up or charm quark. Events with an electron or a muon, a photon, one or more jets, and missing transverse momentum are selected. Multivariate analysis techniques are used to discriminate signal and standard model background processes. No significant deviation is observed over the predicted background. Observed (expected) upper limits are set on the branching fractions of top quark decays: $ \mathcal{B}(\mathrm{t}\to\mathrm{u}\gamma) < $ 0.95 $\times$ 10$^{-5} $ (1.20 $ \times$ 10$^{-5} $) and $ \mathcal{B}(\mathrm{t}\to\mathrm{c}\gamma) < $ 1.51 $\times$ 10$^{-5} $ (1.54 $ \times$ 10$^{-5} $) at 95% confidence level, assuming a single nonzero coupling at a time. The obtained limit for $ \mathcal{B}(\mathrm{t}\to\mathrm{u}\gamma) $ is similar to the current best limit, while the limit for $ \mathcal{B}(\mathrm{t}\to\mathrm{c}\gamma) $ is significantly tighter than previous results. | ||
| Links: e-print arXiv:2312.08229 [hep-ex] (PDF) ; CDS record ; inSPIRE record ; HepData record ; CADI line (restricted) ; | ||
| Figures | |

png pdf |
Figure 1:
LO Feynman diagrams for the production of a single top quark in association with a photon (left), and the decay of a top antiquark to a photon and a light antiquark in top quark pair production (right) via a $ \mathcal{\mathrm{t}\mathrm{q}\gamma} $ FCNC, where $ \mathrm{q}=\mathrm{u} $, c. The leptonic decay of the W boson from the top quark decay is included. The charge conjugate diagrams are also included. The FCNC interaction vertex is marked as a filled red circle. |

png pdf |
Figure 2:
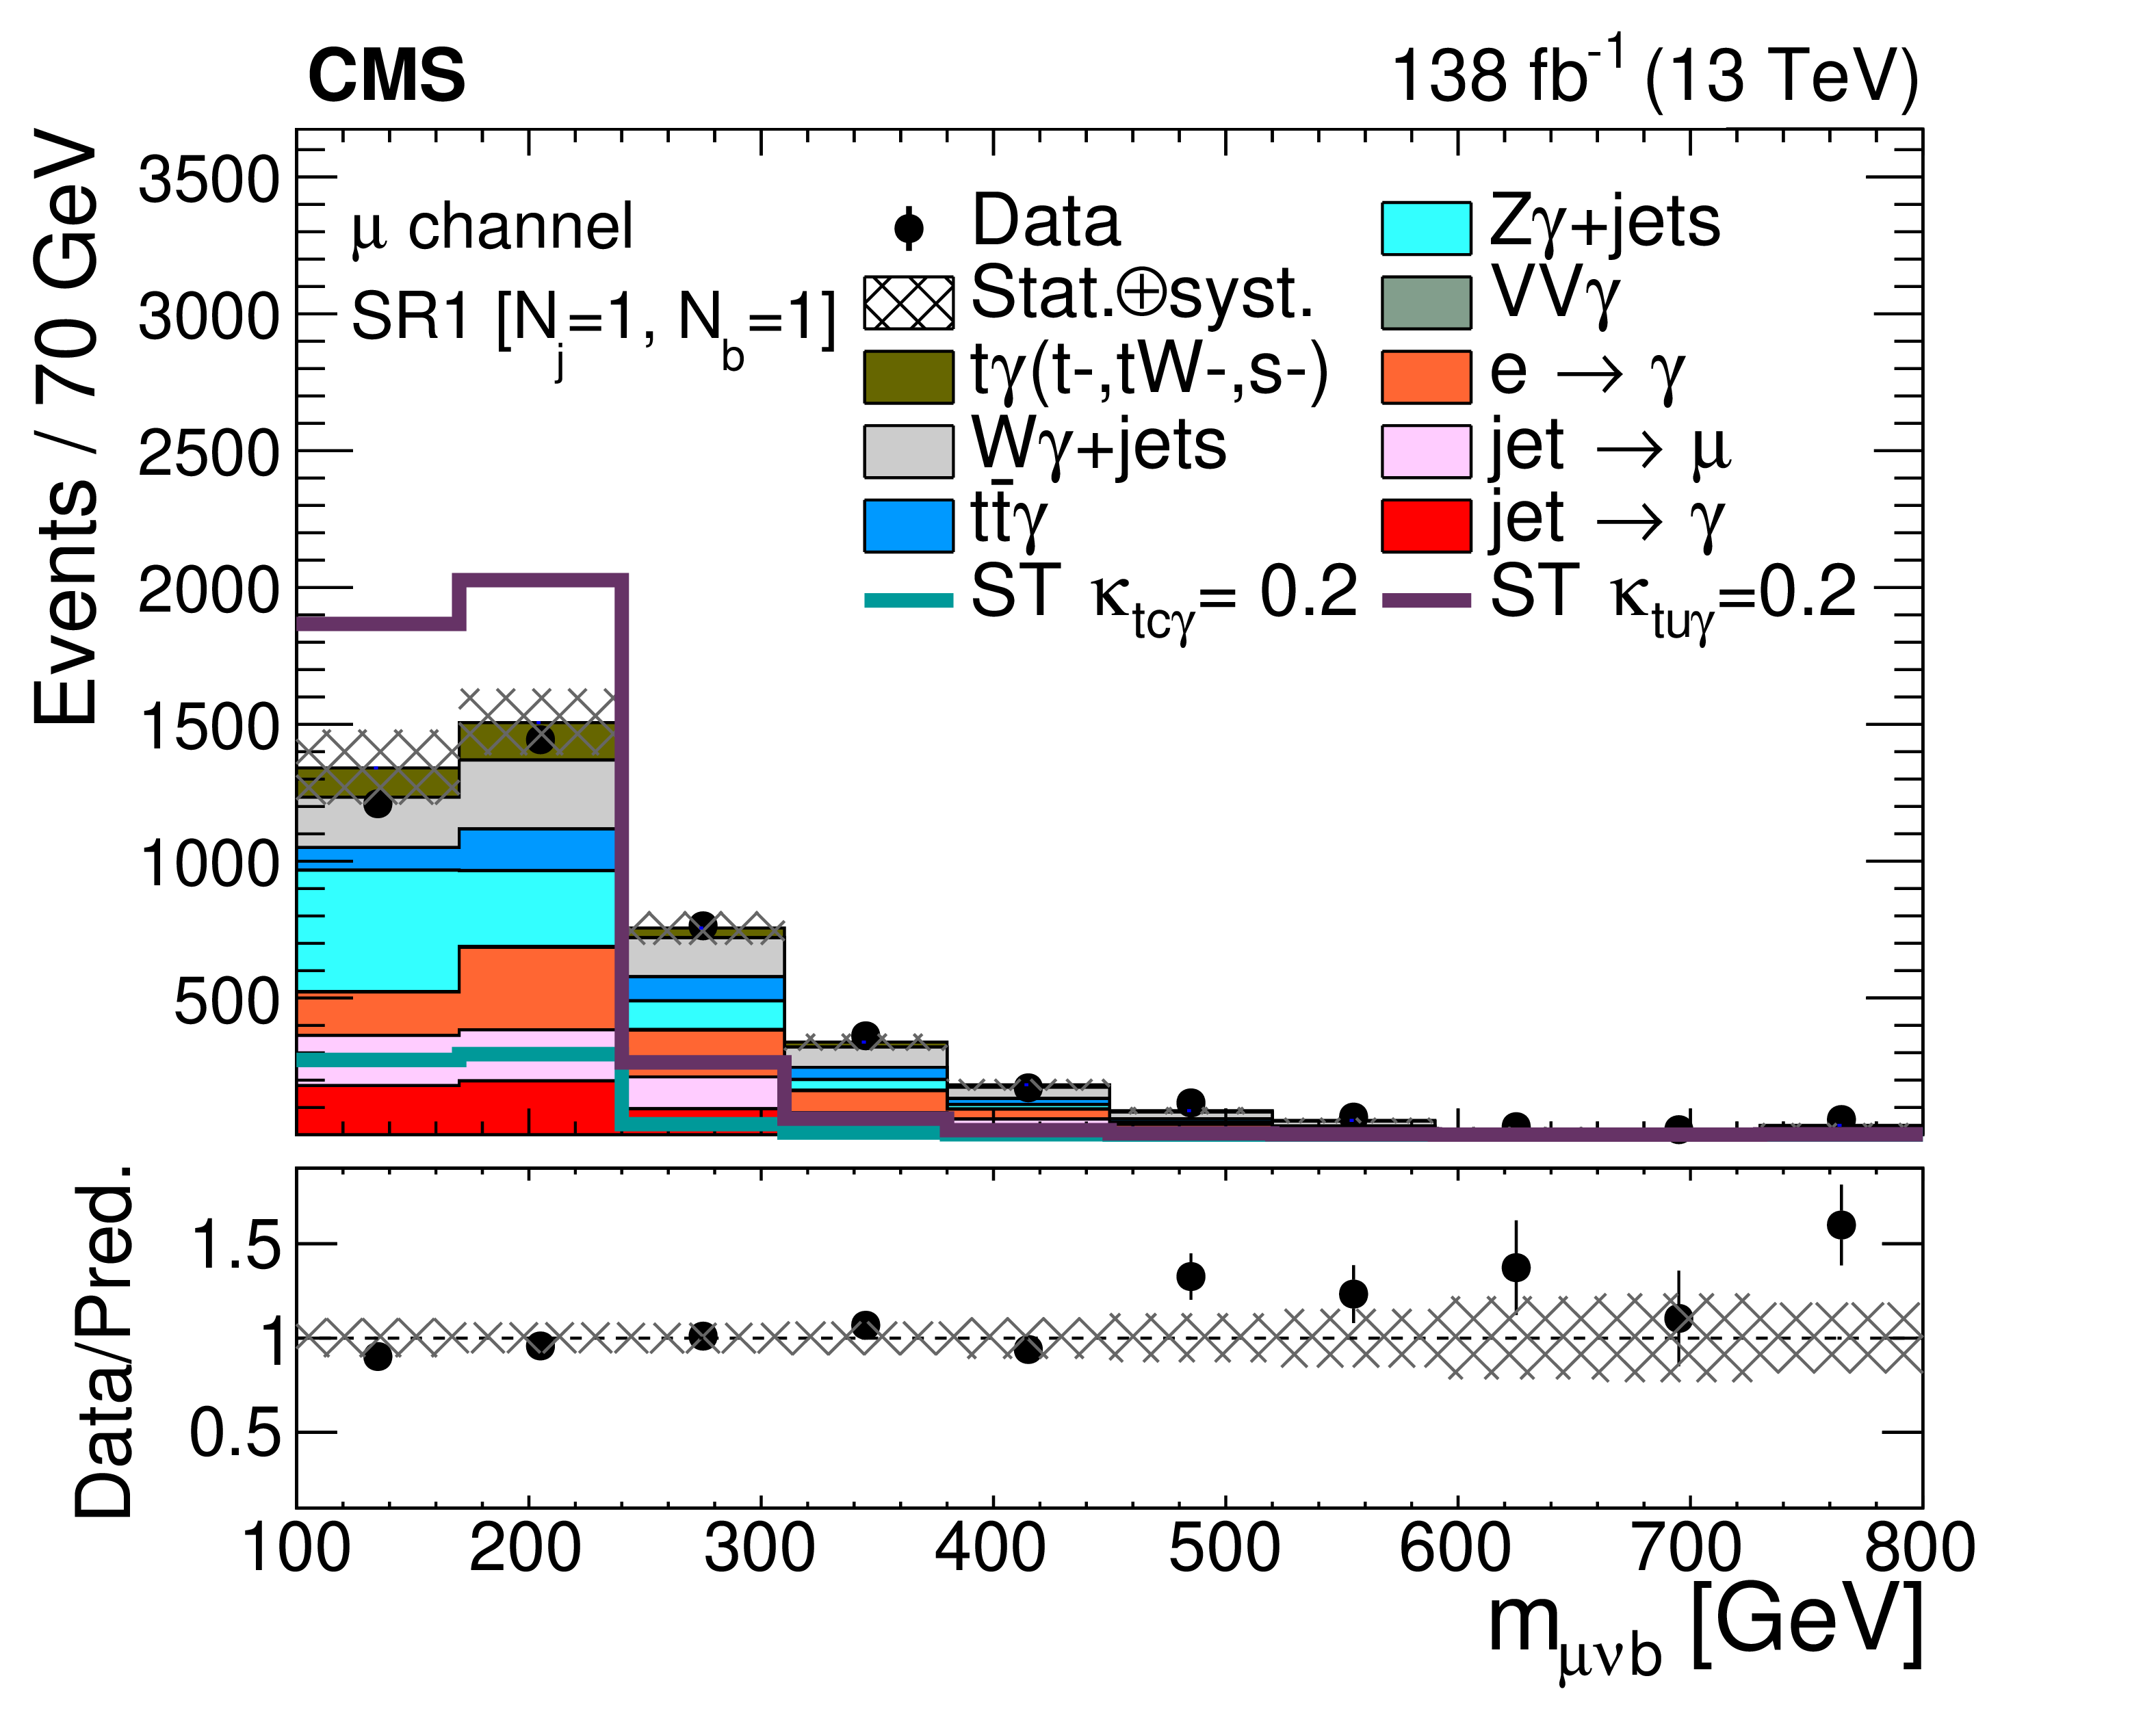
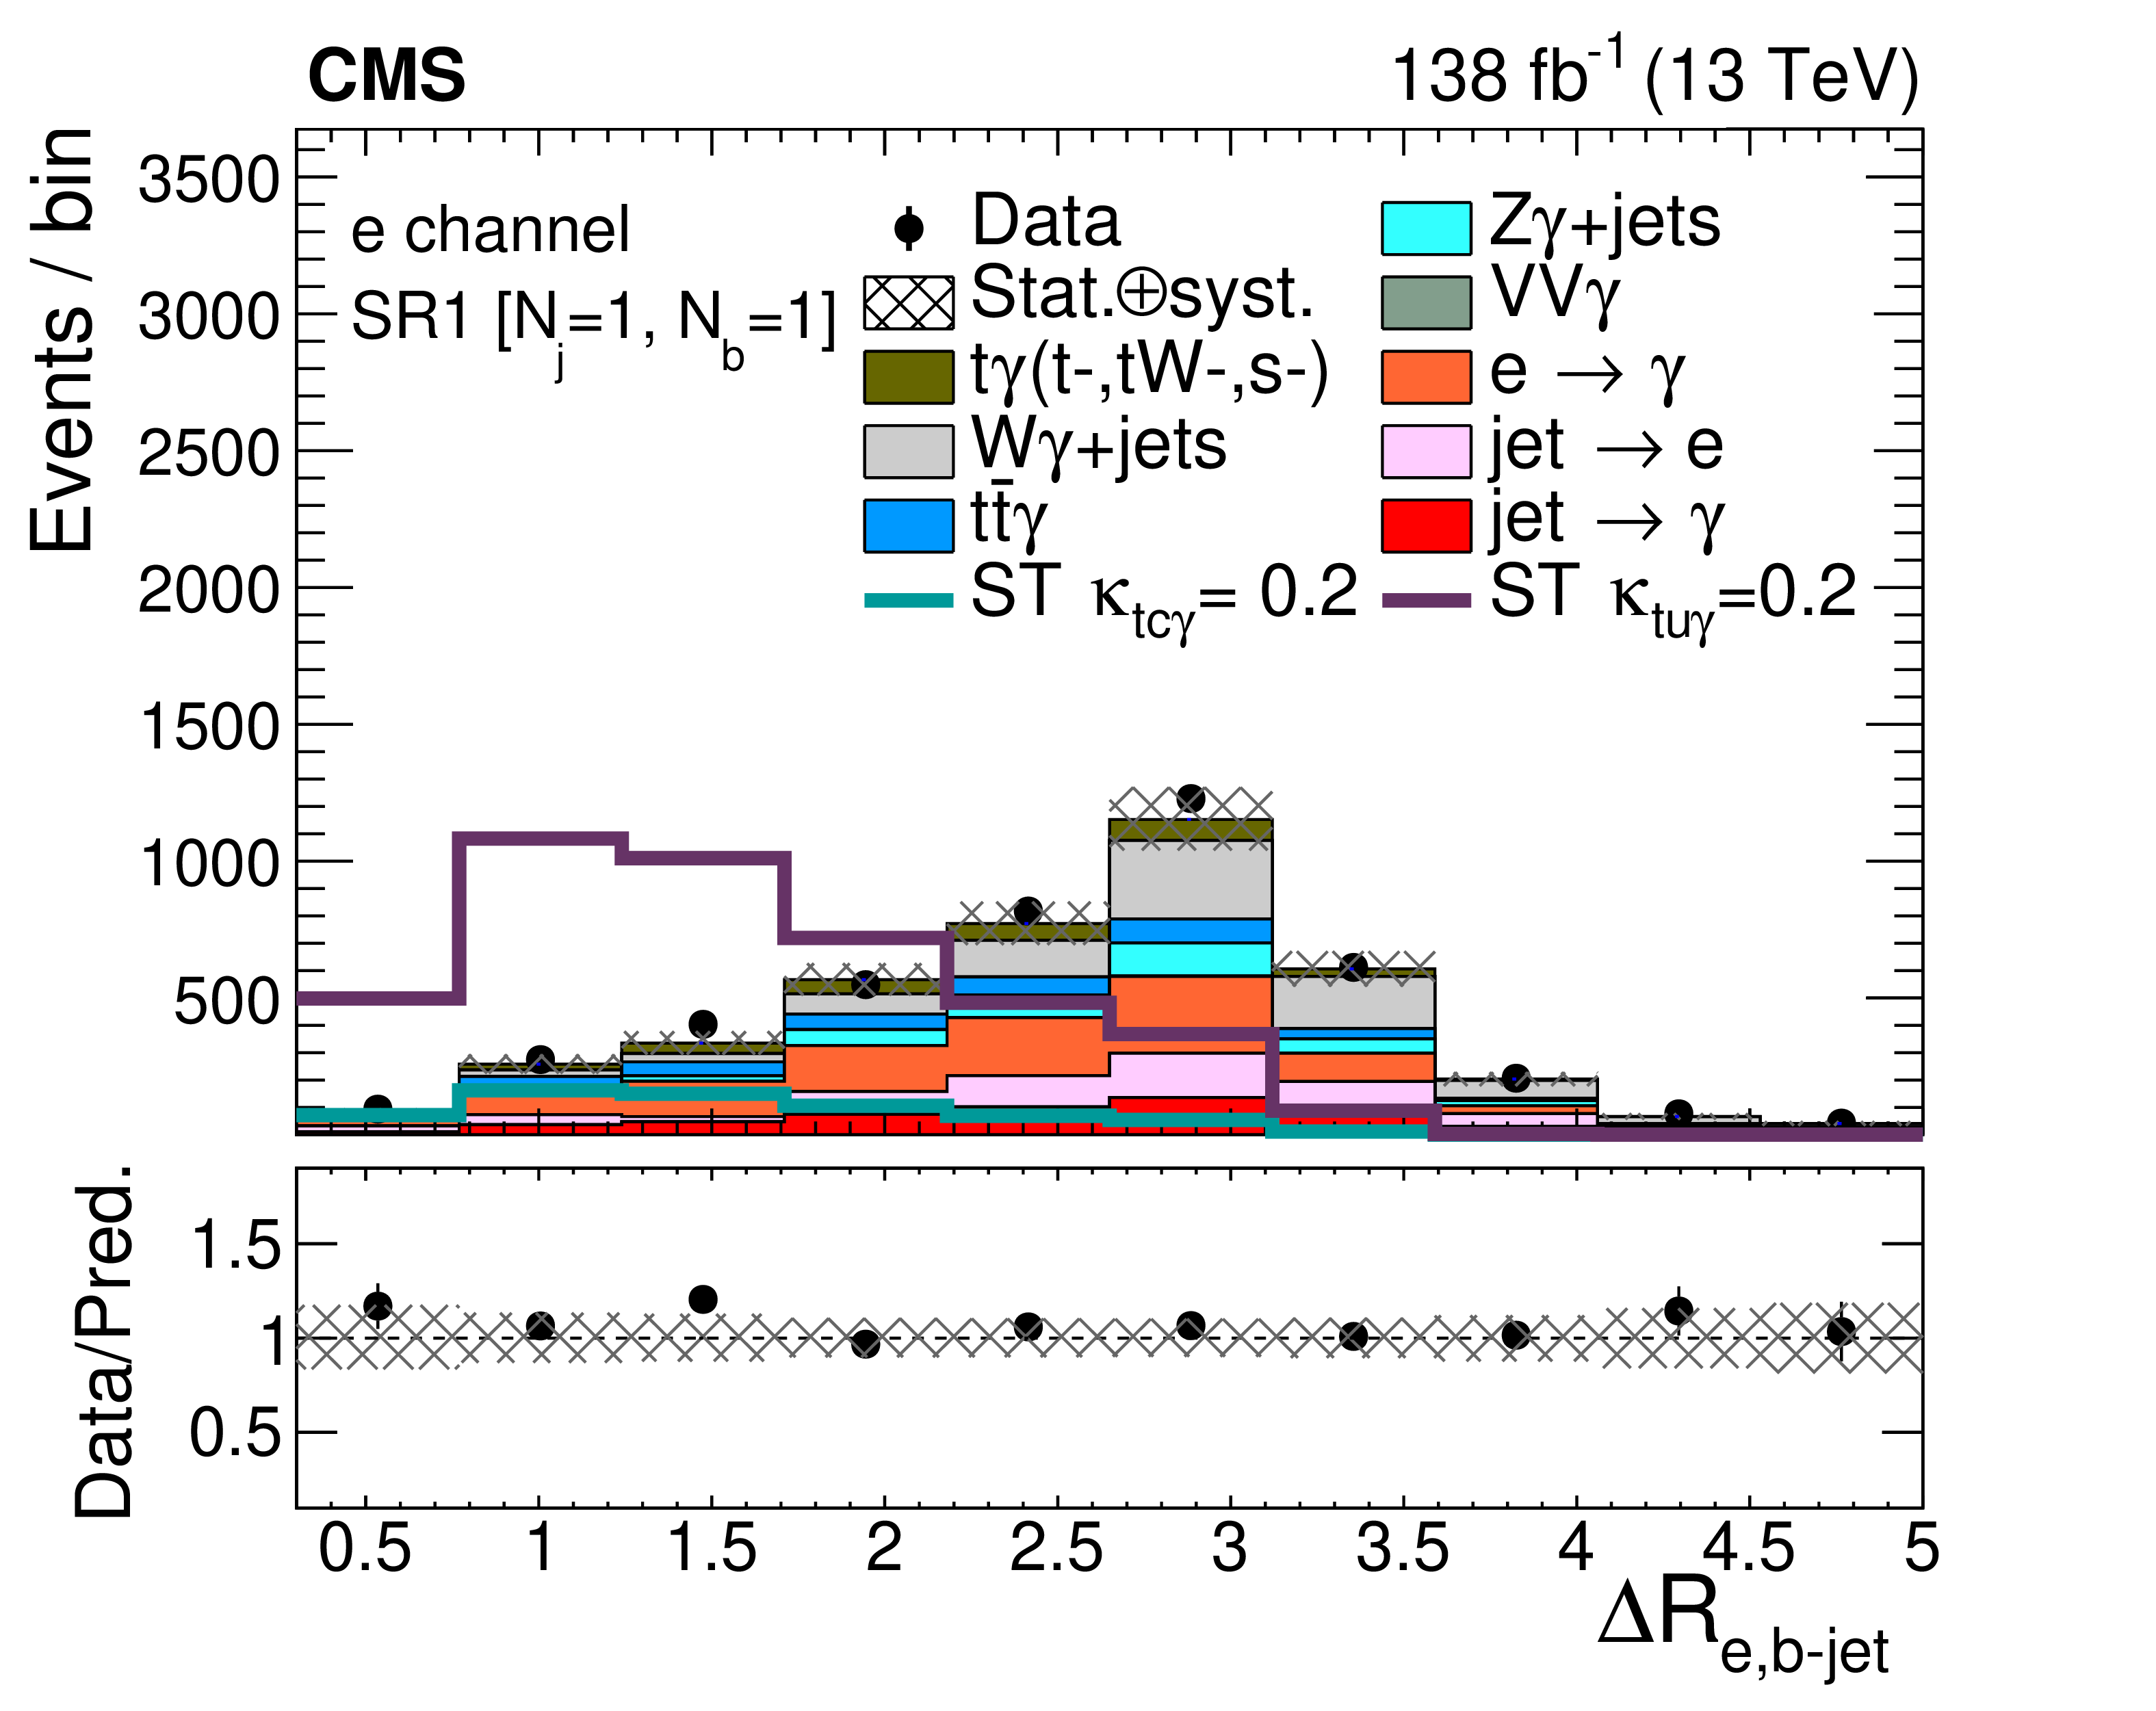
From upper to lower, expected and observed distributions of photon $ p_{\mathrm{T}} $, transverse mass of W boson candidate, reconstructed top quark mass, and $ \Delta R(\ell,\,\mathrm{b}\ \text{jet}) $ for the electron (left) and muon (right) channels in SR1. For presentational purposes, the $ \mathcal{\mathrm{t}\mathrm{u}\gamma} $ and $ \mathcal{\mathrm{t}\mathrm{c}\gamma} $ signal distributions are normalized to a cross section corresponding to $ \kappa_{\mathcal{\mathrm{t}\mathrm{u}\gamma}} = \kappa_{\mathcal{\mathrm{t}\mathrm{c}\gamma}} = $ 0.2 and are superimposed on the background expectations. The last bins include overflows. The vertical bars on the points depict the data statistical uncertainties and the hatched bands show the combined statistical and systematic uncertainties in the estimated background processes. |

png pdf |
Figure 2-a:
From upper to lower, expected and observed distributions of photon $ p_{\mathrm{T}} $, transverse mass of W boson candidate, reconstructed top quark mass, and $ \Delta R(\ell,\,\mathrm{b}\ \text{jet}) $ for the electron (left) and muon (right) channels in SR1. For presentational purposes, the $ \mathcal{\mathrm{t}\mathrm{u}\gamma} $ and $ \mathcal{\mathrm{t}\mathrm{c}\gamma} $ signal distributions are normalized to a cross section corresponding to $ \kappa_{\mathcal{\mathrm{t}\mathrm{u}\gamma}} = \kappa_{\mathcal{\mathrm{t}\mathrm{c}\gamma}} = $ 0.2 and are superimposed on the background expectations. The last bins include overflows. The vertical bars on the points depict the data statistical uncertainties and the hatched bands show the combined statistical and systematic uncertainties in the estimated background processes. |

png pdf |
Figure 2-b:
From upper to lower, expected and observed distributions of photon $ p_{\mathrm{T}} $, transverse mass of W boson candidate, reconstructed top quark mass, and $ \Delta R(\ell,\,\mathrm{b}\ \text{jet}) $ for the electron (left) and muon (right) channels in SR1. For presentational purposes, the $ \mathcal{\mathrm{t}\mathrm{u}\gamma} $ and $ \mathcal{\mathrm{t}\mathrm{c}\gamma} $ signal distributions are normalized to a cross section corresponding to $ \kappa_{\mathcal{\mathrm{t}\mathrm{u}\gamma}} = \kappa_{\mathcal{\mathrm{t}\mathrm{c}\gamma}} = $ 0.2 and are superimposed on the background expectations. The last bins include overflows. The vertical bars on the points depict the data statistical uncertainties and the hatched bands show the combined statistical and systematic uncertainties in the estimated background processes. |

png pdf |
Figure 2-c:
From upper to lower, expected and observed distributions of photon $ p_{\mathrm{T}} $, transverse mass of W boson candidate, reconstructed top quark mass, and $ \Delta R(\ell,\,\mathrm{b}\ \text{jet}) $ for the electron (left) and muon (right) channels in SR1. For presentational purposes, the $ \mathcal{\mathrm{t}\mathrm{u}\gamma} $ and $ \mathcal{\mathrm{t}\mathrm{c}\gamma} $ signal distributions are normalized to a cross section corresponding to $ \kappa_{\mathcal{\mathrm{t}\mathrm{u}\gamma}} = \kappa_{\mathcal{\mathrm{t}\mathrm{c}\gamma}} = $ 0.2 and are superimposed on the background expectations. The last bins include overflows. The vertical bars on the points depict the data statistical uncertainties and the hatched bands show the combined statistical and systematic uncertainties in the estimated background processes. |

png pdf |
Figure 2-d:
From upper to lower, expected and observed distributions of photon $ p_{\mathrm{T}} $, transverse mass of W boson candidate, reconstructed top quark mass, and $ \Delta R(\ell,\,\mathrm{b}\ \text{jet}) $ for the electron (left) and muon (right) channels in SR1. For presentational purposes, the $ \mathcal{\mathrm{t}\mathrm{u}\gamma} $ and $ \mathcal{\mathrm{t}\mathrm{c}\gamma} $ signal distributions are normalized to a cross section corresponding to $ \kappa_{\mathcal{\mathrm{t}\mathrm{u}\gamma}} = \kappa_{\mathcal{\mathrm{t}\mathrm{c}\gamma}} = $ 0.2 and are superimposed on the background expectations. The last bins include overflows. The vertical bars on the points depict the data statistical uncertainties and the hatched bands show the combined statistical and systematic uncertainties in the estimated background processes. |

png pdf |
Figure 2-e:
From upper to lower, expected and observed distributions of photon $ p_{\mathrm{T}} $, transverse mass of W boson candidate, reconstructed top quark mass, and $ \Delta R(\ell,\,\mathrm{b}\ \text{jet}) $ for the electron (left) and muon (right) channels in SR1. For presentational purposes, the $ \mathcal{\mathrm{t}\mathrm{u}\gamma} $ and $ \mathcal{\mathrm{t}\mathrm{c}\gamma} $ signal distributions are normalized to a cross section corresponding to $ \kappa_{\mathcal{\mathrm{t}\mathrm{u}\gamma}} = \kappa_{\mathcal{\mathrm{t}\mathrm{c}\gamma}} = $ 0.2 and are superimposed on the background expectations. The last bins include overflows. The vertical bars on the points depict the data statistical uncertainties and the hatched bands show the combined statistical and systematic uncertainties in the estimated background processes. |
png pdf |
Figure 2-f:
From upper to lower, expected and observed distributions of photon $ p_{\mathrm{T}} $, transverse mass of W boson candidate, reconstructed top quark mass, and $ \Delta R(\ell,\,\mathrm{b}\ \text{jet}) $ for the electron (left) and muon (right) channels in SR1. For presentational purposes, the $ \mathcal{\mathrm{t}\mathrm{u}\gamma} $ and $ \mathcal{\mathrm{t}\mathrm{c}\gamma} $ signal distributions are normalized to a cross section corresponding to $ \kappa_{\mathcal{\mathrm{t}\mathrm{u}\gamma}} = \kappa_{\mathcal{\mathrm{t}\mathrm{c}\gamma}} = $ 0.2 and are superimposed on the background expectations. The last bins include overflows. The vertical bars on the points depict the data statistical uncertainties and the hatched bands show the combined statistical and systematic uncertainties in the estimated background processes. |
png pdf |
Figure 2-g:
From upper to lower, expected and observed distributions of photon $ p_{\mathrm{T}} $, transverse mass of W boson candidate, reconstructed top quark mass, and $ \Delta R(\ell,\,\mathrm{b}\ \text{jet}) $ for the electron (left) and muon (right) channels in SR1. For presentational purposes, the $ \mathcal{\mathrm{t}\mathrm{u}\gamma} $ and $ \mathcal{\mathrm{t}\mathrm{c}\gamma} $ signal distributions are normalized to a cross section corresponding to $ \kappa_{\mathcal{\mathrm{t}\mathrm{u}\gamma}} = \kappa_{\mathcal{\mathrm{t}\mathrm{c}\gamma}} = $ 0.2 and are superimposed on the background expectations. The last bins include overflows. The vertical bars on the points depict the data statistical uncertainties and the hatched bands show the combined statistical and systematic uncertainties in the estimated background processes. |

png pdf |
Figure 2-h:
From upper to lower, expected and observed distributions of photon $ p_{\mathrm{T}} $, transverse mass of W boson candidate, reconstructed top quark mass, and $ \Delta R(\ell,\,\mathrm{b}\ \text{jet}) $ for the electron (left) and muon (right) channels in SR1. For presentational purposes, the $ \mathcal{\mathrm{t}\mathrm{u}\gamma} $ and $ \mathcal{\mathrm{t}\mathrm{c}\gamma} $ signal distributions are normalized to a cross section corresponding to $ \kappa_{\mathcal{\mathrm{t}\mathrm{u}\gamma}} = \kappa_{\mathcal{\mathrm{t}\mathrm{c}\gamma}} = $ 0.2 and are superimposed on the background expectations. The last bins include overflows. The vertical bars on the points depict the data statistical uncertainties and the hatched bands show the combined statistical and systematic uncertainties in the estimated background processes. |

png pdf |
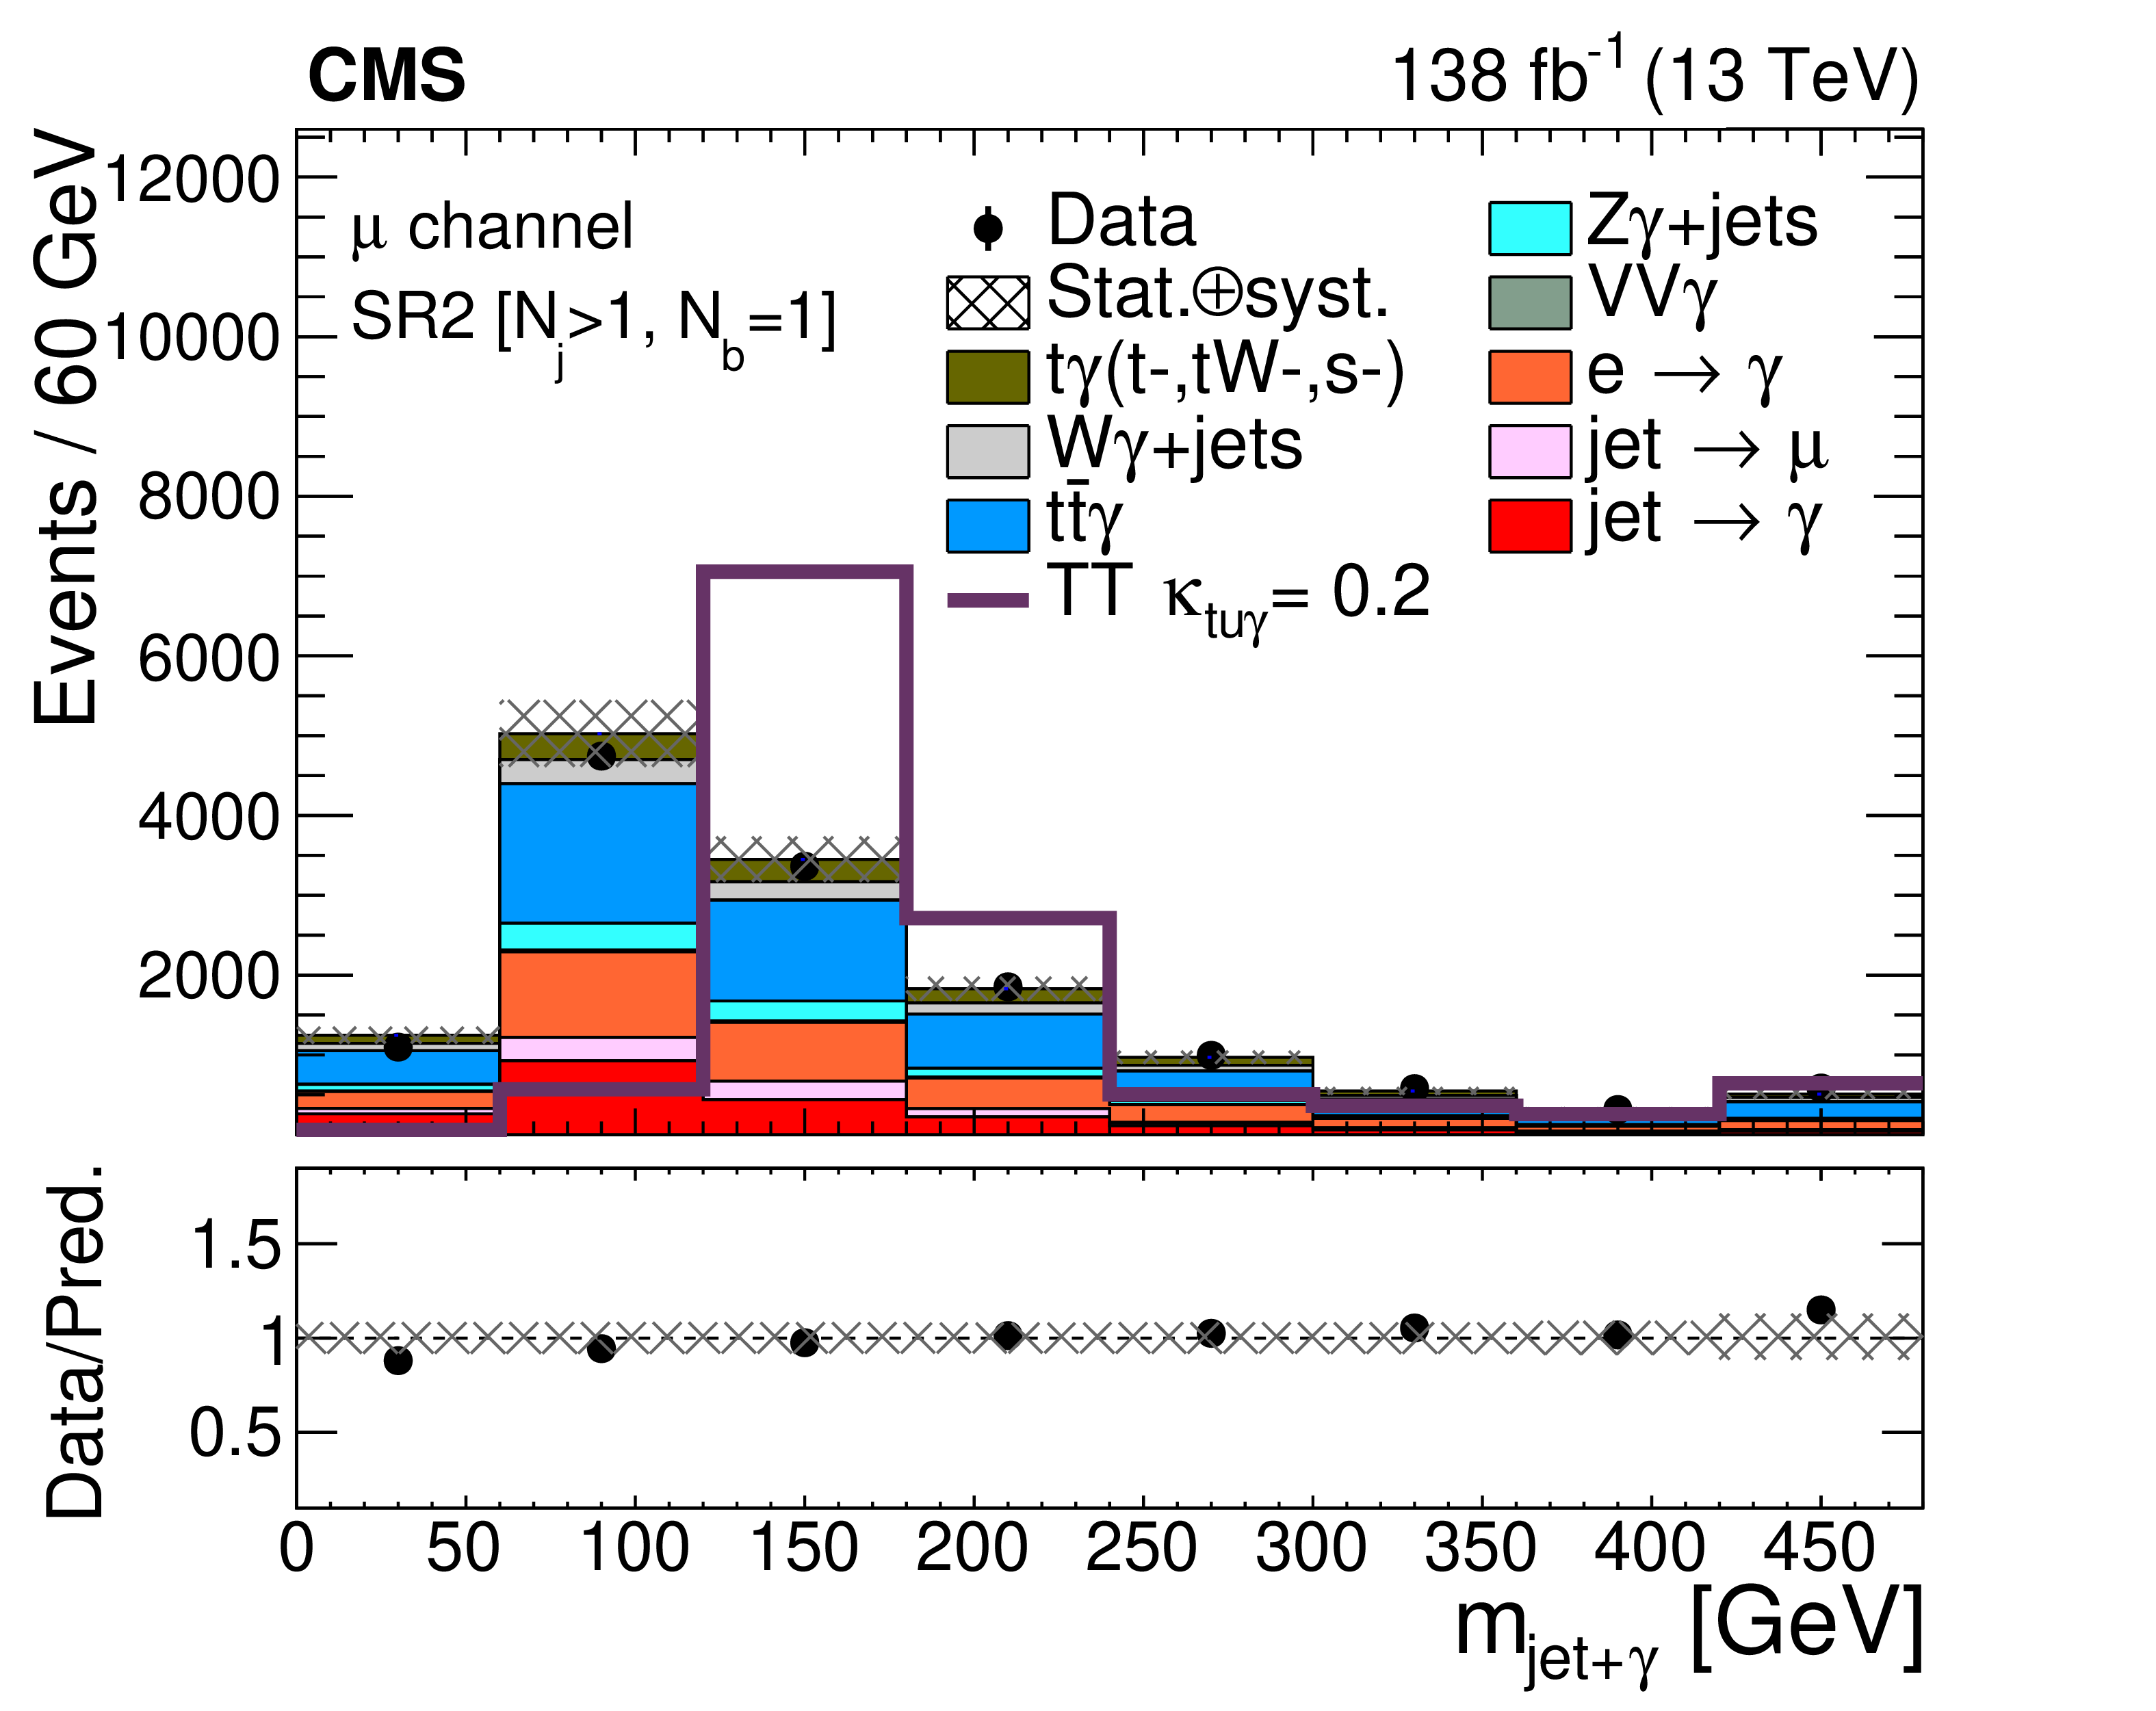
Figure 3:
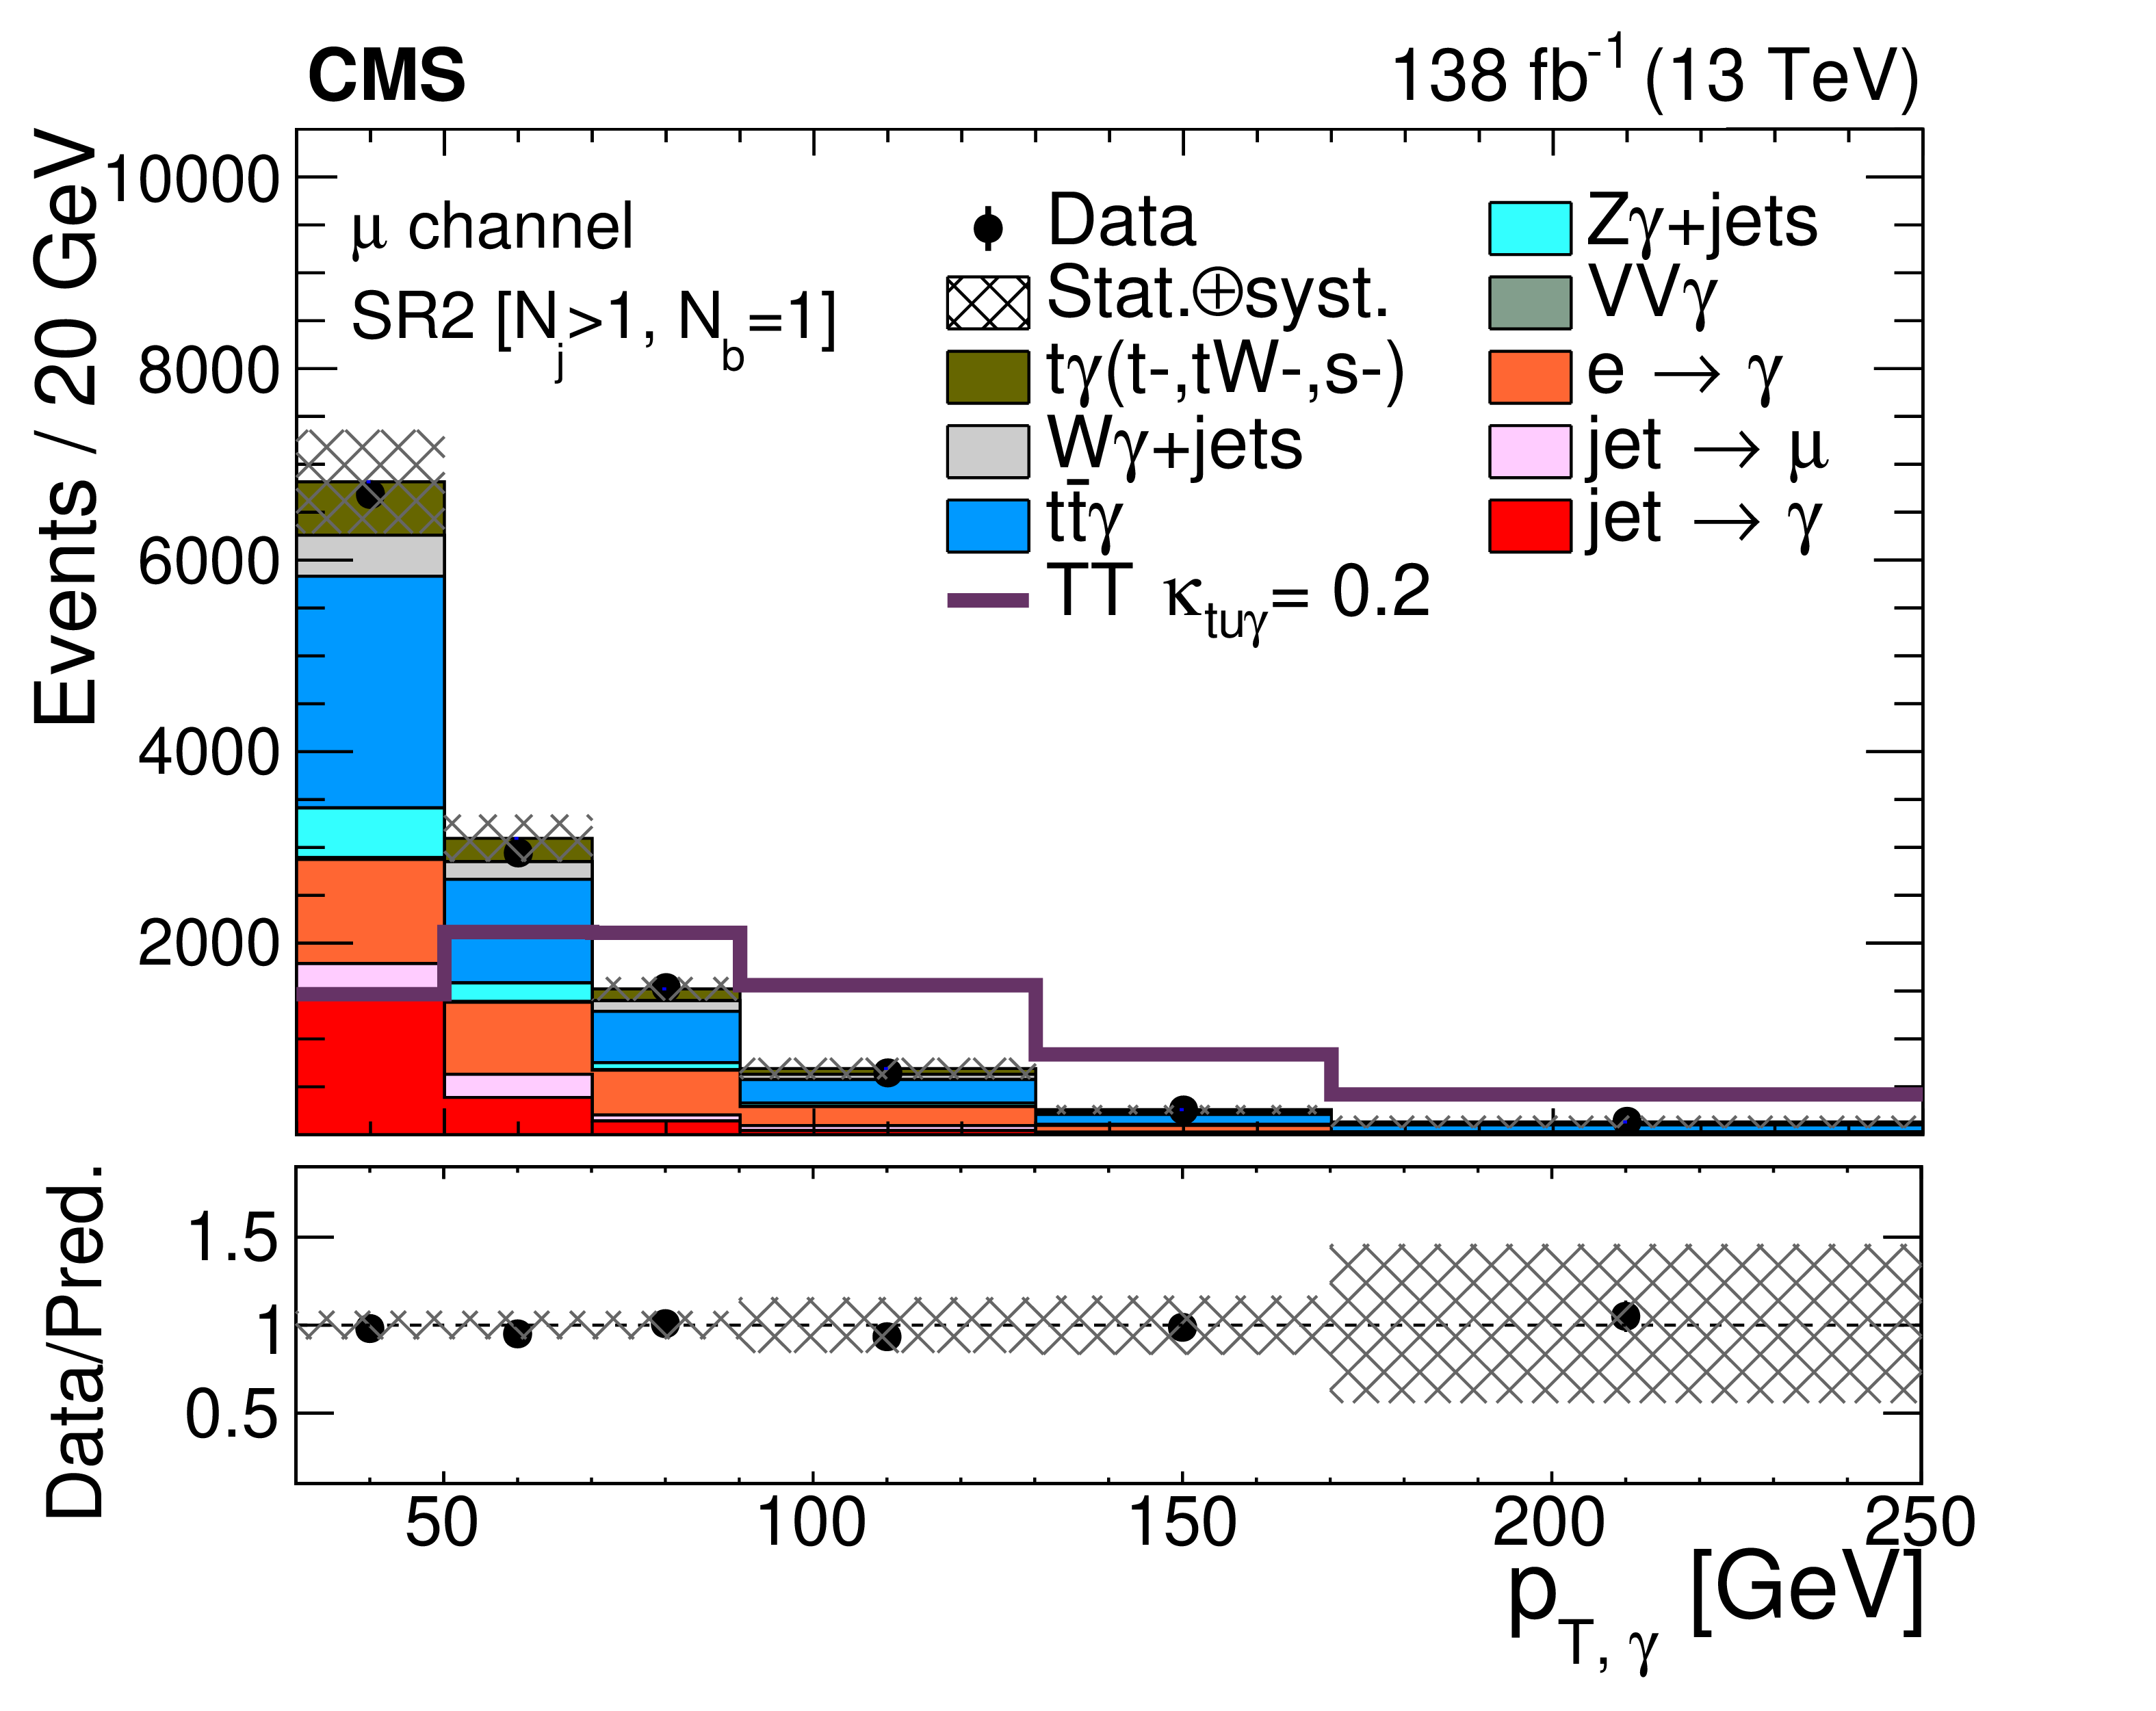
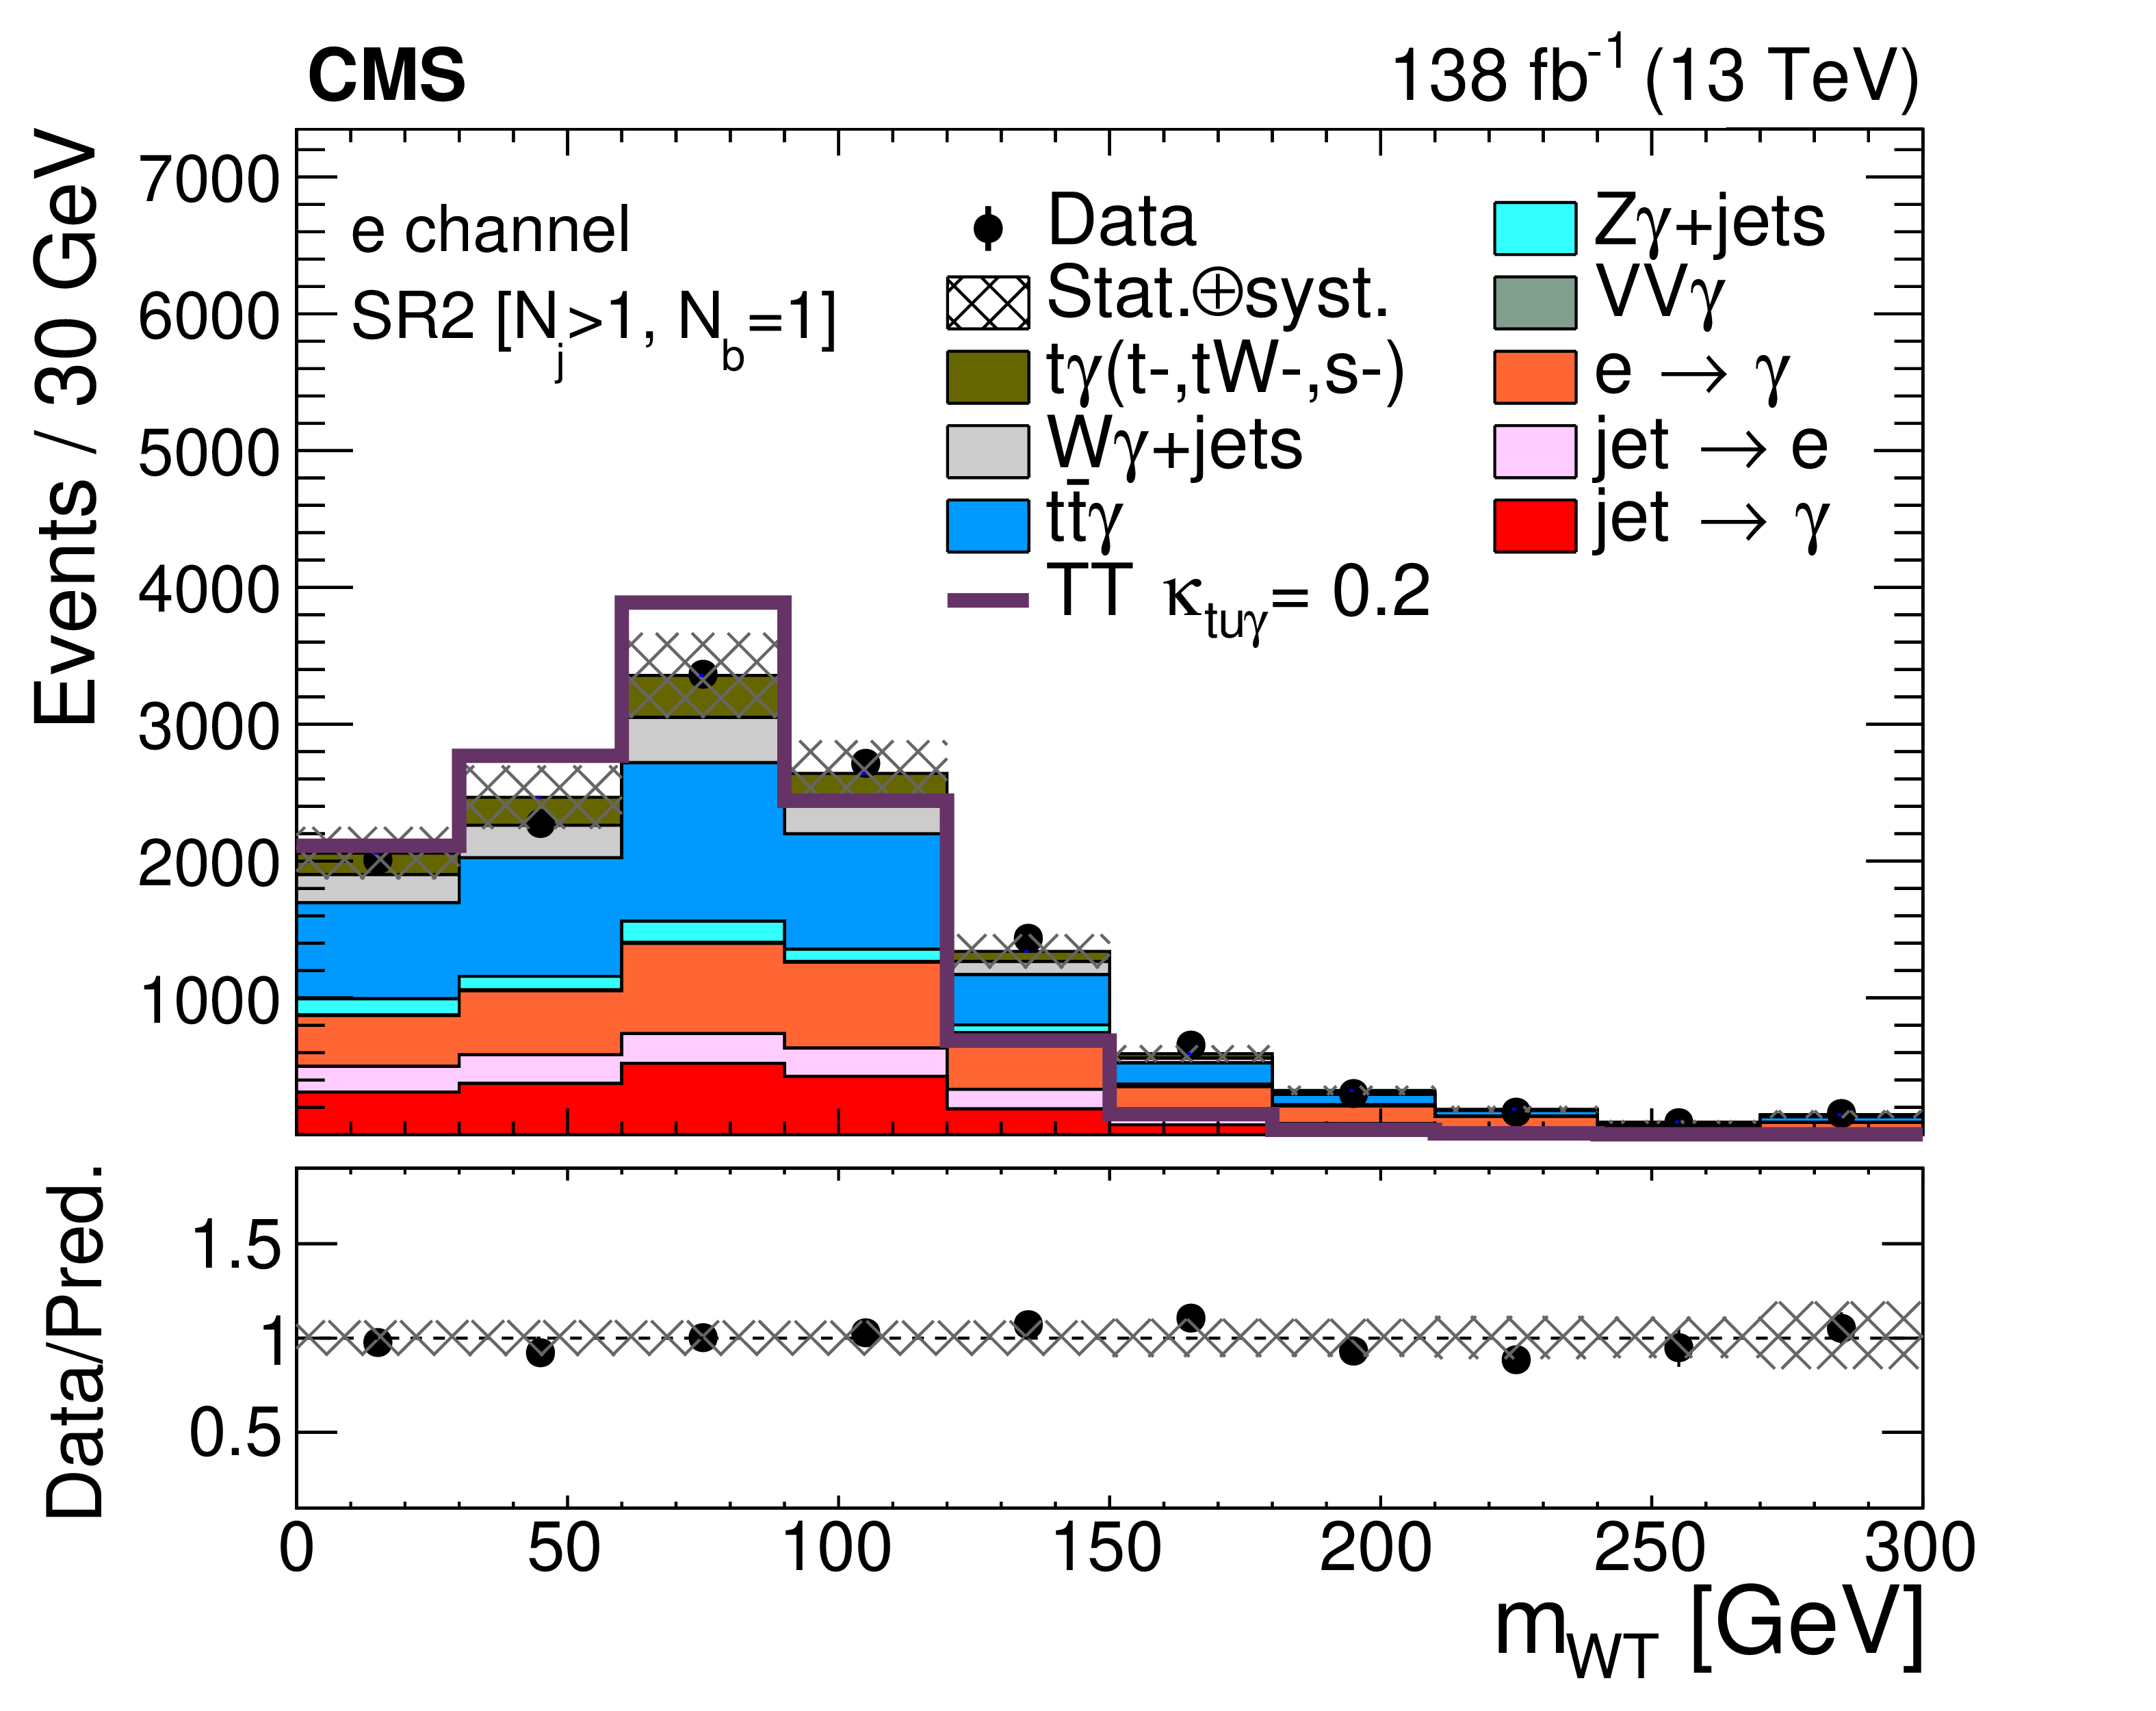
From upper to lower, expected and observed distributions of photon $ p_{\mathrm{T}} $, transverse mass of W boson candidate, invariant mass of jet and photon, and reconstructed top quark mass, for the electron (left) and muon (right) channels in SR2. For presentational purposes, the $ \mathcal{\mathrm{t}\mathrm{u}\gamma} $ signal distributions are normalized to a cross section corresponding to $ \kappa_{\mathcal{\mathrm{t}\mathrm{u}\gamma}}= $ 0.2 and are superimposed on the background expectations. The $ \mathcal{\mathrm{t}\mathrm{c}\gamma} $ distributions are not shown as they are the same as the $ \mathcal{\mathrm{t}\mathrm{u}\gamma} $ distributions. The last bins include overflows. The vertical bars on the points depict the data statistical uncertainties and the hatched bands show the combined statistical and systematic uncertainties in the estimated background processes. |

png pdf |
Figure 3-a:
From upper to lower, expected and observed distributions of photon $ p_{\mathrm{T}} $, transverse mass of W boson candidate, invariant mass of jet and photon, and reconstructed top quark mass, for the electron (left) and muon (right) channels in SR2. For presentational purposes, the $ \mathcal{\mathrm{t}\mathrm{u}\gamma} $ signal distributions are normalized to a cross section corresponding to $ \kappa_{\mathcal{\mathrm{t}\mathrm{u}\gamma}}= $ 0.2 and are superimposed on the background expectations. The $ \mathcal{\mathrm{t}\mathrm{c}\gamma} $ distributions are not shown as they are the same as the $ \mathcal{\mathrm{t}\mathrm{u}\gamma} $ distributions. The last bins include overflows. The vertical bars on the points depict the data statistical uncertainties and the hatched bands show the combined statistical and systematic uncertainties in the estimated background processes. |
png pdf |
Figure 3-b:
From upper to lower, expected and observed distributions of photon $ p_{\mathrm{T}} $, transverse mass of W boson candidate, invariant mass of jet and photon, and reconstructed top quark mass, for the electron (left) and muon (right) channels in SR2. For presentational purposes, the $ \mathcal{\mathrm{t}\mathrm{u}\gamma} $ signal distributions are normalized to a cross section corresponding to $ \kappa_{\mathcal{\mathrm{t}\mathrm{u}\gamma}}= $ 0.2 and are superimposed on the background expectations. The $ \mathcal{\mathrm{t}\mathrm{c}\gamma} $ distributions are not shown as they are the same as the $ \mathcal{\mathrm{t}\mathrm{u}\gamma} $ distributions. The last bins include overflows. The vertical bars on the points depict the data statistical uncertainties and the hatched bands show the combined statistical and systematic uncertainties in the estimated background processes. |
png pdf |
Figure 3-c:
From upper to lower, expected and observed distributions of photon $ p_{\mathrm{T}} $, transverse mass of W boson candidate, invariant mass of jet and photon, and reconstructed top quark mass, for the electron (left) and muon (right) channels in SR2. For presentational purposes, the $ \mathcal{\mathrm{t}\mathrm{u}\gamma} $ signal distributions are normalized to a cross section corresponding to $ \kappa_{\mathcal{\mathrm{t}\mathrm{u}\gamma}}= $ 0.2 and are superimposed on the background expectations. The $ \mathcal{\mathrm{t}\mathrm{c}\gamma} $ distributions are not shown as they are the same as the $ \mathcal{\mathrm{t}\mathrm{u}\gamma} $ distributions. The last bins include overflows. The vertical bars on the points depict the data statistical uncertainties and the hatched bands show the combined statistical and systematic uncertainties in the estimated background processes. |

png pdf |
Figure 3-d:
From upper to lower, expected and observed distributions of photon $ p_{\mathrm{T}} $, transverse mass of W boson candidate, invariant mass of jet and photon, and reconstructed top quark mass, for the electron (left) and muon (right) channels in SR2. For presentational purposes, the $ \mathcal{\mathrm{t}\mathrm{u}\gamma} $ signal distributions are normalized to a cross section corresponding to $ \kappa_{\mathcal{\mathrm{t}\mathrm{u}\gamma}}= $ 0.2 and are superimposed on the background expectations. The $ \mathcal{\mathrm{t}\mathrm{c}\gamma} $ distributions are not shown as they are the same as the $ \mathcal{\mathrm{t}\mathrm{u}\gamma} $ distributions. The last bins include overflows. The vertical bars on the points depict the data statistical uncertainties and the hatched bands show the combined statistical and systematic uncertainties in the estimated background processes. |

png pdf |
Figure 3-e:
From upper to lower, expected and observed distributions of photon $ p_{\mathrm{T}} $, transverse mass of W boson candidate, invariant mass of jet and photon, and reconstructed top quark mass, for the electron (left) and muon (right) channels in SR2. For presentational purposes, the $ \mathcal{\mathrm{t}\mathrm{u}\gamma} $ signal distributions are normalized to a cross section corresponding to $ \kappa_{\mathcal{\mathrm{t}\mathrm{u}\gamma}}= $ 0.2 and are superimposed on the background expectations. The $ \mathcal{\mathrm{t}\mathrm{c}\gamma} $ distributions are not shown as they are the same as the $ \mathcal{\mathrm{t}\mathrm{u}\gamma} $ distributions. The last bins include overflows. The vertical bars on the points depict the data statistical uncertainties and the hatched bands show the combined statistical and systematic uncertainties in the estimated background processes. |
png pdf |
Figure 3-f:
From upper to lower, expected and observed distributions of photon $ p_{\mathrm{T}} $, transverse mass of W boson candidate, invariant mass of jet and photon, and reconstructed top quark mass, for the electron (left) and muon (right) channels in SR2. For presentational purposes, the $ \mathcal{\mathrm{t}\mathrm{u}\gamma} $ signal distributions are normalized to a cross section corresponding to $ \kappa_{\mathcal{\mathrm{t}\mathrm{u}\gamma}}= $ 0.2 and are superimposed on the background expectations. The $ \mathcal{\mathrm{t}\mathrm{c}\gamma} $ distributions are not shown as they are the same as the $ \mathcal{\mathrm{t}\mathrm{u}\gamma} $ distributions. The last bins include overflows. The vertical bars on the points depict the data statistical uncertainties and the hatched bands show the combined statistical and systematic uncertainties in the estimated background processes. |

png pdf |
Figure 3-g:
From upper to lower, expected and observed distributions of photon $ p_{\mathrm{T}} $, transverse mass of W boson candidate, invariant mass of jet and photon, and reconstructed top quark mass, for the electron (left) and muon (right) channels in SR2. For presentational purposes, the $ \mathcal{\mathrm{t}\mathrm{u}\gamma} $ signal distributions are normalized to a cross section corresponding to $ \kappa_{\mathcal{\mathrm{t}\mathrm{u}\gamma}}= $ 0.2 and are superimposed on the background expectations. The $ \mathcal{\mathrm{t}\mathrm{c}\gamma} $ distributions are not shown as they are the same as the $ \mathcal{\mathrm{t}\mathrm{u}\gamma} $ distributions. The last bins include overflows. The vertical bars on the points depict the data statistical uncertainties and the hatched bands show the combined statistical and systematic uncertainties in the estimated background processes. |

png pdf |
Figure 3-h:
From upper to lower, expected and observed distributions of photon $ p_{\mathrm{T}} $, transverse mass of W boson candidate, invariant mass of jet and photon, and reconstructed top quark mass, for the electron (left) and muon (right) channels in SR2. For presentational purposes, the $ \mathcal{\mathrm{t}\mathrm{u}\gamma} $ signal distributions are normalized to a cross section corresponding to $ \kappa_{\mathcal{\mathrm{t}\mathrm{u}\gamma}}= $ 0.2 and are superimposed on the background expectations. The $ \mathcal{\mathrm{t}\mathrm{c}\gamma} $ distributions are not shown as they are the same as the $ \mathcal{\mathrm{t}\mathrm{u}\gamma} $ distributions. The last bins include overflows. The vertical bars on the points depict the data statistical uncertainties and the hatched bands show the combined statistical and systematic uncertainties in the estimated background processes. |

png pdf |
Figure 4:
The BDT output distributions for the data, the background predictions, and the expected $ \mathcal{\mathrm{t}\mathrm{u}\gamma} $ signal for electron (left) and muon (right) channels in SR1 (upper) and SR2 (lower). The signal distribution is normalized to a cross section corresponding to $ \kappa_{\mathcal{\mathrm{t}\mathrm{u}\gamma}}= $ 0.10 (0.01) for ST (TT) and is stacked on the background expectations. The first bins include underflows, and the last bins include overflows. The vertical bars on the points depict the data statistical uncertainties and the hatched bands show the combined statistical and systematic uncertainties in the estimated background processes. |

png pdf |
Figure 4-a:
The BDT output distributions for the data, the background predictions, and the expected $ \mathcal{\mathrm{t}\mathrm{u}\gamma} $ signal for electron (left) and muon (right) channels in SR1 (upper) and SR2 (lower). The signal distribution is normalized to a cross section corresponding to $ \kappa_{\mathcal{\mathrm{t}\mathrm{u}\gamma}}= $ 0.10 (0.01) for ST (TT) and is stacked on the background expectations. The first bins include underflows, and the last bins include overflows. The vertical bars on the points depict the data statistical uncertainties and the hatched bands show the combined statistical and systematic uncertainties in the estimated background processes. |

png pdf |
Figure 4-b:
The BDT output distributions for the data, the background predictions, and the expected $ \mathcal{\mathrm{t}\mathrm{u}\gamma} $ signal for electron (left) and muon (right) channels in SR1 (upper) and SR2 (lower). The signal distribution is normalized to a cross section corresponding to $ \kappa_{\mathcal{\mathrm{t}\mathrm{u}\gamma}}= $ 0.10 (0.01) for ST (TT) and is stacked on the background expectations. The first bins include underflows, and the last bins include overflows. The vertical bars on the points depict the data statistical uncertainties and the hatched bands show the combined statistical and systematic uncertainties in the estimated background processes. |

png pdf |
Figure 4-c:
The BDT output distributions for the data, the background predictions, and the expected $ \mathcal{\mathrm{t}\mathrm{u}\gamma} $ signal for electron (left) and muon (right) channels in SR1 (upper) and SR2 (lower). The signal distribution is normalized to a cross section corresponding to $ \kappa_{\mathcal{\mathrm{t}\mathrm{u}\gamma}}= $ 0.10 (0.01) for ST (TT) and is stacked on the background expectations. The first bins include underflows, and the last bins include overflows. The vertical bars on the points depict the data statistical uncertainties and the hatched bands show the combined statistical and systematic uncertainties in the estimated background processes. |

png pdf |
Figure 4-d:
The BDT output distributions for the data, the background predictions, and the expected $ \mathcal{\mathrm{t}\mathrm{u}\gamma} $ signal for electron (left) and muon (right) channels in SR1 (upper) and SR2 (lower). The signal distribution is normalized to a cross section corresponding to $ \kappa_{\mathcal{\mathrm{t}\mathrm{u}\gamma}}= $ 0.10 (0.01) for ST (TT) and is stacked on the background expectations. The first bins include underflows, and the last bins include overflows. The vertical bars on the points depict the data statistical uncertainties and the hatched bands show the combined statistical and systematic uncertainties in the estimated background processes. |

png pdf |
Figure 5:
The BDT output distributions for the data, the background predictions, and the expected $ \mathcal{\mathrm{t}\mathrm{c}\gamma} $ signal for electron (left) and muon (right) channels in SR1 (upper) and SR2 (lower). The signal distribution is normalized to a cross section corresponding to $ \kappa_{\mathcal{\mathrm{t}\mathrm{c}\gamma}}= $ 0.10 (0.01) for ST (TT) and is stacked on the background expectations. The first bins include underflows, and the last bins include overflows. The vertical bars on the points depict the data statistical uncertainties and the hatched bands show the combined statistical and systematic uncertainties in the estimated background processes. |

png pdf |
Figure 5-a:
The BDT output distributions for the data, the background predictions, and the expected $ \mathcal{\mathrm{t}\mathrm{c}\gamma} $ signal for electron (left) and muon (right) channels in SR1 (upper) and SR2 (lower). The signal distribution is normalized to a cross section corresponding to $ \kappa_{\mathcal{\mathrm{t}\mathrm{c}\gamma}}= $ 0.10 (0.01) for ST (TT) and is stacked on the background expectations. The first bins include underflows, and the last bins include overflows. The vertical bars on the points depict the data statistical uncertainties and the hatched bands show the combined statistical and systematic uncertainties in the estimated background processes. |

png pdf |
Figure 5-b:
The BDT output distributions for the data, the background predictions, and the expected $ \mathcal{\mathrm{t}\mathrm{c}\gamma} $ signal for electron (left) and muon (right) channels in SR1 (upper) and SR2 (lower). The signal distribution is normalized to a cross section corresponding to $ \kappa_{\mathcal{\mathrm{t}\mathrm{c}\gamma}}= $ 0.10 (0.01) for ST (TT) and is stacked on the background expectations. The first bins include underflows, and the last bins include overflows. The vertical bars on the points depict the data statistical uncertainties and the hatched bands show the combined statistical and systematic uncertainties in the estimated background processes. |

png pdf |
Figure 5-c:
The BDT output distributions for the data, the background predictions, and the expected $ \mathcal{\mathrm{t}\mathrm{c}\gamma} $ signal for electron (left) and muon (right) channels in SR1 (upper) and SR2 (lower). The signal distribution is normalized to a cross section corresponding to $ \kappa_{\mathcal{\mathrm{t}\mathrm{c}\gamma}}= $ 0.10 (0.01) for ST (TT) and is stacked on the background expectations. The first bins include underflows, and the last bins include overflows. The vertical bars on the points depict the data statistical uncertainties and the hatched bands show the combined statistical and systematic uncertainties in the estimated background processes. |

png pdf |
Figure 5-d:
The BDT output distributions for the data, the background predictions, and the expected $ \mathcal{\mathrm{t}\mathrm{c}\gamma} $ signal for electron (left) and muon (right) channels in SR1 (upper) and SR2 (lower). The signal distribution is normalized to a cross section corresponding to $ \kappa_{\mathcal{\mathrm{t}\mathrm{c}\gamma}}= $ 0.10 (0.01) for ST (TT) and is stacked on the background expectations. The first bins include underflows, and the last bins include overflows. The vertical bars on the points depict the data statistical uncertainties and the hatched bands show the combined statistical and systematic uncertainties in the estimated background processes. |
| Tables | |

png pdf |
Table 1:
Estimated background yields and observed event counts for the electron and muon channels in the signal regions SR1 and SR2. The uncertainties are the statistical and systematic contributions summed in quadrature. |

png pdf |
Table 2:
The expected and observed 95% CL upper limits using the $ \text{CL}_\text{s} $ criterion on the anomalous couplings $ \kappa_{\mathcal{\mathrm{t}\mathrm{u}\gamma}} $, $ \kappa_{\mathcal{\mathrm{t}\mathrm{c}\gamma}} $ and the corresponding branching fractions $ \mathcal{B}(\mathrm{t}\to\mathrm{u}\gamma) $ and $ \mathcal{B}(\mathrm{t}\to\mathrm{c}\gamma) $ from the combination of the electron and muon channels at NLO for SR1, SR2, and combined (SR1+SR2). |
| Summary |
| The results of a search for flavor changing neutral current (FCNC) interactions in the top quark sector associated with the $ \mathcal{\mathrm{t}\mathrm{u}\gamma} $ and $ \mathcal{\mathrm{t}\mathrm{c}\gamma} $ vertices have been presented. These vertices are probed by a simultaneous evaluation of single top quark production in association with a photon and top quark pair production with one of the top quarks decaying via FCNC. The search is performed using proton-proton collisions at a center-of-mass energy of 13 TeV, corresponding to an integrated luminosity of 138 fb$ ^{-1} $, collected by the CMS detector at the LHC. The results are in agreement with the standard model prediction. Upper limits are set at 95% confidence level on the anomalous FCNC couplings of $ \kappa_{\mathcal{\mathrm{t}\mathrm{u}\gamma}} < 6.2\times10^{-3} $ and $ \kappa_{\mathcal{\mathrm{t}\mathrm{c}\gamma}} < 7.7\times10^{-3} $. The upper limits on the corresponding branching fractions are $ \mathcal{B}(\mathrm{t}\to\mathrm{u}\gamma) < 0.95\times10^{-5} $ and $ \mathcal{B}(\mathrm{t}\to\mathrm{c}\gamma) < 1.51\times10^{-5} $. The obtained limit for $ \mathcal{B}(\mathrm{t}\to\mathrm{u}\gamma) $ is similar to the current best limit from the ATLAS experiment [14], while the limit for $ \mathcal{B}(\mathrm{t}\to\mathrm{c}\gamma) $ is significantly tighter. |
| References | ||||
| 1 | S. L. Glashow, J. Iliopoulos, and L. Maiani | Weak interactions with lepton-hadron symmetry | PRD 2 (1970) 1285 | |
| 2 | J. A. Aguilar-Saavedra | Top flavor-changing neutral interactions: Theoretical expectations and experimental detection | in Proc. Final Meeting of the European Union Network Particle Physics Phenomenology at High Energy Colliders: Montpellier, France, 2004 Acta Phys. Polon. B 35 (2004) 2695 |
hep-ph/0409342 |
| 3 | J. A. Aguilar-Saavedra and B. M. Nobre | Rare top decays $ {\mathrm{t}\to\mathrm{c}\gamma} $, $ {\mathrm{t}\to\mathrm{c}\mathrm{g}} $ | PLB 553 (2003) 251 | hep-ph/0210360 |
| 4 | F. Larios, R. Martinez, and M. A. Perez | New physics effects in the flavor-changing neutral couplings of the top quark | Int. J. Mod. Phys. A 21 (2006) 3473 | hep-ph/0605003 |
| 5 | G. Couture, M. Frank, and H. König | Supersymmetric QCD flavor-changing top quark decay | PRD 56 (1997) 4213 | hep-ph/9704305 |
| 6 | R. A. Diaz, R. Martinez, and J. A. Rodriguez | The rare decay $ {\mathrm{t}\to\mathrm{c}\gamma} $ in the general 2HDM type III | hep-ph/0103307 | |
| 7 | G. Lu, F. Yin, X. Wang, and L. Wan | Rare top quark decays $ {\mathrm{t}\to\mathrm{c}\mathrm{V}} $ in the top-color-assisted technicolor model | PRD 68 (2003) 015002 | hep-ph/0303122 |
| 8 | J. A. Aguilar-Saavedra | A minimal set of top anomalous couplings | NPB 812 (2009) 181 | 0811.3842 |
| 9 | CDF Collaboration | Search for flavor-changing neutral current decays of the top quark in $ {\mathrm{p}\overline{\mathrm{p}}} $ collisions at $ \sqrt{s}= $ 1.8 TeV | PRL 80 (1998) 2525 | |
| 10 | L3 Collaboration | Search for single top production at LEP | PLB 549 (2002) 290 | hep-ex/0210041 |
| 11 | H1 Collaboration | Search for single top quark production at HERA | PLB 678 (2009) 450 | 0904.3876 |
| 12 | ZEUS Collaboration | Search for single-top production in $ {\mathrm{e}\mathrm{p}} $ collisions at HERA | PLB 708 (2012) 27 | 1111.3901 |
| 13 | CMS Collaboration | Search for anomalous single top quark production in association with a photon in $ {\mathrm{p}\mathrm{p}} $ collisions at $ \sqrt{s}= $ 8 TeV | JHEP 04 (2016) 035 | CMS-TOP-14-003 1511.03951 |
| 14 | ATLAS Collaboration | Search for flavour-changing neutral-current couplings between the top quark and the photon with the ATLAS detector at $ \sqrt{s}= $ 13 TeV | PLB 842 (2023) 137379 | 2205.02537 |
| 15 | CMS Collaboration | HEPData record for this analysis | link | |
| 16 | CMS Collaboration | Performance of photon reconstruction and identification with the CMS detector in proton-proton collisions at $ \sqrt{s}= $ 8 TeV | JINST 10 (2015) P08010 | CMS-EGM-14-001 1502.02702 |
| 17 | CMS Collaboration | Electron and photon reconstruction and identification with the CMS experiment at the CERN LHC | JINST 16 (2021) P05014 | CMS-EGM-17-001 2012.06888 |
| 18 | CMS Collaboration | Performance of the CMS muon detector and muon reconstruction with proton-proton collisions at $ \sqrt{s}= $ 13 TeV | JINST 13 (2018) P06015 | CMS-MUO-16-001 1804.04528 |
| 19 | CMS Collaboration | Performance of the CMS Level-1 trigger in proton-proton collisions at $ \sqrt{s}= $ 13 TeV | JINST 15 (2020) P10017 | CMS-TRG-17-001 2006.10165 |
| 20 | CMS Collaboration | The CMS trigger system | JINST 12 (2017) P01020 | CMS-TRG-12-001 1609.02366 |
| 21 | CMS Collaboration | The CMS experiment at the CERN LHC | JINST 3 (2008) S08004 | |
| 22 | J. Alwall et al. | The automated computation of tree-level and next-to-leading order differential cross sections, and their matching to parton shower simulations | JHEP 07 (2014) 079 | 1405.0301 |
| 23 | M. Czakon and A. Mitov | \textsctop++: a program for the calculation of the top-pair cross-section at hadron colliders | Comput. Phys. Commun. 185 (2014) 2930 | 1112.5675 |
| 24 | Y. Zhang et al. | Next-to-leading order QCD predictions for $ {\mathrm{t}\gamma} $ associated production via model-independent flavor-changing neutral-current couplings at hadron colliders | PRD 83 (2011) 094003 | 1101.5346 |
| 25 | P. Nason | A new method for combining NLO QCD with shower Monte Carlo algorithms | JHEP 11 (2004) 040 | hep-ph/0409146 |
| 26 | S. Frixione, P. Nason, and C. Oleari | Matching NLO QCD computations with parton shower simulations: the POWHEG method | JHEP 11 (2007) 070 | 0709.2092 |
| 27 | S. Alioli, P. Nason, C. Oleari, and E. Re | A general framework for implementing NLO calculations in shower Monte Carlo programs: the POWHEG \textscbox | JHEP 06 (2010) 043 | 1002.2581 |
| 28 | T. Sjöstrand et al. | An introduction to PYTHIA8.2 | Comput. Phys. Commun. 191 (2015) 159 | 1410.3012 |
| 29 | CMS Collaboration | Event generator tunes obtained from underlying event and multiparton scattering measurements | EPJC 76 (2016) 155 | CMS-GEN-14-001 1512.00815 |
| 30 | CMS Collaboration | Extraction and validation of a new set of CMS PYTHIA8 tunes from underlying-event measurements | EPJC 80 (2020) 4 | CMS-GEN-17-001 1903.12179 |
| 31 | NNPDF Collaboration | Parton distributions for the LHC run II | JHEP 04 (2015) 040 | 1410.8849 |
| 32 | NNPDF Collaboration | Parton distributions from high-precision collider data | EPJC 77 (2017) 663 | 1706.00428 |
| 33 | GEANT4 Collaboration | GEANT 4---a simulation toolkit | NIM A 506 (2003) 250 | |
| 34 | CMS Collaboration | Measurement of the inelastic proton-proton cross section at $ \sqrt{s}= $ 13 TeV | JHEP 07 (2018) 161 | CMS-FSQ-15-005 1802.02613 |
| 35 | CMS Collaboration | Particle-flow reconstruction and global event description with the CMS detector | JINST 12 (2017) P10003 | CMS-PRF-14-001 1706.04965 |
| 36 | CMS Collaboration | Technical proposal for the Phase-II upgrade of the Compact Muon Solenoid | CMS Technical Proposal CERN-LHCC-2015-010, CMS-TDR-15-02, 2015 CDS |
|
| 37 | CMS Collaboration | Performance of electron reconstruction and selection with the CMS detector in proton-proton collisions at $ \sqrt{s}= $ 8 TeV | JINST 10 (2015) P06005 | CMS-EGM-13-001 1502.02701 |
| 38 | M. Cacciari, G. P. Salam, and G. Soyez | The anti-$ k_{\mathrm{T}} $ jet clustering algorithm | JHEP 04 (2008) 063 | 0802.1189 |
| 39 | M. Cacciari, G. P. Salam, and G. Soyez | FASTJET user manual | EPJC 72 (2012) 1896 | 1111.6097 |
| 40 | CMS Collaboration | Jet energy scale and resolution in the CMS experiment in $ {\mathrm{p}\mathrm{p}} $ collisions at 8 TeV | JINST 12 (2017) P02014 | CMS-JME-13-004 1607.03663 |
| 41 | CMS Collaboration | Jet algorithms performance in 13 TeV data | CMS Physics Analysis Summary, 2017 CMS-PAS-JME-16-003 |
CMS-PAS-JME-16-003 |
| 42 | CMS Collaboration | Performance of missing transverse momentum reconstruction in proton-proton collisions at $ \sqrt{s}= $ 13 TeV using the CMS detector | JINST 14 (2019) P07004 | CMS-JME-17-001 1903.06078 |
| 43 | CMS Collaboration | Identification of heavy-flavour jets with the CMS detector in $ {\mathrm{p}\mathrm{p}} $ collisions at 13 TeV | JINST 13 (2018) P05011 | CMS-BTV-16-002 1712.07158 |
| 44 | B. Vormwald on behalf of the CMS Collaboration | The CMS Phase-1 pixel detector---experience and lessons learned from two years of operation | in Proc. 9th International Workshop on Semiconductor Pixel Detectors for Particles and Imaging (PIXEL ): Taipei, Taiwan, 2019 JINST 14 (2019) C07008 |
|
| 45 | Particle Data Group, R. L. Workman et al. | Review of particle physics | Prog. Theor. Exp. Phys. 2022 (2022) 083C01 | |
| 46 | \DZERO Collaboration | Observation of single top-quark production | PRL 103 (2009) 092001 | 0903.0850 |
| 47 | CDF Collaboration | Observation of electroweak single top-quark production | PRL 103 (2009) 092002 | 0903.0885 |
| 48 | CMS Collaboration | Measurement of the $ t $-channel single top quark production cross section in $ {\mathrm{p}\mathrm{p}} $ collisions at $ \sqrt{s}= $ 7 TeV | PRL 107 (2011) 091802 | CMS-TOP-10-008 1106.3052 |
| 49 | CMS Collaboration | Search for new physics with same-sign isolated dilepton events with jets and missing transverse energy at the LHC | JHEP 06 (2011) 077 | CMS-SUS-10-004 1104.3168 |
| 50 | A. Hoecker et al. | TMVA: Toolkit for multivariate data analysis | PoS ACAT (2007) 040 | physics/0703039 |
| 51 | S. Khatibi and M. Mohammadi Najafabadi | Probing the anomalous FCNC interactions in top-higgs boson final state and the charge ratio approach | PRD 89 (2014) 054011 | 1402.3073 |
| 52 | CMS Collaboration | Precision luminosity measurement in proton-proton collisions at $ \sqrt{s}= $ 13 TeV in 2015 and 2016 at CMS | EPJC 81 (2021) 800 | CMS-LUM-17-003 2104.01927 |
| 53 | CMS Collaboration | CMS luminosity measurement for the 2017 data-taking period at $ \sqrt{s}= $ 13 TeV | CMS Physics Analysis Summary, 2018 CMS-PAS-LUM-17-004 |
CMS-PAS-LUM-17-004 |
| 54 | CMS Collaboration | CMS luminosity measurement for the 2018 data-taking period at $ \sqrt{s}= $ 13 TeV | CMS Physics Analysis Summary, 2019 CMS-PAS-LUM-18-002 |
CMS-PAS-LUM-18-002 |
| 55 | CMS Collaboration | Pileup mitigation at CMS in 13 TeV data | JINST 15 (2020) P09018 | CMS-JME-18-001 2003.00503 |
| 56 | CMS Collaboration | Measurement of the Higgs boson production rate in association with top quarks in final states with electrons, muons, and hadronically decaying tau leptons at $ \sqrt{s}= $ 13 TeV | EPJC 81 (2021) 378 | CMS-HIG-19-008 2011.03652 |
| 57 | CMS Collaboration | $ {\mathrm{W^+}\mathrm{W^-}} $ boson pair production in proton-proton collisions at $ \sqrt{s}= $ 13 TeV | PRD 102 (2020) 092001 | CMS-SMP-18-004 2009.00119 |
| 58 | CMS Collaboration | Measurements of $ {\mathrm{p}\mathrm{p}\to\mathrm{Z}\mathrm{Z}} $ production cross sections and constraints on anomalous triple gauge couplings at $ \sqrt{s}= $ 13 TeV | EPJC 81 (2021) 200 | CMS-SMP-19-001 2009.01186 |
| 59 | CMS Collaboration | Measurements of production cross sections of $ {\mathrm{W}\mathrm{Z}} $ and same-sign $ {\mathrm{W}\mathrm{W}} $ boson pairs in association with two jets in proton-proton collisions at $ \sqrt{s}= $ 13 TeV | PLB 809 (2020) 135710 | CMS-SMP-19-012 2005.01173 |
| 60 | ATLAS Collaboration | Observation of single-top-quark production in association with a photon using the ATLAS detector | PRL 131 (2023) 181901 | 2302.01283 |
| 61 | CMS Collaboration | Measurement of the production cross section for single top quarks in association with W bosons in proton-proton collisions at $ \sqrt{s}= $ 13 TeV | JHEP 10 (2018) 117 | CMS-TOP-17-018 1805.07399 |
| 62 | N. Kidonakis | Theoretical results for electroweak-boson and single-top production | in 23rd International Workshop on Deep-Inelastic Scattering and Related Subjects (DIS ): Dallas TX, USA, 2015 PoS (DIS2015) 170 |
1506.04072 |
| 63 | J. Butterworth et al. | PDF4LHC recommendations for LHC Run II | JPG 43 (2016) 023001 | 1510.03865 |
| 64 | A. L. Read | Presentation of search results: The $ \text{CL}_\text{s} $ technique | JPG 28 (2002) 2693 | |
| 65 | T. Junk | Confidence level computation for combining searches with small statistics | NIM A 434 (1999) 435 | hep-ex/9902006 |
| 66 | G. Cowan, K. Cranmer, E. Gross, and O. Vitells | Asymptotic formulae for likelihood-based tests of new physics | EPJC 71 (2011) 1554 | 1007.1727 |
|
|
Compact Muon Solenoid LHC, CERN |
|

|

|

|

|

|