

Compact Muon Solenoid
LHC, CERN
| CMS-B2G-19-002 ; CERN-EP-2021-159 | ||
| Search for heavy resonances decaying to WW, WZ, or WH boson pairs in the lepton plus merged jet final state in proton-proton collisions at $\sqrt{s} = $ 13 TeV | ||
| CMS Collaboration | ||
| 13 September 2021 | ||
| Phys. Rev. D 105 (2022) 032008 | ||
| Abstract: A search for new heavy resonances decaying to pairs of bosons (WW, WZ, or WH) is presented. The analysis uses data from proton-proton collisions collected with the CMS detector at a center-of-mass energy of 13 TeV, corresponding to an integrated luminosity of 137 fb$^{-1}$. One of the bosons is required to be a W boson decaying to an electron or muon and a neutrino, while the other boson is required to be reconstructed as a single jet with mass and substructure compatible with a quark pair from a W, Z, or Higgs boson decay. The search is performed in the resonance mass range between 1.0 and 4.5 TeV and includes a specific search for resonances produced via vector boson fusion. The signal is extracted using a two-dimensional maximum likelihood fit to the jet mass and the diboson invariant mass distributions. No significant excess is observed above the estimated background. Model-independent upper limits on the production cross sections of spin-0, spin-1, and spin-2 heavy resonances are derived as functions of the resonance mass and are interpreted in the context of bulk radion, heavy vector triplet, and bulk graviton models. The reported bounds are the most stringent to date. | ||
| Links: e-print arXiv:2109.06055 [hep-ex] (PDF) ; CDS record ; inSPIRE record ; HepData record ; CADI line (restricted) ; | ||
| Figures | |
png pdf |
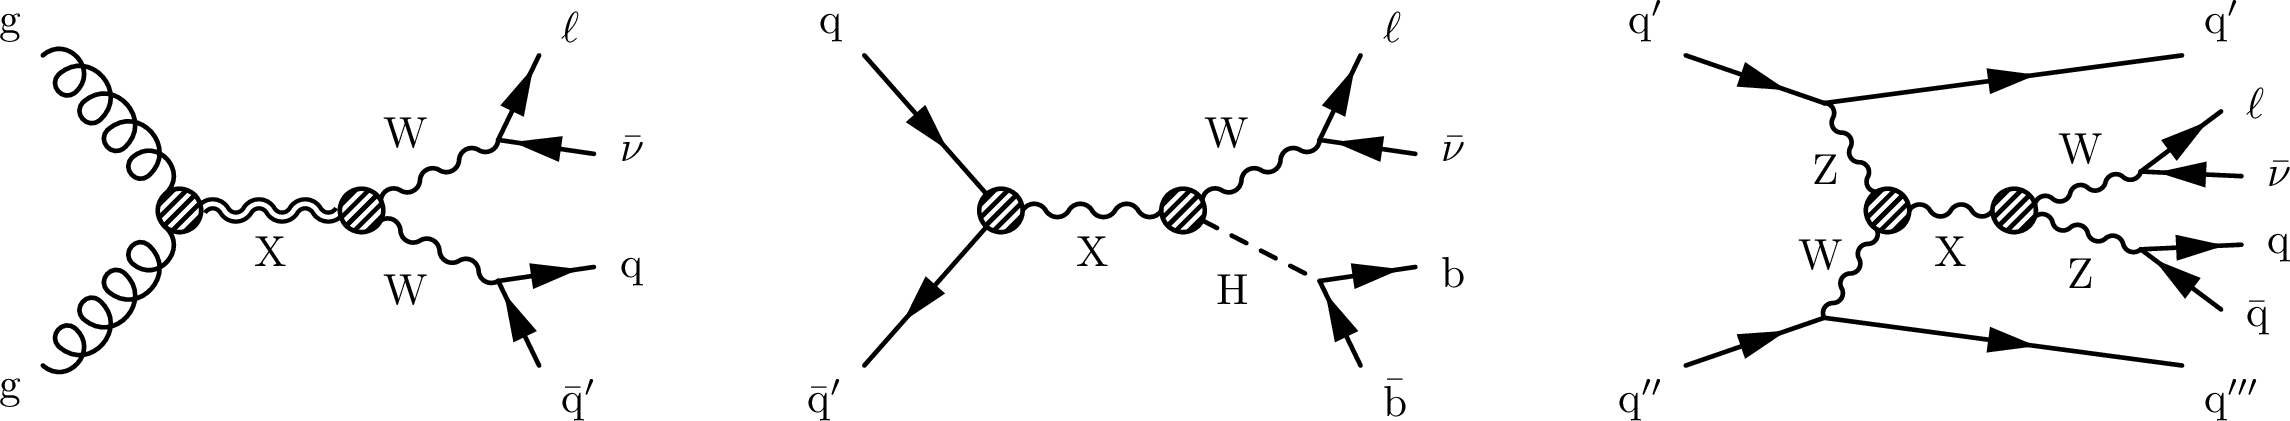
Figure 1:
Feynman diagrams for three of the processes studied in this paper: (left) ggF-produced, spin-2 resonance decaying to ${{\mathrm{W} \mathrm{W}} \,\to \,\nu {\mathrm{q} \mathrm{\bar{q}}} ^{\prime}} $; (center) DY-like, charged spin-1 resonance decaying to ${{\mathrm{W} \mathrm{H}} \,\to \,\nu {\mathrm{b} {}\mathrm{\bar{b}}}} $; (right) VBF-produced, charged spin-1 resonance decaying to ${{\mathrm{W} \mathrm{Z}} \,\to \,\nu {\mathrm{q} \mathrm{\bar{q}}}}$. |

png pdf |
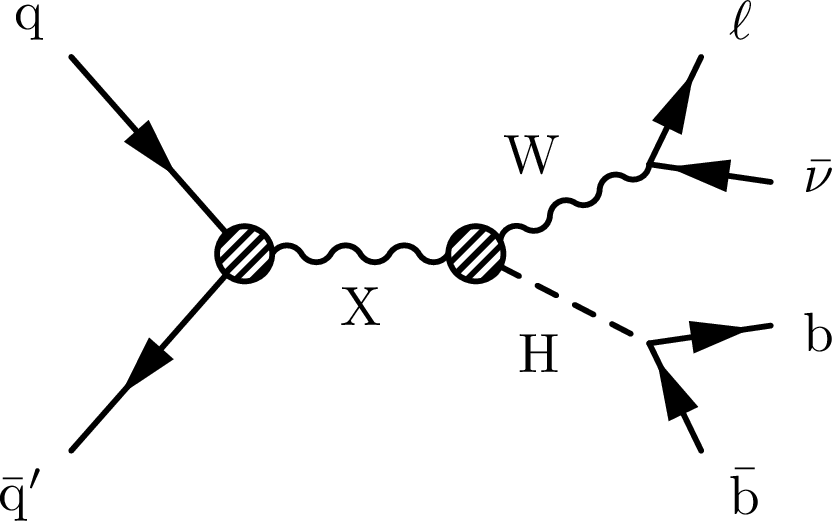
Figure 1-a:
Feynman diagrams for three of the processes studied in this paper: (left) ggF-produced, spin-2 resonance decaying to ${{\mathrm{W} \mathrm{W}} \,\to \,\nu {\mathrm{q} \mathrm{\bar{q}}} ^{\prime}} $; (center) DY-like, charged spin-1 resonance decaying to ${{\mathrm{W} \mathrm{H}} \,\to \,\nu {\mathrm{b} {}\mathrm{\bar{b}}}} $; (right) VBF-produced, charged spin-1 resonance decaying to ${{\mathrm{W} \mathrm{Z}} \,\to \,\nu {\mathrm{q} \mathrm{\bar{q}}}}$. |
png pdf |
Figure 1-b:
Feynman diagrams for three of the processes studied in this paper: (left) ggF-produced, spin-2 resonance decaying to ${{\mathrm{W} \mathrm{W}} \,\to \,\nu {\mathrm{q} \mathrm{\bar{q}}} ^{\prime}} $; (center) DY-like, charged spin-1 resonance decaying to ${{\mathrm{W} \mathrm{H}} \,\to \,\nu {\mathrm{b} {}\mathrm{\bar{b}}}} $; (right) VBF-produced, charged spin-1 resonance decaying to ${{\mathrm{W} \mathrm{Z}} \,\to \,\nu {\mathrm{q} \mathrm{\bar{q}}}}$. |
png pdf |
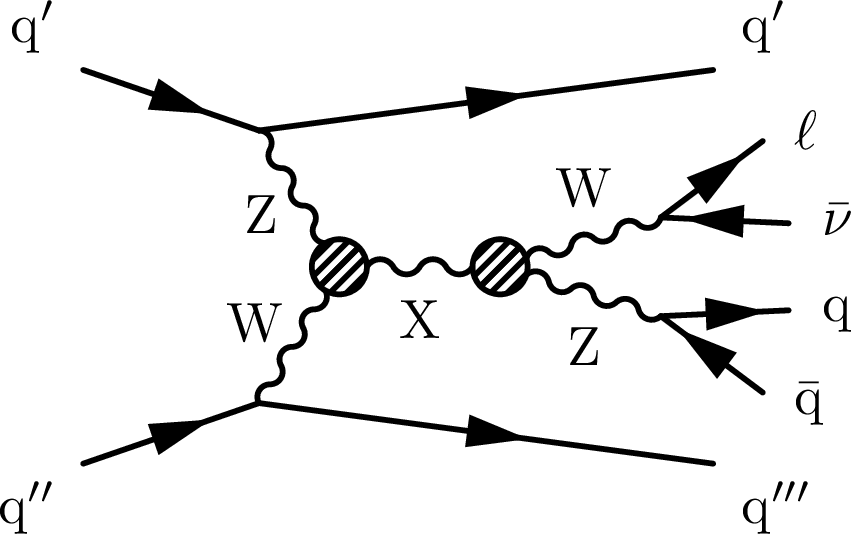
Figure 1-c:
Feynman diagrams for three of the processes studied in this paper: (left) ggF-produced, spin-2 resonance decaying to ${{\mathrm{W} \mathrm{W}} \,\to \,\nu {\mathrm{q} \mathrm{\bar{q}}} ^{\prime}} $; (center) DY-like, charged spin-1 resonance decaying to ${{\mathrm{W} \mathrm{H}} \,\to \,\nu {\mathrm{b} {}\mathrm{\bar{b}}}} $; (right) VBF-produced, charged spin-1 resonance decaying to ${{\mathrm{W} \mathrm{Z}} \,\to \,\nu {\mathrm{q} \mathrm{\bar{q}}}}$. |
png pdf |
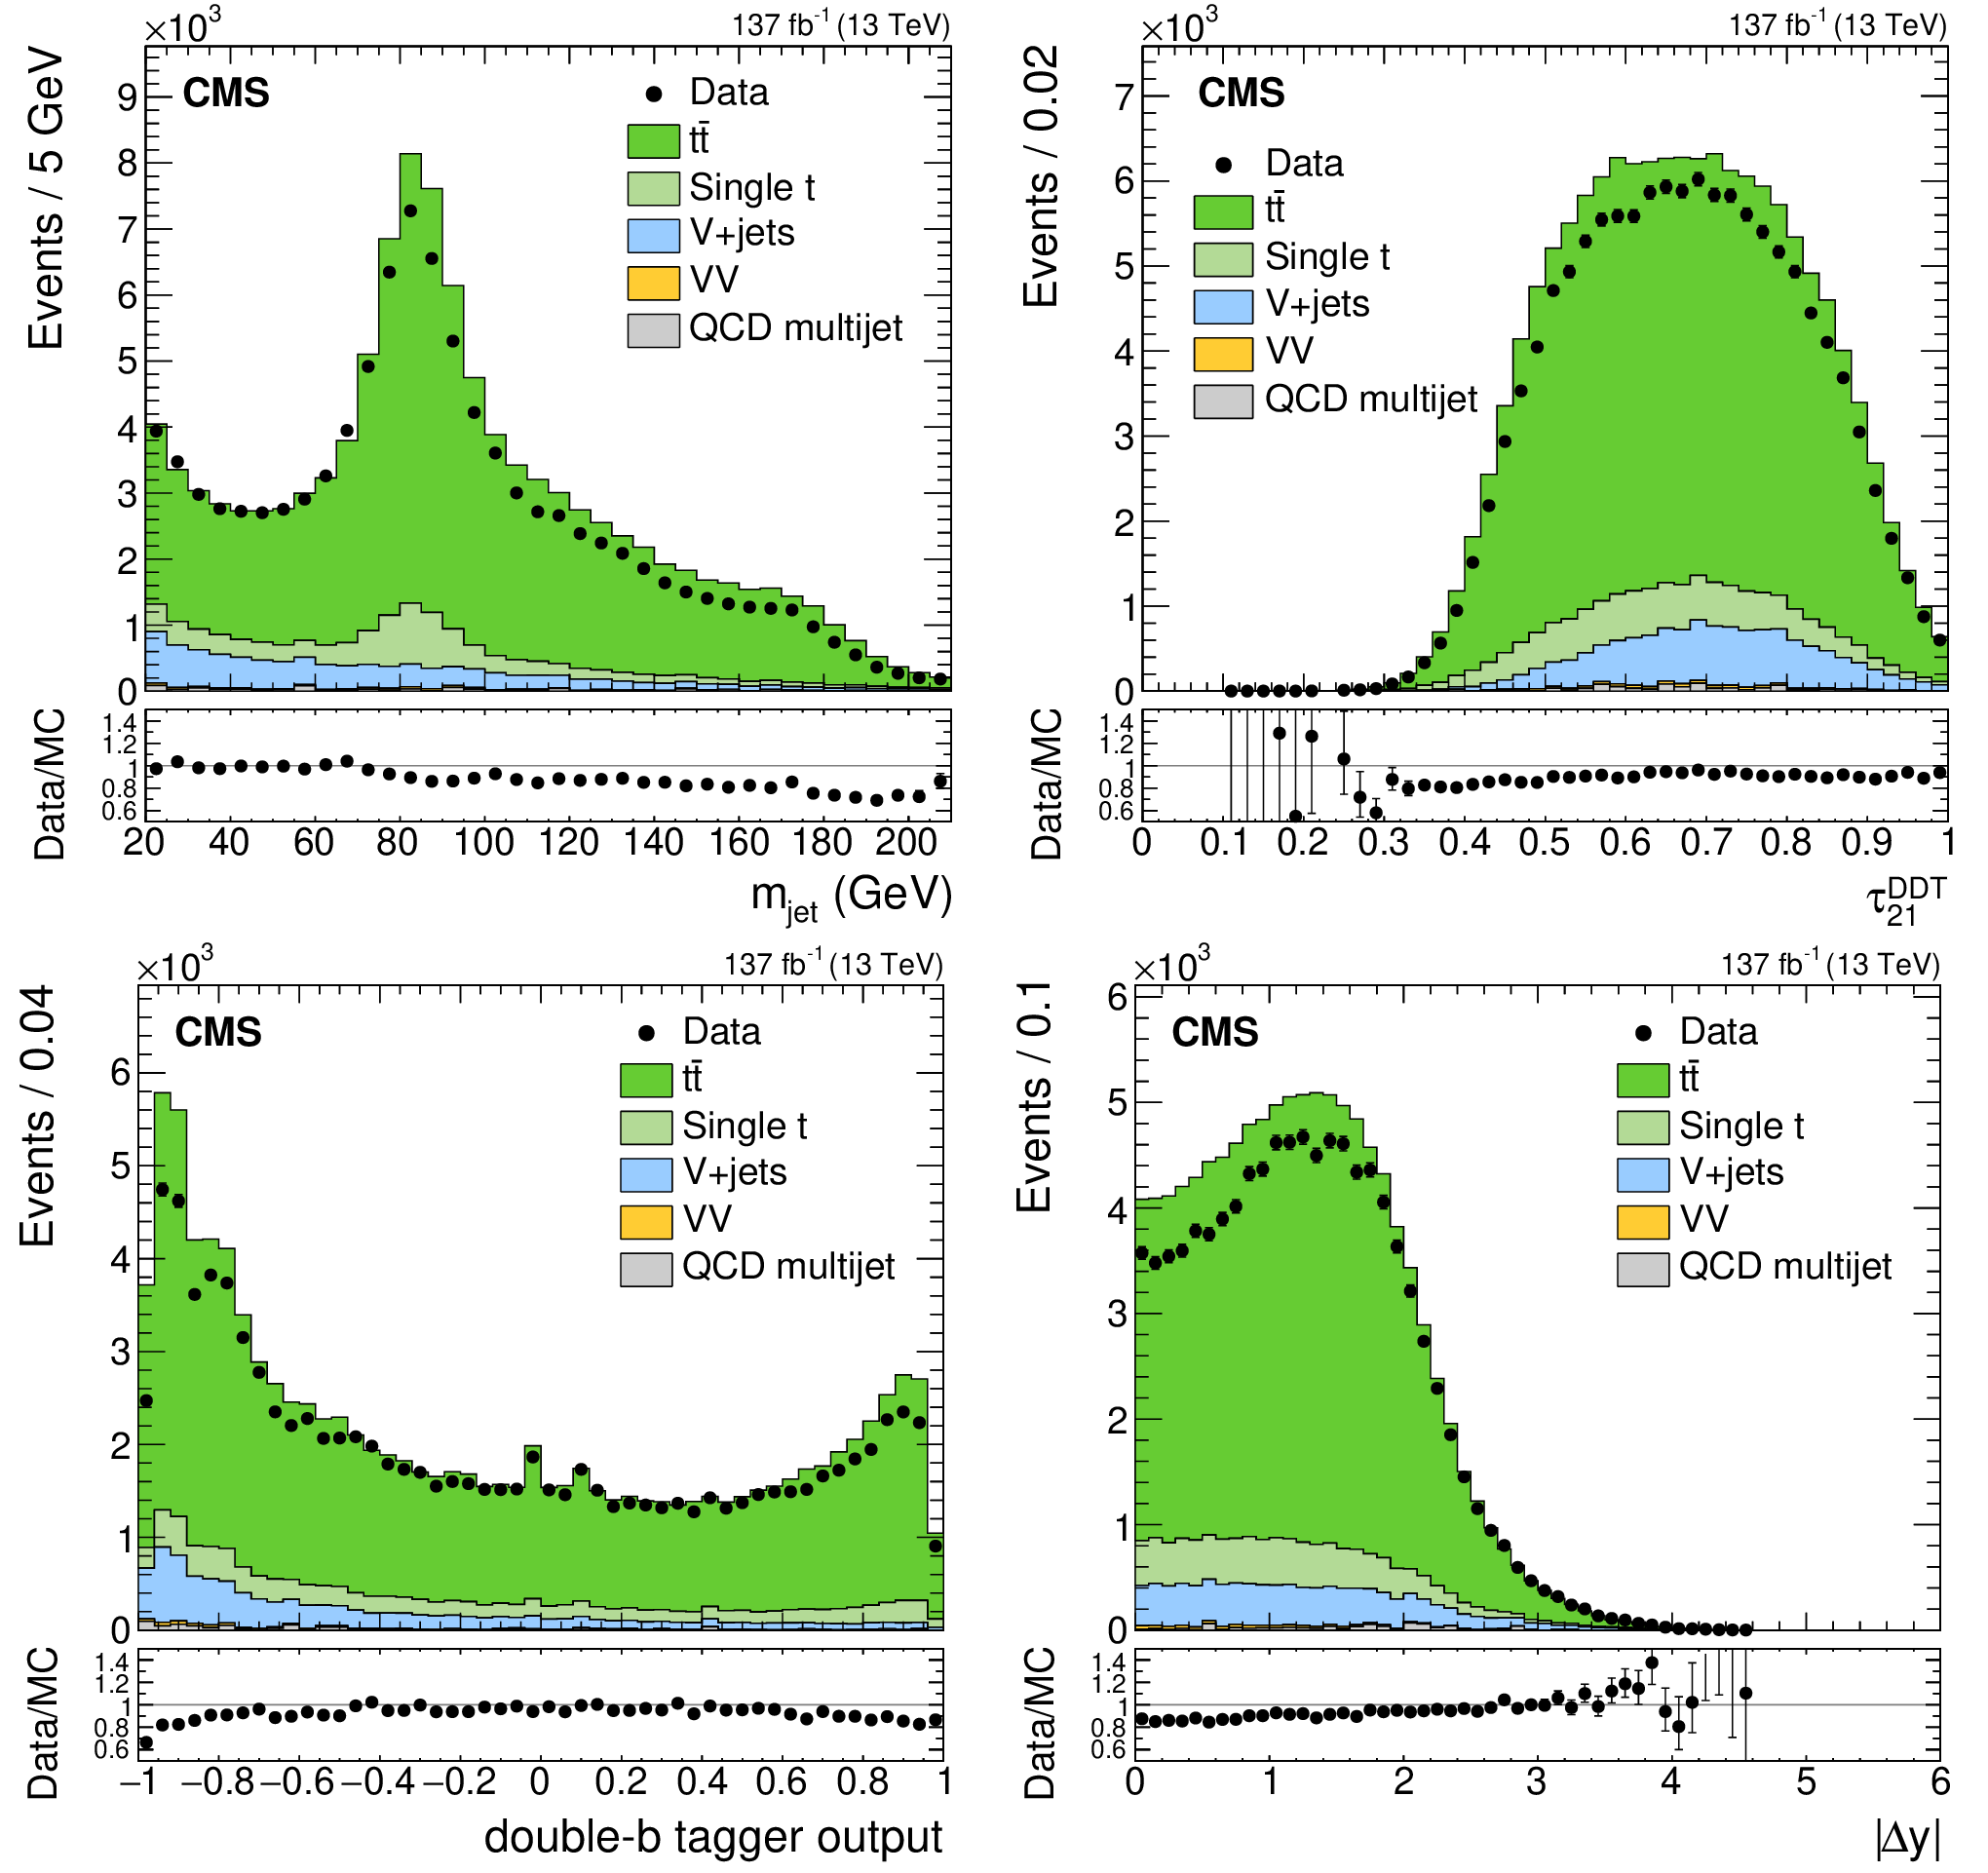
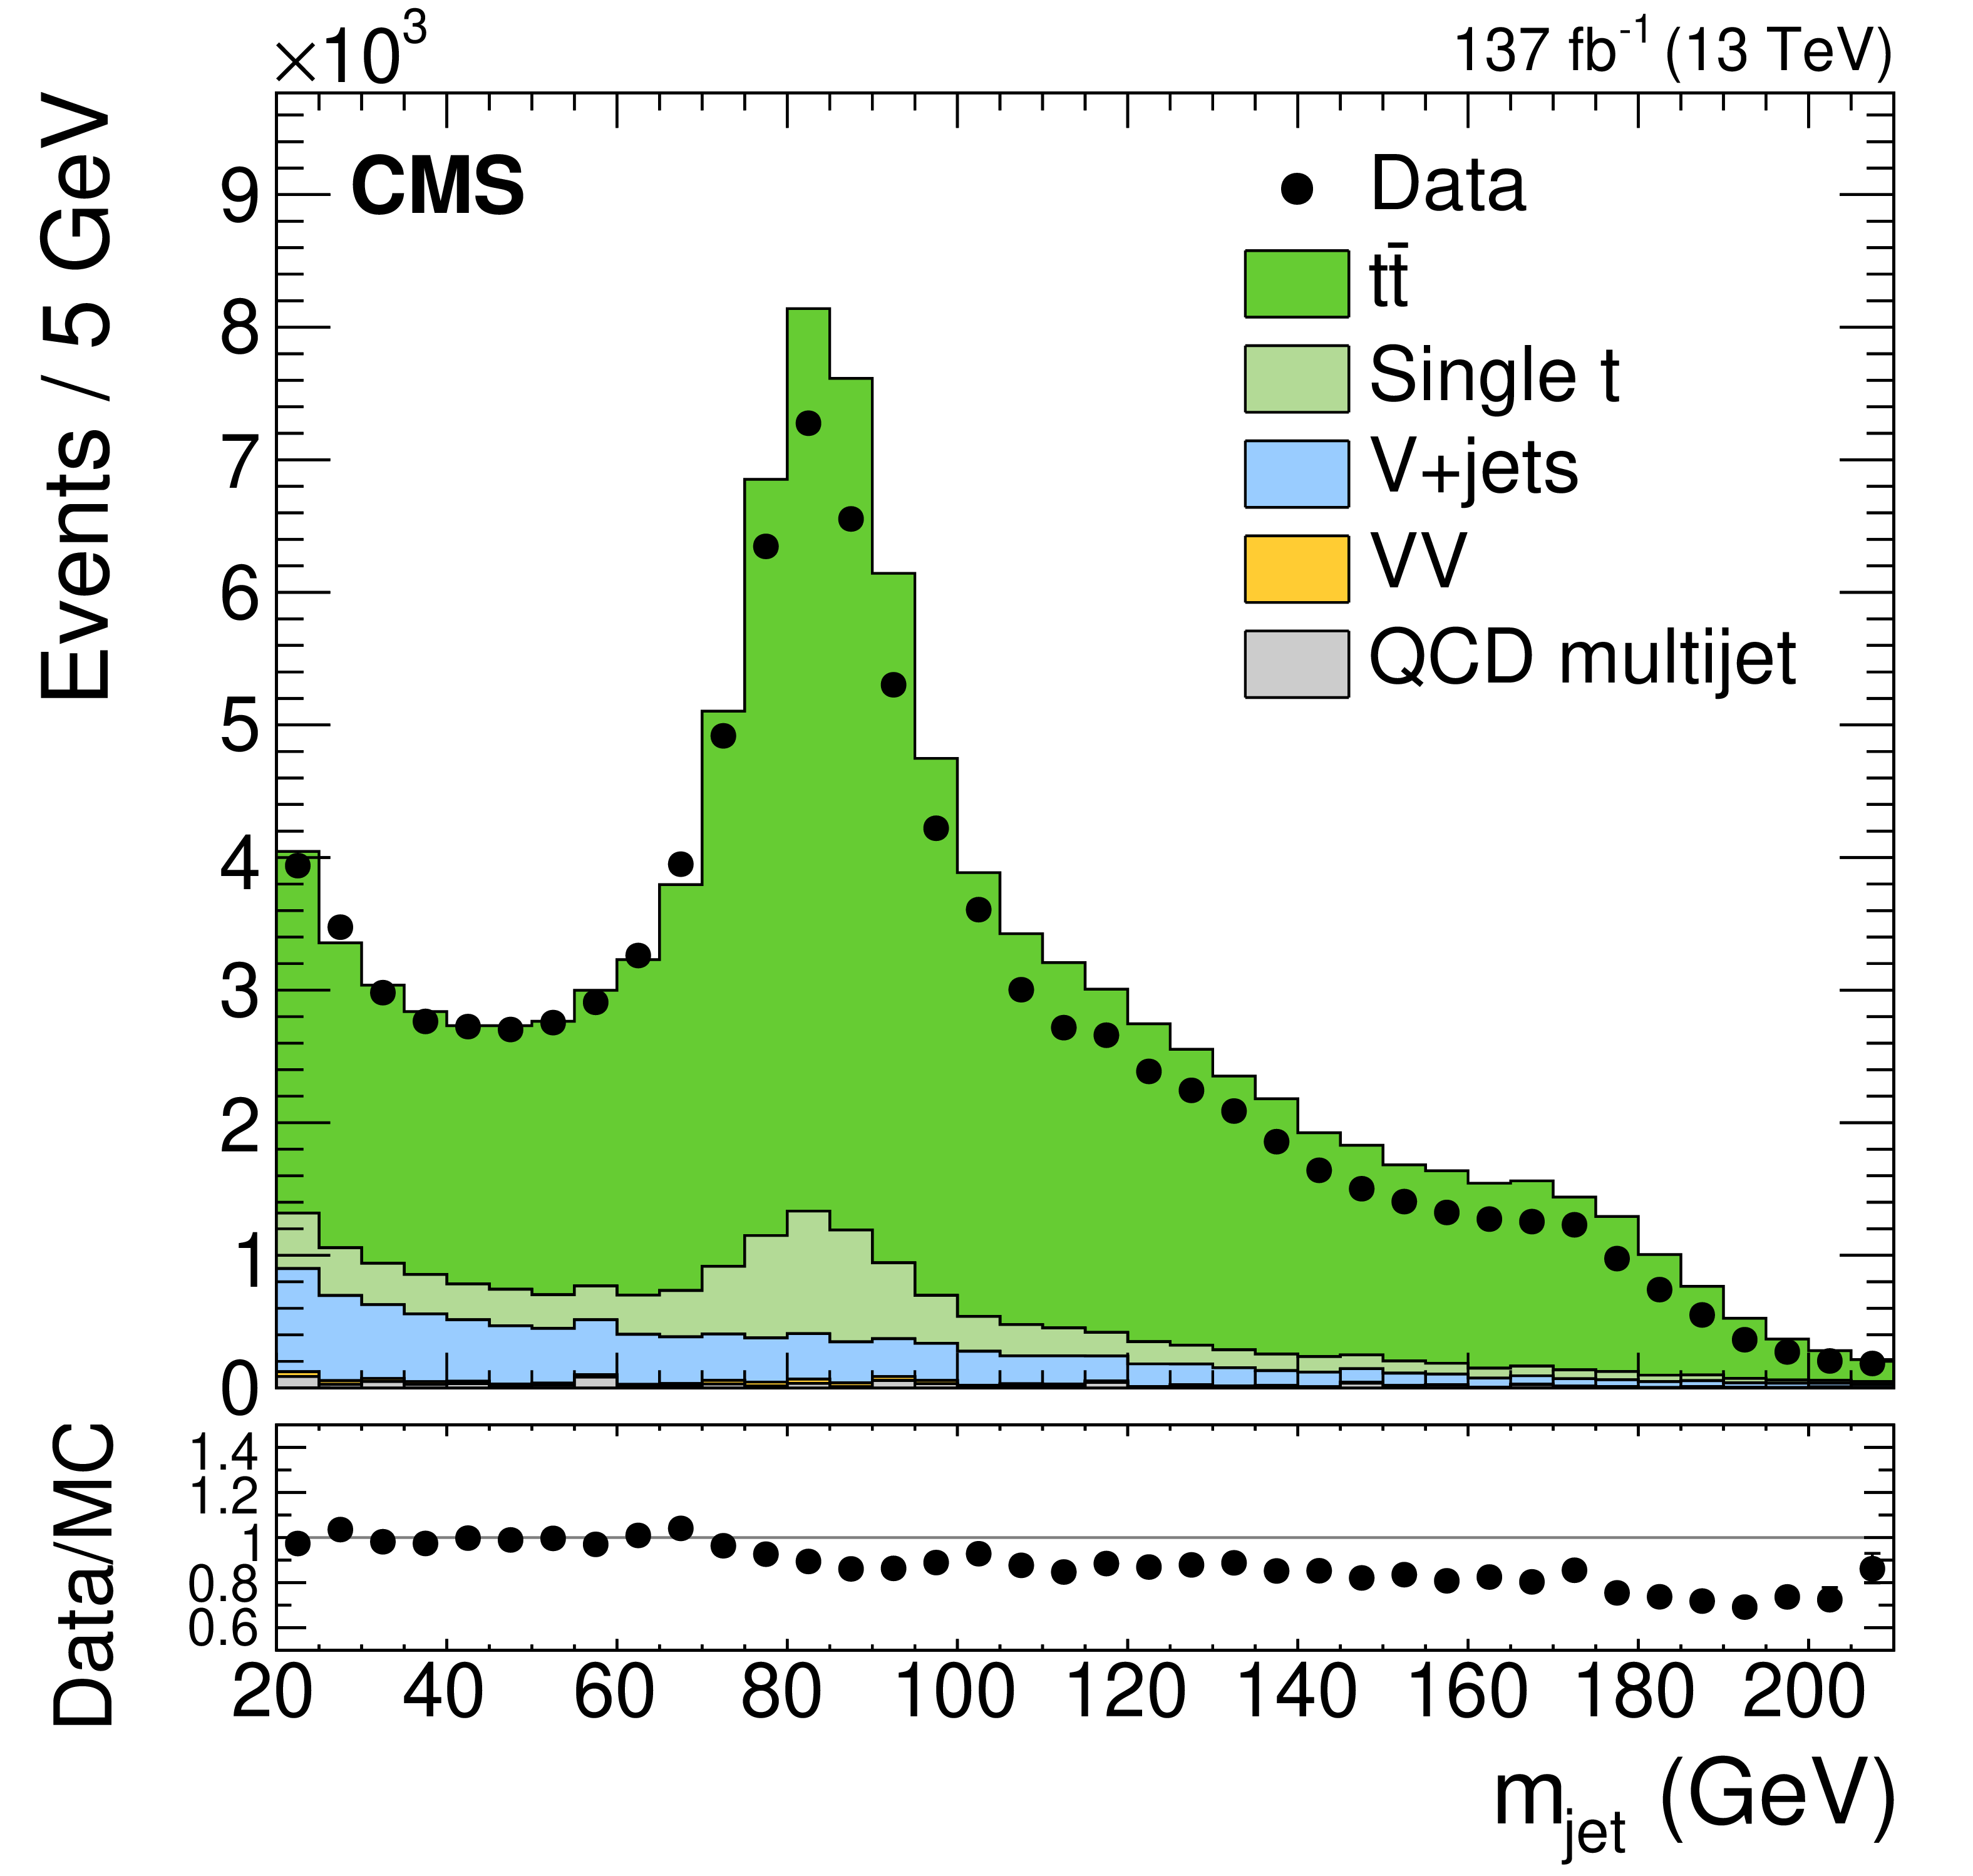
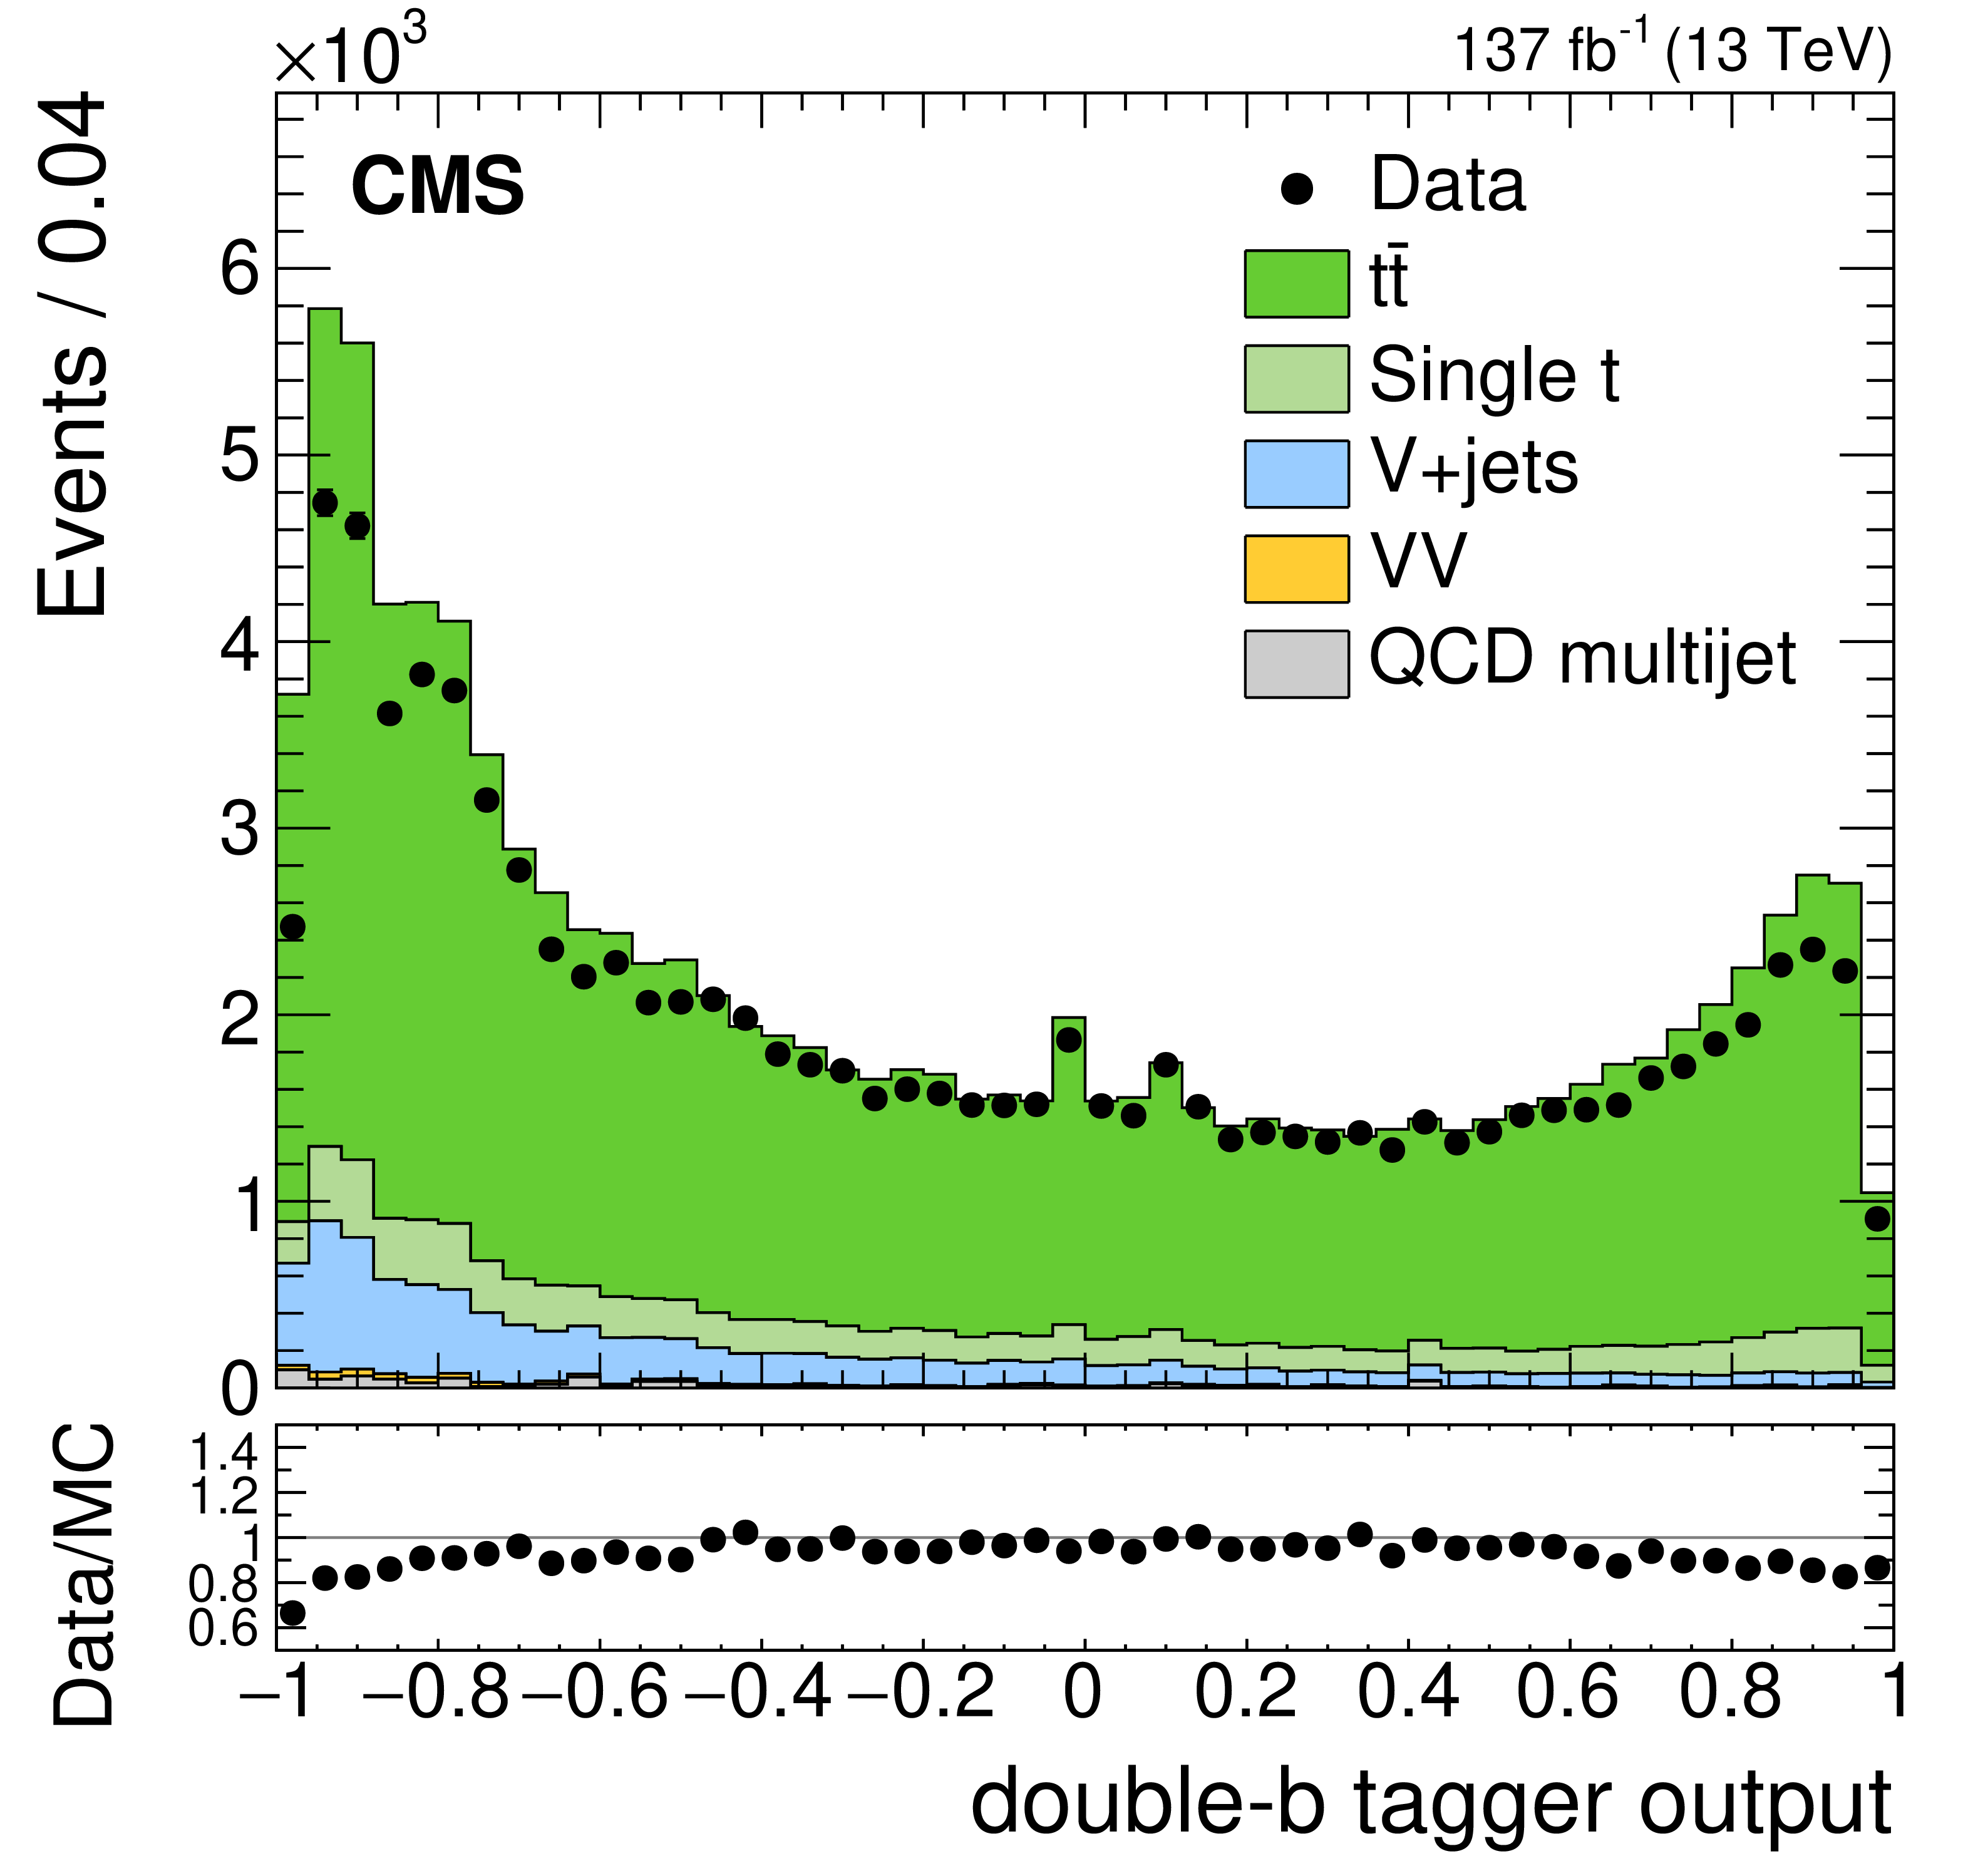
Figure 2:
Uncorrected distributions of the soft-drop jet mass ${m_\text {jet}}$ (upper left), mass-decorrelated $N$-subjettiness ratio ${\tau _{21}^\text {DDT}}$ (upper right), double-b tagger output (lower left), and difference in rapidity ${| \Delta y |}$ between the reconstructed bosons (lower right), for data and simulated events in the top quark enriched control region. The lower panels show the ratio of the data to the simulation. No event categorization is applied. The events with $ {\tau _{21}^\text {DDT}} > $ 0.80 are not shown in any distribution other than ${\tau _{21}^\text {DDT}}$ itself. The vertical bars correspond to the statistical uncertainties of the data. |
png pdf |
Figure 2-a:
Uncorrected distributions of the soft-drop jet mass ${m_\text {jet}}$ (upper left), mass-decorrelated $N$-subjettiness ratio ${\tau _{21}^\text {DDT}}$ (upper right), double-b tagger output (lower left), and difference in rapidity ${| \Delta y |}$ between the reconstructed bosons (lower right), for data and simulated events in the top quark enriched control region. The lower panels show the ratio of the data to the simulation. No event categorization is applied. The events with $ {\tau _{21}^\text {DDT}} > $ 0.80 are not shown in any distribution other than ${\tau _{21}^\text {DDT}}$ itself. The vertical bars correspond to the statistical uncertainties of the data. |

png pdf |
Figure 2-b:
Uncorrected distributions of the soft-drop jet mass ${m_\text {jet}}$ (upper left), mass-decorrelated $N$-subjettiness ratio ${\tau _{21}^\text {DDT}}$ (upper right), double-b tagger output (lower left), and difference in rapidity ${| \Delta y |}$ between the reconstructed bosons (lower right), for data and simulated events in the top quark enriched control region. The lower panels show the ratio of the data to the simulation. No event categorization is applied. The events with $ {\tau _{21}^\text {DDT}} > $ 0.80 are not shown in any distribution other than ${\tau _{21}^\text {DDT}}$ itself. The vertical bars correspond to the statistical uncertainties of the data. |
png pdf |
Figure 2-c:
Uncorrected distributions of the soft-drop jet mass ${m_\text {jet}}$ (upper left), mass-decorrelated $N$-subjettiness ratio ${\tau _{21}^\text {DDT}}$ (upper right), double-b tagger output (lower left), and difference in rapidity ${| \Delta y |}$ between the reconstructed bosons (lower right), for data and simulated events in the top quark enriched control region. The lower panels show the ratio of the data to the simulation. No event categorization is applied. The events with $ {\tau _{21}^\text {DDT}} > $ 0.80 are not shown in any distribution other than ${\tau _{21}^\text {DDT}}$ itself. The vertical bars correspond to the statistical uncertainties of the data. |

png pdf |
Figure 2-d:
Uncorrected distributions of the soft-drop jet mass ${m_\text {jet}}$ (upper left), mass-decorrelated $N$-subjettiness ratio ${\tau _{21}^\text {DDT}}$ (upper right), double-b tagger output (lower left), and difference in rapidity ${| \Delta y |}$ between the reconstructed bosons (lower right), for data and simulated events in the top quark enriched control region. The lower panels show the ratio of the data to the simulation. No event categorization is applied. The events with $ {\tau _{21}^\text {DDT}} > $ 0.80 are not shown in any distribution other than ${\tau _{21}^\text {DDT}}$ itself. The vertical bars correspond to the statistical uncertainties of the data. |

png pdf |
Figure 3:
Projections of the 2D signal likelihood along the ${m_{{\mathrm{W}}}}$ dimension (left) and the ${m_\text {jet}}$ dimension (right). The ${m_{{\mathrm{W}}}}$ projections are shown for different mass hypotheses of 1.5, 2.5, and 4.5 TeV for a ${\mathrm{G} _\text {bulk}}$ signal decaying to WW. The ${m_\text {jet}}$ projections are shown for ${{\mathrm{G} _\text {bulk}} \to {\mathrm{W} \mathrm{W}}}$, ${\mathrm{W'} \to {\mathrm{W} \mathrm{Z}}}$, and ${\mathrm{W'} \to {\mathrm{W} \mathrm{H}}}$ for $ {m_\text {X}} = $ 2.5 TeV. All distributions are normalized to the same area. |

png pdf |
Figure 3-a:
Projections of the 2D signal likelihood along the ${m_{{\mathrm{W}}}}$ dimension (left) and the ${m_\text {jet}}$ dimension (right). The ${m_{{\mathrm{W}}}}$ projections are shown for different mass hypotheses of 1.5, 2.5, and 4.5 TeV for a ${\mathrm{G} _\text {bulk}}$ signal decaying to WW. The ${m_\text {jet}}$ projections are shown for ${{\mathrm{G} _\text {bulk}} \to {\mathrm{W} \mathrm{W}}}$, ${\mathrm{W'} \to {\mathrm{W} \mathrm{Z}}}$, and ${\mathrm{W'} \to {\mathrm{W} \mathrm{H}}}$ for $ {m_\text {X}} = $ 2.5 TeV. All distributions are normalized to the same area. |

png pdf |
Figure 3-b:
Projections of the 2D signal likelihood along the ${m_{{\mathrm{W}}}}$ dimension (left) and the ${m_\text {jet}}$ dimension (right). The ${m_{{\mathrm{W}}}}$ projections are shown for different mass hypotheses of 1.5, 2.5, and 4.5 TeV for a ${\mathrm{G} _\text {bulk}}$ signal decaying to WW. The ${m_\text {jet}}$ projections are shown for ${{\mathrm{G} _\text {bulk}} \to {\mathrm{W} \mathrm{W}}}$, ${\mathrm{W'} \to {\mathrm{W} \mathrm{Z}}}$, and ${\mathrm{W'} \to {\mathrm{W} \mathrm{H}}}$ for $ {m_\text {X}} = $ 2.5 TeV. All distributions are normalized to the same area. |

png pdf |
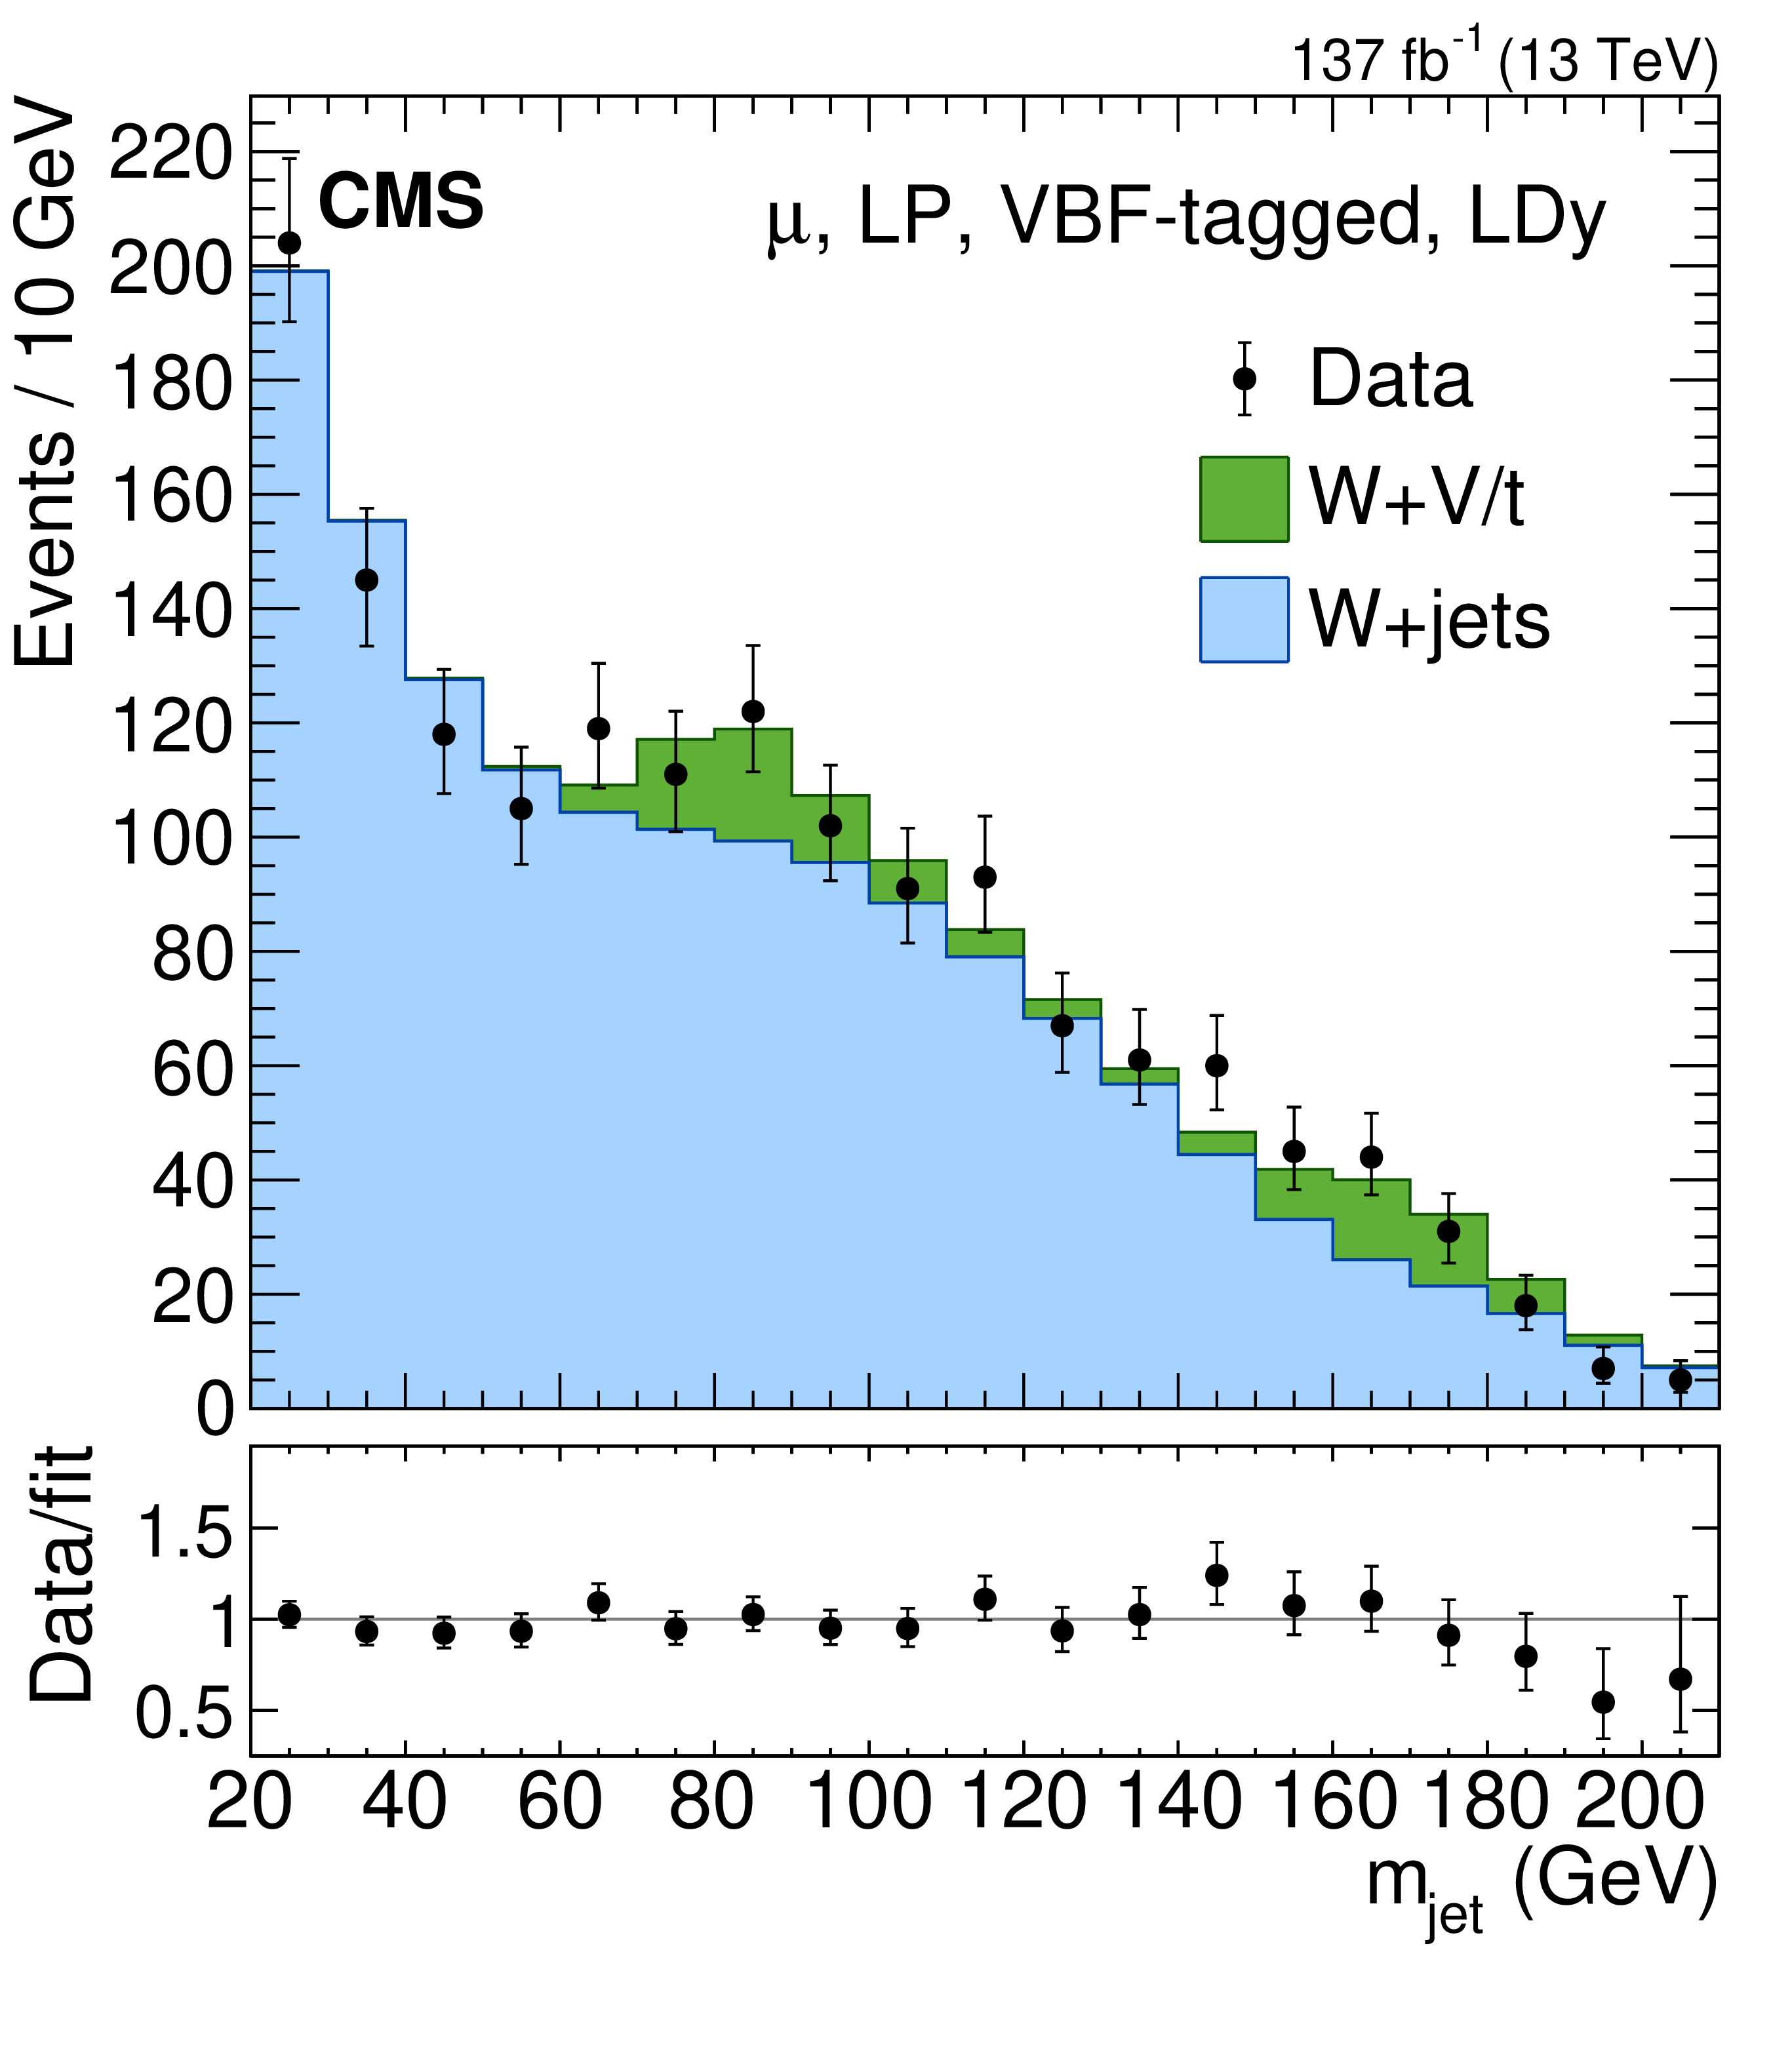
Figure 4:
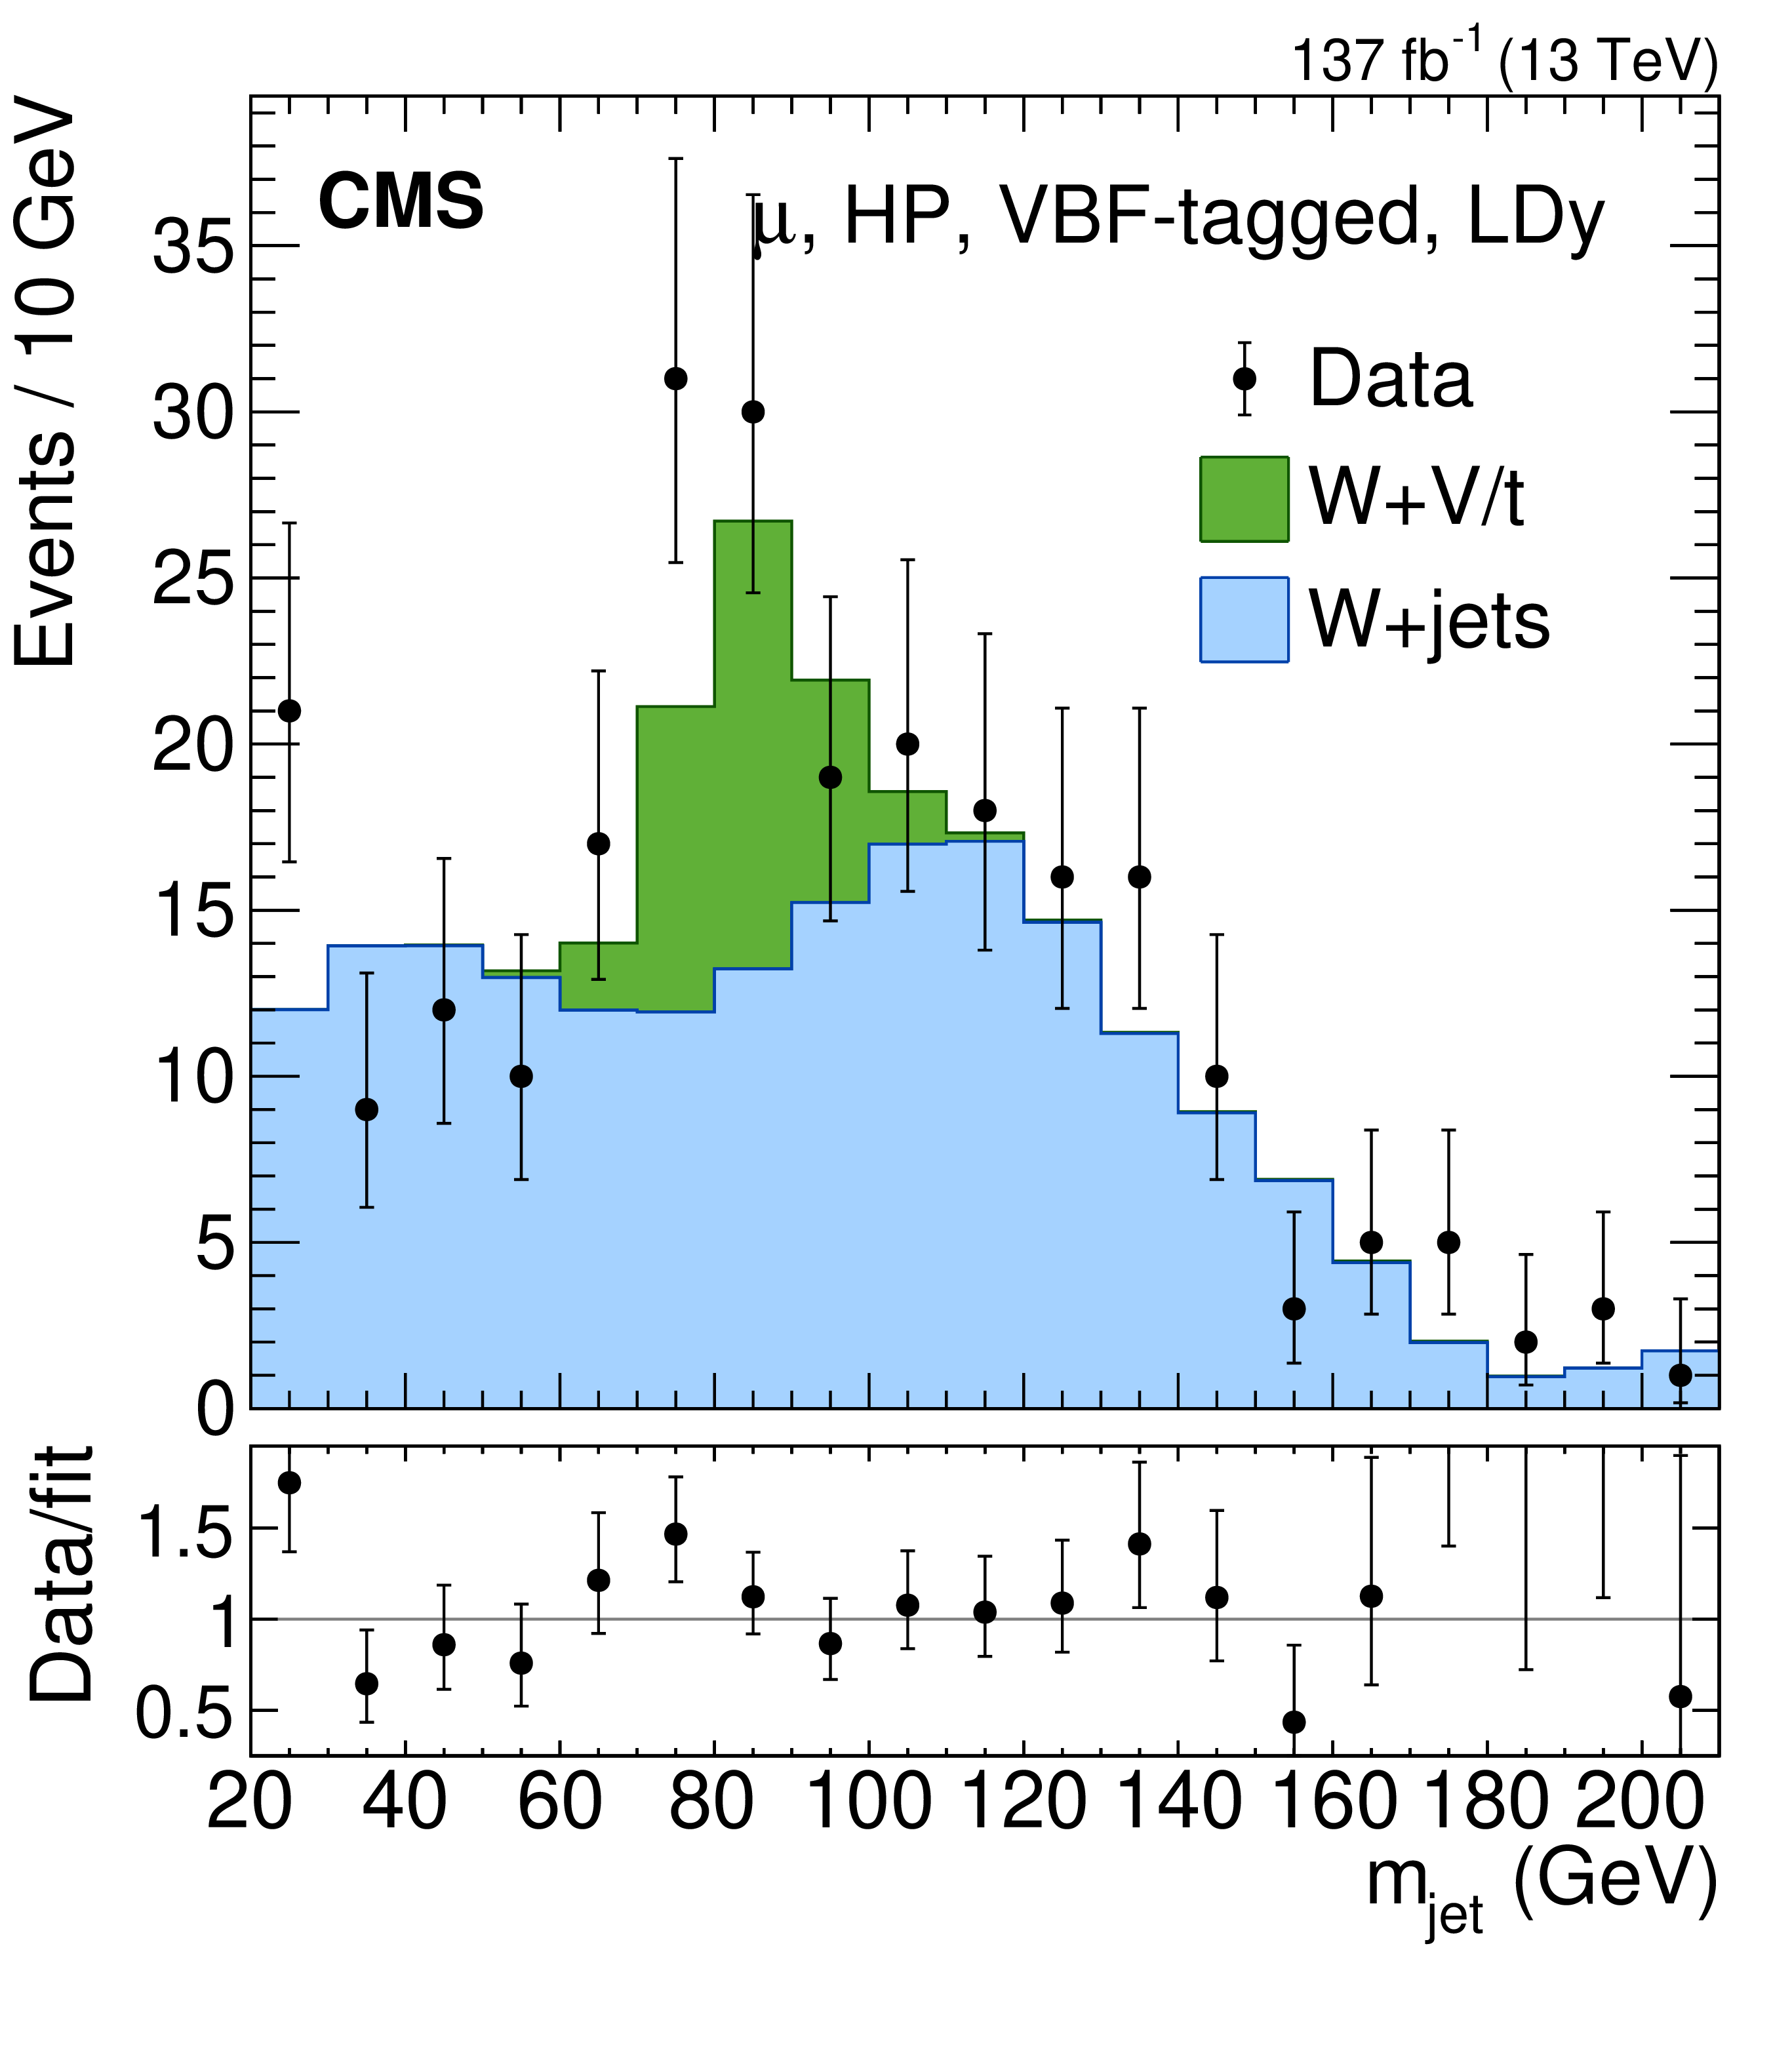
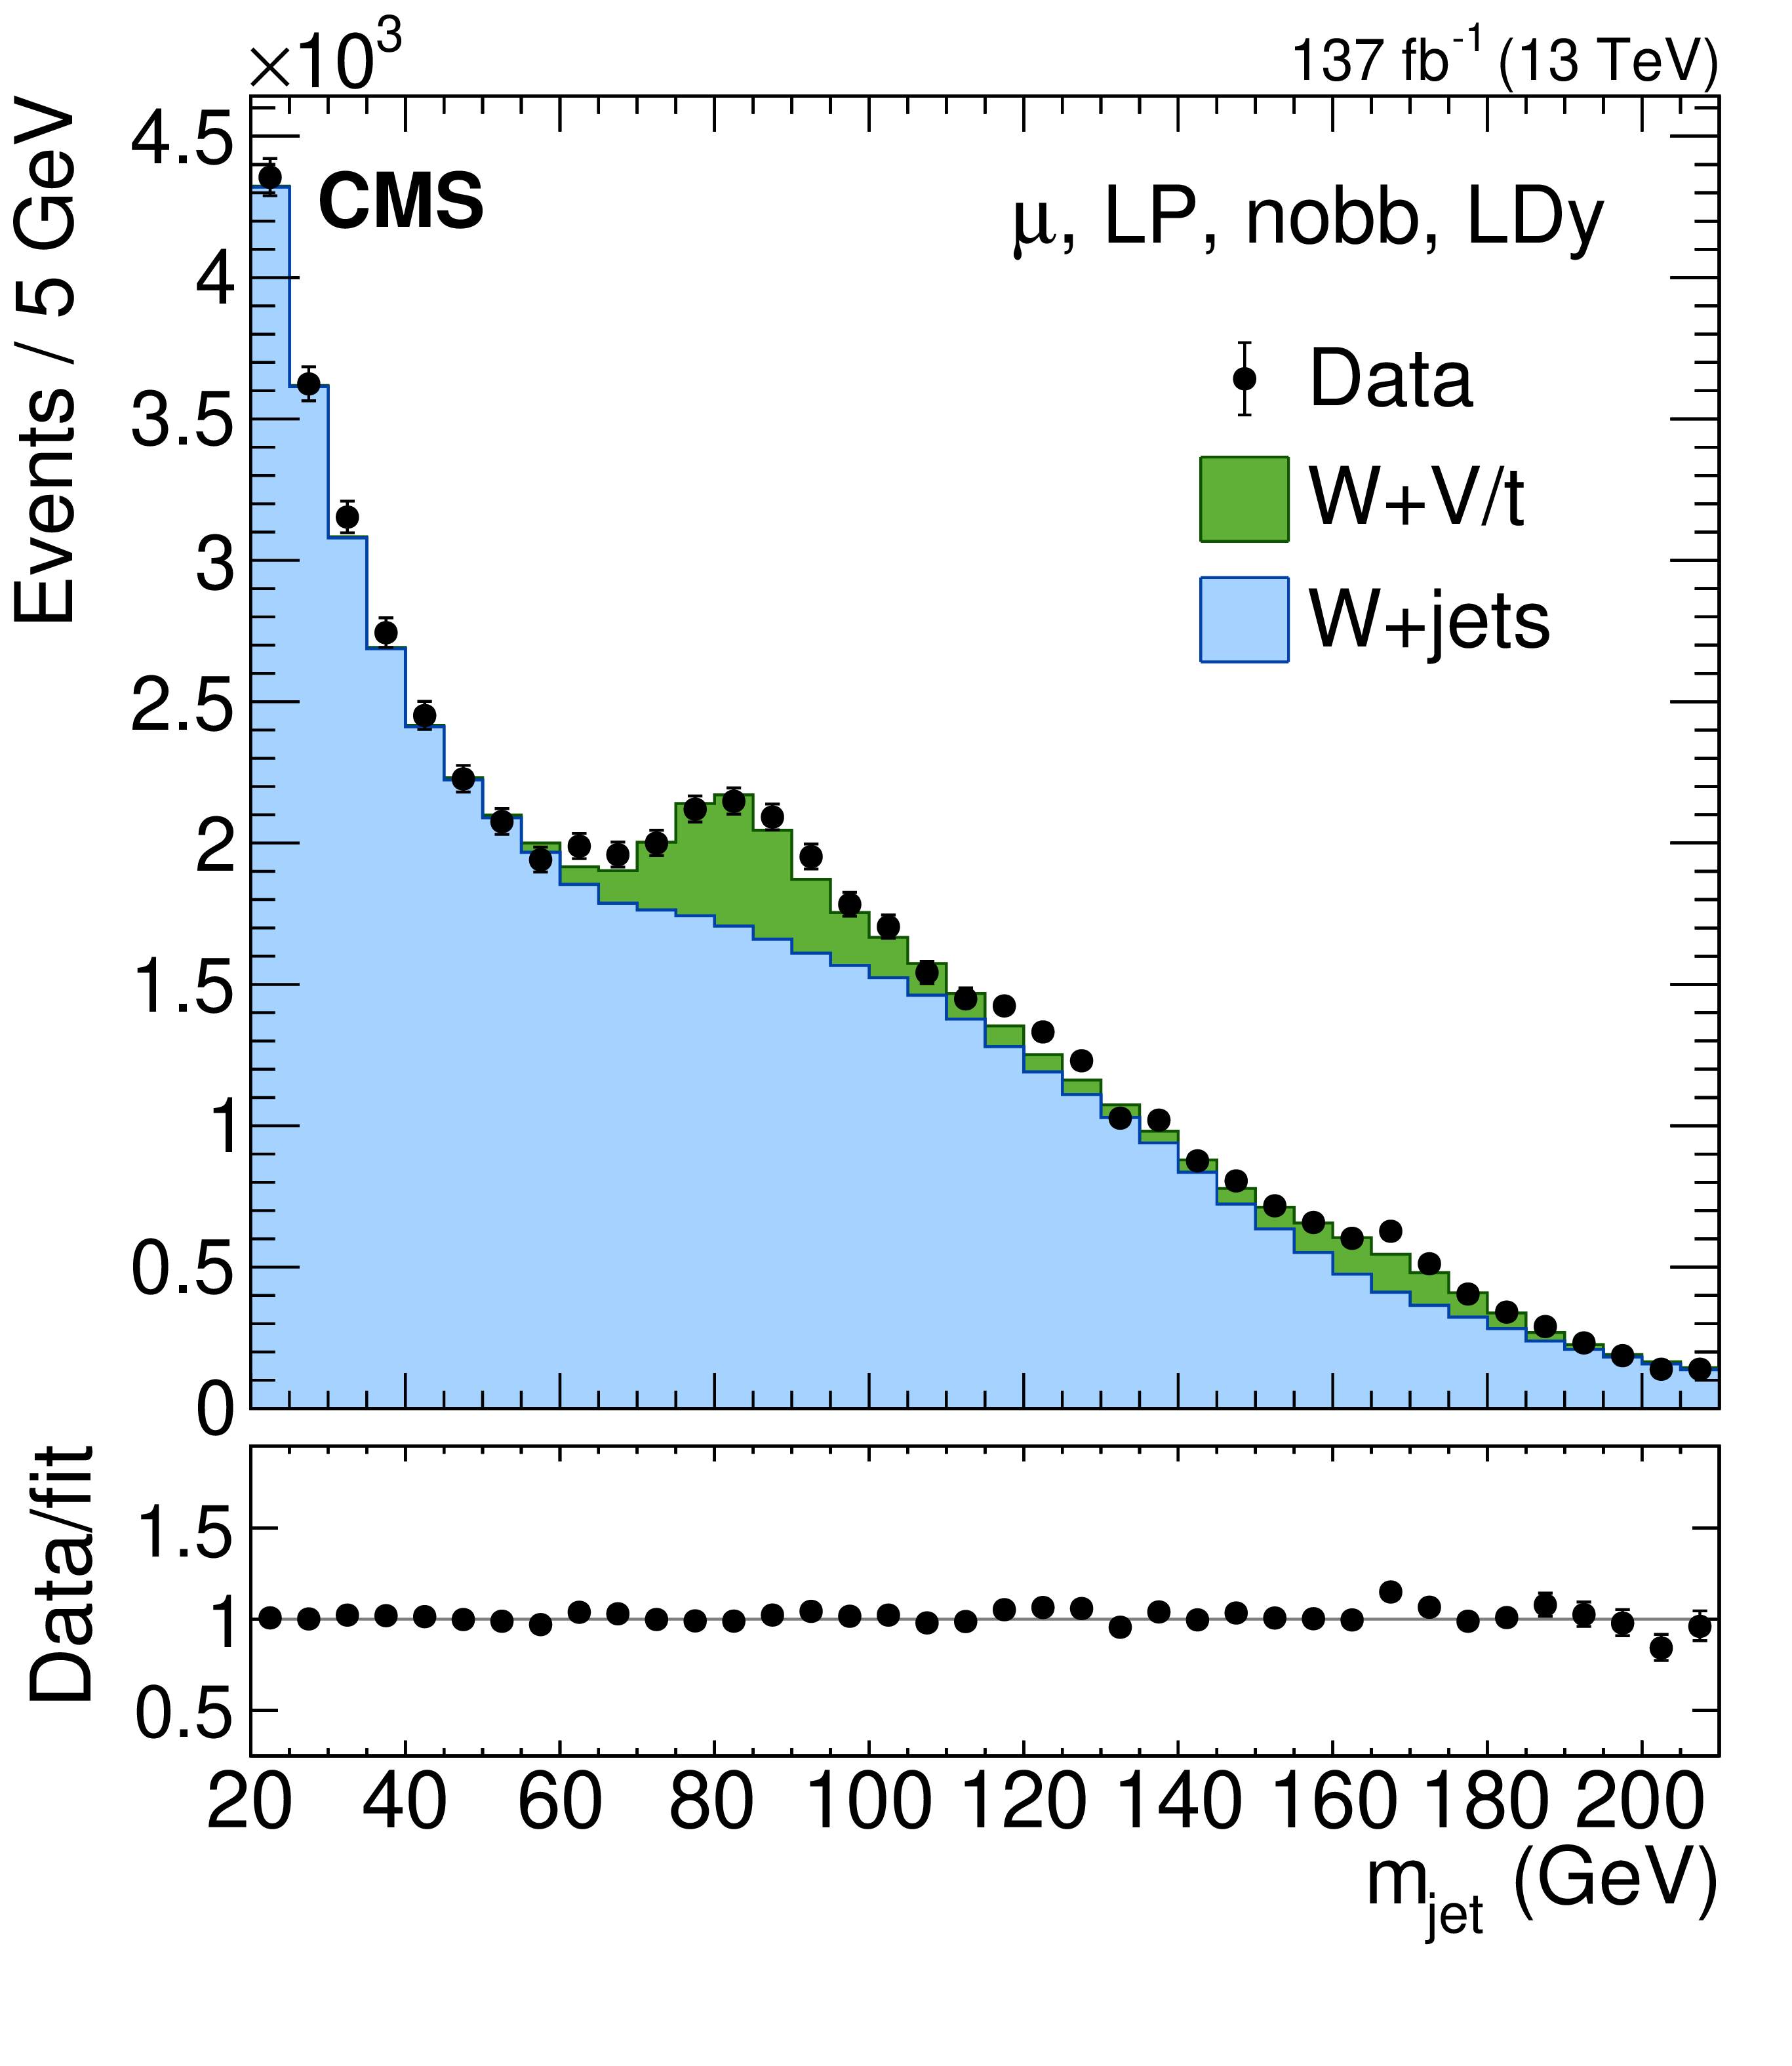
Comparison between the fit result and data distributions of ${m_\text {jet}}$ in six representative muon-LDy categories. The distributions in the remaining 18 categories show very similar levels of agreement. The statistical uncertainties of the data are shown as vertical bars. The lower panels show the ratio of the data to the fit result. |

png pdf |
Figure 4-a:
Comparison between the fit result and data distributions of ${m_\text {jet}}$ in six representative muon-LDy categories. The distributions in the remaining 18 categories show very similar levels of agreement. The statistical uncertainties of the data are shown as vertical bars. The lower panels show the ratio of the data to the fit result. |

png pdf |
Figure 4-b:
Comparison between the fit result and data distributions of ${m_\text {jet}}$ in six representative muon-LDy categories. The distributions in the remaining 18 categories show very similar levels of agreement. The statistical uncertainties of the data are shown as vertical bars. The lower panels show the ratio of the data to the fit result. |
png pdf |
Figure 4-c:
Comparison between the fit result and data distributions of ${m_\text {jet}}$ in six representative muon-LDy categories. The distributions in the remaining 18 categories show very similar levels of agreement. The statistical uncertainties of the data are shown as vertical bars. The lower panels show the ratio of the data to the fit result. |

png pdf |
Figure 4-d:
Comparison between the fit result and data distributions of ${m_\text {jet}}$ in six representative muon-LDy categories. The distributions in the remaining 18 categories show very similar levels of agreement. The statistical uncertainties of the data are shown as vertical bars. The lower panels show the ratio of the data to the fit result. |
png pdf |
Figure 4-e:
Comparison between the fit result and data distributions of ${m_\text {jet}}$ in six representative muon-LDy categories. The distributions in the remaining 18 categories show very similar levels of agreement. The statistical uncertainties of the data are shown as vertical bars. The lower panels show the ratio of the data to the fit result. |
png pdf |
Figure 4-f:
Comparison between the fit result and data distributions of ${m_\text {jet}}$ in six representative muon-LDy categories. The distributions in the remaining 18 categories show very similar levels of agreement. The statistical uncertainties of the data are shown as vertical bars. The lower panels show the ratio of the data to the fit result. |
png pdf |
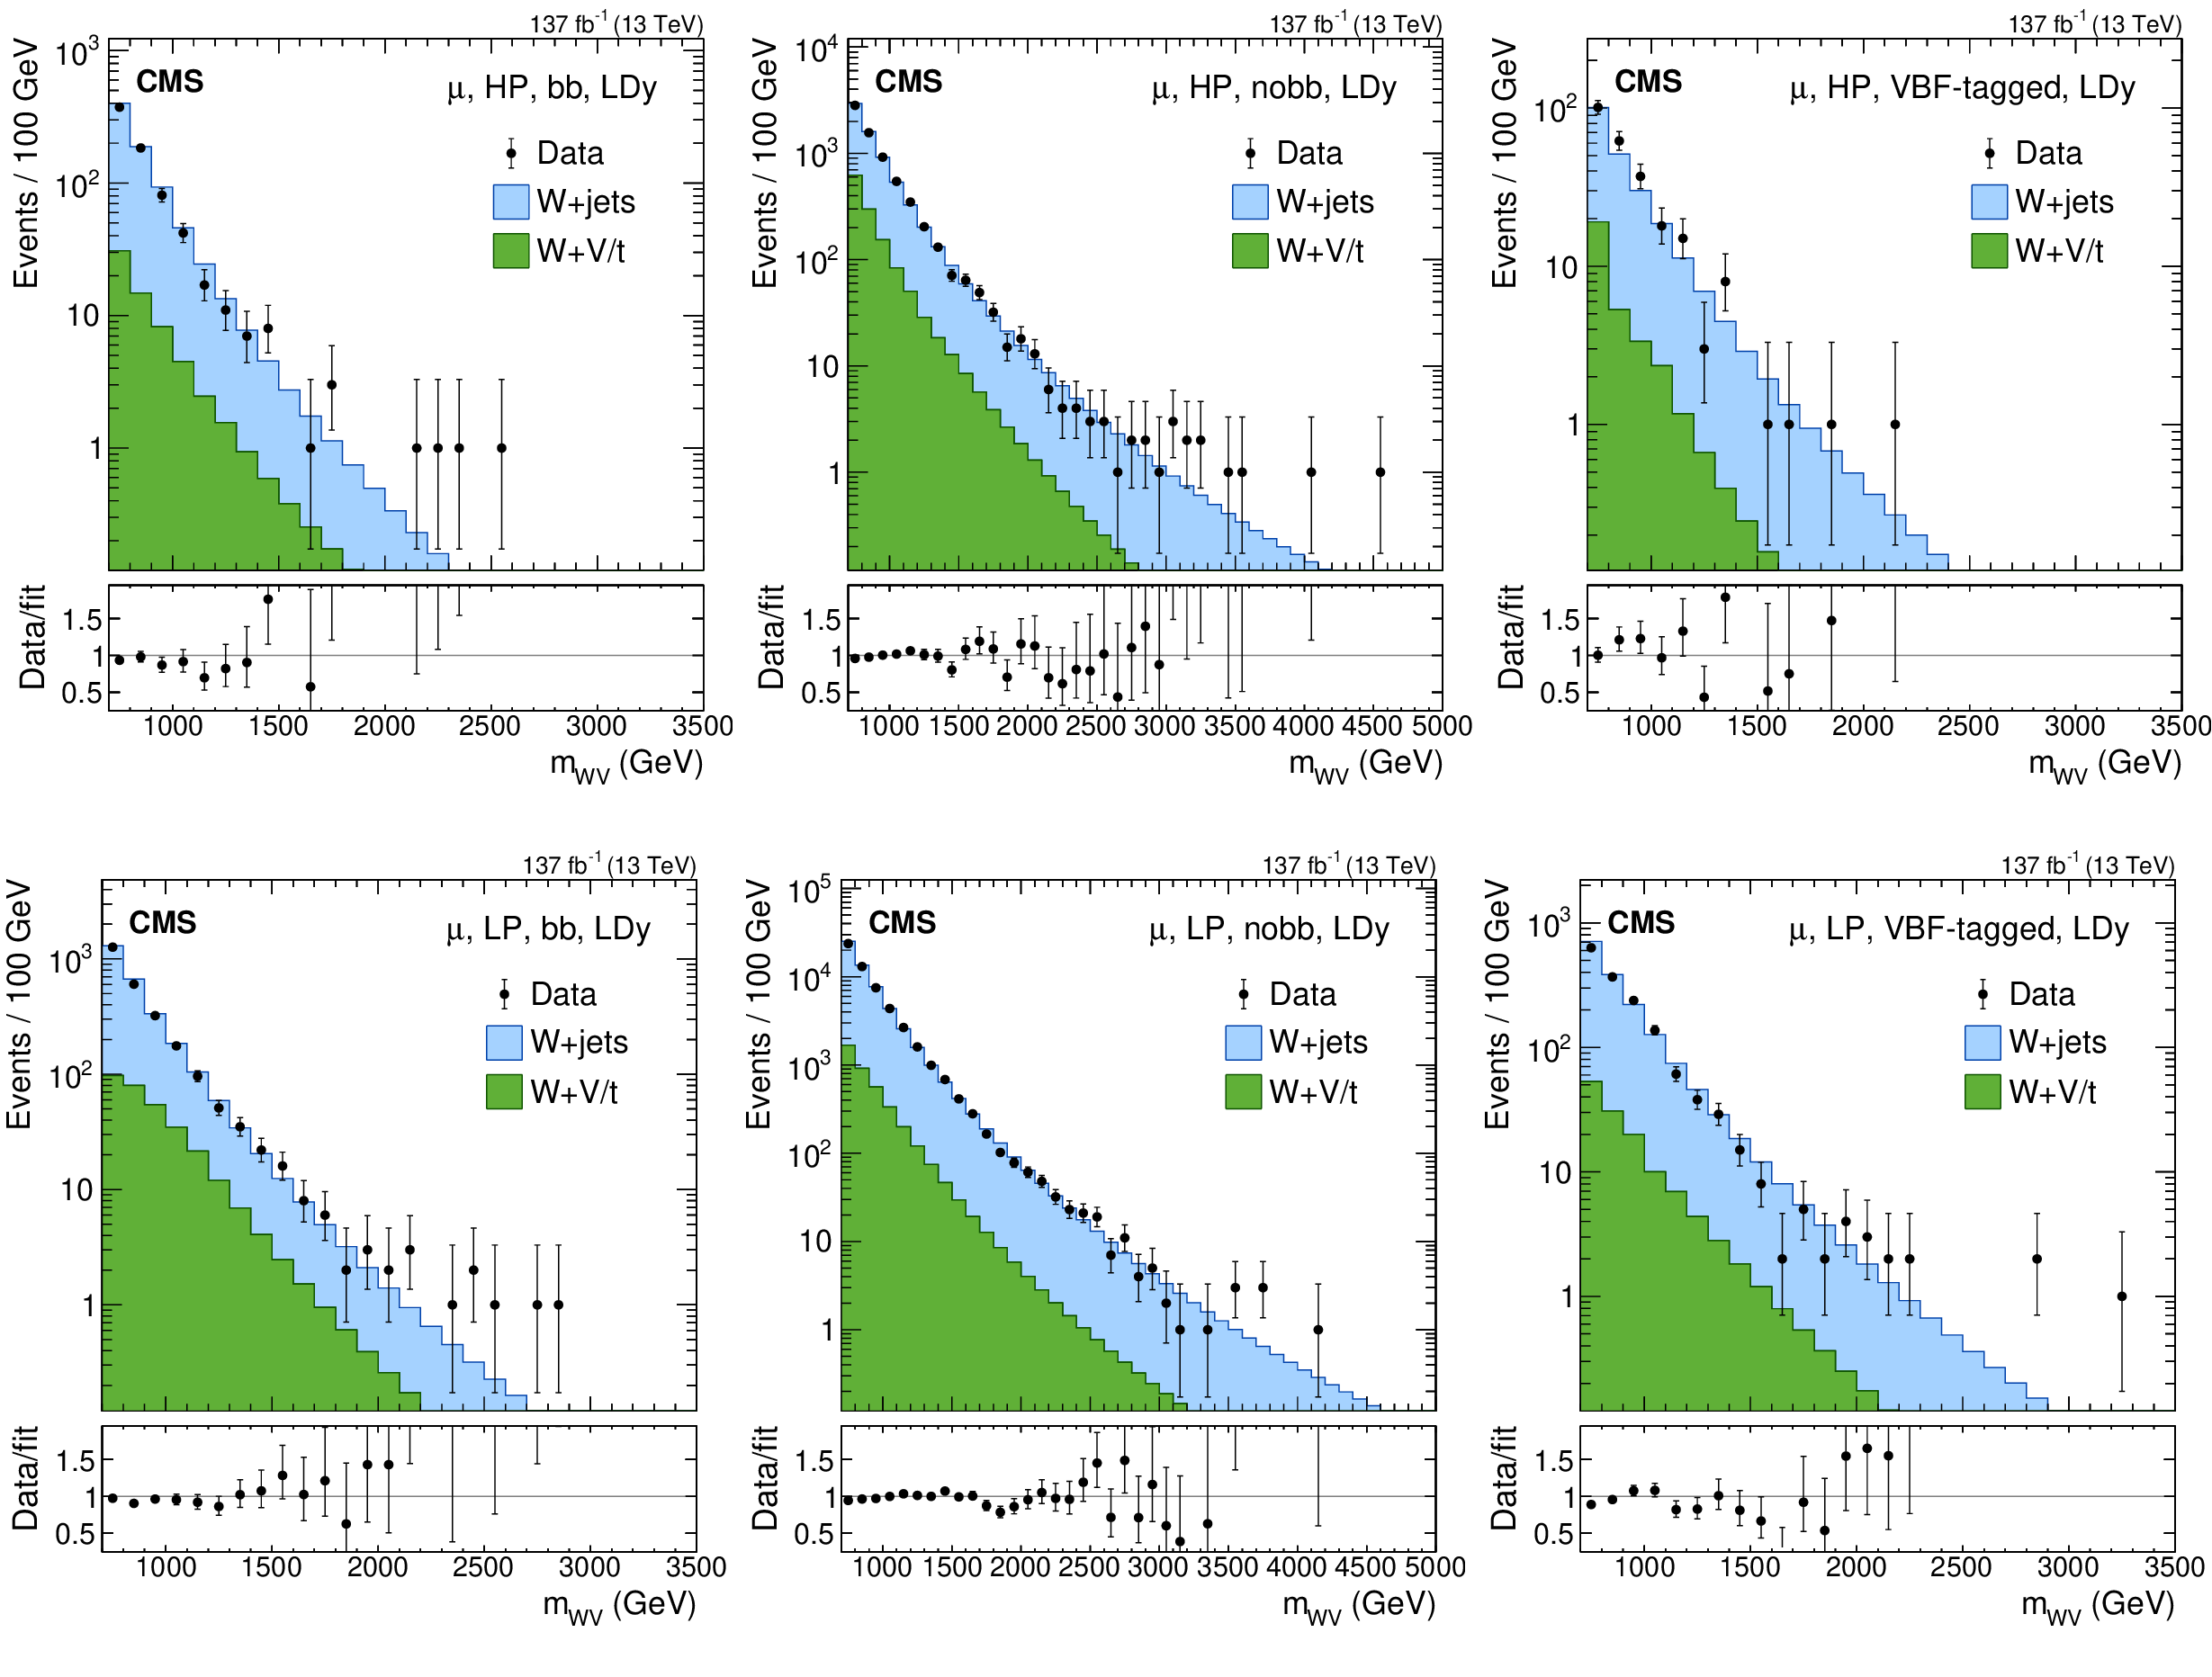
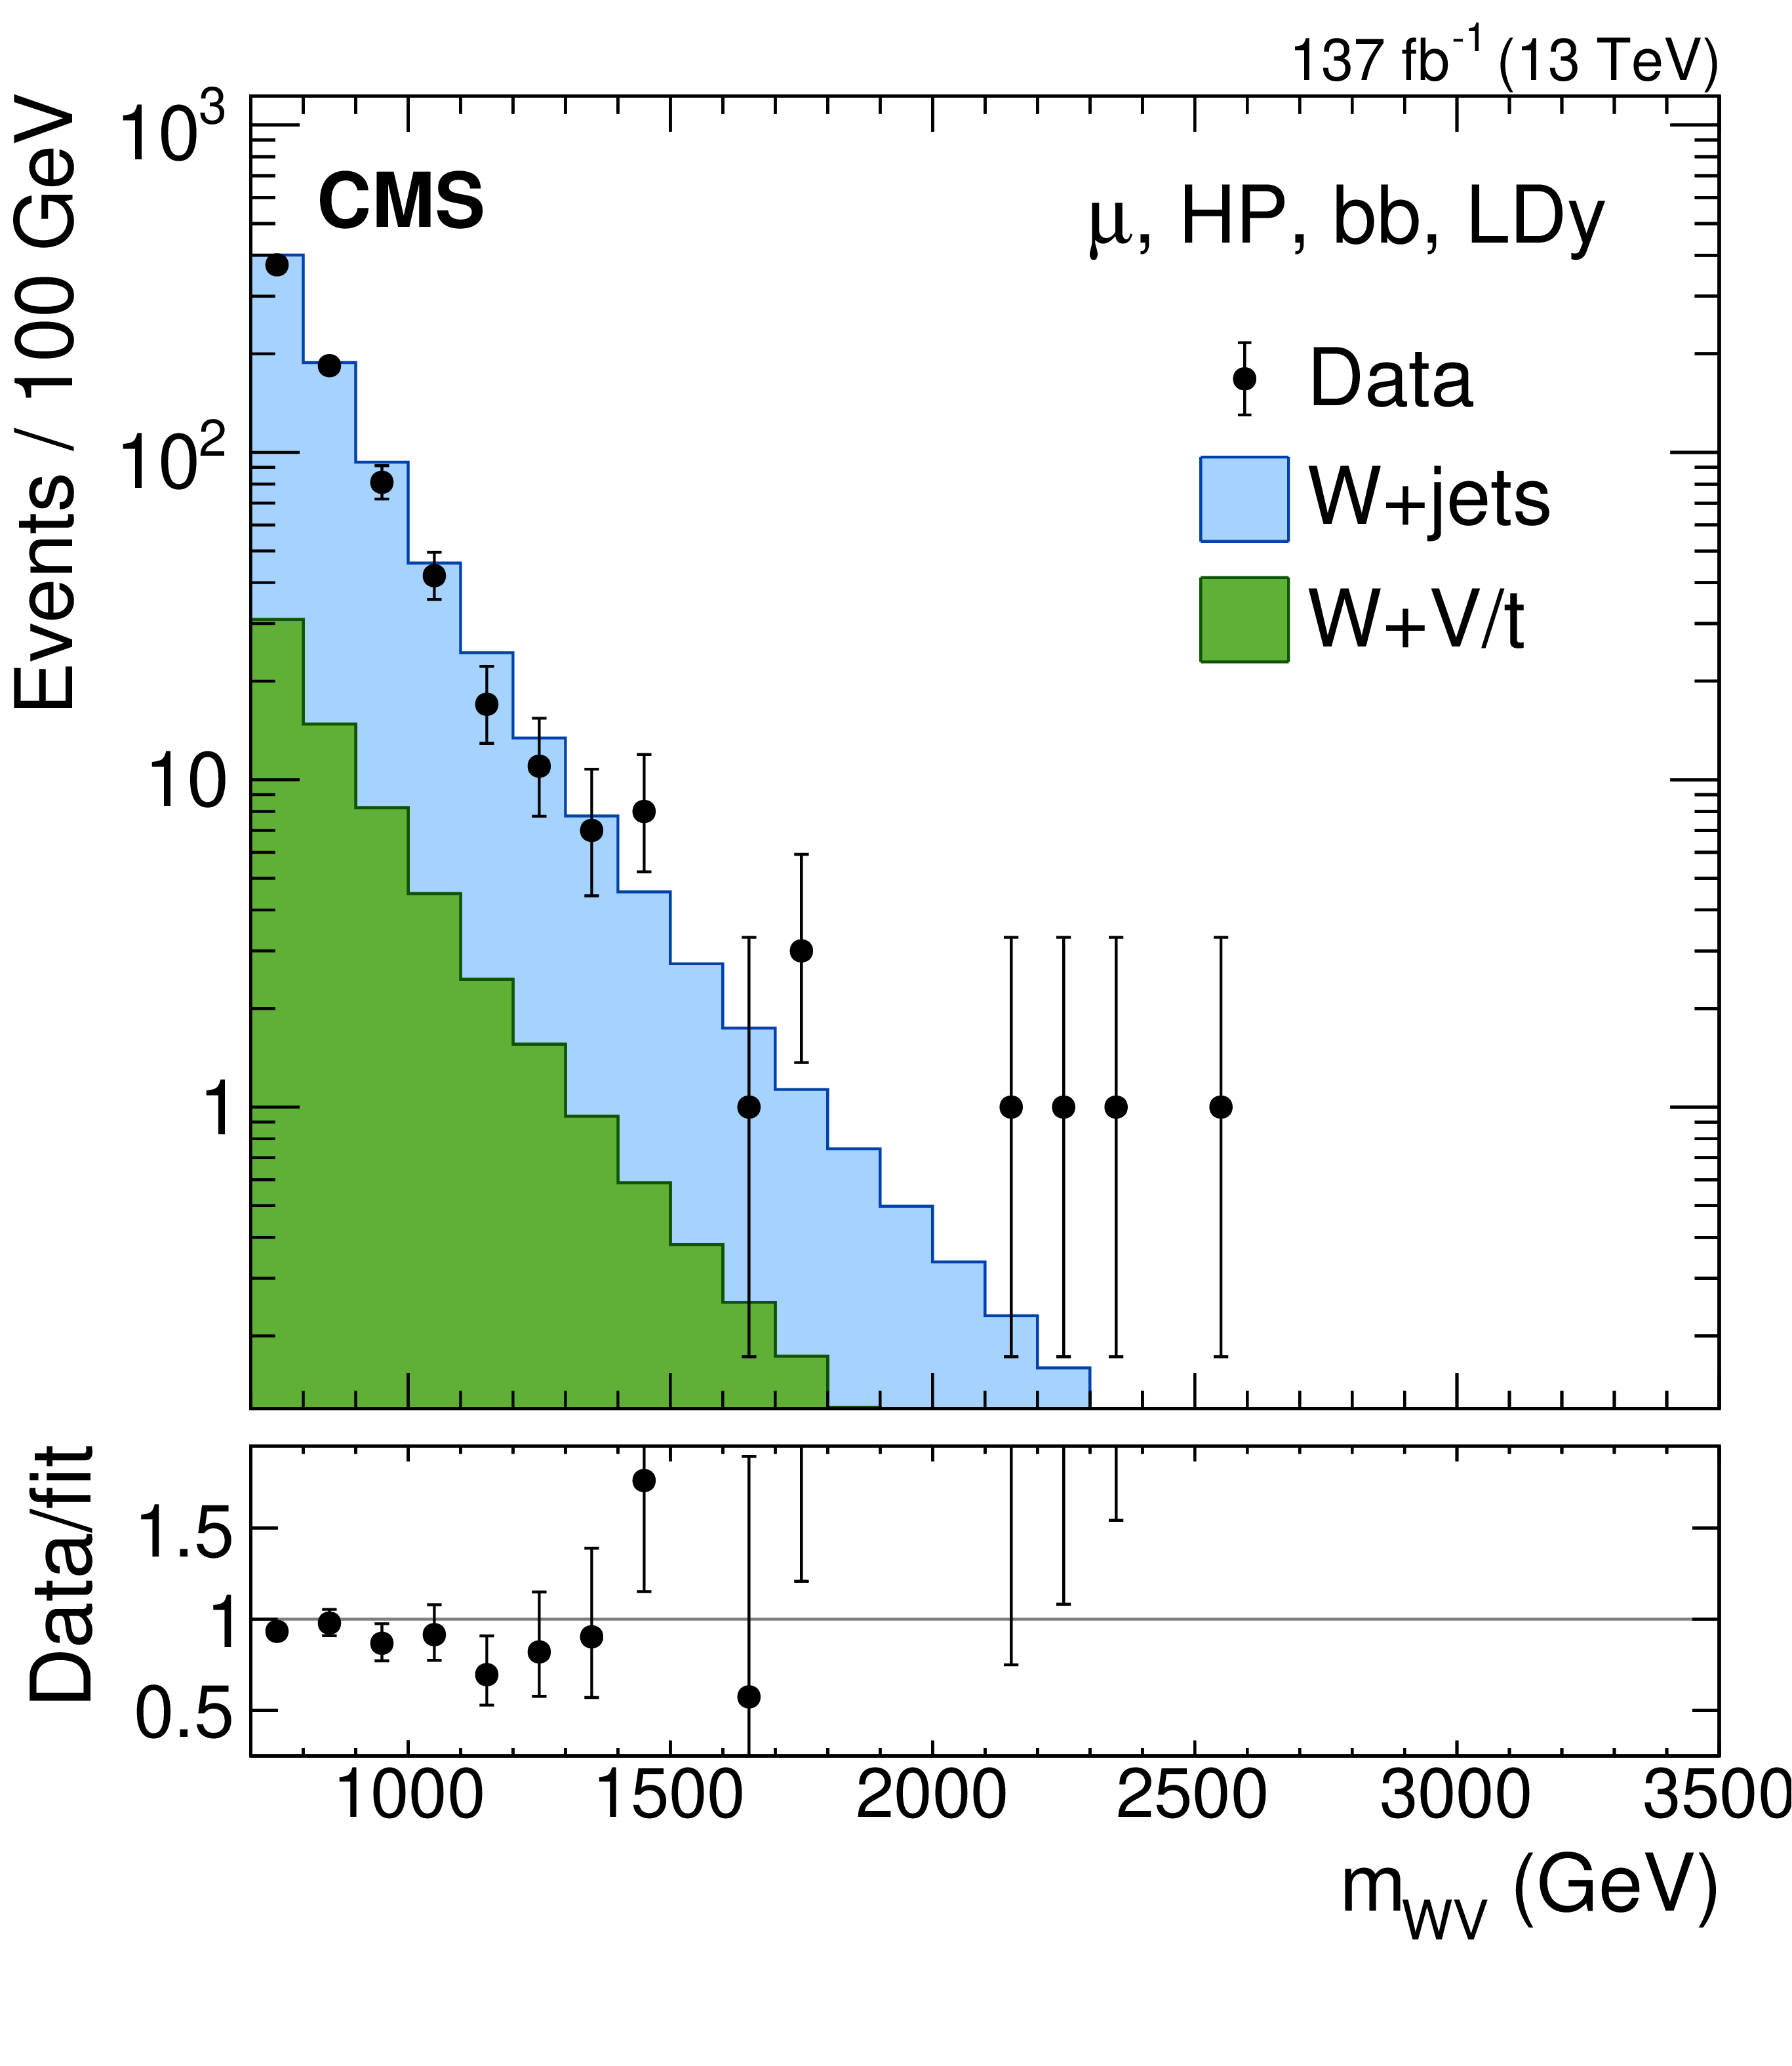
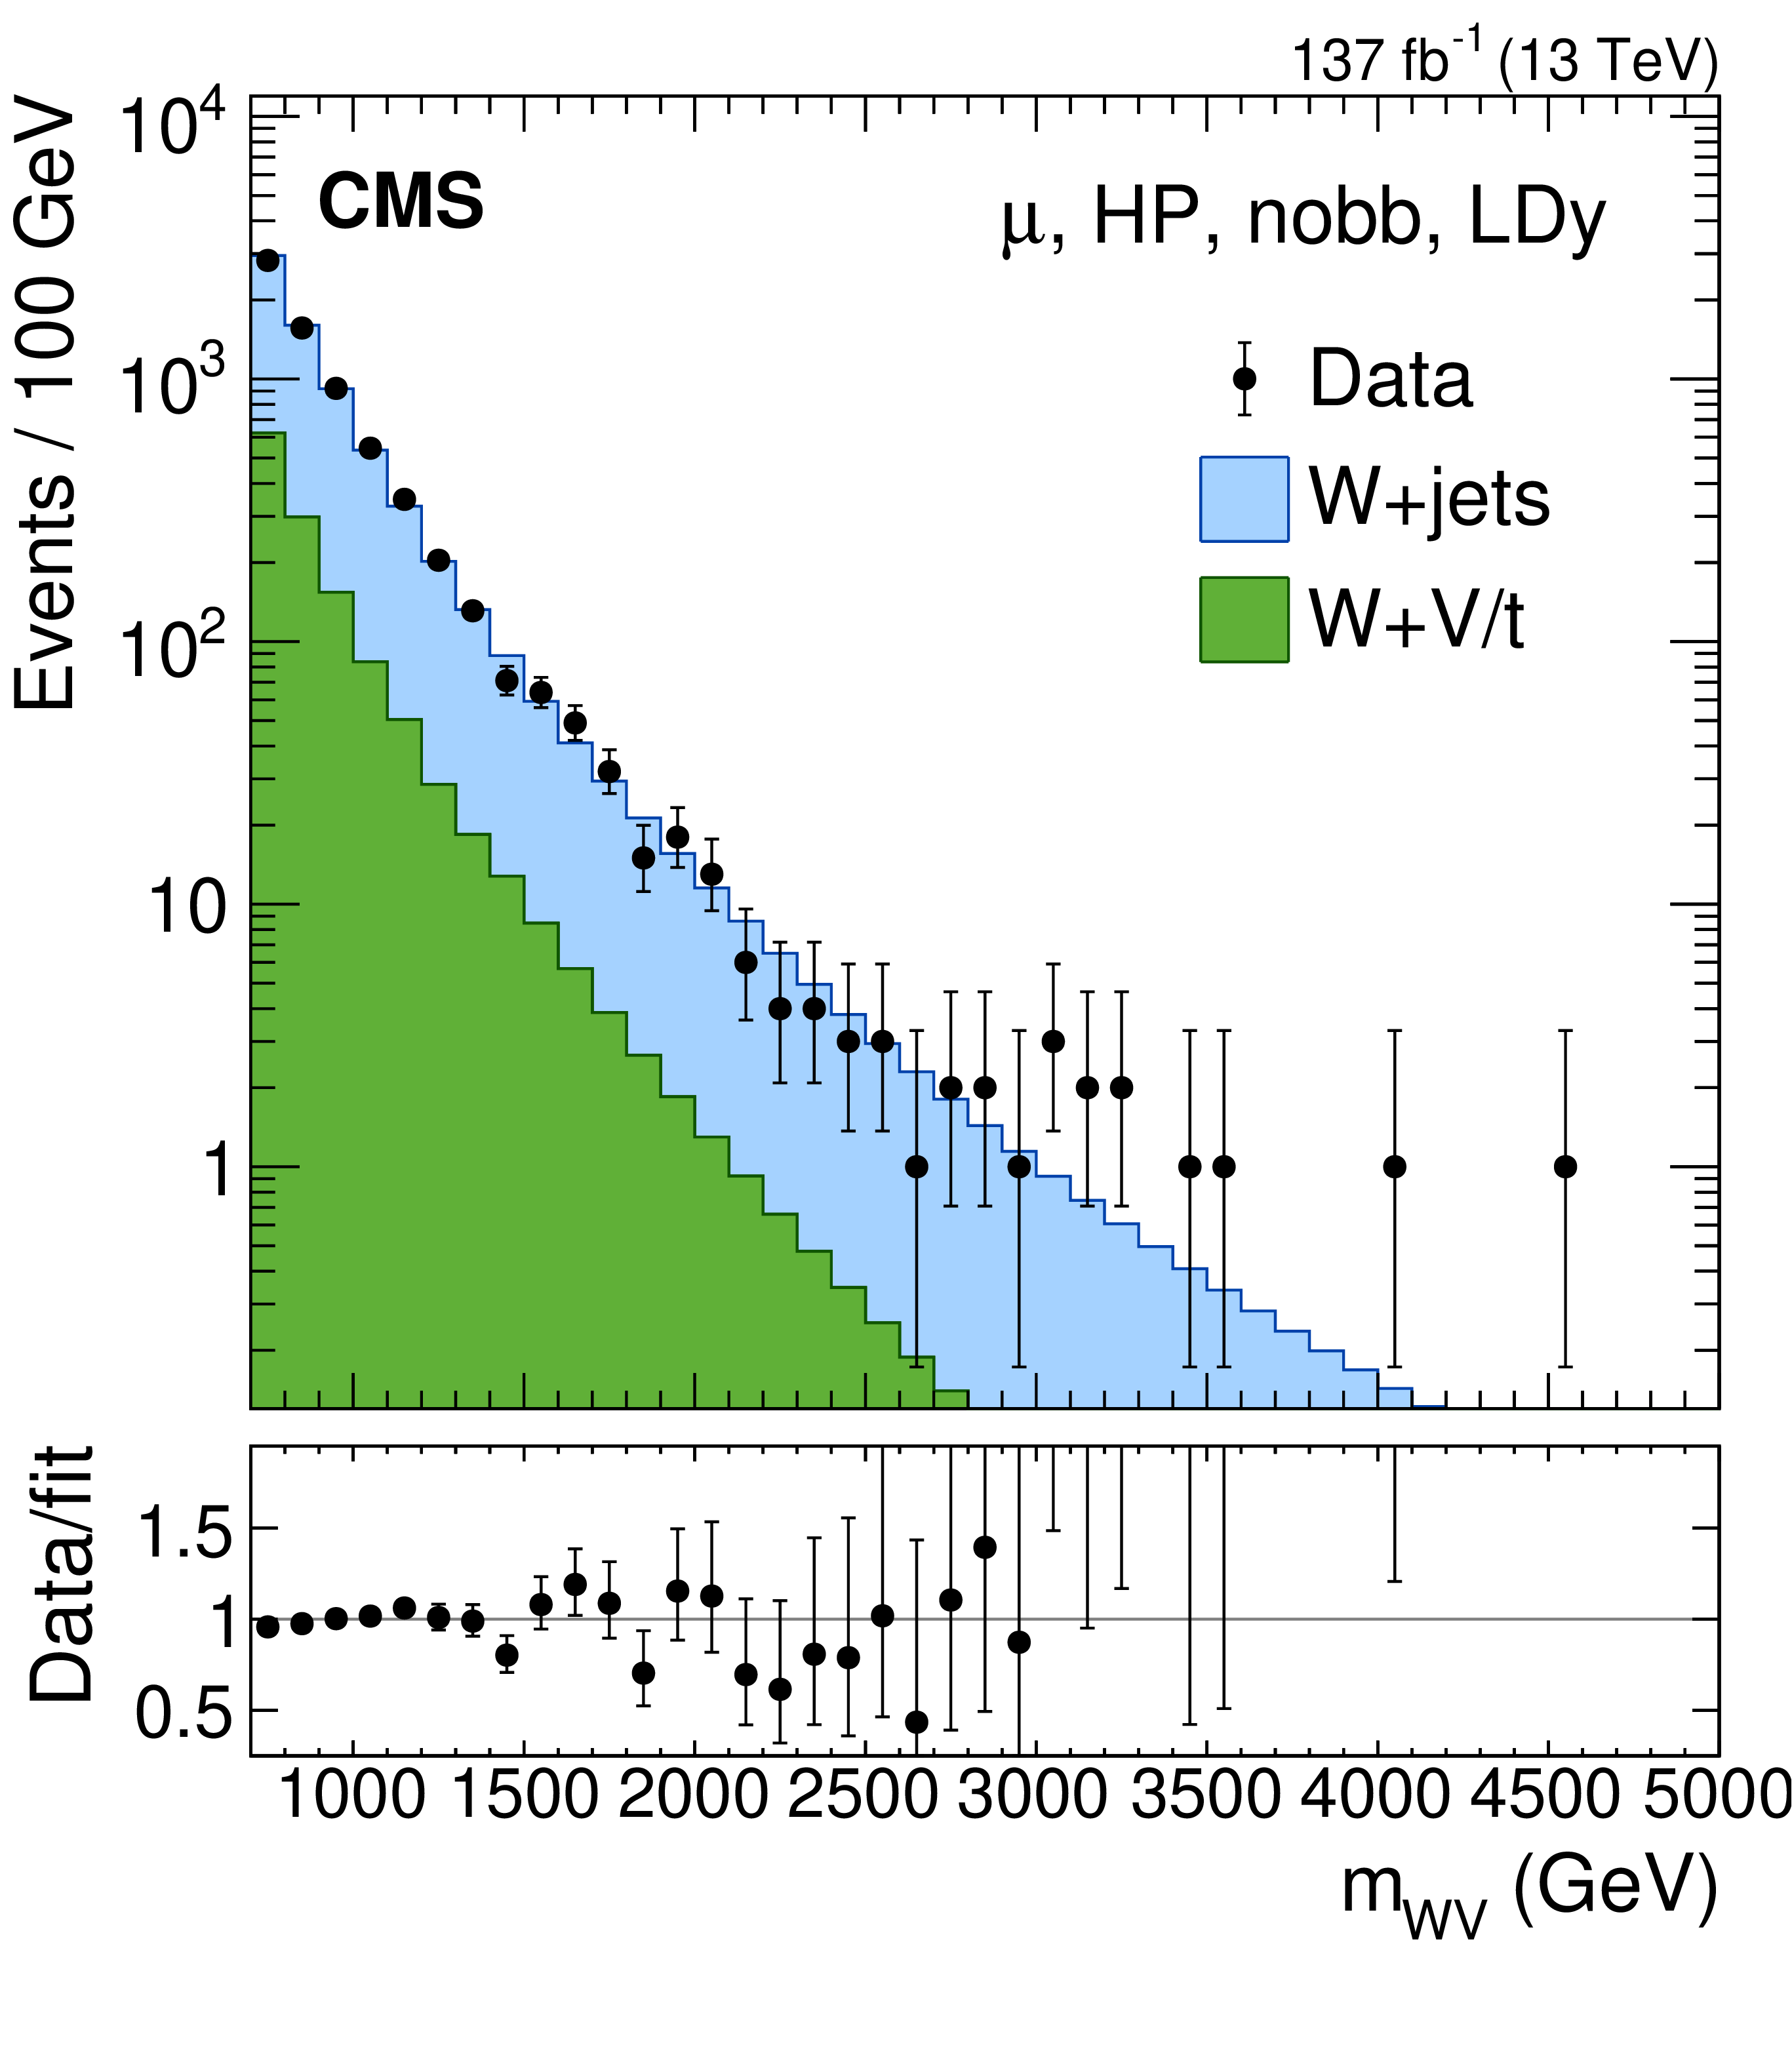
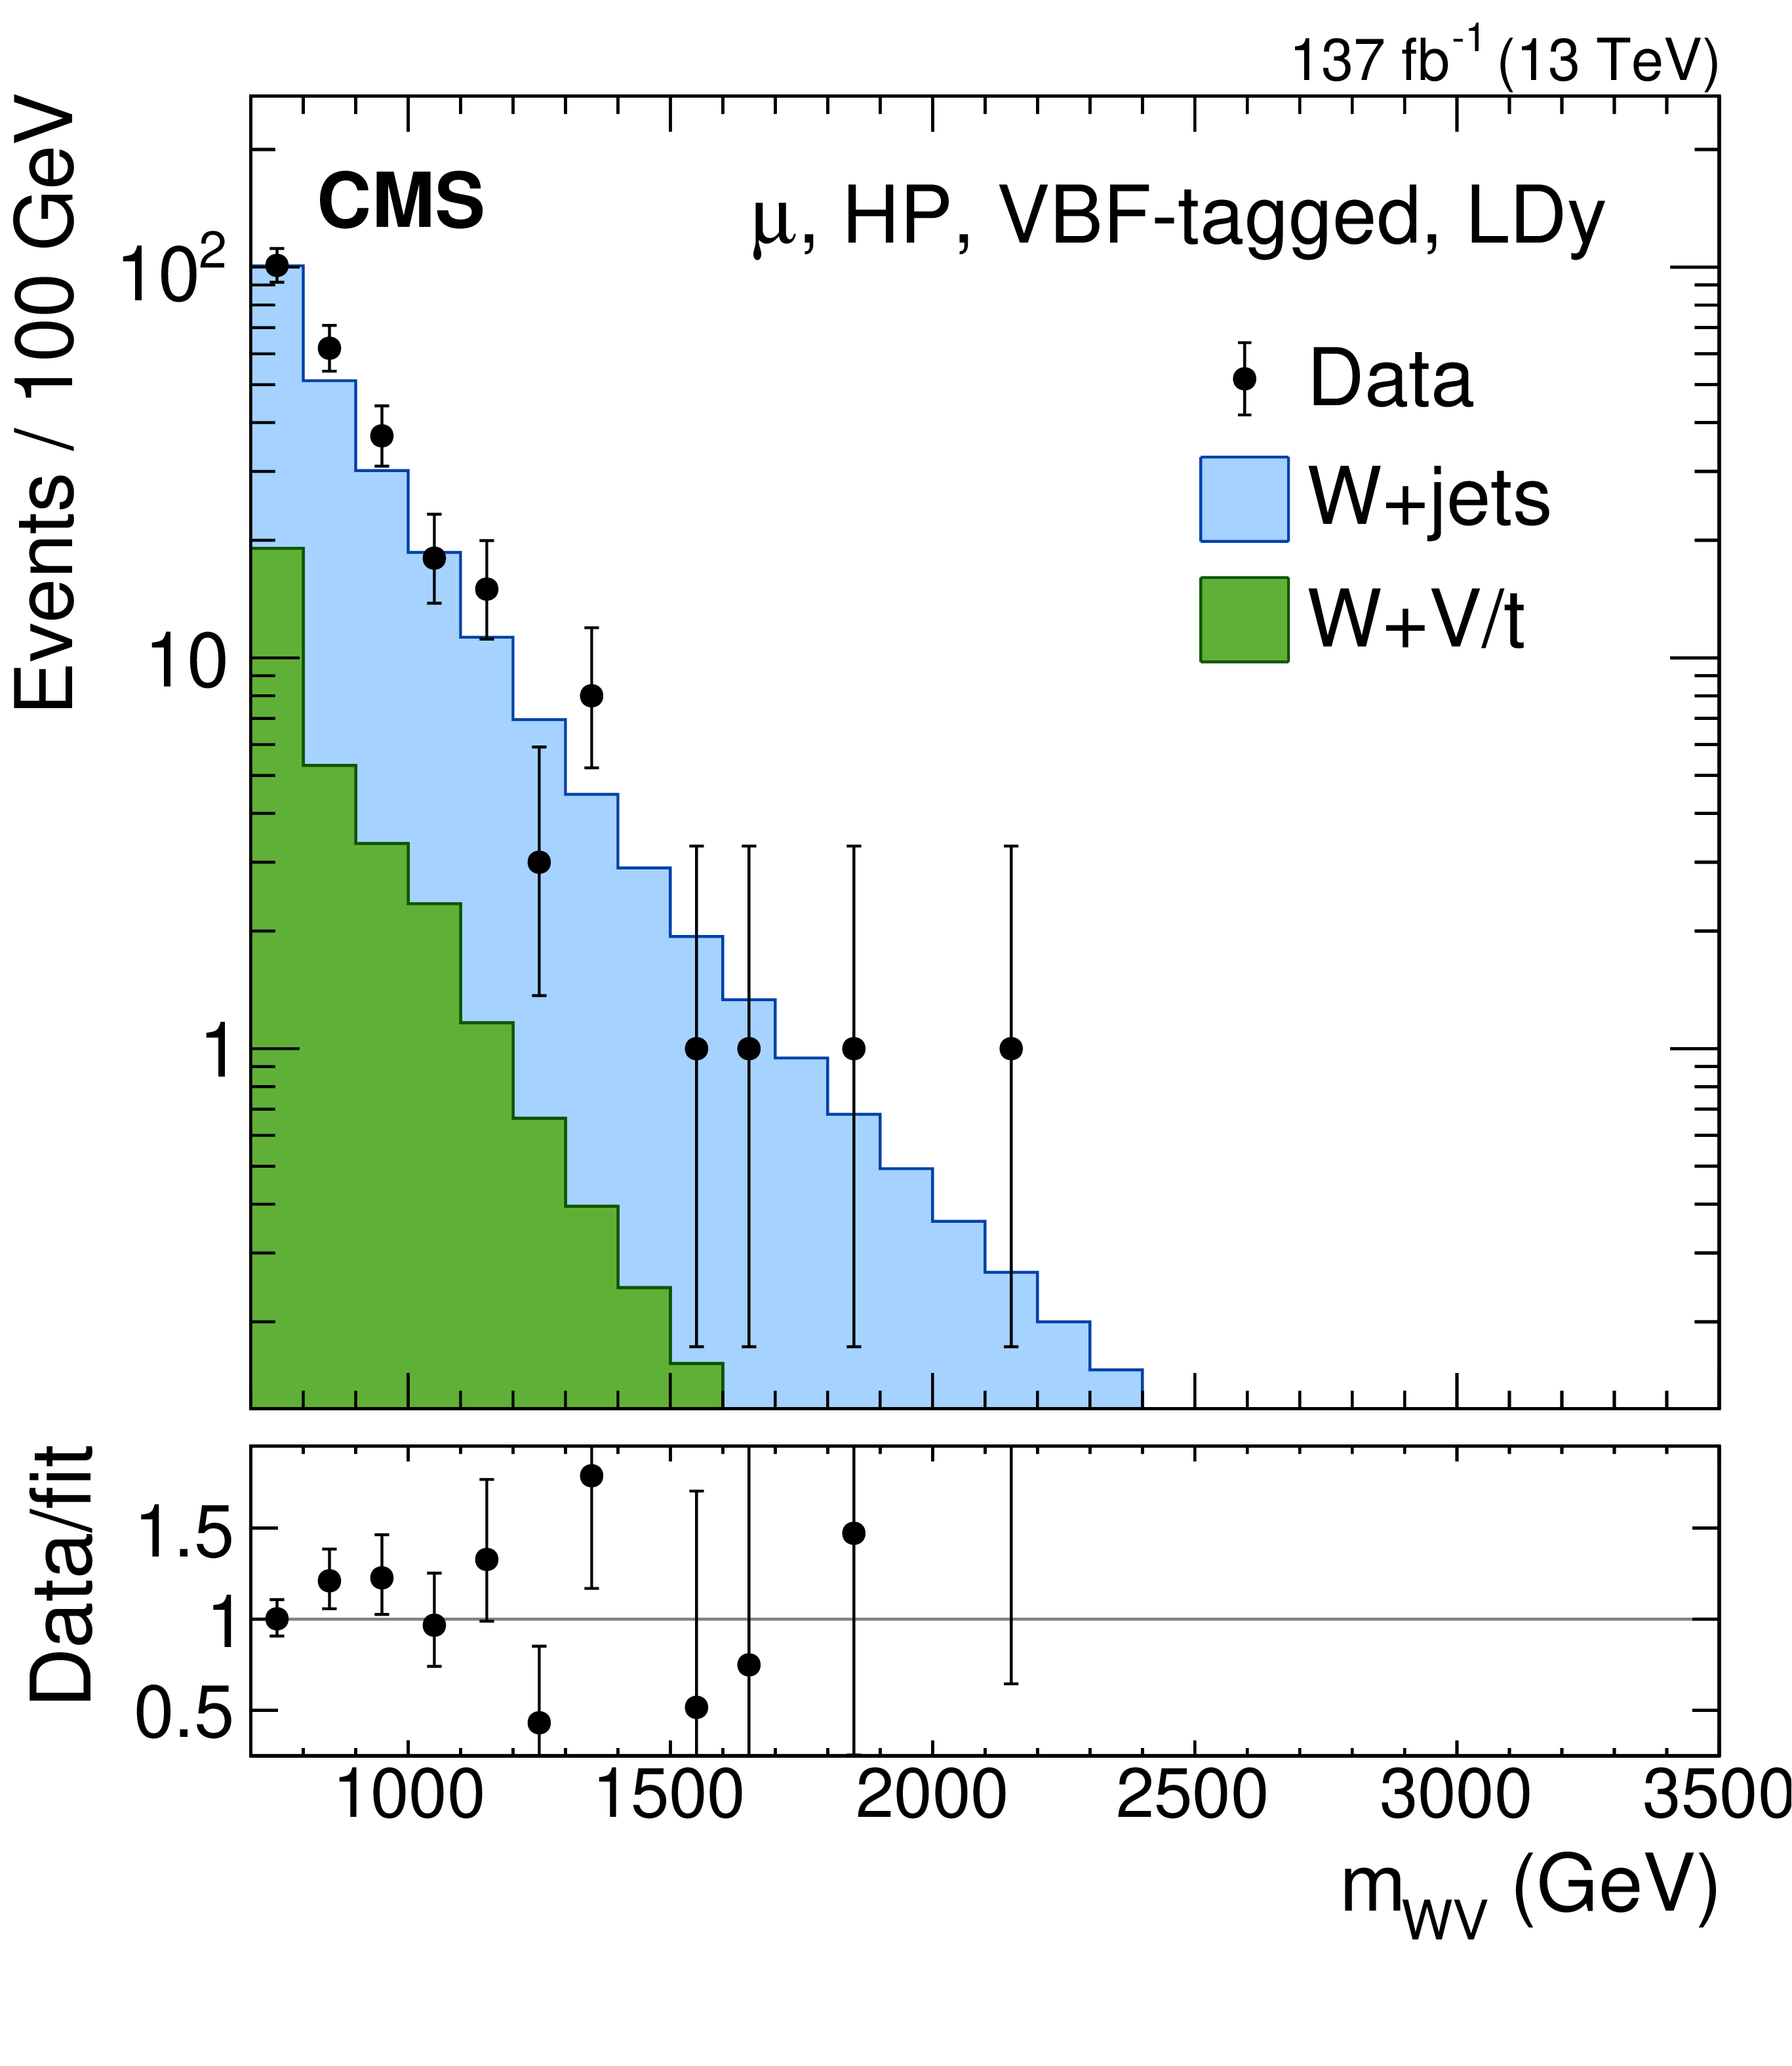
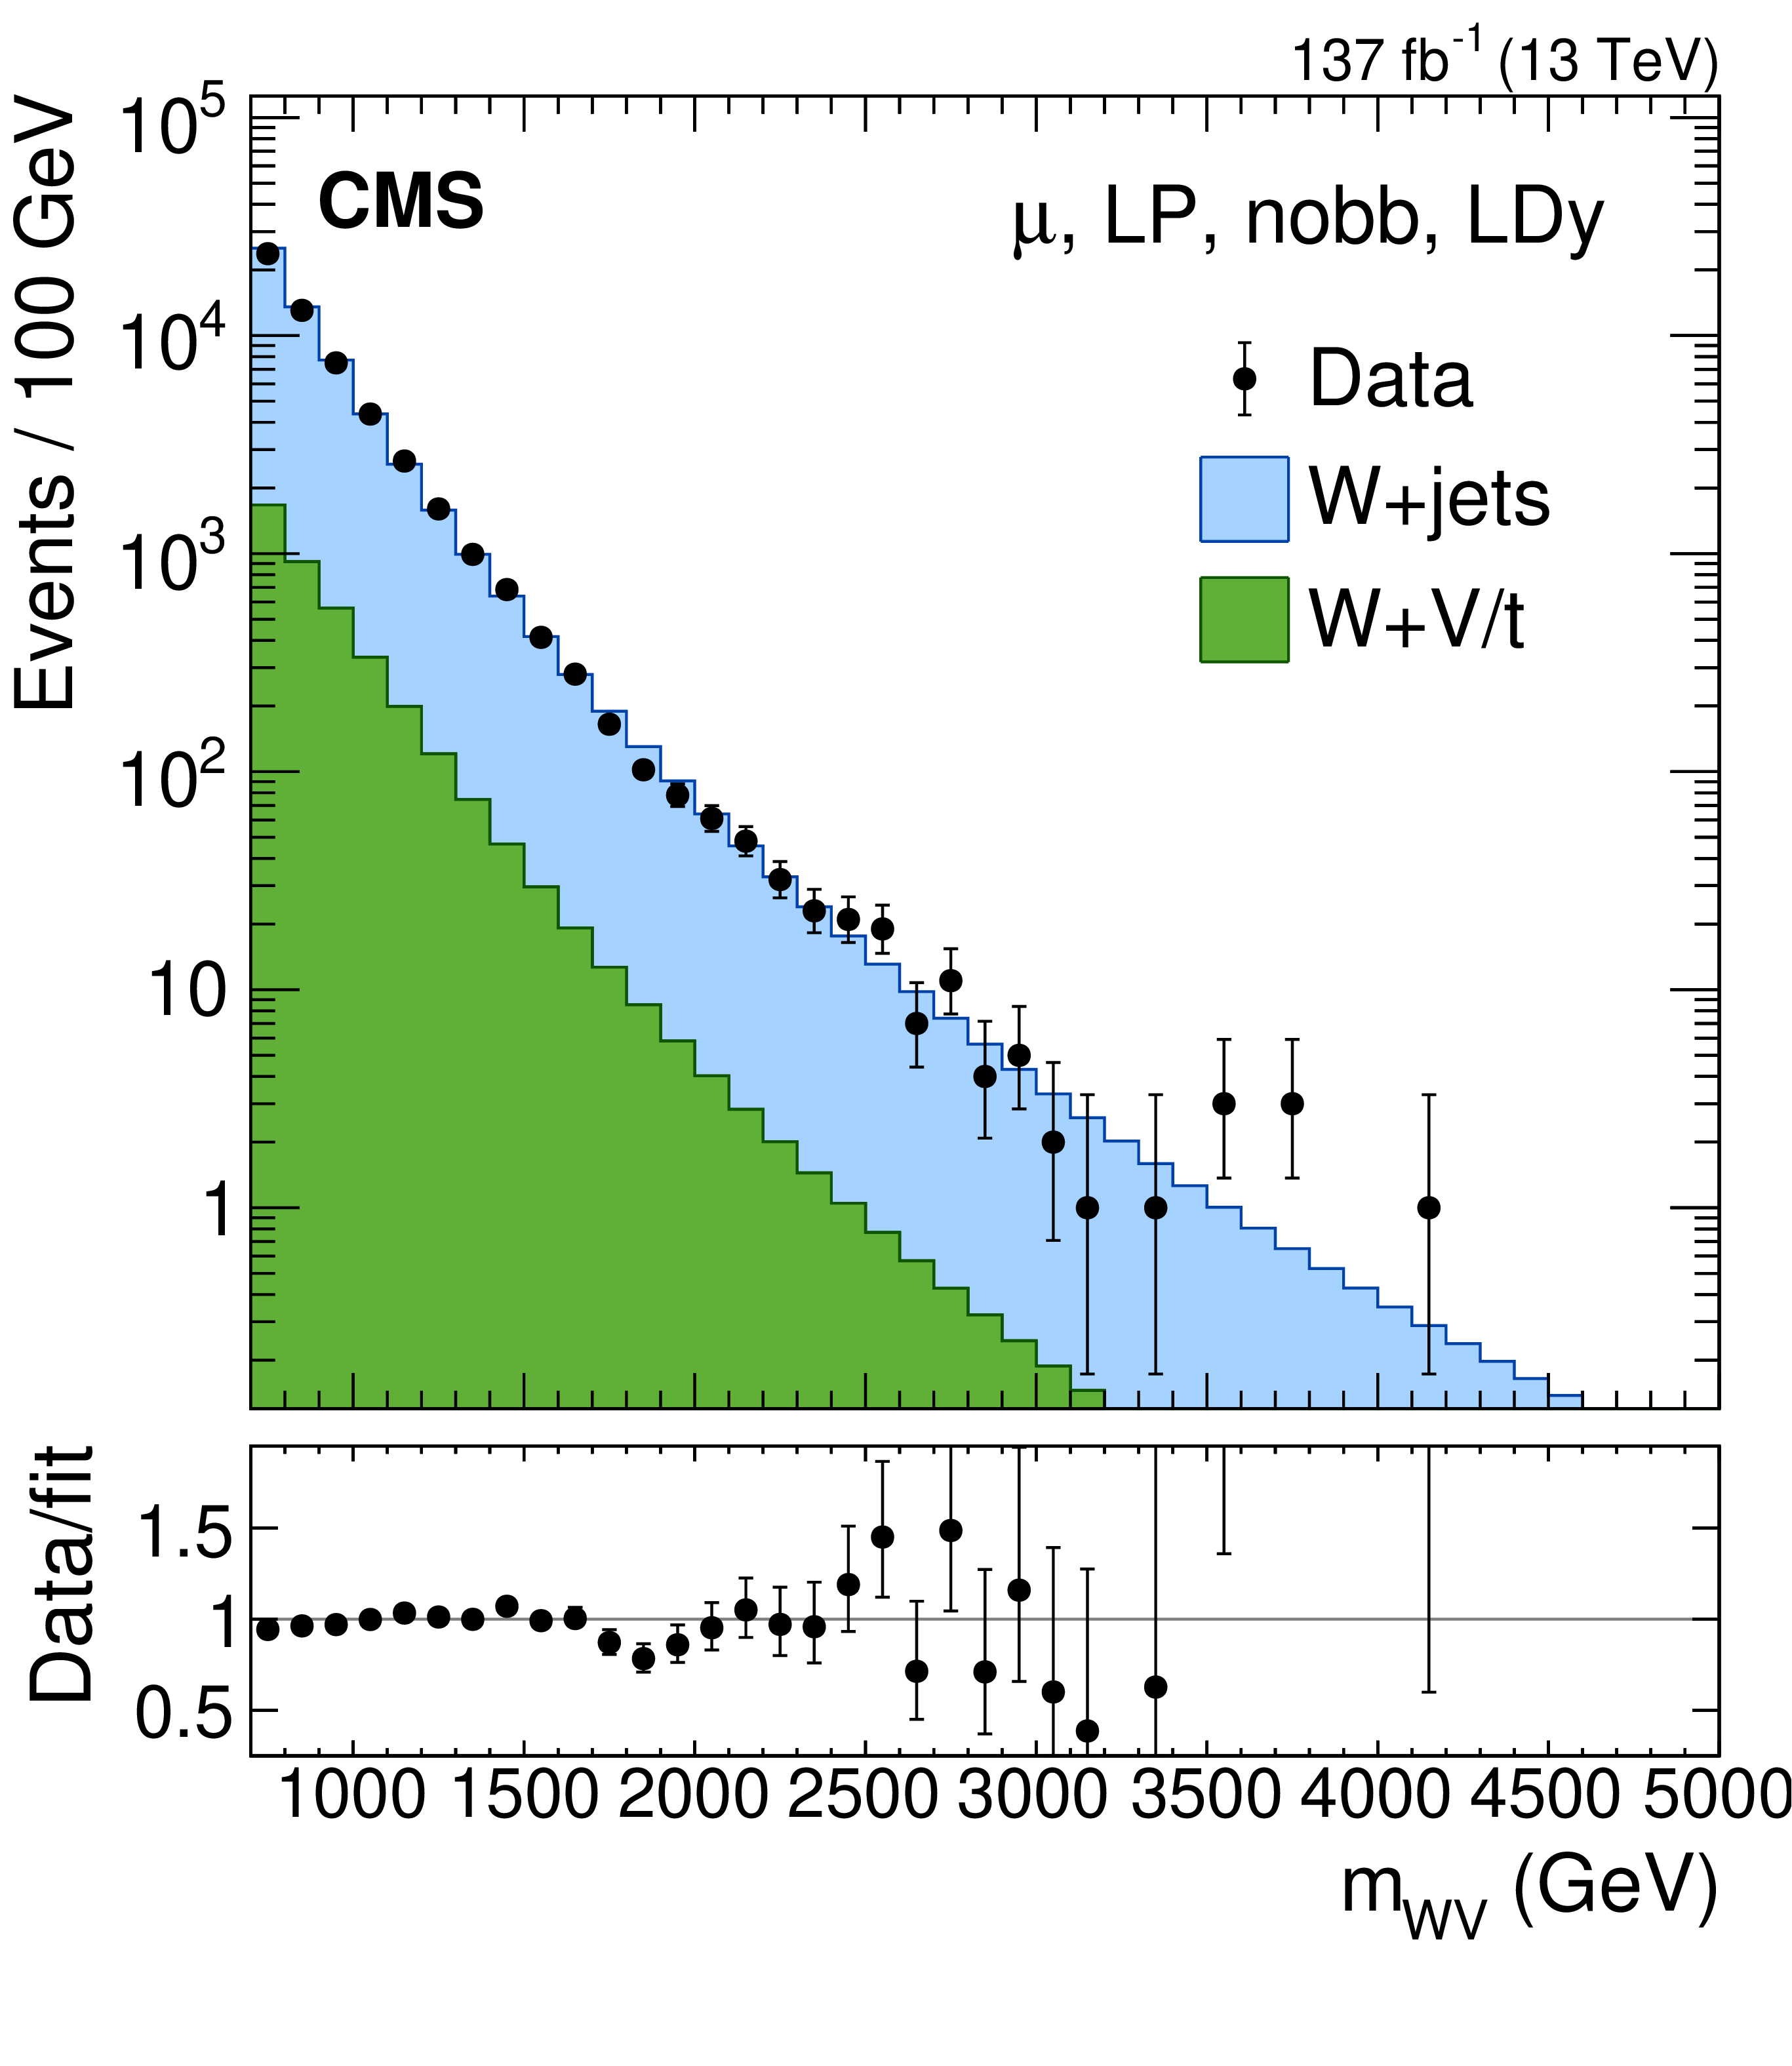
Figure 5:
Comparison between the fit result and data distributions of ${m_{{\mathrm{W}}}}$ in six representative muon-LDy categories. The distributions in the remaining 18 categories show very similar levels of agreement. The statistical uncertainties of the data are shown as vertical bars. The lower panels show the ratio of the data to the fit result. |
png pdf |
Figure 5-a:
Comparison between the fit result and data distributions of ${m_{{\mathrm{W}}}}$ in six representative muon-LDy categories. The distributions in the remaining 18 categories show very similar levels of agreement. The statistical uncertainties of the data are shown as vertical bars. The lower panels show the ratio of the data to the fit result. |
png pdf |
Figure 5-b:
Comparison between the fit result and data distributions of ${m_{{\mathrm{W}}}}$ in six representative muon-LDy categories. The distributions in the remaining 18 categories show very similar levels of agreement. The statistical uncertainties of the data are shown as vertical bars. The lower panels show the ratio of the data to the fit result. |
png pdf |
Figure 5-c:
Comparison between the fit result and data distributions of ${m_{{\mathrm{W}}}}$ in six representative muon-LDy categories. The distributions in the remaining 18 categories show very similar levels of agreement. The statistical uncertainties of the data are shown as vertical bars. The lower panels show the ratio of the data to the fit result. |

png pdf |
Figure 5-d:
Comparison between the fit result and data distributions of ${m_{{\mathrm{W}}}}$ in six representative muon-LDy categories. The distributions in the remaining 18 categories show very similar levels of agreement. The statistical uncertainties of the data are shown as vertical bars. The lower panels show the ratio of the data to the fit result. |
png pdf |
Figure 5-e:
Comparison between the fit result and data distributions of ${m_{{\mathrm{W}}}}$ in six representative muon-LDy categories. The distributions in the remaining 18 categories show very similar levels of agreement. The statistical uncertainties of the data are shown as vertical bars. The lower panels show the ratio of the data to the fit result. |

png pdf |
Figure 5-f:
Comparison between the fit result and data distributions of ${m_{{\mathrm{W}}}}$ in six representative muon-LDy categories. The distributions in the remaining 18 categories show very similar levels of agreement. The statistical uncertainties of the data are shown as vertical bars. The lower panels show the ratio of the data to the fit result. |

png pdf |
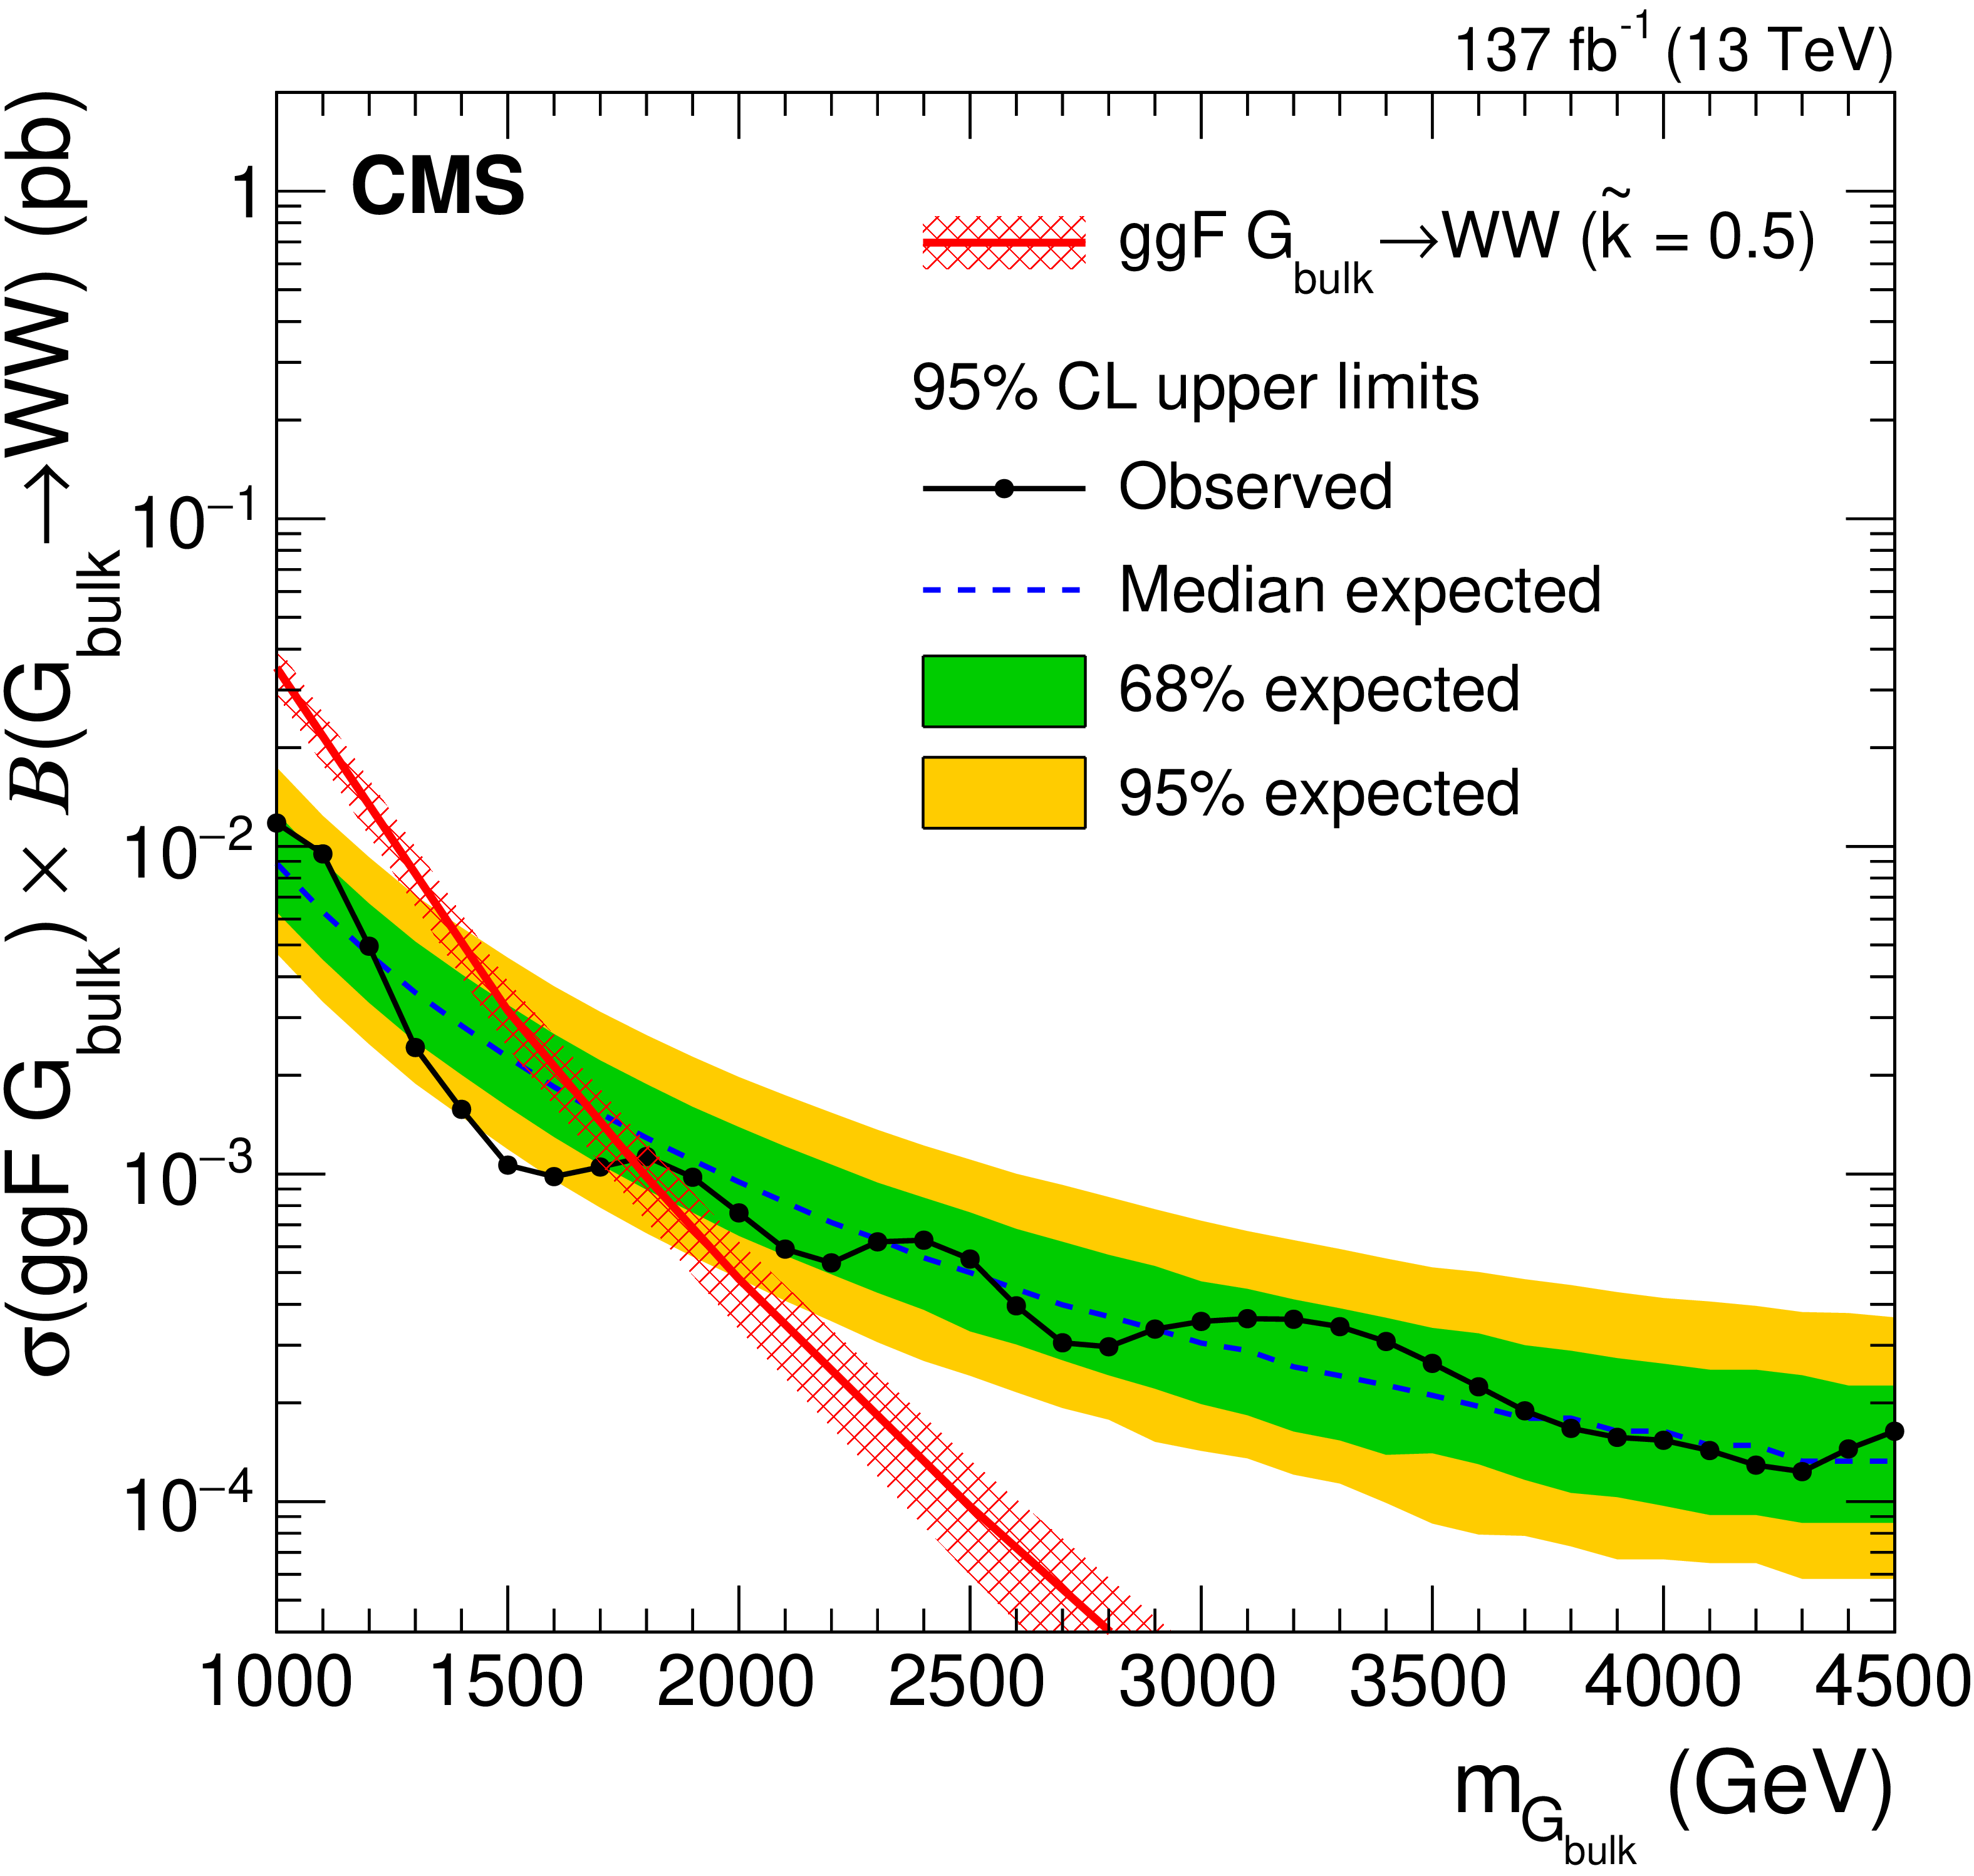
Figure 6:
Exclusion limits on the product of the production cross section and the branching fraction for a new spin-2 resonance produced via gluon-gluon fusion (left) or vector boson fusion (right) and decaying to WW, as functions of the resonance mass hypothesis, compared with the predicted cross sections for a spin-2 bulk graviton with $ {\tilde{k}} =$ 0.5. Signal cross section uncertainties are shown as red cross-hatched bands. |
png pdf |
Figure 6-a:
Exclusion limits on the product of the production cross section and the branching fraction for a new spin-2 resonance produced via gluon-gluon fusion (left) or vector boson fusion (right) and decaying to WW, as functions of the resonance mass hypothesis, compared with the predicted cross sections for a spin-2 bulk graviton with $ {\tilde{k}} =$ 0.5. Signal cross section uncertainties are shown as red cross-hatched bands. |

png pdf |
Figure 6-b:
Exclusion limits on the product of the production cross section and the branching fraction for a new spin-2 resonance produced via gluon-gluon fusion (left) or vector boson fusion (right) and decaying to WW, as functions of the resonance mass hypothesis, compared with the predicted cross sections for a spin-2 bulk graviton with $ {\tilde{k}} =$ 0.5. Signal cross section uncertainties are shown as red cross-hatched bands. |

png pdf |
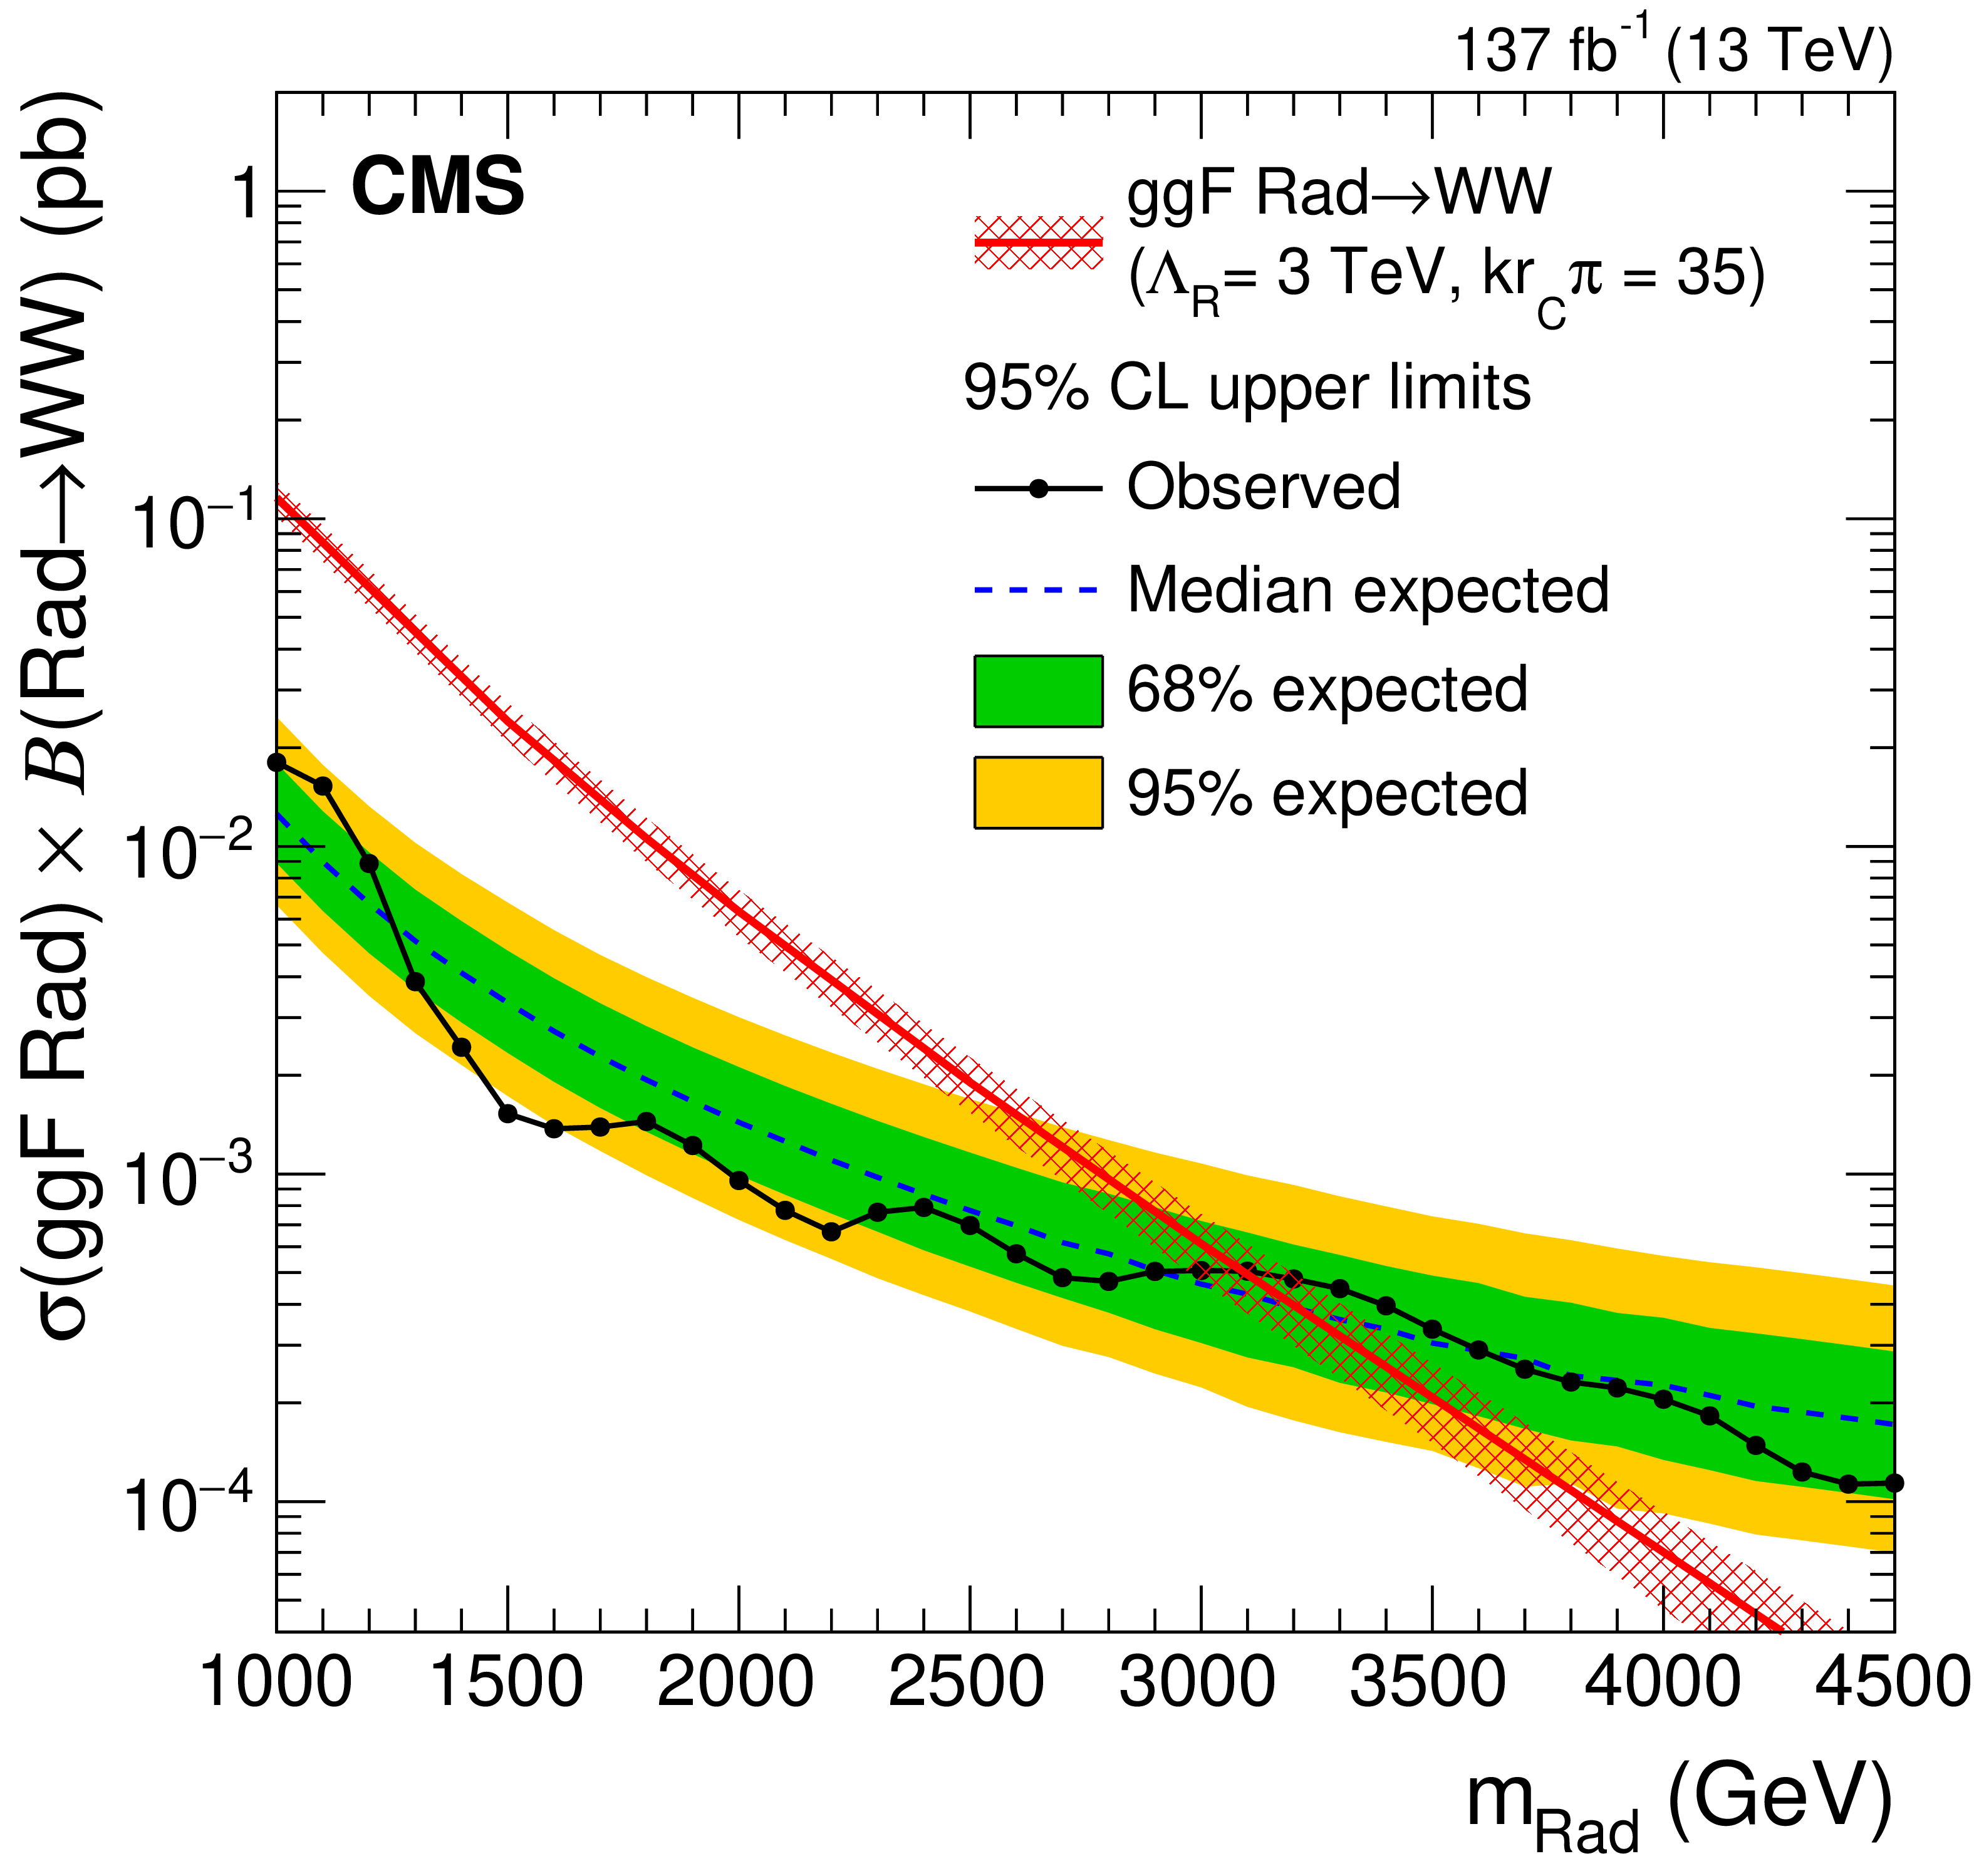
Figure 7:
Exclusion limits on the product of the production cross section and the branching fraction for a new spin-0 resonance produced via gluon-gluon fusion (left) or vector boson fusion (right) and decaying to WW, as functions of the resonance mass hypothesis, compared with the predicted cross sections for a spin-0 bulk radion with $ {\Lambda _\text {R}} = $ 3 TeV and $k r_\text {c} \pi = $ 35. Signal cross section uncertainties are shown as red cross-hatched bands. |
png pdf |
Figure 7-a:
Exclusion limits on the product of the production cross section and the branching fraction for a new spin-0 resonance produced via gluon-gluon fusion (left) or vector boson fusion (right) and decaying to WW, as functions of the resonance mass hypothesis, compared with the predicted cross sections for a spin-0 bulk radion with $ {\Lambda _\text {R}} = $ 3 TeV and $k r_\text {c} \pi = $ 35. Signal cross section uncertainties are shown as red cross-hatched bands. |

png pdf |
Figure 7-b:
Exclusion limits on the product of the production cross section and the branching fraction for a new spin-0 resonance produced via gluon-gluon fusion (left) or vector boson fusion (right) and decaying to WW, as functions of the resonance mass hypothesis, compared with the predicted cross sections for a spin-0 bulk radion with $ {\Lambda _\text {R}} = $ 3 TeV and $k r_\text {c} \pi = $ 35. Signal cross section uncertainties are shown as red cross-hatched bands. |
png pdf |
Figure 8:
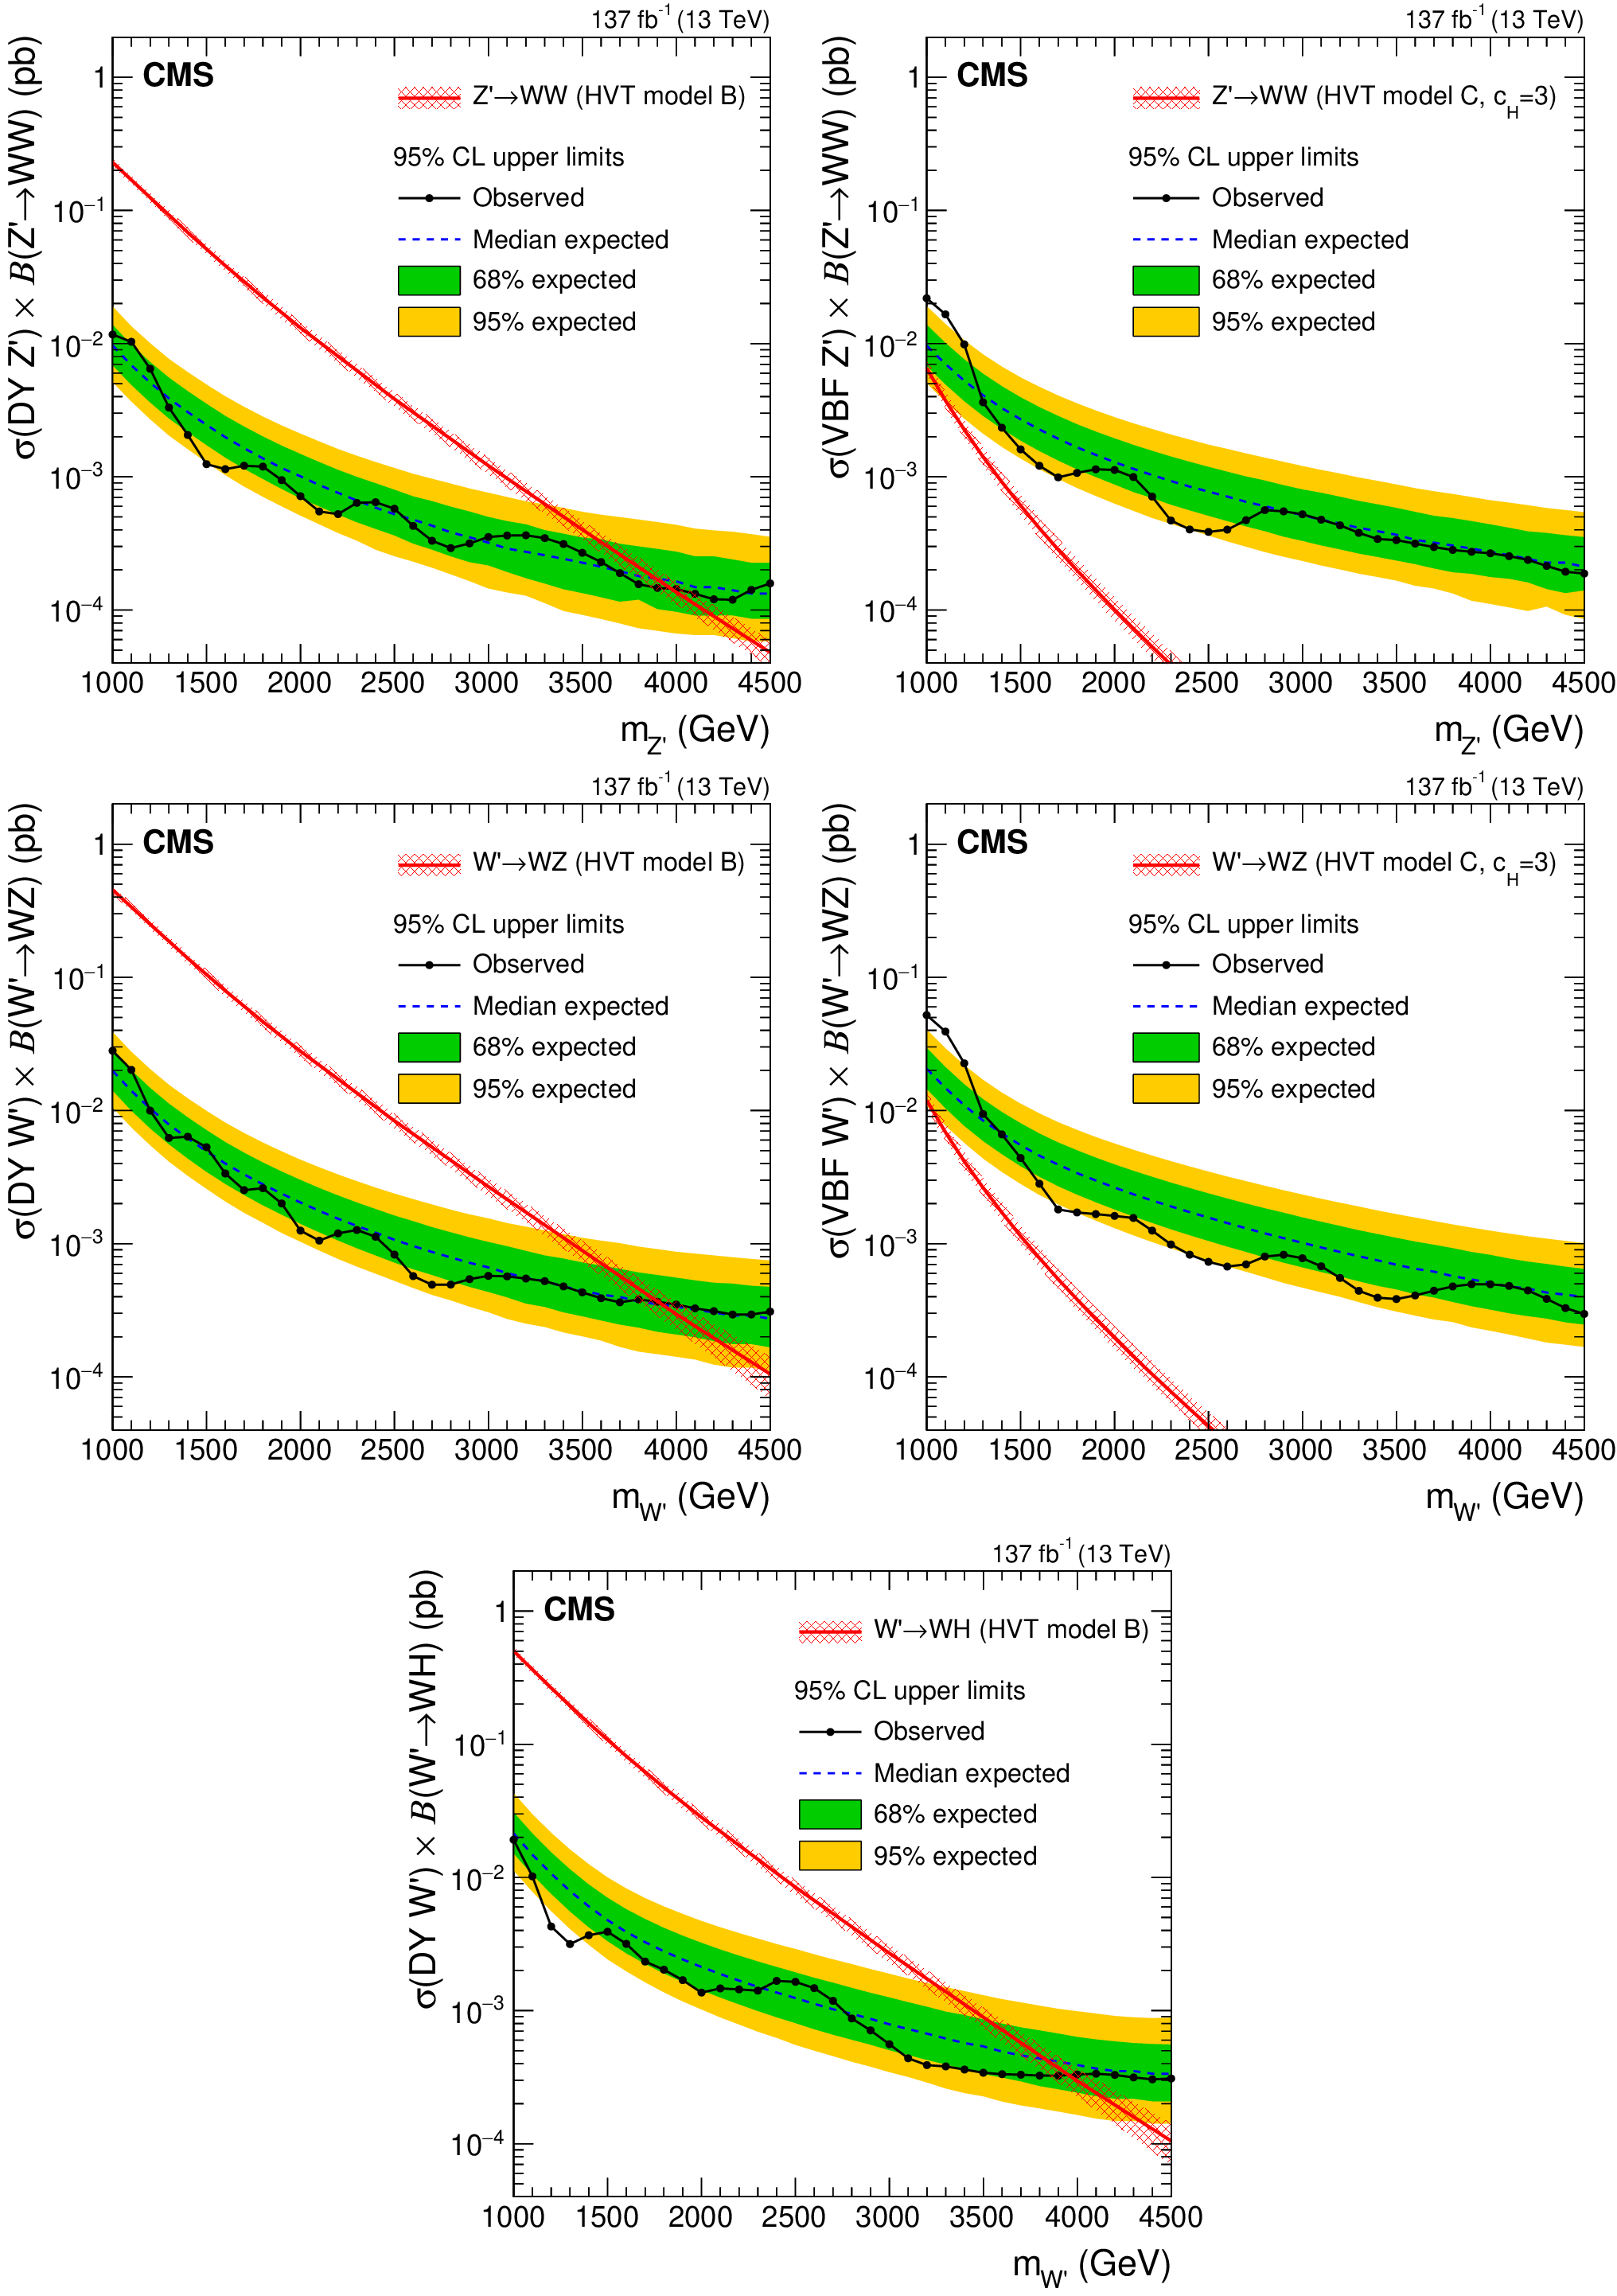
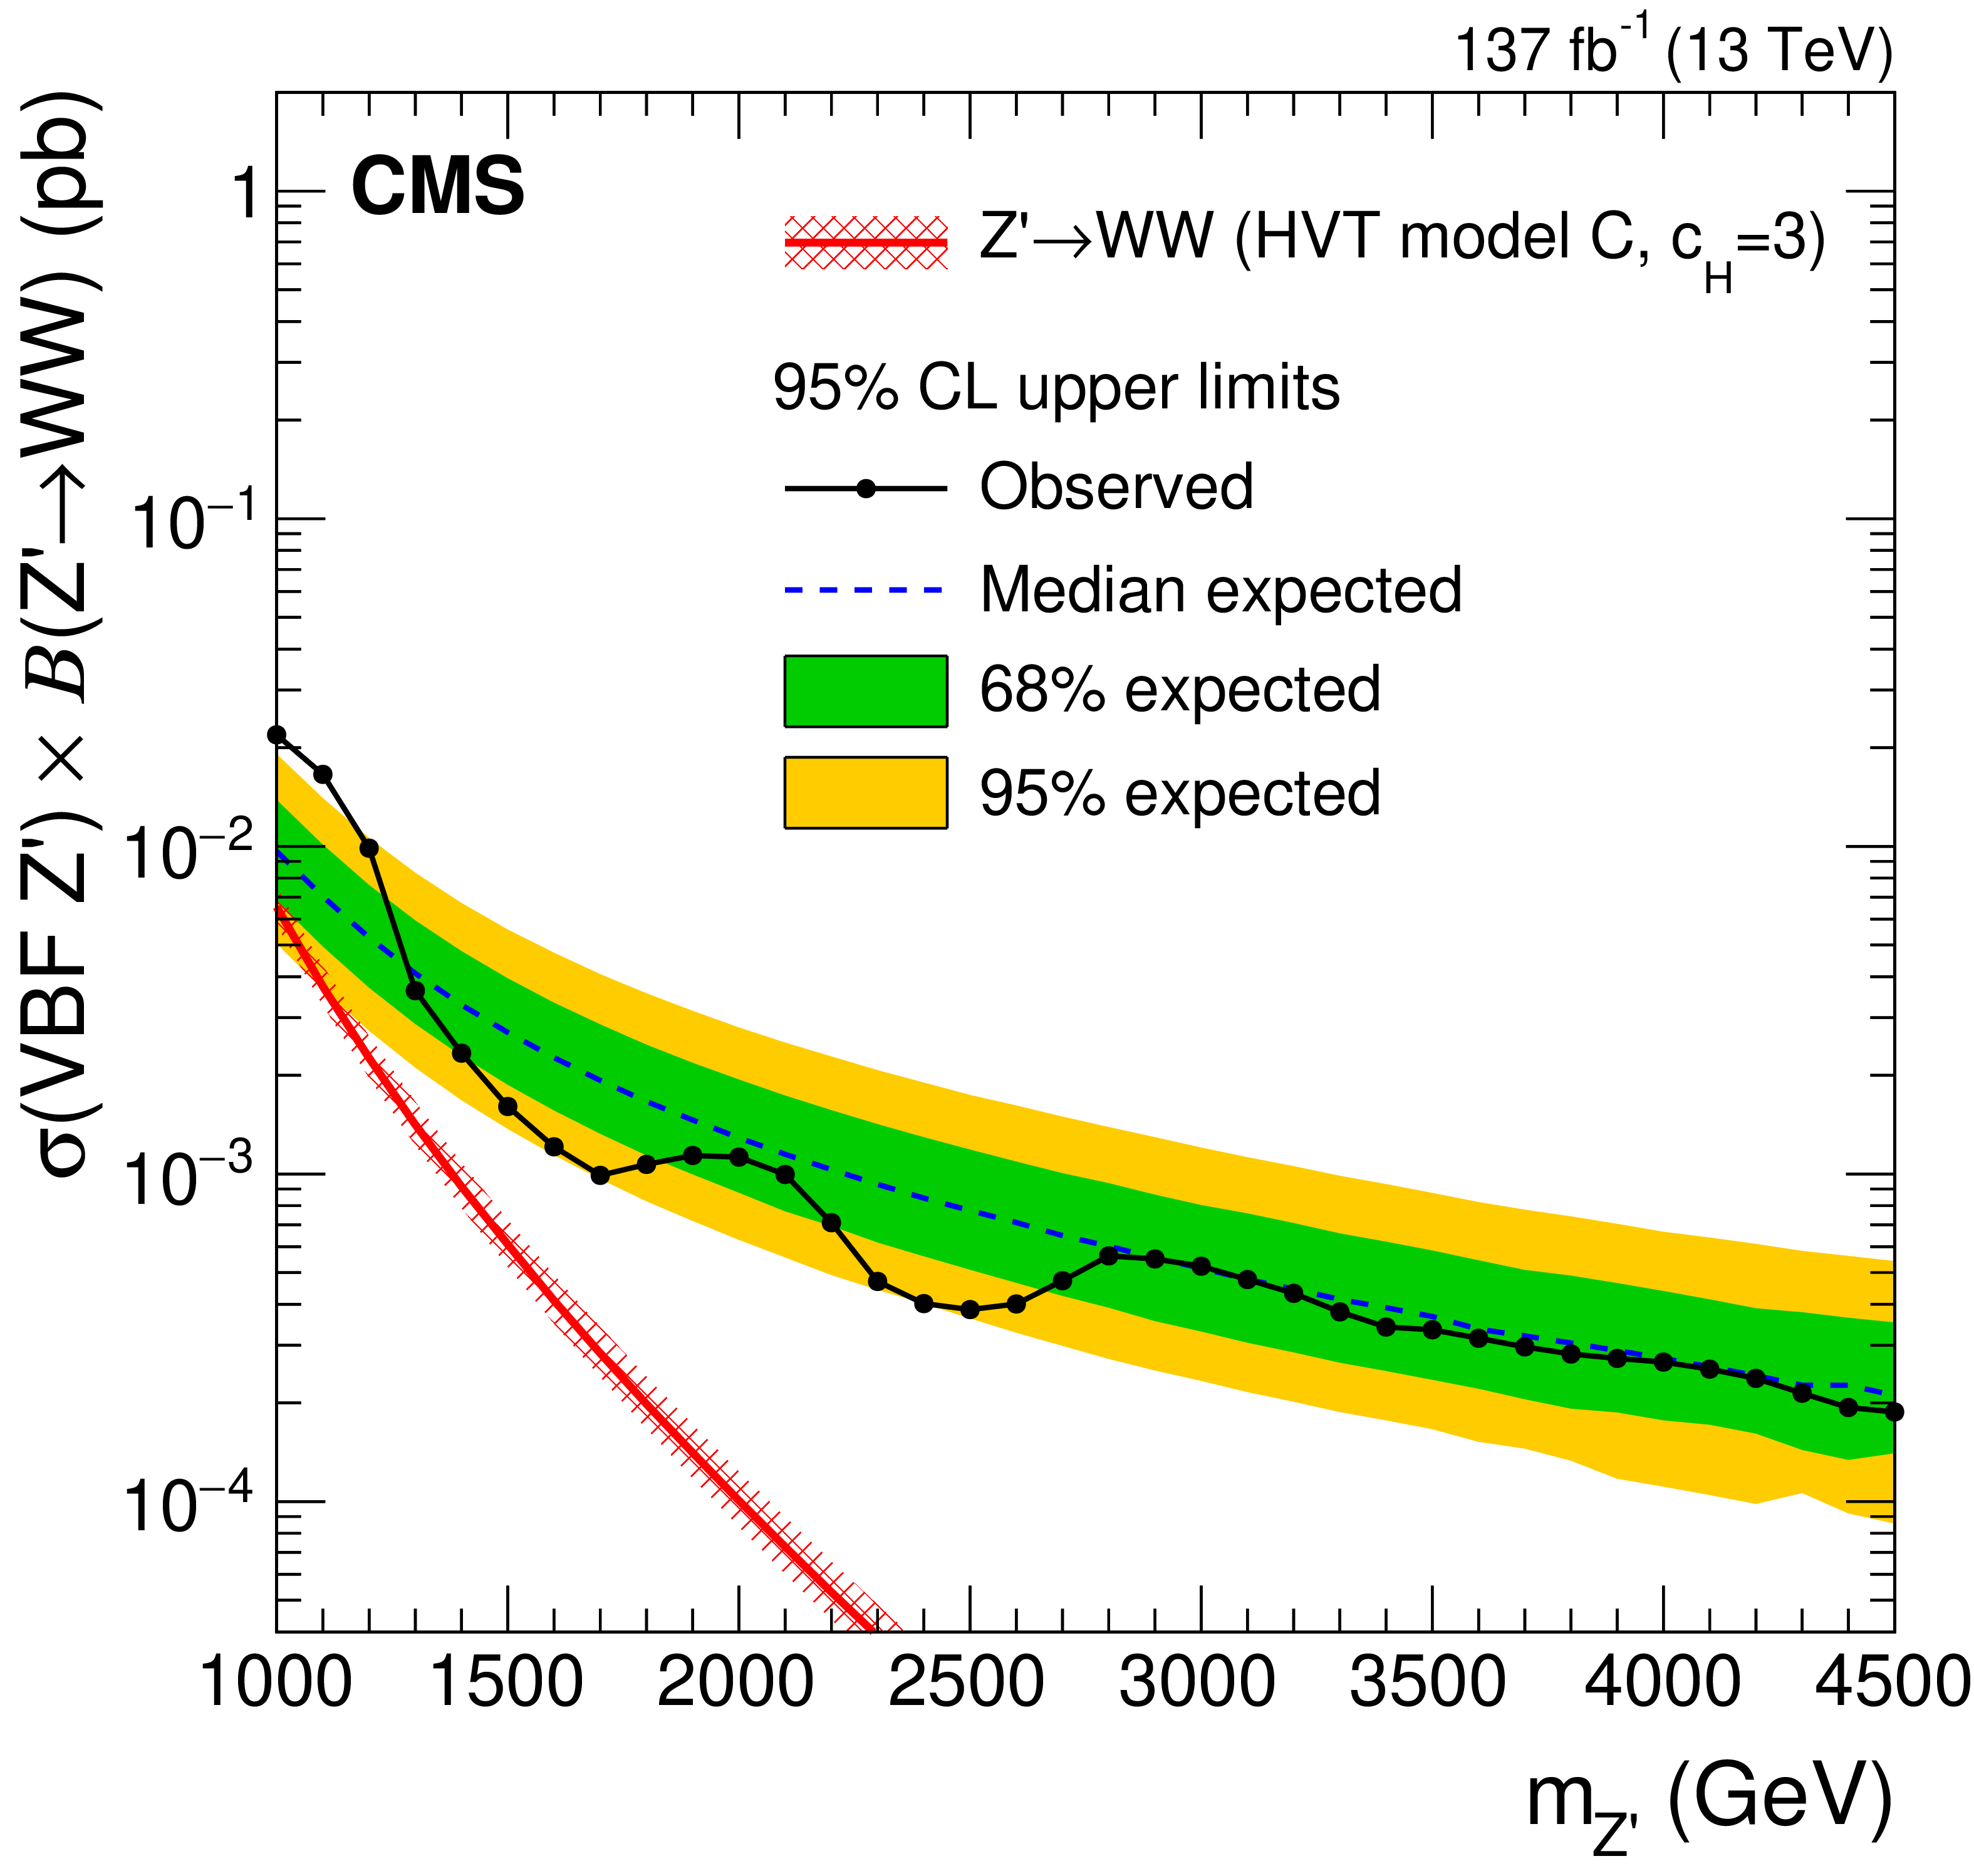
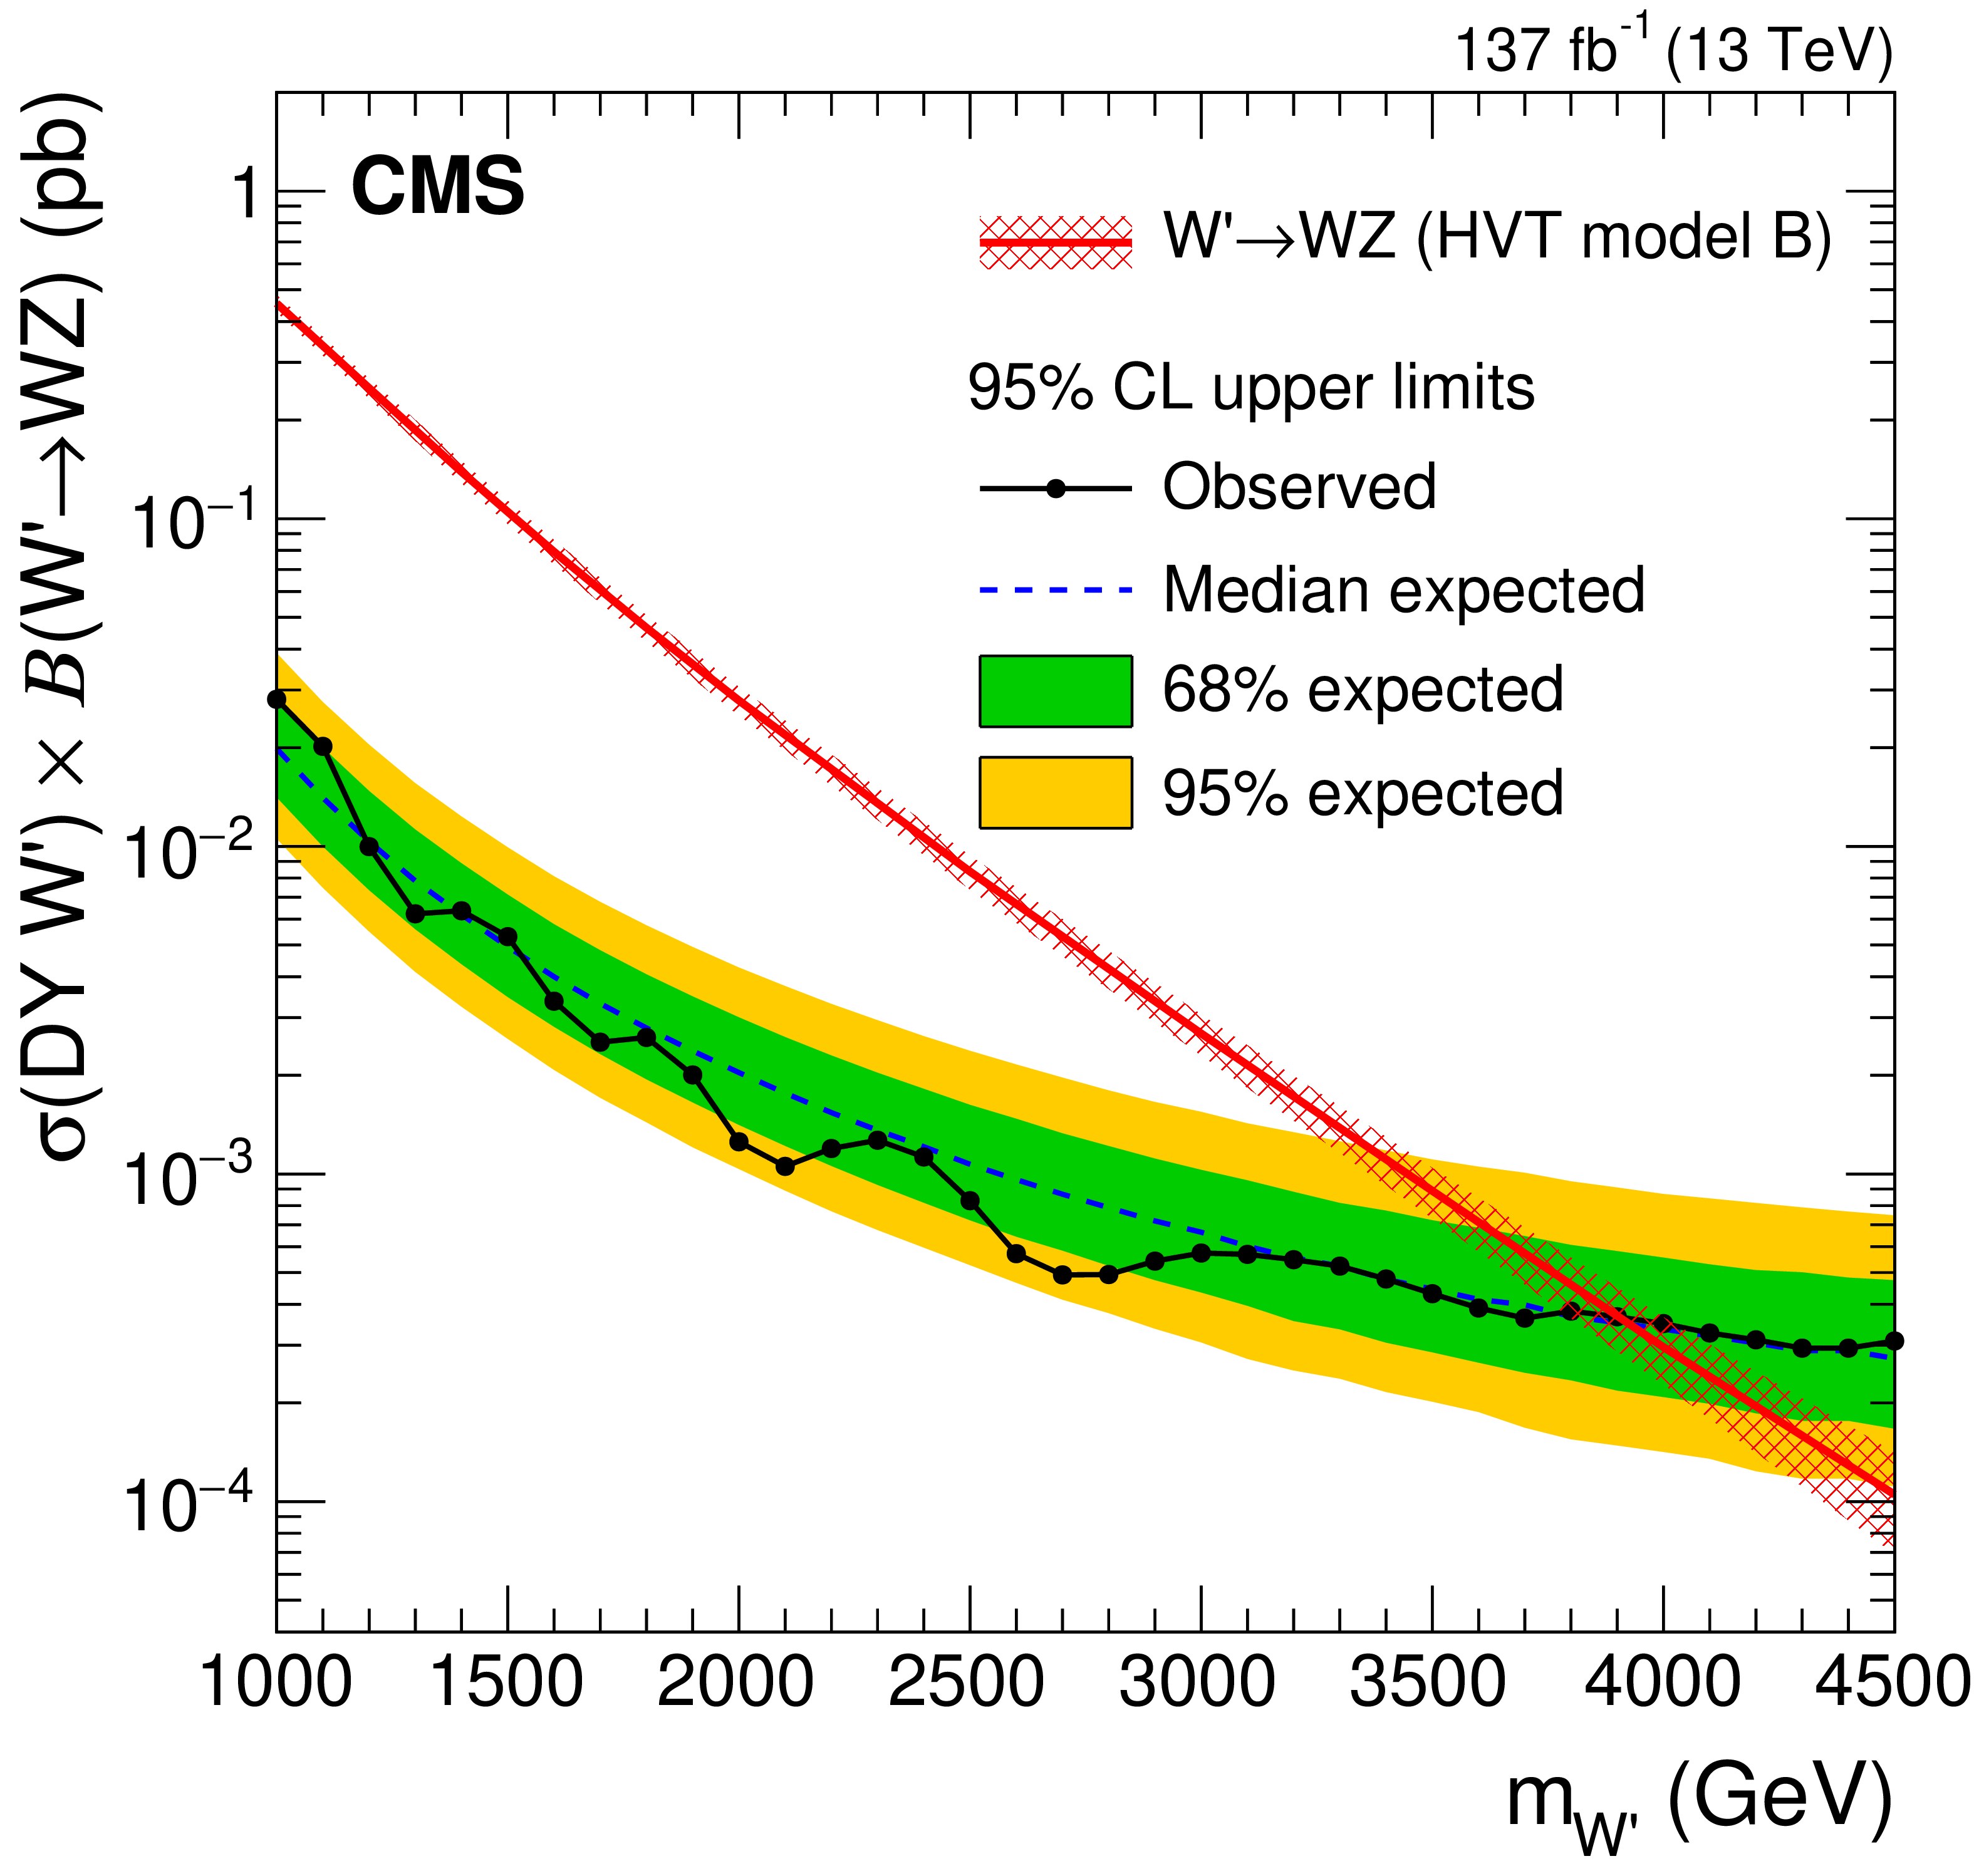
Exclusion limits on the product of the production cross section and the branching fraction for a new neutral spin-1 resonance produced via ${\mathrm{q} \mathrm{\bar{q}}}$ annihilation (upper left) or vector boson fusion (upper right) and decaying to WW, for a new charged spin-1 resonance produced via ${\mathrm{q} \mathrm{\bar{q}}}$ annihilation (center left) or vector boson fusion (center right) and decaying to WZ, and for a new charged spin-1 resonance produced via ${\mathrm{q} \mathrm{\bar{q}}}$ annihilation and decaying to WH (lower), as functions of the resonance mass hypothesis, compared with the predicted cross sections for a W' or Z' from HVT model B (for DY) or HVT model C with $ {c_\text {H}} =$ 3 (for VBF). Signal cross section uncertainties are shown as red cross-hatched bands. |

png pdf |
Figure 8-a:
Exclusion limits on the product of the production cross section and the branching fraction for a new neutral spin-1 resonance produced via ${\mathrm{q} \mathrm{\bar{q}}}$ annihilation (upper left) or vector boson fusion (upper right) and decaying to WW, for a new charged spin-1 resonance produced via ${\mathrm{q} \mathrm{\bar{q}}}$ annihilation (center left) or vector boson fusion (center right) and decaying to WZ, and for a new charged spin-1 resonance produced via ${\mathrm{q} \mathrm{\bar{q}}}$ annihilation and decaying to WH (lower), as functions of the resonance mass hypothesis, compared with the predicted cross sections for a W' or Z' from HVT model B (for DY) or HVT model C with $ {c_\text {H}} =$ 3 (for VBF). Signal cross section uncertainties are shown as red cross-hatched bands. |
png pdf |
Figure 8-b:
Exclusion limits on the product of the production cross section and the branching fraction for a new neutral spin-1 resonance produced via ${\mathrm{q} \mathrm{\bar{q}}}$ annihilation (upper left) or vector boson fusion (upper right) and decaying to WW, for a new charged spin-1 resonance produced via ${\mathrm{q} \mathrm{\bar{q}}}$ annihilation (center left) or vector boson fusion (center right) and decaying to WZ, and for a new charged spin-1 resonance produced via ${\mathrm{q} \mathrm{\bar{q}}}$ annihilation and decaying to WH (lower), as functions of the resonance mass hypothesis, compared with the predicted cross sections for a W' or Z' from HVT model B (for DY) or HVT model C with $ {c_\text {H}} =$ 3 (for VBF). Signal cross section uncertainties are shown as red cross-hatched bands. |
png pdf |
Figure 8-c:
Exclusion limits on the product of the production cross section and the branching fraction for a new neutral spin-1 resonance produced via ${\mathrm{q} \mathrm{\bar{q}}}$ annihilation (upper left) or vector boson fusion (upper right) and decaying to WW, for a new charged spin-1 resonance produced via ${\mathrm{q} \mathrm{\bar{q}}}$ annihilation (center left) or vector boson fusion (center right) and decaying to WZ, and for a new charged spin-1 resonance produced via ${\mathrm{q} \mathrm{\bar{q}}}$ annihilation and decaying to WH (lower), as functions of the resonance mass hypothesis, compared with the predicted cross sections for a W' or Z' from HVT model B (for DY) or HVT model C with $ {c_\text {H}} =$ 3 (for VBF). Signal cross section uncertainties are shown as red cross-hatched bands. |

png pdf |
Figure 8-d:
Exclusion limits on the product of the production cross section and the branching fraction for a new neutral spin-1 resonance produced via ${\mathrm{q} \mathrm{\bar{q}}}$ annihilation (upper left) or vector boson fusion (upper right) and decaying to WW, for a new charged spin-1 resonance produced via ${\mathrm{q} \mathrm{\bar{q}}}$ annihilation (center left) or vector boson fusion (center right) and decaying to WZ, and for a new charged spin-1 resonance produced via ${\mathrm{q} \mathrm{\bar{q}}}$ annihilation and decaying to WH (lower), as functions of the resonance mass hypothesis, compared with the predicted cross sections for a W' or Z' from HVT model B (for DY) or HVT model C with $ {c_\text {H}} =$ 3 (for VBF). Signal cross section uncertainties are shown as red cross-hatched bands. |

png pdf |
Figure 8-e:
Exclusion limits on the product of the production cross section and the branching fraction for a new neutral spin-1 resonance produced via ${\mathrm{q} \mathrm{\bar{q}}}$ annihilation (upper left) or vector boson fusion (upper right) and decaying to WW, for a new charged spin-1 resonance produced via ${\mathrm{q} \mathrm{\bar{q}}}$ annihilation (center left) or vector boson fusion (center right) and decaying to WZ, and for a new charged spin-1 resonance produced via ${\mathrm{q} \mathrm{\bar{q}}}$ annihilation and decaying to WH (lower), as functions of the resonance mass hypothesis, compared with the predicted cross sections for a W' or Z' from HVT model B (for DY) or HVT model C with $ {c_\text {H}} =$ 3 (for VBF). Signal cross section uncertainties are shown as red cross-hatched bands. |
| Tables | |

png pdf |
Table 1:
Summary of the categorization scheme in the analysis. The 24 analysis categories are defined by all possible combinations of the criteria defined in each column. |
png pdf |
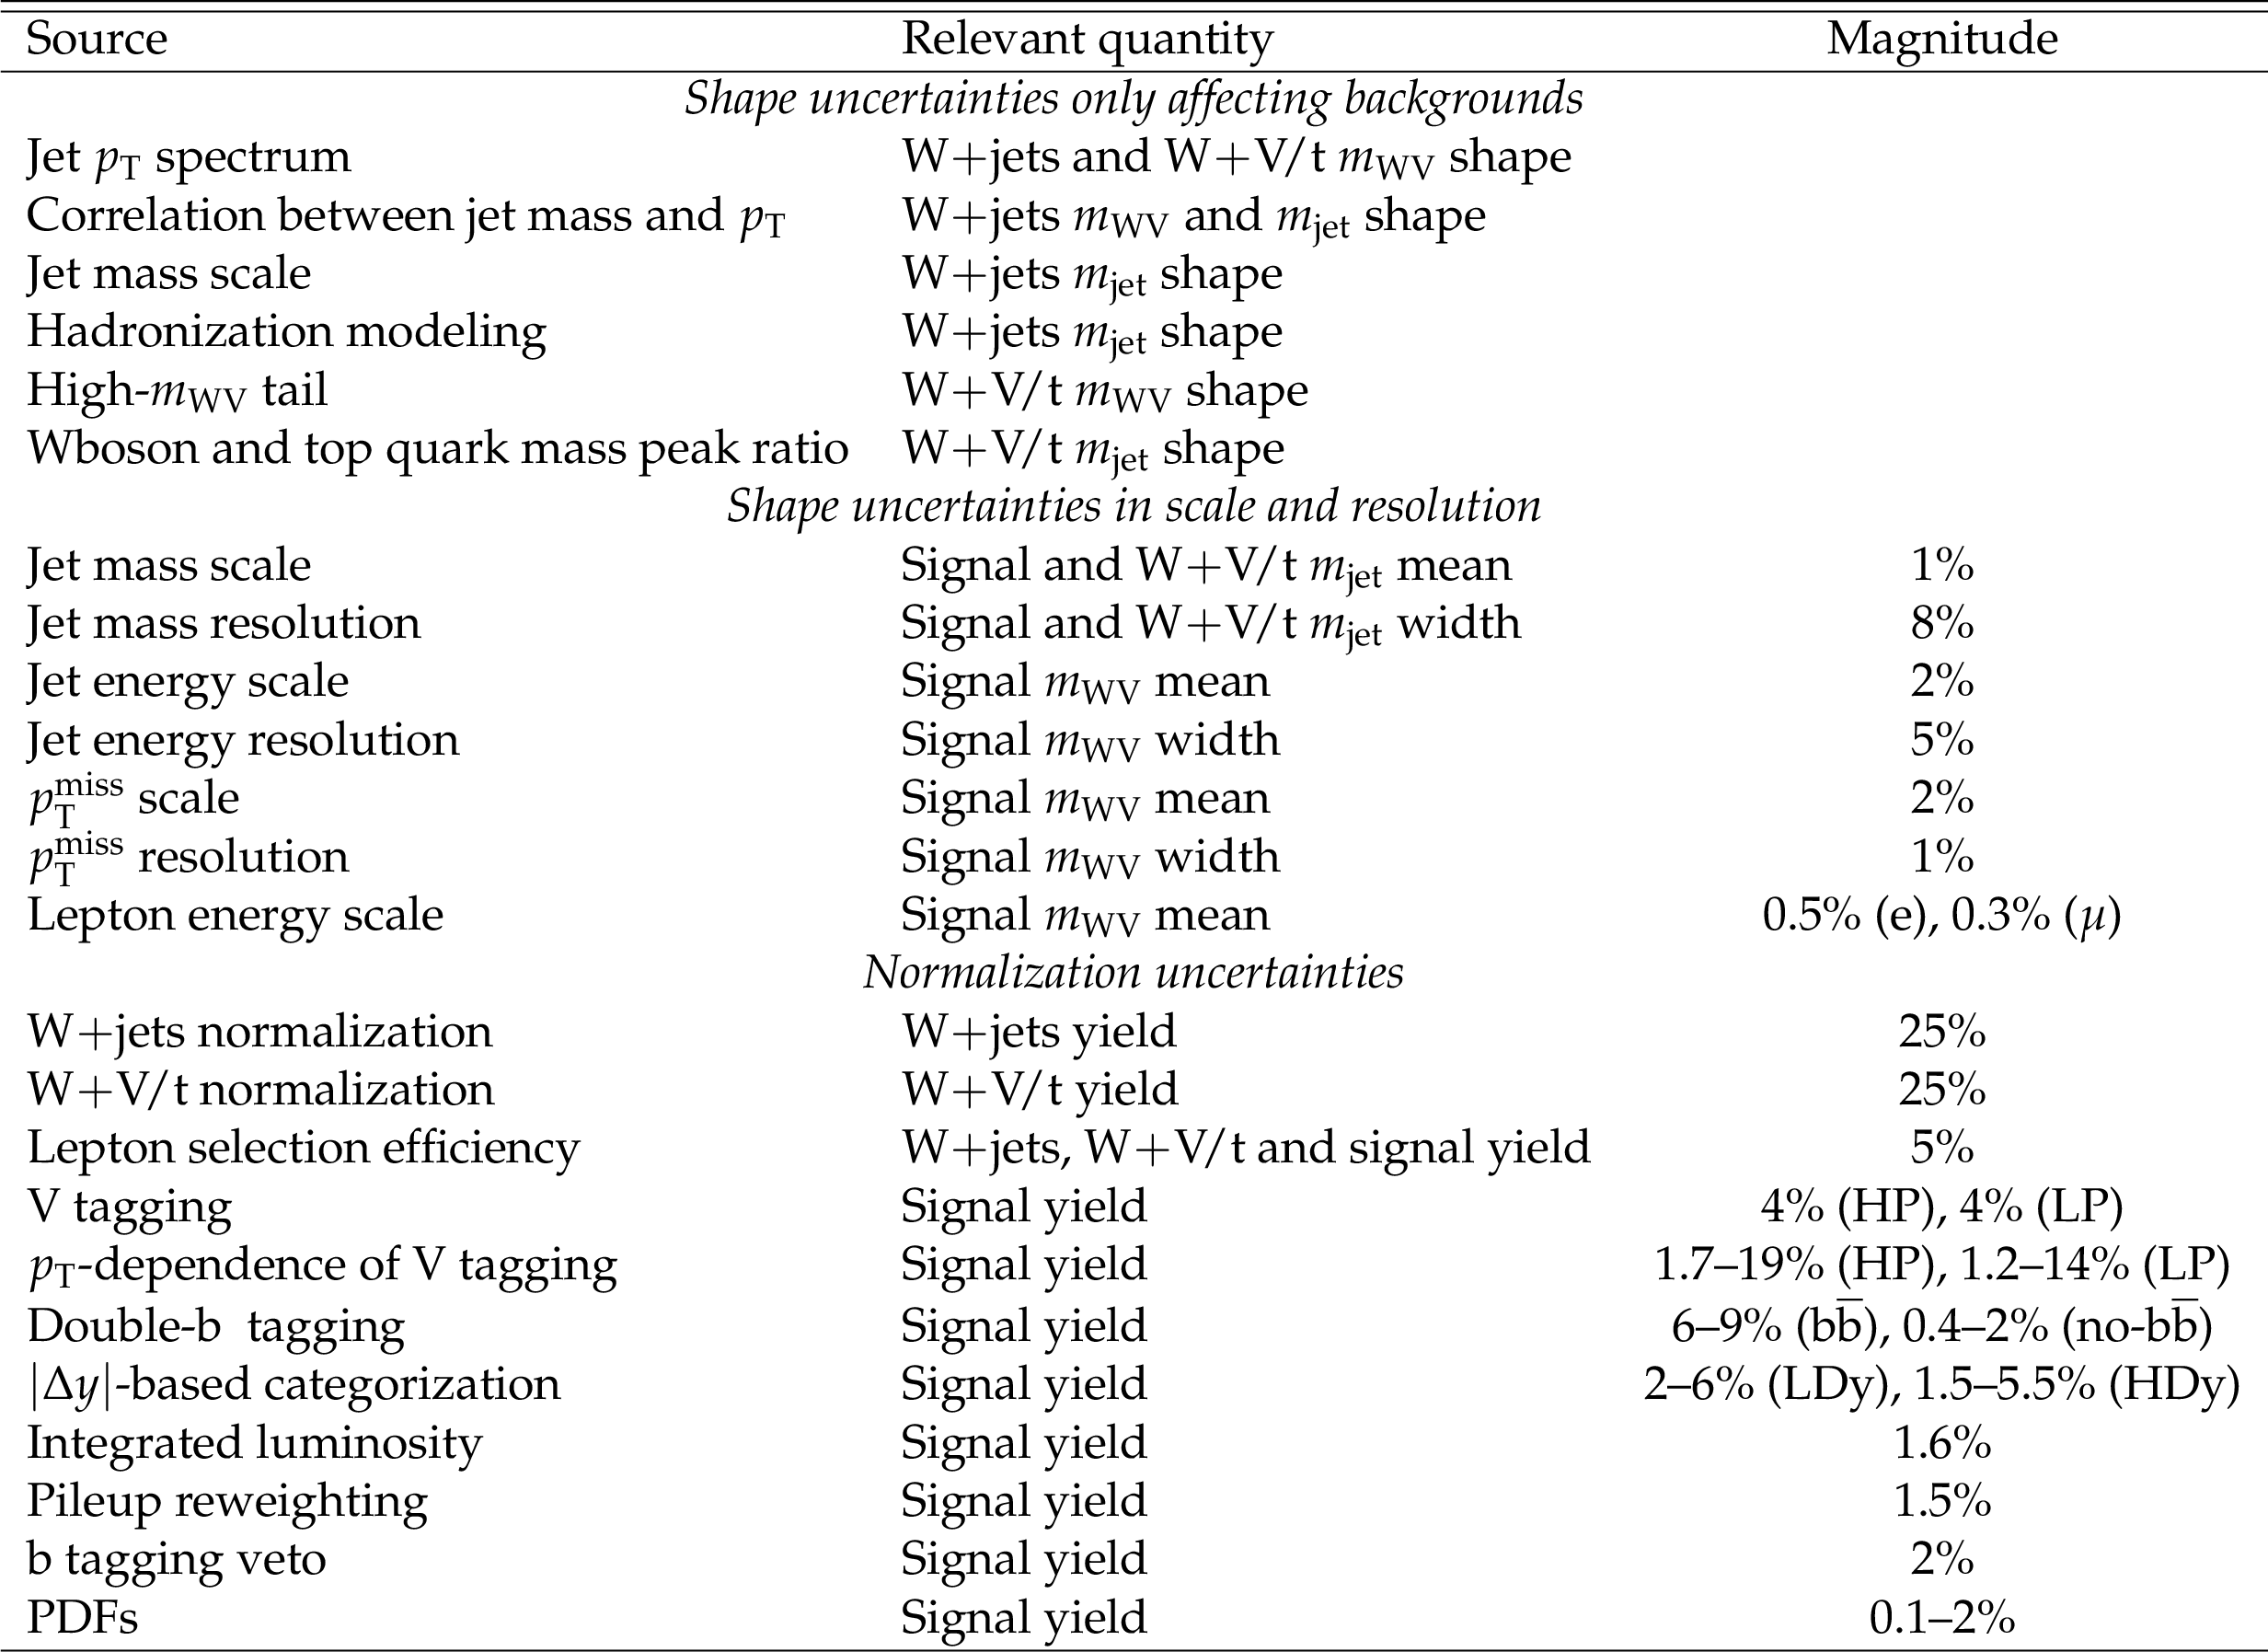
Table 2:
Summary of the systematic uncertainties considered in the 2D fit, the quantities they affect, and their magnitude, when applicable. When ranges are given, the magnitude of the uncertainty depends on the signal model or mass. The three parts of the table concern shape uncertainties only affecting backgrounds, shape uncertainties in the scales and resolutions, and normalization uncertainties. |
| Summary |
| A search for new narrow heavy resonances with mass larger than 1 TeV and decaying to WW, WZ, or WH boson pairs is performed using proton-proton collision events at $\sqrt{s} = $ 13 TeV containing one high-${p_{\mathrm{T}}}$ electron or muon, large missing transverse momentum, and a massive large-radius jet. The data were collected with the CMS detector at the LHC in 2016-2018 and correspond to an integrated luminosity of 137 fb$^{-1}$. The signal extraction strategy is structured around a two-dimensional maximum-likelihood fit to the distributions of the diboson reconstructed mass and the soft-drop jet mass. The sensitivity to different final states and production mechanisms is enhanced by the use of event categories that exploit the mass-decorrelated $N$-subjettiness ratio, the double-b tagger, the presence of a pair of forward jets compatible with vector boson fusion production, and the difference in rapidity between the reconstructed bosons. No significant excess is found, and the results are interpreted in terms of upper limits on the production cross section of new narrow resonances in several benchmark models. Spin-2 ggF-produced bulk gravitons with masses below 1.8 TeV and decaying to WW are excluded at 95% CL. Spin-1 DY-produced $ \mathrm{ Z' \to WW } $ resonances lighter than 3.9 TeV, $ \mathrm{ W' \to WZ } $ resonances lighter than 3.9 TeV, and $ \mathrm{ W' \to WH } $ resonances lighter than 4.0 TeV in the context of HVT model B are excluded at 95% CL. Spin-0 ggF-produced bulk radions with masses below 3.1 TeV, decaying to WW, are excluded at 95% CL. Finally, for particles produced exclusively by vector boson fusion, the present data do not yet have sensitivity to exclude the benchmark scenarios under study. The reported limits, also provided in tabulated form in the HEPData record [82] for this analysis, are generally relevant for any narrow heavy resonance with a given spin produced by gluon fusion, $\mathrm{q\bar{q}}$ annihilation, or vector boson fusion. The excluded cross section values set the most stringent experimental bounds to date. |
| References | ||||
| 1 | S. L. Glashow | Partial symmetries of weak interactions | NP 22 (1961) 579 | |
| 2 | A. Salam and J. C. Ward | Electromagnetic and weak interactions | PL13 (1964) 168 | |
| 3 | S. Weinberg | A model of leptons | PRL 19 (1967) 1264 | |
| 4 | ATLAS Collaboration | Observation of a new particle in the search for the standard model Higgs boson with the ATLAS detector at the LHC | PLB 716 (2012) 1 | 1207.7214 |
| 5 | CMS Collaboration | Observation of a new boson at a mass of 125 GeV with the CMS experiment at the LHC | PLB 716 (2012) 30 | CMS-HIG-12-028 1207.7235 |
| 6 | CMS Collaboration | Observation of a new boson with mass near 125 GeV in pp collisions at $ \sqrt{s} = $ 7 and 8 TeV | JHEP 06 (2013) 081 | CMS-HIG-12-036 1303.4571 |
| 7 | L. Randall and R. Sundrum | A large mass hierarchy from a small extra dimension | PRL 83 (1999) 3370 | hep-ph/9905221 |
| 8 | L. Randall and R. Sundrum | An alternative to compactification | PRL 83 (1999) 4690 | hep-th/9906064 |
| 9 | D. Pappadopulo, A. Thamm, R. Torre, and A. Wulzer | Heavy vector triplets: Bridging theory and data | JHEP 09 (2014) 060 | 1402.4431 |
| 10 | B. Bellazzini, C. Cs\'aki, and J. Serra | Composite Higgses | EPJC 74 (2014) 2766 | 1401.2457 |
| 11 | R. Contino, D. Marzocca, D. Pappadopulo, and R. Rattazzi | On the effect of resonances in composite Higgs phenomenology | JHEP 10 (2011) 081 | 1109.1570 |
| 12 | D. Marzocca, M. Serone, and J. Shu | General composite Higgs models | JHEP 08 (2012) 013 | 1205.0770 |
| 13 | D. Greco and D. Liu | Hunting composite vector resonances at the LHC: naturalness facing data | JHEP 12 (2014) 126 | 1410.2883 |
| 14 | K. Lane and L. Pritchett | The light composite Higgs boson in strong extended technicolor | JHEP 06 (2017) 140 | 1604.07085 |
| 15 | M. Schmaltz and D. Tucker-Smith | Little Higgs review | Ann. Rev. Nucl. Part. Sci. 55 (2005) 229 | hep-ph/0502182 |
| 16 | N. Arkani-Hamed, A. G. Cohen, E. Katz, and A. E. Nelson | The littlest Higgs | JHEP 07 (2002) 034 | hep-ph/0206021 |
| 17 | ATLAS Collaboration | Search for production of WW/WZ resonances decaying to a lepton, neutrino and jets in pp collisions at $ \sqrt{s}=$ 8 TeV with the ATLAS detector | EPJC 75 (2015) 209 | 1503.04677 |
| 18 | ATLAS Collaboration | Searches for heavy diboson resonances in pp collisions at $ \sqrt{s}=13{TeV} $ with the ATLAS detector | JHEP 09 (2016) 173 | 1606.04833 |
| 19 | ATLAS Collaboration | Search for WW/WZ resonance production in $ \ell\nu\mathrm{q}\mathrm{q} $ final states in pp collisions at $ \sqrt{s} = $ 13 TeV with the ATLAS detector | JHEP 03 (2018) 042 | 1710.07235 |
| 20 | CMS Collaboration | Search for massive resonances decaying into pairs of boosted bosons in semi-leptonic final states at $ \sqrt{s} = 8{TeV} $ | JHEP 08 (2014) 174 | CMS-EXO-13-009 1405.3447 |
| 21 | CMS Collaboration | Search for massive resonances decaying into WW, WZ or ZZ bosons in proton-proton collisions at $ \sqrt{s} = $ 13 TeV | JHEP 03 (2017) 162 | CMS-B2G-16-004 1612.09159 |
| 22 | CMS Collaboration | Search for a heavy resonance decaying to a pair of vector bosons in the lepton plus merged jet final state at $ \sqrt{s}= $ 13 TeV | JHEP 05 (2018) 088 | CMS-B2G-16-029 1802.09407 |
| 23 | ATLAS Collaboration | Search for heavy diboson resonances in semileptonic final states in pp collisions at $ \sqrt{s}= $ 13 TeV with the ATLAS detector | EPJC 80 (2020), no. 12 | 2004.14636 |
| 24 | ATLAS Collaboration | Search for a new resonance decaying to a $ \mathrm{W} $ or $ \mathrm{Z} $ boson and a Higgs boson in the $ \ell\ell / \ell \nu / \nu\nu + \mathrm{b\bar{b}} $ final states with the ATLAS detector | EPJC 75 (2015) 263 | 1503.08089 |
| 25 | ATLAS Collaboration | Search for new resonances decaying to a $ \mathrm{W} $ or $ \mathrm{Z} $ boson and a Higgs boson in the $ \ell^+ \ell^- \mathrm{b\bar{b}}{} $, $ \ell \nu\mathrm{b\bar{b}}{} $, and $ \nu\bar{\nu} \mathrm{b\bar{b}}{} $ channels with pp collisions at $ \sqrt s = $ 13 TeV with the ATLAS detector | PLB 765 (2017) 32 | 1607.05621 |
| 26 | ATLAS Collaboration | Search for heavy resonances decaying into a $ W $ or $ Z $ boson and a Higgs boson in final states with leptons and $ b $-jets in 36 fb$ ^{-1} $ of $ \sqrt s = $ 13 TeV pp collisions with the ATLAS detector | JHEP 03 (2018) 174 | 1712.06518 |
| 27 | CMS Collaboration | Search for massive $ \mathrm{W}\mathrm{H} $ resonances decaying into the $ \ell \nu\mathrm{b\bar{b}} $ final state at $ \sqrt{s}=$ 8 TeV | EPJC 76 (2016) 237 | CMS-EXO-14-010 1601.06431 |
| 28 | CMS Collaboration | Search for heavy resonances decaying into a vector boson and a Higgs boson in final states with charged leptons, neutrinos, and b quarks | PLB 768 (2017) 137 | CMS-B2G-16-003 1610.08066 |
| 29 | CMS Collaboration | Search for heavy resonances decaying into a vector boson and a Higgs boson in final states with charged leptons, neutrinos and b quarks at $ \sqrt{s}= $ 13 TeV | JHEP 11 (2018) 172 | CMS-B2G-17-004 1807.02826 |
| 30 | CMS Collaboration | The CMS experiment at the CERN LHC | JINST 3 (2008) S08004 | CMS-00-001 |
| 31 | CMS Collaboration | Particle-flow reconstruction and global event description with the CMS detector | JINST 12 (2017) P10003 | CMS-PRF-14-001 1706.04965 |
| 32 | CMS Collaboration | Performance of missing transverse momentum reconstruction in proton-proton collisions at $ \sqrt{s} = $ 13 TeV using the CMS detector | JINST 14 (2019) P07004 | CMS-JME-17-001 1903.06078 |
| 33 | M. Cacciari, G. P. Salam, and G. Soyez | The anti-$ {k_{\mathrm{T}}} $ jet clustering algorithm | JHEP 04 (2008) 063 | 0802.1189 |
| 34 | M. Cacciari, G. P. Salam, and G. Soyez | FastJet user manual | EPJC 72 (2012) 1896 | 1111.6097 |
| 35 | CMS Collaboration | Jet energy scale and resolution in the CMS experiment in pp collisions at 8 TeV | JINST 12 (2017) P02014 | CMS-JME-13-004 1607.03663 |
| 36 | CMS Collaboration | Pileup mitigation at CMS in 13 TeV data | JINST 15 (2020) P09018 | CMS-JME-18-001 2003.00503 |
| 37 | D. Bertolini, P. Harris, M. Low, and N. Tran | Pileup per particle identification | JHEP 10 (2014) 059 | 1407.6013 |
| 38 | CMS Collaboration | Performance of the CMS Level-1 trigger in proton-proton collisions at $ \sqrt{s} = $ 13 TeV | JINST 15 (2020) P10017 | CMS-TRG-17-001 2006.10165 |
| 39 | CMS Collaboration | The CMS trigger system | JINST 12 (2017) P01020 | CMS-TRG-12-001 1609.02366 |
| 40 | W. D. Goldberger and M. B. Wise | Modulus stabilization with bulk fields | PRL 83 (1999) 4922 | hep-ph/9907447 |
| 41 | C. Csaki, M. Graesser, L. Randall, and J. Terning | Cosmology of brane models with radion stabilization | PRD 62 (2000) 045015 | hep-ph/9911406 |
| 42 | C. Csaki, M. L. Graesser, and G. D. Kribs | Radion dynamics and electroweak physics | PRD 63 (2001) 065002 | hep-th/0008151 |
| 43 | K. Agashe, H. Davoudiasl, G. Perez, and A. Soni | Warped gravitons at the LHC and beyond | PRD 76 (2007) 036006 | hep-ph/0701186 |
| 44 | A. L. Fitzpatrick, J. Kaplan, L. Randall, and L.-T. Wang | Searching for the Kaluza-Klein graviton in bulk RS models | JHEP 09 (2007) 013 | hep-ph/0701150 |
| 45 | O. Antipin, D. Atwood, and A. Soni | Search for RS gravitons via $ \mathrm{W}_\mathrm{L}\mathrm{W}_\mathrm{L} $ decays | PLB 666 (2008) 155 | 0711.3175 |
| 46 | A. Oliveira | Gravity particles from warped extra dimensions, predictions for LHC | 1404.0102 | |
| 47 | J. Alwall et al. | The automated computation of tree-level and next-to-leading order differential cross sections, and their matching to parton shower simulations | JHEP 07 (2014) 079 | 1405.0301 |
| 48 | P. Nason | A new method for combining NLO QCD with shower Monte Carlo algorithms | JHEP 11 (2004) 040 | hep-ph/0409146 |
| 49 | S. Frixione, P. Nason, and C. Oleari | Matching NLO QCD computations with parton shower simulations: the POWHEG method | JHEP 11 (2007) 070 | 0709.2092 |
| 50 | S. Alioli, P. Nason, C. Oleari, and E. Re | A general framework for implementing NLO calculations in shower Monte Carlo programs: the POWHEG BOX | JHEP 06 (2010) 043 | 1002.2581 |
| 51 | S. Alioli, S.-O. Moch, and P. Uwer | Hadronic top-quark pair-production with one jet and parton showering | JHEP 01 (2012) 137 | 1110.5251 |
| 52 | S. Alioli, P. Nason, C. Oleari, and E. Re | NLO single-top production matched with shower in POWHEG: $ s $- and $ t $-channel contributions | JHEP 09 (2009) 111 | 0907.4076 |
| 53 | E. Re | Single-top Wt-channel production matched with parton showers using the POWHEG method | EPJC 71 (2011) 1547 | 1009.2450 |
| 54 | R. Frederix and S. Frixione | Merging meets matching in $ MCatNLO $ | JHEP 12 (2012) 061 | 1209.6215 |
| 55 | P. Nason and G. Zanderighi | $ \mathrm{W}^+\mathrm{W}^- $ , $ \mathrm{W}\mathrm{Z} $ and $ \mathrm{Z}\mathrm{Z} $ production in the POWHEG-BOX-V2 | EPJC 74 (2014) 2702 | 1311.1365 |
| 56 | T. Sjostrand et al. | An introduction to PYTHIA 8.2 | CPC 191 (2015) 159 | 1410.3012 |
| 57 | NNPDF Collaboration | Parton distributions for the LHC Run II | JHEP 04 (2015) 040 | 1410.8849 |
| 58 | CMS Collaboration | Event generator tunes obtained from underlying event and multiparton scattering measurements | EPJC 76 (2016) 155 | CMS-GEN-14-001 1512.00815 |
| 59 | CMS Collaboration | Investigations of the impact of the parton shower tuning in Pythia 8 in the modelling of $ \mathrm{t\overline{t}} $ at $ \sqrt{s}= $ 8 and 13 TeV | CMS-PAS-TOP-16-021 | CMS-PAS-TOP-16-021 |
| 60 | NNPDF Collaboration | Parton distributions from high-precision collider data | EPJC 77 (2017) 663 | 1706.00428 |
| 61 | CMS Collaboration | Extraction and validation of a new set of CMS PYTHIA8 tunes from underlying-event measurements | EPJC 80 (2020) 4 | CMS-GEN-17-001 1903.12179 |
| 62 | GEANT4 Collaboration | GEANT4 --- a simulation toolkit | NIMA 506 (2003) 250 | |
| 63 | CMS Collaboration | Electron and photon reconstruction and identification with the CMS experiment at the CERN LHC | JINST 16 (2021) P05014 | CMS-EGM-17-001 2012.06888 |
| 64 | CMS Collaboration | Performance of the reconstruction and identification of high-momentum muons in proton-proton collisions at $ \sqrt{s} = $ 13 TeV | JINST 15 (2020) P02027 | CMS-MUO-17-001 1912.03516 |
| 65 | CMS Collaboration | Jet algorithms performance in 13 TeV data | CMS-PAS-JME-16-003 | CMS-PAS-JME-16-003 |
| 66 | M. Dasgupta, A. Fregoso, S. Marzani, and G. P. Salam | Towards an understanding of jet substructure | JHEP 09 (2013) 029 | 1307.0007 |
| 67 | J. M. Butterworth, A. R. Davison, M. Rubin, and G. P. Salam | Jet substructure as a new Higgs search channel at the LHC | PRL 100 (2008) 242001 | 0802.2470 |
| 68 | A. J. Larkoski, S. Marzani, G. Soyez, and J. Thaler | Soft drop | JHEP 05 (2014) 146 | 1402.2657 |
| 69 | J. Thaler and K. Van Tilburg | Identifying boosted objects with $ N $-subjettiness | JHEP 03 (2011) 015 | 1011.2268 |
| 70 | J. Dolen et al. | Thinking outside the ROCs: Designing decorrelated taggers (DDT) for jet substructure | JHEP 05 (2016) 156 | 1603.00027 |
| 71 | CMS Collaboration | Identification of heavy-flavour jets with the CMS detector in pp collisions at 13 TeV | JINST 13 (2018) P05011 | CMS-BTV-16-002 1712.07158 |
| 72 | M. J. Oreglia | A study of the reactions $\psi' \to \gamma\gamma \psi$ | PhD thesis, Stanford University, 1980 SLAC Report SLAC-R-236, see A | |
| 73 | CMS Collaboration | Precision luminosity measurement in proton-proton collisions at $ \sqrt{s} = $ 13 TeV in 2015 and 2016 at CMS | Accepted by EPJC | CMS-LUM-17-003 2104.01927 |
| 74 | CMS Collaboration | CMS luminosity measurement for the 2017 data-taking period at $ \sqrt{s} = $ 13 TeV | CMS-PAS-LUM-17-004 | CMS-PAS-LUM-17-004 |
| 75 | CMS Collaboration | CMS luminosity measurement for the 2018 data-taking period at $ \sqrt{s} = $ 13 TeV | CMS-PAS-LUM-18-002 | CMS-PAS-LUM-18-002 |
| 76 | M. Cacciari et al. | The $ \mathrm{t\bar{t}} $ cross-section at 1.8 TeV and 1.96$ TeV: $ A study of the systematics due to parton densities and scale dependence | JHEP 04 (2004) 068 | hep-ph/0303085 |
| 77 | S. Catani, D. de Florian, M. Grazzini, and P. Nason | Soft gluon resummation for Higgs boson production at hadron colliders | JHEP 07 (2003) 028 | hep-ph/0306211 |
| 78 | S. Baker and R. D. Cousins | Clarification of the use of chi square and likelihood functions in fits to histograms | NIM221 (1984) 437 | |
| 79 | G. Cowan, K. Cranmer, E. Gross, and O. Vitells | Asymptotic formulae for likelihood-based tests of new physics | EPJC 71 (2011) 1554 | 1007.1727 |
| 80 | T. Junk | Confidence level computation for combining searches with small statistics | NIMA 434 (1999) 435 | hep-ex/9902006 |
| 81 | A. L. Read | Presentation of search results: The CLs technique | JPG 28 (2002) 2693 | |
| 82 | CMS Collaboration | HEPData record for this analysis | HEPData record for this analysis | |
|
|
Compact Muon Solenoid LHC, CERN |
|

|

|

|

|

|