

Compact Muon Solenoid
LHC, CERN
| CMS-B2G-19-004 ; CERN-EP-2021-115 | ||
| Search for single production of a vector-like T quark decaying to a top quark and a Z boson in the final state with jets and missing transverse momentum at $\sqrt{s} = $ 13 TeV | ||
| CMS Collaboration | ||
| 6 January 2022 | ||
| JHEP 05 (2022) 093 | ||
| Abstract: A search is presented for single production of a vector-like T quark with charge 2/3e, in the decay channel featuring a top quark and a Z boson, with the top quark decaying hadronically and the Z boson decaying to neutrinos. The search uses data collected by the CMS experiment in proton-proton collisions at a center-of-mass energy of 13 TeV, corresponding to an integrated luminosity of 137 fb$^{-1}$ recorded at the CERN LHC in 2016-2018. The search is sensitive to a T quark mass between 0.6 and 1.8 TeV with decay widths ranging from negligibly small up to 30% of the T quark mass. Reconstruction strategies for the top quark are based on the degree of Lorentz boosting of its final state. At 95% confidence level, the upper limit on the product of the cross section and branching fraction for a T quark of small decay width varies between 15 and 602 fb, depending on its mass. For a T quark with decay widths between 10 and 30% of its mass, this upper limit ranges between 16 and 836 fb. For most of the studied range, the results provide the best limits to date. This is the first search for single T quark production based on the full Run 2 data set of the LHC. | ||
| Links: e-print arXiv:2201.02227 [hep-ex] (PDF) ; CDS record ; inSPIRE record ; HepData record ; CADI line (restricted) ; | ||
| Figures | |
png pdf |
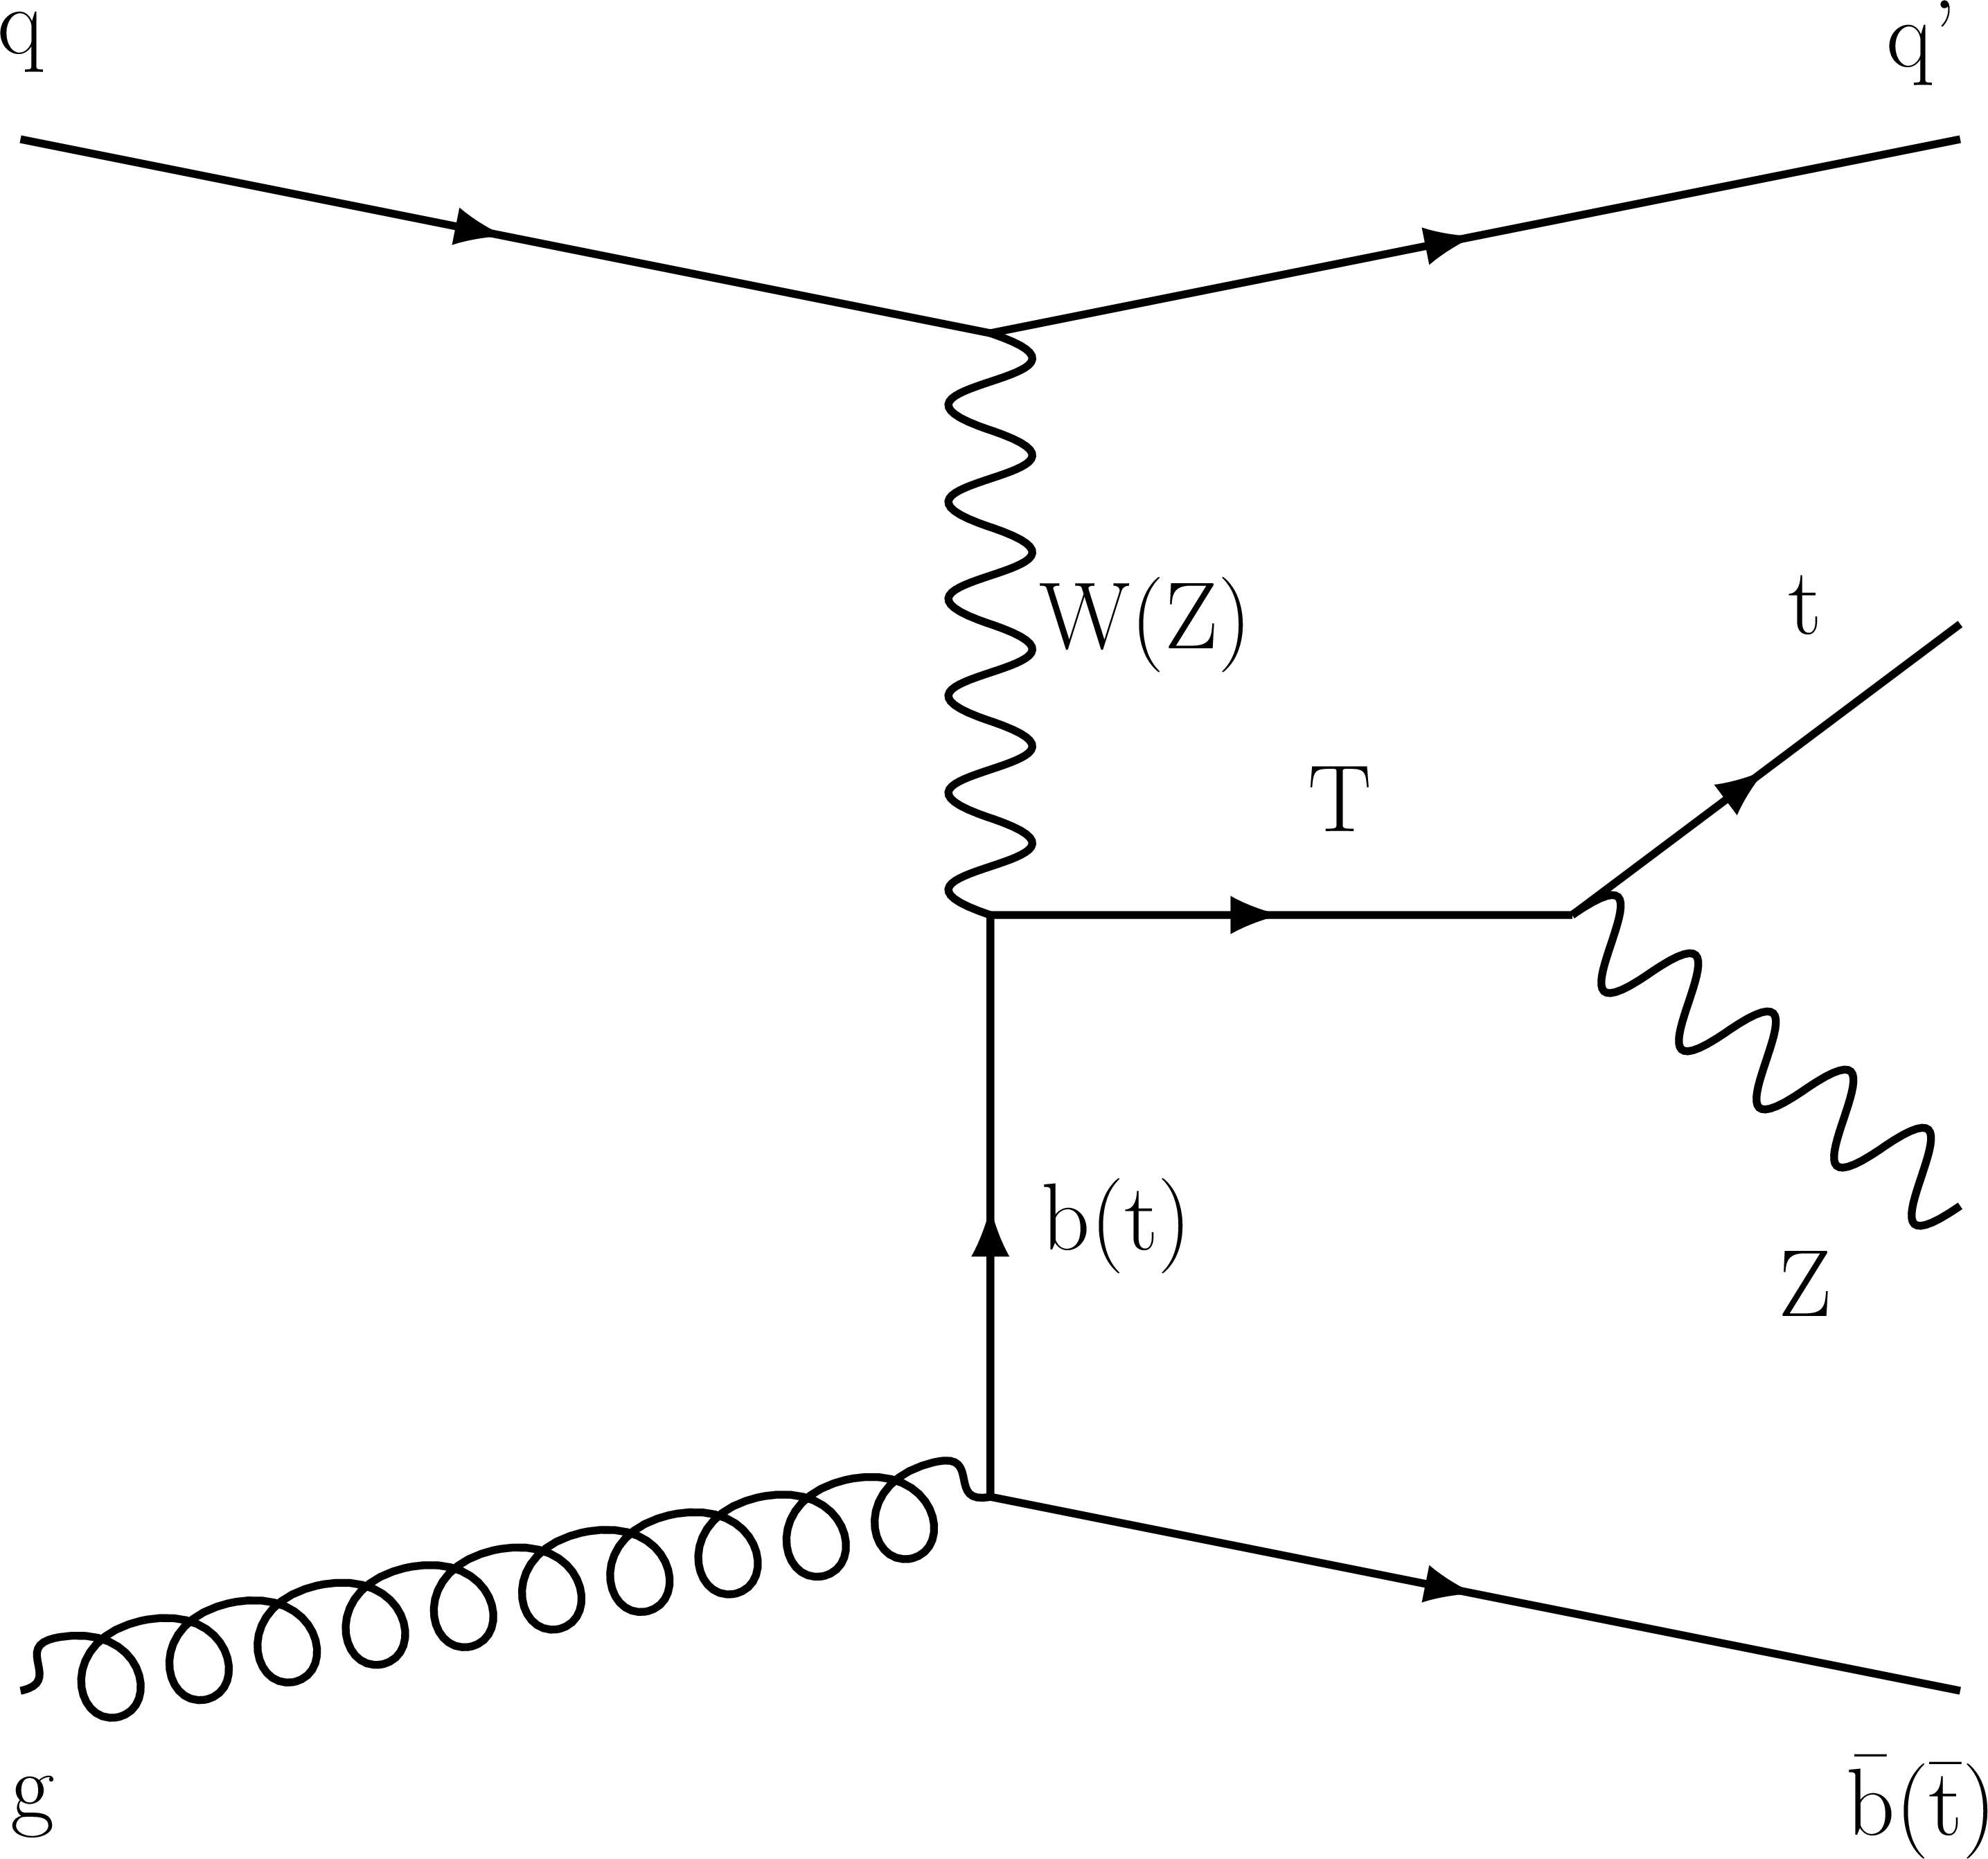
Figure 1:
A representative leading-order Feynman diagram for the production of a single vector-like quark T decaying into a Z boson and a top quark. |
png pdf |
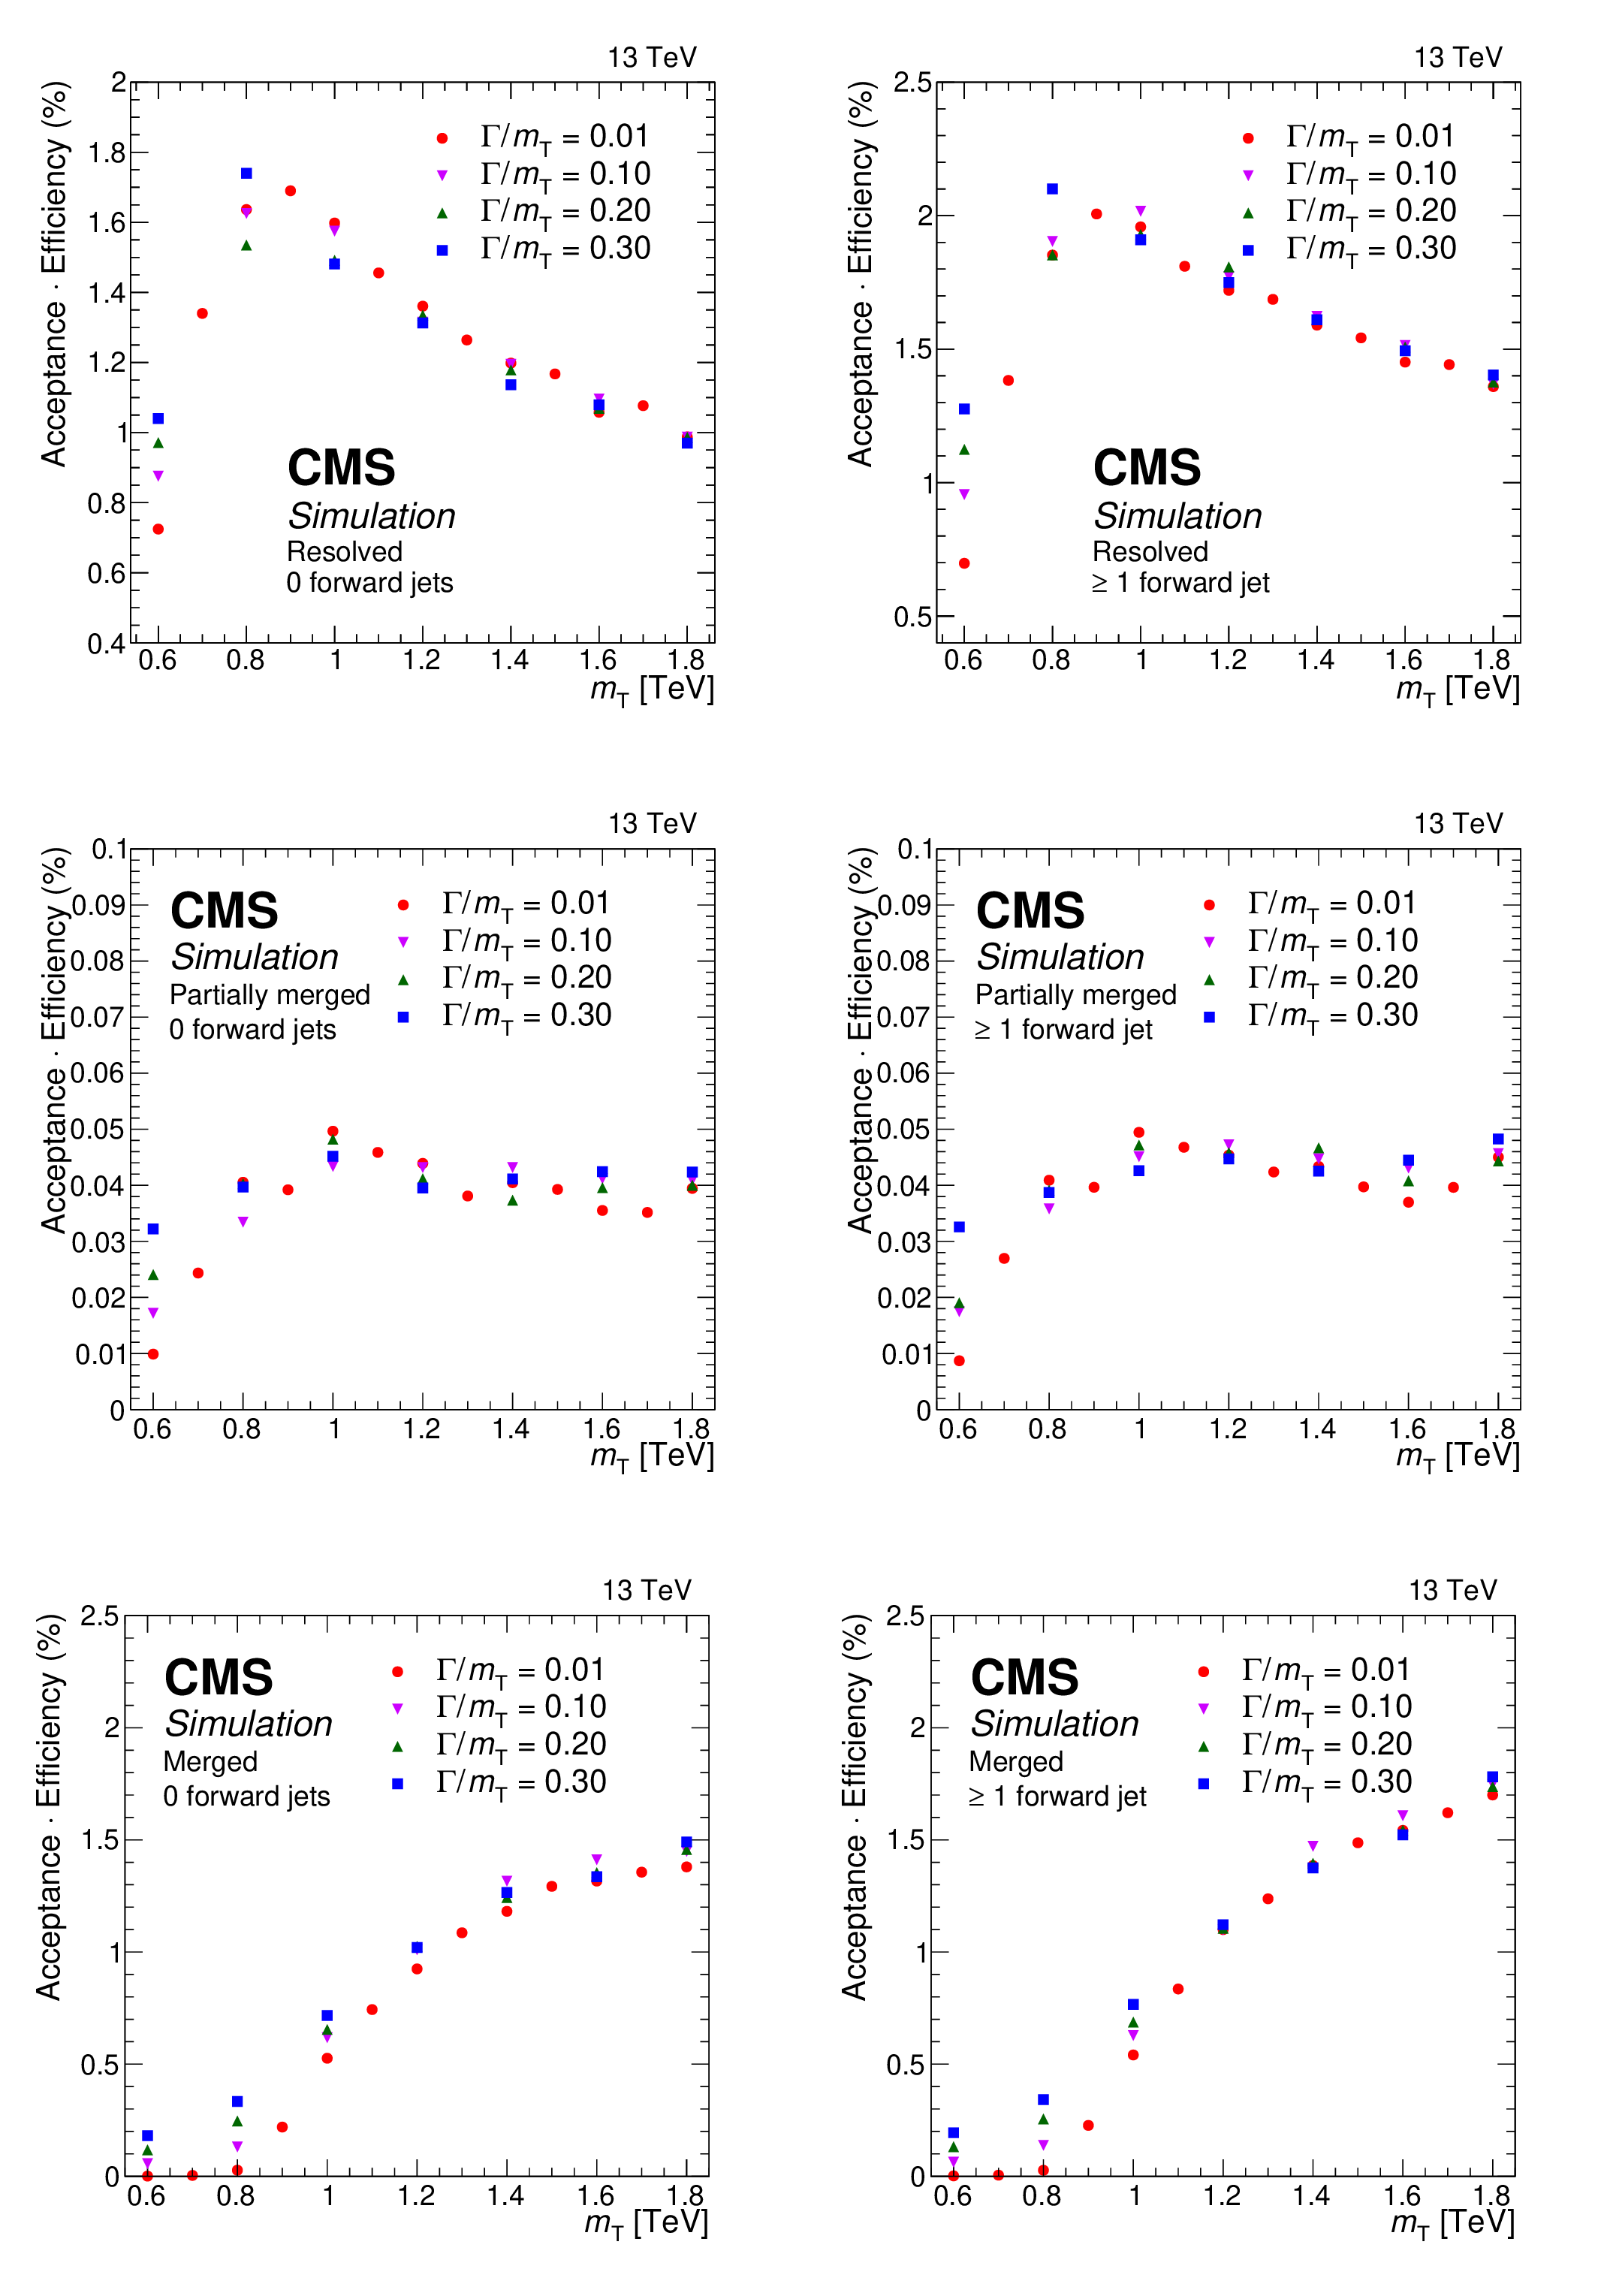
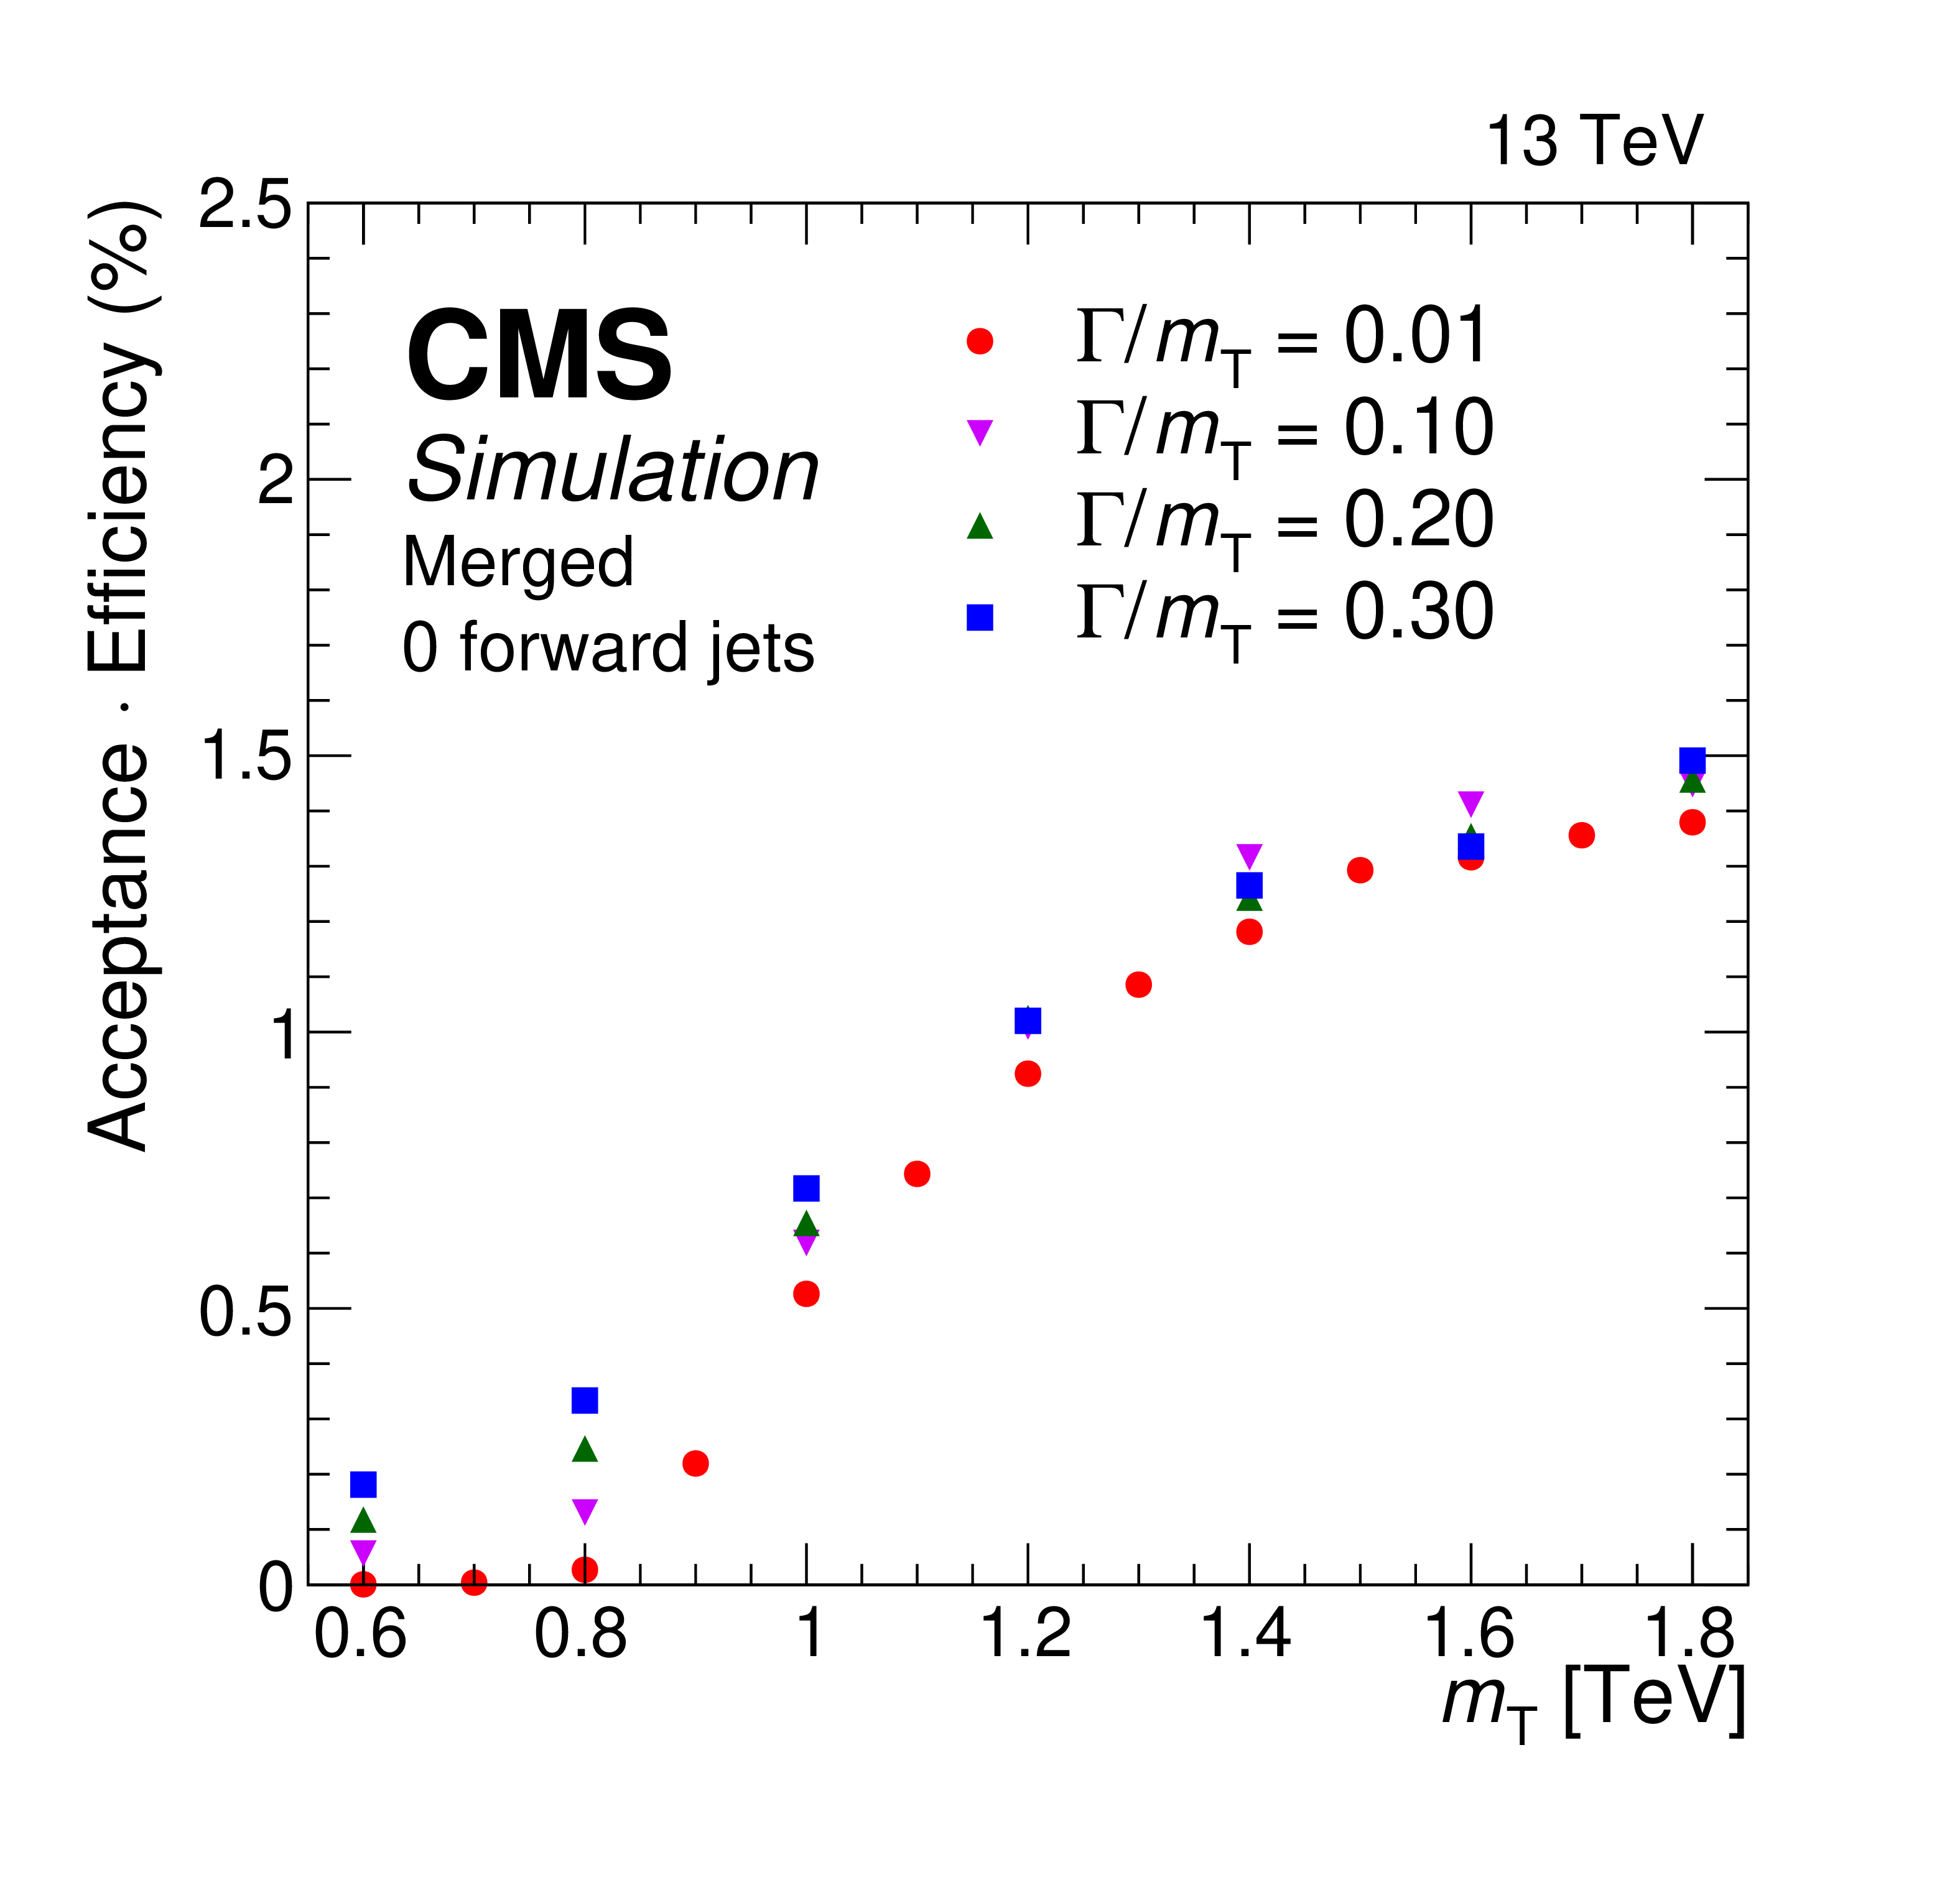
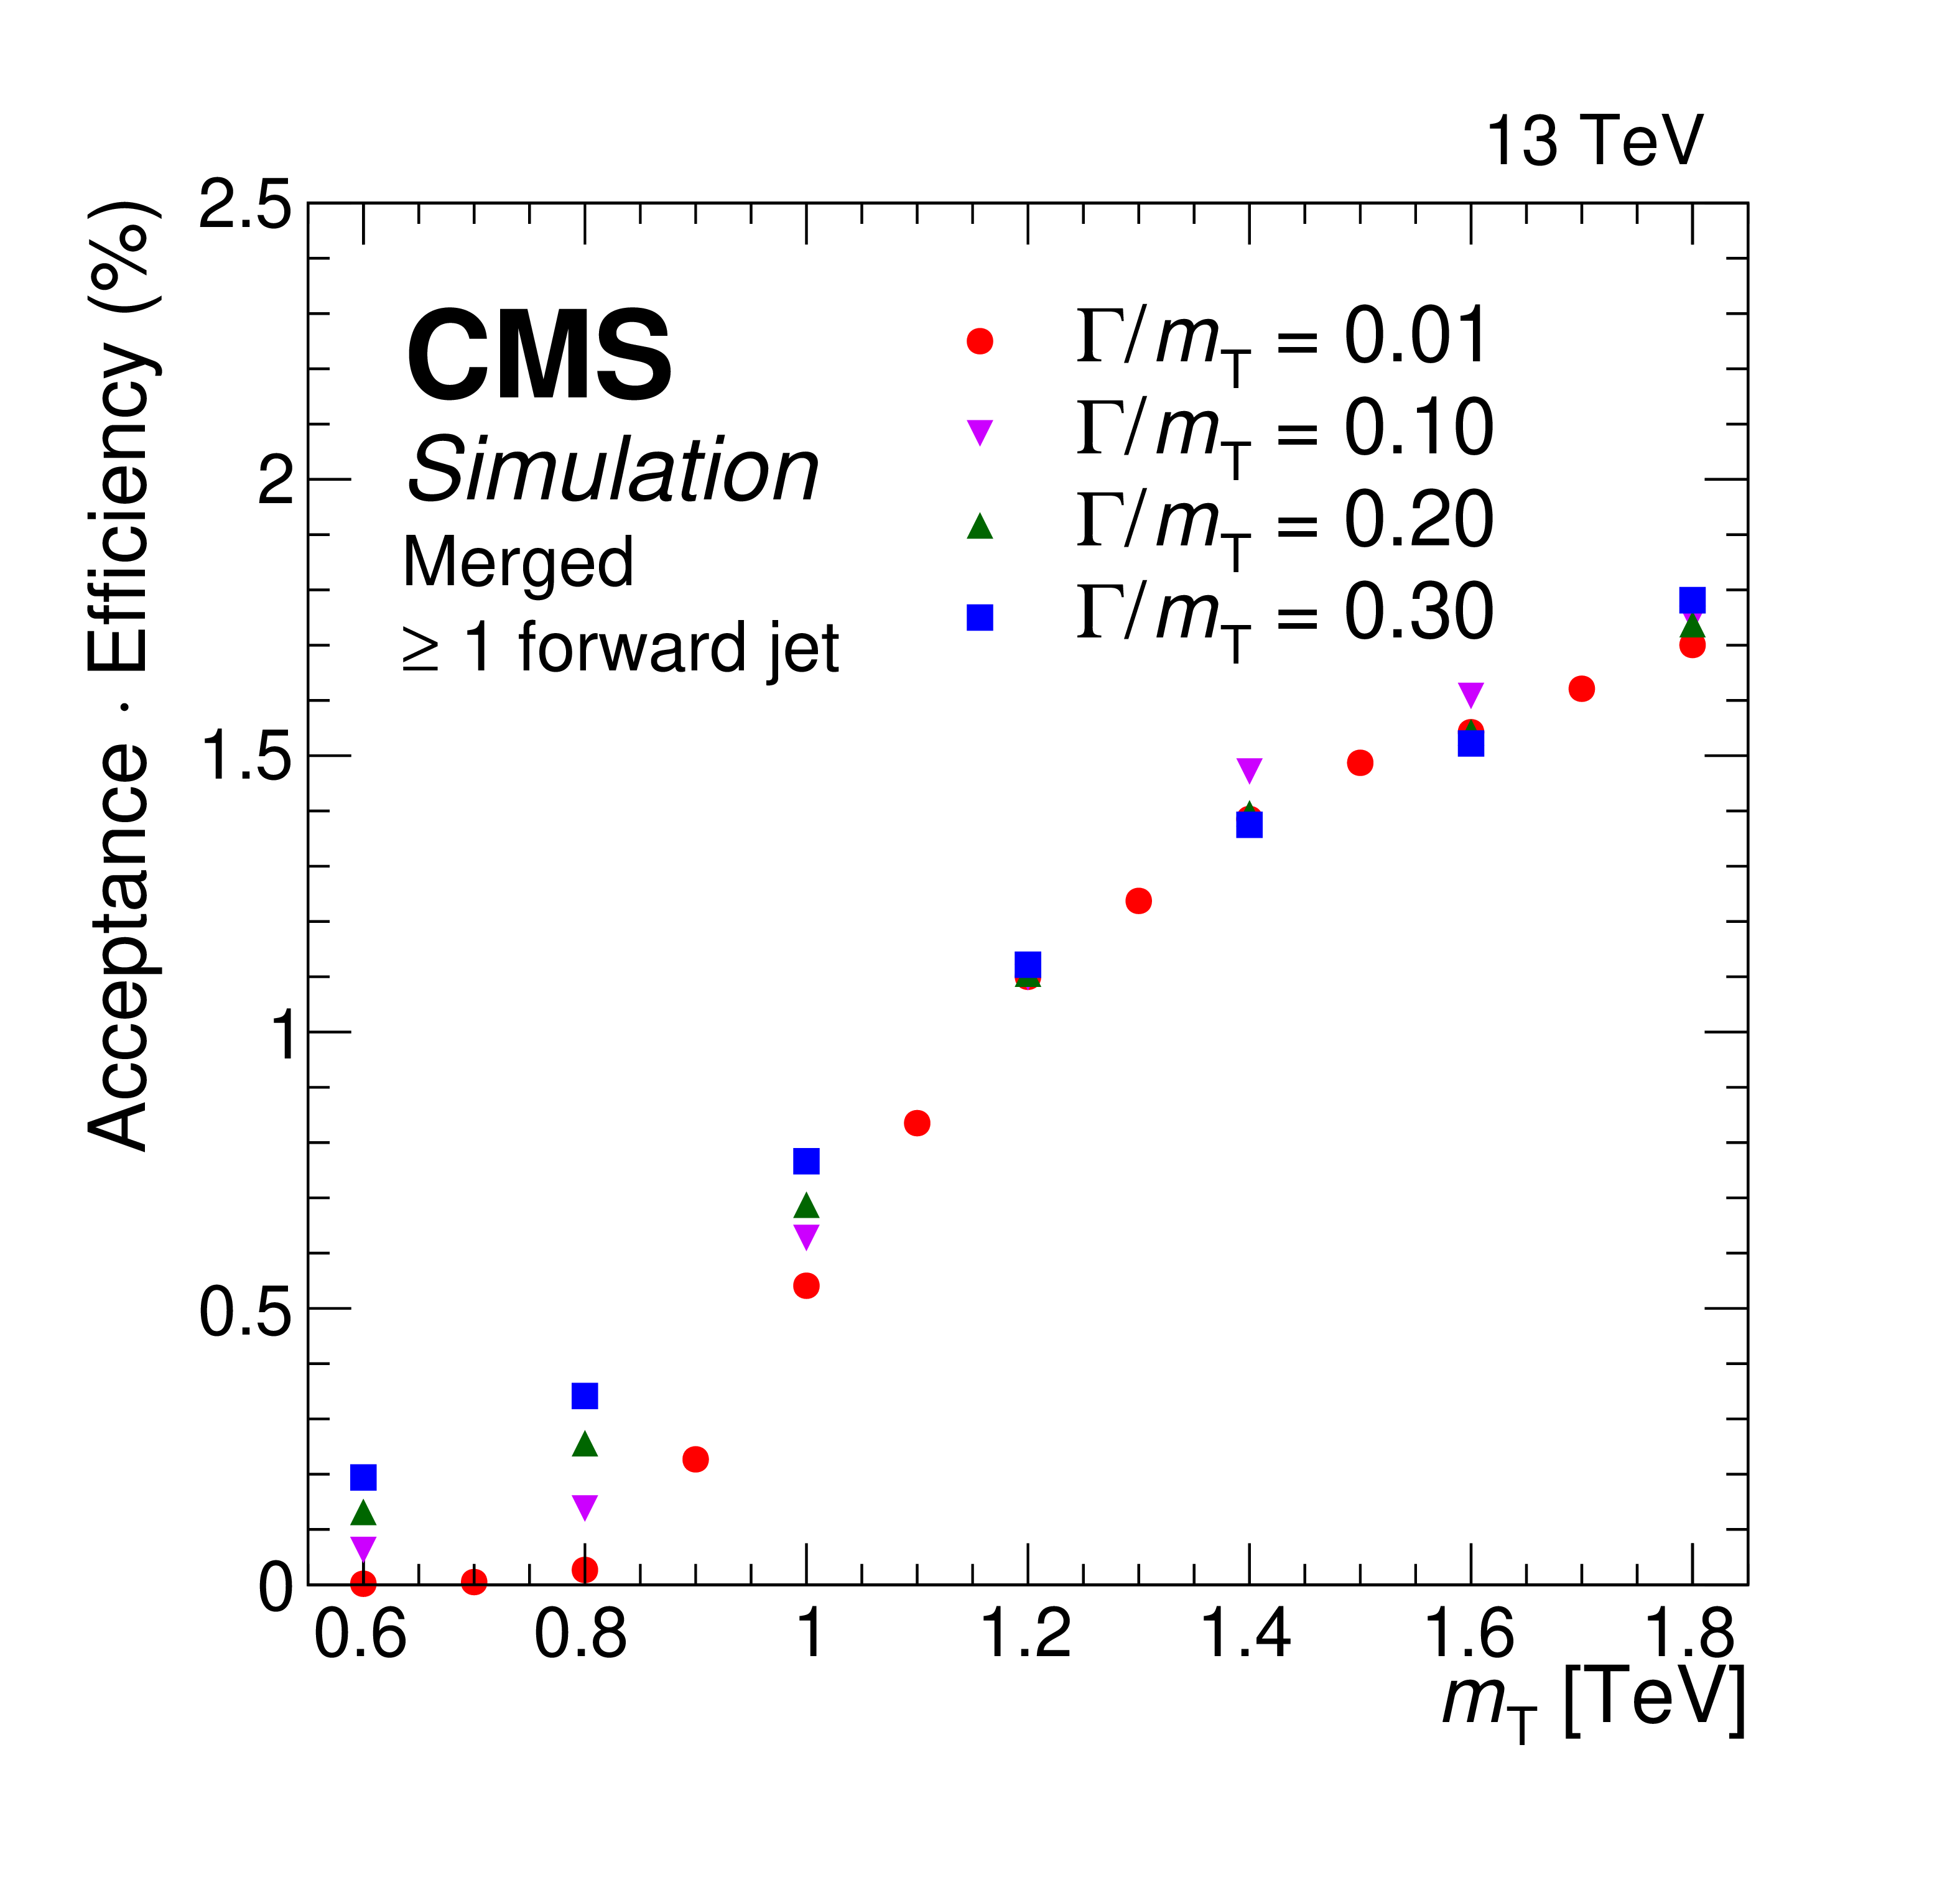
Figure 2:
The product of the signal acceptance and efficiency, averaged over the three data-taking years, for the final event selection in the resolved (upper), partially merged (central), and merged (lower) categories, for the zero forward jets (left), and at least one forward jet (right) categories. The numerator is the number of events passing the respective selection, the denominator is the total expected number of events. All possible decays of the top quark and Z boson are considered in both numerator and denominator of the efficiency computation, therefore the values are not corrected for the branching fraction of the final state. |
png pdf |
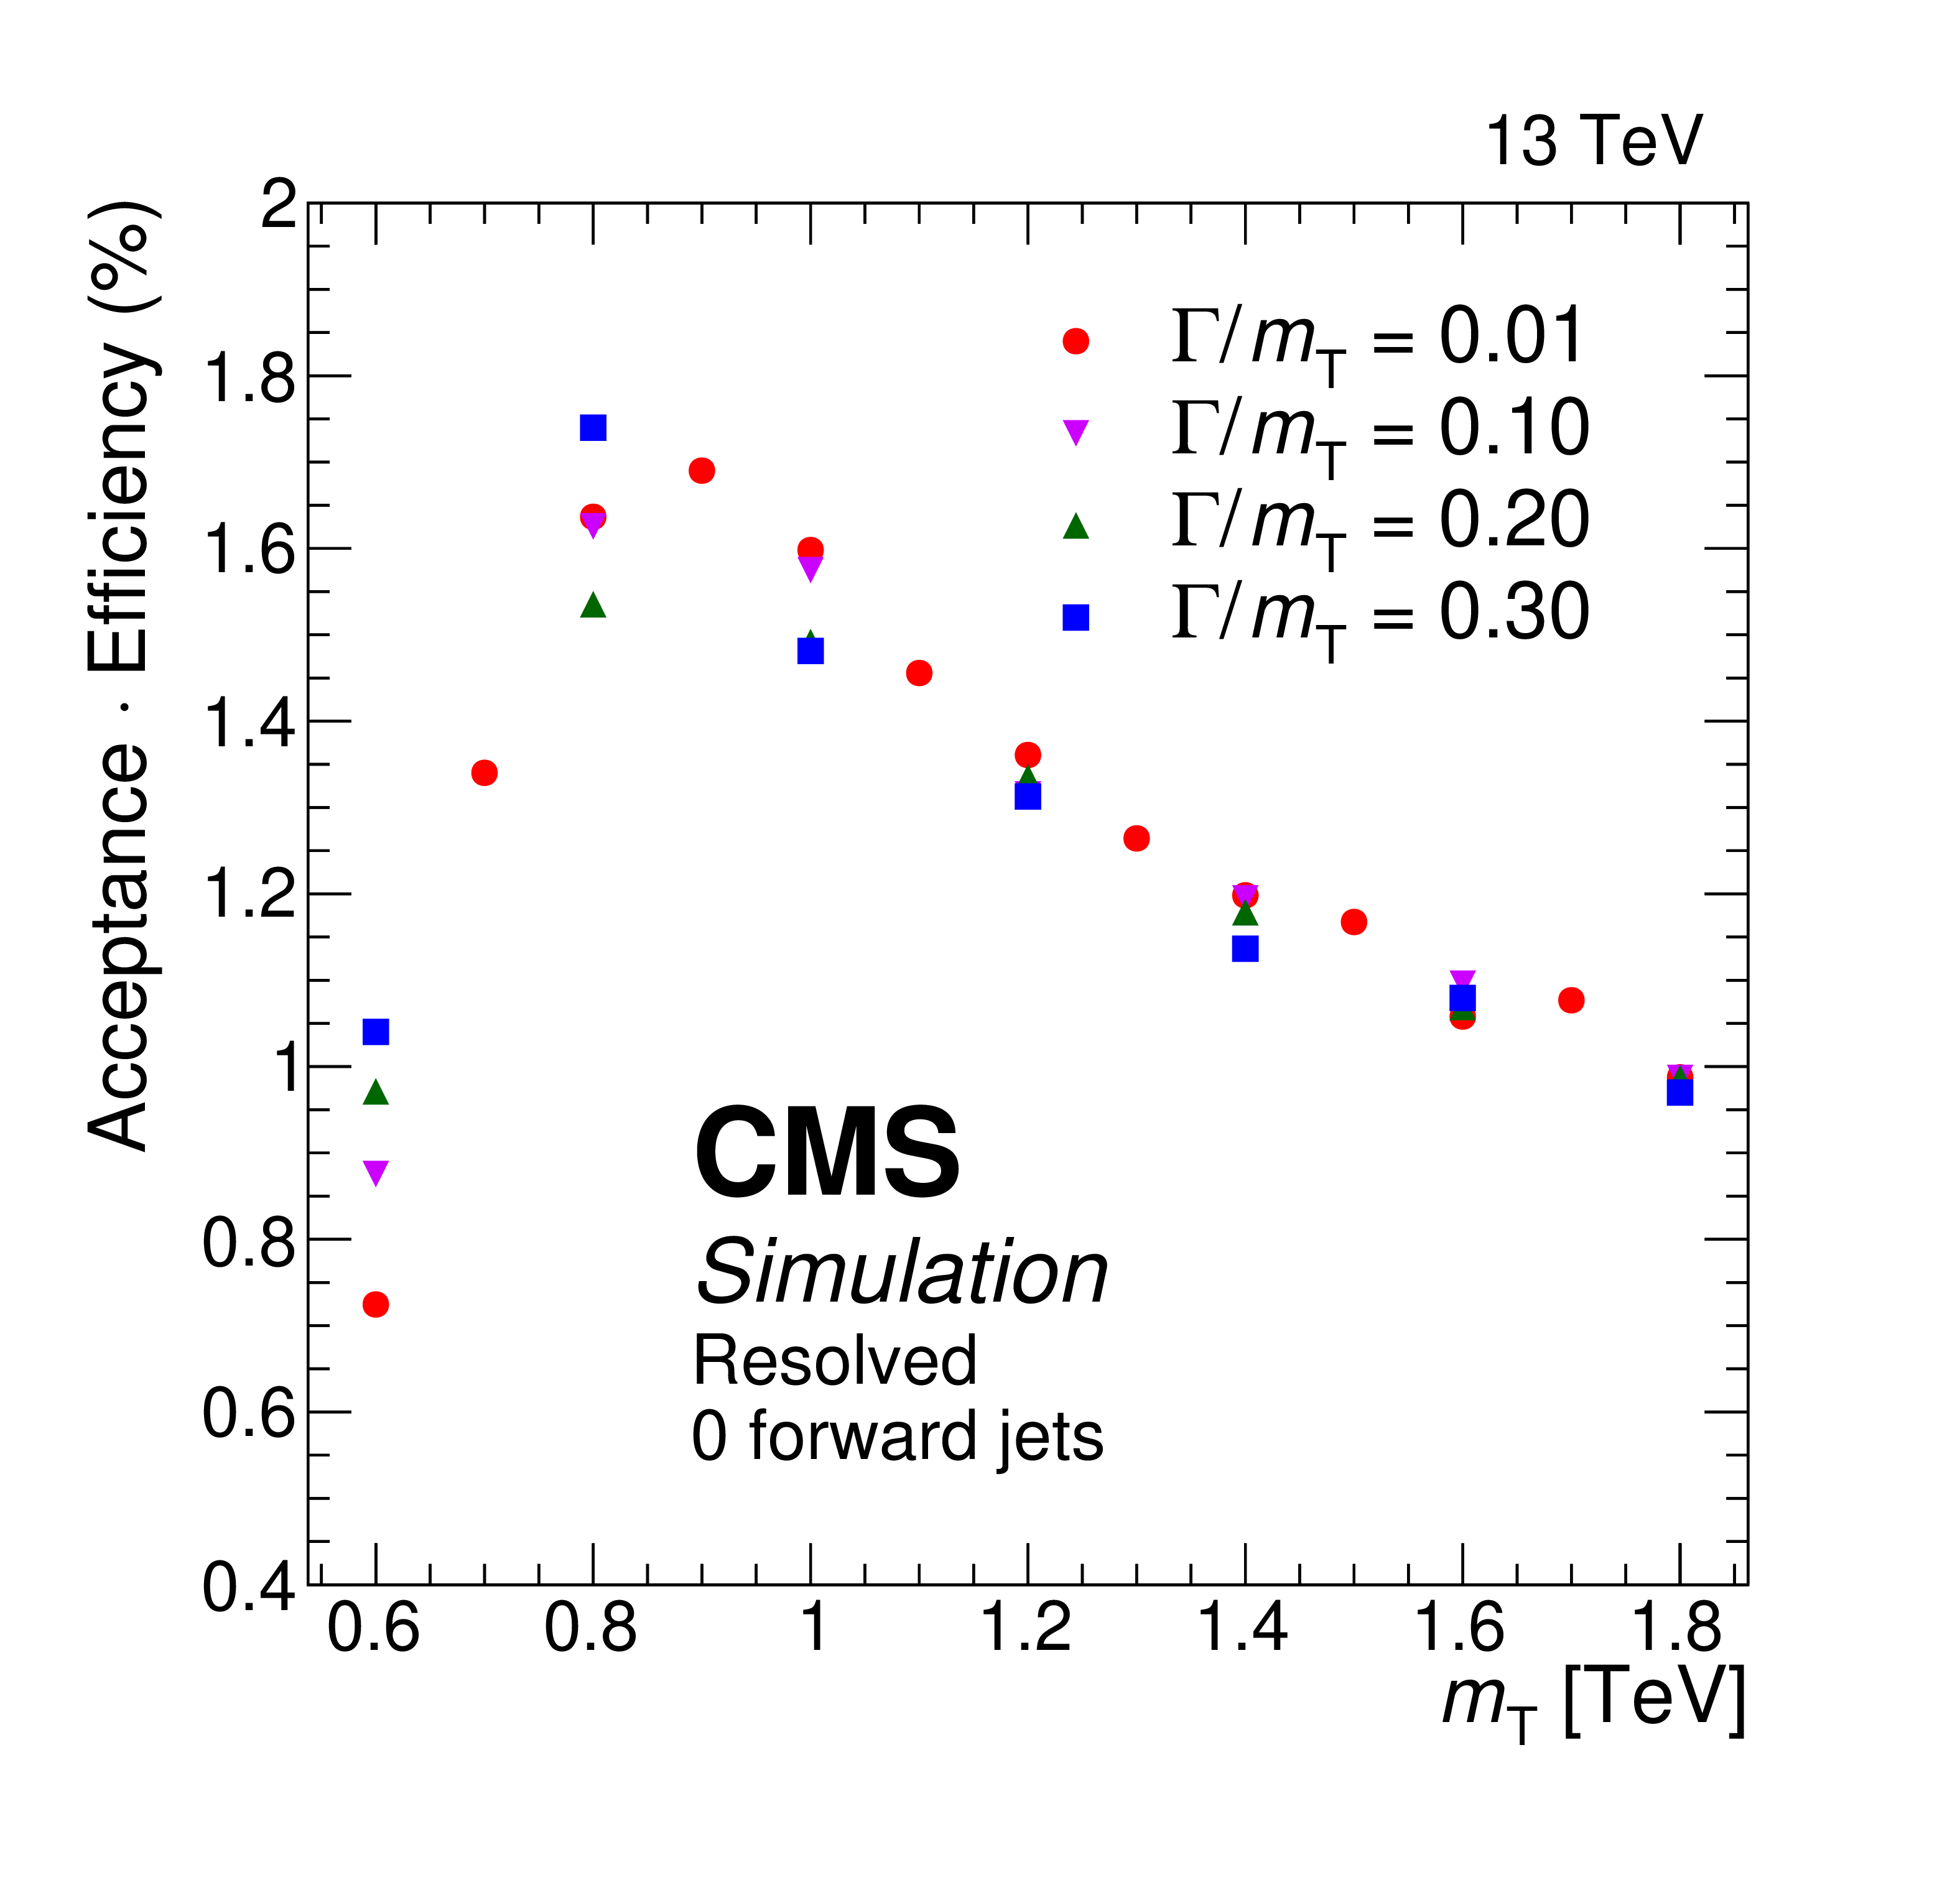
Figure 2-a:
The product of the signal acceptance and efficiency, averaged over the three data-taking years, for the final event selection in the resolved (upper), partially merged (central), and merged (lower) categories, for the zero forward jets (left), and at least one forward jet (right) categories. The numerator is the number of events passing the respective selection, the denominator is the total expected number of events. All possible decays of the top quark and Z boson are considered in both numerator and denominator of the efficiency computation, therefore the values are not corrected for the branching fraction of the final state. |

png pdf |
Figure 2-b:
The product of the signal acceptance and efficiency, averaged over the three data-taking years, for the final event selection in the resolved (upper), partially merged (central), and merged (lower) categories, for the zero forward jets (left), and at least one forward jet (right) categories. The numerator is the number of events passing the respective selection, the denominator is the total expected number of events. All possible decays of the top quark and Z boson are considered in both numerator and denominator of the efficiency computation, therefore the values are not corrected for the branching fraction of the final state. |

png pdf |
Figure 2-c:
The product of the signal acceptance and efficiency, averaged over the three data-taking years, for the final event selection in the resolved (upper), partially merged (central), and merged (lower) categories, for the zero forward jets (left), and at least one forward jet (right) categories. The numerator is the number of events passing the respective selection, the denominator is the total expected number of events. All possible decays of the top quark and Z boson are considered in both numerator and denominator of the efficiency computation, therefore the values are not corrected for the branching fraction of the final state. |
png pdf |
Figure 2-d:
The product of the signal acceptance and efficiency, averaged over the three data-taking years, for the final event selection in the resolved (upper), partially merged (central), and merged (lower) categories, for the zero forward jets (left), and at least one forward jet (right) categories. The numerator is the number of events passing the respective selection, the denominator is the total expected number of events. All possible decays of the top quark and Z boson are considered in both numerator and denominator of the efficiency computation, therefore the values are not corrected for the branching fraction of the final state. |
png pdf |
Figure 2-e:
The product of the signal acceptance and efficiency, averaged over the three data-taking years, for the final event selection in the resolved (upper), partially merged (central), and merged (lower) categories, for the zero forward jets (left), and at least one forward jet (right) categories. The numerator is the number of events passing the respective selection, the denominator is the total expected number of events. All possible decays of the top quark and Z boson are considered in both numerator and denominator of the efficiency computation, therefore the values are not corrected for the branching fraction of the final state. |
png pdf |
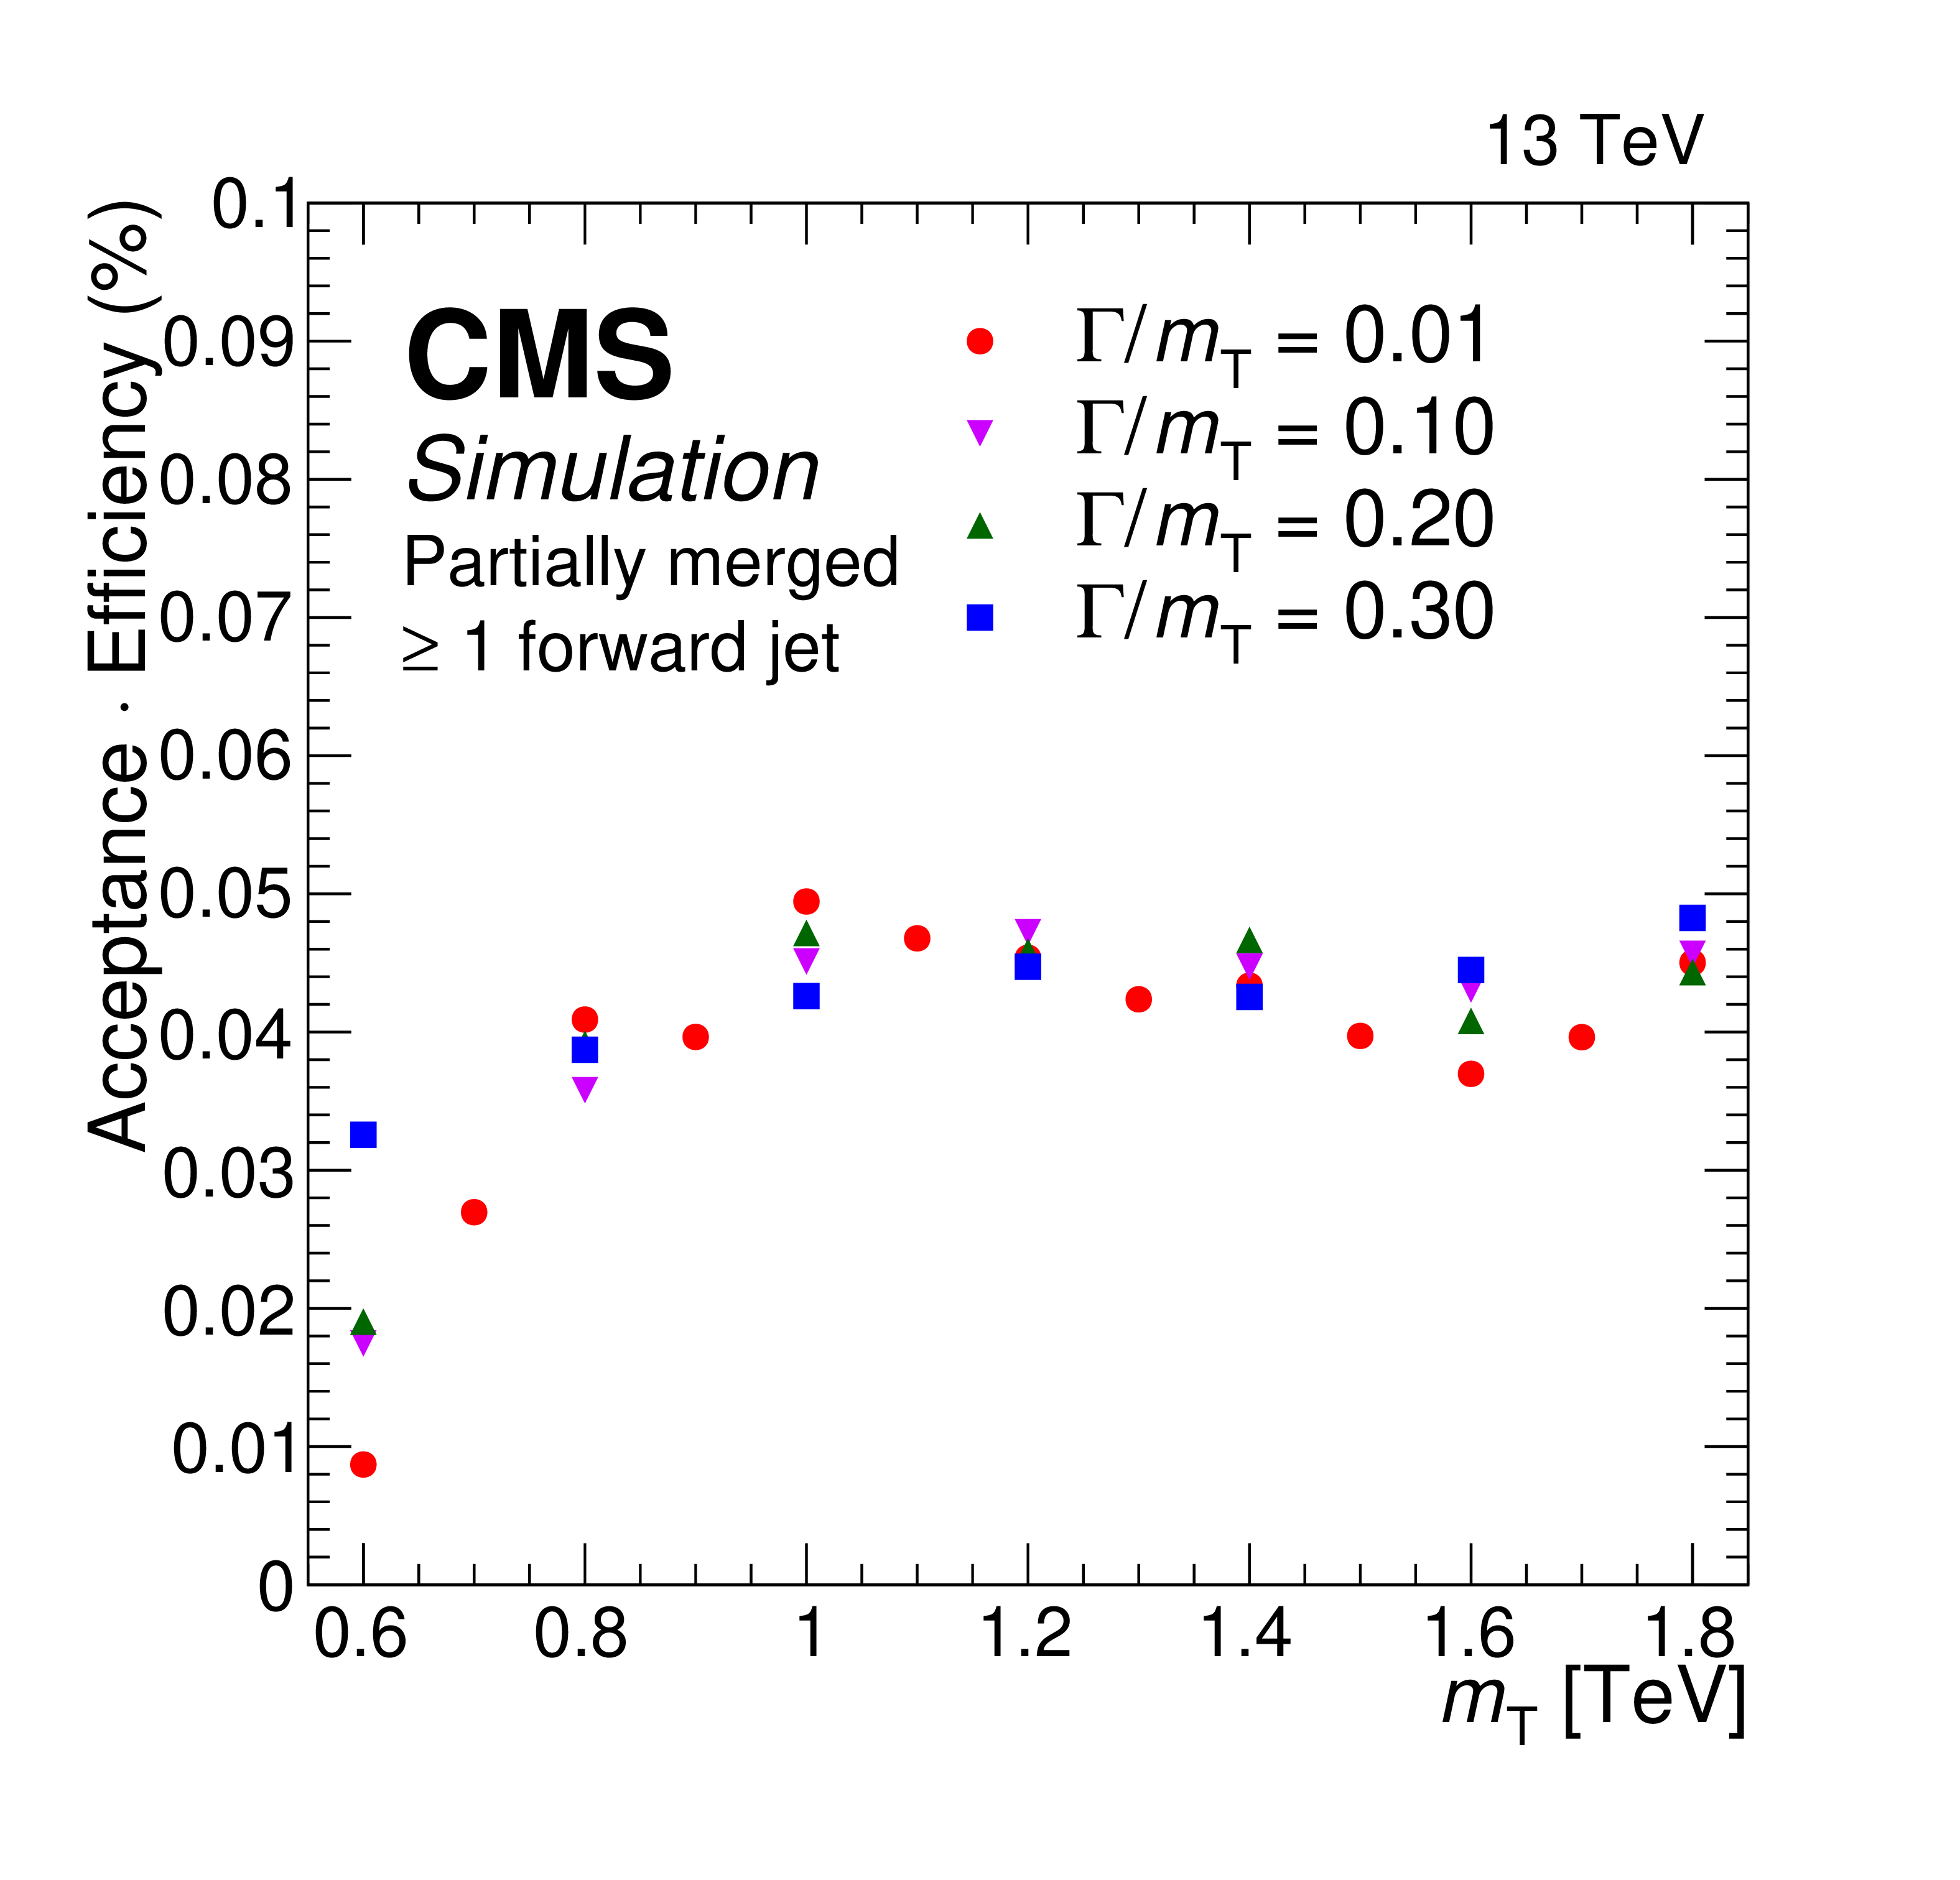
Figure 2-f:
The product of the signal acceptance and efficiency, averaged over the three data-taking years, for the final event selection in the resolved (upper), partially merged (central), and merged (lower) categories, for the zero forward jets (left), and at least one forward jet (right) categories. The numerator is the number of events passing the respective selection, the denominator is the total expected number of events. All possible decays of the top quark and Z boson are considered in both numerator and denominator of the efficiency computation, therefore the values are not corrected for the branching fraction of the final state. |
png pdf |
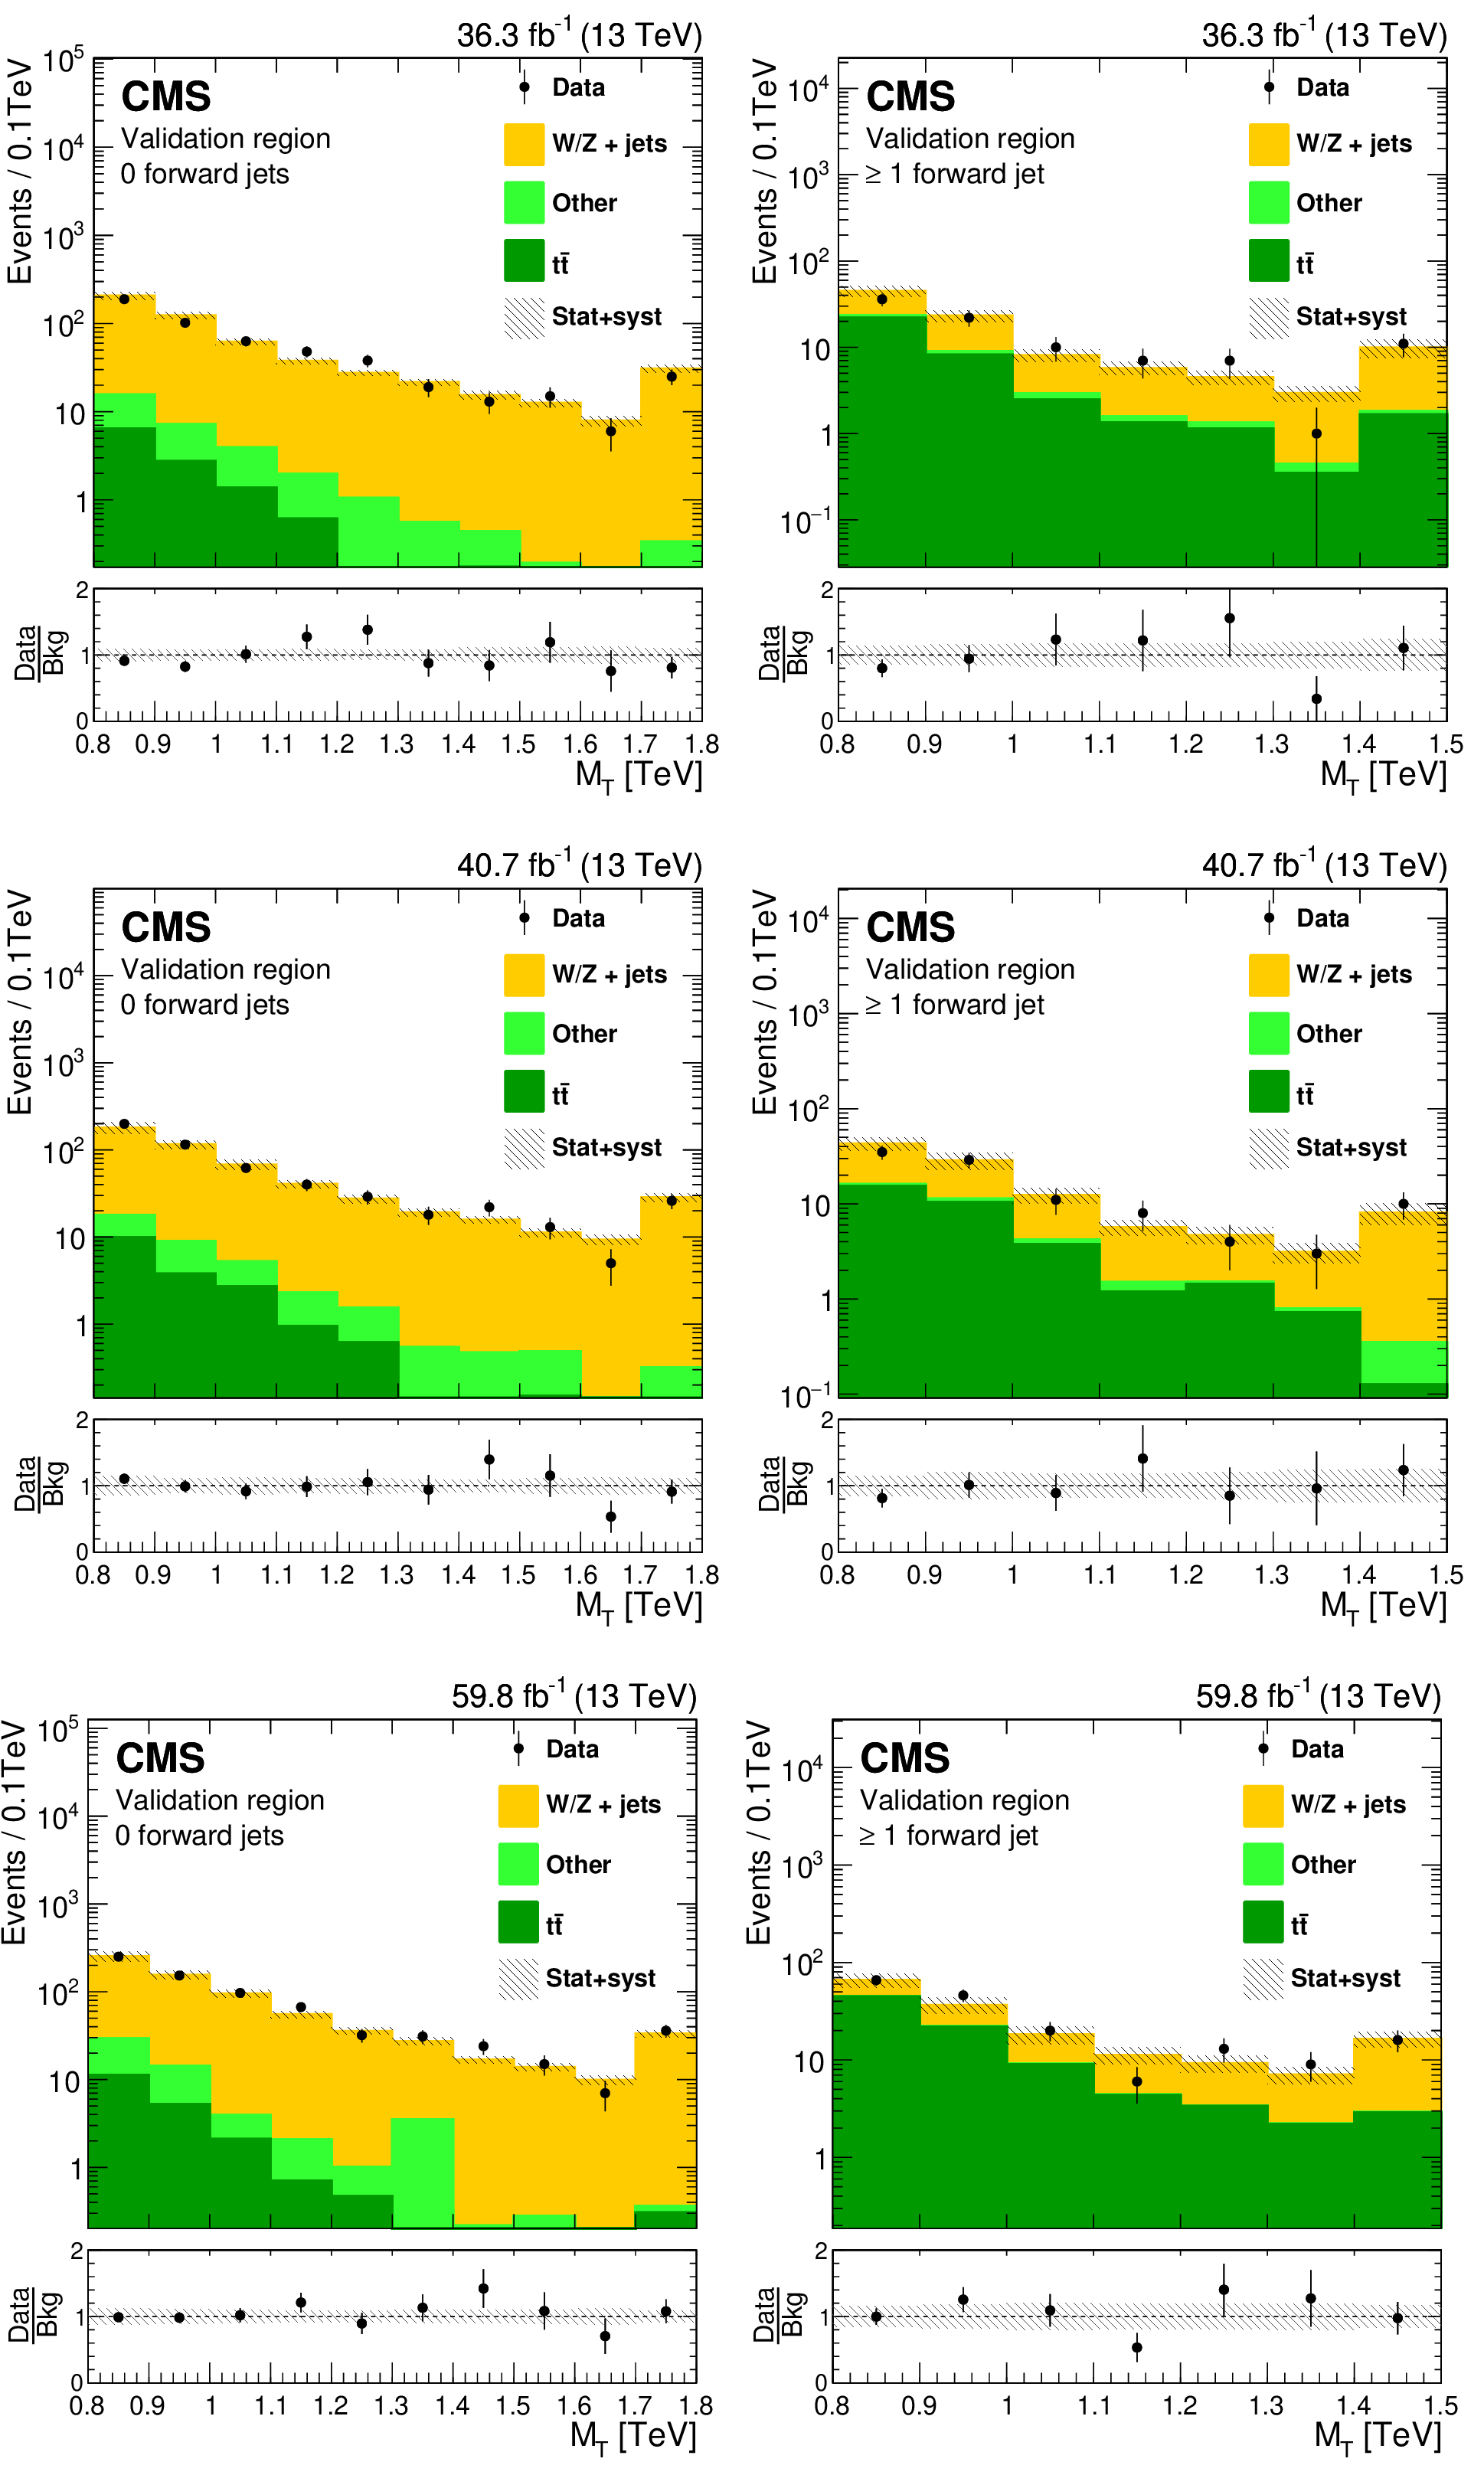
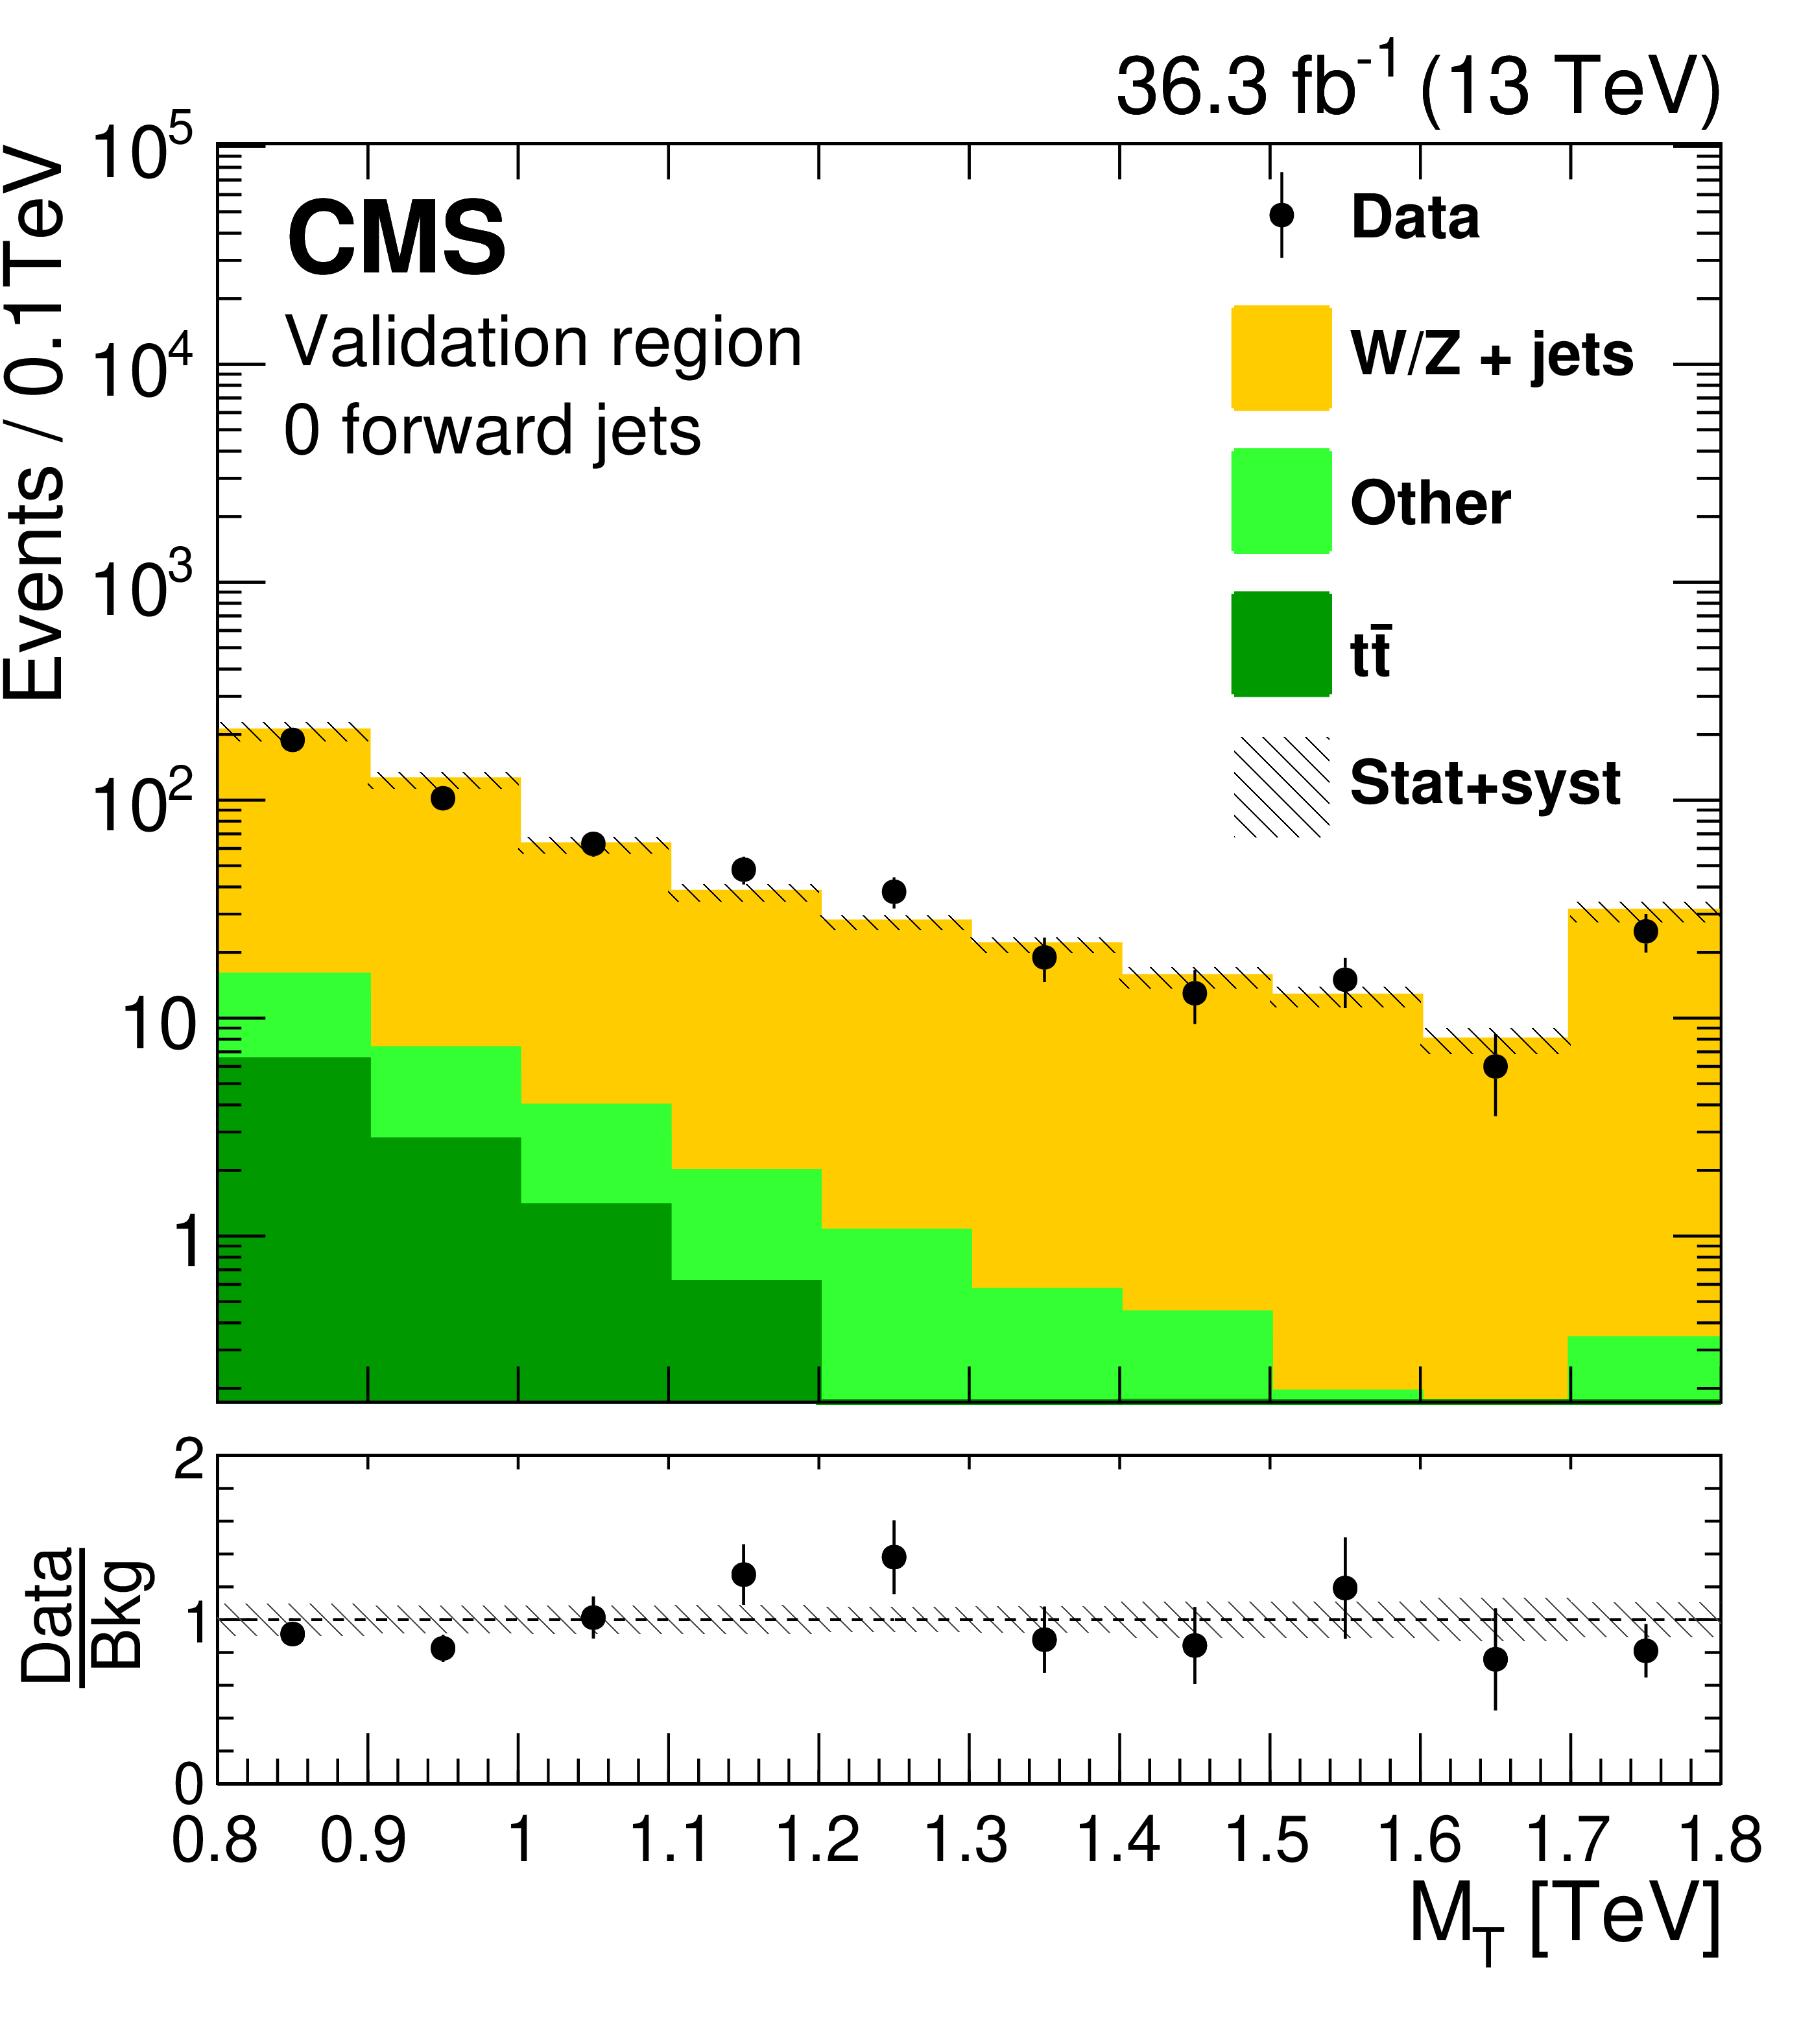
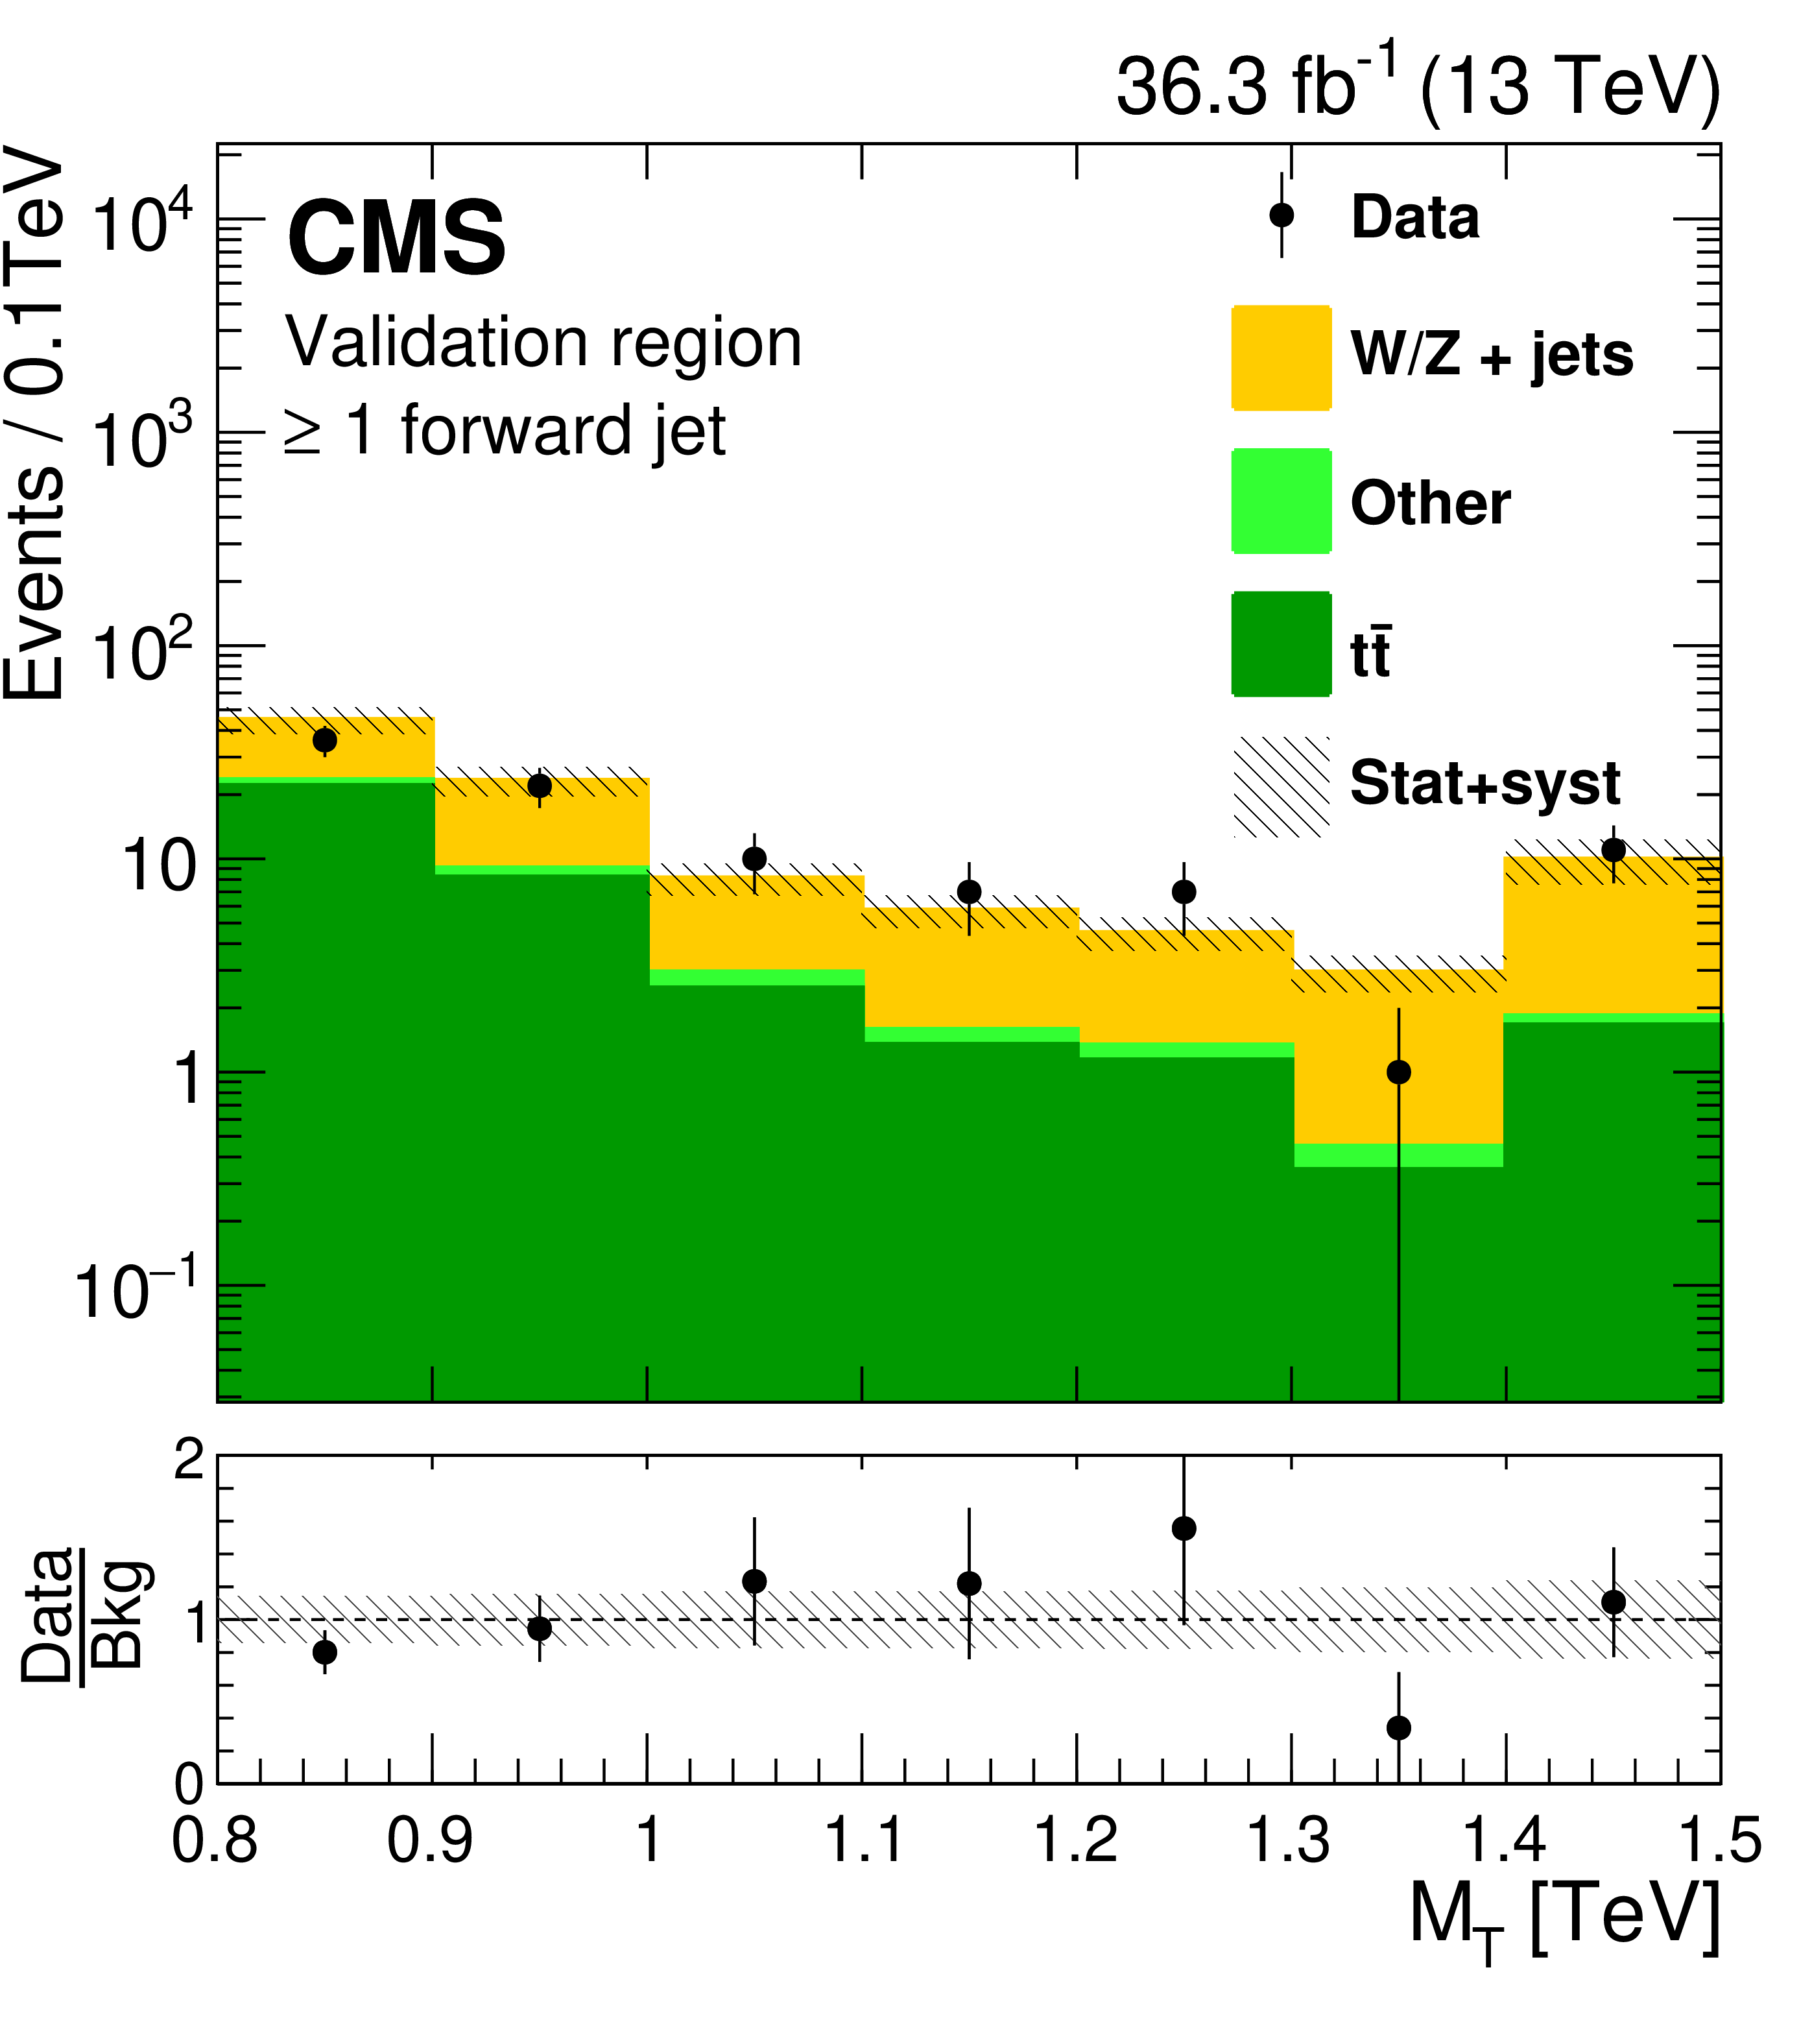
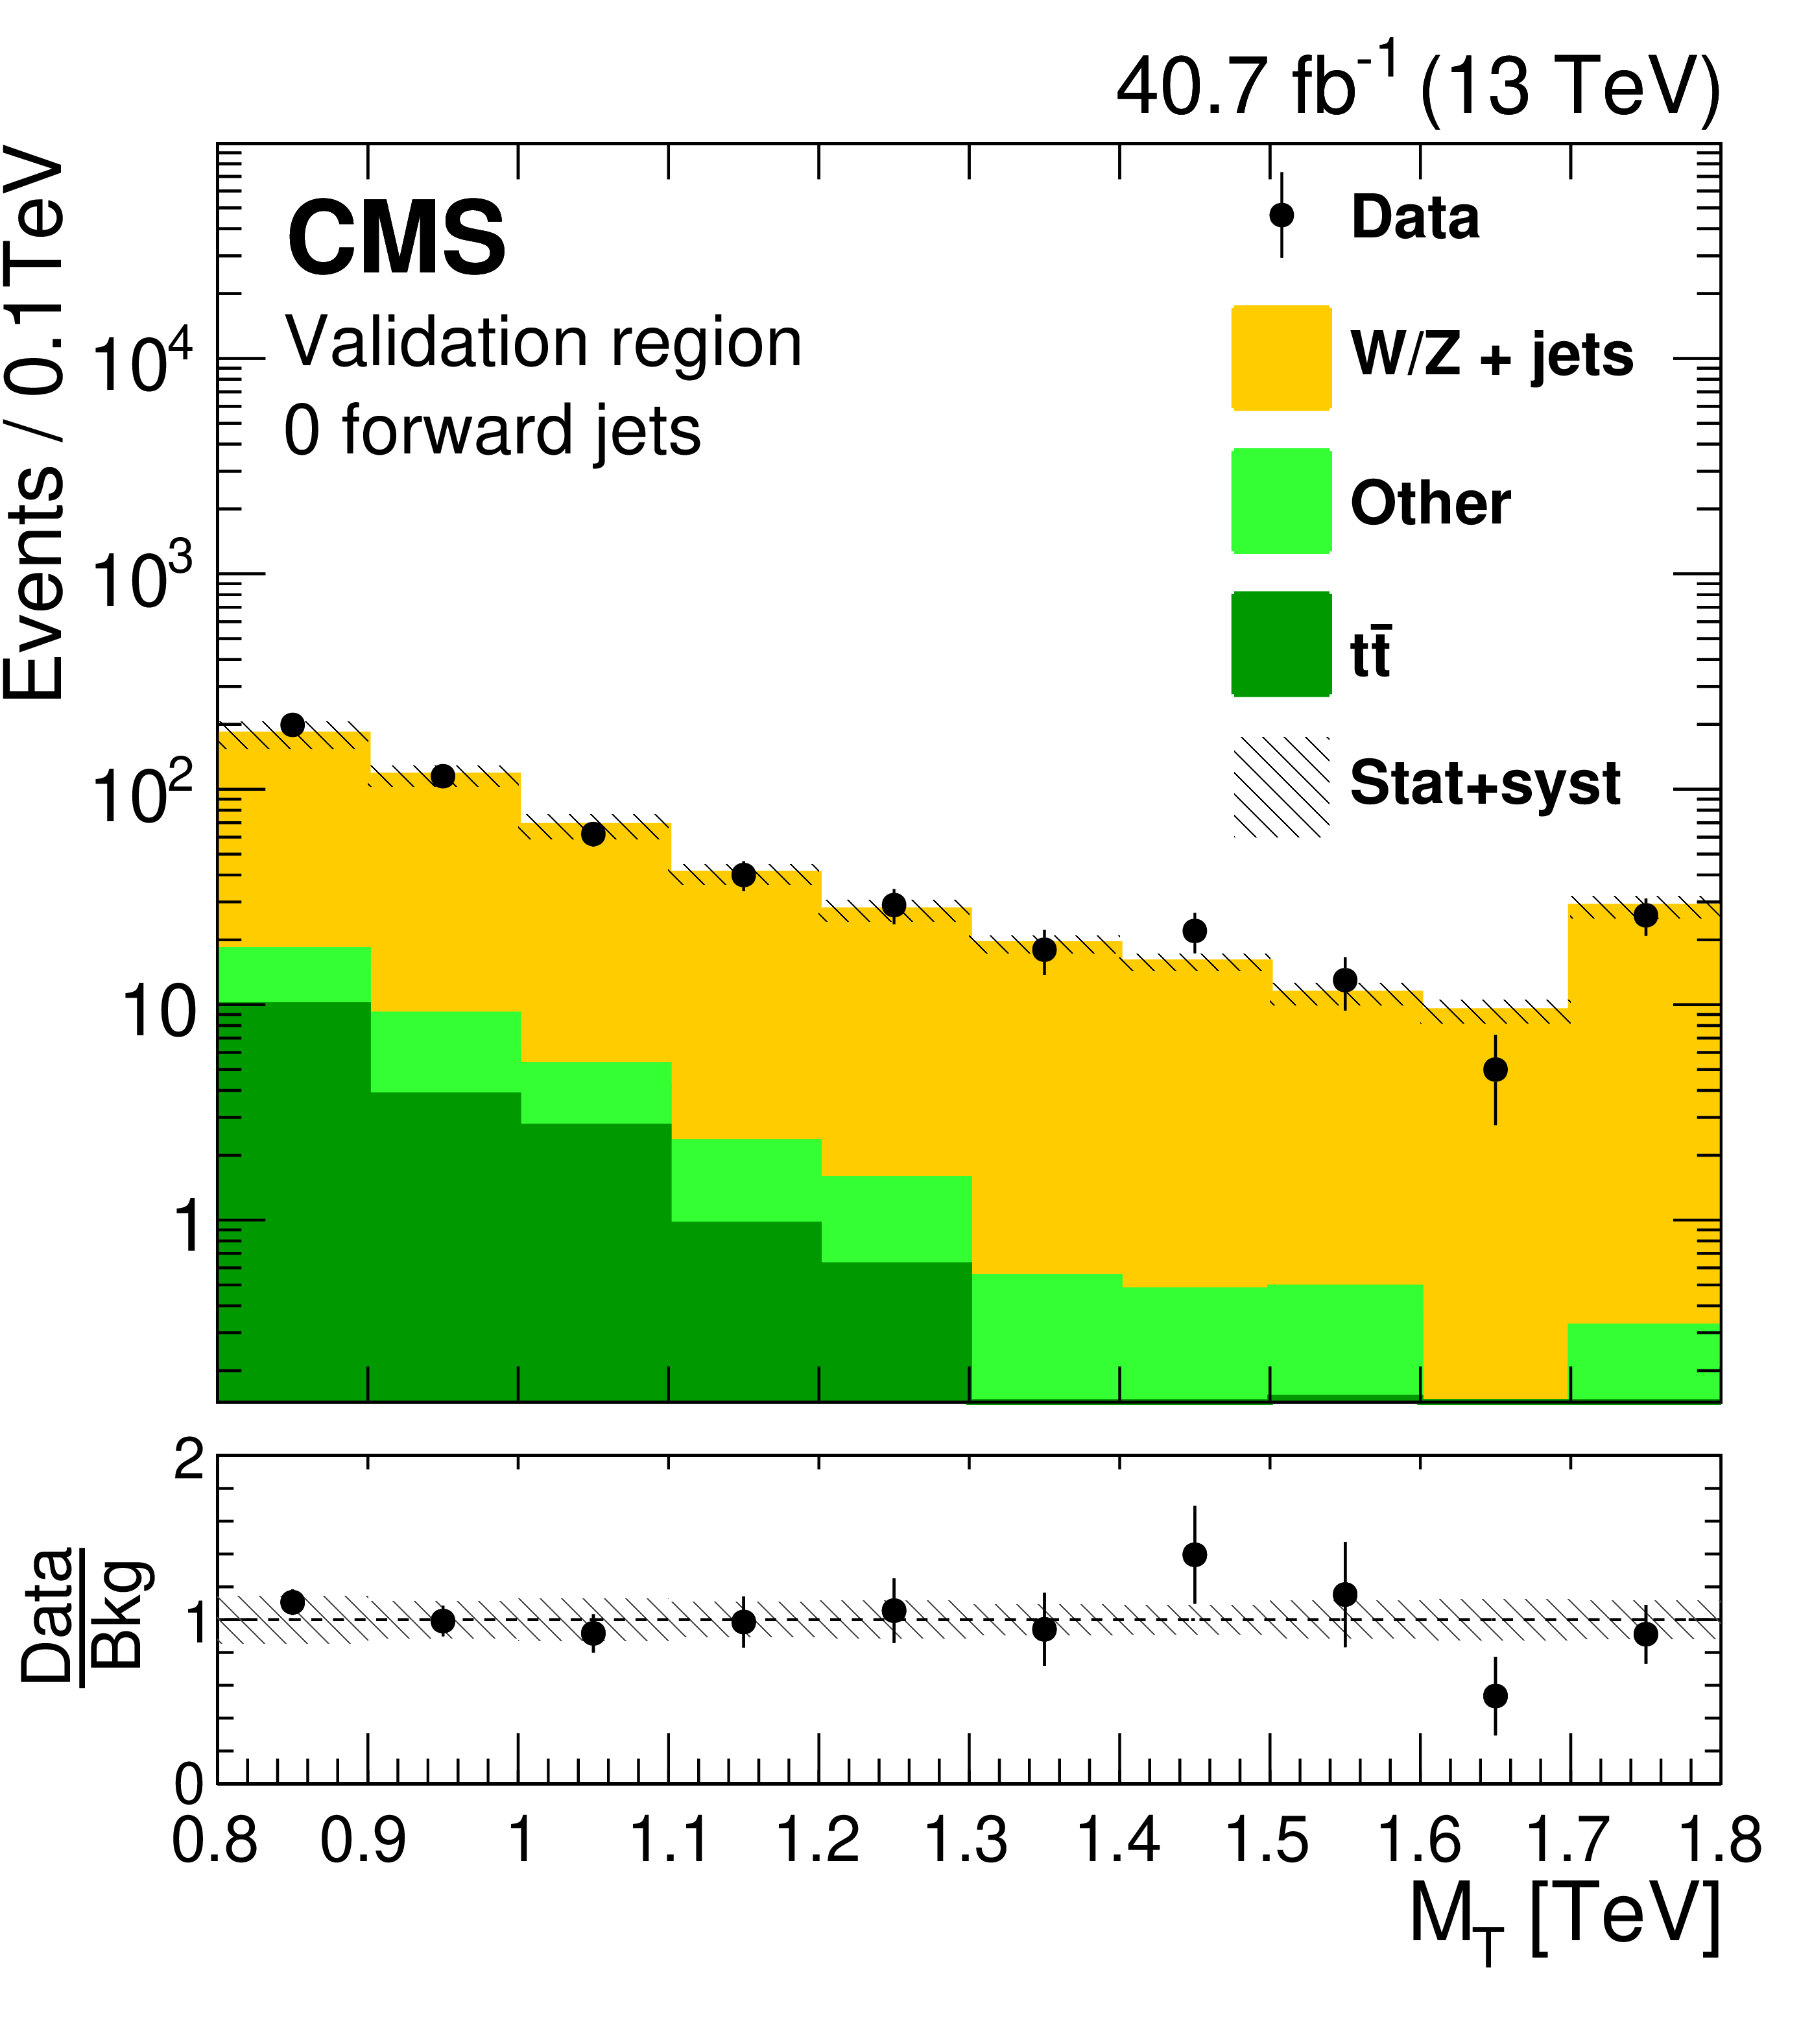
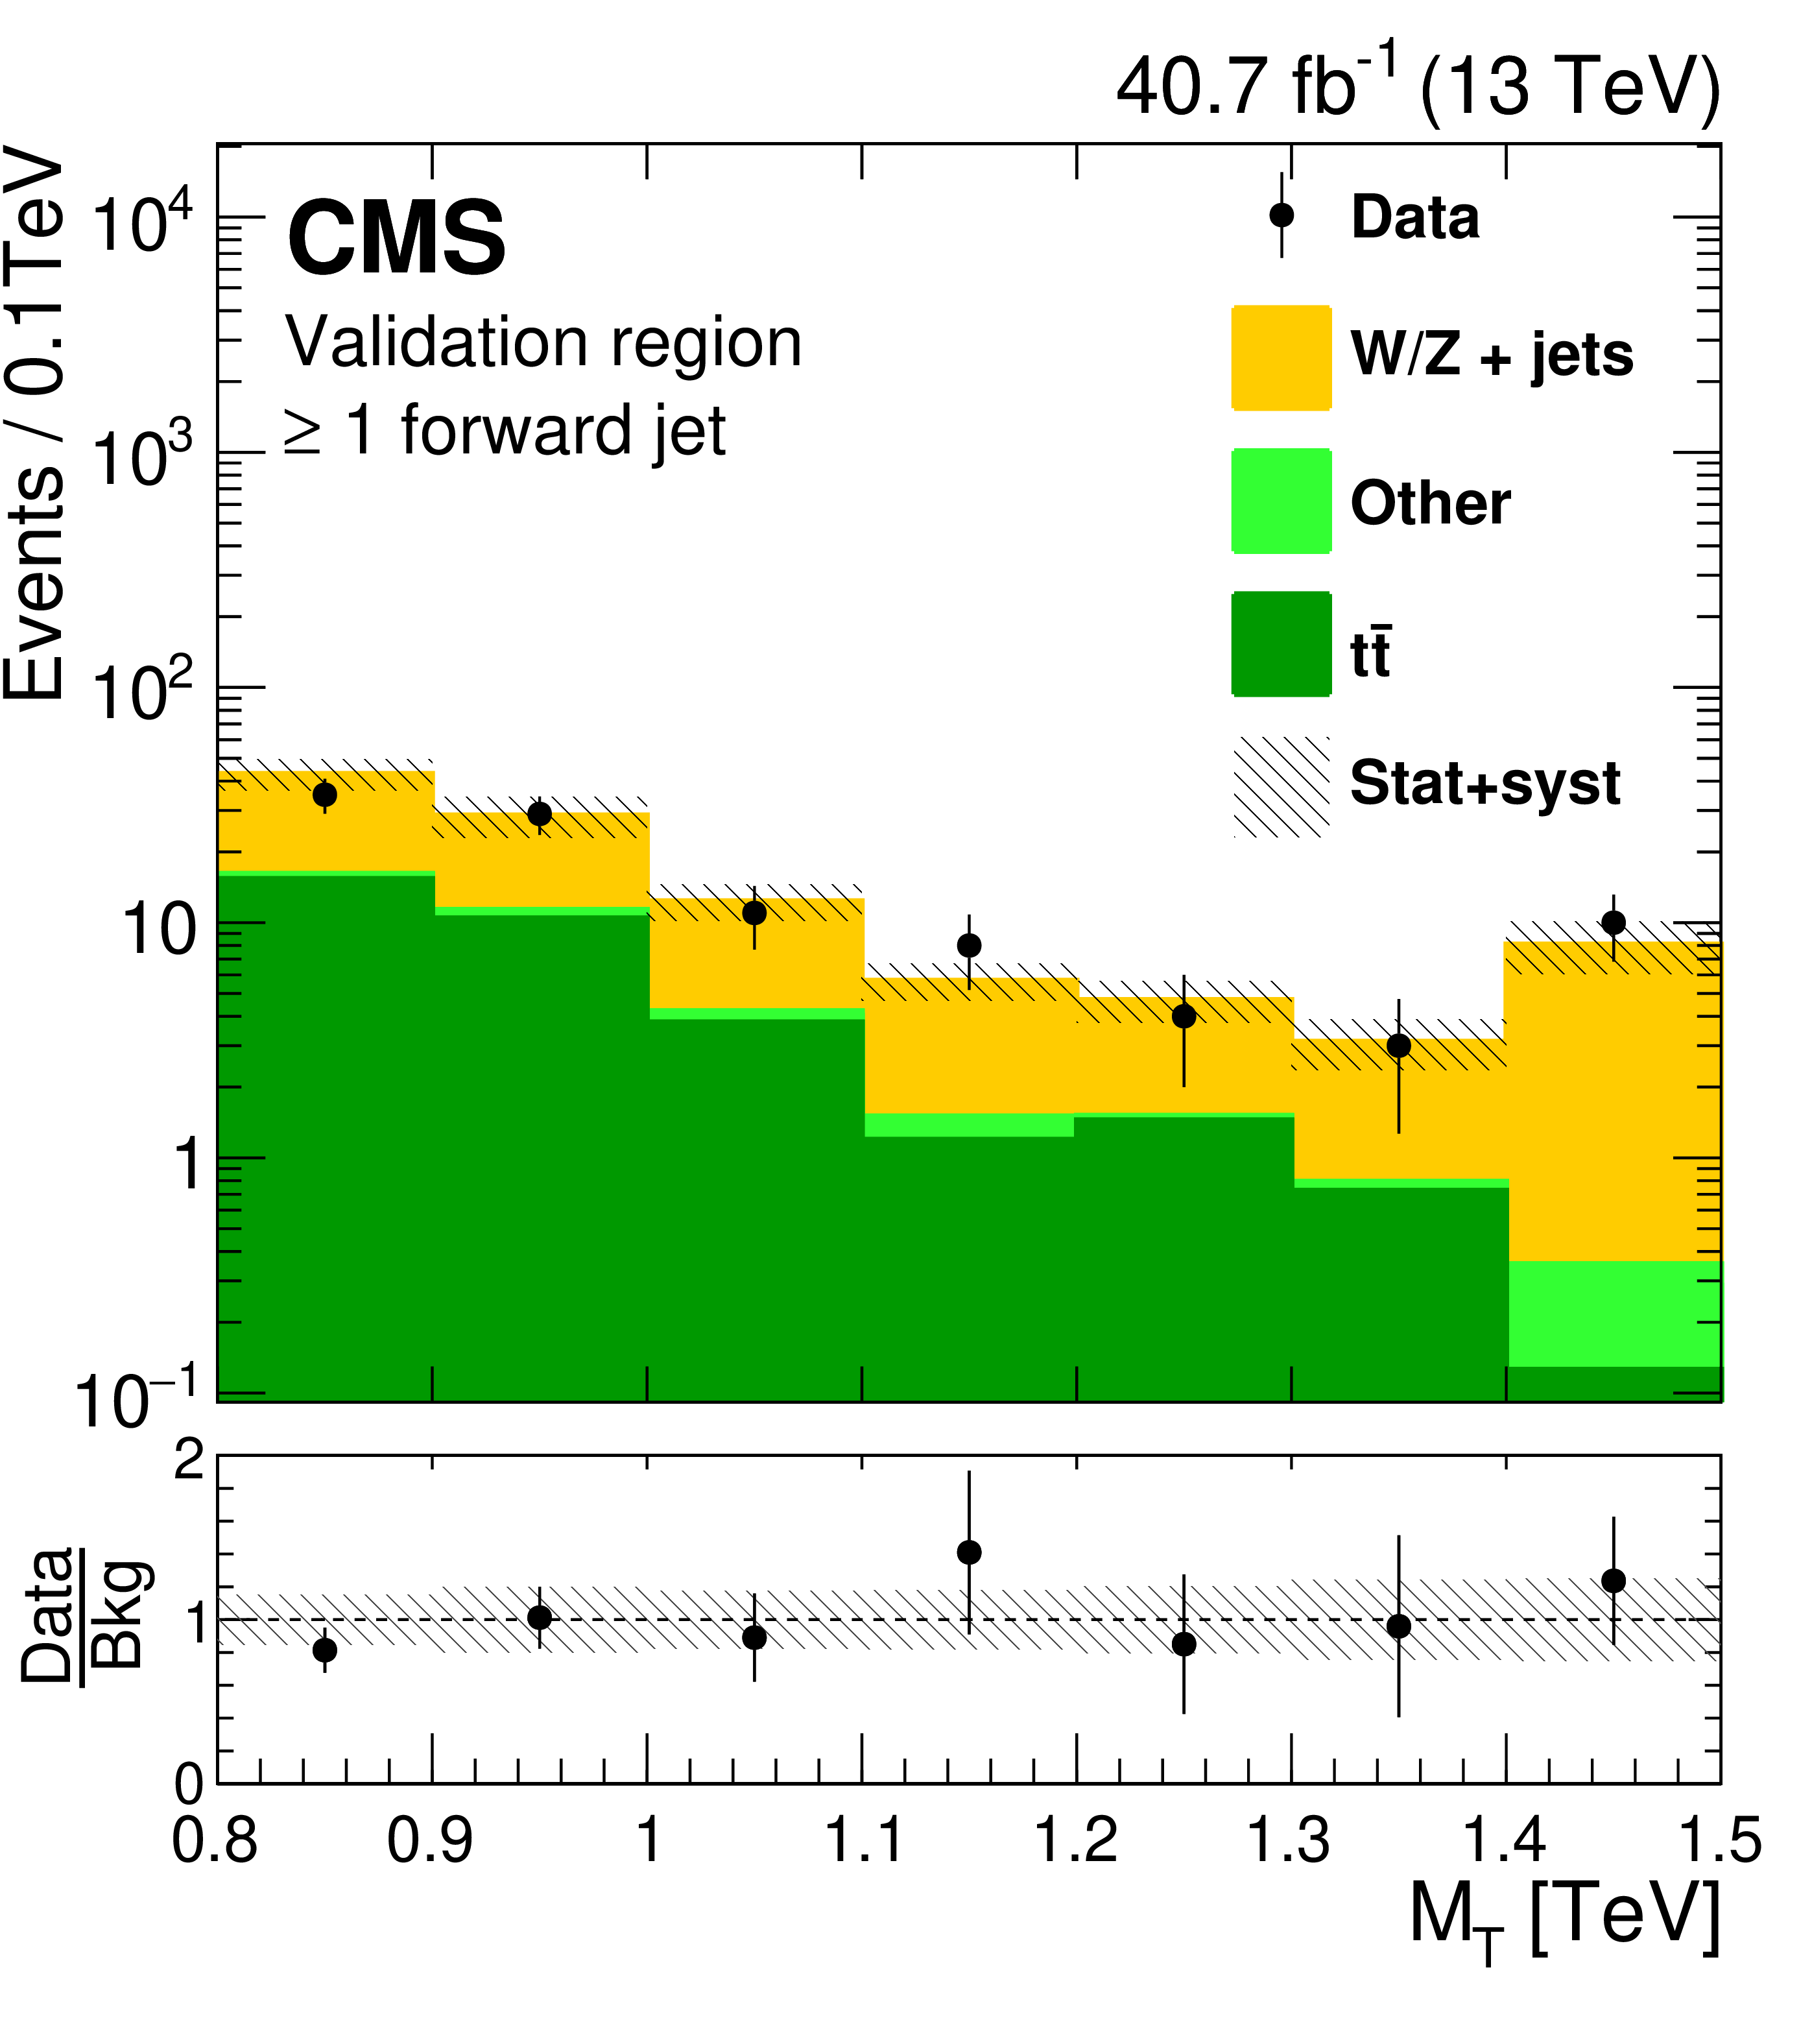
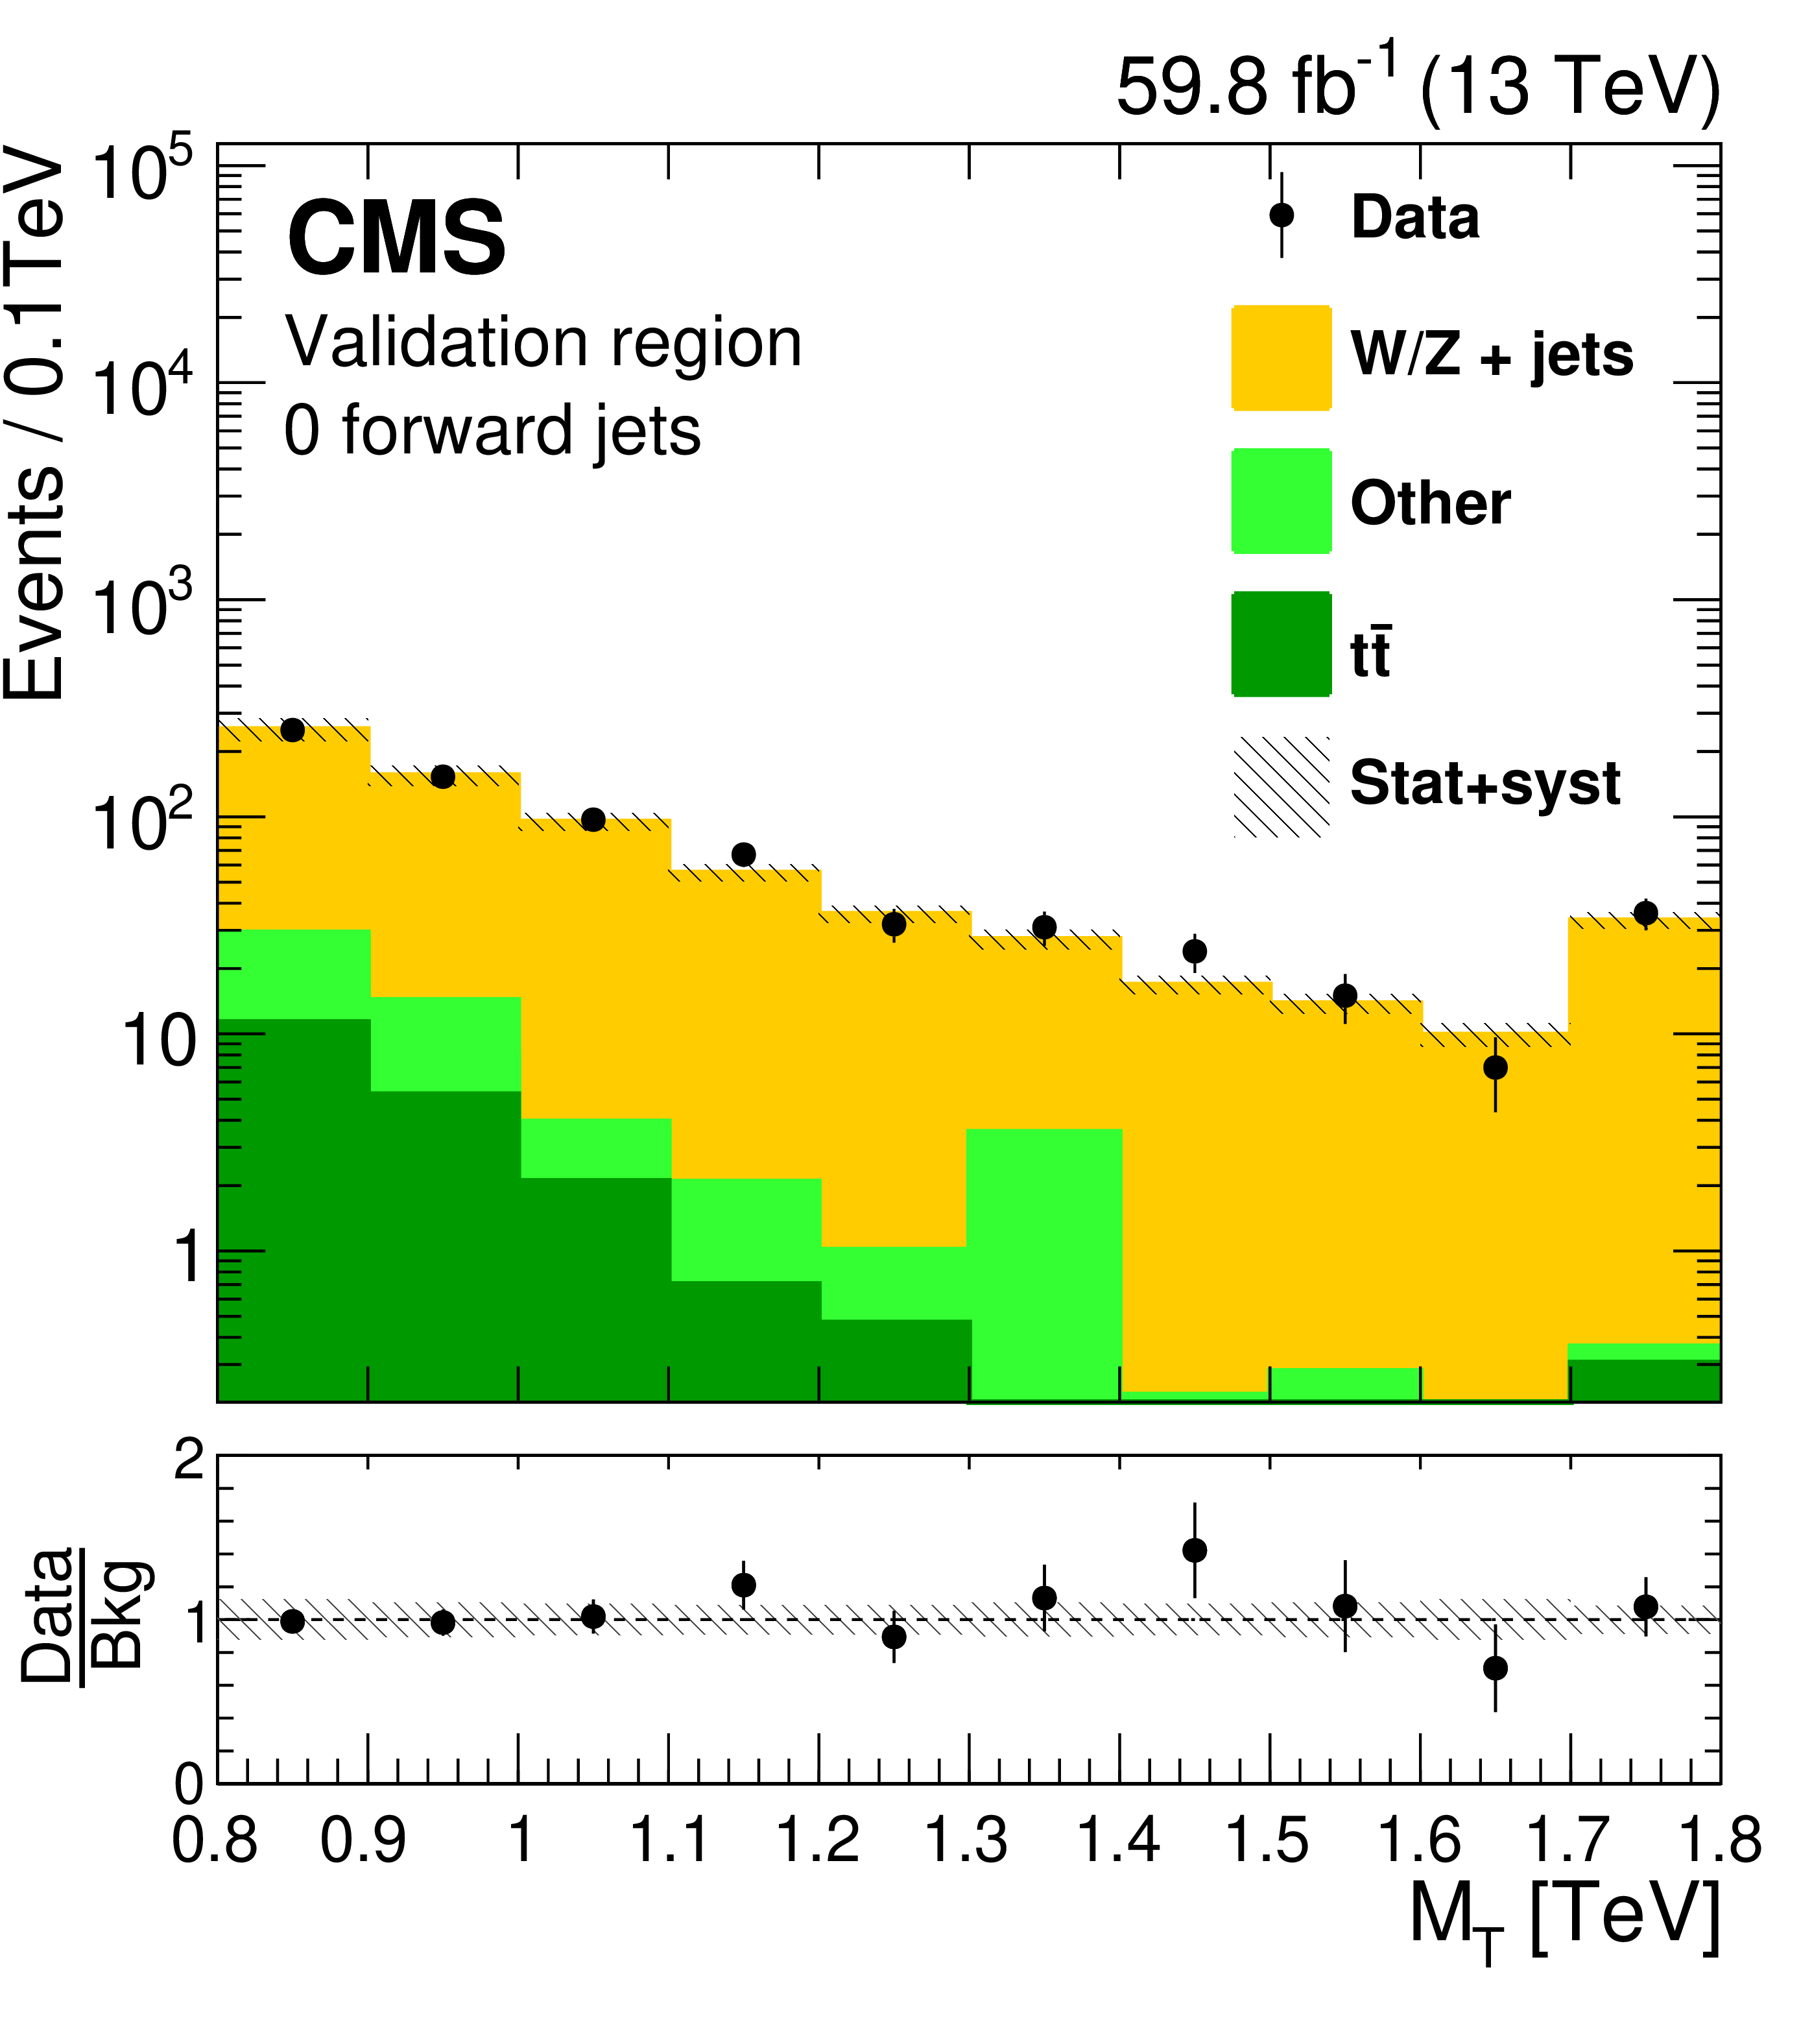
Figure 3:
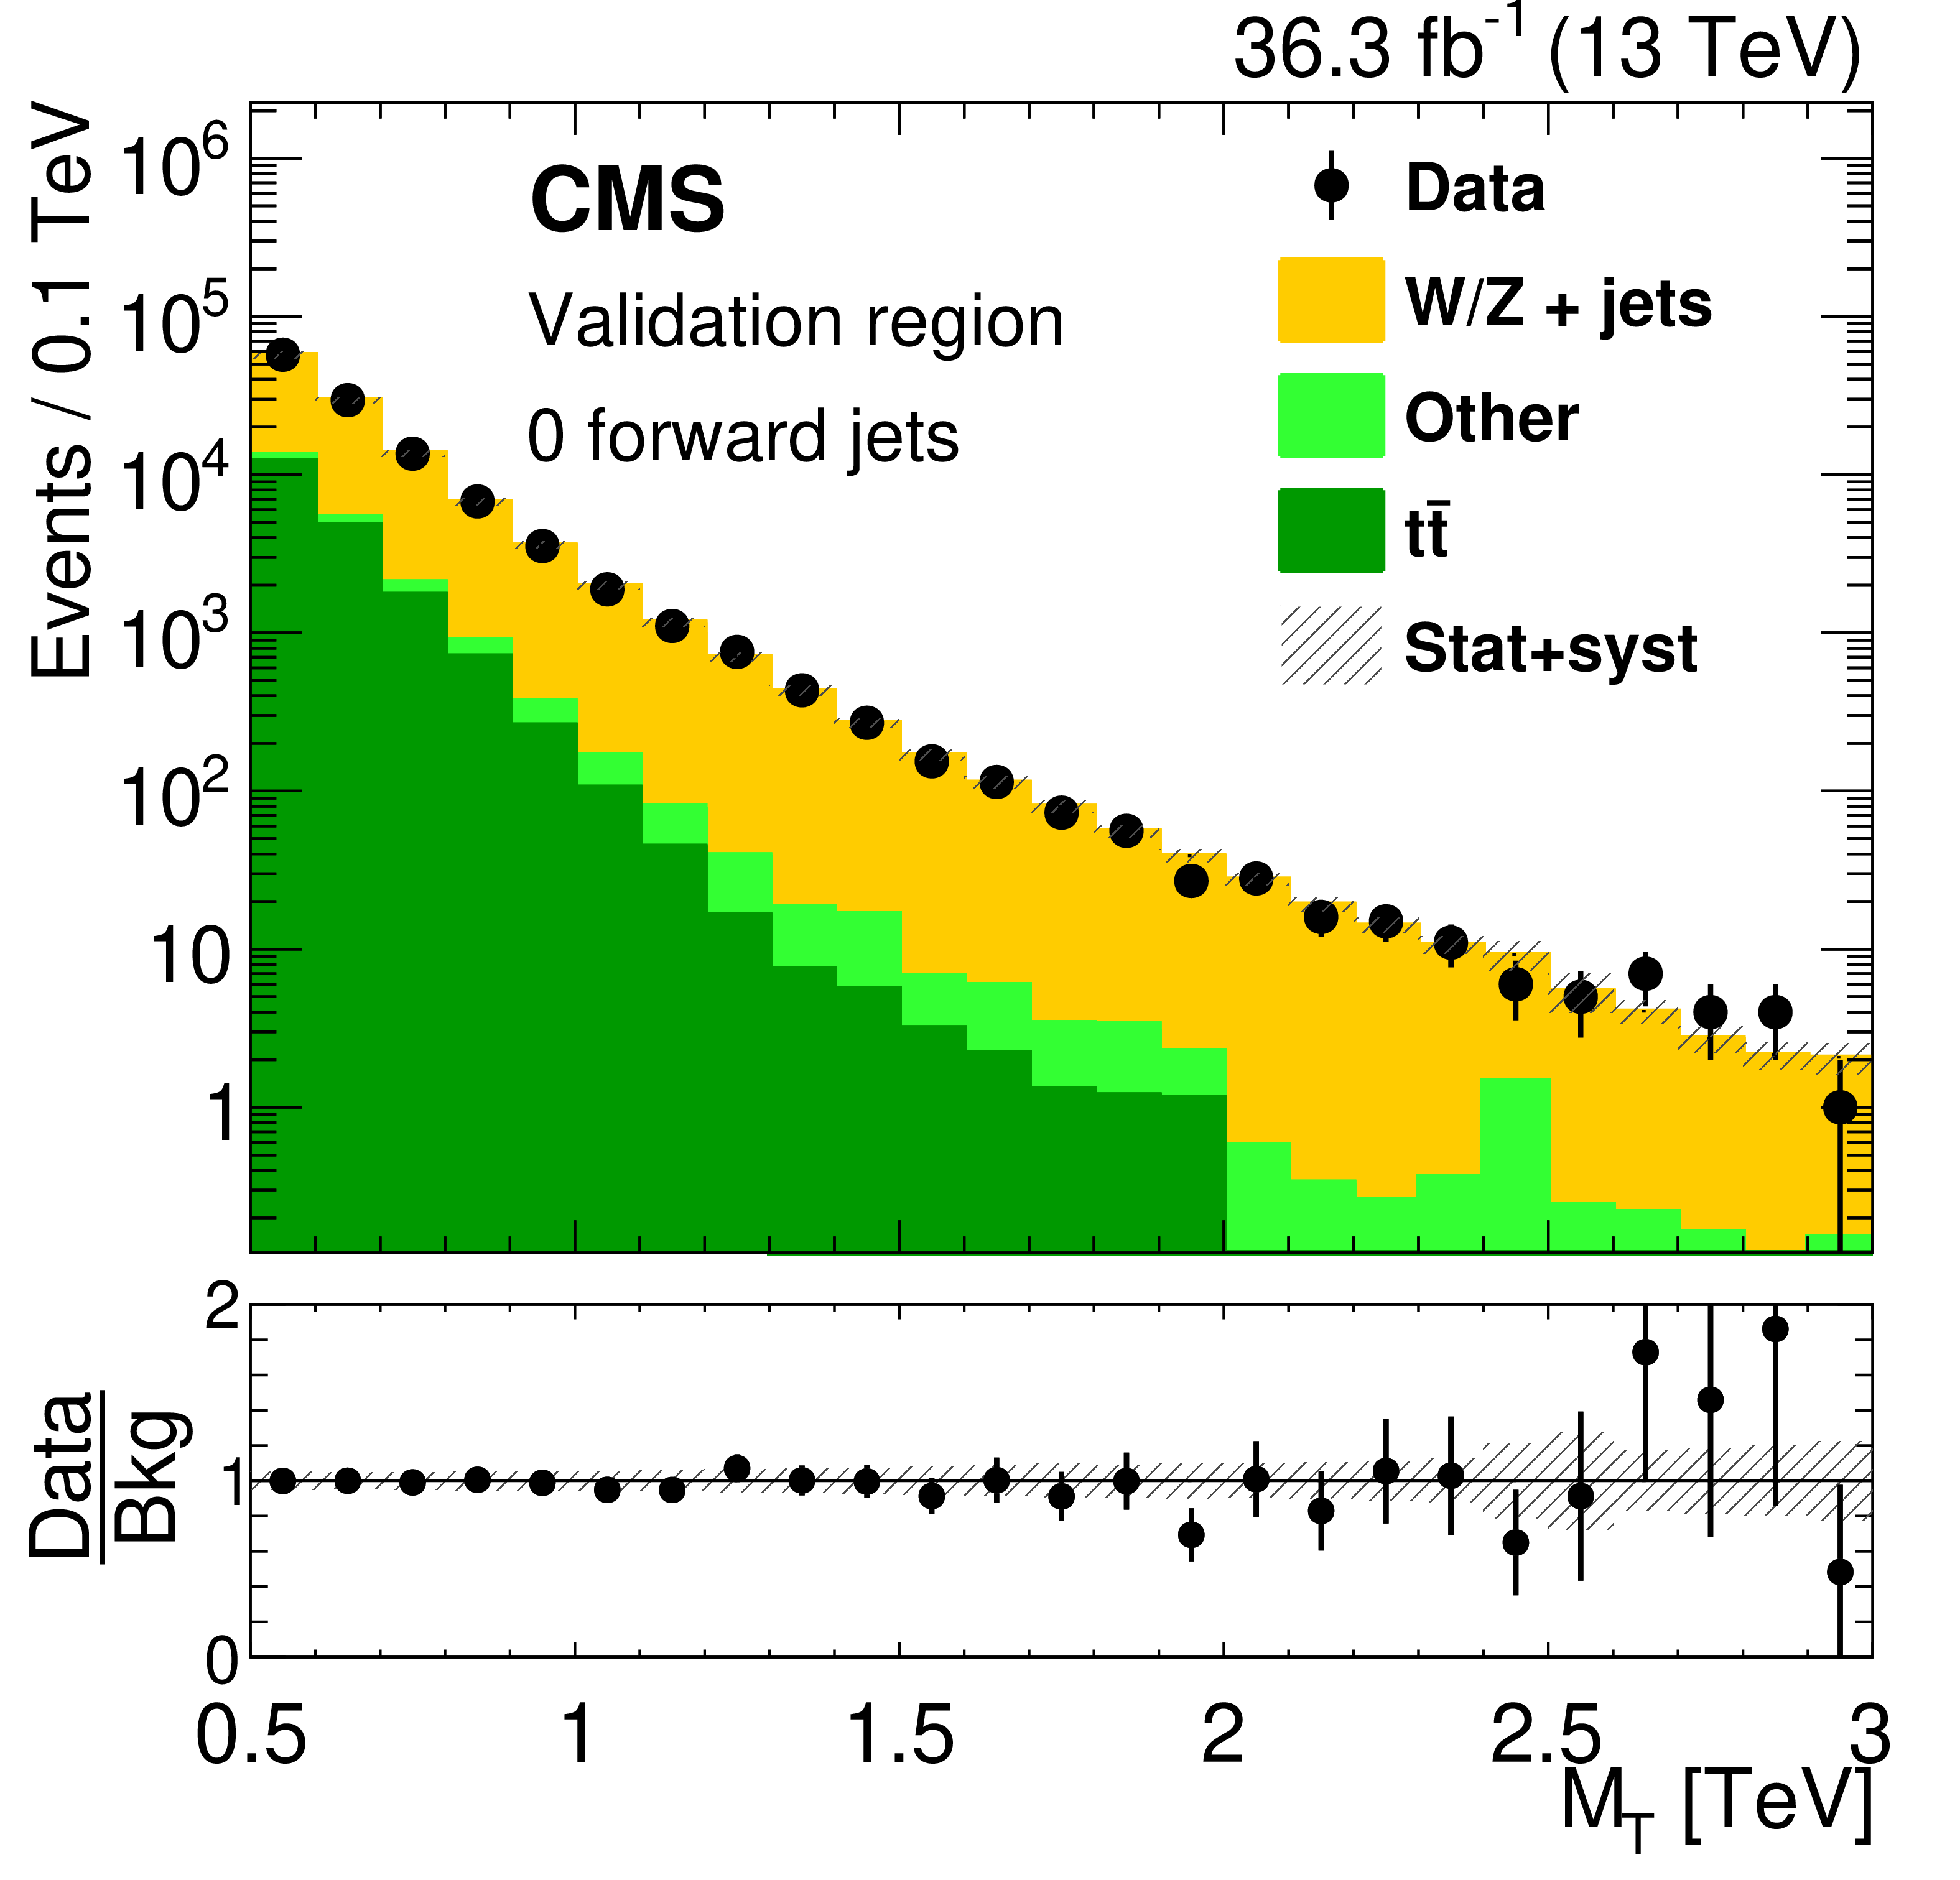
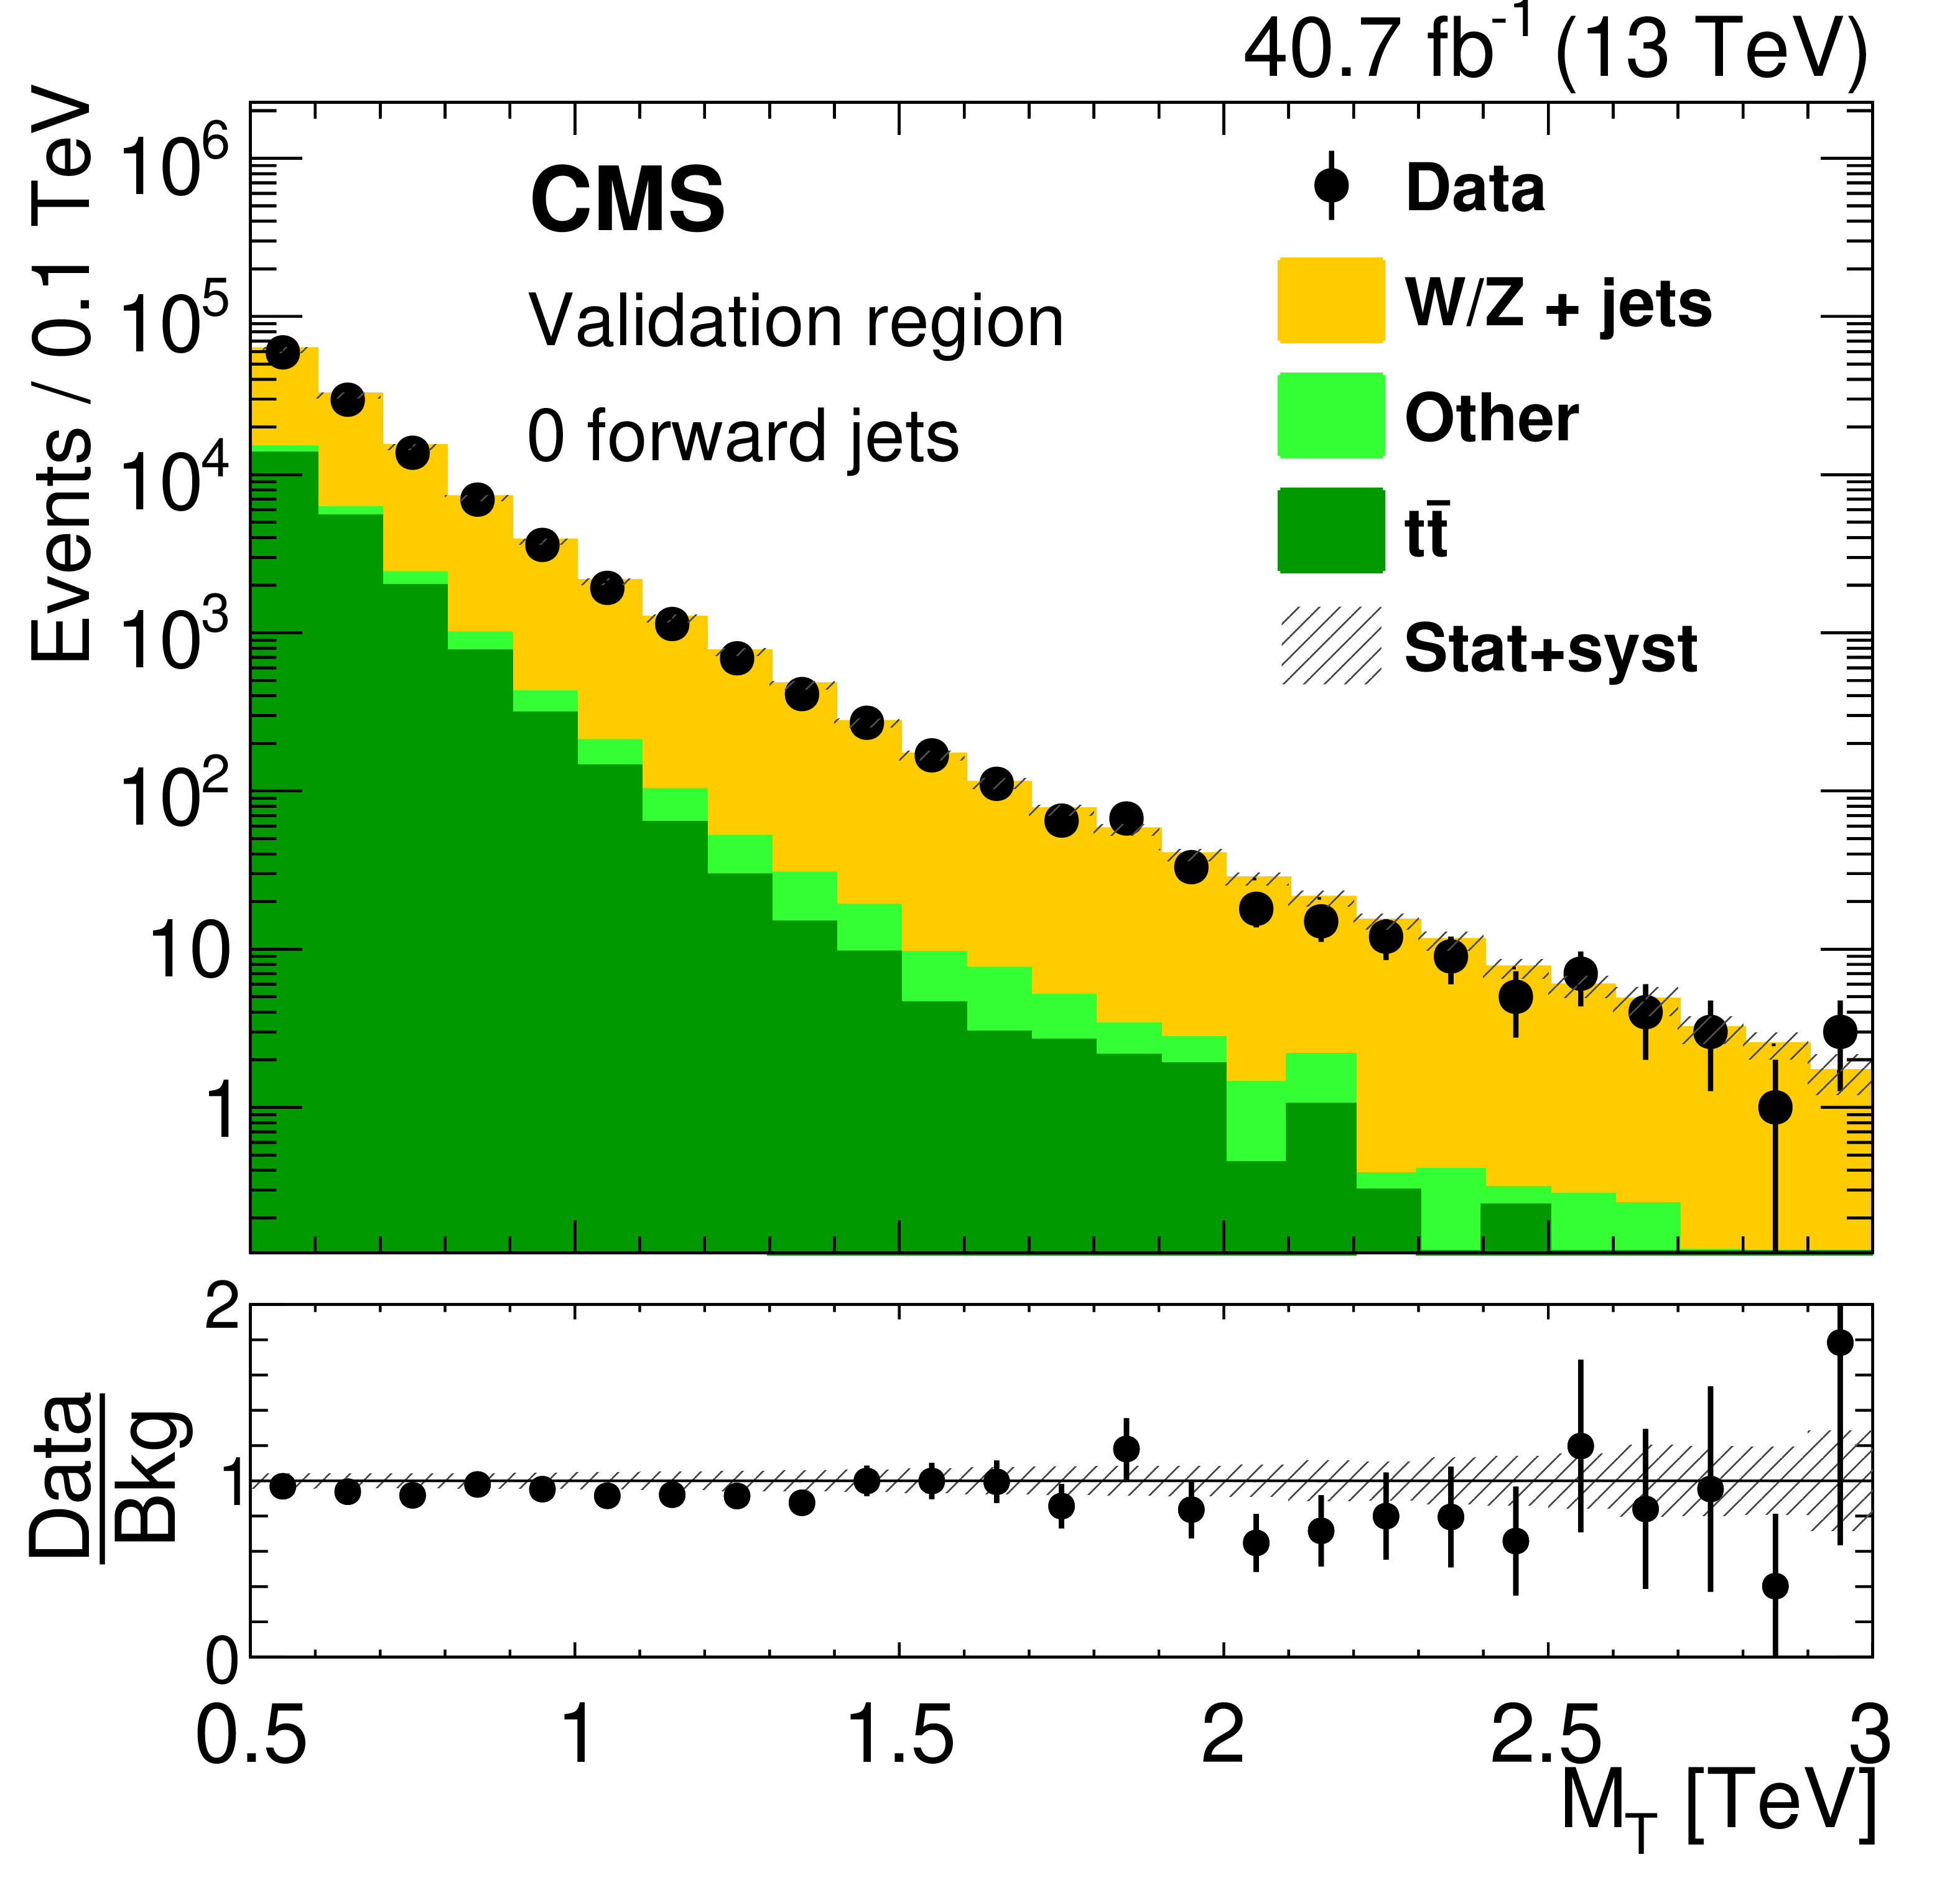
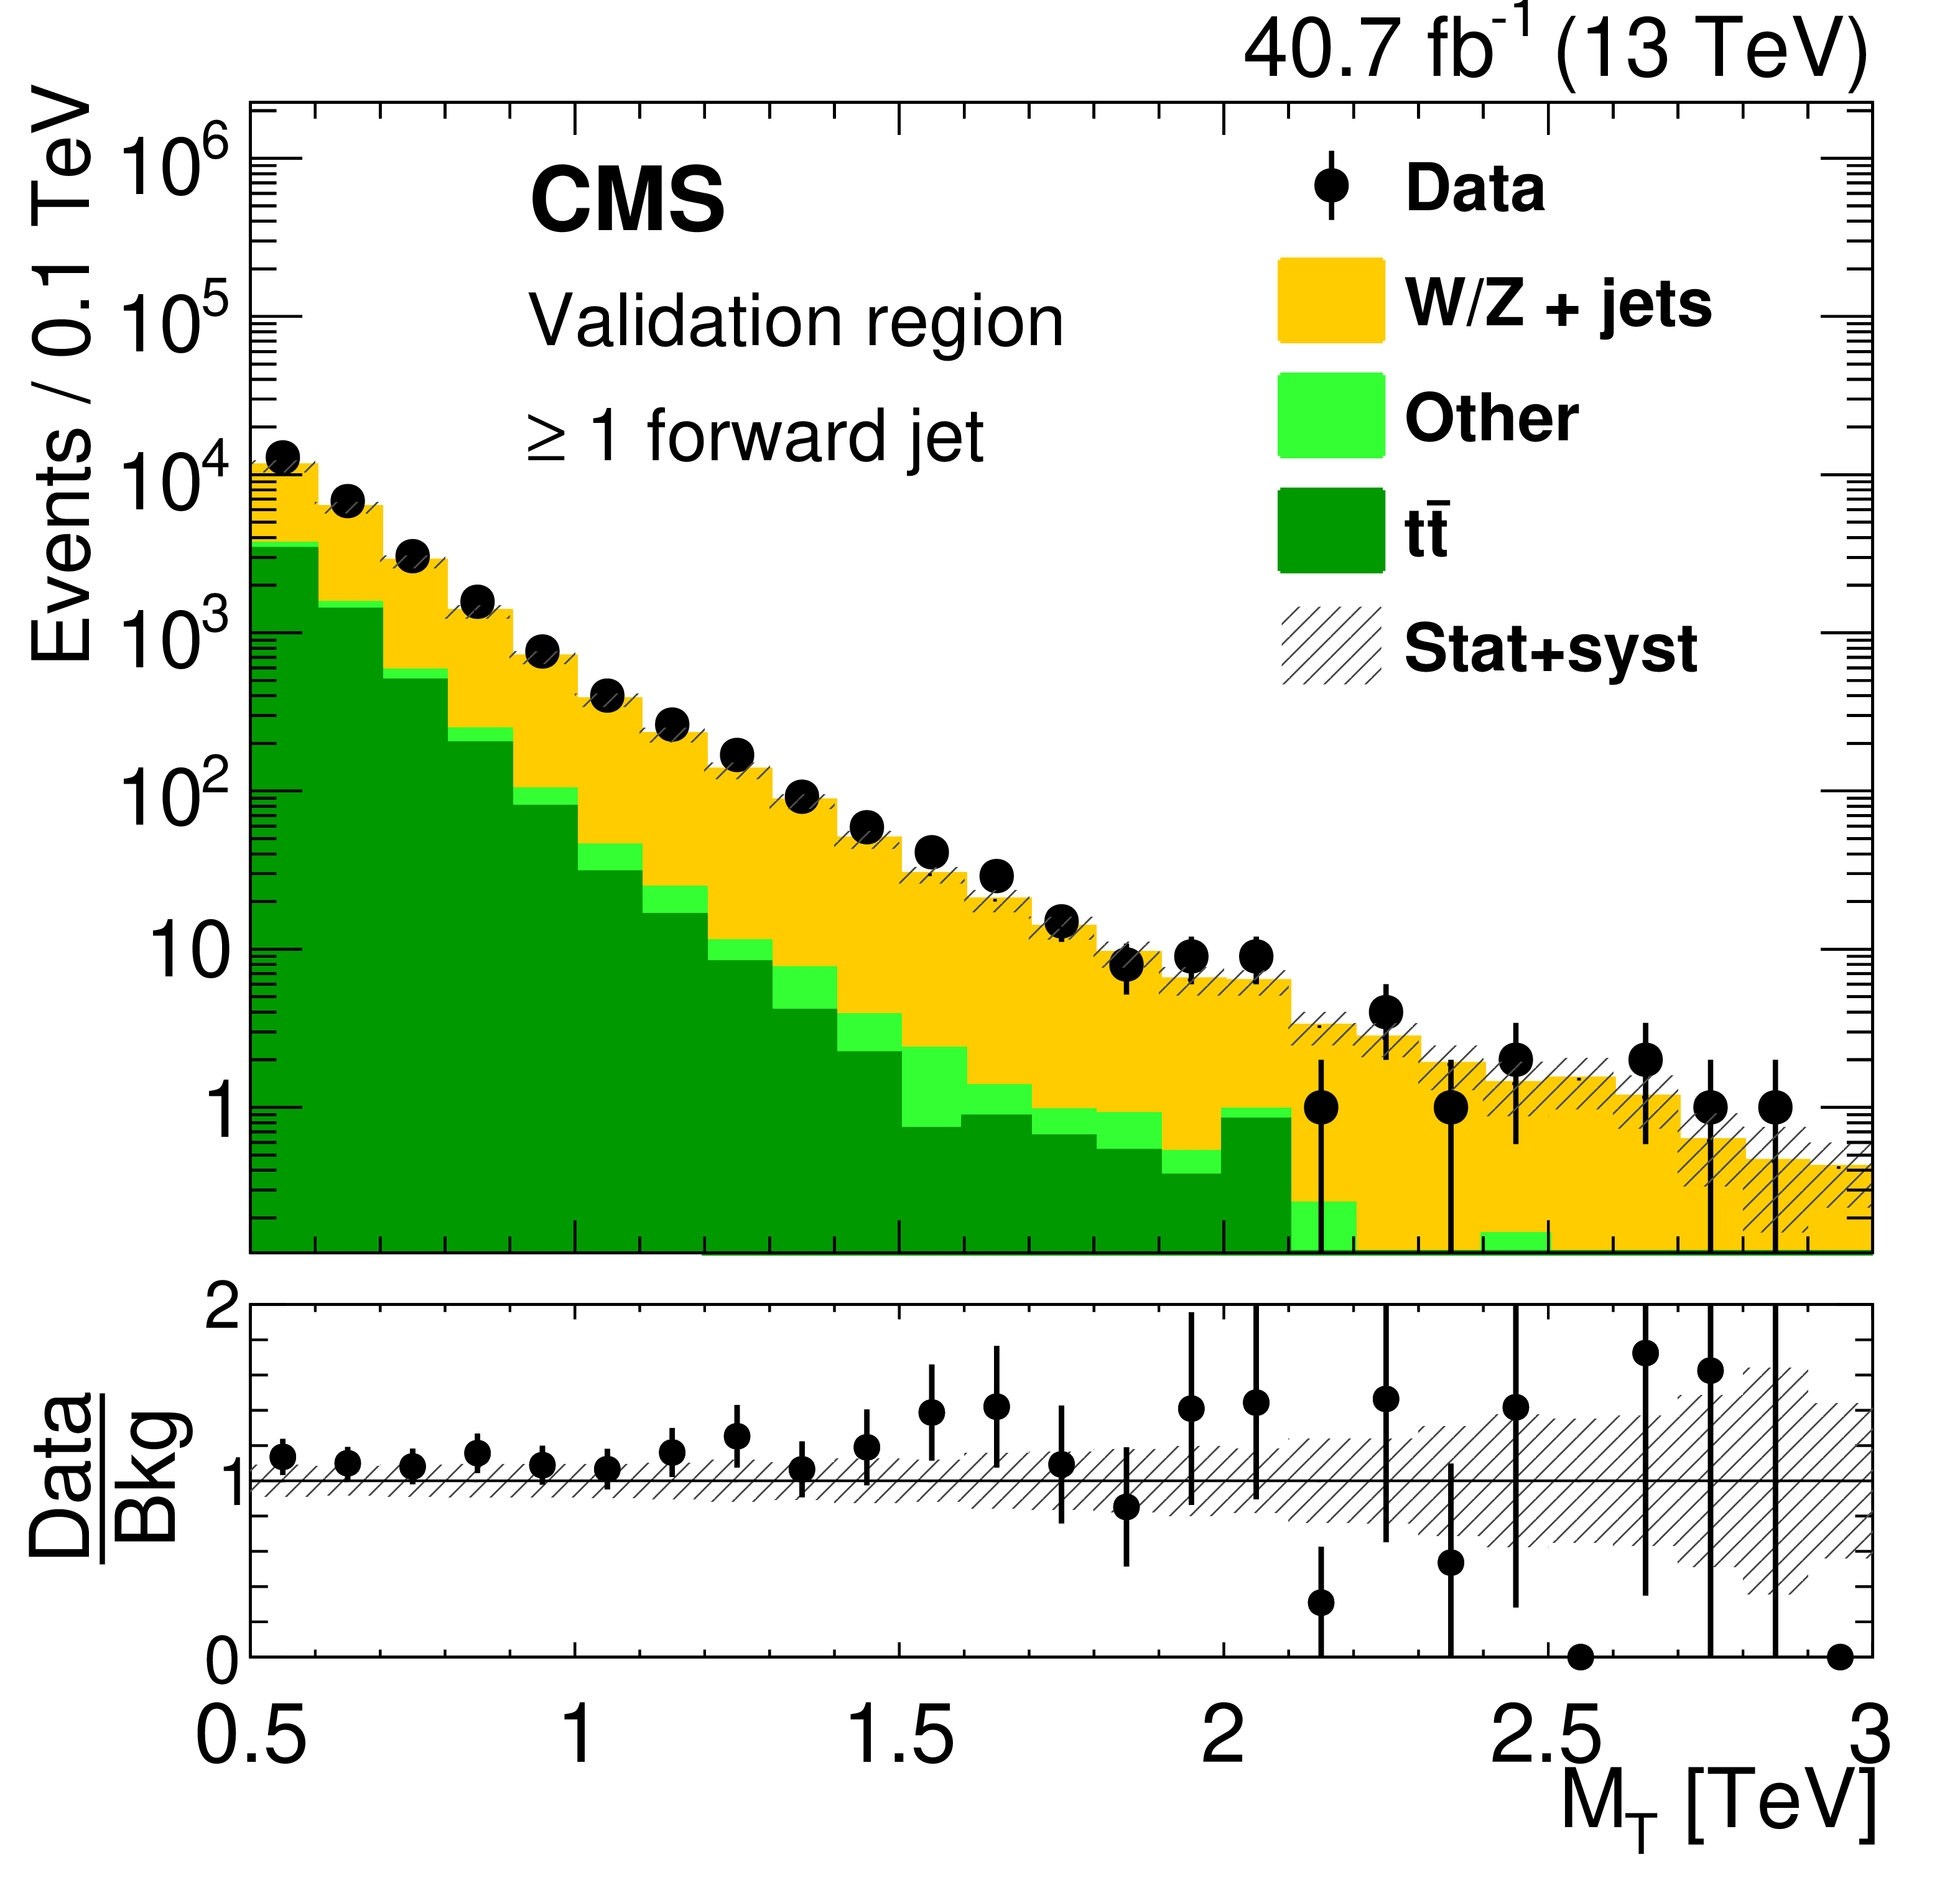
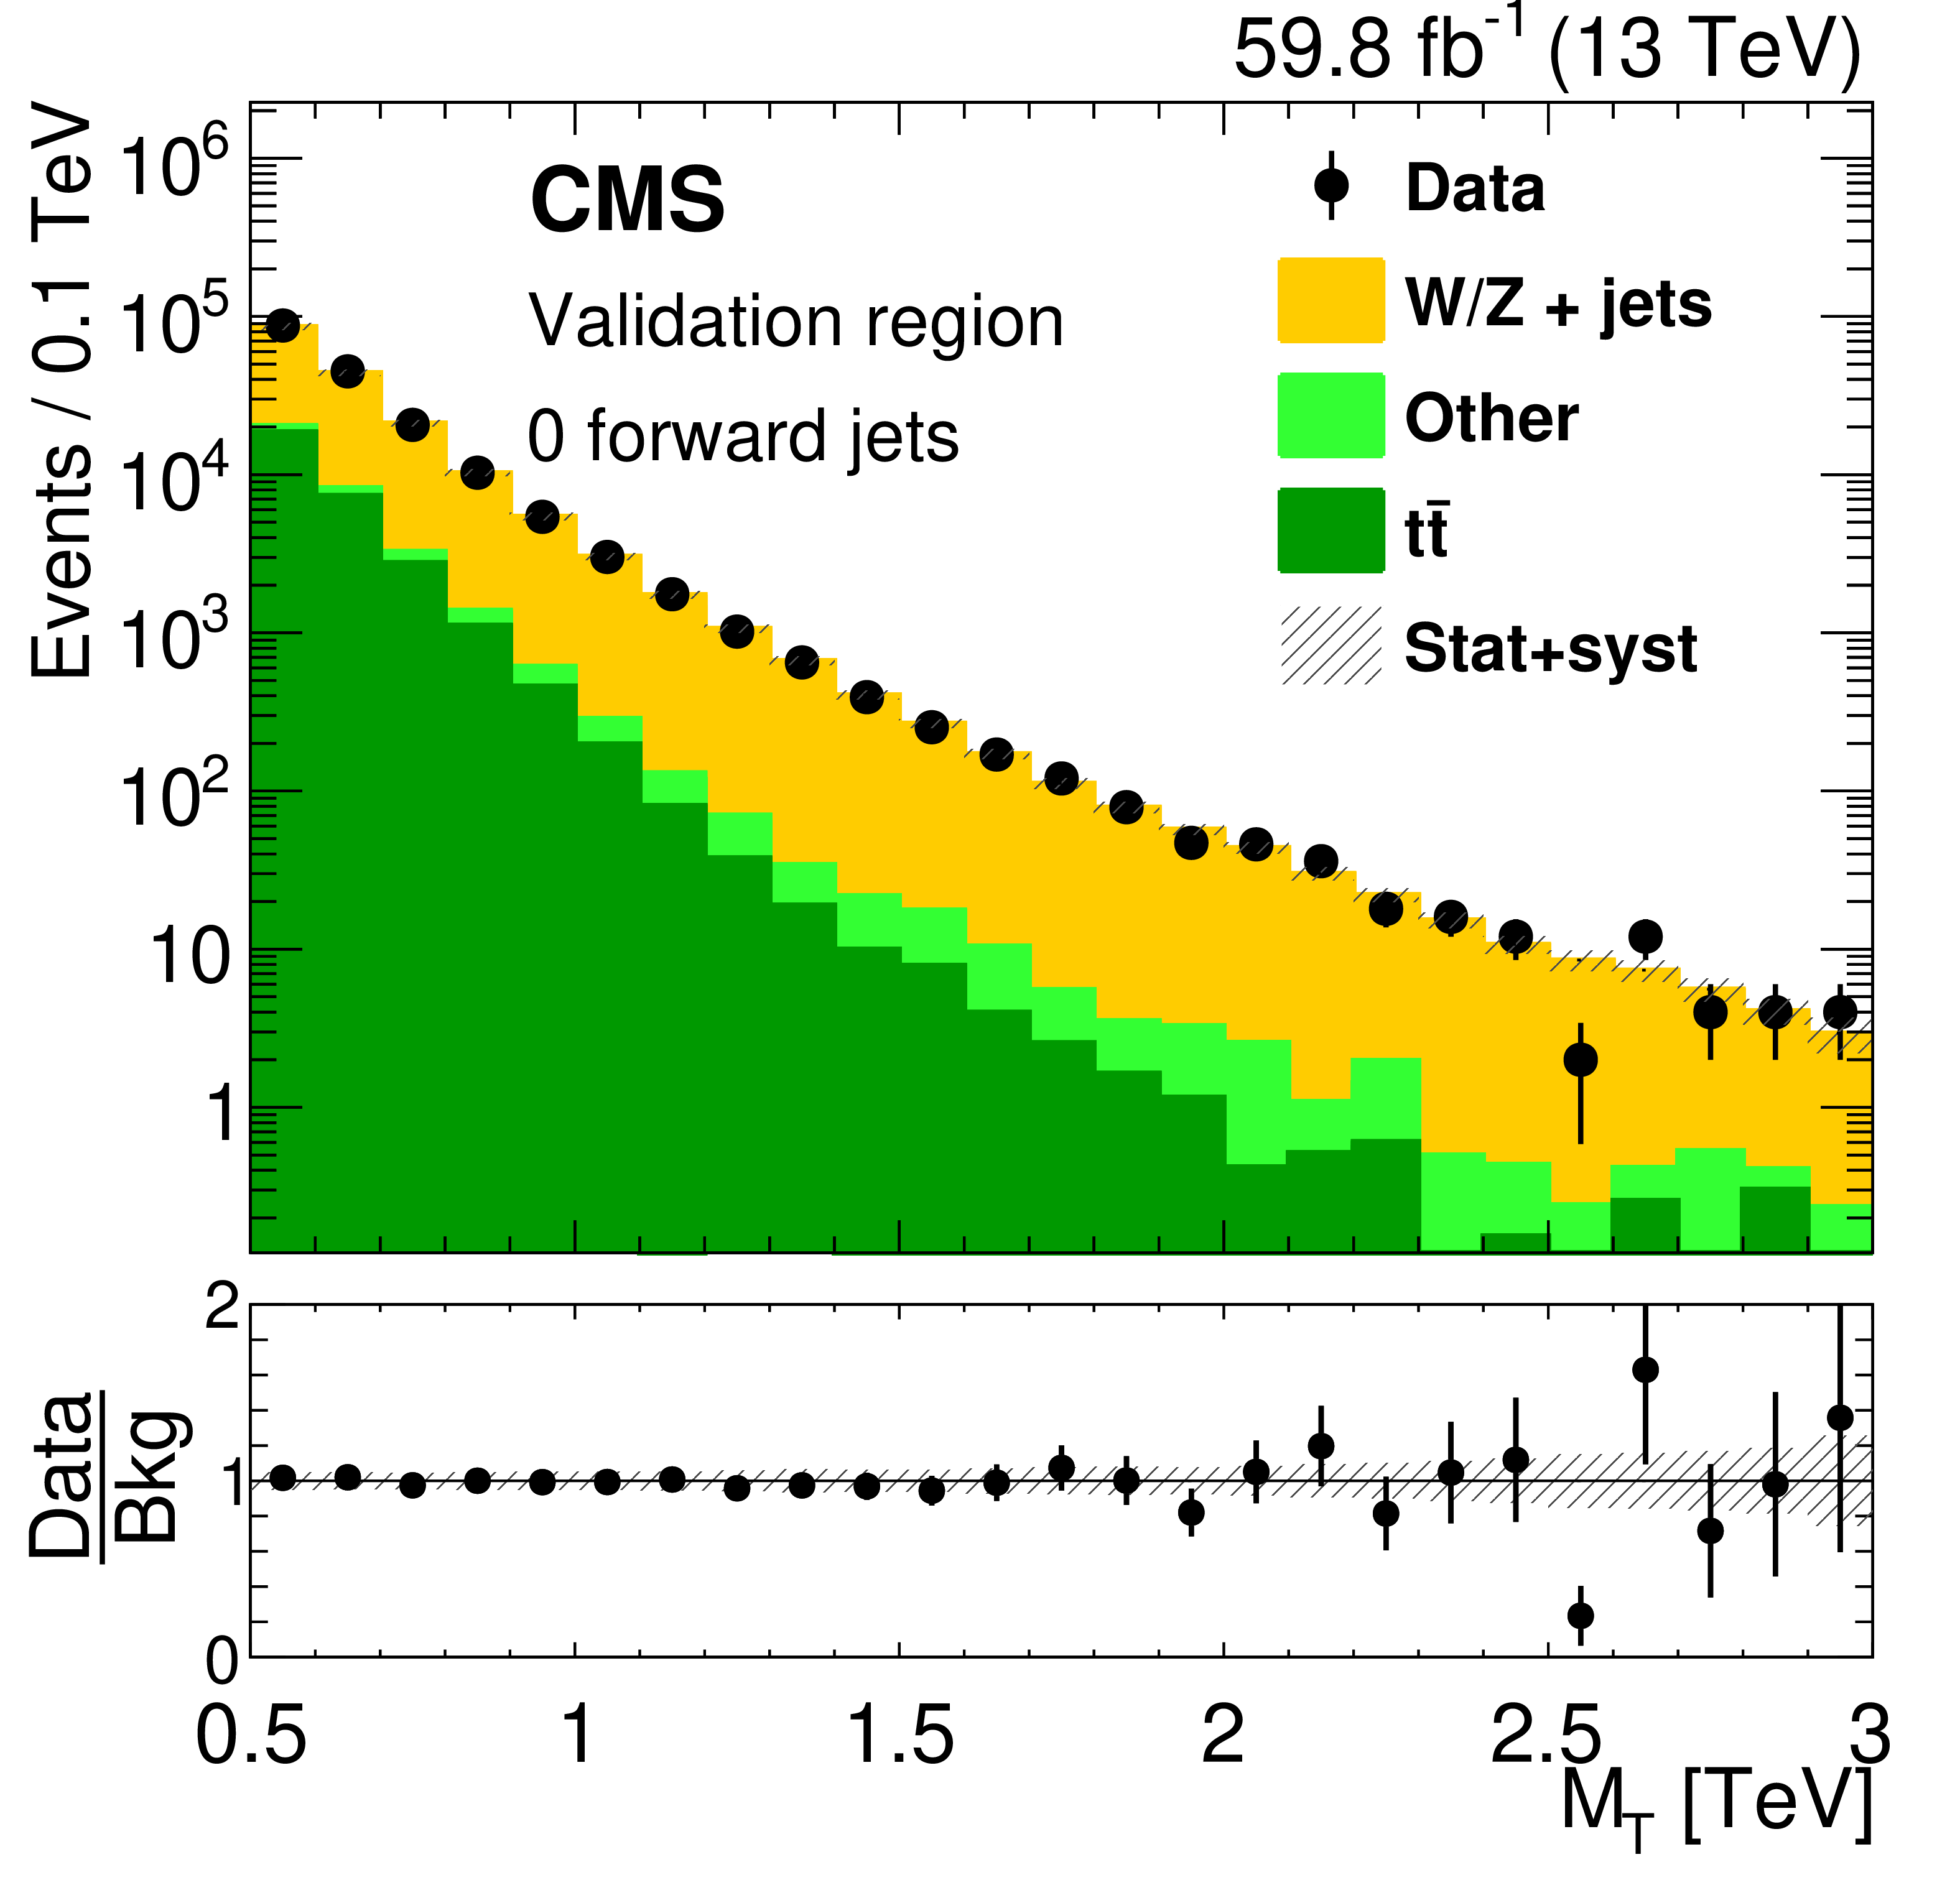
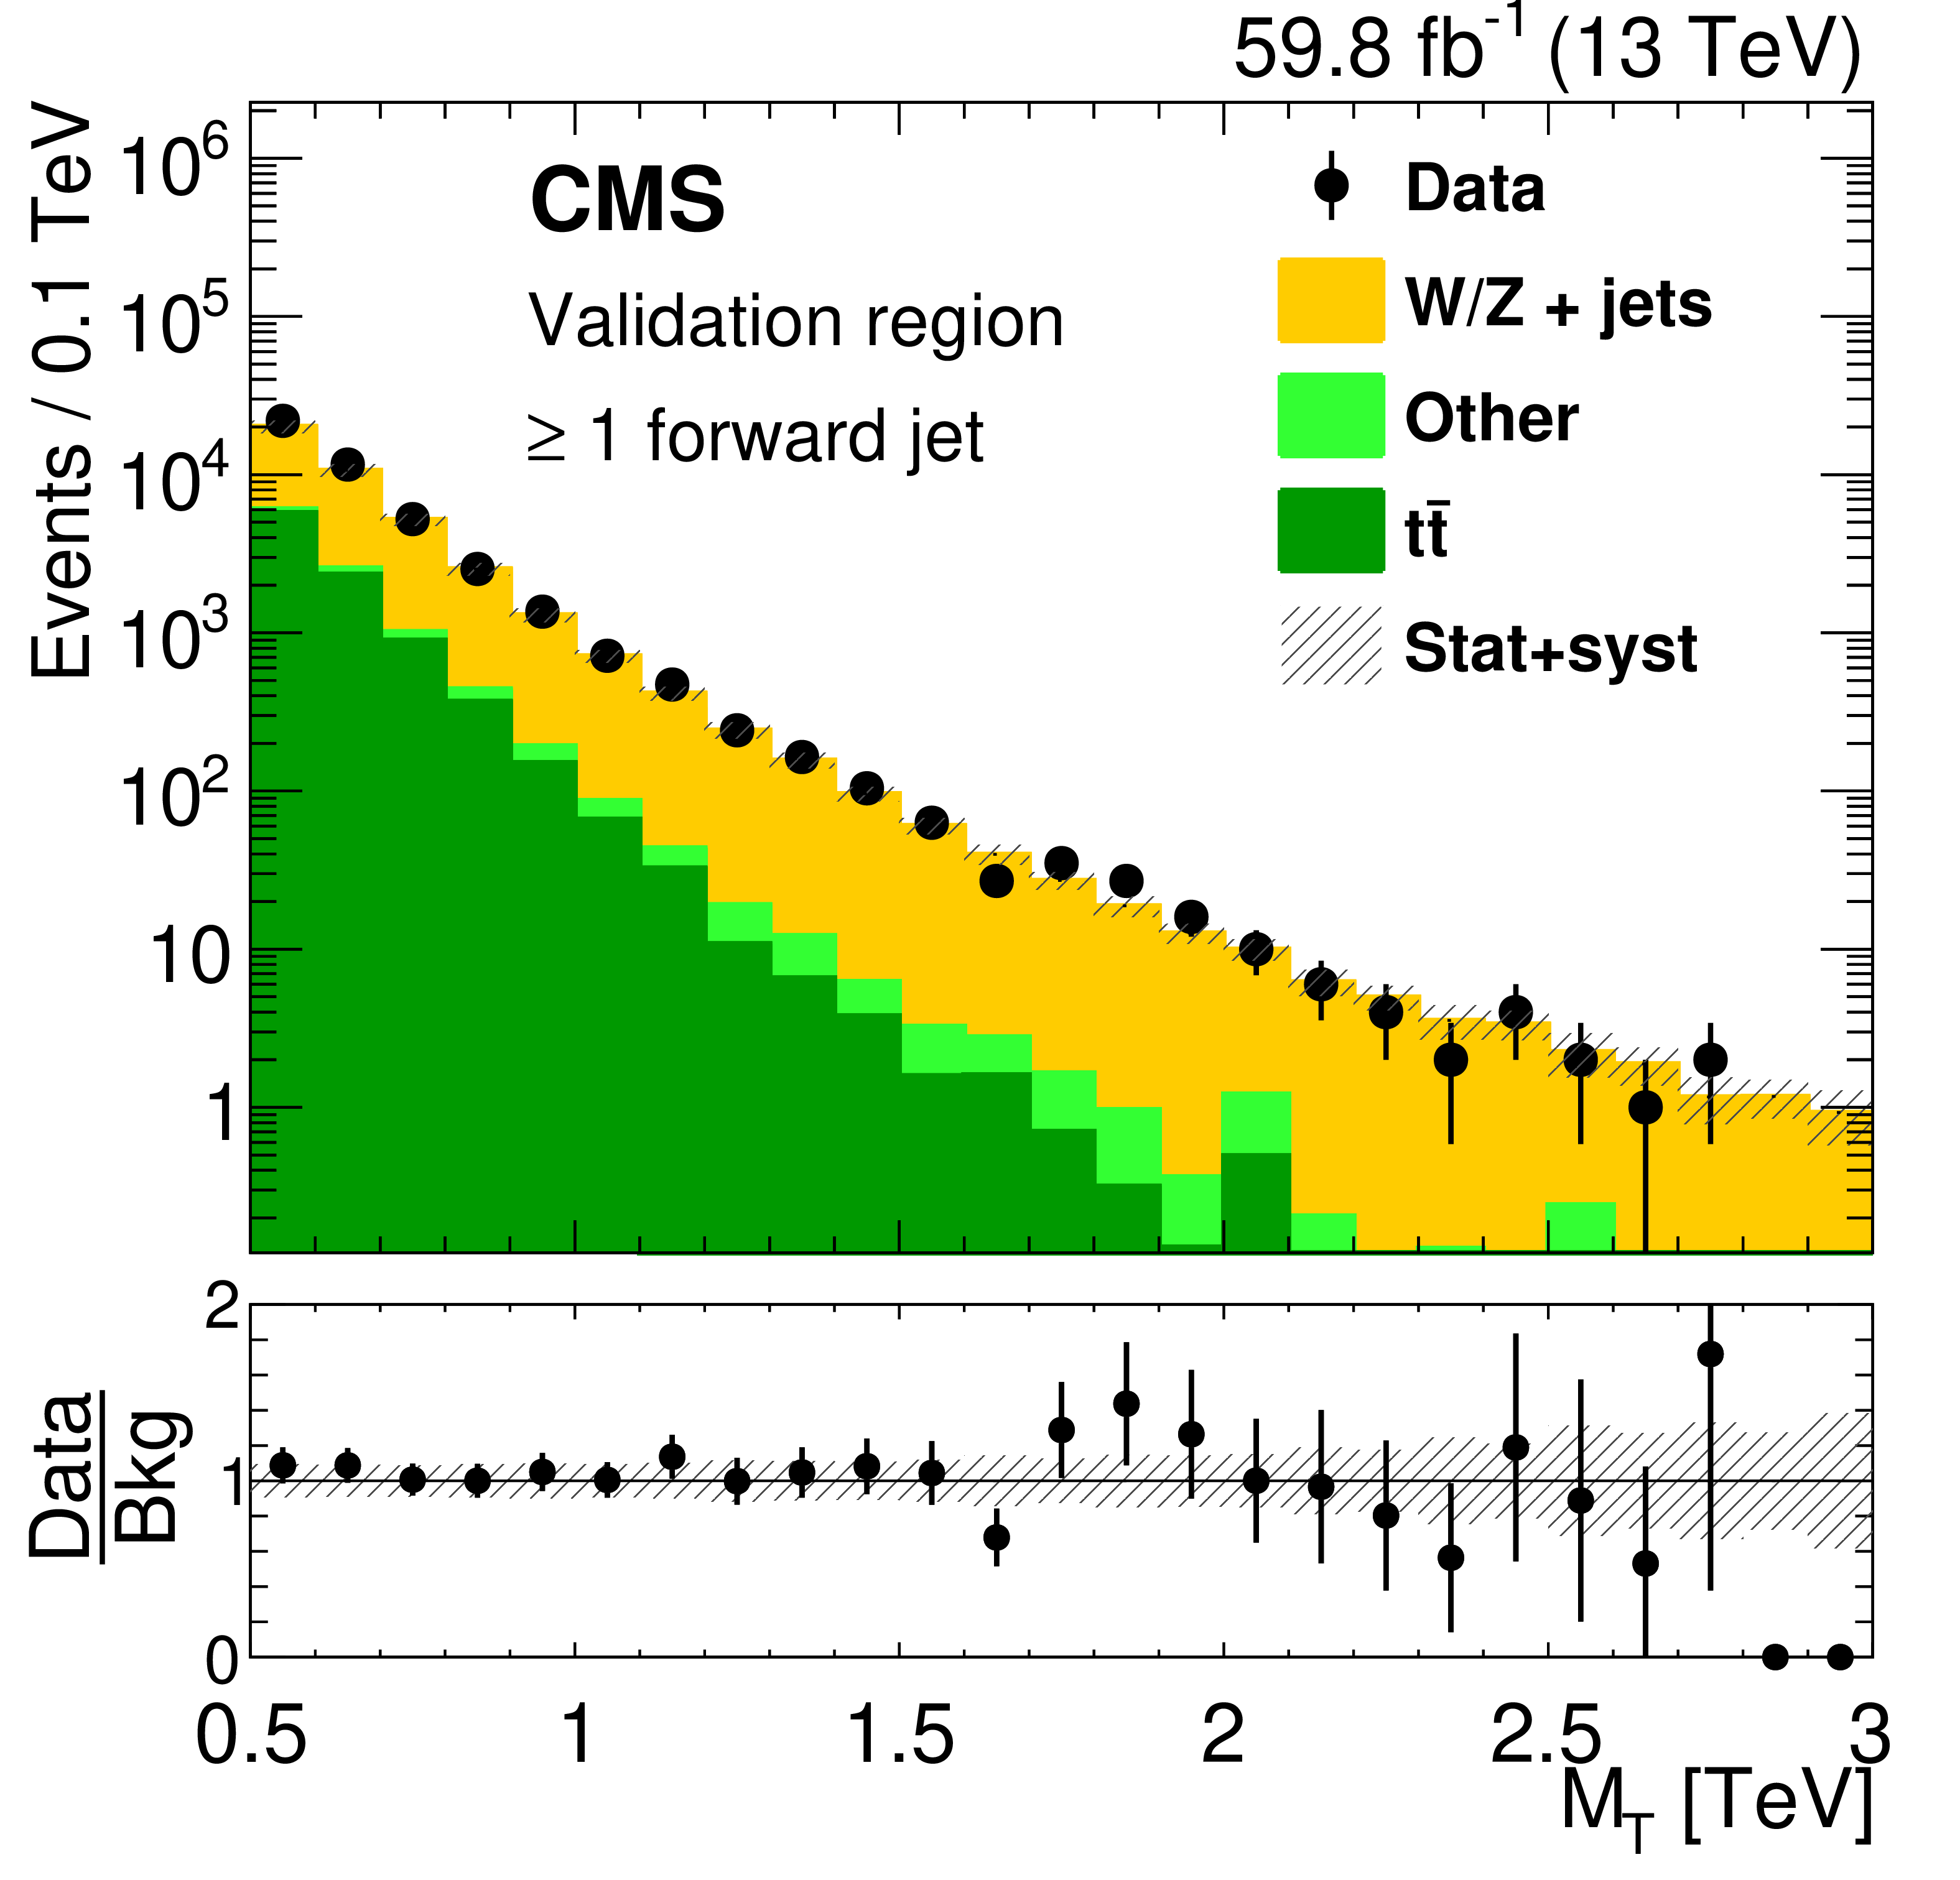
Distributions of the transverse mass ${M_{{\mathrm {T}}}}$ of the reconstructed top quark and ${\vec{p}}_{\mathrm {T}}^{\,\text {miss}}$ system, for events in validation samples selected as in the merged categories, but with the AK8 jet SD mass outside the interval 105-220 GeV, for events with no forward jet (left) and at least one forward jet (right), and for 2016 (upper), 2017 (central), and 2018 (lower). The overflow is included in the last bin. The predictions of the main background components have been determined in simulation with scale factors applied to match data extracted from control regions. The uncertainties after the fit to data in the validation regions are shown. |
png pdf |
Figure 3-a:
Distributions of the transverse mass ${M_{{\mathrm {T}}}}$ of the reconstructed top quark and ${\vec{p}}_{\mathrm {T}}^{\,\text {miss}}$ system, for events in validation samples selected as in the merged categories, but with the AK8 jet SD mass outside the interval 105-220 GeV, for events with no forward jet (left) and at least one forward jet (right), and for 2016 (upper), 2017 (central), and 2018 (lower). The overflow is included in the last bin. The predictions of the main background components have been determined in simulation with scale factors applied to match data extracted from control regions. The uncertainties after the fit to data in the validation regions are shown. |
png pdf |
Figure 3-b:
Distributions of the transverse mass ${M_{{\mathrm {T}}}}$ of the reconstructed top quark and ${\vec{p}}_{\mathrm {T}}^{\,\text {miss}}$ system, for events in validation samples selected as in the merged categories, but with the AK8 jet SD mass outside the interval 105-220 GeV, for events with no forward jet (left) and at least one forward jet (right), and for 2016 (upper), 2017 (central), and 2018 (lower). The overflow is included in the last bin. The predictions of the main background components have been determined in simulation with scale factors applied to match data extracted from control regions. The uncertainties after the fit to data in the validation regions are shown. |
png pdf |
Figure 3-c:
Distributions of the transverse mass ${M_{{\mathrm {T}}}}$ of the reconstructed top quark and ${\vec{p}}_{\mathrm {T}}^{\,\text {miss}}$ system, for events in validation samples selected as in the merged categories, but with the AK8 jet SD mass outside the interval 105-220 GeV, for events with no forward jet (left) and at least one forward jet (right), and for 2016 (upper), 2017 (central), and 2018 (lower). The overflow is included in the last bin. The predictions of the main background components have been determined in simulation with scale factors applied to match data extracted from control regions. The uncertainties after the fit to data in the validation regions are shown. |
png pdf |
Figure 3-d:
Distributions of the transverse mass ${M_{{\mathrm {T}}}}$ of the reconstructed top quark and ${\vec{p}}_{\mathrm {T}}^{\,\text {miss}}$ system, for events in validation samples selected as in the merged categories, but with the AK8 jet SD mass outside the interval 105-220 GeV, for events with no forward jet (left) and at least one forward jet (right), and for 2016 (upper), 2017 (central), and 2018 (lower). The overflow is included in the last bin. The predictions of the main background components have been determined in simulation with scale factors applied to match data extracted from control regions. The uncertainties after the fit to data in the validation regions are shown. |
png pdf |
Figure 3-e:
Distributions of the transverse mass ${M_{{\mathrm {T}}}}$ of the reconstructed top quark and ${\vec{p}}_{\mathrm {T}}^{\,\text {miss}}$ system, for events in validation samples selected as in the merged categories, but with the AK8 jet SD mass outside the interval 105-220 GeV, for events with no forward jet (left) and at least one forward jet (right), and for 2016 (upper), 2017 (central), and 2018 (lower). The overflow is included in the last bin. The predictions of the main background components have been determined in simulation with scale factors applied to match data extracted from control regions. The uncertainties after the fit to data in the validation regions are shown. |
png pdf |
Figure 3-f:
Distributions of the transverse mass ${M_{{\mathrm {T}}}}$ of the reconstructed top quark and ${\vec{p}}_{\mathrm {T}}^{\,\text {miss}}$ system, for events in validation samples selected as in the merged categories, but with the AK8 jet SD mass outside the interval 105-220 GeV, for events with no forward jet (left) and at least one forward jet (right), and for 2016 (upper), 2017 (central), and 2018 (lower). The overflow is included in the last bin. The predictions of the main background components have been determined in simulation with scale factors applied to match data extracted from control regions. The uncertainties after the fit to data in the validation regions are shown. |

png pdf |
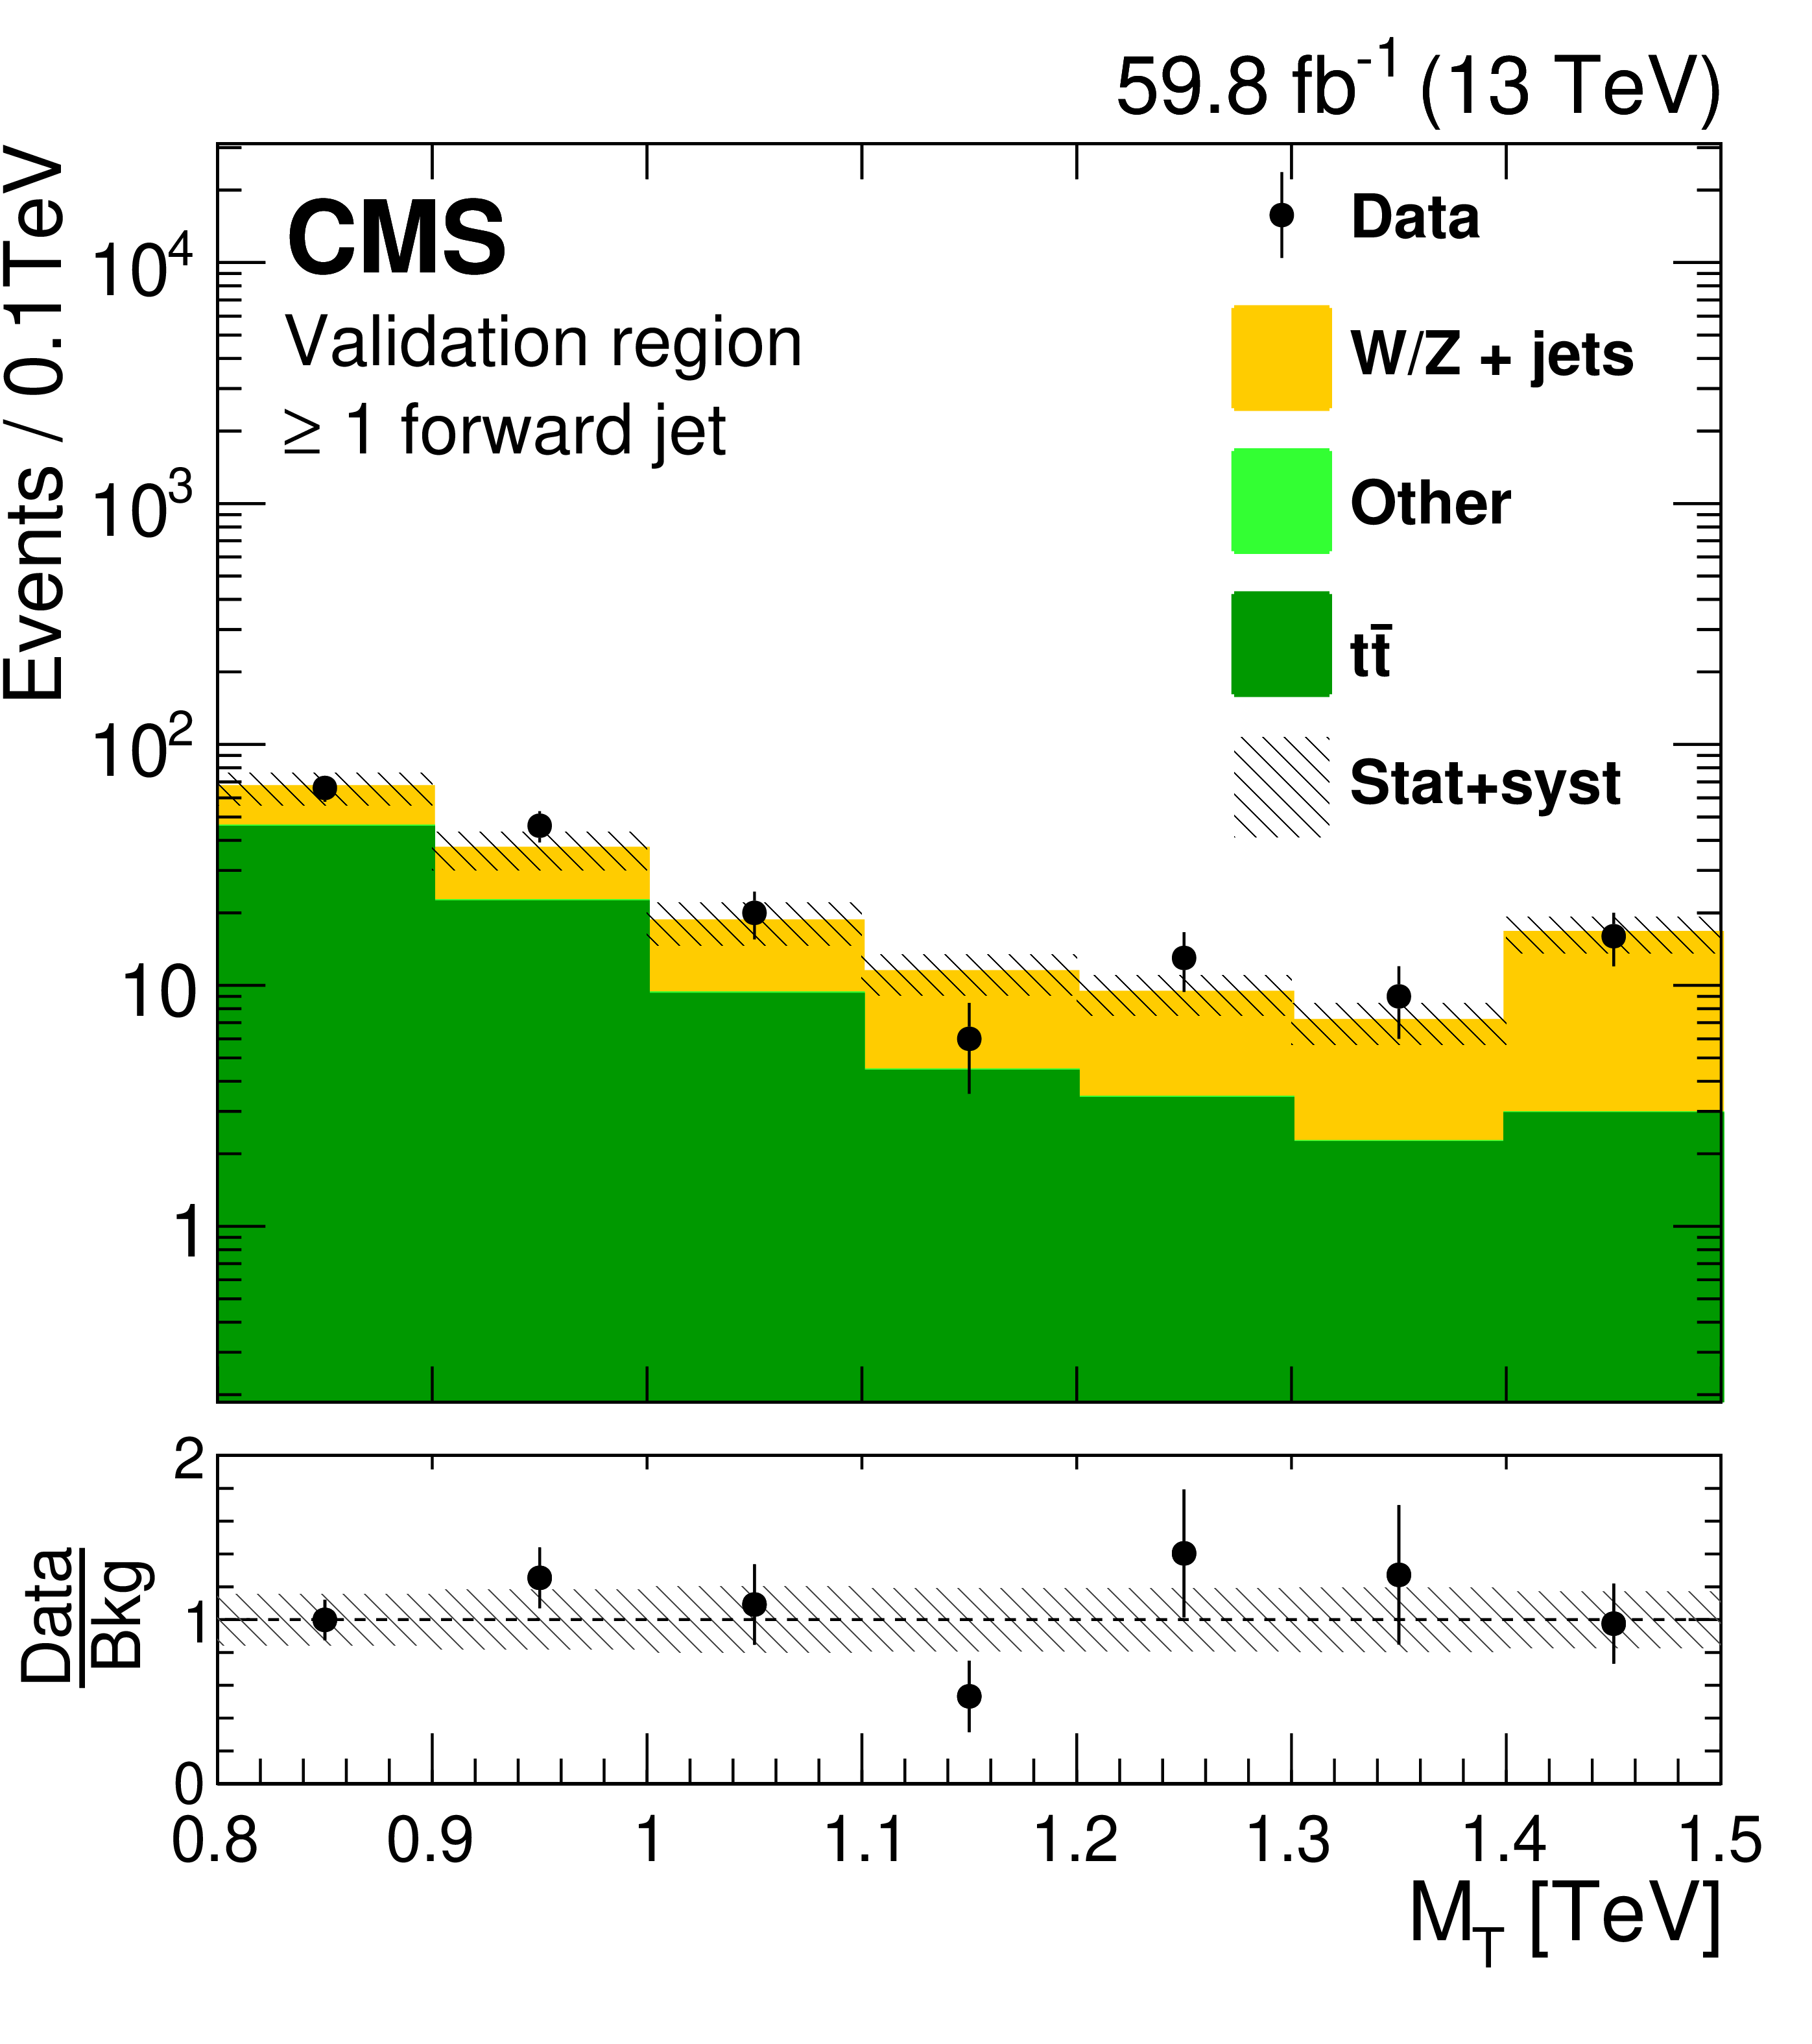
Figure 4:
Distributions of the transverse mass ${M_{{\mathrm {T}}}}$ of the reconstructed top quark and ${\vec{p}}_{\mathrm {T}}^{\,\text {miss}}$ system, for events in validation samples selected as in the resolved categories, but without the requirement of at least one b jet in the event, for events with no forward jet (left) and at least one forward jet (right), and for 2016 (upper), 2017 (central), and 2018 (lower). The predictions of the main background components have been determined in simulation with scale factors applied to match data extracted from control regions. The uncertainties before the fit to data in the validation regions are shown. |
png pdf |
Figure 4-a:
Distributions of the transverse mass ${M_{{\mathrm {T}}}}$ of the reconstructed top quark and ${\vec{p}}_{\mathrm {T}}^{\,\text {miss}}$ system, for events in validation samples selected as in the resolved categories, but without the requirement of at least one b jet in the event, for events with no forward jet (left) and at least one forward jet (right), and for 2016 (upper), 2017 (central), and 2018 (lower). The predictions of the main background components have been determined in simulation with scale factors applied to match data extracted from control regions. The uncertainties before the fit to data in the validation regions are shown. |

png pdf |
Figure 4-b:
Distributions of the transverse mass ${M_{{\mathrm {T}}}}$ of the reconstructed top quark and ${\vec{p}}_{\mathrm {T}}^{\,\text {miss}}$ system, for events in validation samples selected as in the resolved categories, but without the requirement of at least one b jet in the event, for events with no forward jet (left) and at least one forward jet (right), and for 2016 (upper), 2017 (central), and 2018 (lower). The predictions of the main background components have been determined in simulation with scale factors applied to match data extracted from control regions. The uncertainties before the fit to data in the validation regions are shown. |
png pdf |
Figure 4-c:
Distributions of the transverse mass ${M_{{\mathrm {T}}}}$ of the reconstructed top quark and ${\vec{p}}_{\mathrm {T}}^{\,\text {miss}}$ system, for events in validation samples selected as in the resolved categories, but without the requirement of at least one b jet in the event, for events with no forward jet (left) and at least one forward jet (right), and for 2016 (upper), 2017 (central), and 2018 (lower). The predictions of the main background components have been determined in simulation with scale factors applied to match data extracted from control regions. The uncertainties before the fit to data in the validation regions are shown. |
png pdf |
Figure 4-d:
Distributions of the transverse mass ${M_{{\mathrm {T}}}}$ of the reconstructed top quark and ${\vec{p}}_{\mathrm {T}}^{\,\text {miss}}$ system, for events in validation samples selected as in the resolved categories, but without the requirement of at least one b jet in the event, for events with no forward jet (left) and at least one forward jet (right), and for 2016 (upper), 2017 (central), and 2018 (lower). The predictions of the main background components have been determined in simulation with scale factors applied to match data extracted from control regions. The uncertainties before the fit to data in the validation regions are shown. |
png pdf |
Figure 4-e:
Distributions of the transverse mass ${M_{{\mathrm {T}}}}$ of the reconstructed top quark and ${\vec{p}}_{\mathrm {T}}^{\,\text {miss}}$ system, for events in validation samples selected as in the resolved categories, but without the requirement of at least one b jet in the event, for events with no forward jet (left) and at least one forward jet (right), and for 2016 (upper), 2017 (central), and 2018 (lower). The predictions of the main background components have been determined in simulation with scale factors applied to match data extracted from control regions. The uncertainties before the fit to data in the validation regions are shown. |
png pdf |
Figure 4-f:
Distributions of the transverse mass ${M_{{\mathrm {T}}}}$ of the reconstructed top quark and ${\vec{p}}_{\mathrm {T}}^{\,\text {miss}}$ system, for events in validation samples selected as in the resolved categories, but without the requirement of at least one b jet in the event, for events with no forward jet (left) and at least one forward jet (right), and for 2016 (upper), 2017 (central), and 2018 (lower). The predictions of the main background components have been determined in simulation with scale factors applied to match data extracted from control regions. The uncertainties before the fit to data in the validation regions are shown. |
png pdf |
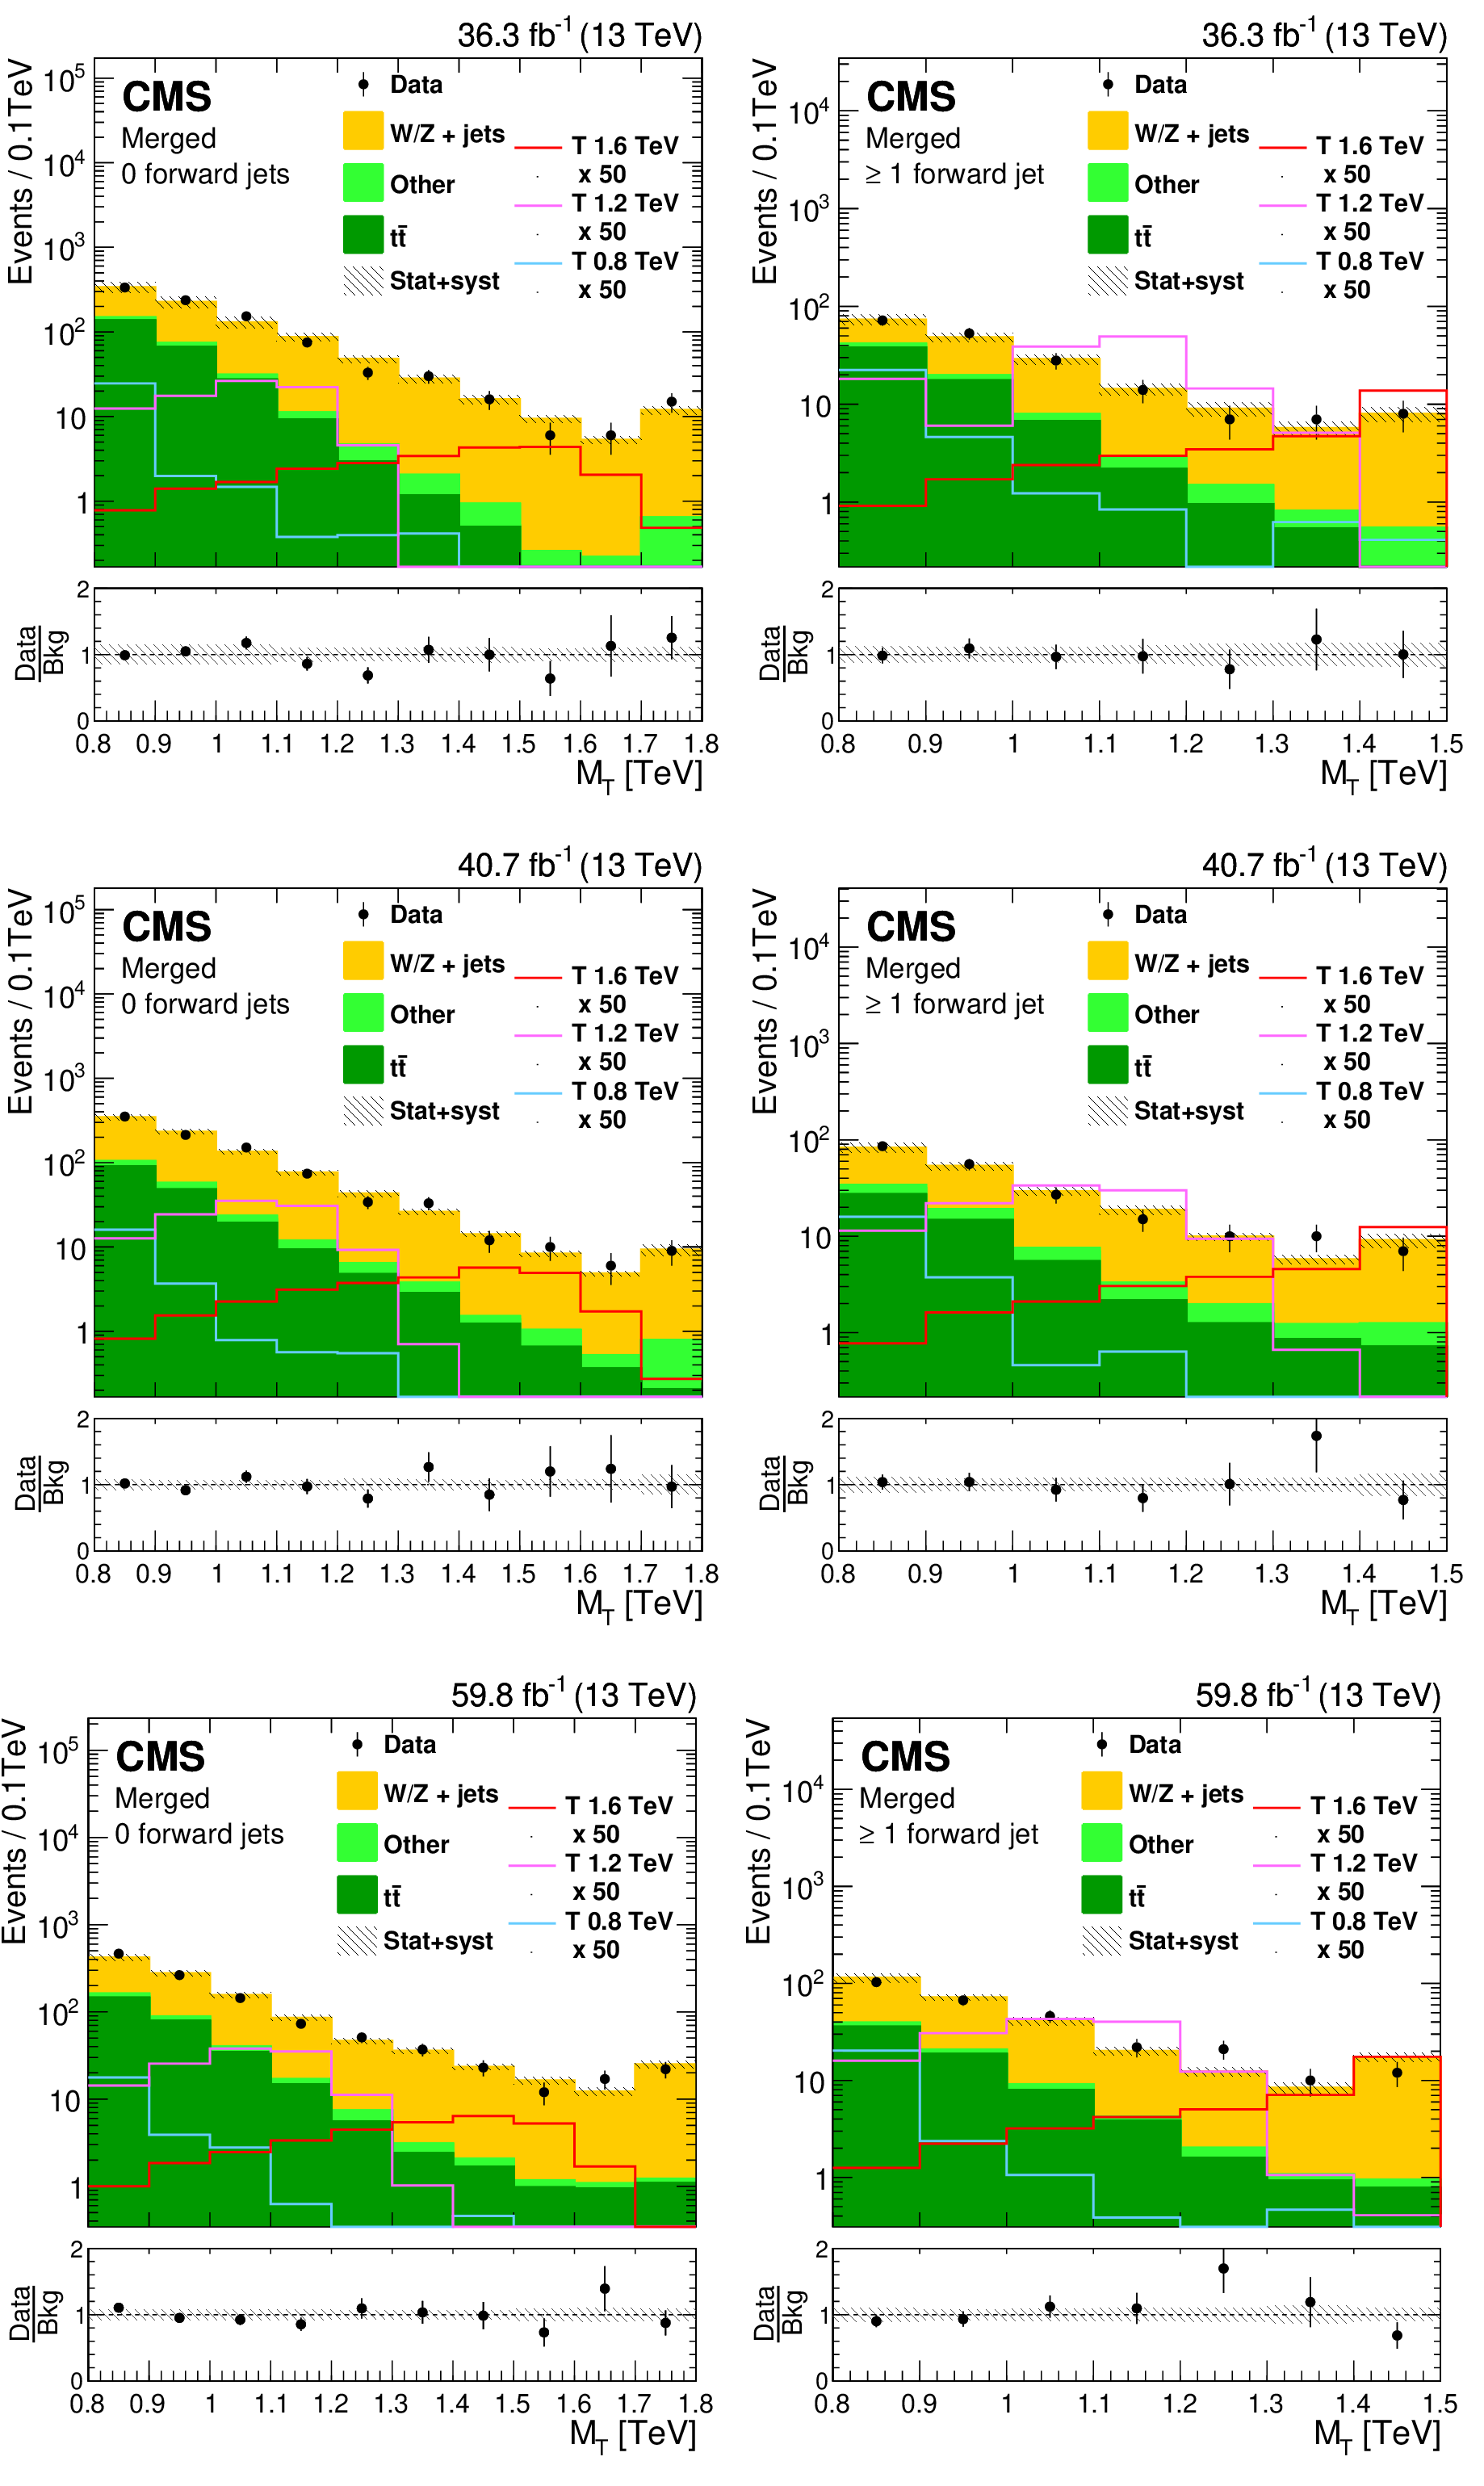
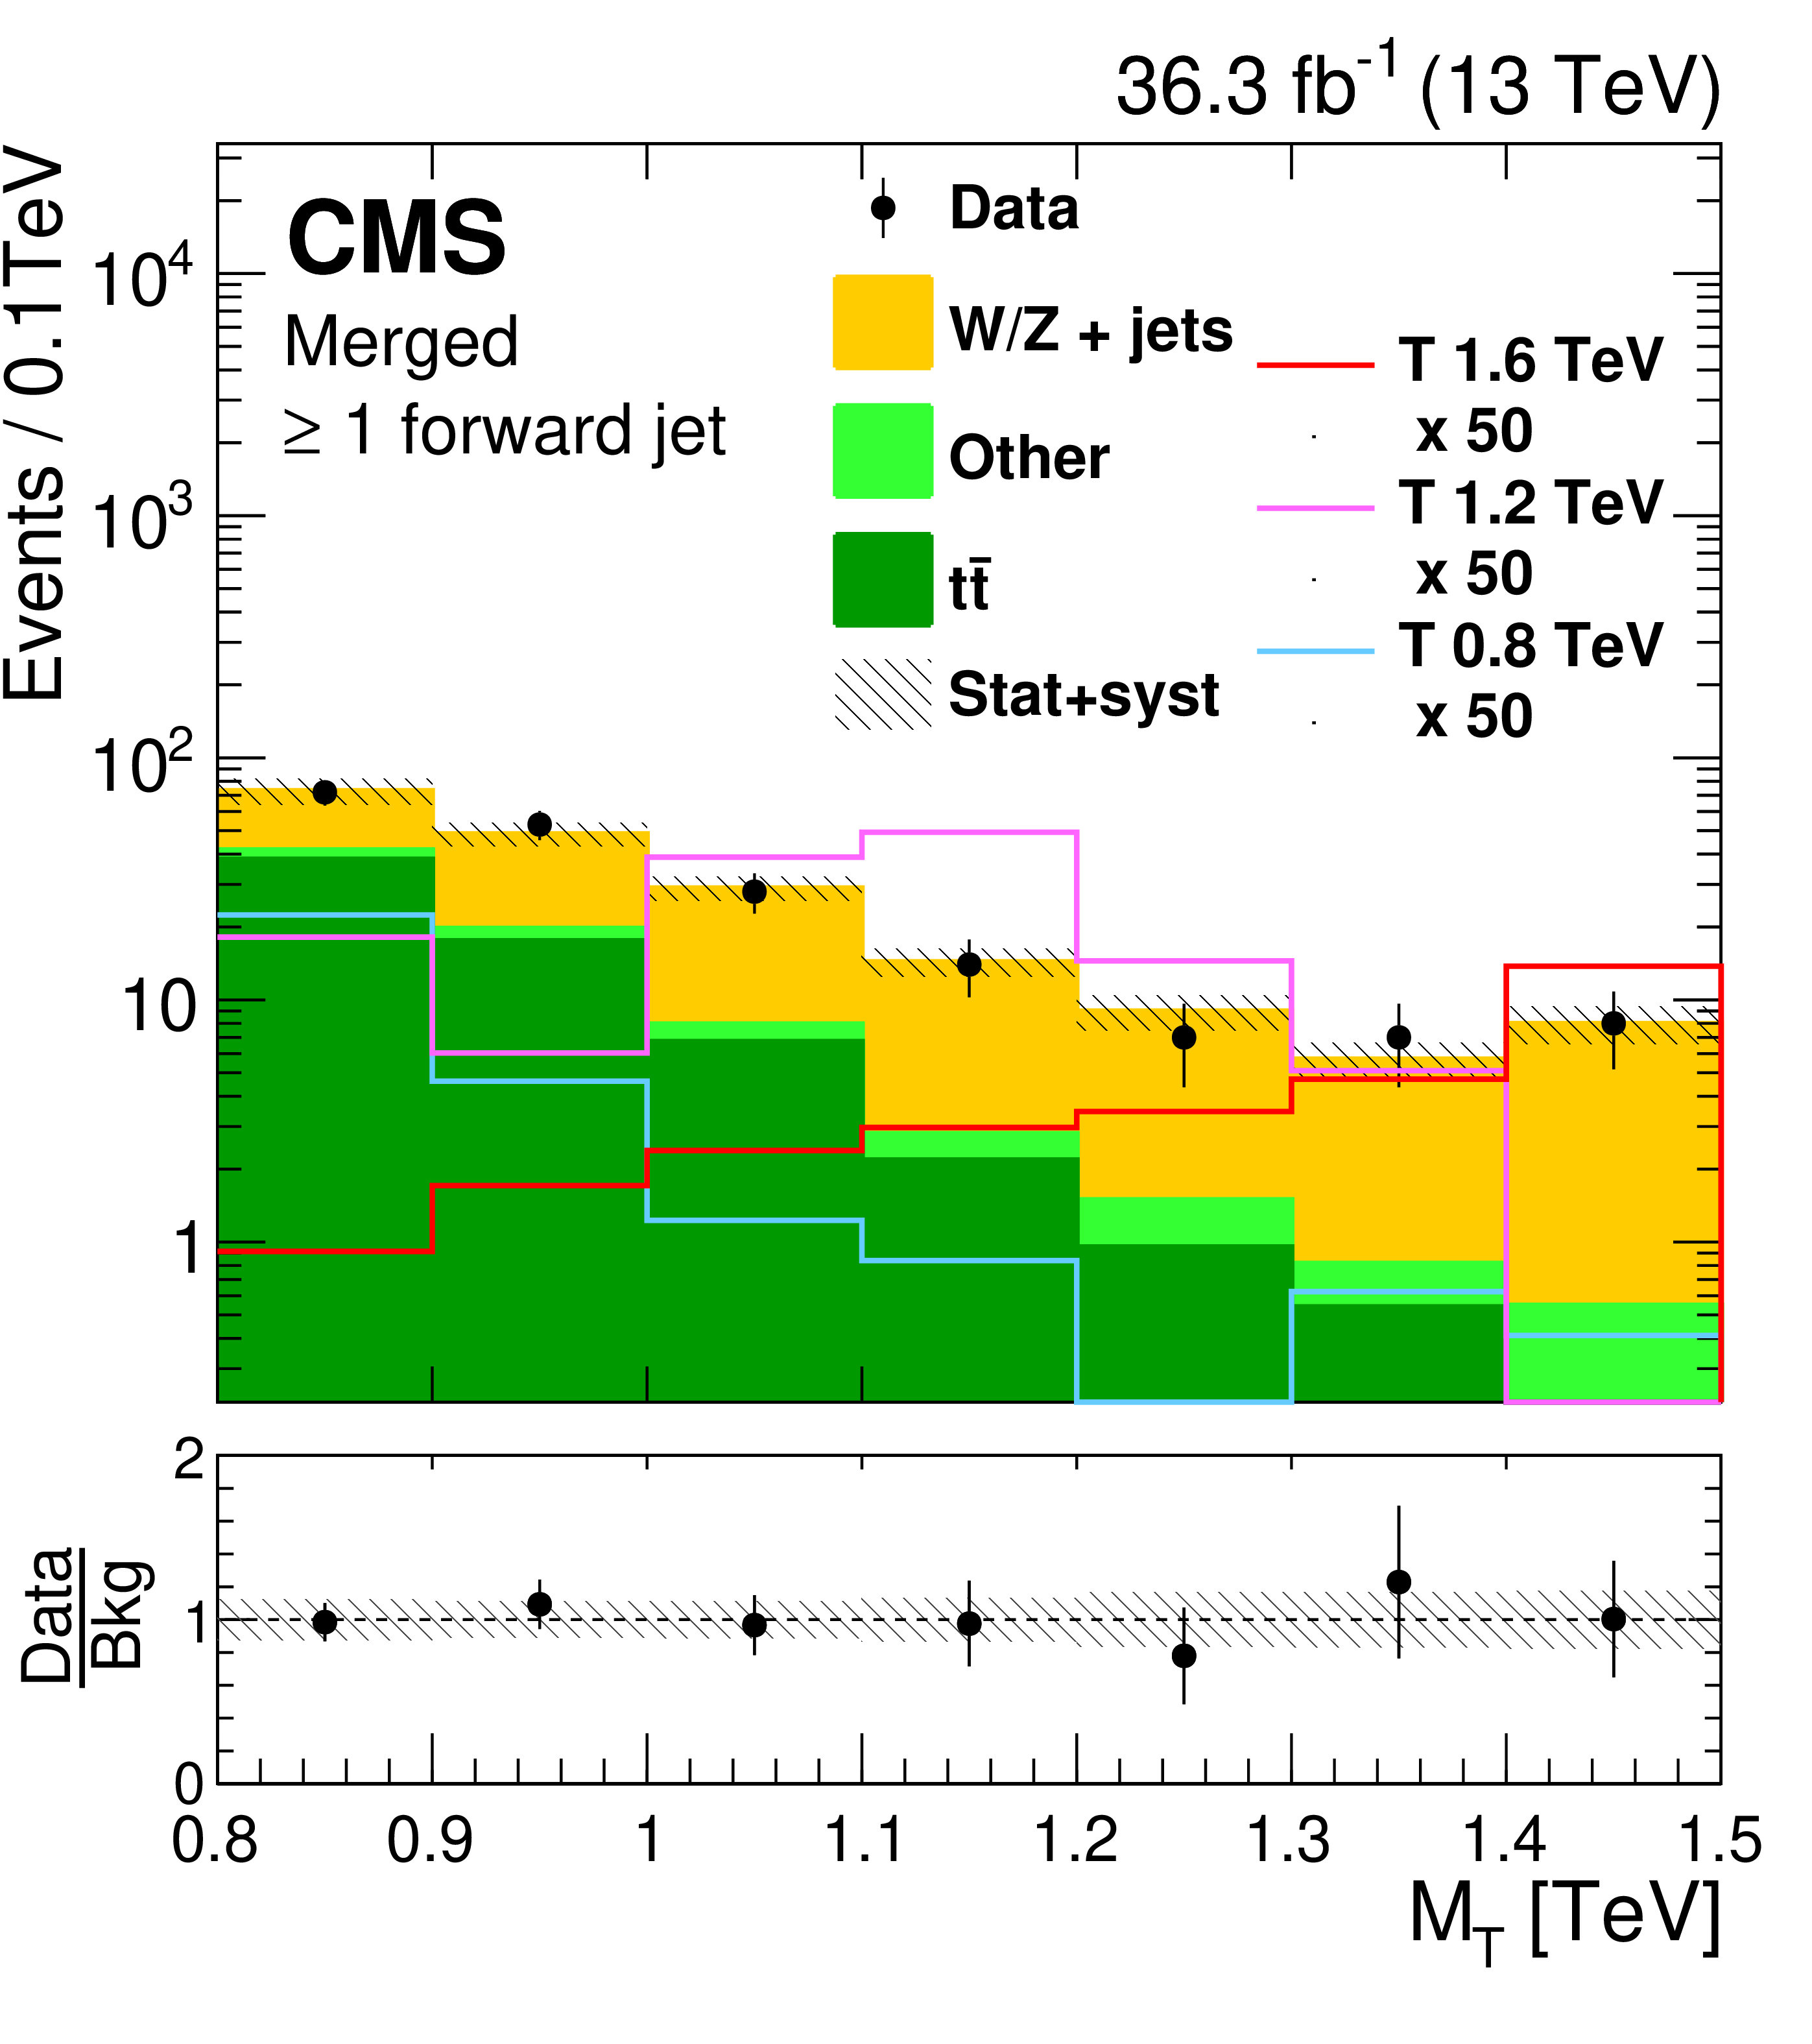
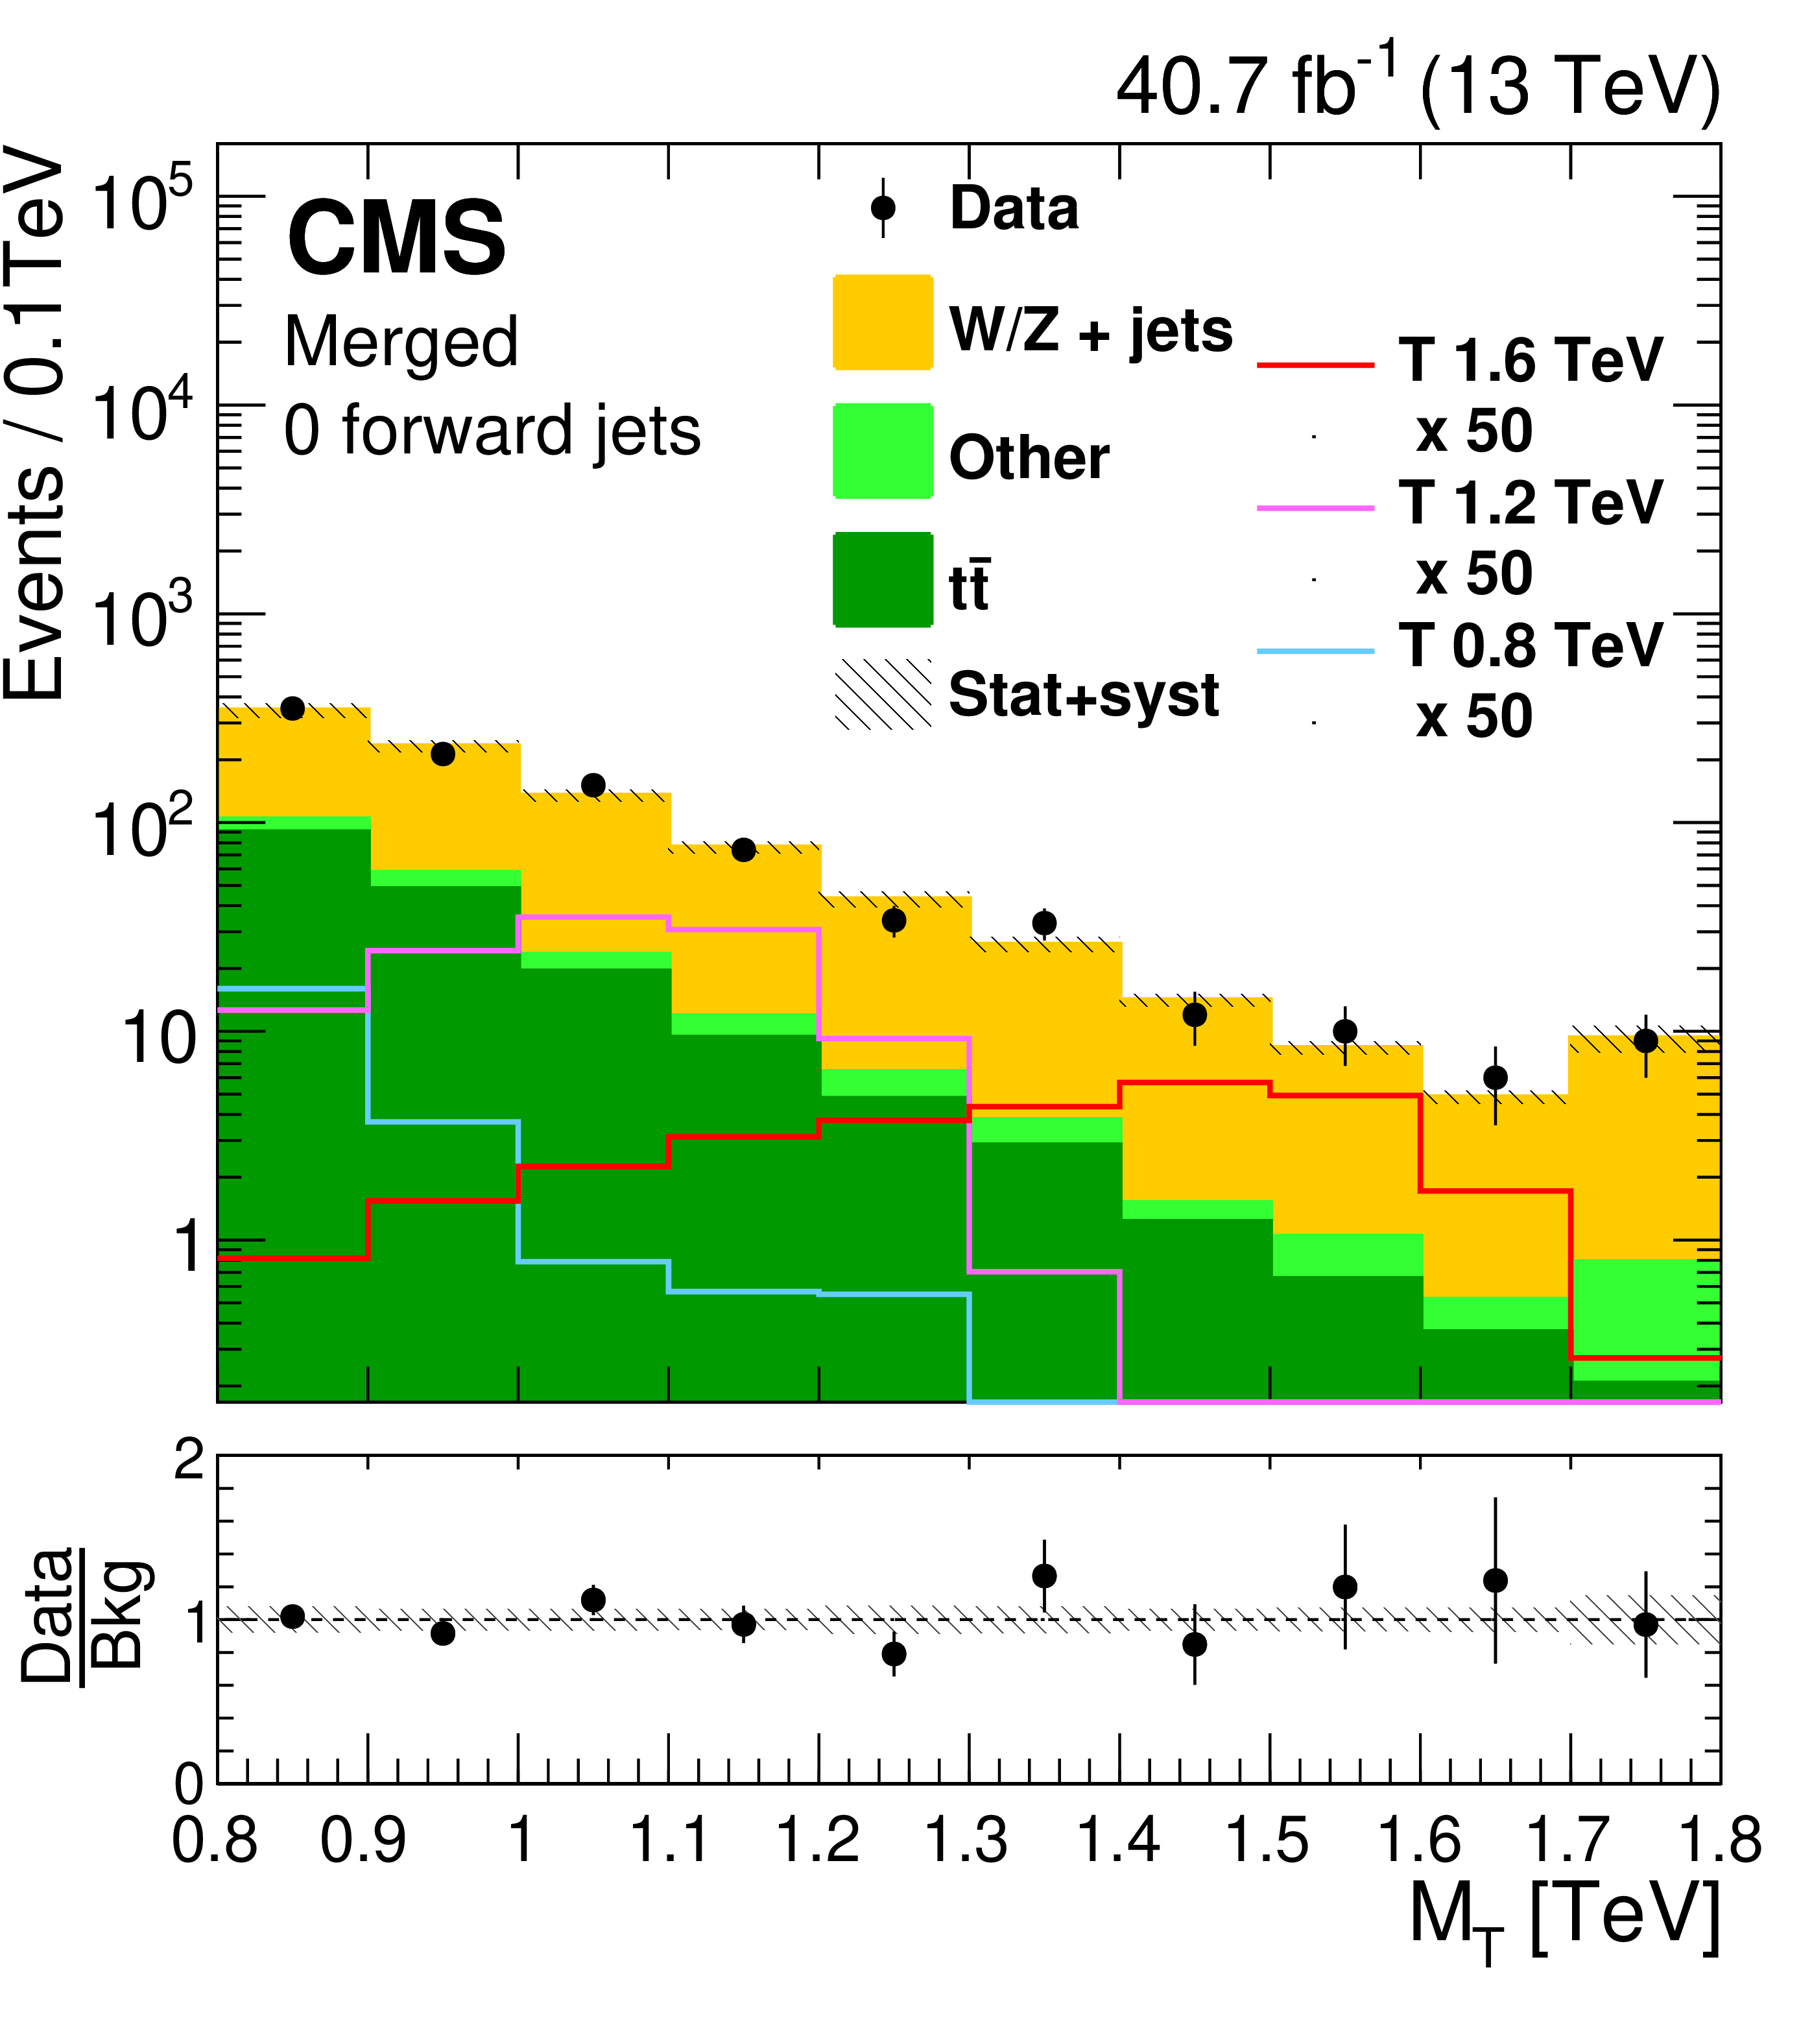
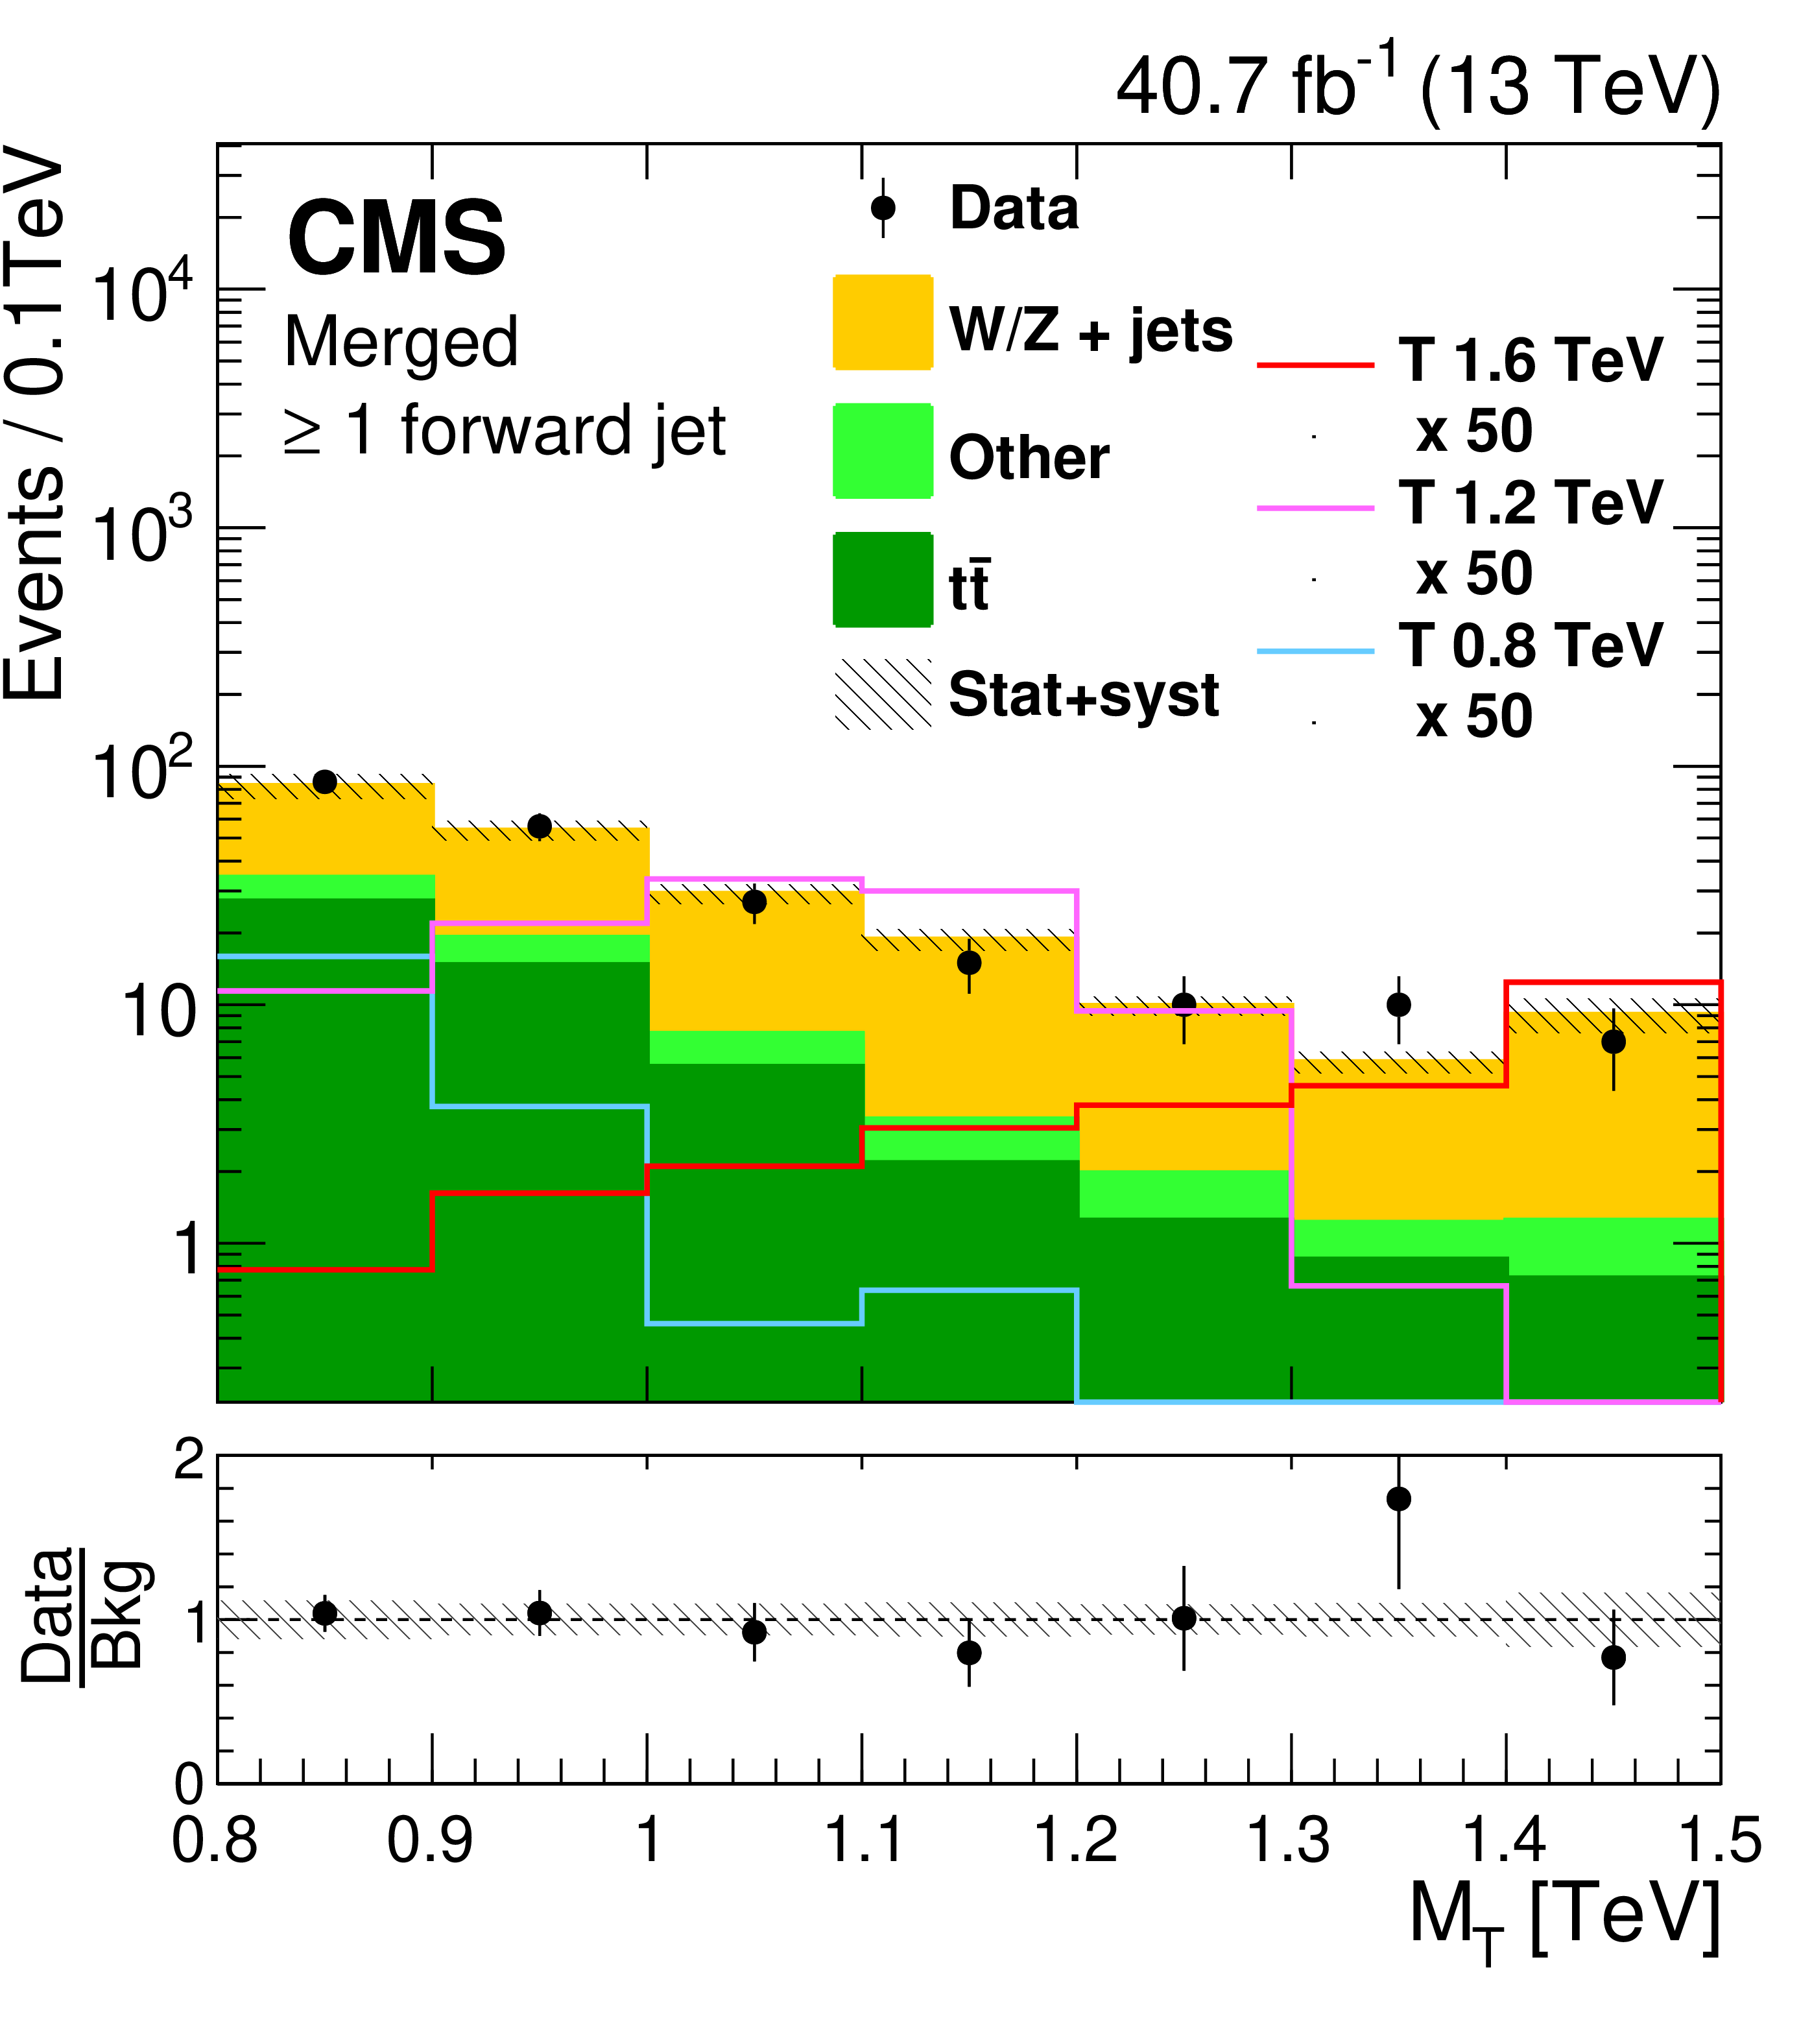
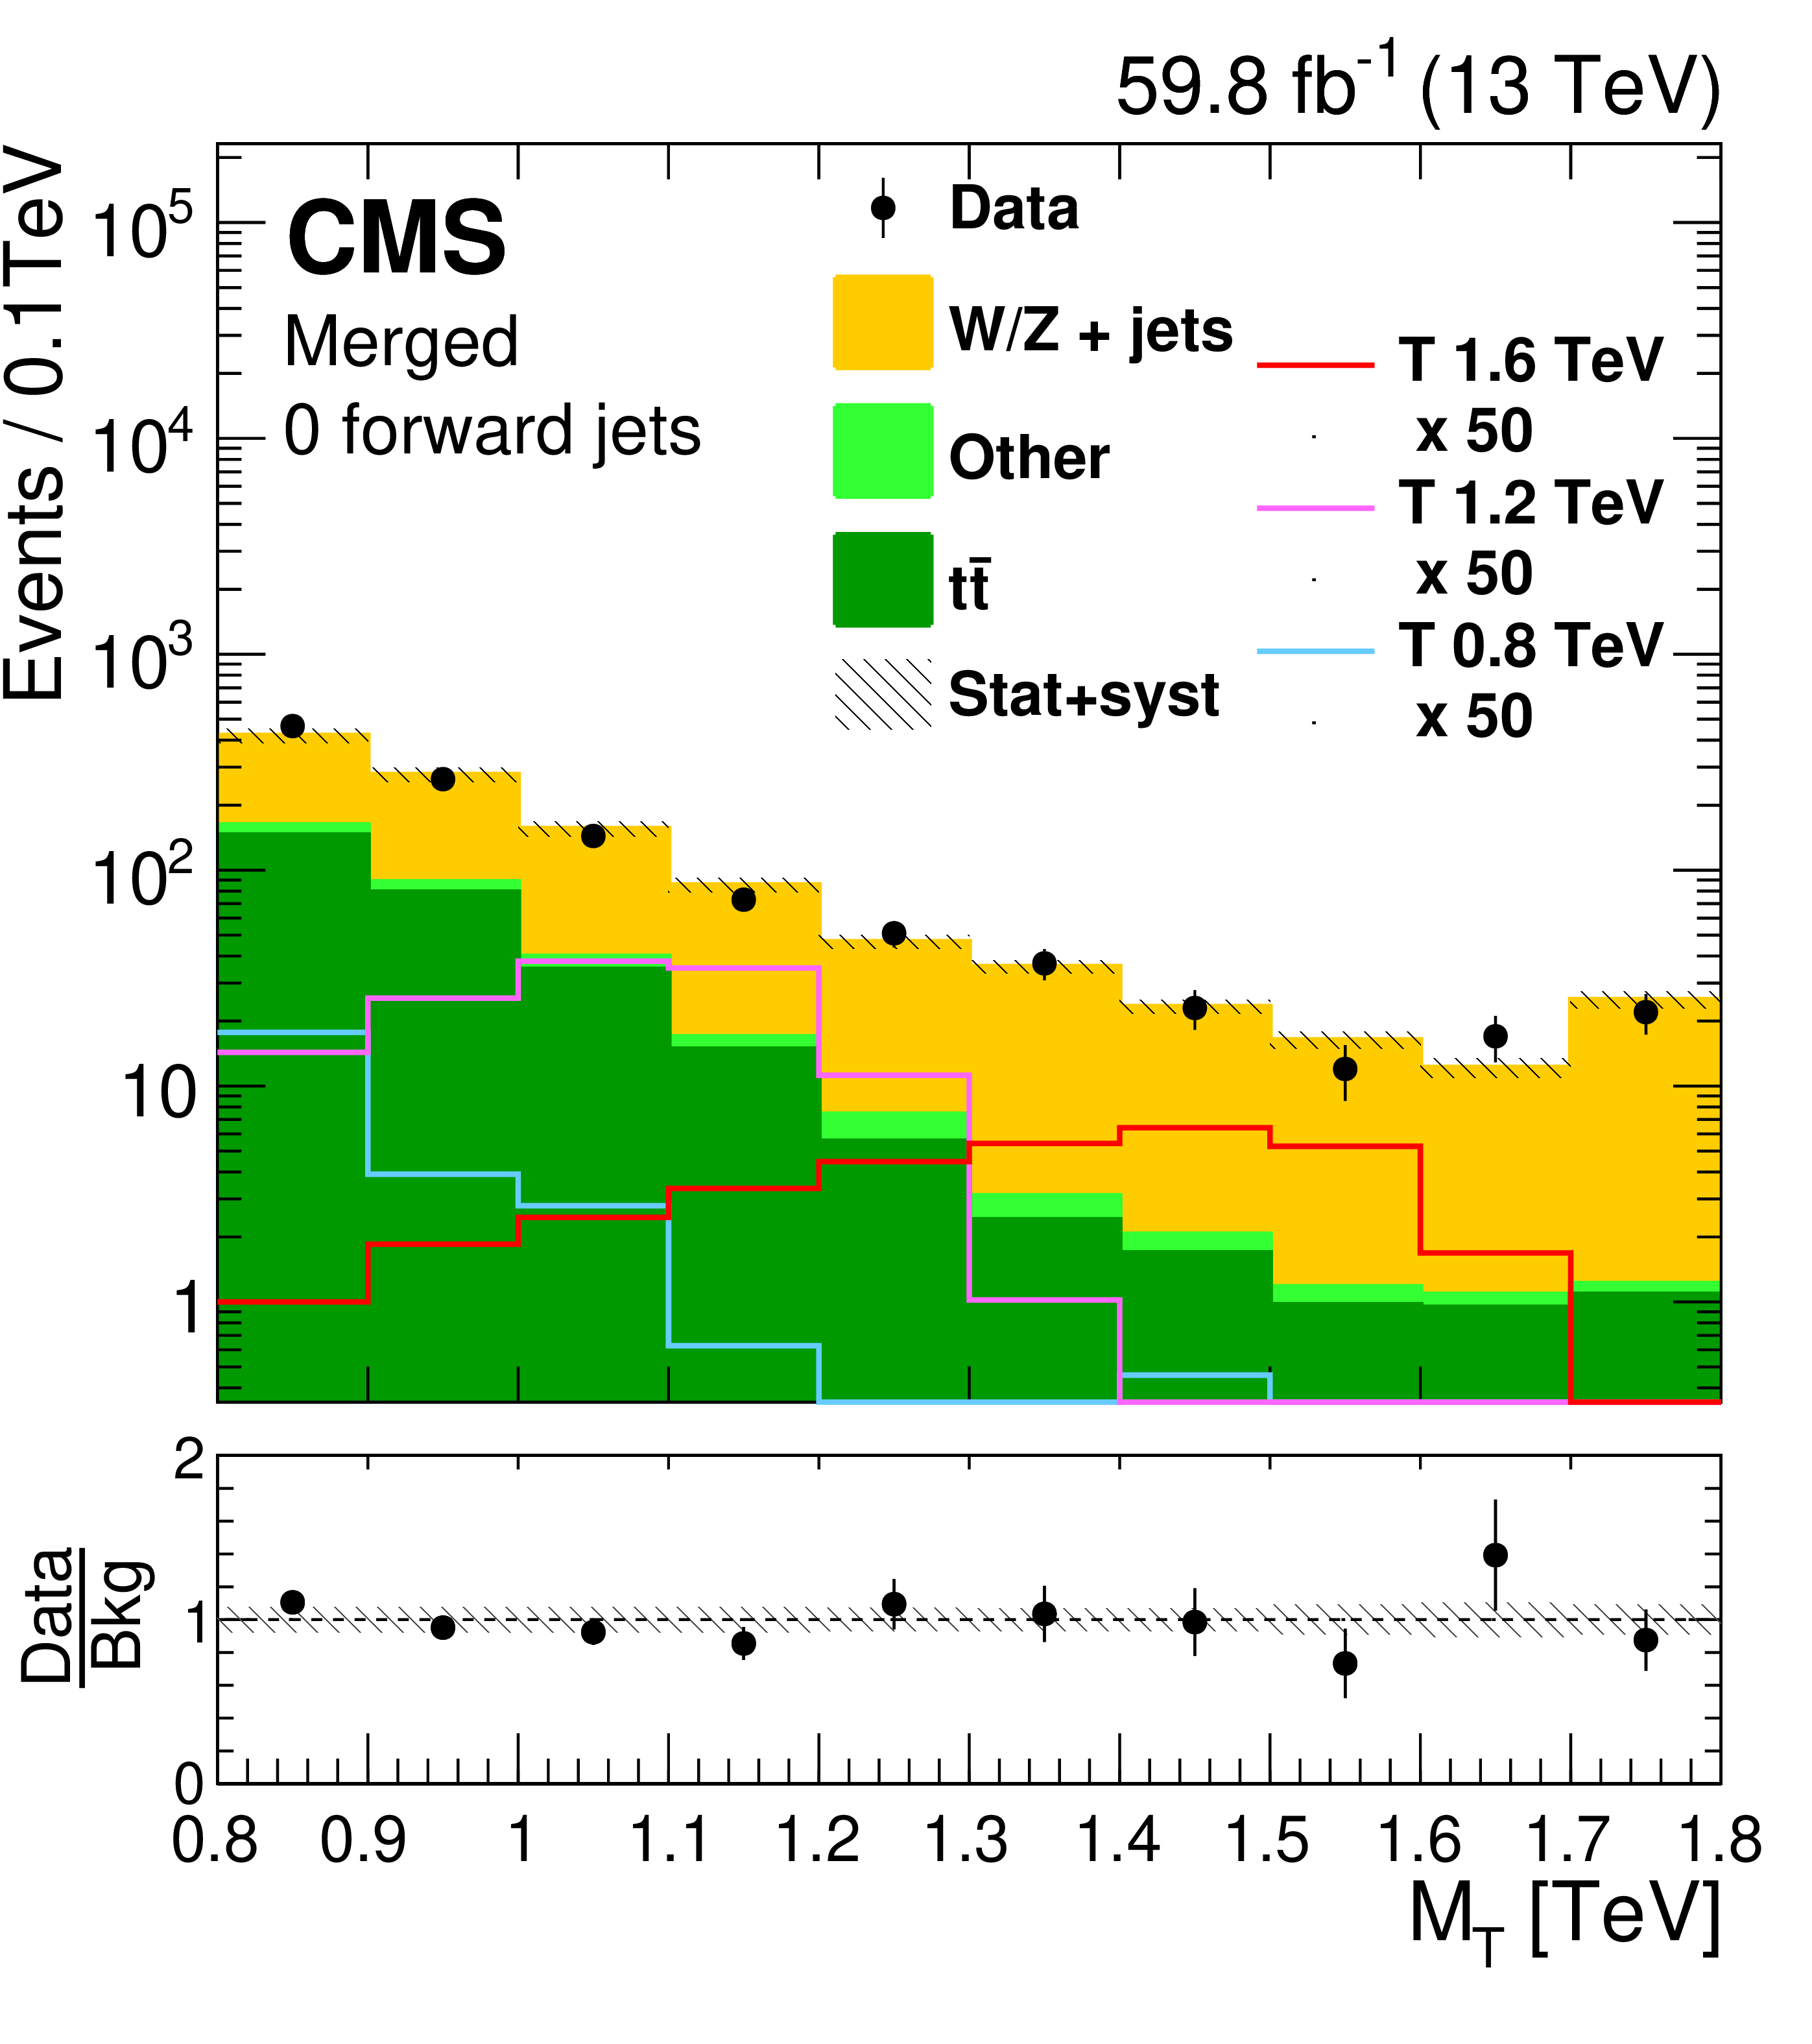
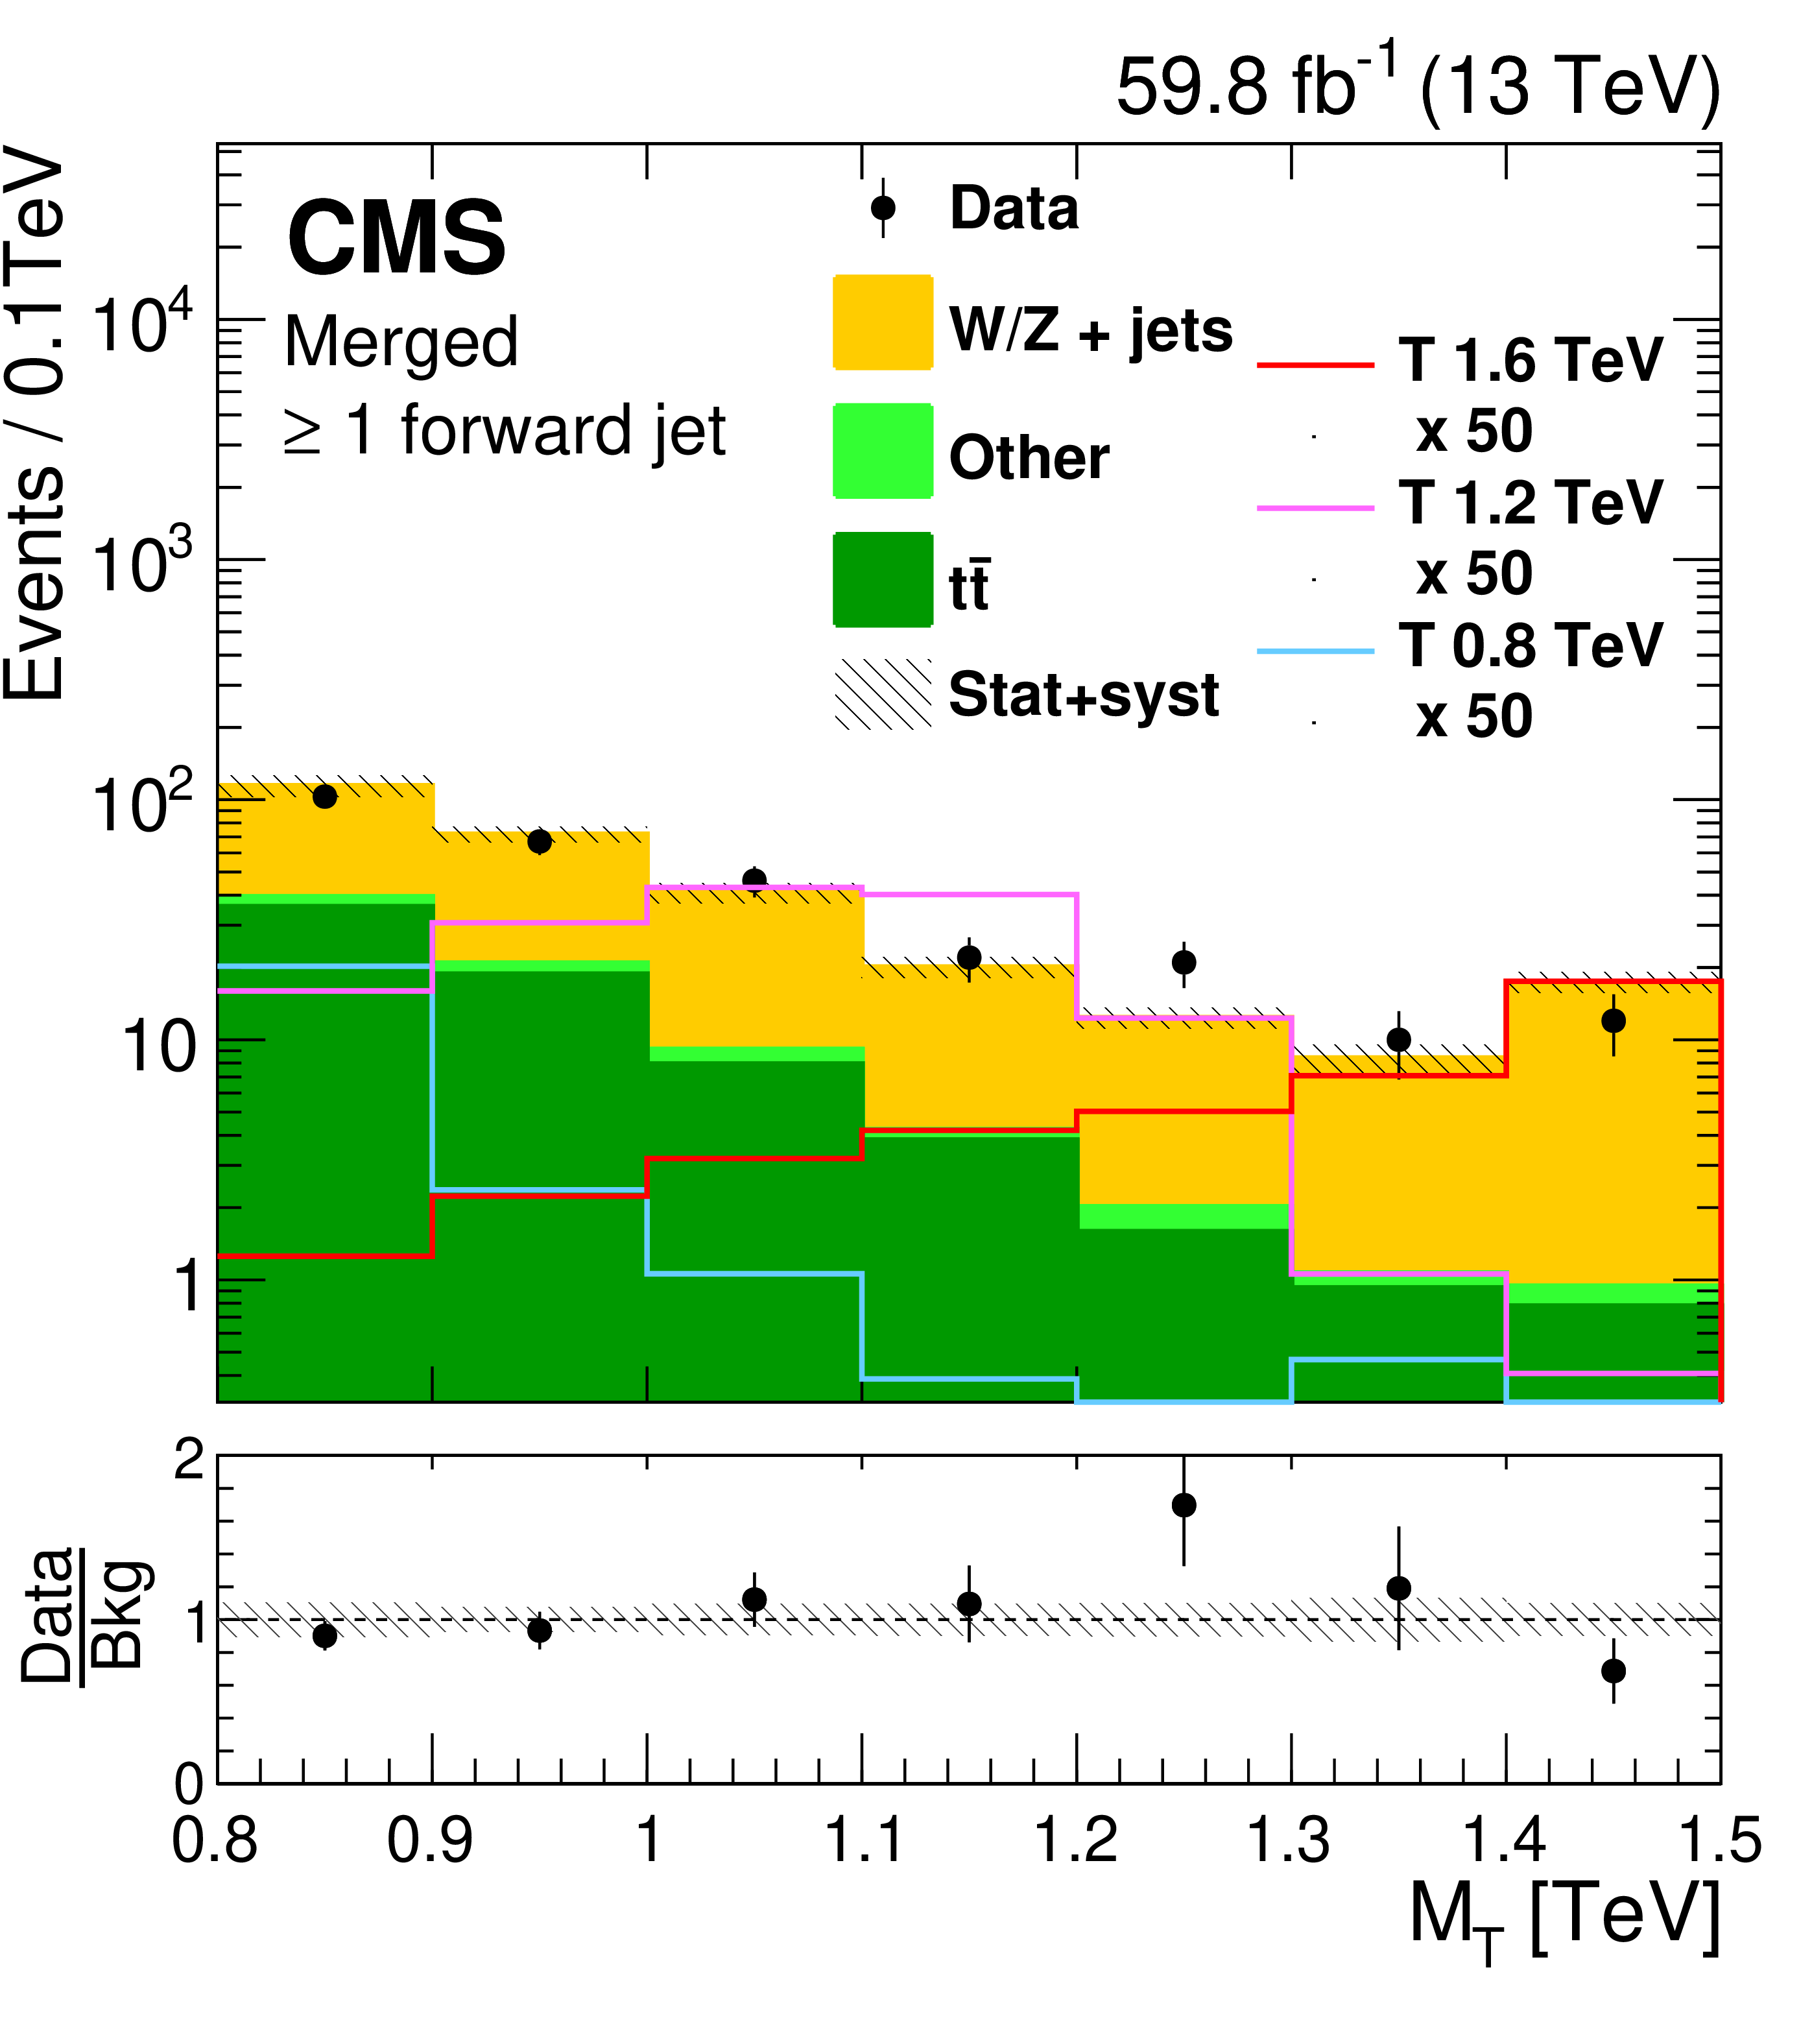
Figure 5:
Distributions of the transverse mass ${M_{{\mathrm {T}}}}$ of the reconstructed top quark and ${\vec{p}}_{\mathrm {T}}^{\,\text {miss}}$ system, for the selected events in the merged categories, for events with no forward jet (left) and at least one forward jet (right), and for 2016 (upper), 2017 (central), and 2018 (lower). The overflow is included in the last bin. The distributions for the main background components have been determined in simulation with scale factors extracted from control regions. All background processes and the respective uncertainties are derived from the fit to data, while the distributions of signal processes are represented according to the expectation before the fit. The lines show the signal predictions for three benchmark mass values (0.8, 1.2, and 1.6 TeV) of a T quark of negligible resonance width. Illustrative signal yields are multiplied by a factor of 50 to improve their visibility. |
png pdf |
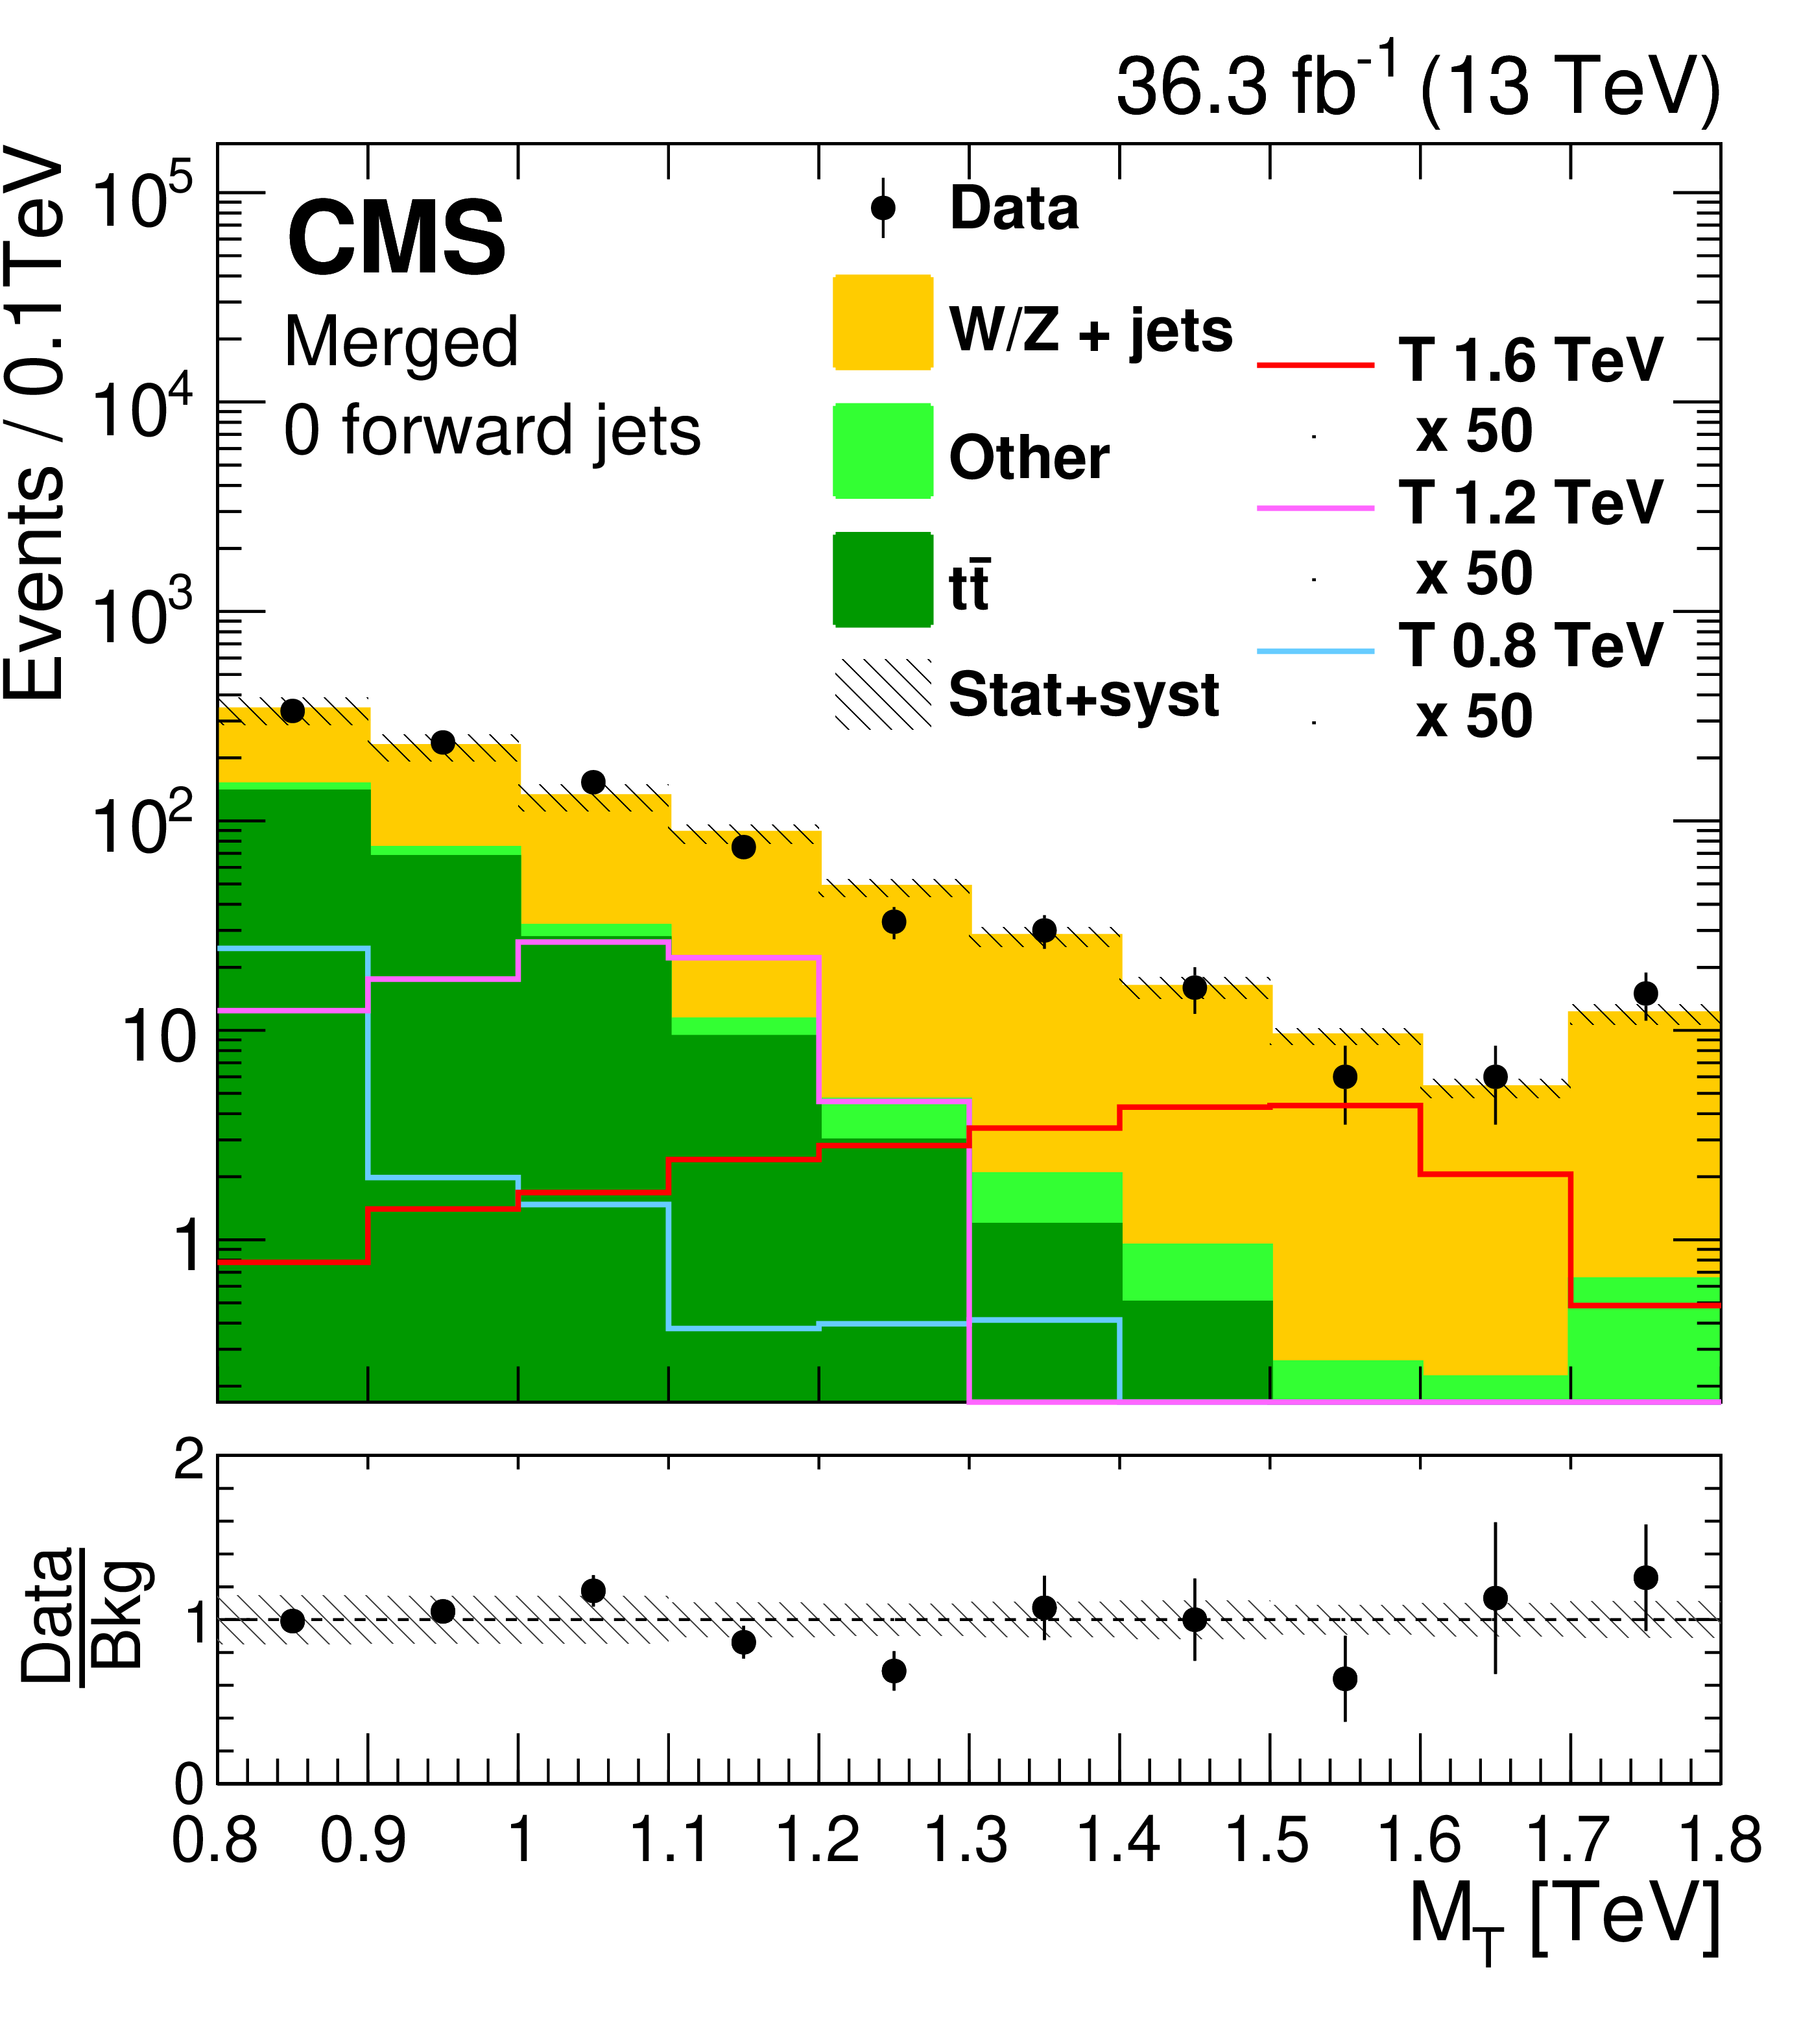
Figure 5-a:
Distributions of the transverse mass ${M_{{\mathrm {T}}}}$ of the reconstructed top quark and ${\vec{p}}_{\mathrm {T}}^{\,\text {miss}}$ system, for the selected events in the merged categories, for events with no forward jet (left) and at least one forward jet (right), and for 2016 (upper), 2017 (central), and 2018 (lower). The overflow is included in the last bin. The distributions for the main background components have been determined in simulation with scale factors extracted from control regions. All background processes and the respective uncertainties are derived from the fit to data, while the distributions of signal processes are represented according to the expectation before the fit. The lines show the signal predictions for three benchmark mass values (0.8, 1.2, and 1.6 TeV) of a T quark of negligible resonance width. Illustrative signal yields are multiplied by a factor of 50 to improve their visibility. |
png pdf |
Figure 5-b:
Distributions of the transverse mass ${M_{{\mathrm {T}}}}$ of the reconstructed top quark and ${\vec{p}}_{\mathrm {T}}^{\,\text {miss}}$ system, for the selected events in the merged categories, for events with no forward jet (left) and at least one forward jet (right), and for 2016 (upper), 2017 (central), and 2018 (lower). The overflow is included in the last bin. The distributions for the main background components have been determined in simulation with scale factors extracted from control regions. All background processes and the respective uncertainties are derived from the fit to data, while the distributions of signal processes are represented according to the expectation before the fit. The lines show the signal predictions for three benchmark mass values (0.8, 1.2, and 1.6 TeV) of a T quark of negligible resonance width. Illustrative signal yields are multiplied by a factor of 50 to improve their visibility. |
png pdf |
Figure 5-c:
Distributions of the transverse mass ${M_{{\mathrm {T}}}}$ of the reconstructed top quark and ${\vec{p}}_{\mathrm {T}}^{\,\text {miss}}$ system, for the selected events in the merged categories, for events with no forward jet (left) and at least one forward jet (right), and for 2016 (upper), 2017 (central), and 2018 (lower). The overflow is included in the last bin. The distributions for the main background components have been determined in simulation with scale factors extracted from control regions. All background processes and the respective uncertainties are derived from the fit to data, while the distributions of signal processes are represented according to the expectation before the fit. The lines show the signal predictions for three benchmark mass values (0.8, 1.2, and 1.6 TeV) of a T quark of negligible resonance width. Illustrative signal yields are multiplied by a factor of 50 to improve their visibility. |
png pdf |
Figure 5-d:
Distributions of the transverse mass ${M_{{\mathrm {T}}}}$ of the reconstructed top quark and ${\vec{p}}_{\mathrm {T}}^{\,\text {miss}}$ system, for the selected events in the merged categories, for events with no forward jet (left) and at least one forward jet (right), and for 2016 (upper), 2017 (central), and 2018 (lower). The overflow is included in the last bin. The distributions for the main background components have been determined in simulation with scale factors extracted from control regions. All background processes and the respective uncertainties are derived from the fit to data, while the distributions of signal processes are represented according to the expectation before the fit. The lines show the signal predictions for three benchmark mass values (0.8, 1.2, and 1.6 TeV) of a T quark of negligible resonance width. Illustrative signal yields are multiplied by a factor of 50 to improve their visibility. |
png pdf |
Figure 5-e:
Distributions of the transverse mass ${M_{{\mathrm {T}}}}$ of the reconstructed top quark and ${\vec{p}}_{\mathrm {T}}^{\,\text {miss}}$ system, for the selected events in the merged categories, for events with no forward jet (left) and at least one forward jet (right), and for 2016 (upper), 2017 (central), and 2018 (lower). The overflow is included in the last bin. The distributions for the main background components have been determined in simulation with scale factors extracted from control regions. All background processes and the respective uncertainties are derived from the fit to data, while the distributions of signal processes are represented according to the expectation before the fit. The lines show the signal predictions for three benchmark mass values (0.8, 1.2, and 1.6 TeV) of a T quark of negligible resonance width. Illustrative signal yields are multiplied by a factor of 50 to improve their visibility. |
png pdf |
Figure 5-f:
Distributions of the transverse mass ${M_{{\mathrm {T}}}}$ of the reconstructed top quark and ${\vec{p}}_{\mathrm {T}}^{\,\text {miss}}$ system, for the selected events in the merged categories, for events with no forward jet (left) and at least one forward jet (right), and for 2016 (upper), 2017 (central), and 2018 (lower). The overflow is included in the last bin. The distributions for the main background components have been determined in simulation with scale factors extracted from control regions. All background processes and the respective uncertainties are derived from the fit to data, while the distributions of signal processes are represented according to the expectation before the fit. The lines show the signal predictions for three benchmark mass values (0.8, 1.2, and 1.6 TeV) of a T quark of negligible resonance width. Illustrative signal yields are multiplied by a factor of 50 to improve their visibility. |
png pdf |
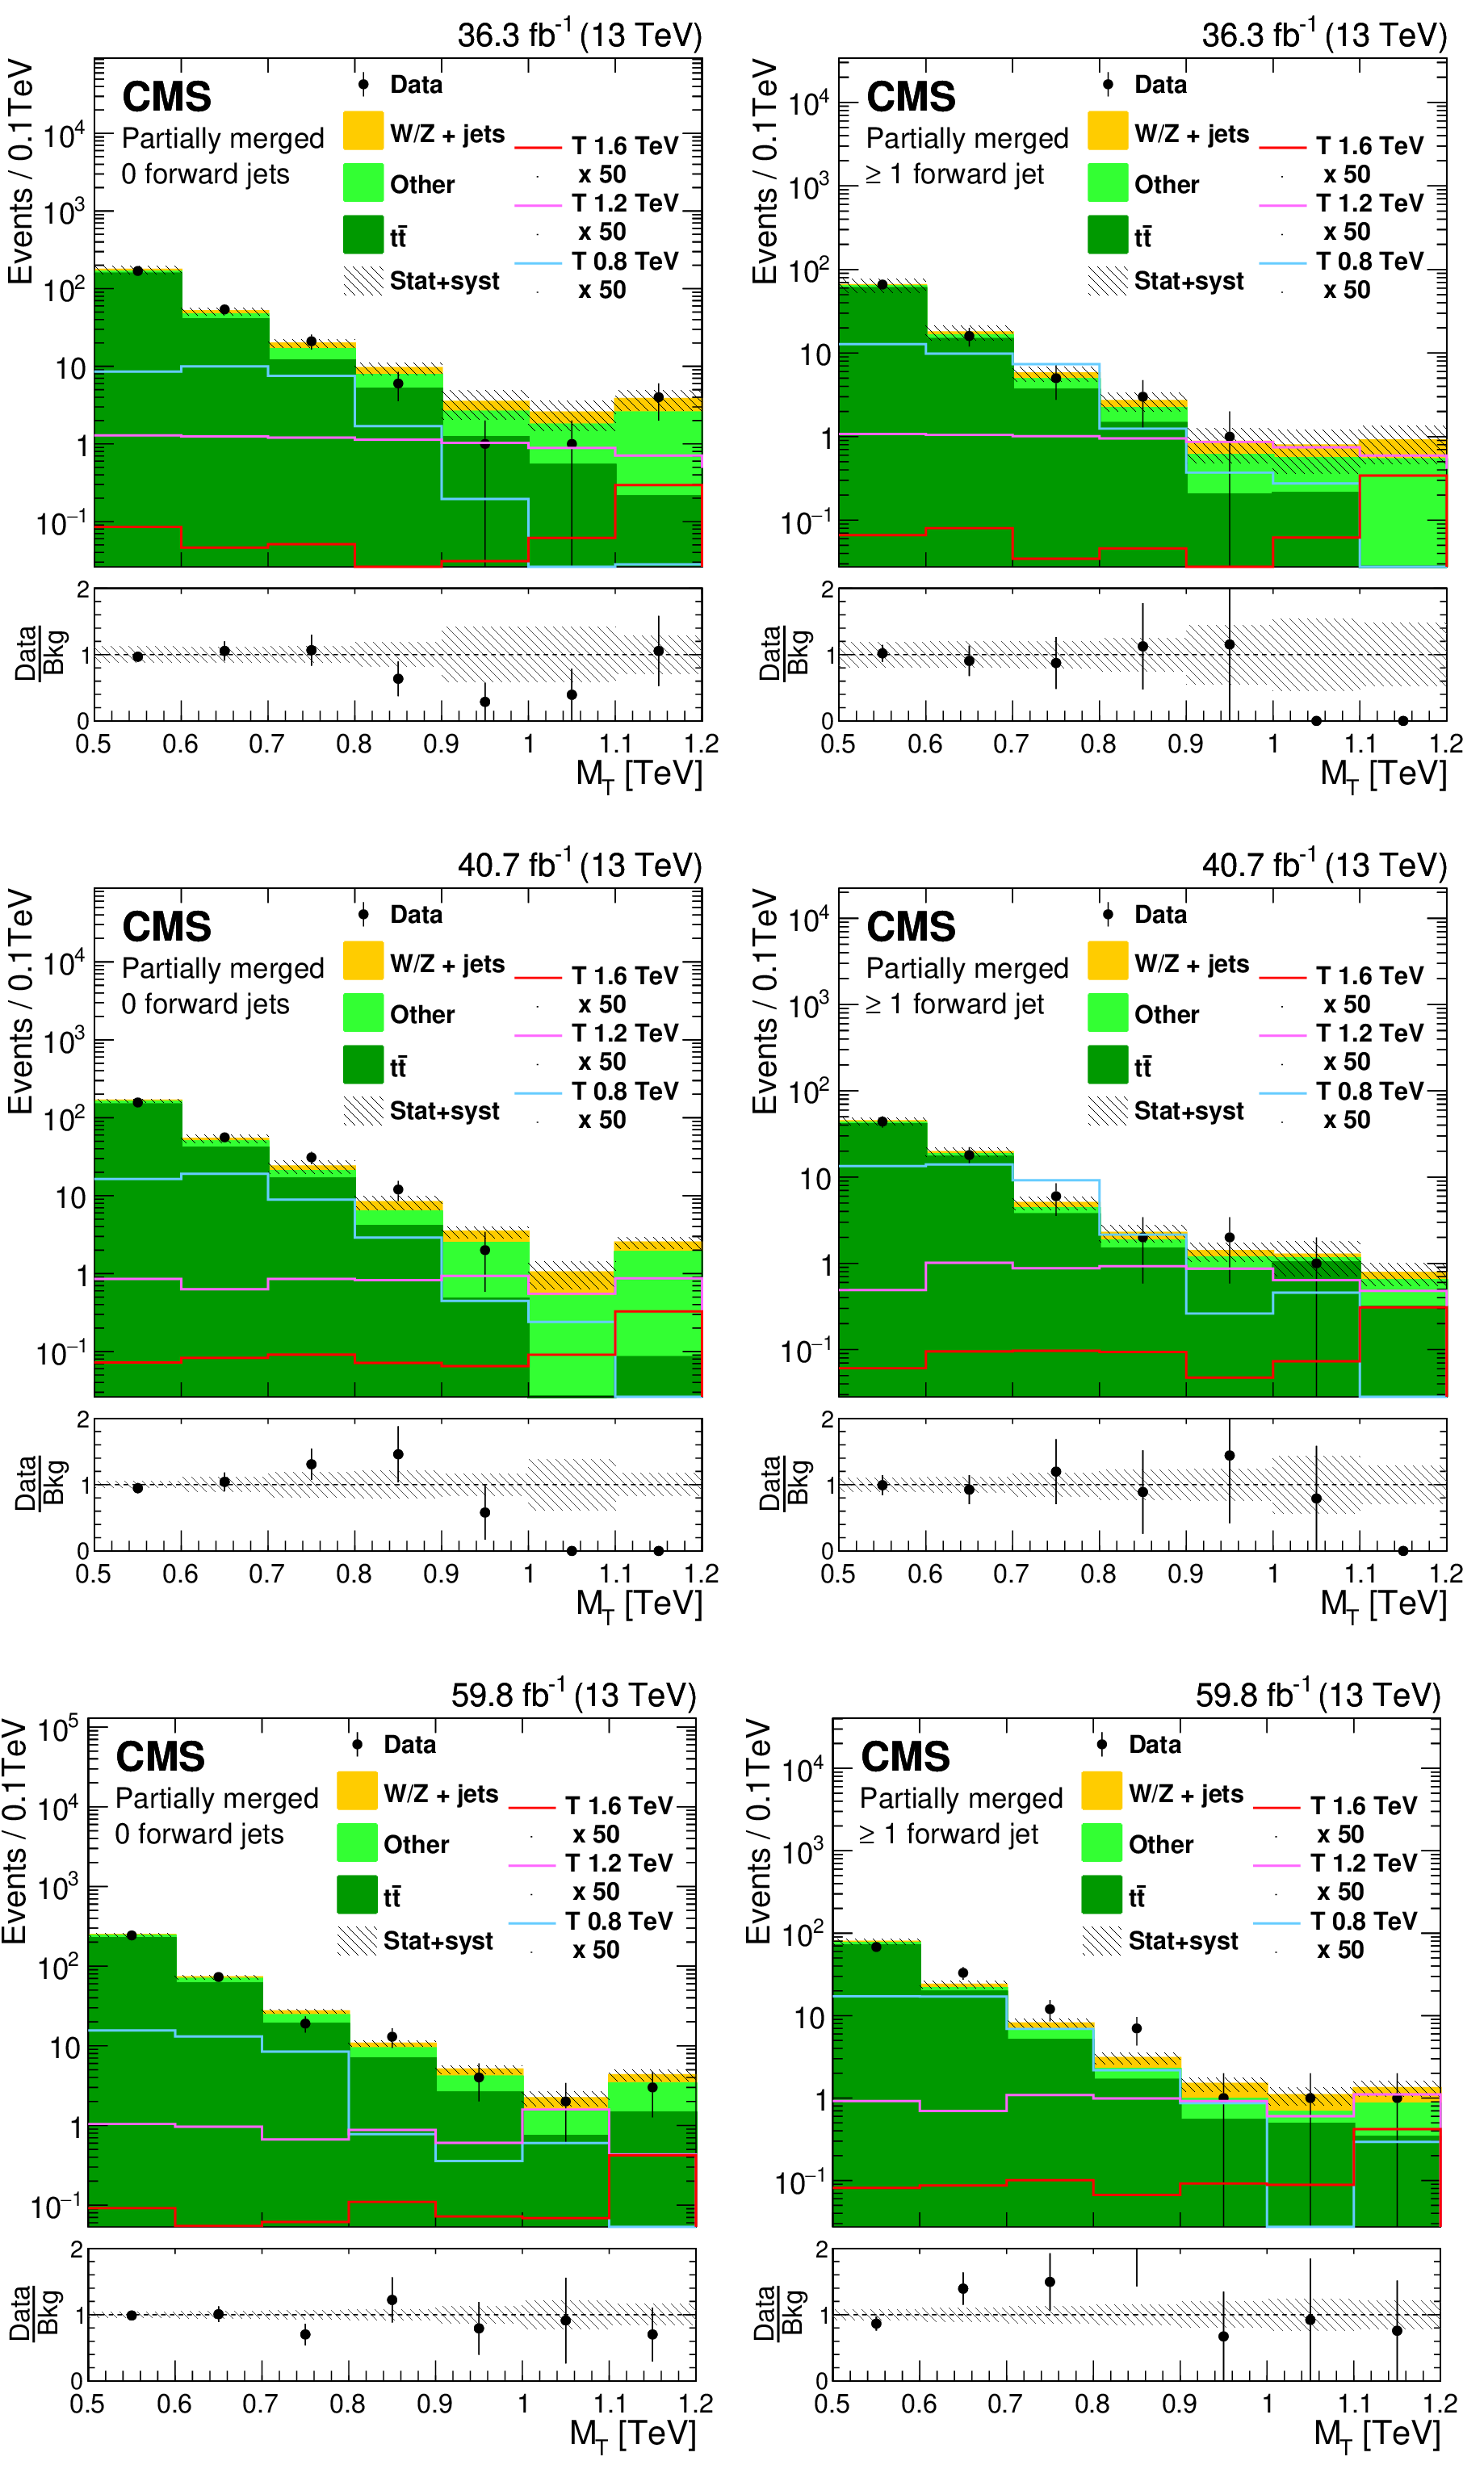
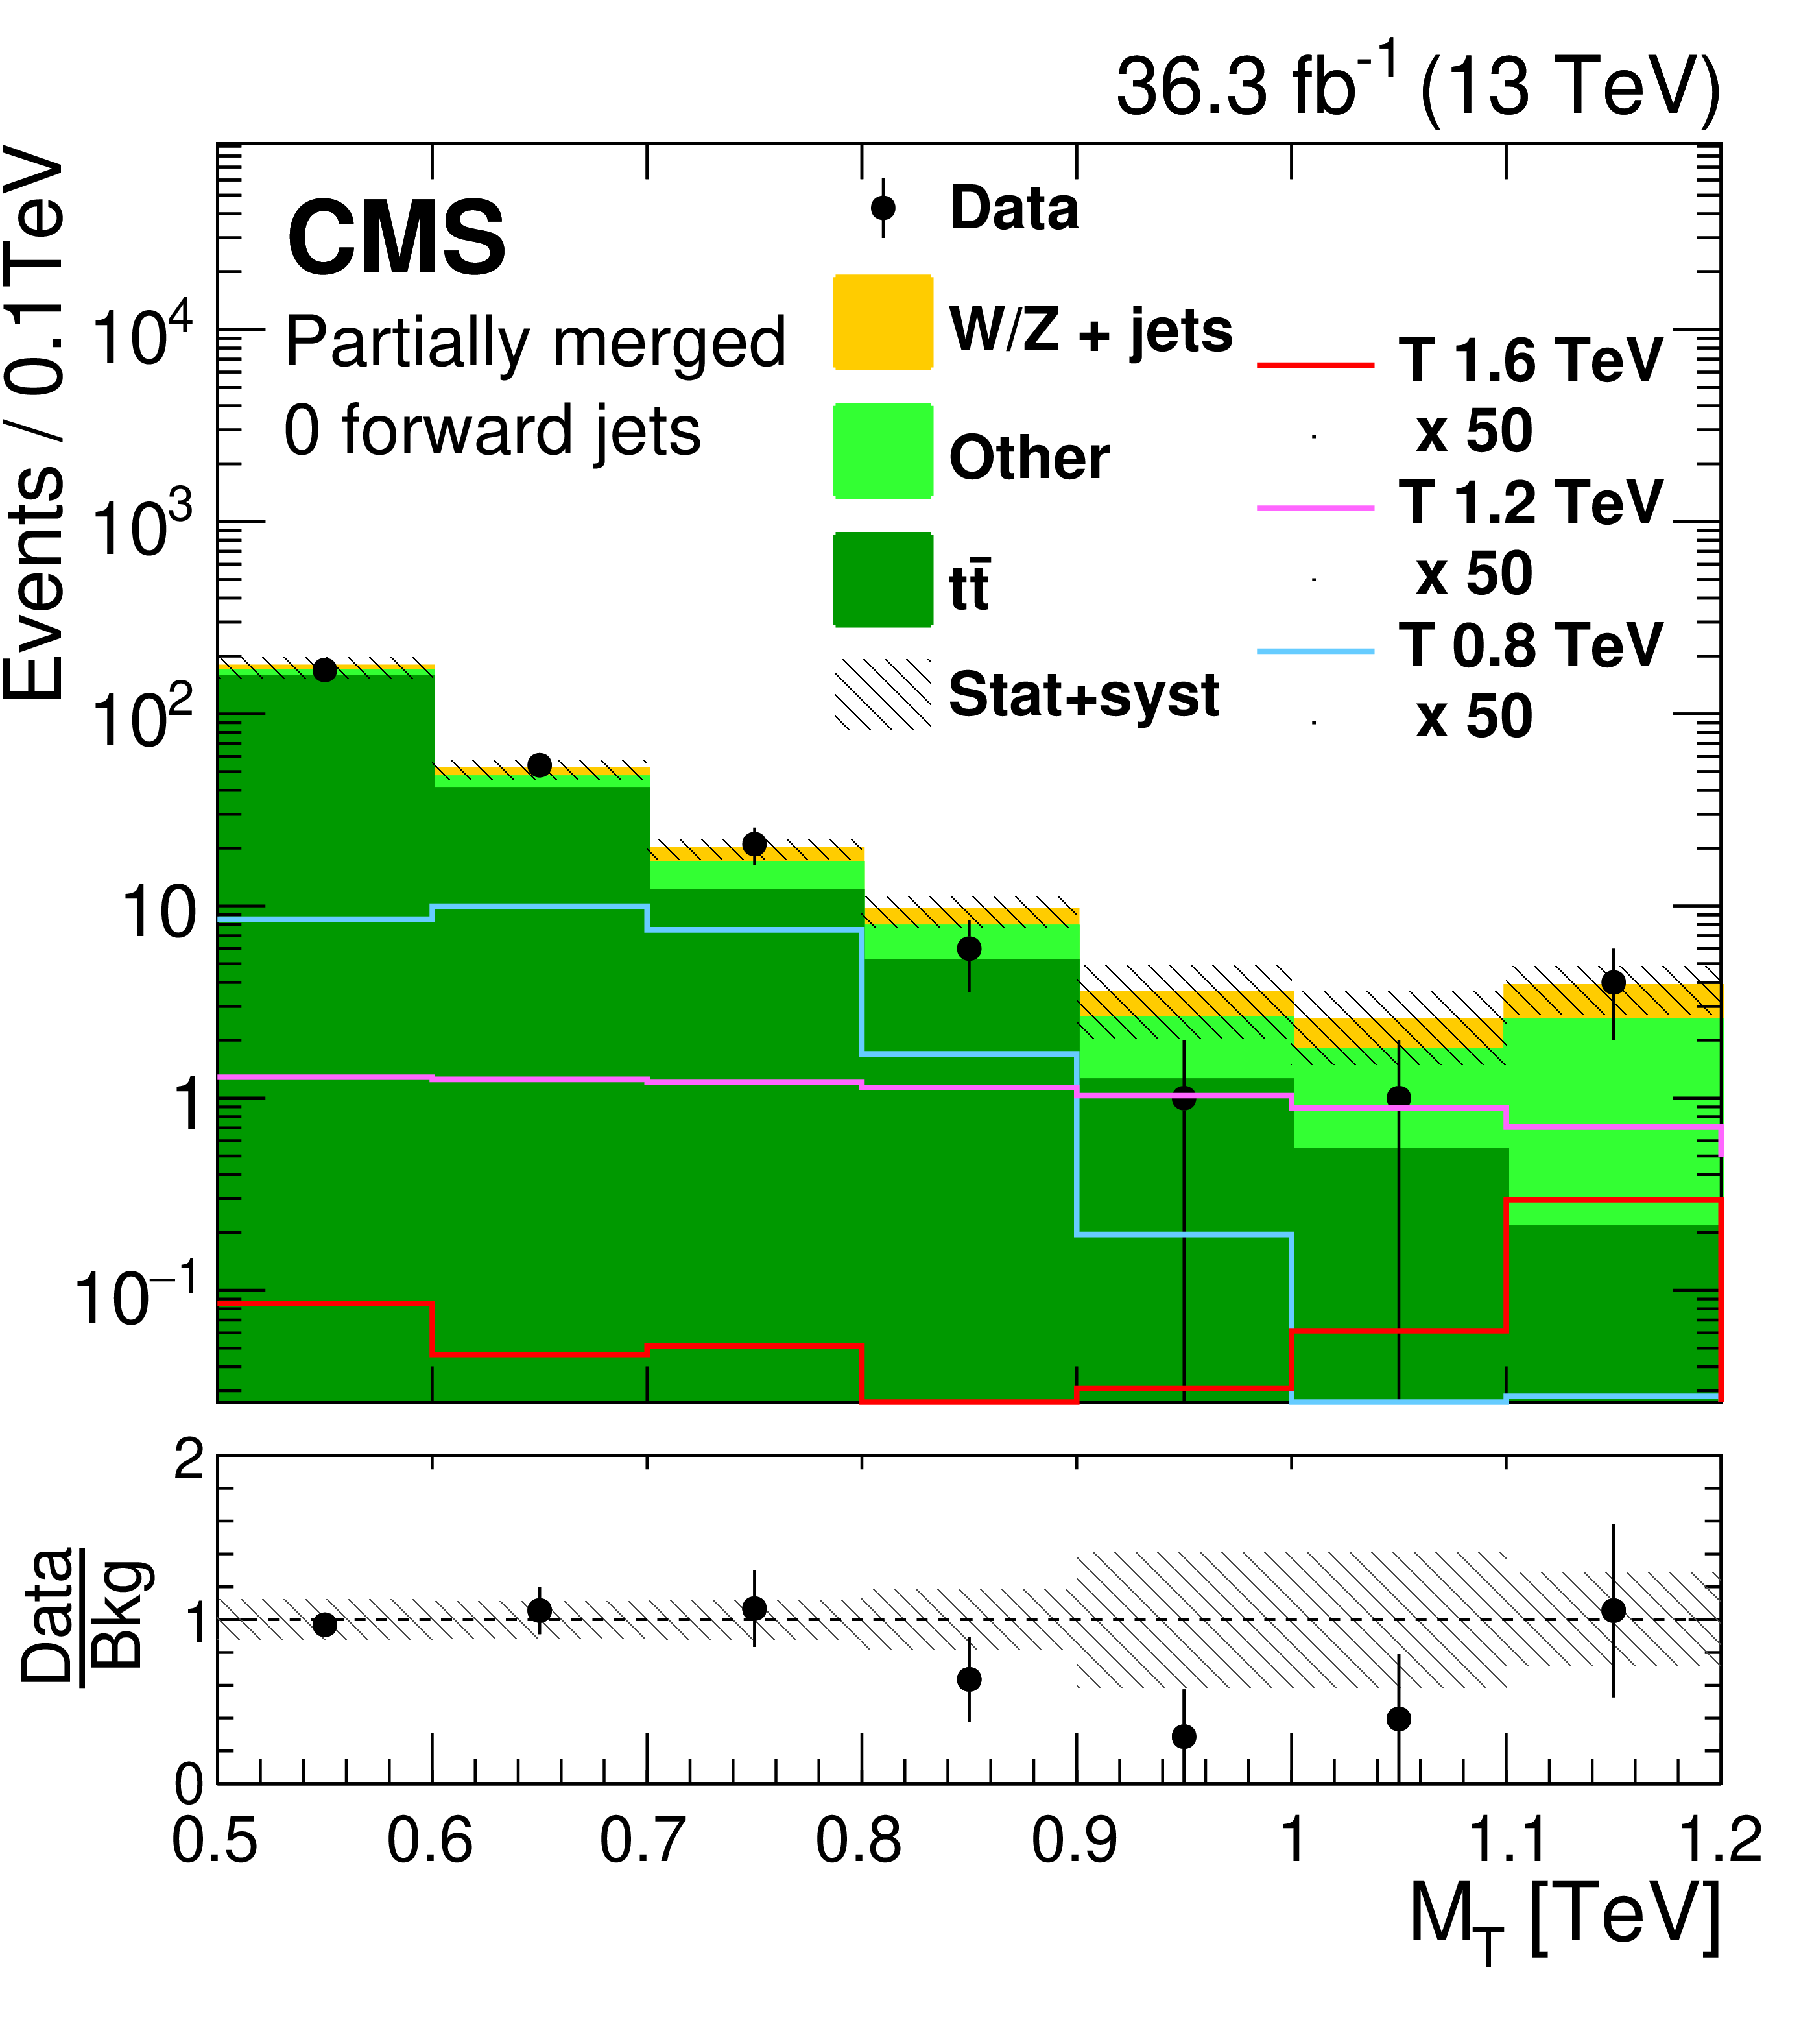
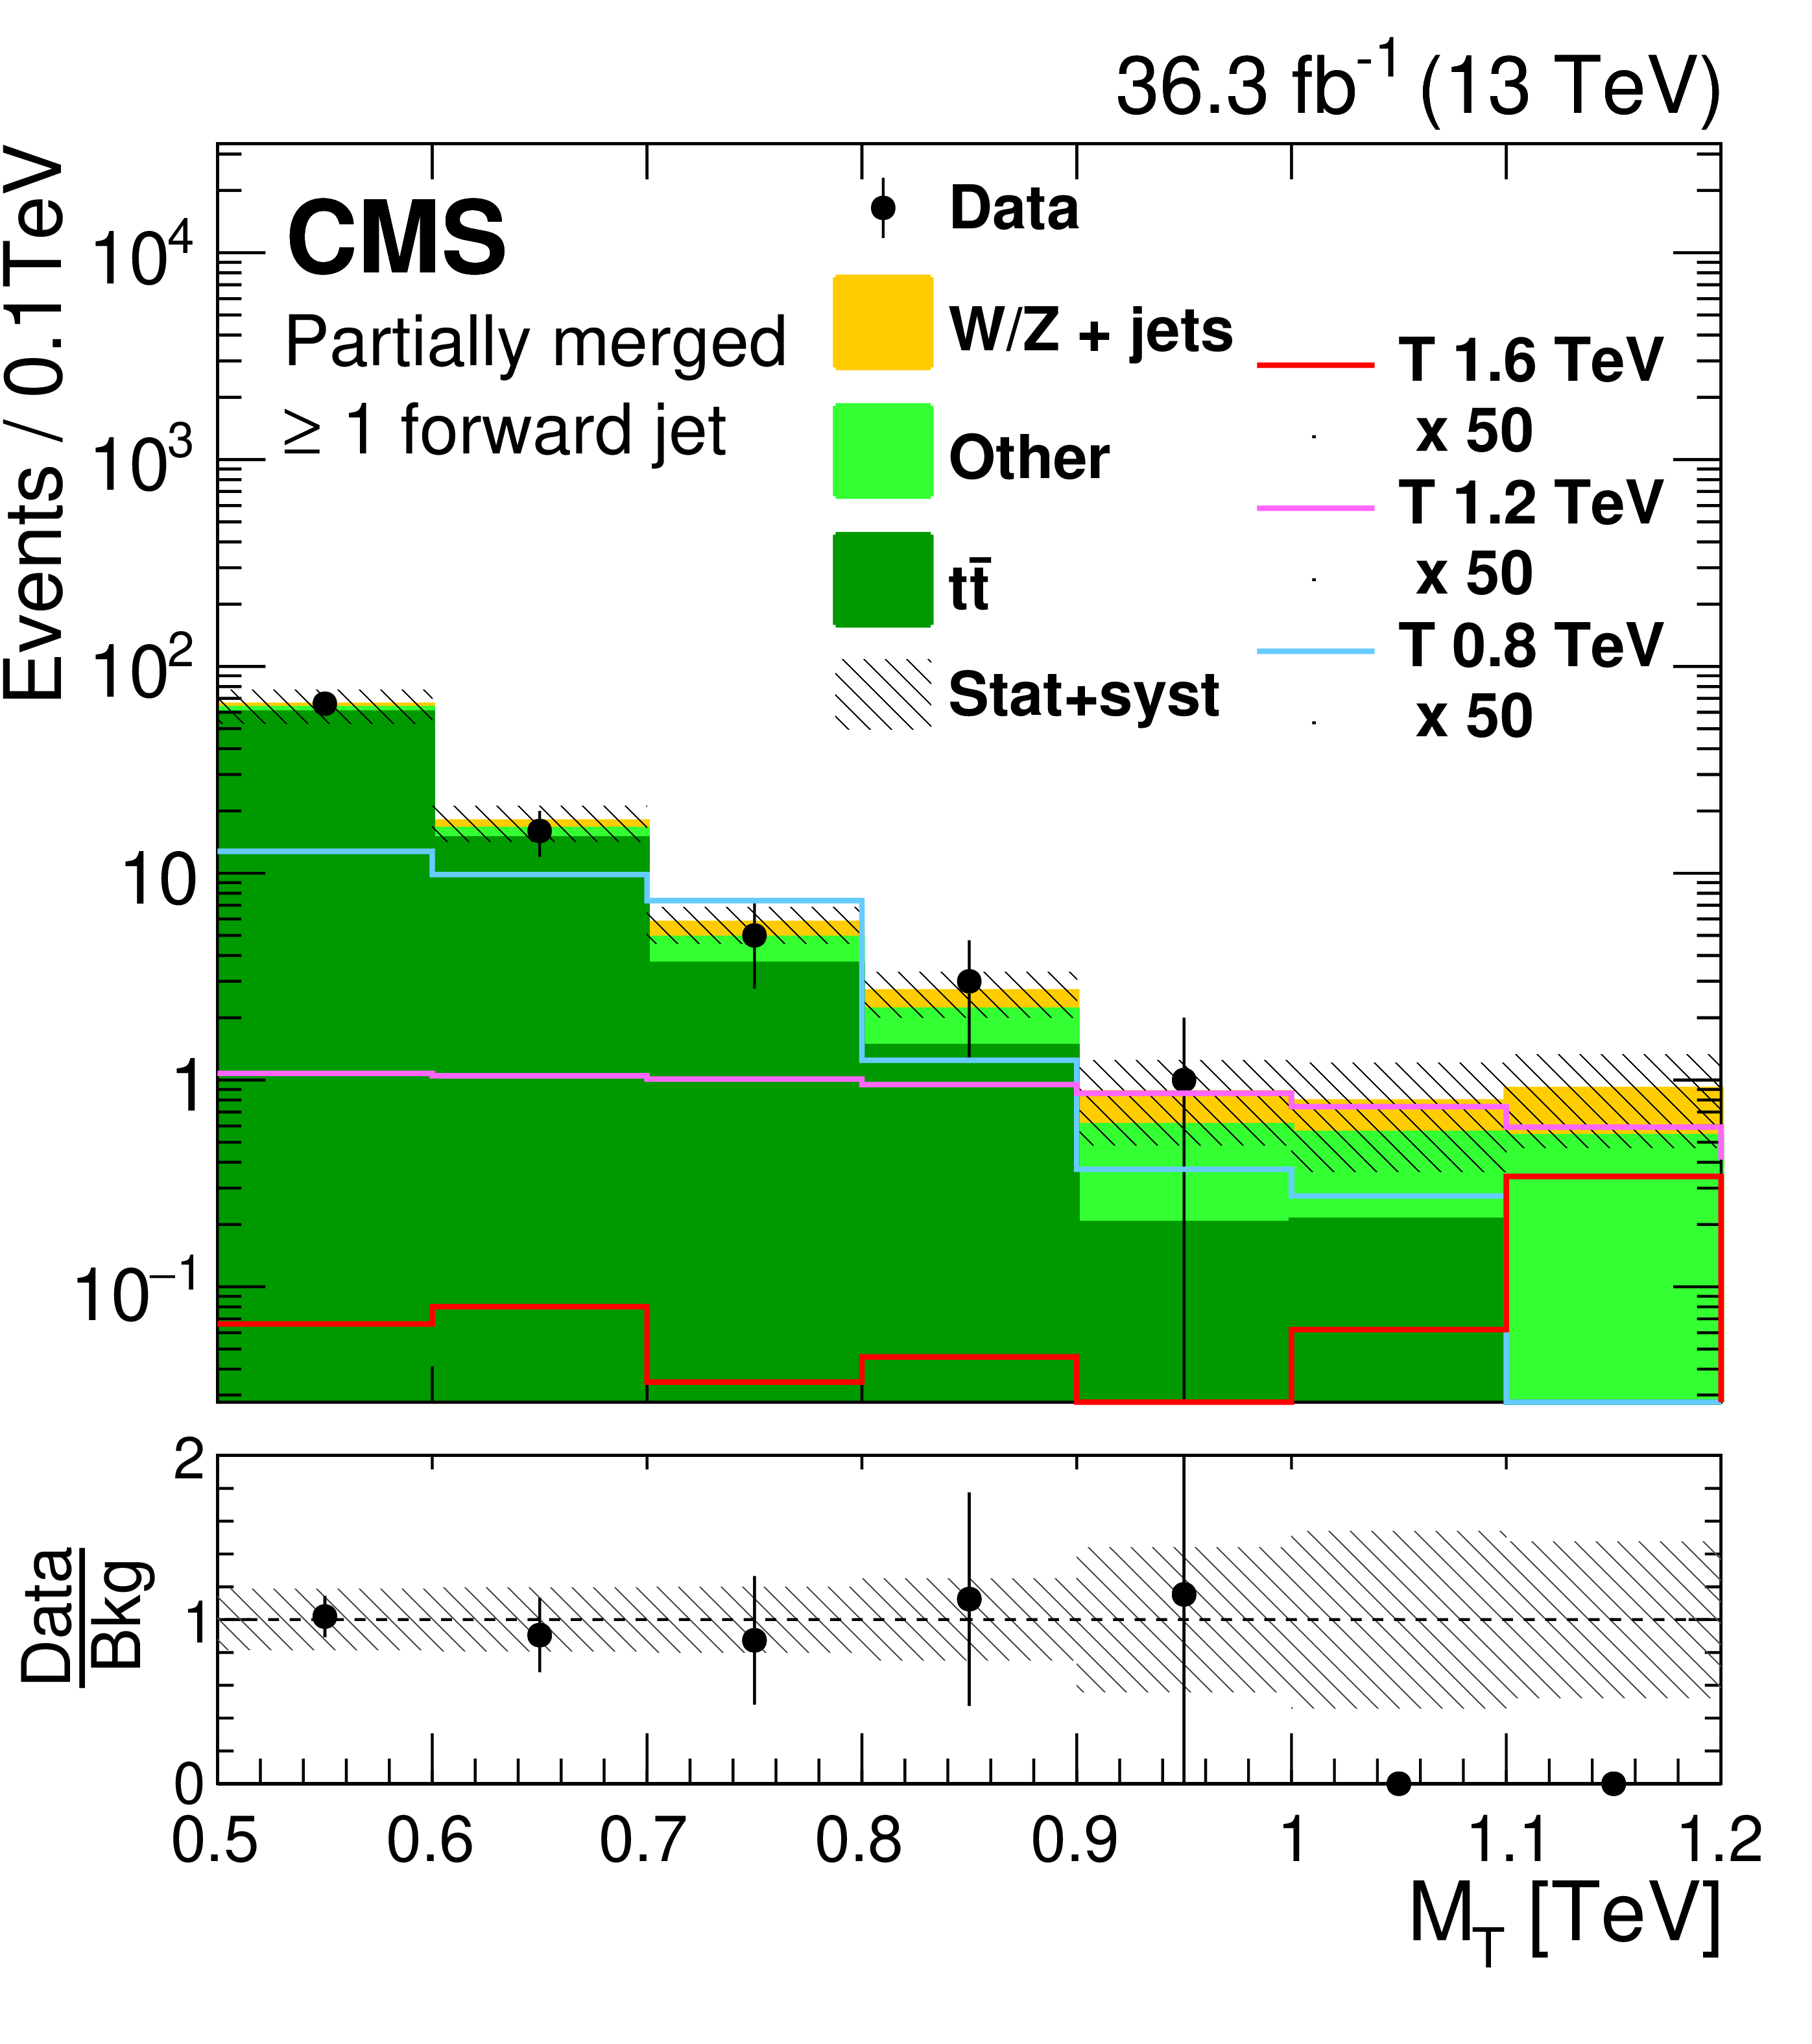
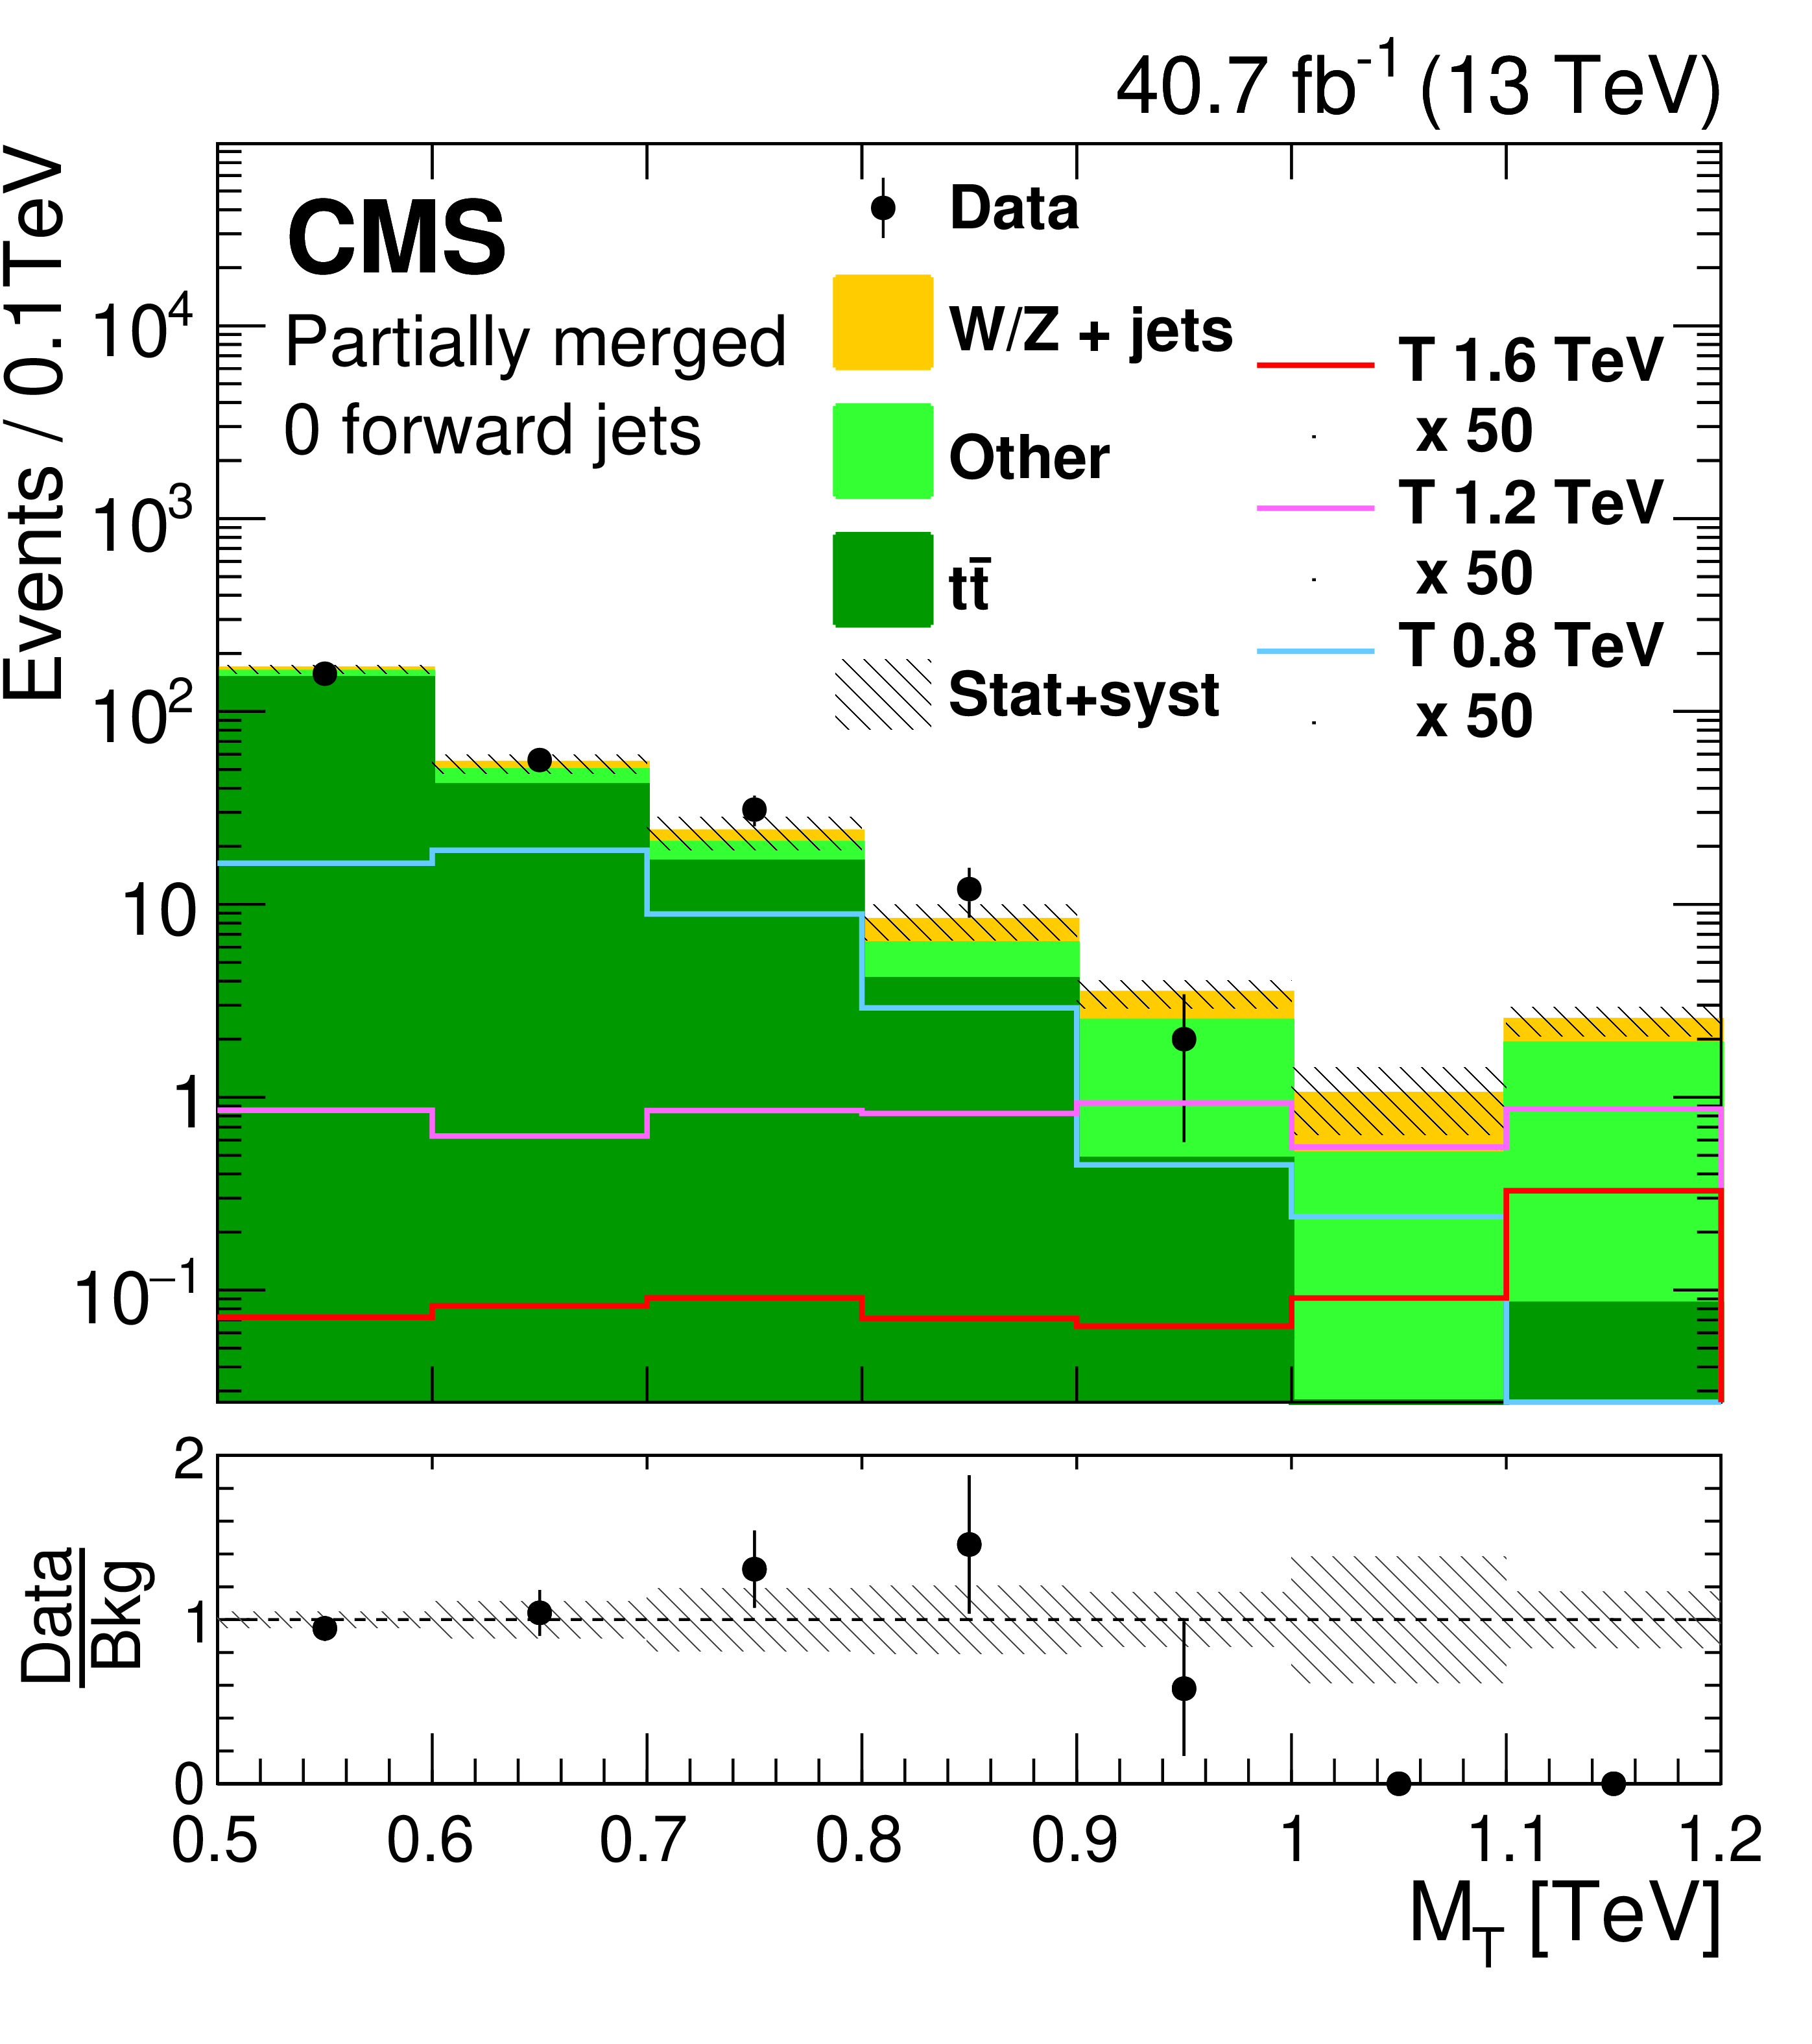
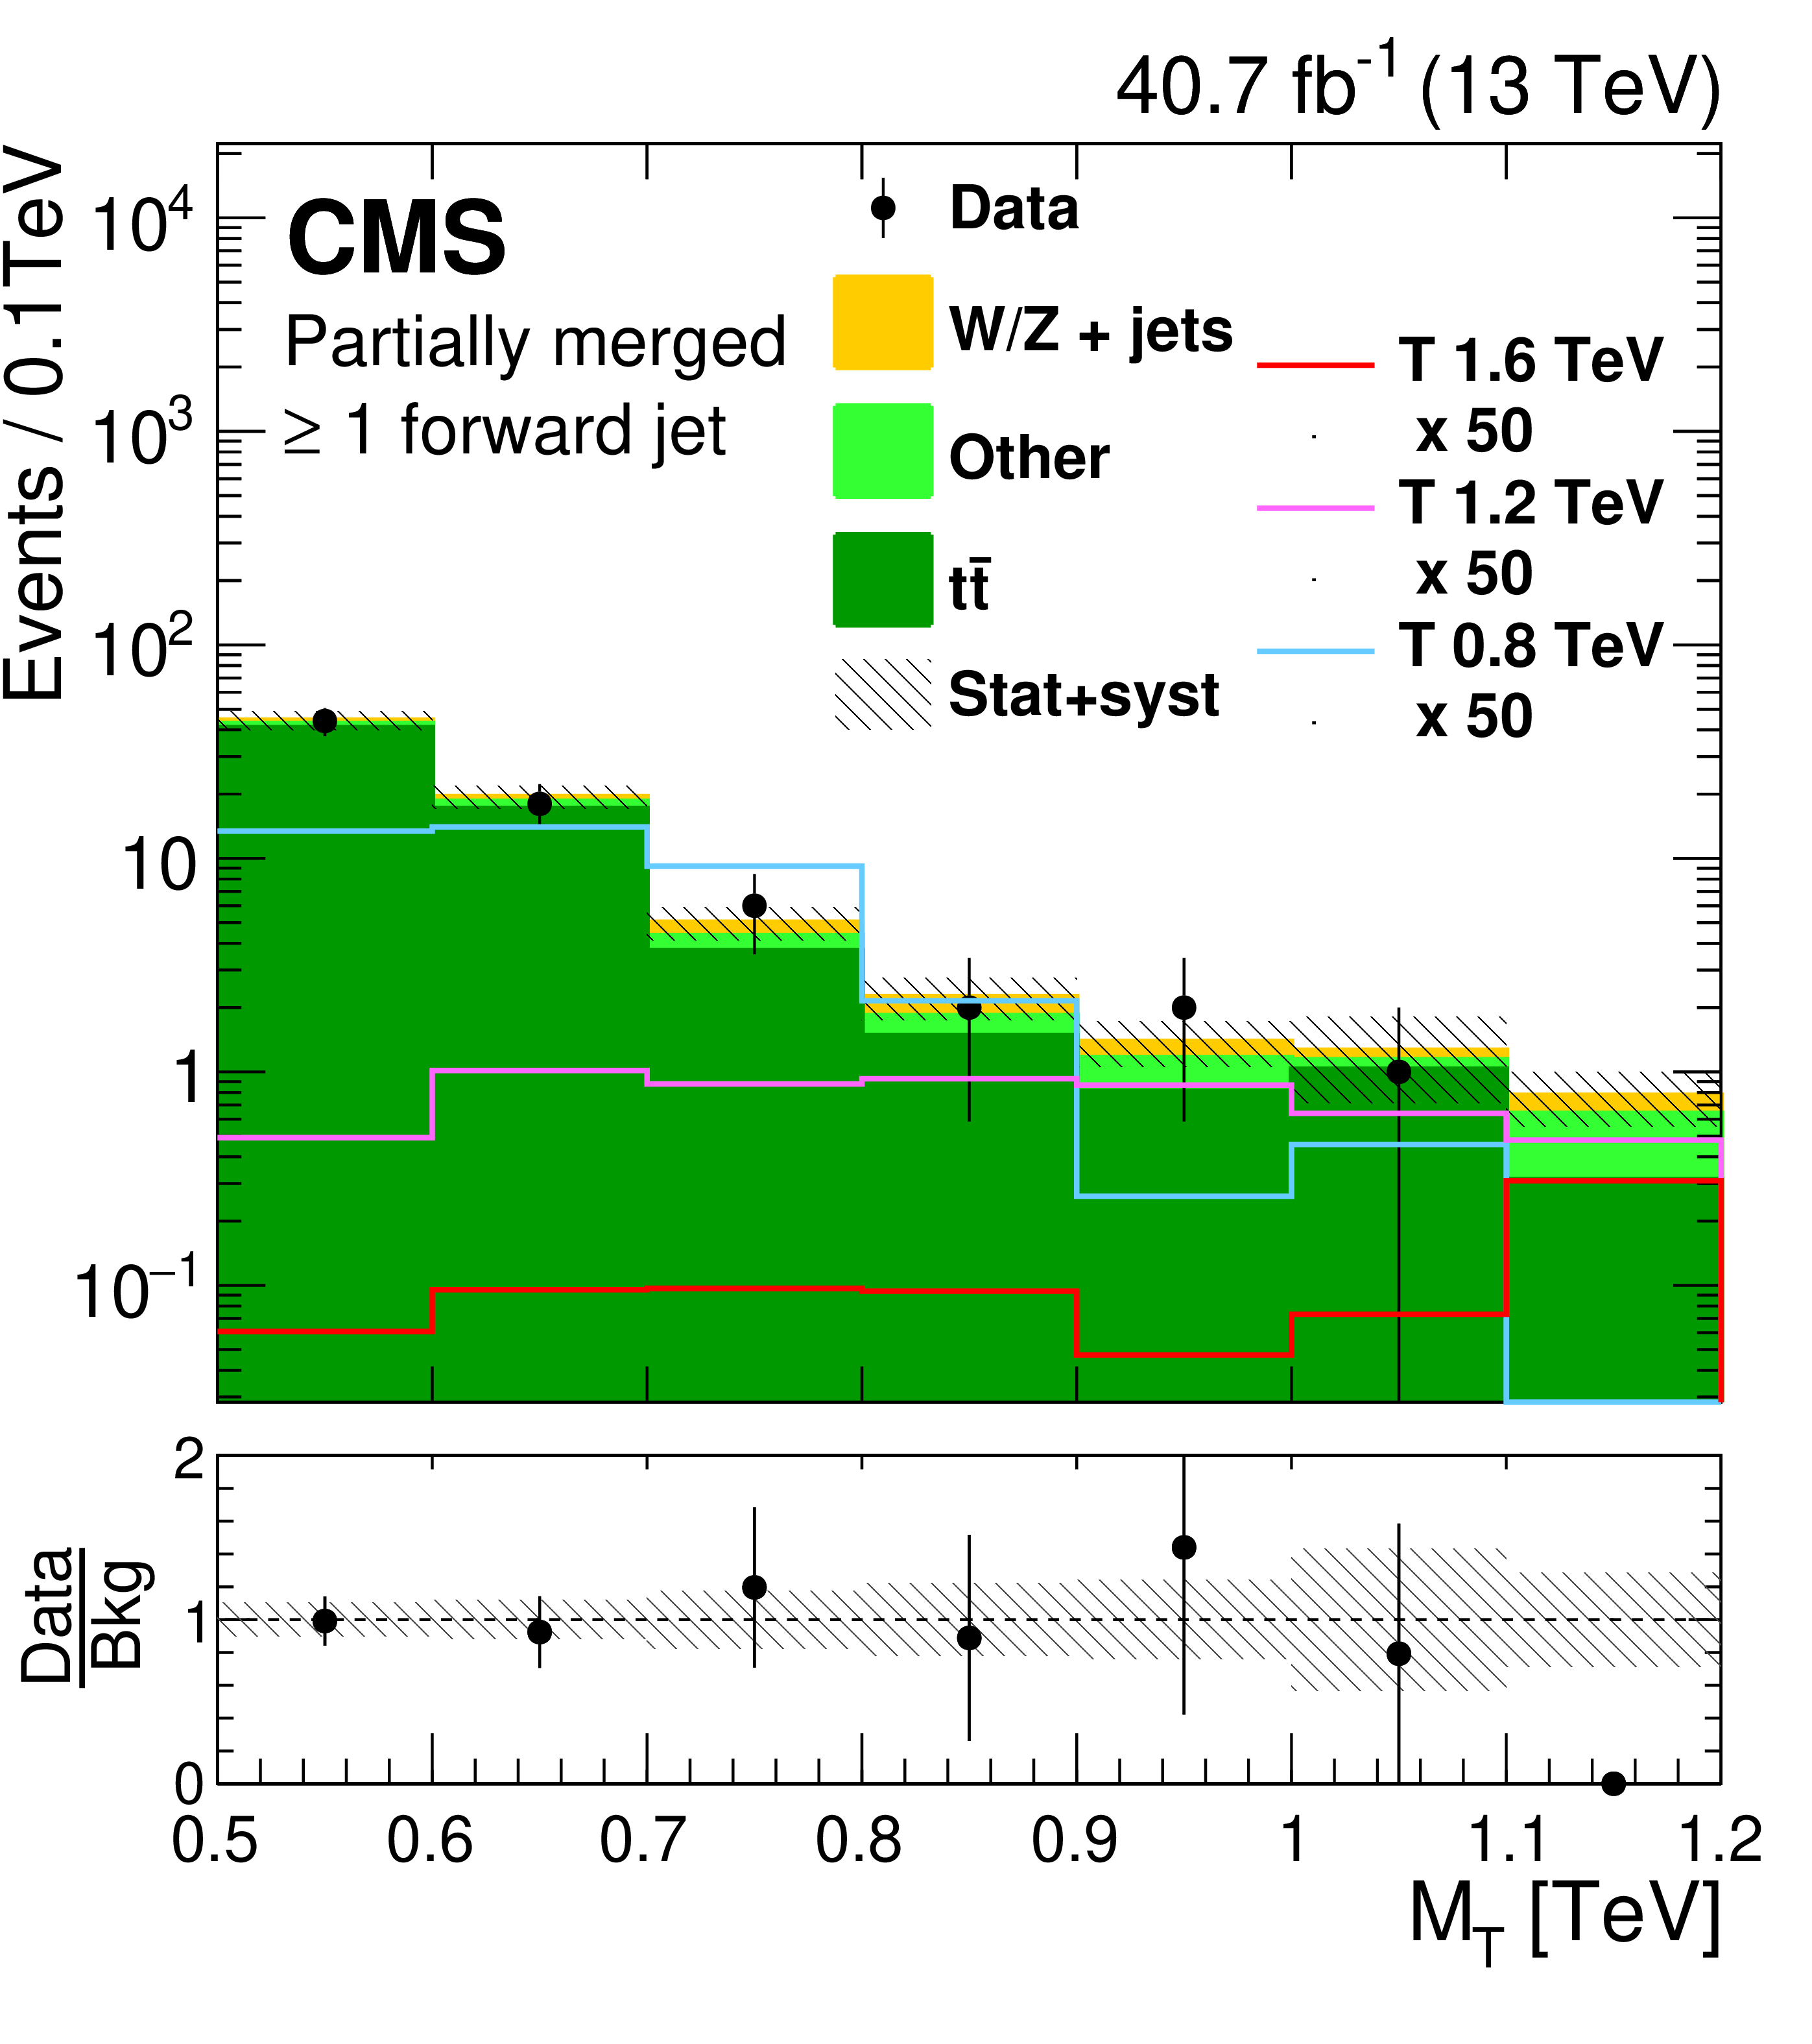
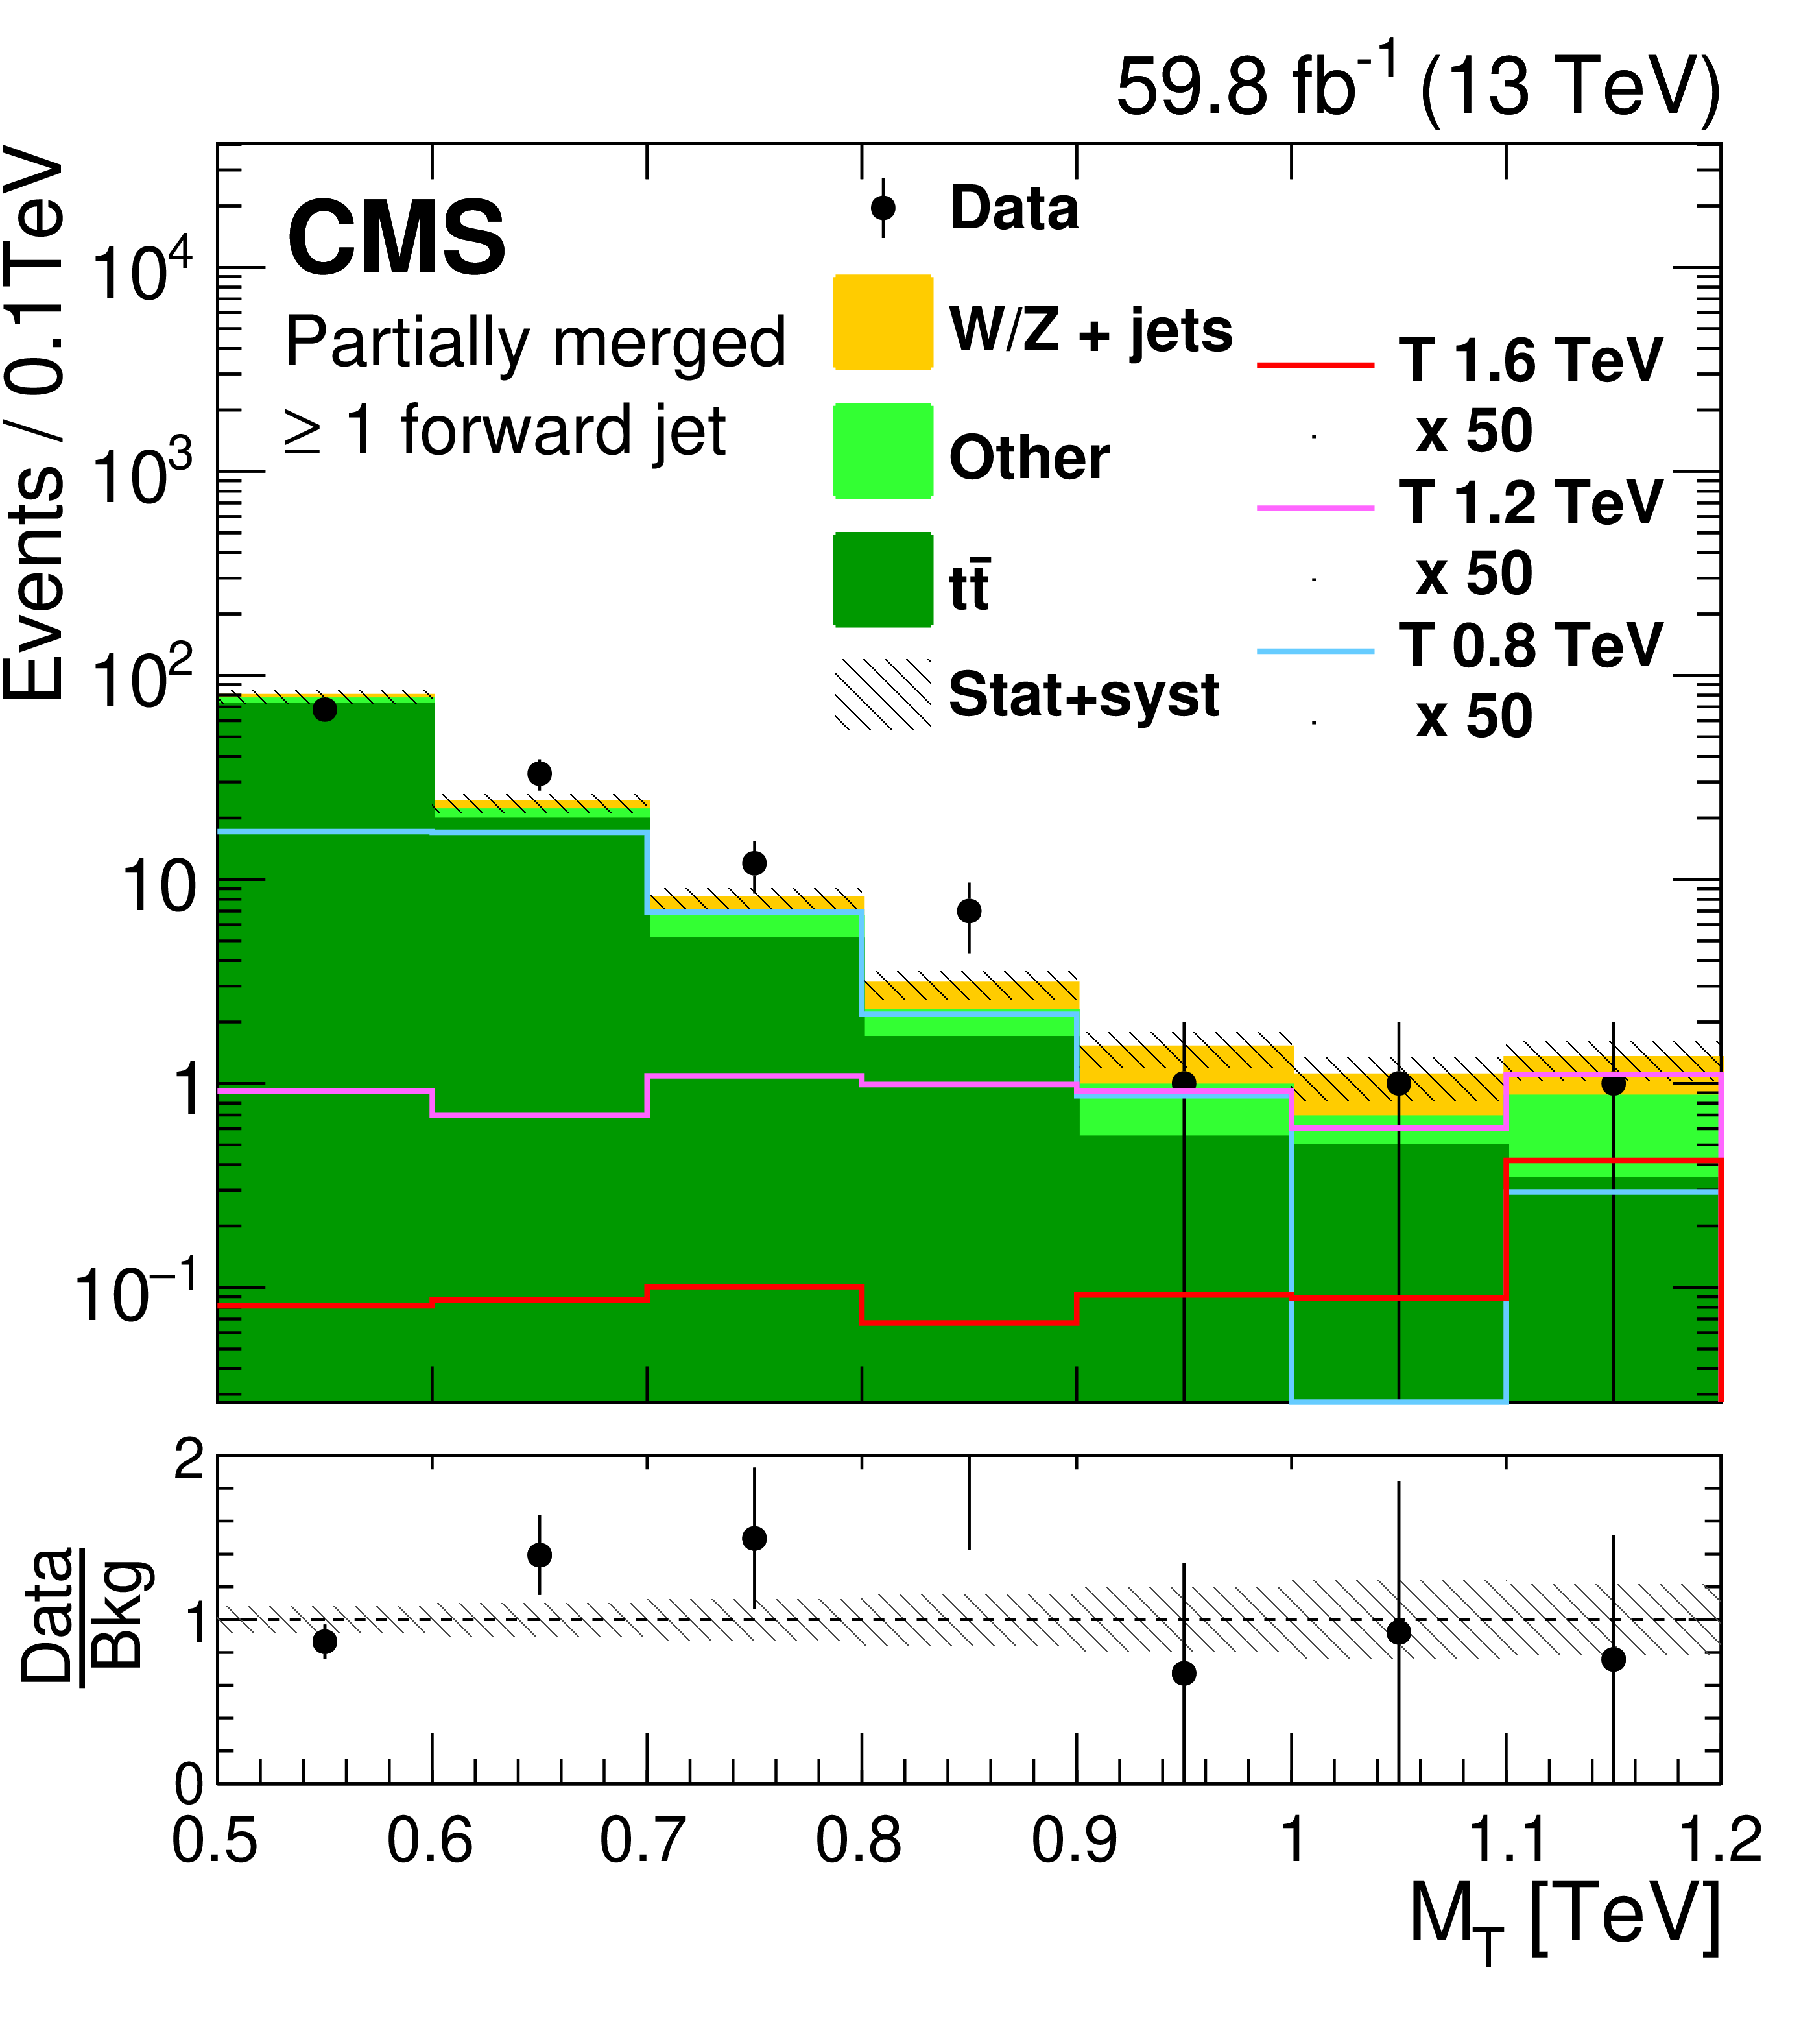
Figure 6:
Distributions of the transverse mass ${M_{{\mathrm {T}}}}$ of the reconstructed top quark and ${\vec{p}}_{\mathrm {T}}^{\,\text {miss}}$ system, for the selected events in the partially merged categories, for events with no forward jet (left) and at least one forward jet (right), and for 2016 (upper), 2017 (central), and 2018 (lower). The overflow is included in the last bin. The distributions for the main background components have been determined in simulation with scale factors extracted from control regions. All background processes and the respective uncertainties are derived from the fit to data, while the distributions of signal processes are represented according to the expectation before the fit. The lines show the signal predictions for three benchmark mass values (0.8, 1.2, and 1.6 TeV) of a T quark of negligible resonance width. Signal yields are multiplied by a factor of 50 to improve their visibility. |
png pdf |
Figure 6-a:
Distributions of the transverse mass ${M_{{\mathrm {T}}}}$ of the reconstructed top quark and ${\vec{p}}_{\mathrm {T}}^{\,\text {miss}}$ system, for the selected events in the partially merged categories, for events with no forward jet (left) and at least one forward jet (right), and for 2016 (upper), 2017 (central), and 2018 (lower). The overflow is included in the last bin. The distributions for the main background components have been determined in simulation with scale factors extracted from control regions. All background processes and the respective uncertainties are derived from the fit to data, while the distributions of signal processes are represented according to the expectation before the fit. The lines show the signal predictions for three benchmark mass values (0.8, 1.2, and 1.6 TeV) of a T quark of negligible resonance width. Signal yields are multiplied by a factor of 50 to improve their visibility. |
png pdf |
Figure 6-b:
Distributions of the transverse mass ${M_{{\mathrm {T}}}}$ of the reconstructed top quark and ${\vec{p}}_{\mathrm {T}}^{\,\text {miss}}$ system, for the selected events in the partially merged categories, for events with no forward jet (left) and at least one forward jet (right), and for 2016 (upper), 2017 (central), and 2018 (lower). The overflow is included in the last bin. The distributions for the main background components have been determined in simulation with scale factors extracted from control regions. All background processes and the respective uncertainties are derived from the fit to data, while the distributions of signal processes are represented according to the expectation before the fit. The lines show the signal predictions for three benchmark mass values (0.8, 1.2, and 1.6 TeV) of a T quark of negligible resonance width. Signal yields are multiplied by a factor of 50 to improve their visibility. |
png pdf |
Figure 6-c:
Distributions of the transverse mass ${M_{{\mathrm {T}}}}$ of the reconstructed top quark and ${\vec{p}}_{\mathrm {T}}^{\,\text {miss}}$ system, for the selected events in the partially merged categories, for events with no forward jet (left) and at least one forward jet (right), and for 2016 (upper), 2017 (central), and 2018 (lower). The overflow is included in the last bin. The distributions for the main background components have been determined in simulation with scale factors extracted from control regions. All background processes and the respective uncertainties are derived from the fit to data, while the distributions of signal processes are represented according to the expectation before the fit. The lines show the signal predictions for three benchmark mass values (0.8, 1.2, and 1.6 TeV) of a T quark of negligible resonance width. Signal yields are multiplied by a factor of 50 to improve their visibility. |
png pdf |
Figure 6-d:
Distributions of the transverse mass ${M_{{\mathrm {T}}}}$ of the reconstructed top quark and ${\vec{p}}_{\mathrm {T}}^{\,\text {miss}}$ system, for the selected events in the partially merged categories, for events with no forward jet (left) and at least one forward jet (right), and for 2016 (upper), 2017 (central), and 2018 (lower). The overflow is included in the last bin. The distributions for the main background components have been determined in simulation with scale factors extracted from control regions. All background processes and the respective uncertainties are derived from the fit to data, while the distributions of signal processes are represented according to the expectation before the fit. The lines show the signal predictions for three benchmark mass values (0.8, 1.2, and 1.6 TeV) of a T quark of negligible resonance width. Signal yields are multiplied by a factor of 50 to improve their visibility. |

png pdf |
Figure 6-e:
Distributions of the transverse mass ${M_{{\mathrm {T}}}}$ of the reconstructed top quark and ${\vec{p}}_{\mathrm {T}}^{\,\text {miss}}$ system, for the selected events in the partially merged categories, for events with no forward jet (left) and at least one forward jet (right), and for 2016 (upper), 2017 (central), and 2018 (lower). The overflow is included in the last bin. The distributions for the main background components have been determined in simulation with scale factors extracted from control regions. All background processes and the respective uncertainties are derived from the fit to data, while the distributions of signal processes are represented according to the expectation before the fit. The lines show the signal predictions for three benchmark mass values (0.8, 1.2, and 1.6 TeV) of a T quark of negligible resonance width. Signal yields are multiplied by a factor of 50 to improve their visibility. |
png pdf |
Figure 6-f:
Distributions of the transverse mass ${M_{{\mathrm {T}}}}$ of the reconstructed top quark and ${\vec{p}}_{\mathrm {T}}^{\,\text {miss}}$ system, for the selected events in the partially merged categories, for events with no forward jet (left) and at least one forward jet (right), and for 2016 (upper), 2017 (central), and 2018 (lower). The overflow is included in the last bin. The distributions for the main background components have been determined in simulation with scale factors extracted from control regions. All background processes and the respective uncertainties are derived from the fit to data, while the distributions of signal processes are represented according to the expectation before the fit. The lines show the signal predictions for three benchmark mass values (0.8, 1.2, and 1.6 TeV) of a T quark of negligible resonance width. Signal yields are multiplied by a factor of 50 to improve their visibility. |
png pdf |
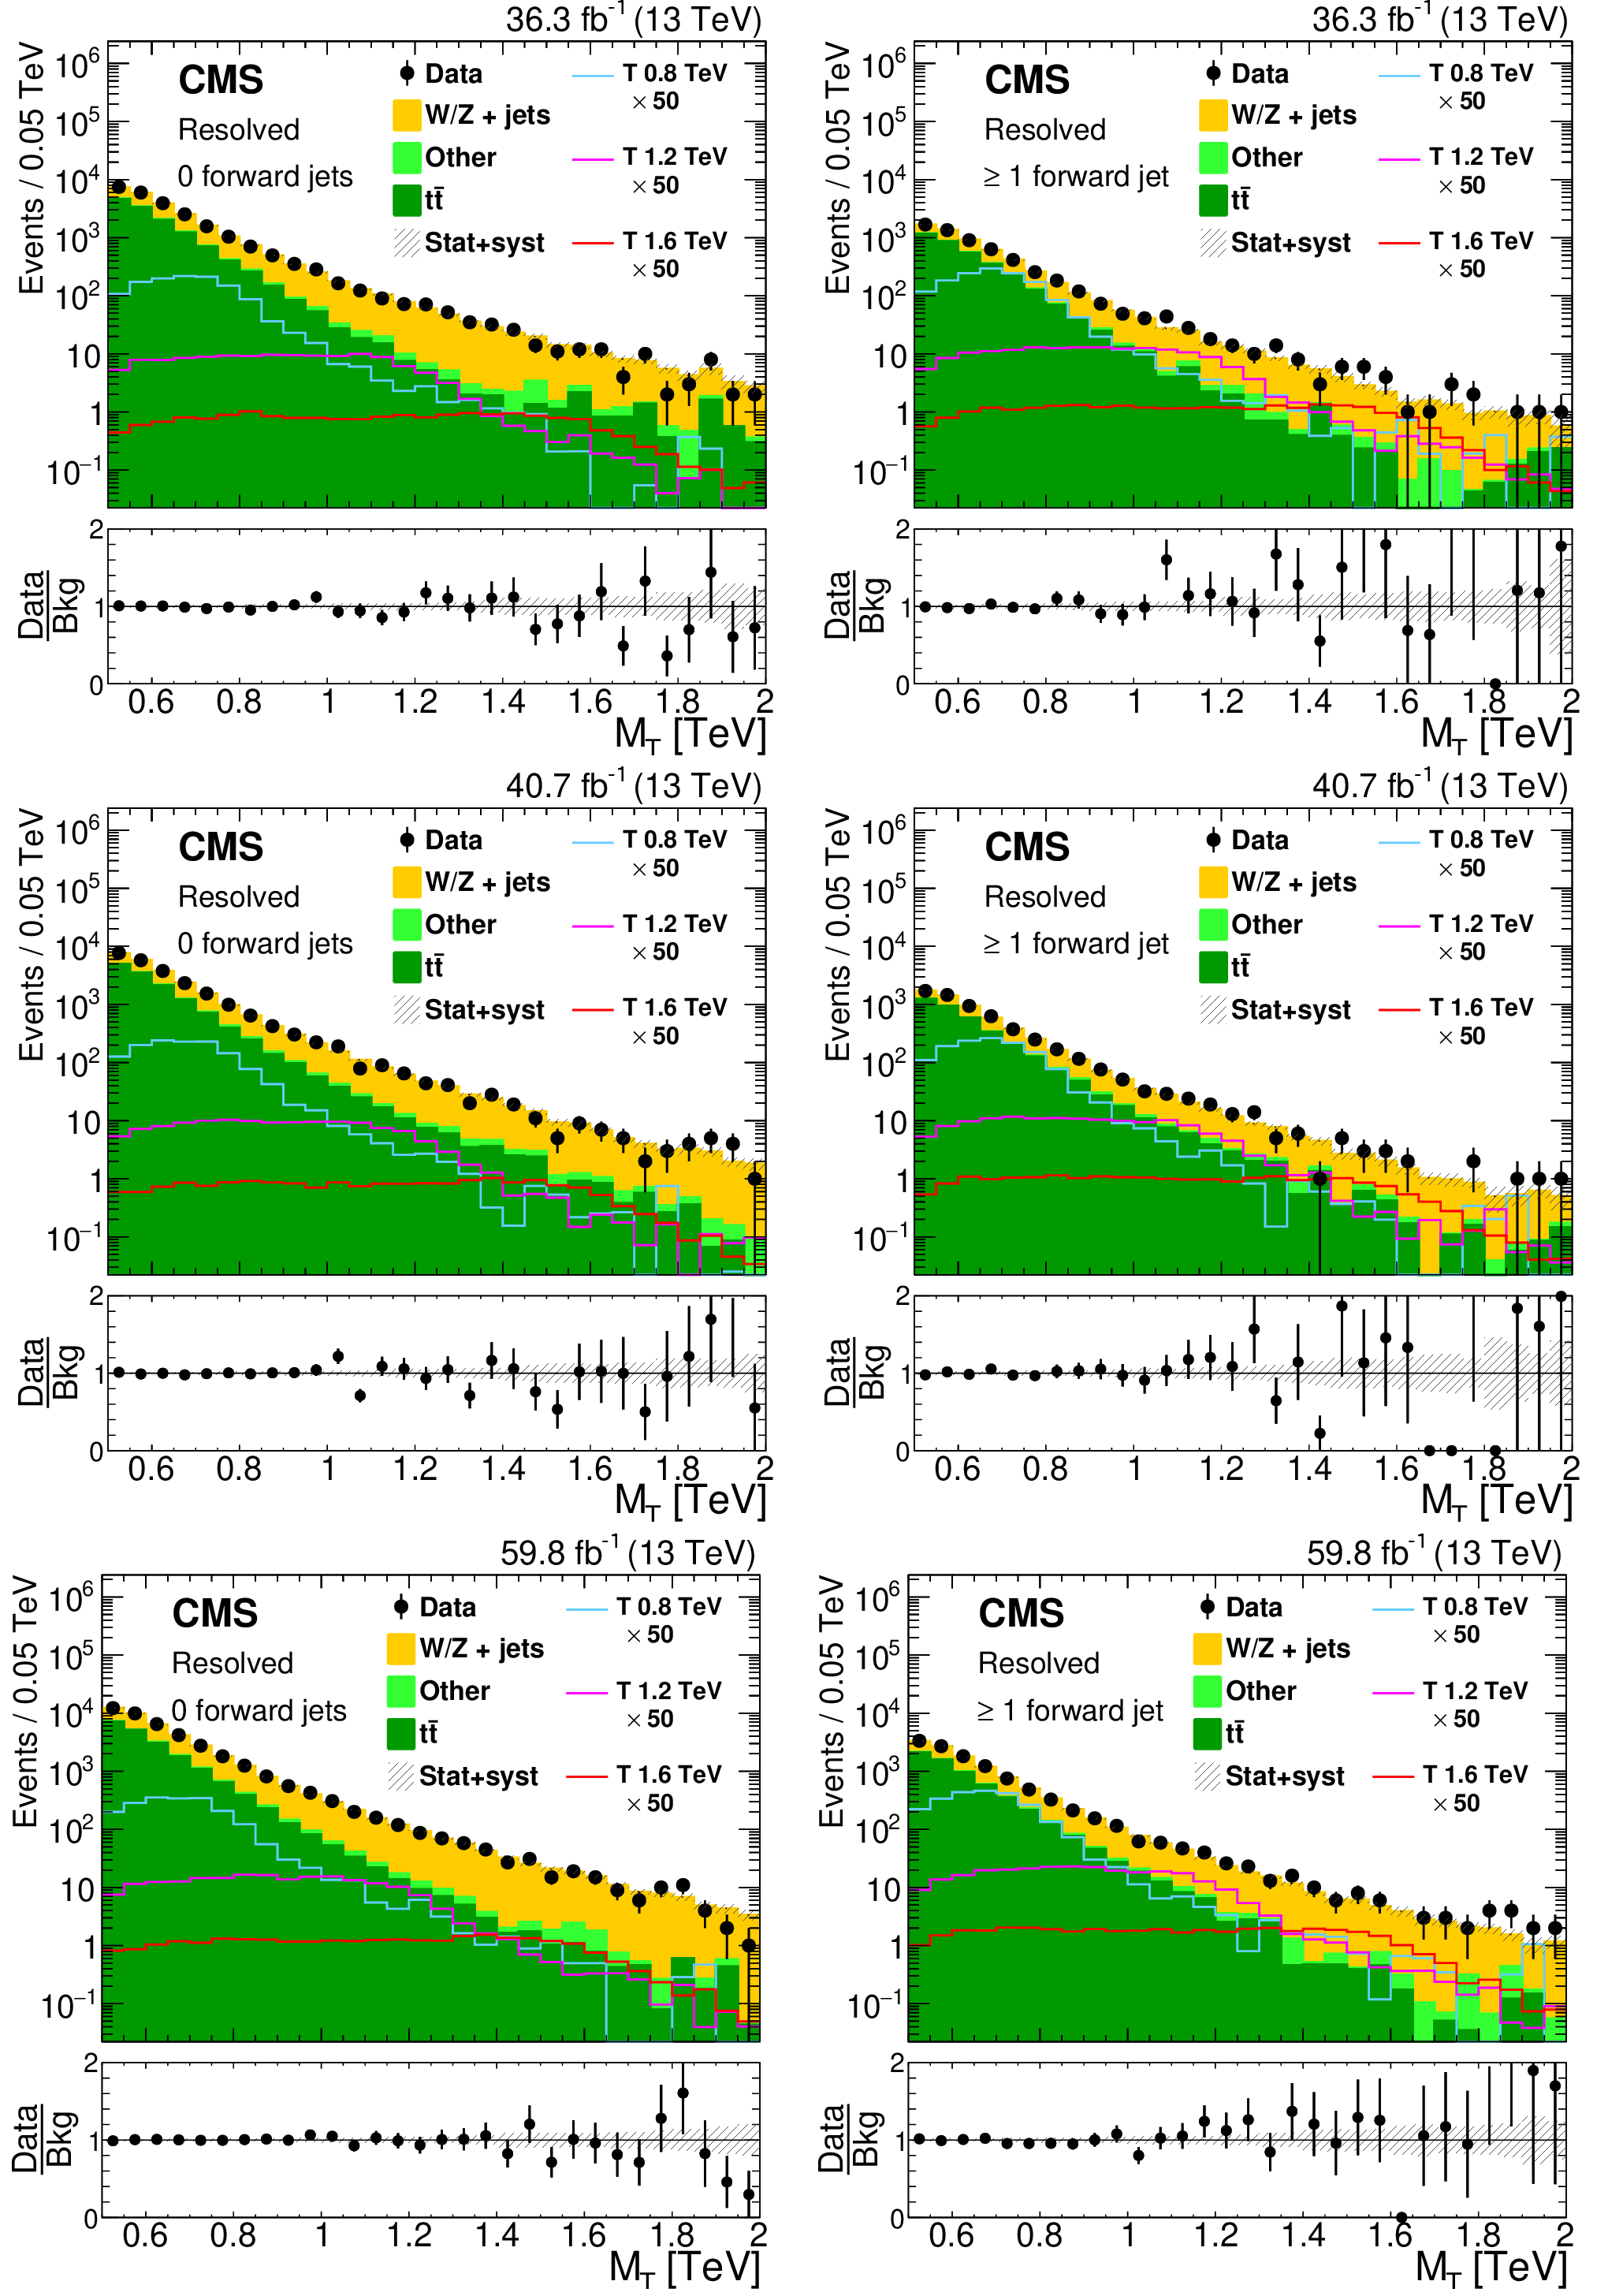
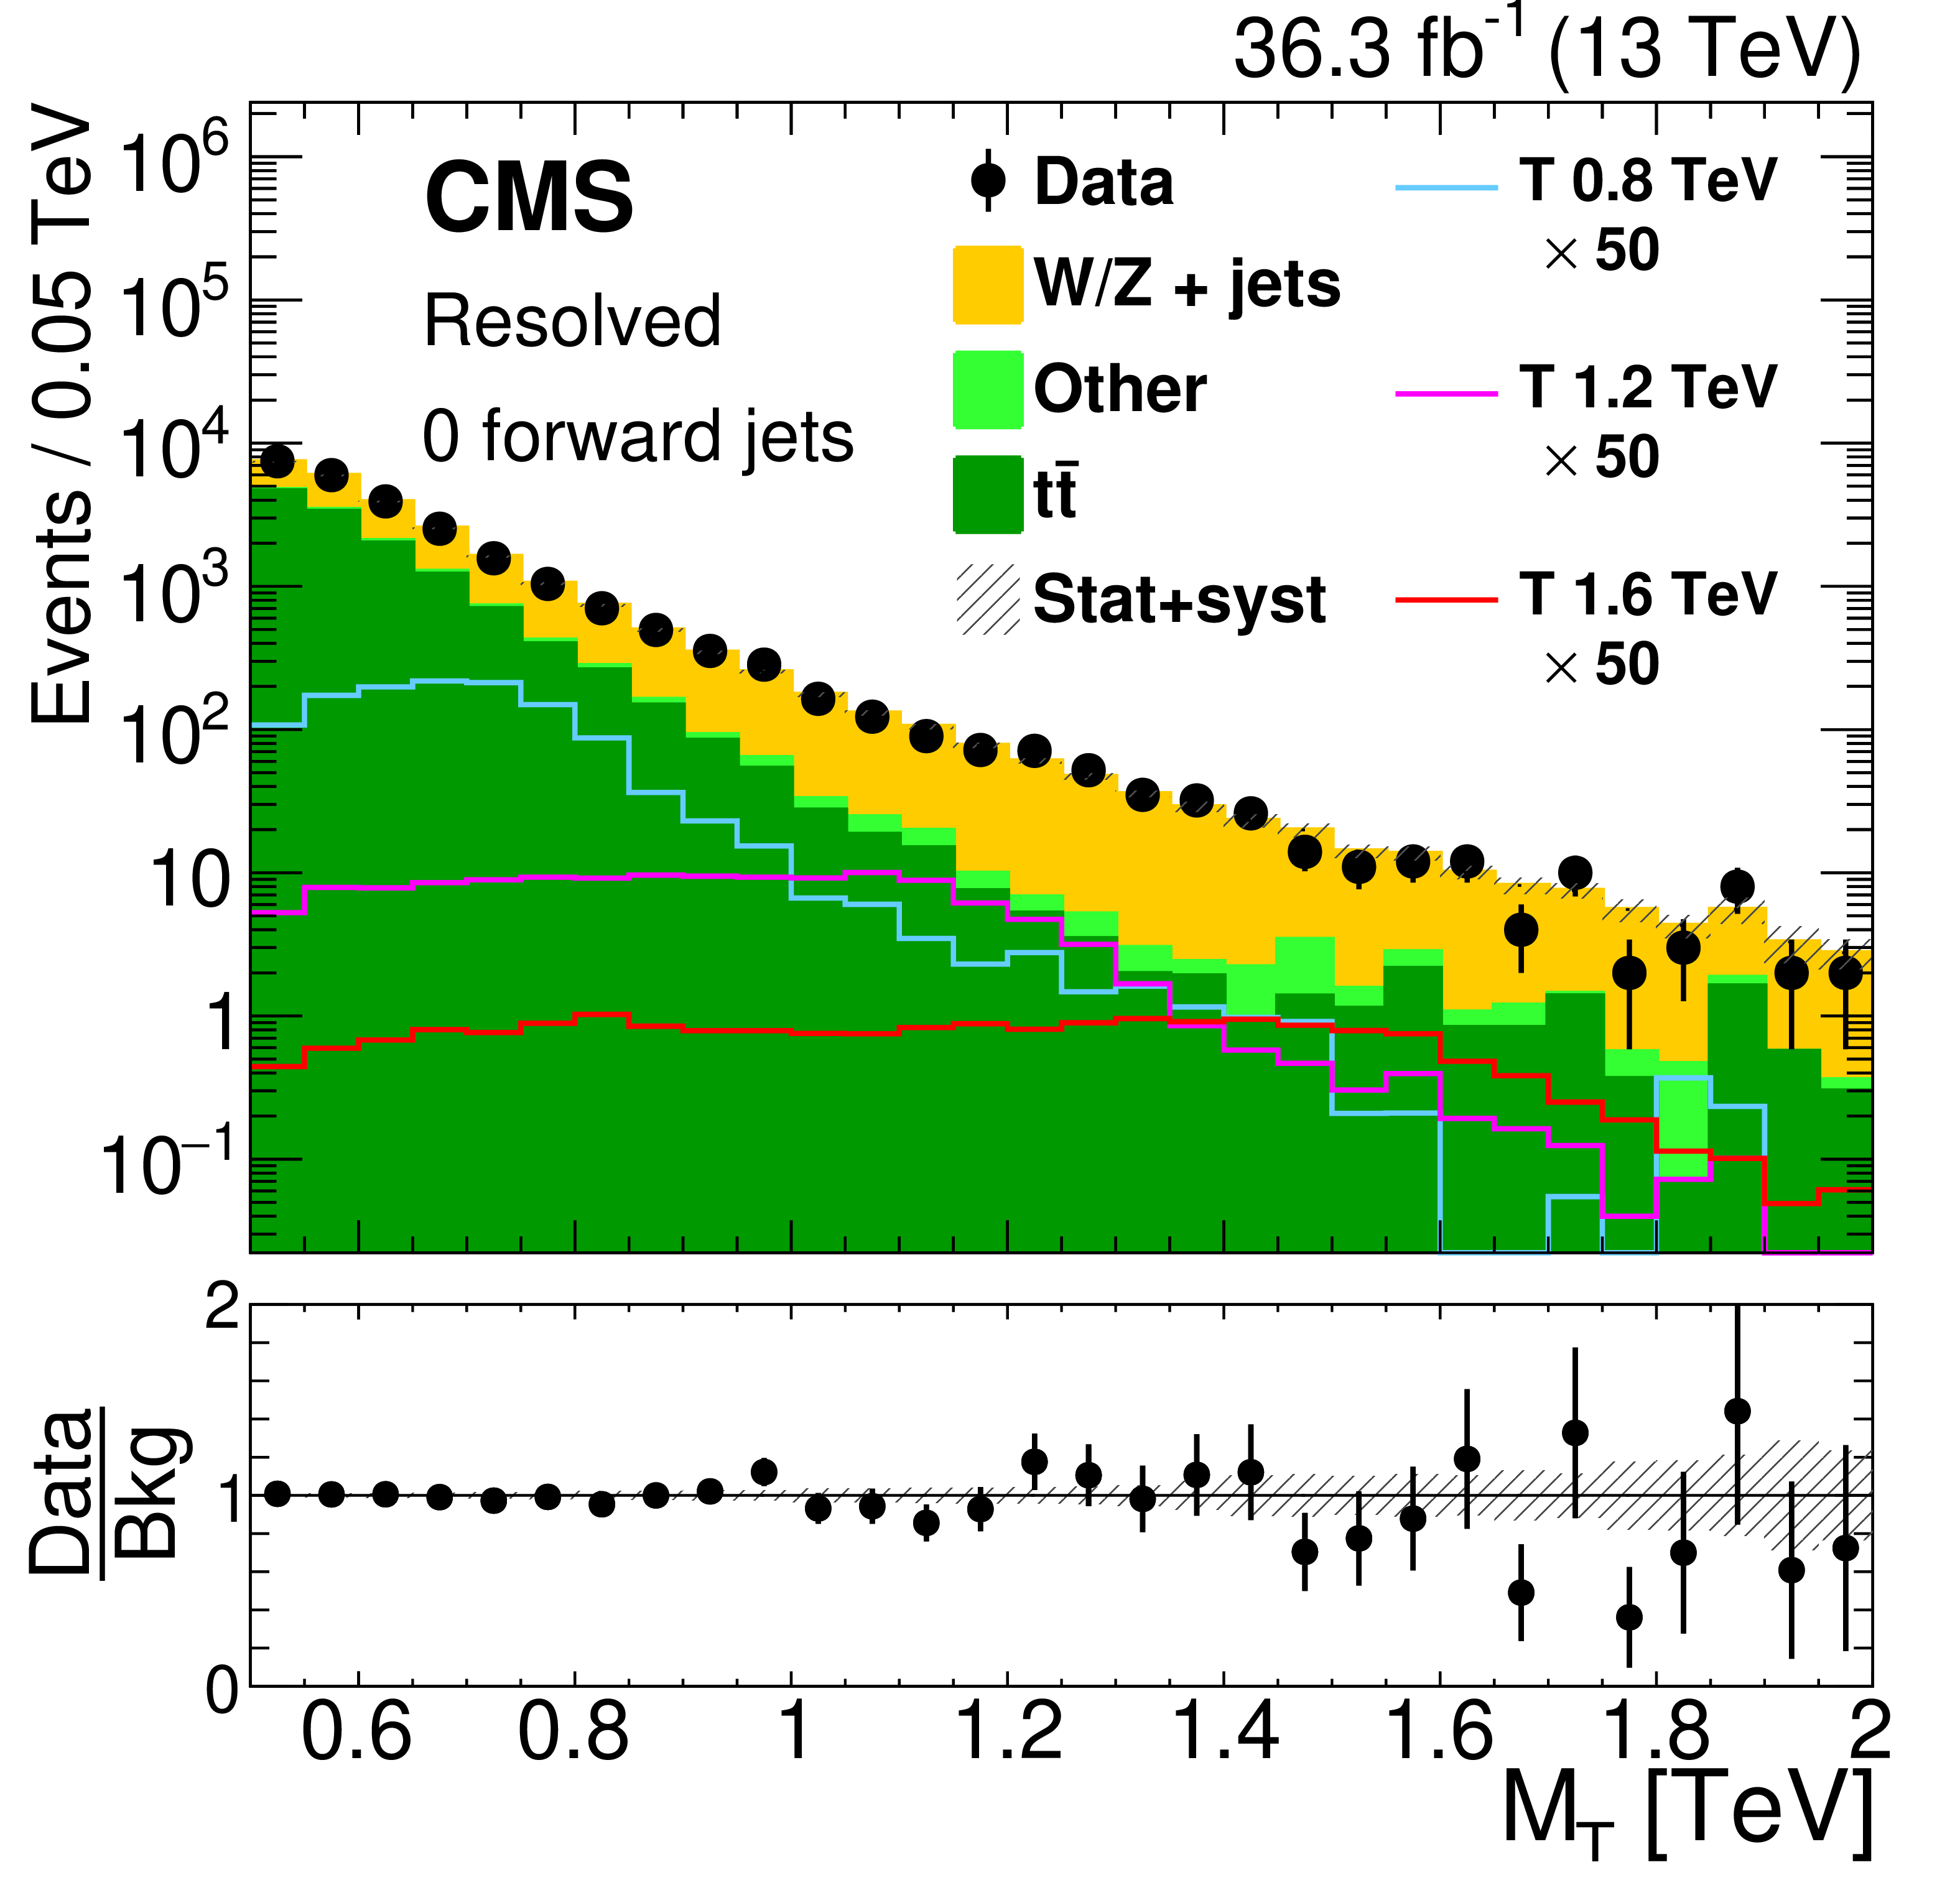
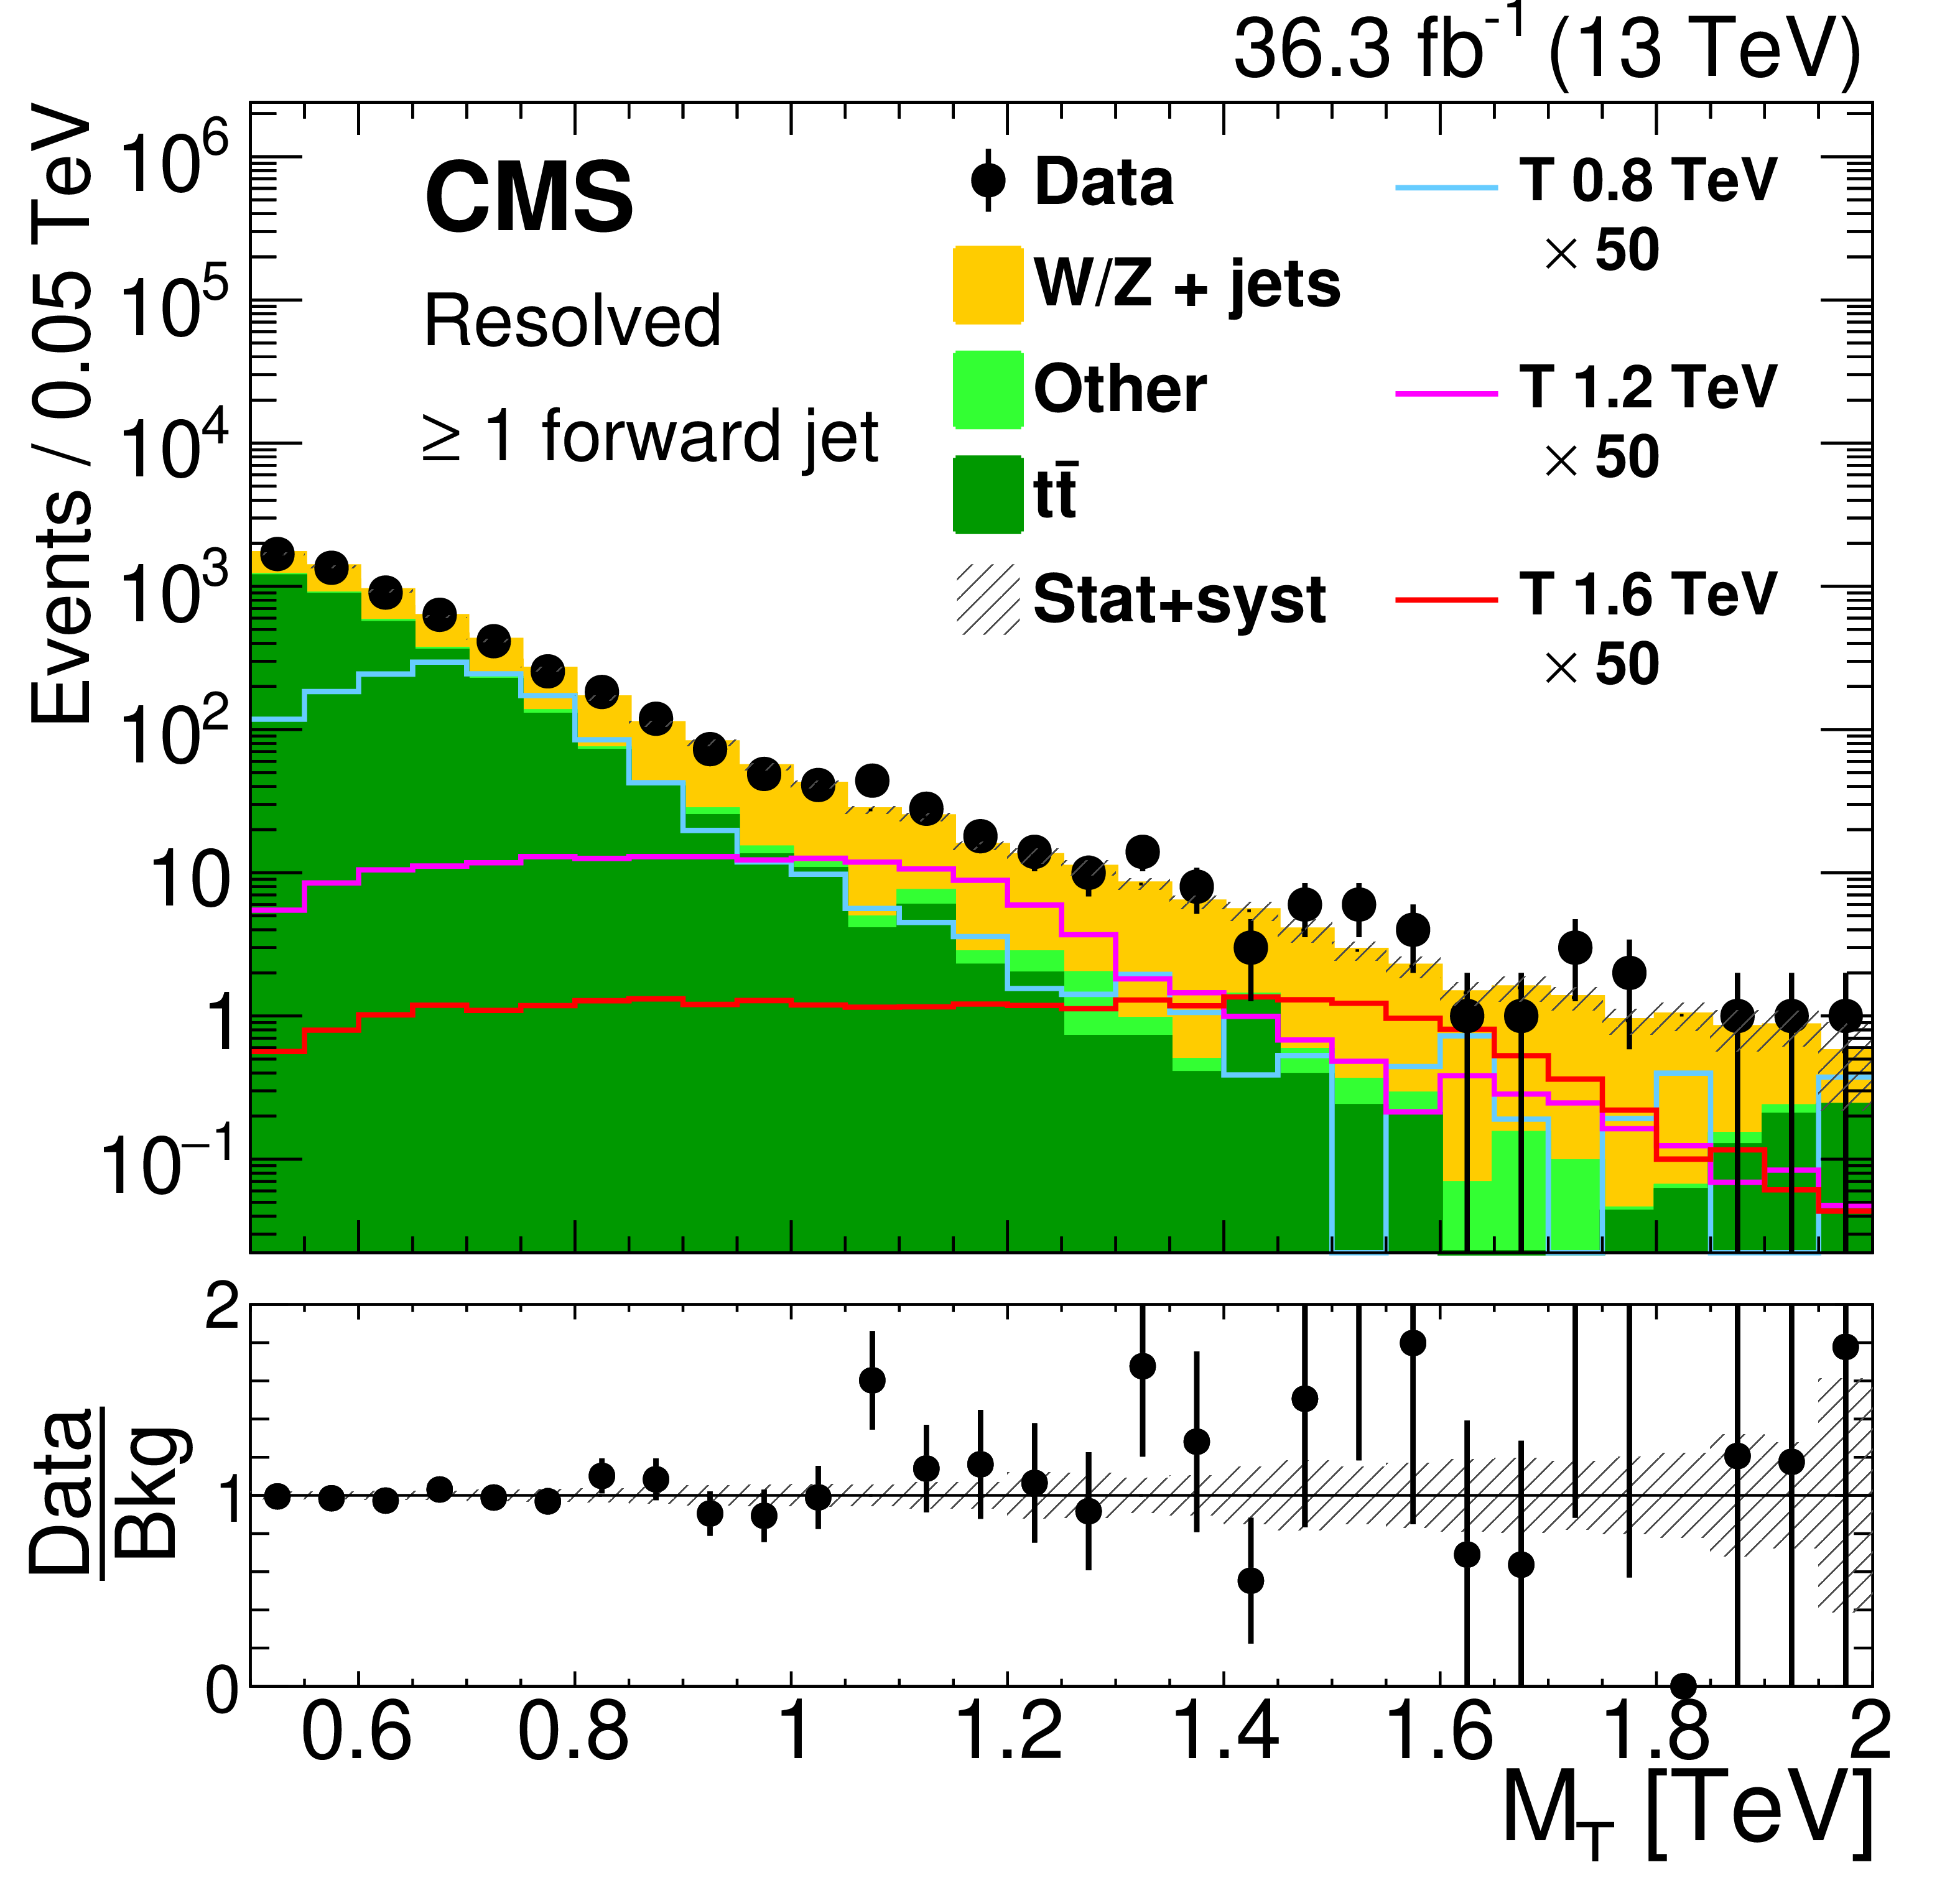
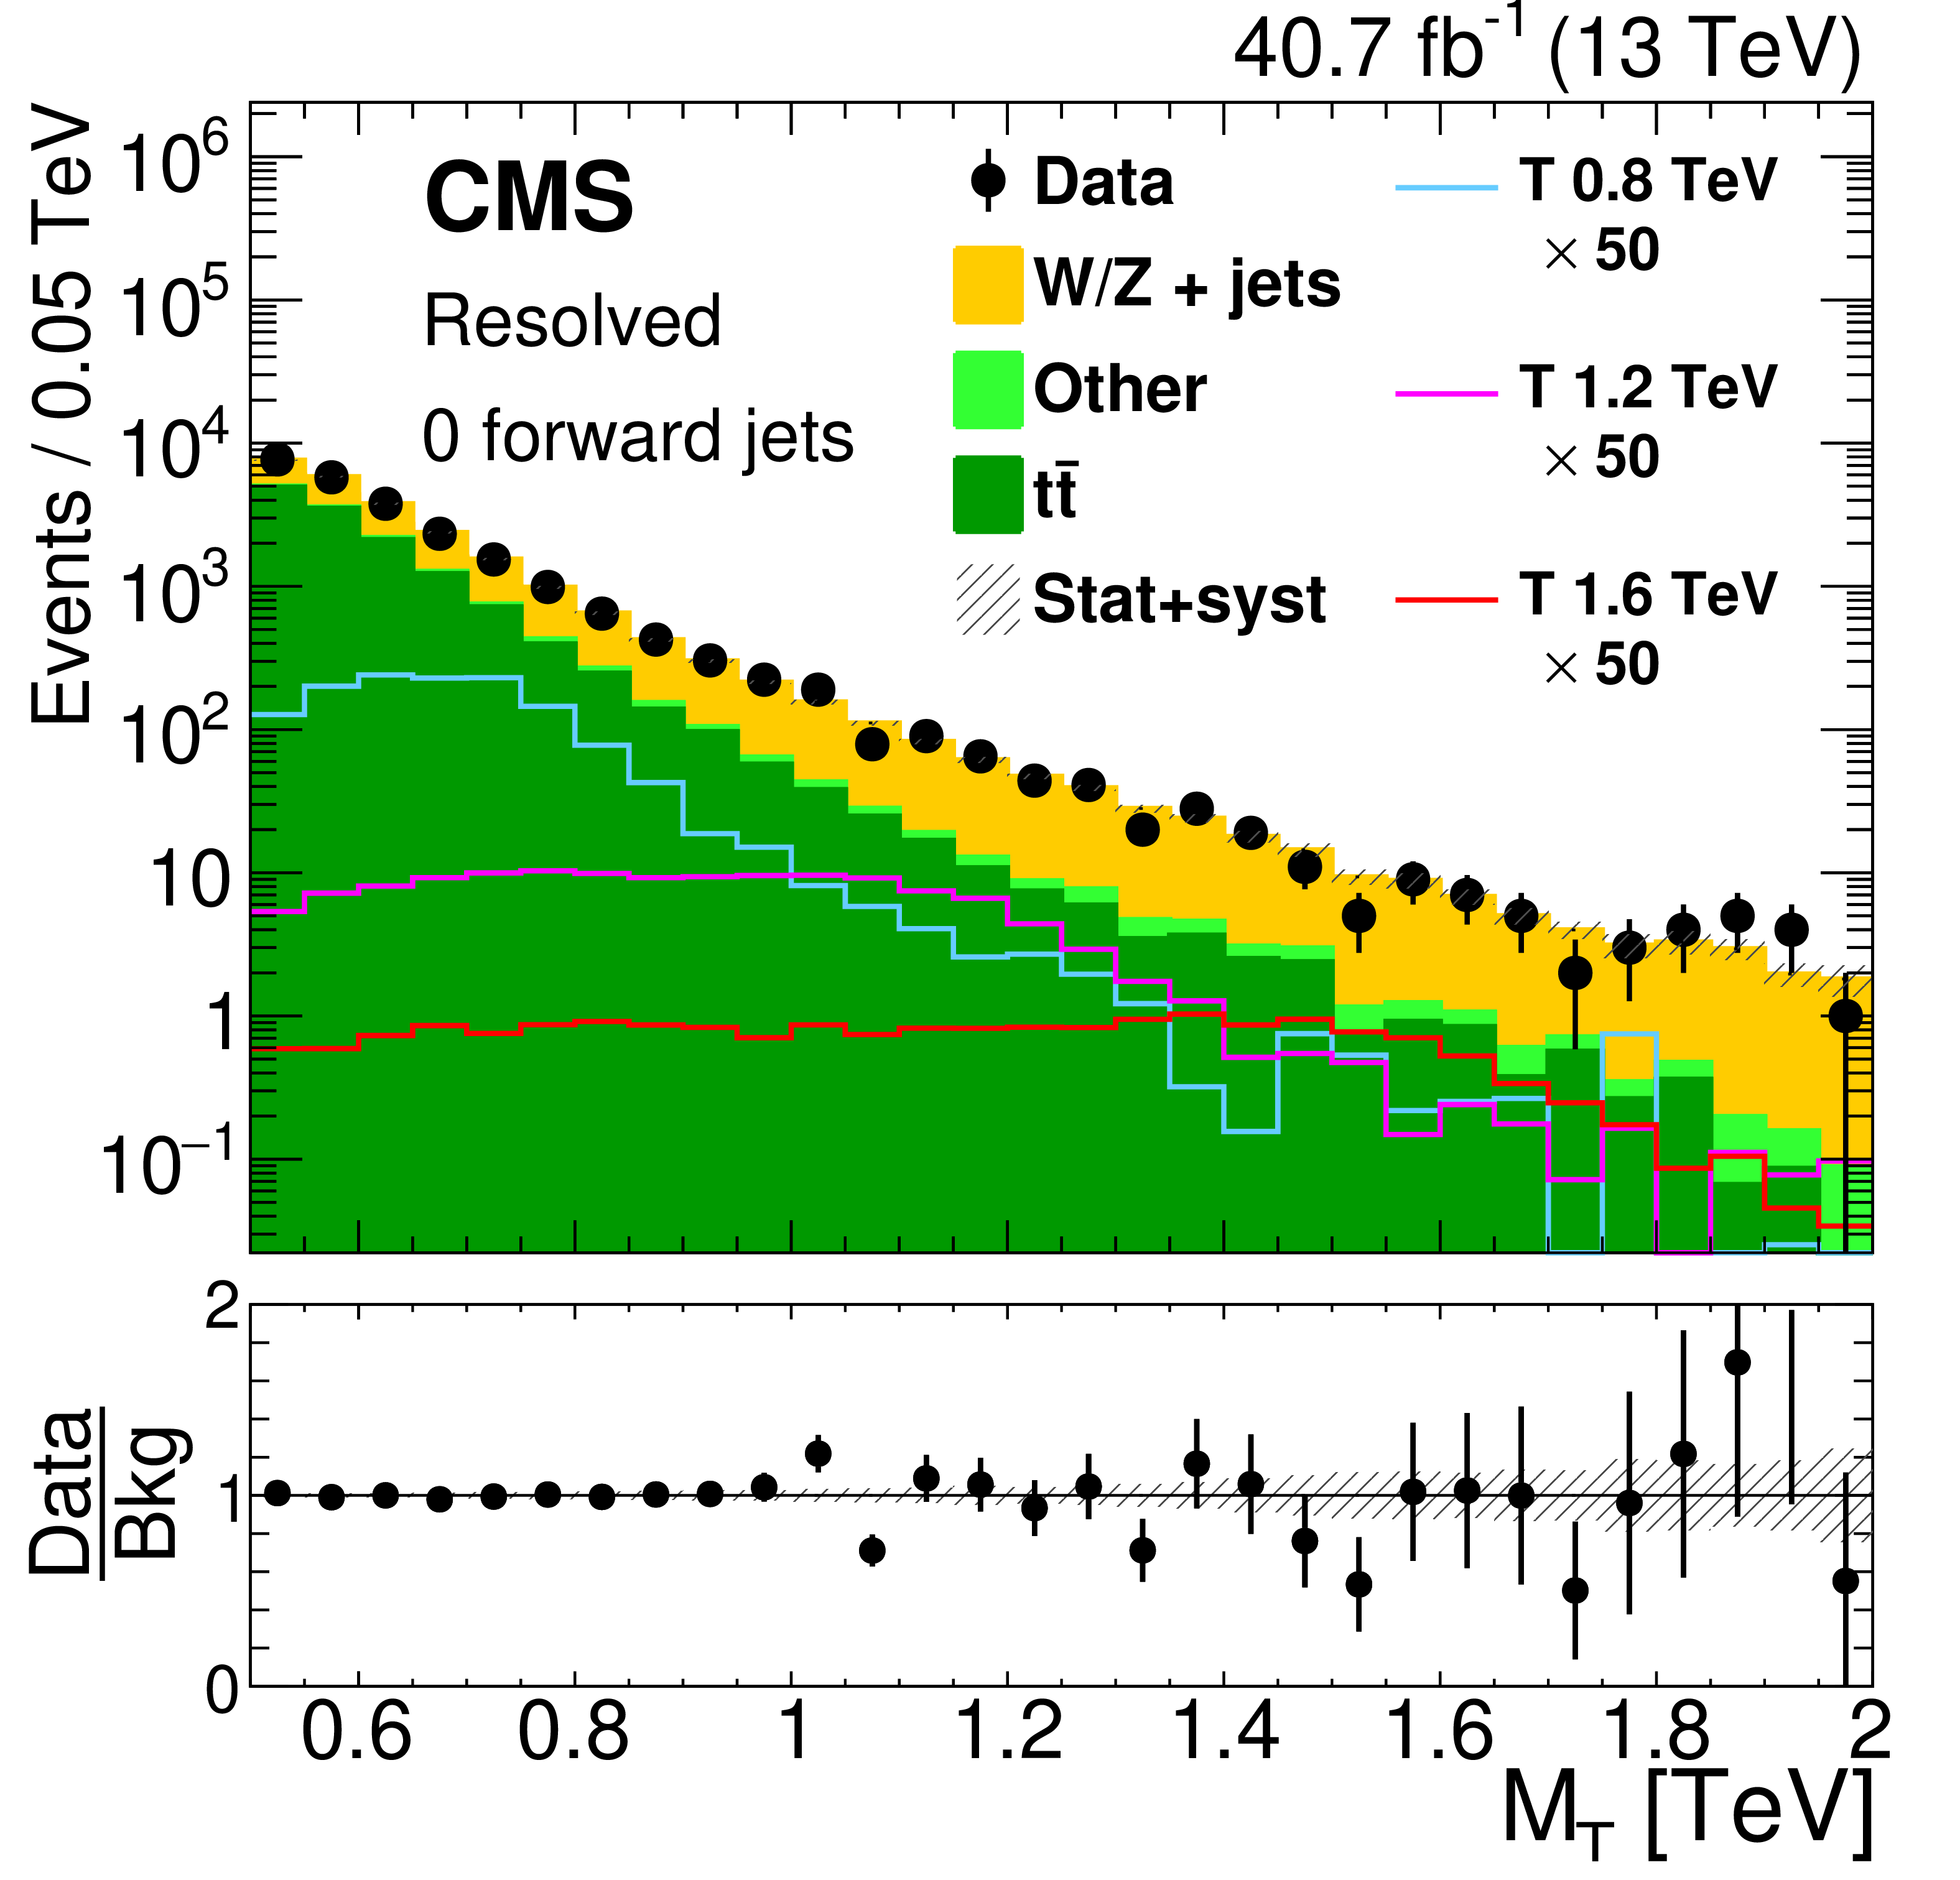
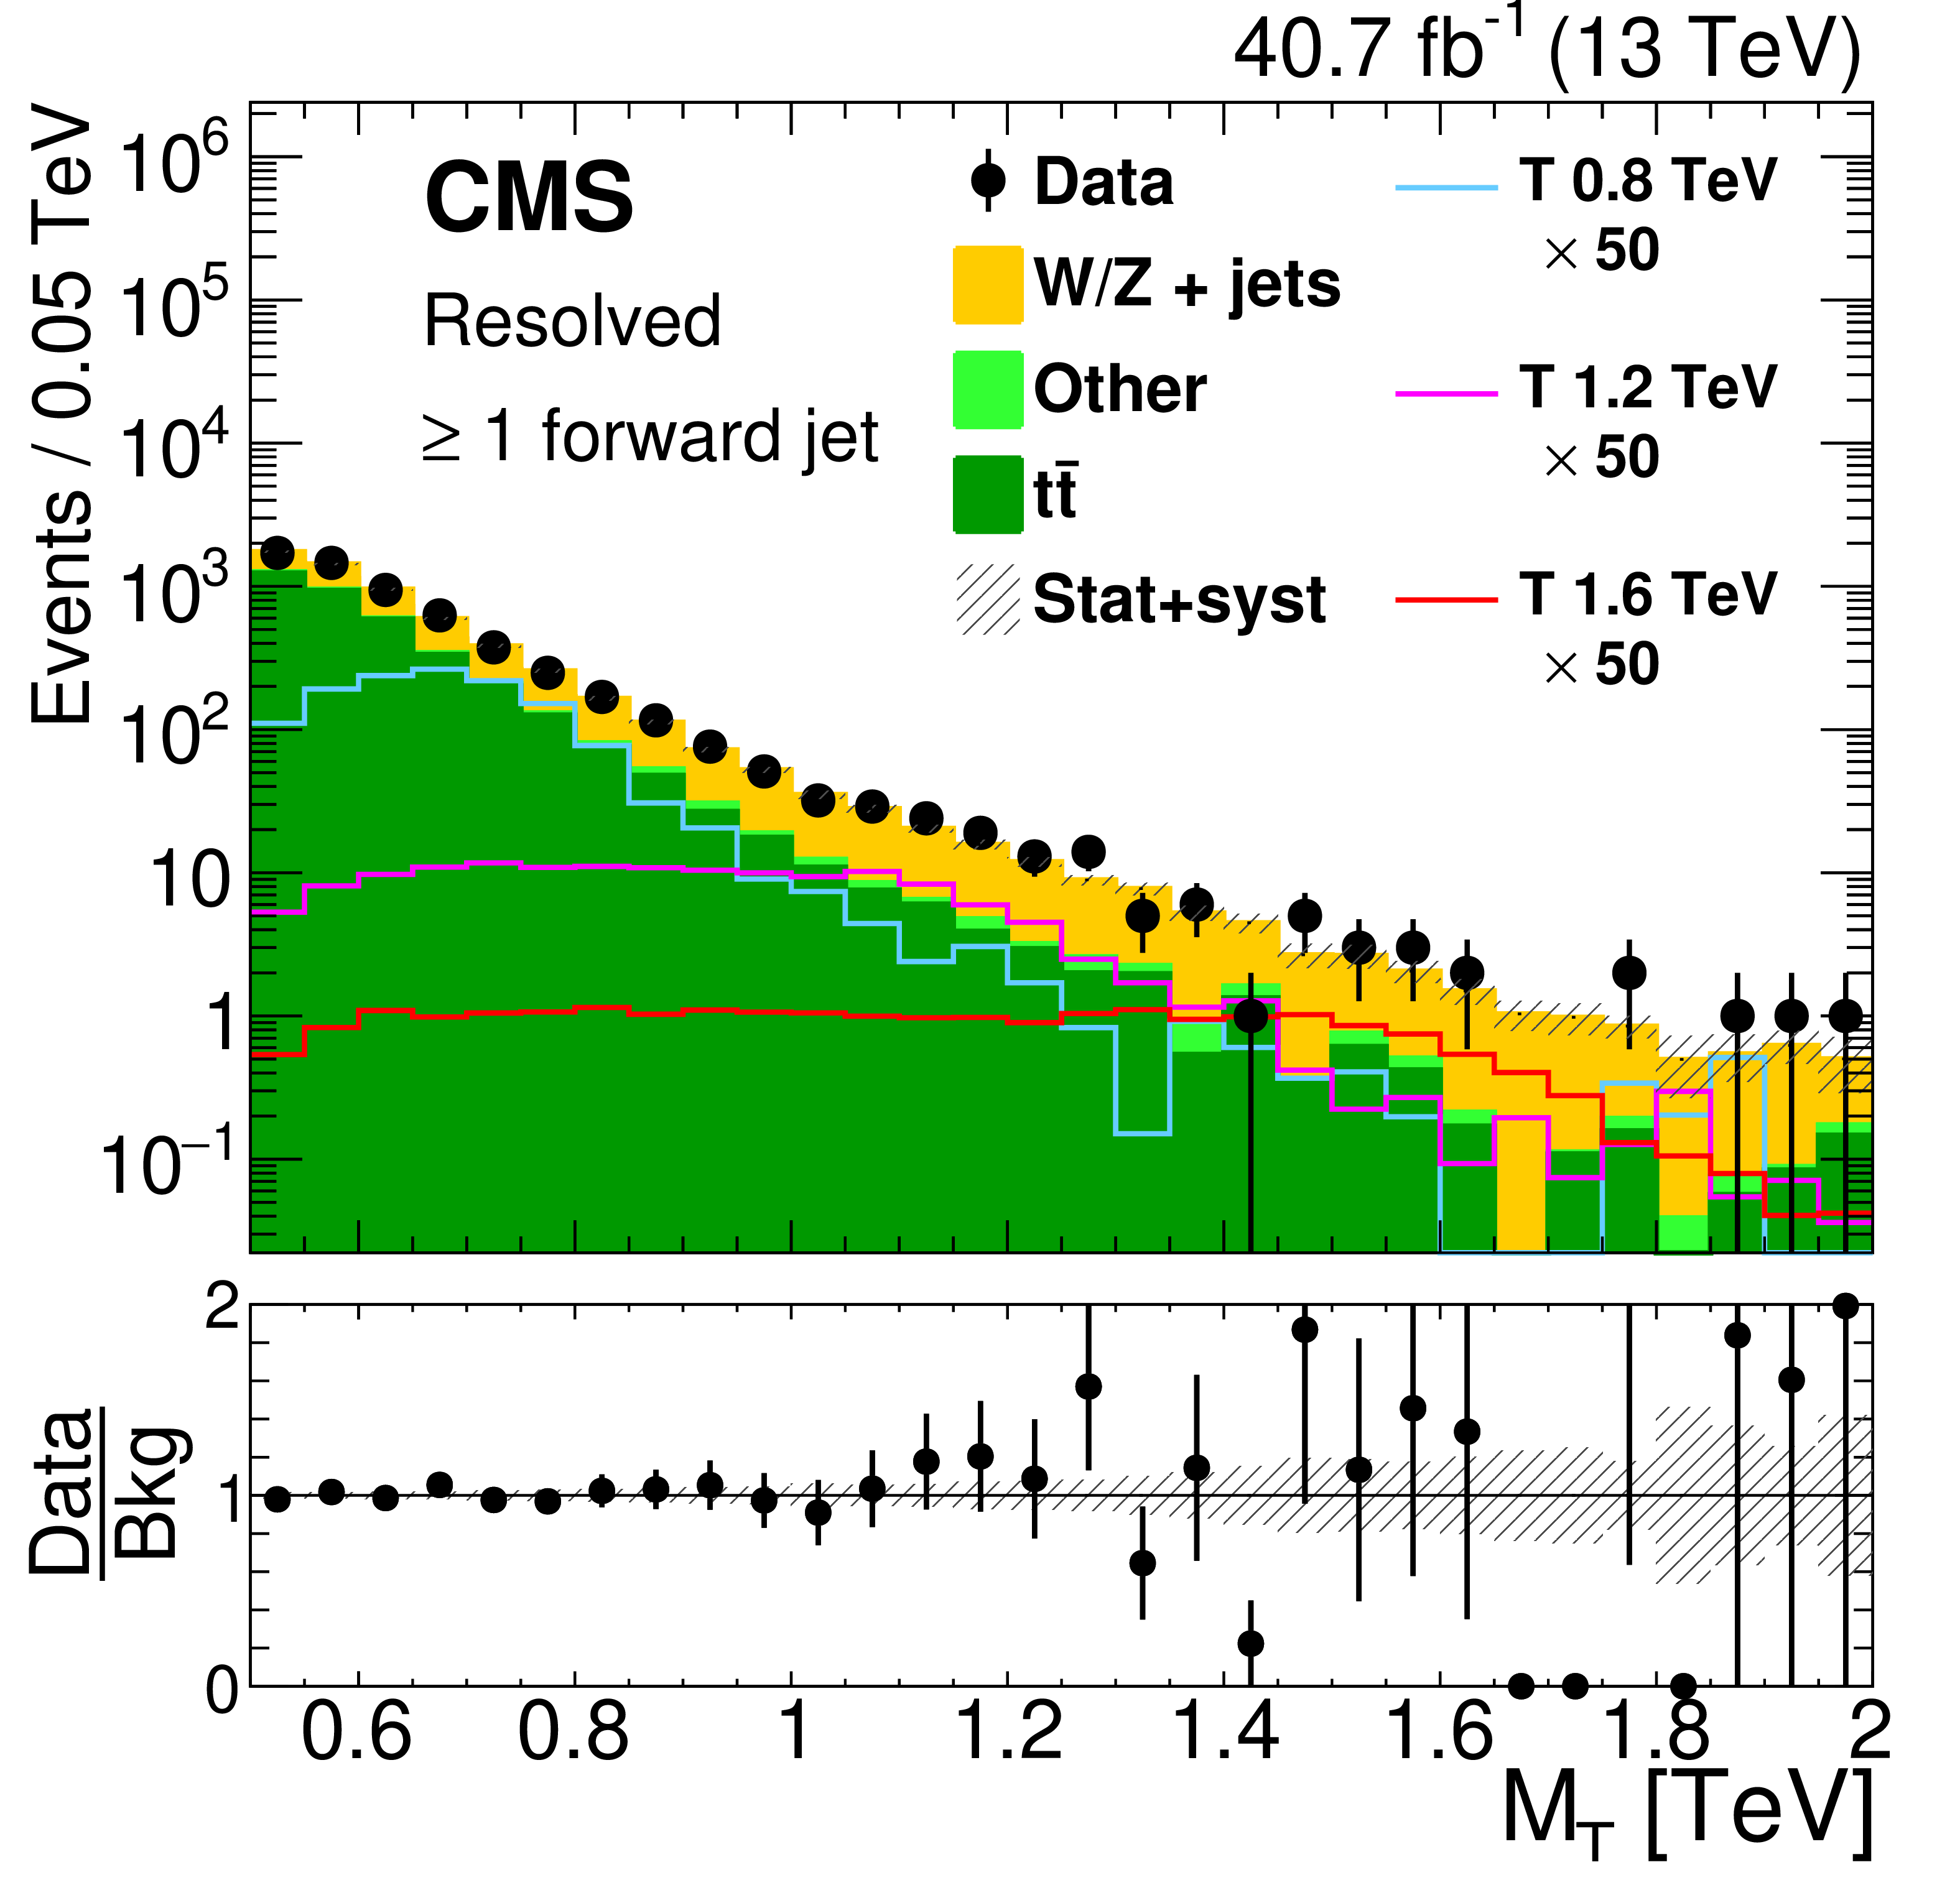
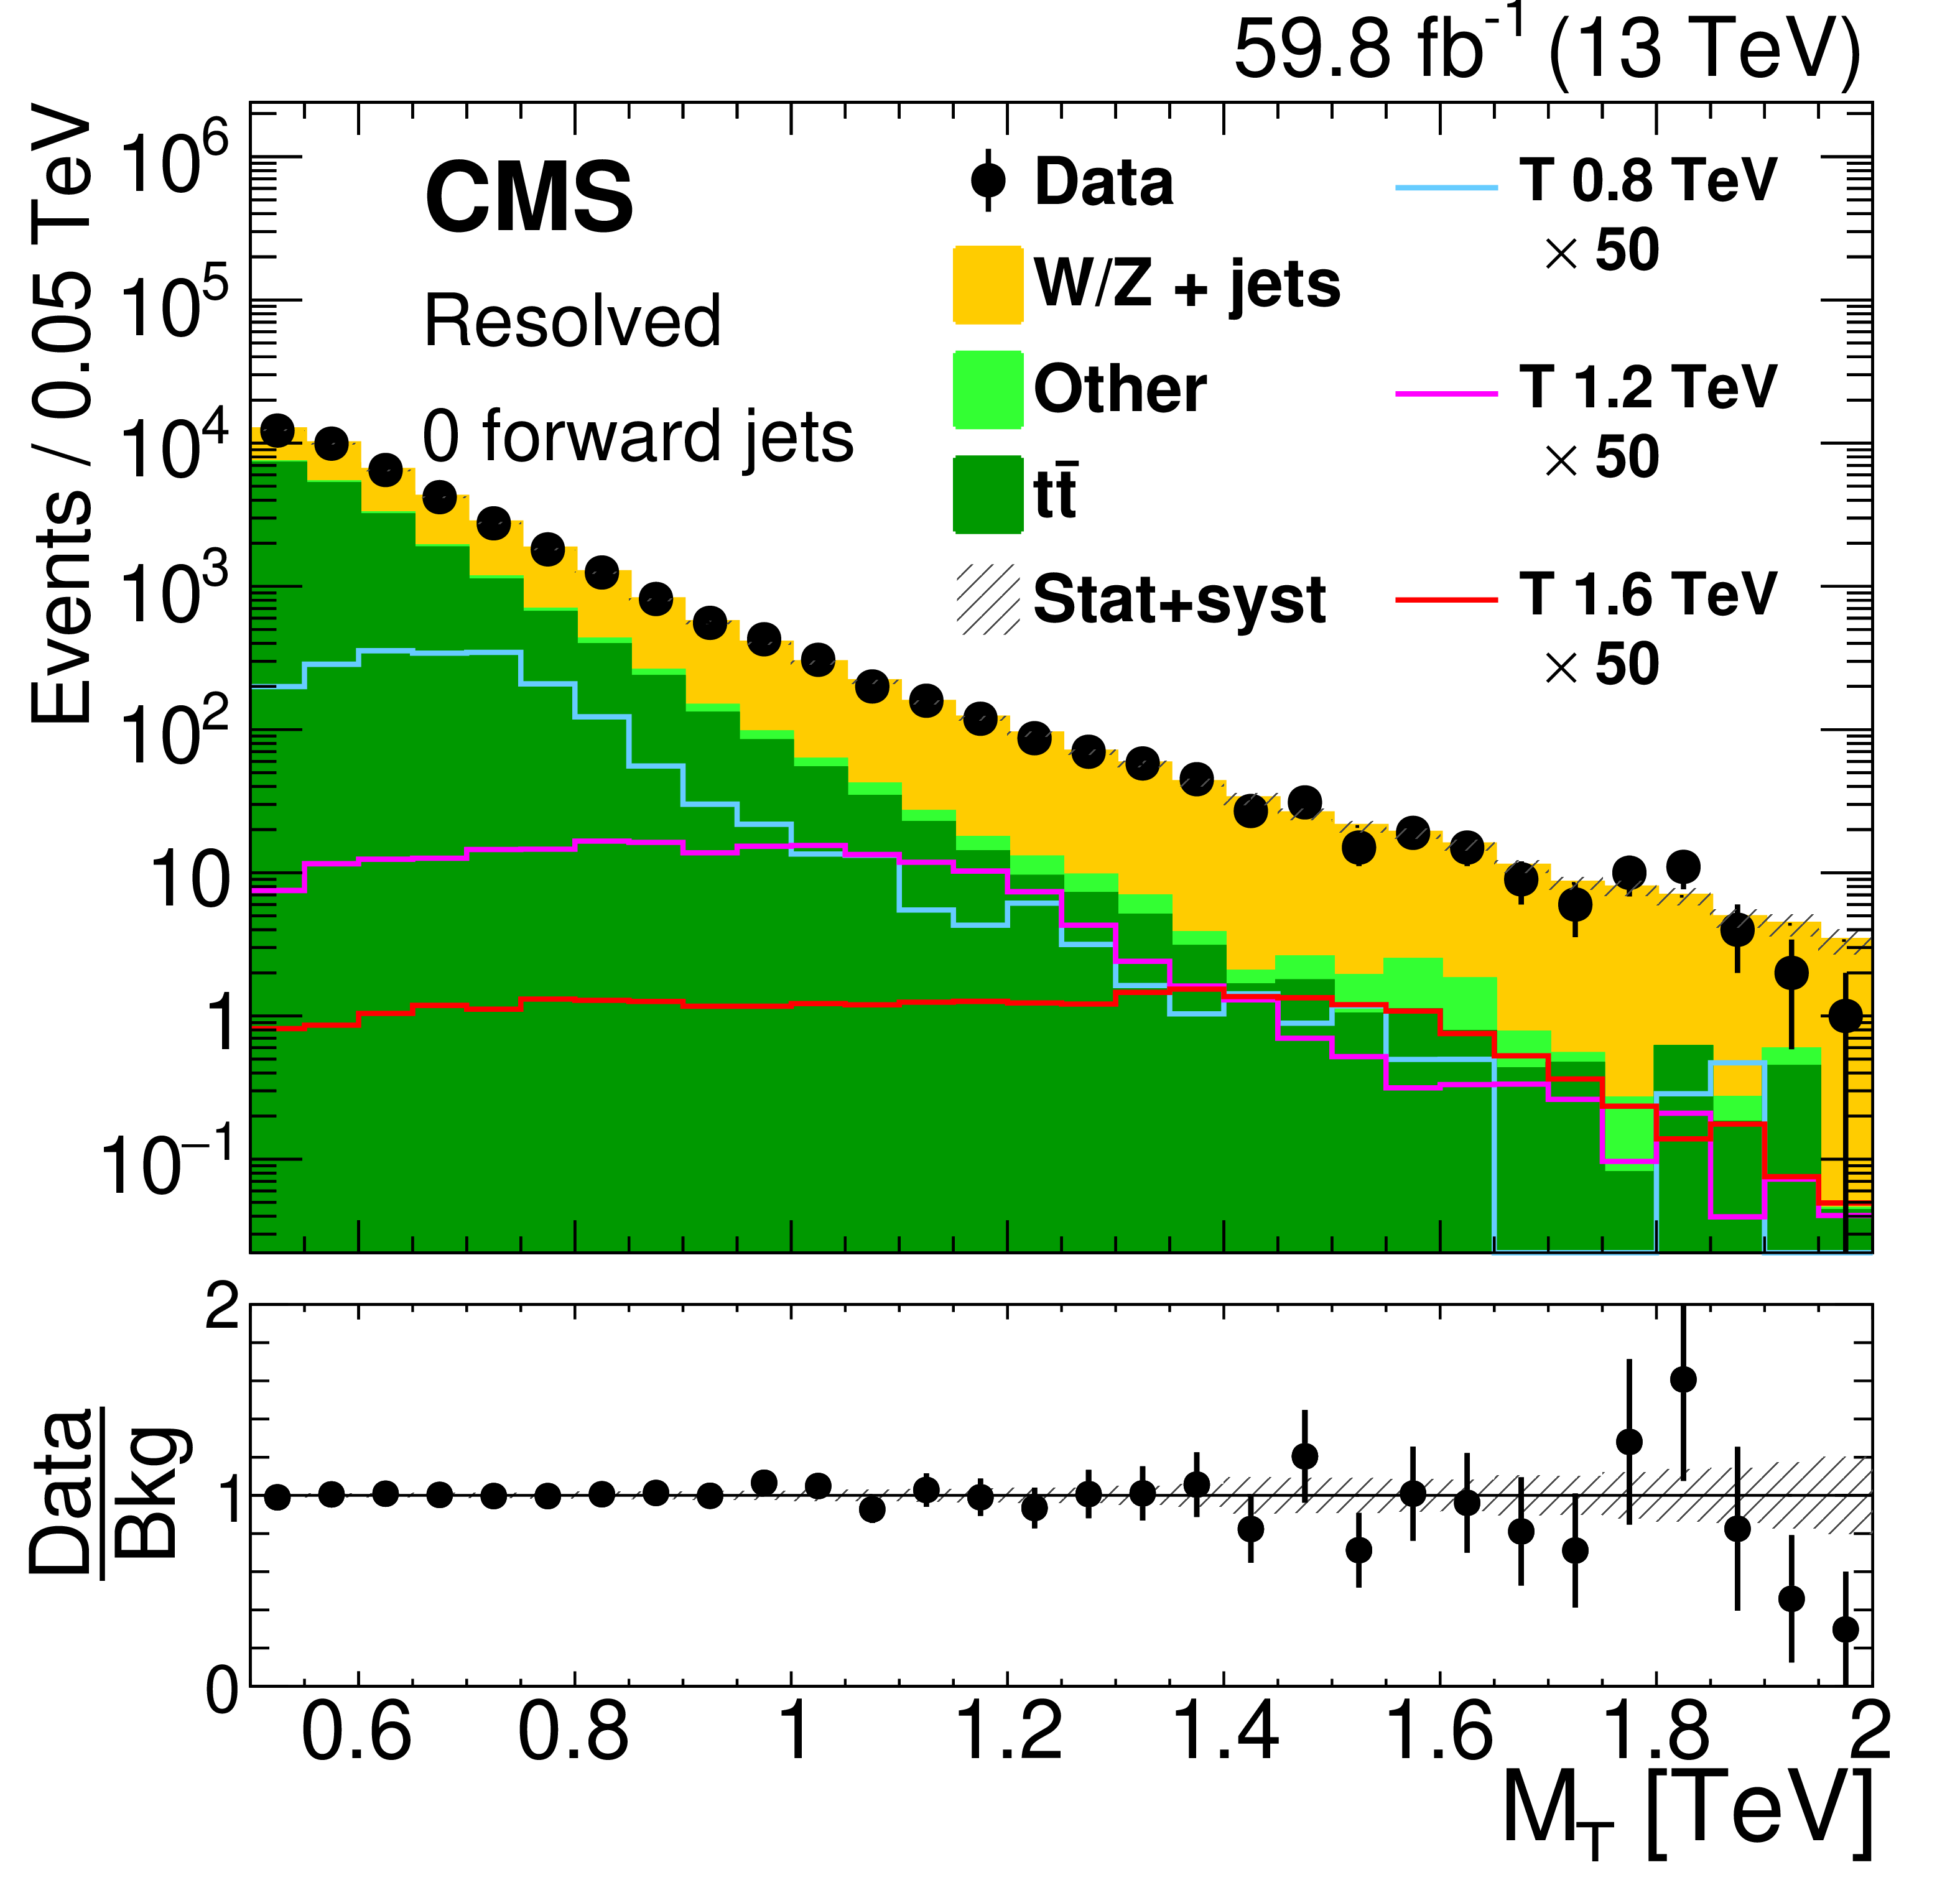
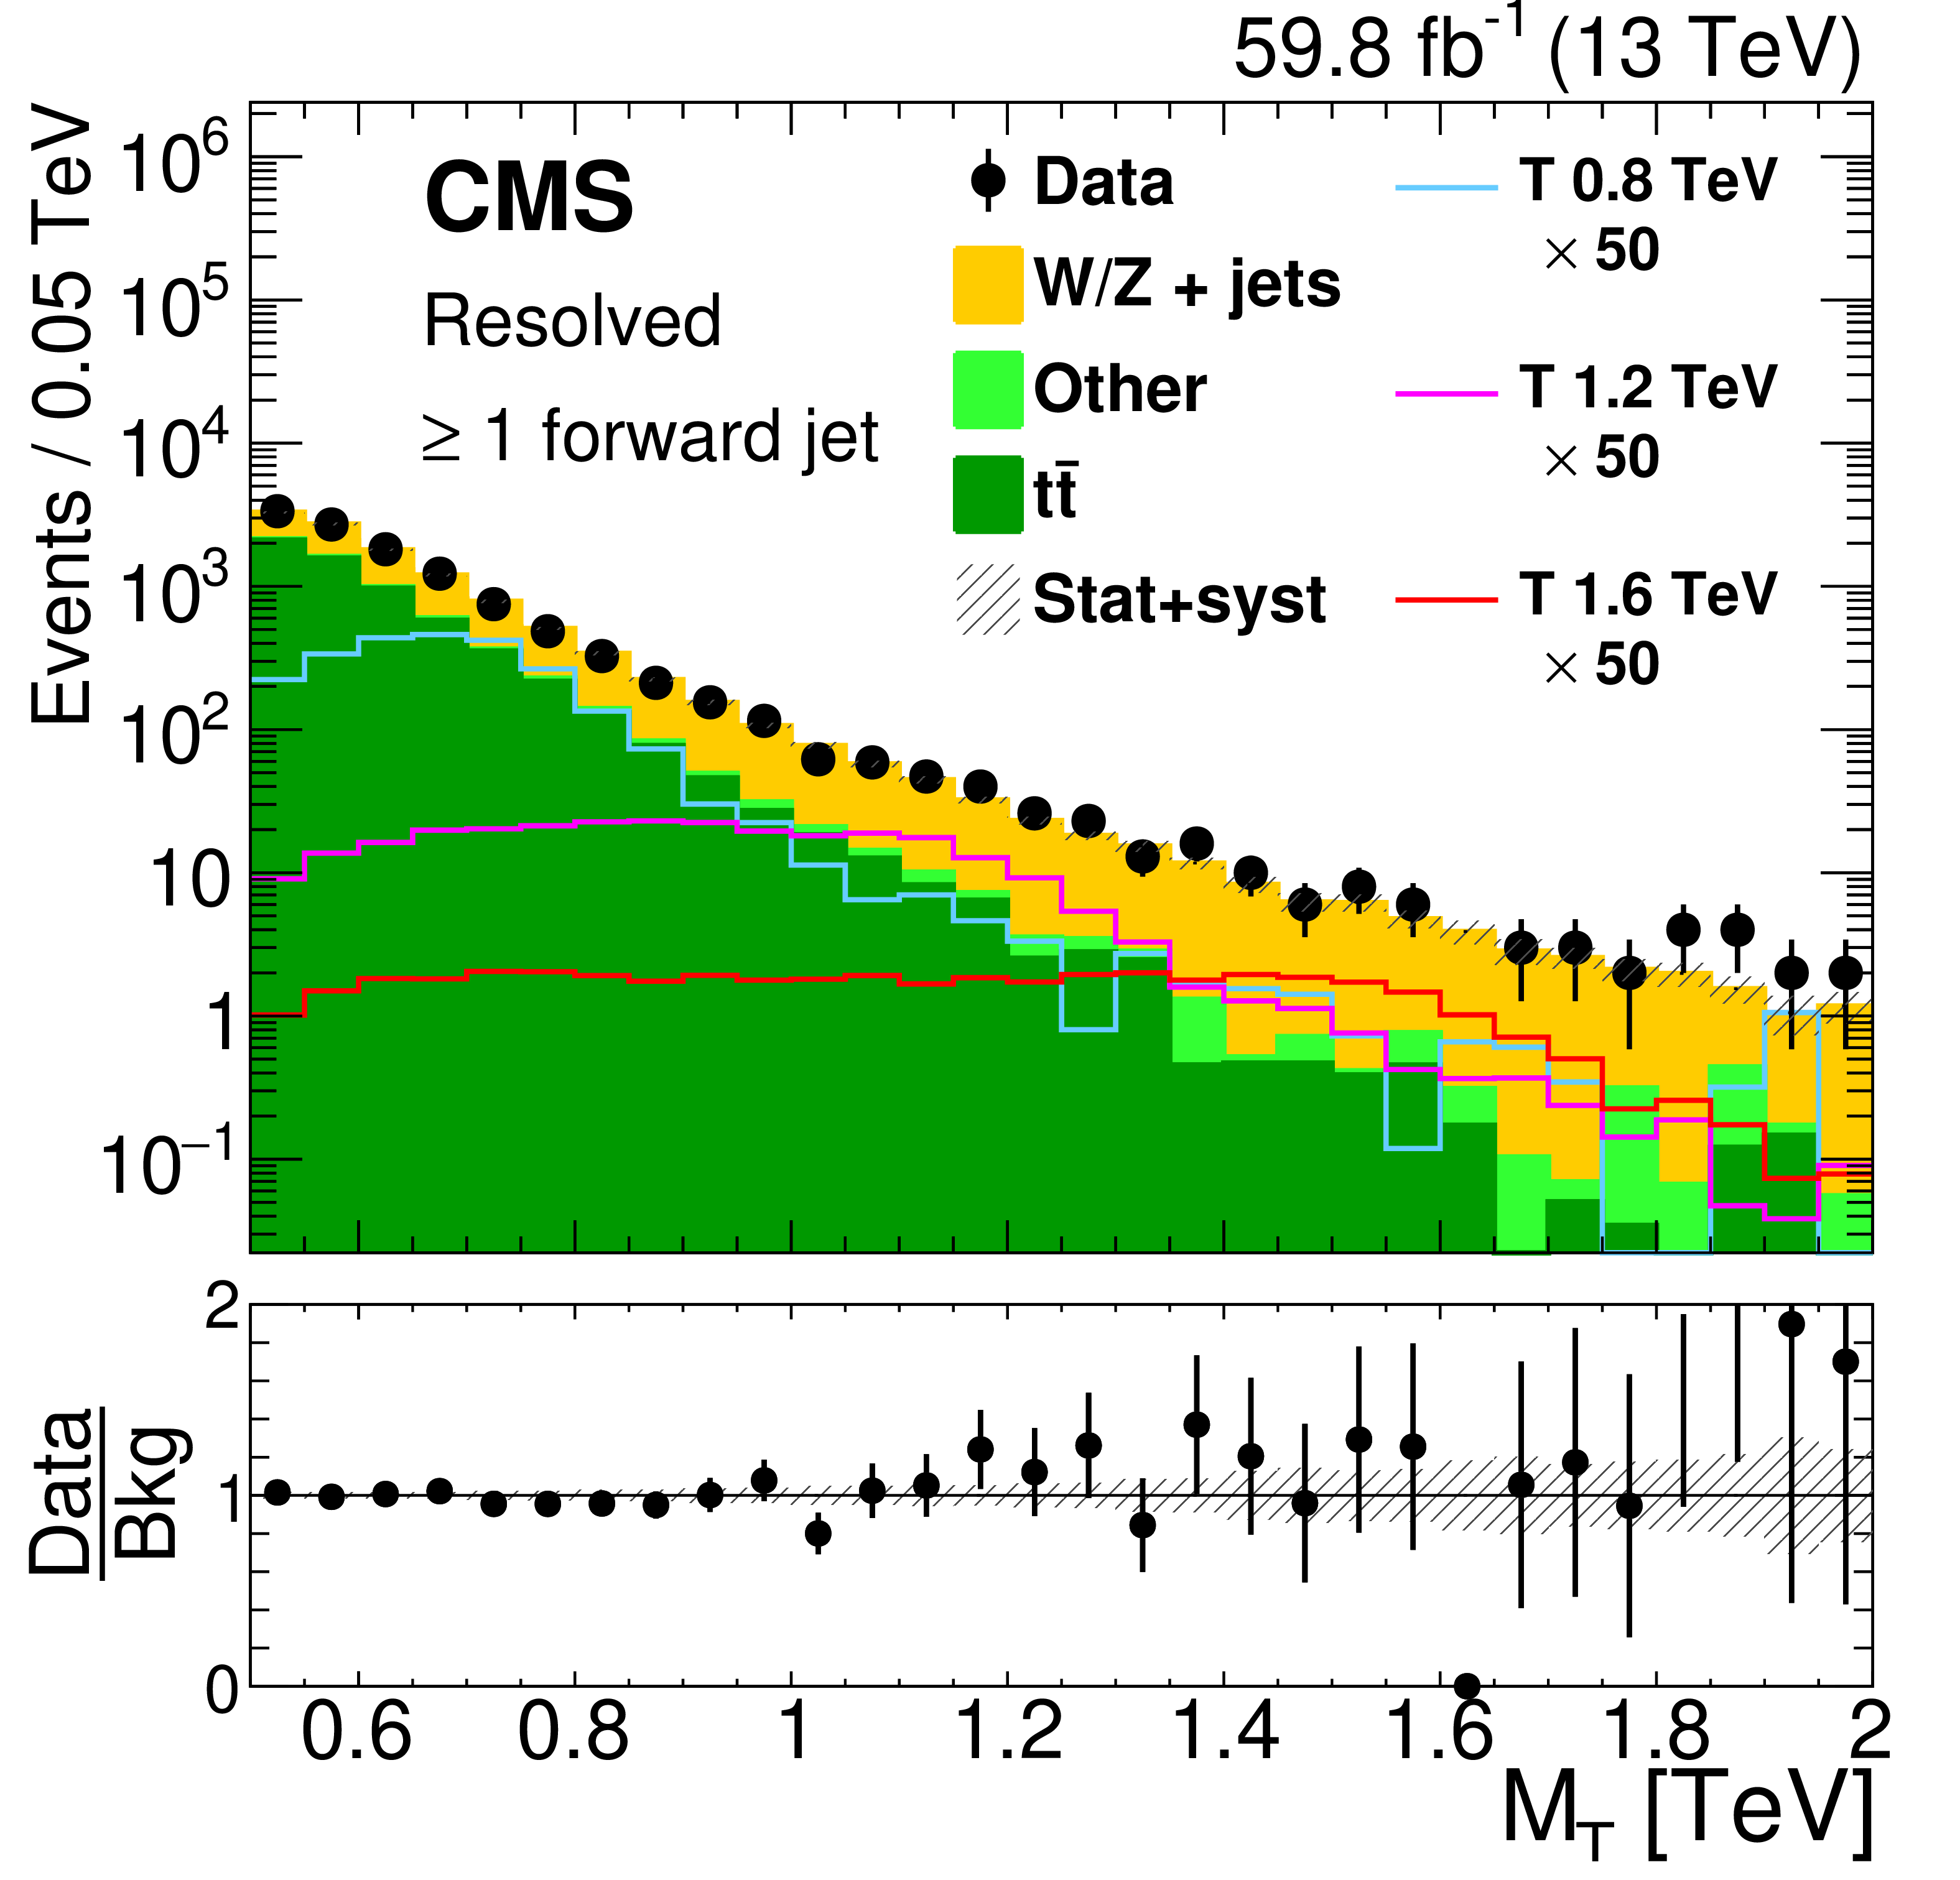
Figure 7:
Distributions of the transverse mass ${M_{{\mathrm {T}}}}$ of the reconstructed top quark and ${\vec{p}}_{\mathrm {T}}^{\,\text {miss}}$ system, for the selected events in the resolved categories, for events with no forward jet (left) and at least one forward jet (right), and for 2016 (upper), 2017 (central), and 2018 (lower). The distributions for the main background components have been determined in simulation with scale factors extracted from control regions. All background processes and the respective uncertainties are derived from the fit to data, while the distributions of signal processes are represented according to the expectation before the fit. The lines show the signal predictions for three benchmark mass values (0.8, 1.2, and 1.6 TeV) of a T quark of negligible resonance width. Signal yields are multiplied by a factor of 50 to improve their visibility. |
png pdf |
Figure 7-a:
Distributions of the transverse mass ${M_{{\mathrm {T}}}}$ of the reconstructed top quark and ${\vec{p}}_{\mathrm {T}}^{\,\text {miss}}$ system, for the selected events in the resolved categories, for events with no forward jet (left) and at least one forward jet (right), and for 2016 (upper), 2017 (central), and 2018 (lower). The distributions for the main background components have been determined in simulation with scale factors extracted from control regions. All background processes and the respective uncertainties are derived from the fit to data, while the distributions of signal processes are represented according to the expectation before the fit. The lines show the signal predictions for three benchmark mass values (0.8, 1.2, and 1.6 TeV) of a T quark of negligible resonance width. Signal yields are multiplied by a factor of 50 to improve their visibility. |
png pdf |
Figure 7-b:
Distributions of the transverse mass ${M_{{\mathrm {T}}}}$ of the reconstructed top quark and ${\vec{p}}_{\mathrm {T}}^{\,\text {miss}}$ system, for the selected events in the resolved categories, for events with no forward jet (left) and at least one forward jet (right), and for 2016 (upper), 2017 (central), and 2018 (lower). The distributions for the main background components have been determined in simulation with scale factors extracted from control regions. All background processes and the respective uncertainties are derived from the fit to data, while the distributions of signal processes are represented according to the expectation before the fit. The lines show the signal predictions for three benchmark mass values (0.8, 1.2, and 1.6 TeV) of a T quark of negligible resonance width. Signal yields are multiplied by a factor of 50 to improve their visibility. |
png pdf |
Figure 7-c:
Distributions of the transverse mass ${M_{{\mathrm {T}}}}$ of the reconstructed top quark and ${\vec{p}}_{\mathrm {T}}^{\,\text {miss}}$ system, for the selected events in the resolved categories, for events with no forward jet (left) and at least one forward jet (right), and for 2016 (upper), 2017 (central), and 2018 (lower). The distributions for the main background components have been determined in simulation with scale factors extracted from control regions. All background processes and the respective uncertainties are derived from the fit to data, while the distributions of signal processes are represented according to the expectation before the fit. The lines show the signal predictions for three benchmark mass values (0.8, 1.2, and 1.6 TeV) of a T quark of negligible resonance width. Signal yields are multiplied by a factor of 50 to improve their visibility. |
png pdf |
Figure 7-d:
Distributions of the transverse mass ${M_{{\mathrm {T}}}}$ of the reconstructed top quark and ${\vec{p}}_{\mathrm {T}}^{\,\text {miss}}$ system, for the selected events in the resolved categories, for events with no forward jet (left) and at least one forward jet (right), and for 2016 (upper), 2017 (central), and 2018 (lower). The distributions for the main background components have been determined in simulation with scale factors extracted from control regions. All background processes and the respective uncertainties are derived from the fit to data, while the distributions of signal processes are represented according to the expectation before the fit. The lines show the signal predictions for three benchmark mass values (0.8, 1.2, and 1.6 TeV) of a T quark of negligible resonance width. Signal yields are multiplied by a factor of 50 to improve their visibility. |
png pdf |
Figure 7-e:
Distributions of the transverse mass ${M_{{\mathrm {T}}}}$ of the reconstructed top quark and ${\vec{p}}_{\mathrm {T}}^{\,\text {miss}}$ system, for the selected events in the resolved categories, for events with no forward jet (left) and at least one forward jet (right), and for 2016 (upper), 2017 (central), and 2018 (lower). The distributions for the main background components have been determined in simulation with scale factors extracted from control regions. All background processes and the respective uncertainties are derived from the fit to data, while the distributions of signal processes are represented according to the expectation before the fit. The lines show the signal predictions for three benchmark mass values (0.8, 1.2, and 1.6 TeV) of a T quark of negligible resonance width. Signal yields are multiplied by a factor of 50 to improve their visibility. |
png pdf |
Figure 7-f:
Distributions of the transverse mass ${M_{{\mathrm {T}}}}$ of the reconstructed top quark and ${\vec{p}}_{\mathrm {T}}^{\,\text {miss}}$ system, for the selected events in the resolved categories, for events with no forward jet (left) and at least one forward jet (right), and for 2016 (upper), 2017 (central), and 2018 (lower). The distributions for the main background components have been determined in simulation with scale factors extracted from control regions. All background processes and the respective uncertainties are derived from the fit to data, while the distributions of signal processes are represented according to the expectation before the fit. The lines show the signal predictions for three benchmark mass values (0.8, 1.2, and 1.6 TeV) of a T quark of negligible resonance width. Signal yields are multiplied by a factor of 50 to improve their visibility. |
png pdf |
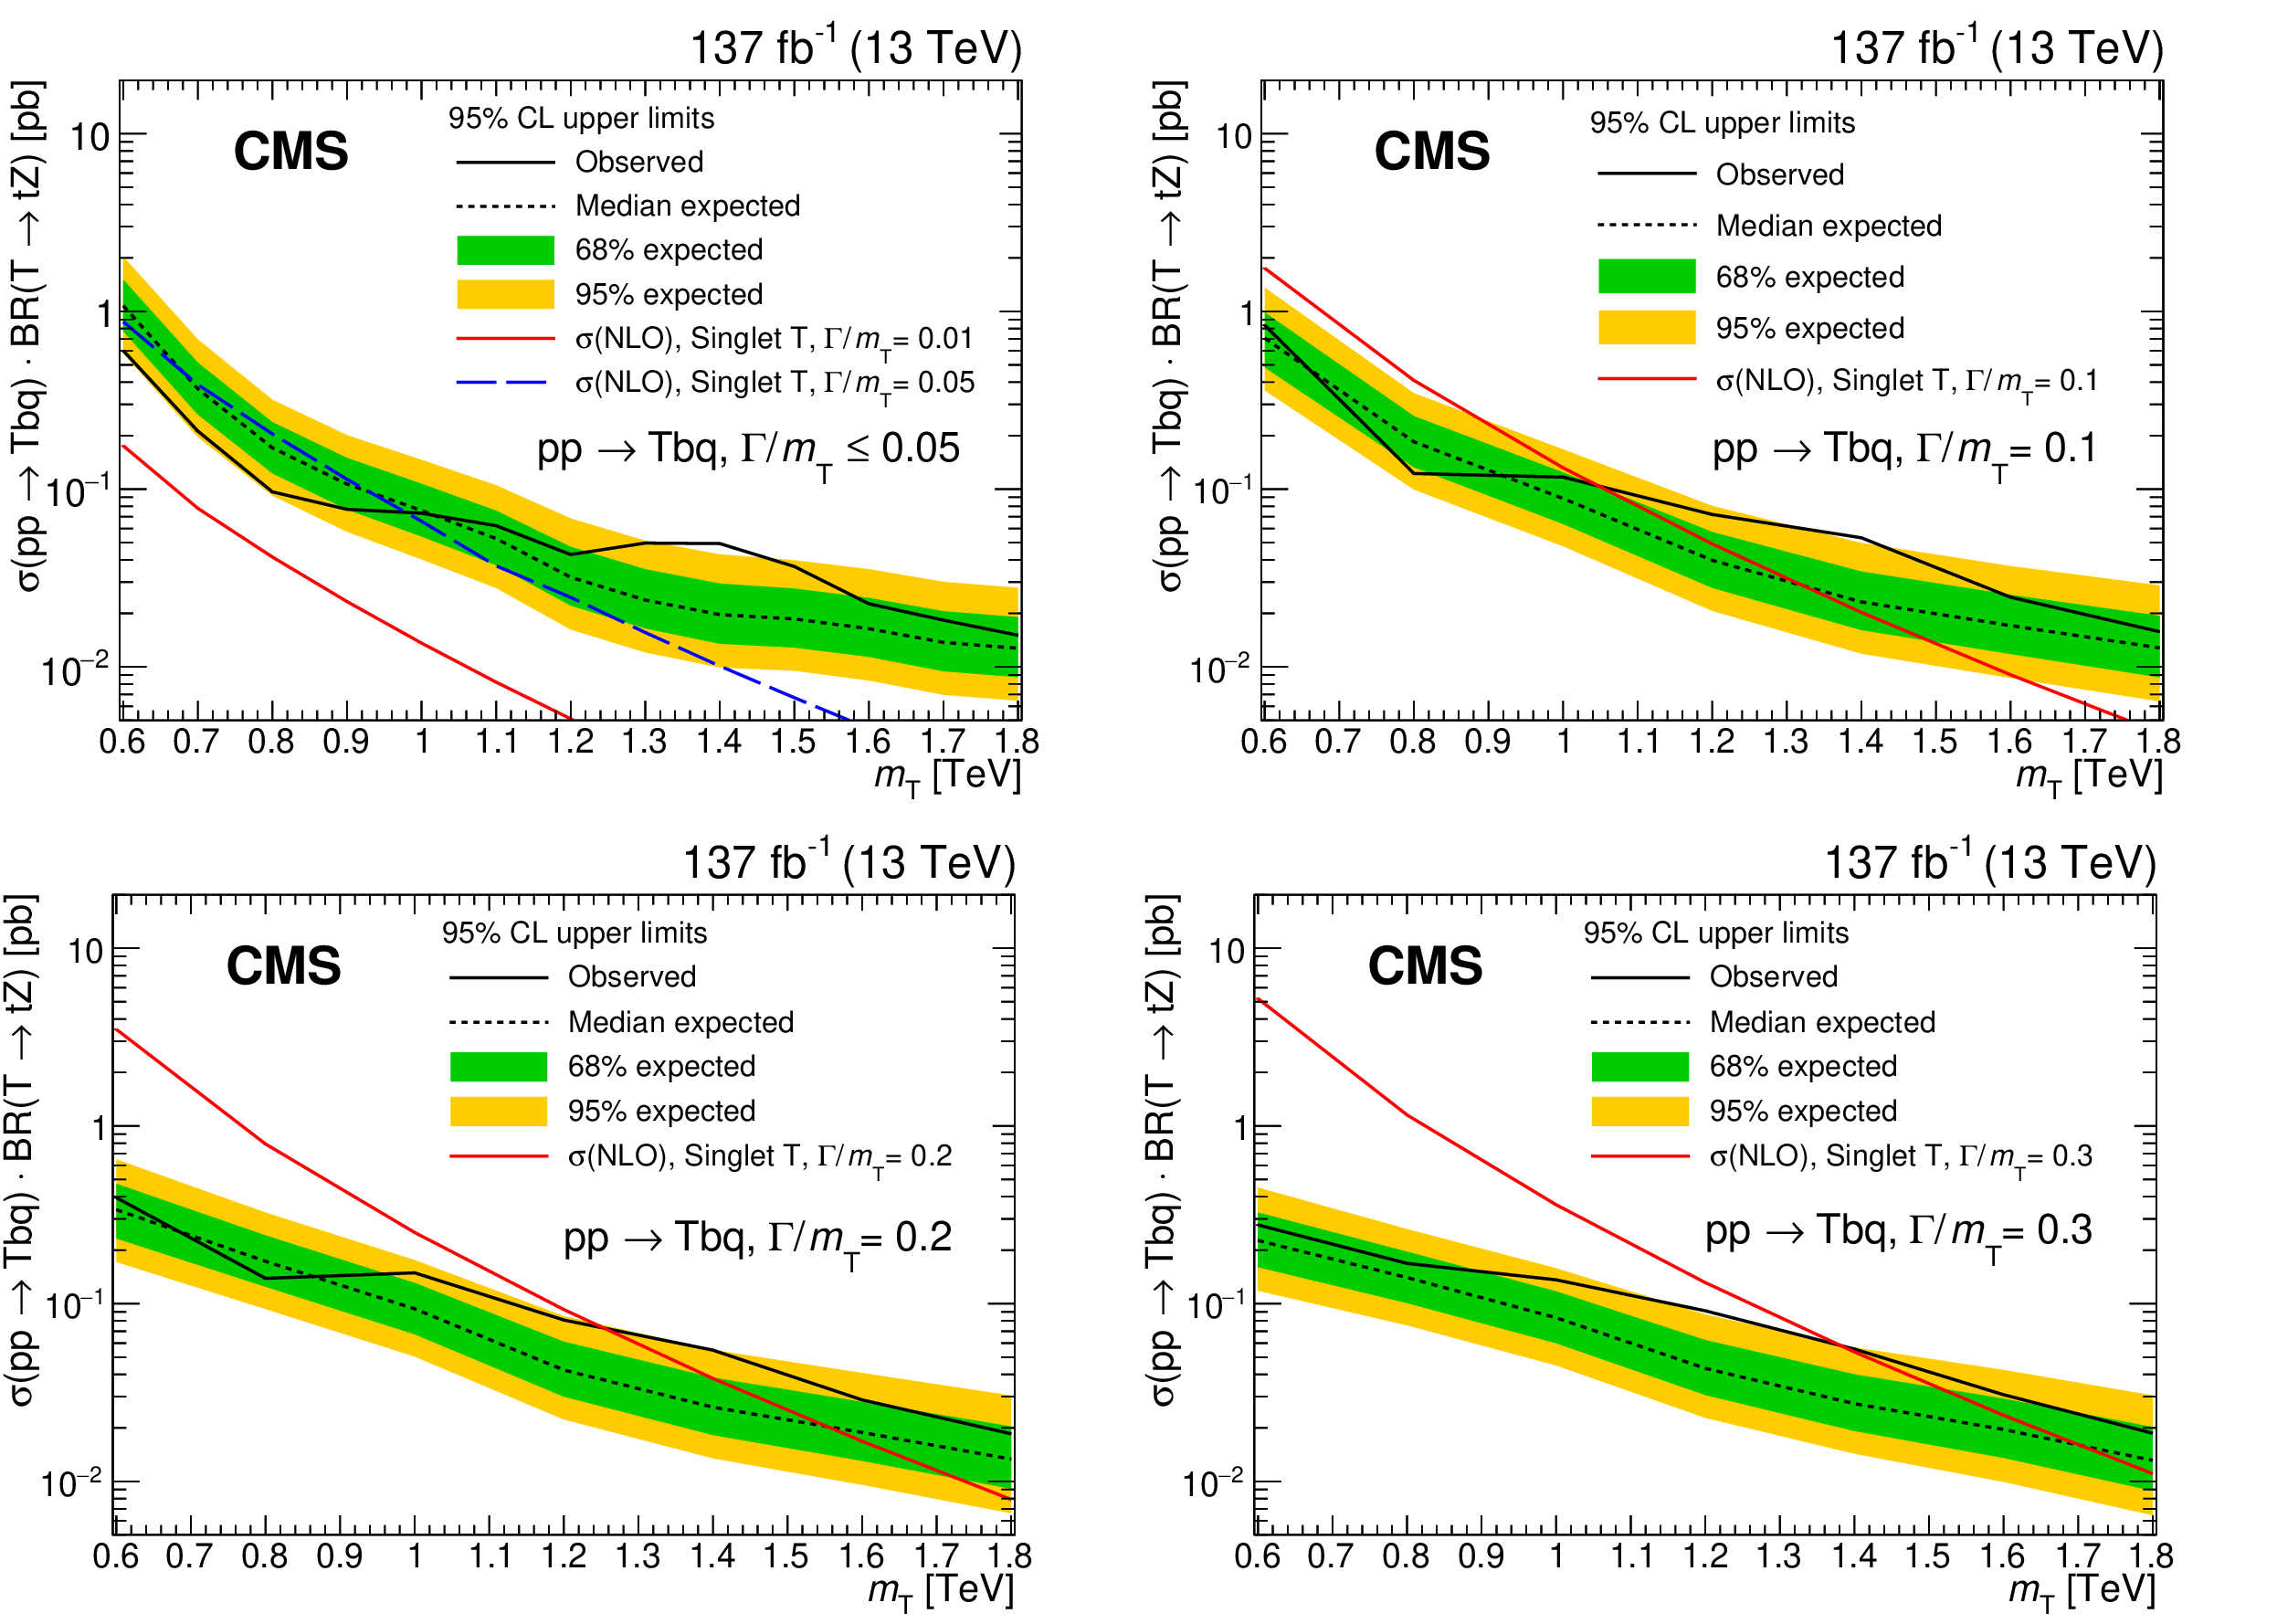
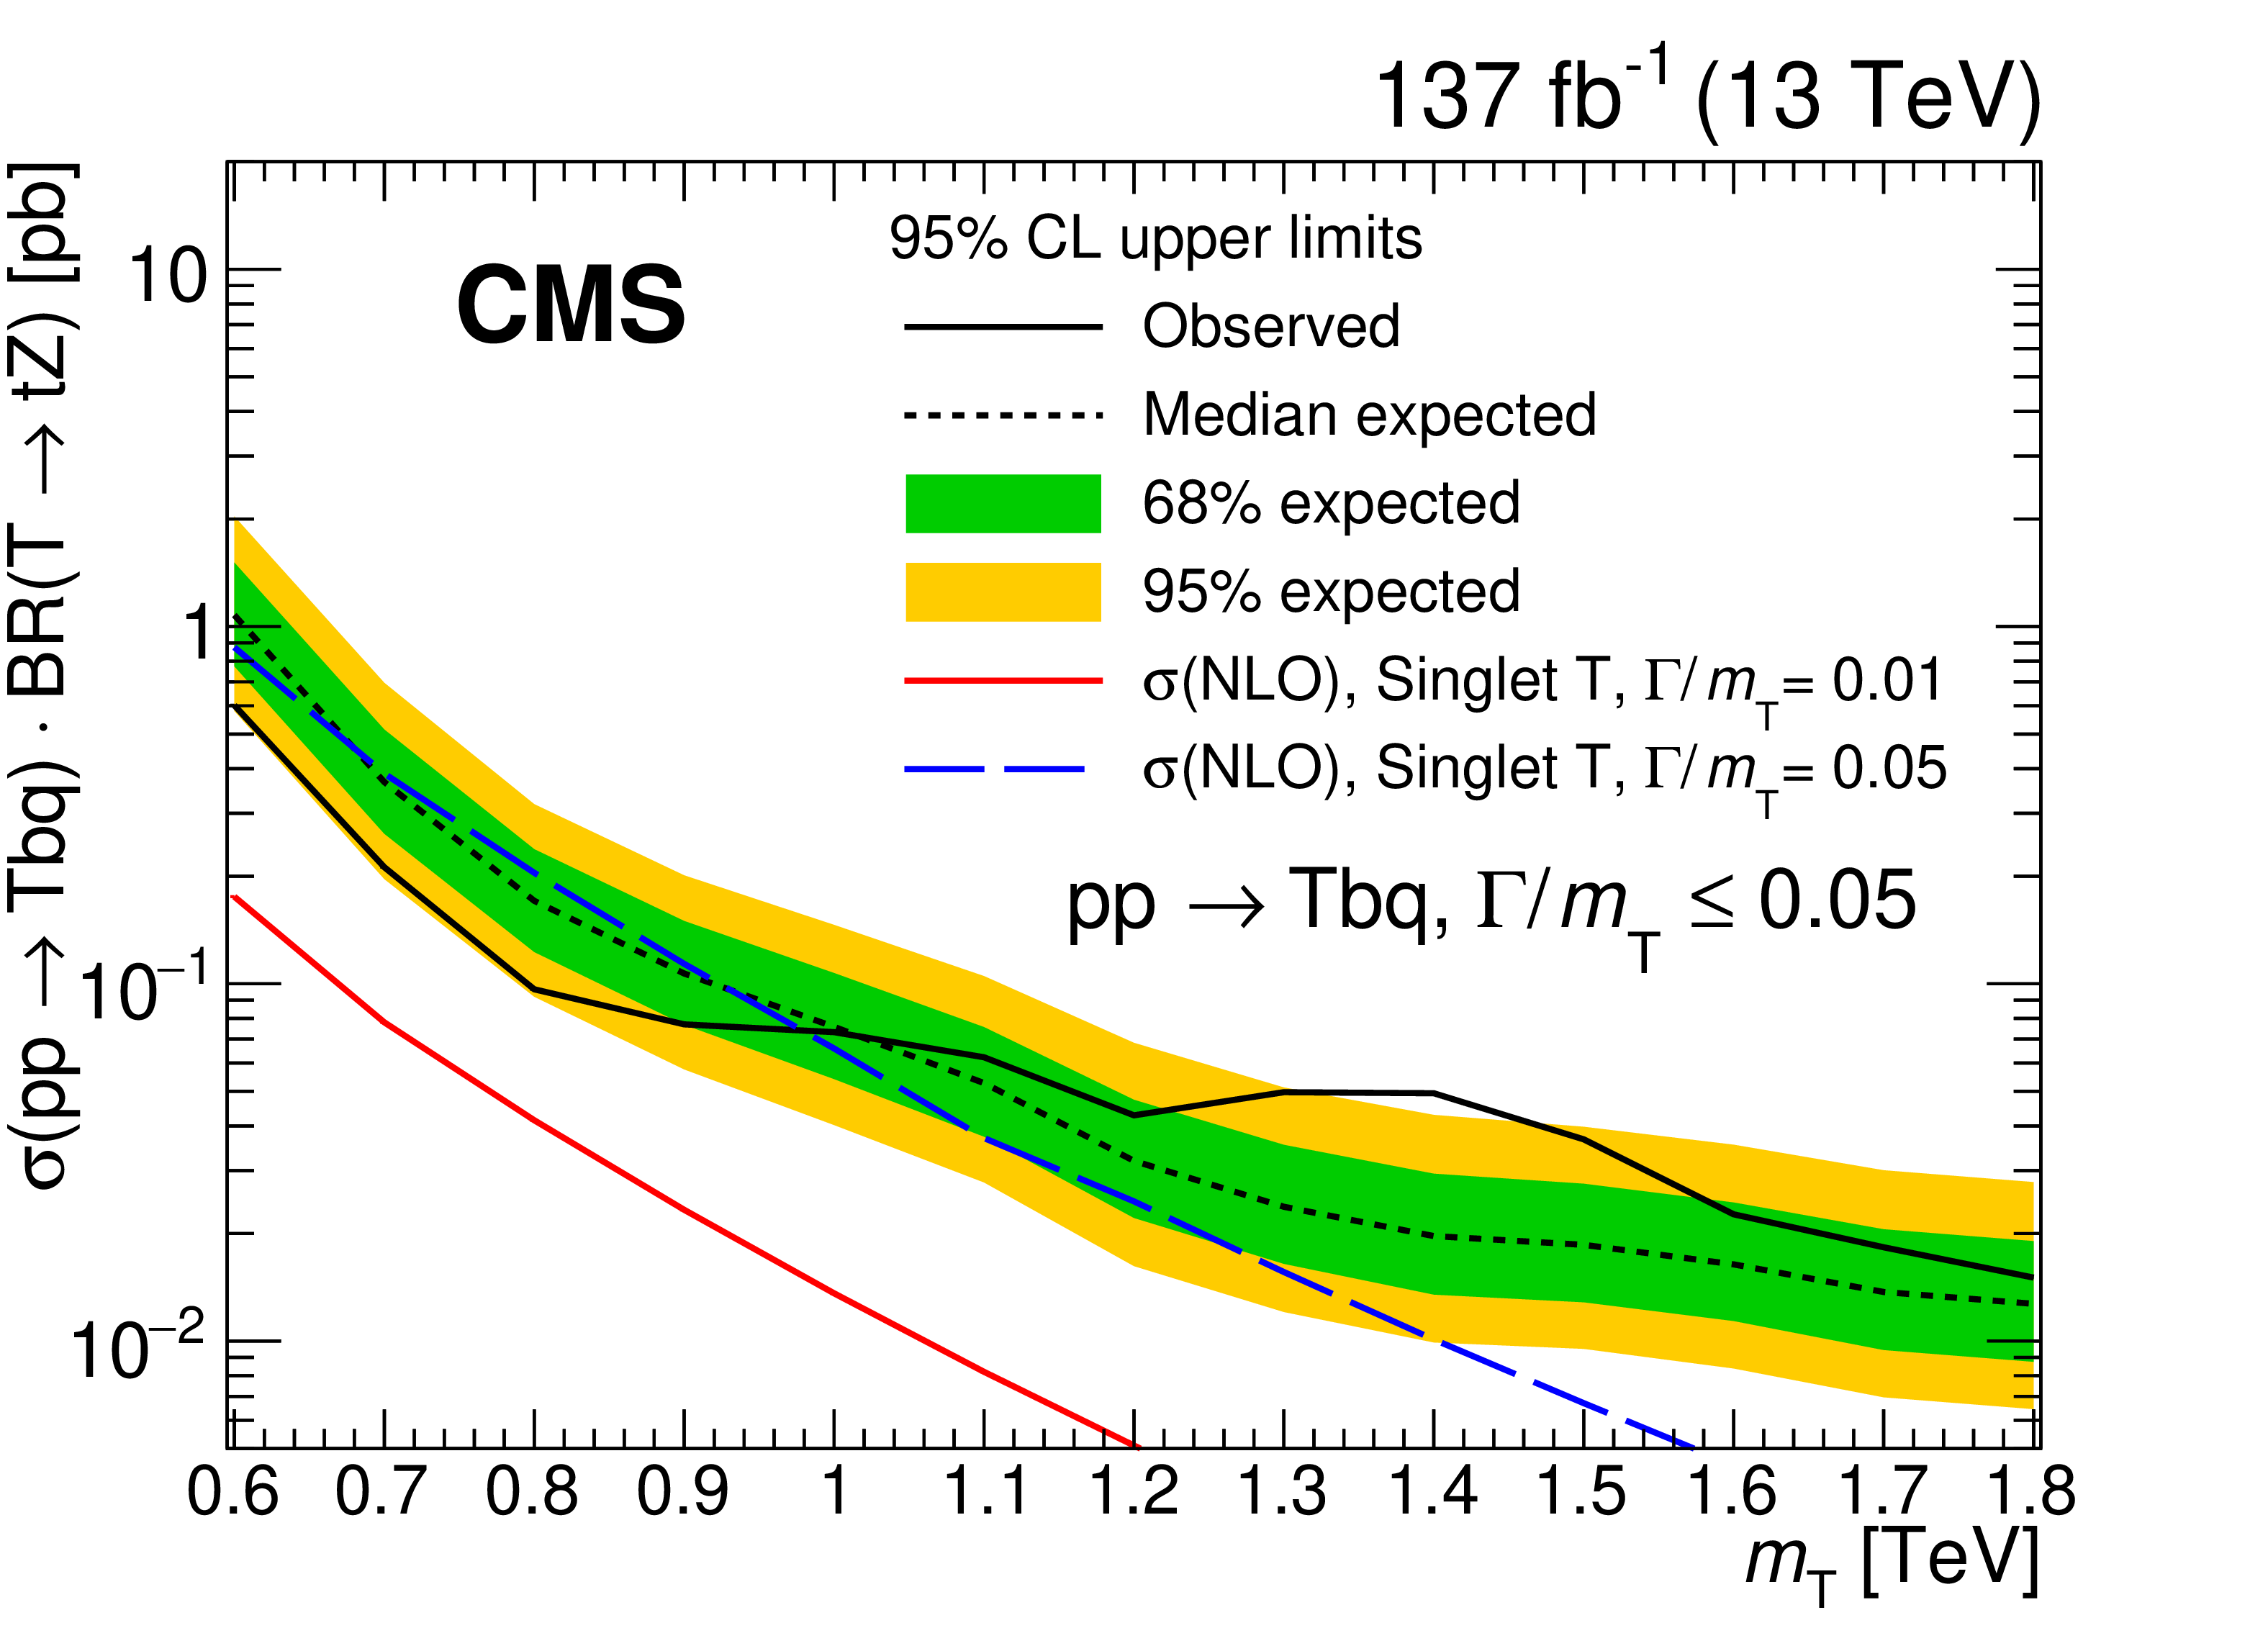
Figure 8:
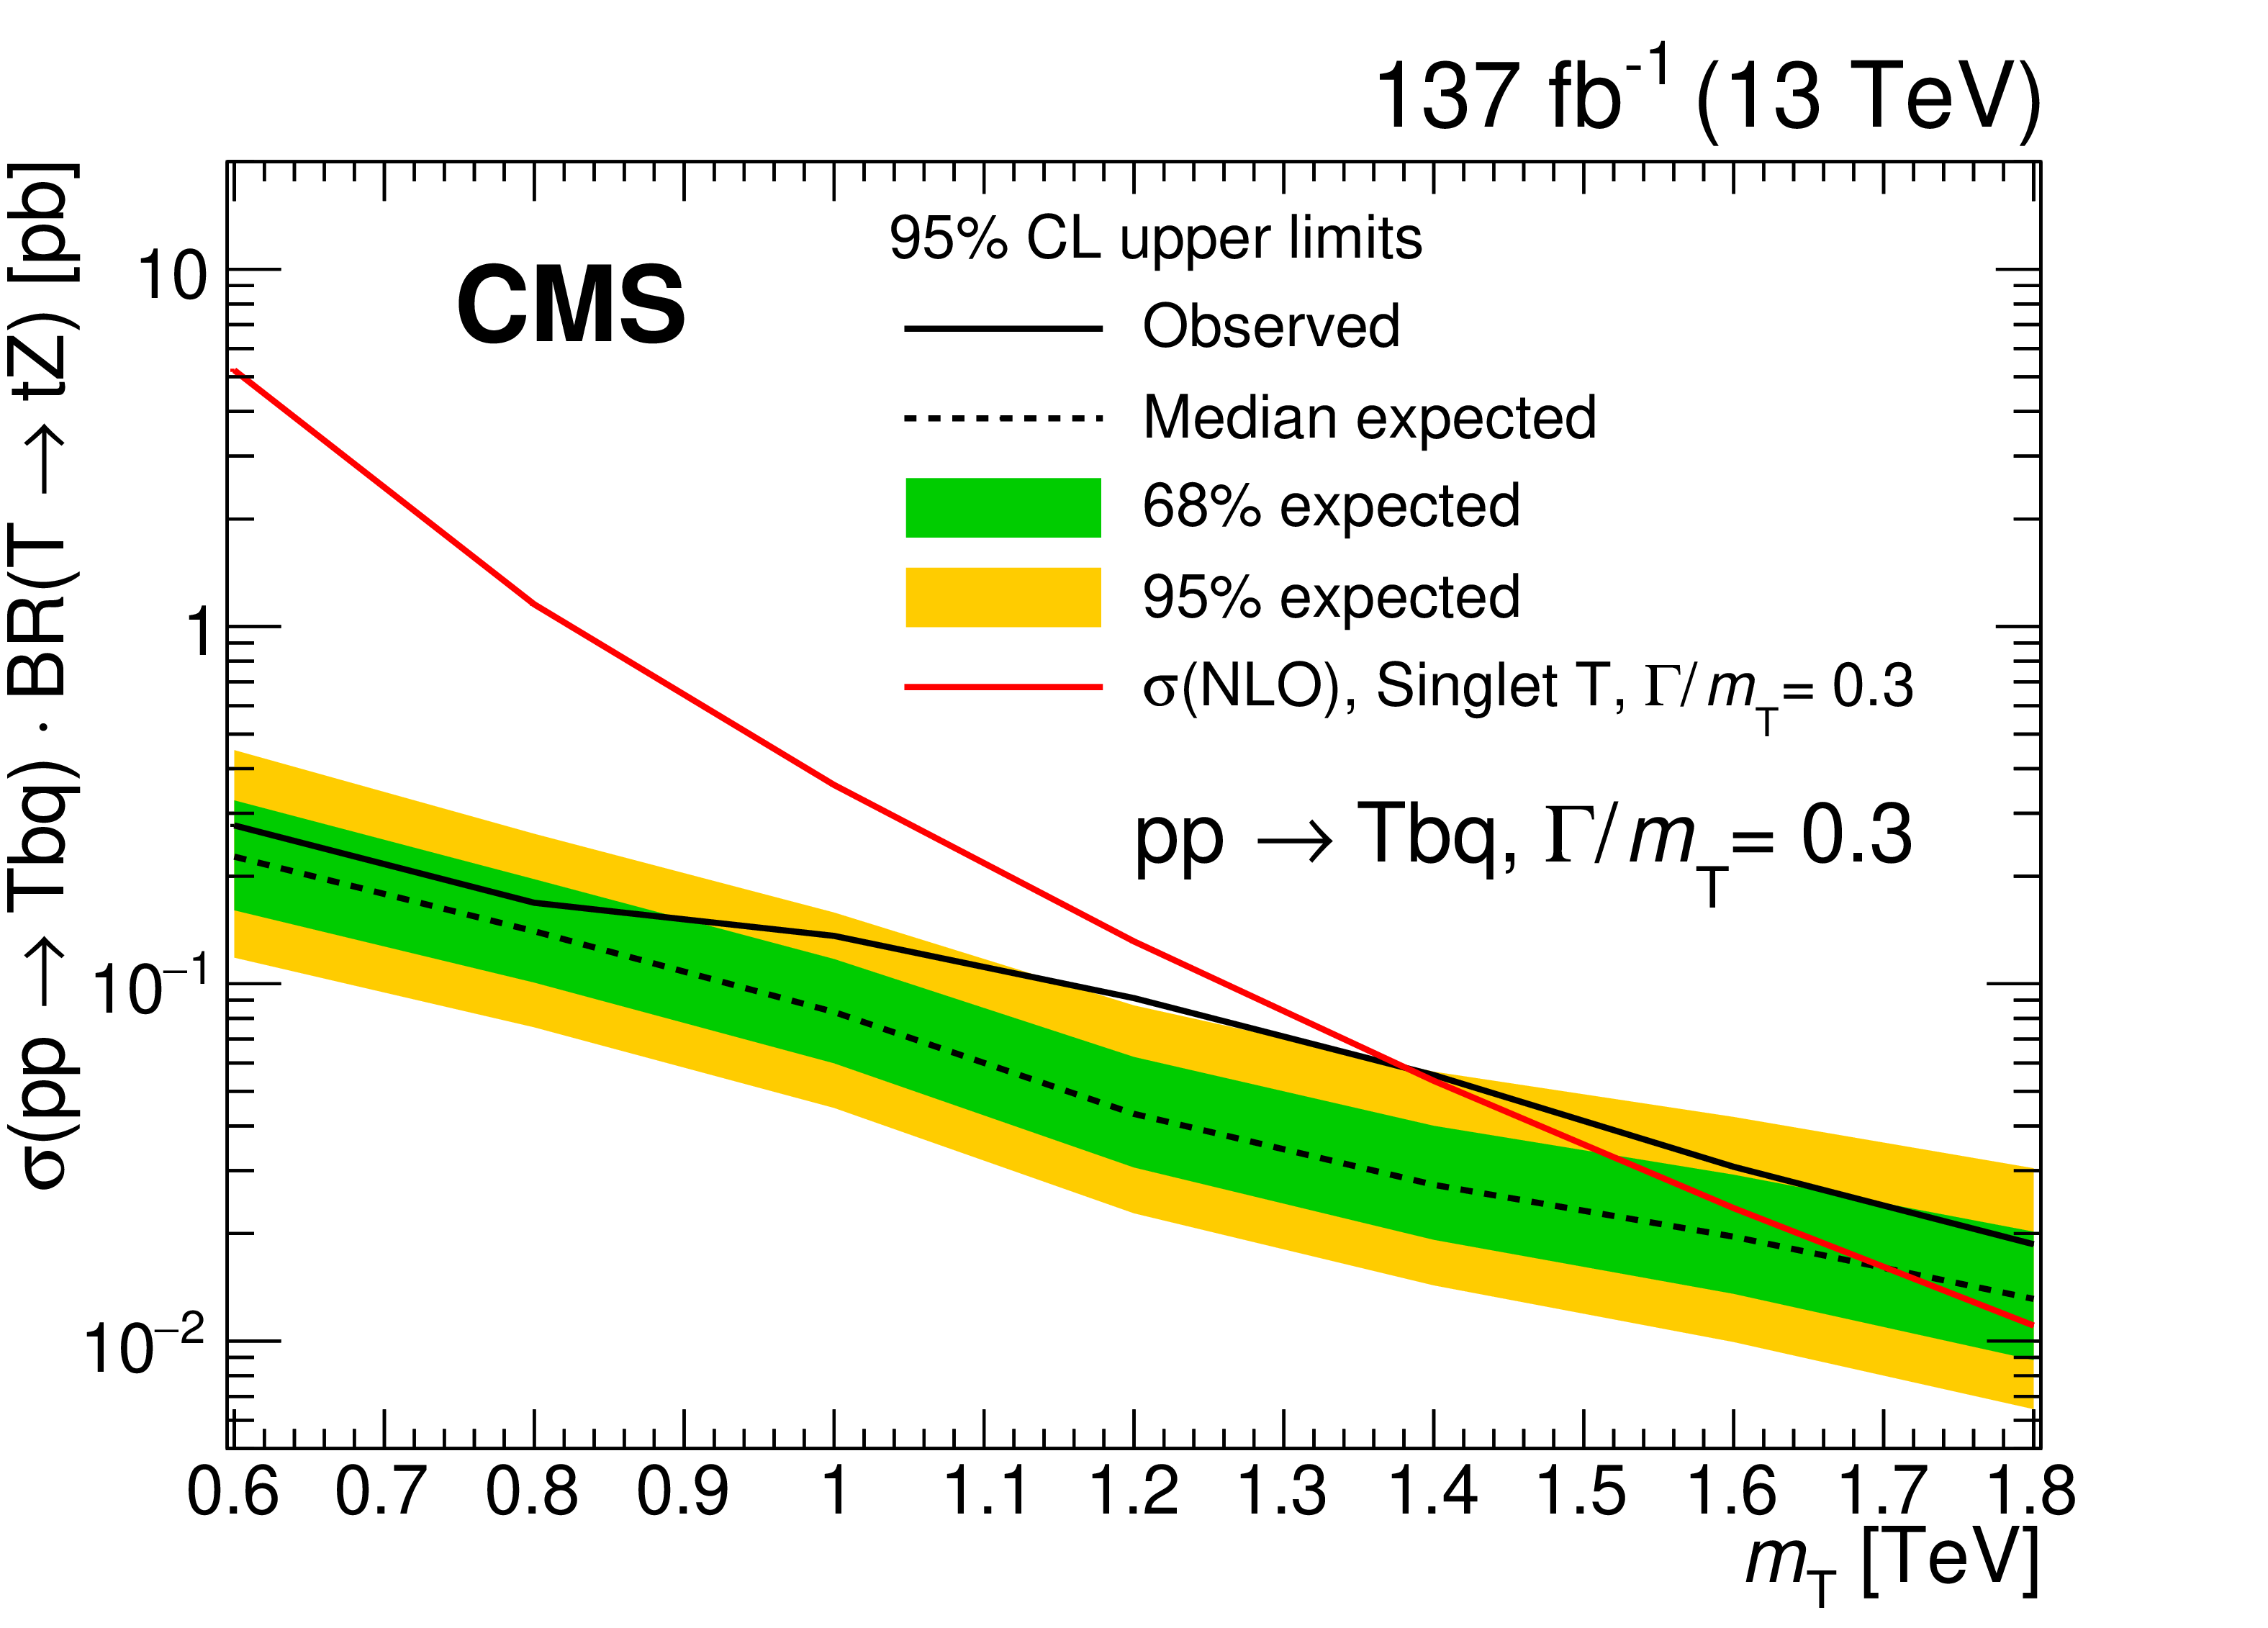
Observed and expected 95% CL upper limits on the product of the single production cross section for a singlet VLQ T quark and the T $ \to $ tZ branching fraction, as functions of the T quark mass $m_{{\mathrm {T}}}$ for a narrow-width resonance (upper left), and a width of 10% (upper right), 20% (lower left), and 30% (lower right) of the T quark mass. A singlet T quark is assumed, produced in association with a bottom quark. The inner (green) band and the outer (yellow) band indicate the regions containing 68 and 95%, respectively, of the distribution of limits expected under the background-only hypothesis. The solid curves show the theoretical expectation at NLO. In the case of a narrow-width resonance, the width of 1 (5)% of the resonance mass is indicated with a red (blue) curve. |
png pdf |
Figure 8-a:
Observed and expected 95% CL upper limits on the product of the single production cross section for a singlet VLQ T quark and the T $ \to $ tZ branching fraction, as functions of the T quark mass $m_{{\mathrm {T}}}$ for a narrow-width resonance (upper left), and a width of 10% (upper right), 20% (lower left), and 30% (lower right) of the T quark mass. A singlet T quark is assumed, produced in association with a bottom quark. The inner (green) band and the outer (yellow) band indicate the regions containing 68 and 95%, respectively, of the distribution of limits expected under the background-only hypothesis. The solid curves show the theoretical expectation at NLO. In the case of a narrow-width resonance, the width of 1 (5)% of the resonance mass is indicated with a red (blue) curve. |

png pdf |
Figure 8-b:
Observed and expected 95% CL upper limits on the product of the single production cross section for a singlet VLQ T quark and the T $ \to $ tZ branching fraction, as functions of the T quark mass $m_{{\mathrm {T}}}$ for a narrow-width resonance (upper left), and a width of 10% (upper right), 20% (lower left), and 30% (lower right) of the T quark mass. A singlet T quark is assumed, produced in association with a bottom quark. The inner (green) band and the outer (yellow) band indicate the regions containing 68 and 95%, respectively, of the distribution of limits expected under the background-only hypothesis. The solid curves show the theoretical expectation at NLO. In the case of a narrow-width resonance, the width of 1 (5)% of the resonance mass is indicated with a red (blue) curve. |

png pdf |
Figure 8-c:
Observed and expected 95% CL upper limits on the product of the single production cross section for a singlet VLQ T quark and the T $ \to $ tZ branching fraction, as functions of the T quark mass $m_{{\mathrm {T}}}$ for a narrow-width resonance (upper left), and a width of 10% (upper right), 20% (lower left), and 30% (lower right) of the T quark mass. A singlet T quark is assumed, produced in association with a bottom quark. The inner (green) band and the outer (yellow) band indicate the regions containing 68 and 95%, respectively, of the distribution of limits expected under the background-only hypothesis. The solid curves show the theoretical expectation at NLO. In the case of a narrow-width resonance, the width of 1 (5)% of the resonance mass is indicated with a red (blue) curve. |
png pdf |
Figure 8-d:
Observed and expected 95% CL upper limits on the product of the single production cross section for a singlet VLQ T quark and the T $ \to $ tZ branching fraction, as functions of the T quark mass $m_{{\mathrm {T}}}$ for a narrow-width resonance (upper left), and a width of 10% (upper right), 20% (lower left), and 30% (lower right) of the T quark mass. A singlet T quark is assumed, produced in association with a bottom quark. The inner (green) band and the outer (yellow) band indicate the regions containing 68 and 95%, respectively, of the distribution of limits expected under the background-only hypothesis. The solid curves show the theoretical expectation at NLO. In the case of a narrow-width resonance, the width of 1 (5)% of the resonance mass is indicated with a red (blue) curve. |
png pdf |
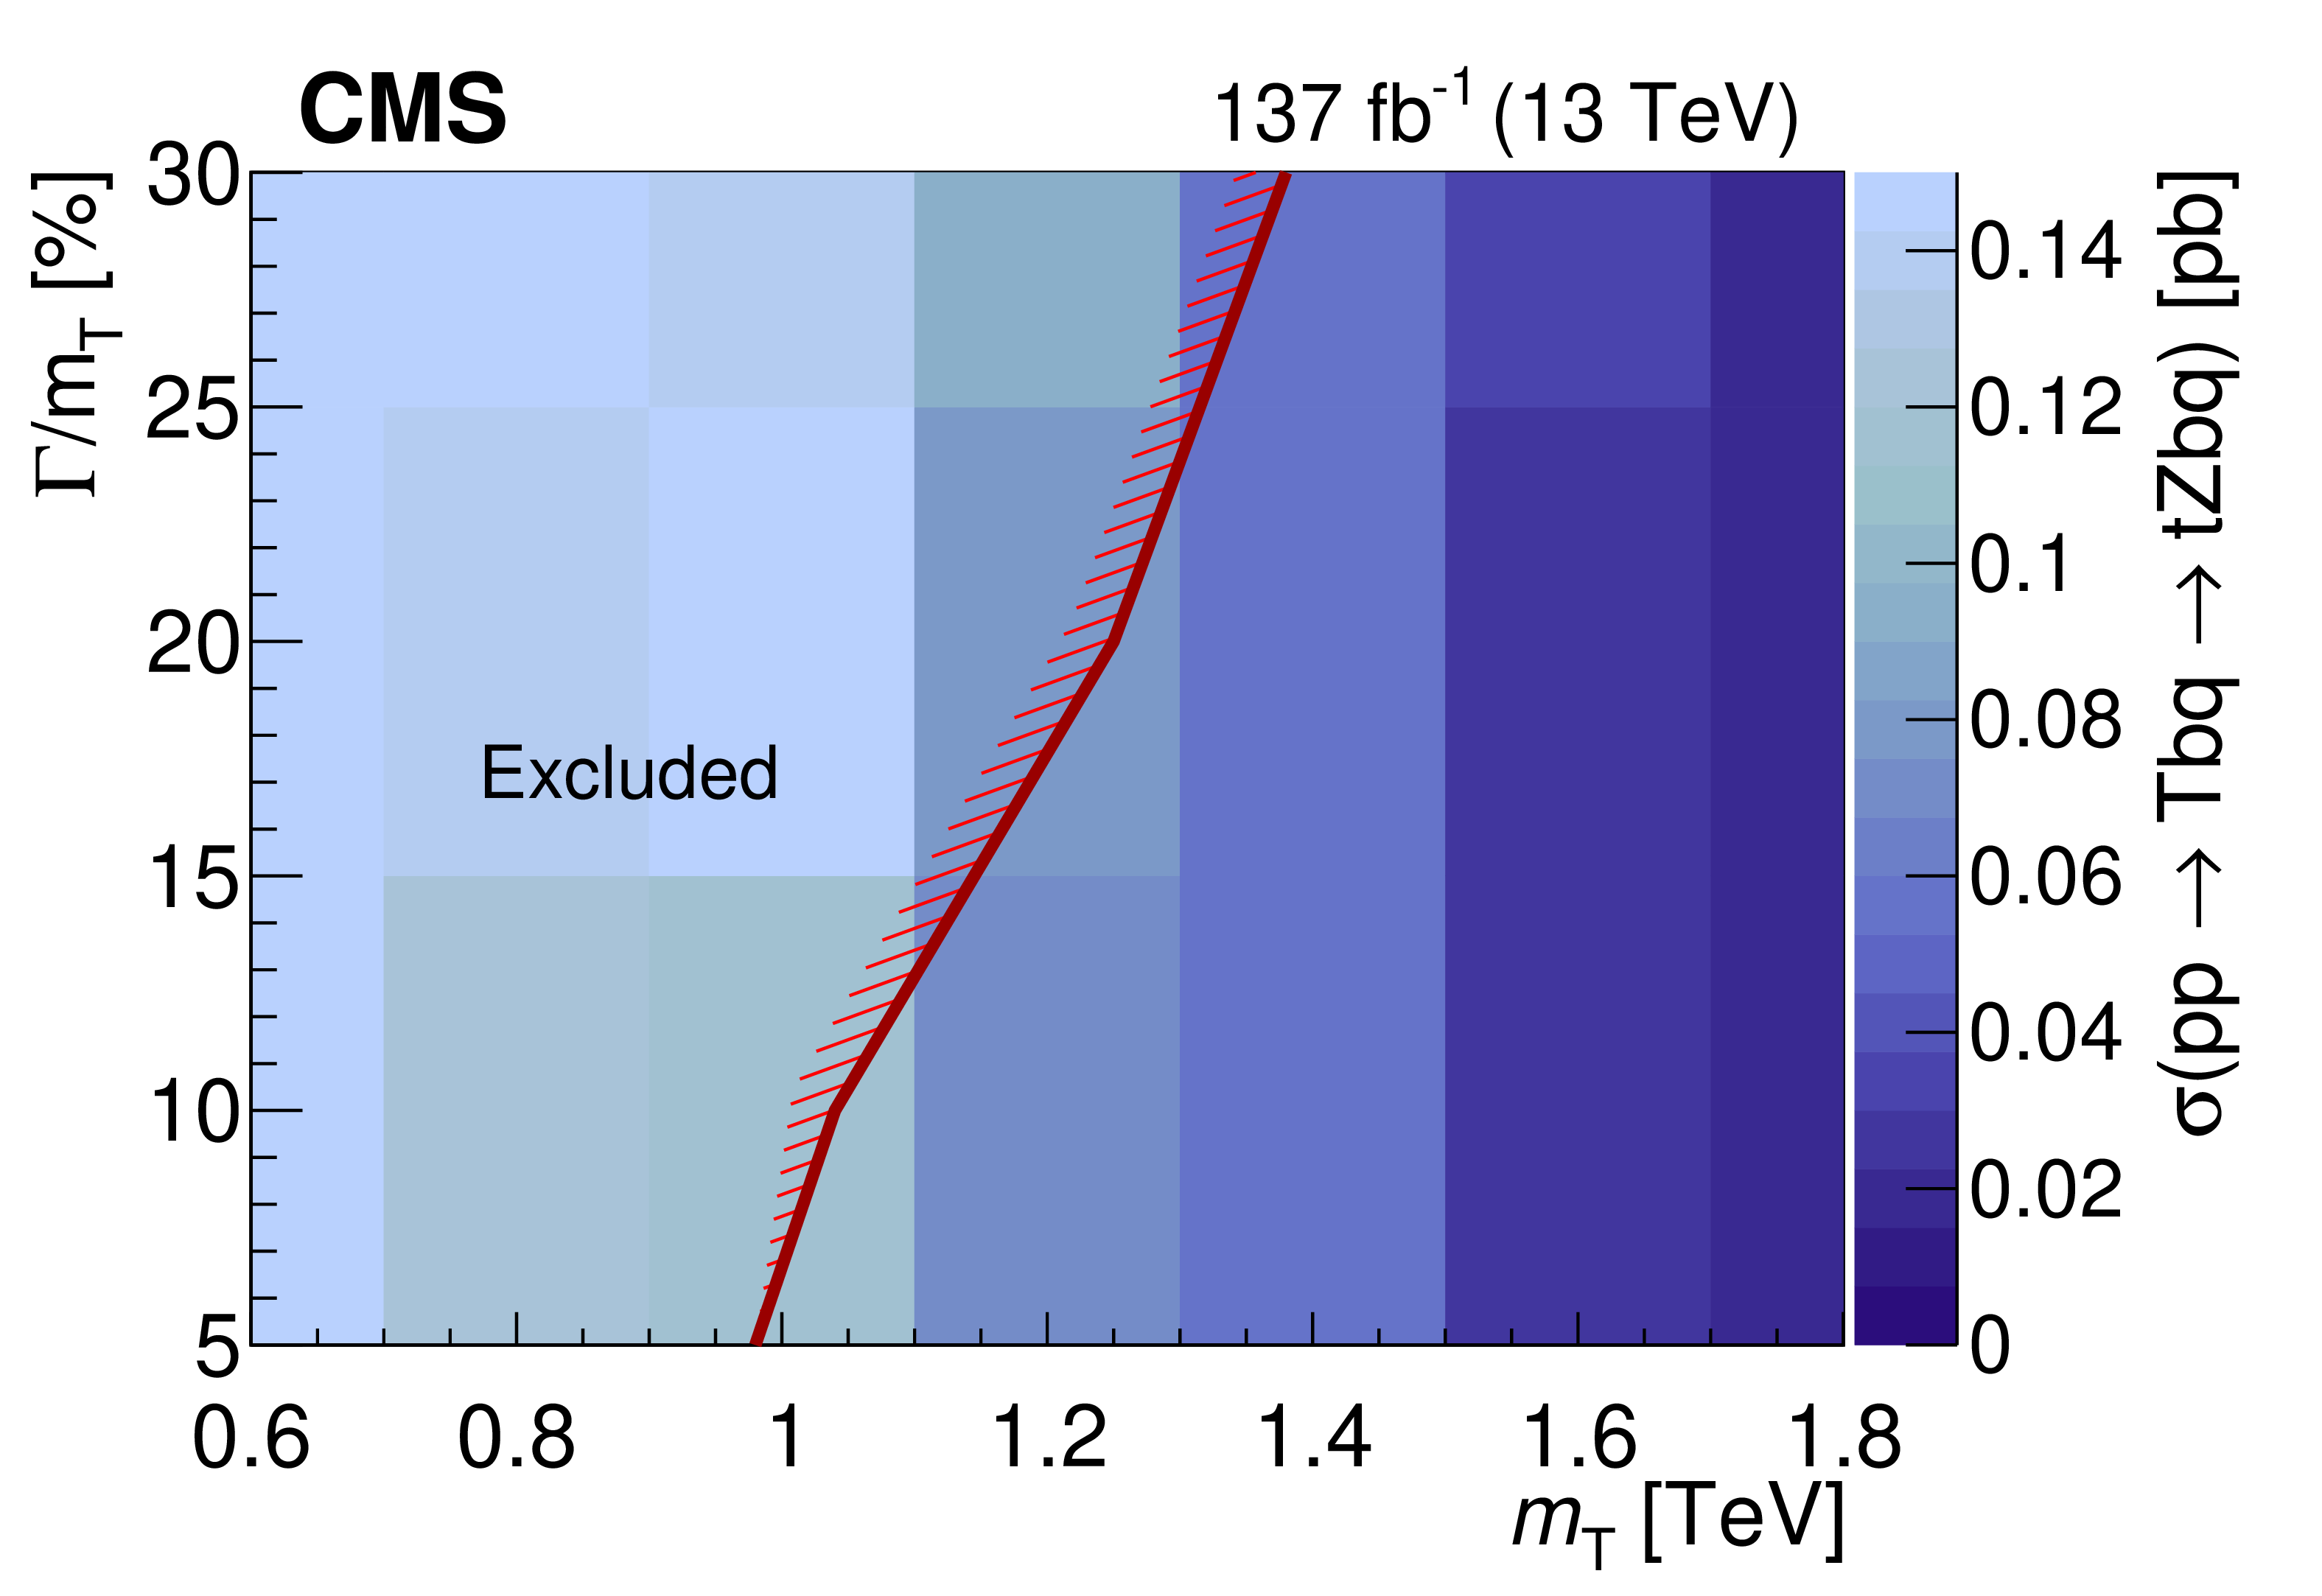
Figure 9:
Observed 95% CL upper limit on the product of the single production cross section for a singlet VLQ T quark and the T $ \to $ tZ branching fraction, as a function of the T quark mass $m_{{\mathrm {T}}}$ and width $\Gamma $, for widths from 5 to 30% of the mass. A singlet T quark that is produced in association with a bottom quark is assumed. The solid red line indicates the boundary of the excluded region (on the hatched side) of theoretical cross sections, as reported in Table 1. |
| Tables | |
png pdf |
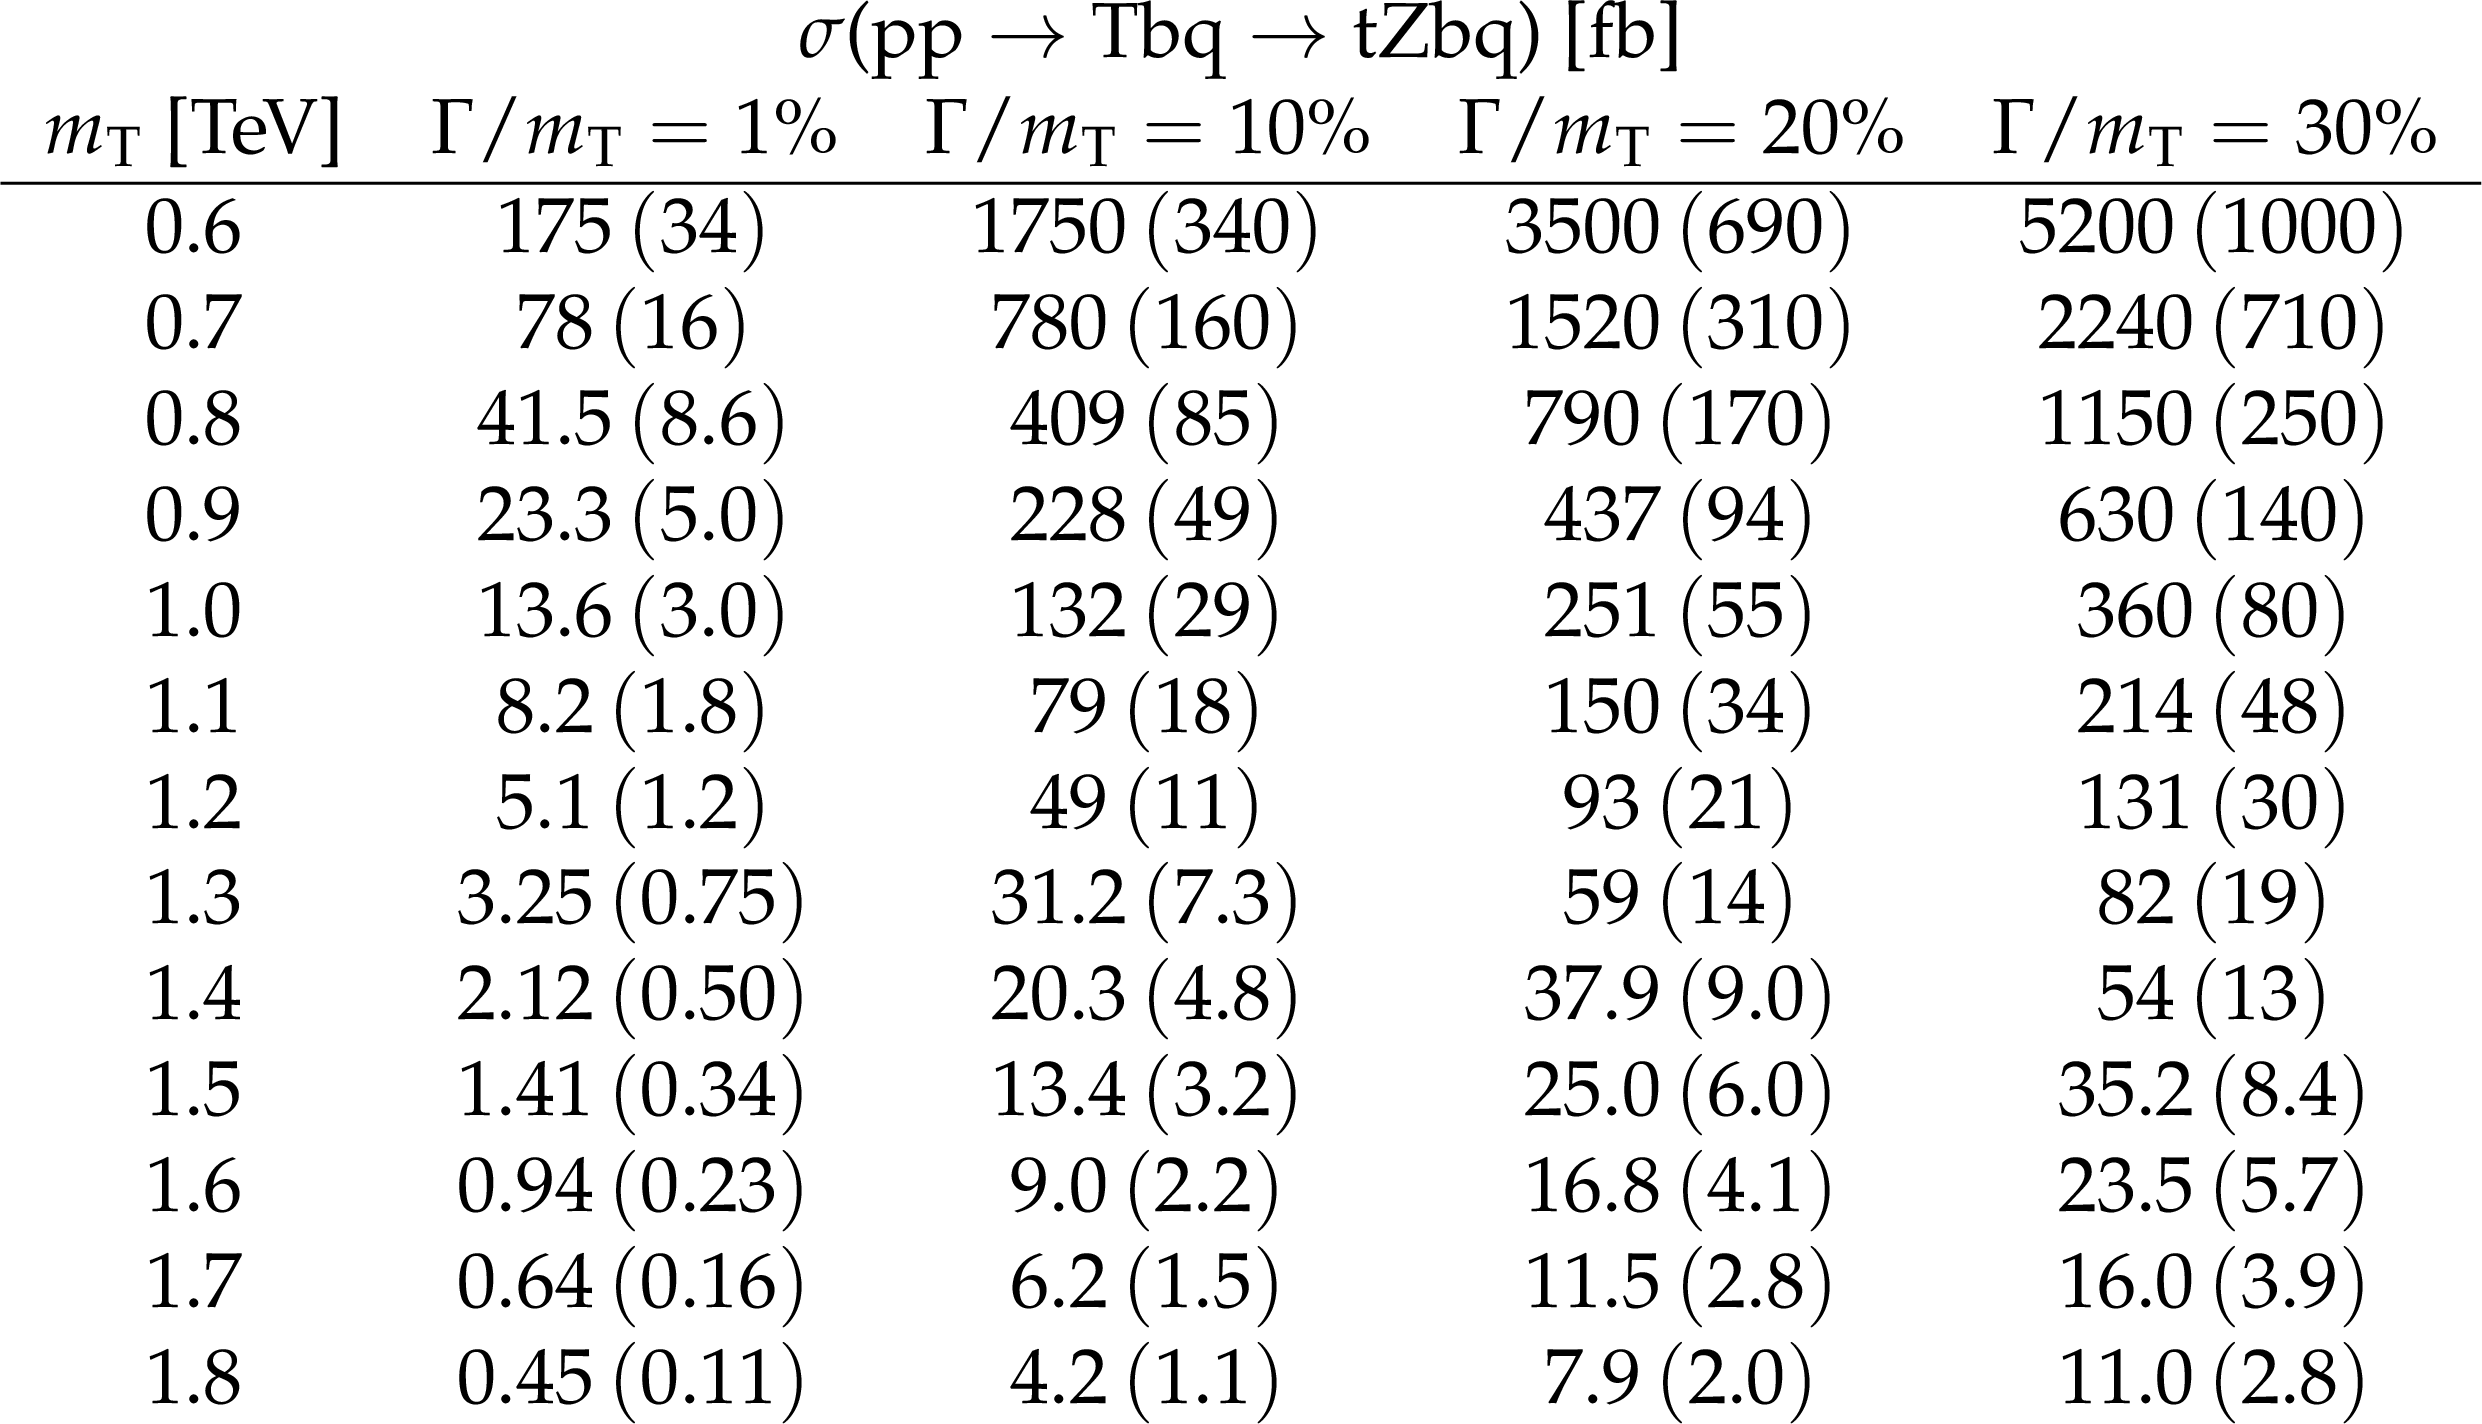
Table 1:
Theoretical cross sections, in fb, for single production of a vector-like singlet T quark in association with a bottom quark, with the T quark decaying to tZ, for mass hypotheses between 0.6 and 1.8 TeV in steps of 0.1 TeV, and for resonance widths that are 1, 10, 20, and 30% of its mass. The framework for the computation is described in Refs. [42,43]. The uncertainties, given in parentheses, are obtained by halving and doubling the values of QCD renormalization and factorization scales. |
png pdf |
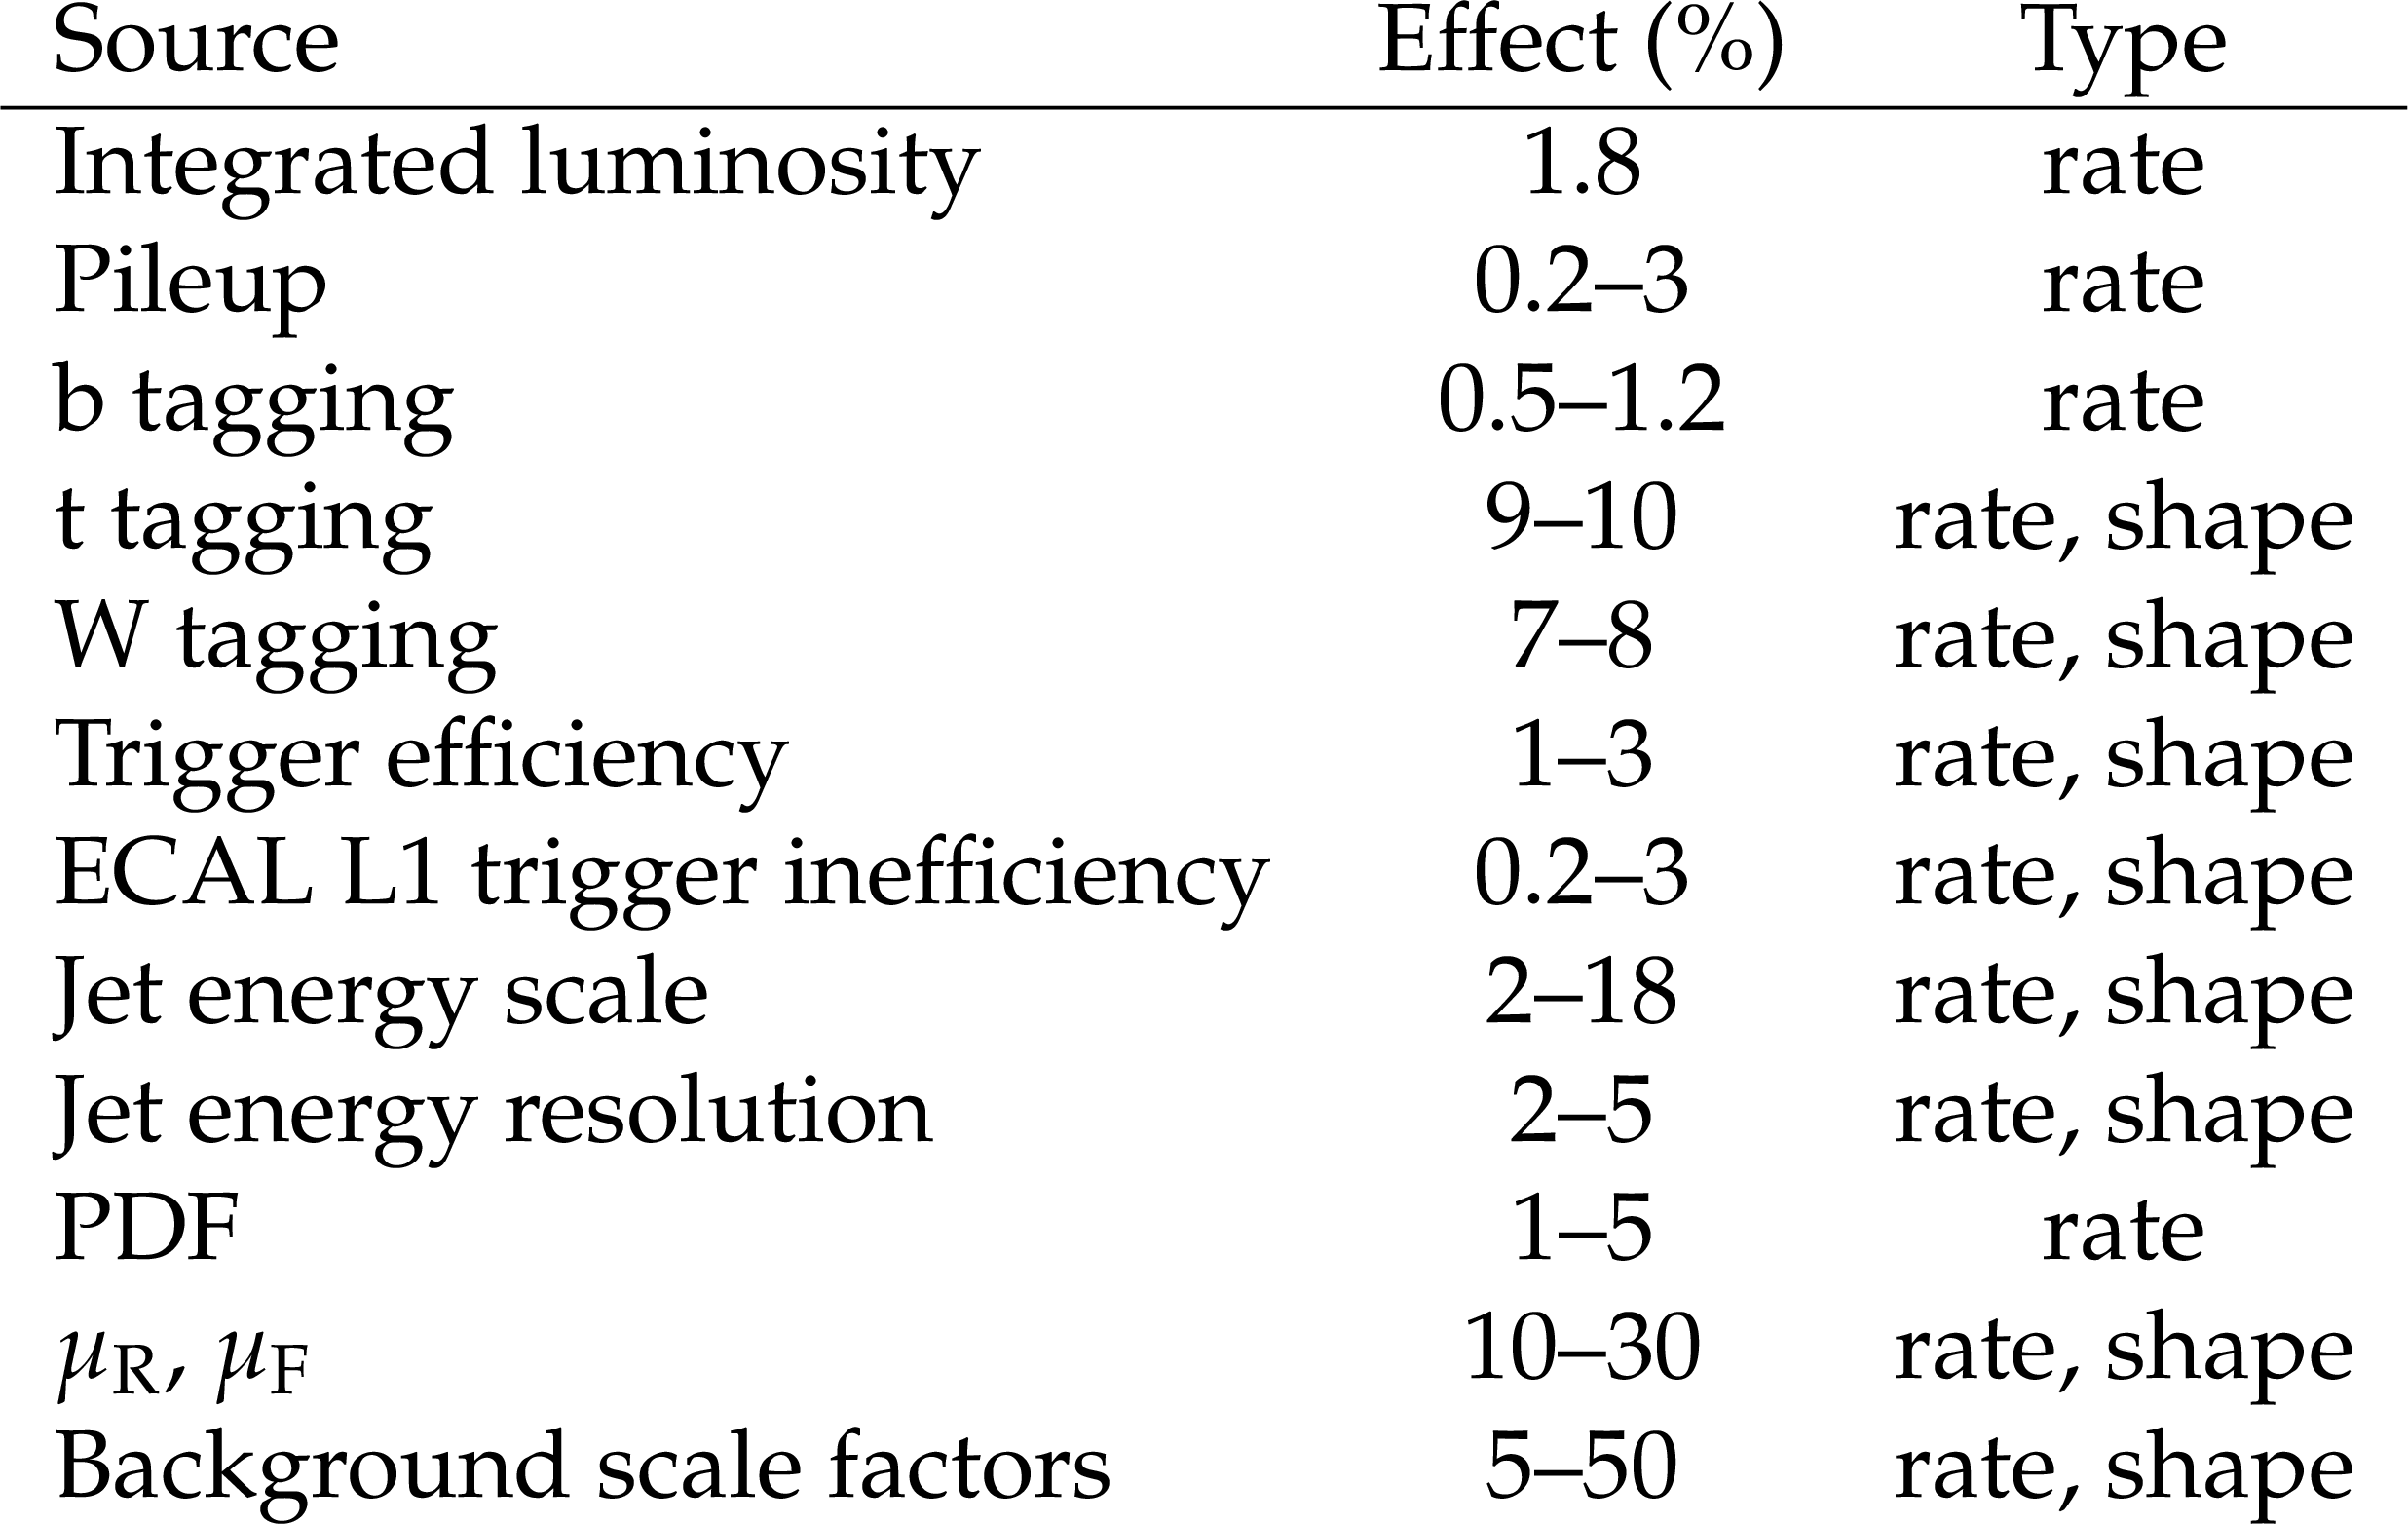
Table 2:
Summary of the systematic uncertainties. The maximum range of change in the pre-fit event rate of signals and backgrounds across all years and categories for one standard deviation change in the systematic uncertainty is reported in the "Effect'' column. All uncertainties are considered fully correlated across the three years of data-taking, except for those corresponding to the ECAL L1 trigger inefficiency and the background scale factors. The third column indicates whether the uncertainty affects both the rate and the shape of the distributions or the rate only. Except for the background scale factors, all the uncertainties affect both signal and background inputs to the fit. |
| Summary |
| A search for the single production of a vector-like quark T with charge 2/3e decaying to a top quark and a Z boson has been presented. The analysis is based on LHC proton-proton collision data collected by the CMS experiment, corresponding to an integrated luminosity of 137 fb$^{-1}$. Upper limits at 95% confidence level are set on the product of the production cross section and the T $\to$ tZ channel branching fraction. Values greater than 602 to 15 fb for T quark masses between 0.6 and 1.8 TeV are excluded at 95% confidence level for a T quark of negligible resonance width produced in association with a bottom quark. Values greater than 836 to 16 fb for masses between 0.6 and 1.8 TeV are excluded at 95% confidence level for a T quark of resonance width from 10 to 30% of its mass. These results provide the best exclusion limits on the production of single vector-like T quarks in the tZ decay channel over the mass range from 0.6 to 1.2 TeV and from 1.5 to 1.8 TeV. An interpretation of these results within a theoretical framework in which the T quark is a singlet, and assuming a resonance width of 5% of the mass, leads to the exclusion of a T quark of mass below 0.98 TeV. The excluded mass range extends up to 1.4 TeV for a resonance width 30% of the mass. This is the first search for single T quark production based on the full LHC Run 2 data set. |
| References | ||||
| 1 | J. A. Aguilar-Saavedra, R. Benbrik, S. Heinemeyer, and M. Perez-Victoria | Handbook of vectorlike quarks: mixing and single production | PRD 88 (2013) 094010 | 1306.0572 |
| 2 | Y. Okada and L. Panizzi | LHC signatures of vector-like quarks | Adv. High Energy Phys. 2013 (2013) 364936 | 1207.5607 |
| 3 | J. A. Aguilar-Saavedra | Identifying top partners at LHC | JHEP 11 (2009) 030 | 0907.3155 |
| 4 | A. De Simone, O. Matsedonskyi, R. Rattazzi, and A. Wulzer | A first top partner hunter's guide | JHEP 04 (2013) 004 | 1211.5663 |
| 5 | O. Matsedonskyi, G. Panico, and A. Wulzer | On the interpretation of top partners searches | JHEP 12 (2014) 097 | 1409.0100 |
| 6 | M. Buchkremer, G. Cacciapaglia, A. Deandrea, and L. Panizzi | Model independent framework for searches of top partners | NPB 876 (2013) 376 | 1305.4172 |
| 7 | O. Eberhardt et al. | Joint analysis of Higgs decays and electroweak precision observables in the standard model with a sequential fourth generation | PRD 86 (2012) 013011 | 1204.3872 |
| 8 | ATLAS Collaboration | Search for pair production of vector-like top quarks in events with one lepton, jets, and missing transverse momentum in $ \sqrt{s} = $ 13 TeV pp collisions with the ATLAS detector | JHEP 08 (2017) 052 | 1705.10751 |
| 9 | ATLAS Collaboration | Search for pair production of heavy vector-like quarks decaying to high-$ {p_{\mathrm{T}}}$ W bosons and b quarks in the lepton-plus-jets final state in pp collisions at $ \sqrt{s} = $ 13 TeV with the ATLAS detector | JHEP 10 (2017) 141 | 1707.03347 |
| 10 | ATLAS Collaboration | Search for pair- and single-production of vector-like quarks in final states with at least one Z boson decaying into a pair of electrons or muons in pp collision data collected with the ATLAS detector at $ \sqrt{s} = $ 13 TeV | PRD 98 (2018) 112010 | 1806.10555 |
| 11 | ATLAS Collaboration | Search for pair production of heavy vector-like quarks decaying into hadronic final states in pp collisions at $ \sqrt{s} = $ 13 TeV with the ATLAS detector | PRD 98 (2018) 092005 | 1808.01771 |
| 12 | ATLAS Collaboration | Search for pair production of up-type vector-like quarks and for four-top-quark events in final states with multiple b-jets with the ATLAS detector | JHEP 07 (2018) 089 | 1803.09678 |
| 13 | ATLAS Collaboration | Combination of the searches for pair-produced vector-like partners of the third-generation quarks at $ \sqrt{s} = $ 13 TeV with the ATLAS detector | PRL 121 (2018) 211801 | 1808.02343 |
| 14 | CMS Collaboration | Search for pair production of vector-like T and B quarks in single-lepton final states using boosted jet substructure in proton-proton collisions at $ \sqrt{s}= $ 13 TeV | JHEP 11 (2017) 085 | CMS-B2G-16-024 1706.03408 |
| 15 | CMS Collaboration | Search for pair production of vector-like quarks in the $ \mathrm{b} \mathrm{W} \mathrm{\bar{b}} \mathrm{W} $ channel from proton-proton collisions at $ \sqrt{s} = $ 13 TeV | PLB 779 (2018) 82 | CMS-B2G-17-003 1710.01539 |
| 16 | CMS Collaboration | Search for vector-like T and B quark pairs in final states with leptons at $ \sqrt{s} = $ 13 TeV | JHEP 08 (2018) 177 | CMS-B2G-17-011 1805.04758 |
| 17 | CMS Collaboration | Search for vector-like quarks in events with two oppositely charged leptons and jets in proton-proton collisions at $ \sqrt{s} = $ 13 TeV | EPJC 79 (2019) 364 | CMS-B2G-17-012 1812.09768 |
| 18 | CMS Collaboration | Search for pair production of vector-like quarks in the fully hadronic final state | PRD 100 (2019) 072001 | CMS-B2G-18-005 1906.11903 |
| 19 | ATLAS Collaboration | Search for large missing transverse momentum in association with one top-quark in proton-proton collisions at $ \sqrt{s} = $ 13 TeV with the ATLAS detector | JHEP 05 (2019) 041 | 1812.09743 |
| 20 | CMS Collaboration | Search for single production of a vector-like T quark decaying to a Z boson and a top quark in proton-proton collisions at $ \sqrt{s} = $ 13 TeV | PLB 781 (2018) 574 | CMS-B2G-17-007 1708.01062 |
| 21 | CMS Collaboration | Search for electroweak production of a vector-like T quark using fully hadronic final states | JHEP 01 (2020) 036 | CMS-B2G-18-003 1909.04721 |
| 22 | ATLAS Collaboration | Search for single production of vector-like quarks decaying into Wb in pp collisions at $ \sqrt{s} = $ 13 TeV with the ATLAS detector | JHEP 05 (2019) 164 | 1812.07343 |
| 23 | CMS Collaboration | Search for single production of vector-like quarks decaying into a b quark and a W boson in proton-proton collisions at $ \sqrt{s} = $ 13 TeV | PLB 772 (2017) 634 | CMS-B2G-16-006 1701.08328 |
| 24 | CMS Collaboration | HEPData record for this analysis | link | |
| 25 | CMS Collaboration | The CMS experiment at the CERN LHC | JINST 3 (2008) S08004 | CMS-00-001 |
| 26 | CMS Collaboration | Performance of the CMS Level-1 trigger in proton-proton collisions at $ \sqrt{s} = $ 13 TeV | JINST 15 (2020) P10017 | CMS-TRG-17-001 2006.10165 |
| 27 | CMS Collaboration | The CMS trigger system | JINST 12 (2017) P01020 | CMS-TRG-12-001 1609.02366 |
| 28 | J. Alwall et al. | The automated computation of tree-level and next-to-leading order differential cross sections, and their matching to parton shower simulations | JHEP 07 (2014) 079 | 1405.0301 |
| 29 | P. Nason | A new method for combining NLO QCD with shower Monte Carlo algorithms | JHEP 11 (2004) 040 | hep-ph/0409146 |
| 30 | S. Frixione, P. Nason, and C. Oleari | Matching NLO QCD computations with parton shower simulations: the POWHEG method | JHEP 11 (2007) 070 | 0709.2092 |
| 31 | S. Alioli, P. Nason, C. Oleari, and E. Re | A general framework for implementing NLO calculations in shower Monte Carlo programs: the POWHEG BOX | JHEP 06 (2010) 043 | 1002.2581 |
| 32 | S. Frixione, P. Nason, and G. Ridolfi | A positive-weight next-to-leading-order Monte Carlo for heavy flavour hadroproduction | JHEP 09 (2007) 126 | 0707.3088 |
| 33 | R. Frederix, E. Re, and P. Torrielli | Single-top $ t $-channel hadroproduction in the four-flavour scheme with POWHEG and aMC@NLO | JHEP 09 (2012) 130 | 1207.5391 |
| 34 | T. Sjostrand et al. | An introduction to pythia 8.2 | CPC 191 (2015) 159 | 1410.3012 |
| 35 | CMS Collaboration | Event generator tunes obtained from underlying event and multiparton scattering measurements | EPJC 76 (2016) 155 | CMS-GEN-14-001 1512.00815 |
| 36 | CMS Collaboration | Extraction and validation of a new set of CMS PYTHIA 8 tunes from underlying-event measurements | EPJC 80 (2020) 155 | CMS-GEN-17-001 1903.12179 |
| 37 | CMS Collaboration | Investigations of the impact of the parton shower tuning in PYTHIA 8 in the modelling of $ \mathrm{t\bar{t}} $ at $ \sqrt{s}= $ 8 and 13 TeV | CMS-PAS-TOP-16-021 | CMS-PAS-TOP-16-021 |
| 38 | J. M. Lindert et al. | Precise predictions for V+jets dark matter backgrounds | EPJC 77 (2017) 829 | 1705.04664 |
| 39 | M. Czakon and A. Mitov | Top++: a program for the calculation of the top-pair cross-section at hadron colliders | CPC 185 (2014) 2930 | 1112.5675 |
| 40 | M. Aliev et al. | HATHOR -- HAdronic Top and Heavy quarks crOss section calculatoR | CPC 182 (2011) 1034 | 1007.1327 |
| 41 | G. Cacciapaglia et al. | Heavy vector-like top partners at the LHC and flavour constraints | JHEP 03 (2012) 070 | 1108.6329 |
| 42 | CMS Collaboration | Search for single production of vector-like quarks decaying to a b quark and a Higgs boson | JHEP 06 (2018) 031 | CMS-B2G-17-009 1802.01486 |
| 43 | A. Carvalho et al. | Single production of vectorlike quarks with large width at the large hadron collider | PRD 98 (2018) 015029 | 1805.06402 |
| 44 | NNPDF Collaboration | Parton distributions for the LHC Run II | JHEP 04 (2015) 040 | 1410.8849 |
| 45 | NNPDF Collaboration | Parton distributions from high-precision collider data | EPJC 77 (2017) 663 | 1706.00428 |
| 46 | GEANT4 Collaboration | GEANT4--a simulation toolkit | NIMA 506 (2003) 250 | |
| 47 | J. Allison et al. | GEANT4 developments and applications | IEEE Trans. Nucl. Sci. 53 (2006) 270 | |
| 48 | M. Cacciari, G. P. Salam, and G. Soyez | The anti-$ {k_{\mathrm{T}}} $ jet clustering algorithm | JHEP 04 (2008) 063 | 0802.1189 |
| 49 | M. Cacciari, G. P. Salam, and G. Soyez | FastJet user manual | EPJC 72 (2012) 1896 | 1111.6097 |
| 50 | CMS Collaboration | Particle-flow reconstruction and global event description with the CMS detector | JINST 12 (2017) P10003 | CMS-PRF-14-001 1706.04965 |
| 51 | M. Cacciari and G. P. Salam | Pileup subtraction using jet areas | PLB 659 (2008) 119 | 0707.1378 |
| 52 | D. Bertolini, P. Harris, M. Low, and N. Tran | Pileup per particle identification | JHEP 10 (2014) 059 | 1407.6013 |
| 53 | CMS Collaboration | Jet energy scale and resolution in the CMS experiment in pp collisions at 8 TeV | JINST 12 (2017) P02014 | CMS-JME-13-004 1607.03663 |
| 54 | CMS Collaboration | Performance of missing transverse momentum reconstruction in proton-proton collisions at $ \sqrt{s} = $ 13 TeV using the CMS detector | JINST 14 (2019) P07004 | CMS-JME-17-001 1903.06078 |
| 55 | Y. L. Dokshitzer, G. D. Leder, S. Moretti, and B. R. Webber | Better jet clustering algorithms | JHEP 08 (1997) 001 | hep-ph/9707323 |
| 56 | M. Wobisch and T. Wengler | Hadronization corrections to jet cross-sections in deep inelastic scattering | in Proceedings of the Workshop on Monte Carlo Generators for HERA Physics, Hamburg, Germany, p. 270 1998 | hep-ph/9907280 |
| 57 | M. Dasgupta, A. Fregoso, S. Marzani, and G. P. Salam | Towards an understanding of jet substructure | JHEP 09 (2013) 029 | 1307.0007 |
| 58 | J. M. Butterworth, A. R. Davison, M. Rubin, and G. P. Salam | Jet substructure as a new Higgs search channel at the LHC | PRL 100 (2008) 242001 | 0802.2470 |
| 59 | A. J. Larkoski, S. Marzani, G. Soyez, and J. Thaler | Soft drop | JHEP 05 (2014) 146 | 1402.2657 |
| 60 | CMS Collaboration | Identification of b-quark jets with the CMS experiment | JINST 8 (2013) P04013 | CMS-BTV-12-001 1211.4462 |
| 61 | CMS Collaboration | Identification of heavy-flavour jets with the CMS detector in pp collisions at 13 TeV | JINST 13 (2018) P05011 | CMS-BTV-16-002 1712.07158 |
| 62 | J. Dolen et al. | Thinking outside the ROCs: Designing decorrelated taggers (DDT) for jet substructure | JHEP 05 (2016) 156 | 1603.00027 |
| 63 | CMS Collaboration | A multi-dimensional search for new heavy resonances decaying to boosted WW, WZ, or ZZ boson pairs in the dijet final state at 13 TeV | EPJC 80 (2020) 237 | CMS-B2G-18-002 1906.05977 |
| 64 | J. Thaler and K. Van Tilburg | Identifying boosted objects with $ N $-subjettiness | JHEP 03 (2011) 015 | 1011.2268 |
| 65 | CMS Collaboration | Identification techniques for highly boosted W bosons that decay into hadrons | JHEP 12 (2014) 017 | CMS-JME-13-006 1410.4227 |
| 66 | CMS Collaboration | Identification of heavy, energetic, hadronically decaying particles using machine-learning techniques | JINST 15 (2020) P06005 | CMS-JME-18-002 2004.08262 |
| 67 | CMS Collaboration | Performance of electron reconstruction and selection with the CMS detector in proton-proton collisions at $ \sqrt{s} = $ 8 TeV | JINST 10 (2015) P06005 | CMS-EGM-13-001 1502.02701 |
| 68 | CMS Collaboration | Performance of the CMS muon detector and muon reconstruction with proton-proton collisions at $ \sqrt{s} = $ 13 TeV | JINST 13 (2018) P06015 | CMS-MUO-16-001 1804.04528 |
| 69 | CMS Collaboration | Precision luminosity measurement in proton-proton collisions at $ \sqrt{s} = $ 13 TeV in 2015 and 2016 at CMS | EPJC 81 (2021) 800 | CMS-LUM-17-003 2104.01927 |
| 70 | CMS Collaboration | Measurement of the inelastic proton-proton cross section at $ \sqrt{s}= $ 13 TeV | JHEP 07 (2018) 161 | CMS-FSQ-15-005 1802.02613 |
| 71 | J. Butterworth et al. | PDF4LHC recommendations for LHC Run II | JPG 43 (2016) 023001 | 1510.03865 |
| 72 | T. Junk | Confidence level computation for combining searches with small statistics | NIMA 434 (1999) 435 | hep-ex/9902006 |
| 73 | A. L. Read | Presentation of search results: the CLs technique | JPG 28 (2002) 2693 | |
| 74 | G. Cowan, K. Cranmer, E. Gross, and O. Vitells | Asymptotic formulae for likelihood-based tests of new physics | EPJC 71 (2011) 1554 | 1007.1727 |
| 75 | ATLAS and CMS Collaborations | Procedure for the LHC Higgs boson search combination in summer 2011 | CMS-NOTE-2011/005, ATL-PHYS-PUB-2011-011 | |
|
|
Compact Muon Solenoid LHC, CERN |
|

|

|

|

|

|