

Compact Muon Solenoid
LHC, CERN
| CMS-SMP-18-008 ; CERN-EP-2019-137 | ||
| Search for anomalous triple gauge couplings in WW and WZ production in lepton + jet events in proton-proton collisions at $\sqrt{s} = $ 13 TeV | ||
| CMS Collaboration | ||
| 19 July 2019 | ||
| JHEP 12 (2019) 062 | ||
| Abstract: A search is presented for three additional operators that would lead to anomalous WW$ \gamma $ or WWZ couplings with respect to those in the standard model. They are constrained by studying events with two vector bosons; a W boson decaying to e$ \nu $ or $ \mu \nu $, and a W or Z boson decaying hadronically, reconstructed as a single, massive, large-radius jet. The search uses a data set of proton-proton collisions at a centre-of-mass energy of 13 TeV, recorded by the CMS experiment at the CERN LHC in 2016, and corresponding to an integrated luminosity of 35.9 fb$^{-1}$. Using the reconstructed diboson invariant mass, 95% confidence intervals are obtained for the anomalous coupling parameters of $-1.58 < {c_{\mathrm{WWW}}}/\Lambda^2 < 1.59 $ TeV$^{-2}$, $-2.00 < {c_{\mathrm{W}}} /\Lambda^2 < 2.65 $ TeV$^{-2}$, and $-8.78 < {c_{\mathrm{B}}} /\Lambda^2 < 8.54 $ TeV$^{-2}$, in agreement with standard model expectations of zero for each parameter. These are the strictest bounds on these parameters to date. | ||
| Links: e-print arXiv:1907.08354 [hep-ex] (PDF) ; CDS record ; inSPIRE record ; HepData record ; CADI line (restricted) ; | ||
| Figures | |
png pdf |
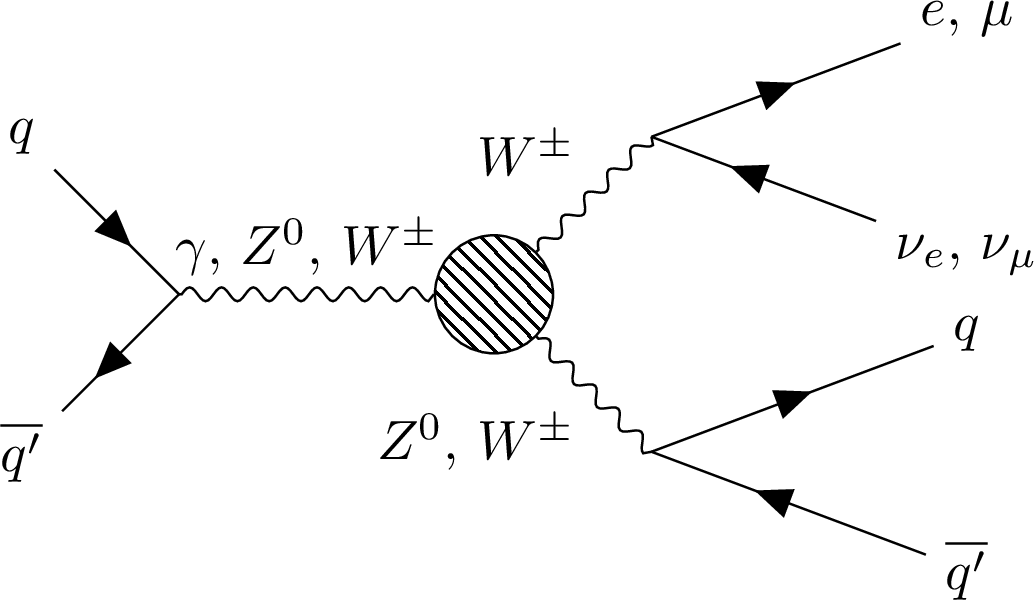
Figure 1:
The LO Feynman diagram for the diboson process involving triple gauge couplings studied in this analysis. One W boson decays to a lepton and a neutrino, and the other W/Z boson decays to a quark-antiquark pair. |
png pdf |
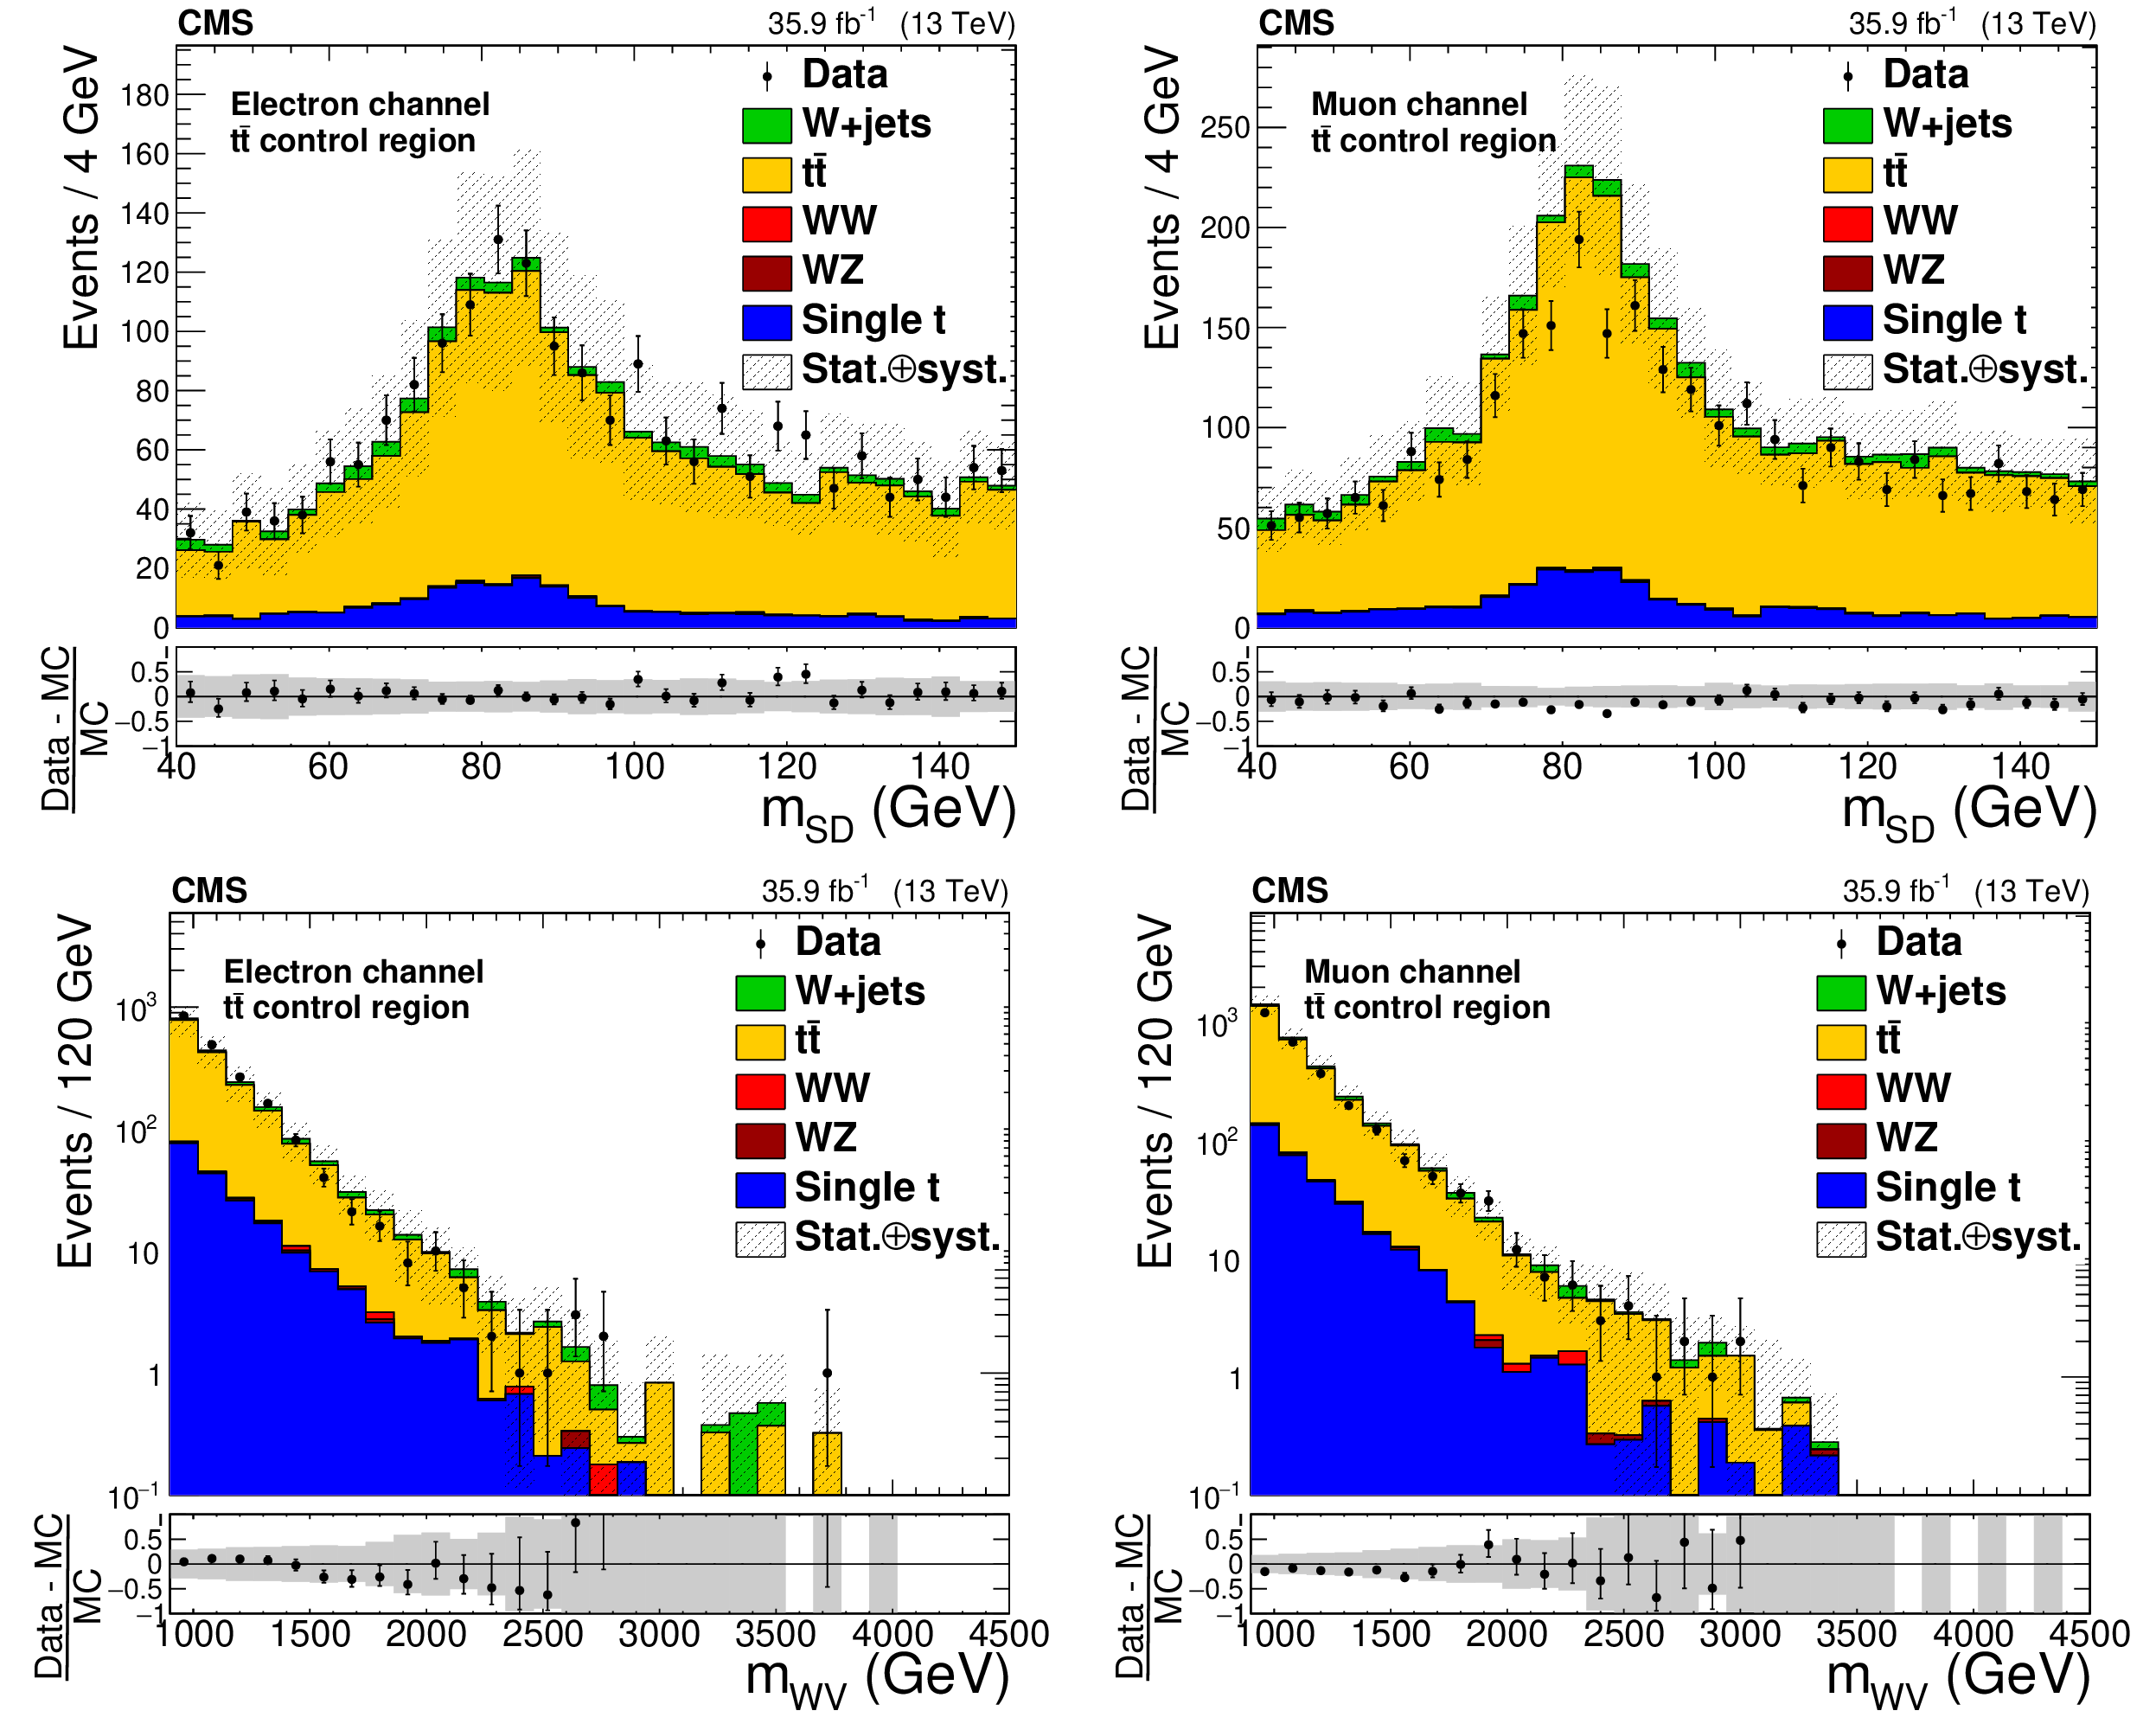
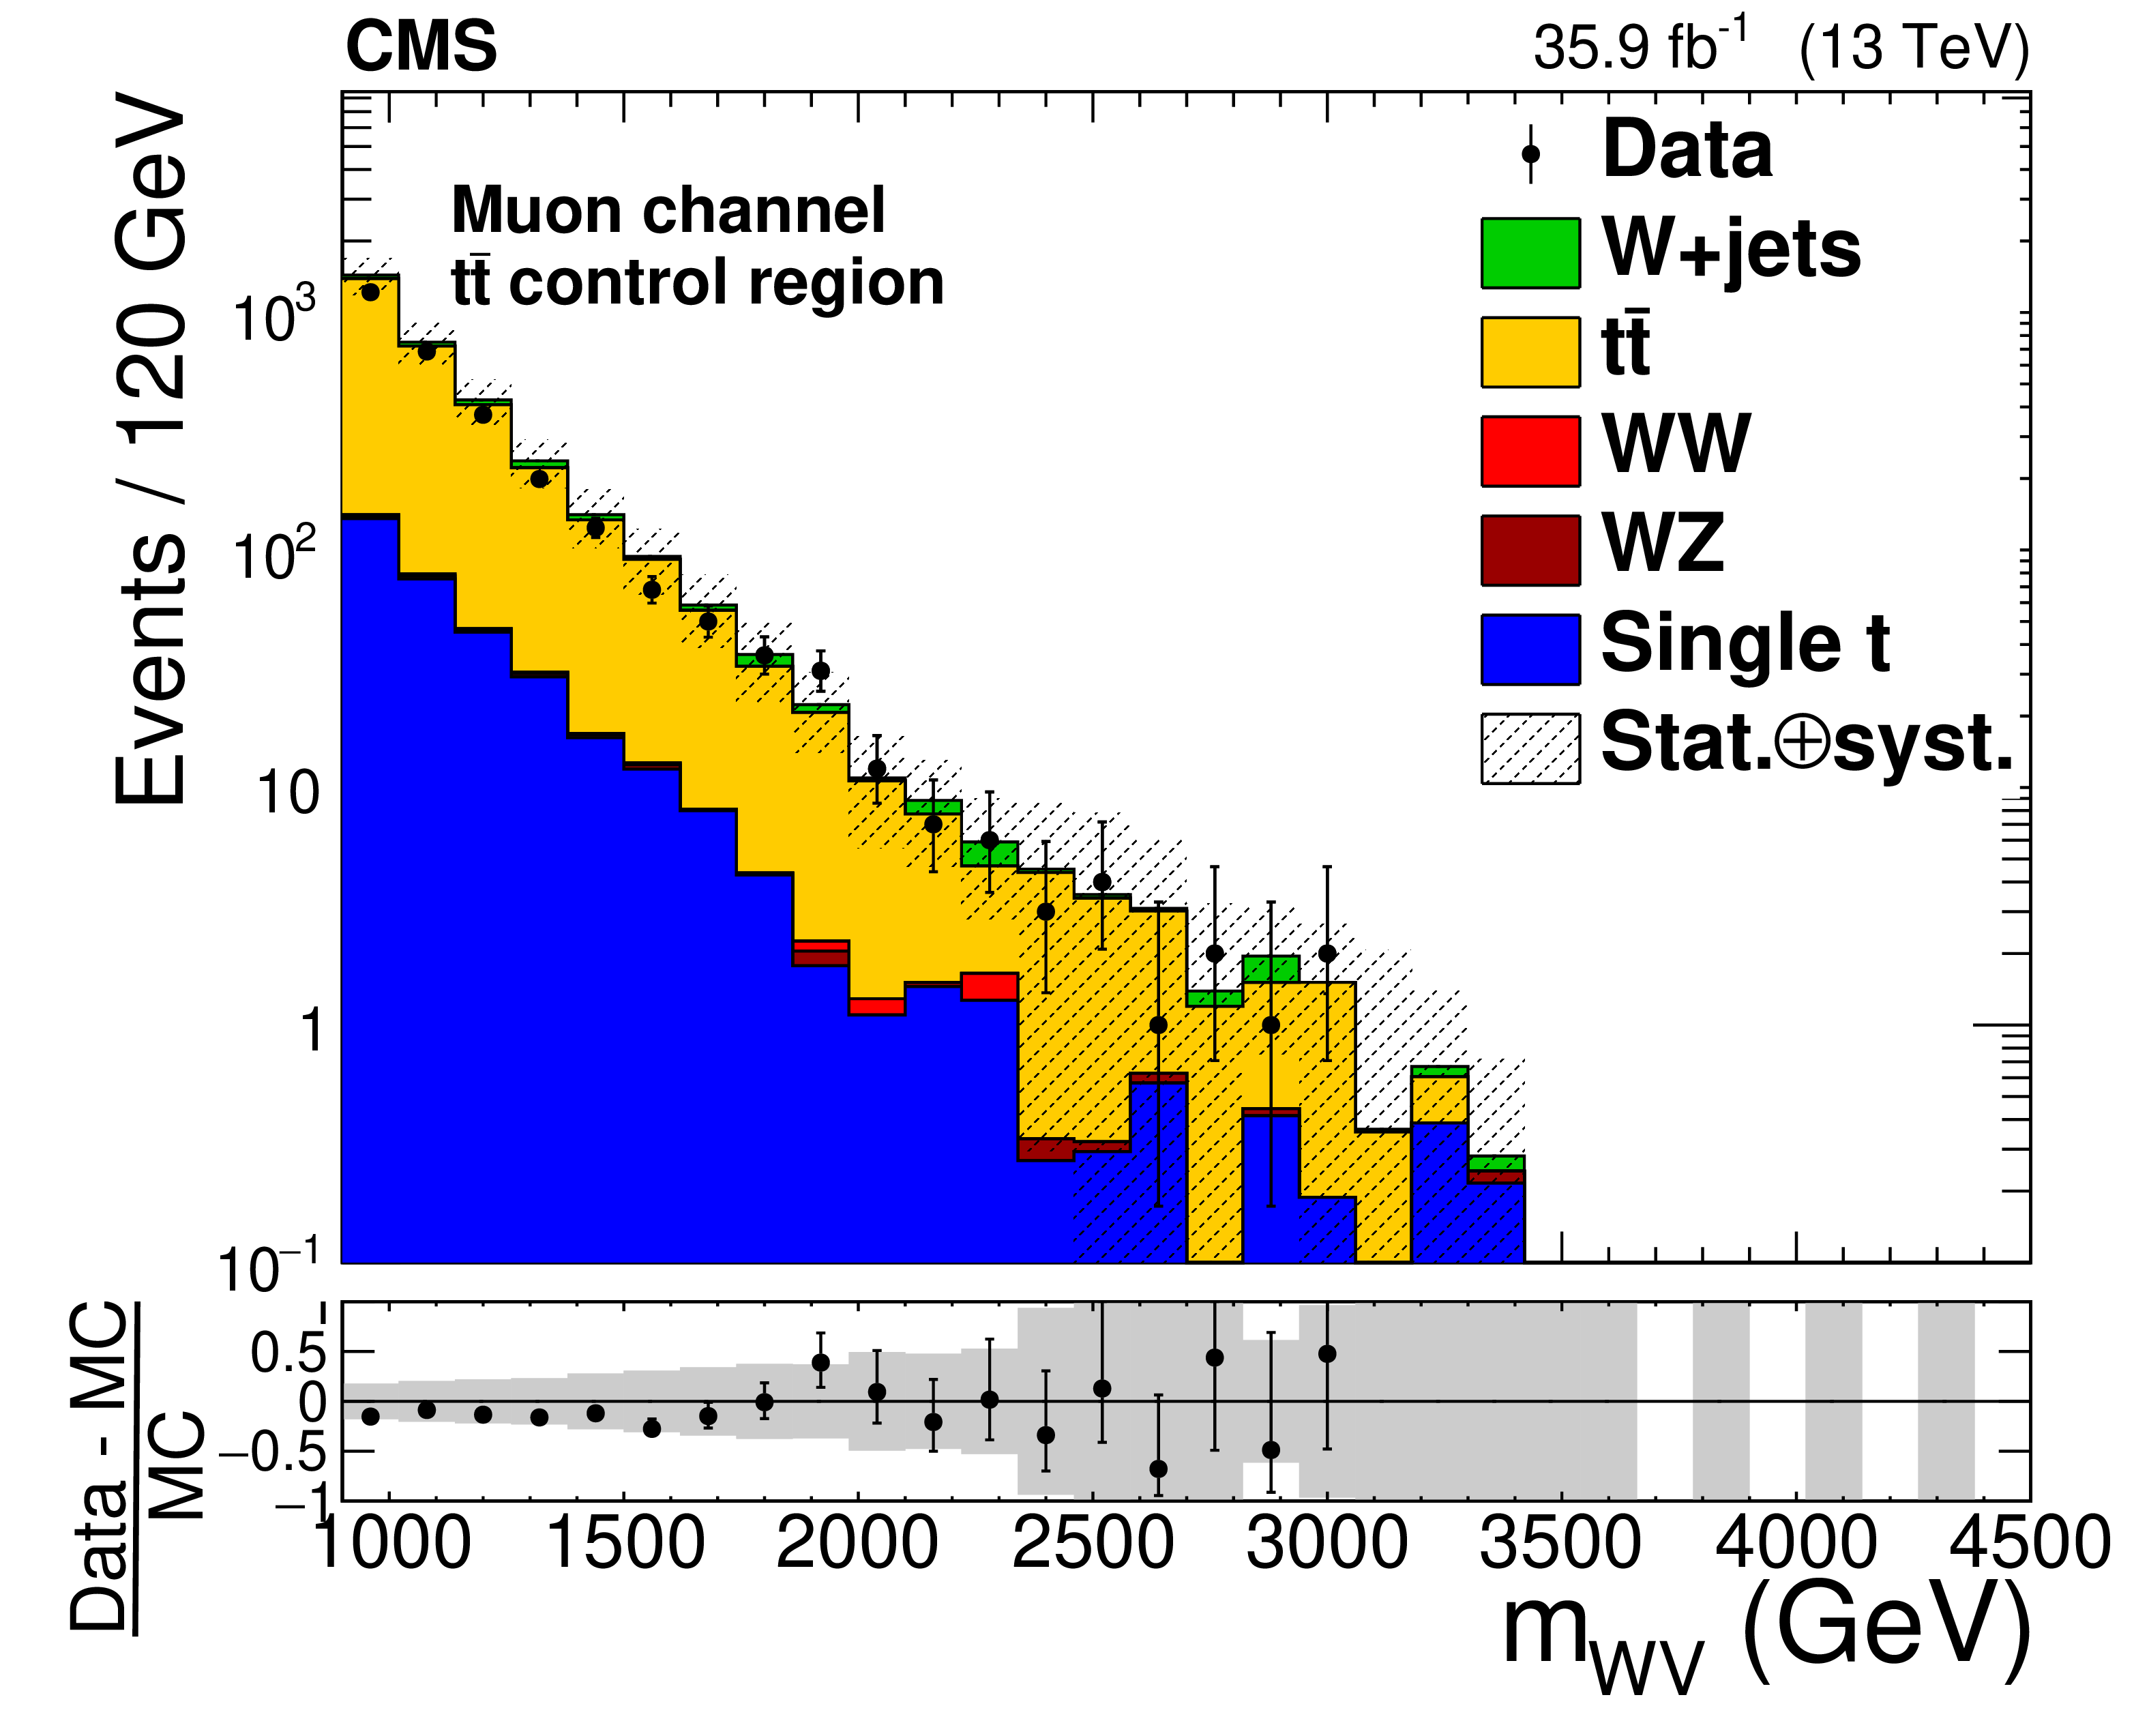
Figure 2:
Comparison between data and simulation for the ${m_{\text {SD}}}$ (upper) and ${m_{\mathrm{W} {\text {V}}}}$ (lower) distributions in the ${\mathrm{t} {}\mathrm{\bar{t}}}$ control region. Contributions from simulation are normalized to the total integrated luminosity of the data using their respective SM cross sections. The electron channel is shown on the left, while the muon channel is shown on the right. The lower panel in each figure shows the relative difference between data and simulation. The light grey hashed region in the main panels and dark grey band in the lower ratio panels represent the combined statistical and systematic uncertainties, with details of the latter discussed in Section 7. |
png pdf |
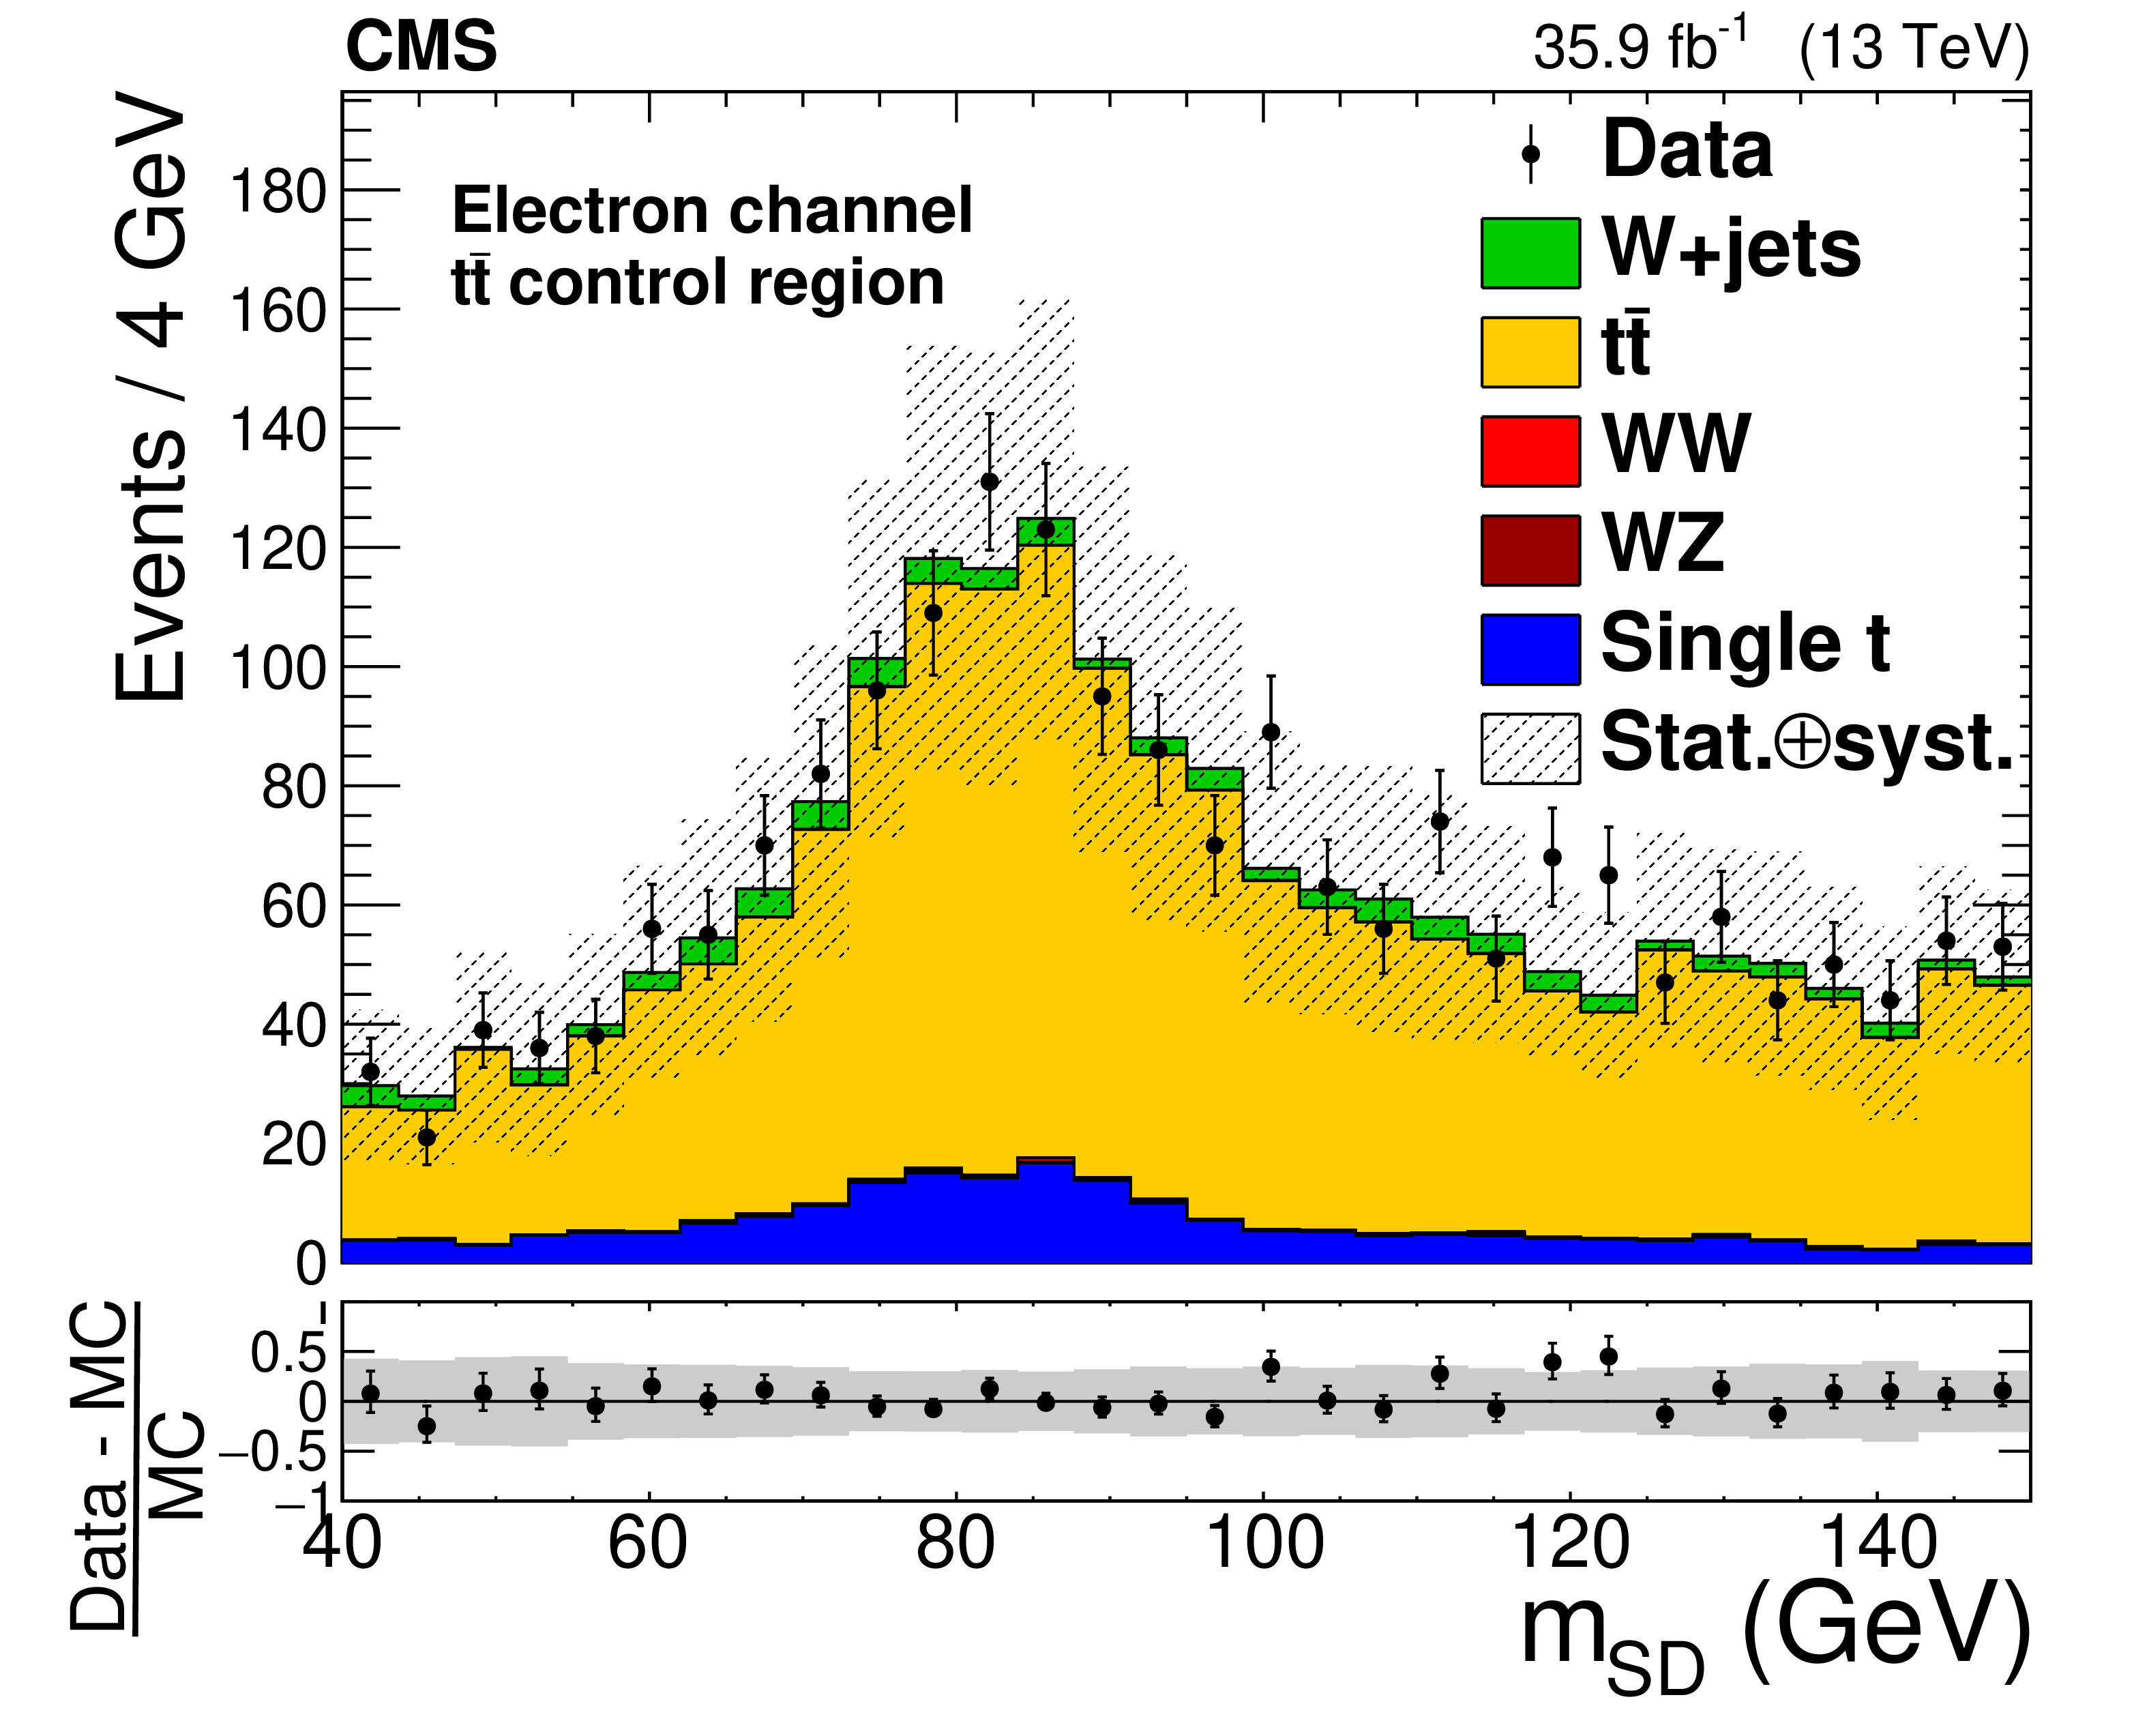
Figure 2-a:
Comparison between data and simulation for the ${m_{\text {SD}}}$ distribution in the ${\mathrm{t} {}\mathrm{\bar{t}}}$ control region, in the electron channel.Contributions from simulation are normalized to the total integrated luminosity of the data using their respective SM cross sections. The lower panel shows the relative difference between data and simulation. The light grey hashed region in the main panel and dark grey band in the lower ratio panel represent the combined statistical and systematic uncertainties, with details of the latter discussed in Section 7. |
png pdf |
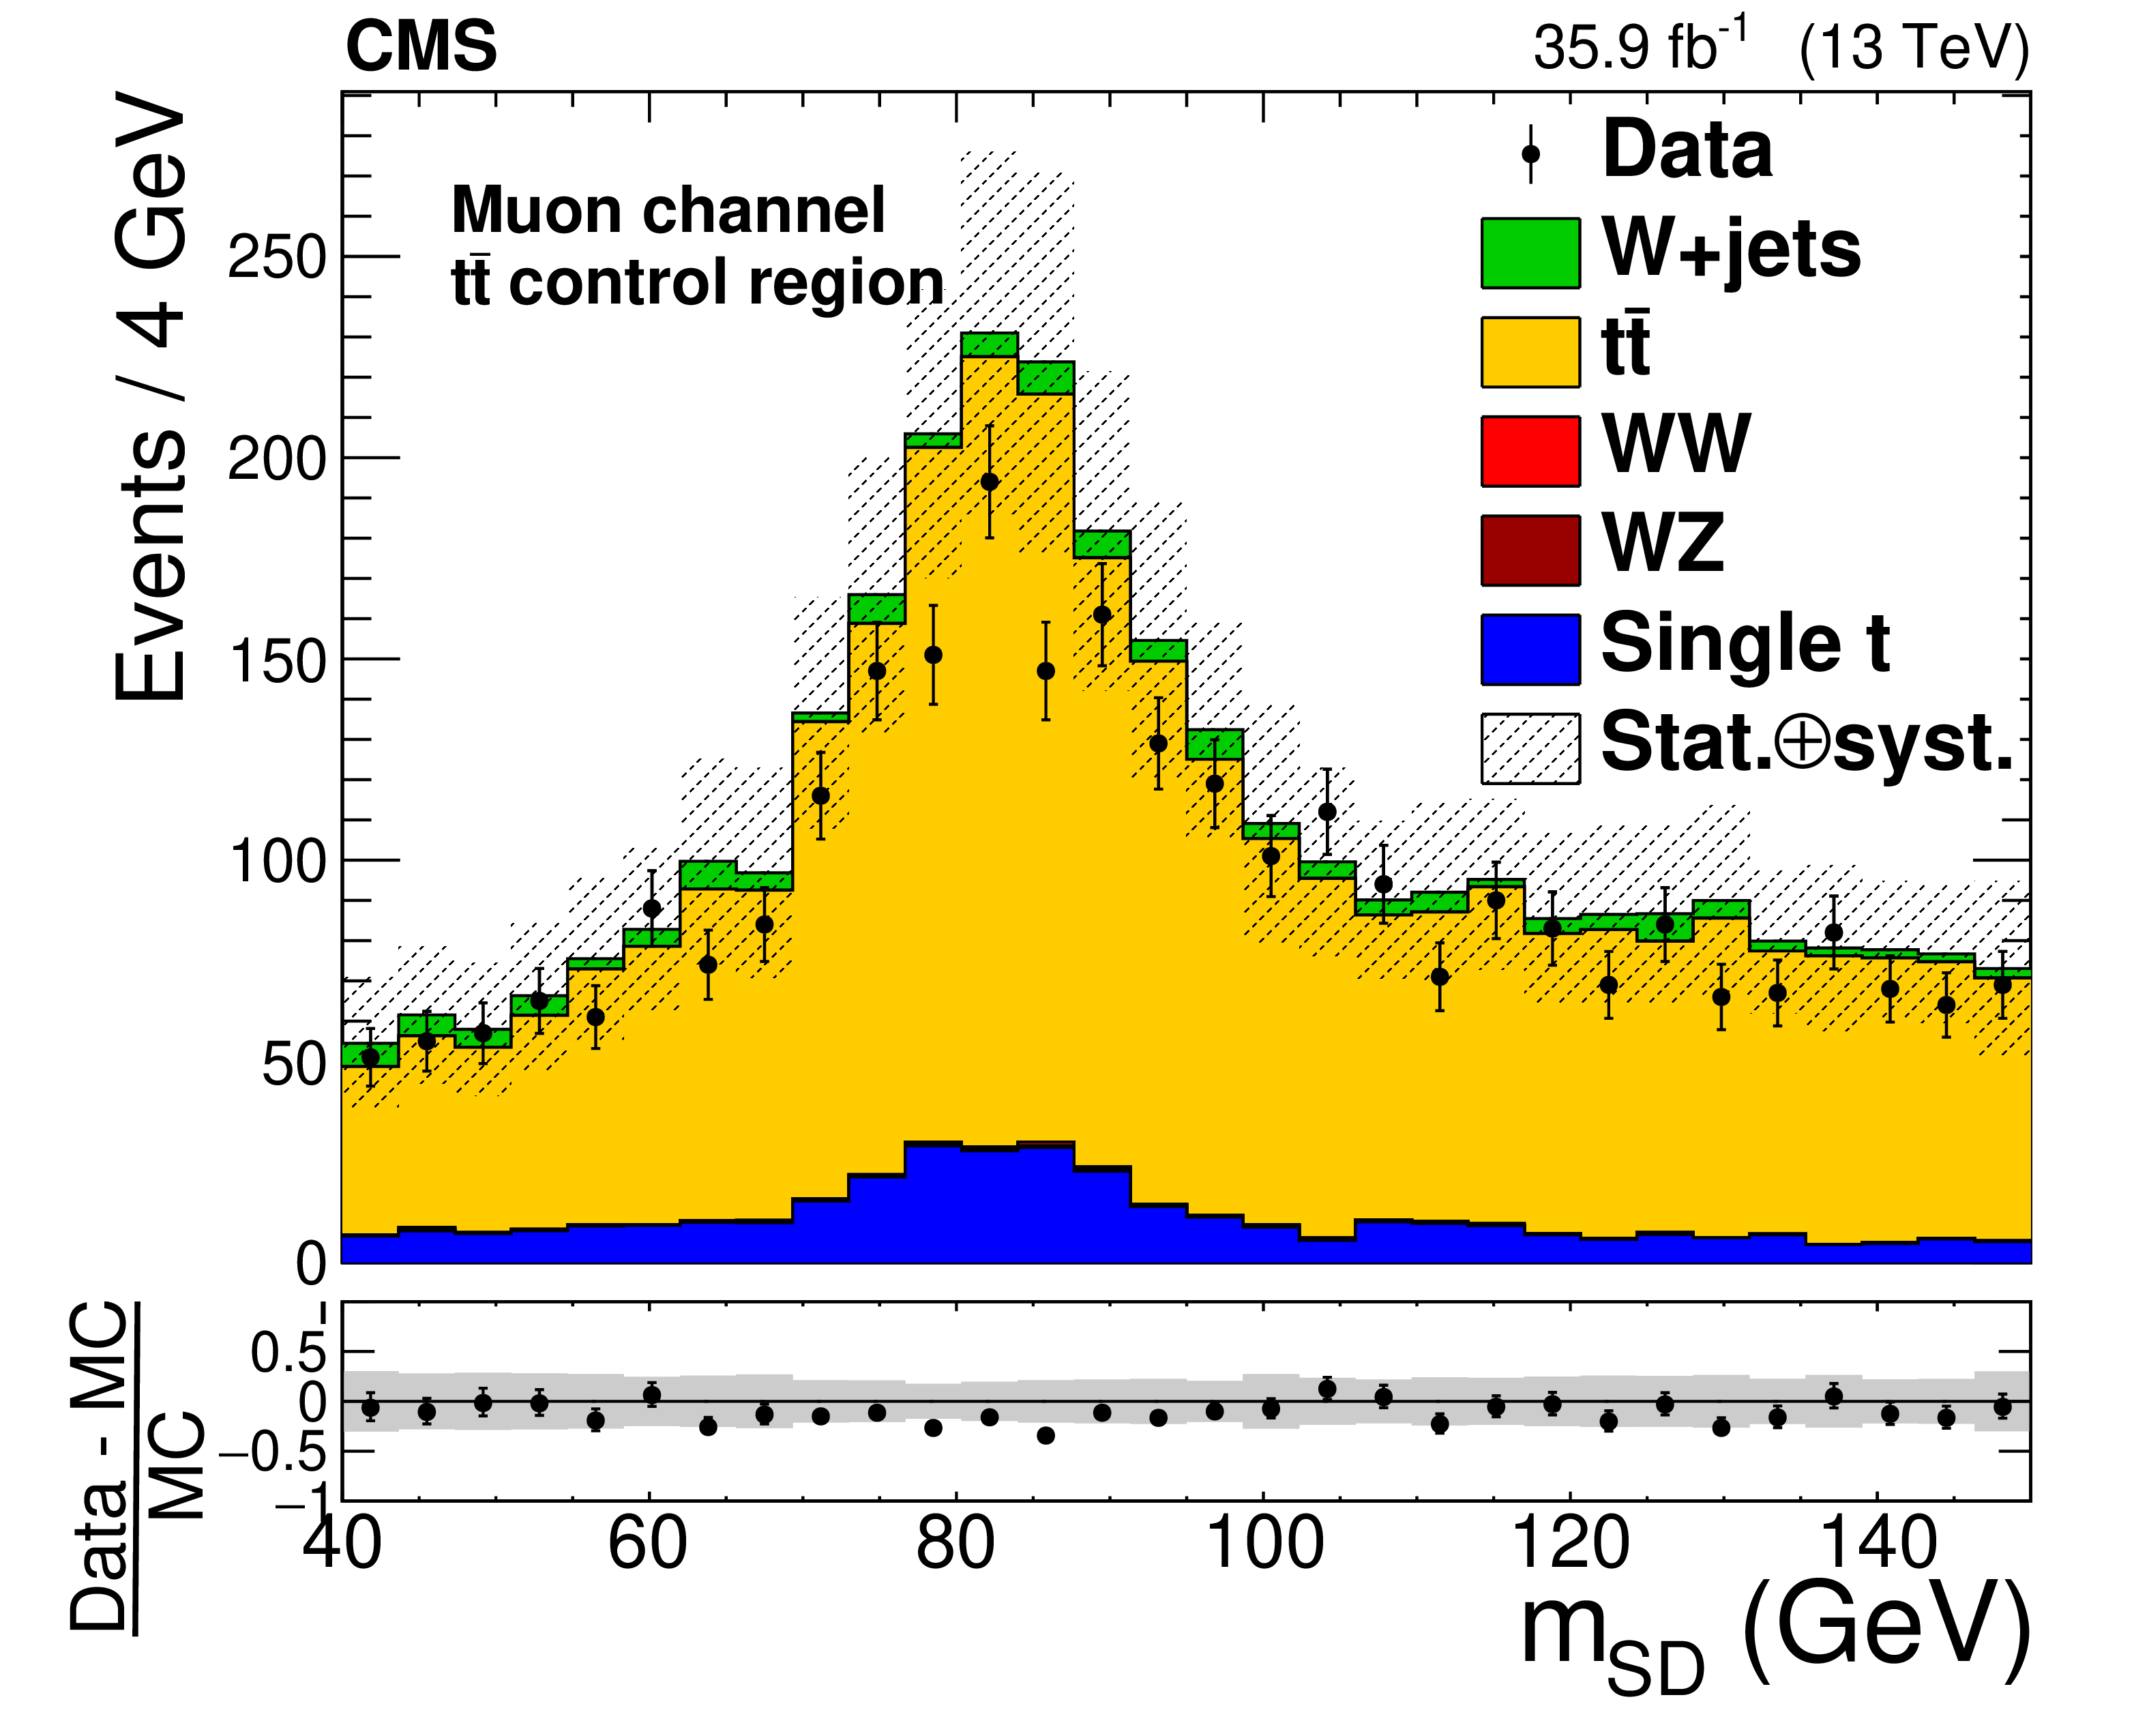
Figure 2-b:
Comparison between data and simulation for the ${m_{\text {SD}}}$ distribution in the ${\mathrm{t} {}\mathrm{\bar{t}}}$ control region, in the muon channel. Contributions from simulation are normalized to the total integrated luminosity of the data using their respective SM cross sections. The lower panel shows the relative difference between data and simulation. The light grey hashed region in the main panel and dark grey band in the lower ratio panel represent the combined statistical and systematic uncertainties, with details of the latter discussed in Section 7. |

png pdf |
Figure 2-c:
Comparison between data and simulation for the ${m_{\mathrm{W} {\text {V}}}}$ distribution in the ${\mathrm{t} {}\mathrm{\bar{t}}}$ control region, in the electron channel. Contributions from simulation are normalized to the total integrated luminosity of the data using their respective SM cross sections. The lower panel shows the relative difference between data and simulation. The light grey hashed region in the main panel and dark grey band in the lower ratio panel represent the combined statistical and systematic uncertainties, with details of the latter discussed in Section 7. |
png pdf |
Figure 2-d:
Comparison between data and simulation for the ${m_{\mathrm{W} {\text {V}}}}$ distribution in the ${\mathrm{t} {}\mathrm{\bar{t}}}$ control region, in the muon channel. Contributions from simulation are normalized to the total integrated luminosity of the data using their respective SM cross sections. The lower panel shows the relative difference between data and simulation. The light grey hashed region in the main panel and dark grey band in the lower ratio panel represent the combined statistical and systematic uncertainties, with details of the latter discussed in Section 7. |

png pdf |
Figure 3:
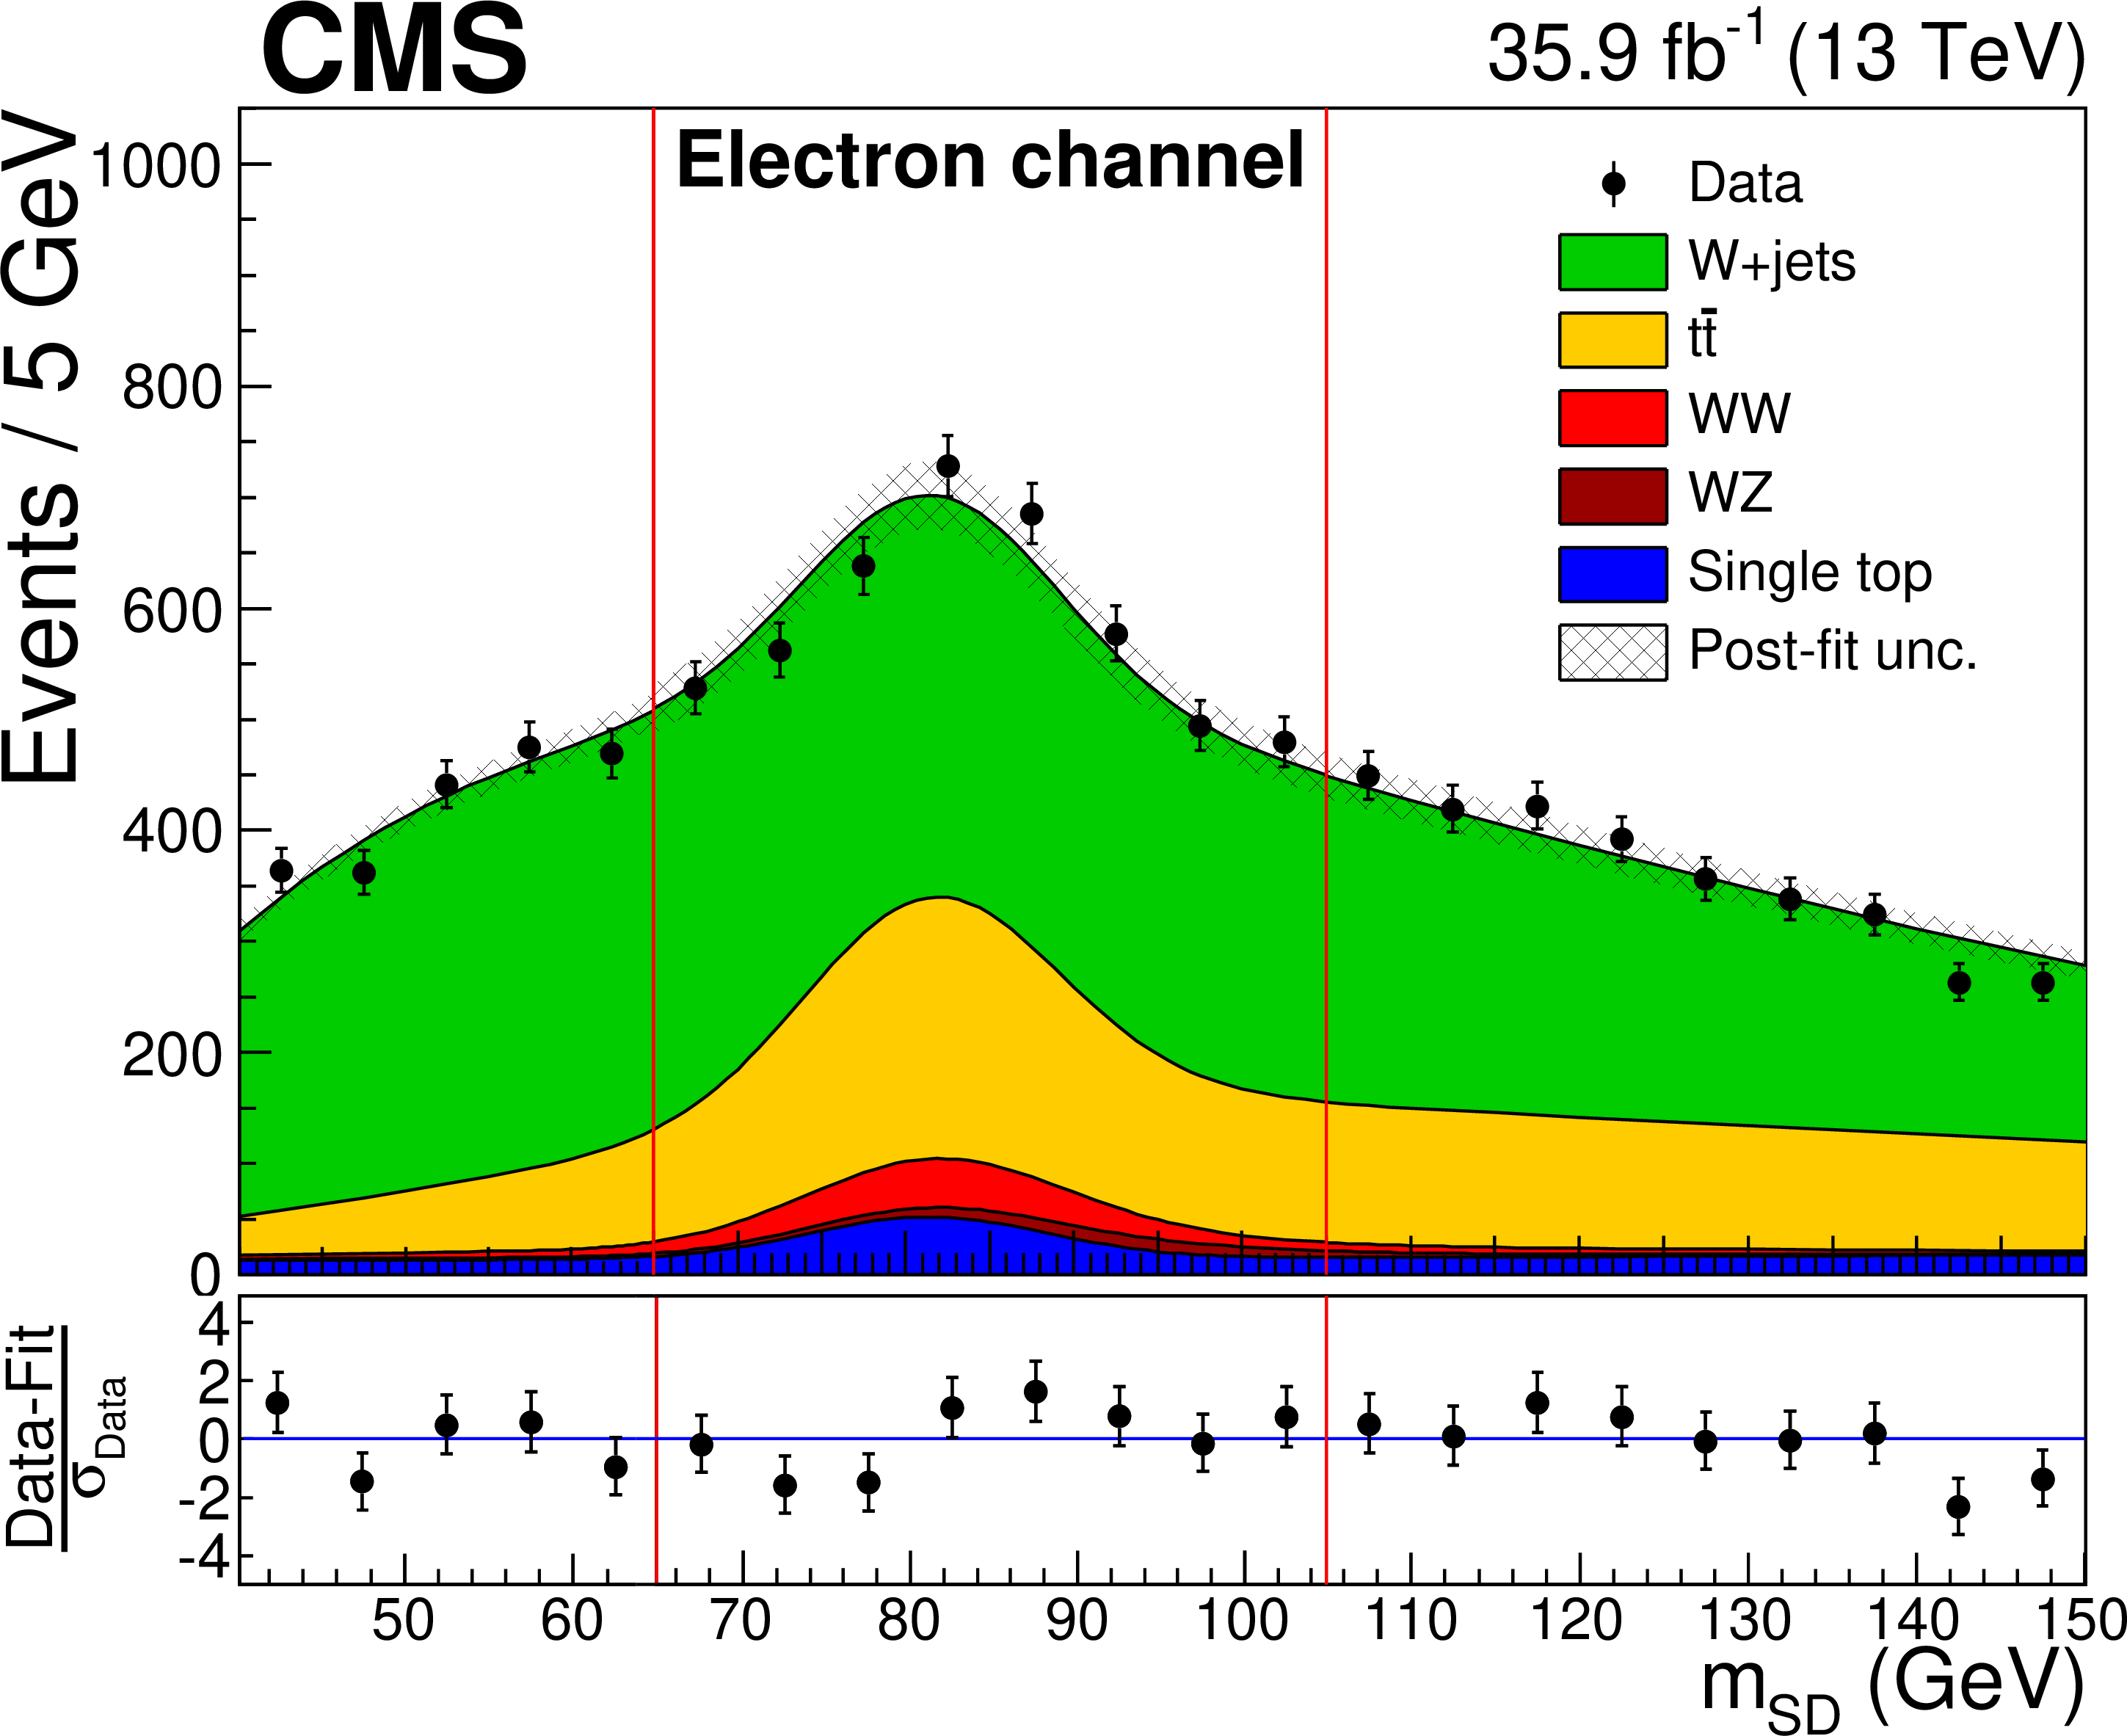
Final result of the two-dimensional fit in the electron (left) and muon (right) channels, showing the ${m_{\text {SD}}}$ distribution. |
png pdf |
Figure 3-a:
Final result of the two-dimensional fit in the electron channel, showing the ${m_{\text {SD}}}$ distribution. |

png pdf |
Figure 3-b:
Final result of the two-dimensional fit in the muon channel, showing the ${m_{\text {SD}}}$ distribution. |
png pdf |
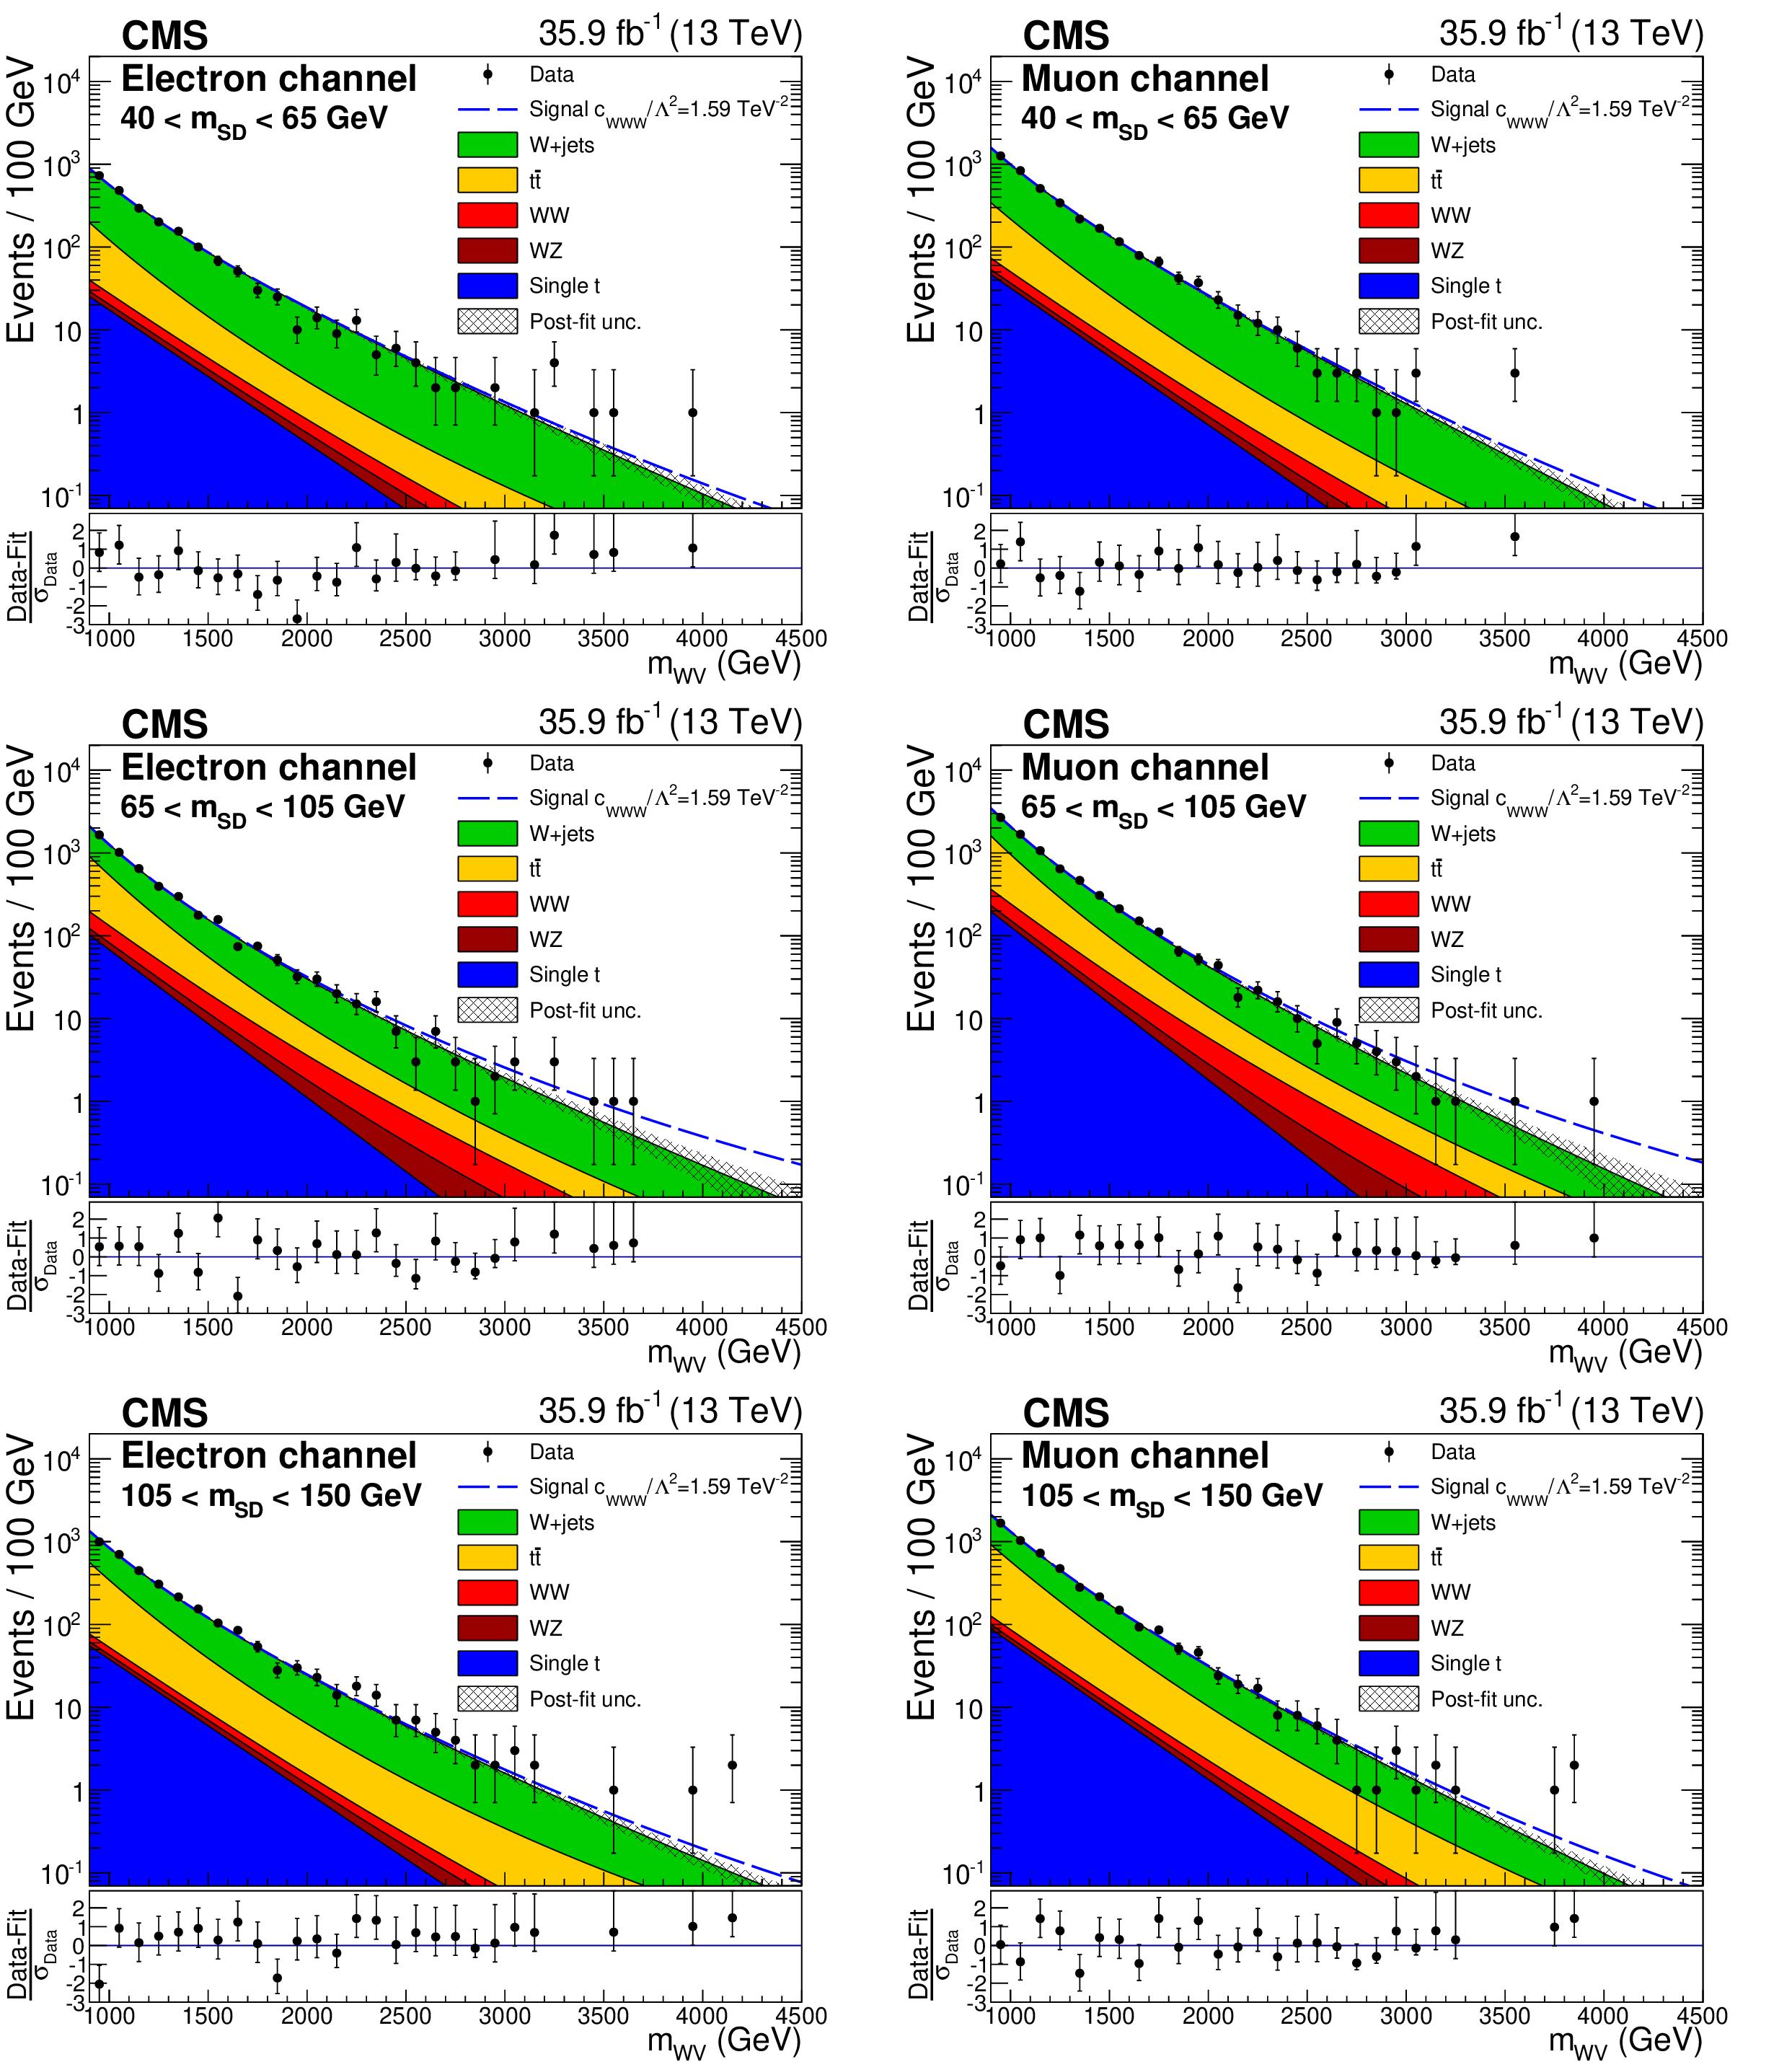
Figure 4:
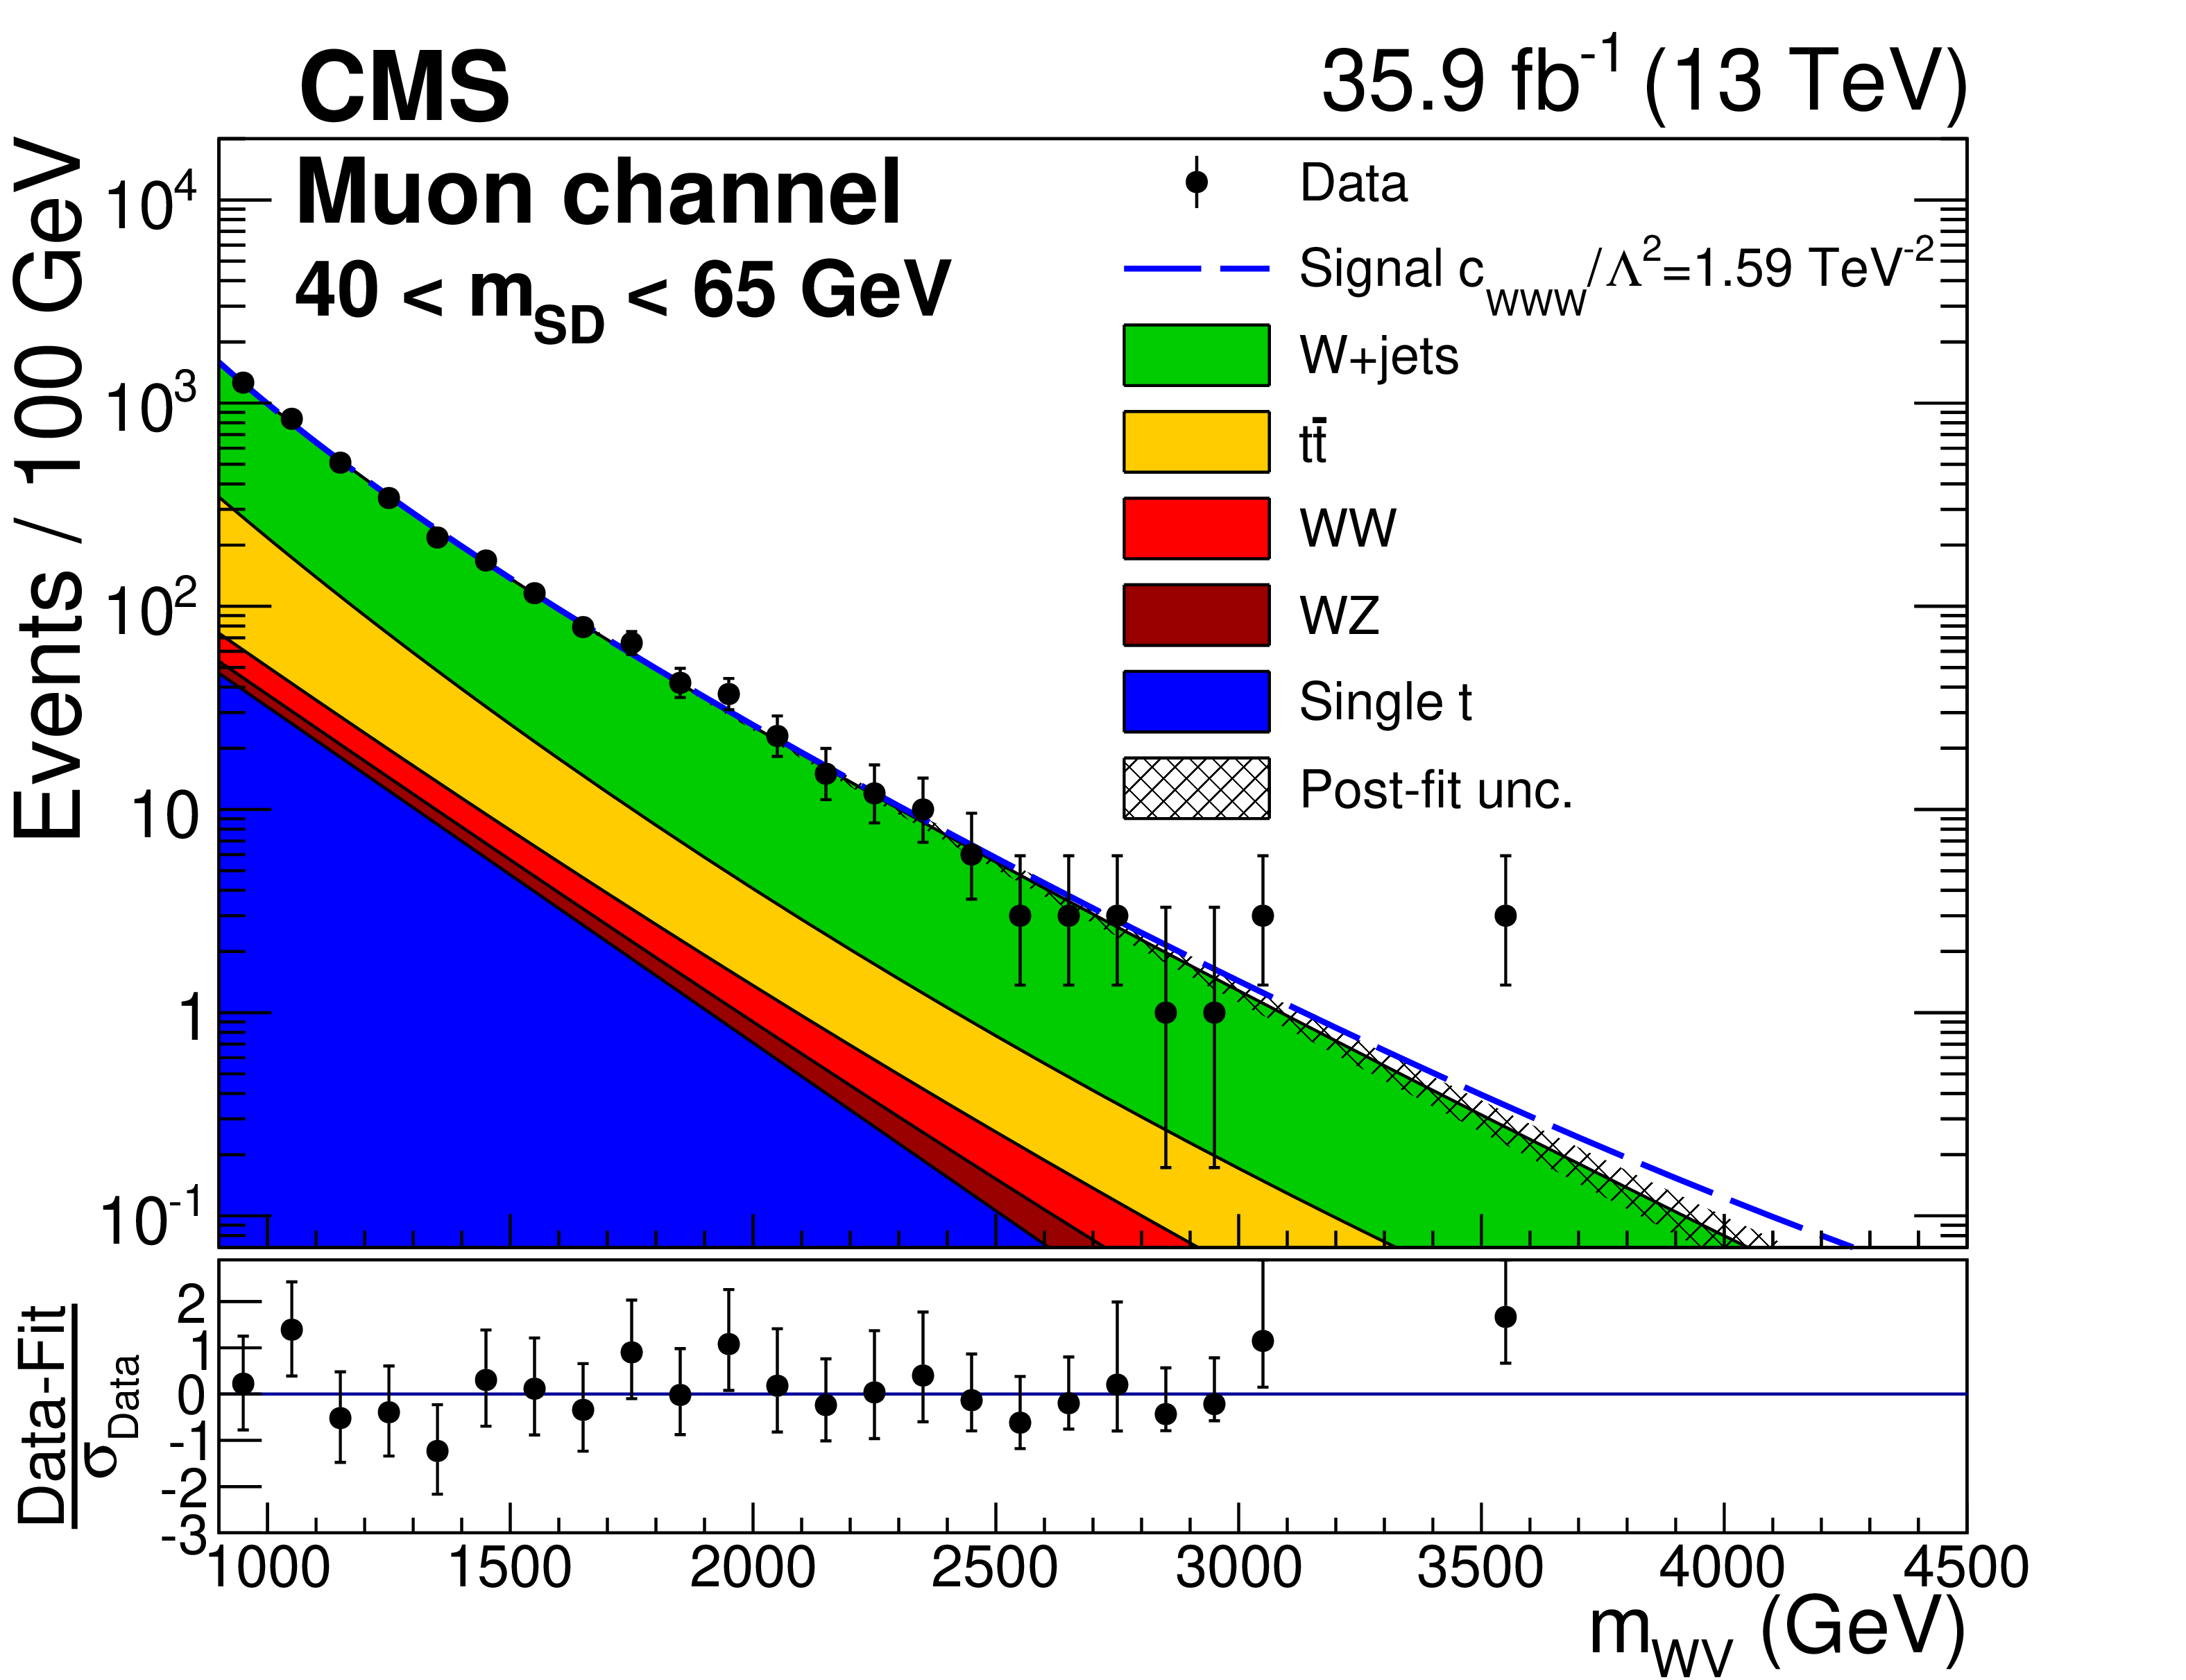
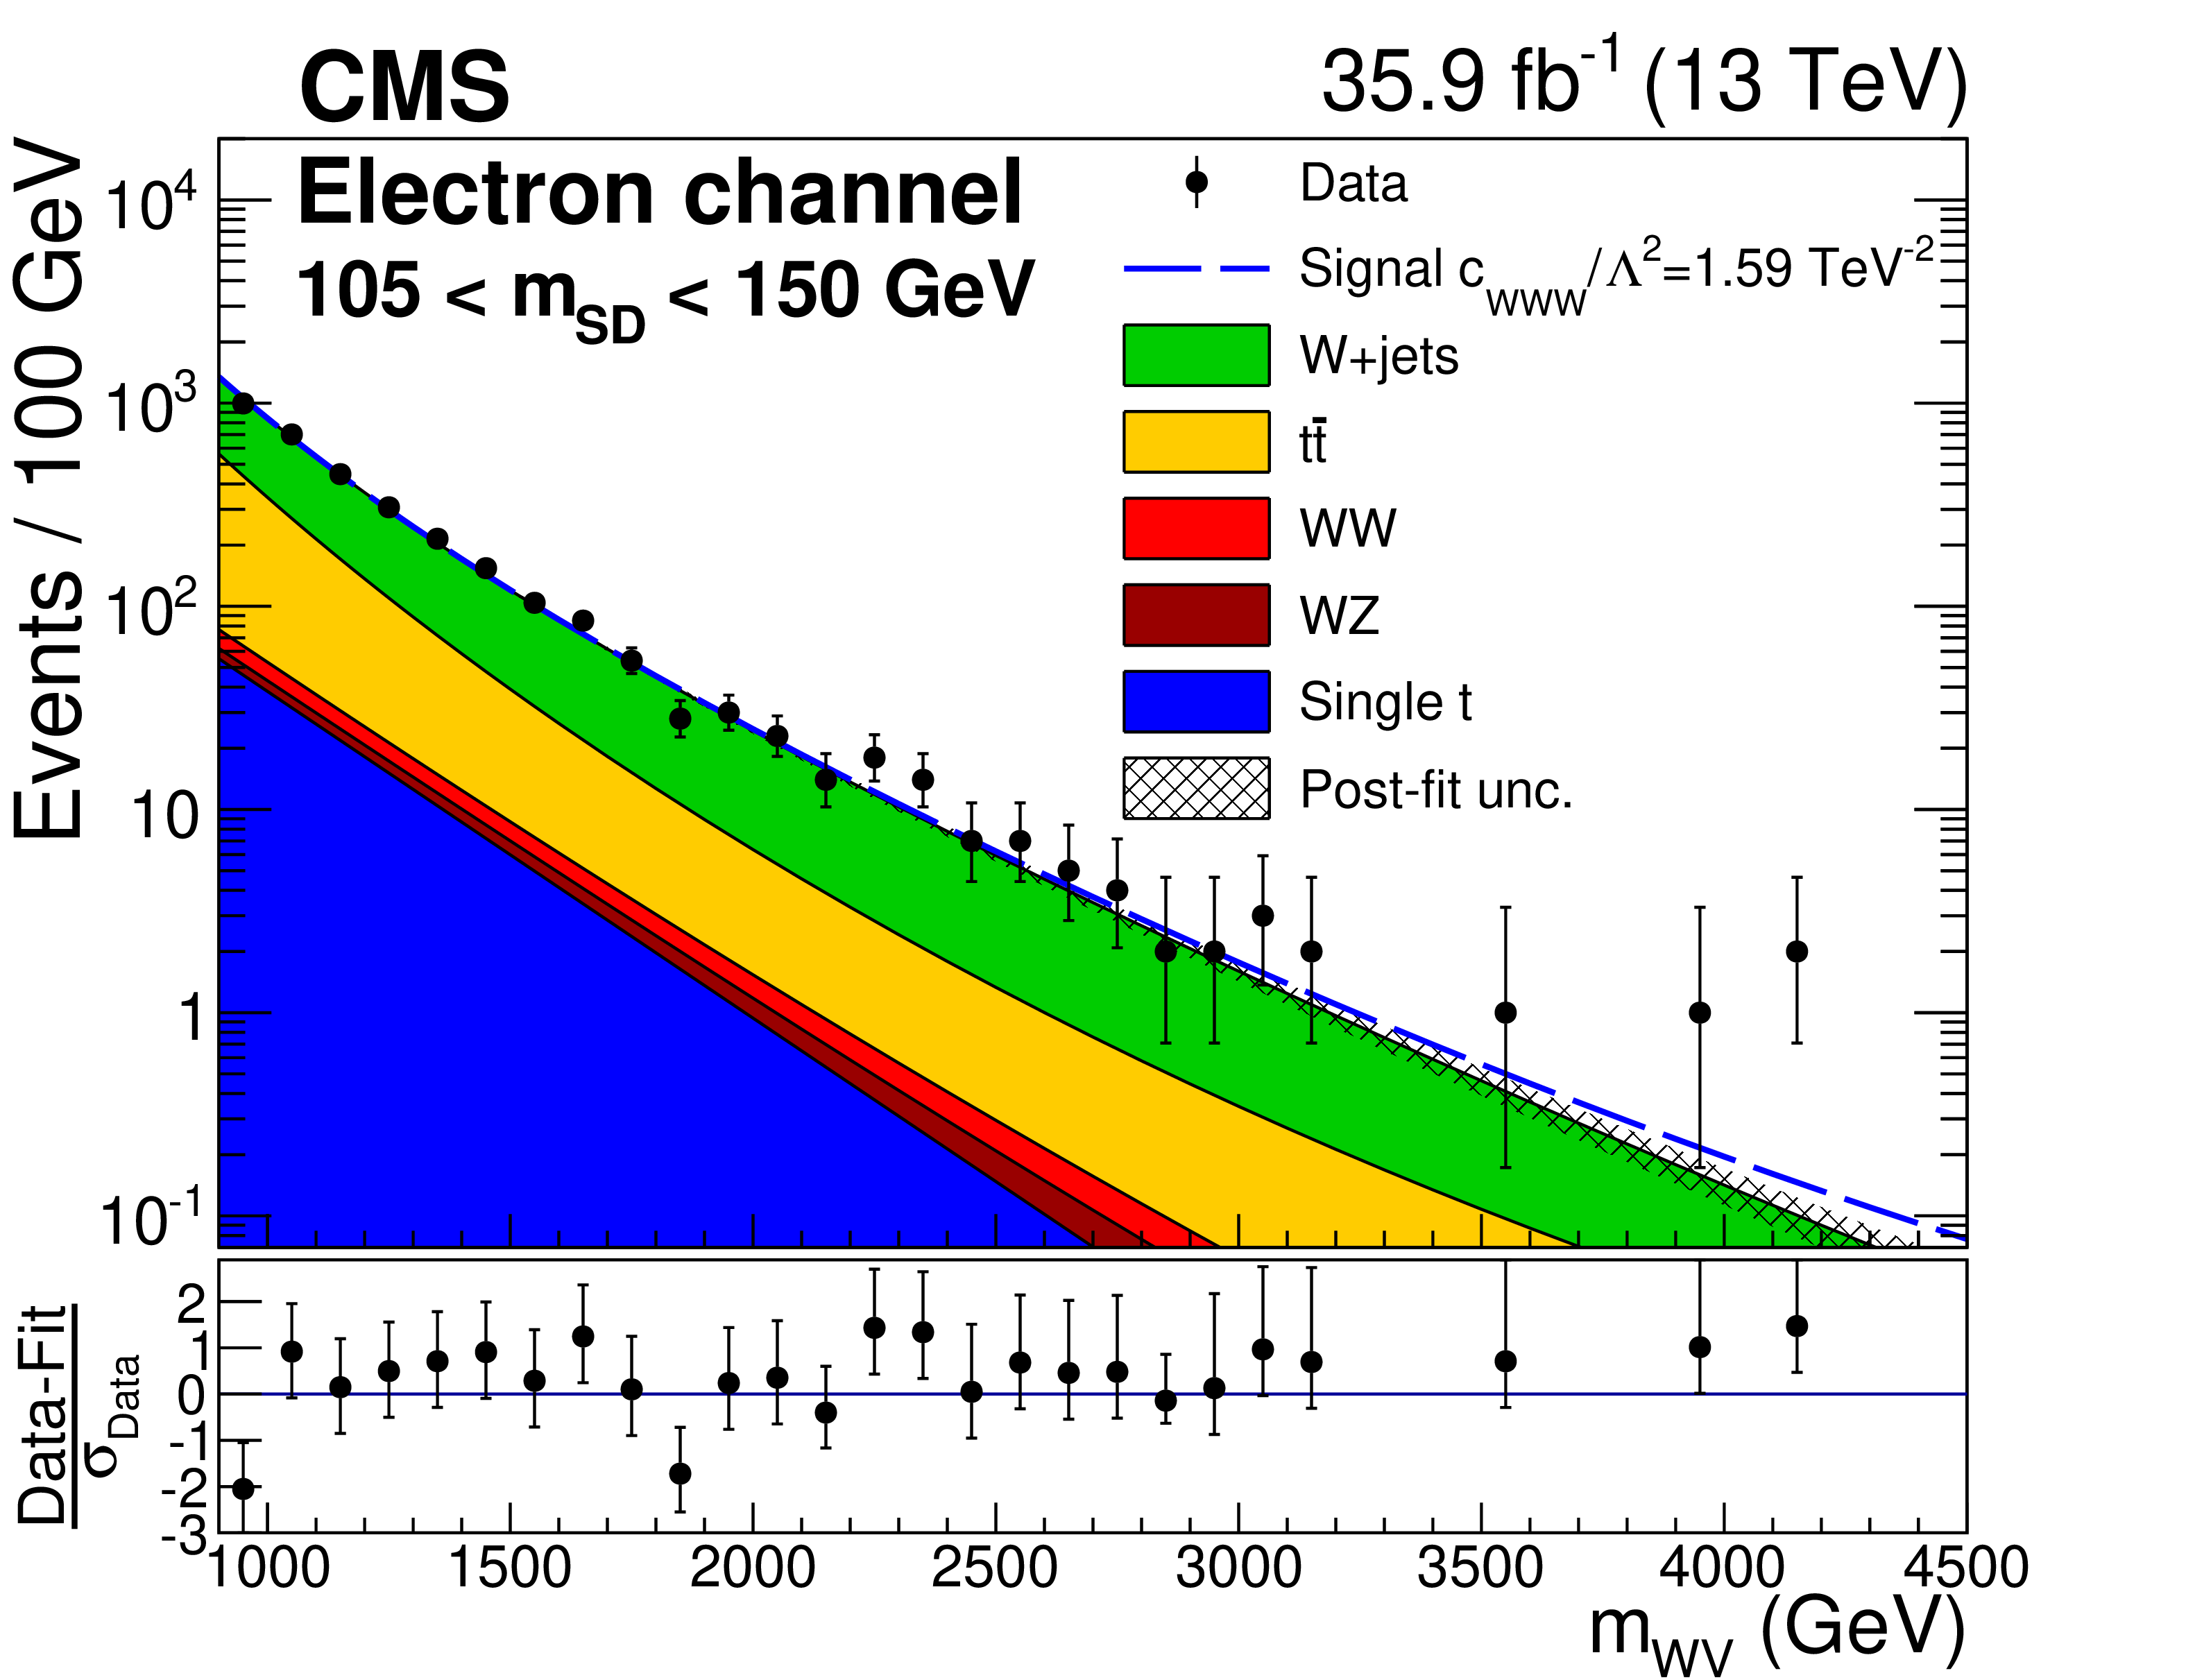
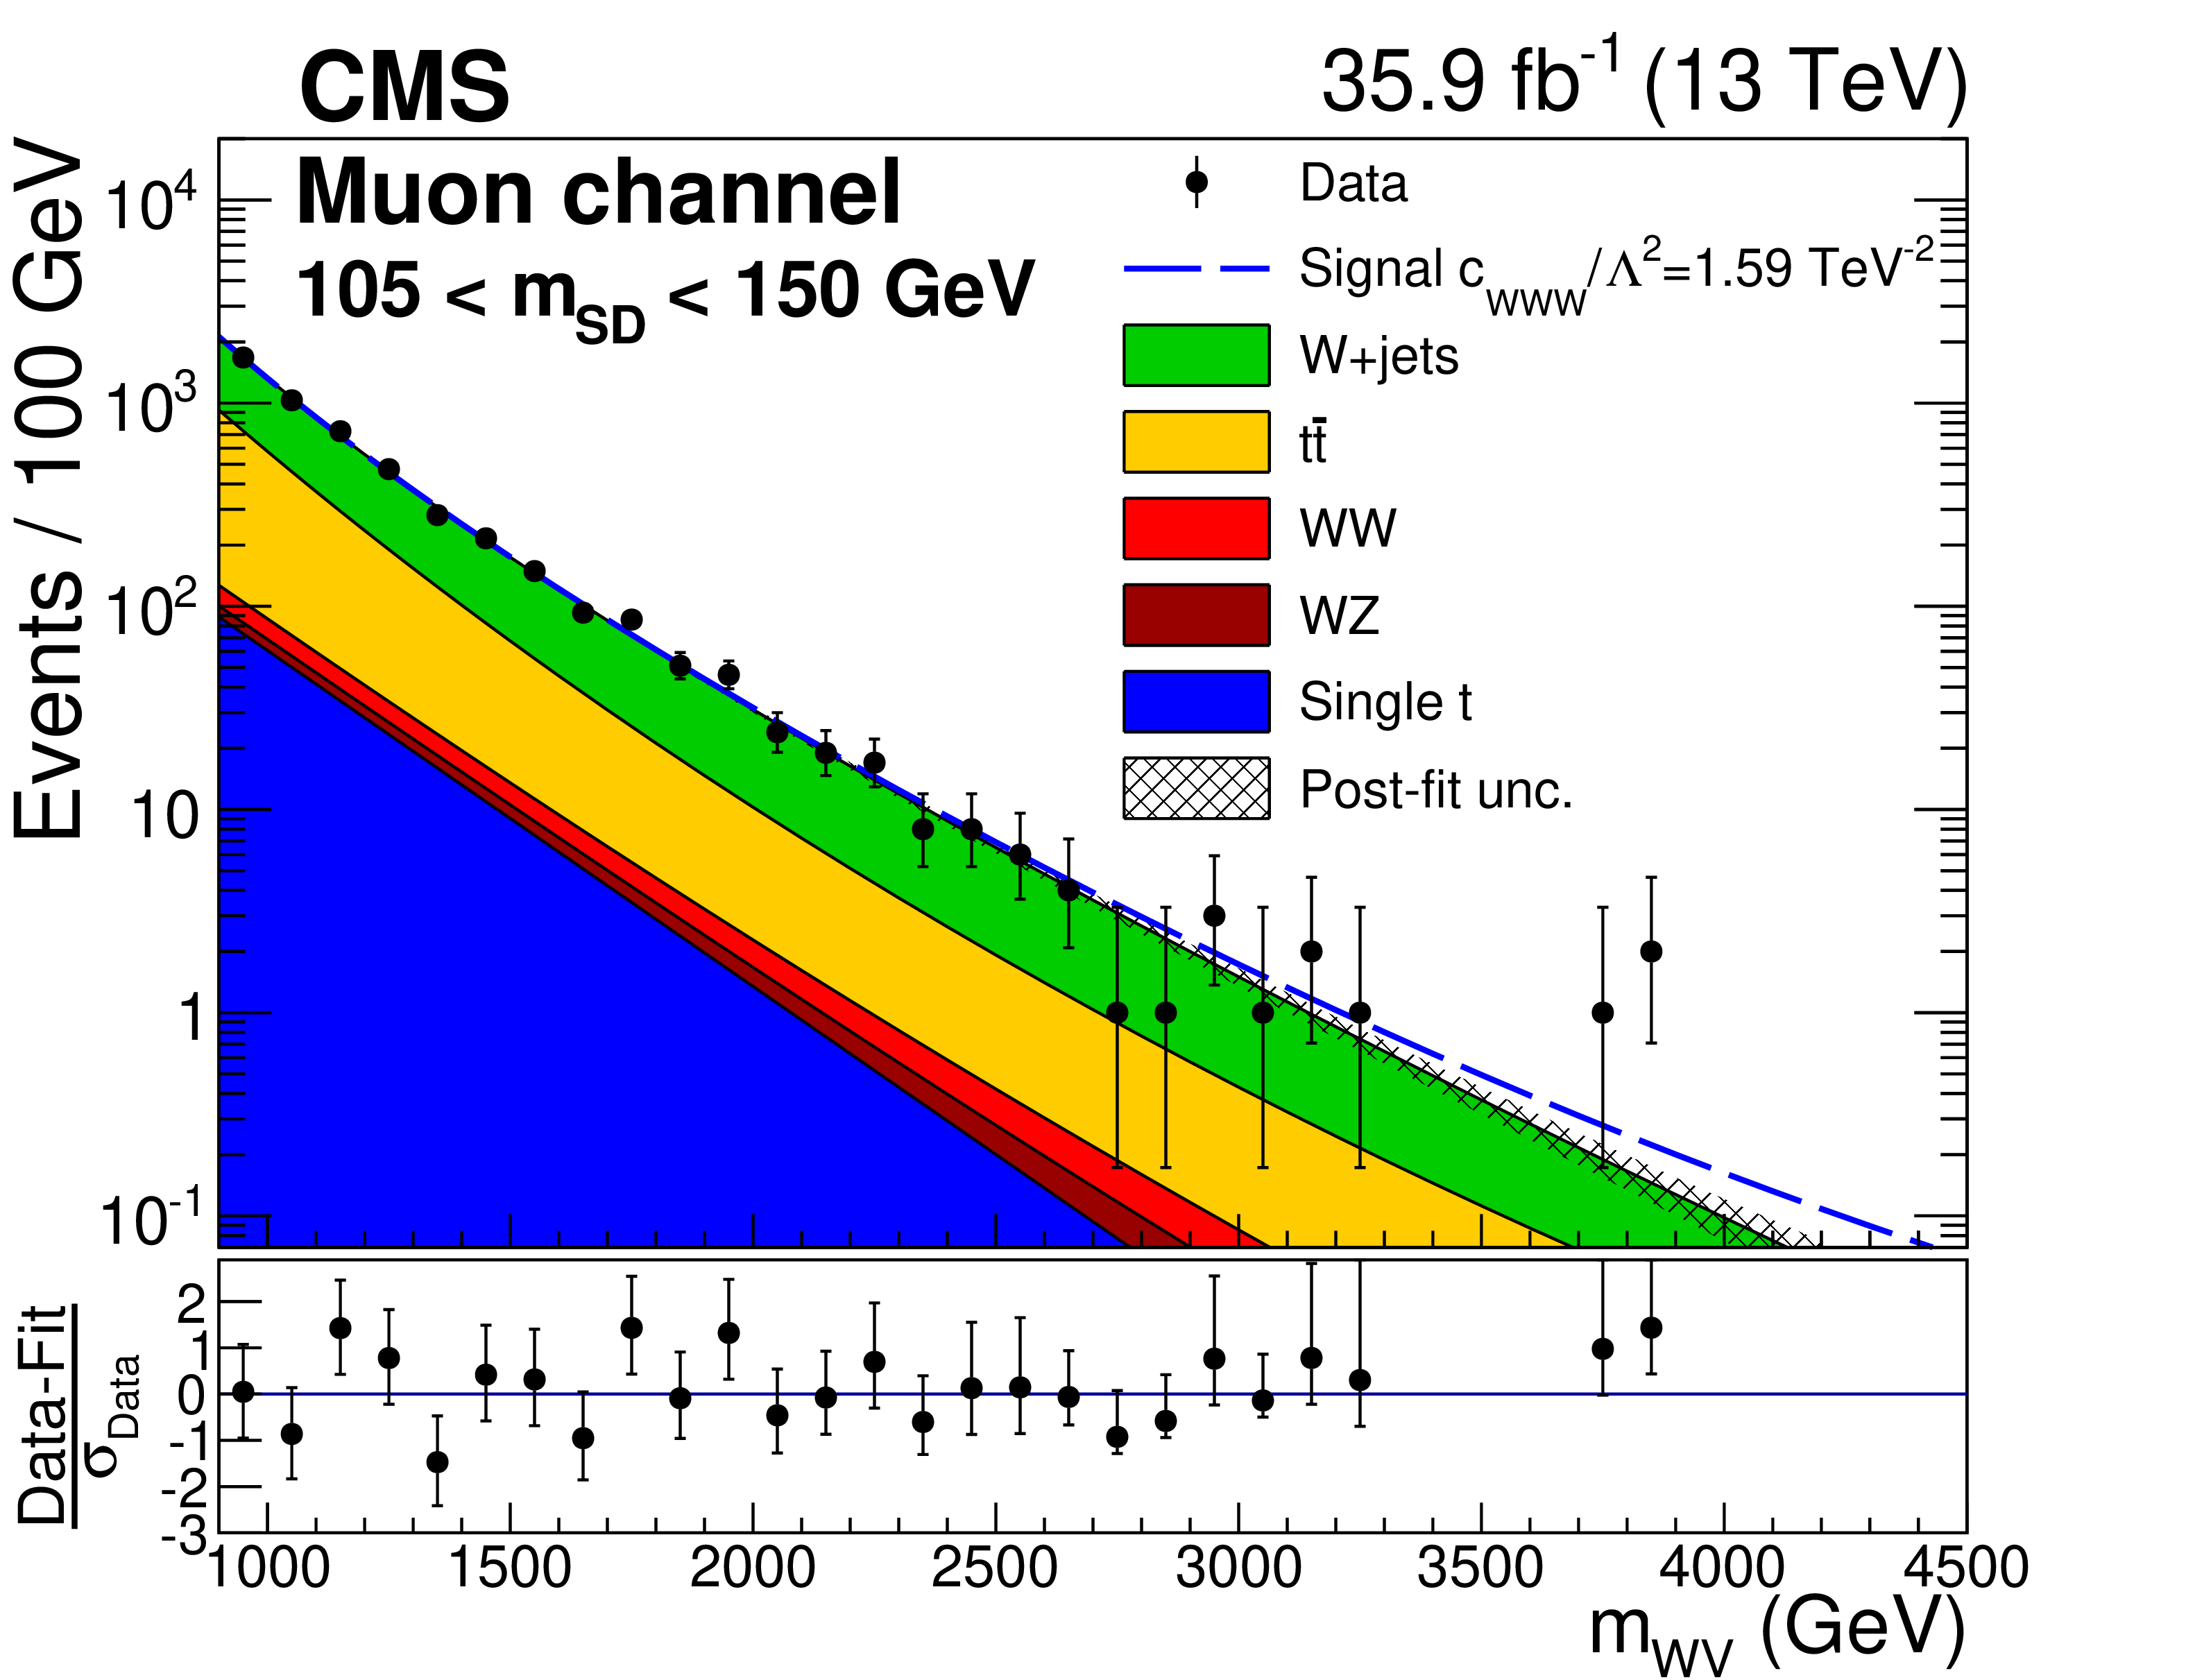
Final result of the two-dimensional fit in the electron (left) and muon (right) channels, showing the ${m_{\mathrm{W} {\text {V}}}}$ distributions. The lower sideband, signal, and upper sideband regions are shown on the top, middle, and bottom, respectively. An example of the excluded signal ($ {c_{\mathrm{W} \mathrm{W} \mathrm{W}}} /\Lambda ^2 = 1.59 $ TeV$^{-2}$) is represented by the dashed line. |
png pdf |
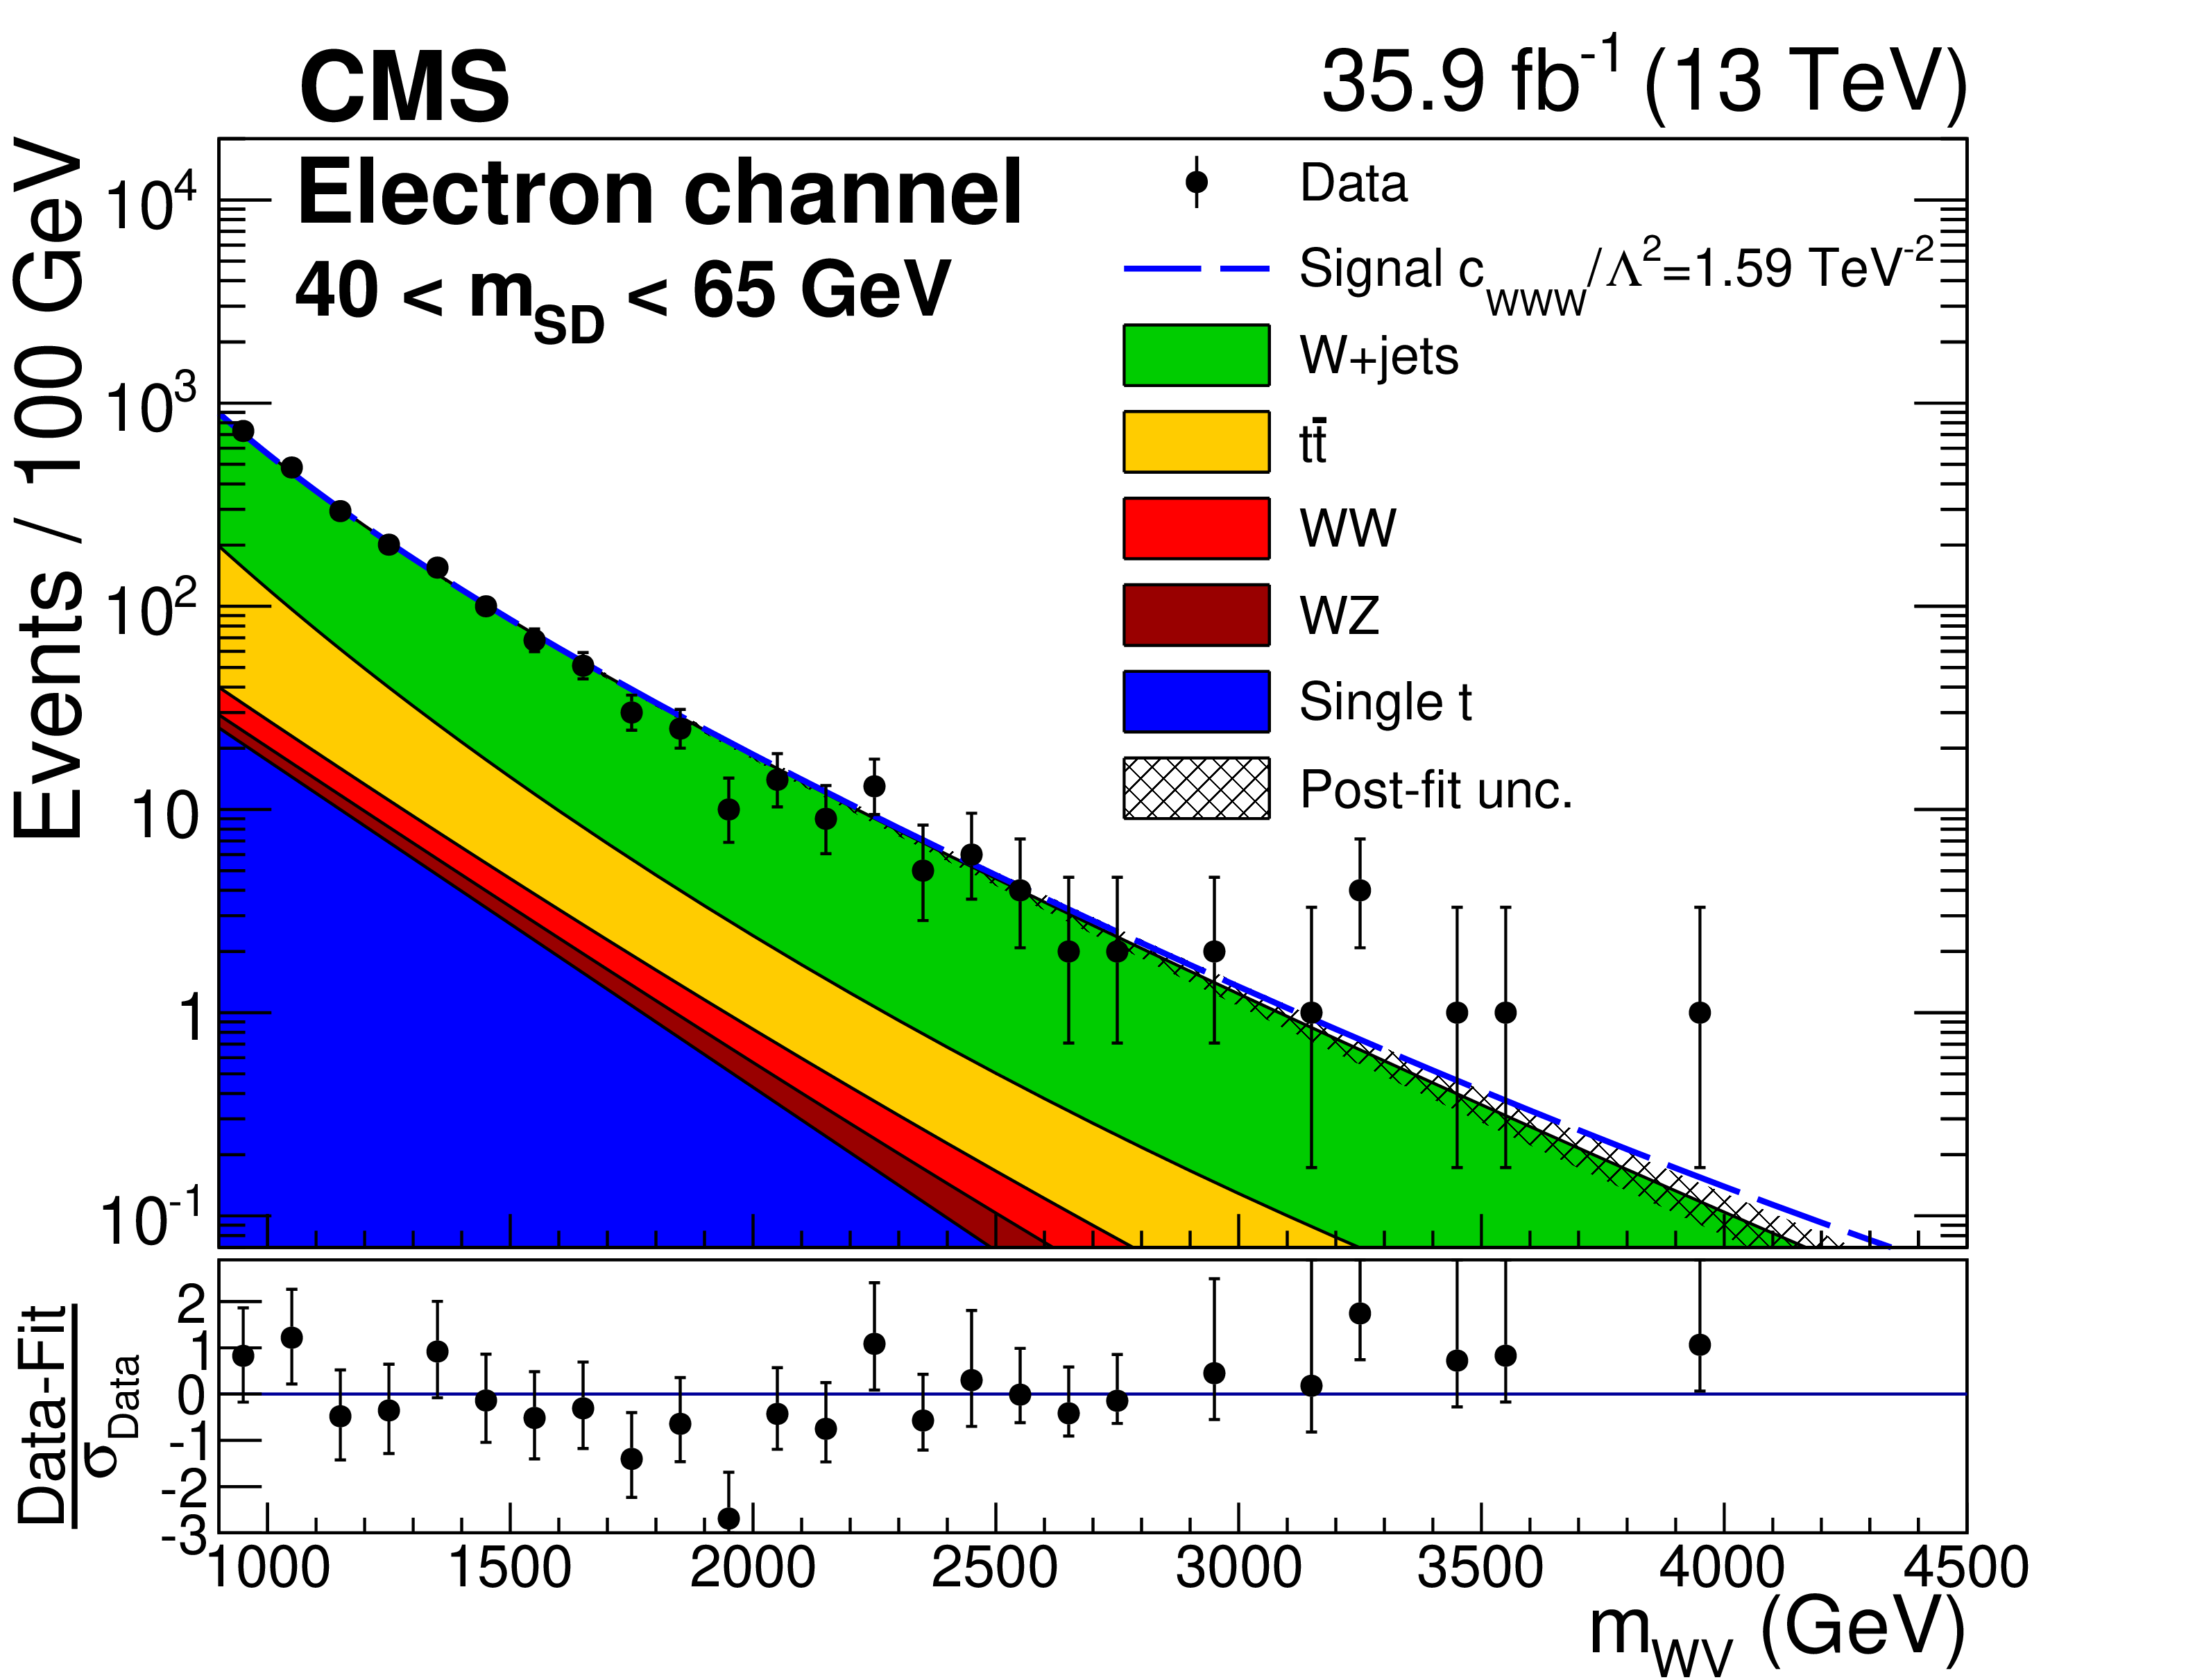
Figure 4-a:
Final result of the two-dimensional fit in the electron channel, showing the ${m_{\mathrm{W} {\text {V}}}}$ distributions. The lower sideband region is shown. An example of the excluded signal ($ {c_{\mathrm{W} \mathrm{W} \mathrm{W}}} /\Lambda ^2 = 1.59 $ TeV$^{-2}$) is represented by the dashed line. |
png pdf |
Figure 4-b:
Final result of the two-dimensional fit in the muon channel, showing the ${m_{\mathrm{W} {\text {V}}}}$ distributions. The lower sideband region is shown. An example of the excluded signal ($ {c_{\mathrm{W} \mathrm{W} \mathrm{W}}} /\Lambda ^2 = 1.59 $ TeV$^{-2}$) is represented by the dashed line. |

png pdf |
Figure 4-c:
Final result of the two-dimensional fit in the electron channel, showing the ${m_{\mathrm{W} {\text {V}}}}$ distributions. The signal region is shown. An example of the excluded signal ($ {c_{\mathrm{W} \mathrm{W} \mathrm{W}}} /\Lambda ^2 = 1.59 $ TeV$^{-2}$) is represented by the dashed line. |

png pdf |
Figure 4-d:
Final result of the two-dimensional fit in the muon channel, showing the ${m_{\mathrm{W} {\text {V}}}}$ distributions. The signal region is shown. An example of the excluded signal ($ {c_{\mathrm{W} \mathrm{W} \mathrm{W}}} /\Lambda ^2 = 1.59 $ TeV$^{-2}$) is represented by the dashed line. |
png pdf |
Figure 4-e:
Final result of the two-dimensional fit in the electron channel, showing the ${m_{\mathrm{W} {\text {V}}}}$ distributions. The lupper sideband region is shown. An example of the excluded signal ($ {c_{\mathrm{W} \mathrm{W} \mathrm{W}}} /\Lambda ^2 = 1.59 $ TeV$^{-2}$) is represented by the dashed line. |
png pdf |
Figure 4-f:
Final result of the two-dimensional fit in the muon channel, showing the ${m_{\mathrm{W} {\text {V}}}}$ distributions. The upper sideband region is shown. An example of the excluded signal ($ {c_{\mathrm{W} \mathrm{W} \mathrm{W}}} /\Lambda ^2 = 1.59 $ TeV$^{-2}$) is represented by the dashed line. |
png pdf |
Figure 5:
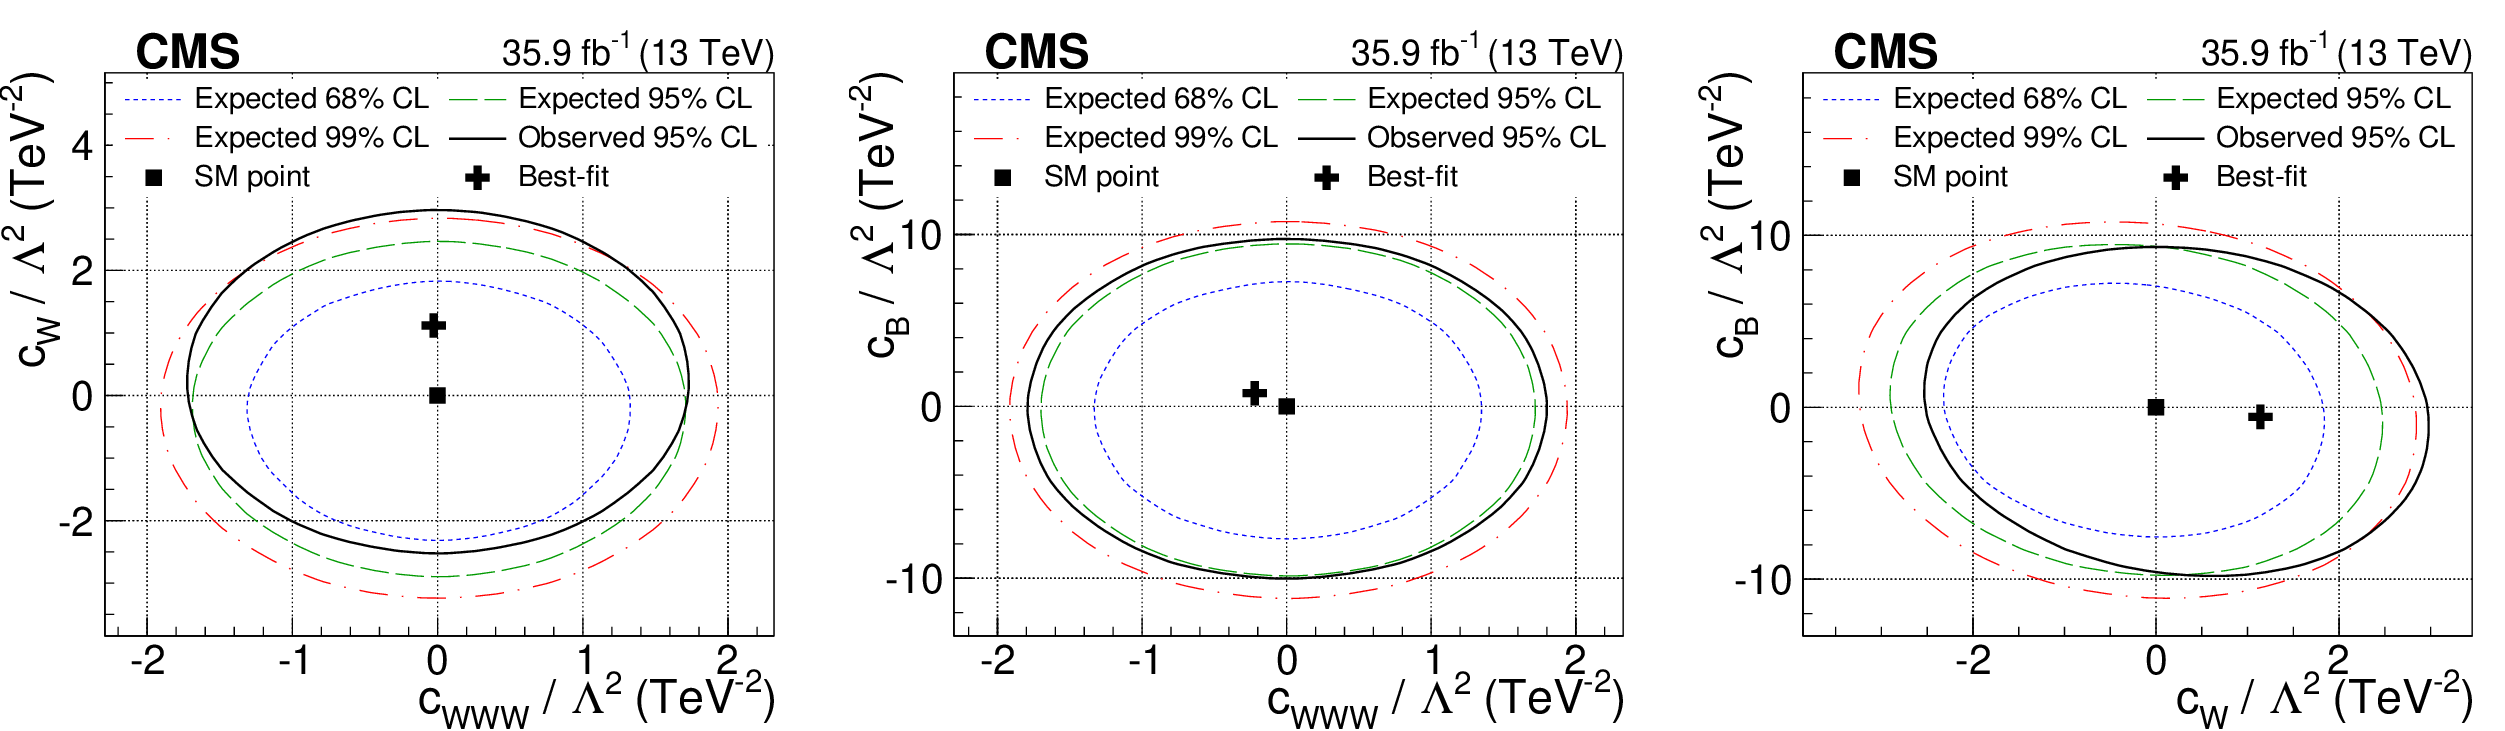
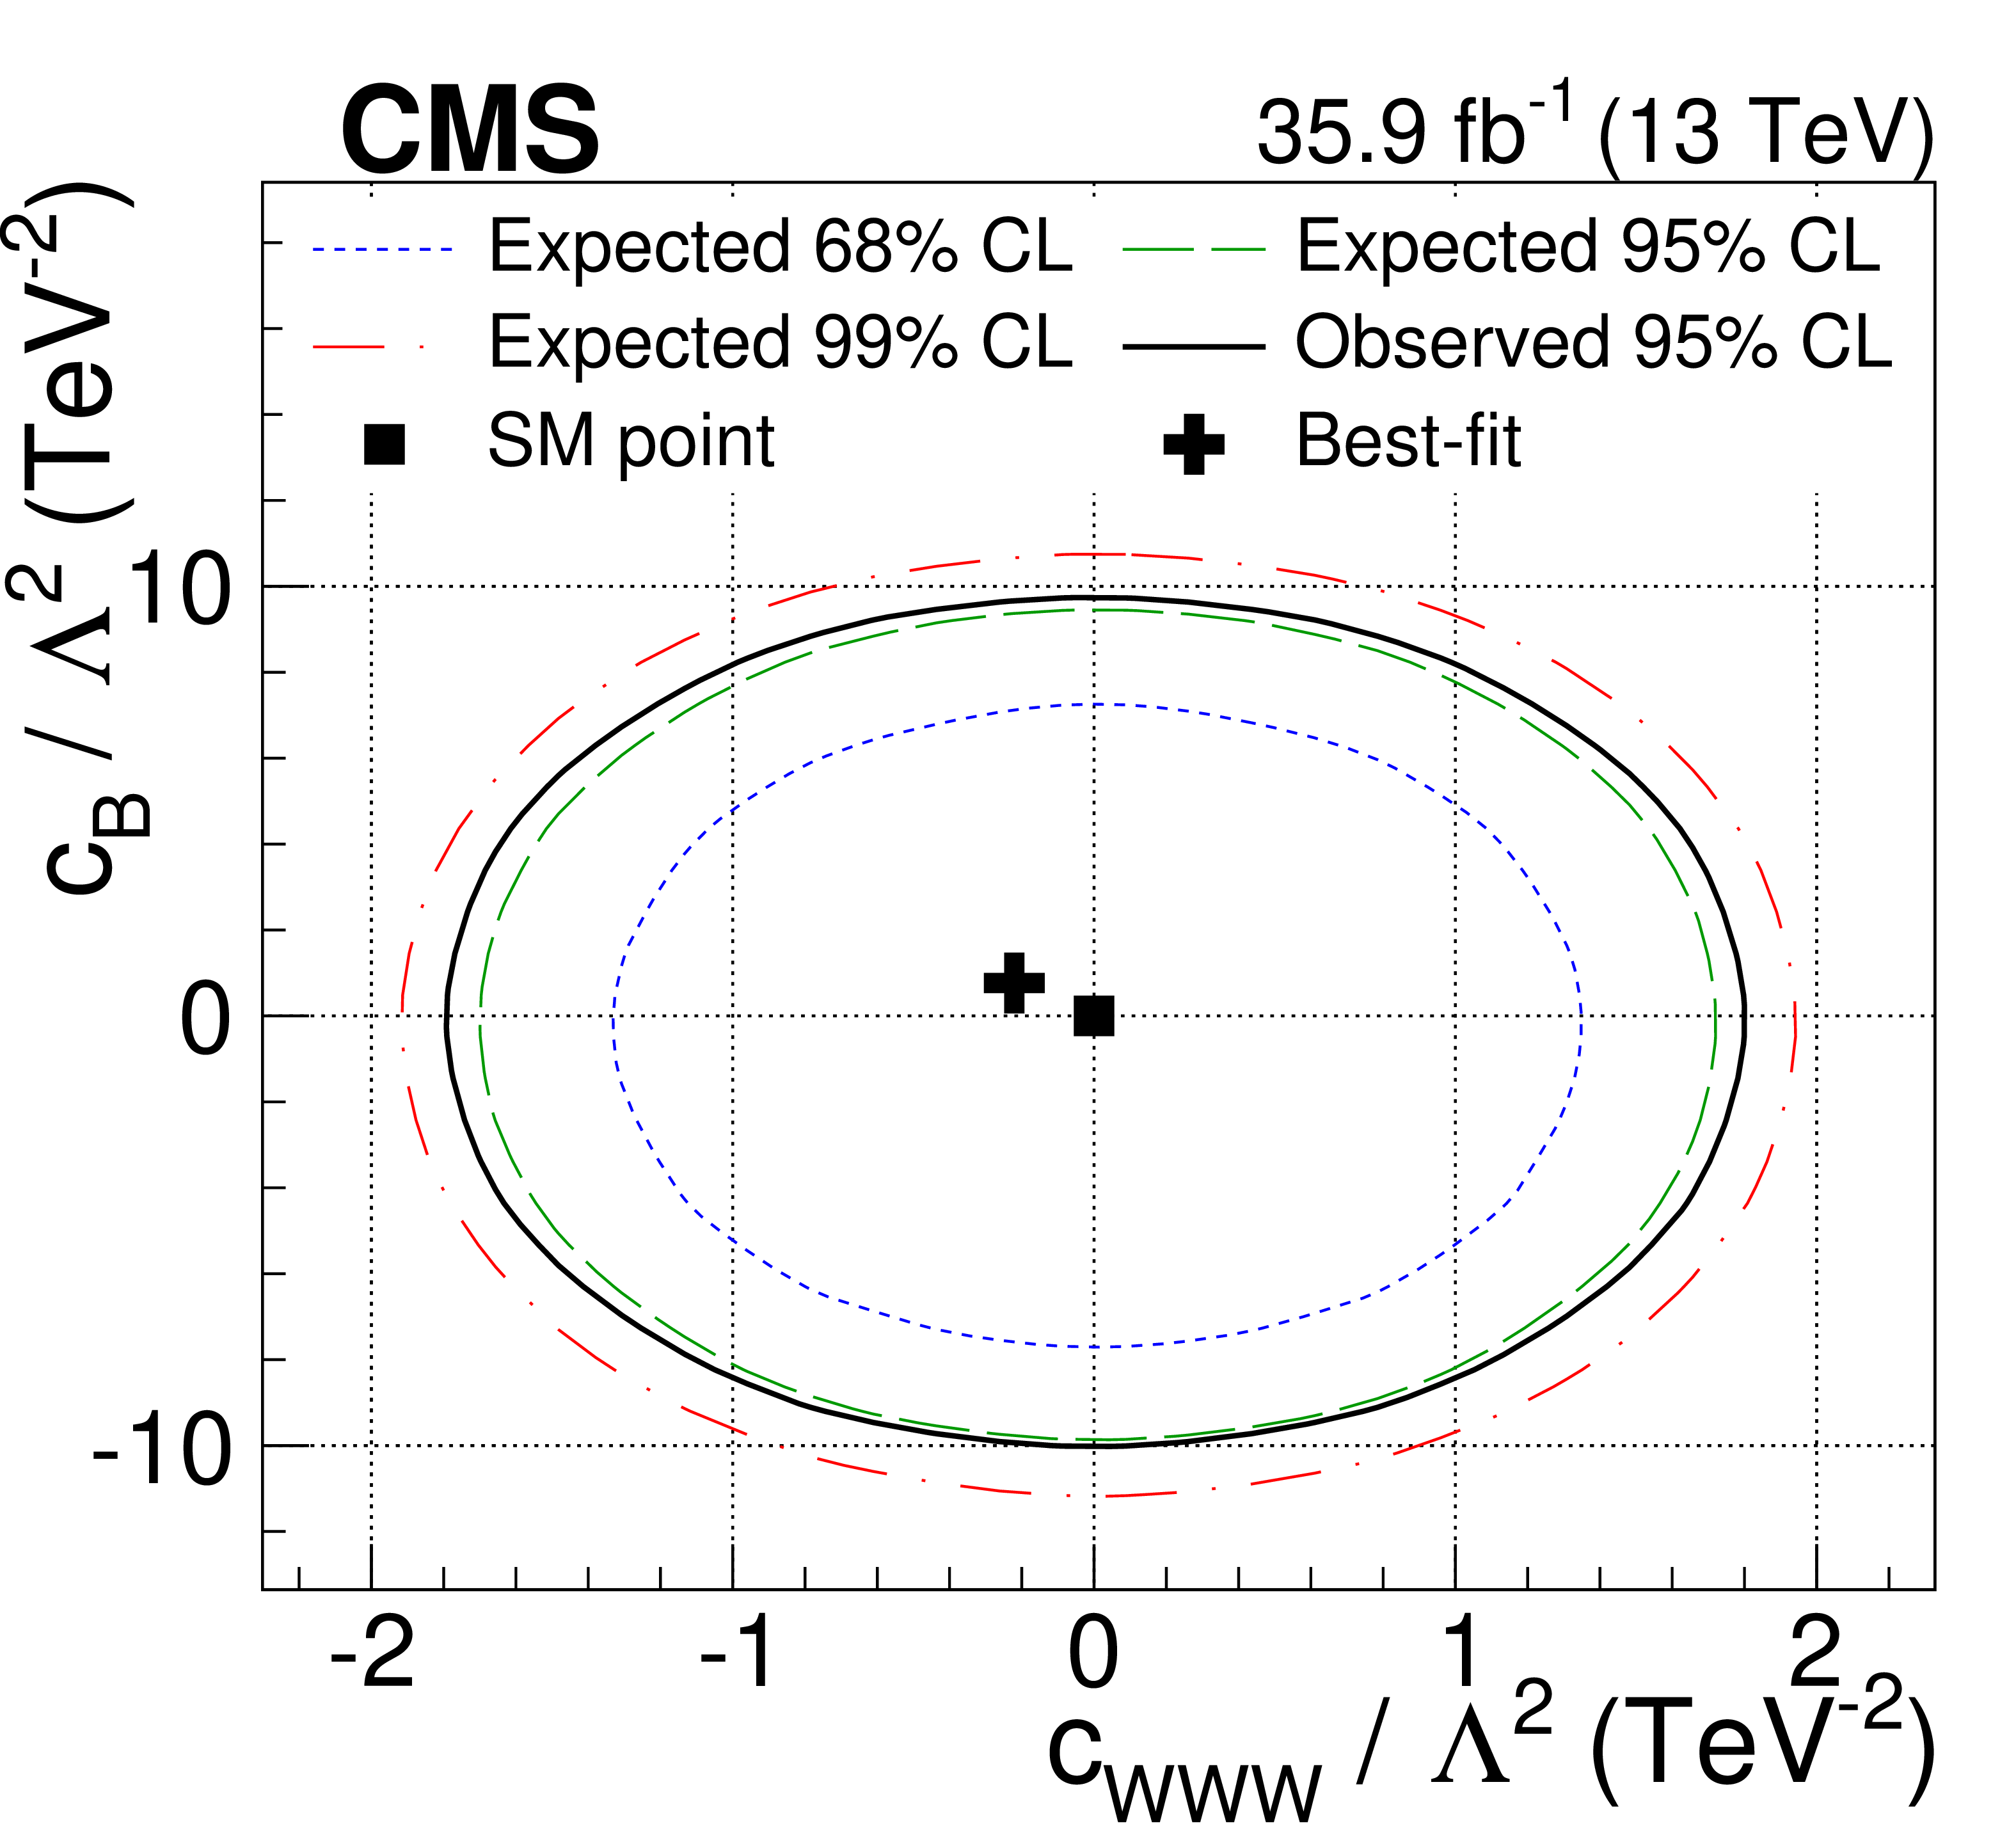
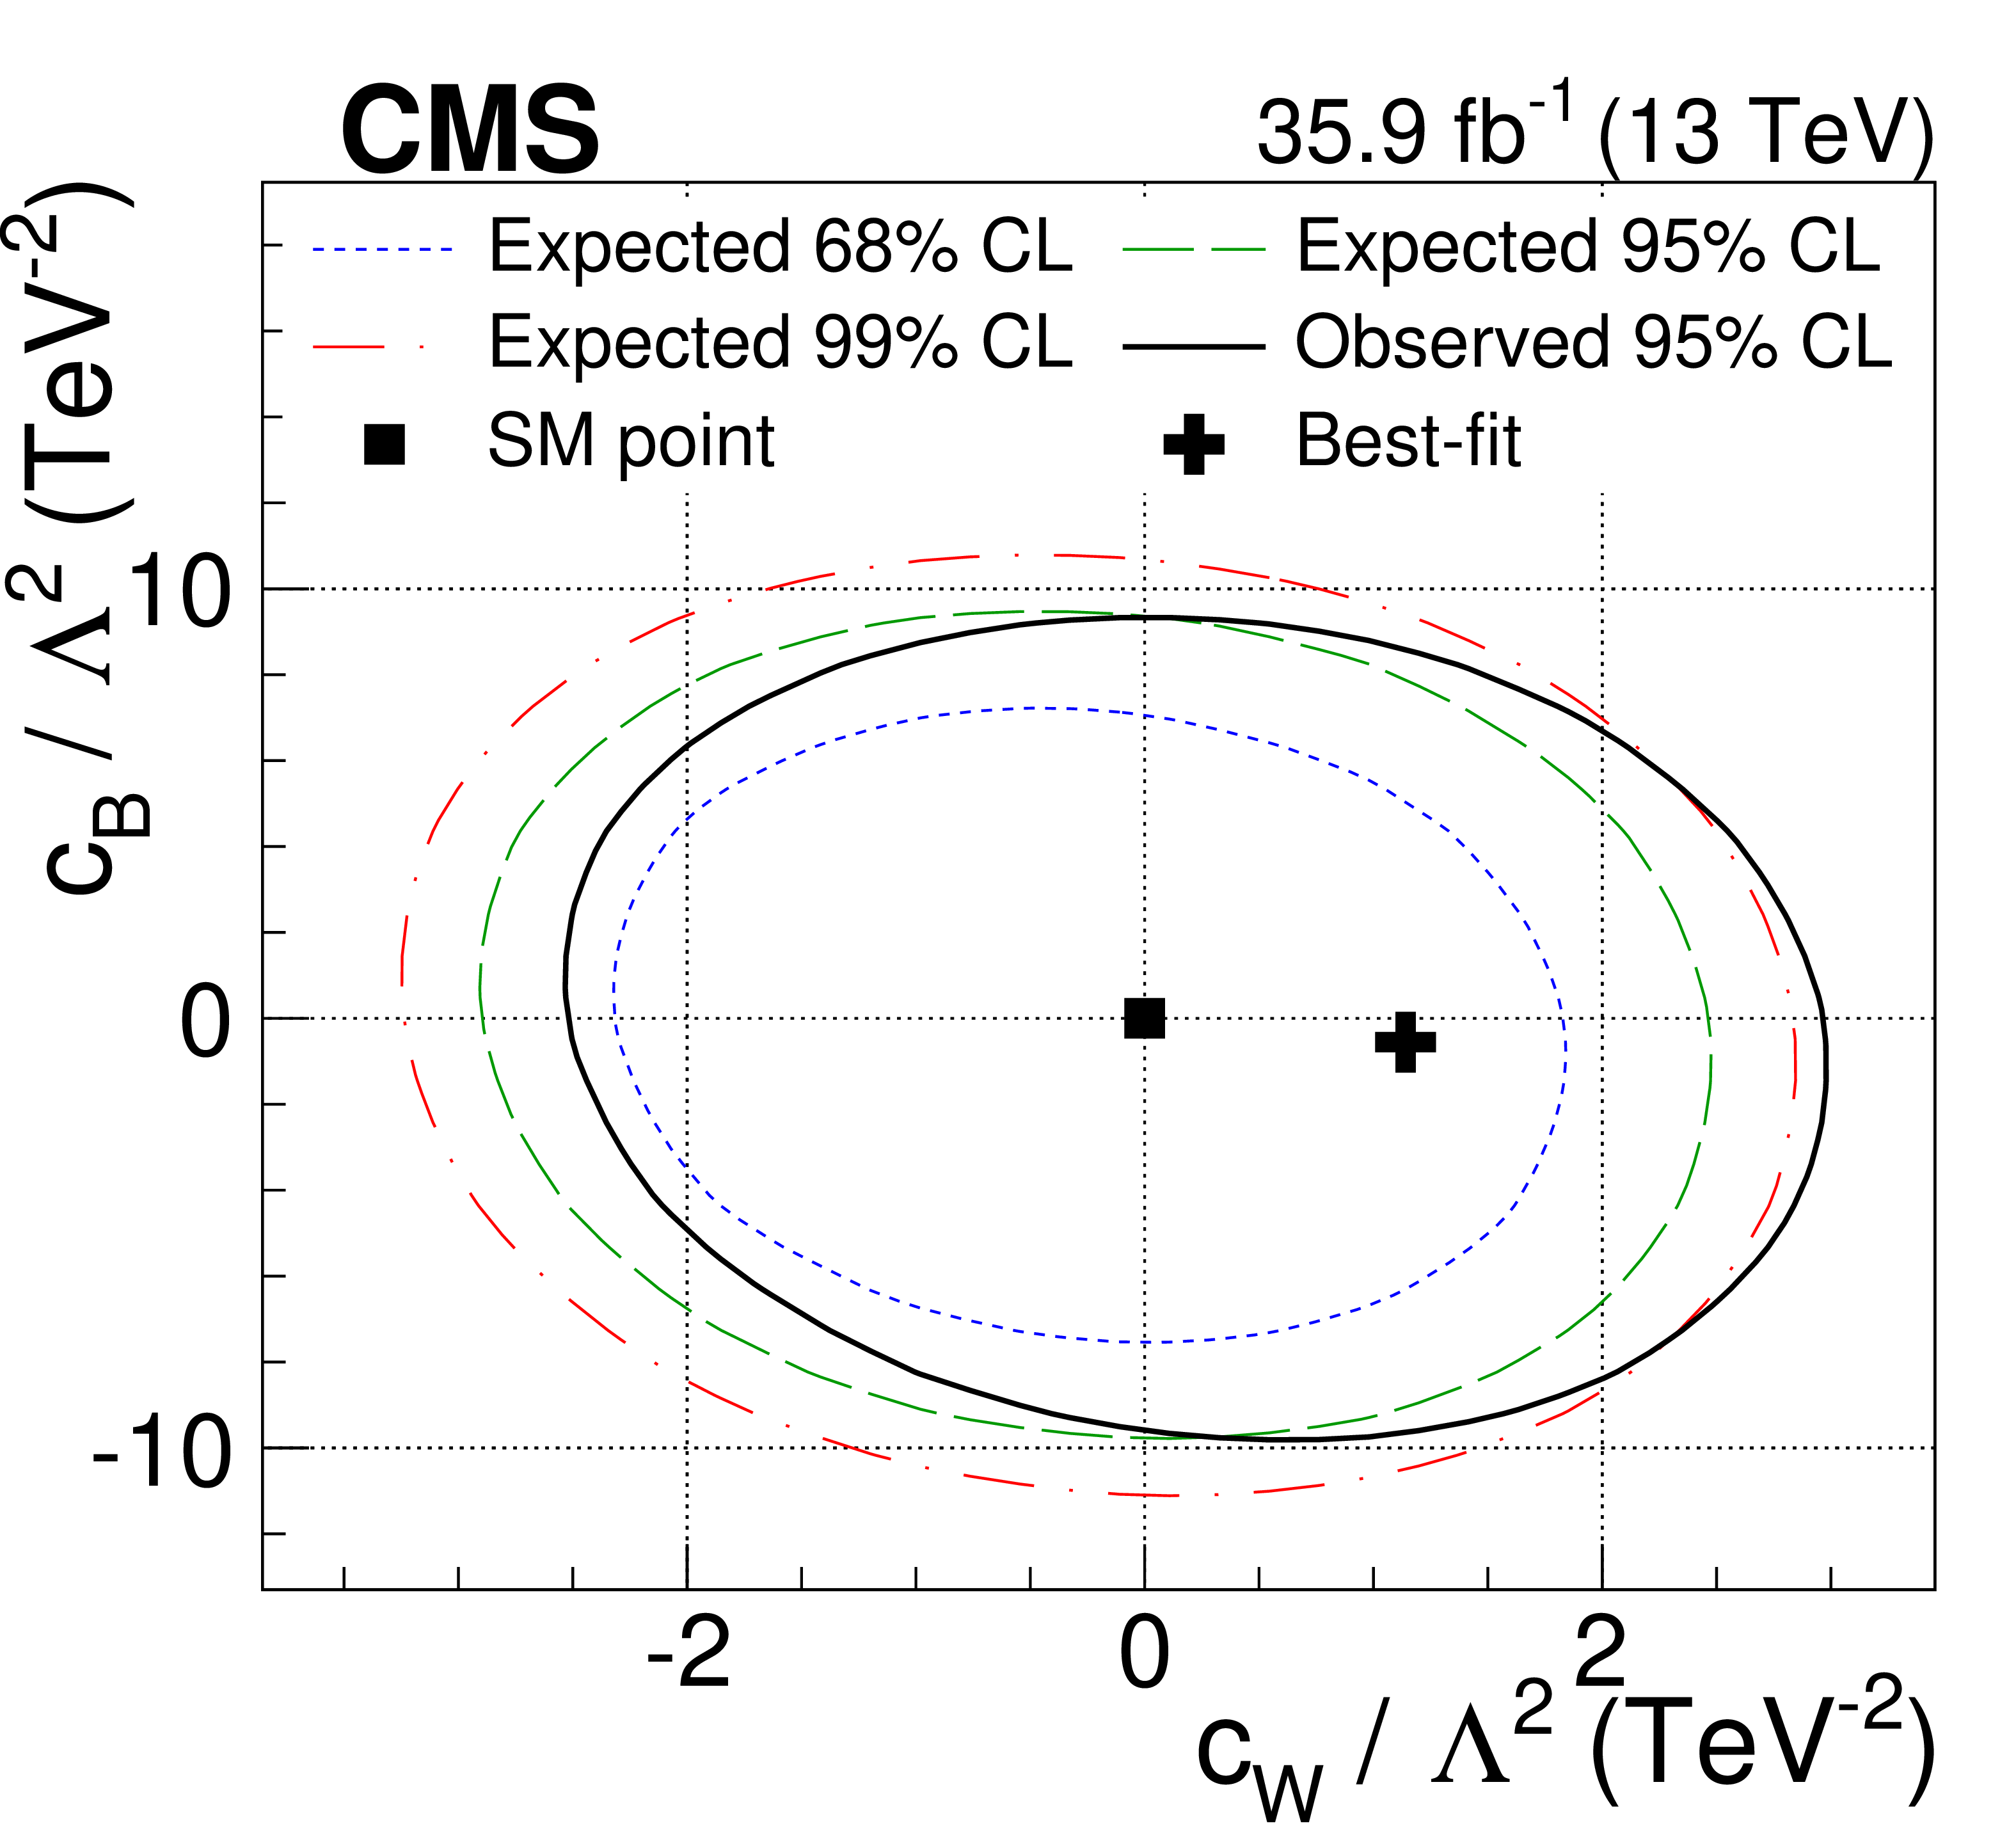
Two-dimensional limits on the aTGC parameters in the EFT parametrization, for the combinations $ {c_{\mathrm{W} \mathrm{W} \mathrm{W}}} /\Lambda ^2$-$ {c_{\mathrm{W}}} /\Lambda ^2$ (left), $ {c_{\mathrm{W} \mathrm{W} \mathrm{W}}} /\Lambda ^2$-$ {c_{\mathrm{B}}} /\Lambda ^2$ (centre), and $ {c_{\mathrm{W}}} /\Lambda ^2$-$ {c_{\mathrm{B}}} /\Lambda ^2$ (right). Contours for the expected 95% CL are shown in dashed green, with the 68 and 99% CL contours shown in dotted blue and dot-dashed red, respectively. Contours for the observed 95% CL are shown in solid black. The black square markers represent the SM expectation, while the black crosses show the observed best-fit points. |

png pdf |
Figure 5-a:
Two-dimensional limits on the aTGC parameters in the EFT parametrization, for the combination $ {c_{\mathrm{W} \mathrm{W} \mathrm{W}}} /\Lambda ^2$-$ {c_{\mathrm{W}}} /\Lambda ^2$. Contours for the expected 95% CL are shown in dashed green, with the 68 and 99% CL contours shown in dotted blue and dot-dashed red, respectively. Contours for the observed 95% CL are shown in solid black. The black square markers represent the SM expectation, while the black crosses show the observed best-fit points. |
png pdf |
Figure 5-b:
Two-dimensional limits on the aTGC parameters in the EFT parametrization, for the combination $ {c_{\mathrm{W} \mathrm{W} \mathrm{W}}} /\Lambda ^2$-$ {c_{\mathrm{B}}} /\Lambda ^2$. Contours for the expected 95% CL are shown in dashed green, with the 68 and 99% CL contours shown in dotted blue and dot-dashed red, respectively. Contours for the observed 95% CL are shown in solid black. The black square markers represent the SM expectation, while the black crosses show the observed best-fit points. |
png pdf |
Figure 5-c:
Two-dimensional limits on the aTGC parameters in the EFT parametrization, for the combination $ {c_{\mathrm{W}}} /\Lambda ^2$-$ {c_{\mathrm{B}}} /\Lambda ^2$. Contours for the expected 95% CL are shown in dashed green, with the 68 and 99% CL contours shown in dotted blue and dot-dashed red, respectively. Contours for the observed 95% CL are shown in solid black. The black square markers represent the SM expectation, while the black crosses show the observed best-fit points. |
png pdf |
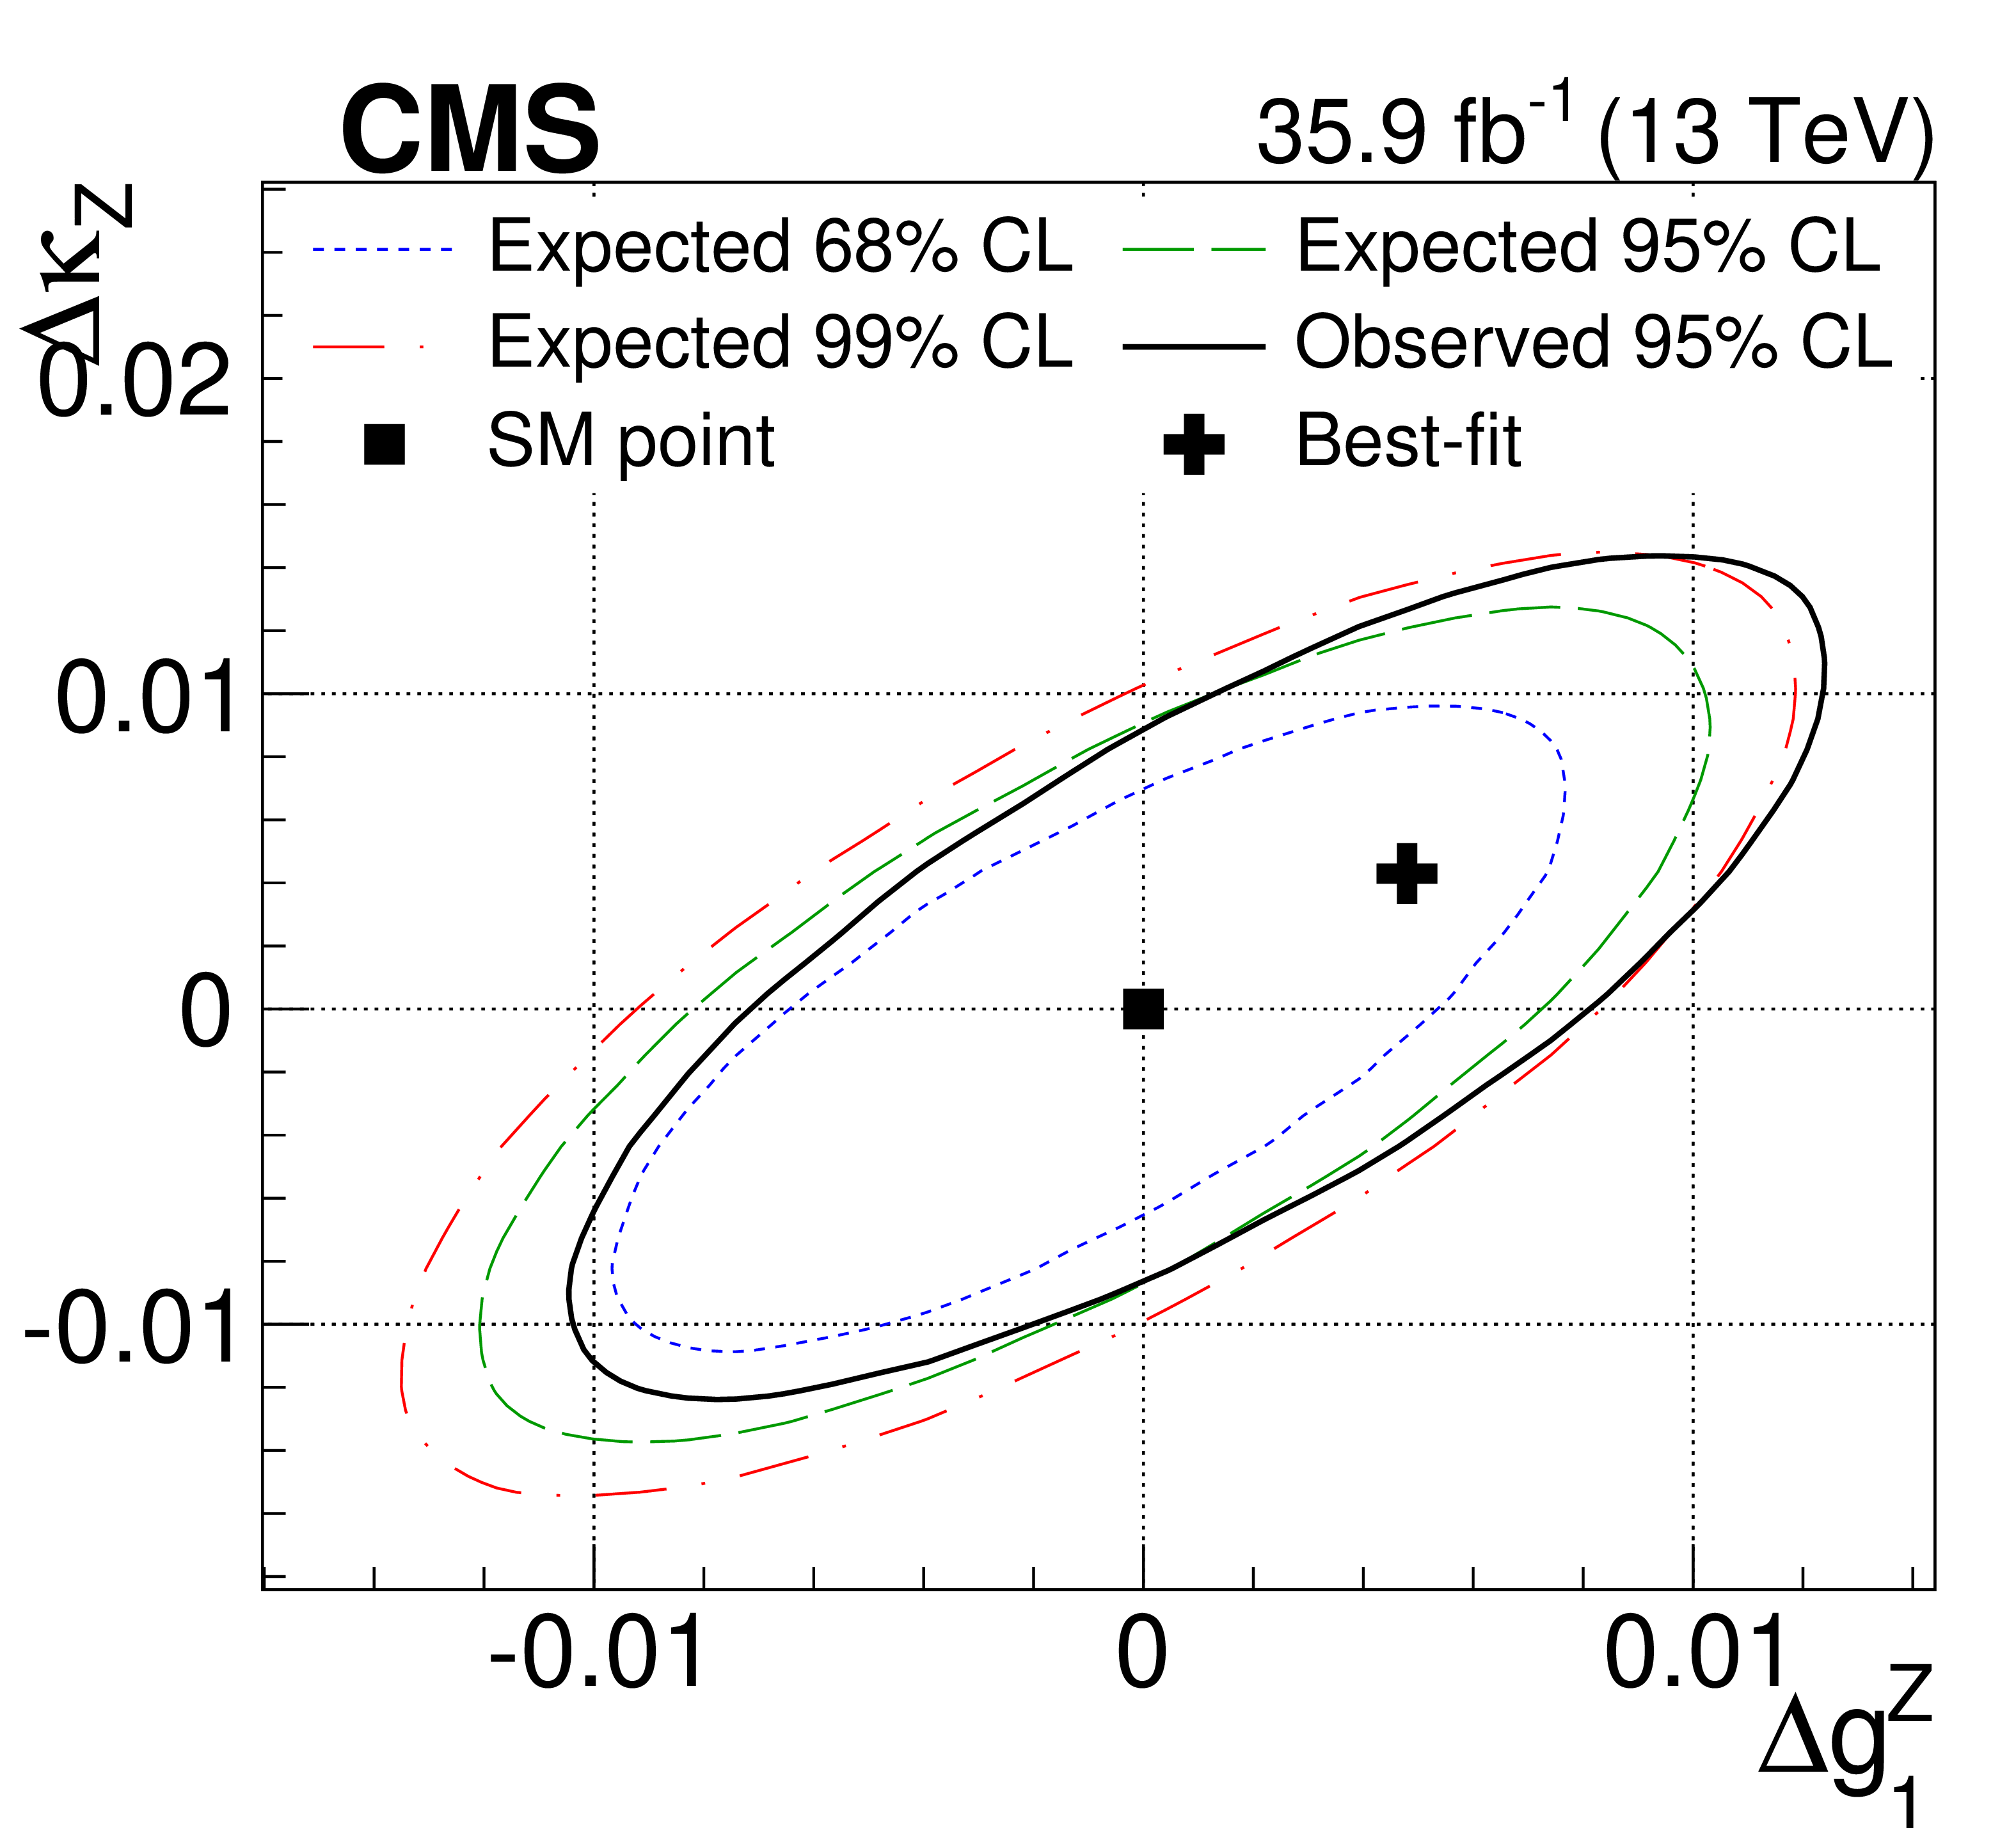
Figure 6:
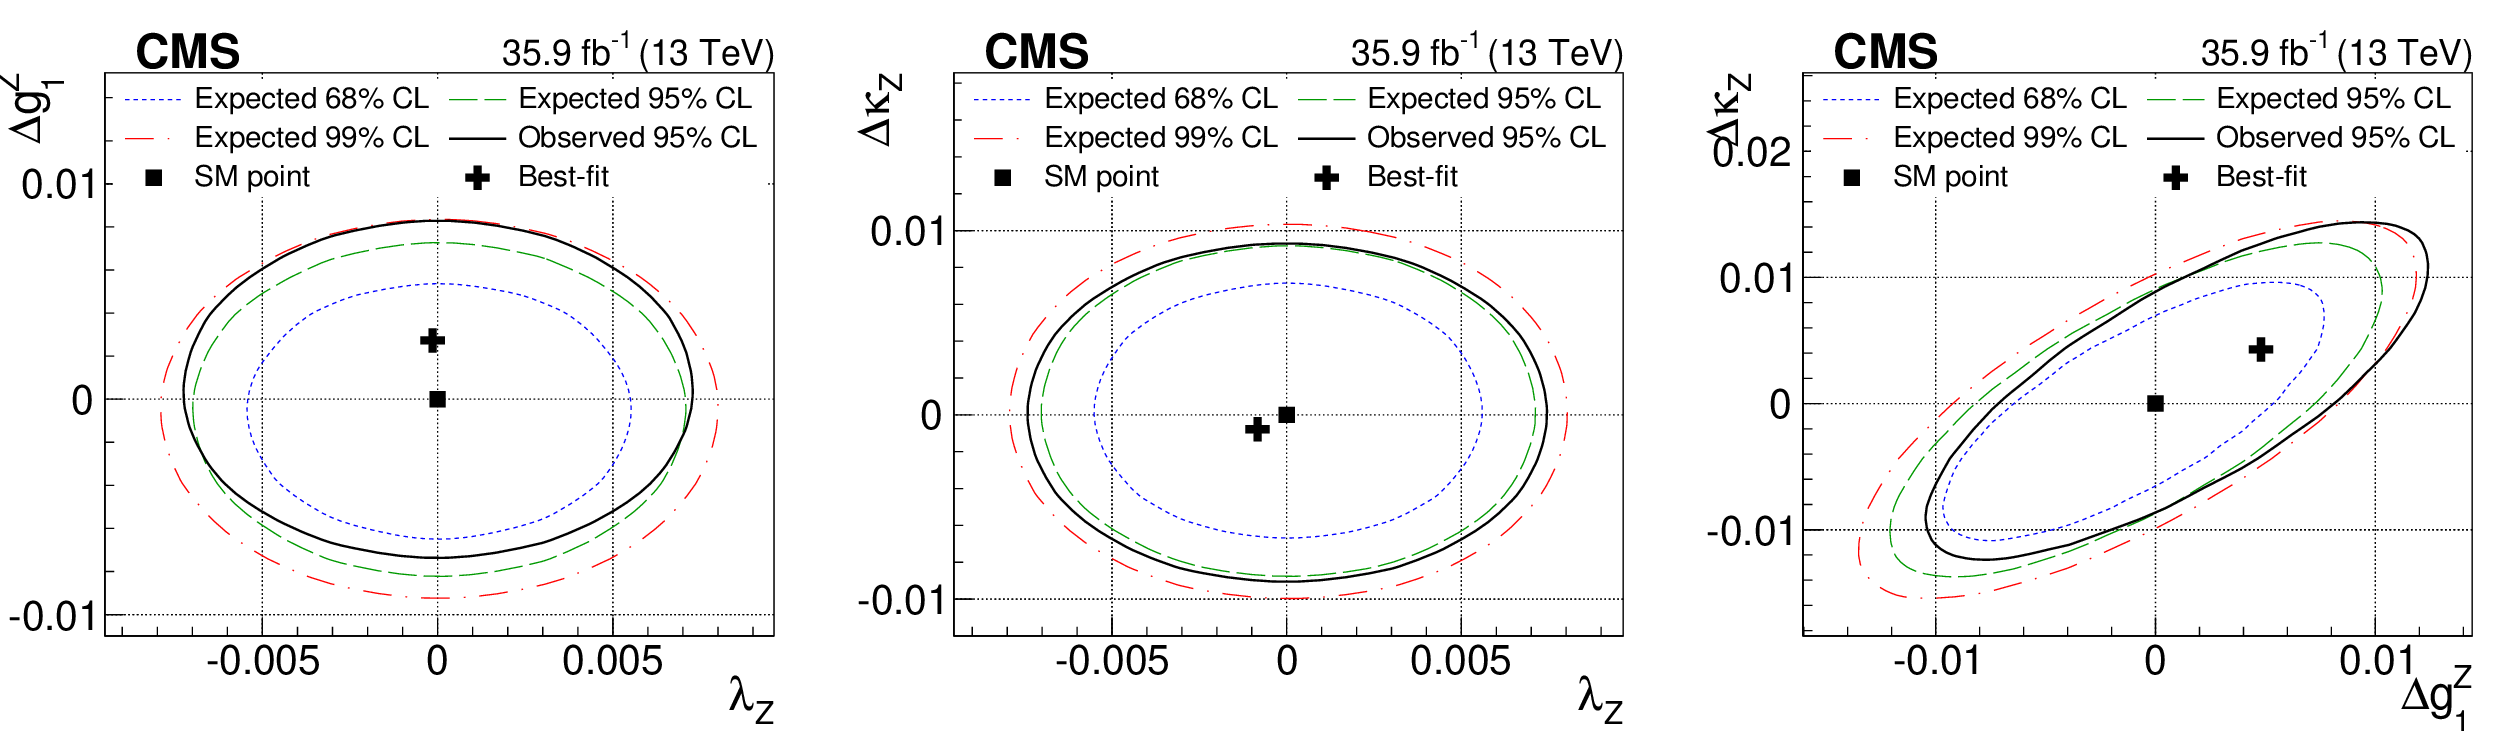
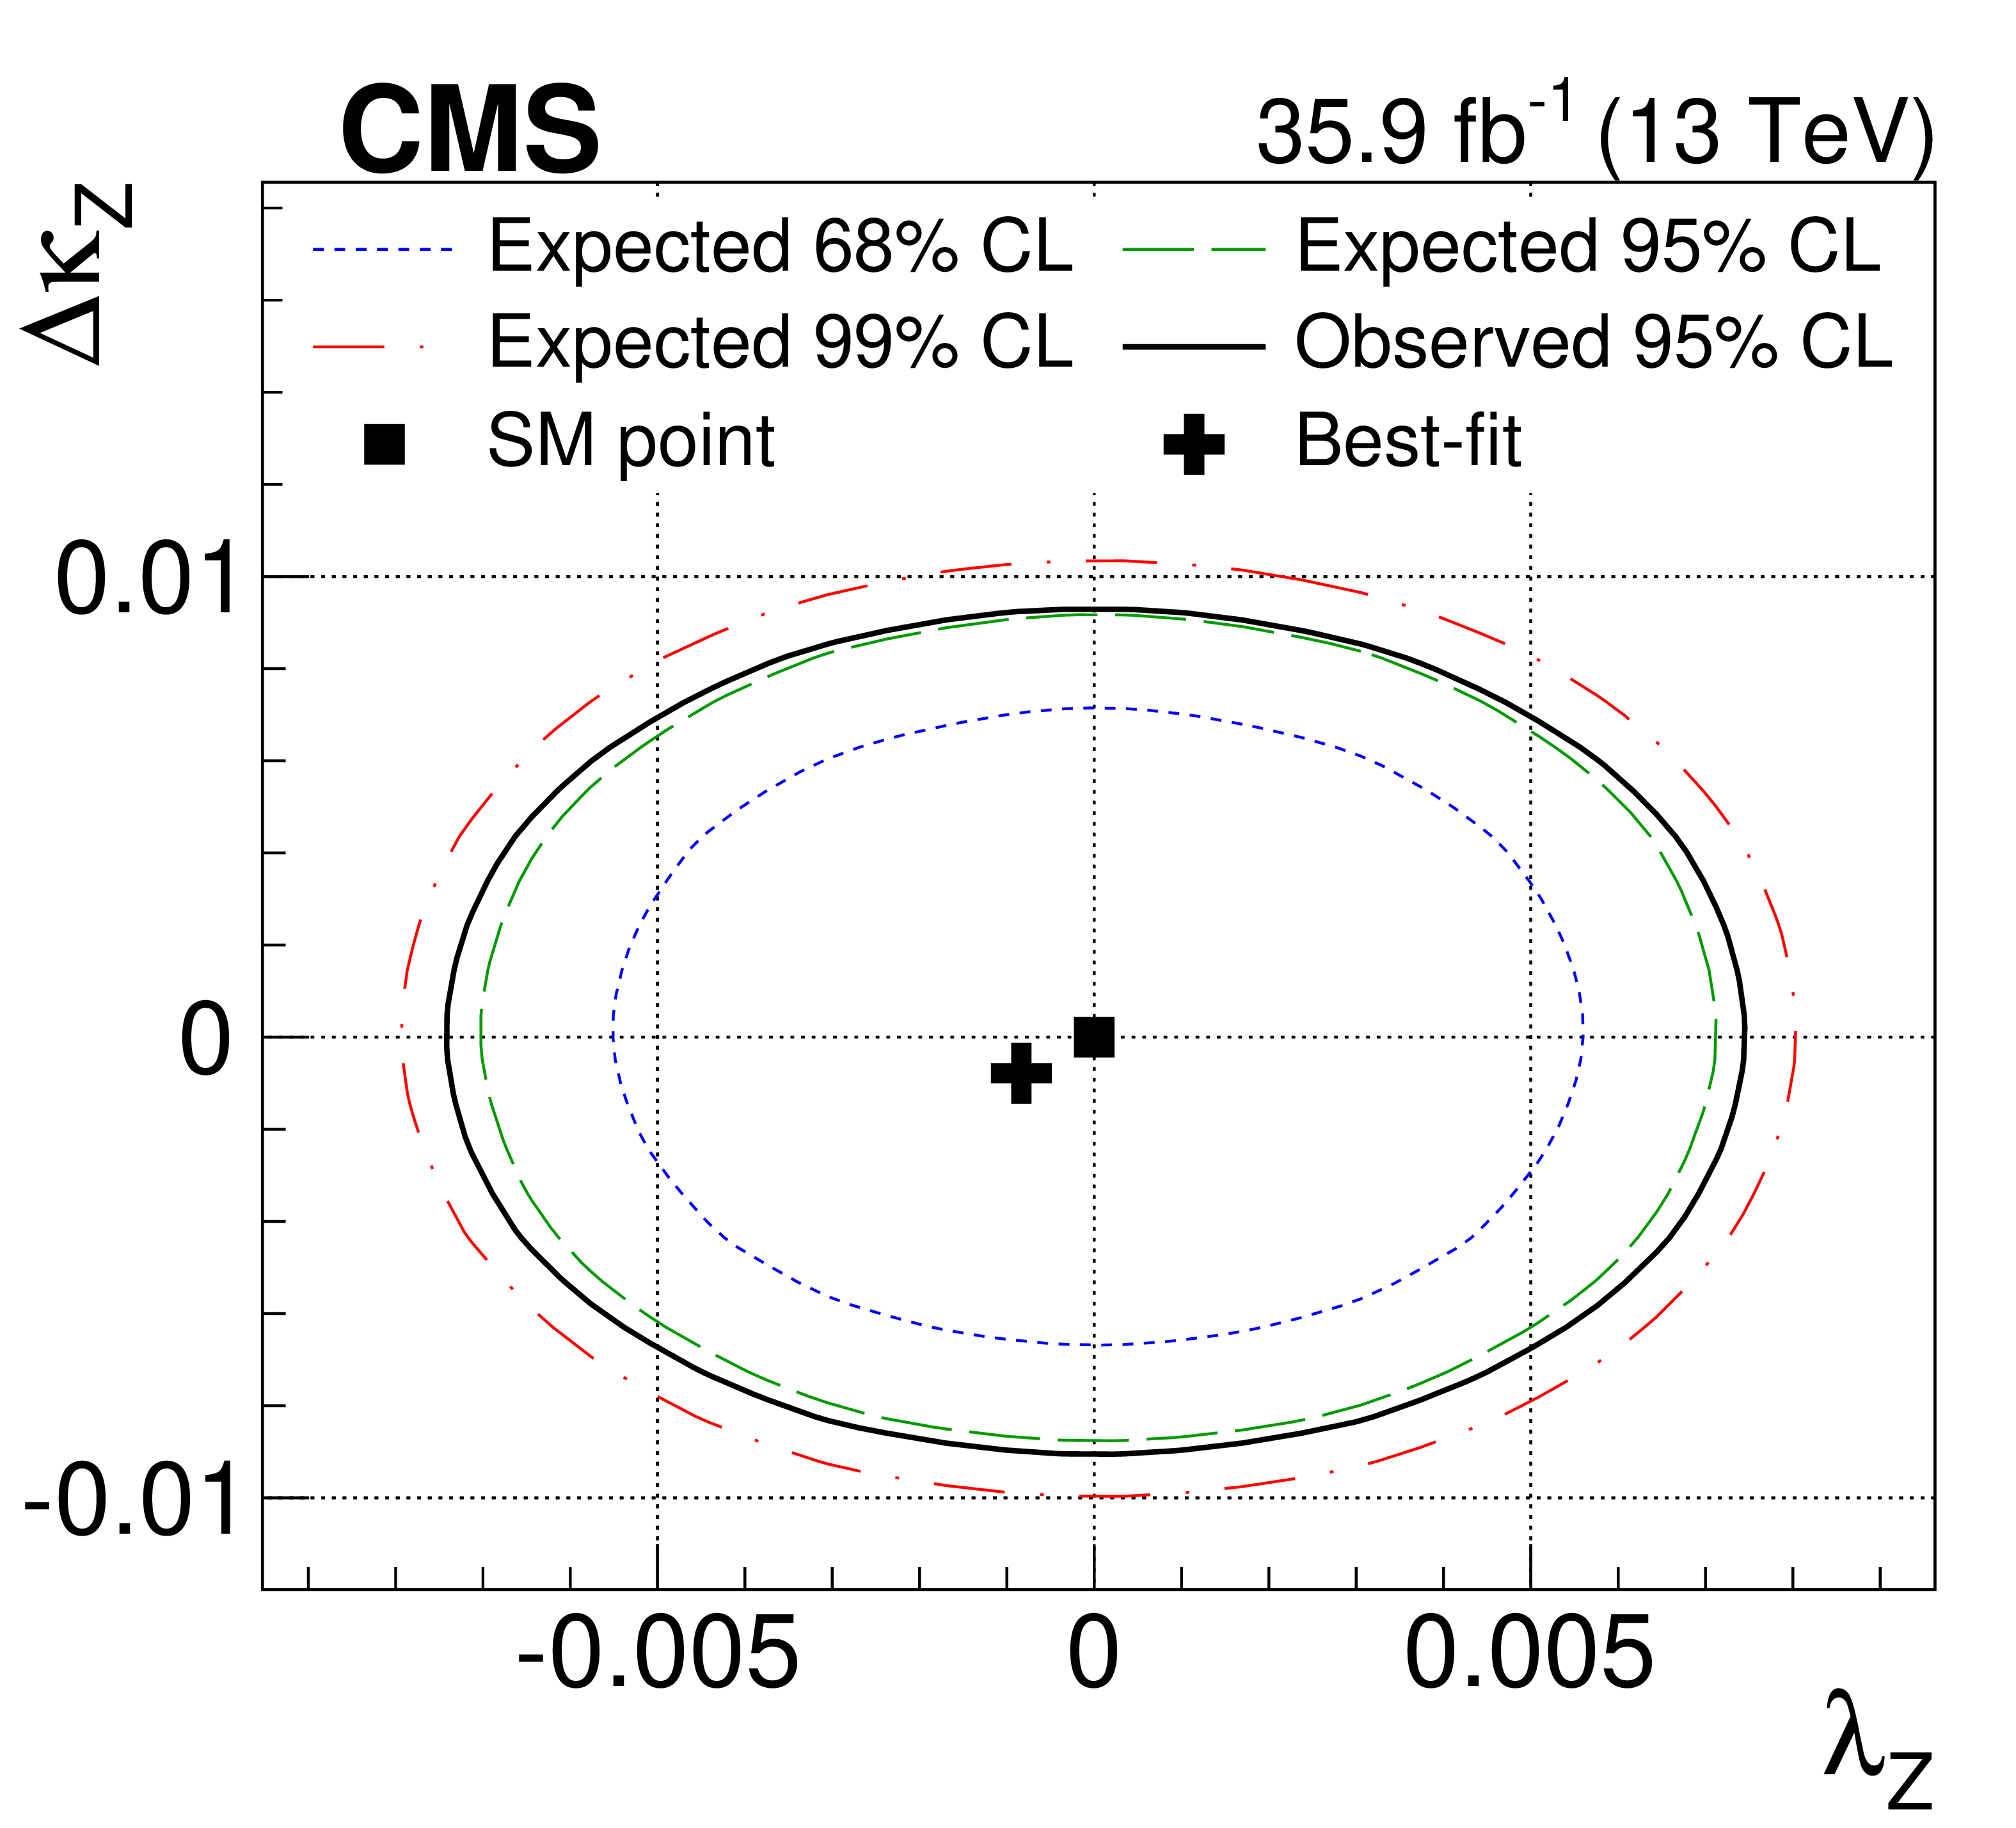
Two-dimensional limits on the aTGC parameters in the LEP parametrization, for the combinations $ {\lambda _{\mathrm{Z}}} $-$ {\Delta g_{1}^{\mathrm{Z}}} $ (left), $ {\lambda _{\mathrm{Z}}} $-$ {\Delta \kappa _{\mathrm{Z}}} $ (centre), and $ {\Delta g_{1}^{\mathrm{Z}}} $-$ {\Delta \kappa _{\mathrm{Z}}} $ (right). Contours for the expected 95% CL are shown in dashed green, with the 68 and 99% CL contours shown in dotted blue and dot-dashed red, respectively. Contours for the observed 95% CL are shown in solid black. The black square markers represent the SM expectation, while the black crosses show the observed best-fit points. |

png pdf |
Figure 6-a:
Two-dimensional limits on the aTGC parameters in the LEP parametrization, for the combinations $ {\lambda _{\mathrm{Z}}} $-$ {\Delta g_{1}^{\mathrm{Z}}} $. Contours for the expected 95% CL are shown in dashed green, with the 68 and 99% CL contours shown in dotted blue and dot-dashed red, respectively. Contours for the observed 95% CL are shown in solid black. The black square markers represent the SM expectation, while the black crosses show the observed best-fit points. |
png pdf |
Figure 6-b:
Two-dimensional limits on the aTGC parameters in the LEP parametrization, for the combinations $ {\lambda _{\mathrm{Z}}} $-$ {\Delta \kappa _{\mathrm{Z}}} $. Contours for the expected 95% CL are shown in dashed green, with the 68 and 99% CL contours shown in dotted blue and dot-dashed red, respectively. Contours for the observed 95% CL are shown in solid black. The black square markers represent the SM expectation, while the black crosses show the observed best-fit points. |
png pdf |
Figure 6-c:
Two-dimensional limits on the aTGC parameters in the LEP parametrization, for the combinations $ {\Delta g_{1}^{\mathrm{Z}}} $-$ {\Delta \kappa _{\mathrm{Z}}} $. Contours for the expected 95% CL are shown in dashed green, with the 68 and 99% CL contours shown in dotted blue and dot-dashed red, respectively. Contours for the observed 95% CL are shown in solid black. The black square markers represent the SM expectation, while the black crosses show the observed best-fit points. |
png pdf |
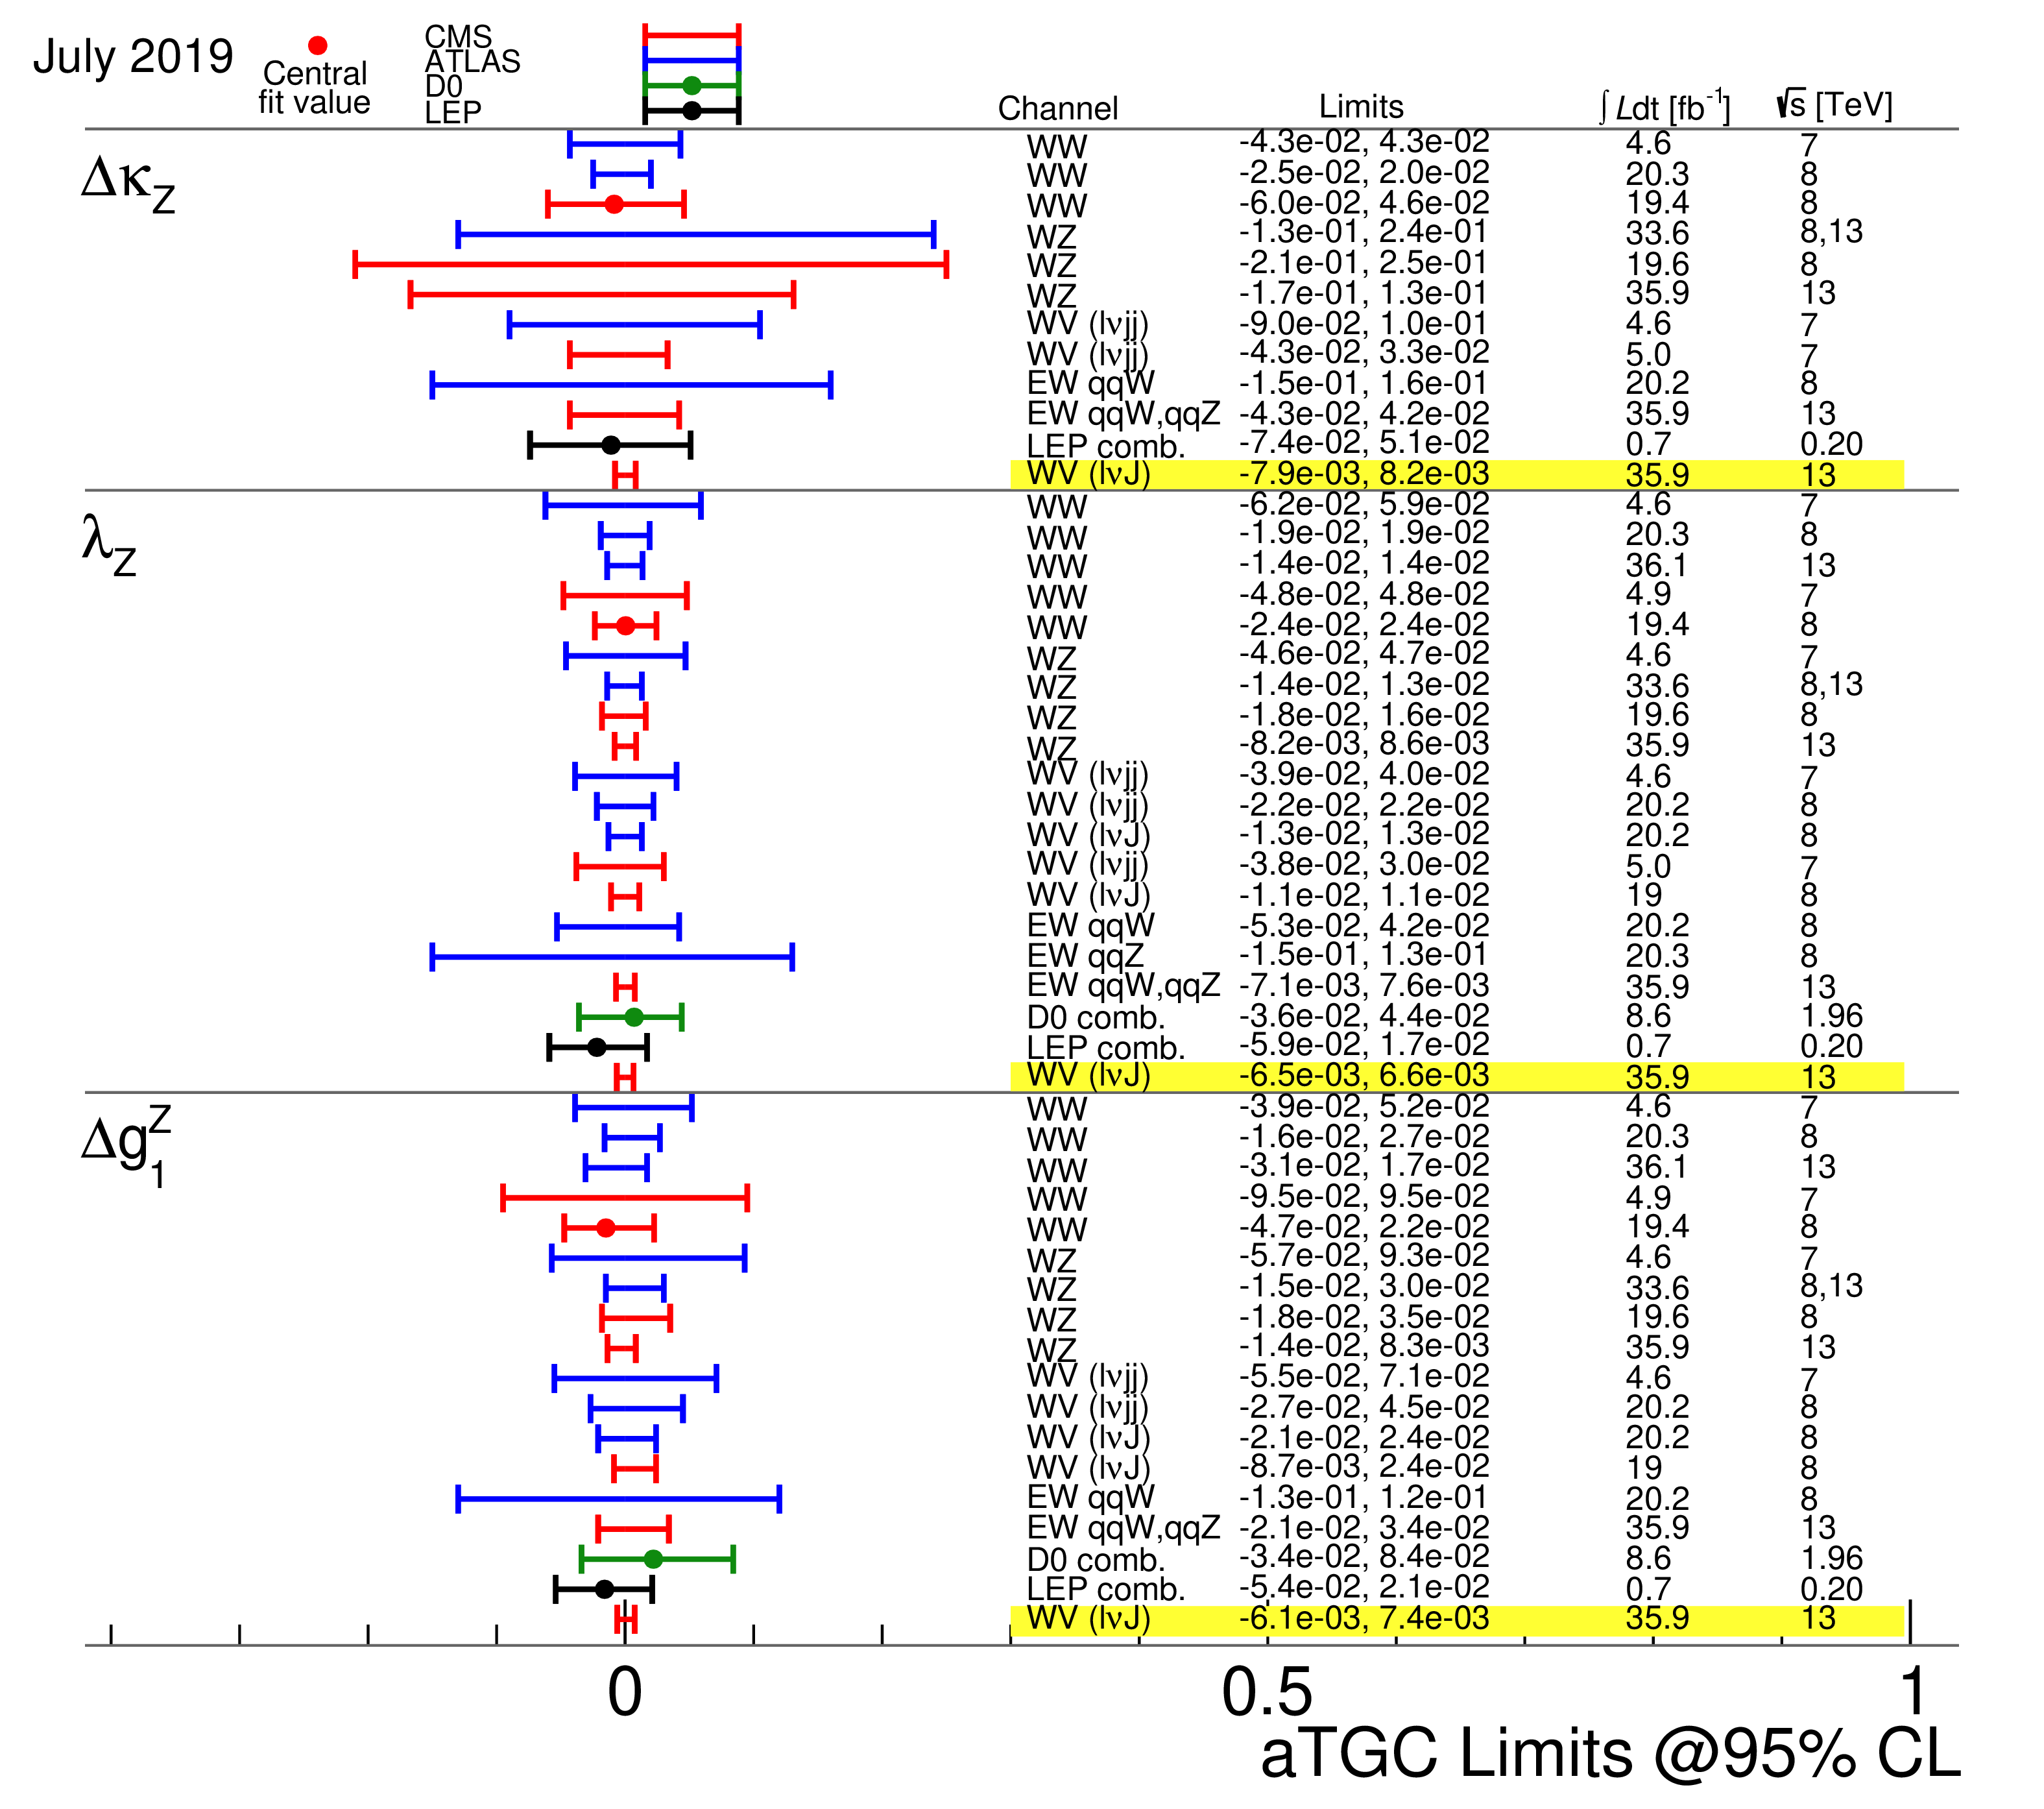
Figure 7:
Comparison of the observed limits on aTGC parameters in the LEP parametrization from different measurements. The highlighted rows represent the limits obtained from this measurement. |
| Tables | |
png pdf |
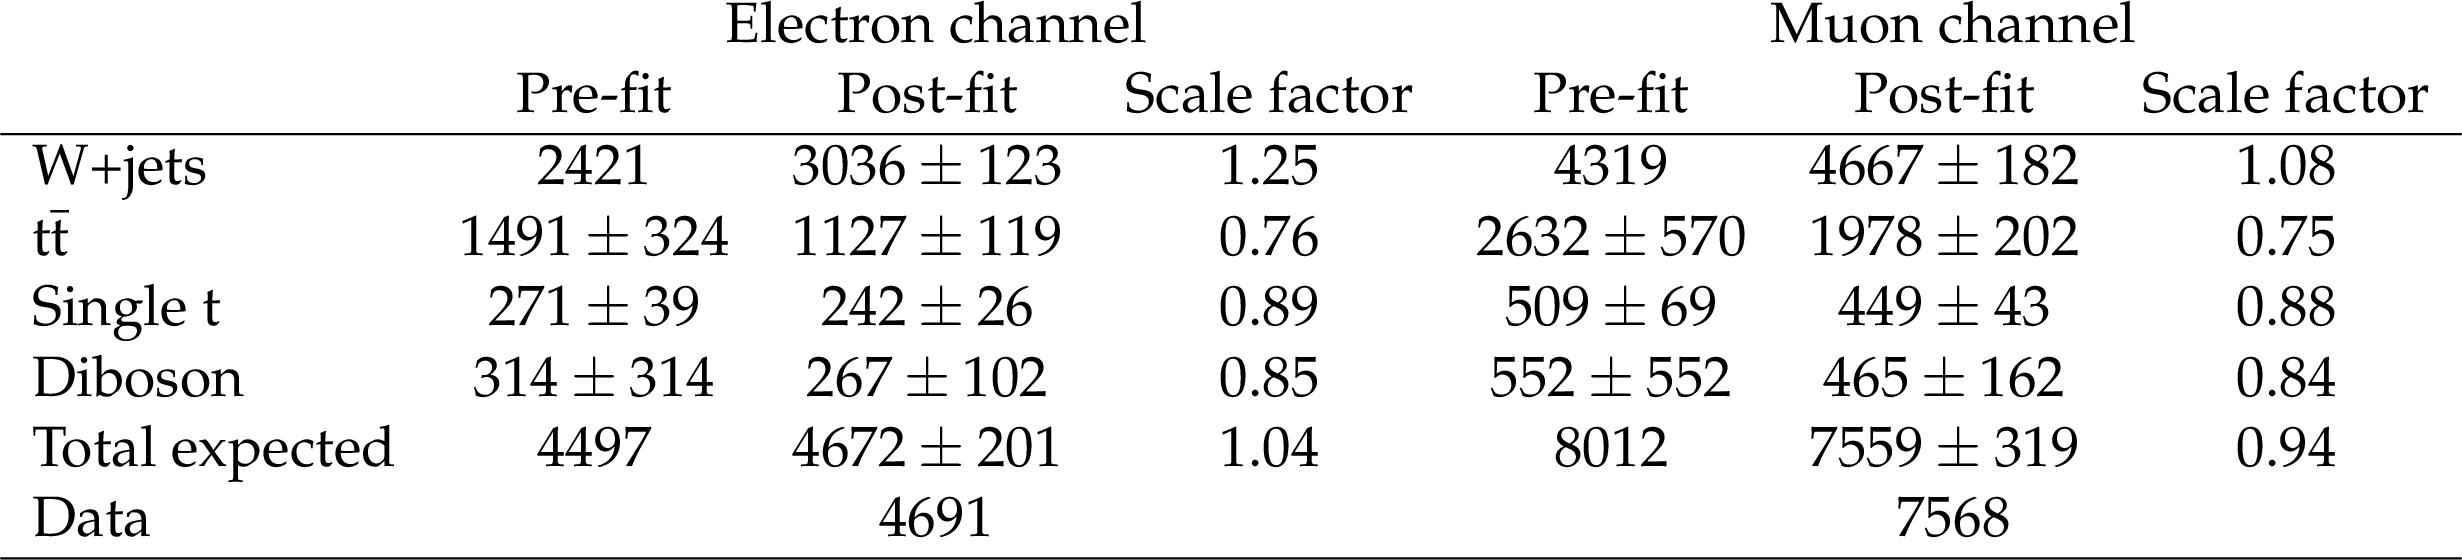
Table 1:
Results of the signal extraction fits. The uncertainties in the pre-fit yields are their respective pre-fit constraints, whilst the uncertainties in the post-fit yields are the corresponding total post-fit uncertainties. Since the normalization of the W+jets contribution is allowed to vary freely in the fit, it does not have any corresponding pre-fit uncertainties. |
png pdf |
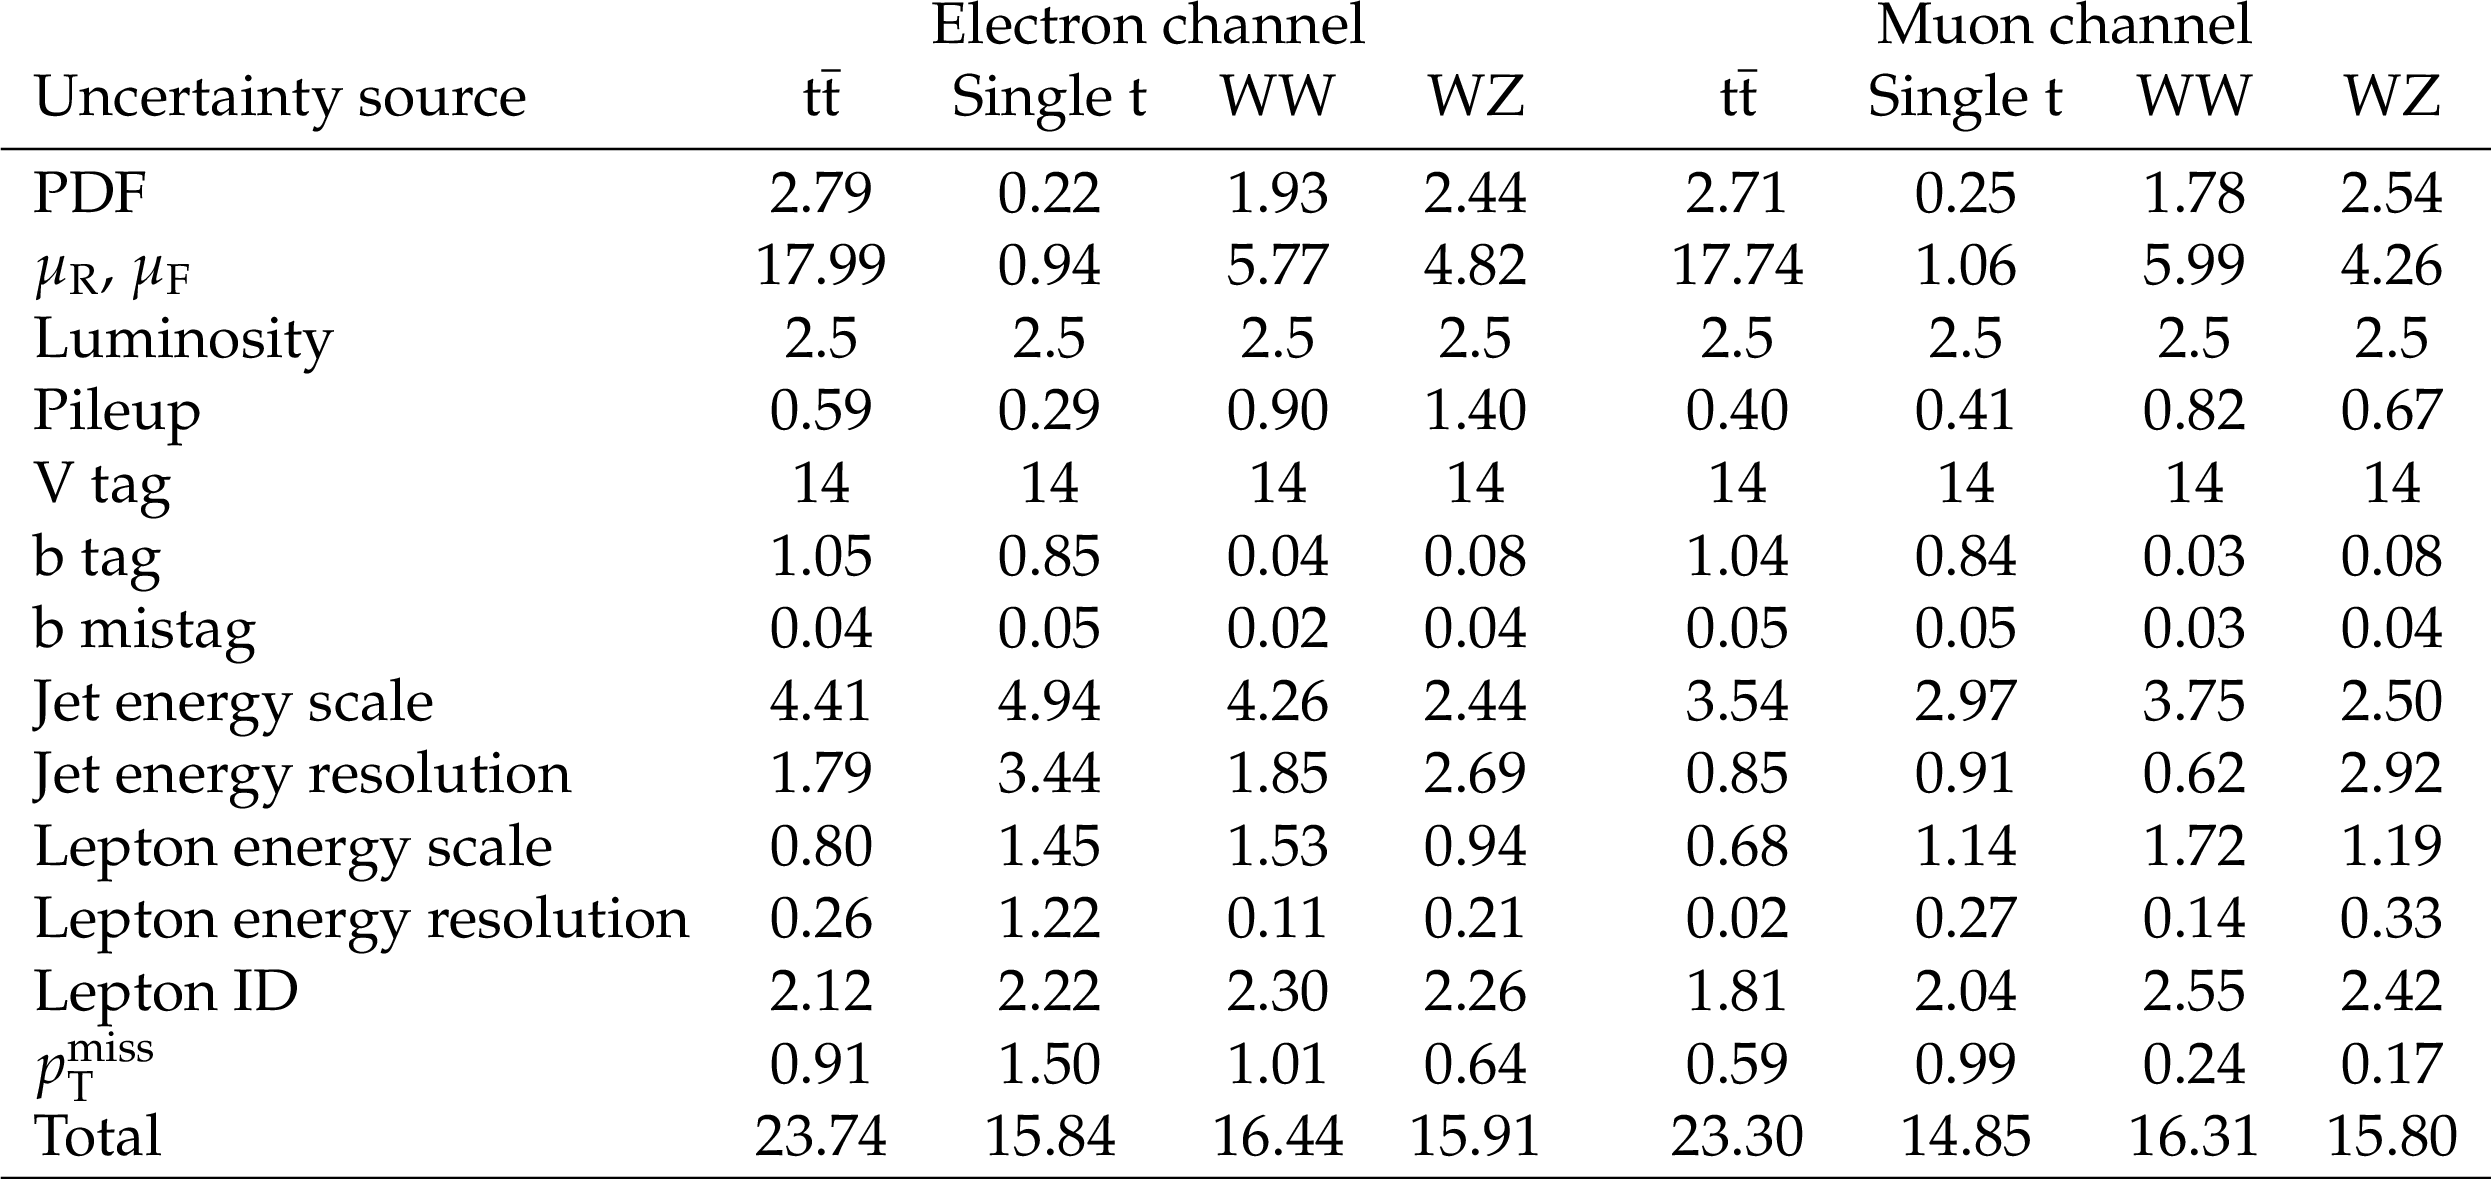
Table 2:
Estimated normalization uncertainties (%) for SM background contributions derived from simulation. |

png pdf |
Table 3:
Summary of background, signal, and data yields in the WW and WZ categories for each lepton channel. Uncertainties in the background contributions are described in Section 7. The diboson signal predictions with anomalous couplings include both standard model and anomalous contributions, as well as the relevant interference terms. |
png pdf |
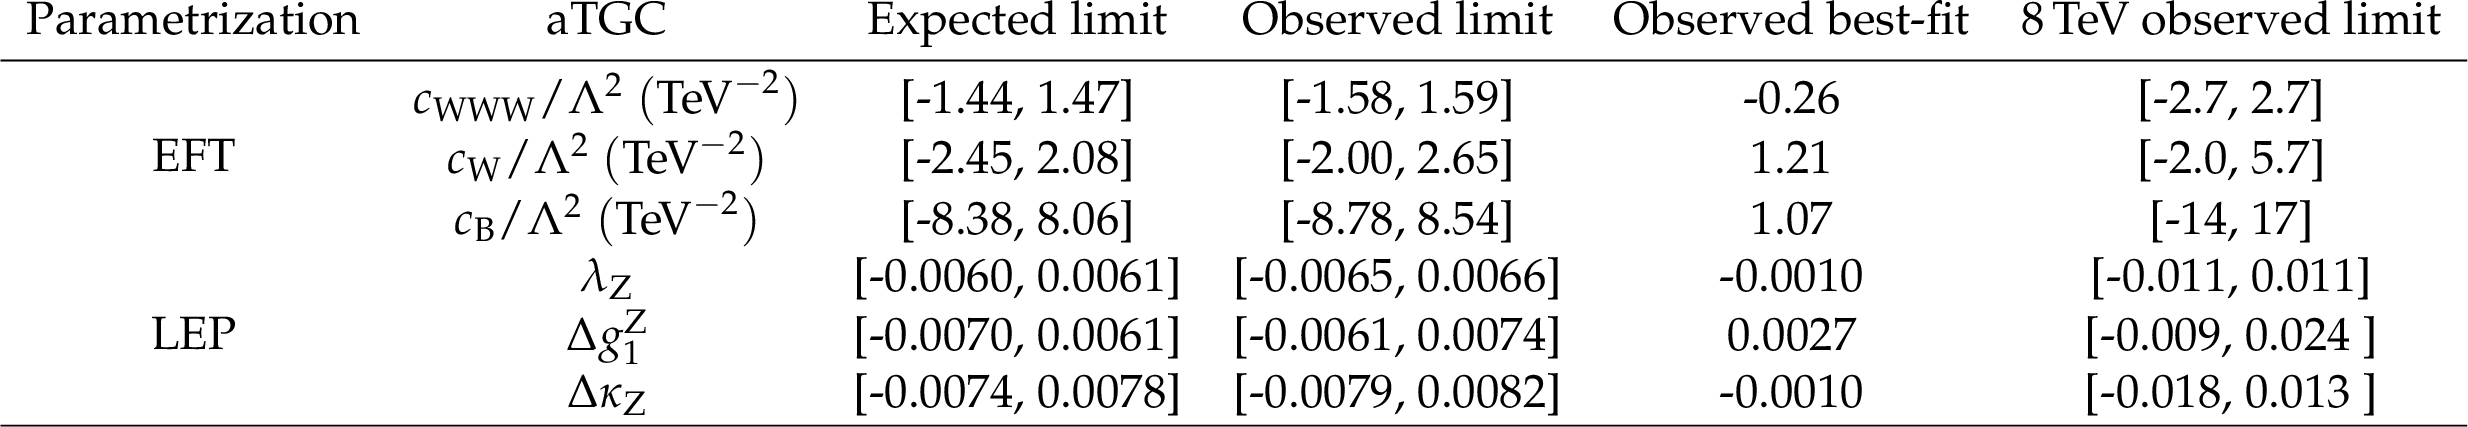
Table 4:
Expected and observed limits at 95% CL on single anomalous couplings, along with observed best-fit values, for both the EFT and LEP parametrizations. For each coupling, all other couplings are explicitly set to zero. Observed limits from collision data taken at a centre-of-mass energy of 8 TeV [26] are also quoted for comparison. |
| Summary |
| A measurement of limits on anomalous triple gauge coupling parameters in terms of dimension-six effective field theory operators has been presented. It uses events where two vector bosons are produced, with one decaying leptonically and the other hadronically to a single, massive, large-radius jet. Results are based on data recorded in proton-proton collisions at $\sqrt{s} = $ 13 TeV with the CMS detector at the CERN LHC in 2016, corresponding to an integrated luminosity of 35.9 fb$^{-1}$. Limits are presented both in terms of the ${c_{\mathrm{WWW}}}$, ${c_{\mathrm{W}}} $, and ${c_{\mathrm{B}}} $ parameters (scaled by an overall new physics energy scale $\Lambda$) in the effective field theory parametrization, and the ${\lambda_{\mathrm{Z}}} $, $\Delta g_{\mathrm{Z}}$, and $\Delta \kappa_{\mathrm{Z}}$ parameters in the LEP parametrization. For each parametrization, limits are set at 95% confidence level on individual parameters, as well as on pairwise combinations of parameters. Limits on individual parameters in the effective field theory parametrization are determined to be $-1.58 < {c_{\mathrm{WWW}}}/\Lambda^2 < 1.59 $ TeV$^{-2}$, $-2.00 < {c_{\mathrm{W}}} /\Lambda^2 < 2.65 $ TeV$^{-2}$, and $-8.78 < {c_{\mathrm{B}}} /\Lambda^2 < 8.54 $ TeV$^{-2}$, in agreement with standard model expectations of zero for each parameter. These are the strictest bounds on these parameters to date. |
| References | ||||
| 1 | K. Hagiwara, S. Ishihara, R. Szalapski, and D. Zeppenfeld | Low energy effects of new interactions in the electroweak boson sector | PRD 48 (1993) 2182 | |
| 2 | C. Degrande et al. | Effective field theory: a modern approach to anomalous couplings | Ann. Phys. 335 (2013) 21 | 1205.4231 |
| 3 | K. Hagiwara, R. D. Peccei, D. Zeppenfeld, and K. Hikasa | Probing the weak boson sector in $ \Pe^+ \Pe^- \rightarrow {\mathrm{W}}^+ {\mathrm{W}}^- $ | NPB 282 (1987) 253 | |
| 4 | G. Buchalla, O. Cata, R. Rahn, and M. Schlaffer | Effective field theory analysis of new physics in $ \mathrm{e^{+}}\mathrm{e^{-}} \to \mathrm{W^{+}}\mathrm{W^{-}} $ at a linear collider | EPJC 73 (2013) 2589 | 1302.6481 |
| 5 | CMS Collaboration | Jet algorithms performance in 13 TeV data | CMS-PAS-JME-16-003 | CMS-PAS-JME-16-003 |
| 6 | CMS Collaboration | Measurement of the $ \mathrm{Z}\mathrm{Z} $ production cross section and search for anomalous couplings in $ 2\ell2\ell' $ final states in $ {\mathrm{p}}{\mathrm{p}} $ collisions at $ \sqrt{s}= $ 7 TeV | JHEP 01 (2013) 063 | CMS-SMP-12-007 1211.4890 |
| 7 | CMS Collaboration | Measurement of the $ \mathrm{W}^+\mathrm{W}^- $ cross section in $ {\mathrm{p}}{\mathrm{p}} $ collisions at $ \sqrt{s} = $ 7 TeV and limits on anomalous $ \mathrm{W}\mathrm{W}\gamma $ and $ \mathrm{W}\mathrm{W}\mathrm{Z} $ couplings | EPJC 73 (2013) 2610 | CMS-SMP-12-005 1306.1126 |
| 8 | CMS Collaboration | Measurement of the $ {\mathrm{p}}{\mathrm{p}} \to \mathrm{Z}\mathrm{Z} $ production cross section and constraints on anomalous triple gauge couplings in four-lepton final states at $ \sqrt s= $ 8 TeV | PLB 740 (2015) 250 | CMS-SMP-13-005 1406.0113 |
| 9 | CMS Collaboration | Measurement of the $ \mathrm{W}^+\mathrm{W}^- $ cross section in pp collisions at $ \sqrt{s} = $ 8 TeV and limits on anomalous gauge couplings | EPJC 76 (2016) 401 | CMS-SMP-14-016 1507.03268 |
| 10 | CMS Collaboration | Measurement of the WZ production cross section in pp collisions at $ \sqrt{s} = $ 7 and 8 TeV and search for anomalous triple gauge couplings at $ \sqrt{s} = $ 8 TeV | EPJC 77 (2017) 236 | CMS-SMP-14-014 1609.05721 |
| 11 | CMS Collaboration | Measurements of the $ {\mathrm{p}} {\mathrm{p}} \rightarrow \mathrm{Z}\mathrm{Z} $ production cross section and the $ \mathrm{Z} \rightarrow 4\ell $ branching fraction, and constraints on anomalous triple gauge couplings at $ \sqrt{s} = $ 13 TeV | EPJC 78 (2018) 165 | CMS-SMP-16-017 1709.08601 |
| 12 | ATLAS Collaboration | Measurement of the $ \mathrm{W}^\pm \mathrm{Z} $ production cross section and limits on anomalous triple gauge couplings in proton-proton collisions at $ \sqrt{s}= $ 7 TeV with the ATLAS detector | PLB 709 (2012) 341 | 1111.5570 |
| 13 | ATLAS Collaboration | Measurement of the $ \mathrm{Z} \mathrm{Z} $ production cross section and limits on anomalous neutral triple gauge couplings in proton-proton collisions at $ \sqrt{s}= $ 7 TeV with the ATLAS detector | PRL 108 (2012) 041804 | 1110.5016 |
| 14 | ATLAS Collaboration | Measurement of the $ \mathrm{W} \mathrm{W} $ cross section in $ \sqrt{s}=7 TeV {\mathrm{p}}{\mathrm{p}} $ collisions with the ATLAS detector and limits on anomalous gauge couplings | PLB 712 (2012) 289 | 1203.6232 |
| 15 | ATLAS Collaboration | Measurement of $ \mathrm{W}\mathrm{Z} $ production in proton-proton collisions at $ \sqrt{s}= $ 7 TeV with the ATLAS detector | EPJC 72 (2012) 2173 | 1208.1390 |
| 16 | ATLAS Collaboration | Measurement of $ \mathrm{W}^+\mathrm{W}^- $ production in pp collisions at $ \sqrt{s}= $ 7 TeV with the ATLAS detector and limits on anomalous $ \mathrm{W}\mathrm{W}\mathrm{Z} $ and $ \mathrm{W}\mathrm{W}\gamma $ couplings | PRD 87 (2013) 112001 | 1210.2979 |
| 17 | ATLAS Collaboration | Measurement of $ \mathrm{Z}\mathrm{Z} $ production in $ {\mathrm{p}}{\mathrm{p}} $ collisions at $ \sqrt{s}= $ 7 TeV and limits on anomalous $ ZZZ $ and $ ZZ\gamma $ couplings with the ATLAS detector | JHEP 03 (2013) 128 | 1211.6096 |
| 18 | ATLAS Collaboration | Measurement of total and differential $ \mathrm{W}^+\mathrm{W}^- $ production cross sections in proton-proton collisions at $ \sqrt{s}= $ 8 TeV with the ATLAS detector and limits on anomalous triple-gauge-boson couplings | JHEP 09 (2016) 029 | 1603.01702 |
| 19 | ATLAS Collaboration | Measurements of $ \mathrm{W}^{\pm} \mathrm{Z} $ production cross sections in $ {\mathrm{p}}{\mathrm{p}} $ collisions at $ \sqrt{s} = $ 8 TeV with the ATLAS detector and limits on anomalous gauge boson self-couplings | PRD 93 (2016) 092004 | 1603.02151 |
| 20 | ATLAS Collaboration | Measurement of the $ \mathrm{Z}\mathrm{Z} $ production cross section in proton-proton collisions at $ \sqrt s = $ 8 TeV using the $ \mathrm{Z}\mathrm{Z}\to\ell^{-}\ell^{+}\ell^{\prime -}\ell^{\prime +} $ and $ \mathrm{Z}\mathrm{Z}\to\ell^{-}\ell^{+}\nu\bar{\nu} $ channels with the ATLAS detector | JHEP 01 (2017) 099 | 1610.07585 |
| 21 | ATLAS Collaboration | $ \mathrm{Z}\mathrm{Z} \to \ell^{+}\ell^{-}\ell^{\prime +}\ell^{\prime -} $ cross-section measurements and search for anomalous triple gauge couplings in 13 $ TeV {\mathrm{p}}{\mathrm{p}} $ collisions with the ATLAS detector | PRD 97 (2018) 032005 | 1709.07703 |
| 22 | CMS Collaboration | Measurements of the $ {\mathrm{p}}{\mathrm{p}} \to \mathrm{W}\mathrm{Z} $ inclusive and differential production cross section and constraints on charged anomalous triple gauge couplings at $ \sqrt{s} = $ 13 TeV | JHEP 04 (2019) 122 | CMS-SMP-18-002 1901.03428 |
| 23 | ATLAS Collaboration | Measurement of $ \mathrm{W}^{\pm}\mathrm{Z} $ boson pair-production in $ {\mathrm{p}}{\mathrm{p}} $ collisions at $ \sqrt{s}= $ 13 TeV with the ATLAS detector and confidence intervals for anomalous triple gauge boson couplings | ATLAS Note ATLAS-CONF-2016-043 | |
| 24 | ATLAS Collaboration | Measurement of fiducial and differential $ \mathrm{W^{+}}\mathrm{W^{-}} $ production cross-sections at $ \sqrt{s}= $ 13 TeV with the ATLAS detector | Submitted to EPJC | 1905.04242 |
| 25 | CMS Collaboration | Measurement of the sum of $ \mathrm{W}\mathrm{W} $ and $ \mathrm{W}\mathrm{Z} $ production with $ \mathrm{W} $+dijet events in $ {\mathrm{p}}{\mathrm{p}} $ collisions at $ \sqrt{s}= $ 7 TeV | EPJC 73 (2013) 2283 | CMS-SMP-12-015 1210.7544 |
| 26 | CMS Collaboration | Search for anomalous couplings in boosted $ \mathrm{W}\mathrm{W}/\mathrm{W}\mathrm{Z} \to\ell\nu\mathrm{q \bar{q}} $ production in proton-proton collisions at $ \sqrt{s} = $ 8 TeV | PLB 772 (2017) 21 | CMS-SMP-13-008 1703.06095 |
| 27 | ATLAS Collaboration | Measurement of the $ \mathrm{W}\mathrm{W}+\mathrm{W}\mathrm{Z} $ cross section and limits on anomalous triple gauge couplings using final states with one lepton, missing transverse momentum, and two jets with the ATLAS detector at $ \sqrt{\rm{s}} = $ 7 TeV | JHEP 01 (2015) 049 | 1410.7238 |
| 28 | ATLAS Collaboration | Measurement of $ \mathrm{W}\mathrm{W}/\mathrm{W}\mathrm{Z} \to \ell \nu \Pq \Pq^{\prime} $ production with the hadronically decaying boson reconstructed as one or two jets in $ {\mathrm{p}}{\mathrm{p}} $ collisions at $ \sqrt{s}= $ 8 TeV with ATLAS, and constraints on anomalous gauge couplings | EPJC 77 (2017) 563 | 1706.01702 |
| 29 | CMS Collaboration | Search for a heavy resonance decaying to a pair of vector bosons in the lepton plus merged jet final state at $ \sqrt{s}= $ 13 TeV | JHEP 05 (2018) 088 | CMS-B2G-16-029 1802.09407 |
| 30 | CMS Collaboration | The CMS trigger system | JINST 12 (2017) P01020 | CMS-TRG-12-001 1609.02366 |
| 31 | CMS Collaboration | The CMS experiment at the CERN LHC | JINST 3 (2008) S08004 | CMS-00-001 |
| 32 | J. Alwall et al. | The automated computation of tree-level and next-to-leading order differential cross sections, and their matching to parton shower simulations | JHEP 07 (2014) 079 | 1405.0301 |
| 33 | M. Grazzini, S. Kallweit, D. Rathlev, and M. Wiesemann | $ \mathrm{W}^{\pm}\mathrm{Z} $ production at hadron colliders in NNLO QCD | PLB 761 (2016) 179 | 1604.08576 |
| 34 | T. Gehrmann et al. | $ \mathrm{W}^+\mathrm{W}^- $ production at hadron colliders in next to next to leading order QCD | PRL 113 (2014) 212001 | 1408.5243 |
| 35 | P. Nason | A new method for combining NLO QCD with shower Monte Carlo algorithms | JHEP 11 (2004) 040 | hep-ph/0409146 |
| 36 | S. Frixione, P. Nason, and C. Oleari | Matching NLO QCD computations with parton shower simulations: the POWHEG method | JHEP 11 (2007) 070 | 0709.2092 |
| 37 | S. Alioli, P. Nason, C. Oleari, and E. Re | A general framework for implementing NLO calculations in shower Monte Carlo programs: the POWHEG BOX | JHEP 06 (2010) 043 | 1002.2581 |
| 38 | E. Re | Single-top Wt-channel production matched with parton showers using the POWHEG method | EPJC 71 (2011) 1547 | 1009.2450 |
| 39 | S. Alioli, P. Nason, C. Oleari, and E. Re | NLO single-top production matched with shower in POWHEG: $ s $- and $ t $-channel contributions | JHEP 09 (2009) 111 | 0907.4076 |
| 40 | S. Alioli, S.-O. Moch, and P. Uwer | Hadronic top quark pair production with one jet and parton showering | JHEP 01 (2012) 137 | 1110.5251 |
| 41 | J. M. Campbell, R. K. Ellis, P. Nason, and E. Re | Top pair production and decay at NLO matched with parton showers | JHEP 04 (2015) 114 | 1412.1828 |
| 42 | R. Frederix, E. Re, and P. Torrielli | Single-top $ t $-channel hadroproduction in the four-flavour scheme with POWHEG and aMC@NLO | JHEP 09 (2012) 130 | 1207.5391 |
| 43 | S. Frixione, P. Nason, and G. Ridolfi | A positive-weight next-to-leading-order Monte Carlo for heavy flavour hadroproduction | JHEP 09 (2007) 126 | 0707.3088 |
| 44 | T. Melia, P. Nason, R. Rontsch, and G. Zanderighi | $ \mathrm{W}^+\mathrm{W}^- $, WZ and ZZ production in the POWHEG BOX | JHEP 11 (2011) 078 | 1107.5051 |
| 45 | P. Nason and G. Zanderighi | $ \mathrm{W}^+\mathrm{W}^- $, $ \mathrm{W}\mathrm{Z} $ and $ \mathrm{Z}\mathrm{Z} $ production in the POWHEG-BOX-V2 | EPJC 74 (2014) 2702 | 1311.1365 |
| 46 | T. Sjostrand et al. | An introduction to PYTHIA 8.2 | CPC 191 (2015) 159 | 1410.3012 |
| 47 | R. Frederix and S. Frixione | Merging meets matching in MC@NLO | JHEP 12 (2012) 061 | 1209.6215 |
| 48 | J. Alwall et al. | Comparative study of various algorithms for the merging of parton showers and matrix elements in hadronic collisions | EPJC 53 (2008) 473 | 0706.2569 |
| 49 | CMS Collaboration | Investigations of the impact of the parton shower tuning in PYTHIA 8 in the modelling of $ \mathrm{t\overline{t}} $ at $ \sqrt{s}= $ 8 and 13 TeV | CMS-PAS-TOP-16-021 | CMS-PAS-TOP-16-021 |
| 50 | CMS Collaboration | Event generator tunes obtained from underlying event and multiparton scattering measurements | EPJC 76 (2016) 155 | CMS-GEN-14-001 1512.00815 |
| 51 | J. M. Campbell, R. K. Ellis, and D. L. Rainwater | Next-to-leading order QCD predictions for $ \mathrm{W} $ + 2 jet and $ \mathrm{Z} $ + 2 jet production at the CERN LHC | PRD 68 (2003) 094021 | hep-ph/0308195 |
| 52 | M. Czakon and A. Mitov | Top++: a program for the calculation of the top-pair cross-section at hadron colliders | CPC 185 (2014) 2930 | 1112.5675 |
| 53 | NNPDF Collaboration | Parton distributions for the LHC Run II | JHEP 04 (2015) 040 | 1410.8849 |
| 54 | GEANT4 Collaboration | GEANT4--a simulation toolkit | NIMA 506 (2003) 250 | |
| 55 | CMS Collaboration | Performance of electron reconstruction and selection with the CMS detector in proton-proton collisions at $ \sqrt{s} = $ 8 TeV | JINST 10 (2015) P06005 | CMS-EGM-13-001 1502.02701 |
| 56 | CMS Collaboration | Performance of the CMS muon detector and muon reconstruction with proton-proton collisions at $ \sqrt{s} = $ 13 TeV | JINST 13 (2018) P06015 | CMS-MUO-16-001 1804.04528 |
| 57 | M. Cacciari, G. P. Salam, and G. Soyez | The anti-$ {k_{\mathrm{T}}} $ jet clustering algorithm | JHEP 04 (2008) 063 | 0802.1189 |
| 58 | M. Cacciari, G. P. Salam, and G. Soyez | FastJet user manual | EPJC 72 (2012) 1896 | 1111.6097 |
| 59 | CMS Collaboration | Technical proposal for the Phase-II upgrade of the Compact Muon Solenoid | CMS-PAS-TDR-15-002 | CMS-PAS-TDR-15-002 |
| 60 | CMS Collaboration | Particle-flow reconstruction and global event description with the CMS detector | JINST 12 (2017) P10003 | CMS-PRF-14-001 1706.04965 |
| 61 | CMS Collaboration | Energy calibration and resolution of the CMS electromagnetic calorimeter in $ {\mathrm{p}}{\mathrm{p}} $ collisions at $ \sqrt{s} = $ 7 TeV | JINST 8 (2013) P09009 | CMS-EGM-11-001 1306.2016 |
| 62 | CMS Collaboration | Search for physics beyond the standard model in dilepton mass spectra in proton-proton collisions at $ \sqrt{s}= $ 8 TeV | JHEP 04 (2015) 025 | CMS-EXO-12-061 1412.6302 |
| 63 | CMS Collaboration | Search for narrow resonances in dilepton mass spectra in proton-proton collisions at $ \sqrt{s} = $ 13 TeV and combination with 8 TeV data | PLB 768 (2017) 57 | CMS-EXO-15-005 1609.05391 |
| 64 | CMS Collaboration | Performance of CMS muon reconstruction in $ {\mathrm{p}}{\mathrm{p}} $ collision events at $ \sqrt{s}= $ 7 TeV | JINST 7 (2012) P10002 | CMS-MUO-10-004 1206.4071 |
| 65 | CMS Collaboration | Jet energy scale and resolution in the CMS experiment in pp collisions at 8 TeV | JINST 12 (2017) P02014 | CMS-JME-13-004 1607.03663 |
| 66 | CMS Collaboration | Performance of missing transverse momentum in pp collisions at $ \sqrt{s}= $ 13 TeV using the CMS detector | CMS-PAS-JME-17-001 | CMS-PAS-JME-17-001 |
| 67 | CMS Collaboration | Identification of heavy-flavour jets with the CMS detector in pp collisions at 13 TeV | JINST 13 (2018) P05011 | CMS-BTV-16-002 1712.07158 |
| 68 | CMS Collaboration | Studies of jet mass in dijet and W/Z+jet events | JHEP 05 (2013) 090 | CMS-SMP-12-019 1303.4811 |
| 69 | CMS Collaboration | V tagging observables and correlations | CMS-PAS-JME-14-002 | CMS-PAS-JME-14-002 |
| 70 | M. Dasgupta, A. Fregoso, S. Marzani, and G. P. Salam | Towards an understanding of jet substructure | JHEP 09 (2013) 029 | 1307.0007 |
| 71 | J. M. Butterworth, A. R. Davison, M. Rubin, and G. P. Salam | Jet substructure as a new Higgs search channel at the LHC | PRL 100 (2008) 242001 | 0802.2470 |
| 72 | A. J. Larkoski, S. Marzani, G. Soyez, and J. Thaler | Soft drop | JHEP 05 (2014) 146 | 1402.2657 |
| 73 | D. Bertolini, P. Harris, M. Low, and N. Tran | Pileup per particle identification | JHEP 10 (2014) 059 | 1407.6013 |
| 74 | J. Thaler and K. Van Tilburg | Identifying boosted objects with N-subjettiness | JHEP 03 (2011) 015 | 1011.2268 |
| 75 | CMS Collaboration | Search for massive resonances decaying into pairs of boosted bosons in semi-leptonic final states at $ \sqrt{s} = $ 8 TeV | JHEP 08 (2014) 174 | CMS-EXO-13-009 1405.3447 |
| 76 | CMS Collaboration | Search for massive resonances decaying into WW, WZ or ZZ bosons in proton-proton collisions at $ \sqrt{s} = $ 13 TeV | JHEP 03 (2017) 162 | CMS-B2G-16-004 1612.09159 |
| 77 | CMS Collaboration | CMS luminosity measurements for the 2016 data taking period | CMS-PAS-LUM-17-001 | CMS-PAS-LUM-17-001 |
| 78 | CMS Collaboration | Measurement of the inelastic proton-proton cross section at $ \sqrt{s}= $ 13 TeV | JHEP 07 (2018) 161 | CMS-FSQ-15-005 1802.02613 |
| 79 | J. Butterworth et al. | PDF4LHC recommendations for LHC Run II | JPG 43 (2016) 023001 | 1510.03865 |
| 80 | CMS Collaboration | Performance of missing transverse momentum reconstruction in proton-proton collisions at $ \sqrt{s} = $ 13 TeV using the CMS detector | Submitted to: JINST | CMS-JME-17-001 1903.06078 |
| 81 | CMS Collaboration | Precise determination of the mass of the Higgs boson and tests of compatibility of its couplings with the standard model predictions using proton collisions at 7 and 8 TeV | EPJC 75 (2015) 212 | CMS-HIG-14-009 1412.8662 |
| 82 | R. Contino et al. | On the validity of the effective field theory approach to SM precision tests | JHEP 07 (2016) 144 | 1604.06444 |
| 83 | ALEPH, DELPHI, L3, OPAL, LEP Electroweak Collaboration | Electroweak measurements in electron-positron collisions at W-boson-pair energies at LEP | PR 532 (2013) 119 | 1302.3415 |
| 84 | \DZERO Collaboration | Limits on anomalous trilinear gauge boson couplings from $ \mathrm{W}\mathrm{W} $, $ \mathrm{W}\mathrm{Z} $ and $ \mathrm{W}\gamma $ production in $ {\mathrm{p}}\mathrm{\bar{p}} $ collisions at $ \sqrt{s}= $ 1.96 TeV | PLB 718 (2012) 451 | 1208.5458 |
| 85 | CMS Collaboration | Electroweak production of two jets in association with a Z boson in proton-proton collisions at $ \sqrt{s}= $ 13 TeV | EPJC 78 (2018) 589 | CMS-SMP-16-018 1712.09814 |
| 86 | CMS Collaboration | Measurement of electroweak production of a W boson in association with two jets in proton-proton collisions at $ \sqrt{s}= $ 13 TeV | Submitted to EPJC | CMS-SMP-17-011 1903.04040 |
| 87 | ATLAS Collaboration | Measurement of the electroweak production of dijets in association with a Z-boson and distributions sensitive to vector boson fusion in proton-proton collisions at $ \sqrt{s} = $ 8 TeV using the ATLAS detector | JHEP 04 (2014) 031 | 1401.7610 |
| 88 | ATLAS Collaboration | Measurements of electroweak Wjj production and constraints on anomalous gauge couplings with the ATLAS detector | EPJC 77 (2017) 474 | 1703.04362 |
|
|
Compact Muon Solenoid LHC, CERN |
|

|

|

|

|

|