

Compact Muon Solenoid
LHC, CERN
| CMS-TOP-18-010 ; CERN-EP-2021-117 | ||
| Measurement of the inclusive and differential $\mathrm{t\bar{t}}\gamma$ cross sections in the single-lepton channel and EFT interpretation at $\sqrt{s} = $ 13 TeV | ||
| CMS Collaboration | ||
| 3 July 2021 | ||
| JHEP 12 (2021) 180 | ||
| Abstract: The production cross section of a top quark pair in association with a photon is measured in proton-proton collisions at a center-of-mass energy of 13 TeV. The data set, corresponding to an integrated luminosity of 137 fb$^{-1}$, was recorded by the CMS experiment during the 2016-2018 data taking of the LHC. The measurements are performed in a fiducial volume defined at the particle level. Events with an isolated, highly energetic lepton, at least three jets from the hadronization of quarks, among which at least one is b tagged, and one isolated photon are selected. The inclusive fiducial ${\mathrm{t\bar{t}}\gamma}$ cross section, for a photon with transverse momentum greater than 20 GeV and pseudorapidity ${|\eta|} < $ 1.4442, is measured to be 800 $\pm$ 7 (stat) $\pm$ 46 (syst) fb, in goo d agreement with the prediction from the standard model at next-to-leading order in quantum chromodynamics. The differential cross sections are also measured as a function of several kinematic observables and interpreted in the framework of the standard model effective field theory (EFT), leading to the most stringent direct limits to date on anomalous electromagnetic dipole moment interactions of the top quark and the photon. | ||
| Links: e-print arXiv:2107.01508 [hep-ex] (PDF) ; CDS record ; inSPIRE record ; HepData record ; CADI line (restricted) ; | ||
| Figures | |
png pdf |
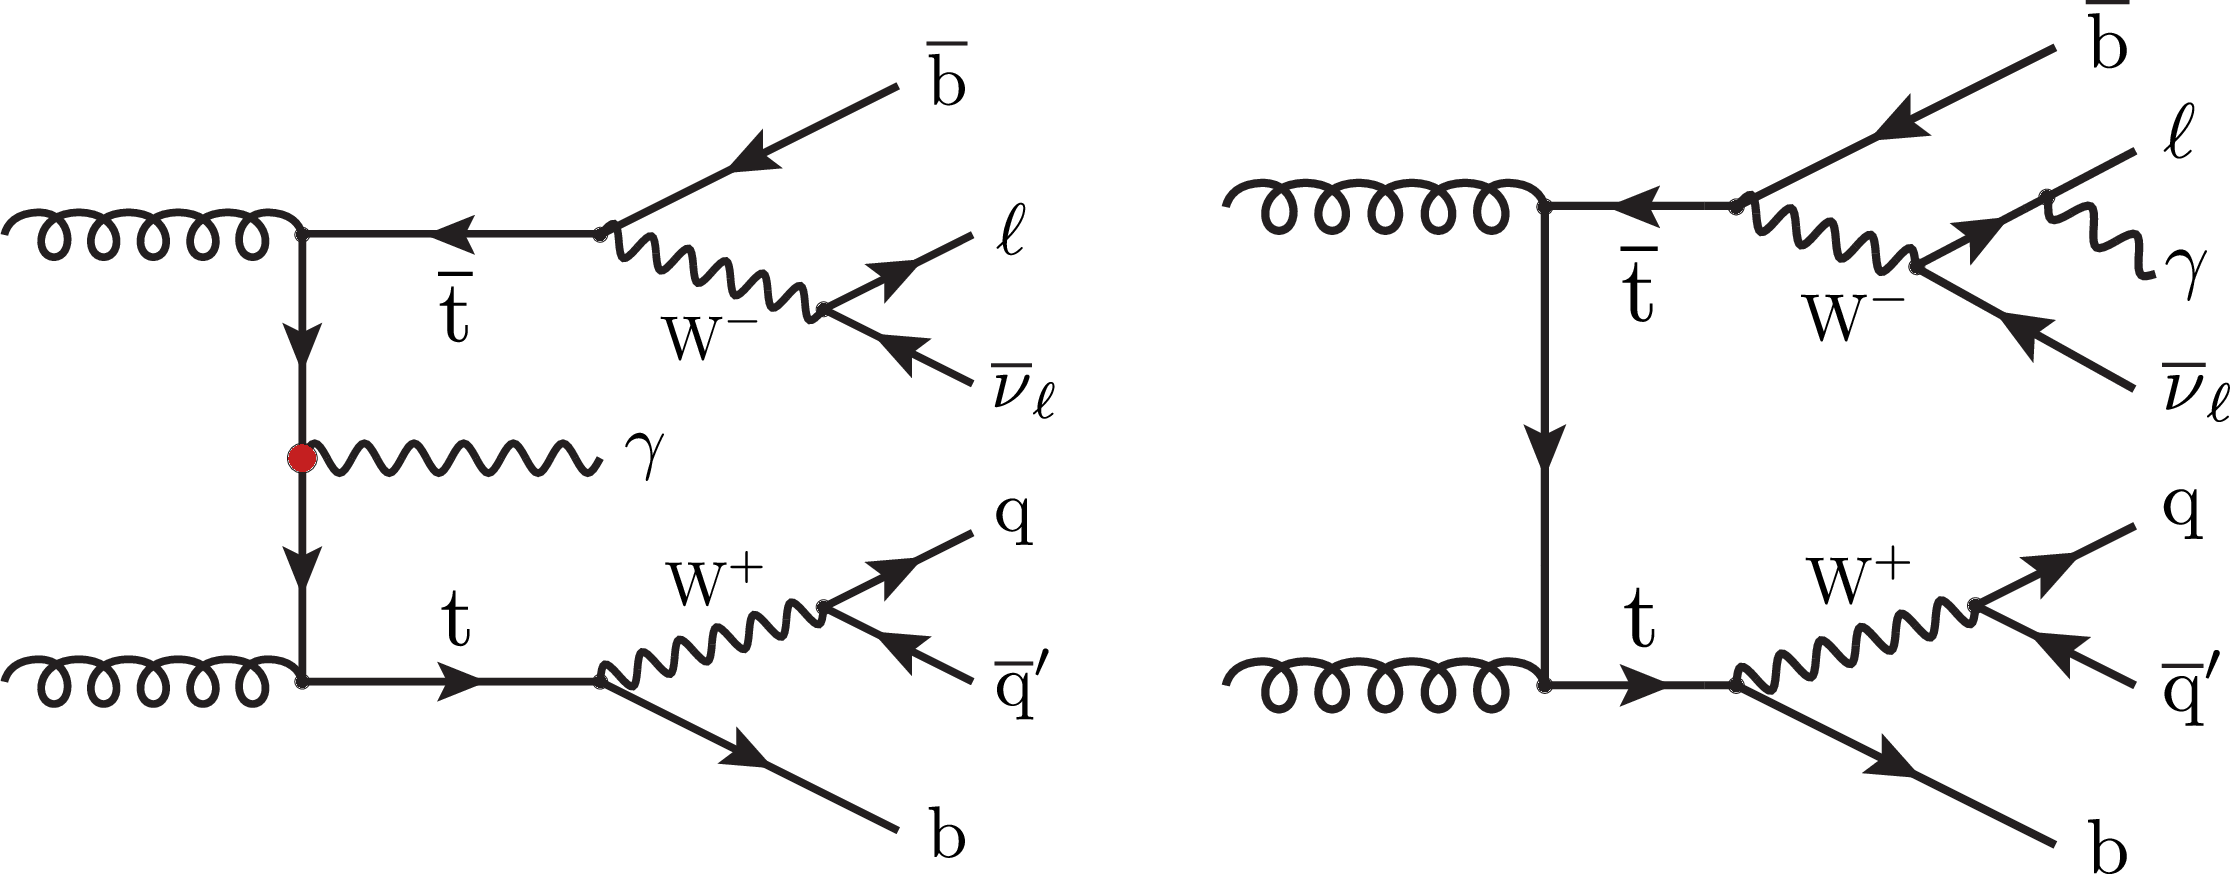
Figure 1:
Representative LO Feynman diagrams for the ${{\mathrm{t} \mathrm{\bar{t}}} \gamma}$ signal process in the single-lepton channel, where the highly energetic photon originates from the top quark (left), or is emitted from a lepton (right). The ${{\mathrm{t} \mathrm{\bar{t}}} \gamma}$ interaction vertex is indicated by a circle. |
png pdf |
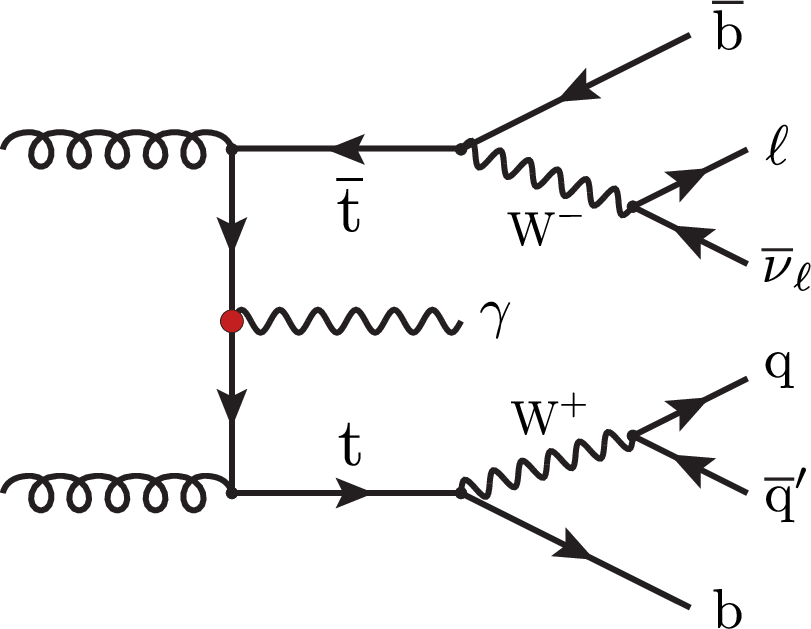
Figure 1-a:
LO Feynman diagram for the ${{\mathrm{t} \mathrm{\bar{t}}} \gamma}$ signal process in the single-lepton channel, where the highly energetic photon originates from the top quark. The ${{\mathrm{t} \mathrm{\bar{t}}} \gamma}$ interaction vertex is indicated by a circle. |
png pdf |
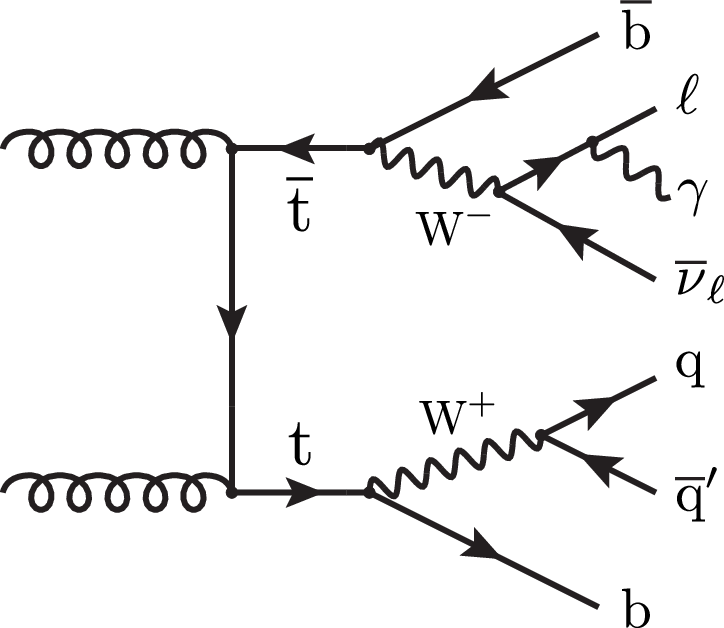
Figure 1-b:
LO Feynman diagram for the ${{\mathrm{t} \mathrm{\bar{t}}} \gamma}$ signal process in the single-lepton channel, where the highly energetic photon is emitted from a lepton. |
png pdf |
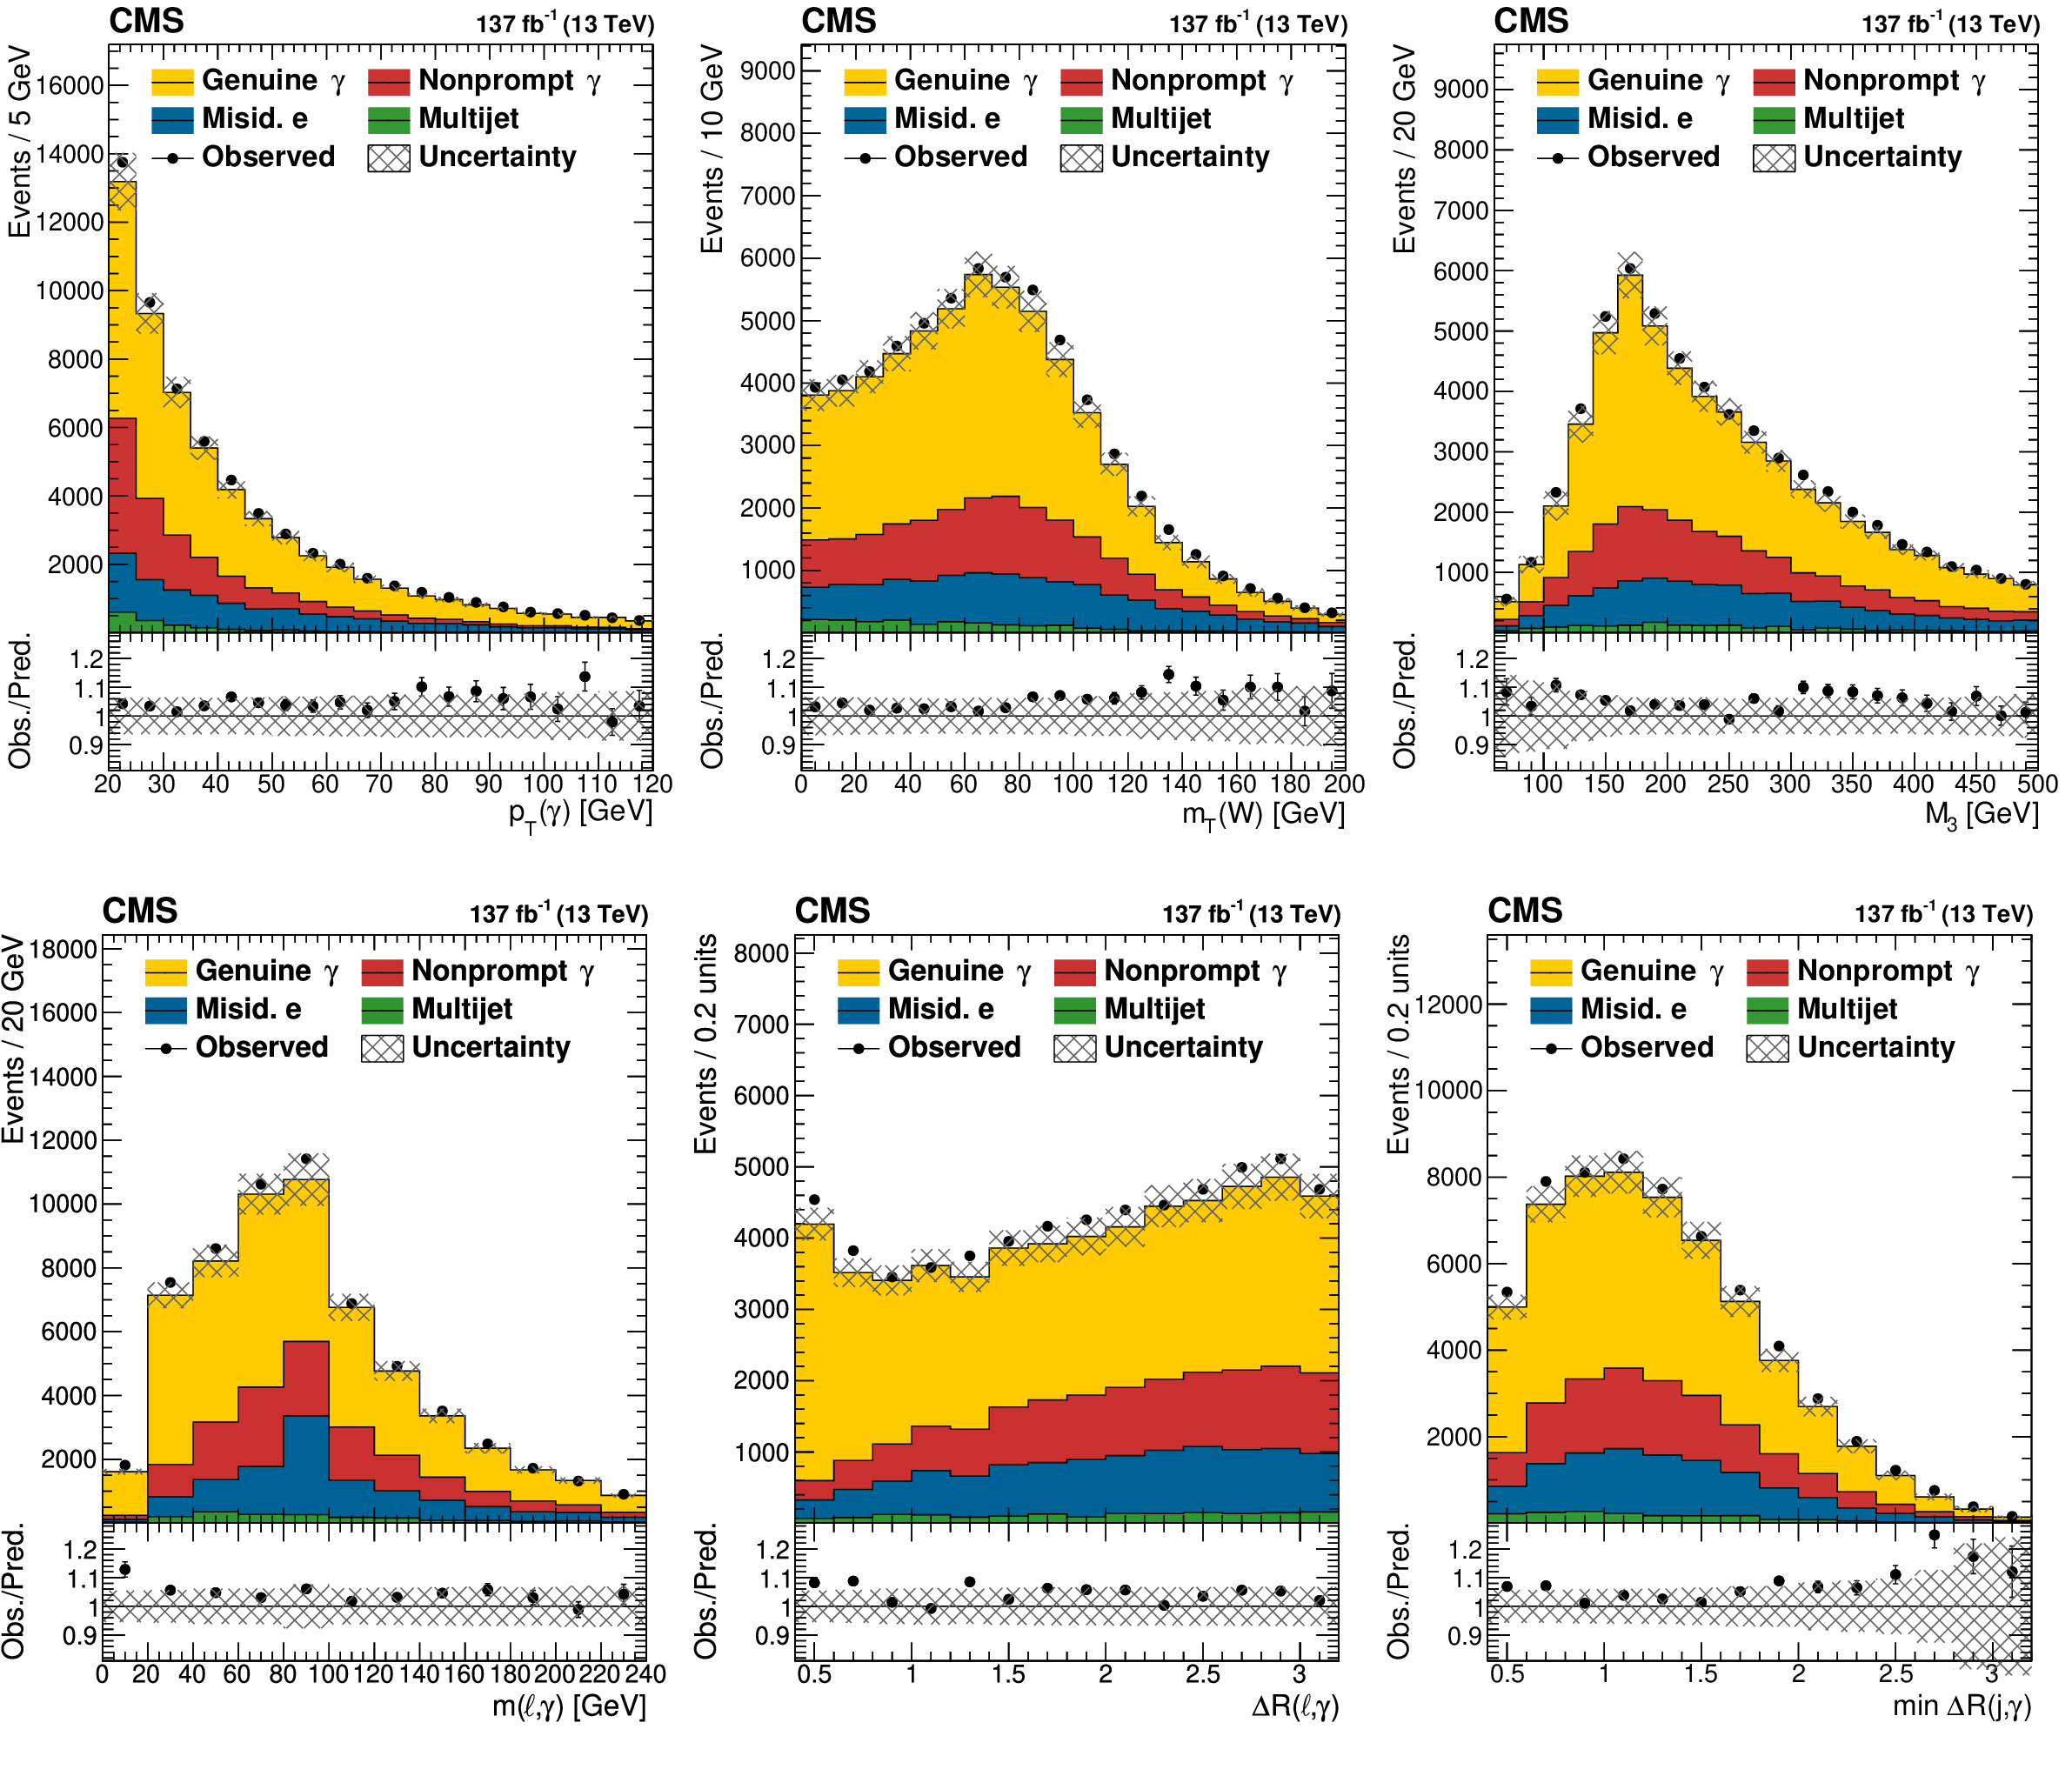
Figure 2:
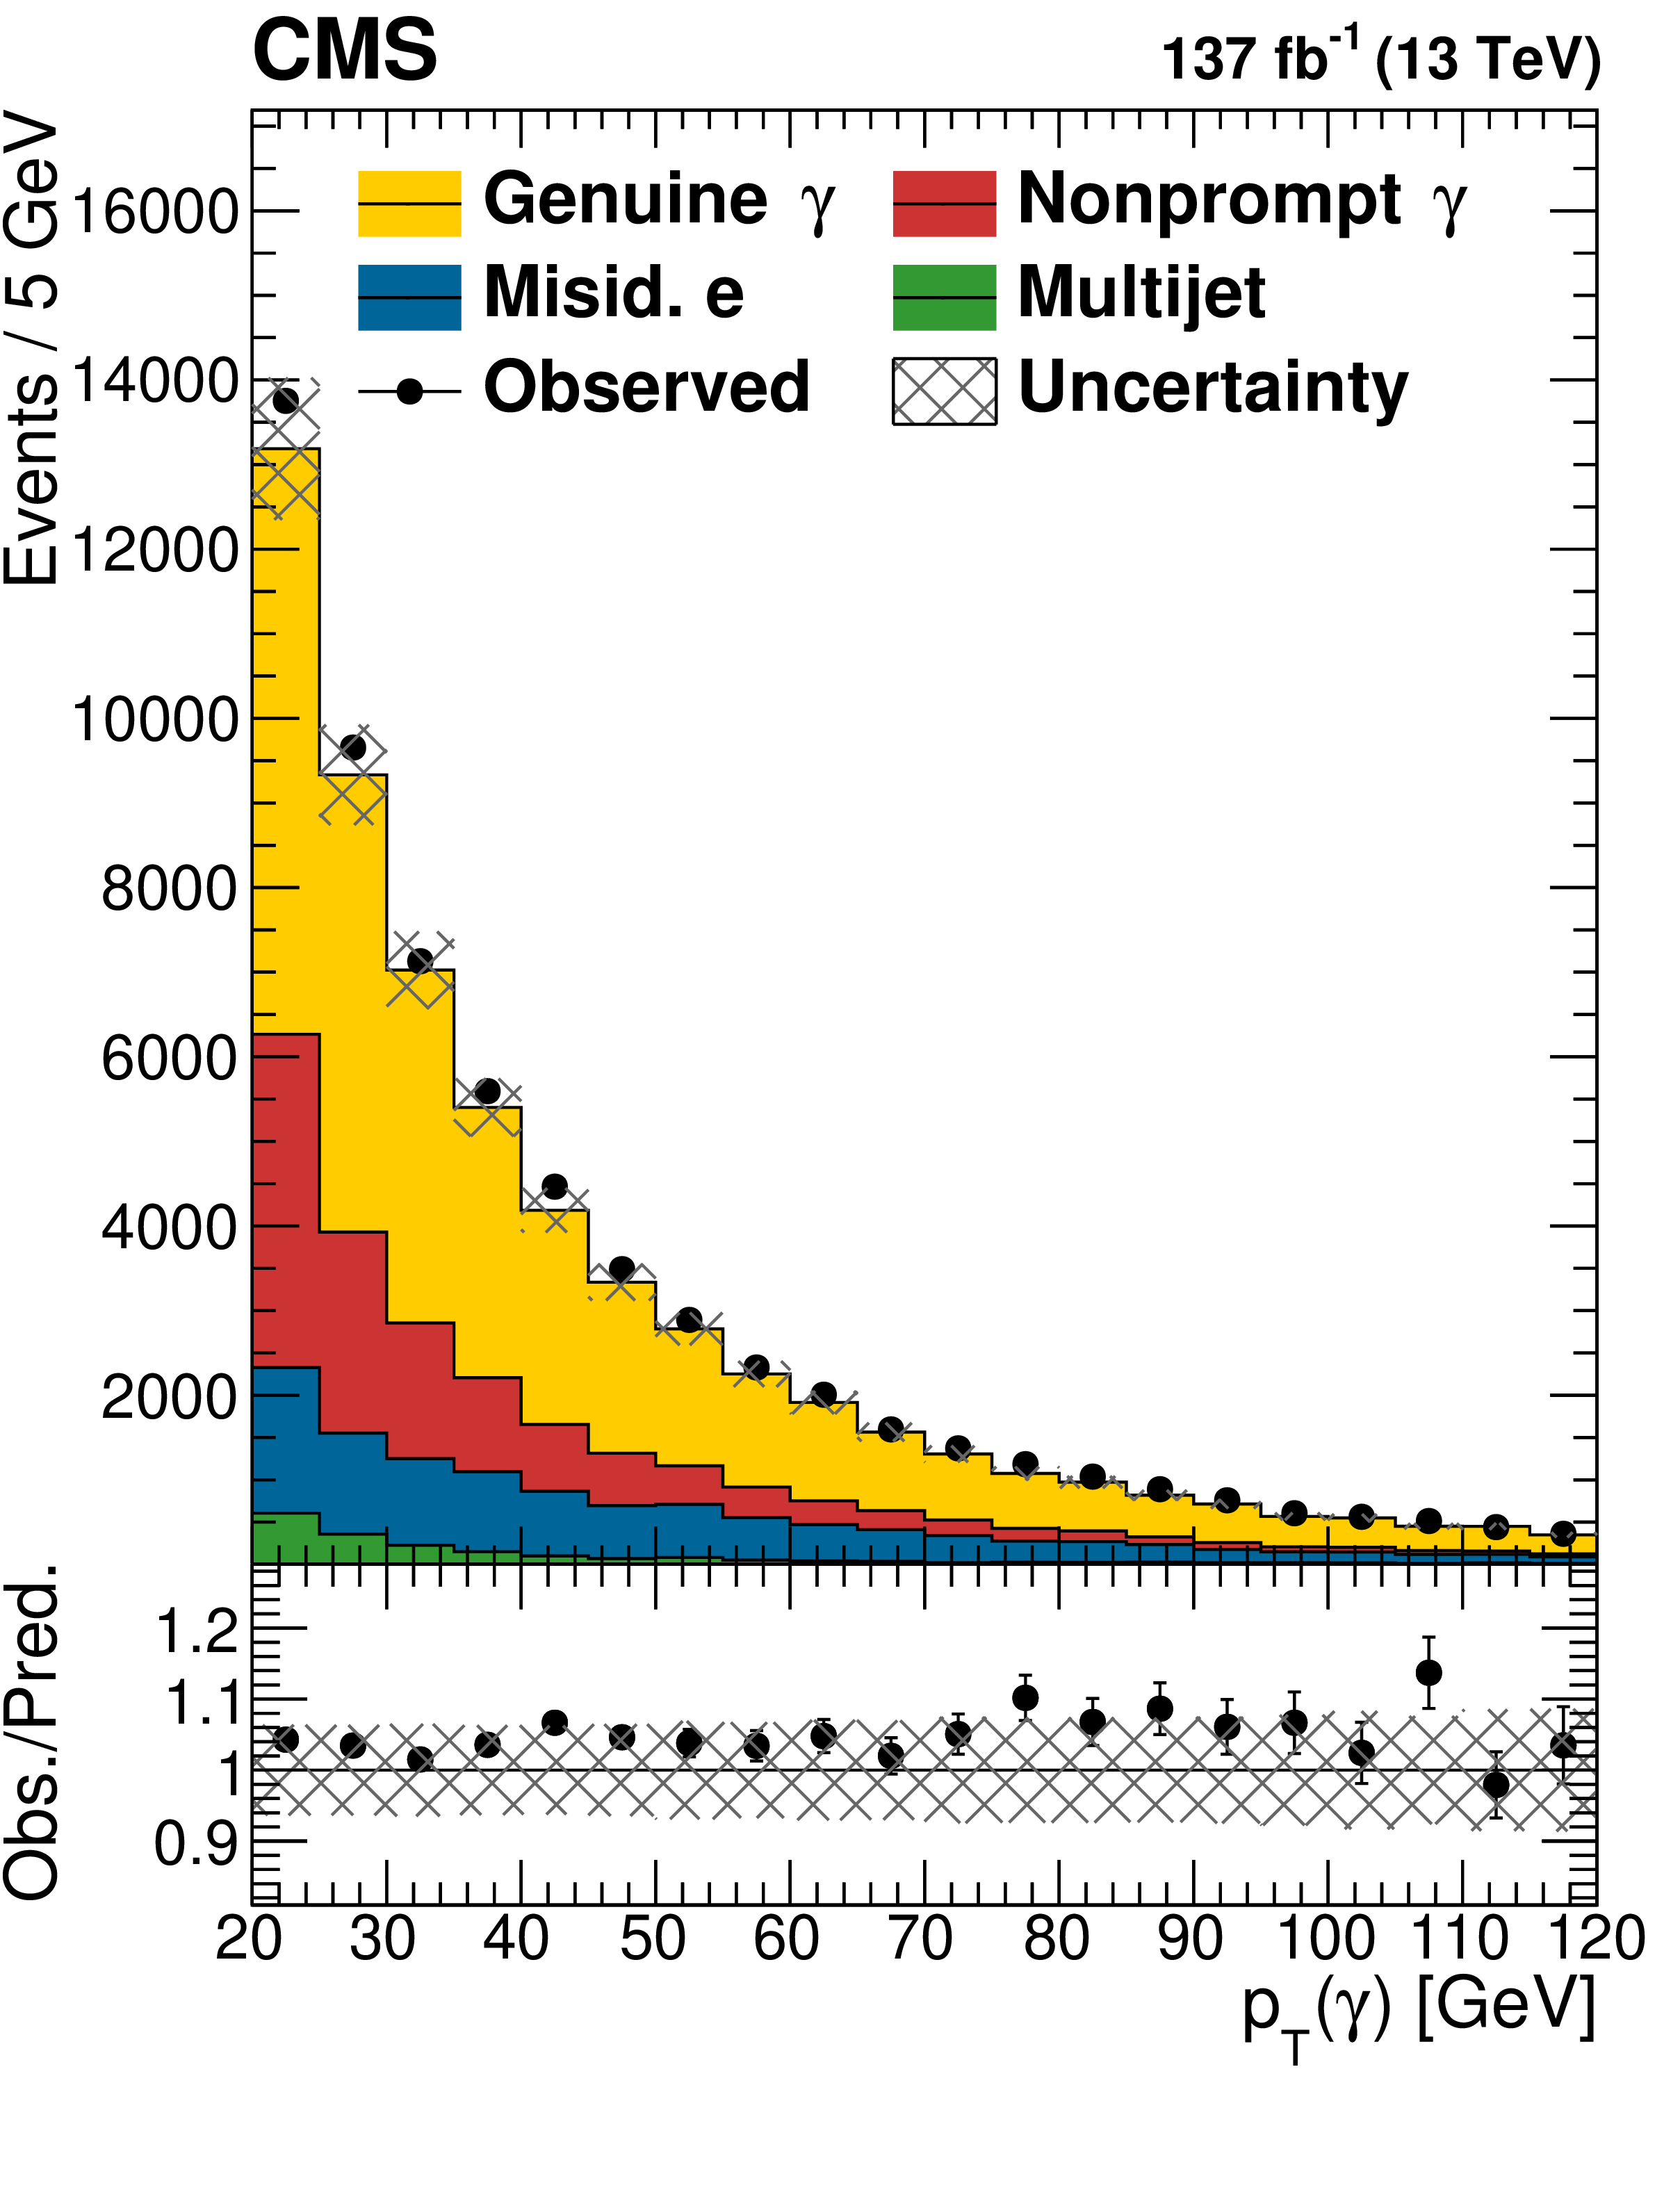
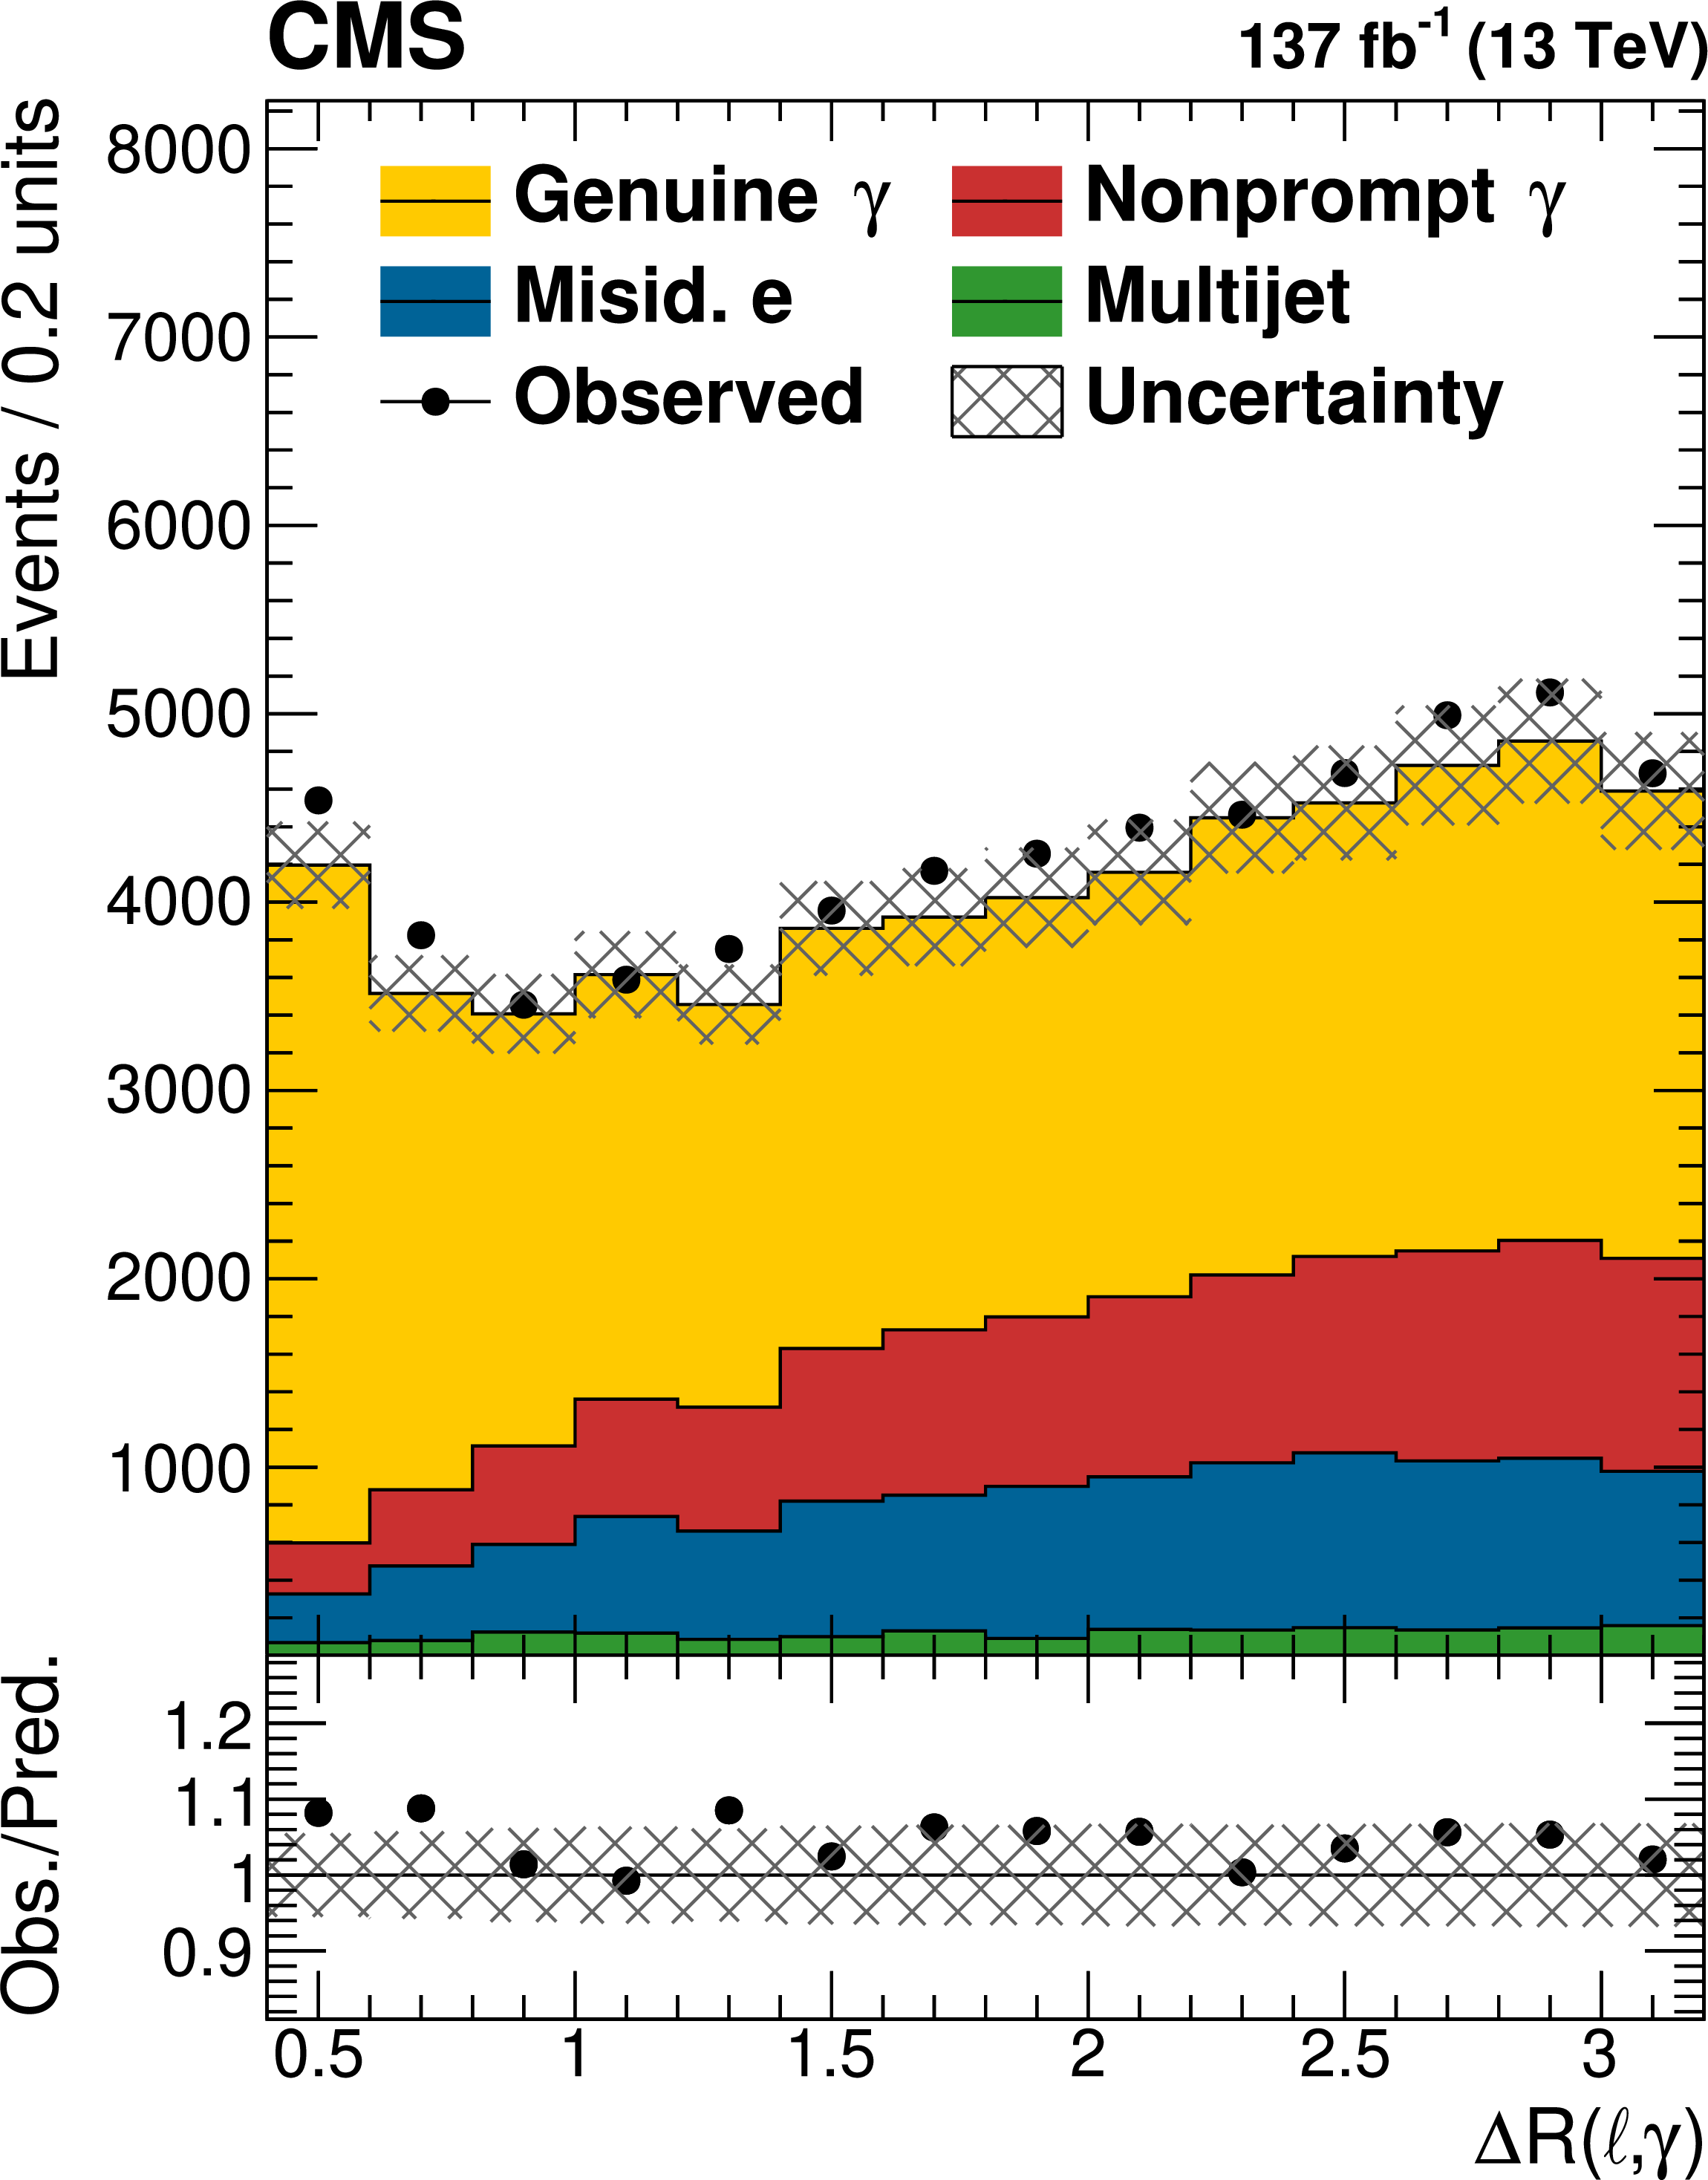
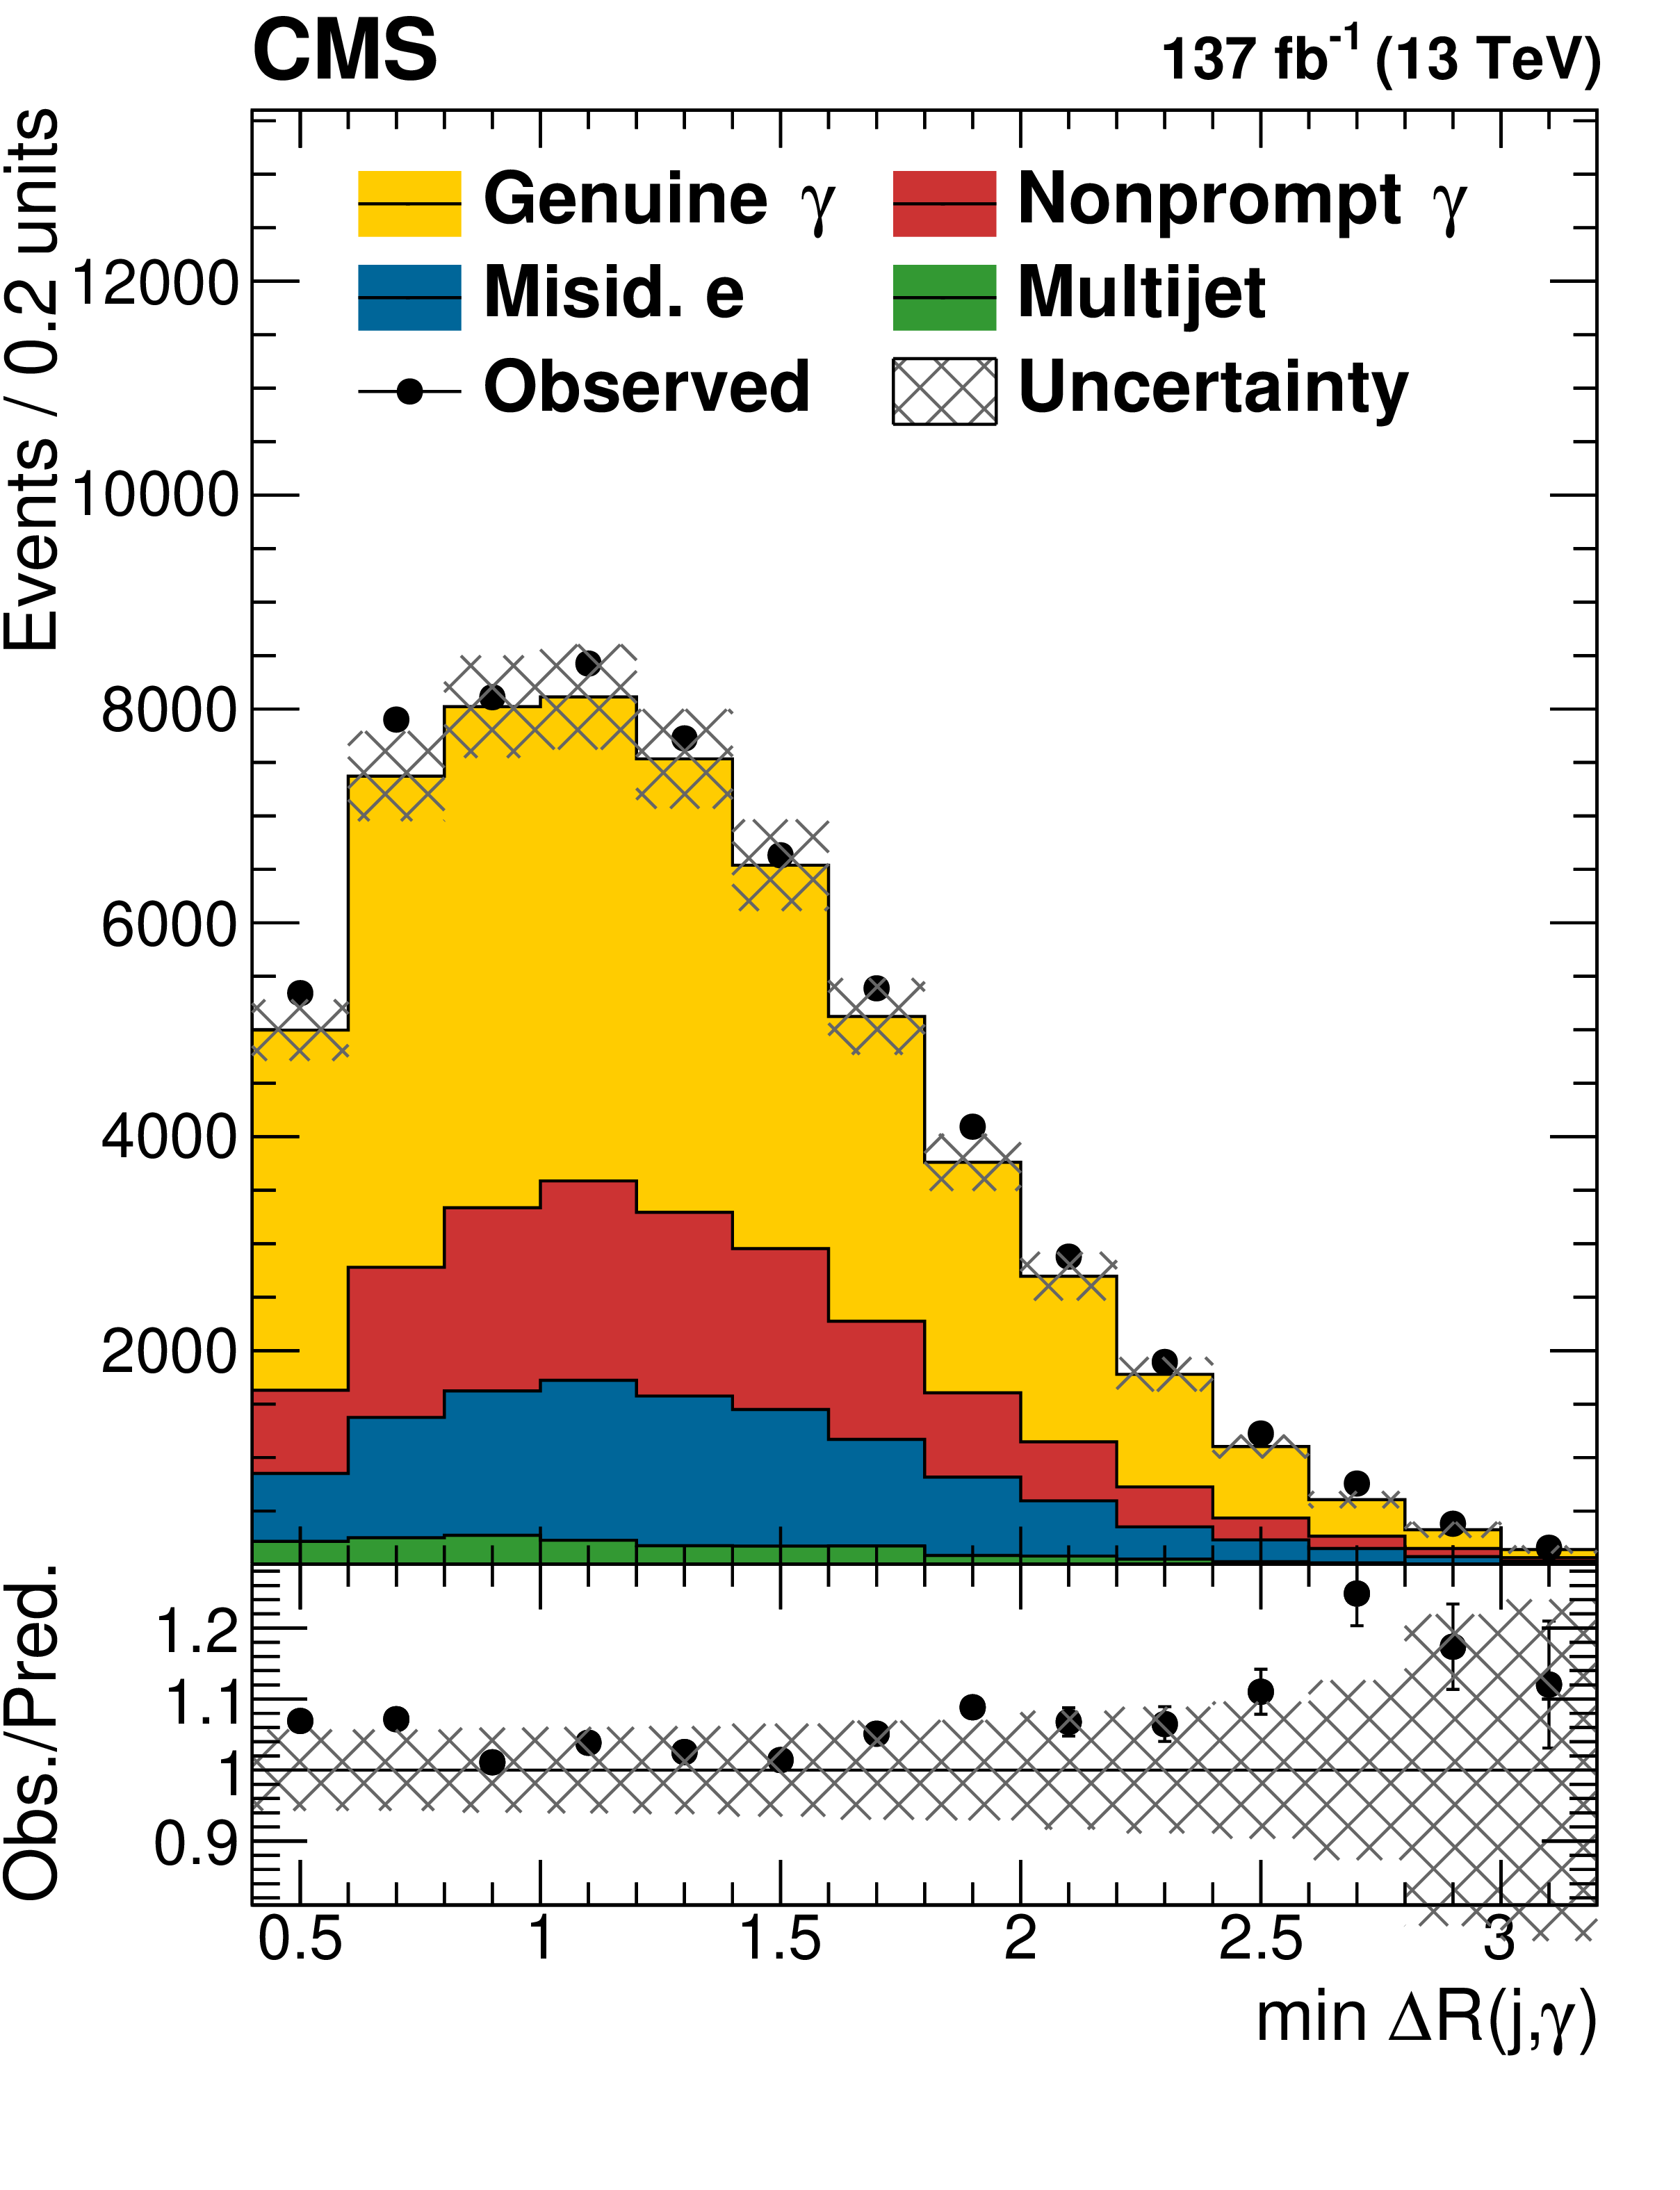
Distribution of ${{p_{\mathrm {T}}} (\gamma)}$, the transverse mass ${{m_{\mathrm {T}}} (\mathrm{W})}$ of the W boson candidate, the three-jet invariant mass ${M_3}$ (upper row); the invariant mass ${m(\ell,\gamma)}$ of the lepton and the photon, the angular separation ${\Delta R(\ell,\gamma)}$ of the lepton and the photon, and the minimal angular separation $\textrm {min}\, {\Delta R}(j, \gamma)$ of the photon and all jets (lower row) in the SR3p region. The backgrounds are normalized according to the methods described in Sec. 7. The systematic uncertainties are shown as a hatched band. |
png pdf |
Figure 2-a:
Distribution of ${{p_{\mathrm {T}}} (\gamma)}$, in the SR3p region. The backgrounds are normalized according to the methods described in Sec. 7. The systematic uncertainties are shown as a hatched band. |

png pdf |
Figure 2-b:
Distribution of the transverse mass ${{m_{\mathrm {T}}} (\mathrm{W})}$ of the W boson candidate, in the SR3p region. The backgrounds are normalized according to the methods described in Sec. 7. The systematic uncertainties are shown as a hatched band. |

png pdf |
Figure 2-c:
Distribution of the three-jet invariant mass ${M_3}$, in the SR3p region. The backgrounds are normalized according to the methods described in Sec. 7. The systematic uncertainties are shown as a hatched band. |

png pdf |
Figure 2-d:
Distribution of the invariant mass ${m(\ell,\gamma)}$ of the lepton and the photon, in the SR3p region. The backgrounds are normalized according to the methods described in Sec. 7. The systematic uncertainties are shown as a hatched band. |
png pdf |
Figure 2-e:
Distribution of the angular separation ${\Delta R(\ell,\gamma)}$ of the lepton and the photon, in the SR3p region. The backgrounds are normalized according to the methods described in Sec. 7. The systematic uncertainties are shown as a hatched band. |
png pdf |
Figure 2-f:
Distribution of the minimal angular separation $\textrm {min}\, {\Delta R}(j, \gamma)$ of the photon and all jets, in the SR3p region. The backgrounds are normalized according to the methods described in Sec. 7. The systematic uncertainties are shown as a hatched band. |
png pdf |
Figure 3:
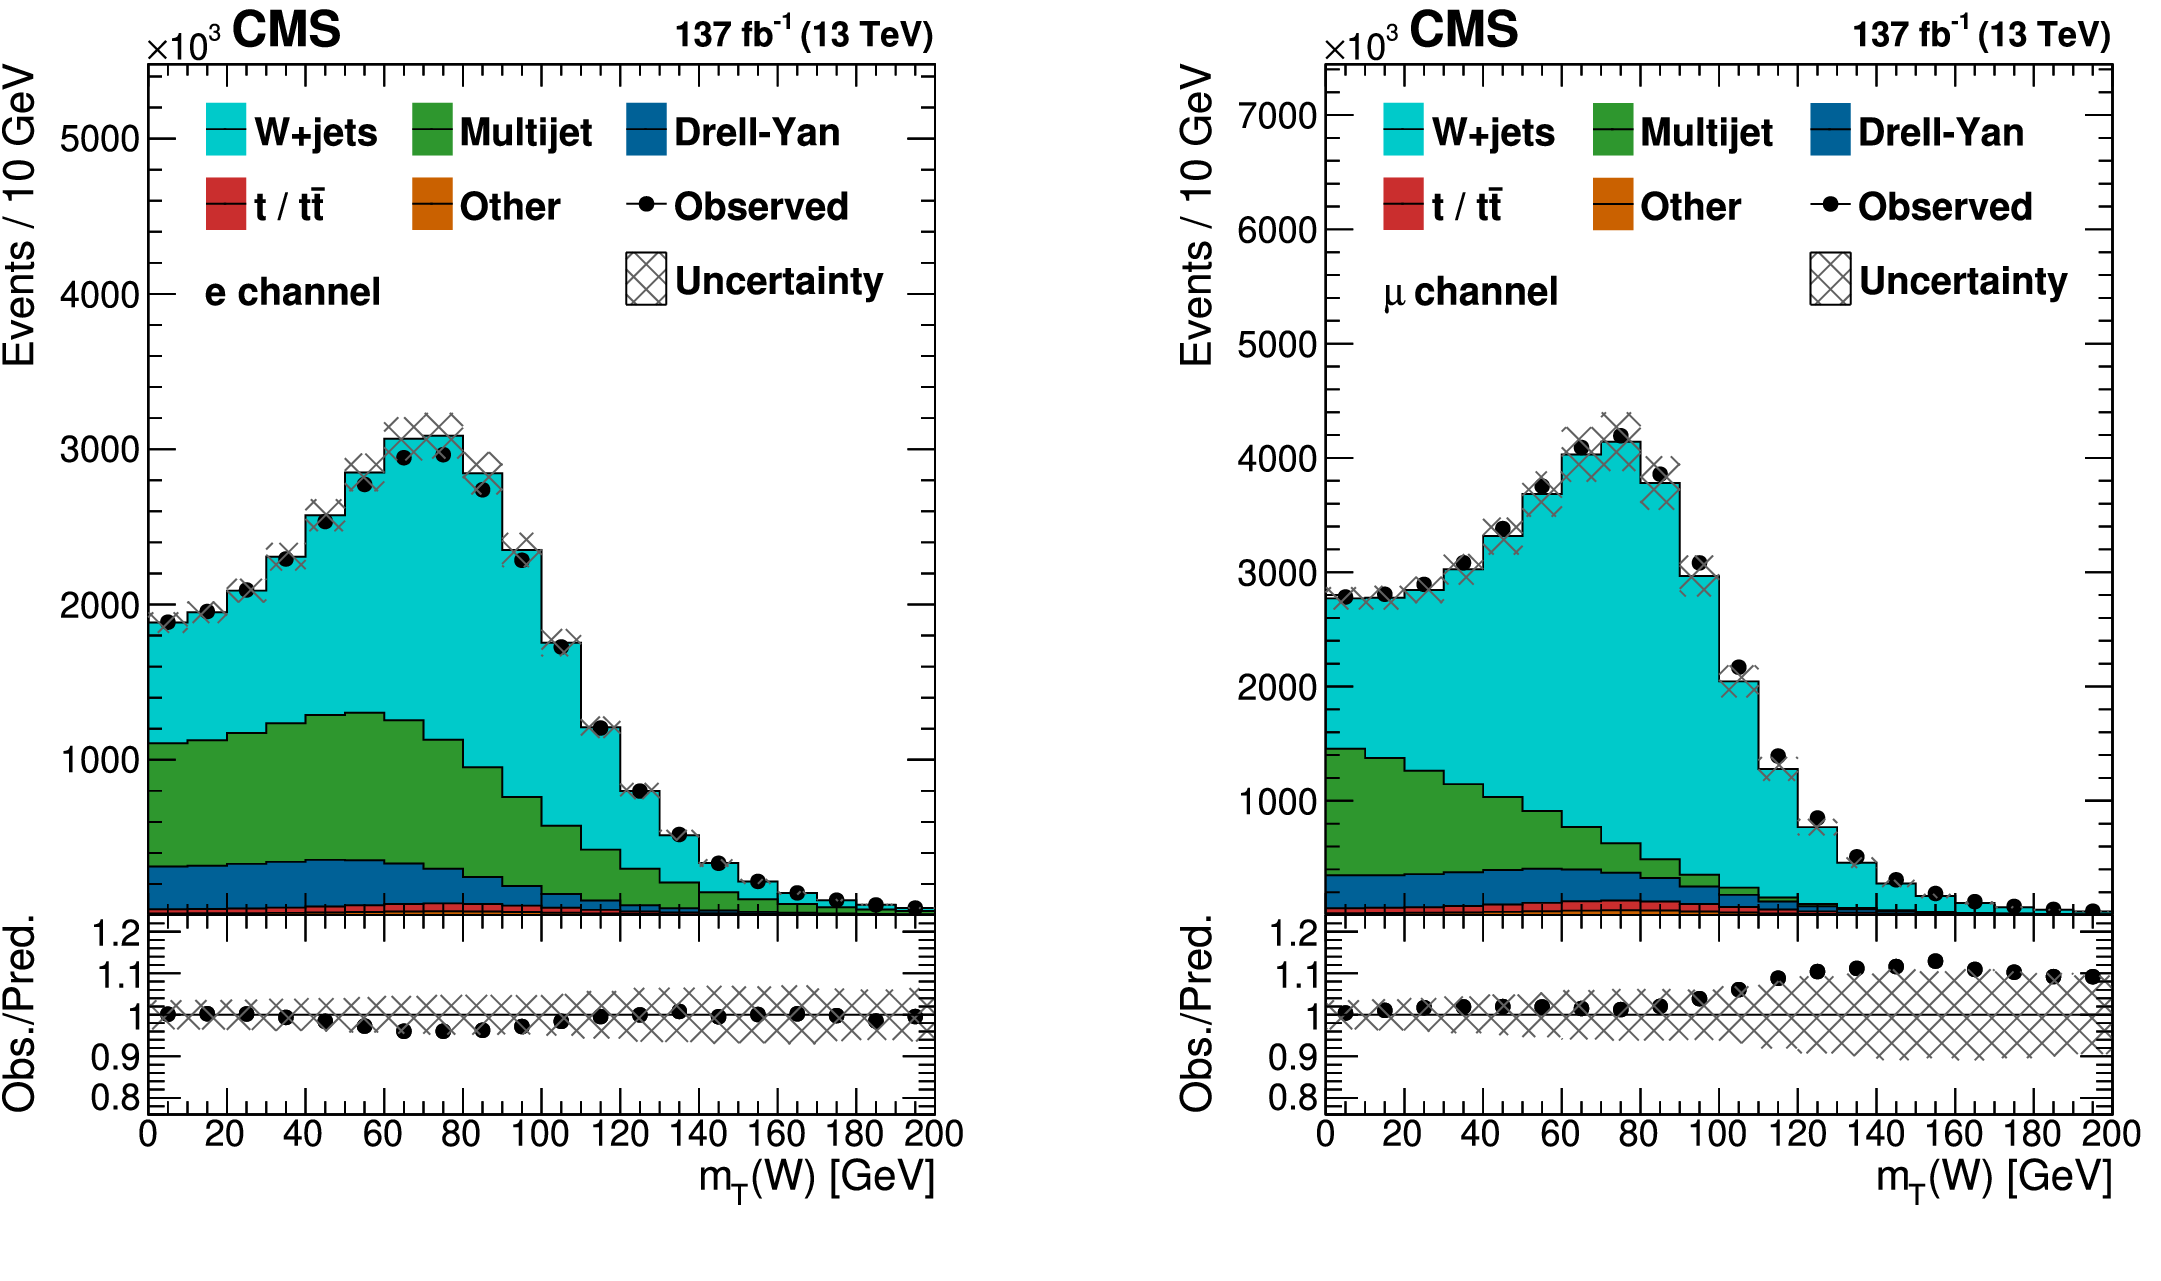
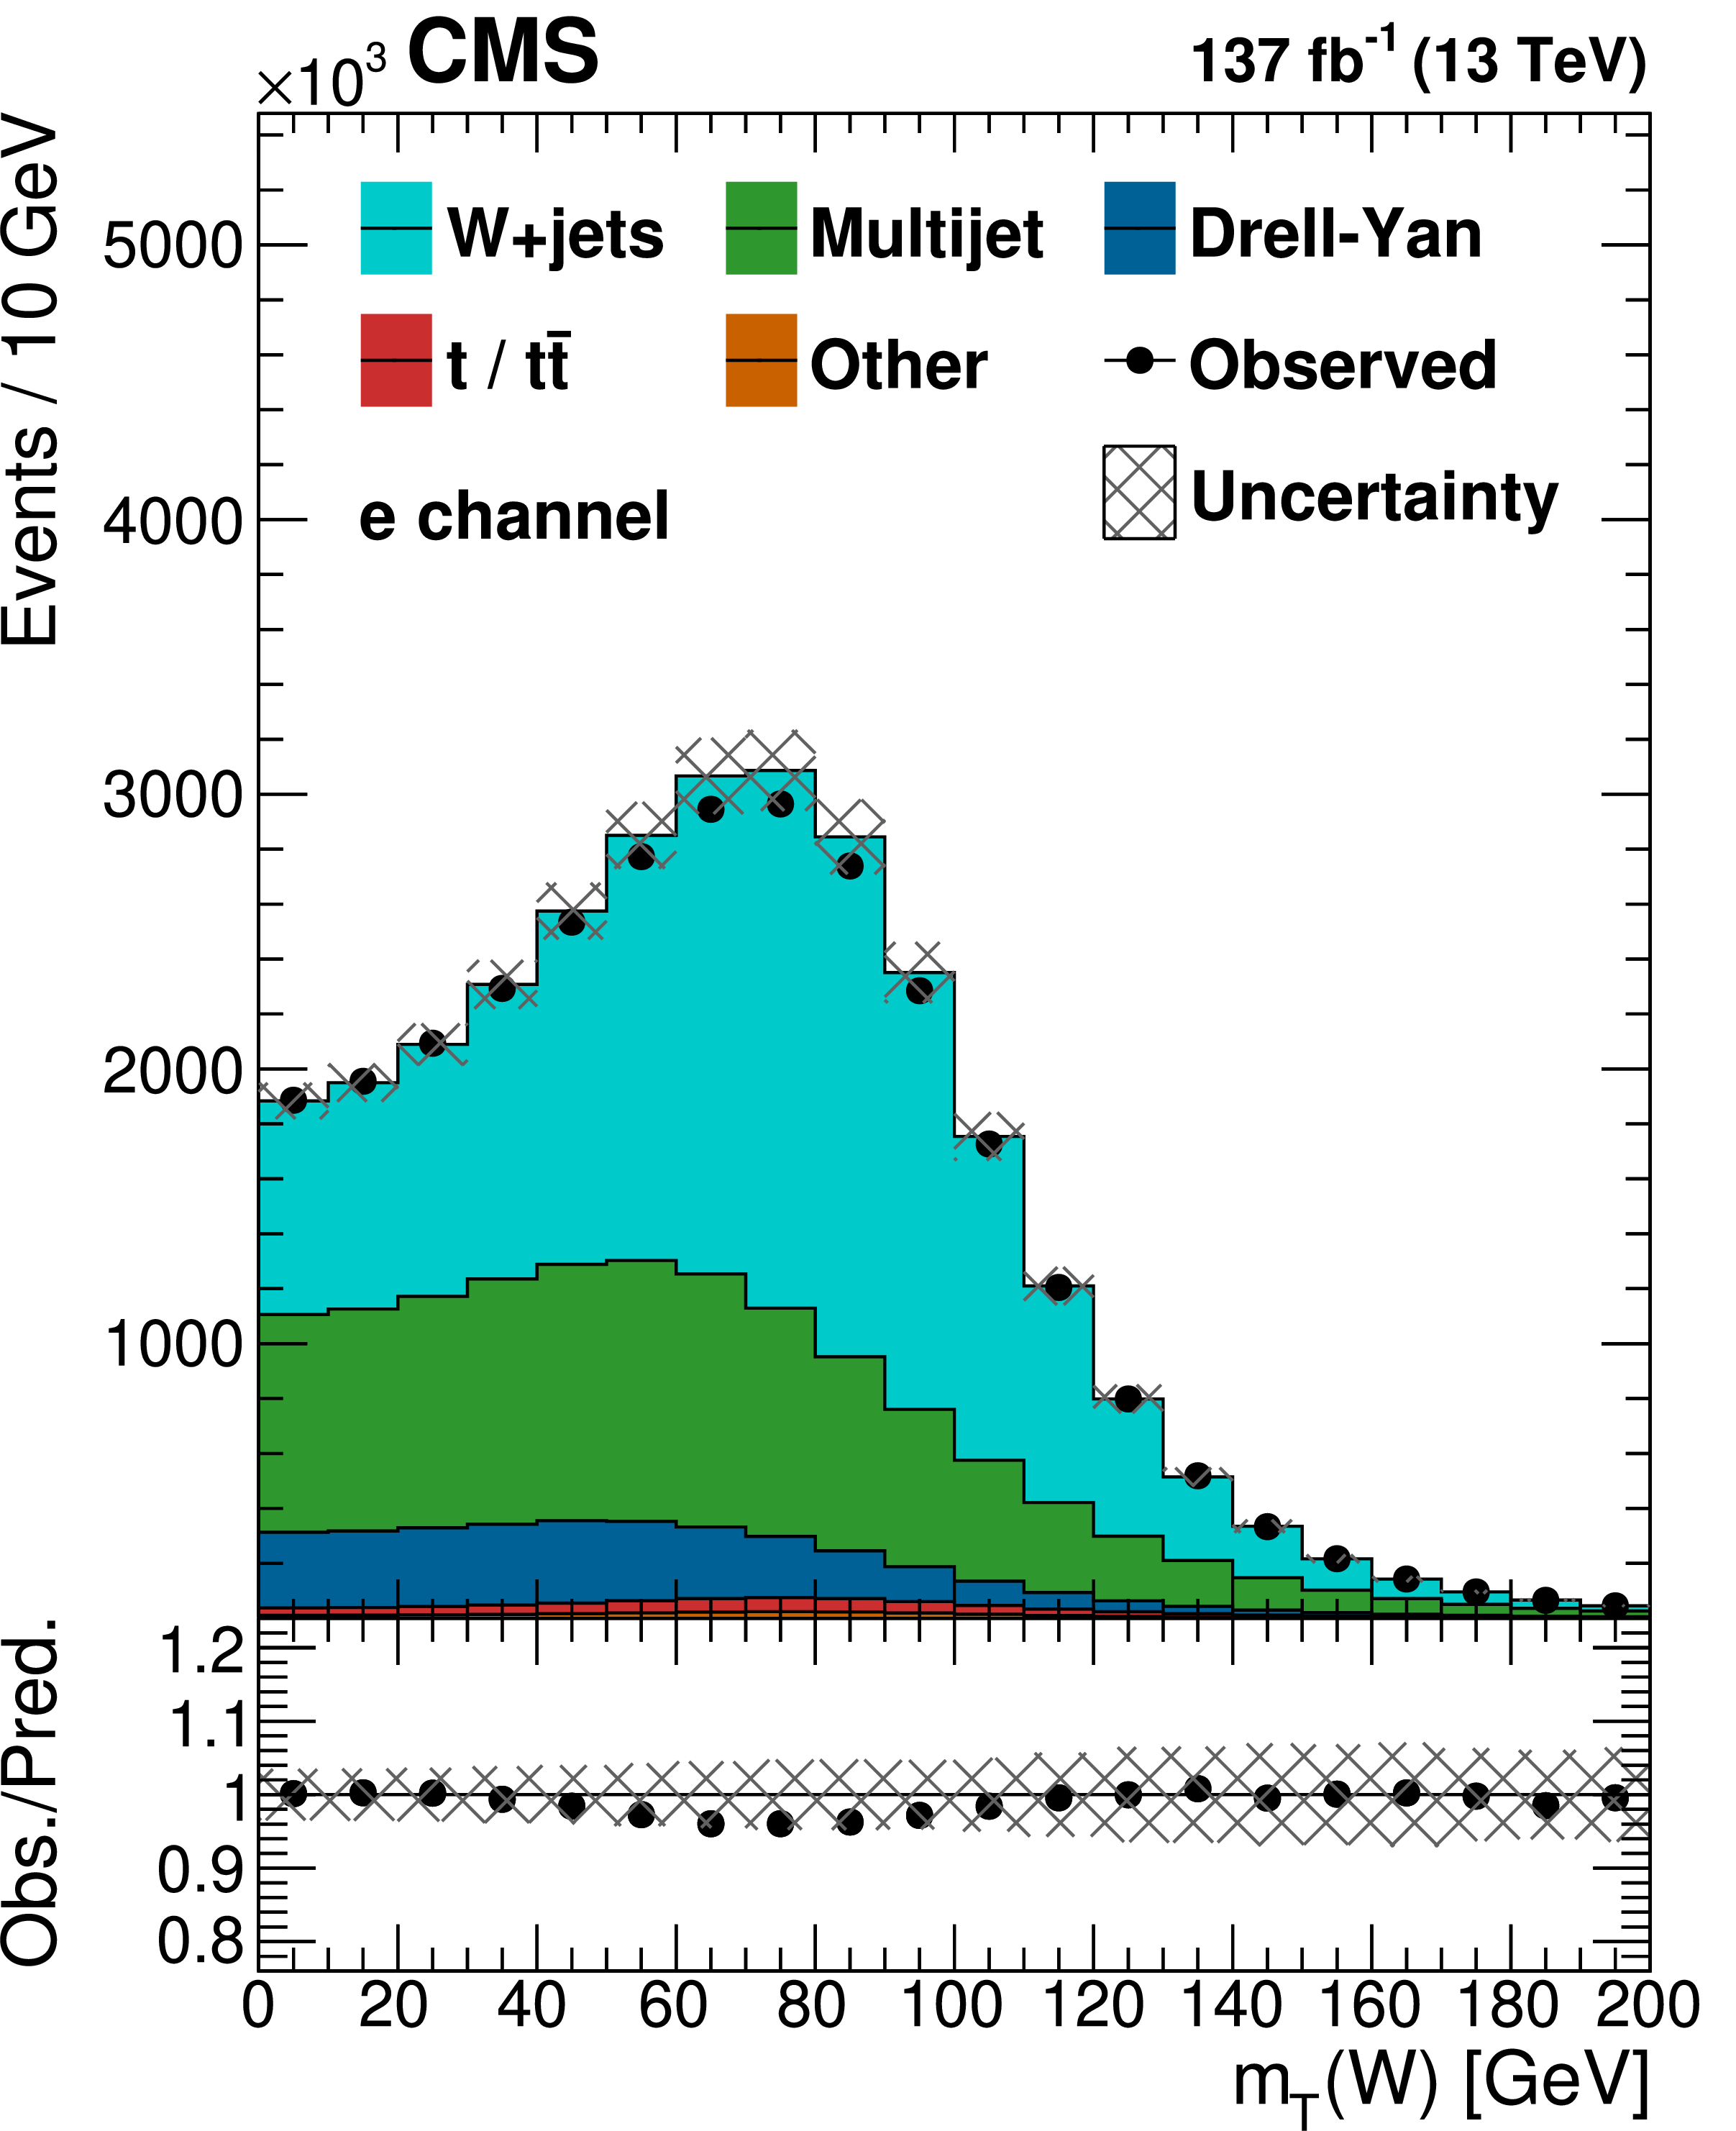
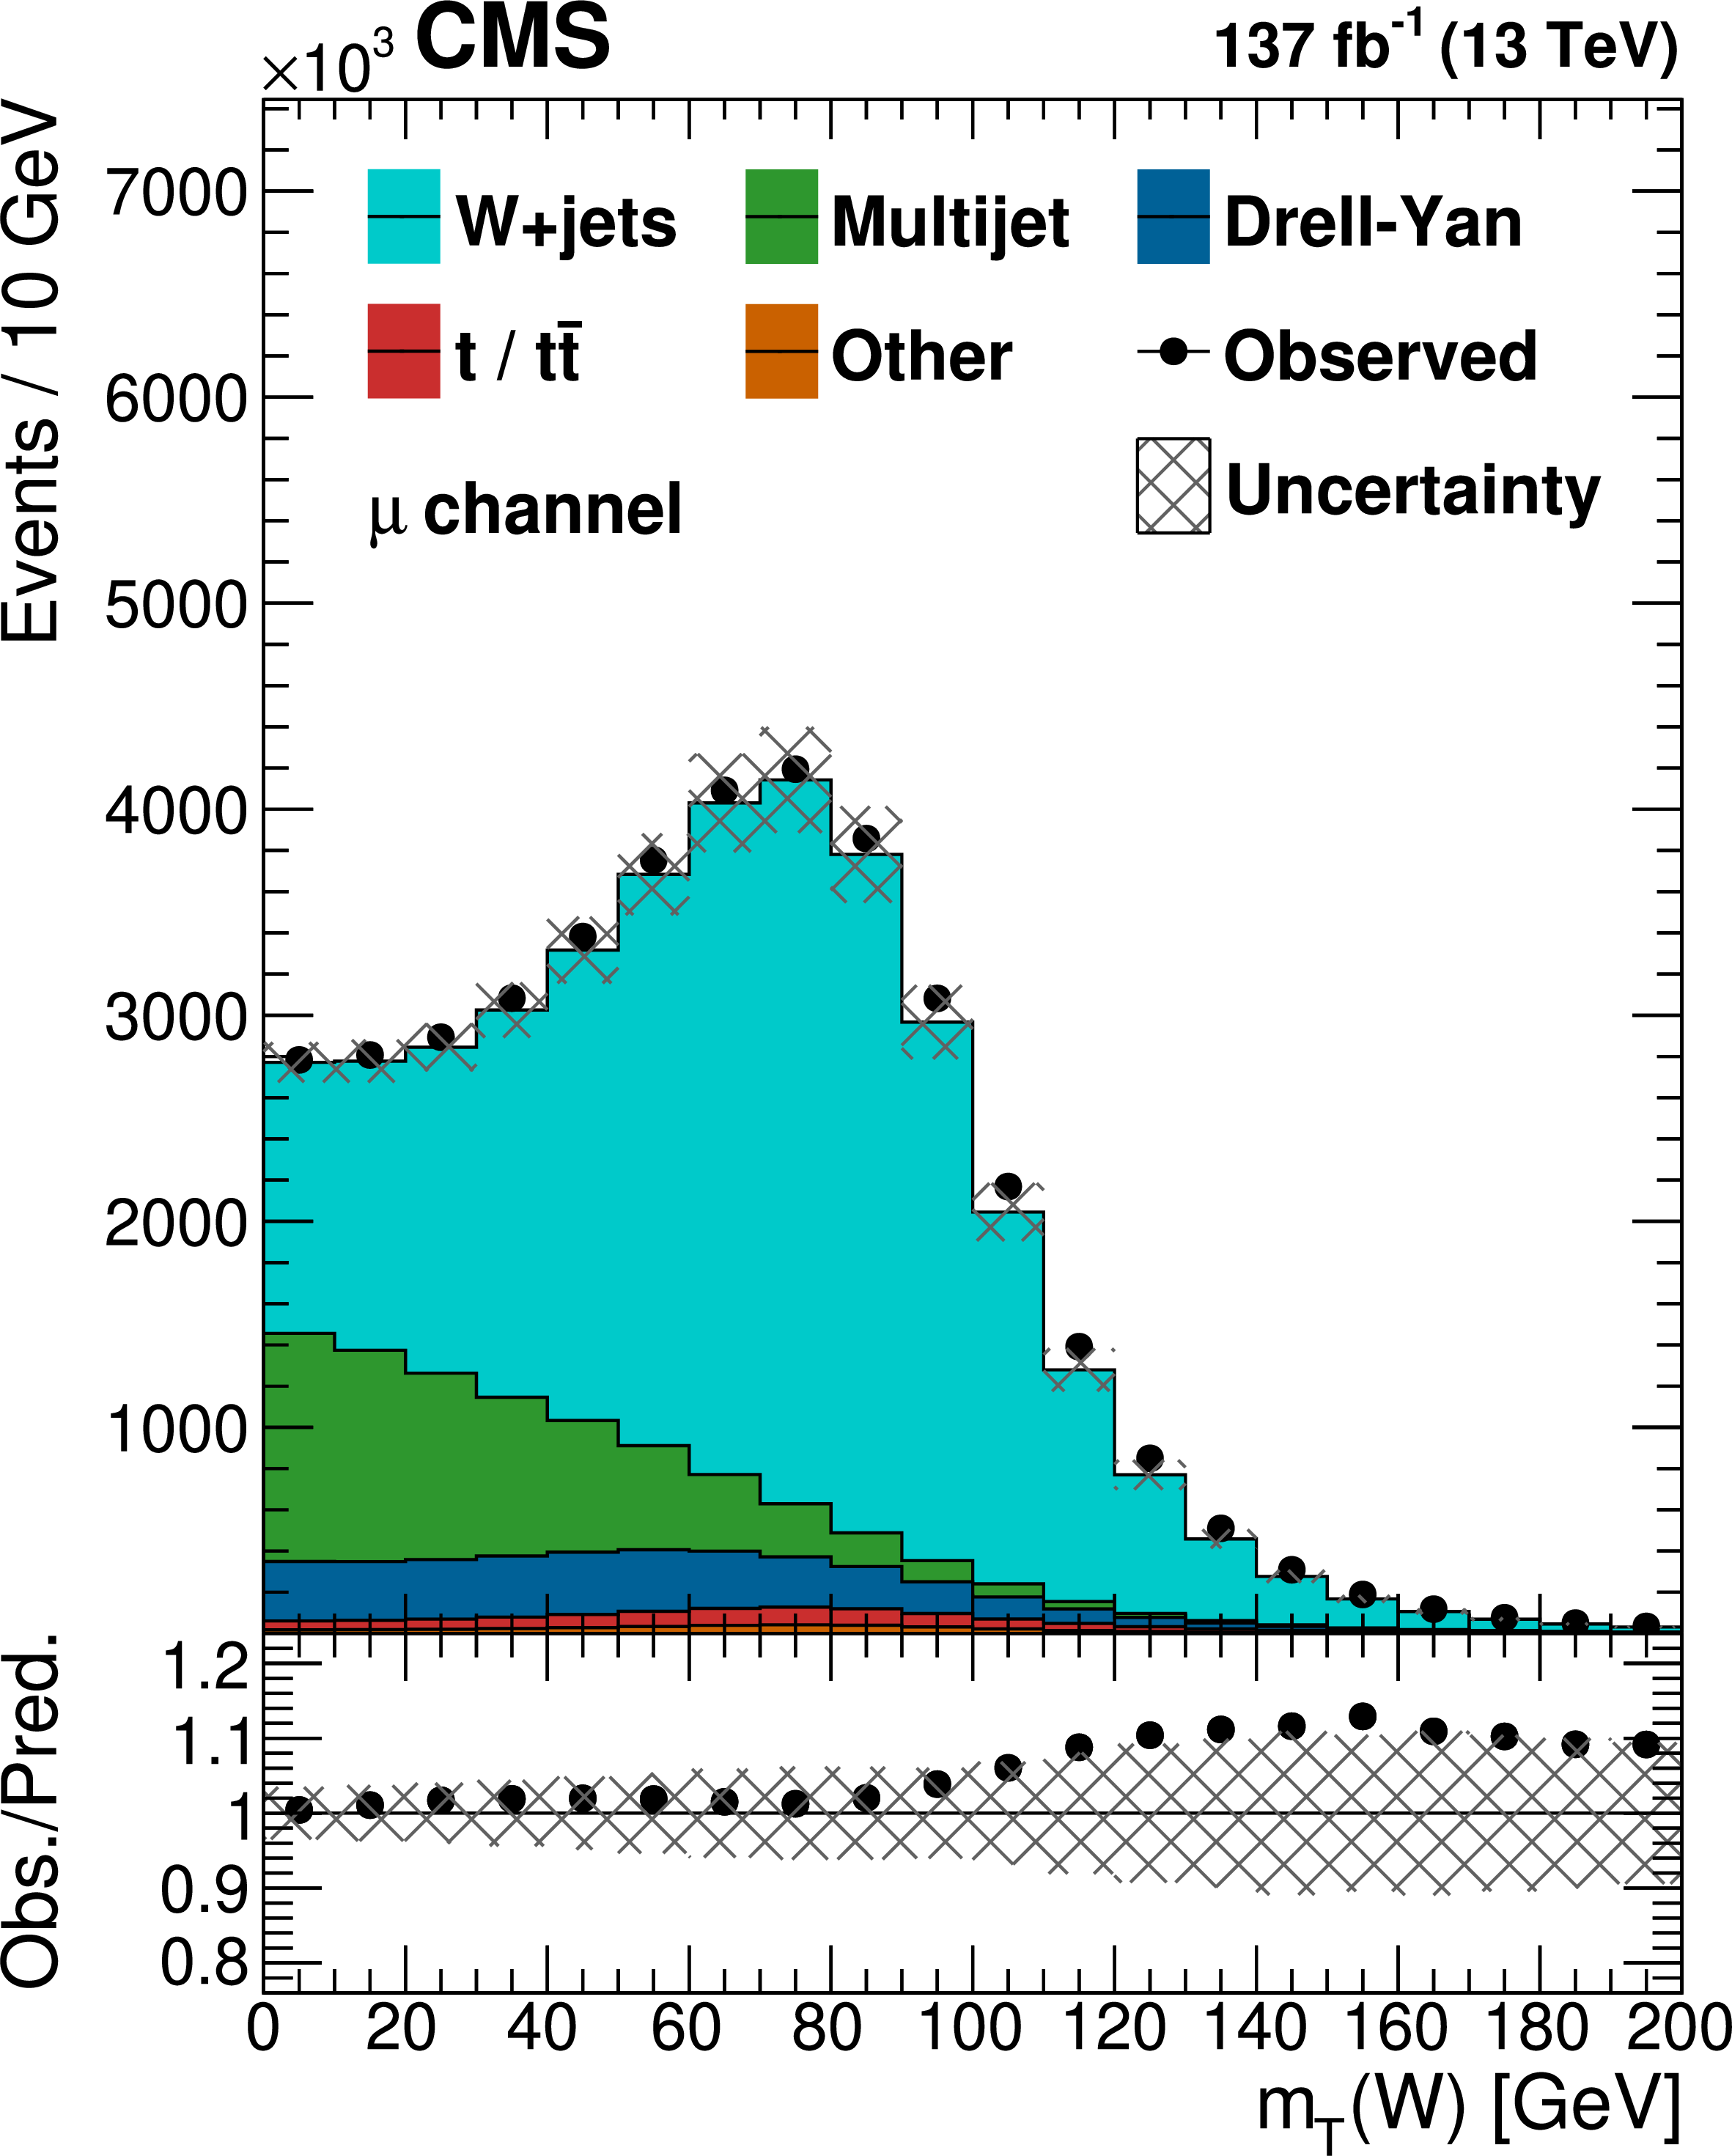
Fit result of the ${{m_{\mathrm {T}}} (\mathrm{W})}$ multijet distribution in the selection with $ {N_\text {j}} =$ 2, $ {N_\mathrm{b}} =$ 0, and tightly isolated electrons (left) and muons (right). The template obtained from the selection with loosely isolated leptons (green) and the total normalization of the electroweak background are floating in the fit. The lower panels show the ratio of the observed to the predicted event yields. The systematic uncertainties are shown as a hatched band. |
png pdf |
Figure 3-a:
Fit result of the ${{m_{\mathrm {T}}} (\mathrm{W})}$ multijet distribution in the selection with $ {N_\text {j}} =$ 2, $ {N_\mathrm{b}} =$ 0, and tightly isolated electrons. The template obtained from the selection with loosely isolated leptons (green) and the total normalization of the electroweak background are floating in the fit. The lower panel shows the ratio of the observed to the predicted event yields. The systematic uncertainties are shown as a hatched band. |
png pdf |
Figure 3-b:
Fit result of the ${{m_{\mathrm {T}}} (\mathrm{W})}$ multijet distribution in the selection with $ {N_\text {j}} =$ 2, $ {N_\mathrm{b}} =$ 0, and tightly isolated muons. The template obtained from the selection with loosely isolated leptons (green) and the total normalization of the electroweak background are floating in the fit. The lower panel shows the ratio of the observed to the predicted event yields. The systematic uncertainties are shown as a hatched band. |

png pdf |
Figure 4:
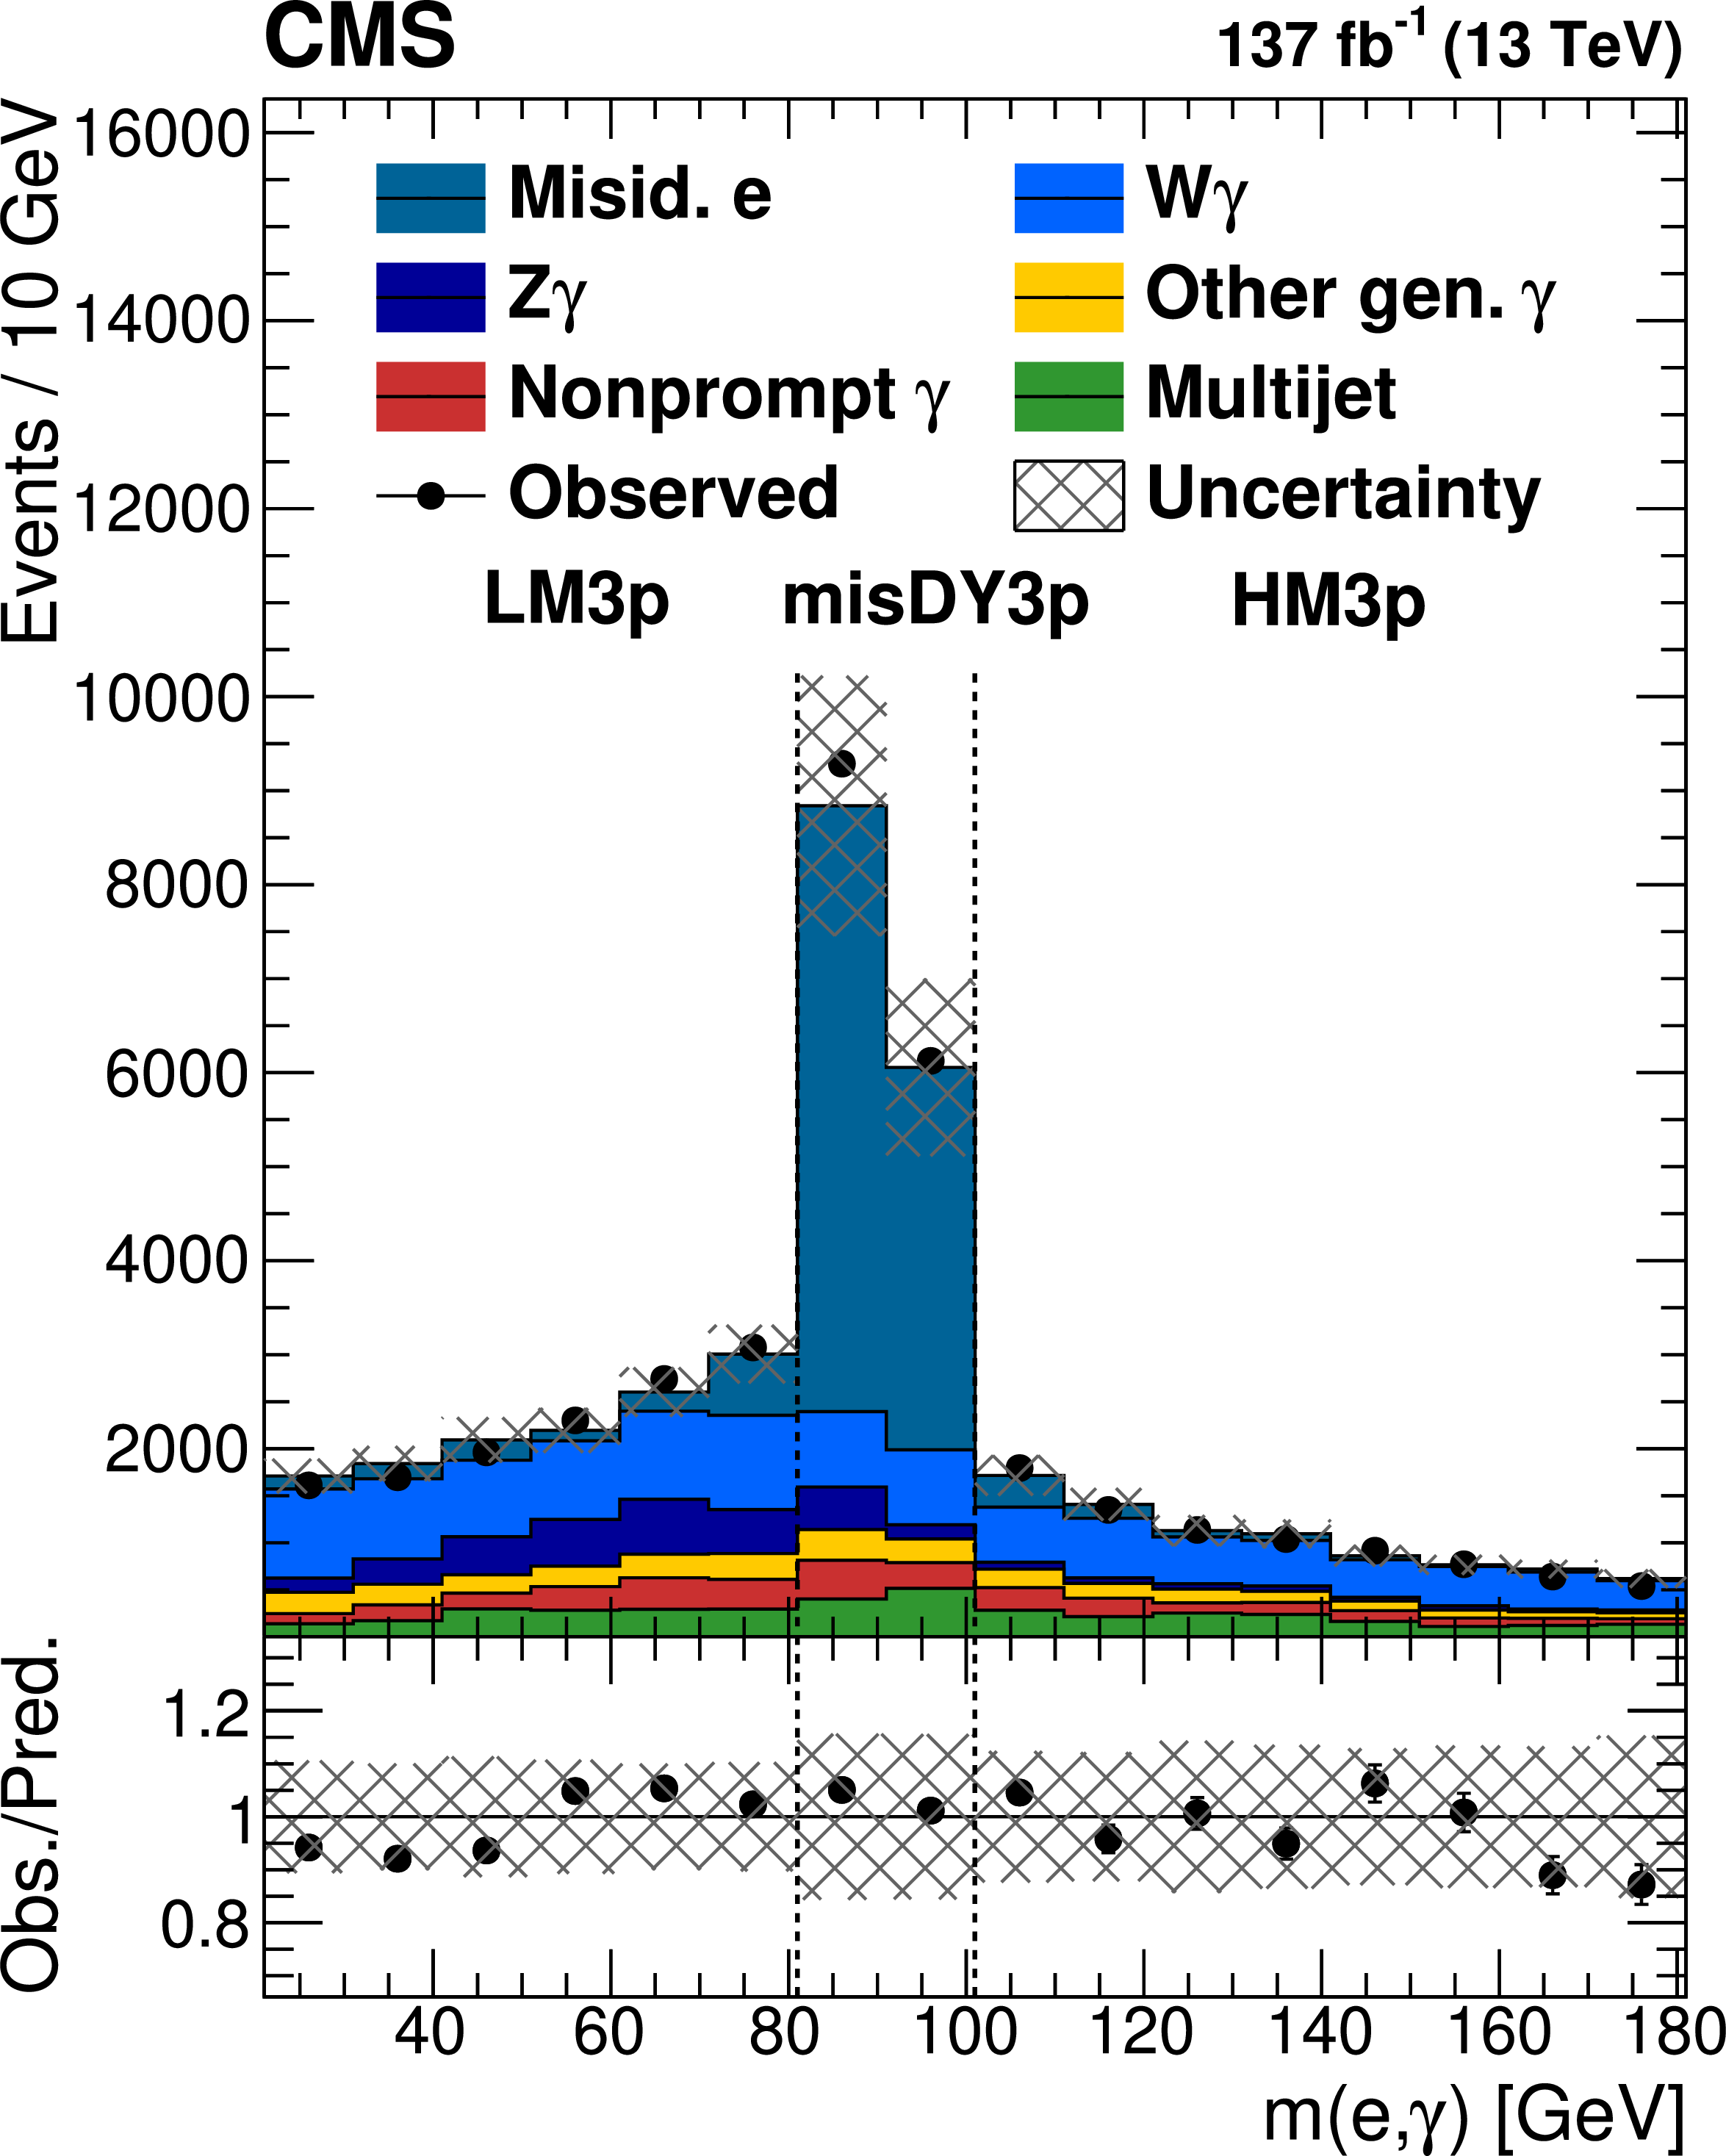
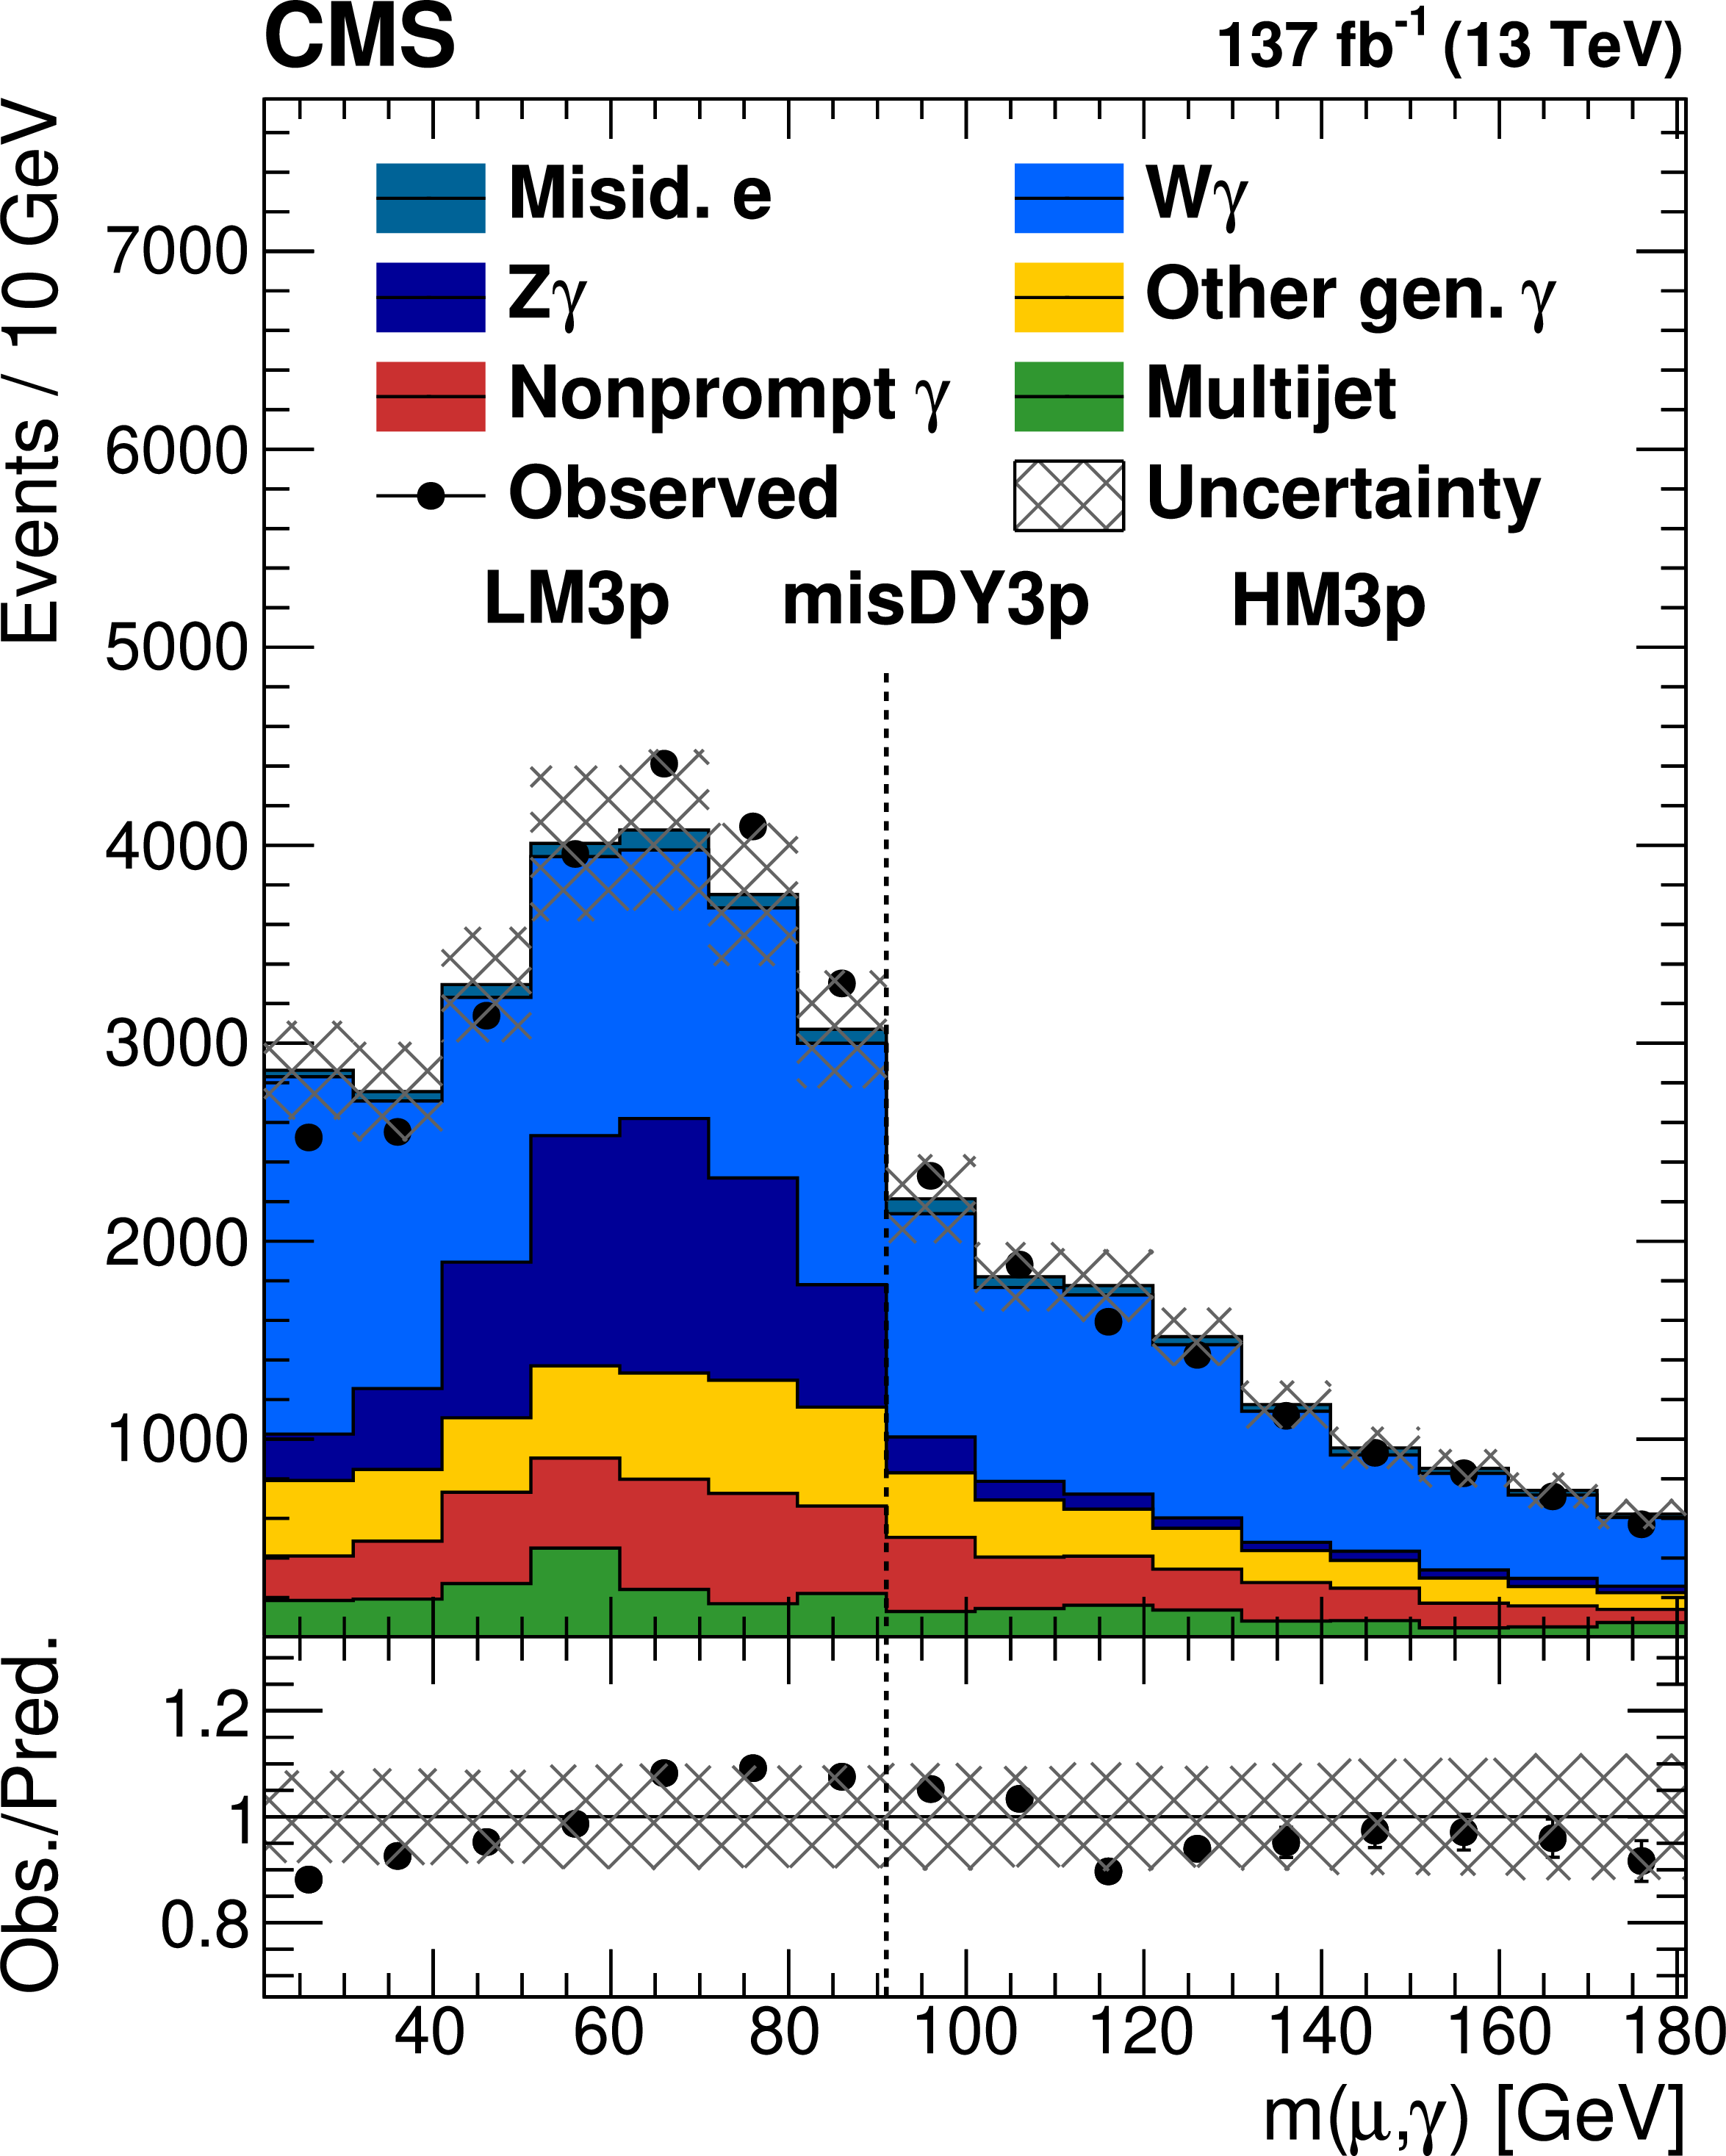
Distribution of the invariant mass of the lepton and the photon, ${m(\ell,\gamma)}$, in the ${N_\text {j}} \geq $ 3, ${N_\mathrm{b}} =$ 0 selection for the e channel (left) and the $\mu$ channel (right). The genuine photon contributions of W$\gamma$ and Z$\gamma$ are visualized separately. The lower panels show the ratio of the observed to the predicted event yields. The systematic uncertainties are shown as a hatched band. |
png pdf |
Figure 4-a:
Distribution of the invariant mass of the lepton and the photon, ${m(\ell,\gamma)}$, in the ${N_\text {j}} \geq $ 3, ${N_\mathrm{b}} =$ 0 selection for the e channel. The genuine photon contributions of W$\gamma$ and Z$\gamma$ are visualized separately. The lower panels show the ratio of the observed to the predicted event yields. The systematic uncertainties are shown as a hatched band. |
png pdf |
Figure 4-b:
Distribution of the invariant mass of the lepton and the photon, ${m(\ell,\gamma)}$, in the ${N_\text {j}} \geq $ 3, ${N_\mathrm{b}} =$ 0 selection for the $\mu$ channel. The genuine photon contributions of W$\gamma$ and Z$\gamma$ are visualized separately. The lower panels show the ratio of the observed to the predicted event yields. The systematic uncertainties are shown as a hatched band. |
png pdf |
Figure 5:
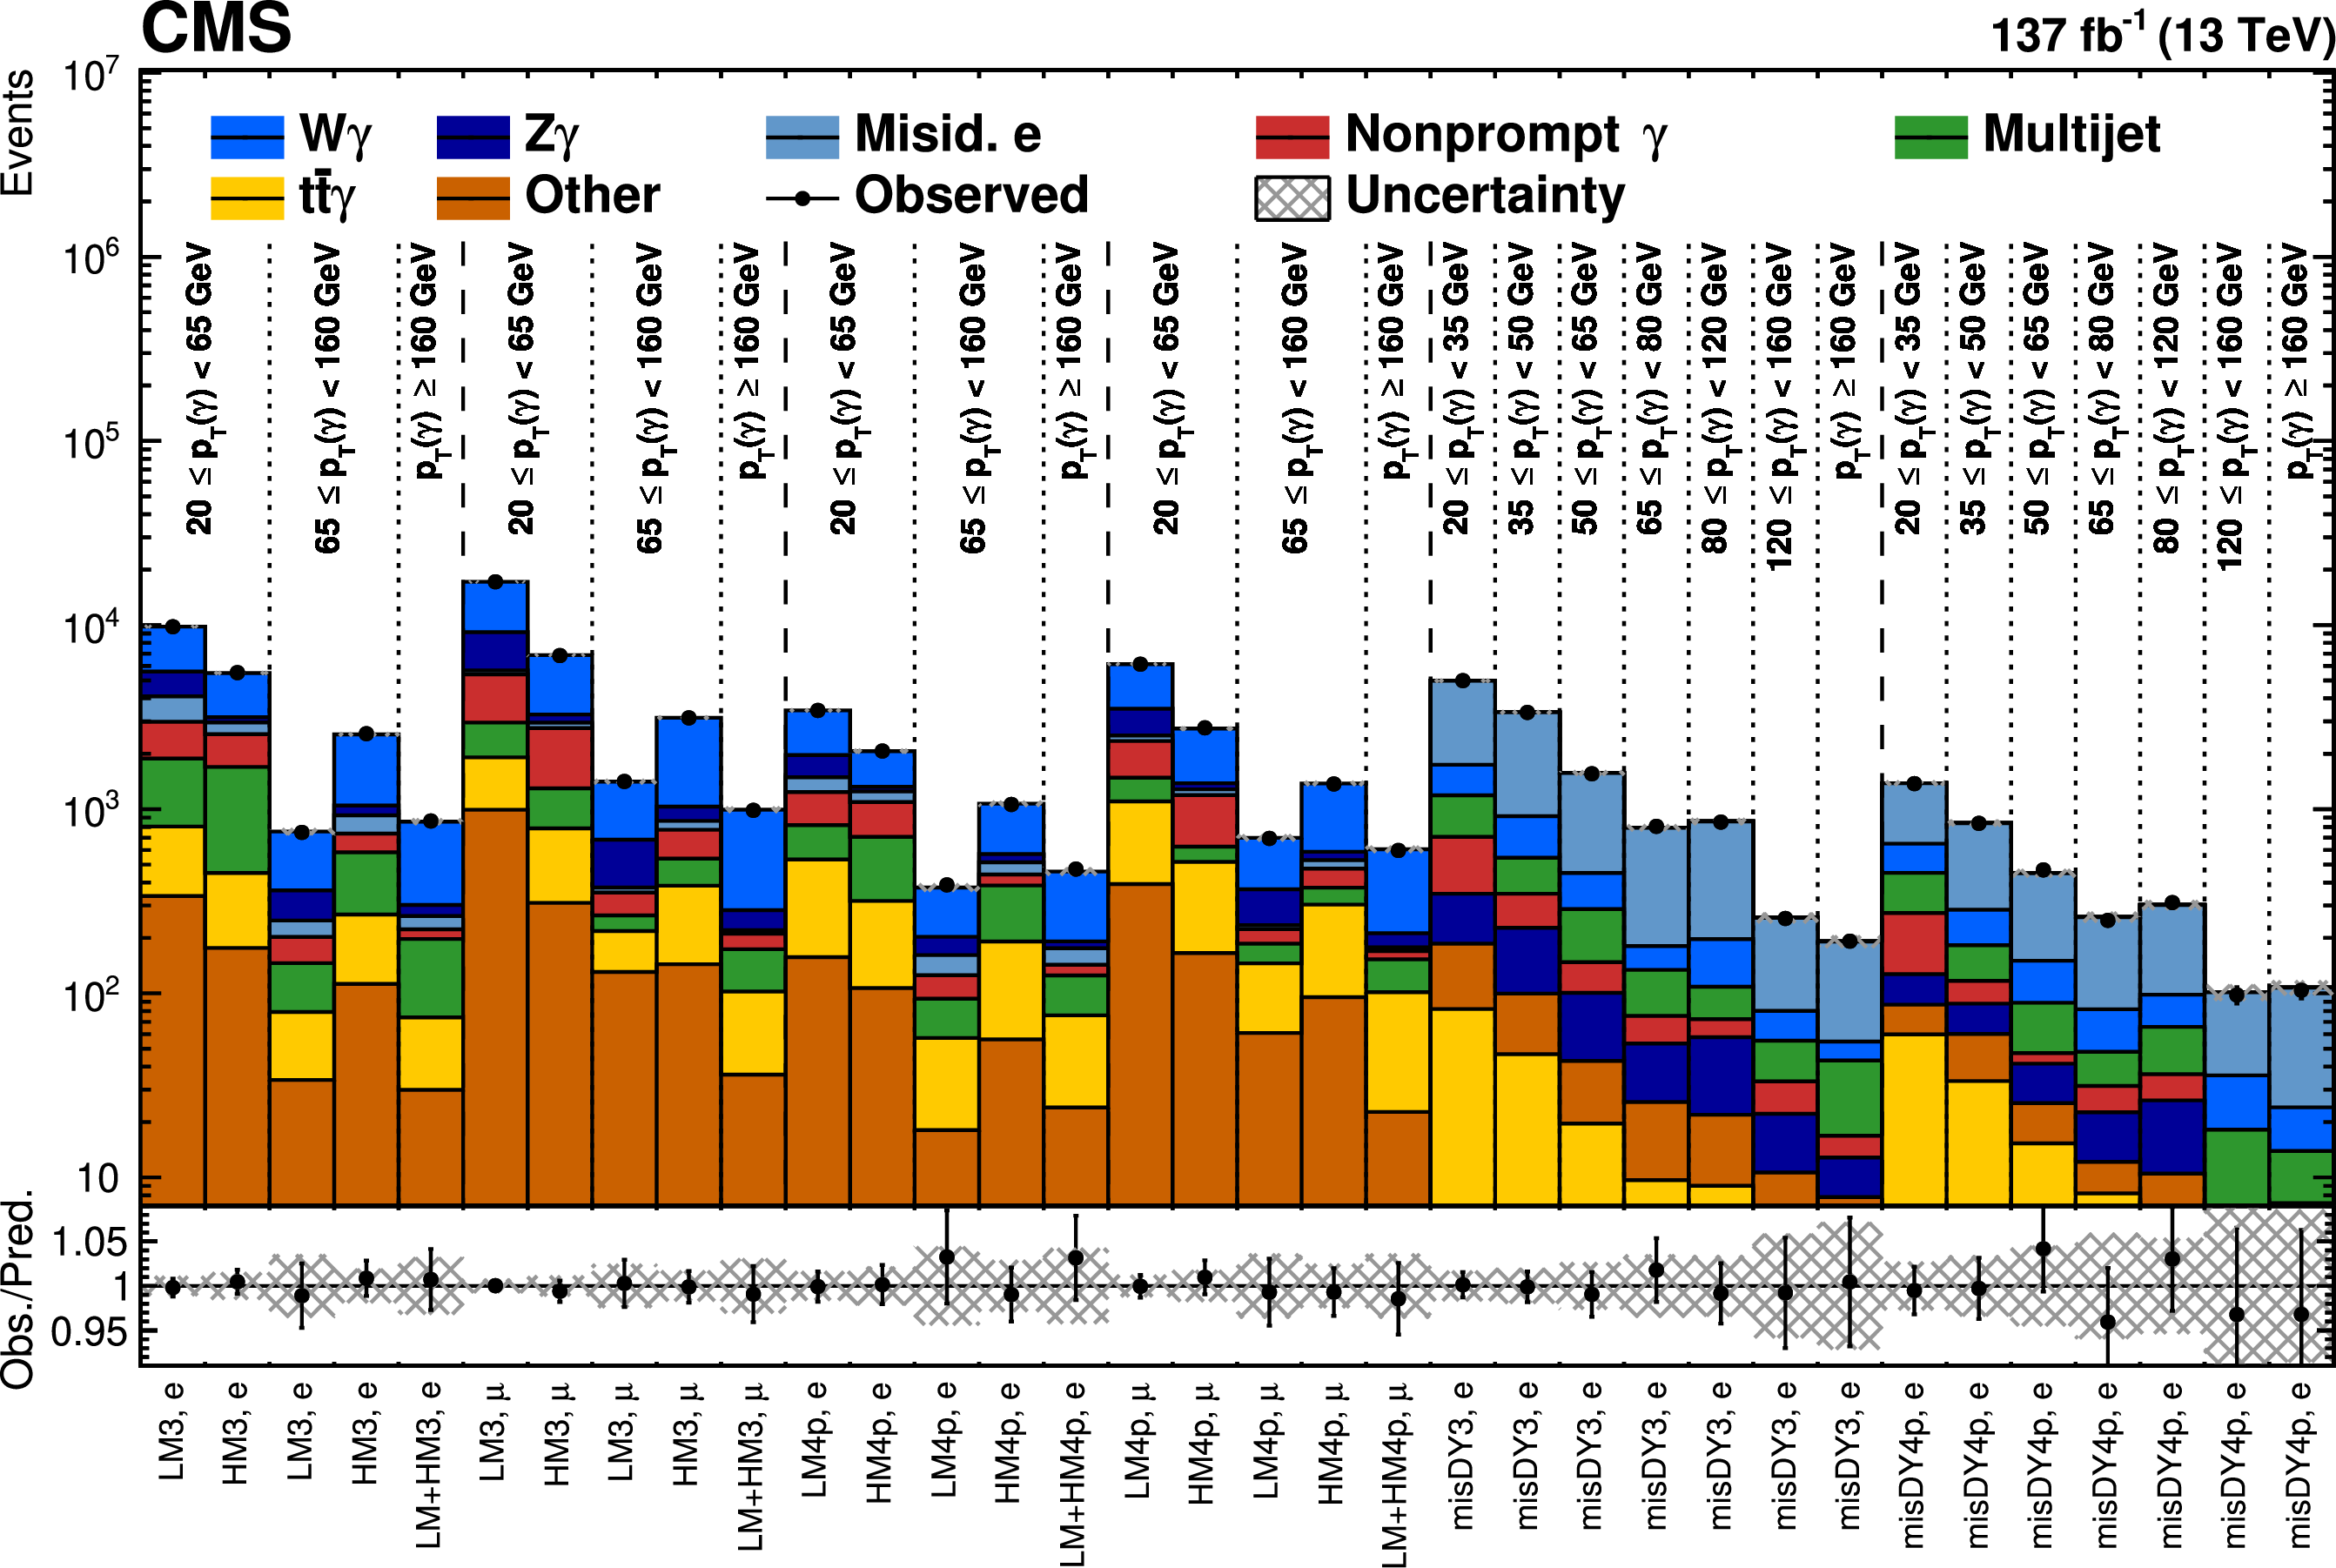
Fitted and observed yields in the LM3, LM4p, HM3, HM4p, misDY3, and misDY4p control regions using the post-fit values of the nuisance parameters. The lower panel shows the ratio of the observed to the predicted event yields. The hatched band shows the systematic uncertainty in the background prediction. |
png pdf |
Figure 6:
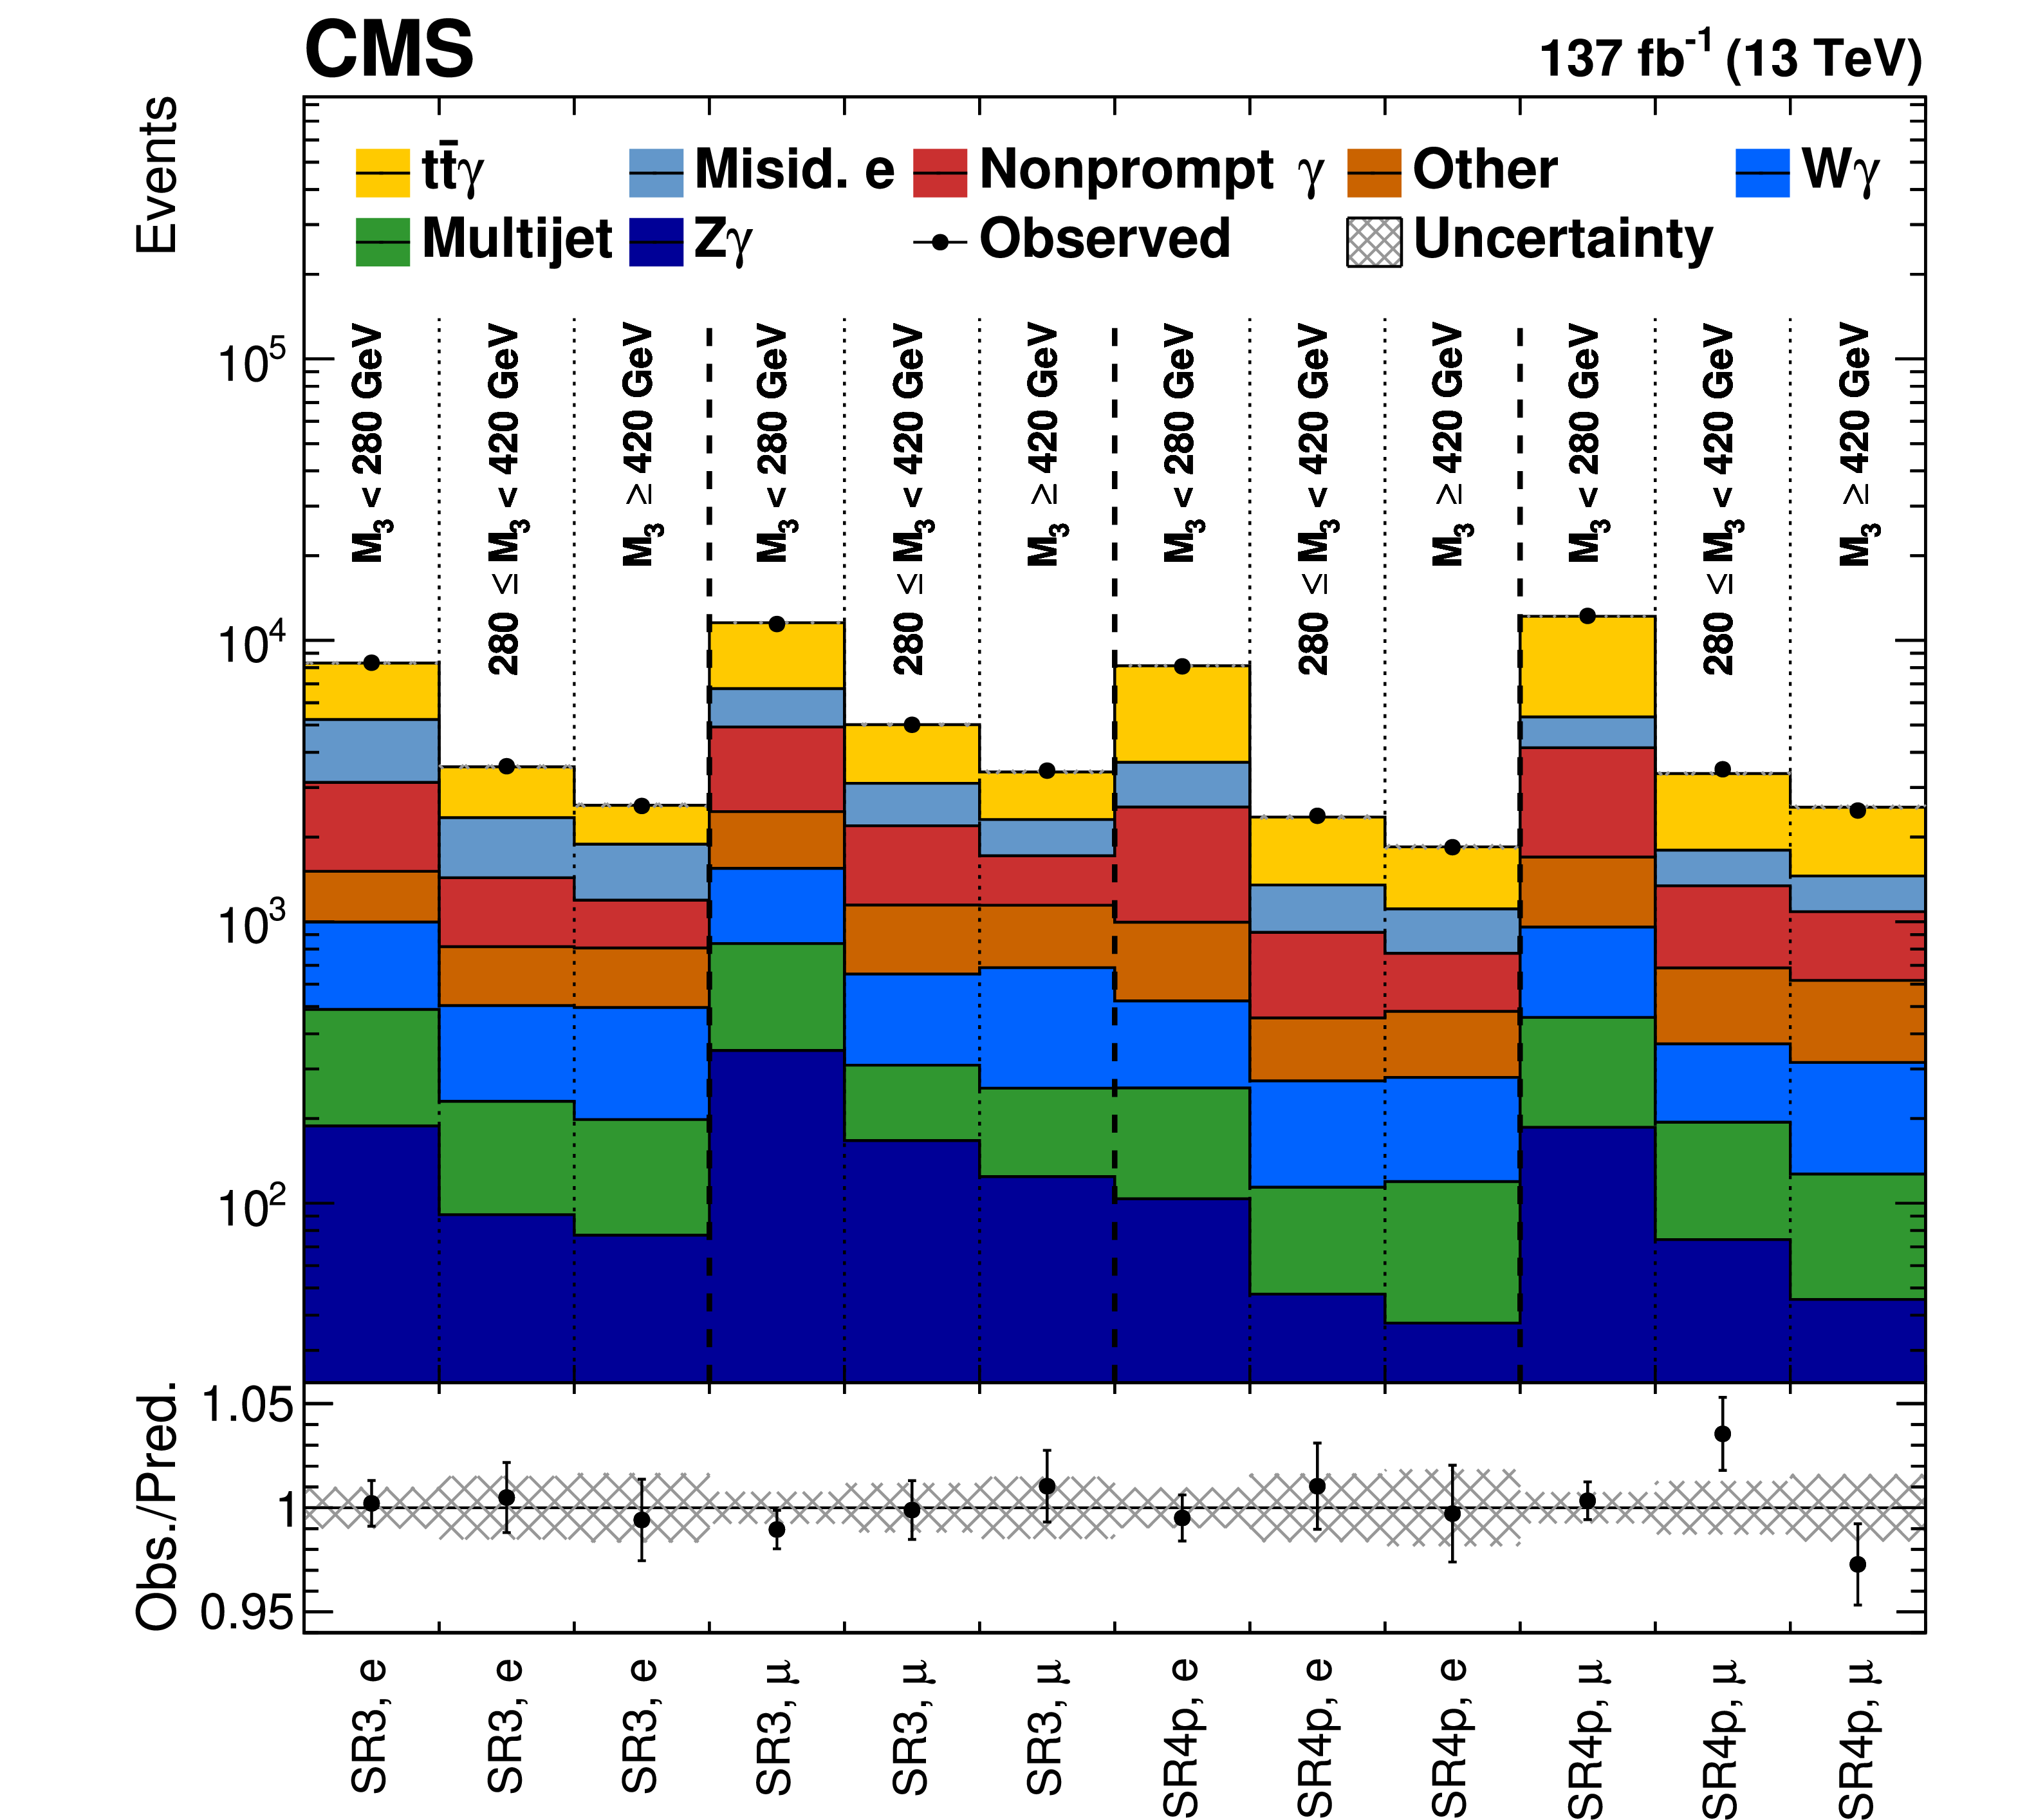
Fitted and observed yields in the SR3 and SR4p signal regions using the post-fit values of the nuisance parameters. The lower panel shows the ratio of the observed to the predicted event yields. The systematic uncertainties are shown as a hatched band. |
png pdf |
Figure 7 :
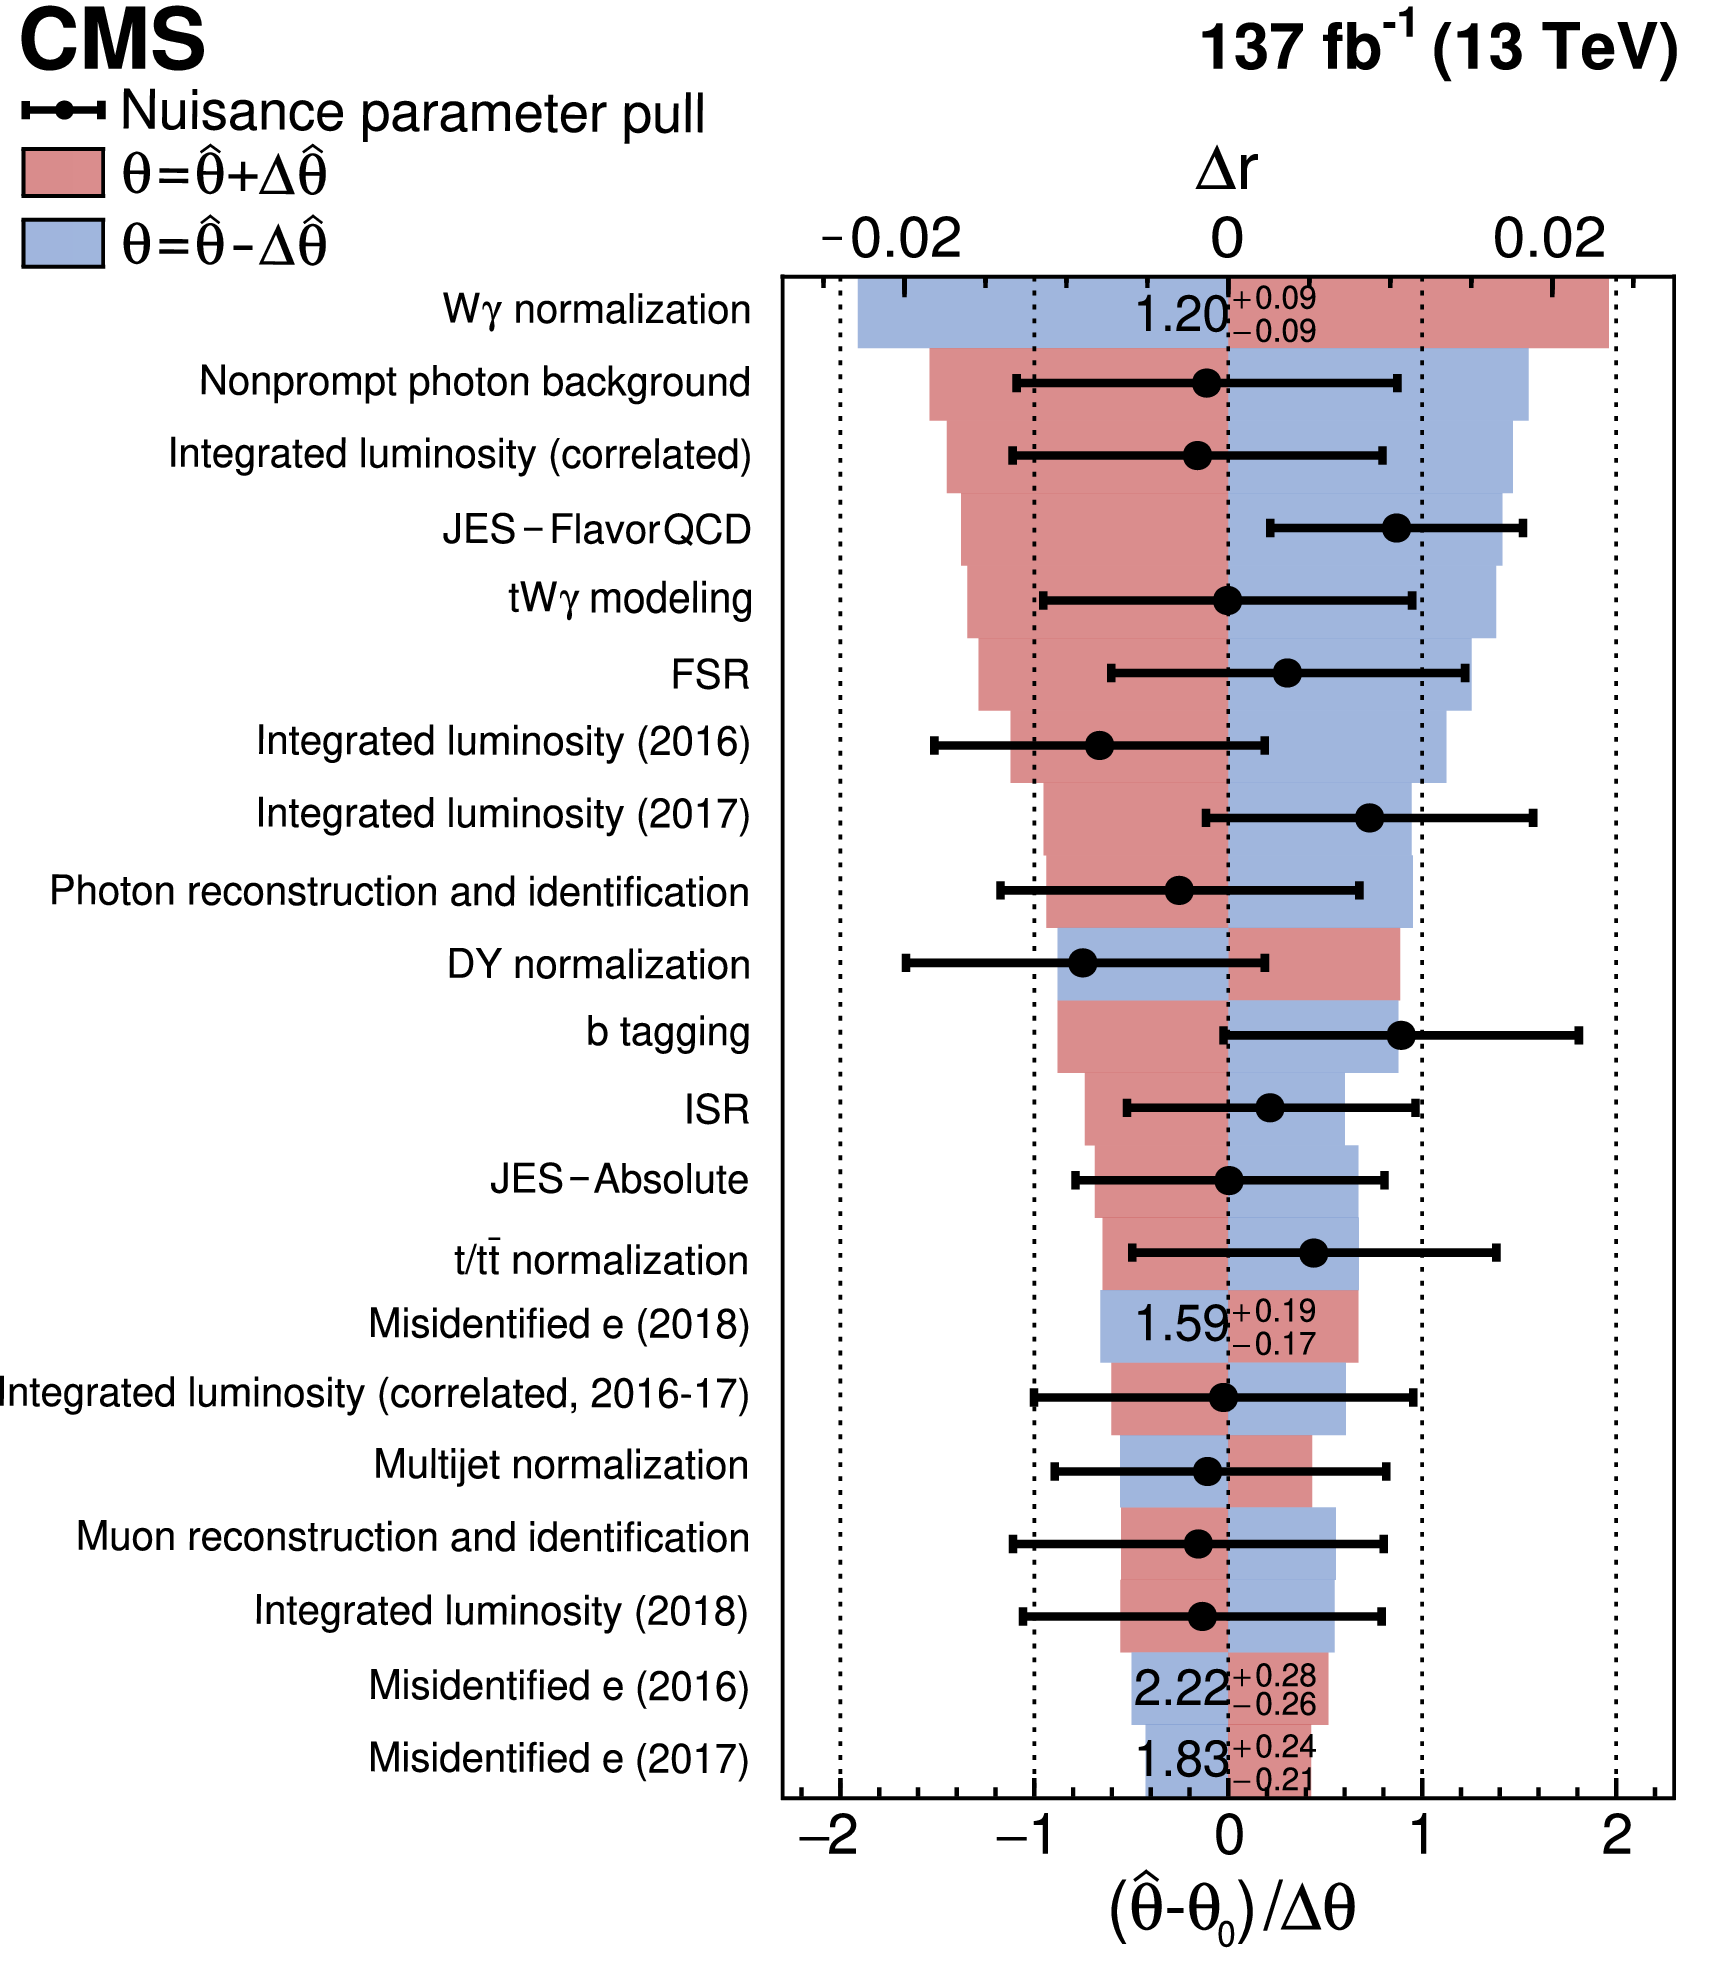
Ranking of the systematic uncertainties from the profile likelihood fit used in the inclusive cross section measurement. For each uncertainty, the red and blue bands indicate the post-fit impact on the fit result. The black dots indicate the post-fit values of the nuisance parameters and the numerical values provide the extracted SFs for the misidentified electron background and the normalization of the W$\gamma$ process. The black lines represent the post-fit uncertainties normalized to the pre-fit uncertainties (constraints). |
png pdf |
Figure 8:
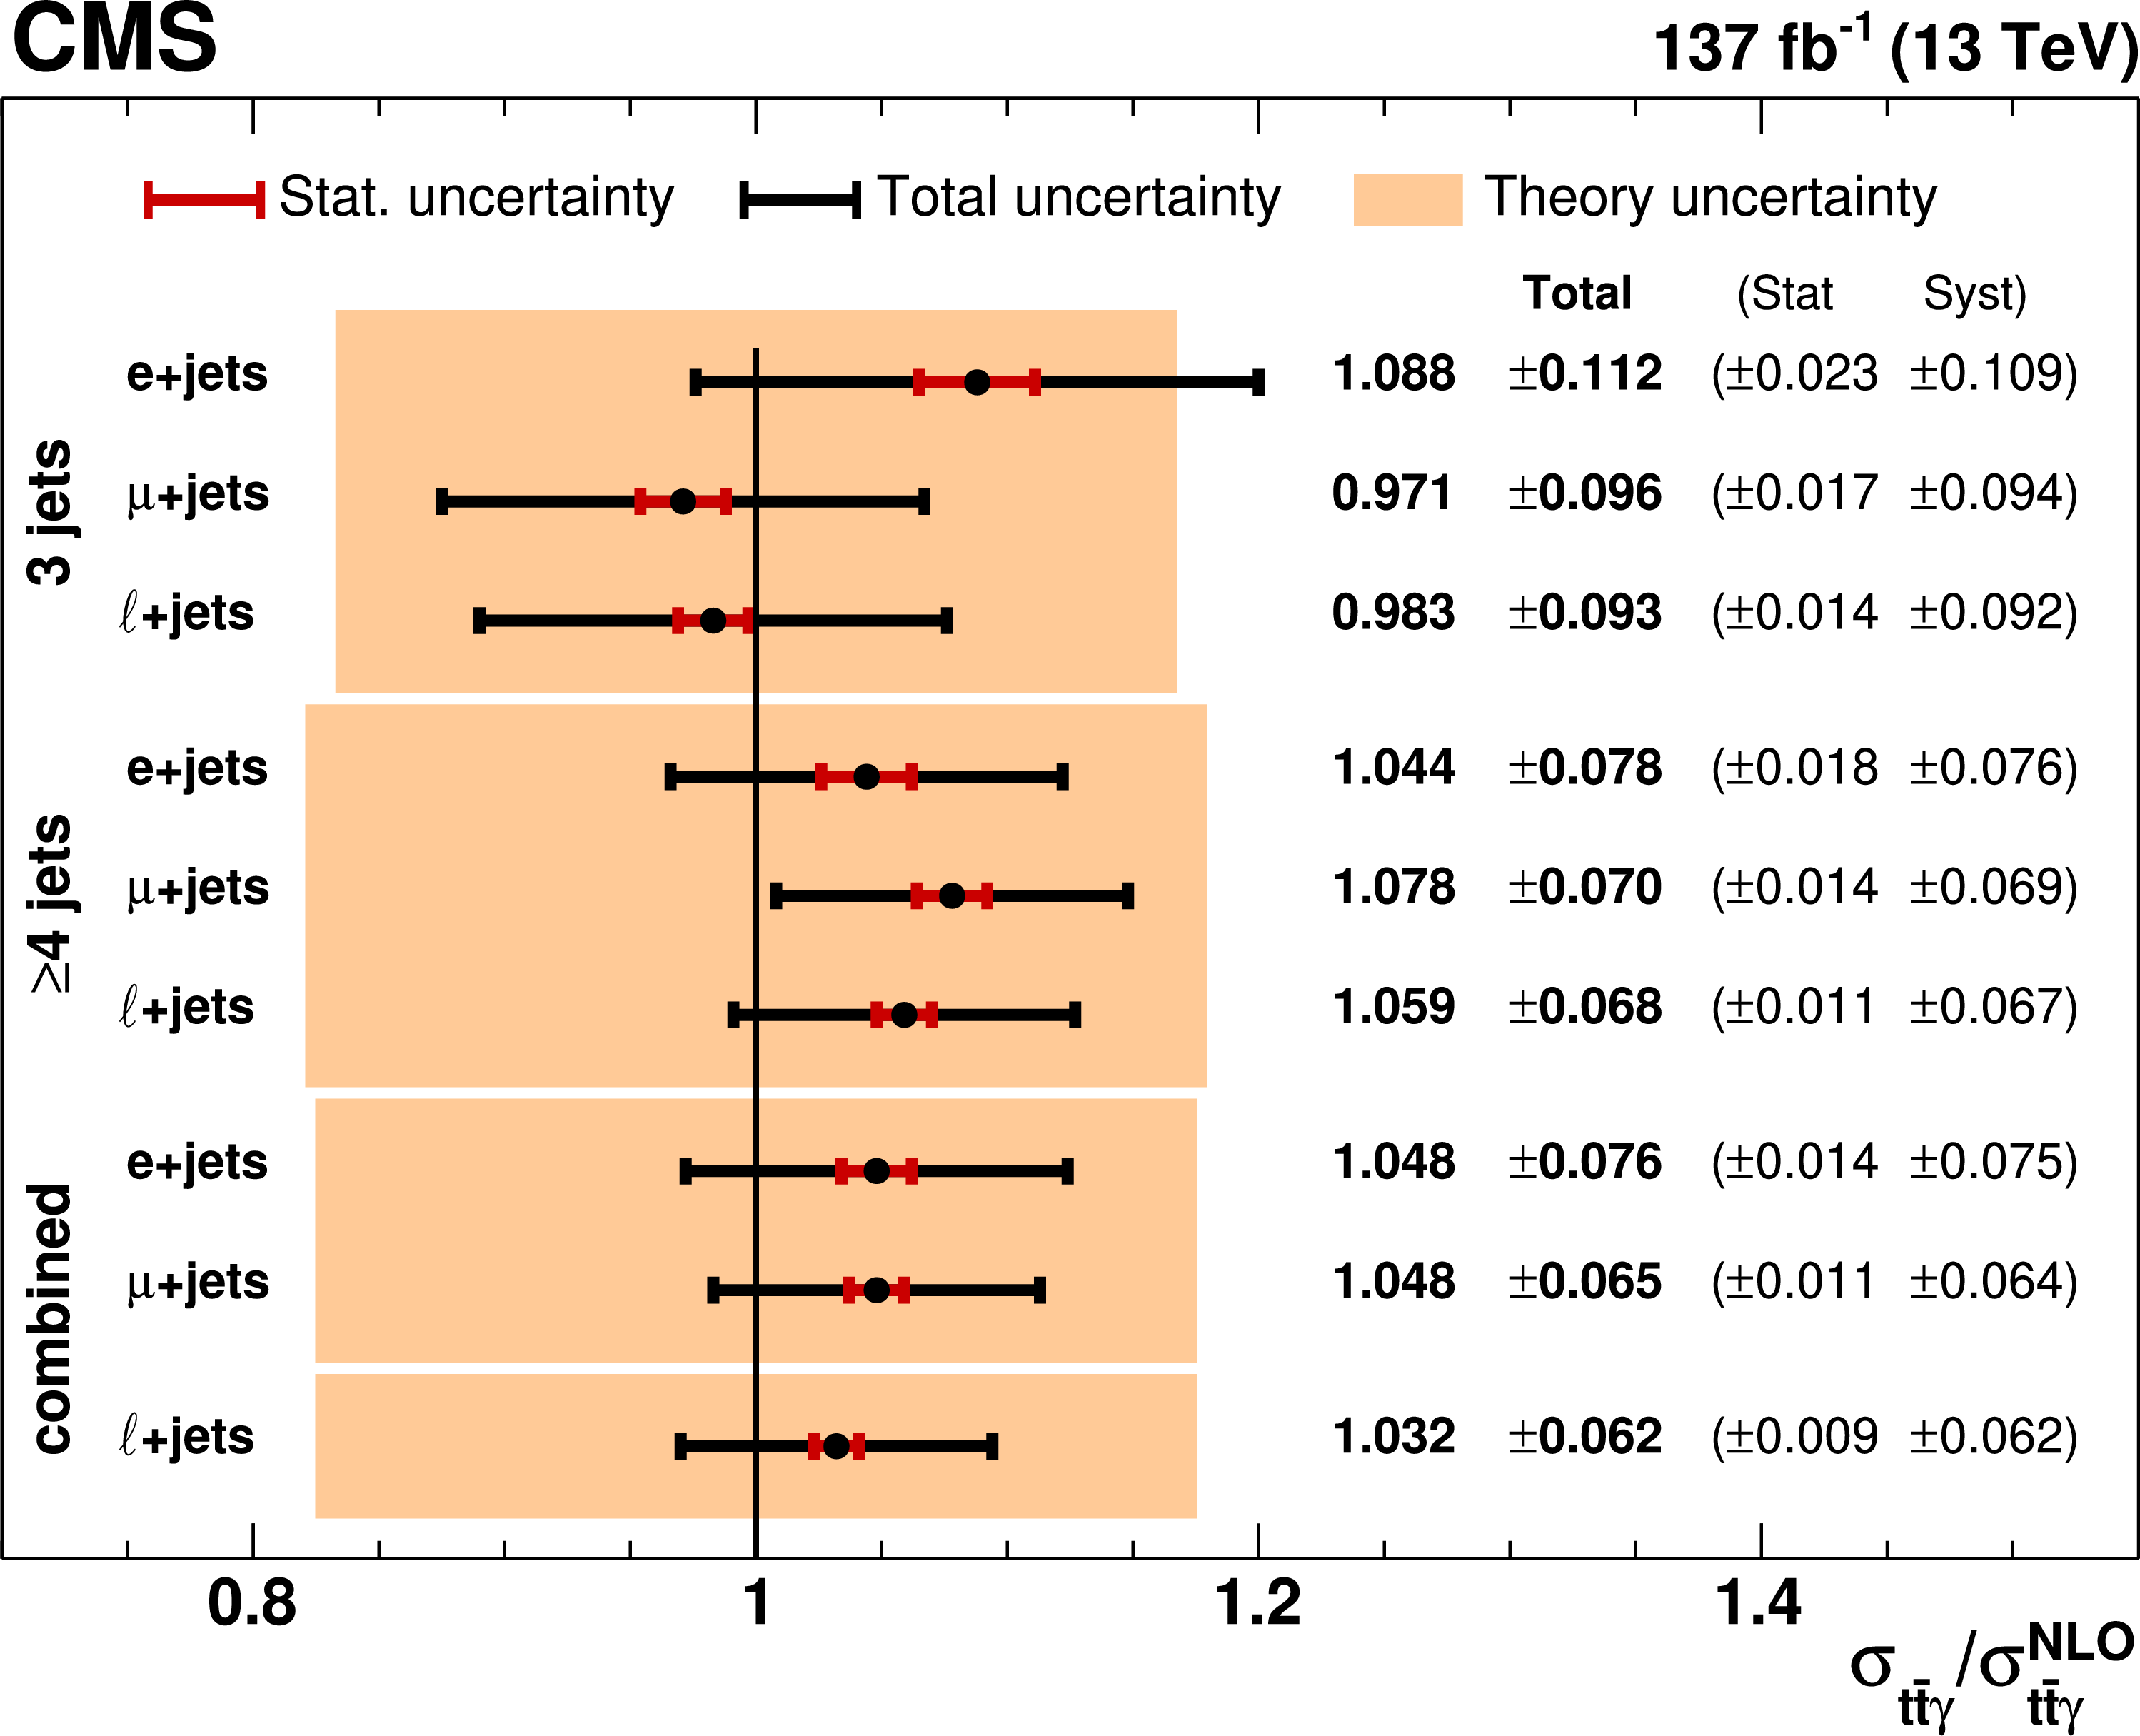
Summary of the measured cross section ratios with respect to the NLO cross section prediction for $ {N_\text {j}} =$ 3, $\geq $4, and combined signal regions in the electron channel, muon channel, and the combined single-lepton channel. The orange band indicates the theory uncertainty in the prediction. |
png pdf |
Figure 9:
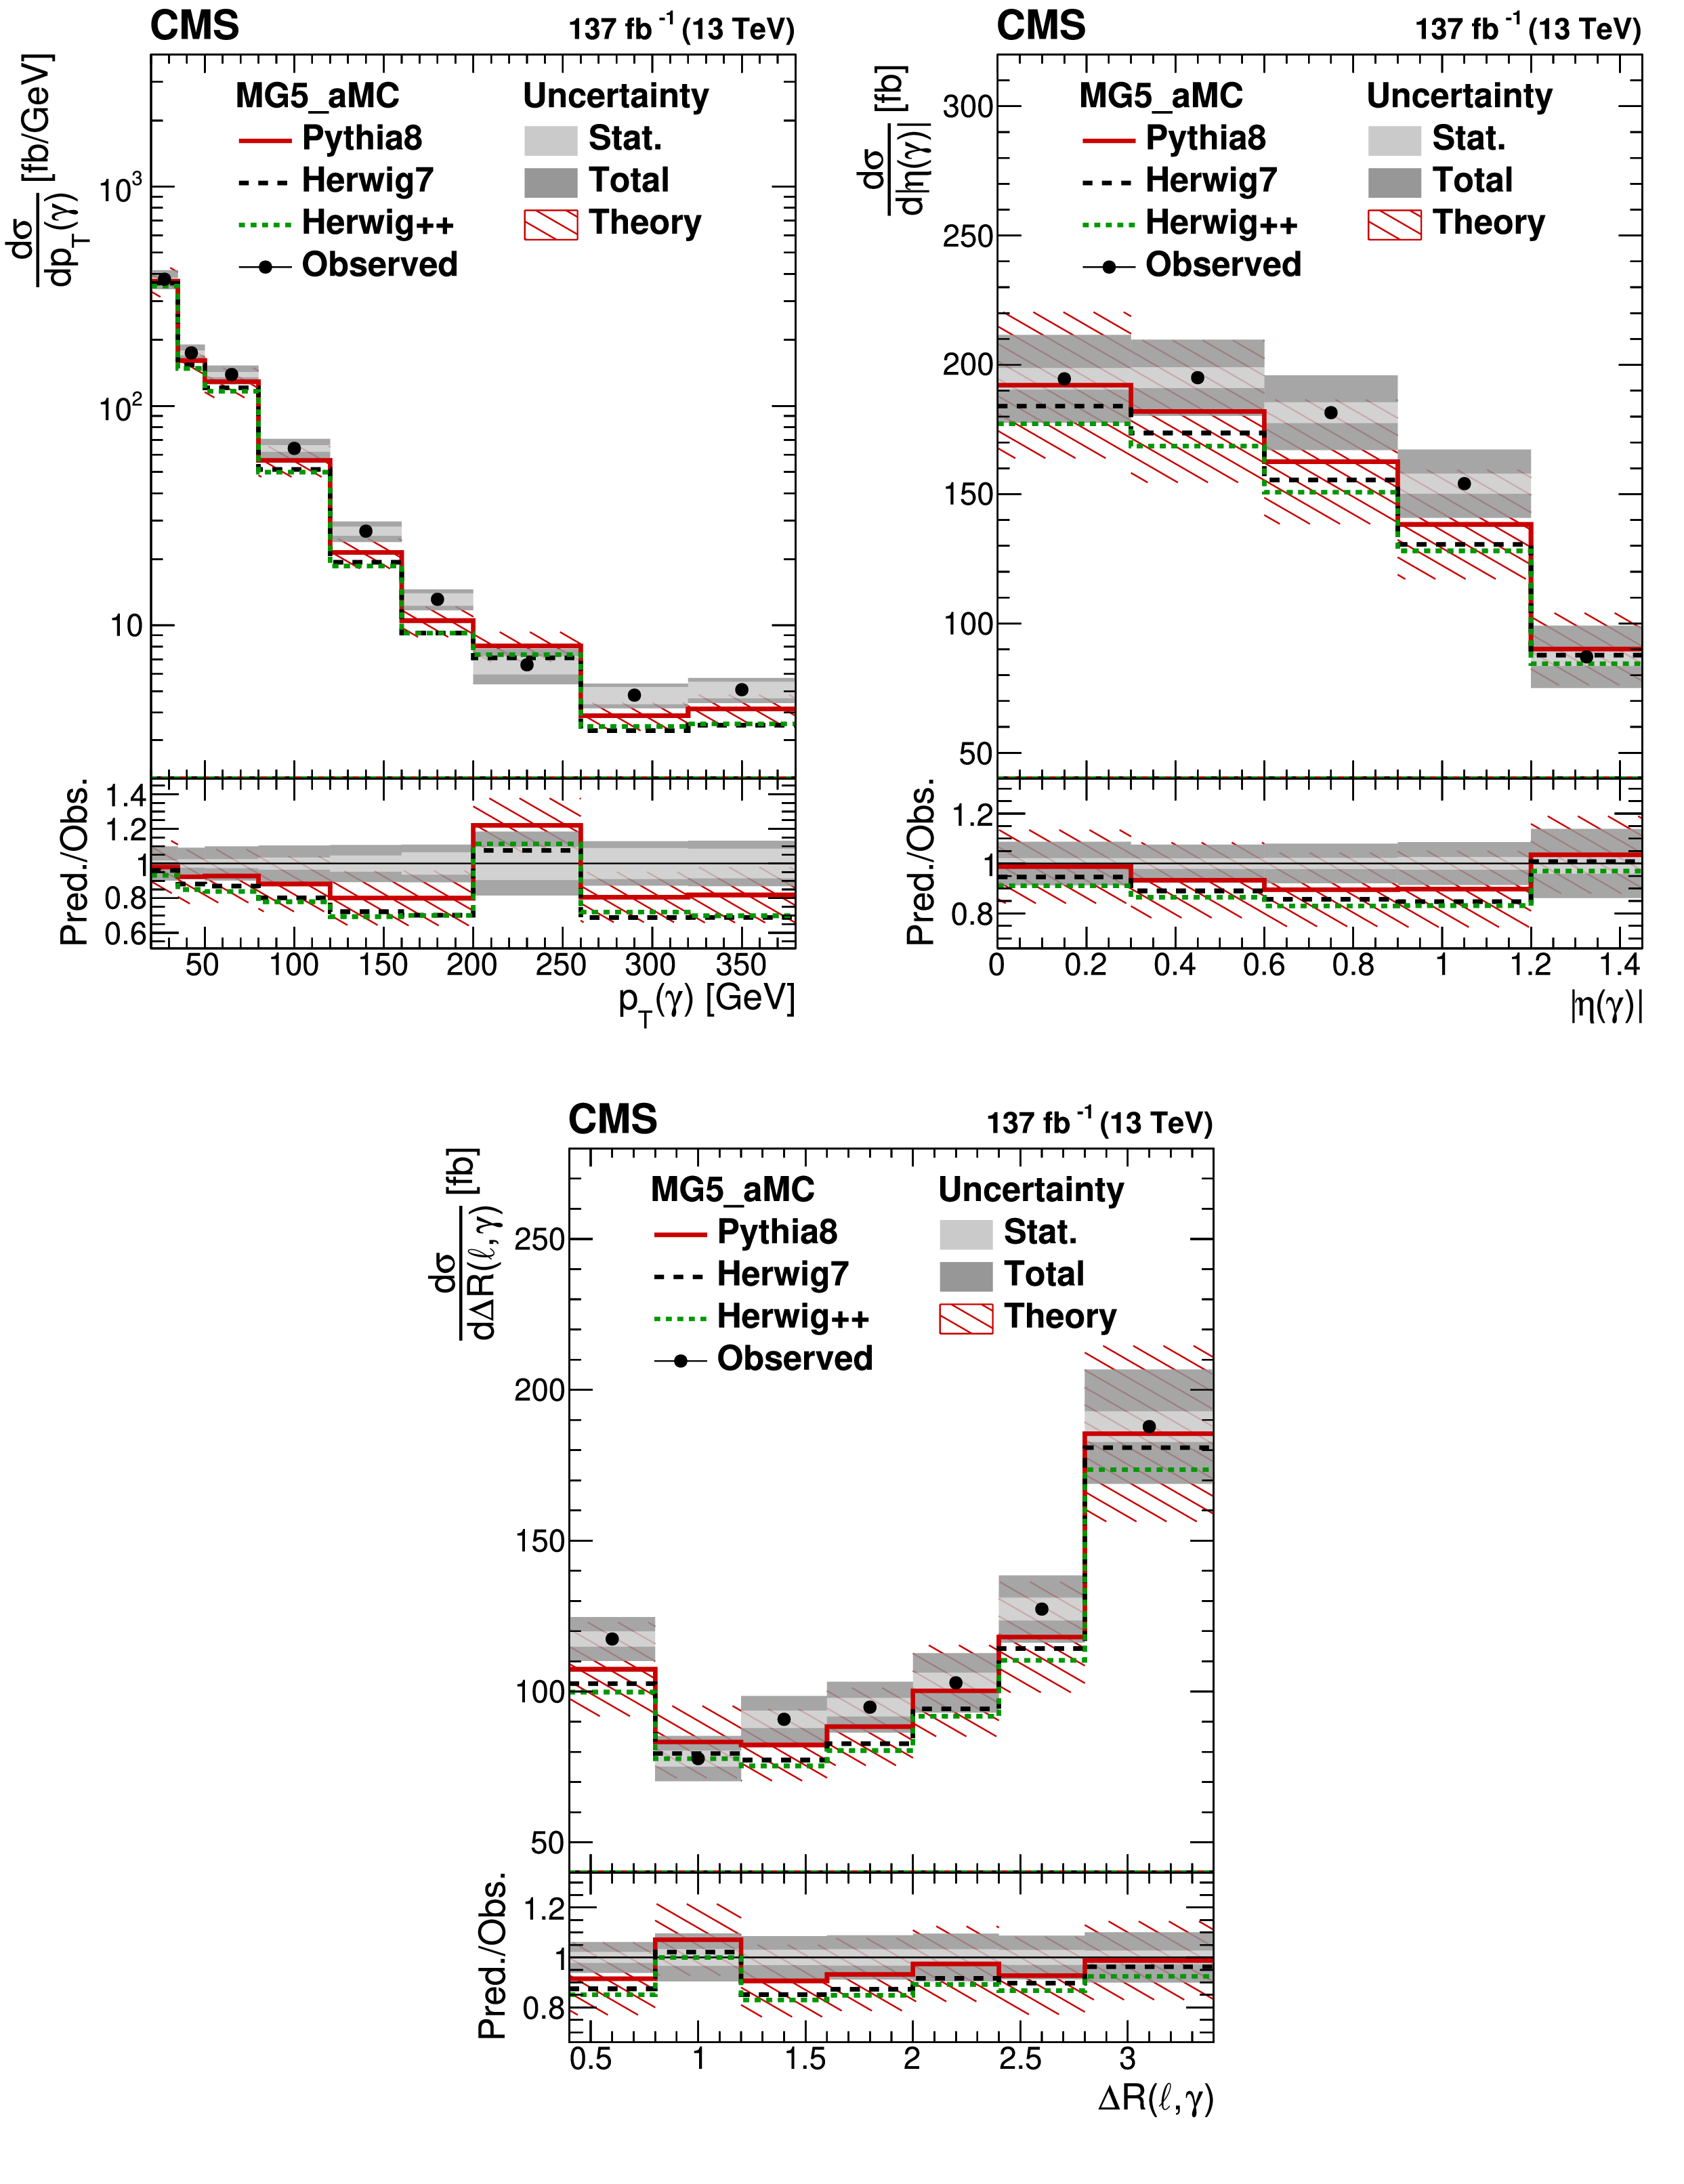
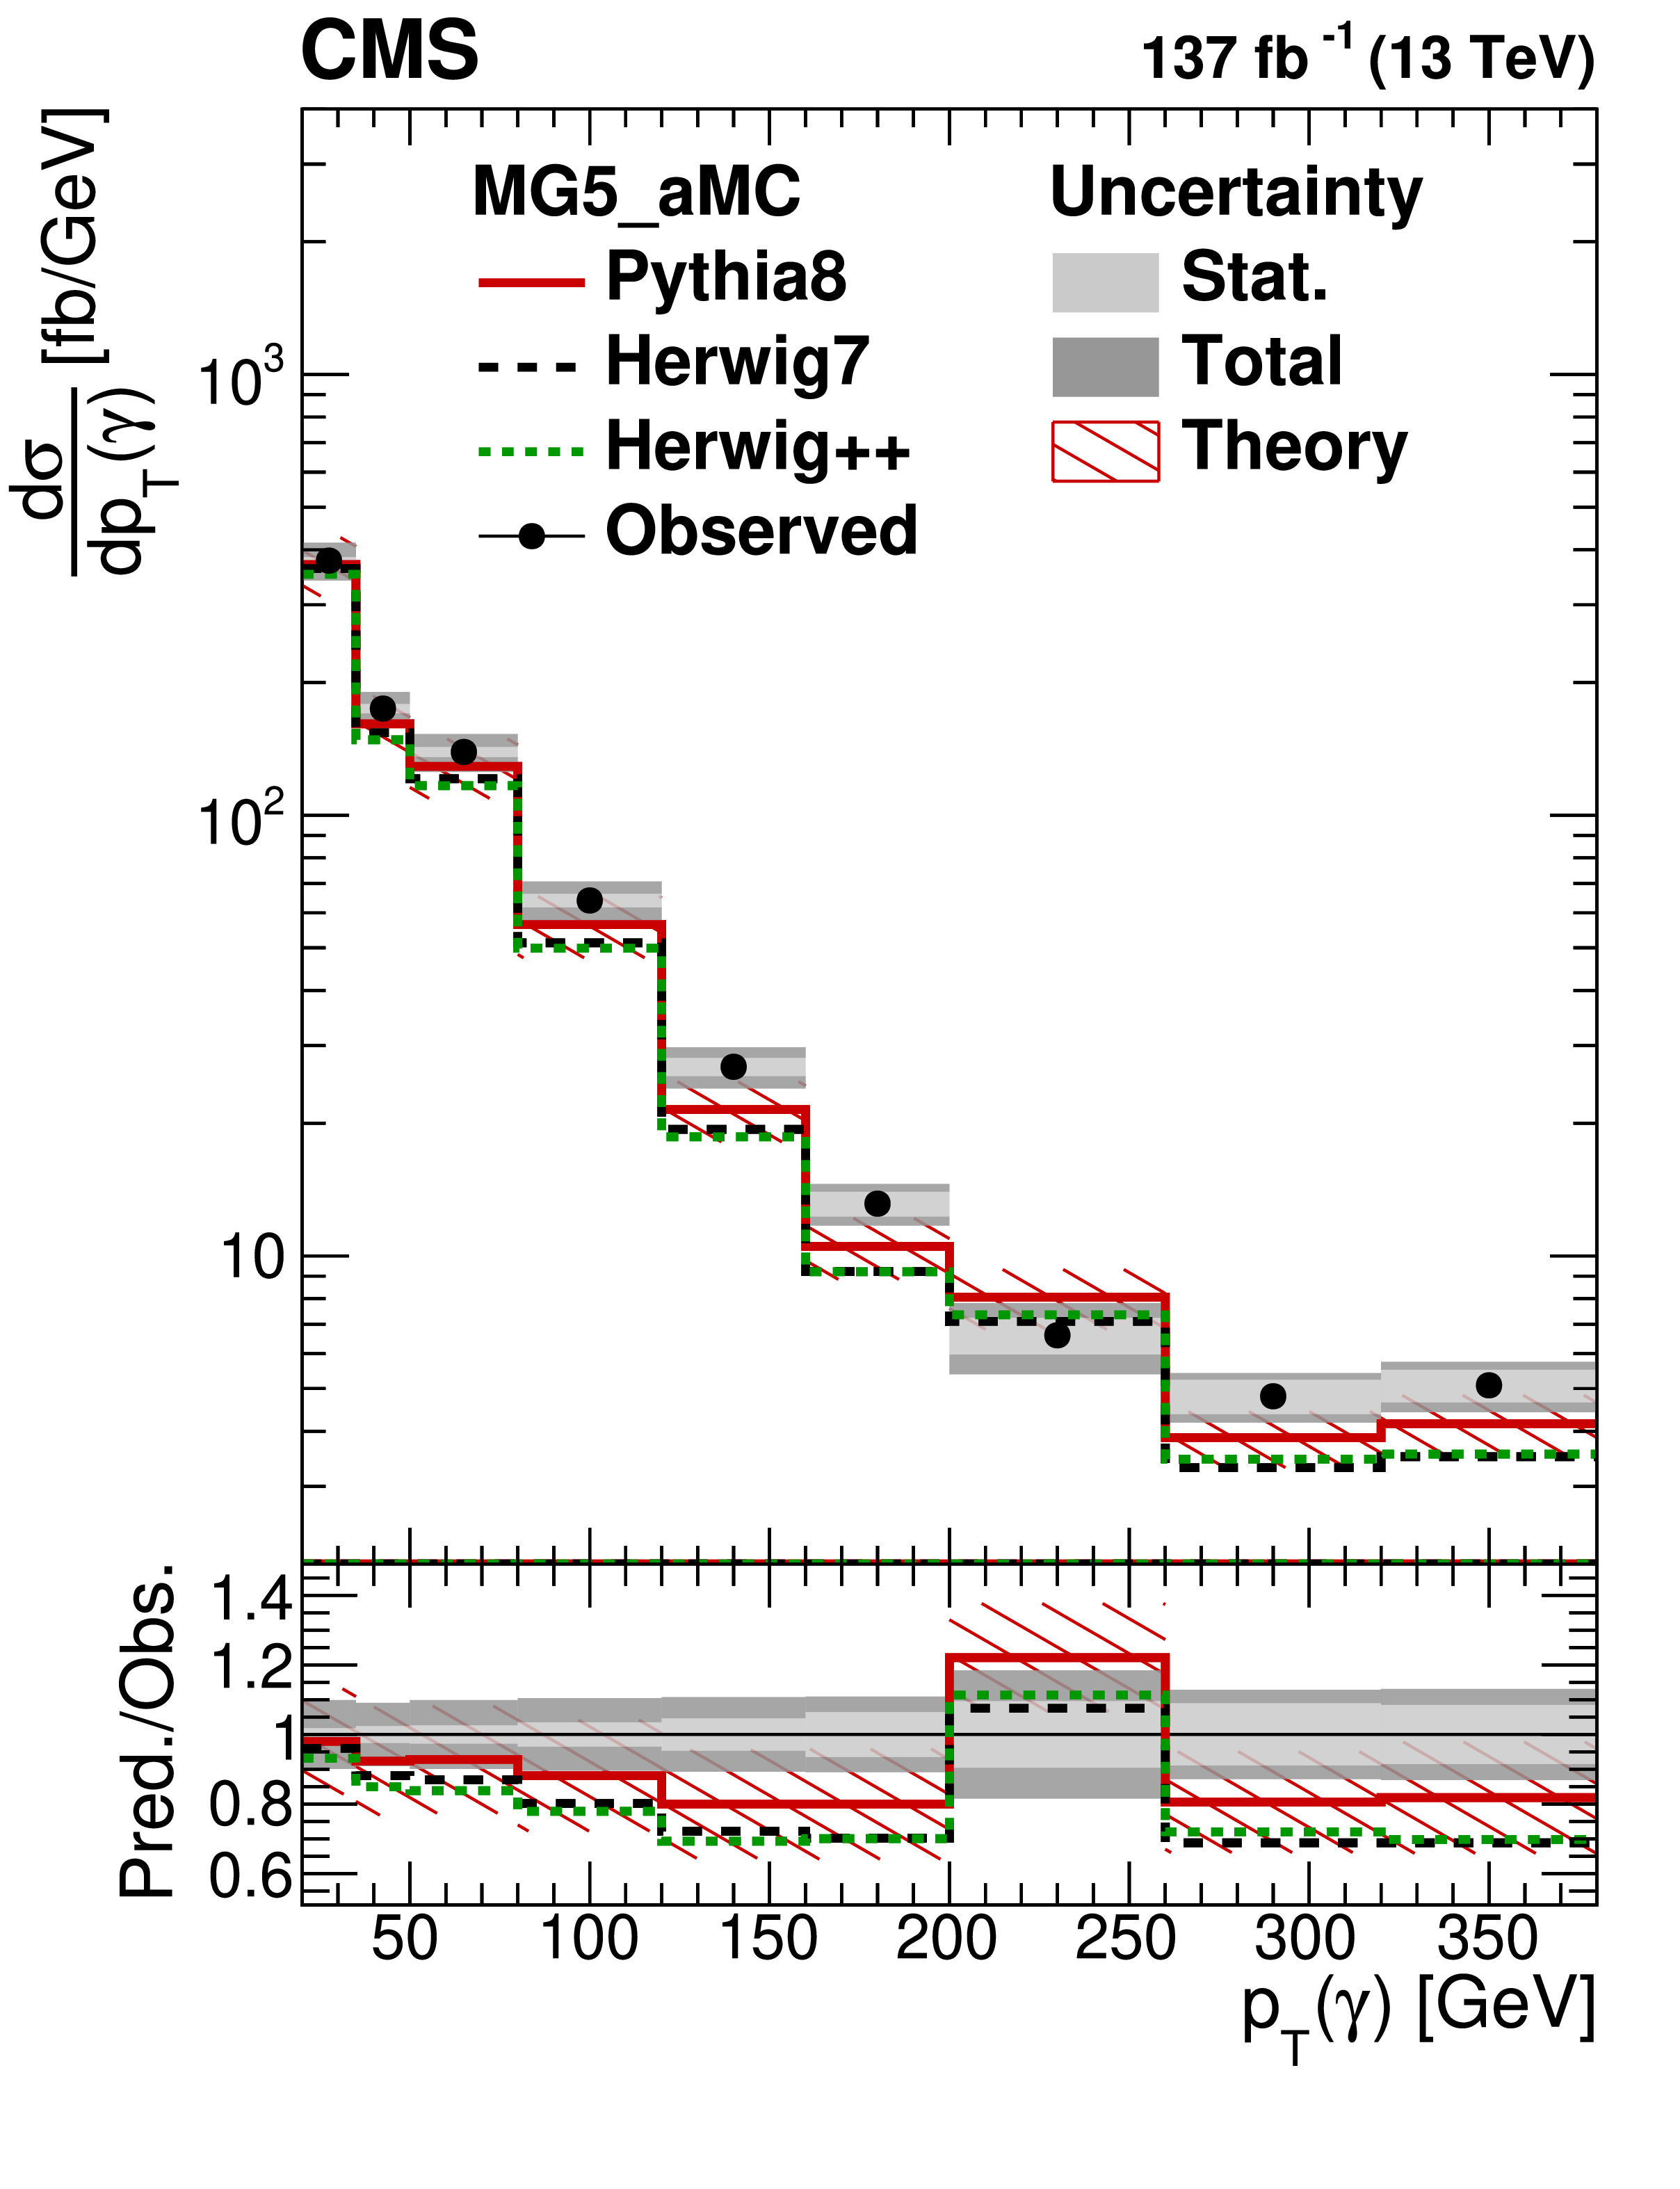
The unfolded differential cross sections for ${{p_{\mathrm {T}}} (\gamma)}$ (upper left), ${| \eta (\gamma) |}$ (upper right), and ${\Delta R(\ell,\gamma)}$ (lower) compared with simulation obtained from the MadGraph 5_aMC@NLO event generator interfaced to PYTHIA (red, solid), HERWIG 7 (black, dashed) and HERWIG++ (green, dotted) for the parton shower and hadronization. For ${{p_{\mathrm {T}}} (\gamma)}$ and ${\Delta R(\ell,\gamma)}$, the last bin includes the overflow. The lower panel displays the ratio of simulation to the observation. The inner and outer bands show the statistical and total uncertainties, respectively. Photons radiated from leptons and satisfying $ {\Delta R(\ell,\gamma)} > $ 0.4 are included in the signal and contribute significantly to the first bin of the differential ${\Delta R(\ell,\gamma)}$ cross section. |
png pdf |
Figure 9-a:
The unfolded differential cross section for ${{p_{\mathrm {T}}} (\gamma)}$ compared with simulation obtained from the MadGraph 5_aMC@NLO event generator interfaced to PYTHIA (red, solid), HERWIG 7 (black, dashed) and HERWIG++ (green, dotted) for the parton shower and hadronization. For ${{p_{\mathrm {T}}} (\gamma)}$ and ${\Delta R(\ell,\gamma)}$, the last bin includes the overflow. The lower panel displays the ratio of simulation to the observation. The inner and outer bands show the statistical and total uncertainties, respectively. Photons radiated from leptons and satisfying $ {\Delta R(\ell,\gamma)} > $ 0.4 are included in the signal. |
png pdf |
Figure 9-b:
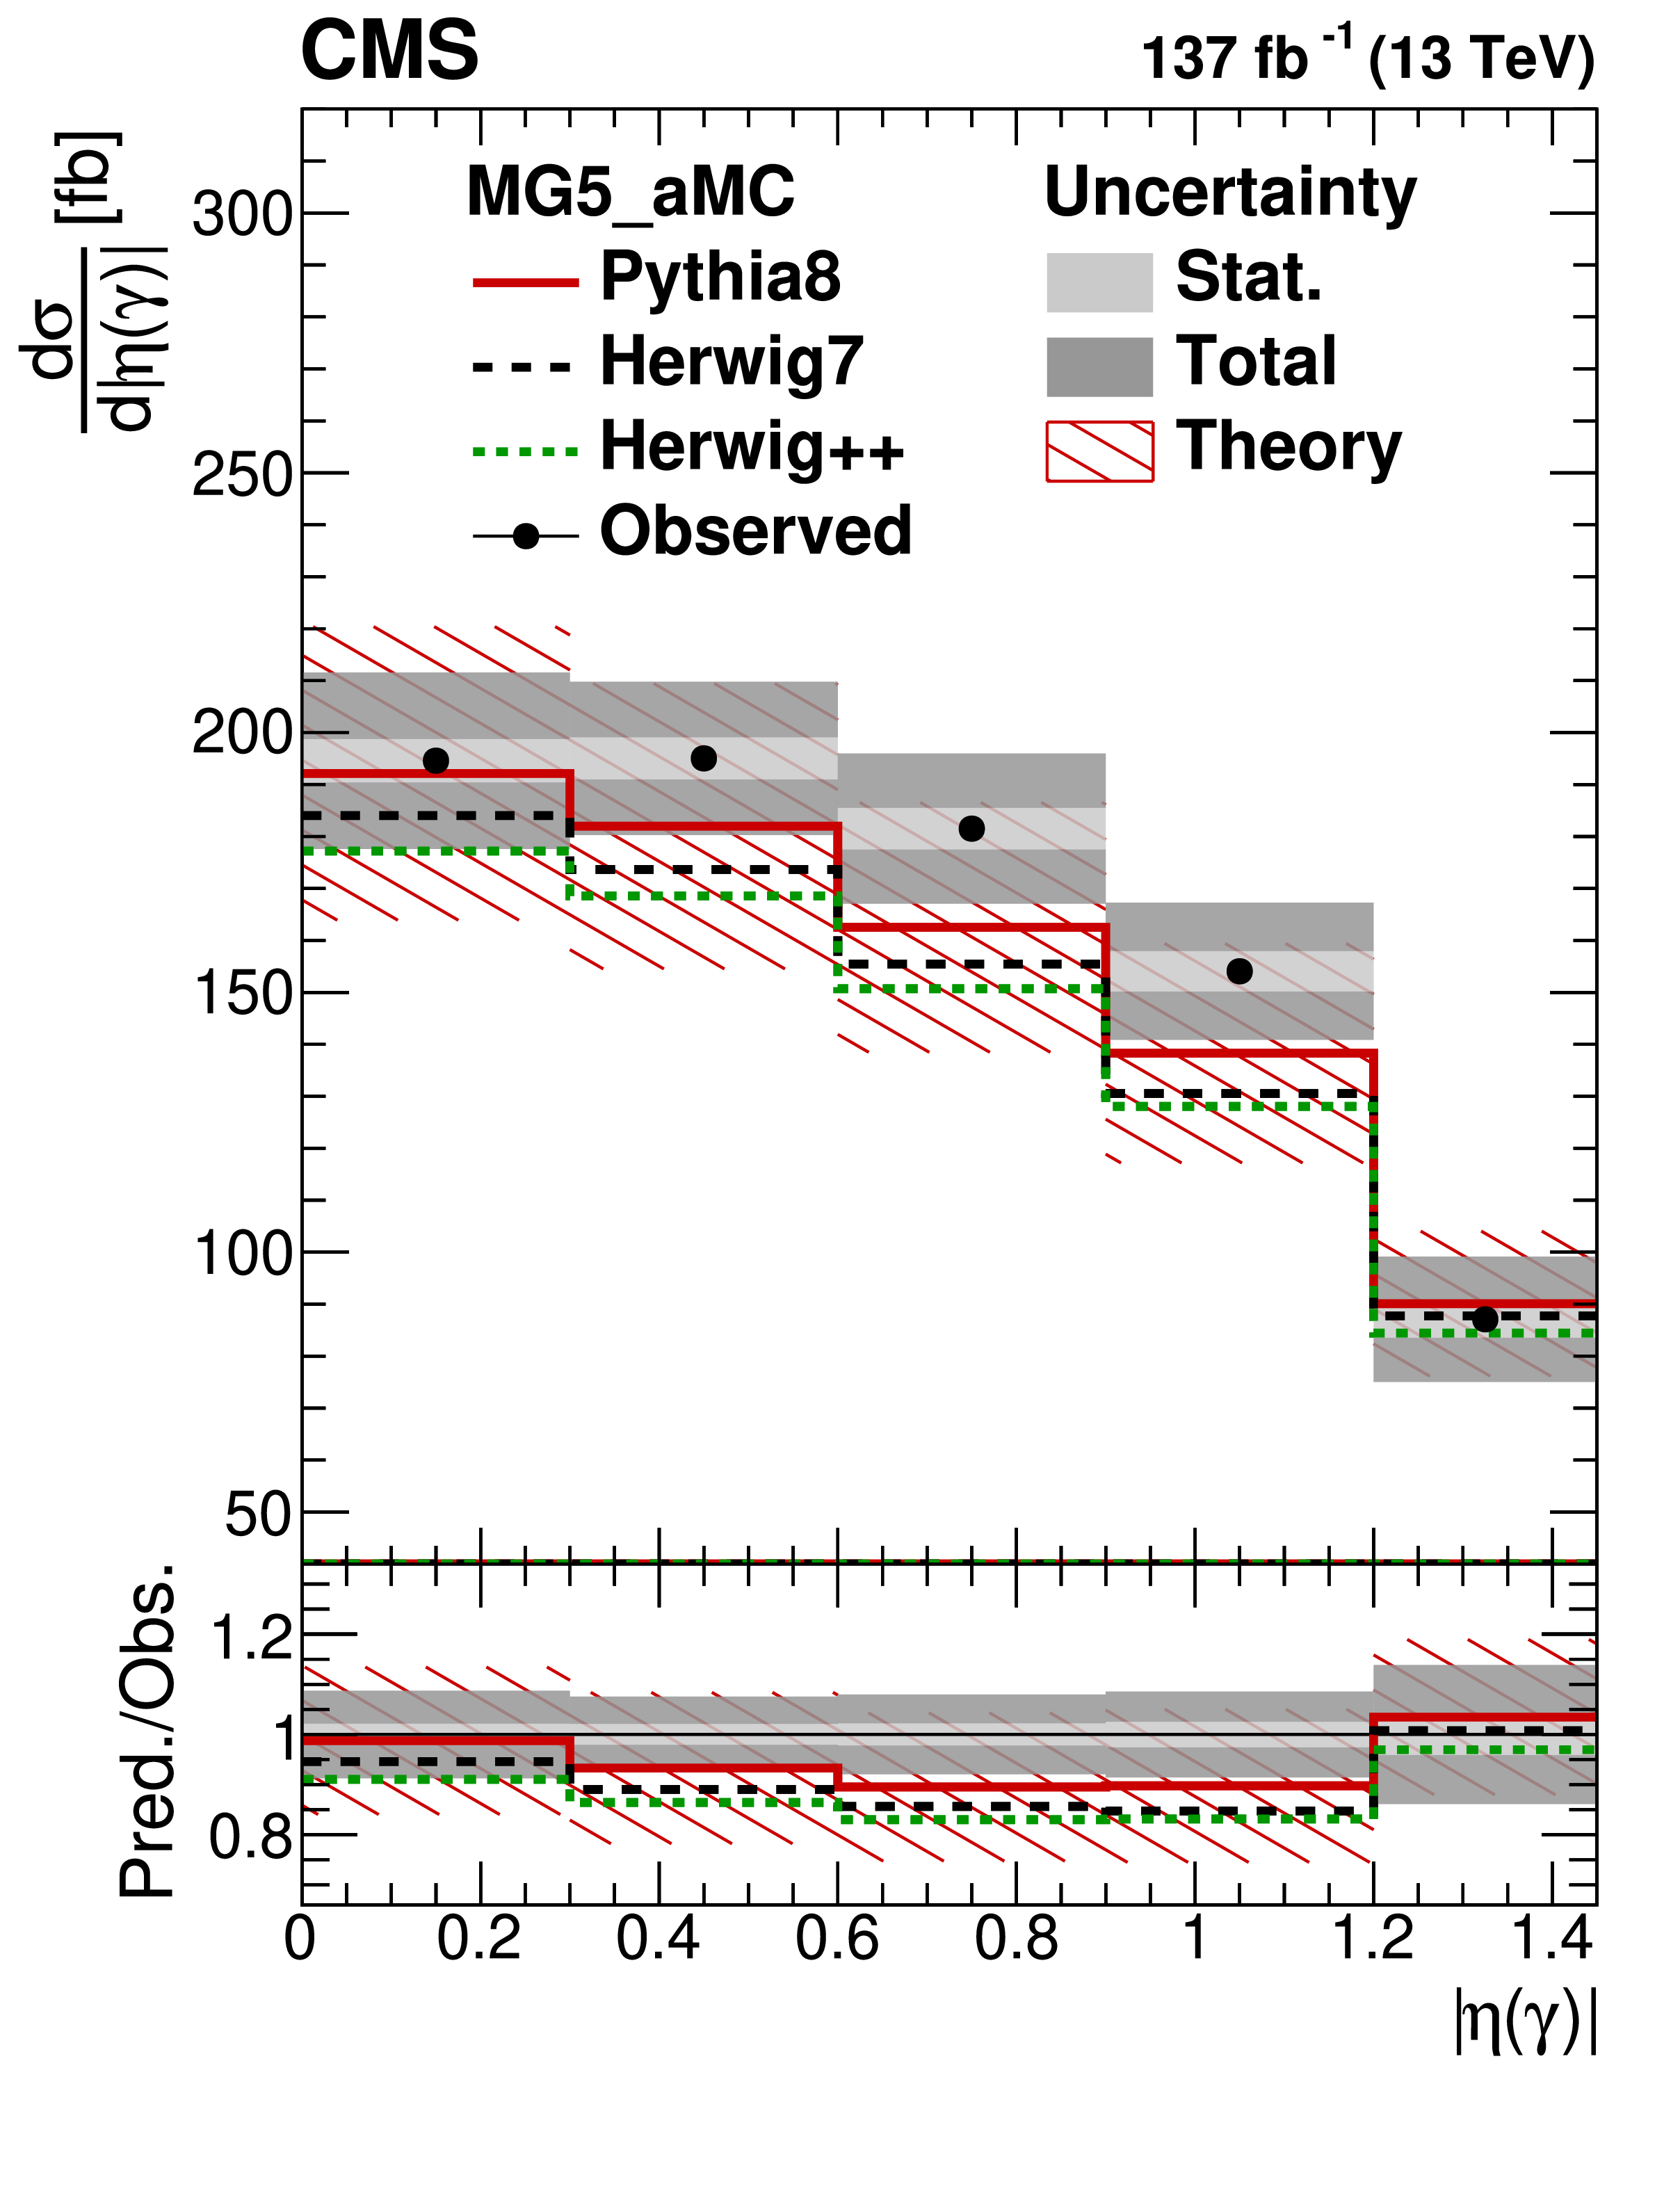
The unfolded differential cross section for ${| \eta (\gamma) |}$ compared with simulation obtained from the MadGraph 5_aMC@NLO event generator interfaced to PYTHIA (red, solid), HERWIG 7 (black, dashed) and HERWIG++ (green, dotted) for the parton shower and hadronization. For ${{p_{\mathrm {T}}} (\gamma)}$ and ${\Delta R(\ell,\gamma)}$, the last bin includes the overflow. The lower panel displays the ratio of simulation to the observation. The inner and outer bands show the statistical and total uncertainties, respectively. Photons radiated from leptons and satisfying $ {\Delta R(\ell,\gamma)} > $ 0.4 are included in the signal. |
png pdf |
Figure 9-c:
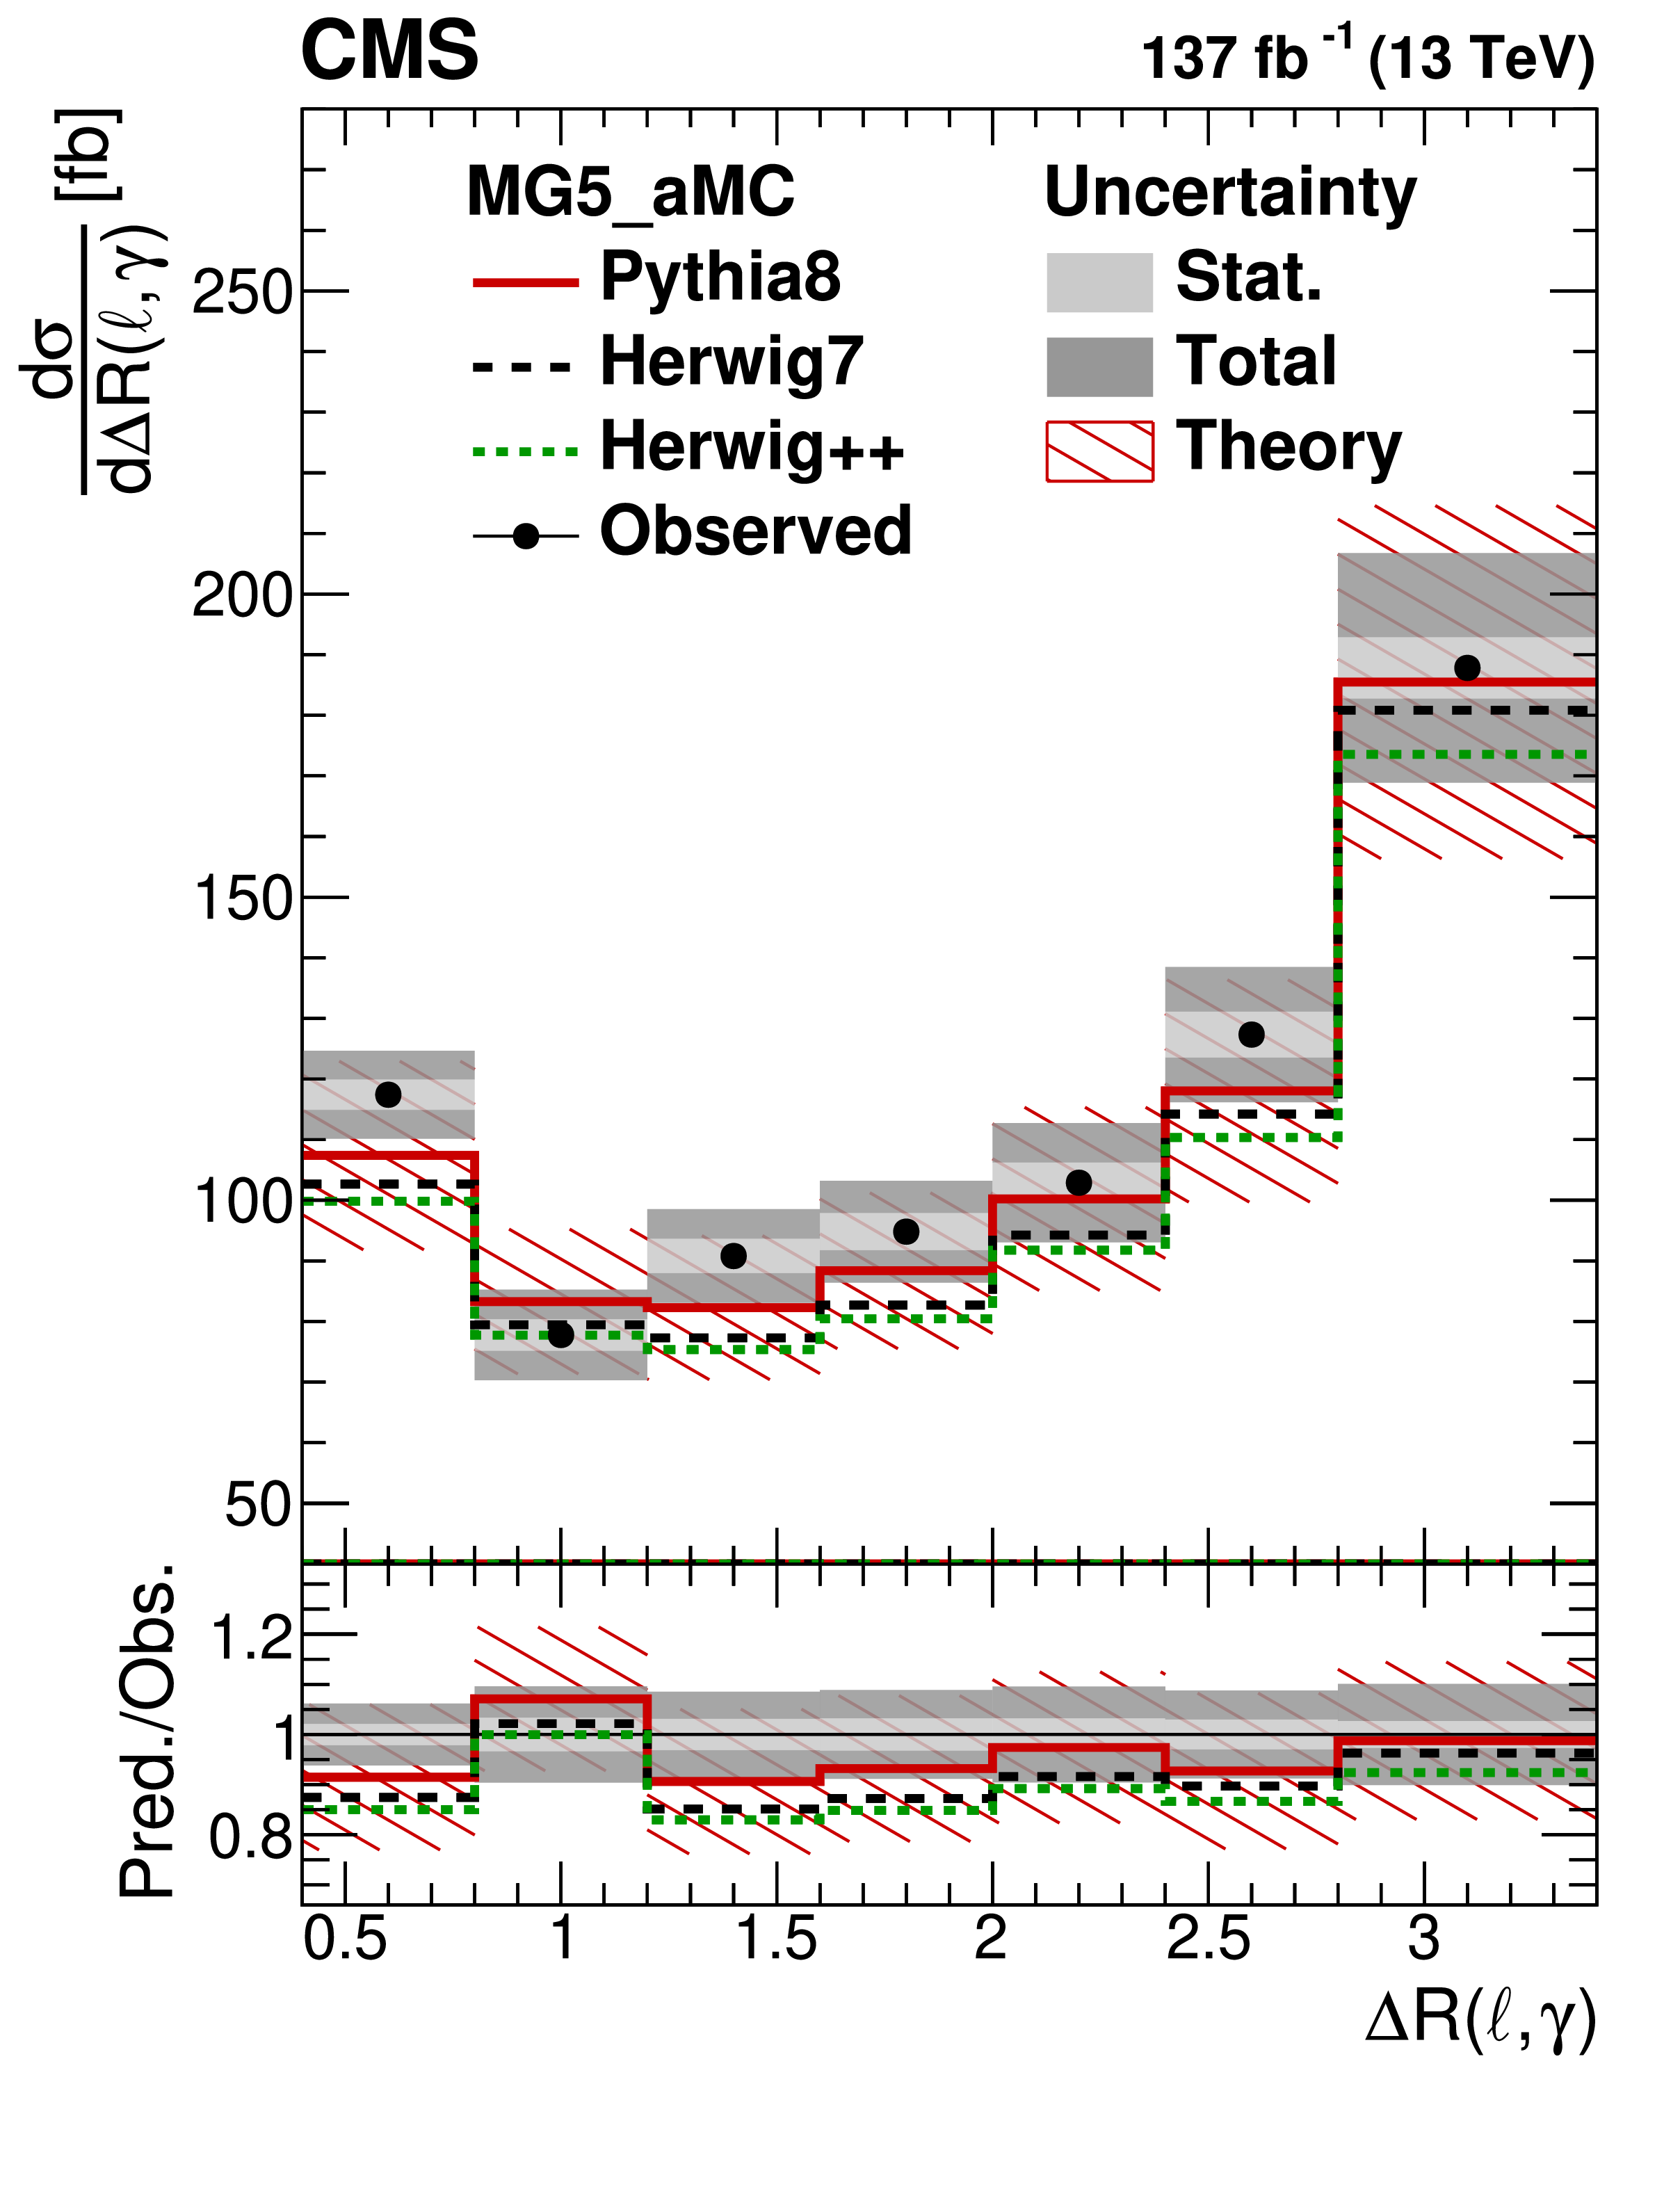
The unfolded differential cross section for ${\Delta R(\ell,\gamma)}$ compared with simulation obtained from the MadGraph 5_aMC@NLO event generator interfaced to PYTHIA (red, solid), HERWIG 7 (black, dashed) and HERWIG++ (green, dotted) for the parton shower and hadronization. For ${{p_{\mathrm {T}}} (\gamma)}$ and ${\Delta R(\ell,\gamma)}$, the last bin includes the overflow. The lower panel displays the ratio of simulation to the observation. The inner and outer bands show the statistical and total uncertainties, respectively. Photons radiated from leptons and satisfying $ {\Delta R(\ell,\gamma)} > $ 0.4 are included in the signal and contribute significantly to the first bin of the differential cross section. |

png pdf |
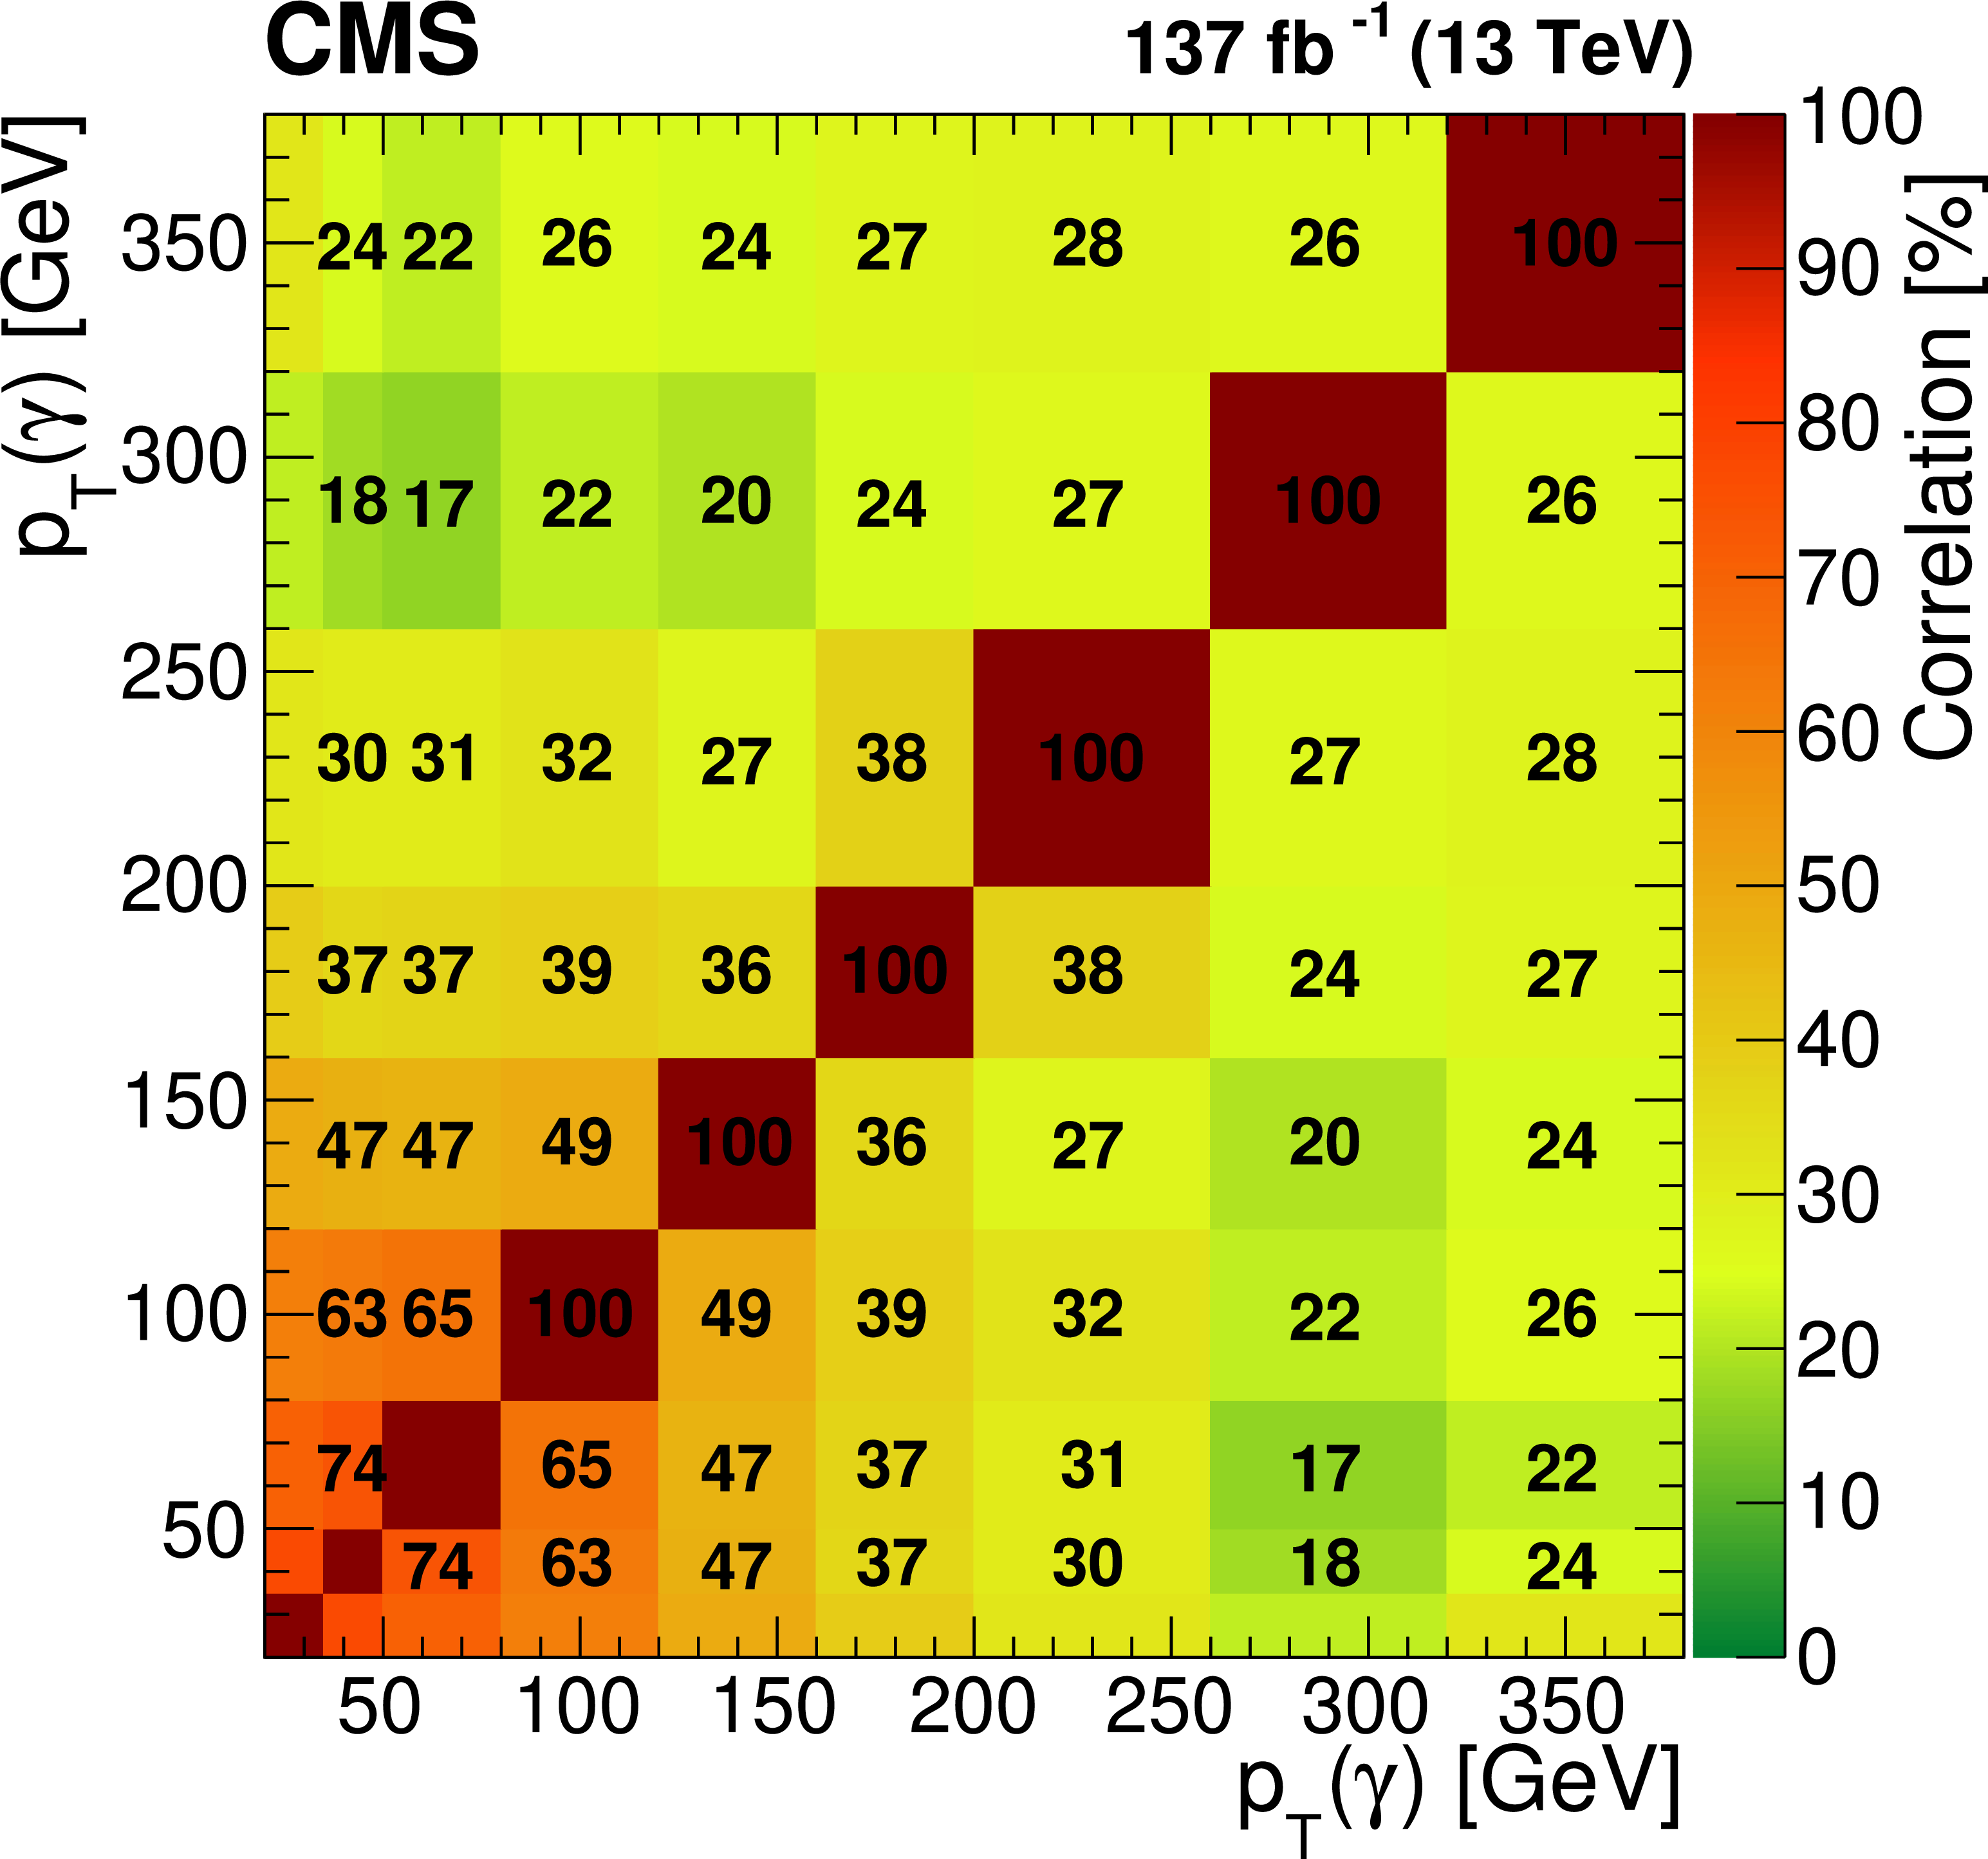
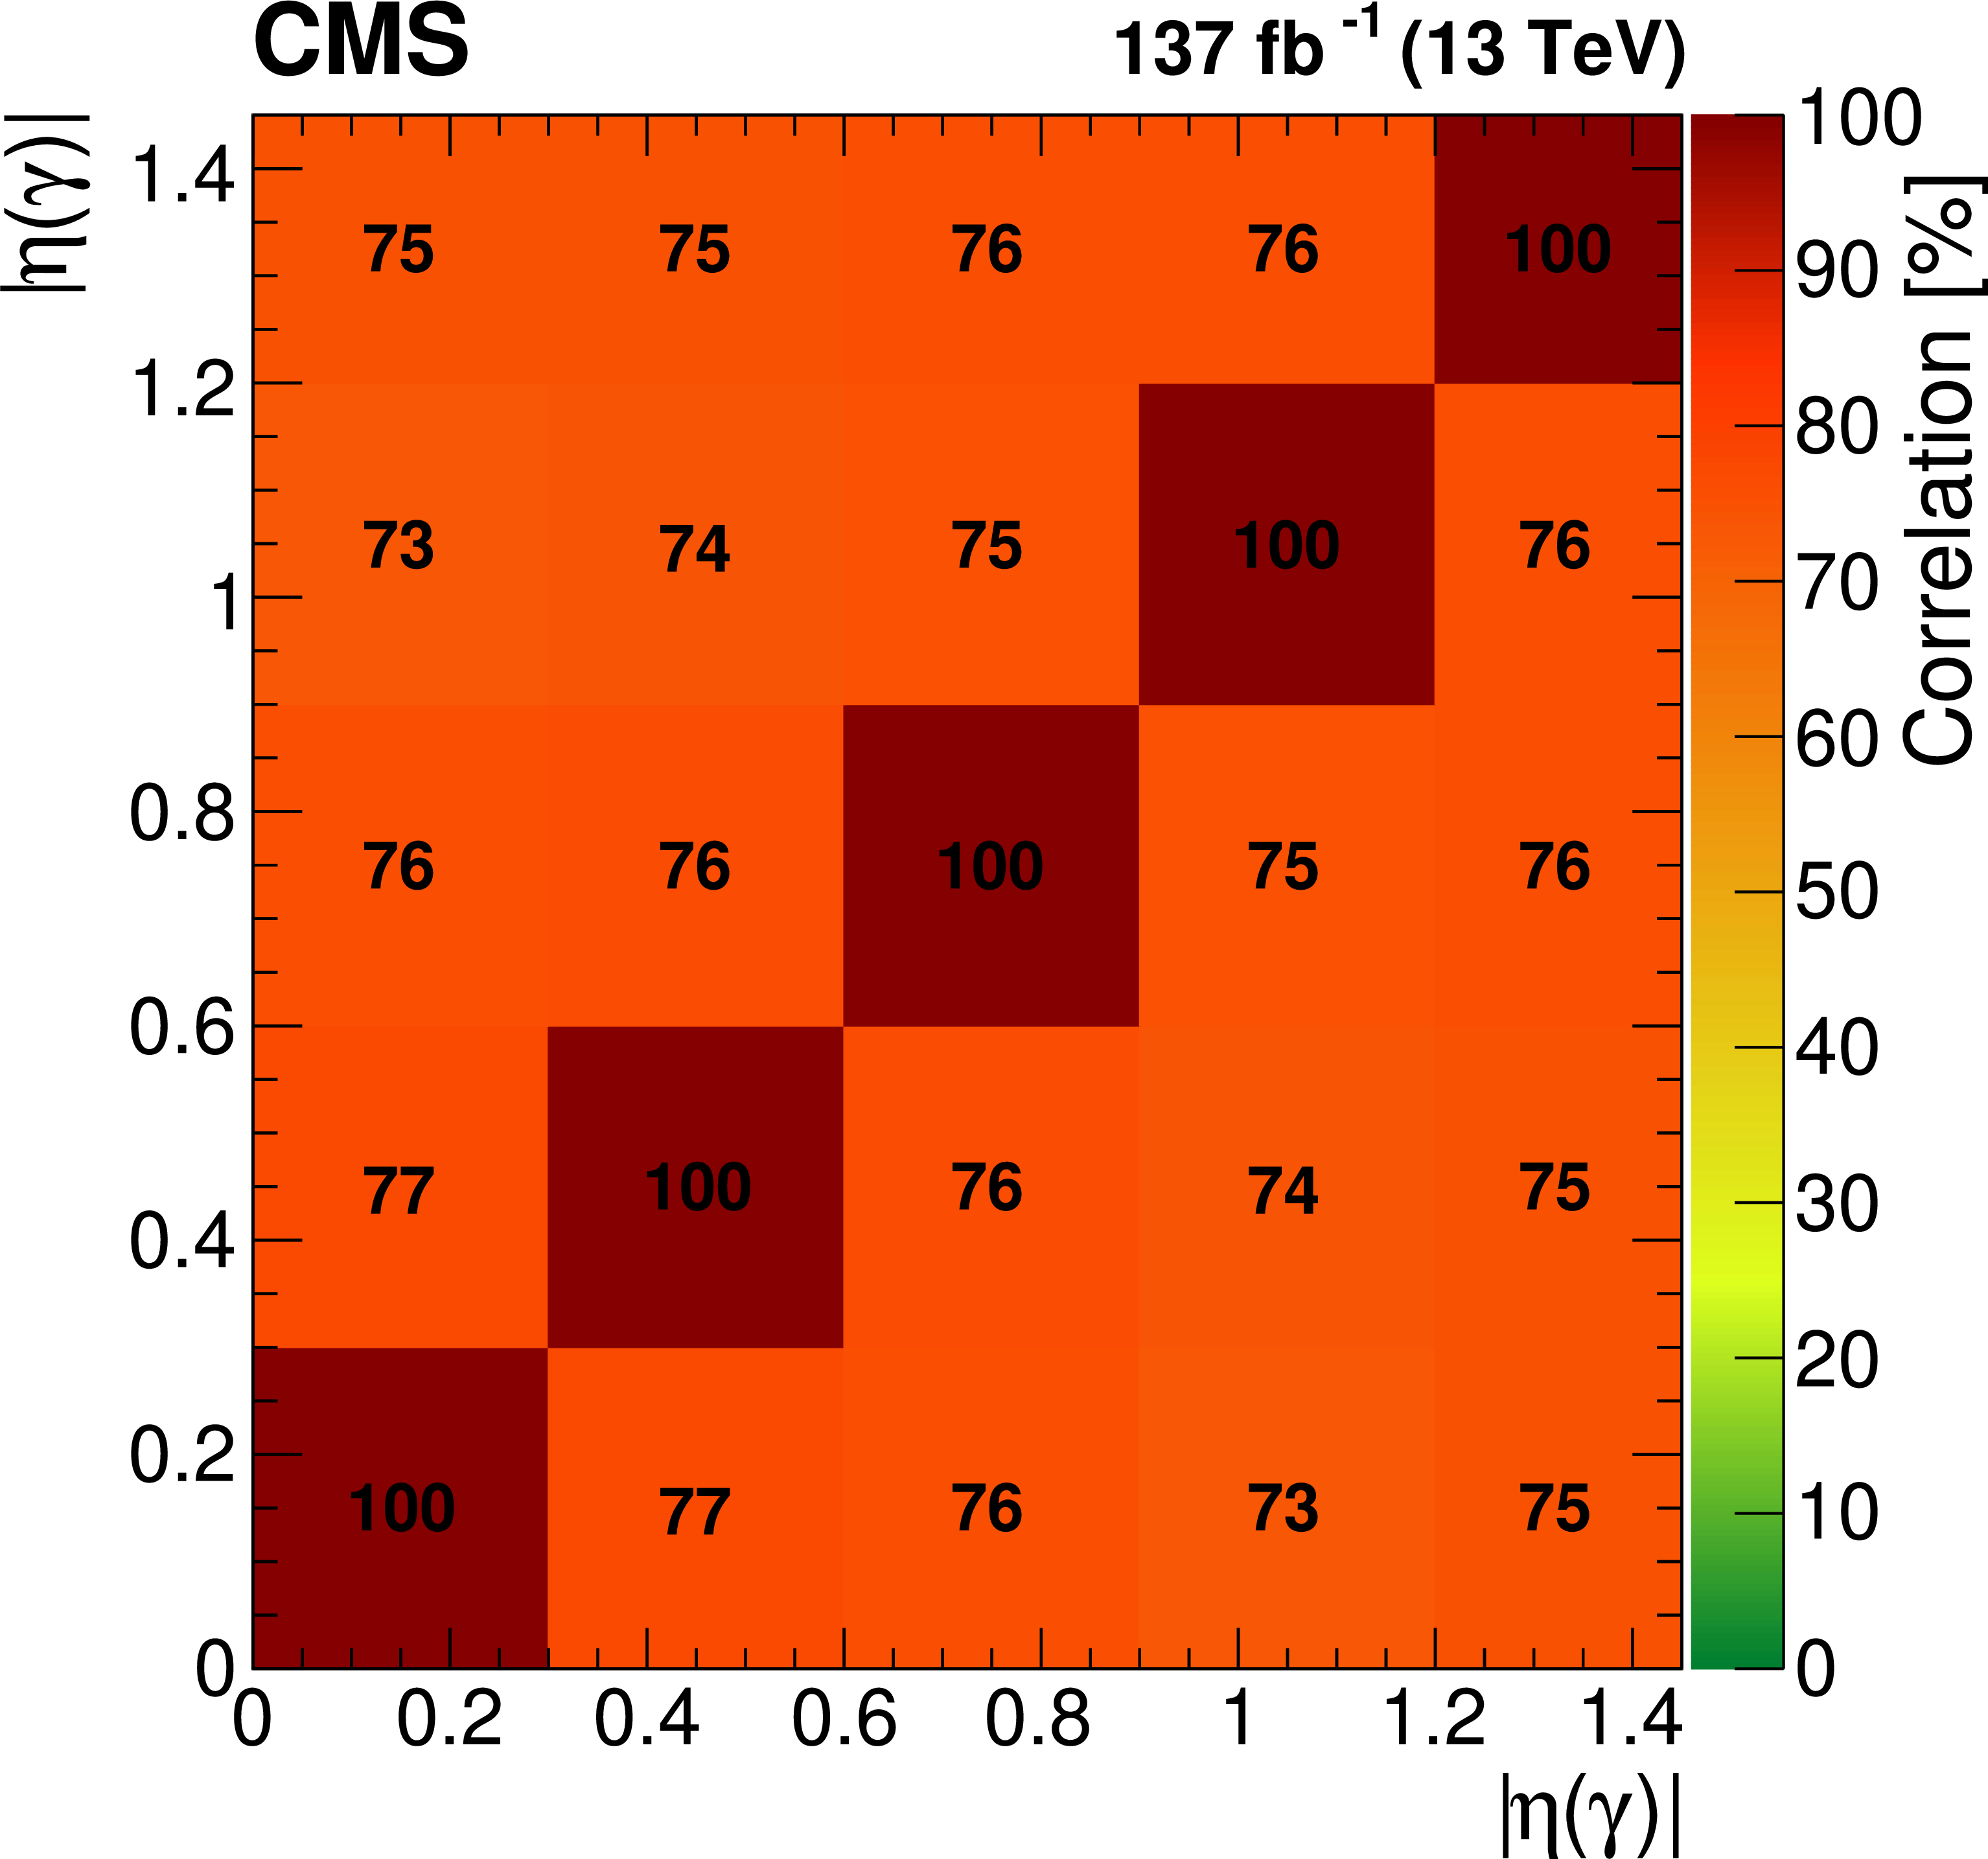
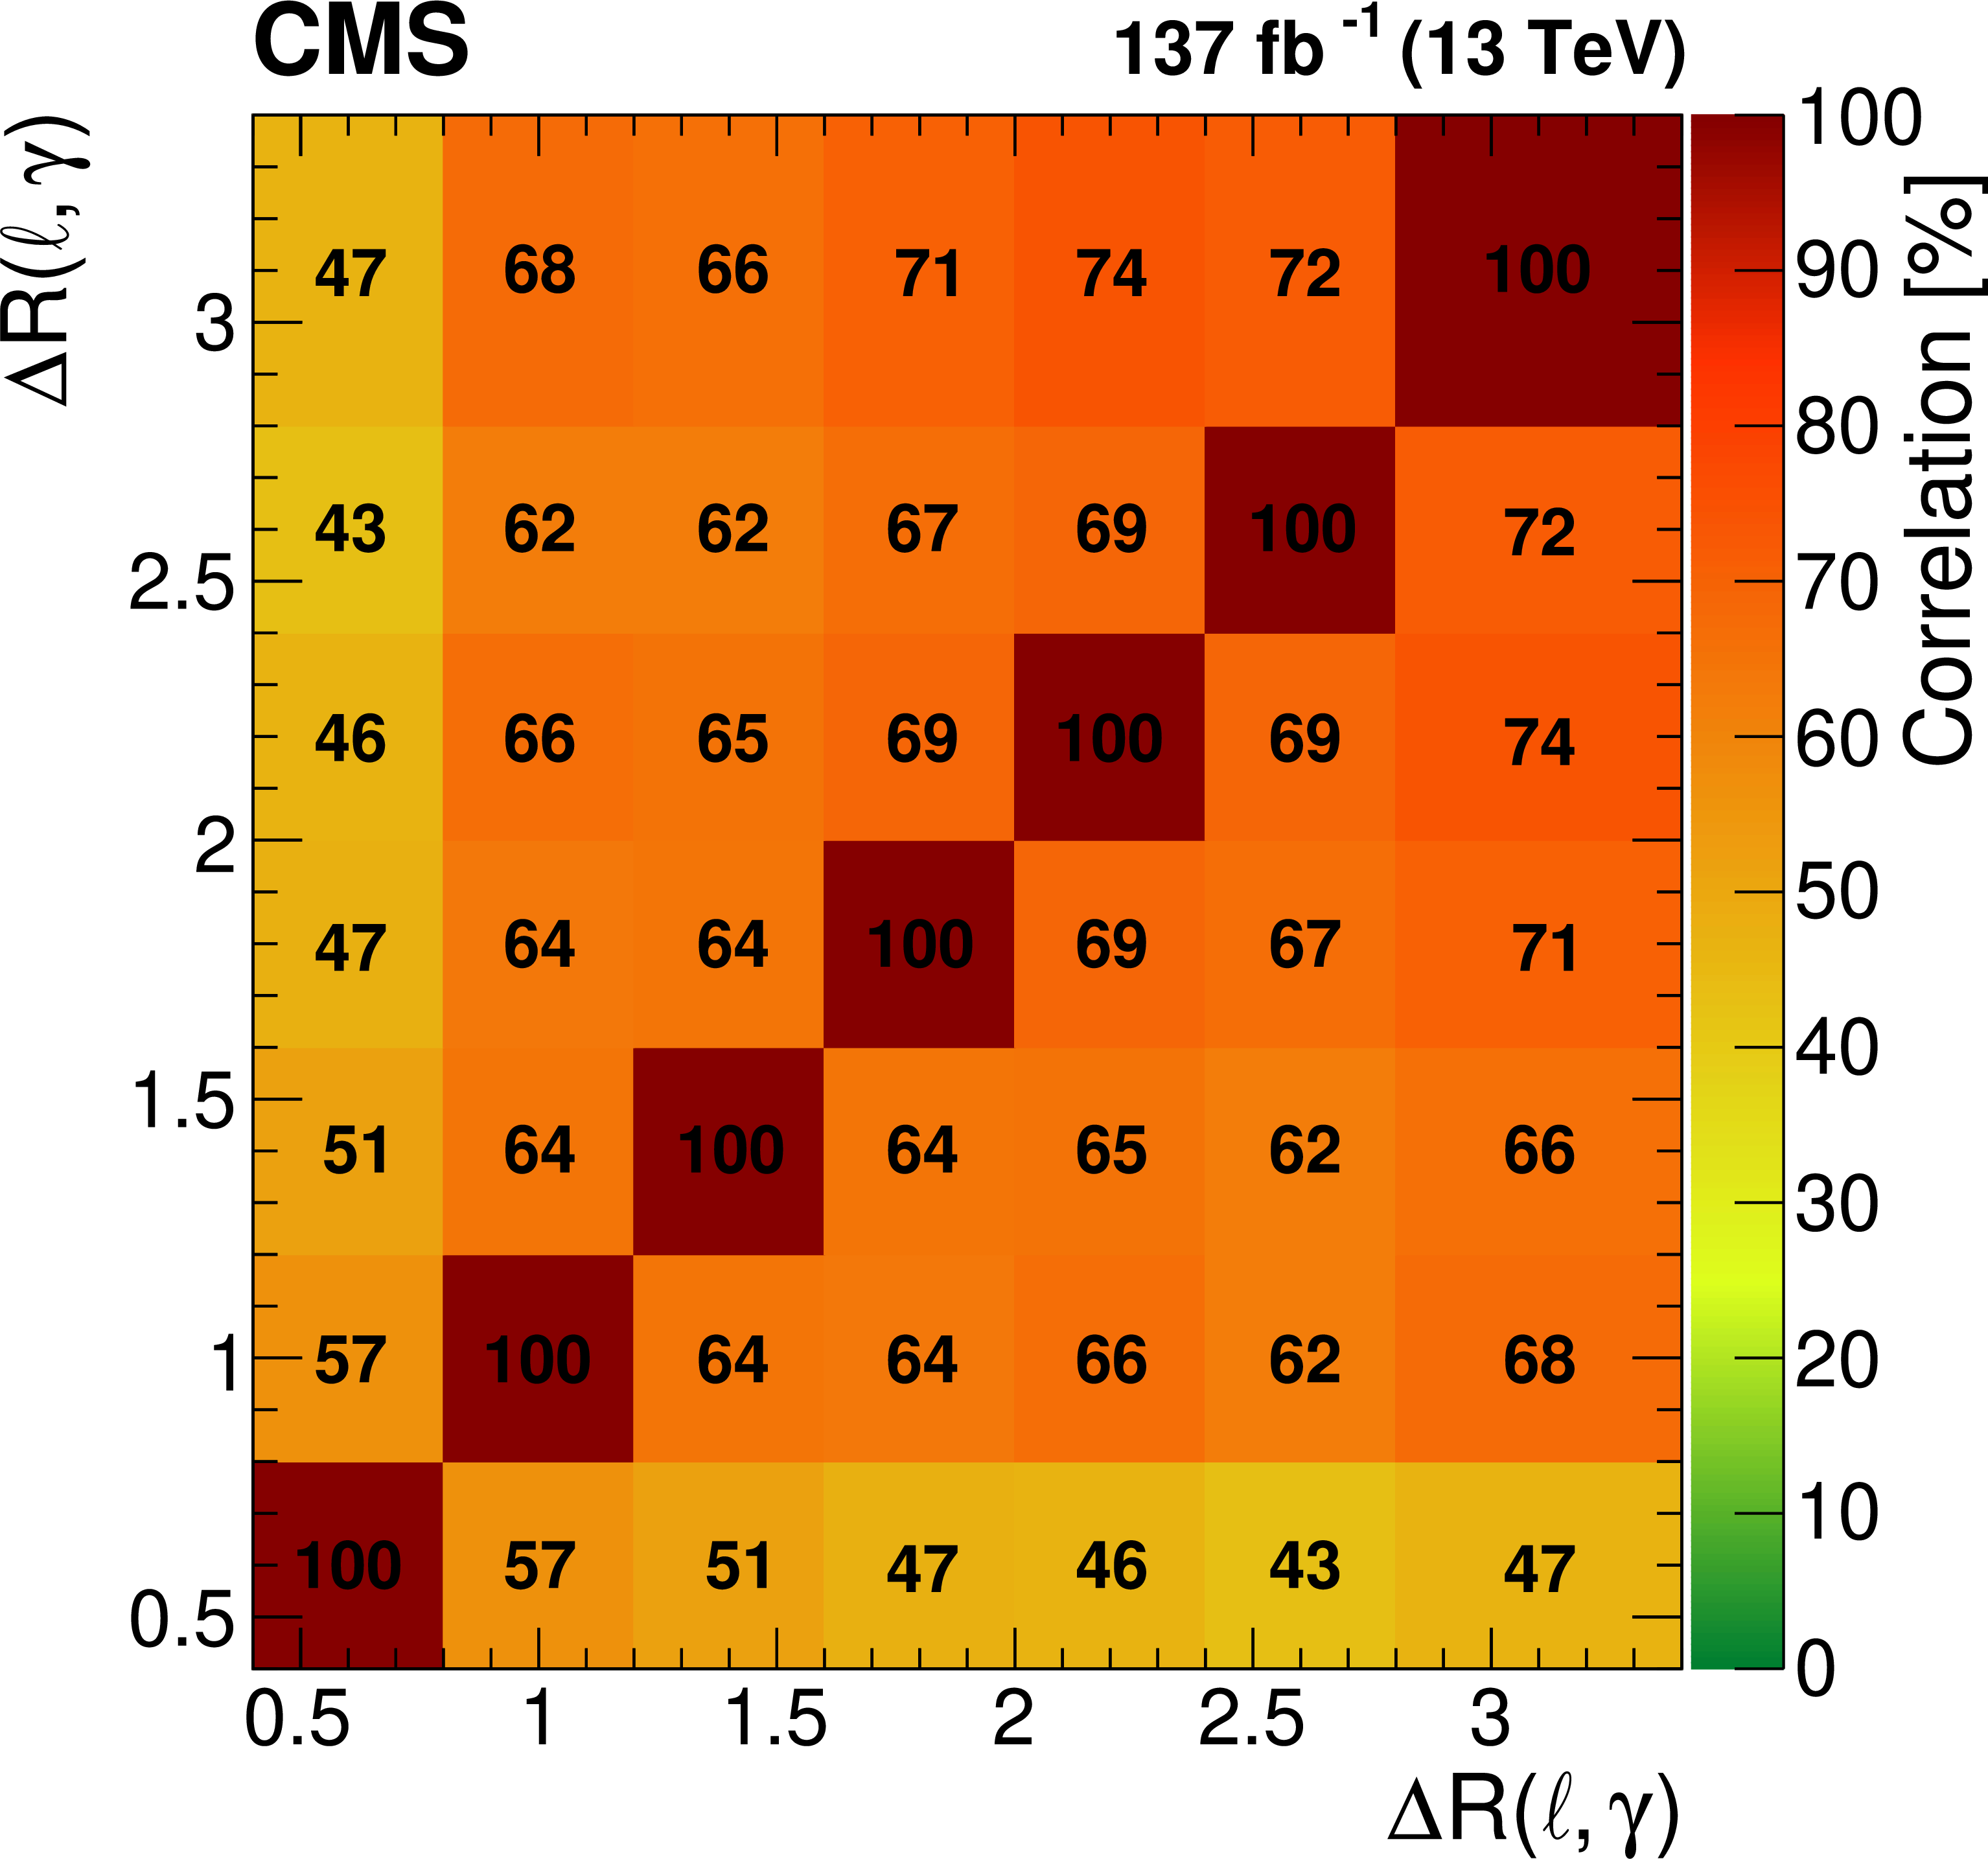
Figure 10:
The correlation matrices of systematic uncertainties for the unfolded differential measurement for ${{p_{\mathrm {T}}} (\gamma)}$ (upper left), ${| \eta (\gamma) |}$ (upper right), and ${\Delta R(\ell,\gamma)}$ (lower). |
png pdf |
Figure 10-a:
The correlation matrix of systematic uncertainties for the unfolded differential measurement for ${{p_{\mathrm {T}}} (\gamma)}$. |
png pdf |
Figure 10-b:
The correlation matrix of systematic uncertainties for the unfolded differential measurement for ${| \eta (\gamma) |}$. |
png pdf |
Figure 10-c:
The correlation matrix of systematic uncertainties for the unfolded differential measurement for ${\Delta R(\ell,\gamma)}$. |
png pdf |
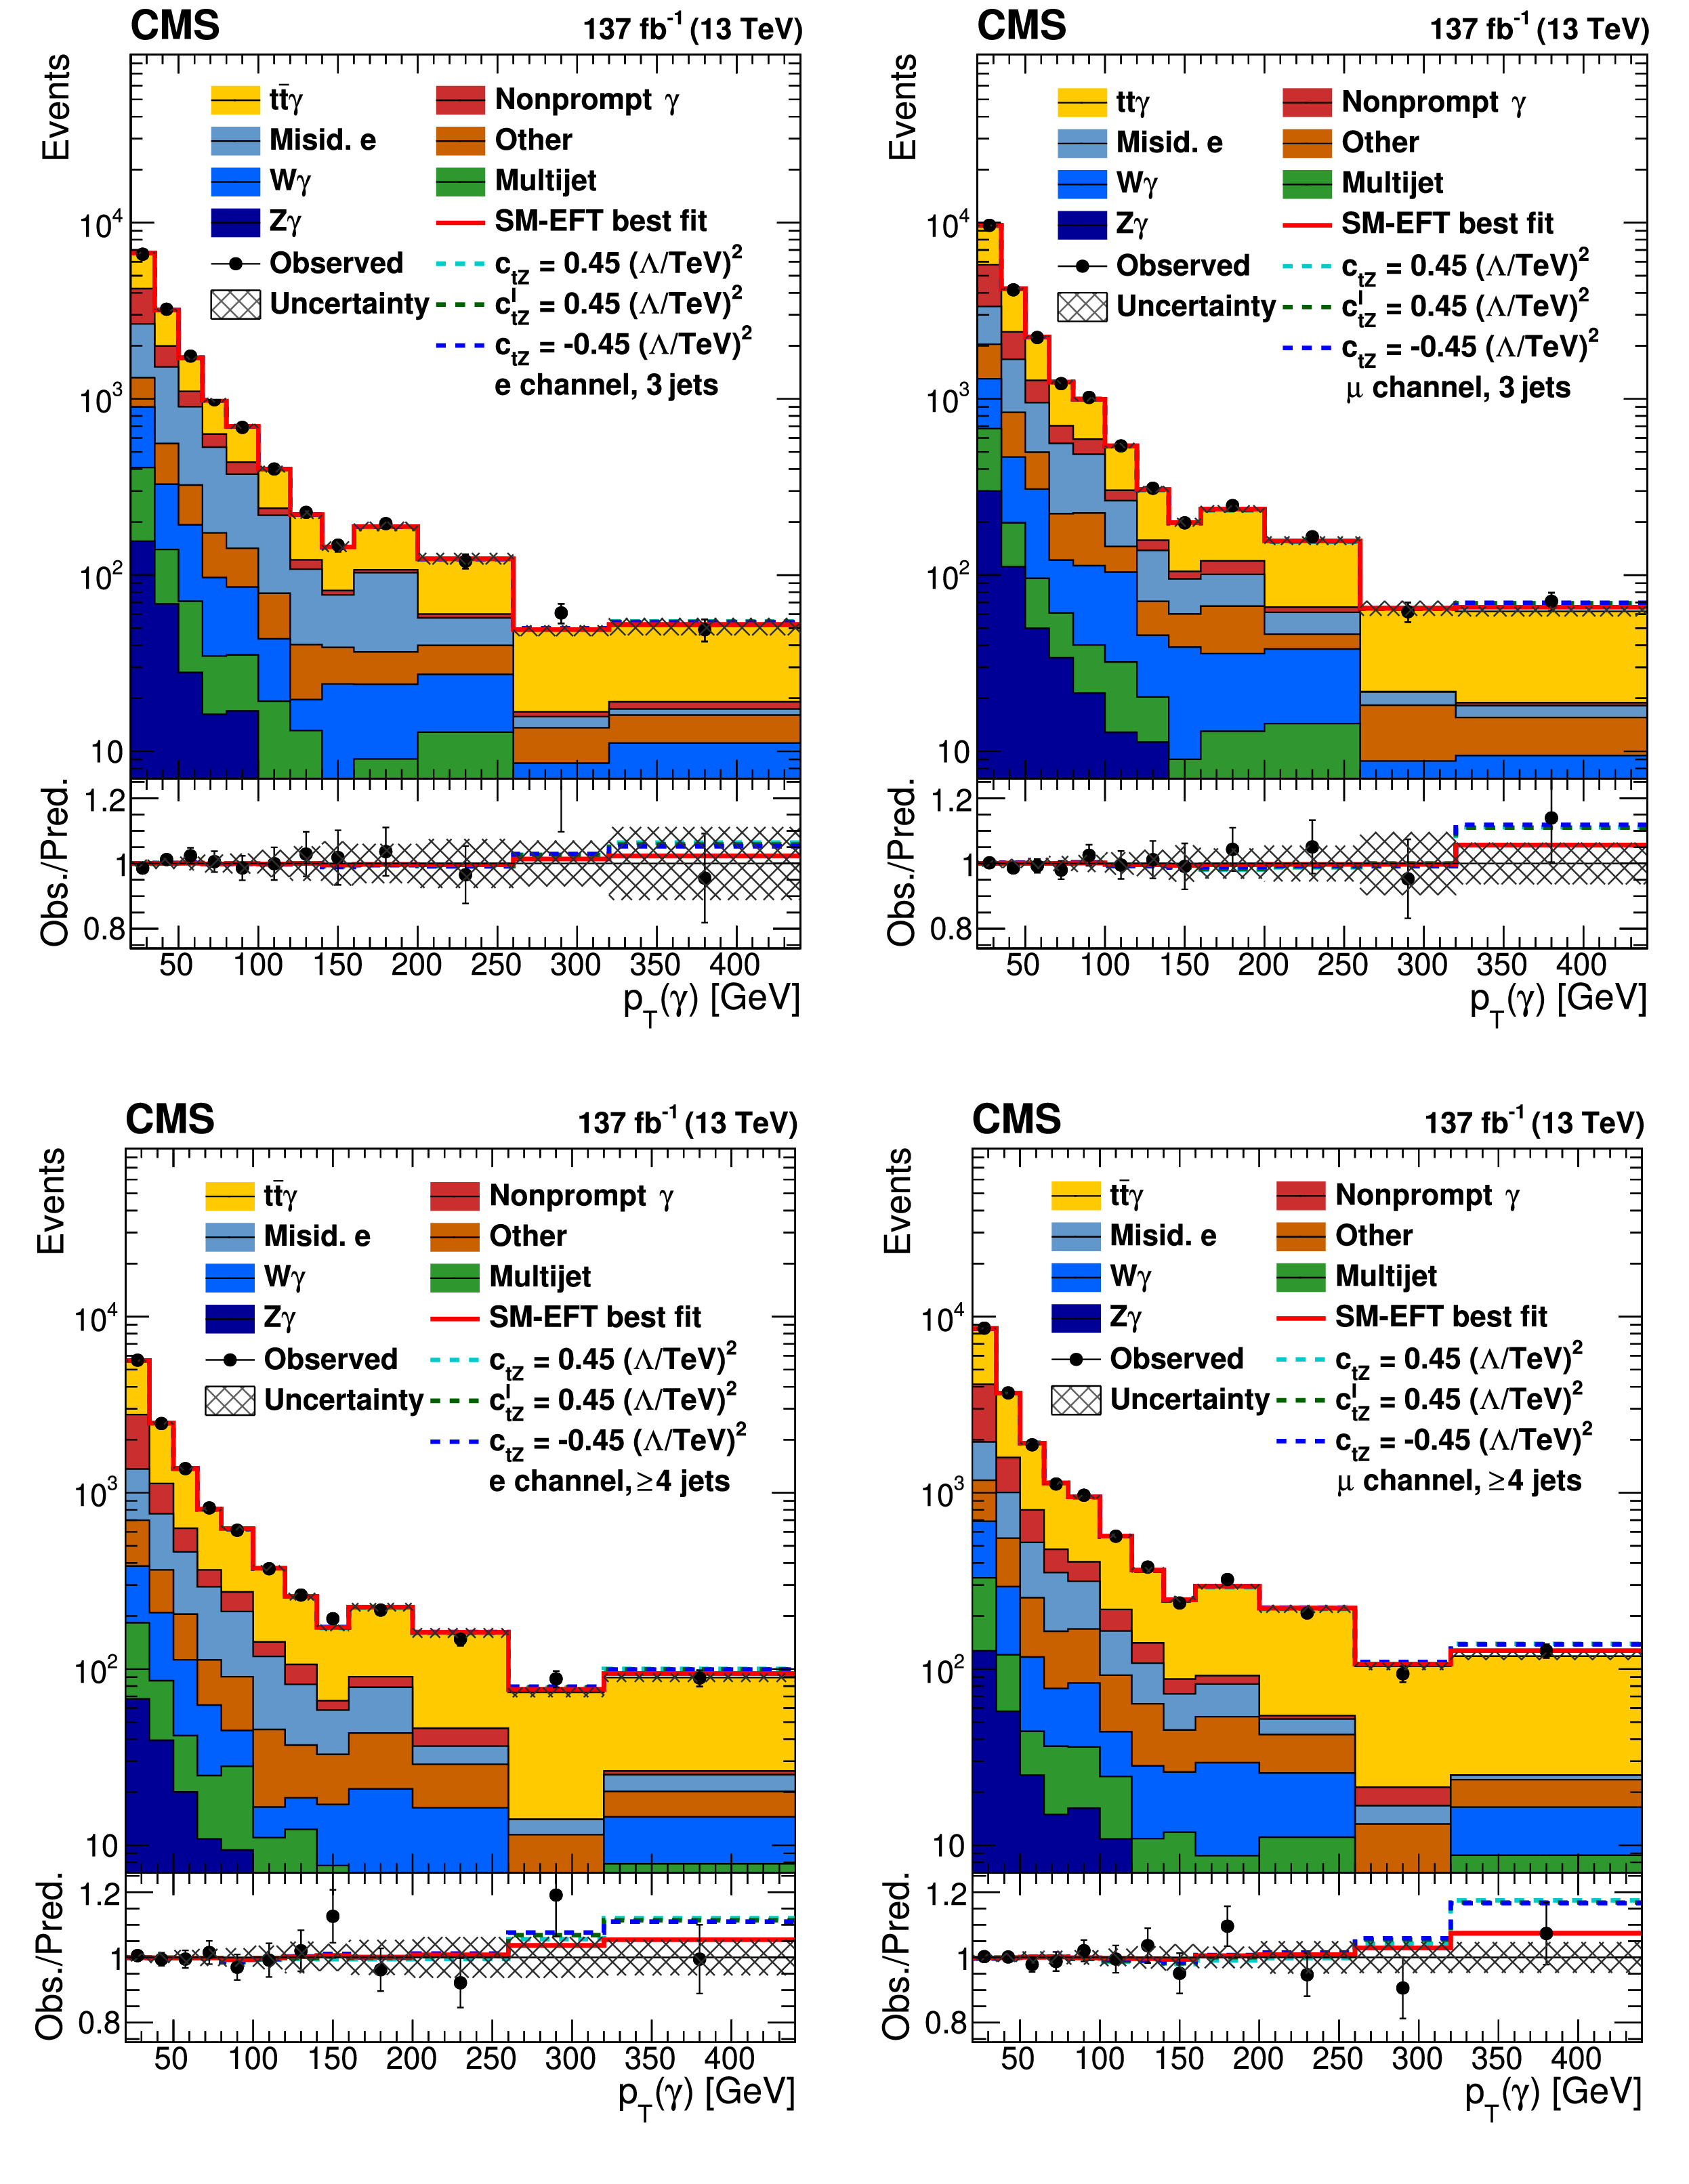
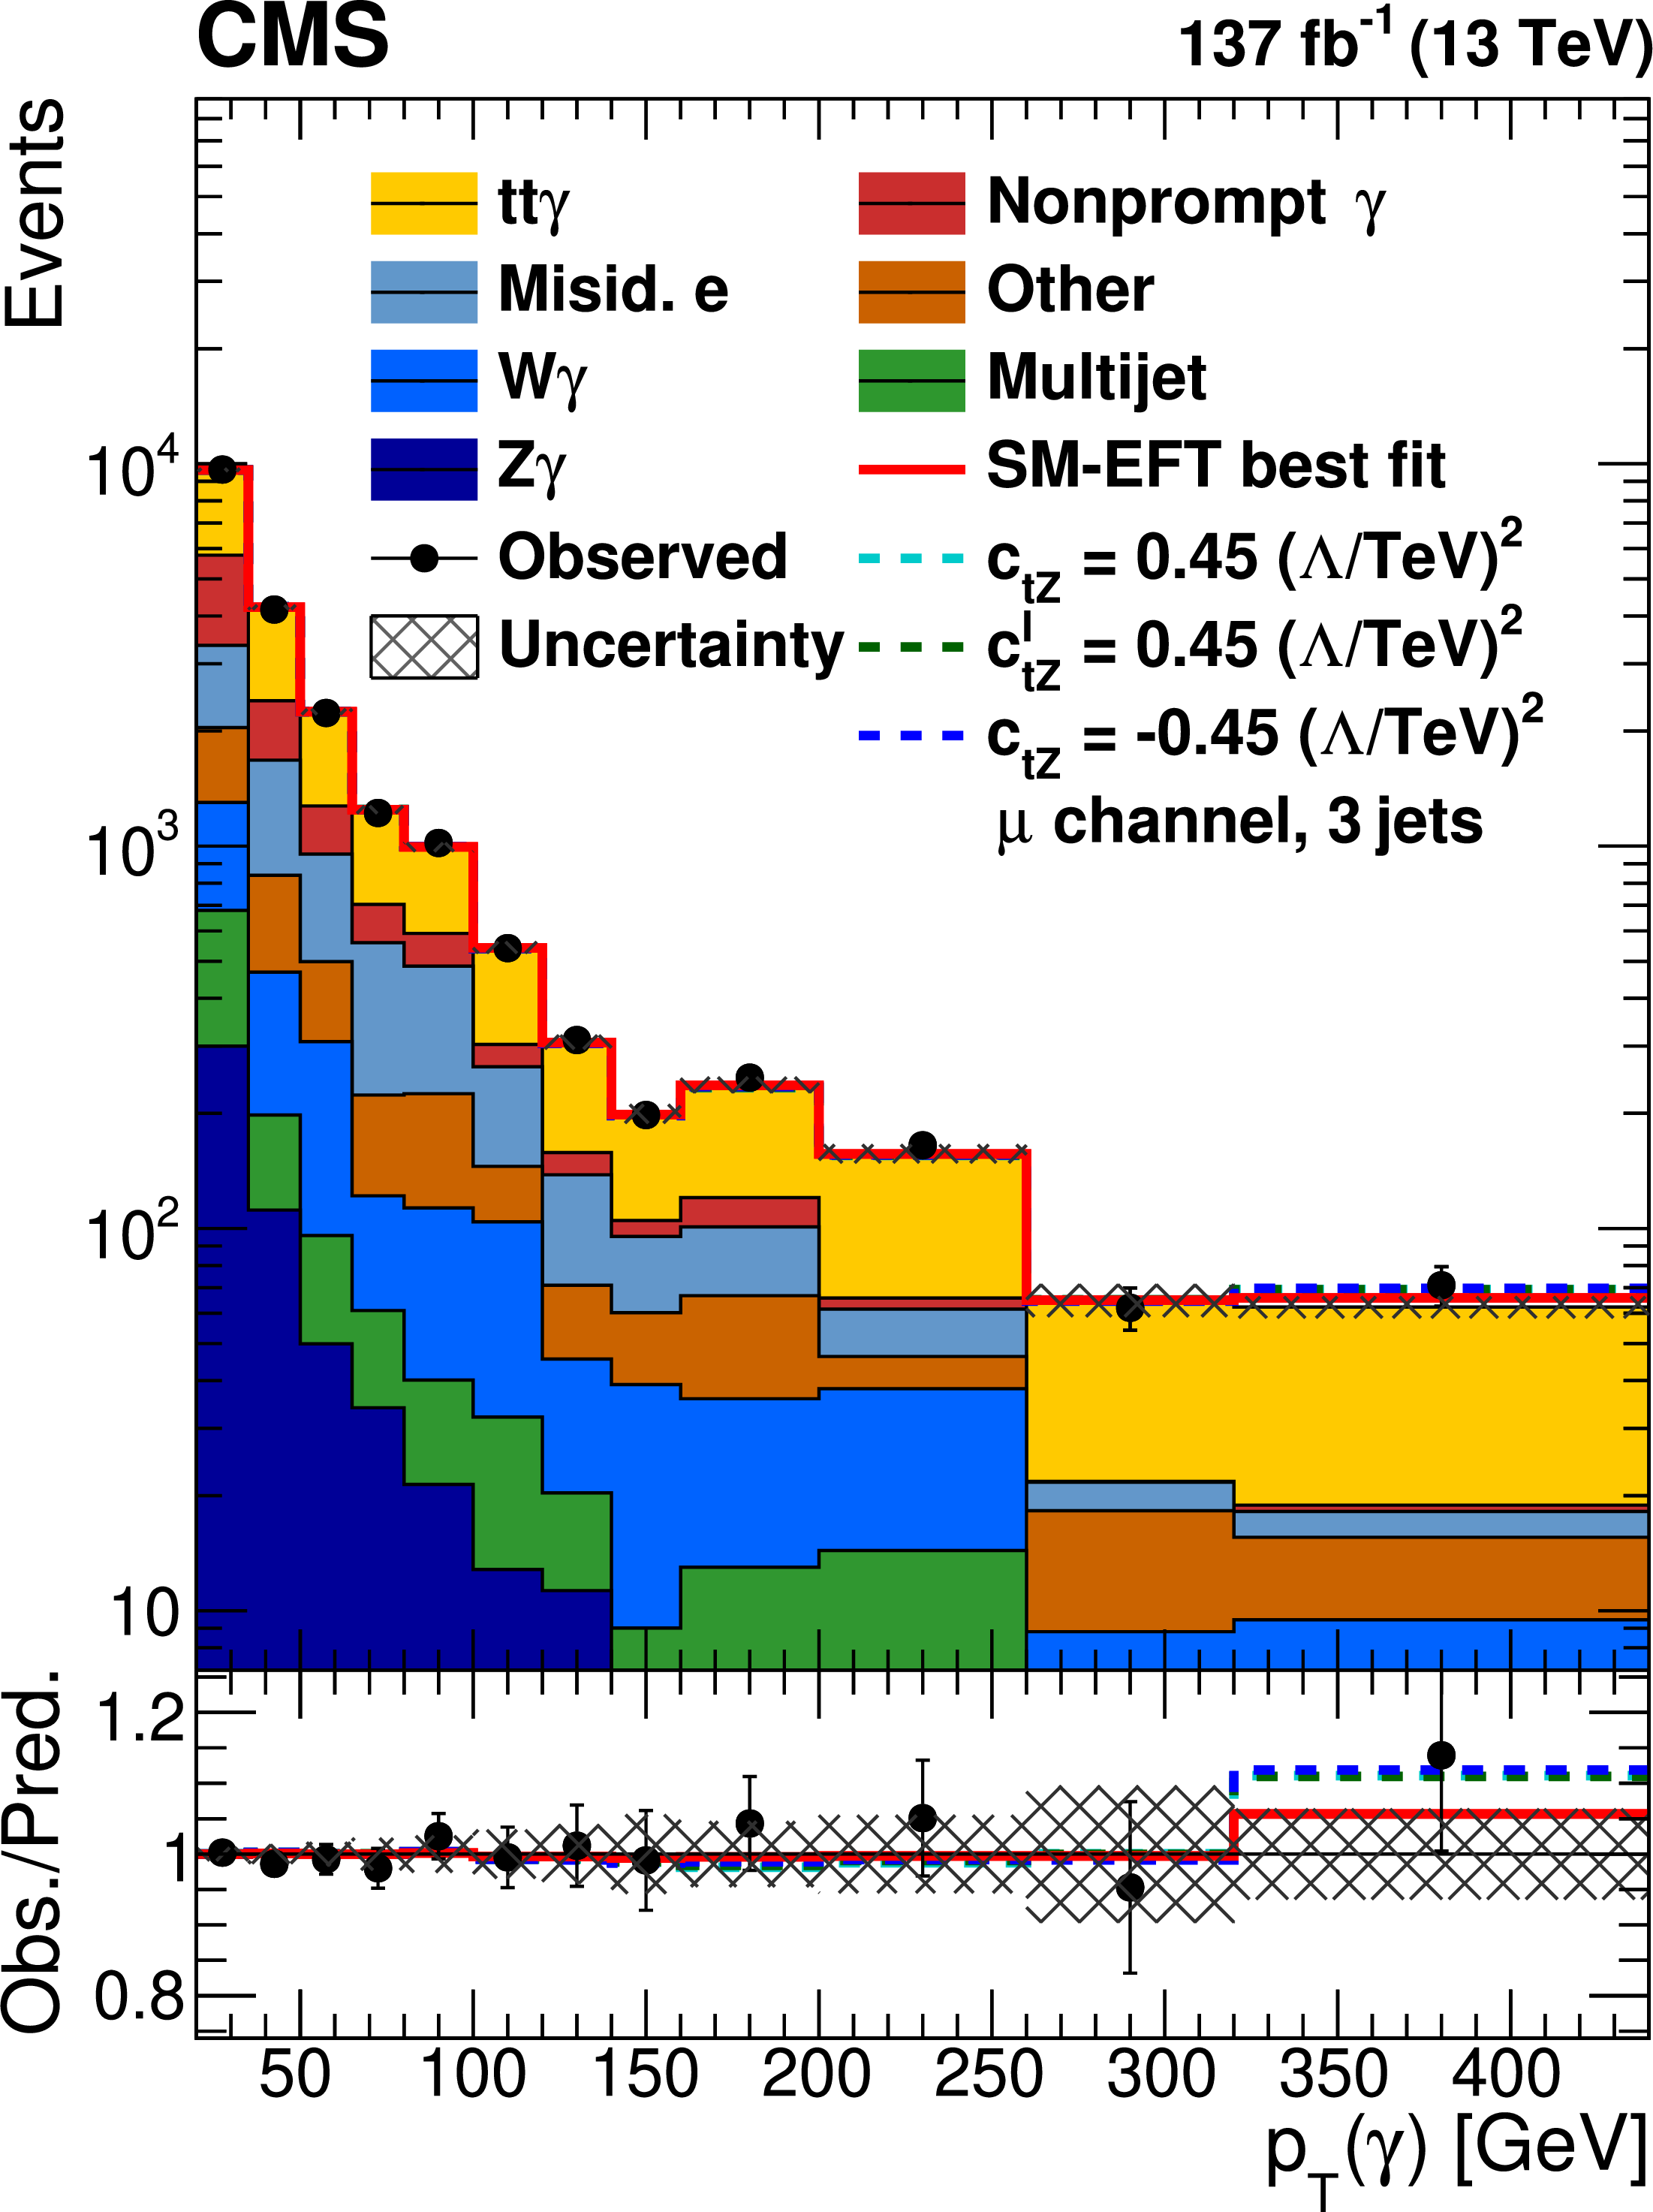
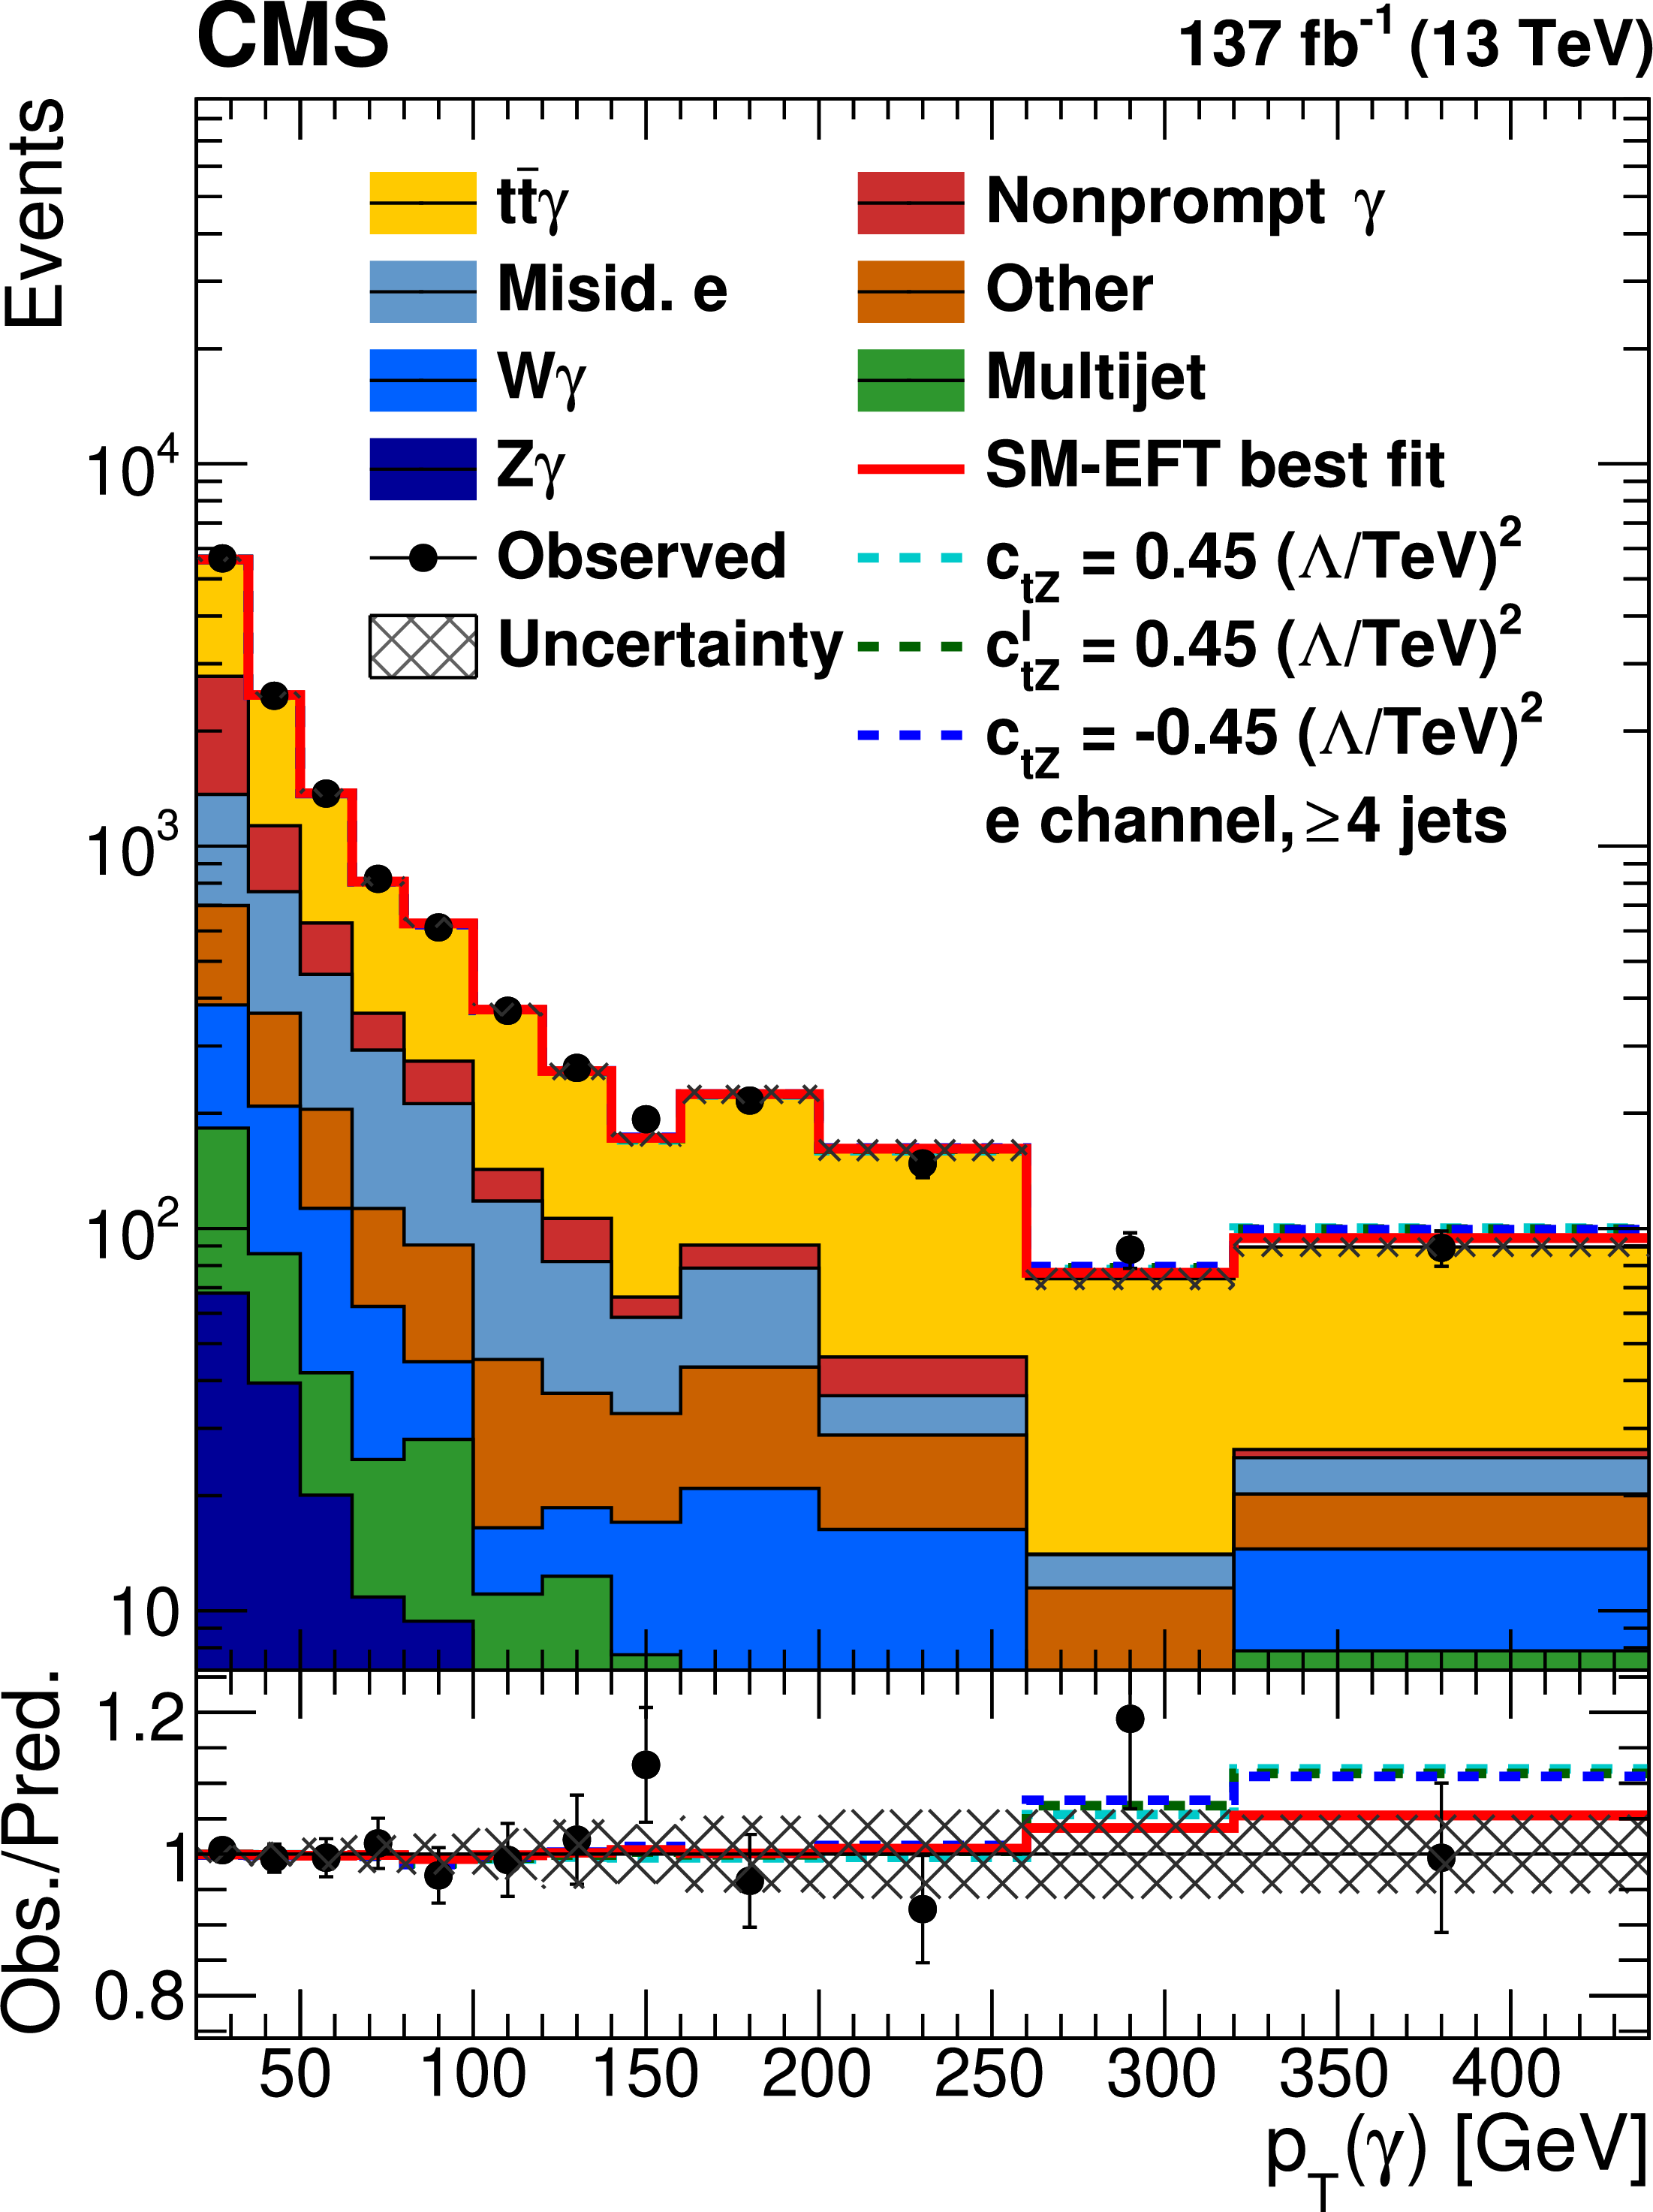
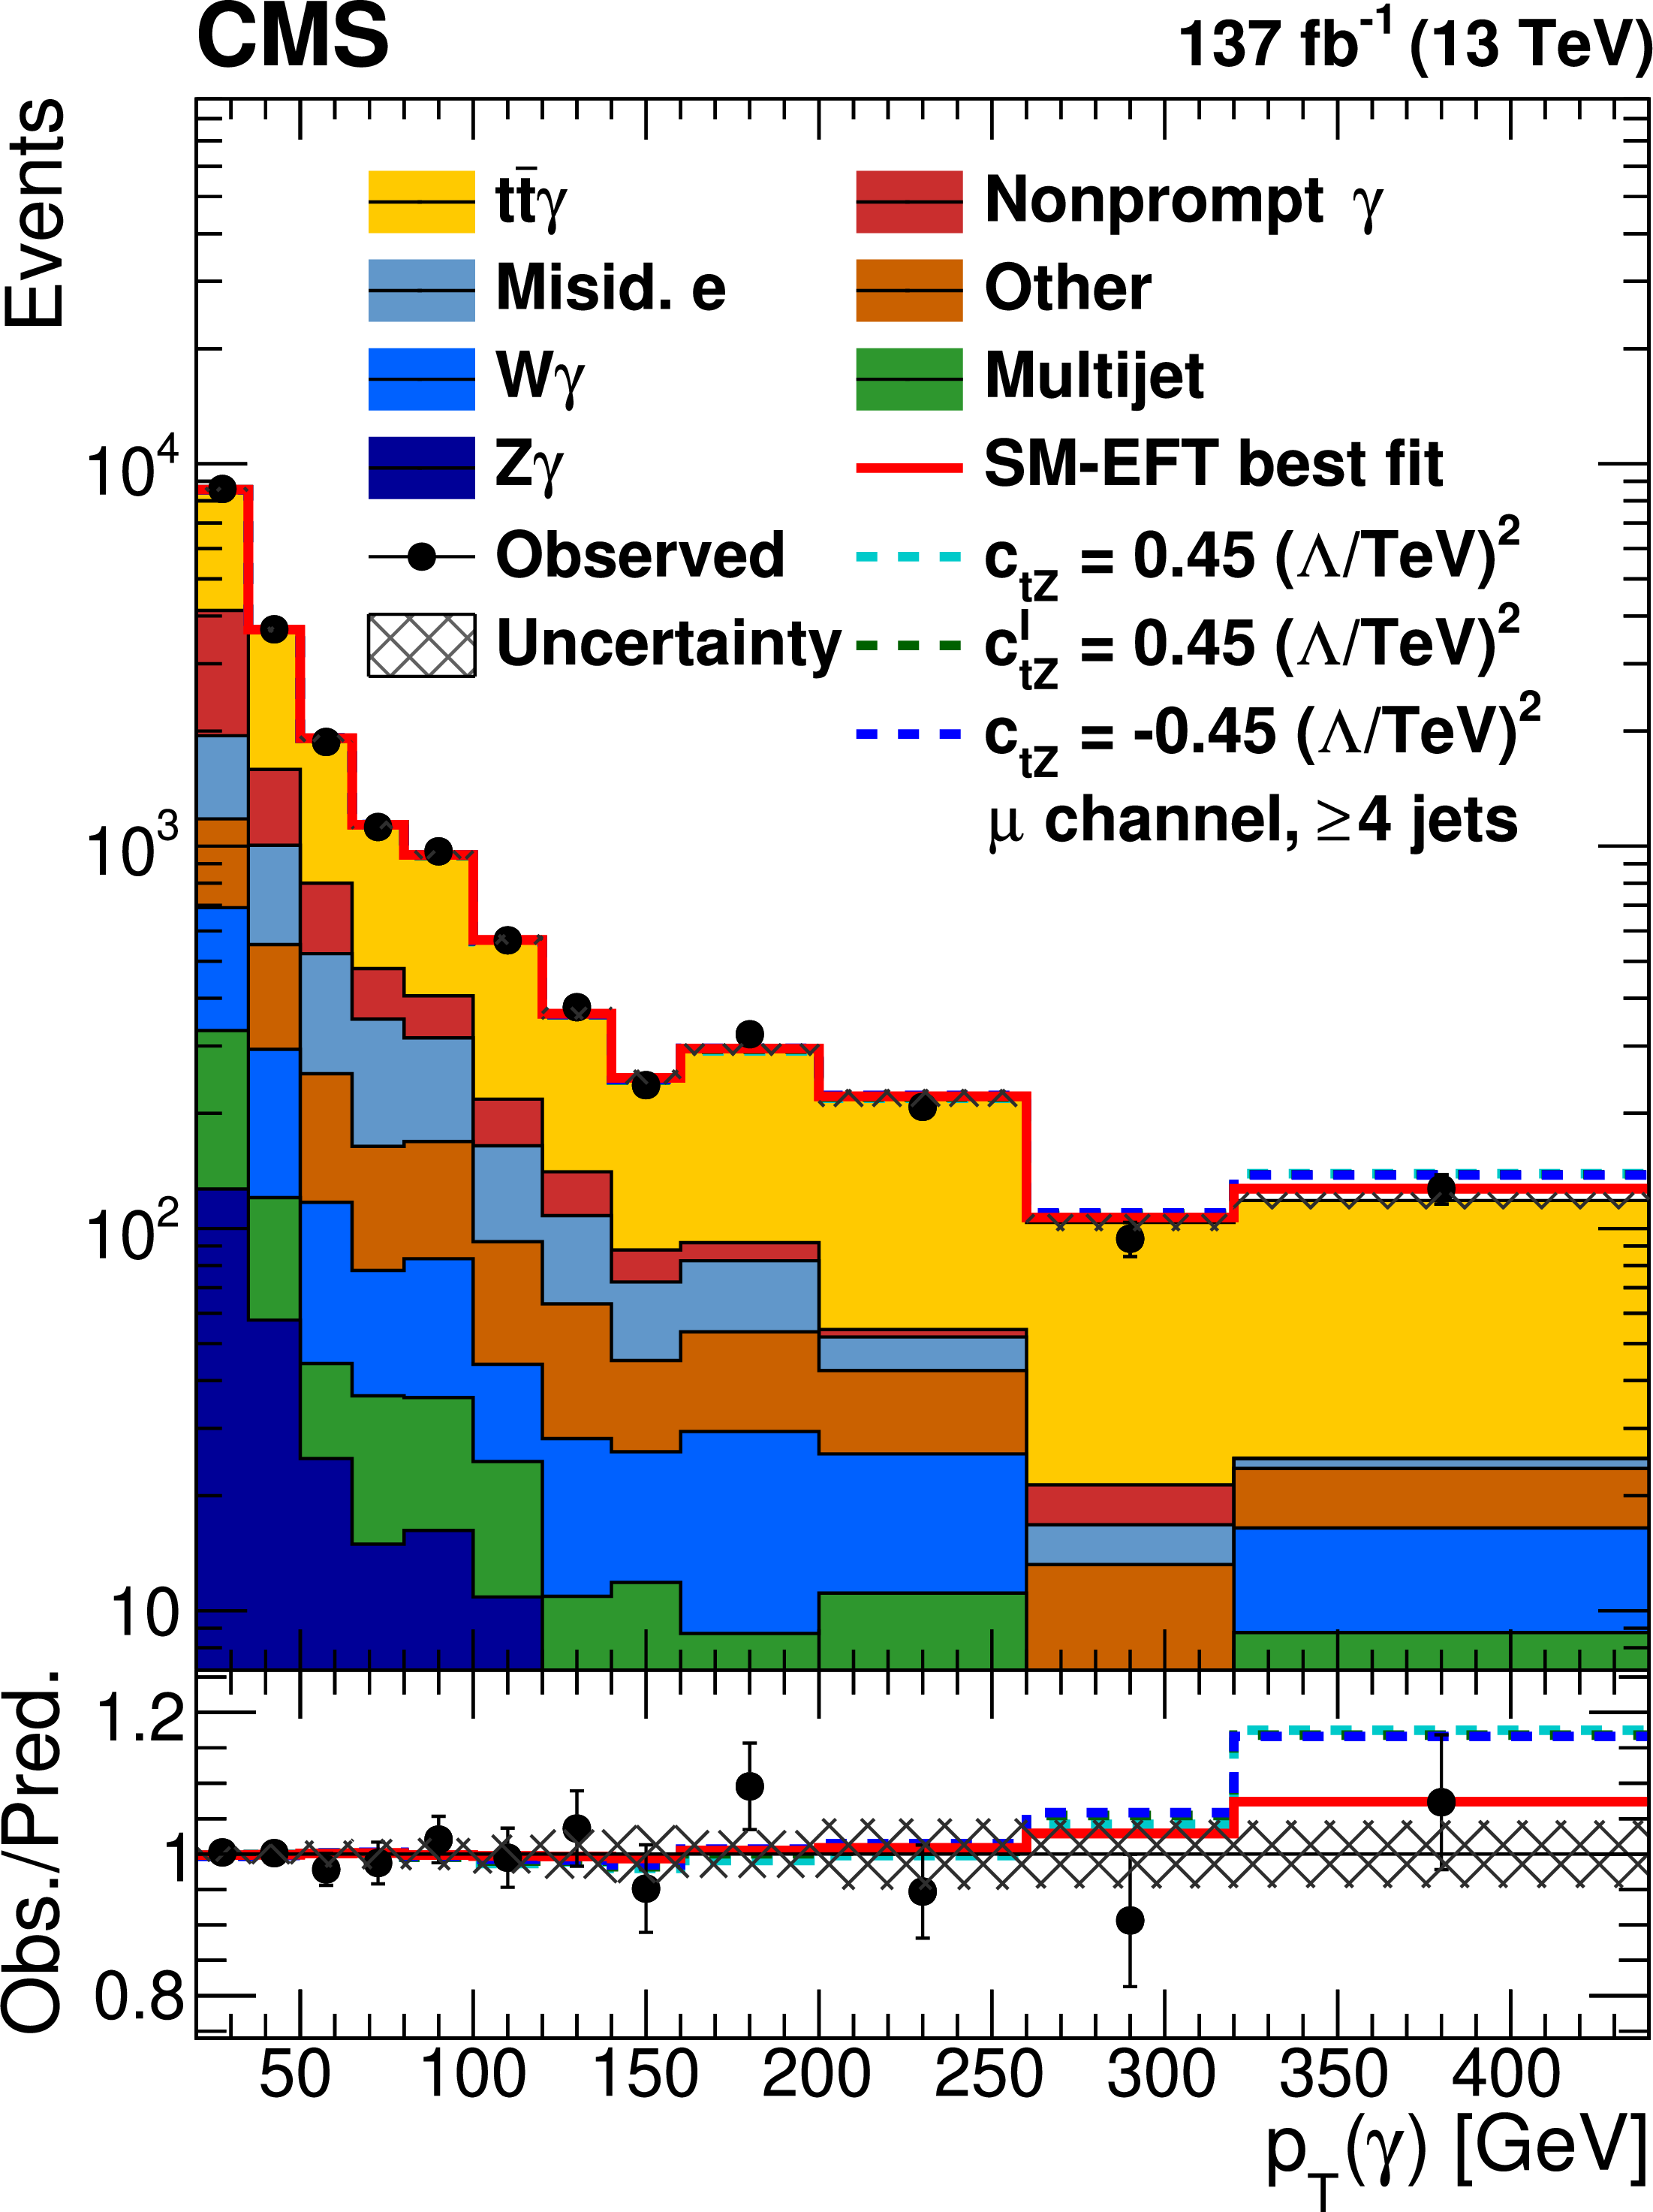
Figure 11:
The observed (points) and predicted (shaded histograms) post-fit yields for the combined Run 2 data set in the SR3 (upper) and SR4p (lower) signal regions for the electron (left) and muon channel (right). The vertical bars on the points give the statistical uncertainties in the data. The lower panel displays the ratio of the data to the predictions and the hatched regions show the total uncertainty. The solid line shows the SM-EFT best fit prediction and the dashed lines show different predictions for non-zero Wilson coefficients, $ {c_{\mathrm{t} \mathrm{Z}}} =0.45$ (light blue), $ {c_{\mathrm{t} \mathrm{Z}}^\mathrm {I}} =0.45$ (green), and $ {c_{\mathrm{t} \mathrm{Z}}} =-0.45$ (dark blue), where $\Lambda $ is set to 1 TeV. |
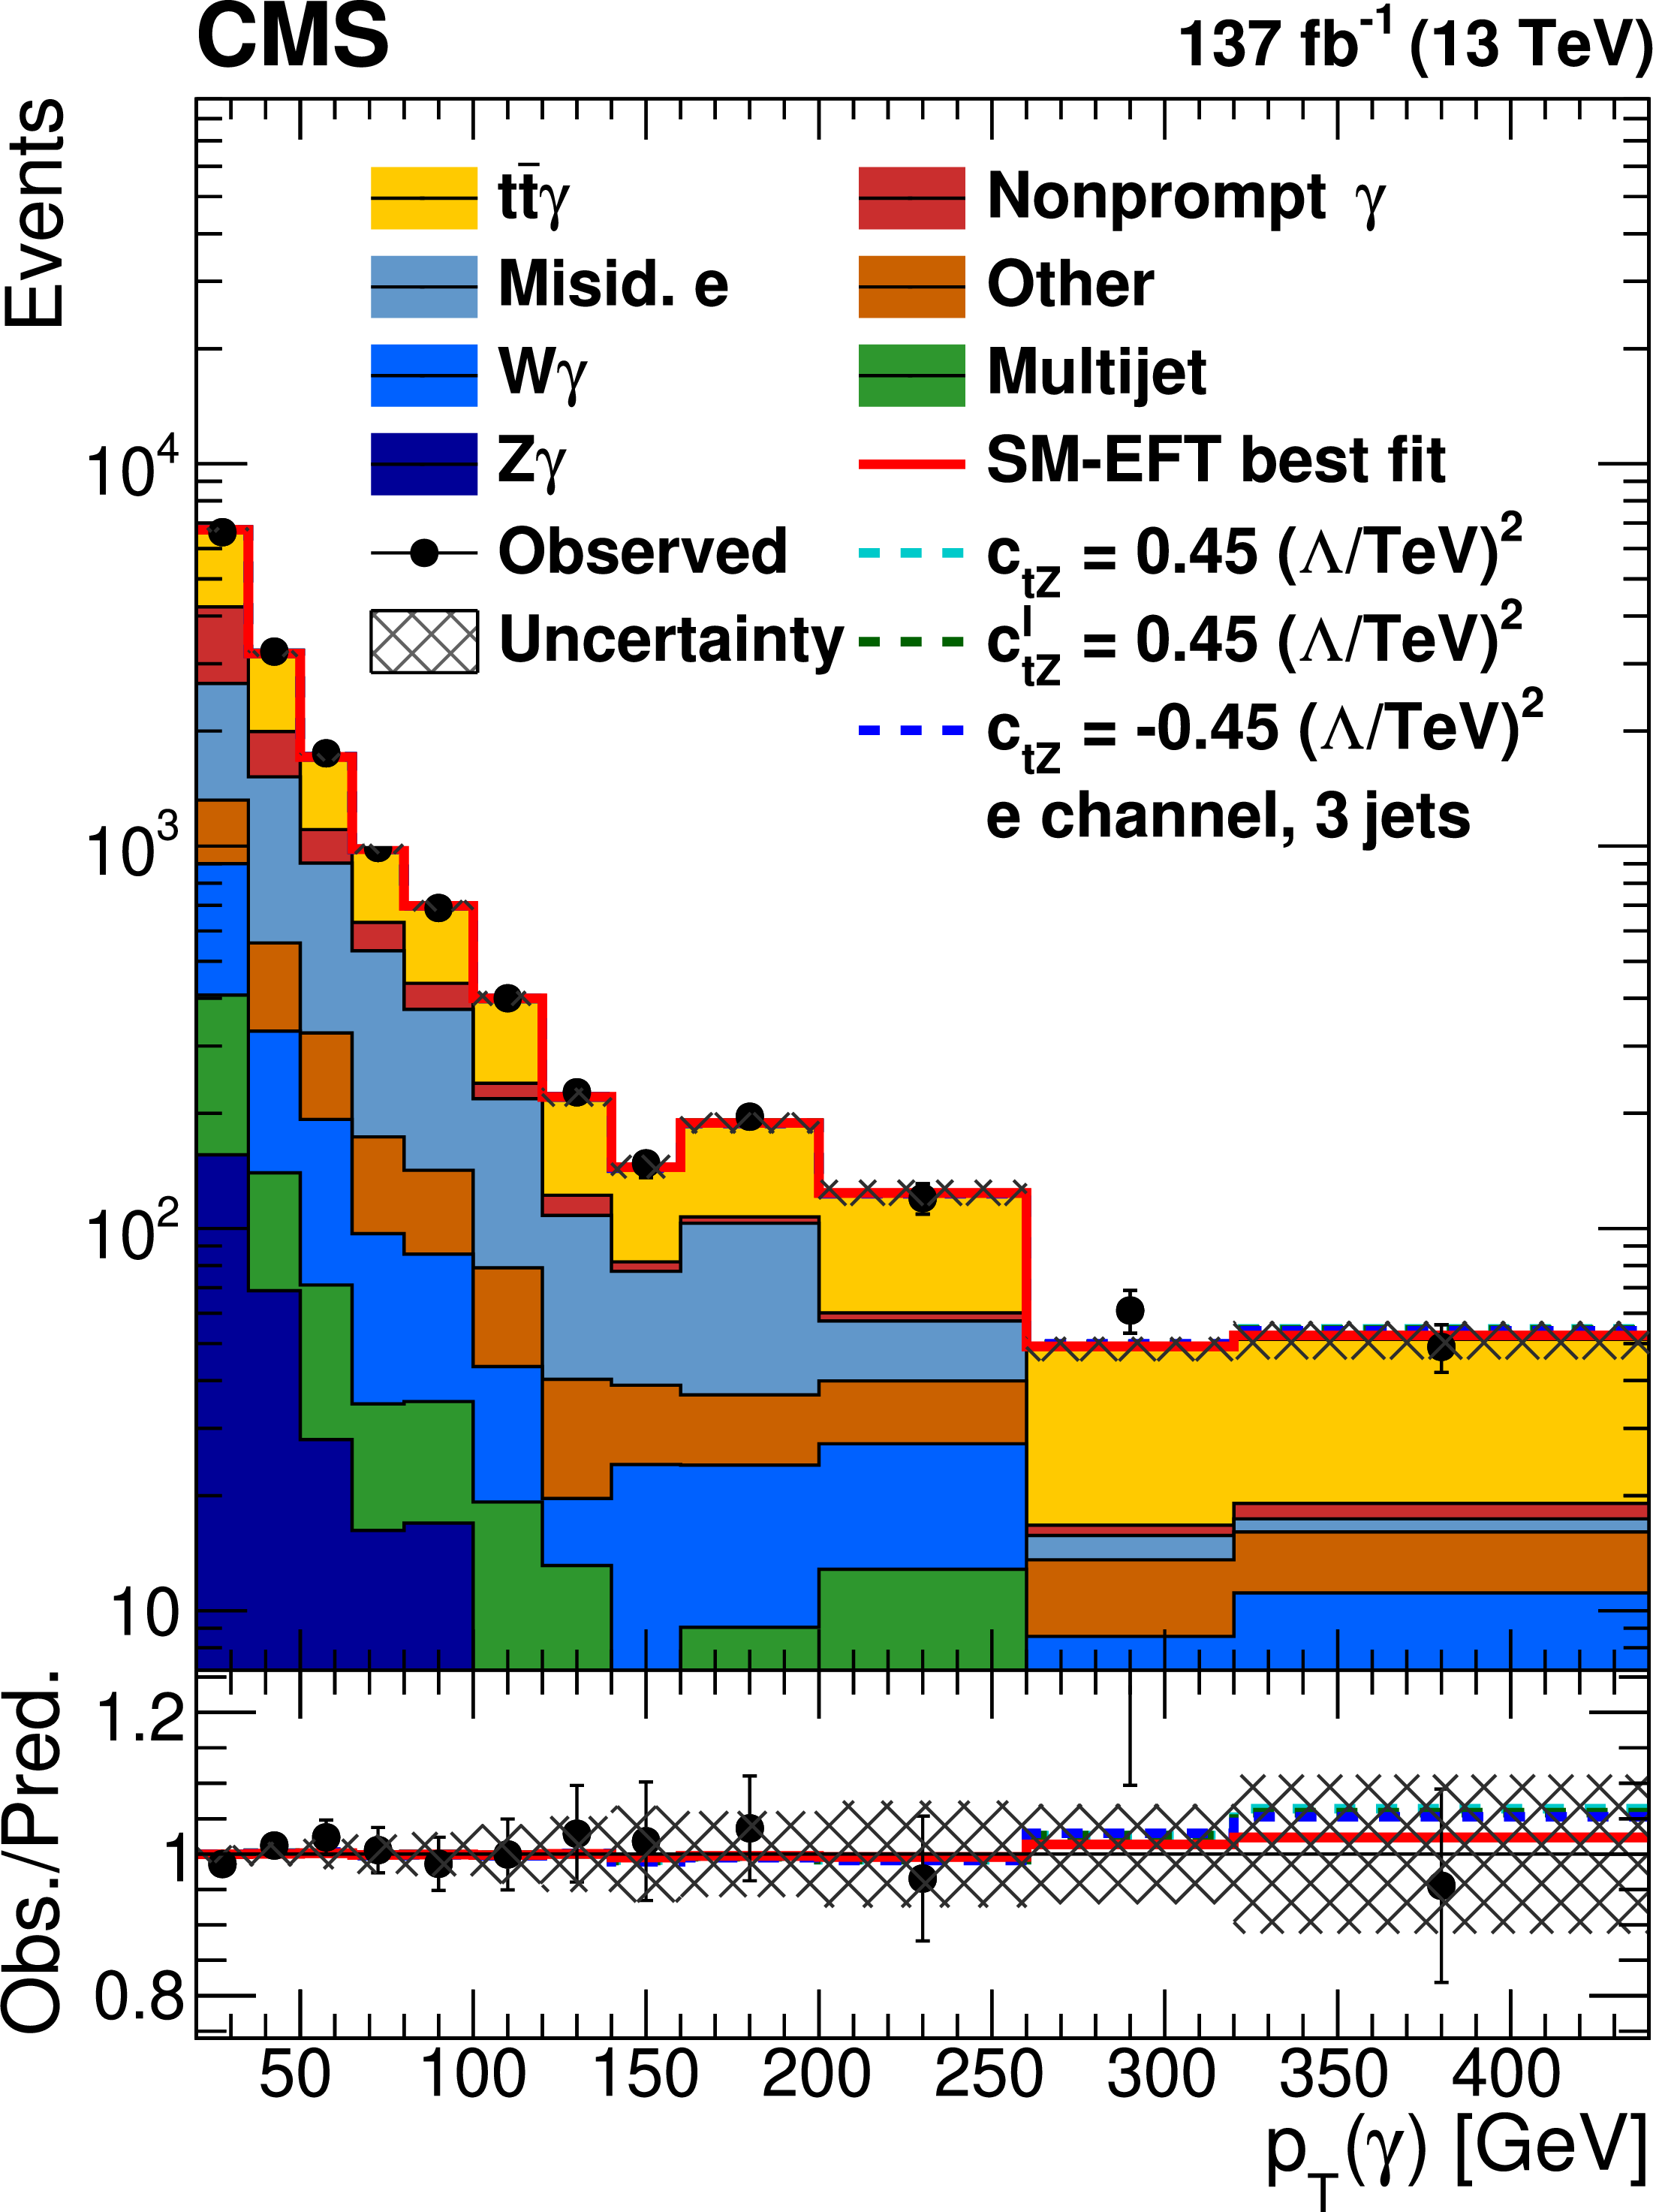
png pdf |
Figure 11-a:
The observed (points) and predicted (shaded histograms) post-fit yields for the combined Run 2 data set in the SR3 signal region for the electron channel. The vertical bars on the points give the statistical uncertainties in the data. The lower panel displays the ratio of the data to the predictions and the hatched regions show the total uncertainty. The solid line shows the SM-EFT best fit prediction and the dashed lines show different predictions for non-zero Wilson coefficients, $ {c_{\mathrm{t} \mathrm{Z}}} =0.45$ (light blue), $ {c_{\mathrm{t} \mathrm{Z}}^\mathrm {I}} =0.45$ (green), and $ {c_{\mathrm{t} \mathrm{Z}}} =-0.45$ (dark blue), where $\Lambda $ is set to 1 TeV. |
png pdf |
Figure 11-b:
The observed (points) and predicted (shaded histograms) post-fit yields for the combined Run 2 data set in the SR3 signal region for the muon channel. The vertical bars on the points give the statistical uncertainties in the data. The lower panel displays the ratio of the data to the predictions and the hatched regions show the total uncertainty. The solid line shows the SM-EFT best fit prediction and the dashed lines show different predictions for non-zero Wilson coefficients, $ {c_{\mathrm{t} \mathrm{Z}}} =0.45$ (light blue), $ {c_{\mathrm{t} \mathrm{Z}}^\mathrm {I}} =0.45$ (green), and $ {c_{\mathrm{t} \mathrm{Z}}} =-0.45$ (dark blue), where $\Lambda $ is set to 1 TeV. |
png pdf |
Figure 11-c:
The observed (points) and predicted (shaded histograms) post-fit yields for the combined Run 2 data set in the SR4p signal region for the electron channel. The vertical bars on the points give the statistical uncertainties in the data. The lower panel displays the ratio of the data to the predictions and the hatched regions show the total uncertainty. The solid line shows the SM-EFT best fit prediction and the dashed lines show different predictions for non-zero Wilson coefficients, $ {c_{\mathrm{t} \mathrm{Z}}} =0.45$ (light blue), $ {c_{\mathrm{t} \mathrm{Z}}^\mathrm {I}} =0.45$ (green), and $ {c_{\mathrm{t} \mathrm{Z}}} =-0.45$ (dark blue), where $\Lambda $ is set to 1 TeV. |
png pdf |
Figure 11-d:
The observed (points) and predicted (shaded histograms) post-fit yields for the combined Run 2 data set in the SR4p signal region for the muon channel. The vertical bars on the points give the statistical uncertainties in the data. The lower panel displays the ratio of the data to the predictions and the hatched regions show the total uncertainty. The solid line shows the SM-EFT best fit prediction and the dashed lines show different predictions for non-zero Wilson coefficients, $ {c_{\mathrm{t} \mathrm{Z}}} =0.45$ (light blue), $ {c_{\mathrm{t} \mathrm{Z}}^\mathrm {I}} =0.45$ (green), and $ {c_{\mathrm{t} \mathrm{Z}}} =-0.45$ (dark blue), where $\Lambda $ is set to 1 TeV. |
png pdf |
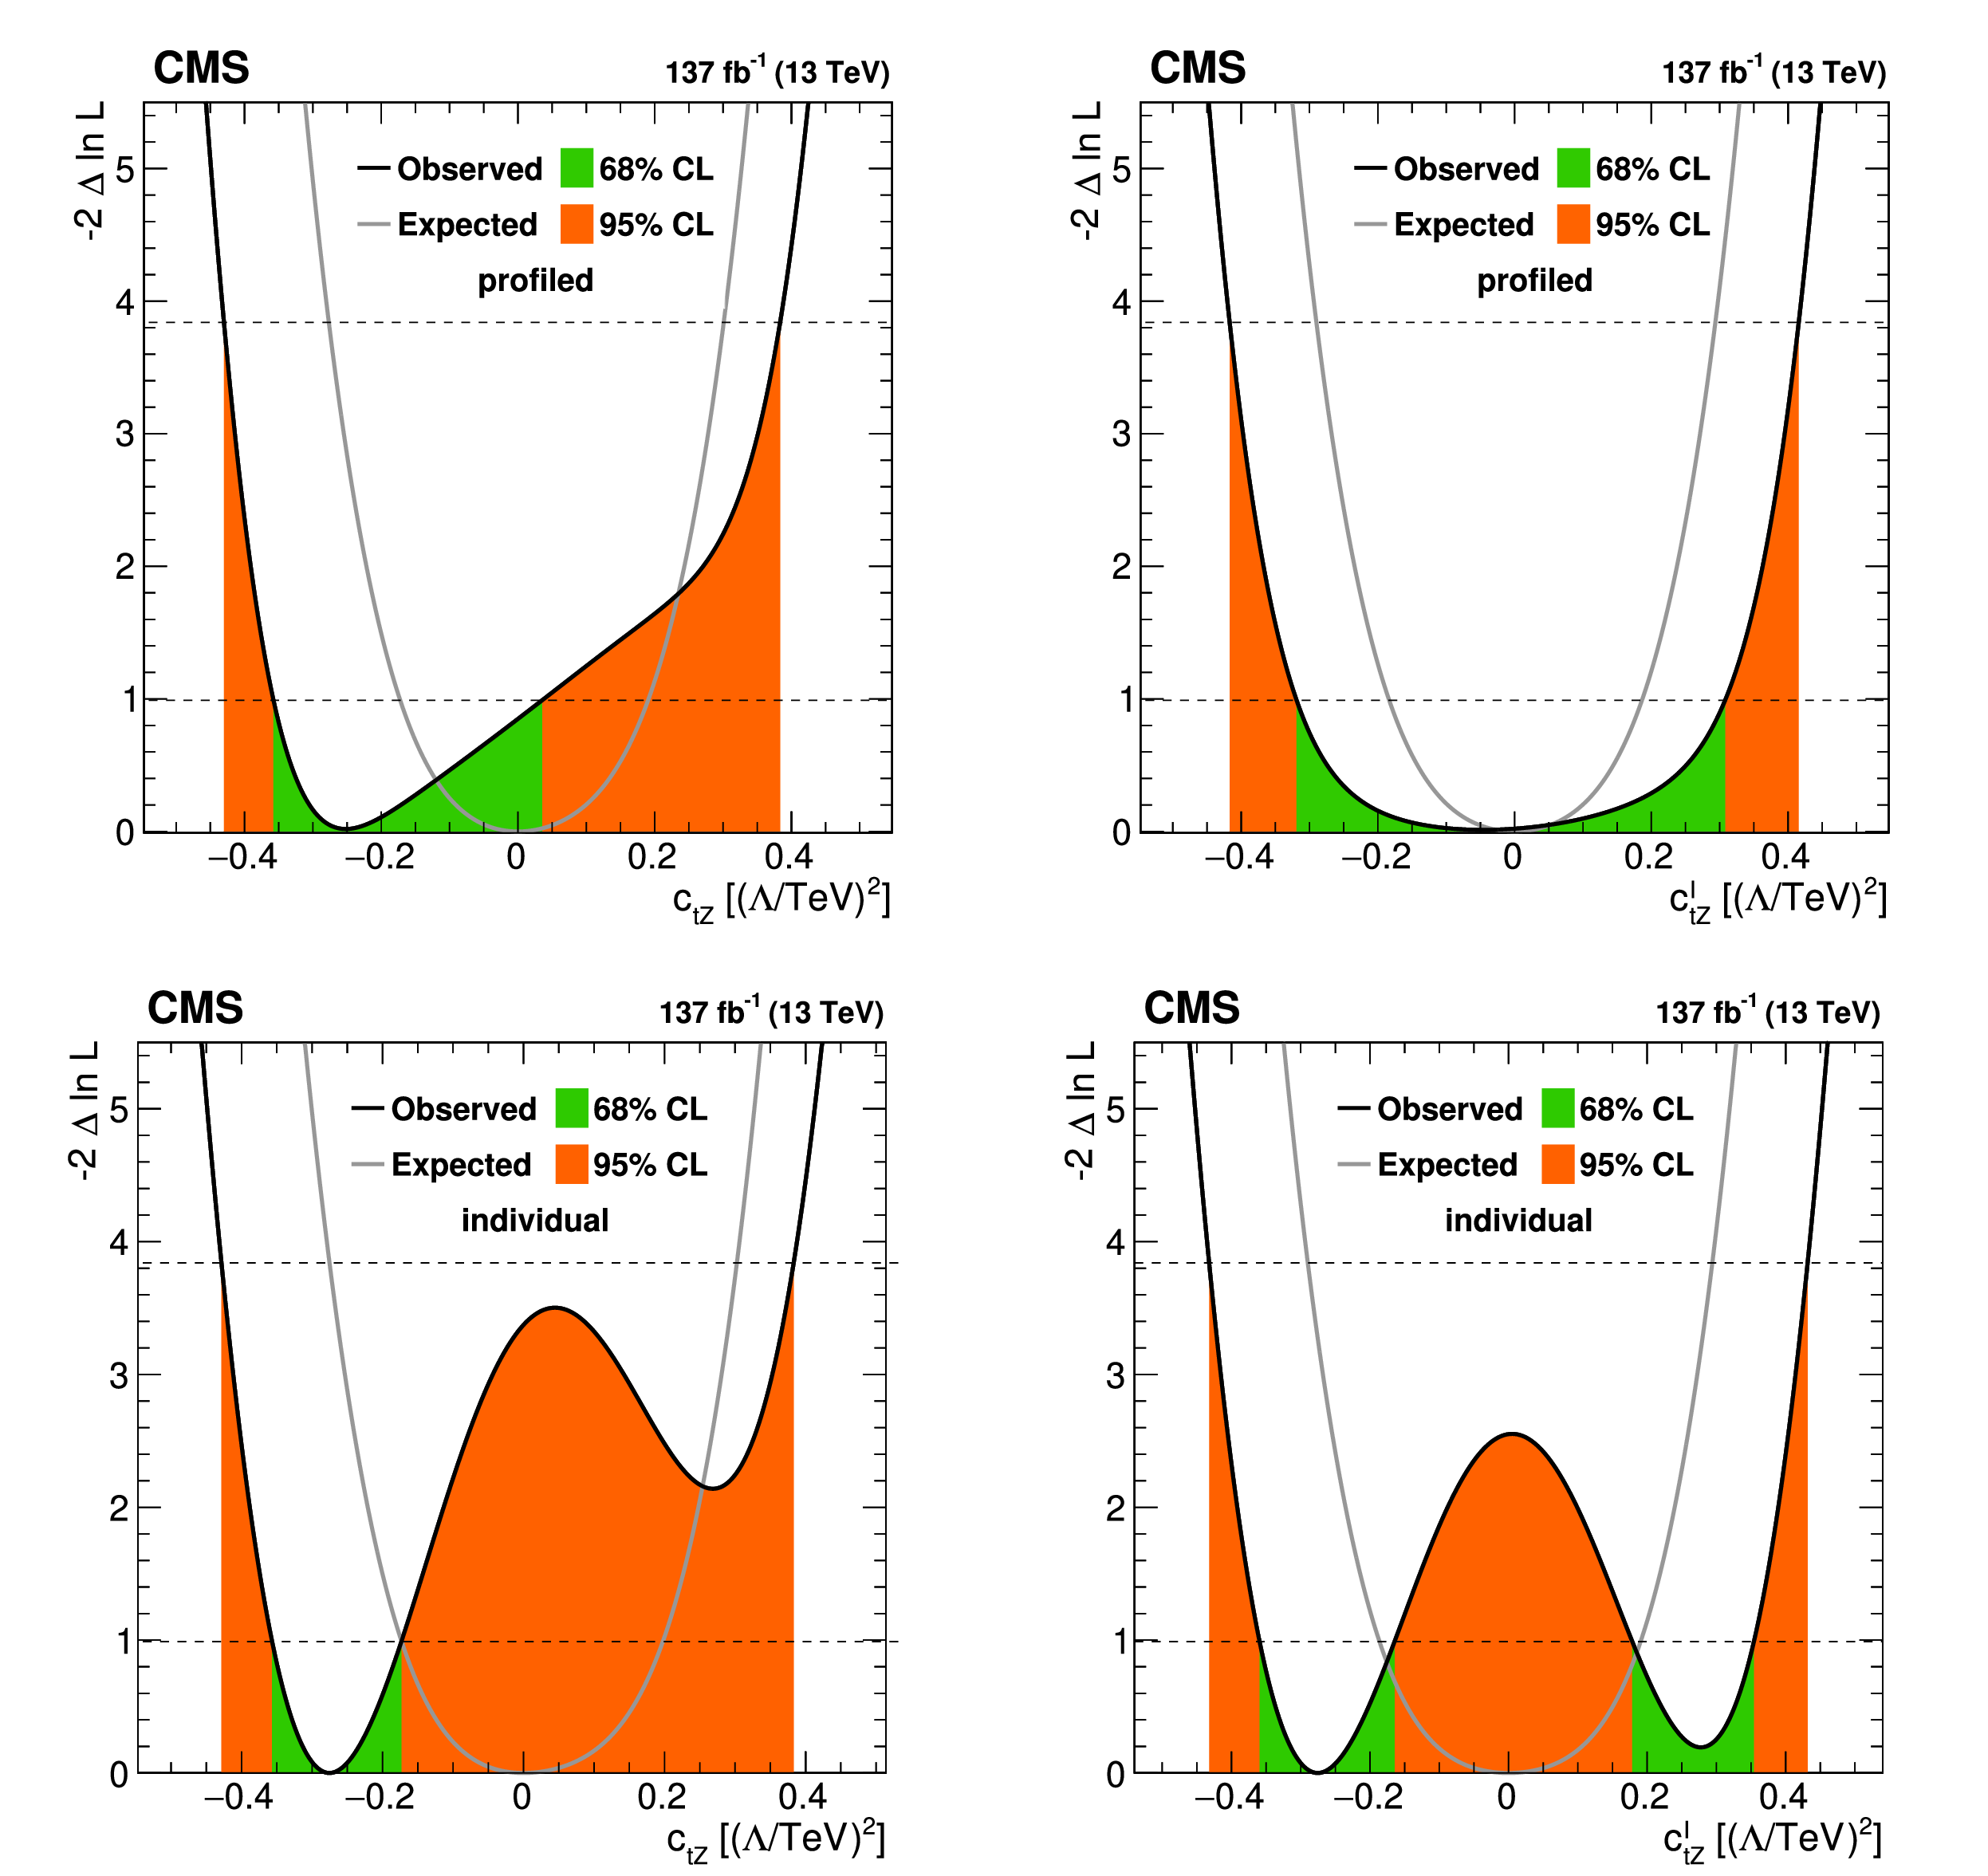
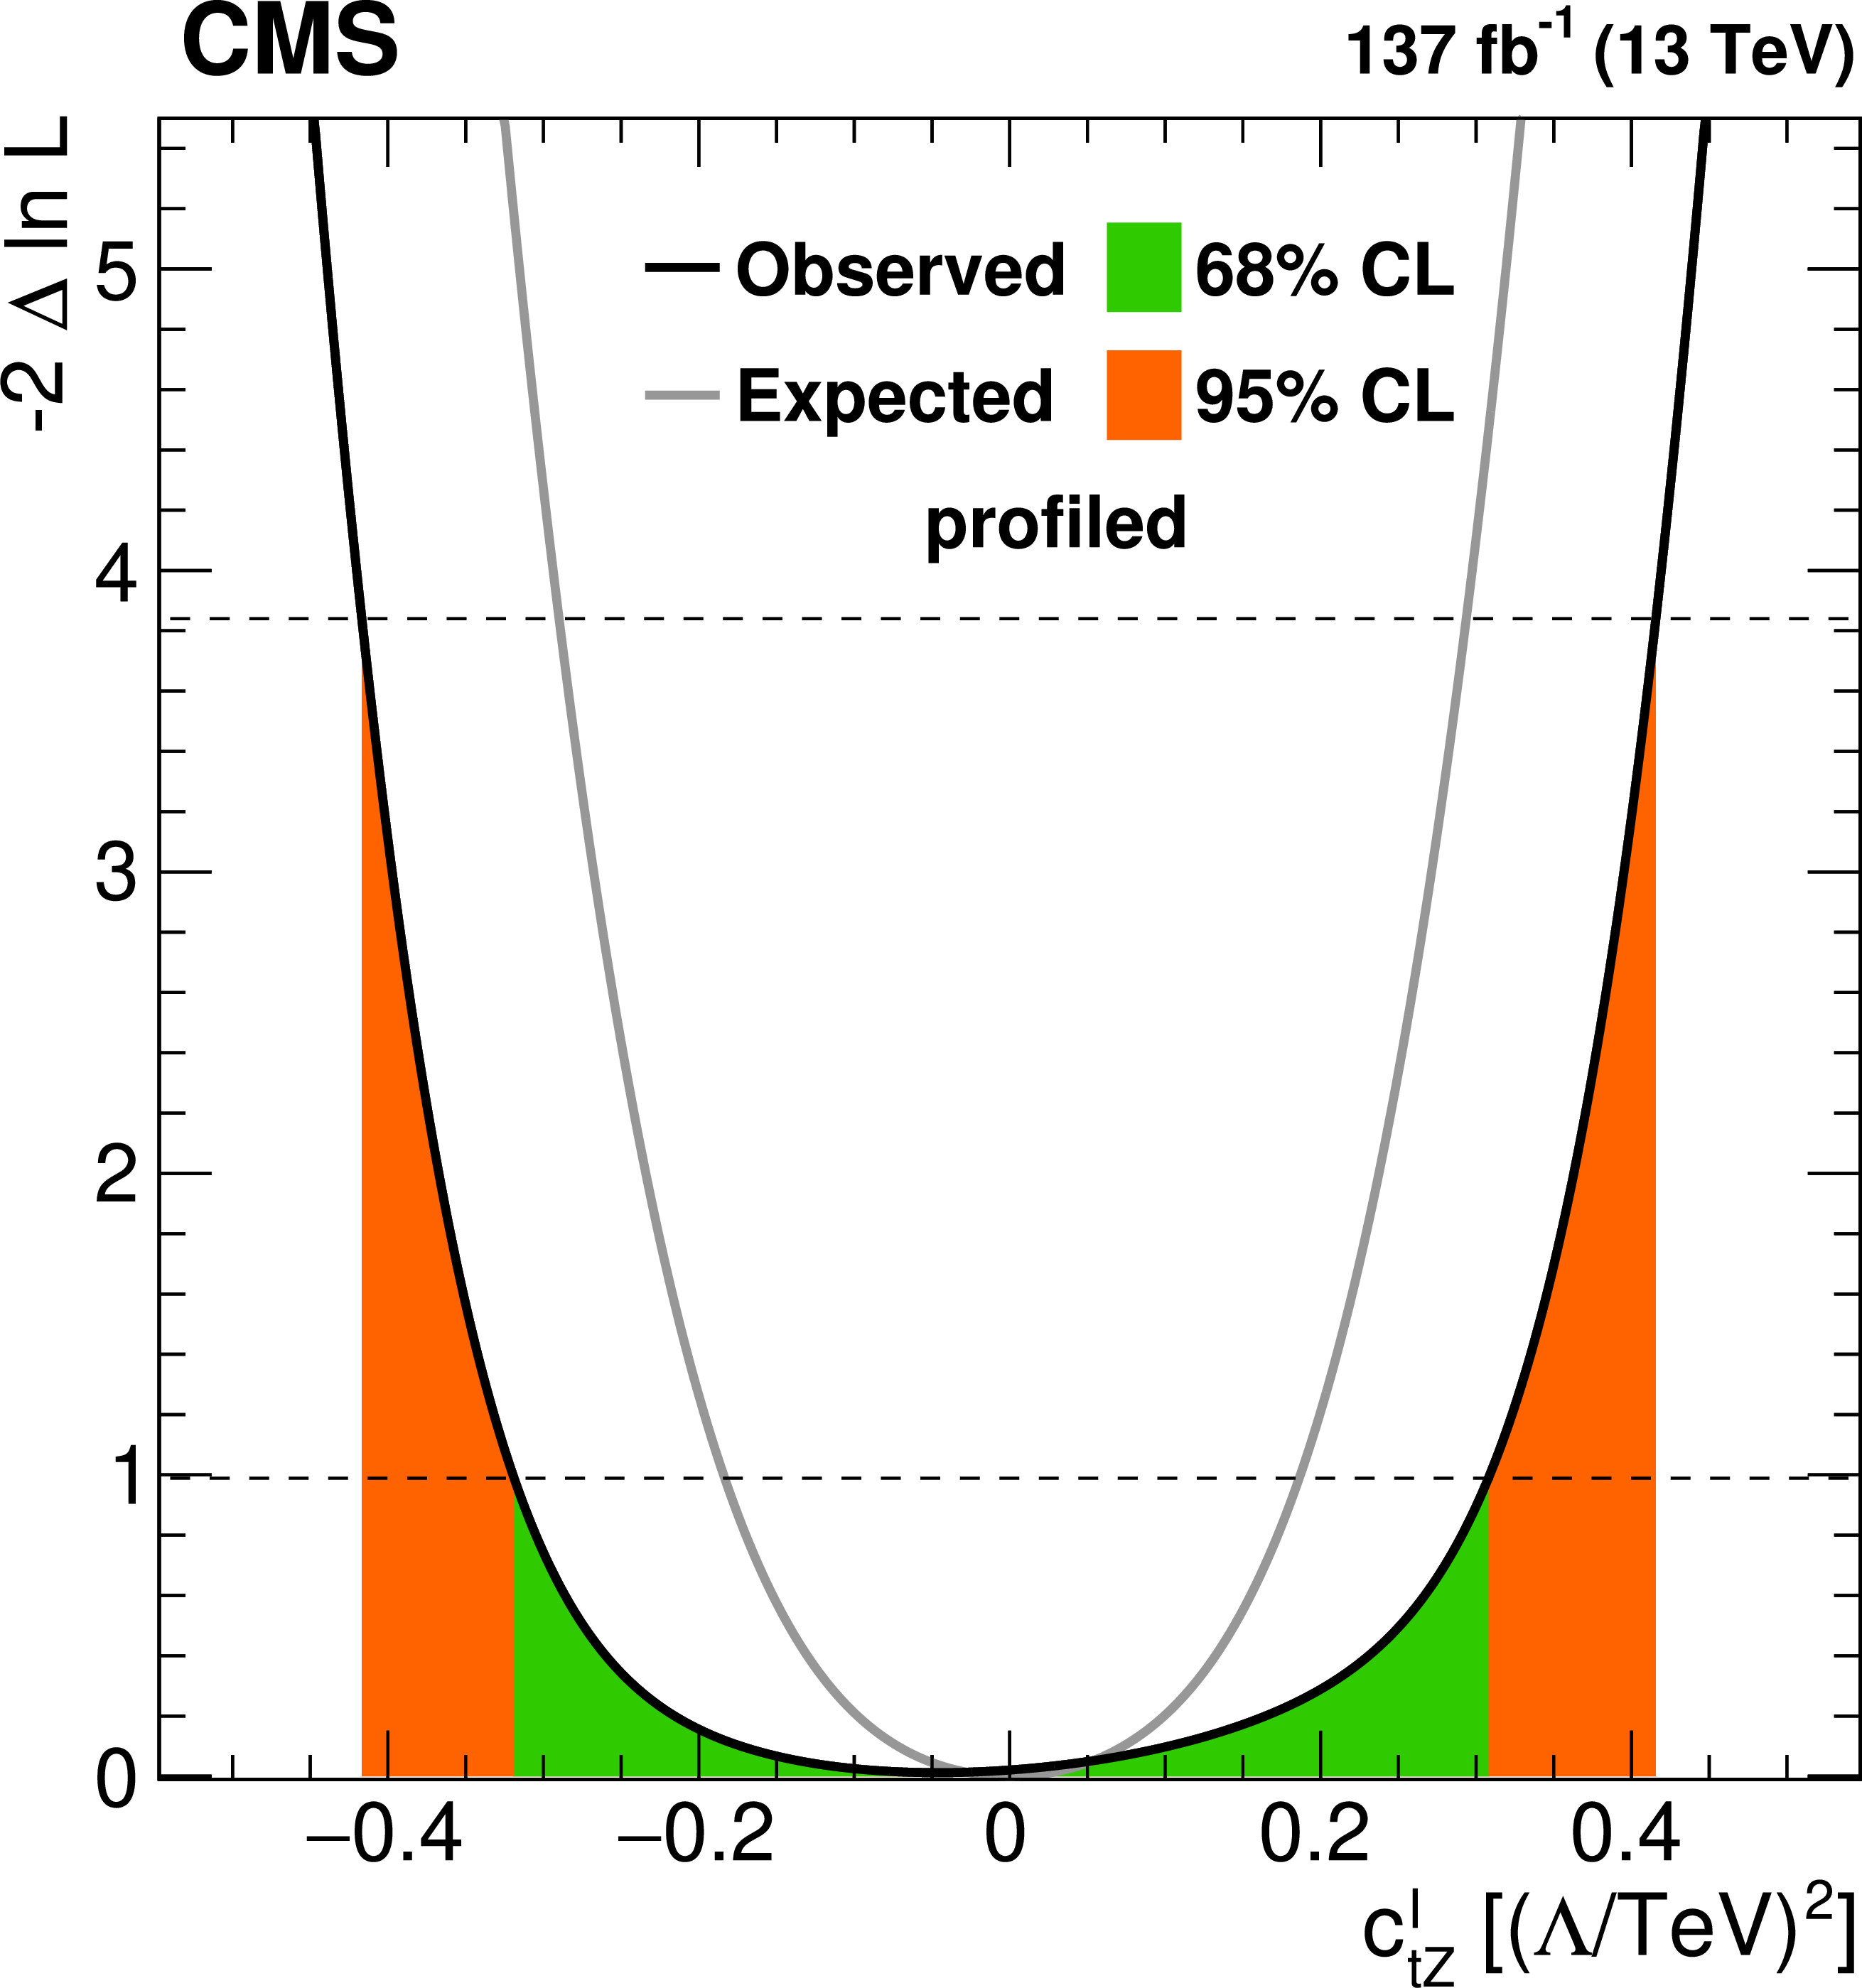
Figure 12:
Results of the one-dimensional scans of the Wilson coefficients ${c_{\mathrm{t} \mathrm{Z}}}$ (left) and ${c_{\mathrm{t} \mathrm{Z}}^\mathrm {I}}$ (right). In the upper row, the other Wilson coefficient is profiled, while in the lower row it is set to zero. The green and orange bands indicate the 68 and 95% CL contours on the Wilson coefficients, respectively. |
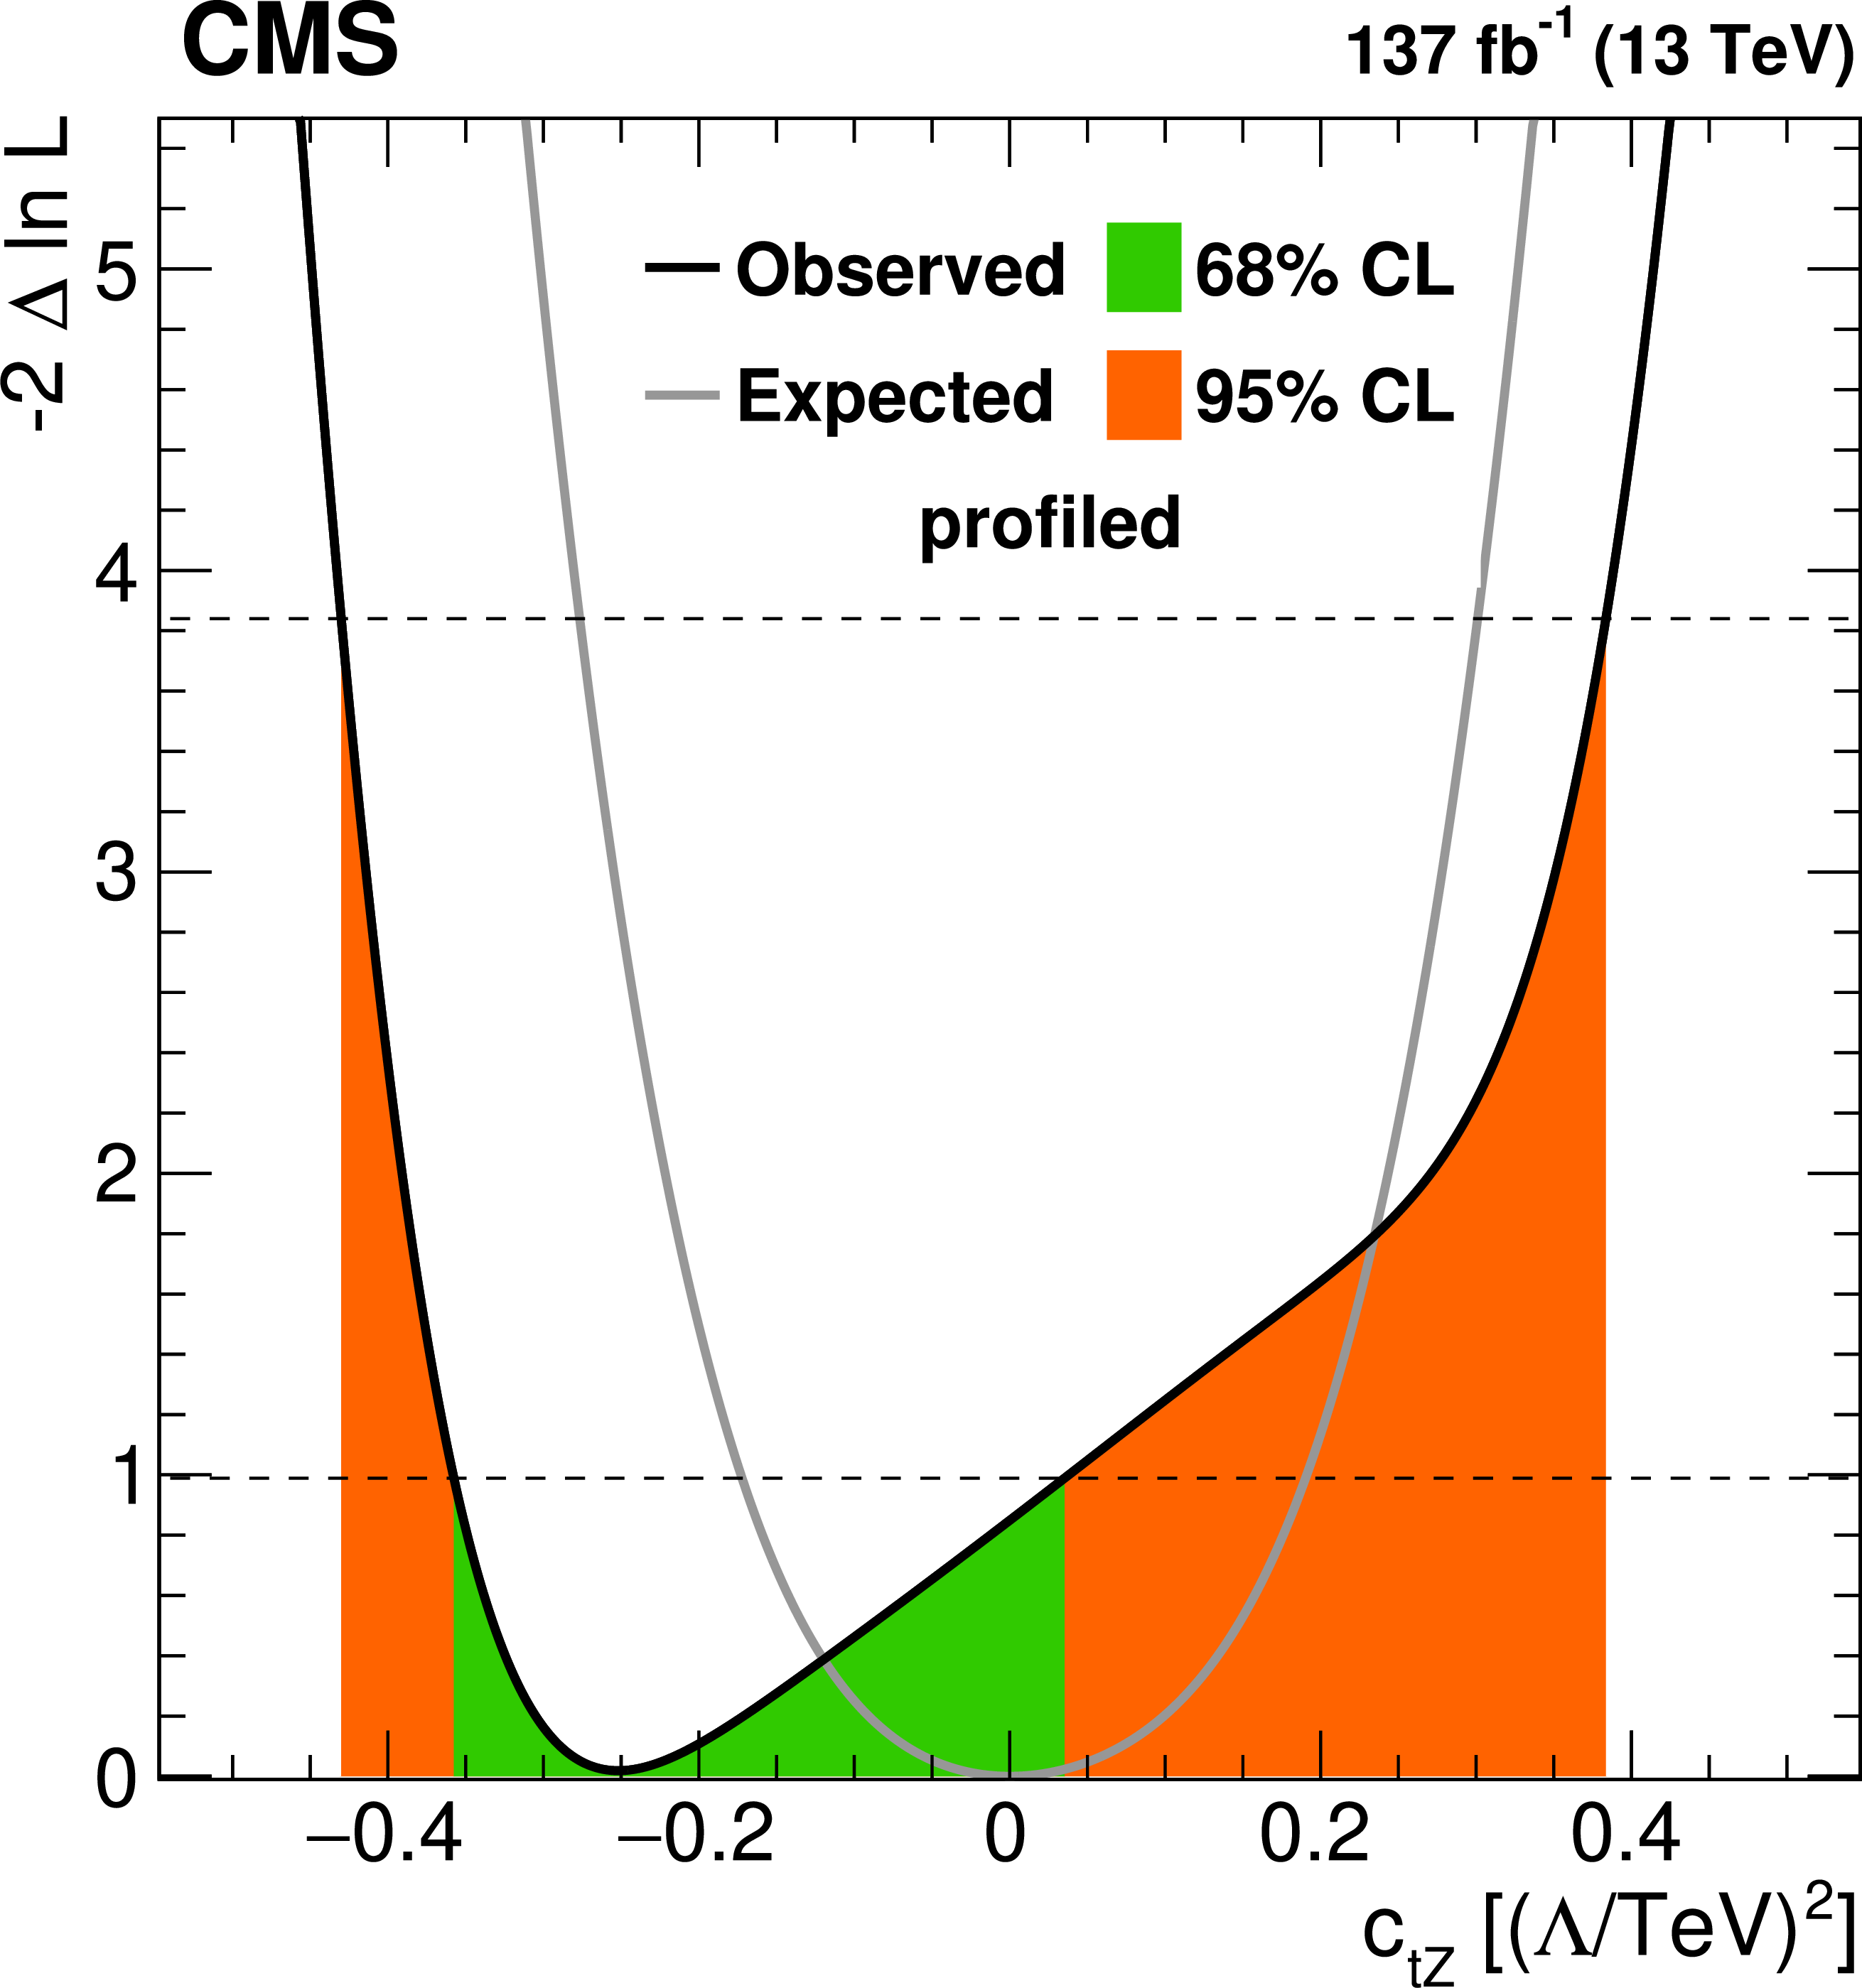
png pdf |
Figure 12-a:
Results of the one-dimensional scans of the Wilson coefficient ${c_{\mathrm{t} \mathrm{Z}}}$. The other Wilson coefficient is profiled. The green and orange bands indicate the 68 and 95% CL contours on the Wilson coefficients, respectively. |
png pdf |
Figure 12-b:
Results of the one-dimensional scans of the Wilson coefficient ${c_{\mathrm{t} \mathrm{Z}}^\mathrm {I}}$. The other Wilson coefficient is profiled. The green and orange bands indicate the 68 and 95% CL contours on the Wilson coefficients, respectively. |

png pdf |
Figure 12-c:
Results of the one-dimensional scans of the Wilson coefficient ${c_{\mathrm{t} \mathrm{Z}}}$. The other Wilson coefficient is set to zero. The green and orange bands indicate the 68 and 95% CL contours on the Wilson coefficients, respectively. |

png pdf |
Figure 12-d:
Results of the one-dimensional scans of the Wilson coefficient ${c_{\mathrm{t} \mathrm{Z}}^\mathrm {I}}$. The other Wilson coefficient is set to zero. The green and orange bands indicate the 68 and 95% CL contours on the Wilson coefficients, respectively. |
png pdf |
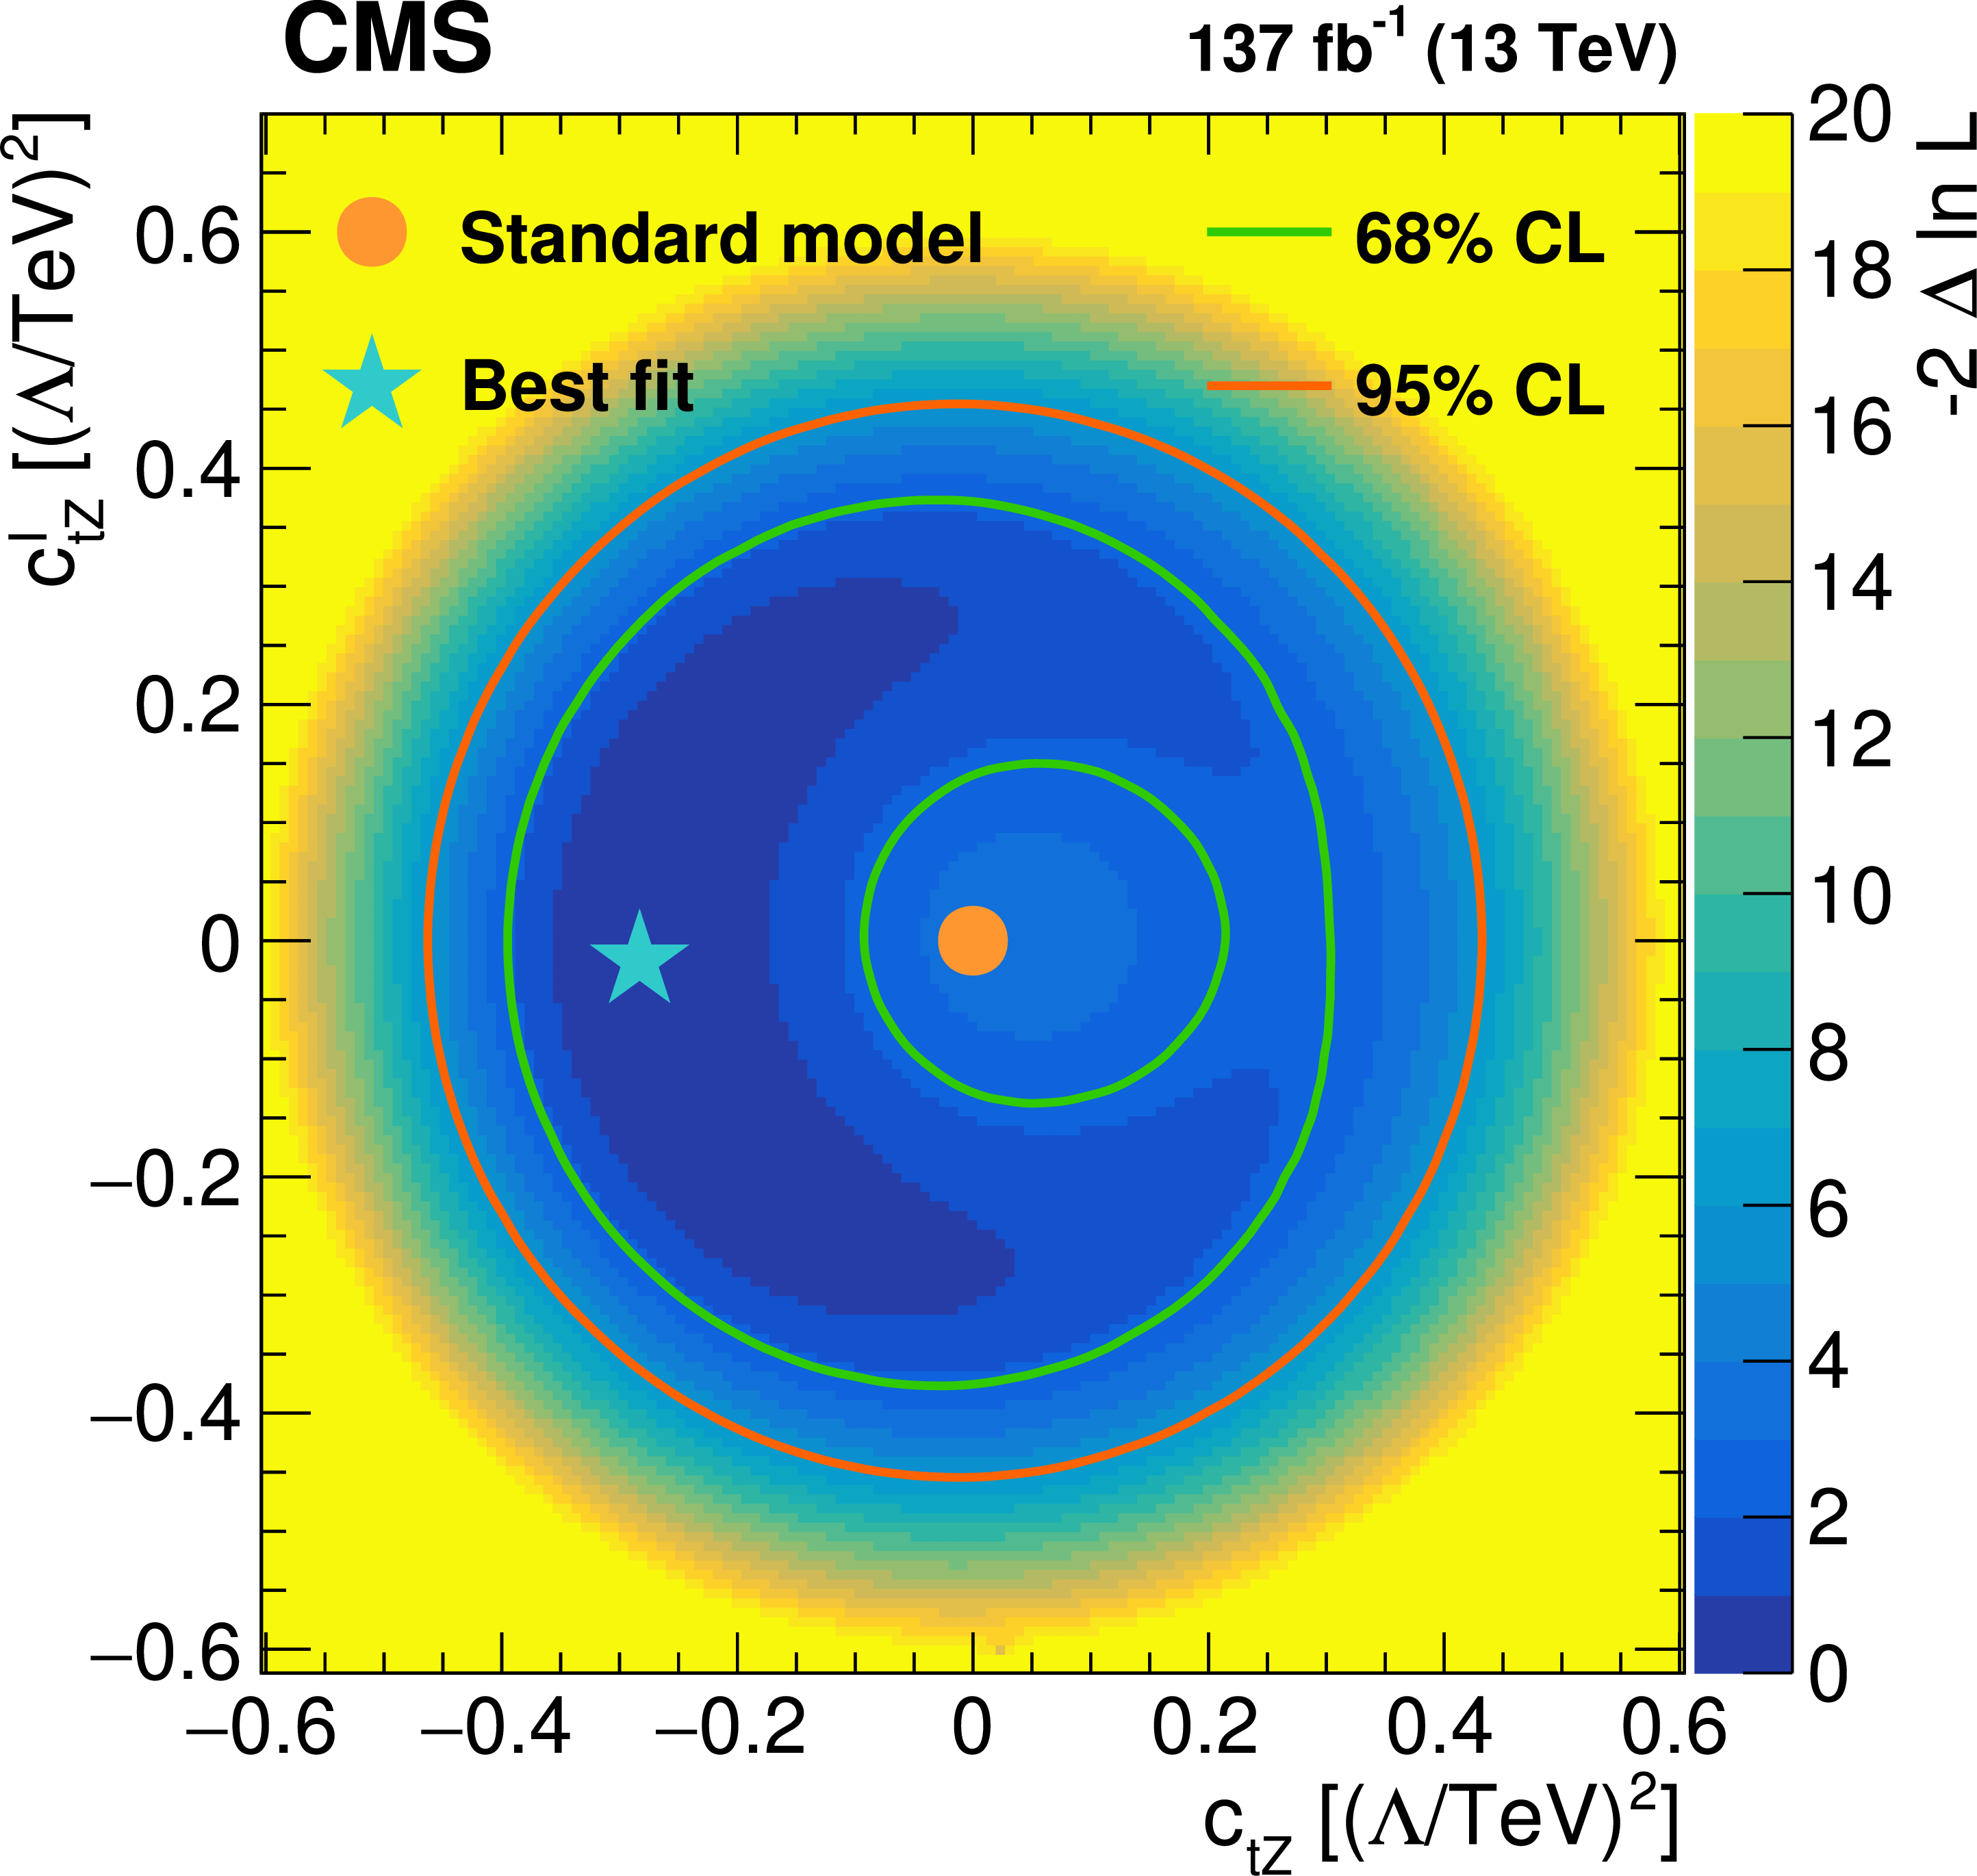
Figure 13:
Result of the two-dimensional scan of the Wilson coefficients ${c_{\mathrm{t} \mathrm{Z}}}$ and ${c_{\mathrm{t} \mathrm{Z}}^\mathrm {I}}$. The shading quantified by the color scale on the right reflects the negative log-likelihood ratio with respect to the best fit value that is designated by the star. The green and orange lines indicate the 68 and 95% CL contours from the fit, respectively. The allowed areas are those between the two green contours and that inside the orange contour. The dot shows the SM prediction. |
png pdf |
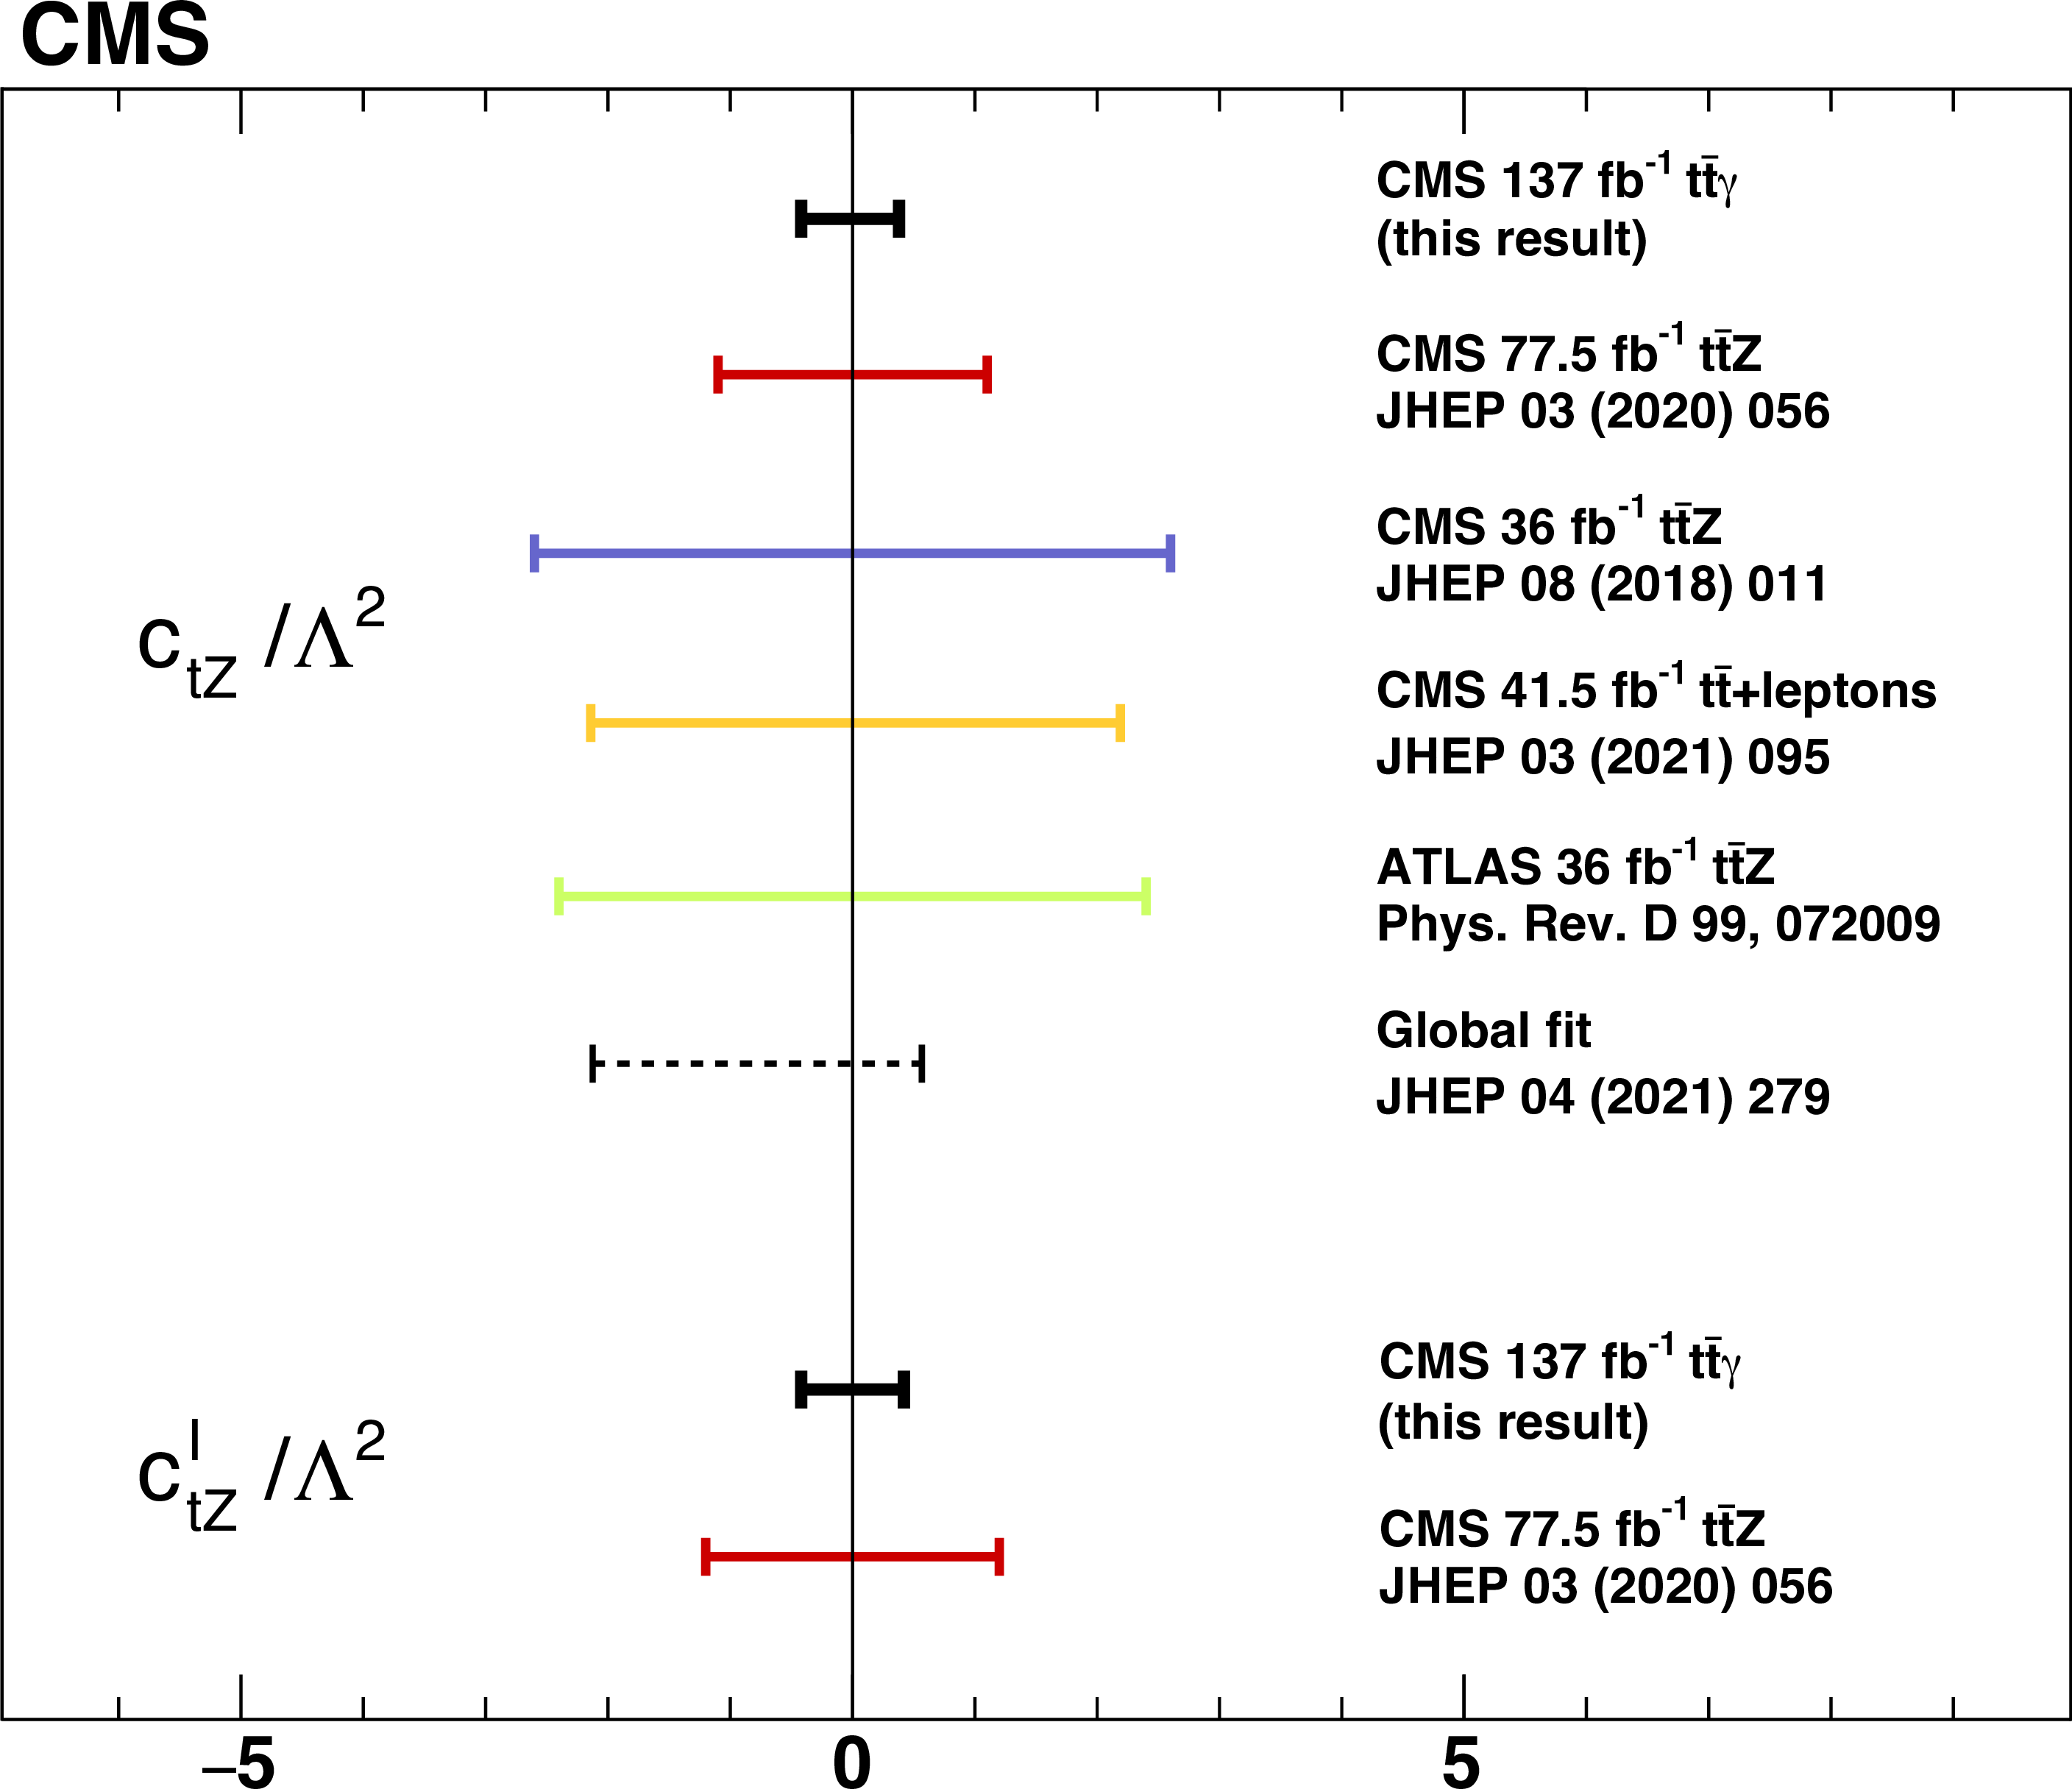
Figure 14:
The observed 95% CL intervals for the Wilson coefficients from this measurement with the other Wilson coefficient set to zero, the previous CMS results based on the inclusive [97] and differential [95] ${{\mathrm{t} \mathrm{\bar{t}}} \mathrm{Z}}$ cross section measurement, a CMS result based on ${\mathrm{t} \mathrm{\bar{t}}}$ in final states with additional leptons [94], and the most recent ATLAS result [96]. The result of a global SM-EFT analysis, including results from Ref. [95], is also shown [98]. The vertical line displays the SM prediction. |
| Tables | |
png pdf |
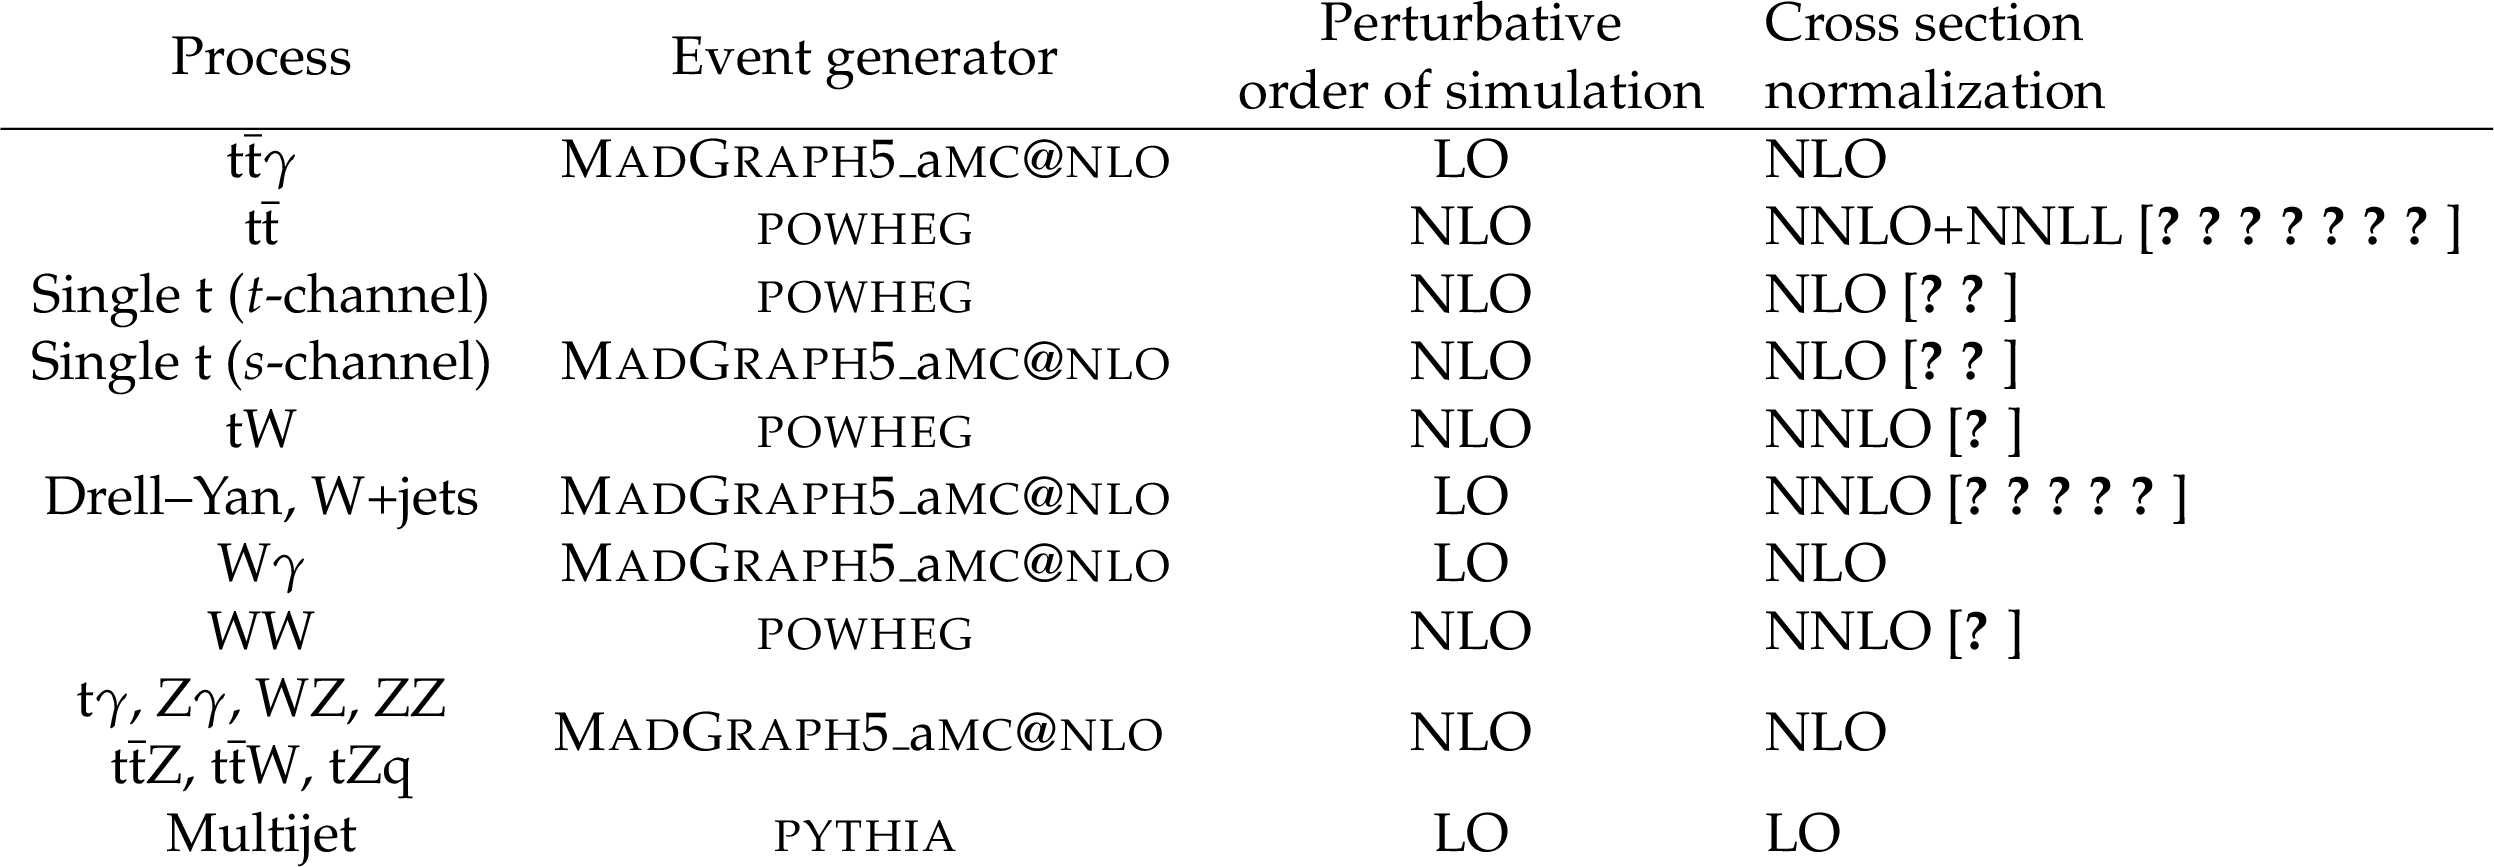
Table 1:
Event generator, perturbative order in QCD of the simulation, and perturbative order of the cross section normalization for each process. |

png pdf |
Table 2:
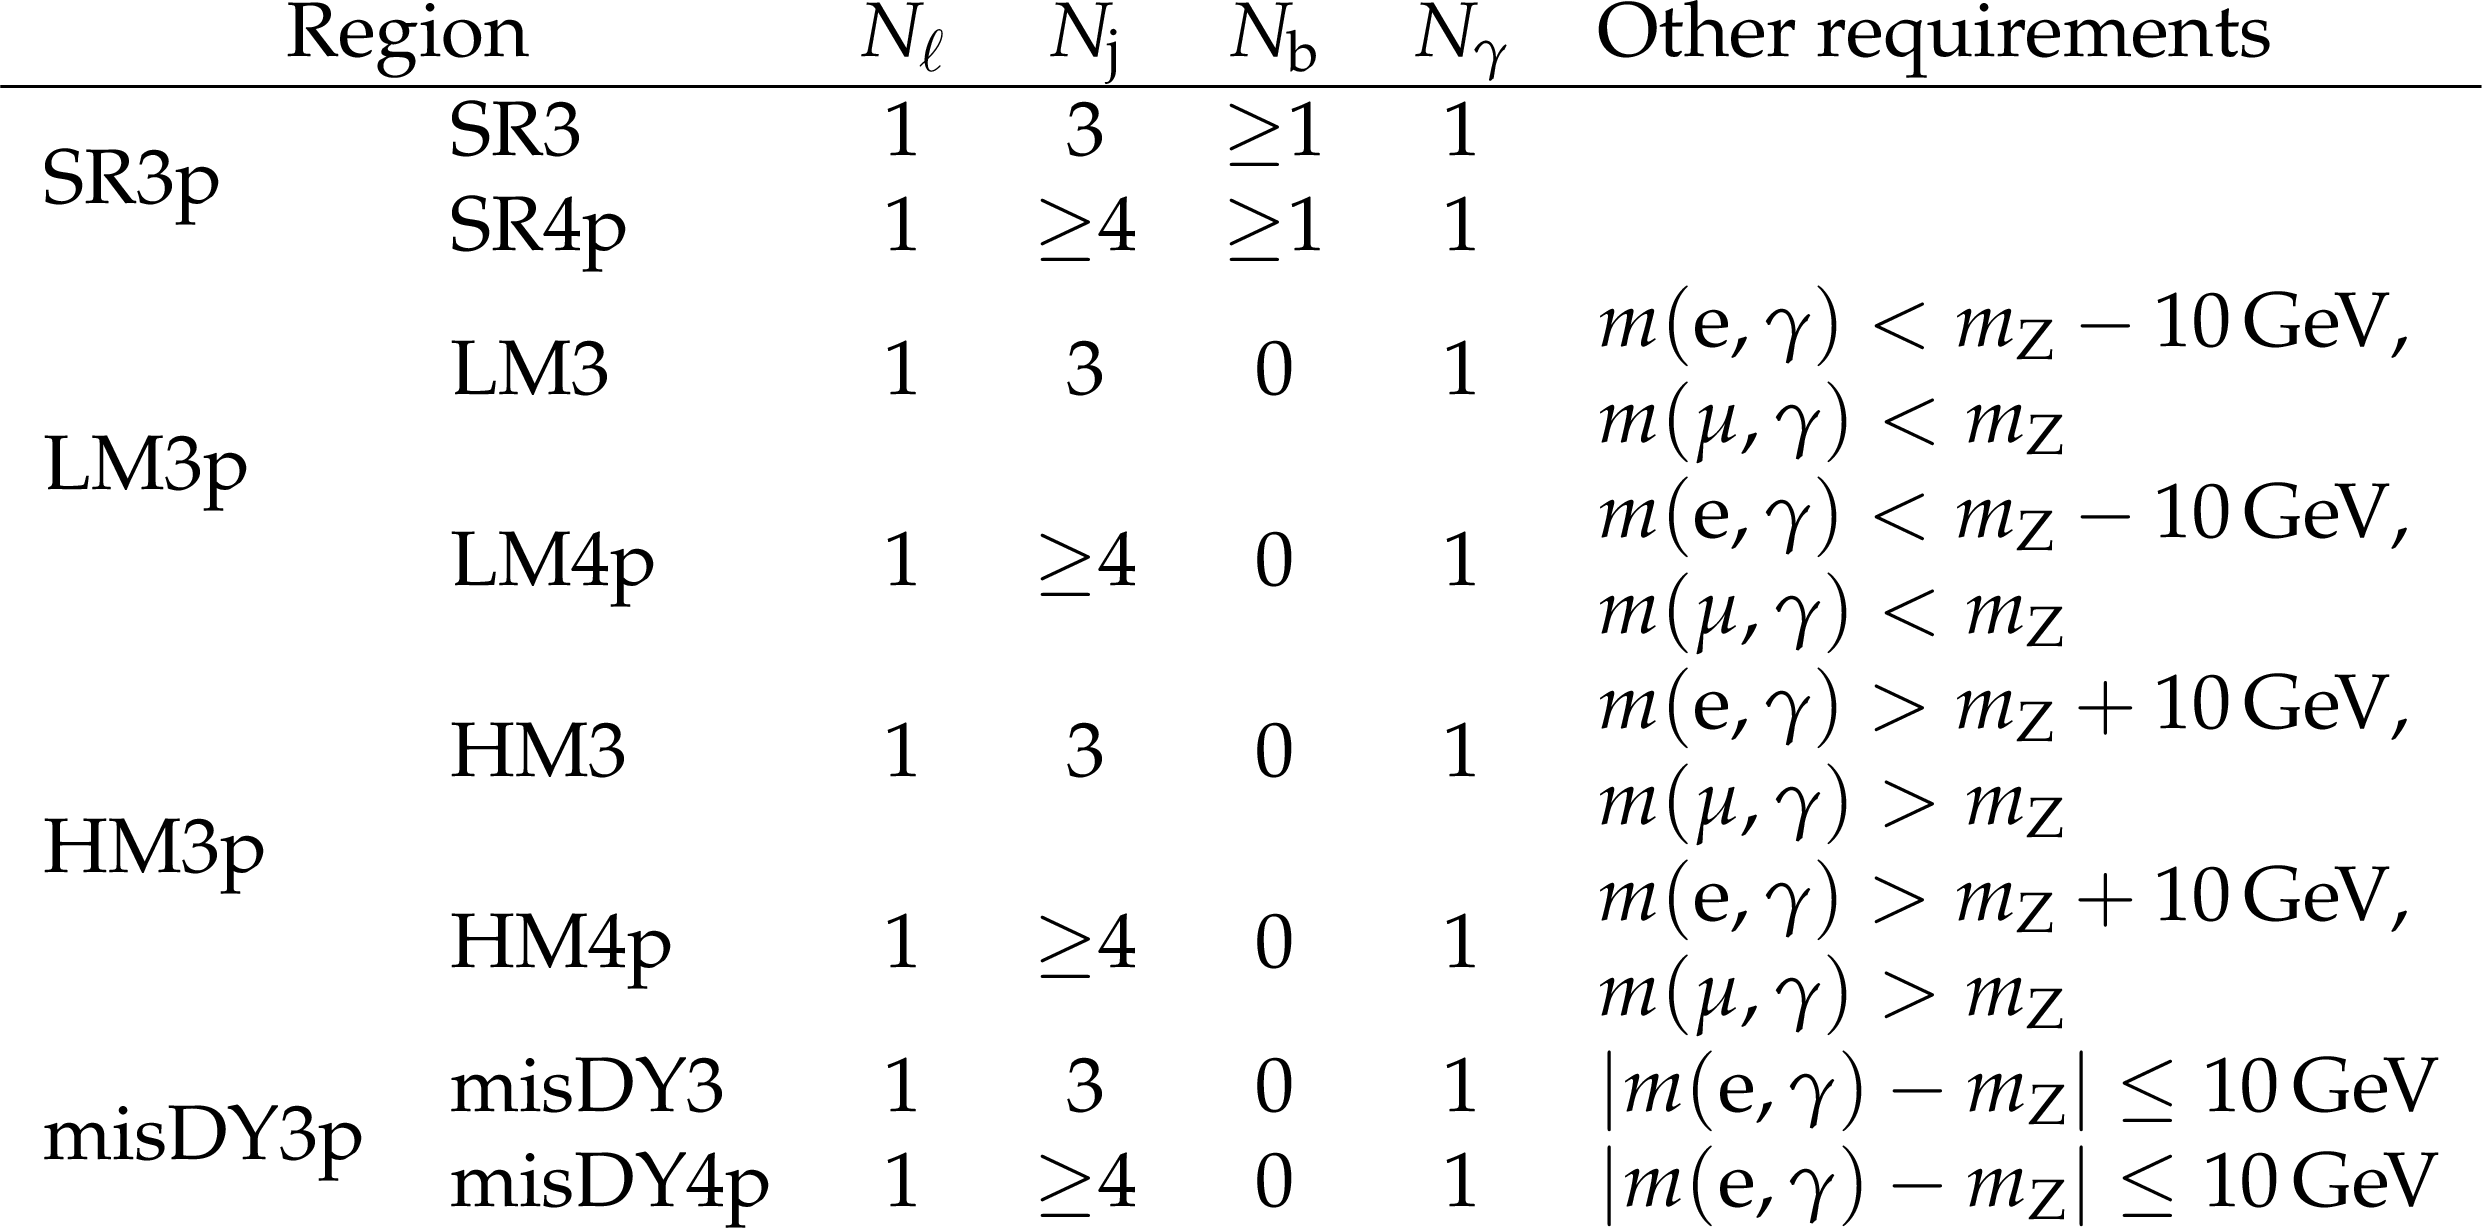
Overview of the definition of fiducial regions for various objects at particle level. A photon is isolated, if there are no stable particles (except neutrinos) with $ {p_{\mathrm {T}}} > $ 5 GeV within a cone of $ {\Delta R}=$ 0.1. |
png pdf |
Table 3:
Overview of signal and control regions. |
png pdf |
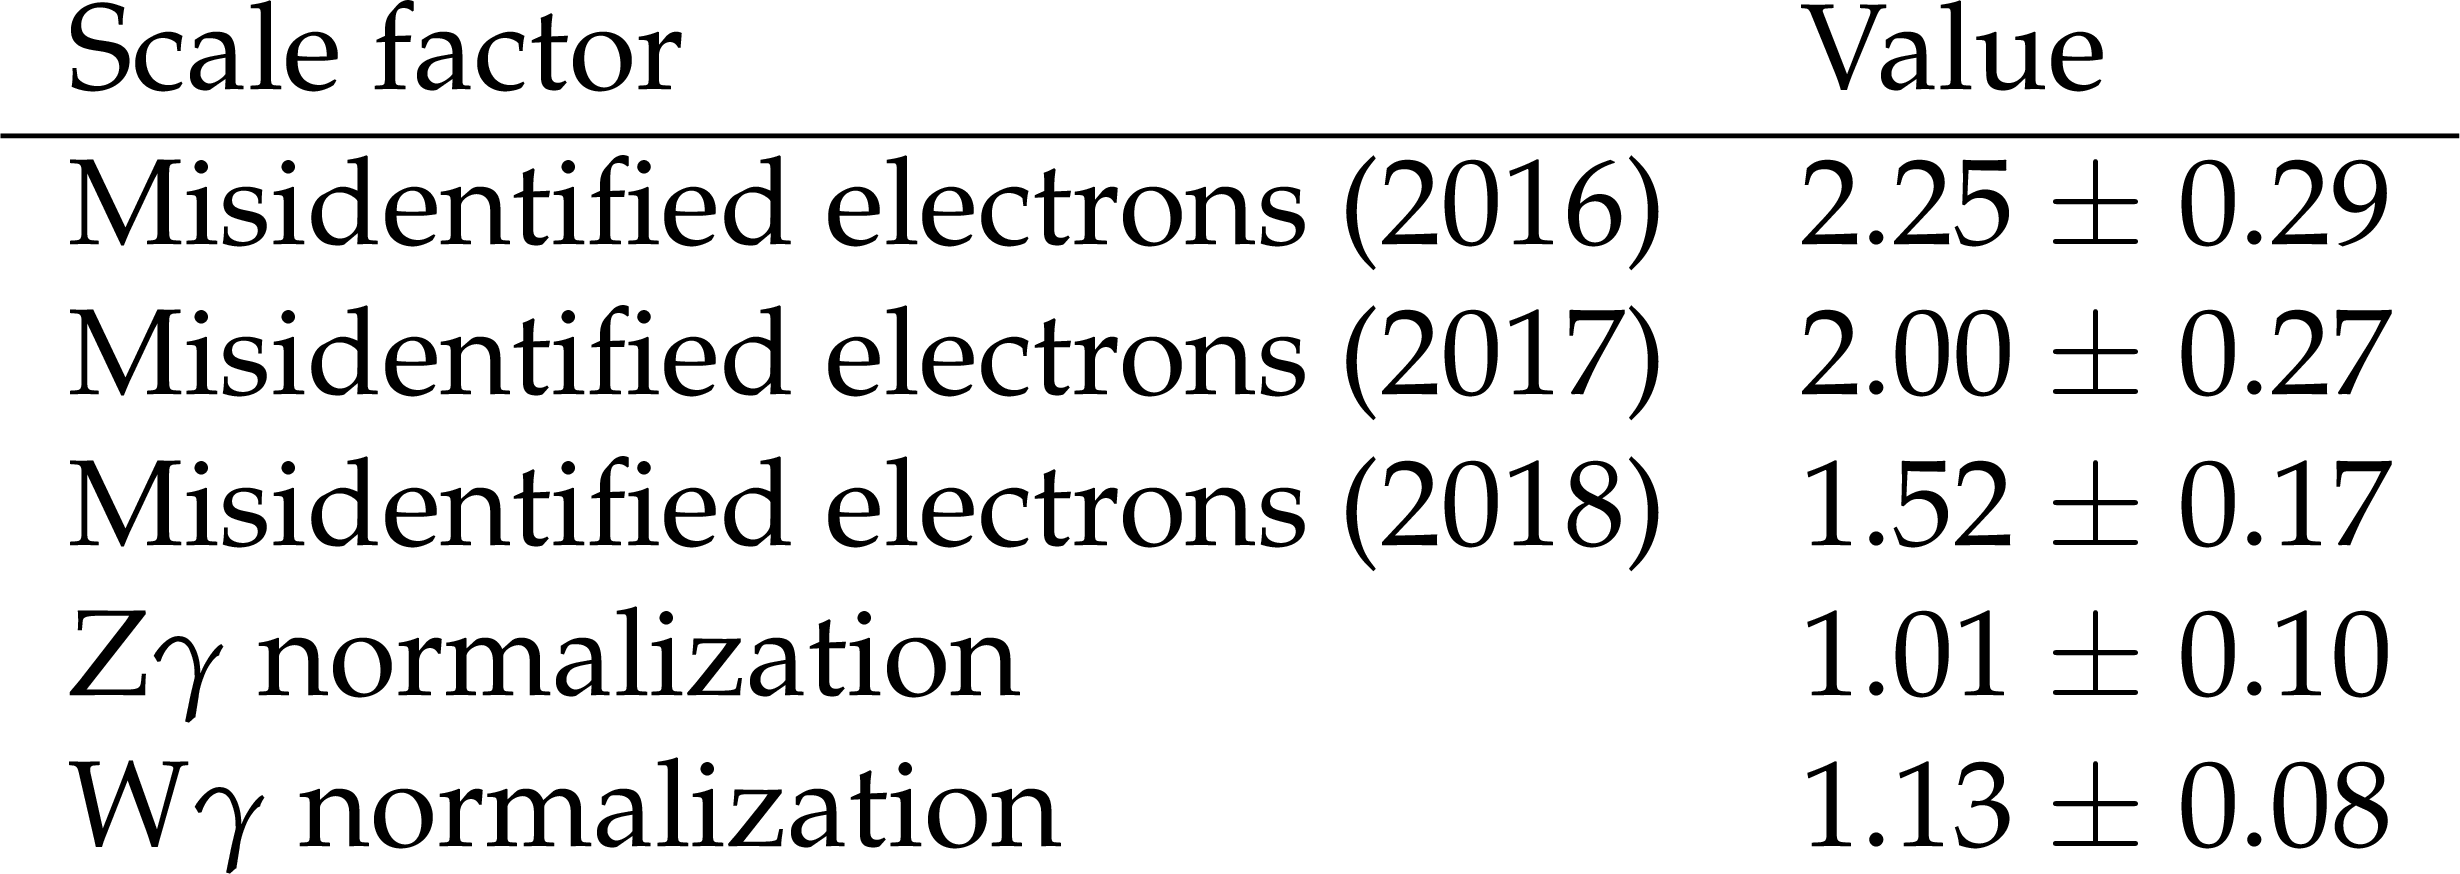
Table 4:
Extracted SFs for the contribution from misidentified electrons for the three data-taking periods and for the normalization of the Z$\gamma$ and W$\gamma$ background components obtained from the likelihood fit. |
png pdf |
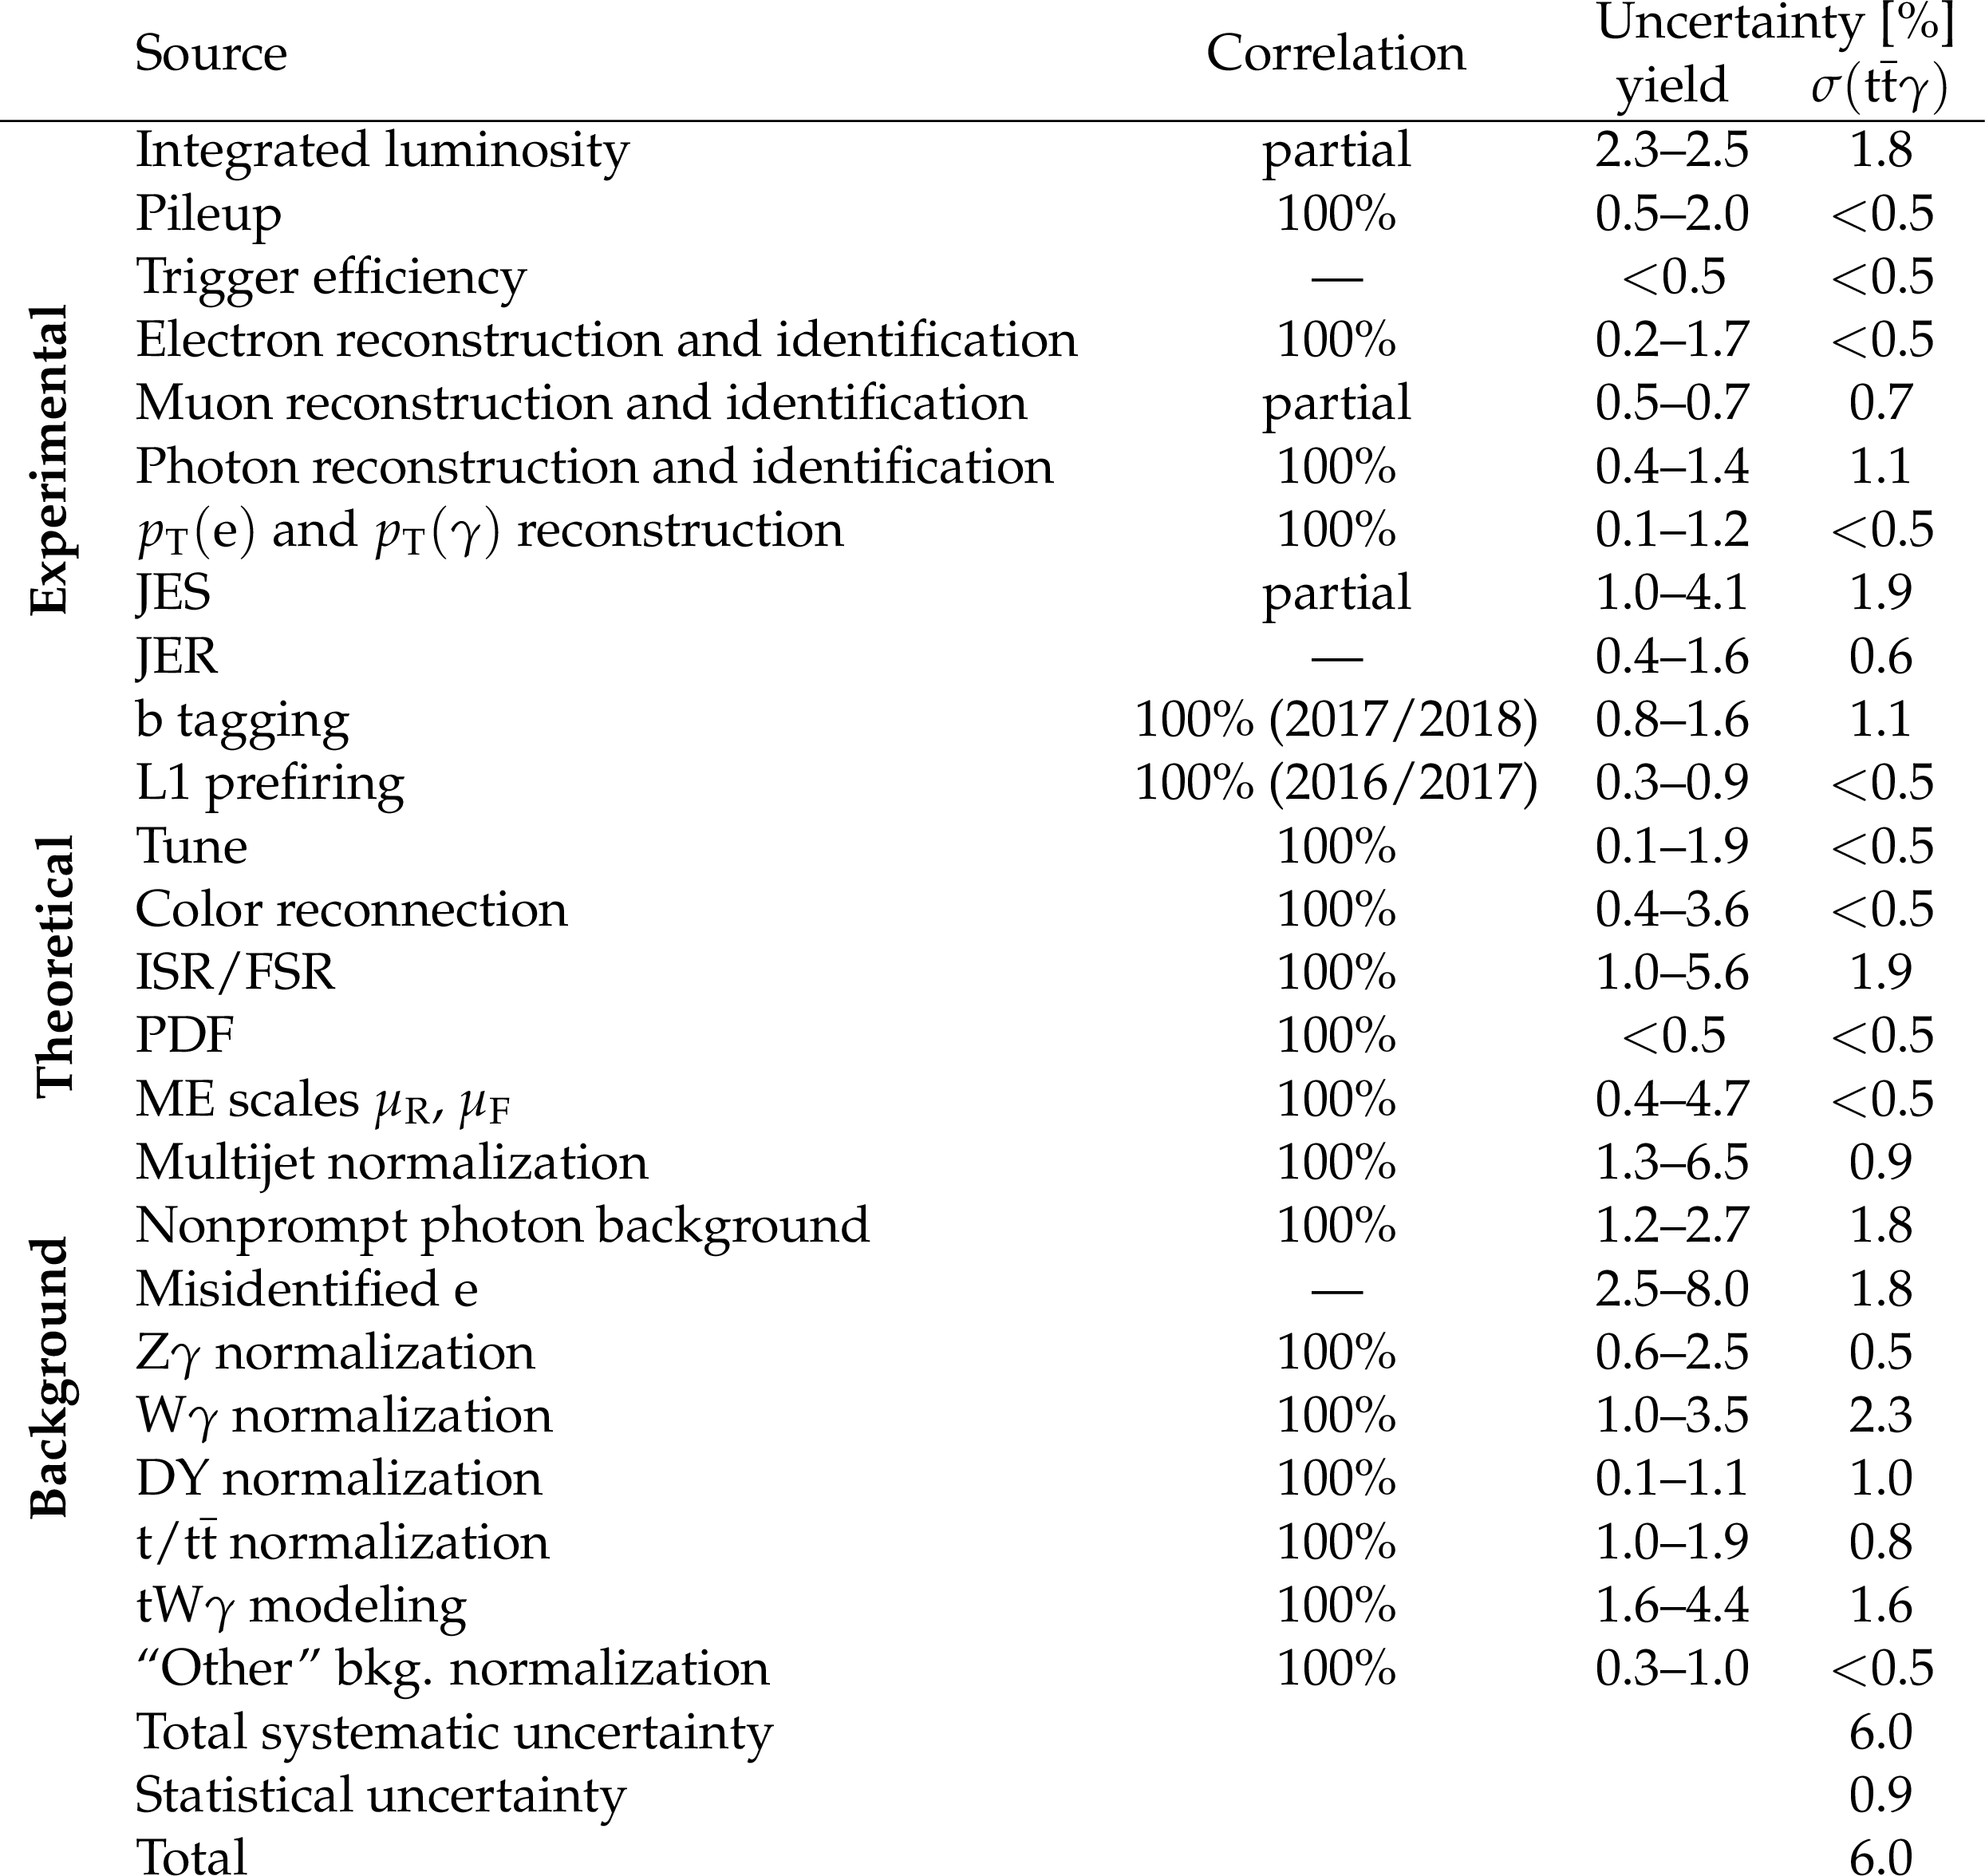
Table 5:
Breakdown of the total uncertainty in its statistical and systematic components. The first column indicates the source of the uncertainty. The second column shows the correlation between the data-taking periods. The third column shows the typical pre-fit uncertainties in the total simulated yields in the signal region. The last column gives the corresponding systematic uncertainty in the ${{\mathrm{t} \mathrm{\bar{t}}} \gamma}$ cross section from the fit to the data. |
png pdf |
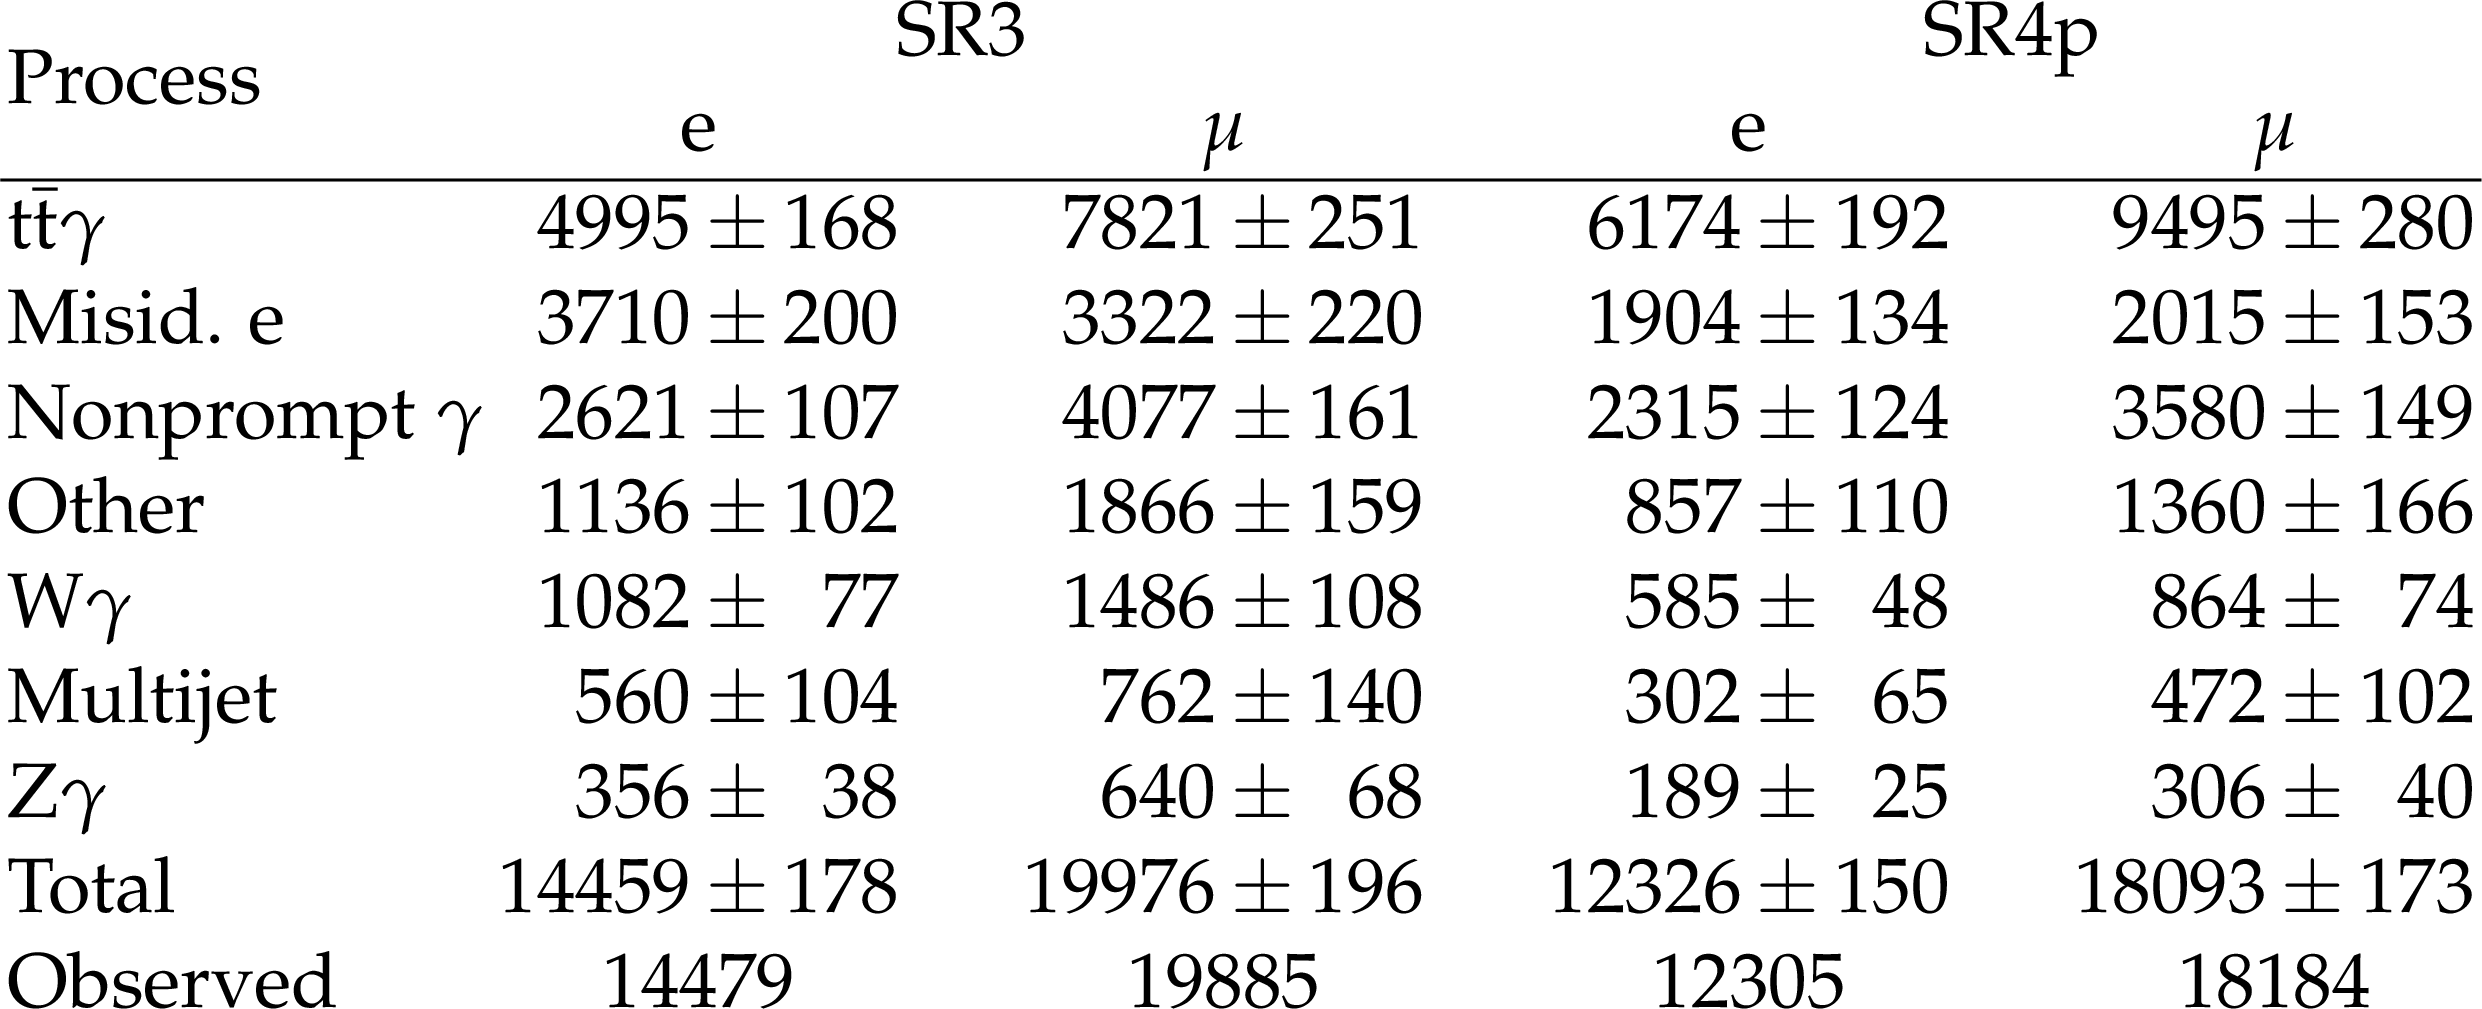
Table 6 :
The observed number of events for the SR3 and SR4p signal regions in the e and $\mu$ channels, and the predicted yields and total post-fit uncertainties in each background component. |

png pdf |
Table 7:
Binning choices in the differential measurements at the reconstruction level. |

png pdf |
Table 8:
Summary of the one-dimensional intervals at 68 and 95% CL. |
| Summary |
|
A measurement of the cross section for the top quark pair production in association with a photon using a data sample of proton-proton collisions at $\sqrt{s} = $ 13 TeV, corresponding to an integrated luminosity of 137 fb$^{-1}$, collected with the CMS detector at the LHC has been presented. It is the first result of the CMS Collaboration on measurements in the ${\mathrm{t\bar{t}}\gamma}$ final state using 13 TeV data. The analysis has been performed in the single-lepton channel with events with exactly three and four or more jets among which at least one is b tagged. Background components with misidentified electrons, photons originating in the hadronization of jets, the multijet component, and prompt photons from the W$\gamma$ and Z$\gamma$ processes are estimated from data. The measured inclusive cross section in a fiducial region with photon transverse momentum ${{p_{\mathrm {T}}} (\gamma)} > $ 20 GeV and jet multiplicity greater than 3 is measured to be 800 $\pm$ 7 (stat) $\pm$ 46 (syst) fb, in good agreement with the standard model prediction at next-to-leading order in quantum chromodynamics. Differential cross sections for ${{p_{\mathrm {T}}} (\gamma)}$ and absolute value of the photon pseudorapidity, as well as for the angular separation of the lepton and the photon, have been measured and unfolded to particle level in the same fiducial volume. The comparison to simulation was performed using different showering algorithms. The measurements are also interpreted in terms of limits on the Wilson coefficients in the context of the standard model effective field theory. The confidence intervals for the Wilson coefficients ${c_{\mathrm{t}\mathrm{Z}}} $ and ${c_{\mathrm{t}\mathrm{Z}}^\mathrm{I}}$ are the most stringent to date. |
| References | ||||
| 1 | U. Baur, A. Juste, L. H. Orr, and D. Rainwater | Probing electroweak top quark couplings at hadron colliders | PRD 71 (2005) 054013 | hep-ph/0412021 |
| 2 | A. O. Bouzas and F. Larios | Electromagnetic dipole moments of the top quark | PRD 87 (2013) 074015 | 1212.6575 |
| 3 | M. Schulze and Y. Soreq | Pinning down electroweak dipole operators of the top quark | EPJC 76 (2016) 466 | 1603.08911 |
| 4 | R. Rontsch and M. Schulze | Probing top-$ \mathrm{Z} $ dipole moments at the LHC and ILC | JHEP 08 (2015) 044 | 1501.05939 |
| 5 | CDF Collaboration | Evidence for $ \mathrm{t\bar{t}}\gamma $ production and measurement of $ \sigma_{\mathrm{t\bar{t}}\gamma}/\sigma_{\mathrm{t\bar{t}}} $ | PRD 48 (2011) 031104 | 1106.3970 |
| 6 | ATLAS Collaboration | Observation of top-quark pair production in association with a photon and measurement of the $ \mathrm{t\bar{t}}\gamma $ production cross section in pp collisions at $ \sqrt{s}= $ 7 TeV using the ATLAS detector | PRD 91 (2015) 072007 | 1502.00586 |
| 7 | ATLAS Collaboration | Measurement of the $ \mathrm{t\bar{t}}\gamma $ production cross section in proton-proton collisions at $ \sqrt{s}= $ 8 TeV with the ATLAS detector | JHEP 11 (2017) 086 | 1706.03046 |
| 8 | CMS Collaboration | Measurement of the semileptonic $ \mathrm{t\bar{t}} $+$ \gamma $ production cross section in pp collisions at $ \sqrt{s}= $ 8 TeV | JHEP 10 (2017) 006 | CMS-TOP-14-008 1706.08128 |
| 9 | ATLAS Collaboration | Measurements of inclusive and differential fiducial cross-sections of $ \mathrm{t\bar{t}}\gamma $ production in leptonic final states at $ \sqrt{s}= $ 13 TeV in ATLAS | EPJC 79 (2019) 382 | 1812.01697 |
| 10 | ATLAS Collaboration | Measurements of inclusive and differential cross-sections of combined $ \mathrm{t\bar{t}}\gamma $ and $ \mathrm{tW}\gamma $ production in the e$\mu$ channel at 13 TeV with the ATLAS detector | JHEP 09 (2020) 049 | 2007.06946 |
| 11 | O. Bessidskaia Bylund et al. | Probing top quark neutral couplings in the standard model effective field theory at NLO in QCD | JHEP 05 (2016) 052 | 1601.08193 |
| 12 | D. Barducci et al. | Interpreting top-quark LHC measurements in the standard-model effective field theory | 2018 | 1802.07237 |
| 13 | CMS Collaboration | HEPData record for this analysis | link | |
| 14 | CMS Collaboration | The CMS trigger system | JINST 12 (2017) P01020 | CMS-TRG-12-001 1609.02366 |
| 15 | CMS Collaboration | Performance of the CMS Level-1 trigger in proton-proton collisions at $ \sqrt{s}= $ 13 TeV | JINST 15 (2020) P10017 | CMS-TRG-17-001 2006.10165 |
| 16 | CMS Collaboration | The CMS experiment at the CERN LHC | JINST 3 (2008) S08004 | CMS-00-001 |
| 17 | P. Nason | A new method for combining NLO QCD with shower Monte Carlo algorithms | JHEP 11 (2004) 040 | hep-ph/0409146 |
| 18 | S. Frixione, P. Nason, and C. Oleari | Matching NLO QCD computations with parton shower simulations: the POWHEG method | JHEP 11 (2007) 070 | 0709.2092 |
| 19 | S. Alioli, P. Nason, C. Oleari, and E. Re | A general framework for implementing NLO calculations in shower Monte Carlo programs: the POWHEG BOX | JHEP 06 (2010) 043 | 1002.2581 |
| 20 | J. M. Campbell, R. K. Ellis, P. Nason, and E. Re | Top-pair production and decay at NLO matched with parton showers | JHEP 04 (2015) 114 | 1412.1828 |
| 21 | S. Alioli, P. Nason, C. Oleari, and E. Re | NLO single-top production matched with shower in POWHEG: $ s $- and $ t $-channel contributions | JHEP 09 (2009) 111 | 0907.4076 |
| 22 | S. Frixione, P. Nason, and G. Ridolfi | A positive-weight next-to-leading-order Monte Carlo for heavy flavour hadroproduction | JHEP 09 (2007) 126 | 0707.3088 |
| 23 | E. Re | Single-top $ \mathrm{W}\mathrm{t} $-channel production matched with parton showers using the POWHEG method | EPJC 71 (2011) 1547 | 1009.2450 |
| 24 | T. Sjostrand et al. | An introduction to PYTHIA 8.2 | CPC 191 (2015) 159 | 1410.3012 |
| 25 | J. Alwall et al. | The automated computation of tree-level and next-to-leading order differential cross sections, and their matching to parton shower simulations | JHEP 07 (2014) 079 | 1405.0301 |
| 26 | M. Czakon and A. Mitov | Top++: a program for the calculation of the top-pair cross-section at hadron colliders | CPC 185 (2014) 2930 | 1112.5675 |
| 27 | M. Beneke, P. Falgari, S. Klein, and C. Schwinn | Hadronic top-quark pair production with NNLL threshold resummation | NPB 855 (2012) 695 | 1109.1536 |
| 28 | M. Cacciari et al. | Top-pair production at hadron colliders with next-to-next-to-leading logarithmic soft-gluon resummation | PLB 710 (2012) 612 | 1111.5869 |
| 29 | P. Barnreuther, M. Czakon, and A. Mitov | Percent level precision physics at the Tevatron: First genuine NNLO QCD corrections to $ \mathrm{q\bar{q}}\to\mathrm{t\bar{t}} $+X | PRL 109 (2012) 132001 | 1204.5201 |
| 30 | M. Czakon and A. Mitov | NNLO corrections to top-pair production at hadron colliders: the all-fermionic scattering channels | JHEP 12 (2012) 054 | 1207.0236 |
| 31 | M. Czakon and A. Mitov | NNLO corrections to top pair production at hadron colliders: the quark-gluon reaction | JHEP 01 (2013) 080 | 1210.6832 |
| 32 | M. Czakon, P. Fiedler, and A. Mitov | Total top-quark pair-production cross section at hadron colliders through $ O(\alpha^4_S) $ | PRL 110 (2013) 252004 | 1303.6254 |
| 33 | M. Aliev et al. | HATHOR: HAdronic Top and Heavy quarks crOss section calculatoR | CPC 182 (2011) 1034 | 1007.1327 |
| 34 | P. Kant et al. | HATHOR for single top-quark production: Updated predictions and uncertainty estimates for single top-quark production in hadronic collisions | CPC 191 (2015) 74 | 1406.4403 |
| 35 | N. Kidonakis | Theoretical results for electroweak-boson and single-top production | PoS DIS2015 (2015) 170 | 1506.04072 |
| 36 | K. Melnikov and F. Petriello | Electroweak gauge boson production at hadron colliders through $ O(\alpha^2_S) $ | PRD 74 (2006) 114017 | hep-ph/0609070 |
| 37 | S. Catani et al. | Vector boson production at hadron colliders: a fully exclusive QCD calculation at NNLO | PRL 103 (2009) 082001 | 0903.2120 |
| 38 | C. Anastasiou, L. J. Dixon, K. Melnikov, and F. Petriello | High precision QCD at hadron colliders: Electroweak gauge boson rapidity distributions at NNLO | PRD 69 (2004) 094008 | hep-ph/0312266 |
| 39 | S. Dittmaier, A. Huss, and C. Schwinn | Mixed QCD-electroweak $ O(\alpha_S\alpha) $ corrections to Drell--Yan processes in the resonance region: pole approximation and non-factorizable corrections | NPB 885 (2014) 318 | 1403.3216 |
| 40 | J. M. Lindert et al. | Precise predictions for V+jets dark matter backgrounds | EPJC 77 (2017) 829 | 1705.04664 |
| 41 | M. V. Garzelli, A. Kardos, C. G. Papadopoulos, and Z. Trocsanyi | $ \mathrm{t\bar{t}}\mathrm{W^{\pm}} $ and $ \mathrm{t\bar{t}}\mathrm{Z} $ hadroproduction at NLO accuracy in QCD with parton shower and hadronization effects | JHEP 11 (2012) 056 | 1208.2665 |
| 42 | S. Frixione et al. | Electroweak and QCD corrections to top-pair hadroproduction in association with heavy bosons | JHEP 06 (2015) 184 | 1504.03446 |
| 43 | T. Gehrmann et al. | $ \mathrm{W^{+}}\mathrm{W^{-}} $ production at hadron colliders in next to next to leading order QCD | PRL 113 (2014) 212001 | 1408.5243 |
| 44 | P. Skands, S. Carrazza, and J. Rojo | Tuning PYTHIA 8.1: the Monash 2013 tune | EPJC 74 (2014) 3024 | 1404.5630 |
| 45 | CMS Collaboration | Event generator tunes obtained from underlying event and multiparton scattering measurements | EPJC 76 (2016) 155 | CMS-GEN-14-001 1512.00815 |
| 46 | CMS Collaboration | Extraction and validation of a new set of CMS PYTHIA8 tunes from underlying-event measurements | EPJC 80 (2020) 4 | CMS-GEN-17-001 1903.12179 |
| 47 | NNPDF Collaboration | Parton distributions from high-precision collider data | EPJC 77 (2017) 663 | 1706.00428 |
| 48 | NNPDF Collaboration | Parton distributions for the LHC Run II | JHEP 04 (2015) 040 | 1410.8849 |
| 49 | J. Alwall et al. | Comparative study of various algorithms for the merging of parton showers and matrix elements in hadronic collisions | EPJC 53 (2008) 473 | 0706.2569 |
| 50 | R. Frederix and S. Frixione | Merging meets matching in MC@NLO | JHEP 12 (2012) 061 | 1209.6215 |
| 51 | GEANT4 Collaboration | GEANT4--a simulation toolkit | NIMA 506 (2003) 250 | |
| 52 | CMS Collaboration | Measurement of the inelastic proton-proton cross section at $ \sqrt{s}= $ 13 TeV | JHEP 07 (2018) 161 | CMS-FSQ-15-005 1802.02613 |
| 53 | CMS Collaboration | Particle-flow reconstruction and global event description with the CMS detector | JINST 12 (2017) P10003 | CMS-PRF-14-001 1706.04965 |
| 54 | CMS Collaboration | Performance of the CMS muon detector and muon reconstruction with proton-proton collisions at $ \sqrt{s}= $ 13 TeV | JINST 13 (2018) P06015 | CMS-MUO-16-001 1804.04528 |
| 55 | CMS Collaboration | Performance of electron reconstruction and selection with the CMS detector in proton-proton collisions at $ \sqrt{s}= $ 8 TeV | JINST 10 (2015) P06005 | CMS-EGM-13-001 1502.02701 |
| 56 | CMS Collaboration | Performance of photon reconstruction and identification with the CMS detector in proton-proton collisions at $ \sqrt{s}= $ 8 TeV | JINST 10 (2015) P08010 | CMS-EGM-14-001 1502.02702 |
| 57 | CMS Collaboration | Electron and photon reconstruction and identification with the CMS experiment at the CERN LHC | JINST 16 (2021) P05014 | CMS-EGM-17-001 2012.06888 |
| 58 | CMS Collaboration | Performance of CMS muon reconstruction in pp collision events at $ \sqrt{s}= $ 7 TeV | JINST 7 (2012) P10002 | CMS-MUO-10-004 1206.4071 |
| 59 | M. Cacciari, G. P. Salam, and G. Soyez | The anti-$ {k_{\mathrm{T}}} $ jet clustering algorithm | JHEP 04 (2008) 063 | 0802.1189 |
| 60 | M. Cacciari, G. P. Salam, and G. Soyez | FastJet user manual | EPJC 72 (2012) 1896 | 1111.6097 |
| 61 | CMS Collaboration | Jet energy scale and resolution in the CMS experiment in pp collisions at 8 TeV | JINST 12 (2017) P02014 | CMS-JME-13-004 1607.03663 |
| 62 | CMS Collaboration | Identification of heavy-flavour jets with the CMS detector in pp collisions at 13 TeV | JINST 13 (2018) P05011 | CMS-BTV-16-002 1712.07158 |
| 63 | CMS Collaboration | Measurement of the differential Drell--Yan cross section in proton-proton collisions at $ \sqrt{s}= $ 13 TeV | JHEP 12 (2019) 059 | CMS-SMP-17-001 1812.10529 |
| 64 | M. Cacciari and G. P. Salam | Pileup subtraction using jet areas | PLB 659 (2008) 119 | 0707.1378 |
| 65 | CMS Collaboration | Measurement of the top-antitop production cross section in pp collisions at $ \sqrt{s}= $ 7 TeV using the kinematic properties of events with leptons and jets | EPJC 71 (2011) 1721 | CMS-TOP-10-002 1106.0902 |
| 66 | Particle Data Group, P. A. Zyla et al. | Review of particle physics | Prog. Theor. Exp. Phys. 2020 (2020) 083C01 | |
| 67 | The ATLAS Collaboration, The CMS Collaboration, The LHC Higgs Combination Group | Procedure for the LHC Higgs boson search combination in Summer 2011 | CMS-NOTE-2011-005 | |
| 68 | G. Cowan, K. Cranmer, E. Gross, and O. Vitells | Asymptotic formulae for likelihood-based tests of new physics | EPJC 71 (2011) 1554 | 1007.1727 |
| 69 | CMS Collaboration | Precision luminosity measurement in proton-proton collisions at $ \sqrt{s}= $ 13 TeV in 2015 and 2016 at CMS | 2021. Submitted to EPJC | CMS-LUM-17-003 2104.01927 |
| 70 | CMS Collaboration | CMS luminosity measurement for the 2017 data-taking period at $ \sqrt{s} = $ 13 TeV | CMS-PAS-LUM-17-004 | CMS-PAS-LUM-17-004 |
| 71 | CMS Collaboration | CMS luminosity measurement for the 2018 data-taking period at $ \sqrt{s} = $ 13 TeV | CMS-PAS-LUM-18-002 | CMS-PAS-LUM-18-002 |
| 72 | ATLAS Collaboration | Measurement of the inelastic proton-proton cross section at $ \sqrt{s}= $ 13 TeV with the ATLAS detector at the LHC | PRL 117 (2016) 182002 | 1606.02625 |
| 73 | CMS Collaboration | Energy calibration and resolution of the CMS electromagnetic calorimeter in pp collisions at $ \sqrt{s}= $ 7 TeV | JINST 8 (2013) P09009 | CMS-EGM-11-001 1306.2016 |
| 74 | CMS Collaboration | Identification of b-quark jets with the CMS experiment | JINST 8 (2013) P04013 | CMS-BTV-12-001 1211.4462 |
| 75 | S. Argyropoulos and T. Sjostrand | Effects of color reconnection on $ \mathrm{t\bar{t}} $ final states at the LHC | JHEP 11 (2014) 043 | 1407.6653 |
| 76 | J. R. Christiansen and P. Z. Skands | String formation beyond leading colour | JHEP 08 (2015) 003 | 1505.01681 |
| 77 | G. Cowan | Statistical data analysis | Clarendon Press | |
| 78 | S. Schmitt | TUnfold, an algorithm for correcting migration effects in high energy physics | JINST 7 (2012) T10003 | 1205.6201 |
| 79 | J. Bellm et al. | Herwig 7.0/Herwig++ 3.0 release note | EPJC 76 (2016) 196 | 1512.01178 |
| 80 | CMS Collaboration | Development and validation of HERWIG 7 tunes from CMS underlying-event measurements | EPJC 81 (2021) 312 | CMS-GEN-19-001 2011.03422 |
| 81 | W. Hollik et al. | Top dipole form-factors and loop induced CP violation in supersymmetry | NPB 551 (1999) 3 | hep-ph/9812298 |
| 82 | K. Agashe, G. Perez, and A. Soni | Collider signals of top quark flavor violation from a warped extra dimension | PRD 75 (2007) 015002 | hep-ph/0606293 |
| 83 | A. L. Kagan, G. Perez, T. Volansky, and J. Zupan | General minimal flavor violation | PRD 80 (2009) 076002 | 0903.1794 |
| 84 | T. Ibrahim and P. Nath | The top quark electric dipole moment in an MSSM extension with vector like multiplets | PRD 82 (2010) 055001 | 1007.0432 |
| 85 | T. Ibrahim and P. Nath | The chromoelectric dipole moment of the top quark in models with vector like multiplets | PRD 84 (2011) 015003 | 1104.3851 |
| 86 | C. Grojean, O. Matsedonskyi, and G. Panico | Light top partners and precision physics | JHEP 10 (2013) 160 | 1306.4655 |
| 87 | F. Richard | Can LHC observe an anomaly in ttZ production? | 2013 | 1304.3594 |
| 88 | B. Grzadkowski, M. Iskrzynski, M. Misiak, and J. Rosiek | Dimension-six terms in the standard model Lagrangian | JHEP 10 (2010) 085 | 1008.4884 |
| 89 | C. Zhang and S. Willenbrock | Effective-field-theory approach to top-quark production and decay | PRD 83 (2011) 034006 | 1008.3869 |
| 90 | CMS Collaboration | Measurements of $ \mathrm{t\bar{t}} $ differential cross sections in proton-proton collisions at $ \sqrt{s}= $ 13 TeV using events containing two leptons | JHEP 02 (2019) 149 | CMS-TOP-17-014 1811.06625 |
| 91 | CMS Collaboration | Measurement of the top quark polarization and $ \mathrm{t\bar{t}} $ spin correlations using dilepton final states in proton-proton collisions at $ \sqrt{s}= $ 13 TeV | PRD 100 (2019) 072002 | CMS-TOP-18-006 1907.03729 |
| 92 | CMS Collaboration | Measurement of the W boson helicity fractions in the decays of top quark pairs to lepton$ + $jets final states produced in pp collisions at $ \sqrt{s}= $ 8 TeV | PLB 762 (2016) 512 | CMS-TOP-13-008 1605.09047 |
| 93 | J. A. Aguilar-Saavedra and J. Bernabeu | W polarisation beyond helicity fractions in top quark decays | NPB 840 (2010) 349 | 1005.5382 |
| 94 | CMS Collaboration | Search for new physics in top quark production with additional leptons in proton-proton collisions at $ \sqrt{s}= $ 13 TeV using effective field theory | JHEP 03 (2021) 095 | CMS-TOP-19-001 2012.04120 |
| 95 | CMS Collaboration | Measurement of top quark pair production in association with a Z boson in proton-proton collisions at $ \sqrt{s}= $ 13 TeV | JHEP 03 (2020) 056 | CMS-TOP-18-009 1907.11270 |
| 96 | ATLAS Collaboration | Measurement of the $\mathrm{t\bar{t}}$Z and $\mathrm{t\bar{t}}$W cross sections in proton-proton collisions at $ \sqrt{s}= $ 13 TeV with the ATLAS detector | PRD 99 (2019) 072009 | 1901.03584 |
| 97 | CMS Collaboration | Measurement of the cross section for top quark pair production in association with a W or Z boson in proton-proton collisions at $ \sqrt{s}= $ 13 TeV | JHEP 08 (2018) 011 | CMS-TOP-17-005 1711.02547 |
| 98 | J. Ellis et al. | Top, Higgs, diboson and electroweak fit to the standard model effective field theory | JHEP 04 (2021) 279 | 2012.02779 |
|
|
Compact Muon Solenoid LHC, CERN |
|

|

|

|

|

|