

Compact Muon Solenoid
LHC, CERN
| CMS-HIG-21-002 ; CERN-EP-2022-113 | ||
| Search for Higgs boson pairs decaying to WWWW, WW$\tau\tau$, and $\tau\tau\tau\tau$ in proton-proton collisions at $\sqrt{s} = $ 13 TeV | ||
| CMS Collaboration | ||
| 21 June 2022 | ||
| JHEP 07 (2023) 095 | ||
| Abstract: The results of a search for Higgs boson pair (HH) production in the WWWW, WW$\tau\tau$, and $\tau\tau\tau\tau$ decay modes are presented. The search uses 138 fb$^{-1}$ of proton-proton collision data recorded by the CMS experiment at the LHC at a center-of-mass energy of 13 TeV from 2016 to 2018. Analyzed events contain two, three, or four reconstructed leptons, including electrons, muons, and hadronically decaying tau leptons. No evidence for a signal is found in the data. Upper limits are set on the cross section for nonresonant HH production, as well as resonant production in which a new heavy particle decays to a pair of Higgs bosons. For nonresonant production, the observed (expected) upper limit on the cross section at 95% confidence level (CL) is 21.3 (19.4) times the standard model (SM) prediction. The observed (expected) ratio of the trilinear Higgs boson self-coupling to its value in the SM is constrained to be within the interval $-$6.9 to 11.1 ($-$6.9 to 11.7) at 95% CL, and limits are set on a variety of new-physics models using an effective field theory approach. The observed (expected) limits on the cross section for resonant HH production amount to 0.18-0.90 (0.08-1.06) pb at 95% CL for new heavy-particle masses in the range 250-1000 GeV. | ||
| Links: e-print arXiv:2206.10268 [hep-ex] (PDF) ; CDS record ; inSPIRE record ; HepData record ; Physics Briefing ; CADI line (restricted) ; | ||
| Figures | |
png pdf |
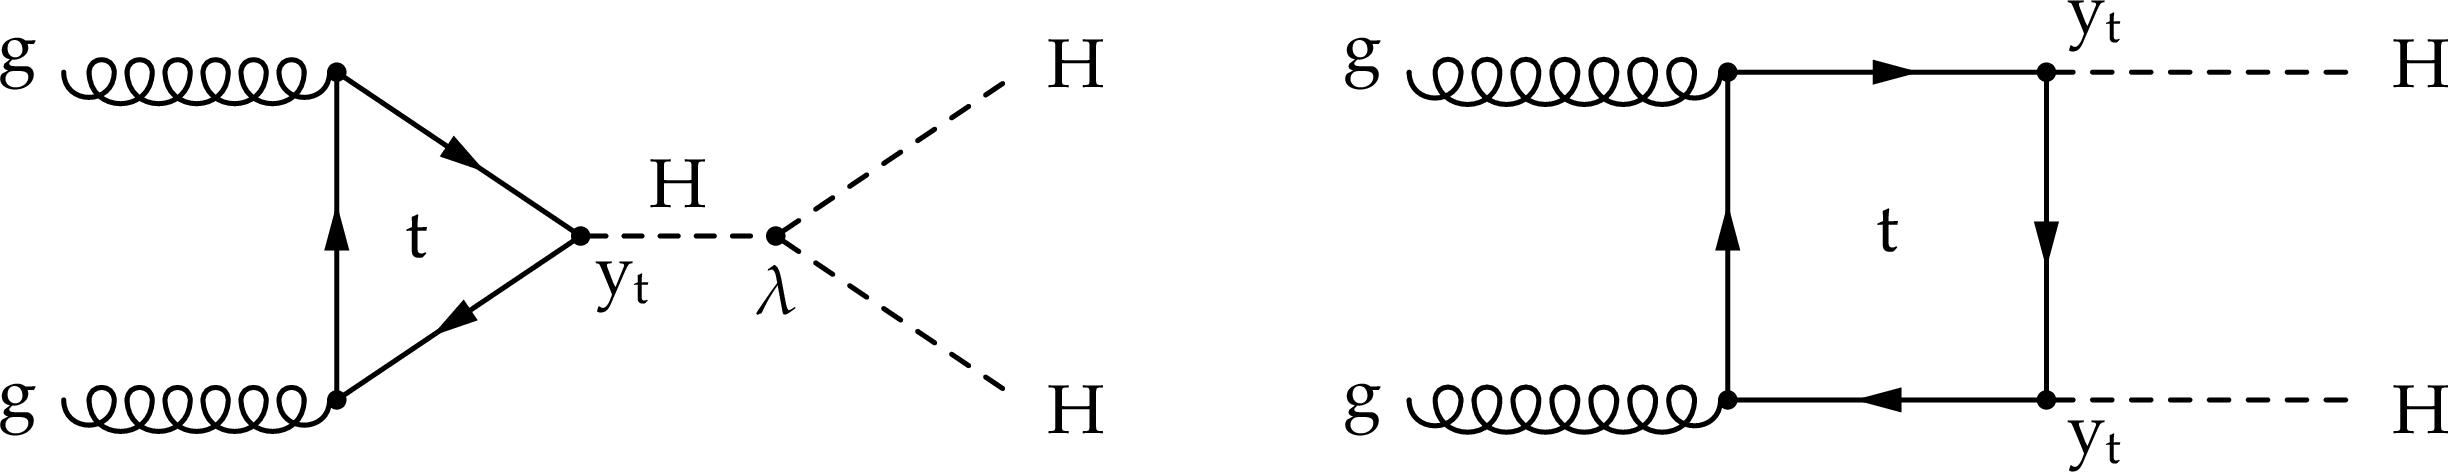
Figure 1:
Leading order Feynman diagrams for SM nonresonant HH production via gluon fusion, including the "triangle'' diagram (left) and the "box'' diagram (right). |

png pdf |
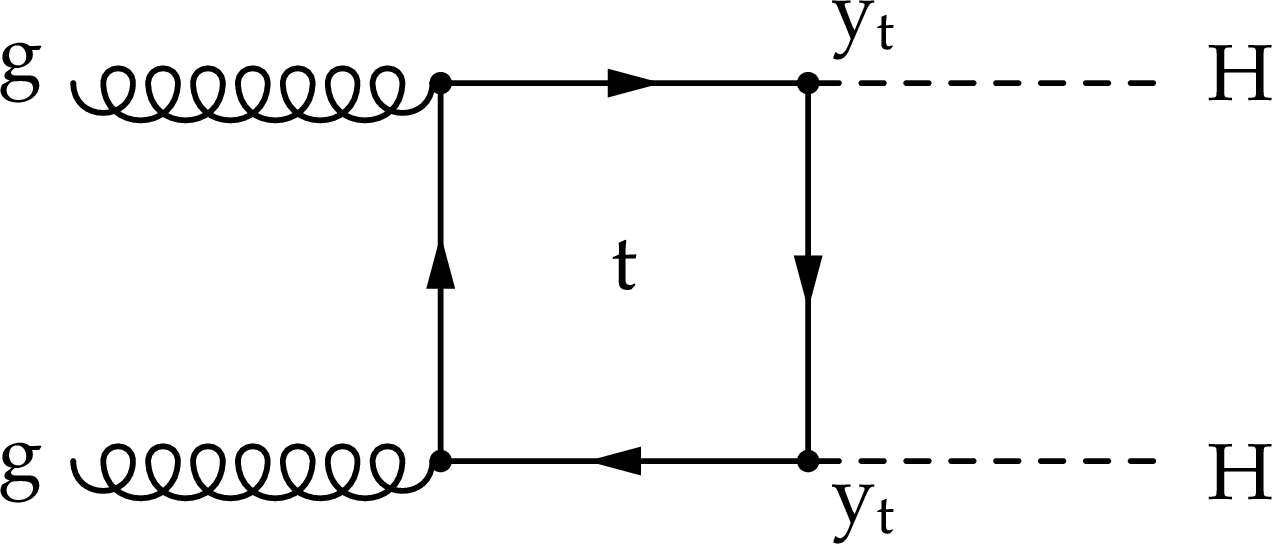
Figure 1-a:
Leading order Feynman diagrams for SM nonresonant HH production via gluon fusion, including the "triangle'' diagram (left) and the "box'' diagram (right). |
png pdf |
Figure 1-b:
Leading order Feynman diagrams for SM nonresonant HH production via gluon fusion, including the "triangle'' diagram (left) and the "box'' diagram (right). |
png pdf |
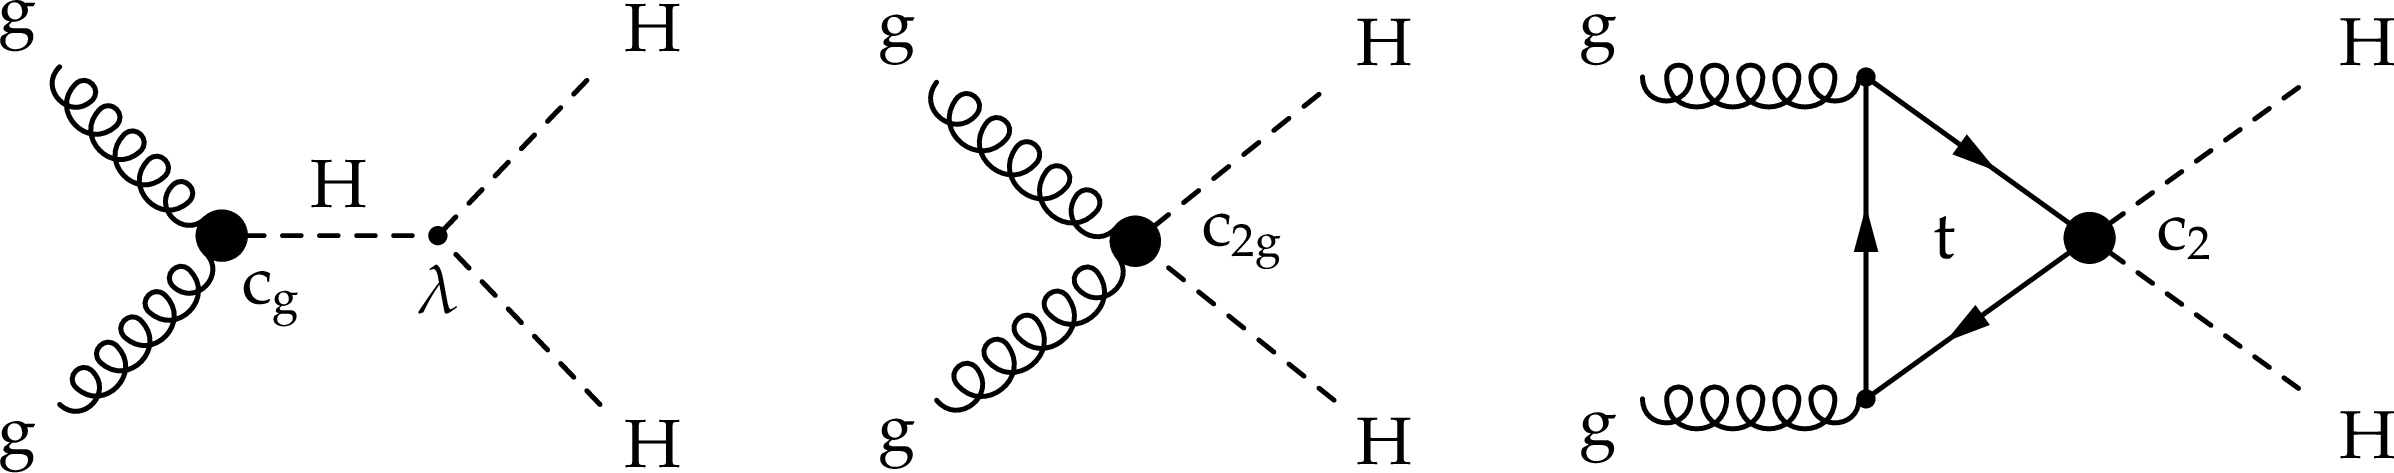
Figure 2:
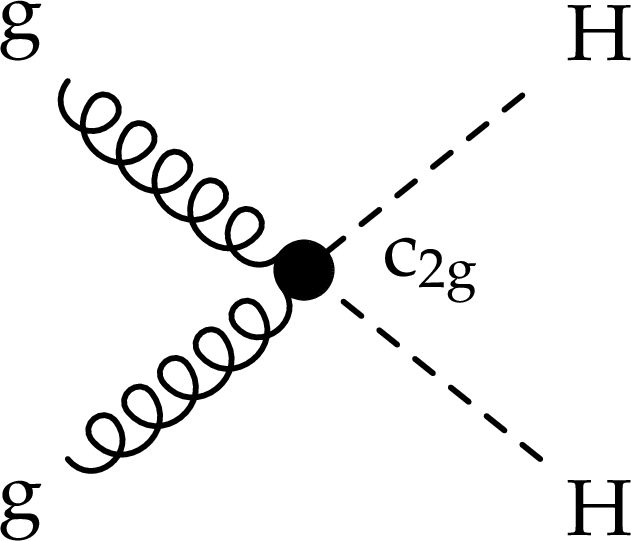
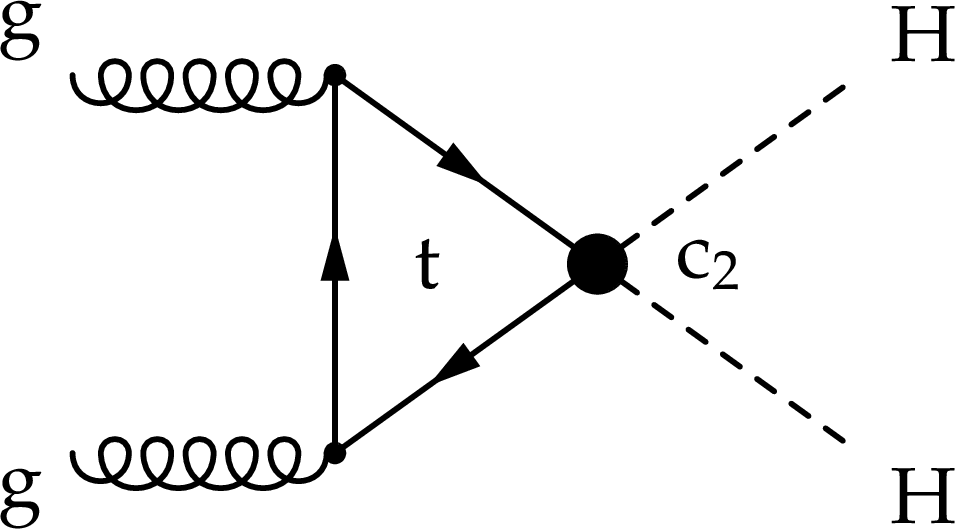
Leading order Feynman diagrams for nonresonant HH production via gluon fusion in an EFT approach, where loop-mediated contact interactions between (left) two gluons and one H boson, (middle) two gluons and two H bosons, and (right) two top quarks and two H bosons are parametrized by three effective couplings: ${\text {c}_{{\mathrm{g}}}}$, ${\text {c}_{2 {\mathrm{g}}}}$, and ${\text {c}_{2}}$. |
png pdf |
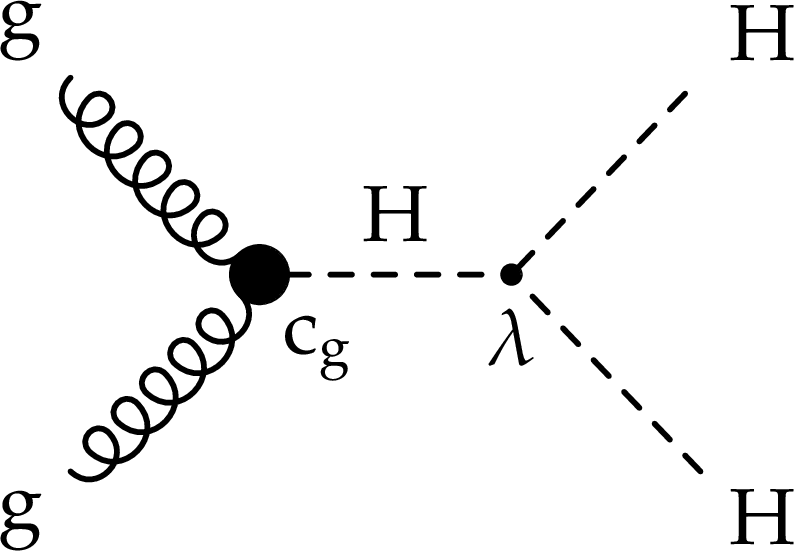
Figure 2-a:
Leading order Feynman diagrams for nonresonant HH production via gluon fusion in an EFT approach, where loop-mediated contact interactions between (left) two gluons and one H boson, (middle) two gluons and two H bosons, and (right) two top quarks and two H bosons are parametrized by three effective couplings: ${\text {c}_{{\mathrm{g}}}}$, ${\text {c}_{2 {\mathrm{g}}}}$, and ${\text {c}_{2}}$. |
png pdf |
Figure 2-b:
Leading order Feynman diagrams for nonresonant HH production via gluon fusion in an EFT approach, where loop-mediated contact interactions between (left) two gluons and one H boson, (middle) two gluons and two H bosons, and (right) two top quarks and two H bosons are parametrized by three effective couplings: ${\text {c}_{{\mathrm{g}}}}$, ${\text {c}_{2 {\mathrm{g}}}}$, and ${\text {c}_{2}}$. |
png pdf |
Figure 2-c:
Leading order Feynman diagrams for nonresonant HH production via gluon fusion in an EFT approach, where loop-mediated contact interactions between (left) two gluons and one H boson, (middle) two gluons and two H bosons, and (right) two top quarks and two H bosons are parametrized by three effective couplings: ${\text {c}_{{\mathrm{g}}}}$, ${\text {c}_{2 {\mathrm{g}}}}$, and ${\text {c}_{2}}$. |
png pdf |
Figure 3:
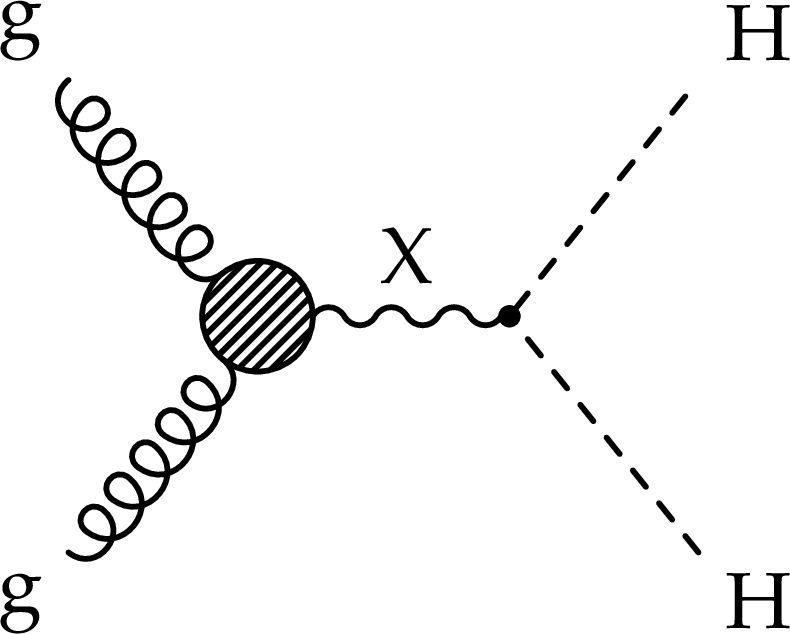
Leading order Feynman diagram for resonant HH production. |
png pdf |
Figure 4:
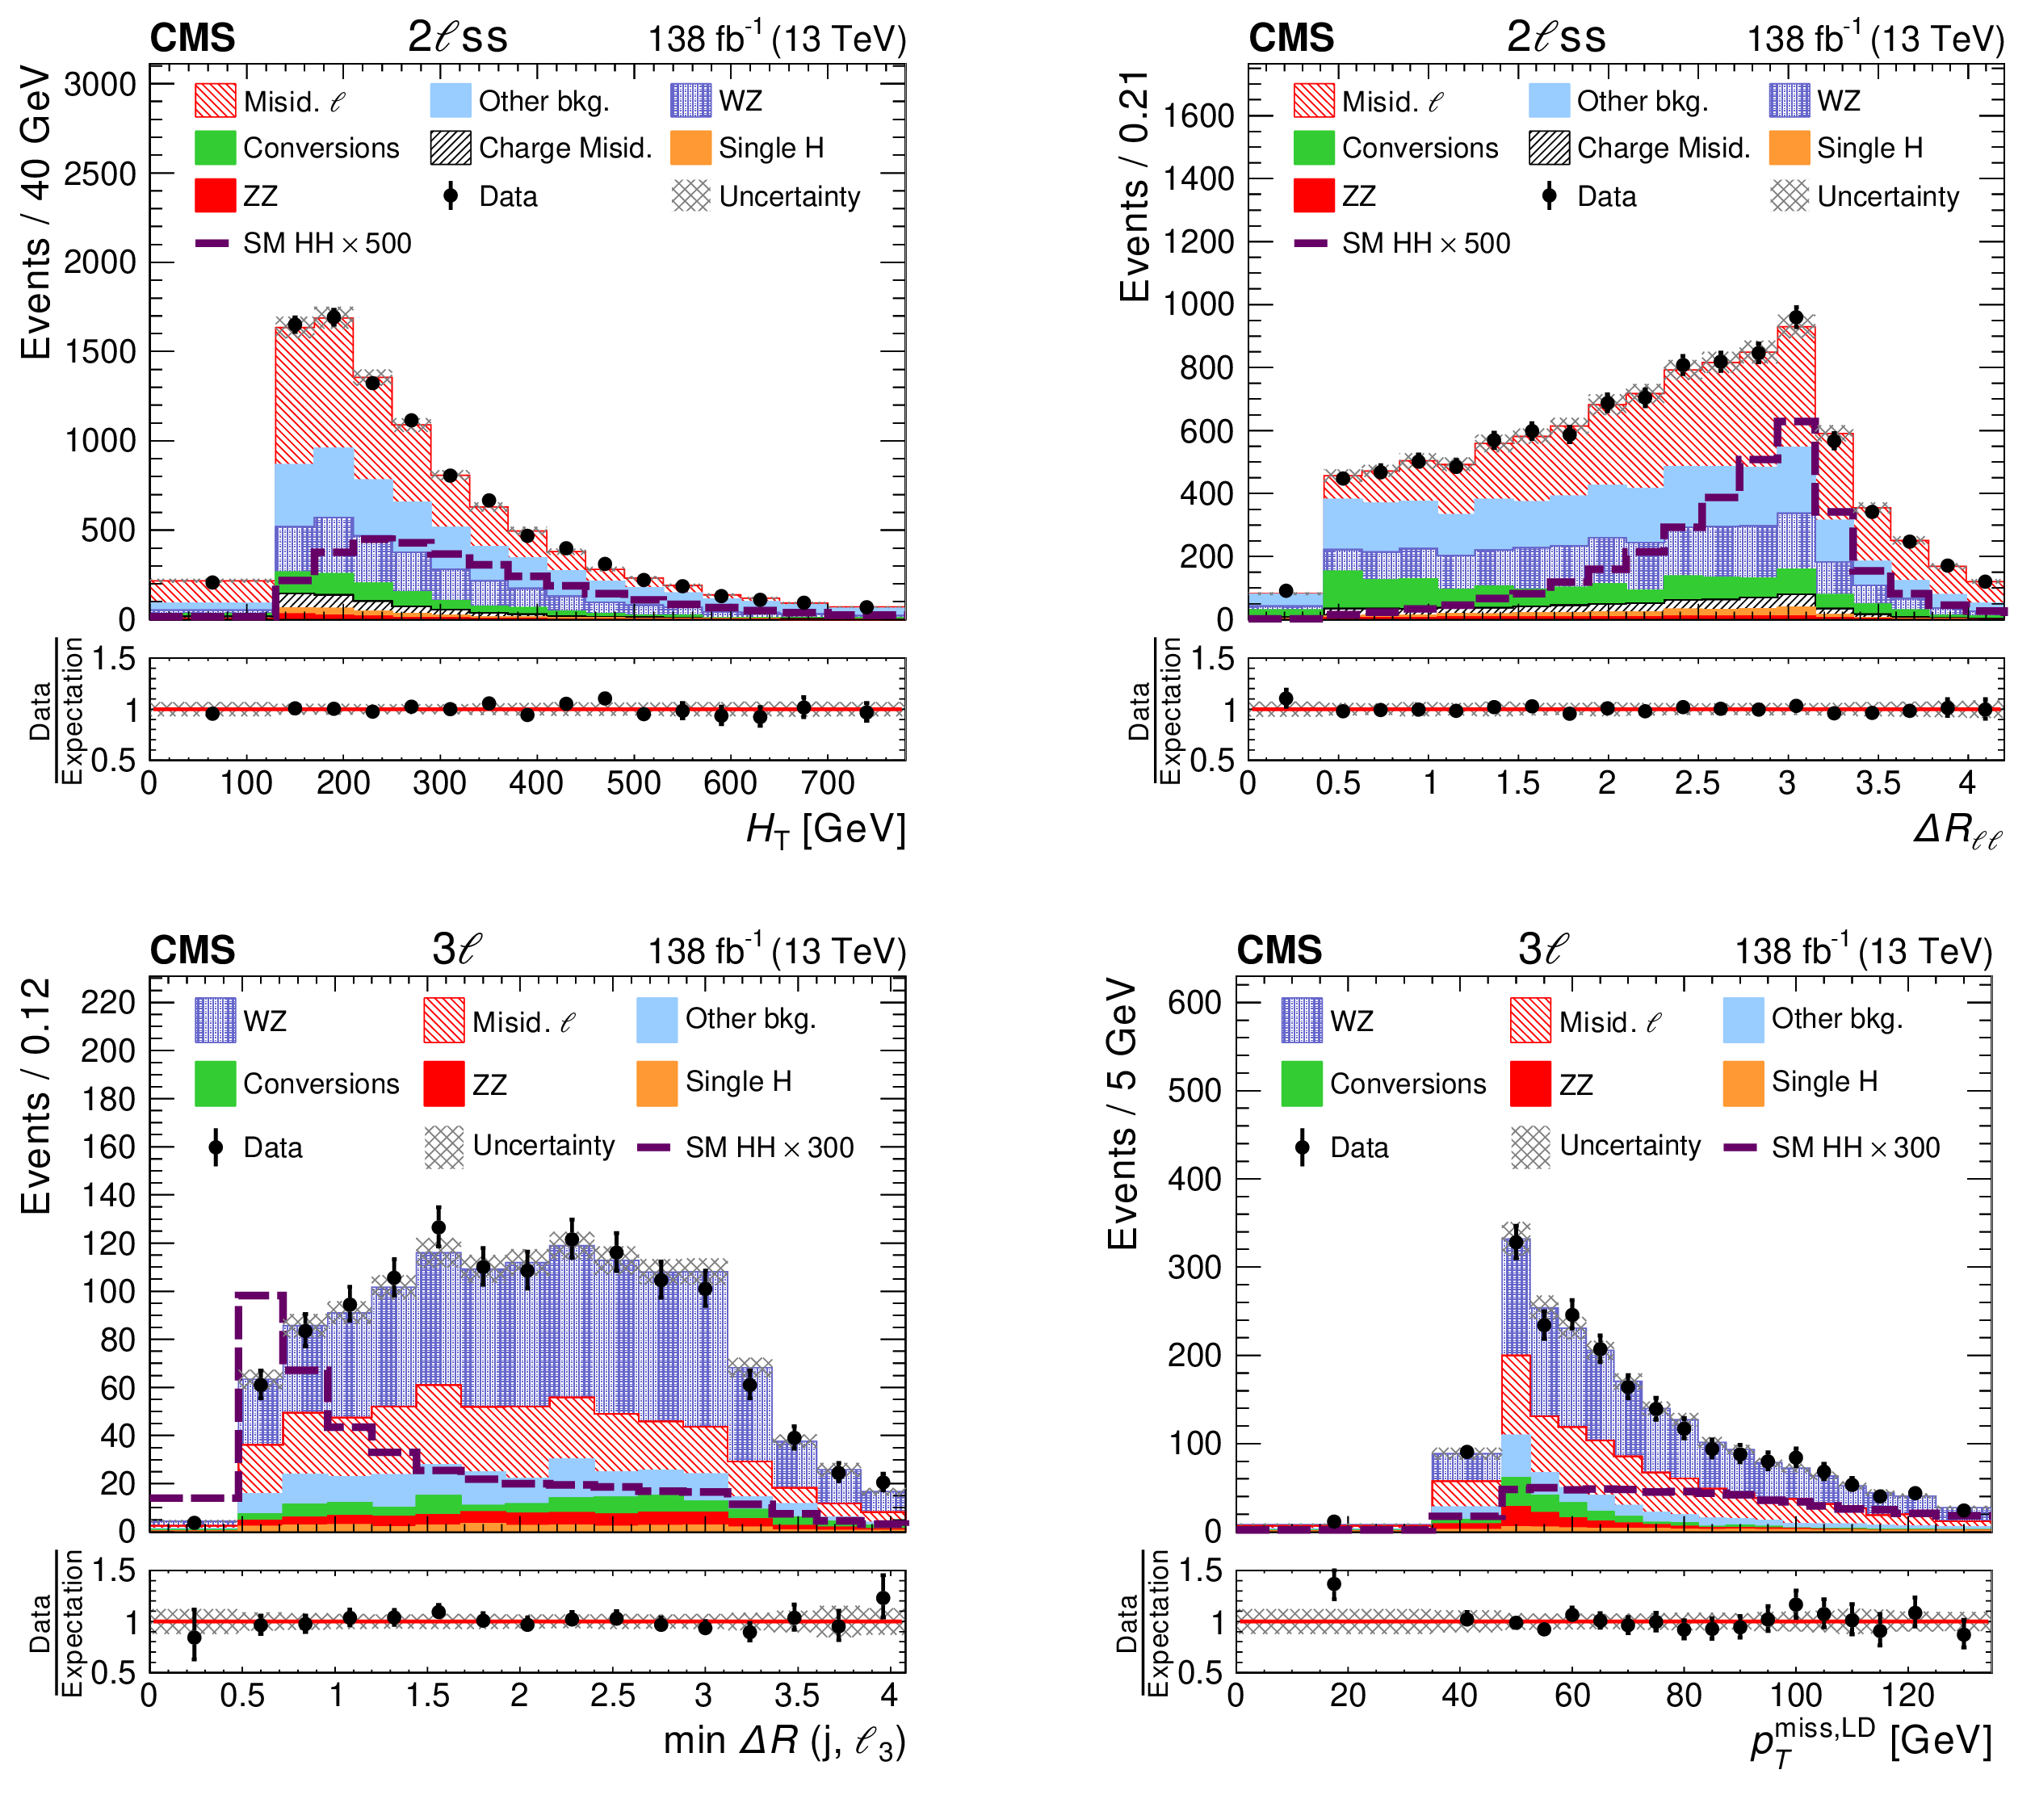
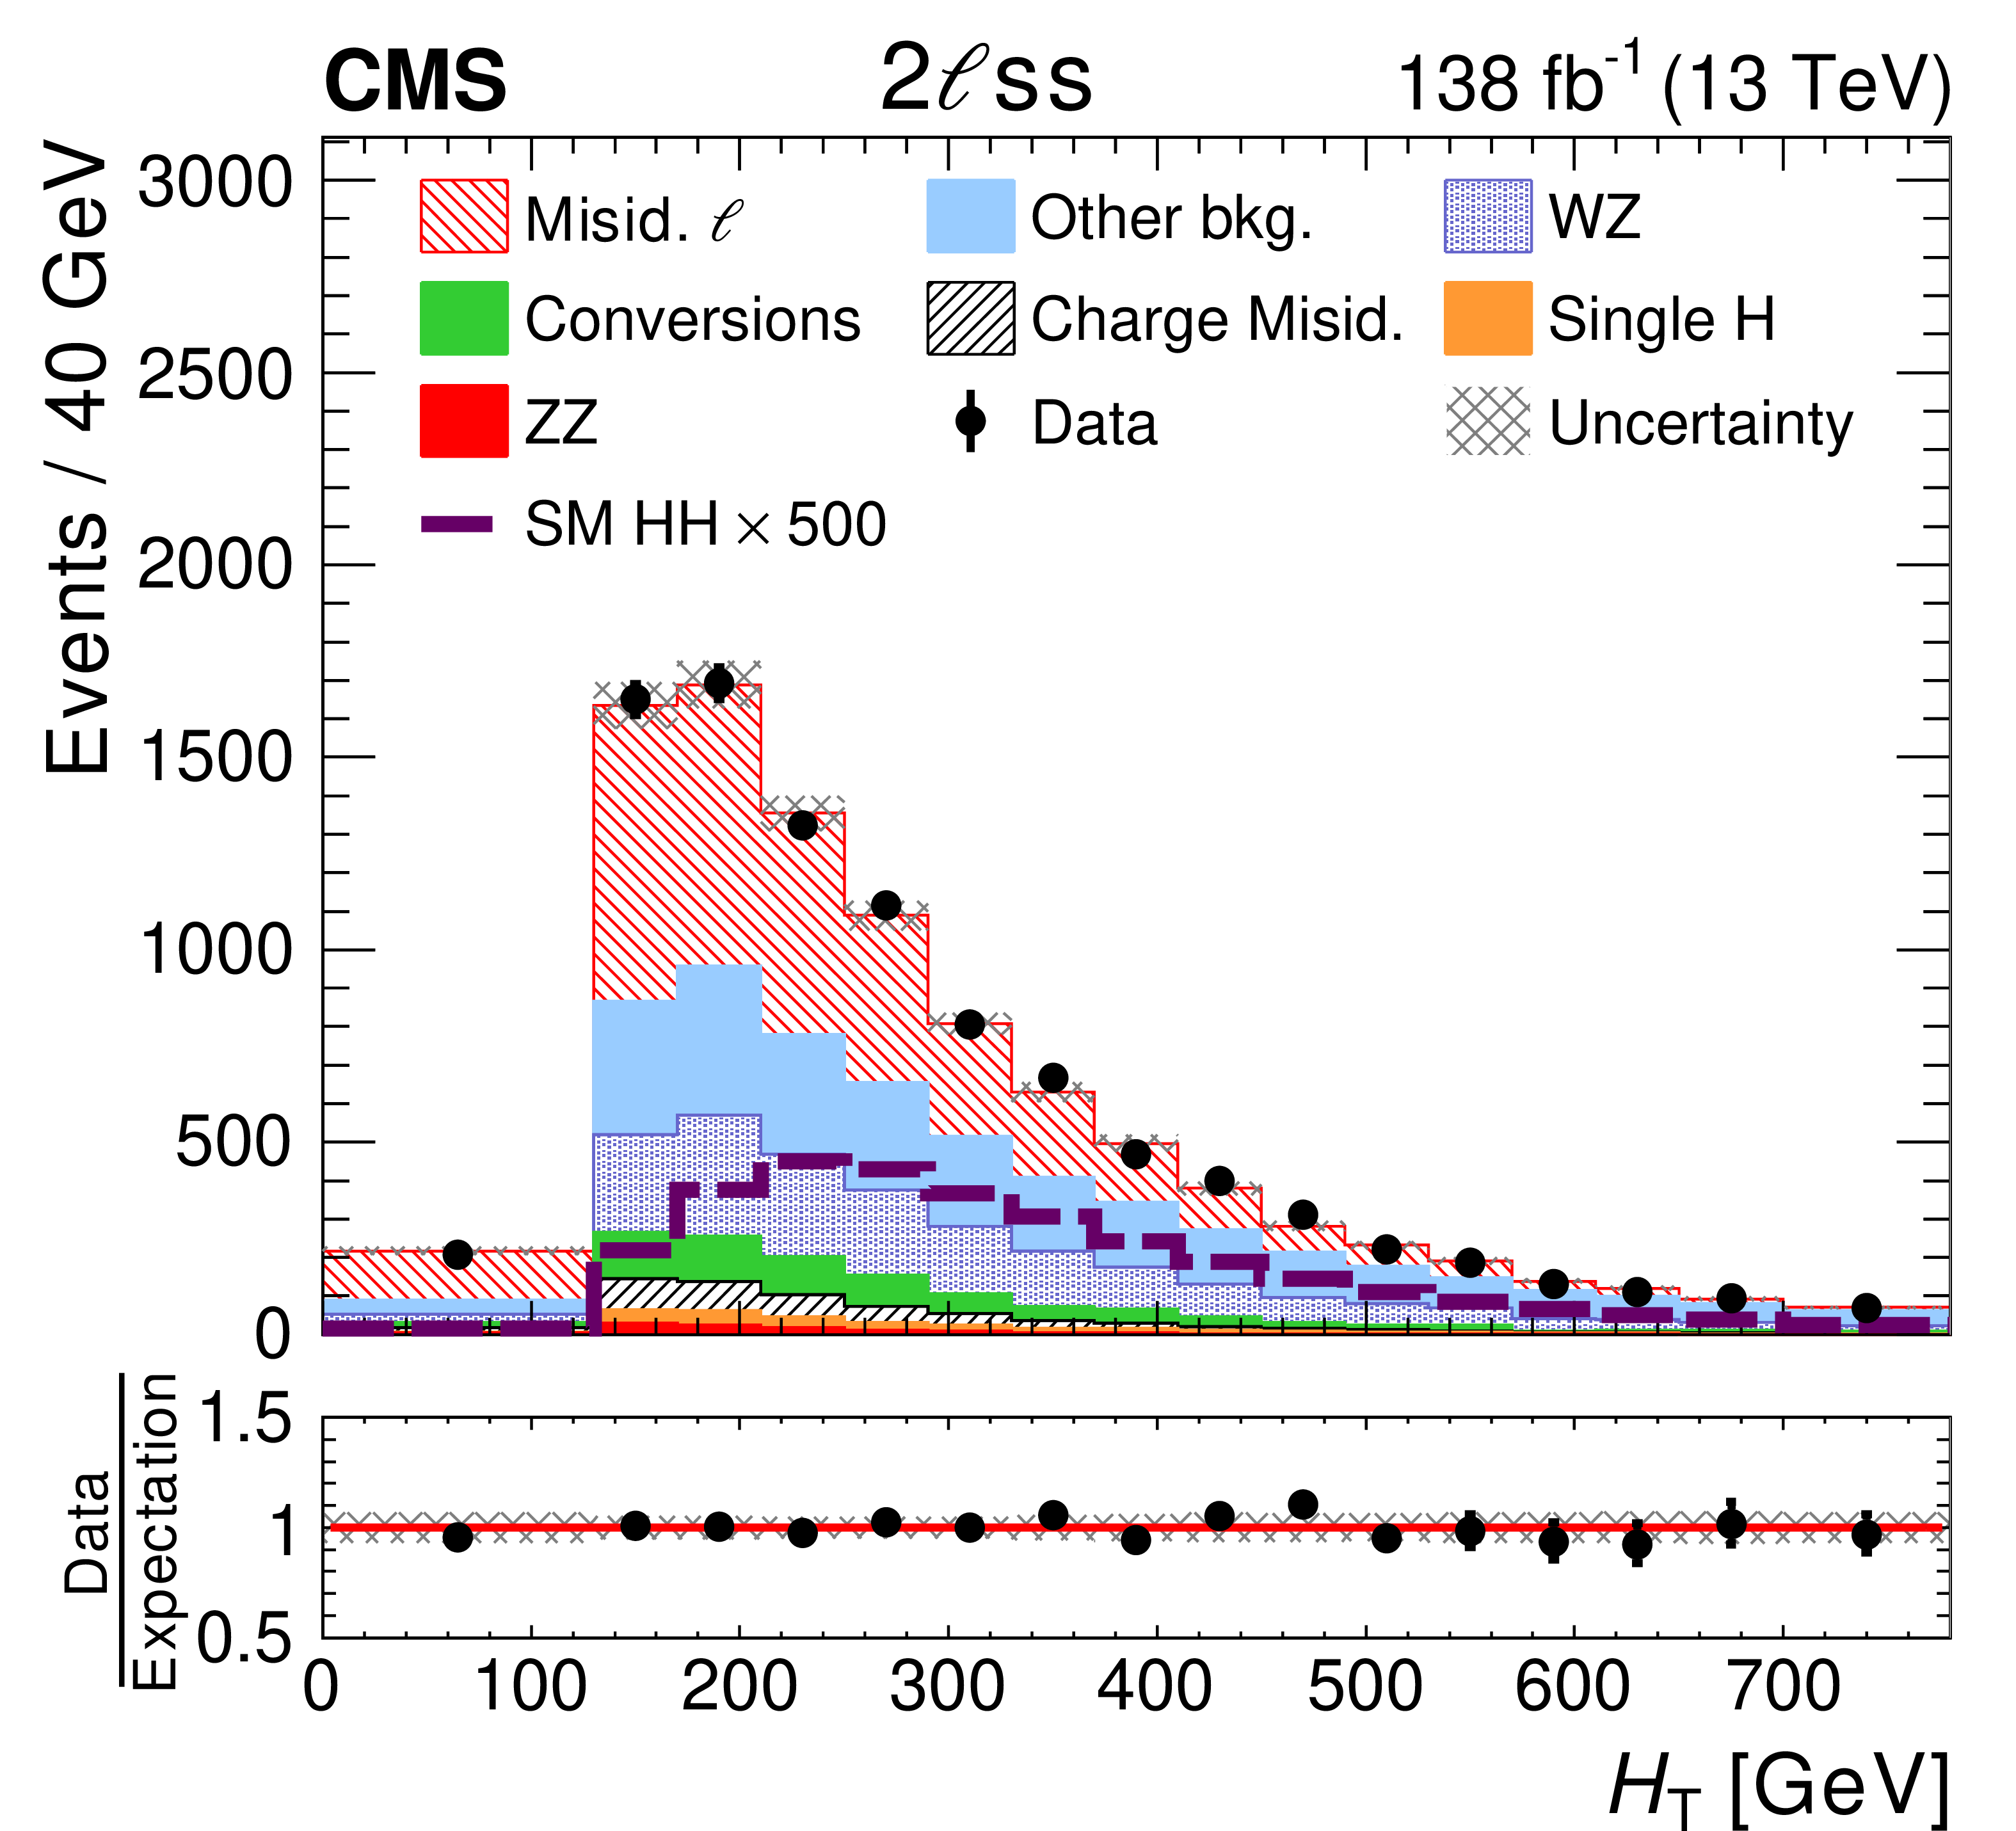
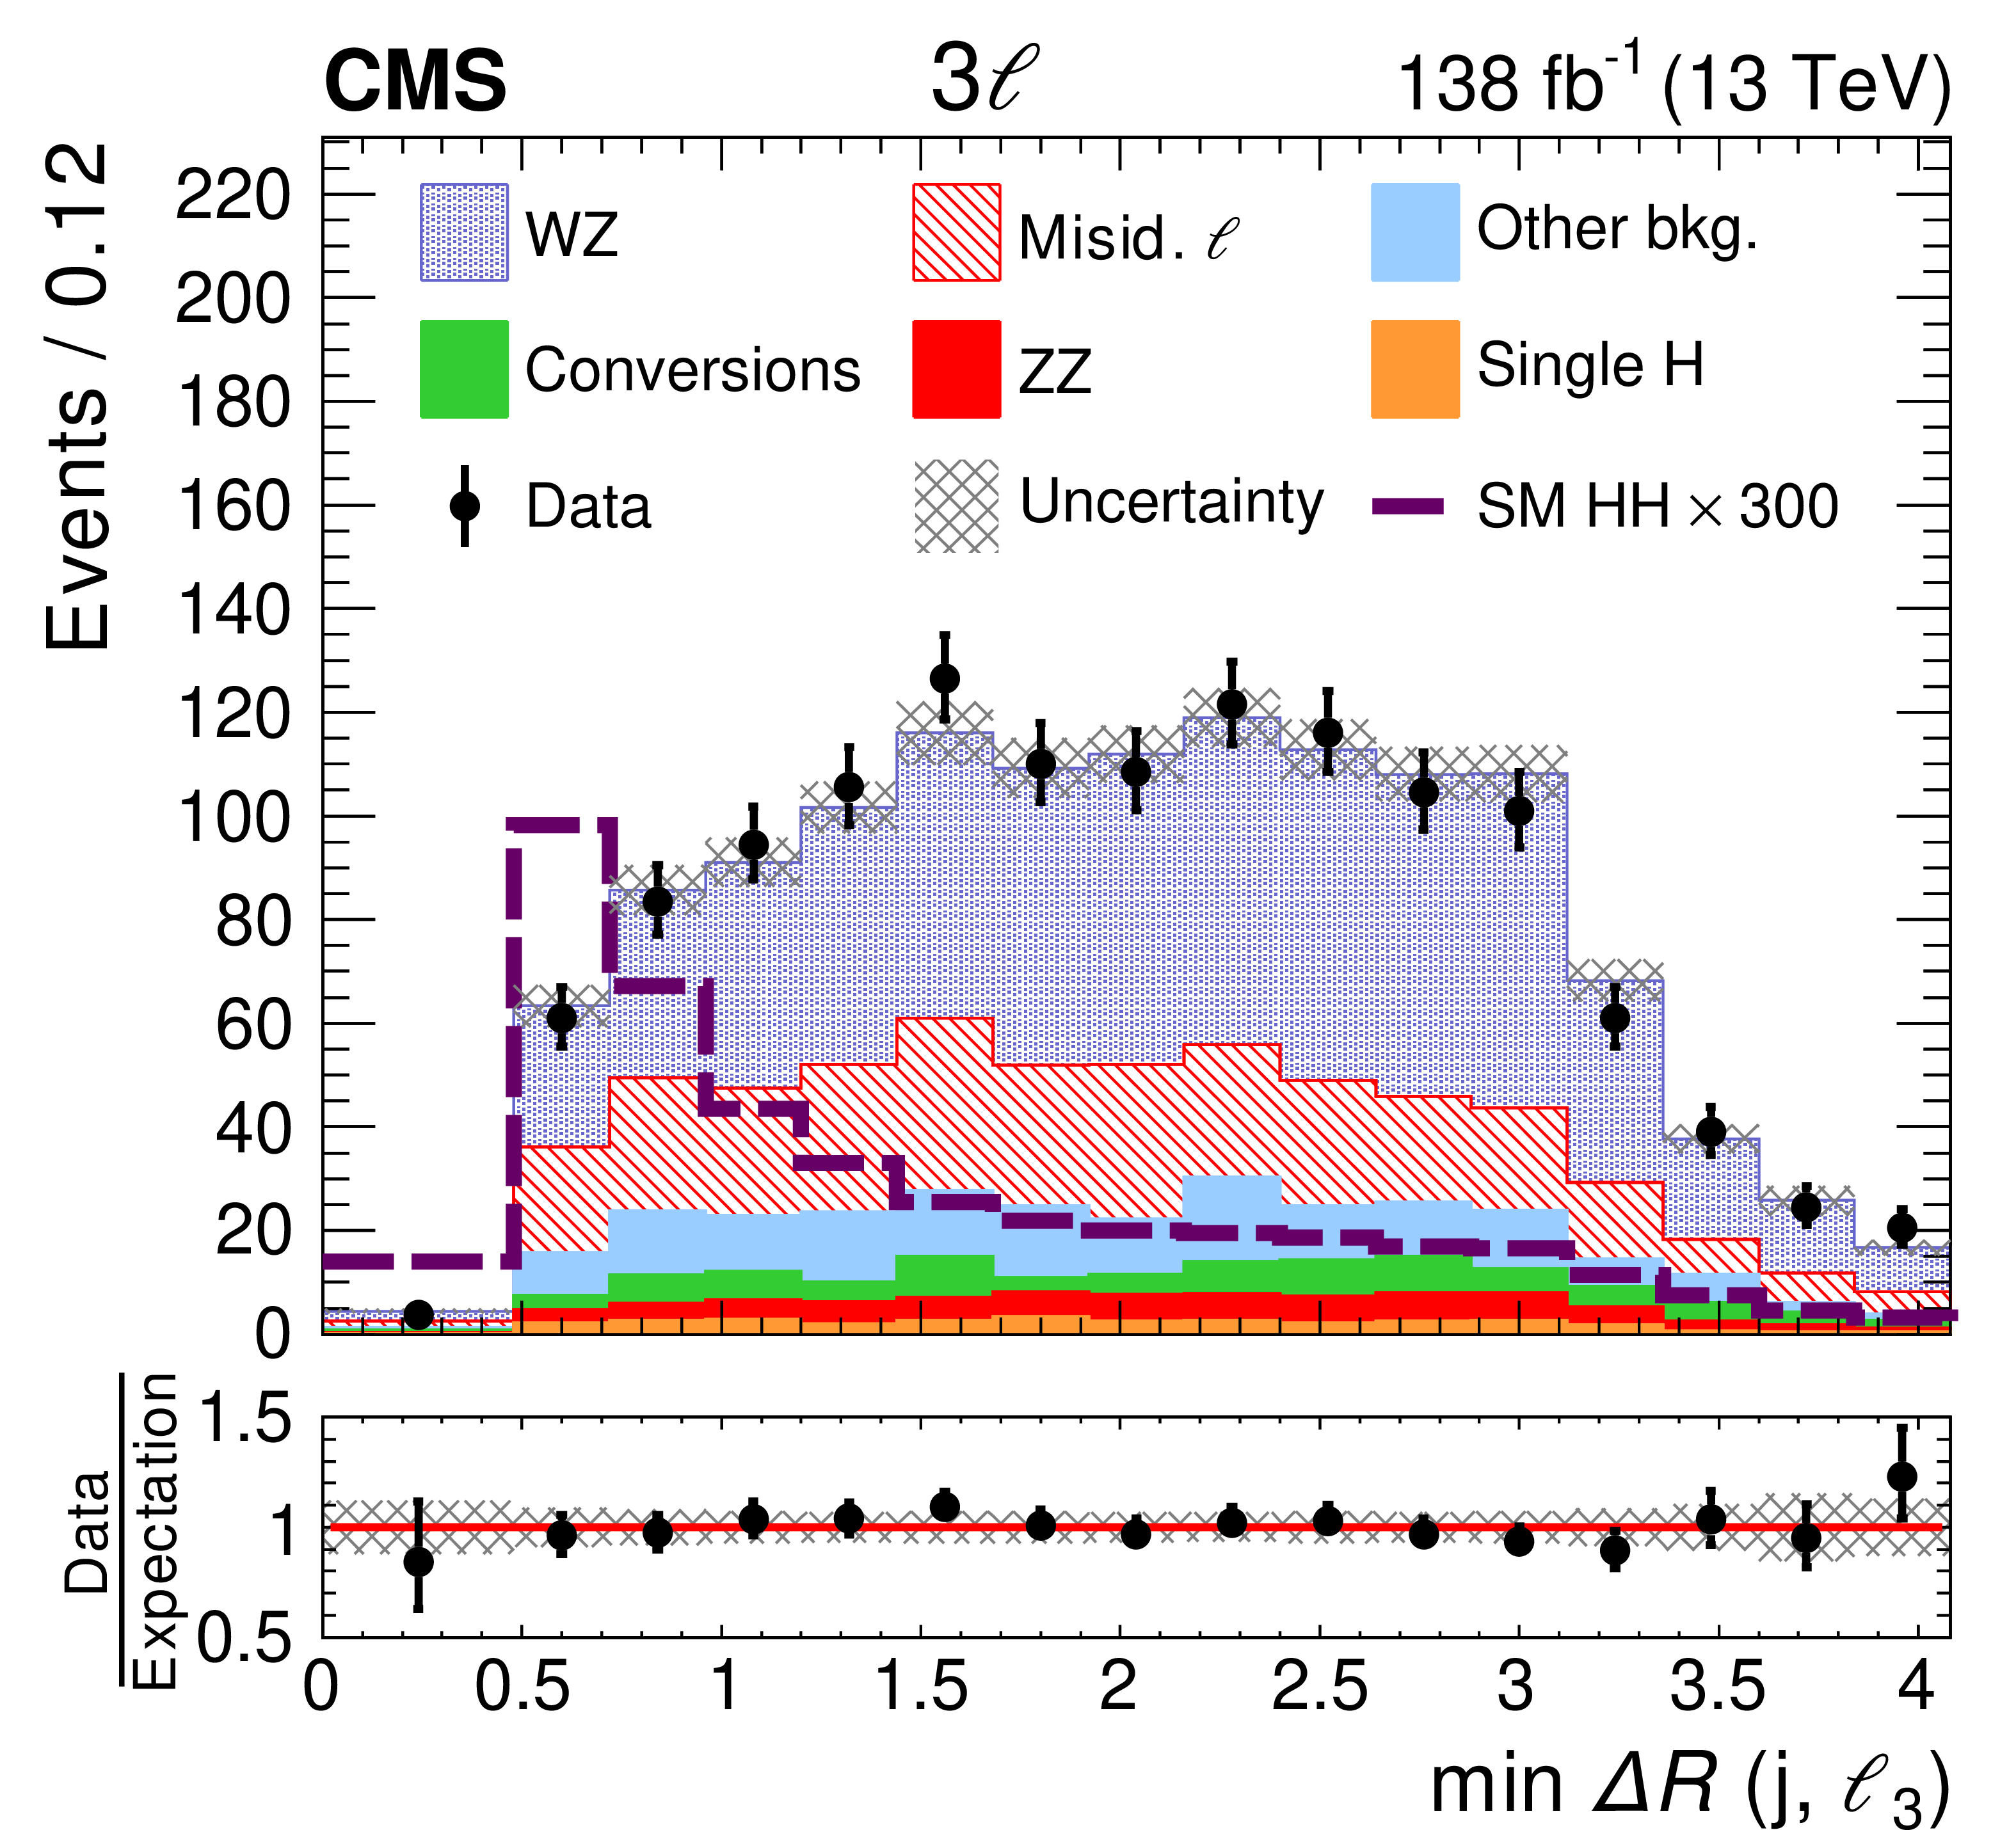
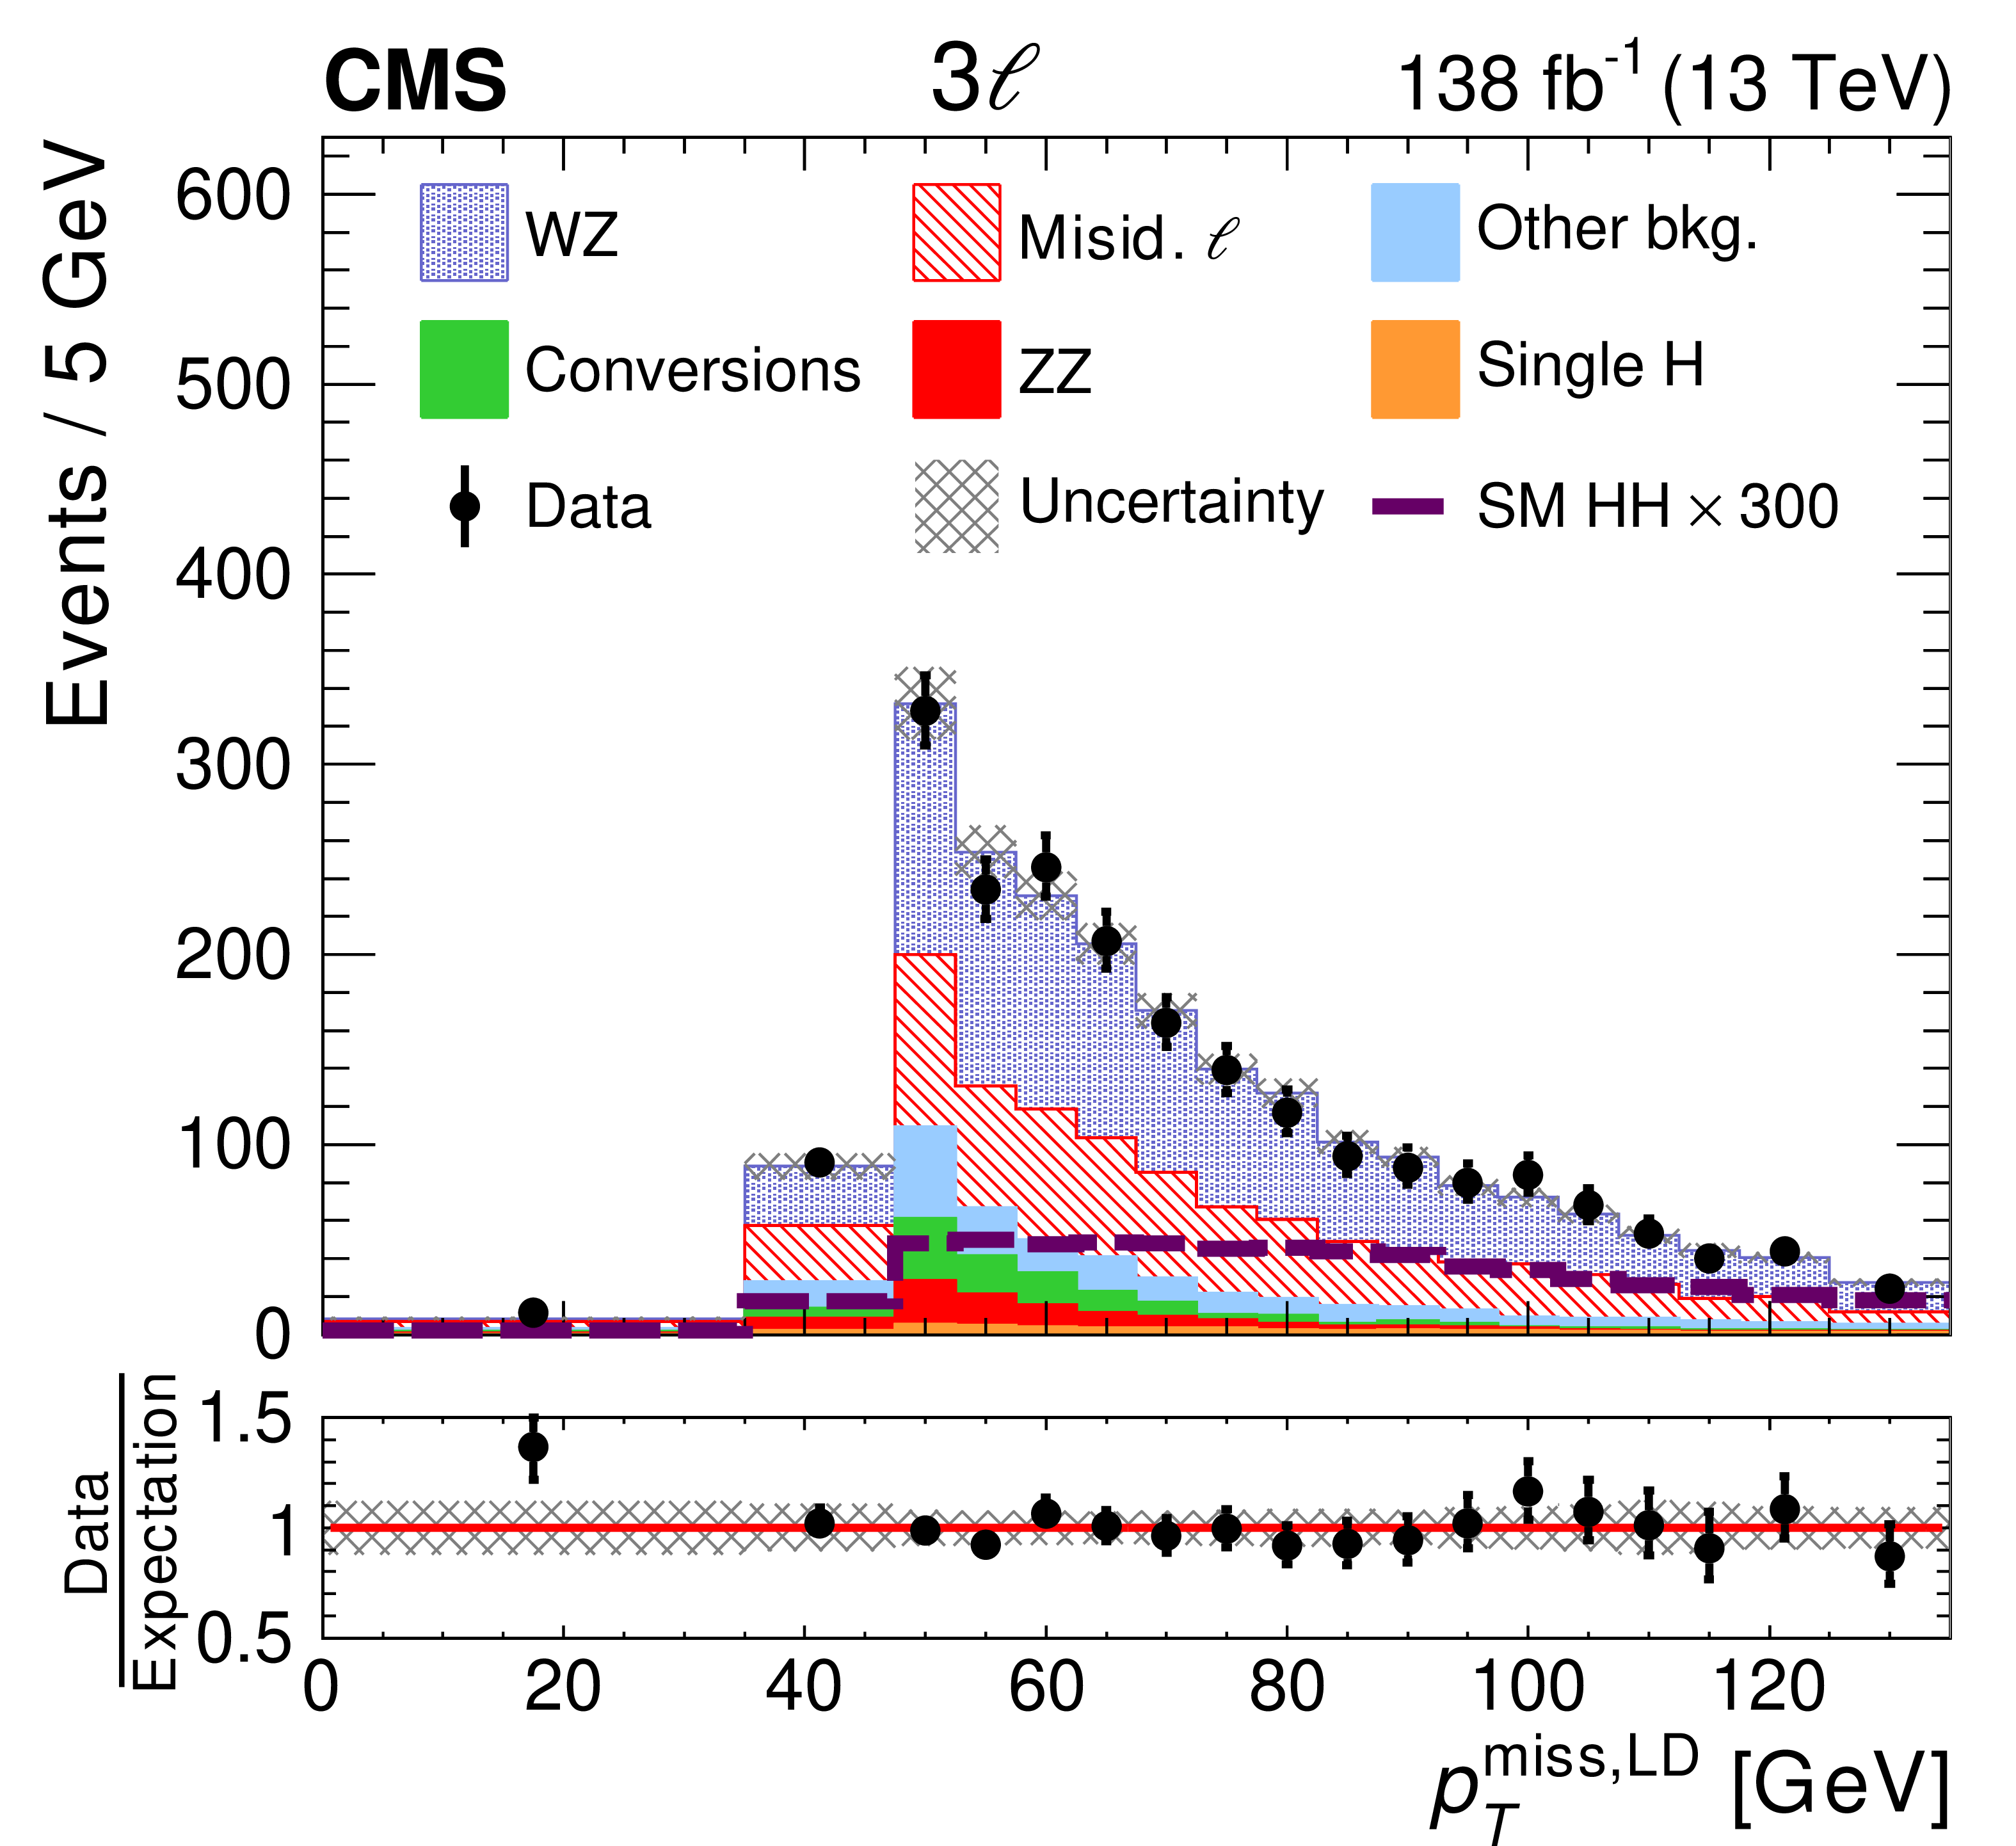
Distributions in a few observables used as inputs to the BDT classifiers in the 2$\ell$ss and 3$\ell$ categories: the scalar ${p_{\mathrm {T}}}$ sum, denoted as ${H_{\mathrm {T}}}$, of the two reconstructed ${\ell}$ and all small-radius jets in the 2$\ell$ss category (upper left); the angular separation $\Delta R$ between the two ${\ell}$ in the 2$\ell$ss category (upper right); the angular separation between $ {\ell} _{3}$ and the nearest small-radius jet in the 3$\ell$ category (lower left); and ${{p_{\mathrm {T}}} ^\text {miss,LD}}$ in the 3$\ell$ category (lower right). The $ {\ell} _{3}$ in the 3$\ell$ category is defined as the ${\ell}$ that is not part of the opposite-sign ${\ell \ell}$ pair of lowest mass. The distributions expected for the different background processes are shown for the values of nuisance parameters obtained from the background-only ML fit, in which the HH signal is constrained to be zero. |
png pdf |
Figure 4-a:
Distributions in a few observables used as inputs to the BDT classifiers in the 2$\ell$ss and 3$\ell$ categories: the scalar ${p_{\mathrm {T}}}$ sum, denoted as ${H_{\mathrm {T}}}$, of the two reconstructed ${\ell}$ and all small-radius jets in the 2$\ell$ss category (upper left); the angular separation $\Delta R$ between the two ${\ell}$ in the 2$\ell$ss category (upper right); the angular separation between $ {\ell} _{3}$ and the nearest small-radius jet in the 3$\ell$ category (lower left); and ${{p_{\mathrm {T}}} ^\text {miss,LD}}$ in the 3$\ell$ category (lower right). The $ {\ell} _{3}$ in the 3$\ell$ category is defined as the ${\ell}$ that is not part of the opposite-sign ${\ell \ell}$ pair of lowest mass. The distributions expected for the different background processes are shown for the values of nuisance parameters obtained from the background-only ML fit, in which the HH signal is constrained to be zero. |

png pdf |
Figure 4-b:
Distributions in a few observables used as inputs to the BDT classifiers in the 2$\ell$ss and 3$\ell$ categories: the scalar ${p_{\mathrm {T}}}$ sum, denoted as ${H_{\mathrm {T}}}$, of the two reconstructed ${\ell}$ and all small-radius jets in the 2$\ell$ss category (upper left); the angular separation $\Delta R$ between the two ${\ell}$ in the 2$\ell$ss category (upper right); the angular separation between $ {\ell} _{3}$ and the nearest small-radius jet in the 3$\ell$ category (lower left); and ${{p_{\mathrm {T}}} ^\text {miss,LD}}$ in the 3$\ell$ category (lower right). The $ {\ell} _{3}$ in the 3$\ell$ category is defined as the ${\ell}$ that is not part of the opposite-sign ${\ell \ell}$ pair of lowest mass. The distributions expected for the different background processes are shown for the values of nuisance parameters obtained from the background-only ML fit, in which the HH signal is constrained to be zero. |
png pdf |
Figure 4-c:
Distributions in a few observables used as inputs to the BDT classifiers in the 2$\ell$ss and 3$\ell$ categories: the scalar ${p_{\mathrm {T}}}$ sum, denoted as ${H_{\mathrm {T}}}$, of the two reconstructed ${\ell}$ and all small-radius jets in the 2$\ell$ss category (upper left); the angular separation $\Delta R$ between the two ${\ell}$ in the 2$\ell$ss category (upper right); the angular separation between $ {\ell} _{3}$ and the nearest small-radius jet in the 3$\ell$ category (lower left); and ${{p_{\mathrm {T}}} ^\text {miss,LD}}$ in the 3$\ell$ category (lower right). The $ {\ell} _{3}$ in the 3$\ell$ category is defined as the ${\ell}$ that is not part of the opposite-sign ${\ell \ell}$ pair of lowest mass. The distributions expected for the different background processes are shown for the values of nuisance parameters obtained from the background-only ML fit, in which the HH signal is constrained to be zero. |
png pdf |
Figure 4-d:
Distributions in a few observables used as inputs to the BDT classifiers in the 2$\ell$ss and 3$\ell$ categories: the scalar ${p_{\mathrm {T}}}$ sum, denoted as ${H_{\mathrm {T}}}$, of the two reconstructed ${\ell}$ and all small-radius jets in the 2$\ell$ss category (upper left); the angular separation $\Delta R$ between the two ${\ell}$ in the 2$\ell$ss category (upper right); the angular separation between $ {\ell} _{3}$ and the nearest small-radius jet in the 3$\ell$ category (lower left); and ${{p_{\mathrm {T}}} ^\text {miss,LD}}$ in the 3$\ell$ category (lower right). The $ {\ell} _{3}$ in the 3$\ell$ category is defined as the ${\ell}$ that is not part of the opposite-sign ${\ell \ell}$ pair of lowest mass. The distributions expected for the different background processes are shown for the values of nuisance parameters obtained from the background-only ML fit, in which the HH signal is constrained to be zero. |
png pdf |
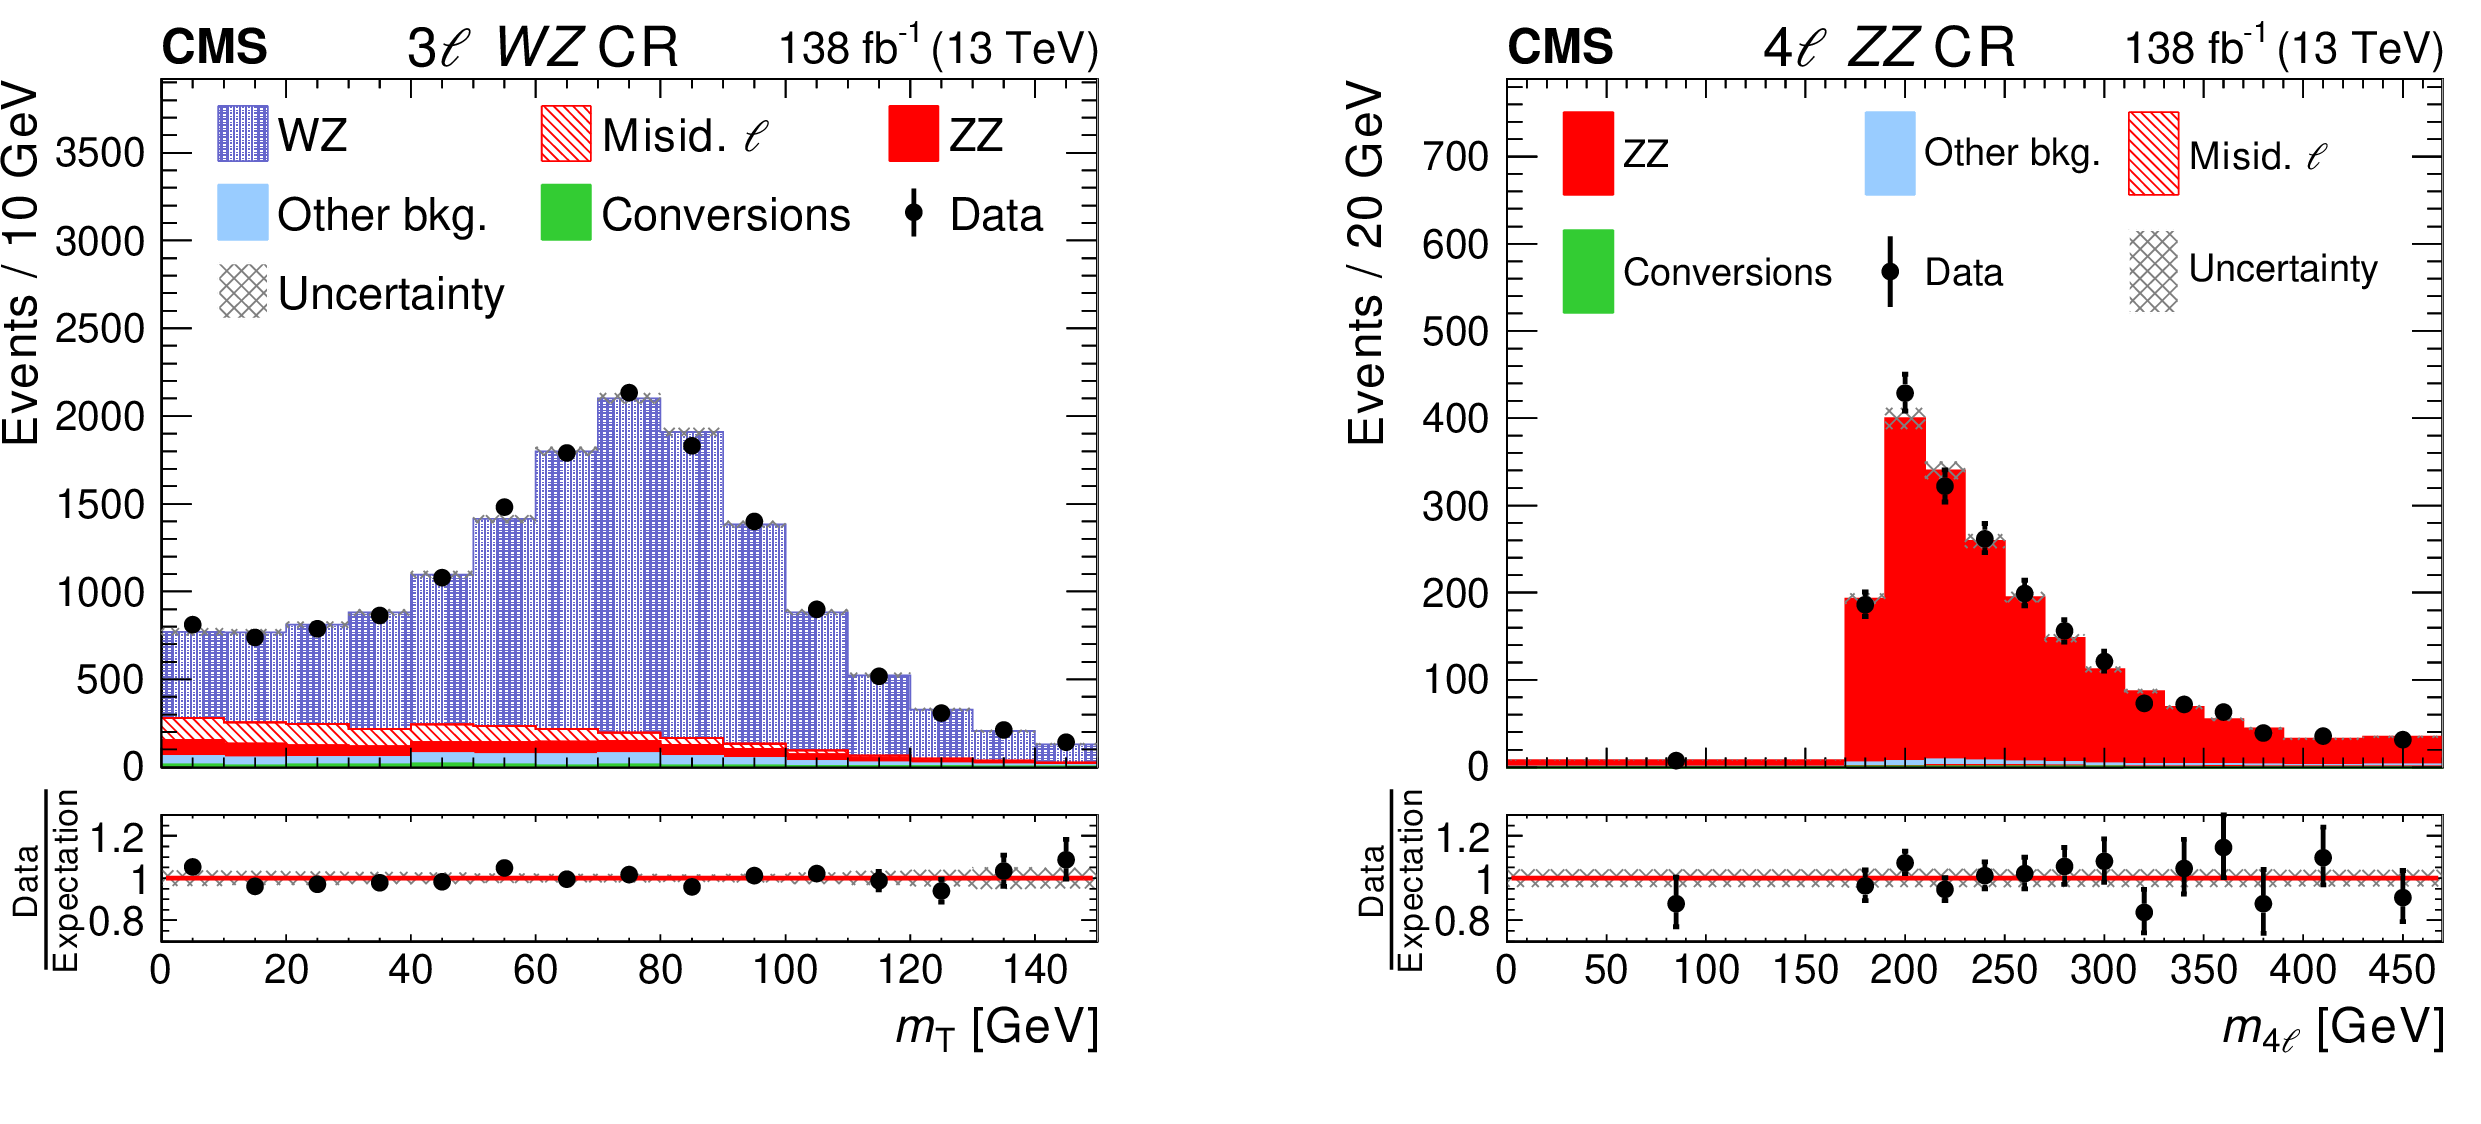
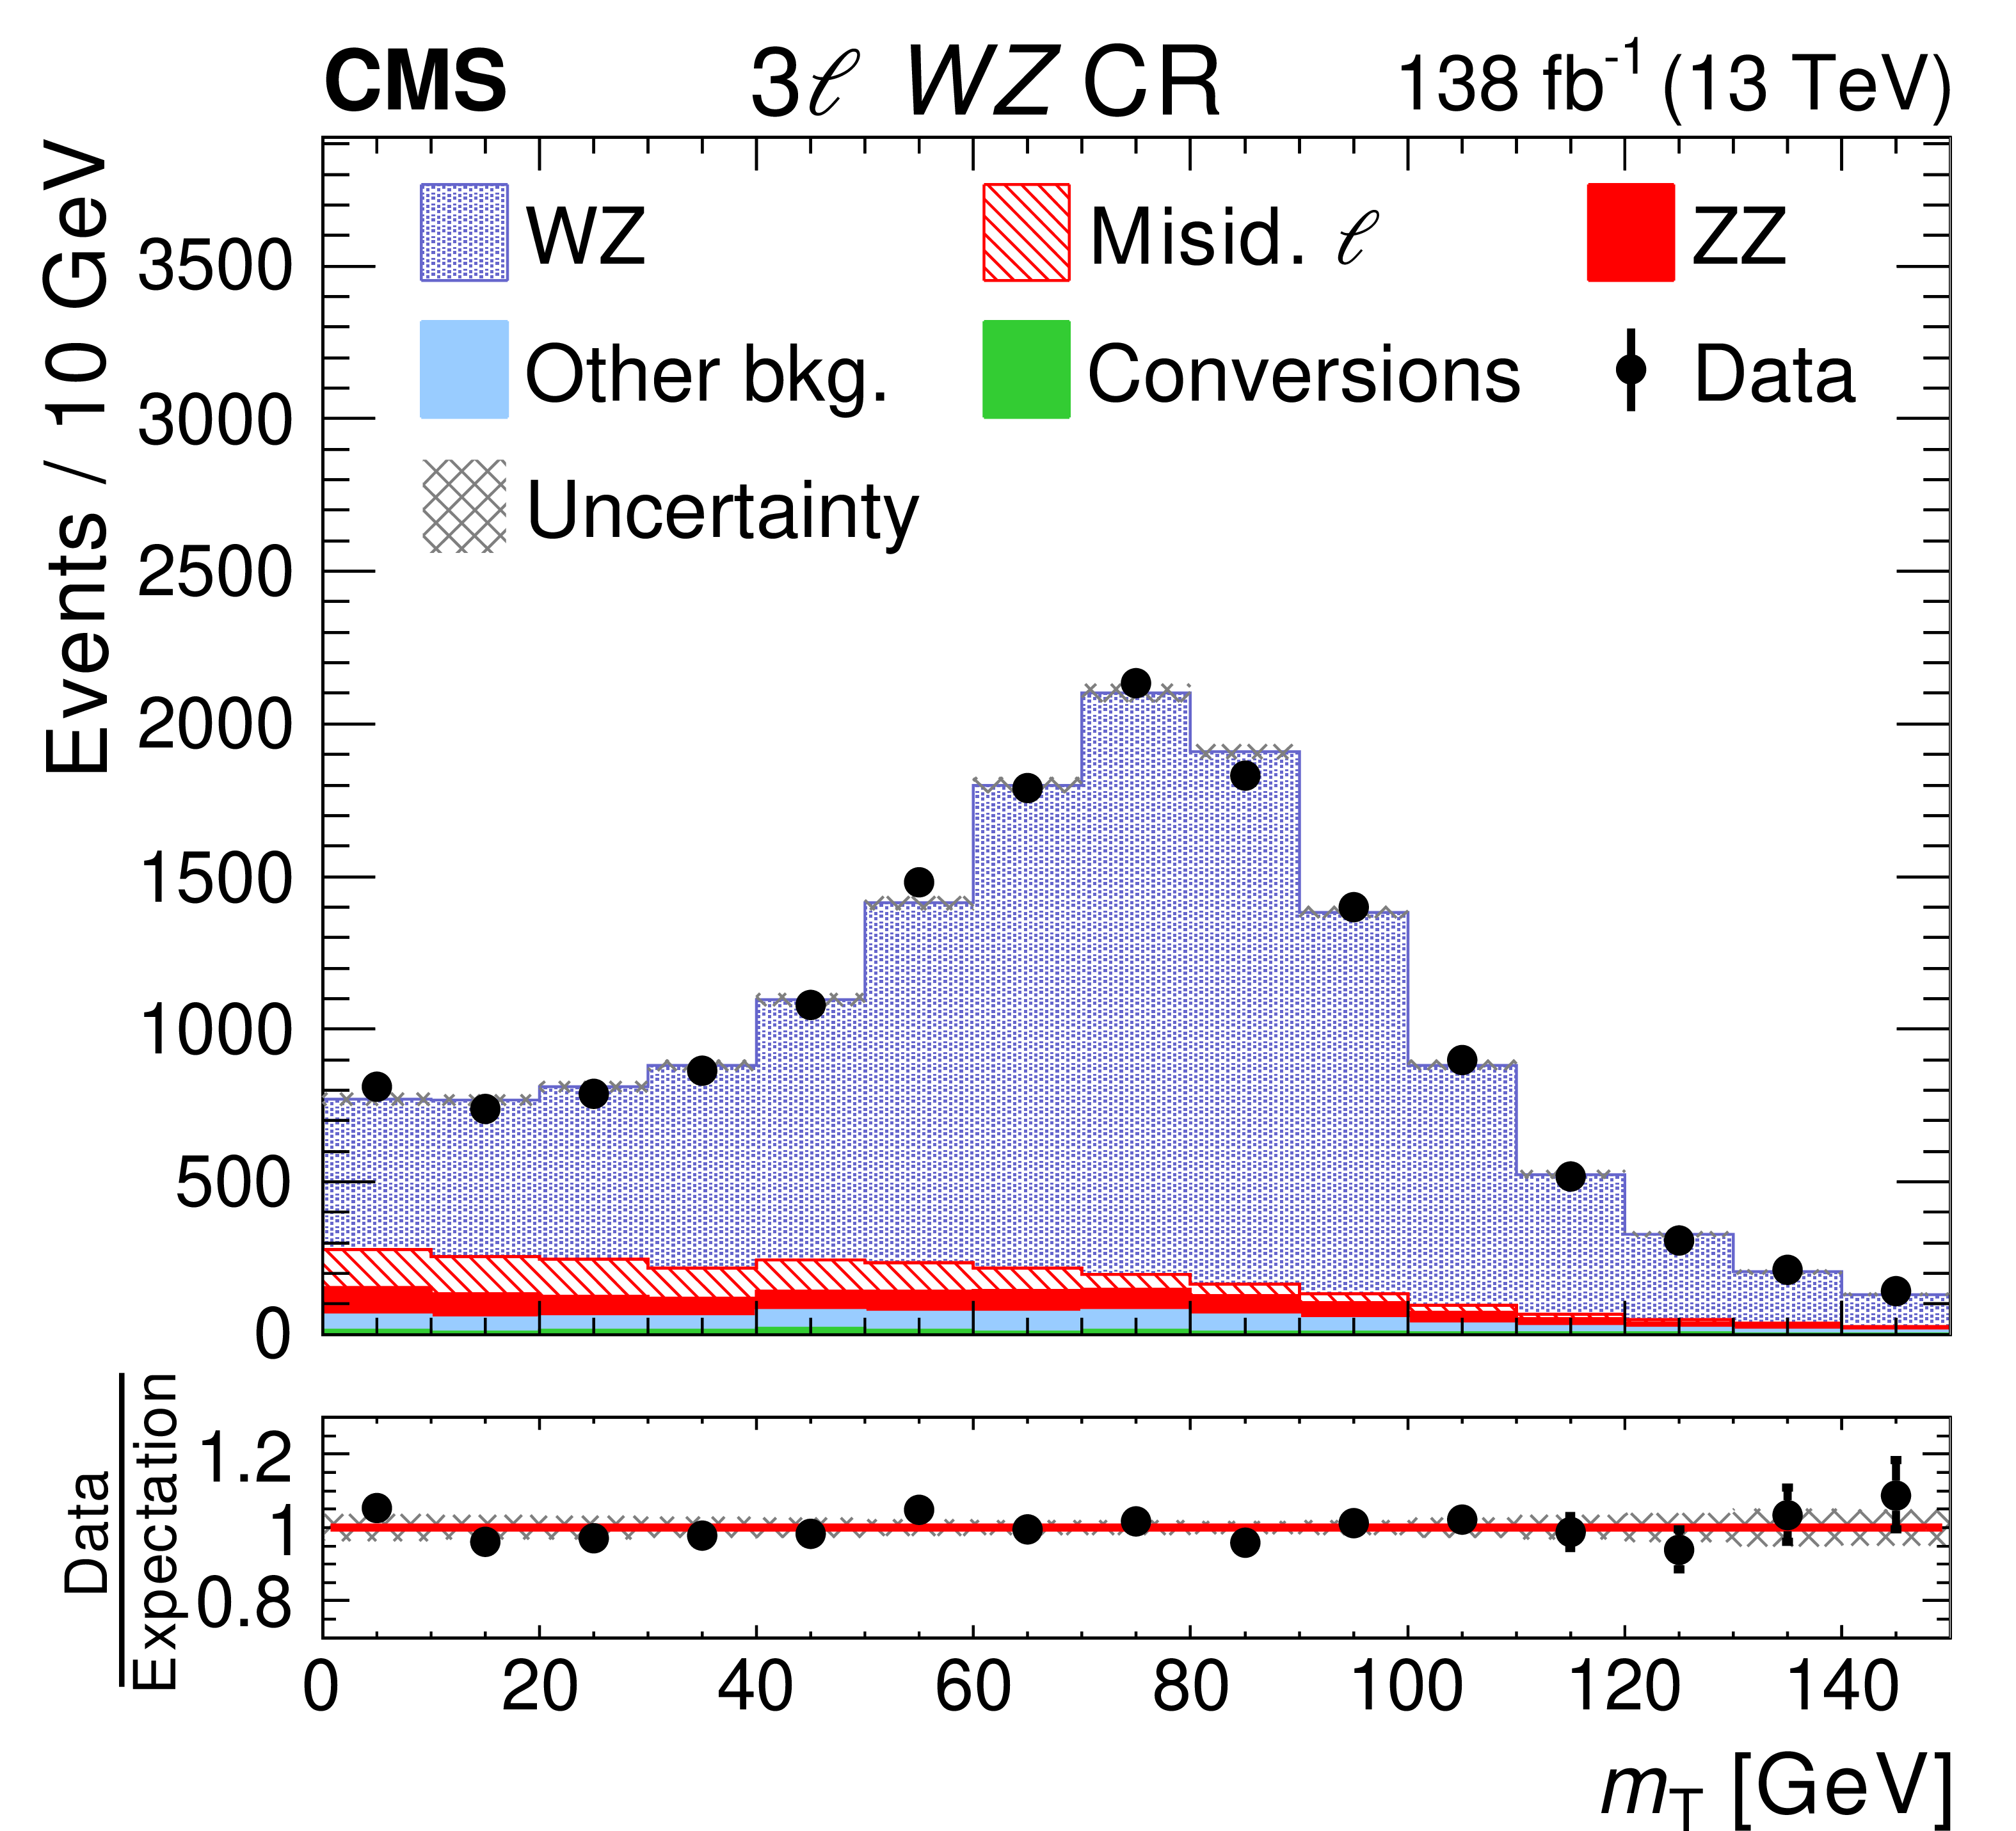
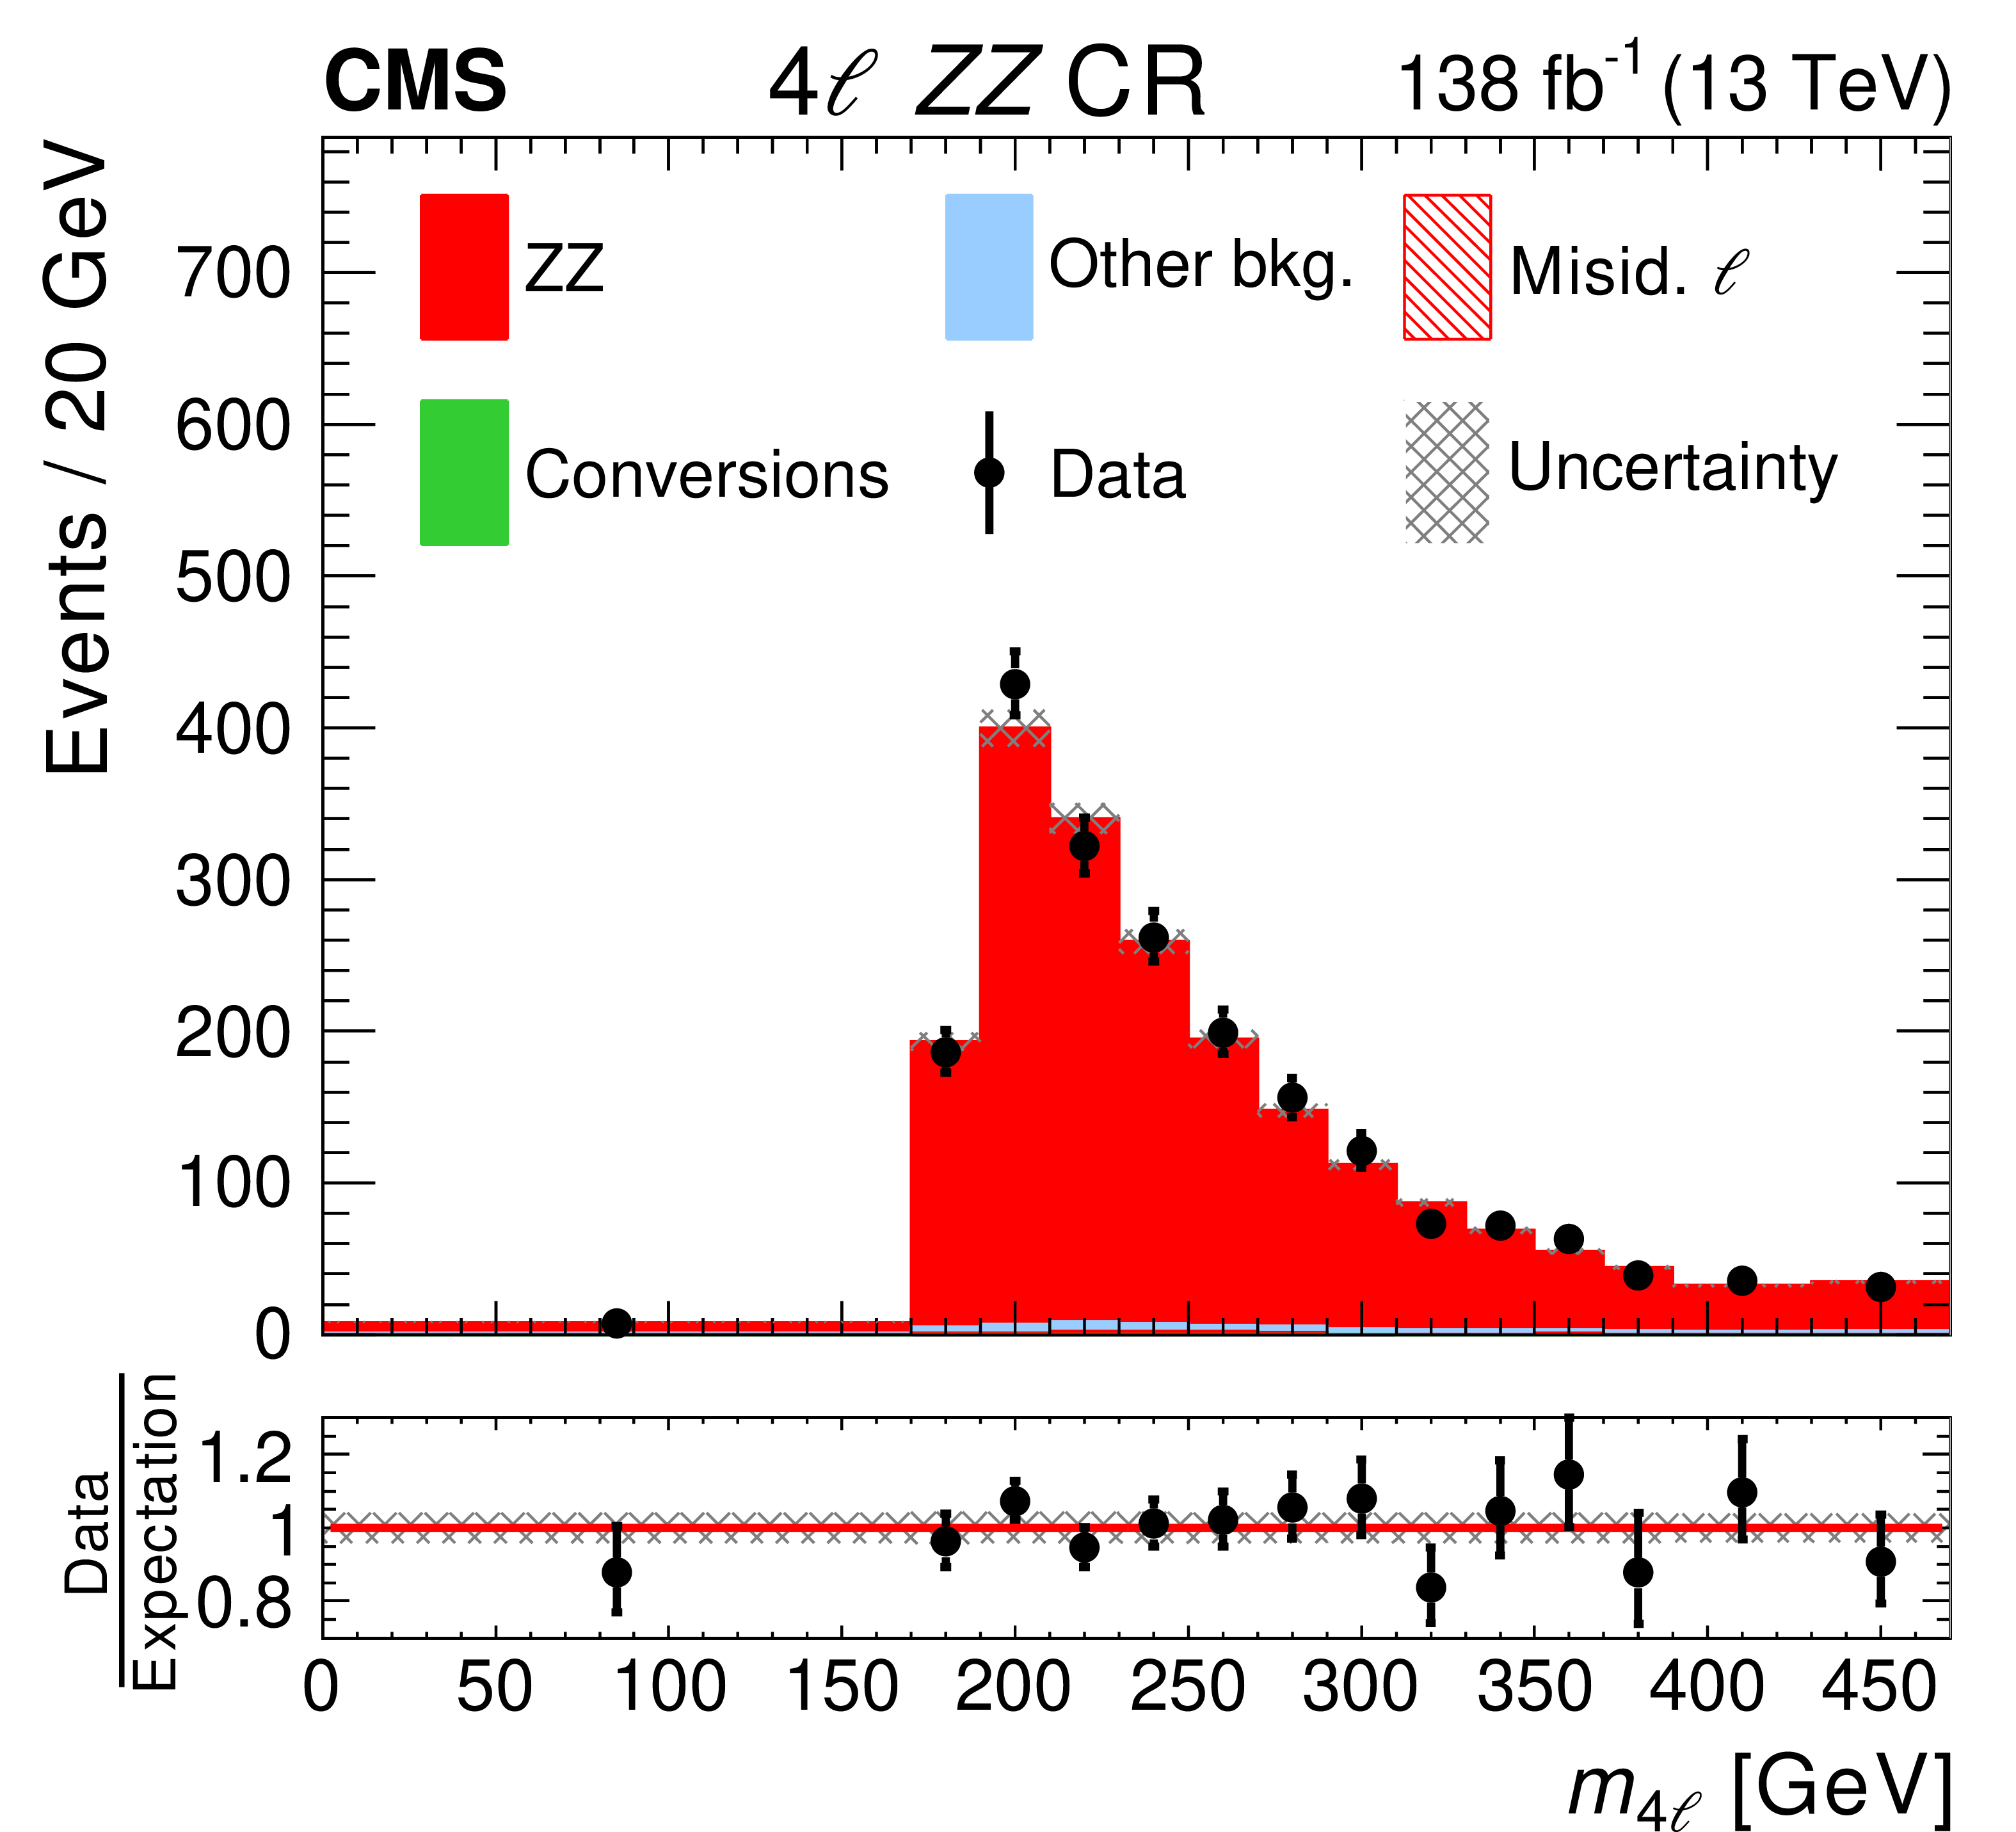
Figure 5:
Distributions in ${m_{\mathrm {T}}}$ in the 3$\ell$WZ CR (left) and in $m_{4 {\ell}}$ in the 4$\ell$ZZ CR (right). The distributions expected for the WZ and ZZ as well as for other background processes are shown for the values of nuisance parameters obtained from the ML fit described in Section 9. |
png pdf |
Figure 5-a:
Distributions in ${m_{\mathrm {T}}}$ in the 3$\ell$WZ CR (left) and in $m_{4 {\ell}}$ in the 4$\ell$ZZ CR (right). The distributions expected for the WZ and ZZ as well as for other background processes are shown for the values of nuisance parameters obtained from the ML fit described in Section 9. |
png pdf |
Figure 5-b:
Distributions in ${m_{\mathrm {T}}}$ in the 3$\ell$WZ CR (left) and in $m_{4 {\ell}}$ in the 4$\ell$ZZ CR (right). The distributions expected for the WZ and ZZ as well as for other background processes are shown for the values of nuisance parameters obtained from the ML fit described in Section 9. |
png pdf |
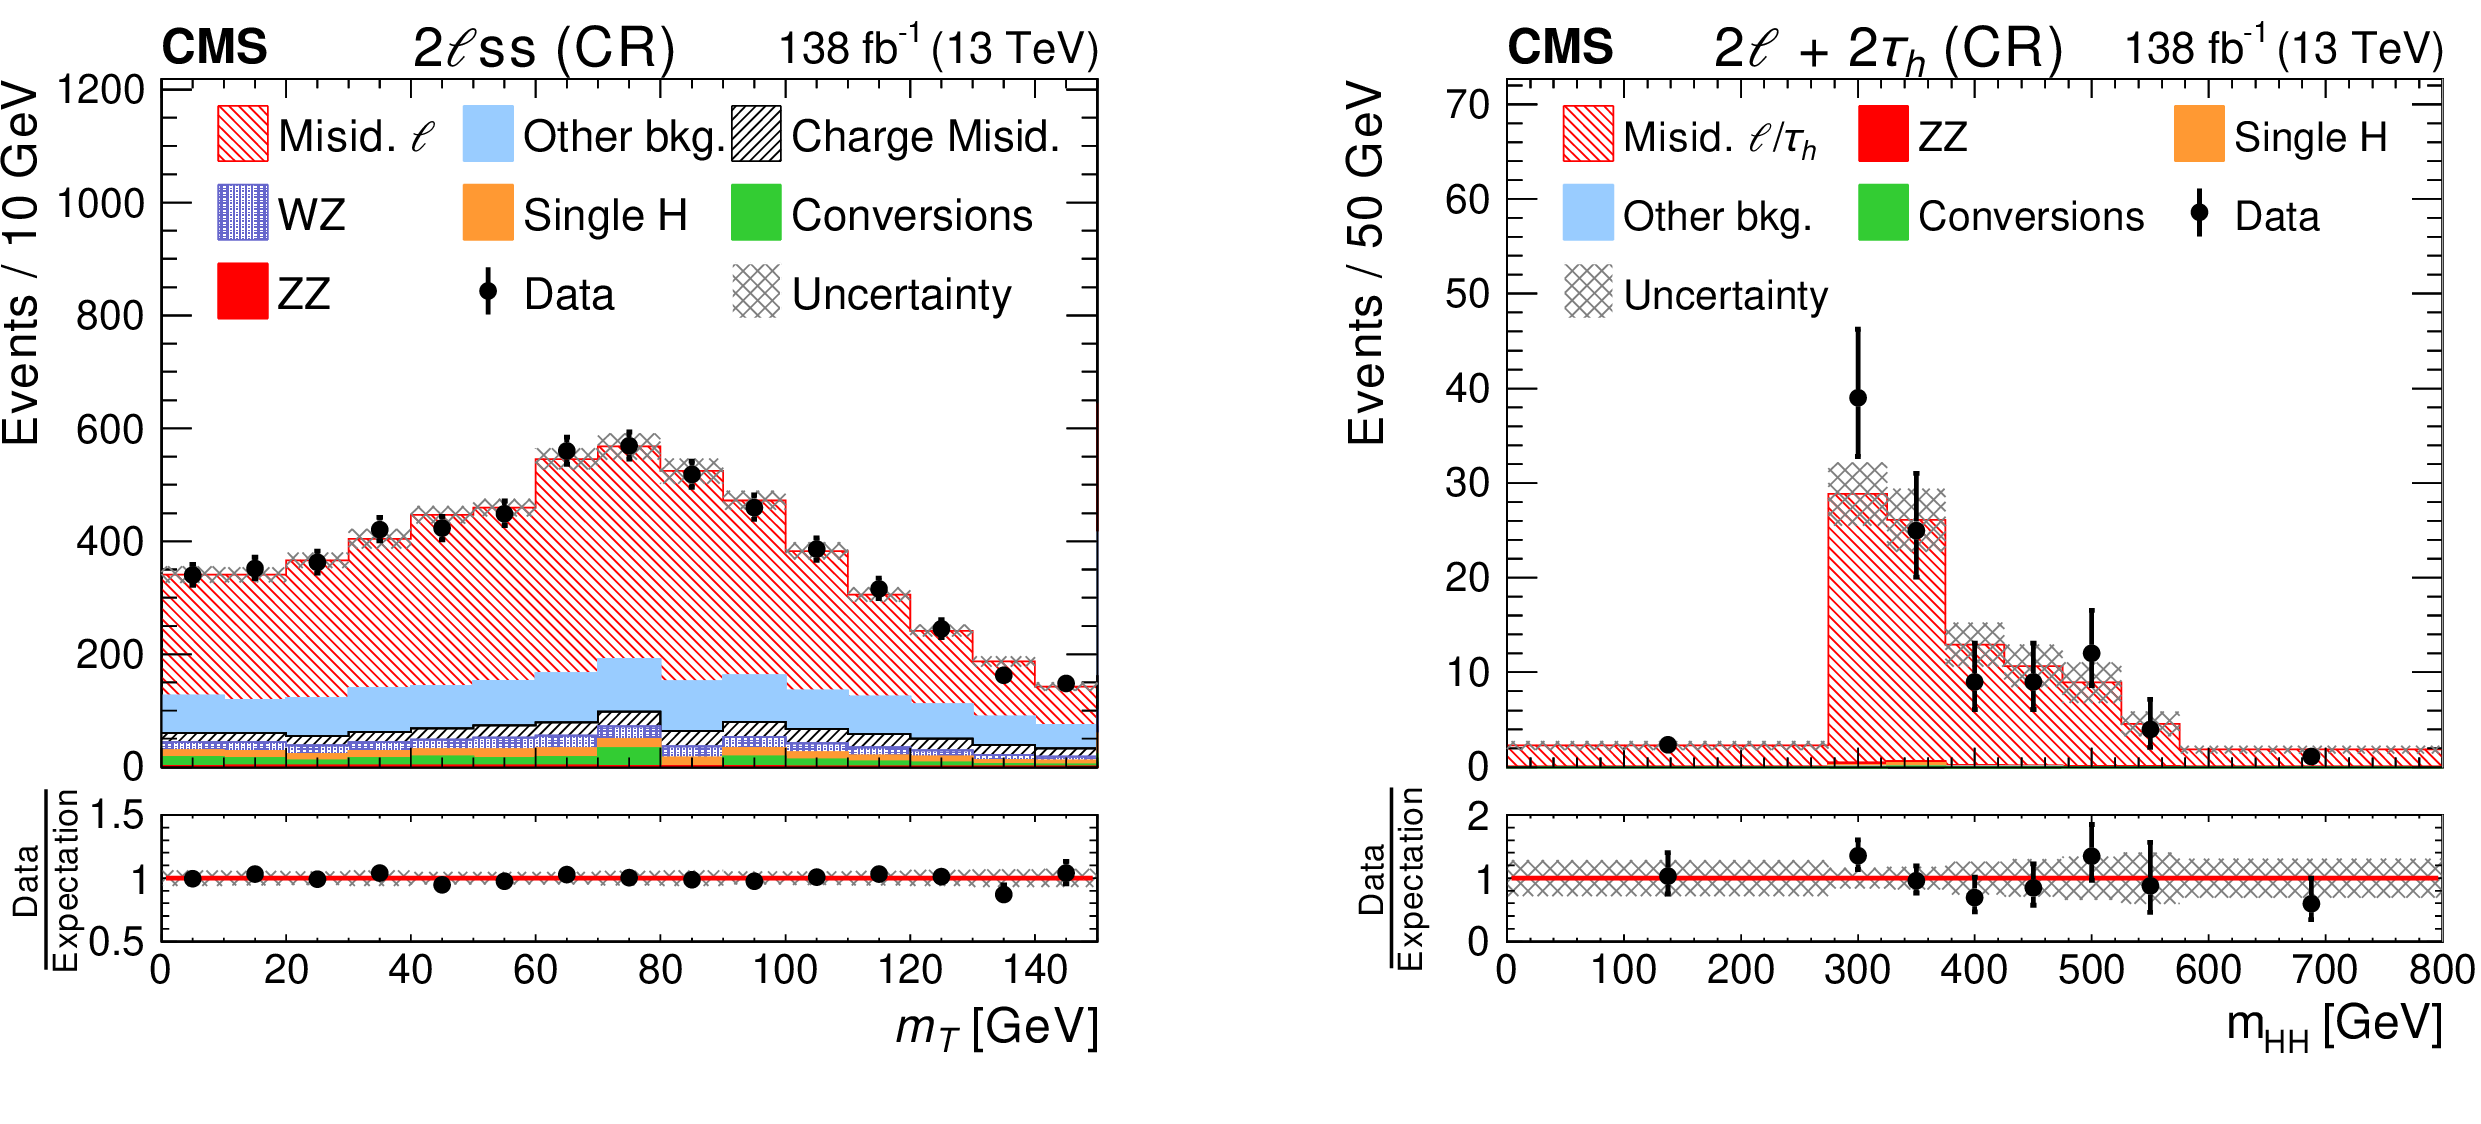
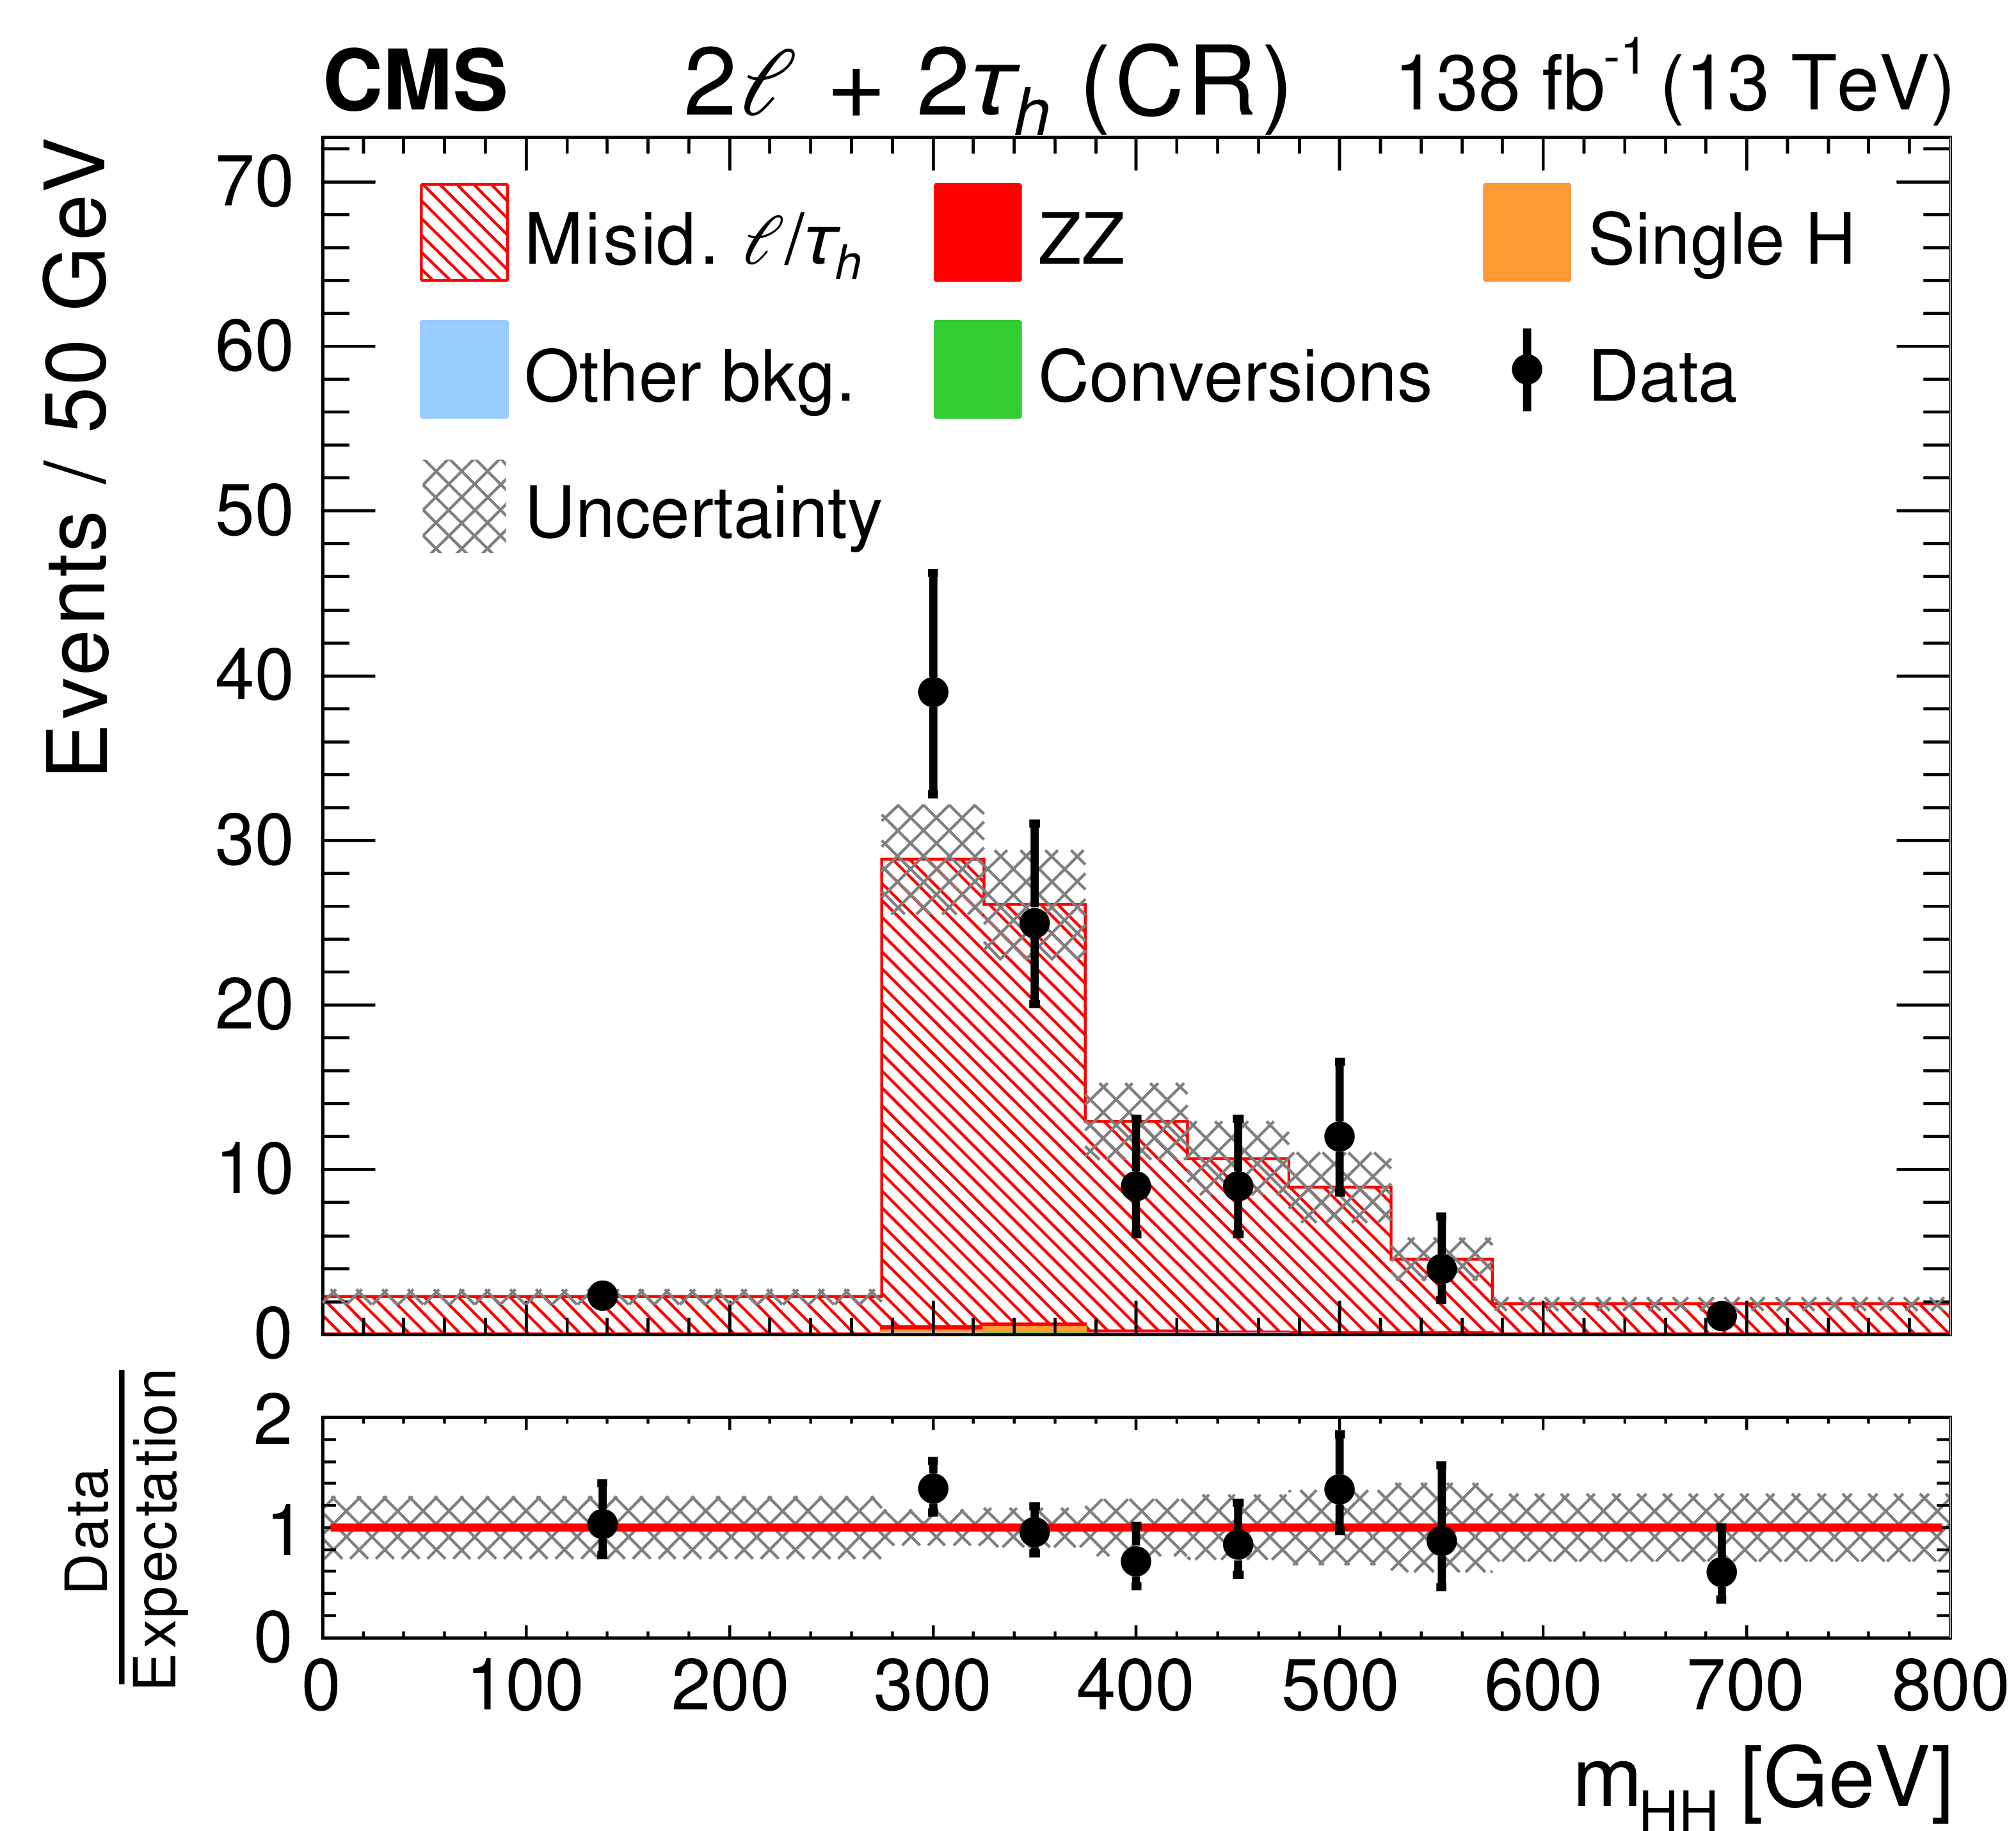
Figure 6:
Distributions in ${m_{\mathrm {T}}}$ in the 2$\ell$ss CR (left) and in the mass of the HH candidate in the 2${\ell}$+2${\tau _\mathrm {h}}$ CR (right). The distributions expected for the misidentified ${\ell} $/${\tau _\mathrm {h}}$ background as well as for other background processes are shown for the values of nuisance parameters obtained from the background-only ML fit, in which the HH signal is constrained to be zero. |

png pdf |
Figure 6-a:
Distributions in ${m_{\mathrm {T}}}$ in the 2$\ell$ss CR (left) and in the mass of the HH candidate in the 2${\ell}$+2${\tau _\mathrm {h}}$ CR (right). The distributions expected for the misidentified ${\ell} $/${\tau _\mathrm {h}}$ background as well as for other background processes are shown for the values of nuisance parameters obtained from the background-only ML fit, in which the HH signal is constrained to be zero. |
png pdf |
Figure 6-b:
Distributions in ${m_{\mathrm {T}}}$ in the 2$\ell$ss CR (left) and in the mass of the HH candidate in the 2${\ell}$+2${\tau _\mathrm {h}}$ CR (right). The distributions expected for the misidentified ${\ell} $/${\tau _\mathrm {h}}$ background as well as for other background processes are shown for the values of nuisance parameters obtained from the background-only ML fit, in which the HH signal is constrained to be zero. |
png pdf |
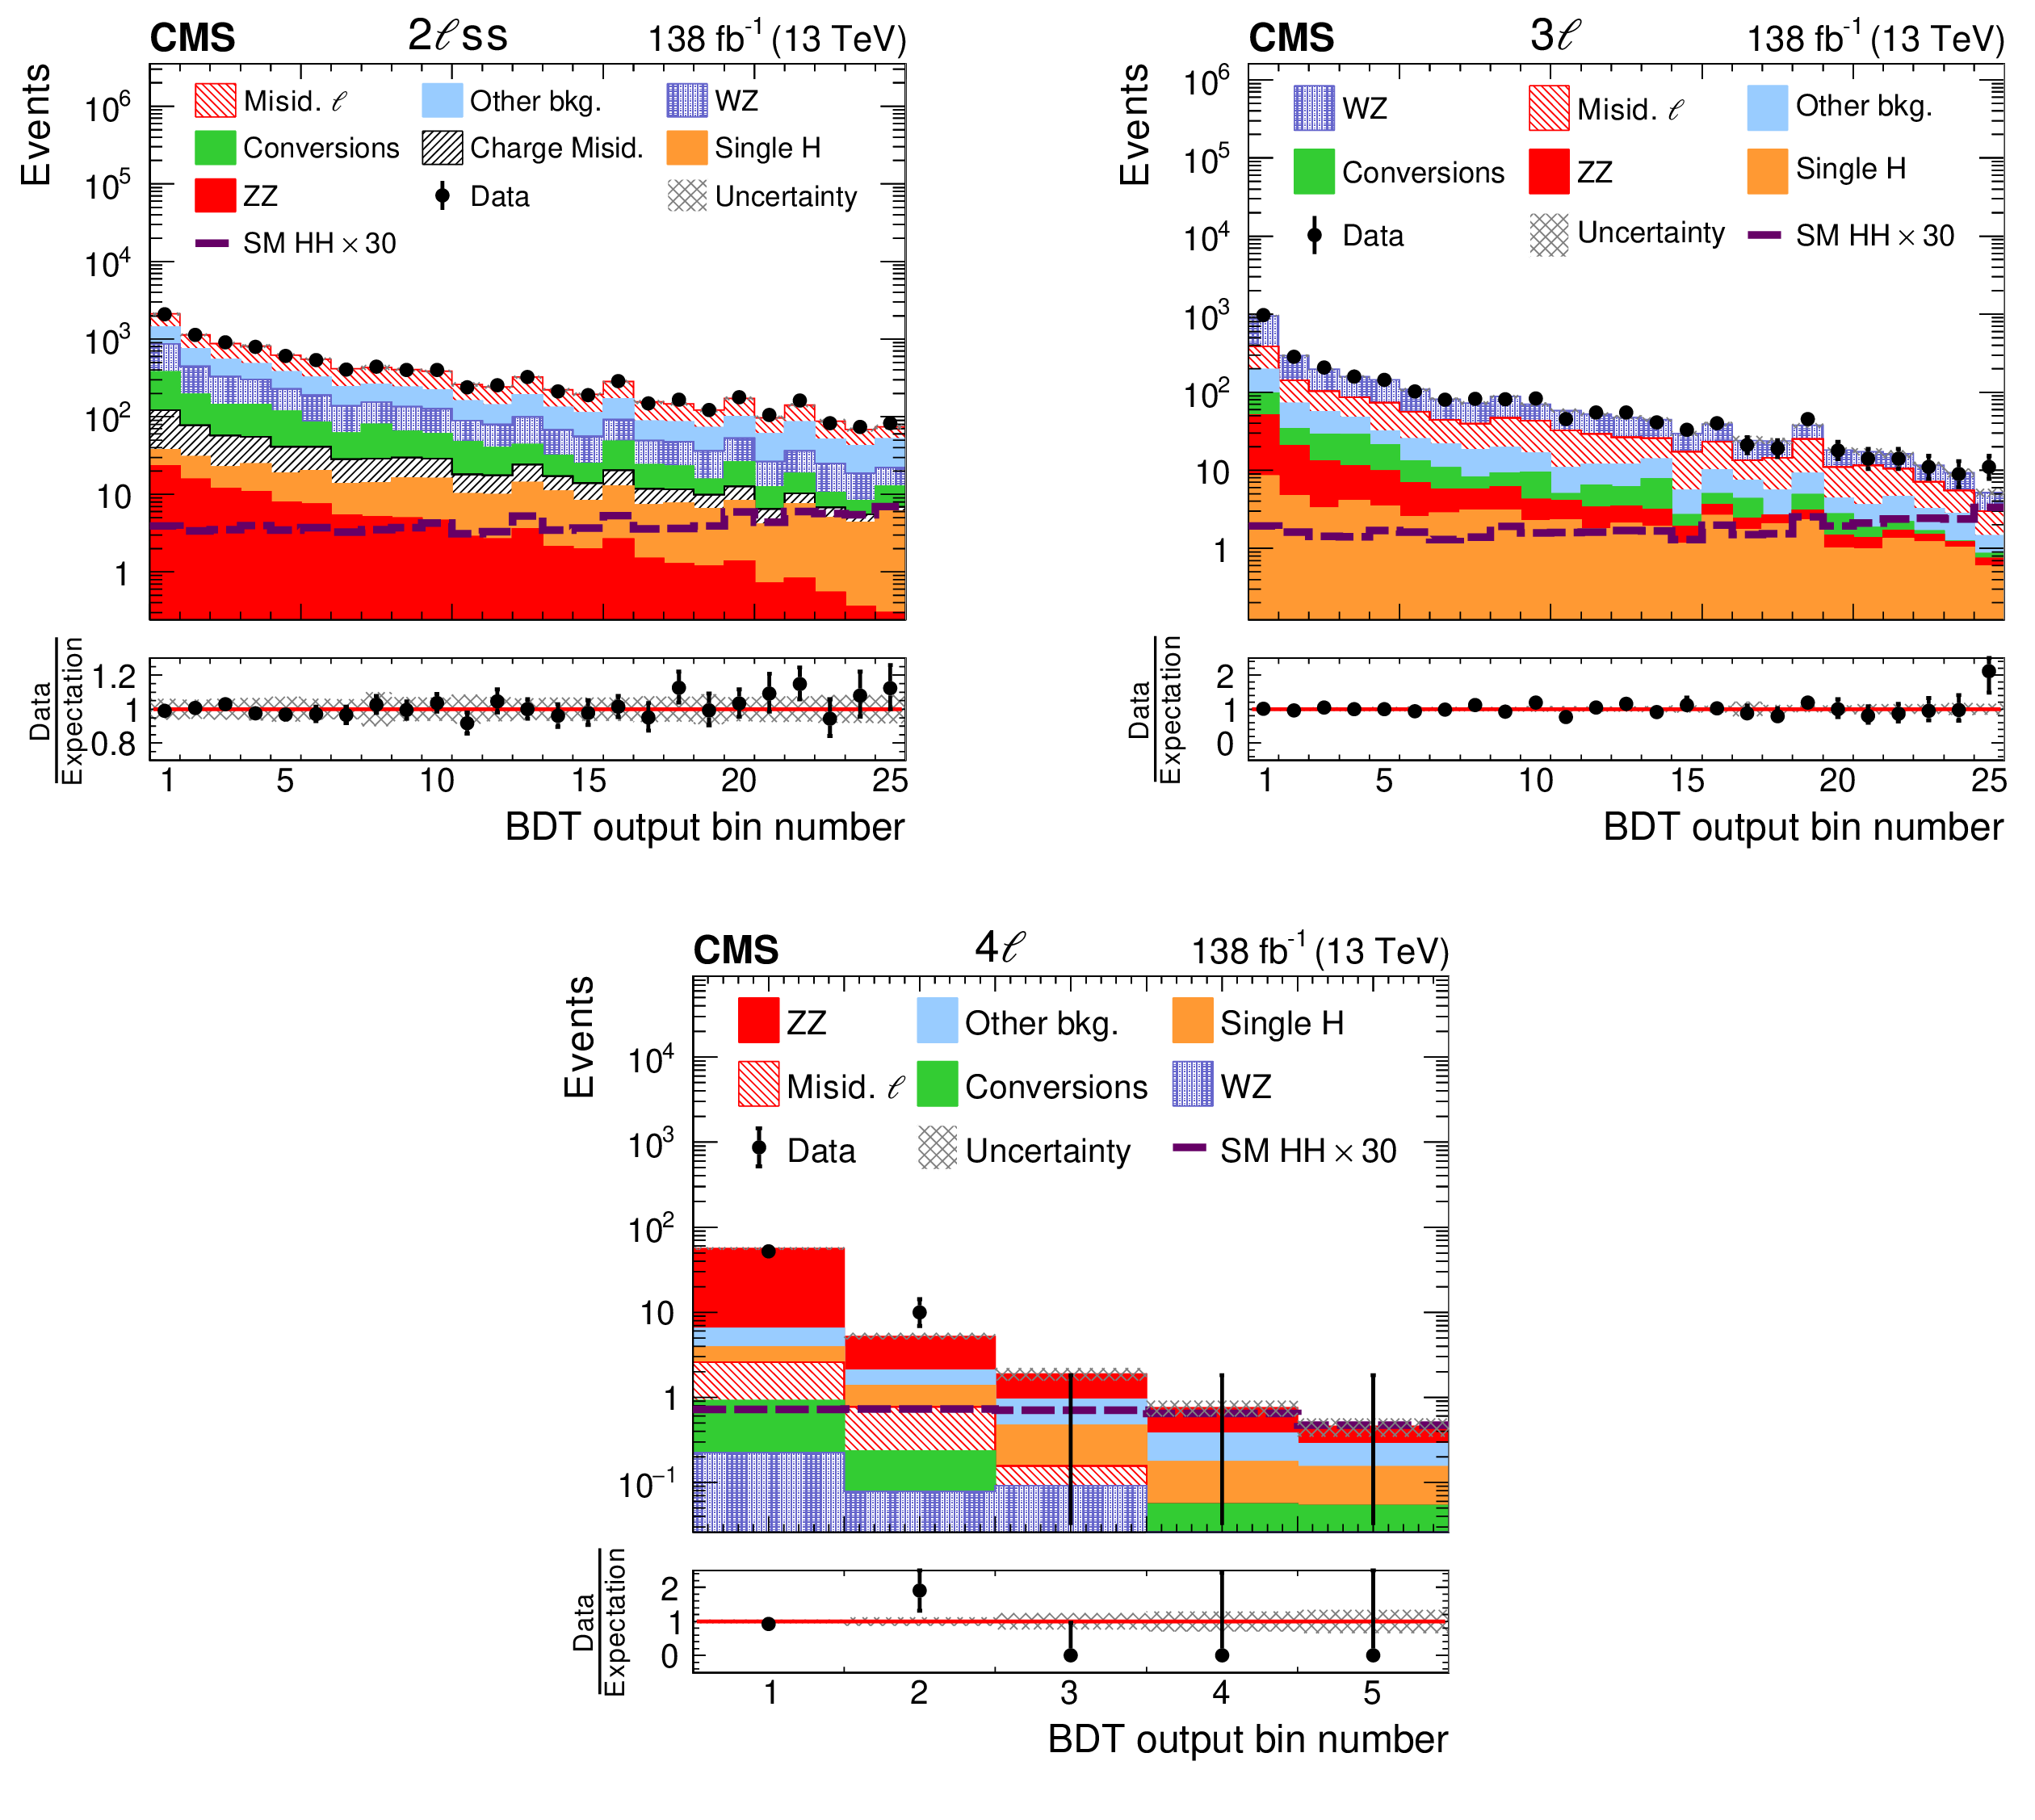
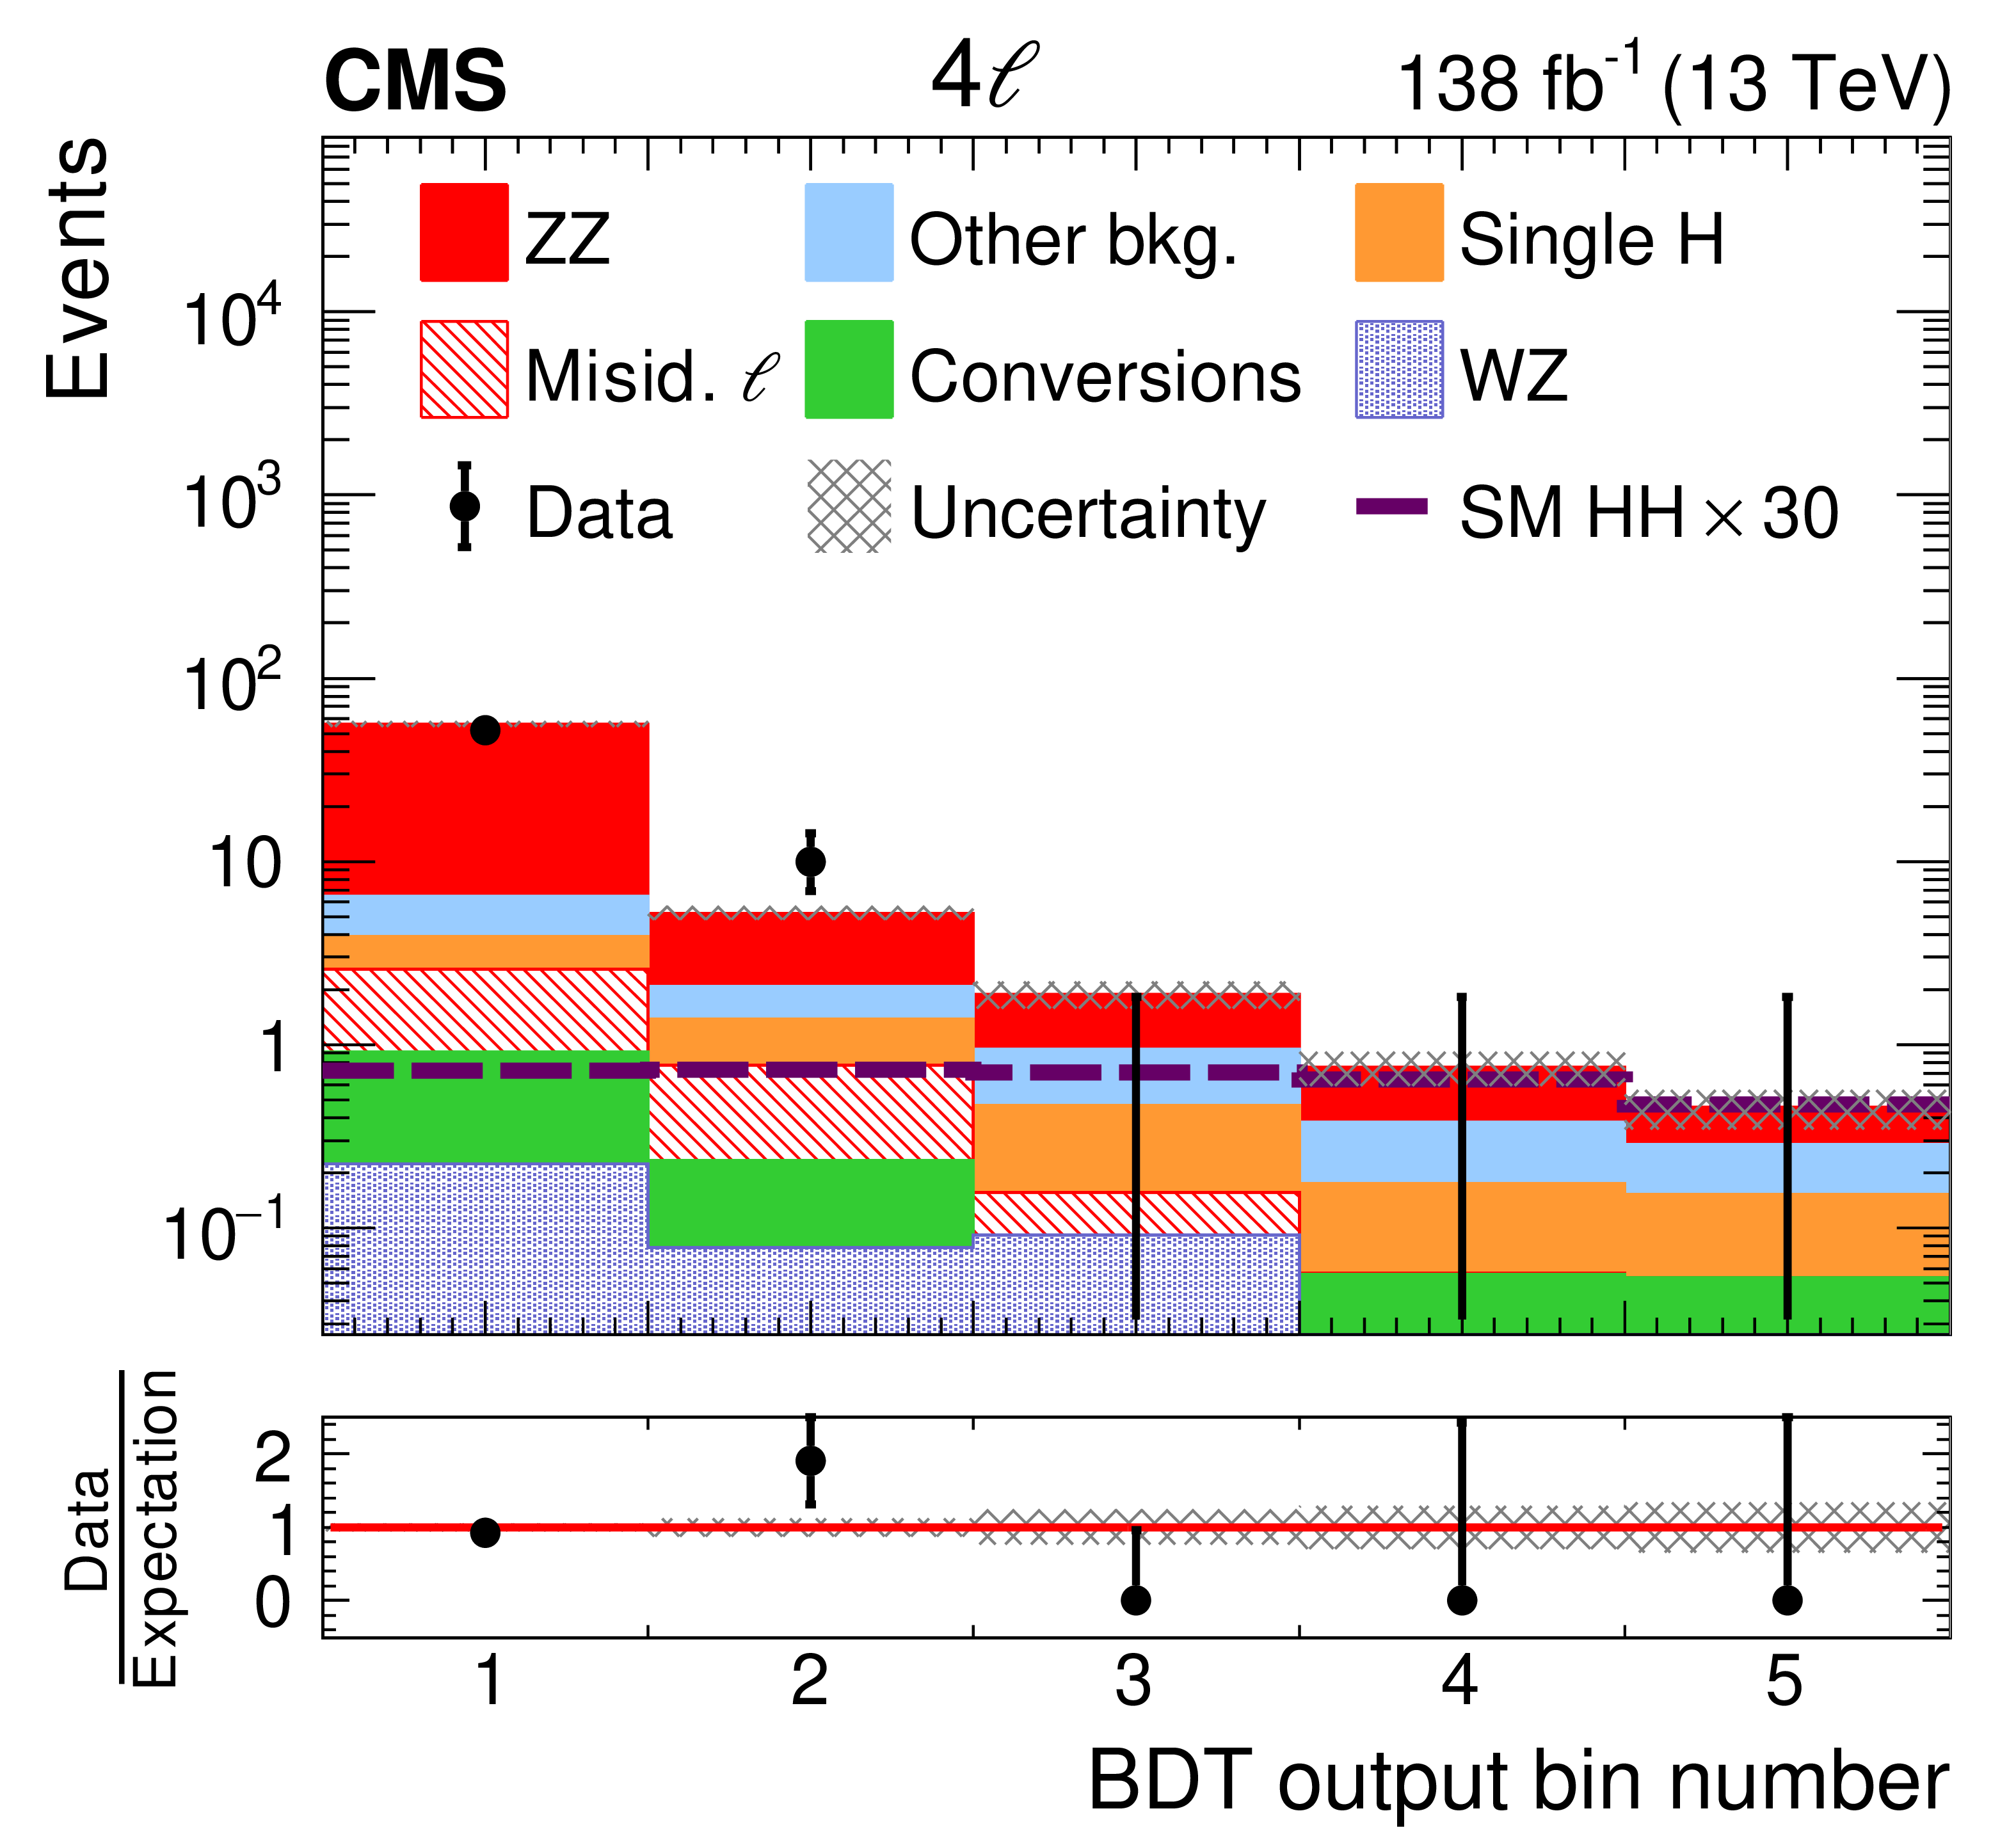
Figure 7:
Distribution in the output of the BDT trained for nonresonant HH production and evaluated for the benchmark scenario JHEP04 BM7 for the 2$\ell$ss (upper left), 3$\ell$ (upper right), and 4$\ell$ (lower) categories. The SM HH signal is shown for a cross section amounting to 30 times the value predicted in the SM. The distributions expected for the background processes are shown for the values of nuisance parameters obtained from the ML fit of the signal+background hypothesis to the data. |

png pdf |
Figure 7-a:
Distribution in the output of the BDT trained for nonresonant HH production and evaluated for the benchmark scenario JHEP04 BM7 for the 2$\ell$ss (upper left), 3$\ell$ (upper right), and 4$\ell$ (lower) categories. The SM HH signal is shown for a cross section amounting to 30 times the value predicted in the SM. The distributions expected for the background processes are shown for the values of nuisance parameters obtained from the ML fit of the signal+background hypothesis to the data. |

png pdf |
Figure 7-b:
Distribution in the output of the BDT trained for nonresonant HH production and evaluated for the benchmark scenario JHEP04 BM7 for the 2$\ell$ss (upper left), 3$\ell$ (upper right), and 4$\ell$ (lower) categories. The SM HH signal is shown for a cross section amounting to 30 times the value predicted in the SM. The distributions expected for the background processes are shown for the values of nuisance parameters obtained from the ML fit of the signal+background hypothesis to the data. |
png pdf |
Figure 7-c:
Distribution in the output of the BDT trained for nonresonant HH production and evaluated for the benchmark scenario JHEP04 BM7 for the 2$\ell$ss (upper left), 3$\ell$ (upper right), and 4$\ell$ (lower) categories. The SM HH signal is shown for a cross section amounting to 30 times the value predicted in the SM. The distributions expected for the background processes are shown for the values of nuisance parameters obtained from the ML fit of the signal+background hypothesis to the data. |

png pdf |
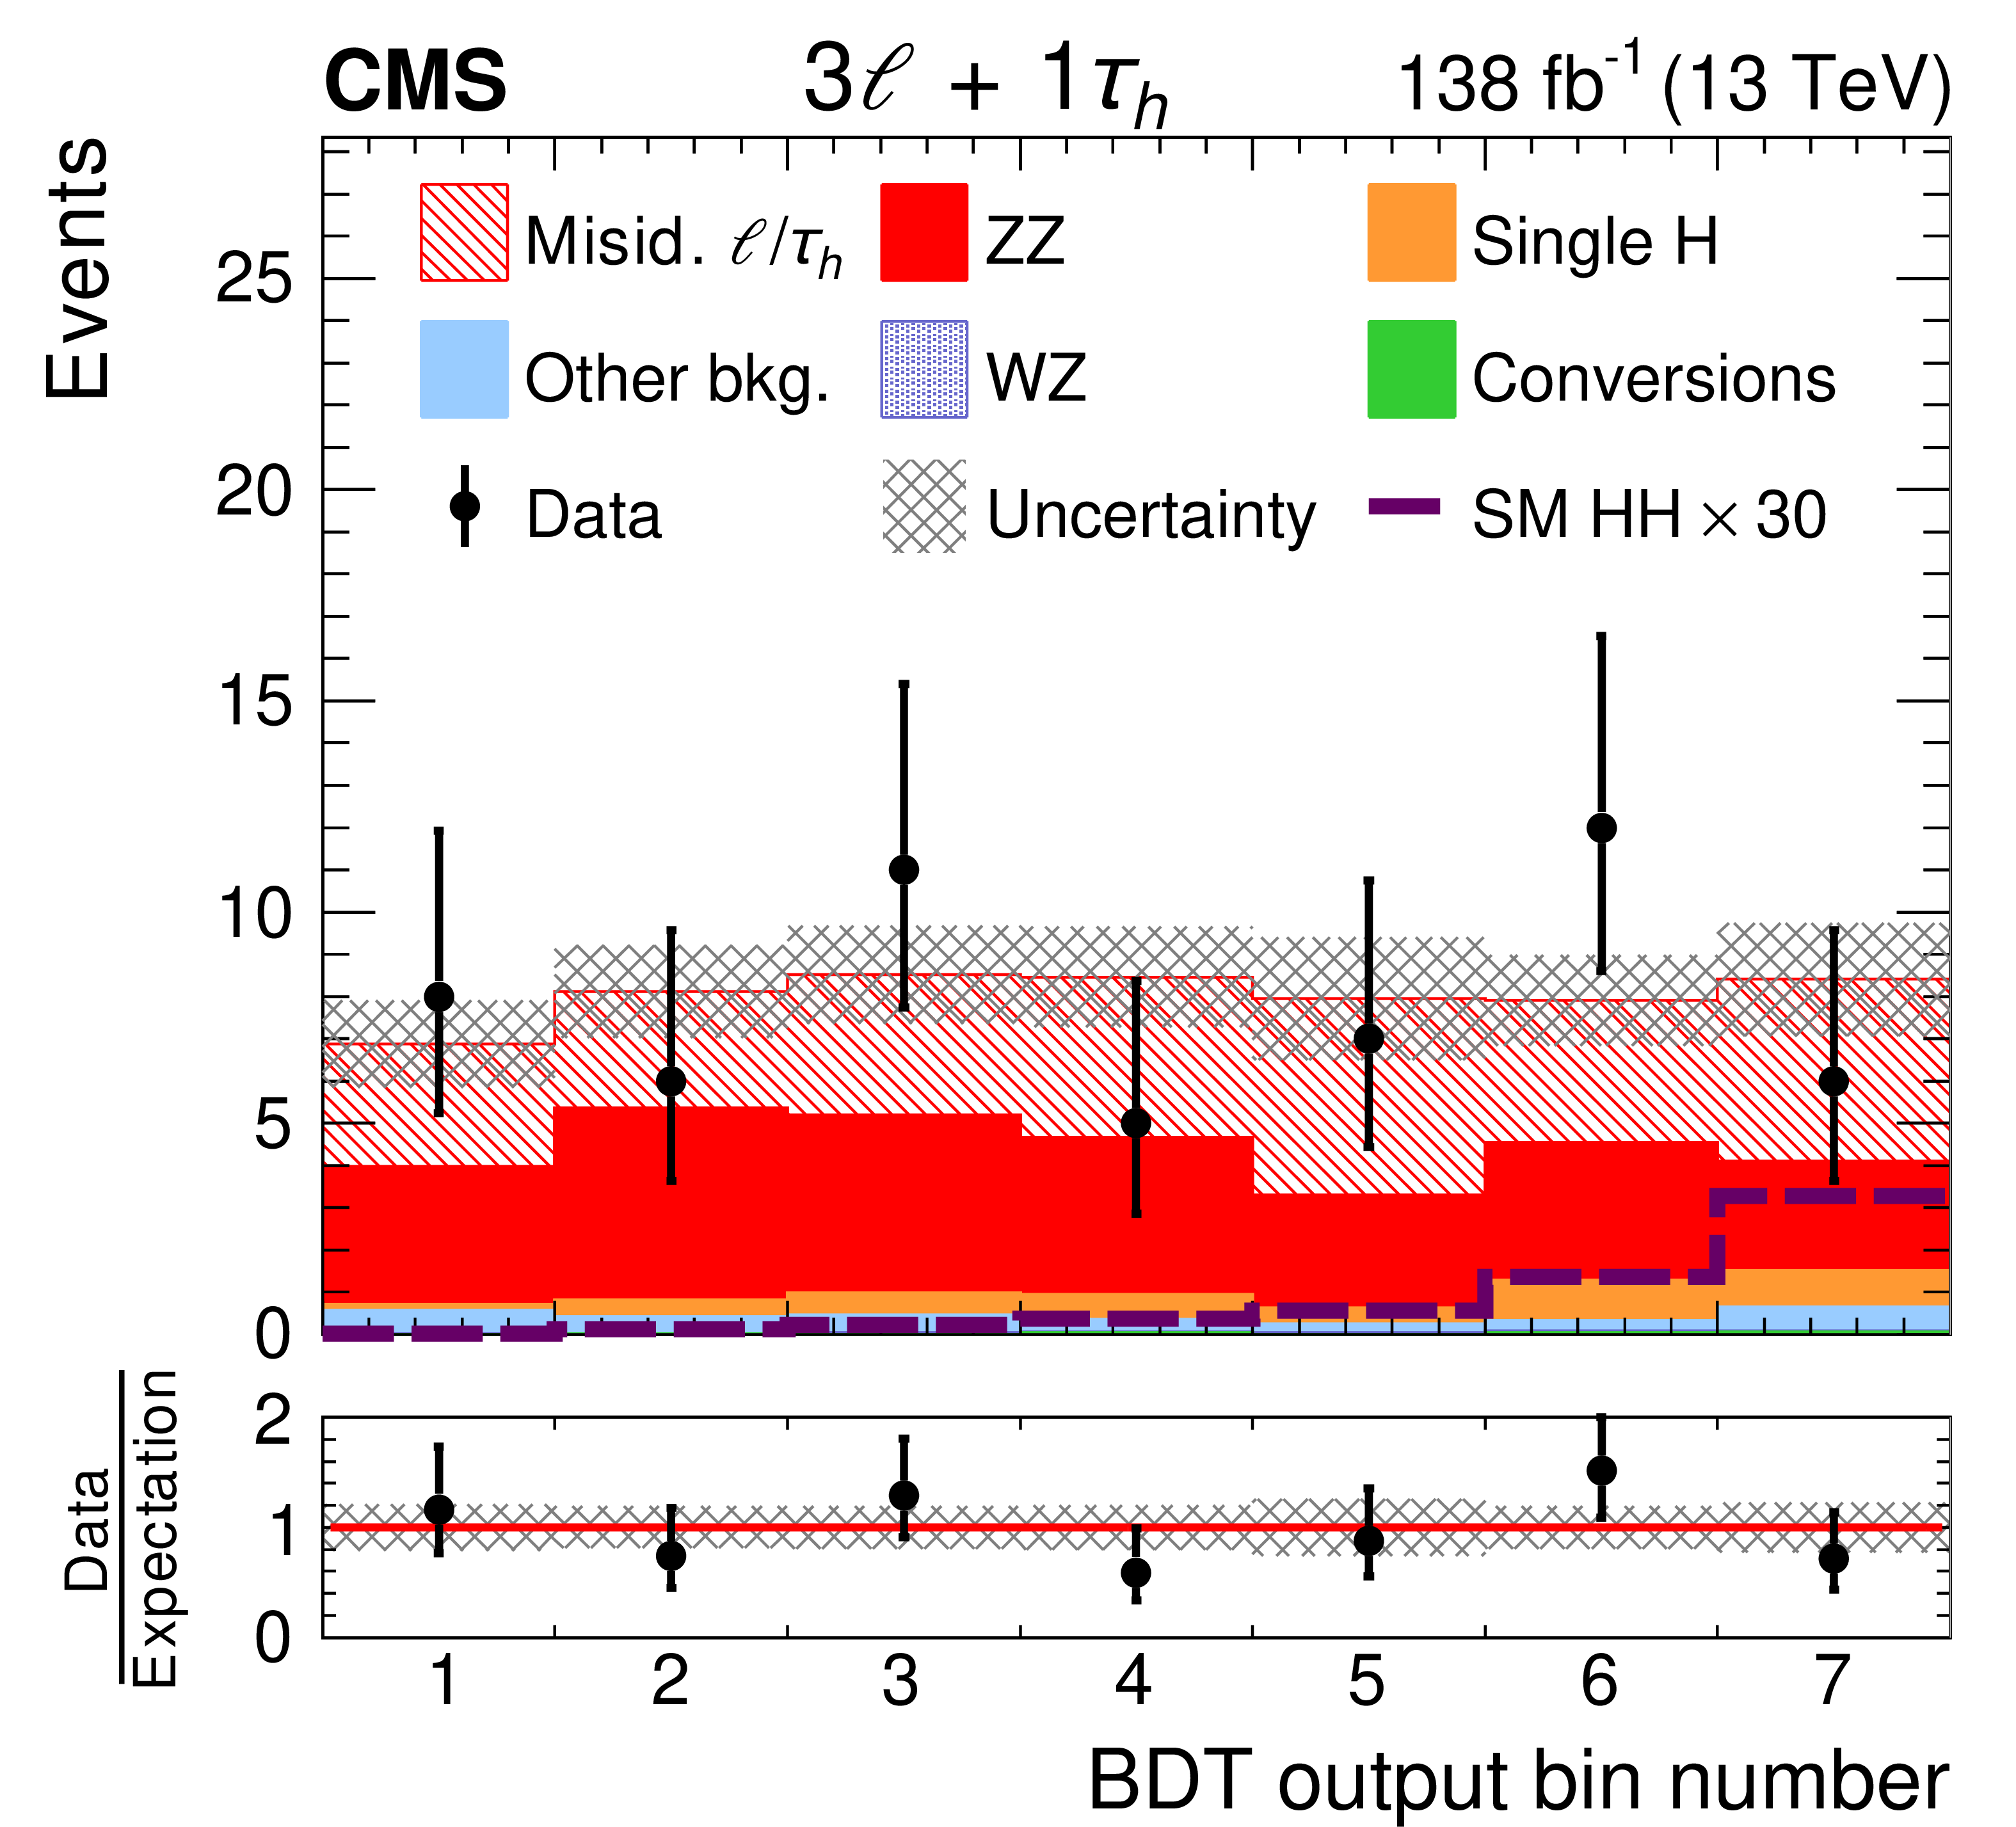
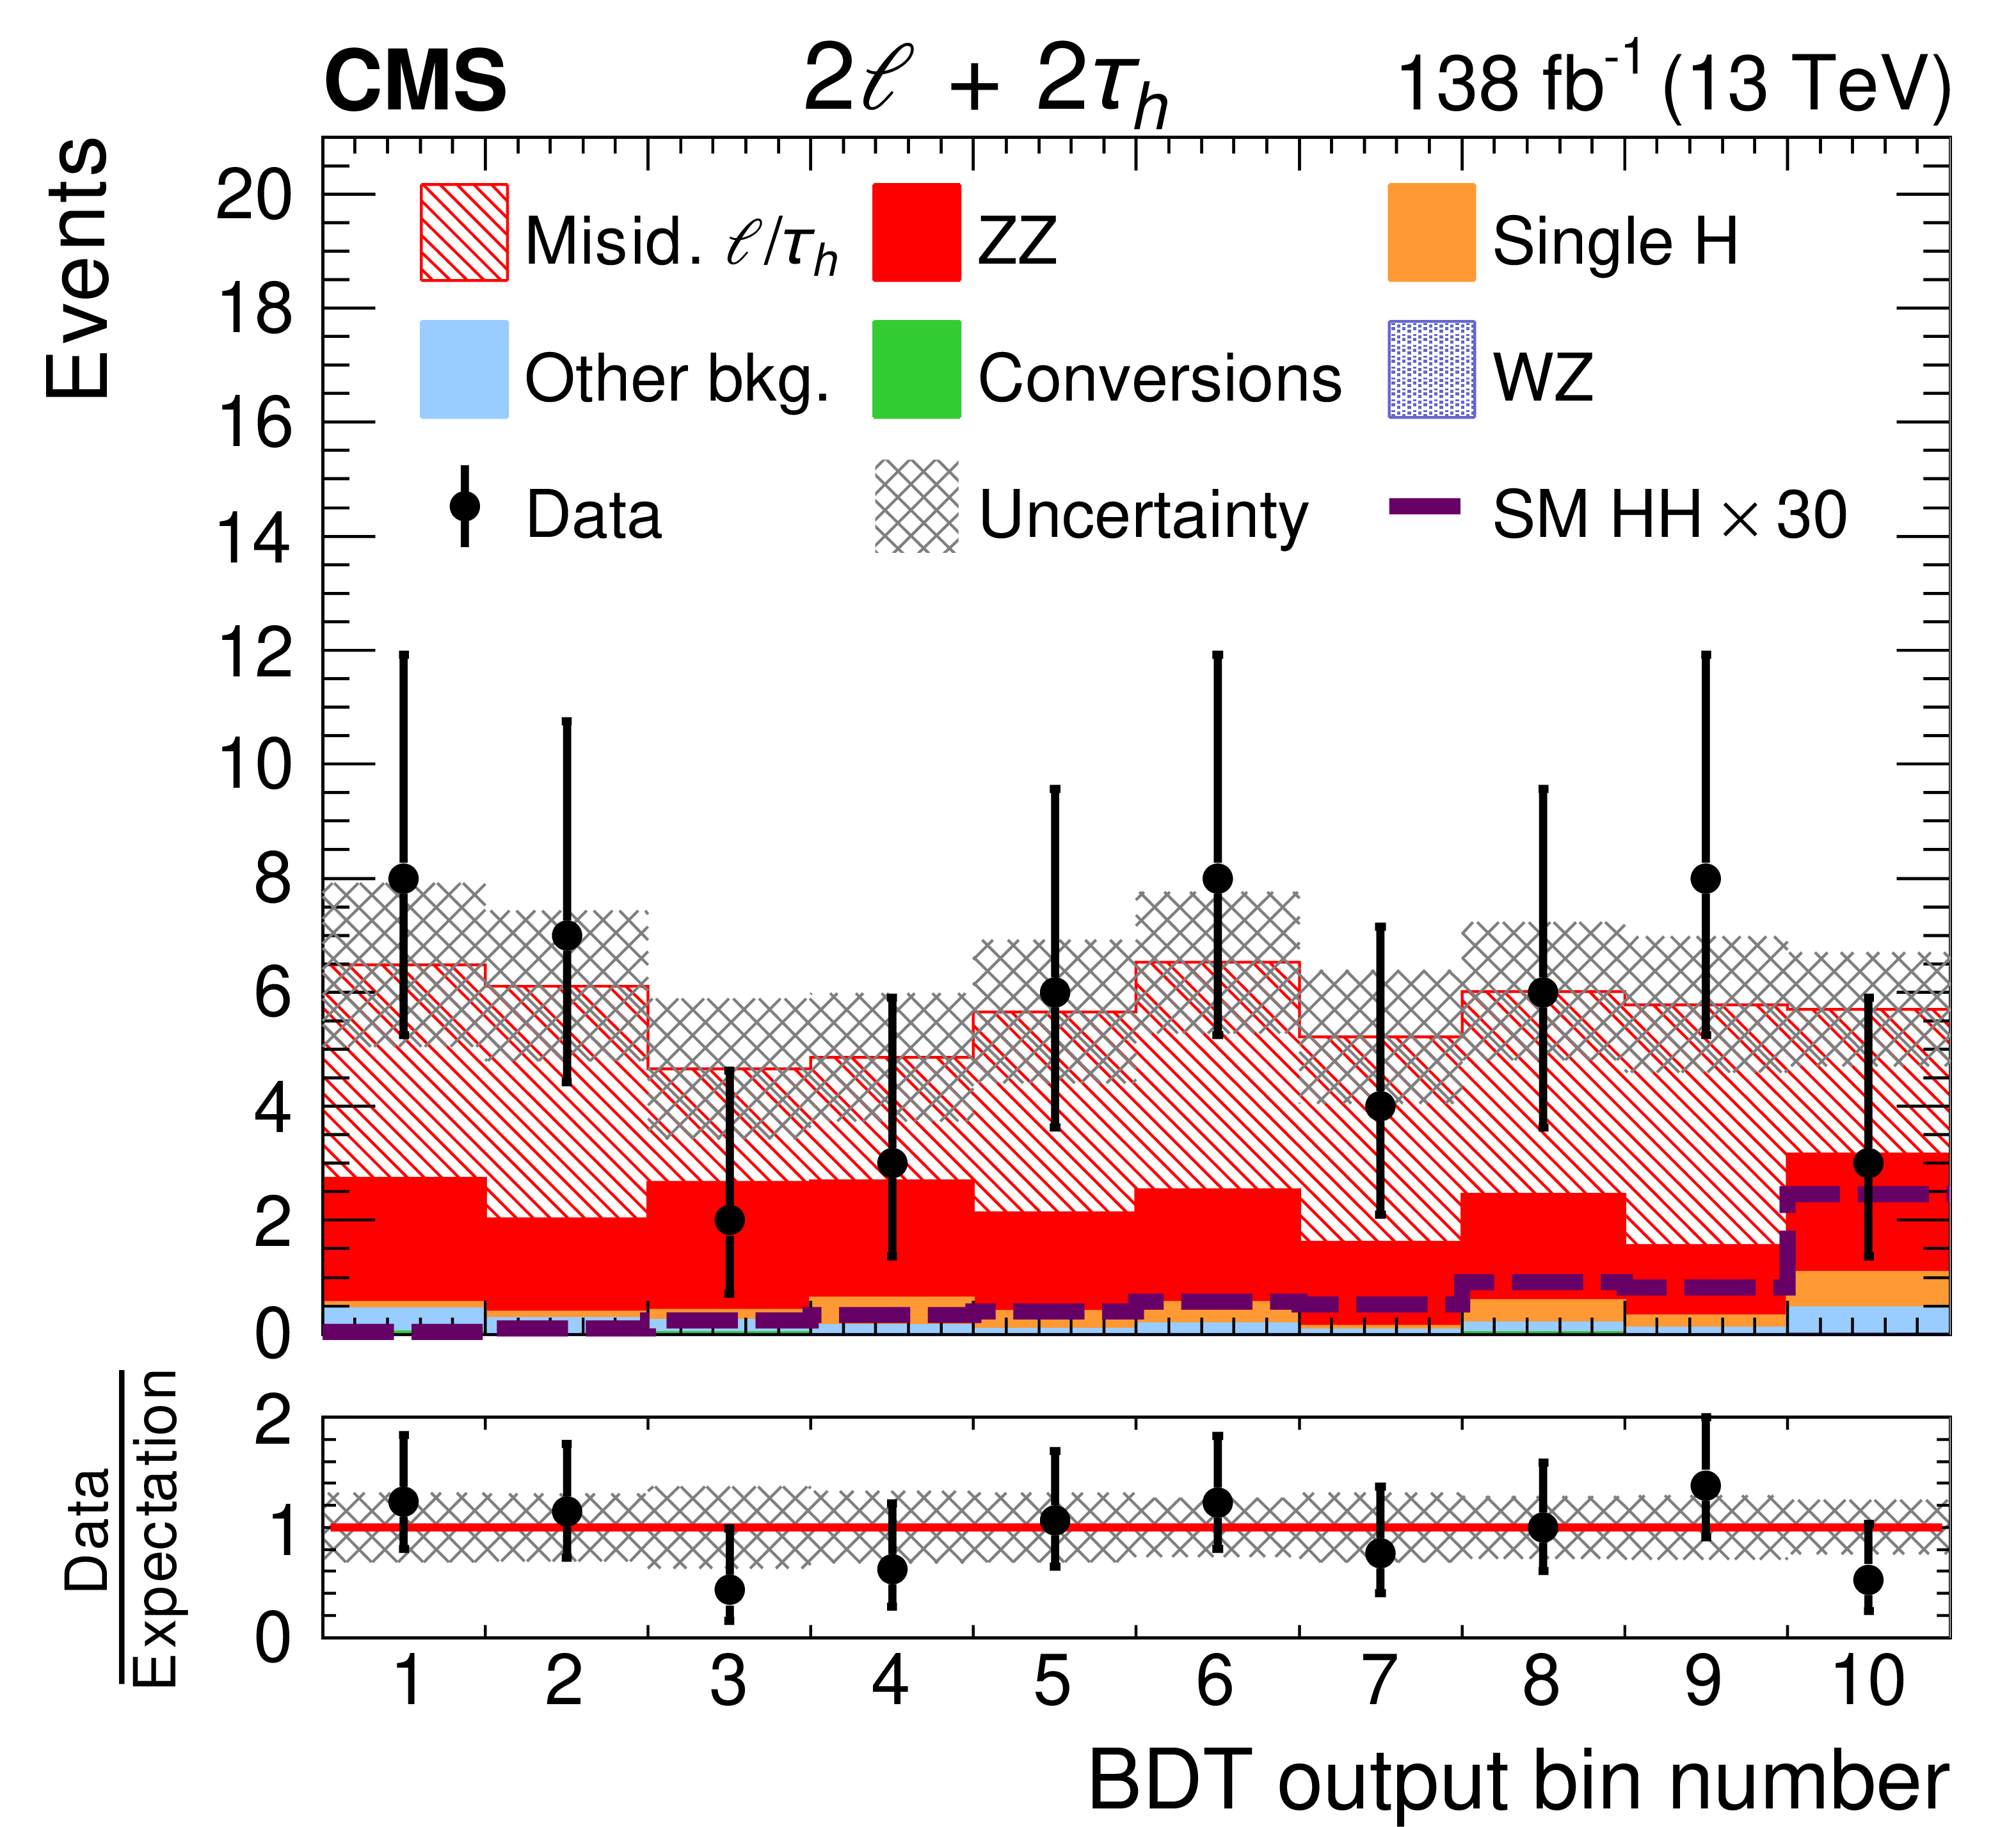
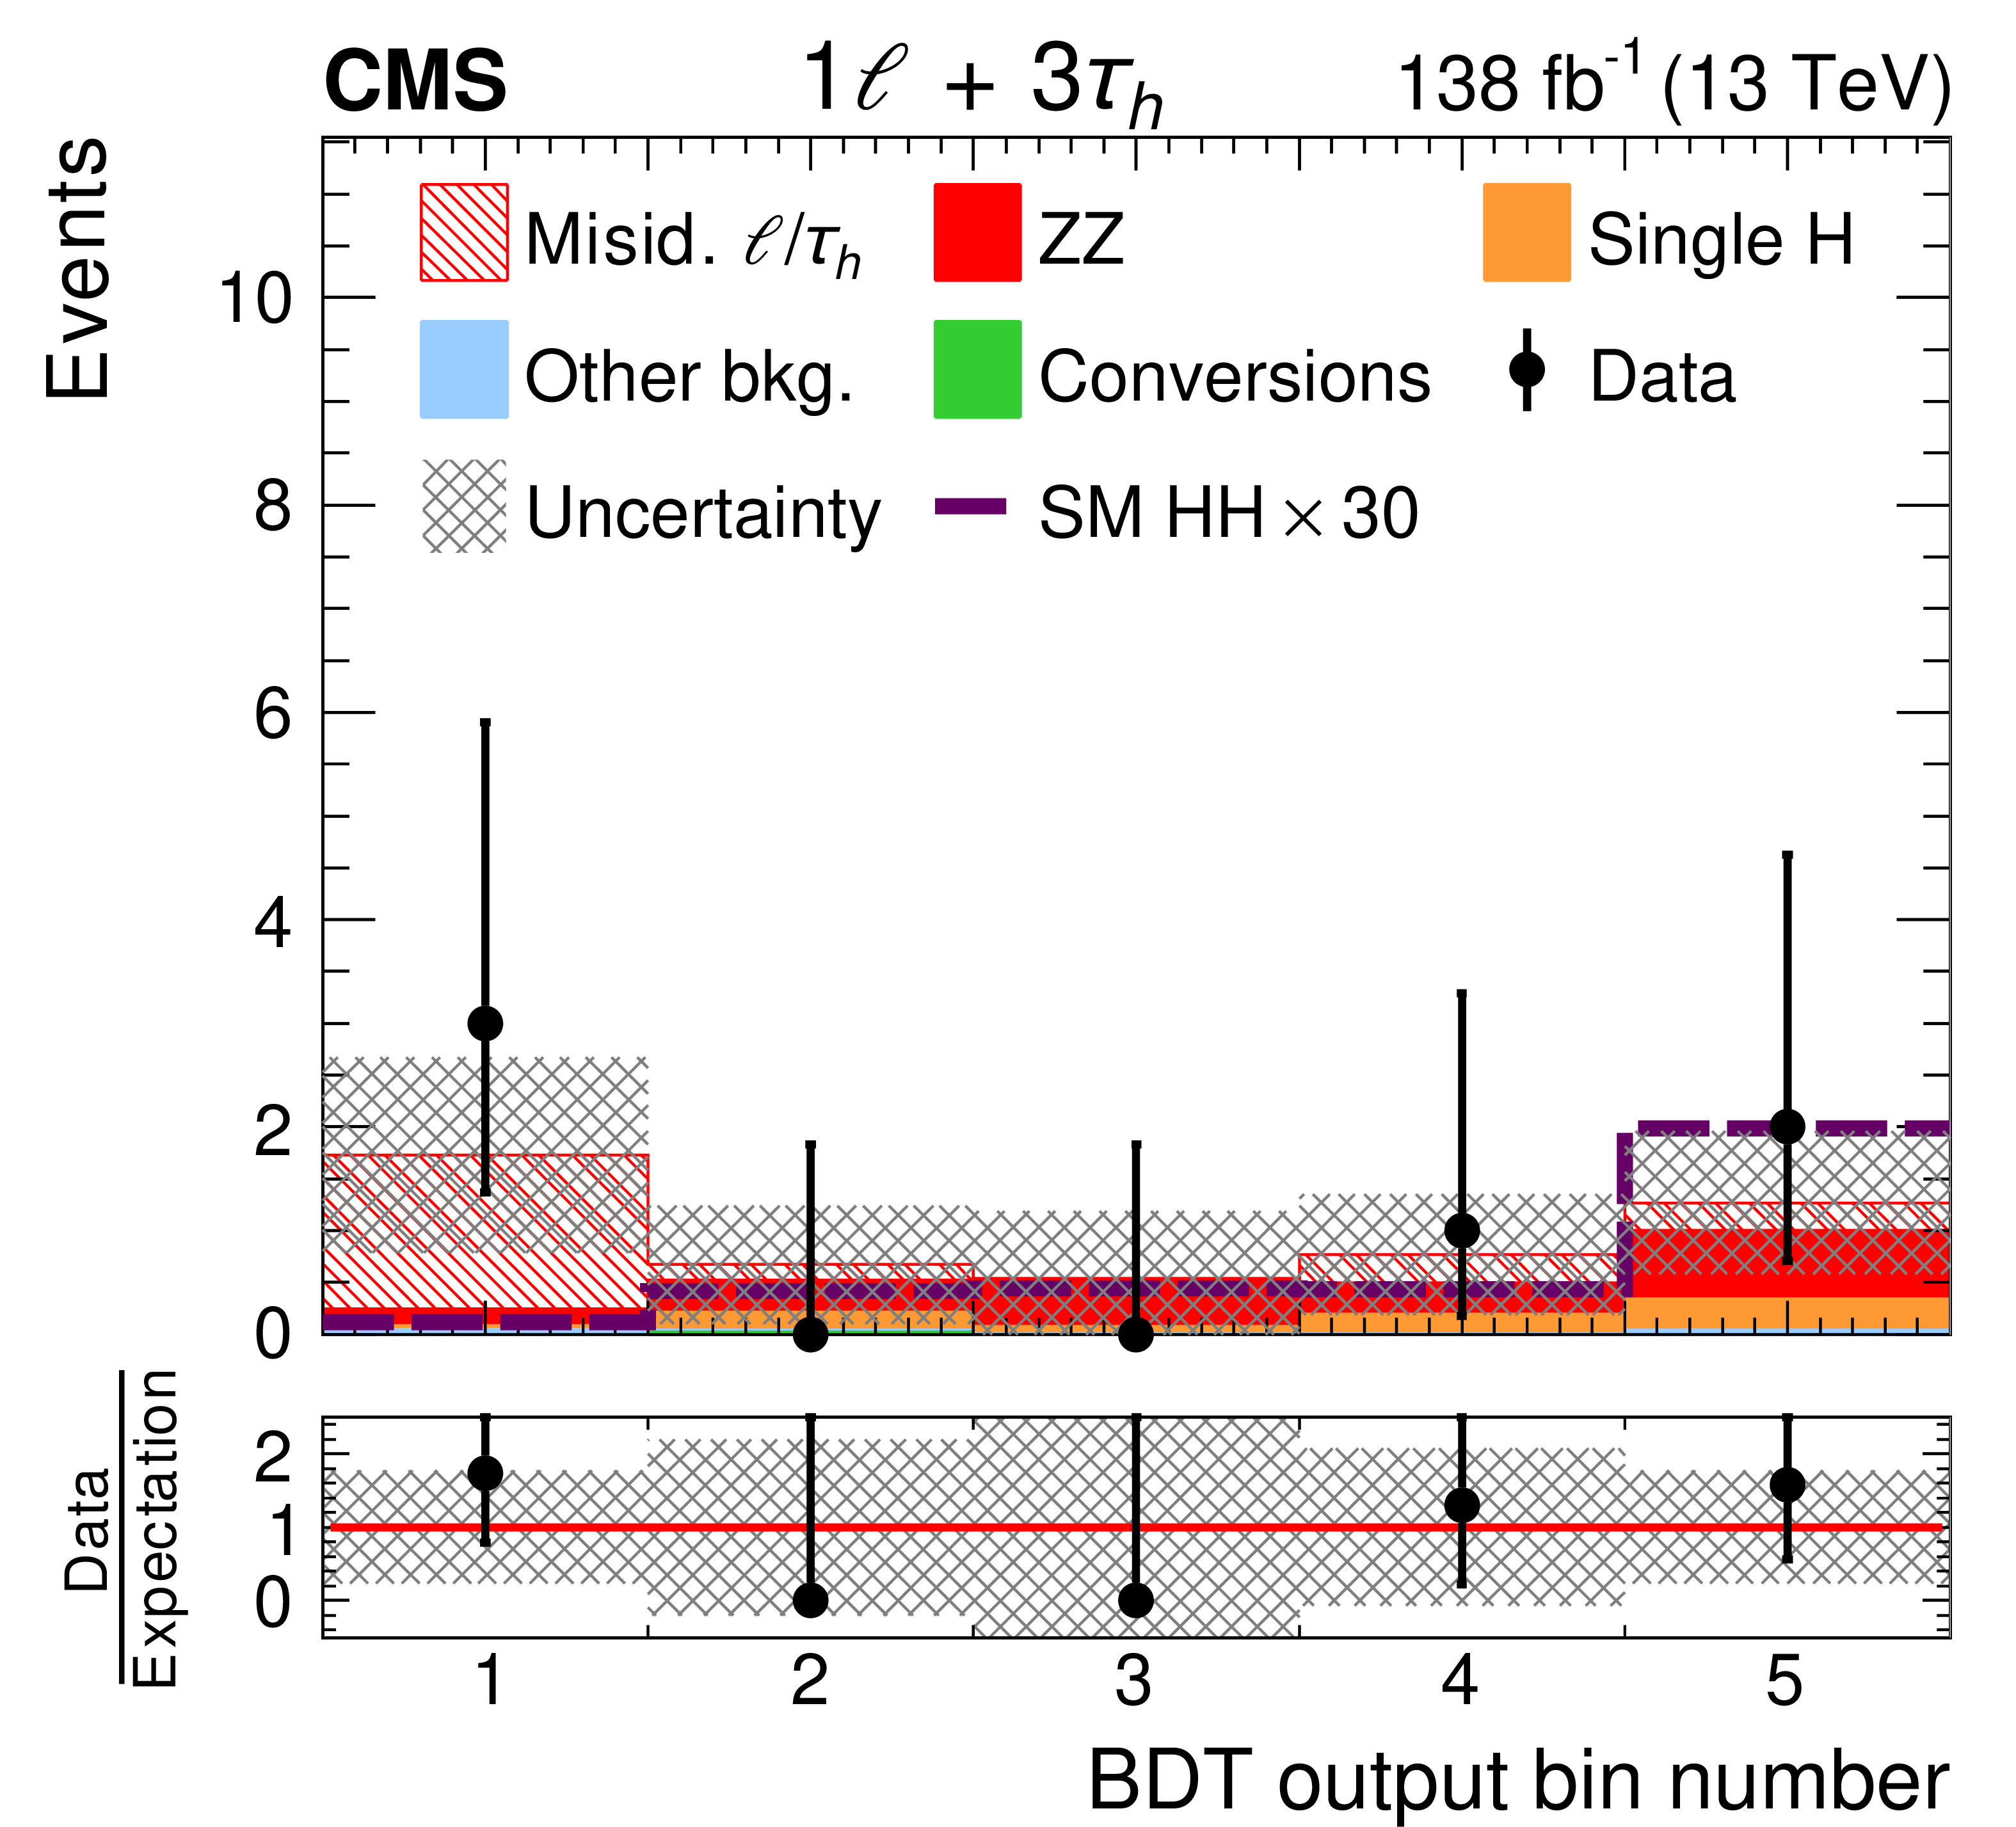
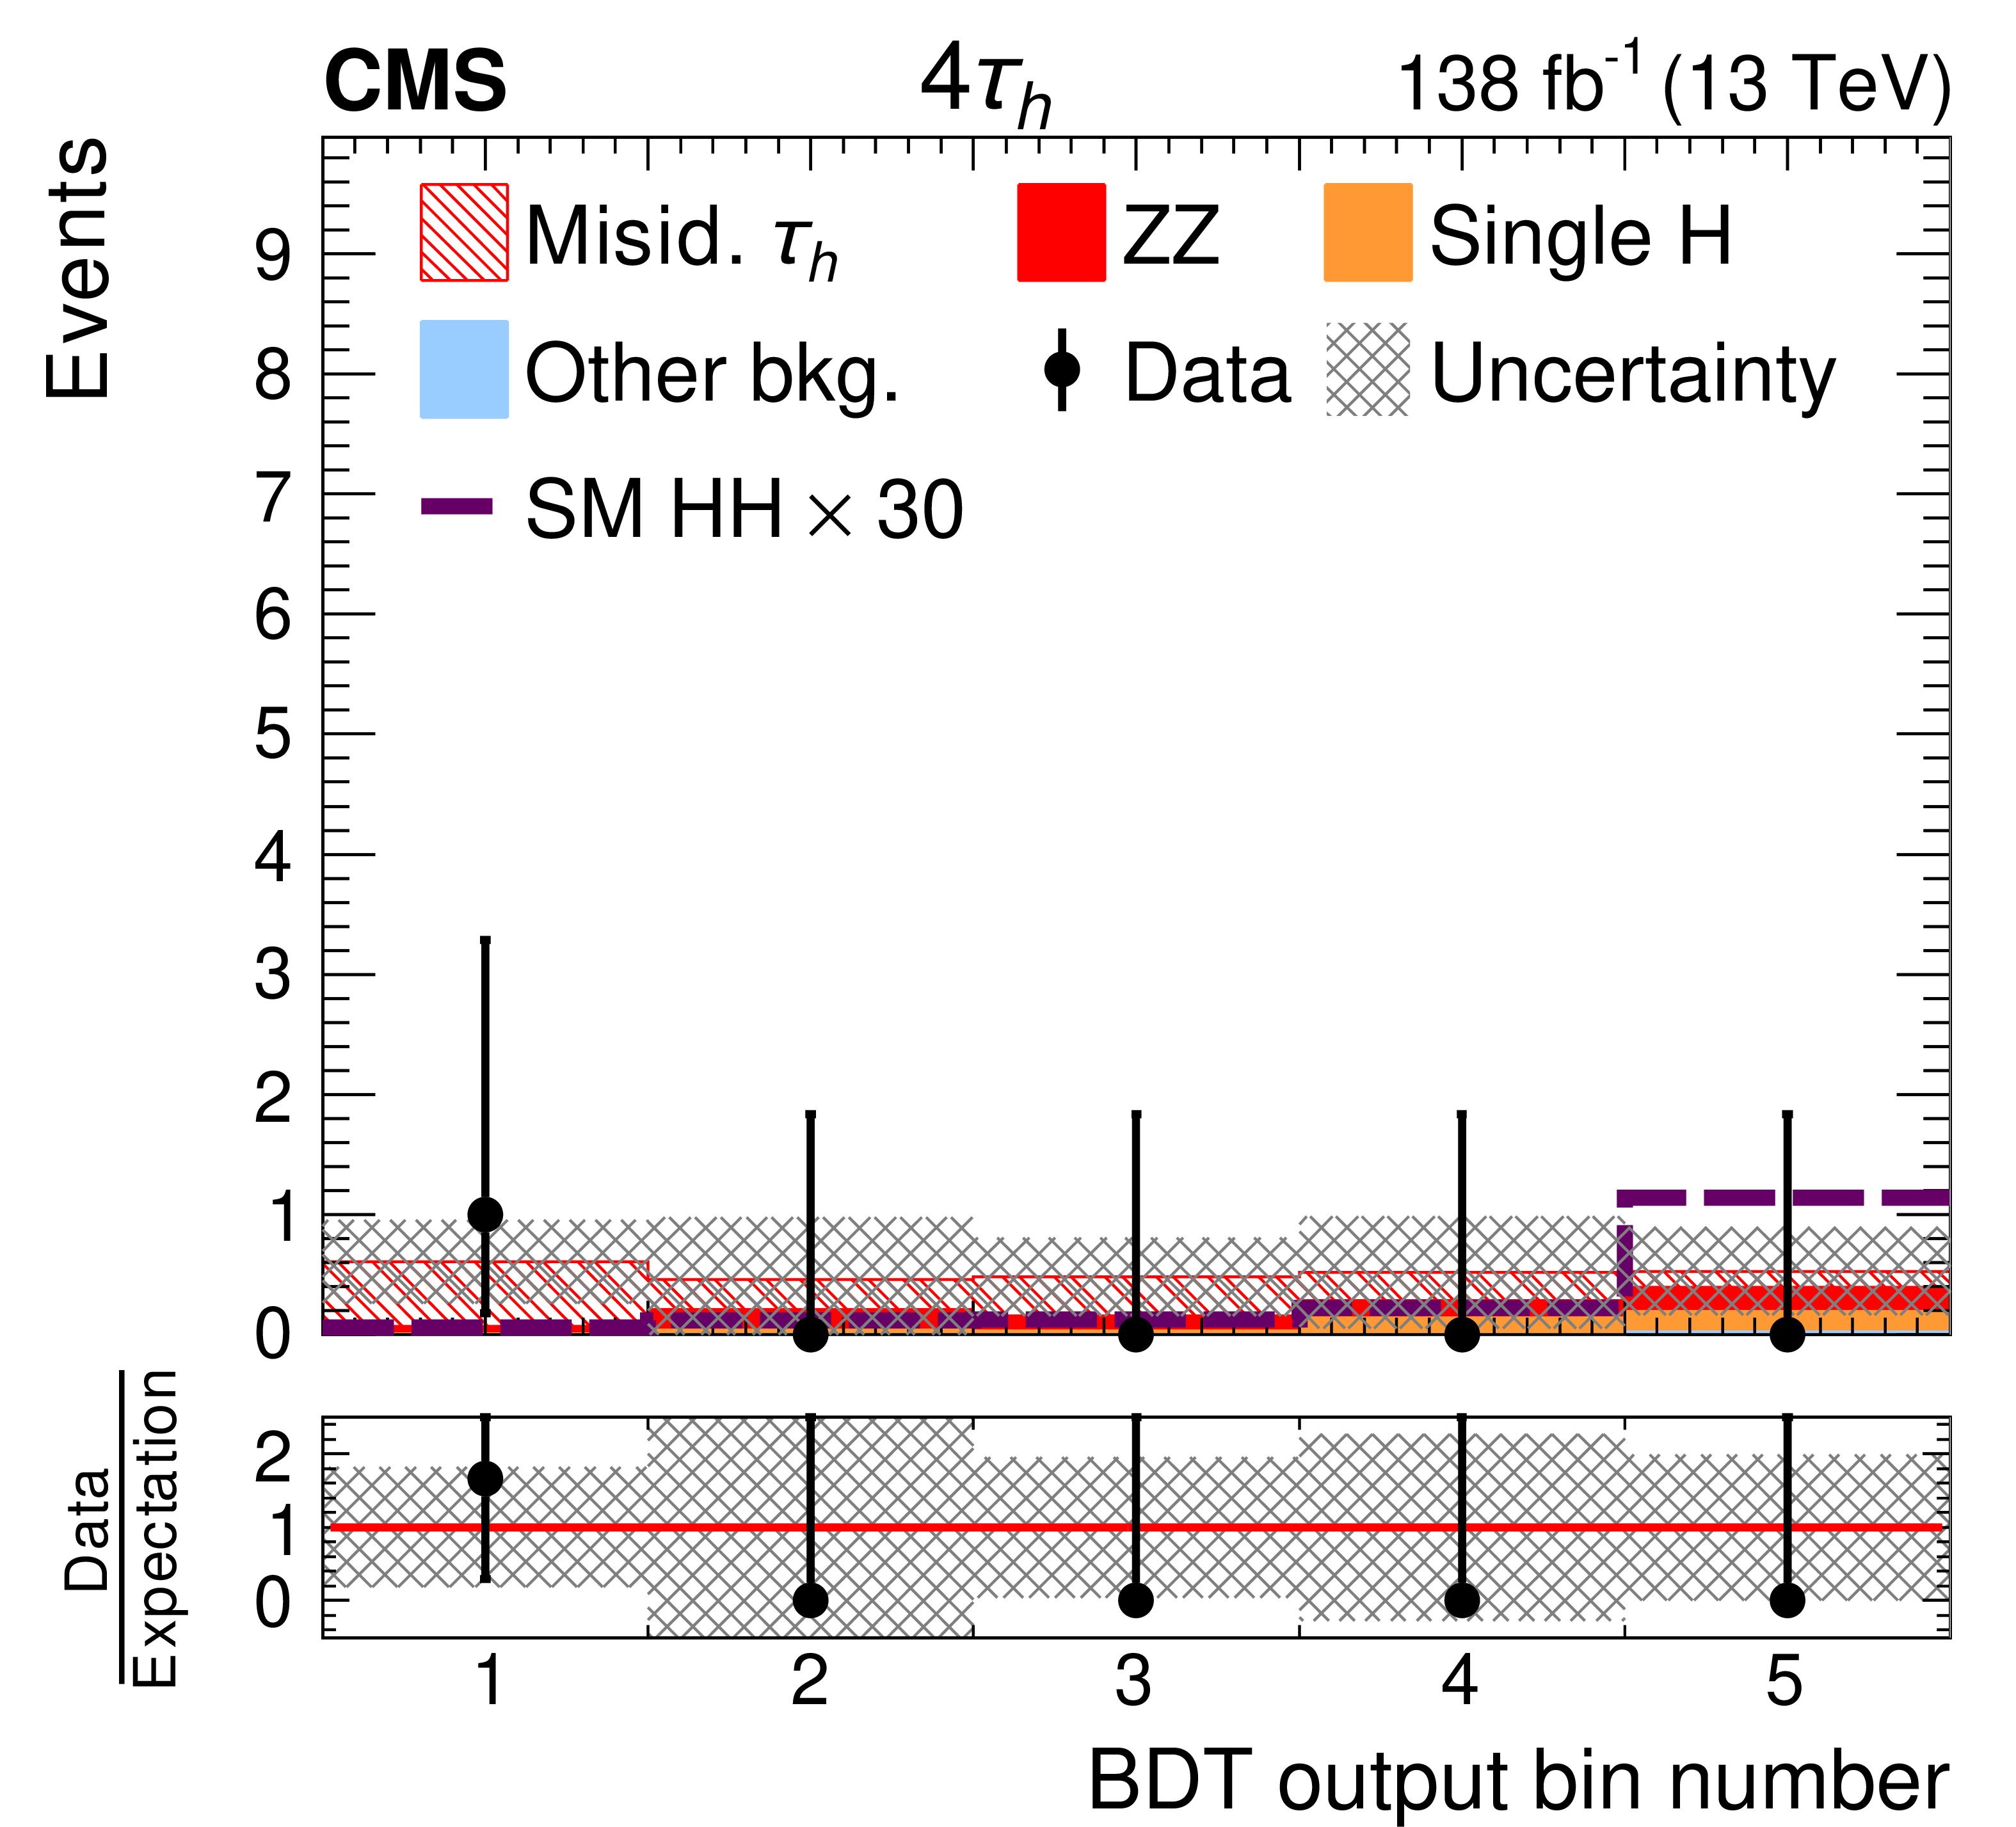
Figure 8:
Distribution in the output of the BDT trained for nonresonant HH production and evaluated for the benchmark scenario JHEP04 BM7 for the 3${\ell}$+1${\tau _\mathrm {h}}$ (upper left), 2${\ell}$+2${\tau _\mathrm {h}}$ (upper right), 1${\ell}$+3${\tau _\mathrm {h}}$ (lower left), and 4${\tau _\mathrm {h}}$ (lower right) categories. The SM HH signal is shown for a cross section amounting to 30 times the value predicted in the SM. The distributions expected for the background processes are shown for the values of nuisance parameters obtained from the ML fit of the signal+background hypothesis to the data. |
png pdf |
Figure 8-a:
Distribution in the output of the BDT trained for nonresonant HH production and evaluated for the benchmark scenario JHEP04 BM7 for the 3${\ell}$+1${\tau _\mathrm {h}}$ (upper left), 2${\ell}$+2${\tau _\mathrm {h}}$ (upper right), 1${\ell}$+3${\tau _\mathrm {h}}$ (lower left), and 4${\tau _\mathrm {h}}$ (lower right) categories. The SM HH signal is shown for a cross section amounting to 30 times the value predicted in the SM. The distributions expected for the background processes are shown for the values of nuisance parameters obtained from the ML fit of the signal+background hypothesis to the data. |
png pdf |
Figure 8-b:
Distribution in the output of the BDT trained for nonresonant HH production and evaluated for the benchmark scenario JHEP04 BM7 for the 3${\ell}$+1${\tau _\mathrm {h}}$ (upper left), 2${\ell}$+2${\tau _\mathrm {h}}$ (upper right), 1${\ell}$+3${\tau _\mathrm {h}}$ (lower left), and 4${\tau _\mathrm {h}}$ (lower right) categories. The SM HH signal is shown for a cross section amounting to 30 times the value predicted in the SM. The distributions expected for the background processes are shown for the values of nuisance parameters obtained from the ML fit of the signal+background hypothesis to the data. |
png pdf |
Figure 8-c:
Distribution in the output of the BDT trained for nonresonant HH production and evaluated for the benchmark scenario JHEP04 BM7 for the 3${\ell}$+1${\tau _\mathrm {h}}$ (upper left), 2${\ell}$+2${\tau _\mathrm {h}}$ (upper right), 1${\ell}$+3${\tau _\mathrm {h}}$ (lower left), and 4${\tau _\mathrm {h}}$ (lower right) categories. The SM HH signal is shown for a cross section amounting to 30 times the value predicted in the SM. The distributions expected for the background processes are shown for the values of nuisance parameters obtained from the ML fit of the signal+background hypothesis to the data. |
png pdf |
Figure 8-d:
Distribution in the output of the BDT trained for nonresonant HH production and evaluated for the benchmark scenario JHEP04 BM7 for the 3${\ell}$+1${\tau _\mathrm {h}}$ (upper left), 2${\ell}$+2${\tau _\mathrm {h}}$ (upper right), 1${\ell}$+3${\tau _\mathrm {h}}$ (lower left), and 4${\tau _\mathrm {h}}$ (lower right) categories. The SM HH signal is shown for a cross section amounting to 30 times the value predicted in the SM. The distributions expected for the background processes are shown for the values of nuisance parameters obtained from the ML fit of the signal+background hypothesis to the data. |
png pdf |
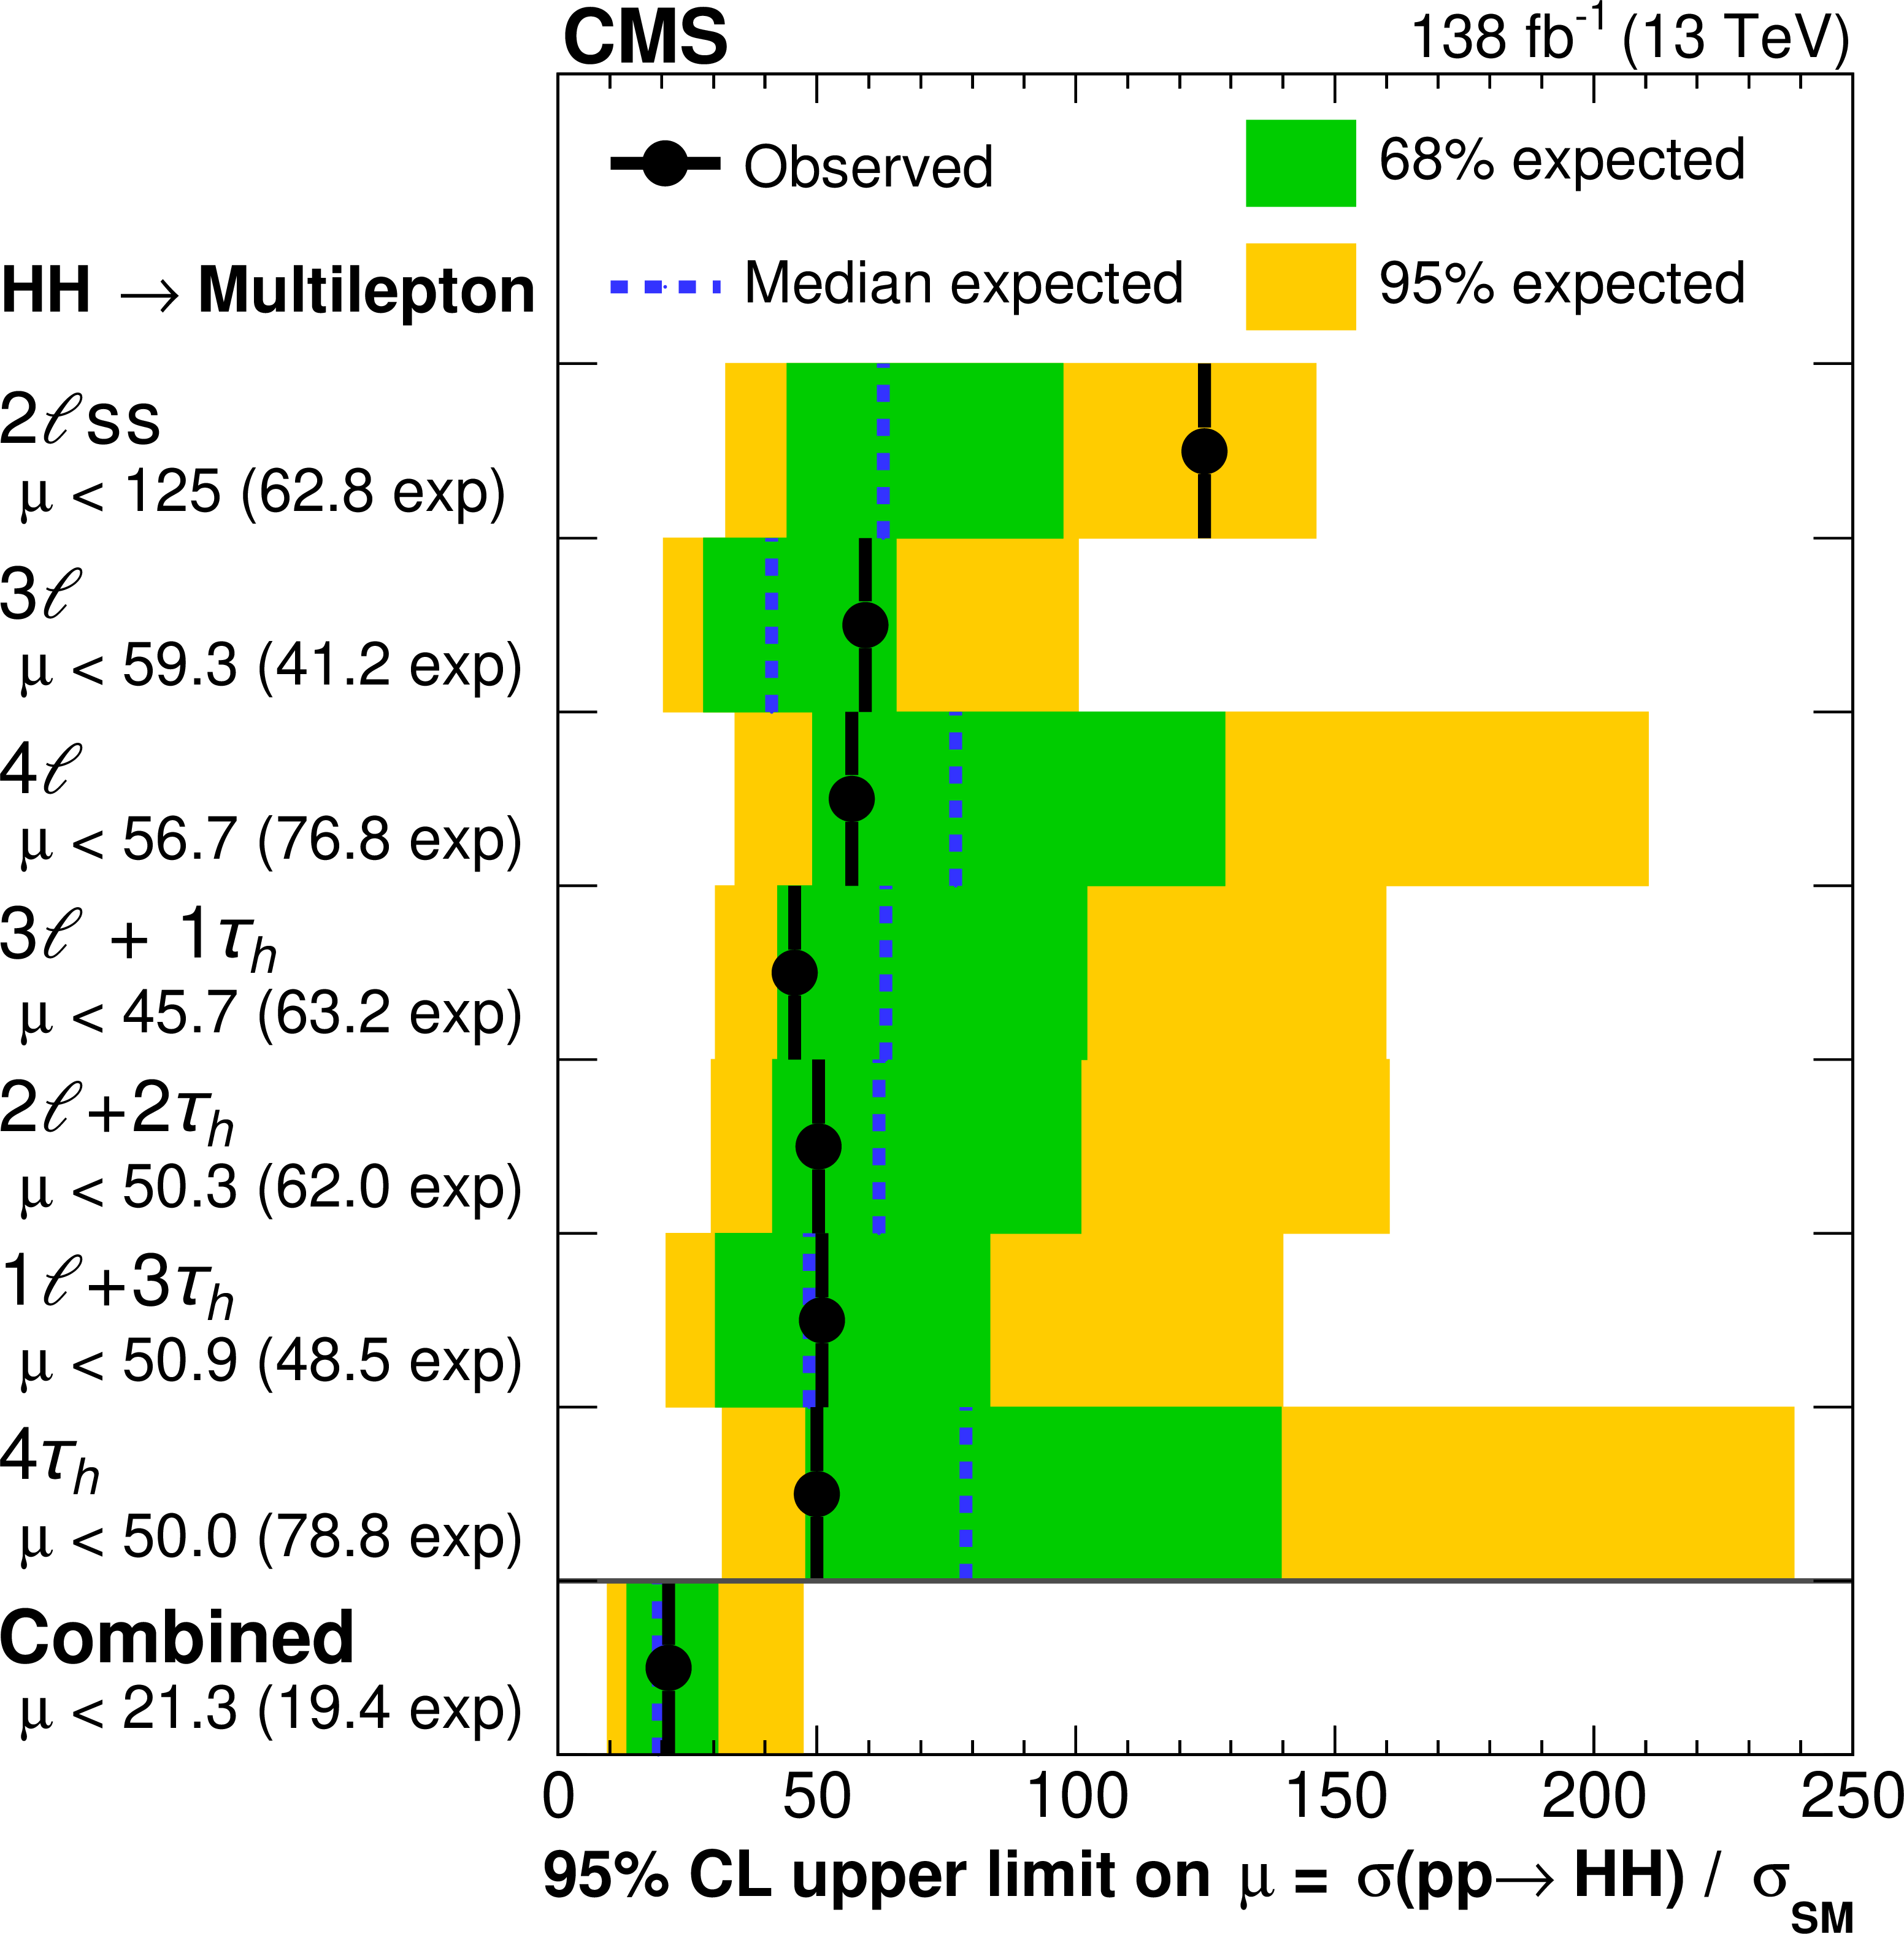
Figure 9:
Observed and expected 95% CL upper limits on the SM HH production cross section, obtained for both individual search categories and from a simultaneous fit of all seven categories combined. |
png pdf |
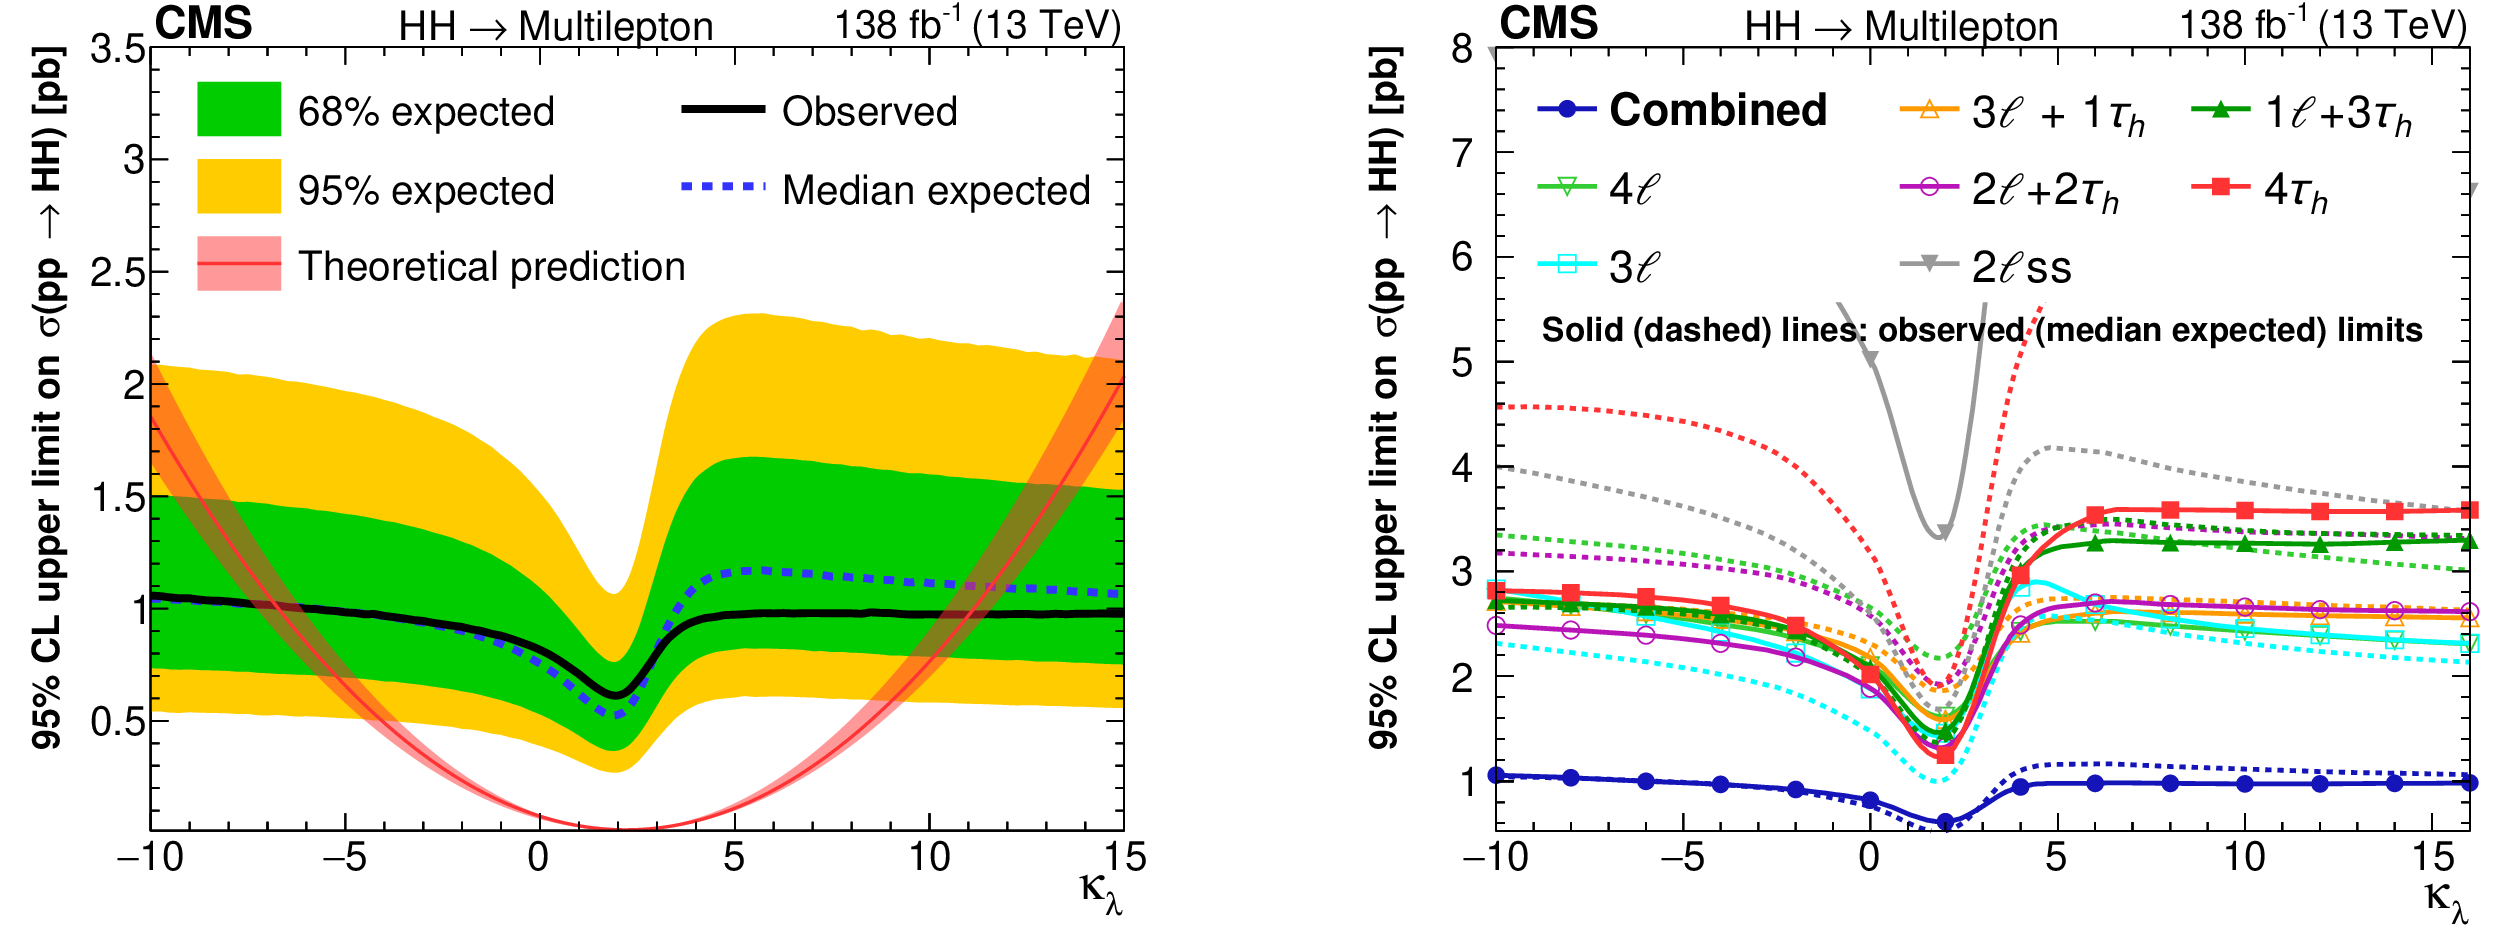
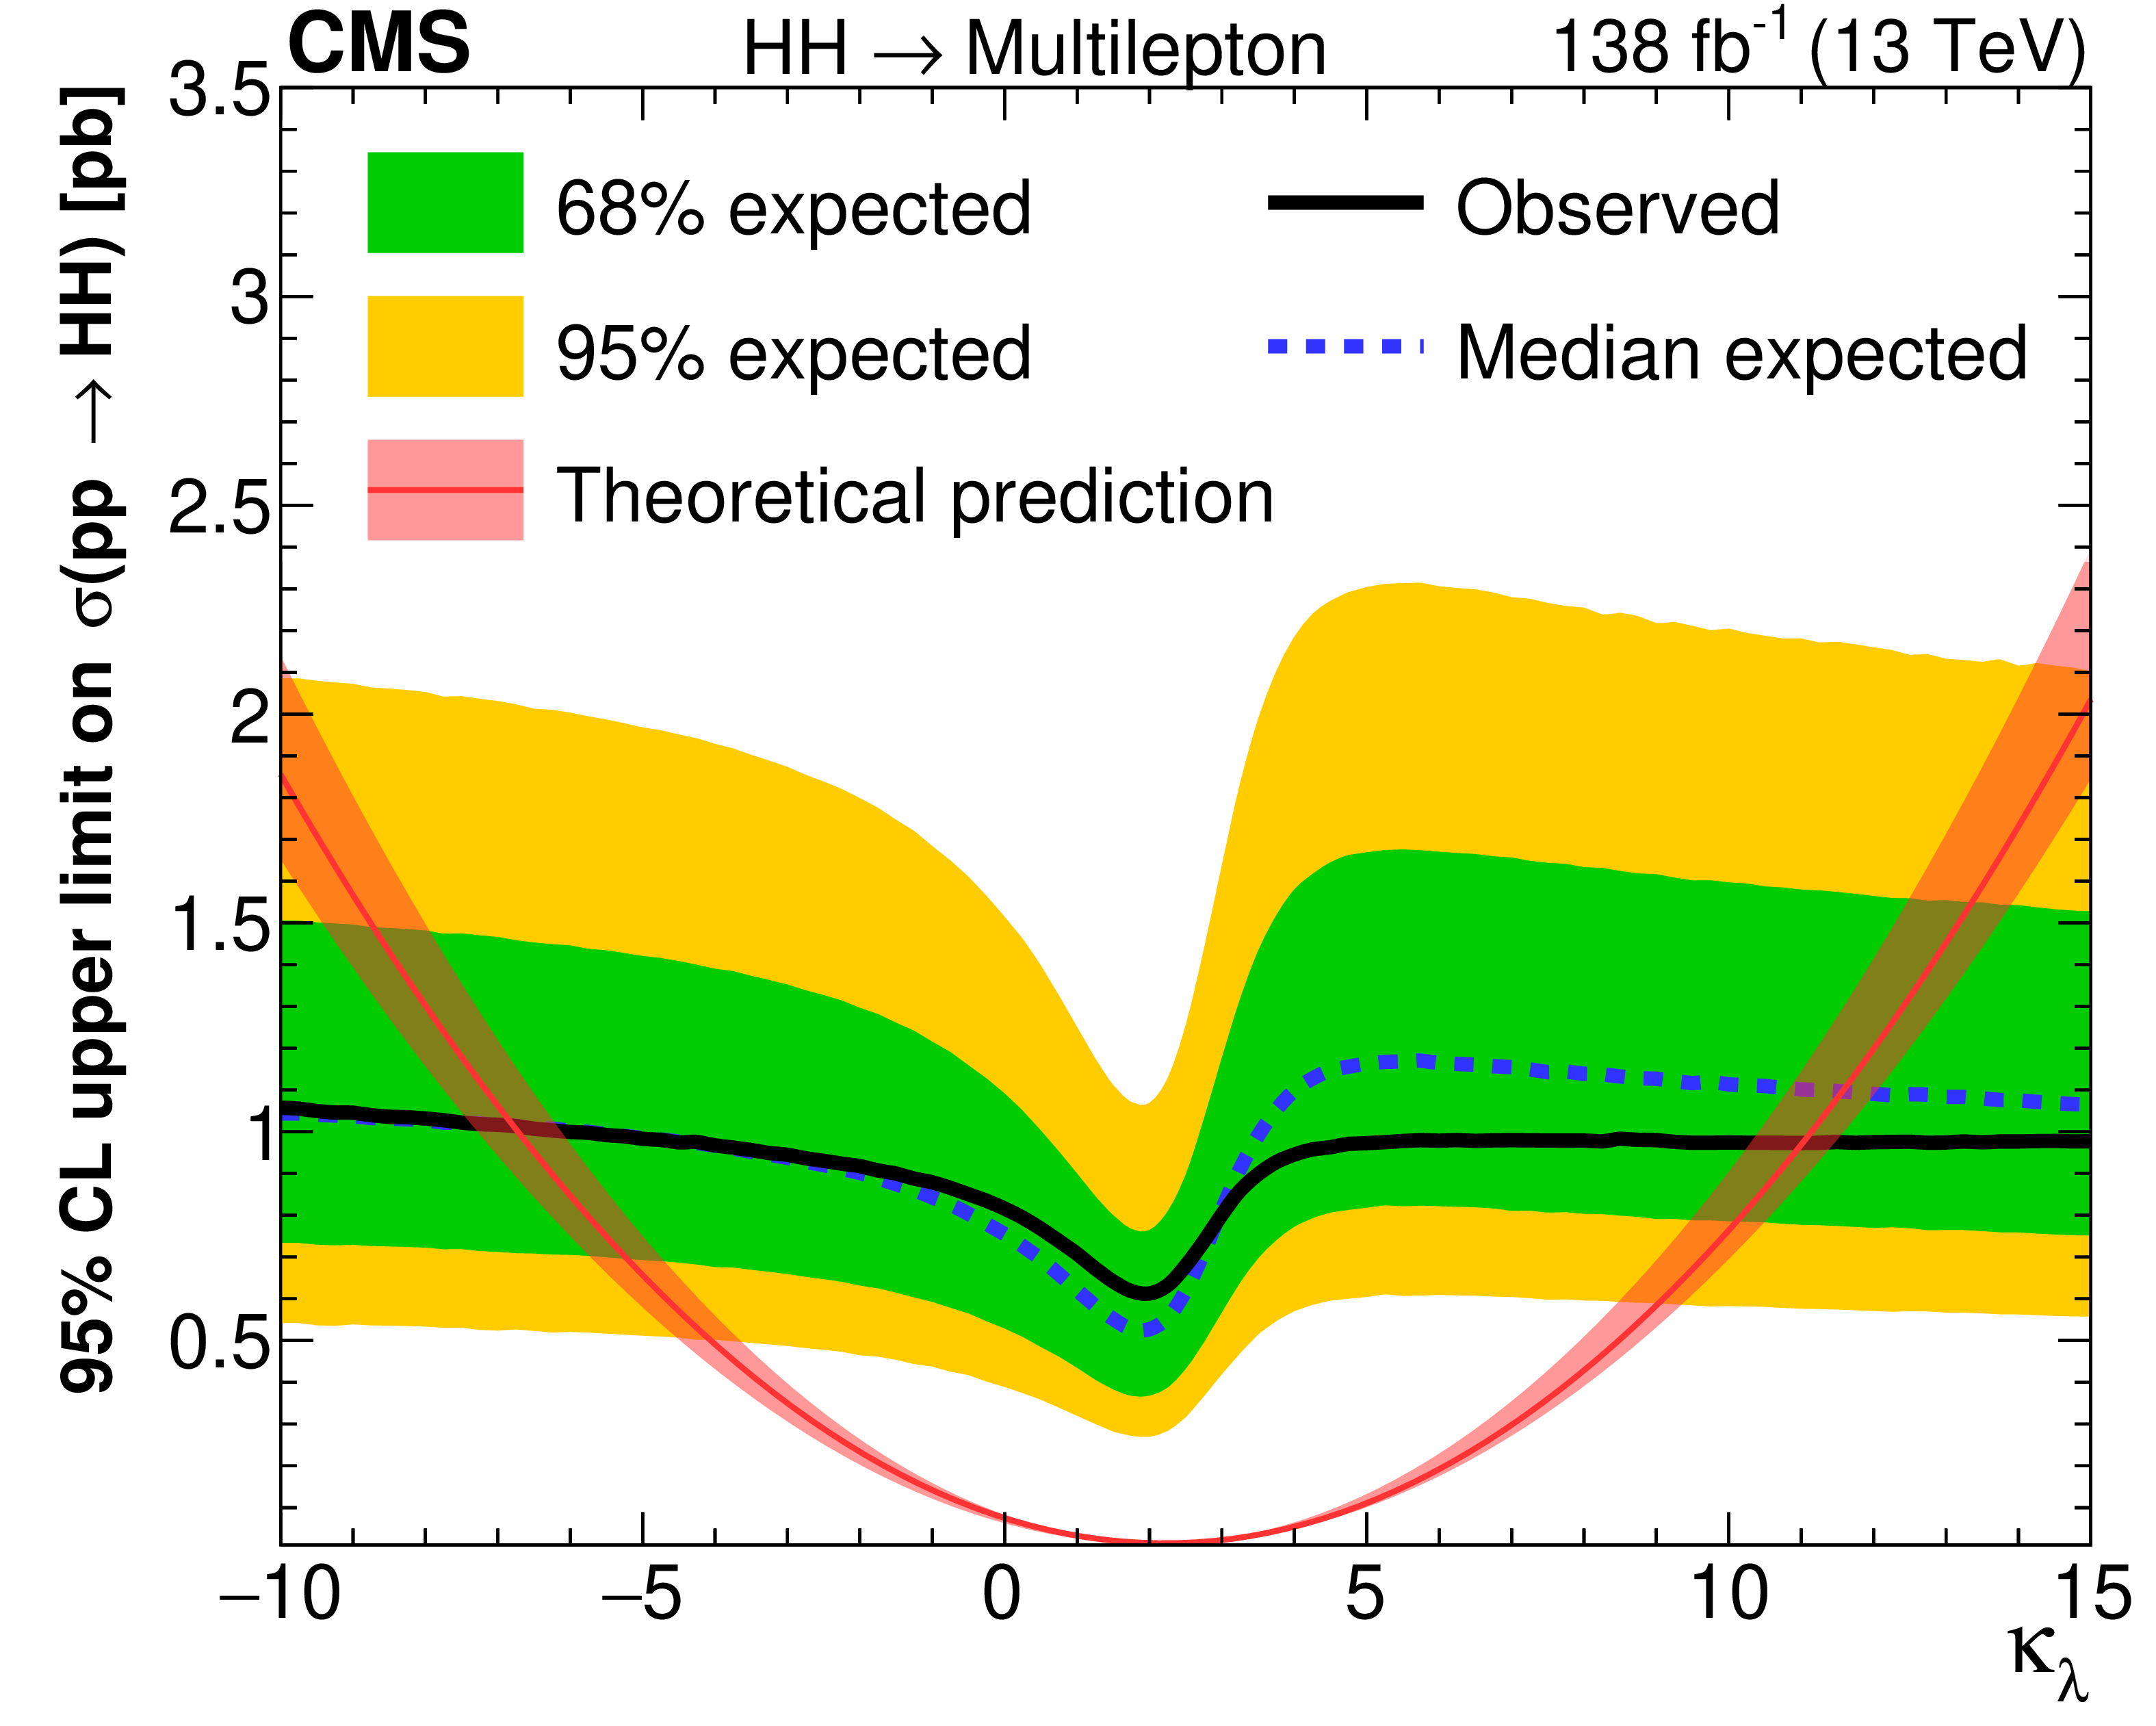
Figure 10:
Observed and expected 95% CL upper limits on the HH production cross section as a function of the H boson self-coupling strength modifier ${\kappa _{\lambda}}$. All H boson couplings other than $\lambda $ are assumed to have the values predicted in the SM. The left plot shows the result obtained by combining all seven search categories, while the right plot shows the limits obtained for each category separately. The red curve in the left plot represents the SM prediction for the HH production cross section as a function of ${\kappa _{\lambda}}$ , and the red shaded band the theoretical uncertainty in this prediction. |
png pdf |
Figure 10-a:
Observed and expected 95% CL upper limits on the HH production cross section as a function of the H boson self-coupling strength modifier ${\kappa _{\lambda}}$. All H boson couplings other than $\lambda $ are assumed to have the values predicted in the SM. The left plot shows the result obtained by combining all seven search categories, while the right plot shows the limits obtained for each category separately. The red curve in the left plot represents the SM prediction for the HH production cross section as a function of ${\kappa _{\lambda}}$ , and the red shaded band the theoretical uncertainty in this prediction. |
png pdf |
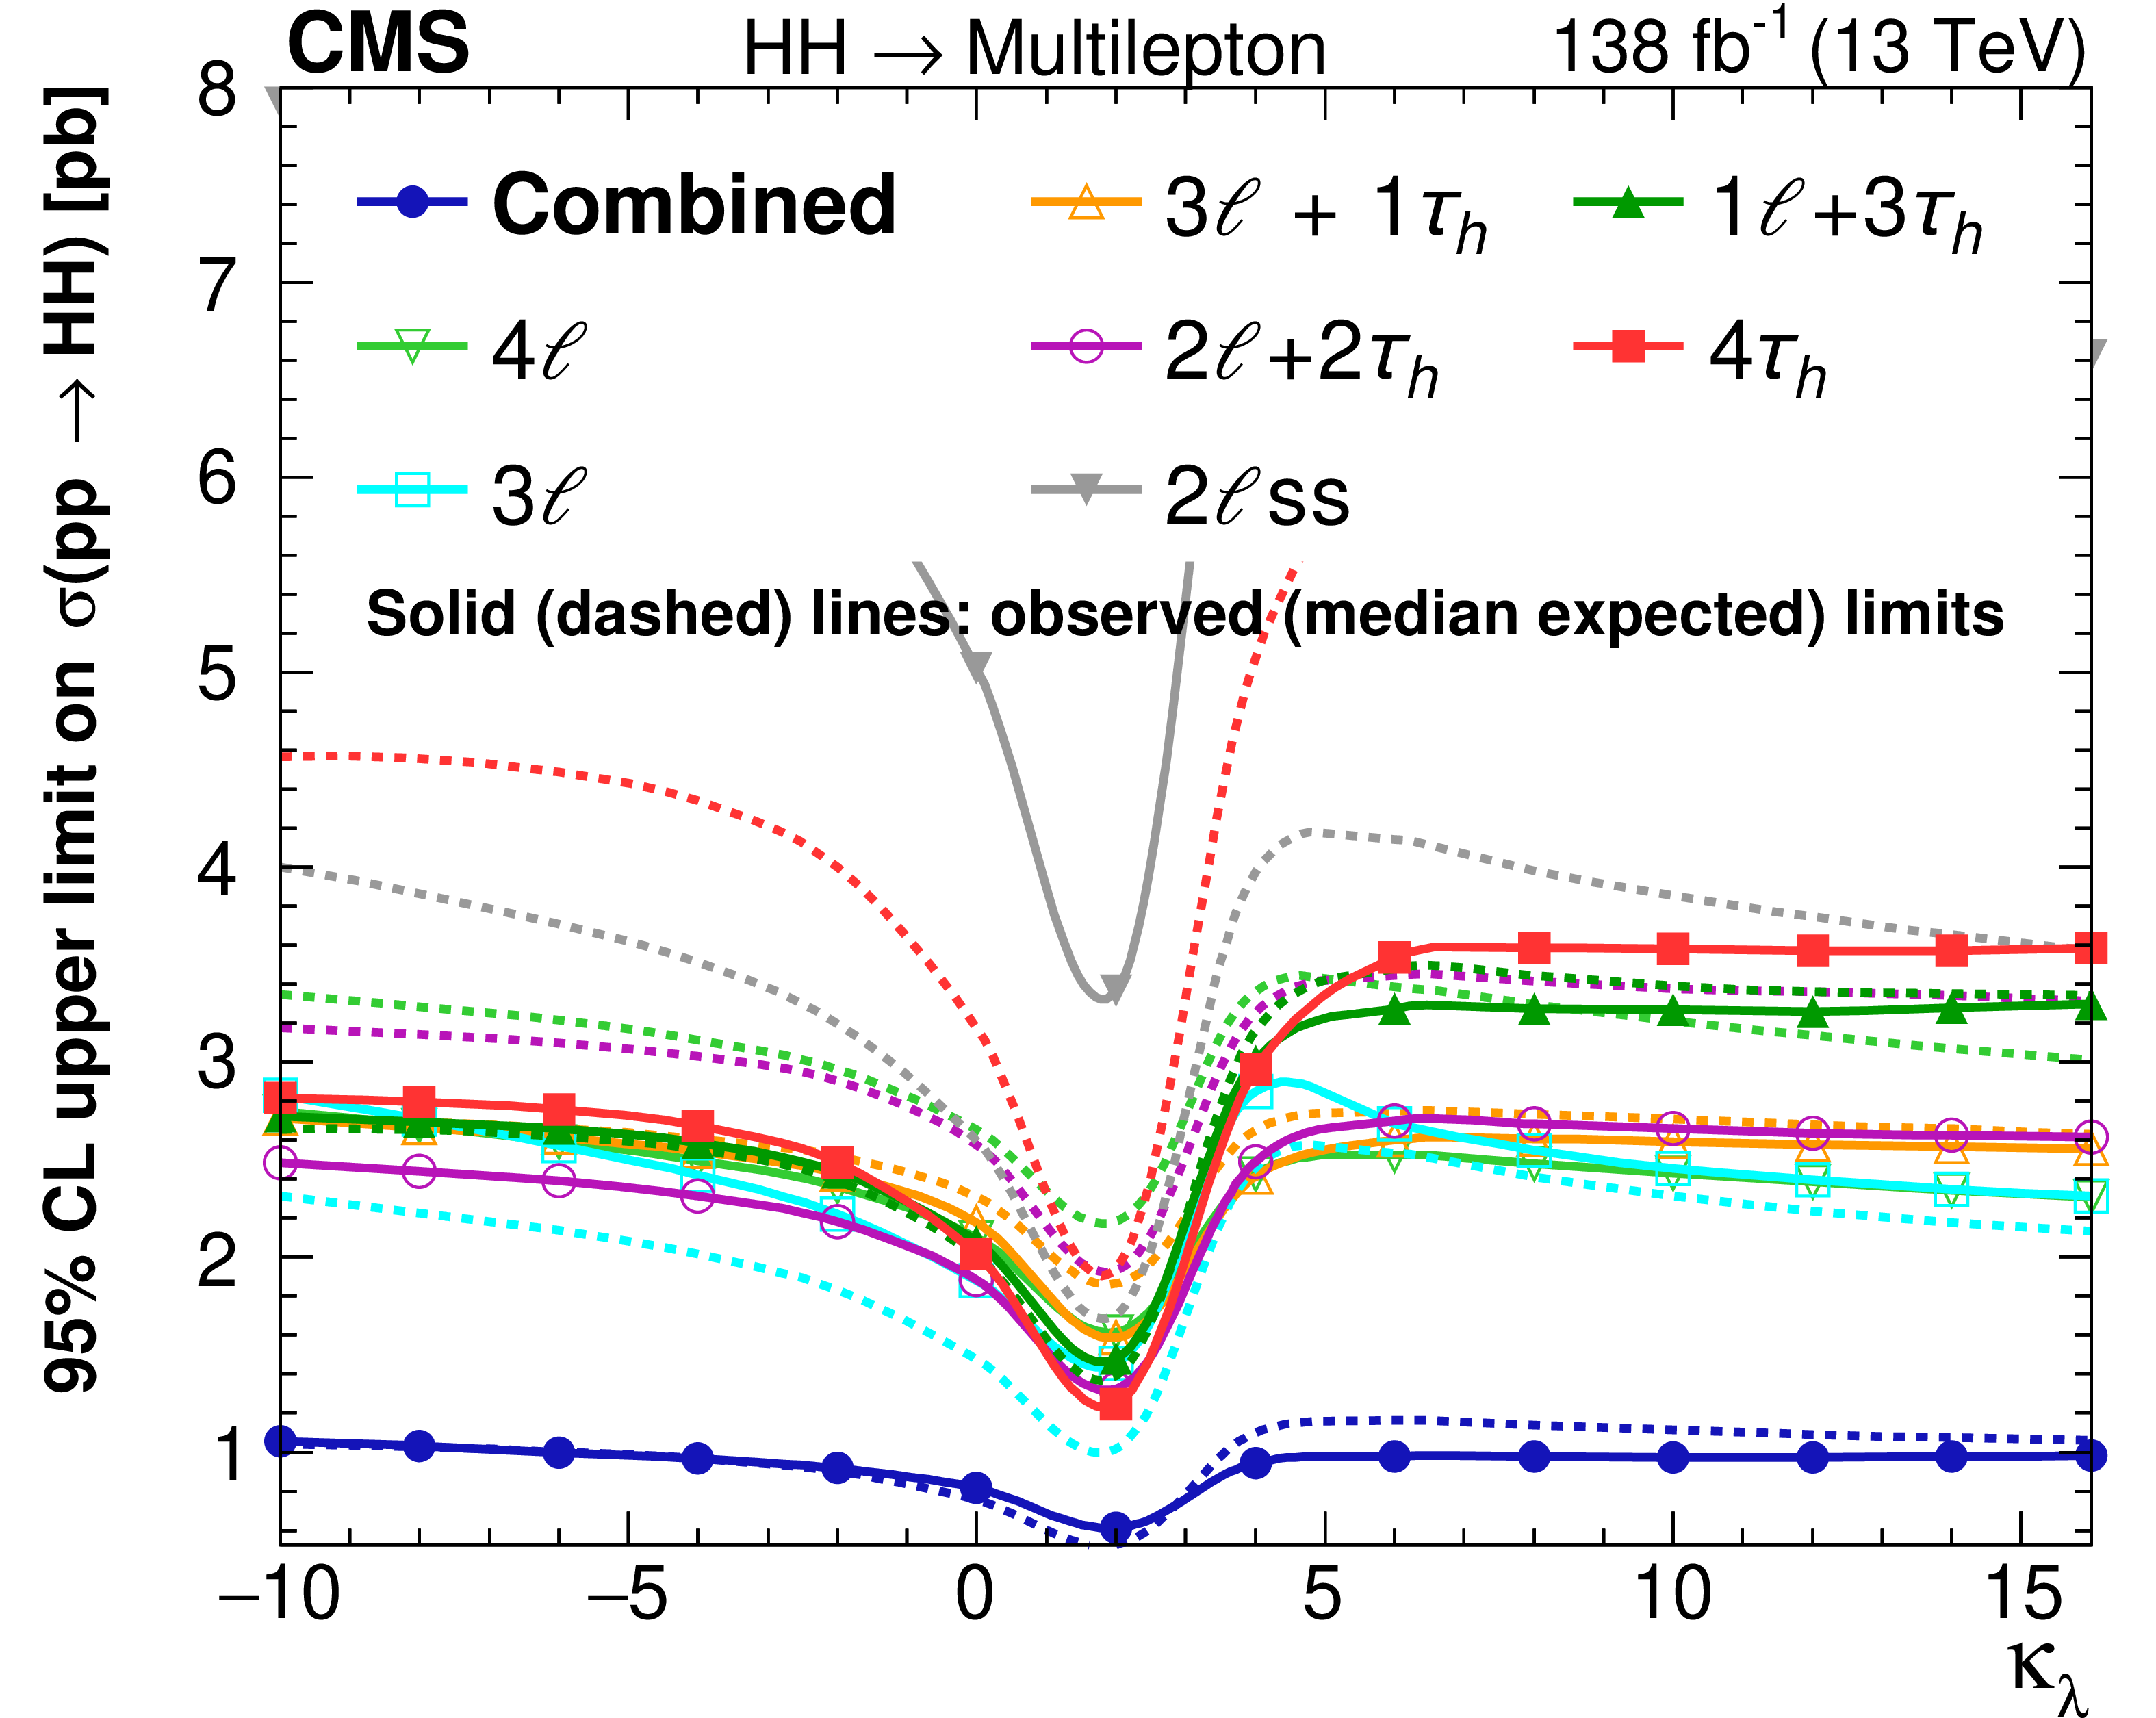
Figure 10-b:
Observed and expected 95% CL upper limits on the HH production cross section as a function of the H boson self-coupling strength modifier ${\kappa _{\lambda}}$. All H boson couplings other than $\lambda $ are assumed to have the values predicted in the SM. The left plot shows the result obtained by combining all seven search categories, while the right plot shows the limits obtained for each category separately. The red curve in the left plot represents the SM prediction for the HH production cross section as a function of ${\kappa _{\lambda}}$ , and the red shaded band the theoretical uncertainty in this prediction. |

png pdf |
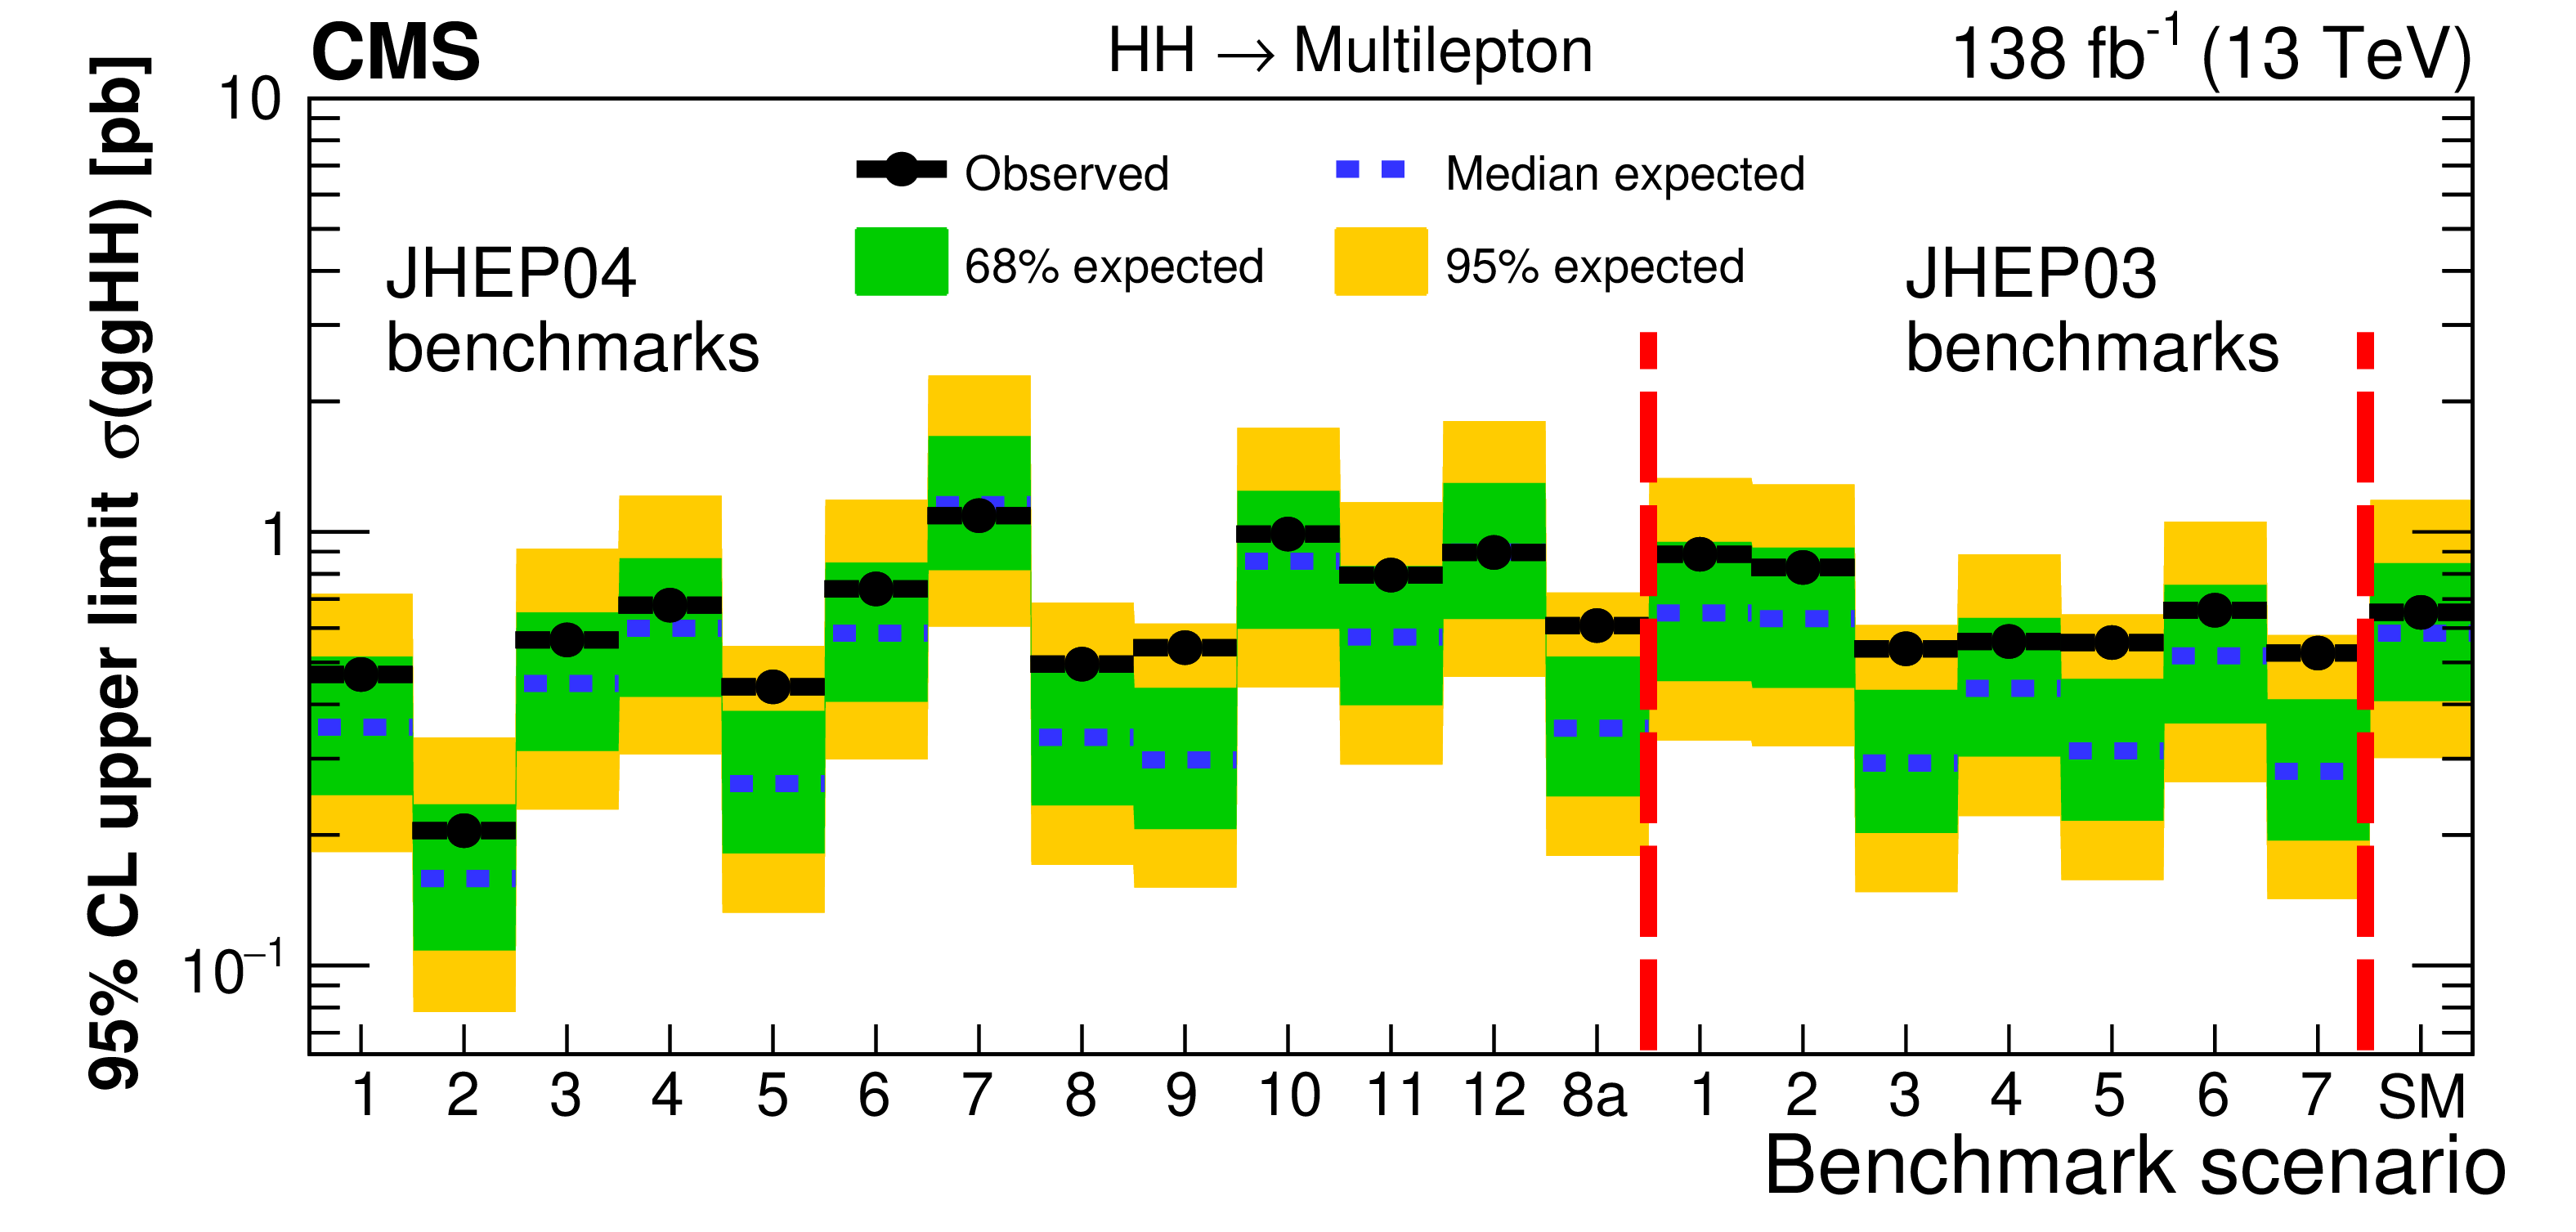
Figure 11:
Observed and expected 95% CL upper limits on the HH production cross section for the twelve benchmark scenarios from Ref. [24], the additional benchmark scenario 8a from Ref. [59], the seven benchmark scenarios from Ref. [58], and for the SM. The upper plot shows the result obtained by combining all seven search categories, while the lower plot shows the limits obtained for each category separately, and the combined limit. |
png pdf |
Figure 11-a:
Observed and expected 95% CL upper limits on the HH production cross section for the twelve benchmark scenarios from Ref. [24], the additional benchmark scenario 8a from Ref. [59], the seven benchmark scenarios from Ref. [58], and for the SM. The upper plot shows the result obtained by combining all seven search categories, while the lower plot shows the limits obtained for each category separately, and the combined limit. |

png pdf |
Figure 11-b:
Observed and expected 95% CL upper limits on the HH production cross section for the twelve benchmark scenarios from Ref. [24], the additional benchmark scenario 8a from Ref. [59], the seven benchmark scenarios from Ref. [58], and for the SM. The upper plot shows the result obtained by combining all seven search categories, while the lower plot shows the limits obtained for each category separately, and the combined limit. |
png pdf |
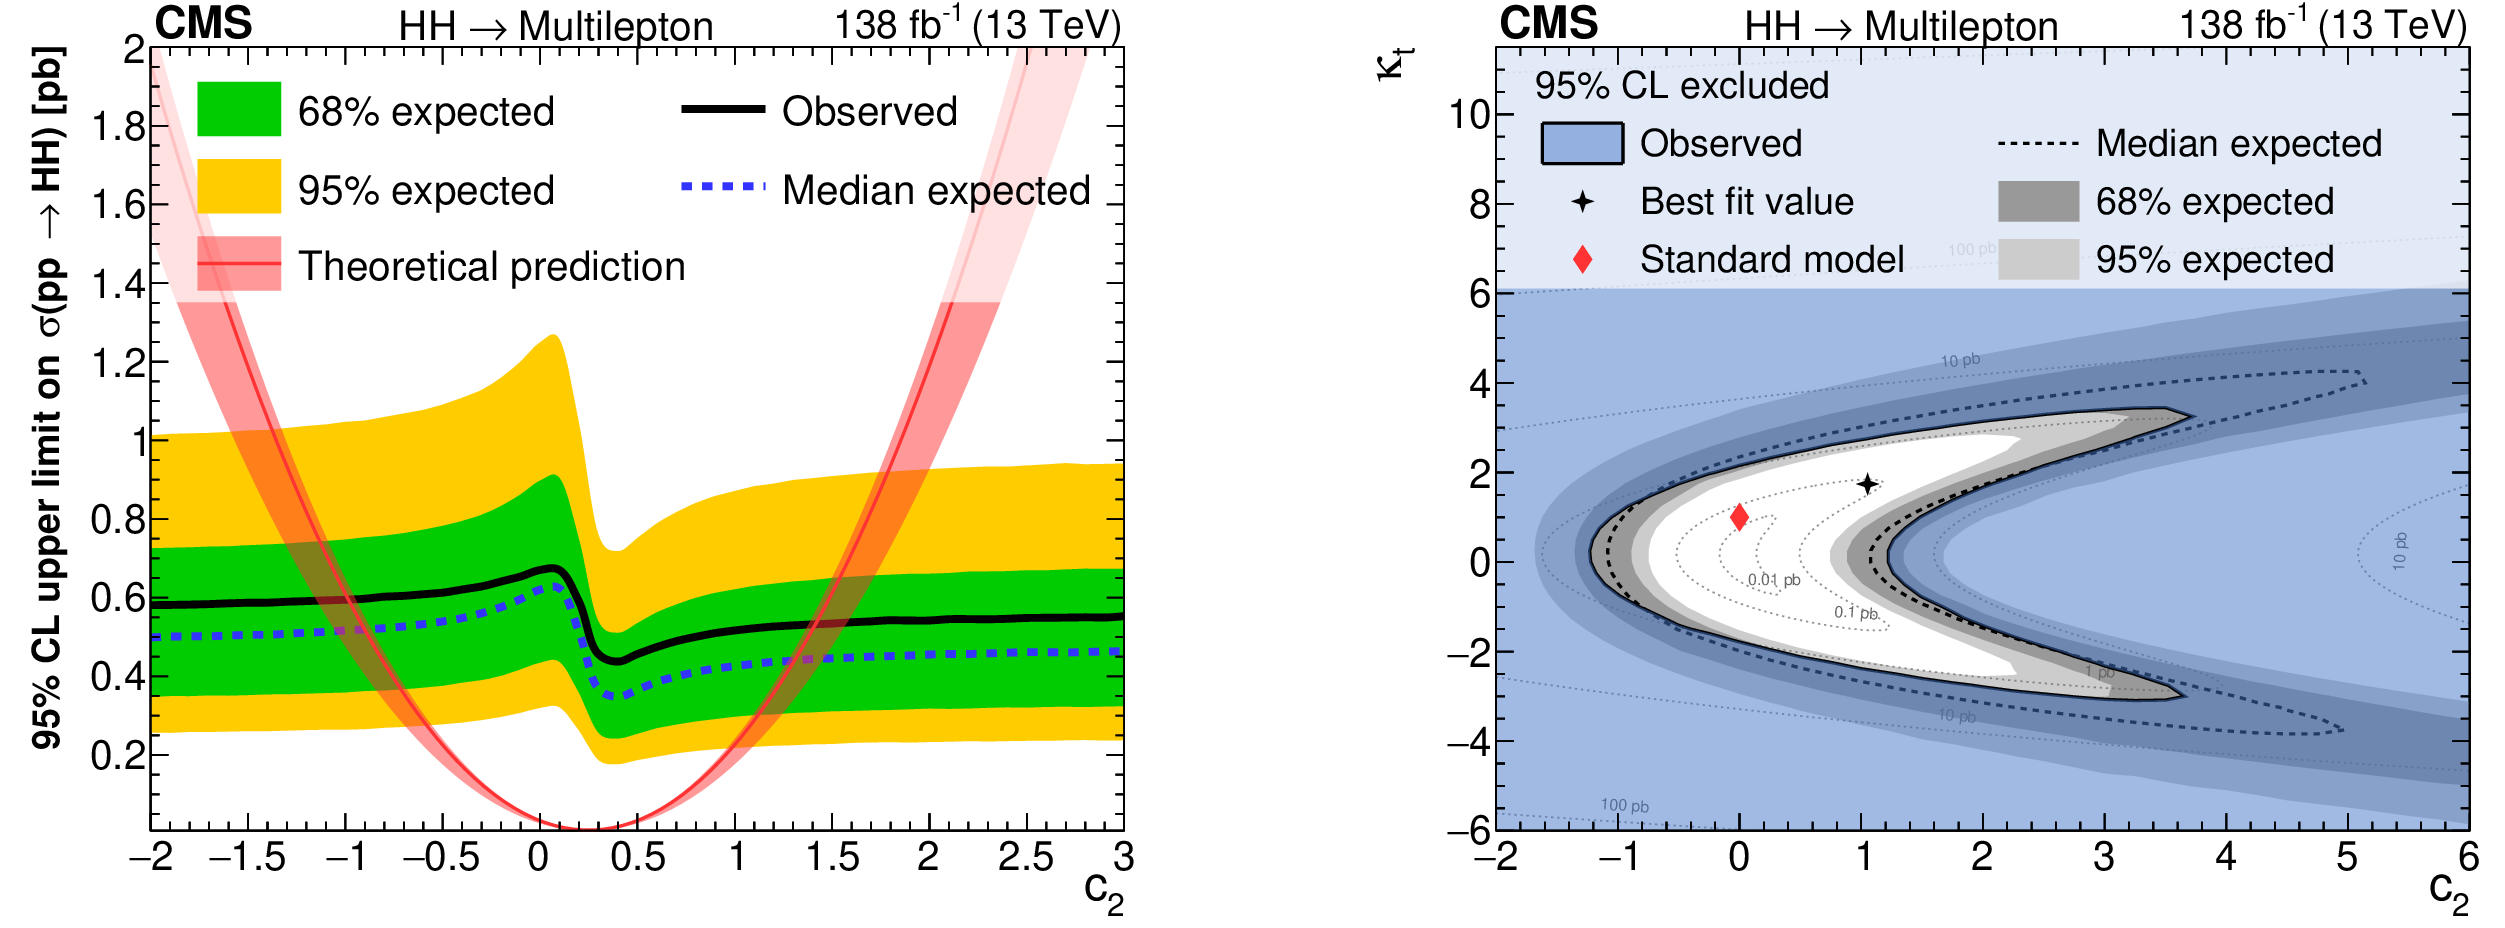
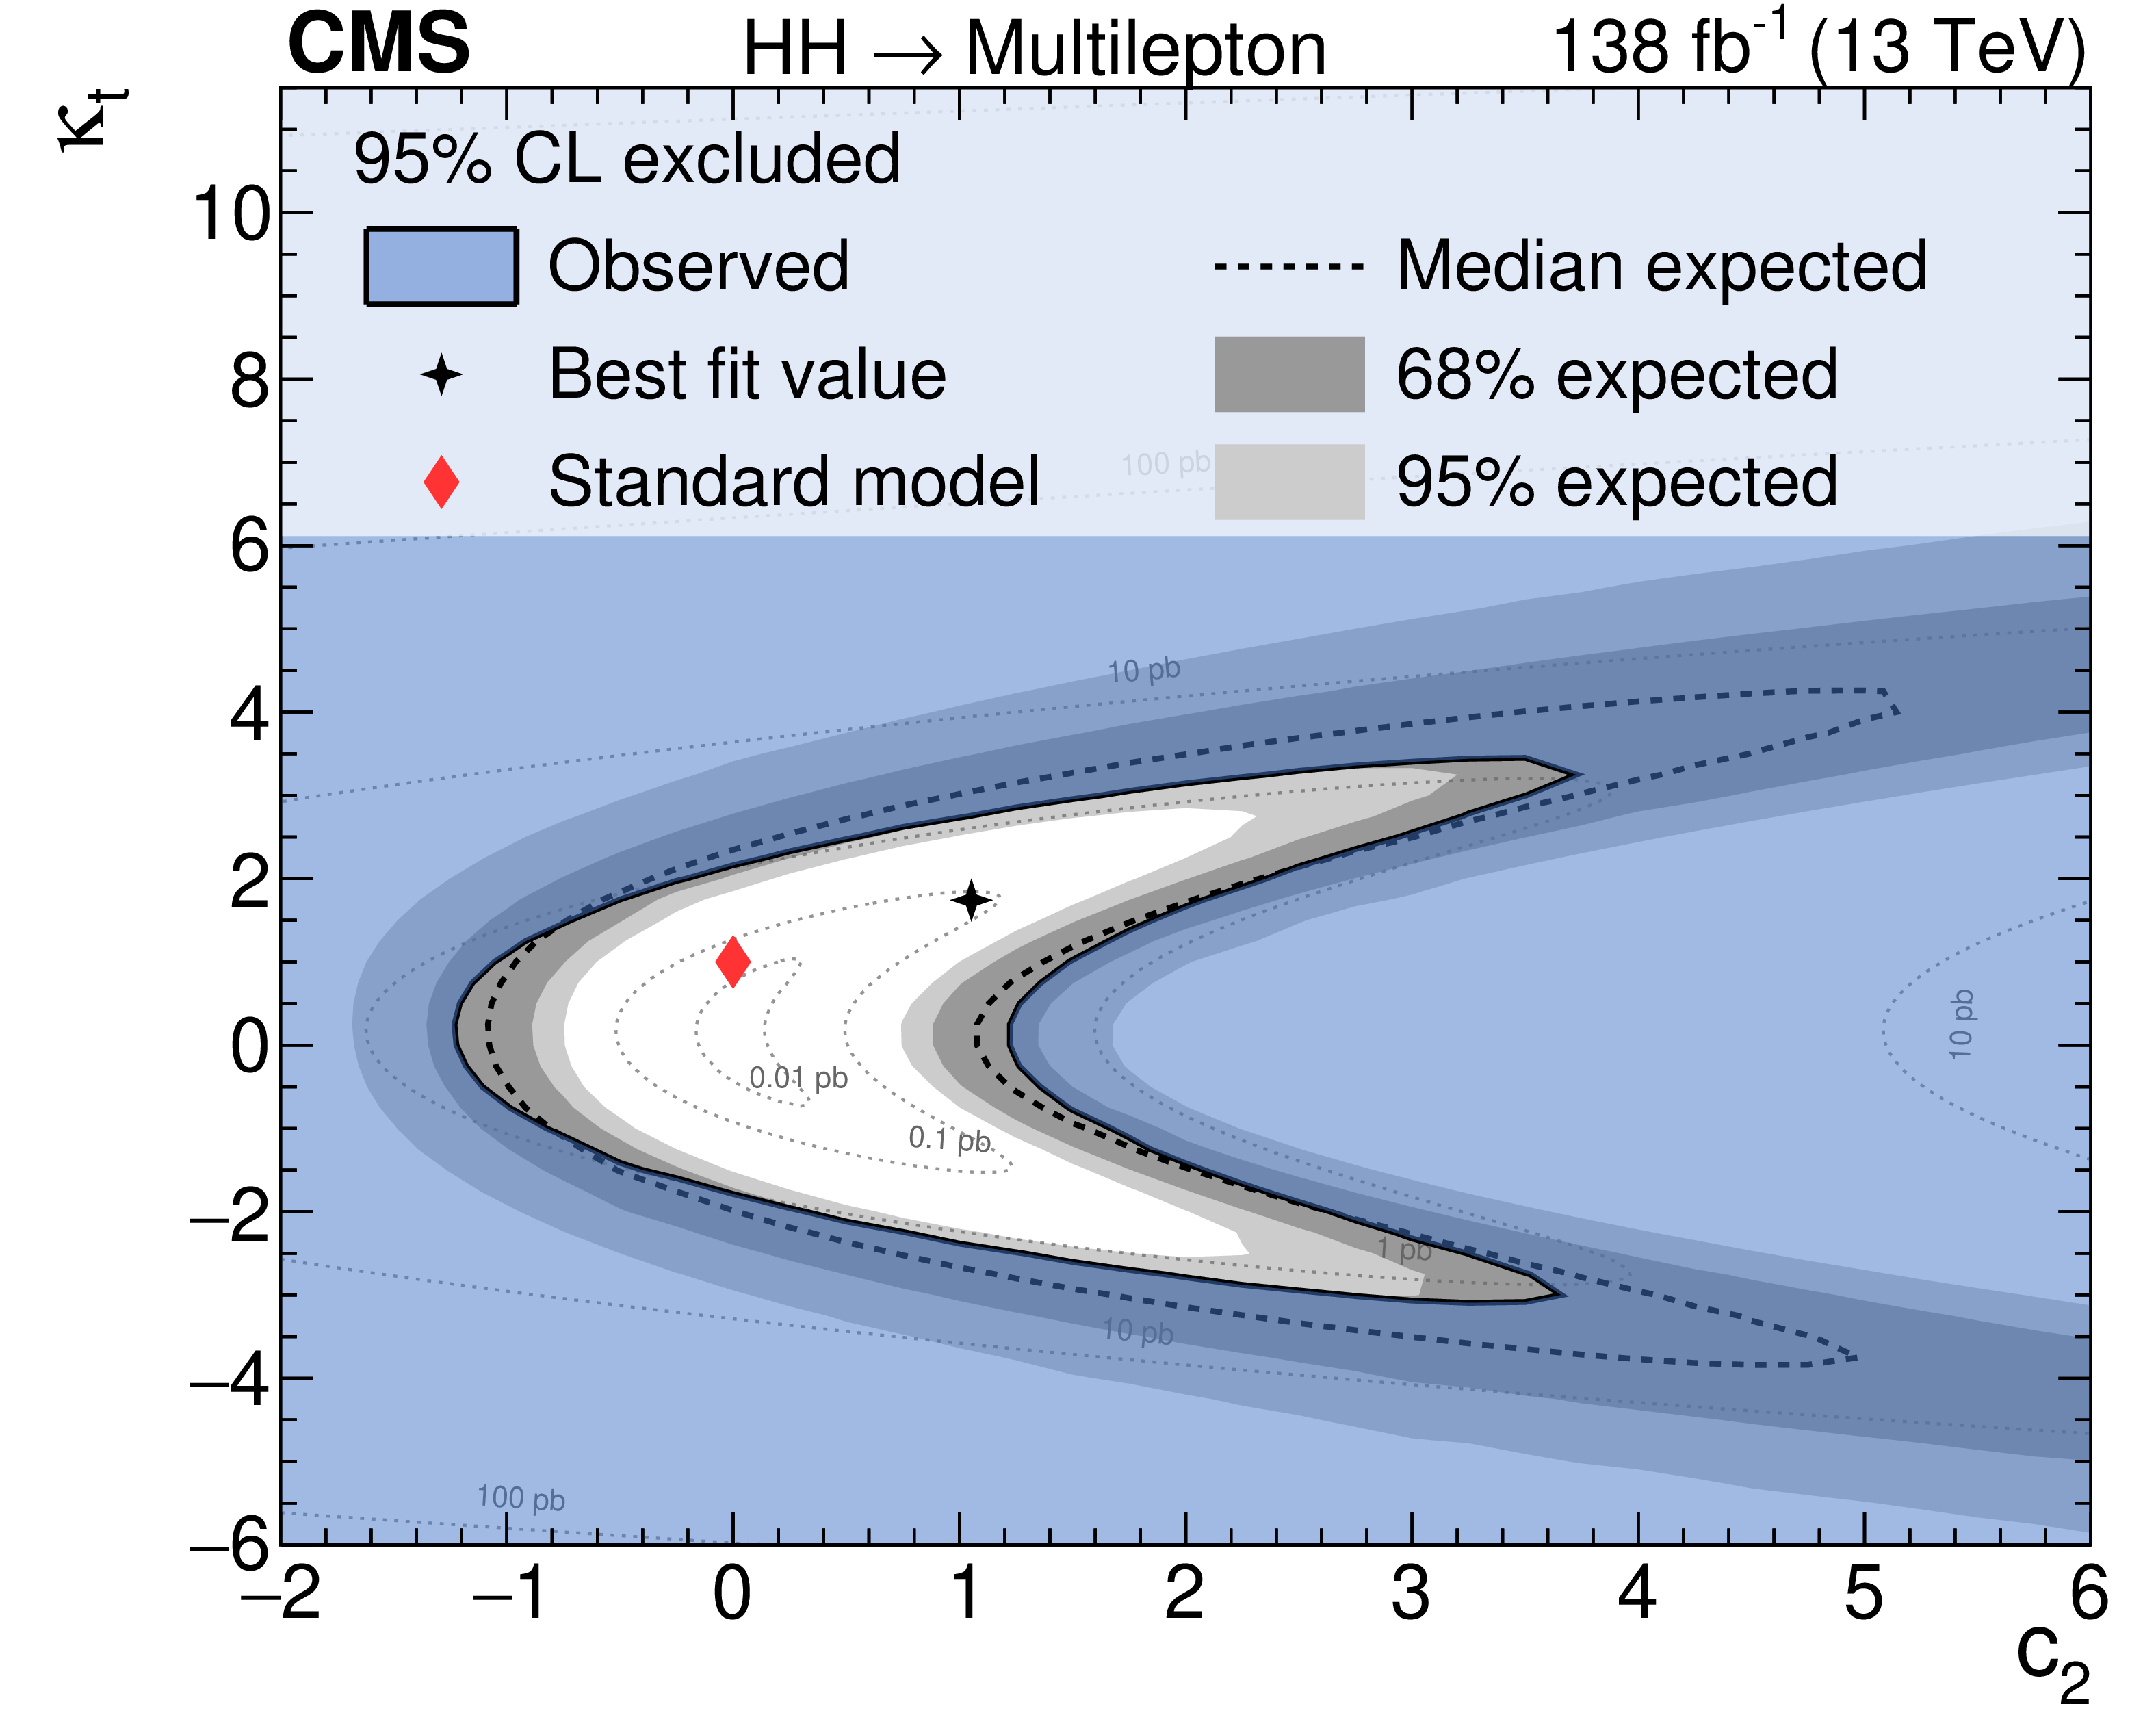
Figure 12:
Observed and expected limits on the HH production cross section as a function of the effective coupling ${\text {c}_{2}}$ (left), and the region excluded in the ${\kappa _{{\mathrm{t}}}} - {\text {c}_{2}}$ plane (right). All limits are computed at 95% CL. H boson couplings other than the ones shown in the plots (${\text {c}_{2}}$ in the left plot and ${\text {c}_{2}}$ and ${\kappa _{{\mathrm{t}}}}$ in the right plot) are assumed to have the values predicted by the SM. |

png pdf |
Figure 12-a:
Observed and expected limits on the HH production cross section as a function of the effective coupling ${\text {c}_{2}}$ (left), and the region excluded in the ${\kappa _{{\mathrm{t}}}} - {\text {c}_{2}}$ plane (right). All limits are computed at 95% CL. H boson couplings other than the ones shown in the plots (${\text {c}_{2}}$ in the left plot and ${\text {c}_{2}}$ and ${\kappa _{{\mathrm{t}}}}$ in the right plot) are assumed to have the values predicted by the SM. |
png pdf |
Figure 12-b:
Observed and expected limits on the HH production cross section as a function of the effective coupling ${\text {c}_{2}}$ (left), and the region excluded in the ${\kappa _{{\mathrm{t}}}} - {\text {c}_{2}}$ plane (right). All limits are computed at 95% CL. H boson couplings other than the ones shown in the plots (${\text {c}_{2}}$ in the left plot and ${\text {c}_{2}}$ and ${\kappa _{{\mathrm{t}}}}$ in the right plot) are assumed to have the values predicted by the SM. |
png pdf |
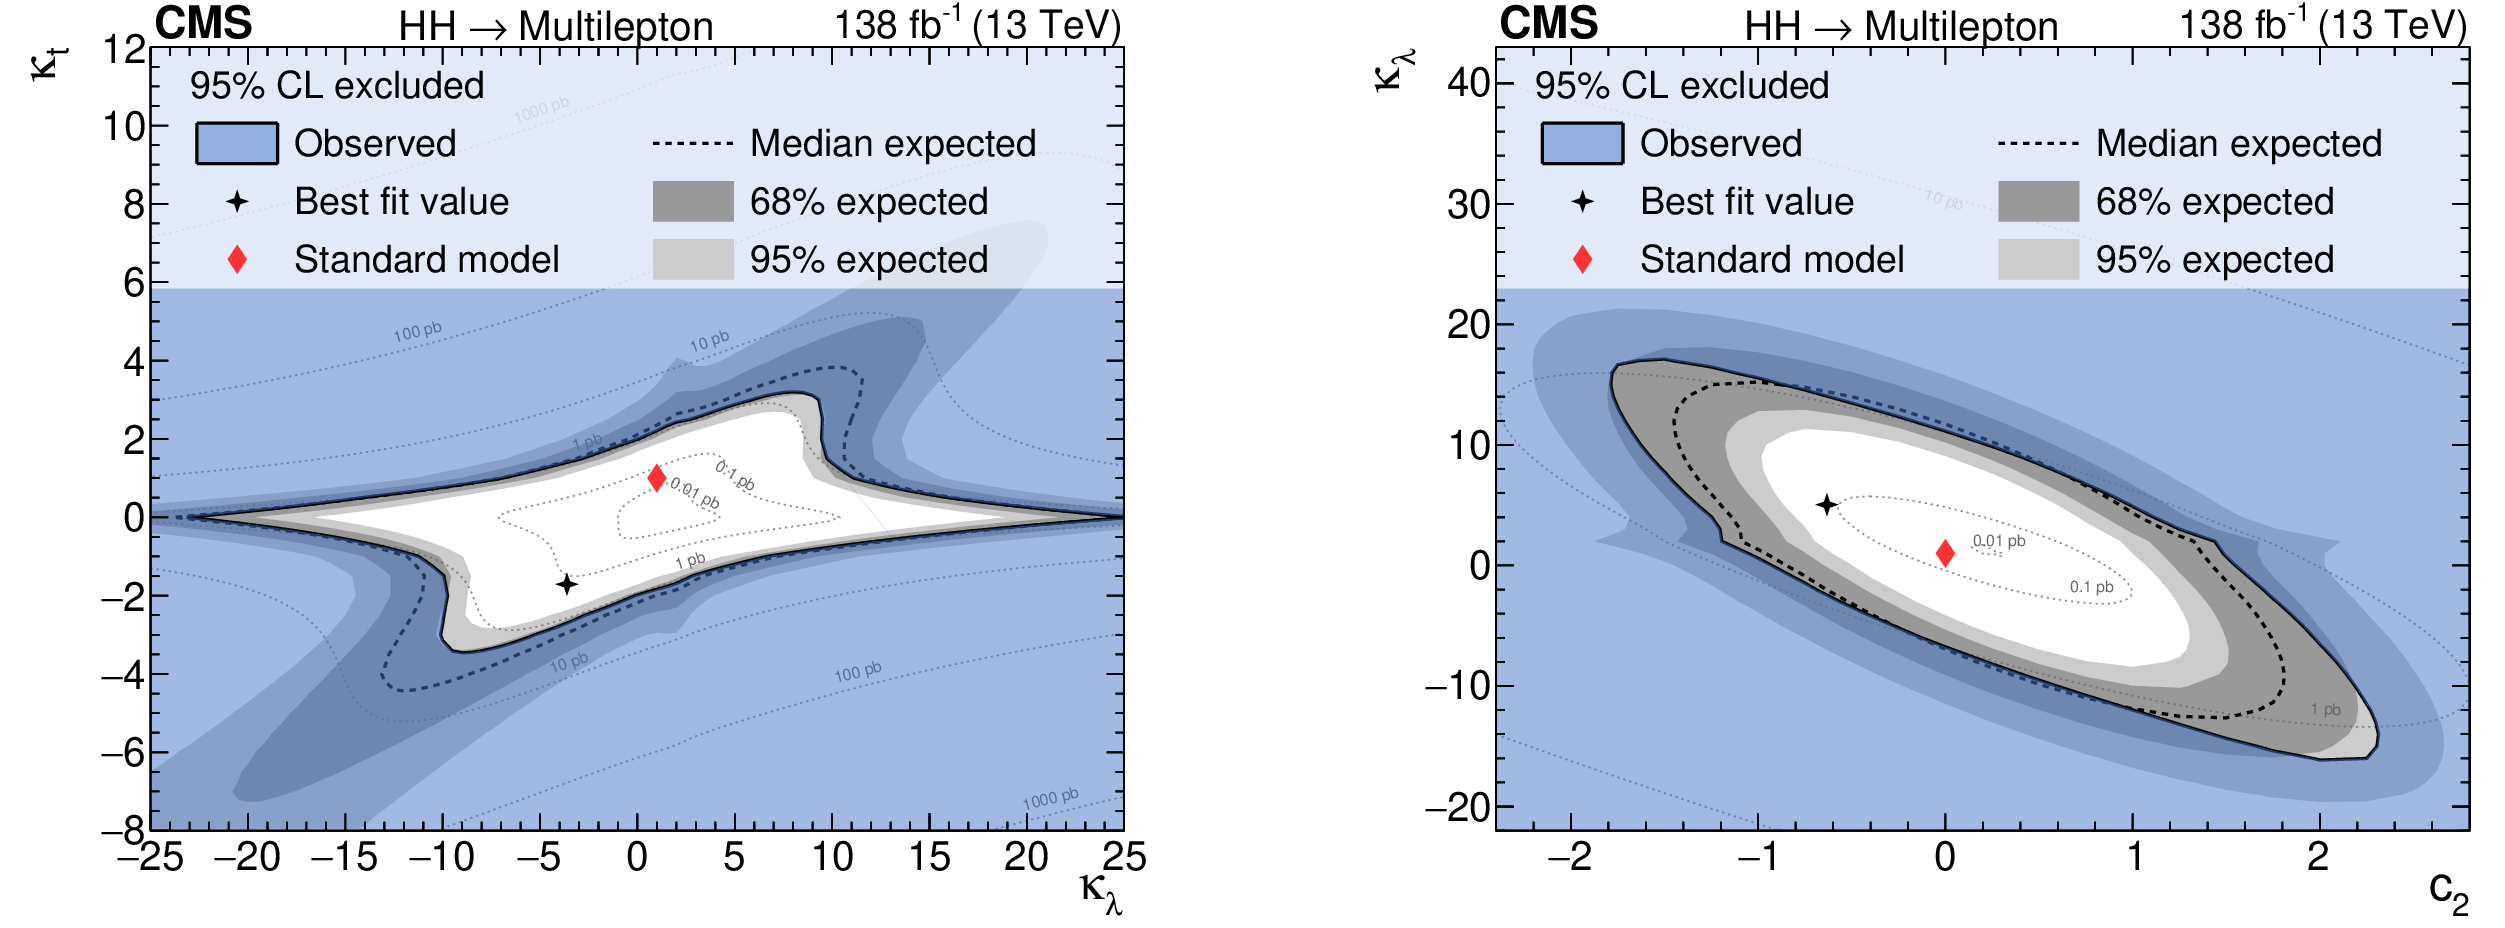
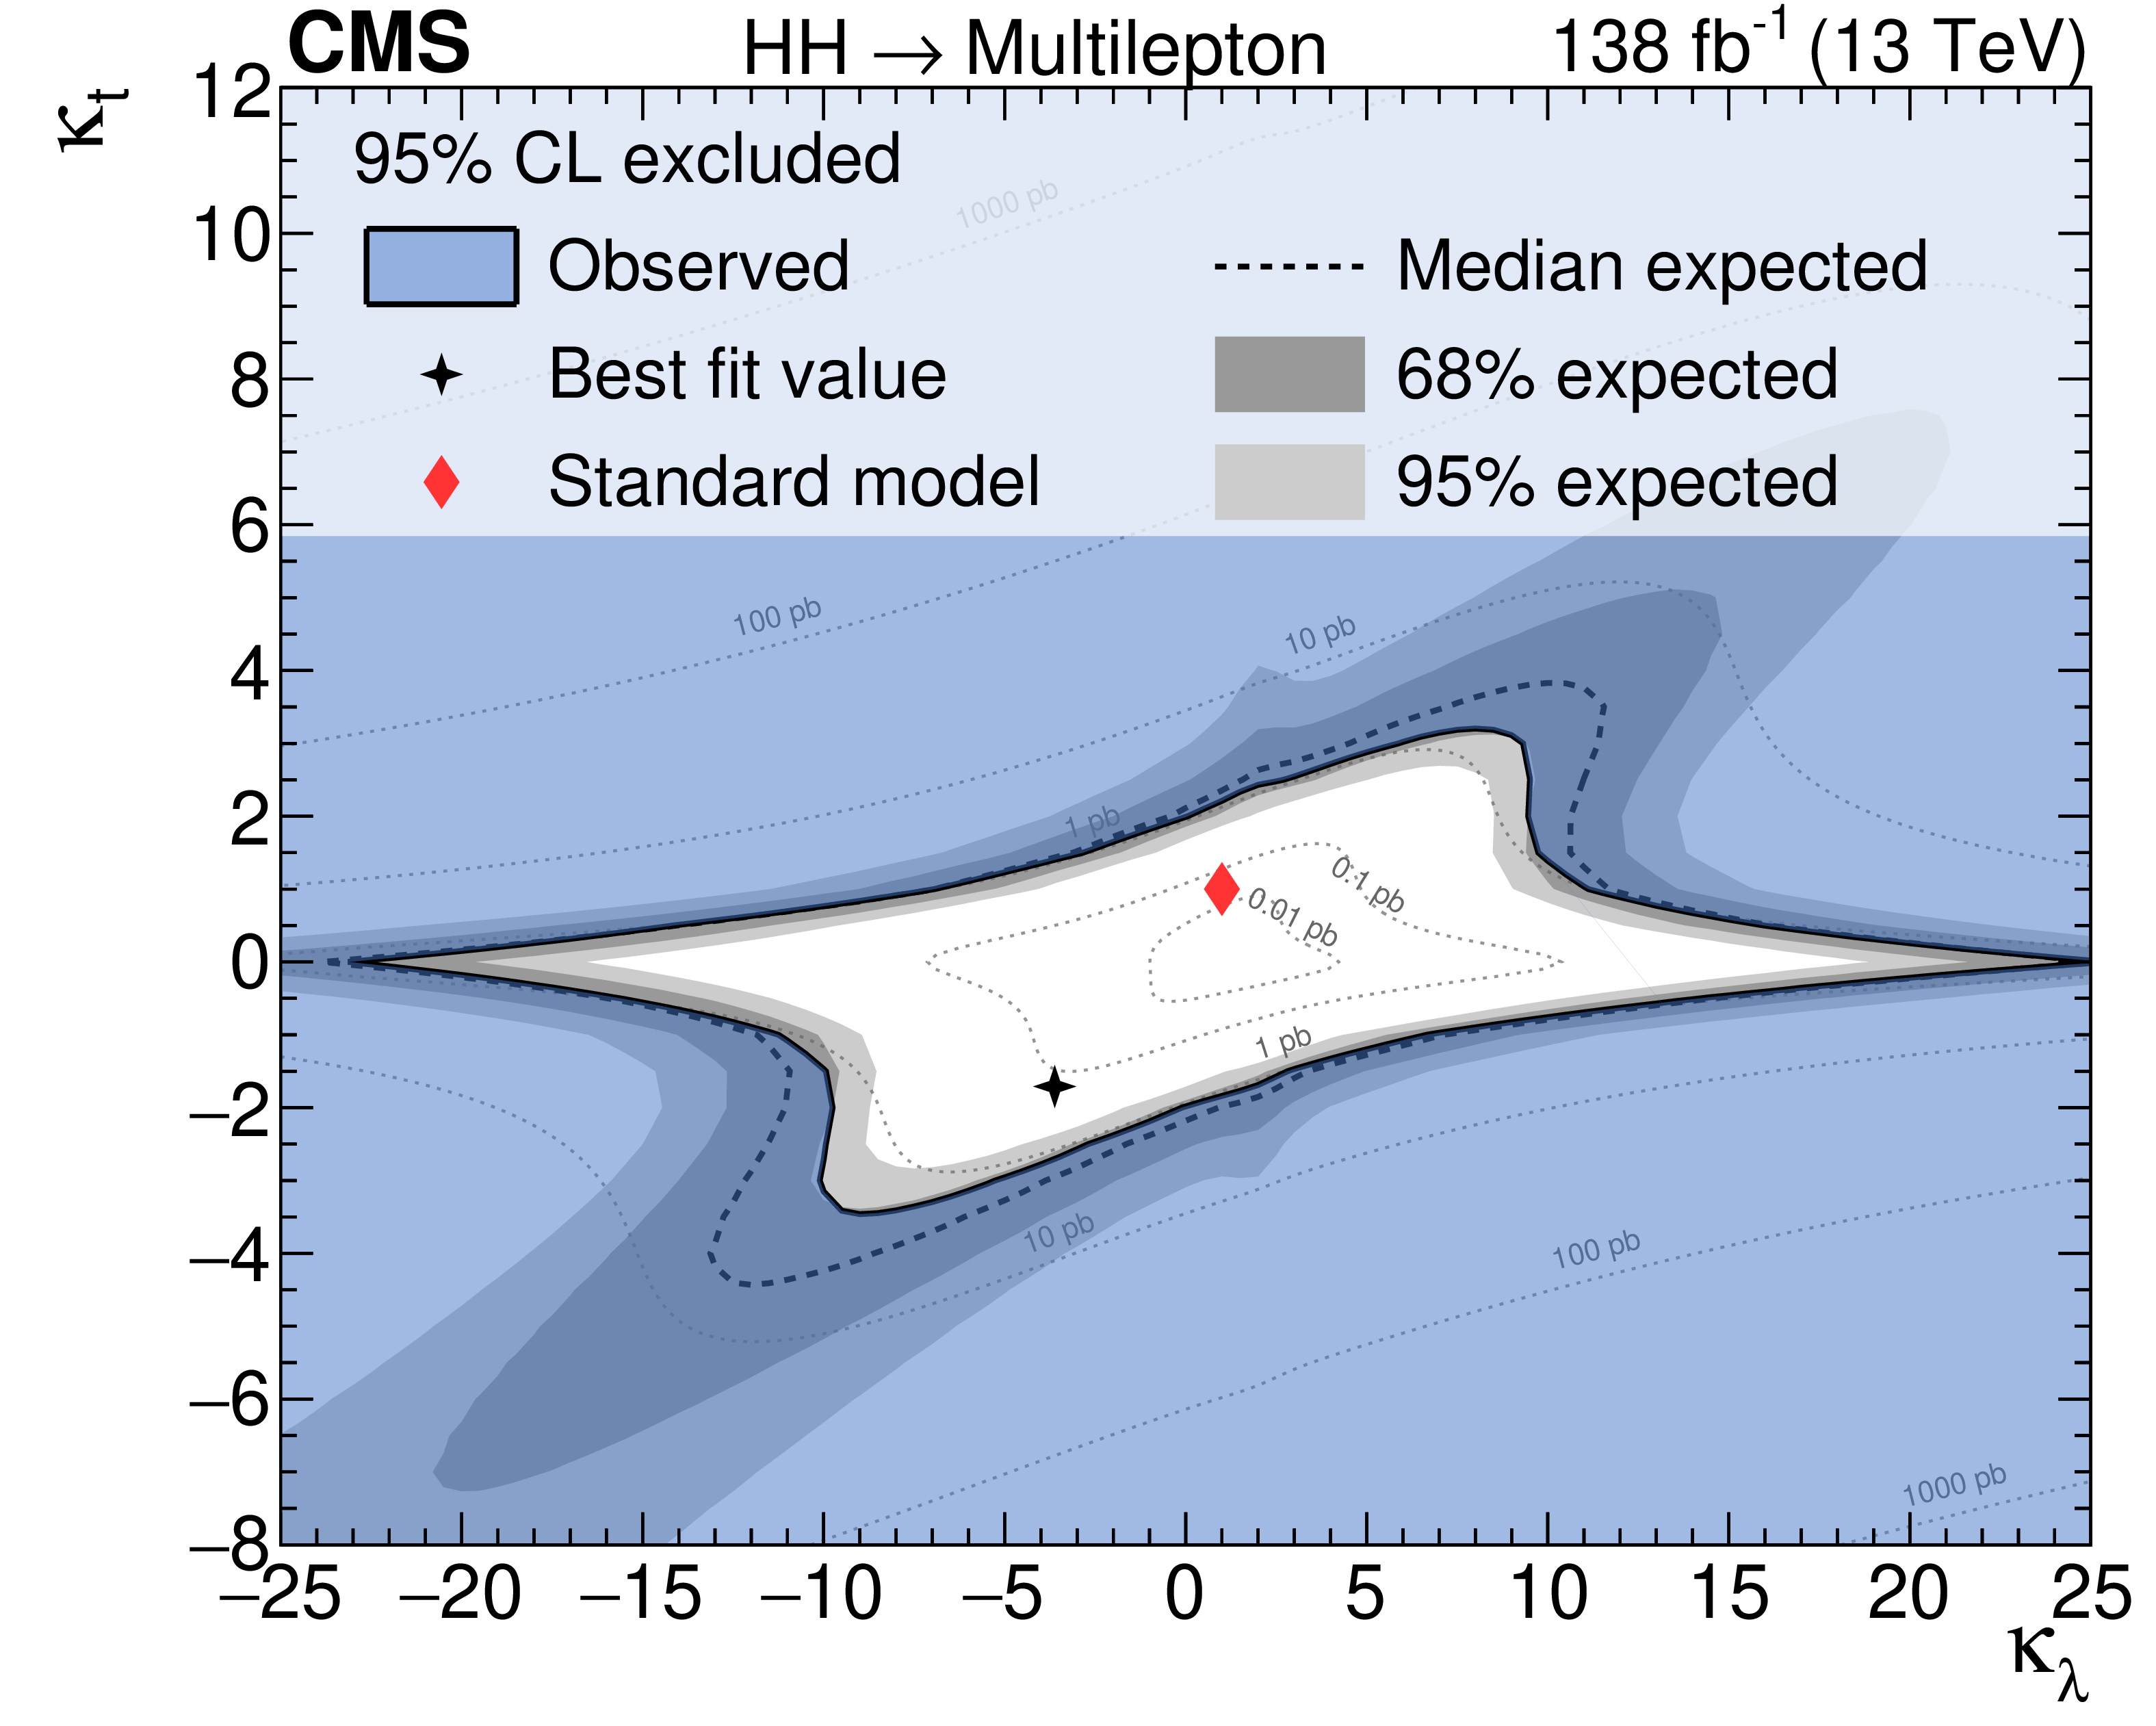
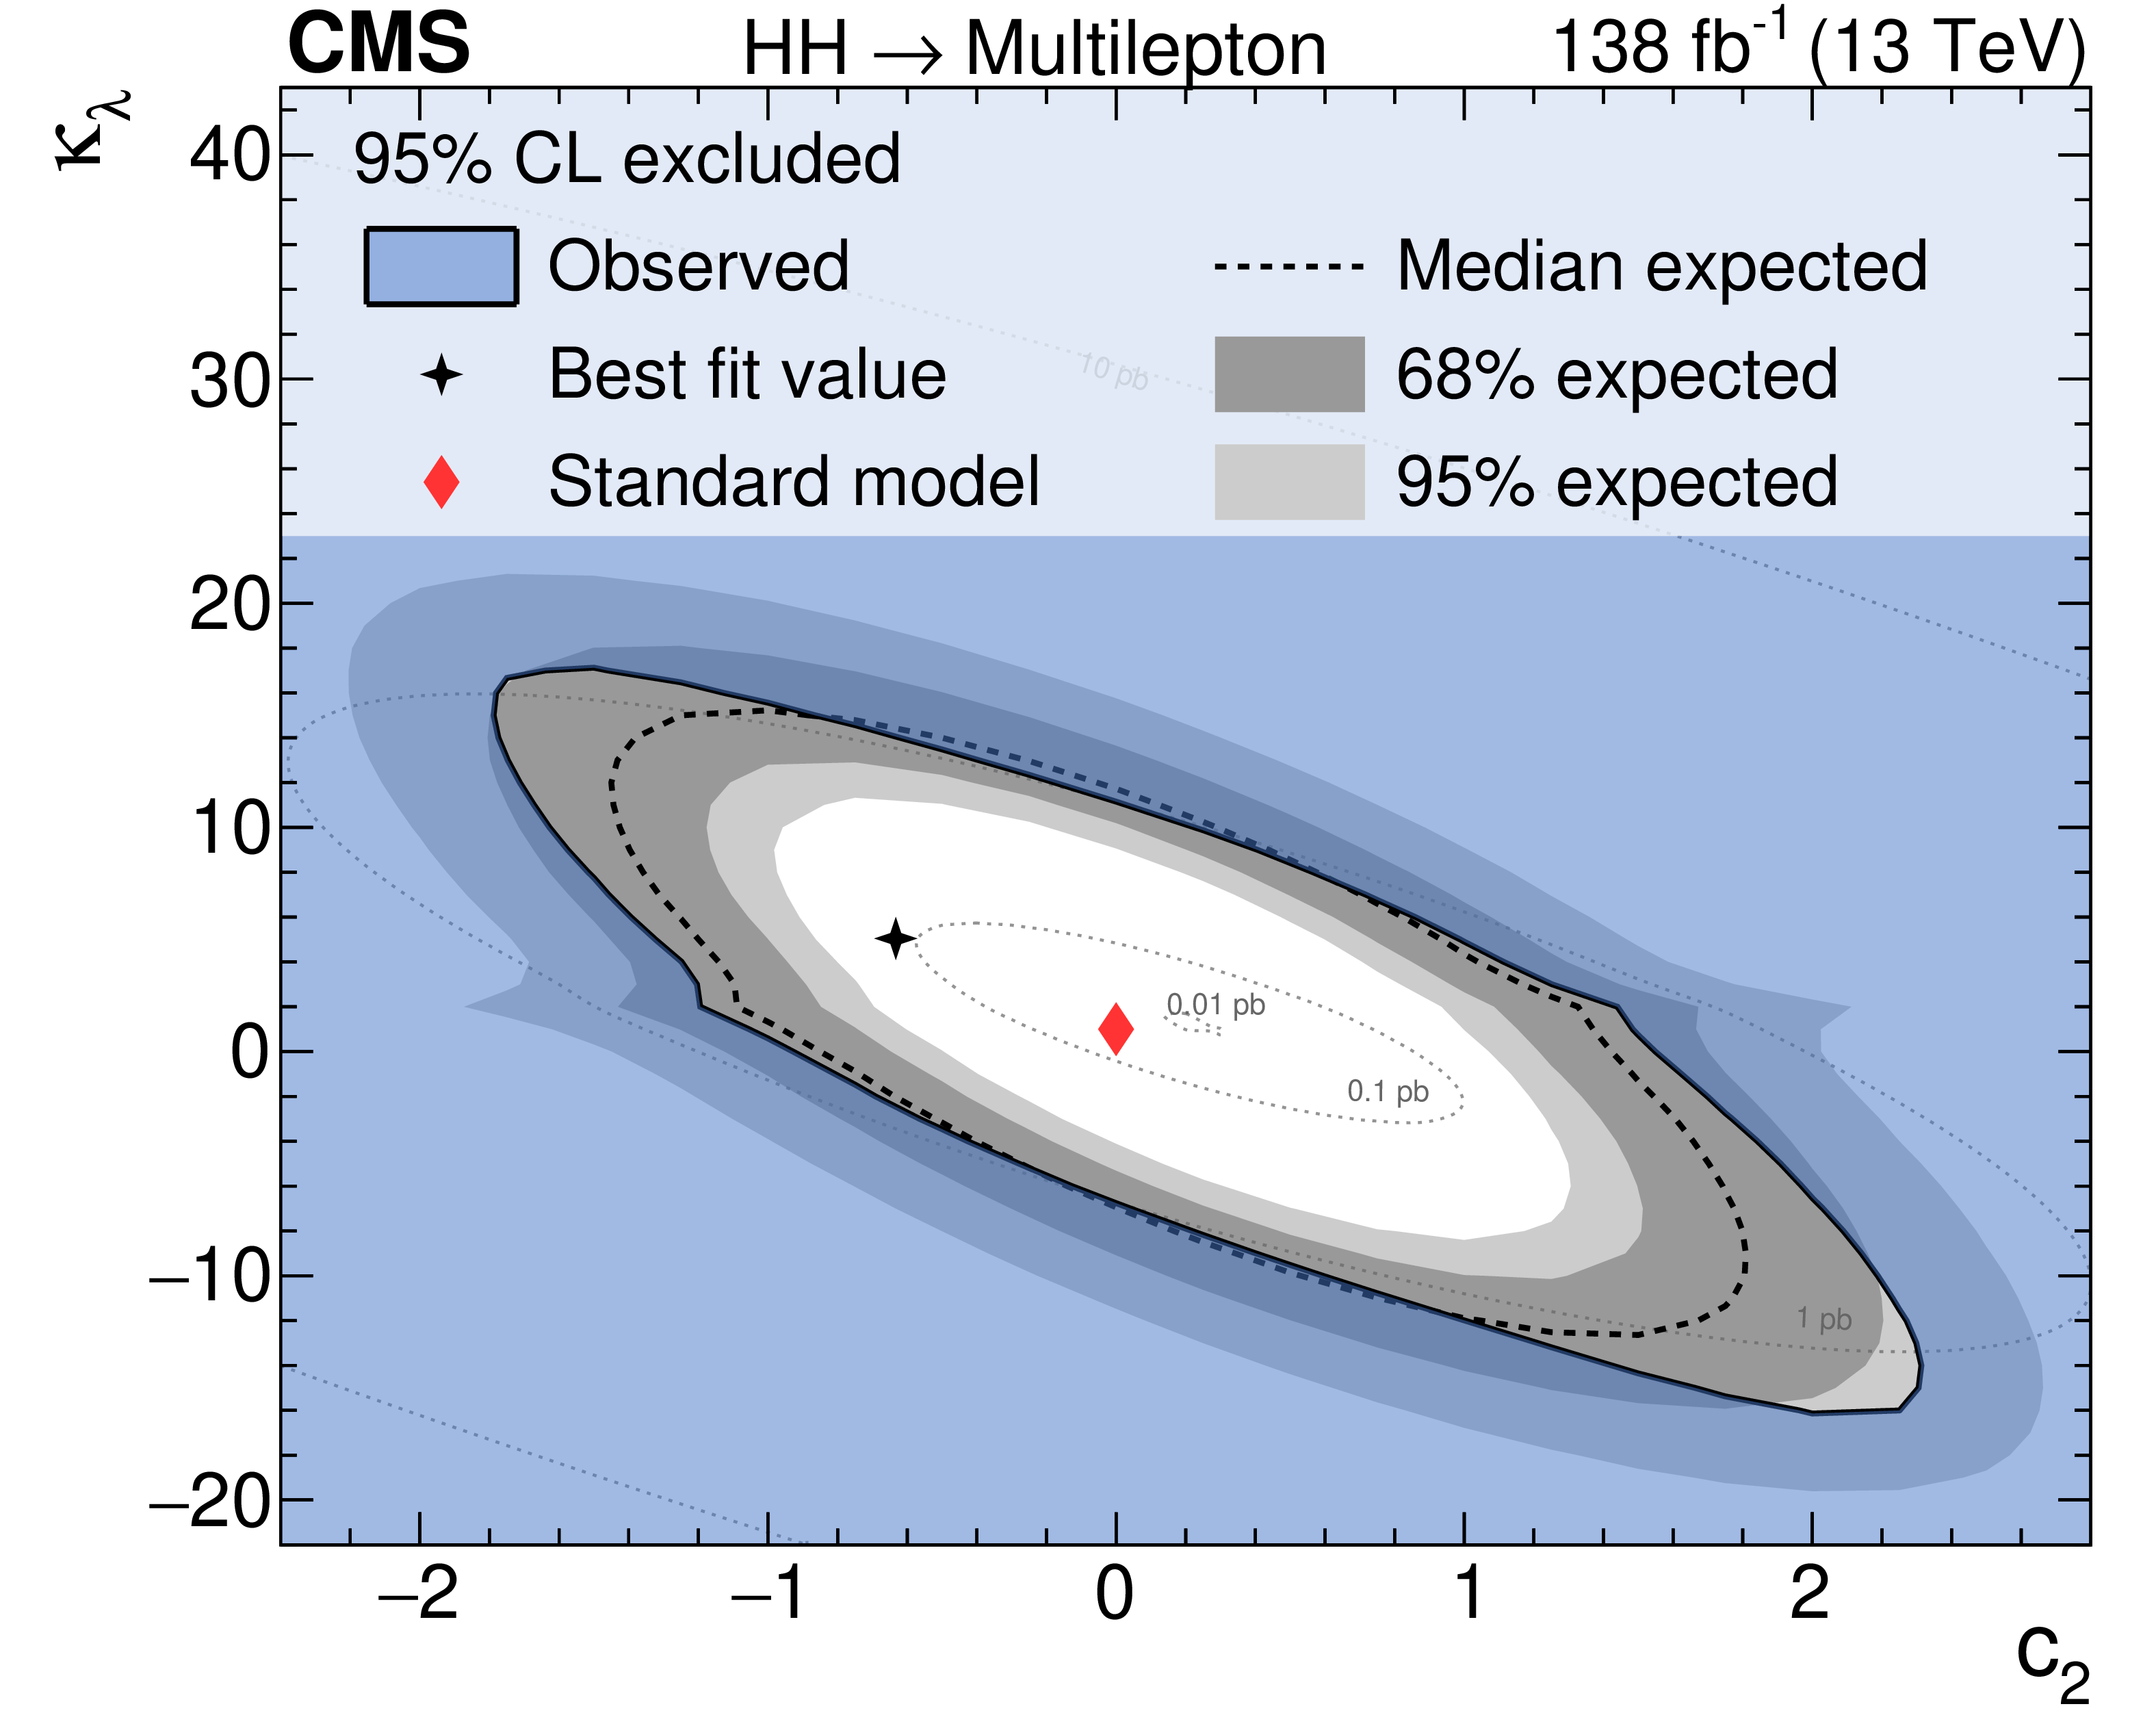
Figure 13:
Observed and expected regions excluded in the $ \kappa_{\mathrm{t}} $-$ \kappa_{\lambda} $ (left) and $ \kappa_{\lambda} $-$ \text{c}_{2} $ (right) planes. H boson couplings other than the ones shown in the plots ($ \kappa_{\lambda} $ and $ \kappa_{\mathrm{t}} $ in the left plot, and $ \text{c}_{2} $ and $ \kappa_{\lambda} $ in the right plot) are assumed to have the values predicted by the SM. |
png pdf |
Figure 13-a:
Observed and expected regions excluded in the $ \kappa_{\mathrm{t}} $-$ \kappa_{\lambda} $ (left) and $ \kappa_{\lambda} $-$ \text{c}_{2} $ (right) planes. H boson couplings other than the ones shown in the plots ($ \kappa_{\lambda} $ and $ \kappa_{\mathrm{t}} $ in the left plot, and $ \text{c}_{2} $ and $ \kappa_{\lambda} $ in the right plot) are assumed to have the values predicted by the SM. |
png pdf |
Figure 13-b:
Observed and expected regions excluded in the $ \kappa_{\mathrm{t}} $-$ \kappa_{\lambda} $ (left) and $ \kappa_{\lambda} $-$ \text{c}_{2} $ (right) planes. H boson couplings other than the ones shown in the plots ($ \kappa_{\lambda} $ and $ \kappa_{\mathrm{t}} $ in the left plot, and $ \text{c}_{2} $ and $ \kappa_{\lambda} $ in the right plot) are assumed to have the values predicted by the SM. |
png pdf |
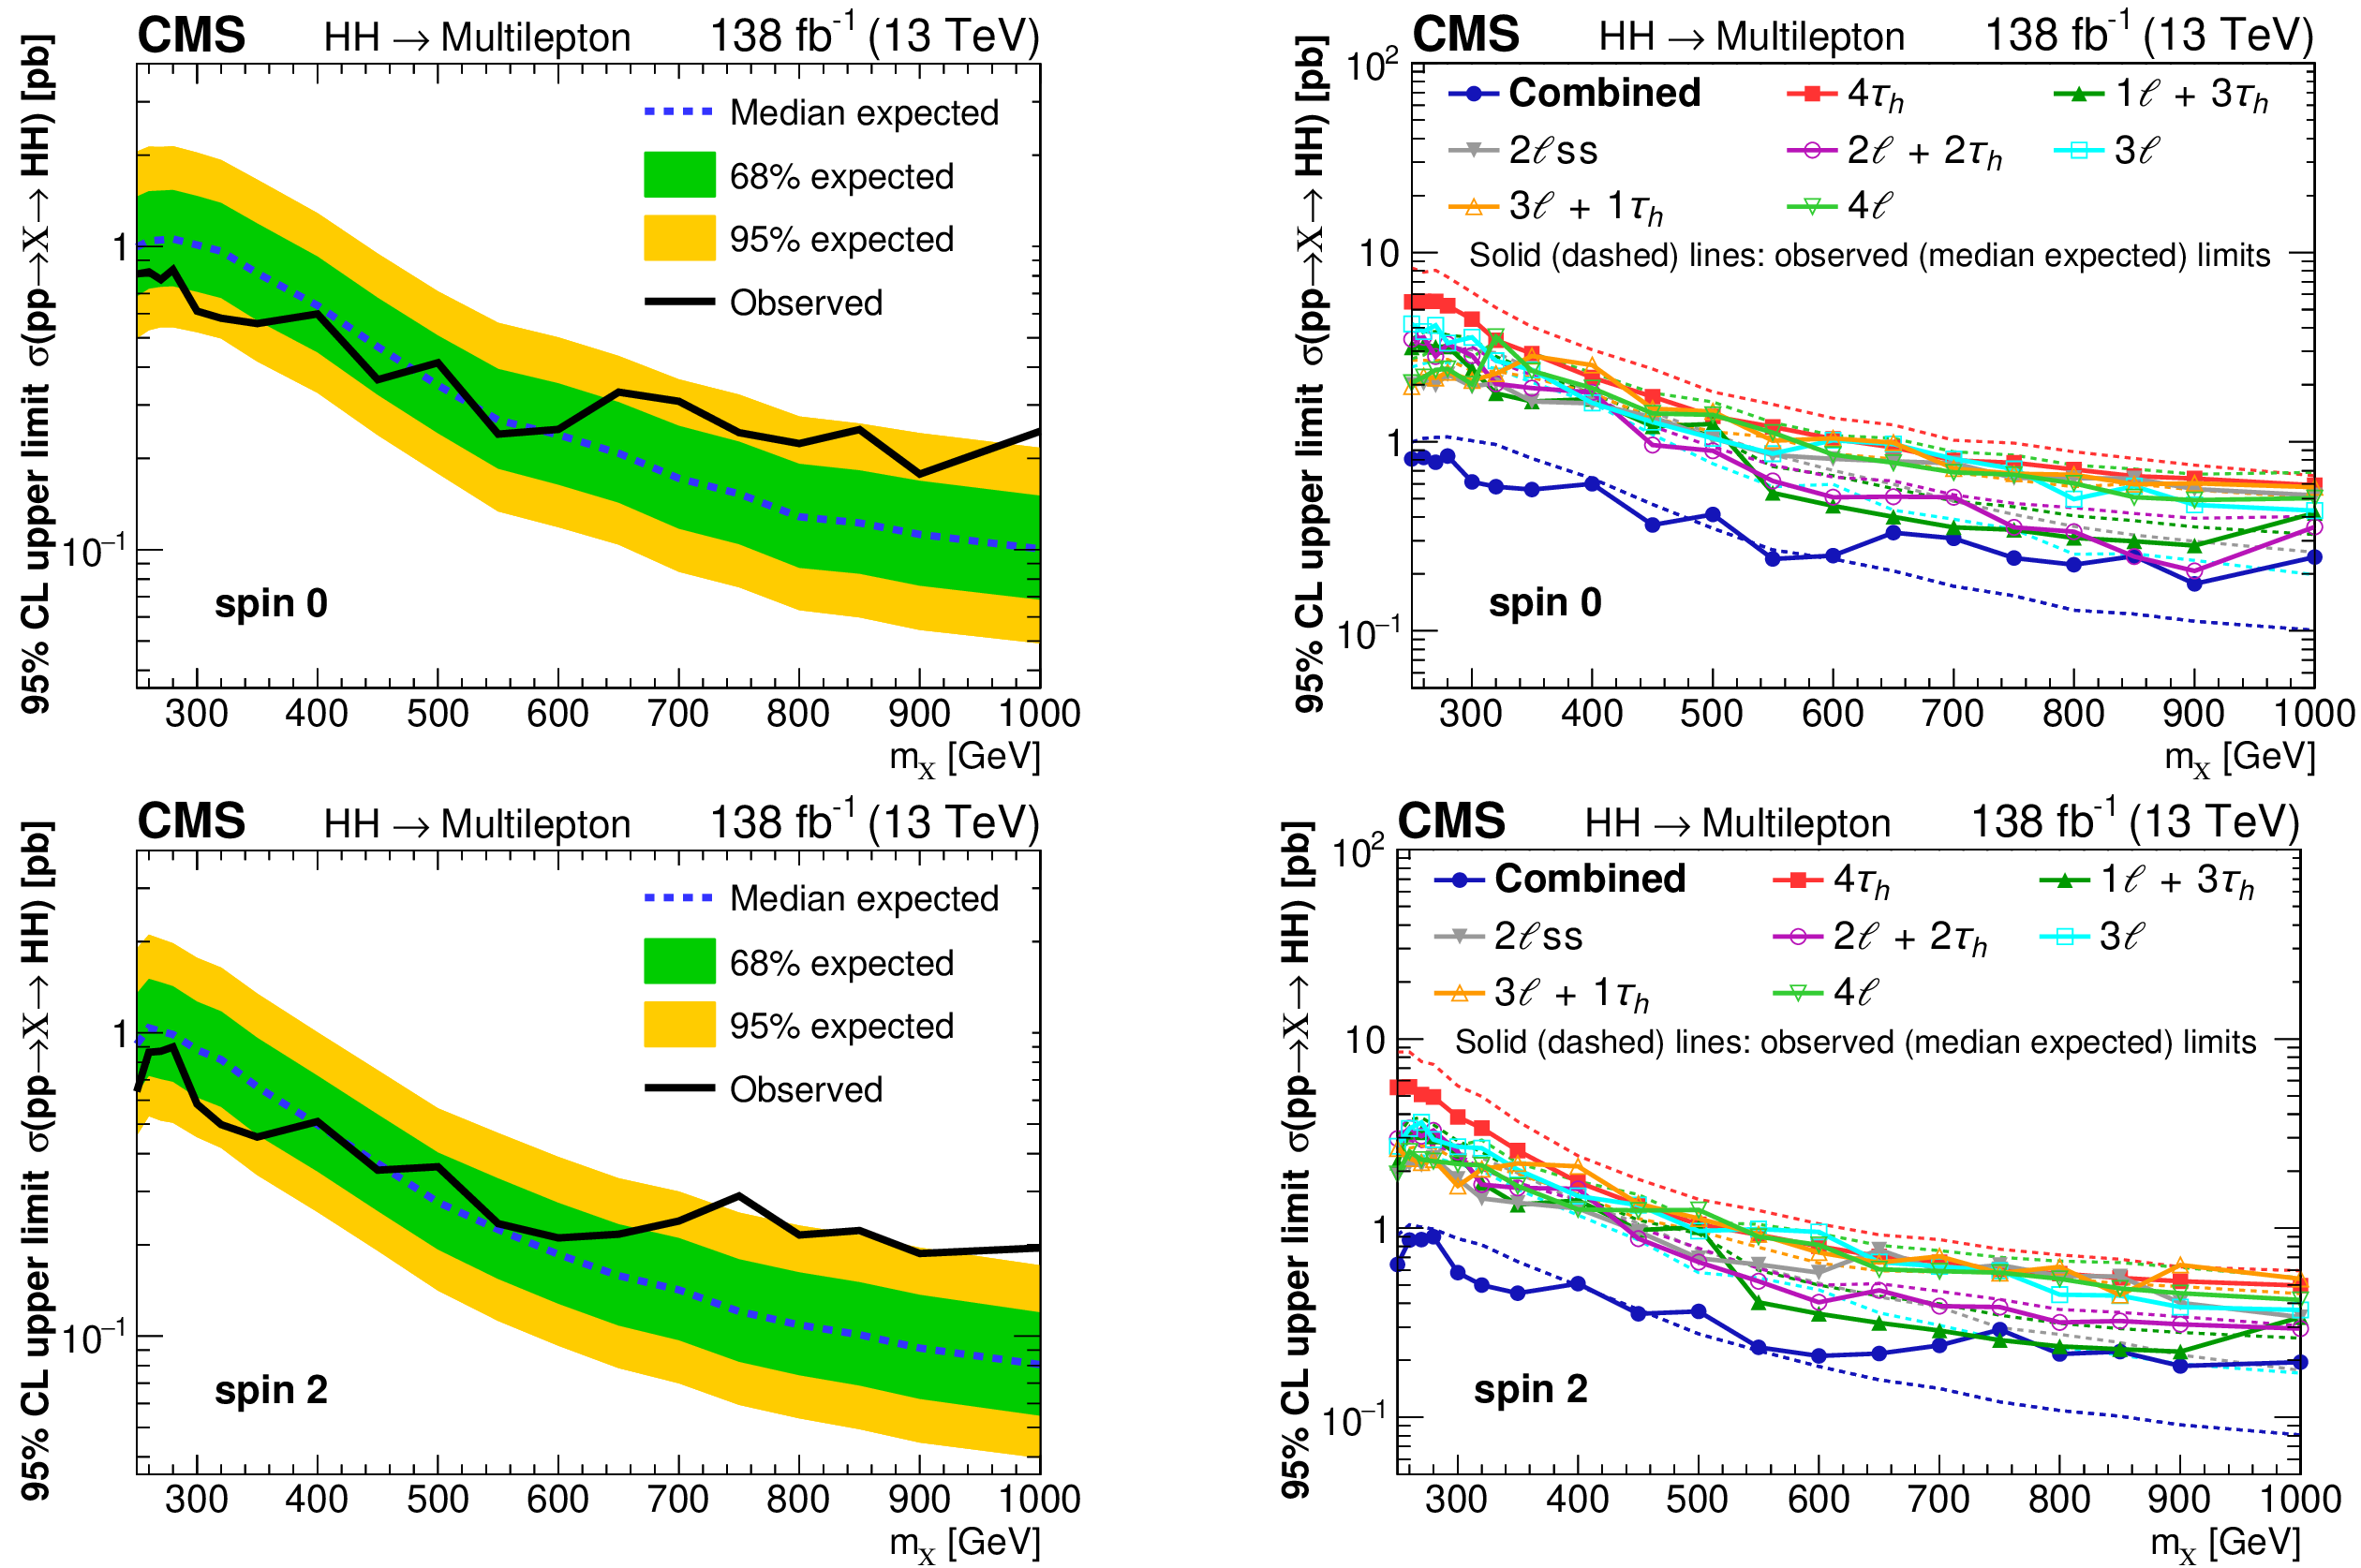
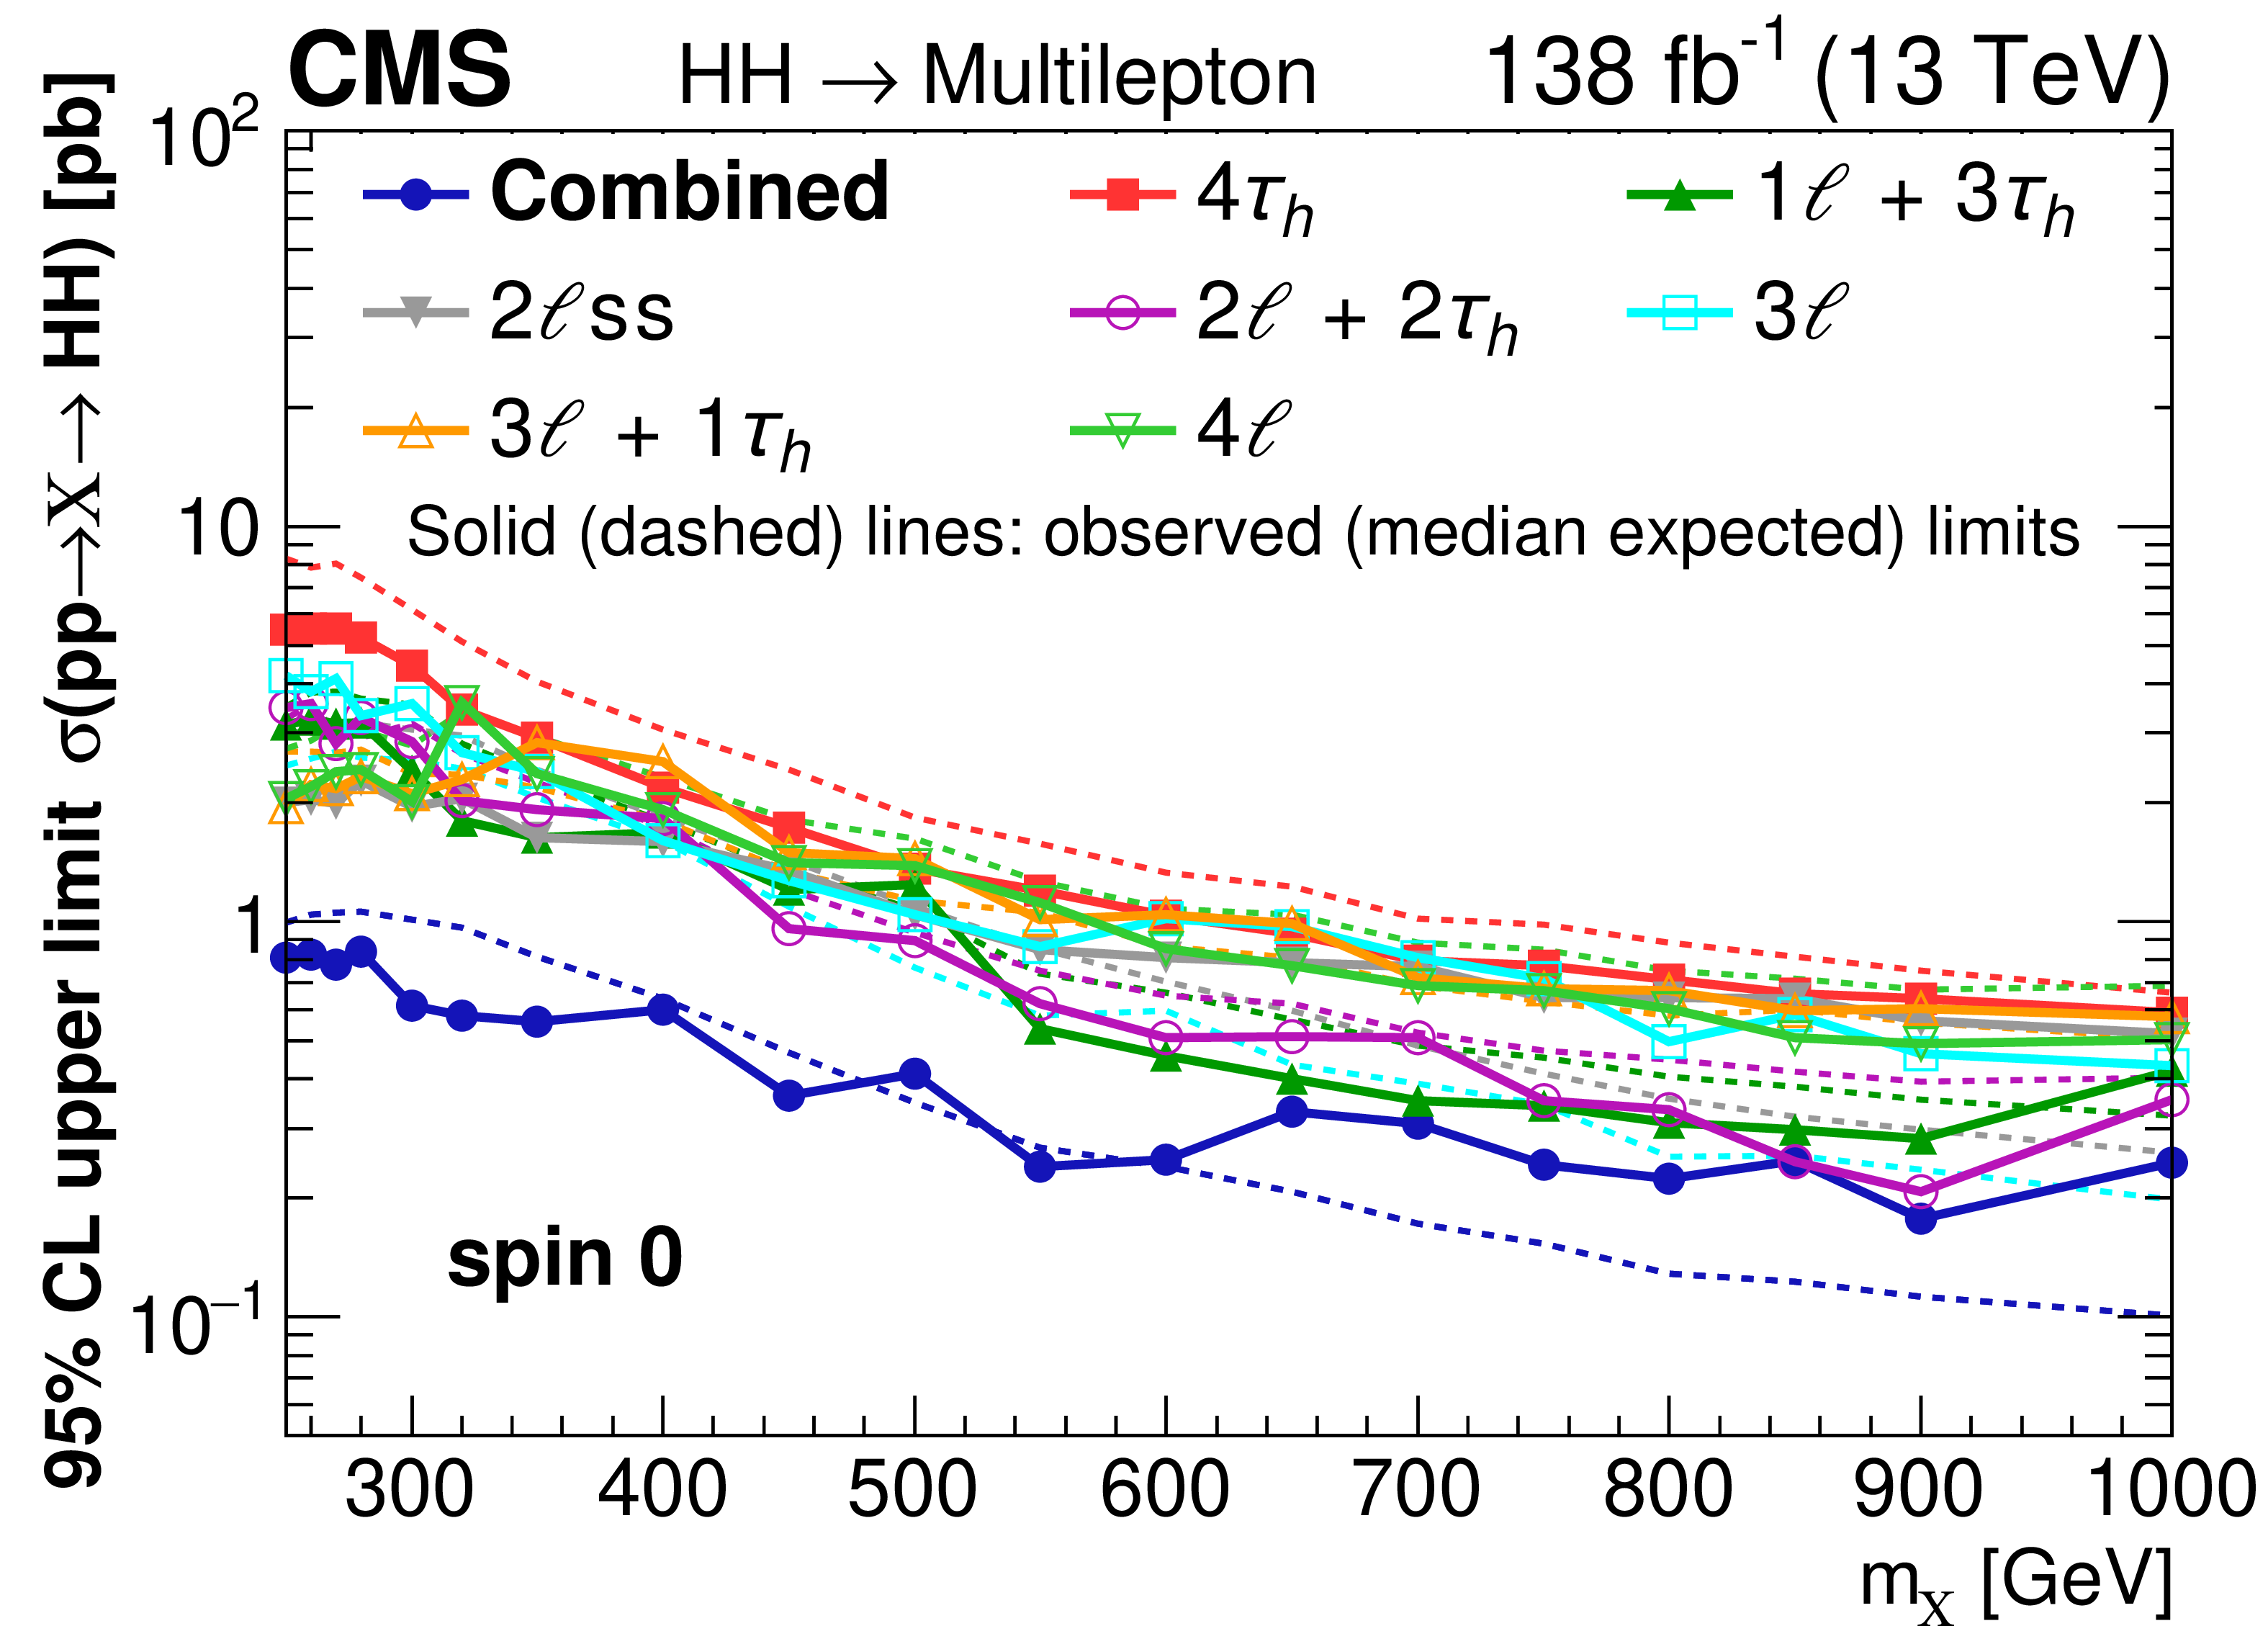
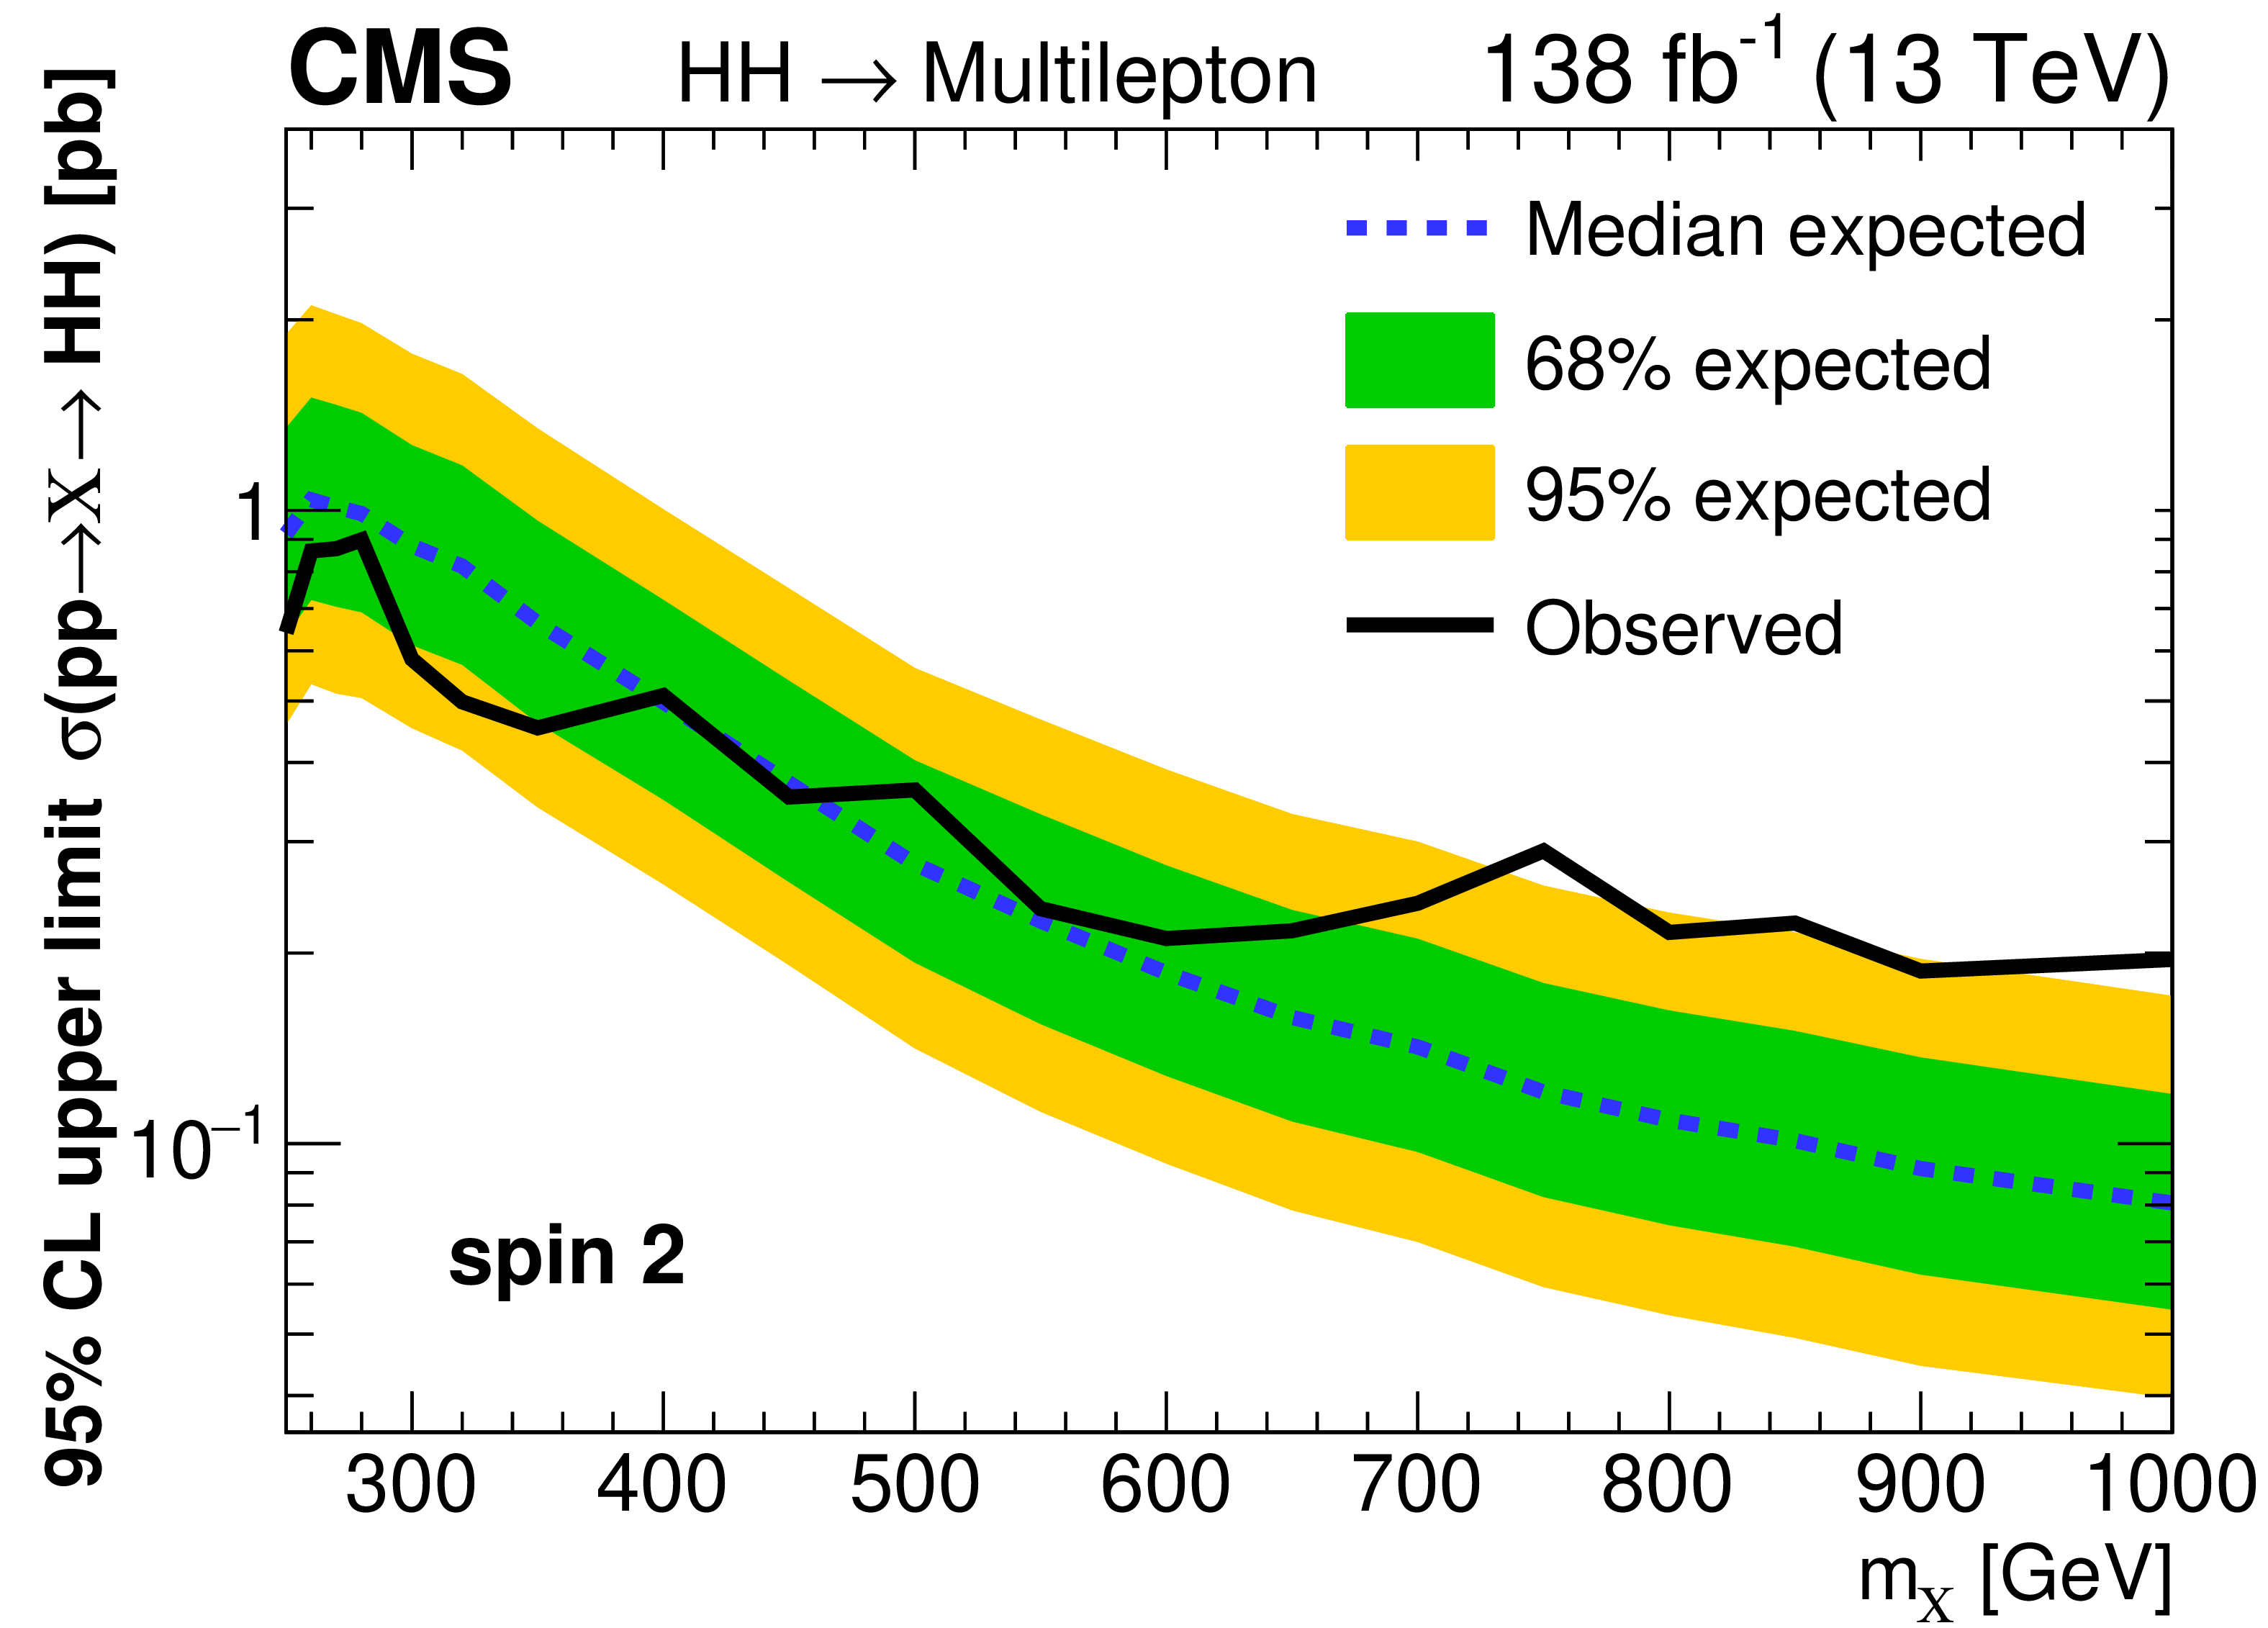
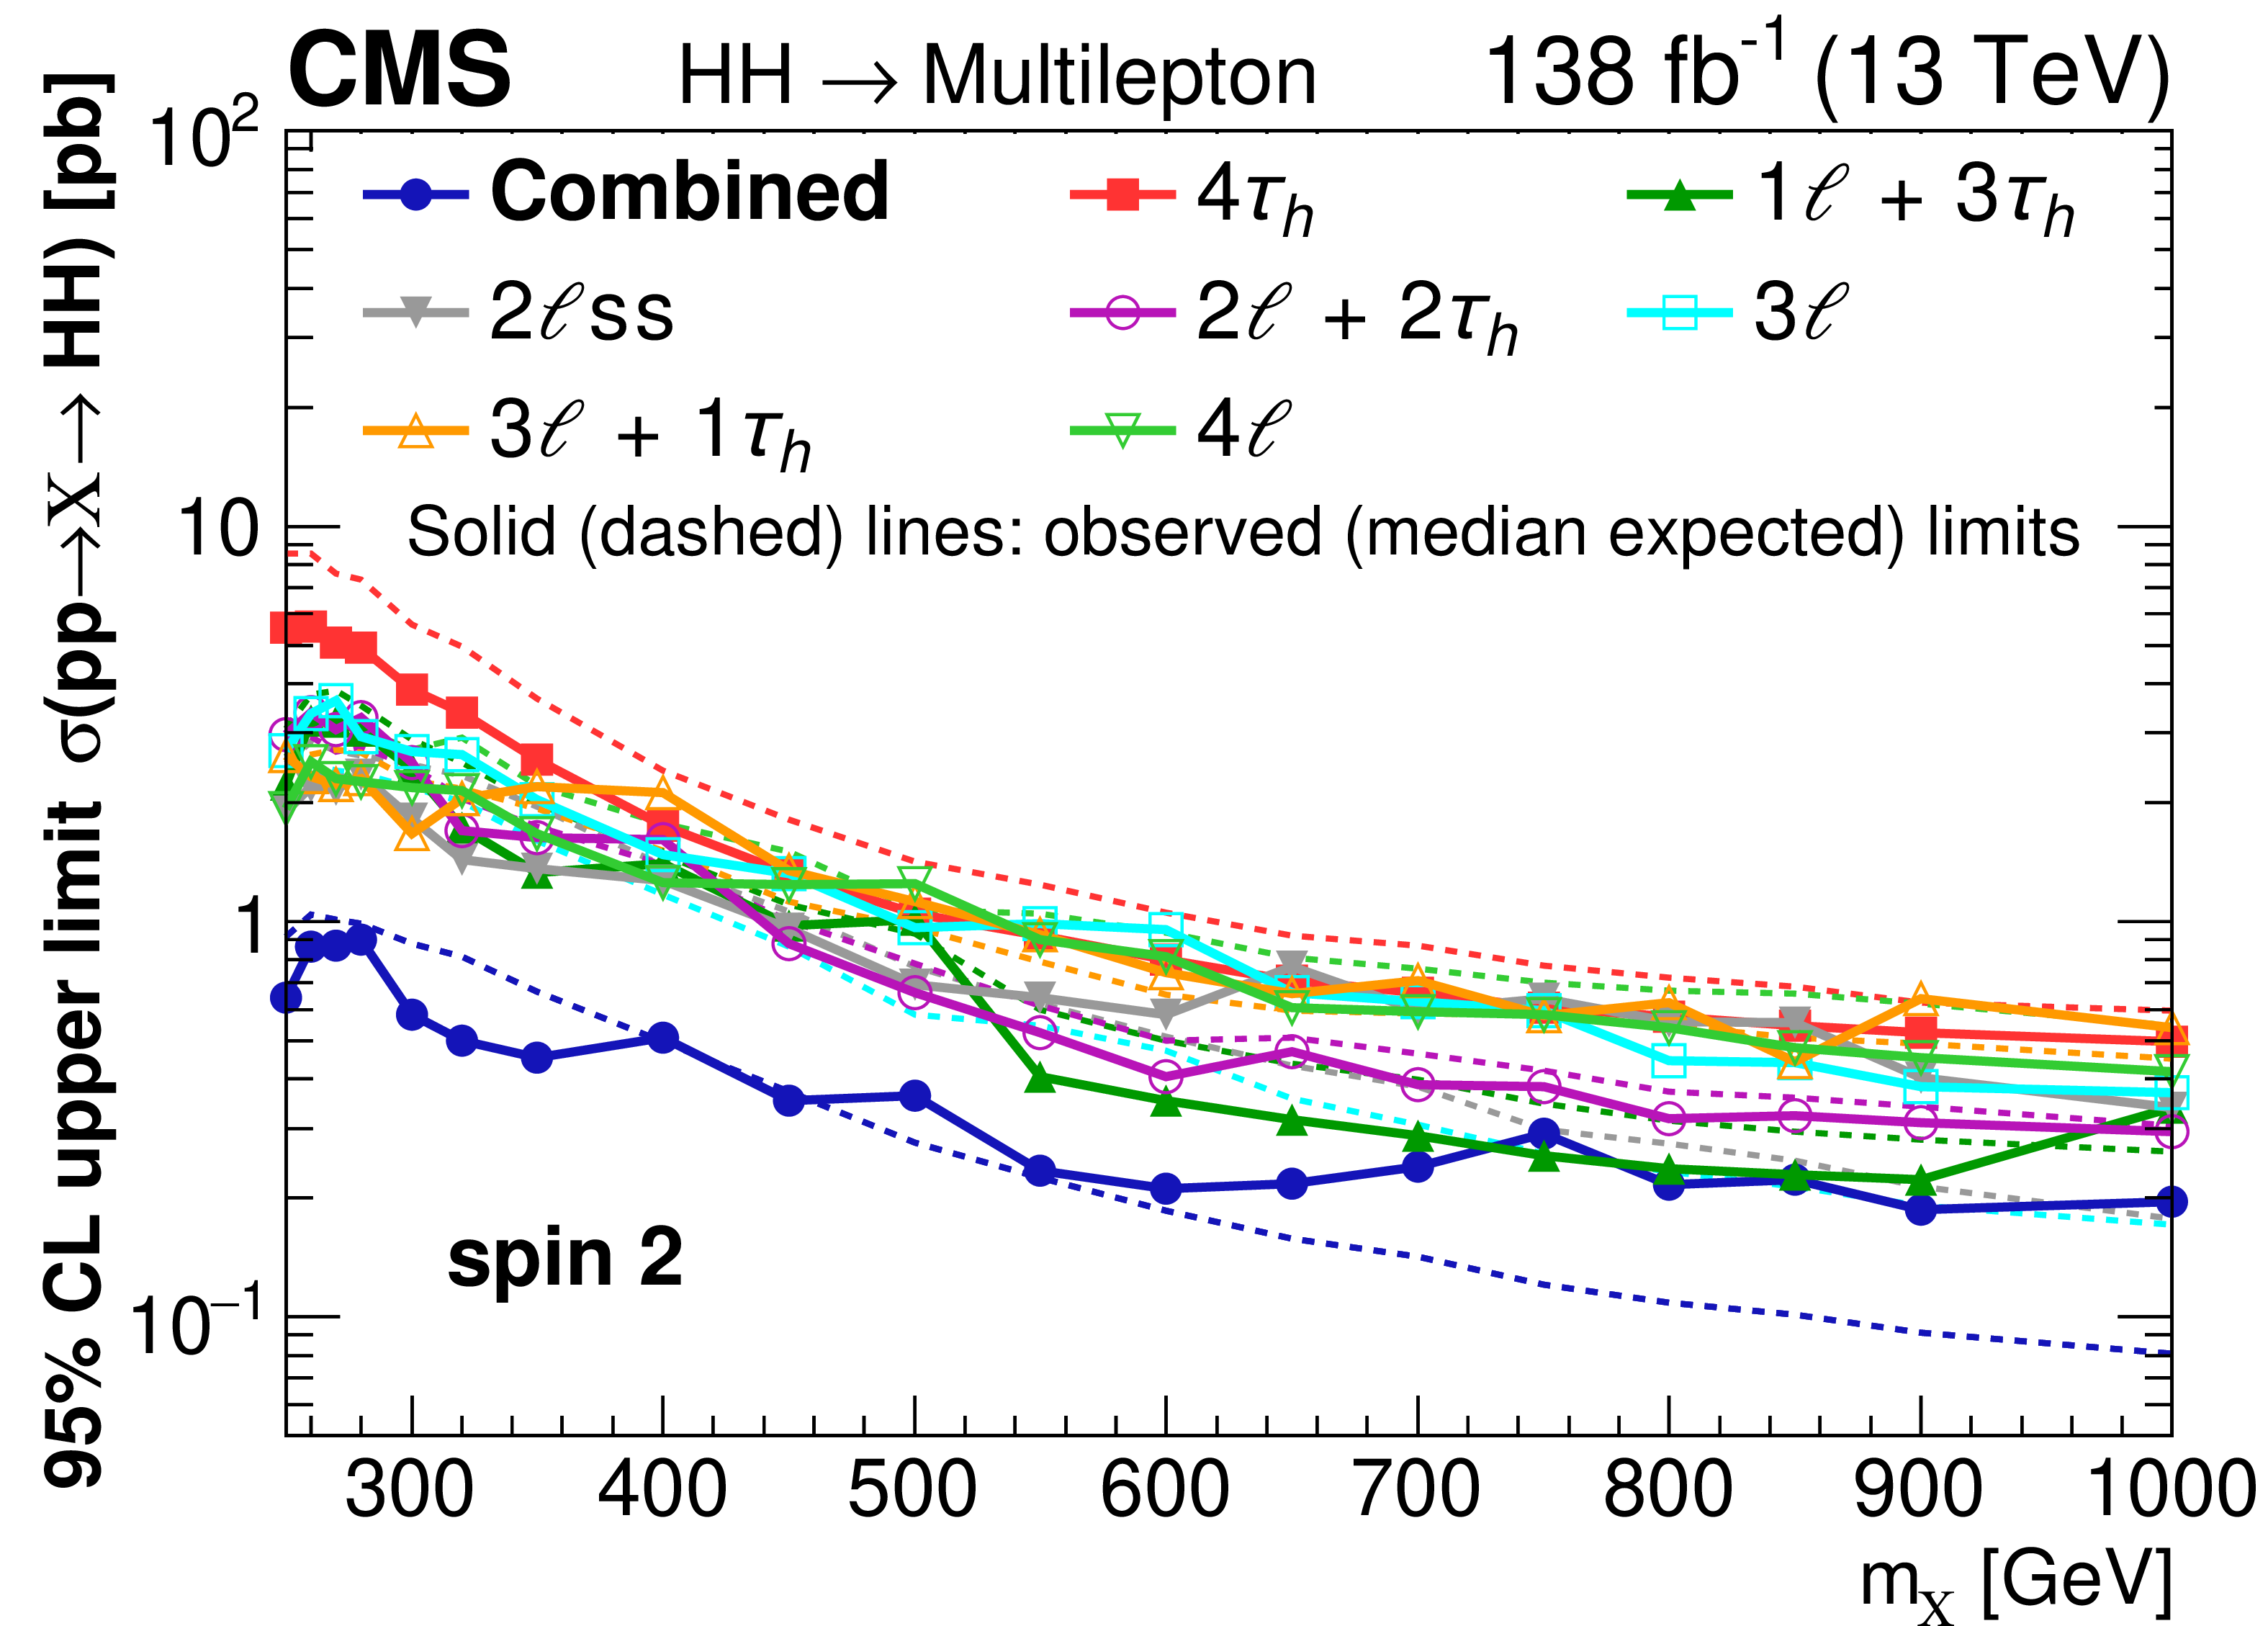
Figure 14:
Observed and expected 95% CL upper limits on the production of new particles X of spin 0 (upper) and spin 2 (lower) and mass $m_{{\textrm {X}}}$ in the range 250-1000 GeV, which decay to H boson pairs. The plot on the left shows the result obtained by combining all seven search categories, while the plot on the right shows the limits obtained for each category separately, and the combined limit. |

png pdf |
Figure 14-a:
Observed and expected 95% CL upper limits on the production of new particles X of spin 0 (upper) and spin 2 (lower) and mass $m_{{\textrm {X}}}$ in the range 250-1000 GeV, which decay to H boson pairs. The plot on the left shows the result obtained by combining all seven search categories, while the plot on the right shows the limits obtained for each category separately, and the combined limit. |
png pdf |
Figure 14-b:
Observed and expected 95% CL upper limits on the production of new particles X of spin 0 (upper) and spin 2 (lower) and mass $m_{{\textrm {X}}}$ in the range 250-1000 GeV, which decay to H boson pairs. The plot on the left shows the result obtained by combining all seven search categories, while the plot on the right shows the limits obtained for each category separately, and the combined limit. |
png pdf |
Figure 14-c:
Observed and expected 95% CL upper limits on the production of new particles X of spin 0 (upper) and spin 2 (lower) and mass $m_{{\textrm {X}}}$ in the range 250-1000 GeV, which decay to H boson pairs. The plot on the left shows the result obtained by combining all seven search categories, while the plot on the right shows the limits obtained for each category separately, and the combined limit. |
png pdf |
Figure 14-d:
Observed and expected 95% CL upper limits on the production of new particles X of spin 0 (upper) and spin 2 (lower) and mass $m_{{\textrm {X}}}$ in the range 250-1000 GeV, which decay to H boson pairs. The plot on the left shows the result obtained by combining all seven search categories, while the plot on the right shows the limits obtained for each category separately, and the combined limit. |
| Tables | |
png pdf |
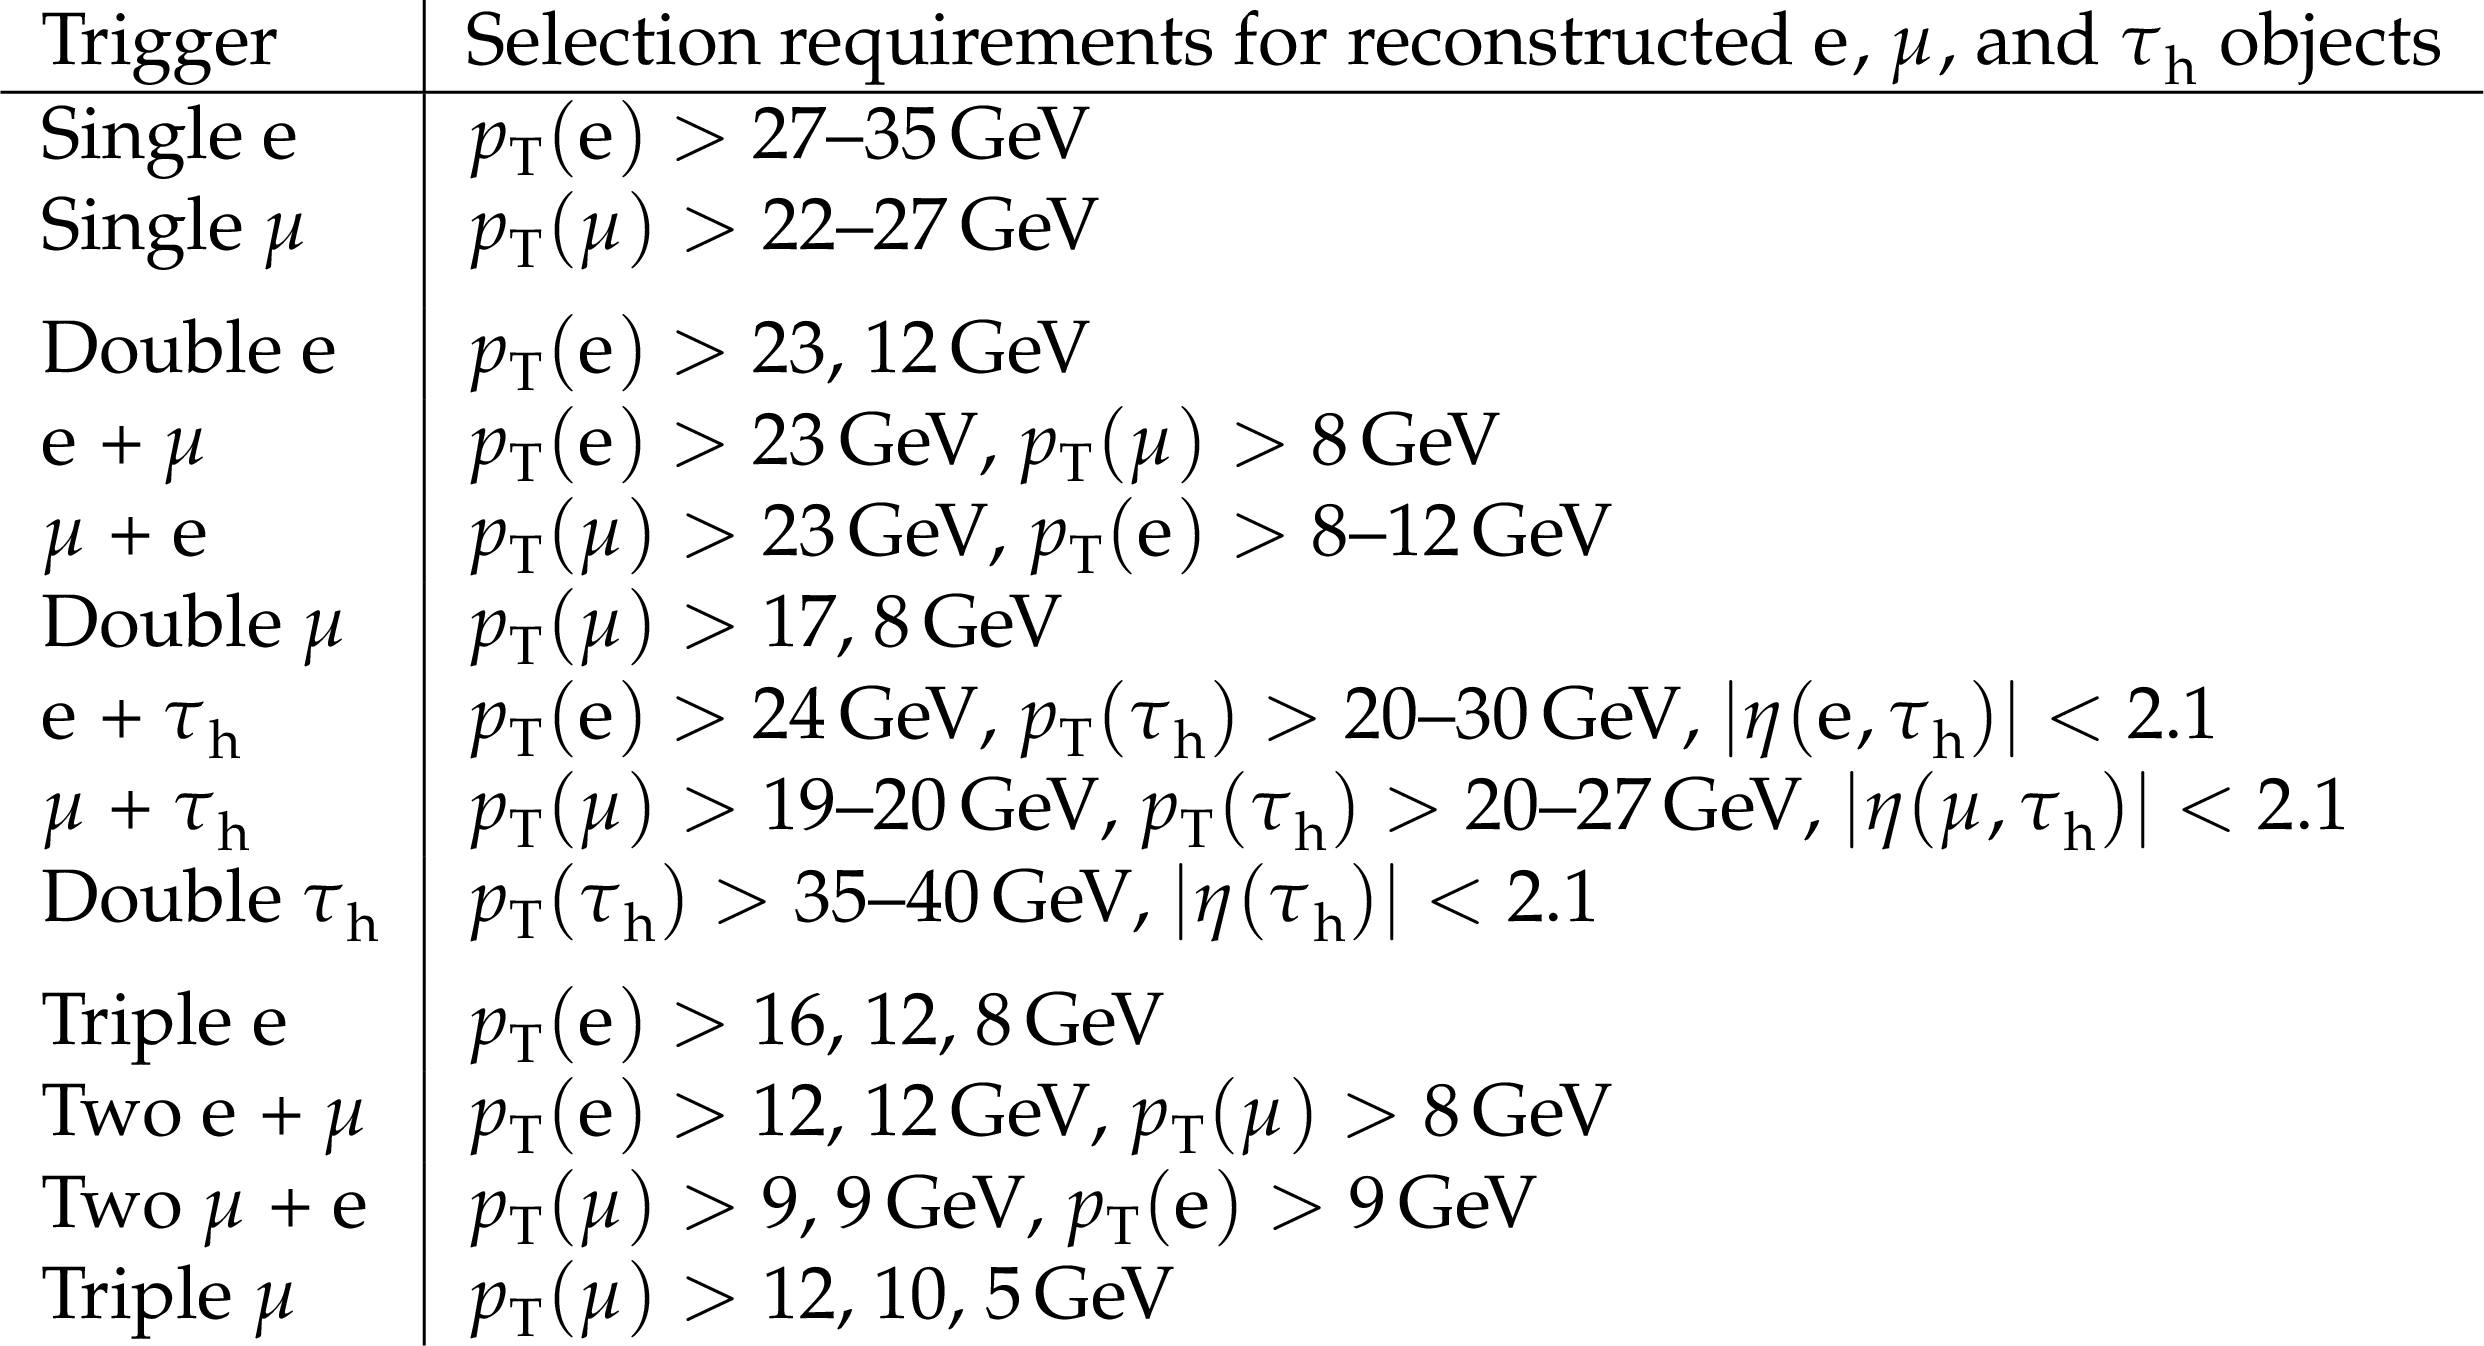
Table 1:
Selection requirements on $ p_{\mathrm{T}} $ and $ \eta $ of reconstructed electrons (e), muons ($ \mu $), and hadronically decaying tau leptons ($ \tau_\mathrm{h} $) applied by the triggers used in this analysis. The trigger $ p_{\mathrm{T}} $ thresholds for leading, subleading, and third e, $ \mu $, or $ \tau_\mathrm{h} $ are separated by commas. For trigger thresholds that varied over time, the range of variation is indicated. |
png pdf |
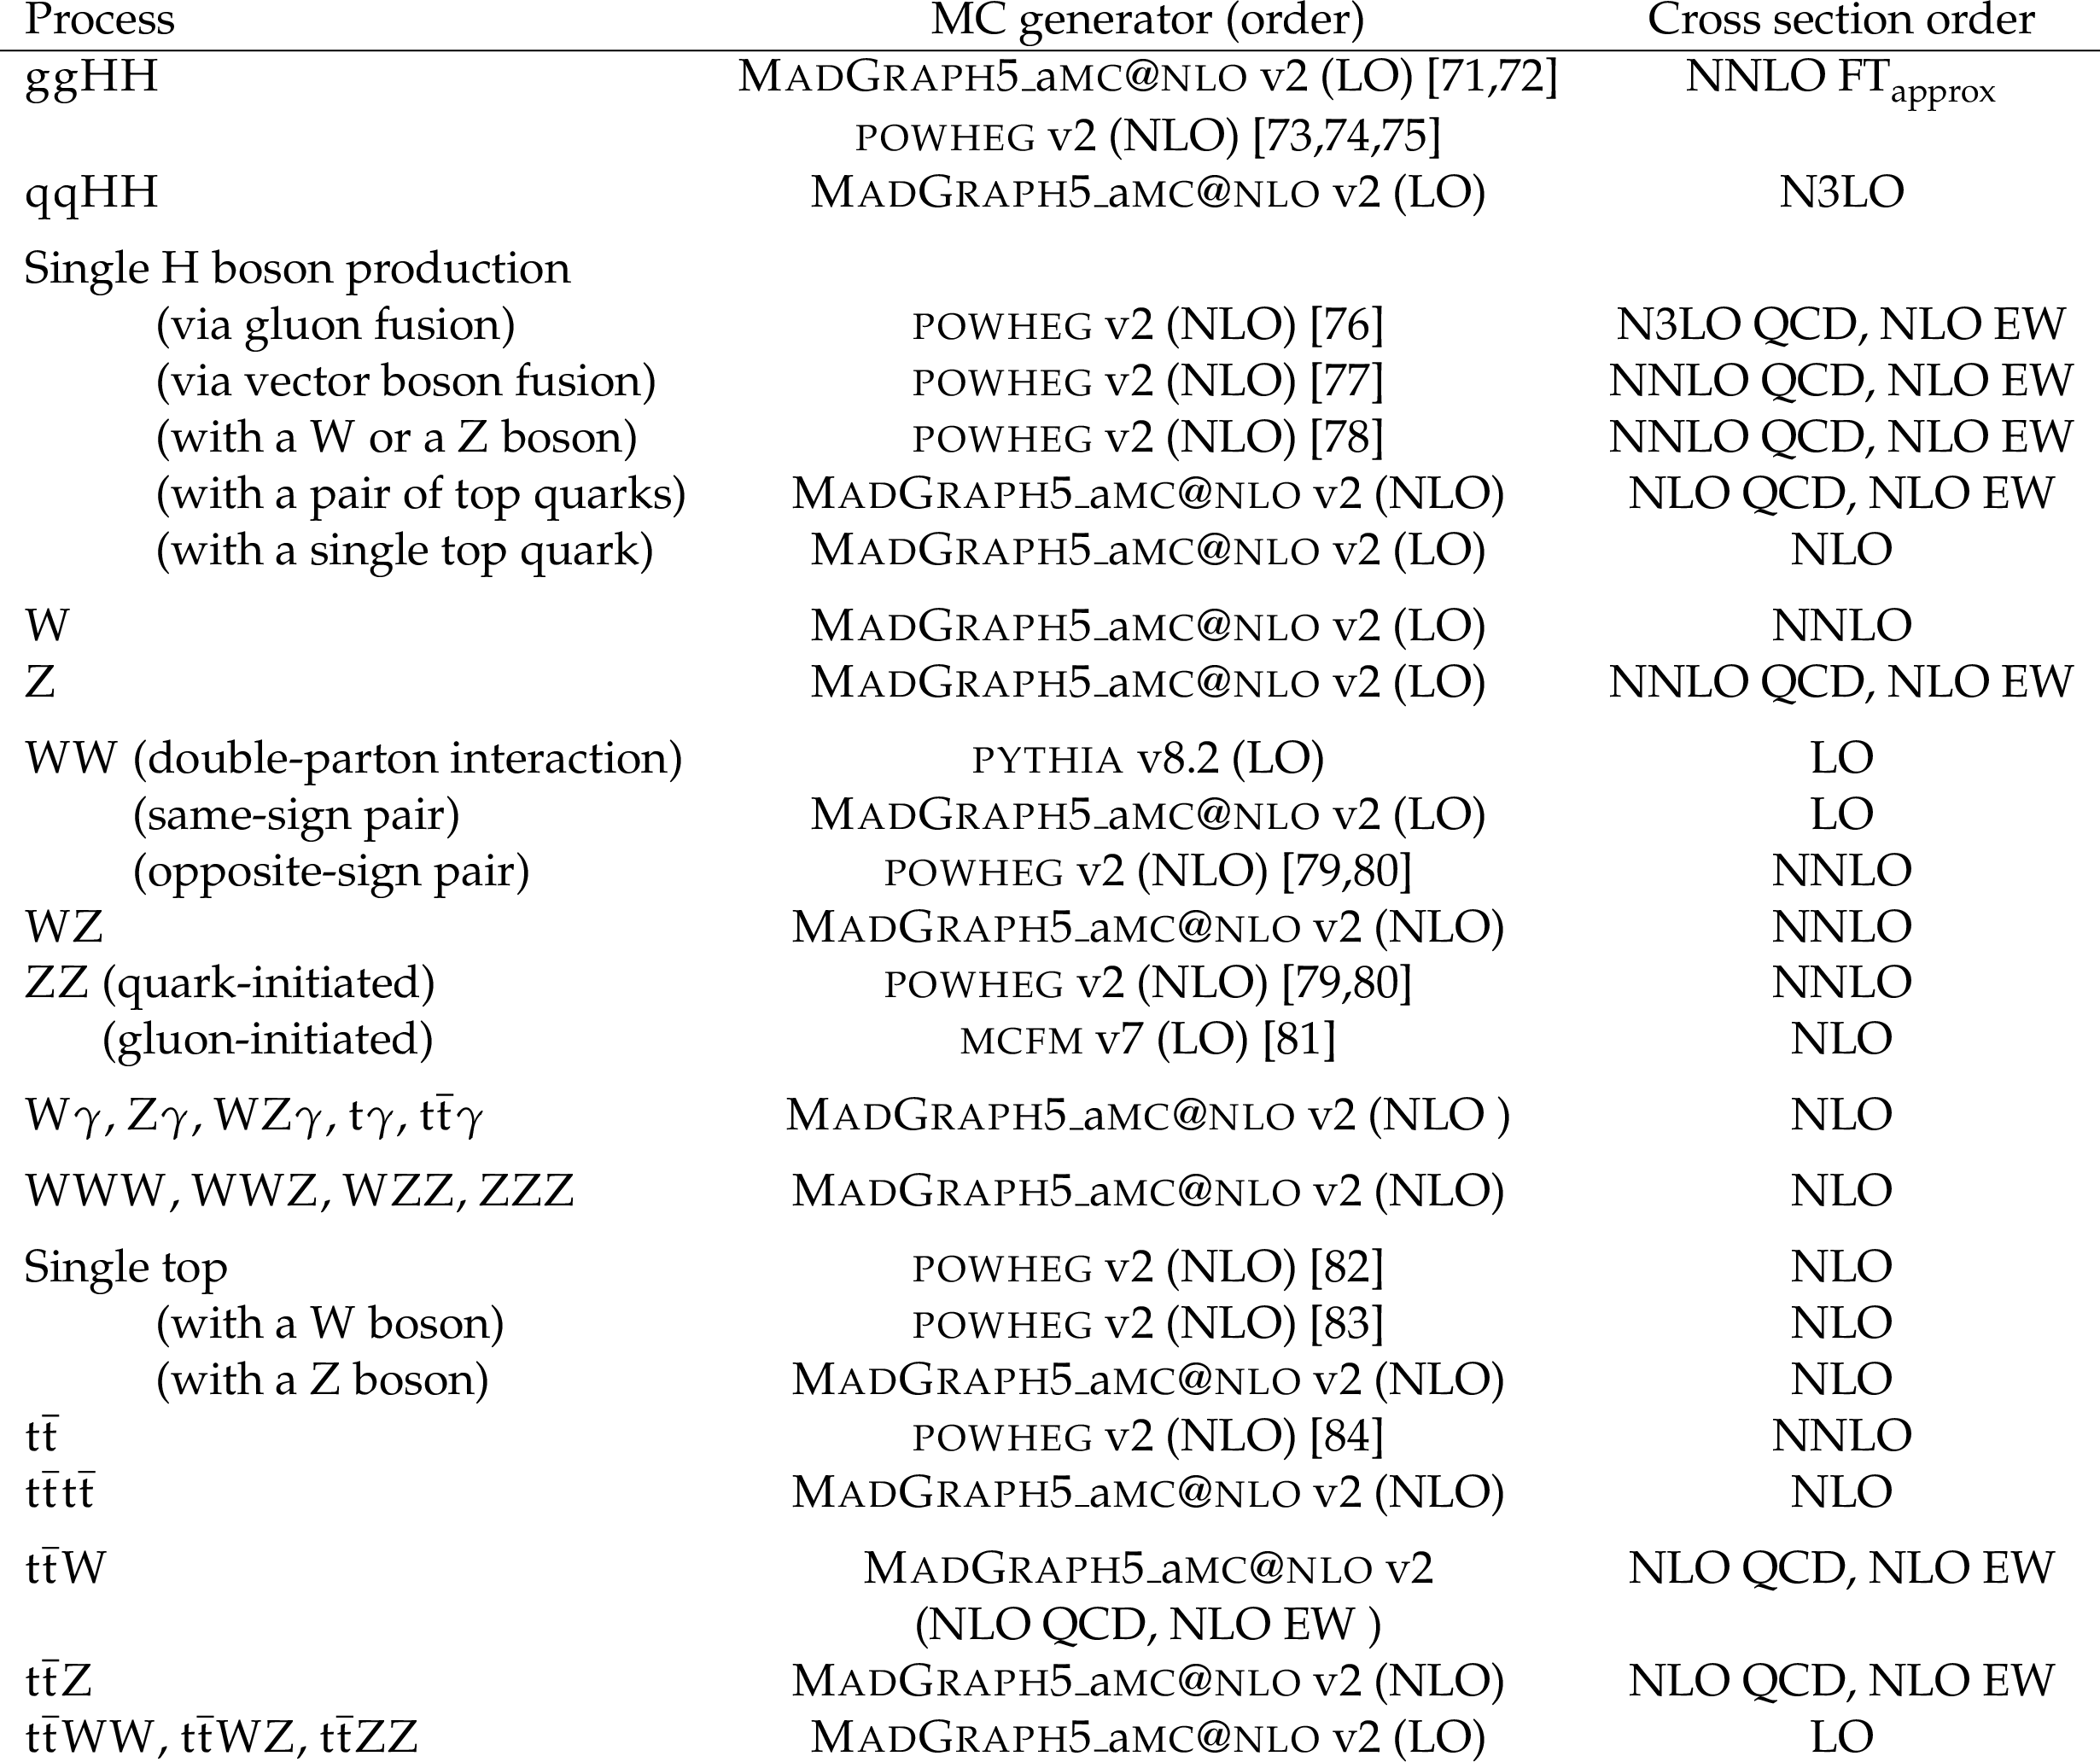
Table 2:
The MC generators that are used to simulate HH signal and background processes. The order of MC simulation and cross section calculation both refer to the perturbative expansion in QCD. Additional higher order electroweak (EW) corrections, if present, are indicated separately. |
png pdf |
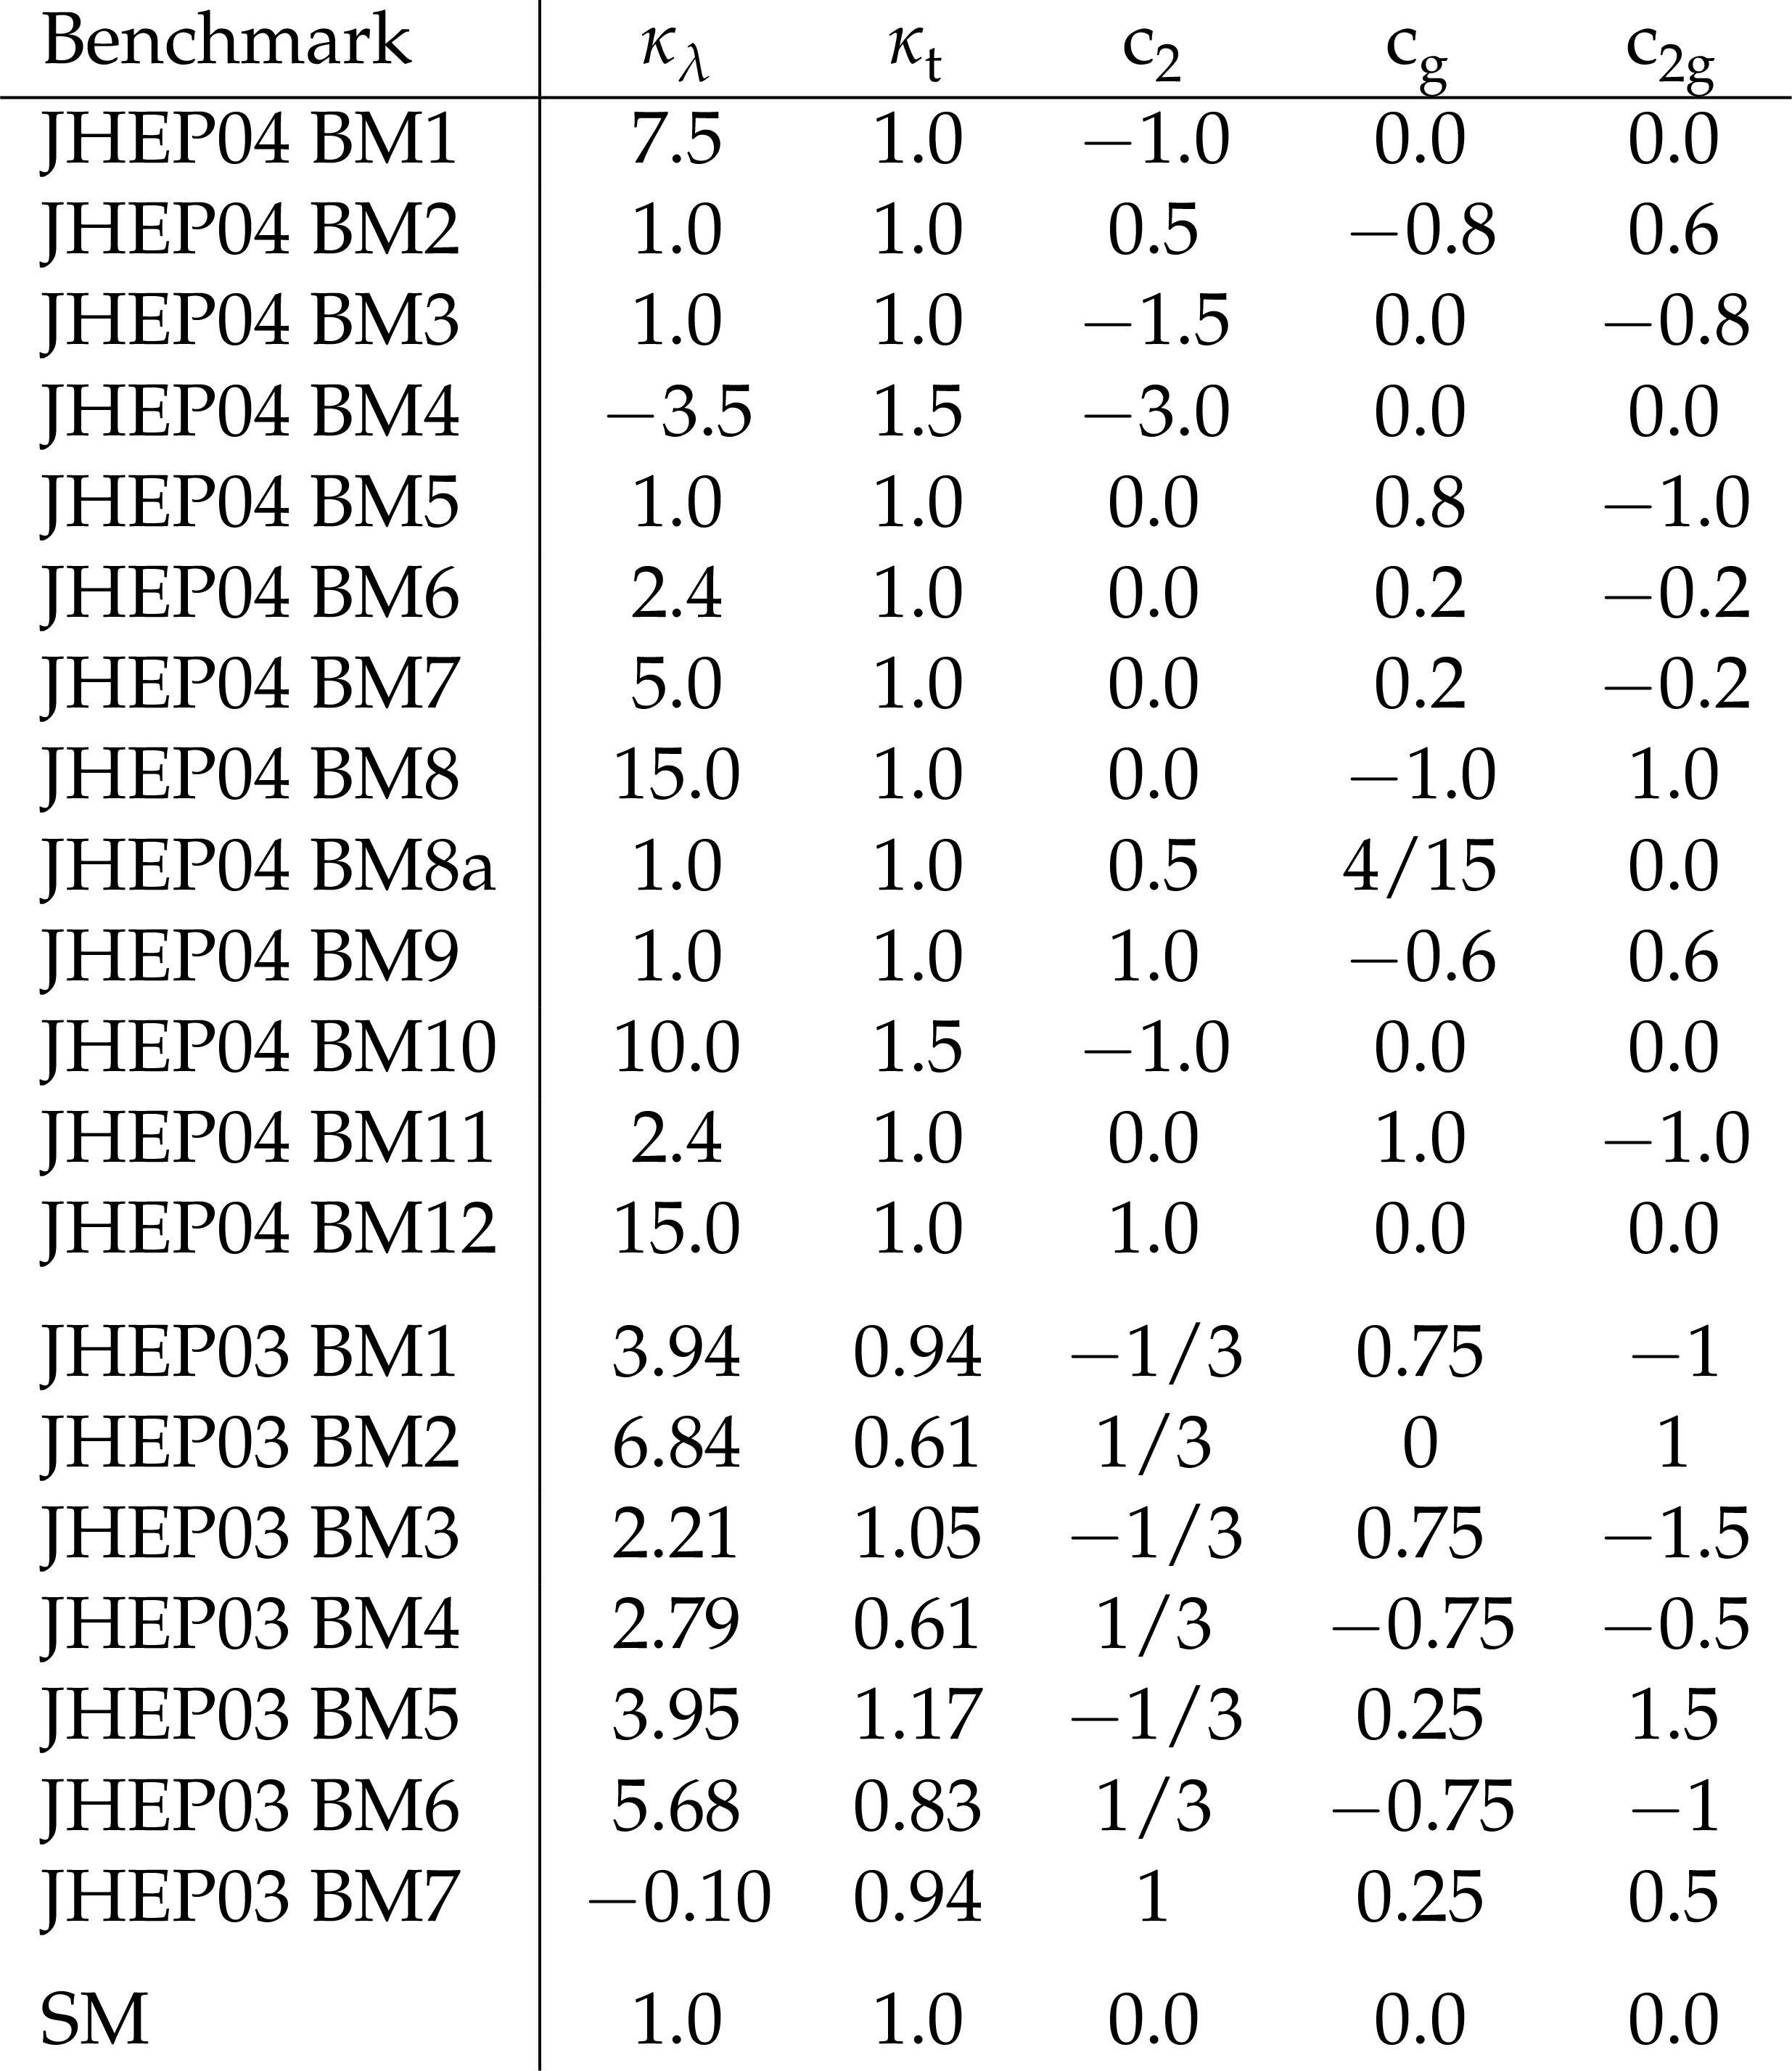
Table 3:
Parameter values for $ \kappa_{\lambda} $, $ \kappa_{\mathrm{t}} $, $ \text{c}_{2} $, $ \text{c}_{\mathrm{g}} $, and $ \text{c}_{2\mathrm{g}} $ in MC samples modeling twenty benchmark scenarios in the EFT approach, plus SM HH production. |

png pdf |
Table 4:
Event selection criteria applied in the seven search categories. The $ p_{\mathrm{T}} $ thresholds for $ \ell $ and $ \tau_\mathrm{h} $ with the highest, second-, third-, and fourth-highest $ p_{\mathrm{T}} $ are separated by slashes. The symbol ``$ \text{---} $'' indicates that no requirement is applied. |
png pdf |
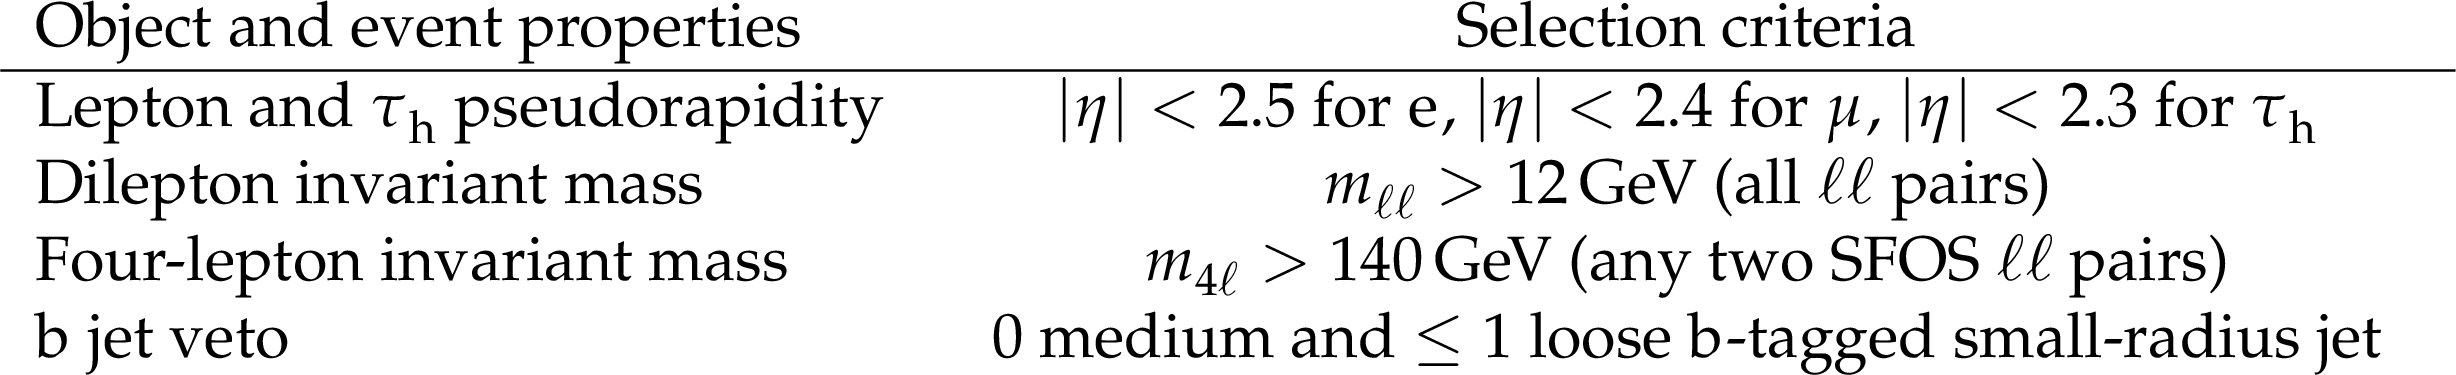
Table 5:
Reconstructed object and event selection requirements in all seven search categories. Electrons or muons in the $ \ell\ell $ pairs include any leptons passing the loose selection criteria. |

png pdf |
Table 6:
The number of expected and observed events in each of the seven search categories, and in two CRs, which validate the modeling of the WZ and ZZ backgrounds. The symbol ``$ \text{---} $'' indicates that the background is not relevant for the category. The HH signal represents the sum of the $ \mathrm{g}\mathrm{g}\mathrm{H}\mathrm{H} $ and $ \mathrm{q}\mathrm{q}\mathrm{H}\mathrm{H} $ production processes and is normalized to 30 times the event yield expected in the SM, corresponding to a cross section of about 1$ \,\text{pb} $. The event yields are obtained by performing the event selection and applying appropriate corrections to the simulated events. Quoted uncertainties represent the sum of statistical and systematic components. Uncertainties that are smaller than half the value of the least significant digit have been rounded to zero. |
png pdf |
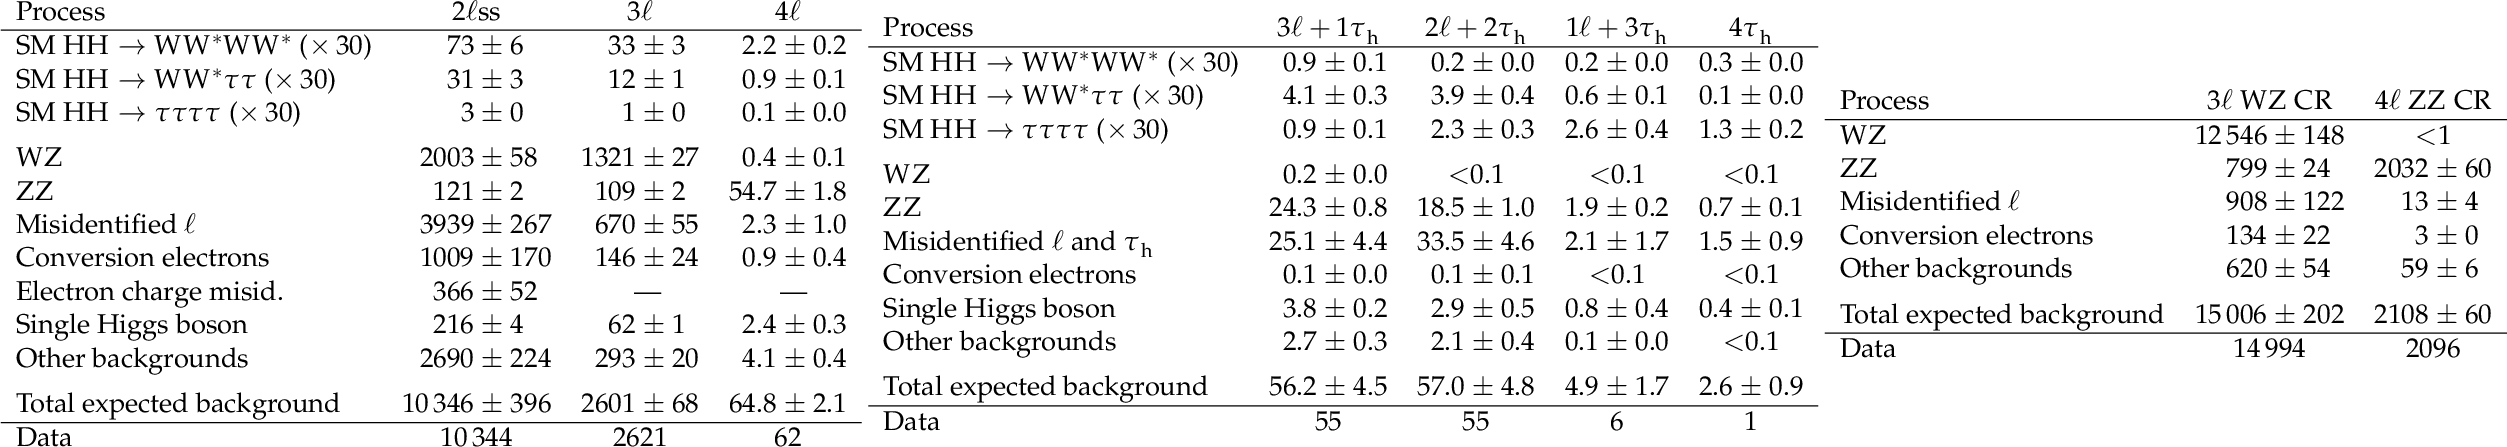
Table 7:
The number of expected and observed events in each of the seven search categories, and in two CRs, which validate the modeling of the WZ and ZZ backgrounds. The $ \ell $/$ \tau_\mathrm{h} $ misidentification and electron charge misidentification backgrounds are determined from data, as described in Section 7, while the HH signal and all other backgrounds are modeled using MC simulation. The symbol ``$ \text{---} $'' indicates that the background is not relevant for the category. The HH signal represents the sum of the $ \mathrm{g}\mathrm{g}\mathrm{H}\mathrm{H} $ and $ \mathrm{q}\mathrm{q}\mathrm{H}\mathrm{H} $ production processes and is normalized to 30 times the event yield expected in the SM, corresponding to a cross section of about 1$ \,\text{pb} $. The expected event yields are computed for the values of nuisance parameters obtained from the ML fit described in Section 9. Quoted uncertainties represent the sum of statistical and systematic components. Uncertainties that are smaller than half the value of the least significant digit have been rounded to zero. |
png pdf |
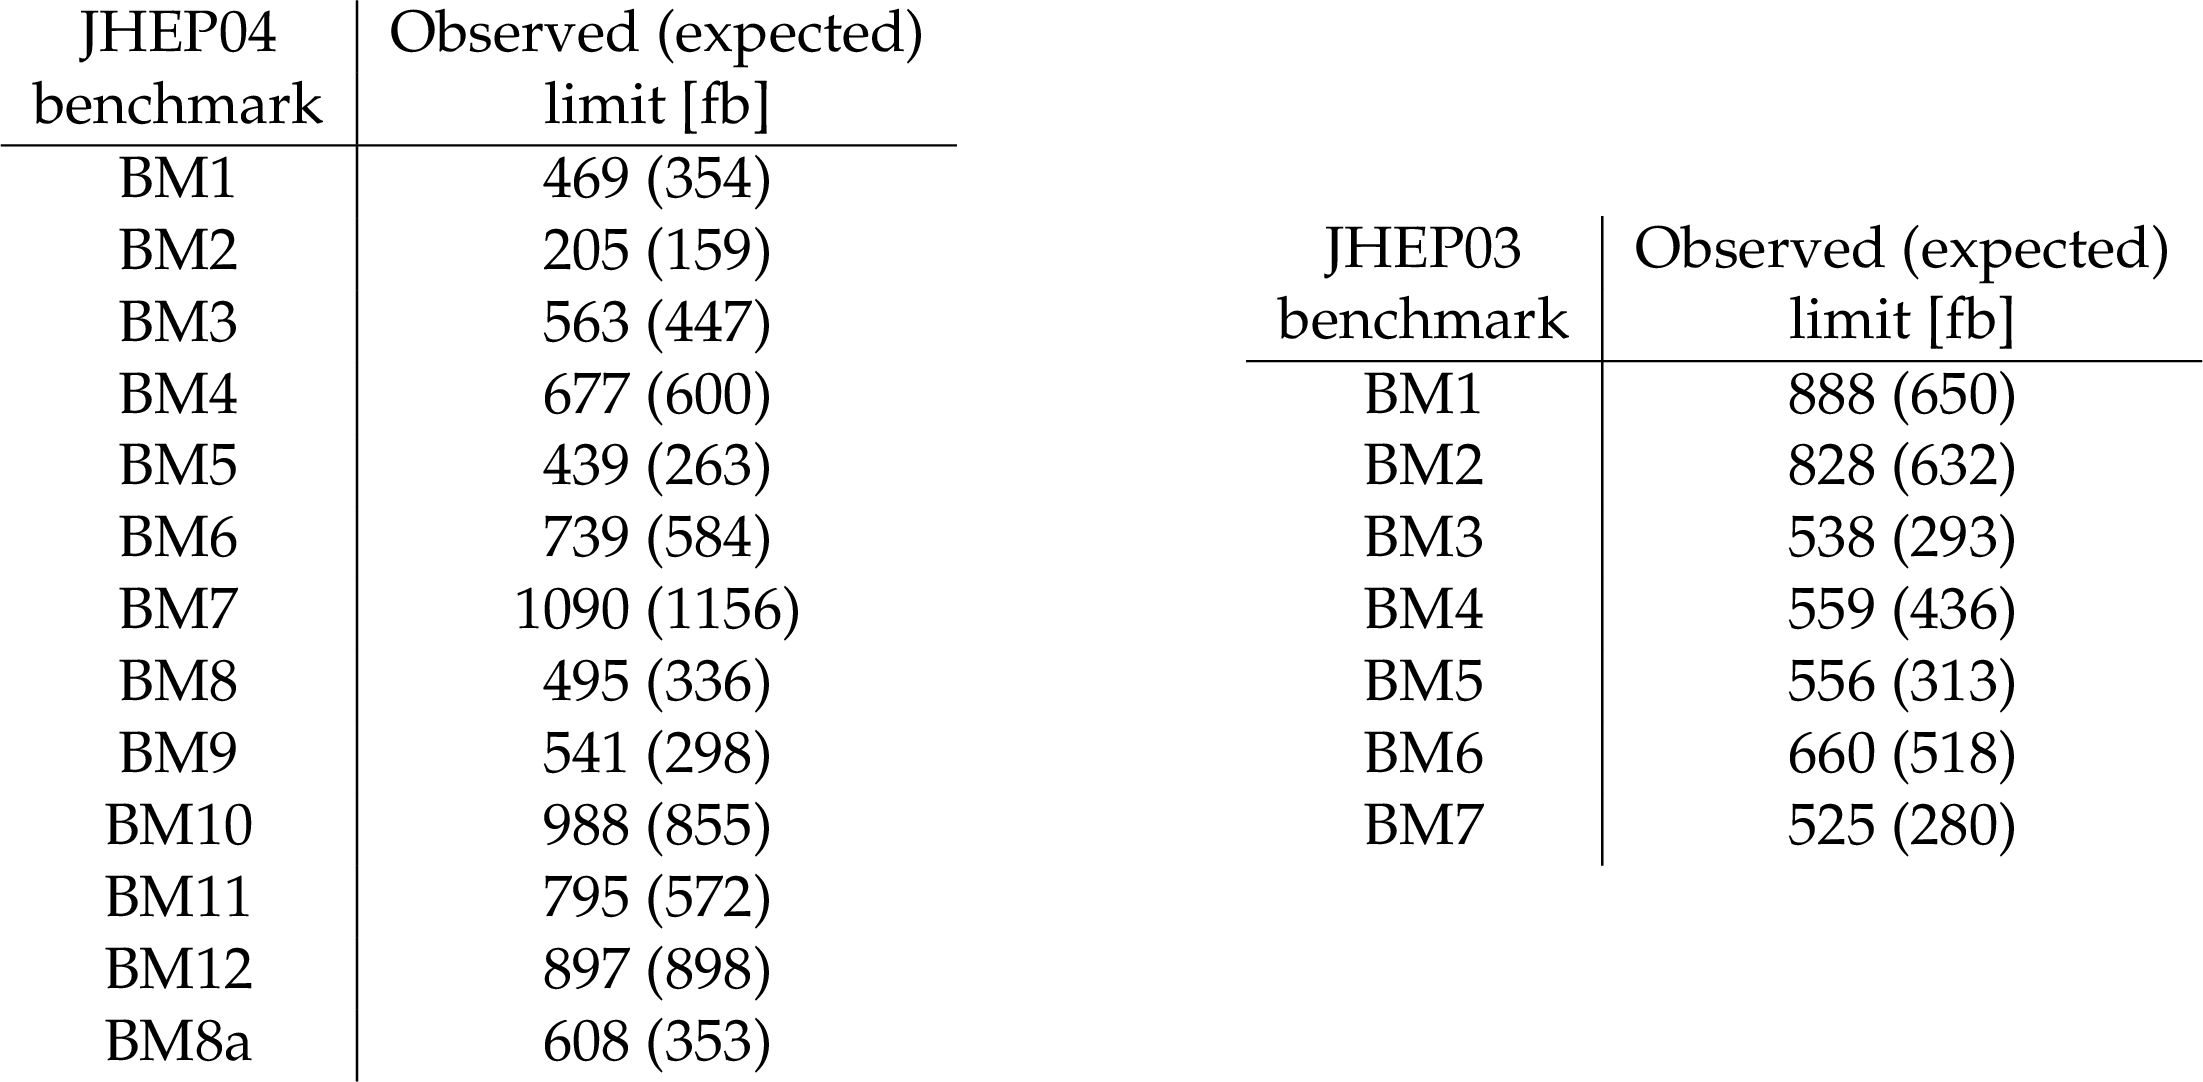
Table 8:
Observed (expected) 95% CL upper limits on the $ \mathrm{g}\mathrm{g}\mathrm{H}\mathrm{H} $ production cross section for the twelve benchmark scenarios from Ref. [24], the additional benchmark scenario 8a from Ref. [97] and the seven benchmark scenarios from Ref. [96]. The corresponding observed (expected) upper limit for the SM is 652 (583)$ \,\text{fb} $. The limits correspond to the combination of all seven search categories. |
| Summary |
| The results of a search for nonresonant as well as resonant Higgs boson pair (HH) production in final states with multiple reconstructed leptons, including electrons and muons (${\ell} $) as well as hadronically decaying tau leptons (${\tau_\mathrm{h}}$), has been presented. The search targets the HH decay modes WWWW, WW$\tau\tau$, and $\tau\tau\tau\tau$, using proton-proton collision data recorded by the CMS experiment at a center-of-mass energy of 13 TeV and corresponding to an integrated luminosity of 138 fb$^{-1}$. Seven search categories, distinguished by ${\ell}$ and ${\tau_\mathrm{h}}$ multiplicity, are included in the analysis: 2$\ell$ss, 3$\ell$, 4$\ell$, 3$\ell$+1${\tau_\mathrm{h}}$, 2$\ell$+2${\tau_\mathrm{h}}$, 1$\ell$+3${\tau_\mathrm{h}}$, and 4${\tau_\mathrm{h}}$, where "ss'' indicates an $\ell\ell$ pair with the same charge. No evidence for a signal is found in the data. Upper limits on the cross section for nonresonant as well as resonant HH production are set. The observed (expected) limits on the nonresonant HH production cross section in twenty EFT benchmark scenarios range from 0.21 to 1.09 (0.16 to 1.16) pb at 95% confidence level (CL), depending on the scenario. For nonresonant HH production with event kinematics as predicted by the standard model (SM), the observed (expected) 95% CL upper limit on the HH production rate is 21.3 (19.4) times the rate expected in the SM. The results of the search for nonresonant HH production are used to exclude regions in the plane of the H boson coupling to the top quark, ${\text{y}_{{\mathrm{t}} }}$, and of the trilinear Higgs boson self-coupling, $\lambda$. Assuming ${\text{y}_{{\mathrm{t}} }}$ has the value expected in the SM, the observed (expected) 95% CL interval for $\lambda$ is between $-$6.9 and 11.1 ($-$6.9 and 11.7) times the value expected in the SM. The resonant production of H boson pairs, resulting from decays of new heavy particles X with mass $m_{{\textrm{X}} }$, is probed within the mass range 250-1000 GeV. The corresponding observed (expected) 95% CL upper limits on the cross section for resonant HH production range from 0.18 to 0.90 (0.08 to 1.06) pb, depending on the mass and spin of the resonance. |
| References | ||||
| 1 | ATLAS Collaboration | Observation of a new particle in the search for the standard model Higgs boson with the ATLAS detector at the LHC | PLB 716 (2012) 1 | 1207.7214 |
| 2 | CMS Collaboration | Observation of a new boson at a mass of 125 GeV with the CMS experiment at the LHC | PLB 716 (2012) 30 | CMS-HIG-12-028 1207.7235 |
| 3 | CMS Collaboration | Observation of a new boson with mass near 125 GeV in pp collisions at $ \sqrt{s} = $ 7 and 8 TeV | JHEP 06 (2013) 081 | CMS-HIG-12-036 1303.4571 |
| 4 | CMS Collaboration | Combined measurements of Higgs boson couplings in proton-proton collisions at $ \sqrt{s} = $ 13 TeV | EPJC 79 (2019) 421 | CMS-HIG-17-031 1809.10733 |
| 5 | ATLAS Collaboration | Combined measurements of Higgs boson production and decay using up to 80 fb$^{-1}$ of proton-proton collision data at $ \sqrt{s} = $ 13 TeV collected with the ATLAS experiment | PRD 101 (2020) 012002 | 1909.02845 |
| 6 | CMS Collaboration | Measurement of the Higgs boson width and evidence of its off-shell contributions to ZZ production | Nat. Phys., 2022 | CMS-HIG-21-013 2202.06923 |
| 7 | F. Englert and R. Brout | Broken symmetry and the mass of gauge vector mesons | PRL 13 (1964) 321 | |
| 8 | P. W. Higgs | Broken symmetries, massless particles and gauge fields | PL 12 (1964) 132 | |
| 9 | P. W. Higgs | Broken symmetries and the masses of gauge bosons | PRL 13 (1964) 508 | |
| 10 | G. S. Guralnik, C. R. Hagen, and T. W. B. Kibble | Global conservation laws and massless particles | PRL 13 (1964) 585 | |
| 11 | P. W. Higgs | Spontaneous symmetry breakdown without massless bosons | PR 145 (1966) 1156 | |
| 12 | T. W. B. Kibble | Symmetry breaking in non-Abelian gauge theories | PR 155 (1967) 1554 | |
| 13 | S. L. Glashow | Partial symmetries of weak interactions | NP 22 (1961) 579 | |
| 14 | S. Weinberg | A model of leptons | PRL 19 (1967) 1264 | |
| 15 | A. Salam | Weak and electromagnetic interactions | Conf. Proc. C 680519 (1968) 367 | |
| 16 | D. de Florian, I. Fabre, and J. Mazzitelli | Triple Higgs production at hadron colliders at NNLO in QCD | JHEP 03 (2020) 155 | 1912.02760 |
| 17 | O. Aberle et al. | High-Luminosity Large Hadron Collider (HL-LHC): Technical design report V. 0.1 | CERN Yellow Rep. Monogr. 4 (2017) | |
| 18 | M. Grazzini et al. | Higgs boson pair production at NNLO with top quark mass effects | JHEP 05 (2018) 059 | 1803.02463 |
| 19 | F. A. Dreyer and A. Karlberg | Vector-boson fusion Higgs pair production at N$ ^3 $LO | PRD 98 (2018) 114016 | 1811.07906 |
| 20 | G. Degrassi, P. P. Giardino, F. Maltoni, and D. Pagani | Probing the Higgs self coupling via single Higgs production at the LHC | JHEP 12 (2016) 080 | 1607.04251 |
| 21 | F. Maltoni, D. Pagani, A. Shivaji, and X. Zhao | Trilinear Higgs coupling determination via single-Higgs differential measurements at the LHC | EPJC 77 (2017) 887 | 1709.08649 |
| 22 | W. Buchmuller and D. Wyler | Effective Lagrangian analysis of new interactions and flavor conservation | NPB 268 (1986) 621 | |
| 23 | B. Grzadkowski, M. Iskrzynski, M. Misiak, and J. Rosiek | Dimension-six terms in the standard model Lagrangian | JHEP 10 (2010) 085 | 1008.4884 |
| 24 | A. Carvalho et al. | Higgs pair production: choosing benchmarks with cluster analysis | JHEP 04 (2016) 126 | 1507.02245 |
| 25 | N. Craig, J. Galloway, and S. Thomas | Searching for signs of the second Higgs doublet | 1305.2424 | |
| 26 | D. T. Nhung, M. Mühlleitner, J. Streicher, and K. Walz | Higher order corrections to the trilinear Higgs self-couplings in the real NMSSM | JHEP 11 (2013) 181 | 1306.3926 |
| 27 | R. Grober and M. Mühlleitner | Composite Higgs boson pair production at the LHC | JHEP 06 (2011) 020 | 1012.1562 |
| 28 | R. Contino et al. | Strong double Higgs production at the LHC | JHEP 05 (2010) 089 | 1002.1011 |
| 29 | C. Englert, T. Plehn, D. Zerwas, and P. M. Zerwas | Exploring the Higgs portal | PLB 703 (2011) 298 | 1106.3097 |
| 30 | J. M. No and M. Ramsey-Musolf | Probing the Higgs portal at the LHC through resonant di-Higgs production | PRD 89 (2014) 095031 | 1310.6035 |
| 31 | L. Randall and R. Sundrum | A large mass hierarchy from a small extra dimension | PRL 83 (1999) 3370 | hep-ph/9905221 |
| 32 | K. Cheung | Phenomenology of radion in Randall-Sundrum scenario | PRD 63 (2001) 056007 | hep-ph/0009232 |
| 33 | ATLAS Collaboration | Search for resonant pair production of Higgs bosons in the $ \mathrm{b}\overline{\mathrm{b}}\mathrm{b}\overline{\mathrm{b}} $ final state using pp collisions at $ \sqrt{s} = $ 13 TeV with the ATLAS detector | PRD 105 (2022) 092002 | 2202.07288 |
| 34 | CMS Collaboration | Search for heavy resonances decaying to a pair of Lorentz-boosted Higgs bosons in final states with leptons and a bottom quark pair at $ \sqrt{s} = $ 13 TeV | JHEP 05 (2022) 005 | 2112.03161 |
| 35 | ATLAS Collaboration | Search for resonant and non-resonant Higgs boson pair production in the $ \mathrm{b}\overline{\mathrm{b}}\tau^{+}\tau^{-} $ decay channel using 13 TeV pp collision data from the ATLAS detector | Submitted to JHEP, 2022 | 2209.10910 |
| 36 | U. Baur, T. Plehn, and D. L. Rainwater | Measuring the Higgs boson self-coupling at the LHC and finite top mass matrix elements | PRL 89 (2002) 151801 | hep-ph/0206024 |
| 37 | U. Baur, T. Plehn, and D. L. Rainwater | Determining the Higgs boson self-coupling at hadron colliders | PRD 67 (2003) 033003 | hep-ph/0211224 |
| 38 | Q. Li, Z. Li, Q.-S. Yan, and X. Zhao | Probe Higgs boson pair production via the 3 $ \ell \, 2\text{j} + p_{\mathrm{T}}^\text{miss} $ mode | PRD 92 (2015) 014015 | 1503.07611 |
| 39 | A. Adhikary et al. | Revisiting the non-resonant Higgs pair production at the HL-LHC | JHEP 07 (2018) 116 | 1712.05346 |
| 40 | J. Ren et al. | LHC search of new Higgs boson via resonant di-Higgs production with decays into 4 W | JHEP 06 (2018) 090 | 1706.05980 |
| 41 | ATLAS Collaboration | Search for Higgs boson pair production in the $ \mathrm{W}\mathrm{W}^{\ast}\mathrm{W}\mathrm{W}^{\ast} $ decay channel using ATLAS data recorded at $ \sqrt{s} = $ 13 TeV | JHEP 05 (2019) 124 | 1811.11028 |
| 42 | CMS Collaboration | Search for nonresonant Higgs boson pair production in final states with two bottom quarks and two photons in proton-proton collisions at $ \sqrt{s} = $ 13 TeV | JHEP 03 (2021) 257 | CMS-HIG-19-018 2011.12373 |
| 43 | ATLAS Collaboration | Search for Higgs boson pair production in the two bottom quarks plus two photons final state in pp collisions at $ \sqrt{s} = $ 13 TeV with the ATLAS detector | PRD 106 (2022) 052001 | 2112.11876 |
| 44 | ATLAS Collaboration | Search for the $ \mathrm{H}\mathrm{H} \rightarrow \mathrm{b}\overline{\mathrm{b}}\mathrm{b}\overline{\mathrm{b}} $ process via vector-boson fusion production using proton-proton collisions at $ \sqrt{s} = $ 13 TeV with the ATLAS detector | JHEP 07 (2020) 108 | 2001.05178 |
| 45 | CMS Collaboration | Search for Higgs boson pair production in the four b quark final state in proton-proton collisions at $ \sqrt{s} = $ 13 TeV | PRL 129 (2022) 081802 | CMS-HIG-20-005 2202.09617 |
| 46 | CMS Collaboration | Search for nonresonant pair production of highly energetic Higgs bosons decaying to bottom quarks | Submitted to PRL, 2022 | 2205.06667 |
| 47 | CMS Collaboration | Search for resonant pair production of Higgs bosons decaying to bottom quark-antiquark pairs in proton-proton collisions at 13 TeV | JHEP 08 (2018) 152 | CMS-HIG-17-009 1806.03548 |
| 48 | CMS Collaboration | Search for nonresonant Higgs boson pair production in final state with two bottom quarks and two tau leptons in proton-proton collisions at $ \sqrt{s} = $ 13 TeV | Submitted to PLB, 2022 | CMS-HIG-20-010 2206.09401 |
| 49 | ATLAS Collaboration | Reconstruction and identification of boosted di-$ \tau $ systems in a search for Higgs boson pairs using 13 TeV proton-proton collision data in ATLAS | JHEP 11 (2020) 163 | 2007.14811 |
| 50 | CMS Collaboration | Search for resonant and non-resonant Higgs boson pair production in the $ \mathrm{b}\overline{\mathrm{b}}\ell\nu\ell\nu $ final state in proton-proton collisions at $ \sqrt{s} = $ 13 TeV | JHEP 01 (2018) 054 | CMS-HIG-17-006 1708.04188 |
| 51 | ATLAS Collaboration | Search for non-resonant Higgs boson pair production in the $ \mathrm{b}\overline{\mathrm{b}}\ell\nu\ell\nu $ final state with the ATLAS detector in pp collisions at $ \sqrt{s} = $ 13 TeV | PLB 801 (2020) 135145 | 1908.06765 |
| 52 | ATLAS Collaboration | Search for Higgs boson pair production in the $ \mathrm{b}\overline{\mathrm{b}}\mathrm{W}{\mathrm{W}}^{*} $ decay mode at $ \sqrt{s} = $ 13 TeV with the ATLAS detector | JHEP 04 (2019) 092 | 1811.04671 |
| 53 | ATLAS Collaboration | Search for Higgs boson pair production in the $ \gamma\gamma\mathrm{W}\mathrm{W}^{\ast} $ channel using pp collision data recorded at $ \sqrt{s} = $ 13 TeV with the ATLAS detector | EPJC 78 (2018) 1007 | 1807.08567 |
| 54 | CMS Collaboration | Combination of searches for Higgs boson pair production in proton-proton collisions at $ \sqrt{s} = $ 13 TeV | PRL 122 (2019) 121803 | CMS-HIG-17-030 1811.09689 |
| 55 | ATLAS Collaboration | Combination of searches for Higgs boson pairs in pp collisions at $ \sqrt{s} = $ 13 TeV with the ATLAS detector | PLB 800 (2020) 135103 | 1906.02025 |
| 56 | CMS Collaboration | Performance of the CMS level-1 trigger in proton-proton collisions at $ \sqrt{s} = $ 13 TeV | JINST 15 (2020) P10017 | CMS-TRG-17-001 2006.10165 |
| 57 | CMS Collaboration | The CMS trigger system | JINST 12 (2017) P01020 | CMS-TRG-12-001 1609.02366 |
| 58 | CMS Collaboration | The CMS experiment at the CERN LHC | JINST 3 (2008) S08004 | |
| 59 | CMS Collaboration | Precision luminosity measurement in proton-proton collisions at $ \sqrt{s} = $ 13 TeV in 2015 and 2016 at CMS | EPJC 81 (2021) 800 | CMS-LUM-17-003 2104.01927 |
| 60 | CMS Collaboration | CMS luminosity measurement for the 2017 data-taking period at $ \sqrt{s} = $ 13 TeV | CMS Physics Analysis Summary, 2018 link |
CMS-PAS-LUM-17-004 |
| 61 | CMS Collaboration | CMS luminosity measurement for the 2018 data-taking period at $ \sqrt{s} = $ 13 TeV | CMS Physics Analysis Summary, 2019 link |
CMS-PAS-LUM-18-002 |
| 62 | J. Alwall et al. | The automated computation of tree-level and next-to-leading order differential cross sections, and their matching to parton shower simulations | JHEP 07 (2014) 079 | 1405.0301 |
| 63 | A. Kalogeropoulos and J. Alwall | The SysCalc code: A tool to derive theoretical systematic uncertainties | 1801.08401 | |
| 64 | P. Nason | A new method for combining NLO QCD with shower Monte Carlo algorithms | JHEP 11 (2004) 040 | hep-ph/0409146 |
| 65 | S. Frixione, P. Nason, and C. Oleari | Matching NLO QCD computations with parton shower simulations: The powheg method | JHEP 11 (2007) 070 | 0709.2092 |
| 66 | S. Alioli, P. Nason, C. Oleari, and E. Re | A general framework for implementing NLO calculations in shower Monte Carlo programs: The POWHEG BOX | JHEP 06 (2010) 043 | 1002.2581 |
| 67 | J. M. Campbell and R. K. Ellis | An Update on vector boson pair production at hadron colliders | PRD 60 (1999) 113006 | hep-ph/9905386 |
| 68 | J. M. Campbell, R. K. Ellis, and C. Williams | Vector boson pair production at the LHC | JHEP 07 (2011) 018 | 1105.0020 |
| 69 | J. M. Campbell, R. K. Ellis, and W. T. Giele | A Multi-Threaded Version of MCFM | EPJC 75 (2015) 246 | 1503.06182 |
| 70 | T. Sjöstrand et al. | An introduction to PYTHIA 8.2 | Comput. Phys. Commun. 191 (2015) 159 | 1410.3012 |
| 71 | B. Hespel, D. Lopez-Val, and E. Vryonidou | Higgs pair production via gluon fusion in the two-Higgs-doublet model | JHEP 09 (2014) 124 | 1407.0281 |
| 72 | A. Carvalho | Gravity particles from warped extra dimensions, predictions for LHC | 1404.0102 | |
| 73 | G. Heinrich et al. | NLO predictions for Higgs boson pair production with full top quark mass dependence matched to parton showers | JHEP 08 (2017) 088 | 1703.09252 |
| 74 | G. Heinrich et al. | Probing the trilinear Higgs boson coupling in di-Higgs production at NLO QCD including parton shower effects | JHEP 06 (2019) 066 | 1903.08137 |
| 75 | G. Heinrich, S. P. Jones, M. Kerner, and L. Scyboz | A non-linear EFT description of $ \mathrm{g}\mathrm{g} \to \mathrm{H}\mathrm{H} $ at NLO interfaced to POWHEG | JHEP 10 (2020) 021 | 2006.16877 |
| 76 | E. Bagnaschi, G. Degrassi, P. Slavich, and A. Vicini | Higgs production via gluon fusion in the POWHEG approach in the SM and in the MSSM | JHEP 02 (2012) 088 | 1111.2854 |
| 77 | P. Nason and C. Oleari | NLO Higgs boson production via vector-boson fusion matched with shower in POWHEG | JHEP 02 (2010) 037 | 0911.5299 |
| 78 | G. Luisoni, P. Nason, C. Oleari, and F. Tramontano | $ \mathrm{H}\mathrm{W}^{\pm} $/HZ + 0 and 1 jet at NLO with the POWHEG BOX interfaced to GoSam and their merging within MiNLO | JHEP 10 (2013) 083 | 1306.2542 |
| 79 | T. Melia, P. Nason, R. Rontsch, and G. Zanderighi | $ \mathrm{W}^{+}\mathrm{W}^{-} $, WZ and ZZ production in the POWHEG BOX | JHEP 11 (2011) 078 | 1107.5051 |
| 80 | P. Nason and G. Zanderighi | $ \mathrm{W}^{+}\mathrm{W}^{-} $, $\mathrm{WZ}$ and $\mathrm{ZZ}$ production in the POWHEG-BOX-V2 | EPJC 74 (2014) 2702 | 1311.1365 |
| 81 | J. M. Campbell, R. K. Ellis, and C. Williams | Bounding the Higgs Width at the LHC Using Full Analytic Results for $ gg \to e^- e^+ \mu^- \mu^+ $ | JHEP 04 (2014) 060 | 1311.3589 |
| 82 | R. Frederix, E. Re, and P. Torrielli | Single-top $ t $-channel hadroproduction in the four-flavour scheme with POWHEG and aMC@NLO | JHEP 09 (2012) 130 | 1207.5391 |
| 83 | E. Re | Single-top $ Wt $ production matched with parton showers using the POWHEG method | EPJC 71 (2011) 1547 | 1009.2450 |
| 84 | S. Frixione, P. Nason, and G. Ridolfi | A positive-weight next-to-leading-order Monte Carlo for heavy flavour hadroproduction | JHEP 09 (2007) 126 | 0707.3088 |
| 85 | NNPDF Collaboration | Parton distributions for the LHC Run II | JHEP 04 (2015) 040 | 1410.8849 |
| 86 | NNPDF Collaboration | Parton distributions from high-precision collider data | EPJC 77 (2017) 663 | 1706.00428 |
| 87 | J. Butterworth et al. | PDF4LHC recommendations for LHC Run II | JPG 43 (2016) 023001 | 1510.03865 |
| 88 | J. Rojo et al. | The PDF4LHC report on PDFs and LHC data: Results from Run I and preparation for Run II | JPG 42 (2015) 103103 | 1507.00556 |
| 89 | A. Accardi et al. | A critical appraisal and evaluation of modern PDFs | EPJC 76 (2016) 471 | 1603.08906 |
| 90 | CMS Collaboration | Event generator tunes obtained from underlying event and multiparton scattering measurements | EPJC 76 (2016) 155 | CMS-GEN-14-001 1512.00815 |
| 91 | CMS Collaboration | Extraction and validation of a new set of CMS PYTHIA 8 tunes from underlying-event measurements | Eur. Phys. J. C. 80 (2020) 4 | CMS-GEN-17-001 1903.12179 |
| 92 | P. Skands, S. Carrazza, and J. Rojo | Tuning PYTHIA 8.1: The Monash 2013 tune | EPJC 74 (2014) 3024 | 1404.5630 |
| 93 | J. Alwall et al. | Comparative study of various algorithms for the merging of parton showers and matrix elements in hadronic collisions | EPJC 53 (2008) 473 | 0706.2569 |
| 94 | R. Frederix and S. Frixione | Merging meets matching in MC@NLO | JHEP 12 (2012) 061 | 1209.6215 |
| 95 | GEANT4 Collaboration | GEANT 4: A simulation toolkit | NIM A 506 (2003) 250 | |
| 96 | M. Capozi and G. Heinrich | Exploring anomalous couplings in Higgs boson pair production through shape analysis | JHEP 03 (2020) 091 | 1908.08923 |
| 97 | G. Buchalla et al. | Higgs boson pair production in non-linear effective field theory with full $ m_{\mathrm{t}} $-dependence at NLO QCD | JHEP 09 (2018) 057 | 1806.05162 |
| 98 | A. Carvalho et al. | On the reinterpretation of non-resonant searches for Higgs boson pairs | JHEP 02 (2021) 049 | 1710.08261 |
| 99 | CMS Collaboration | Particle-flow reconstruction and global event description with the CMS detector | JINST 12 (2017) P10003 | CMS-PRF-14-001 1706.04965 |
| 100 | M. Cacciari, G. P. Salam, and G. Soyez | The anti-$ k_{\mathrm{T}} $ jet clustering algorithm | JHEP 04 (2008) 063 | 0802.1189 |
| 101 | M. Cacciari, G. P. Salam, and G. Soyez | FASTJET user manual | EPJC 72 (2012) 1896 | 1111.6097 |
| 102 | CMS Collaboration | Electron and photon reconstruction and identification with the CMS experiment at the CERN LHC | JINST 16 (2021) P05014 | CMS-EGM-17-001 2012.06888 |
| 103 | CMS Collaboration | Measurement of the Higgs boson production rate in association with top quarks in final states with electrons, muons, and hadronically decaying tau leptons at $ \sqrt{s} = $ 13 TeV | EPJC 81 (2021) 378 | CMS-HIG-19-008 2011.03652 |
| 104 | CMS Collaboration | Performance of electron reconstruction and selection with the CMS detector in pp collisions at $ \sqrt{s} = $ 8 TeV | JINST 10 (2015) P06005 | CMS-EGM-13-001 1502.02701 |
| 105 | CMS Collaboration | Performance of the CMS muon detector and muon reconstruction with proton-proton collisions at $ \sqrt{s} = $ 13 TeV | JINST 13 (2018) P06015 | CMS-MUO-16-001 1804.04528 |
| 106 | CMS Collaboration | Performance of reconstruction and identification of $ \tau $ leptons decaying to hadrons and $ \nu_{\tau} $ in pp collisions at $ \sqrt{s} = $ 13 TeV | JINST 13 (2018) P10005 | CMS-TAU-16-003 1809.02816 |
| 107 | CMS Collaboration | Identification of hadronic tau lepton decays using a deep neural network | JINST 17 (2022) P07023 | CMS-TAU-20-001 2201.08458 |
| 108 | Y. LeCun | Generalization and network design strategies | in Connectionism in perspective, R. Pfeifer, Z. Schreter, F. Fogelman, and L. Steels, editors, Elsevier. An extended version was published as a technical report of the University of Toronto, 1989. | |
| 109 | CMS Collaboration | Pileup mitigation at CMS in 13 TeV data | JINST 15 (2020) P09018 | CMS-JME-18-001 2003.00503 |
| 110 | D. Bertolini, P. Harris, M. Low, and N. Tran | Pileup per particle identification | JHEP 10 (2014) 059 | 1407.6013 |
| 111 | CMS Collaboration | Jet energy scale and resolution in the CMS experiment in pp collisions at 8 TeV | JINST 12 (2017) P02014 | CMS-JME-13-004 1607.03663 |
| 112 | CMS Collaboration | Search for resonances decaying to a pair of Higgs bosons in the $ \mathrm{b}\overline{\mathrm{b}}\mathrm{q}\overline{\mathrm{q}}'\ell\nu $ final state in proton-proton collisions at $ \sqrt{s} = $ 13 TeV | JHEP 10 (2019) 125 | 1904.04193 |
| 113 | E. Bols et al. | Jet flavour classification using DeepJet | JINST 15 (2020) P12012 | 2008.10519 |
| 114 | CMS Collaboration | Performance of missing transverse momentum reconstruction in proton-proton collisions at $ \sqrt{s} = $ 13 TeV using the CMS detector | JINST 14 (2019) P07004 | CMS-JME-17-001 1903.06078 |
| 115 | CMS Collaboration | Evidence for associated production of a Higgs boson with a top quark pair in final states with electrons, muons, and hadronically decaying $ \tau $ leptons at $ \sqrt{s} = $ 13 TeV | JHEP 08 (2018) 066 | CMS-HIG-17-018 1803.05485 |
| 116 | L. Breiman, J. Friedman, R. A. Olshen, and C. J. Stone | Classification and regression trees | Chapman and Hall/CRC, 1984 | |
| 117 | K. Ehat ä ht, L. Marzola, and C. Veelken | Reconstruction of the mass of Higgs boson pairs in events with Higgs boson pairs decaying into four $ \tau $ leptons | 1809.06140 | |
| 118 | T. Chen and C. Guestrin | XGBoost: A scalable tree boosting system | in 22nd ACM SIGKDD International Conference on Knowledge Discovery and Data Mining, New York, 2016 link |
1603.02754 |
| 119 | F. Pedregosa et al. | Scikit-learn: Machine learning in Python | J. Mach. Learn. Res. 12 (2011) 2825 | 1201.0490 |
| 120 | L. Tani, D. Rand, C. Veelken, and M. Kadastik | Evolutionary algorithms for hyperparameter optimization in machine learning for application in high energy physics | EPJC 81 (2021) 170 | 2011.04434 |
| 121 | CMS Collaboration | Search for electroweak production of charginos and neutralinos in multilepton final states in proton-proton collisions at $ \sqrt{s} = $ 13 TeV | JHEP 03 (2018) 166 | CMS-SUS-16-039 1709.05406 |
| 122 | J. Baglio et al. | $ gg\to HH $: Combined uncertainties | PRD 103 (2021) 056002 | 2008.11626 |
| 123 | LHC Higgs Cross Section Working Group | Handbook of LHC Higgs Cross Sections: 4. Deciphering the nature of the Higgs sector | CERN Yellow Rep. Monogr. 2 (2017) | 1610.07922 |
| 124 | M. Grazzini, S. Kallweit, D. Rathlev, and M. Wiesemann | $ \mathrm{W}^{\pm}\mathrm{Z} $ production at hadron colliders in NNLO QCD | PLB 761 (2016) 179 | 1604.08576 |
| 125 | F. Cascioli et al. | ZZ production at hadron colliders in NNLO QCD | PLB 735 (2014) 311 | 1405.2219 |
| 126 | Caola, F. and Melnikov, K. and Rontsch, R. and Tancredi, L. | QCD corrections to ZZ production in gluon fusion at the LHC | PRD 92 (2015) 094028 | 1509.06734 |
| 127 | CMS Collaboration | Jet algorithms performance in 13 TeV data | CMS Physics Analysis Summary, 2017 CMS-PAS-JME-16-003 |
CMS-PAS-JME-16-003 |
| 128 | CMS Collaboration | Measurement of the inelastic proton-proton cross section at $ \sqrt{s} = $ 13 TeV | JHEP 07 (2018) 161 | CMS-FSQ-15-005 1802.02613 |
| 129 | G. Cowan, K. Cranmer, E. Gross, and O. Vitells | Asymptotic formulae for likelihood-based tests of new physics | EPJC 71 (2011) 1554 | 1007.1727 |
| 130 | ATLAS and CMS Collaborations, and LHC Higgs Combination Group | Procedure for the LHC Higgs boson search combination in summer 2011 | technical report, 2011 link |
|
| 131 | J. S. Conway | Incorporating nuisance parameters in likelihoods for multisource spectra | PHYSTAT 201 (2011) 115 | 1103.0354 |
| 132 | T. Junk | Confidence level computation for combining searches with small statistics | NIM A 434 (1999) 435 | hep-ex/9902006 |
| 133 | A. L. Read | Presentation of search results: The $ \textrm{CL}_{s} $ technique | JPG 28 (2002) 2693 | |
| 134 | CMS Collaboration | HEPData record for this analysis | link | |
| 135 | E. Gross and O. Vitells | Trial factors for the look elsewhere effect in high energy physics | EPJC 70 (2010) 525 | 1005.1891 |
|
|
Compact Muon Solenoid LHC, CERN |
|

|

|

|

|

|