

Compact Muon Solenoid
LHC, CERN
| CMS-TOP-20-008 ; CERN-EP-2022-245 | ||
| Measurement of the top quark mass using a profile likelihood approach with the lepton+jets final states in proton-proton collisions at $ \sqrt{s}= $ 13 TeV | ||
| CMS Collaboration | ||
| 3 February 2023 | ||
| Eur. Phys. J. C 83 (2023) 963 | ||
| Abstract: The mass of the top quark is measured in 36.3 fb$ ^{-1} $ of LHC proton-proton collision data collected with the CMS detector at $ \sqrt{s}= $ 13 TeV. The measurement uses a sample of top quark pair candidate events containing one isolated electron or muon and at least four jets in the final state. For each event, the mass is reconstructed from a kinematic fit of the decay products to a top quark pair hypothesis. A profile likelihood method is applied using up to four observables per event to extract the top quark mass. The top quark mass is measured to be 171.77 $ \pm $ 0.37 GeV. This approach significantly improves the precision over previous measurements. We dedicate this paper to the memory of our friend and colleague Thomas Ferbel, whose innovative work on precision measurements of the top quark mass laid the foundation for this publication. | ||
| Links: e-print arXiv:2302.01967 [hep-ex] (PDF) ; CDS record ; inSPIRE record ; HepData record ; Physics Briefing ; CADI line (restricted) ; | ||
| Figures | |

png pdf |
Figure 1:
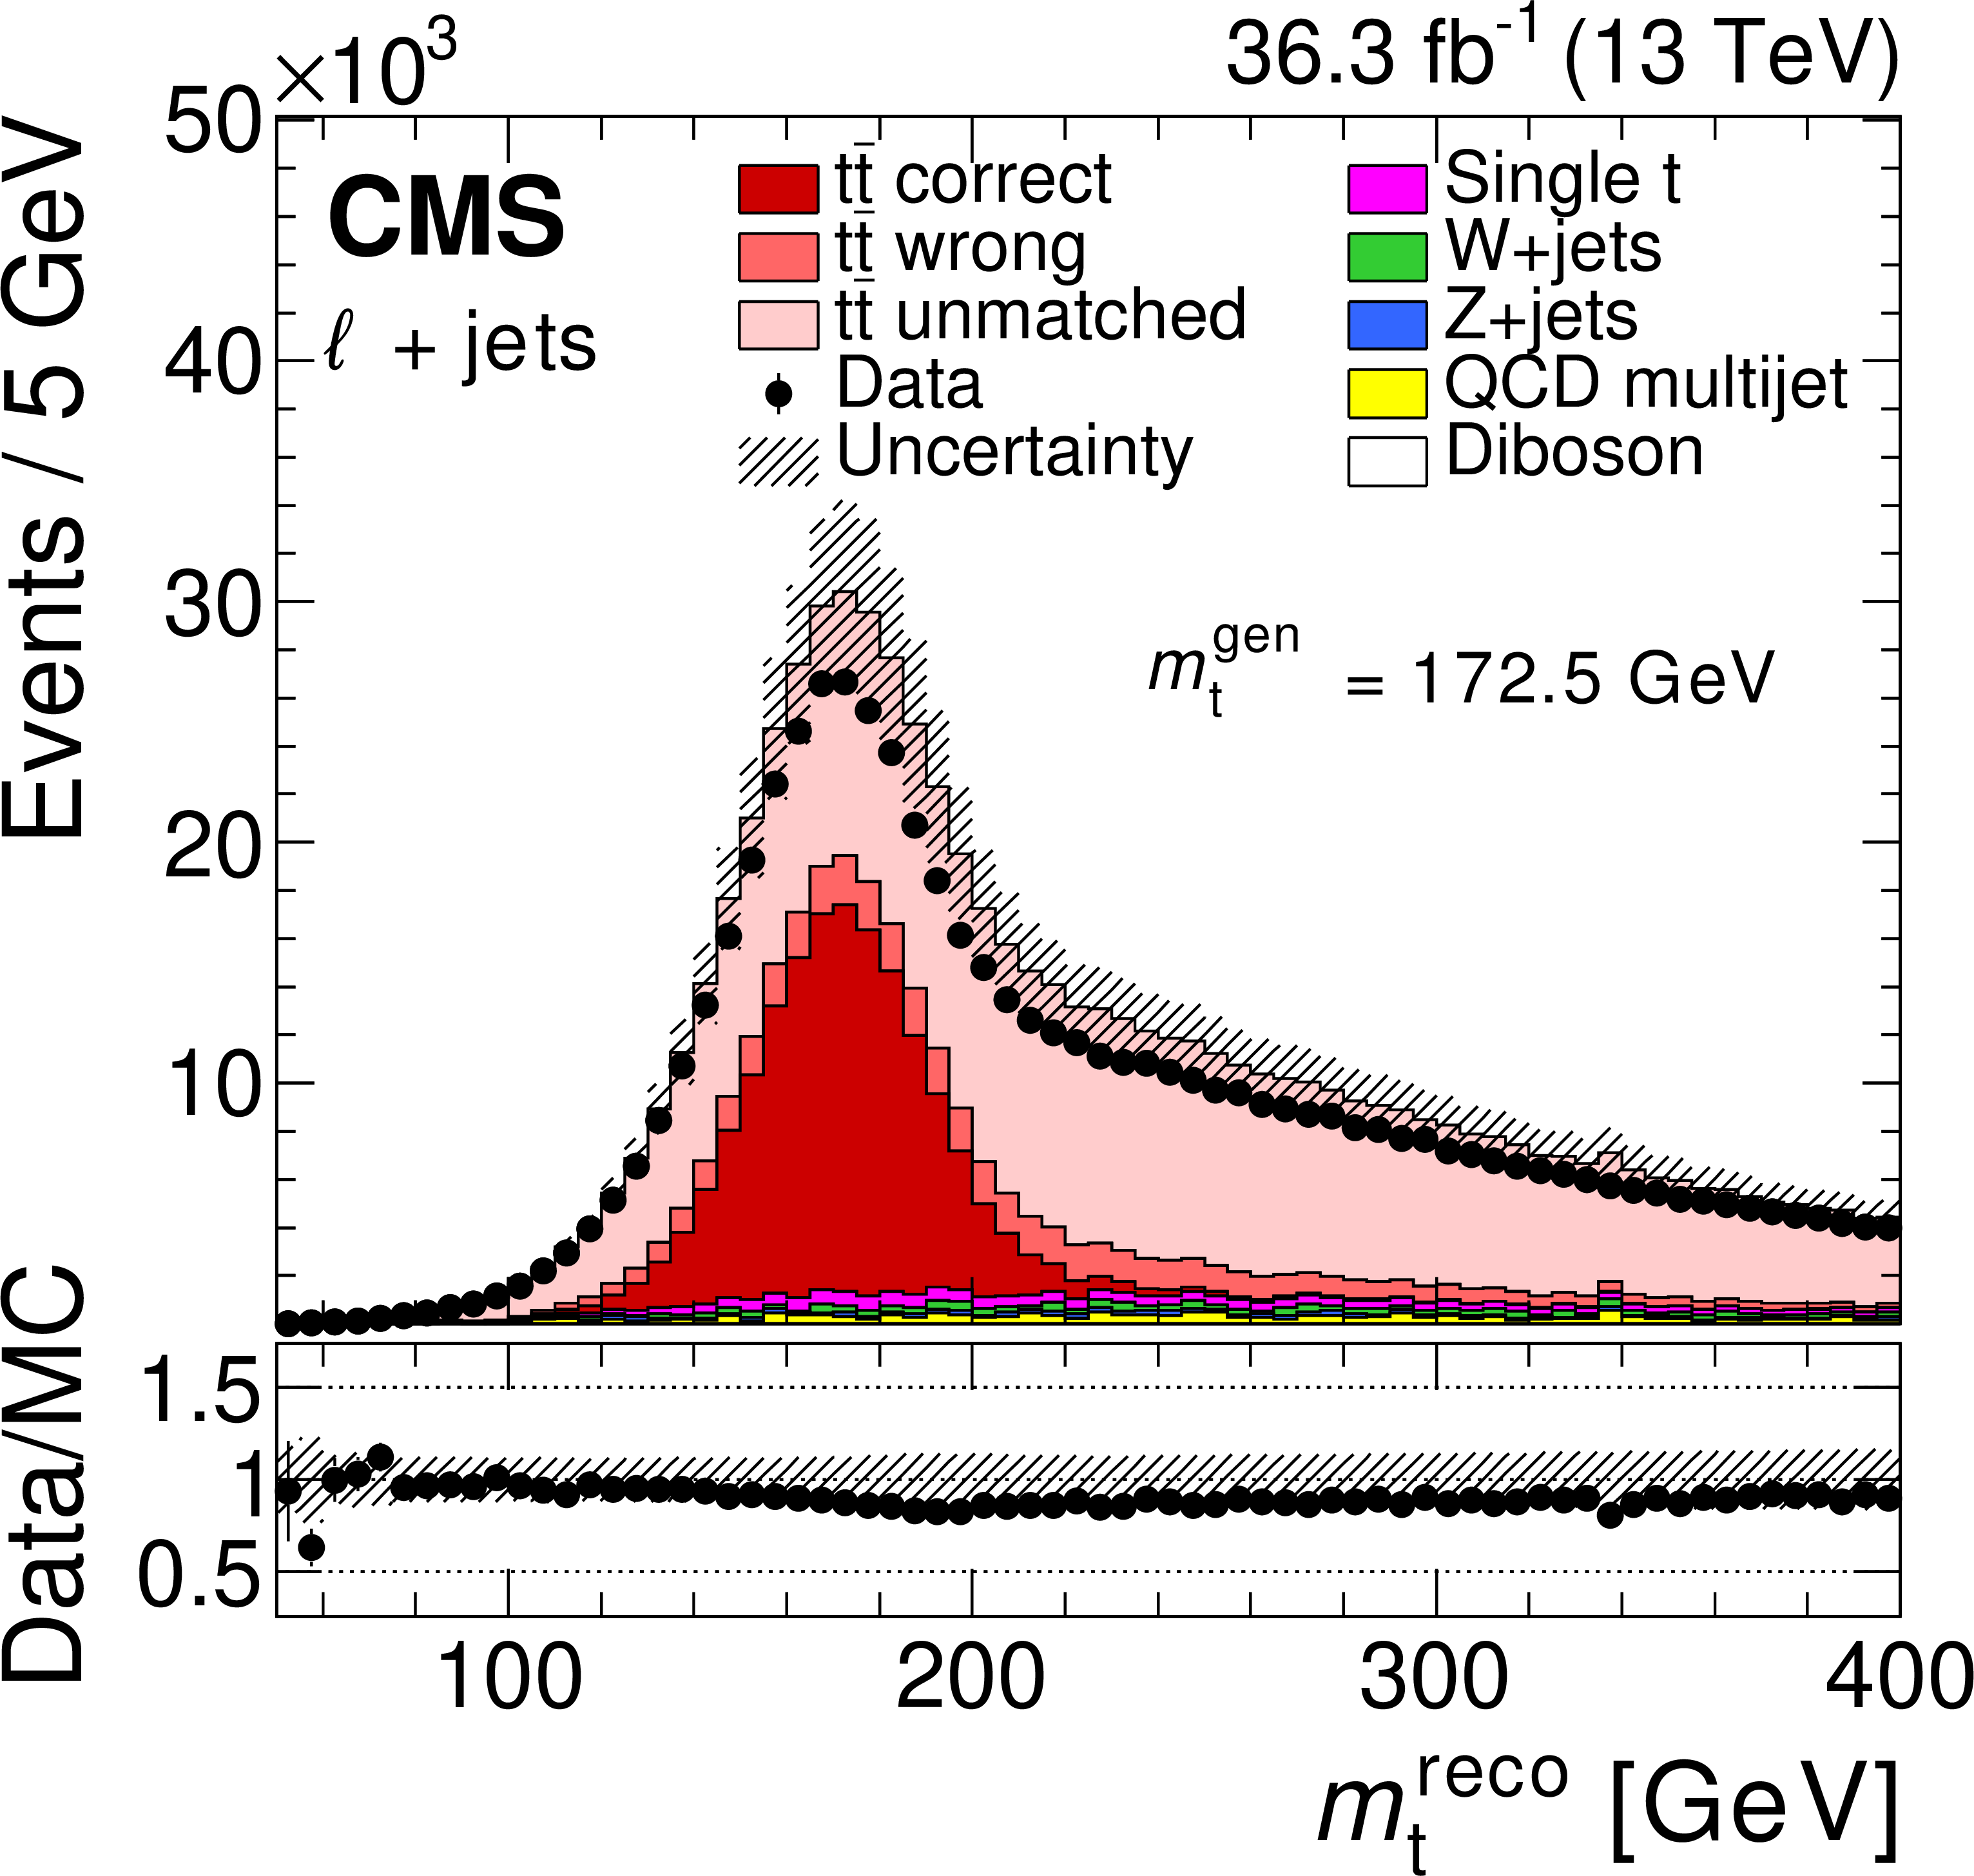
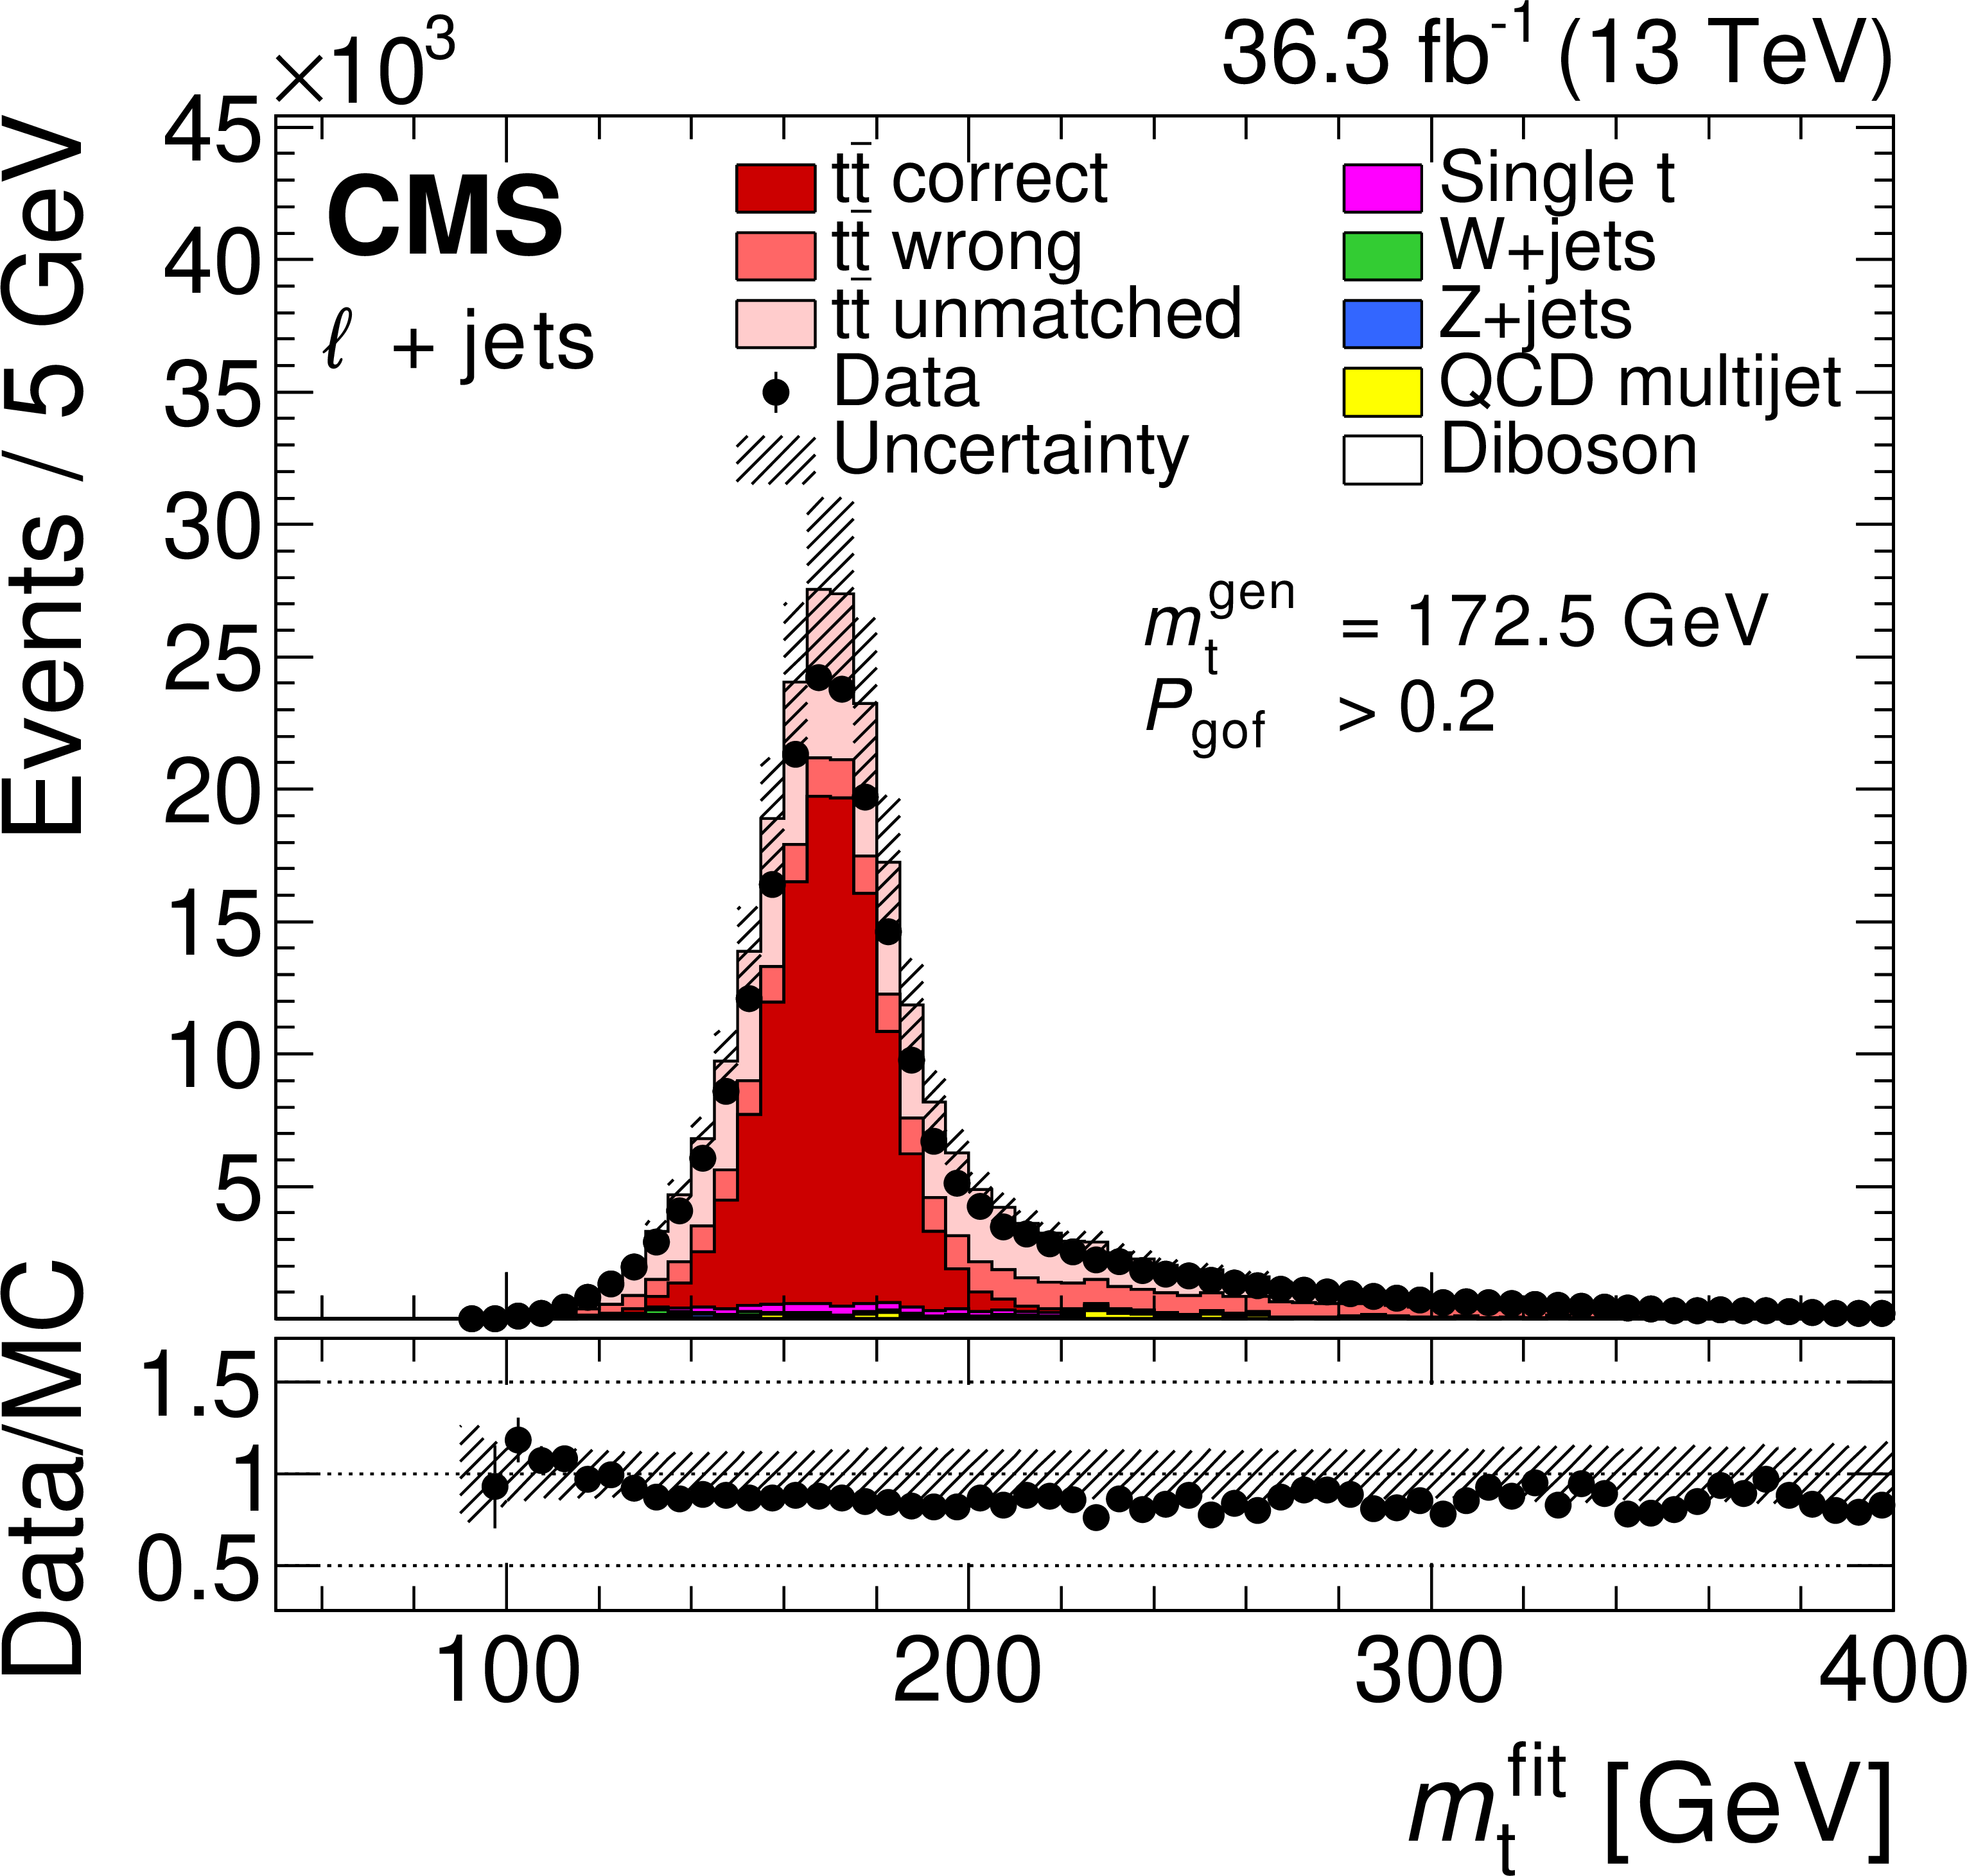
The top quark mass distribution before (left) and after (right) the $ P_\text{gof} > $ 0.2 selection and the kinematic fit. For the simulated $\mathrm{ t \bar{t} }$ events, the jet-parton assignments are classified as correct, wrong, and unmatched permutations, as described in the text. The uncertainty bands contain statistical uncertainties in the simulation, normalization uncertainties due to luminosity and cross section, jet energy correction uncertainties, and all uncertainties that are evaluated from event-based weights. A large part of the depicted uncertainties on the expected event yields are correlated. The lower panels show the ratio of data to the prediction. A value of $ m_{\,\mathrm{t}}^{\,\text{gen}} = $ 172.5 GeV is used in the simulation. |
png pdf |
Figure 1-a:
The top quark mass distribution before the $ P_\text{gof} > $ 0.2 selection and the kinematic fit. For the simulated $\mathrm{ t \bar{t} }$ events, the jet-parton assignments are classified as correct, wrong, and unmatched permutations, as described in the text. The uncertainty bands contain statistical uncertainties in the simulation, normalization uncertainties due to luminosity and cross section, jet energy correction uncertainties, and all uncertainties that are evaluated from event-based weights. A large part of the depicted uncertainties on the expected event yields are correlated. The lower panel shows the ratio of data to the prediction. A value of $ m_{\,\mathrm{t}}^{\,\text{gen}} = $ 172.5 GeV is used in the simulation. |
png pdf |
Figure 1-b:
The top quark mass distribution after the $ P_\text{gof} > $ 0.2 selection and the kinematic fit. For the simulated $\mathrm{ t \bar{t} }$ events, the jet-parton assignments are classified as correct, wrong, and unmatched permutations, as described in the text. The uncertainty bands contain statistical uncertainties in the simulation, normalization uncertainties due to luminosity and cross section, jet energy correction uncertainties, and all uncertainties that are evaluated from event-based weights. A large part of the depicted uncertainties on the expected event yields are correlated. The lower panel shows the ratio of data to the prediction. A value of $ m_{\,\mathrm{t}}^{\,\text{gen}} = $ 172.5 GeV is used in the simulation. |

png pdf |
Figure 2:
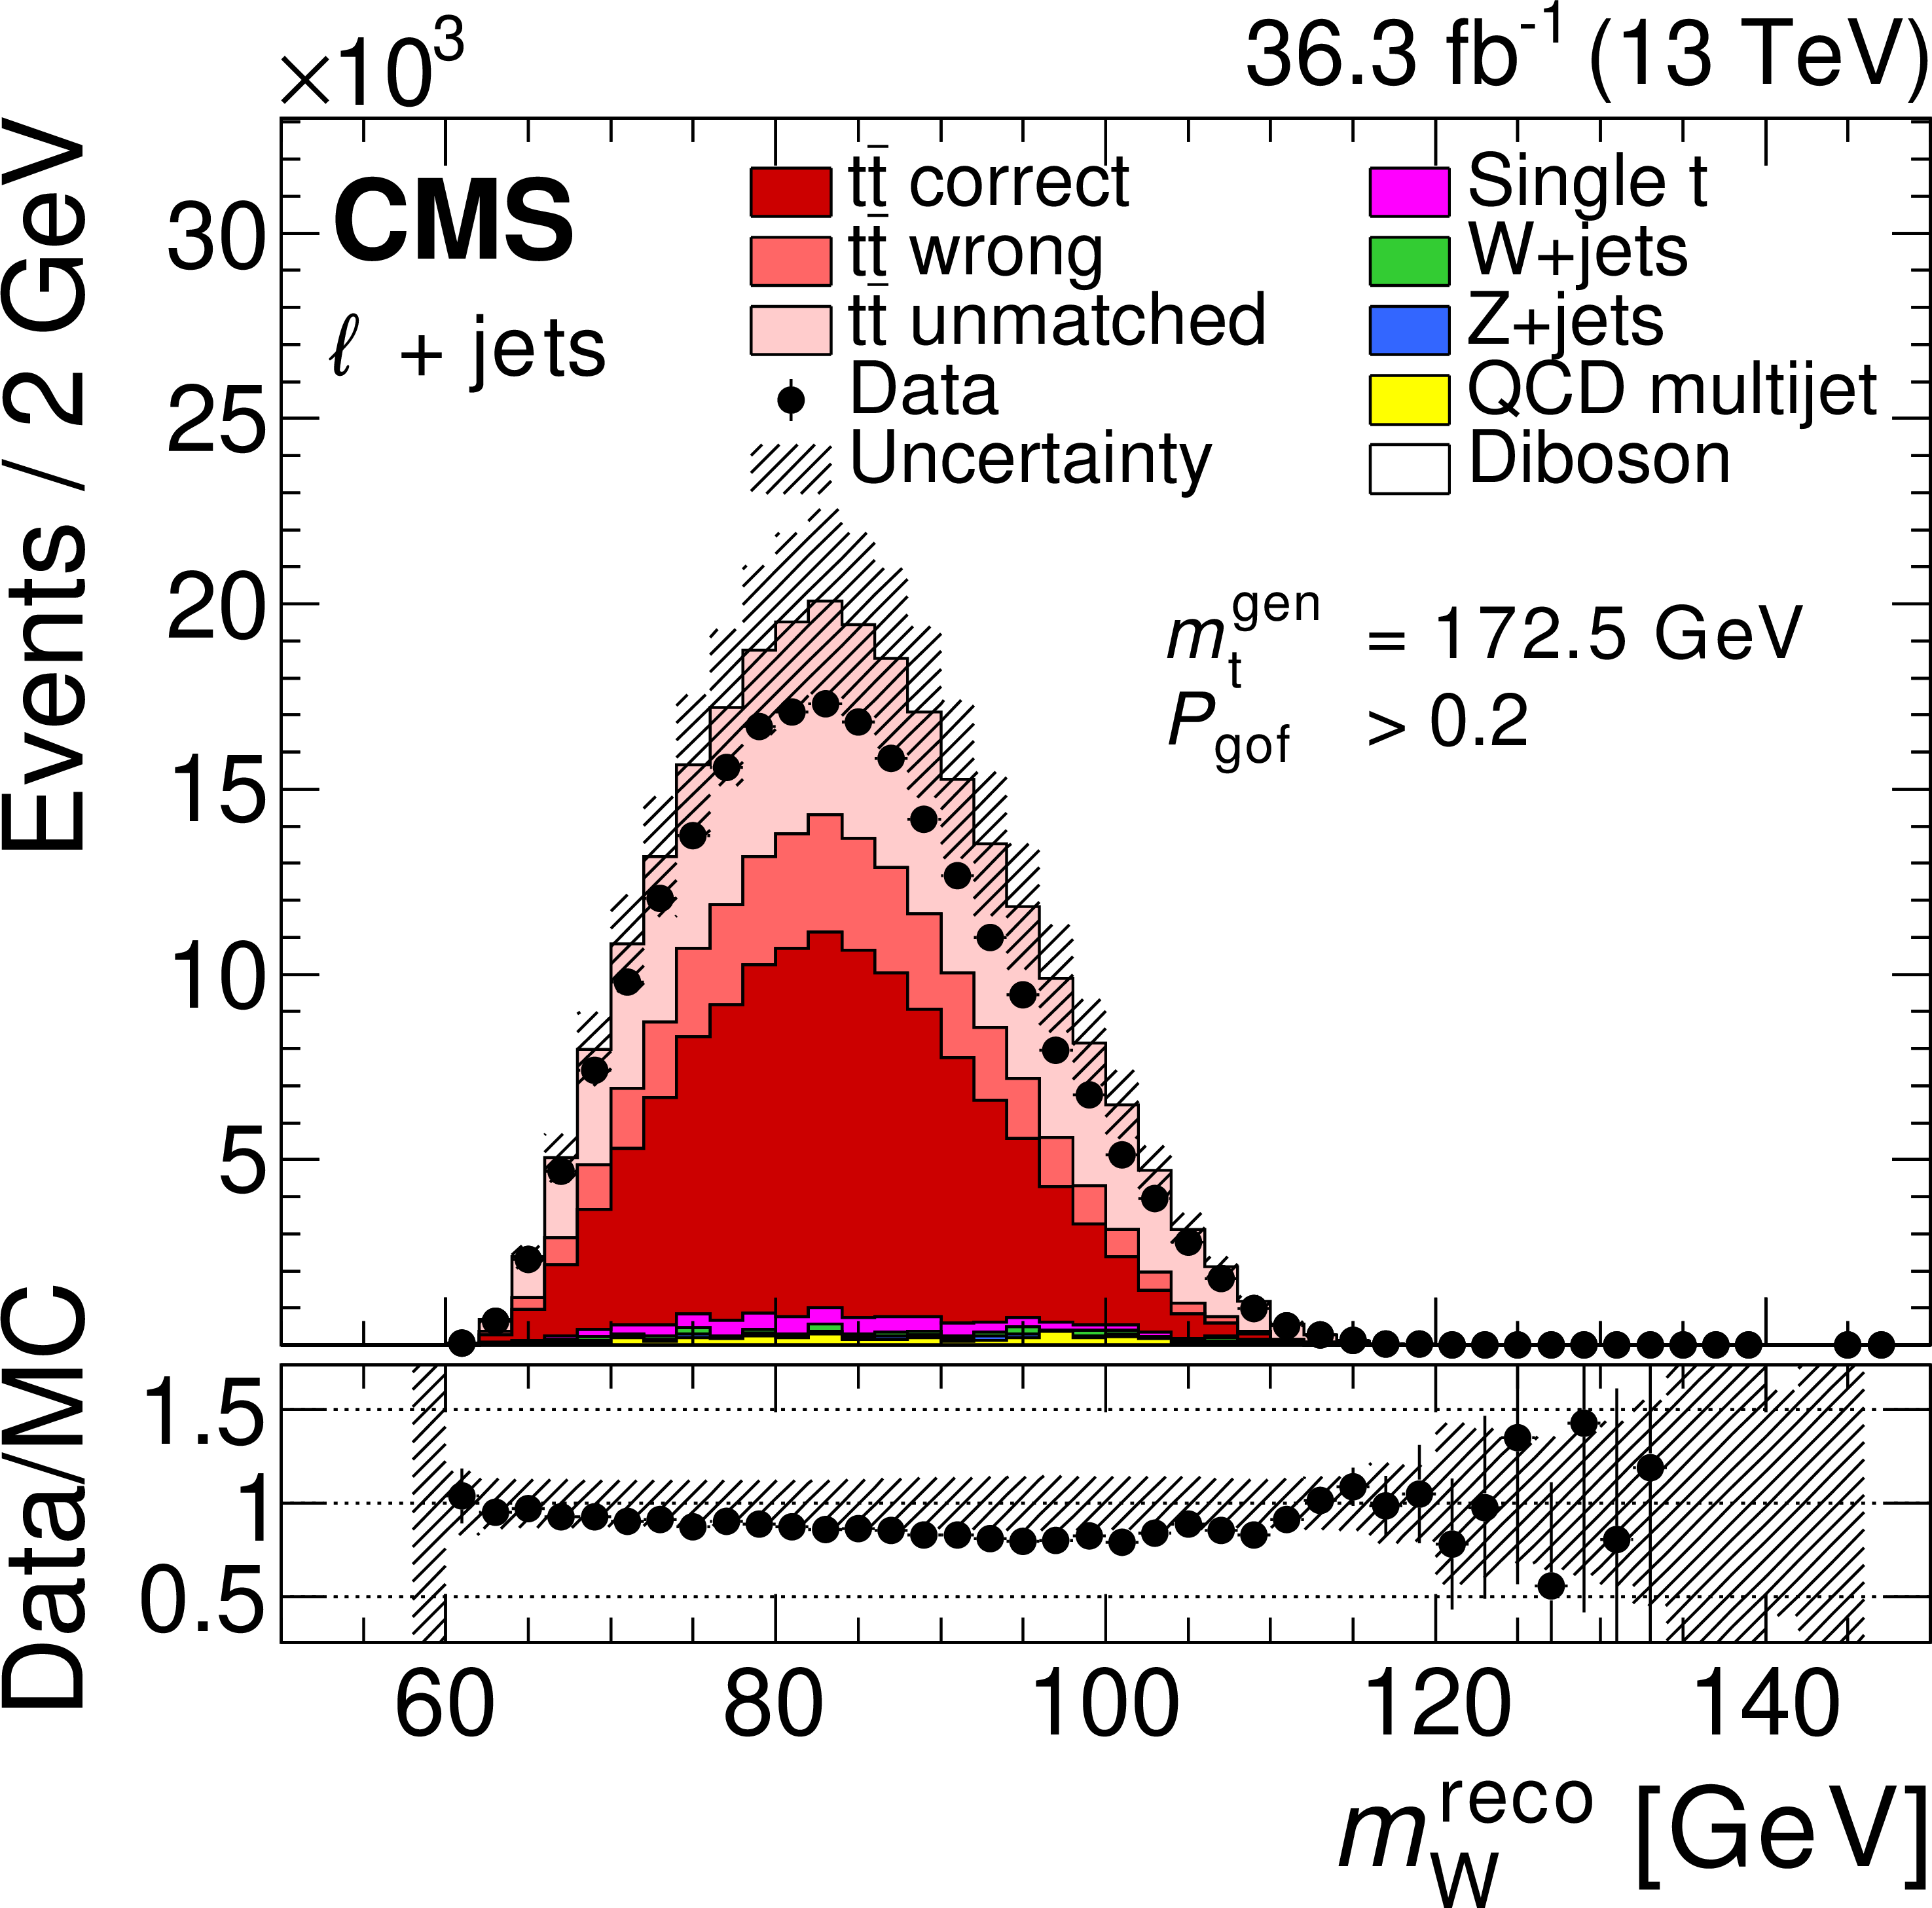
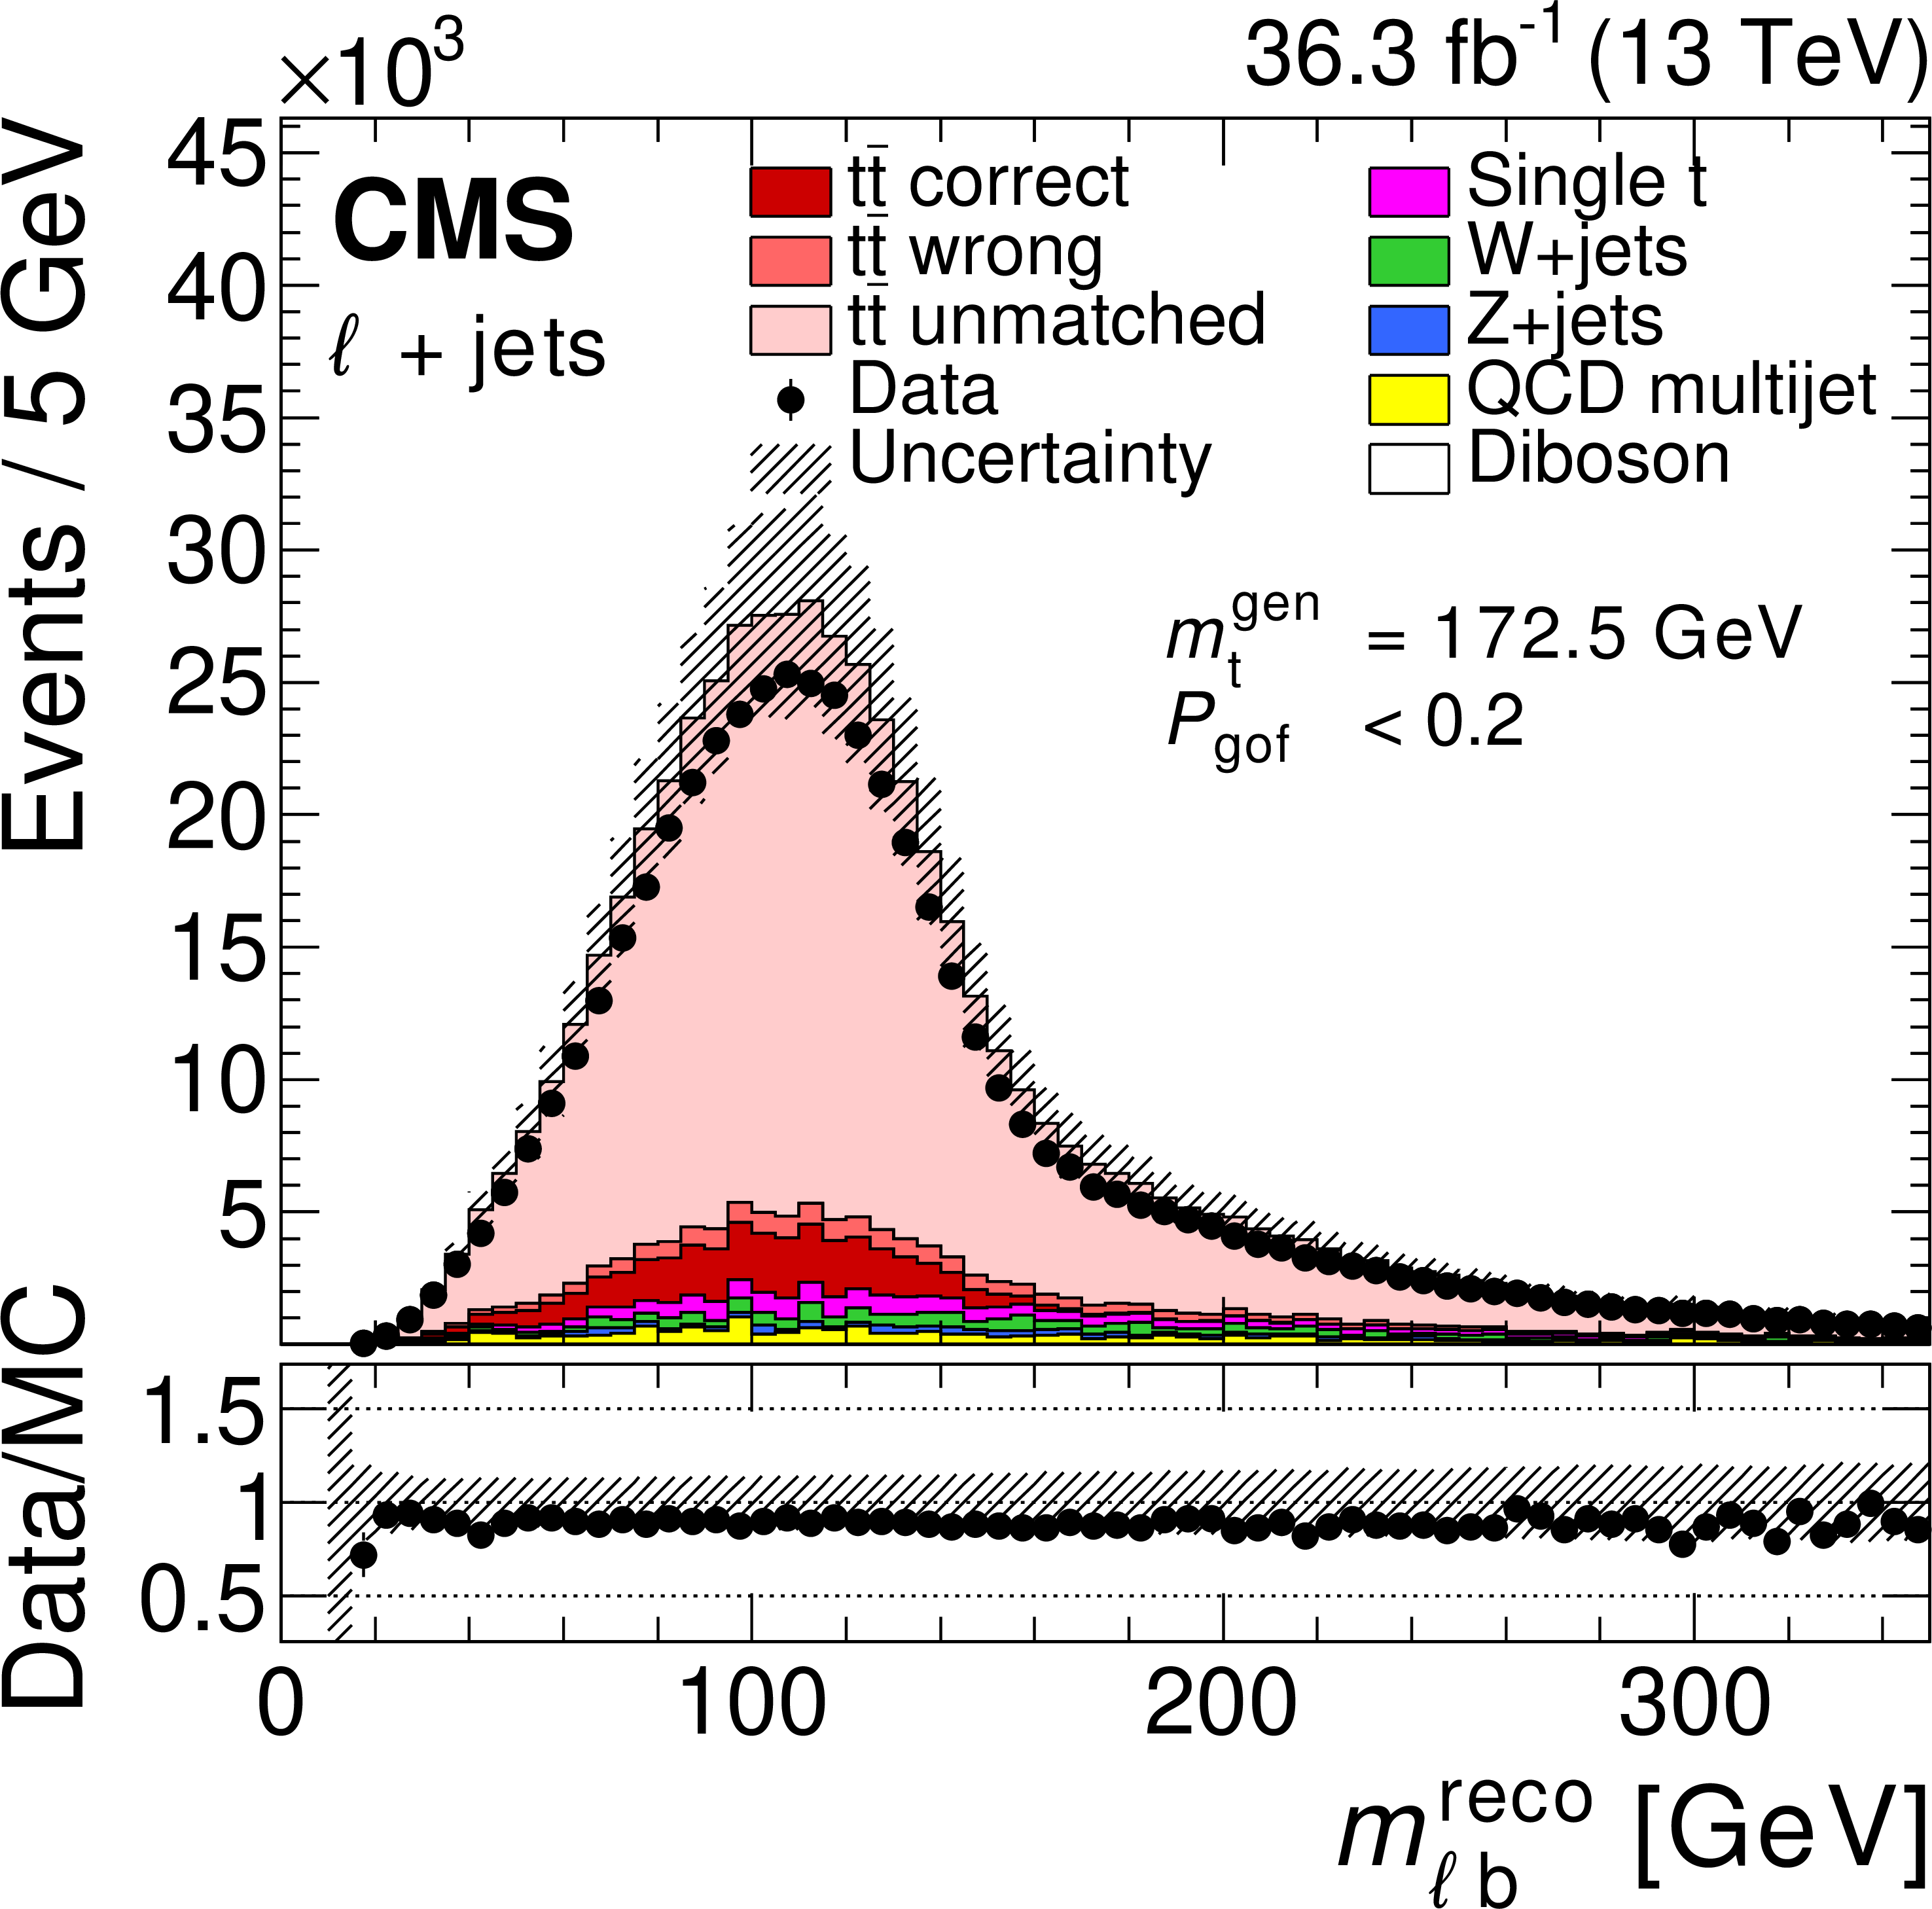
The distributions of the reconstructed W boson mass for the $ P_\text{gof} > $ 0.2 category (left) and of the invariant mass of the lepton and the jet assigned to the semileptonic decaying top quark for the $ P_\text{gof} < $ 0.2 category (right). The uncertainty bands contain statistical uncertainties in the simulation, normalization uncertainties due to luminosity and cross section, jet energy correction uncertainties, and all uncertainties that are evaluated from event-based weights. A large part of the depicted uncertainties on the expected event yields are correlated. The lower panels show the ratio of data to the prediction. A value of $ m_{\,\mathrm{t}}^{\,\text{gen}} = $ 172.5 GeV is used in the simulation. |
png pdf |
Figure 2-a:
The distribution of the reconstructed W boson mass for the $ P_\text{gof} > $ 0.2 category. The uncertainty bands contain statistical uncertainties in the simulation, normalization uncertainties due to luminosity and cross section, jet energy correction uncertainties, and all uncertainties that are evaluated from event-based weights. A large part of the depicted uncertainties on the expected event yields are correlated. The lower panel shows the ratio of data to the prediction. A value of $ m_{\,\mathrm{t}}^{\,\text{gen}} = $ 172.5 GeV is used in the simulation. |
png pdf |
Figure 2-b:
The distribution of the invariant mass of the lepton and the jet assigned to the semileptonic decaying top quark for the $ P_\text{gof} < $ 0.2 category. The uncertainty bands contain statistical uncertainties in the simulation, normalization uncertainties due to luminosity and cross section, jet energy correction uncertainties, and all uncertainties that are evaluated from event-based weights. A large part of the depicted uncertainties on the expected event yields are correlated. The lower panel shows the ratio of data to the prediction. A value of $ m_{\,\mathrm{t}}^{\,\text{gen}} = $ 172.5 GeV is used in the simulation. |
png pdf |
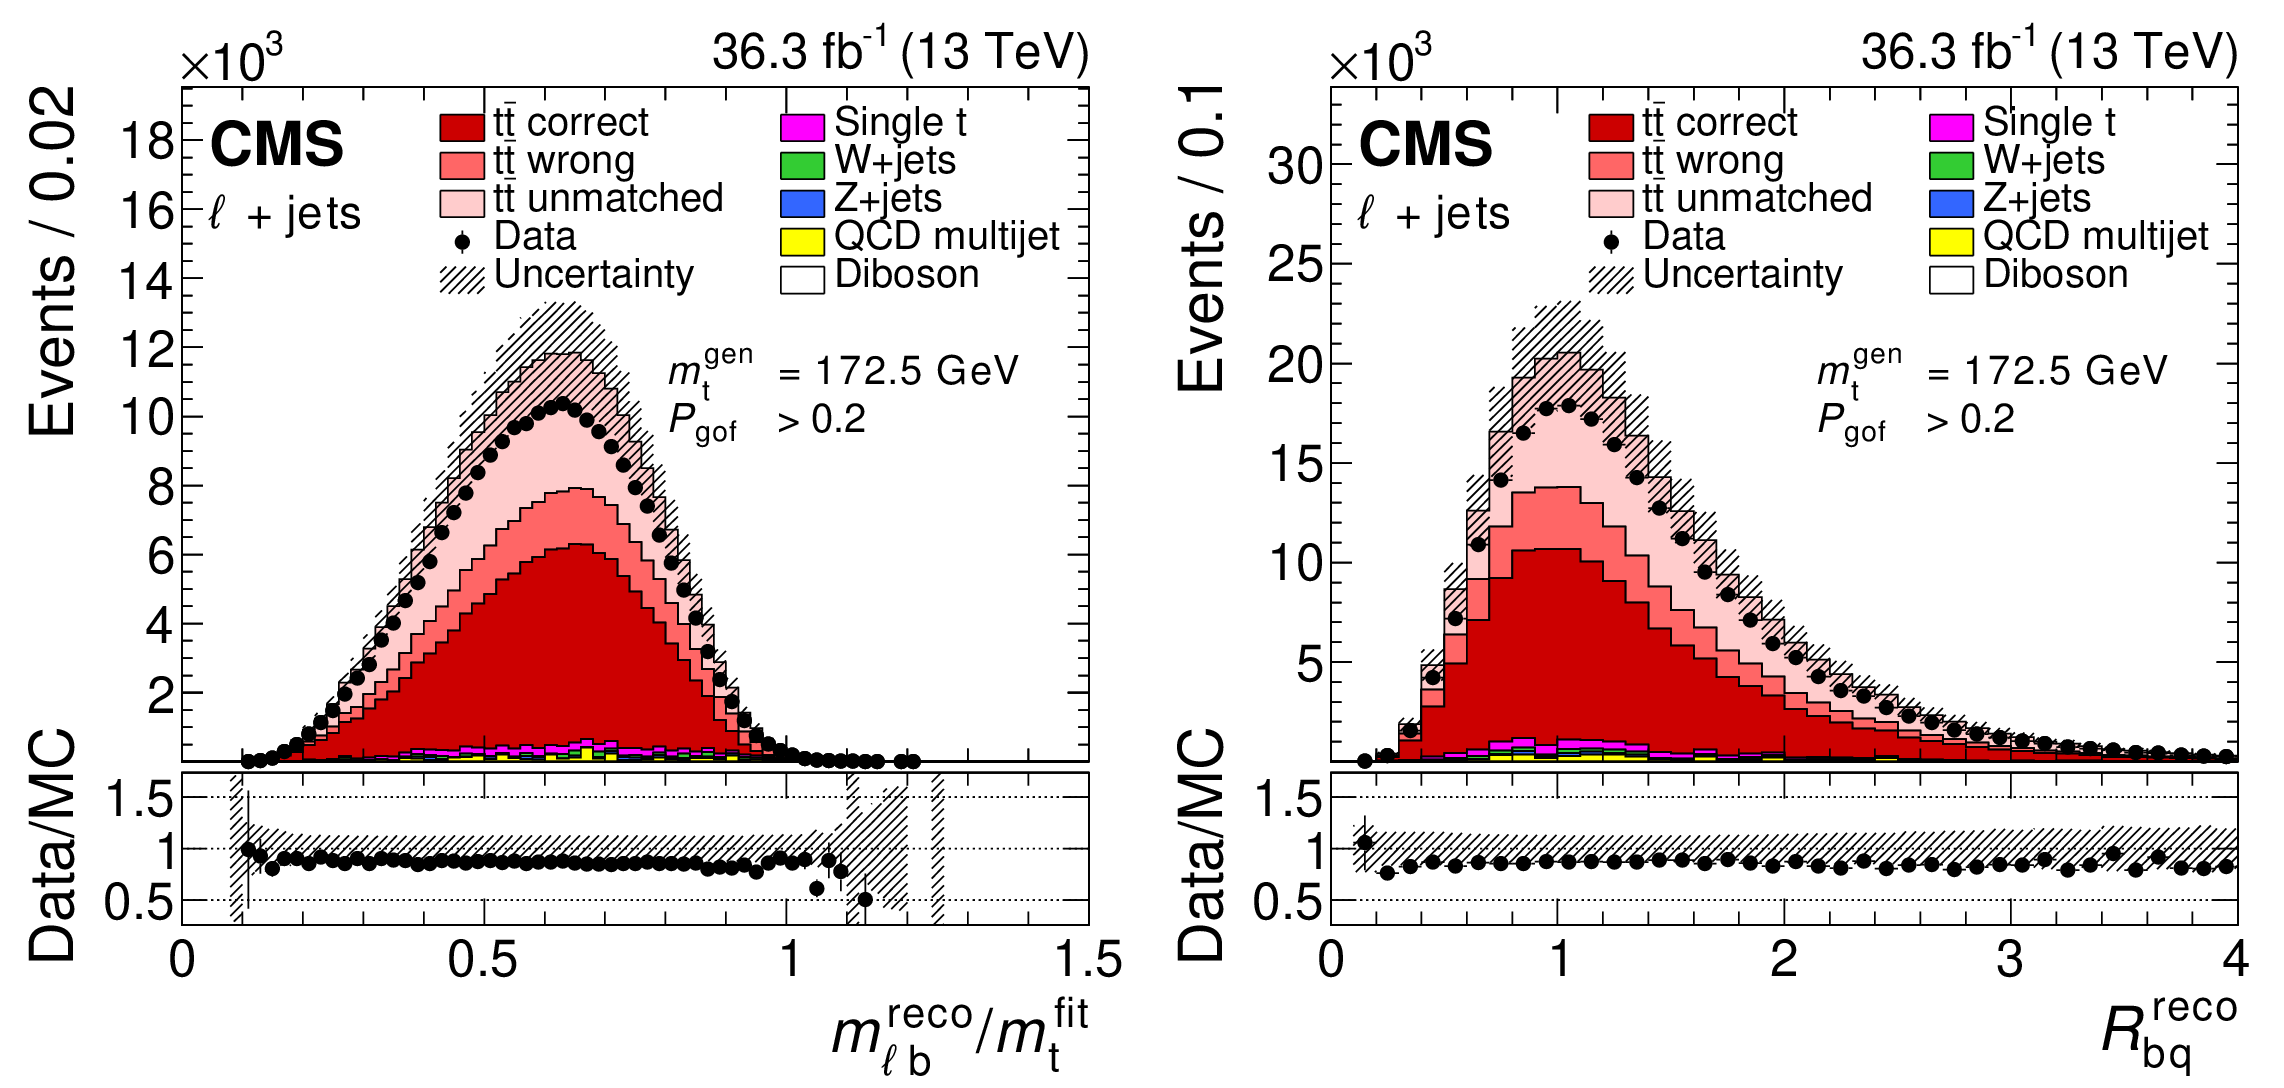
Figure 3:
The distributions of $ m_{\ell\mathrm{b}}^{\,\text{reco}}/m_{\,\mathrm{t}}^{\,\text{fit}} $ (left) and of $ R_{\mathrm{b}\mathrm{q}}^{\,\text{reco}} $ (right), both for the $ P_\text{gof} > $ 0.2 category. The uncertainty bands contain statistical uncertainties in the simulation, normalization uncertainties due to luminosity and cross section, jet energy correction uncertainties, and all uncertainties that are evaluated from event-based weights. A large part of the depicted uncertainties on the expected event yields are correlated. The lower panels show the ratio of data to the prediction. A value of $ m_{\,\mathrm{t}}^{\,\text{gen}} = $ 172.5 GeV is used in the simulation. |
png pdf |
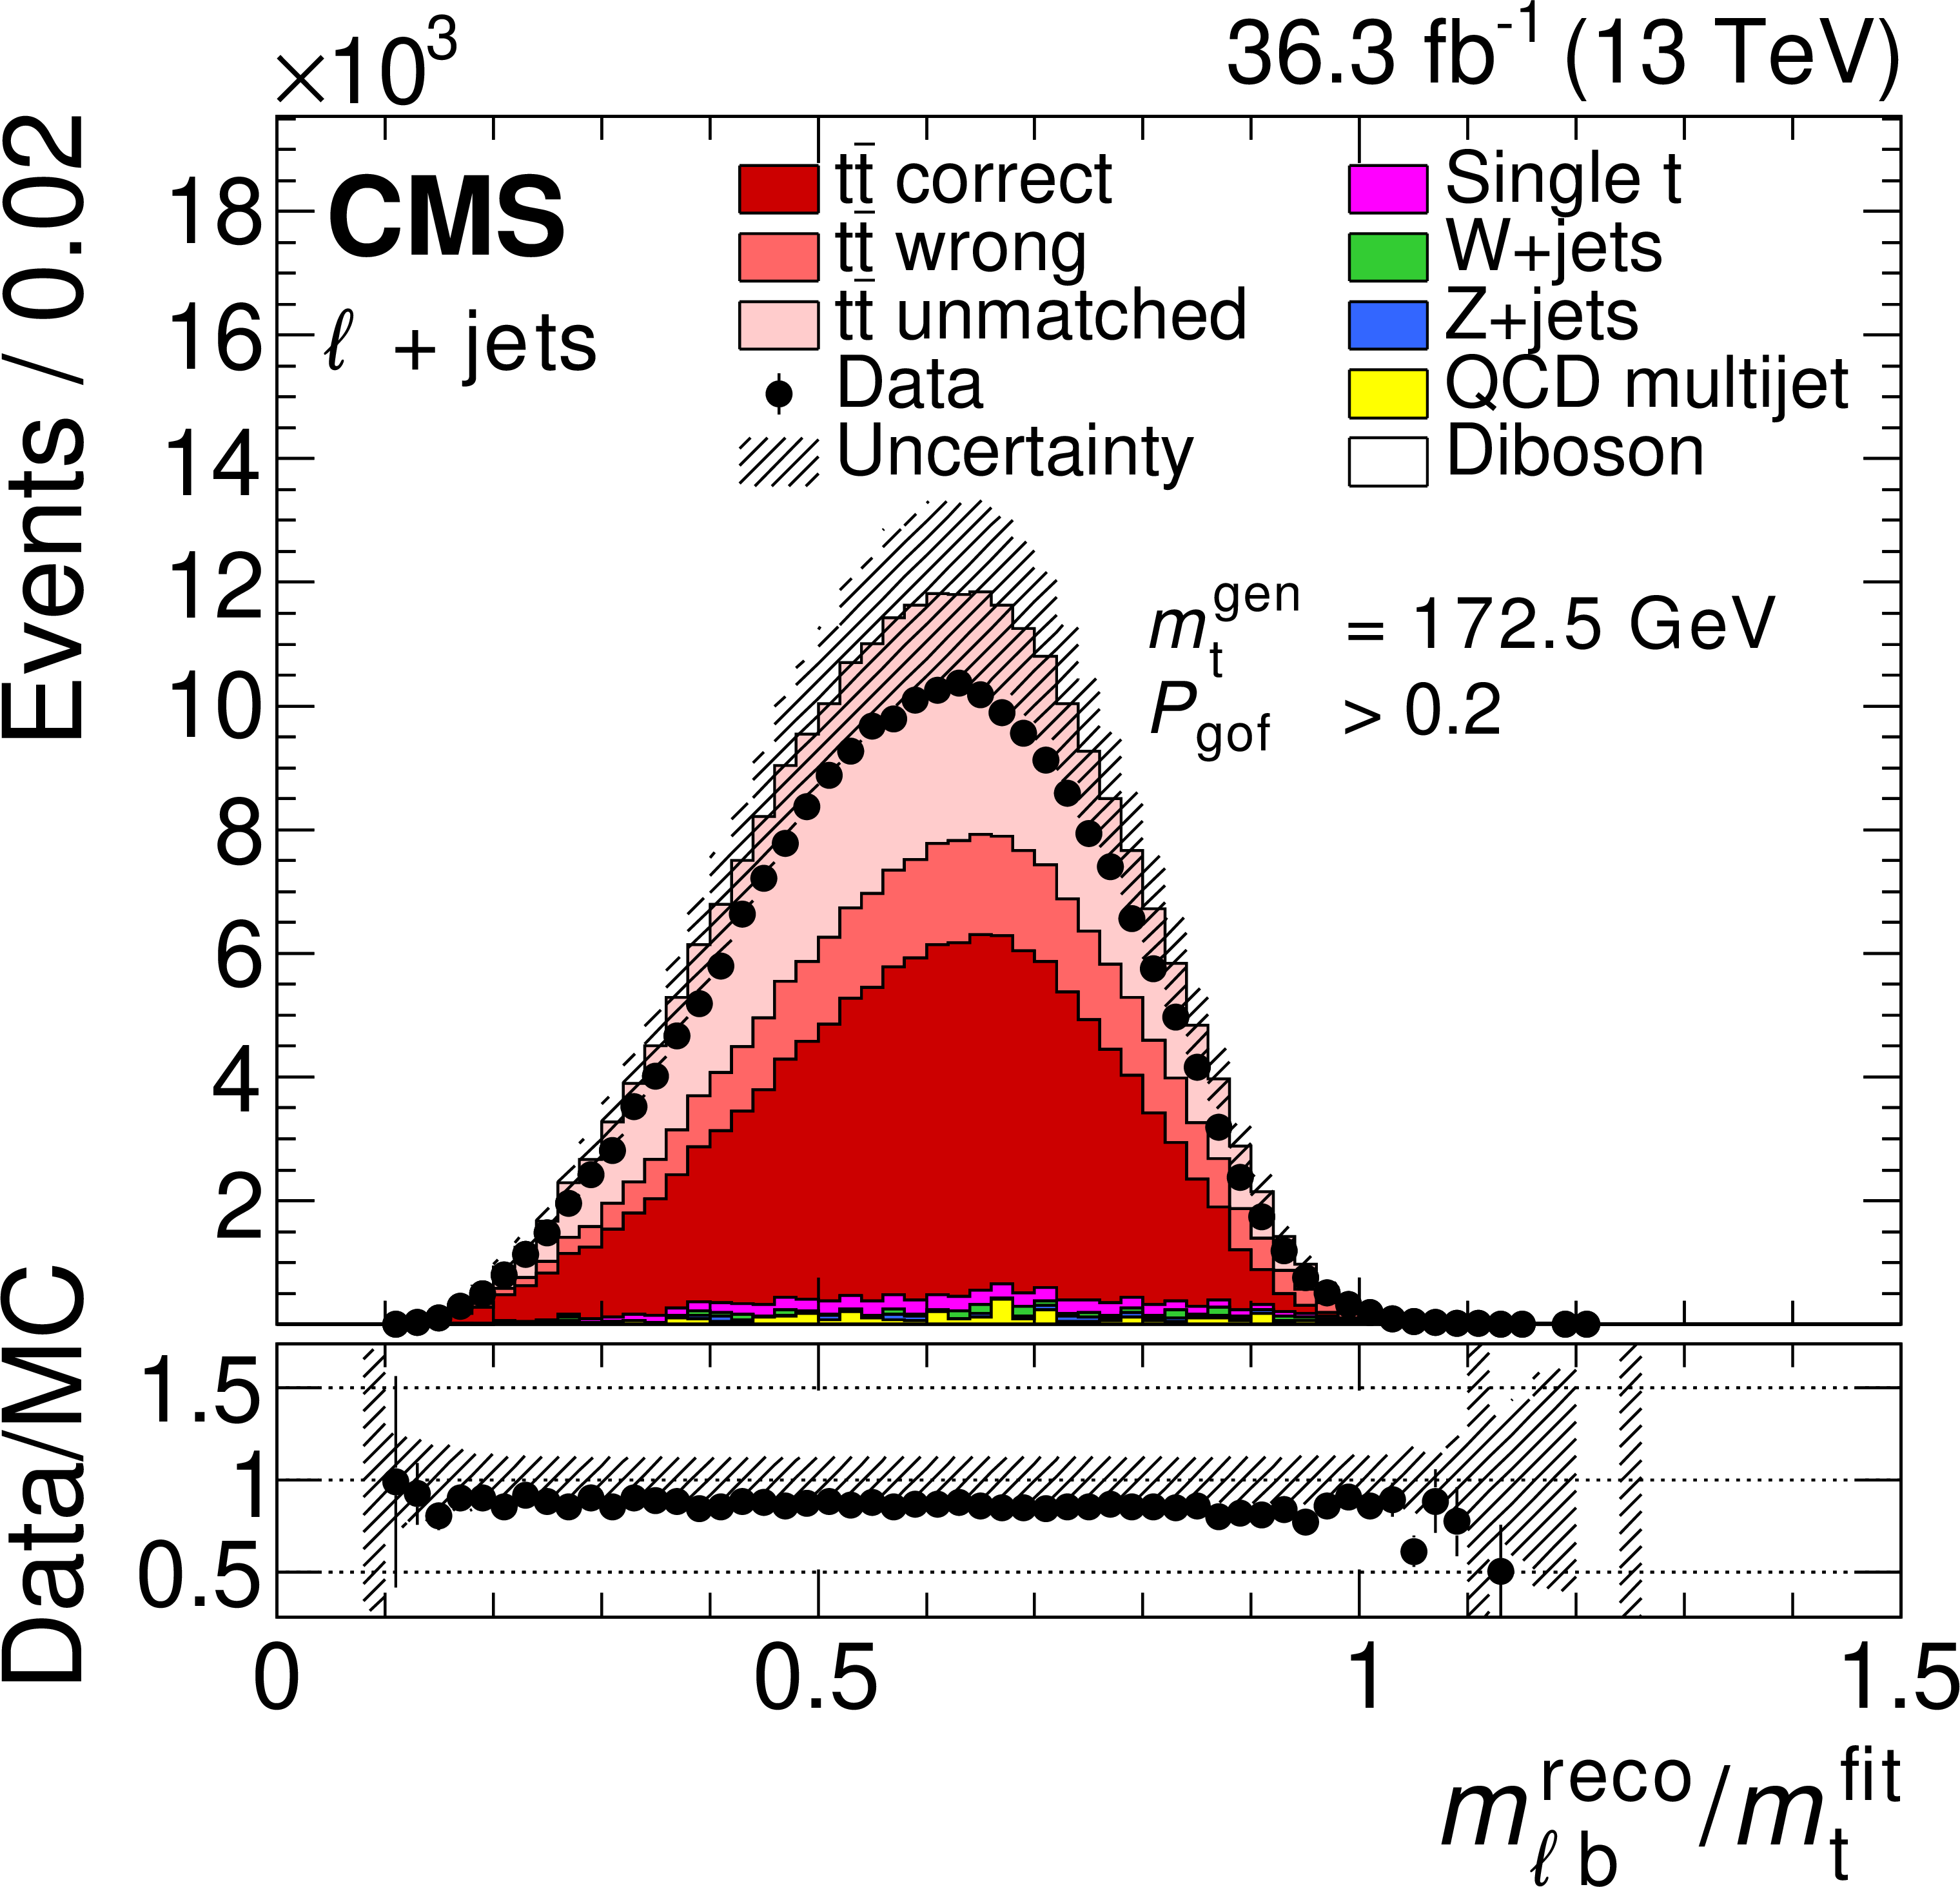
Figure 3-a:
The distribution of $ m_{\ell\mathrm{b}}^{\,\text{reco}}/m_{\,\mathrm{t}}^{\,\text{fit}} $, for the $ P_\text{gof} > $ 0.2 category. The uncertainty bands contain statistical uncertainties in the simulation, normalization uncertainties due to luminosity and cross section, jet energy correction uncertainties, and all uncertainties that are evaluated from event-based weights. A large part of the depicted uncertainties on the expected event yields are correlated. The lower panel shows the ratio of data to the prediction. A value of $ m_{\,\mathrm{t}}^{\,\text{gen}} = $ 172.5 GeV is used in the simulation. |
png pdf |
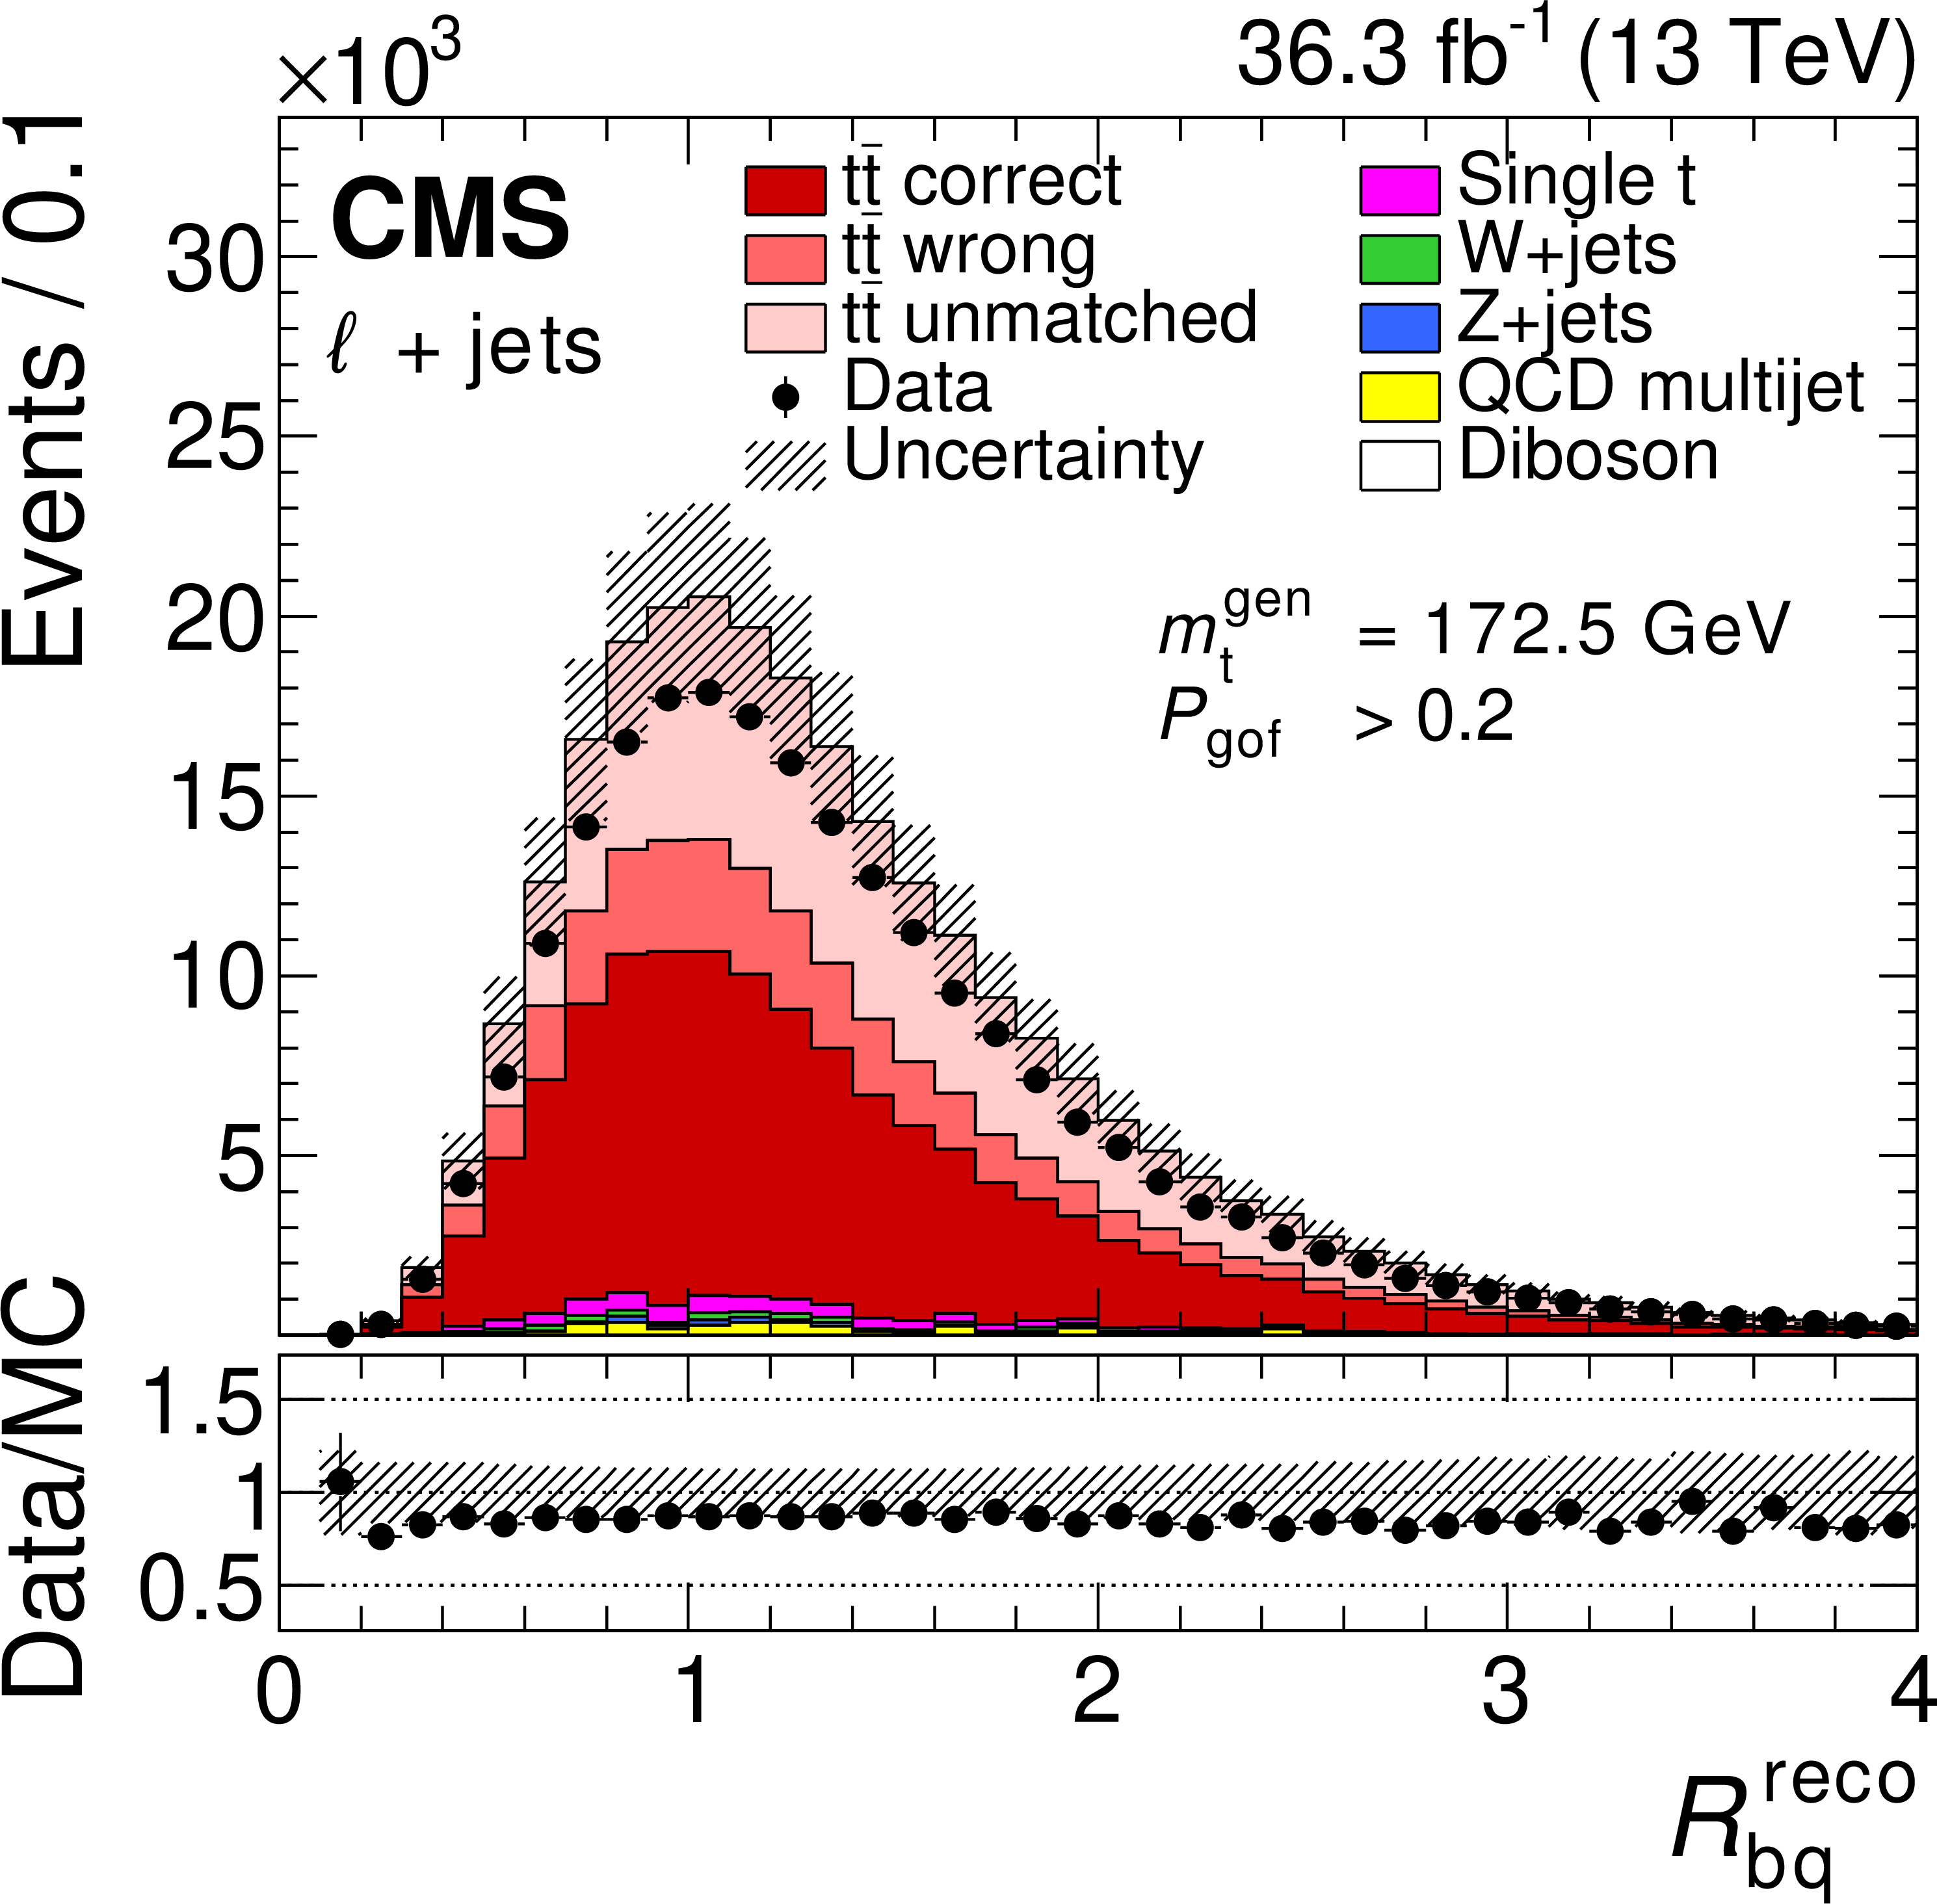
Figure 3-b:
The distribution of $ R_{\mathrm{b}\mathrm{q}}^{\,\text{reco}} $, for the $ P_\text{gof} > $ 0.2 category. The uncertainty bands contain statistical uncertainties in the simulation, normalization uncertainties due to luminosity and cross section, jet energy correction uncertainties, and all uncertainties that are evaluated from event-based weights. A large part of the depicted uncertainties on the expected event yields are correlated. The lower panel shows the ratio of data to the prediction. A value of $ m_{\,\mathrm{t}}^{\,\text{gen}} = $ 172.5 GeV is used in the simulation. |
png pdf |
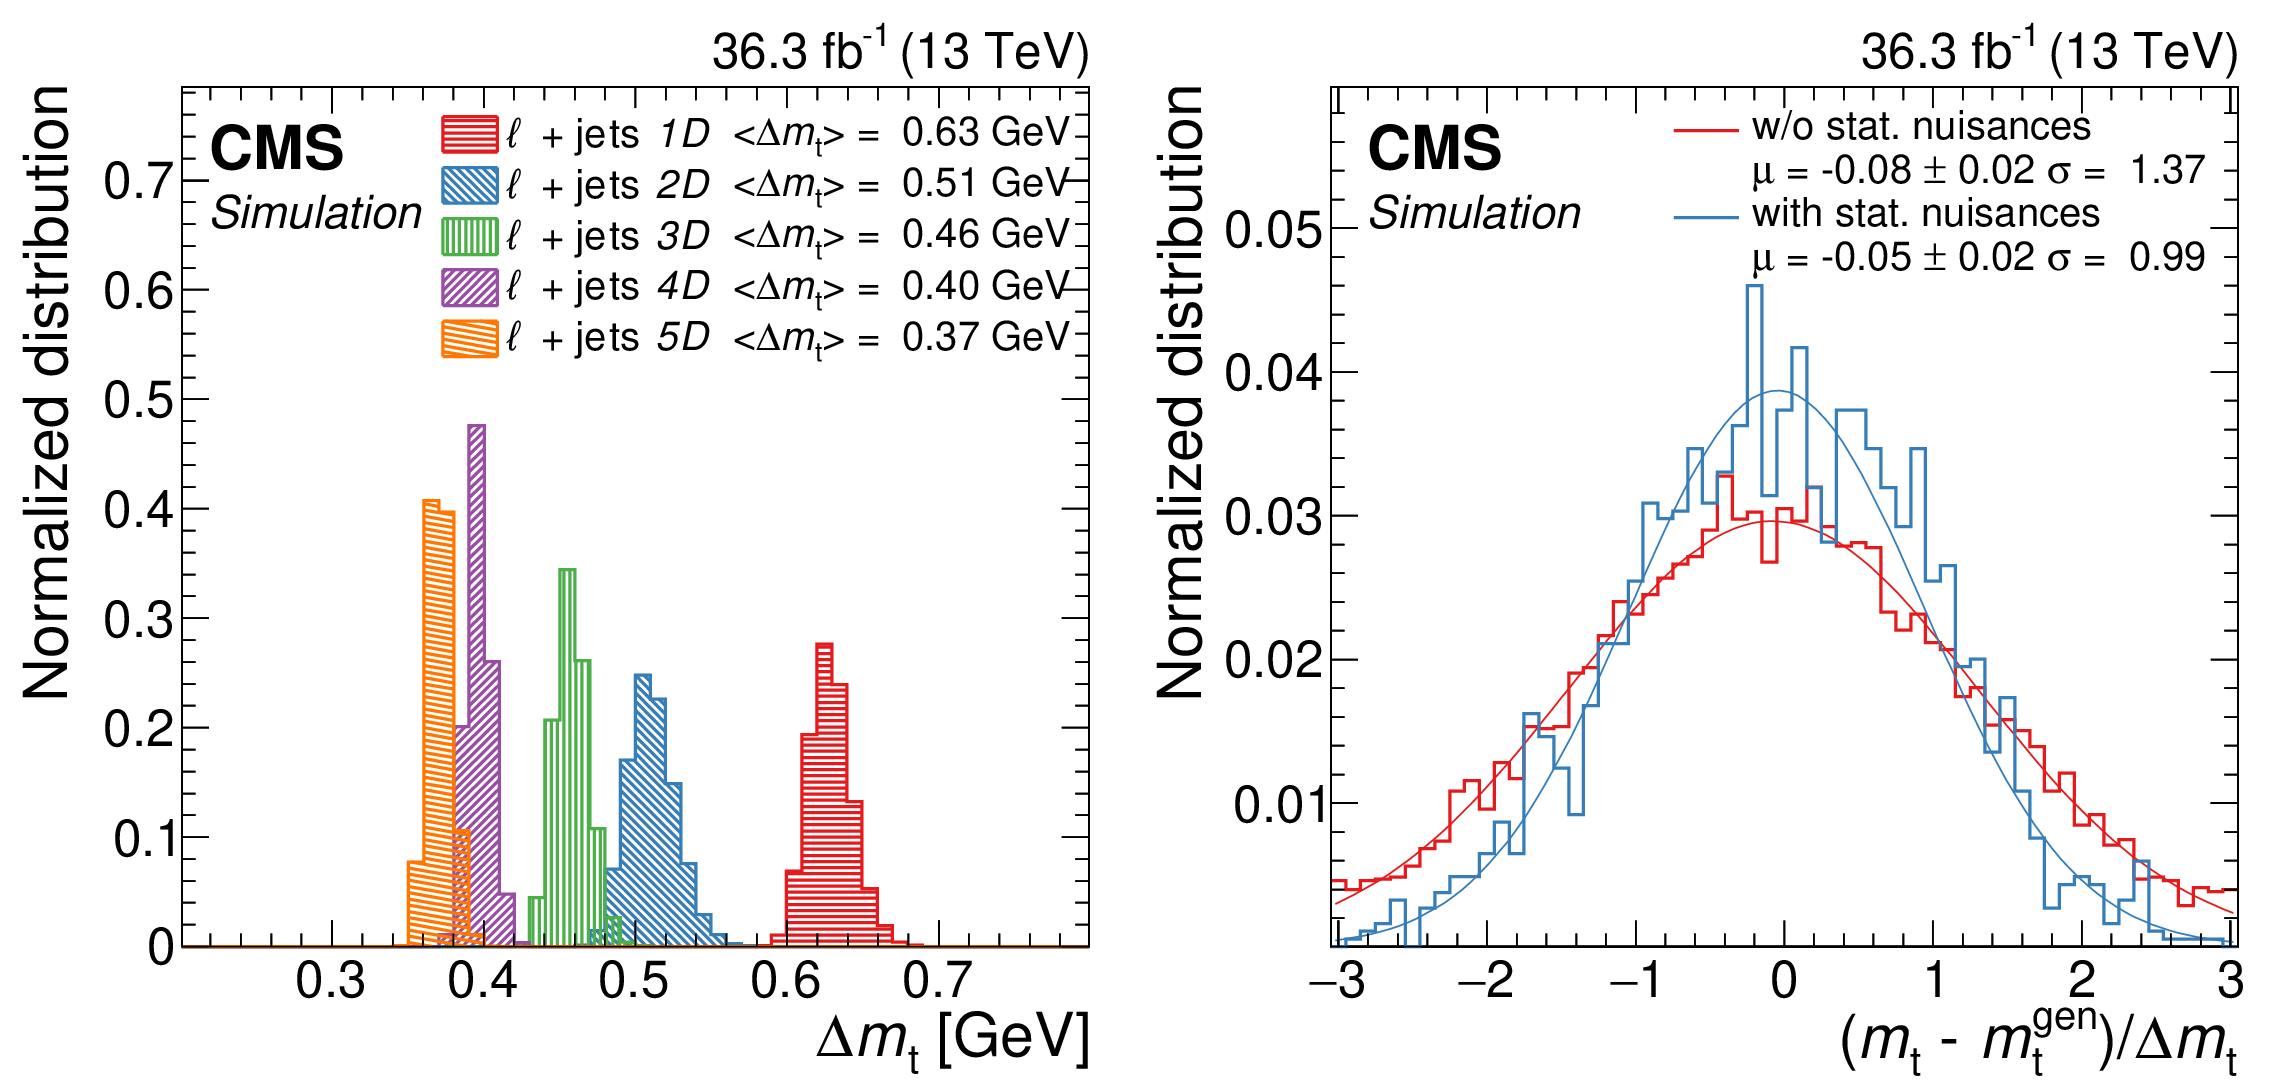
Figure 4:
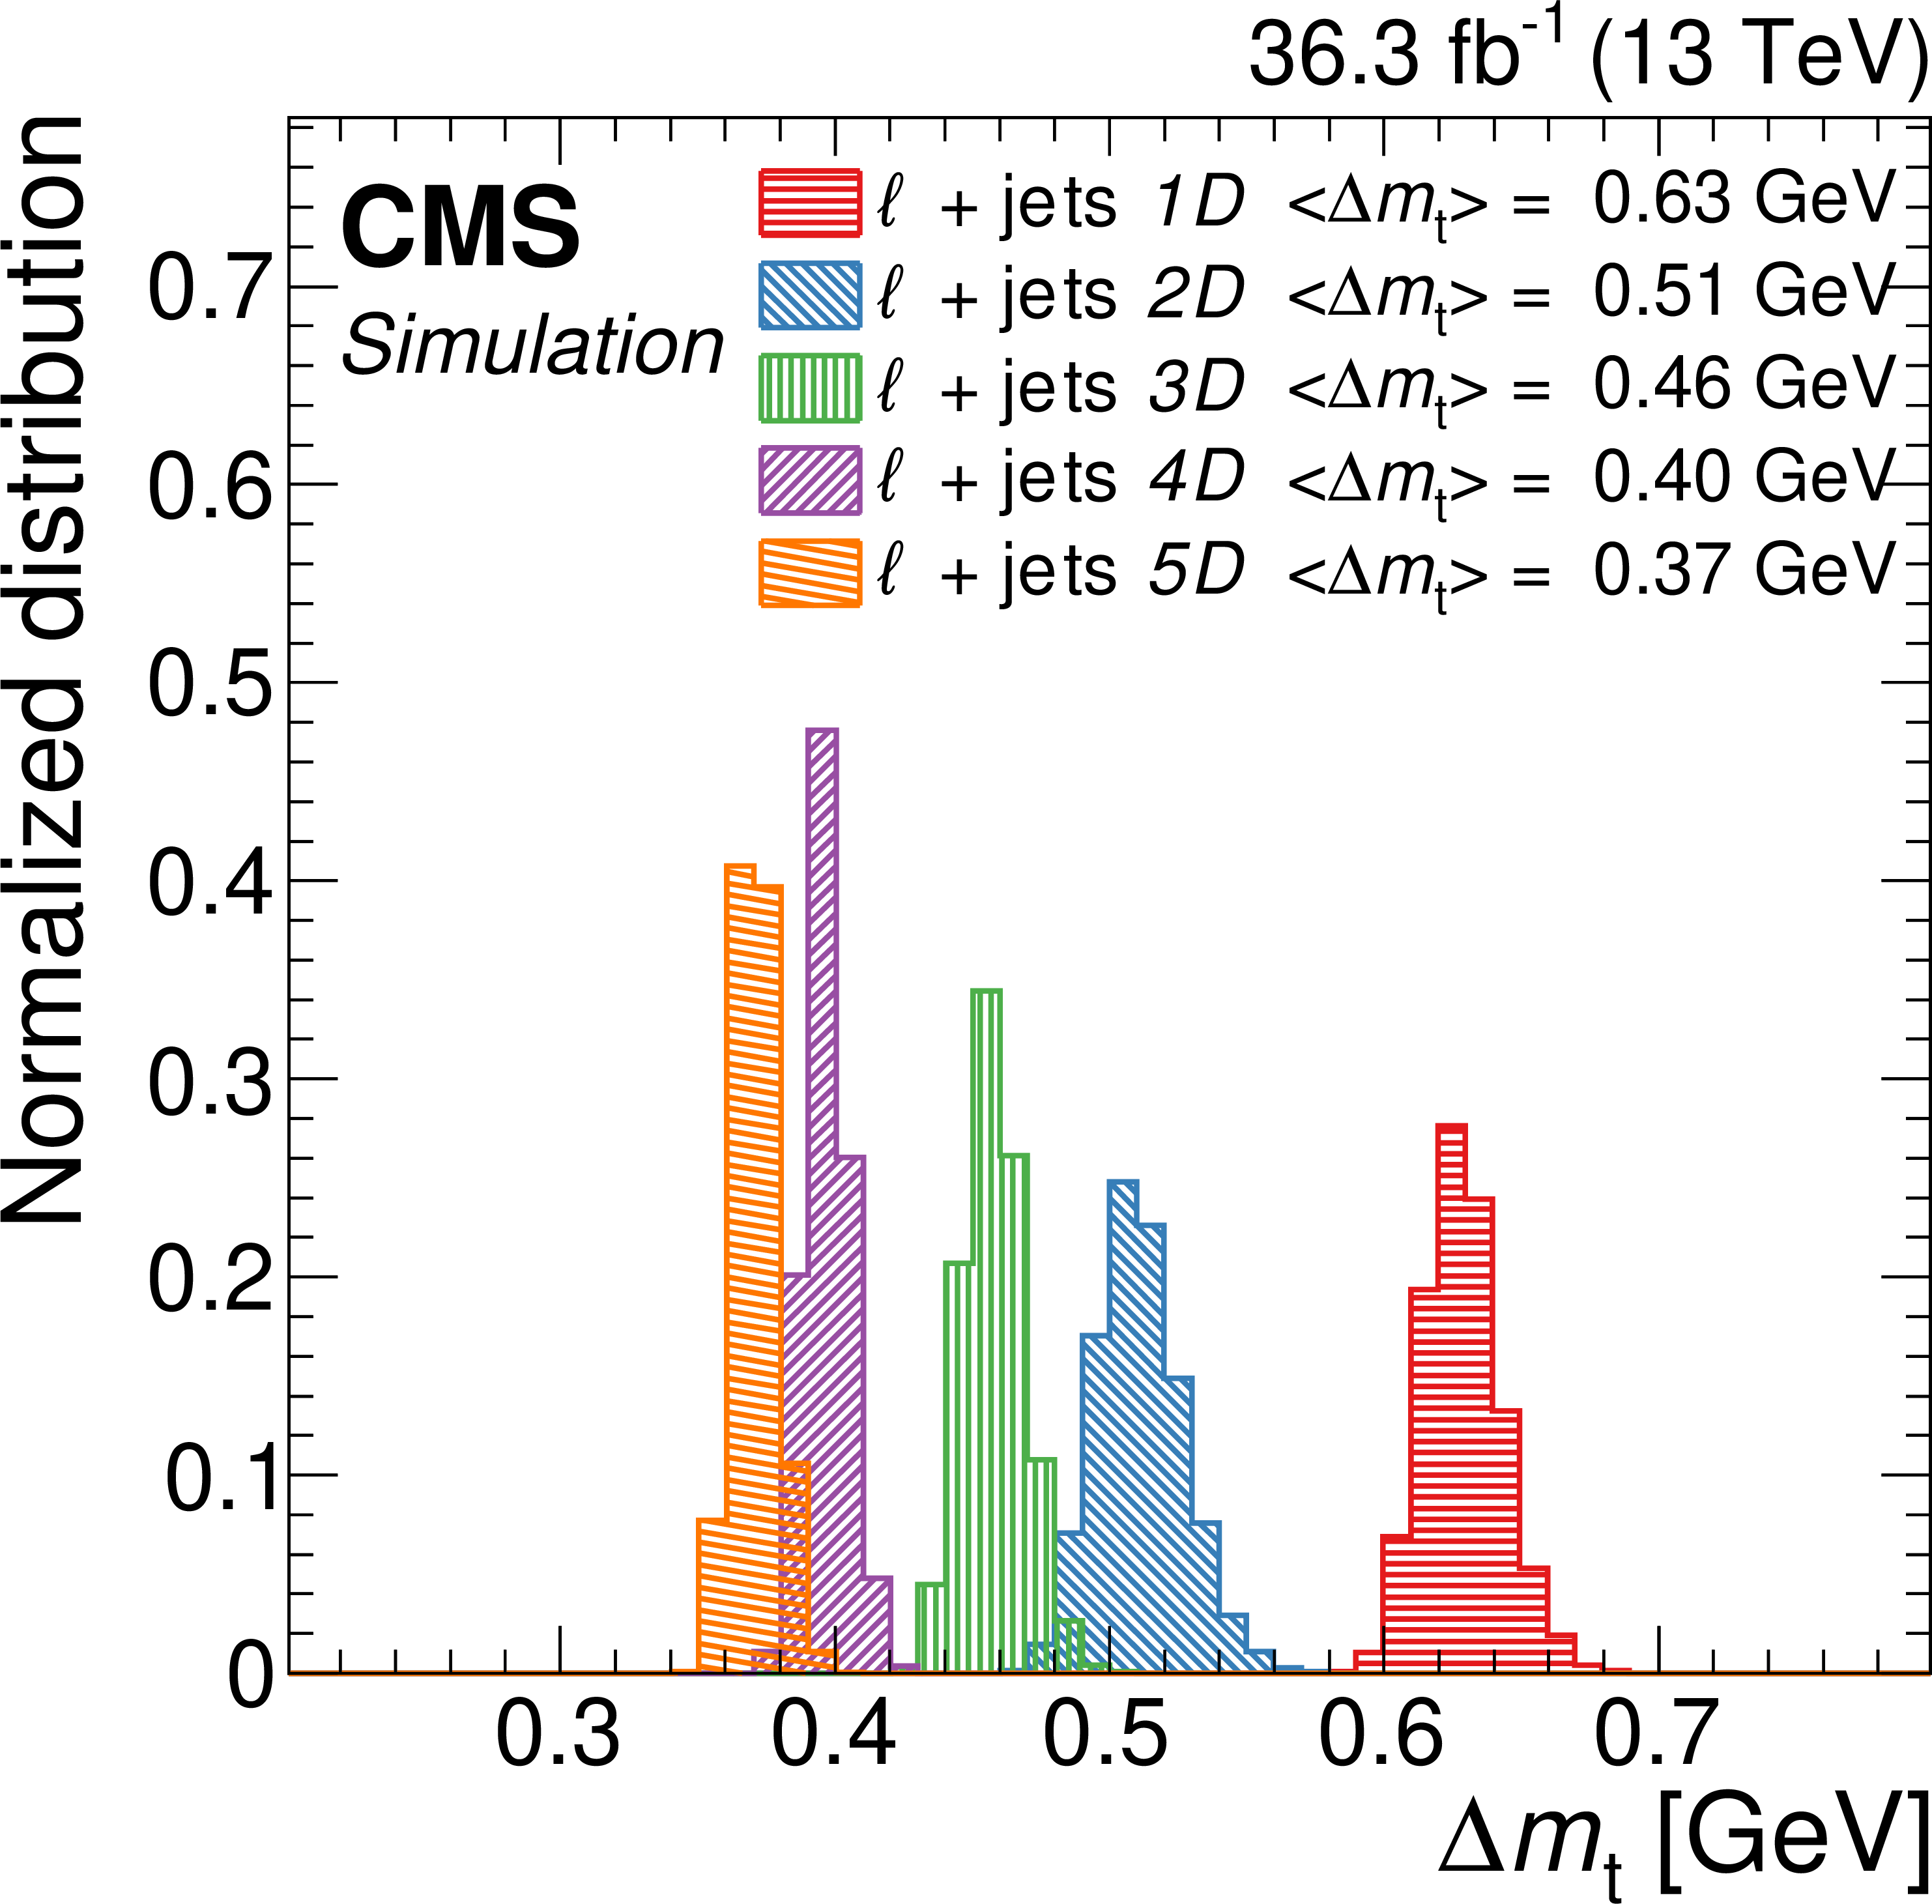
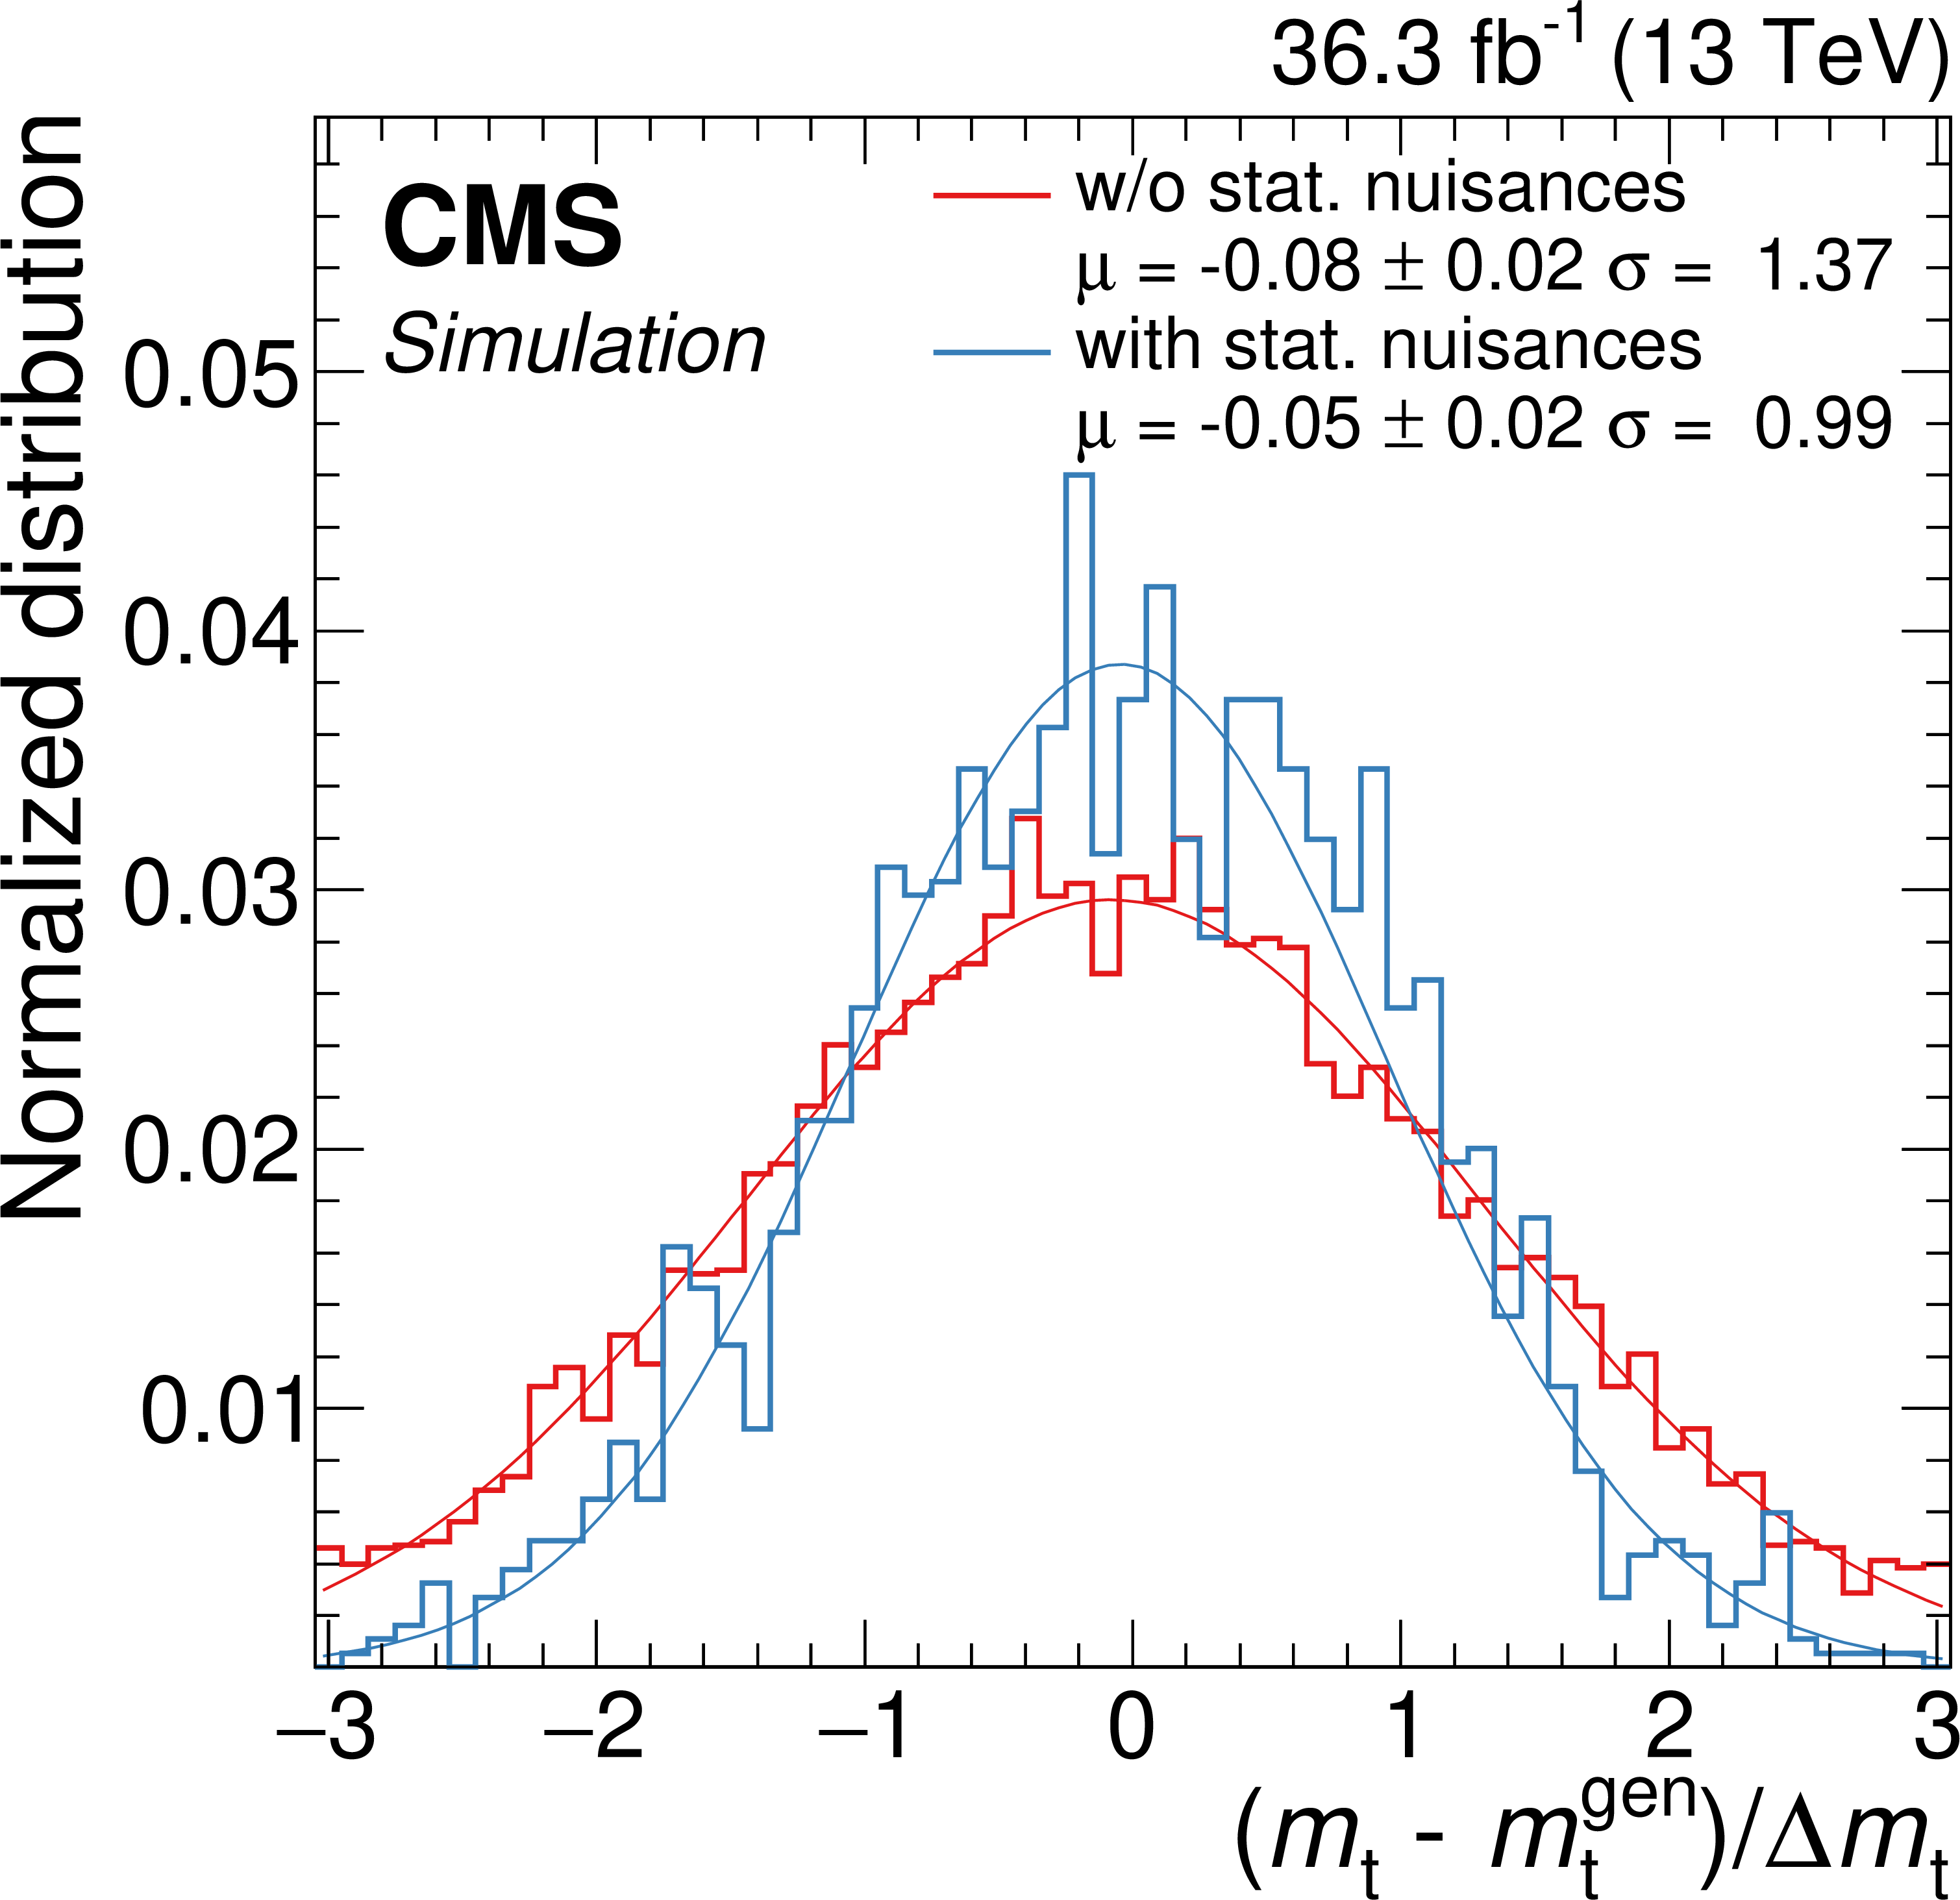
Left: Comparison of the expected total uncertainty in $ m_{\,\mathrm{t}} $ in the combined lepton+jets channel and for the different observable-category sets defined in Table 1. Right: The difference between the measured and generated $ m_{\,\mathrm{t}} $ values, divided by the uncertainty reported by the fit from pseudo-experiments without (red) or with (blue) the statistical nuisance parameters $ \vec{\beta} $ and $ \vec{\omega} $ in the 5D ML fit. Also included in the legend are the $ \mu $ and $ \sigma $ parameters of Gaussian functions (red and blue lines) fit to the histograms. |
png pdf |
Figure 4-a:
Comparison of the expected total uncertainty in $ m_{\,\mathrm{t}} $ in the combined lepton+jets channel and for the different observable-category sets defined in Table 1. |
png pdf |
Figure 4-b:
The difference between the measured and generated $ m_{\,\mathrm{t}} $ values, divided by the uncertainty reported by the fit from pseudo-experiments without (red) or with (blue) the statistical nuisance parameters $ \vec{\beta} $ and $ \vec{\omega} $ in the 5D ML fit. Also included in the legend are the $ \mu $ and $ \sigma $ parameters of Gaussian functions (red and blue lines) fit to the histograms. |
png pdf |
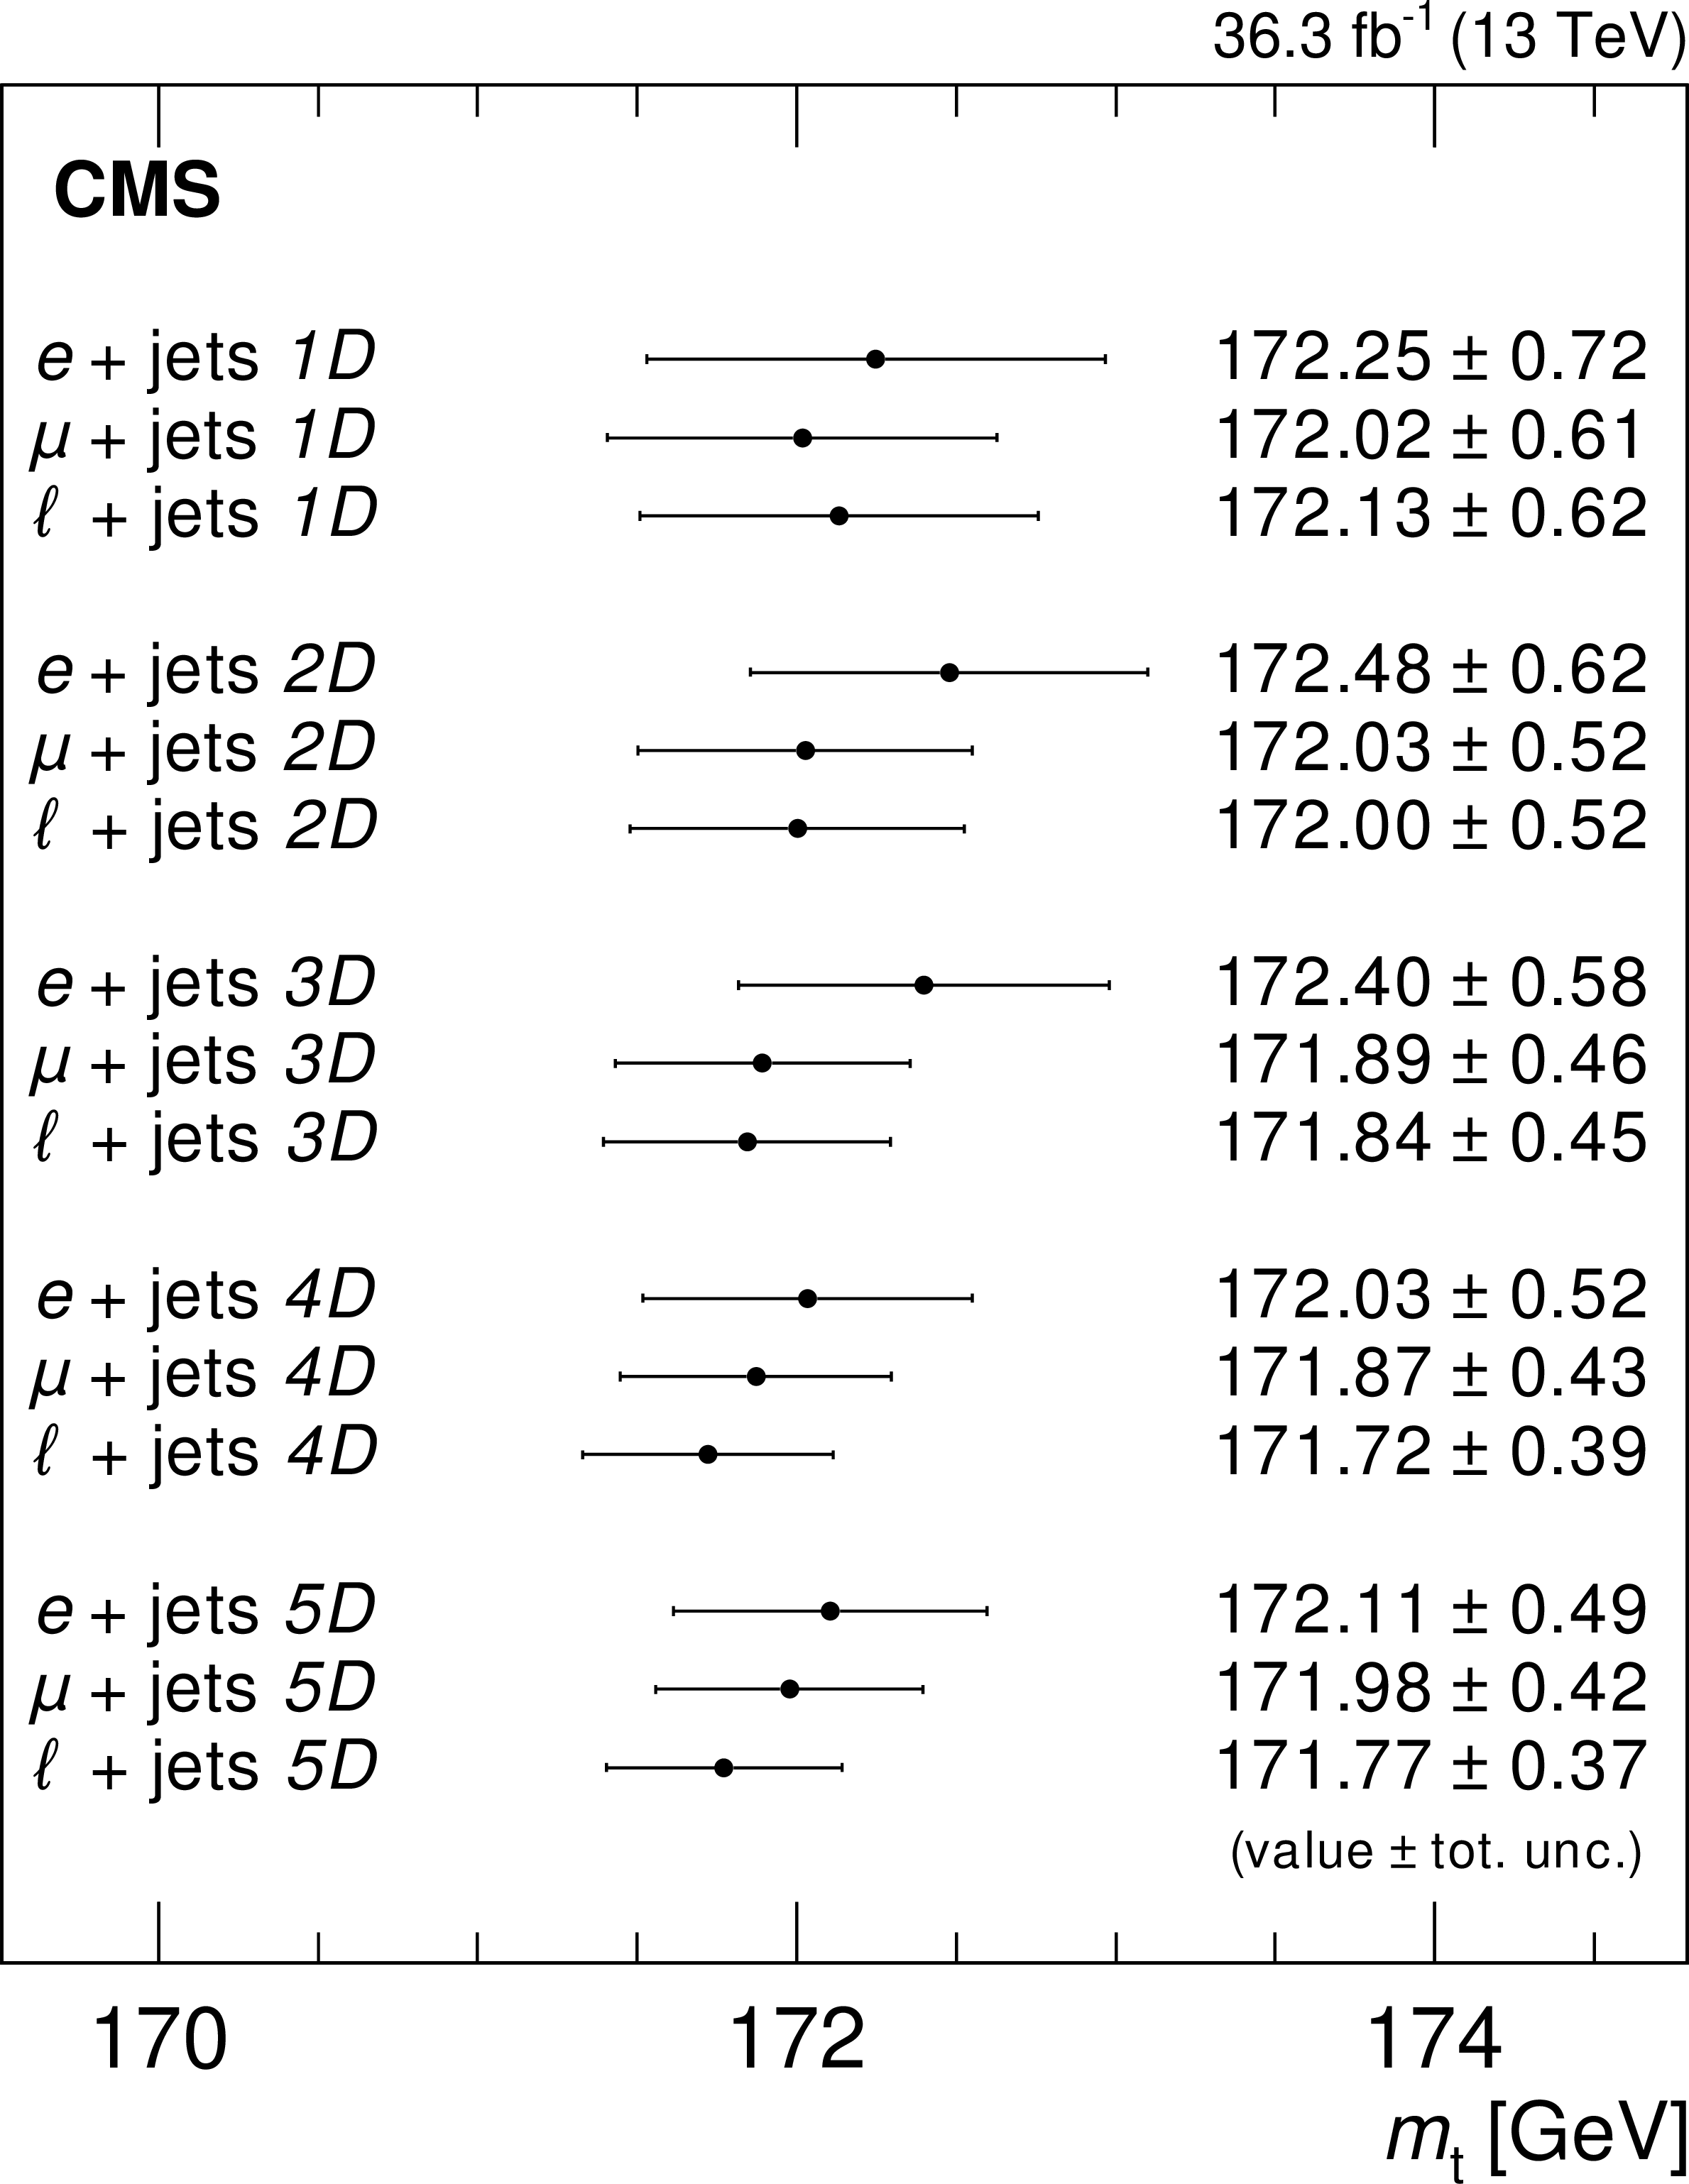
Figure 5:
Measurement of $ m_{\,\mathrm{t}} $ in the three different channels for the different sets of observables and categories as defined in Table 1. |
png pdf |
Figure 6:
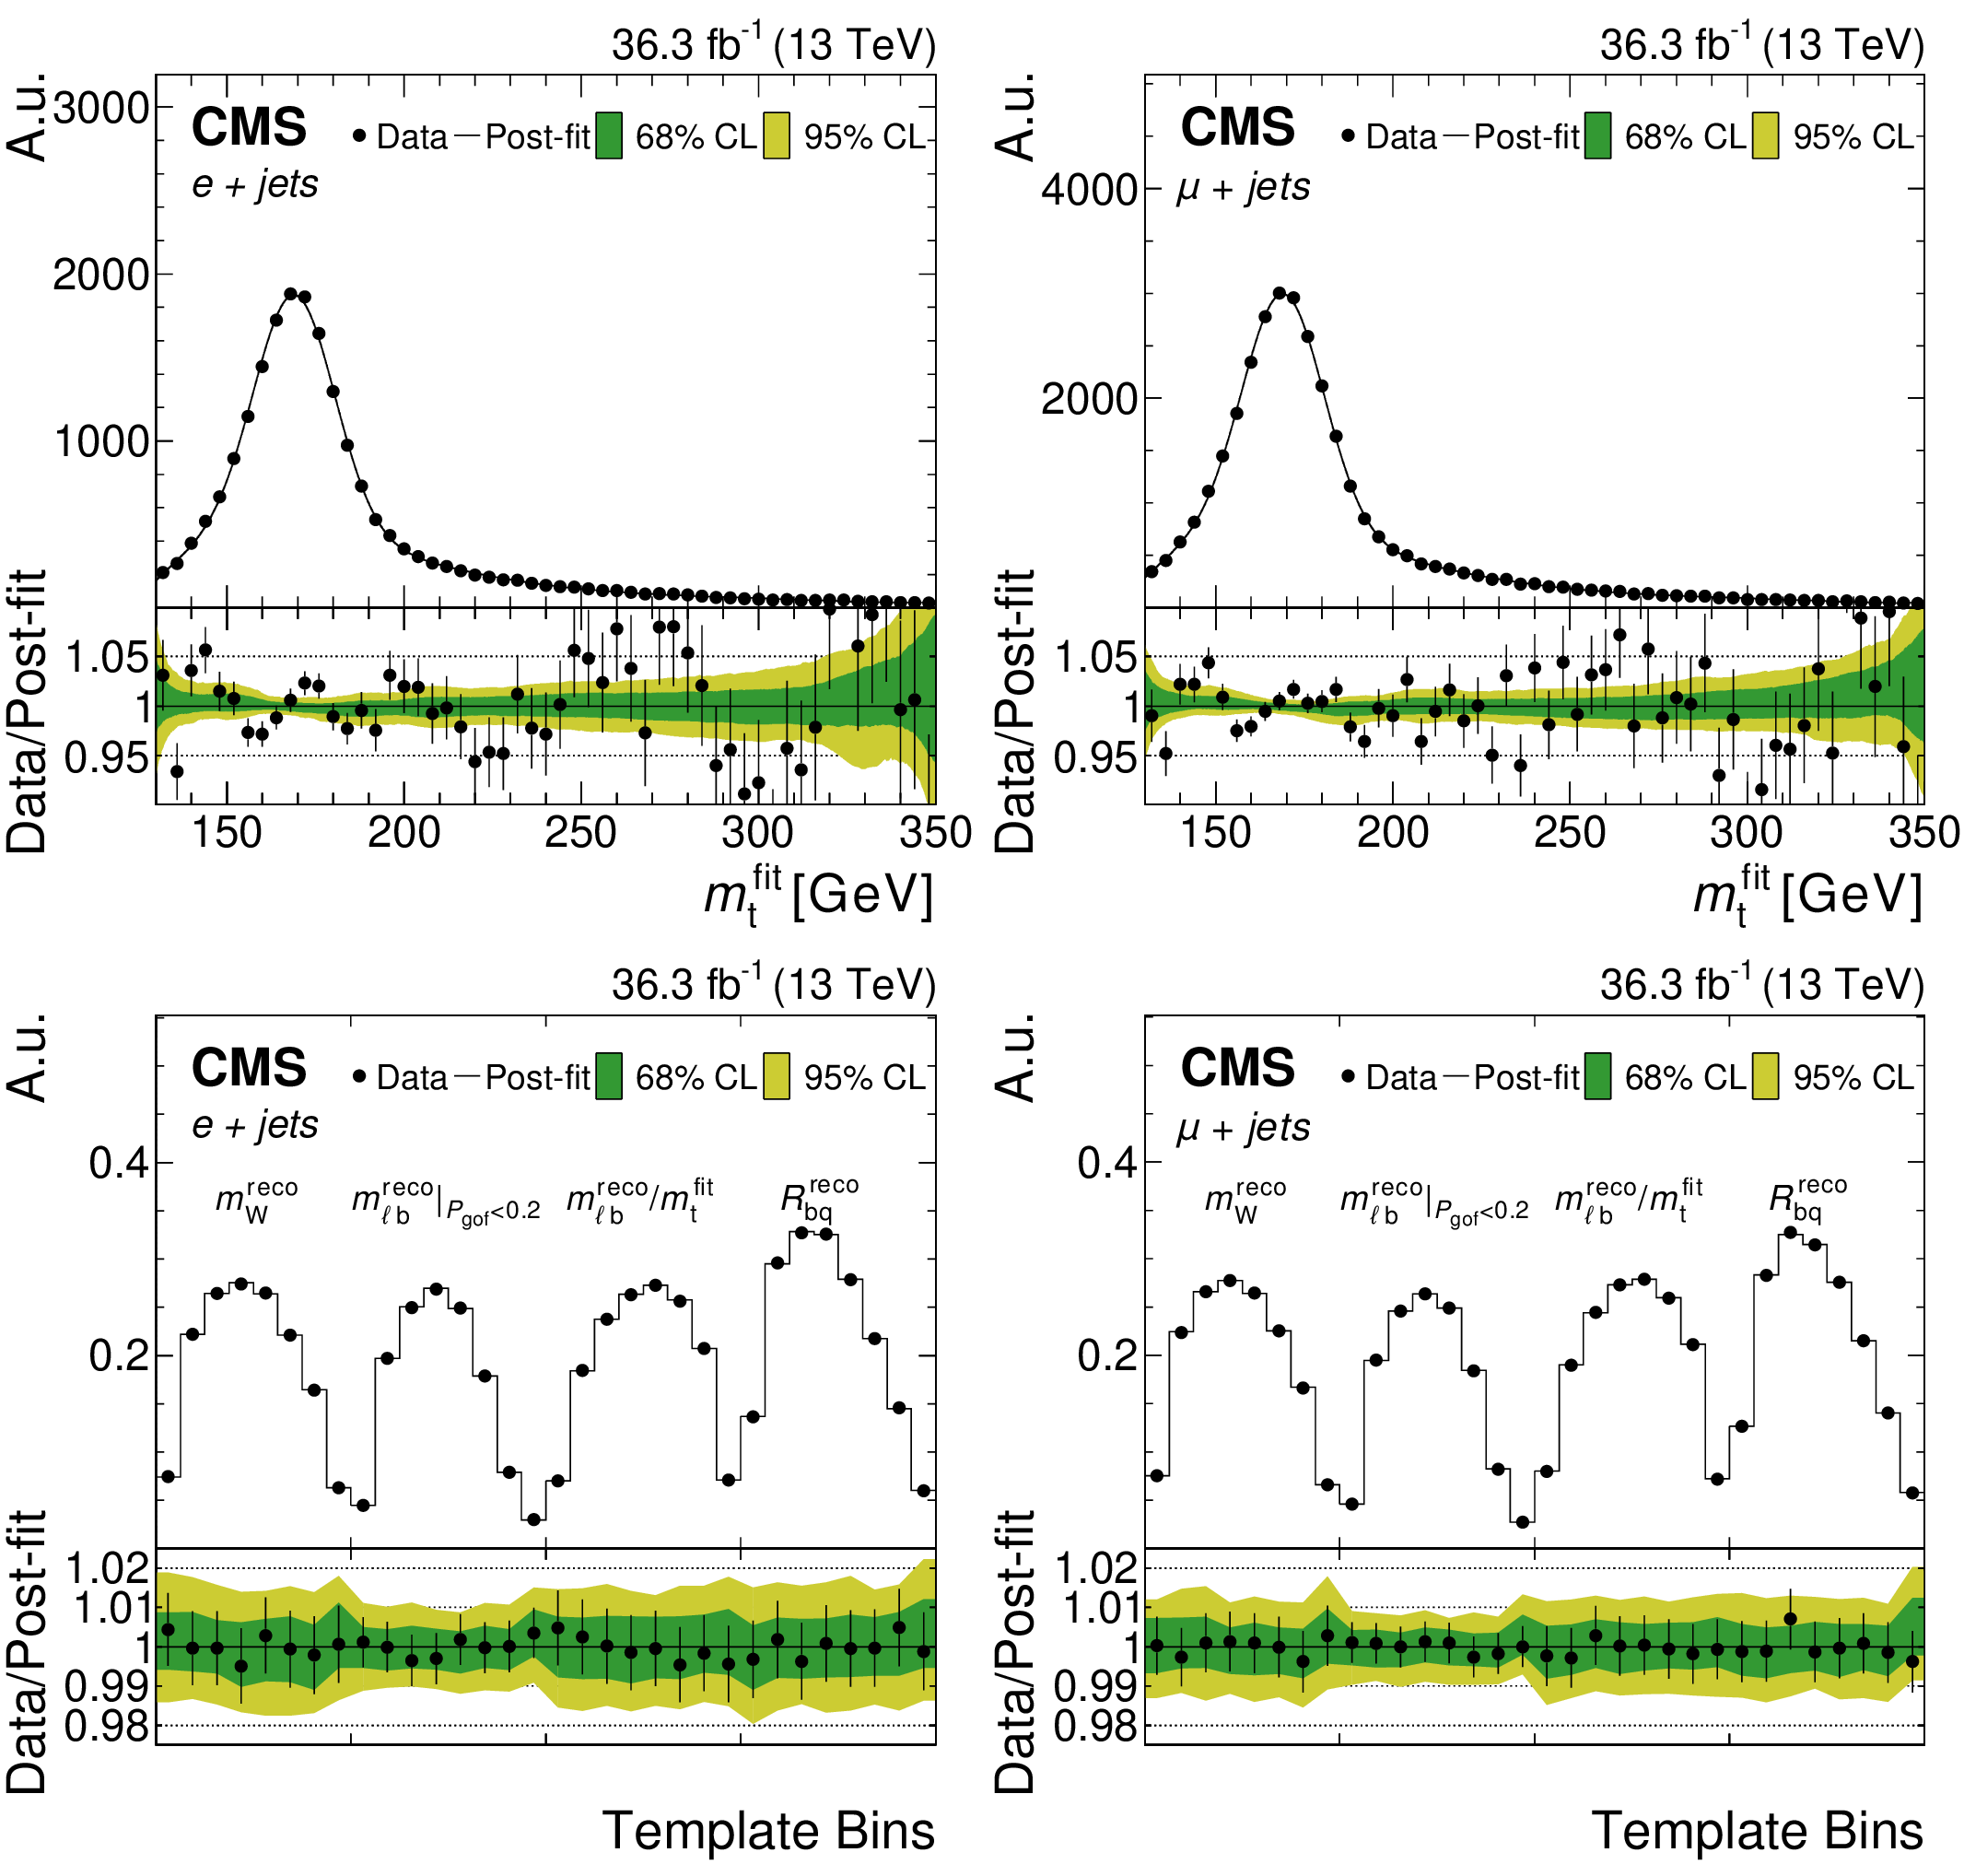
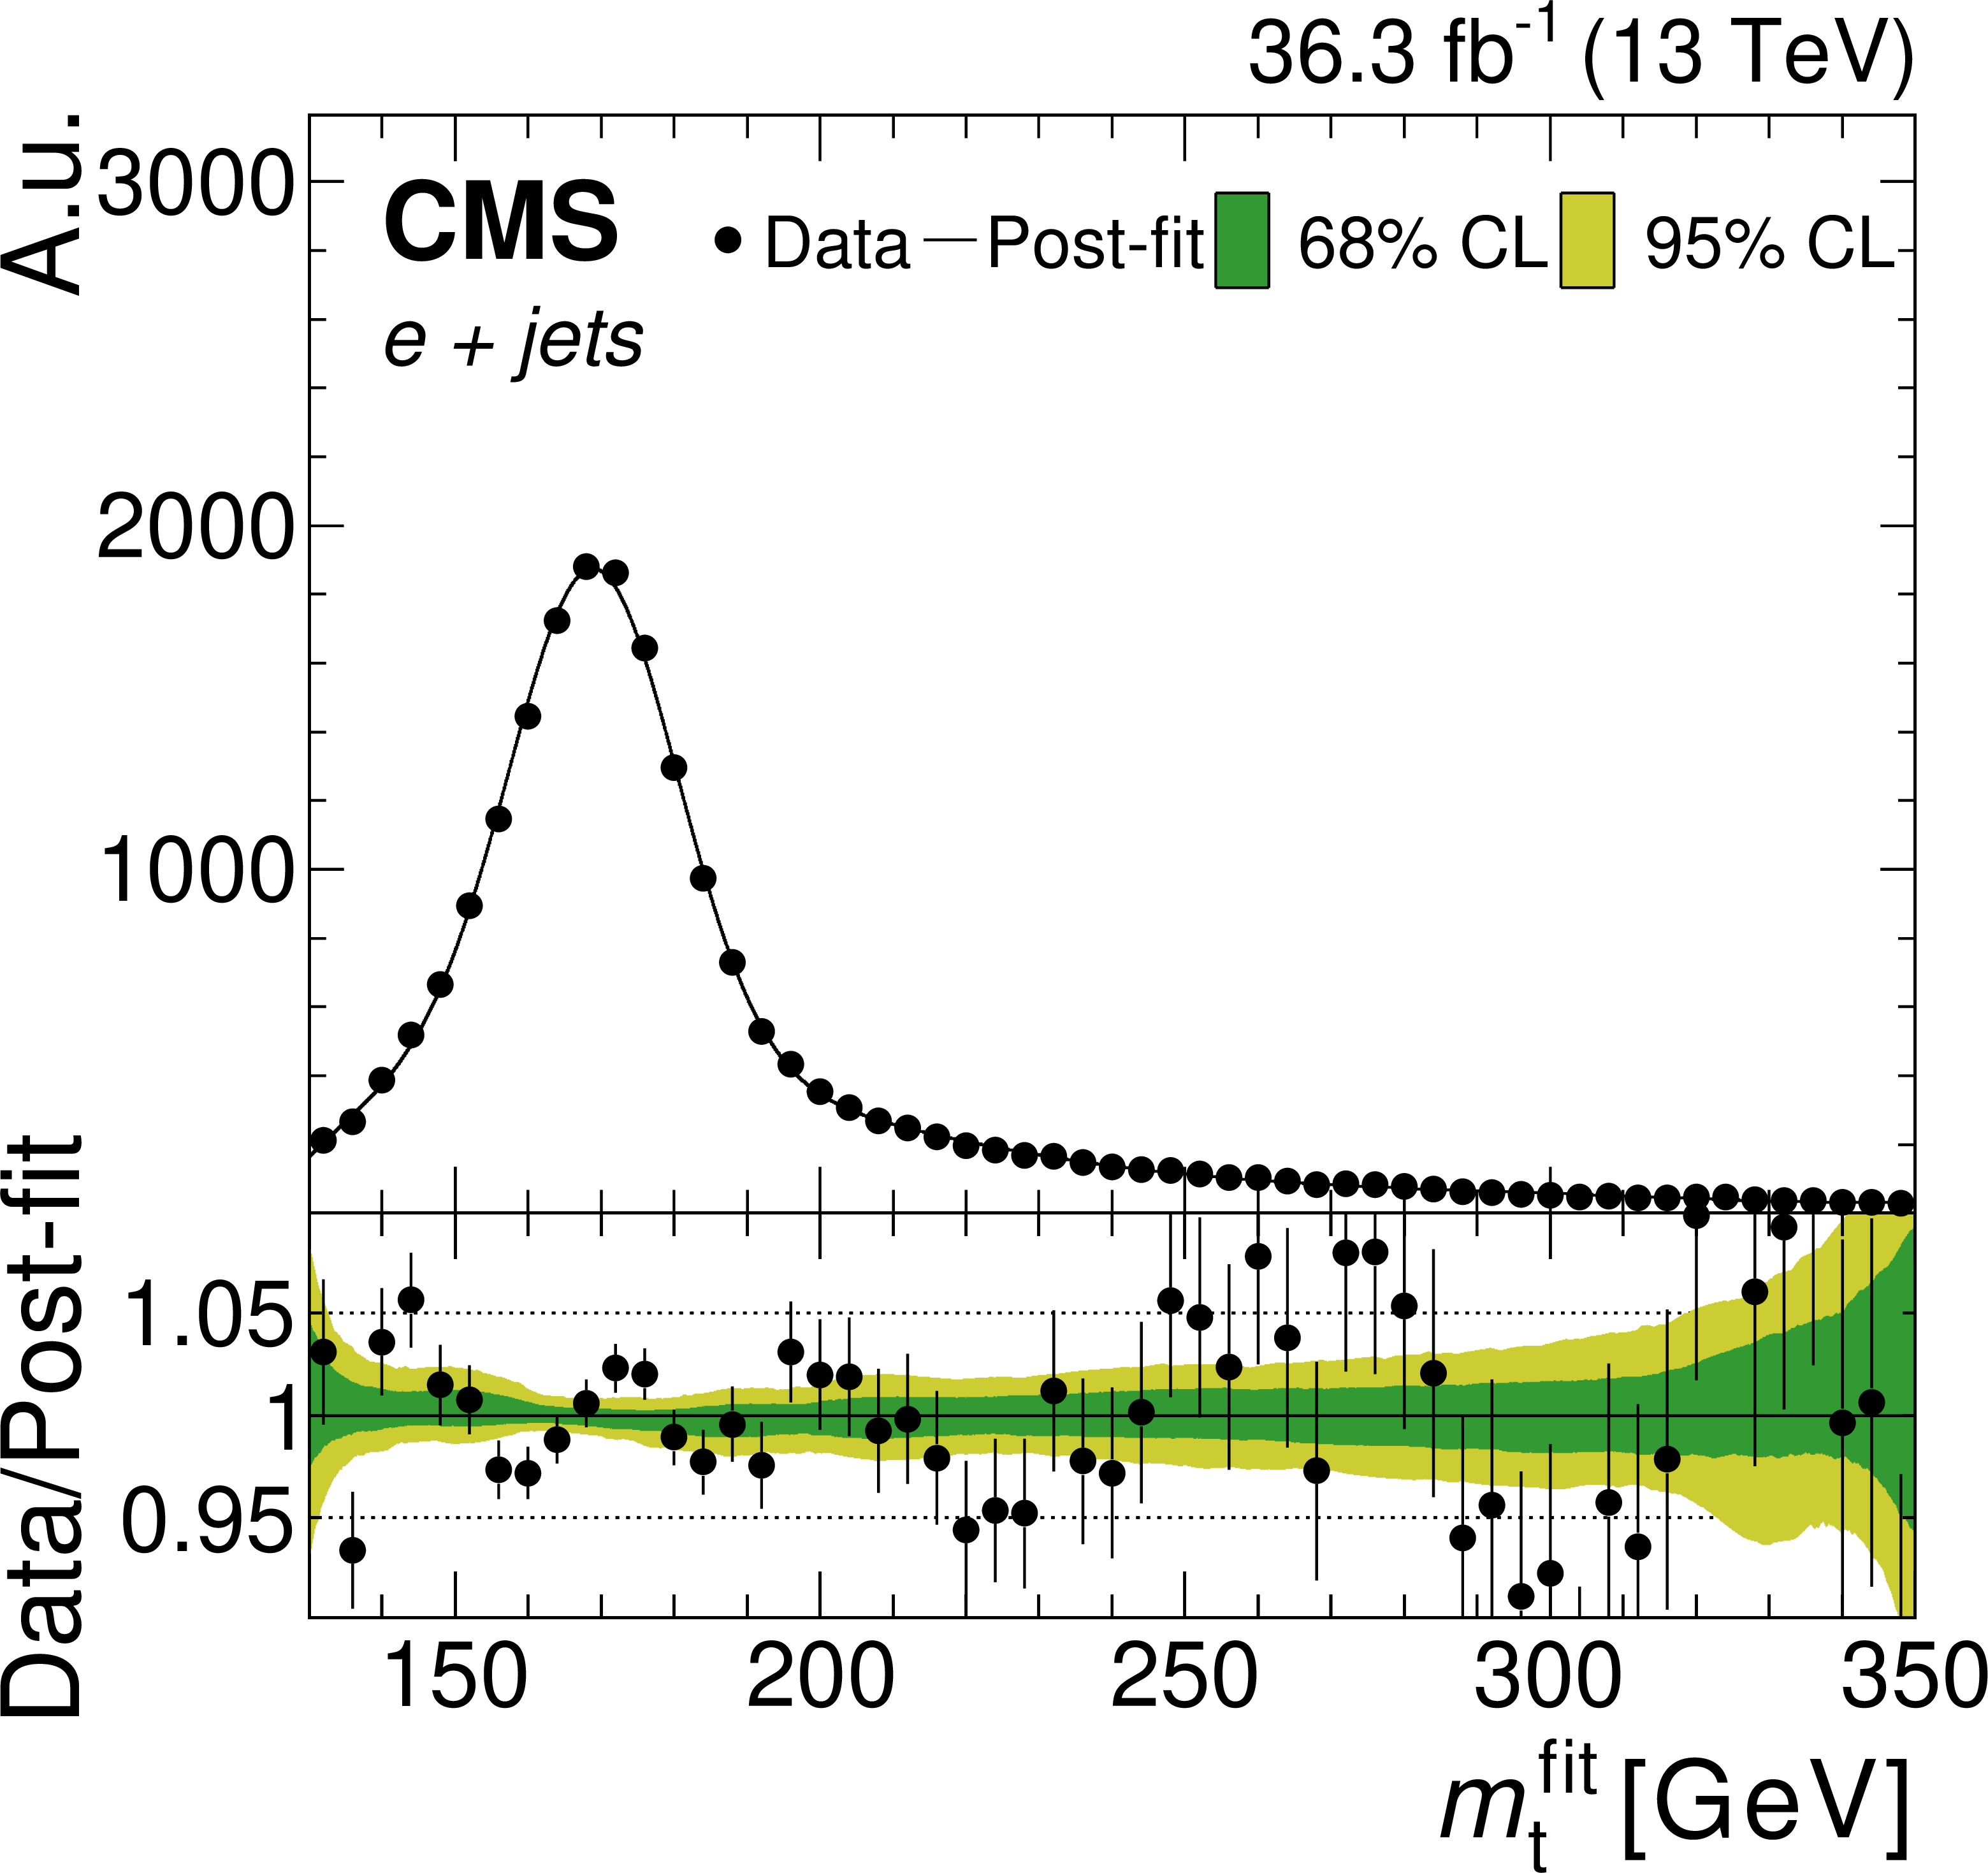
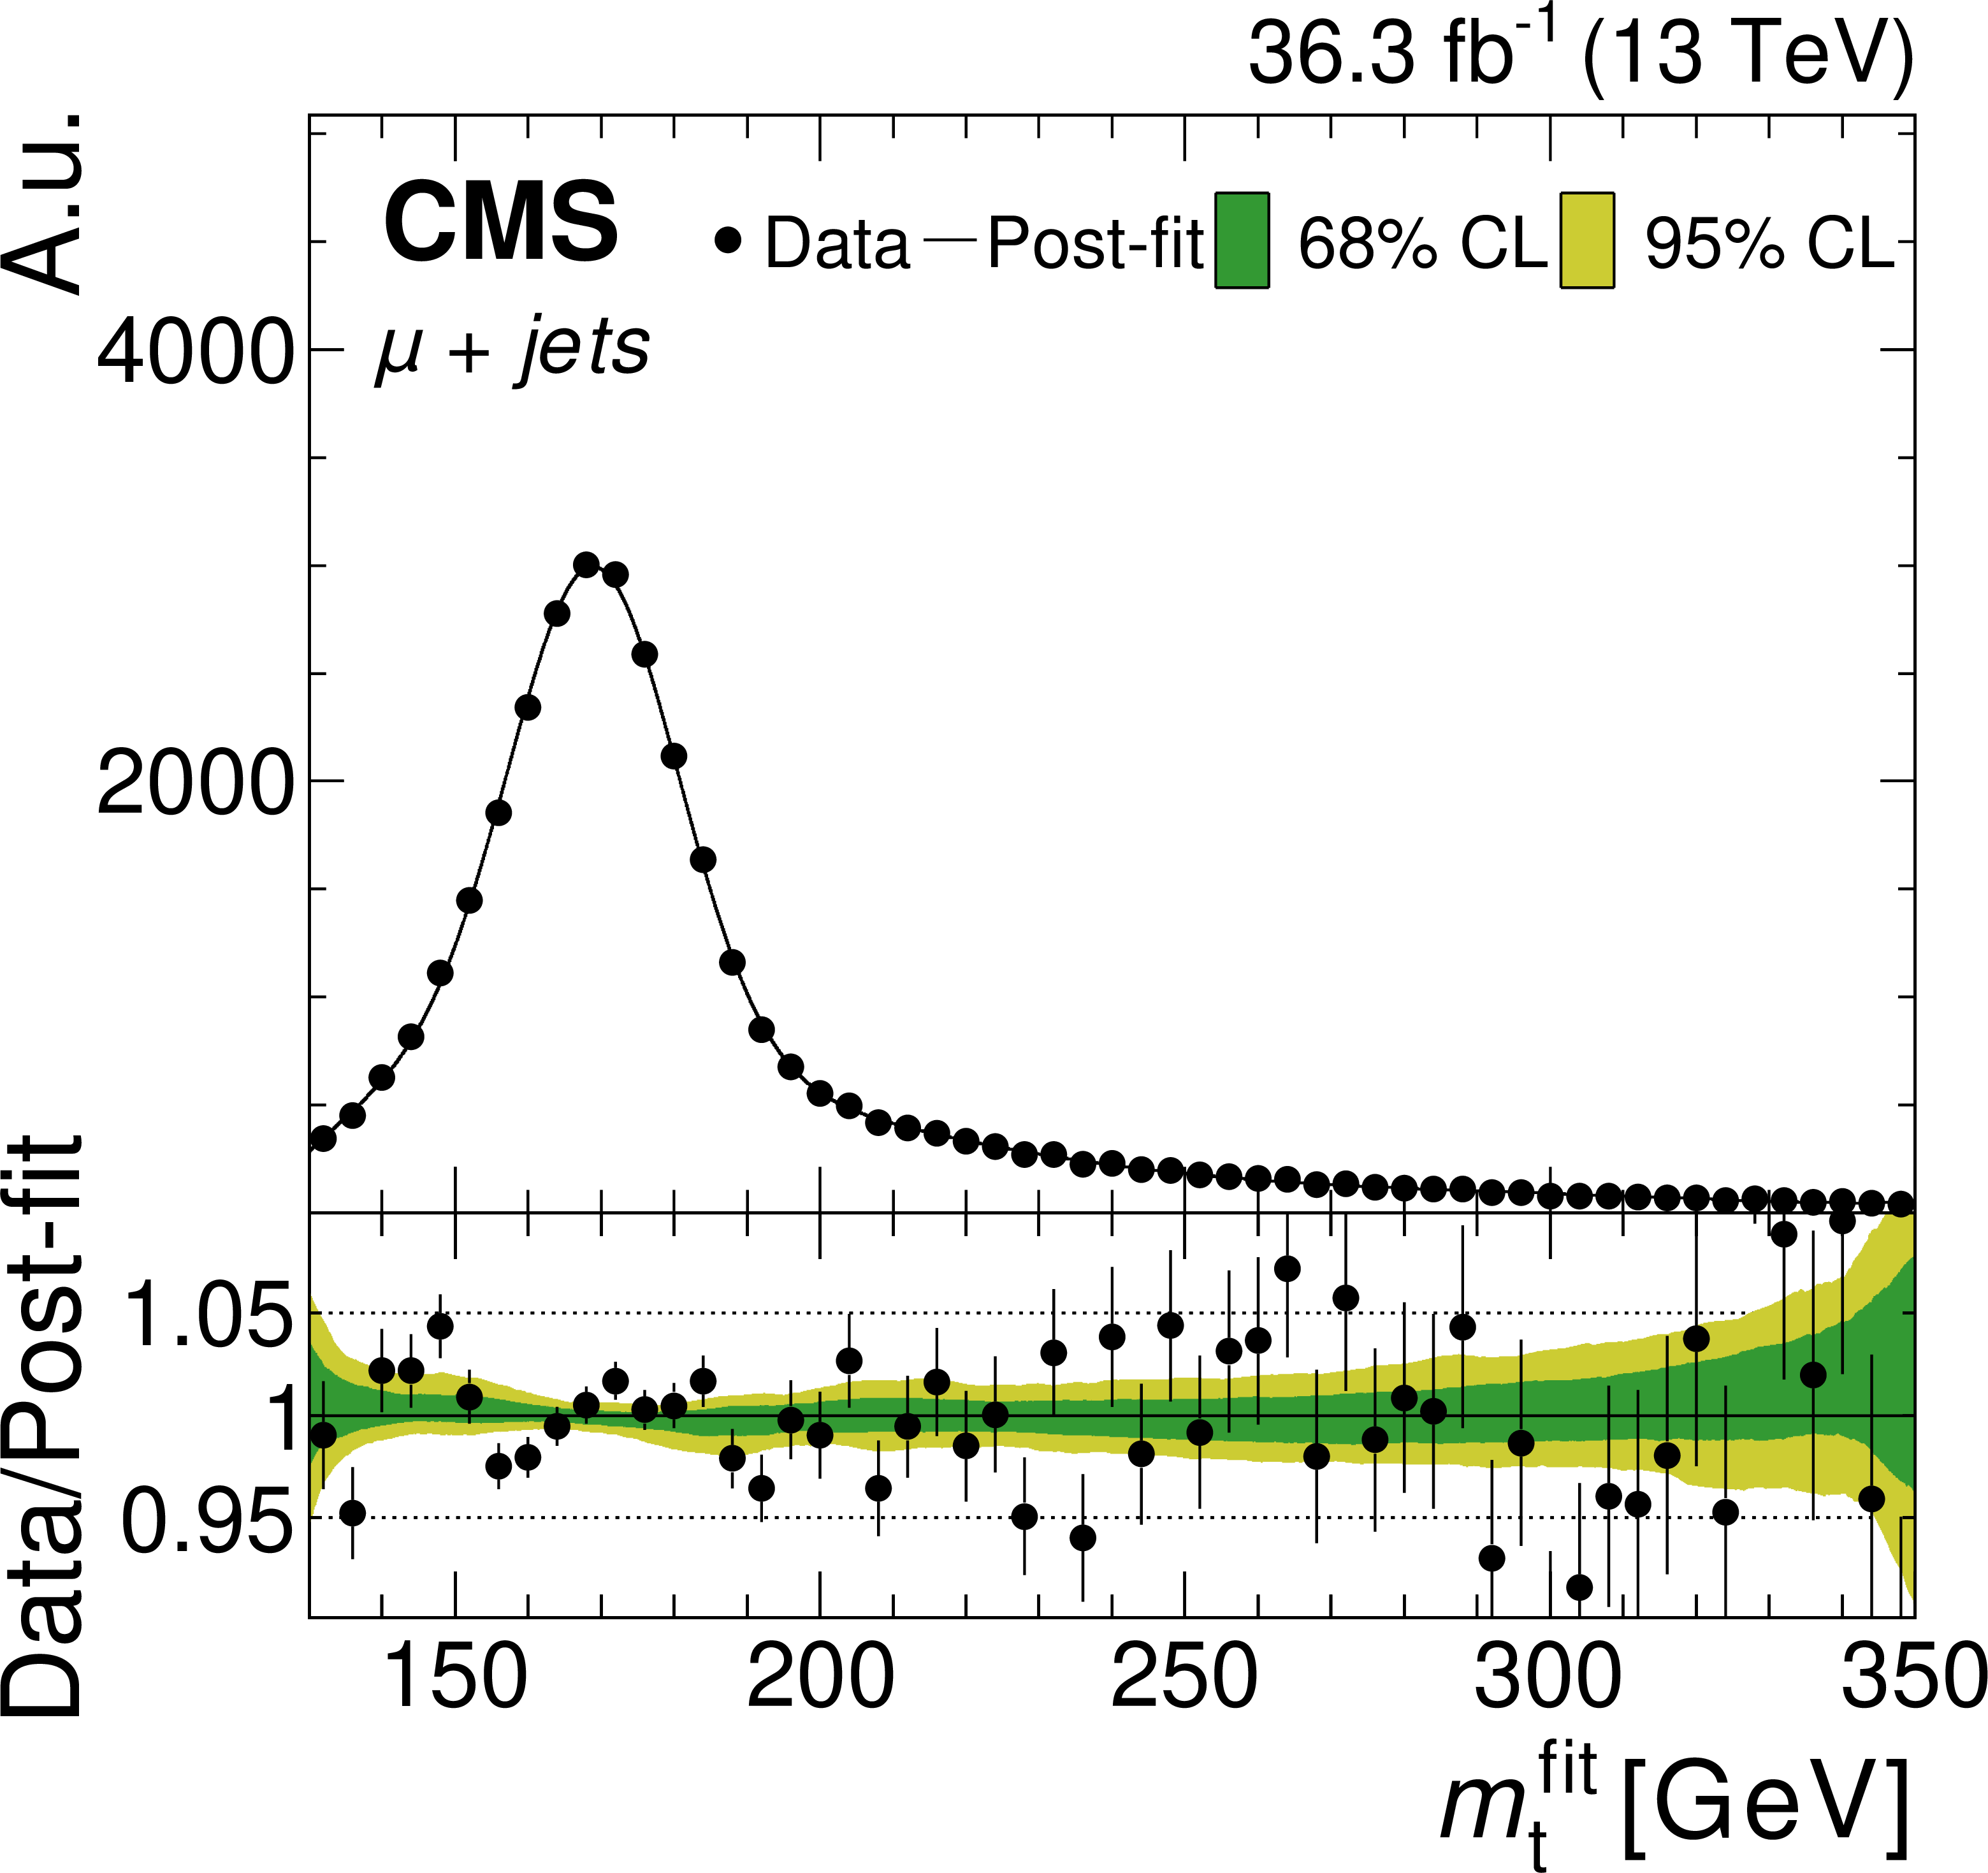
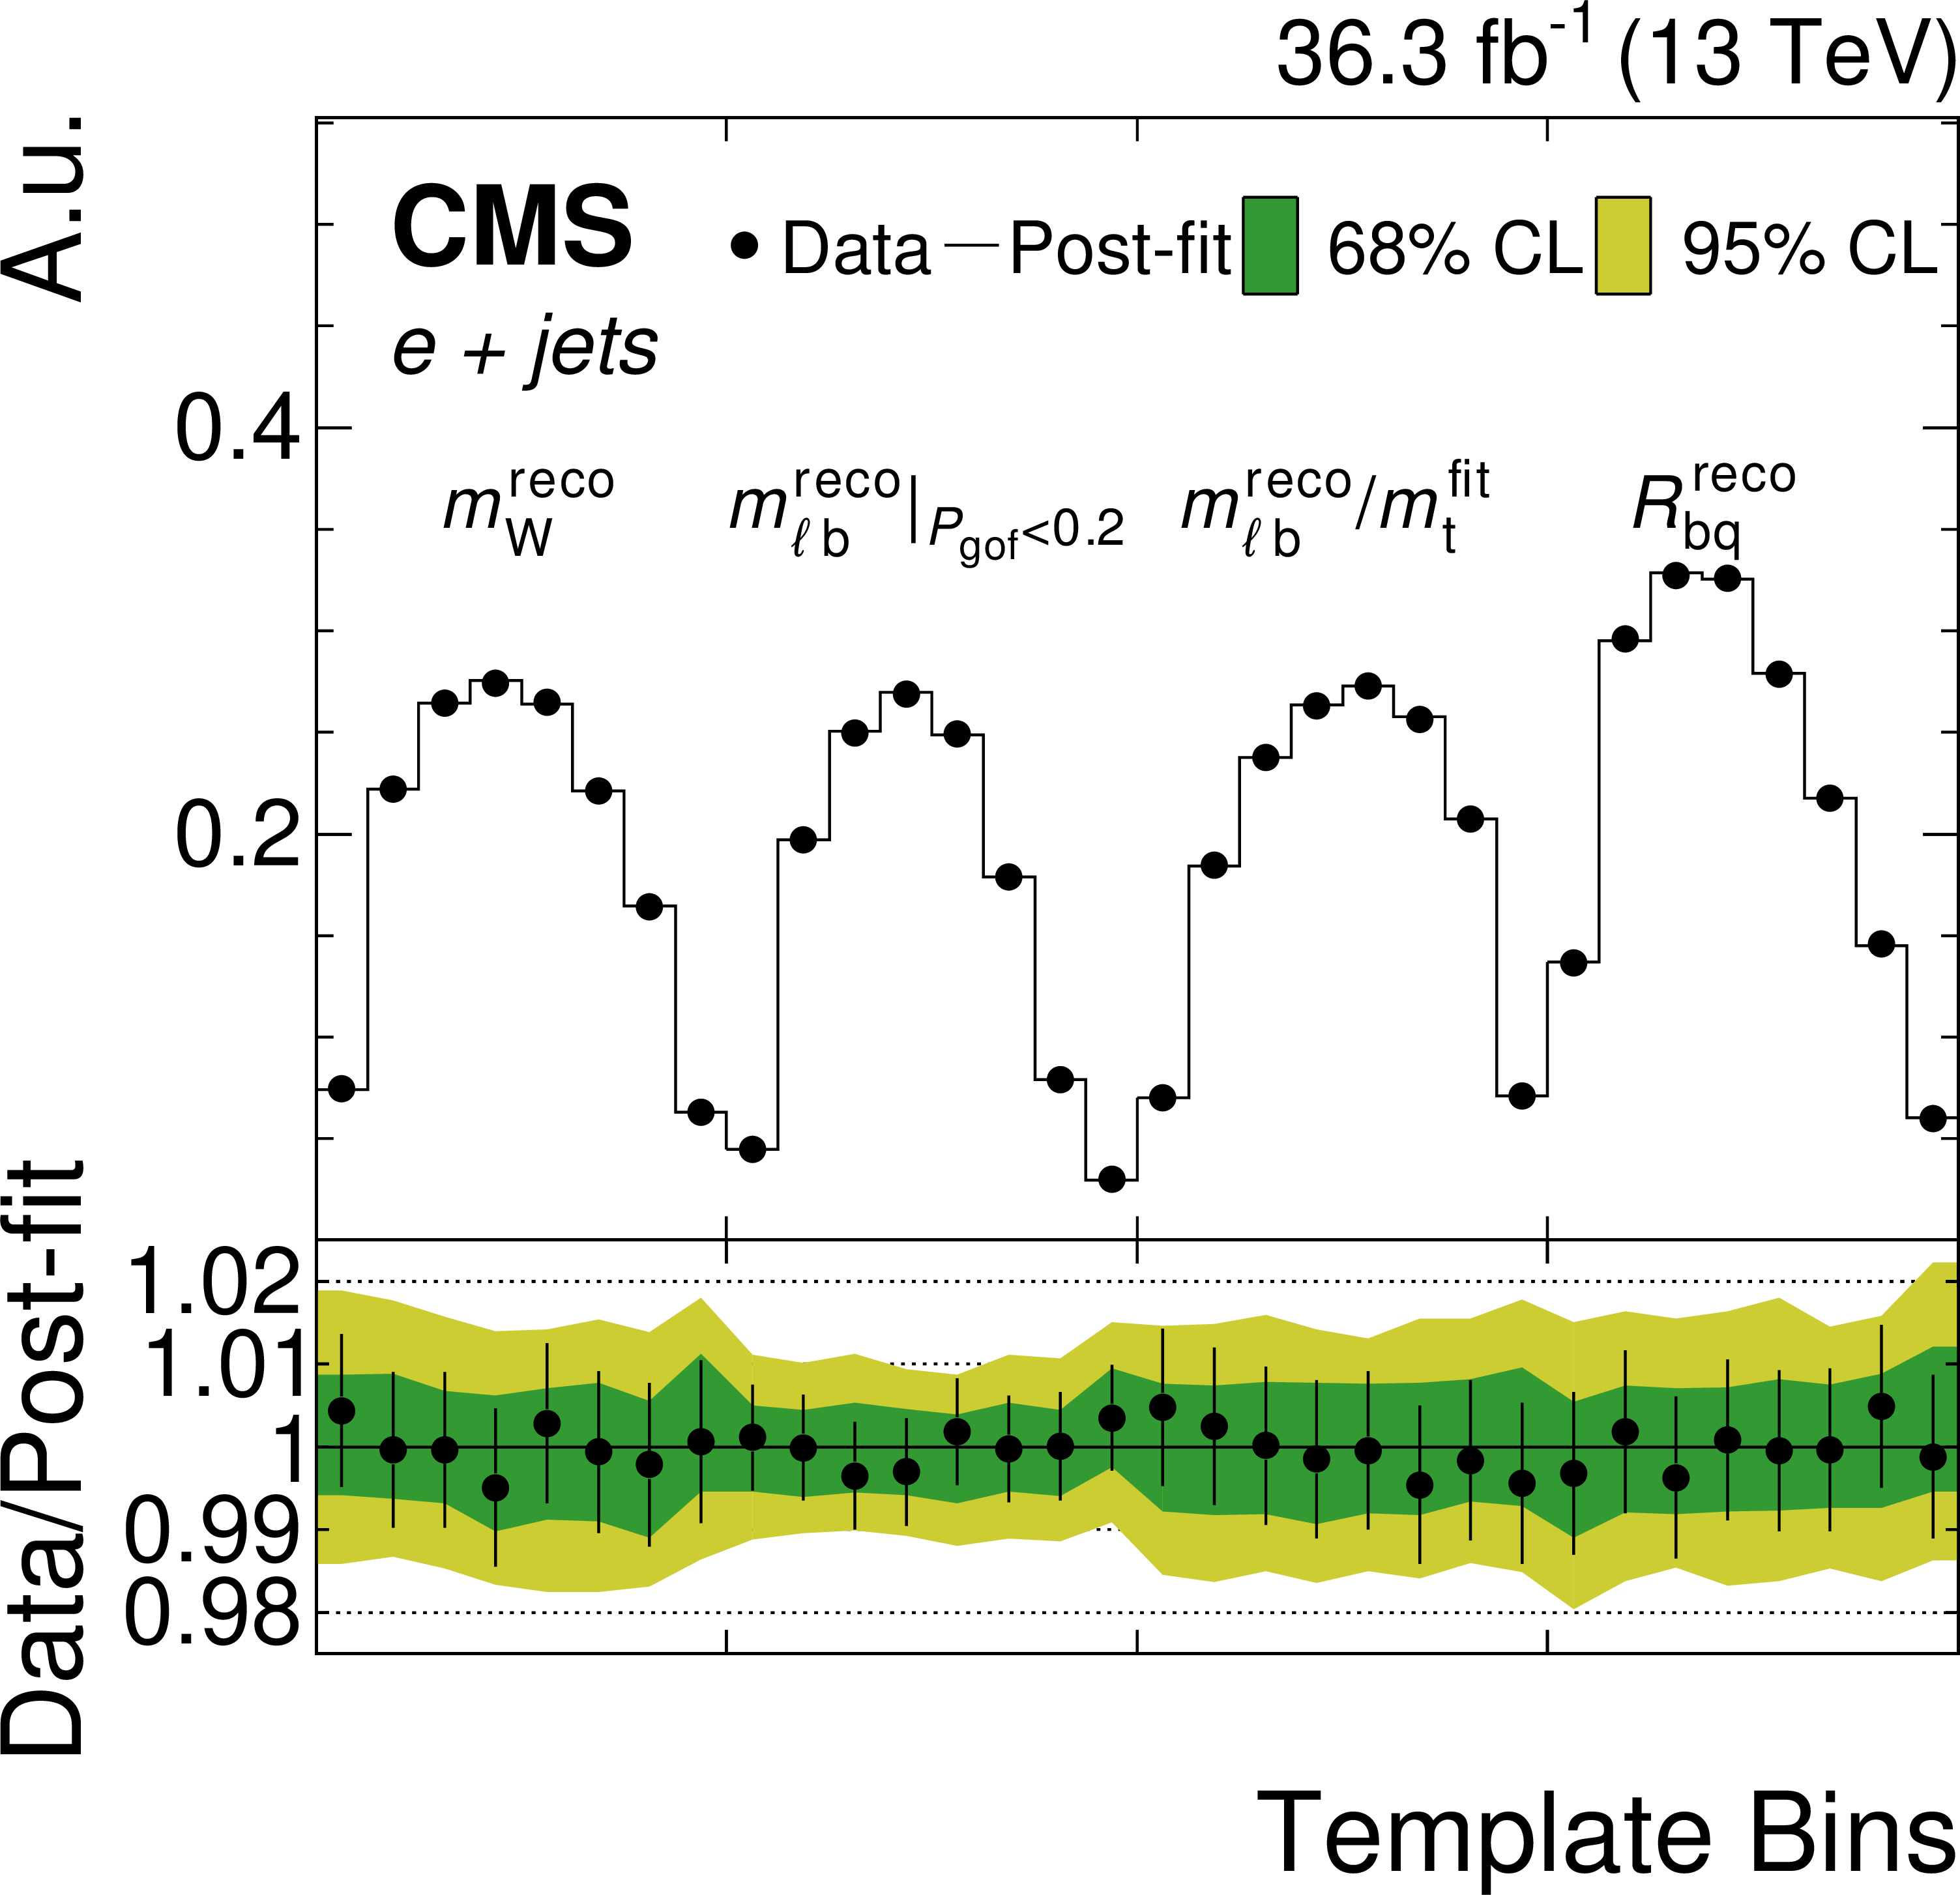
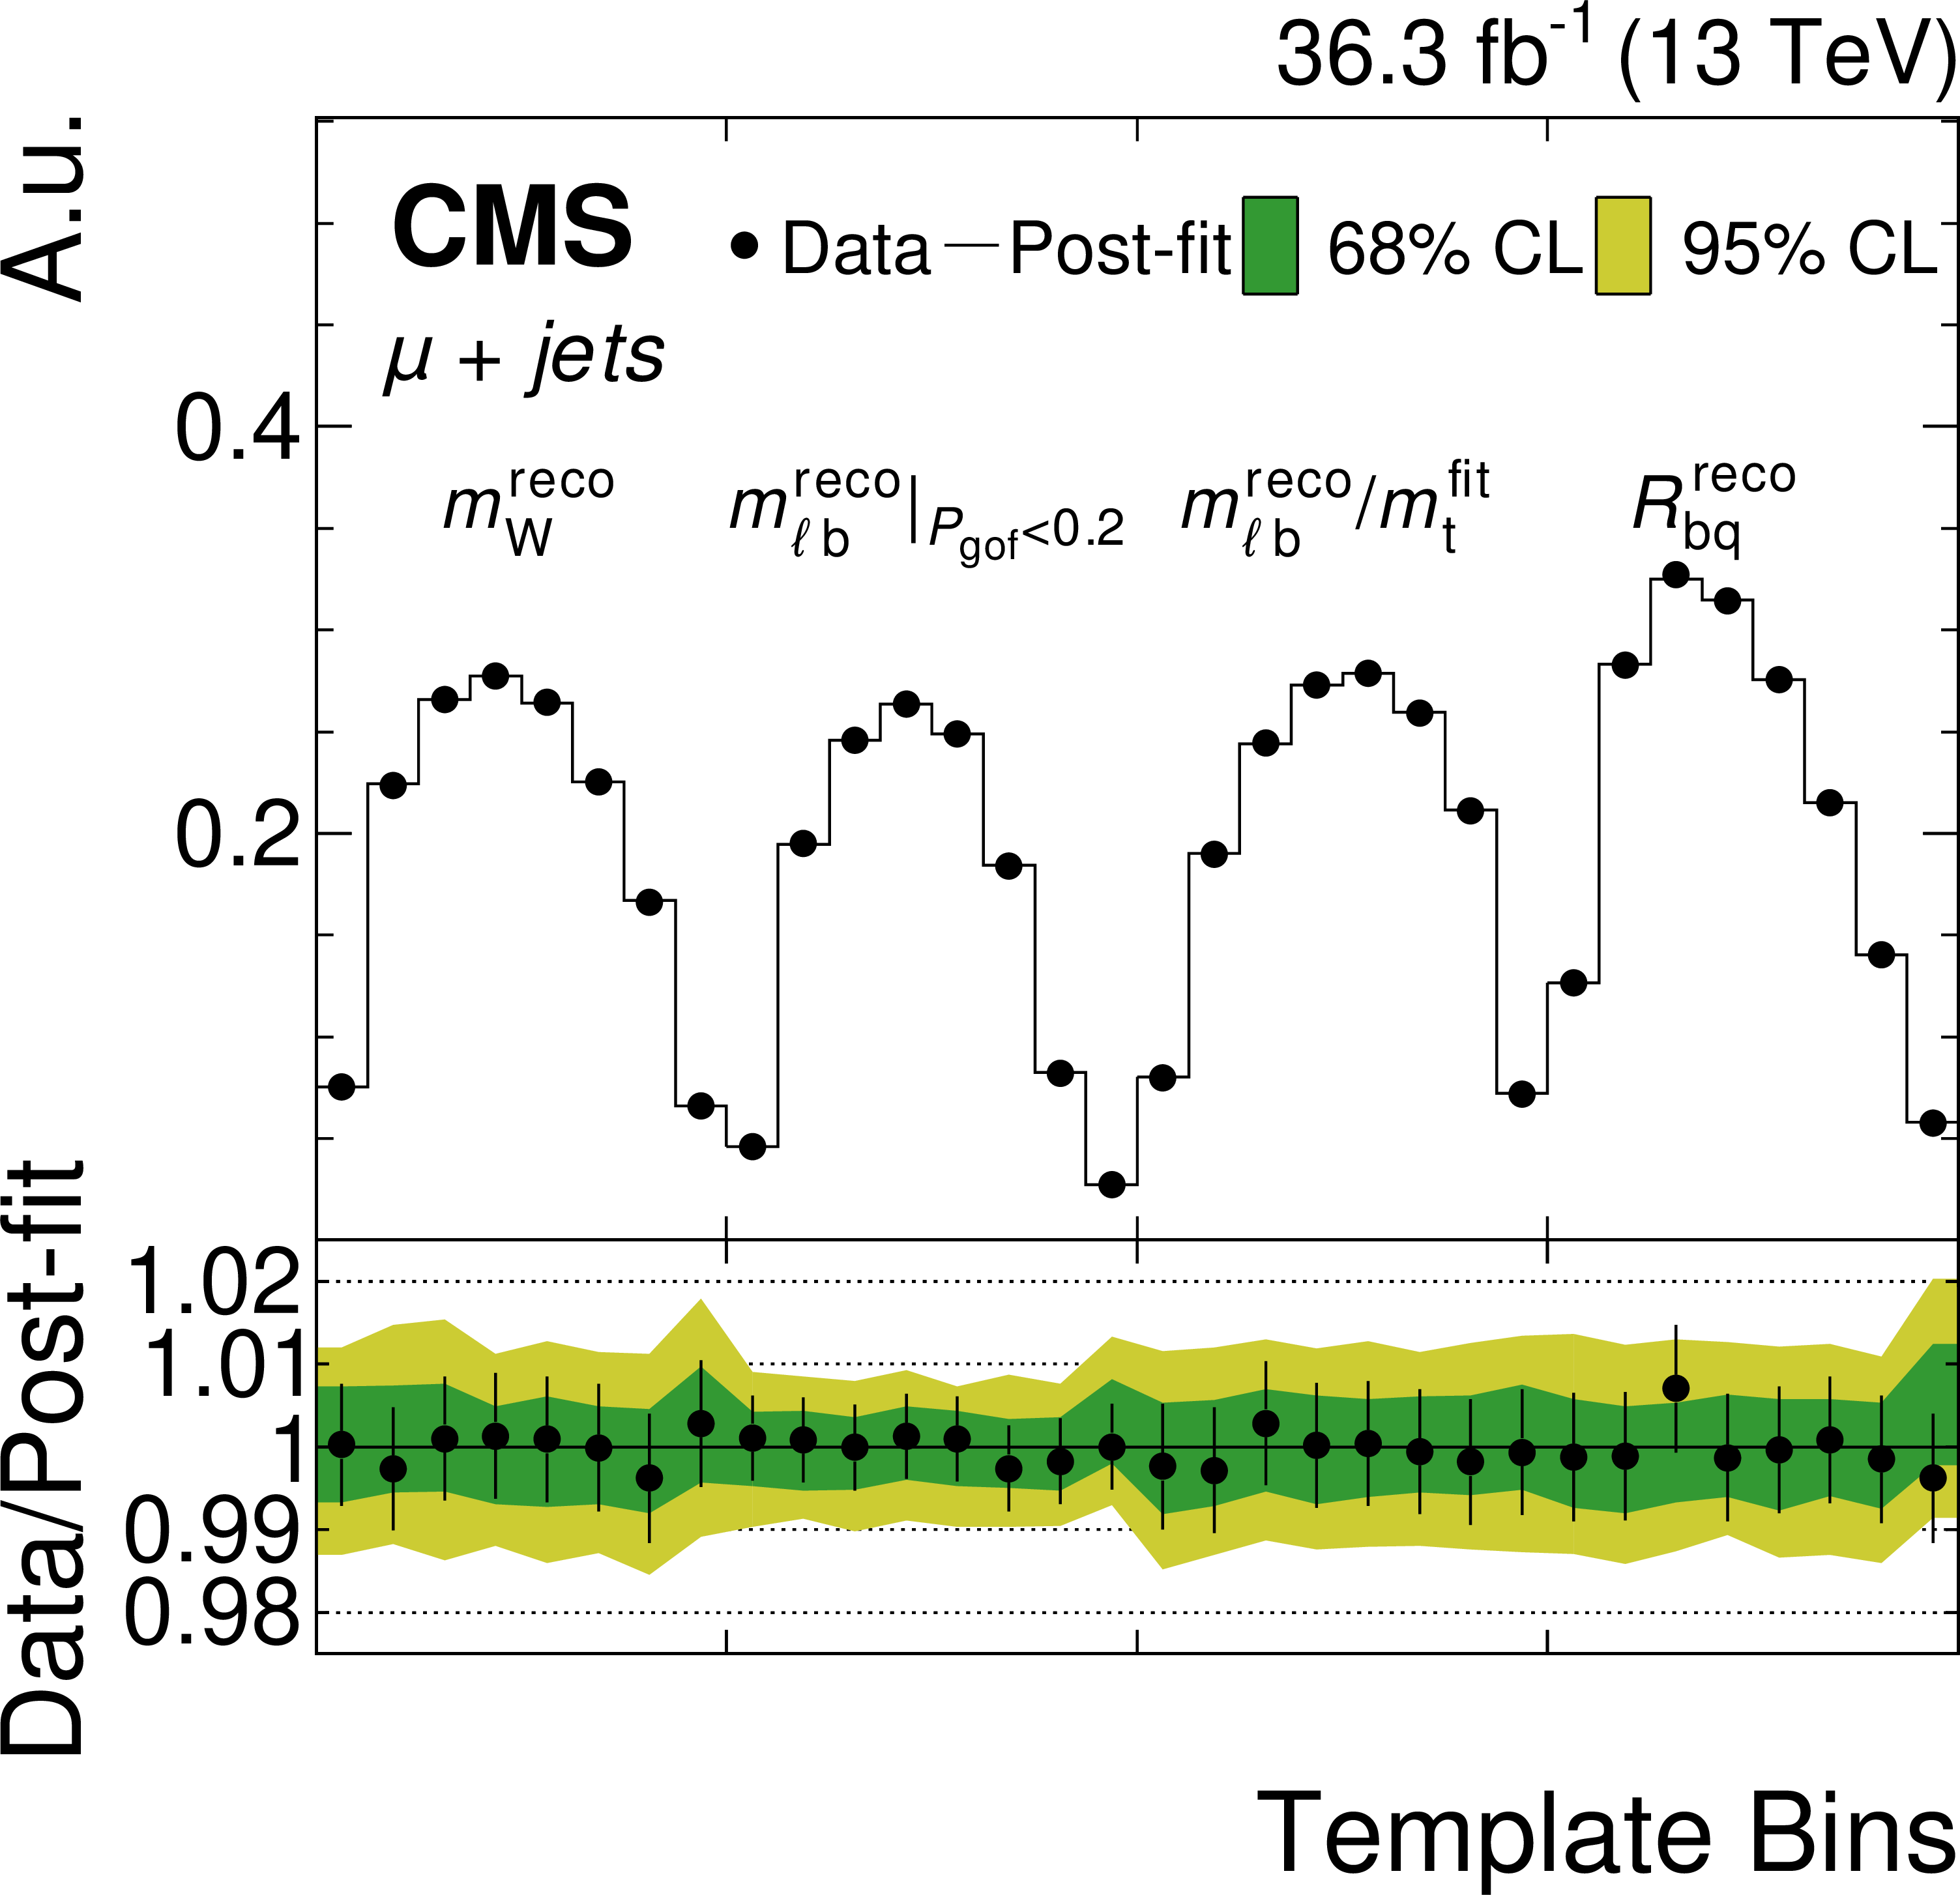
Distribution of $ m_{\,\mathrm{t}}^{\,\text{fit}} $ (upper) and the additional observables (lower) that are the input to the 5D ML fit and their post-fit probability density functions for the combined fit to the electron+jets (left) and muon+jets (right) channels. The lower panels show the ratio of data and post-fit template values. The green and yellow bands represent the 68 and 95% confidence levels in the fit uncertainty. |
png pdf |
Figure 6-a:
Distribution of $ m_{\,\mathrm{t}}^{\,\text{fit}} $ and its post-fit probability density function for the combined fit to the electron+jets channel. The lower panel shows the ratio of data and post-fit template values. The green and yellow bands represent the 68 and 95% confidence levels in the fit uncertainty. |
png pdf |
Figure 6-b:
Distribution of $ m_{\,\mathrm{t}}^{\,\text{fit}} $ and its post-fit probability density function for the combined fit to the muon+jets channel. The lower panel shows the ratio of data and post-fit template values. The green and yellow bands represent the 68 and 95% confidence levels in the fit uncertainty. |
png pdf |
Figure 6-c:
Distribution of additional observables that are the input to the 5D ML fit and their post-fit probability density functions for the combined fit to the electron+jets channel. The lower panel shows the ratio of data and post-fit template values. The green and yellow bands represent the 68 and 95% confidence levels in the fit uncertainty. |
png pdf |
Figure 6-d:
Distribution of additional observables that are the input to the 5D ML fit and their post-fit probability density functions for the combined fit to the muon+jets channel. The lower panel shows the ratio of data and post-fit template values. The green and yellow bands represent the 68 and 95% confidence levels in the fit uncertainty. |
png pdf |
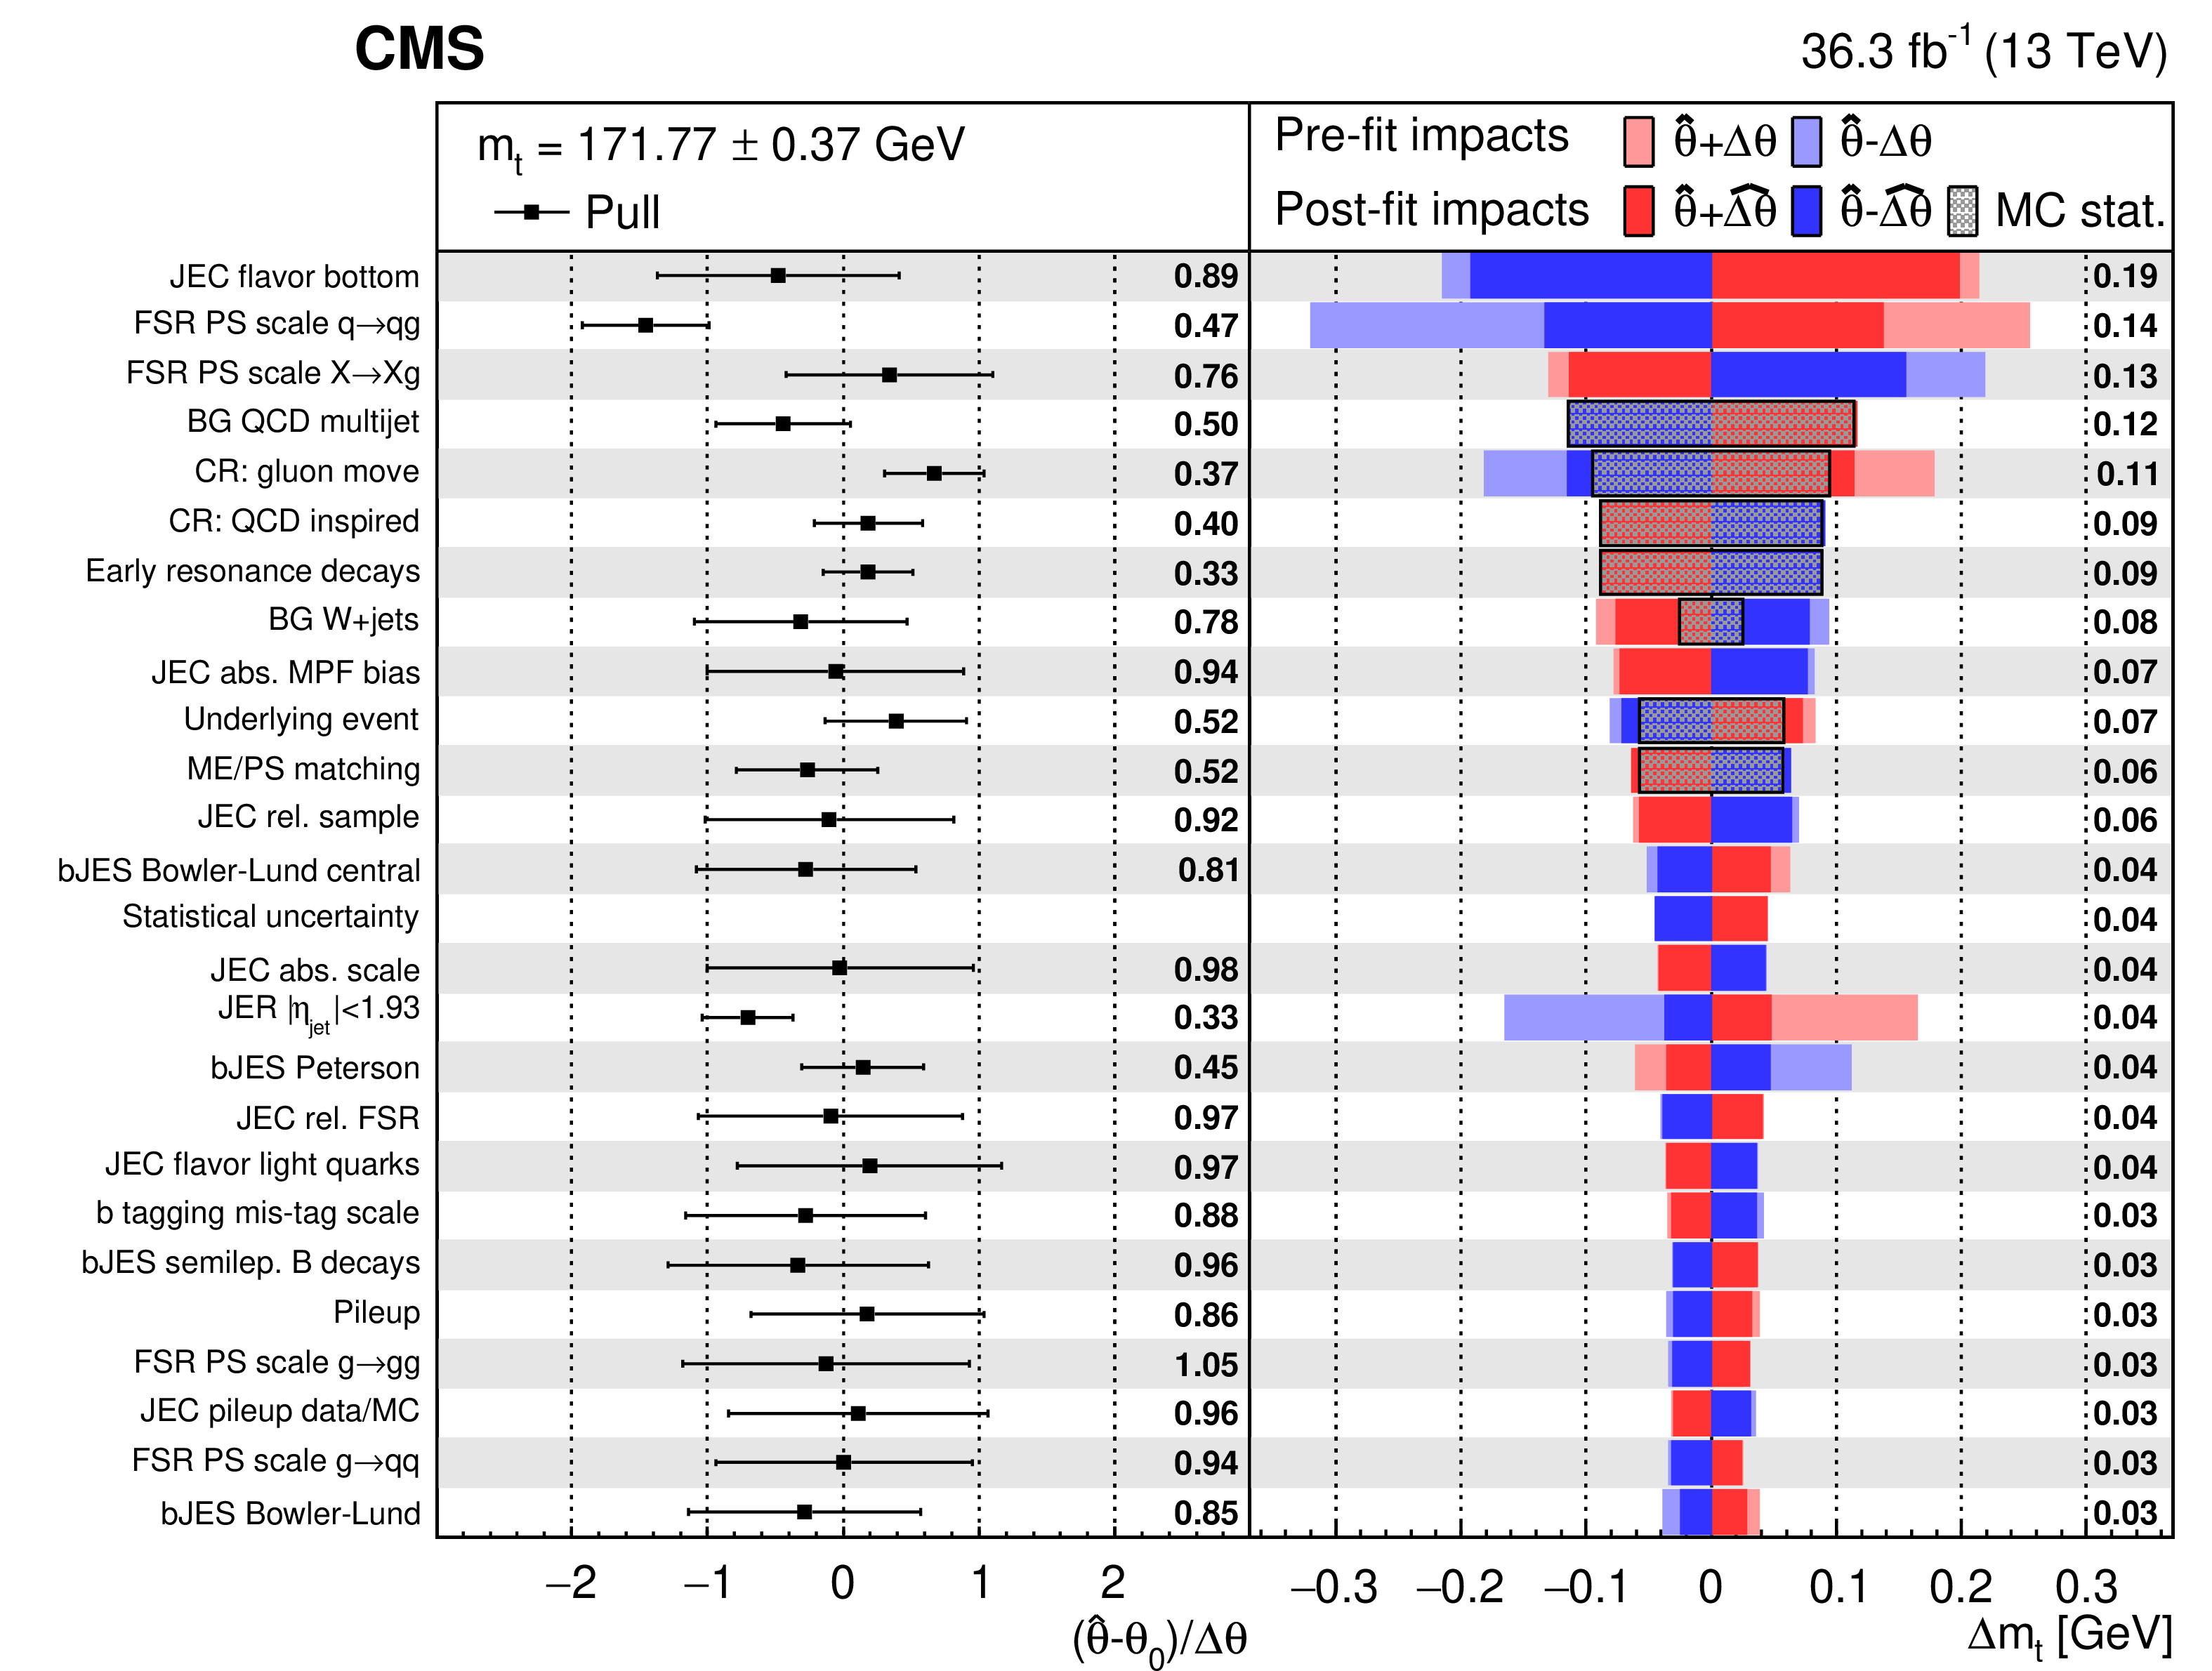
Figure 7:
Measurement of $ m_{\,\mathrm{t}} $ in the combined lepton+jets channel using the 5D set of observables and categories. The left plot shows the post-fit pulls on the most important nuisance parameters and the numbers quote the post-fit uncertainty in the nuisance parameter. The right plot shows their pre-fit (lighter colored bars) and post-fit impacts (darker colored bars) on $ m_{\,\mathrm{t}} $ for up (red) and down (blue) variations. The post-fit impacts include the contribution from the nuisance parameters accounting for the limited size of simulation samples (MC stat. as gray-dotted areas). The average of the post-fit impacts for up and down variations is printed on the right. The rows are sorted by the size of the averaged post-fit impact. The statistical uncertainty in $ m_{\,\mathrm{t}} $ is depicted in the corresponding row. |

png pdf |
Figure 8:
Dependence of the 5D result on the assumed correlation $ \rho_\text{{FSR}} $ between the FSR PS scales in the lepton+jets channel. |
| Tables | |
png pdf |
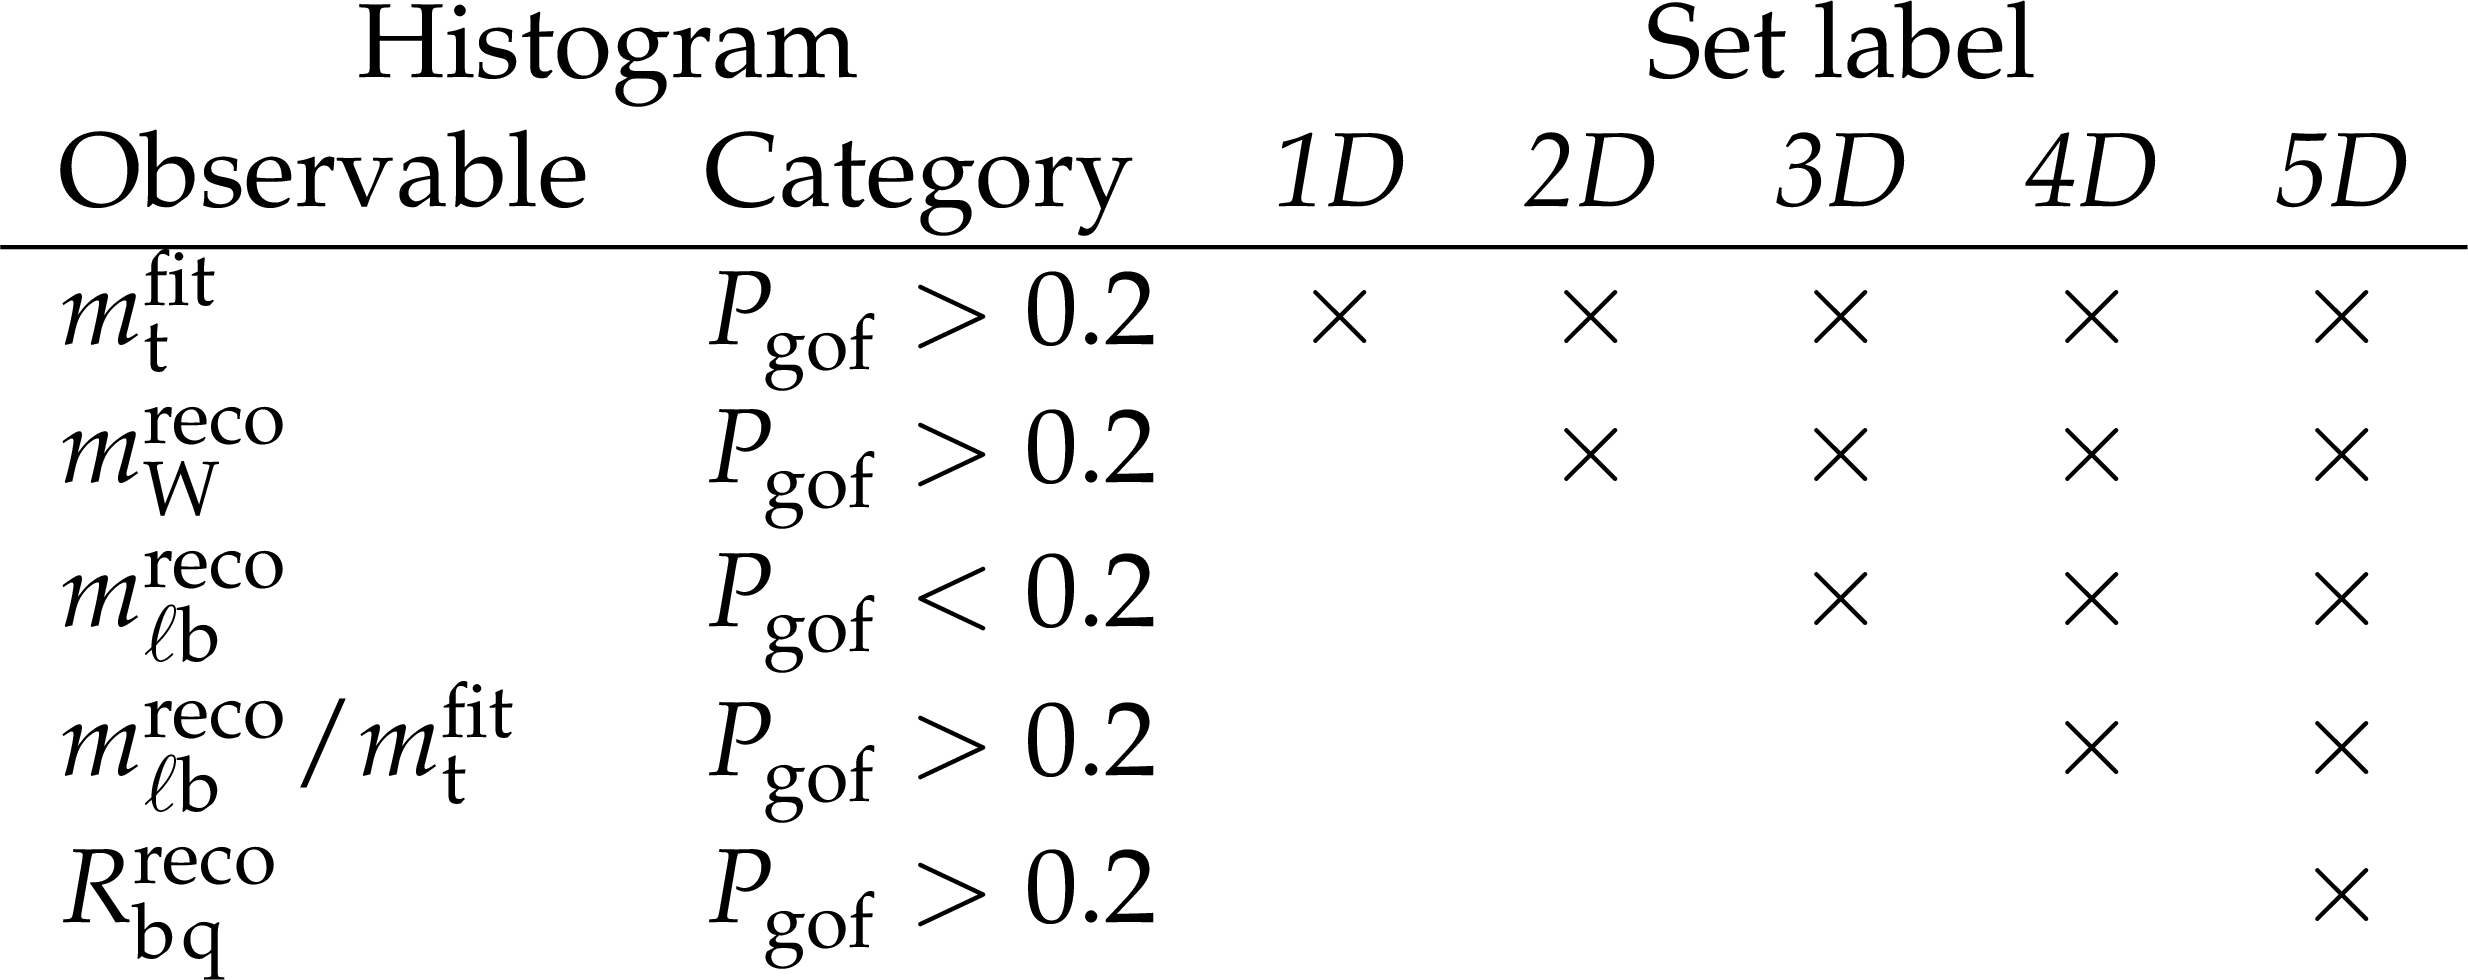
Table 1:
The overall list of different input histograms and their inclusion in a certain histogram set. A histogram marked with "$ \times $" is included in a set (measurement). |
png pdf |
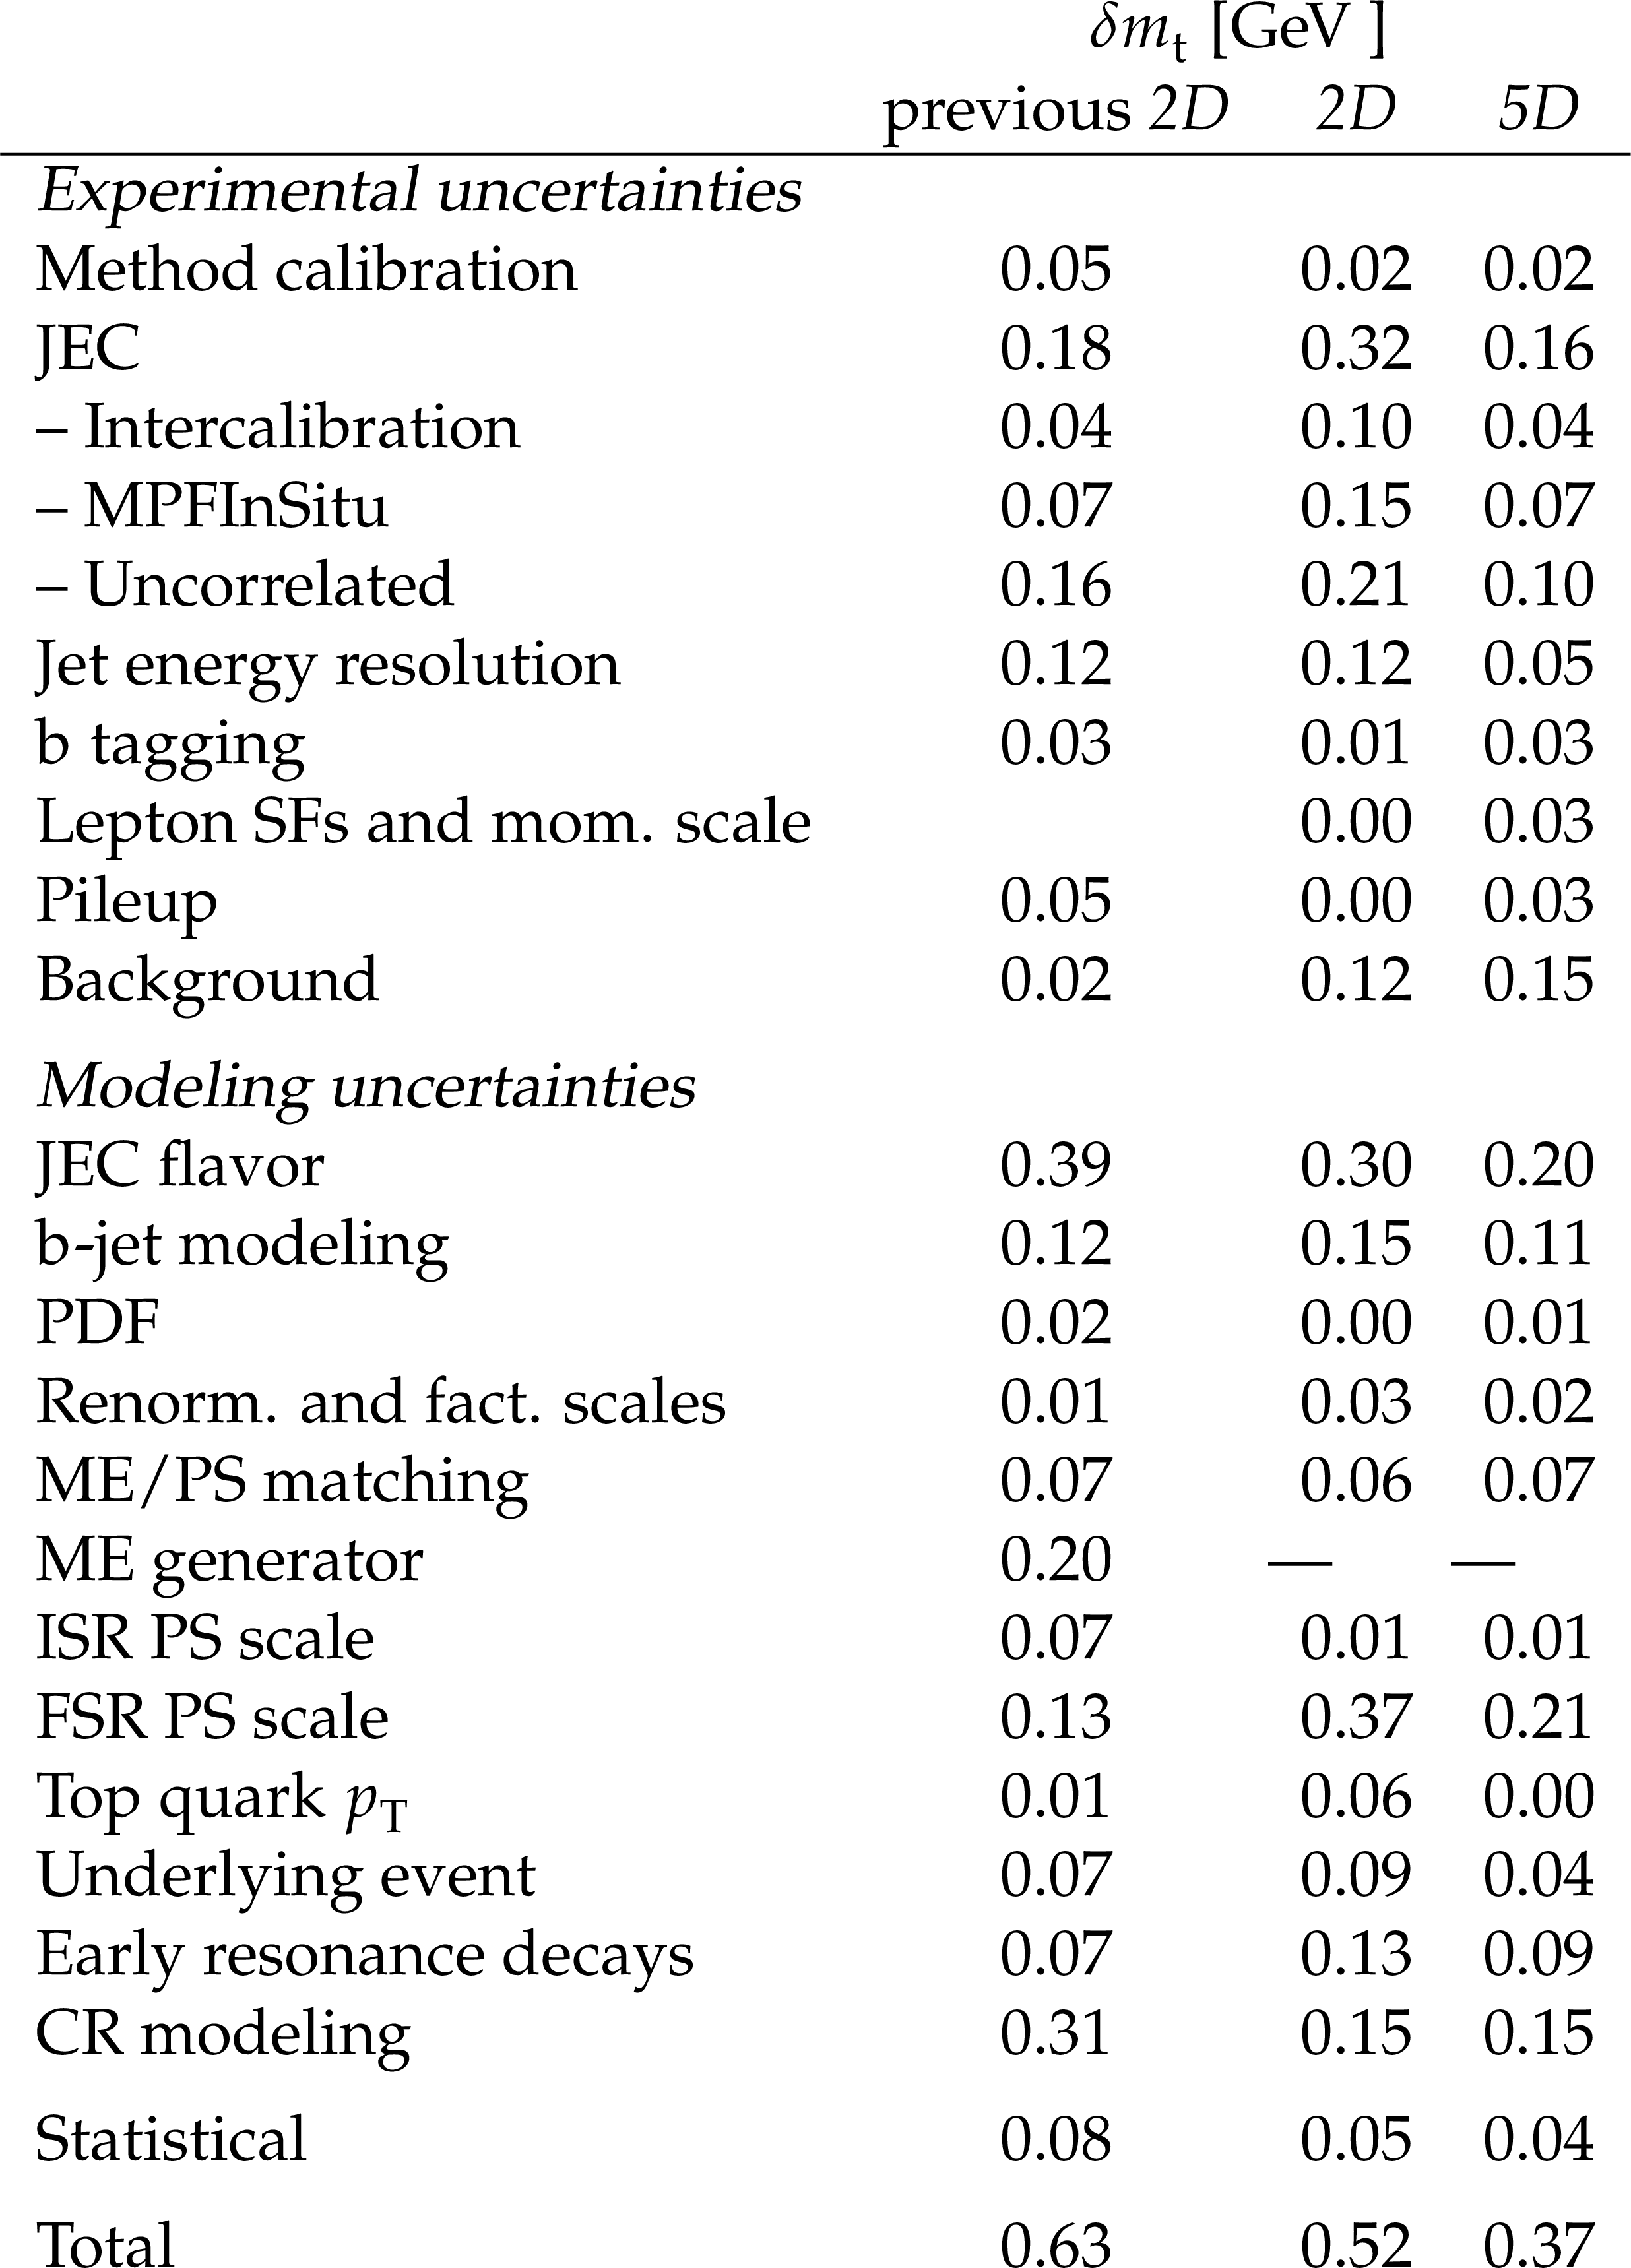
Table 2:
Comparison of the uncertainty in the top quark mass in the previous measurement [13] and the new 2D and 5D results in the lepton+jets channel. |
| Summary |
| The mass of the top quark is measured using LHC proton-proton collision data collected in 2016 with the CMS detector at $ \sqrt{s}= $ 13 TeV, corresponding to an integrated luminosity of 36.3 fb$ ^{-1} $. The measurement uses a sample of $\mathrm{ t \bar{t} }$ events containing one isolated electron or muon and at least four jets in the final state. For each event, the mass is reconstructed from a kinematic fit of the decay products to a $\mathrm{ t \bar{t} }$ hypothesis. A likelihood method is applied using up to four observables per event to extract the top quark mass and constrain the influences of systematic effects, which are included as nuisance parameters in the likelihood. The top quark mass is measured to be 171.77 $ \pm $ 0.37 GeV. This result achieves a considerable improvement compared to all previously published top quark mass measurements and supersedes the previously published measurement in this channel on the same data set. |
| References | ||||
| 1 | CDF Collaboration | Observation of top quark production in $ \bar{p}p $ collisions | PRL 74 (1995) 2626 | hep-ex/9503002 |
| 2 | D0 Collaboration | Observation of the top quark | PRL 74 (1995) 2632 | hep-ex/9503003 |
| 3 | G. Degrassi et al. | Higgs mass and vacuum stability in the standard model at NNLO | JHEP 08 (2012) 1 | 1205.6497 |
| 4 | F. Bezrukov, M. Y. Kalmykov, B. A. Kniehl, and M. Shaposhnikov | Higgs boson mass and new physics | JHEP 10 (2012) 140 | 1205.2893 |
| 5 | The ALEPH, DELPHI, L3, and OPAL Collaborations and the LEP Electroweak Working Group | Electroweak measurements in electron-positron collisions at W-boson-pair energies at LEP | Phys. Rept. 532 (2013) 119 | 1302.3415 |
| 6 | M. Baak et al. | The electroweak fit of the standard model after the discovery of a new boson at the LHC | EPJC 72 (2012) 2205 | 1209.2716 |
| 7 | M. Baak et al. | The global electroweak fit at NNLO and prospects for the LHC and ILC | EPJC 74 (2014) 3046 | 1407.3792 |
| 8 | Particle Data Group , P. A. Zyla et al. | Review of particle physics | Prog. Theor. Exp. Phys. 2020 (2020) 083C01 | |
| 9 | CDF and D0 Collaborations | Combination of CDF and D0 results on the mass of the top quark using up 9.7 fb$^{-1}$ at the Tevatron | FERMILAB-CONF-16-298-E link |
1608.01881 |
| 10 | ATLAS Collaboration | Measurement of the top quark mass in the $ t\bar{t}\rightarrow $ lepton+jets channel from $ \sqrt{s}= $ 8 TeV ATLAS data and combination with previous results | EPJC 79 (2019) 290 | 1810.01772 |
| 11 | CMS Collaboration | Measurement of the top quark mass using proton-proton data at $ {\sqrt{s}} =$ 7 and 8 TeV | PRD 93 (2016) 072004 | CMS-TOP-14-022 1509.04044 |
| 12 | A. H. Hoang | What is the top quark mass? | Ann. Rev. Nucl. Part. Sci. 70 (2020) 225 | 2004.12915 |
| 13 | CMS Collaboration | Measurement of the top quark mass with lepton+jets final states using pp collisions at $ \sqrt{s}=$ 13 TeV | EPJC 78 (2018) 891 | CMS-TOP-17-007 1805.01428 |
| 14 | DELPHI Collaboration | Measurement of the mass and width of the W boson in $ {\rm e}^{+}{\rm e}^{-} $ collisions at $ \sqrt{s} =$ 161--209 GeV | EPJC 55 (2008) 1 | 0803.2534 |
| 15 | CMS Collaboration | Measurement of the top-quark mass in $ \mathrm{t} \overline{\mathrm{t}} $ events with lepton+jets final states in pp collisions at $ \sqrt{s}= $ 7 TeV | JHEP 12 (2012) 105 | CMS-TOP-11-015 1209.2319 |
| 16 | CMS Collaboration | Extraction and validation of a new set of CMS PYTHIA 8 tunes from underlying-event measurements | EPJC 80 (2020) 4 | CMS-GEN-17-001 1903.12179 |
| 17 | E. Bols et al. | Jet flavour classification using DeepJet | JINST 15 (2020) P12012 | 2008.10519 |
| 18 | CMS Collaboration | HEPData record for this analysis | link | |
| 19 | CMS Collaboration | The CMS experiment at the CERN LHC | JINST 3 (2008) S08004 | |
| 20 | CMS Collaboration | Technical proposal for the Phase-II upgrade of the Compact Muon Solenoid | CMS Technical Proposal CERN-LHCC-2015-010, CMS-TDR-15-02, 2015 CDS |
|
| 21 | CMS Collaboration | Particle-flow reconstruction and global event description with the CMS detector | JINST 12 (2017) P10003 | CMS-PRF-14-001 1706.04965 |
| 22 | M. Cacciari, G. P. Salam, and G. Soyez | The anti-$ k_{\mathrm{T}} $ jet clustering algorithm | JHEP 04 (2008) 063 | 0802.1189 |
| 23 | M. Cacciari, G. P. Salam, and G. Soyez | FastJet user manual | EPJC 72 (2012) 1896 | 1111.6097 |
| 24 | CMS Collaboration | Jet energy scale and resolution in the CMS experiment in pp collisions at 8 TeV | JINST 12 (2017) P02014 | CMS-JME-13-004 1607.03663 |
| 25 | CMS Collaboration | Identification of heavy-flavour jets with the CMS detector in pp collisions at 13 TeV | Submitted to JINST (2017) | CMS-BTV-16-002 1712.07158 |
| 26 | CMS Collaboration | Performance of the DeepJet b tagging algorithm using 41.9/fb of data from proton-proton collisions at 13 TeV with Phase 1 CMS detector | CMS Detector Performance Note CMS-DP-2018-058, 2018 CDS |
|
| 27 | CMS Collaboration | Performance of missing transverse momentum reconstruction in proton-proton collisions at $ \sqrt{s} = $ 13\,TeV using the CMS detector | JINST 14 (2019) P07004 | CMS-JME-17-001 1903.06078 |
| 28 | CMS Collaboration | Electron and photon reconstruction and identification with the CMS experiment at the CERN LHC | JINST 16 (2021) P05014 | CMS-EGM-17-001 2012.06888 |
| 29 | CMS Collaboration | ECAL 2016 refined calibration and Run2 summary plots | CMS Detector Performance Note CMS-DP-2020-021, 2020 CDS |
|
| 30 | CMS Collaboration | Performance of the CMS muon detector and muon reconstruction with proton-proton collisions at $ \sqrt{s}= $ 13 TeV | JINST 13 (2018) P06015 | CMS-MUO-16-001 1804.04528 |
| 31 | CMS Collaboration | Precision luminosity measurement in proton-proton collisions at $ \sqrt{s} = $ 13\,TeV in 2015 and 2016 at CMS | EPJC 81 (2021) 800 | CMS-LUM-17-003 2104.01927 |
| 32 | CMS Collaboration | The CMS trigger system | JINST 12 (2017) P01020 | CMS-TRG-12-001 1609.02366 |
| 33 | P. Nason | A new method for combining NLO QCD with shower Monte Carlo algorithms | JHEP 11 (2004) 040 | hep-ph/0409146 |
| 34 | S. Frixione, P. Nason, and C. Oleari | Matching NLO QCD computations with parton shower simulations: the POWHEG method | JHEP 11 (2007) 070 | 0709.2092 |
| 35 | S. Alioli, P. Nason, C. Oleari, and E. Re | A general framework for implementing NLO calculations in shower Monte Carlo programs: the POWHEG BOX | JHEP 06 (2010) 043 | 1002.2581 |
| 36 | T. Sjöstrand et al. | An introduction to PYTHIA 8.2 | Comput. Phys. Commun. 191 (2015) 159 | 1410.3012 |
| 37 | J. Butterworth et al. | PDF4LHC recommendations for LHC Run II | JPG 43 (2016) 023001 | 1510.03865 |
| 38 | NNPDF Collaboration | Parton distributions from high-precision collider data | EPJC 77 (2017) 663 | 1706.00428 |
| 39 | S. Alioli, P. Nason, C. Oleari, and E. Re | NLO single-top production matched with shower in POWHEG: $ s $- and $ t $-channel contributions | JHEP 09 (2009) 111 | 0907.4076 |
| 40 | E. Re | Single-top Wt-channel production matched with parton showers using the POWHEG method | EPJC 71 (2011) 1547 | 1009.2450 |
| 41 | J. Alwall et al. | The automated computation of tree-level and next-to-leading order differential cross sections, and their matching to parton shower simulations | JHEP 07 (2014) 079 | 1405.0301 |
| 42 | J. Alwall et al. | Comparative study of various algorithms for the merging of parton showers and matrix elements in hadronic collisions | EPJC 53 (2008) 473 | 0706.2569 |
| 43 | R. Frederix and S. Frixione | Merging meets matching in MC@NLO | JHEP 12 (2012) 061 | 1209.6215 |
| 44 | P. Skands, S. Carrazza, and J. Rojo | Tuning PYTHIA 8.1: the Monash 2013 tune | EPJC 74 (2014) 3024 | 1404.5630 |
| 45 | GEANT4 Collaboration | GEANT 4---a simulation toolkit | NIM A 506 (2003) 250 | |
| 46 | M. Czakon and A. Mitov | Top++: A program for the calculation of the top-pair cross-section at hadron colliders | Comput. Phys. Commun. 185 (2014) 2930 | 1112.5675 |
| 47 | Y. Li and F. Petriello | Combining QCD and electroweak corrections to dilepton production in FEWZ | PRD 86 (2012) 094034 | 1208.5967 |
| 48 | M. Aliev et al. | HATHOR: HAdronic Top and Heavy quarks crOss section calculatoR | Comput. Phys. Commun. 182 (2011) 1034 | 1007.1327 |
| 49 | P. Kant et al. | HATHOR for single top-quark production: Updated predictions and uncertainty estimates for single top-quark production in hadronic collisions | Comput. Phys. Commun. 191 (2015) 74 | 1406.4403 |
| 50 | D0 Collaboration | Direct measurement of the top quark mass at D0 | PRD 58 (1998) 052001 | hep-ex/9801025 |
| 51 | ATLAS Collaboration | Measurement of the top quark mass in the $ {\mathrm{t}\overline{\mathrm{t}}} \to $ dilepton channel from $ \sqrt{s}= $ 8 TeV ATLAS data | PLB 761 (2016) 350 | 1606.02179 |
| 52 | CMS Collaboration | Measurement of the $ \mathrm{t\bar{t}} $ production cross section, the top quark mass, and the strong coupling constant using dilepton events in pp collisions at $ \sqrt{s} = $ 13 TeV | EPJC 79 (2019) 368 | CMS-TOP-17-001 1812.10505 |
| 53 | ATLAS Collaboration | Measurement of the top quark mass in the $ t\bar{t}\rightarrow $ lepton+jets and $ t\bar{t}\rightarrow $ dilepton channels using $ \sqrt{s}= $ 7 TeV ATLAS data | EPJC 75 (2015) 330 | 1503.05427 |
| 54 | CMS Collaboration | Measurement of the top quark mass in the all-jets final state at $ \sqrt{s} = $ 13 TeV and combination with the lepton+jets channel | EPJC 79 (2019) 313 | CMS-TOP-17-008 1812.10534 |
| 55 | CMS Collaboration | Jet energy scale and resolution performance with 13 TeV data collected by CMS in 2016-2018 | CMS Detector Performance Note CMS-DP-2020-019, 2020 CDS |
|
| 56 | CMS Collaboration | Measurement of the inelastic proton-proton cross section at $ \sqrt{s}= $ 13 TeV | JHEP 07 (2018) 161 | CMS-FSQ-15-005 1802.02613 |
| 57 | CMS Collaboration | Measurement of the $ t $-channel single-top-quark production cross section and of the $ |V_{\mathrm{t}\mathrm{b}}| $ CKM matrix element in pp collisions at $ \sqrt{s} = $ 8 TeV | JHEP 06 (2014) 090 | CMS-TOP-12-038 1403.7366 |
| 58 | CMS Collaboration | Cross section measurement of $ t $-channel single top quark production in pp collisions at $ \sqrt s = $ 13 TeV | PLB 772 (2017) 752 | CMS-TOP-16-003 1610.00678 |
| 59 | CMS Collaboration | Measurement of the production cross section of a W boson in association with two b jets in pp collisions at $ \sqrt{s} = $ 8 TeV | Eur. Phys. J C. 77 (2017) 92 | CMS-SMP-14-020 1608.07561 |
| 60 | CMS Collaboration | Measurements of the associated production of a Z boson and b jets in pp collisions at $ {\sqrt{s}} = $ 8 TeV | EPJC 77 (2017) 751 | CMS-SMP-14-010 1611.06507 |
| 61 | CMS Collaboration | Measurement of the WZ production cross section in pp collisions at $ {\sqrt{s}} = $ 13 TeV | PLB 766 (2017) 268 | CMS-SMP-16-002 1607.06943 |
| 62 | CMS Collaboration | Measurements of the $ \mathrm {p}\mathrm {p}\rightarrow \mathrm{Z}\mathrm{Z} $ production cross section and the $ \mathrm{Z}\rightarrow 4\ell $ branching fraction, and constraints on anomalous triple gauge couplings at $ \sqrt{s} = $ 13 TeV | EPJC 78 (2018) 165 | CMS-SMP-16-017 1709.08601 |
| 63 | T. Sjöstrand, S. Mrenna, and P. Z. Skands | PYTHIA 6.4 physics and manual | JHEP 05 (2006) 026 | hep-ph/0603175 |
| 64 | M. Bähr et al. | Herwig++ physics and manual | EPJC 58 (2008) 639 | 0803.0883 |
| 65 | DELPHI Collaboration | A study of the b-quark fragmentation function with the DELPHI detector at LEP I and an averaged distribution obtained at the Z pole | EPJC 71 (2011) 1557 | 1102.4748 |
| 66 | ALEPH Collaboration | Study of the fragmentation of b quarks into B mesons at the Z peak | PLB 512 (2001) 30 | hep-ex/0106051 |
| 67 | S. Dulat et al. | New parton distribution functions from a global analysis of quantum chromodynamics | PRD 93 (2016) 033006 | 1506.07443 |
| 68 | L. A. Harland-Lang, A. D. Martin, P. Motylinski, and R. S. Thorne | Parton distributions in the LHC era: MMHT 2014 PDFs | EPJC 75 (2015) 204 | 1412.3989 |
| 69 | CMS Collaboration | Investigations of the impact of the parton shower tuning in PYTHIA 8 in the modelling of $ \mathrm{t\overline{t}} $ at $ \sqrt{s}= $ 8 and 13 TeV | CMS Physics Analysis Summary, 2016 CMS-PAS-TOP-16-021 |
CMS-PAS-TOP-16-021 |
| 70 | S. Mrenna and P. Skands | Automated parton-shower variations in PYTHIA 8 | PRD 94 (2016) 074005 | 1605.08352 |
| 71 | M. Czakon, D. Heymes, and A. Mitov | High-precision differential predictions for top-quark pairs at the LHC | PRL 116 (2016) 082003 | 1511.00549 |
| 72 | M. Czakon et al. | Top-pair production at the LHC through NNLO QCD and NLO EW | JHEP 10 (2017) 186 | 1705.04105 |
| 73 | S. Catani et al. | Top-quark pair production at the LHC: Fully differential QCD predictions at NNLO | JHEP 07 (2019) 100 | 1906.06535 |
| 74 | CMS Collaboration | Measurement of differential cross sections for top quark pair production using the lepton+jets final state in proton-proton collisions at 13 TeV | PRD 95 (2017) 092001 | CMS-TOP-16-008 1610.04191 |
| 75 | CMS Collaboration | Measurement of normalized differential $ \mathrm{t\bar{t}} $ cross sections in the dilepton channel from pp collisions at $ \sqrt{s}= $ 13 TeV | JHEP 04 (2018) 060 | CMS-TOP-16-007 1708.07638 |
| 76 | J. R. Christiansen and P. Z. Skands | String formation beyond leading colour | JHEP 08 (2015) 003 | 1505.01681 |
| 77 | S. Argyropoulos and T. Sjöstrand | Effects of color reconnection on $ \mathrm{t} \overline{\mathrm{t}} $ final states at the LHC | JHEP 11 (2014) 043 | 1407.6653 |
| 78 | CMS Collaboration | CMS PYTHIA 8 colour reconnection tunes based on underlying-event data | EPJC 83 (2023) 587 | CMS-GEN-17-002 2205.02905 |
| 79 | W. Verkerke and D. P. Kirkby | The RooFit toolkit for data modeling | in th International Conference for Computing in High-Energy and Nuclear Physics (CHEP03). . . [eConf C0303241, MOLT007], 2003 Proceedings of the 1 (2003) 3 |
0306116 |
| 80 | F. James and M. Roos | Minuit: A system for function minimization and analysis of the parameter errors and correlations | Comput. Phys. Commun. 10 (1975) 343 | |
| 81 | R. J. Barlow and C. Beeston | Fitting using finite Monte Carlo samples | Comput. Phys. Commun. 77 (1993) 219 | |
| 83 | ATLAS and CMS Collaborations | Jet energy scale uncertainty correlations between ATLAS and CMS at 8 TeV | ATL-PHYS-PUB-2015-049, 2015 CMS-PAS-JME-15-001 |
CMS-PAS-JME-15-001 |
|
|
Compact Muon Solenoid LHC, CERN |
|

|

|

|

|

|