

Compact Muon Solenoid
LHC, CERN
| CMS-TOP-21-005 ; CERN-EP-2023-014 | ||
| Evidence for four-top quark production in proton-proton collisions at $ \sqrt{s} = $ 13 TeV | ||
| CMS Collaboration | ||
| 7 March 2023 | ||
| Phys. Lett. B 844 (2023) 138076 | ||
| Abstract: The production of four top quarks ($ \mathrm{t}\bar{\mathrm{t}}\mathrm{t}\bar{\mathrm{t}} $) is studied with LHC proton-proton collision data samples collected by the CMS experiment at a center-of-mass energy of 13 TeV, and corresponding to integrated luminosities of up to 138 fb$ ^{-1} $. Events that have no leptons (all-hadronic), one lepton, or two opposite-sign leptons (where lepton refers only to prompt electrons or prompt muons) are considered. This is the first $ \mathrm{t}\bar{\mathrm{t}}\mathrm{t}\bar{\mathrm{t}} $ measurement that includes the all-hadronic final state. The observed significance of the $ \mathrm{t}\bar{\mathrm{t}}\mathrm{t}\bar{\mathrm{t}} $ signal in these final states of 3.9 standard deviations (1.5 expected) provides evidence for $ \mathrm{t}\bar{\mathrm{t}}\mathrm{t}\bar{\mathrm{t}} $ production, with a measured cross section of 36 $ ^{+12}_{-11} $ fb. Combined with earlier CMS results in other final states, the signal significance is 4.0 standard deviations (3.2 expected). The combination returns an observed cross section of 17 $ \pm $ 4 (stat) $ \pm $ 3 (syst) fb, which is consistent with the standard model prediction. | ||
| Links: e-print arXiv:2303.03864 [hep-ex] (PDF) ; CDS record ; inSPIRE record ; HepData record ; Physics Briefing ; CADI line (restricted) ; | ||
| Figures & Tables | Summary | Additional Figures & Tables | References | CMS Publications |
|---|
| Figures | |
png pdf |
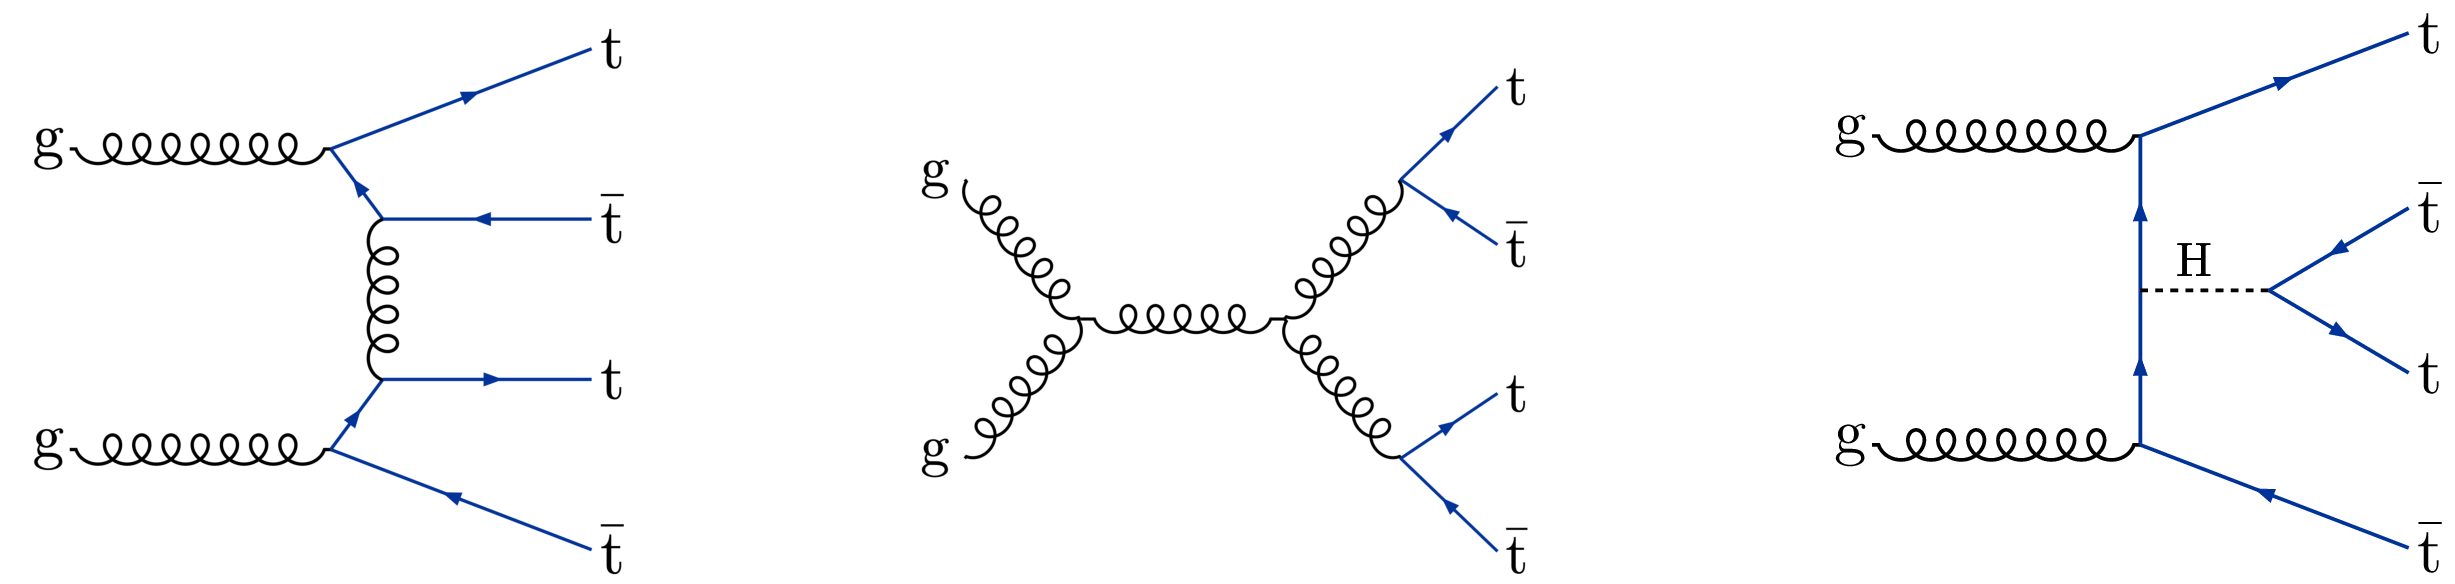
Figure 1:
Examples of Feynman diagrams for $ \mathrm{t}\bar{\mathrm{t}}\mathrm{t}\bar{\mathrm{t}} $ production at leading order in the SM. |
png pdf |
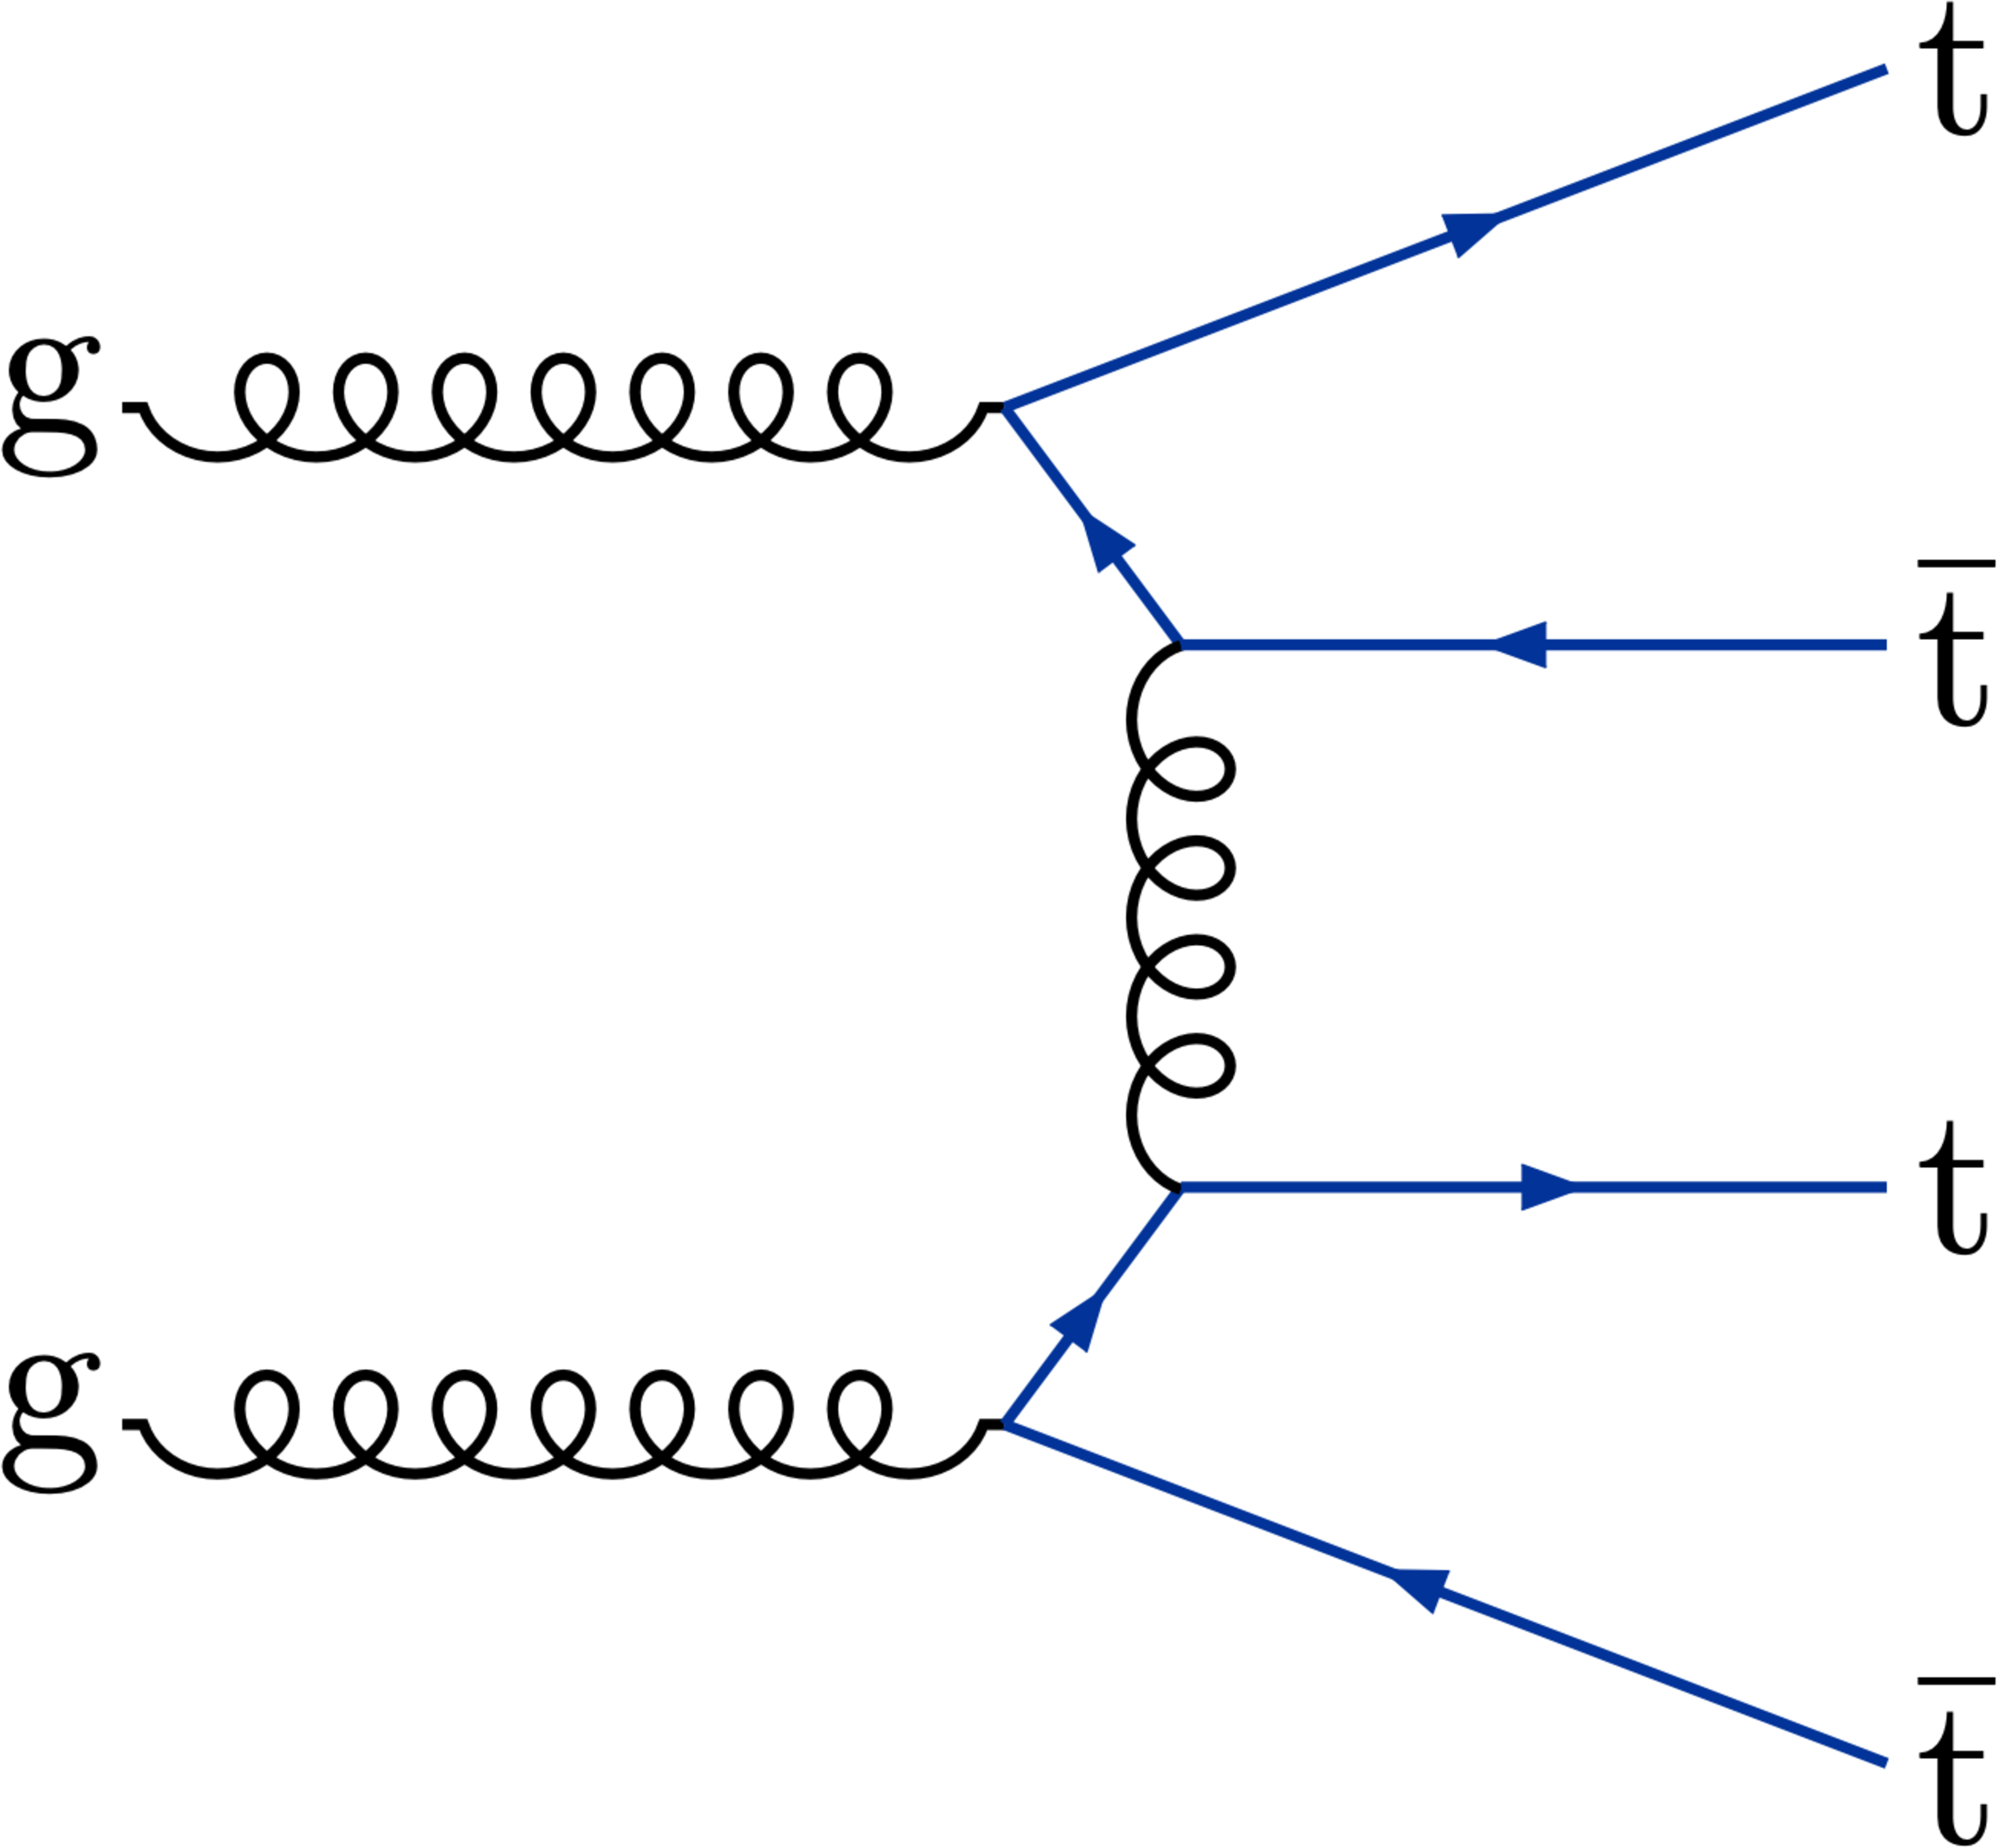
Figure 1-a:
Example of Feynman diagram for $ \mathrm{t}\bar{\mathrm{t}}\mathrm{t}\bar{\mathrm{t}} $ production at leading order in the SM. |
png pdf |
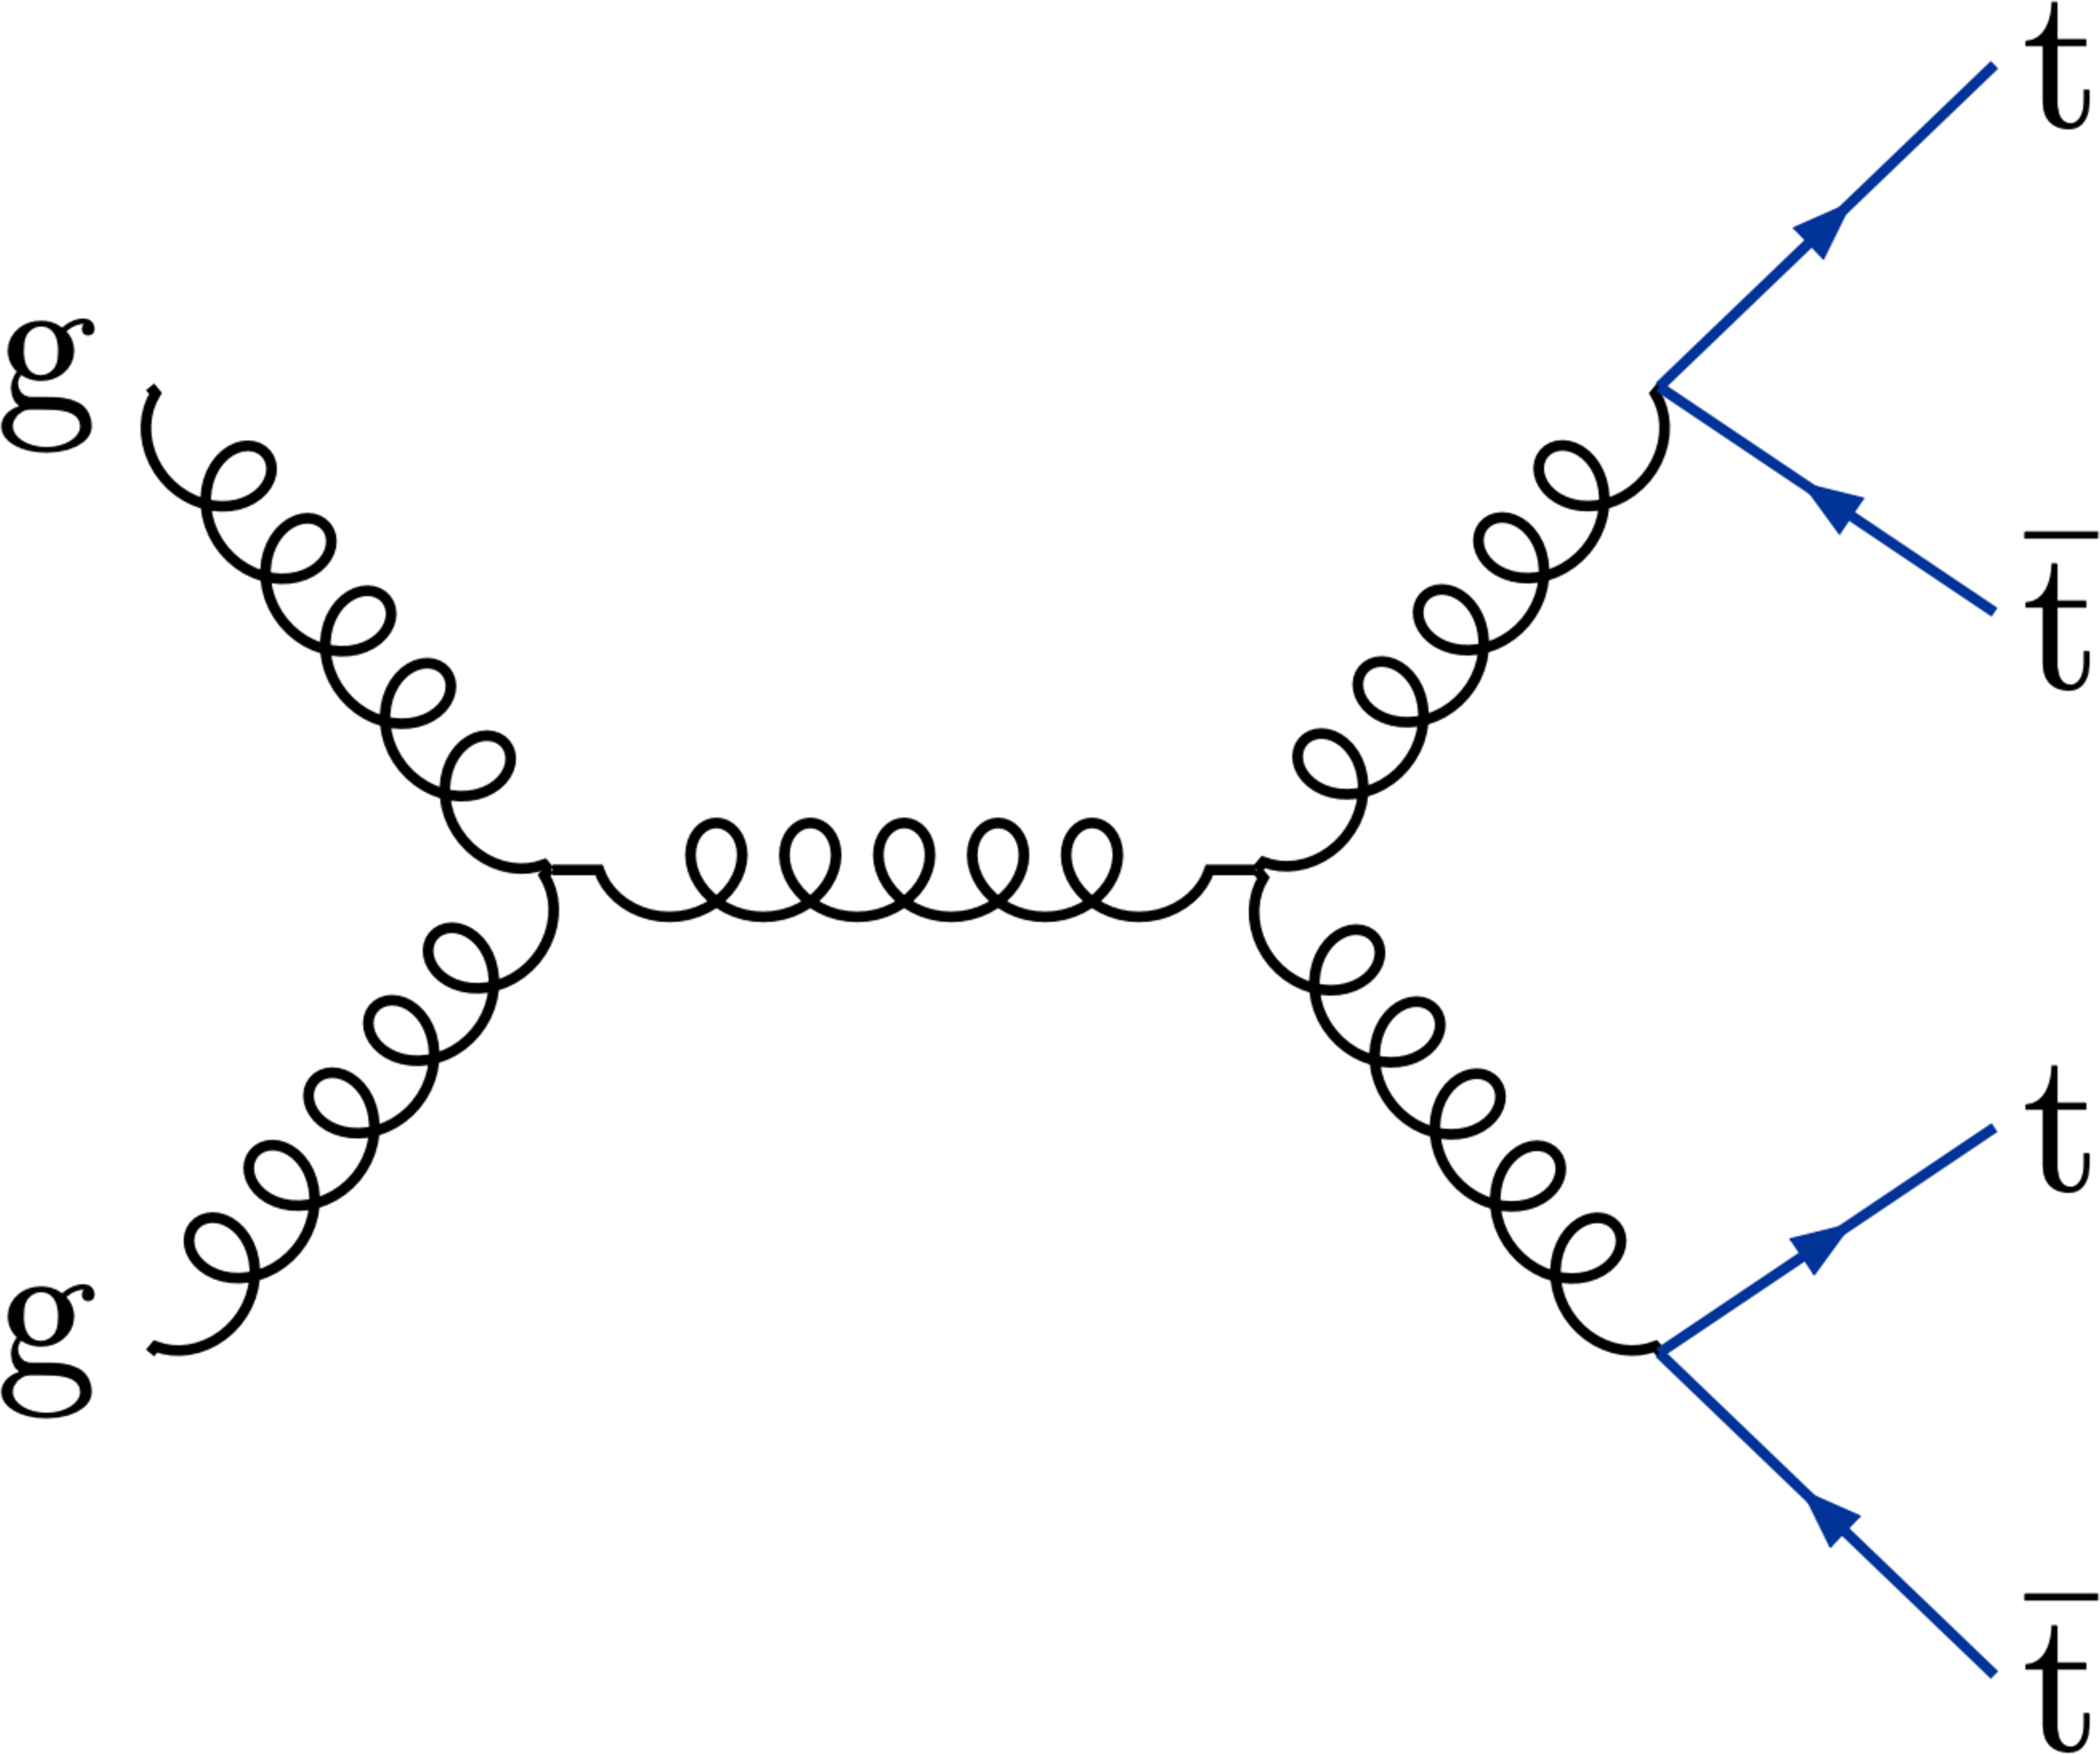
Figure 1-b:
Example of Feynman diagram for $ \mathrm{t}\bar{\mathrm{t}}\mathrm{t}\bar{\mathrm{t}} $ production at leading order in the SM. |

png pdf |
Figure 1-c:
Example of Feynman diagram for $ \mathrm{t}\bar{\mathrm{t}}\mathrm{t}\bar{\mathrm{t}} $ production at leading order in the SM. |
png pdf |
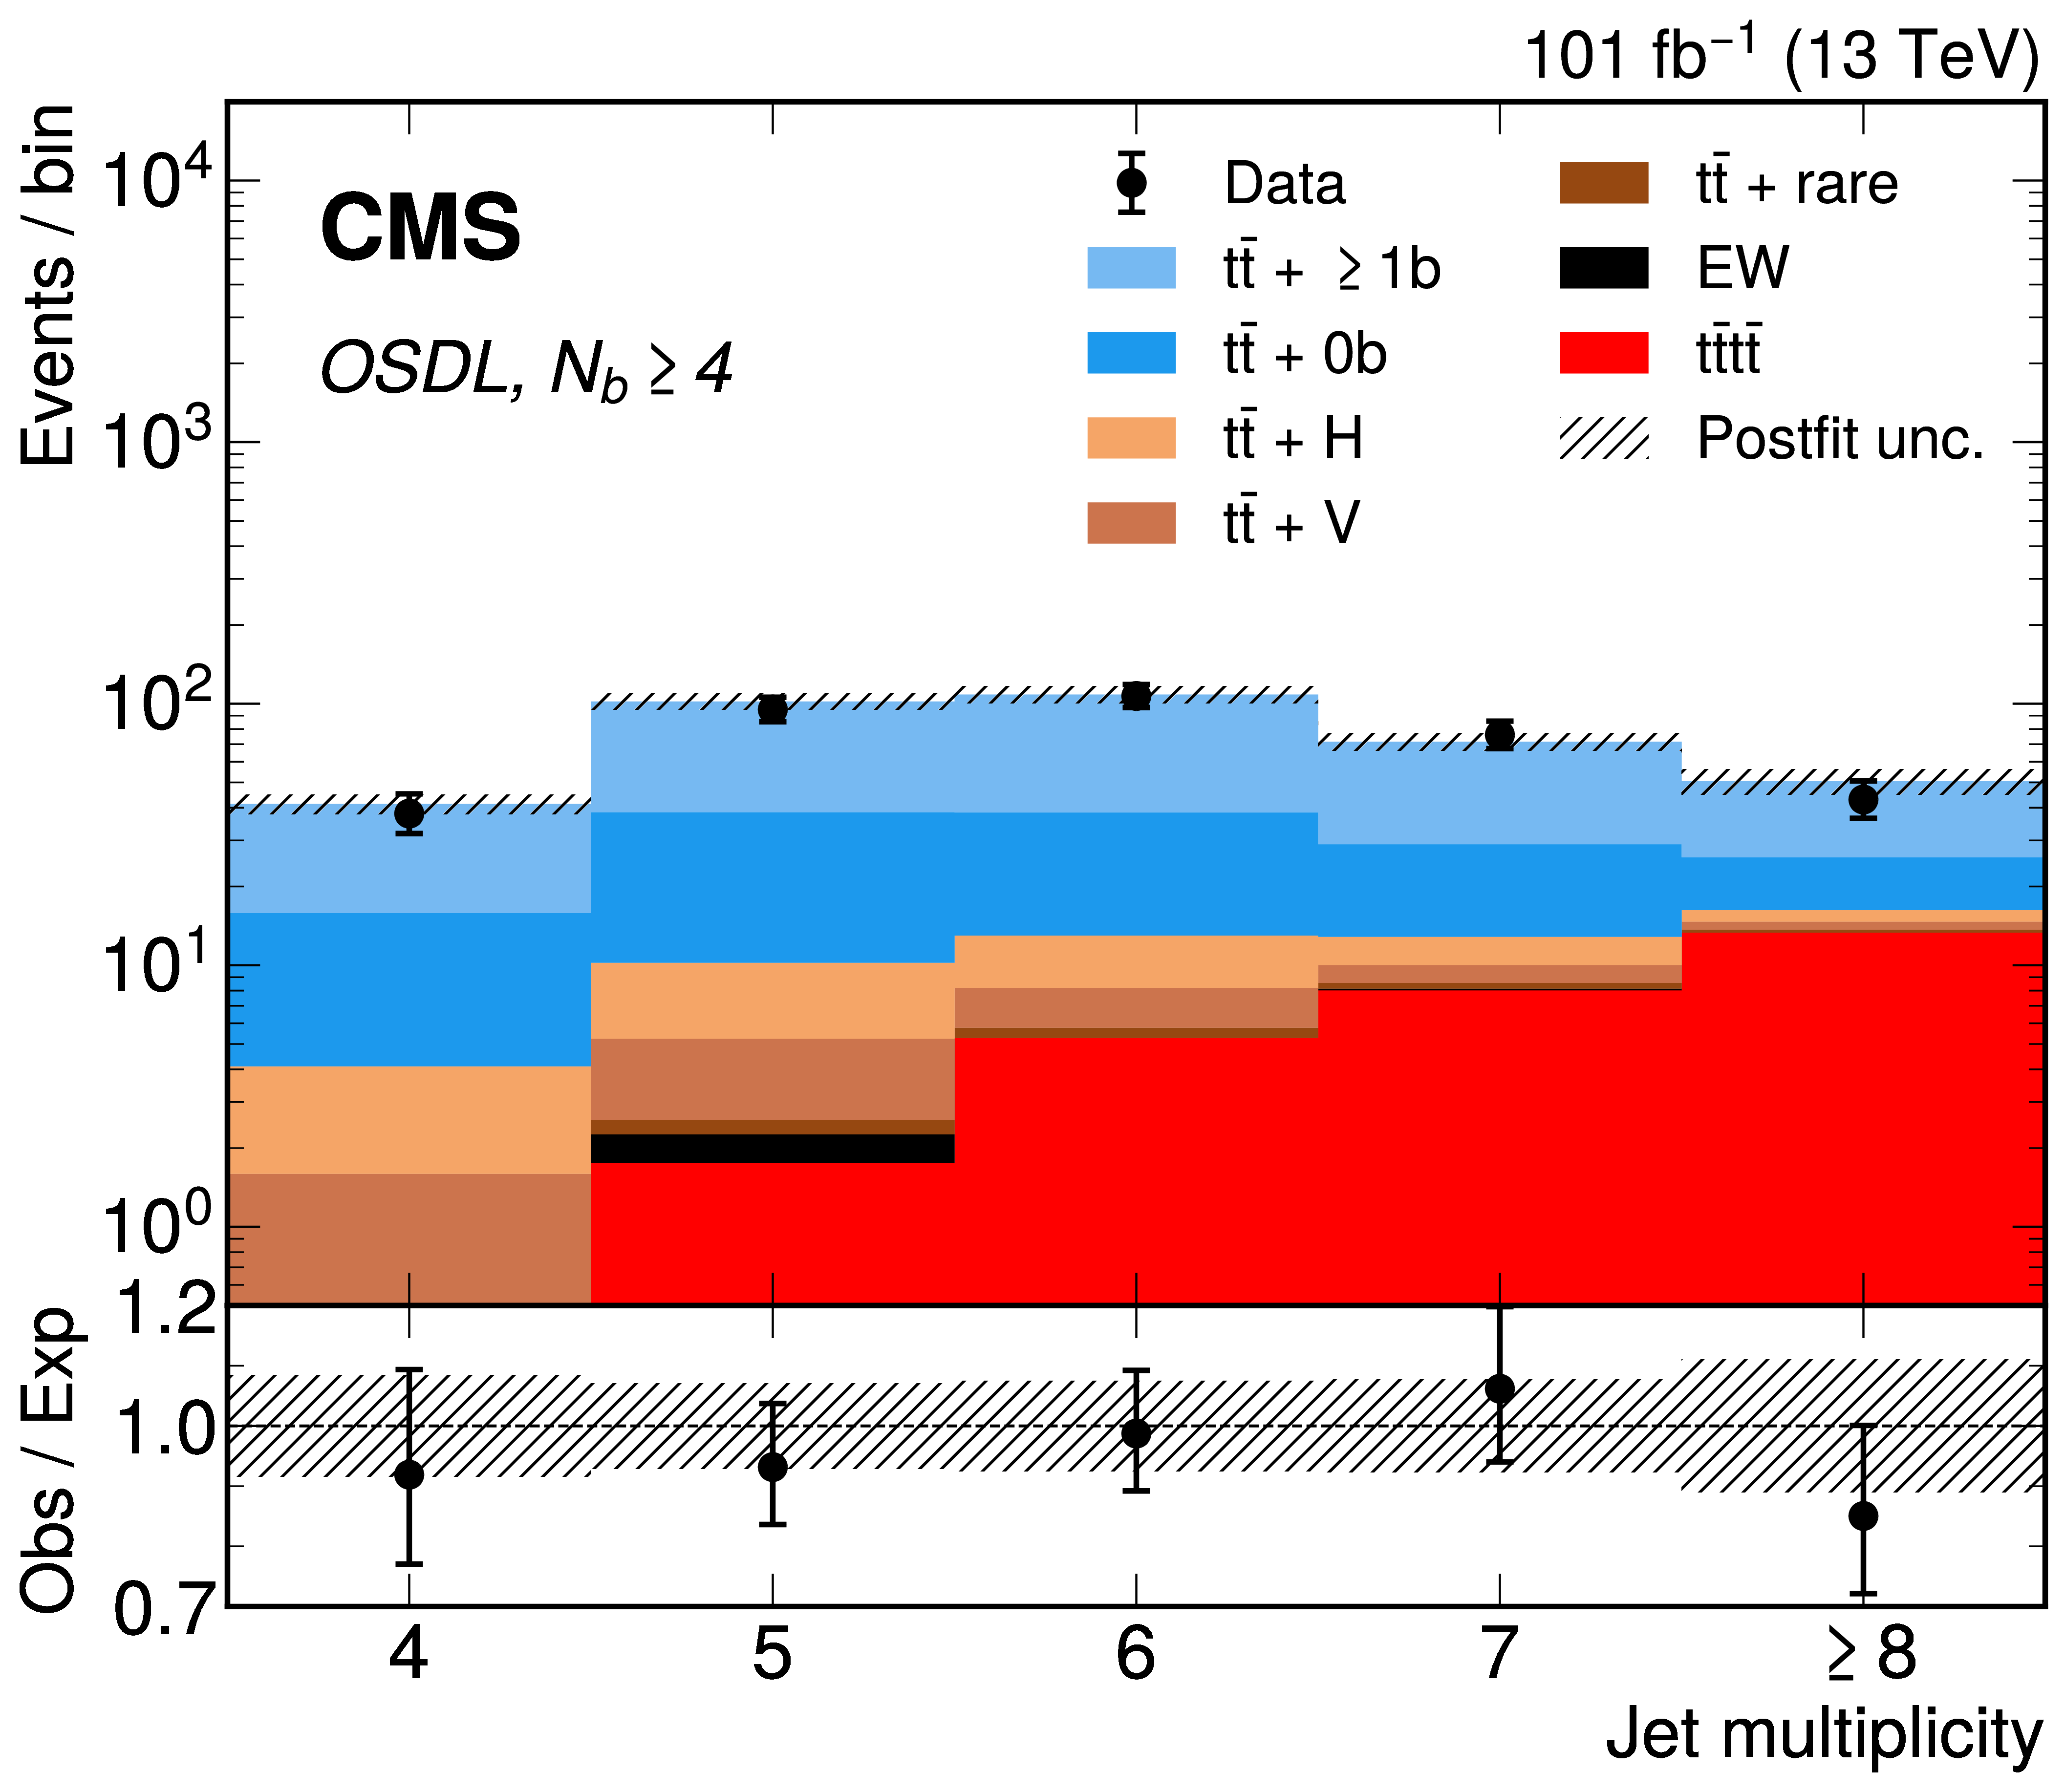
Figure 2:
The jet multiplicity for $ N_{\mathrm{b}}\ge $ 4 in the opposite-sign dilepton channel for the combined 2017--2018 dataset with dilepton decay categories combined. Here, $ {\mathrm{t}\bar{\mathrm{t}}} +{\geq} 1 \mathrm{b} $ refers to $ \mathrm{t} \bar{\mathrm{t}} $ events with at least one additional b jet, $ {\mathrm{t}\bar{\mathrm{t}}} + 0 \mathrm{b} $ includes all other $ \mathrm{t} \bar{\mathrm{t}} $ events not produced in association with a boson, and EW refers to events that contain W and Z bosons but no top quarks. The backgrounds and $ \mathrm{t}\bar{\mathrm{t}}\mathrm{t}\bar{\mathrm{t}} $ signal (derived from the fit described below) are shown as a stacked histogram. The hatched bands correspond to the estimated total uncertainty after the fit. |
png pdf |
Figure 3:
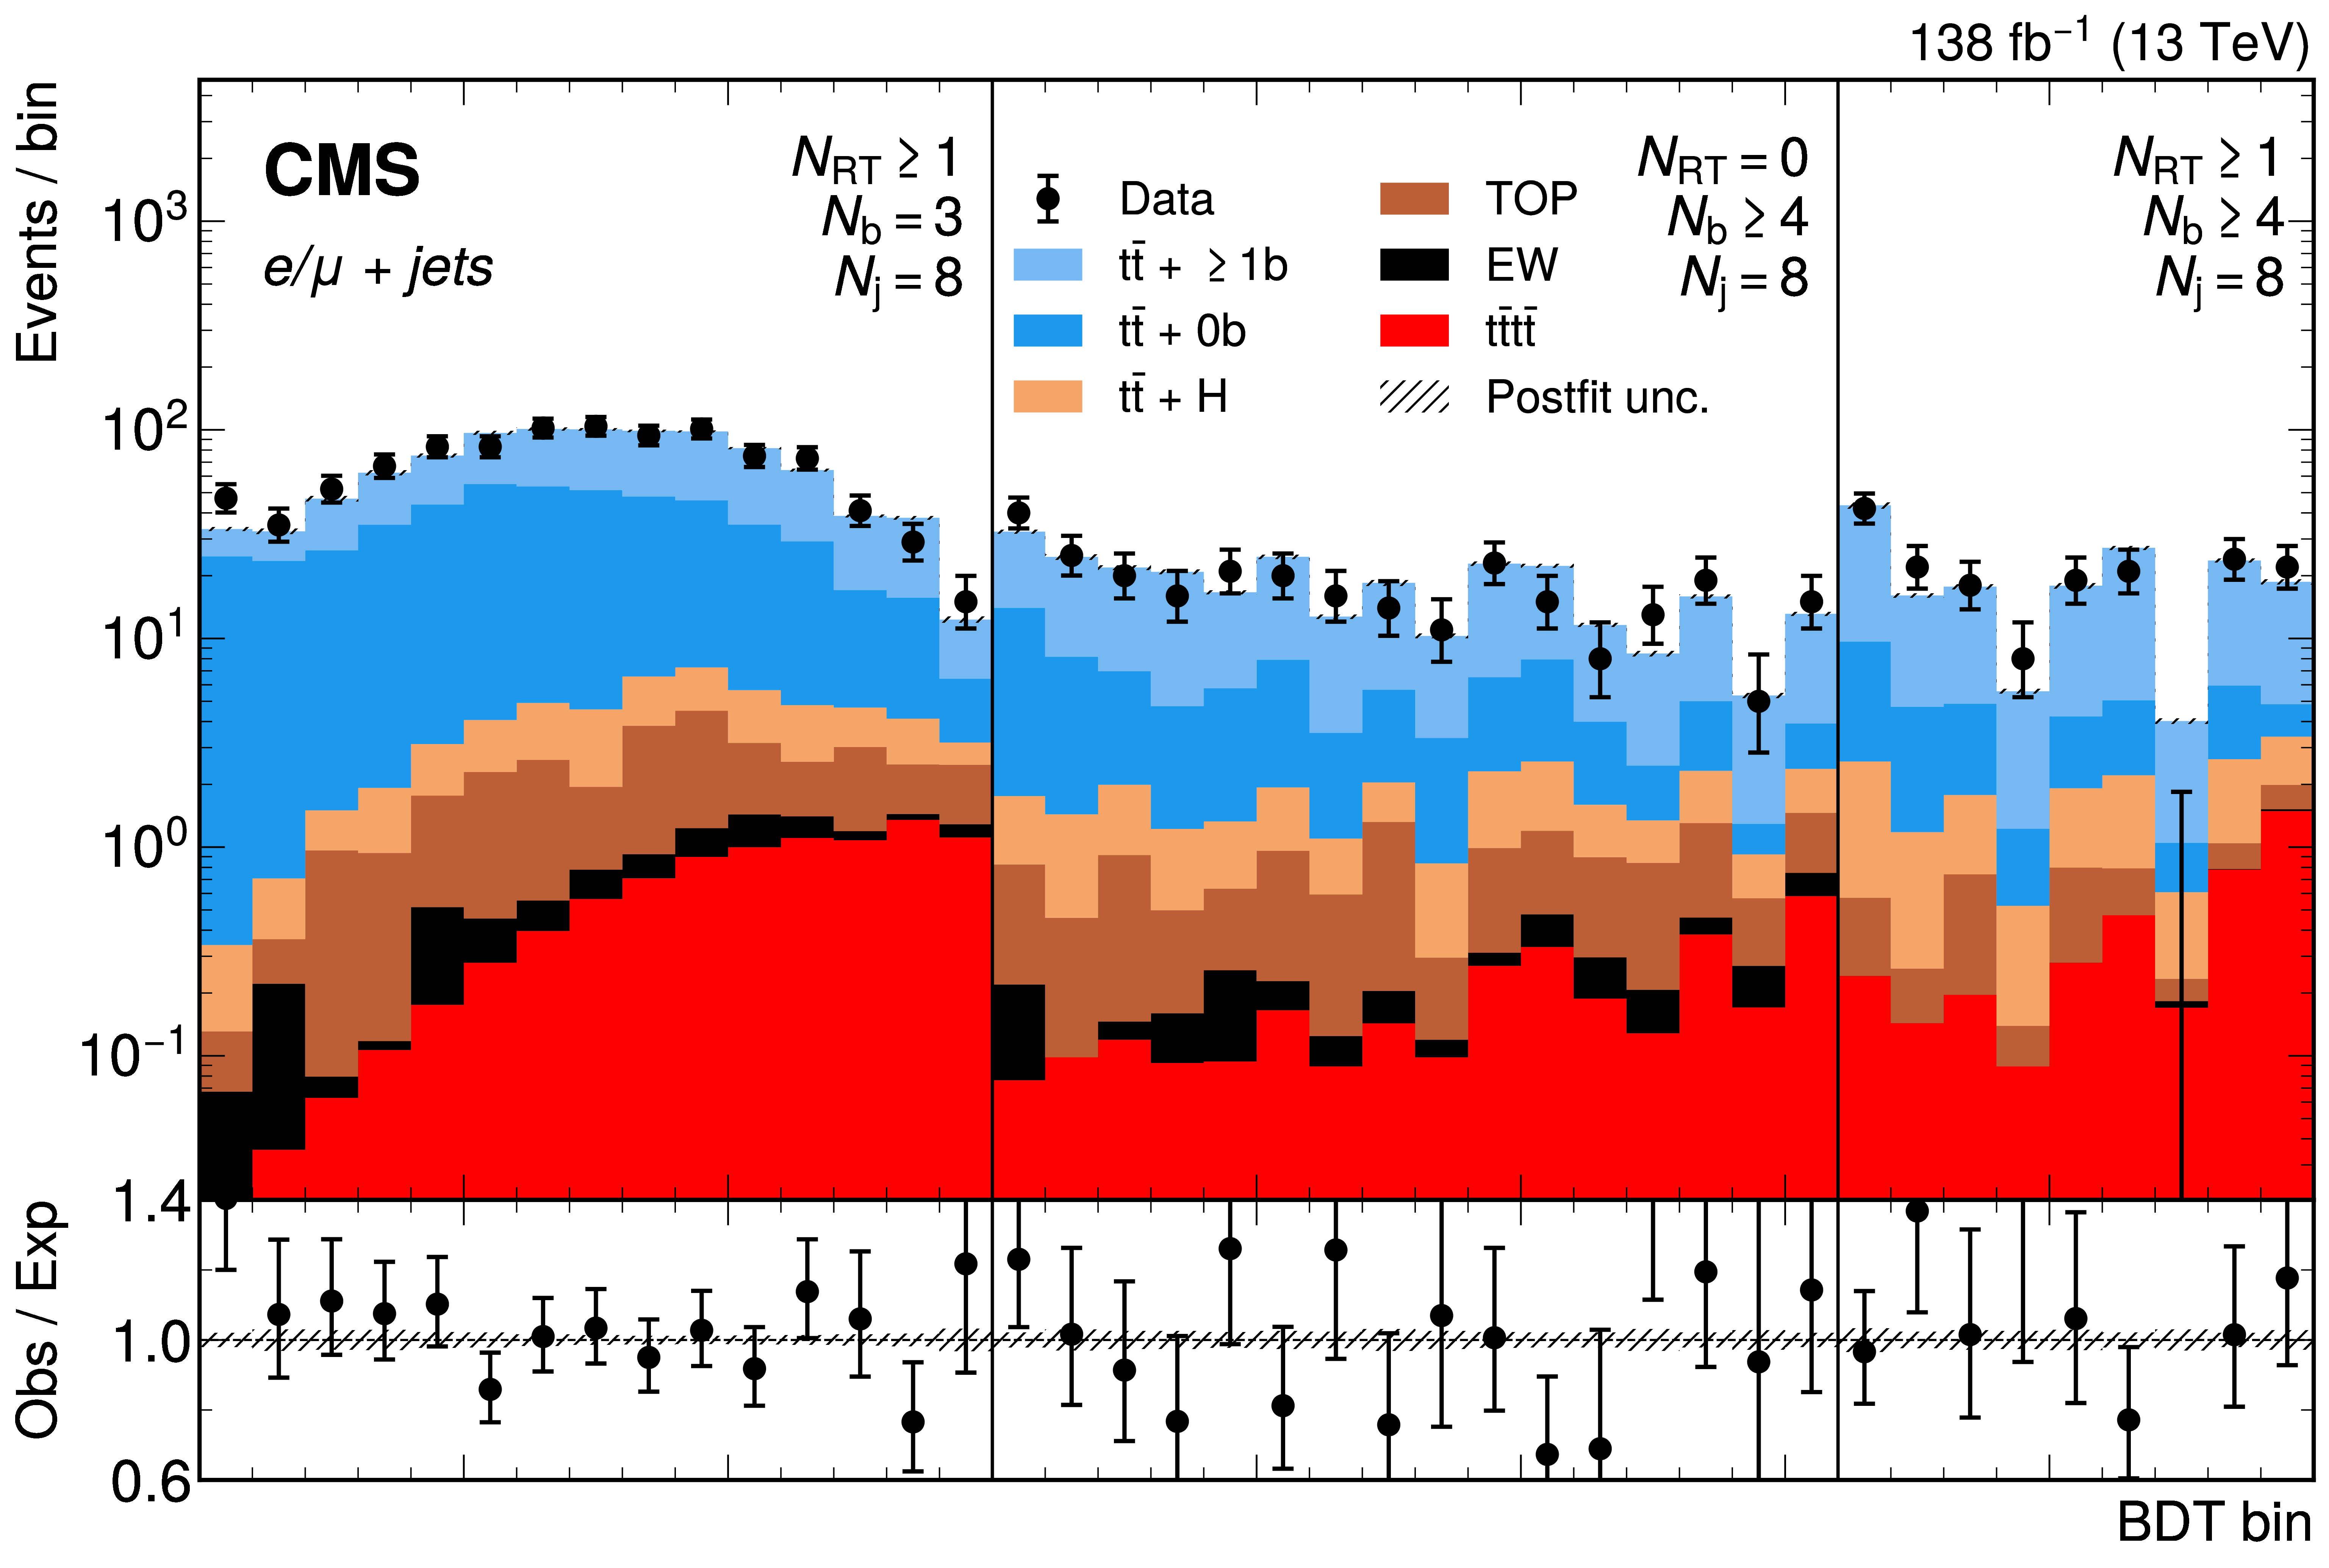
The distribution of the BDT discriminants for the 2016--2018 data set for three different categories in the combined single-electron and single-muon channels. The three categories are defined by the number of resolved t tags ($ N_\text{RT} $), b tags ($ N_{\mathrm{b}} $), and jets ($ N_{\text{j}} $), selected as representative based on their sensitivity to signal. Here, $ {\mathrm{t}\bar{\mathrm{t}}} + {\geq} 1 \mathrm{b} $ refers to $ \mathrm{t} \bar{\mathrm{t}} $ events with at least one additional b jet, while $ {\mathrm{t}\bar{\mathrm{t}}} + 0 \mathrm{b} $ includes all other $ \mathrm{t} \bar{\mathrm{t}} $ events not produced in association with a boson. The TOP grouping contains single top quark production along with the other $ \mathrm{t} \bar{\mathrm{t}} $ processes not explicitly shown, and EW refers to events that contain W and Z bosons but no top quarks. The backgrounds and $ \mathrm{t}\bar{\mathrm{t}}\mathrm{t}\bar{\mathrm{t}} $ signal (derived from the fit described below) are shown as a stacked histogram. The hatched bands correspond to the estimated total uncertainty after the fit. While the bins are shown to be equal width, they do not correspond to equal width in BDT value. |

png pdf |
Figure 4:
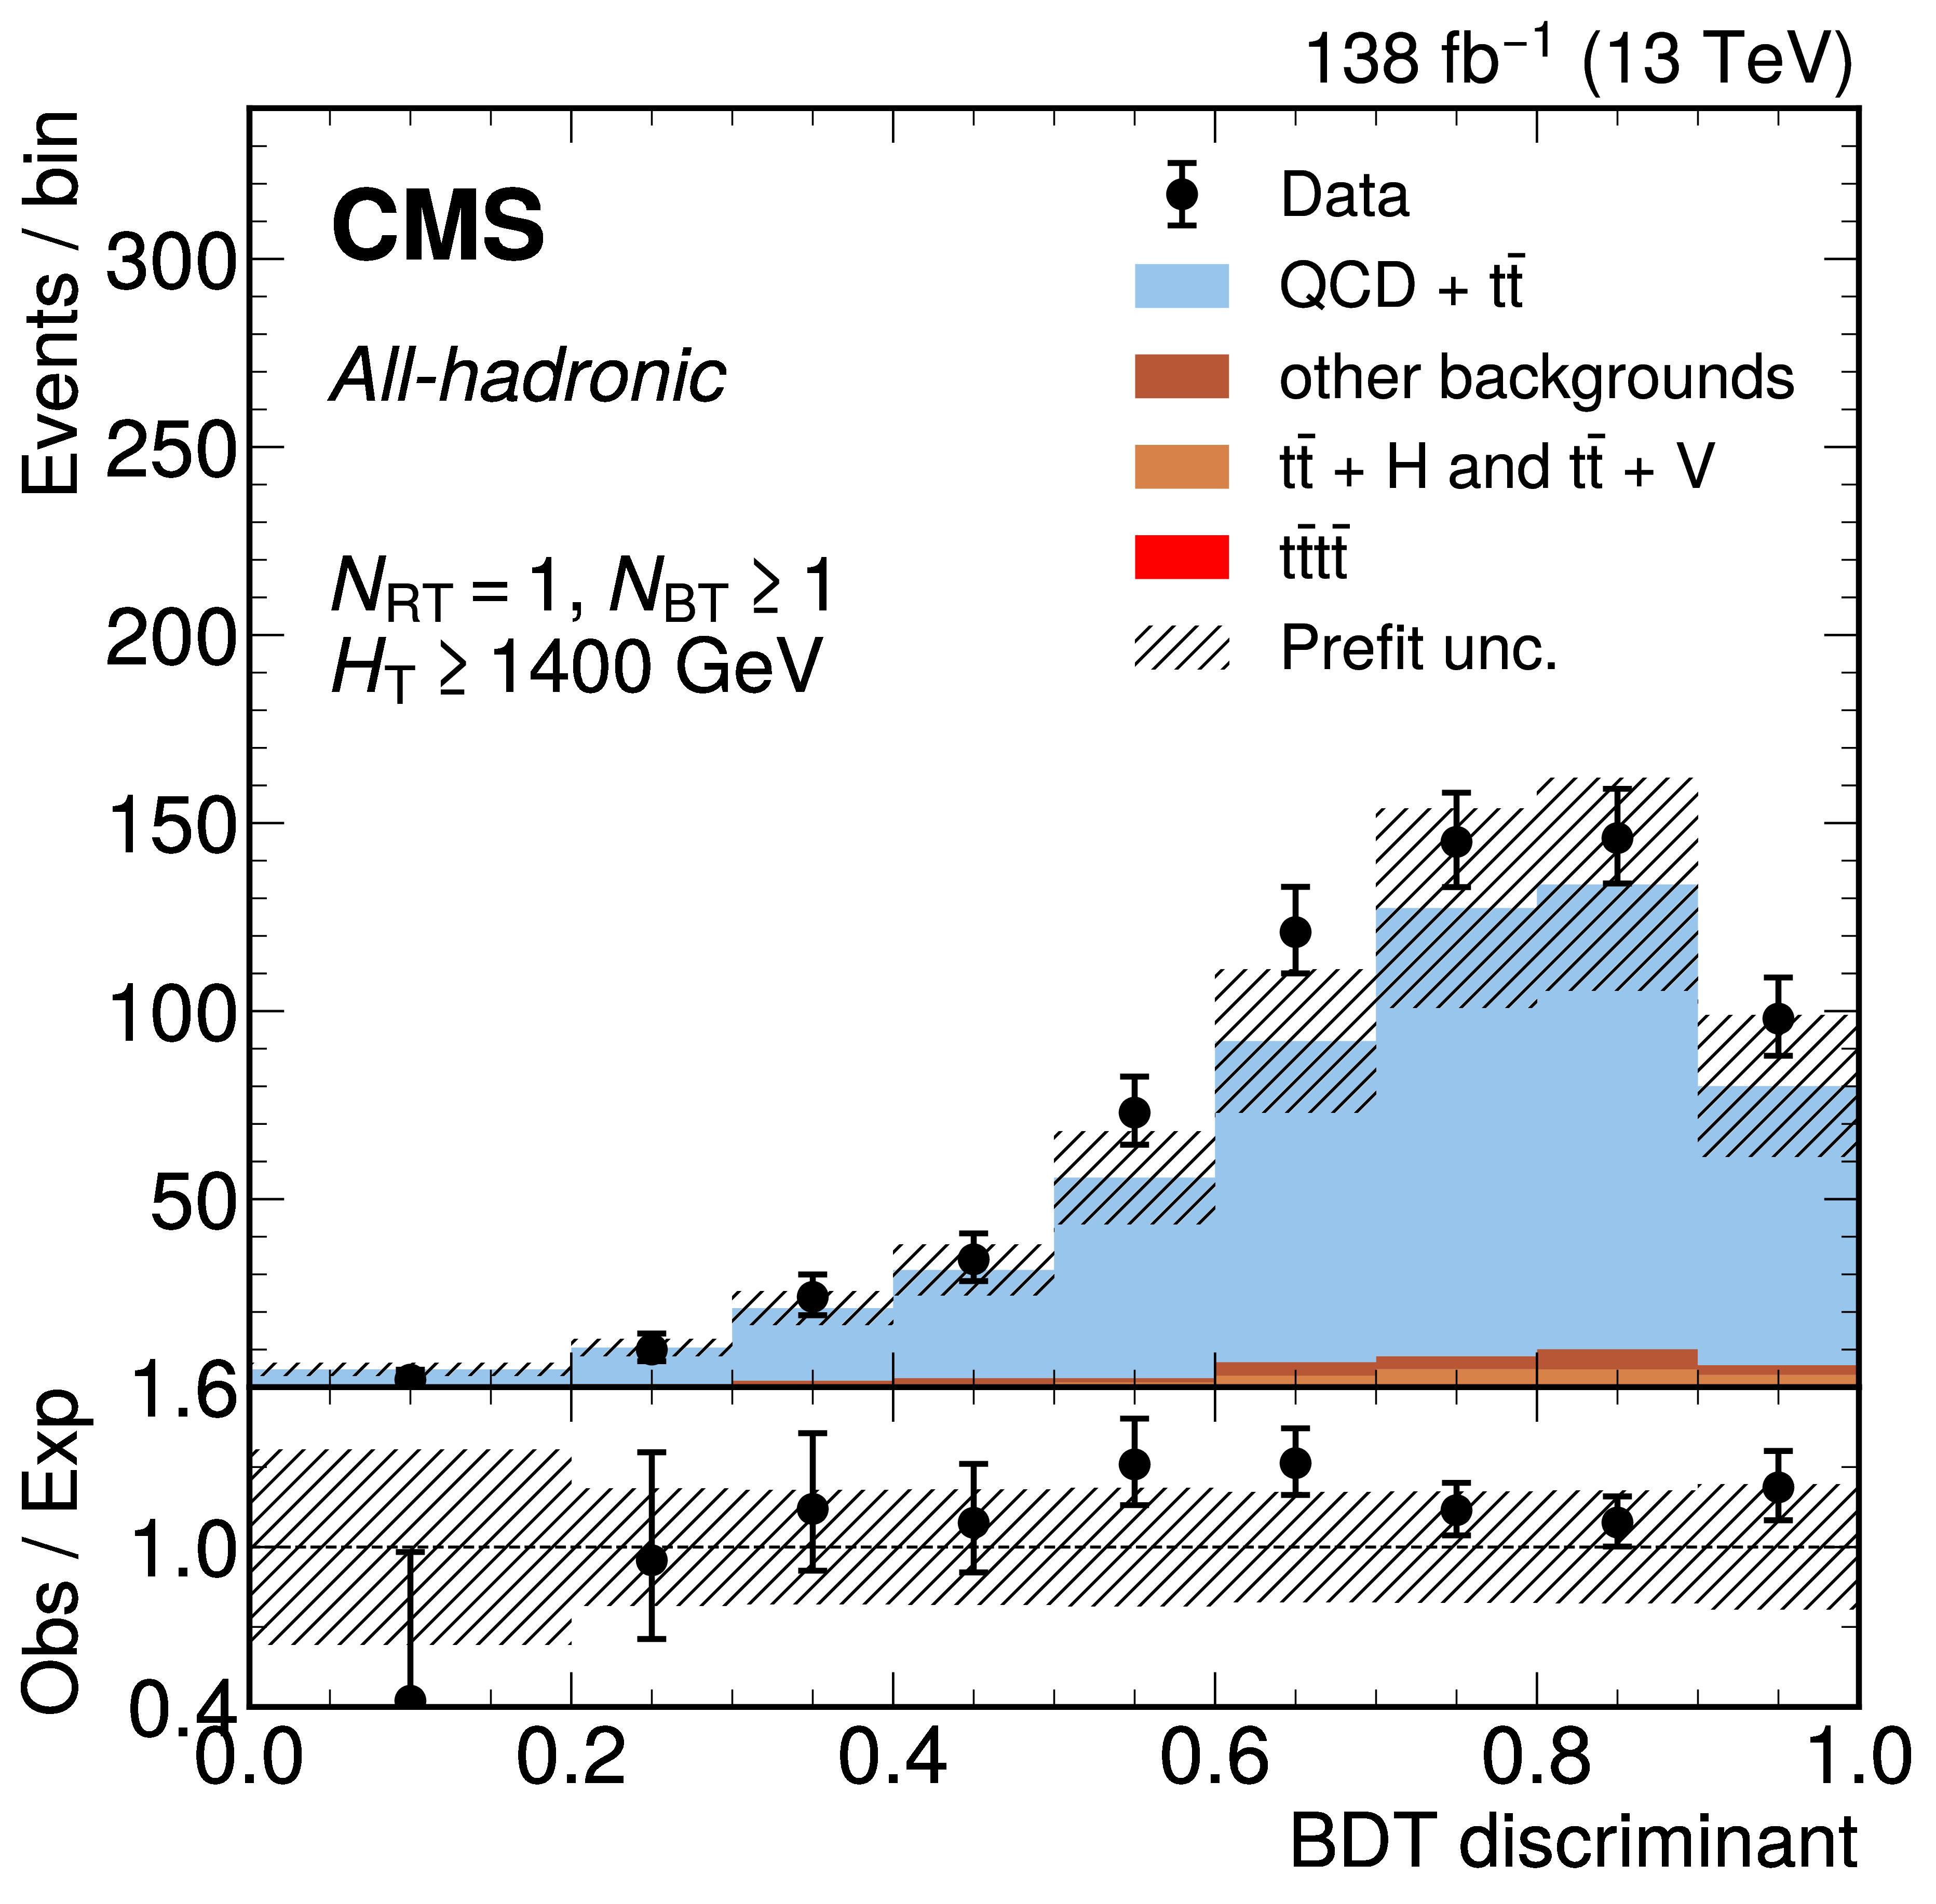
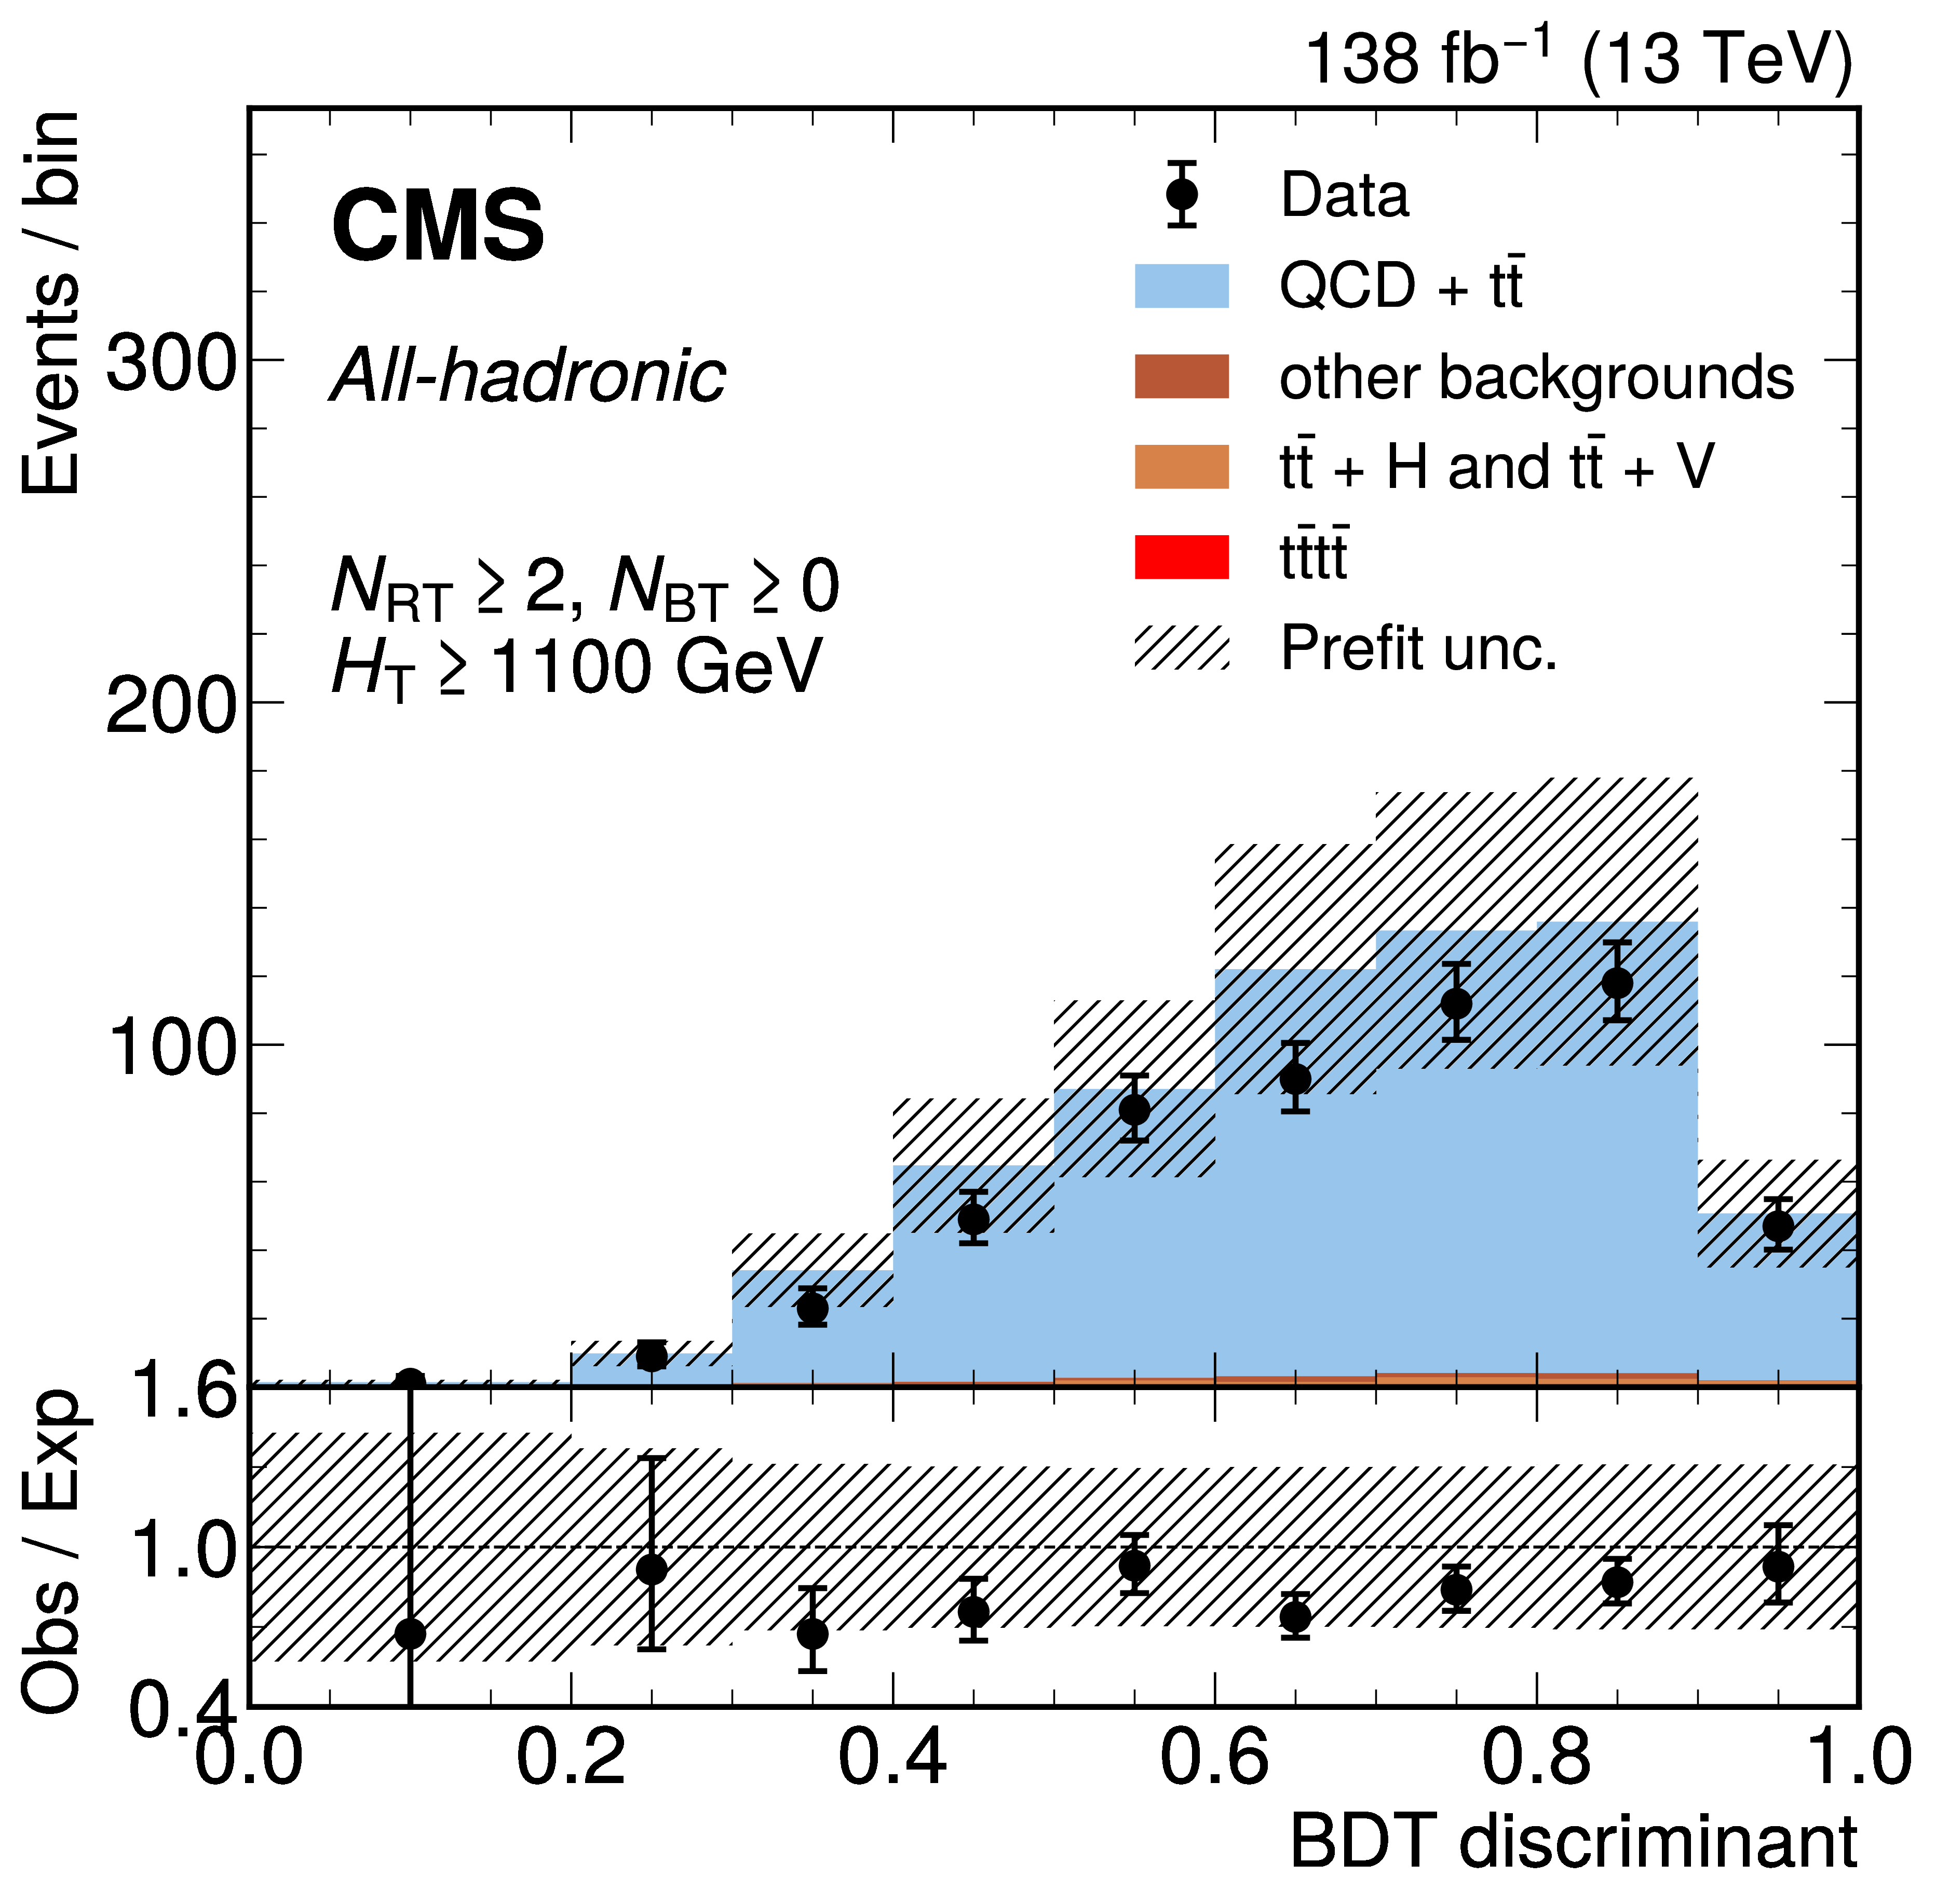
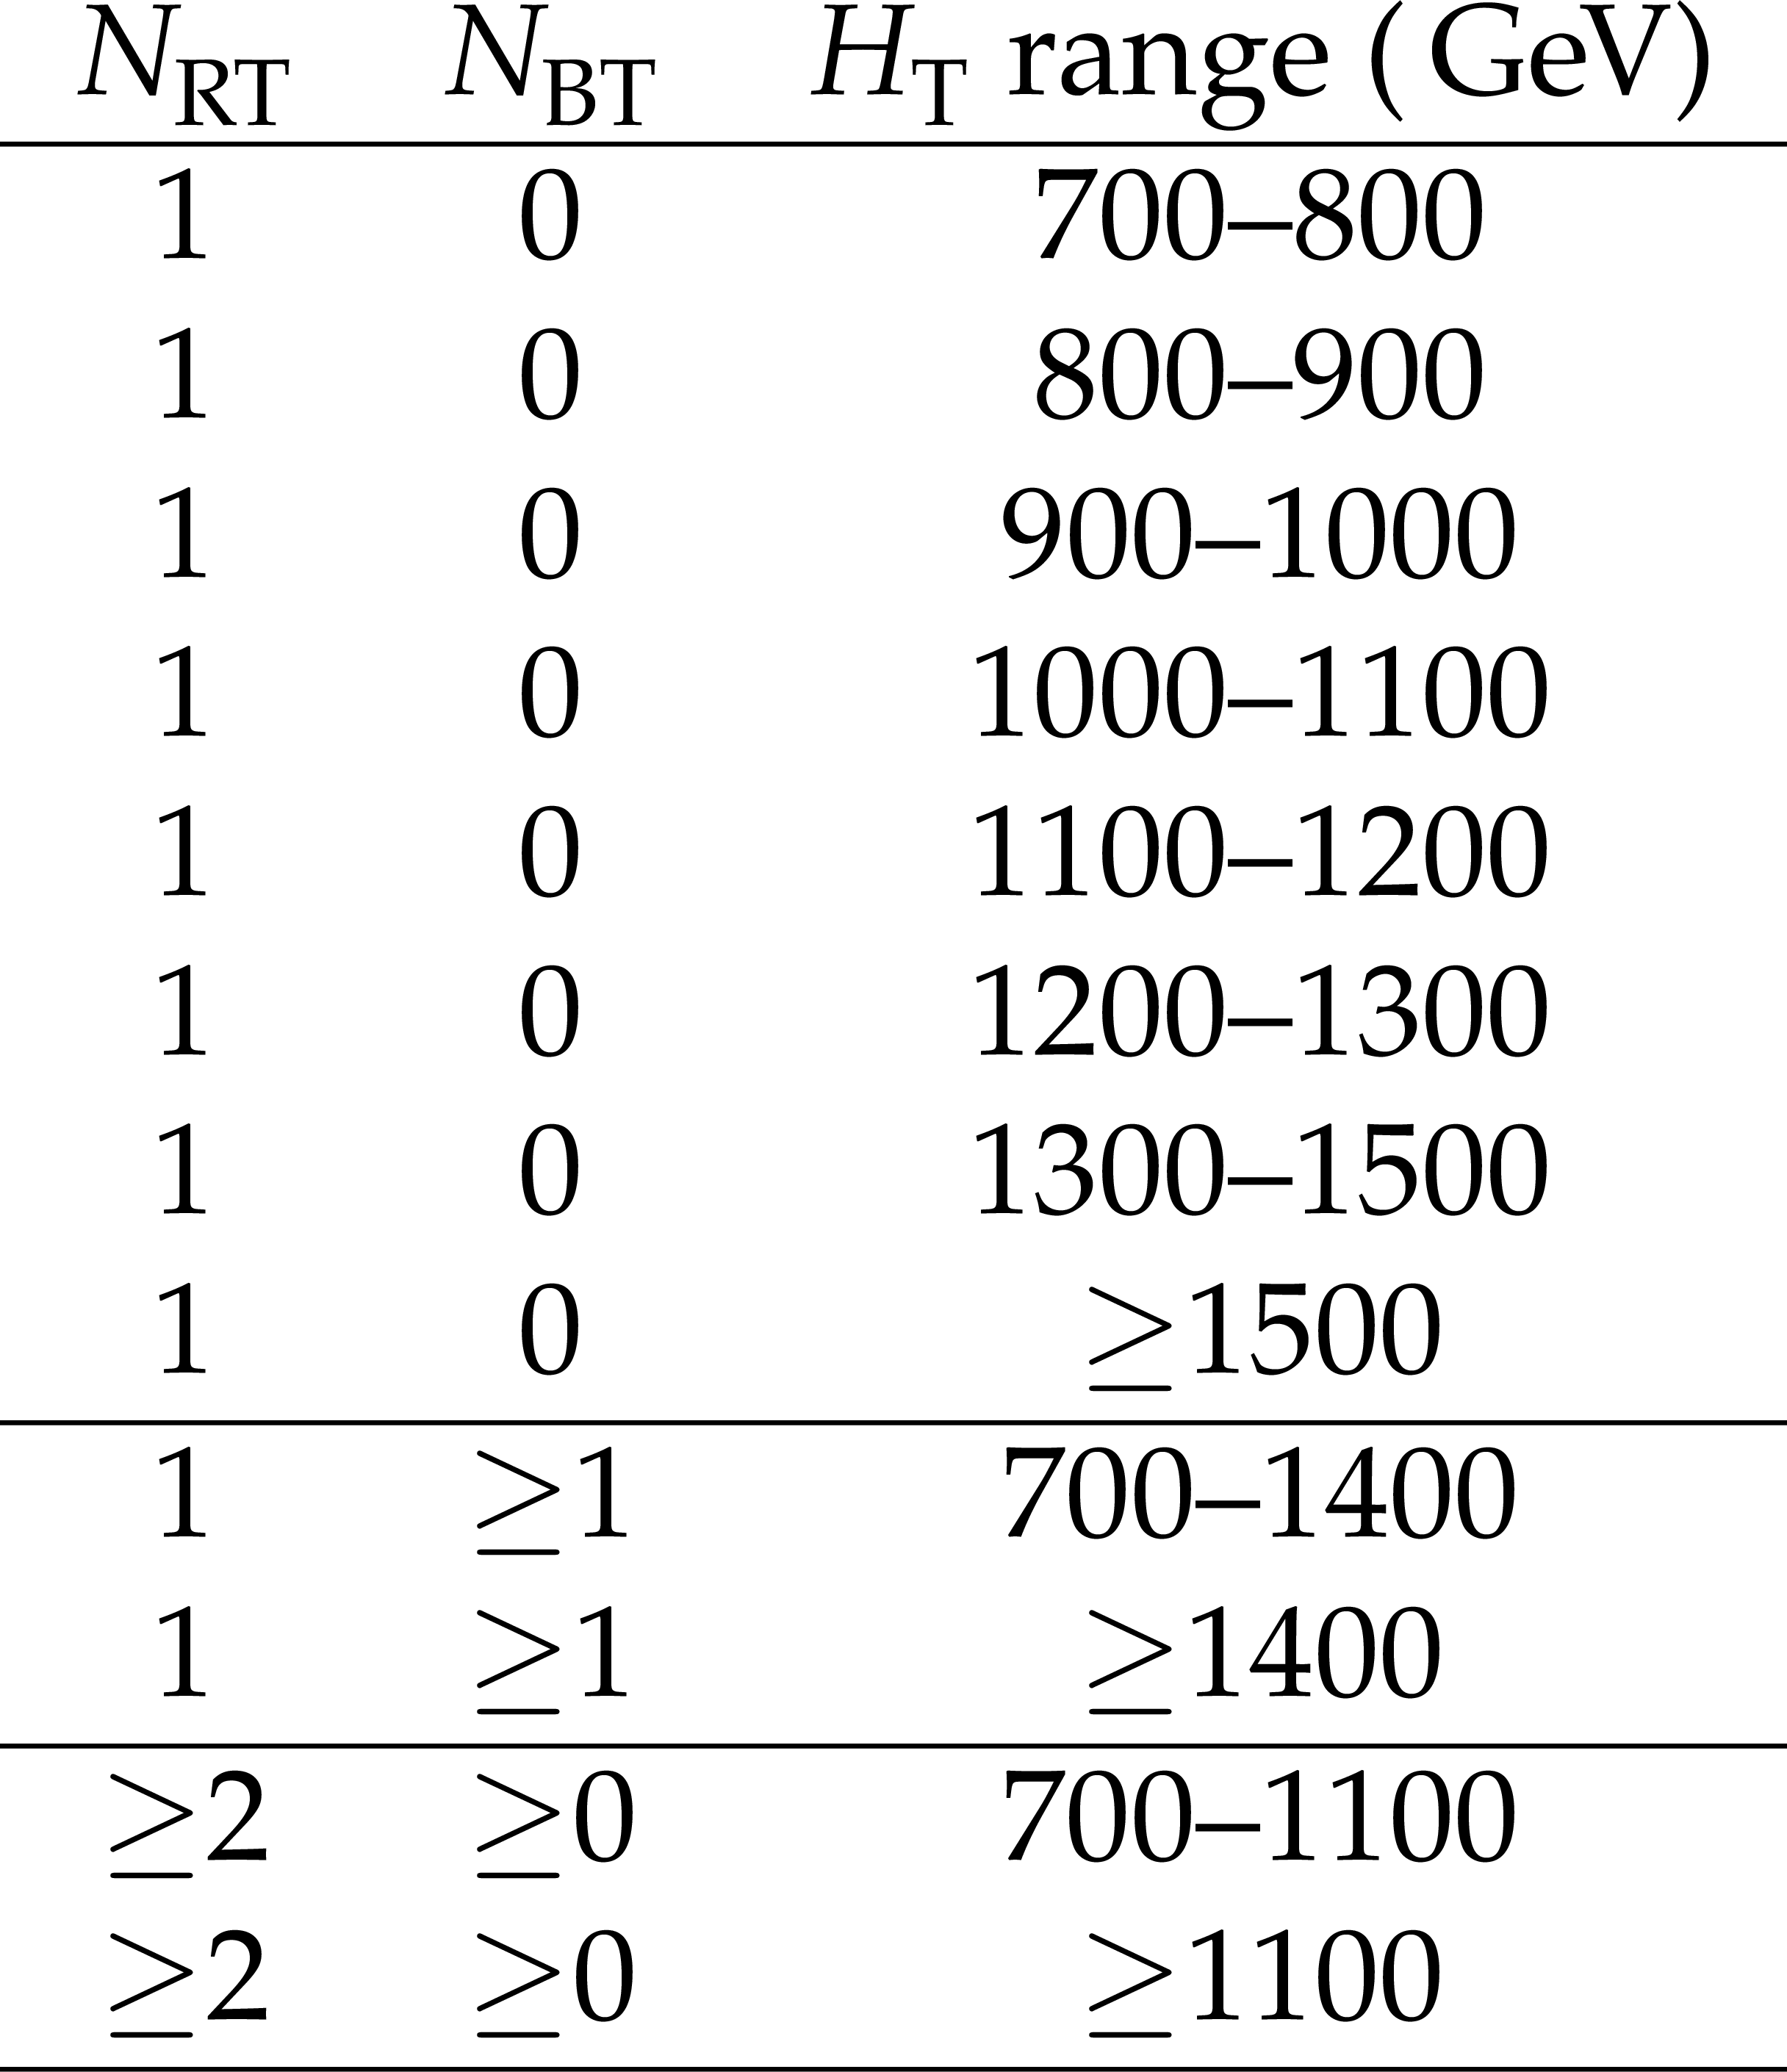
The distribution of the BDT discriminants for the full 2016--2018 data set in the all-hadronic channel for two VRs. The two sample VRs are defined by $ N_\text{RT}= $ 1, $ N_\text{BT}\ge $ 1, $ H_{\mathrm{T}} > $ 1400 GeV (left), and $ N_\text{BT}\ge $ 2, $ H_{\mathrm{T}} > $ 1100 GeV (right). The background from QCD multijet and $ \mathrm{t} \overline{\mathrm{t}} $ production is derived from control regions in the data. Estimates for the $ \mathrm{t}\overline{\mathrm{t}}\mathrm{t}\overline{\mathrm{t}} $ signal and other backgrounds are shown using simulated samples. The hatched bands correspond to the estimated total uncertainty. |
png pdf |
Figure 4-a:
The distribution of the BDT discriminant for the full 2016--2018 data set in the all-hadronic channel for VR sample defined by $ N_\text{RT}= $ 1, $ N_\text{BT}\ge $ 1, $ H_{\mathrm{T}} > $ 1400 GeV. The background from QCD multijet and $ \mathrm{t} \overline{\mathrm{t}} $ production is derived from control regions in the data. Estimates for the $ \mathrm{t}\overline{\mathrm{t}}\mathrm{t}\overline{\mathrm{t}} $ signal and other backgrounds are shown using simulated samples. The hatched bands correspond to the estimated total uncertainty. |
png pdf |
Figure 4-b:
The distribution of the BDT discriminant for the full 2016--2018 data set in the all-hadronic channel for VR sample defined by $ N_\text{BT}\ge $ 2, $ H_{\mathrm{T}} > $ 1100 GeV. The background from QCD multijet and $ \mathrm{t} \overline{\mathrm{t}} $ production is derived from control regions in the data. Estimates for the $ \mathrm{t}\overline{\mathrm{t}}\mathrm{t}\overline{\mathrm{t}} $ signal and other backgrounds are shown using simulated samples. The hatched bands correspond to the estimated total uncertainty. |
png pdf |
Figure 5:
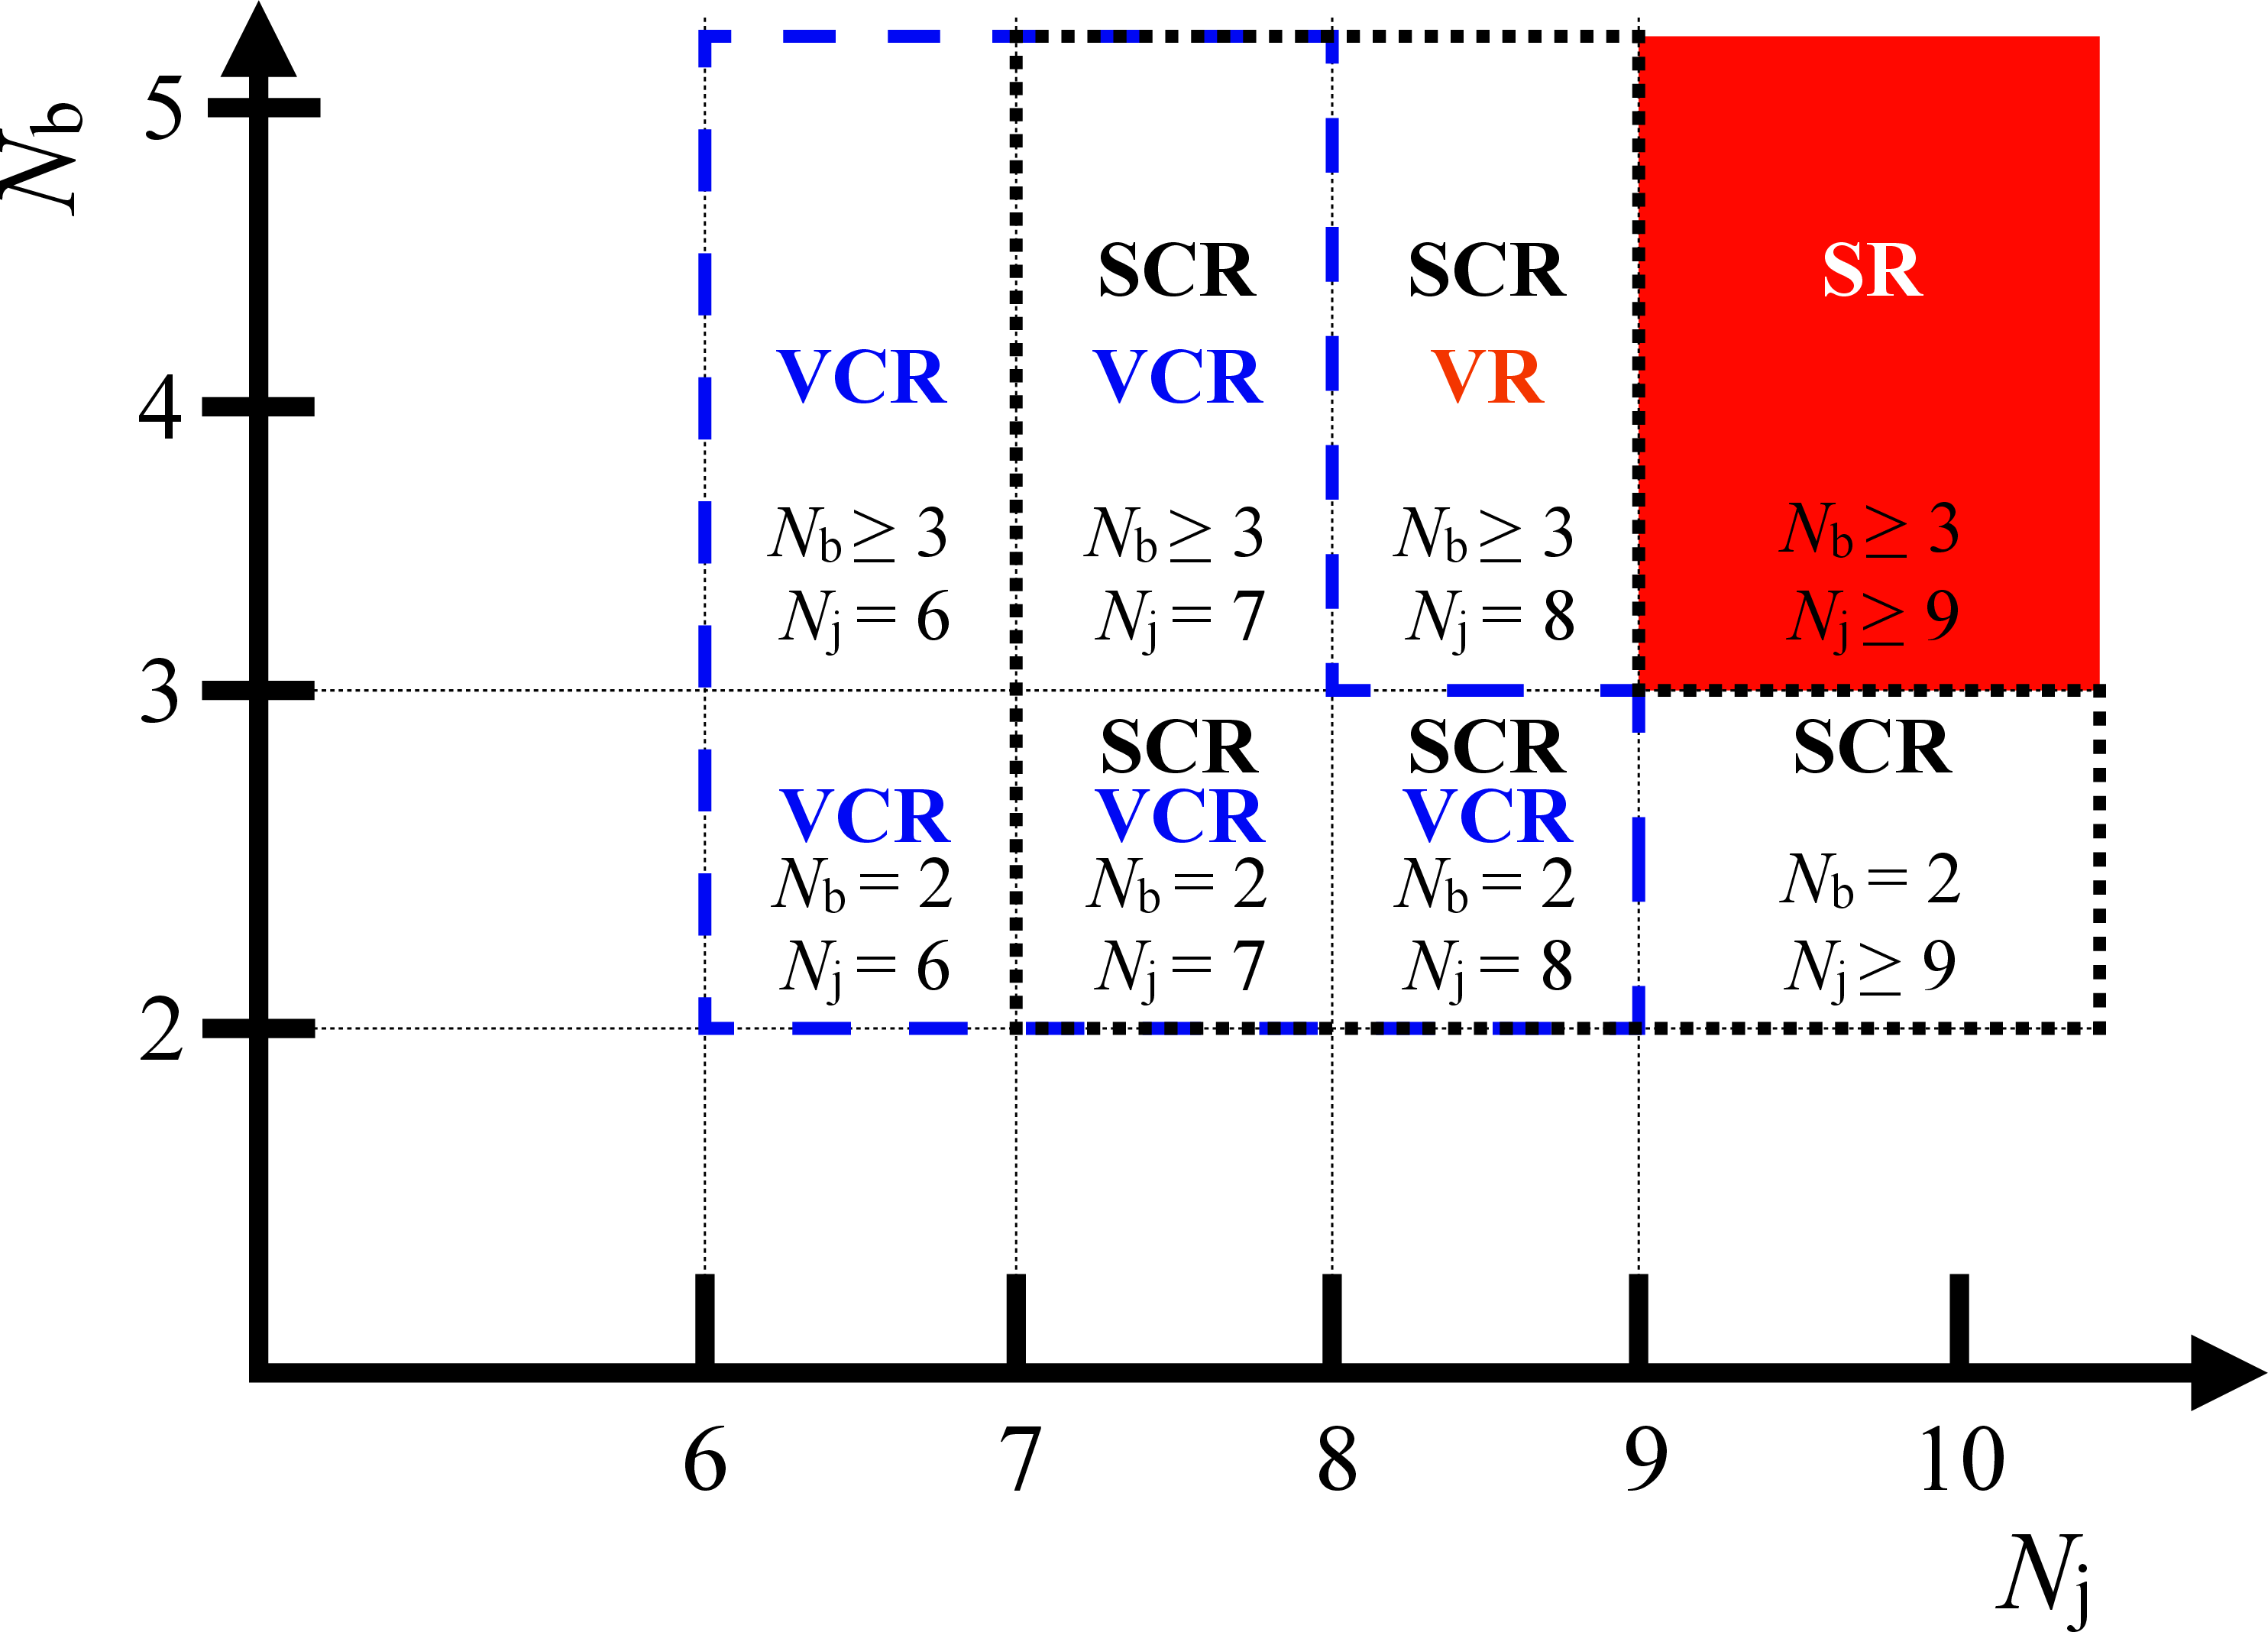
Schematic showing the definitions of the signal region (SR), validation region (VR) and control regions (CRs) used in the all-hadronic analysis as a function of $ N_{\text{j}} $ and $ N_{\mathrm{b}} $. |

png pdf |
Figure 5-a:
Schematic showing the definitions of the signal region (SR), validation region (VR) and control regions (CRs) used in the all-hadronic analysis as a function of $ N_{\text{j}} $ and $ N_{\mathrm{b}} $. |
png pdf |
Figure 5-b:
Schematic showing the definitions of the signal region (SR), validation region (VR) and control regions (CRs) used in the all-hadronic analysis as a function of $ N_{\text{j}} $ and $ N_{\mathrm{b}} $. |
png pdf |
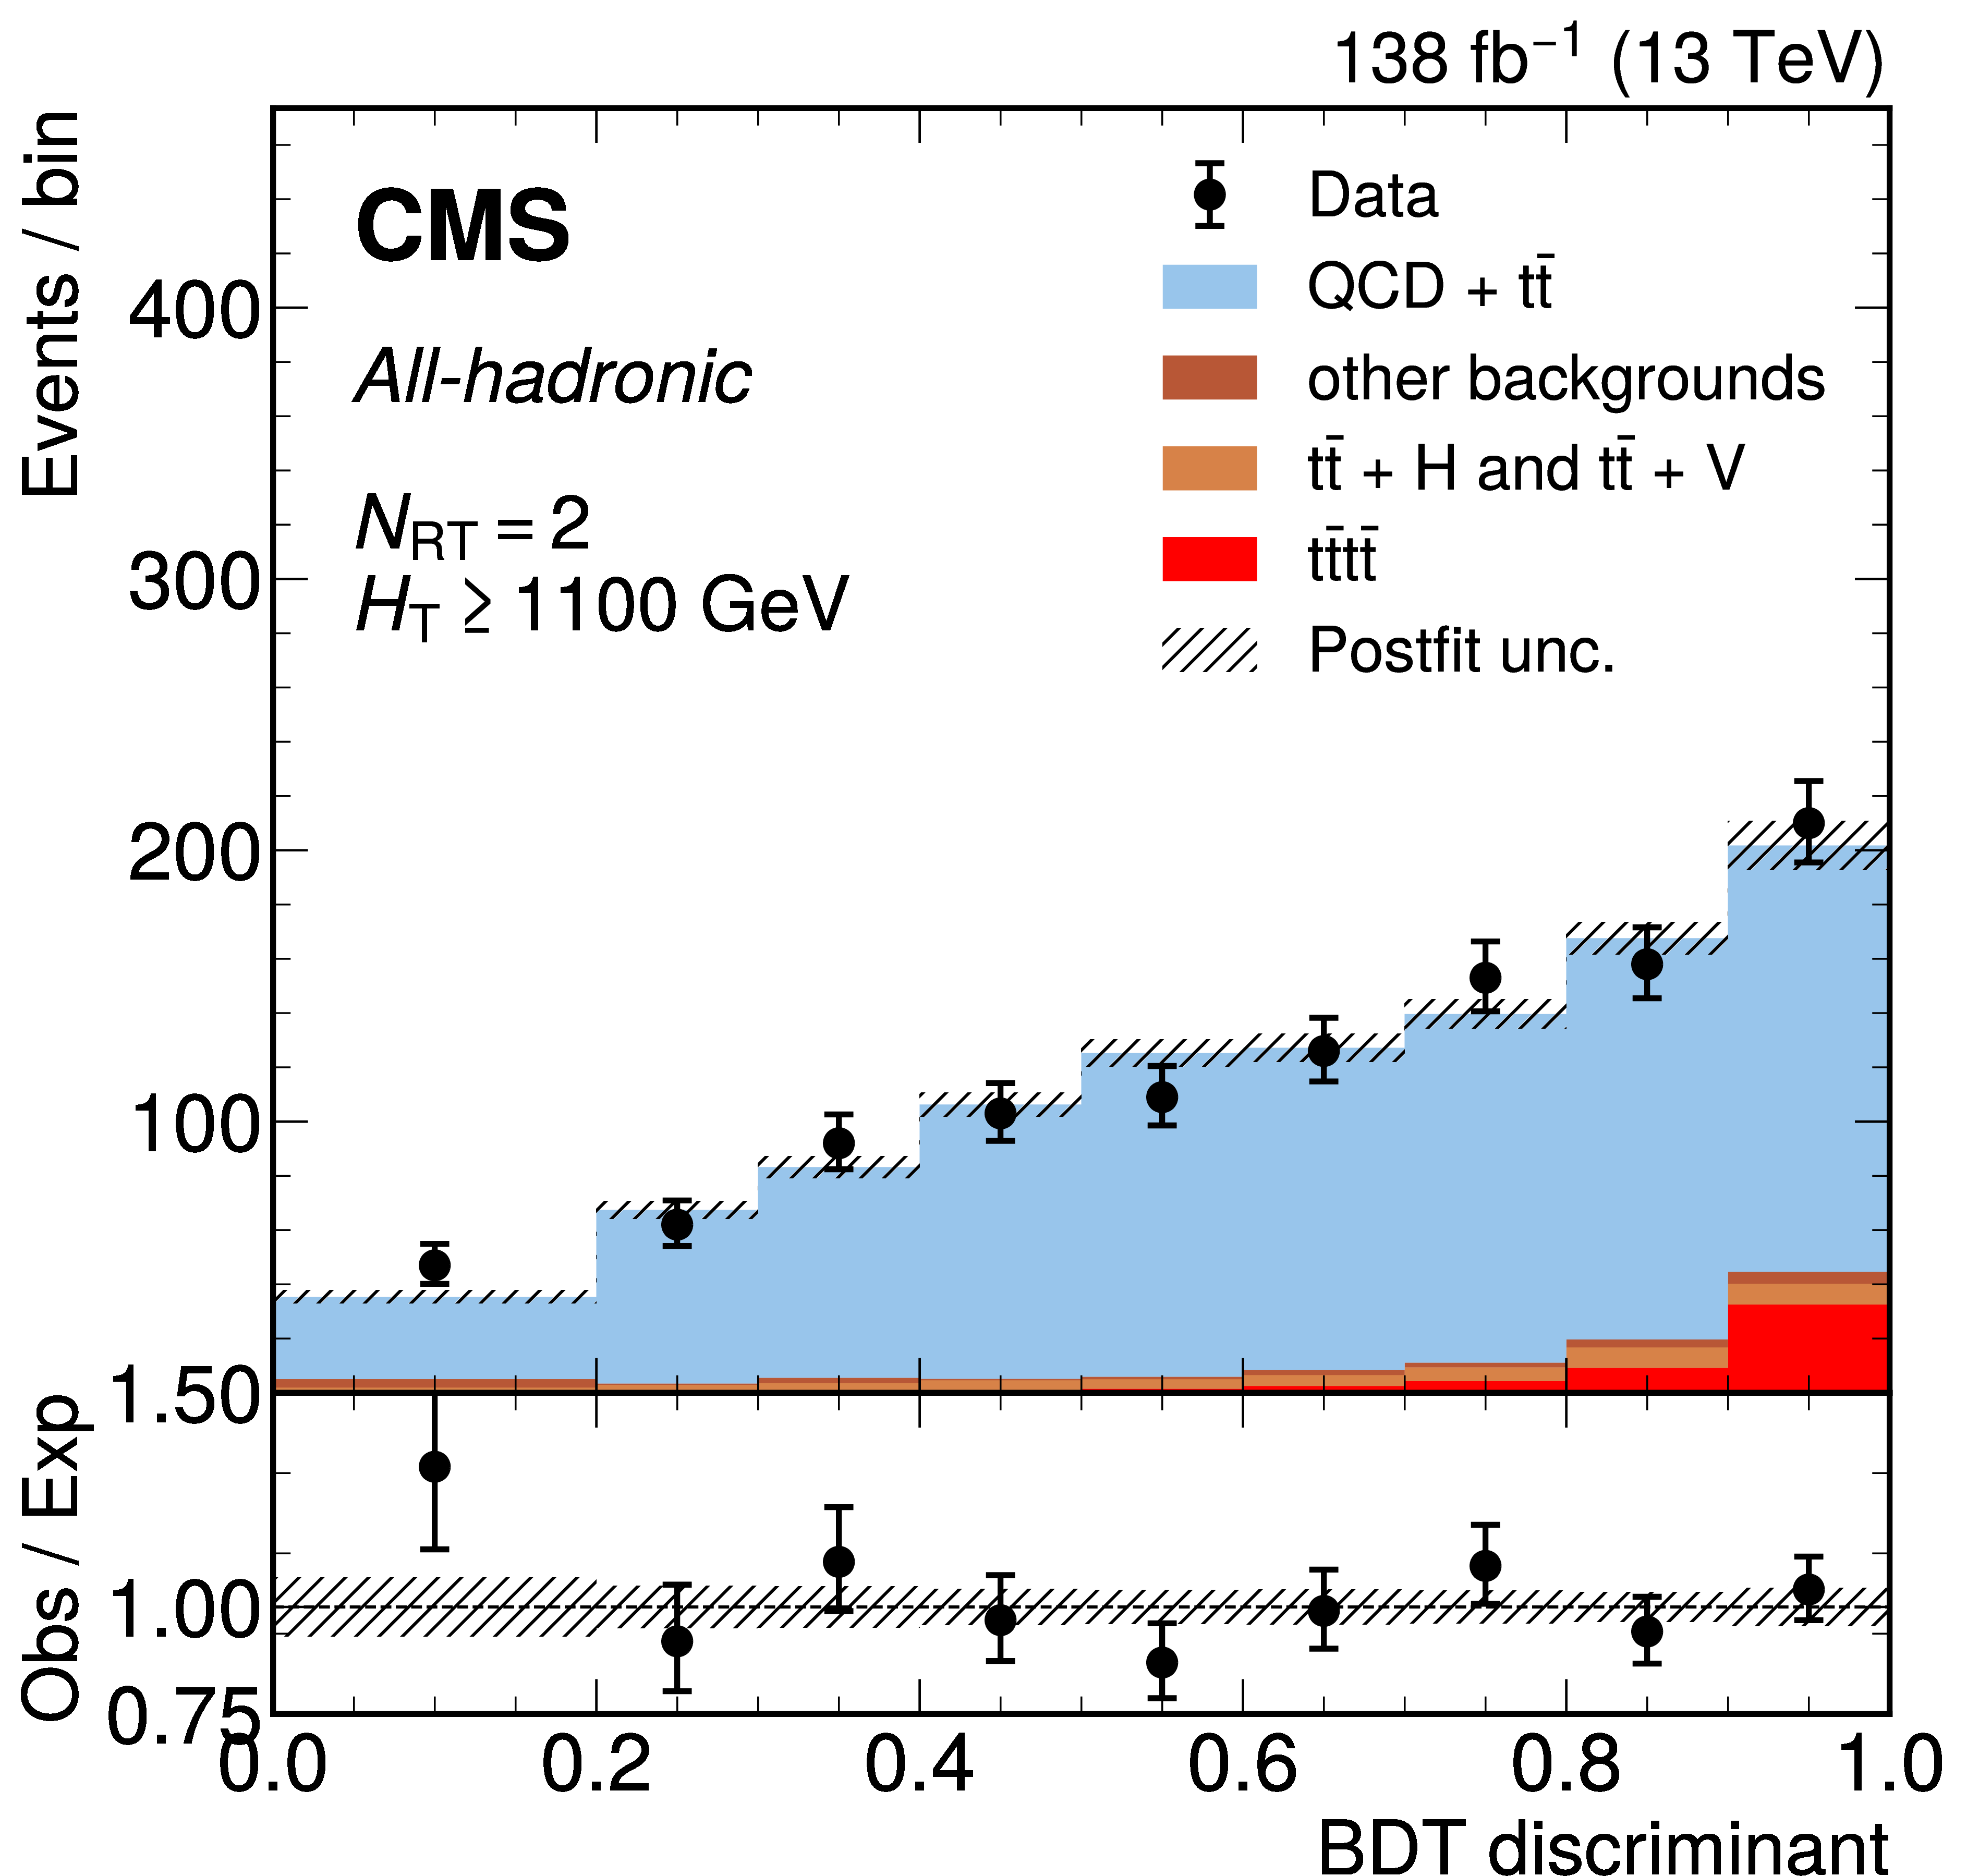
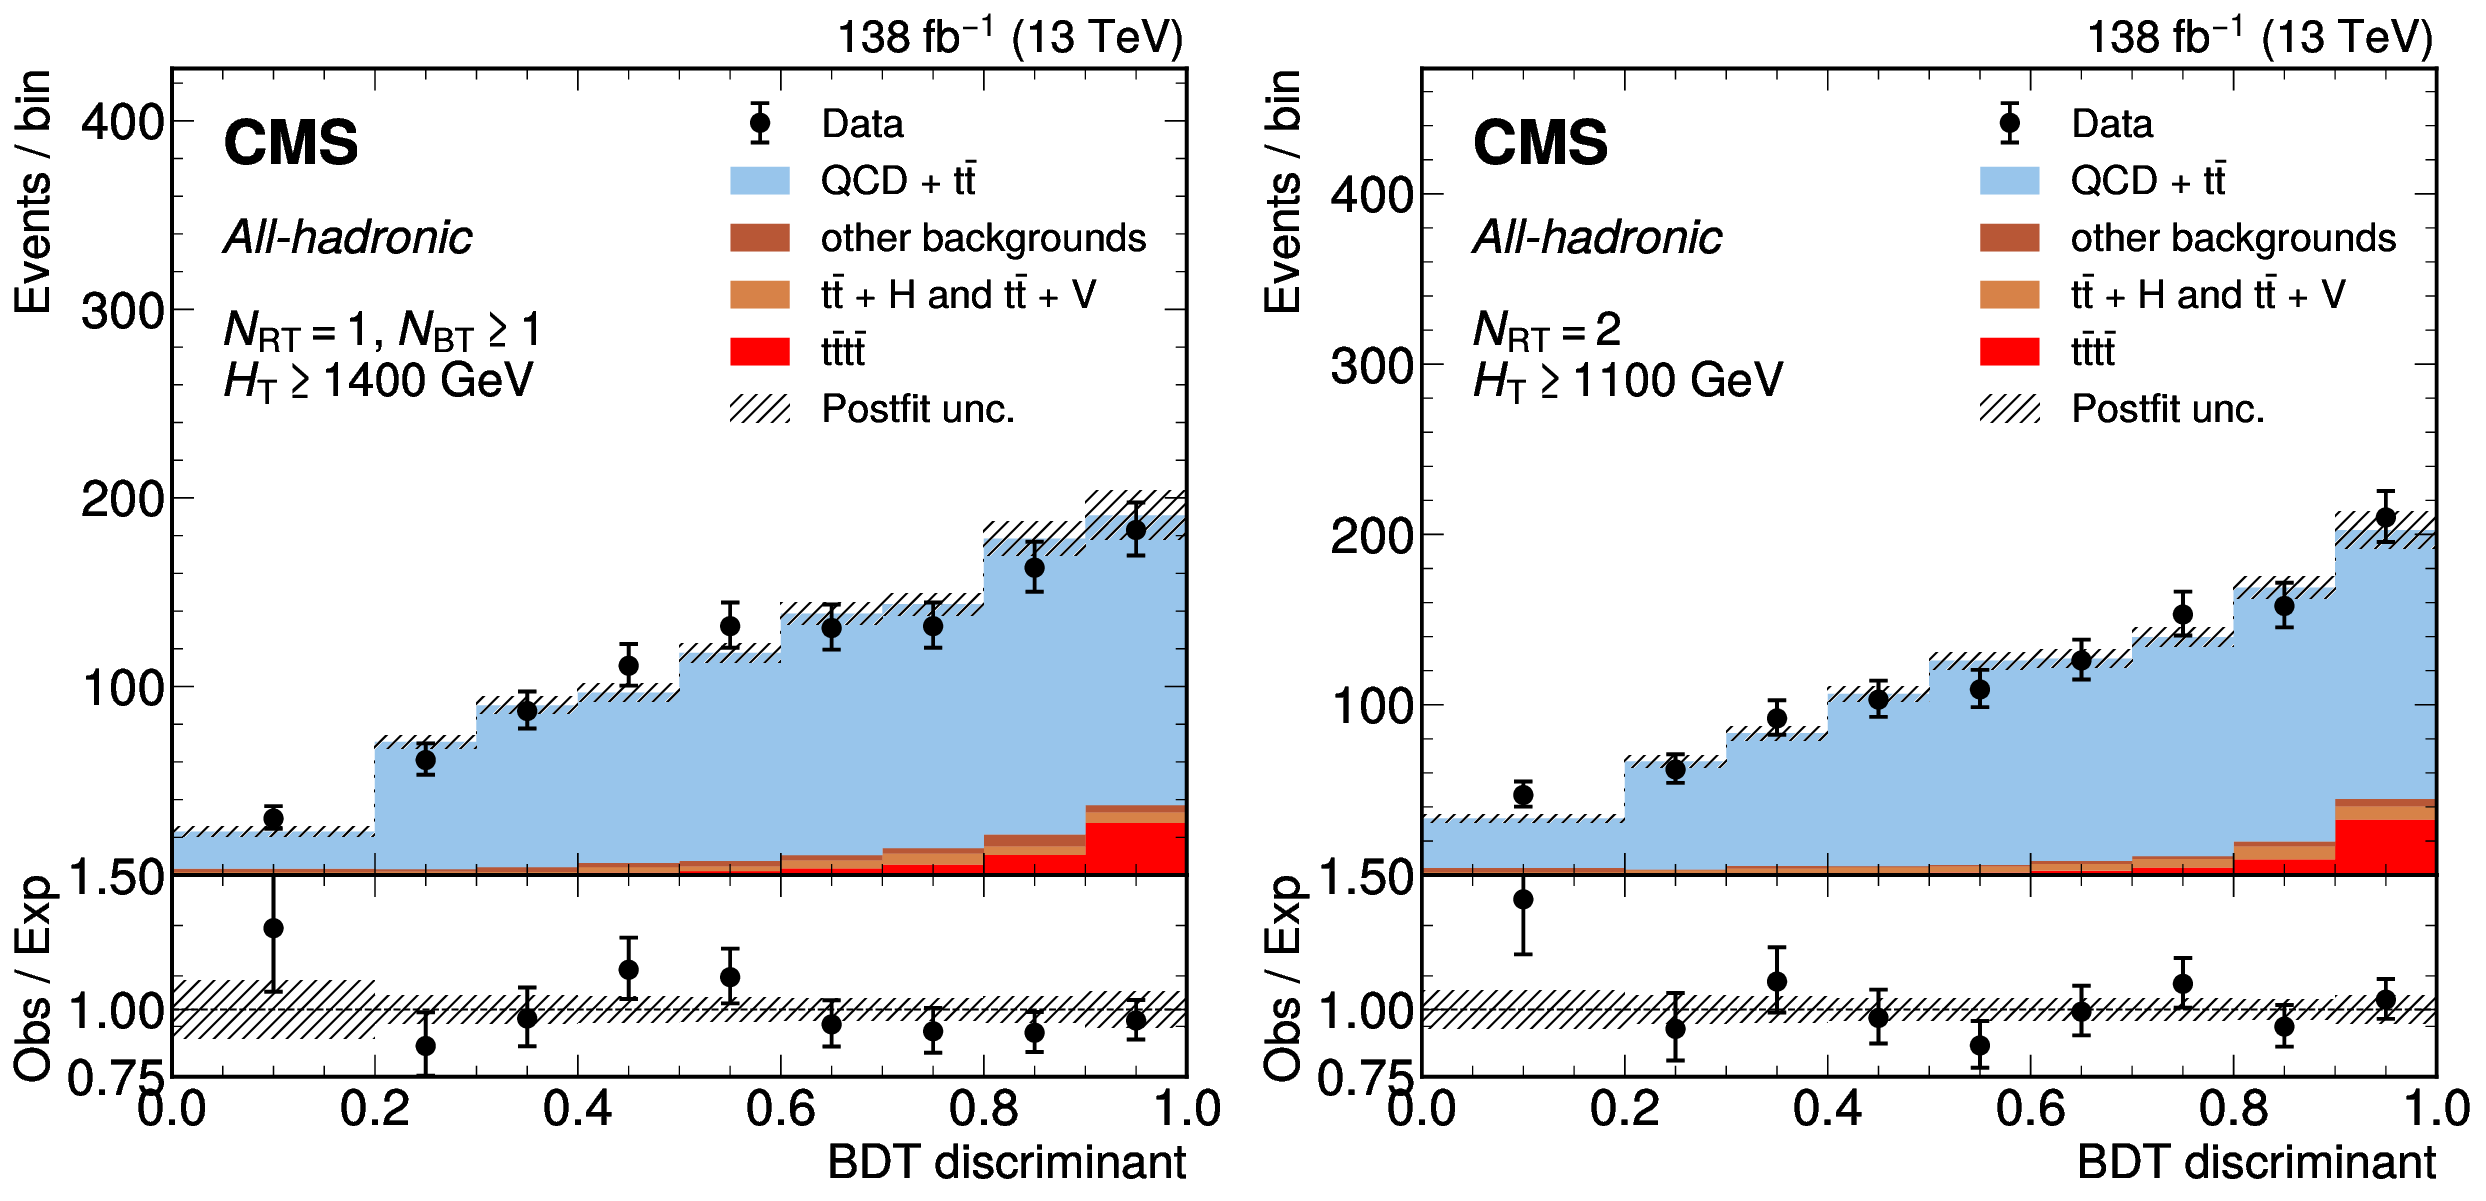
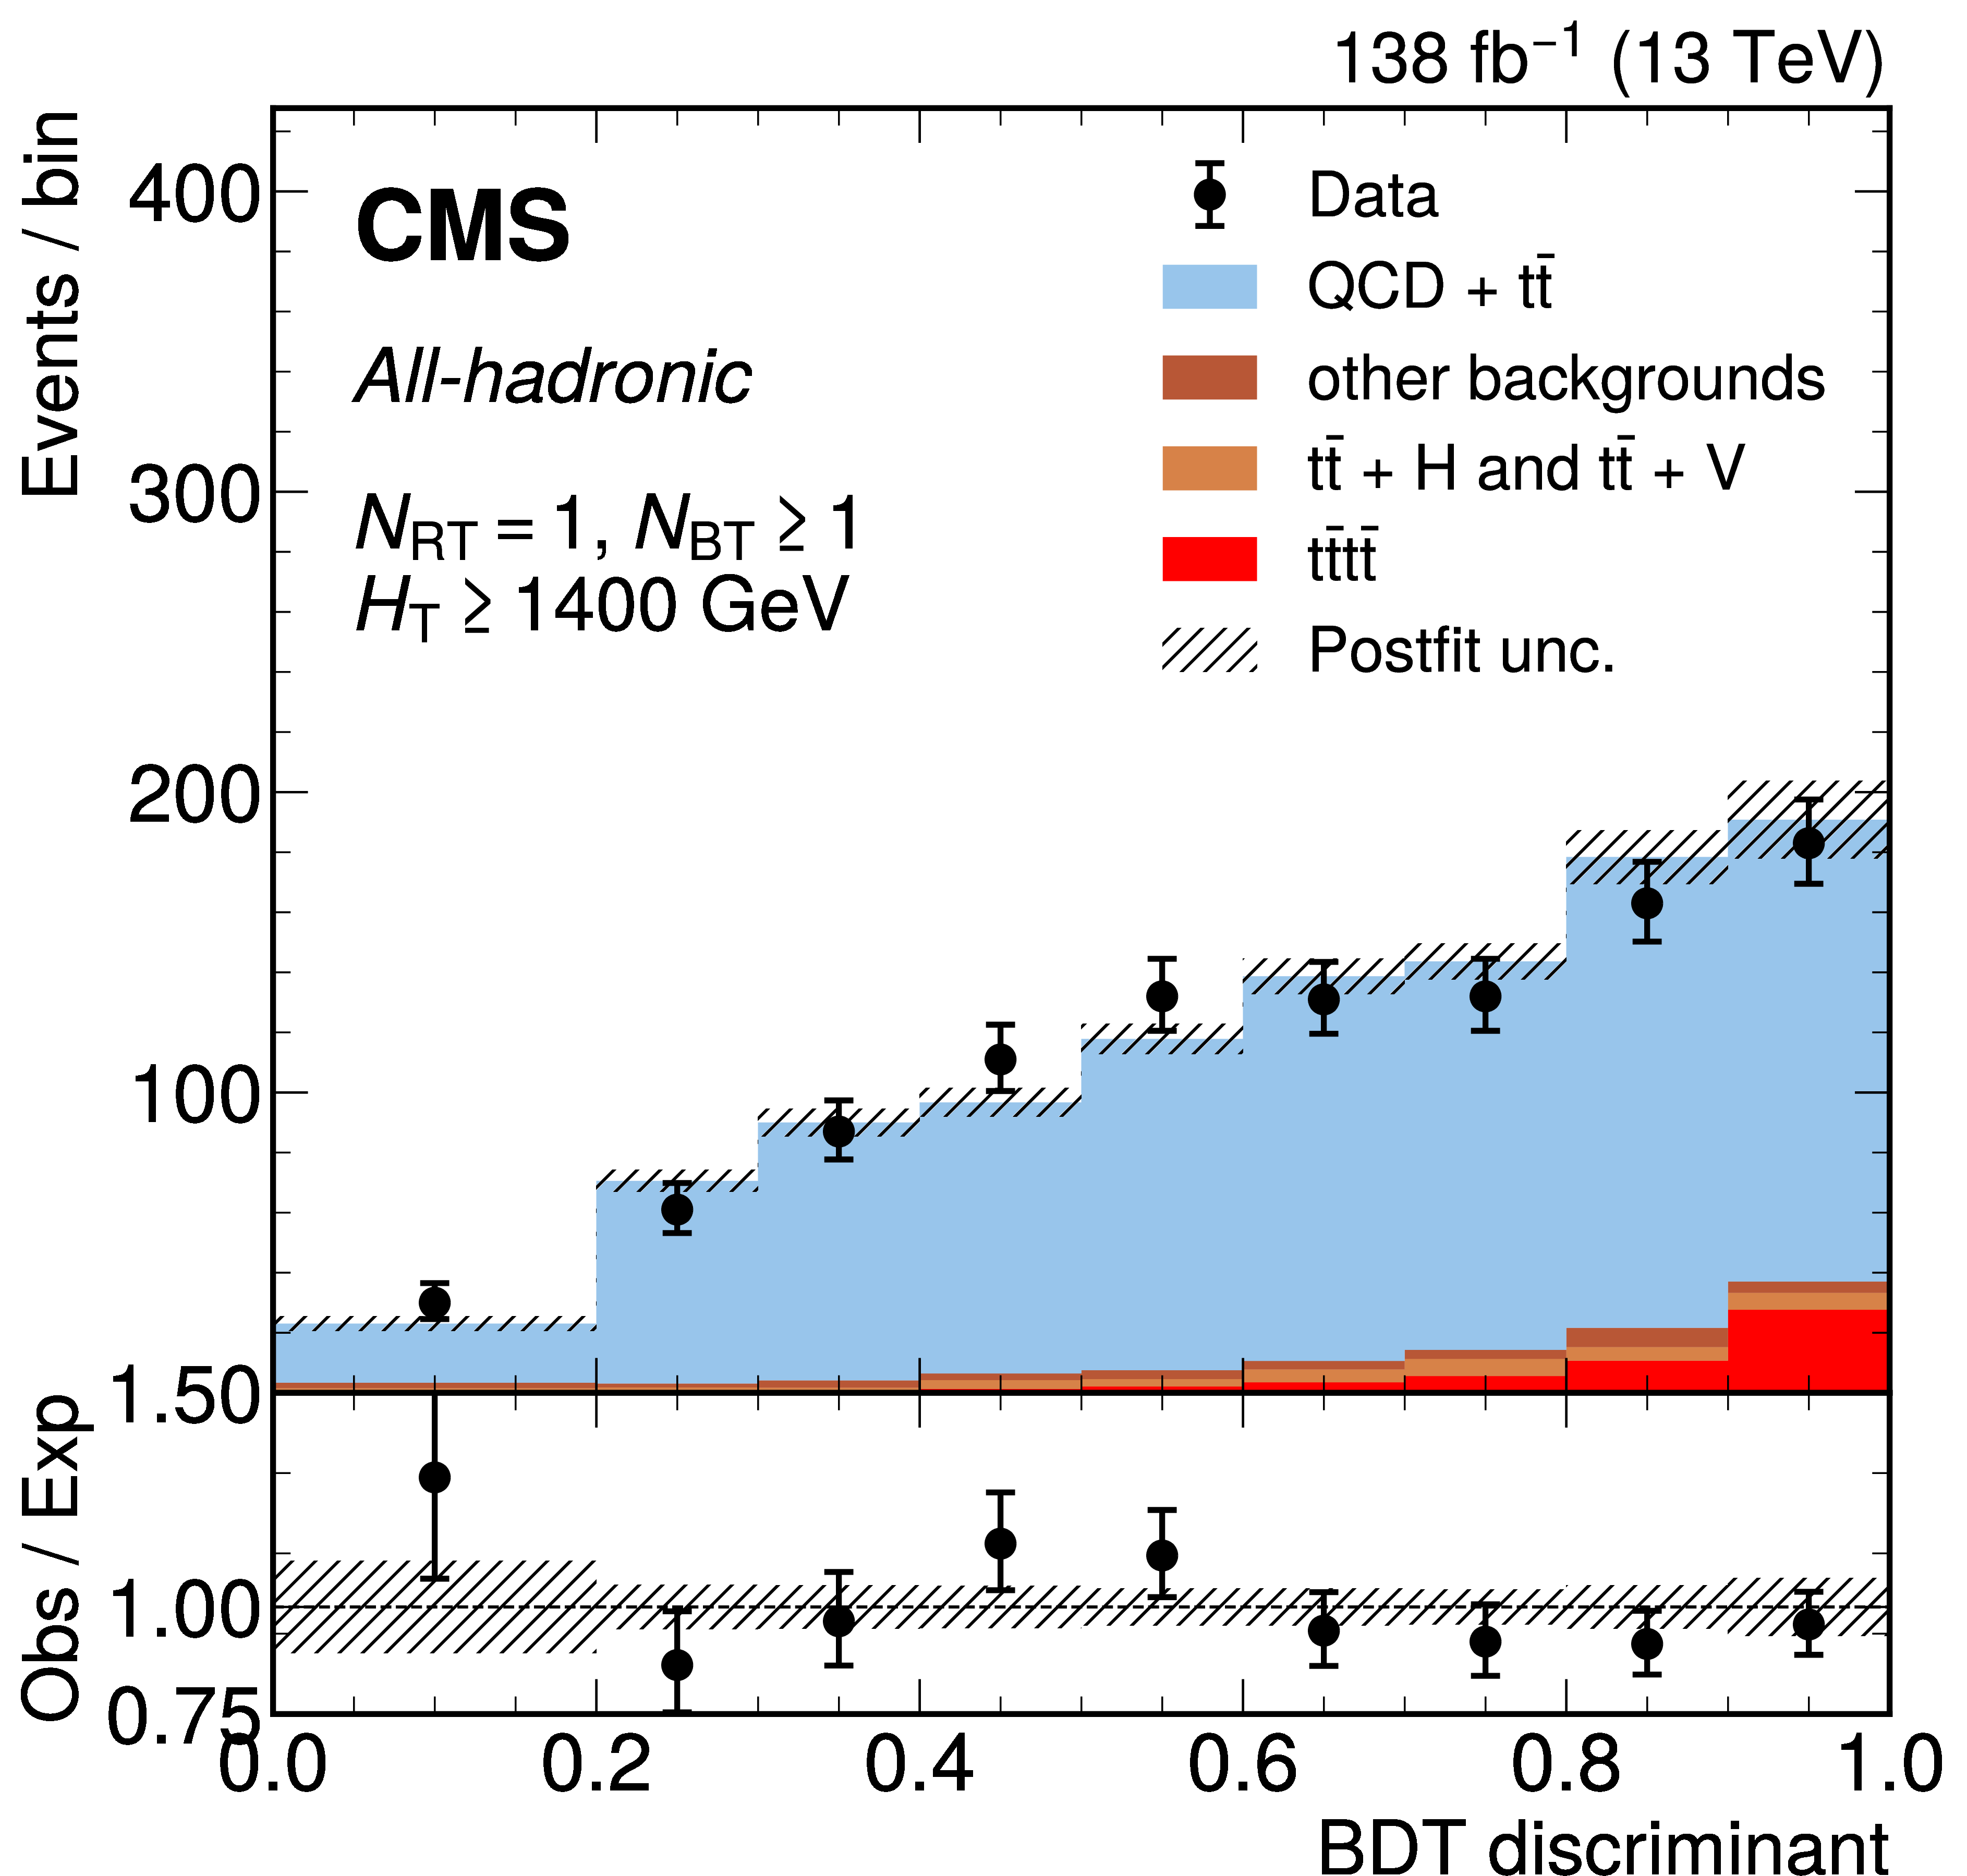
Figure 6:
The distribution of the BDT discriminants for the full 2016-2018 data set in the all-hadronic channel. The two most sensitive SR categories are shown, defined by $ N_\text{RT}= $ 1, $ N_\text{BT}\ge $ 1, $ H_{\mathrm{T}} > $ 1400 GeV (left), and $ N_\text{BT}\ge $ 2, $ H_{\mathrm{T}} > $ 1100 GeV (right). The background from QCD multijet and $ \mathrm{t} \bar{\mathrm{t}} $ production is derived from control regions in the data. Estimates for the $ \mathrm{t}\bar{\mathrm{t}}\mathrm{t}\bar{\mathrm{t}} $ signal and other backgrounds are shown using simulated samples. The hatched bands correspond to the estimated total uncertainty after the fit. |
png pdf |
Figure 6-a:
The distribution of the BDT discriminants for the full 2016-2018 data set in the all-hadronic channel. The two most sensitive SR categories are shown, defined by $ N_\text{RT}= $ 1, $ N_\text{BT}\ge $ 1, $ H_{\mathrm{T}} > $ 1400 GeV. The background from QCD multijet and $ \mathrm{t} \bar{\mathrm{t}} $ production is derived from control regions in the data. Estimates for the $ \mathrm{t}\bar{\mathrm{t}}\mathrm{t}\bar{\mathrm{t}} $ signal and other backgrounds are shown using simulated samples. The hatched bands correspond to the estimated total uncertainty after the fit. |

png pdf |
Figure 6-b:
The distribution of the BDT discriminants for the full 2016-2018 data set in the all-hadronic channel. The two most sensitive SR categories are shown, defined by $ N_\text{BT}\ge $ 2, $ H_{\mathrm{T}} > $ 1100 GeV. The background from QCD multijet and $ \mathrm{t} \bar{\mathrm{t}} $ production is derived from control regions in the data. Estimates for the $ \mathrm{t}\bar{\mathrm{t}}\mathrm{t}\bar{\mathrm{t}} $ signal and other backgrounds are shown using simulated samples. The hatched bands correspond to the estimated total uncertainty after the fit. |
png pdf |
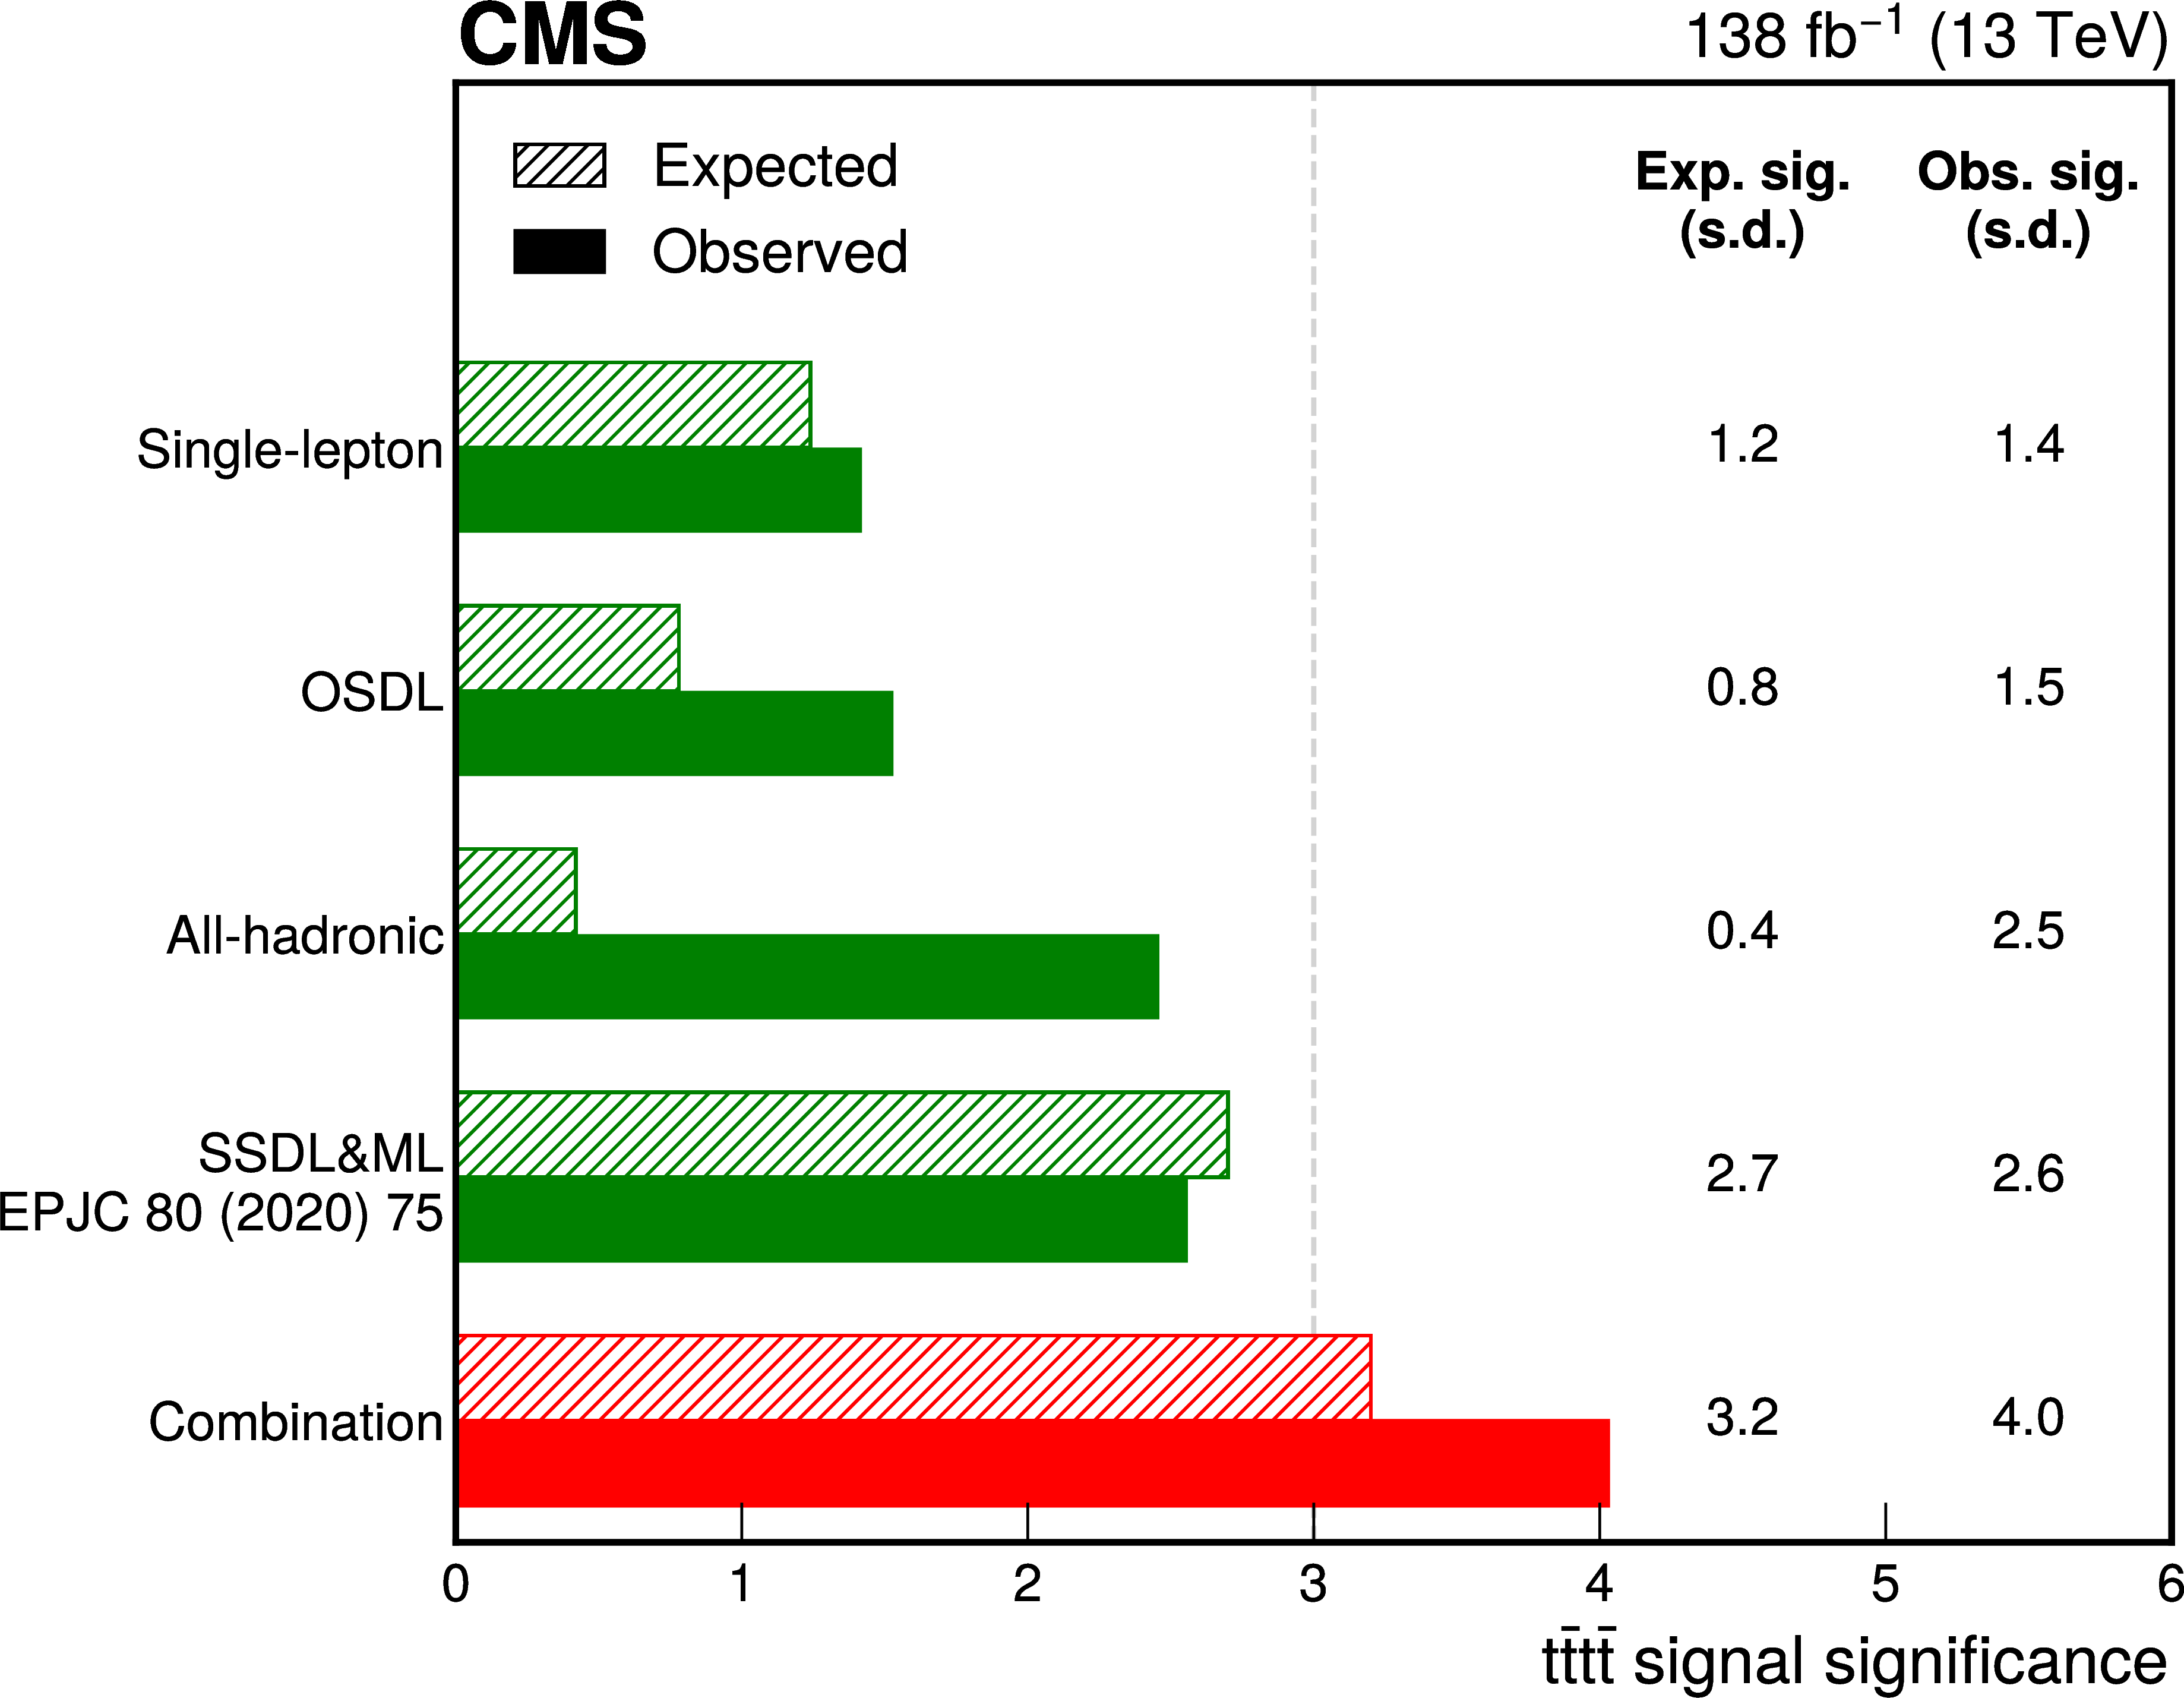
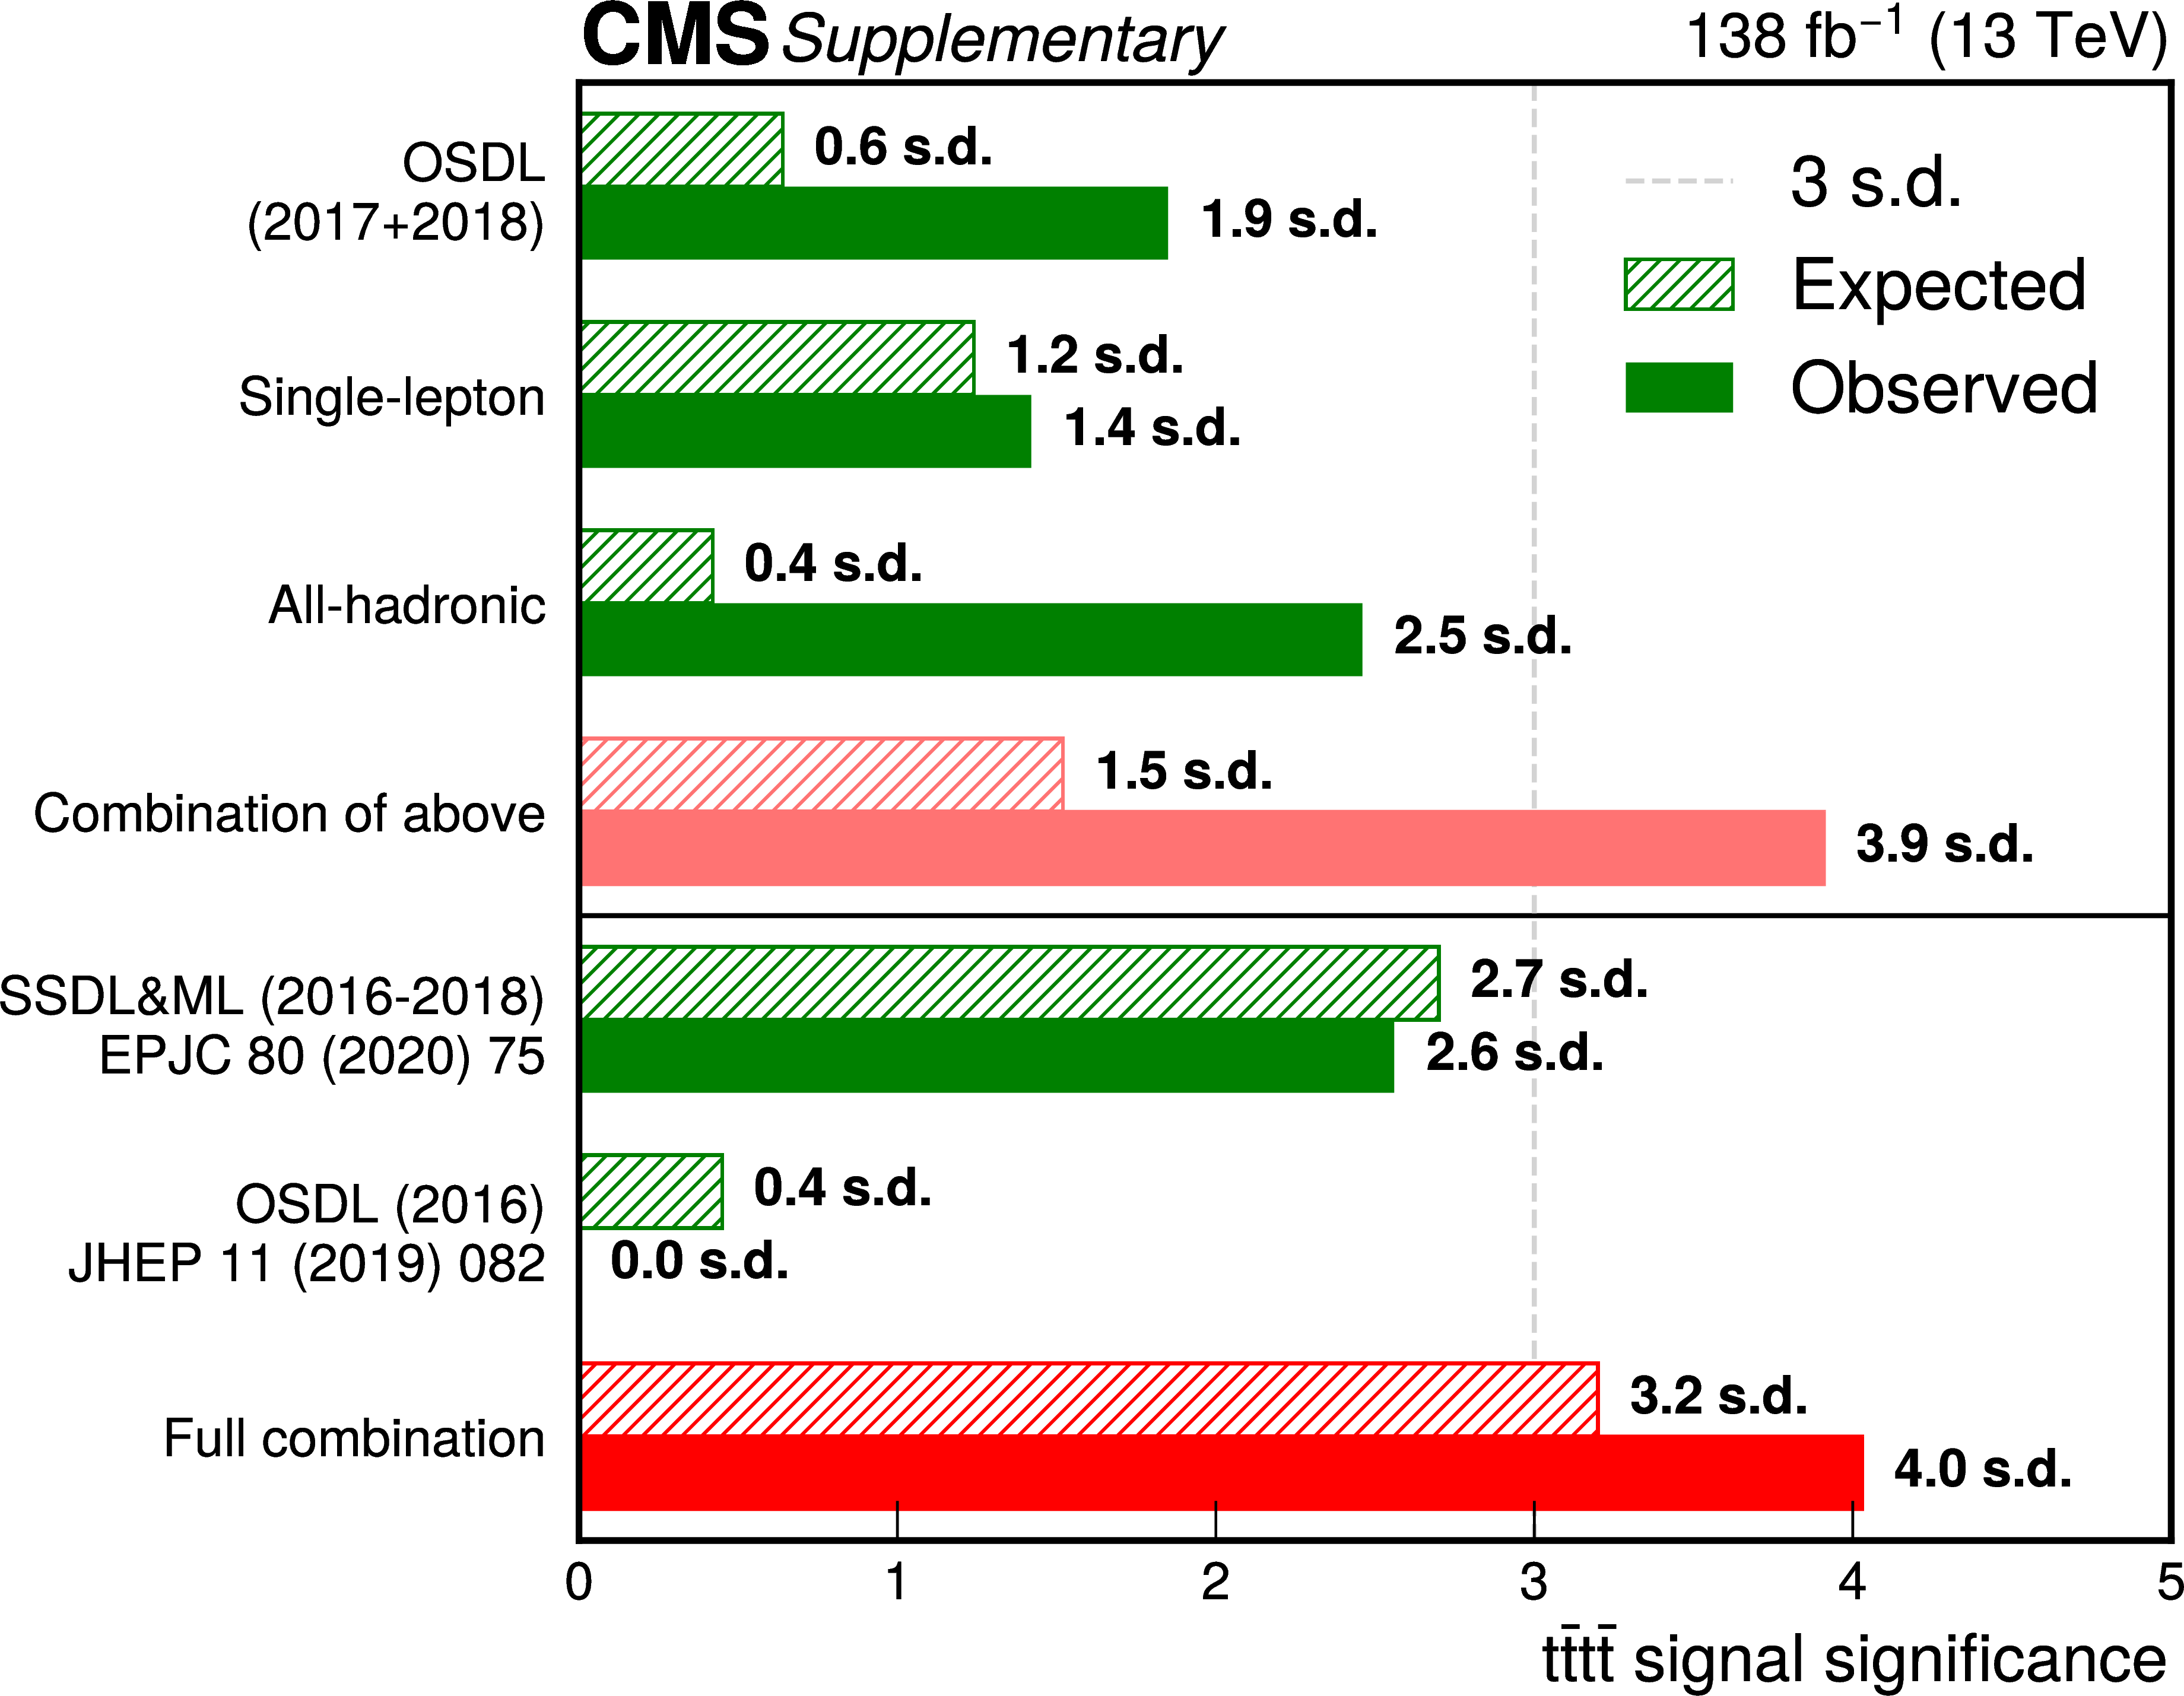
Figure 7:
Expected and observed significance (in standard deviations) for $ \mathrm{t}\bar{\mathrm{t}}\mathrm{t}\bar{\mathrm{t}} $ production from each final state and the combination with previous CMS results [21,22]. The same-sign dilepton and multilepton (SSDL&ML) final state results are from Ref. [21]. |
| Tables | |
png pdf |
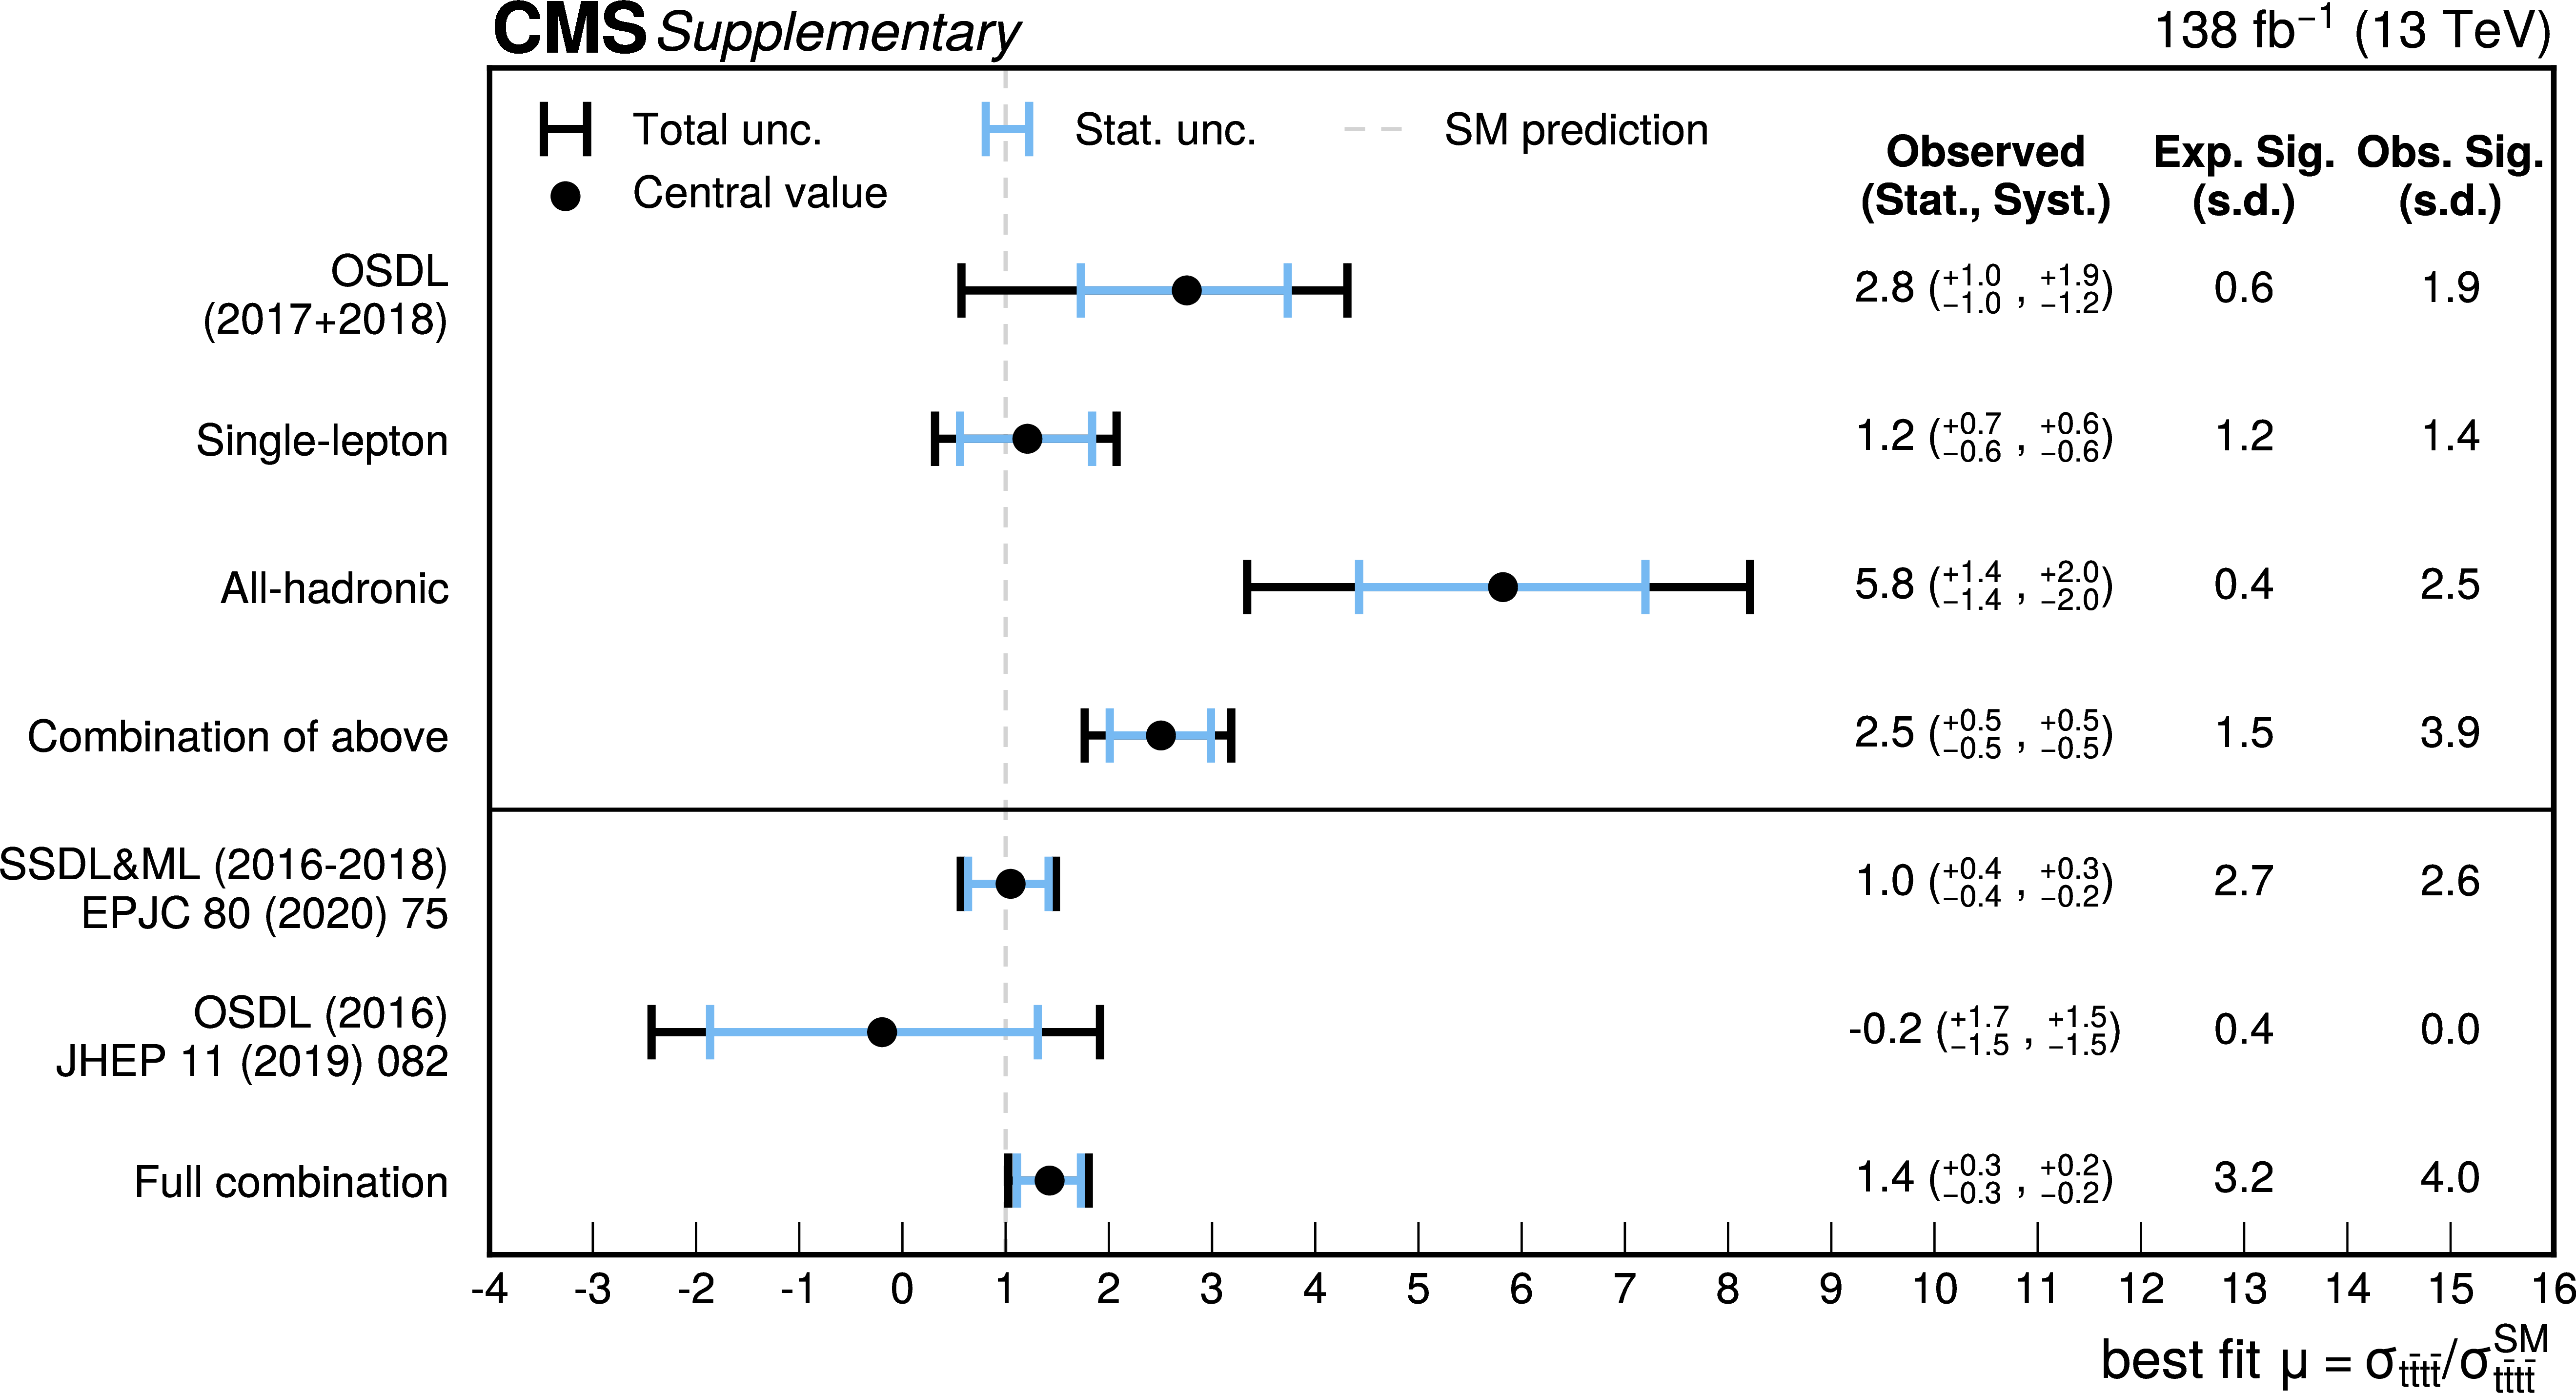
Table 1:
Measured signal strength ($ \mu = \sigma_{\mathrm{t}\bar{\mathrm{t}}\mathrm{t}\bar{\mathrm{t}}}/\sigma_{\mathrm{t}\bar{\mathrm{t}}\mathrm{t}\bar{\mathrm{t}}}^{\mathrm{SM}} $ where $ \sigma_{\mathrm{t}\bar{\mathrm{t}}\mathrm{t}\bar{\mathrm{t}}}^{\mathrm{SM}} = $ 12 fb), corresponding cross section (in fb), and the expected and observed significance (in standard deviations) for $ \mathrm{t}\bar{\mathrm{t}}\mathrm{t}\bar{\mathrm{t}} $ production from all analysis channels. This table shows production from each analysis channel in this Letter, the combination of those channels, the results from previously published results, and the full combination of all CMS 2016--2018 results. |
| Summary |
| We have measured the cross section for the simultaneous production of four top quarks ($ \mathrm{t}\bar{\mathrm{t}}\mathrm{t}\bar{\mathrm{t}} $) in proton-proton collisions. The data were collected by the CMS experiment at the LHC in 2016--2018, and correspond to an integrated luminosity of up to 138 fb$ ^{-1} $ at a center-of-mass energy of 13 TeV. The all-hadronic final state has been studied for the first time in a $ \mathrm{t}\bar{\mathrm{t}}\mathrm{t}\bar{\mathrm{t}} $ production analysis, using a background estimation strategy based on a deep neural network trained using control regions in data. Final states with one lepton (electron or muon), or two opposite-sign leptons have also been analyzed. The observed and expected significances obtained from the combination of the new analyses described here are 3.9 and 1.5 standard deviations, respectively. When combined with published CMS results in other final states, the significances increase to 4.0 (observed) and 3.2 (expected) standard deviations. This is a significant improvement compared to previous CMS results and the first CMS evidence for $ \mathrm{t}\bar{\mathrm{t}}\mathrm{t}\bar{\mathrm{t}} $ production with a significance above three standard deviations. |
| Additional Figures | |
png pdf |
Additional Figure 1:
Observed best fit of $ \mathrm{t}\bar{\mathrm{t}}\mathrm{t}\bar{\mathrm{t}} $ signal strength ($ \mu $) from each final state and the combination. |
png pdf |
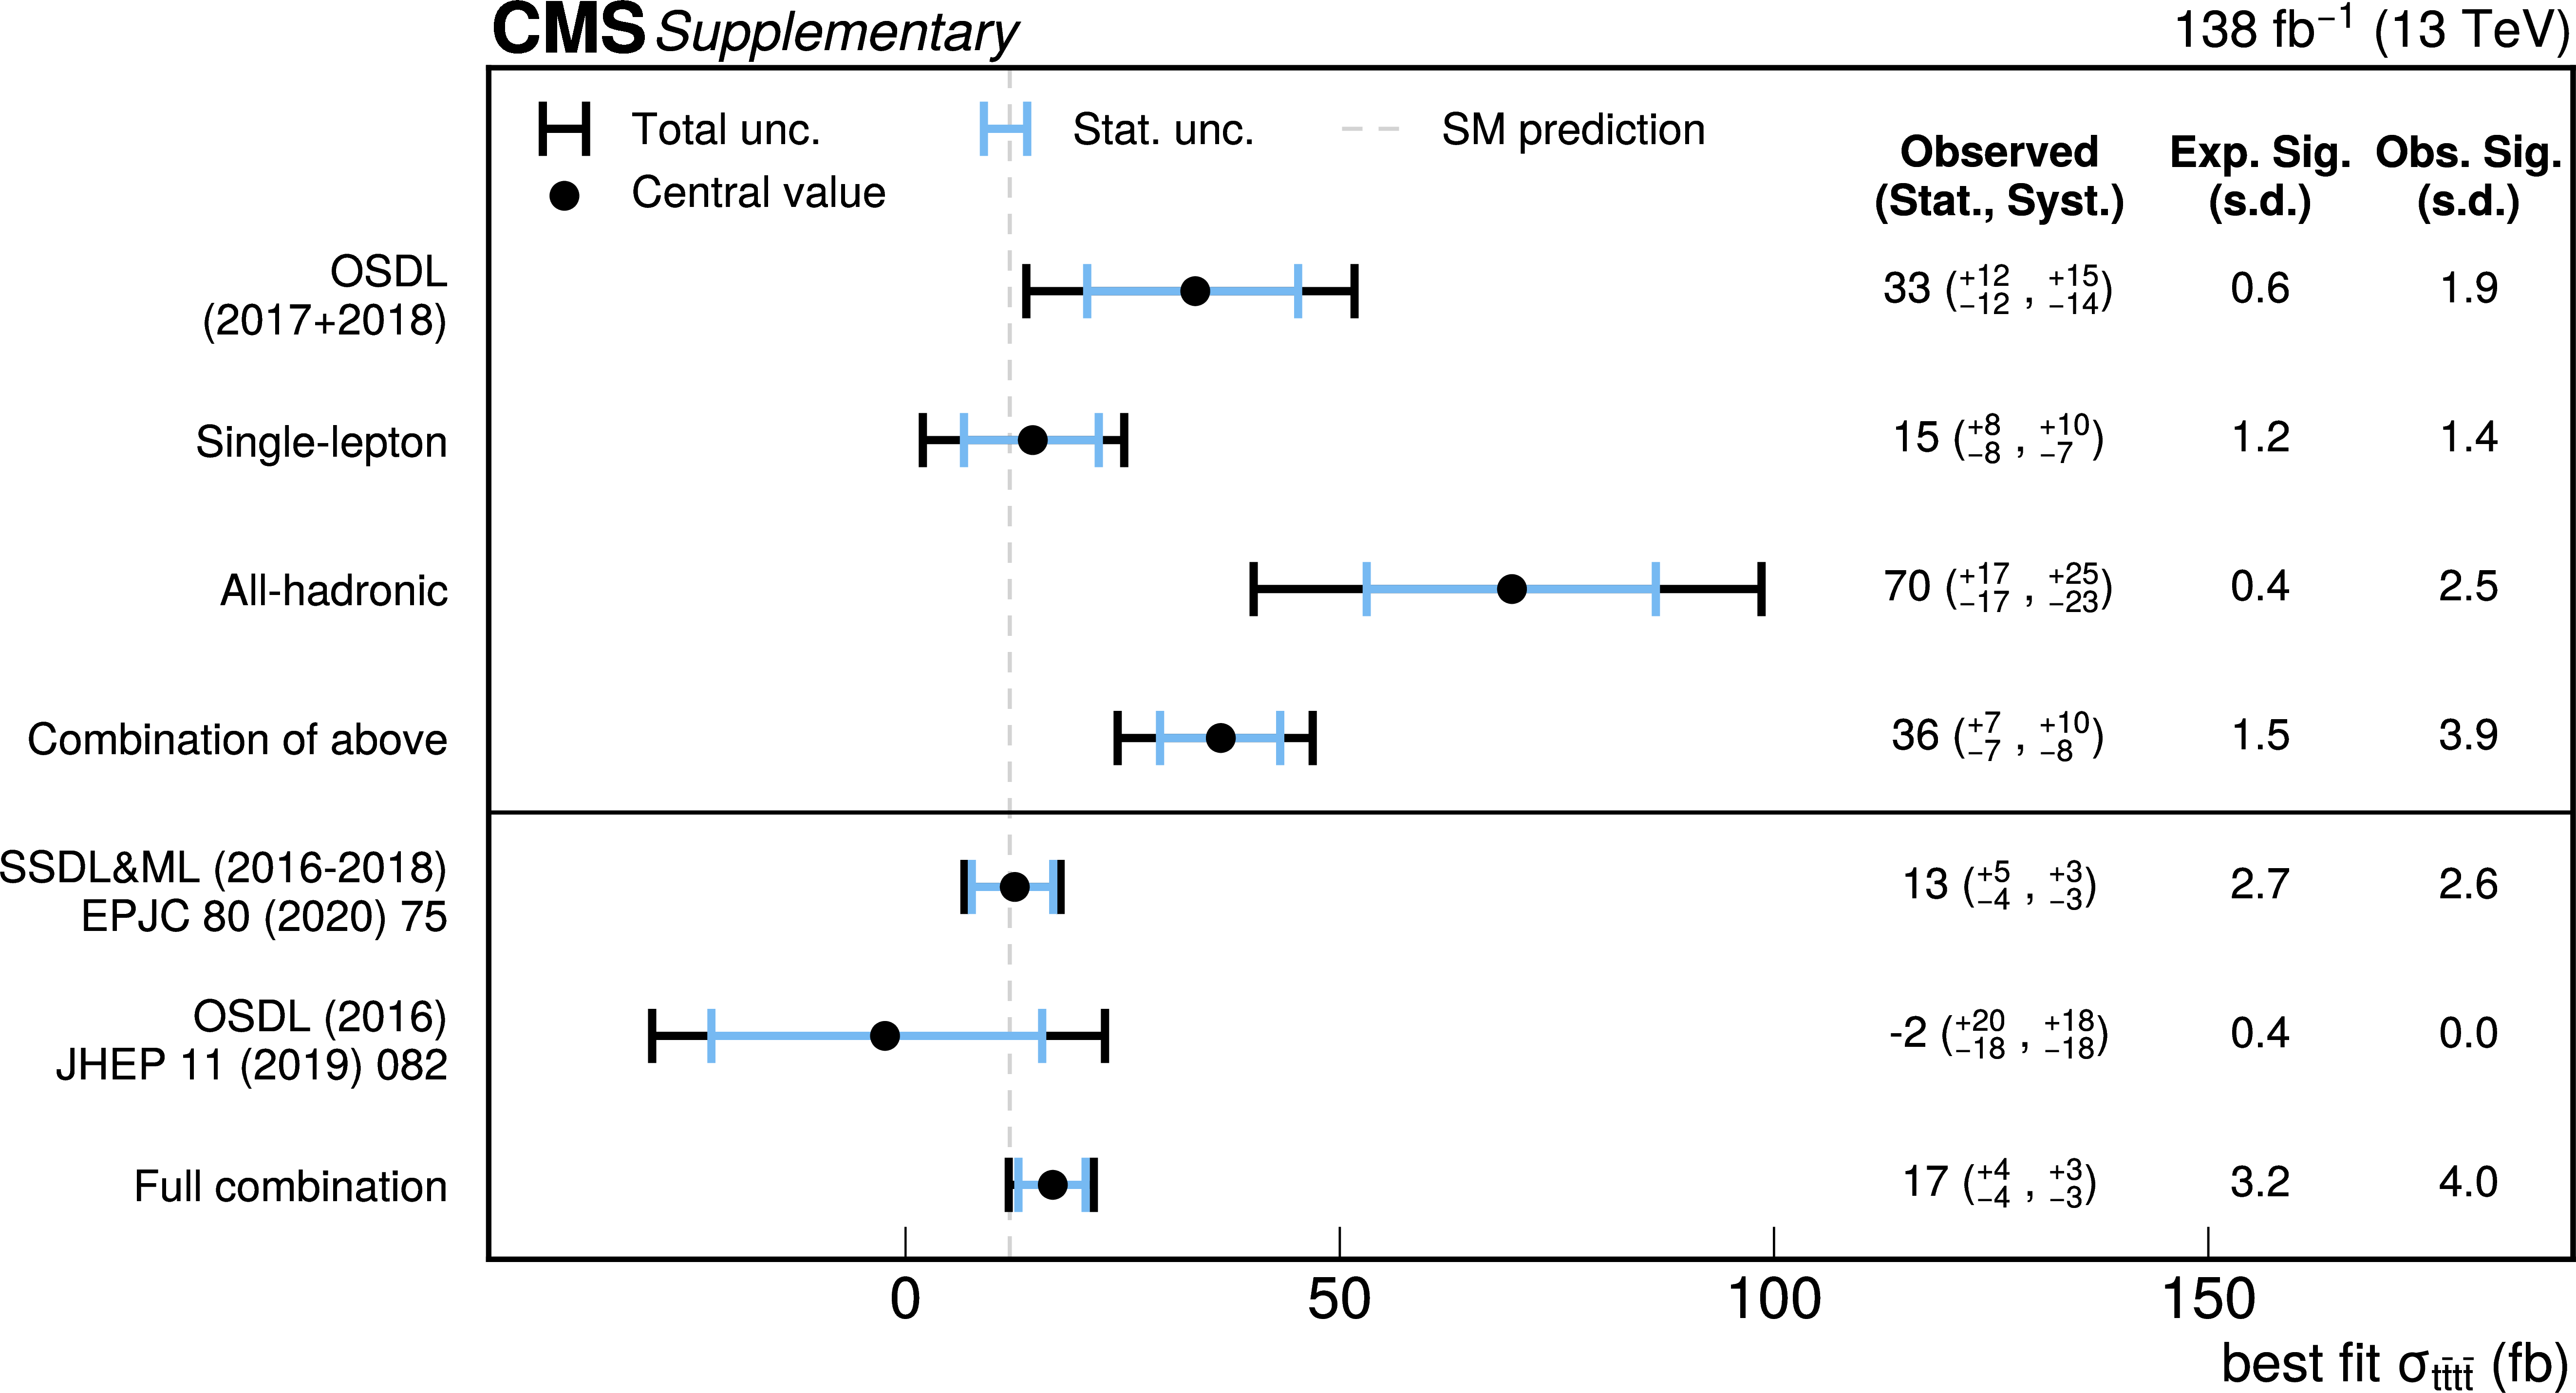
Additional Figure 2:
Observed best fit of $ \mathrm{t}\bar{\mathrm{t}}\mathrm{t}\bar{\mathrm{t}} $ cross section (in fb) from each final state and the combination. |
png pdf |
Additional Figure 3:
Expected and observed significance (in standard deviations) for $ \mathrm{t}\bar{\mathrm{t}}\mathrm{t}\bar{\mathrm{t}} $ production from each final state and the combination with previous CMS results [21,22]. In this figure, SSDL&ML represents same-sign dilepton and multilepton final state, which has its results reported in [21]. |
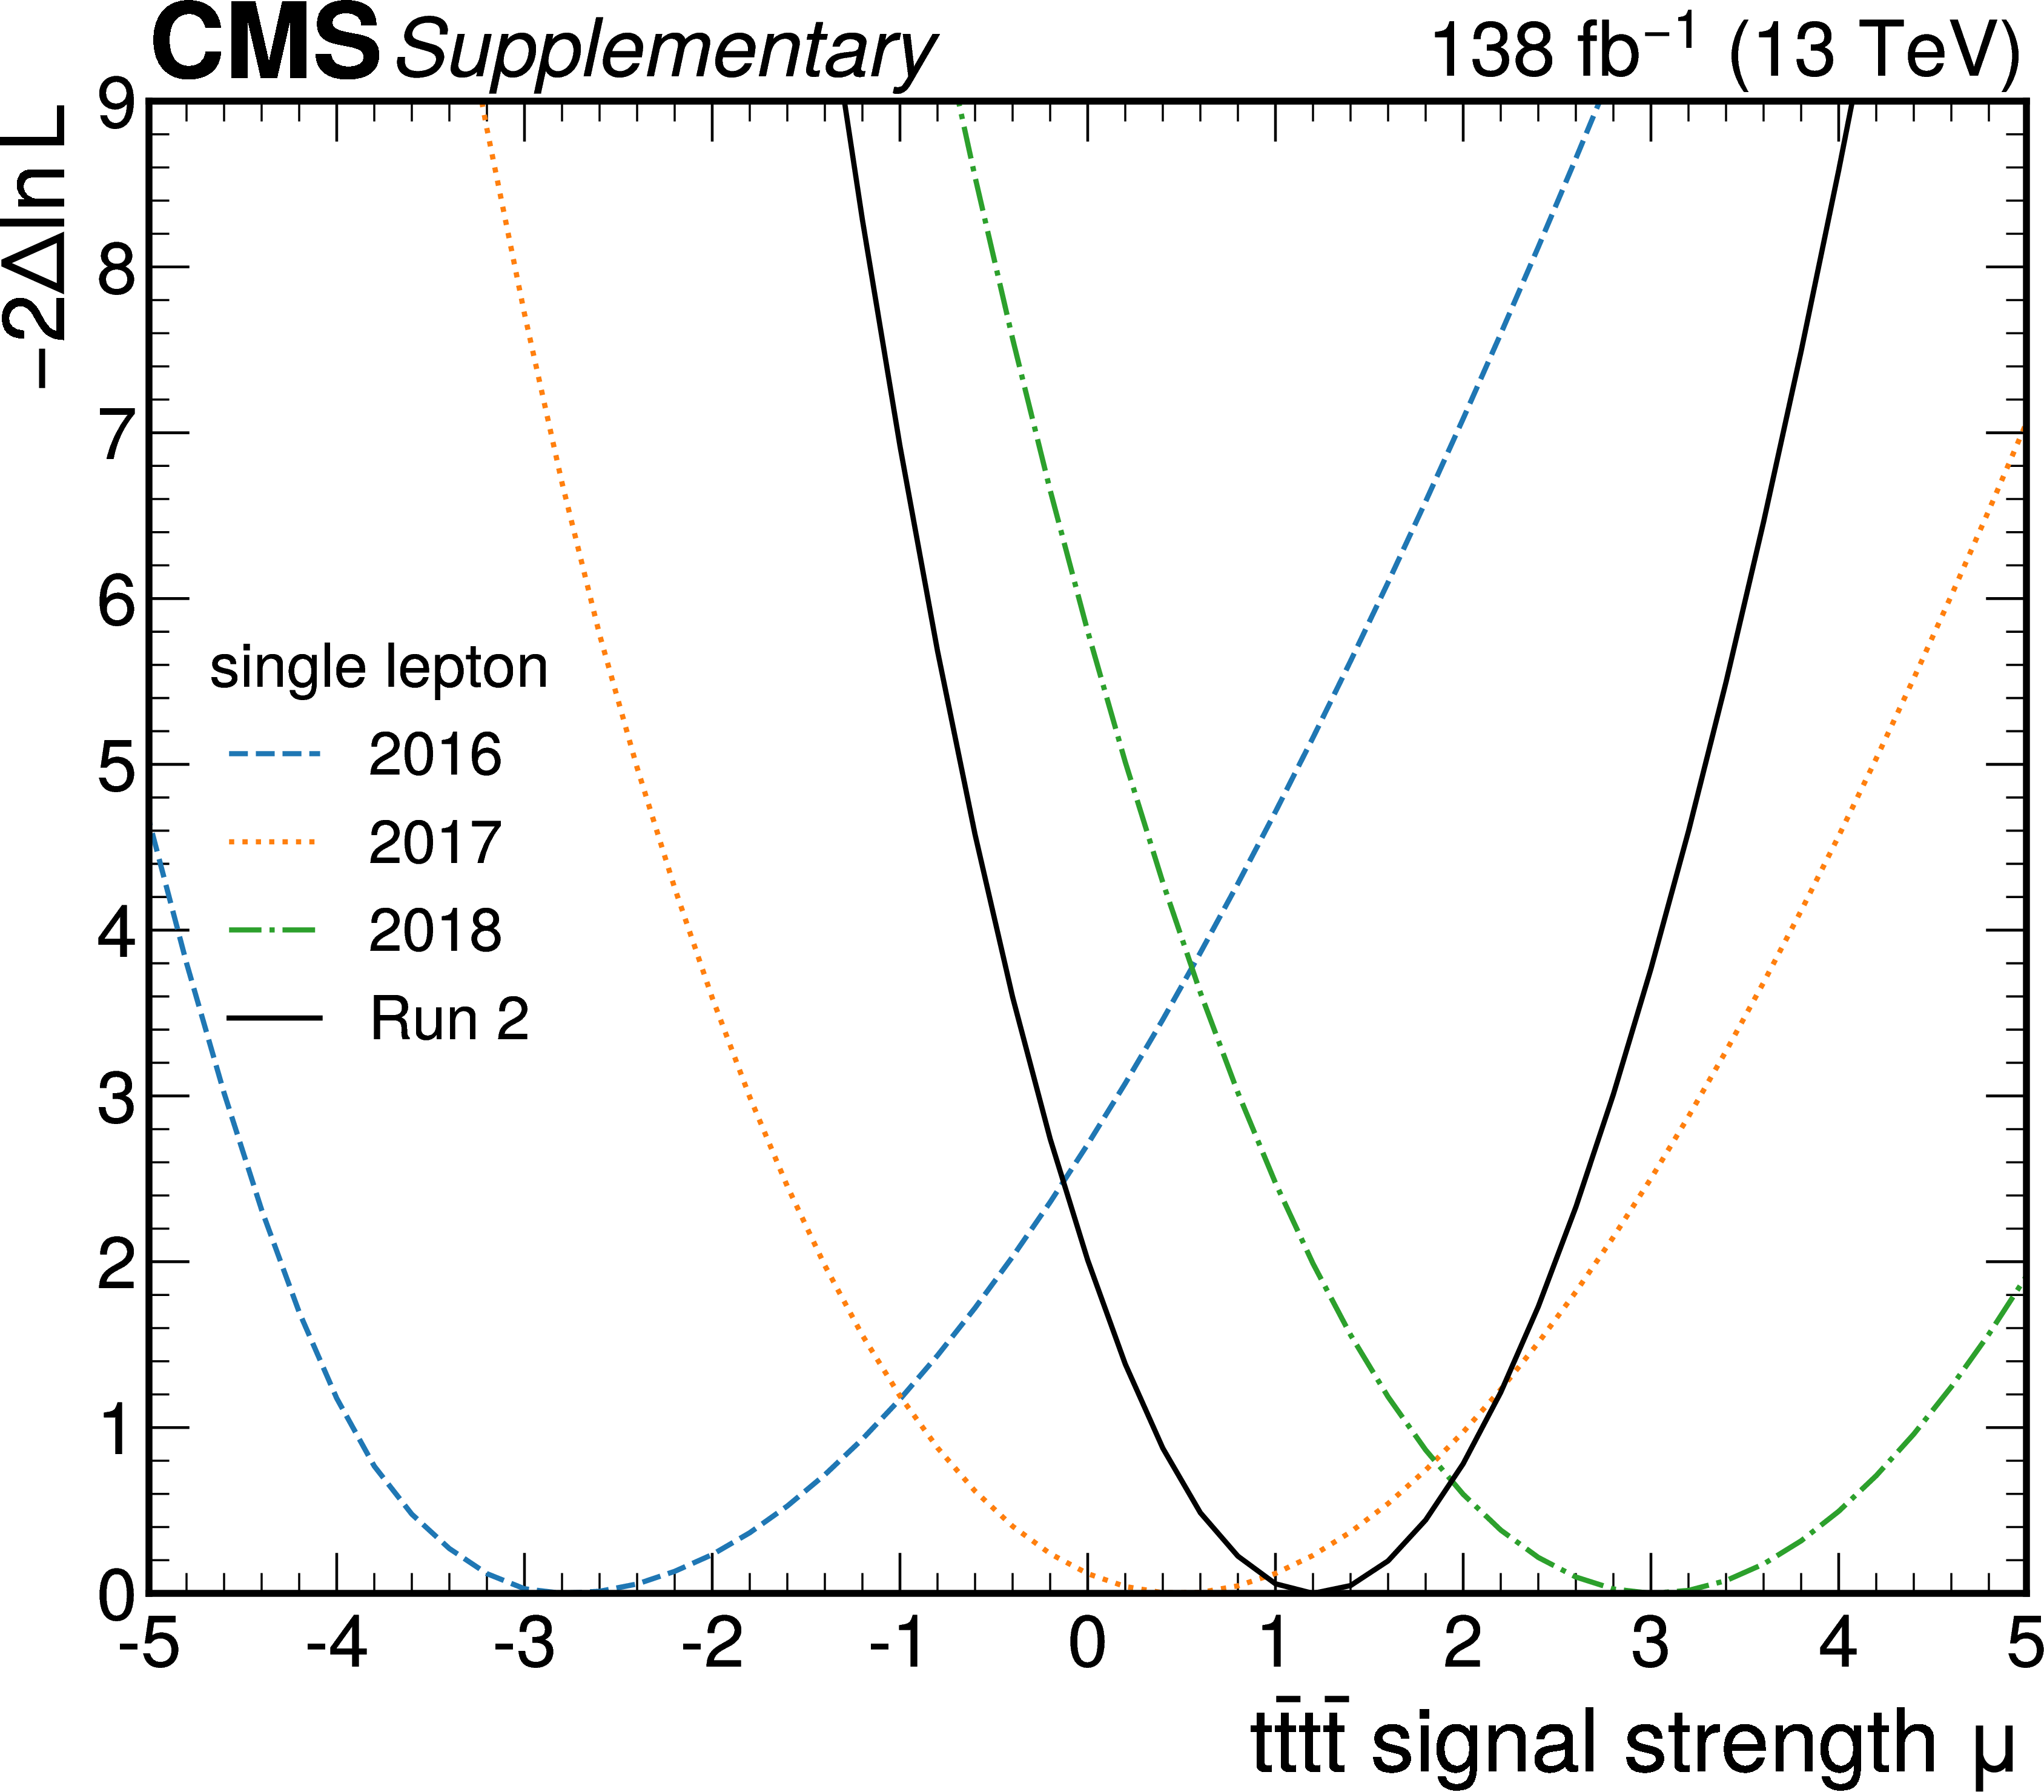
png pdf |
Additional Figure 4:
Post-fit negative log-likelihood scan for single lepton final state, separated per year and combined |
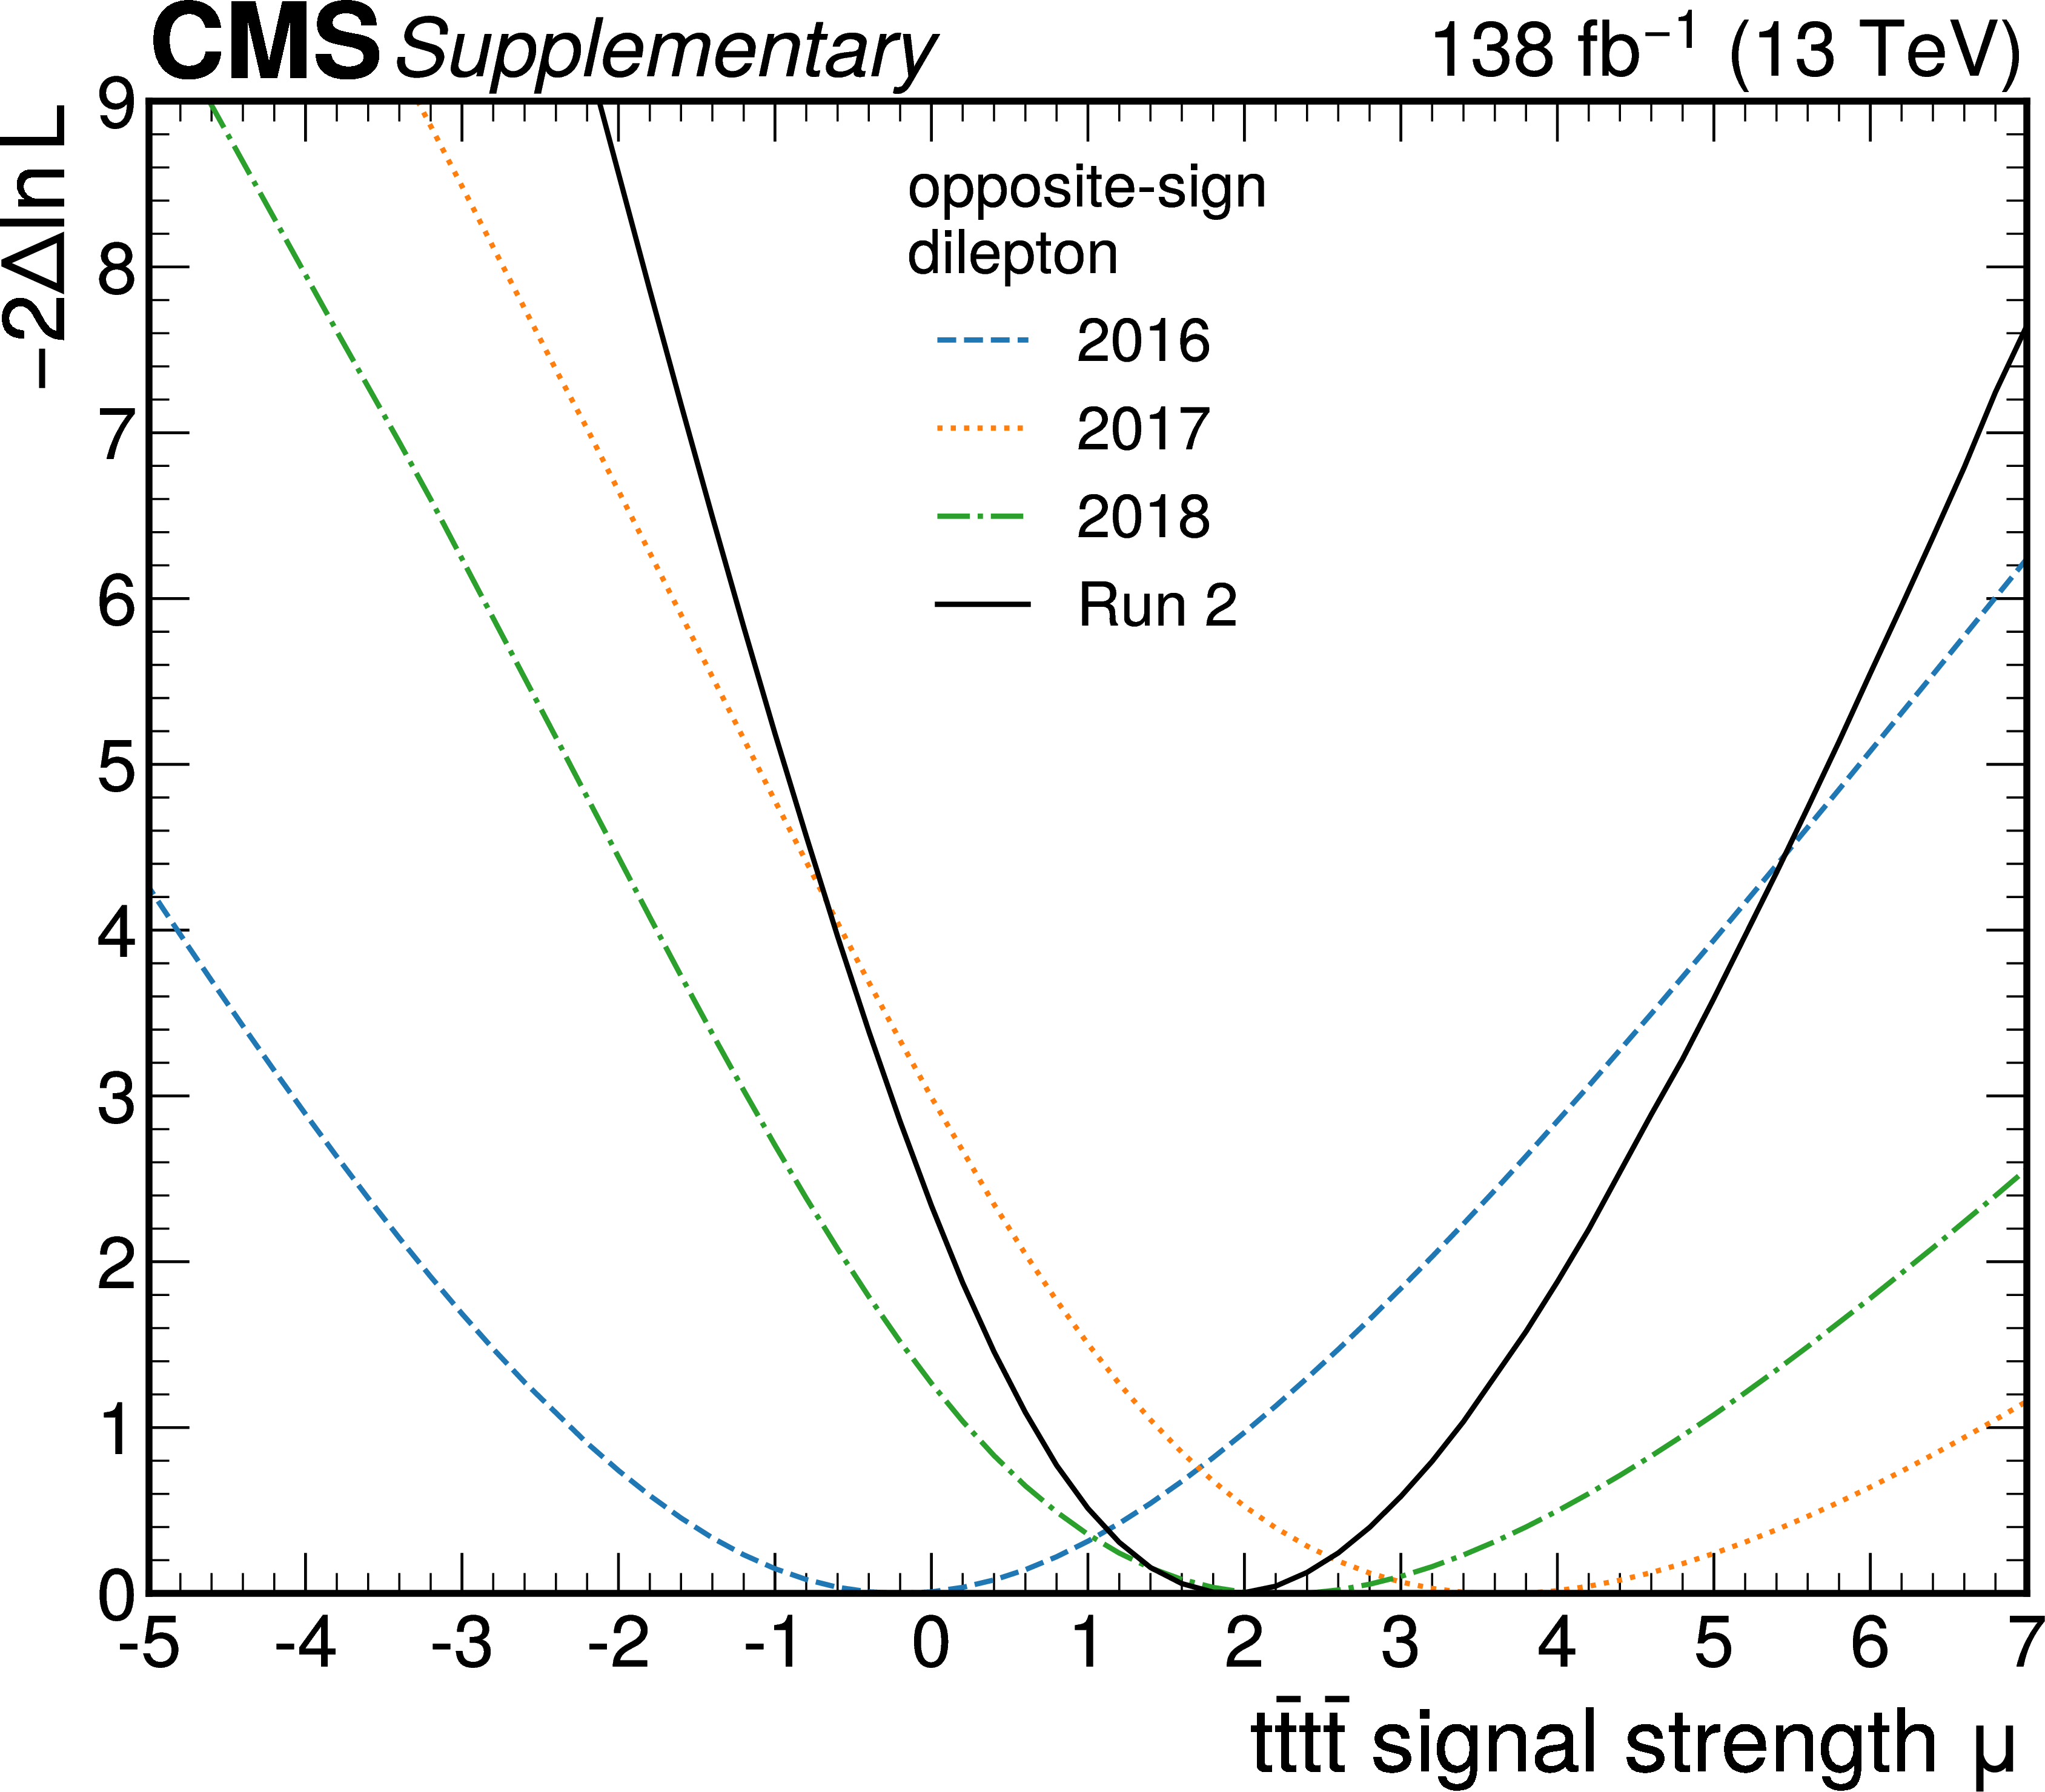
png pdf |
Additional Figure 5:
Post-fit negative log-likelihood scan for opposite-sign dilepton final state, separated per year and combined |
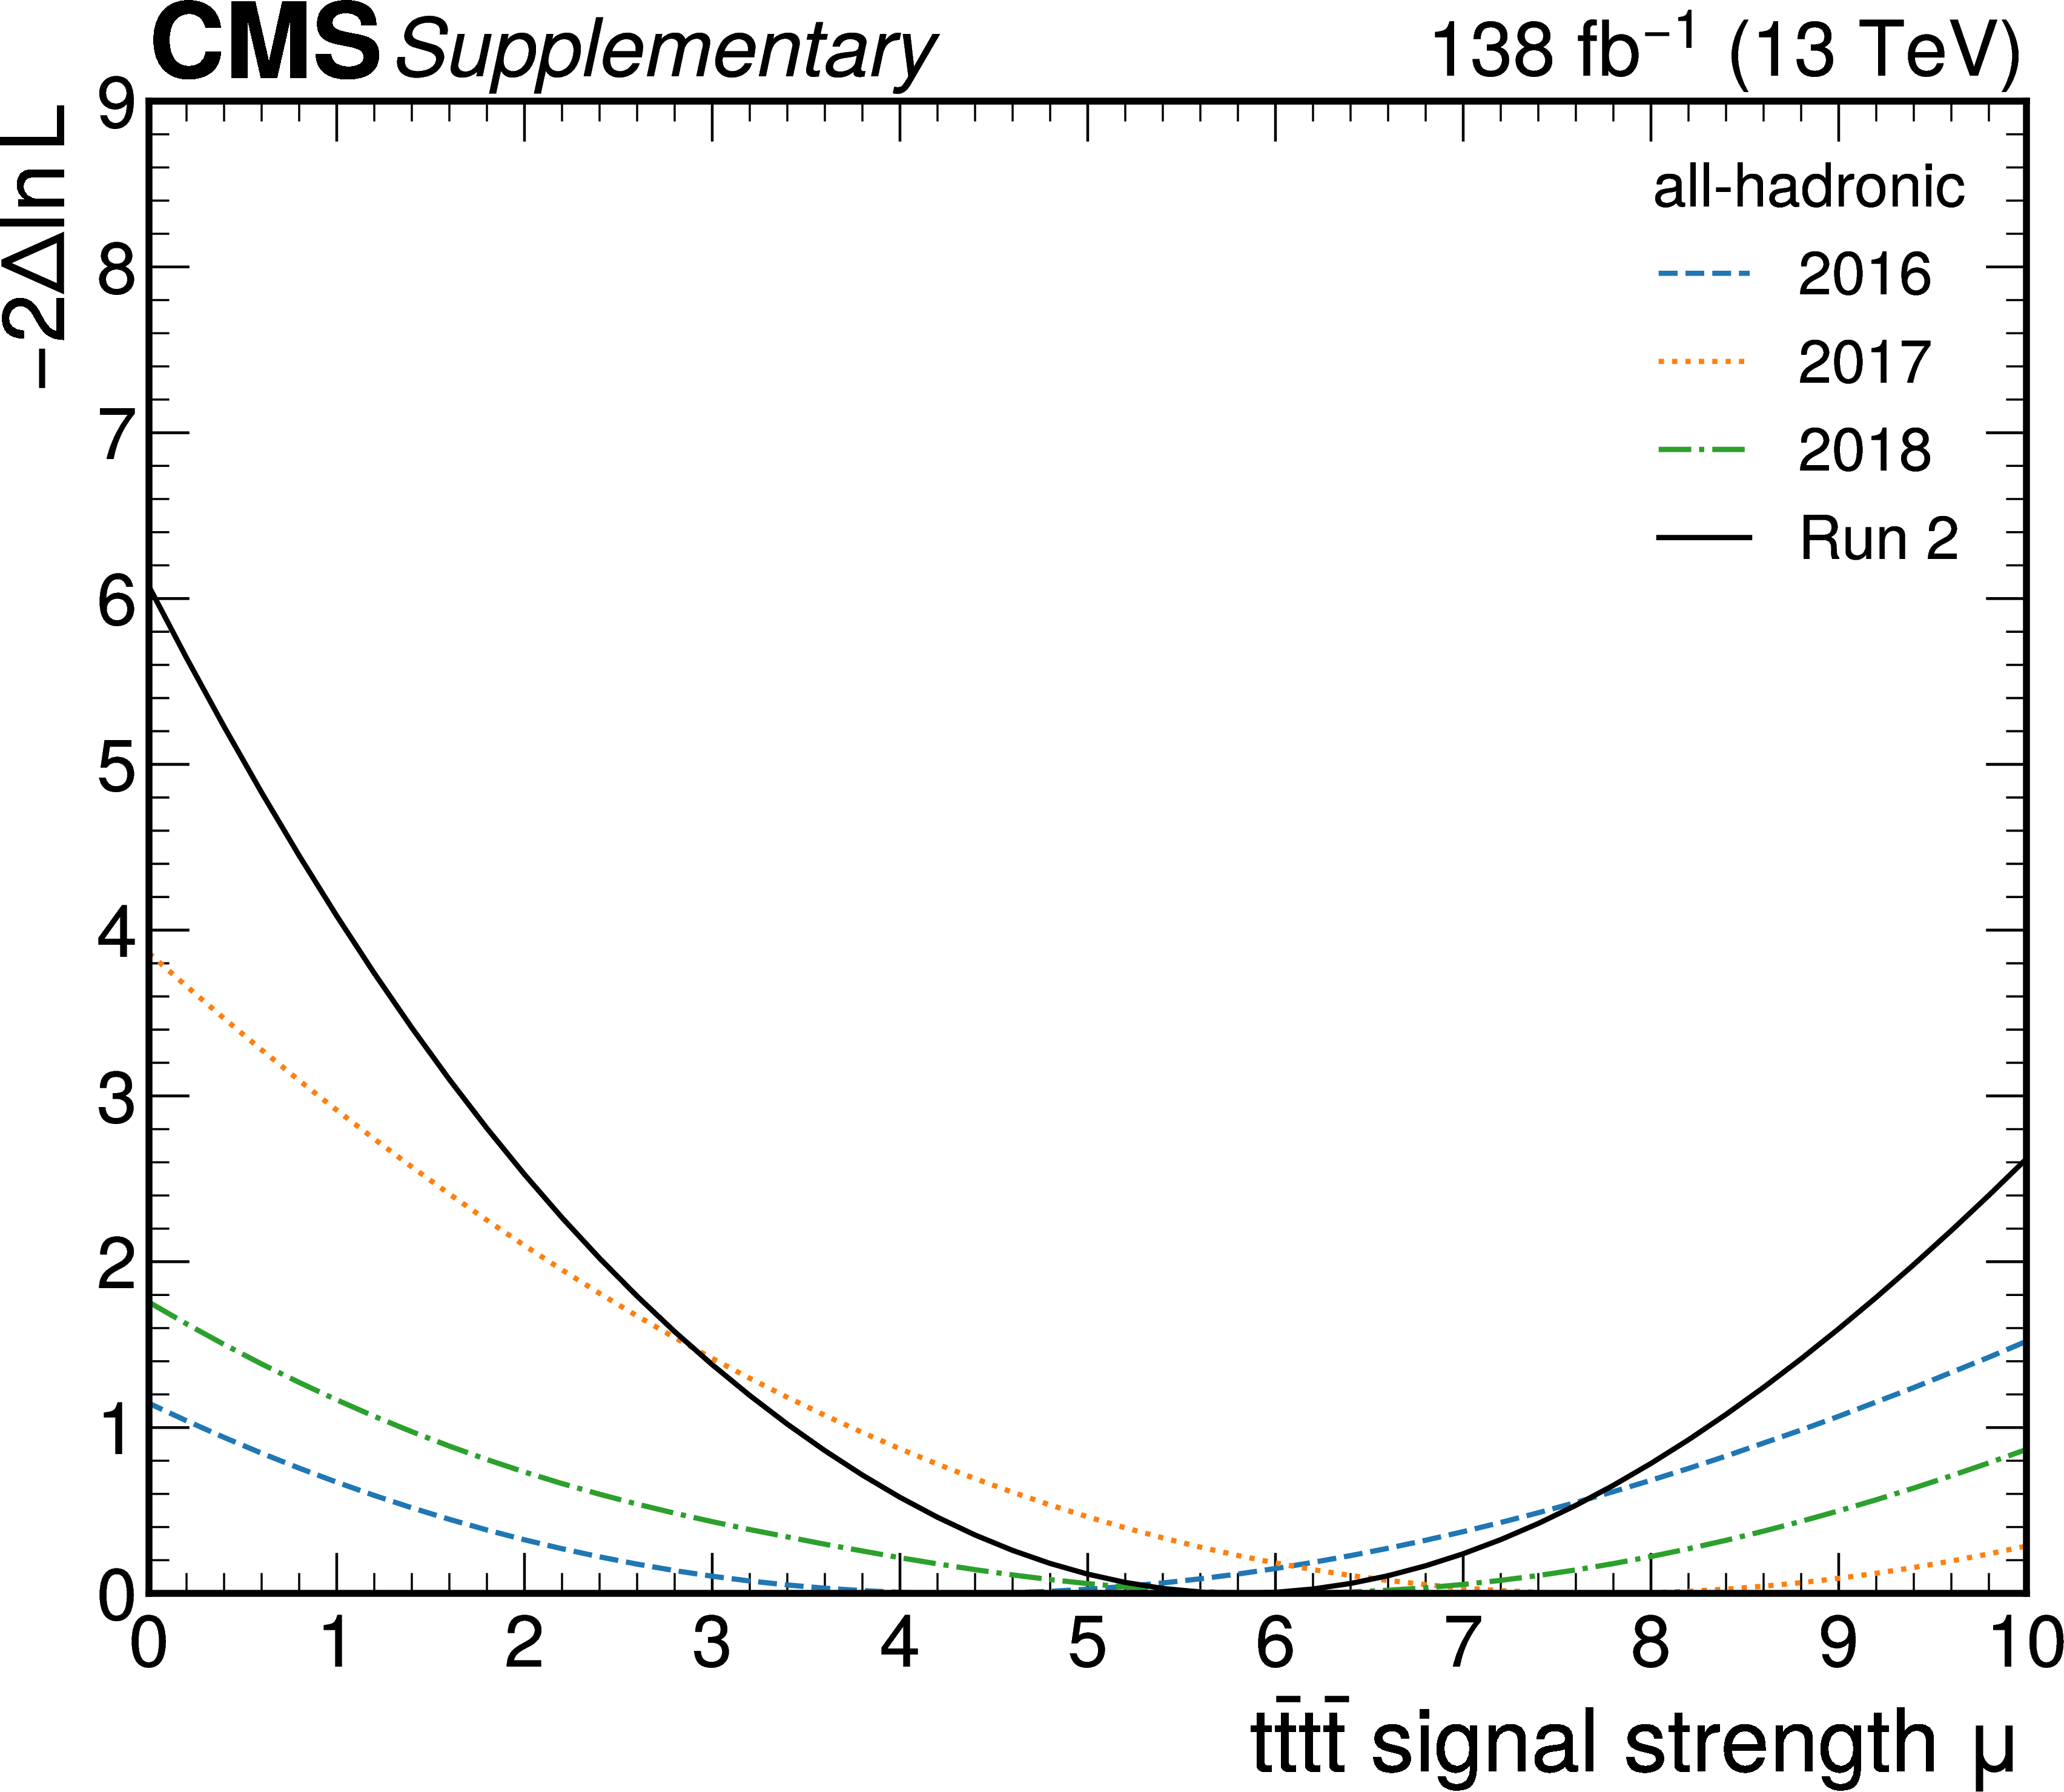
png pdf |
Additional Figure 6:
Post-fit negative log-likelihood scan for all-hadronic final state, separated per year and combined |
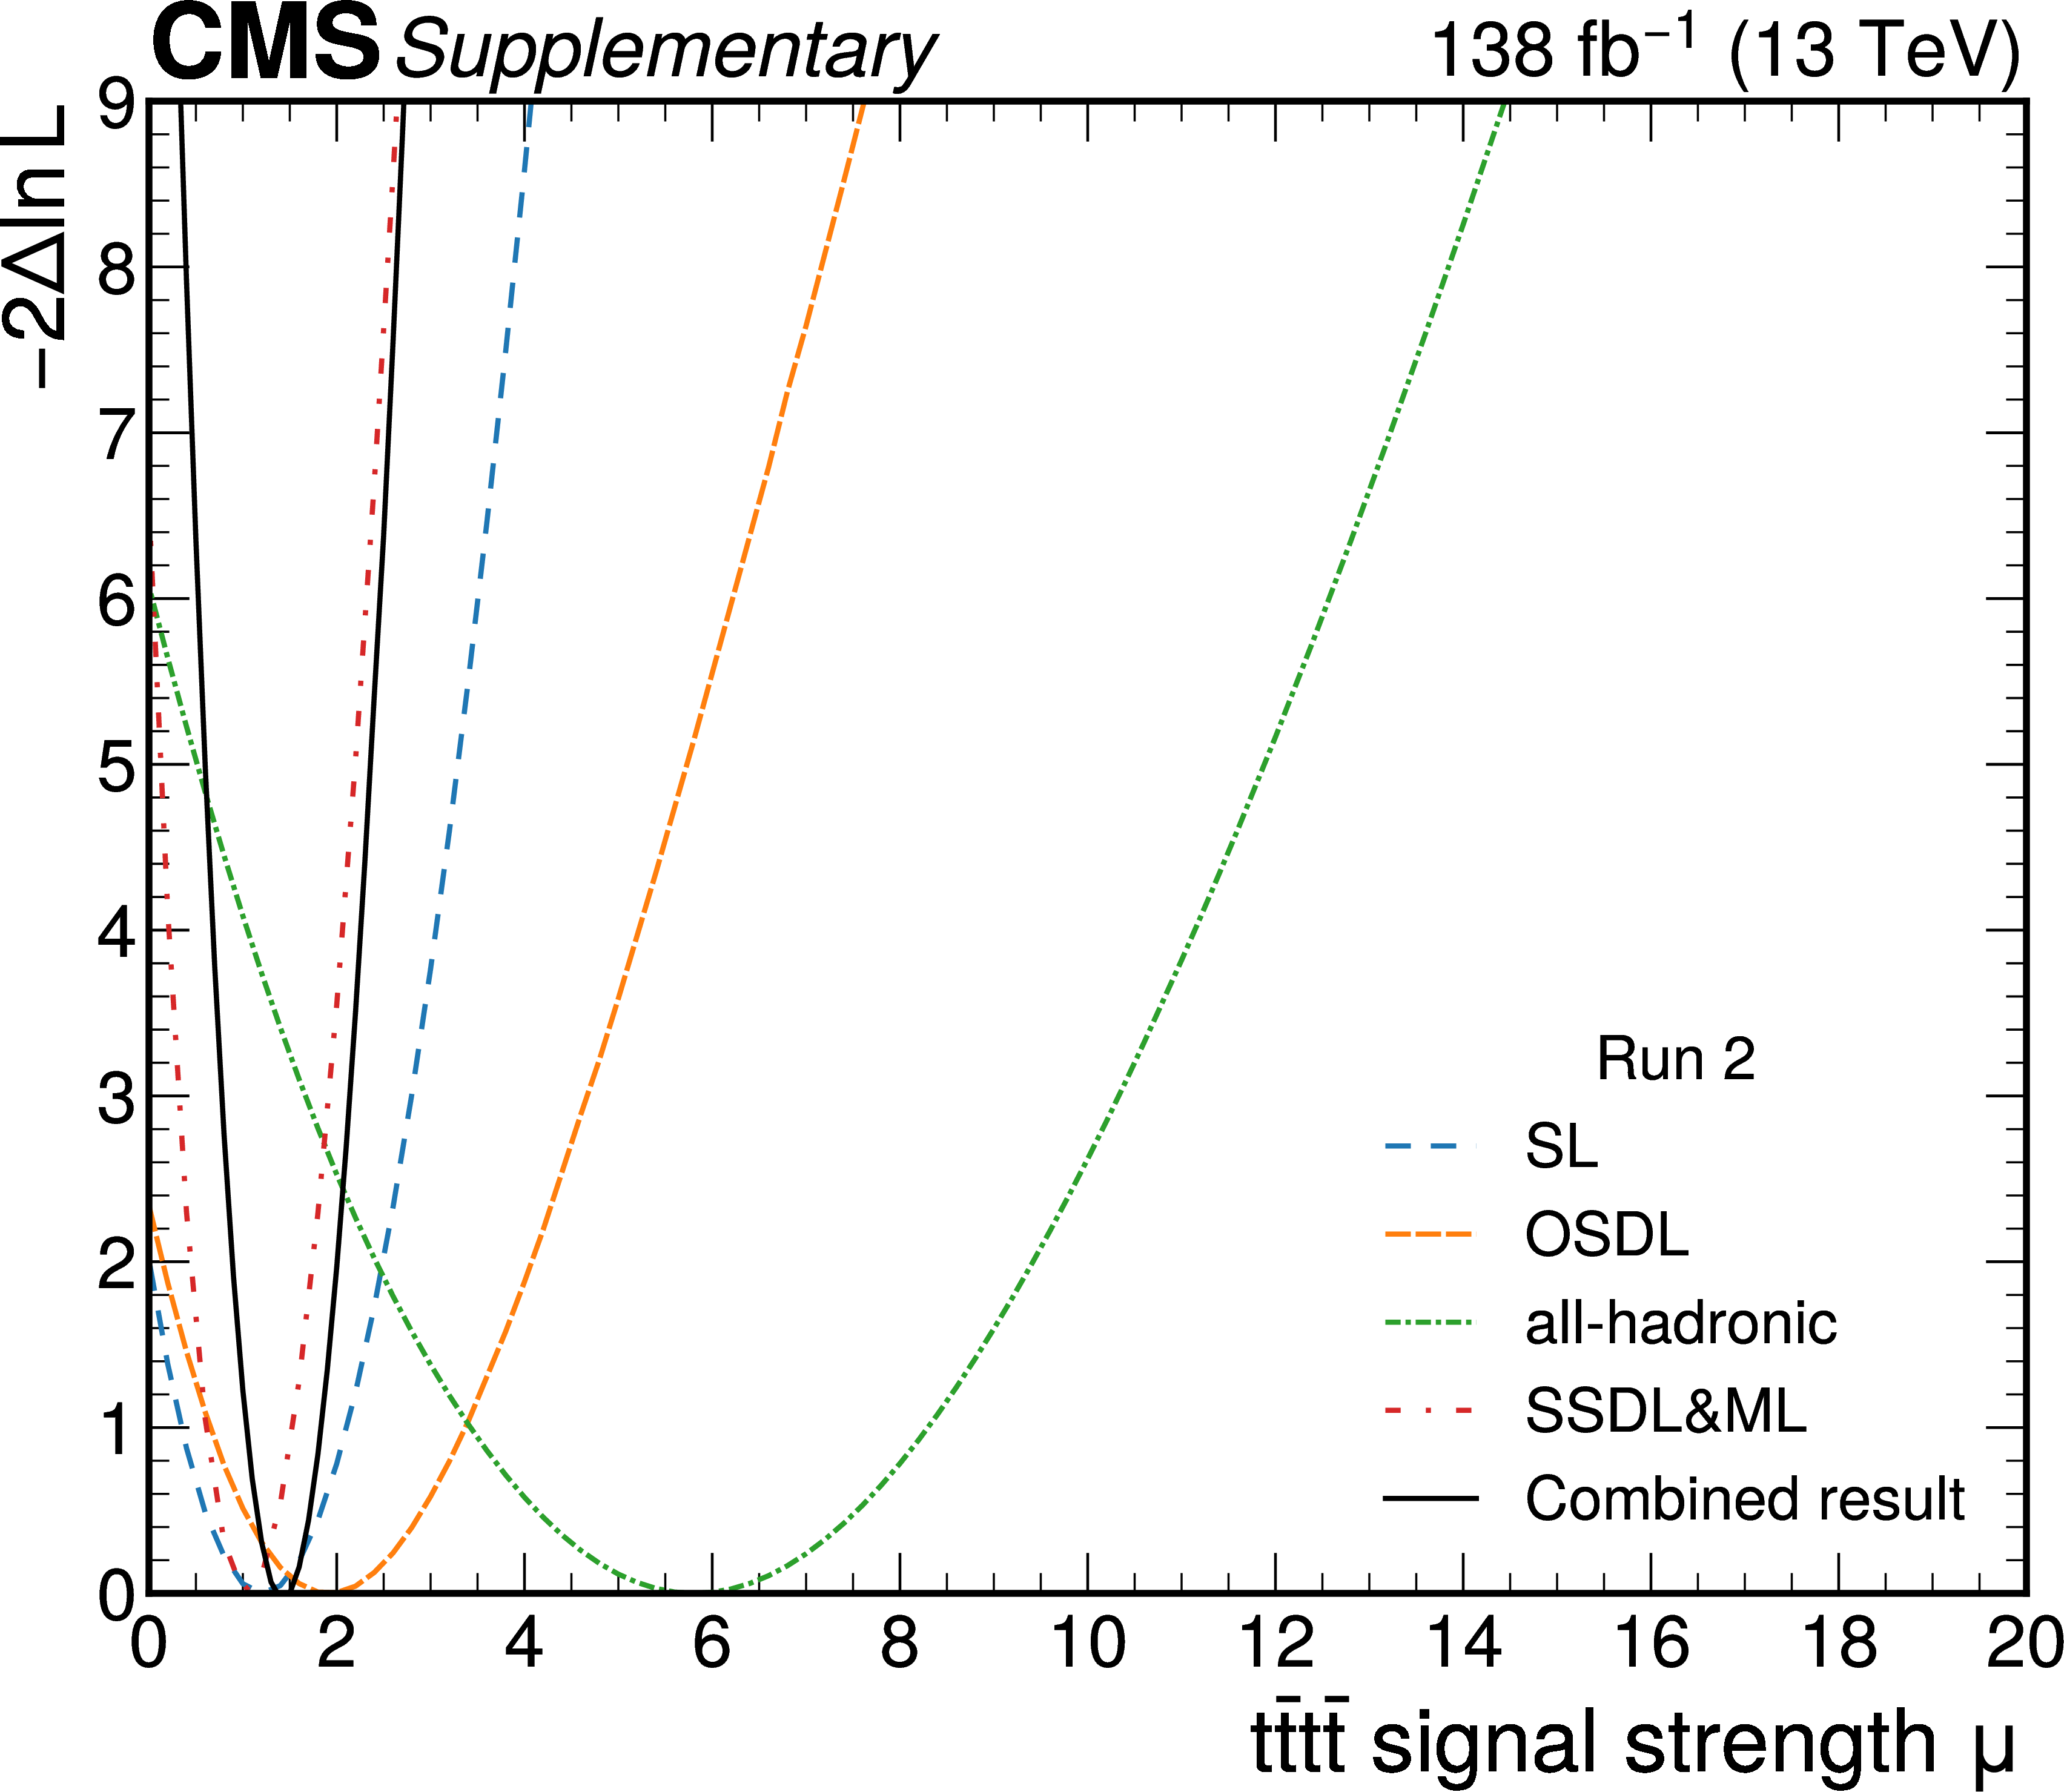
png pdf |
Additional Figure 7:
Post-fit negative log-likelihood scan for all final states and the combination of all final states |
png pdf |
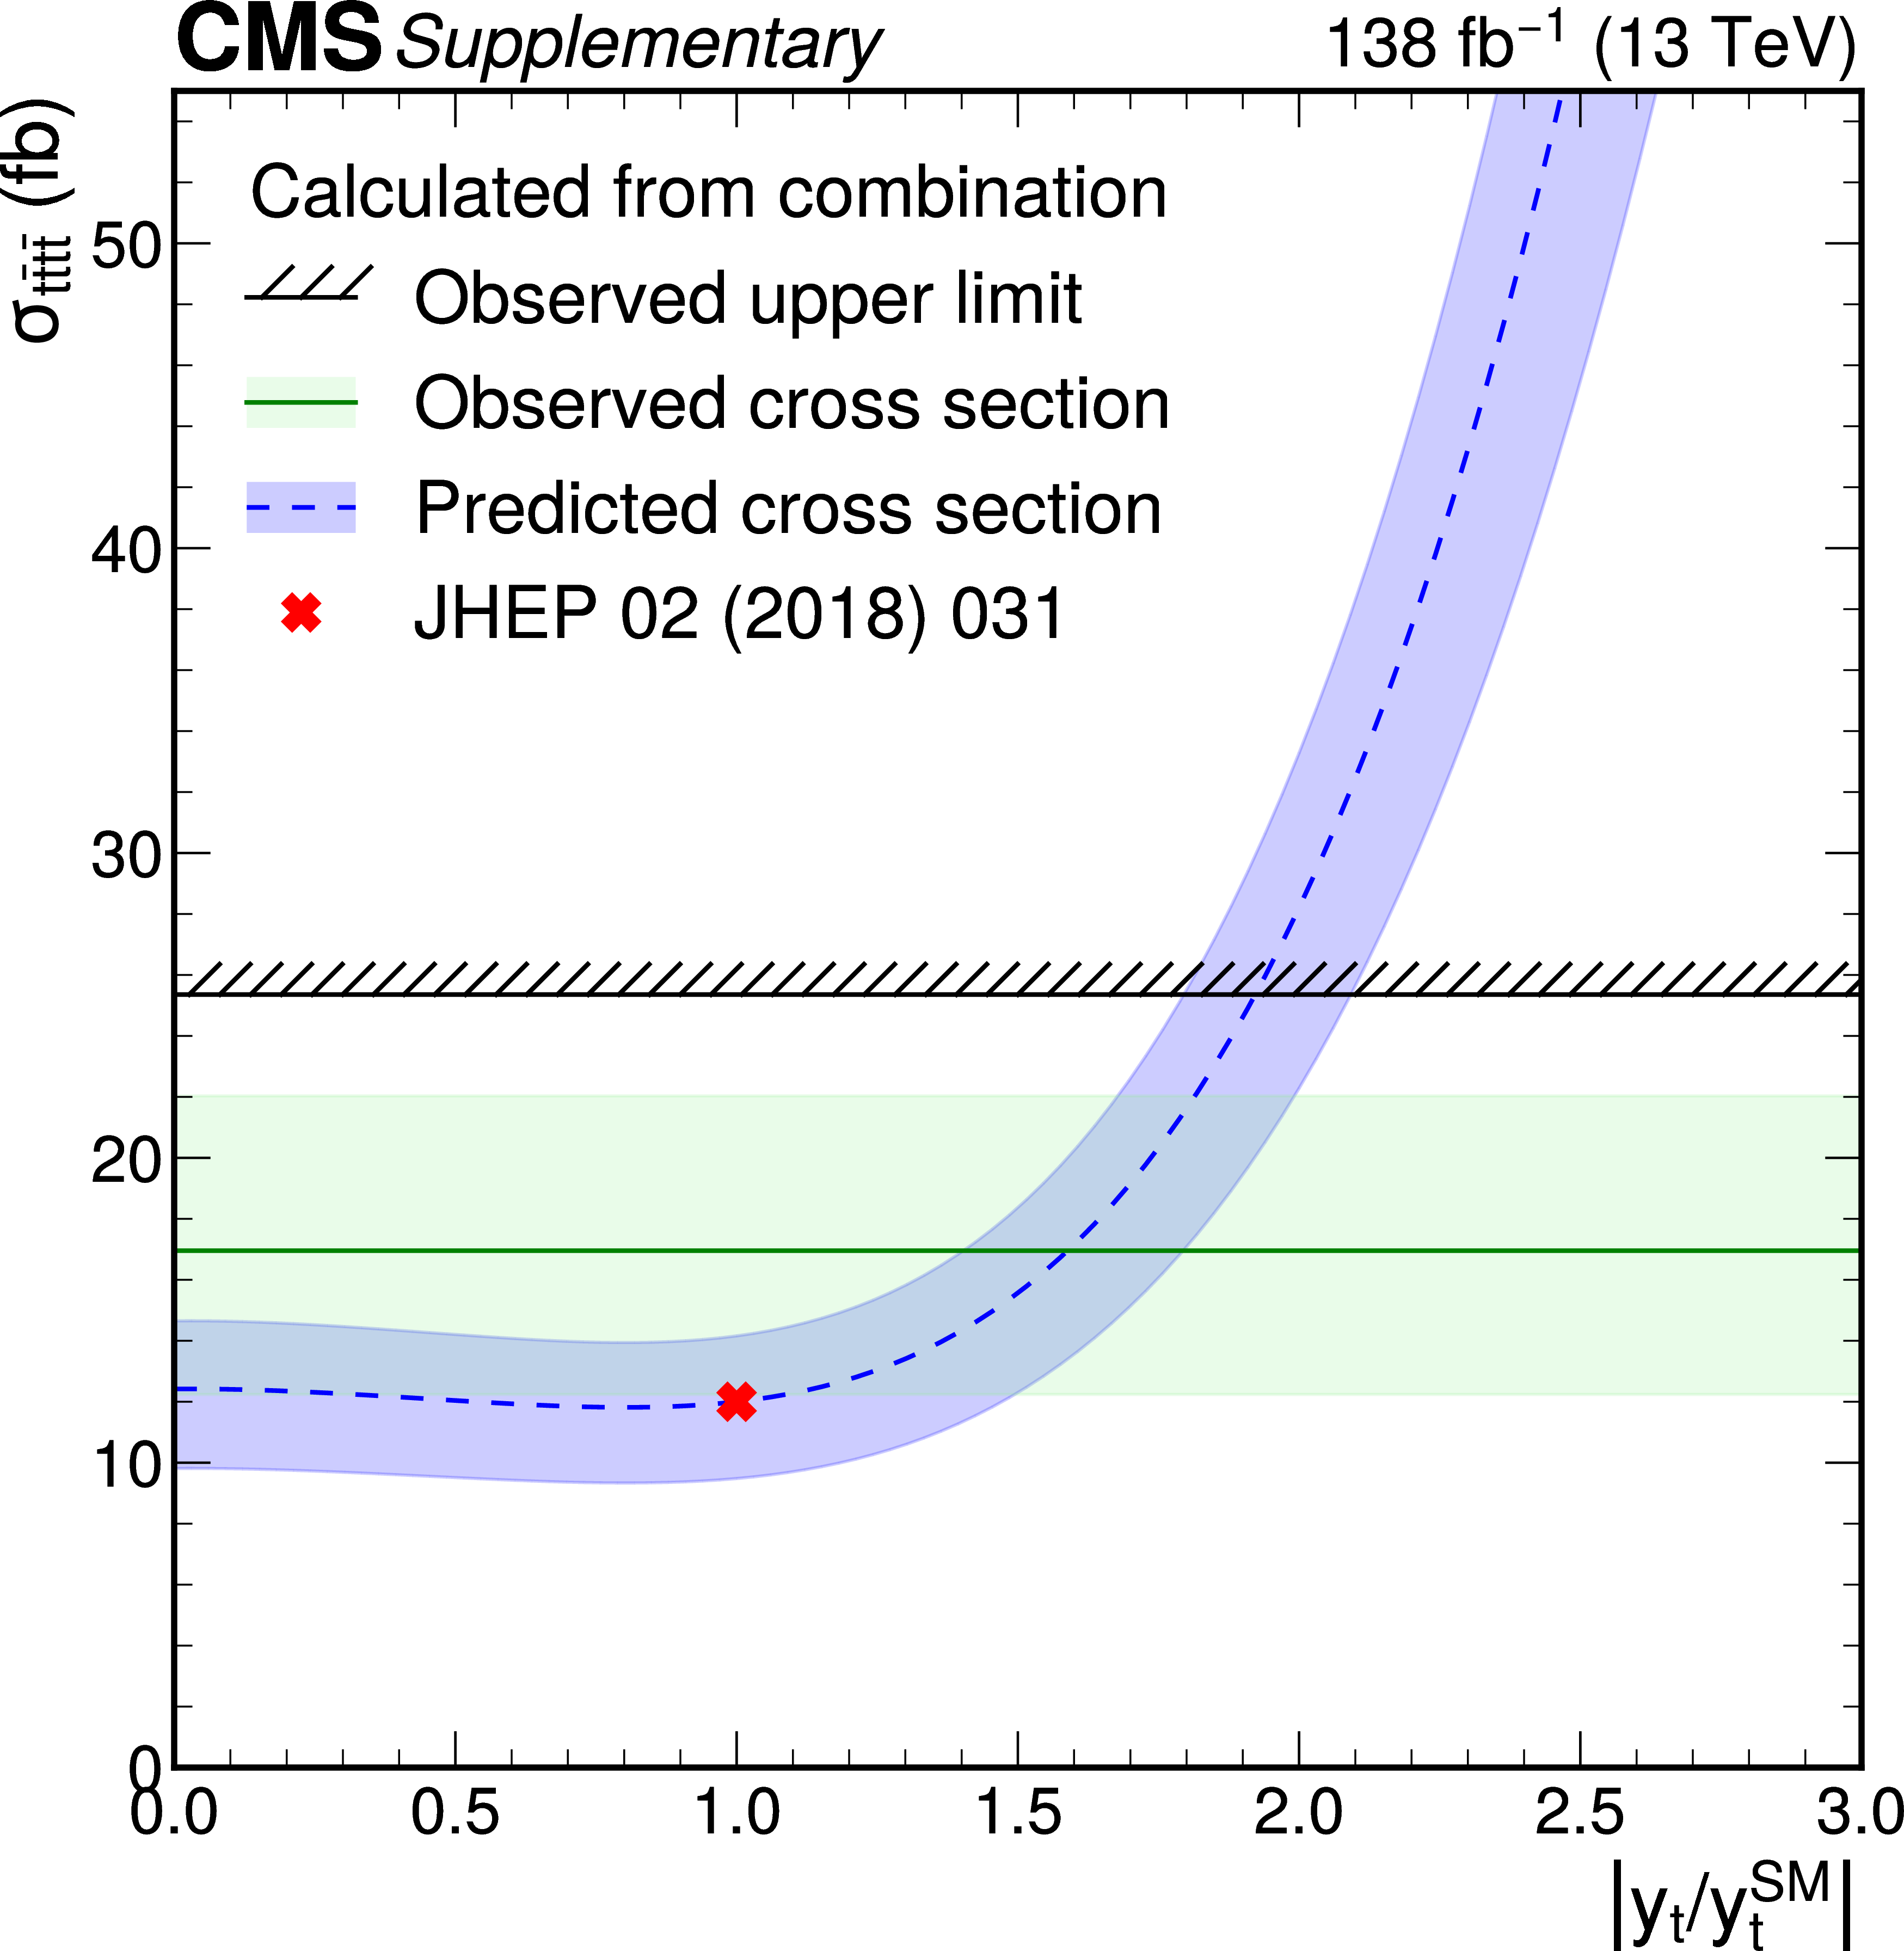
Additional Figure 8:
The $ \mathrm{t}\bar{\mathrm{t}}\mathrm{t}\bar{\mathrm{t}} $ production cross section as a function of top Yukawa coupling normalised to SM. The observed $ \mathrm{t}\bar{\mathrm{t}}\mathrm{t}\bar{\mathrm{t}} $ cross section (solid line) and 95% CL upper limit (hatched line) from the full combination are also shown. The dashed line shows the SM prediction of the dependence of the $ \mathrm{t}\bar{\mathrm{t}}\mathrm{t}\bar{\mathrm{t}} $ cross section as a function of the Yukawa coupling, calculated at LO with MadGraph-5\_aMC@NLO 2.7.3 including electroweak diagrams [1]. The prediction is normalised to the calculation at NLO+EW in the SM that is represented by the red cross [3]. The shaded bands represent the total uncertainty from the measurement or theoretical uncertainties taken from [3]. |
png pdf |
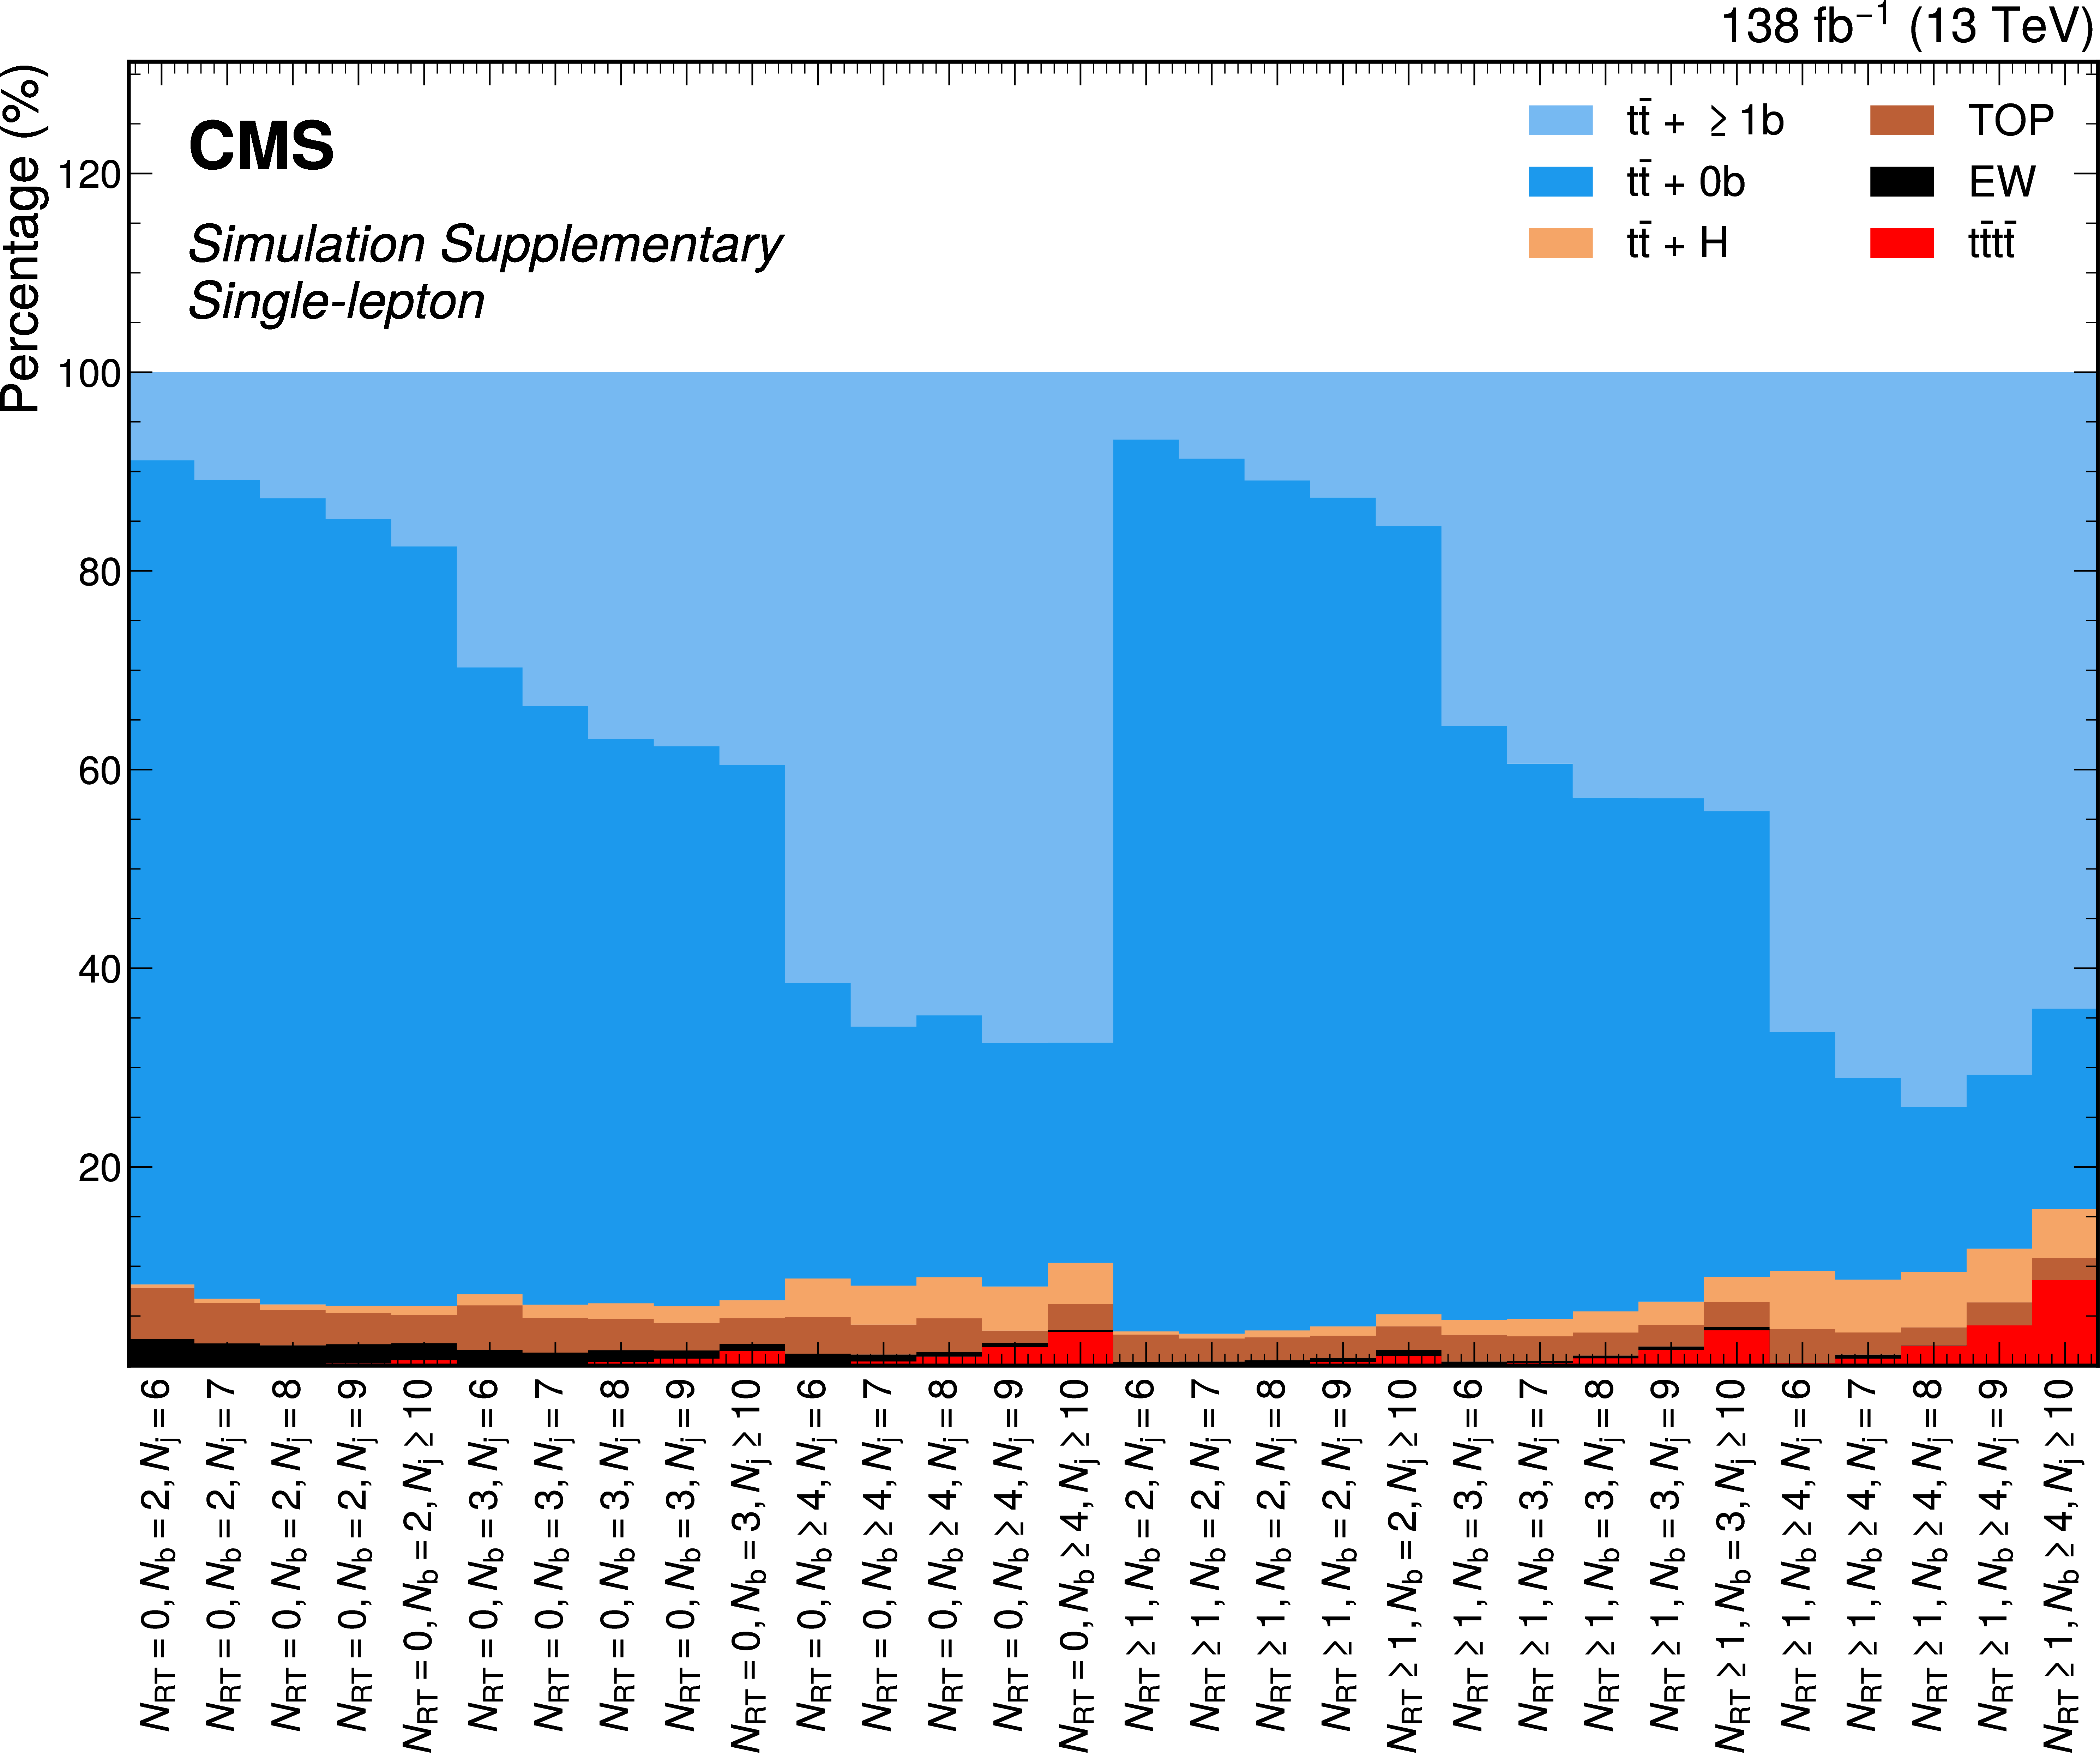
Additional Figure 9:
Fraction of background and $ \mathrm{t}\bar{\mathrm{t}}\mathrm{t}\bar{\mathrm{t}} $ signal processes for the 2016--2018 data set in each tagging category in the combined single-electron and single-muon channels before fit to data. The tagging categories are defined by the number of resolved t tags ($ N_\text{RT} $), b tags ($ N_\mathrm{b} $), and jets ($ N_\text{j} $). Here, $ {\mathrm{t}\bar{\mathrm{t}}} + {\geq} 1 \mathrm{b} $ refers to $ \mathrm{t} \bar{\mathrm{t}} $ events with at least one additional b jet, while $ {\mathrm{t}\bar{\mathrm{t}}} + 0 \mathrm{b} $ includes all other $ \mathrm{t} \bar{\mathrm{t}} $ events not produced in association with a boson. The TOP grouping contains single top quark production along with the other $ \mathrm{t} \bar{\mathrm{t}} $ processes not explicitly shown, and EW refers to events that contain W and Z bosons but no top quarks. |
png pdf |
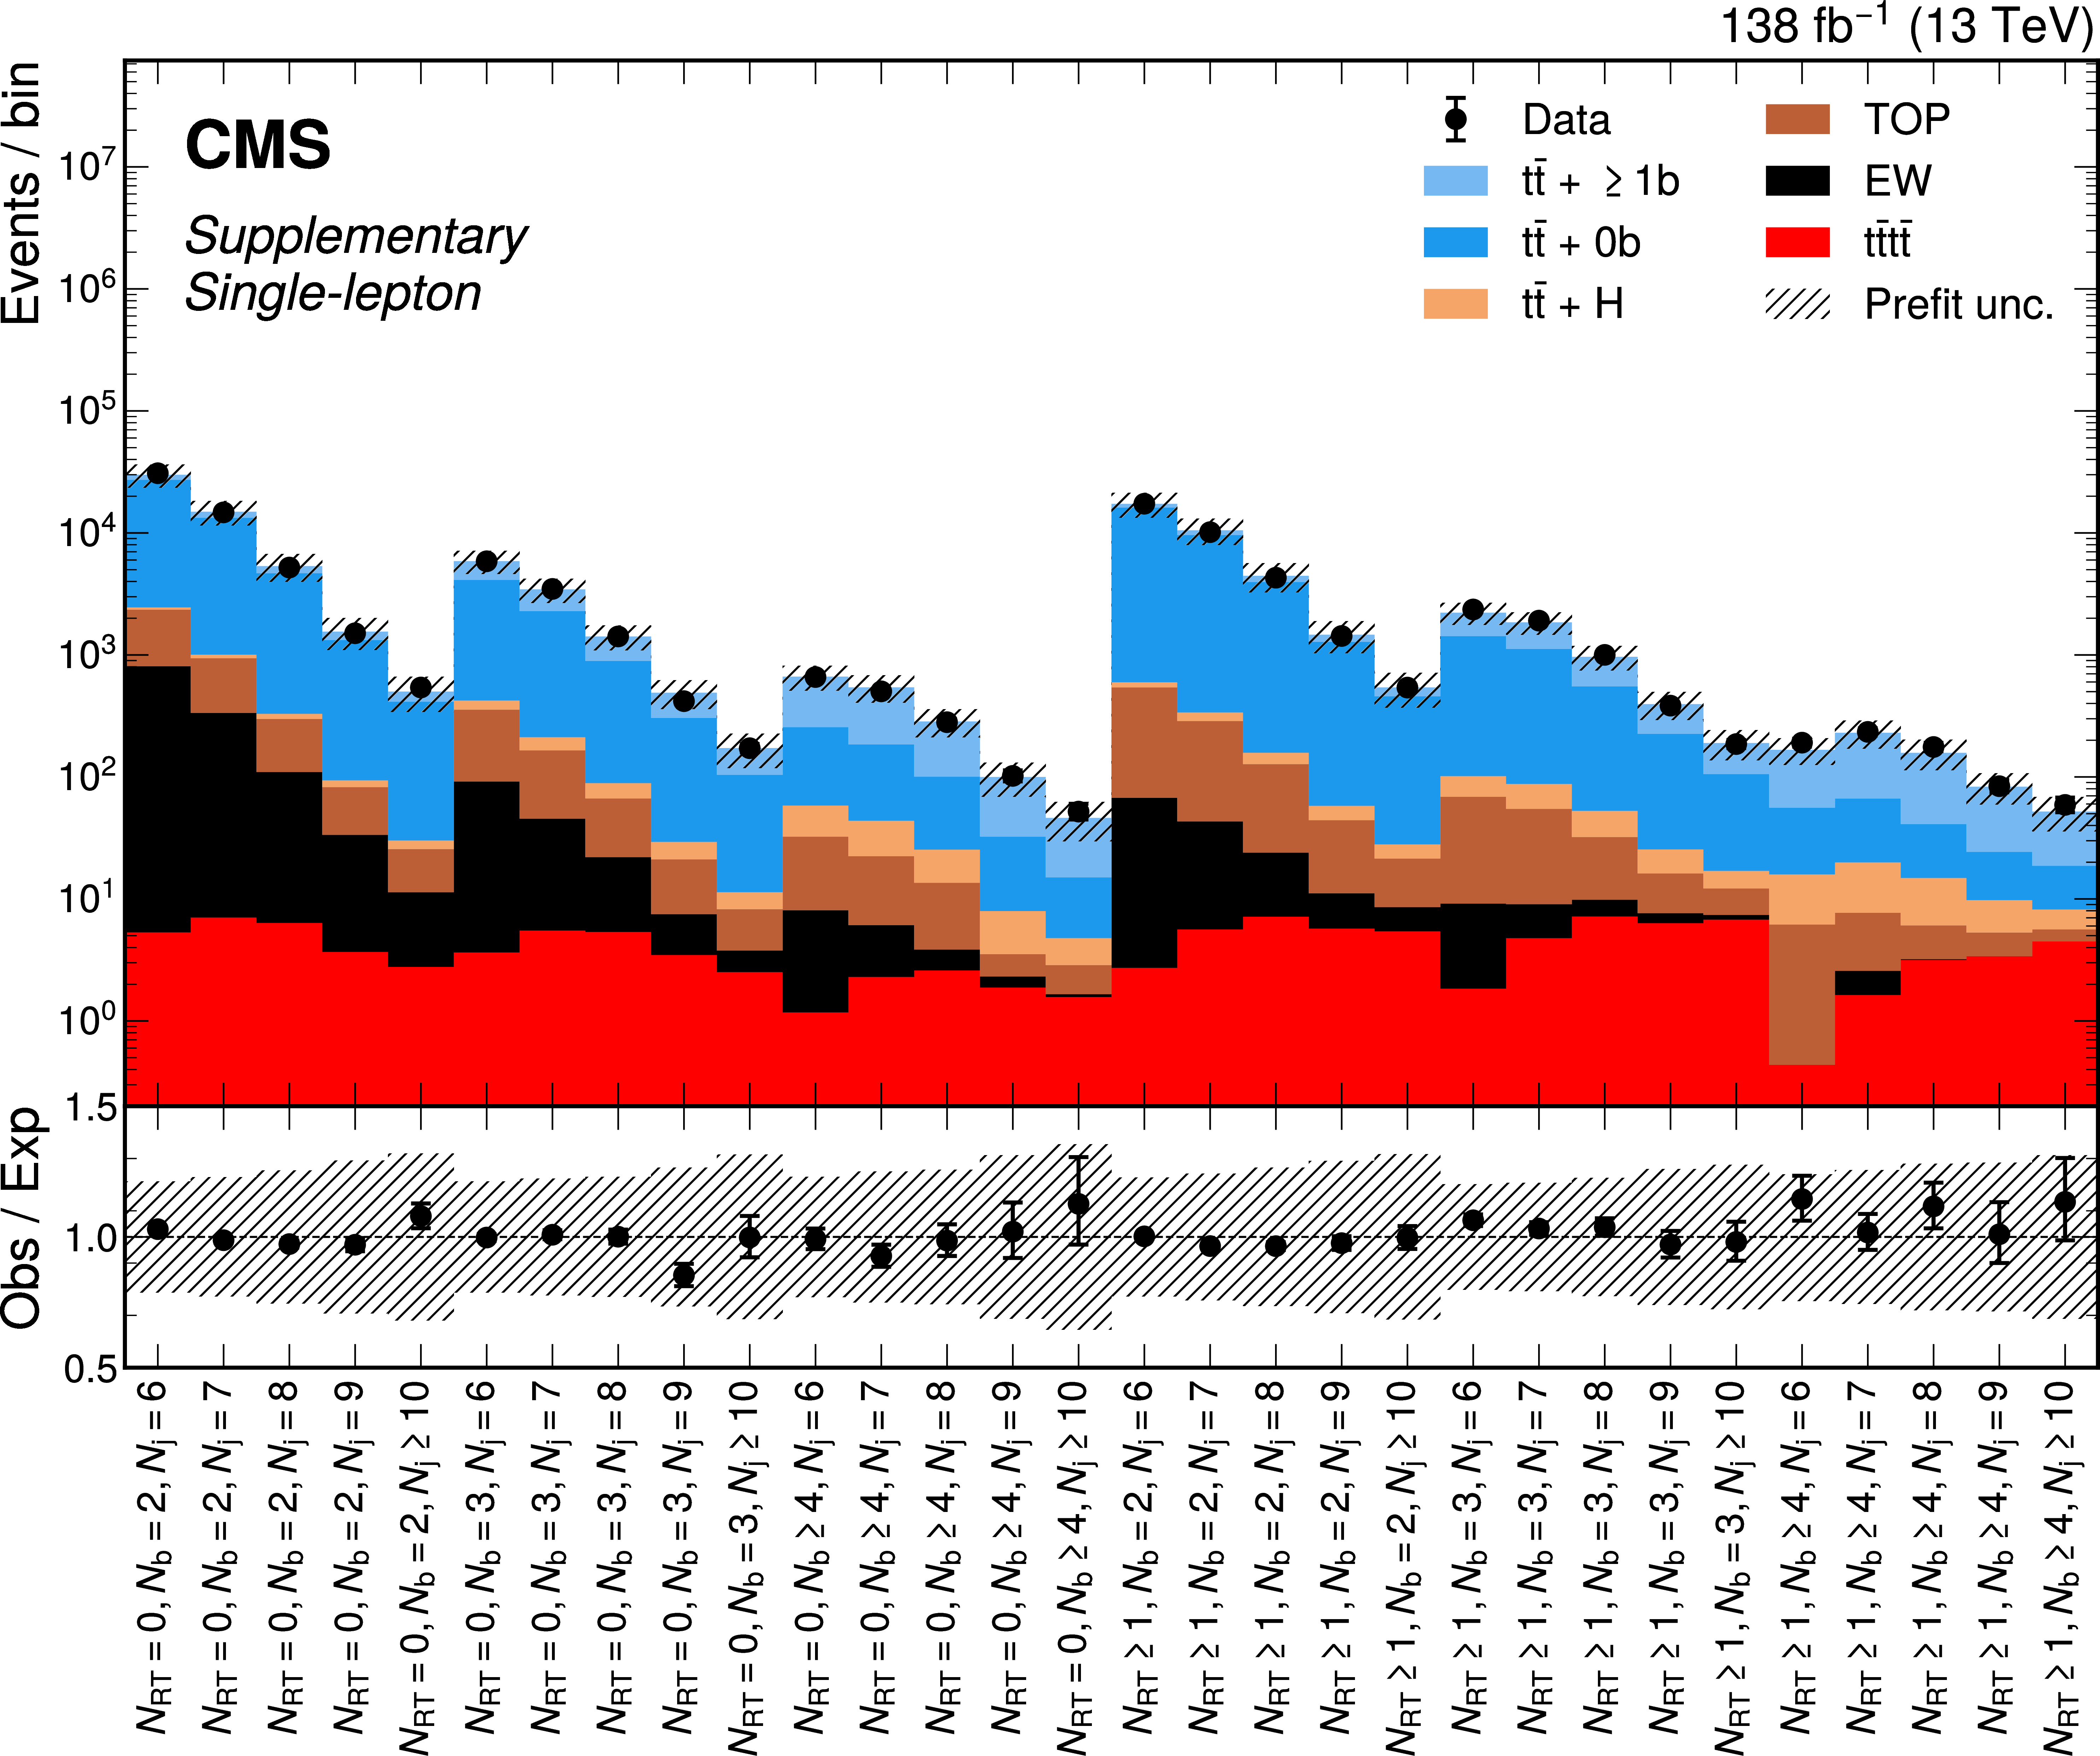
Additional Figure 10:
Number of events for the 2016--2018 data set in each tagging category in the combined single-electron and single-muon channels before fit to data. The tagging categories are defined by the number of resolved t tags ($ N_\text{RT} $), b tags ($ N_\mathrm{b} $), and jets ($ N_\text{j} $). Here, $ {\mathrm{t}\bar{\mathrm{t}}} + {\geq} 1 \mathrm{b} $ refers to $ \mathrm{t} \bar{\mathrm{t}} $ events with at least one additional b jet, while $ {\mathrm{t}\bar{\mathrm{t}}} + 0 \mathrm{b} $ includes all other $ \mathrm{t} \bar{\mathrm{t}} $ events not produced in association with a boson. The TOP grouping contains single top quark production along with the other $ \mathrm{t} \bar{\mathrm{t}} $ processes not explicitly shown, and EW refers to events that contain W and Z bosons but no top quarks. The backgrounds and $ \mathrm{t}\bar{\mathrm{t}}\mathrm{t}\bar{\mathrm{t}} $ signal are shown as a stacked histogram. The hatched bands correspond to the estimated total uncertainty before the fit. |

png pdf |
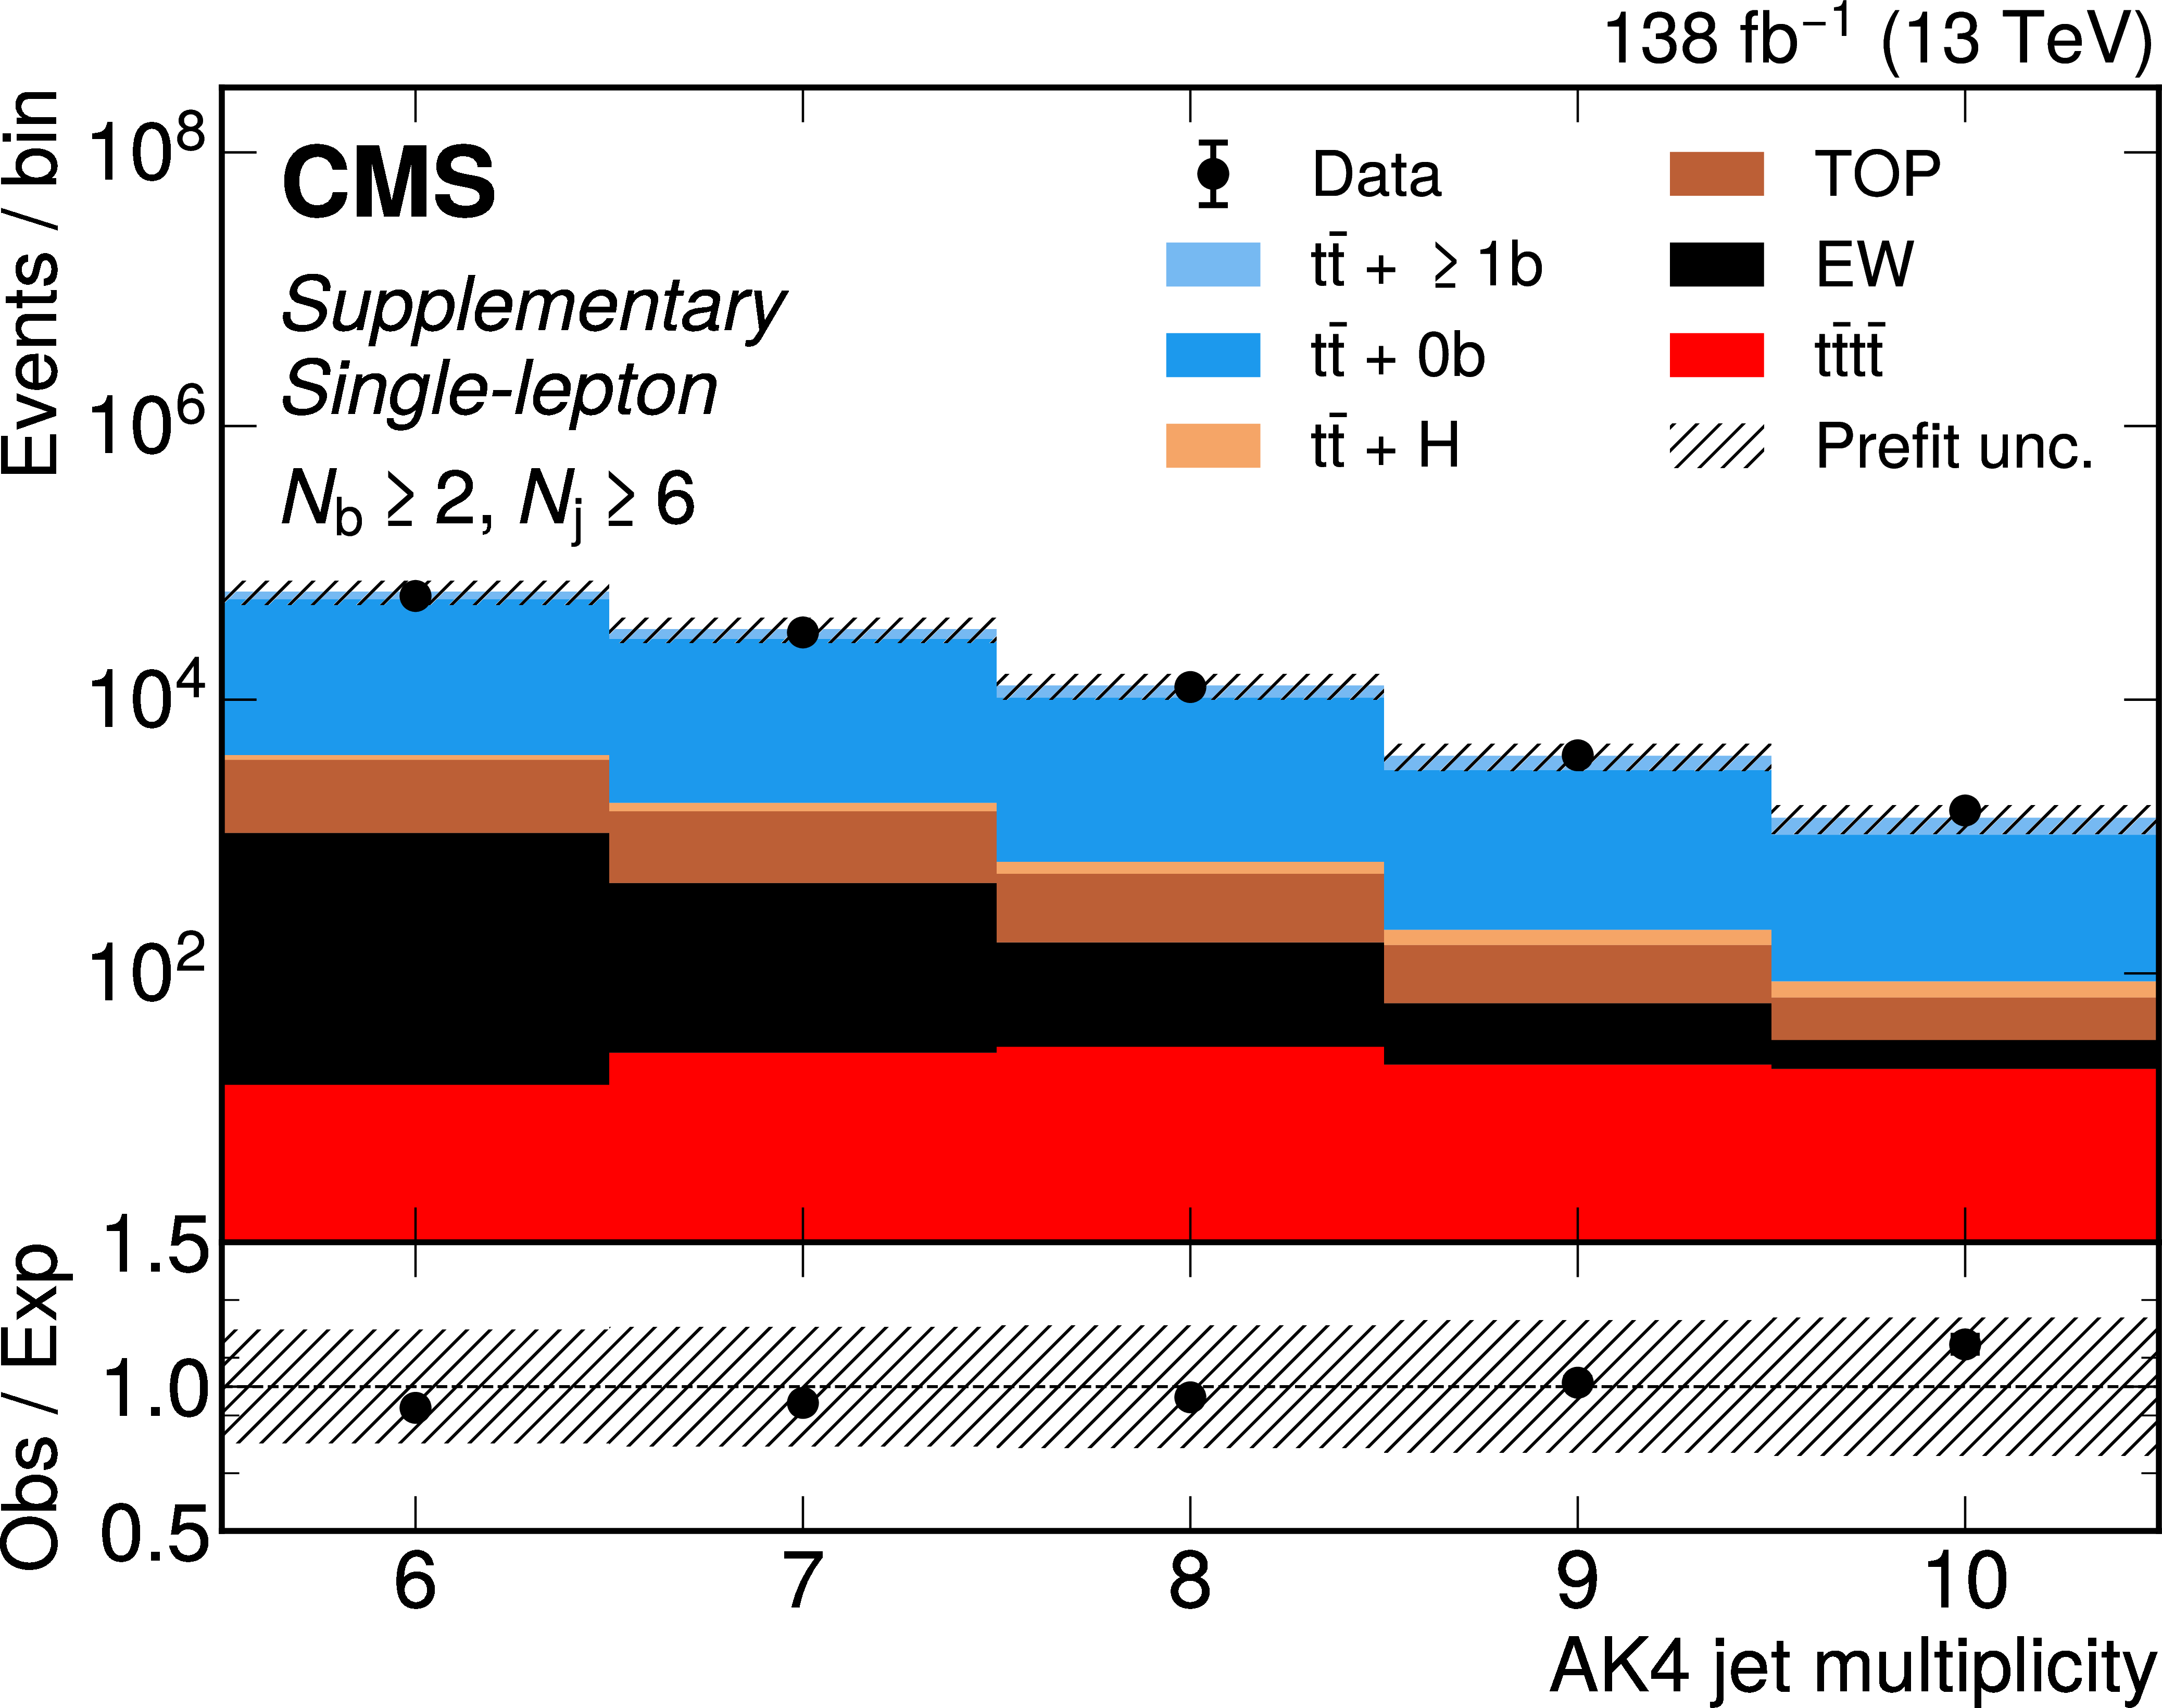
Additional Figure 11:
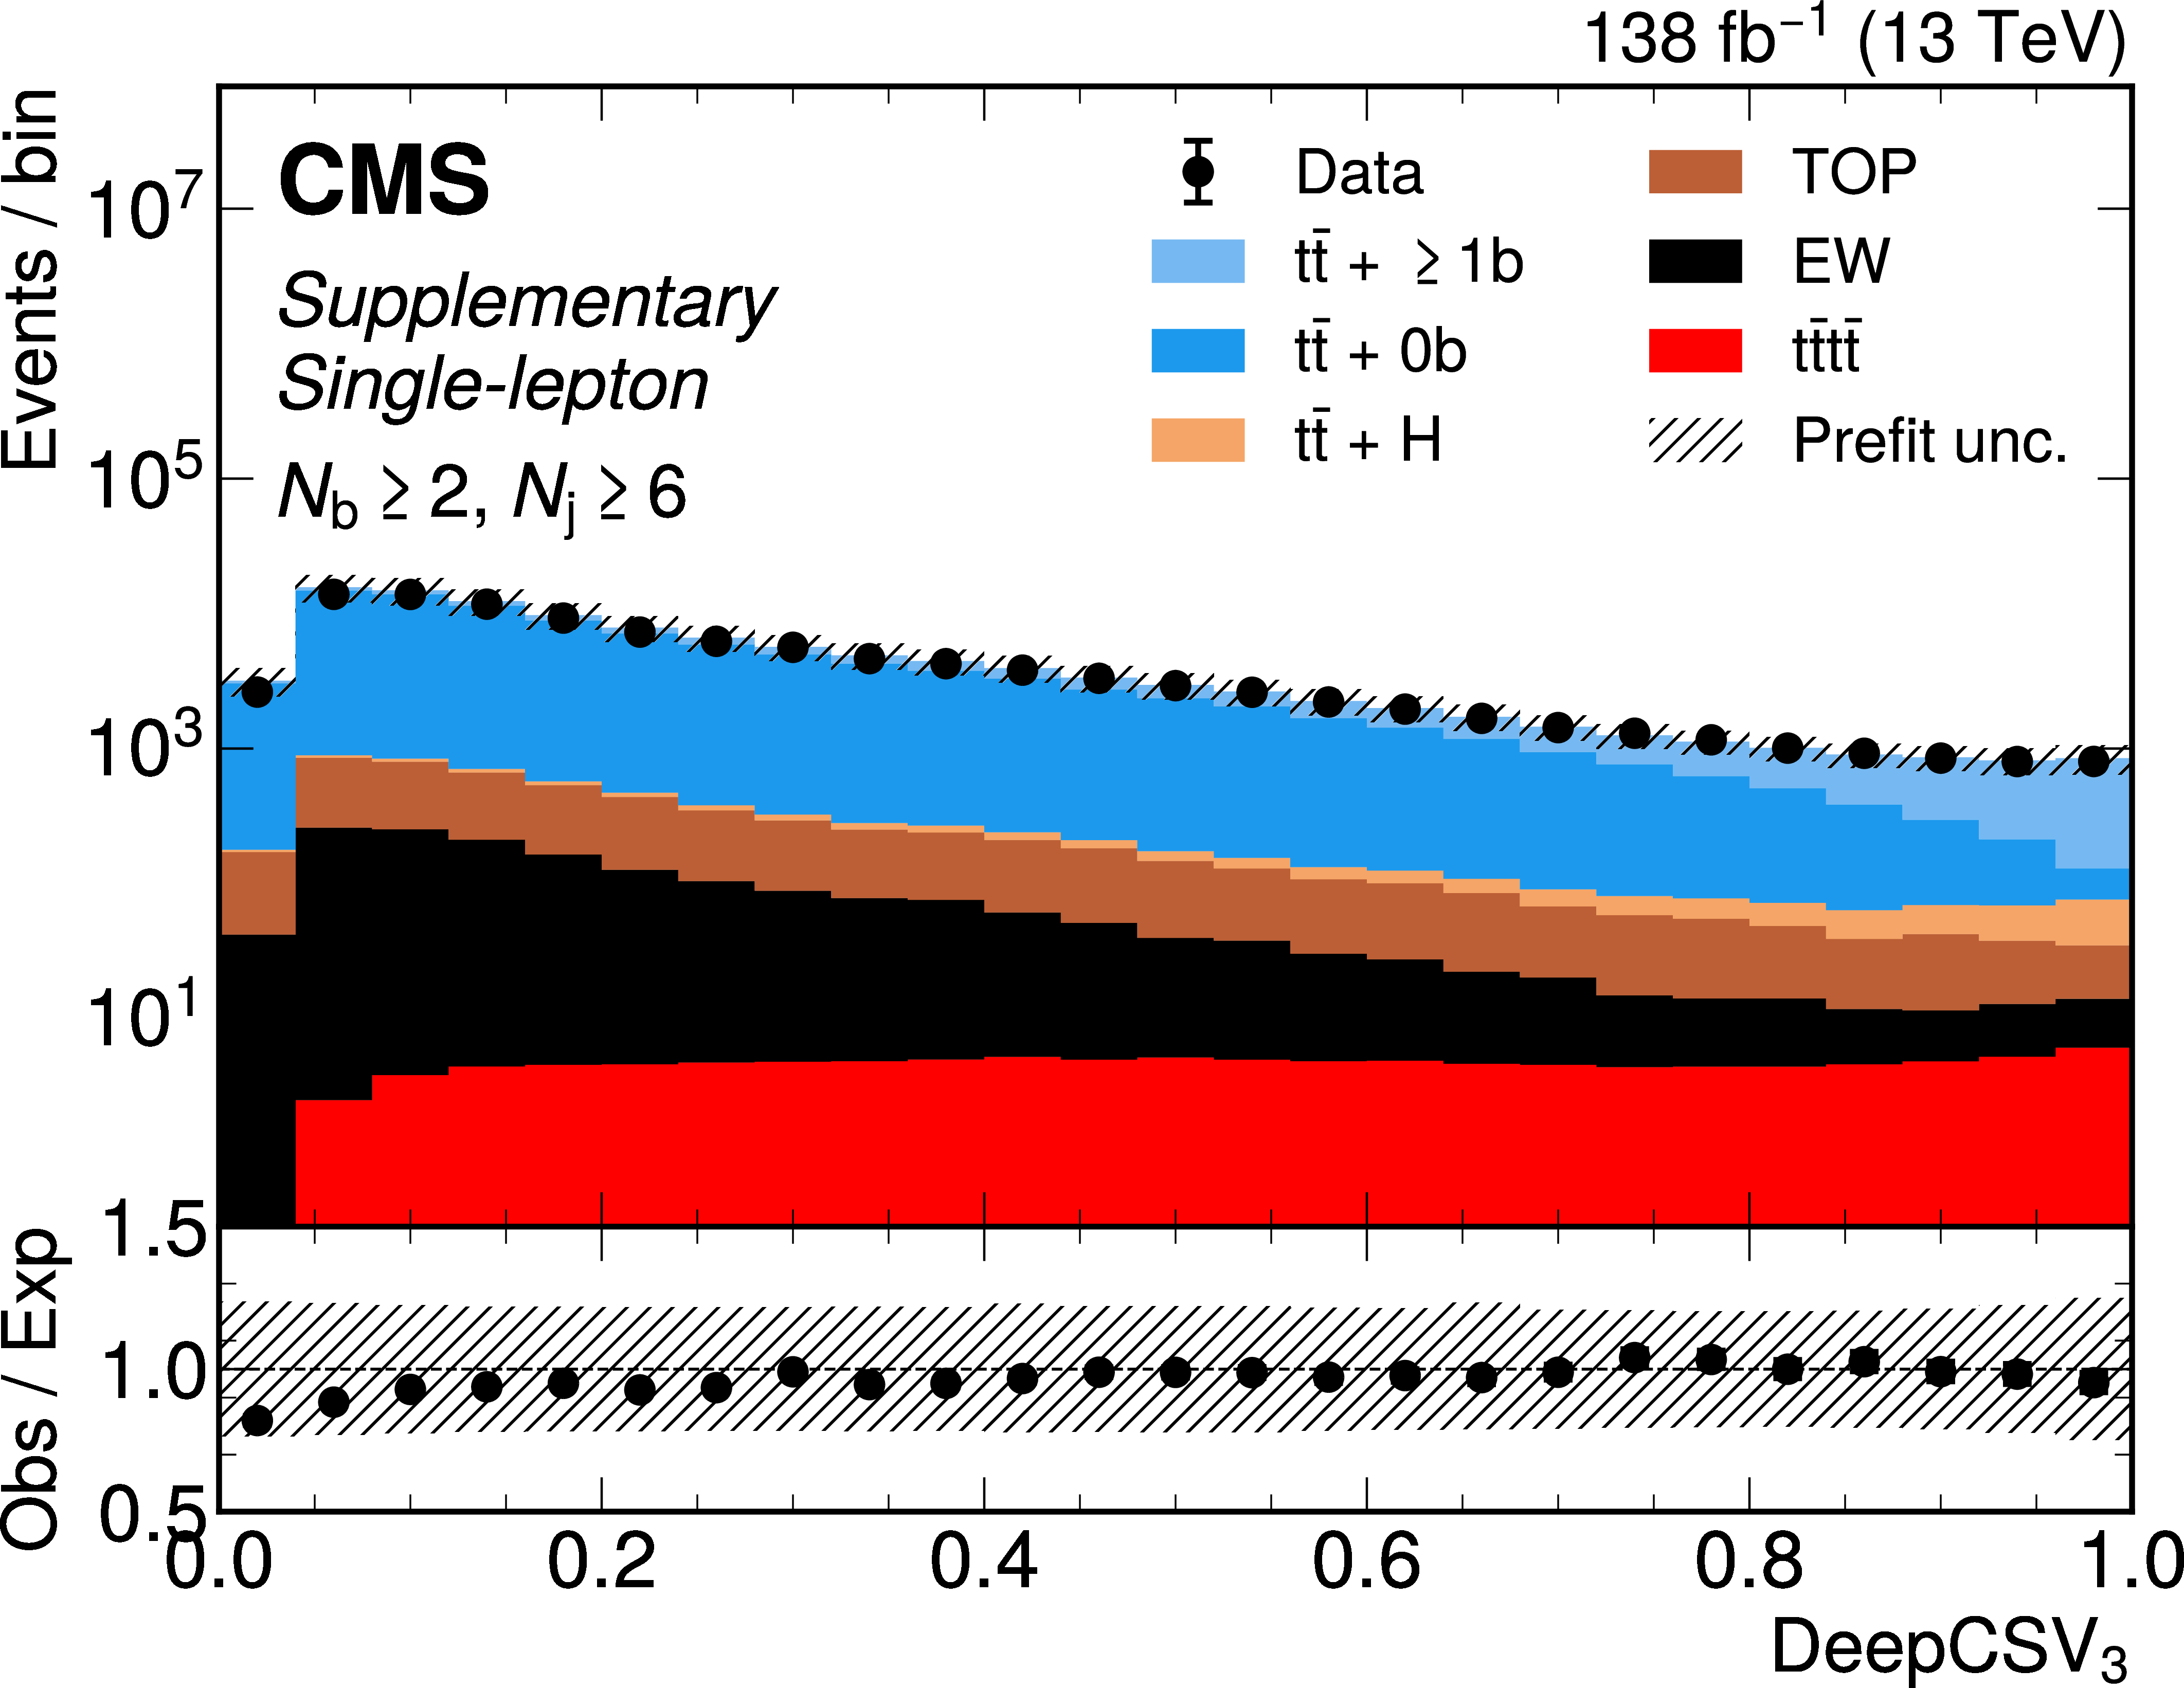
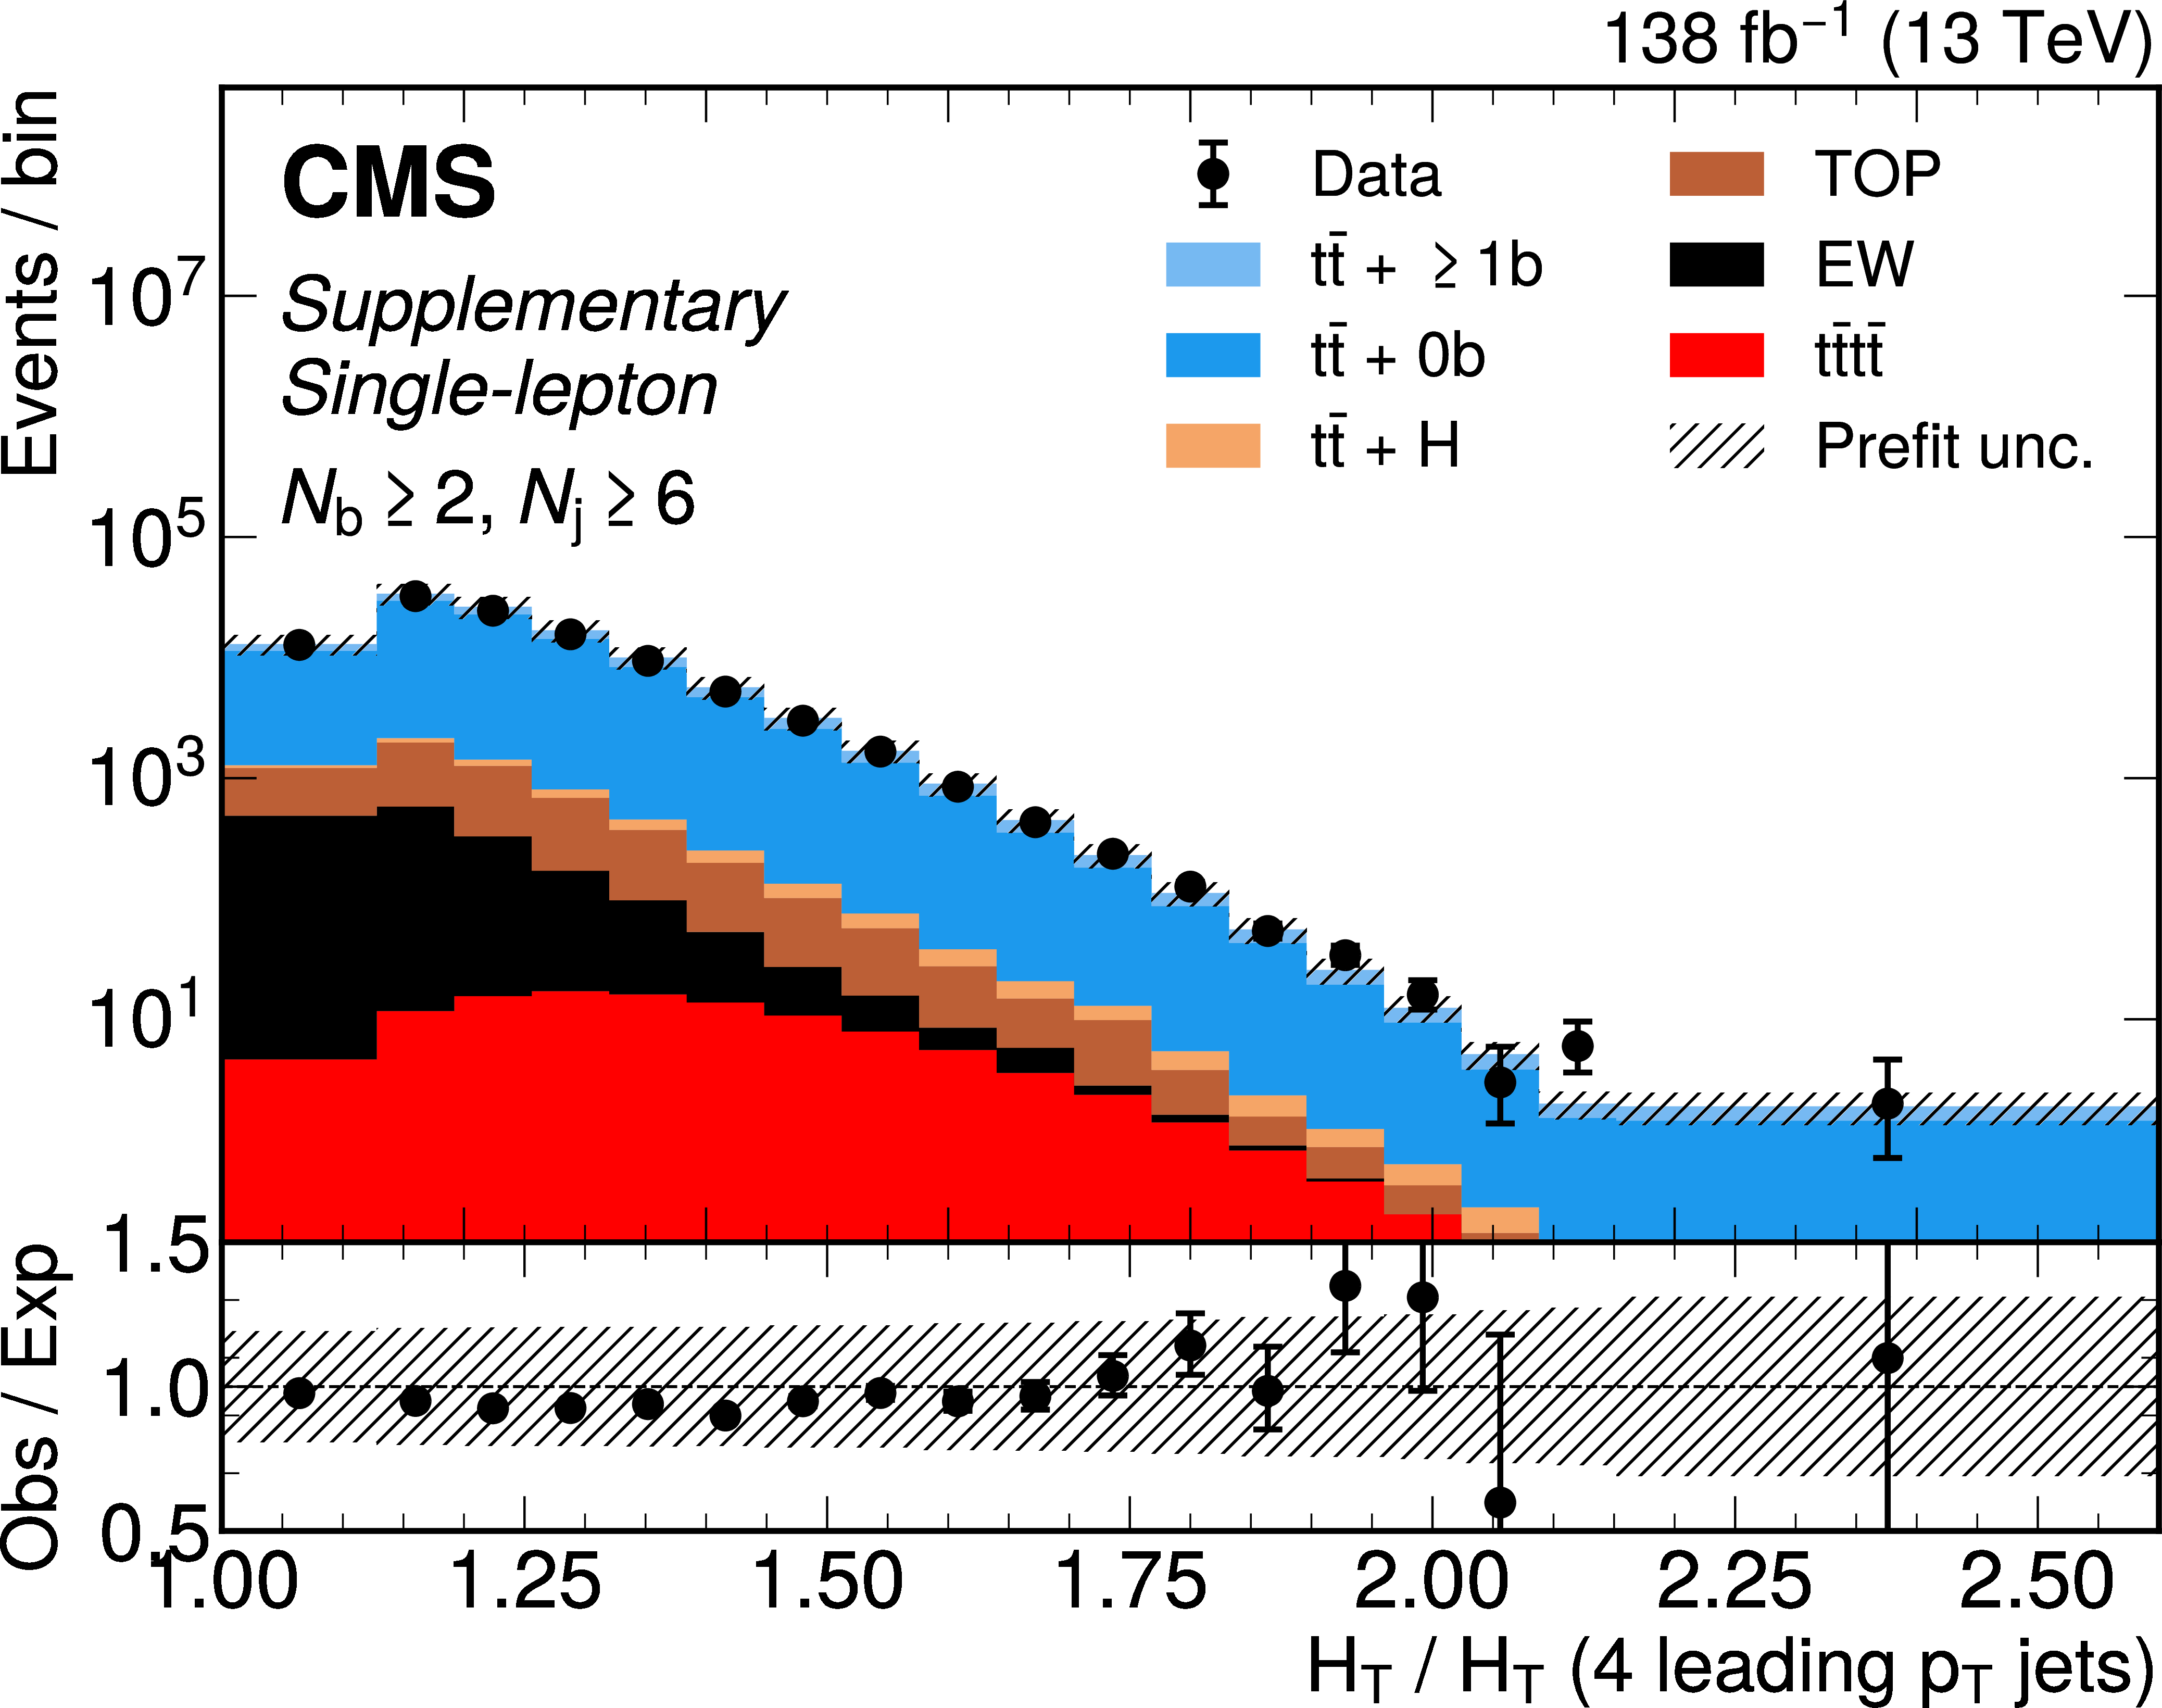
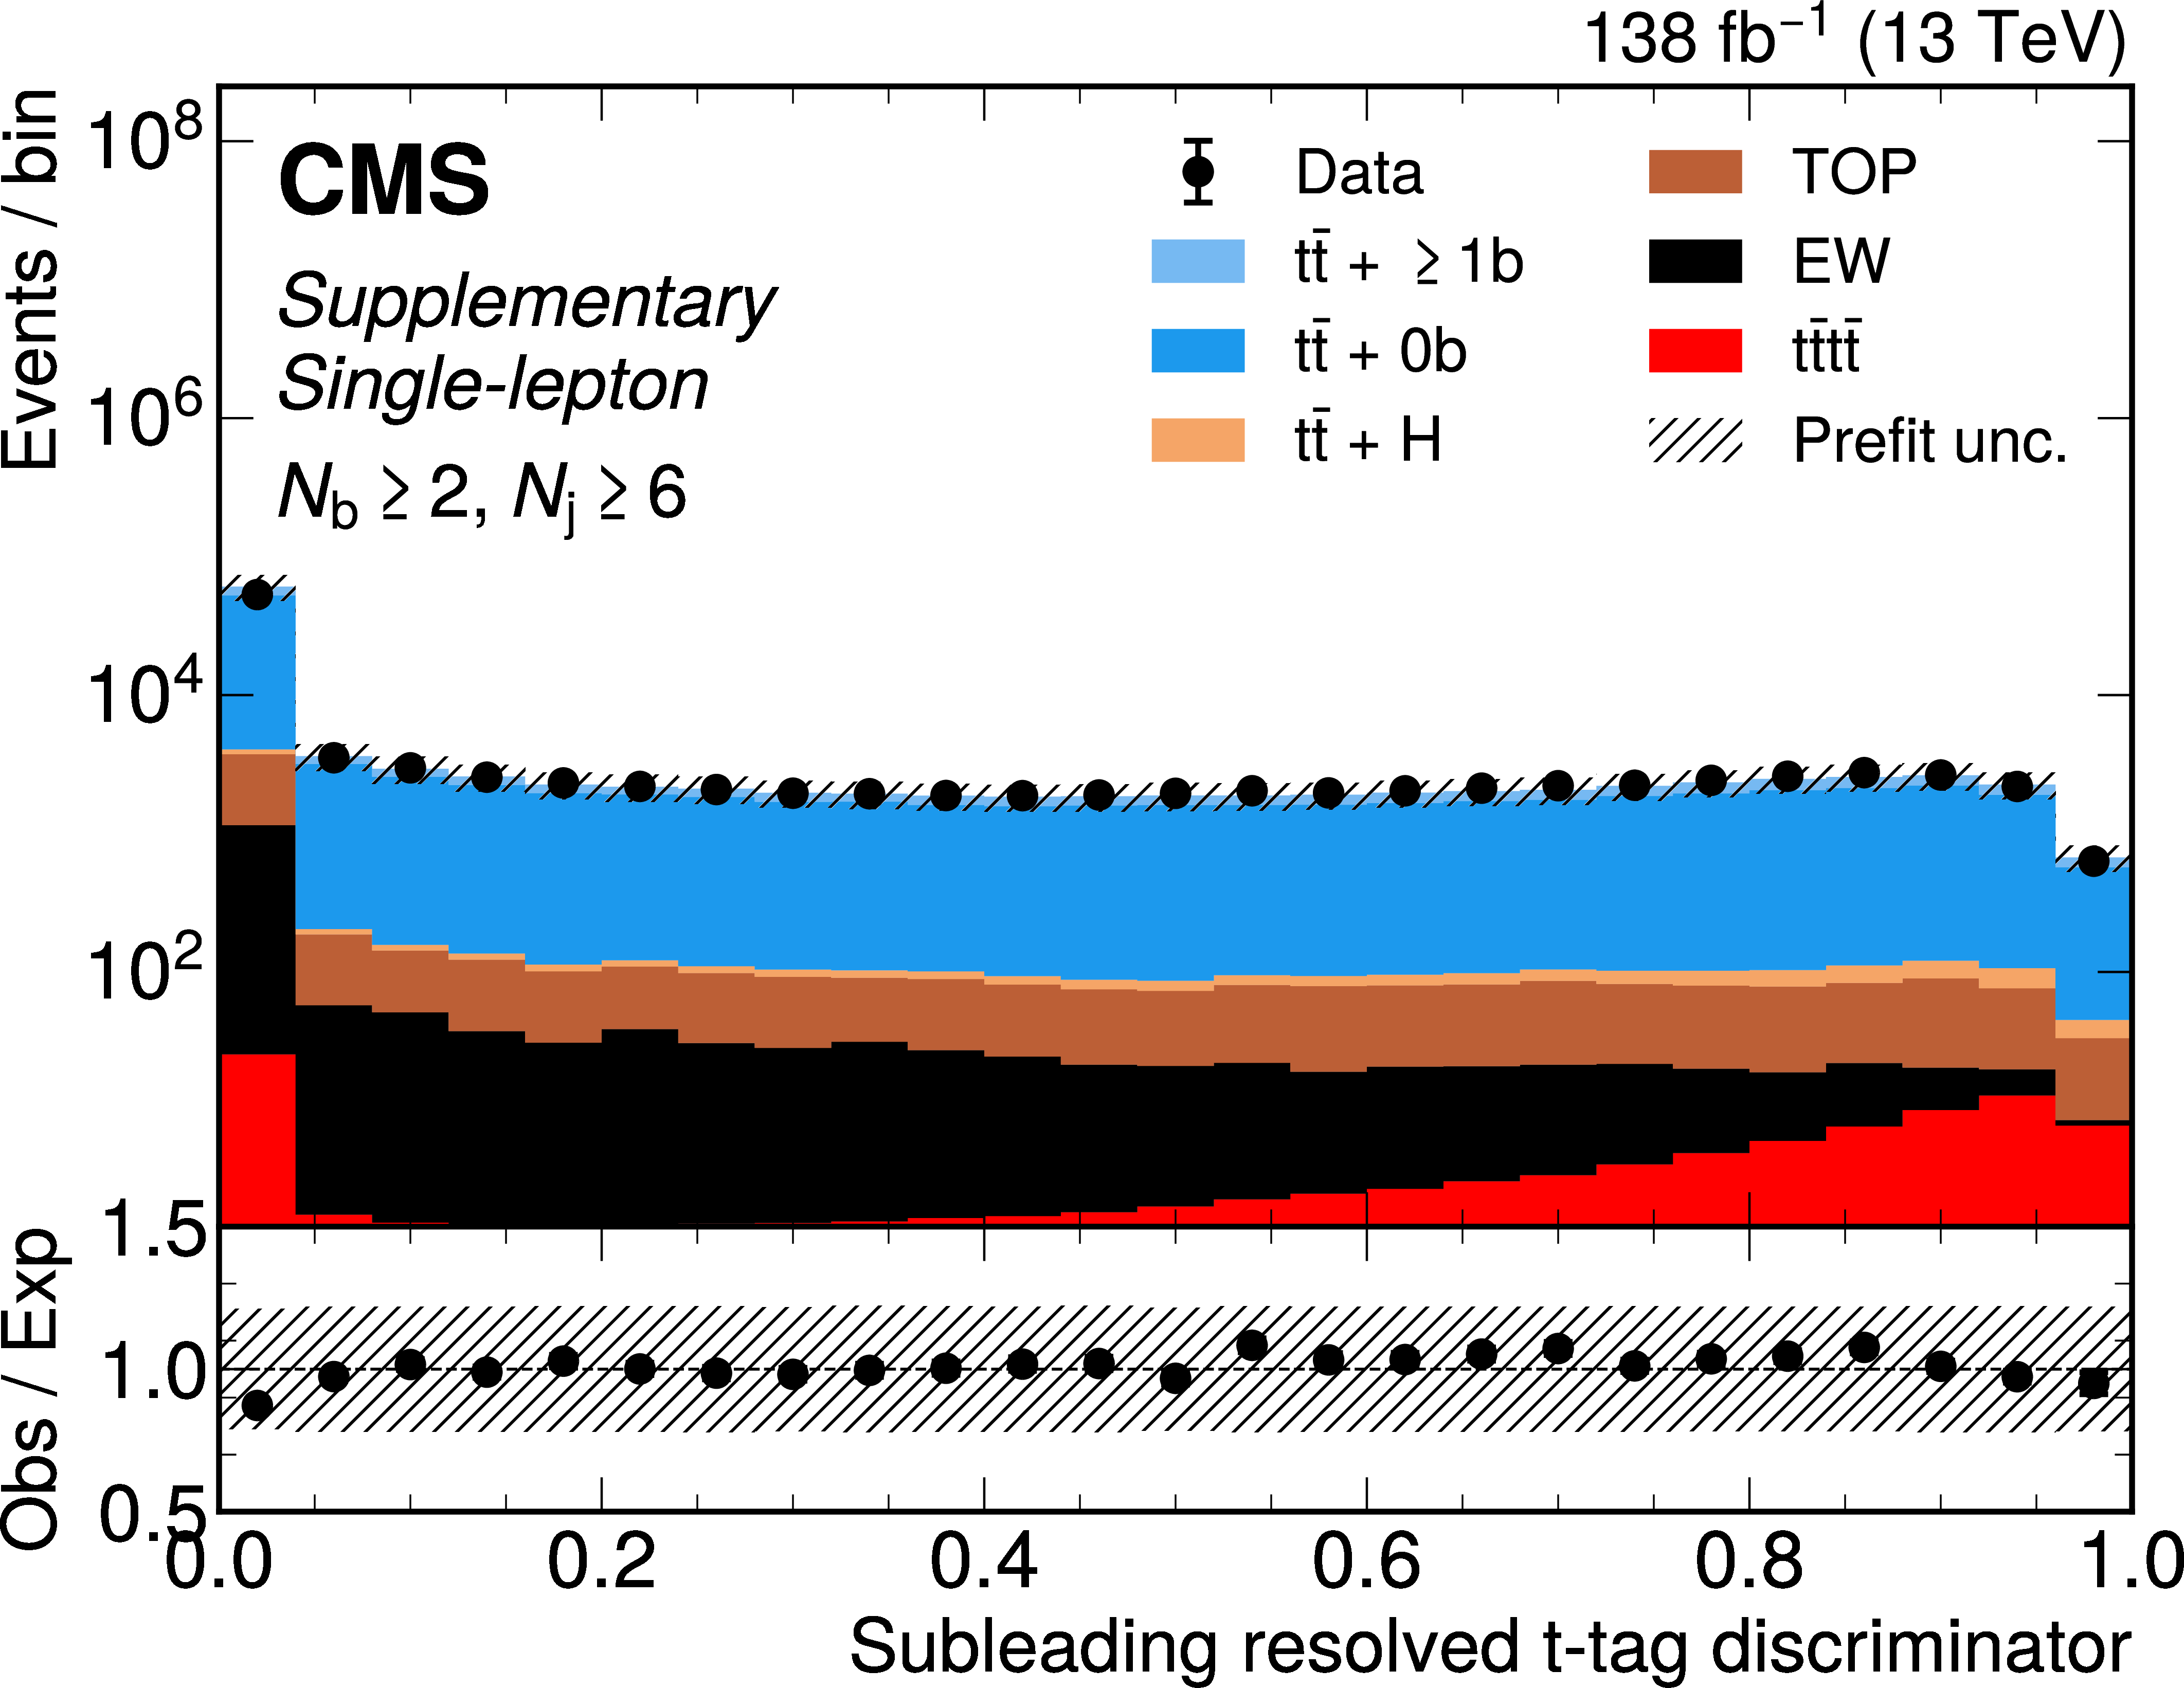
Distributions of (from upper left to lower right) AK4 jet multiplicity, DEEPCSV value of fourth and third leading jets, ratio of $ H_{\mathrm{T}} $ over $ H_{\mathrm{T}} $ of the four leading $ p_{\mathrm{T}} $ jets, subleading resolved t tagger discriminator value, and b-tag multiplicity for the 2016--2018 data set in the combined single-electron and single-muon channels before fit to data, requiring $ {\ge} $ 6 AK4 jets and $ {\ge} $ 2 b tags. Here, $ {\mathrm{t}\bar{\mathrm{t}}} + {\geq} 1 \mathrm{b} $ refers to $ \mathrm{t} \bar{\mathrm{t}} $ events with at least one additional b jet, while $ {\mathrm{t}\bar{\mathrm{t}}} + 0 \mathrm{b} $ includes all other $ \mathrm{t} \bar{\mathrm{t}} $ events not produced in association with a boson. The TOP grouping contains single top quark production along with the other $ \mathrm{t} \bar{\mathrm{t}} $ processes not explicitly shown, and EW refers to events that contain W and Z bosons but no top quarks. The backgrounds and $ \mathrm{t}\bar{\mathrm{t}}\mathrm{t}\bar{\mathrm{t}} $ signal are shown as a stacked histogram. The hatched bands correspond to the estimated total uncertainty before the fit. |
png pdf |
Additional Figure 11-a:
Distributions of (from upper left to lower right) AK4 jet multiplicity, DEEPCSV value of fourth and third leading jets, ratio of $ H_{\mathrm{T}} $ over $ H_{\mathrm{T}} $ of the four leading $ p_{\mathrm{T}} $ jets, subleading resolved t tagger discriminator value, and b-tag multiplicity for the 2016--2018 data set in the combined single-electron and single-muon channels before fit to data, requiring $ {\ge} $ 6 AK4 jets and $ {\ge} $ 2 b tags. Here, $ {\mathrm{t}\bar{\mathrm{t}}} + {\geq} 1 \mathrm{b} $ refers to $ \mathrm{t} \bar{\mathrm{t}} $ events with at least one additional b jet, while $ {\mathrm{t}\bar{\mathrm{t}}} + 0 \mathrm{b} $ includes all other $ \mathrm{t} \bar{\mathrm{t}} $ events not produced in association with a boson. The TOP grouping contains single top quark production along with the other $ \mathrm{t} \bar{\mathrm{t}} $ processes not explicitly shown, and EW refers to events that contain W and Z bosons but no top quarks. The backgrounds and $ \mathrm{t}\bar{\mathrm{t}}\mathrm{t}\bar{\mathrm{t}} $ signal are shown as a stacked histogram. The hatched bands correspond to the estimated total uncertainty before the fit. |

png pdf |
Additional Figure 11-b:
Distributions of (from upper left to lower right) AK4 jet multiplicity, DEEPCSV value of fourth and third leading jets, ratio of $ H_{\mathrm{T}} $ over $ H_{\mathrm{T}} $ of the four leading $ p_{\mathrm{T}} $ jets, subleading resolved t tagger discriminator value, and b-tag multiplicity for the 2016--2018 data set in the combined single-electron and single-muon channels before fit to data, requiring $ {\ge} $ 6 AK4 jets and $ {\ge} $ 2 b tags. Here, $ {\mathrm{t}\bar{\mathrm{t}}} + {\geq} 1 \mathrm{b} $ refers to $ \mathrm{t} \bar{\mathrm{t}} $ events with at least one additional b jet, while $ {\mathrm{t}\bar{\mathrm{t}}} + 0 \mathrm{b} $ includes all other $ \mathrm{t} \bar{\mathrm{t}} $ events not produced in association with a boson. The TOP grouping contains single top quark production along with the other $ \mathrm{t} \bar{\mathrm{t}} $ processes not explicitly shown, and EW refers to events that contain W and Z bosons but no top quarks. The backgrounds and $ \mathrm{t}\bar{\mathrm{t}}\mathrm{t}\bar{\mathrm{t}} $ signal are shown as a stacked histogram. The hatched bands correspond to the estimated total uncertainty before the fit. |
png pdf |
Additional Figure 11-c:
Distributions of (from upper left to lower right) AK4 jet multiplicity, DEEPCSV value of fourth and third leading jets, ratio of $ H_{\mathrm{T}} $ over $ H_{\mathrm{T}} $ of the four leading $ p_{\mathrm{T}} $ jets, subleading resolved t tagger discriminator value, and b-tag multiplicity for the 2016--2018 data set in the combined single-electron and single-muon channels before fit to data, requiring $ {\ge} $ 6 AK4 jets and $ {\ge} $ 2 b tags. Here, $ {\mathrm{t}\bar{\mathrm{t}}} + {\geq} 1 \mathrm{b} $ refers to $ \mathrm{t} \bar{\mathrm{t}} $ events with at least one additional b jet, while $ {\mathrm{t}\bar{\mathrm{t}}} + 0 \mathrm{b} $ includes all other $ \mathrm{t} \bar{\mathrm{t}} $ events not produced in association with a boson. The TOP grouping contains single top quark production along with the other $ \mathrm{t} \bar{\mathrm{t}} $ processes not explicitly shown, and EW refers to events that contain W and Z bosons but no top quarks. The backgrounds and $ \mathrm{t}\bar{\mathrm{t}}\mathrm{t}\bar{\mathrm{t}} $ signal are shown as a stacked histogram. The hatched bands correspond to the estimated total uncertainty before the fit. |
png pdf |
Additional Figure 11-d:
Distributions of (from upper left to lower right) AK4 jet multiplicity, DEEPCSV value of fourth and third leading jets, ratio of $ H_{\mathrm{T}} $ over $ H_{\mathrm{T}} $ of the four leading $ p_{\mathrm{T}} $ jets, subleading resolved t tagger discriminator value, and b-tag multiplicity for the 2016--2018 data set in the combined single-electron and single-muon channels before fit to data, requiring $ {\ge} $ 6 AK4 jets and $ {\ge} $ 2 b tags. Here, $ {\mathrm{t}\bar{\mathrm{t}}} + {\geq} 1 \mathrm{b} $ refers to $ \mathrm{t} \bar{\mathrm{t}} $ events with at least one additional b jet, while $ {\mathrm{t}\bar{\mathrm{t}}} + 0 \mathrm{b} $ includes all other $ \mathrm{t} \bar{\mathrm{t}} $ events not produced in association with a boson. The TOP grouping contains single top quark production along with the other $ \mathrm{t} \bar{\mathrm{t}} $ processes not explicitly shown, and EW refers to events that contain W and Z bosons but no top quarks. The backgrounds and $ \mathrm{t}\bar{\mathrm{t}}\mathrm{t}\bar{\mathrm{t}} $ signal are shown as a stacked histogram. The hatched bands correspond to the estimated total uncertainty before the fit. |
png pdf |
Additional Figure 11-e:
Distributions of (from upper left to lower right) AK4 jet multiplicity, DEEPCSV value of fourth and third leading jets, ratio of $ H_{\mathrm{T}} $ over $ H_{\mathrm{T}} $ of the four leading $ p_{\mathrm{T}} $ jets, subleading resolved t tagger discriminator value, and b-tag multiplicity for the 2016--2018 data set in the combined single-electron and single-muon channels before fit to data, requiring $ {\ge} $ 6 AK4 jets and $ {\ge} $ 2 b tags. Here, $ {\mathrm{t}\bar{\mathrm{t}}} + {\geq} 1 \mathrm{b} $ refers to $ \mathrm{t} \bar{\mathrm{t}} $ events with at least one additional b jet, while $ {\mathrm{t}\bar{\mathrm{t}}} + 0 \mathrm{b} $ includes all other $ \mathrm{t} \bar{\mathrm{t}} $ events not produced in association with a boson. The TOP grouping contains single top quark production along with the other $ \mathrm{t} \bar{\mathrm{t}} $ processes not explicitly shown, and EW refers to events that contain W and Z bosons but no top quarks. The backgrounds and $ \mathrm{t}\bar{\mathrm{t}}\mathrm{t}\bar{\mathrm{t}} $ signal are shown as a stacked histogram. The hatched bands correspond to the estimated total uncertainty before the fit. |

png pdf |
Additional Figure 11-f:
Distributions of (from upper left to lower right) AK4 jet multiplicity, DEEPCSV value of fourth and third leading jets, ratio of $ H_{\mathrm{T}} $ over $ H_{\mathrm{T}} $ of the four leading $ p_{\mathrm{T}} $ jets, subleading resolved t tagger discriminator value, and b-tag multiplicity for the 2016--2018 data set in the combined single-electron and single-muon channels before fit to data, requiring $ {\ge} $ 6 AK4 jets and $ {\ge} $ 2 b tags. Here, $ {\mathrm{t}\bar{\mathrm{t}}} + {\geq} 1 \mathrm{b} $ refers to $ \mathrm{t} \bar{\mathrm{t}} $ events with at least one additional b jet, while $ {\mathrm{t}\bar{\mathrm{t}}} + 0 \mathrm{b} $ includes all other $ \mathrm{t} \bar{\mathrm{t}} $ events not produced in association with a boson. The TOP grouping contains single top quark production along with the other $ \mathrm{t} \bar{\mathrm{t}} $ processes not explicitly shown, and EW refers to events that contain W and Z bosons but no top quarks. The backgrounds and $ \mathrm{t}\bar{\mathrm{t}}\mathrm{t}\bar{\mathrm{t}} $ signal are shown as a stacked histogram. The hatched bands correspond to the estimated total uncertainty before the fit. |
png pdf |
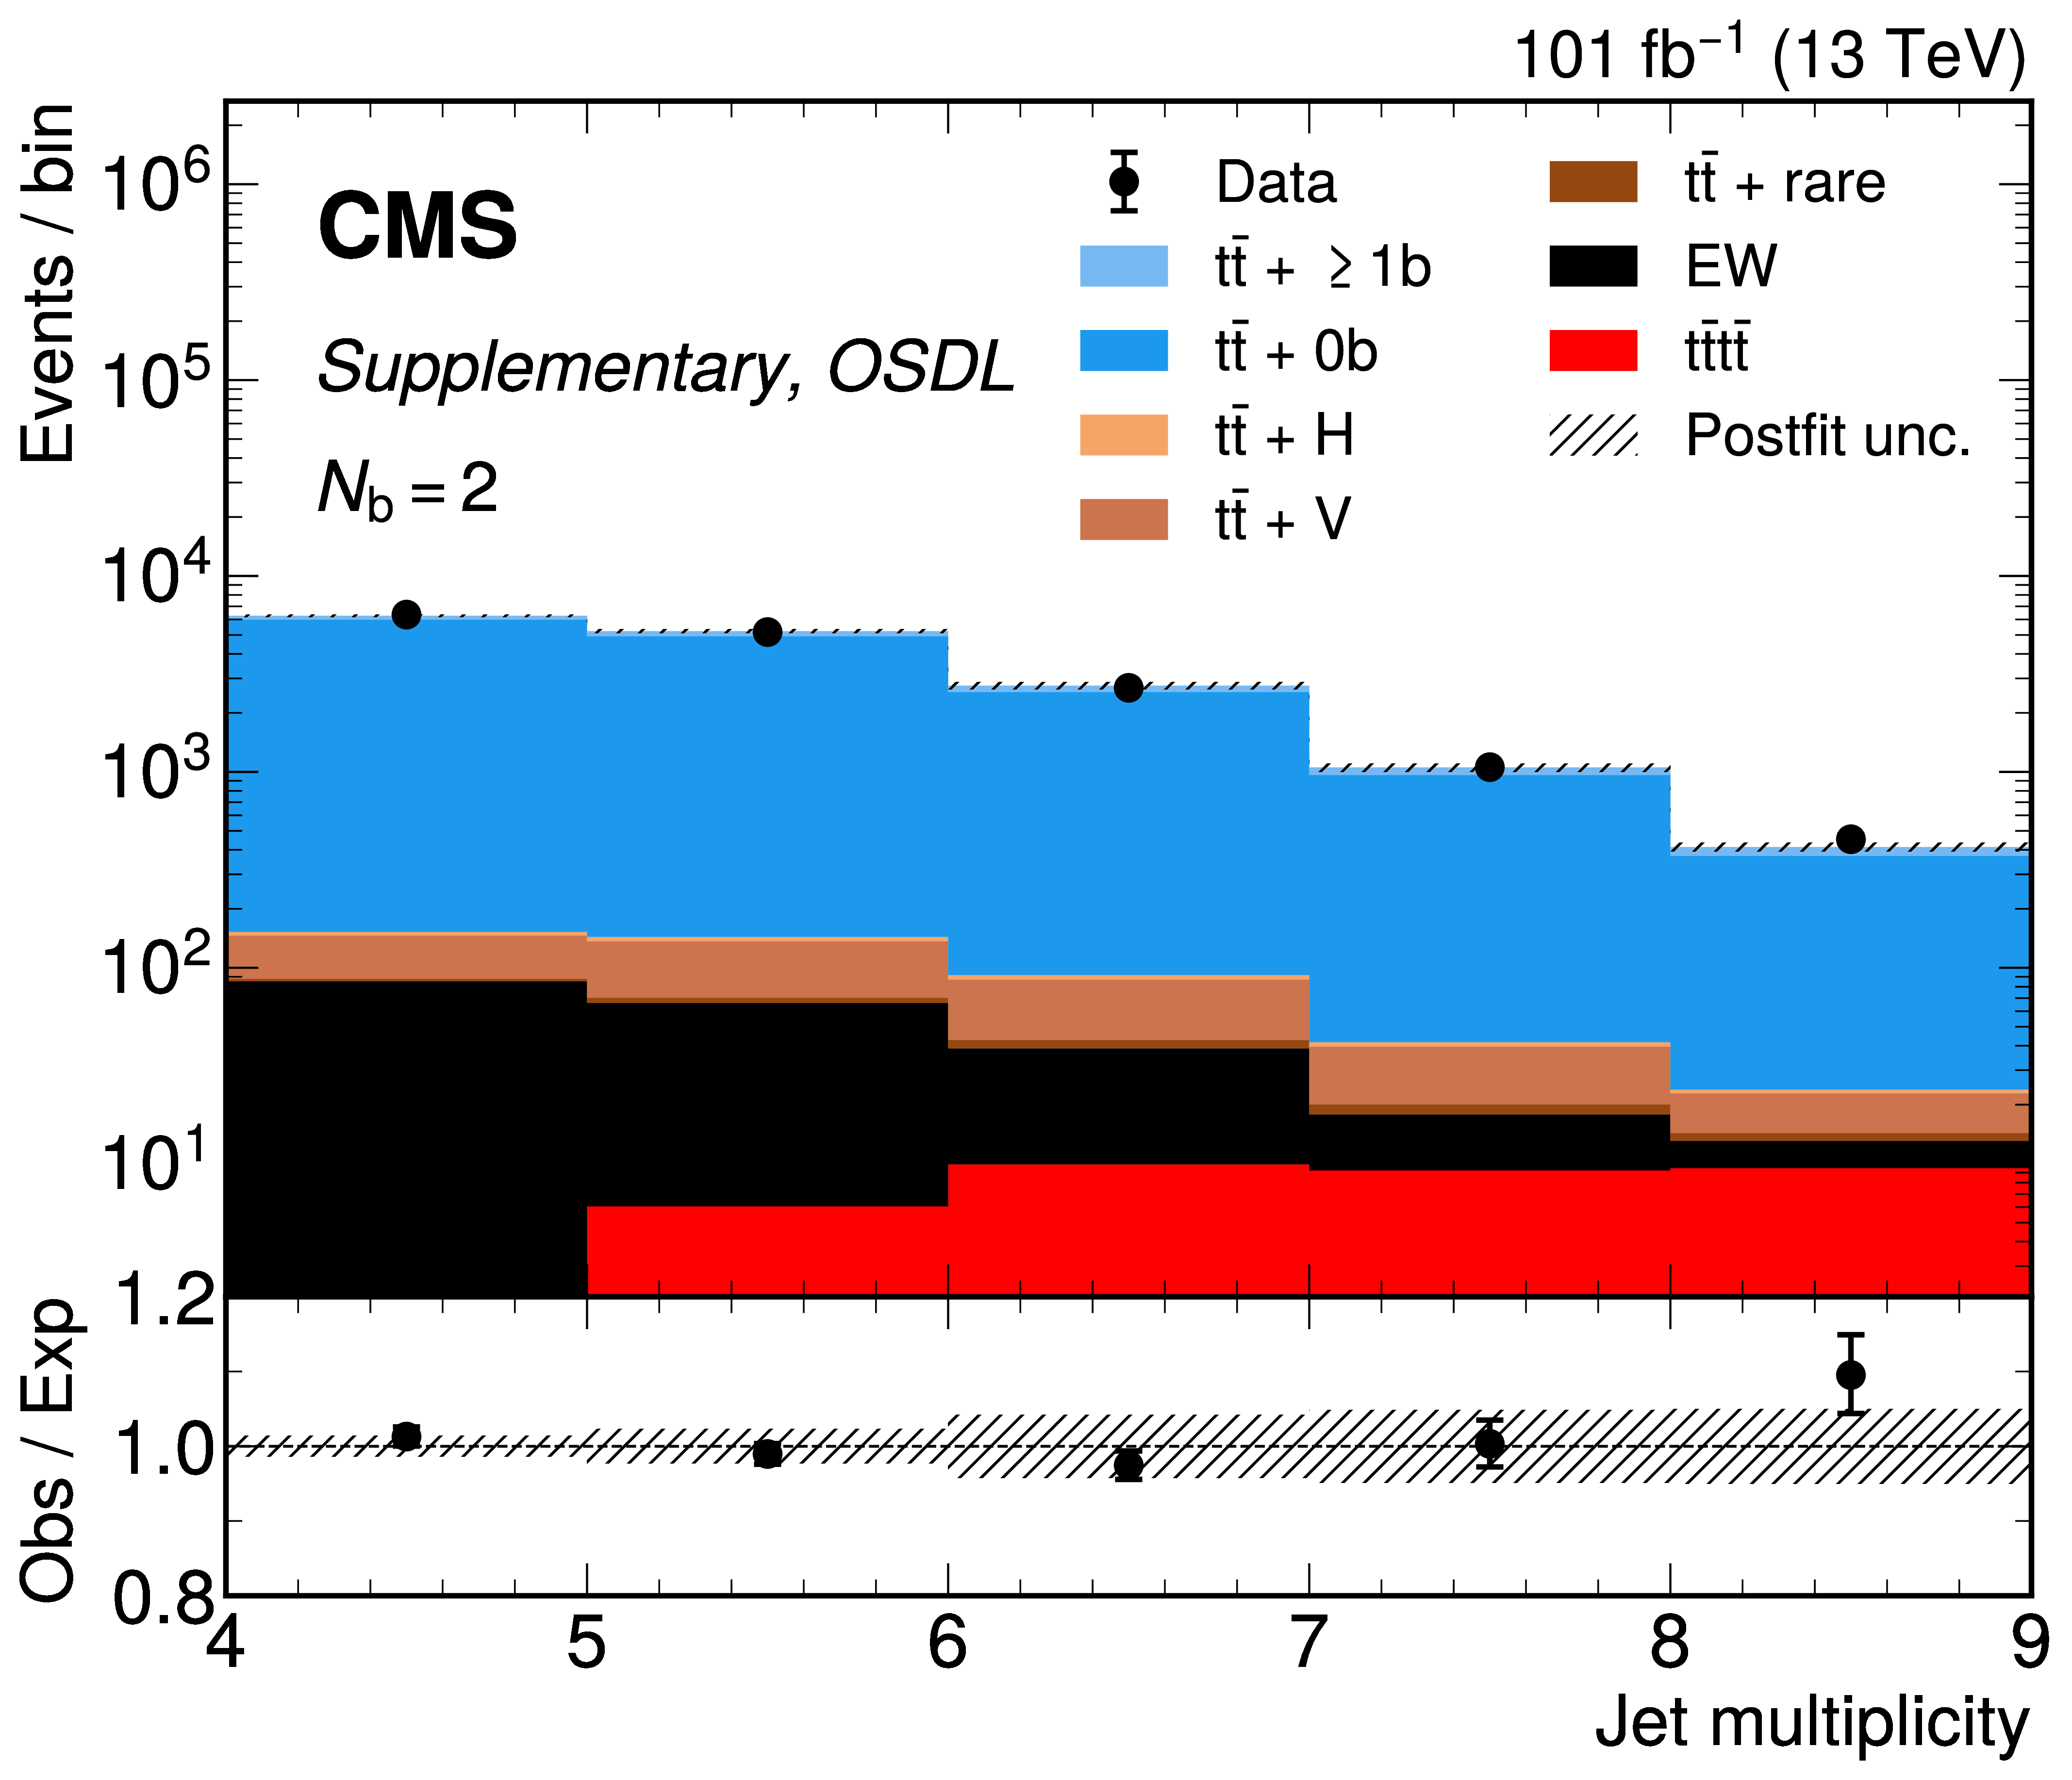
Additional Figure 12:
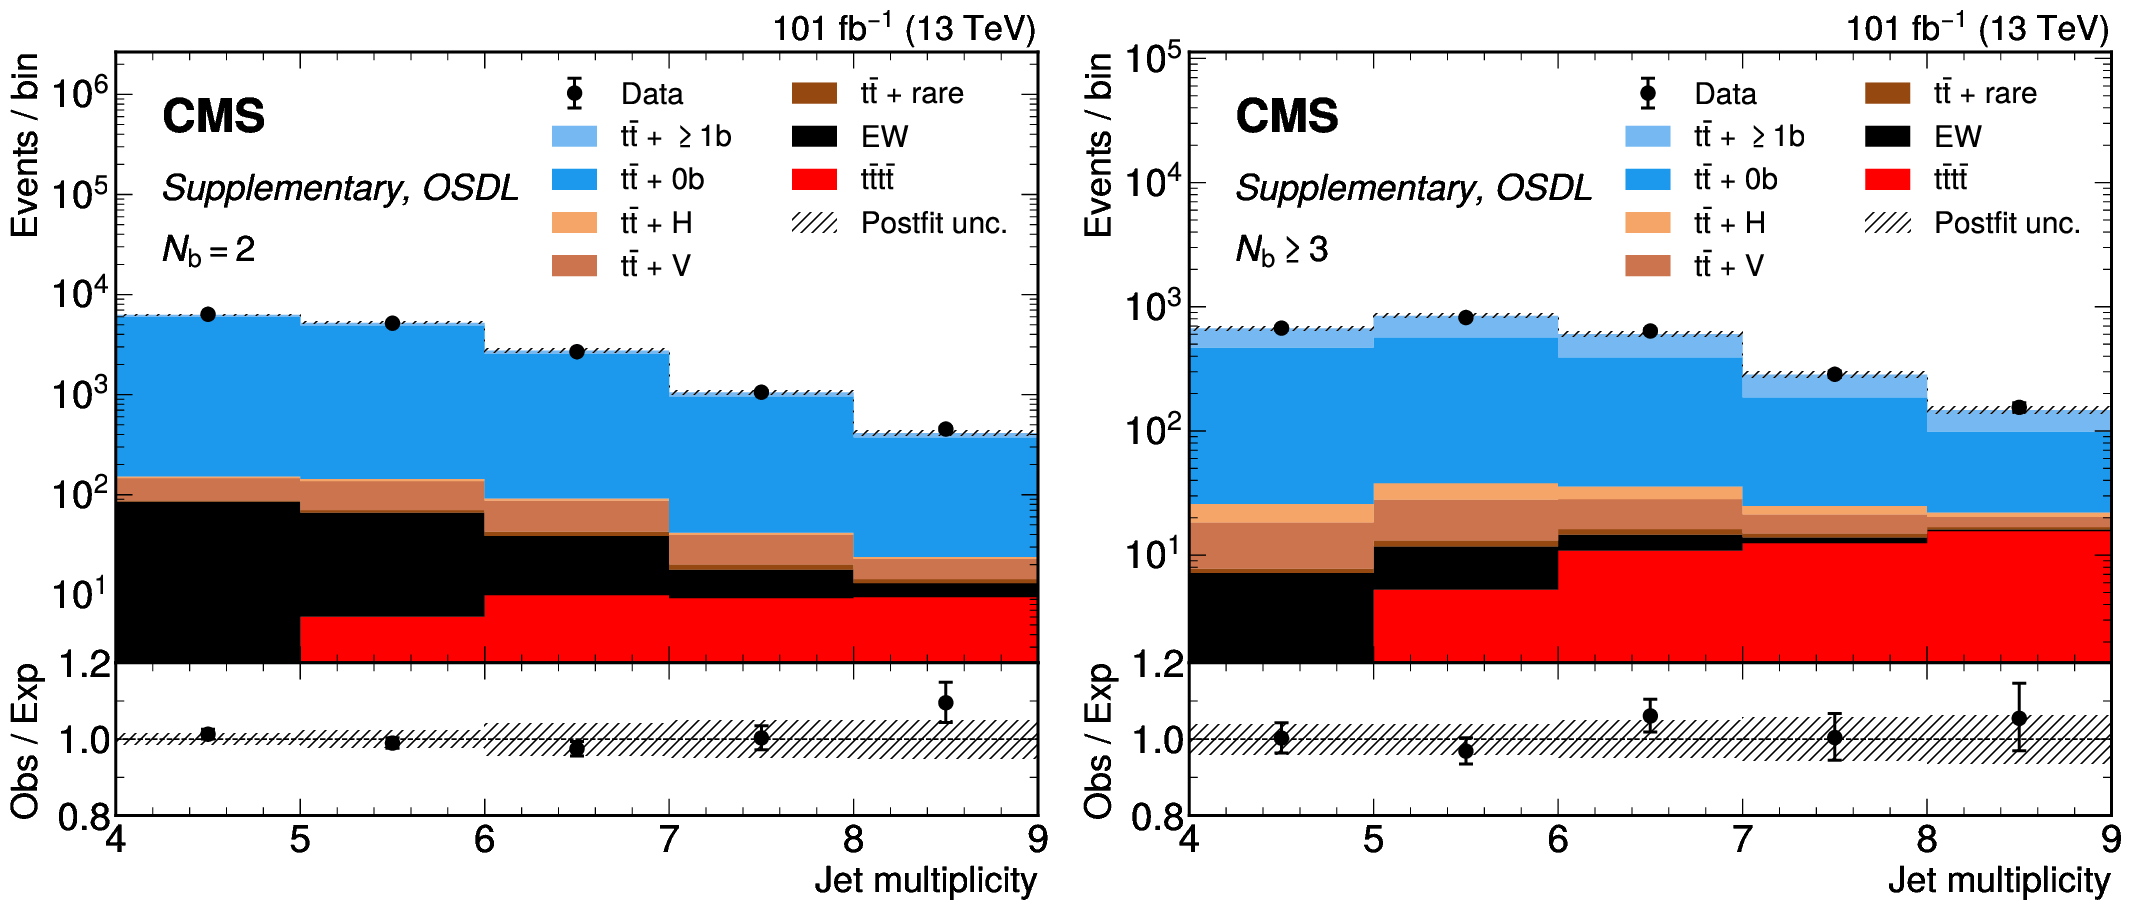
Postfit jet multiplicity distributions in the OSDL channel for the 2 b-tagged jets categories (left) and 3 b-tagged jets categories (right). |
png pdf |
Additional Figure 12-a:
Postfit jet multiplicity distributions in the OSDL channel for the 2 b-tagged jets categories (left) and 3 b-tagged jets categories (right). |
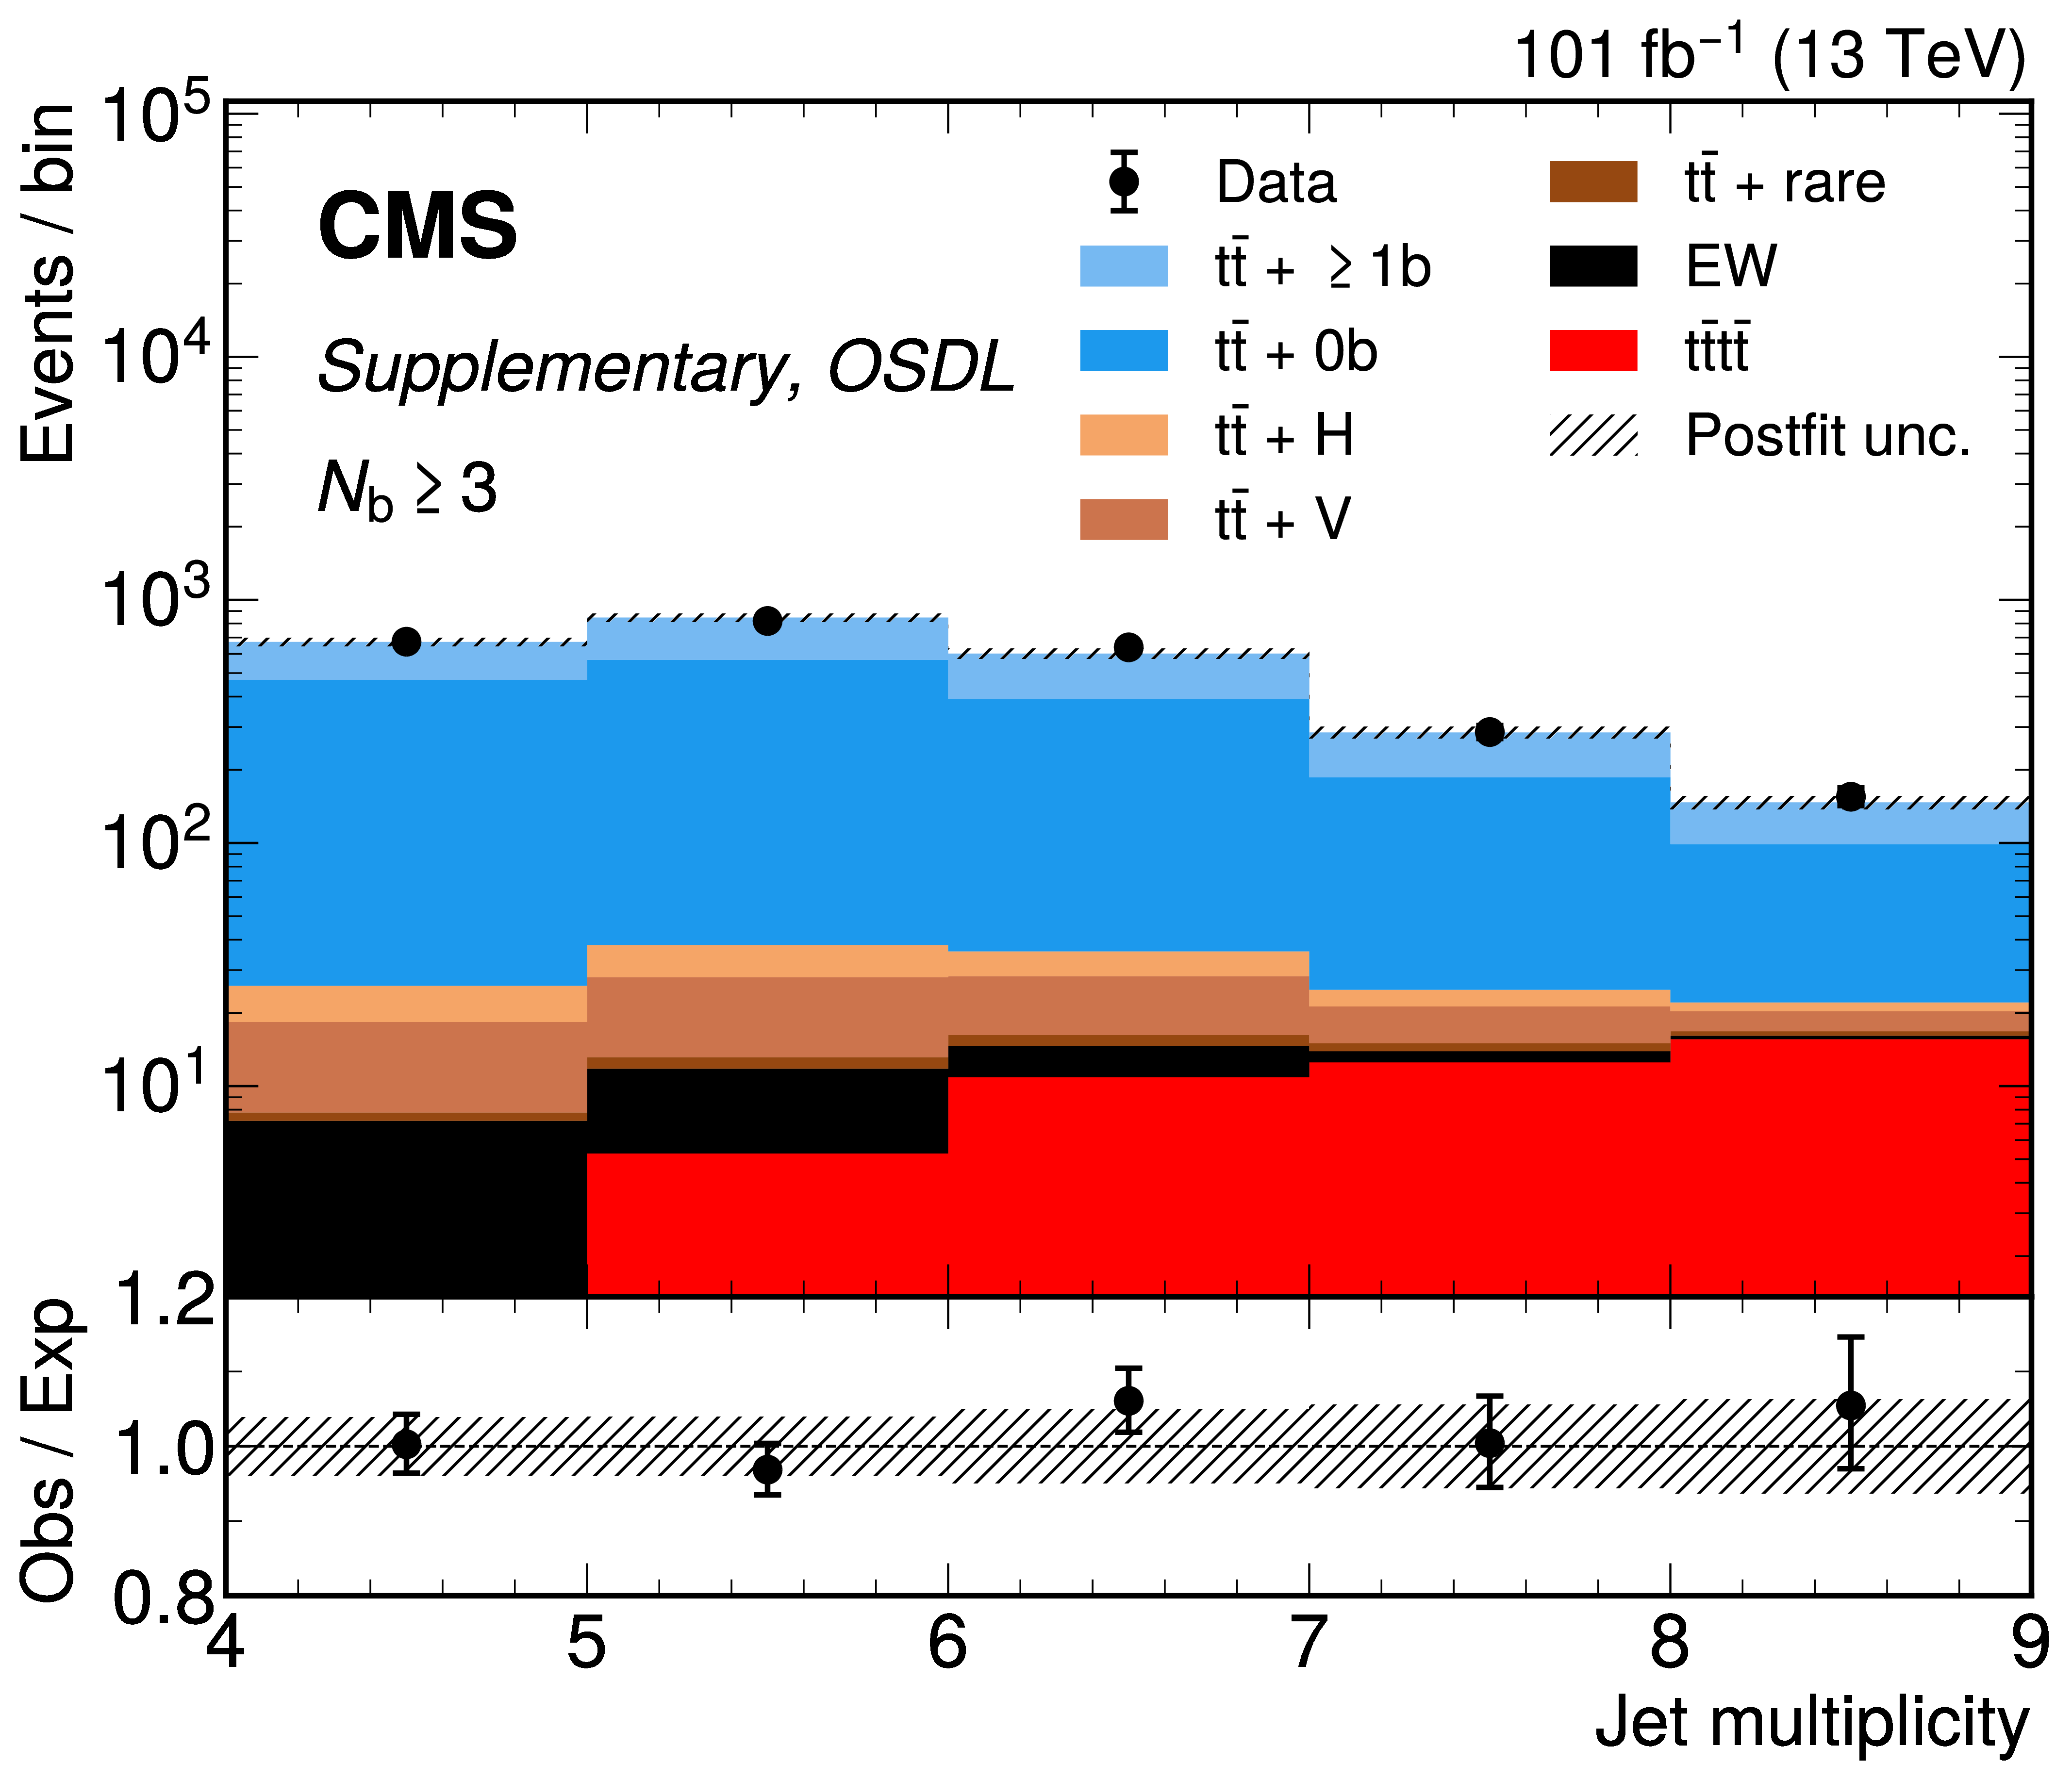
png pdf |
Additional Figure 12-b:
Postfit jet multiplicity distributions in the OSDL channel for the 2 b-tagged jets categories (left) and 3 b-tagged jets categories (right). |
png pdf |
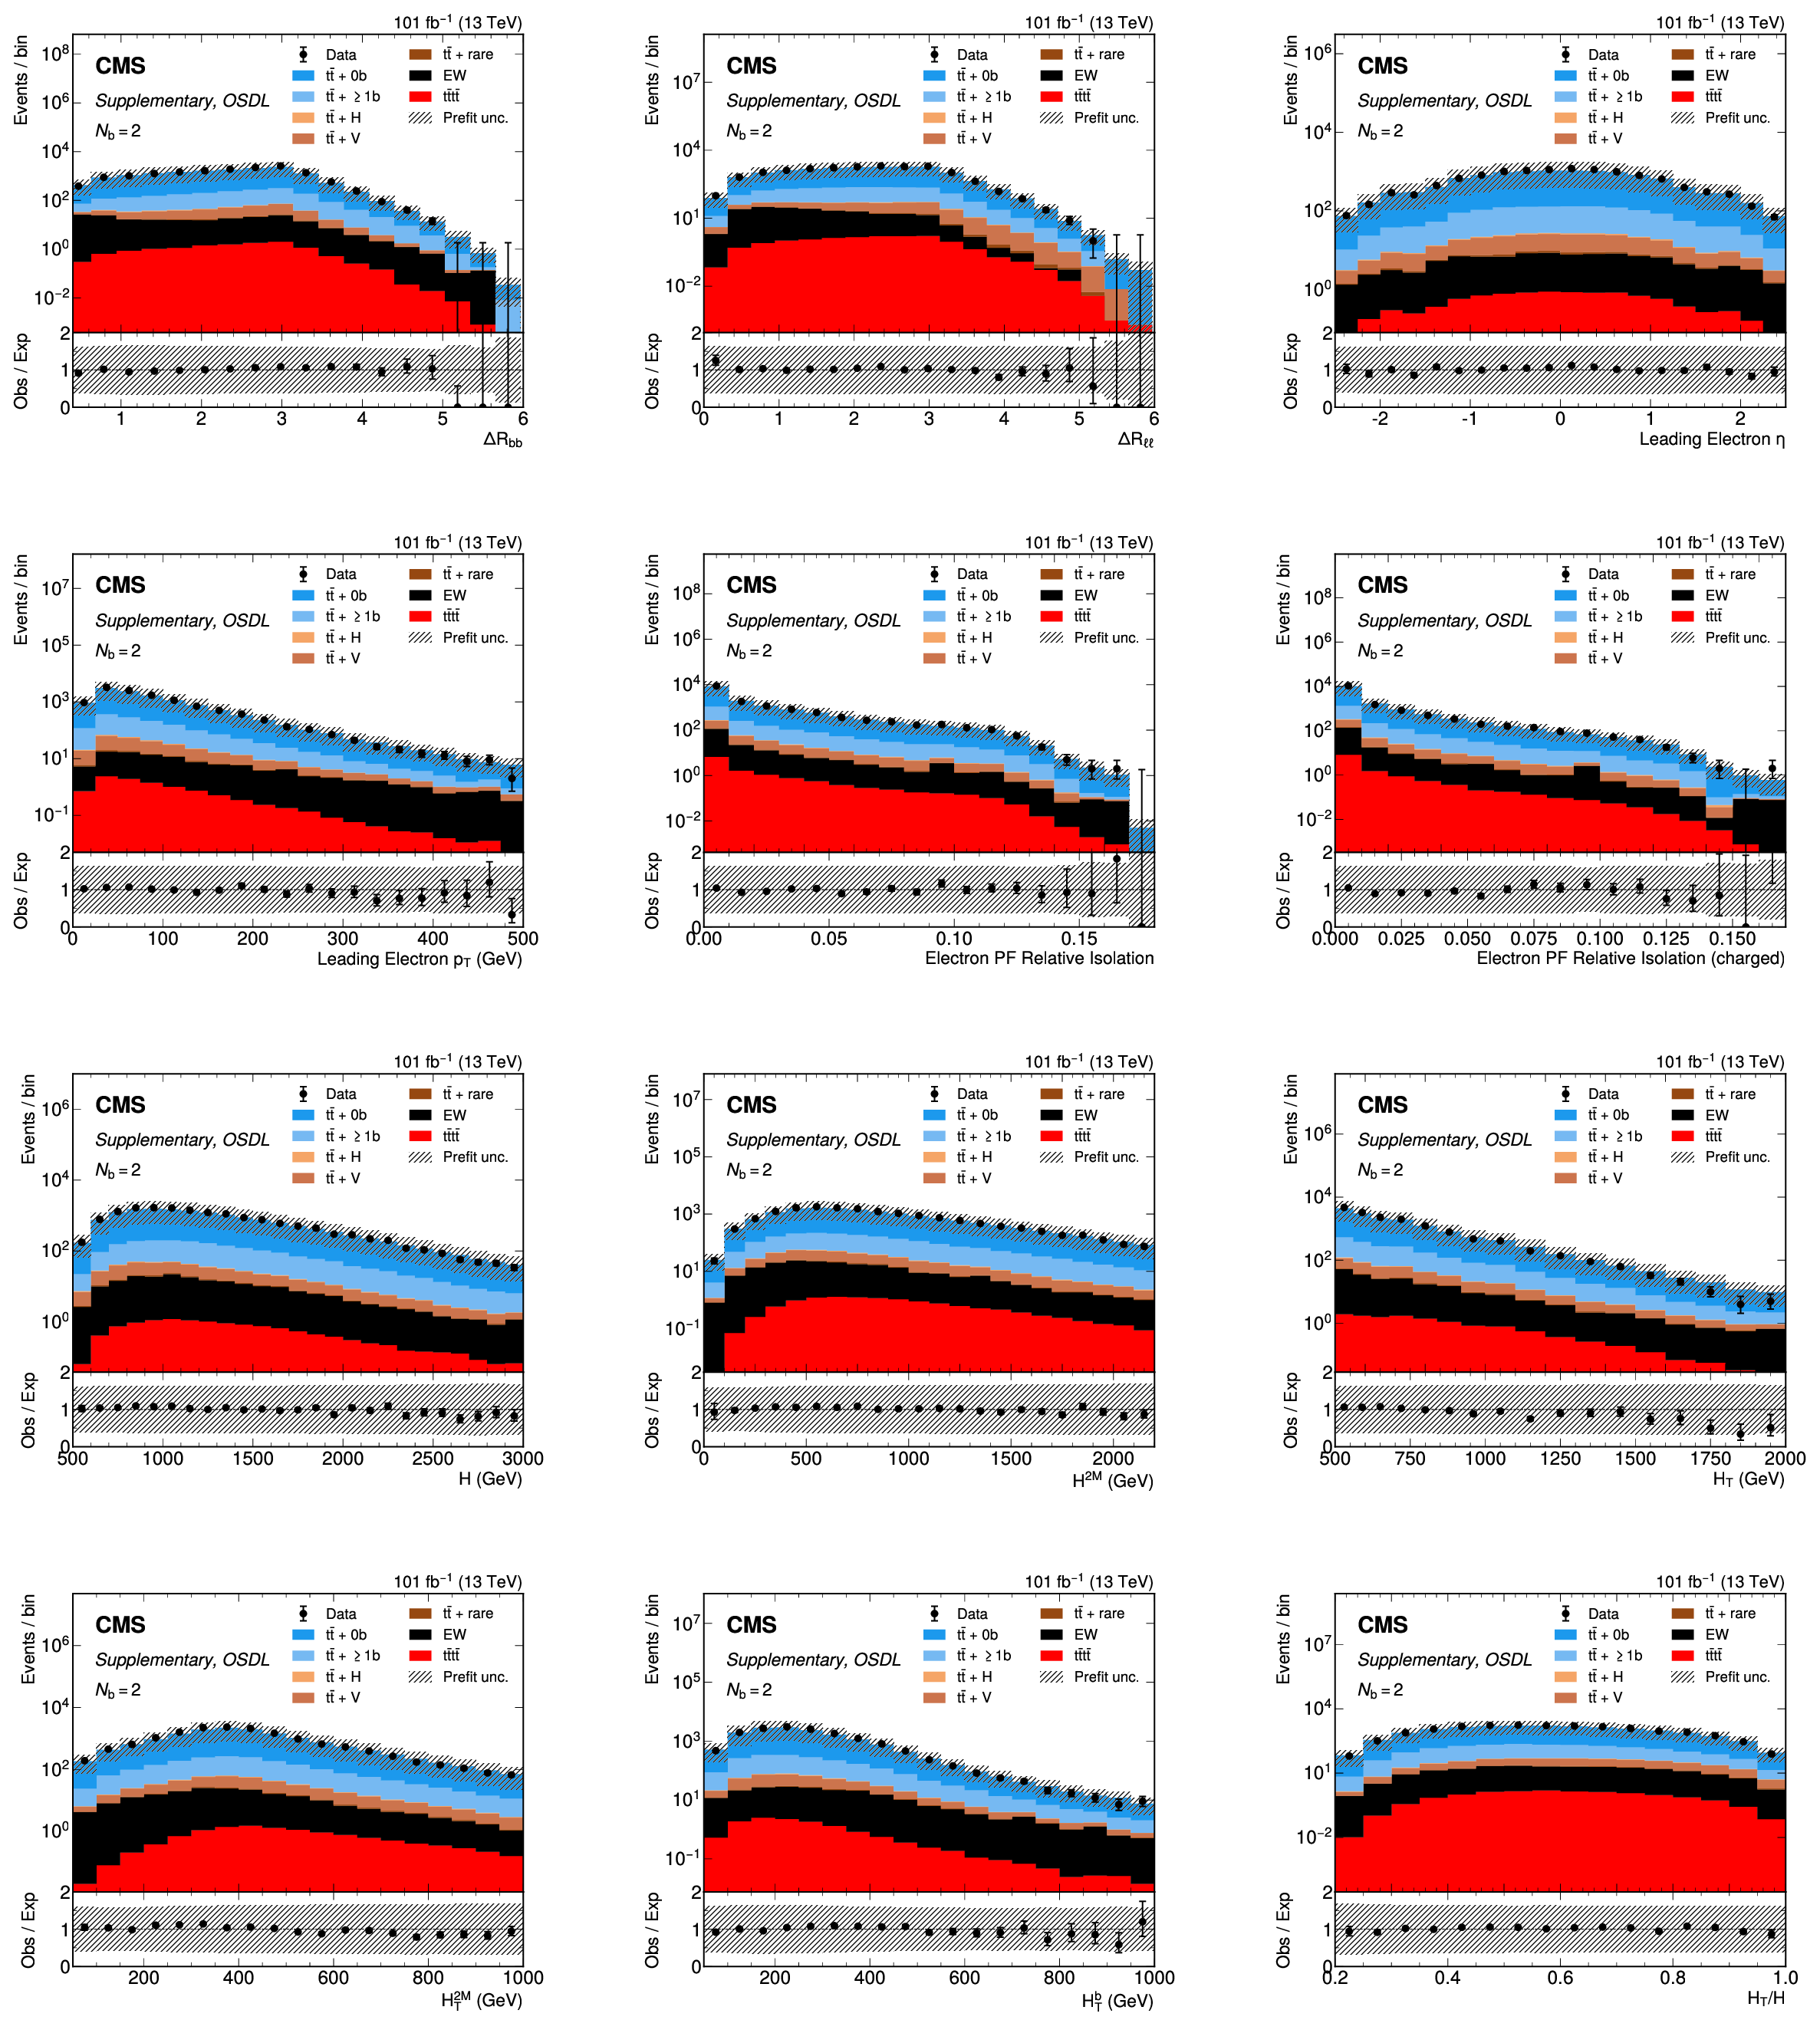
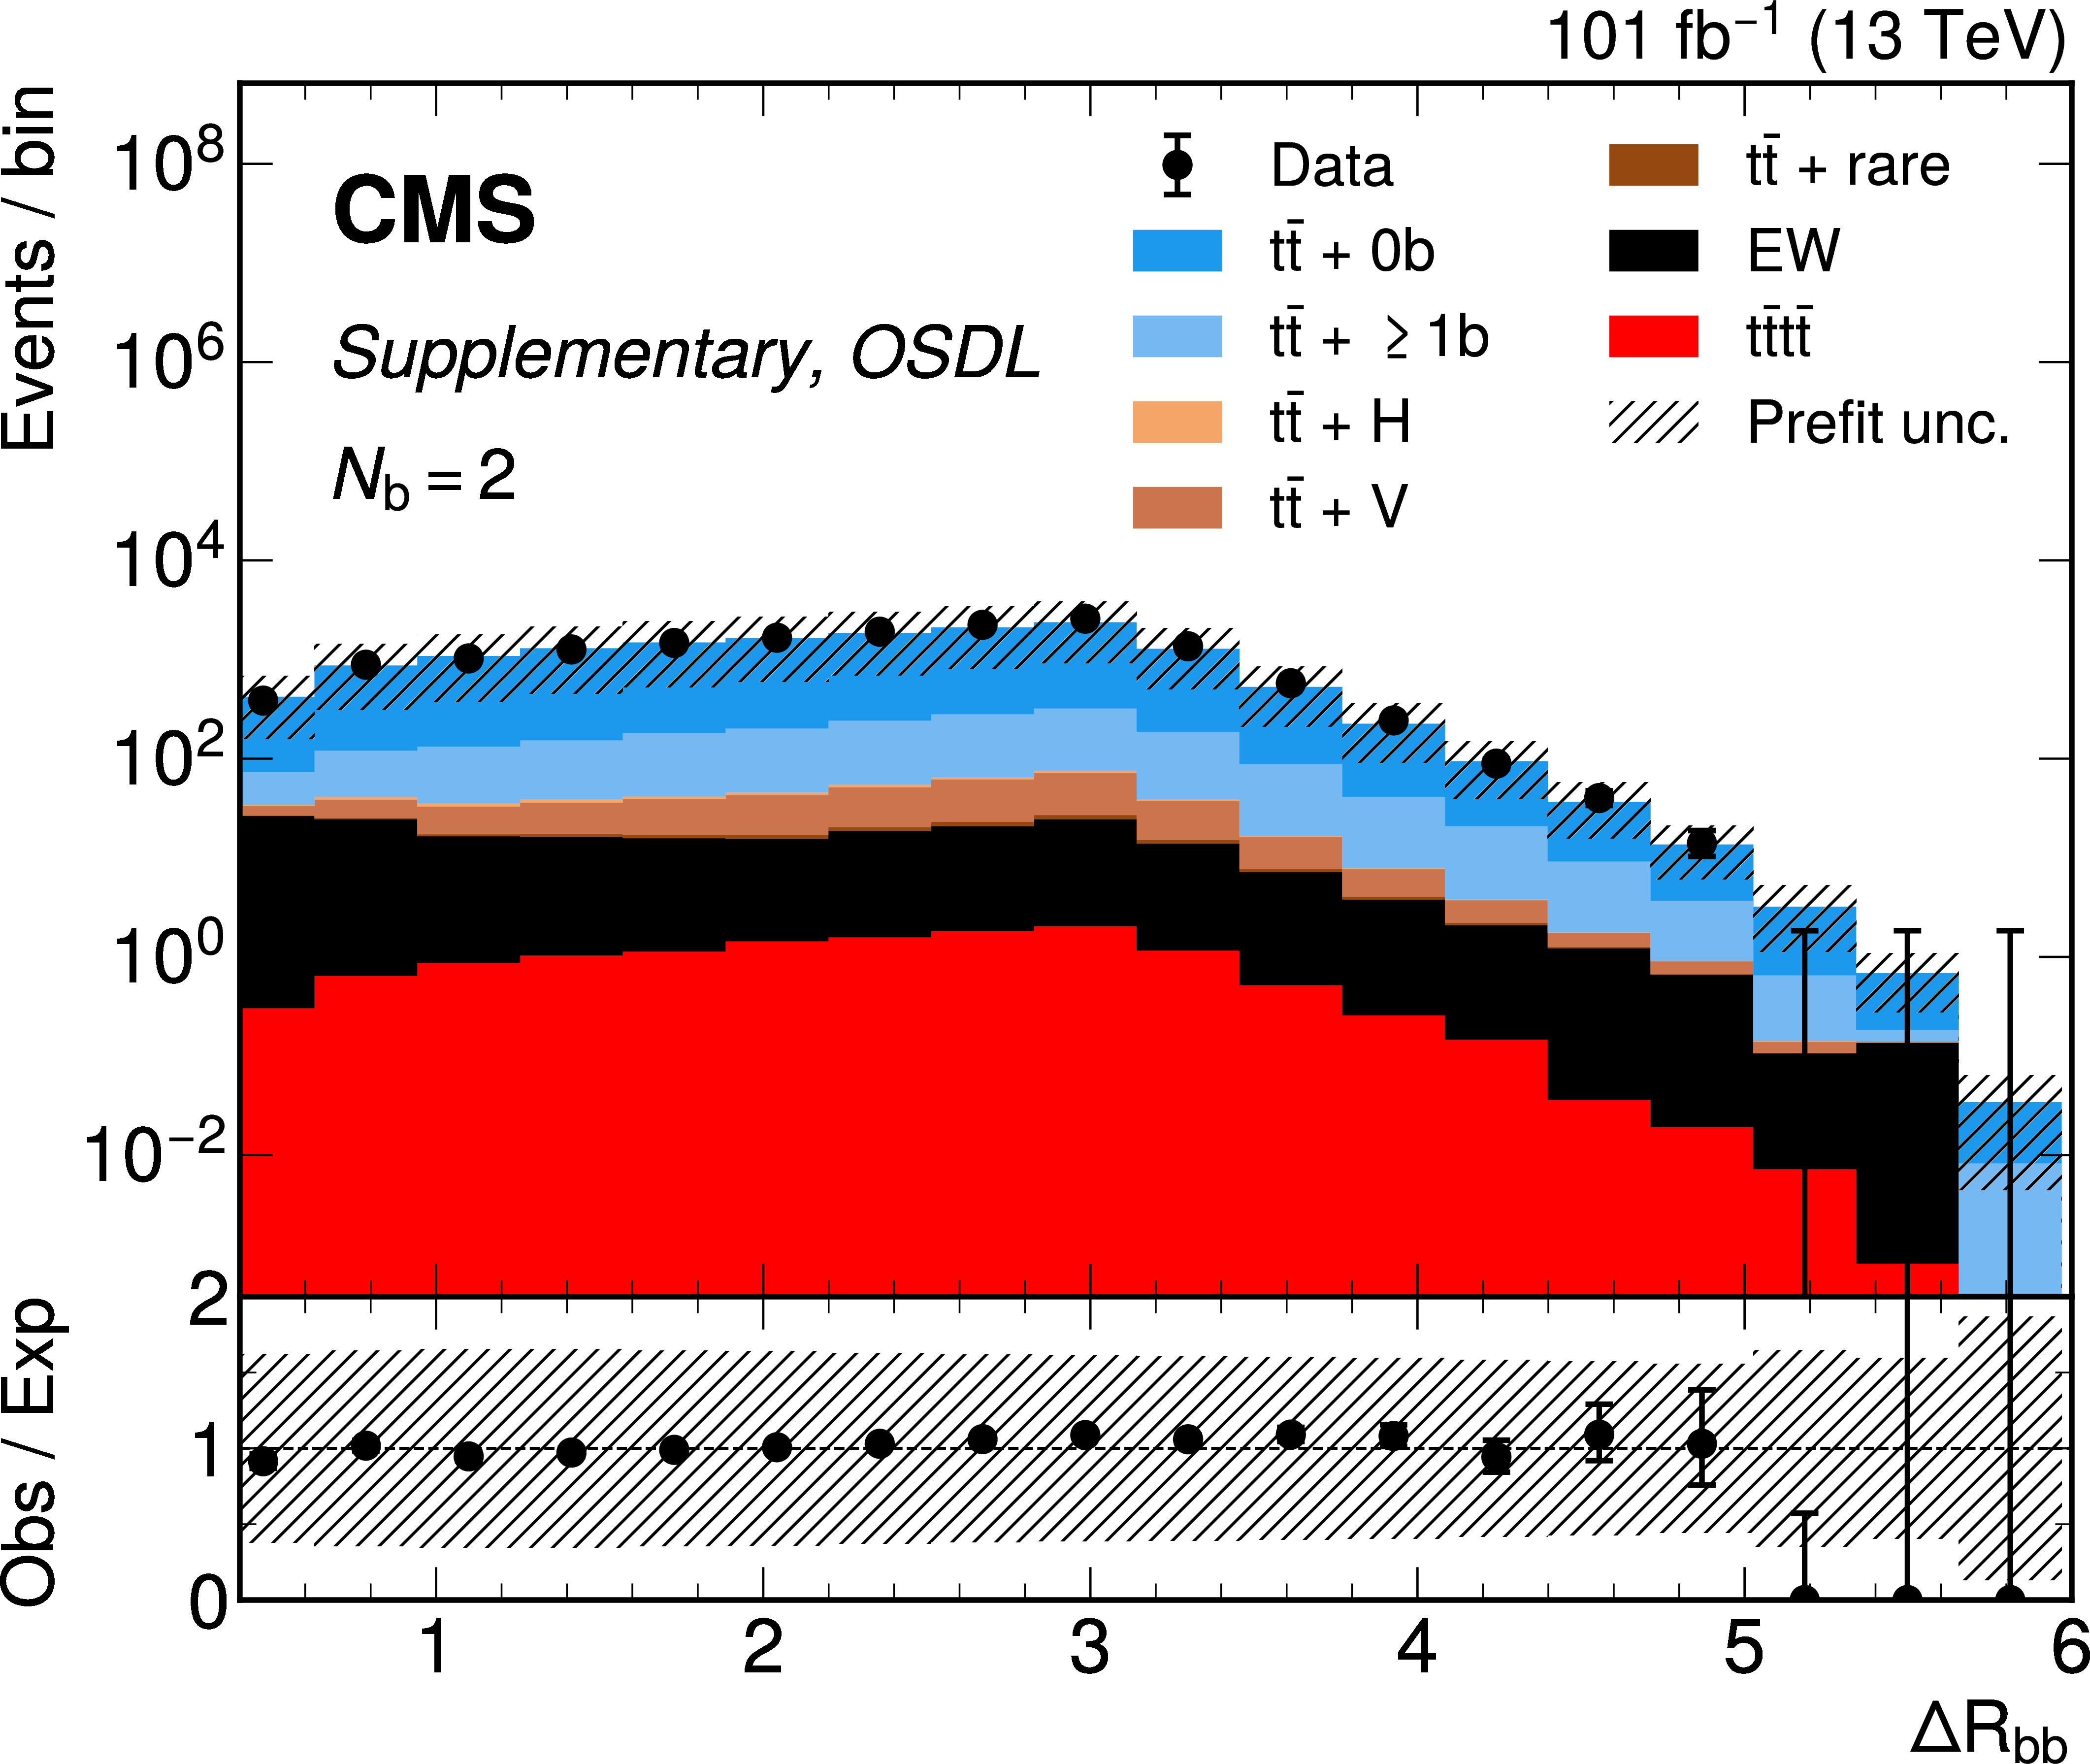
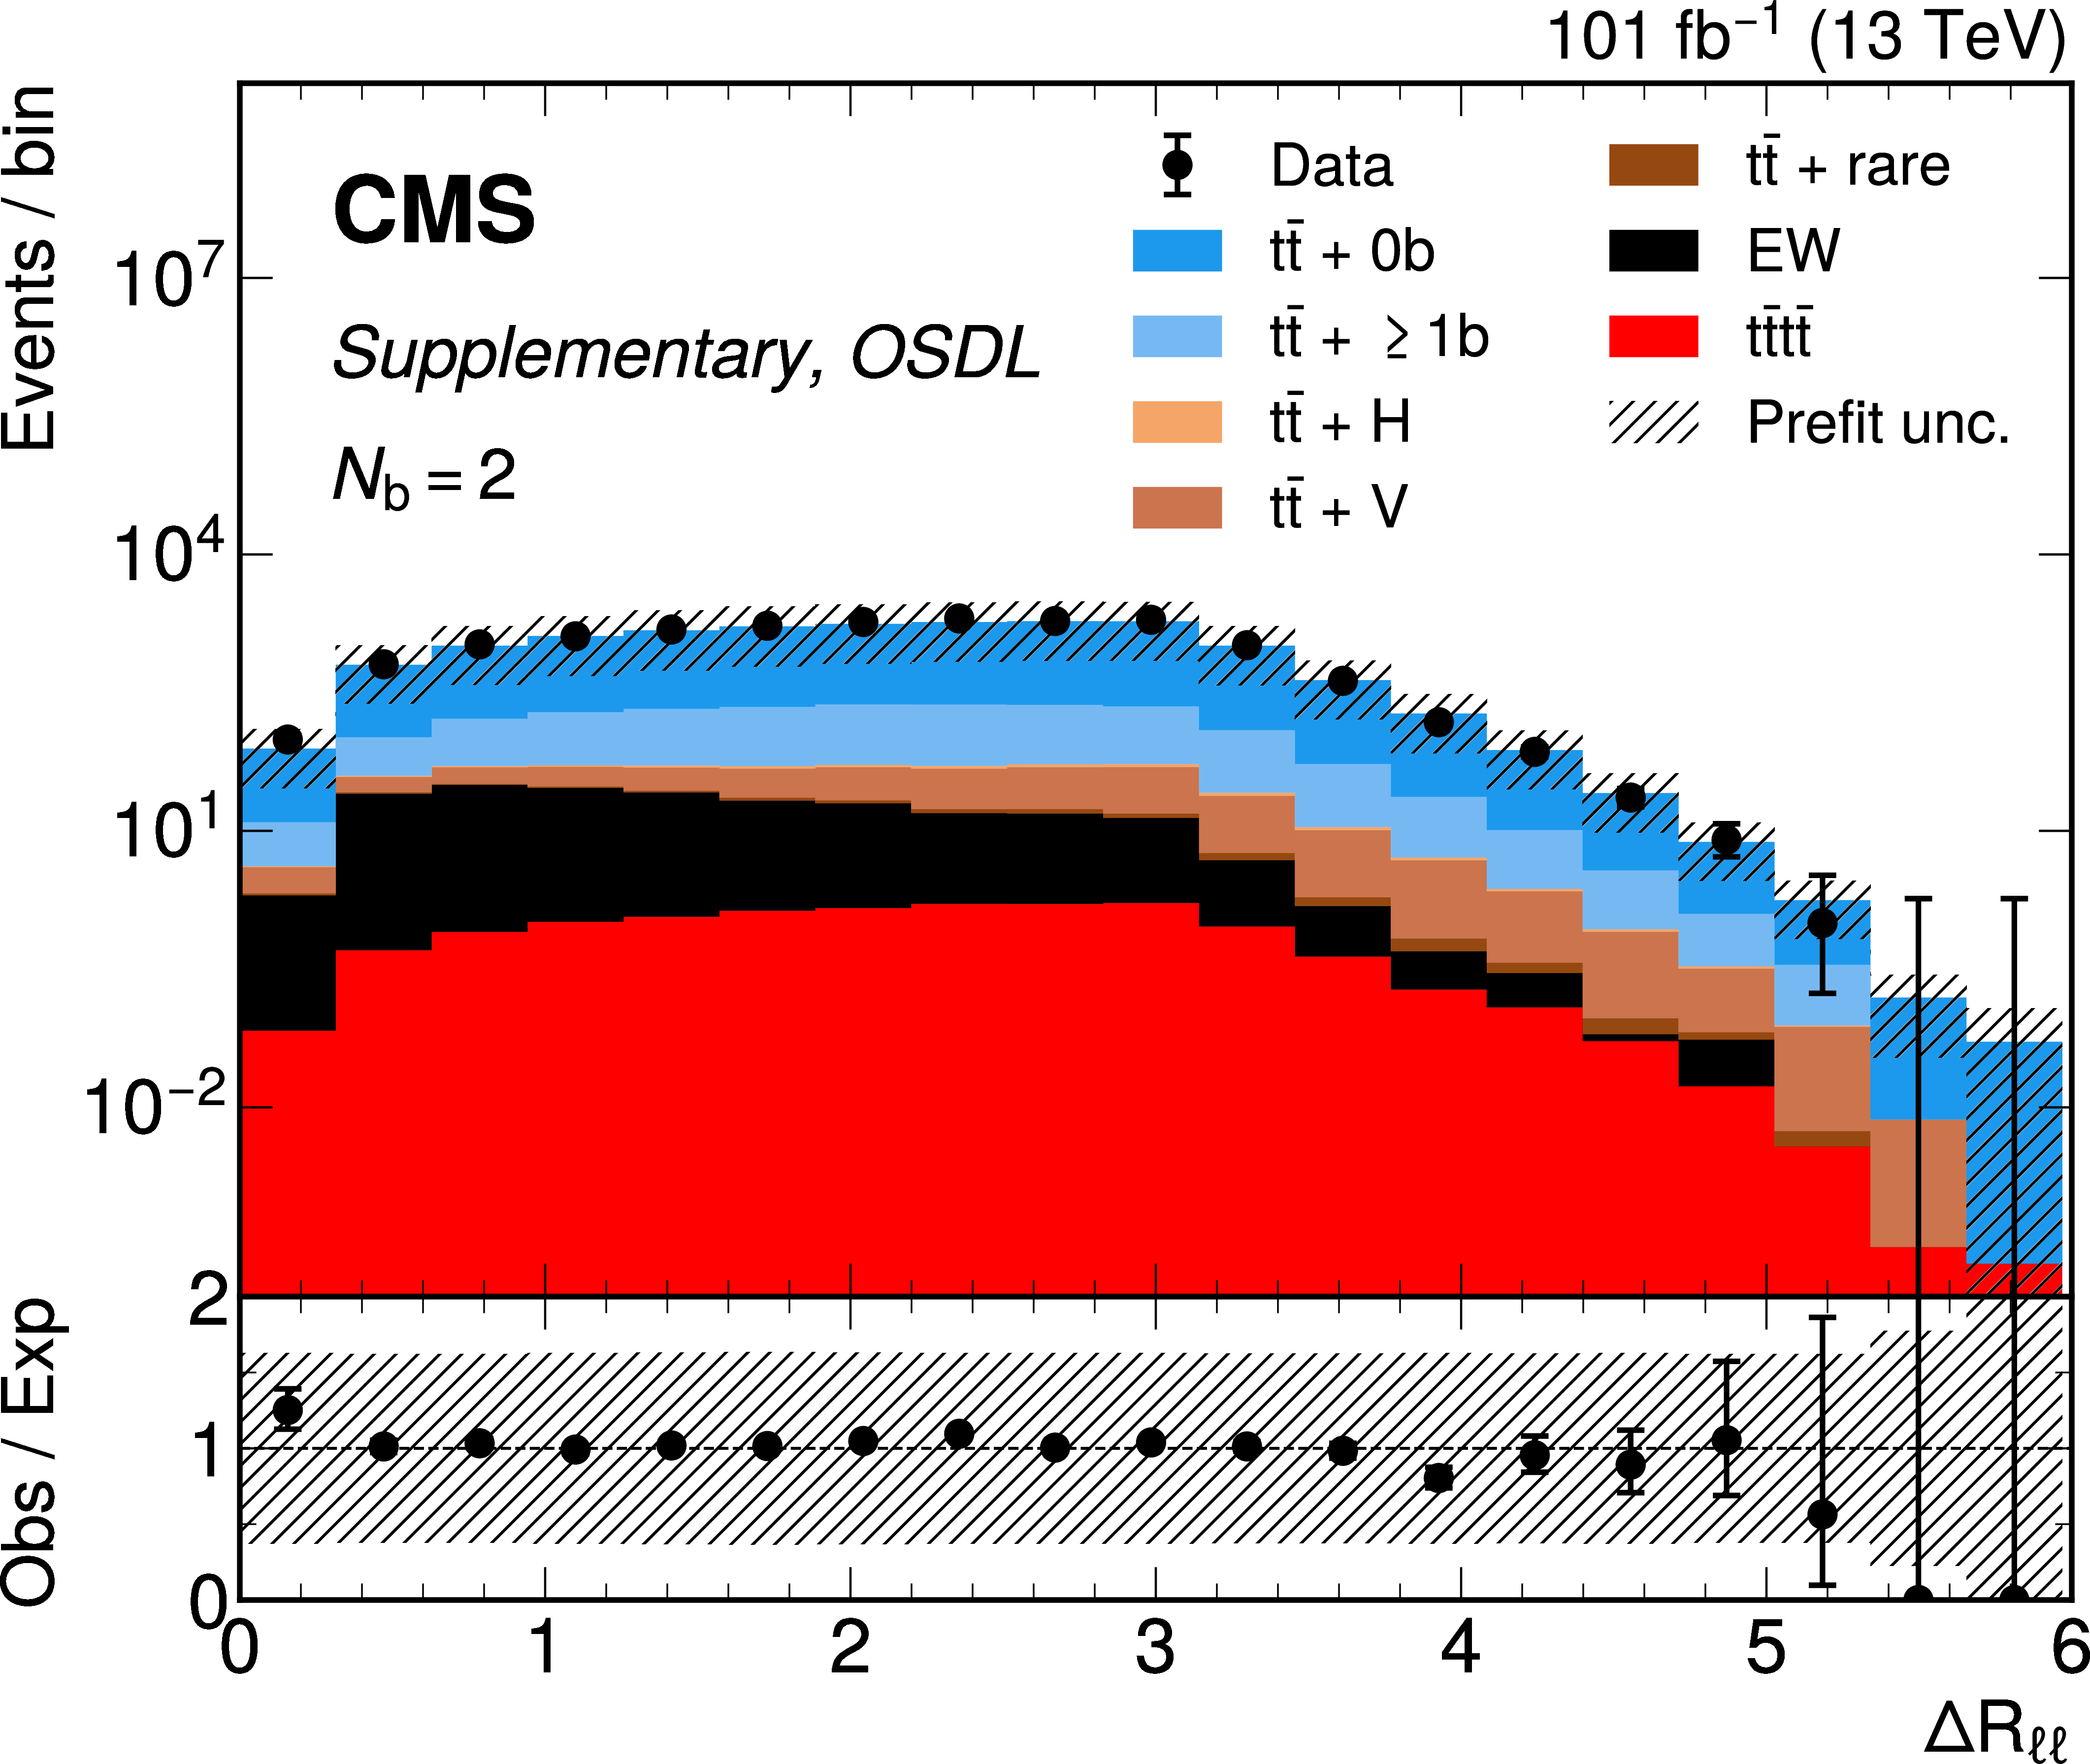
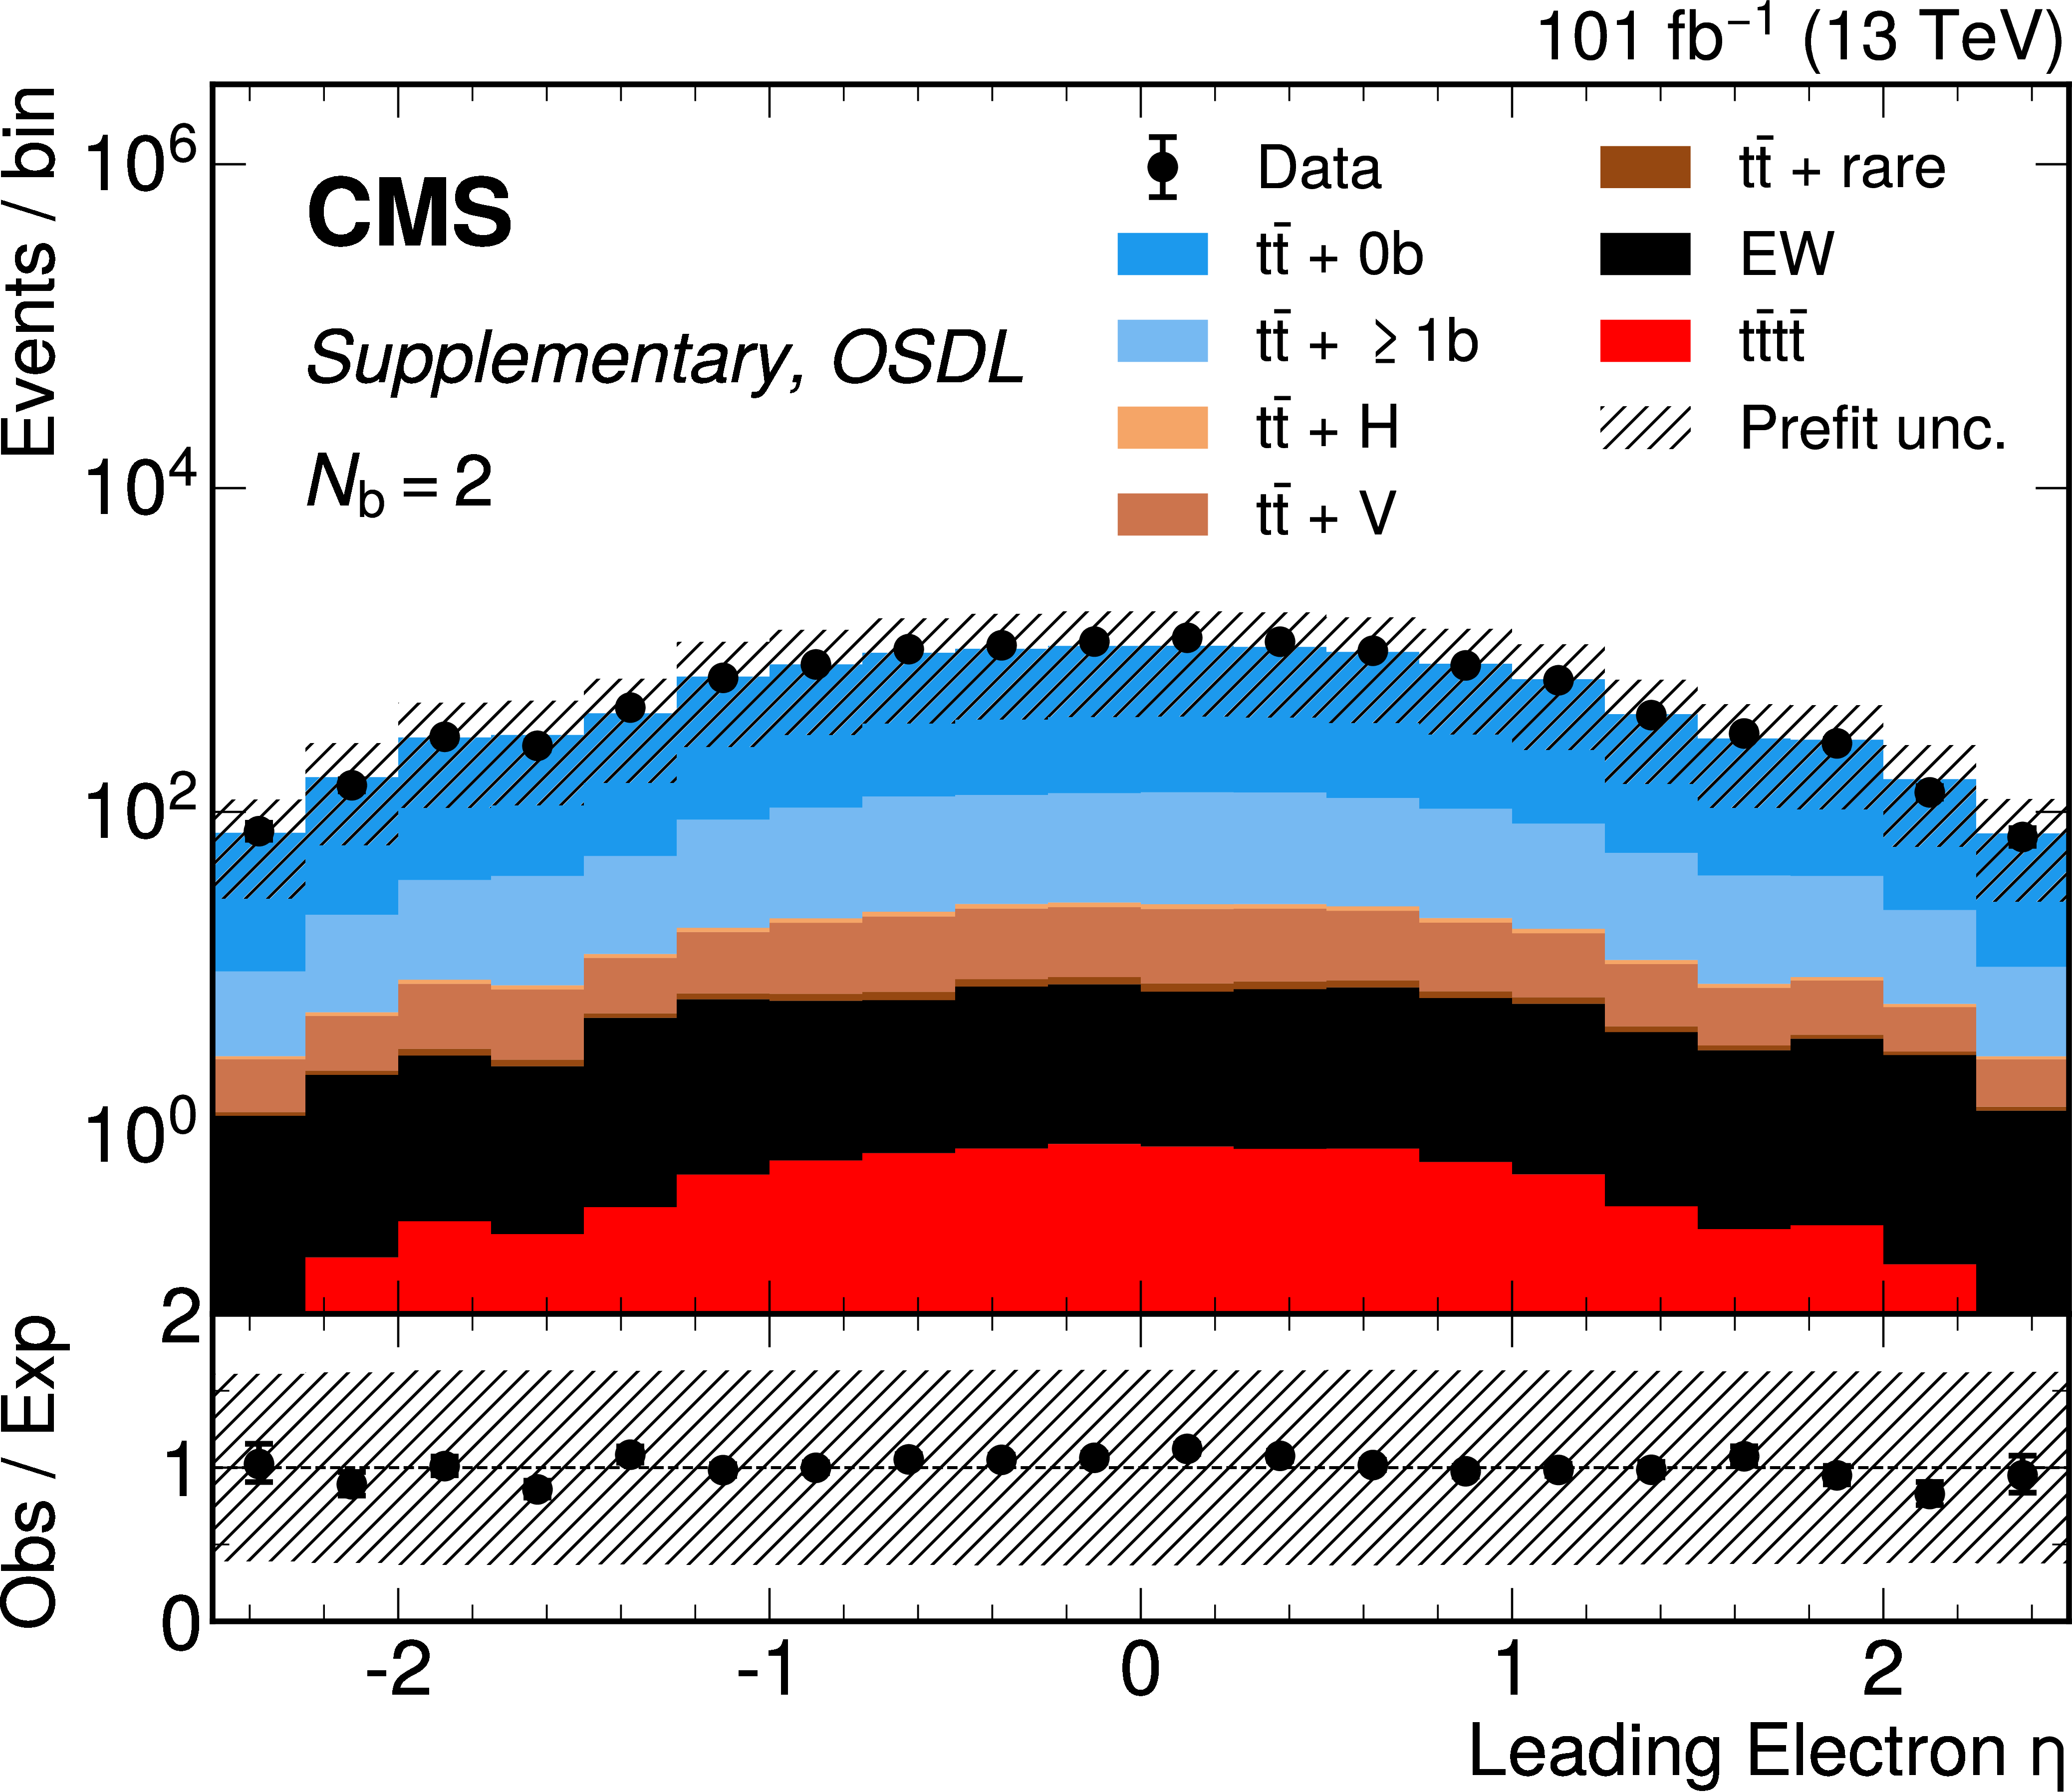
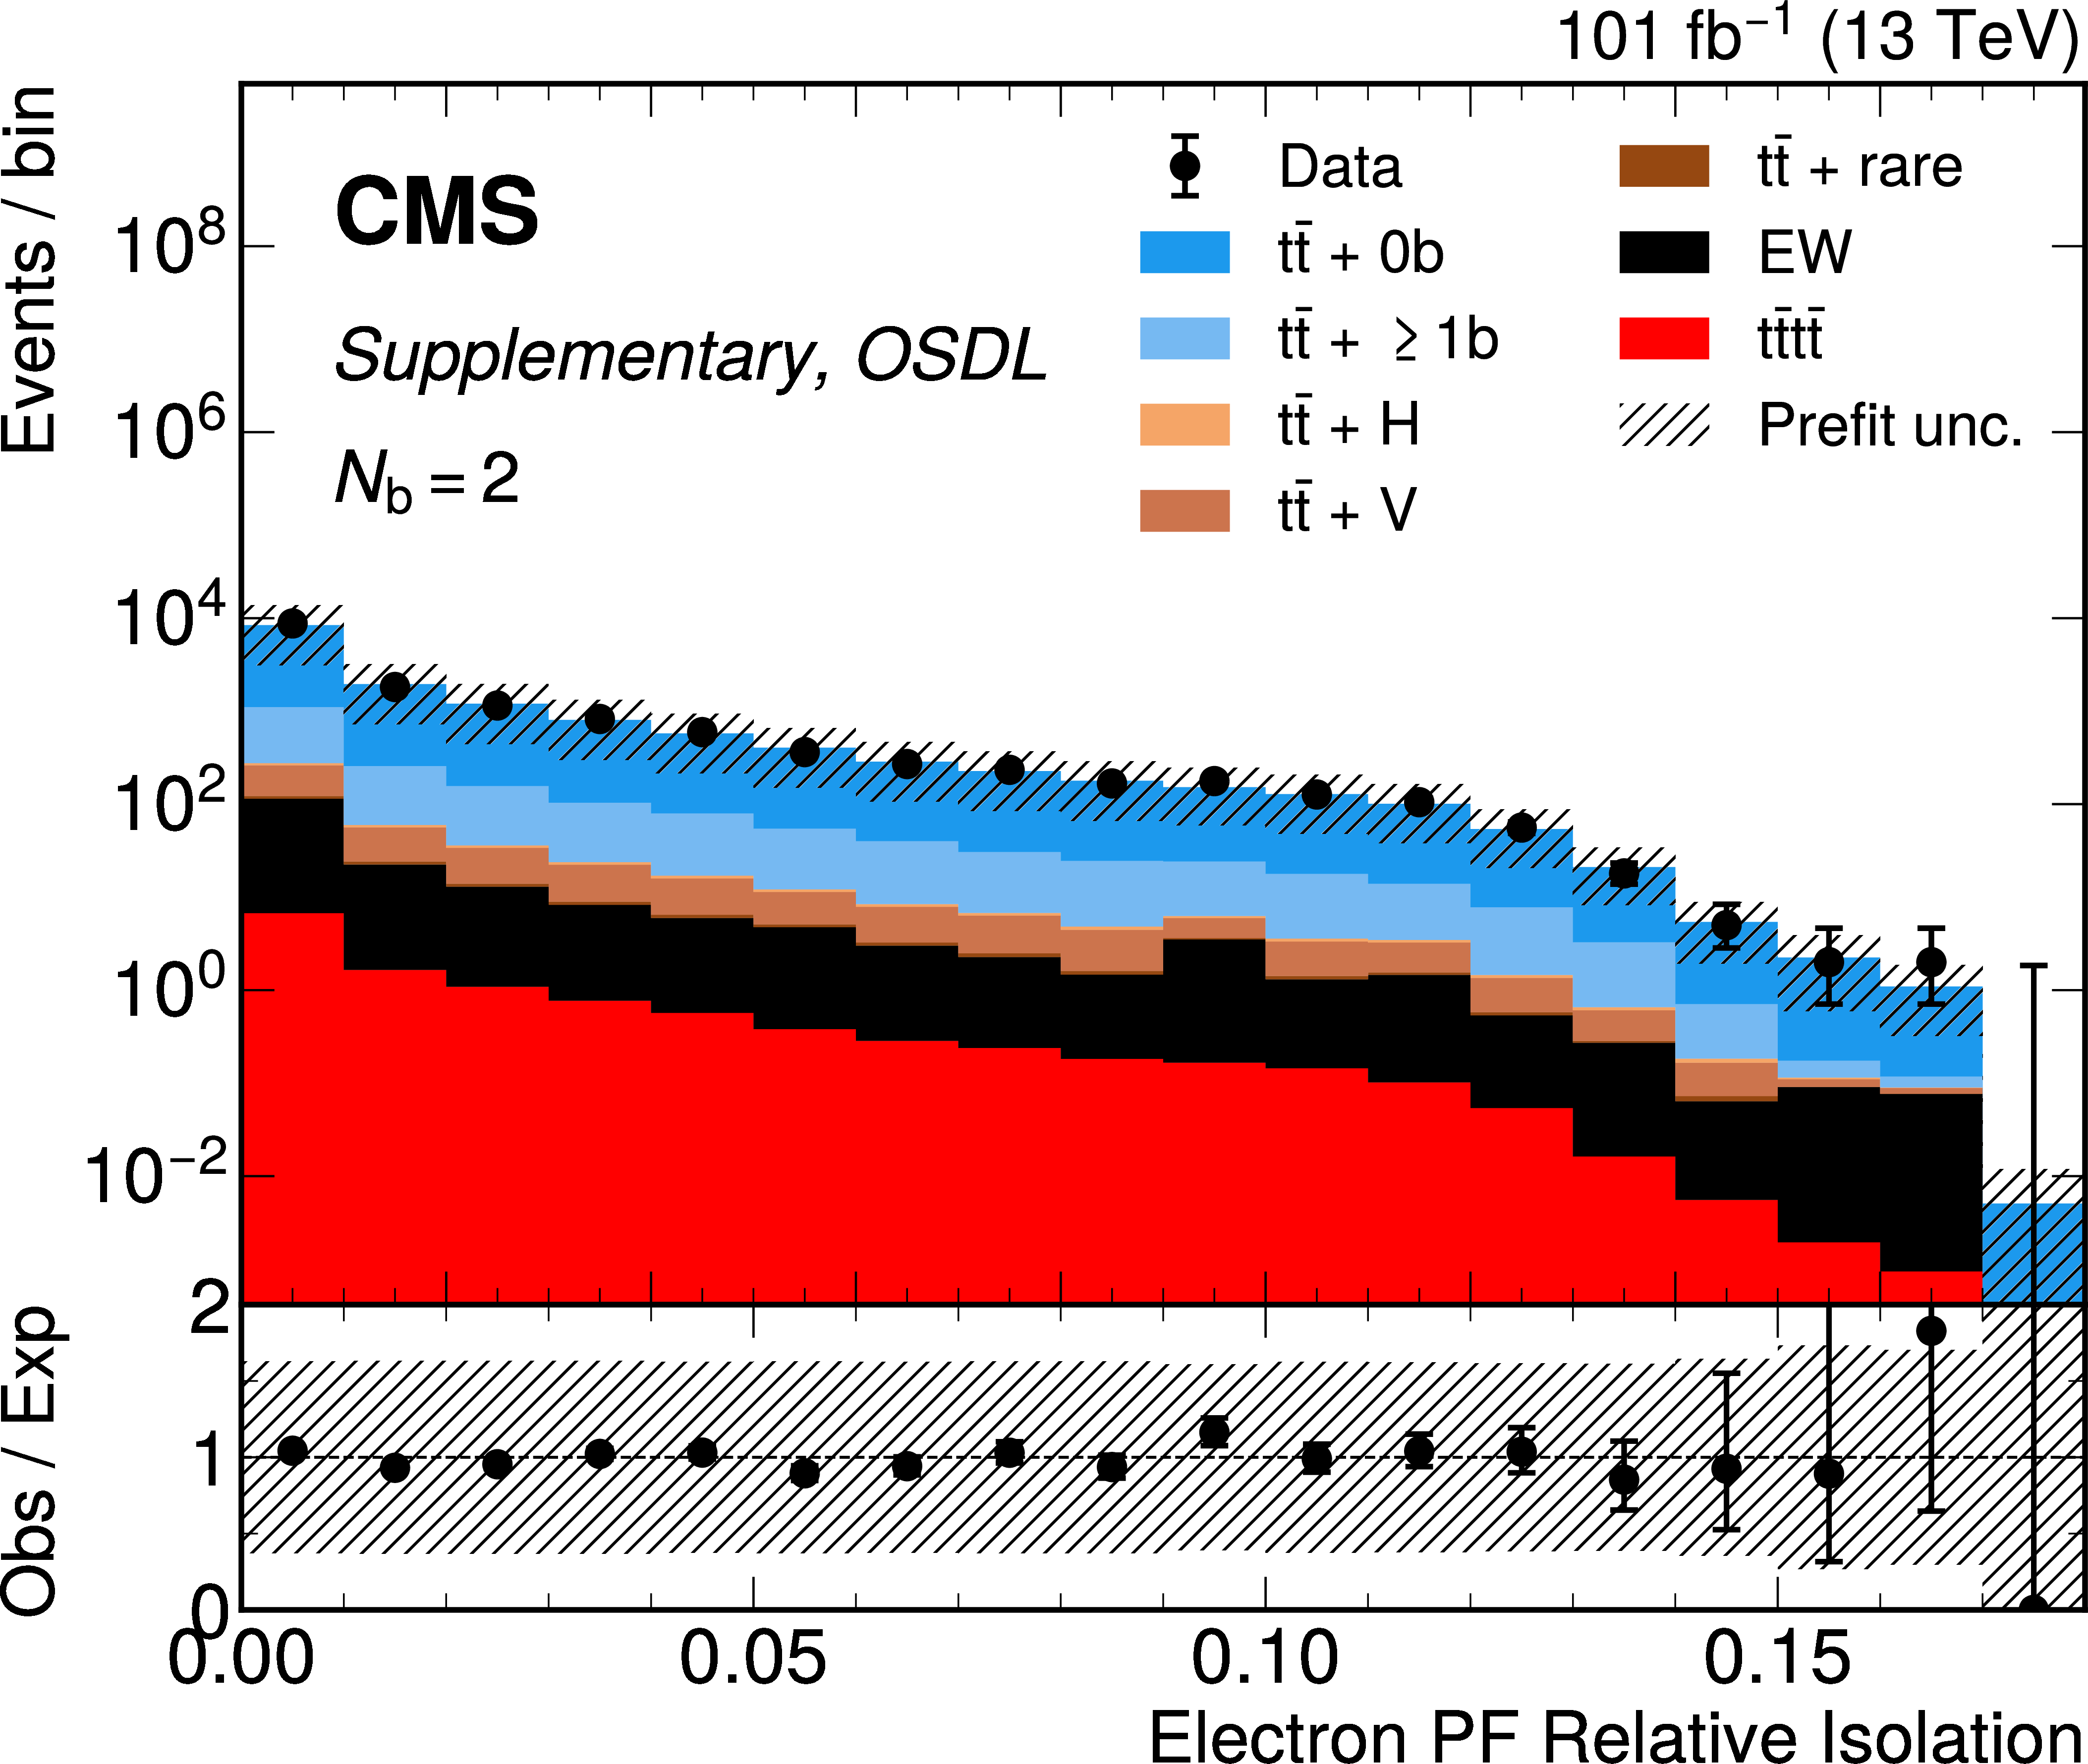
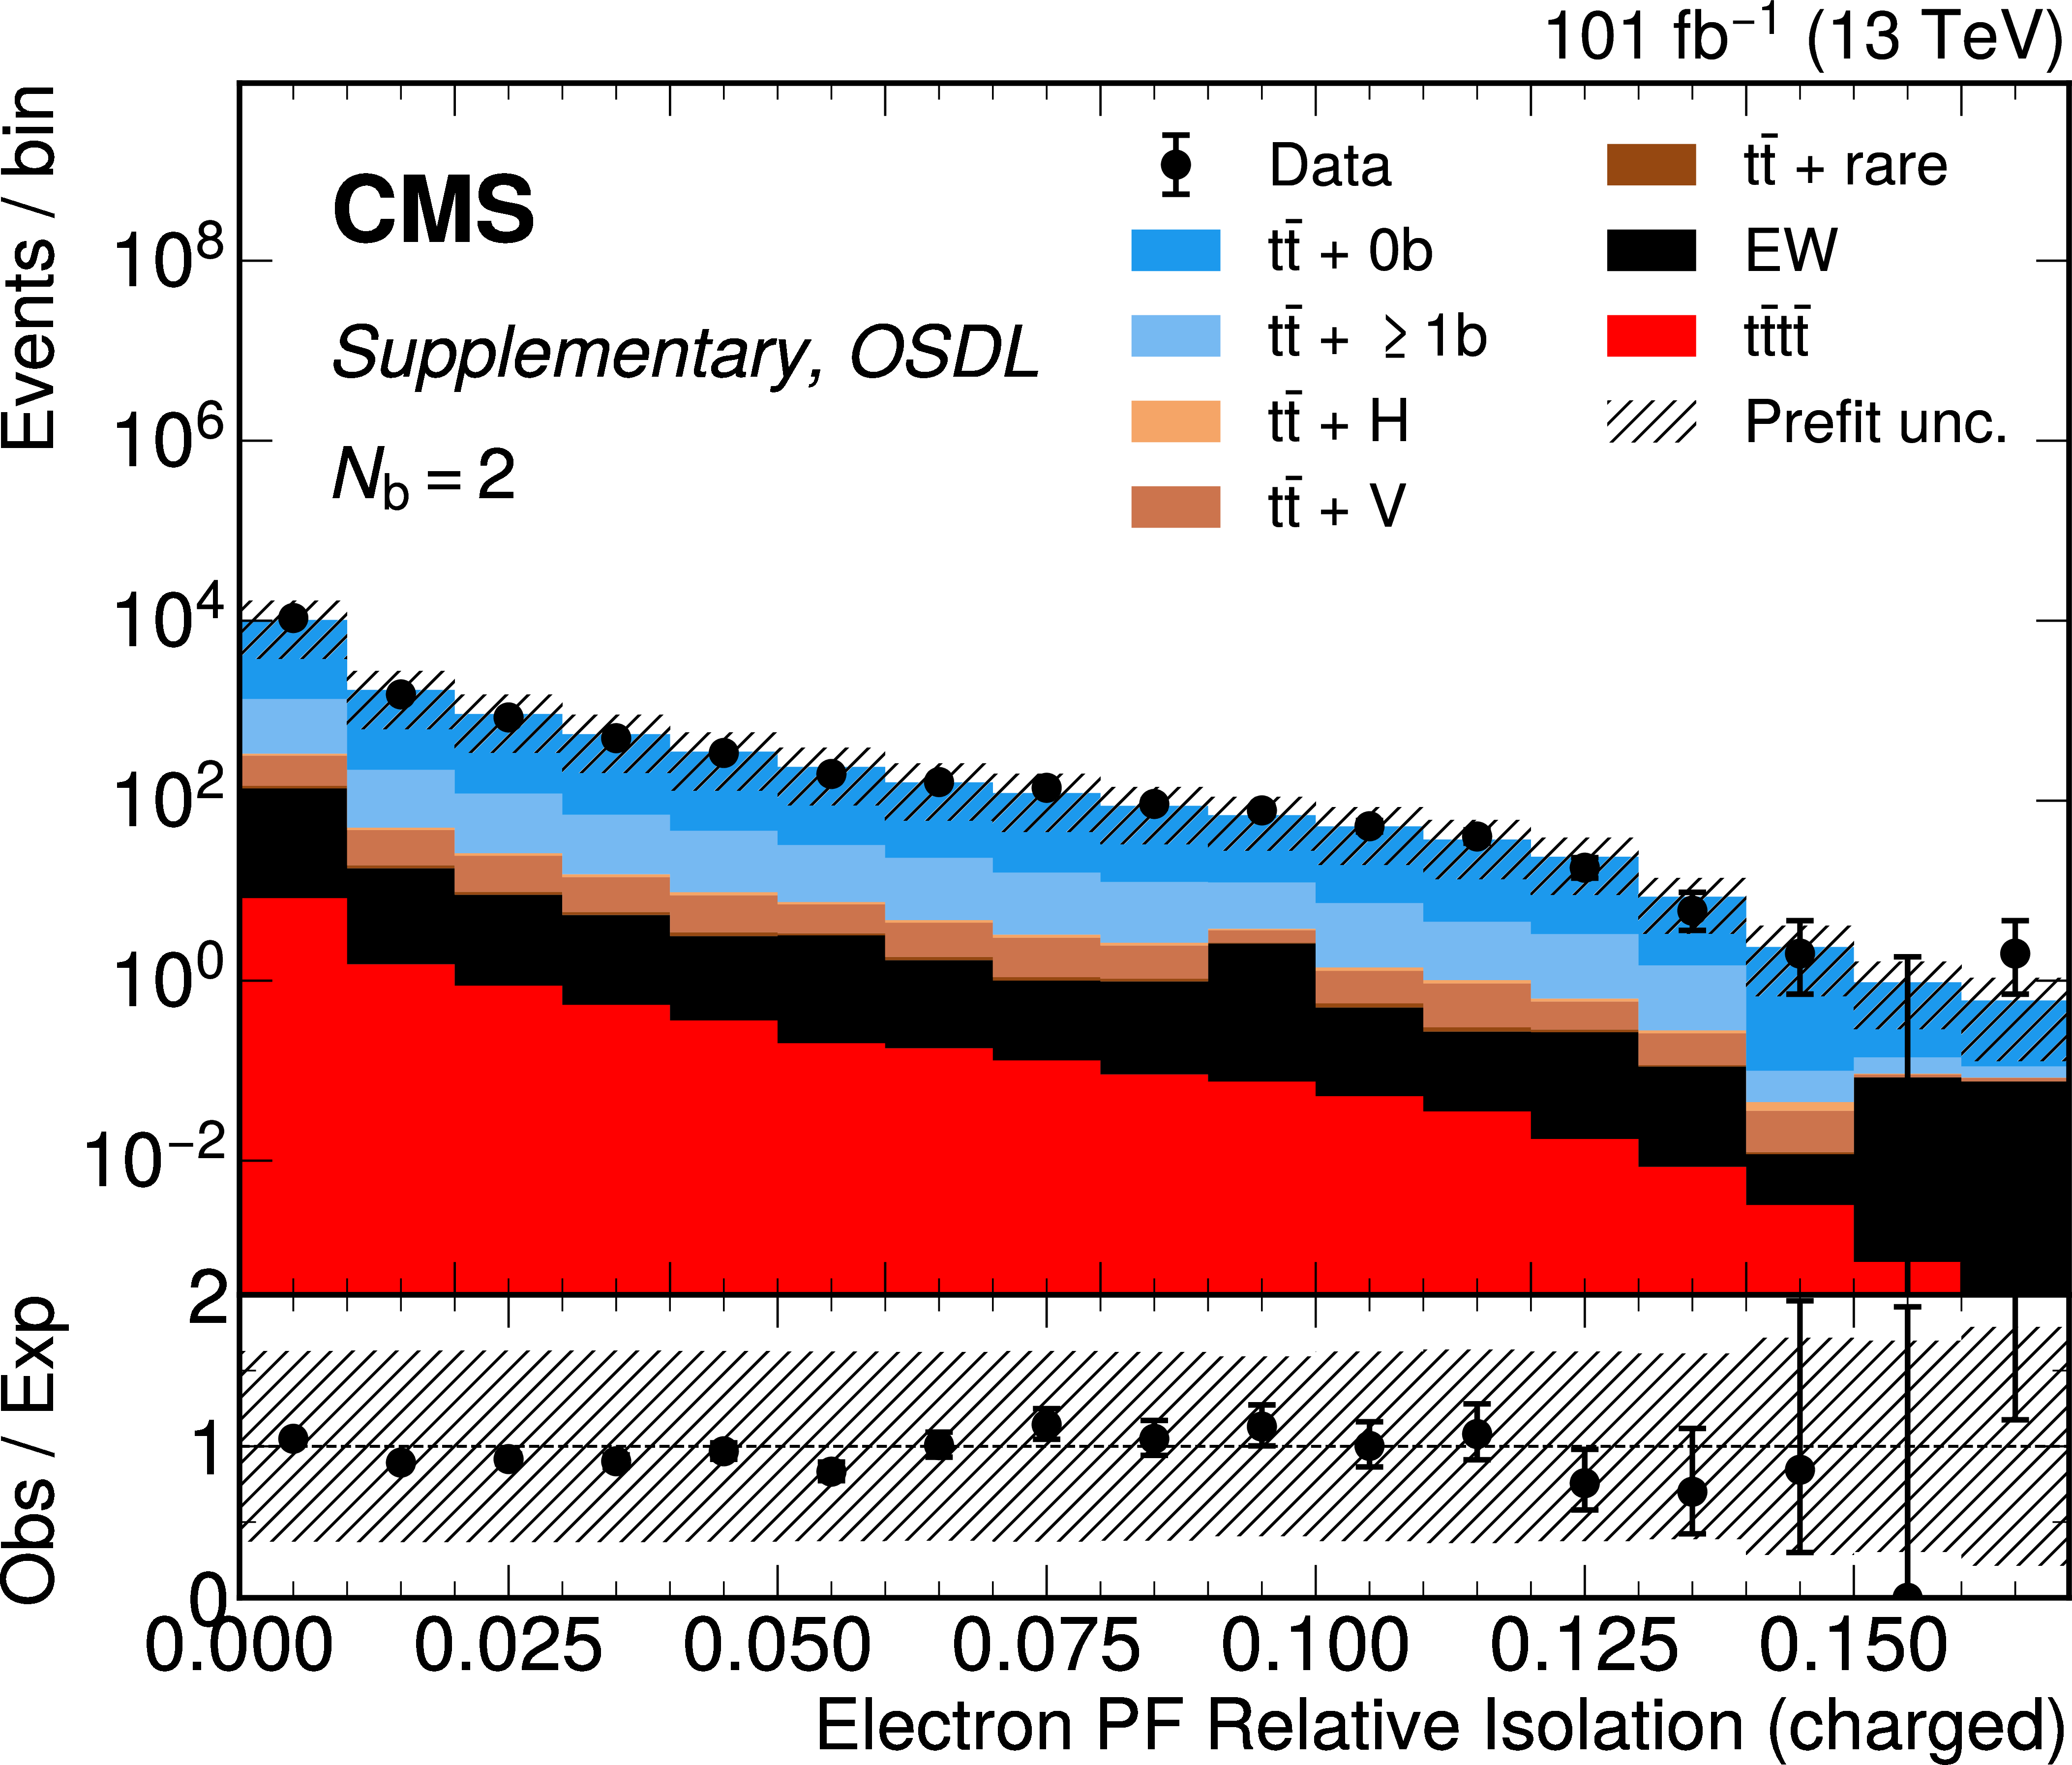
Additional Figure 13:
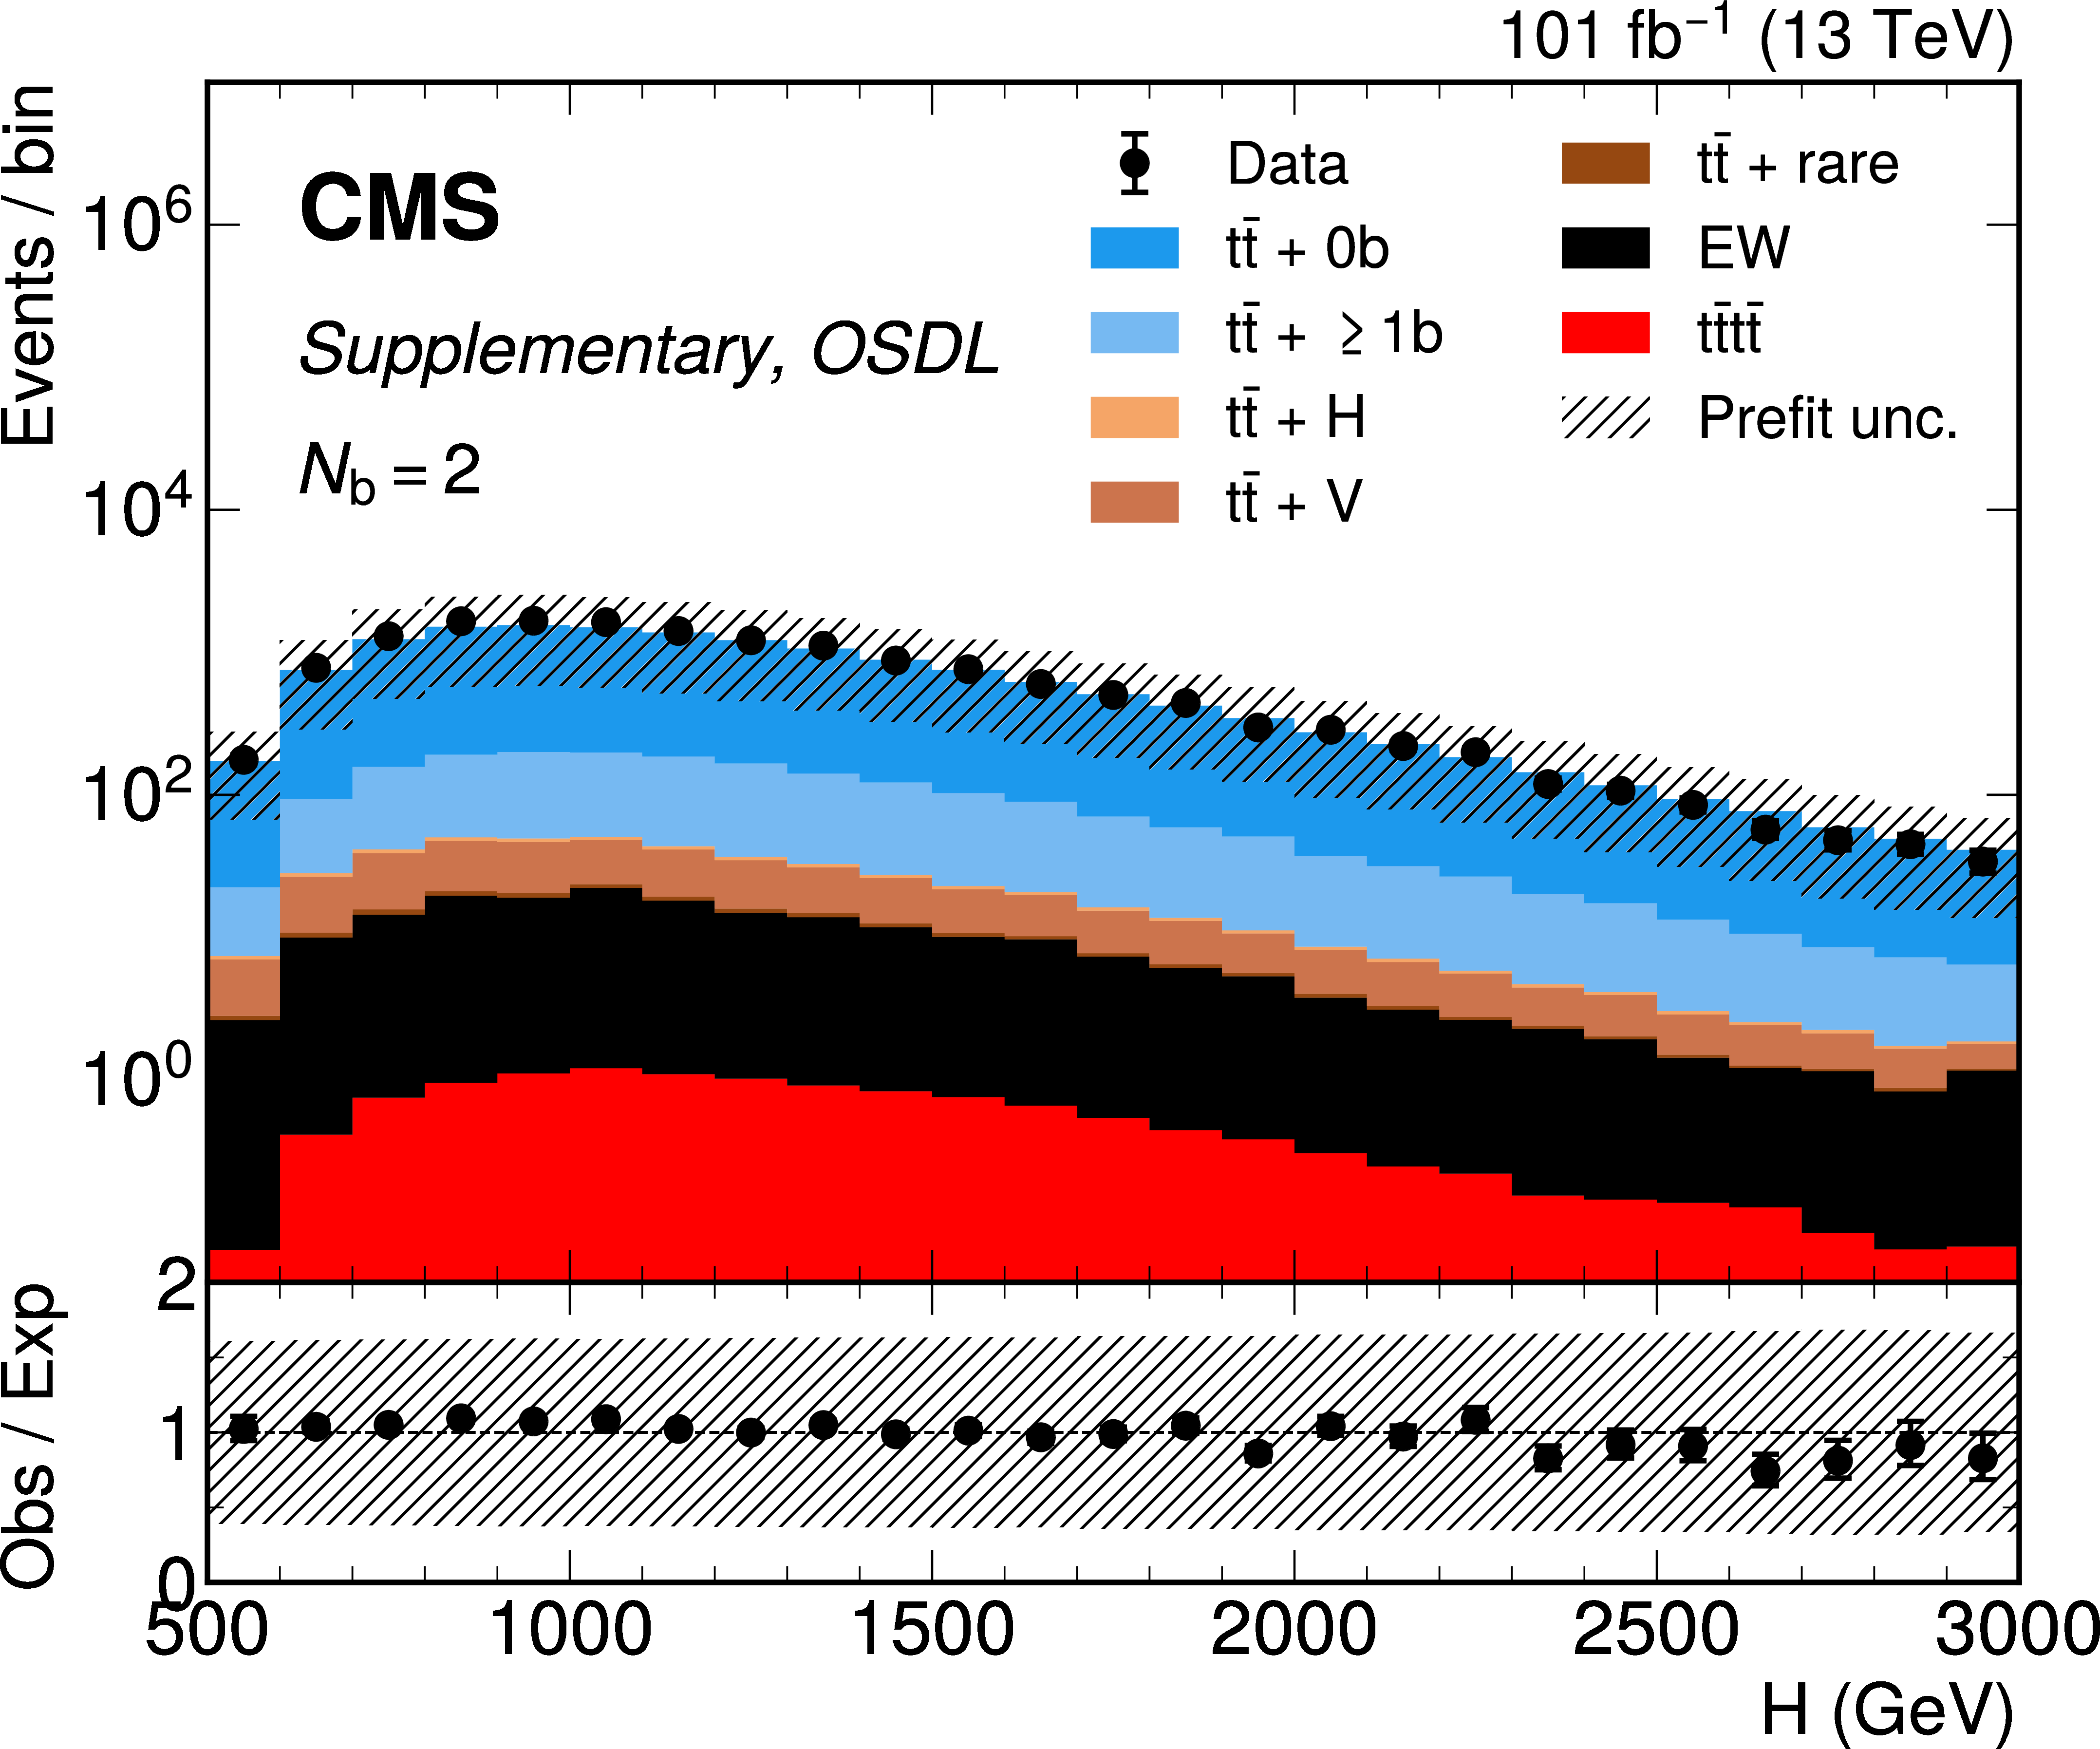
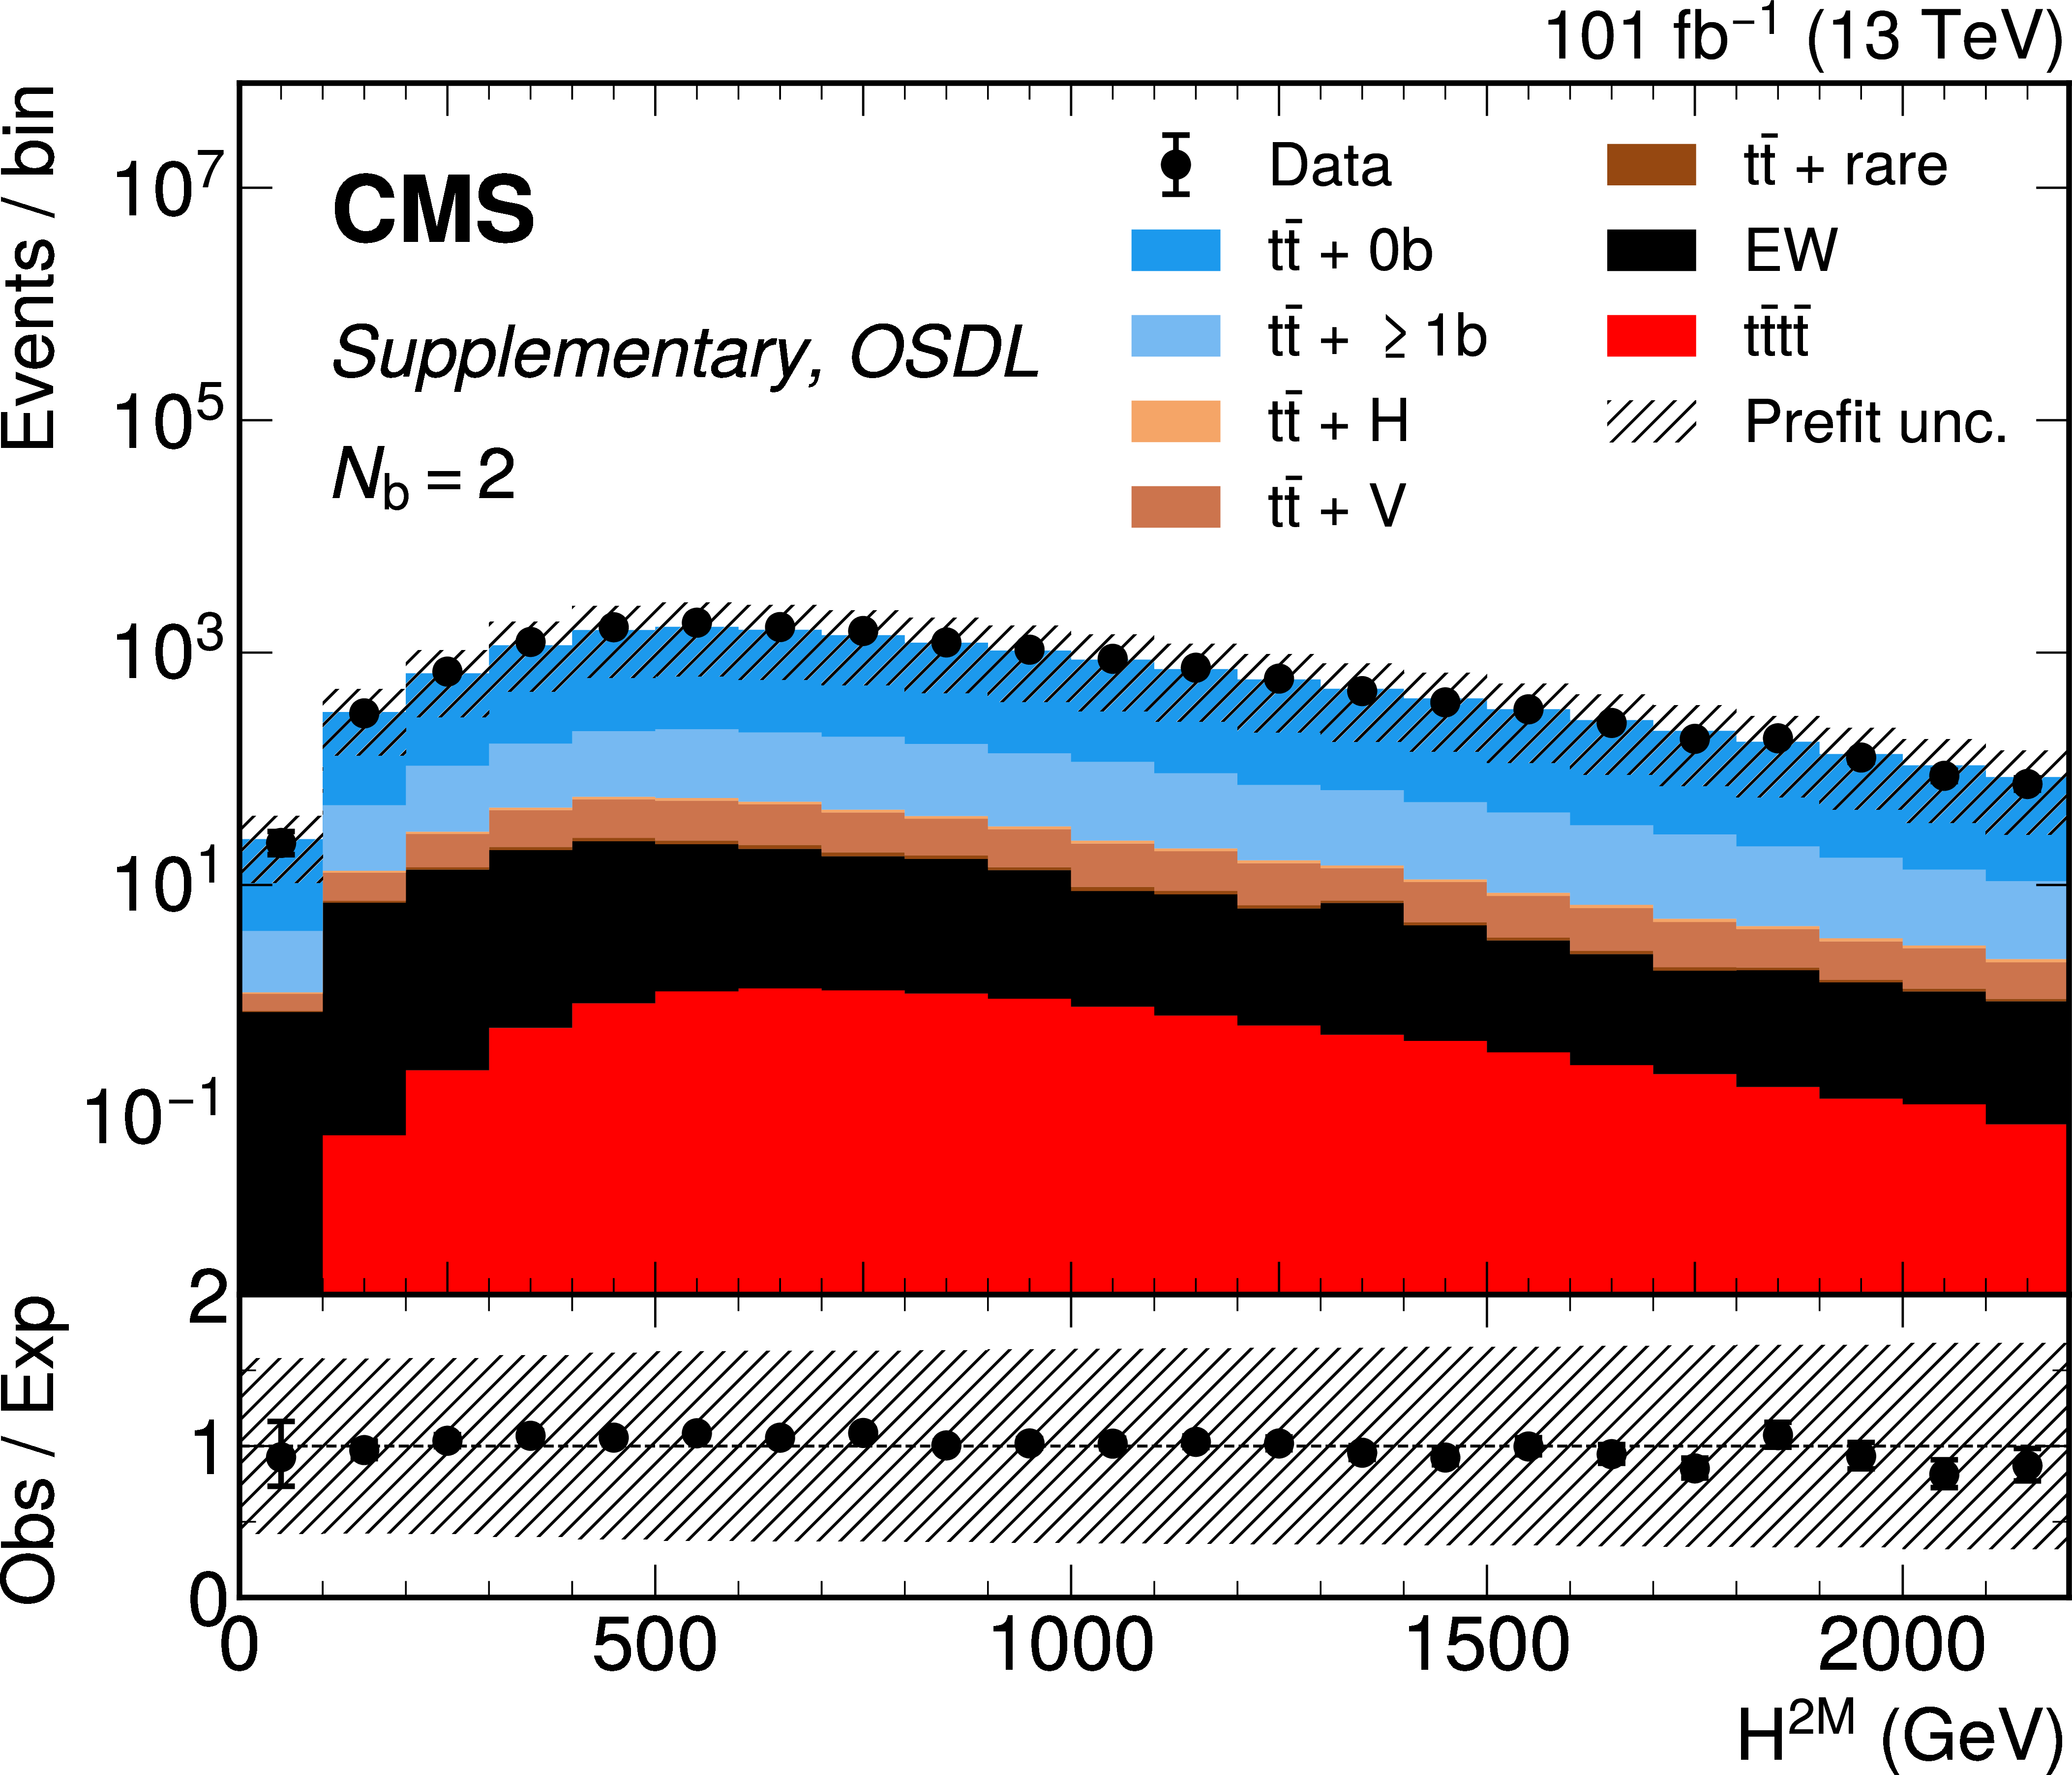
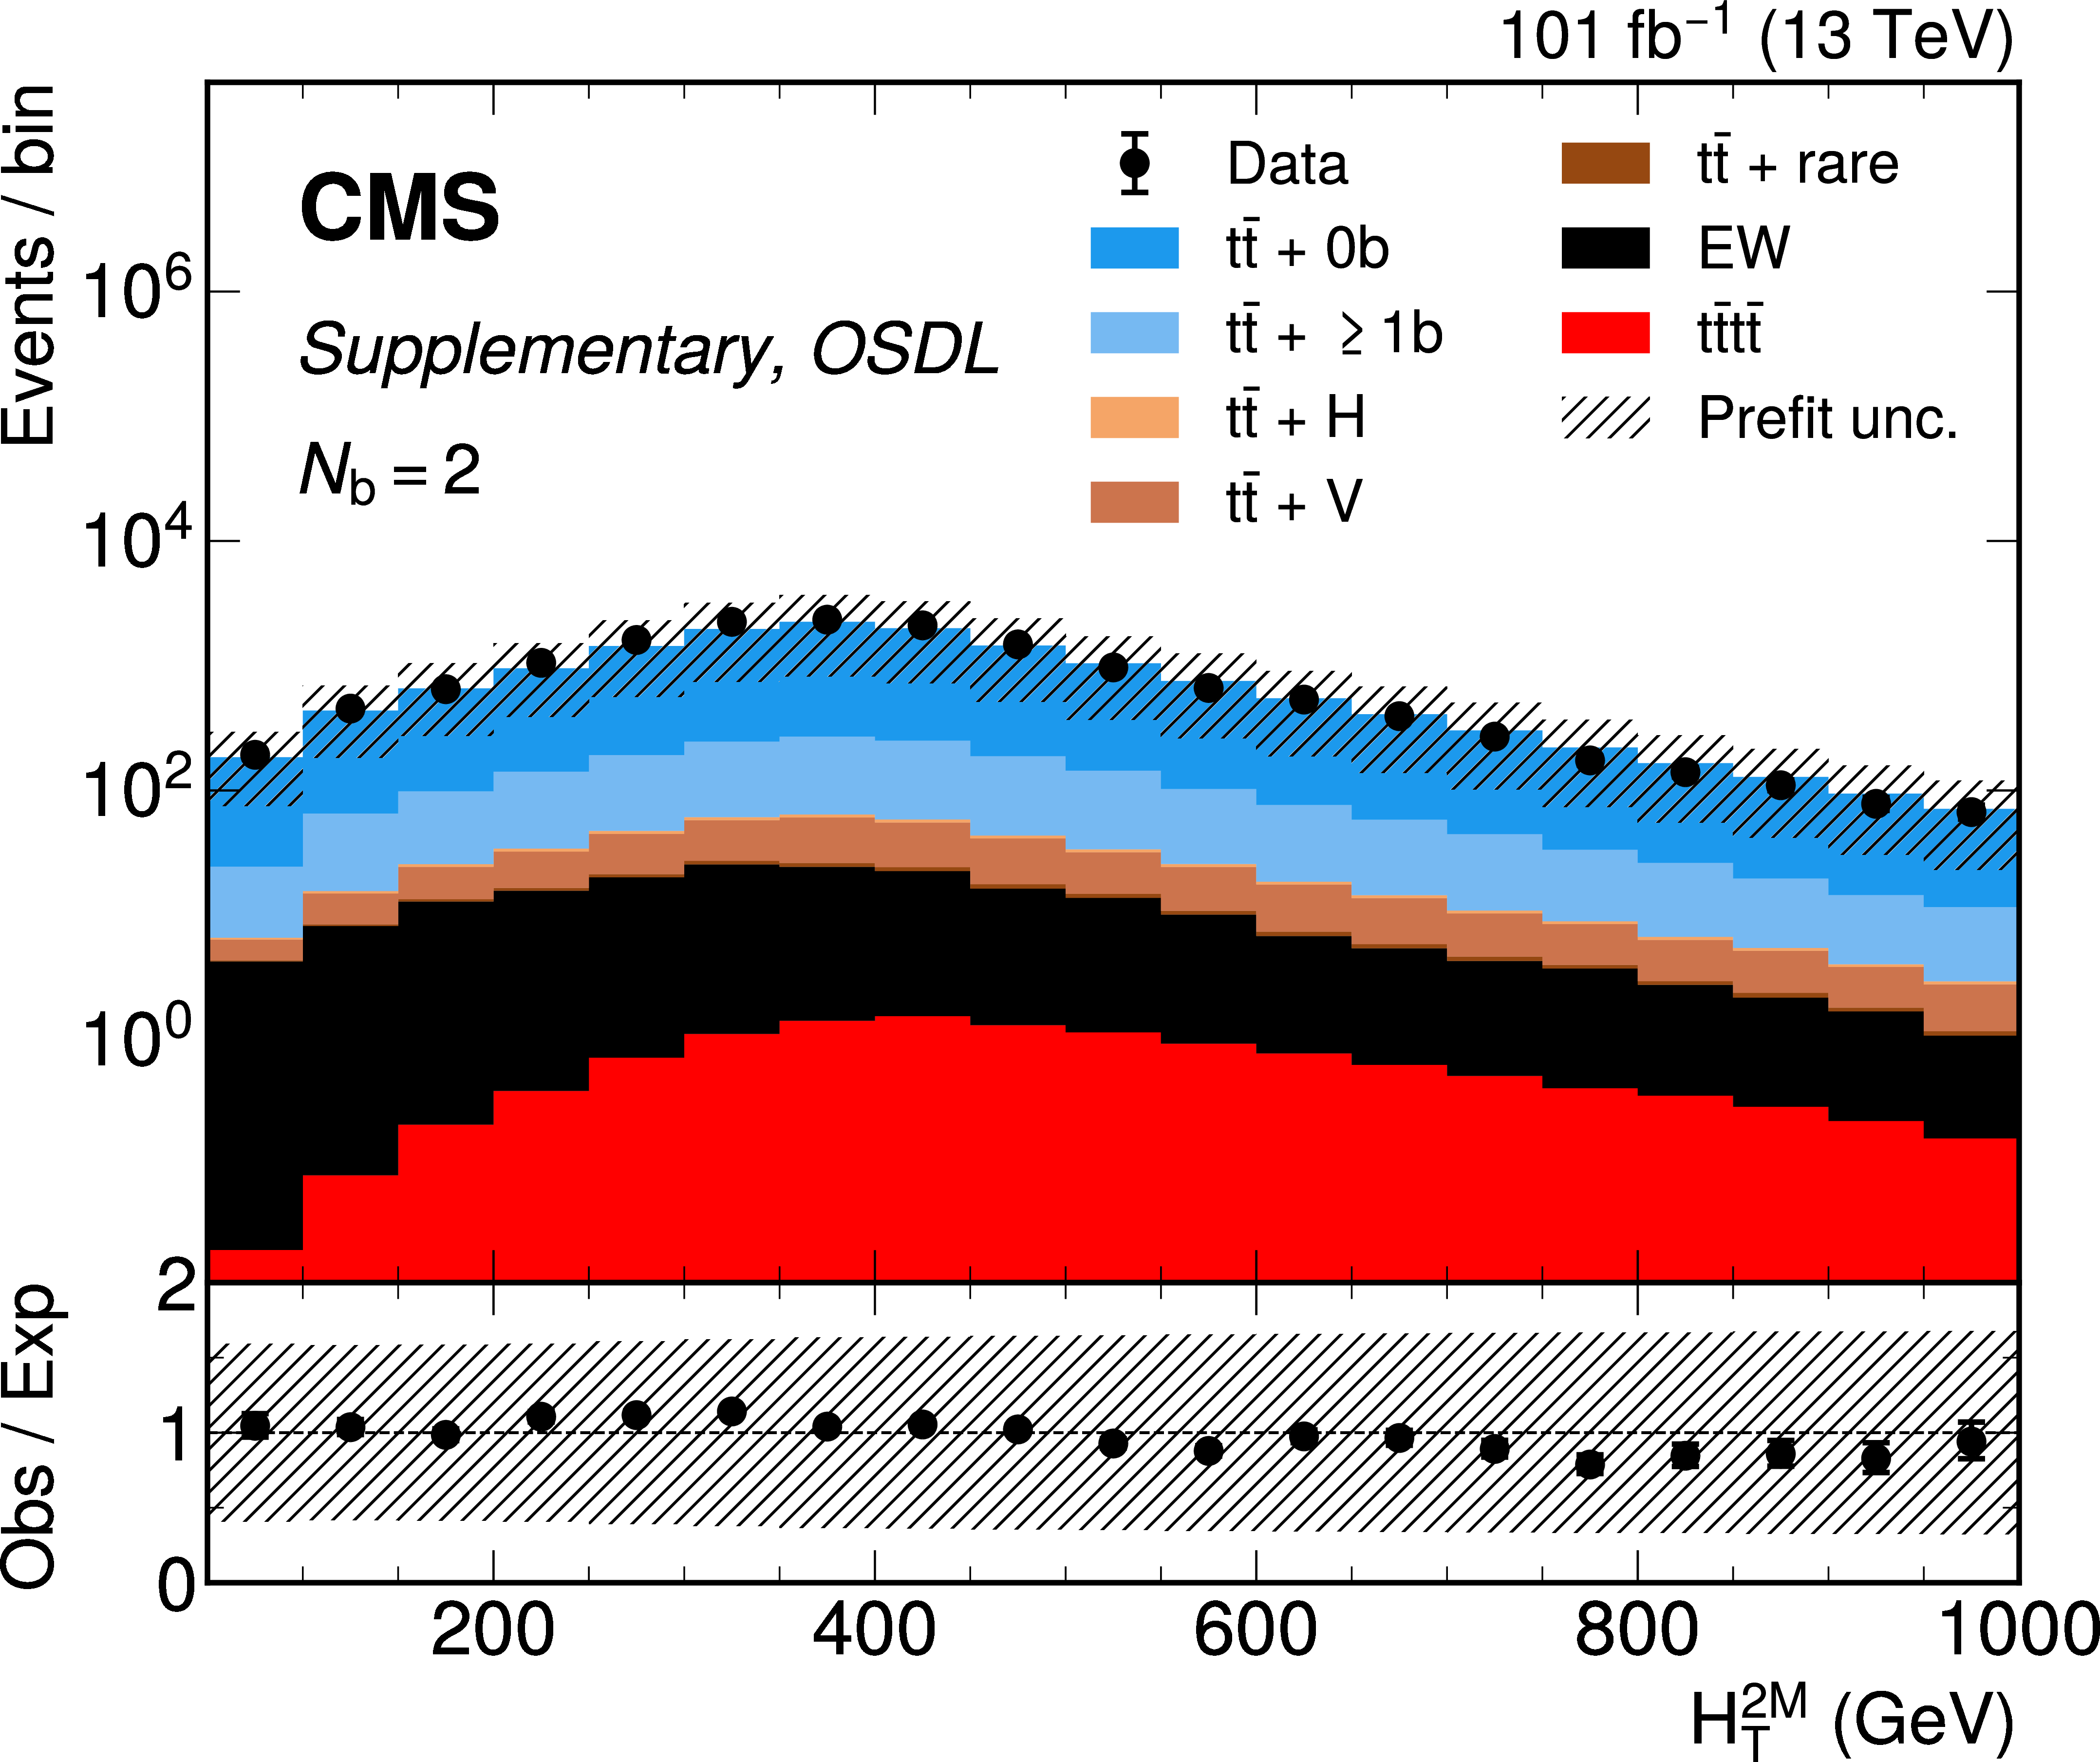
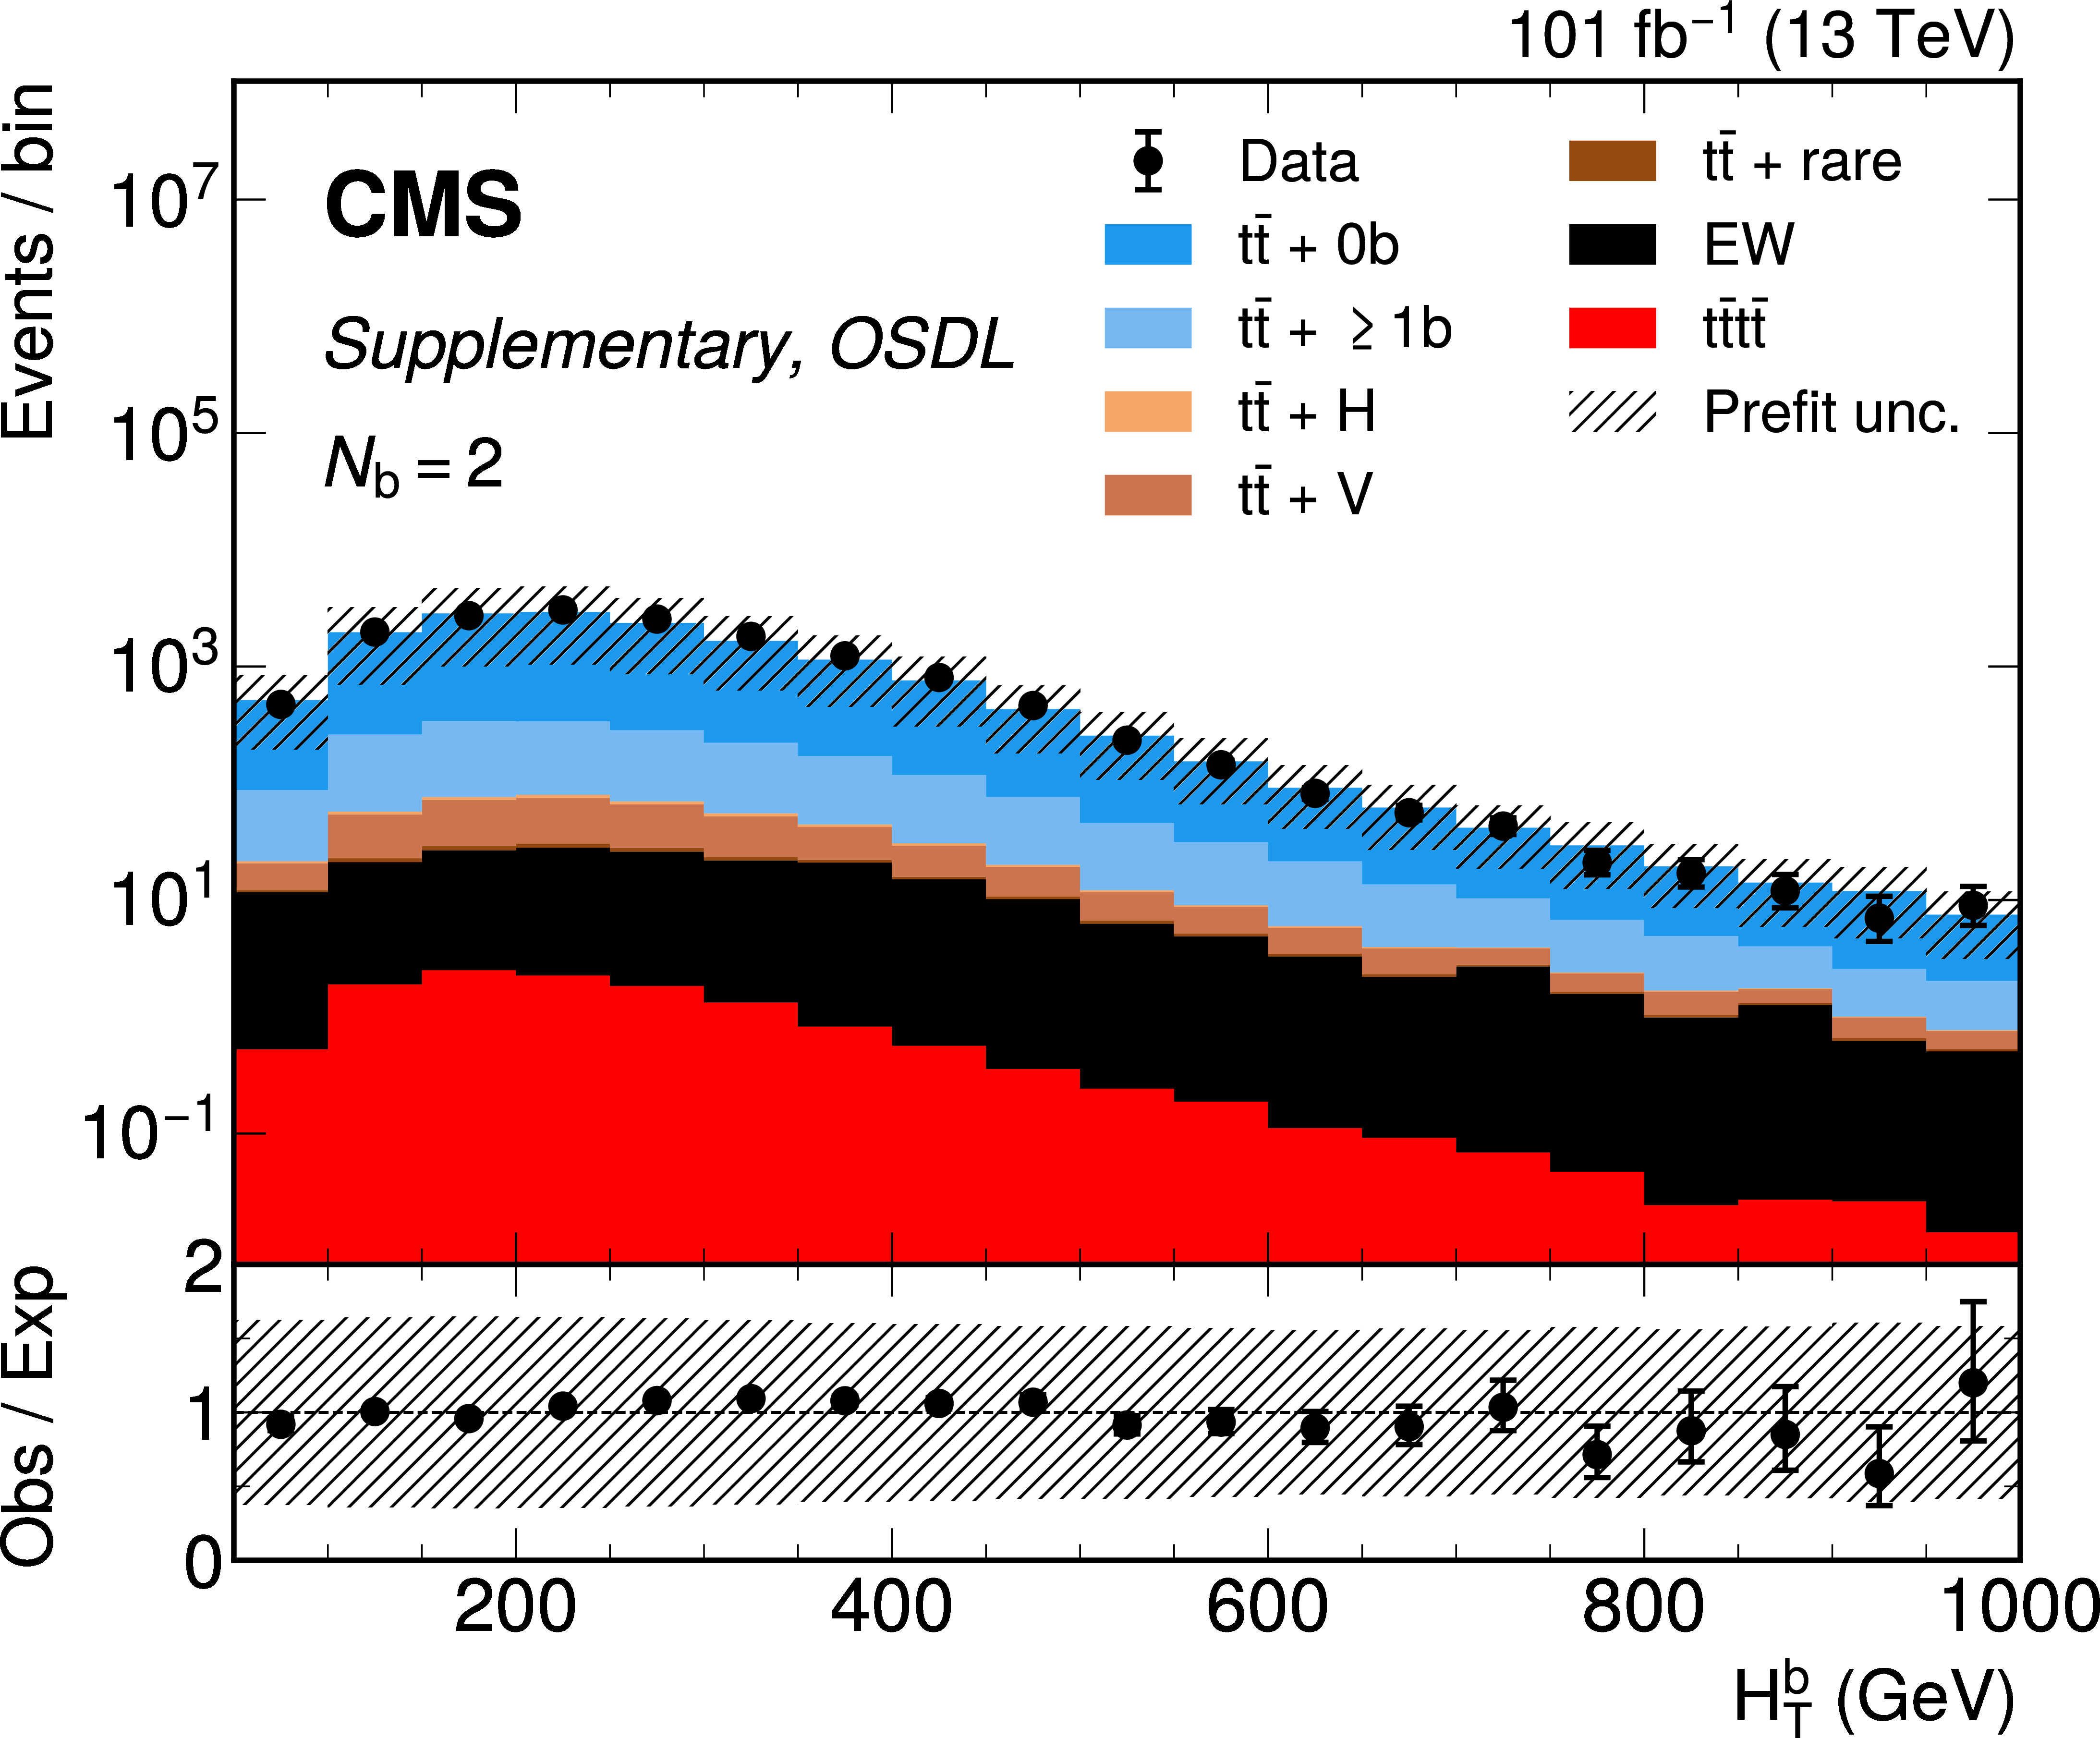
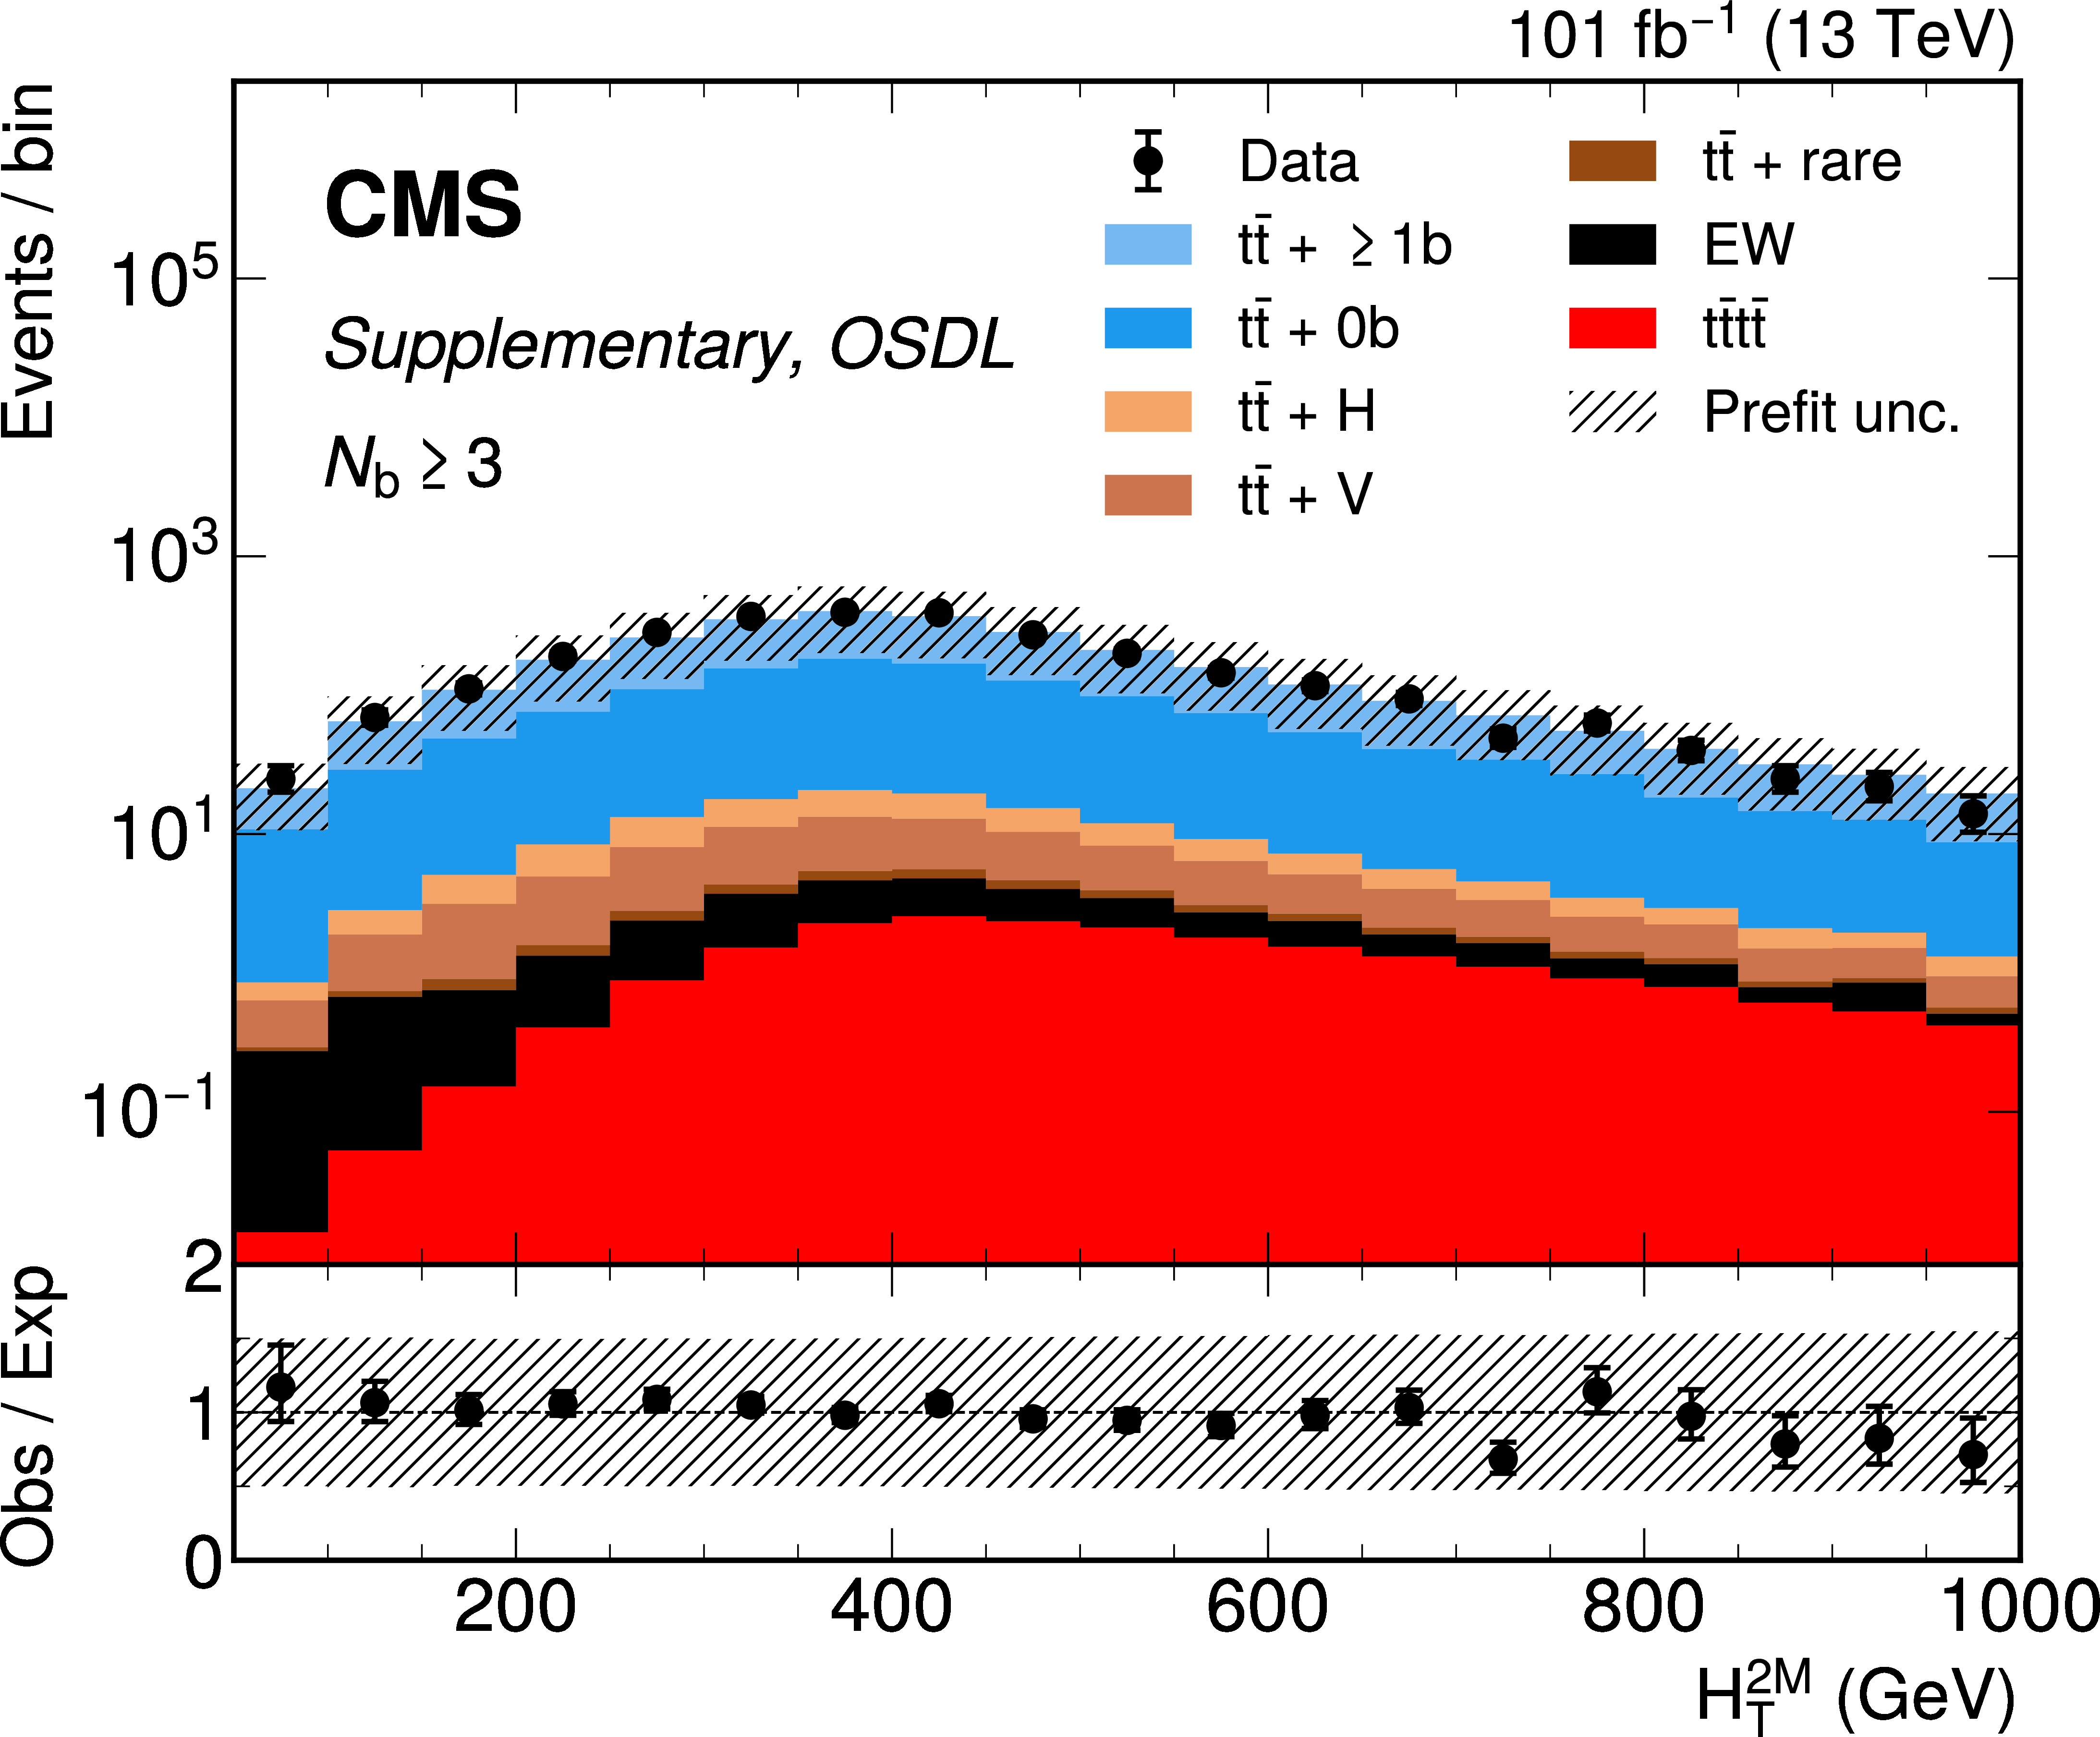
OSDL channel prefit distributions for $ N_\text{BT} = $ 2 jets categories. From left to right, top to bottom, are figures for the $ \Delta R $ between the 2 leading b-tagged jets; the $ \Delta R $ between the isolated leptons; the $ \eta $ and $ p_{\mathrm{T}} $ of the leading electron; the muon Particle Flow isolation (complete and charged components); the scalar sum of jet three-momenta and the scalar sum without the 2 leading b-tagged jets; the scalar sum of jet $ p_{\mathrm{T}} $ and scalar sum without the 2 leading b-tagged jets ($ H_T^{2M} $); the scalar sum of medium b-tagged jets' $ p_{\mathrm{T}} $ and the ratio of $ H_{\mathrm{T}} $ over $ H $. Background processes include $ \mathrm{t} \bar{\mathrm{t}} $ + V (V = W, Z) and $ \mathrm{t} \bar{\mathrm{t}} $ + H in which $ \mathrm{t} \bar{\mathrm{t}} $ is produced in association with 1 massive boson, $ \mathrm{t} \bar{\mathrm{t}} $ events with zero ($ {\mathrm{t}\bar{\mathrm{t}}} + 0 \mathrm{b} $) or at least one additional b jet ($ {\mathrm{t}\bar{\mathrm{t}}} +\geq 1 \mathrm{b} $). Events with W or Z but no top quarks are referred to as EW, and $ \mathrm{t} \bar{\mathrm{t}} $ + rare includes $ \mathrm{t} \bar{\mathrm{t}} $ production in associaton with two massive bosons or a third (anti)top quark. |
png pdf |
Additional Figure 13-a:
OSDL channel prefit distributions for $ N_\text{BT} = $ 2 jets categories. From left to right, top to bottom, are figures for the $ \Delta R $ between the 2 leading b-tagged jets; the $ \Delta R $ between the isolated leptons; the $ \eta $ and $ p_{\mathrm{T}} $ of the leading electron; the muon Particle Flow isolation (complete and charged components); the scalar sum of jet three-momenta and the scalar sum without the 2 leading b-tagged jets; the scalar sum of jet $ p_{\mathrm{T}} $ and scalar sum without the 2 leading b-tagged jets ($ H_T^{2M} $); the scalar sum of medium b-tagged jets' $ p_{\mathrm{T}} $ and the ratio of $ H_{\mathrm{T}} $ over $ H $. Background processes include $ \mathrm{t} \bar{\mathrm{t}} $ + V (V = W, Z) and $ \mathrm{t} \bar{\mathrm{t}} $ + H in which $ \mathrm{t} \bar{\mathrm{t}} $ is produced in association with 1 massive boson, $ \mathrm{t} \bar{\mathrm{t}} $ events with zero ($ {\mathrm{t}\bar{\mathrm{t}}} + 0 \mathrm{b} $) or at least one additional b jet ($ {\mathrm{t}\bar{\mathrm{t}}} +\geq 1 \mathrm{b} $). Events with W or Z but no top quarks are referred to as EW, and $ \mathrm{t} \bar{\mathrm{t}} $ + rare includes $ \mathrm{t} \bar{\mathrm{t}} $ production in associaton with two massive bosons or a third (anti)top quark. |
png pdf |
Additional Figure 13-b:
OSDL channel prefit distributions for $ N_\text{BT} = $ 2 jets categories. From left to right, top to bottom, are figures for the $ \Delta R $ between the 2 leading b-tagged jets; the $ \Delta R $ between the isolated leptons; the $ \eta $ and $ p_{\mathrm{T}} $ of the leading electron; the muon Particle Flow isolation (complete and charged components); the scalar sum of jet three-momenta and the scalar sum without the 2 leading b-tagged jets; the scalar sum of jet $ p_{\mathrm{T}} $ and scalar sum without the 2 leading b-tagged jets ($ H_T^{2M} $); the scalar sum of medium b-tagged jets' $ p_{\mathrm{T}} $ and the ratio of $ H_{\mathrm{T}} $ over $ H $. Background processes include $ \mathrm{t} \bar{\mathrm{t}} $ + V (V = W, Z) and $ \mathrm{t} \bar{\mathrm{t}} $ + H in which $ \mathrm{t} \bar{\mathrm{t}} $ is produced in association with 1 massive boson, $ \mathrm{t} \bar{\mathrm{t}} $ events with zero ($ {\mathrm{t}\bar{\mathrm{t}}} + 0 \mathrm{b} $) or at least one additional b jet ($ {\mathrm{t}\bar{\mathrm{t}}} +\geq 1 \mathrm{b} $). Events with W or Z but no top quarks are referred to as EW, and $ \mathrm{t} \bar{\mathrm{t}} $ + rare includes $ \mathrm{t} \bar{\mathrm{t}} $ production in associaton with two massive bosons or a third (anti)top quark. |
png pdf |
Additional Figure 13-c:
OSDL channel prefit distributions for $ N_\text{BT} = $ 2 jets categories. From left to right, top to bottom, are figures for the $ \Delta R $ between the 2 leading b-tagged jets; the $ \Delta R $ between the isolated leptons; the $ \eta $ and $ p_{\mathrm{T}} $ of the leading electron; the muon Particle Flow isolation (complete and charged components); the scalar sum of jet three-momenta and the scalar sum without the 2 leading b-tagged jets; the scalar sum of jet $ p_{\mathrm{T}} $ and scalar sum without the 2 leading b-tagged jets ($ H_T^{2M} $); the scalar sum of medium b-tagged jets' $ p_{\mathrm{T}} $ and the ratio of $ H_{\mathrm{T}} $ over $ H $. Background processes include $ \mathrm{t} \bar{\mathrm{t}} $ + V (V = W, Z) and $ \mathrm{t} \bar{\mathrm{t}} $ + H in which $ \mathrm{t} \bar{\mathrm{t}} $ is produced in association with 1 massive boson, $ \mathrm{t} \bar{\mathrm{t}} $ events with zero ($ {\mathrm{t}\bar{\mathrm{t}}} + 0 \mathrm{b} $) or at least one additional b jet ($ {\mathrm{t}\bar{\mathrm{t}}} +\geq 1 \mathrm{b} $). Events with W or Z but no top quarks are referred to as EW, and $ \mathrm{t} \bar{\mathrm{t}} $ + rare includes $ \mathrm{t} \bar{\mathrm{t}} $ production in associaton with two massive bosons or a third (anti)top quark. |

png pdf |
Additional Figure 13-d:
OSDL channel prefit distributions for $ N_\text{BT} = $ 2 jets categories. From left to right, top to bottom, are figures for the $ \Delta R $ between the 2 leading b-tagged jets; the $ \Delta R $ between the isolated leptons; the $ \eta $ and $ p_{\mathrm{T}} $ of the leading electron; the muon Particle Flow isolation (complete and charged components); the scalar sum of jet three-momenta and the scalar sum without the 2 leading b-tagged jets; the scalar sum of jet $ p_{\mathrm{T}} $ and scalar sum without the 2 leading b-tagged jets ($ H_T^{2M} $); the scalar sum of medium b-tagged jets' $ p_{\mathrm{T}} $ and the ratio of $ H_{\mathrm{T}} $ over $ H $. Background processes include $ \mathrm{t} \bar{\mathrm{t}} $ + V (V = W, Z) and $ \mathrm{t} \bar{\mathrm{t}} $ + H in which $ \mathrm{t} \bar{\mathrm{t}} $ is produced in association with 1 massive boson, $ \mathrm{t} \bar{\mathrm{t}} $ events with zero ($ {\mathrm{t}\bar{\mathrm{t}}} + 0 \mathrm{b} $) or at least one additional b jet ($ {\mathrm{t}\bar{\mathrm{t}}} +\geq 1 \mathrm{b} $). Events with W or Z but no top quarks are referred to as EW, and $ \mathrm{t} \bar{\mathrm{t}} $ + rare includes $ \mathrm{t} \bar{\mathrm{t}} $ production in associaton with two massive bosons or a third (anti)top quark. |
png pdf |
Additional Figure 13-e:
OSDL channel prefit distributions for $ N_\text{BT} = $ 2 jets categories. From left to right, top to bottom, are figures for the $ \Delta R $ between the 2 leading b-tagged jets; the $ \Delta R $ between the isolated leptons; the $ \eta $ and $ p_{\mathrm{T}} $ of the leading electron; the muon Particle Flow isolation (complete and charged components); the scalar sum of jet three-momenta and the scalar sum without the 2 leading b-tagged jets; the scalar sum of jet $ p_{\mathrm{T}} $ and scalar sum without the 2 leading b-tagged jets ($ H_T^{2M} $); the scalar sum of medium b-tagged jets' $ p_{\mathrm{T}} $ and the ratio of $ H_{\mathrm{T}} $ over $ H $. Background processes include $ \mathrm{t} \bar{\mathrm{t}} $ + V (V = W, Z) and $ \mathrm{t} \bar{\mathrm{t}} $ + H in which $ \mathrm{t} \bar{\mathrm{t}} $ is produced in association with 1 massive boson, $ \mathrm{t} \bar{\mathrm{t}} $ events with zero ($ {\mathrm{t}\bar{\mathrm{t}}} + 0 \mathrm{b} $) or at least one additional b jet ($ {\mathrm{t}\bar{\mathrm{t}}} +\geq 1 \mathrm{b} $). Events with W or Z but no top quarks are referred to as EW, and $ \mathrm{t} \bar{\mathrm{t}} $ + rare includes $ \mathrm{t} \bar{\mathrm{t}} $ production in associaton with two massive bosons or a third (anti)top quark. |
png pdf |
Additional Figure 13-f:
OSDL channel prefit distributions for $ N_\text{BT} = $ 2 jets categories. From left to right, top to bottom, are figures for the $ \Delta R $ between the 2 leading b-tagged jets; the $ \Delta R $ between the isolated leptons; the $ \eta $ and $ p_{\mathrm{T}} $ of the leading electron; the muon Particle Flow isolation (complete and charged components); the scalar sum of jet three-momenta and the scalar sum without the 2 leading b-tagged jets; the scalar sum of jet $ p_{\mathrm{T}} $ and scalar sum without the 2 leading b-tagged jets ($ H_T^{2M} $); the scalar sum of medium b-tagged jets' $ p_{\mathrm{T}} $ and the ratio of $ H_{\mathrm{T}} $ over $ H $. Background processes include $ \mathrm{t} \bar{\mathrm{t}} $ + V (V = W, Z) and $ \mathrm{t} \bar{\mathrm{t}} $ + H in which $ \mathrm{t} \bar{\mathrm{t}} $ is produced in association with 1 massive boson, $ \mathrm{t} \bar{\mathrm{t}} $ events with zero ($ {\mathrm{t}\bar{\mathrm{t}}} + 0 \mathrm{b} $) or at least one additional b jet ($ {\mathrm{t}\bar{\mathrm{t}}} +\geq 1 \mathrm{b} $). Events with W or Z but no top quarks are referred to as EW, and $ \mathrm{t} \bar{\mathrm{t}} $ + rare includes $ \mathrm{t} \bar{\mathrm{t}} $ production in associaton with two massive bosons or a third (anti)top quark. |
png pdf |
Additional Figure 13-g:
OSDL channel prefit distributions for $ N_\text{BT} = $ 2 jets categories. From left to right, top to bottom, are figures for the $ \Delta R $ between the 2 leading b-tagged jets; the $ \Delta R $ between the isolated leptons; the $ \eta $ and $ p_{\mathrm{T}} $ of the leading electron; the muon Particle Flow isolation (complete and charged components); the scalar sum of jet three-momenta and the scalar sum without the 2 leading b-tagged jets; the scalar sum of jet $ p_{\mathrm{T}} $ and scalar sum without the 2 leading b-tagged jets ($ H_T^{2M} $); the scalar sum of medium b-tagged jets' $ p_{\mathrm{T}} $ and the ratio of $ H_{\mathrm{T}} $ over $ H $. Background processes include $ \mathrm{t} \bar{\mathrm{t}} $ + V (V = W, Z) and $ \mathrm{t} \bar{\mathrm{t}} $ + H in which $ \mathrm{t} \bar{\mathrm{t}} $ is produced in association with 1 massive boson, $ \mathrm{t} \bar{\mathrm{t}} $ events with zero ($ {\mathrm{t}\bar{\mathrm{t}}} + 0 \mathrm{b} $) or at least one additional b jet ($ {\mathrm{t}\bar{\mathrm{t}}} +\geq 1 \mathrm{b} $). Events with W or Z but no top quarks are referred to as EW, and $ \mathrm{t} \bar{\mathrm{t}} $ + rare includes $ \mathrm{t} \bar{\mathrm{t}} $ production in associaton with two massive bosons or a third (anti)top quark. |
png pdf |
Additional Figure 13-h:
OSDL channel prefit distributions for $ N_\text{BT} = $ 2 jets categories. From left to right, top to bottom, are figures for the $ \Delta R $ between the 2 leading b-tagged jets; the $ \Delta R $ between the isolated leptons; the $ \eta $ and $ p_{\mathrm{T}} $ of the leading electron; the muon Particle Flow isolation (complete and charged components); the scalar sum of jet three-momenta and the scalar sum without the 2 leading b-tagged jets; the scalar sum of jet $ p_{\mathrm{T}} $ and scalar sum without the 2 leading b-tagged jets ($ H_T^{2M} $); the scalar sum of medium b-tagged jets' $ p_{\mathrm{T}} $ and the ratio of $ H_{\mathrm{T}} $ over $ H $. Background processes include $ \mathrm{t} \bar{\mathrm{t}} $ + V (V = W, Z) and $ \mathrm{t} \bar{\mathrm{t}} $ + H in which $ \mathrm{t} \bar{\mathrm{t}} $ is produced in association with 1 massive boson, $ \mathrm{t} \bar{\mathrm{t}} $ events with zero ($ {\mathrm{t}\bar{\mathrm{t}}} + 0 \mathrm{b} $) or at least one additional b jet ($ {\mathrm{t}\bar{\mathrm{t}}} +\geq 1 \mathrm{b} $). Events with W or Z but no top quarks are referred to as EW, and $ \mathrm{t} \bar{\mathrm{t}} $ + rare includes $ \mathrm{t} \bar{\mathrm{t}} $ production in associaton with two massive bosons or a third (anti)top quark. |

png pdf |
Additional Figure 13-i:
OSDL channel prefit distributions for $ N_\text{BT} = $ 2 jets categories. From left to right, top to bottom, are figures for the $ \Delta R $ between the 2 leading b-tagged jets; the $ \Delta R $ between the isolated leptons; the $ \eta $ and $ p_{\mathrm{T}} $ of the leading electron; the muon Particle Flow isolation (complete and charged components); the scalar sum of jet three-momenta and the scalar sum without the 2 leading b-tagged jets; the scalar sum of jet $ p_{\mathrm{T}} $ and scalar sum without the 2 leading b-tagged jets ($ H_T^{2M} $); the scalar sum of medium b-tagged jets' $ p_{\mathrm{T}} $ and the ratio of $ H_{\mathrm{T}} $ over $ H $. Background processes include $ \mathrm{t} \bar{\mathrm{t}} $ + V (V = W, Z) and $ \mathrm{t} \bar{\mathrm{t}} $ + H in which $ \mathrm{t} \bar{\mathrm{t}} $ is produced in association with 1 massive boson, $ \mathrm{t} \bar{\mathrm{t}} $ events with zero ($ {\mathrm{t}\bar{\mathrm{t}}} + 0 \mathrm{b} $) or at least one additional b jet ($ {\mathrm{t}\bar{\mathrm{t}}} +\geq 1 \mathrm{b} $). Events with W or Z but no top quarks are referred to as EW, and $ \mathrm{t} \bar{\mathrm{t}} $ + rare includes $ \mathrm{t} \bar{\mathrm{t}} $ production in associaton with two massive bosons or a third (anti)top quark. |
png pdf |
Additional Figure 13-j:
OSDL channel prefit distributions for $ N_\text{BT} = $ 2 jets categories. From left to right, top to bottom, are figures for the $ \Delta R $ between the 2 leading b-tagged jets; the $ \Delta R $ between the isolated leptons; the $ \eta $ and $ p_{\mathrm{T}} $ of the leading electron; the muon Particle Flow isolation (complete and charged components); the scalar sum of jet three-momenta and the scalar sum without the 2 leading b-tagged jets; the scalar sum of jet $ p_{\mathrm{T}} $ and scalar sum without the 2 leading b-tagged jets ($ H_T^{2M} $); the scalar sum of medium b-tagged jets' $ p_{\mathrm{T}} $ and the ratio of $ H_{\mathrm{T}} $ over $ H $. Background processes include $ \mathrm{t} \bar{\mathrm{t}} $ + V (V = W, Z) and $ \mathrm{t} \bar{\mathrm{t}} $ + H in which $ \mathrm{t} \bar{\mathrm{t}} $ is produced in association with 1 massive boson, $ \mathrm{t} \bar{\mathrm{t}} $ events with zero ($ {\mathrm{t}\bar{\mathrm{t}}} + 0 \mathrm{b} $) or at least one additional b jet ($ {\mathrm{t}\bar{\mathrm{t}}} +\geq 1 \mathrm{b} $). Events with W or Z but no top quarks are referred to as EW, and $ \mathrm{t} \bar{\mathrm{t}} $ + rare includes $ \mathrm{t} \bar{\mathrm{t}} $ production in associaton with two massive bosons or a third (anti)top quark. |
png pdf |
Additional Figure 13-k:
OSDL channel prefit distributions for $ N_\text{BT} = $ 2 jets categories. From left to right, top to bottom, are figures for the $ \Delta R $ between the 2 leading b-tagged jets; the $ \Delta R $ between the isolated leptons; the $ \eta $ and $ p_{\mathrm{T}} $ of the leading electron; the muon Particle Flow isolation (complete and charged components); the scalar sum of jet three-momenta and the scalar sum without the 2 leading b-tagged jets; the scalar sum of jet $ p_{\mathrm{T}} $ and scalar sum without the 2 leading b-tagged jets ($ H_T^{2M} $); the scalar sum of medium b-tagged jets' $ p_{\mathrm{T}} $ and the ratio of $ H_{\mathrm{T}} $ over $ H $. Background processes include $ \mathrm{t} \bar{\mathrm{t}} $ + V (V = W, Z) and $ \mathrm{t} \bar{\mathrm{t}} $ + H in which $ \mathrm{t} \bar{\mathrm{t}} $ is produced in association with 1 massive boson, $ \mathrm{t} \bar{\mathrm{t}} $ events with zero ($ {\mathrm{t}\bar{\mathrm{t}}} + 0 \mathrm{b} $) or at least one additional b jet ($ {\mathrm{t}\bar{\mathrm{t}}} +\geq 1 \mathrm{b} $). Events with W or Z but no top quarks are referred to as EW, and $ \mathrm{t} \bar{\mathrm{t}} $ + rare includes $ \mathrm{t} \bar{\mathrm{t}} $ production in associaton with two massive bosons or a third (anti)top quark. |
png pdf |
Additional Figure 13-l:
OSDL channel prefit distributions for $ N_\text{BT} = $ 2 jets categories. From left to right, top to bottom, are figures for the $ \Delta R $ between the 2 leading b-tagged jets; the $ \Delta R $ between the isolated leptons; the $ \eta $ and $ p_{\mathrm{T}} $ of the leading electron; the muon Particle Flow isolation (complete and charged components); the scalar sum of jet three-momenta and the scalar sum without the 2 leading b-tagged jets; the scalar sum of jet $ p_{\mathrm{T}} $ and scalar sum without the 2 leading b-tagged jets ($ H_T^{2M} $); the scalar sum of medium b-tagged jets' $ p_{\mathrm{T}} $ and the ratio of $ H_{\mathrm{T}} $ over $ H $. Background processes include $ \mathrm{t} \bar{\mathrm{t}} $ + V (V = W, Z) and $ \mathrm{t} \bar{\mathrm{t}} $ + H in which $ \mathrm{t} \bar{\mathrm{t}} $ is produced in association with 1 massive boson, $ \mathrm{t} \bar{\mathrm{t}} $ events with zero ($ {\mathrm{t}\bar{\mathrm{t}}} + 0 \mathrm{b} $) or at least one additional b jet ($ {\mathrm{t}\bar{\mathrm{t}}} +\geq 1 \mathrm{b} $). Events with W or Z but no top quarks are referred to as EW, and $ \mathrm{t} \bar{\mathrm{t}} $ + rare includes $ \mathrm{t} \bar{\mathrm{t}} $ production in associaton with two massive bosons or a third (anti)top quark. |
png pdf |
Additional Figure 14:
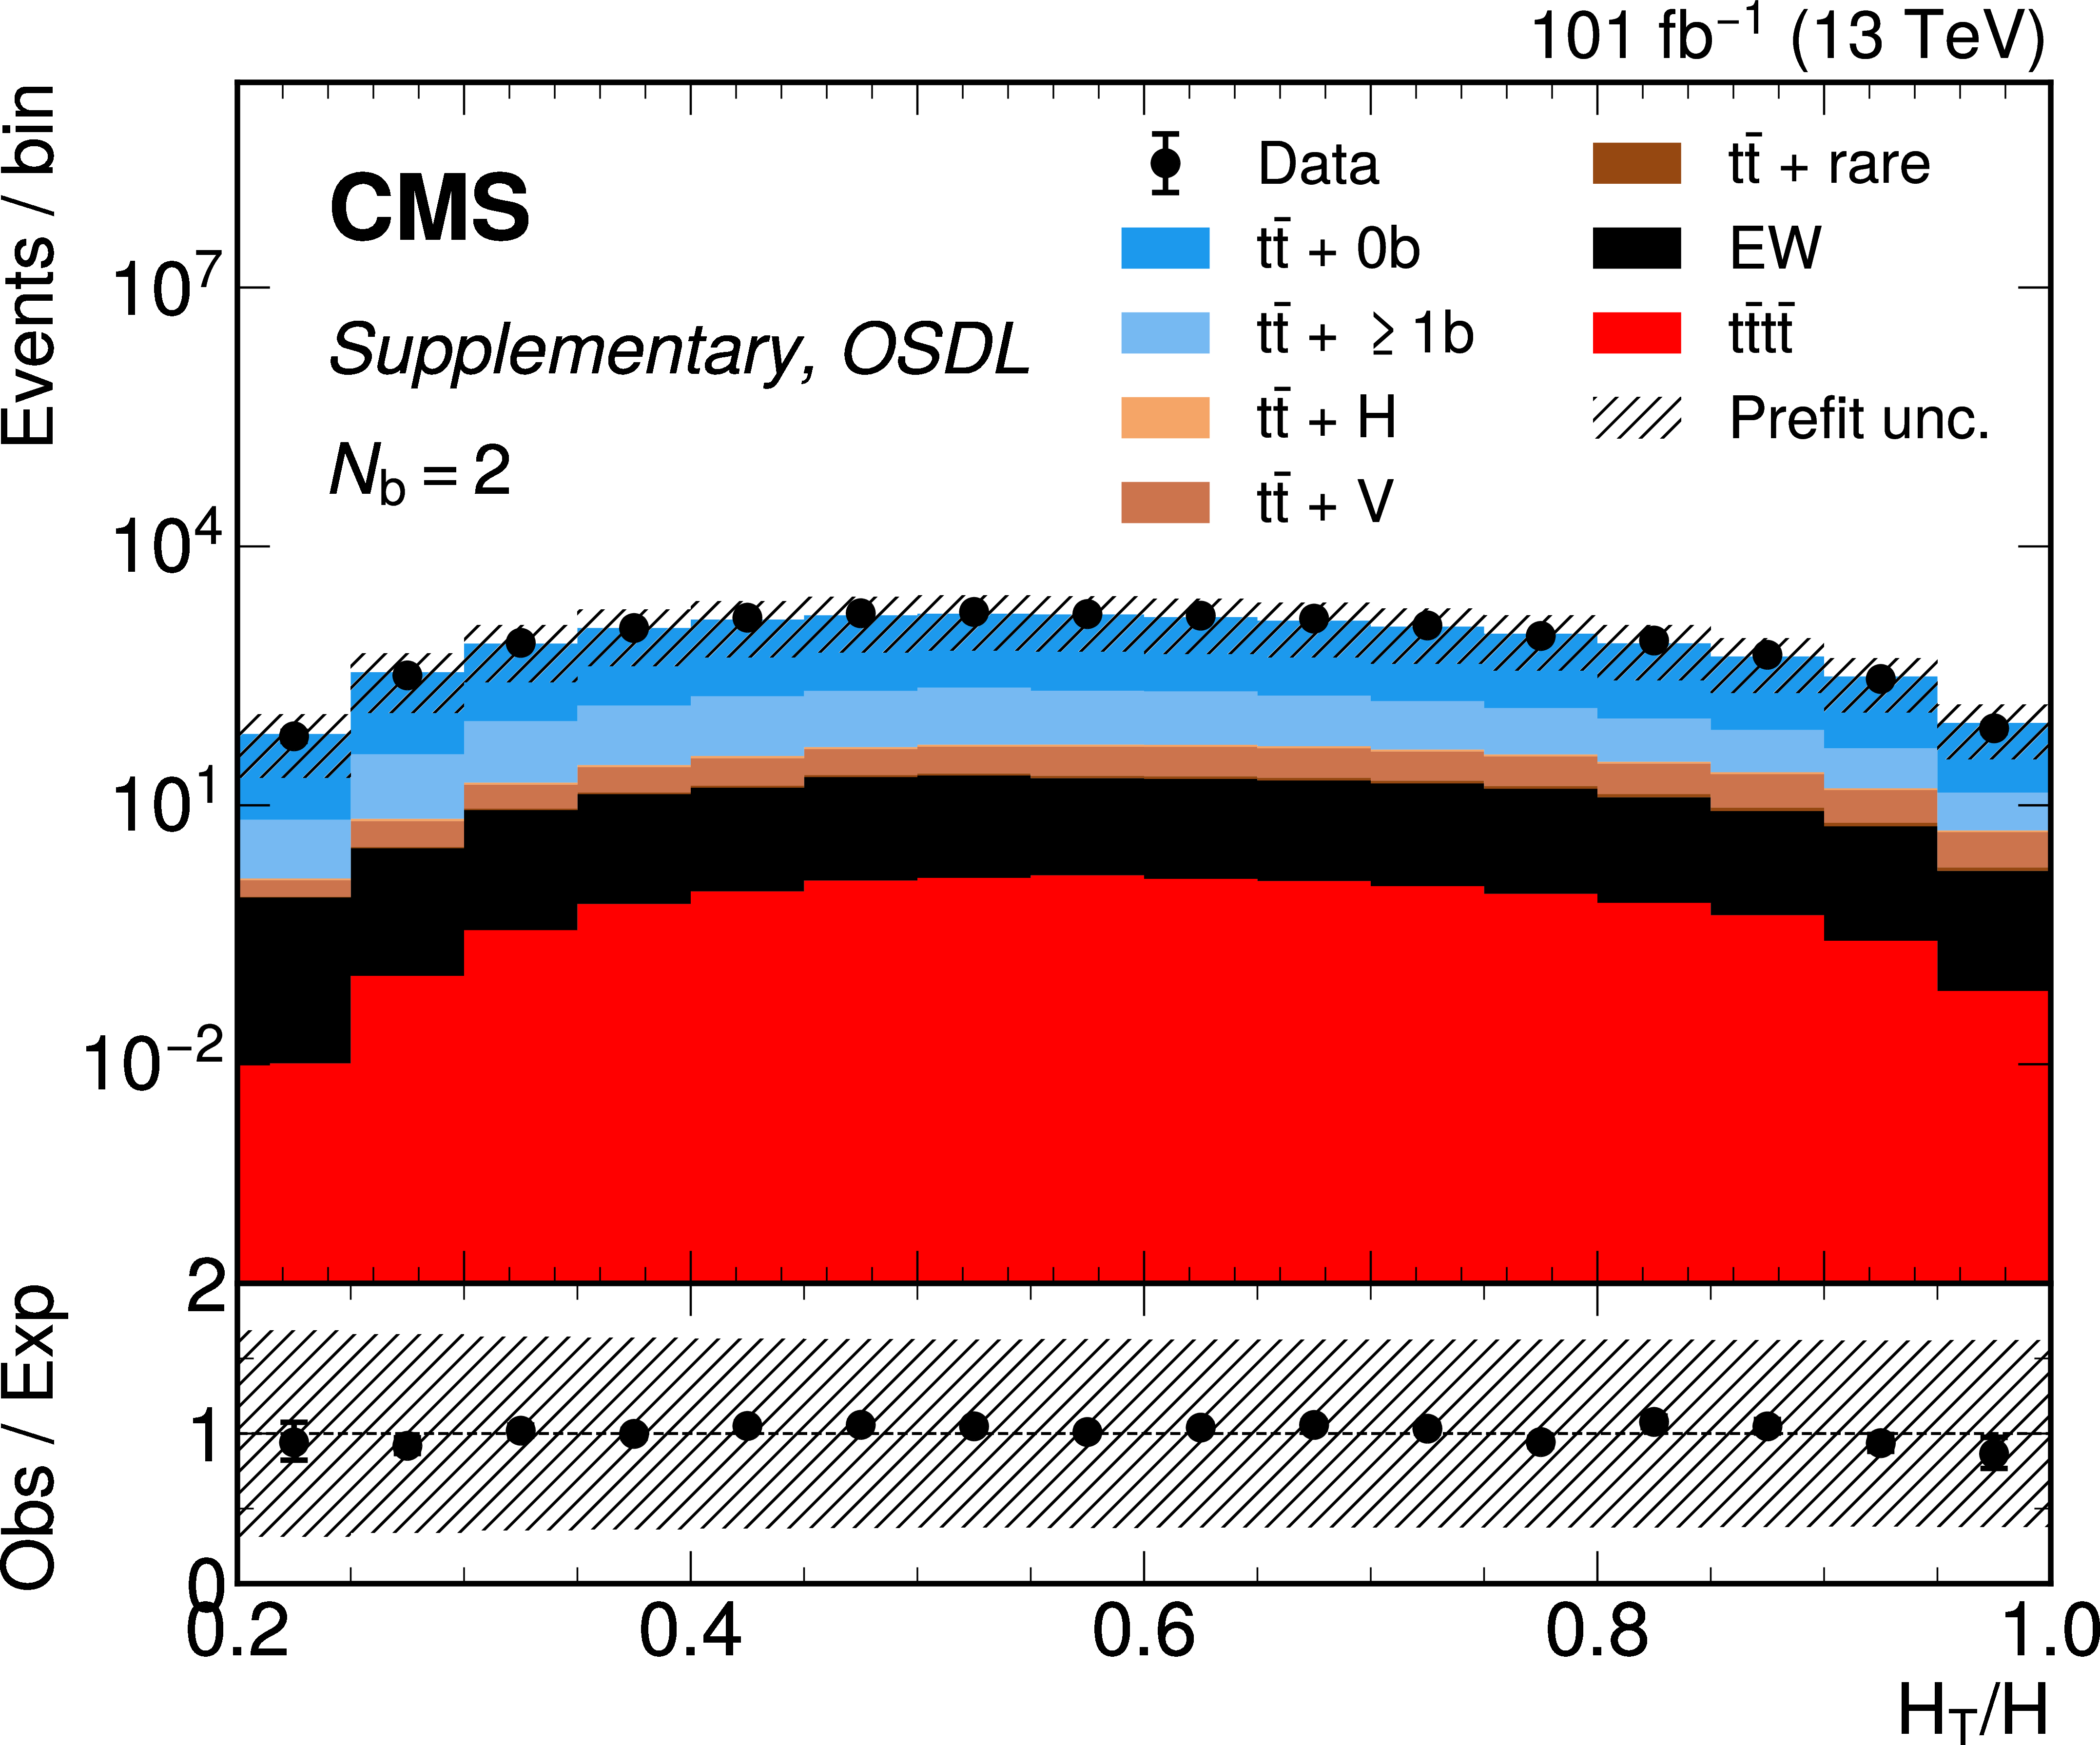
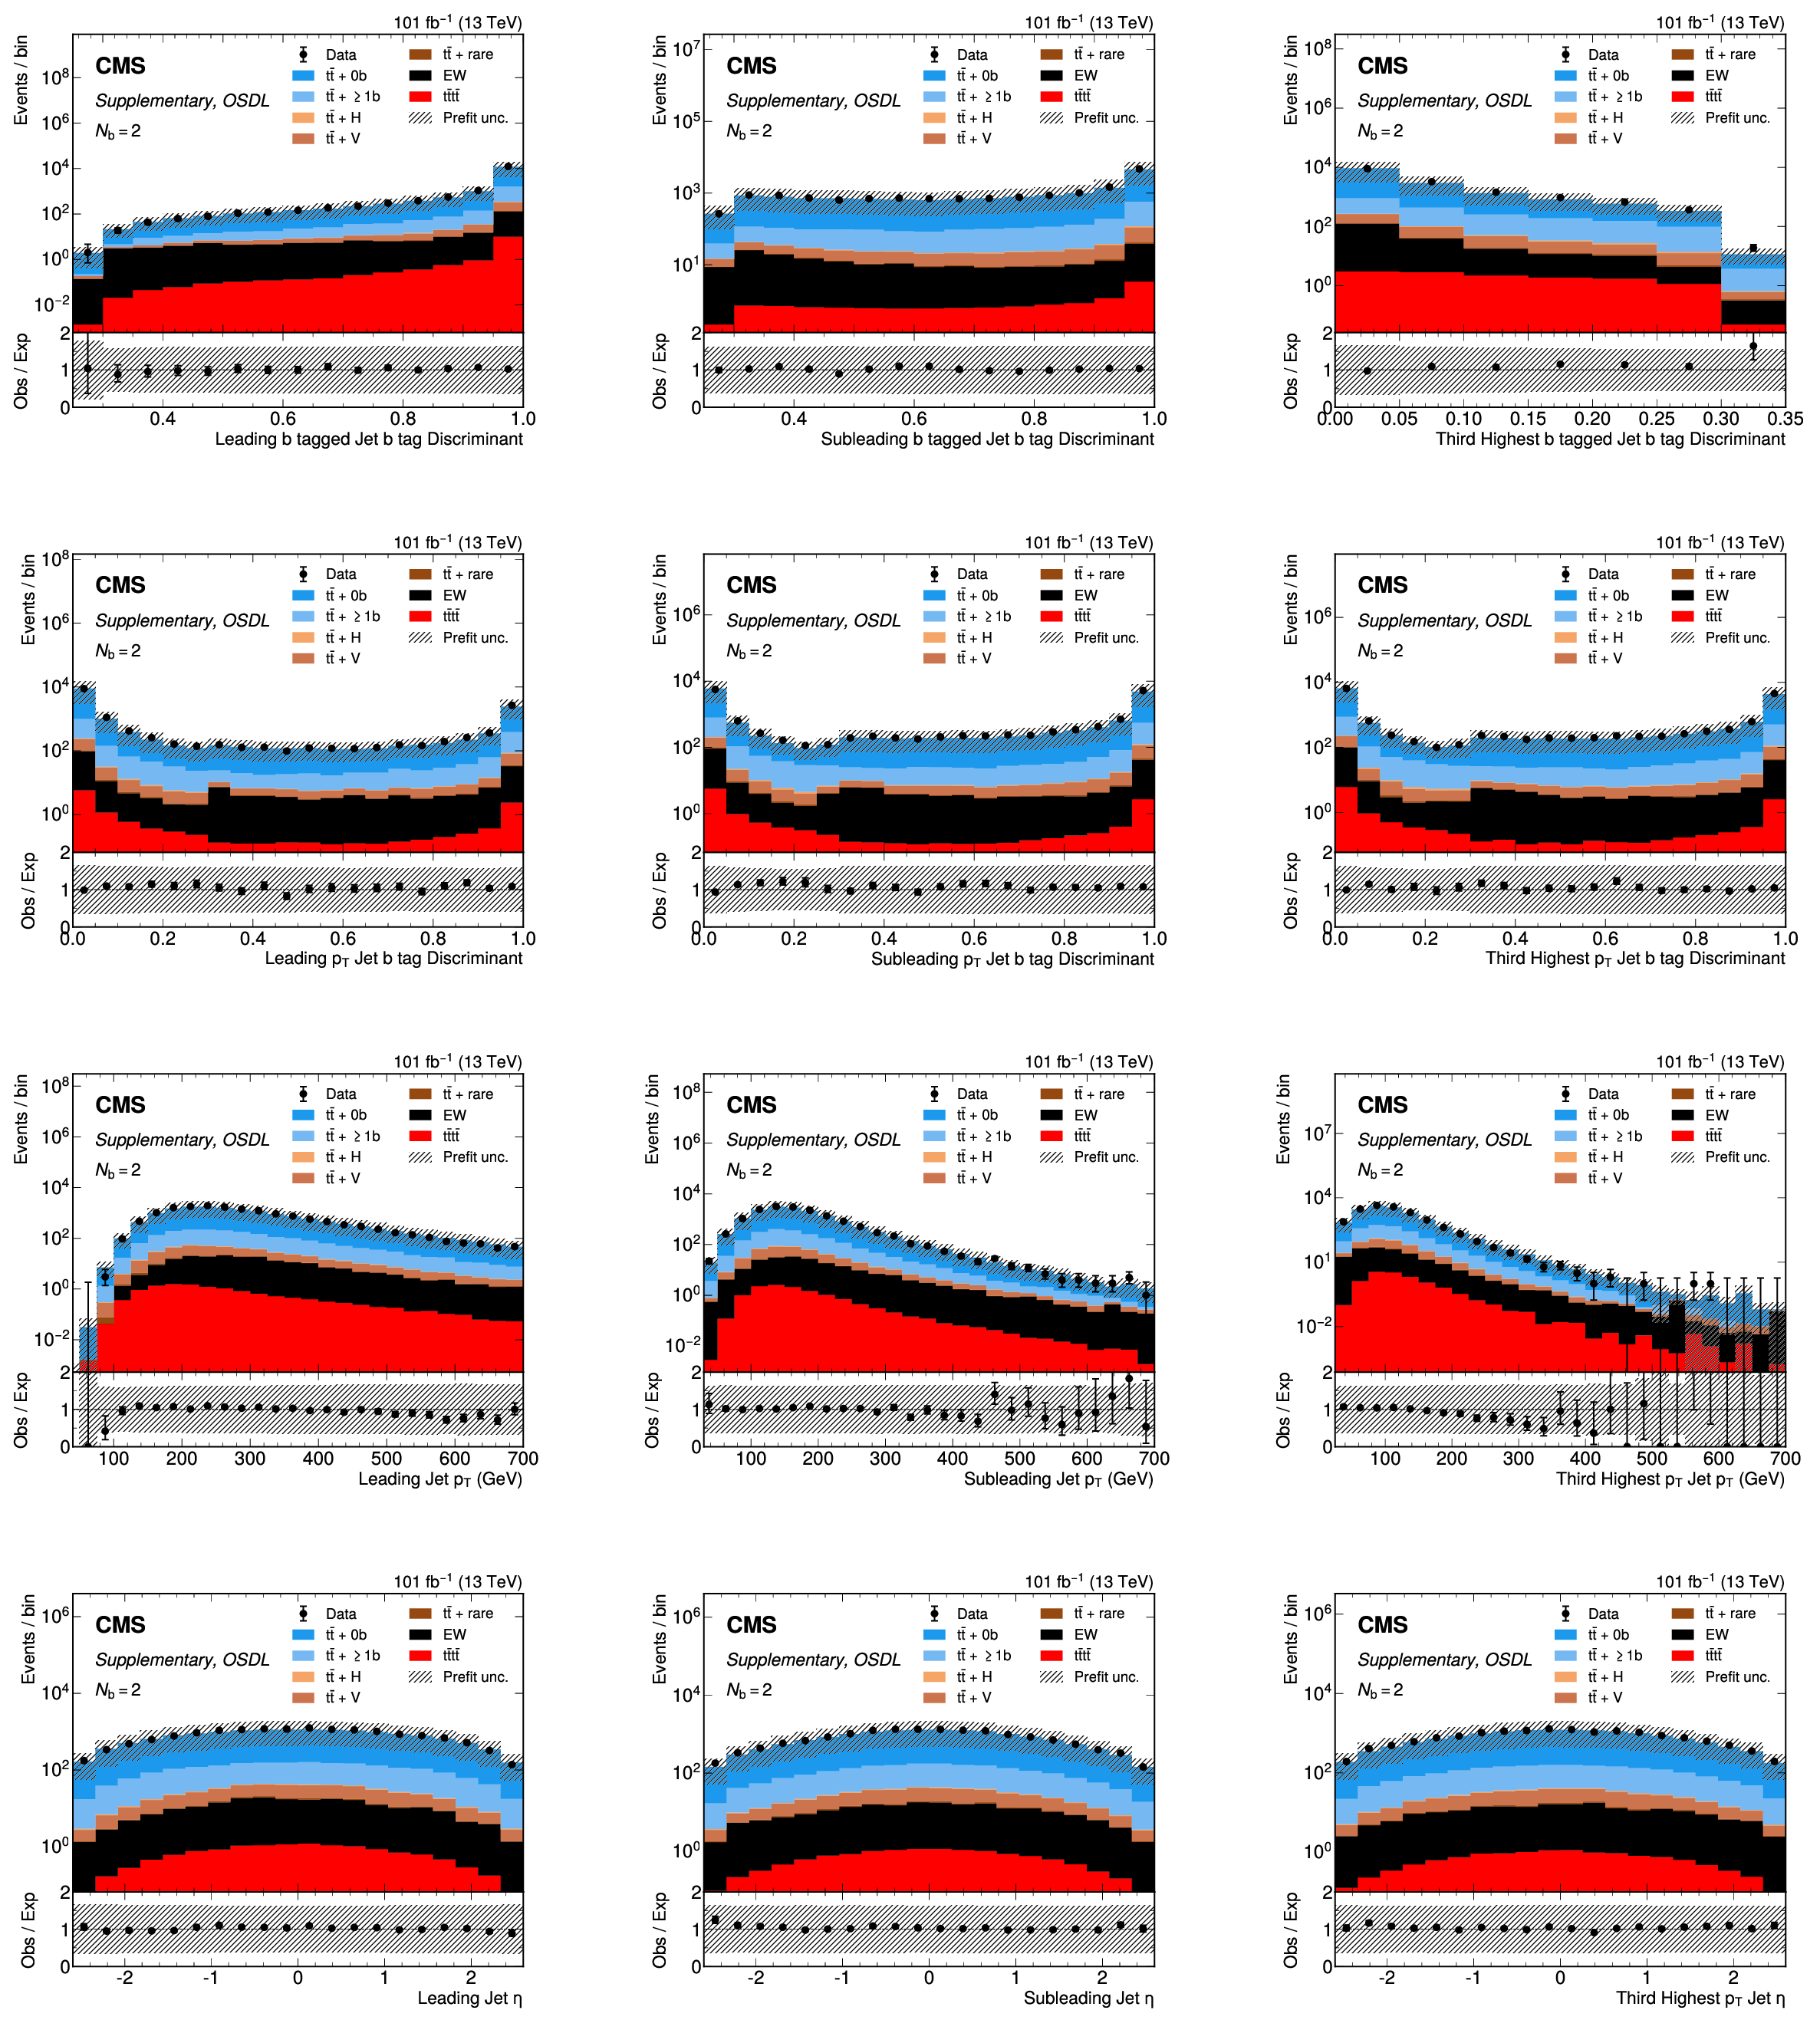
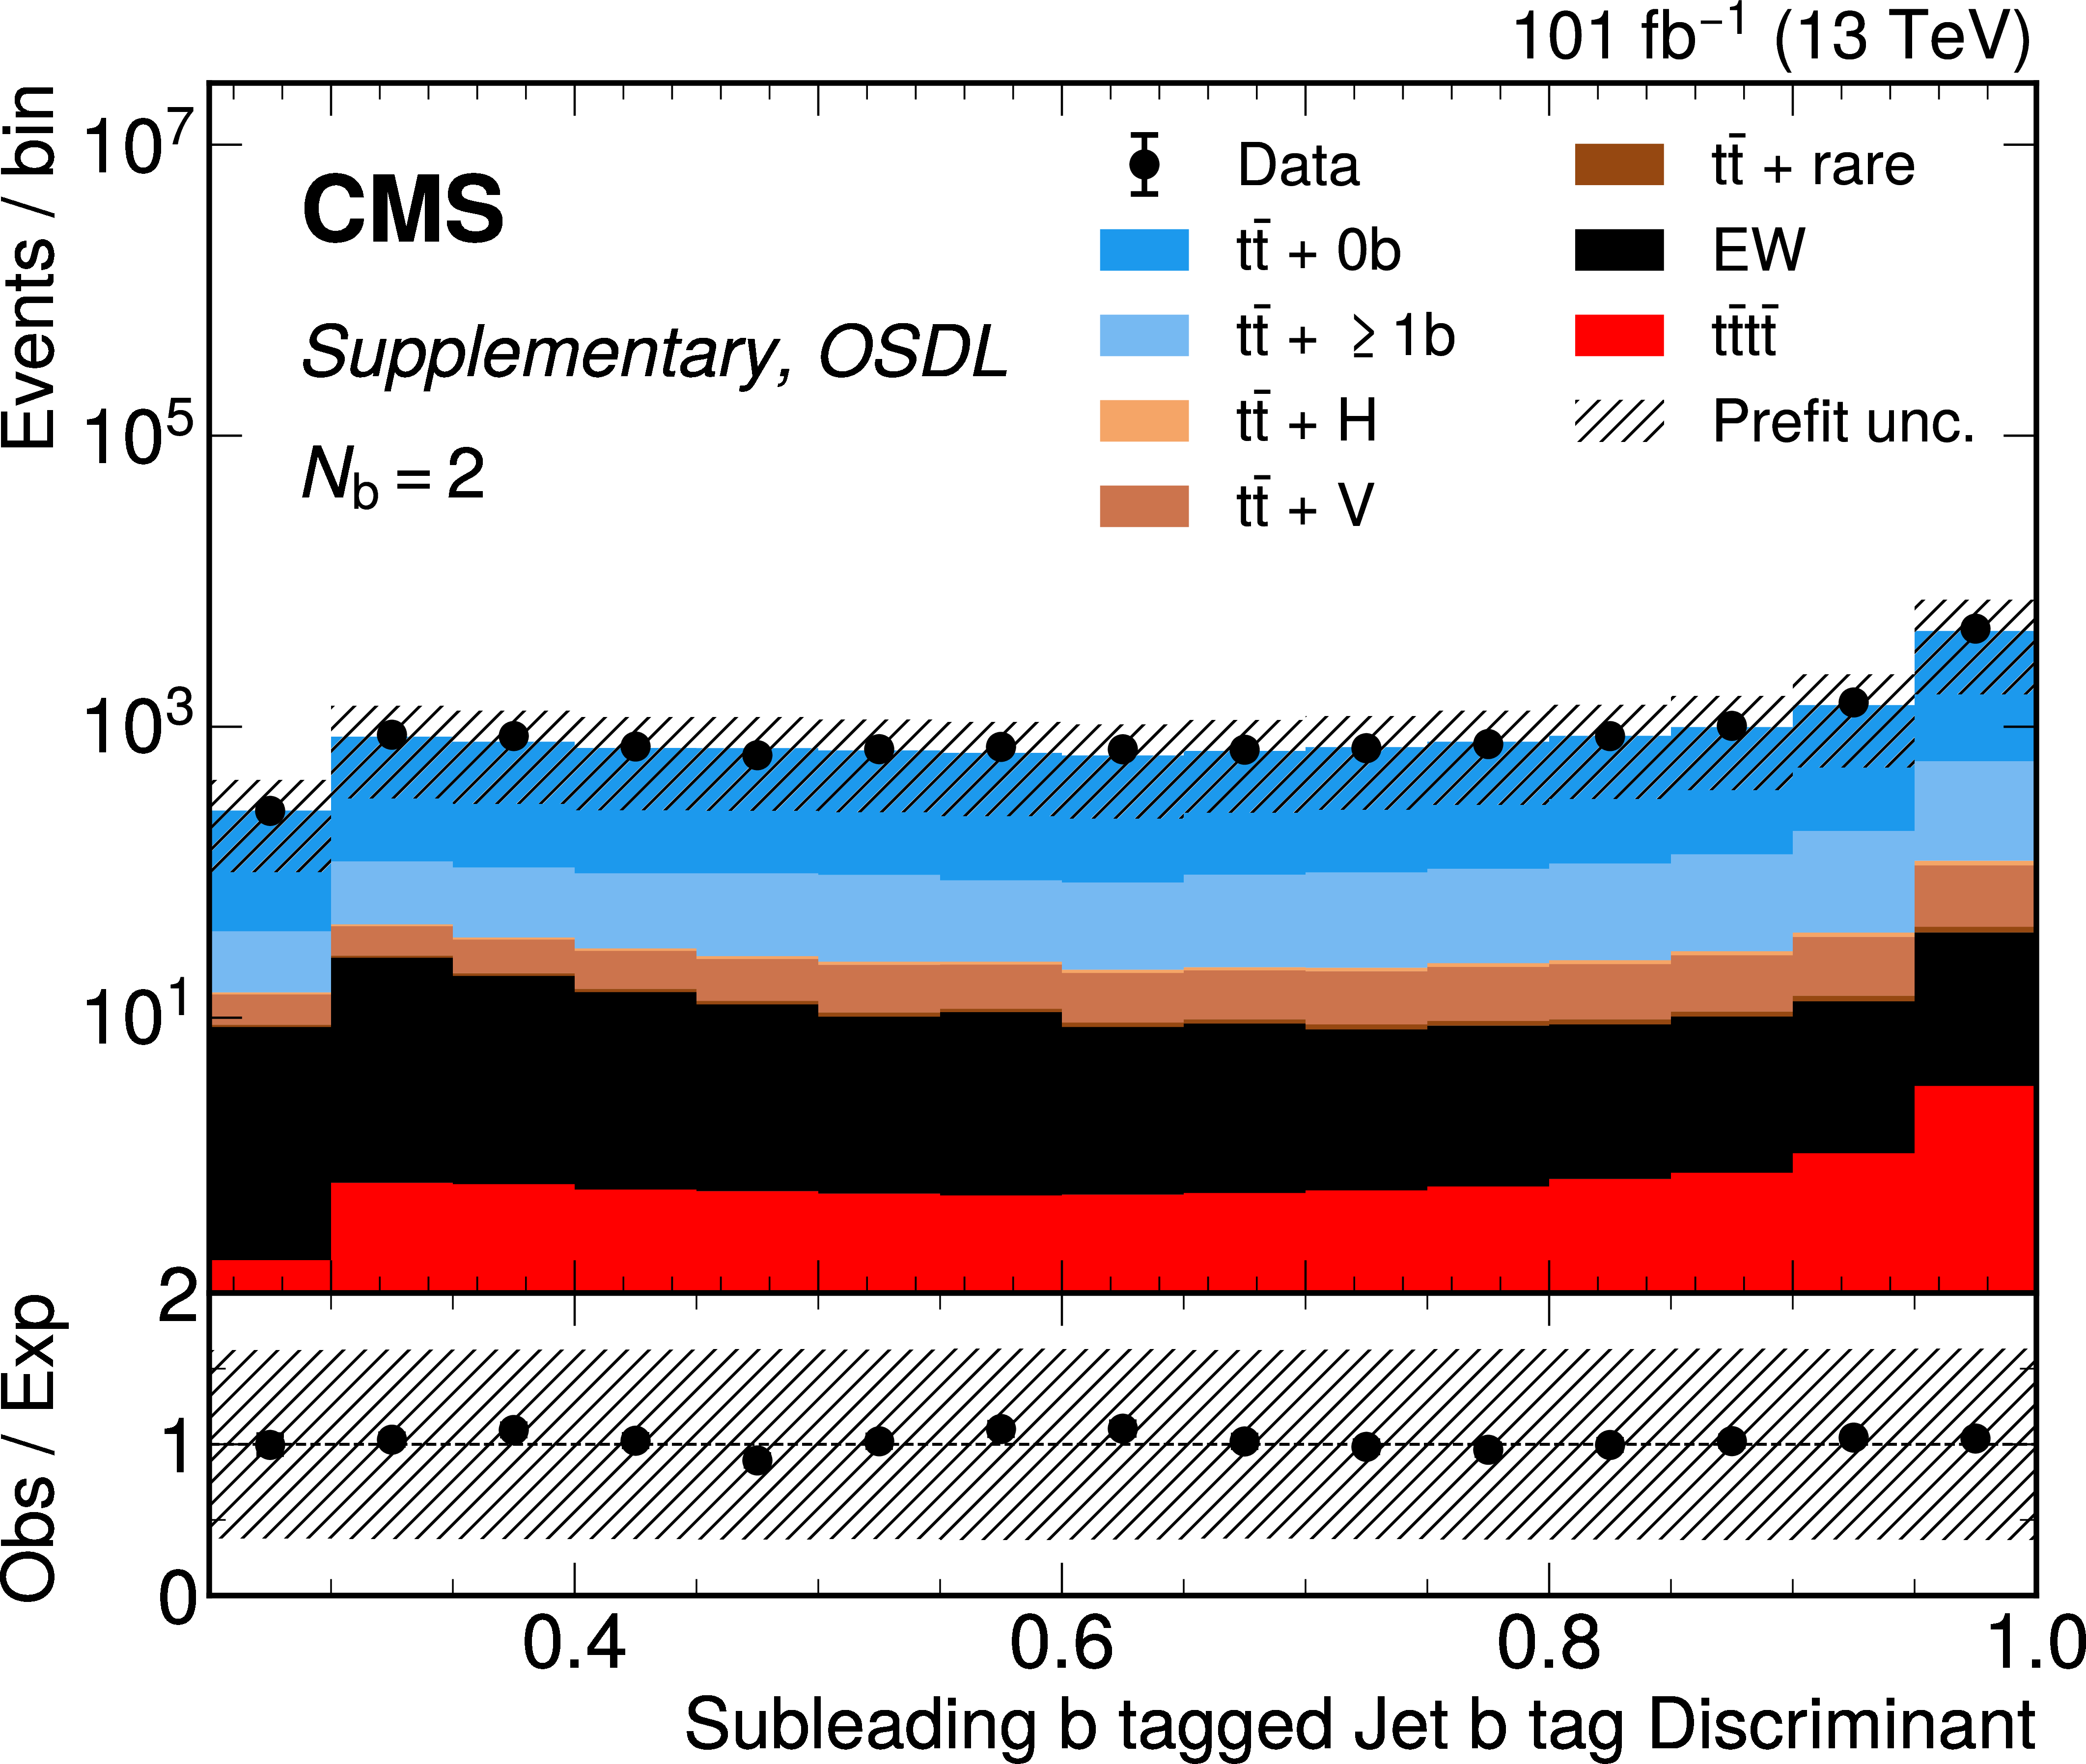
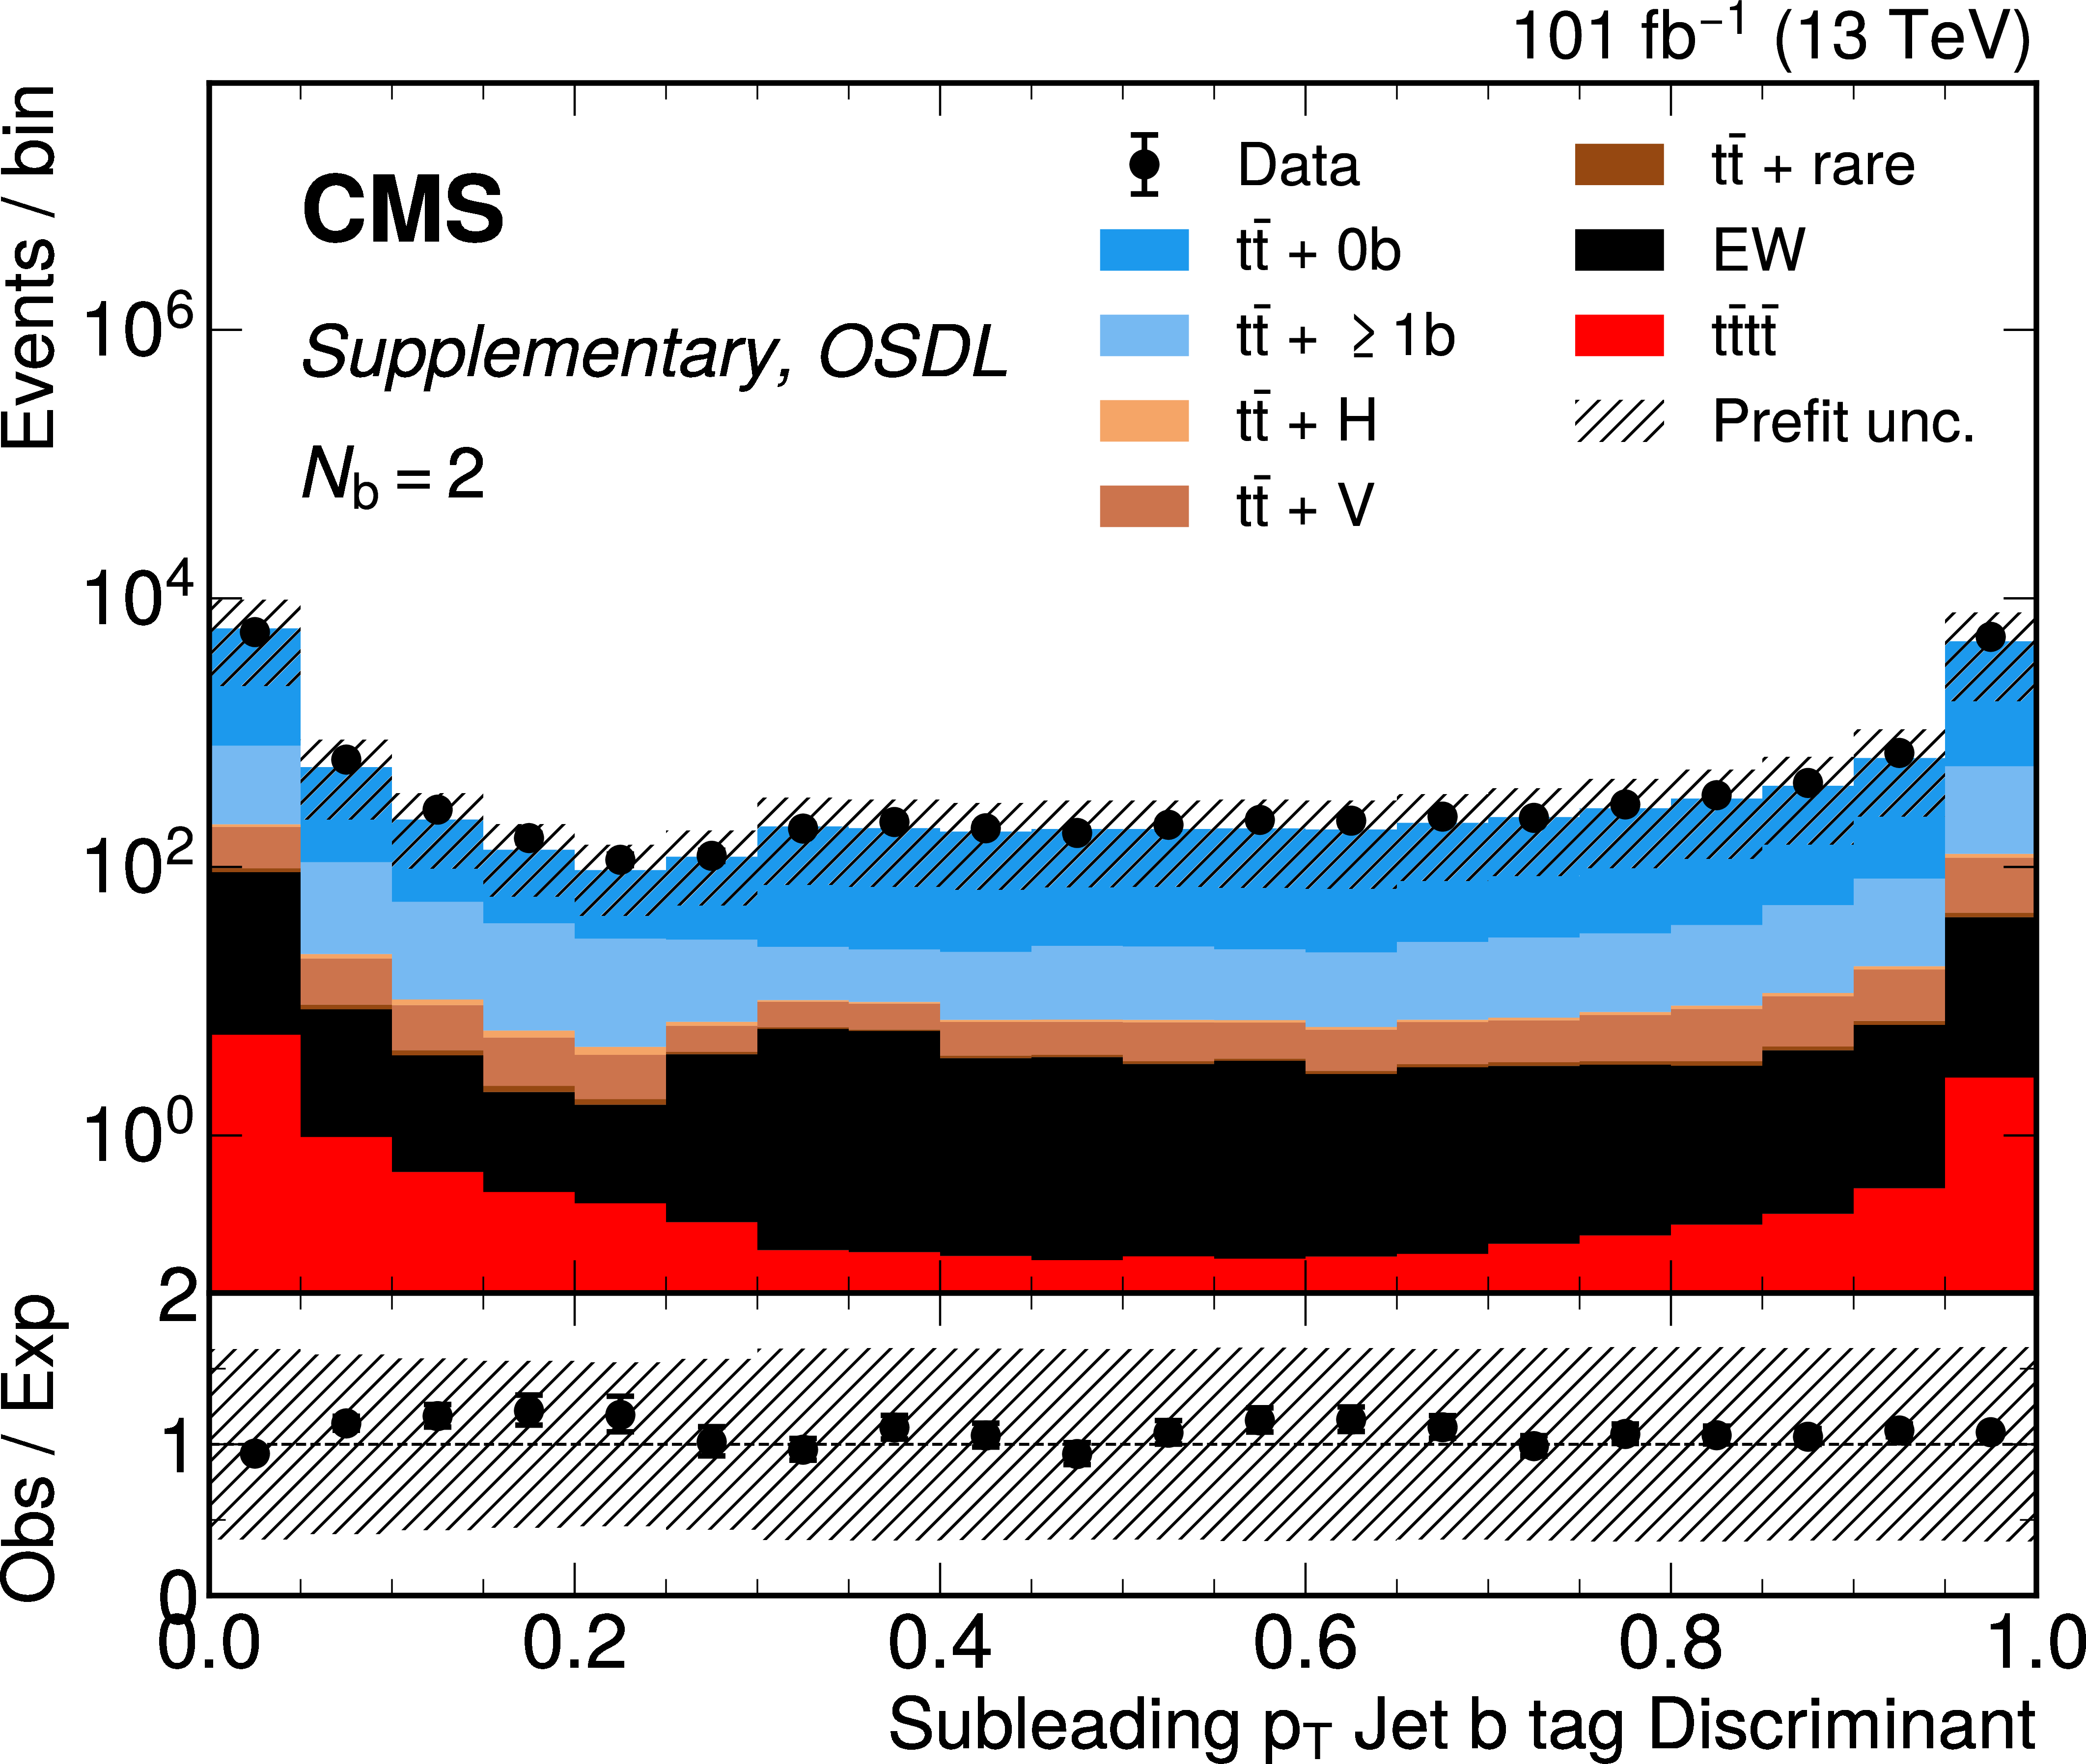
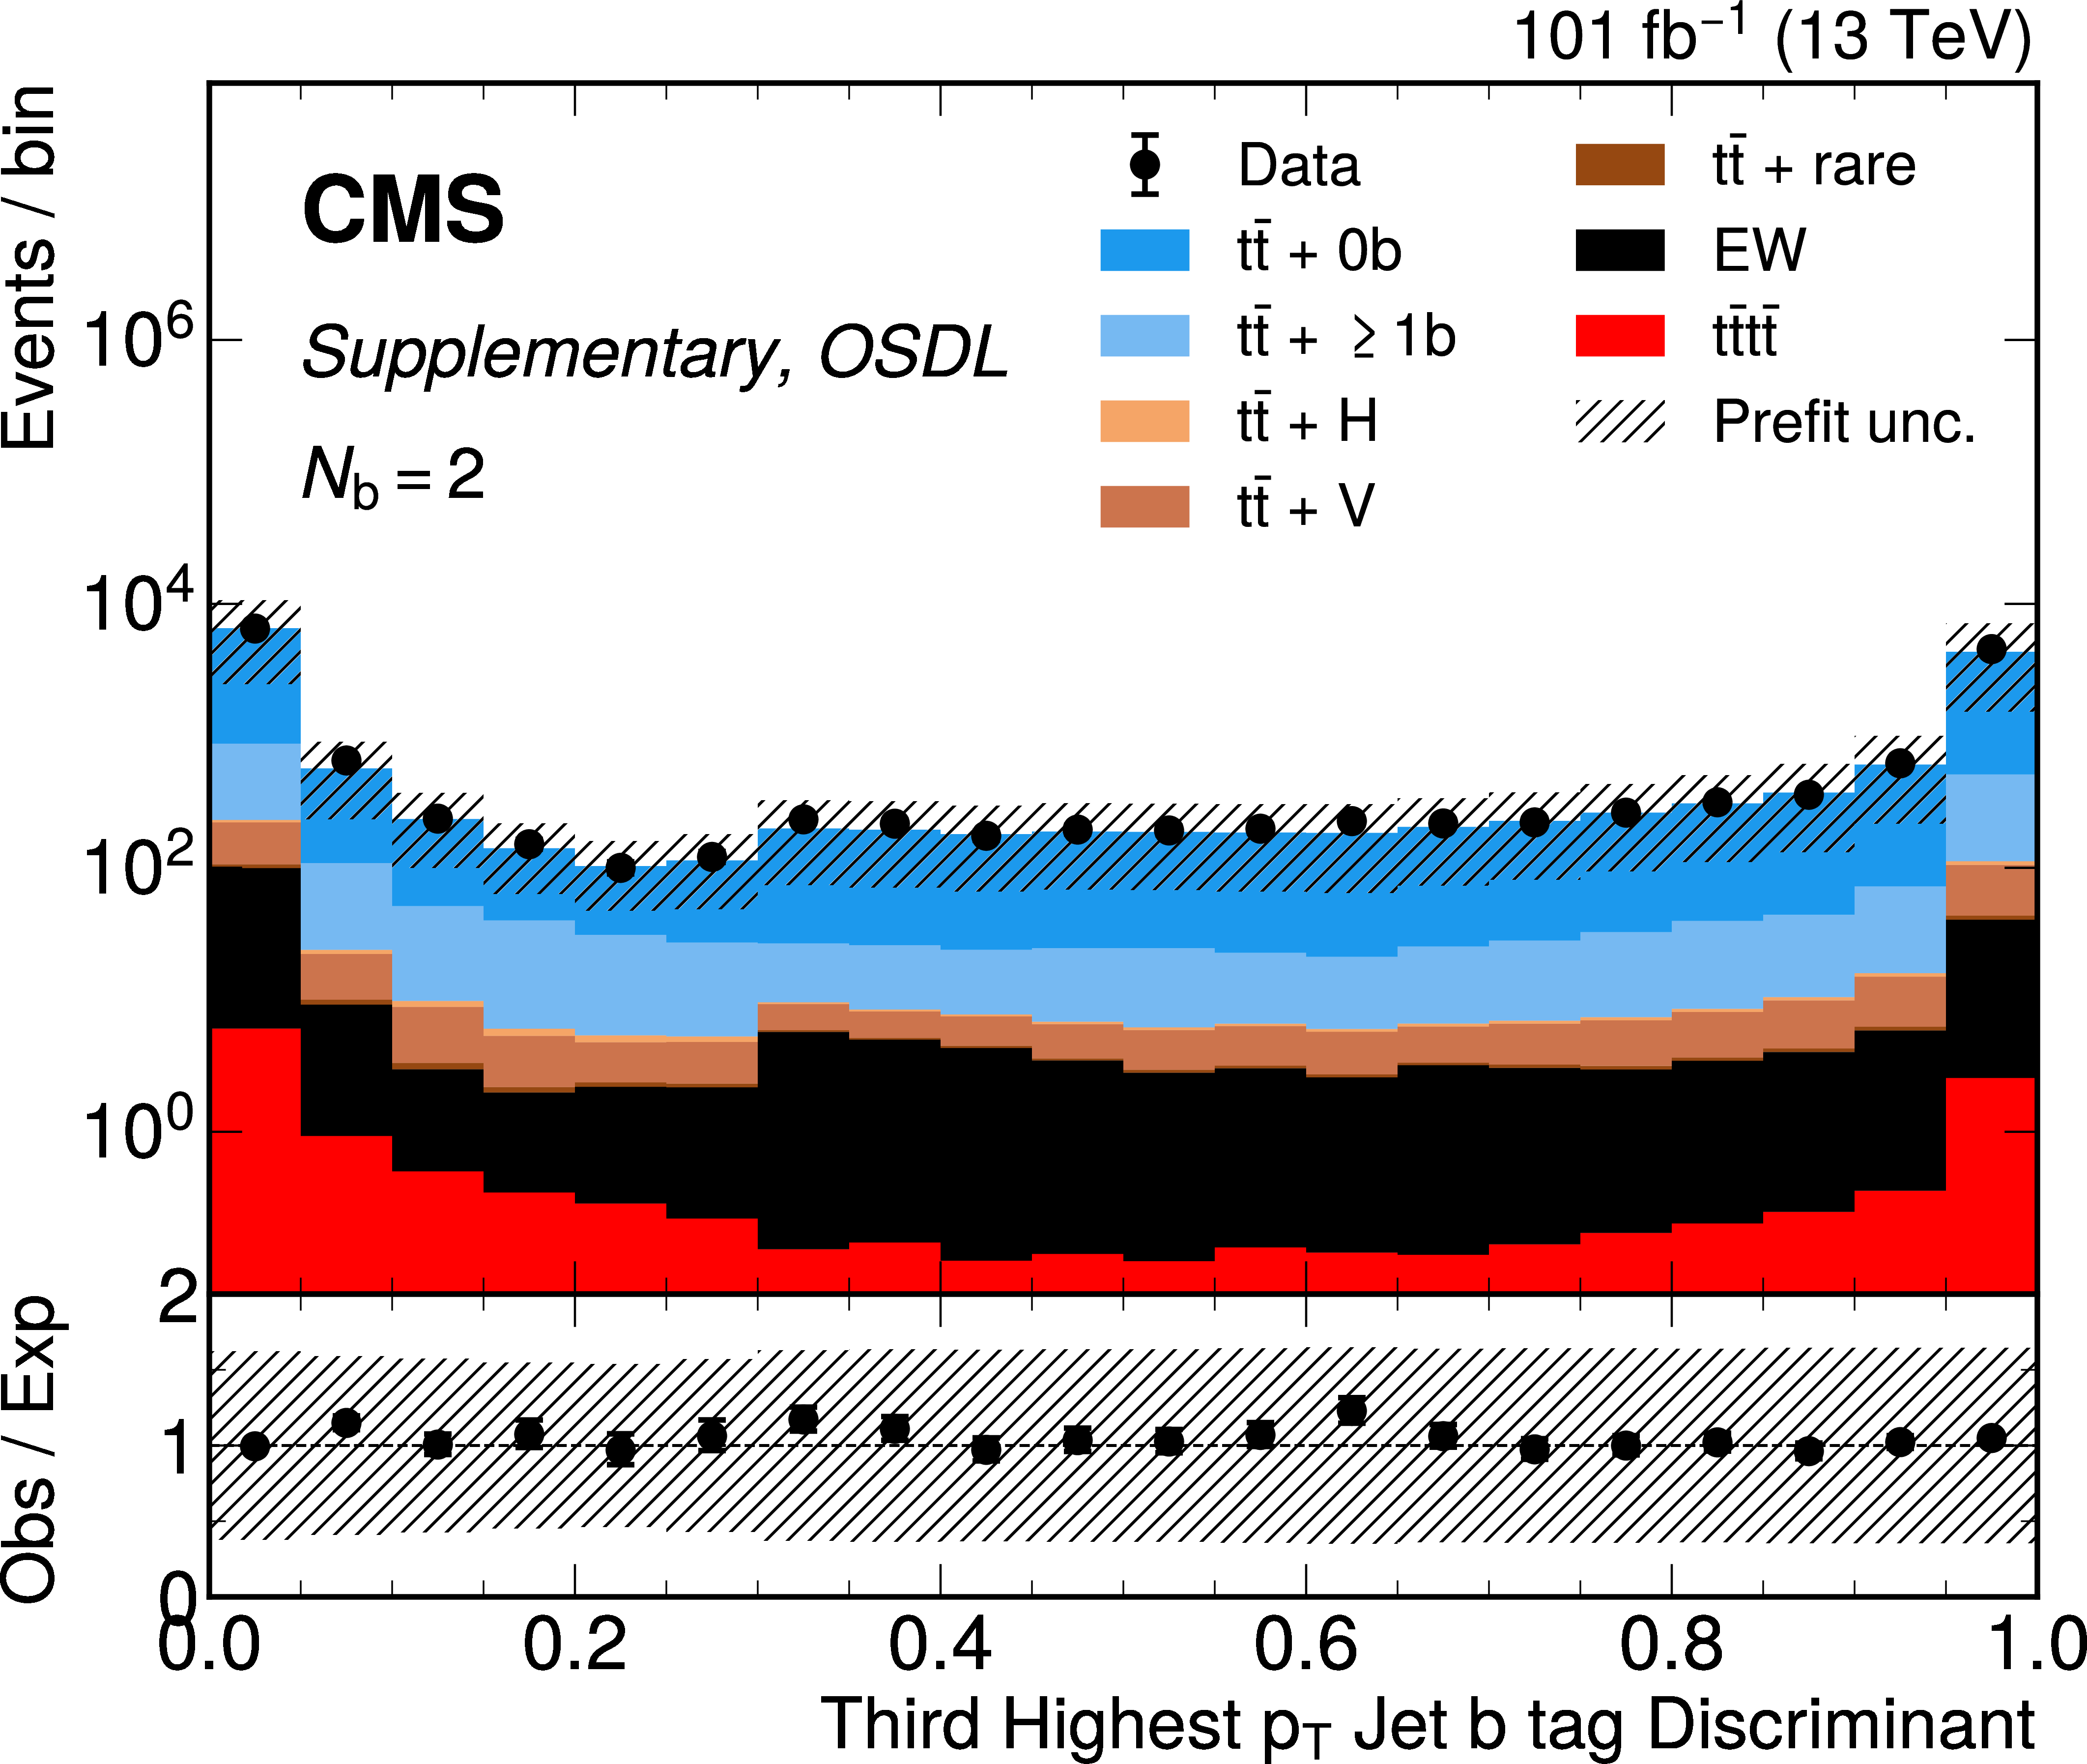
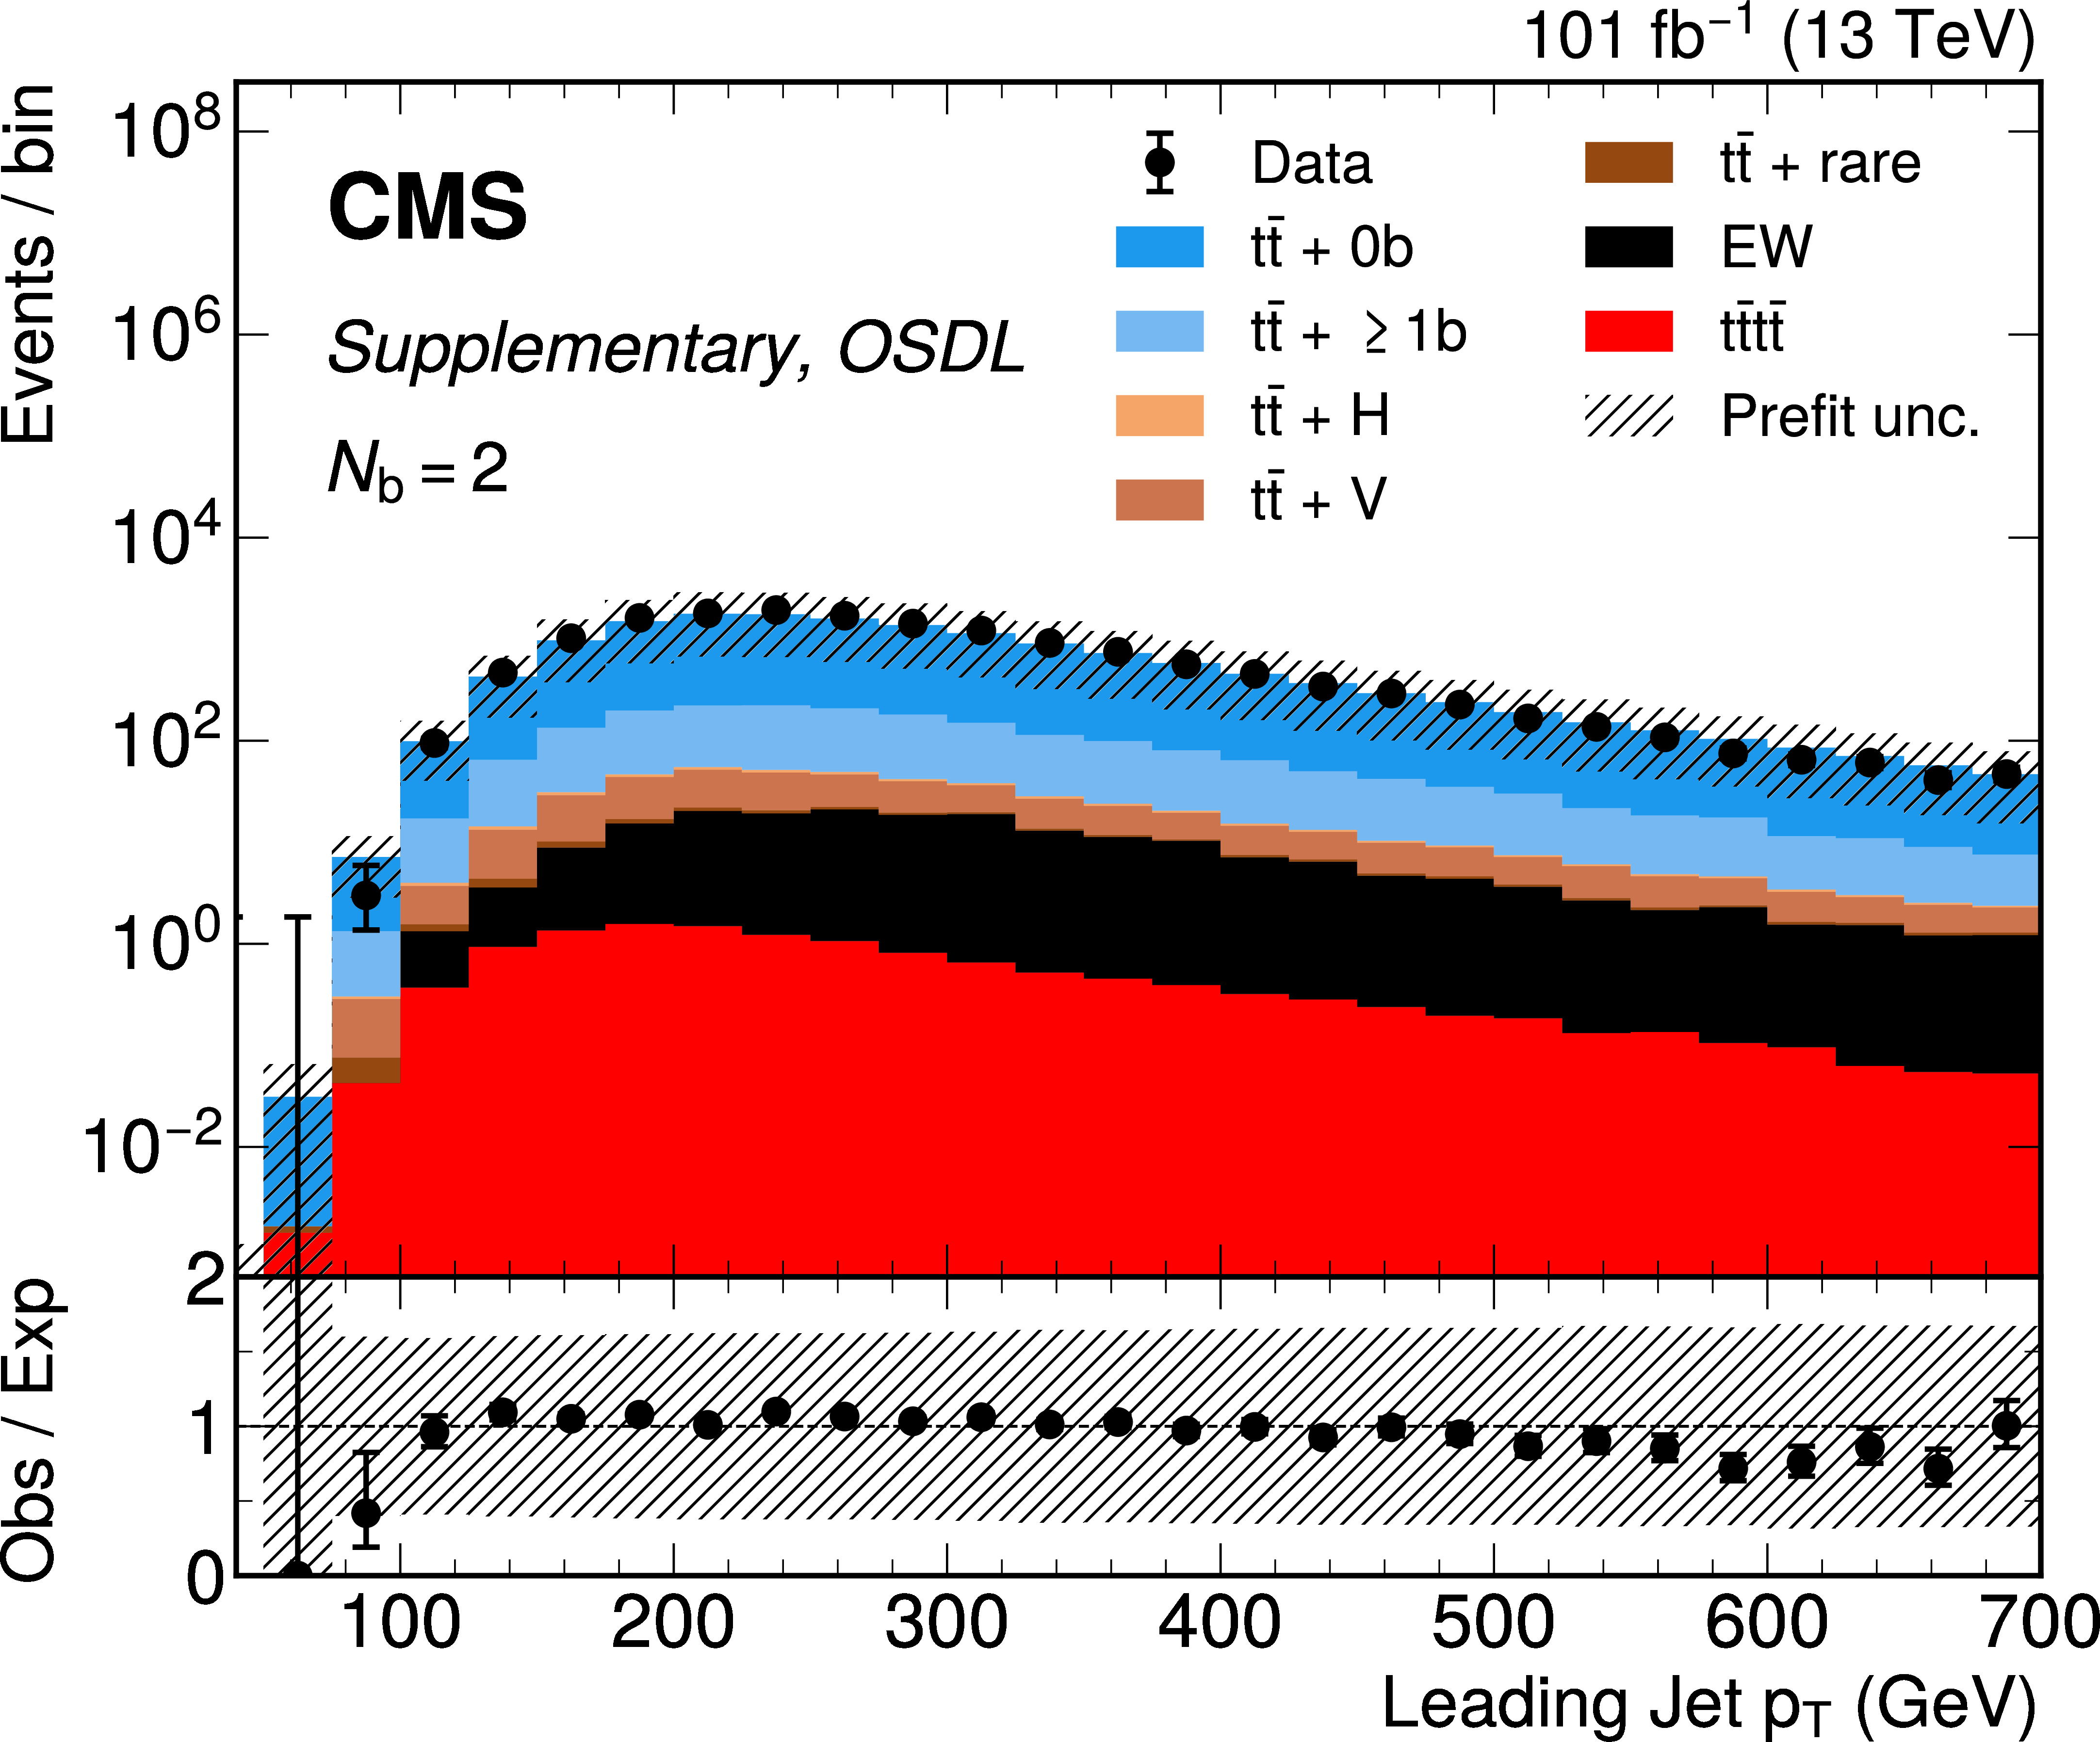
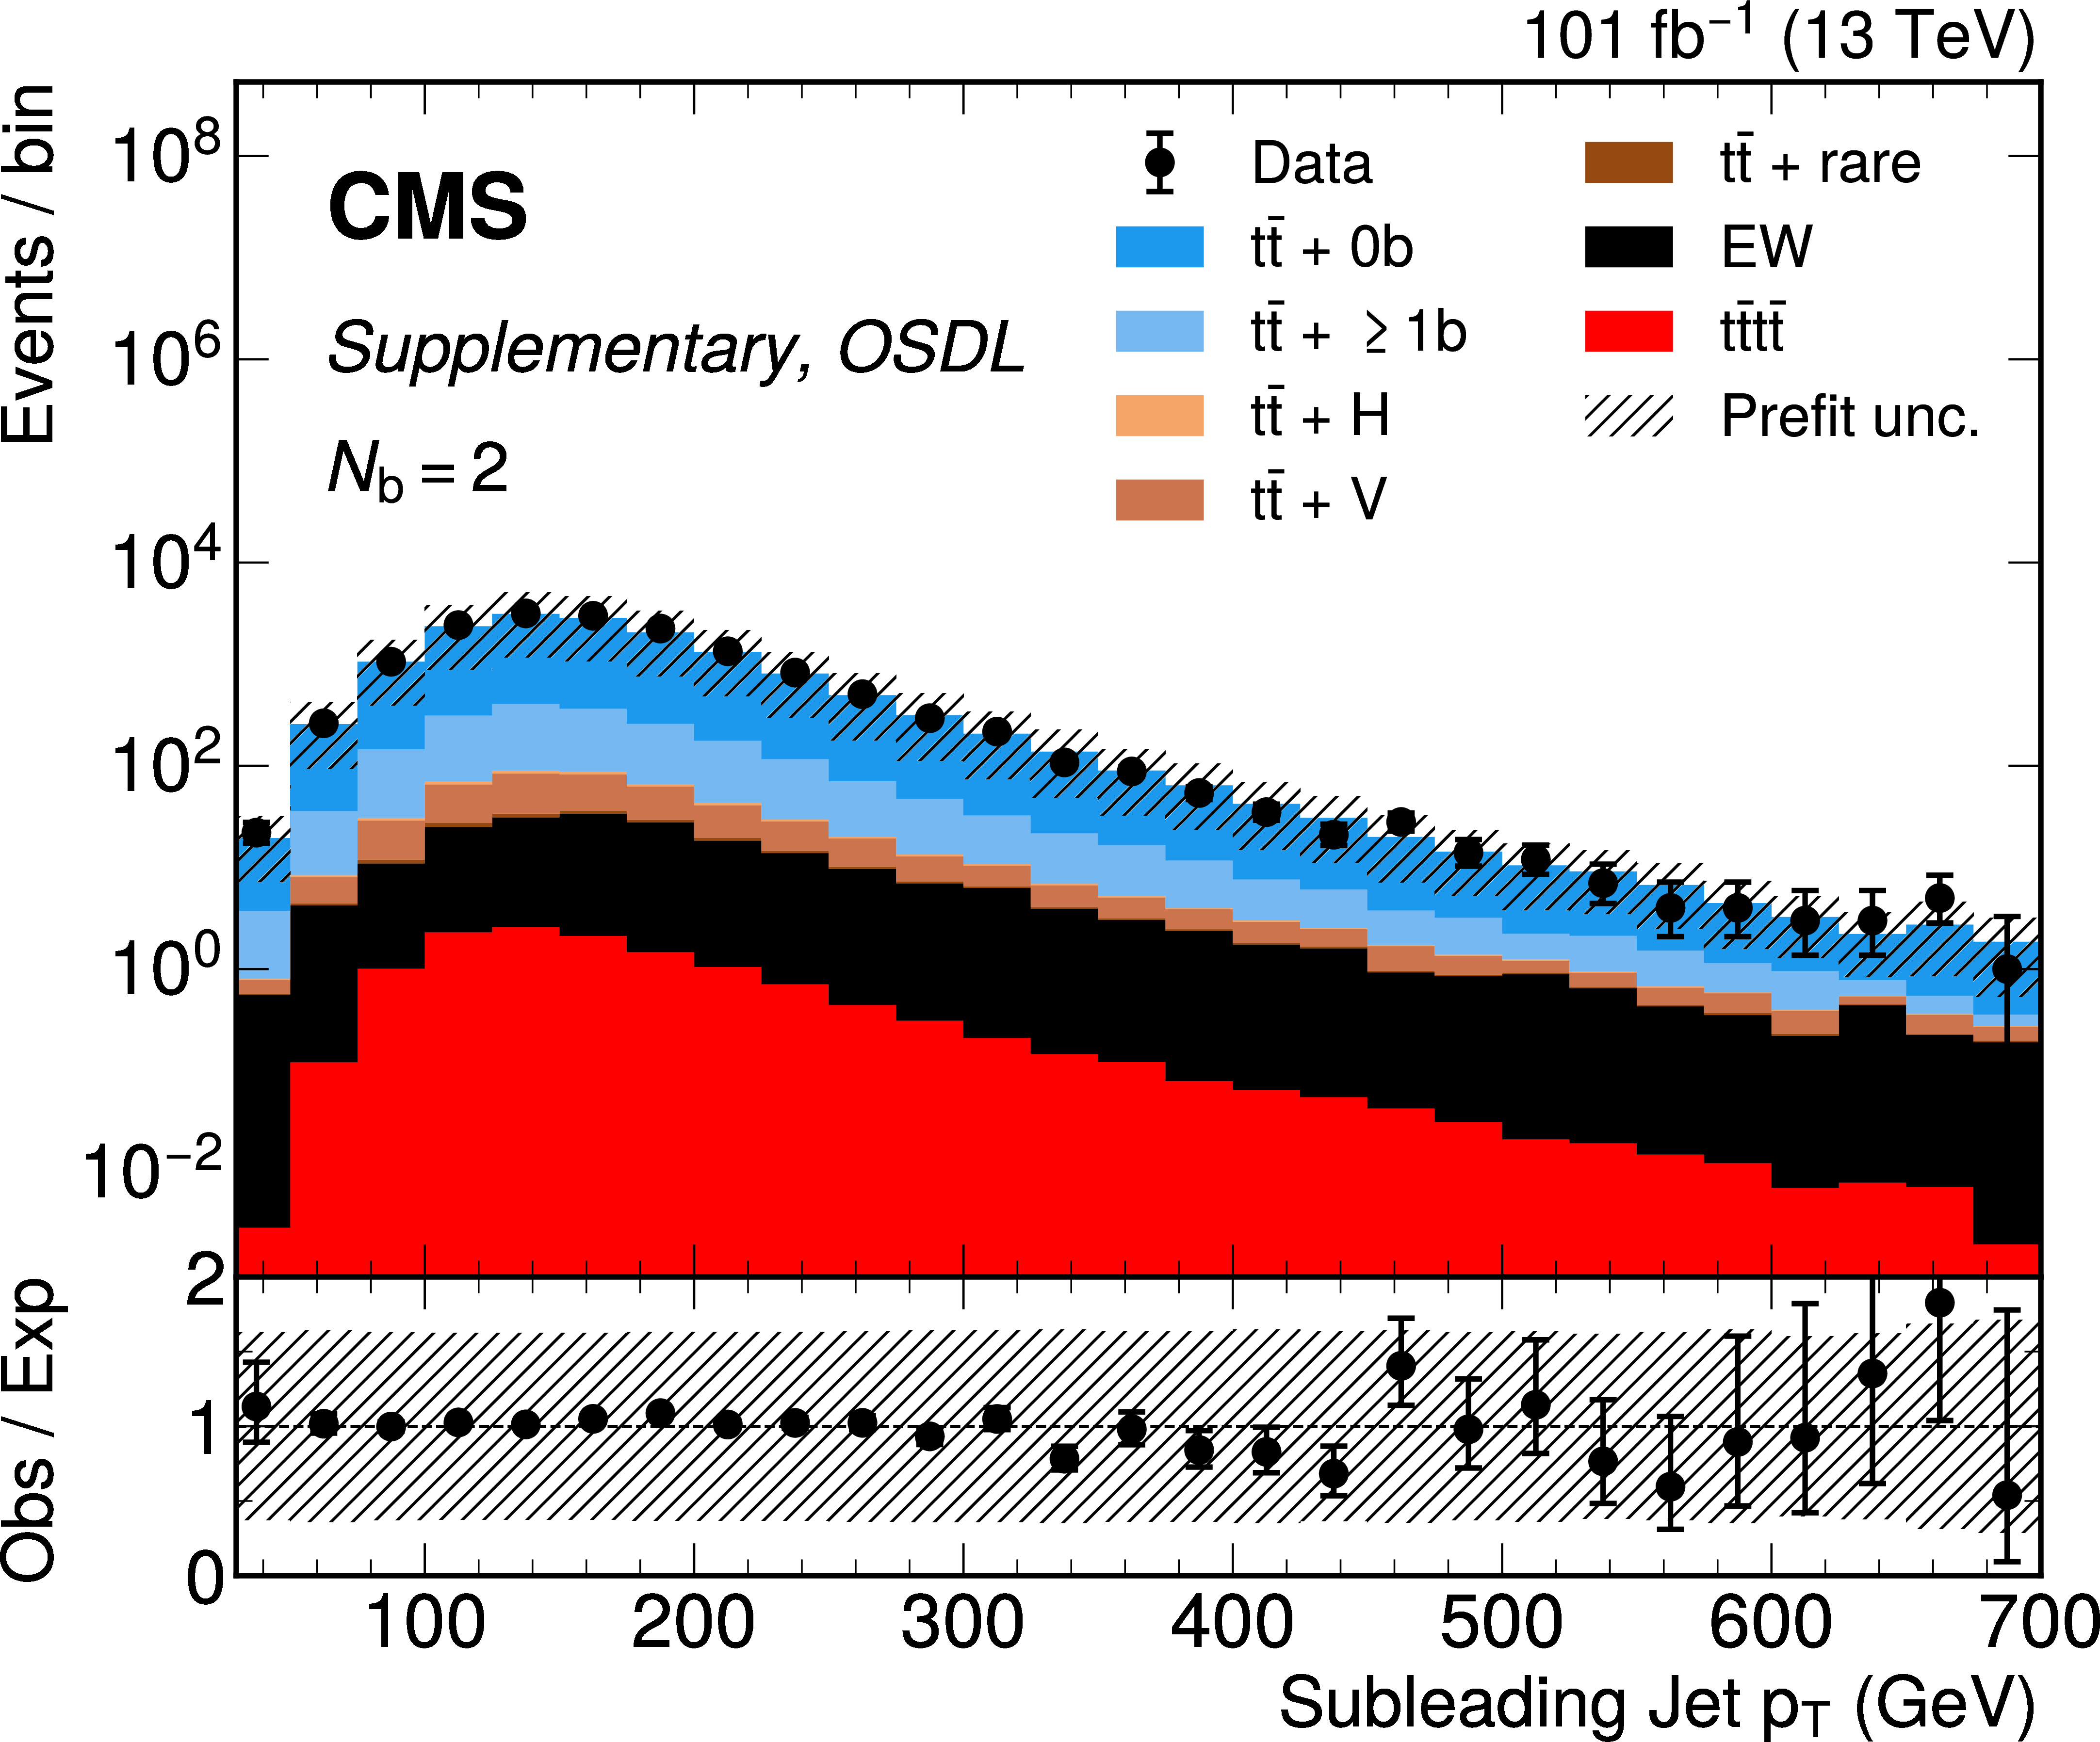
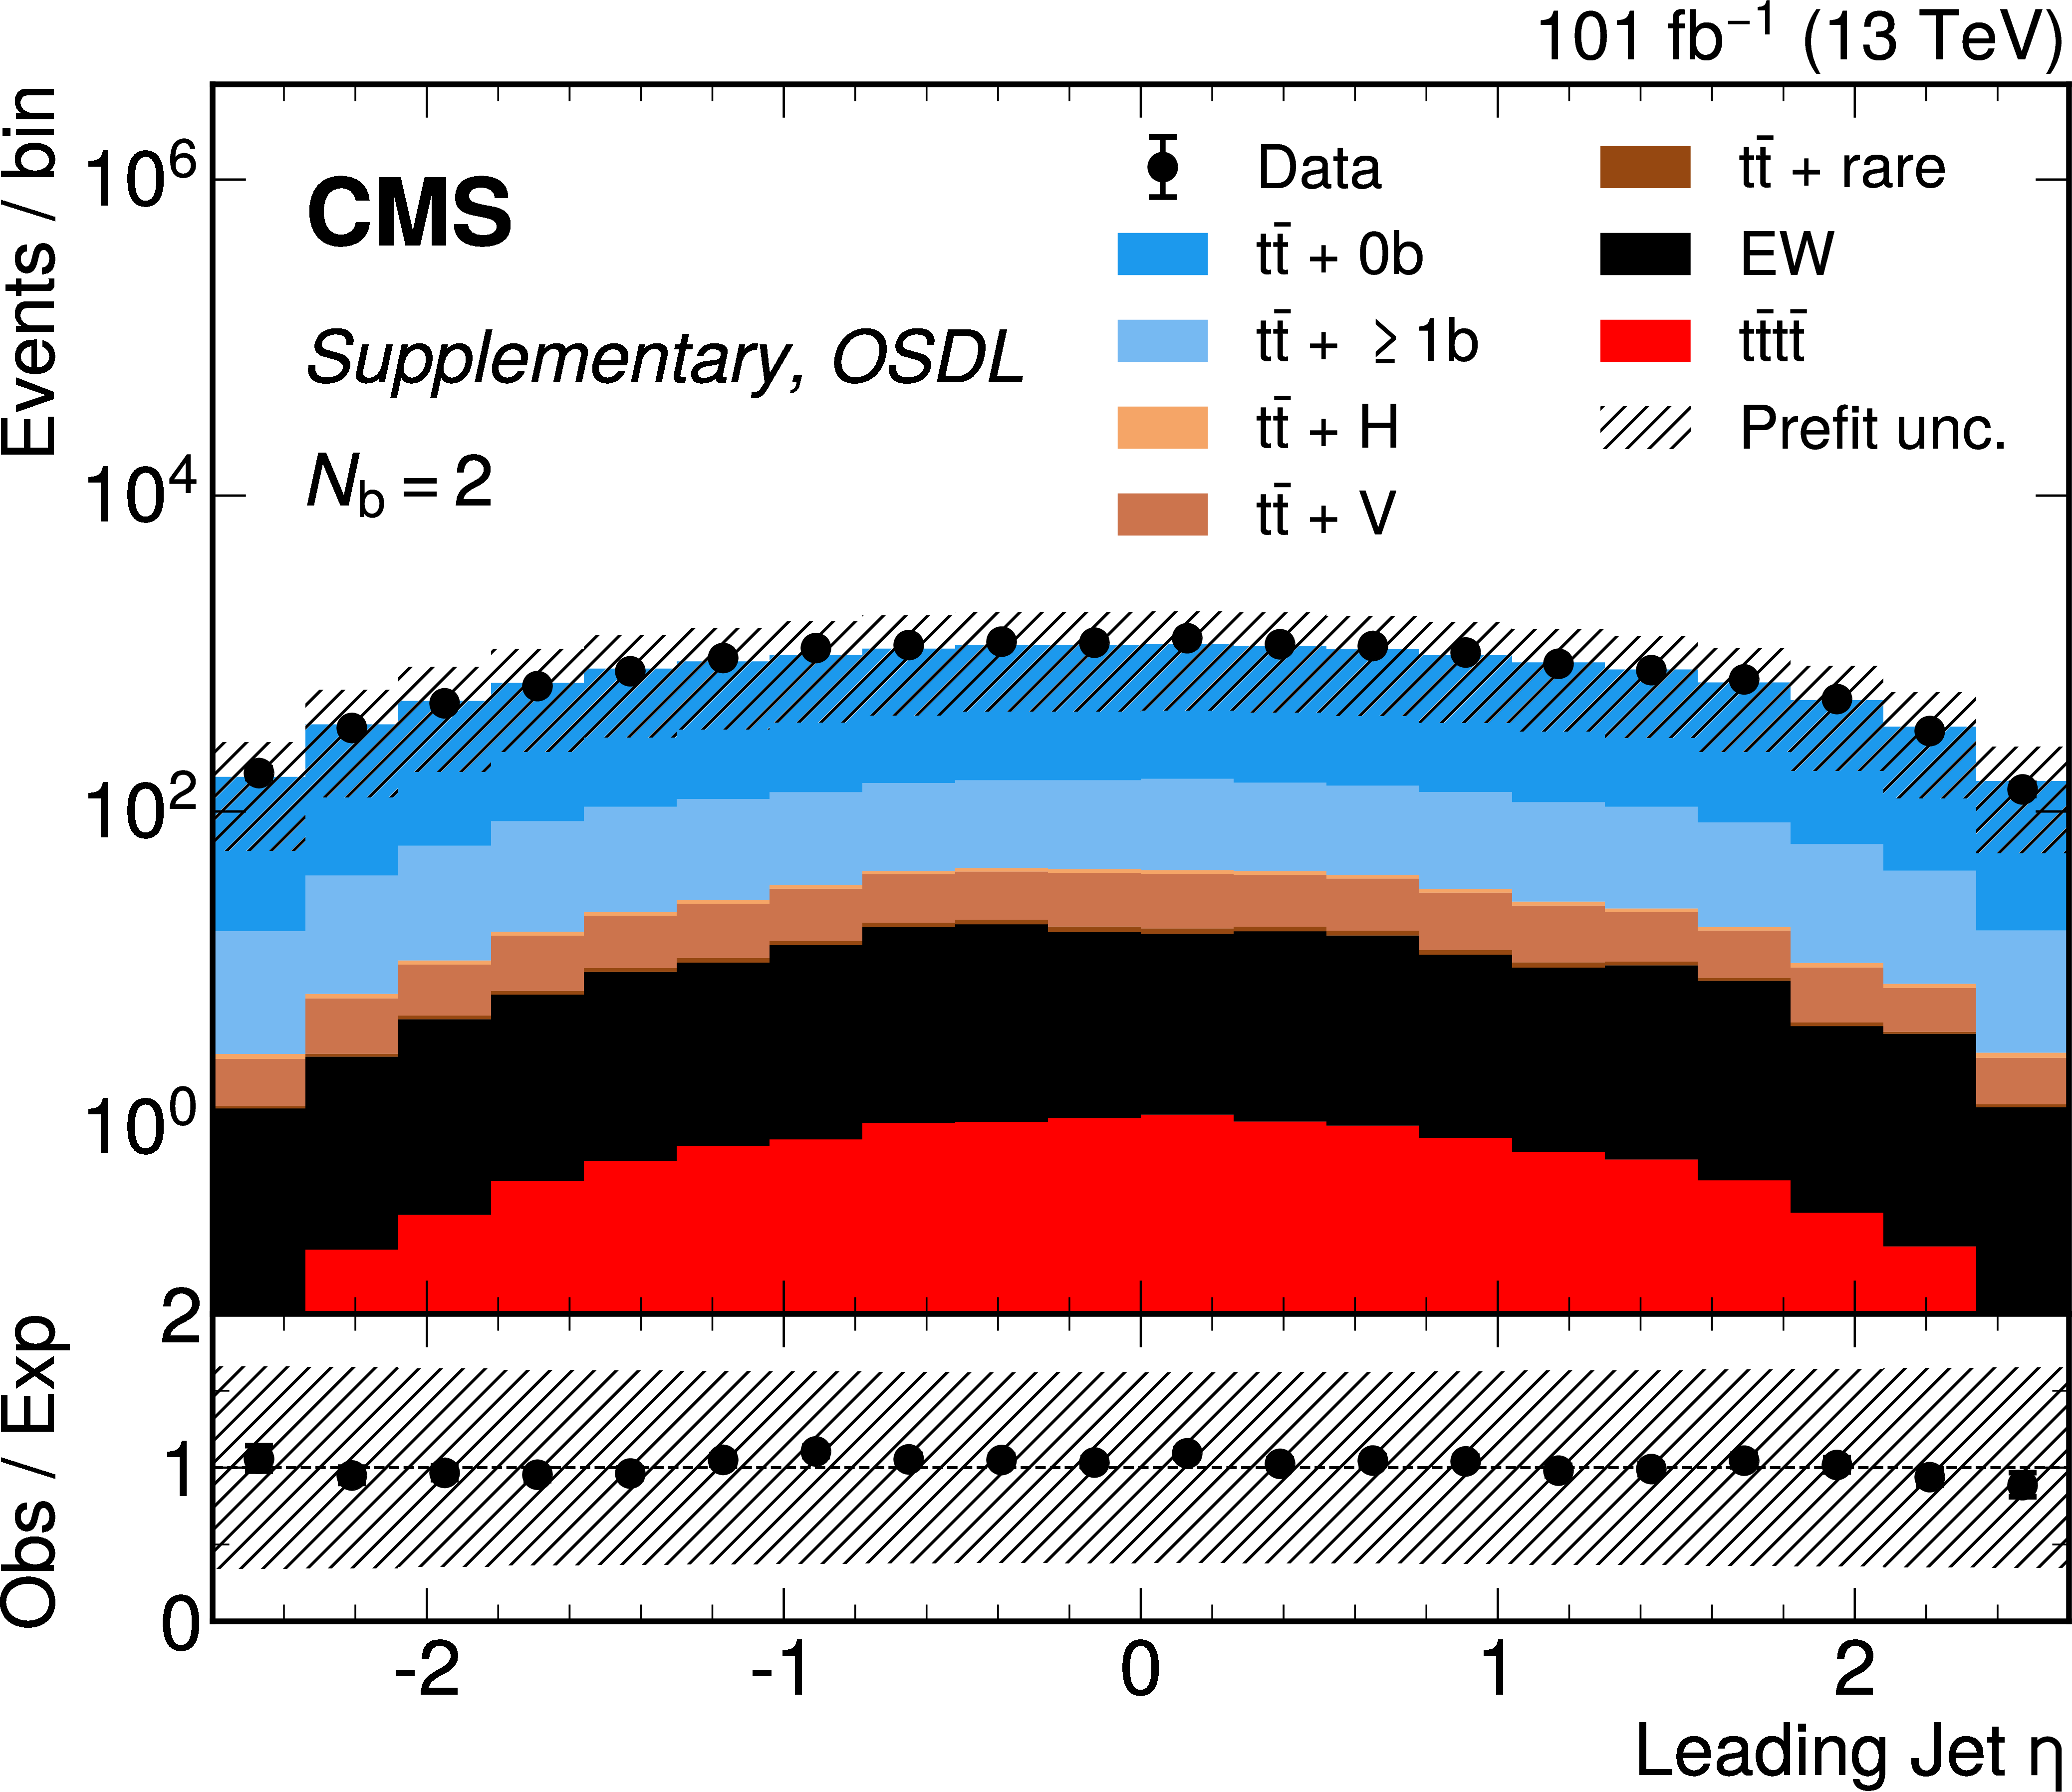
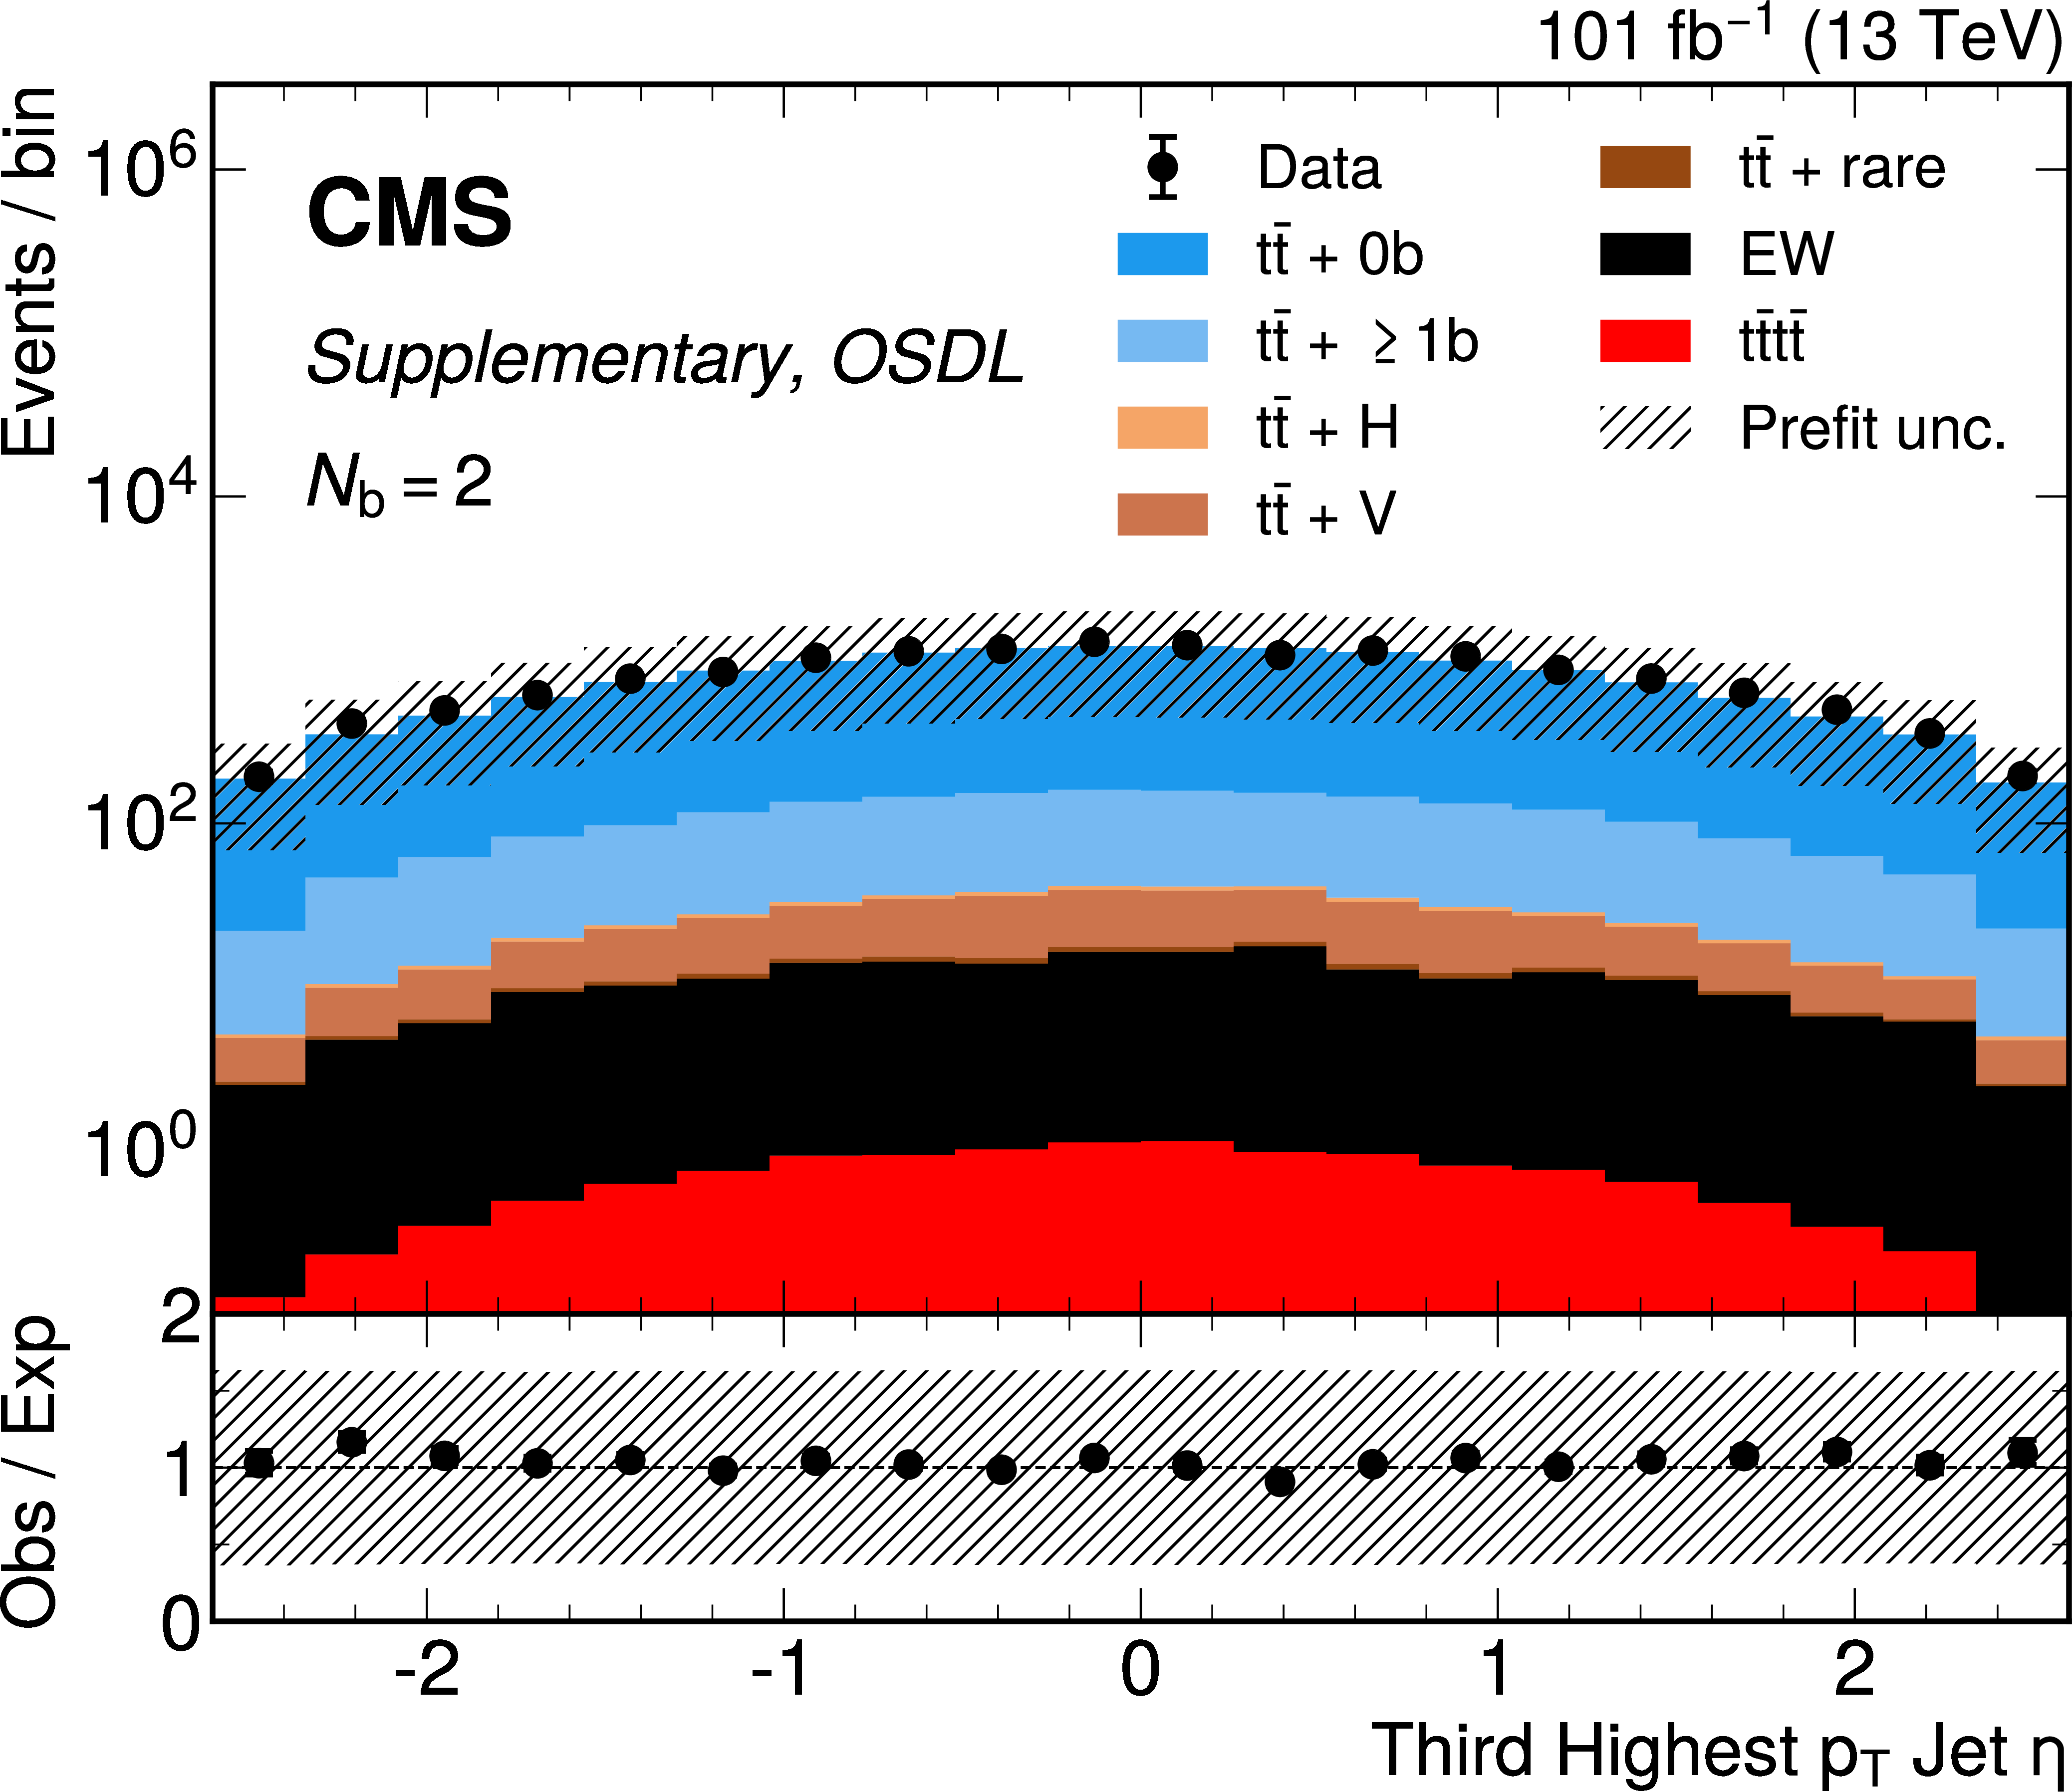
OSDL channel prefit distributions for $ N_\text{BT} = $ 2 jets categories. From left to right, top to bottom, are figures for the b-tag discriminant of the 3 highest b-tagged jets; the the b-tag discriminant of the 3 highest $ p_{\mathrm{T}} $ jets; the $ p_{\mathrm{T}} $ of the 3 highest $ p_{\mathrm{T}} $ jets; and the $ \eta $ of the 3 highest $ p_{\mathrm{T}} $ jets. Background processes include $ \mathrm{t} \bar{\mathrm{t}} $ + V (V = W, Z) and $ \mathrm{t} \bar{\mathrm{t}} $ + H in which $ \mathrm{t} \bar{\mathrm{t}} $ is produced in association with 1 massive boson, $ \mathrm{t} \bar{\mathrm{t}} $ events with zero ($ {\mathrm{t}\bar{\mathrm{t}}} + 0 \mathrm{b} $) or at least one additional b jet ($ {\mathrm{t}\bar{\mathrm{t}}} +\geq 1 \mathrm{b} $). Events with W or Z but no top quarks are referred to as EW, and $ \mathrm{t} \bar{\mathrm{t}} $ + rare includes $ \mathrm{t} \bar{\mathrm{t}} $ production in associaton with two massive bosons or a third (anti)top quark. |

png pdf |
Additional Figure 14-a:
OSDL channel prefit distributions for $ N_\text{BT} = $ 2 jets categories. From left to right, top to bottom, are figures for the b-tag discriminant of the 3 highest b-tagged jets; the the b-tag discriminant of the 3 highest $ p_{\mathrm{T}} $ jets; the $ p_{\mathrm{T}} $ of the 3 highest $ p_{\mathrm{T}} $ jets; and the $ \eta $ of the 3 highest $ p_{\mathrm{T}} $ jets. Background processes include $ \mathrm{t} \bar{\mathrm{t}} $ + V (V = W, Z) and $ \mathrm{t} \bar{\mathrm{t}} $ + H in which $ \mathrm{t} \bar{\mathrm{t}} $ is produced in association with 1 massive boson, $ \mathrm{t} \bar{\mathrm{t}} $ events with zero ($ {\mathrm{t}\bar{\mathrm{t}}} + 0 \mathrm{b} $) or at least one additional b jet ($ {\mathrm{t}\bar{\mathrm{t}}} +\geq 1 \mathrm{b} $). Events with W or Z but no top quarks are referred to as EW, and $ \mathrm{t} \bar{\mathrm{t}} $ + rare includes $ \mathrm{t} \bar{\mathrm{t}} $ production in associaton with two massive bosons or a third (anti)top quark. |
png pdf |
Additional Figure 14-b:
OSDL channel prefit distributions for $ N_\text{BT} = $ 2 jets categories. From left to right, top to bottom, are figures for the b-tag discriminant of the 3 highest b-tagged jets; the the b-tag discriminant of the 3 highest $ p_{\mathrm{T}} $ jets; the $ p_{\mathrm{T}} $ of the 3 highest $ p_{\mathrm{T}} $ jets; and the $ \eta $ of the 3 highest $ p_{\mathrm{T}} $ jets. Background processes include $ \mathrm{t} \bar{\mathrm{t}} $ + V (V = W, Z) and $ \mathrm{t} \bar{\mathrm{t}} $ + H in which $ \mathrm{t} \bar{\mathrm{t}} $ is produced in association with 1 massive boson, $ \mathrm{t} \bar{\mathrm{t}} $ events with zero ($ {\mathrm{t}\bar{\mathrm{t}}} + 0 \mathrm{b} $) or at least one additional b jet ($ {\mathrm{t}\bar{\mathrm{t}}} +\geq 1 \mathrm{b} $). Events with W or Z but no top quarks are referred to as EW, and $ \mathrm{t} \bar{\mathrm{t}} $ + rare includes $ \mathrm{t} \bar{\mathrm{t}} $ production in associaton with two massive bosons or a third (anti)top quark. |

png pdf |
Additional Figure 14-c:
OSDL channel prefit distributions for $ N_\text{BT} = $ 2 jets categories. From left to right, top to bottom, are figures for the b-tag discriminant of the 3 highest b-tagged jets; the the b-tag discriminant of the 3 highest $ p_{\mathrm{T}} $ jets; the $ p_{\mathrm{T}} $ of the 3 highest $ p_{\mathrm{T}} $ jets; and the $ \eta $ of the 3 highest $ p_{\mathrm{T}} $ jets. Background processes include $ \mathrm{t} \bar{\mathrm{t}} $ + V (V = W, Z) and $ \mathrm{t} \bar{\mathrm{t}} $ + H in which $ \mathrm{t} \bar{\mathrm{t}} $ is produced in association with 1 massive boson, $ \mathrm{t} \bar{\mathrm{t}} $ events with zero ($ {\mathrm{t}\bar{\mathrm{t}}} + 0 \mathrm{b} $) or at least one additional b jet ($ {\mathrm{t}\bar{\mathrm{t}}} +\geq 1 \mathrm{b} $). Events with W or Z but no top quarks are referred to as EW, and $ \mathrm{t} \bar{\mathrm{t}} $ + rare includes $ \mathrm{t} \bar{\mathrm{t}} $ production in associaton with two massive bosons or a third (anti)top quark. |

png pdf |
Additional Figure 14-d:
OSDL channel prefit distributions for $ N_\text{BT} = $ 2 jets categories. From left to right, top to bottom, are figures for the b-tag discriminant of the 3 highest b-tagged jets; the the b-tag discriminant of the 3 highest $ p_{\mathrm{T}} $ jets; the $ p_{\mathrm{T}} $ of the 3 highest $ p_{\mathrm{T}} $ jets; and the $ \eta $ of the 3 highest $ p_{\mathrm{T}} $ jets. Background processes include $ \mathrm{t} \bar{\mathrm{t}} $ + V (V = W, Z) and $ \mathrm{t} \bar{\mathrm{t}} $ + H in which $ \mathrm{t} \bar{\mathrm{t}} $ is produced in association with 1 massive boson, $ \mathrm{t} \bar{\mathrm{t}} $ events with zero ($ {\mathrm{t}\bar{\mathrm{t}}} + 0 \mathrm{b} $) or at least one additional b jet ($ {\mathrm{t}\bar{\mathrm{t}}} +\geq 1 \mathrm{b} $). Events with W or Z but no top quarks are referred to as EW, and $ \mathrm{t} \bar{\mathrm{t}} $ + rare includes $ \mathrm{t} \bar{\mathrm{t}} $ production in associaton with two massive bosons or a third (anti)top quark. |
png pdf |
Additional Figure 14-e:
OSDL channel prefit distributions for $ N_\text{BT} = $ 2 jets categories. From left to right, top to bottom, are figures for the b-tag discriminant of the 3 highest b-tagged jets; the the b-tag discriminant of the 3 highest $ p_{\mathrm{T}} $ jets; the $ p_{\mathrm{T}} $ of the 3 highest $ p_{\mathrm{T}} $ jets; and the $ \eta $ of the 3 highest $ p_{\mathrm{T}} $ jets. Background processes include $ \mathrm{t} \bar{\mathrm{t}} $ + V (V = W, Z) and $ \mathrm{t} \bar{\mathrm{t}} $ + H in which $ \mathrm{t} \bar{\mathrm{t}} $ is produced in association with 1 massive boson, $ \mathrm{t} \bar{\mathrm{t}} $ events with zero ($ {\mathrm{t}\bar{\mathrm{t}}} + 0 \mathrm{b} $) or at least one additional b jet ($ {\mathrm{t}\bar{\mathrm{t}}} +\geq 1 \mathrm{b} $). Events with W or Z but no top quarks are referred to as EW, and $ \mathrm{t} \bar{\mathrm{t}} $ + rare includes $ \mathrm{t} \bar{\mathrm{t}} $ production in associaton with two massive bosons or a third (anti)top quark. |
png pdf |
Additional Figure 14-f:
OSDL channel prefit distributions for $ N_\text{BT} = $ 2 jets categories. From left to right, top to bottom, are figures for the b-tag discriminant of the 3 highest b-tagged jets; the the b-tag discriminant of the 3 highest $ p_{\mathrm{T}} $ jets; the $ p_{\mathrm{T}} $ of the 3 highest $ p_{\mathrm{T}} $ jets; and the $ \eta $ of the 3 highest $ p_{\mathrm{T}} $ jets. Background processes include $ \mathrm{t} \bar{\mathrm{t}} $ + V (V = W, Z) and $ \mathrm{t} \bar{\mathrm{t}} $ + H in which $ \mathrm{t} \bar{\mathrm{t}} $ is produced in association with 1 massive boson, $ \mathrm{t} \bar{\mathrm{t}} $ events with zero ($ {\mathrm{t}\bar{\mathrm{t}}} + 0 \mathrm{b} $) or at least one additional b jet ($ {\mathrm{t}\bar{\mathrm{t}}} +\geq 1 \mathrm{b} $). Events with W or Z but no top quarks are referred to as EW, and $ \mathrm{t} \bar{\mathrm{t}} $ + rare includes $ \mathrm{t} \bar{\mathrm{t}} $ production in associaton with two massive bosons or a third (anti)top quark. |
png pdf |
Additional Figure 14-g:
OSDL channel prefit distributions for $ N_\text{BT} = $ 2 jets categories. From left to right, top to bottom, are figures for the b-tag discriminant of the 3 highest b-tagged jets; the the b-tag discriminant of the 3 highest $ p_{\mathrm{T}} $ jets; the $ p_{\mathrm{T}} $ of the 3 highest $ p_{\mathrm{T}} $ jets; and the $ \eta $ of the 3 highest $ p_{\mathrm{T}} $ jets. Background processes include $ \mathrm{t} \bar{\mathrm{t}} $ + V (V = W, Z) and $ \mathrm{t} \bar{\mathrm{t}} $ + H in which $ \mathrm{t} \bar{\mathrm{t}} $ is produced in association with 1 massive boson, $ \mathrm{t} \bar{\mathrm{t}} $ events with zero ($ {\mathrm{t}\bar{\mathrm{t}}} + 0 \mathrm{b} $) or at least one additional b jet ($ {\mathrm{t}\bar{\mathrm{t}}} +\geq 1 \mathrm{b} $). Events with W or Z but no top quarks are referred to as EW, and $ \mathrm{t} \bar{\mathrm{t}} $ + rare includes $ \mathrm{t} \bar{\mathrm{t}} $ production in associaton with two massive bosons or a third (anti)top quark. |
png pdf |
Additional Figure 14-h:
OSDL channel prefit distributions for $ N_\text{BT} = $ 2 jets categories. From left to right, top to bottom, are figures for the b-tag discriminant of the 3 highest b-tagged jets; the the b-tag discriminant of the 3 highest $ p_{\mathrm{T}} $ jets; the $ p_{\mathrm{T}} $ of the 3 highest $ p_{\mathrm{T}} $ jets; and the $ \eta $ of the 3 highest $ p_{\mathrm{T}} $ jets. Background processes include $ \mathrm{t} \bar{\mathrm{t}} $ + V (V = W, Z) and $ \mathrm{t} \bar{\mathrm{t}} $ + H in which $ \mathrm{t} \bar{\mathrm{t}} $ is produced in association with 1 massive boson, $ \mathrm{t} \bar{\mathrm{t}} $ events with zero ($ {\mathrm{t}\bar{\mathrm{t}}} + 0 \mathrm{b} $) or at least one additional b jet ($ {\mathrm{t}\bar{\mathrm{t}}} +\geq 1 \mathrm{b} $). Events with W or Z but no top quarks are referred to as EW, and $ \mathrm{t} \bar{\mathrm{t}} $ + rare includes $ \mathrm{t} \bar{\mathrm{t}} $ production in associaton with two massive bosons or a third (anti)top quark. |

png pdf |
Additional Figure 14-i:
OSDL channel prefit distributions for $ N_\text{BT} = $ 2 jets categories. From left to right, top to bottom, are figures for the b-tag discriminant of the 3 highest b-tagged jets; the the b-tag discriminant of the 3 highest $ p_{\mathrm{T}} $ jets; the $ p_{\mathrm{T}} $ of the 3 highest $ p_{\mathrm{T}} $ jets; and the $ \eta $ of the 3 highest $ p_{\mathrm{T}} $ jets. Background processes include $ \mathrm{t} \bar{\mathrm{t}} $ + V (V = W, Z) and $ \mathrm{t} \bar{\mathrm{t}} $ + H in which $ \mathrm{t} \bar{\mathrm{t}} $ is produced in association with 1 massive boson, $ \mathrm{t} \bar{\mathrm{t}} $ events with zero ($ {\mathrm{t}\bar{\mathrm{t}}} + 0 \mathrm{b} $) or at least one additional b jet ($ {\mathrm{t}\bar{\mathrm{t}}} +\geq 1 \mathrm{b} $). Events with W or Z but no top quarks are referred to as EW, and $ \mathrm{t} \bar{\mathrm{t}} $ + rare includes $ \mathrm{t} \bar{\mathrm{t}} $ production in associaton with two massive bosons or a third (anti)top quark. |
png pdf |
Additional Figure 14-j:
OSDL channel prefit distributions for $ N_\text{BT} = $ 2 jets categories. From left to right, top to bottom, are figures for the b-tag discriminant of the 3 highest b-tagged jets; the the b-tag discriminant of the 3 highest $ p_{\mathrm{T}} $ jets; the $ p_{\mathrm{T}} $ of the 3 highest $ p_{\mathrm{T}} $ jets; and the $ \eta $ of the 3 highest $ p_{\mathrm{T}} $ jets. Background processes include $ \mathrm{t} \bar{\mathrm{t}} $ + V (V = W, Z) and $ \mathrm{t} \bar{\mathrm{t}} $ + H in which $ \mathrm{t} \bar{\mathrm{t}} $ is produced in association with 1 massive boson, $ \mathrm{t} \bar{\mathrm{t}} $ events with zero ($ {\mathrm{t}\bar{\mathrm{t}}} + 0 \mathrm{b} $) or at least one additional b jet ($ {\mathrm{t}\bar{\mathrm{t}}} +\geq 1 \mathrm{b} $). Events with W or Z but no top quarks are referred to as EW, and $ \mathrm{t} \bar{\mathrm{t}} $ + rare includes $ \mathrm{t} \bar{\mathrm{t}} $ production in associaton with two massive bosons or a third (anti)top quark. |
png pdf |
Additional Figure 14-k:
OSDL channel prefit distributions for $ N_\text{BT} = $ 2 jets categories. From left to right, top to bottom, are figures for the b-tag discriminant of the 3 highest b-tagged jets; the the b-tag discriminant of the 3 highest $ p_{\mathrm{T}} $ jets; the $ p_{\mathrm{T}} $ of the 3 highest $ p_{\mathrm{T}} $ jets; and the $ \eta $ of the 3 highest $ p_{\mathrm{T}} $ jets. Background processes include $ \mathrm{t} \bar{\mathrm{t}} $ + V (V = W, Z) and $ \mathrm{t} \bar{\mathrm{t}} $ + H in which $ \mathrm{t} \bar{\mathrm{t}} $ is produced in association with 1 massive boson, $ \mathrm{t} \bar{\mathrm{t}} $ events with zero ($ {\mathrm{t}\bar{\mathrm{t}}} + 0 \mathrm{b} $) or at least one additional b jet ($ {\mathrm{t}\bar{\mathrm{t}}} +\geq 1 \mathrm{b} $). Events with W or Z but no top quarks are referred to as EW, and $ \mathrm{t} \bar{\mathrm{t}} $ + rare includes $ \mathrm{t} \bar{\mathrm{t}} $ production in associaton with two massive bosons or a third (anti)top quark. |
png pdf |
Additional Figure 14-l:
OSDL channel prefit distributions for $ N_\text{BT} = $ 2 jets categories. From left to right, top to bottom, are figures for the b-tag discriminant of the 3 highest b-tagged jets; the the b-tag discriminant of the 3 highest $ p_{\mathrm{T}} $ jets; the $ p_{\mathrm{T}} $ of the 3 highest $ p_{\mathrm{T}} $ jets; and the $ \eta $ of the 3 highest $ p_{\mathrm{T}} $ jets. Background processes include $ \mathrm{t} \bar{\mathrm{t}} $ + V (V = W, Z) and $ \mathrm{t} \bar{\mathrm{t}} $ + H in which $ \mathrm{t} \bar{\mathrm{t}} $ is produced in association with 1 massive boson, $ \mathrm{t} \bar{\mathrm{t}} $ events with zero ($ {\mathrm{t}\bar{\mathrm{t}}} + 0 \mathrm{b} $) or at least one additional b jet ($ {\mathrm{t}\bar{\mathrm{t}}} +\geq 1 \mathrm{b} $). Events with W or Z but no top quarks are referred to as EW, and $ \mathrm{t} \bar{\mathrm{t}} $ + rare includes $ \mathrm{t} \bar{\mathrm{t}} $ production in associaton with two massive bosons or a third (anti)top quark. |
png pdf |
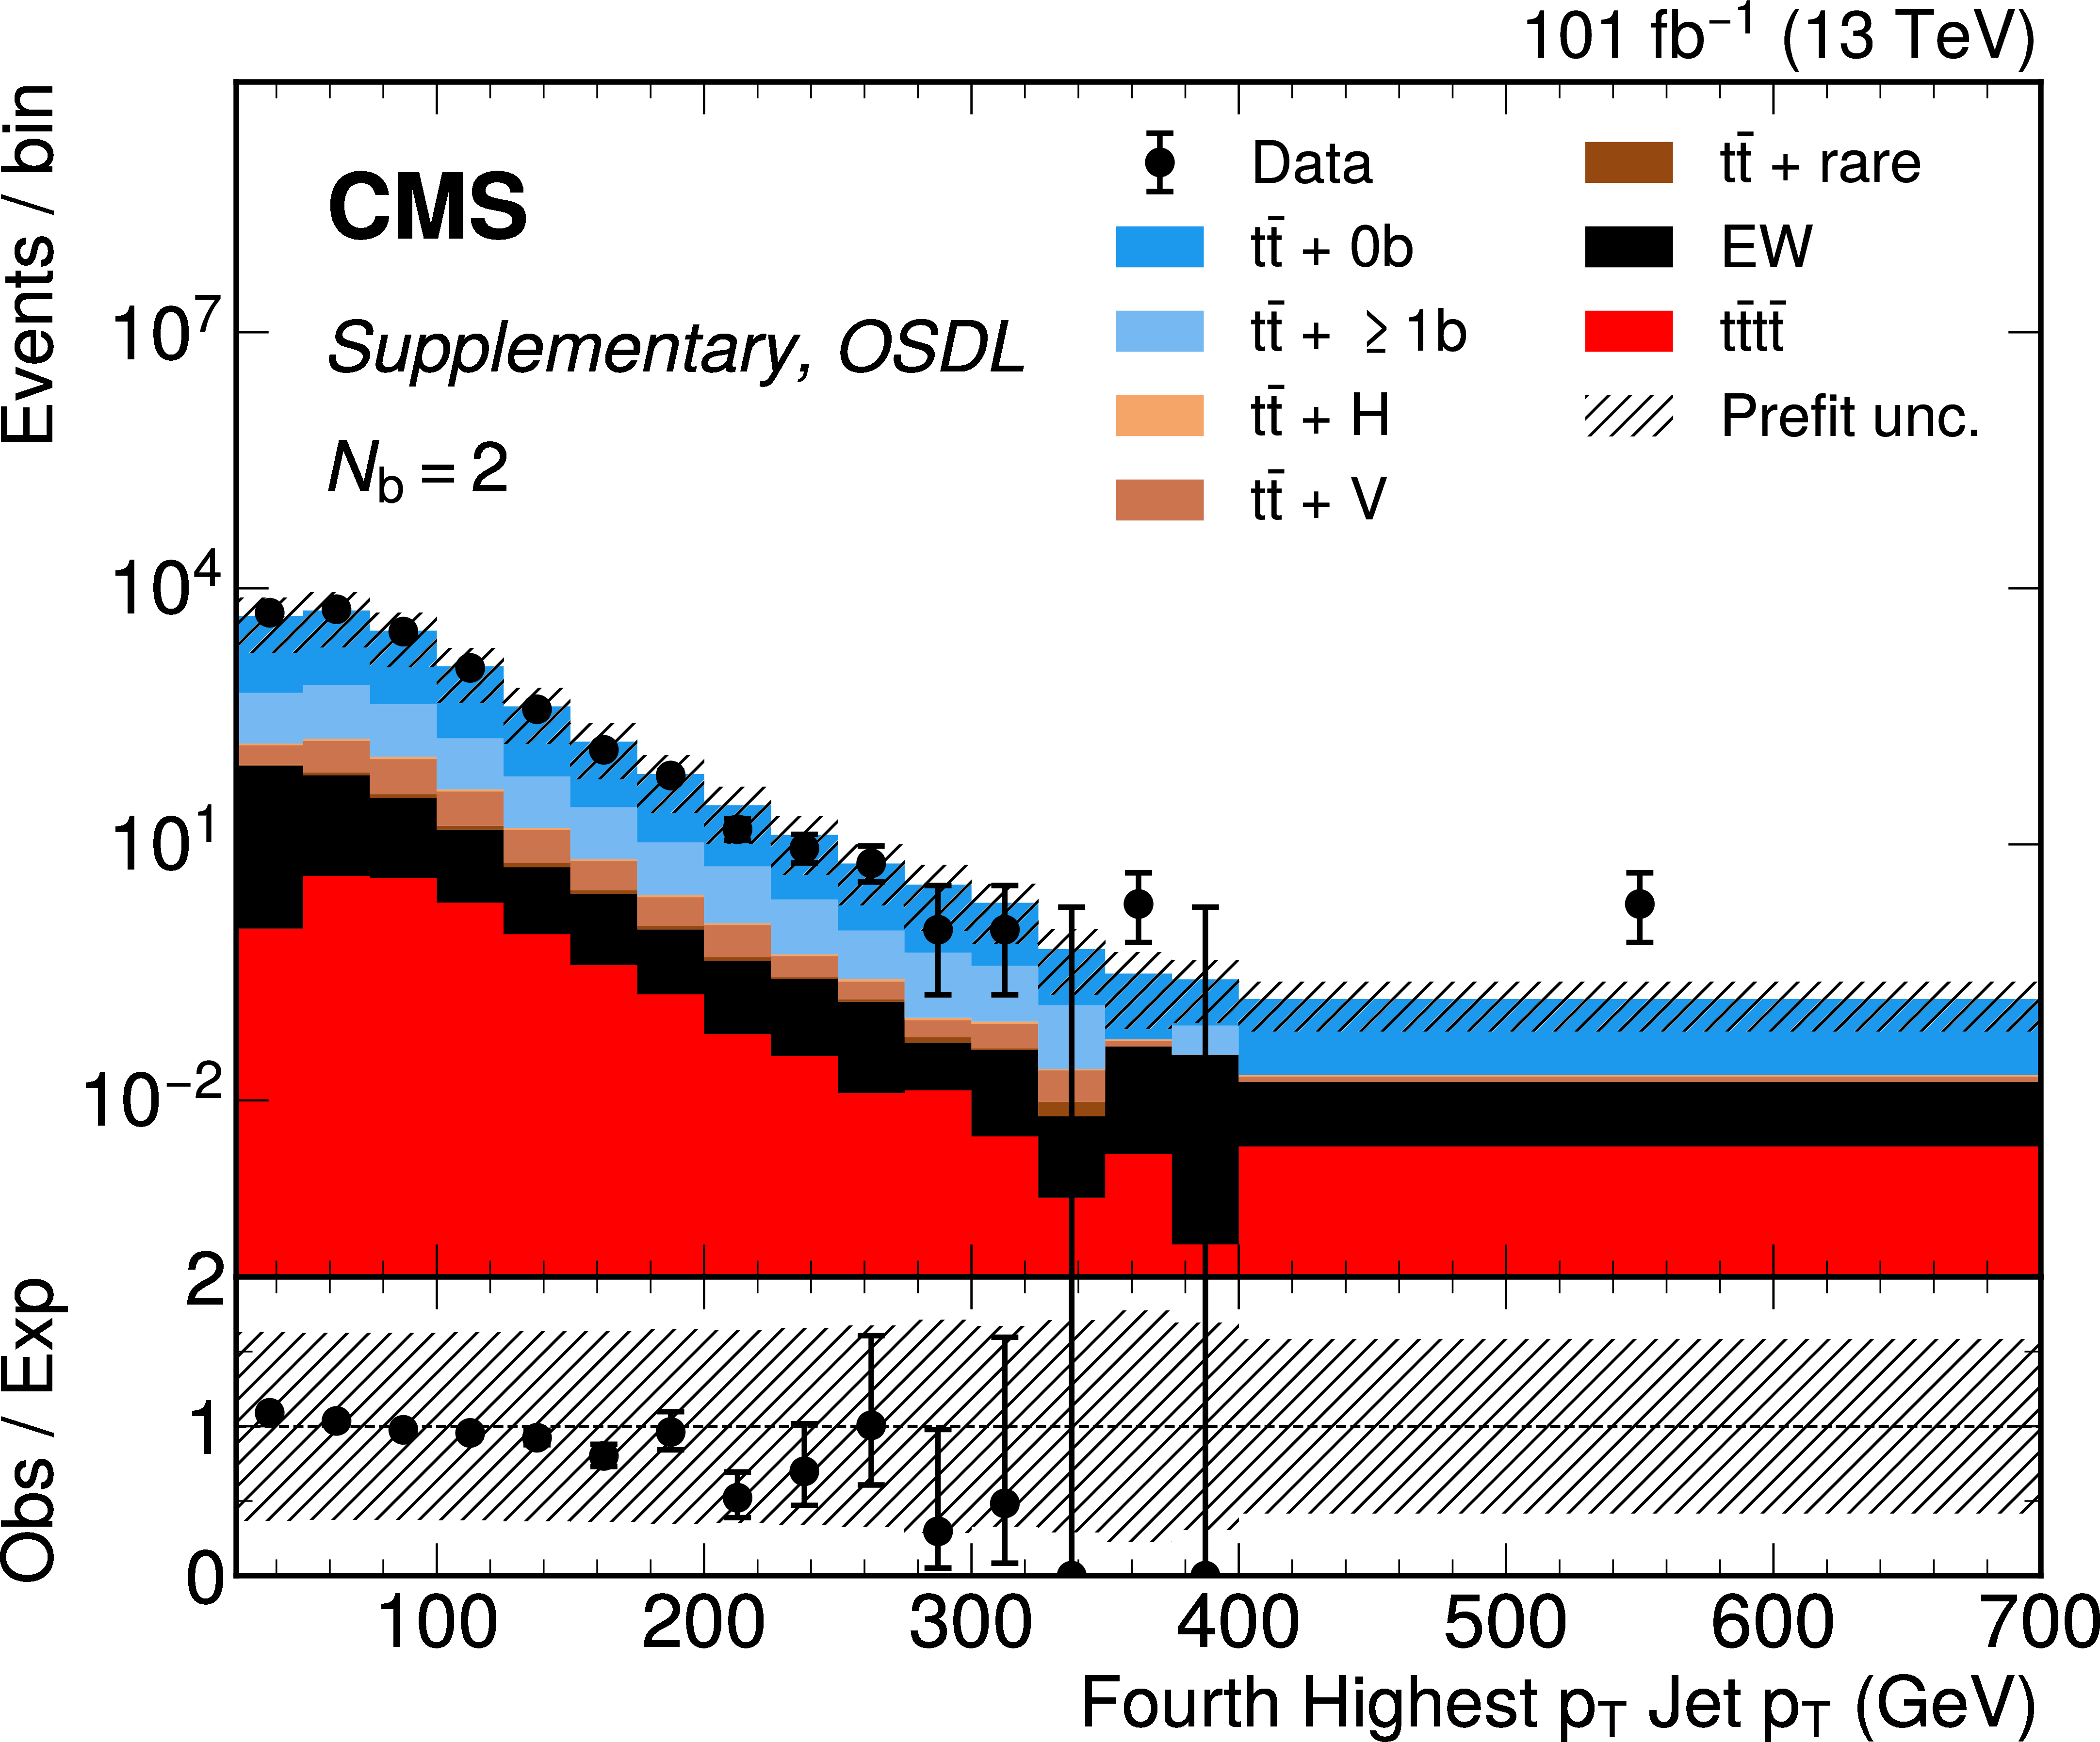
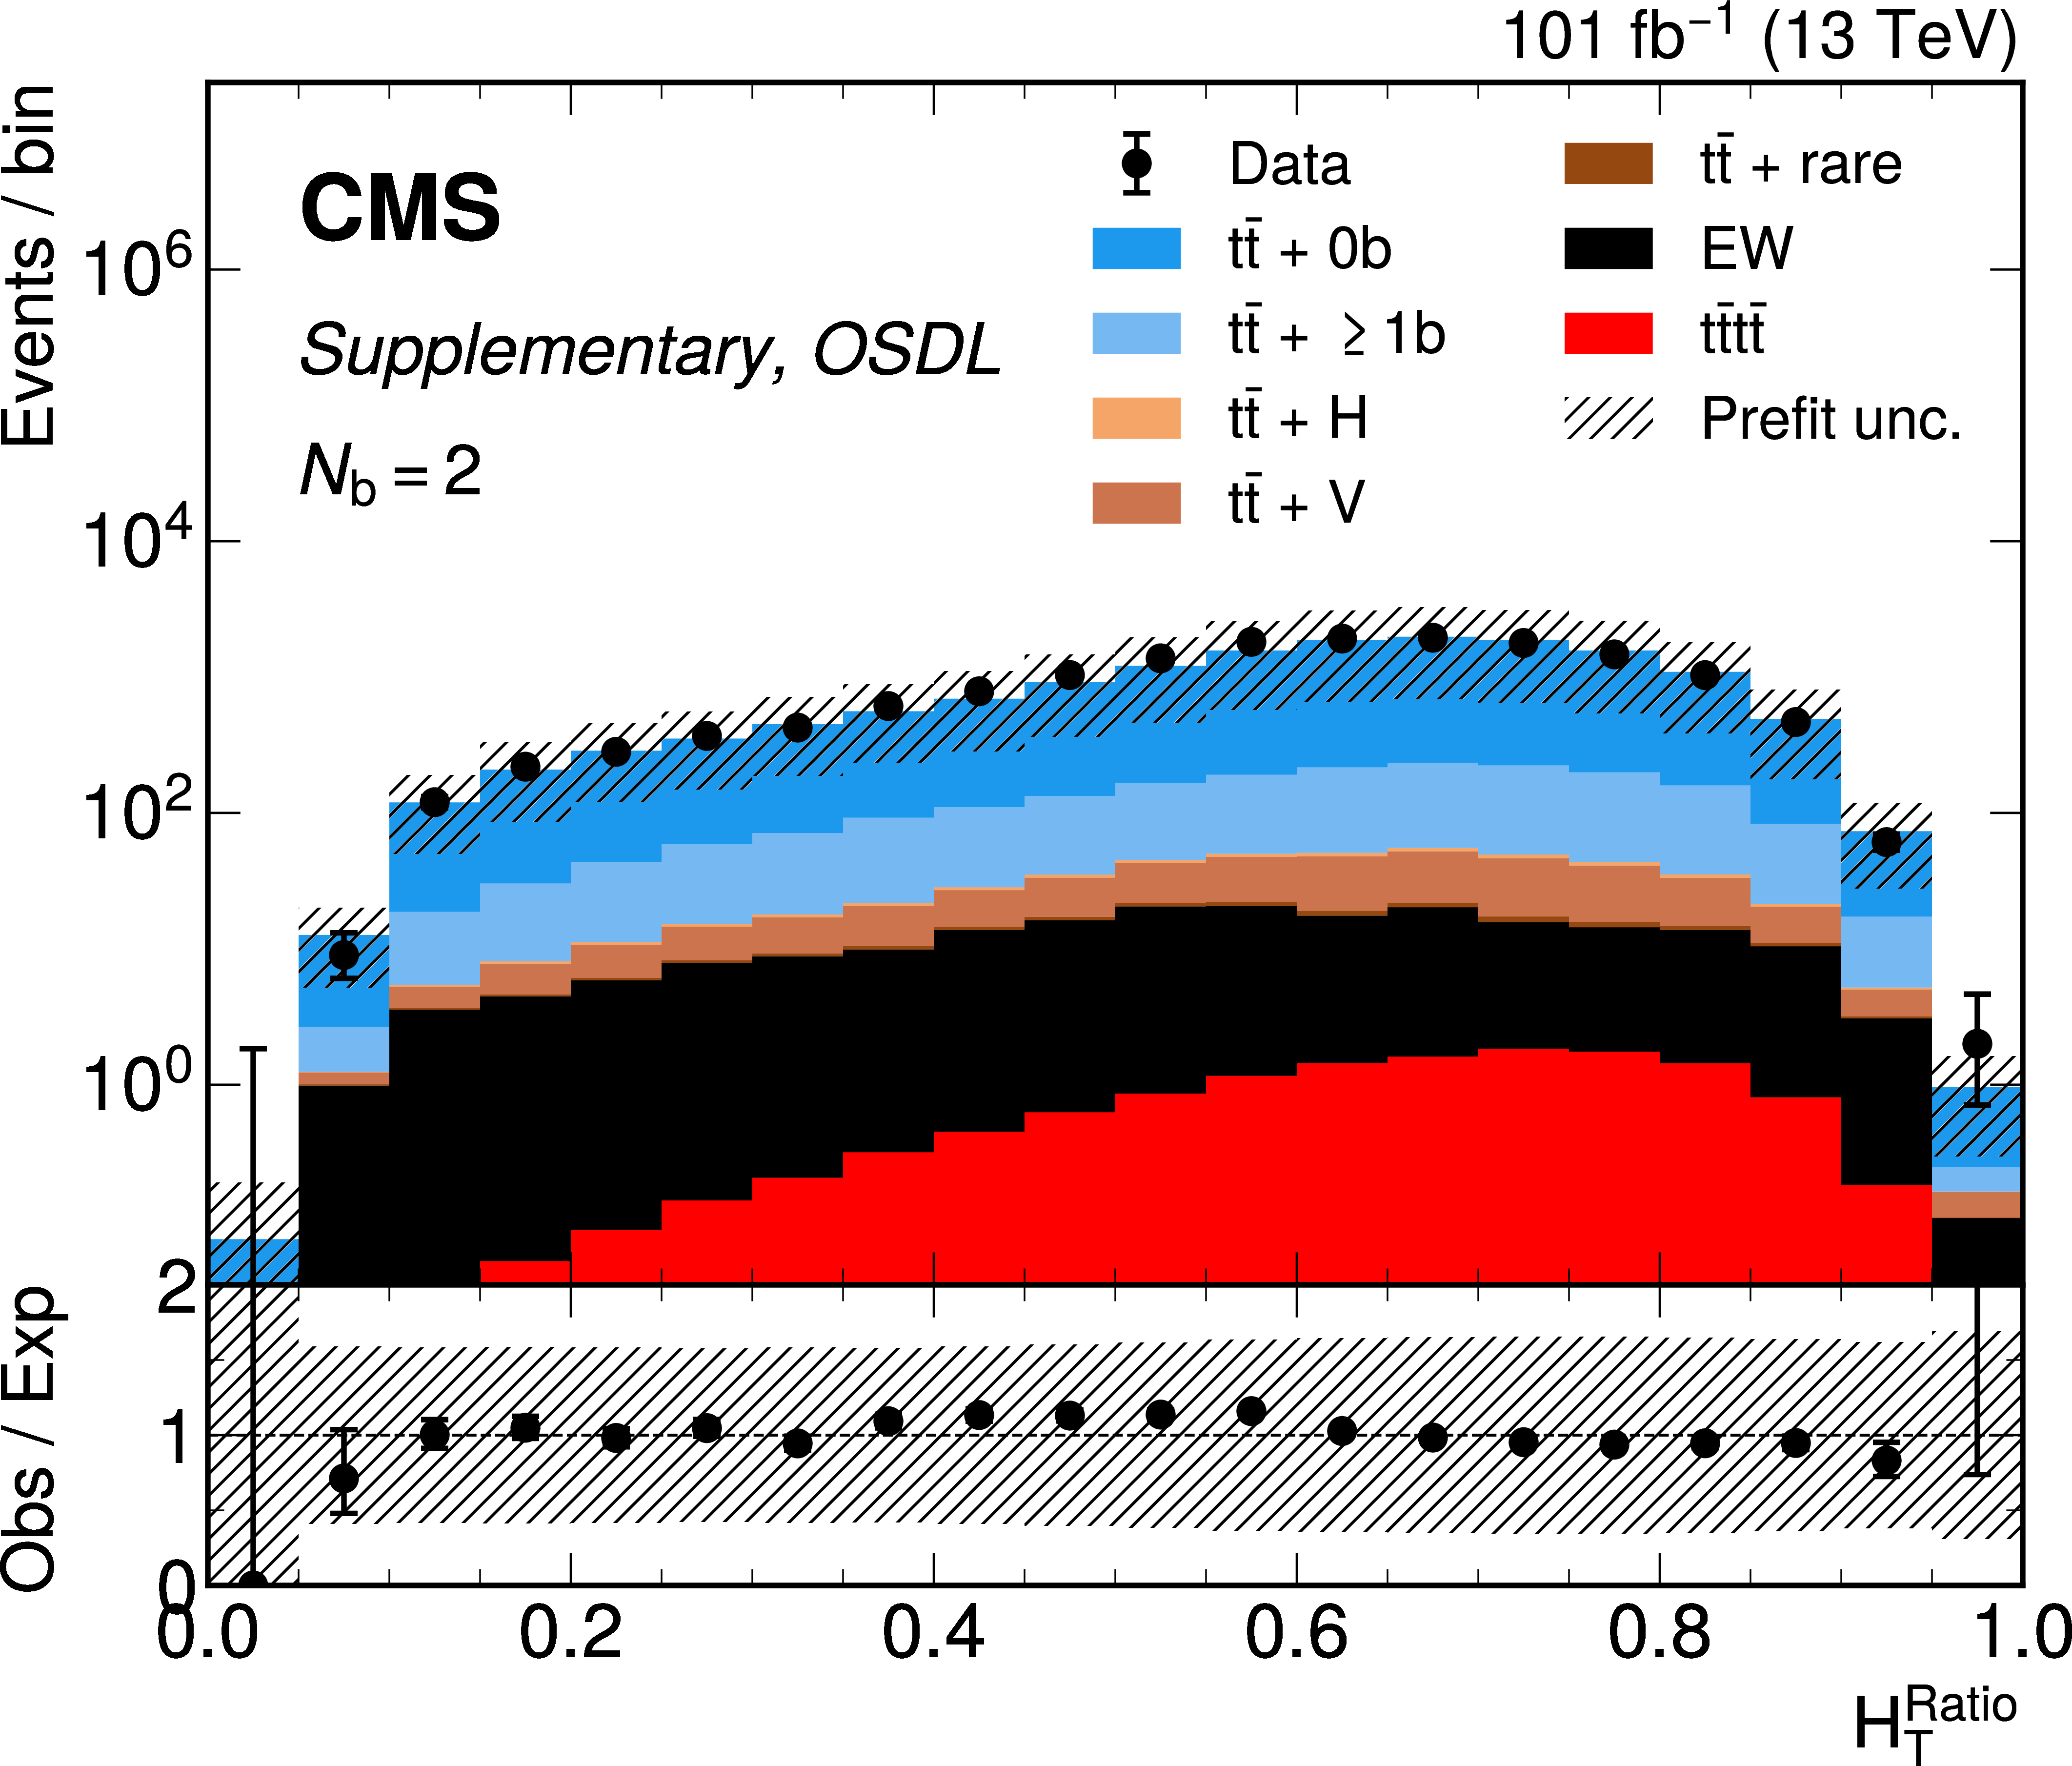
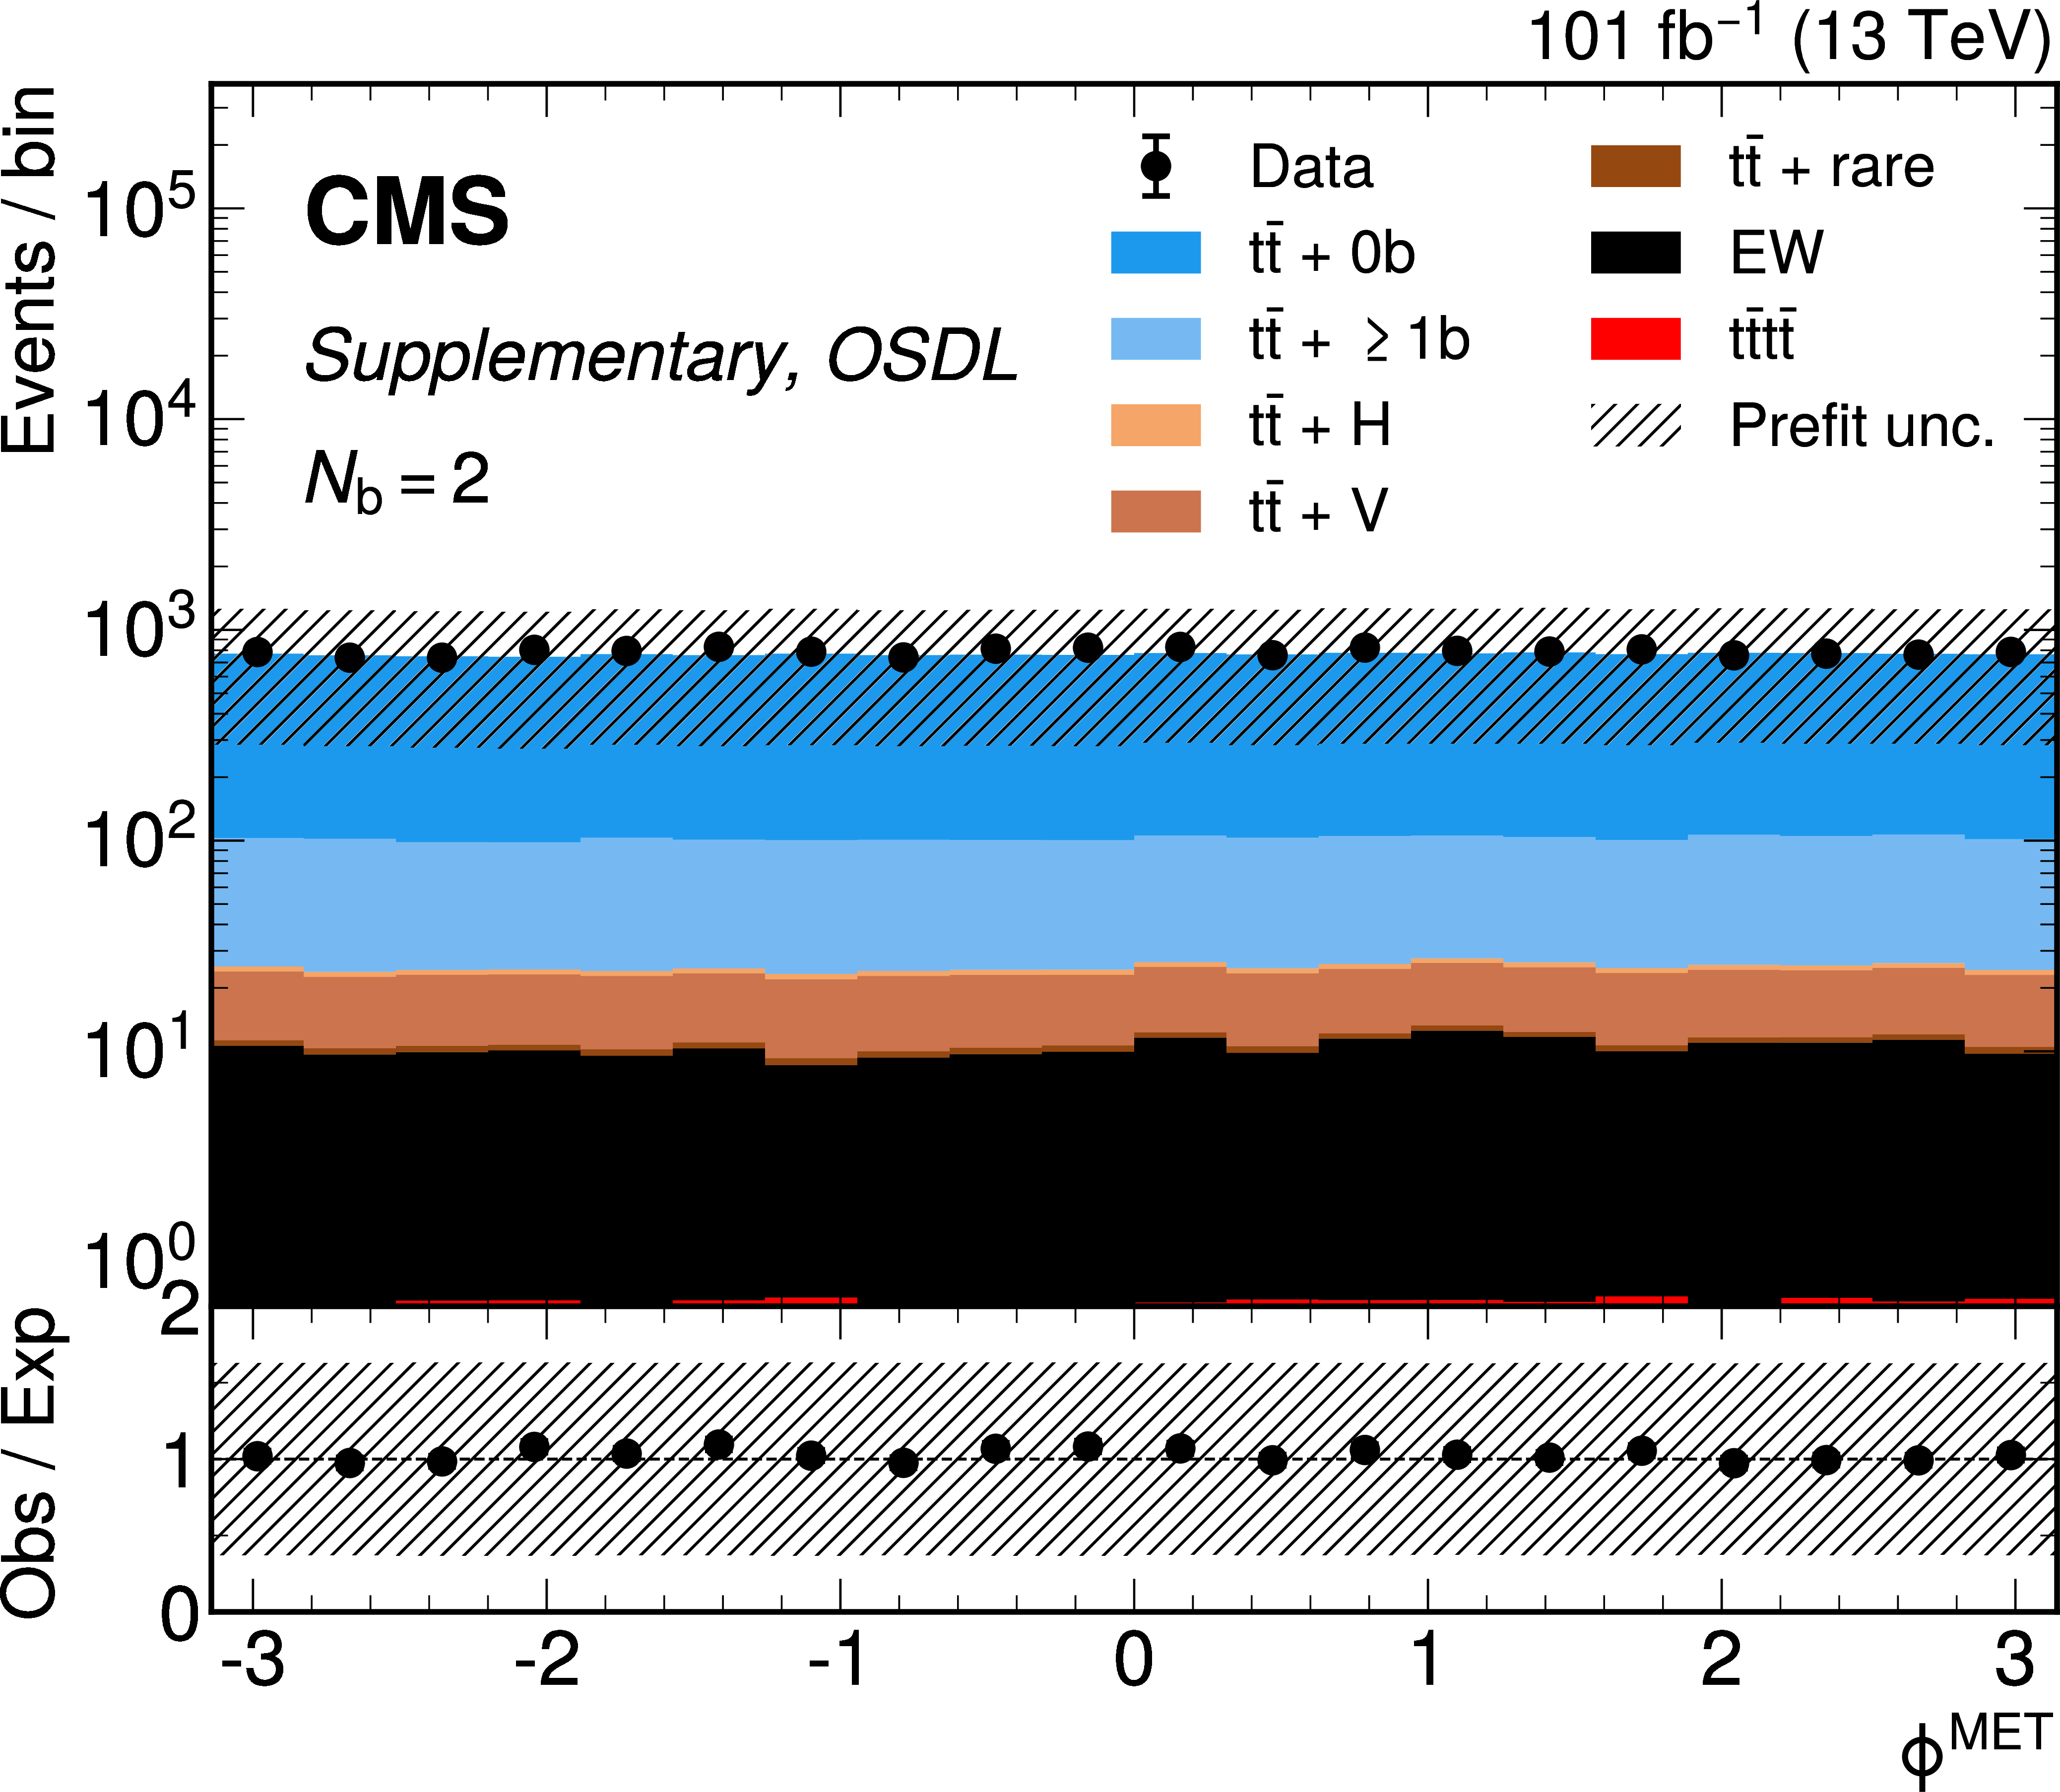
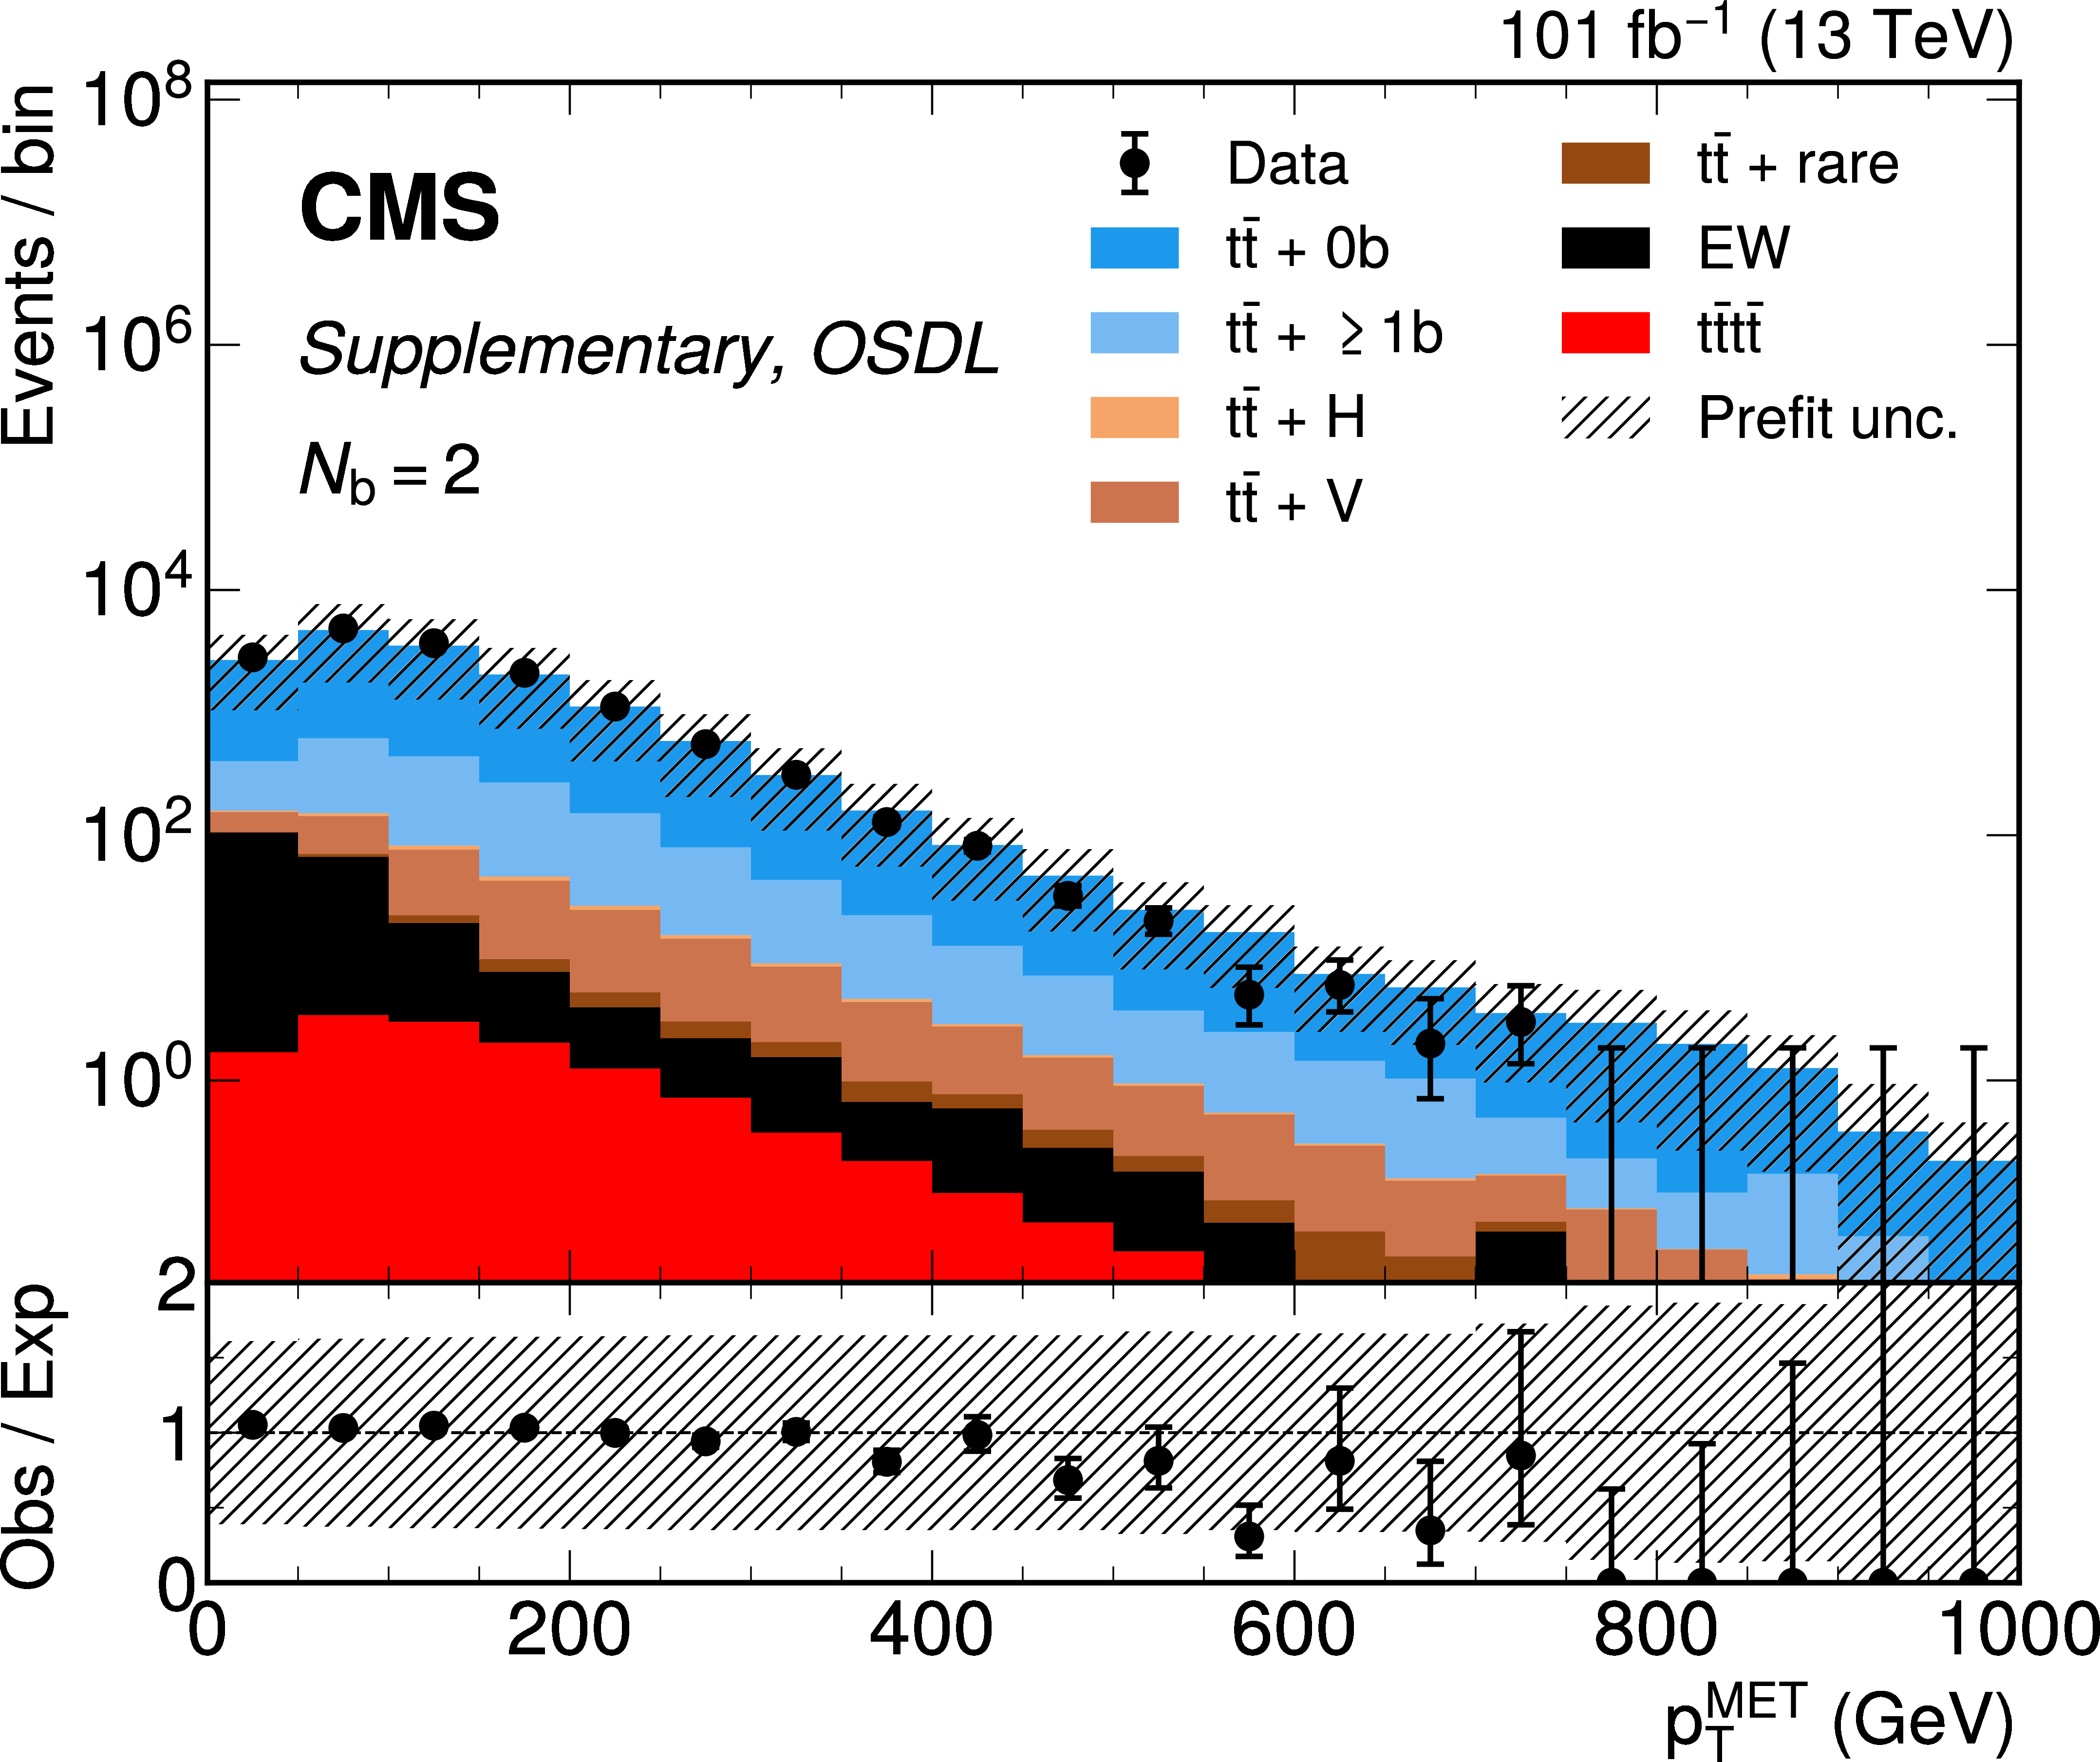
Additional Figure 15:
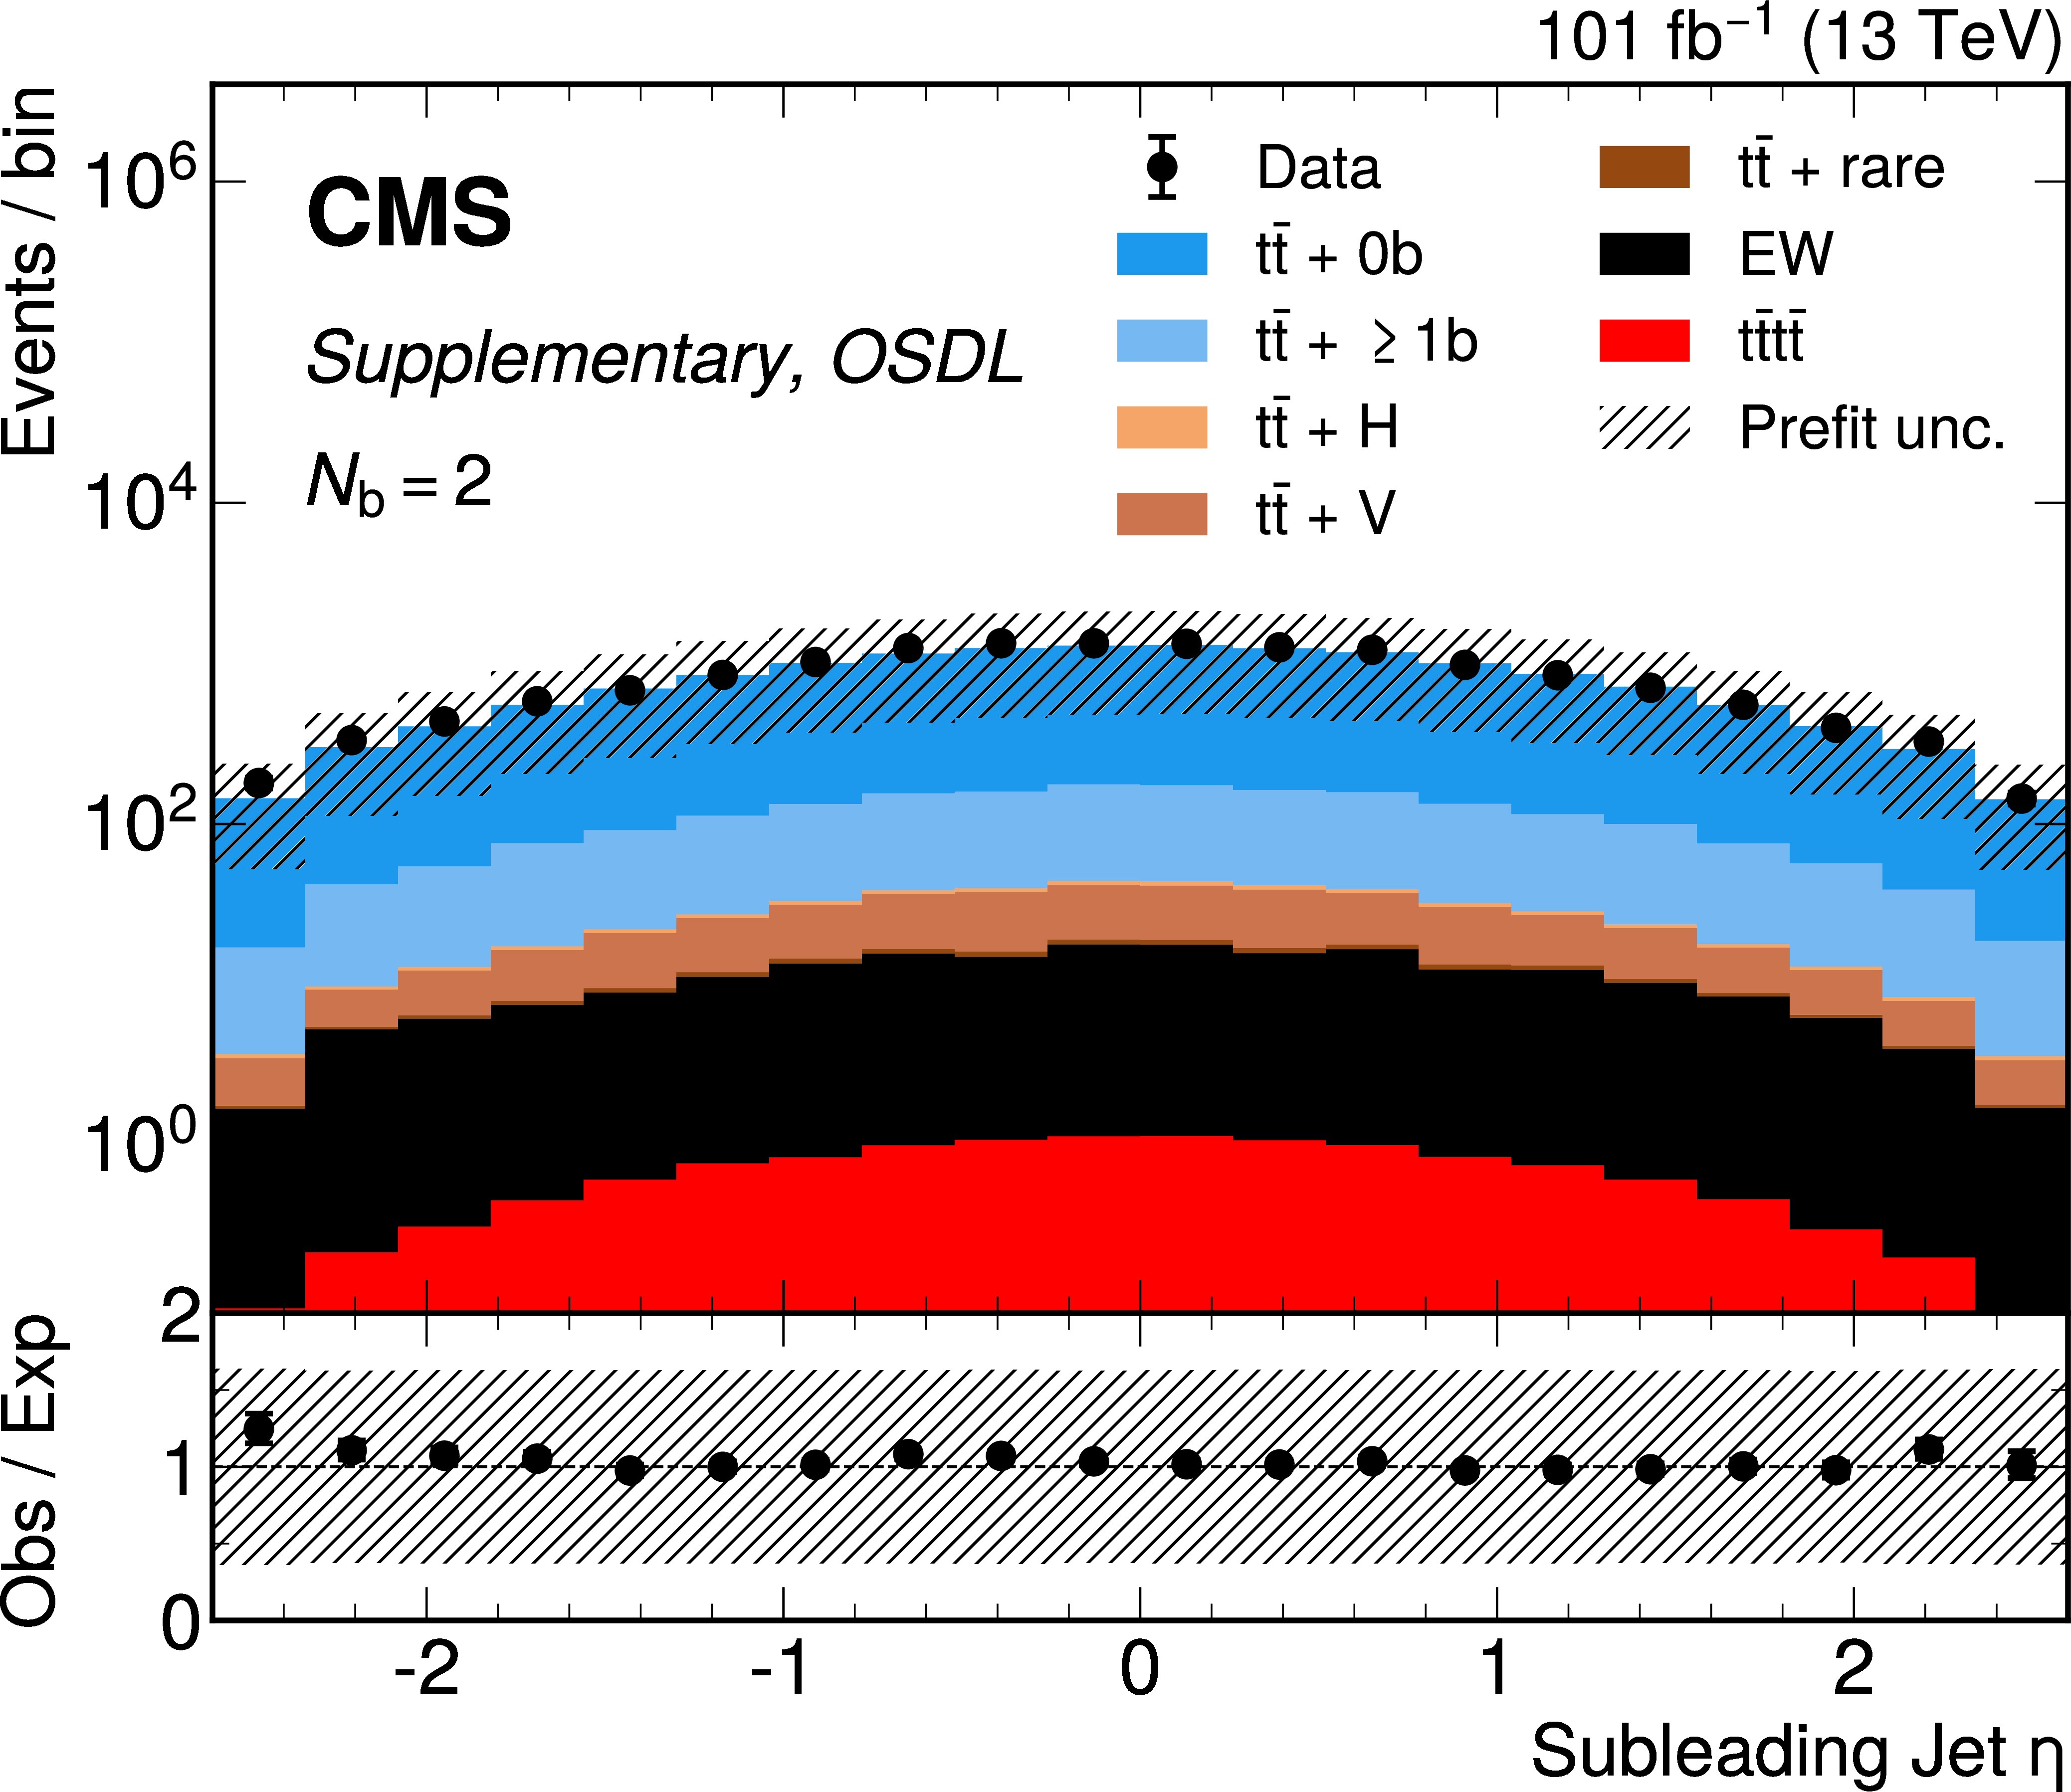
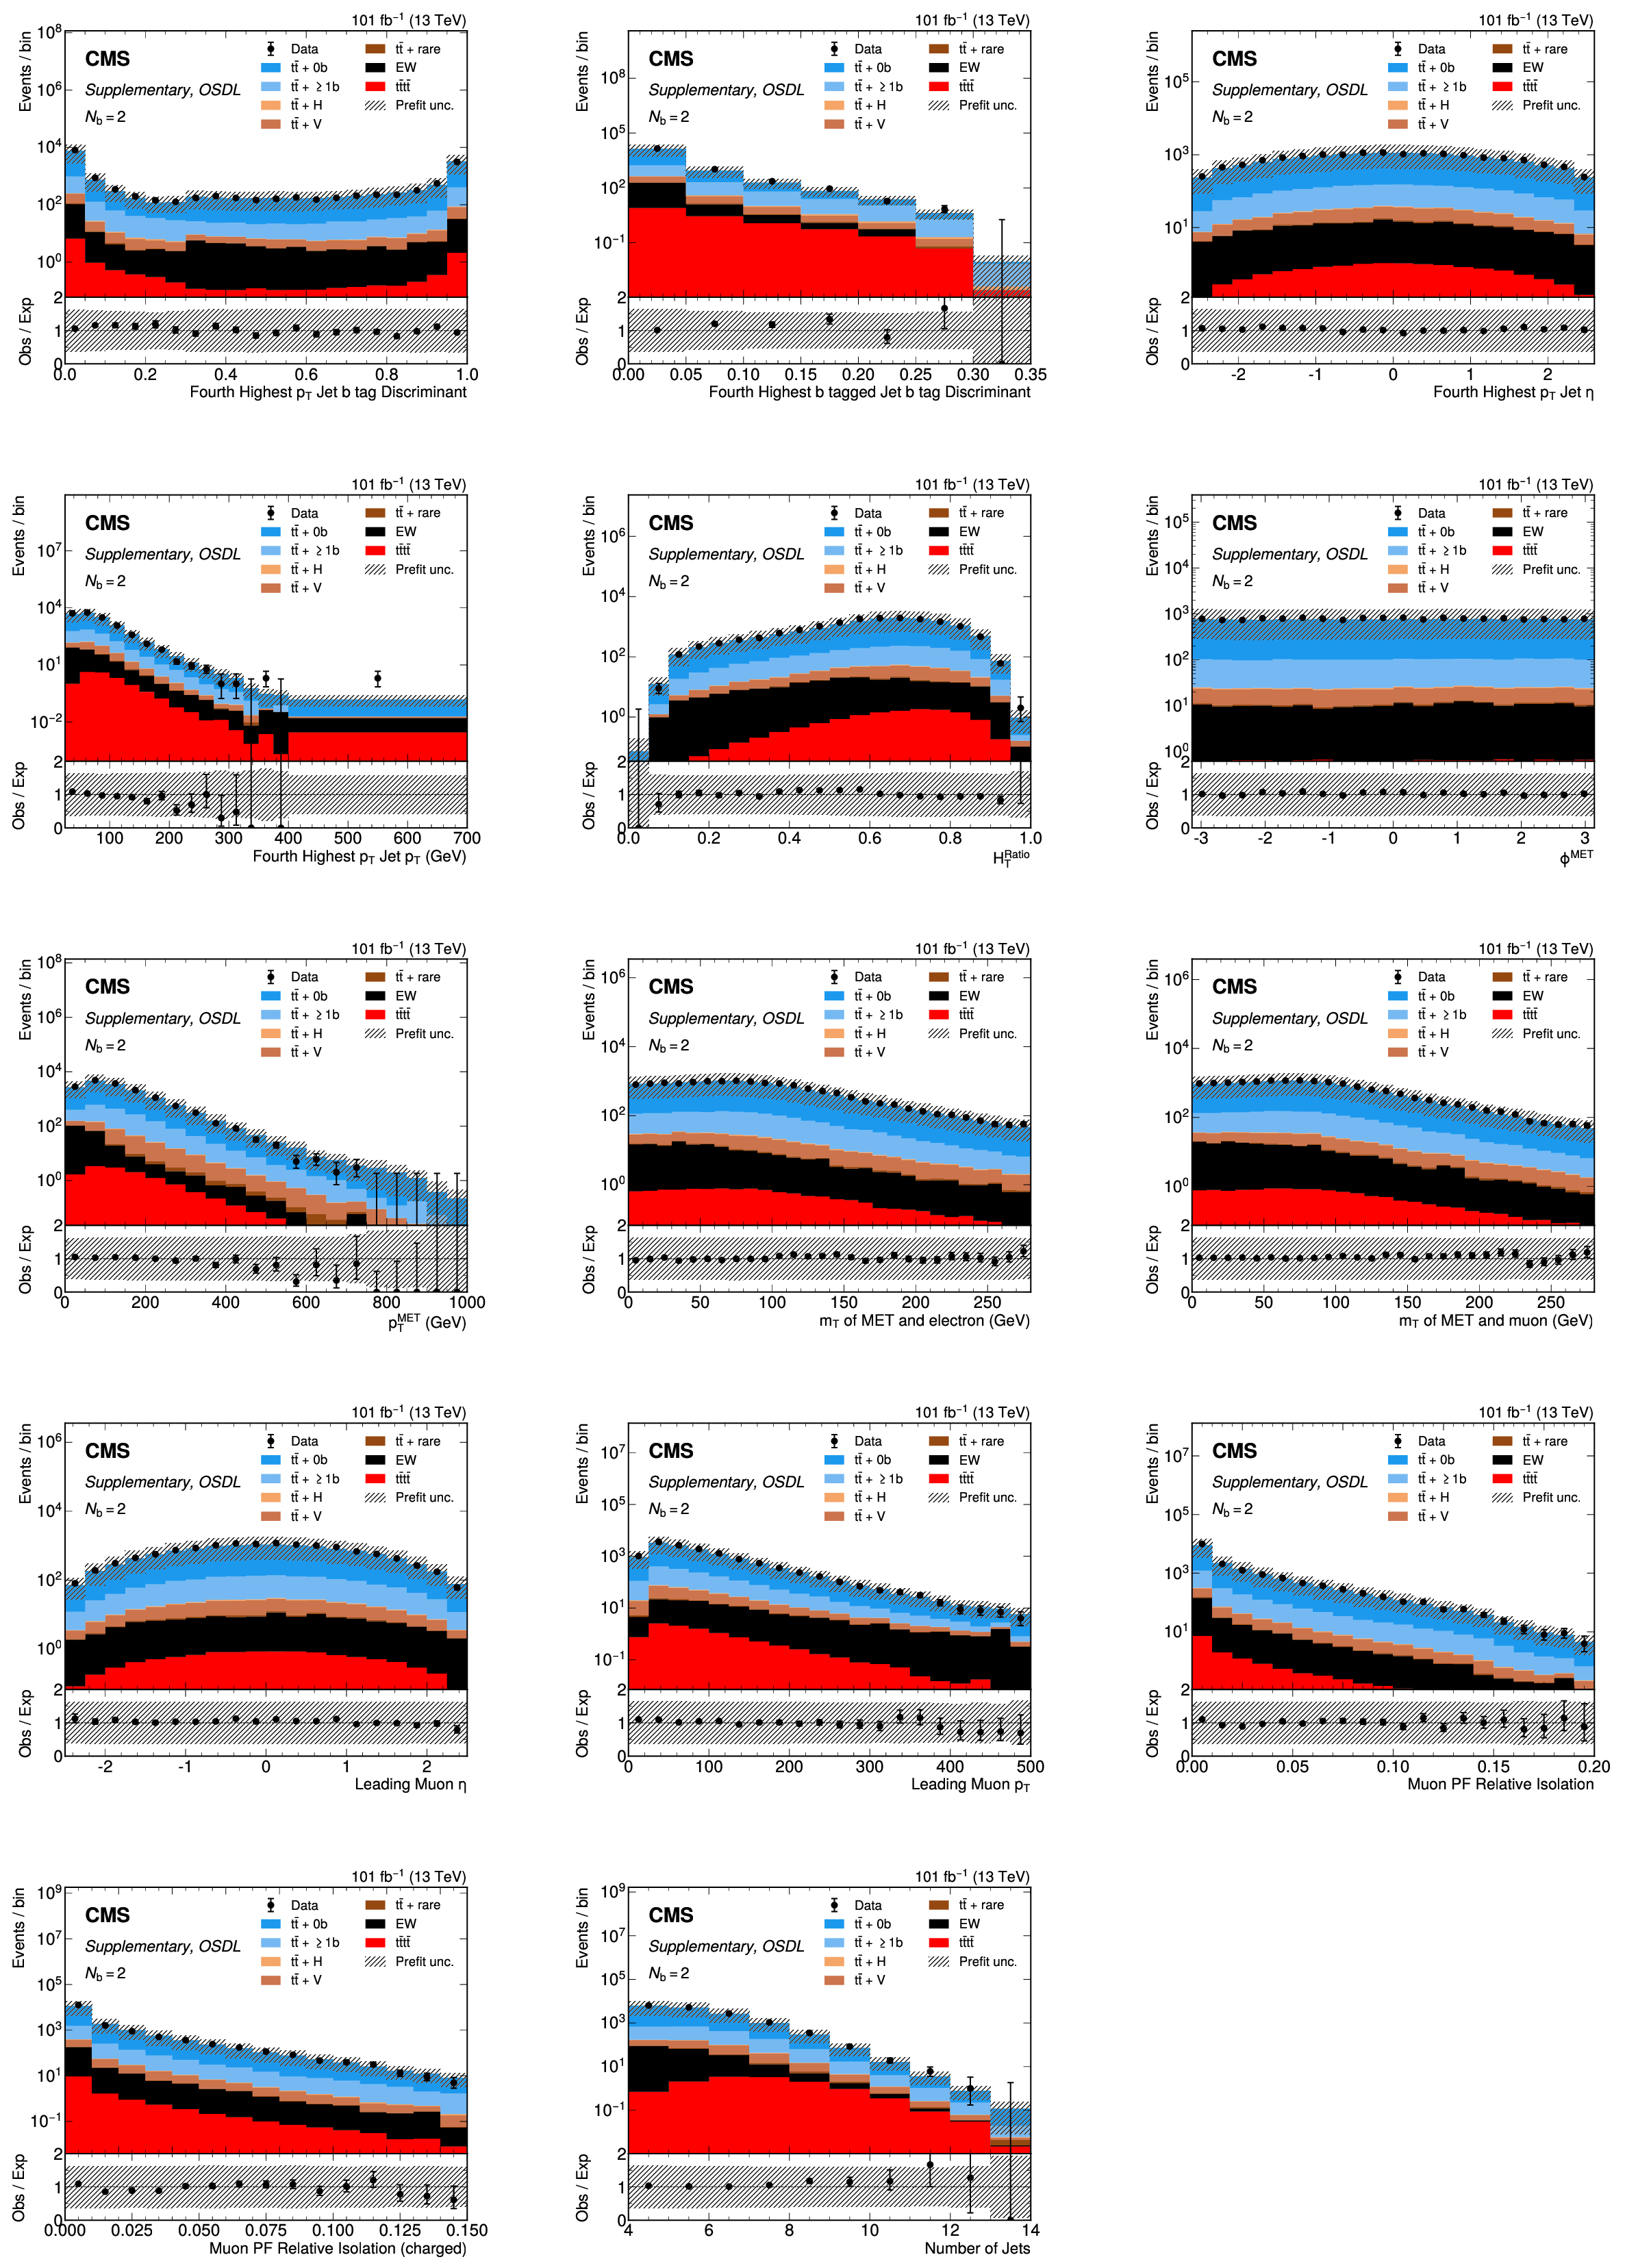
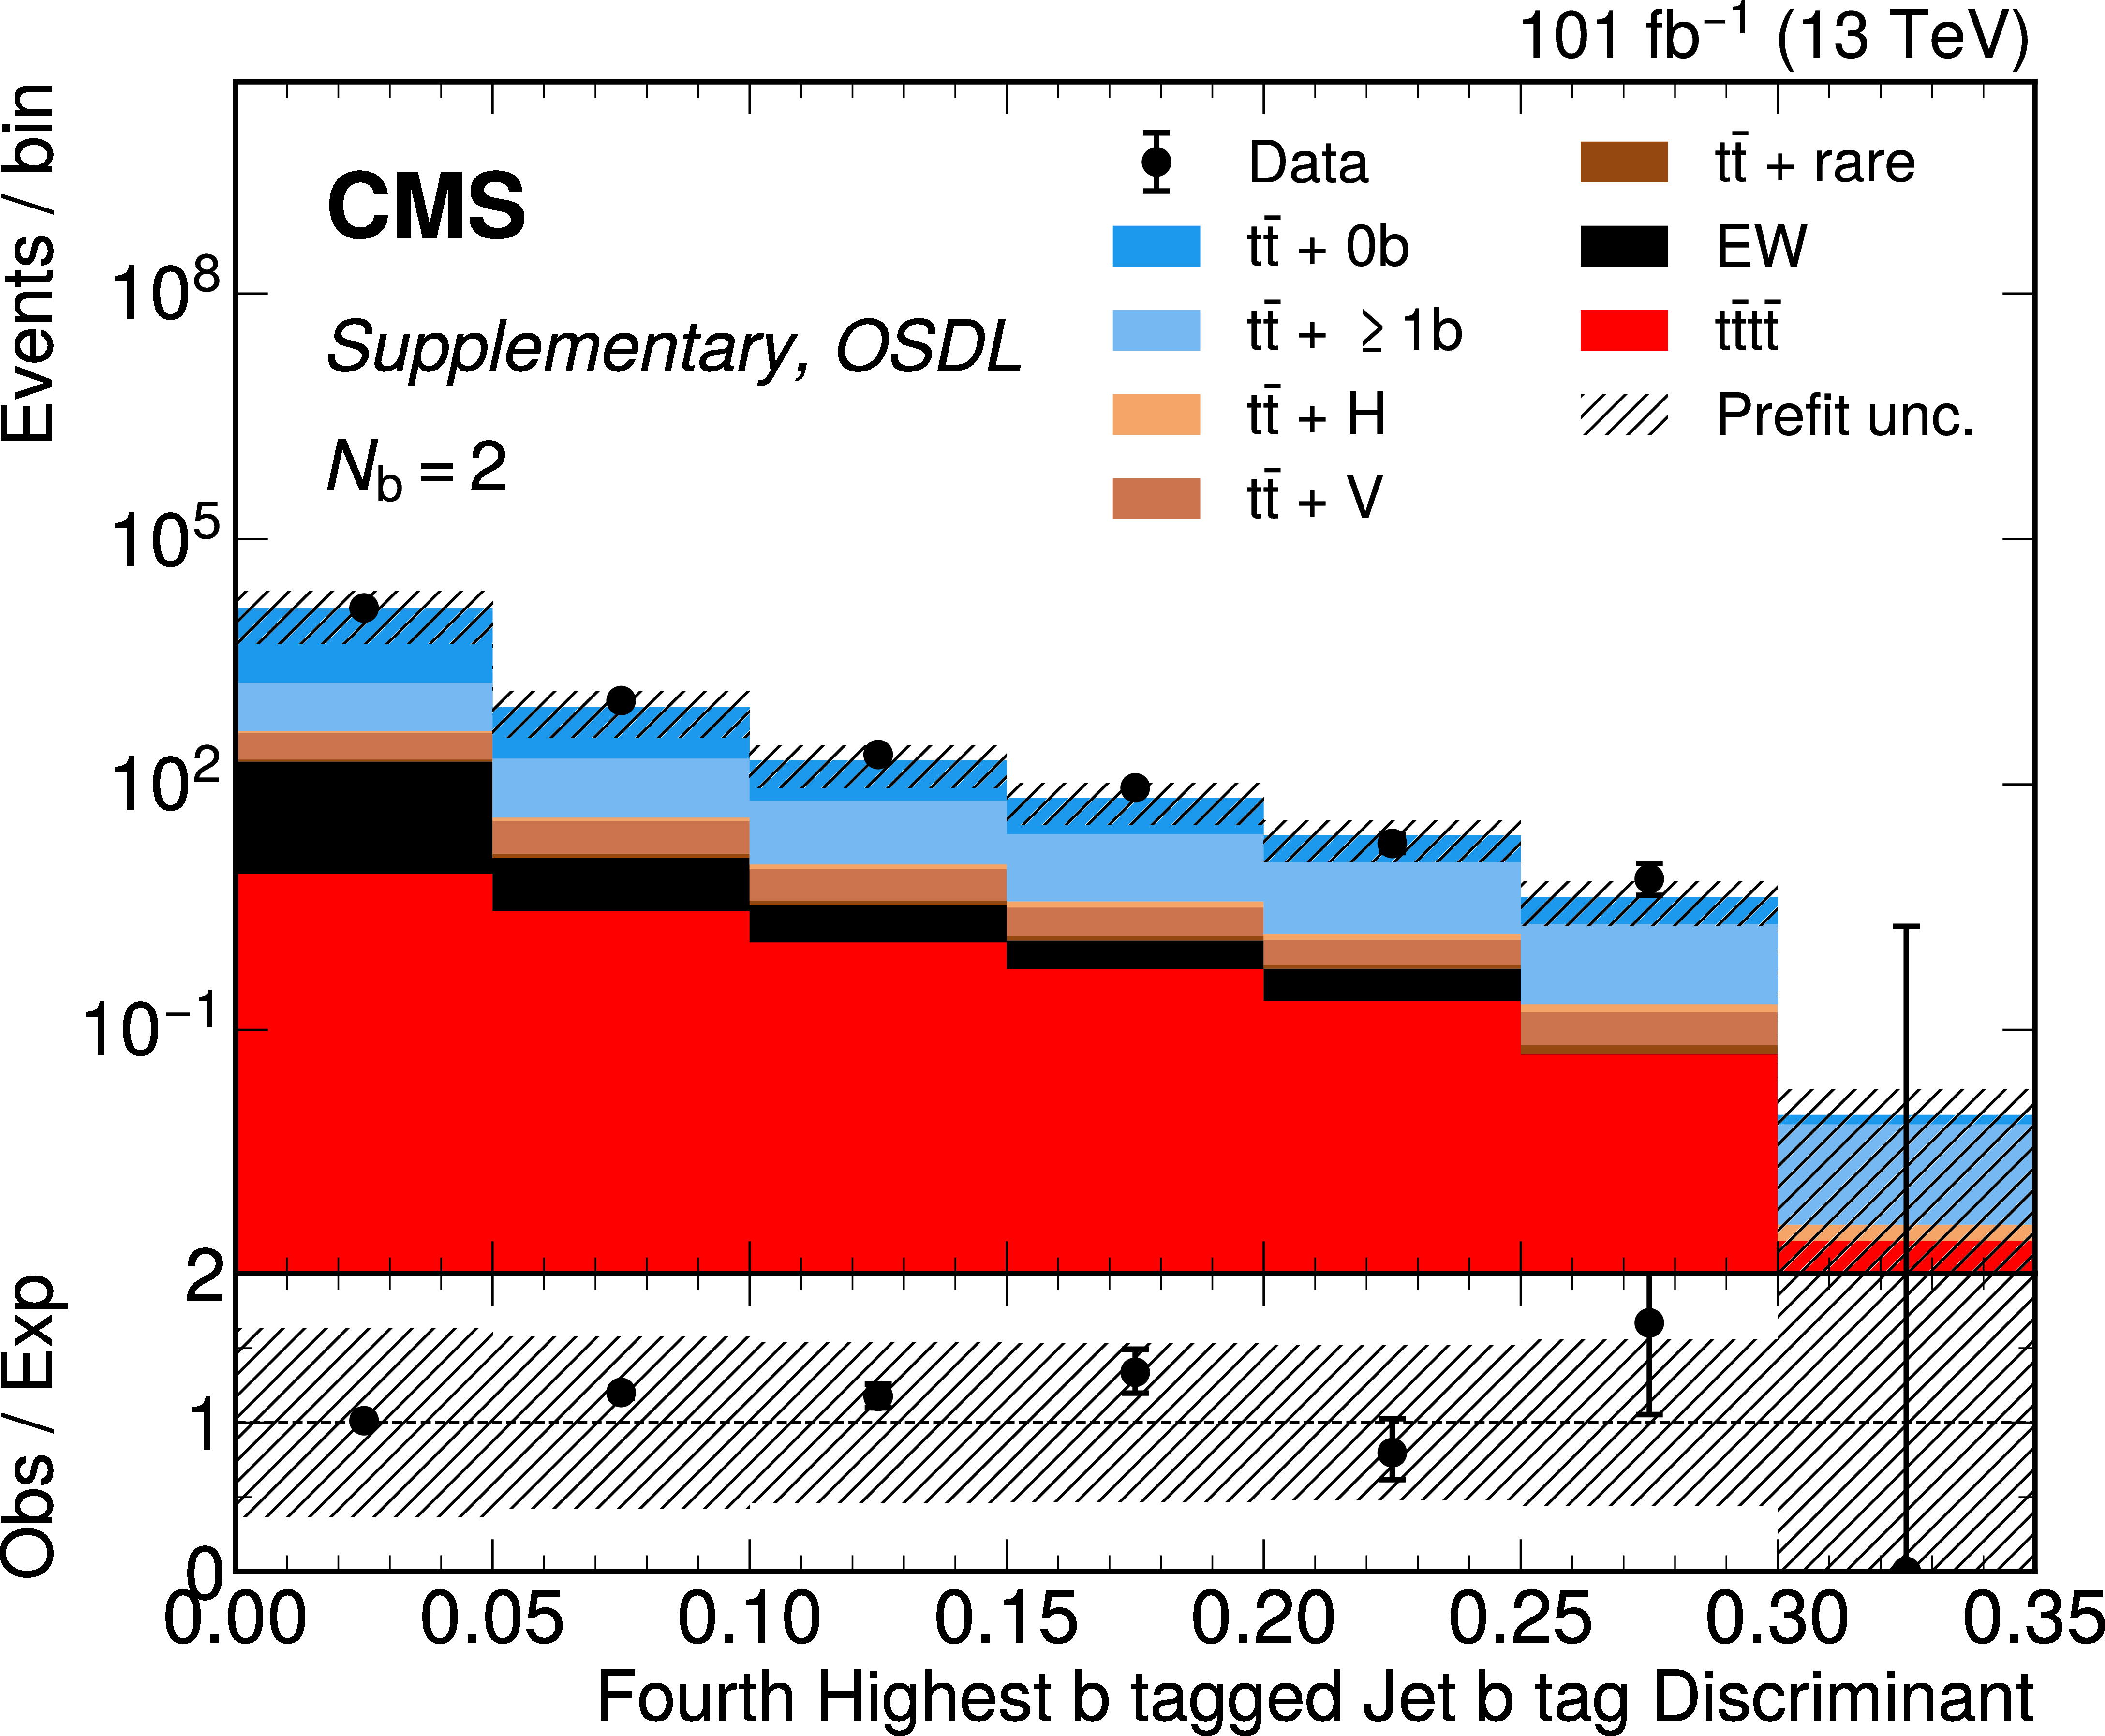
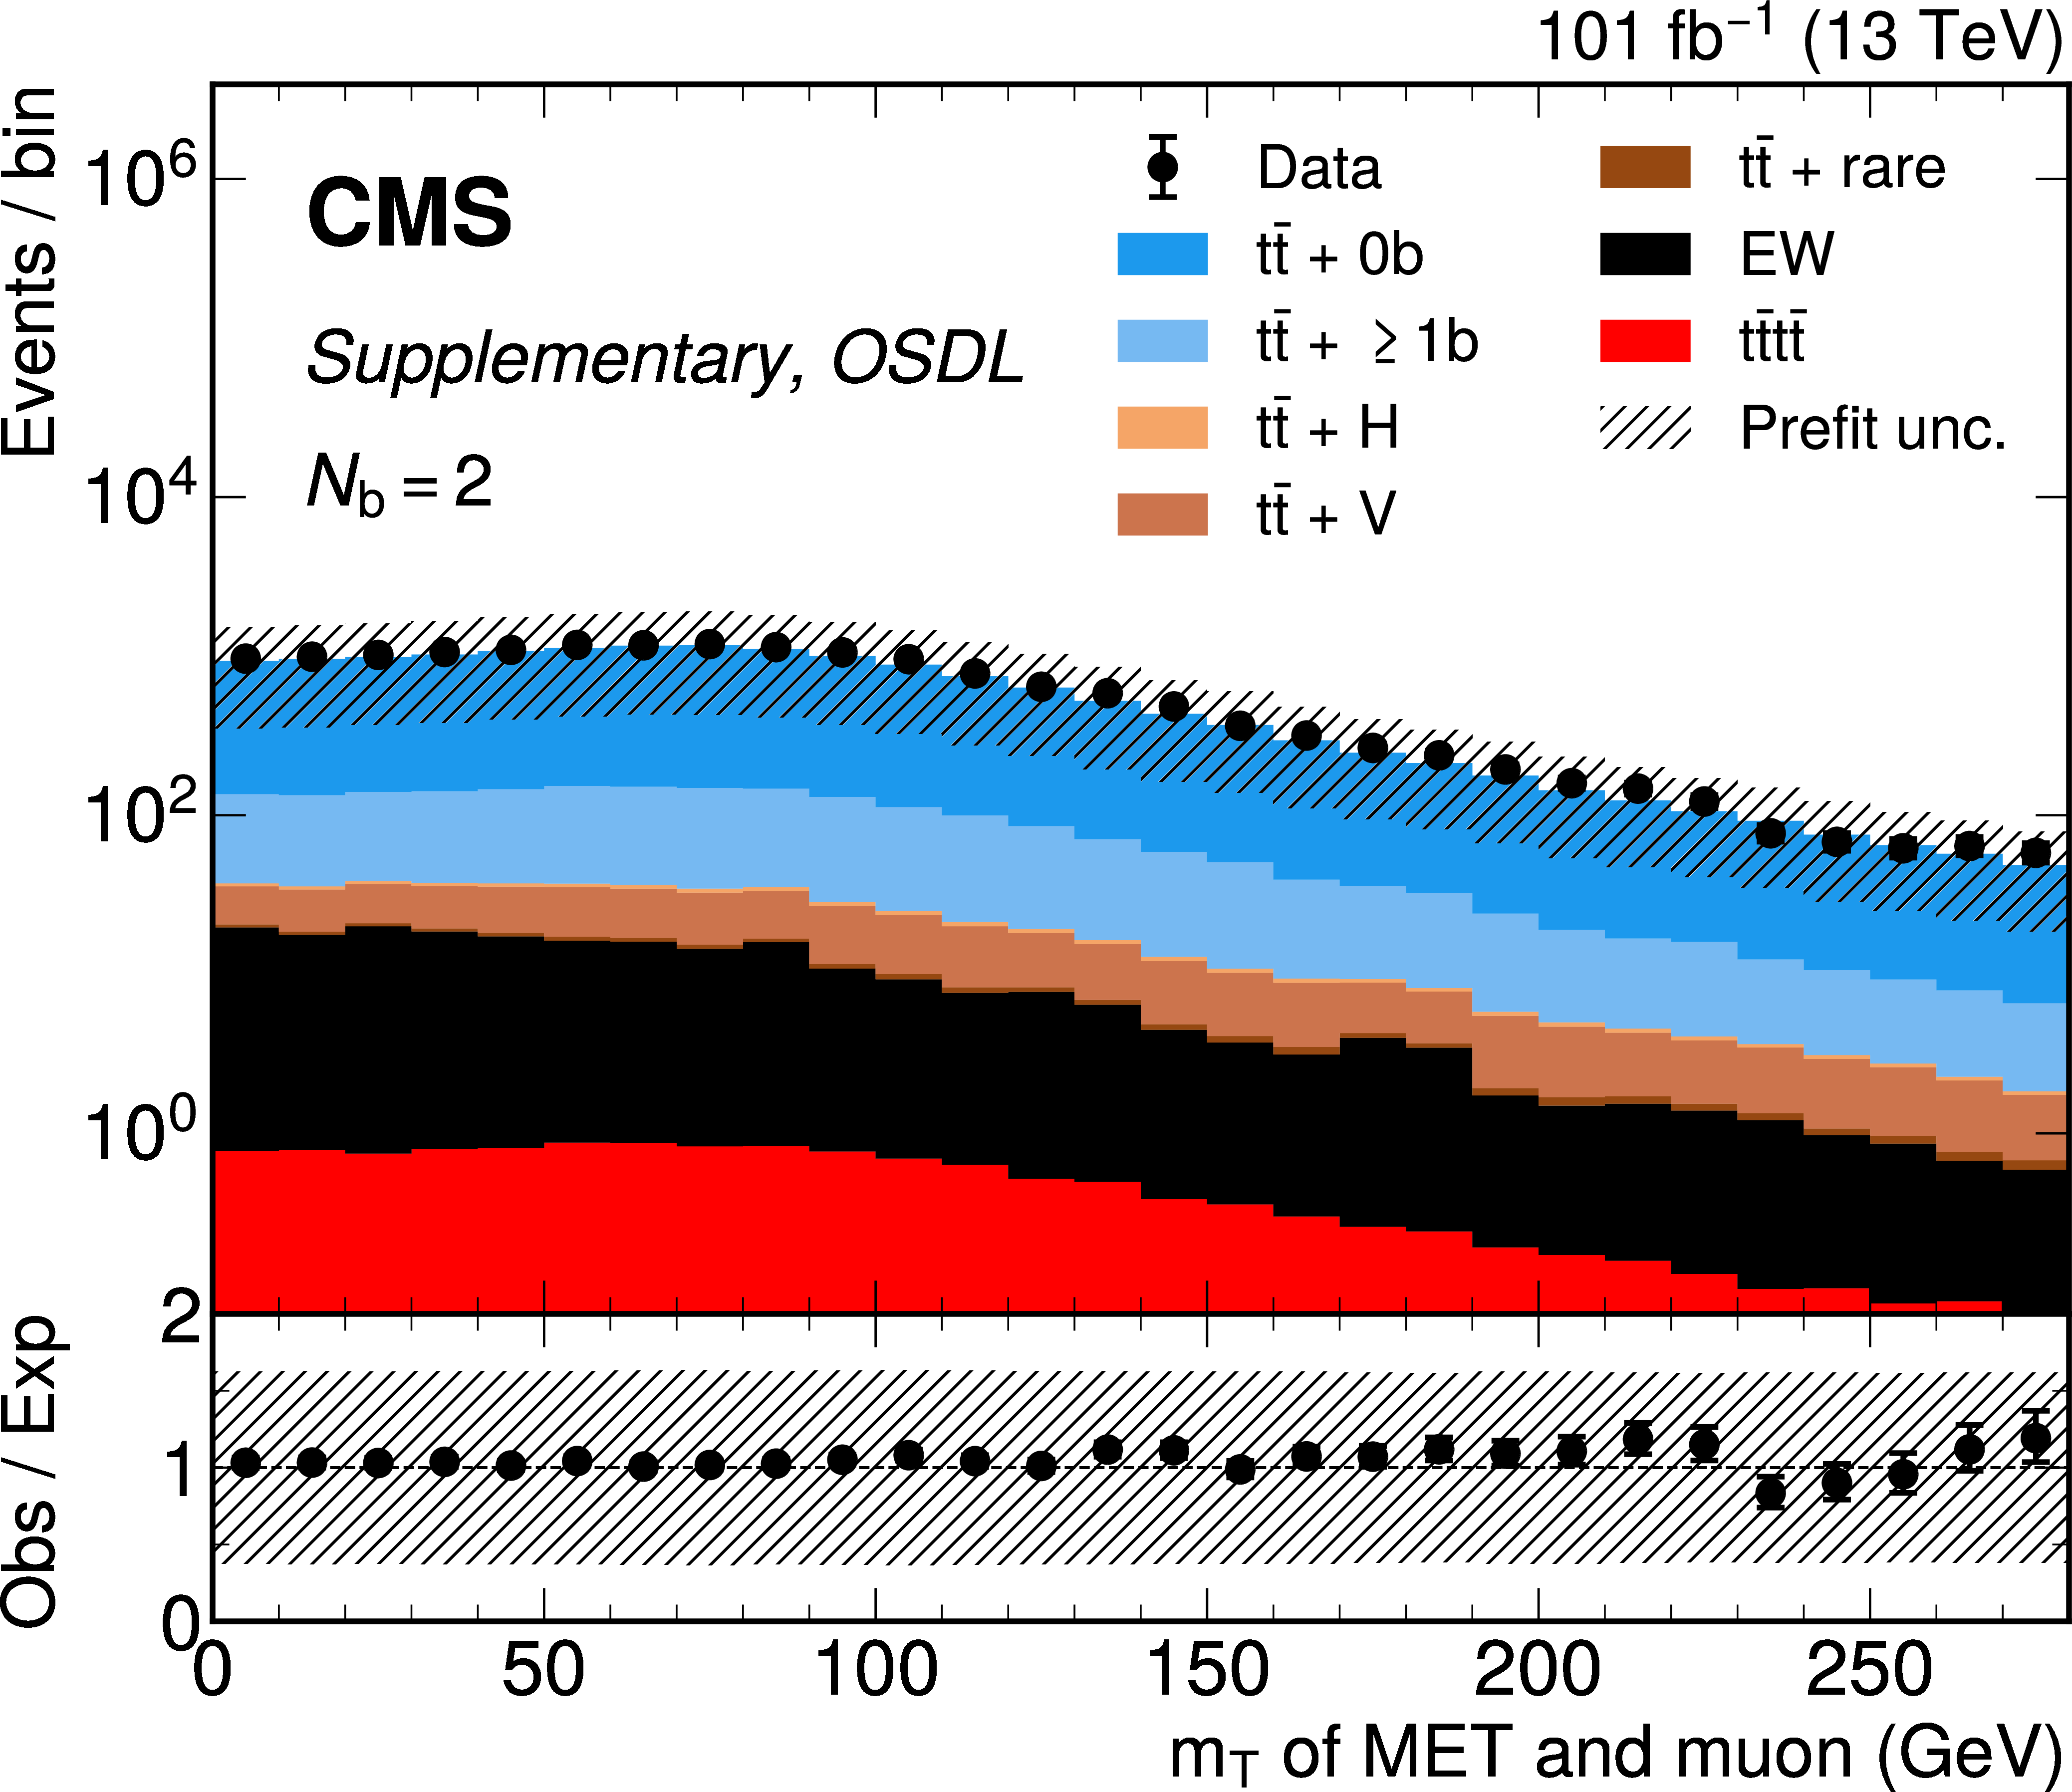
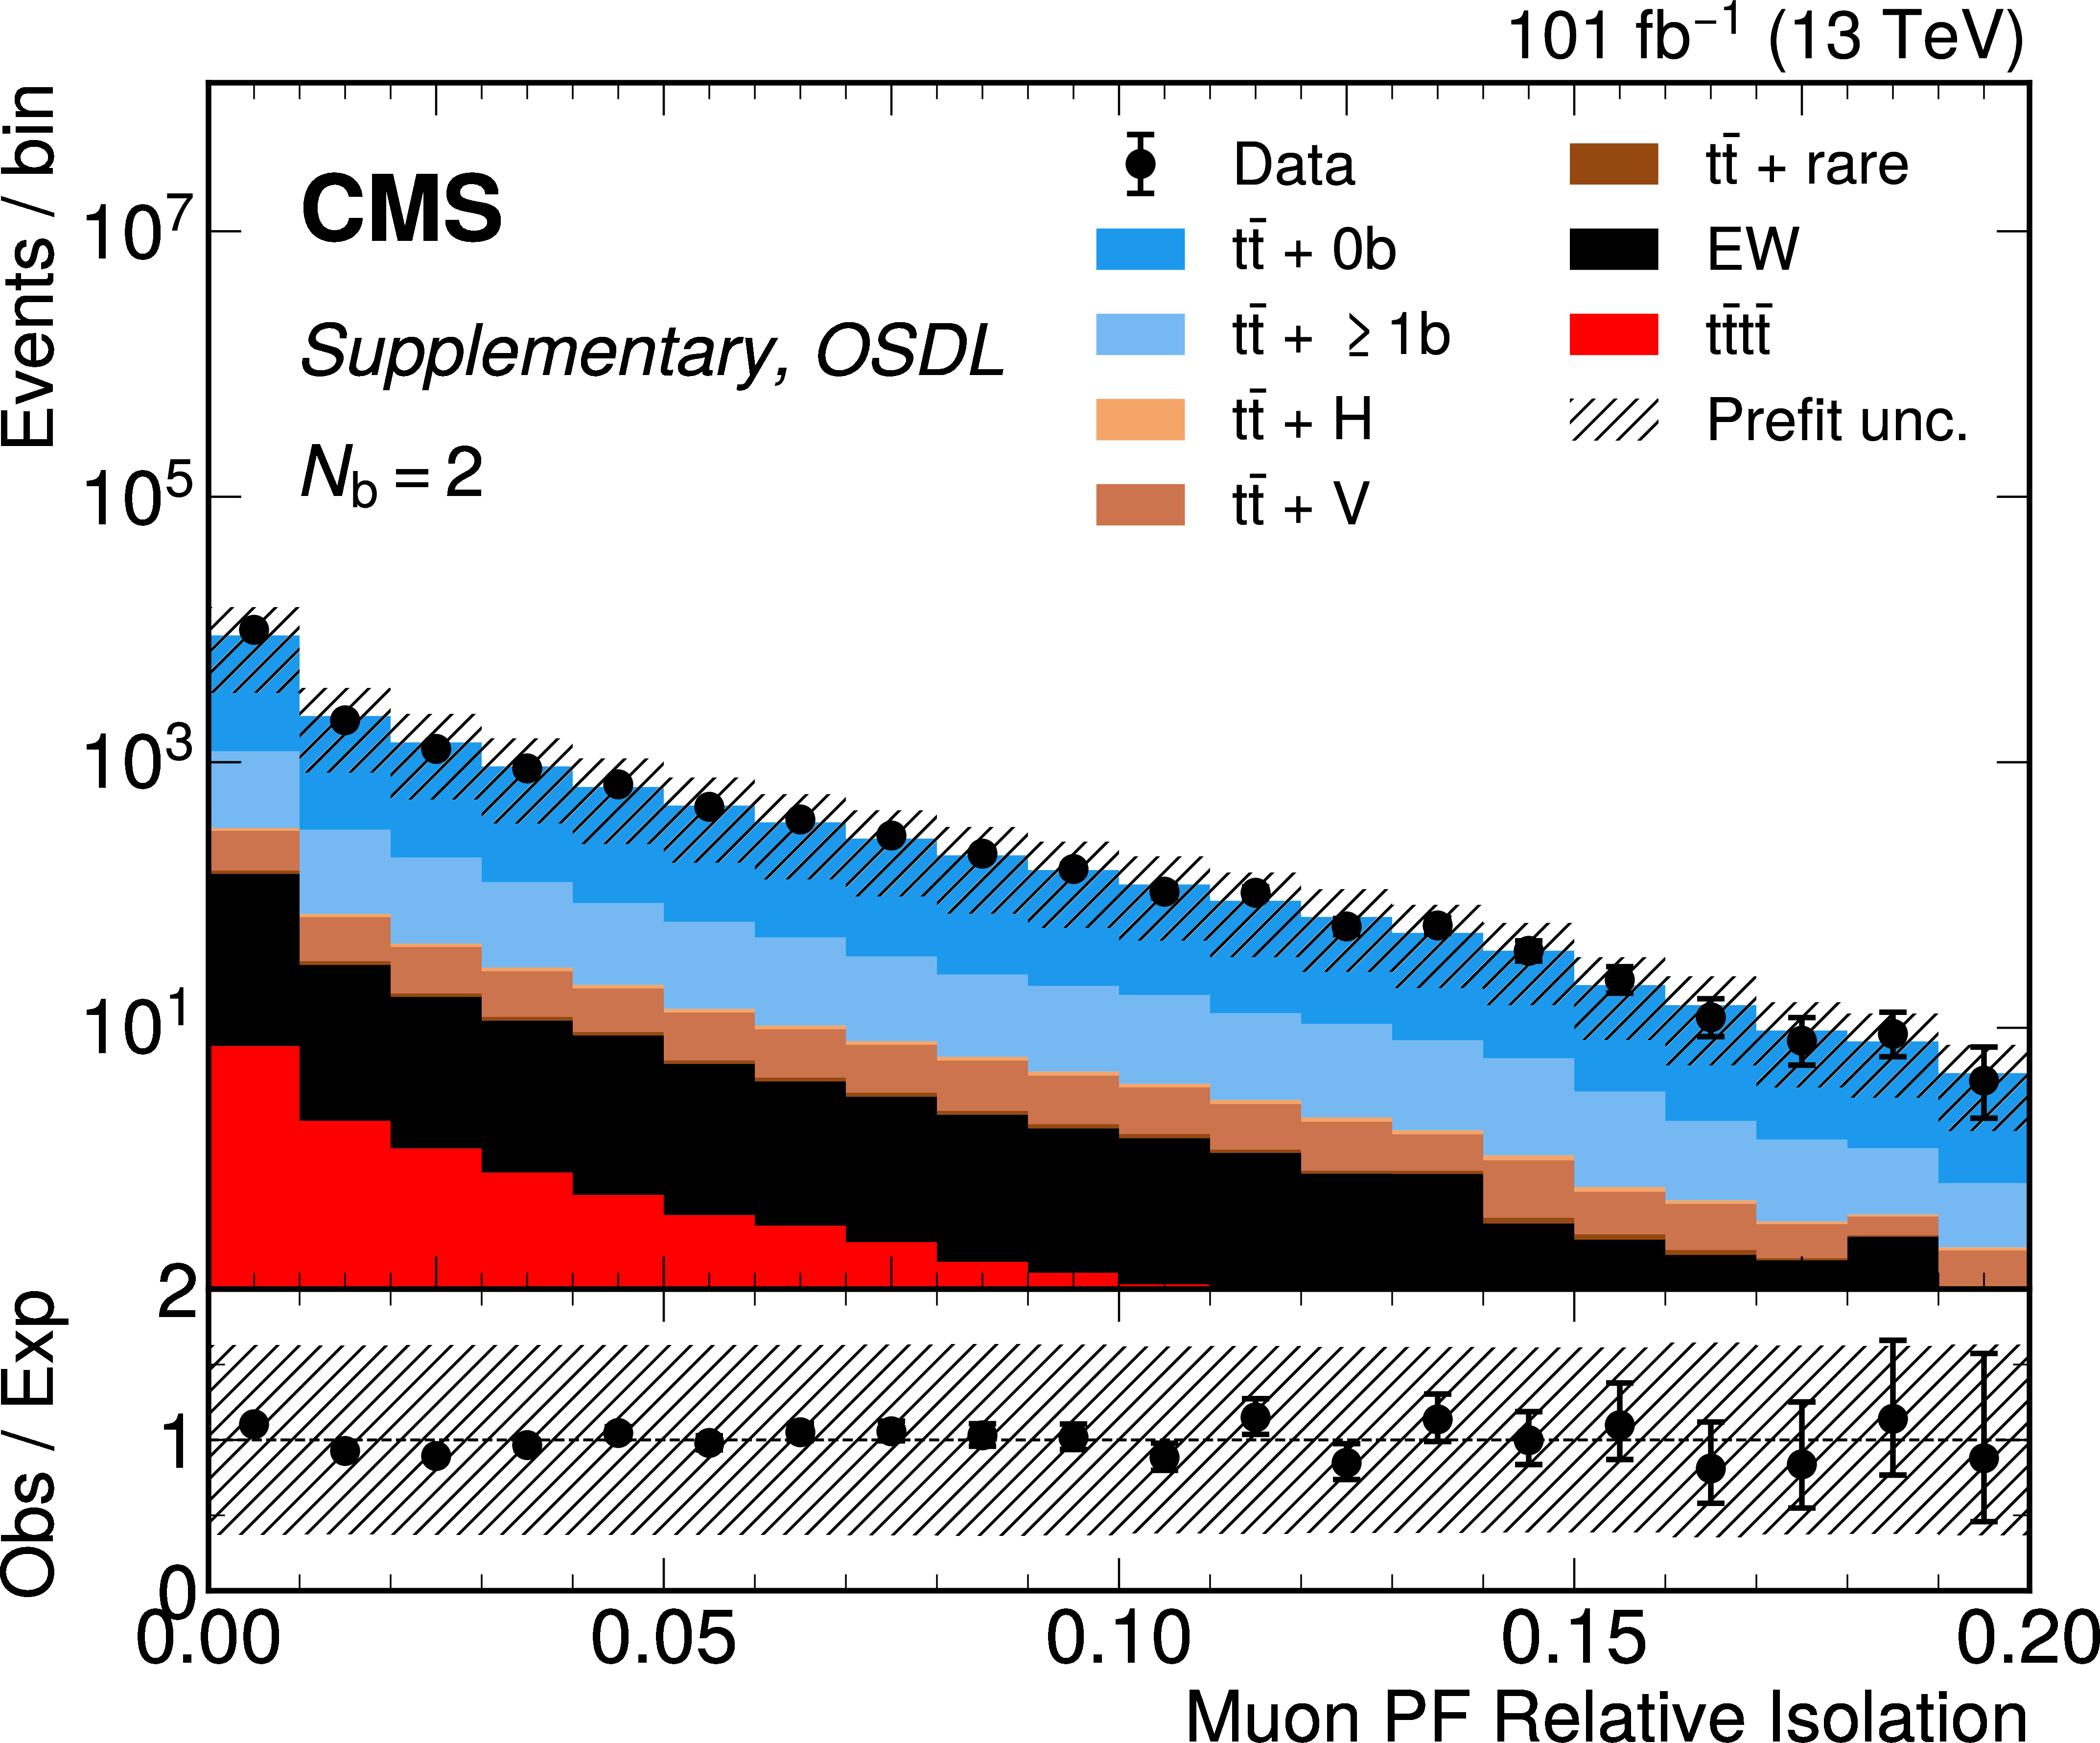
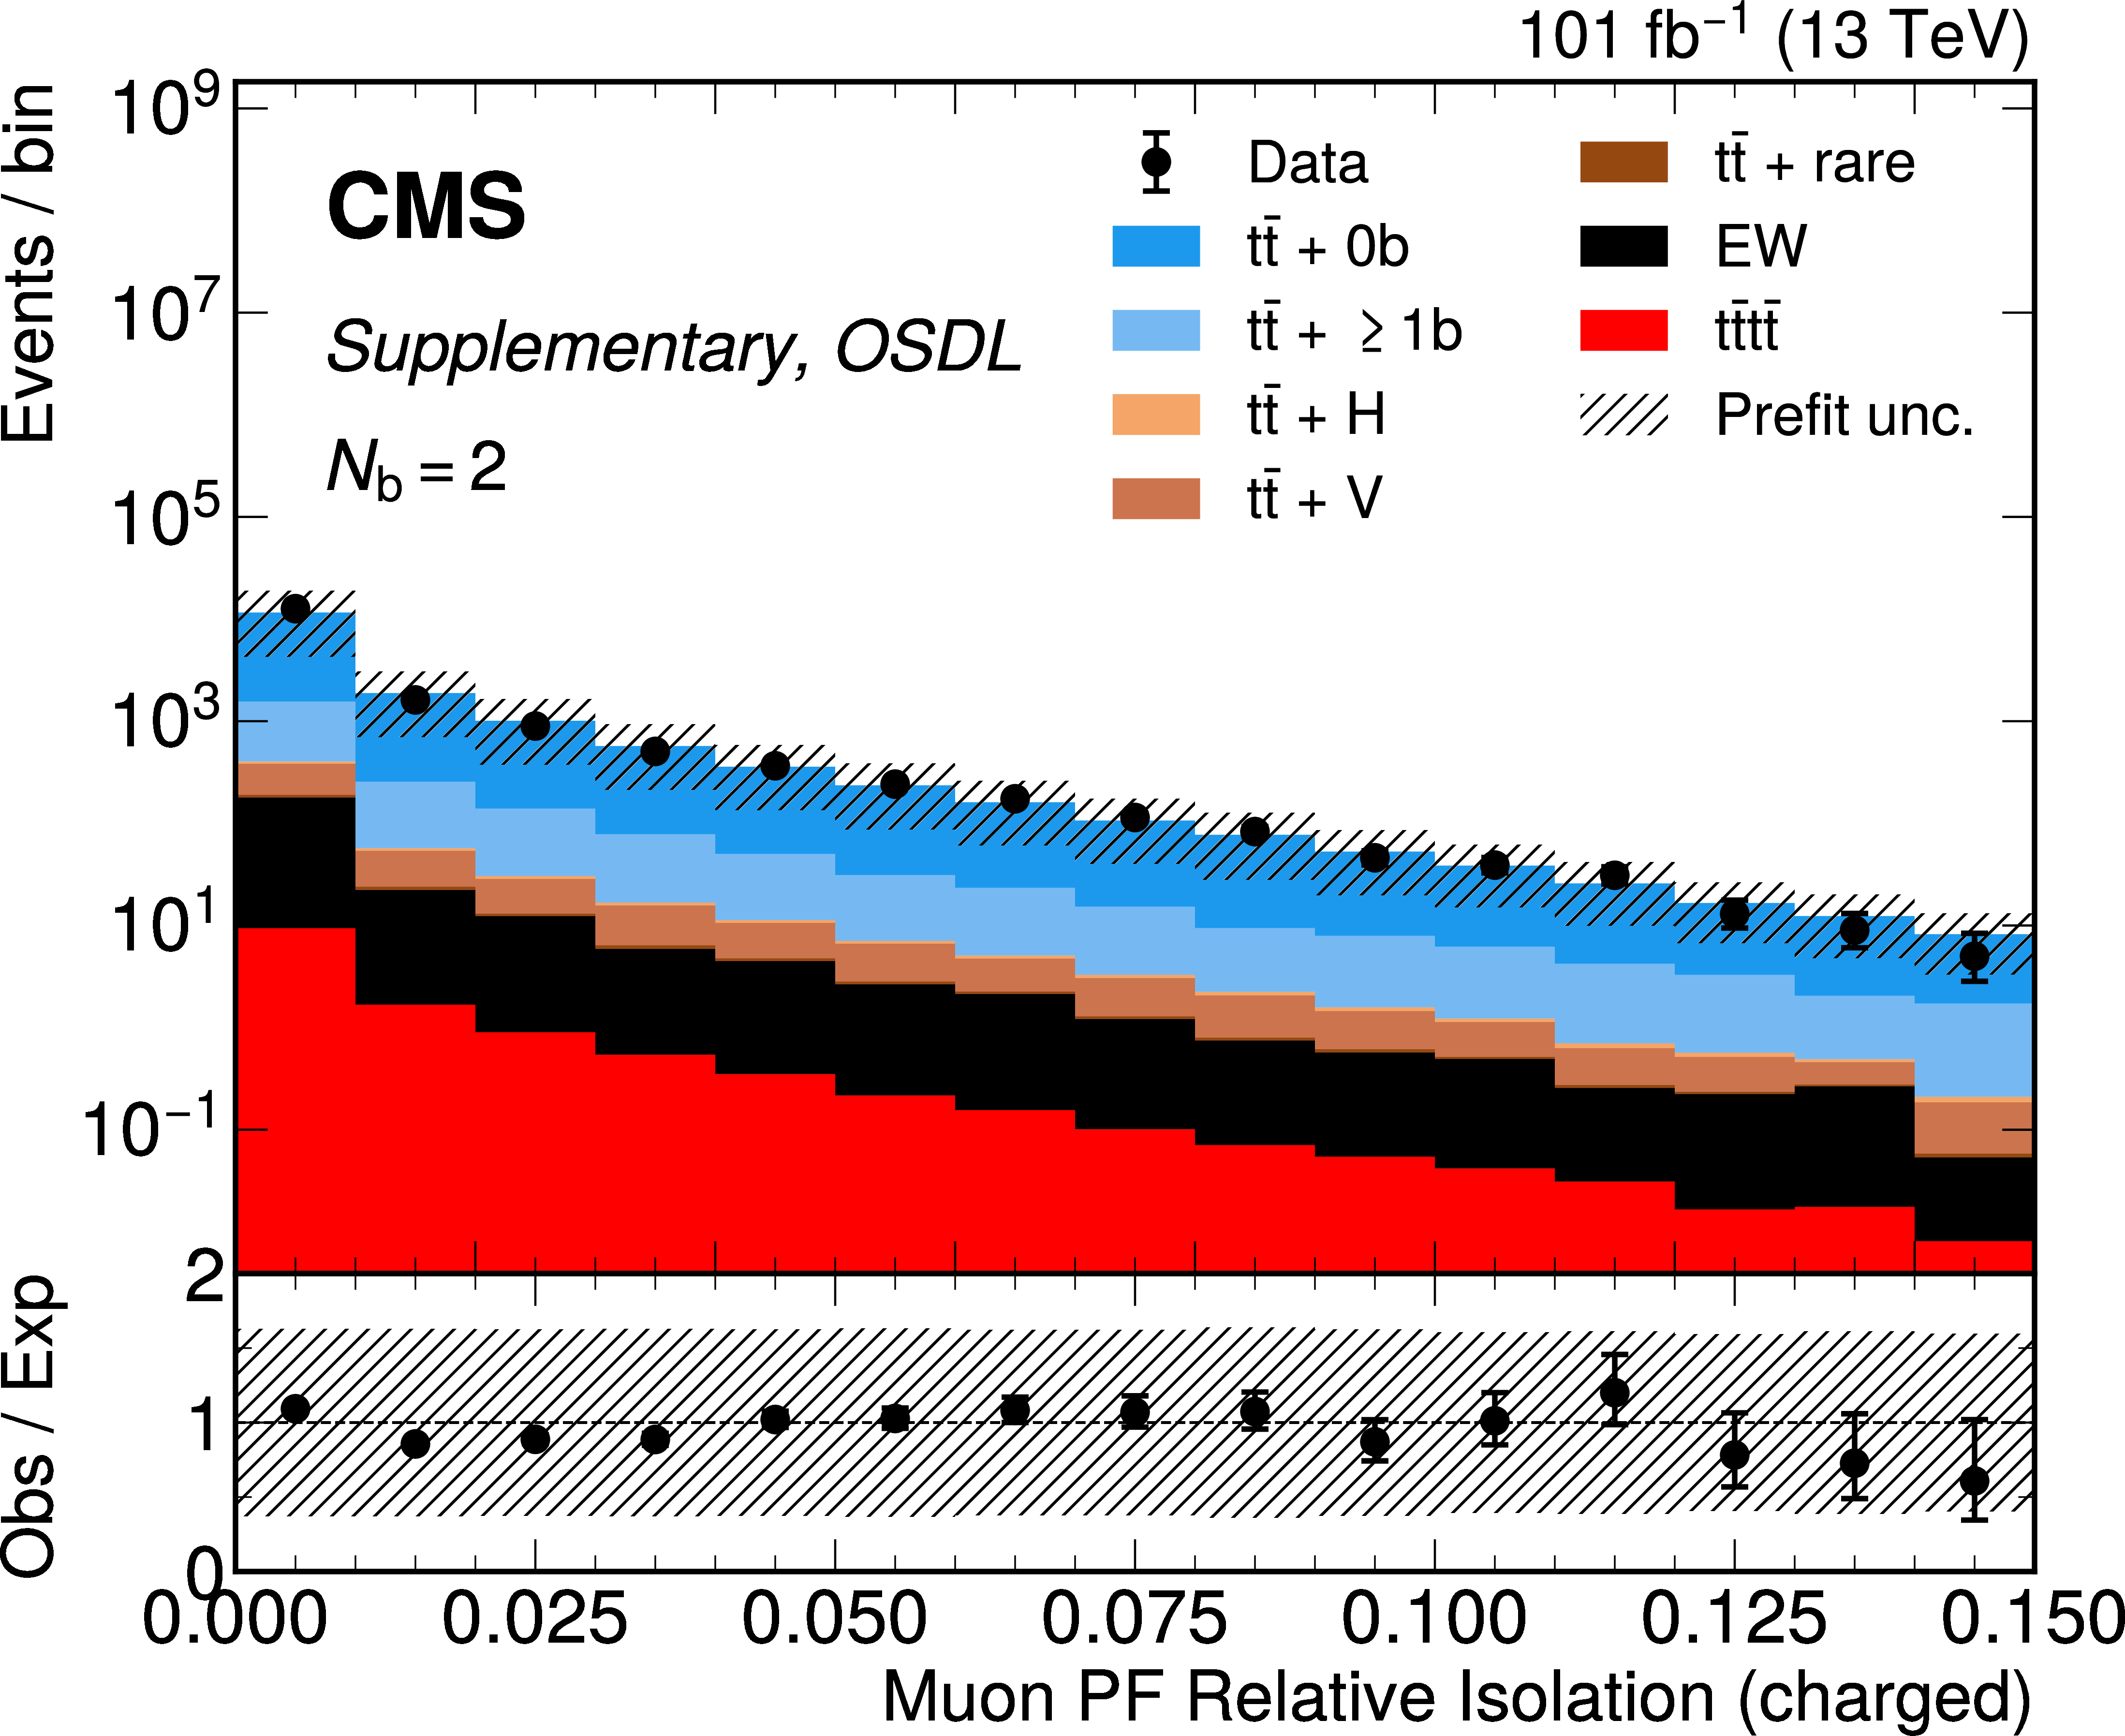
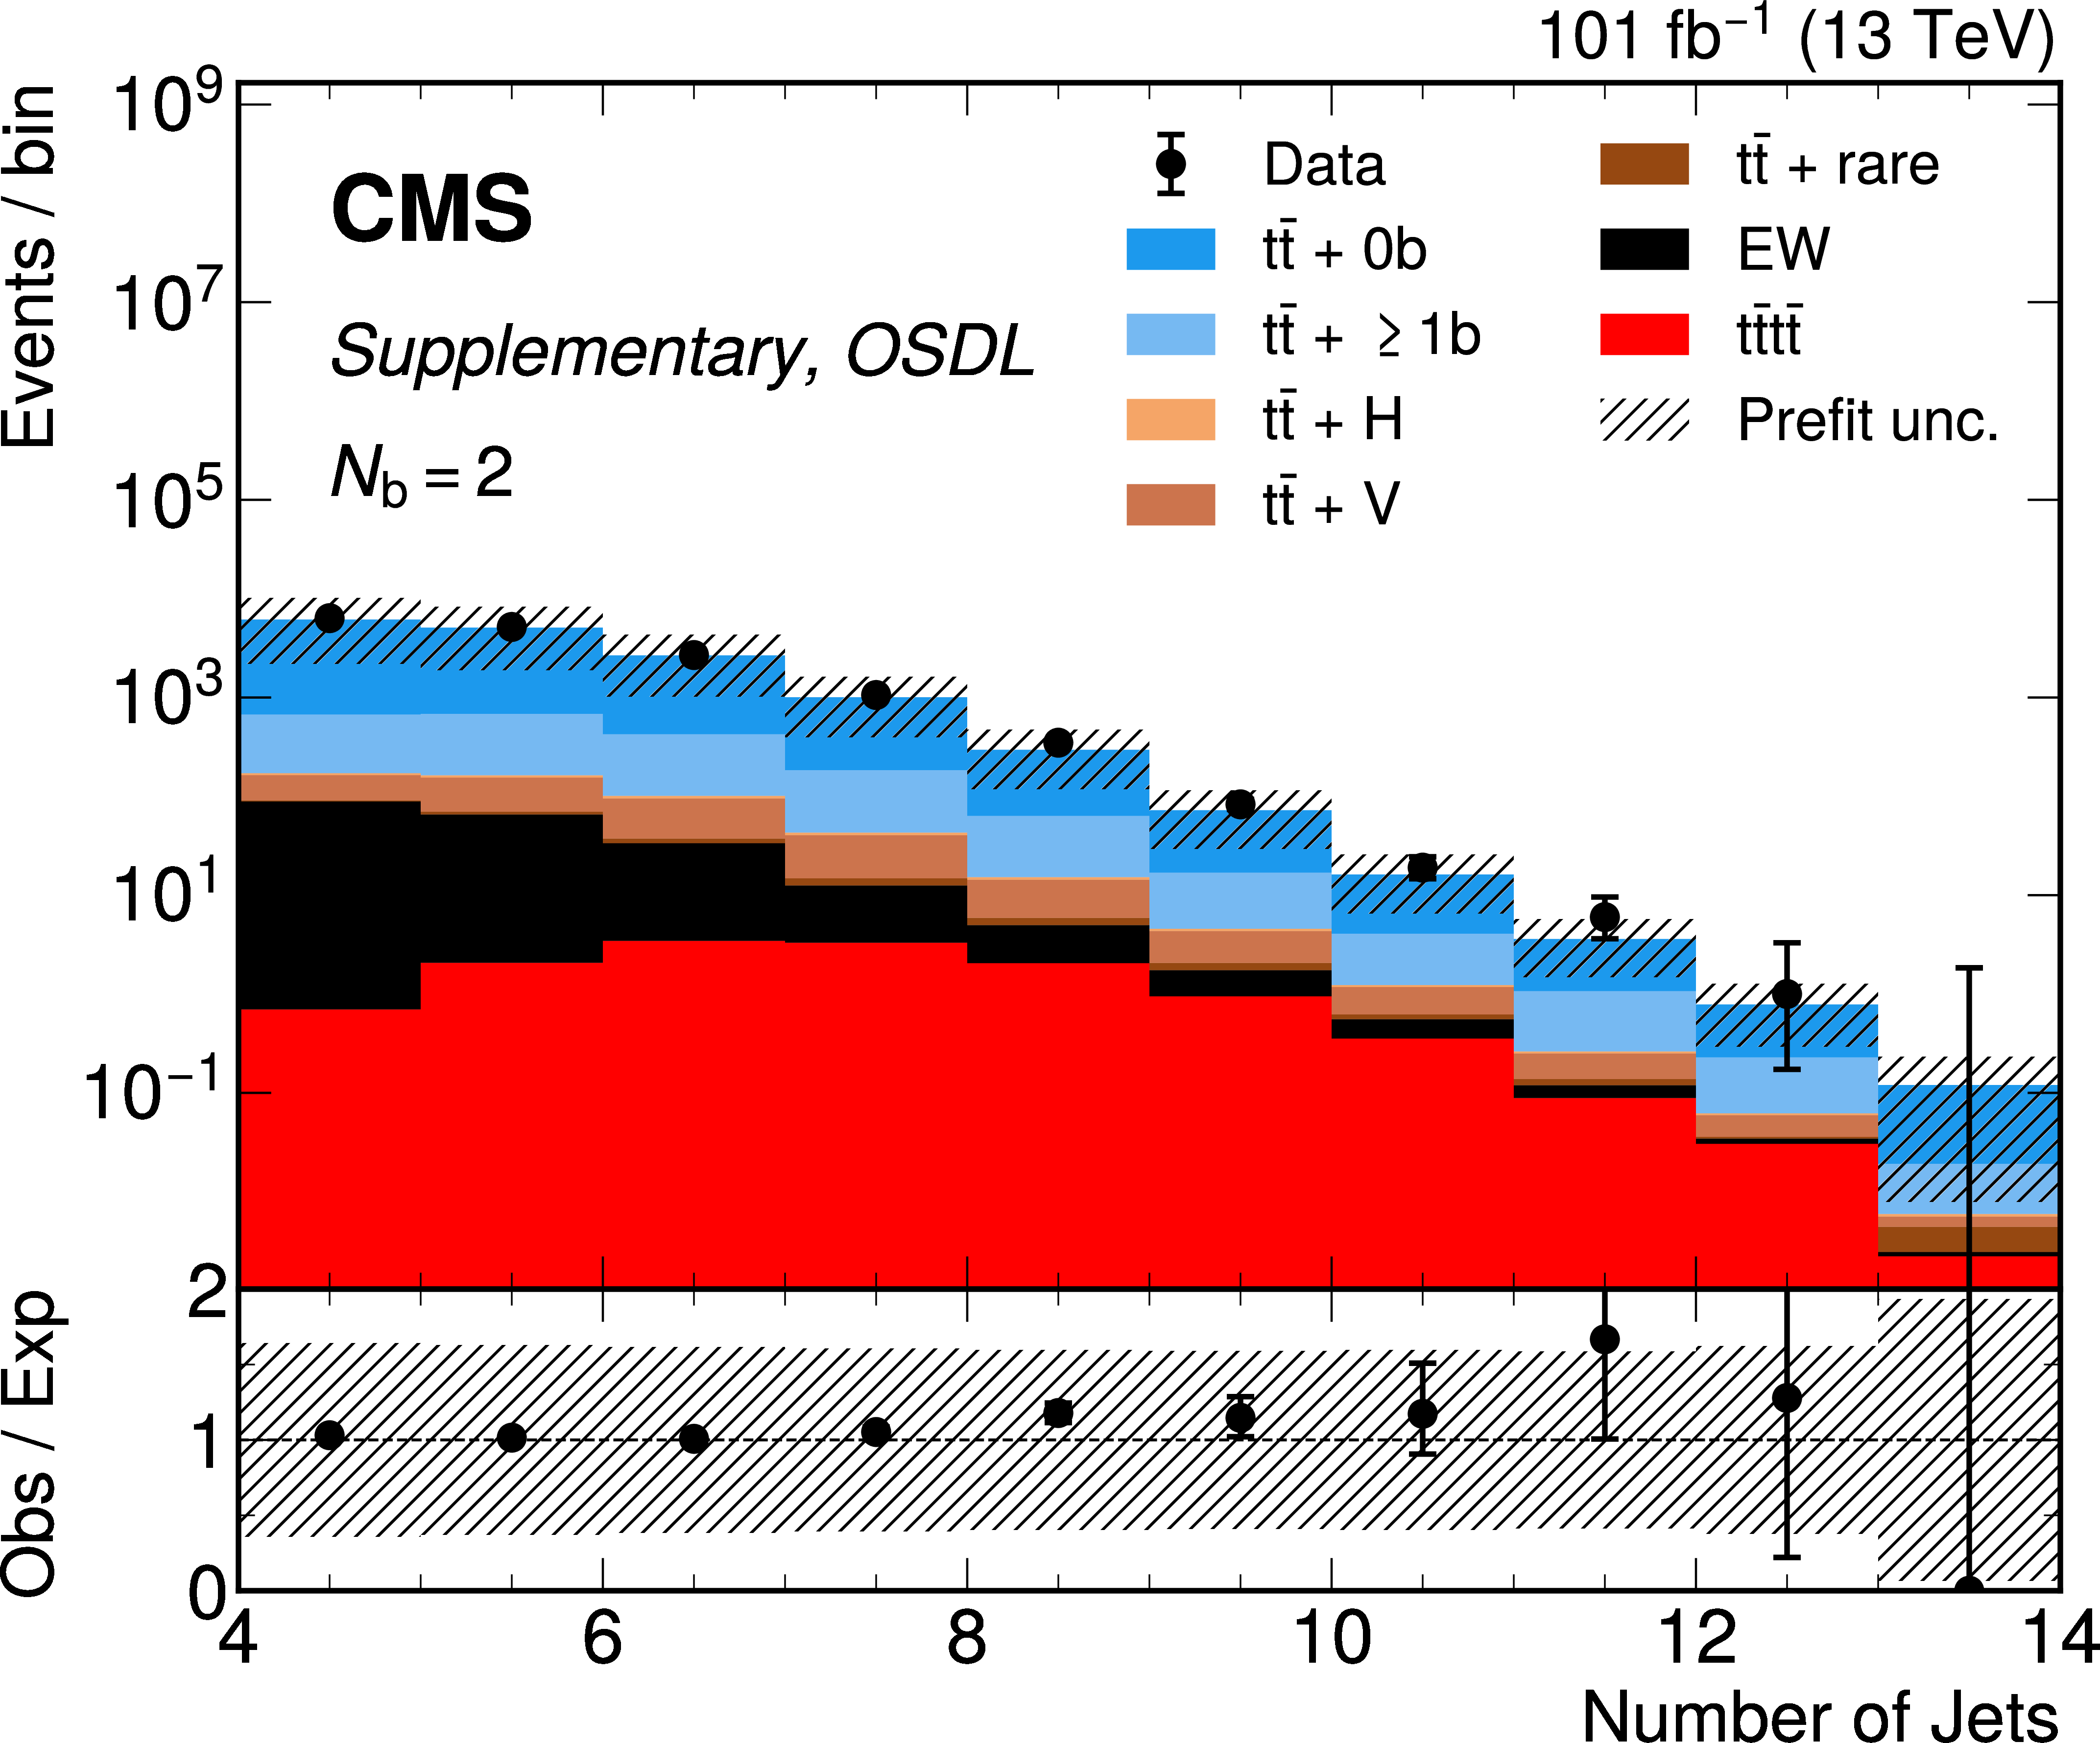
OSDL channel prefit distributions for $ N_\text{BT} = $ 2 jets categories. From left to right, top to bottom, are figures for the b-tag discriminant of the fourth highest $ p_{\mathrm{T}} $ and b-tagged jets per event; the $ \eta $ and $ p_{\mathrm{T}} $ of the fourth highest $ p_{\mathrm{T}} $ jet; the ratio of $ H_T^{2M} $ to $ H_{\mathrm{T}} $; the $ \phi $ and magnitude of the missing transverse energy (MET); the transverse mass of the MET with the electron or muon; the $ \eta $, $ p_{\mathrm{T}} $ of the leading muon; the muon PF isolation (complete and charged components); and the jet multiplicity. Backgrounds are as described in Fig. 14. |

png pdf |
Additional Figure 15-a:
OSDL channel prefit distributions for $ N_\text{BT} = $ 2 jets categories. From left to right, top to bottom, are figures for the b-tag discriminant of the fourth highest $ p_{\mathrm{T}} $ and b-tagged jets per event; the $ \eta $ and $ p_{\mathrm{T}} $ of the fourth highest $ p_{\mathrm{T}} $ jet; the ratio of $ H_T^{2M} $ to $ H_{\mathrm{T}} $; the $ \phi $ and magnitude of the missing transverse energy (MET); the transverse mass of the MET with the electron or muon; the $ \eta $, $ p_{\mathrm{T}} $ of the leading muon; the muon PF isolation (complete and charged components); and the jet multiplicity. Backgrounds are as described in Fig. 14. |
png pdf |
Additional Figure 15-b:
OSDL channel prefit distributions for $ N_\text{BT} = $ 2 jets categories. From left to right, top to bottom, are figures for the b-tag discriminant of the fourth highest $ p_{\mathrm{T}} $ and b-tagged jets per event; the $ \eta $ and $ p_{\mathrm{T}} $ of the fourth highest $ p_{\mathrm{T}} $ jet; the ratio of $ H_T^{2M} $ to $ H_{\mathrm{T}} $; the $ \phi $ and magnitude of the missing transverse energy (MET); the transverse mass of the MET with the electron or muon; the $ \eta $, $ p_{\mathrm{T}} $ of the leading muon; the muon PF isolation (complete and charged components); and the jet multiplicity. Backgrounds are as described in Fig. 14. |

png pdf |
Additional Figure 15-c:
OSDL channel prefit distributions for $ N_\text{BT} = $ 2 jets categories. From left to right, top to bottom, are figures for the b-tag discriminant of the fourth highest $ p_{\mathrm{T}} $ and b-tagged jets per event; the $ \eta $ and $ p_{\mathrm{T}} $ of the fourth highest $ p_{\mathrm{T}} $ jet; the ratio of $ H_T^{2M} $ to $ H_{\mathrm{T}} $; the $ \phi $ and magnitude of the missing transverse energy (MET); the transverse mass of the MET with the electron or muon; the $ \eta $, $ p_{\mathrm{T}} $ of the leading muon; the muon PF isolation (complete and charged components); and the jet multiplicity. Backgrounds are as described in Fig. 14. |
png pdf |
Additional Figure 15-d:
OSDL channel prefit distributions for $ N_\text{BT} = $ 2 jets categories. From left to right, top to bottom, are figures for the b-tag discriminant of the fourth highest $ p_{\mathrm{T}} $ and b-tagged jets per event; the $ \eta $ and $ p_{\mathrm{T}} $ of the fourth highest $ p_{\mathrm{T}} $ jet; the ratio of $ H_T^{2M} $ to $ H_{\mathrm{T}} $; the $ \phi $ and magnitude of the missing transverse energy (MET); the transverse mass of the MET with the electron or muon; the $ \eta $, $ p_{\mathrm{T}} $ of the leading muon; the muon PF isolation (complete and charged components); and the jet multiplicity. Backgrounds are as described in Fig. 14. |
png pdf |
Additional Figure 15-e:
OSDL channel prefit distributions for $ N_\text{BT} = $ 2 jets categories. From left to right, top to bottom, are figures for the b-tag discriminant of the fourth highest $ p_{\mathrm{T}} $ and b-tagged jets per event; the $ \eta $ and $ p_{\mathrm{T}} $ of the fourth highest $ p_{\mathrm{T}} $ jet; the ratio of $ H_T^{2M} $ to $ H_{\mathrm{T}} $; the $ \phi $ and magnitude of the missing transverse energy (MET); the transverse mass of the MET with the electron or muon; the $ \eta $, $ p_{\mathrm{T}} $ of the leading muon; the muon PF isolation (complete and charged components); and the jet multiplicity. Backgrounds are as described in Fig. 14. |
png pdf |
Additional Figure 15-f:
OSDL channel prefit distributions for $ N_\text{BT} = $ 2 jets categories. From left to right, top to bottom, are figures for the b-tag discriminant of the fourth highest $ p_{\mathrm{T}} $ and b-tagged jets per event; the $ \eta $ and $ p_{\mathrm{T}} $ of the fourth highest $ p_{\mathrm{T}} $ jet; the ratio of $ H_T^{2M} $ to $ H_{\mathrm{T}} $; the $ \phi $ and magnitude of the missing transverse energy (MET); the transverse mass of the MET with the electron or muon; the $ \eta $, $ p_{\mathrm{T}} $ of the leading muon; the muon PF isolation (complete and charged components); and the jet multiplicity. Backgrounds are as described in Fig. 14. |
png pdf |
Additional Figure 15-g:
OSDL channel prefit distributions for $ N_\text{BT} = $ 2 jets categories. From left to right, top to bottom, are figures for the b-tag discriminant of the fourth highest $ p_{\mathrm{T}} $ and b-tagged jets per event; the $ \eta $ and $ p_{\mathrm{T}} $ of the fourth highest $ p_{\mathrm{T}} $ jet; the ratio of $ H_T^{2M} $ to $ H_{\mathrm{T}} $; the $ \phi $ and magnitude of the missing transverse energy (MET); the transverse mass of the MET with the electron or muon; the $ \eta $, $ p_{\mathrm{T}} $ of the leading muon; the muon PF isolation (complete and charged components); and the jet multiplicity. Backgrounds are as described in Fig. 14. |

png pdf |
Additional Figure 15-h:
OSDL channel prefit distributions for $ N_\text{BT} = $ 2 jets categories. From left to right, top to bottom, are figures for the b-tag discriminant of the fourth highest $ p_{\mathrm{T}} $ and b-tagged jets per event; the $ \eta $ and $ p_{\mathrm{T}} $ of the fourth highest $ p_{\mathrm{T}} $ jet; the ratio of $ H_T^{2M} $ to $ H_{\mathrm{T}} $; the $ \phi $ and magnitude of the missing transverse energy (MET); the transverse mass of the MET with the electron or muon; the $ \eta $, $ p_{\mathrm{T}} $ of the leading muon; the muon PF isolation (complete and charged components); and the jet multiplicity. Backgrounds are as described in Fig. 14. |
png pdf |
Additional Figure 15-i:
OSDL channel prefit distributions for $ N_\text{BT} = $ 2 jets categories. From left to right, top to bottom, are figures for the b-tag discriminant of the fourth highest $ p_{\mathrm{T}} $ and b-tagged jets per event; the $ \eta $ and $ p_{\mathrm{T}} $ of the fourth highest $ p_{\mathrm{T}} $ jet; the ratio of $ H_T^{2M} $ to $ H_{\mathrm{T}} $; the $ \phi $ and magnitude of the missing transverse energy (MET); the transverse mass of the MET with the electron or muon; the $ \eta $, $ p_{\mathrm{T}} $ of the leading muon; the muon PF isolation (complete and charged components); and the jet multiplicity. Backgrounds are as described in Fig. 14. |

png pdf |
Additional Figure 15-j:
OSDL channel prefit distributions for $ N_\text{BT} = $ 2 jets categories. From left to right, top to bottom, are figures for the b-tag discriminant of the fourth highest $ p_{\mathrm{T}} $ and b-tagged jets per event; the $ \eta $ and $ p_{\mathrm{T}} $ of the fourth highest $ p_{\mathrm{T}} $ jet; the ratio of $ H_T^{2M} $ to $ H_{\mathrm{T}} $; the $ \phi $ and magnitude of the missing transverse energy (MET); the transverse mass of the MET with the electron or muon; the $ \eta $, $ p_{\mathrm{T}} $ of the leading muon; the muon PF isolation (complete and charged components); and the jet multiplicity. Backgrounds are as described in Fig. 14. |

png pdf |
Additional Figure 15-k:
OSDL channel prefit distributions for $ N_\text{BT} = $ 2 jets categories. From left to right, top to bottom, are figures for the b-tag discriminant of the fourth highest $ p_{\mathrm{T}} $ and b-tagged jets per event; the $ \eta $ and $ p_{\mathrm{T}} $ of the fourth highest $ p_{\mathrm{T}} $ jet; the ratio of $ H_T^{2M} $ to $ H_{\mathrm{T}} $; the $ \phi $ and magnitude of the missing transverse energy (MET); the transverse mass of the MET with the electron or muon; the $ \eta $, $ p_{\mathrm{T}} $ of the leading muon; the muon PF isolation (complete and charged components); and the jet multiplicity. Backgrounds are as described in Fig. 14. |
png pdf |
Additional Figure 15-l:
OSDL channel prefit distributions for $ N_\text{BT} = $ 2 jets categories. From left to right, top to bottom, are figures for the b-tag discriminant of the fourth highest $ p_{\mathrm{T}} $ and b-tagged jets per event; the $ \eta $ and $ p_{\mathrm{T}} $ of the fourth highest $ p_{\mathrm{T}} $ jet; the ratio of $ H_T^{2M} $ to $ H_{\mathrm{T}} $; the $ \phi $ and magnitude of the missing transverse energy (MET); the transverse mass of the MET with the electron or muon; the $ \eta $, $ p_{\mathrm{T}} $ of the leading muon; the muon PF isolation (complete and charged components); and the jet multiplicity. Backgrounds are as described in Fig. 14. |
png pdf |
Additional Figure 15-m:
OSDL channel prefit distributions for $ N_\text{BT} = $ 2 jets categories. From left to right, top to bottom, are figures for the b-tag discriminant of the fourth highest $ p_{\mathrm{T}} $ and b-tagged jets per event; the $ \eta $ and $ p_{\mathrm{T}} $ of the fourth highest $ p_{\mathrm{T}} $ jet; the ratio of $ H_T^{2M} $ to $ H_{\mathrm{T}} $; the $ \phi $ and magnitude of the missing transverse energy (MET); the transverse mass of the MET with the electron or muon; the $ \eta $, $ p_{\mathrm{T}} $ of the leading muon; the muon PF isolation (complete and charged components); and the jet multiplicity. Backgrounds are as described in Fig. 14. |
png pdf |
Additional Figure 15-n:
OSDL channel prefit distributions for $ N_\text{BT} = $ 2 jets categories. From left to right, top to bottom, are figures for the b-tag discriminant of the fourth highest $ p_{\mathrm{T}} $ and b-tagged jets per event; the $ \eta $ and $ p_{\mathrm{T}} $ of the fourth highest $ p_{\mathrm{T}} $ jet; the ratio of $ H_T^{2M} $ to $ H_{\mathrm{T}} $; the $ \phi $ and magnitude of the missing transverse energy (MET); the transverse mass of the MET with the electron or muon; the $ \eta $, $ p_{\mathrm{T}} $ of the leading muon; the muon PF isolation (complete and charged components); and the jet multiplicity. Backgrounds are as described in Fig. 14. |
png pdf |
Additional Figure 16:
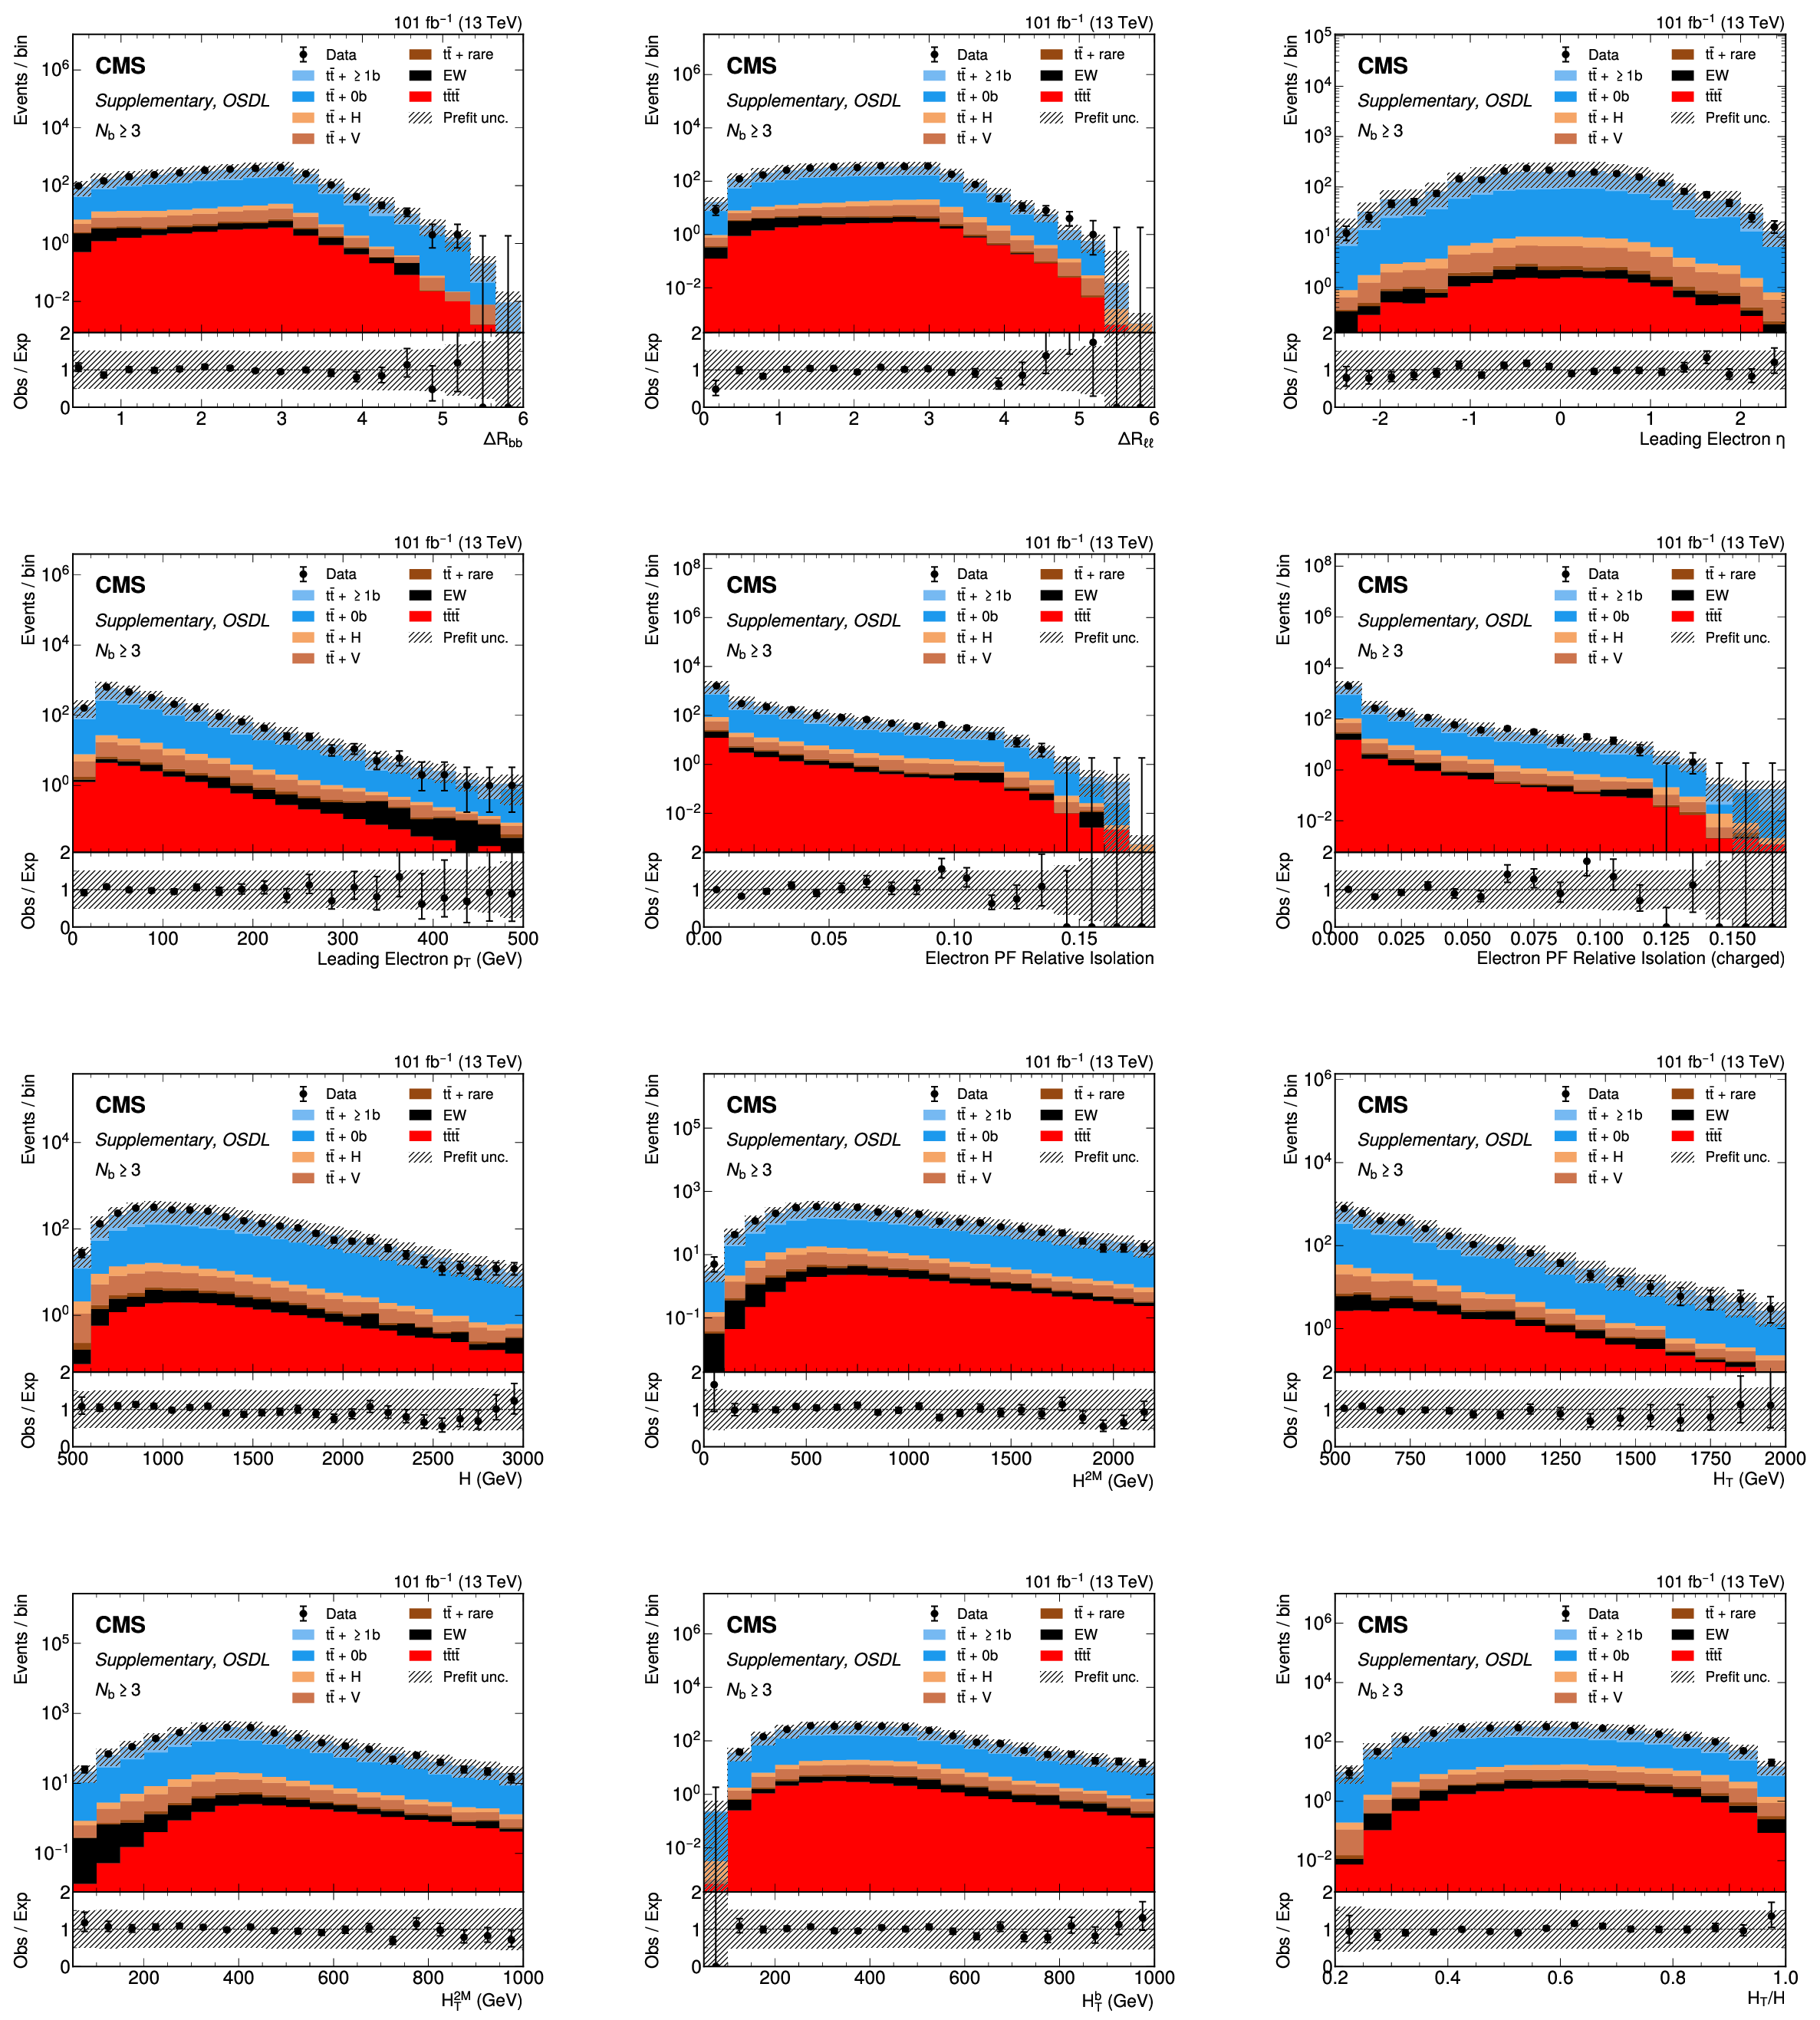
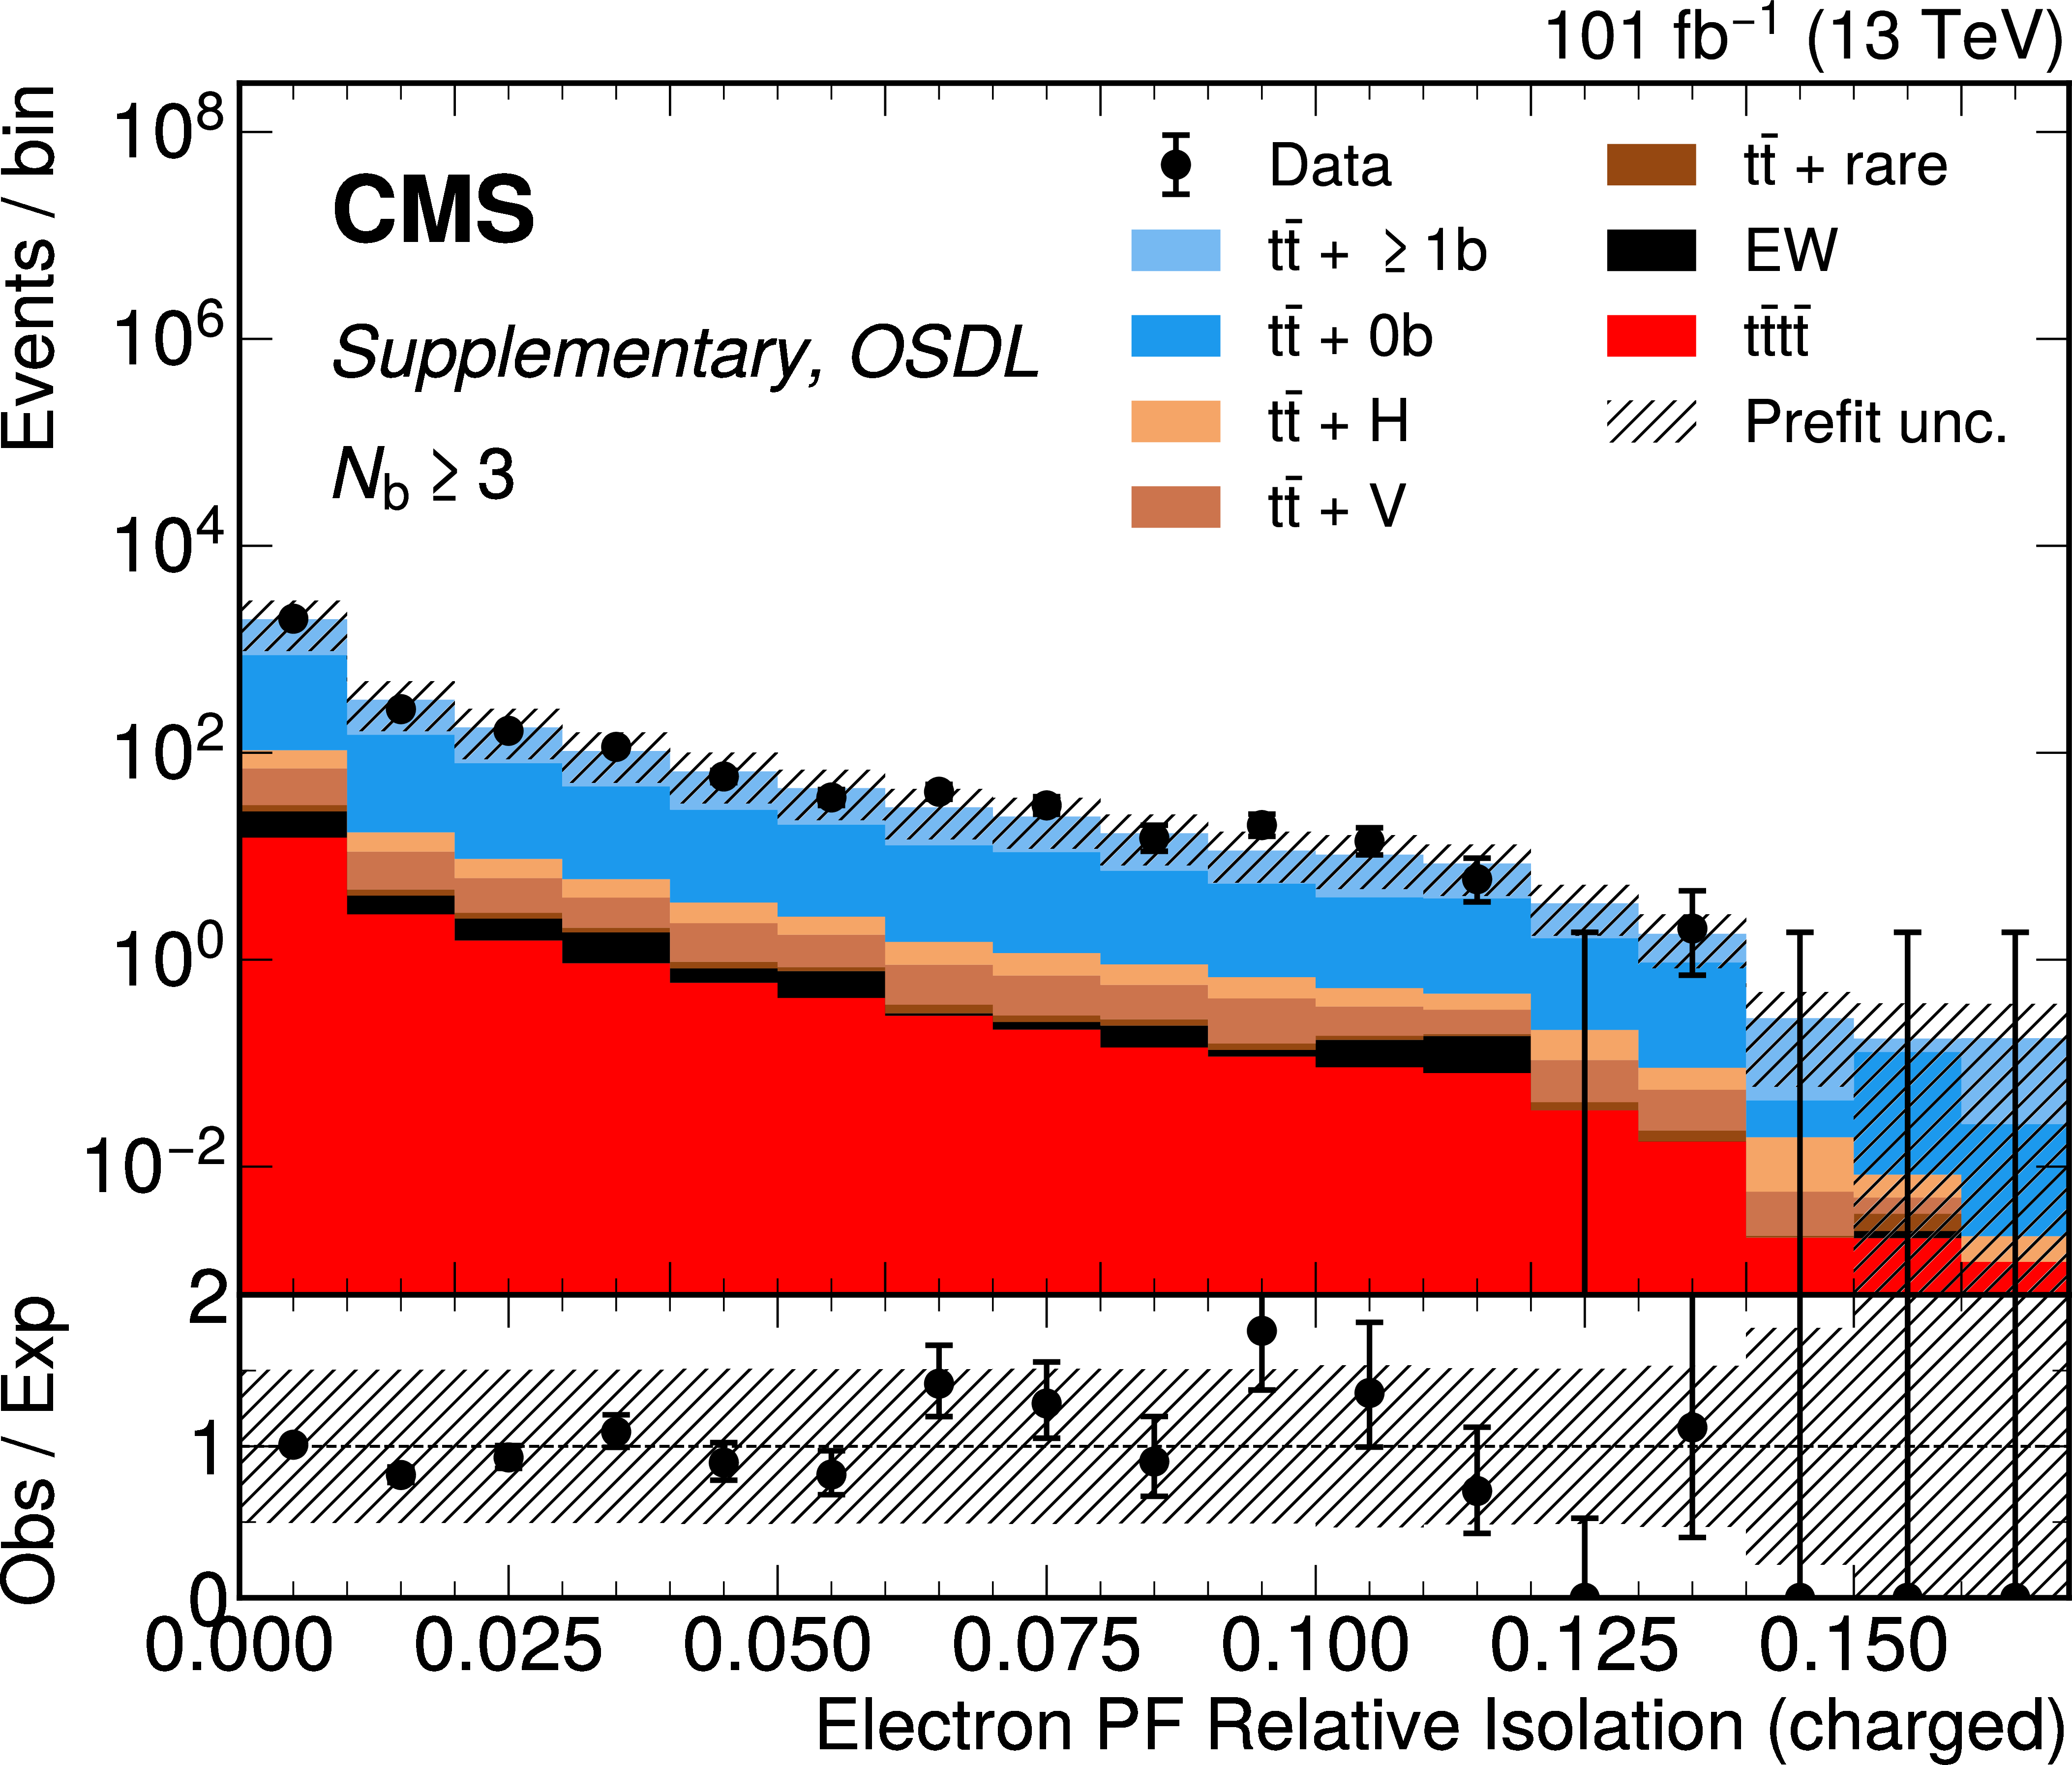
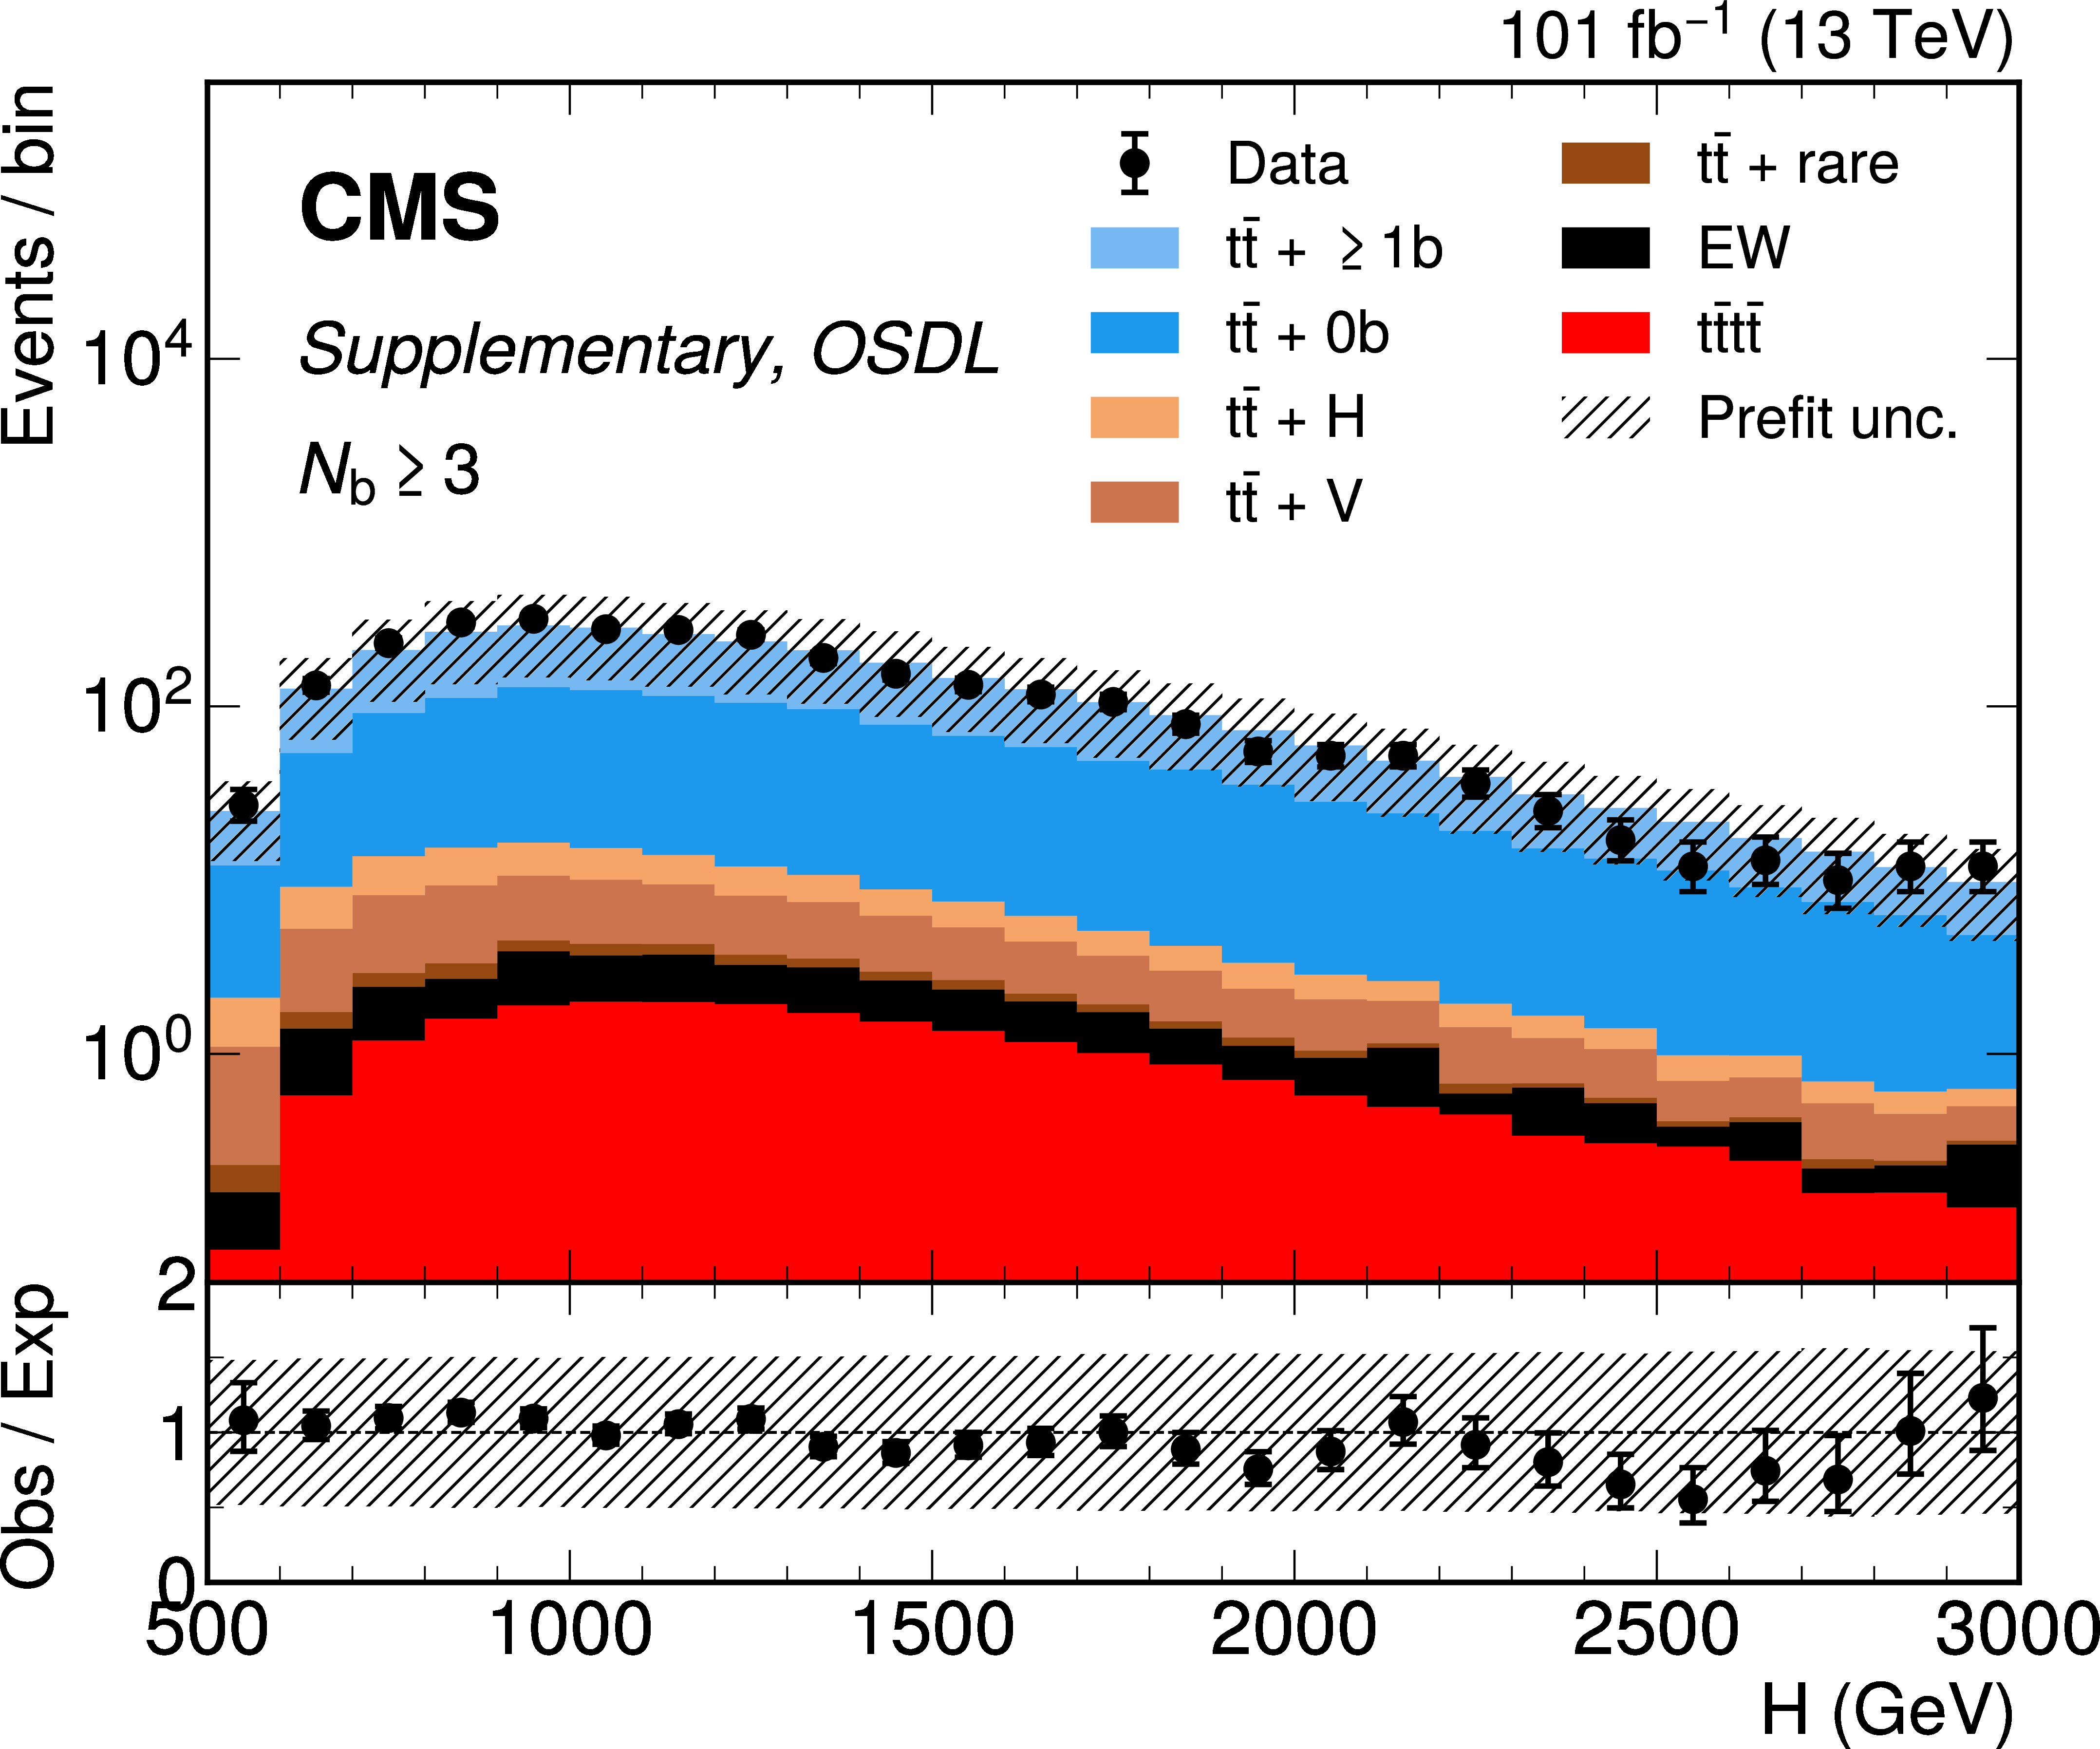
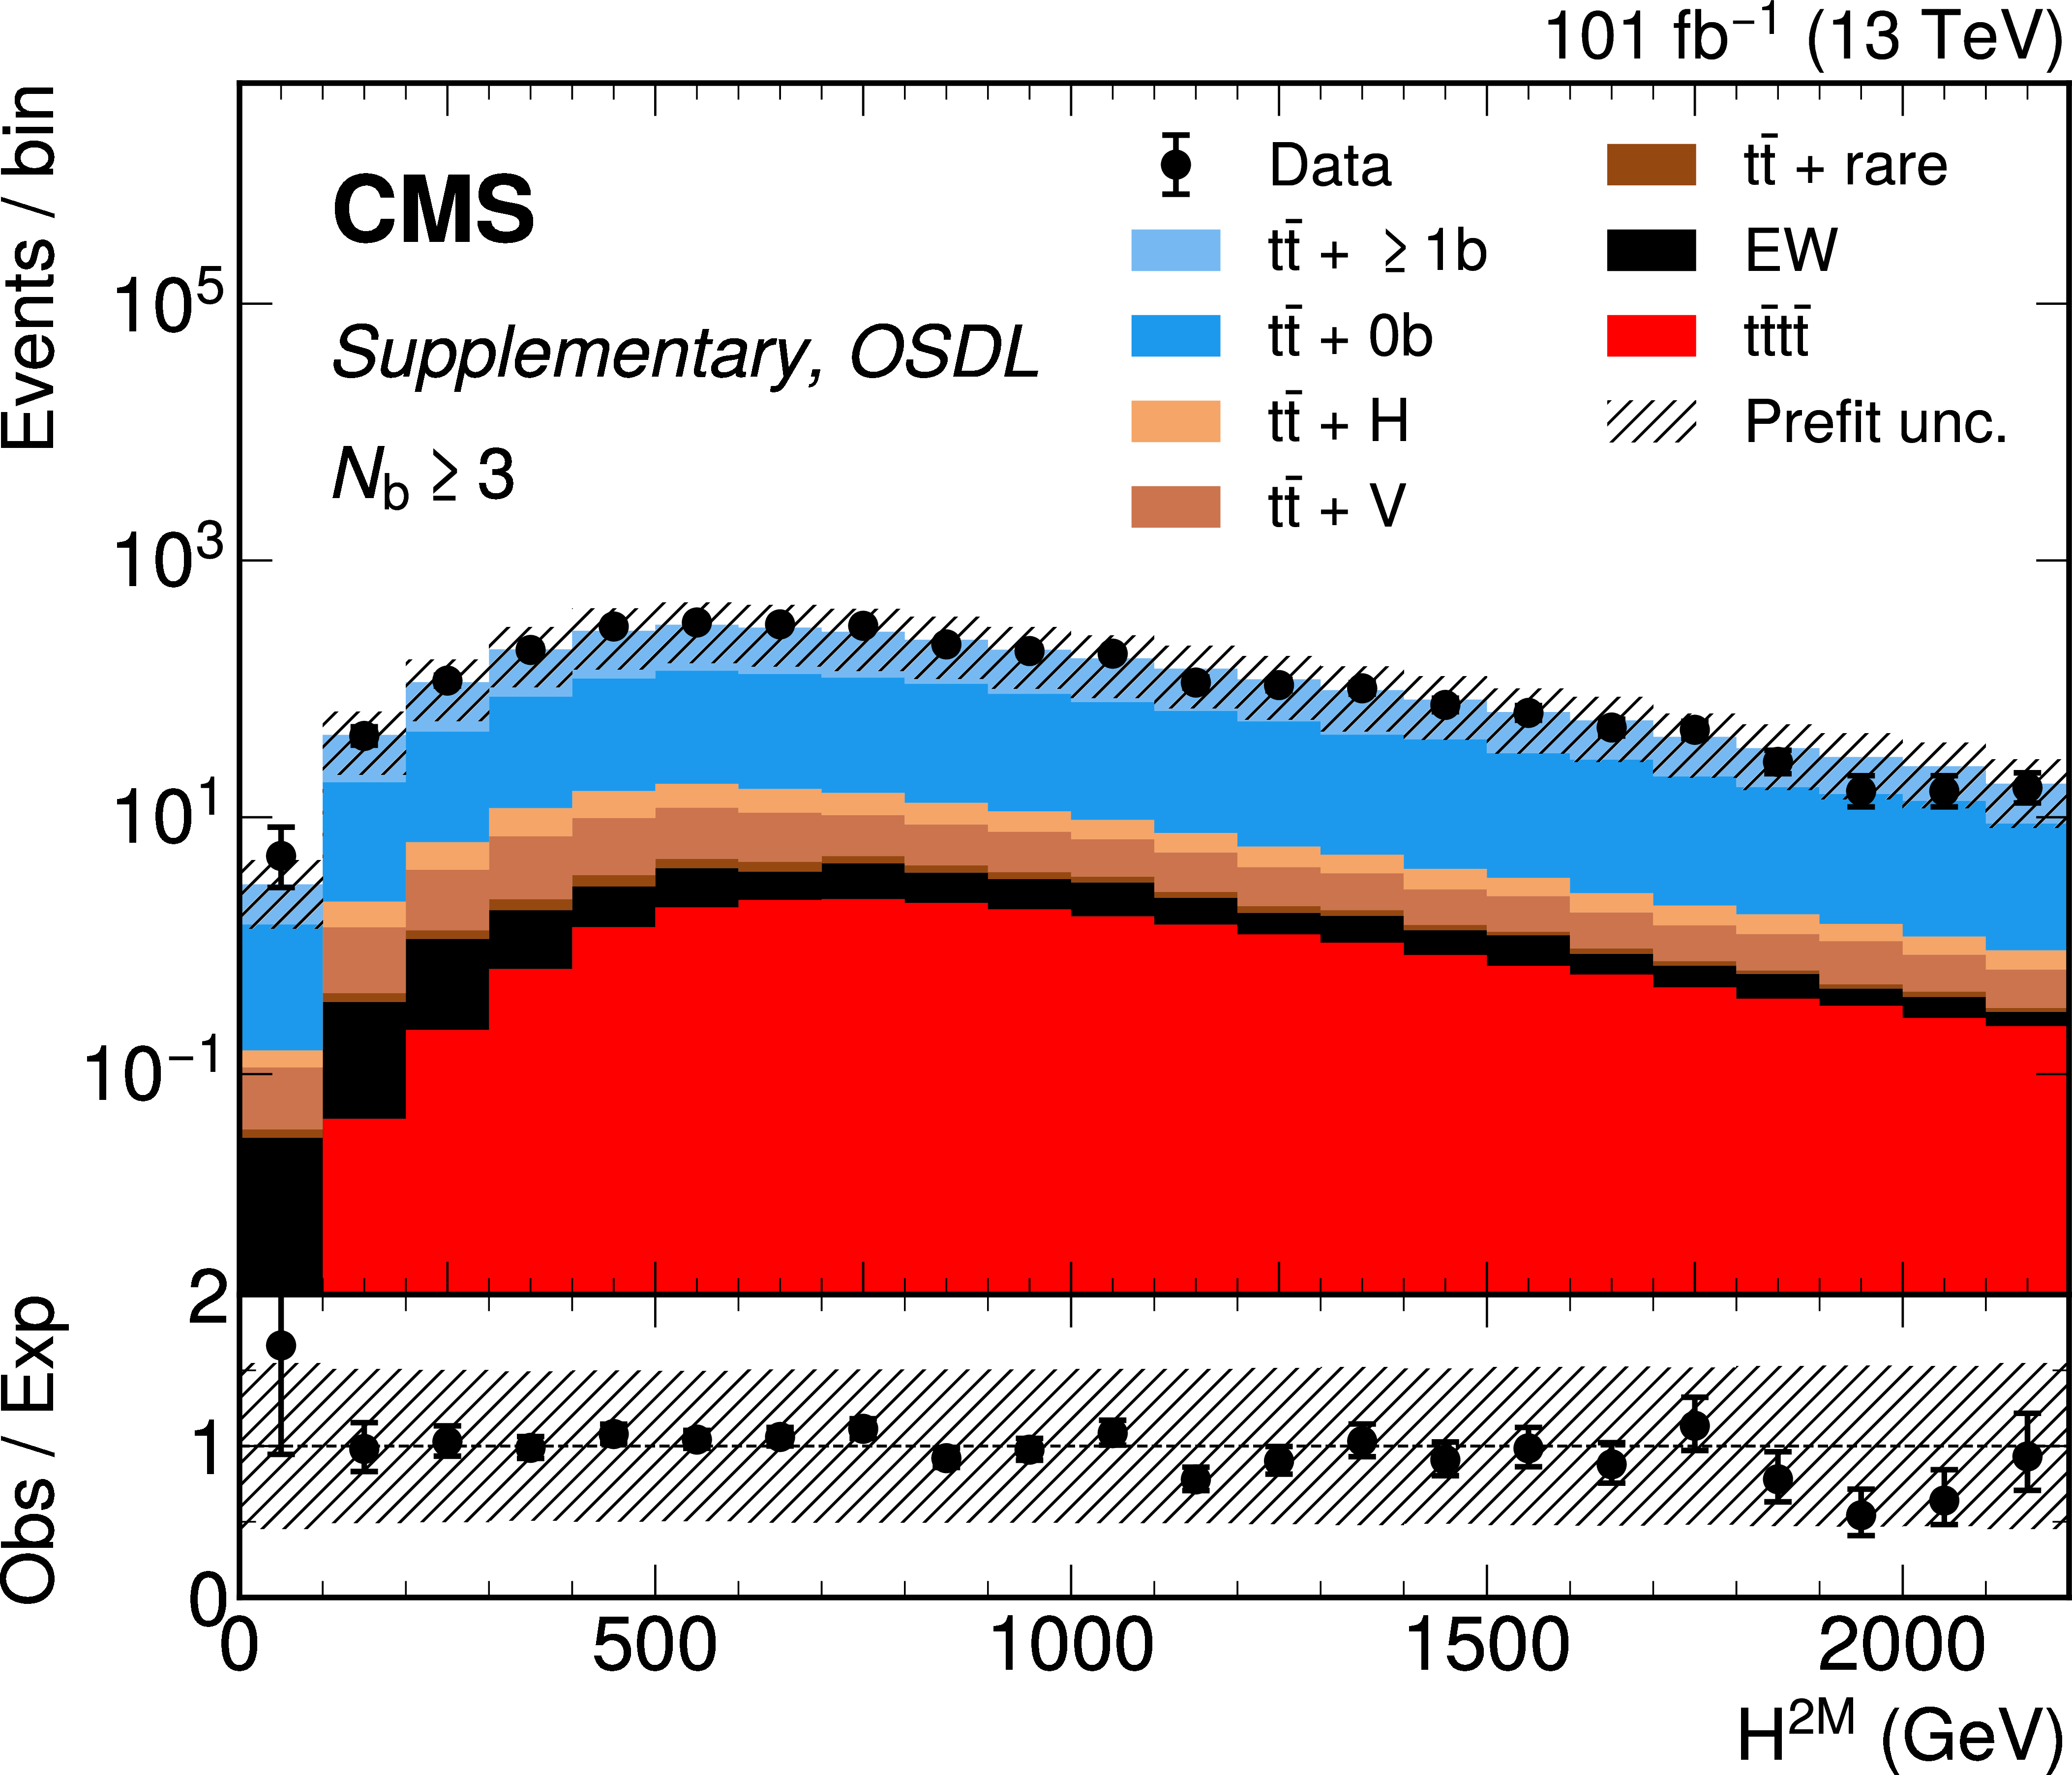
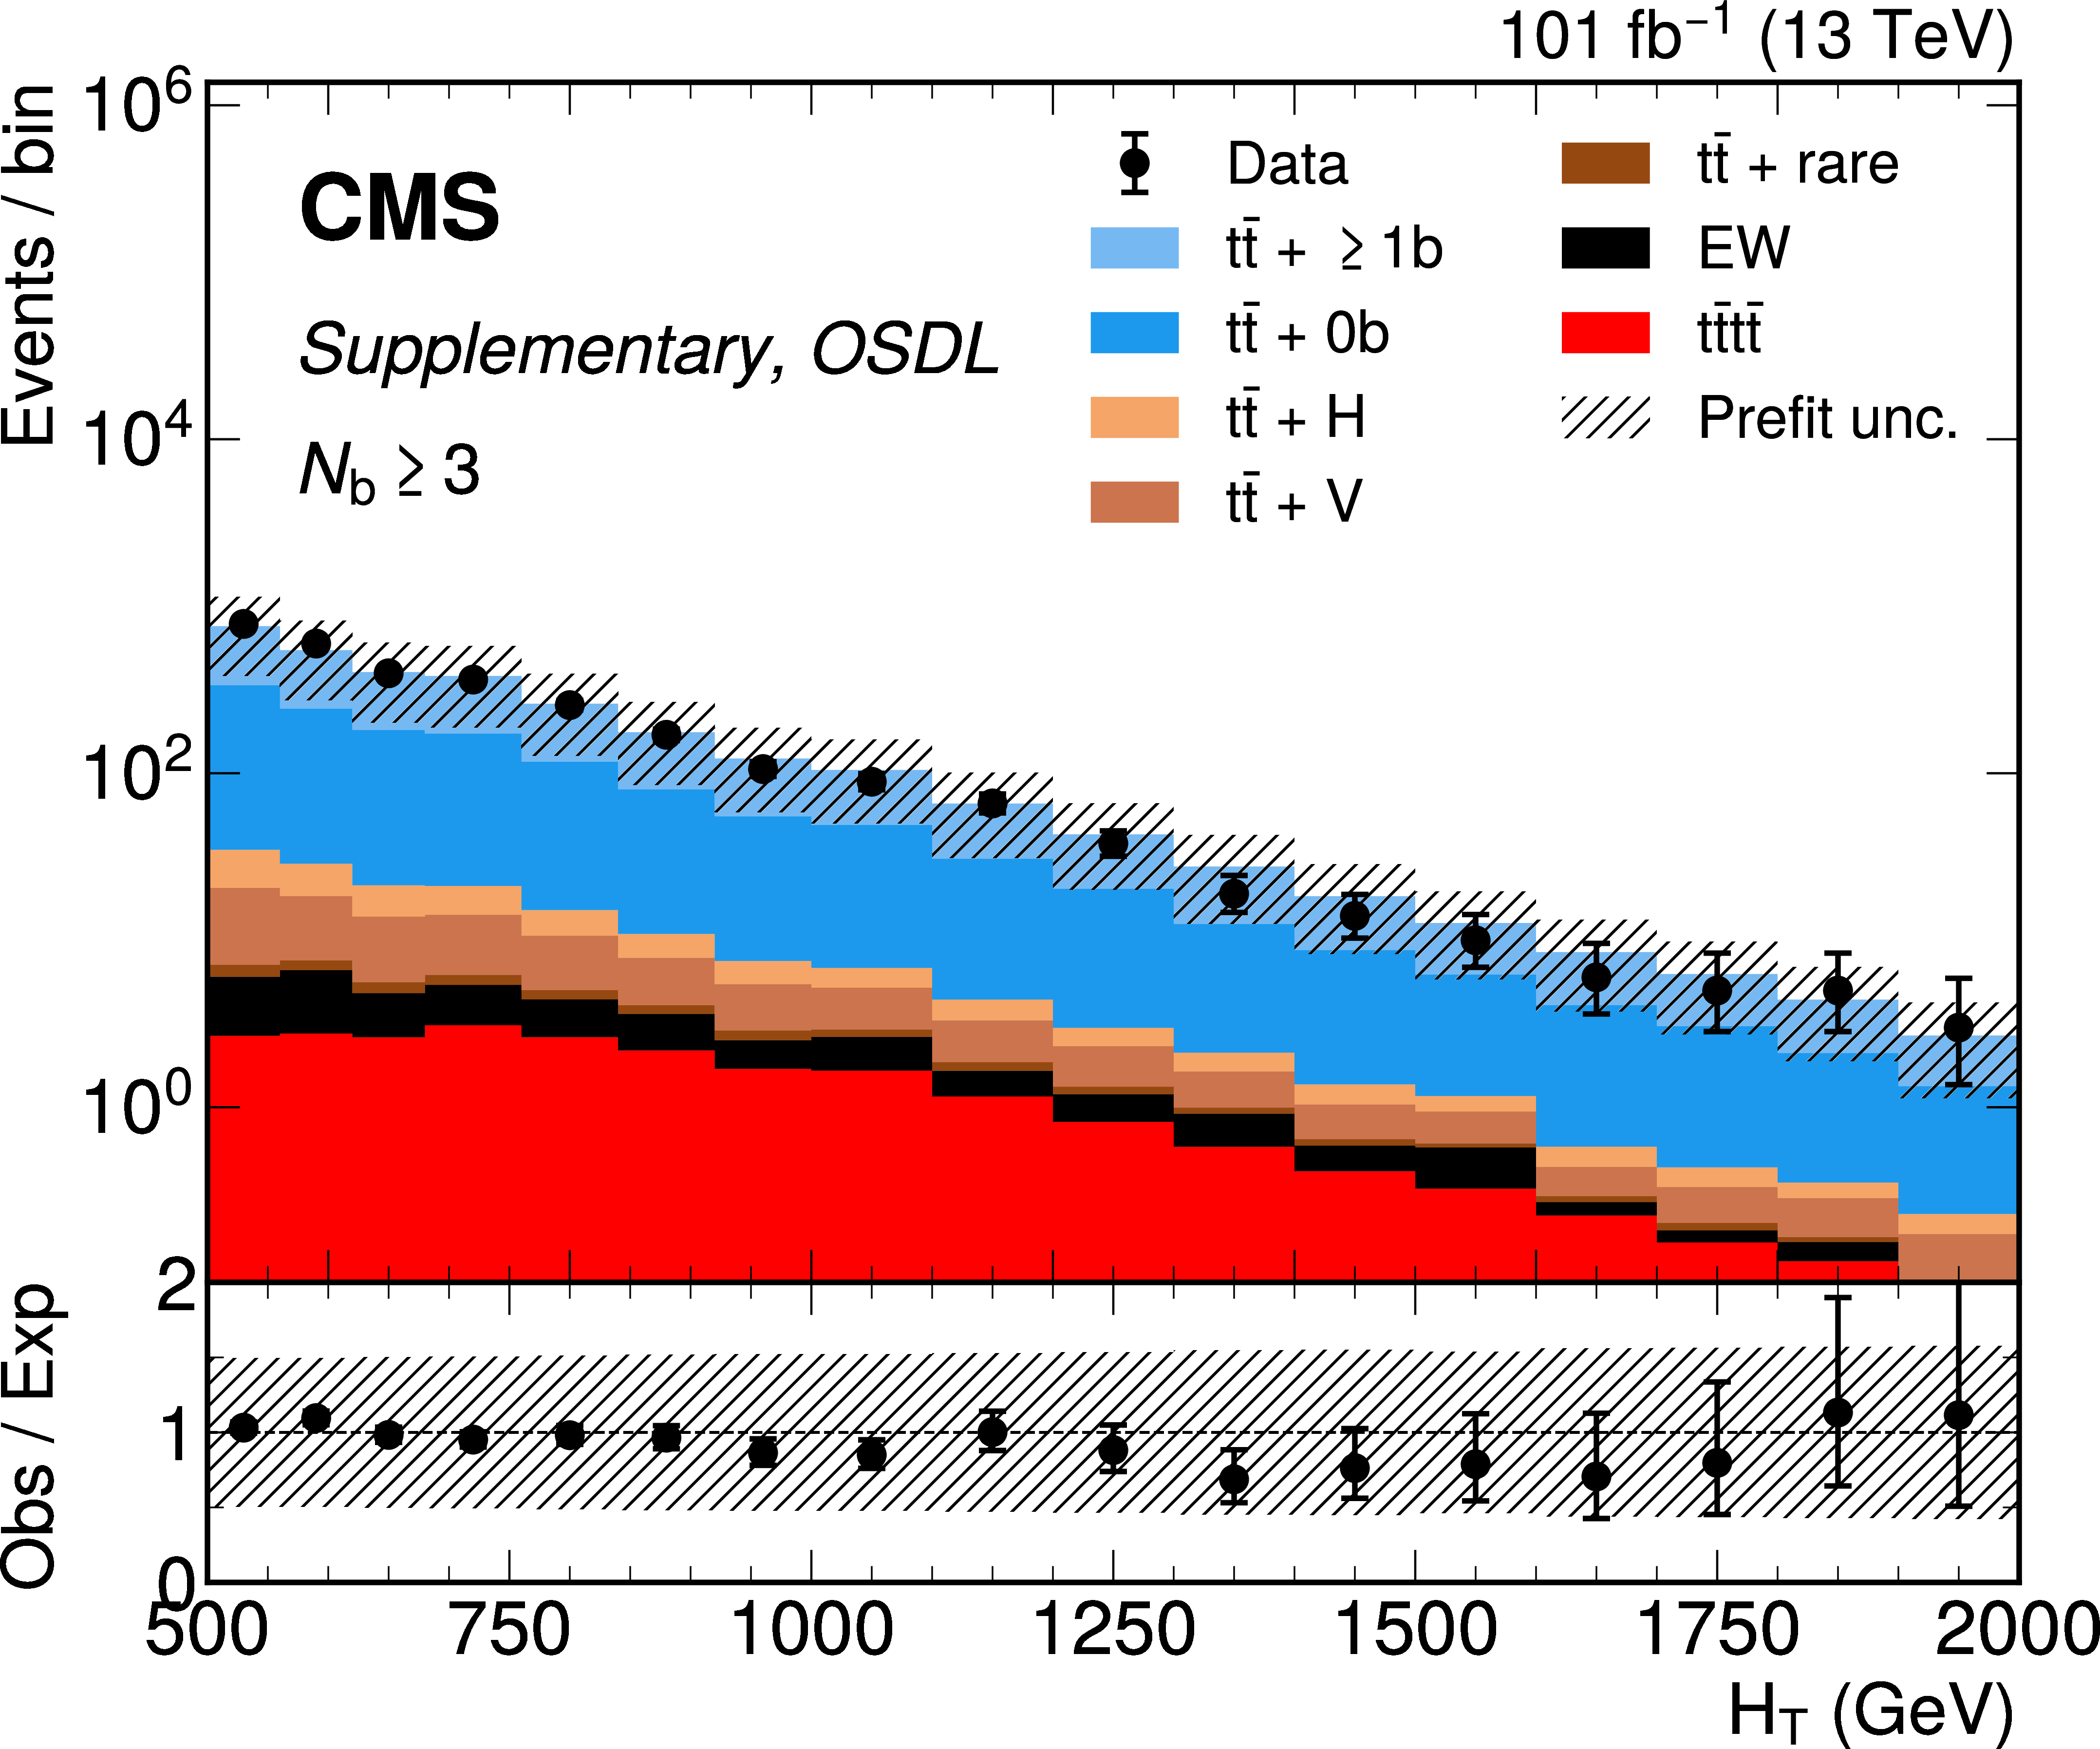
OSDL channel prefit distributions for $ N_\text{BT} \geq $ 3 jets categories.From left to right, top to bottom, are figures for the $ \Delta R $ between the 2 leading b-tagged jets; $ \Delta R $ between the isolated leptons; the $ \eta $ and $ p_{\mathrm{T}} $ of the leading electron; the electron Particle Flow isolation (complete and charged components); the scalar sum of jet three-momenta and the scalar sum without the 2 leading b-tagged jets; the scalar sum of jet $ p_{\mathrm{T}} $ and scalar sum without the 2 leading b-tagged jets ($ H_T^{2M} $); the scalar sum of medium b-tagged jets' $ p_{\mathrm{T}} $ and the ratio of $ H_{\mathrm{T}} $ over $ H $). Background processes include $ \mathrm{t} \bar{\mathrm{t}} $ + V (V = W, Z) and $ \mathrm{t} \bar{\mathrm{t}} $ + H in which $ \mathrm{t} \bar{\mathrm{t}} $ is produced in association with 1 massive boson, $ \mathrm{t} \bar{\mathrm{t}} $ events with zero ($ {\mathrm{t}\bar{\mathrm{t}}} + 0 \mathrm{b} $) or at least one additional b jet ($ {\mathrm{t}\bar{\mathrm{t}}} +\geq 1 \mathrm{b} $). Events with W or Z but no top quarks are referred to as EW, and $ \mathrm{t} \bar{\mathrm{t}} $ + rare includes $ \mathrm{t} \bar{\mathrm{t}} $ production in associaton with two massive bosons or a third (anti)top quark. |
png pdf |
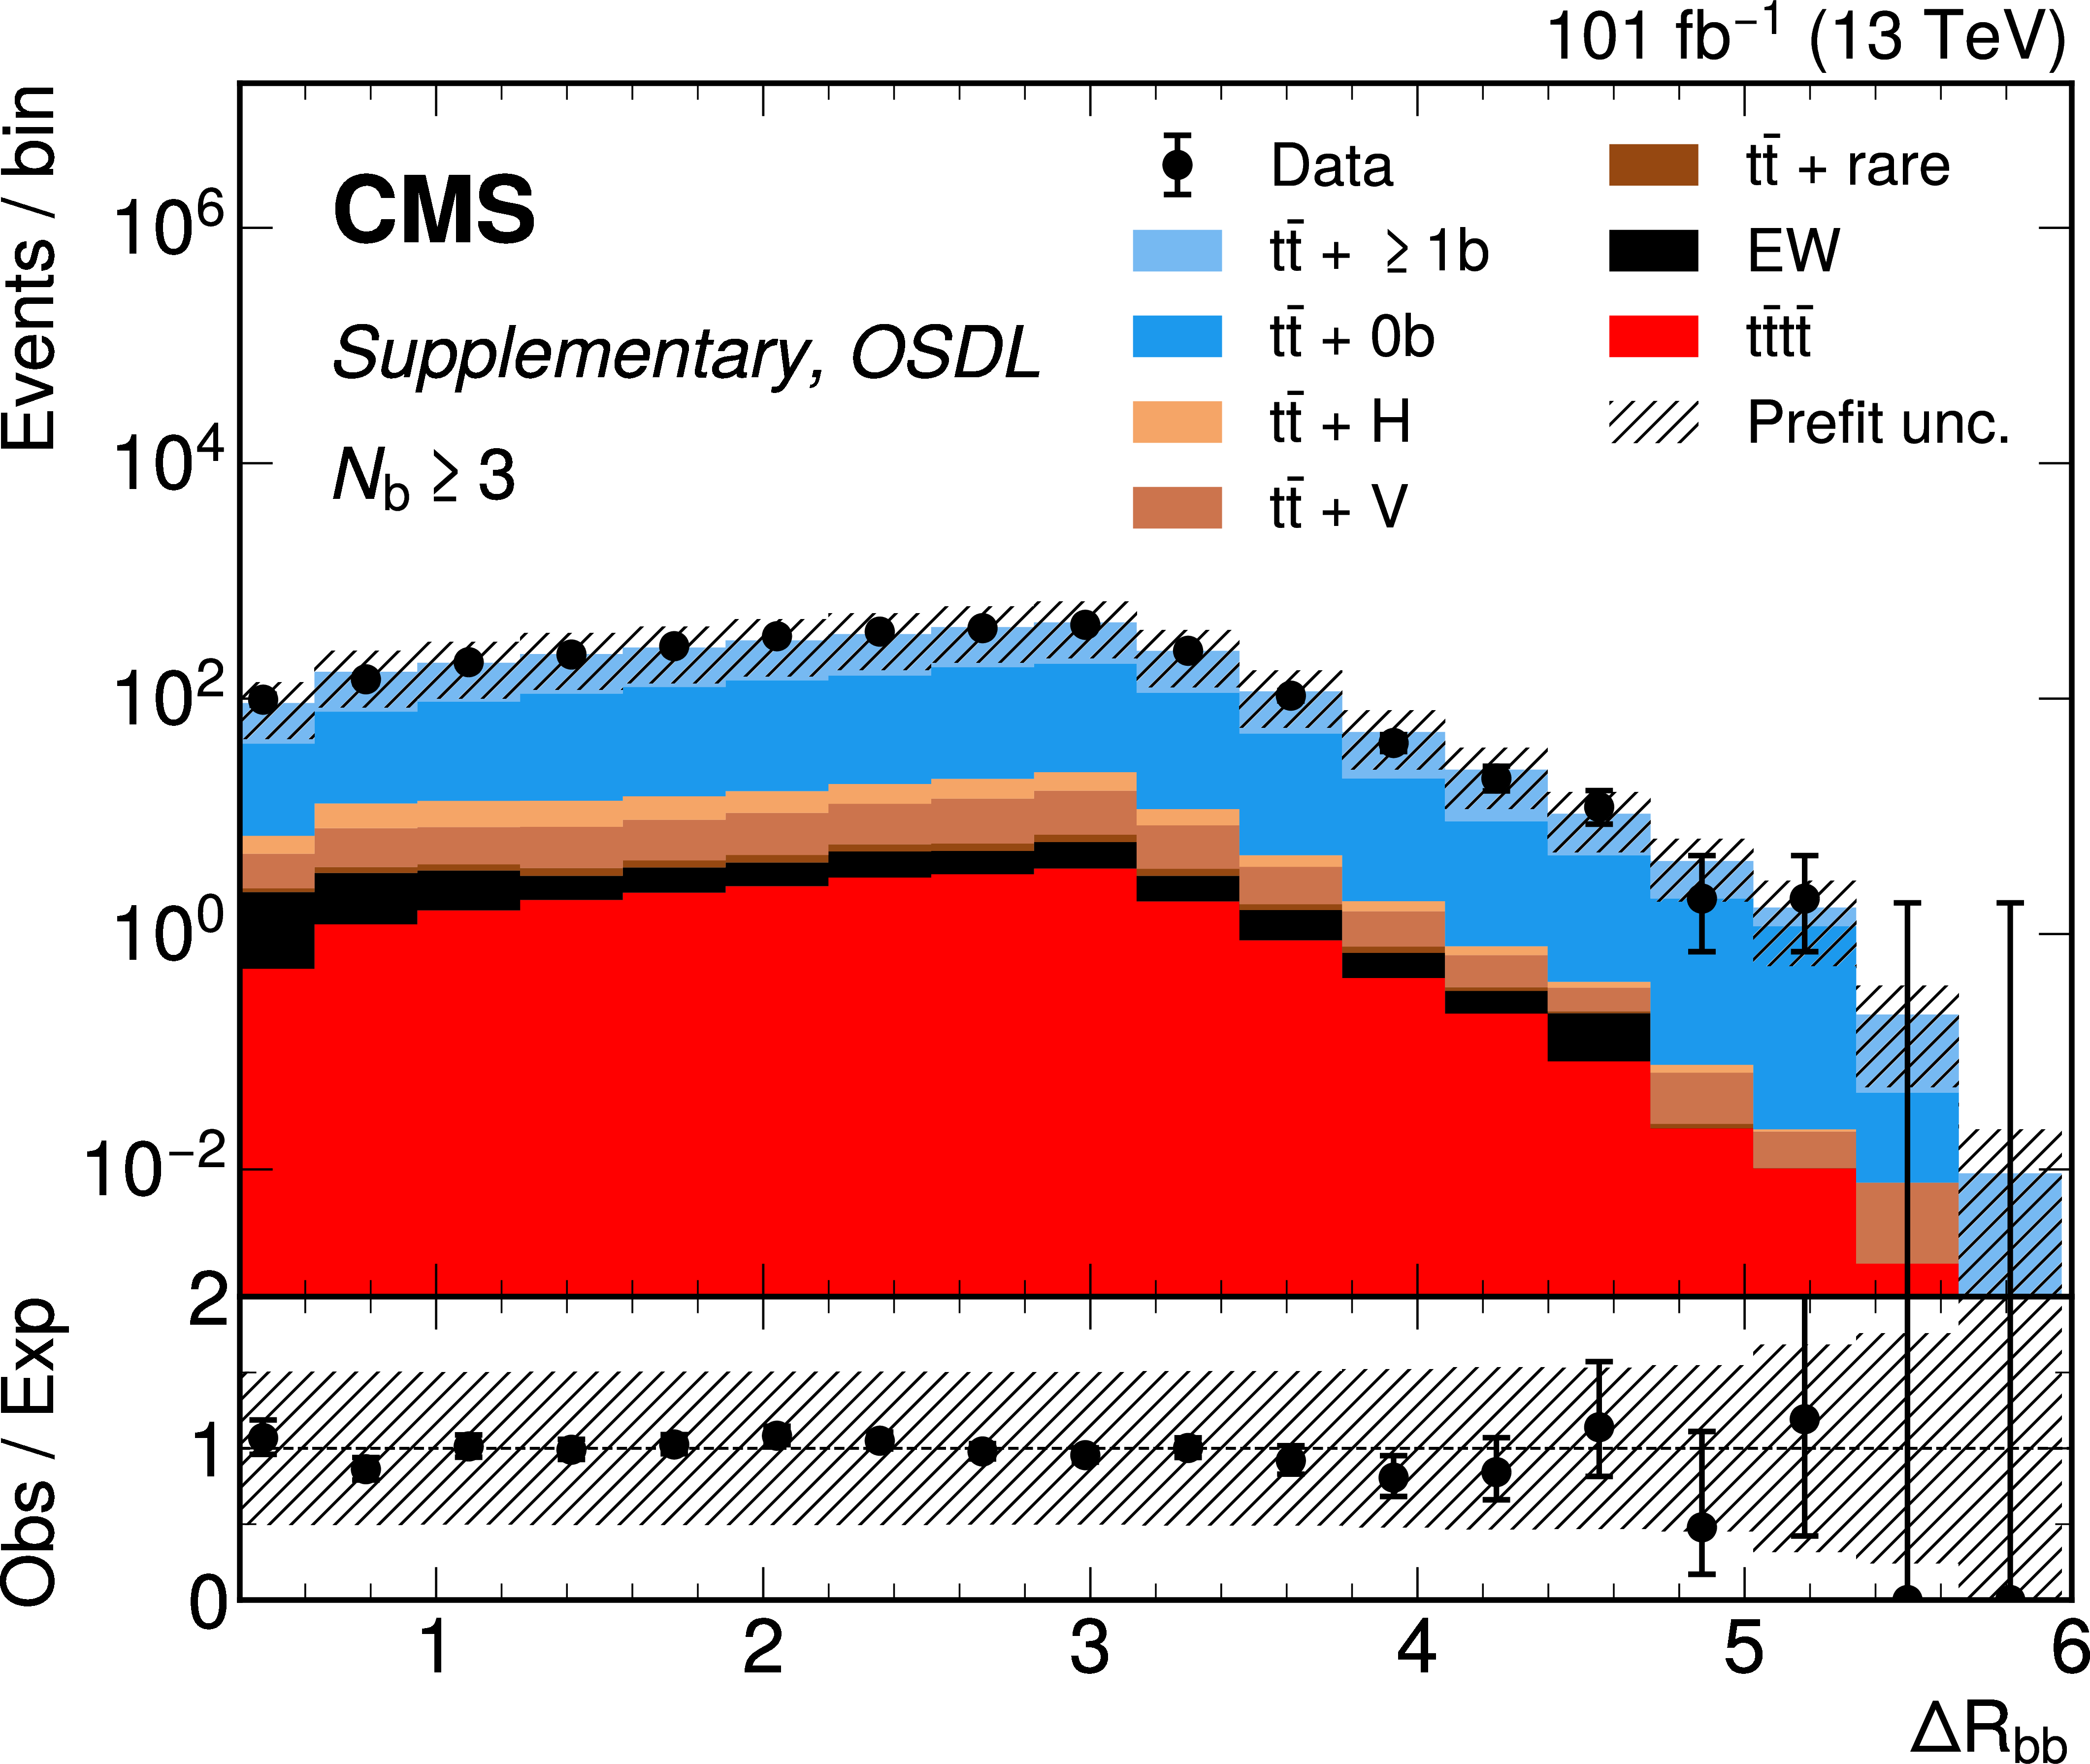
Additional Figure 16-a:
OSDL channel prefit distributions for $ N_\text{BT} \geq $ 3 jets categories.From left to right, top to bottom, are figures for the $ \Delta R $ between the 2 leading b-tagged jets; $ \Delta R $ between the isolated leptons; the $ \eta $ and $ p_{\mathrm{T}} $ of the leading electron; the electron Particle Flow isolation (complete and charged components); the scalar sum of jet three-momenta and the scalar sum without the 2 leading b-tagged jets; the scalar sum of jet $ p_{\mathrm{T}} $ and scalar sum without the 2 leading b-tagged jets ($ H_T^{2M} $); the scalar sum of medium b-tagged jets' $ p_{\mathrm{T}} $ and the ratio of $ H_{\mathrm{T}} $ over $ H $). Background processes include $ \mathrm{t} \bar{\mathrm{t}} $ + V (V = W, Z) and $ \mathrm{t} \bar{\mathrm{t}} $ + H in which $ \mathrm{t} \bar{\mathrm{t}} $ is produced in association with 1 massive boson, $ \mathrm{t} \bar{\mathrm{t}} $ events with zero ($ {\mathrm{t}\bar{\mathrm{t}}} + 0 \mathrm{b} $) or at least one additional b jet ($ {\mathrm{t}\bar{\mathrm{t}}} +\geq 1 \mathrm{b} $). Events with W or Z but no top quarks are referred to as EW, and $ \mathrm{t} \bar{\mathrm{t}} $ + rare includes $ \mathrm{t} \bar{\mathrm{t}} $ production in associaton with two massive bosons or a third (anti)top quark. |
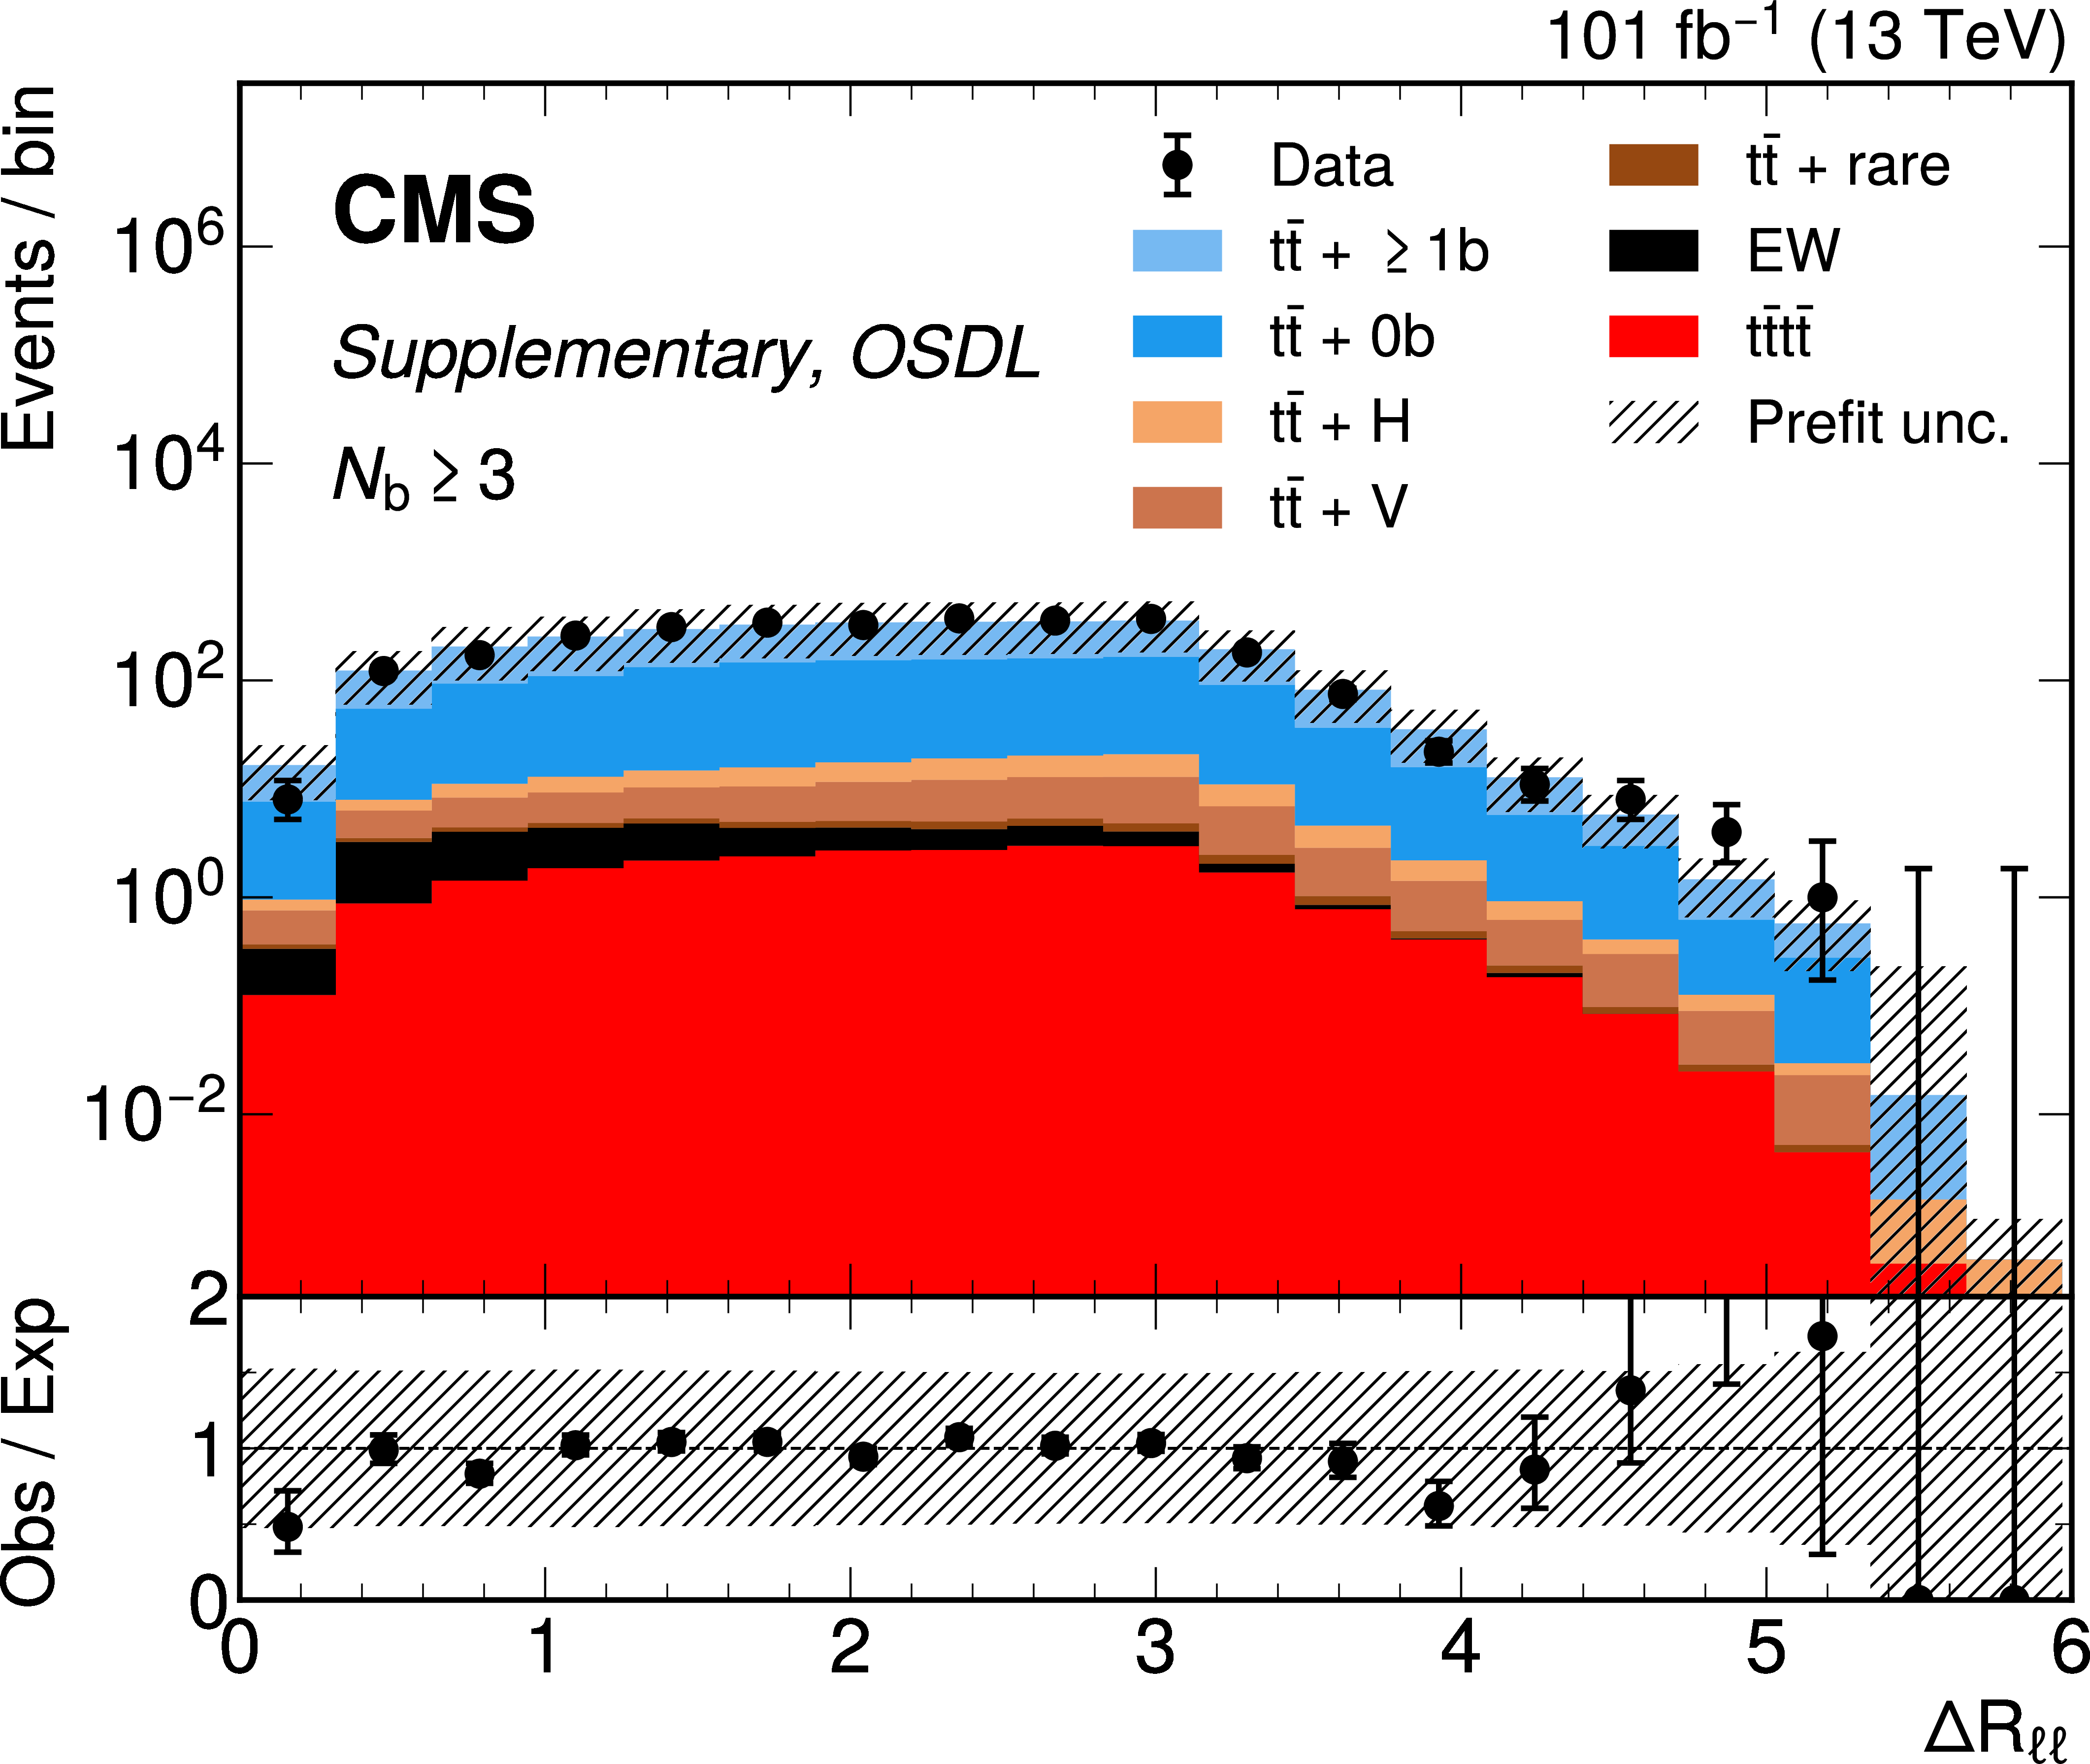
png pdf |
Additional Figure 16-b:
OSDL channel prefit distributions for $ N_\text{BT} \geq $ 3 jets categories.From left to right, top to bottom, are figures for the $ \Delta R $ between the 2 leading b-tagged jets; $ \Delta R $ between the isolated leptons; the $ \eta $ and $ p_{\mathrm{T}} $ of the leading electron; the electron Particle Flow isolation (complete and charged components); the scalar sum of jet three-momenta and the scalar sum without the 2 leading b-tagged jets; the scalar sum of jet $ p_{\mathrm{T}} $ and scalar sum without the 2 leading b-tagged jets ($ H_T^{2M} $); the scalar sum of medium b-tagged jets' $ p_{\mathrm{T}} $ and the ratio of $ H_{\mathrm{T}} $ over $ H $). Background processes include $ \mathrm{t} \bar{\mathrm{t}} $ + V (V = W, Z) and $ \mathrm{t} \bar{\mathrm{t}} $ + H in which $ \mathrm{t} \bar{\mathrm{t}} $ is produced in association with 1 massive boson, $ \mathrm{t} \bar{\mathrm{t}} $ events with zero ($ {\mathrm{t}\bar{\mathrm{t}}} + 0 \mathrm{b} $) or at least one additional b jet ($ {\mathrm{t}\bar{\mathrm{t}}} +\geq 1 \mathrm{b} $). Events with W or Z but no top quarks are referred to as EW, and $ \mathrm{t} \bar{\mathrm{t}} $ + rare includes $ \mathrm{t} \bar{\mathrm{t}} $ production in associaton with two massive bosons or a third (anti)top quark. |

png pdf |
Additional Figure 16-c:
OSDL channel prefit distributions for $ N_\text{BT} \geq $ 3 jets categories.From left to right, top to bottom, are figures for the $ \Delta R $ between the 2 leading b-tagged jets; $ \Delta R $ between the isolated leptons; the $ \eta $ and $ p_{\mathrm{T}} $ of the leading electron; the electron Particle Flow isolation (complete and charged components); the scalar sum of jet three-momenta and the scalar sum without the 2 leading b-tagged jets; the scalar sum of jet $ p_{\mathrm{T}} $ and scalar sum without the 2 leading b-tagged jets ($ H_T^{2M} $); the scalar sum of medium b-tagged jets' $ p_{\mathrm{T}} $ and the ratio of $ H_{\mathrm{T}} $ over $ H $). Background processes include $ \mathrm{t} \bar{\mathrm{t}} $ + V (V = W, Z) and $ \mathrm{t} \bar{\mathrm{t}} $ + H in which $ \mathrm{t} \bar{\mathrm{t}} $ is produced in association with 1 massive boson, $ \mathrm{t} \bar{\mathrm{t}} $ events with zero ($ {\mathrm{t}\bar{\mathrm{t}}} + 0 \mathrm{b} $) or at least one additional b jet ($ {\mathrm{t}\bar{\mathrm{t}}} +\geq 1 \mathrm{b} $). Events with W or Z but no top quarks are referred to as EW, and $ \mathrm{t} \bar{\mathrm{t}} $ + rare includes $ \mathrm{t} \bar{\mathrm{t}} $ production in associaton with two massive bosons or a third (anti)top quark. |

png pdf |
Additional Figure 16-d:
OSDL channel prefit distributions for $ N_\text{BT} \geq $ 3 jets categories.From left to right, top to bottom, are figures for the $ \Delta R $ between the 2 leading b-tagged jets; $ \Delta R $ between the isolated leptons; the $ \eta $ and $ p_{\mathrm{T}} $ of the leading electron; the electron Particle Flow isolation (complete and charged components); the scalar sum of jet three-momenta and the scalar sum without the 2 leading b-tagged jets; the scalar sum of jet $ p_{\mathrm{T}} $ and scalar sum without the 2 leading b-tagged jets ($ H_T^{2M} $); the scalar sum of medium b-tagged jets' $ p_{\mathrm{T}} $ and the ratio of $ H_{\mathrm{T}} $ over $ H $). Background processes include $ \mathrm{t} \bar{\mathrm{t}} $ + V (V = W, Z) and $ \mathrm{t} \bar{\mathrm{t}} $ + H in which $ \mathrm{t} \bar{\mathrm{t}} $ is produced in association with 1 massive boson, $ \mathrm{t} \bar{\mathrm{t}} $ events with zero ($ {\mathrm{t}\bar{\mathrm{t}}} + 0 \mathrm{b} $) or at least one additional b jet ($ {\mathrm{t}\bar{\mathrm{t}}} +\geq 1 \mathrm{b} $). Events with W or Z but no top quarks are referred to as EW, and $ \mathrm{t} \bar{\mathrm{t}} $ + rare includes $ \mathrm{t} \bar{\mathrm{t}} $ production in associaton with two massive bosons or a third (anti)top quark. |
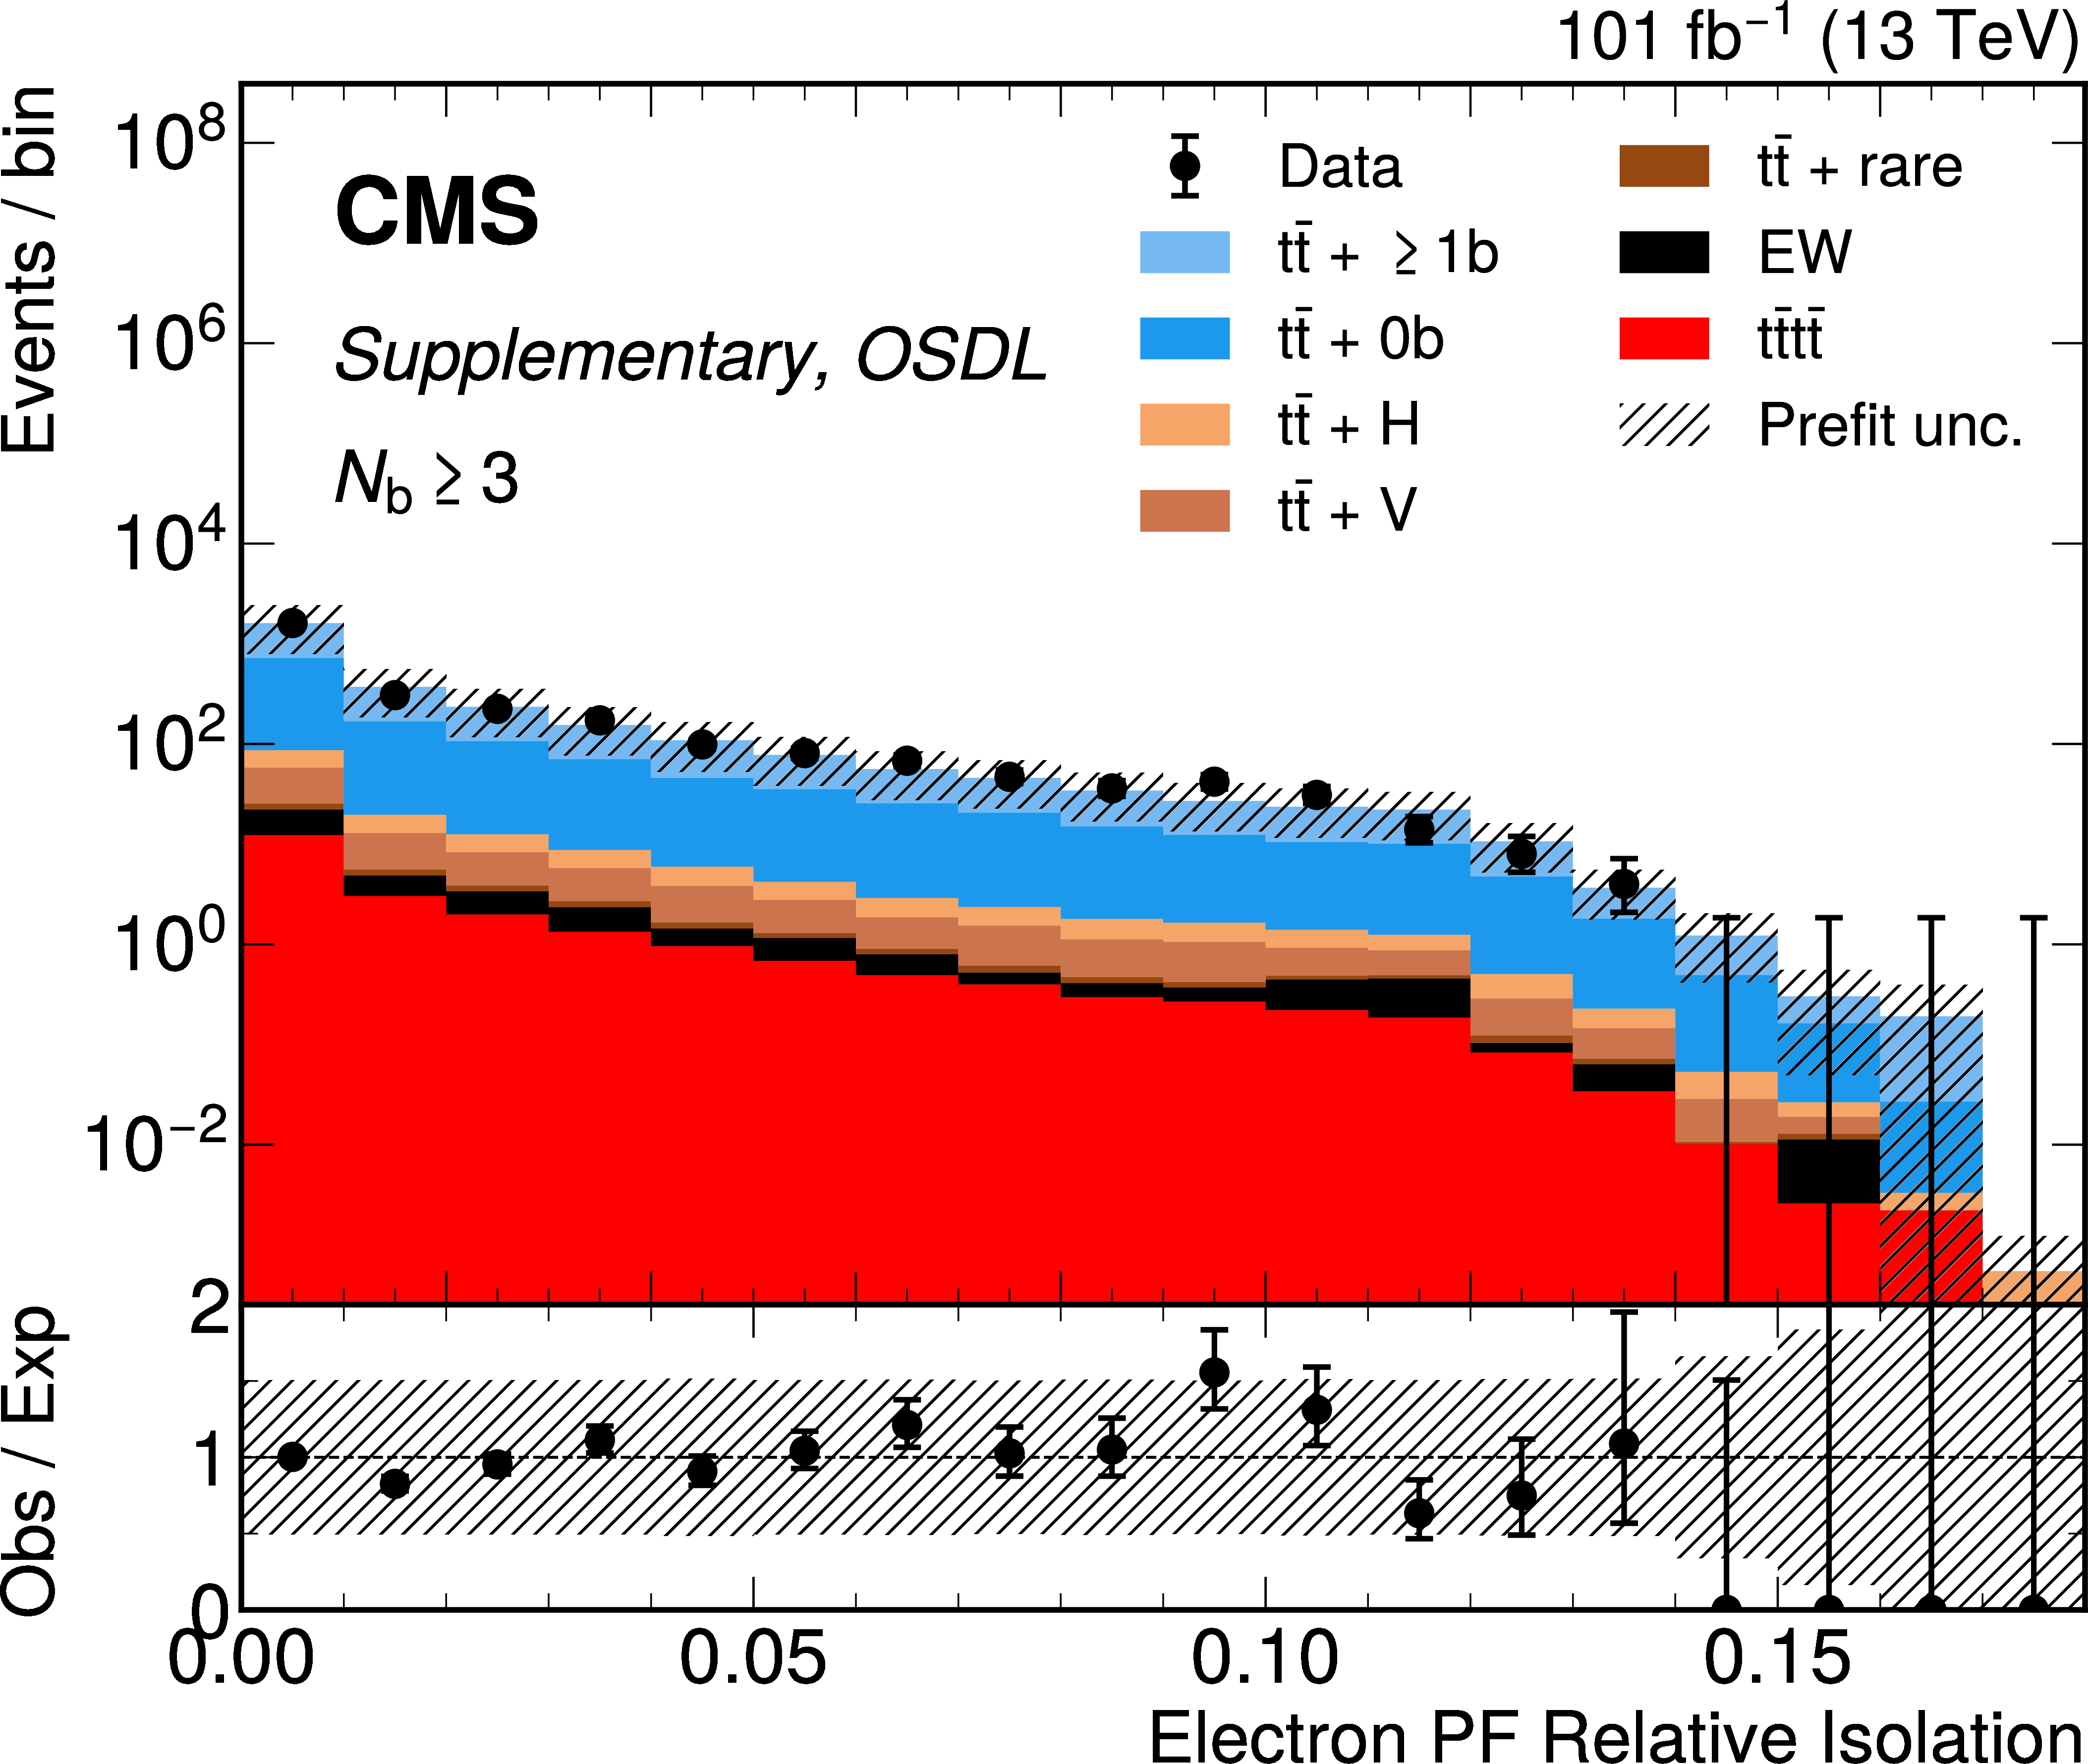
png pdf |
Additional Figure 16-e:
OSDL channel prefit distributions for $ N_\text{BT} \geq $ 3 jets categories.From left to right, top to bottom, are figures for the $ \Delta R $ between the 2 leading b-tagged jets; $ \Delta R $ between the isolated leptons; the $ \eta $ and $ p_{\mathrm{T}} $ of the leading electron; the electron Particle Flow isolation (complete and charged components); the scalar sum of jet three-momenta and the scalar sum without the 2 leading b-tagged jets; the scalar sum of jet $ p_{\mathrm{T}} $ and scalar sum without the 2 leading b-tagged jets ($ H_T^{2M} $); the scalar sum of medium b-tagged jets' $ p_{\mathrm{T}} $ and the ratio of $ H_{\mathrm{T}} $ over $ H $). Background processes include $ \mathrm{t} \bar{\mathrm{t}} $ + V (V = W, Z) and $ \mathrm{t} \bar{\mathrm{t}} $ + H in which $ \mathrm{t} \bar{\mathrm{t}} $ is produced in association with 1 massive boson, $ \mathrm{t} \bar{\mathrm{t}} $ events with zero ($ {\mathrm{t}\bar{\mathrm{t}}} + 0 \mathrm{b} $) or at least one additional b jet ($ {\mathrm{t}\bar{\mathrm{t}}} +\geq 1 \mathrm{b} $). Events with W or Z but no top quarks are referred to as EW, and $ \mathrm{t} \bar{\mathrm{t}} $ + rare includes $ \mathrm{t} \bar{\mathrm{t}} $ production in associaton with two massive bosons or a third (anti)top quark. |
png pdf |
Additional Figure 16-f:
OSDL channel prefit distributions for $ N_\text{BT} \geq $ 3 jets categories.From left to right, top to bottom, are figures for the $ \Delta R $ between the 2 leading b-tagged jets; $ \Delta R $ between the isolated leptons; the $ \eta $ and $ p_{\mathrm{T}} $ of the leading electron; the electron Particle Flow isolation (complete and charged components); the scalar sum of jet three-momenta and the scalar sum without the 2 leading b-tagged jets; the scalar sum of jet $ p_{\mathrm{T}} $ and scalar sum without the 2 leading b-tagged jets ($ H_T^{2M} $); the scalar sum of medium b-tagged jets' $ p_{\mathrm{T}} $ and the ratio of $ H_{\mathrm{T}} $ over $ H $). Background processes include $ \mathrm{t} \bar{\mathrm{t}} $ + V (V = W, Z) and $ \mathrm{t} \bar{\mathrm{t}} $ + H in which $ \mathrm{t} \bar{\mathrm{t}} $ is produced in association with 1 massive boson, $ \mathrm{t} \bar{\mathrm{t}} $ events with zero ($ {\mathrm{t}\bar{\mathrm{t}}} + 0 \mathrm{b} $) or at least one additional b jet ($ {\mathrm{t}\bar{\mathrm{t}}} +\geq 1 \mathrm{b} $). Events with W or Z but no top quarks are referred to as EW, and $ \mathrm{t} \bar{\mathrm{t}} $ + rare includes $ \mathrm{t} \bar{\mathrm{t}} $ production in associaton with two massive bosons or a third (anti)top quark. |
png pdf |
Additional Figure 16-g:
OSDL channel prefit distributions for $ N_\text{BT} \geq $ 3 jets categories.From left to right, top to bottom, are figures for the $ \Delta R $ between the 2 leading b-tagged jets; $ \Delta R $ between the isolated leptons; the $ \eta $ and $ p_{\mathrm{T}} $ of the leading electron; the electron Particle Flow isolation (complete and charged components); the scalar sum of jet three-momenta and the scalar sum without the 2 leading b-tagged jets; the scalar sum of jet $ p_{\mathrm{T}} $ and scalar sum without the 2 leading b-tagged jets ($ H_T^{2M} $); the scalar sum of medium b-tagged jets' $ p_{\mathrm{T}} $ and the ratio of $ H_{\mathrm{T}} $ over $ H $). Background processes include $ \mathrm{t} \bar{\mathrm{t}} $ + V (V = W, Z) and $ \mathrm{t} \bar{\mathrm{t}} $ + H in which $ \mathrm{t} \bar{\mathrm{t}} $ is produced in association with 1 massive boson, $ \mathrm{t} \bar{\mathrm{t}} $ events with zero ($ {\mathrm{t}\bar{\mathrm{t}}} + 0 \mathrm{b} $) or at least one additional b jet ($ {\mathrm{t}\bar{\mathrm{t}}} +\geq 1 \mathrm{b} $). Events with W or Z but no top quarks are referred to as EW, and $ \mathrm{t} \bar{\mathrm{t}} $ + rare includes $ \mathrm{t} \bar{\mathrm{t}} $ production in associaton with two massive bosons or a third (anti)top quark. |
png pdf |
Additional Figure 16-h:
OSDL channel prefit distributions for $ N_\text{BT} \geq $ 3 jets categories.From left to right, top to bottom, are figures for the $ \Delta R $ between the 2 leading b-tagged jets; $ \Delta R $ between the isolated leptons; the $ \eta $ and $ p_{\mathrm{T}} $ of the leading electron; the electron Particle Flow isolation (complete and charged components); the scalar sum of jet three-momenta and the scalar sum without the 2 leading b-tagged jets; the scalar sum of jet $ p_{\mathrm{T}} $ and scalar sum without the 2 leading b-tagged jets ($ H_T^{2M} $); the scalar sum of medium b-tagged jets' $ p_{\mathrm{T}} $ and the ratio of $ H_{\mathrm{T}} $ over $ H $). Background processes include $ \mathrm{t} \bar{\mathrm{t}} $ + V (V = W, Z) and $ \mathrm{t} \bar{\mathrm{t}} $ + H in which $ \mathrm{t} \bar{\mathrm{t}} $ is produced in association with 1 massive boson, $ \mathrm{t} \bar{\mathrm{t}} $ events with zero ($ {\mathrm{t}\bar{\mathrm{t}}} + 0 \mathrm{b} $) or at least one additional b jet ($ {\mathrm{t}\bar{\mathrm{t}}} +\geq 1 \mathrm{b} $). Events with W or Z but no top quarks are referred to as EW, and $ \mathrm{t} \bar{\mathrm{t}} $ + rare includes $ \mathrm{t} \bar{\mathrm{t}} $ production in associaton with two massive bosons or a third (anti)top quark. |
png pdf |
Additional Figure 16-i:
OSDL channel prefit distributions for $ N_\text{BT} \geq $ 3 jets categories.From left to right, top to bottom, are figures for the $ \Delta R $ between the 2 leading b-tagged jets; $ \Delta R $ between the isolated leptons; the $ \eta $ and $ p_{\mathrm{T}} $ of the leading electron; the electron Particle Flow isolation (complete and charged components); the scalar sum of jet three-momenta and the scalar sum without the 2 leading b-tagged jets; the scalar sum of jet $ p_{\mathrm{T}} $ and scalar sum without the 2 leading b-tagged jets ($ H_T^{2M} $); the scalar sum of medium b-tagged jets' $ p_{\mathrm{T}} $ and the ratio of $ H_{\mathrm{T}} $ over $ H $). Background processes include $ \mathrm{t} \bar{\mathrm{t}} $ + V (V = W, Z) and $ \mathrm{t} \bar{\mathrm{t}} $ + H in which $ \mathrm{t} \bar{\mathrm{t}} $ is produced in association with 1 massive boson, $ \mathrm{t} \bar{\mathrm{t}} $ events with zero ($ {\mathrm{t}\bar{\mathrm{t}}} + 0 \mathrm{b} $) or at least one additional b jet ($ {\mathrm{t}\bar{\mathrm{t}}} +\geq 1 \mathrm{b} $). Events with W or Z but no top quarks are referred to as EW, and $ \mathrm{t} \bar{\mathrm{t}} $ + rare includes $ \mathrm{t} \bar{\mathrm{t}} $ production in associaton with two massive bosons or a third (anti)top quark. |
png pdf |
Additional Figure 16-j:
OSDL channel prefit distributions for $ N_\text{BT} \geq $ 3 jets categories.From left to right, top to bottom, are figures for the $ \Delta R $ between the 2 leading b-tagged jets; $ \Delta R $ between the isolated leptons; the $ \eta $ and $ p_{\mathrm{T}} $ of the leading electron; the electron Particle Flow isolation (complete and charged components); the scalar sum of jet three-momenta and the scalar sum without the 2 leading b-tagged jets; the scalar sum of jet $ p_{\mathrm{T}} $ and scalar sum without the 2 leading b-tagged jets ($ H_T^{2M} $); the scalar sum of medium b-tagged jets' $ p_{\mathrm{T}} $ and the ratio of $ H_{\mathrm{T}} $ over $ H $). Background processes include $ \mathrm{t} \bar{\mathrm{t}} $ + V (V = W, Z) and $ \mathrm{t} \bar{\mathrm{t}} $ + H in which $ \mathrm{t} \bar{\mathrm{t}} $ is produced in association with 1 massive boson, $ \mathrm{t} \bar{\mathrm{t}} $ events with zero ($ {\mathrm{t}\bar{\mathrm{t}}} + 0 \mathrm{b} $) or at least one additional b jet ($ {\mathrm{t}\bar{\mathrm{t}}} +\geq 1 \mathrm{b} $). Events with W or Z but no top quarks are referred to as EW, and $ \mathrm{t} \bar{\mathrm{t}} $ + rare includes $ \mathrm{t} \bar{\mathrm{t}} $ production in associaton with two massive bosons or a third (anti)top quark. |

png pdf |
Additional Figure 16-k:
OSDL channel prefit distributions for $ N_\text{BT} \geq $ 3 jets categories.From left to right, top to bottom, are figures for the $ \Delta R $ between the 2 leading b-tagged jets; $ \Delta R $ between the isolated leptons; the $ \eta $ and $ p_{\mathrm{T}} $ of the leading electron; the electron Particle Flow isolation (complete and charged components); the scalar sum of jet three-momenta and the scalar sum without the 2 leading b-tagged jets; the scalar sum of jet $ p_{\mathrm{T}} $ and scalar sum without the 2 leading b-tagged jets ($ H_T^{2M} $); the scalar sum of medium b-tagged jets' $ p_{\mathrm{T}} $ and the ratio of $ H_{\mathrm{T}} $ over $ H $). Background processes include $ \mathrm{t} \bar{\mathrm{t}} $ + V (V = W, Z) and $ \mathrm{t} \bar{\mathrm{t}} $ + H in which $ \mathrm{t} \bar{\mathrm{t}} $ is produced in association with 1 massive boson, $ \mathrm{t} \bar{\mathrm{t}} $ events with zero ($ {\mathrm{t}\bar{\mathrm{t}}} + 0 \mathrm{b} $) or at least one additional b jet ($ {\mathrm{t}\bar{\mathrm{t}}} +\geq 1 \mathrm{b} $). Events with W or Z but no top quarks are referred to as EW, and $ \mathrm{t} \bar{\mathrm{t}} $ + rare includes $ \mathrm{t} \bar{\mathrm{t}} $ production in associaton with two massive bosons or a third (anti)top quark. |
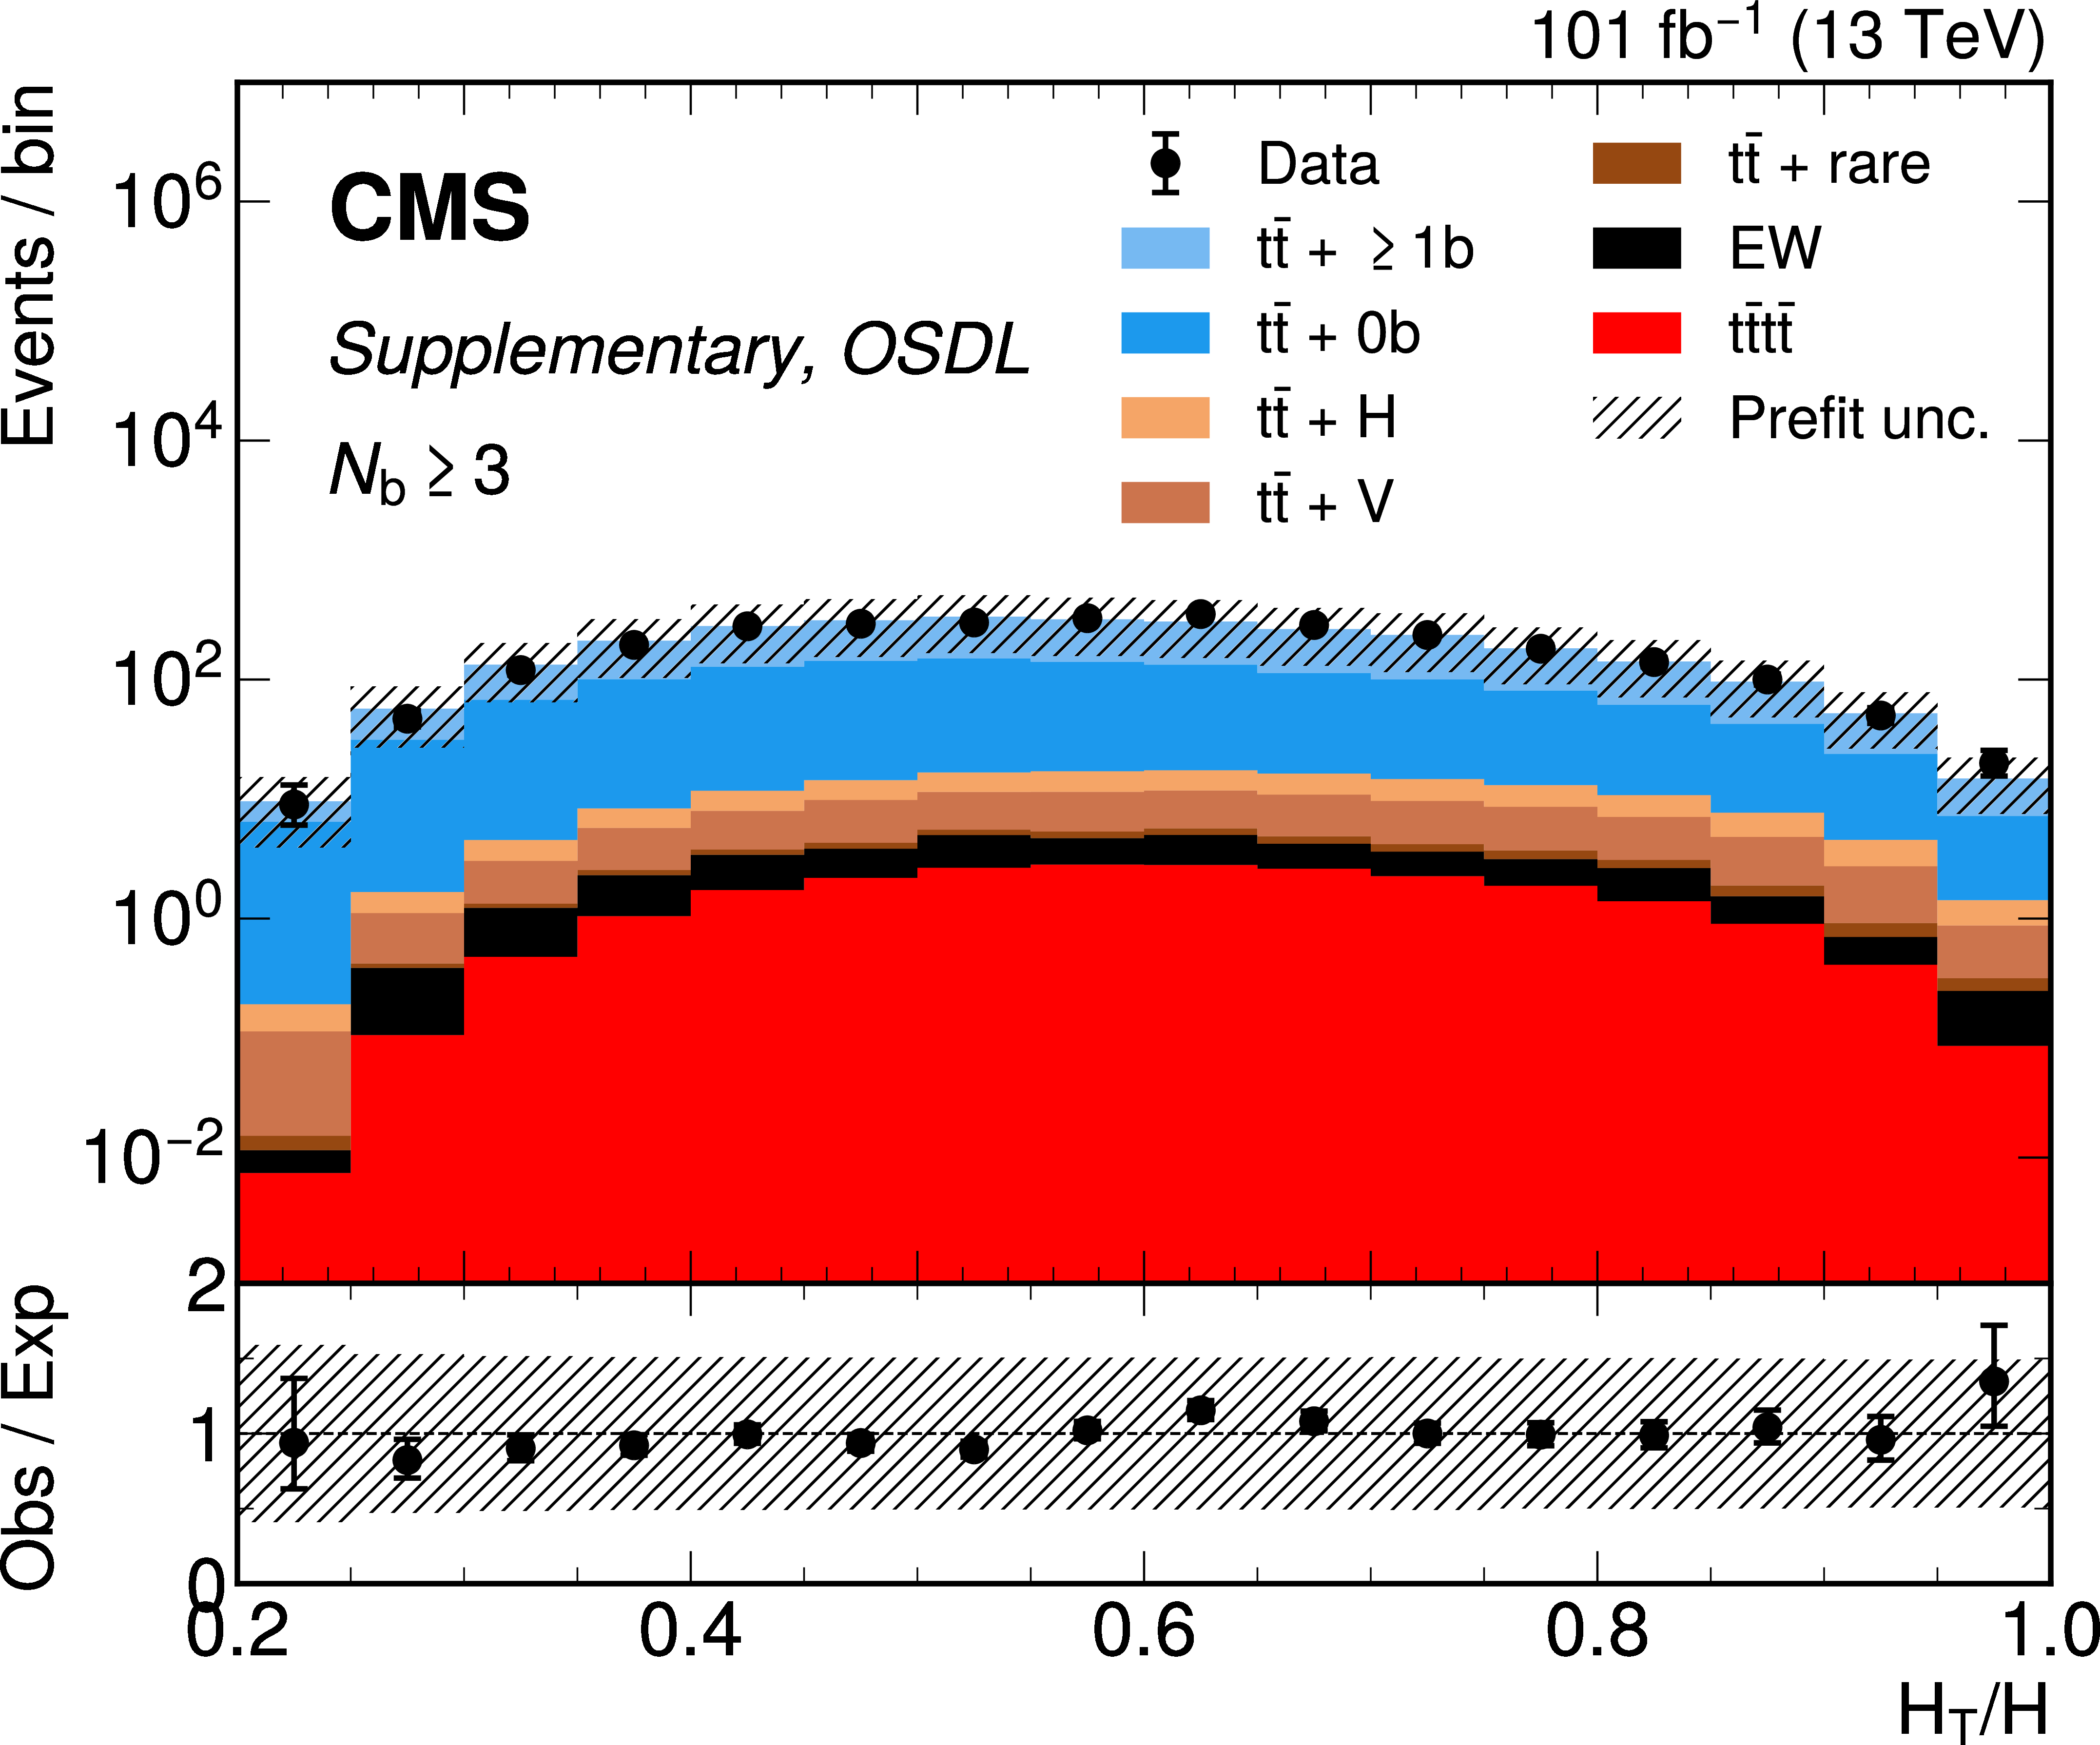
png pdf |
Additional Figure 16-l:
OSDL channel prefit distributions for $ N_\text{BT} \geq $ 3 jets categories.From left to right, top to bottom, are figures for the $ \Delta R $ between the 2 leading b-tagged jets; $ \Delta R $ between the isolated leptons; the $ \eta $ and $ p_{\mathrm{T}} $ of the leading electron; the electron Particle Flow isolation (complete and charged components); the scalar sum of jet three-momenta and the scalar sum without the 2 leading b-tagged jets; the scalar sum of jet $ p_{\mathrm{T}} $ and scalar sum without the 2 leading b-tagged jets ($ H_T^{2M} $); the scalar sum of medium b-tagged jets' $ p_{\mathrm{T}} $ and the ratio of $ H_{\mathrm{T}} $ over $ H $). Background processes include $ \mathrm{t} \bar{\mathrm{t}} $ + V (V = W, Z) and $ \mathrm{t} \bar{\mathrm{t}} $ + H in which $ \mathrm{t} \bar{\mathrm{t}} $ is produced in association with 1 massive boson, $ \mathrm{t} \bar{\mathrm{t}} $ events with zero ($ {\mathrm{t}\bar{\mathrm{t}}} + 0 \mathrm{b} $) or at least one additional b jet ($ {\mathrm{t}\bar{\mathrm{t}}} +\geq 1 \mathrm{b} $). Events with W or Z but no top quarks are referred to as EW, and $ \mathrm{t} \bar{\mathrm{t}} $ + rare includes $ \mathrm{t} \bar{\mathrm{t}} $ production in associaton with two massive bosons or a third (anti)top quark. |
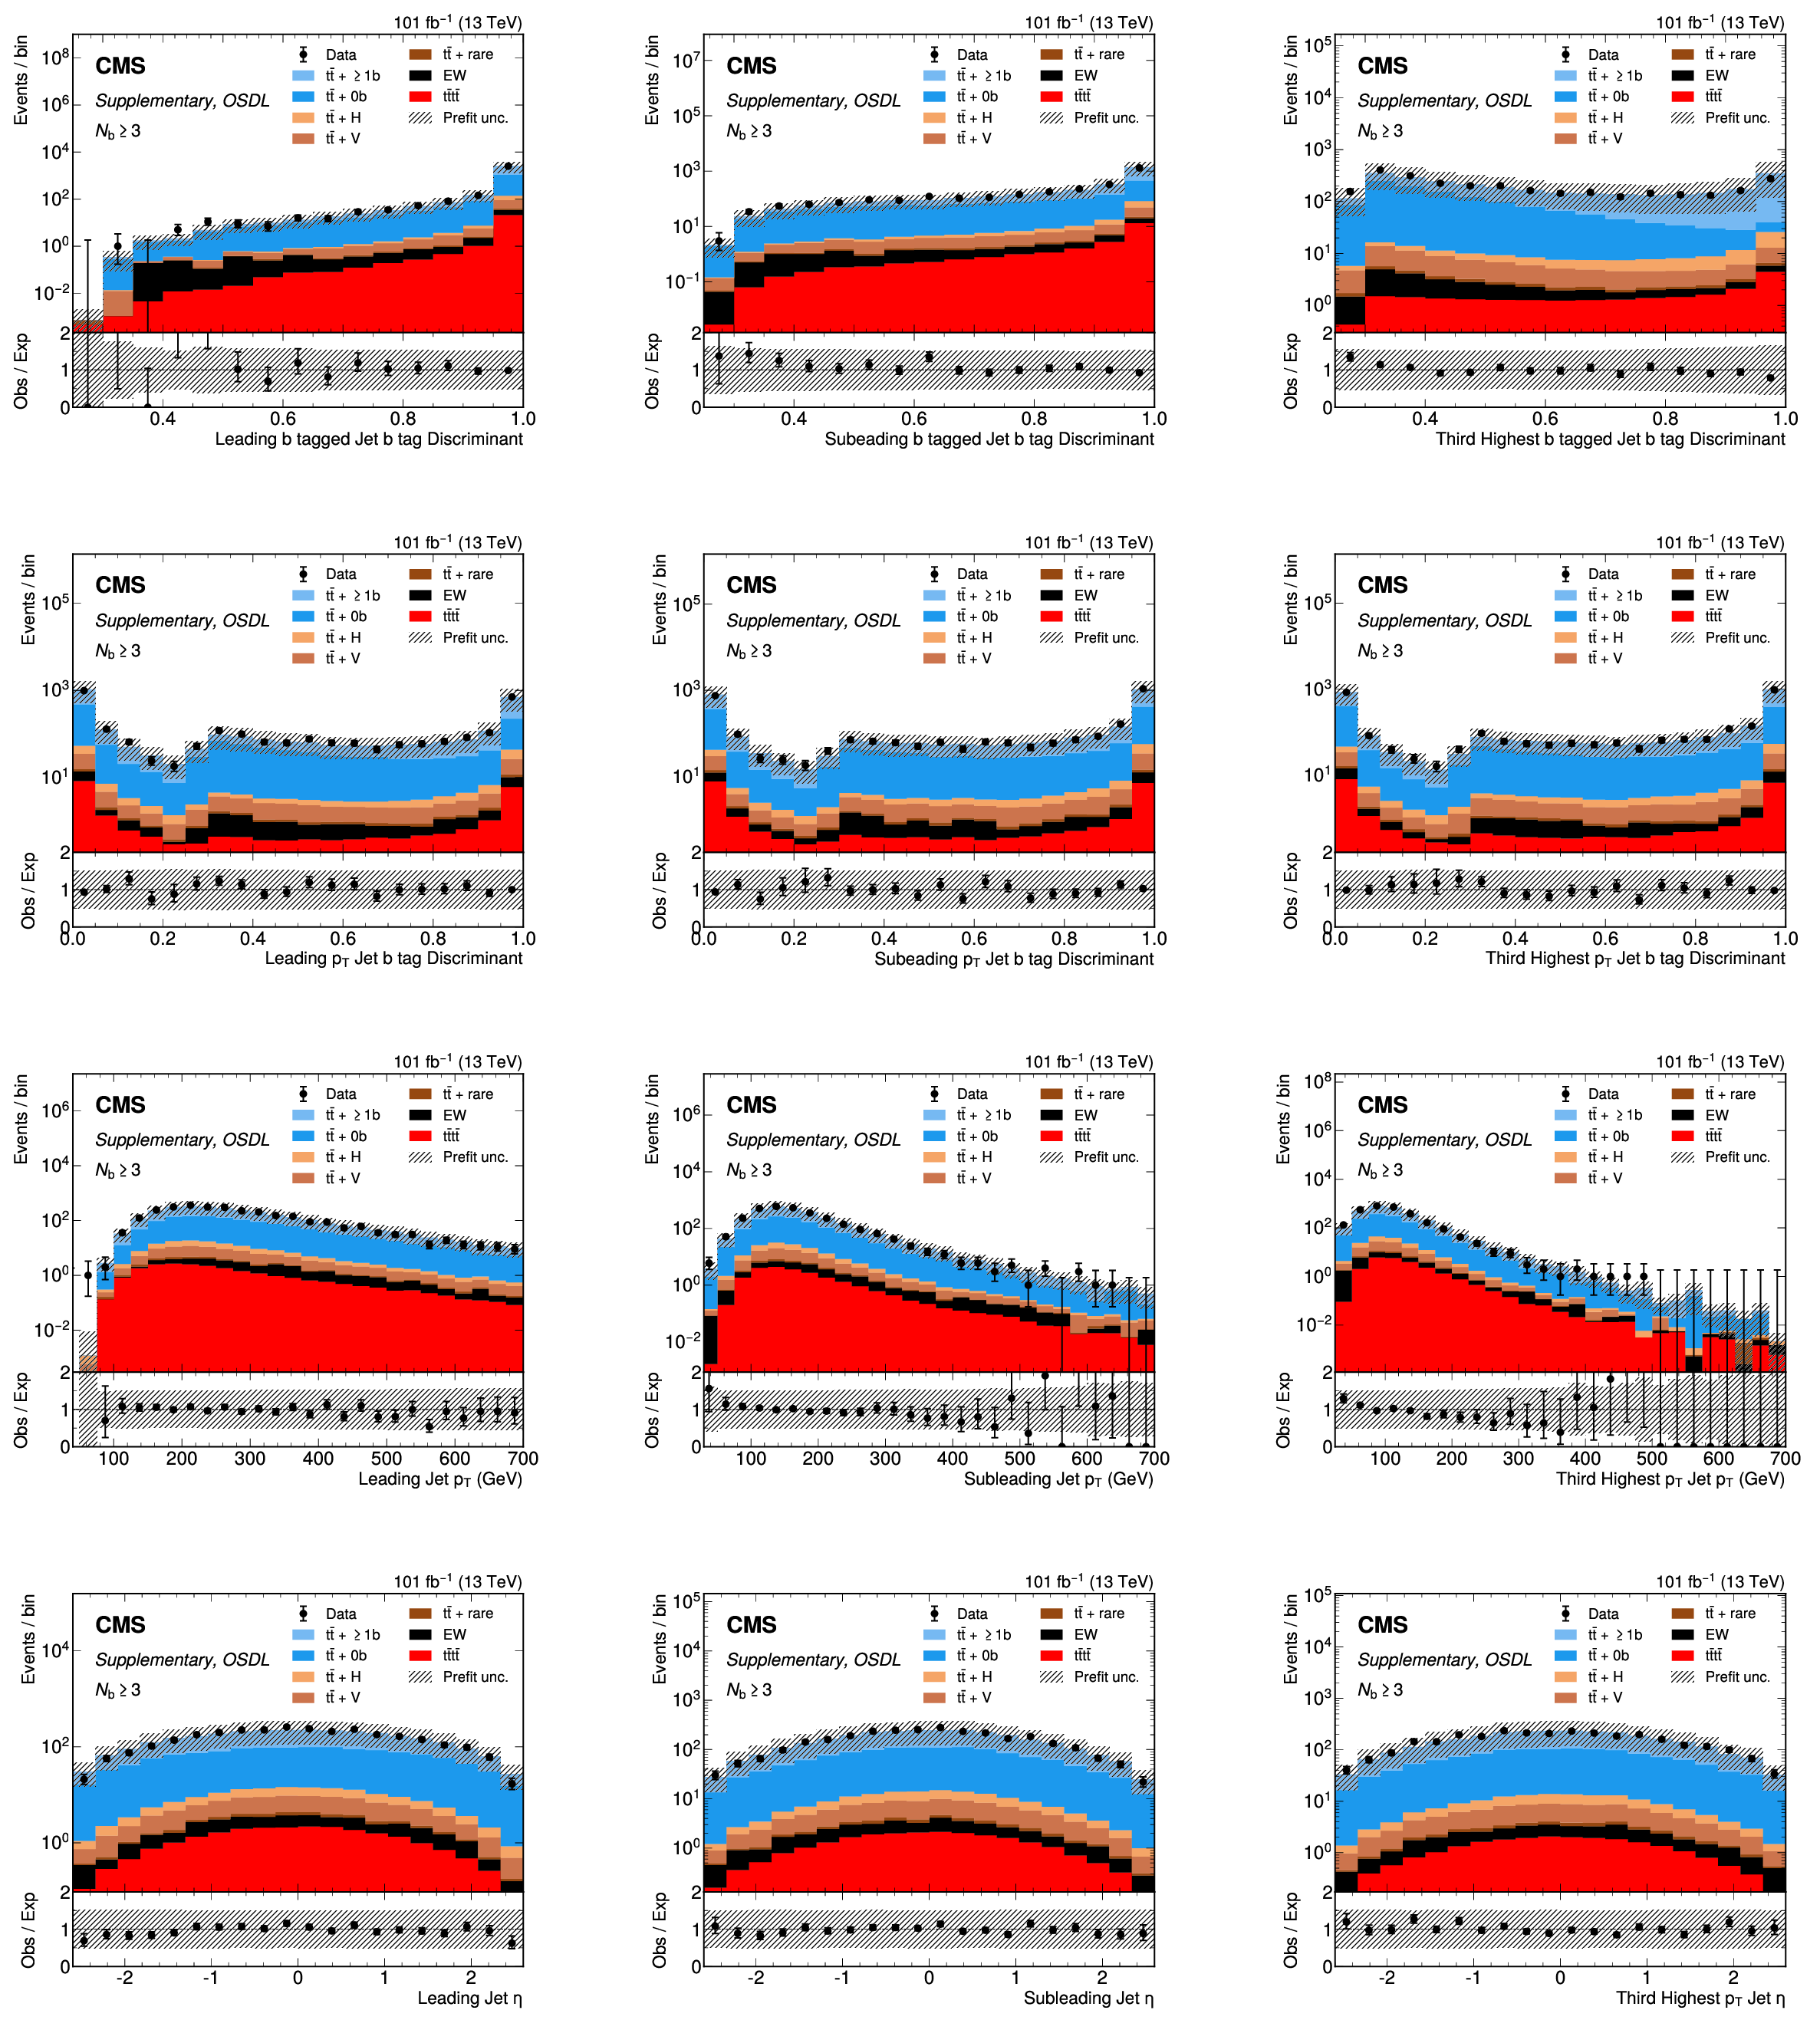
png pdf |
Additional Figure 17:
OSDL channel prefit distributions for $ N_\text{BT} \geq $ 3 jets categories.From left to right, top to bottom, are figures for the b-tag discriminant of the 3 highest b-tagged jets; the the b-tag discriminant of the 3 highest $ p_{\mathrm{T}} $ jets; the $ p_{\mathrm{T}} $ of the 3 highest $ p_{\mathrm{T}} $ jets; and the $ \eta $ of the 3 highest $ p_{\mathrm{T}} $ jets. Background processes include $ \mathrm{t} \bar{\mathrm{t}} $ + V (V = W, Z) and $ \mathrm{t} \bar{\mathrm{t}} $ + H in which $ \mathrm{t} \bar{\mathrm{t}} $ is produced in association with 1 massive boson, $ \mathrm{t} \bar{\mathrm{t}} $ events with zero ($ {\mathrm{t}\bar{\mathrm{t}}} + 0 \mathrm{b} $) or at least one additional b jet ($ {\mathrm{t}\bar{\mathrm{t}}} +\geq 1 \mathrm{b} $). Events with W or Z but no top quarks are referred to as EW, and $ \mathrm{t} \bar{\mathrm{t}} $ + rare includes $ \mathrm{t} \bar{\mathrm{t}} $ production in associaton with two massive bosons or a third (anti)top quark. |
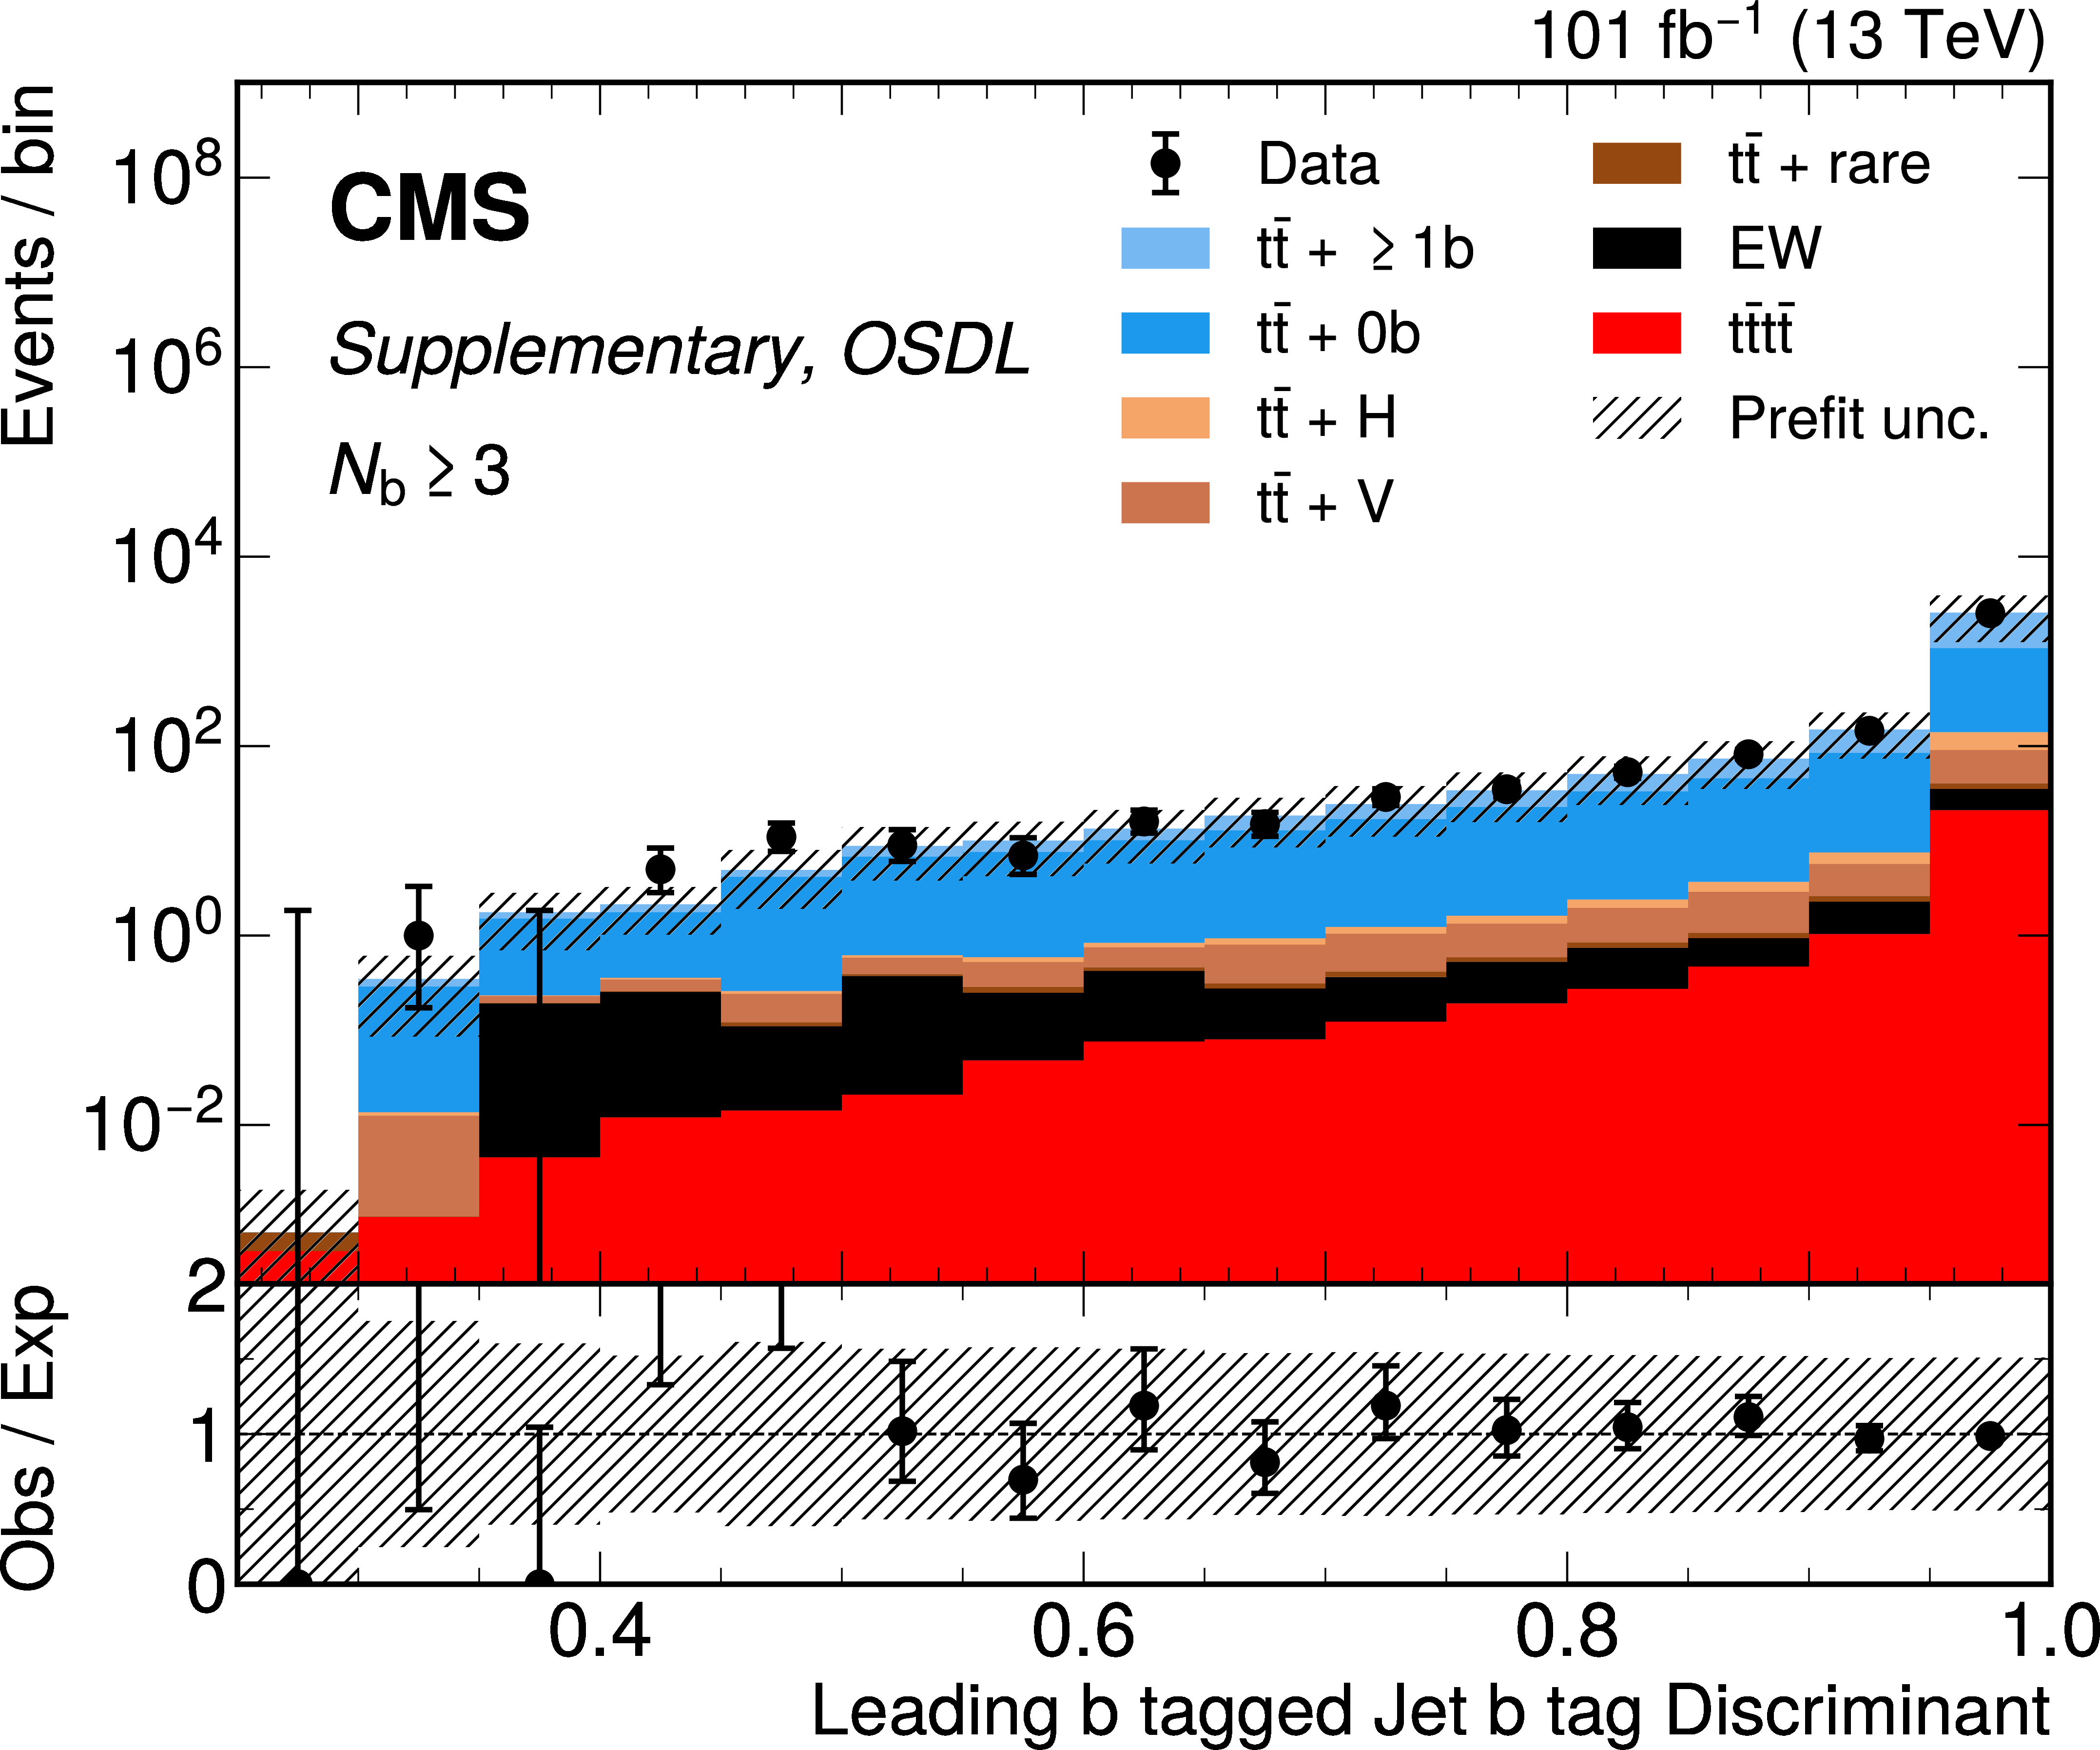
png pdf |
Additional Figure 17-a:
OSDL channel prefit distributions for $ N_\text{BT} \geq $ 3 jets categories.From left to right, top to bottom, are figures for the b-tag discriminant of the 3 highest b-tagged jets; the the b-tag discriminant of the 3 highest $ p_{\mathrm{T}} $ jets; the $ p_{\mathrm{T}} $ of the 3 highest $ p_{\mathrm{T}} $ jets; and the $ \eta $ of the 3 highest $ p_{\mathrm{T}} $ jets. Background processes include $ \mathrm{t} \bar{\mathrm{t}} $ + V (V = W, Z) and $ \mathrm{t} \bar{\mathrm{t}} $ + H in which $ \mathrm{t} \bar{\mathrm{t}} $ is produced in association with 1 massive boson, $ \mathrm{t} \bar{\mathrm{t}} $ events with zero ($ {\mathrm{t}\bar{\mathrm{t}}} + 0 \mathrm{b} $) or at least one additional b jet ($ {\mathrm{t}\bar{\mathrm{t}}} +\geq 1 \mathrm{b} $). Events with W or Z but no top quarks are referred to as EW, and $ \mathrm{t} \bar{\mathrm{t}} $ + rare includes $ \mathrm{t} \bar{\mathrm{t}} $ production in associaton with two massive bosons or a third (anti)top quark. |
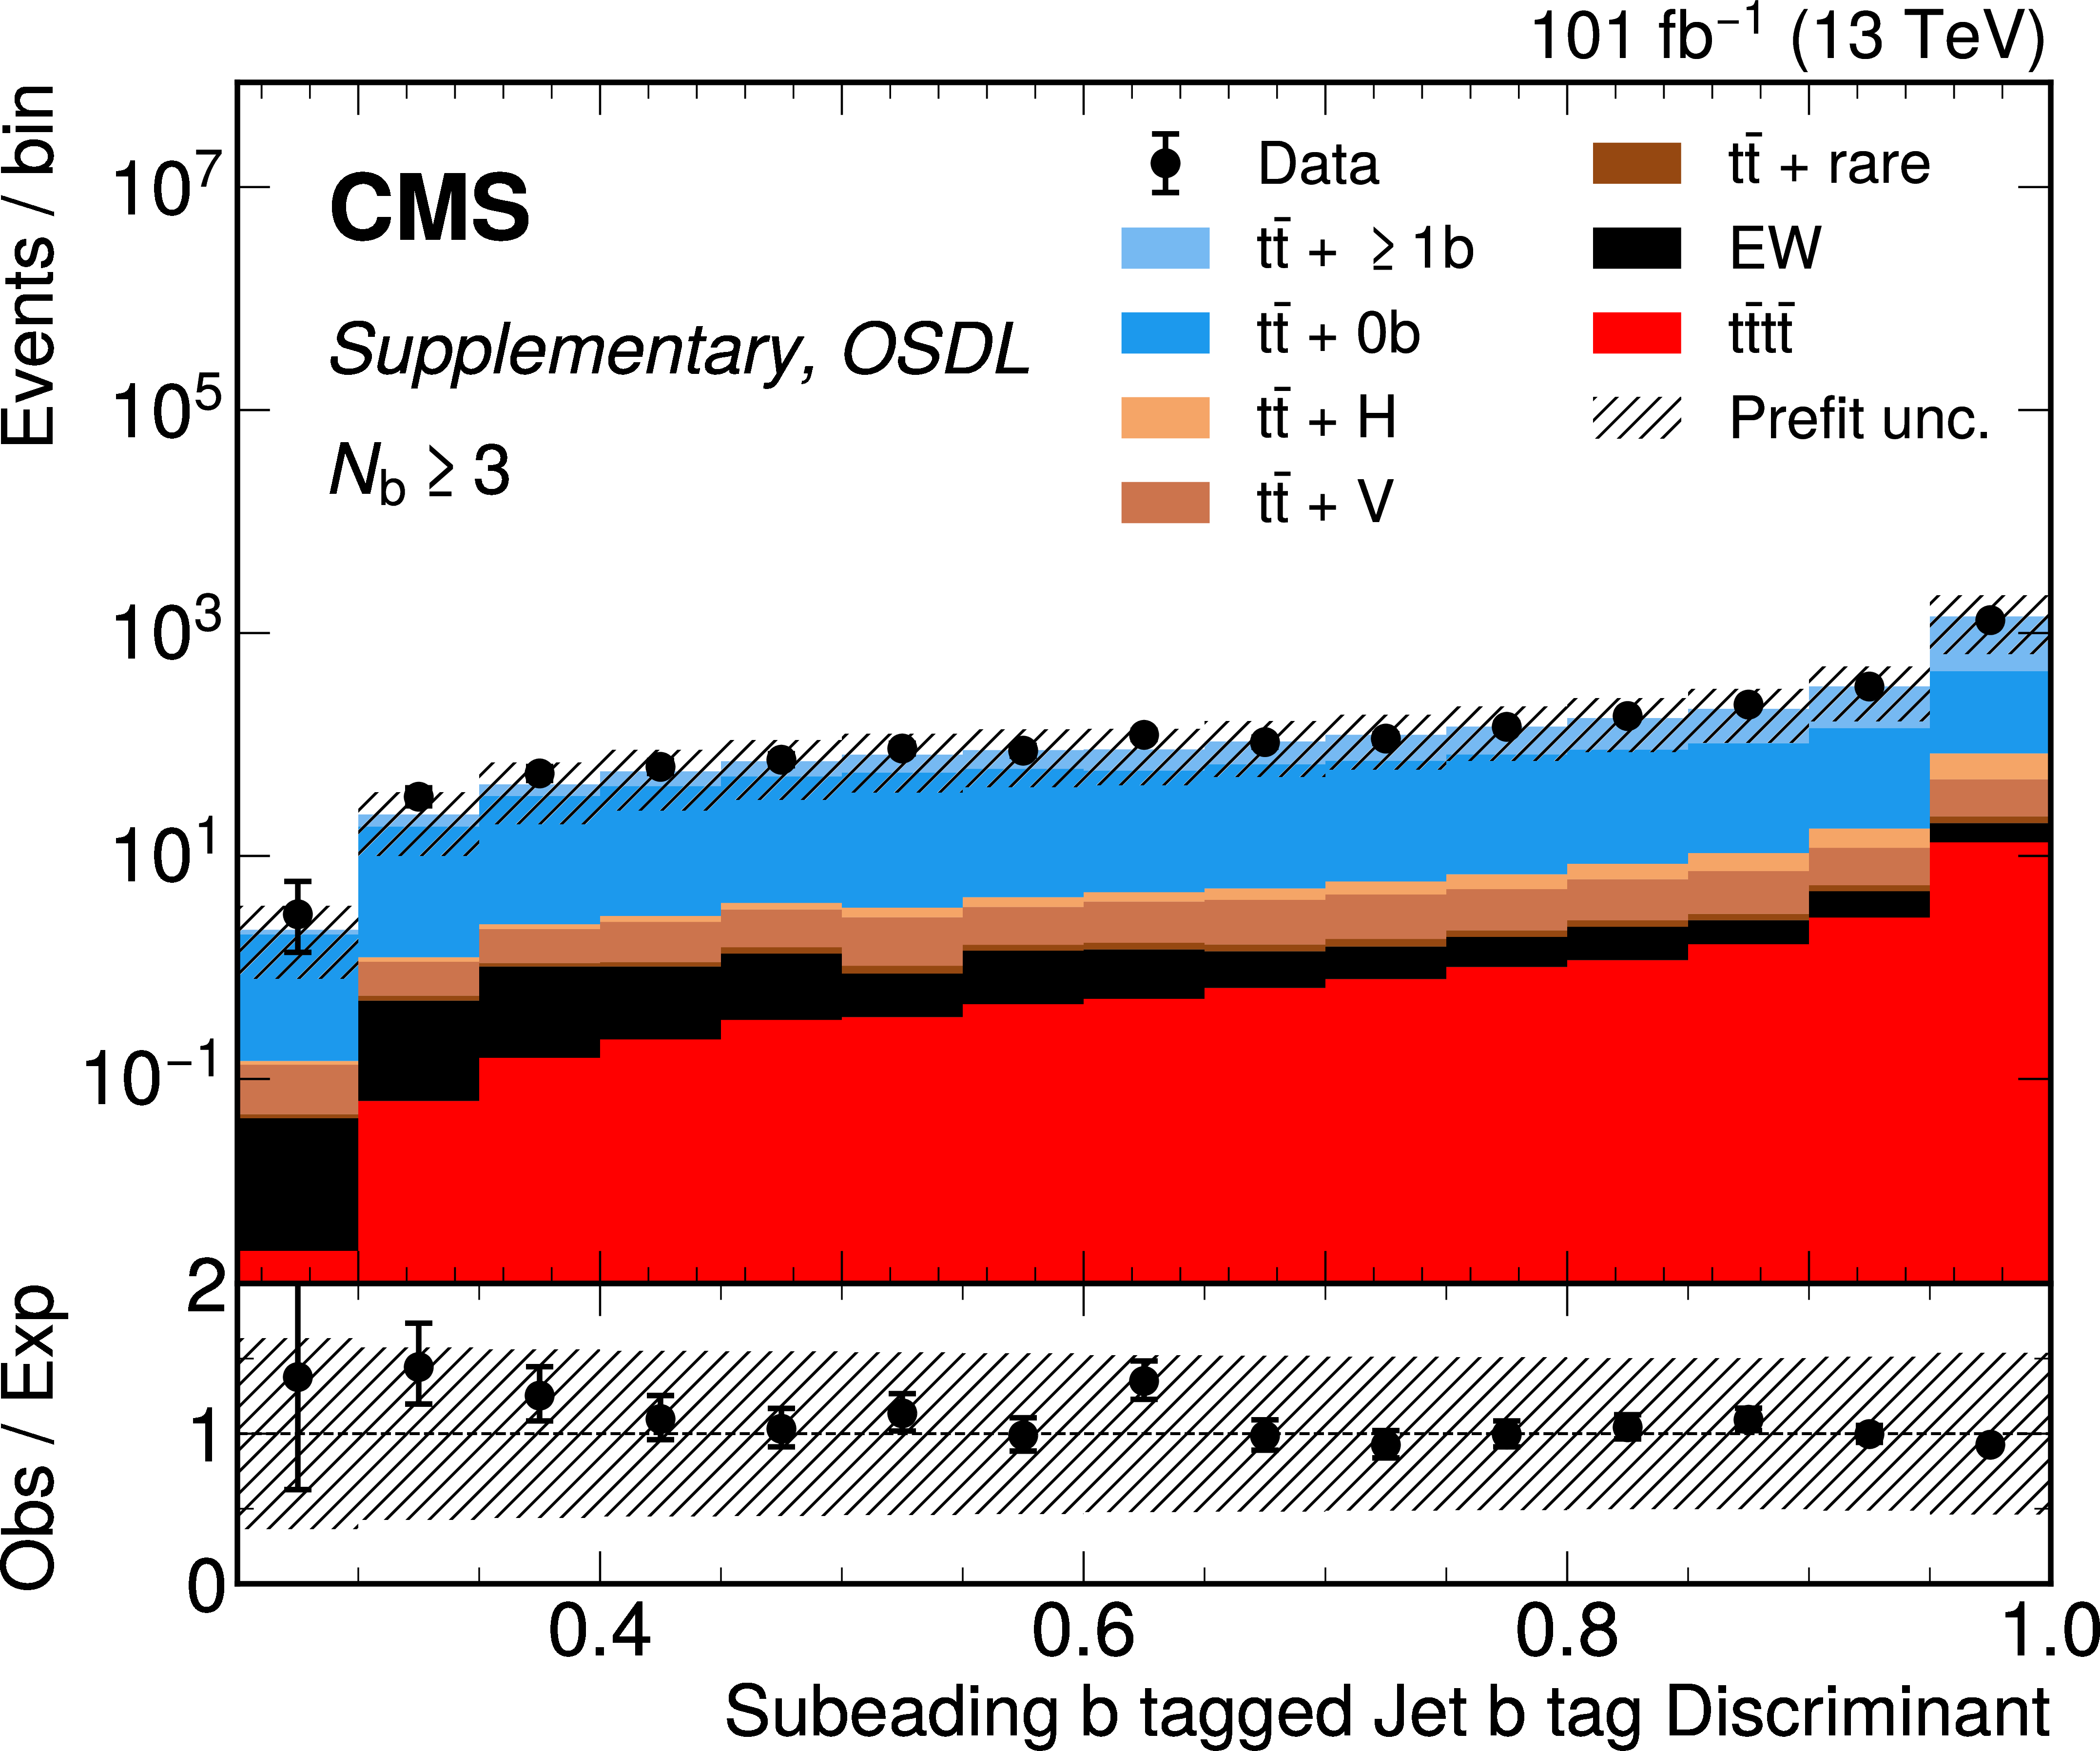
png pdf |
Additional Figure 17-b:
OSDL channel prefit distributions for $ N_\text{BT} \geq $ 3 jets categories.From left to right, top to bottom, are figures for the b-tag discriminant of the 3 highest b-tagged jets; the the b-tag discriminant of the 3 highest $ p_{\mathrm{T}} $ jets; the $ p_{\mathrm{T}} $ of the 3 highest $ p_{\mathrm{T}} $ jets; and the $ \eta $ of the 3 highest $ p_{\mathrm{T}} $ jets. Background processes include $ \mathrm{t} \bar{\mathrm{t}} $ + V (V = W, Z) and $ \mathrm{t} \bar{\mathrm{t}} $ + H in which $ \mathrm{t} \bar{\mathrm{t}} $ is produced in association with 1 massive boson, $ \mathrm{t} \bar{\mathrm{t}} $ events with zero ($ {\mathrm{t}\bar{\mathrm{t}}} + 0 \mathrm{b} $) or at least one additional b jet ($ {\mathrm{t}\bar{\mathrm{t}}} +\geq 1 \mathrm{b} $). Events with W or Z but no top quarks are referred to as EW, and $ \mathrm{t} \bar{\mathrm{t}} $ + rare includes $ \mathrm{t} \bar{\mathrm{t}} $ production in associaton with two massive bosons or a third (anti)top quark. |
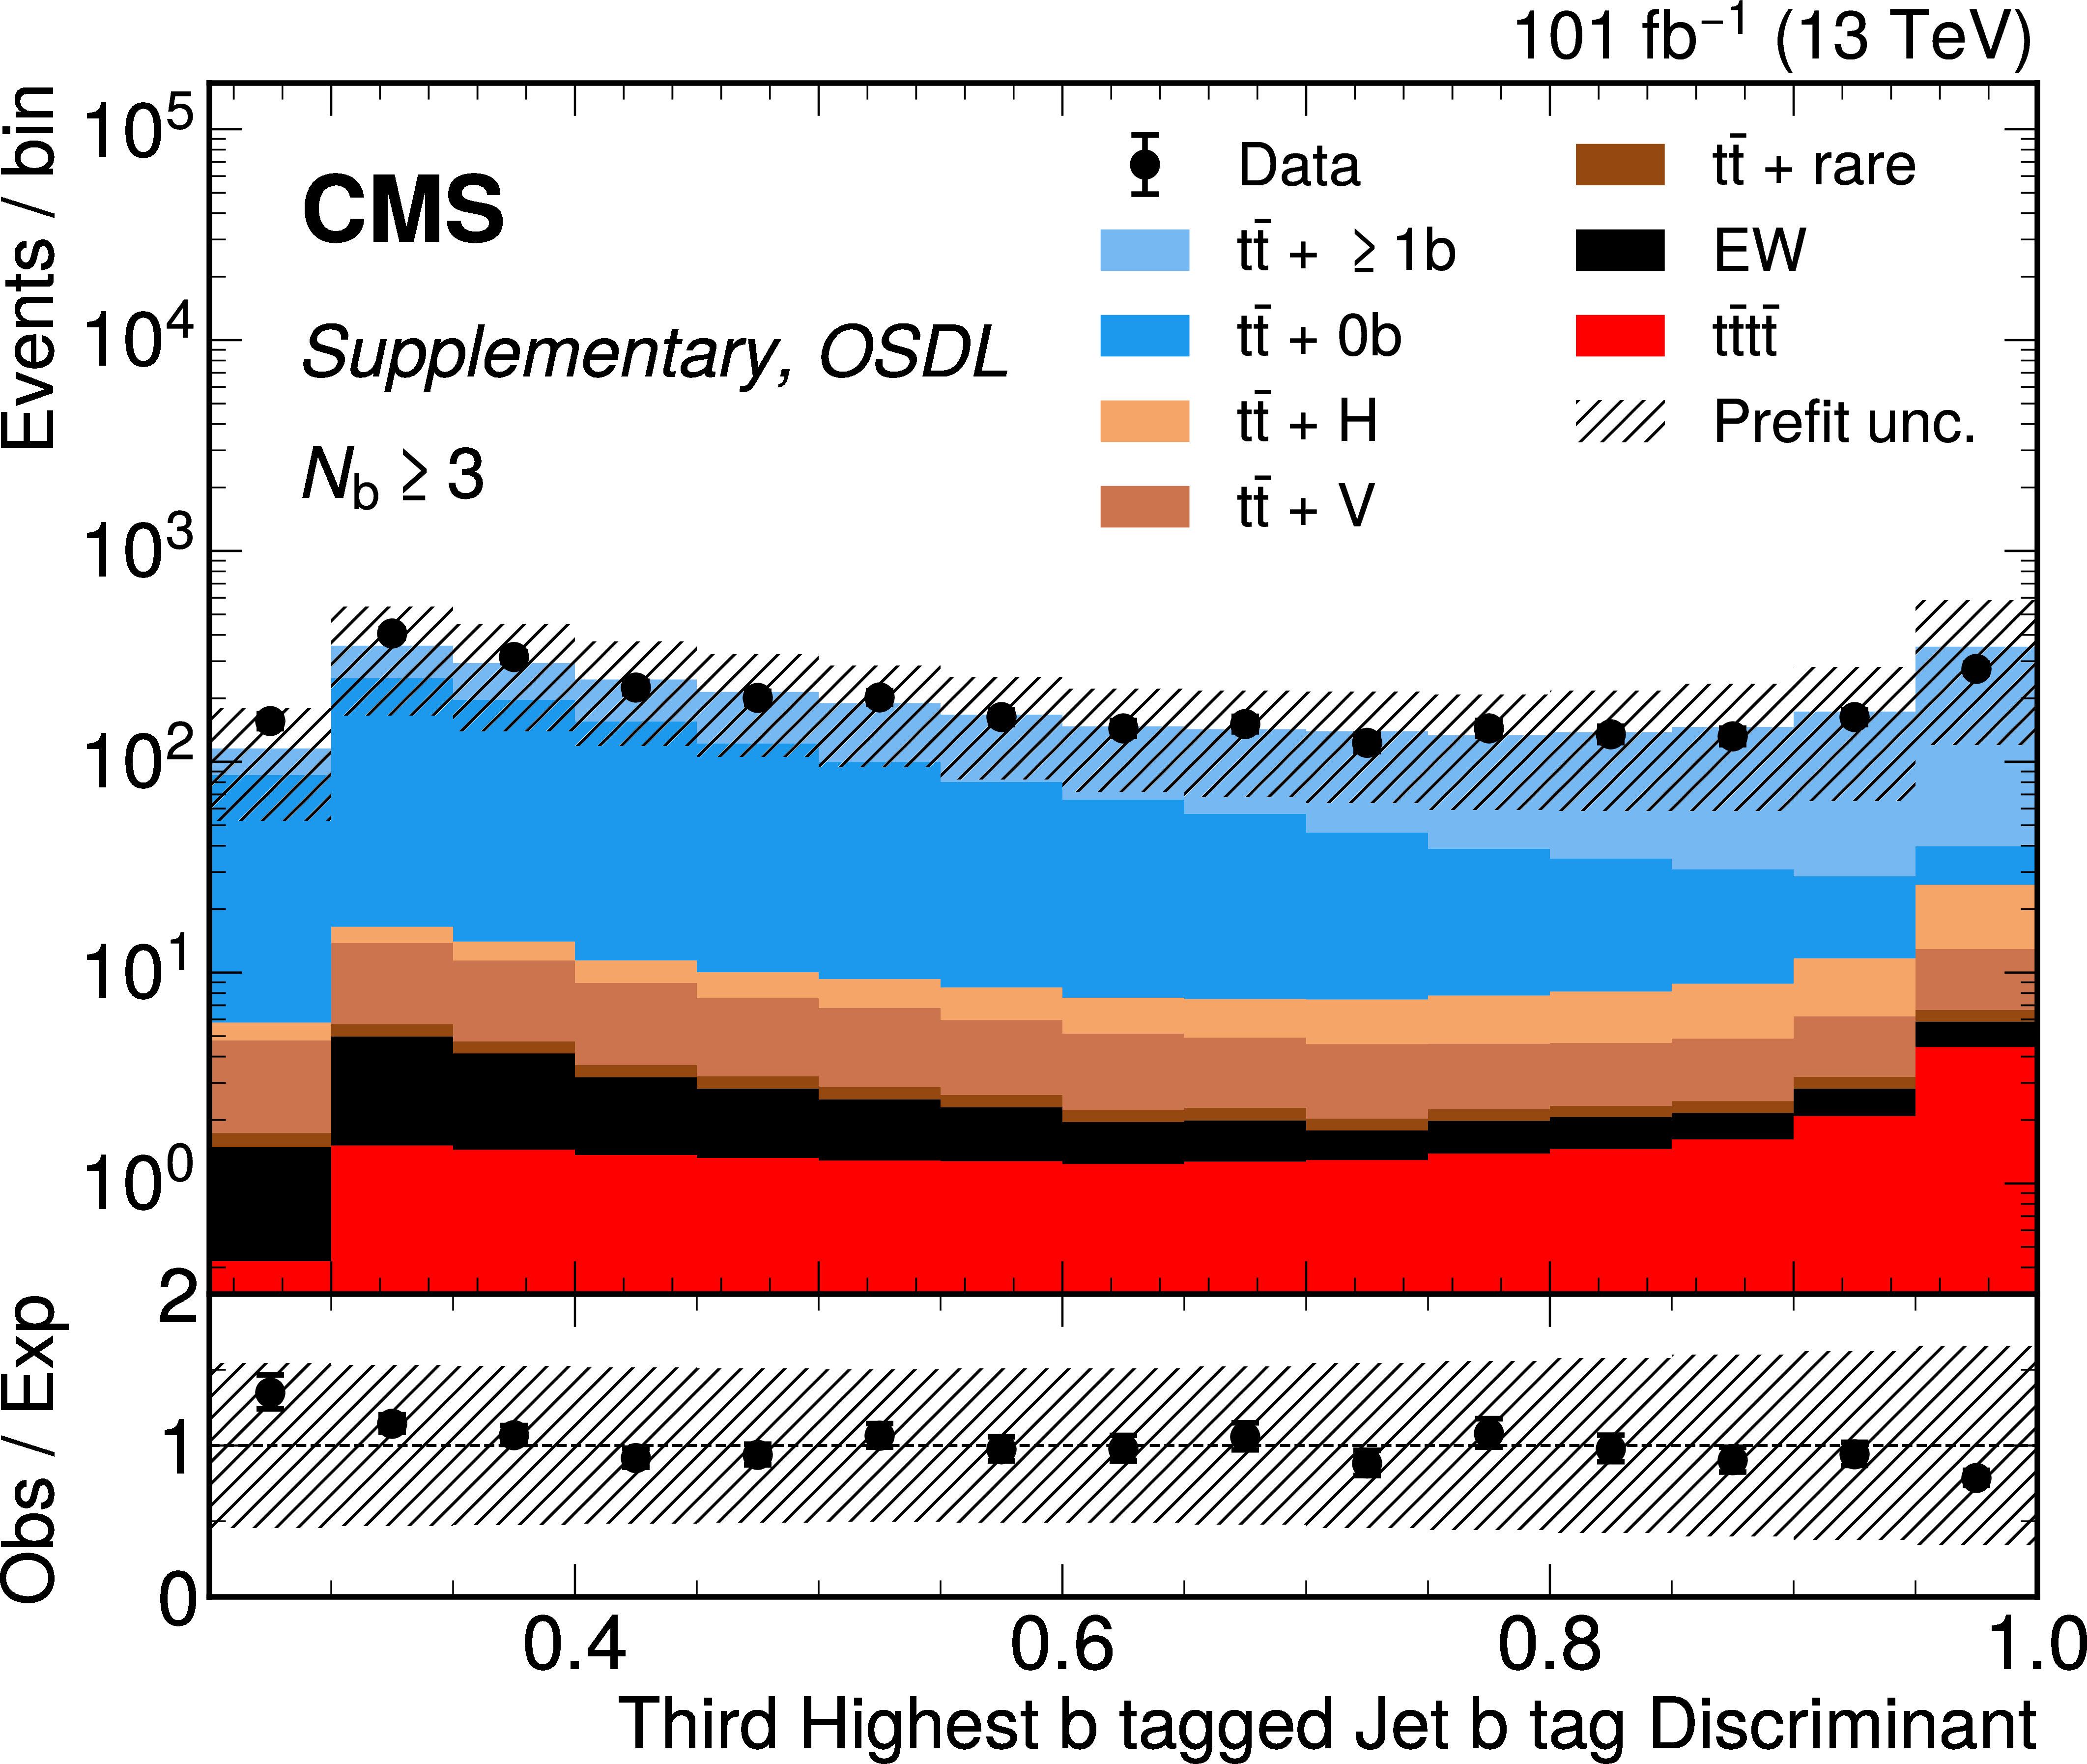
png pdf |
Additional Figure 17-c:
OSDL channel prefit distributions for $ N_\text{BT} \geq $ 3 jets categories.From left to right, top to bottom, are figures for the b-tag discriminant of the 3 highest b-tagged jets; the the b-tag discriminant of the 3 highest $ p_{\mathrm{T}} $ jets; the $ p_{\mathrm{T}} $ of the 3 highest $ p_{\mathrm{T}} $ jets; and the $ \eta $ of the 3 highest $ p_{\mathrm{T}} $ jets. Background processes include $ \mathrm{t} \bar{\mathrm{t}} $ + V (V = W, Z) and $ \mathrm{t} \bar{\mathrm{t}} $ + H in which $ \mathrm{t} \bar{\mathrm{t}} $ is produced in association with 1 massive boson, $ \mathrm{t} \bar{\mathrm{t}} $ events with zero ($ {\mathrm{t}\bar{\mathrm{t}}} + 0 \mathrm{b} $) or at least one additional b jet ($ {\mathrm{t}\bar{\mathrm{t}}} +\geq 1 \mathrm{b} $). Events with W or Z but no top quarks are referred to as EW, and $ \mathrm{t} \bar{\mathrm{t}} $ + rare includes $ \mathrm{t} \bar{\mathrm{t}} $ production in associaton with two massive bosons or a third (anti)top quark. |
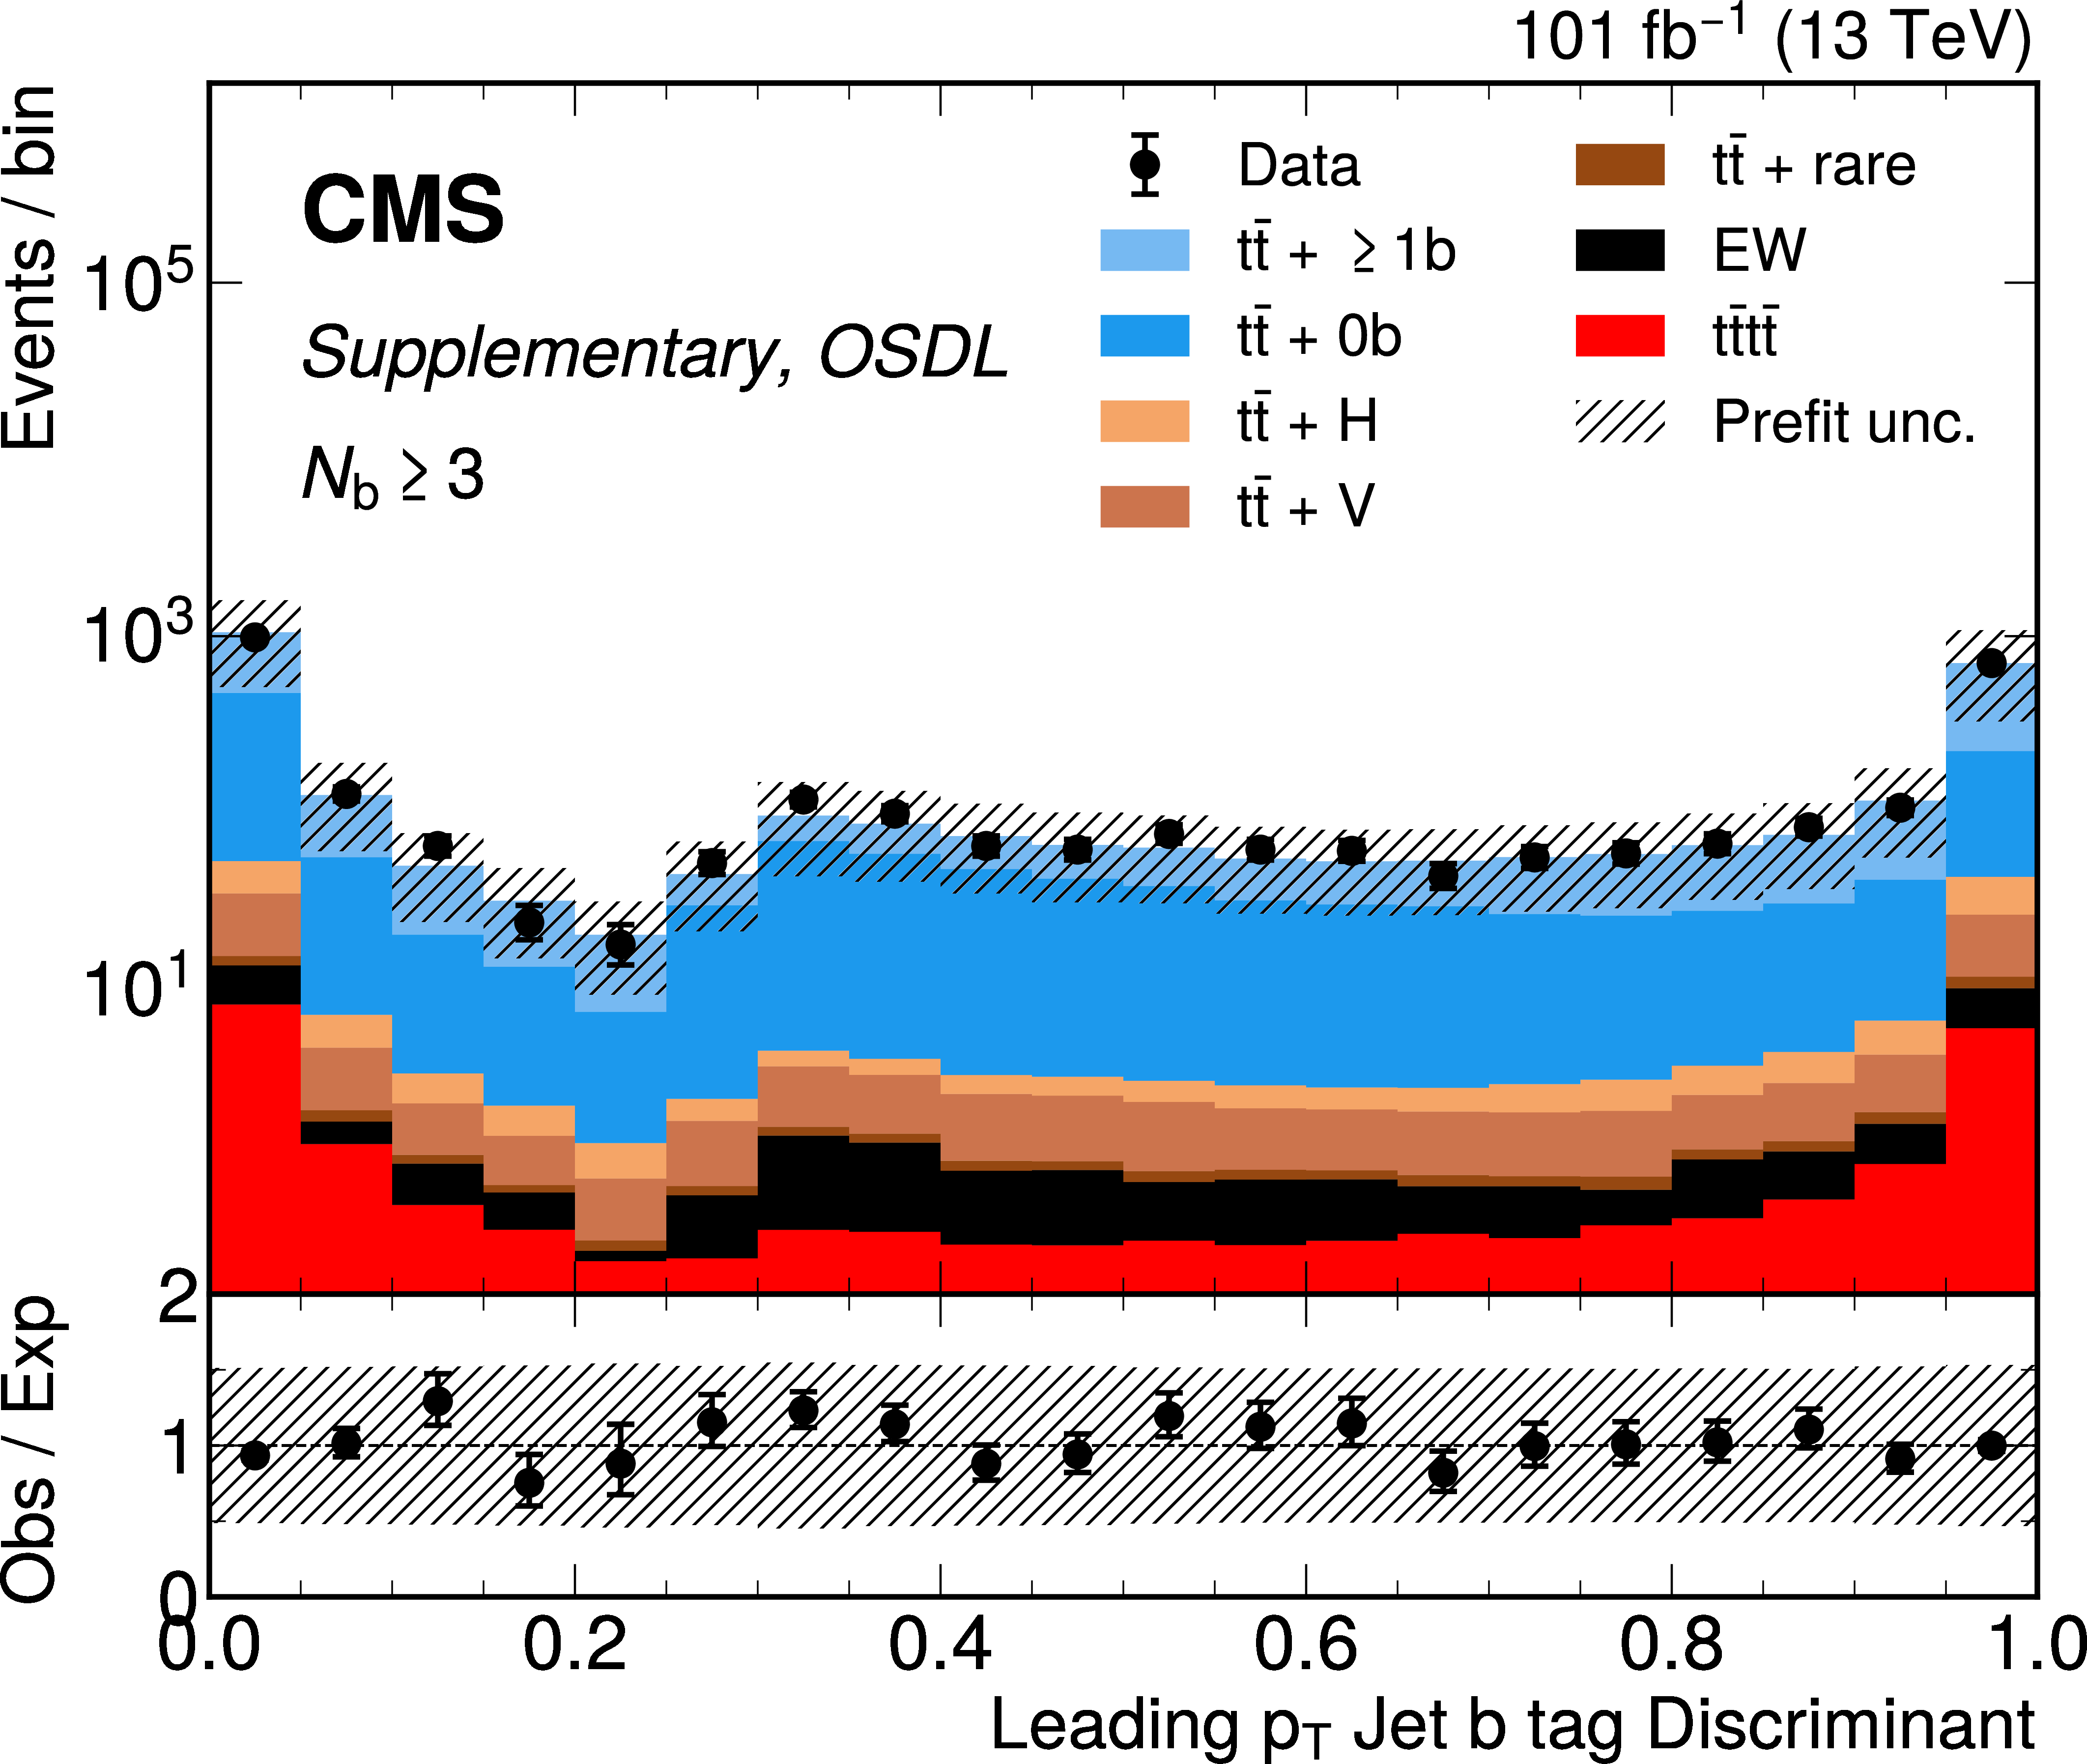
png pdf |
Additional Figure 17-d:
OSDL channel prefit distributions for $ N_\text{BT} \geq $ 3 jets categories.From left to right, top to bottom, are figures for the b-tag discriminant of the 3 highest b-tagged jets; the the b-tag discriminant of the 3 highest $ p_{\mathrm{T}} $ jets; the $ p_{\mathrm{T}} $ of the 3 highest $ p_{\mathrm{T}} $ jets; and the $ \eta $ of the 3 highest $ p_{\mathrm{T}} $ jets. Background processes include $ \mathrm{t} \bar{\mathrm{t}} $ + V (V = W, Z) and $ \mathrm{t} \bar{\mathrm{t}} $ + H in which $ \mathrm{t} \bar{\mathrm{t}} $ is produced in association with 1 massive boson, $ \mathrm{t} \bar{\mathrm{t}} $ events with zero ($ {\mathrm{t}\bar{\mathrm{t}}} + 0 \mathrm{b} $) or at least one additional b jet ($ {\mathrm{t}\bar{\mathrm{t}}} +\geq 1 \mathrm{b} $). Events with W or Z but no top quarks are referred to as EW, and $ \mathrm{t} \bar{\mathrm{t}} $ + rare includes $ \mathrm{t} \bar{\mathrm{t}} $ production in associaton with two massive bosons or a third (anti)top quark. |
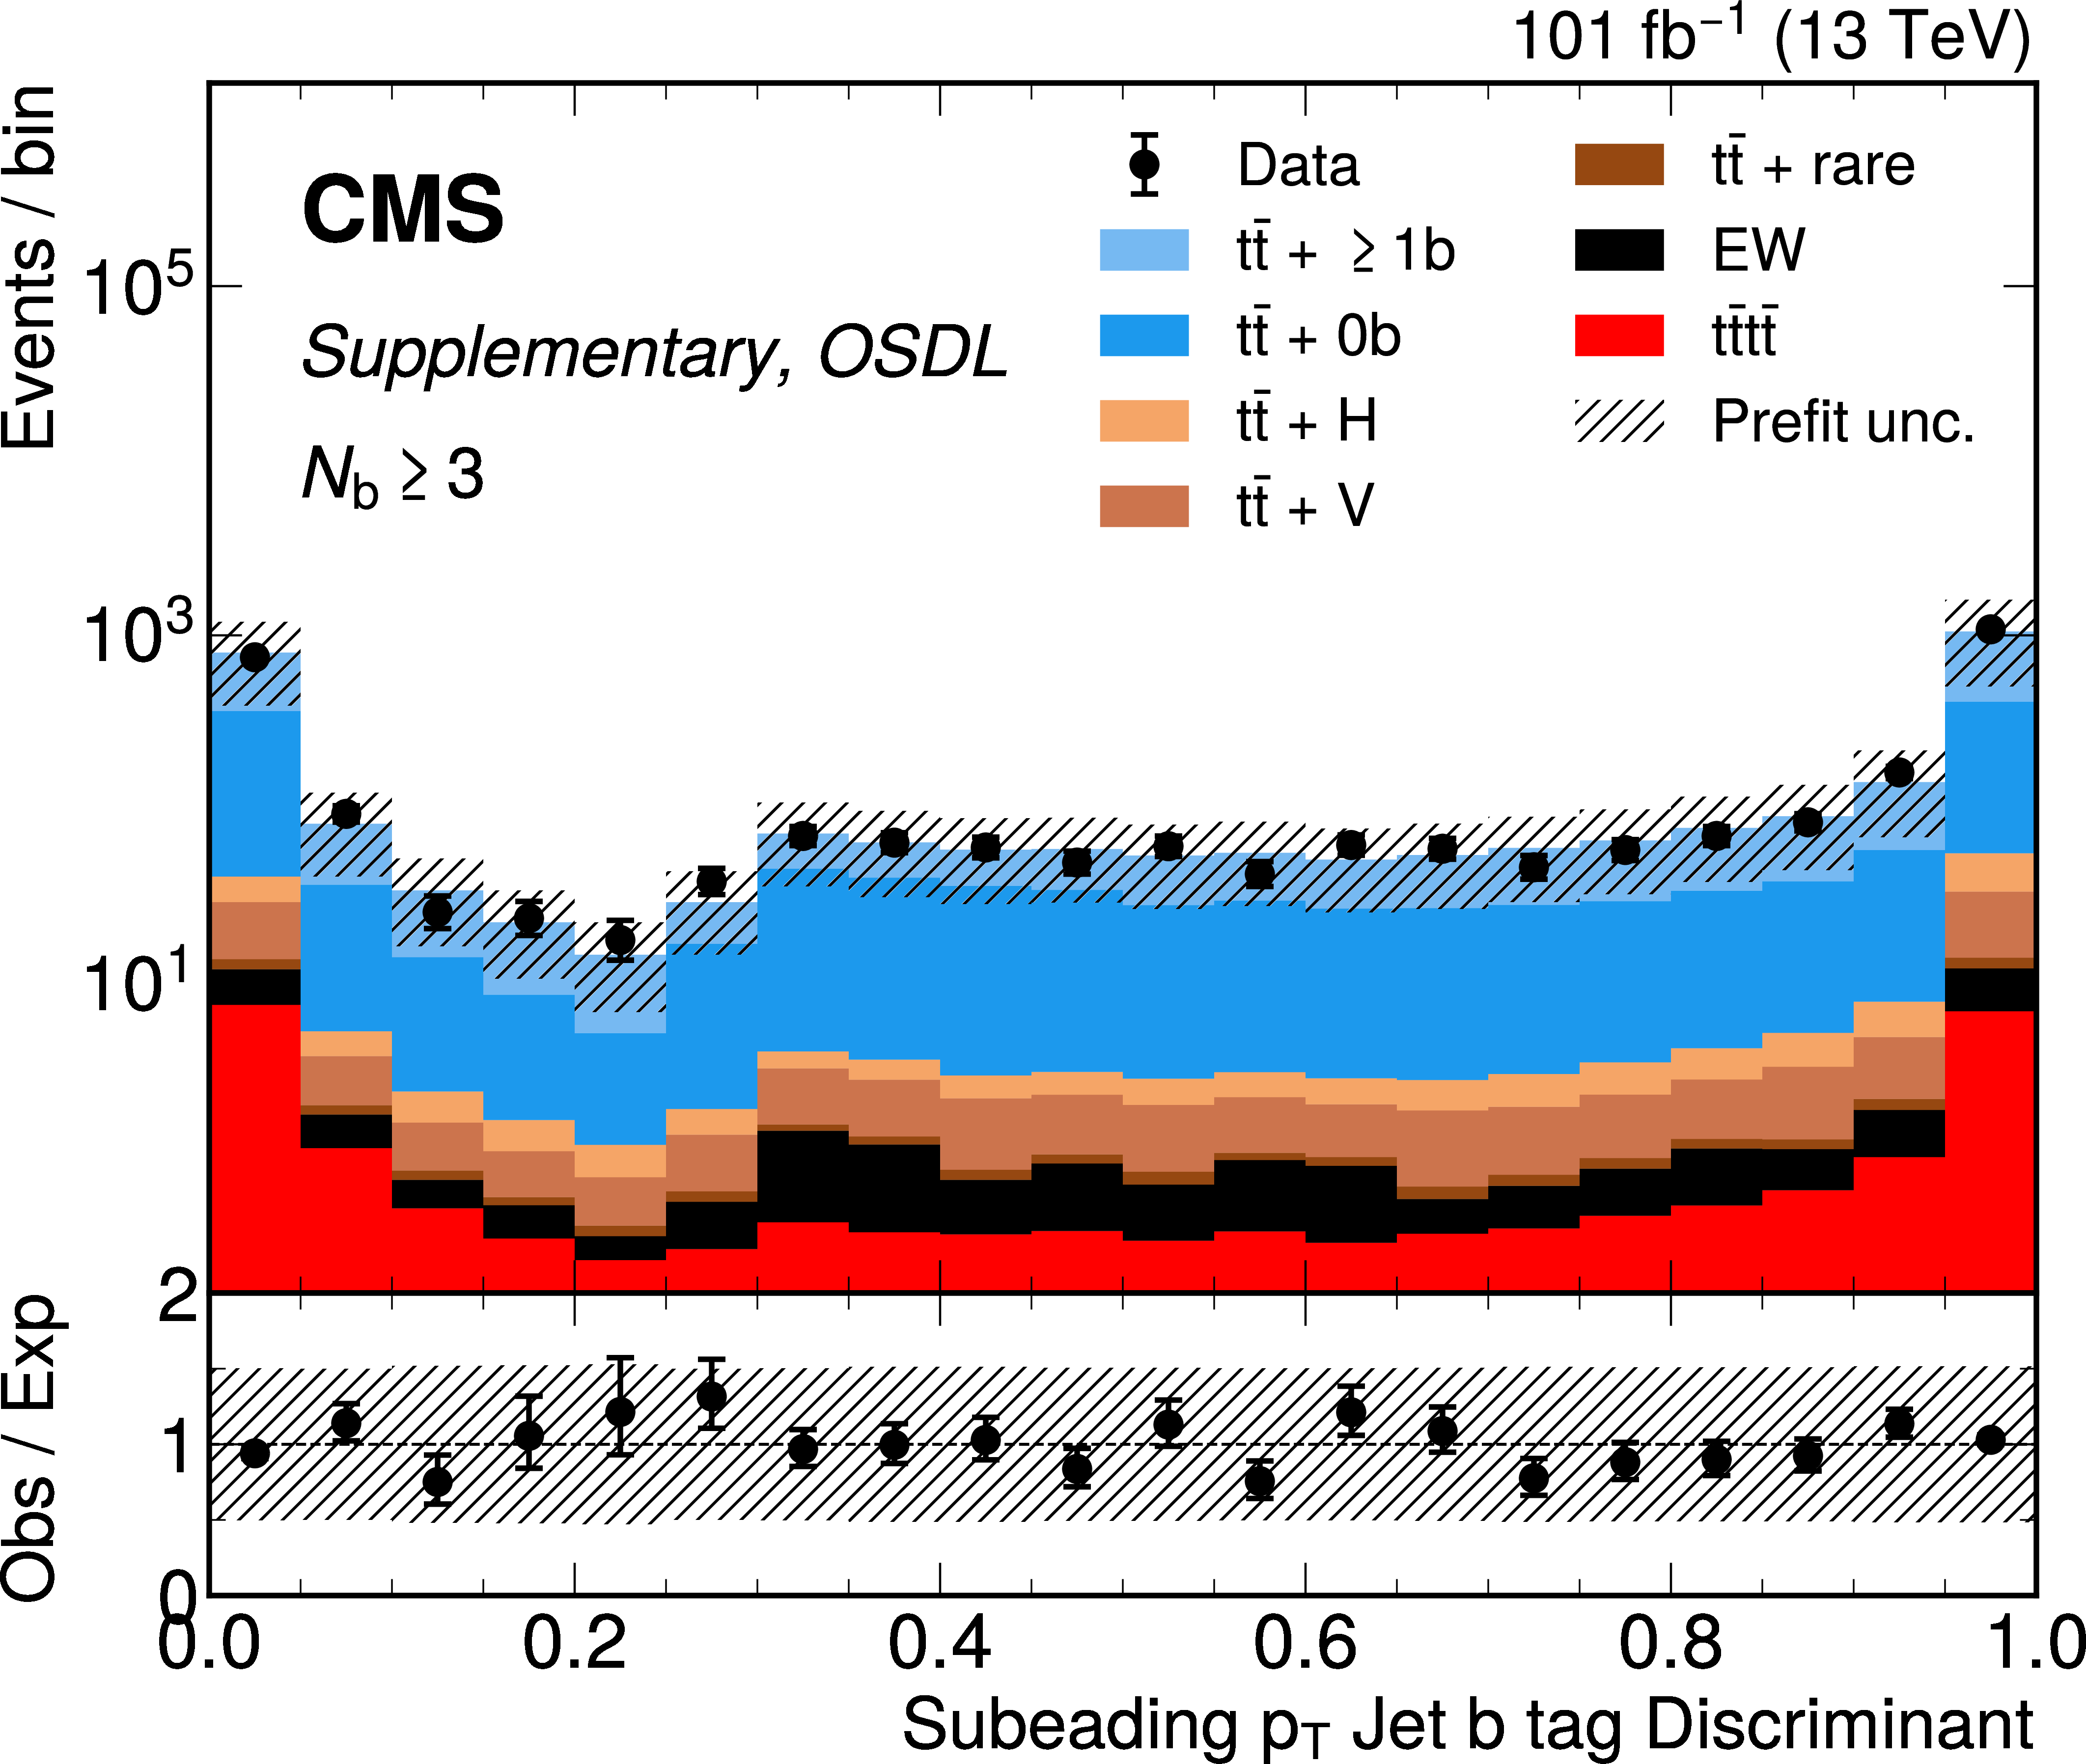
png pdf |
Additional Figure 17-e:
OSDL channel prefit distributions for $ N_\text{BT} \geq $ 3 jets categories.From left to right, top to bottom, are figures for the b-tag discriminant of the 3 highest b-tagged jets; the the b-tag discriminant of the 3 highest $ p_{\mathrm{T}} $ jets; the $ p_{\mathrm{T}} $ of the 3 highest $ p_{\mathrm{T}} $ jets; and the $ \eta $ of the 3 highest $ p_{\mathrm{T}} $ jets. Background processes include $ \mathrm{t} \bar{\mathrm{t}} $ + V (V = W, Z) and $ \mathrm{t} \bar{\mathrm{t}} $ + H in which $ \mathrm{t} \bar{\mathrm{t}} $ is produced in association with 1 massive boson, $ \mathrm{t} \bar{\mathrm{t}} $ events with zero ($ {\mathrm{t}\bar{\mathrm{t}}} + 0 \mathrm{b} $) or at least one additional b jet ($ {\mathrm{t}\bar{\mathrm{t}}} +\geq 1 \mathrm{b} $). Events with W or Z but no top quarks are referred to as EW, and $ \mathrm{t} \bar{\mathrm{t}} $ + rare includes $ \mathrm{t} \bar{\mathrm{t}} $ production in associaton with two massive bosons or a third (anti)top quark. |

png pdf |
Additional Figure 17-f:
OSDL channel prefit distributions for $ N_\text{BT} \geq $ 3 jets categories.From left to right, top to bottom, are figures for the b-tag discriminant of the 3 highest b-tagged jets; the the b-tag discriminant of the 3 highest $ p_{\mathrm{T}} $ jets; the $ p_{\mathrm{T}} $ of the 3 highest $ p_{\mathrm{T}} $ jets; and the $ \eta $ of the 3 highest $ p_{\mathrm{T}} $ jets. Background processes include $ \mathrm{t} \bar{\mathrm{t}} $ + V (V = W, Z) and $ \mathrm{t} \bar{\mathrm{t}} $ + H in which $ \mathrm{t} \bar{\mathrm{t}} $ is produced in association with 1 massive boson, $ \mathrm{t} \bar{\mathrm{t}} $ events with zero ($ {\mathrm{t}\bar{\mathrm{t}}} + 0 \mathrm{b} $) or at least one additional b jet ($ {\mathrm{t}\bar{\mathrm{t}}} +\geq 1 \mathrm{b} $). Events with W or Z but no top quarks are referred to as EW, and $ \mathrm{t} \bar{\mathrm{t}} $ + rare includes $ \mathrm{t} \bar{\mathrm{t}} $ production in associaton with two massive bosons or a third (anti)top quark. |
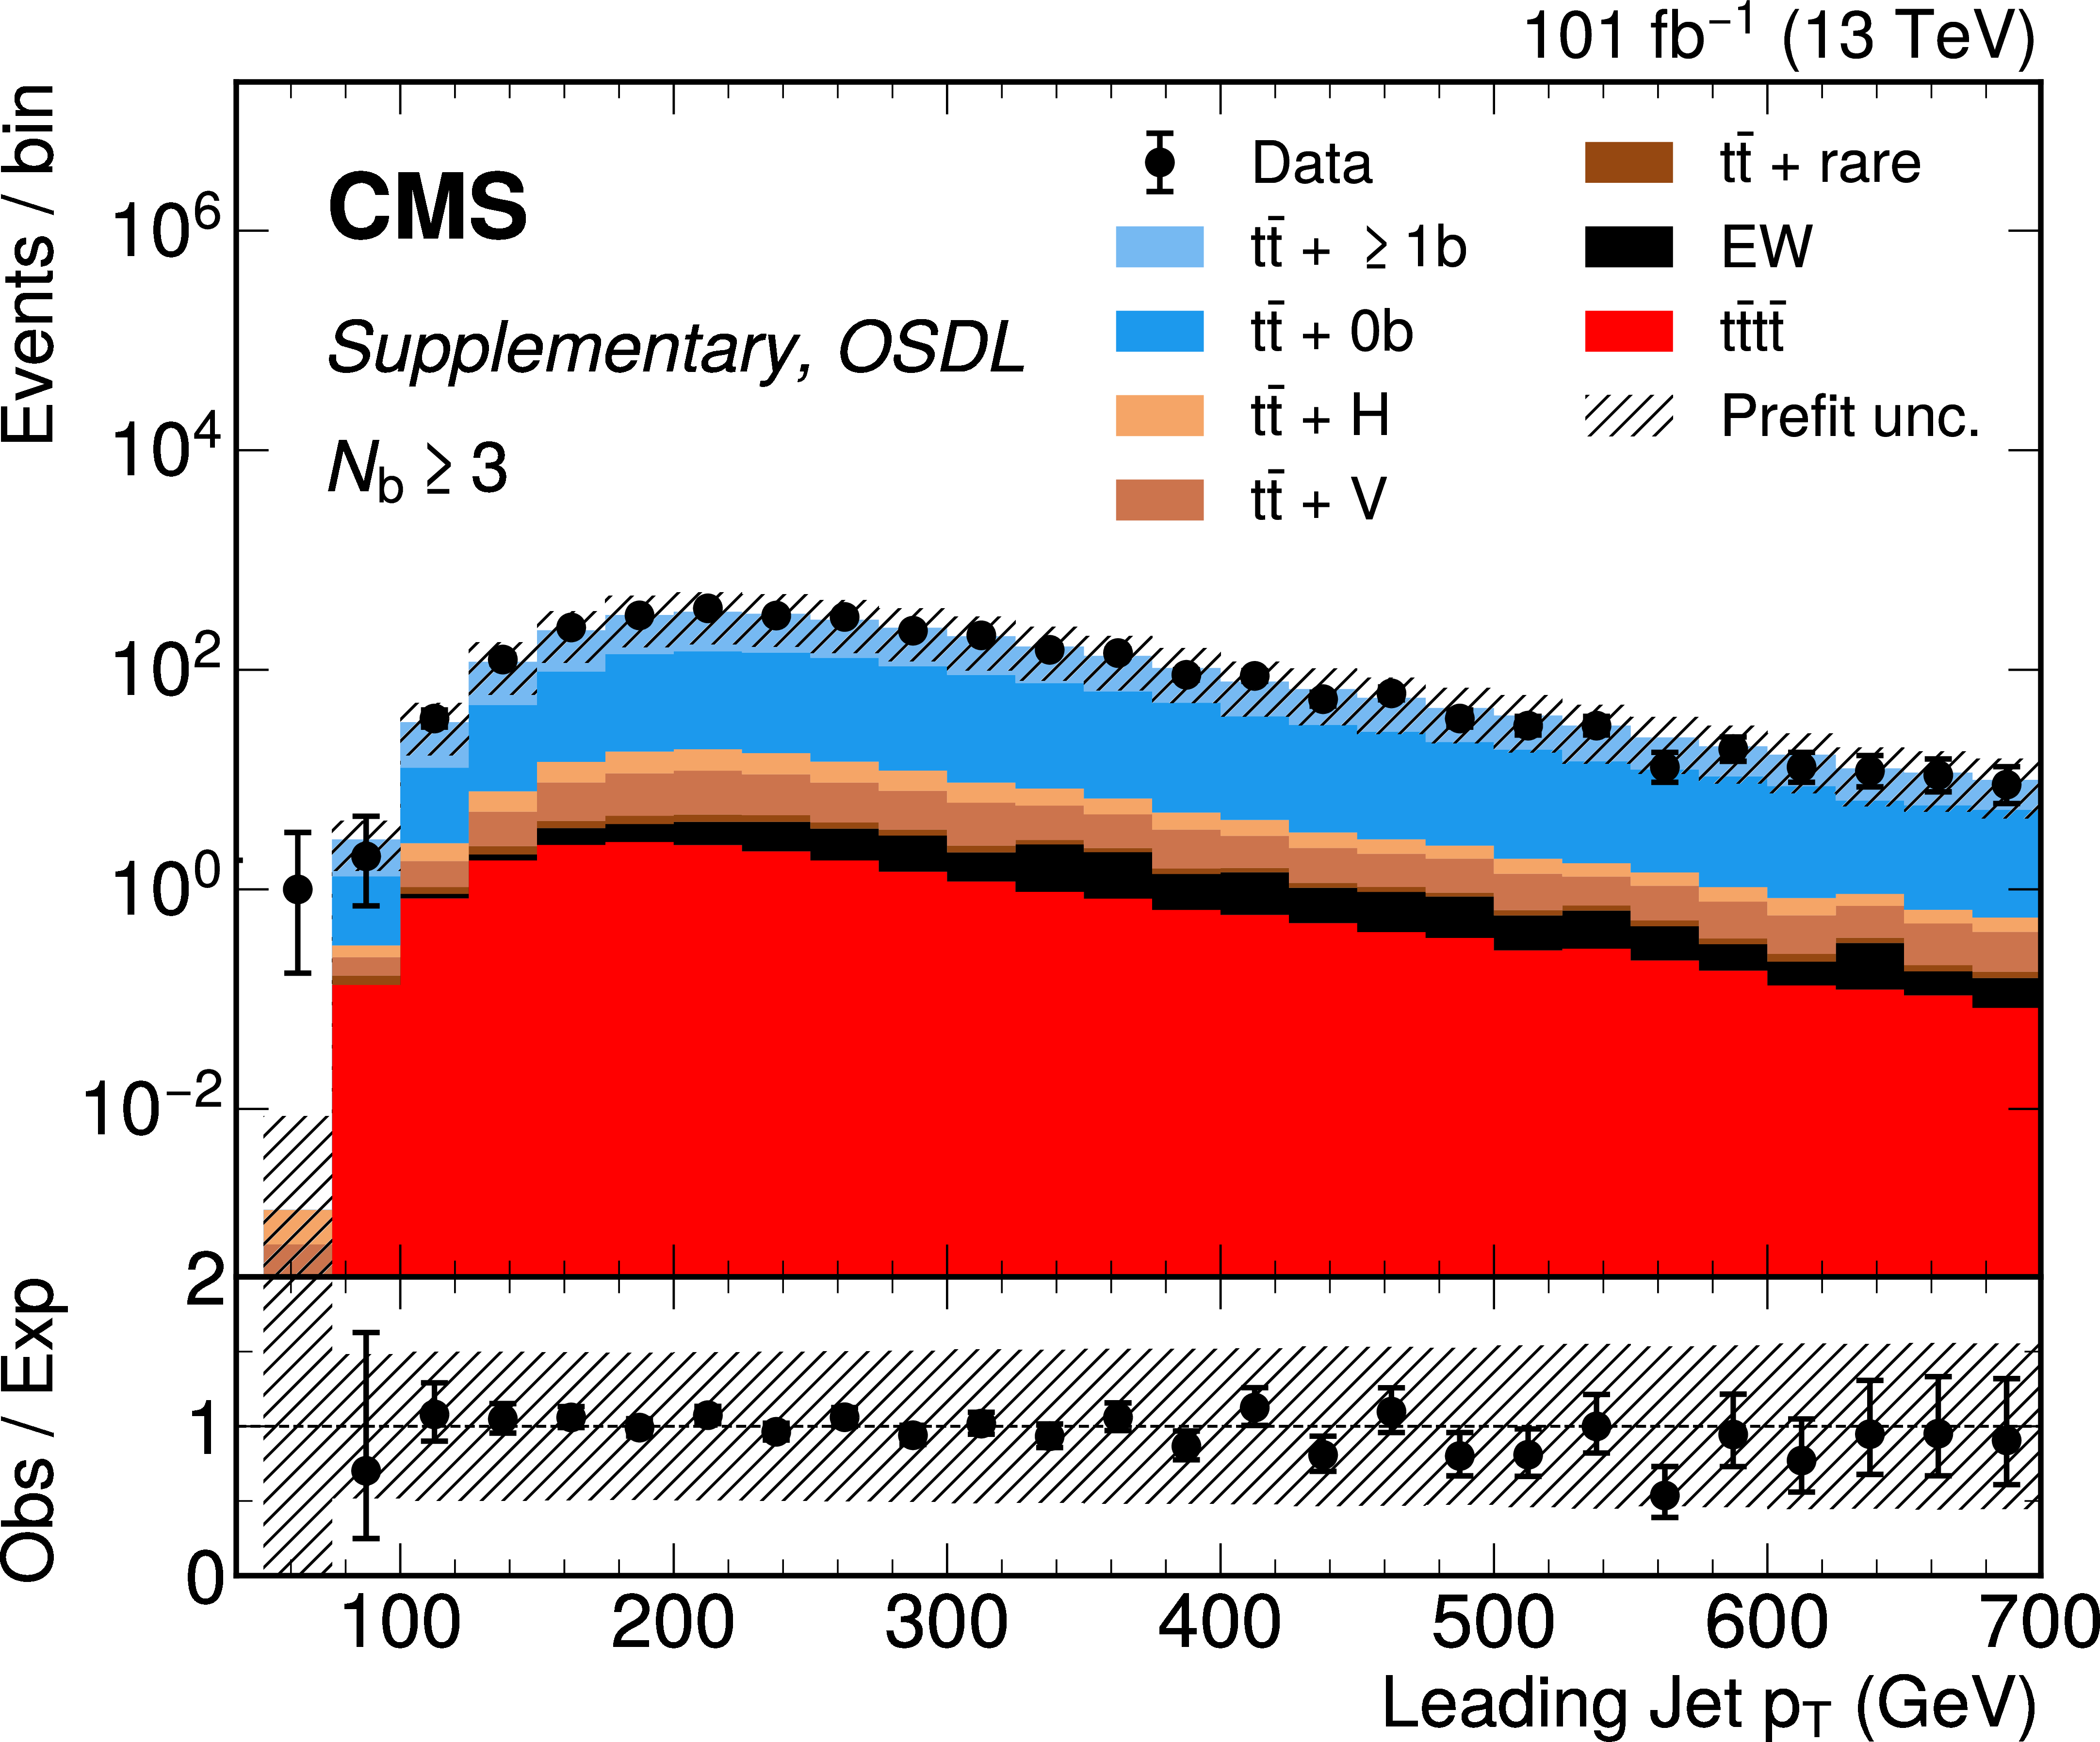
png pdf |
Additional Figure 17-g:
OSDL channel prefit distributions for $ N_\text{BT} \geq $ 3 jets categories.From left to right, top to bottom, are figures for the b-tag discriminant of the 3 highest b-tagged jets; the the b-tag discriminant of the 3 highest $ p_{\mathrm{T}} $ jets; the $ p_{\mathrm{T}} $ of the 3 highest $ p_{\mathrm{T}} $ jets; and the $ \eta $ of the 3 highest $ p_{\mathrm{T}} $ jets. Background processes include $ \mathrm{t} \bar{\mathrm{t}} $ + V (V = W, Z) and $ \mathrm{t} \bar{\mathrm{t}} $ + H in which $ \mathrm{t} \bar{\mathrm{t}} $ is produced in association with 1 massive boson, $ \mathrm{t} \bar{\mathrm{t}} $ events with zero ($ {\mathrm{t}\bar{\mathrm{t}}} + 0 \mathrm{b} $) or at least one additional b jet ($ {\mathrm{t}\bar{\mathrm{t}}} +\geq 1 \mathrm{b} $). Events with W or Z but no top quarks are referred to as EW, and $ \mathrm{t} \bar{\mathrm{t}} $ + rare includes $ \mathrm{t} \bar{\mathrm{t}} $ production in associaton with two massive bosons or a third (anti)top quark. |

png pdf |
Additional Figure 17-h:
OSDL channel prefit distributions for $ N_\text{BT} \geq $ 3 jets categories.From left to right, top to bottom, are figures for the b-tag discriminant of the 3 highest b-tagged jets; the the b-tag discriminant of the 3 highest $ p_{\mathrm{T}} $ jets; the $ p_{\mathrm{T}} $ of the 3 highest $ p_{\mathrm{T}} $ jets; and the $ \eta $ of the 3 highest $ p_{\mathrm{T}} $ jets. Background processes include $ \mathrm{t} \bar{\mathrm{t}} $ + V (V = W, Z) and $ \mathrm{t} \bar{\mathrm{t}} $ + H in which $ \mathrm{t} \bar{\mathrm{t}} $ is produced in association with 1 massive boson, $ \mathrm{t} \bar{\mathrm{t}} $ events with zero ($ {\mathrm{t}\bar{\mathrm{t}}} + 0 \mathrm{b} $) or at least one additional b jet ($ {\mathrm{t}\bar{\mathrm{t}}} +\geq 1 \mathrm{b} $). Events with W or Z but no top quarks are referred to as EW, and $ \mathrm{t} \bar{\mathrm{t}} $ + rare includes $ \mathrm{t} \bar{\mathrm{t}} $ production in associaton with two massive bosons or a third (anti)top quark. |
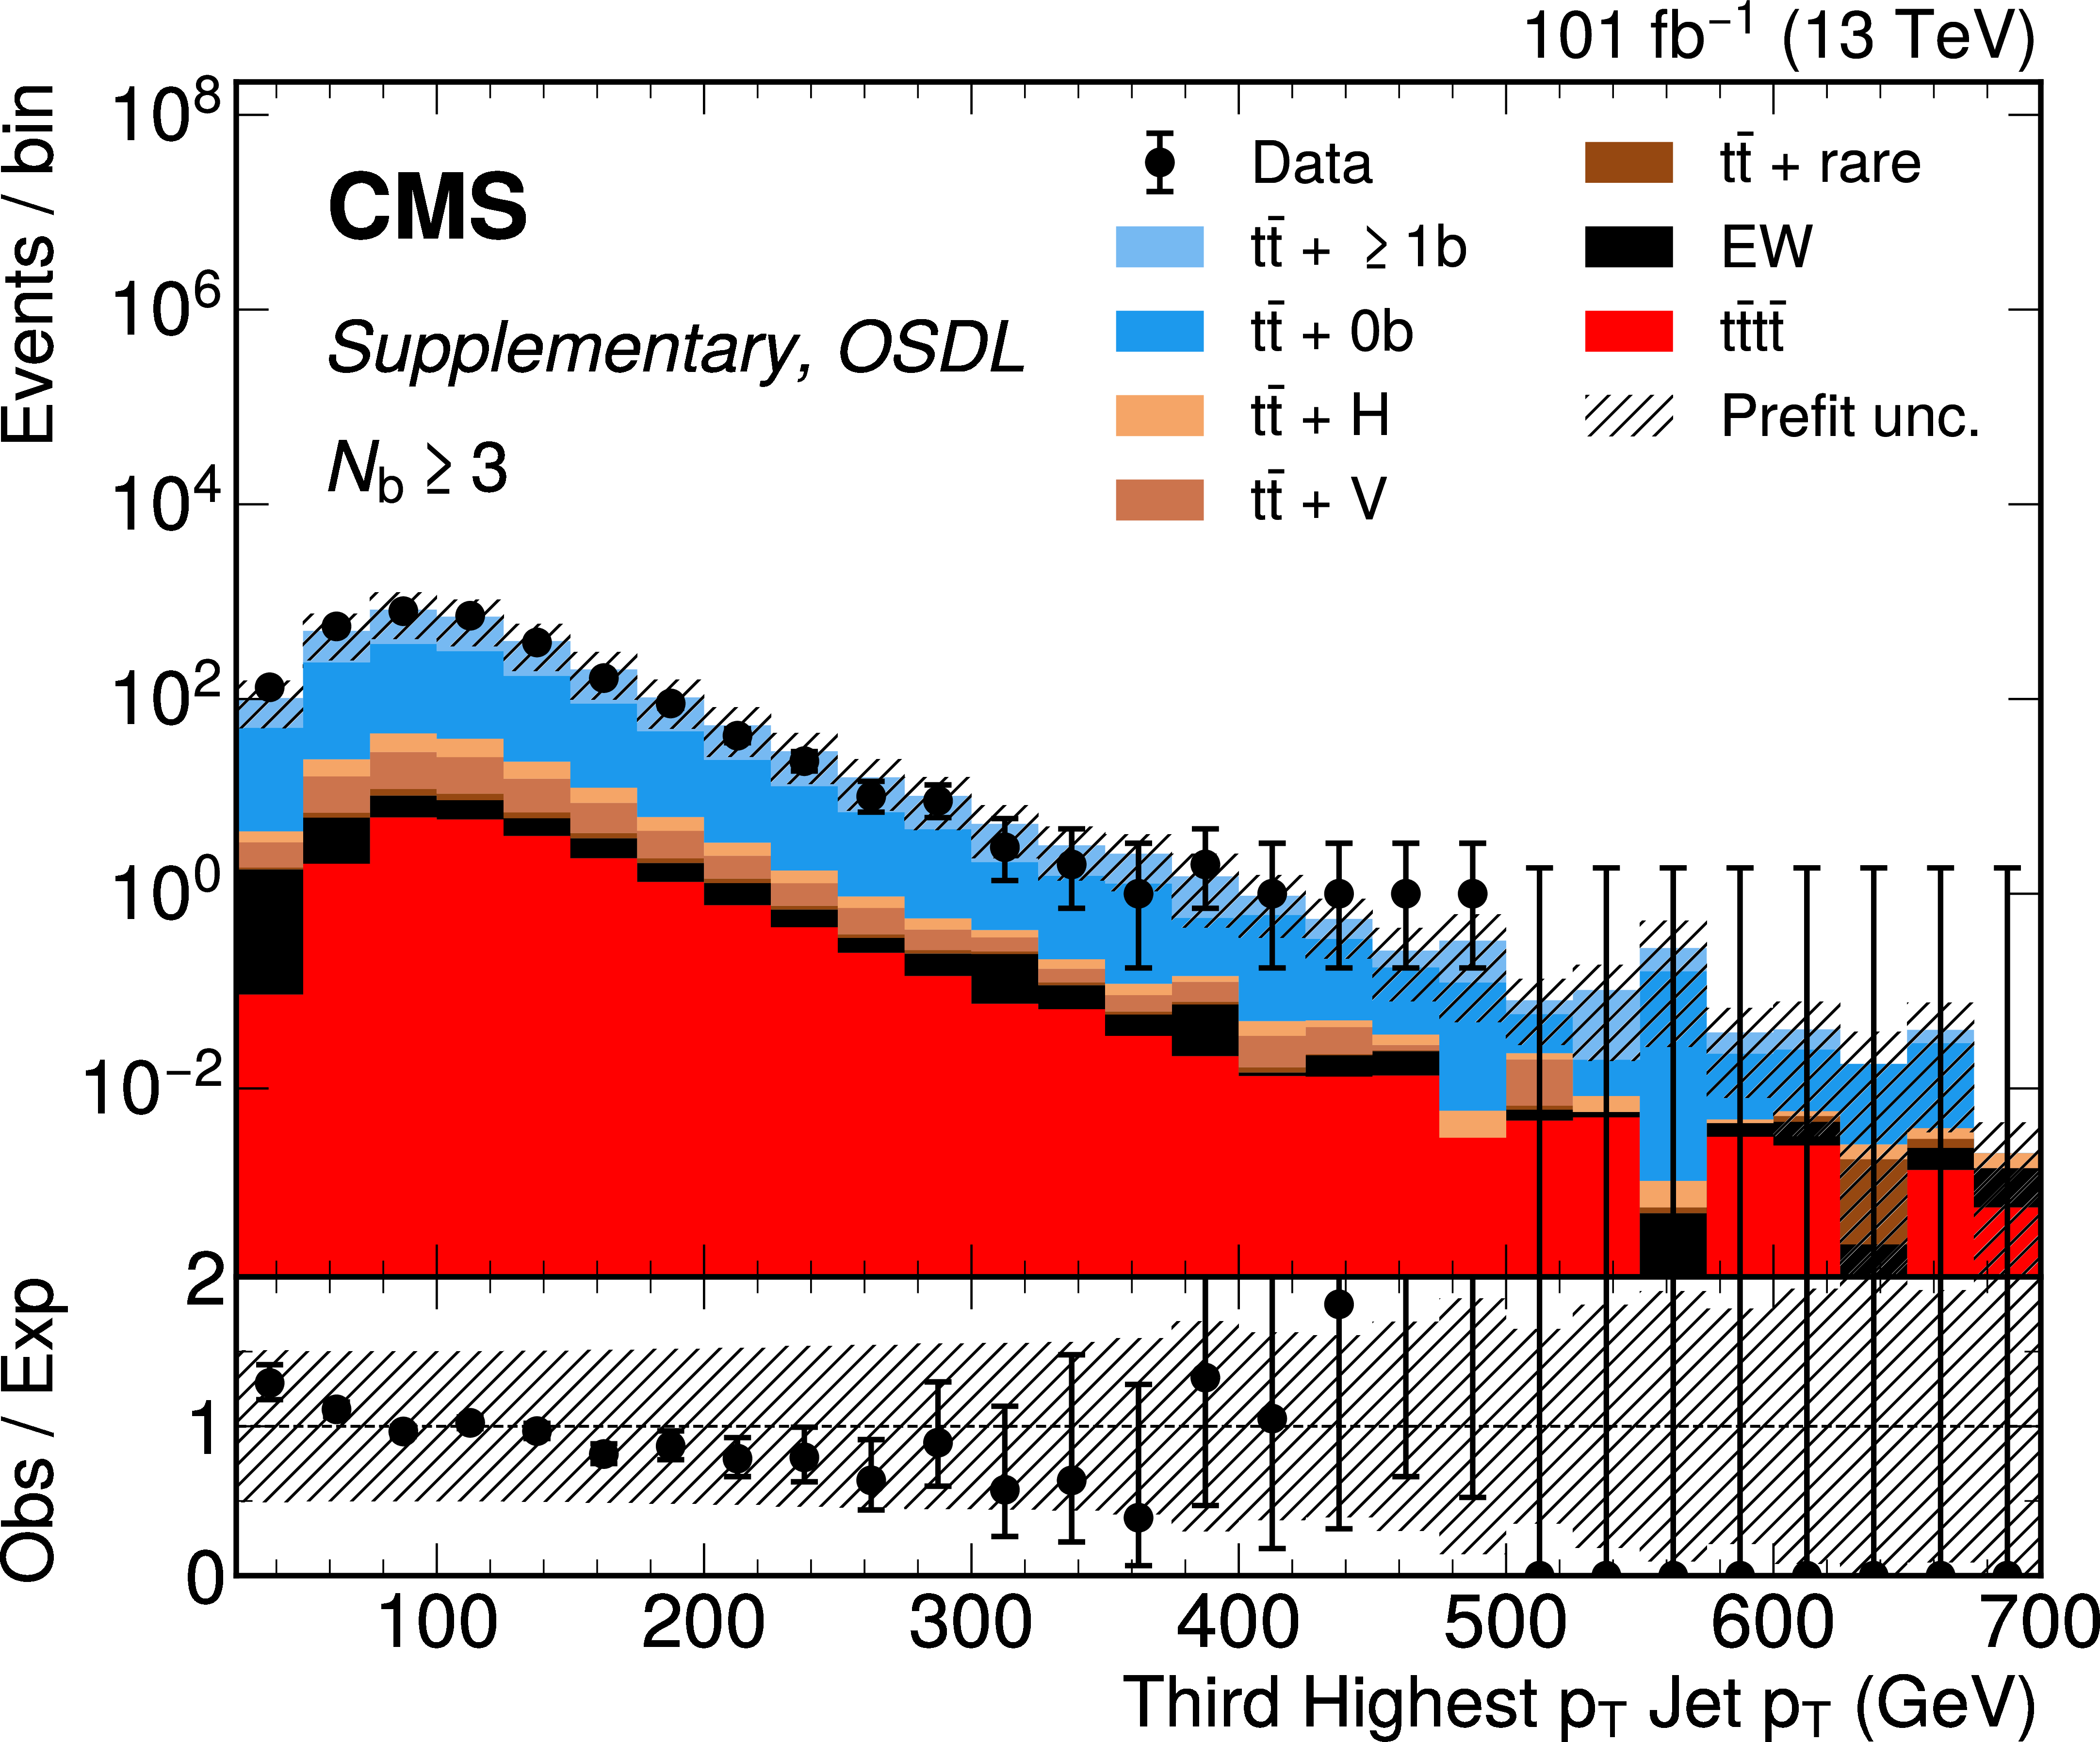
png pdf |
Additional Figure 17-i:
OSDL channel prefit distributions for $ N_\text{BT} \geq $ 3 jets categories.From left to right, top to bottom, are figures for the b-tag discriminant of the 3 highest b-tagged jets; the the b-tag discriminant of the 3 highest $ p_{\mathrm{T}} $ jets; the $ p_{\mathrm{T}} $ of the 3 highest $ p_{\mathrm{T}} $ jets; and the $ \eta $ of the 3 highest $ p_{\mathrm{T}} $ jets. Background processes include $ \mathrm{t} \bar{\mathrm{t}} $ + V (V = W, Z) and $ \mathrm{t} \bar{\mathrm{t}} $ + H in which $ \mathrm{t} \bar{\mathrm{t}} $ is produced in association with 1 massive boson, $ \mathrm{t} \bar{\mathrm{t}} $ events with zero ($ {\mathrm{t}\bar{\mathrm{t}}} + 0 \mathrm{b} $) or at least one additional b jet ($ {\mathrm{t}\bar{\mathrm{t}}} +\geq 1 \mathrm{b} $). Events with W or Z but no top quarks are referred to as EW, and $ \mathrm{t} \bar{\mathrm{t}} $ + rare includes $ \mathrm{t} \bar{\mathrm{t}} $ production in associaton with two massive bosons or a third (anti)top quark. |
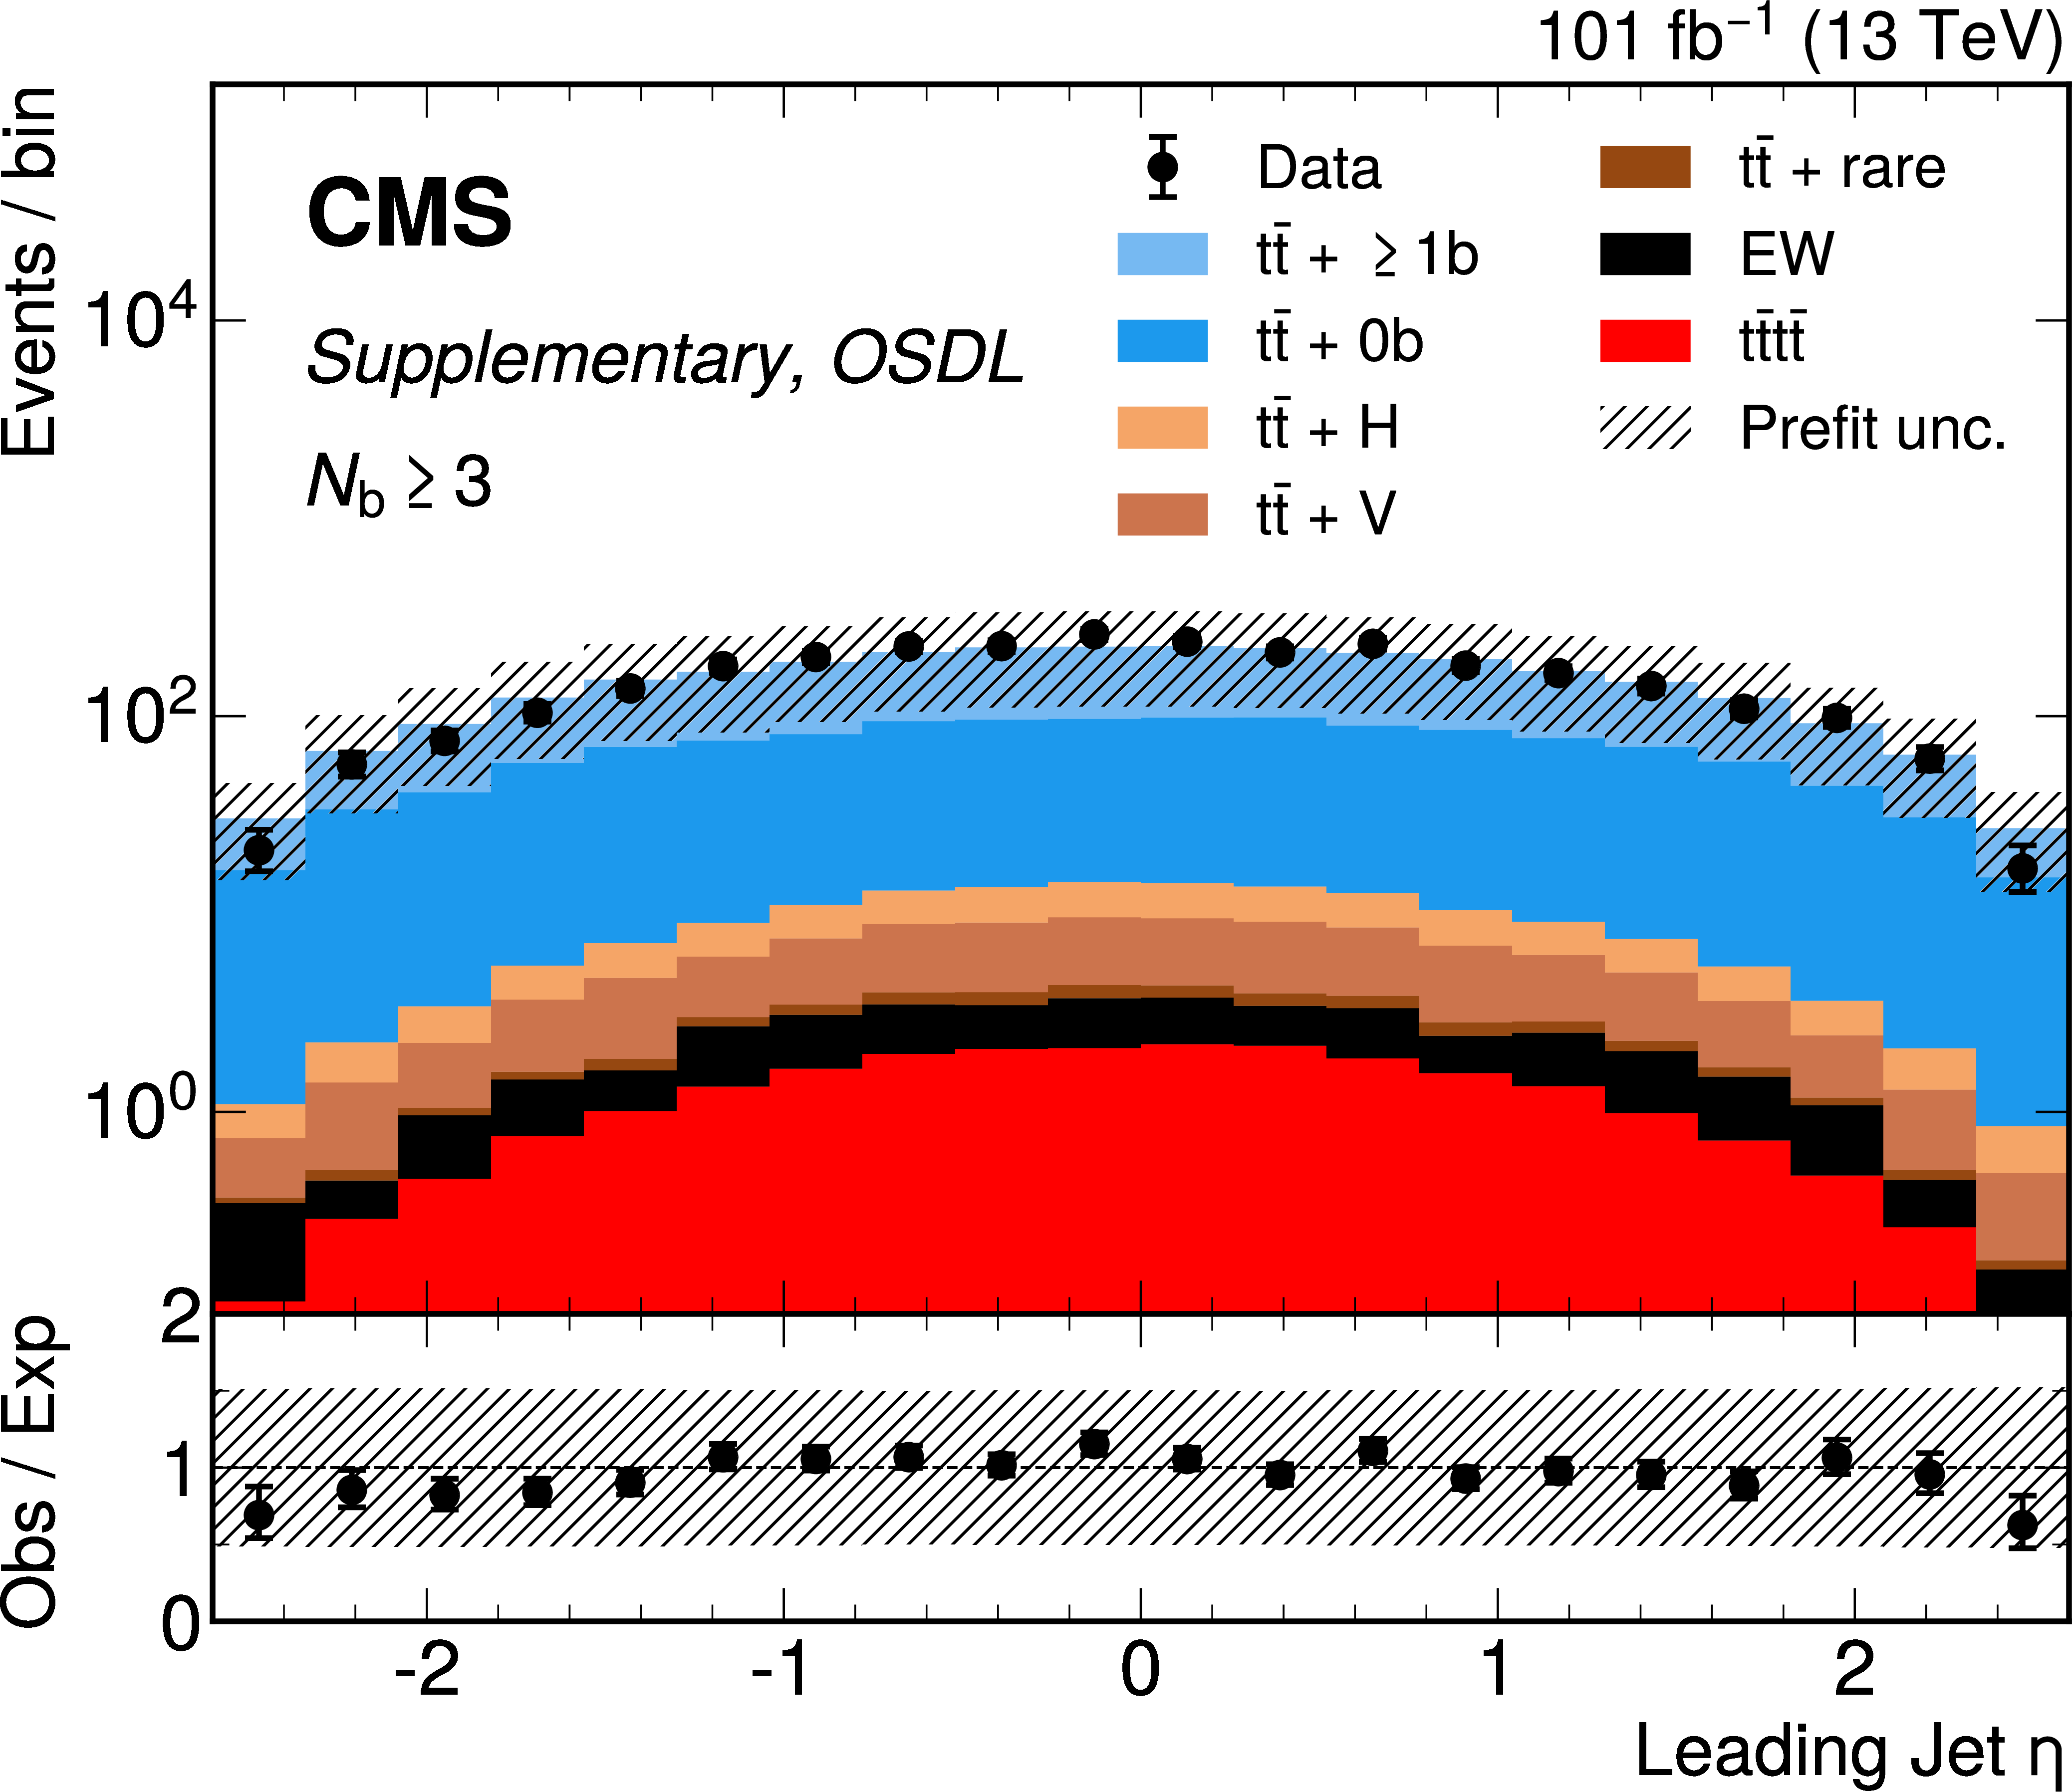
png pdf |
Additional Figure 17-j:
OSDL channel prefit distributions for $ N_\text{BT} \geq $ 3 jets categories.From left to right, top to bottom, are figures for the b-tag discriminant of the 3 highest b-tagged jets; the the b-tag discriminant of the 3 highest $ p_{\mathrm{T}} $ jets; the $ p_{\mathrm{T}} $ of the 3 highest $ p_{\mathrm{T}} $ jets; and the $ \eta $ of the 3 highest $ p_{\mathrm{T}} $ jets. Background processes include $ \mathrm{t} \bar{\mathrm{t}} $ + V (V = W, Z) and $ \mathrm{t} \bar{\mathrm{t}} $ + H in which $ \mathrm{t} \bar{\mathrm{t}} $ is produced in association with 1 massive boson, $ \mathrm{t} \bar{\mathrm{t}} $ events with zero ($ {\mathrm{t}\bar{\mathrm{t}}} + 0 \mathrm{b} $) or at least one additional b jet ($ {\mathrm{t}\bar{\mathrm{t}}} +\geq 1 \mathrm{b} $). Events with W or Z but no top quarks are referred to as EW, and $ \mathrm{t} \bar{\mathrm{t}} $ + rare includes $ \mathrm{t} \bar{\mathrm{t}} $ production in associaton with two massive bosons or a third (anti)top quark. |

png pdf |
Additional Figure 17-k:
OSDL channel prefit distributions for $ N_\text{BT} \geq $ 3 jets categories.From left to right, top to bottom, are figures for the b-tag discriminant of the 3 highest b-tagged jets; the the b-tag discriminant of the 3 highest $ p_{\mathrm{T}} $ jets; the $ p_{\mathrm{T}} $ of the 3 highest $ p_{\mathrm{T}} $ jets; and the $ \eta $ of the 3 highest $ p_{\mathrm{T}} $ jets. Background processes include $ \mathrm{t} \bar{\mathrm{t}} $ + V (V = W, Z) and $ \mathrm{t} \bar{\mathrm{t}} $ + H in which $ \mathrm{t} \bar{\mathrm{t}} $ is produced in association with 1 massive boson, $ \mathrm{t} \bar{\mathrm{t}} $ events with zero ($ {\mathrm{t}\bar{\mathrm{t}}} + 0 \mathrm{b} $) or at least one additional b jet ($ {\mathrm{t}\bar{\mathrm{t}}} +\geq 1 \mathrm{b} $). Events with W or Z but no top quarks are referred to as EW, and $ \mathrm{t} \bar{\mathrm{t}} $ + rare includes $ \mathrm{t} \bar{\mathrm{t}} $ production in associaton with two massive bosons or a third (anti)top quark. |

png pdf |
Additional Figure 17-l:
OSDL channel prefit distributions for $ N_\text{BT} \geq $ 3 jets categories.From left to right, top to bottom, are figures for the b-tag discriminant of the 3 highest b-tagged jets; the the b-tag discriminant of the 3 highest $ p_{\mathrm{T}} $ jets; the $ p_{\mathrm{T}} $ of the 3 highest $ p_{\mathrm{T}} $ jets; and the $ \eta $ of the 3 highest $ p_{\mathrm{T}} $ jets. Background processes include $ \mathrm{t} \bar{\mathrm{t}} $ + V (V = W, Z) and $ \mathrm{t} \bar{\mathrm{t}} $ + H in which $ \mathrm{t} \bar{\mathrm{t}} $ is produced in association with 1 massive boson, $ \mathrm{t} \bar{\mathrm{t}} $ events with zero ($ {\mathrm{t}\bar{\mathrm{t}}} + 0 \mathrm{b} $) or at least one additional b jet ($ {\mathrm{t}\bar{\mathrm{t}}} +\geq 1 \mathrm{b} $). Events with W or Z but no top quarks are referred to as EW, and $ \mathrm{t} \bar{\mathrm{t}} $ + rare includes $ \mathrm{t} \bar{\mathrm{t}} $ production in associaton with two massive bosons or a third (anti)top quark. |
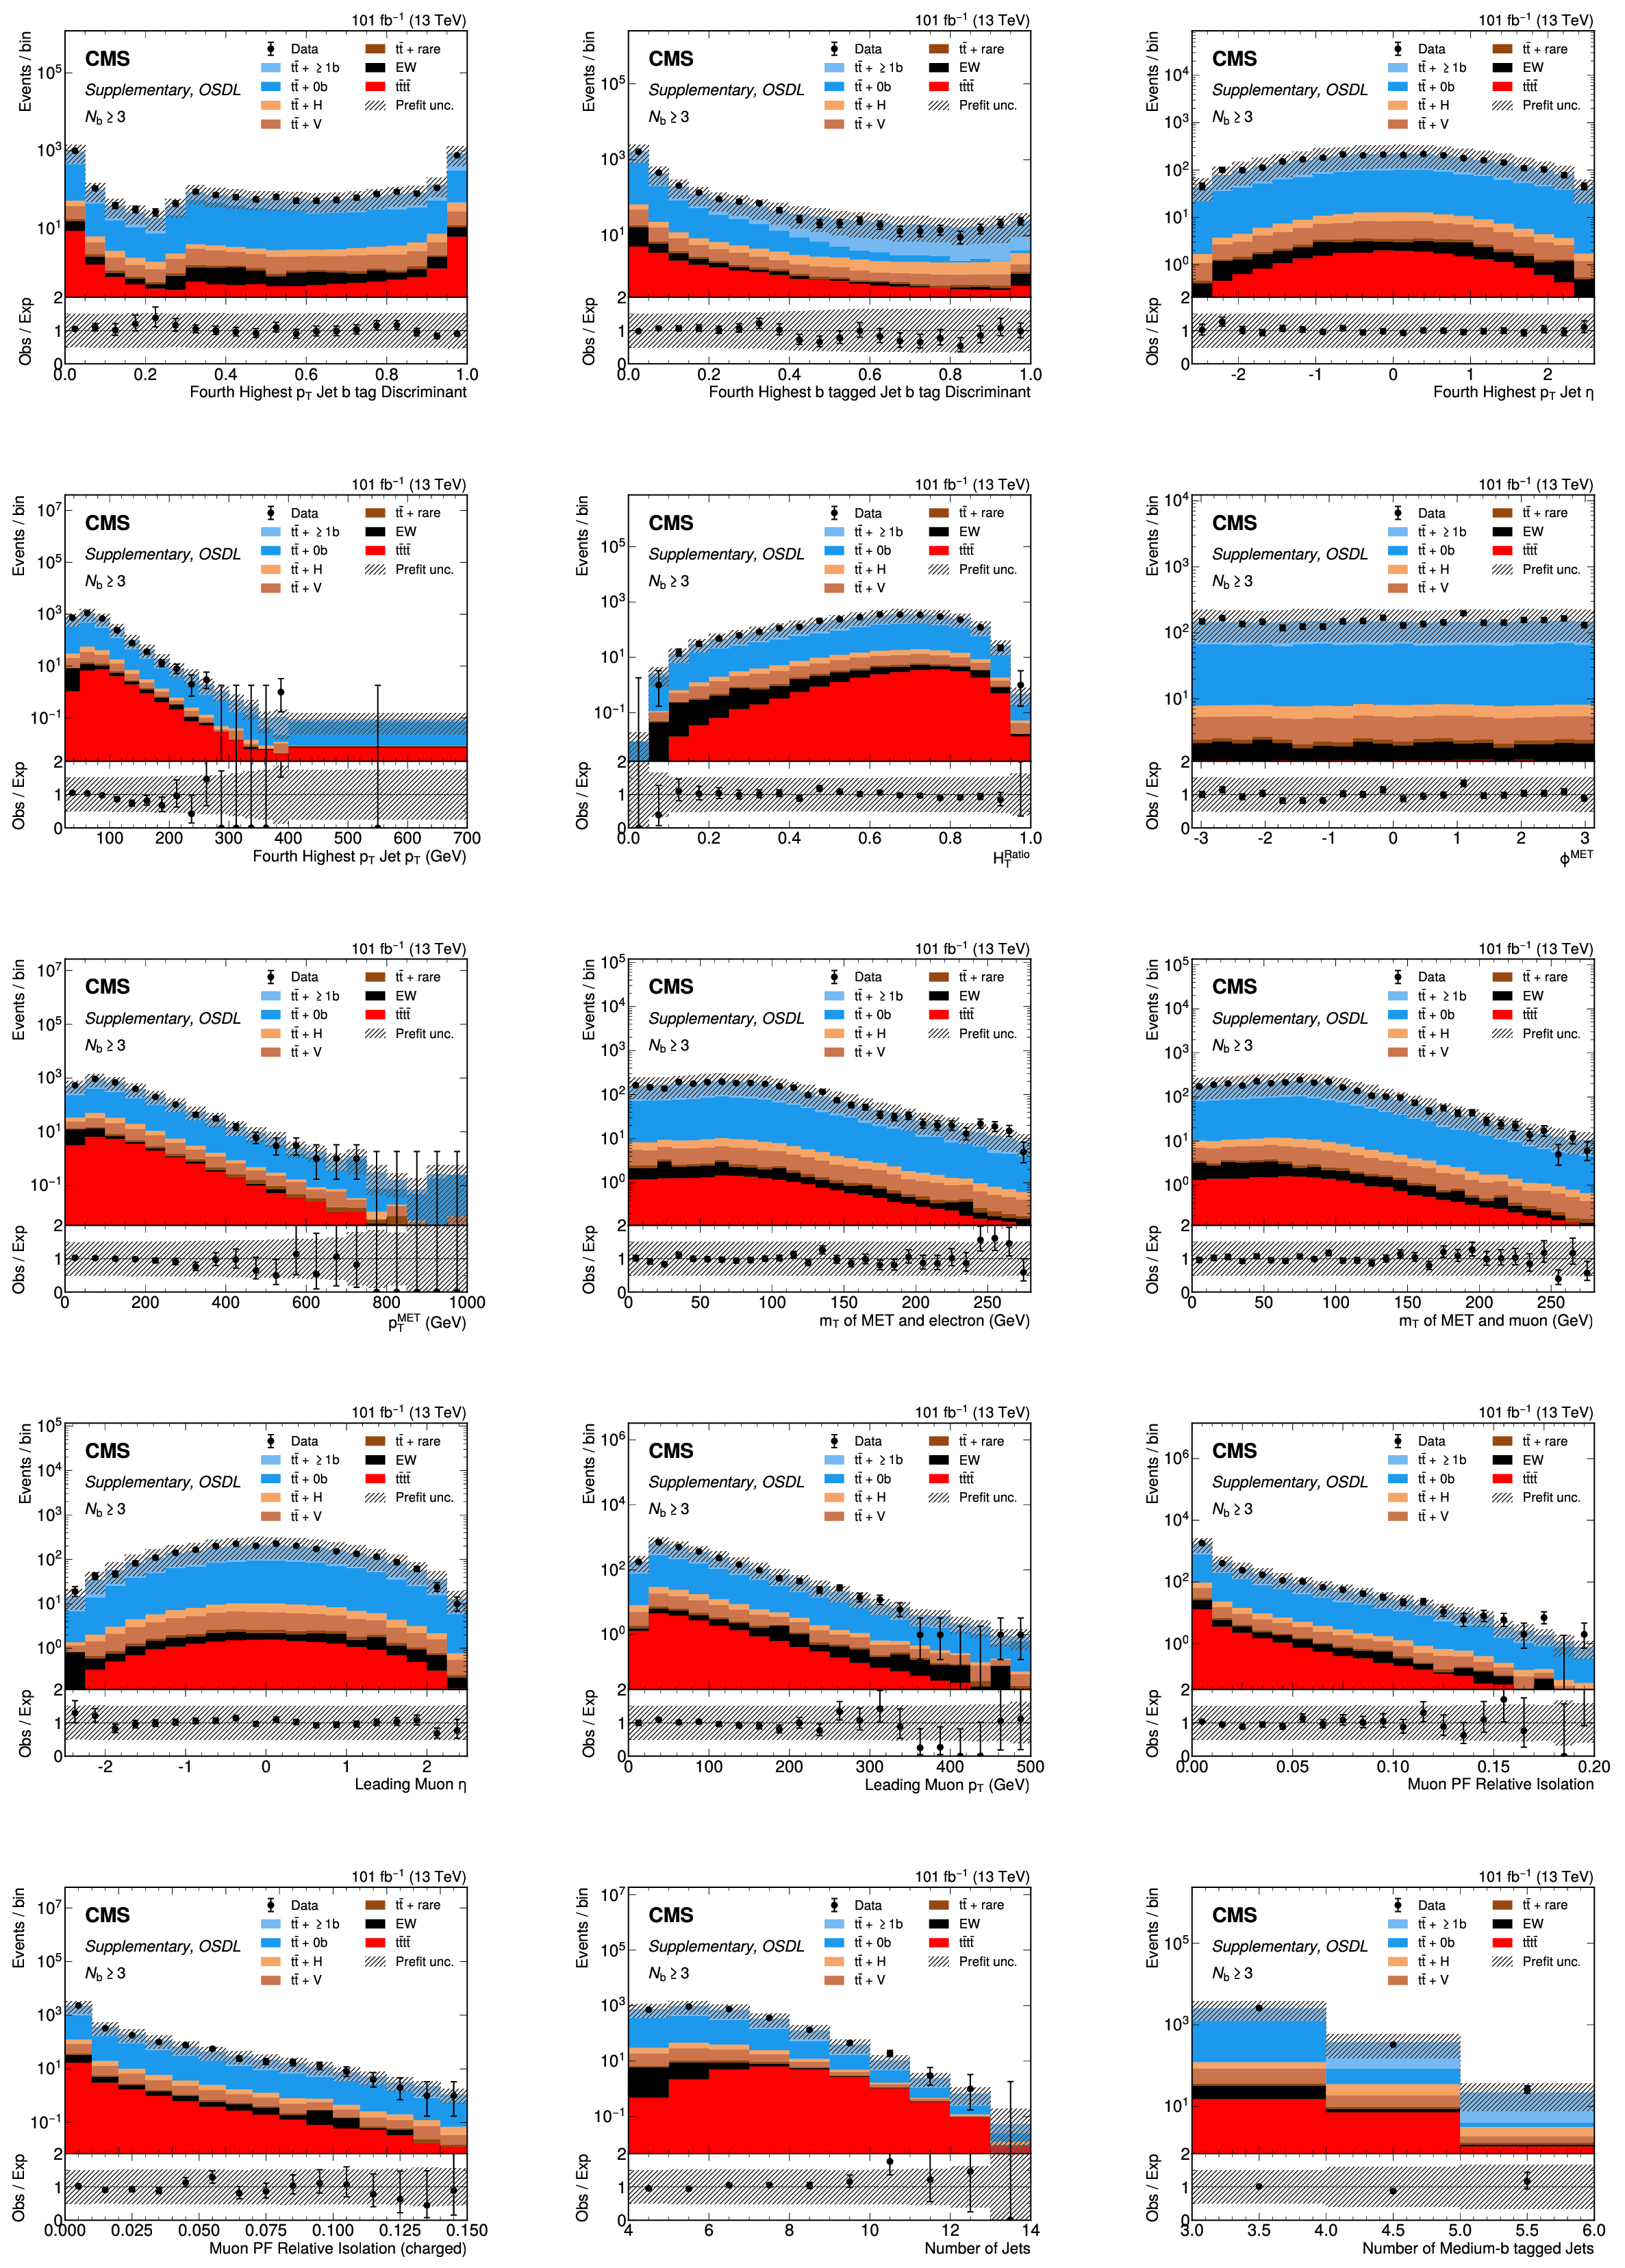
png pdf |
Additional Figure 18:
OSDL channel prefit distributions for $ N_\text{BT} \geq $ 3 jets categories. From left to right, top to bottom, are figures for the b-tag discriminant of the fourth highest $ p_{\mathrm{T}} $ and b-tagged jets per event; the $ \eta $ and $ p_{\mathrm{T}} $ of the fourth highest $ p_{\mathrm{T}} $ jet; the ratio of $ H_T^{2M} $ to $ H_{\mathrm{T}} $; the $ \phi $ and magnitude of the missing transverse energy (MET); the transverse mass of the MET with the electron or muon; the $ \eta $, $ p_{\mathrm{T}} $ of the leading muon; the muon PF isolation (complete and charged components); and the jet multiplicity and b-tag multiplicity. Backgrounds are as described in Fig. 17. |
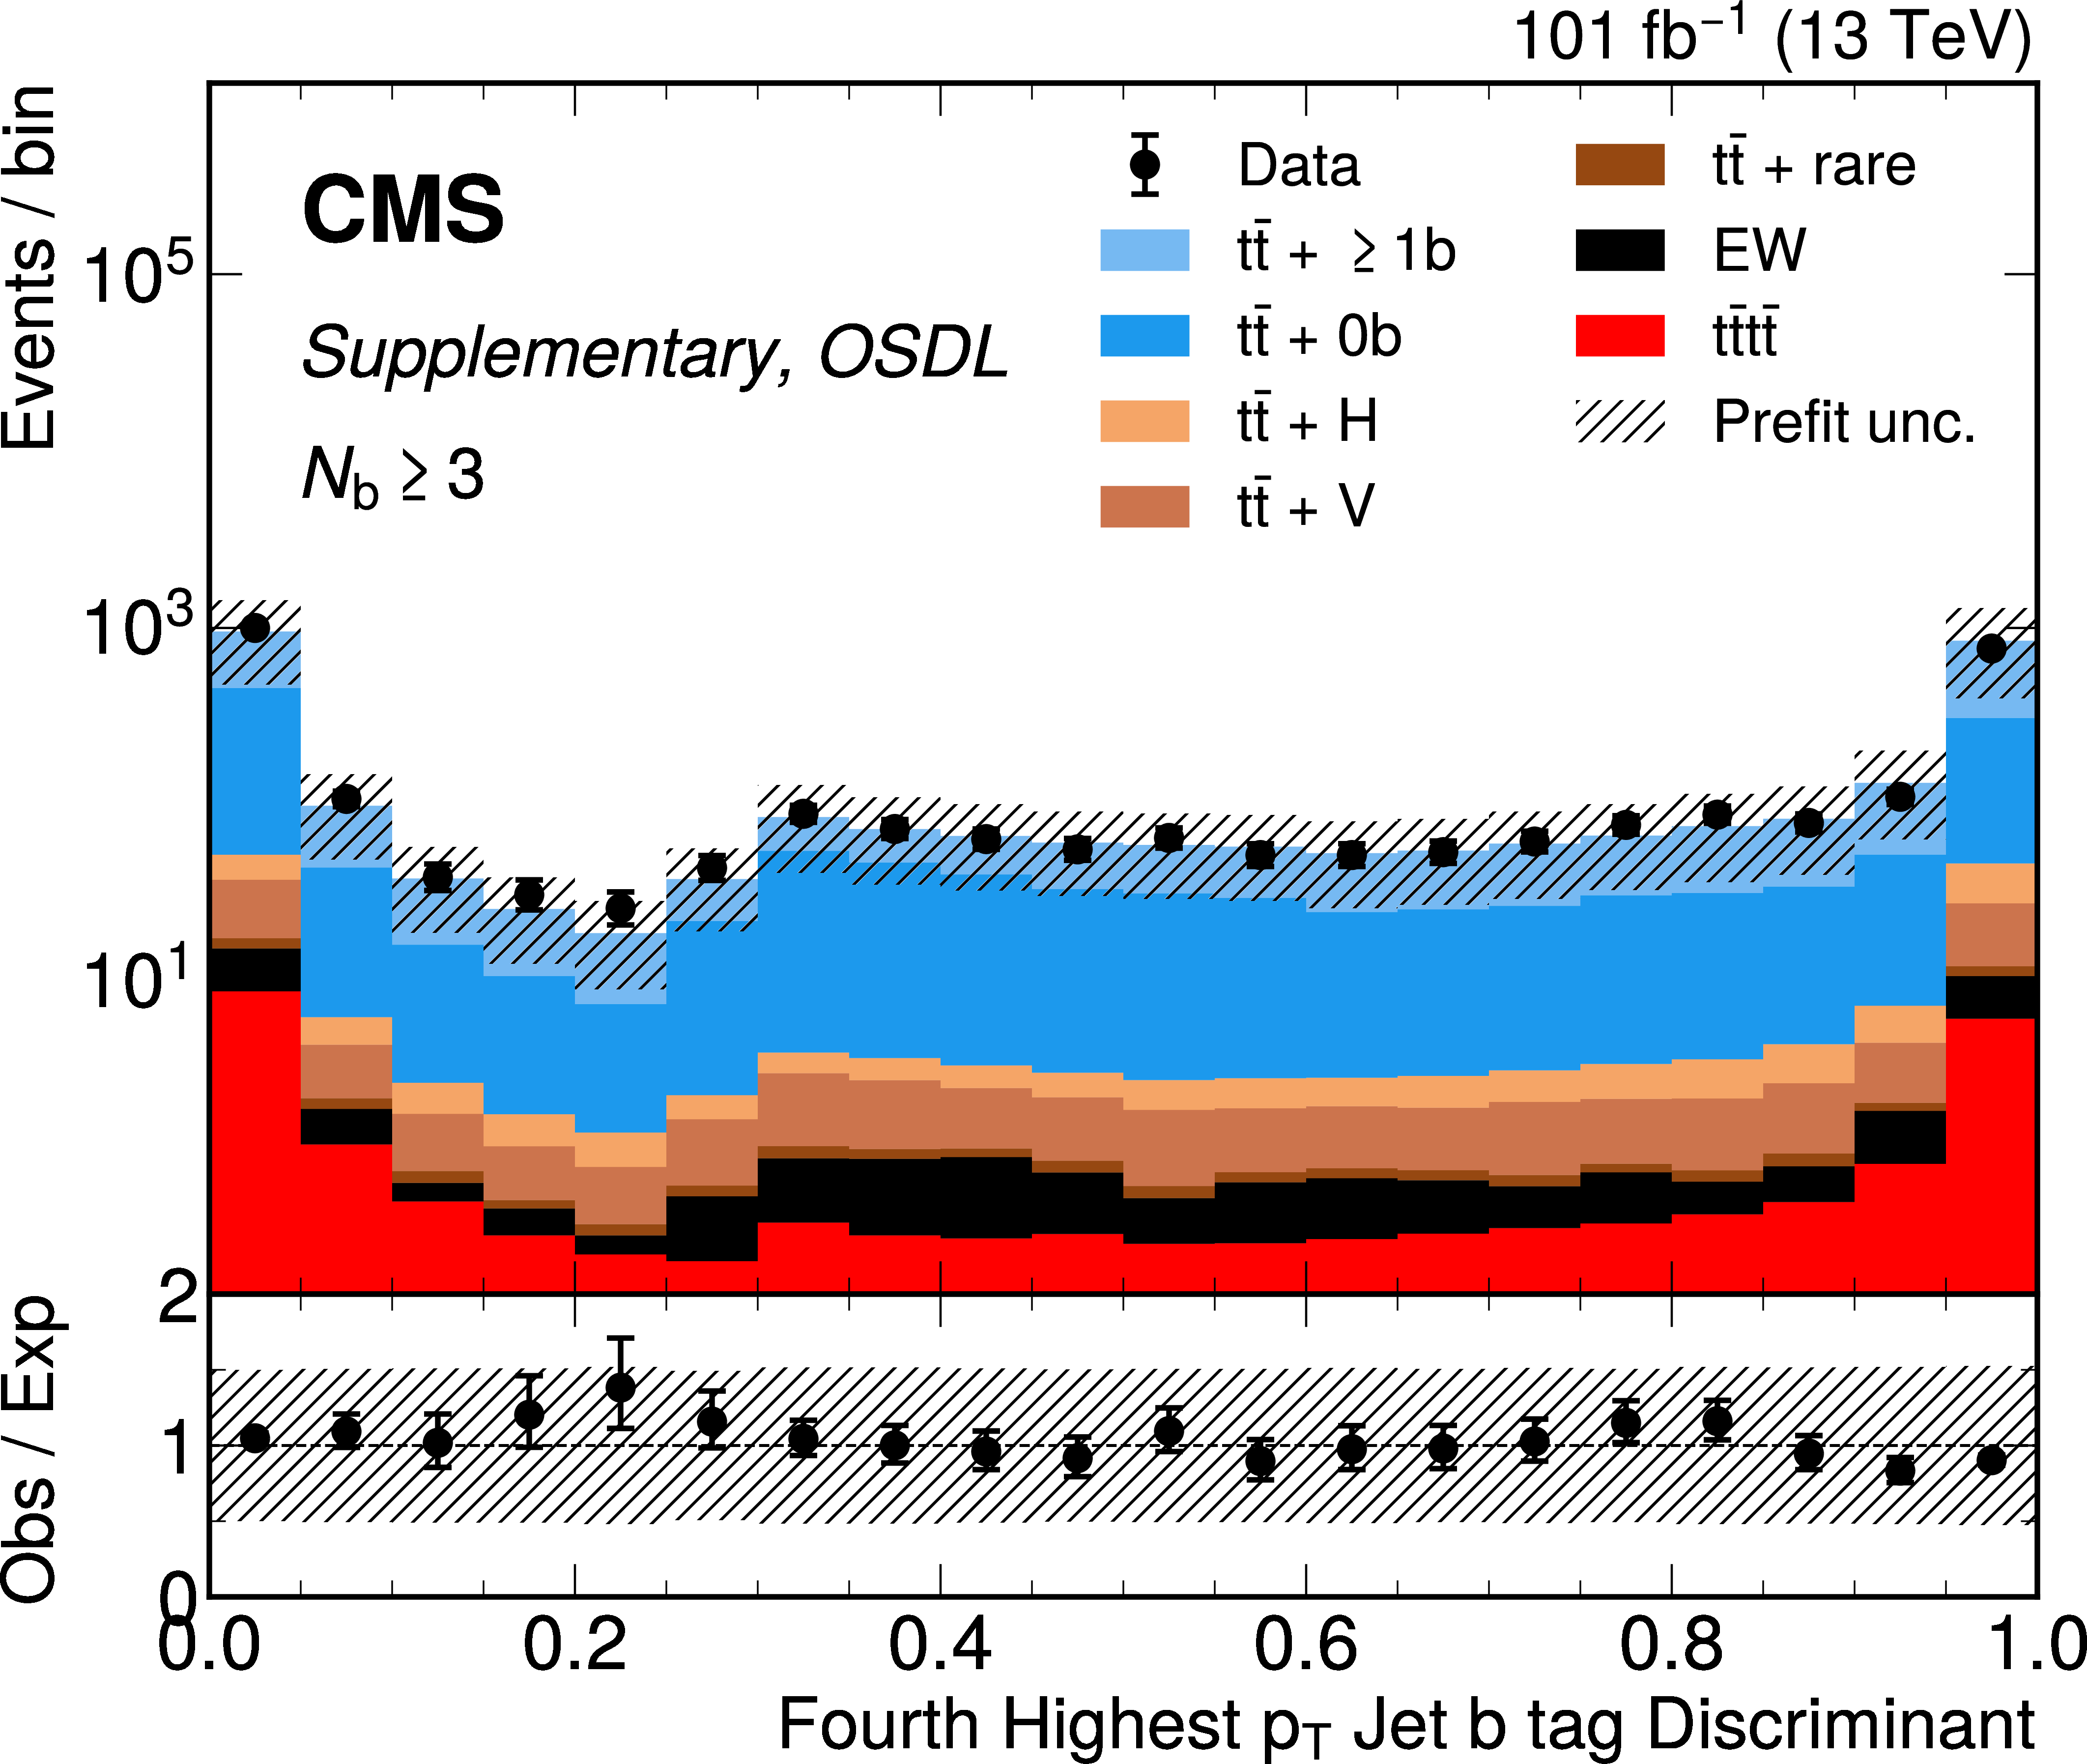
png pdf |
Additional Figure 18-a:
OSDL channel prefit distributions for $ N_\text{BT} \geq $ 3 jets categories. From left to right, top to bottom, are figures for the b-tag discriminant of the fourth highest $ p_{\mathrm{T}} $ and b-tagged jets per event; the $ \eta $ and $ p_{\mathrm{T}} $ of the fourth highest $ p_{\mathrm{T}} $ jet; the ratio of $ H_T^{2M} $ to $ H_{\mathrm{T}} $; the $ \phi $ and magnitude of the missing transverse energy (MET); the transverse mass of the MET with the electron or muon; the $ \eta $, $ p_{\mathrm{T}} $ of the leading muon; the muon PF isolation (complete and charged components); and the jet multiplicity and b-tag multiplicity. Backgrounds are as described in Fig. 17. |

png pdf |
Additional Figure 18-b:
OSDL channel prefit distributions for $ N_\text{BT} \geq $ 3 jets categories. From left to right, top to bottom, are figures for the b-tag discriminant of the fourth highest $ p_{\mathrm{T}} $ and b-tagged jets per event; the $ \eta $ and $ p_{\mathrm{T}} $ of the fourth highest $ p_{\mathrm{T}} $ jet; the ratio of $ H_T^{2M} $ to $ H_{\mathrm{T}} $; the $ \phi $ and magnitude of the missing transverse energy (MET); the transverse mass of the MET with the electron or muon; the $ \eta $, $ p_{\mathrm{T}} $ of the leading muon; the muon PF isolation (complete and charged components); and the jet multiplicity and b-tag multiplicity. Backgrounds are as described in Fig. 17. |
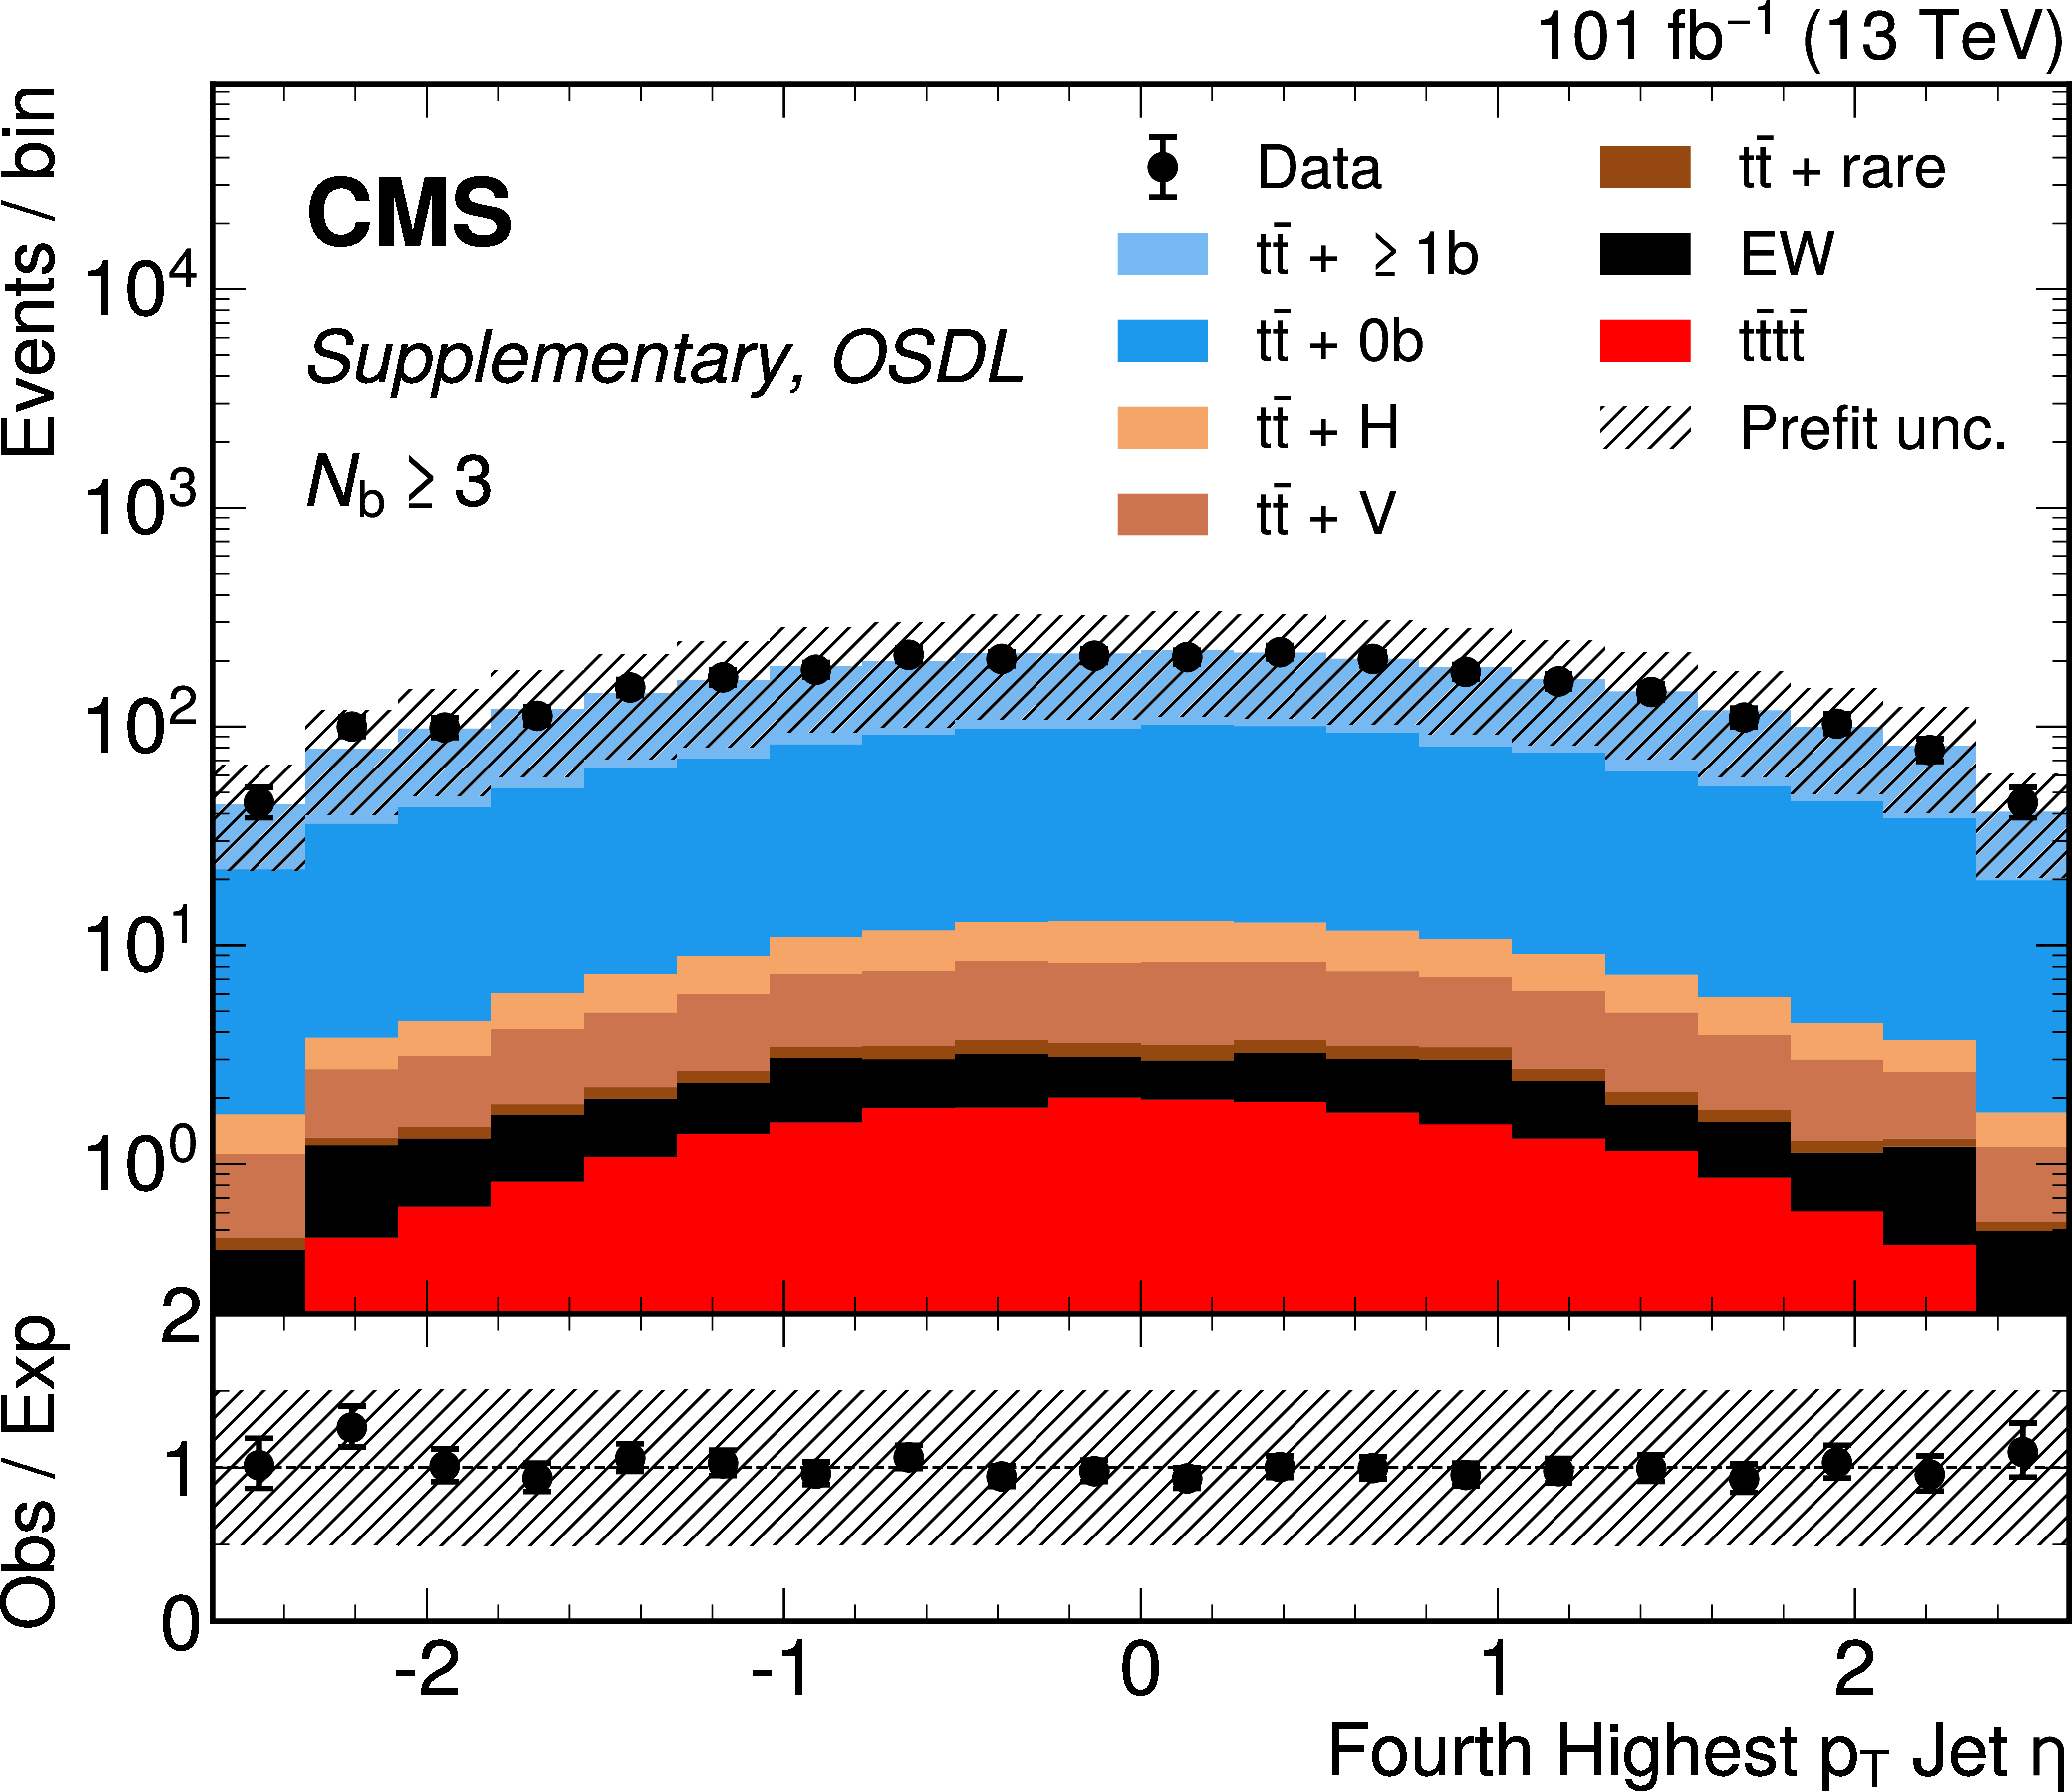
png pdf |
Additional Figure 18-c:
OSDL channel prefit distributions for $ N_\text{BT} \geq $ 3 jets categories. From left to right, top to bottom, are figures for the b-tag discriminant of the fourth highest $ p_{\mathrm{T}} $ and b-tagged jets per event; the $ \eta $ and $ p_{\mathrm{T}} $ of the fourth highest $ p_{\mathrm{T}} $ jet; the ratio of $ H_T^{2M} $ to $ H_{\mathrm{T}} $; the $ \phi $ and magnitude of the missing transverse energy (MET); the transverse mass of the MET with the electron or muon; the $ \eta $, $ p_{\mathrm{T}} $ of the leading muon; the muon PF isolation (complete and charged components); and the jet multiplicity and b-tag multiplicity. Backgrounds are as described in Fig. 17. |
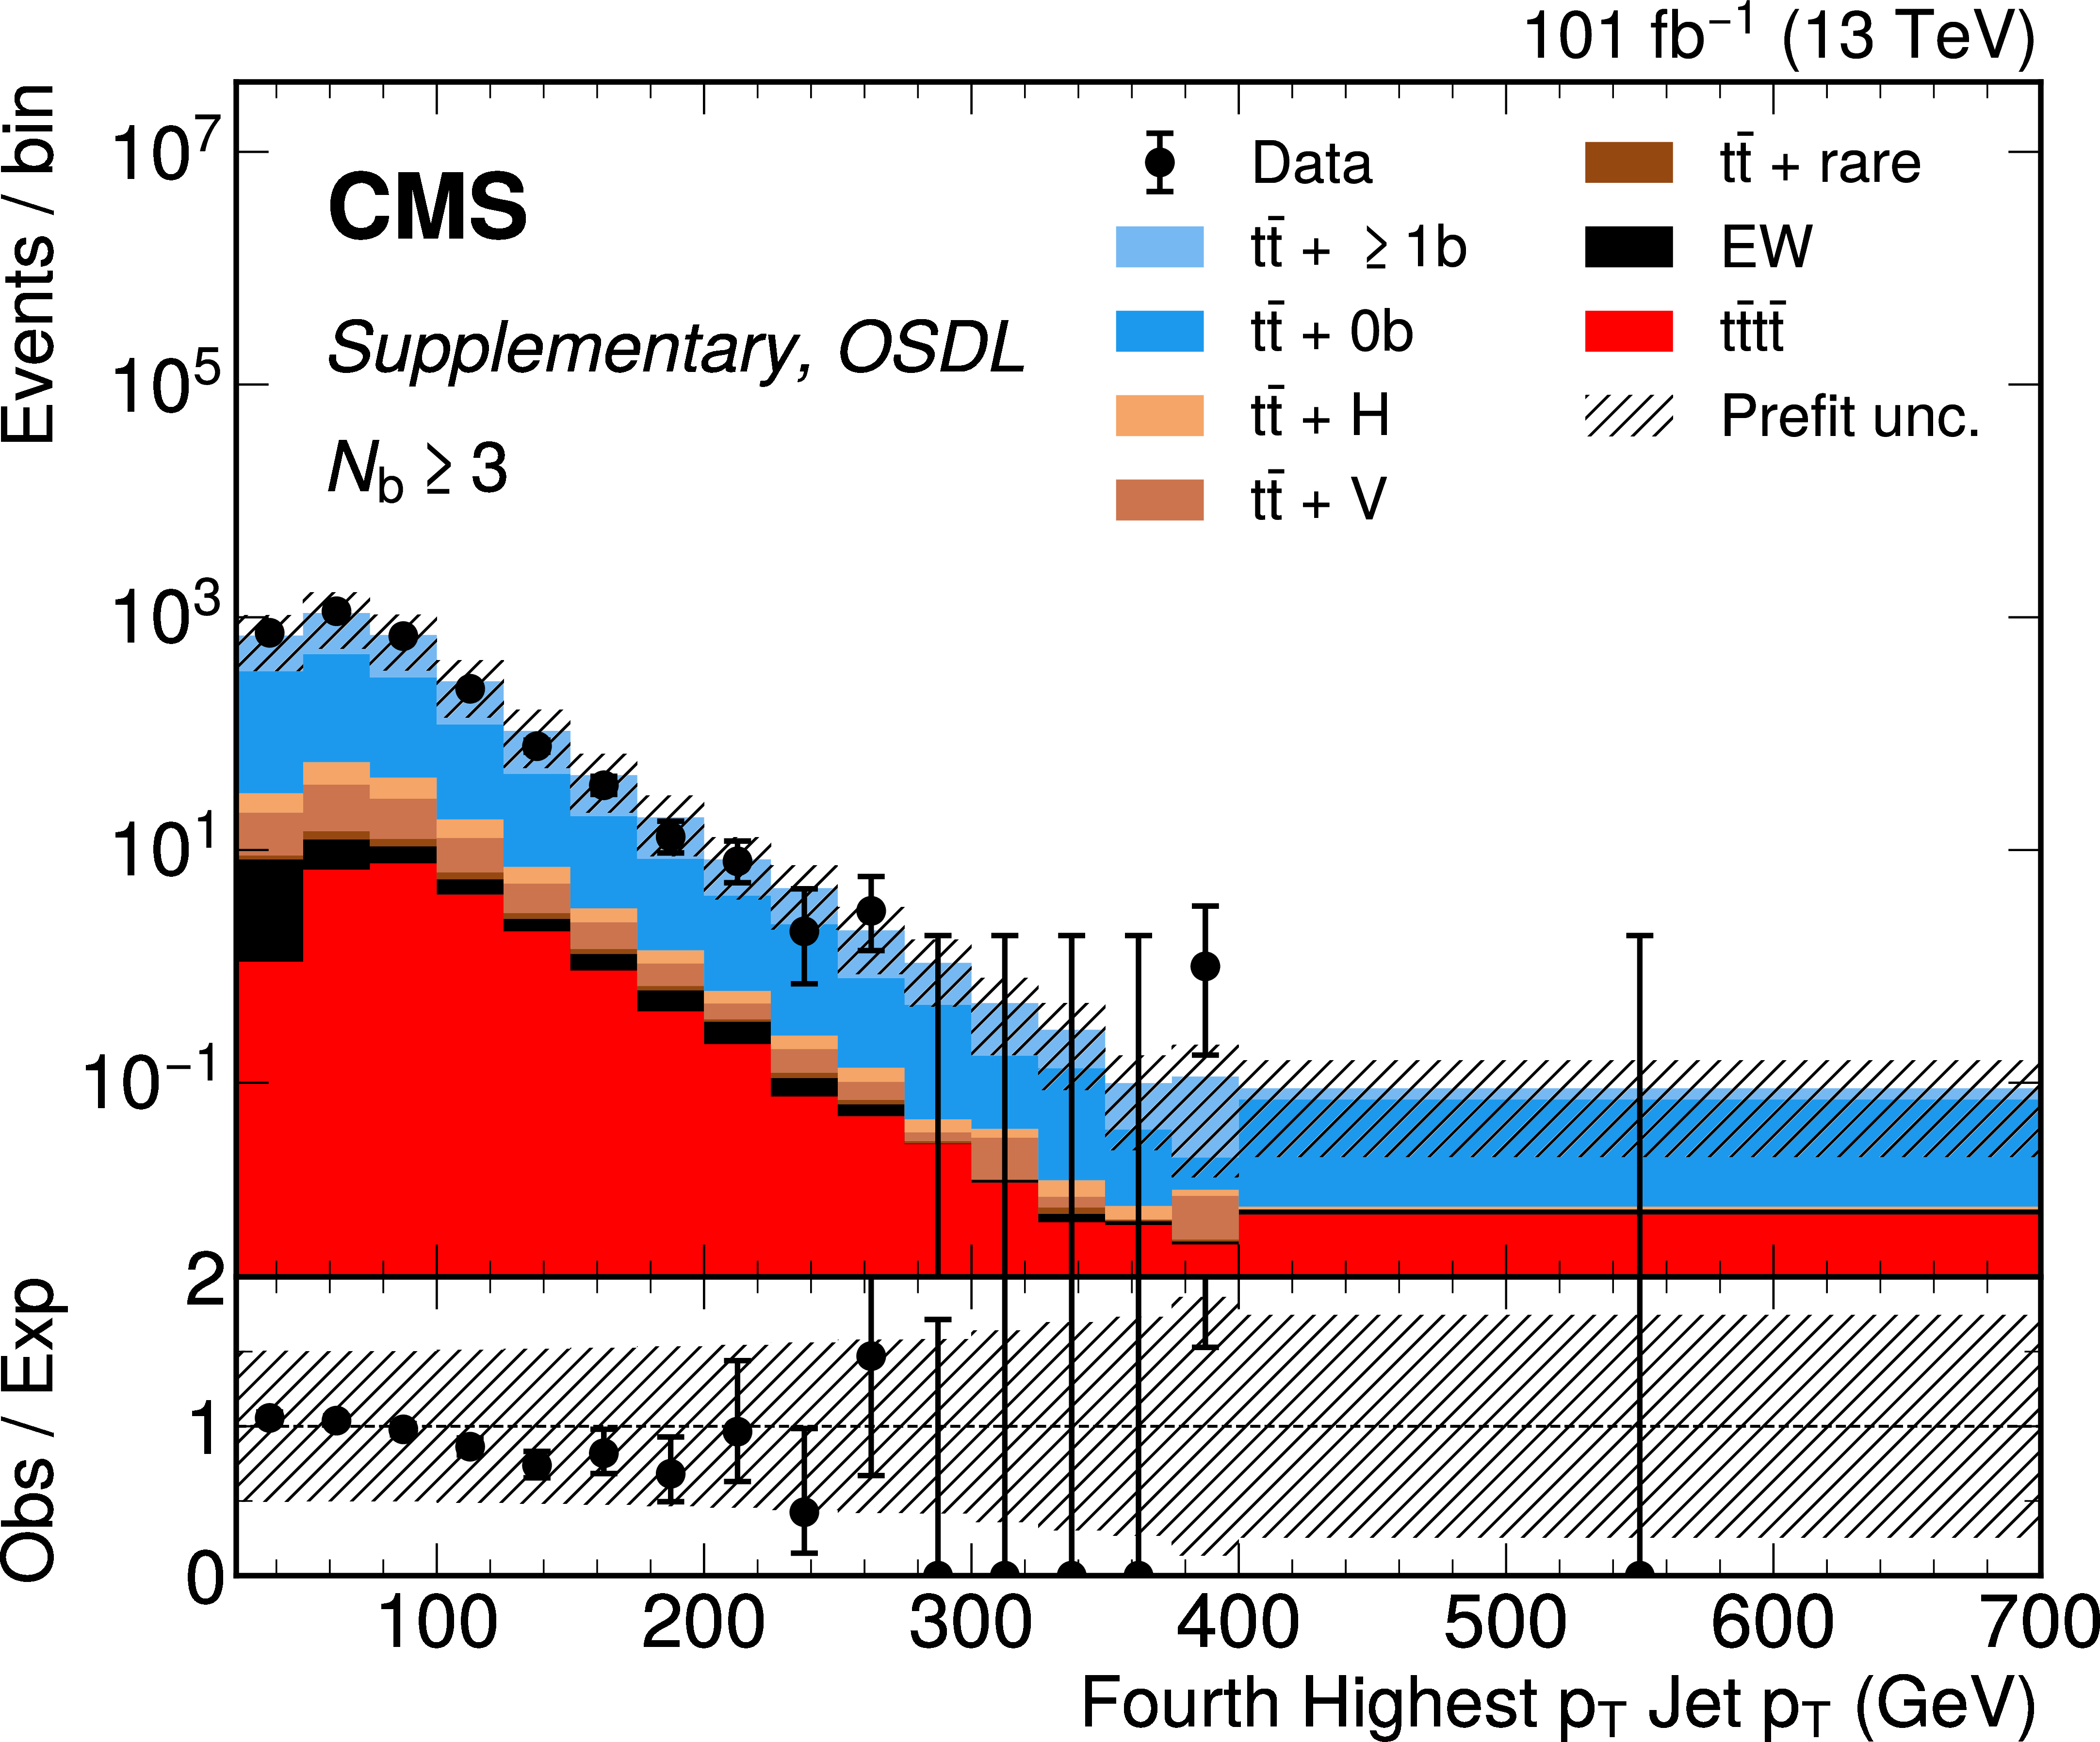
png pdf |
Additional Figure 18-d:
OSDL channel prefit distributions for $ N_\text{BT} \geq $ 3 jets categories. From left to right, top to bottom, are figures for the b-tag discriminant of the fourth highest $ p_{\mathrm{T}} $ and b-tagged jets per event; the $ \eta $ and $ p_{\mathrm{T}} $ of the fourth highest $ p_{\mathrm{T}} $ jet; the ratio of $ H_T^{2M} $ to $ H_{\mathrm{T}} $; the $ \phi $ and magnitude of the missing transverse energy (MET); the transverse mass of the MET with the electron or muon; the $ \eta $, $ p_{\mathrm{T}} $ of the leading muon; the muon PF isolation (complete and charged components); and the jet multiplicity and b-tag multiplicity. Backgrounds are as described in Fig. 17. |
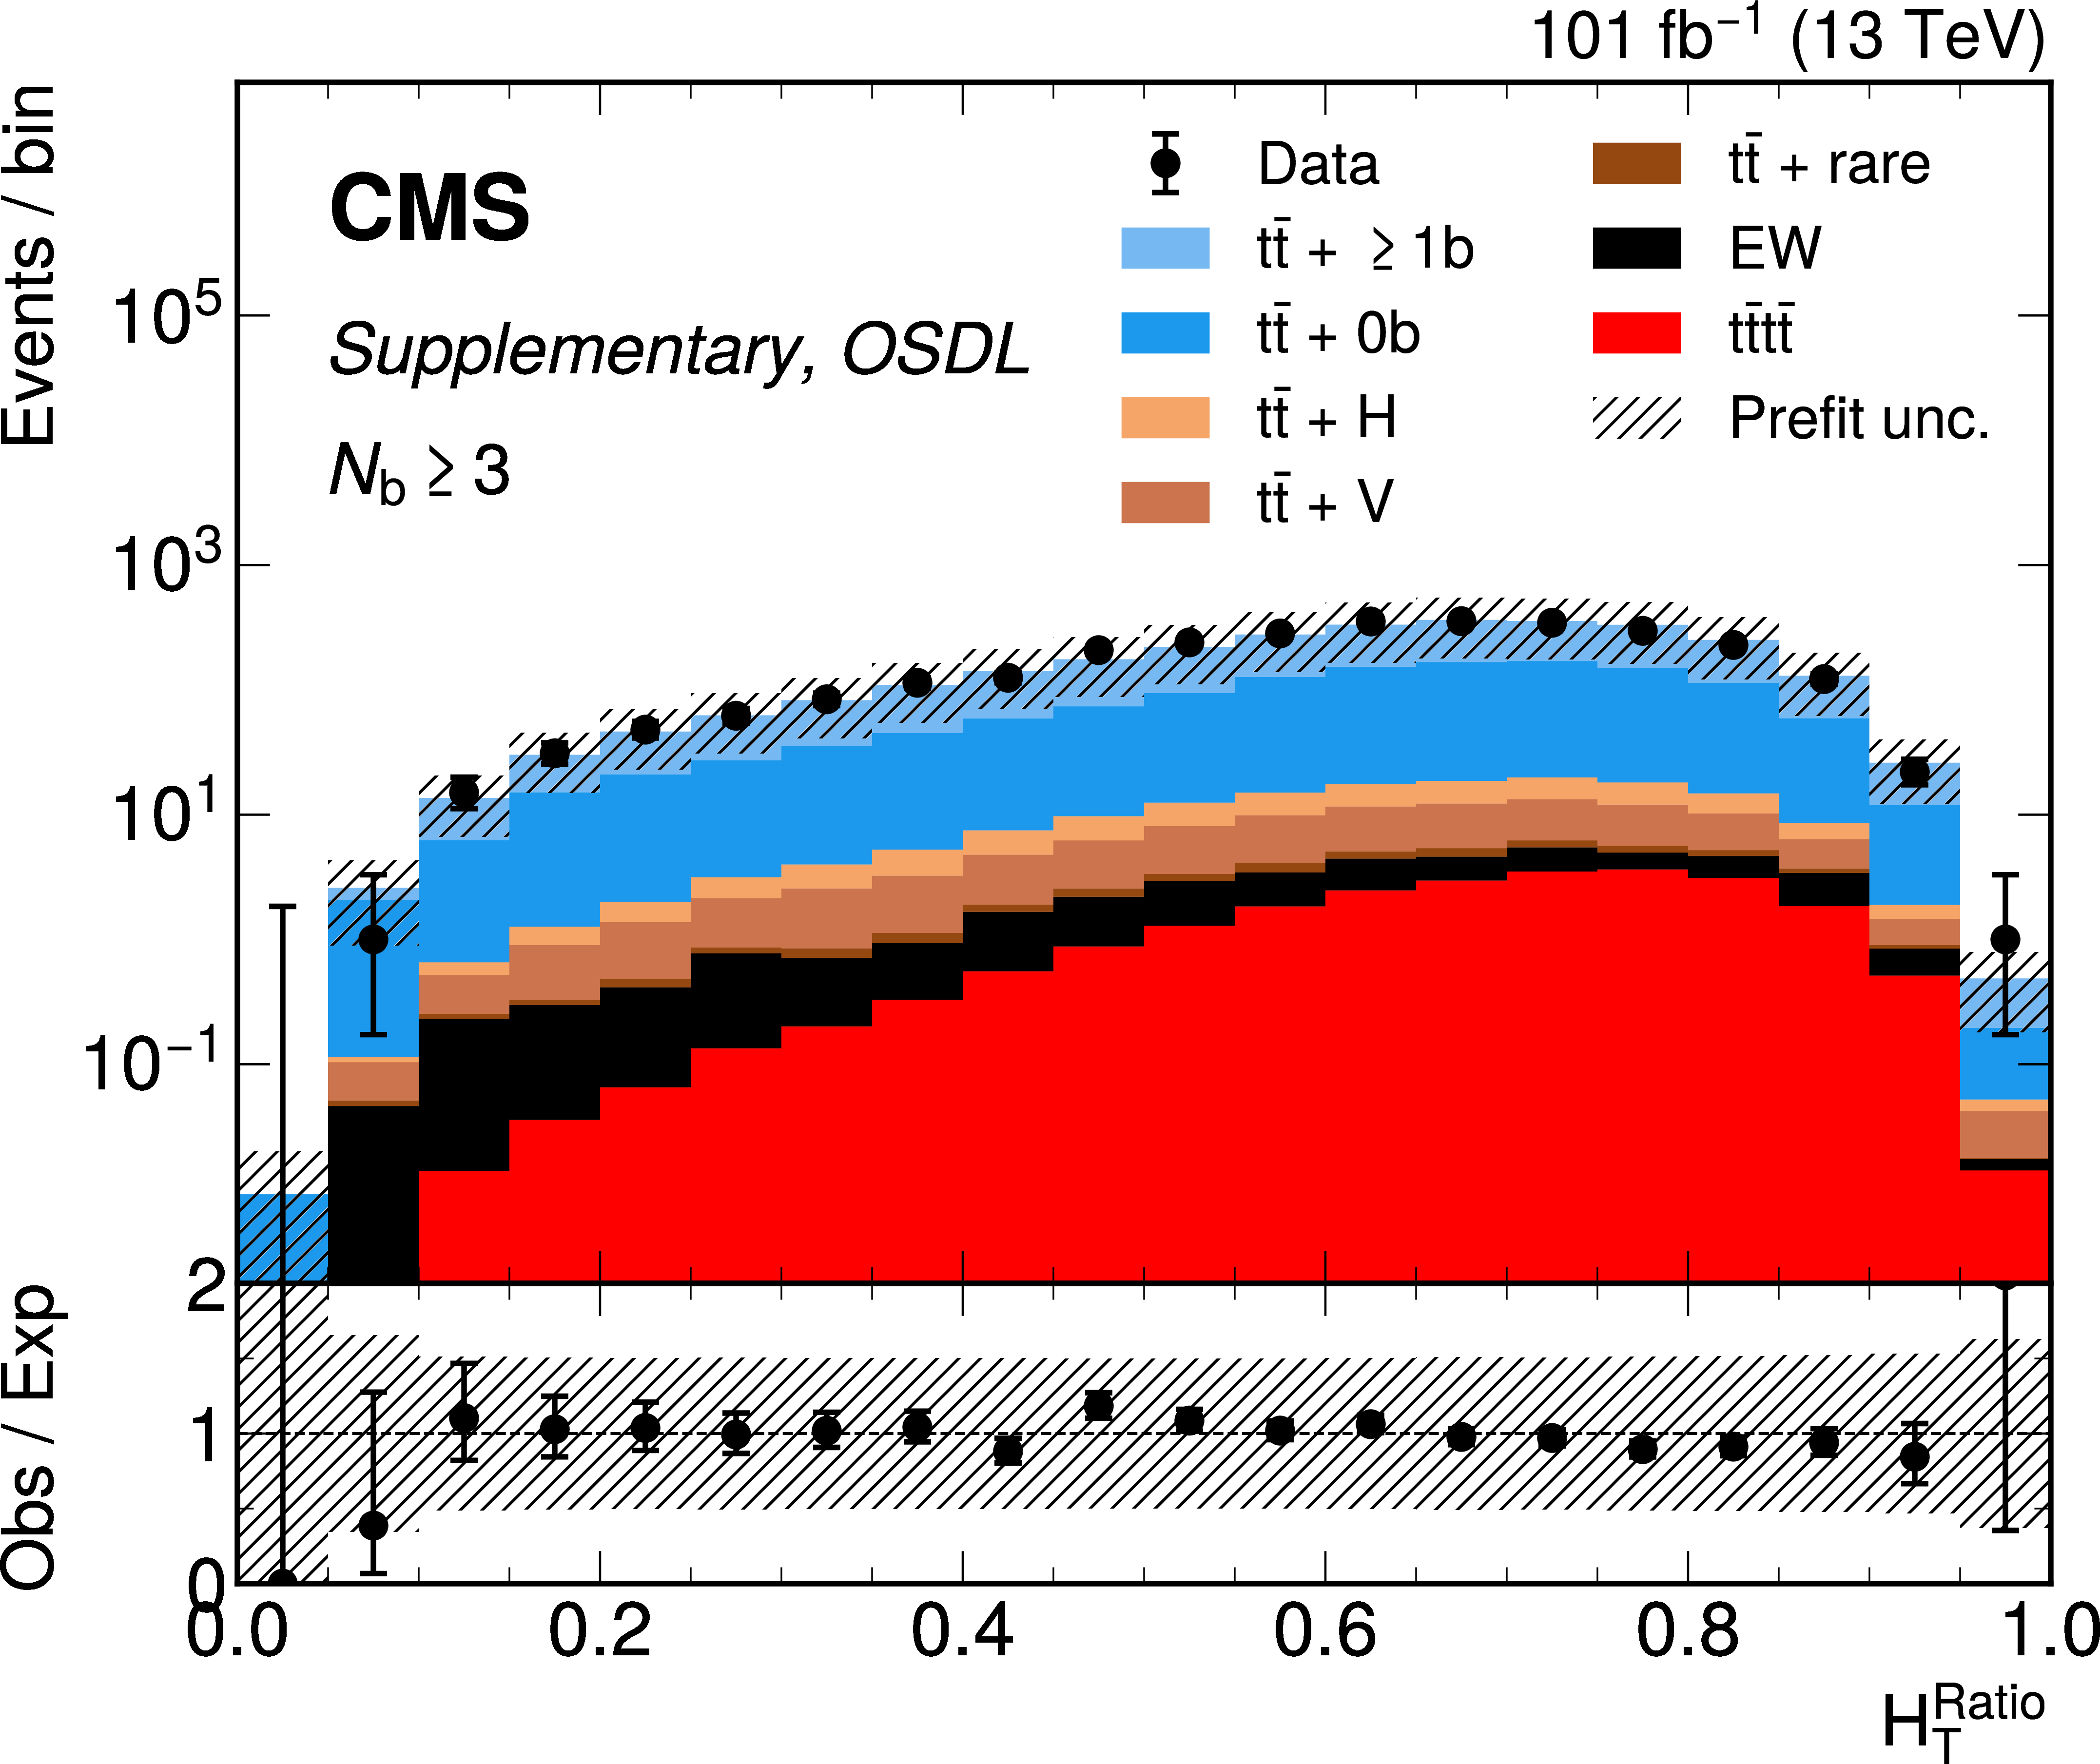
png pdf |
Additional Figure 18-e:
OSDL channel prefit distributions for $ N_\text{BT} \geq $ 3 jets categories. From left to right, top to bottom, are figures for the b-tag discriminant of the fourth highest $ p_{\mathrm{T}} $ and b-tagged jets per event; the $ \eta $ and $ p_{\mathrm{T}} $ of the fourth highest $ p_{\mathrm{T}} $ jet; the ratio of $ H_T^{2M} $ to $ H_{\mathrm{T}} $; the $ \phi $ and magnitude of the missing transverse energy (MET); the transverse mass of the MET with the electron or muon; the $ \eta $, $ p_{\mathrm{T}} $ of the leading muon; the muon PF isolation (complete and charged components); and the jet multiplicity and b-tag multiplicity. Backgrounds are as described in Fig. 17. |
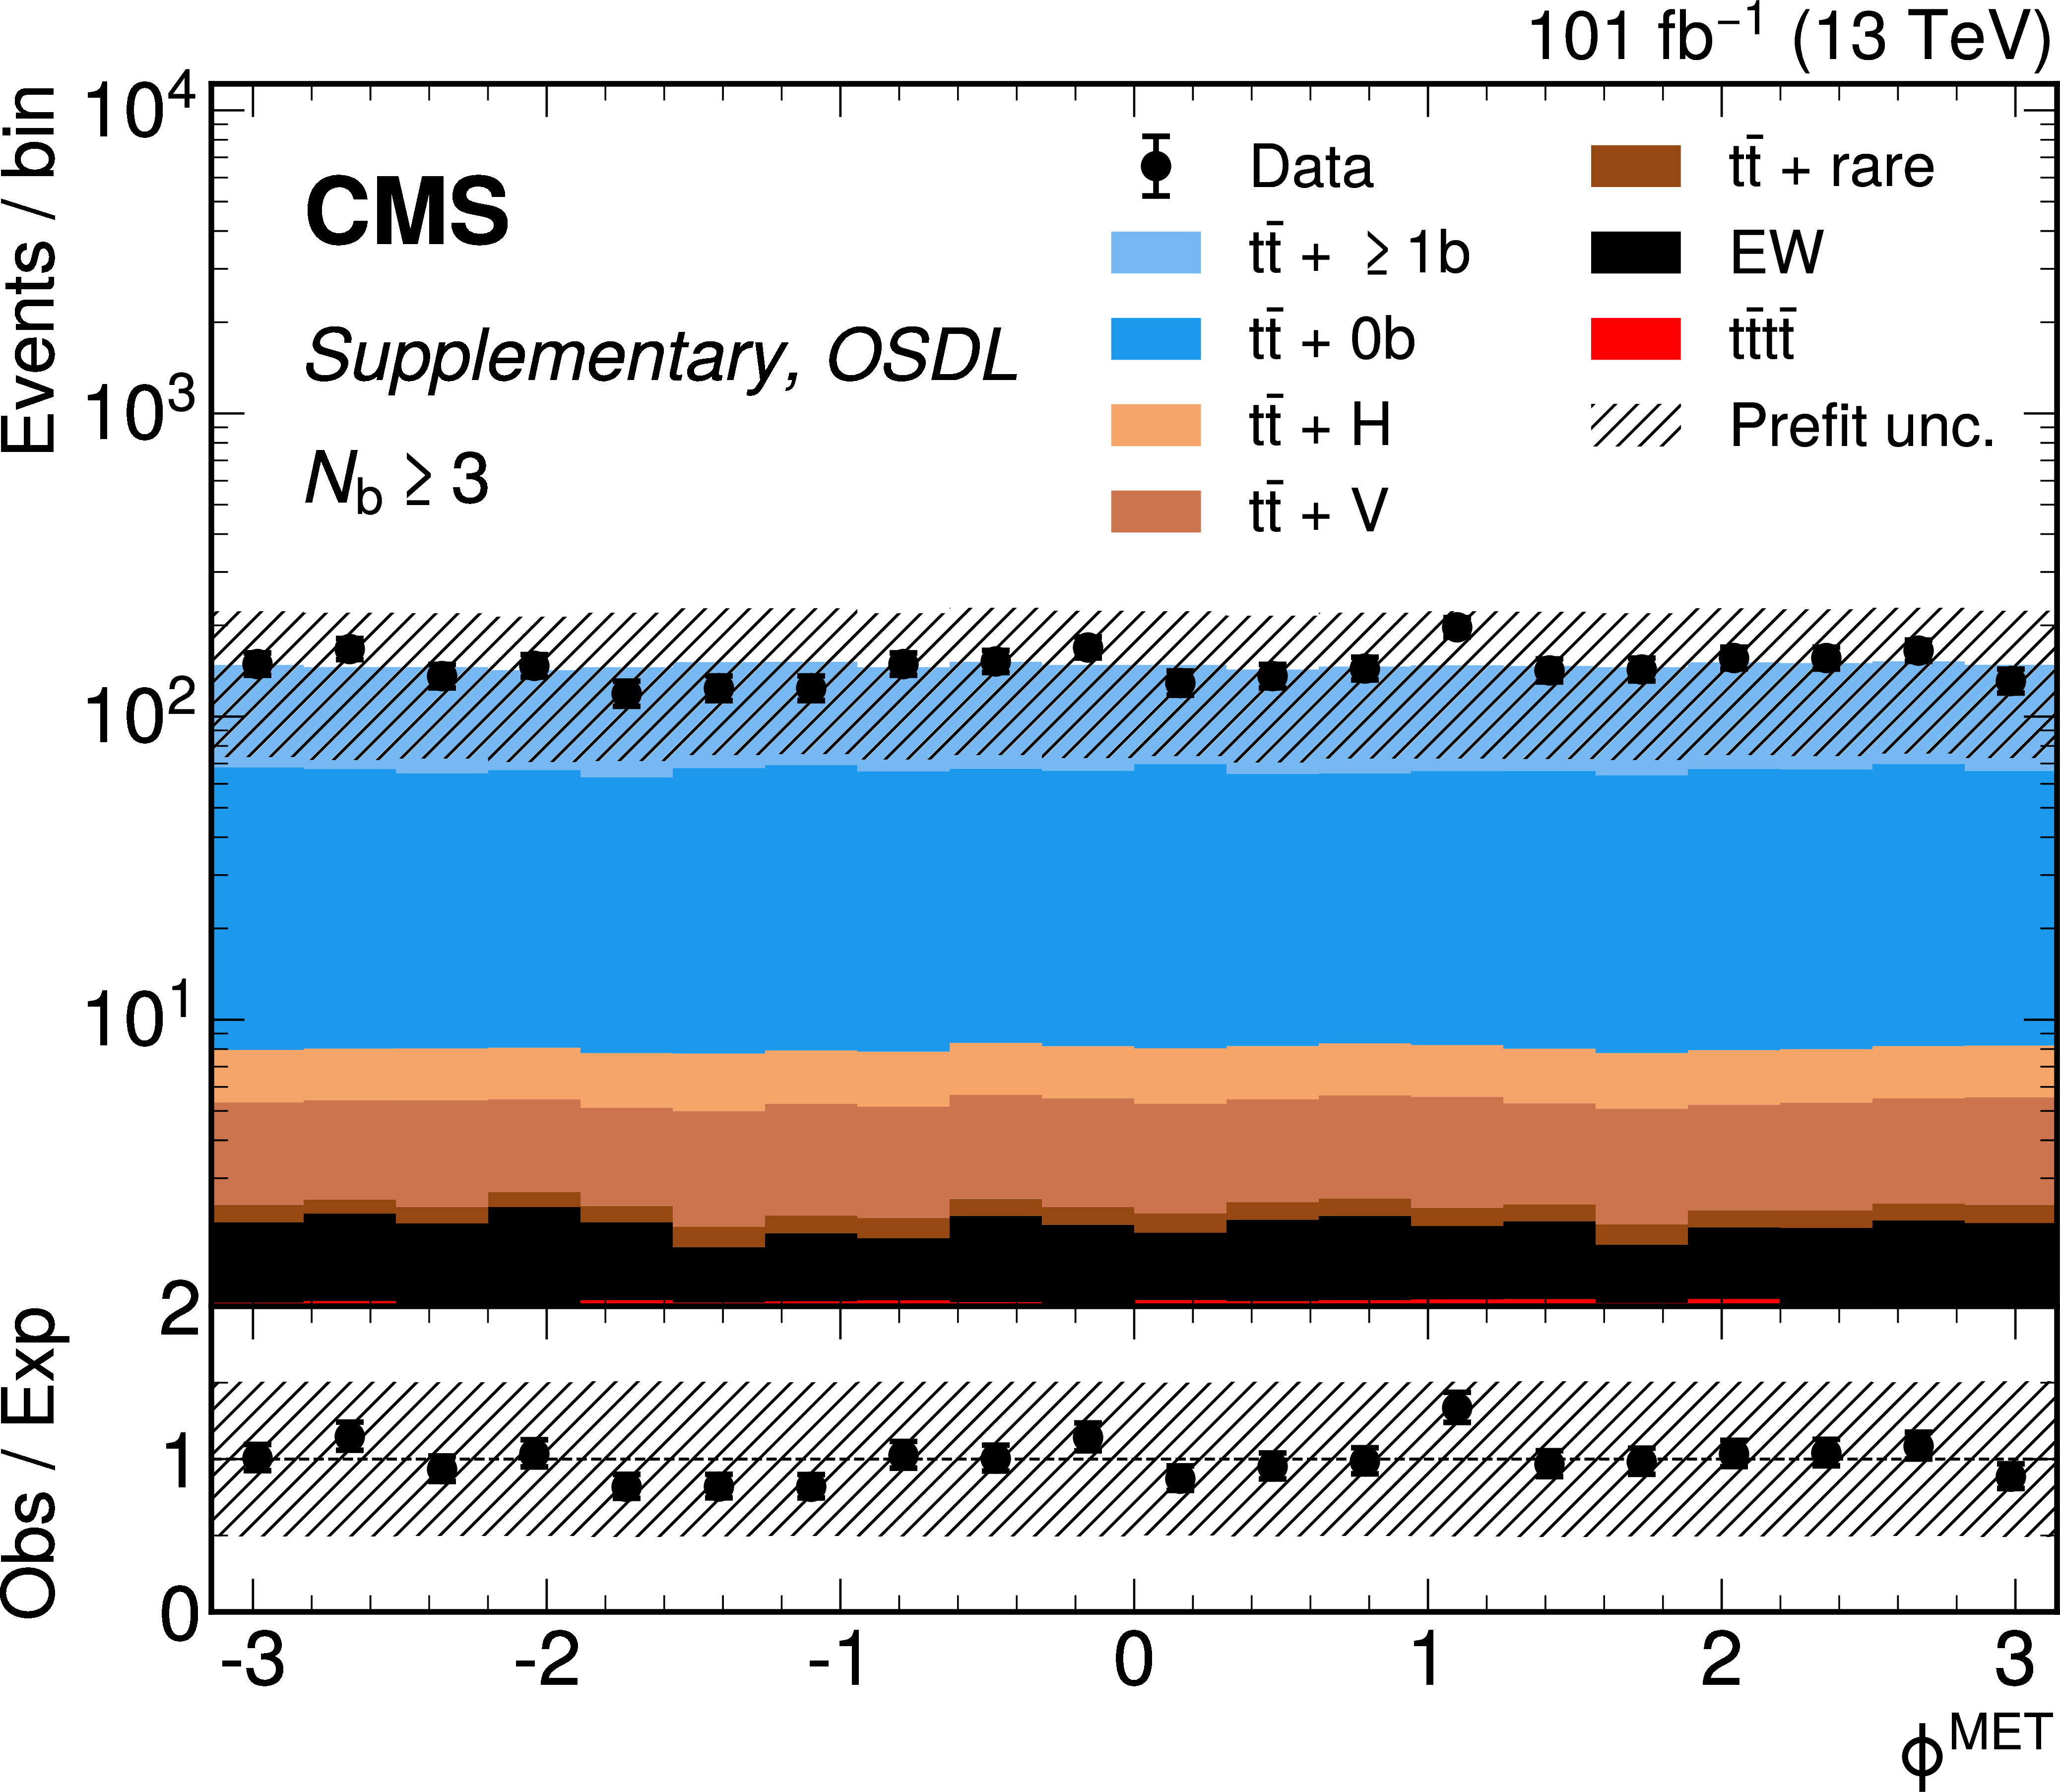
png pdf |
Additional Figure 18-f:
OSDL channel prefit distributions for $ N_\text{BT} \geq $ 3 jets categories. From left to right, top to bottom, are figures for the b-tag discriminant of the fourth highest $ p_{\mathrm{T}} $ and b-tagged jets per event; the $ \eta $ and $ p_{\mathrm{T}} $ of the fourth highest $ p_{\mathrm{T}} $ jet; the ratio of $ H_T^{2M} $ to $ H_{\mathrm{T}} $; the $ \phi $ and magnitude of the missing transverse energy (MET); the transverse mass of the MET with the electron or muon; the $ \eta $, $ p_{\mathrm{T}} $ of the leading muon; the muon PF isolation (complete and charged components); and the jet multiplicity and b-tag multiplicity. Backgrounds are as described in Fig. 17. |
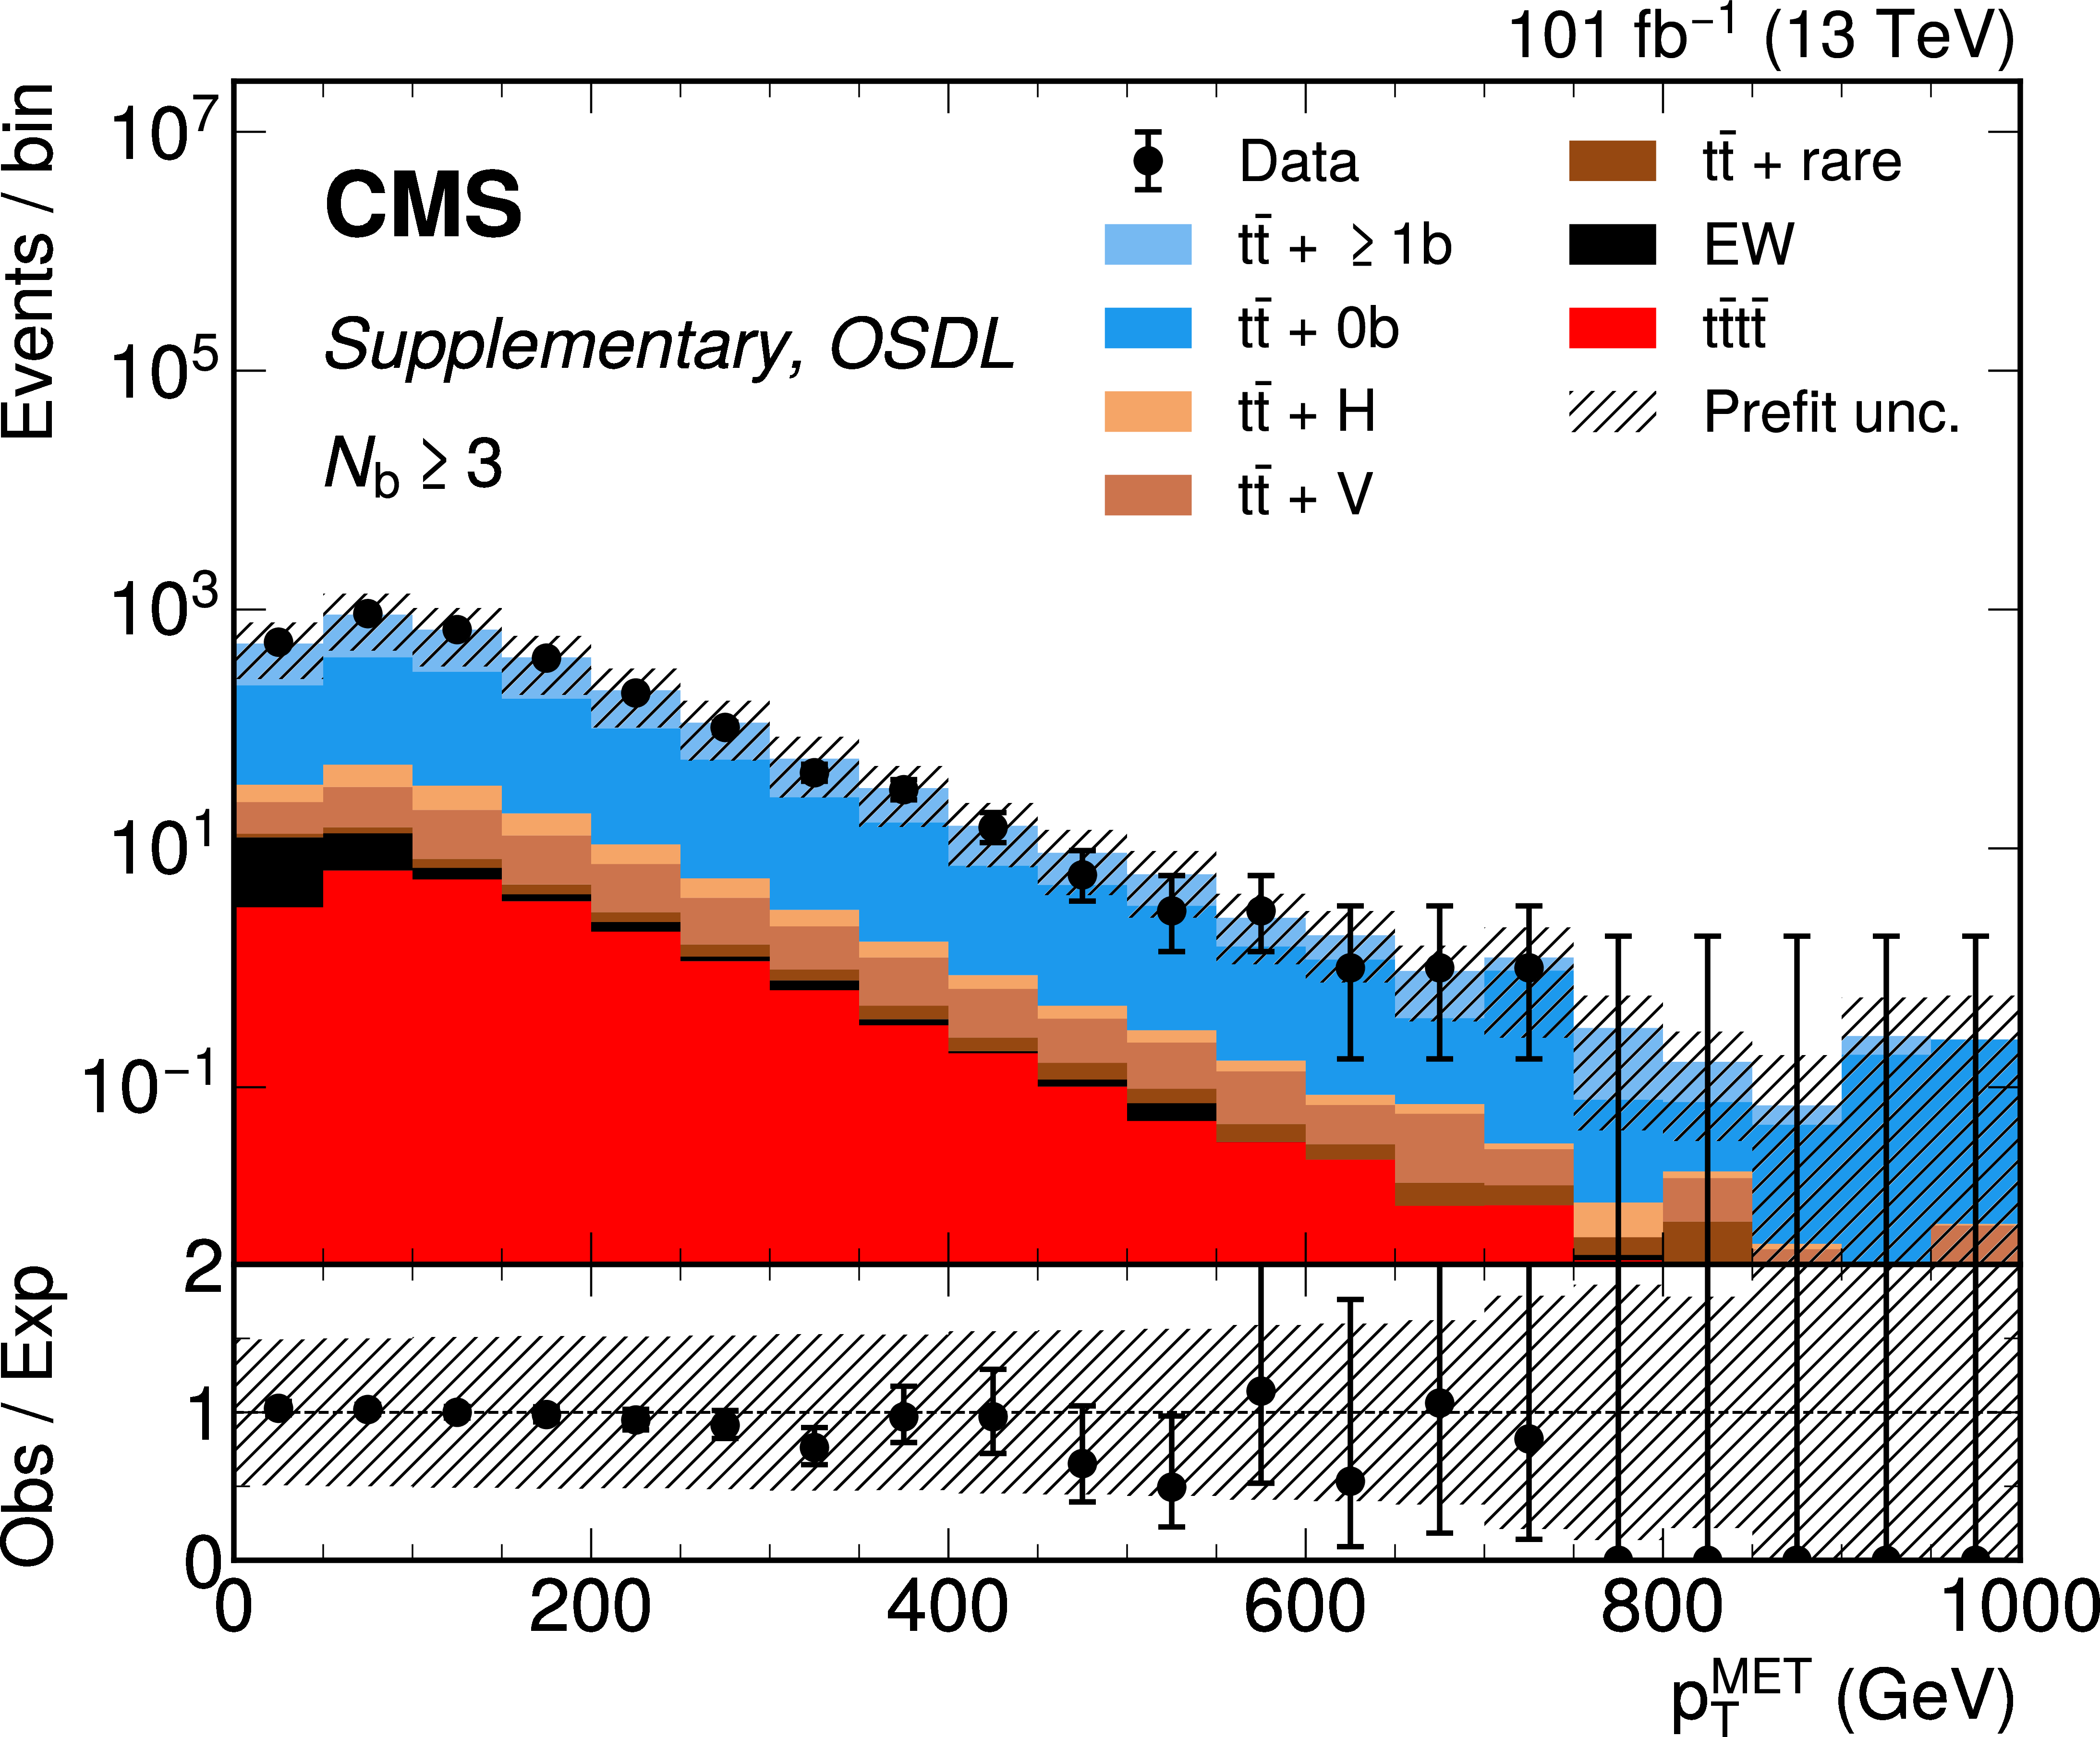
png pdf |
Additional Figure 18-g:
OSDL channel prefit distributions for $ N_\text{BT} \geq $ 3 jets categories. From left to right, top to bottom, are figures for the b-tag discriminant of the fourth highest $ p_{\mathrm{T}} $ and b-tagged jets per event; the $ \eta $ and $ p_{\mathrm{T}} $ of the fourth highest $ p_{\mathrm{T}} $ jet; the ratio of $ H_T^{2M} $ to $ H_{\mathrm{T}} $; the $ \phi $ and magnitude of the missing transverse energy (MET); the transverse mass of the MET with the electron or muon; the $ \eta $, $ p_{\mathrm{T}} $ of the leading muon; the muon PF isolation (complete and charged components); and the jet multiplicity and b-tag multiplicity. Backgrounds are as described in Fig. 17. |
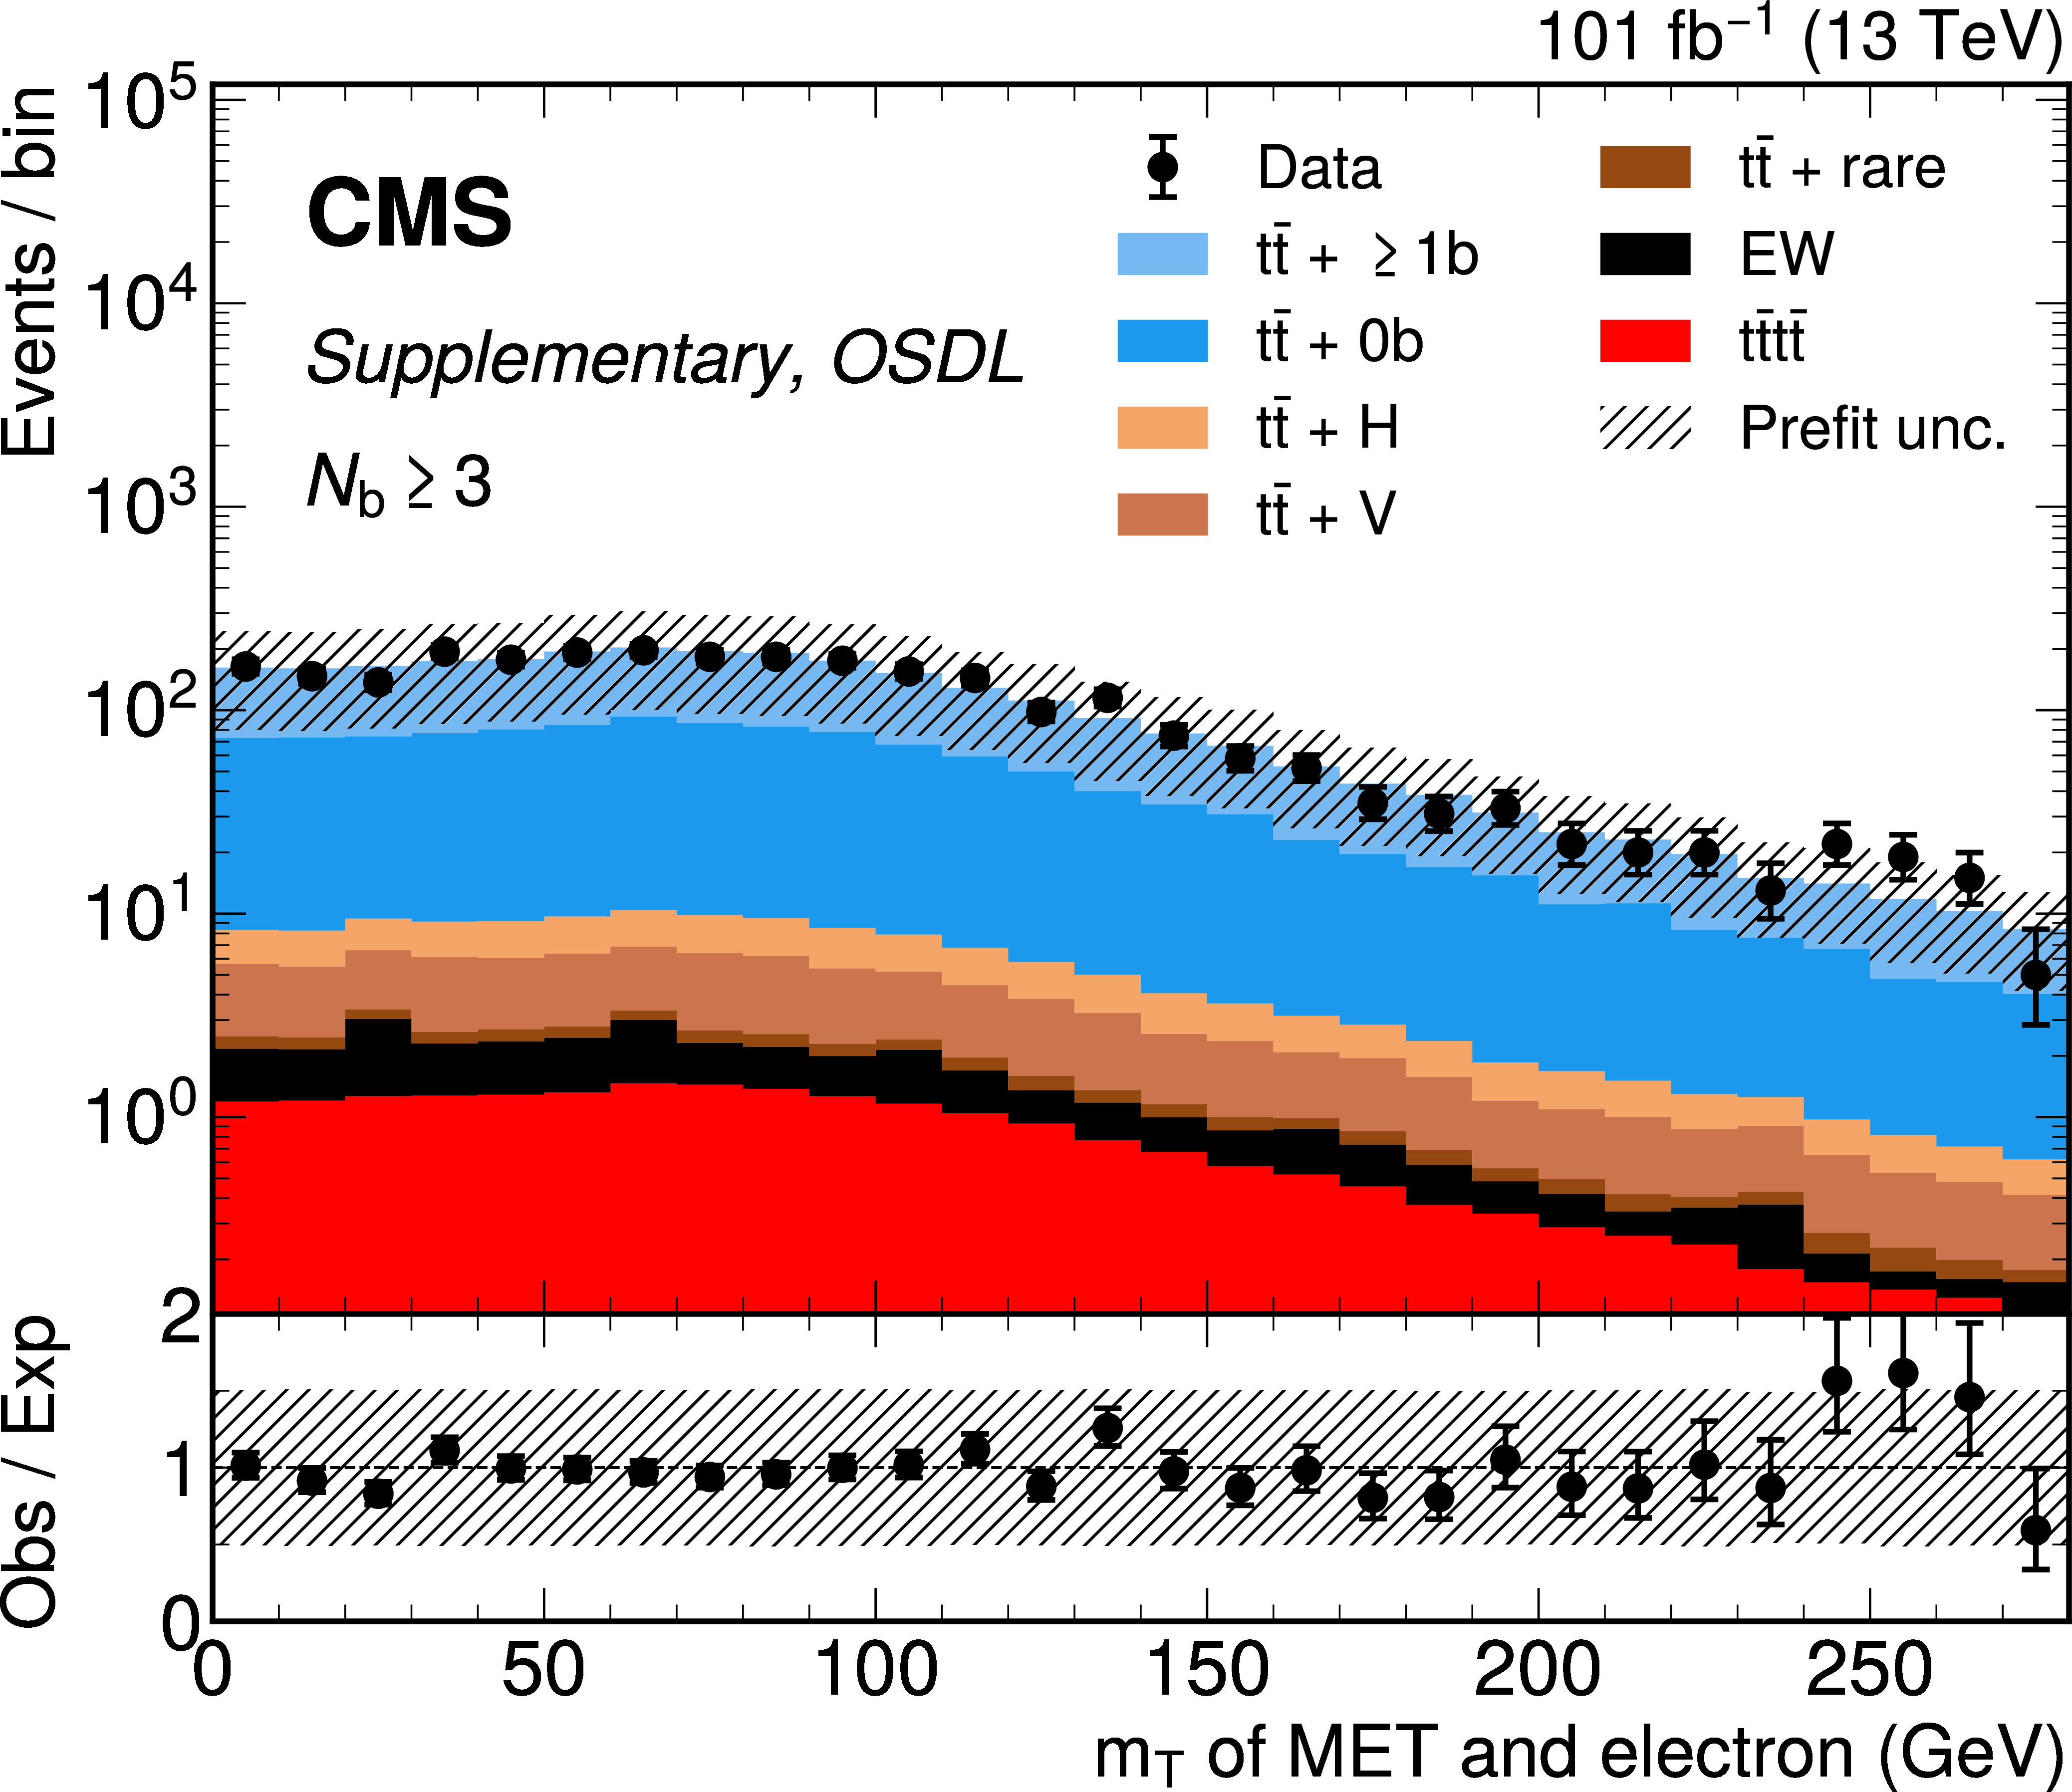
png pdf |
Additional Figure 18-h:
OSDL channel prefit distributions for $ N_\text{BT} \geq $ 3 jets categories. From left to right, top to bottom, are figures for the b-tag discriminant of the fourth highest $ p_{\mathrm{T}} $ and b-tagged jets per event; the $ \eta $ and $ p_{\mathrm{T}} $ of the fourth highest $ p_{\mathrm{T}} $ jet; the ratio of $ H_T^{2M} $ to $ H_{\mathrm{T}} $; the $ \phi $ and magnitude of the missing transverse energy (MET); the transverse mass of the MET with the electron or muon; the $ \eta $, $ p_{\mathrm{T}} $ of the leading muon; the muon PF isolation (complete and charged components); and the jet multiplicity and b-tag multiplicity. Backgrounds are as described in Fig. 17. |

png pdf |
Additional Figure 18-i:
OSDL channel prefit distributions for $ N_\text{BT} \geq $ 3 jets categories. From left to right, top to bottom, are figures for the b-tag discriminant of the fourth highest $ p_{\mathrm{T}} $ and b-tagged jets per event; the $ \eta $ and $ p_{\mathrm{T}} $ of the fourth highest $ p_{\mathrm{T}} $ jet; the ratio of $ H_T^{2M} $ to $ H_{\mathrm{T}} $; the $ \phi $ and magnitude of the missing transverse energy (MET); the transverse mass of the MET with the electron or muon; the $ \eta $, $ p_{\mathrm{T}} $ of the leading muon; the muon PF isolation (complete and charged components); and the jet multiplicity and b-tag multiplicity. Backgrounds are as described in Fig. 17. |
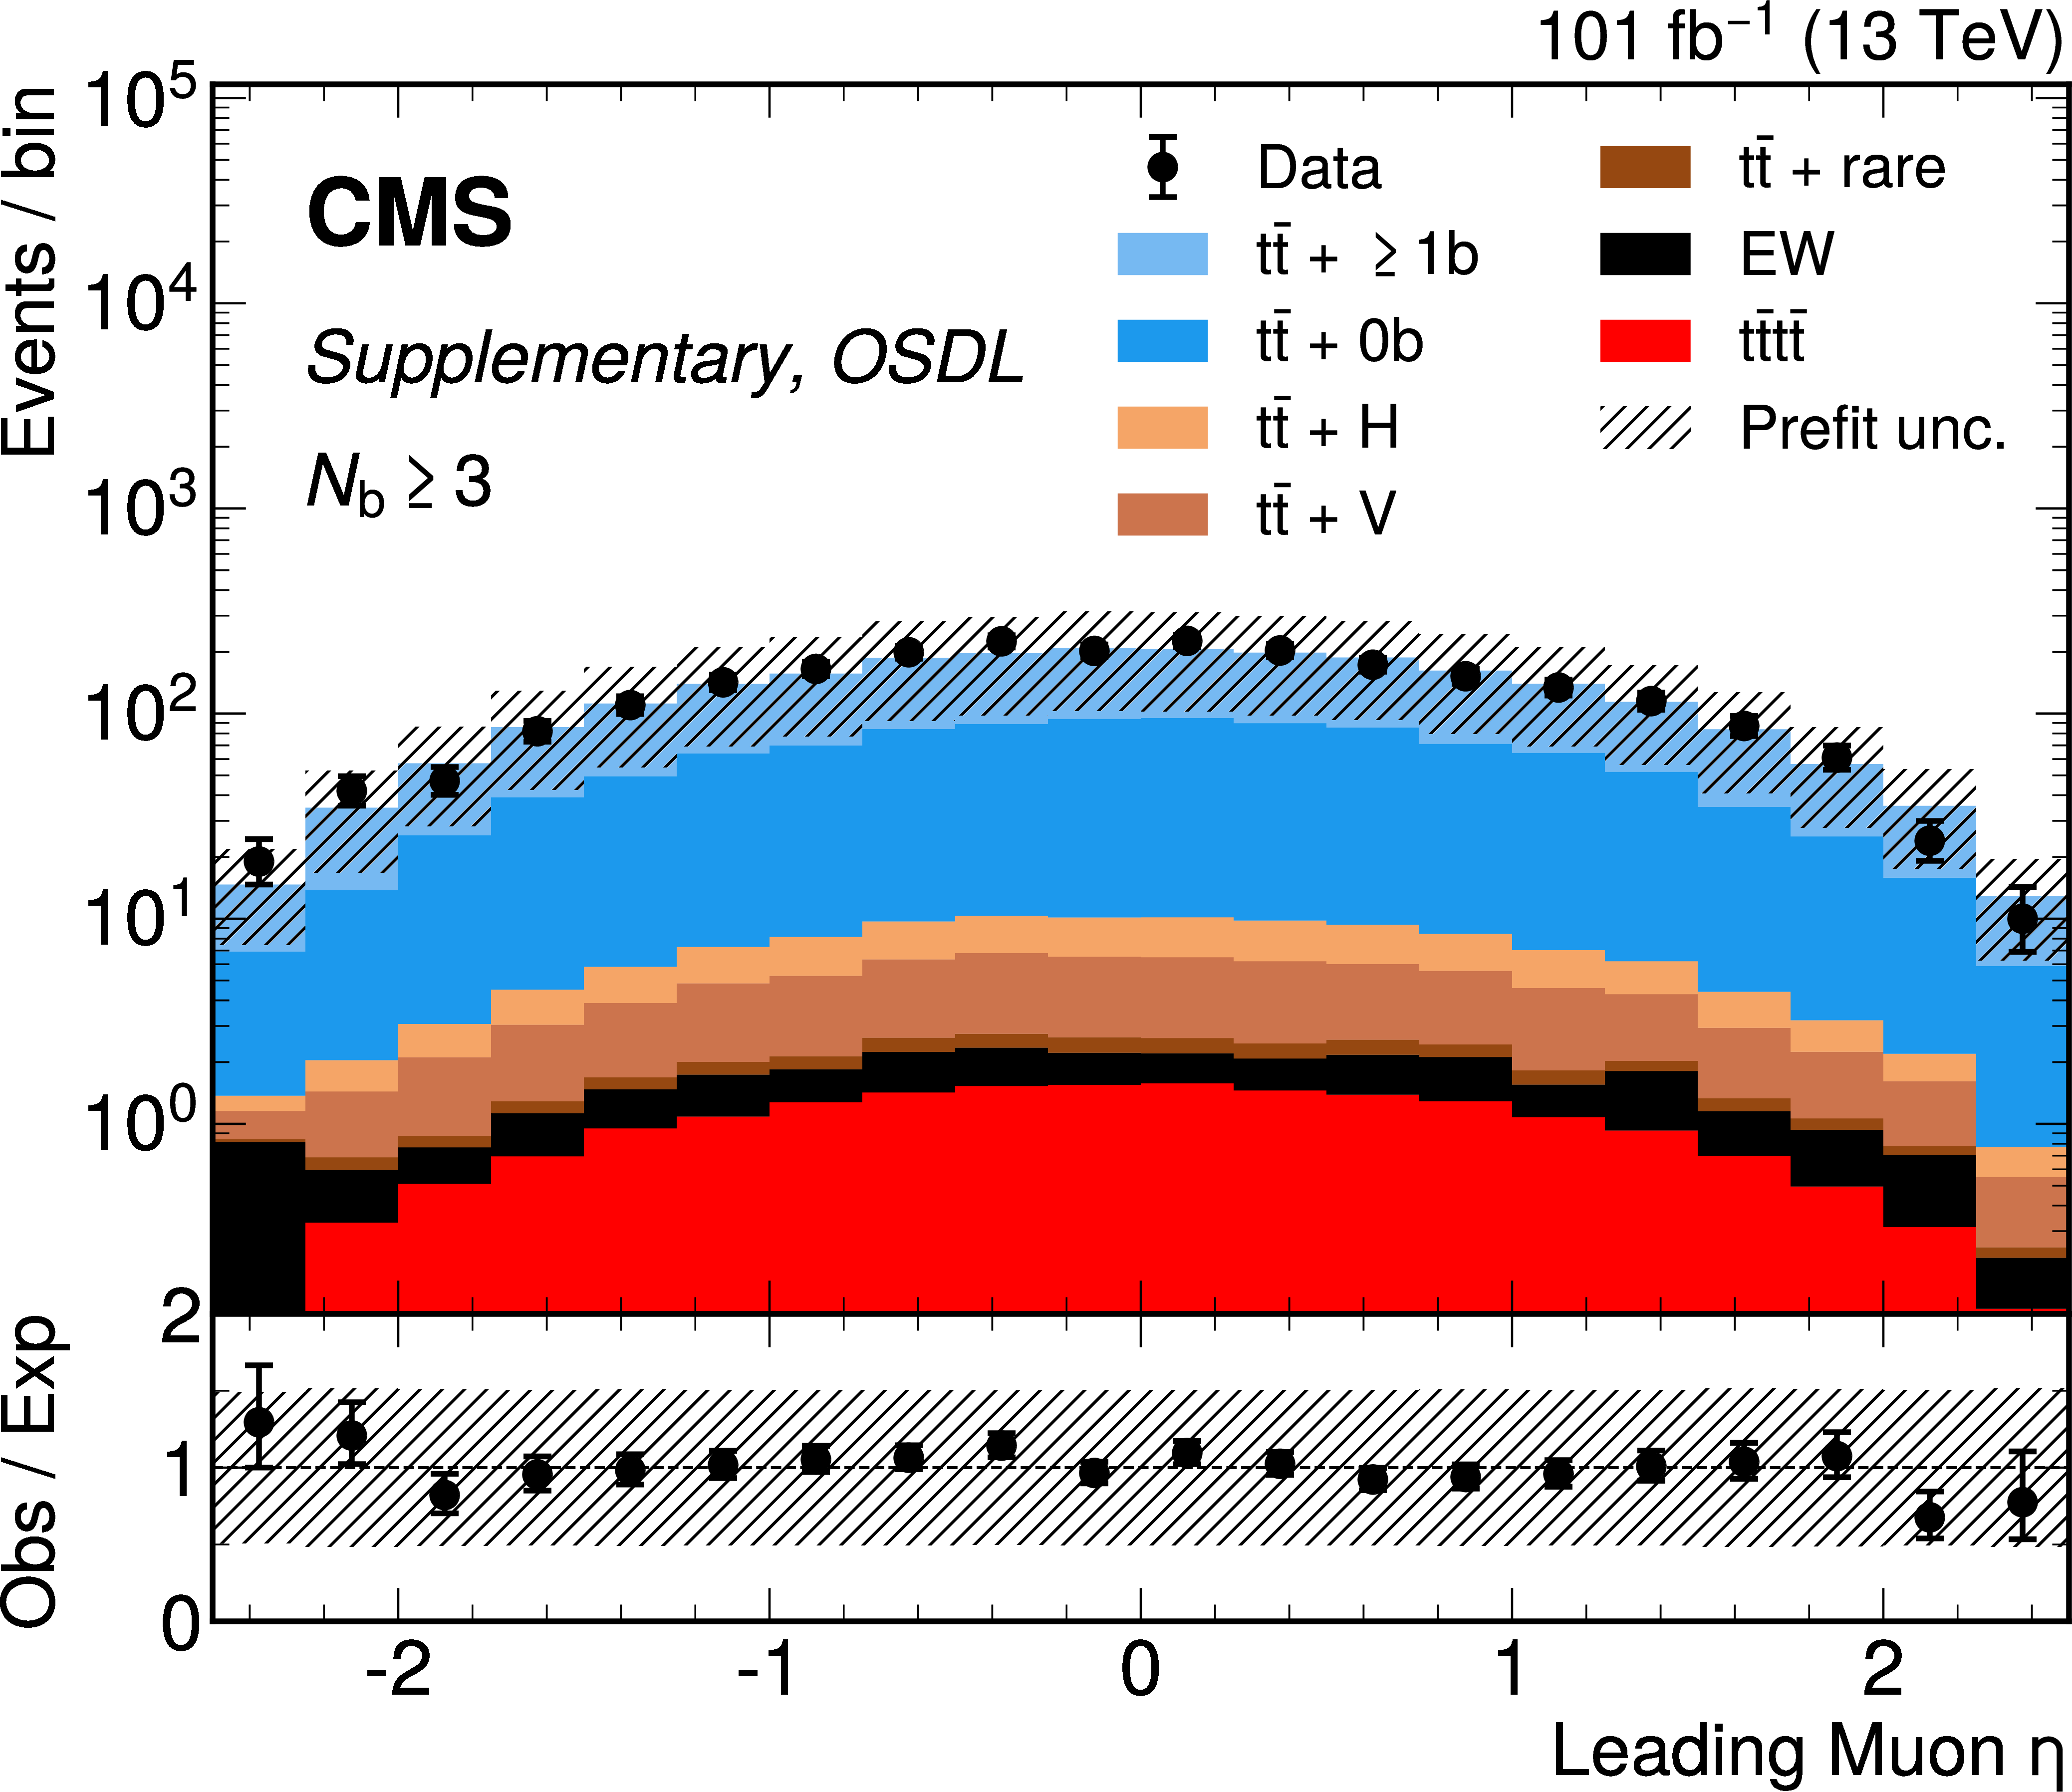
png pdf |
Additional Figure 18-j:
OSDL channel prefit distributions for $ N_\text{BT} \geq $ 3 jets categories. From left to right, top to bottom, are figures for the b-tag discriminant of the fourth highest $ p_{\mathrm{T}} $ and b-tagged jets per event; the $ \eta $ and $ p_{\mathrm{T}} $ of the fourth highest $ p_{\mathrm{T}} $ jet; the ratio of $ H_T^{2M} $ to $ H_{\mathrm{T}} $; the $ \phi $ and magnitude of the missing transverse energy (MET); the transverse mass of the MET with the electron or muon; the $ \eta $, $ p_{\mathrm{T}} $ of the leading muon; the muon PF isolation (complete and charged components); and the jet multiplicity and b-tag multiplicity. Backgrounds are as described in Fig. 17. |
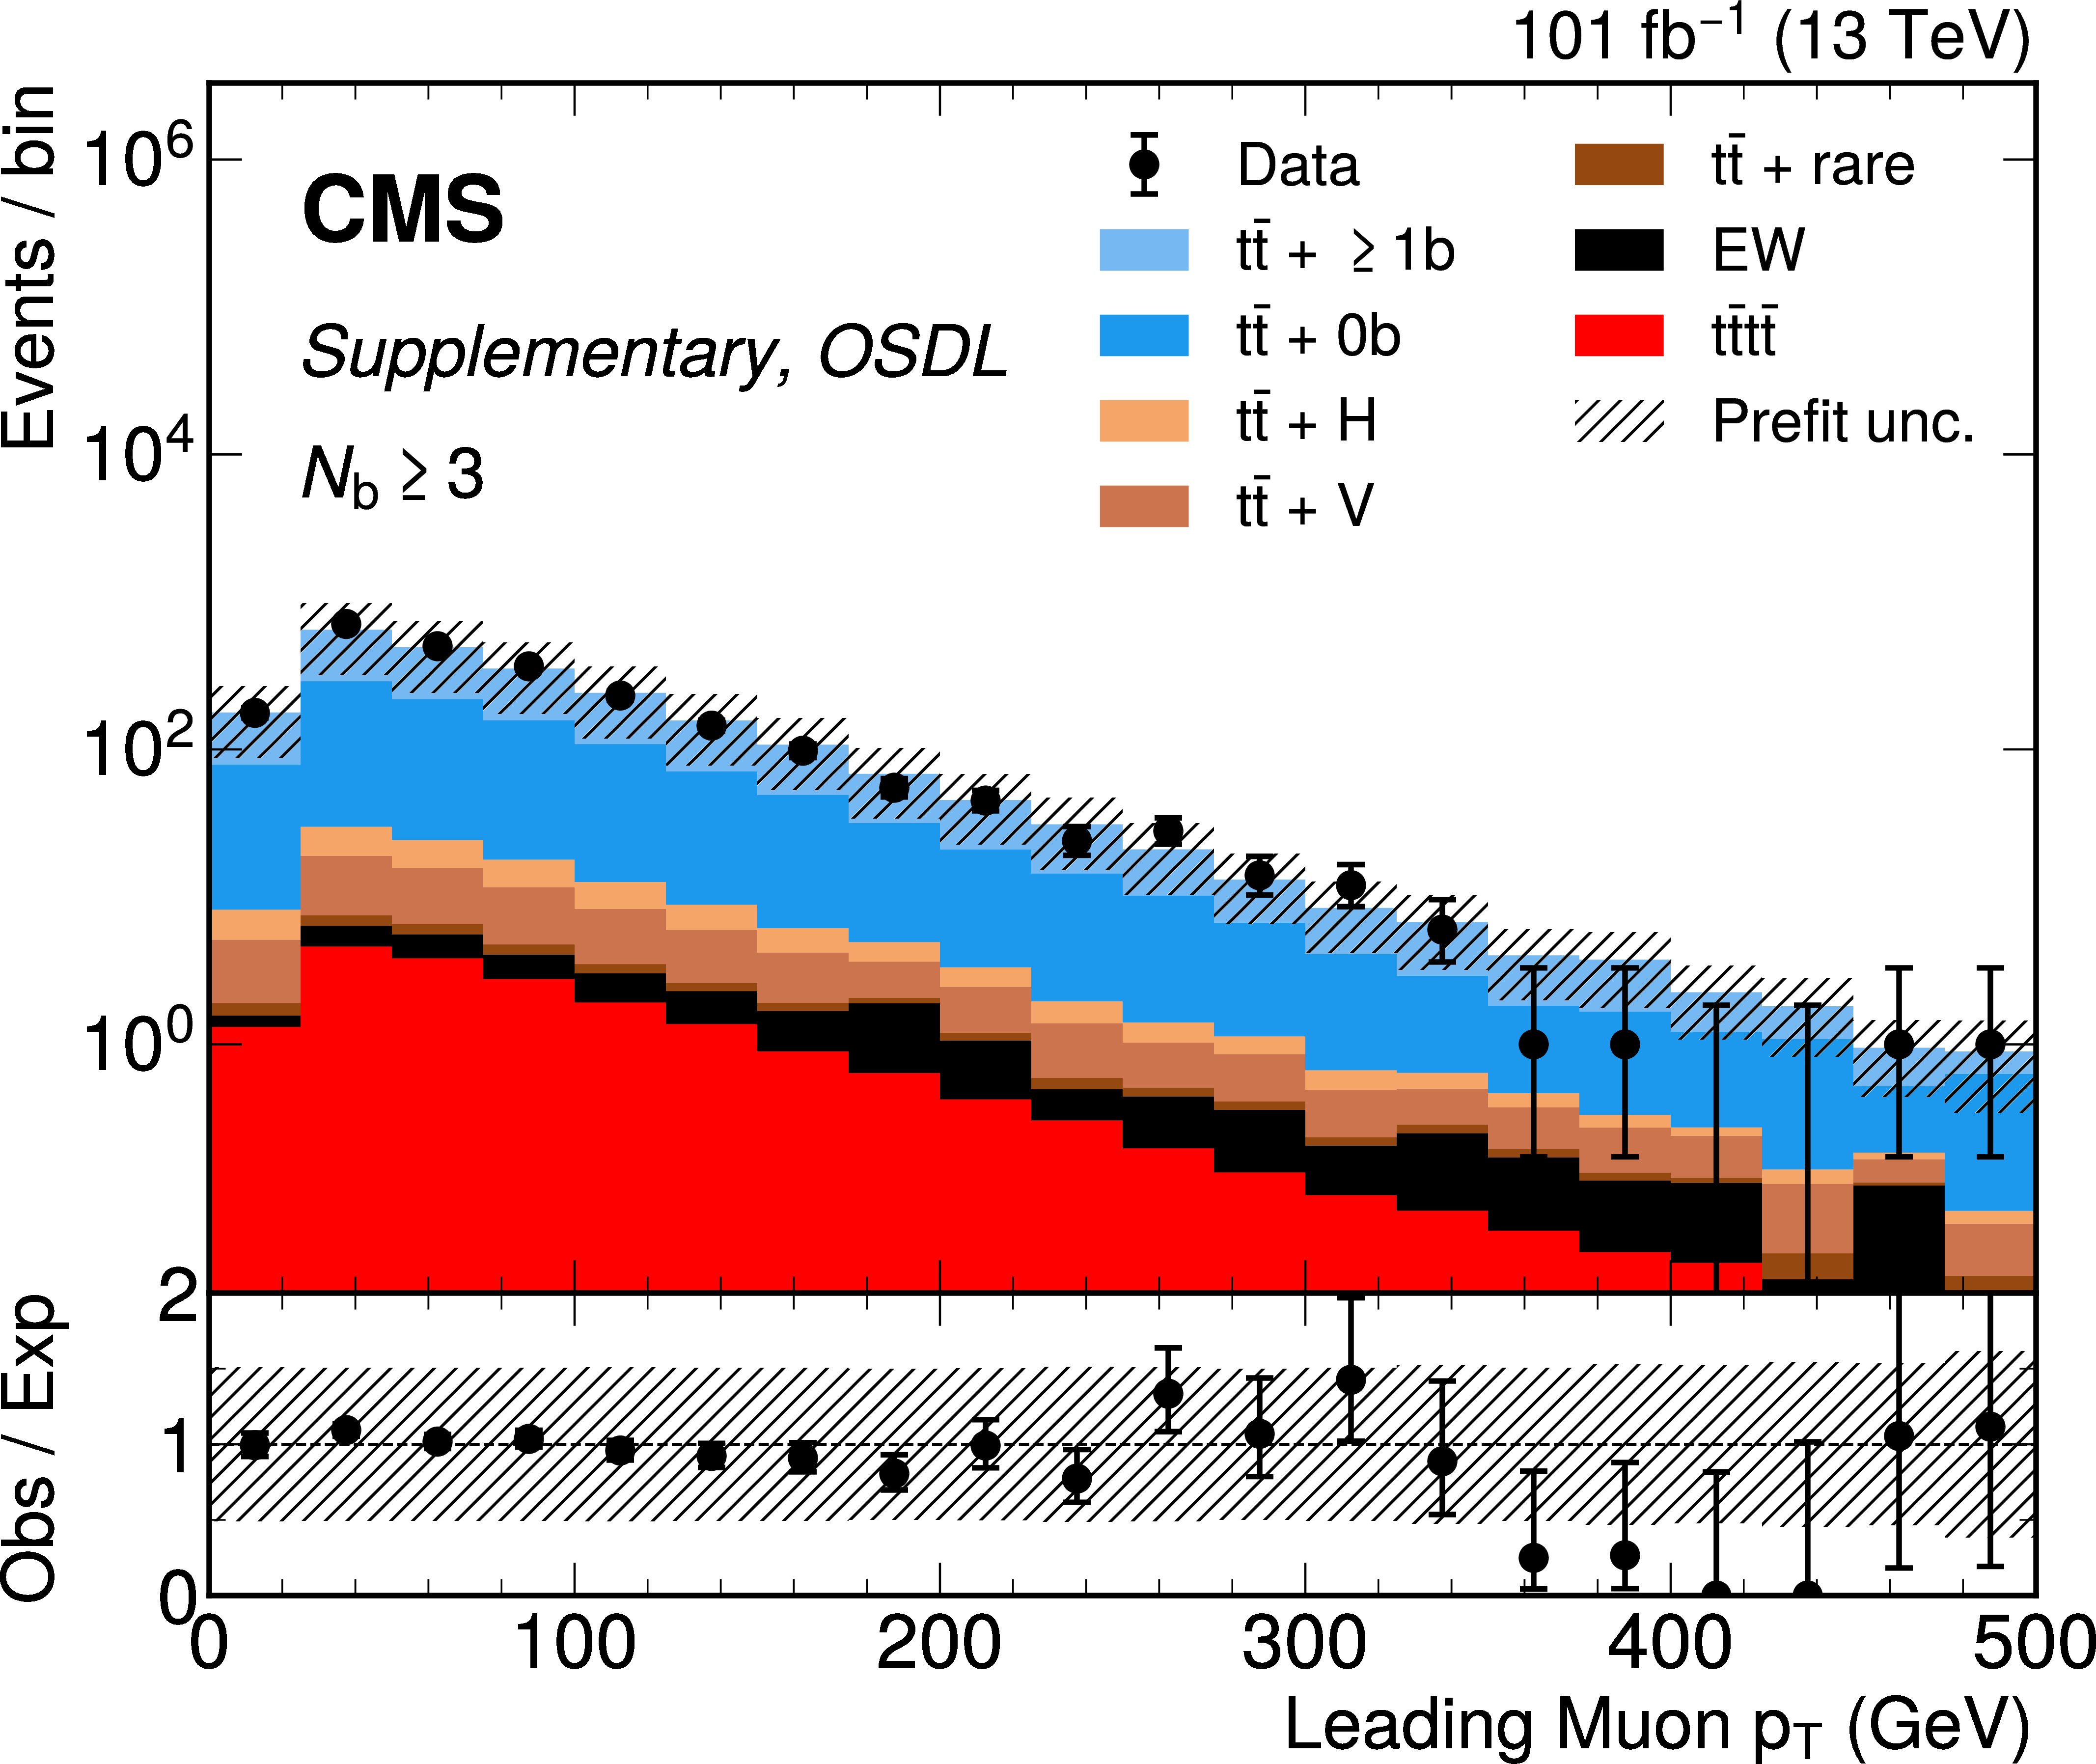
png pdf |
Additional Figure 18-k:
OSDL channel prefit distributions for $ N_\text{BT} \geq $ 3 jets categories. From left to right, top to bottom, are figures for the b-tag discriminant of the fourth highest $ p_{\mathrm{T}} $ and b-tagged jets per event; the $ \eta $ and $ p_{\mathrm{T}} $ of the fourth highest $ p_{\mathrm{T}} $ jet; the ratio of $ H_T^{2M} $ to $ H_{\mathrm{T}} $; the $ \phi $ and magnitude of the missing transverse energy (MET); the transverse mass of the MET with the electron or muon; the $ \eta $, $ p_{\mathrm{T}} $ of the leading muon; the muon PF isolation (complete and charged components); and the jet multiplicity and b-tag multiplicity. Backgrounds are as described in Fig. 17. |
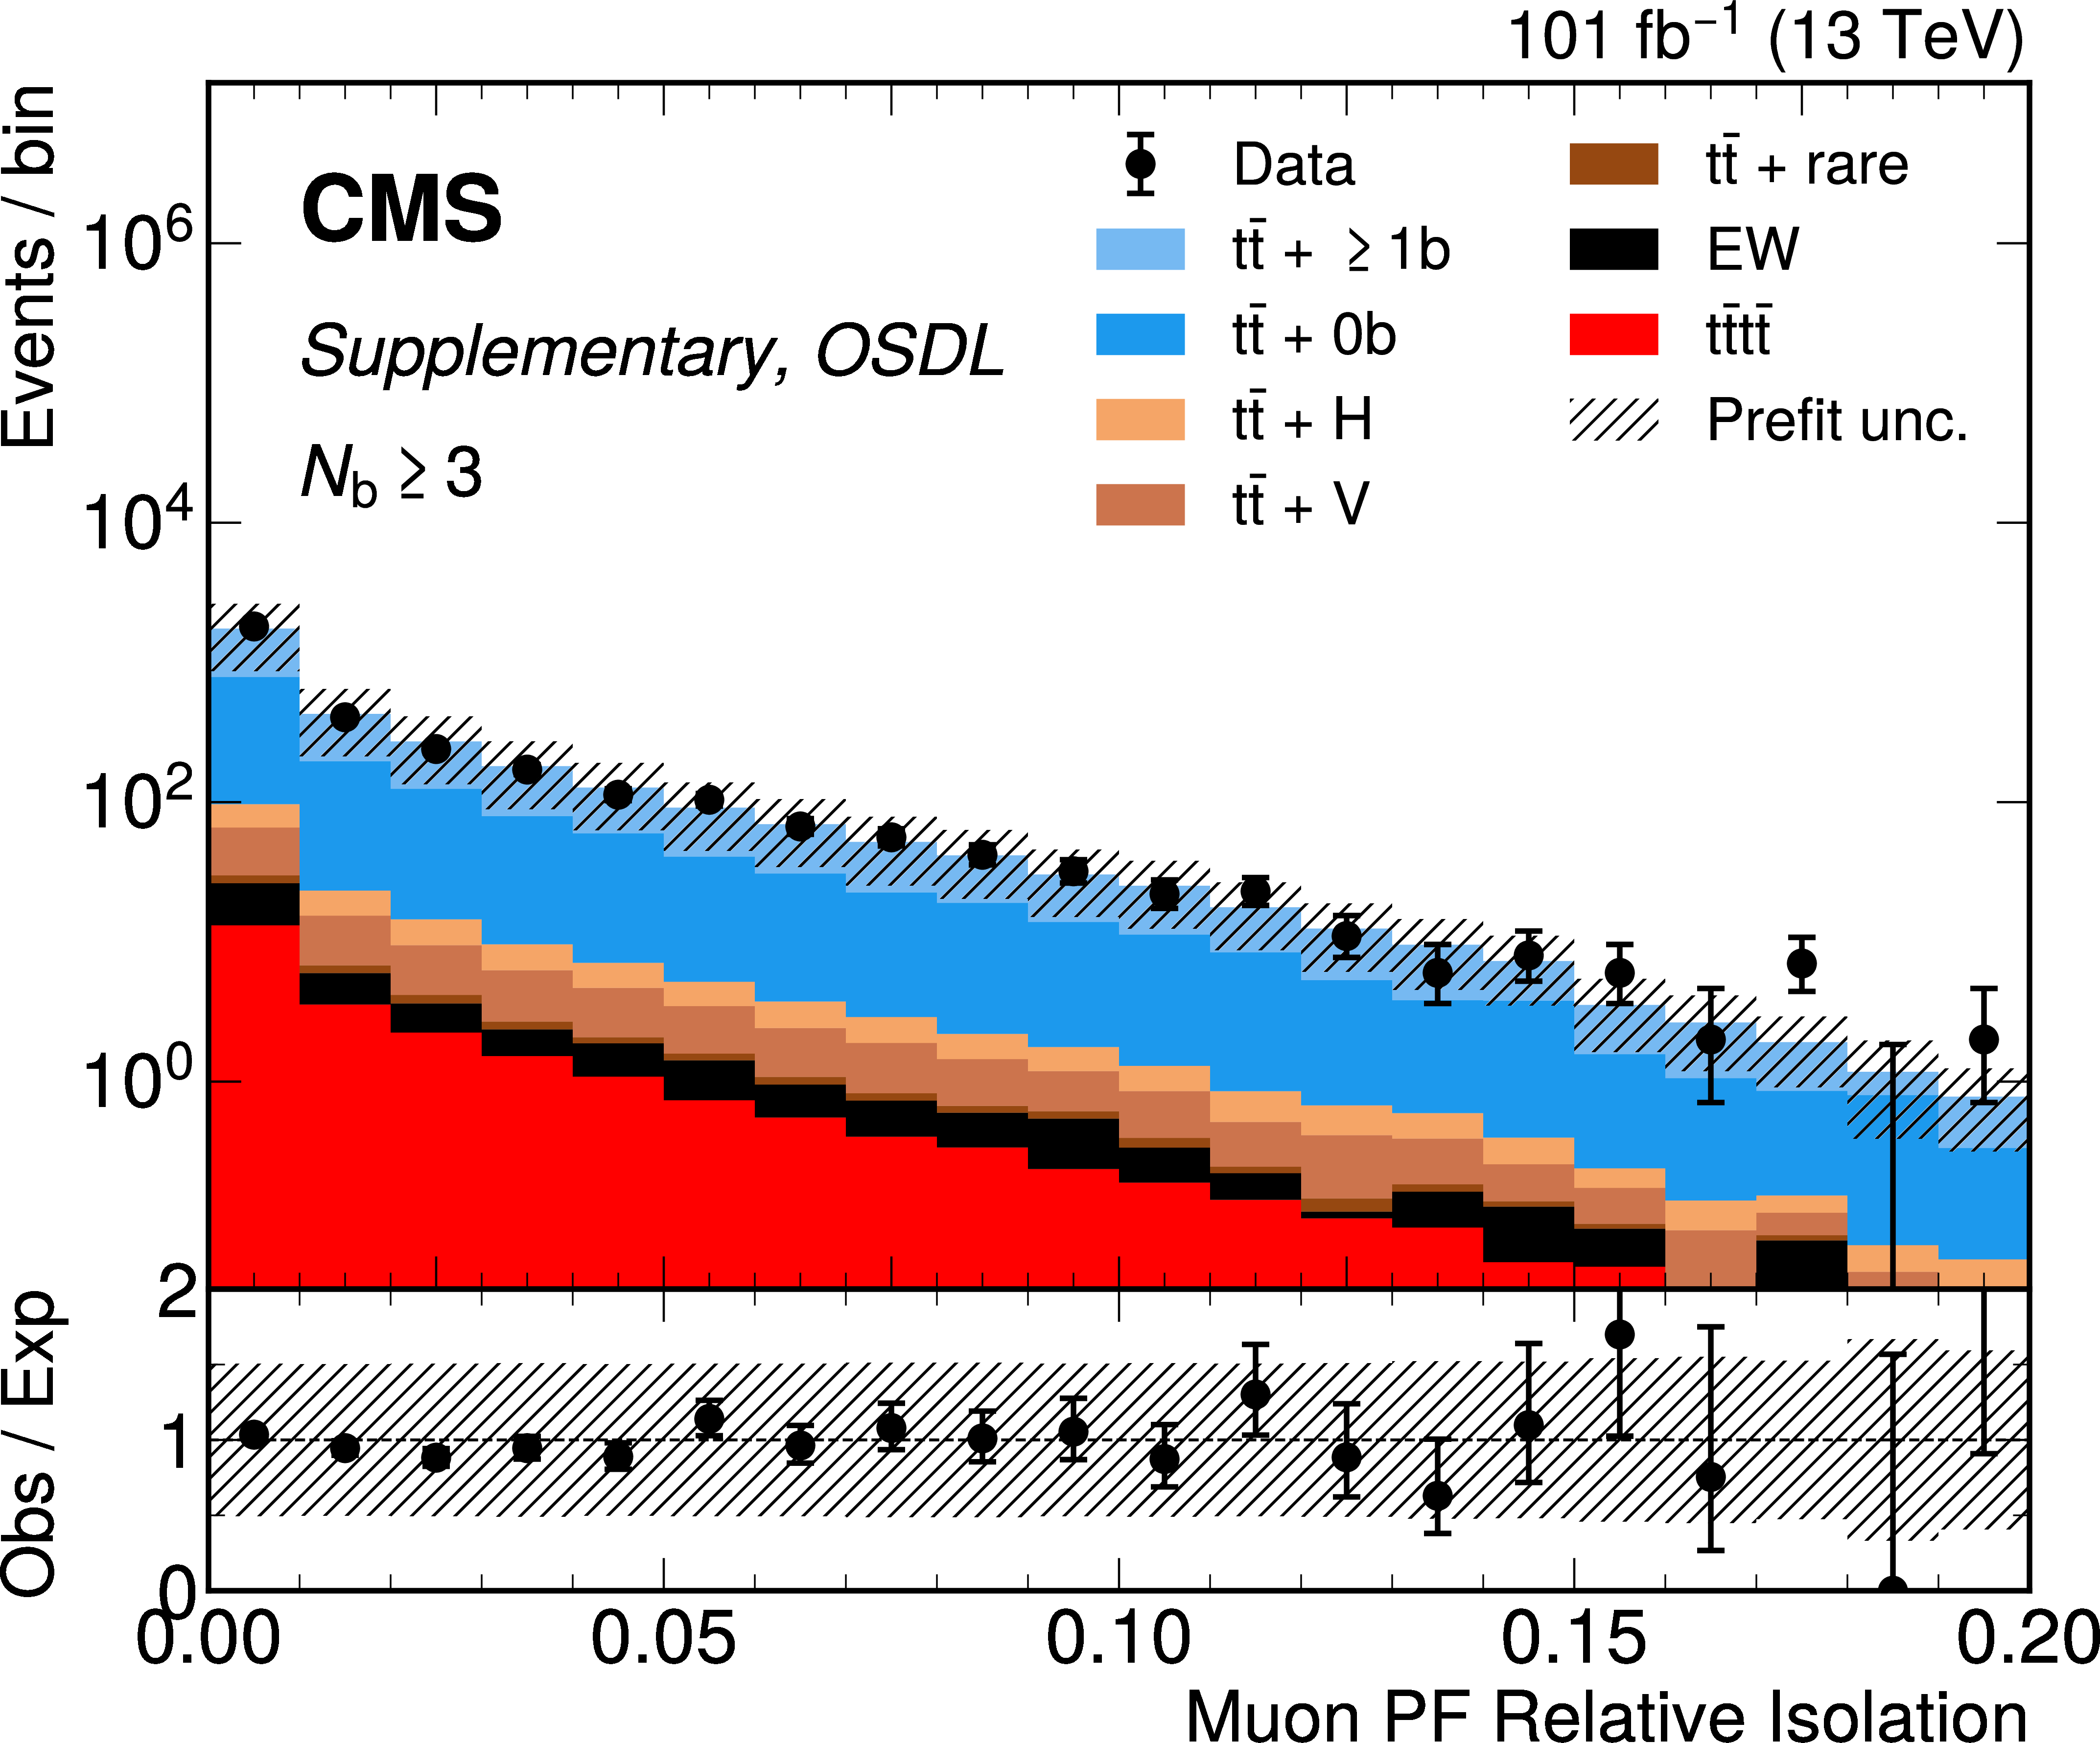
png pdf |
Additional Figure 18-l:
OSDL channel prefit distributions for $ N_\text{BT} \geq $ 3 jets categories. From left to right, top to bottom, are figures for the b-tag discriminant of the fourth highest $ p_{\mathrm{T}} $ and b-tagged jets per event; the $ \eta $ and $ p_{\mathrm{T}} $ of the fourth highest $ p_{\mathrm{T}} $ jet; the ratio of $ H_T^{2M} $ to $ H_{\mathrm{T}} $; the $ \phi $ and magnitude of the missing transverse energy (MET); the transverse mass of the MET with the electron or muon; the $ \eta $, $ p_{\mathrm{T}} $ of the leading muon; the muon PF isolation (complete and charged components); and the jet multiplicity and b-tag multiplicity. Backgrounds are as described in Fig. 17. |

png pdf |
Additional Figure 18-m:
OSDL channel prefit distributions for $ N_\text{BT} \geq $ 3 jets categories. From left to right, top to bottom, are figures for the b-tag discriminant of the fourth highest $ p_{\mathrm{T}} $ and b-tagged jets per event; the $ \eta $ and $ p_{\mathrm{T}} $ of the fourth highest $ p_{\mathrm{T}} $ jet; the ratio of $ H_T^{2M} $ to $ H_{\mathrm{T}} $; the $ \phi $ and magnitude of the missing transverse energy (MET); the transverse mass of the MET with the electron or muon; the $ \eta $, $ p_{\mathrm{T}} $ of the leading muon; the muon PF isolation (complete and charged components); and the jet multiplicity and b-tag multiplicity. Backgrounds are as described in Fig. 17. |

png pdf |
Additional Figure 18-n:
OSDL channel prefit distributions for $ N_\text{BT} \geq $ 3 jets categories. From left to right, top to bottom, are figures for the b-tag discriminant of the fourth highest $ p_{\mathrm{T}} $ and b-tagged jets per event; the $ \eta $ and $ p_{\mathrm{T}} $ of the fourth highest $ p_{\mathrm{T}} $ jet; the ratio of $ H_T^{2M} $ to $ H_{\mathrm{T}} $; the $ \phi $ and magnitude of the missing transverse energy (MET); the transverse mass of the MET with the electron or muon; the $ \eta $, $ p_{\mathrm{T}} $ of the leading muon; the muon PF isolation (complete and charged components); and the jet multiplicity and b-tag multiplicity. Backgrounds are as described in Fig. 17. |
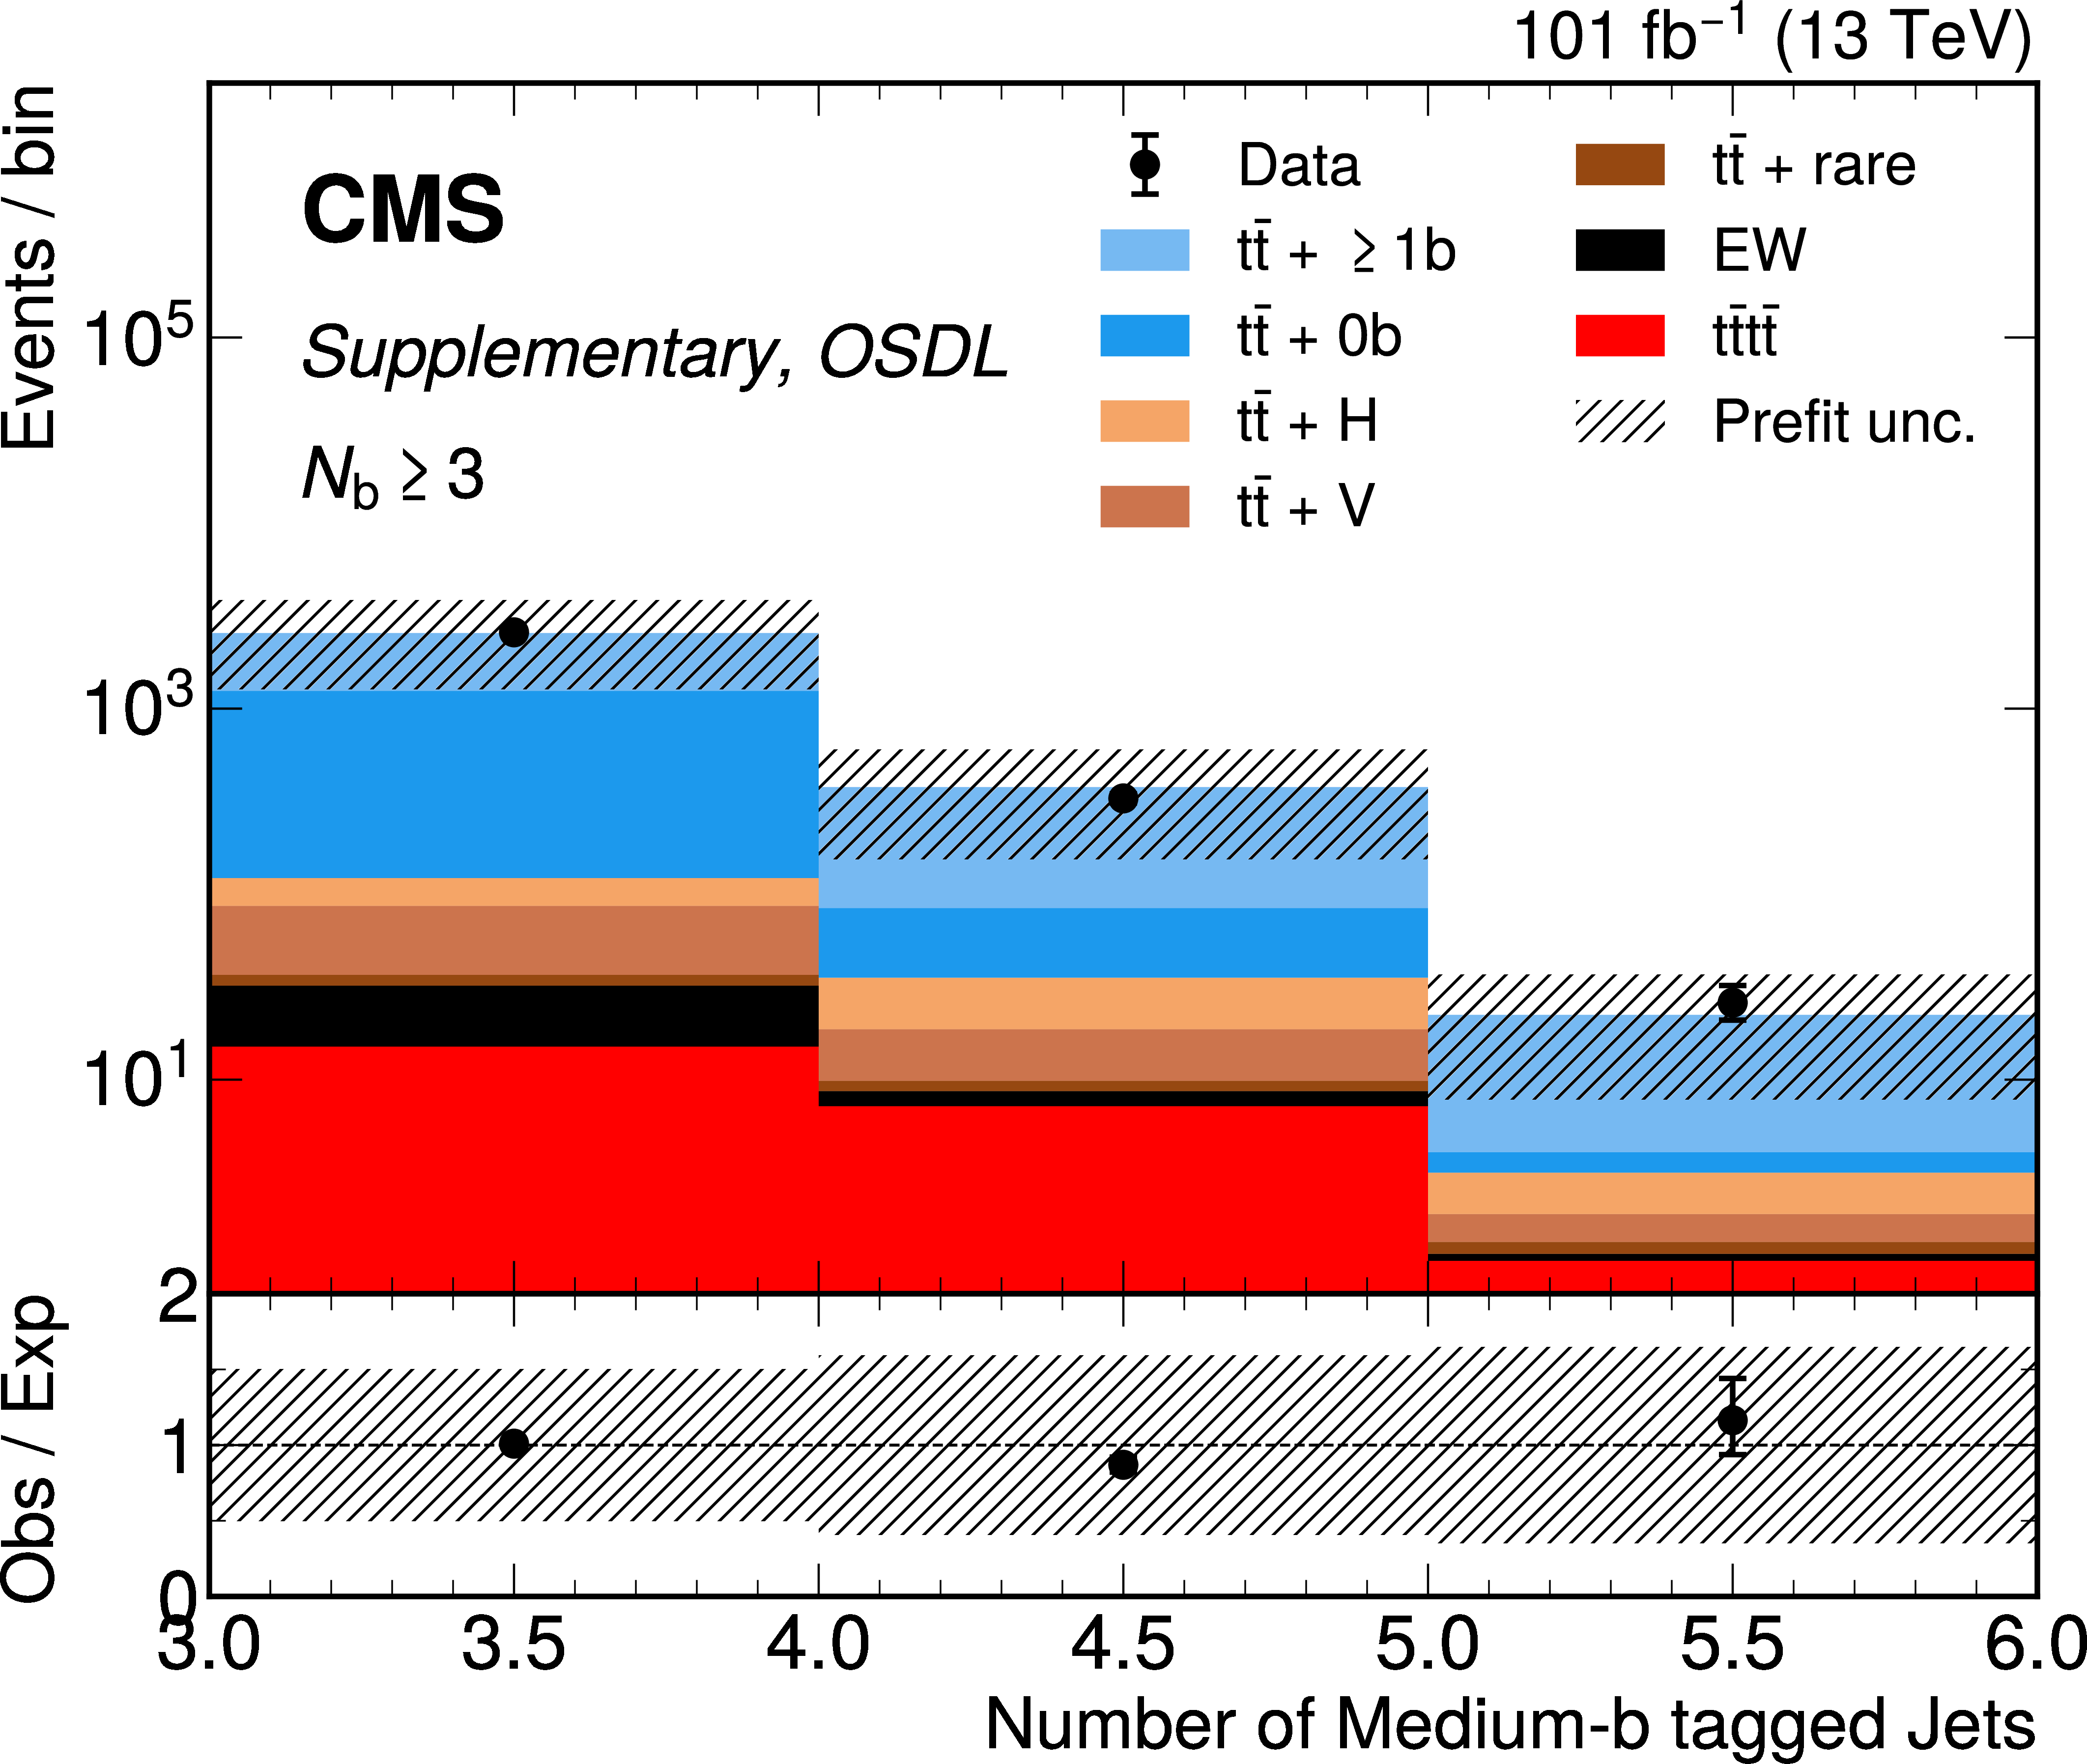
png pdf |
Additional Figure 18-o:
OSDL channel prefit distributions for $ N_\text{BT} \geq $ 3 jets categories. From left to right, top to bottom, are figures for the b-tag discriminant of the fourth highest $ p_{\mathrm{T}} $ and b-tagged jets per event; the $ \eta $ and $ p_{\mathrm{T}} $ of the fourth highest $ p_{\mathrm{T}} $ jet; the ratio of $ H_T^{2M} $ to $ H_{\mathrm{T}} $; the $ \phi $ and magnitude of the missing transverse energy (MET); the transverse mass of the MET with the electron or muon; the $ \eta $, $ p_{\mathrm{T}} $ of the leading muon; the muon PF isolation (complete and charged components); and the jet multiplicity and b-tag multiplicity. Backgrounds are as described in Fig. 17. |
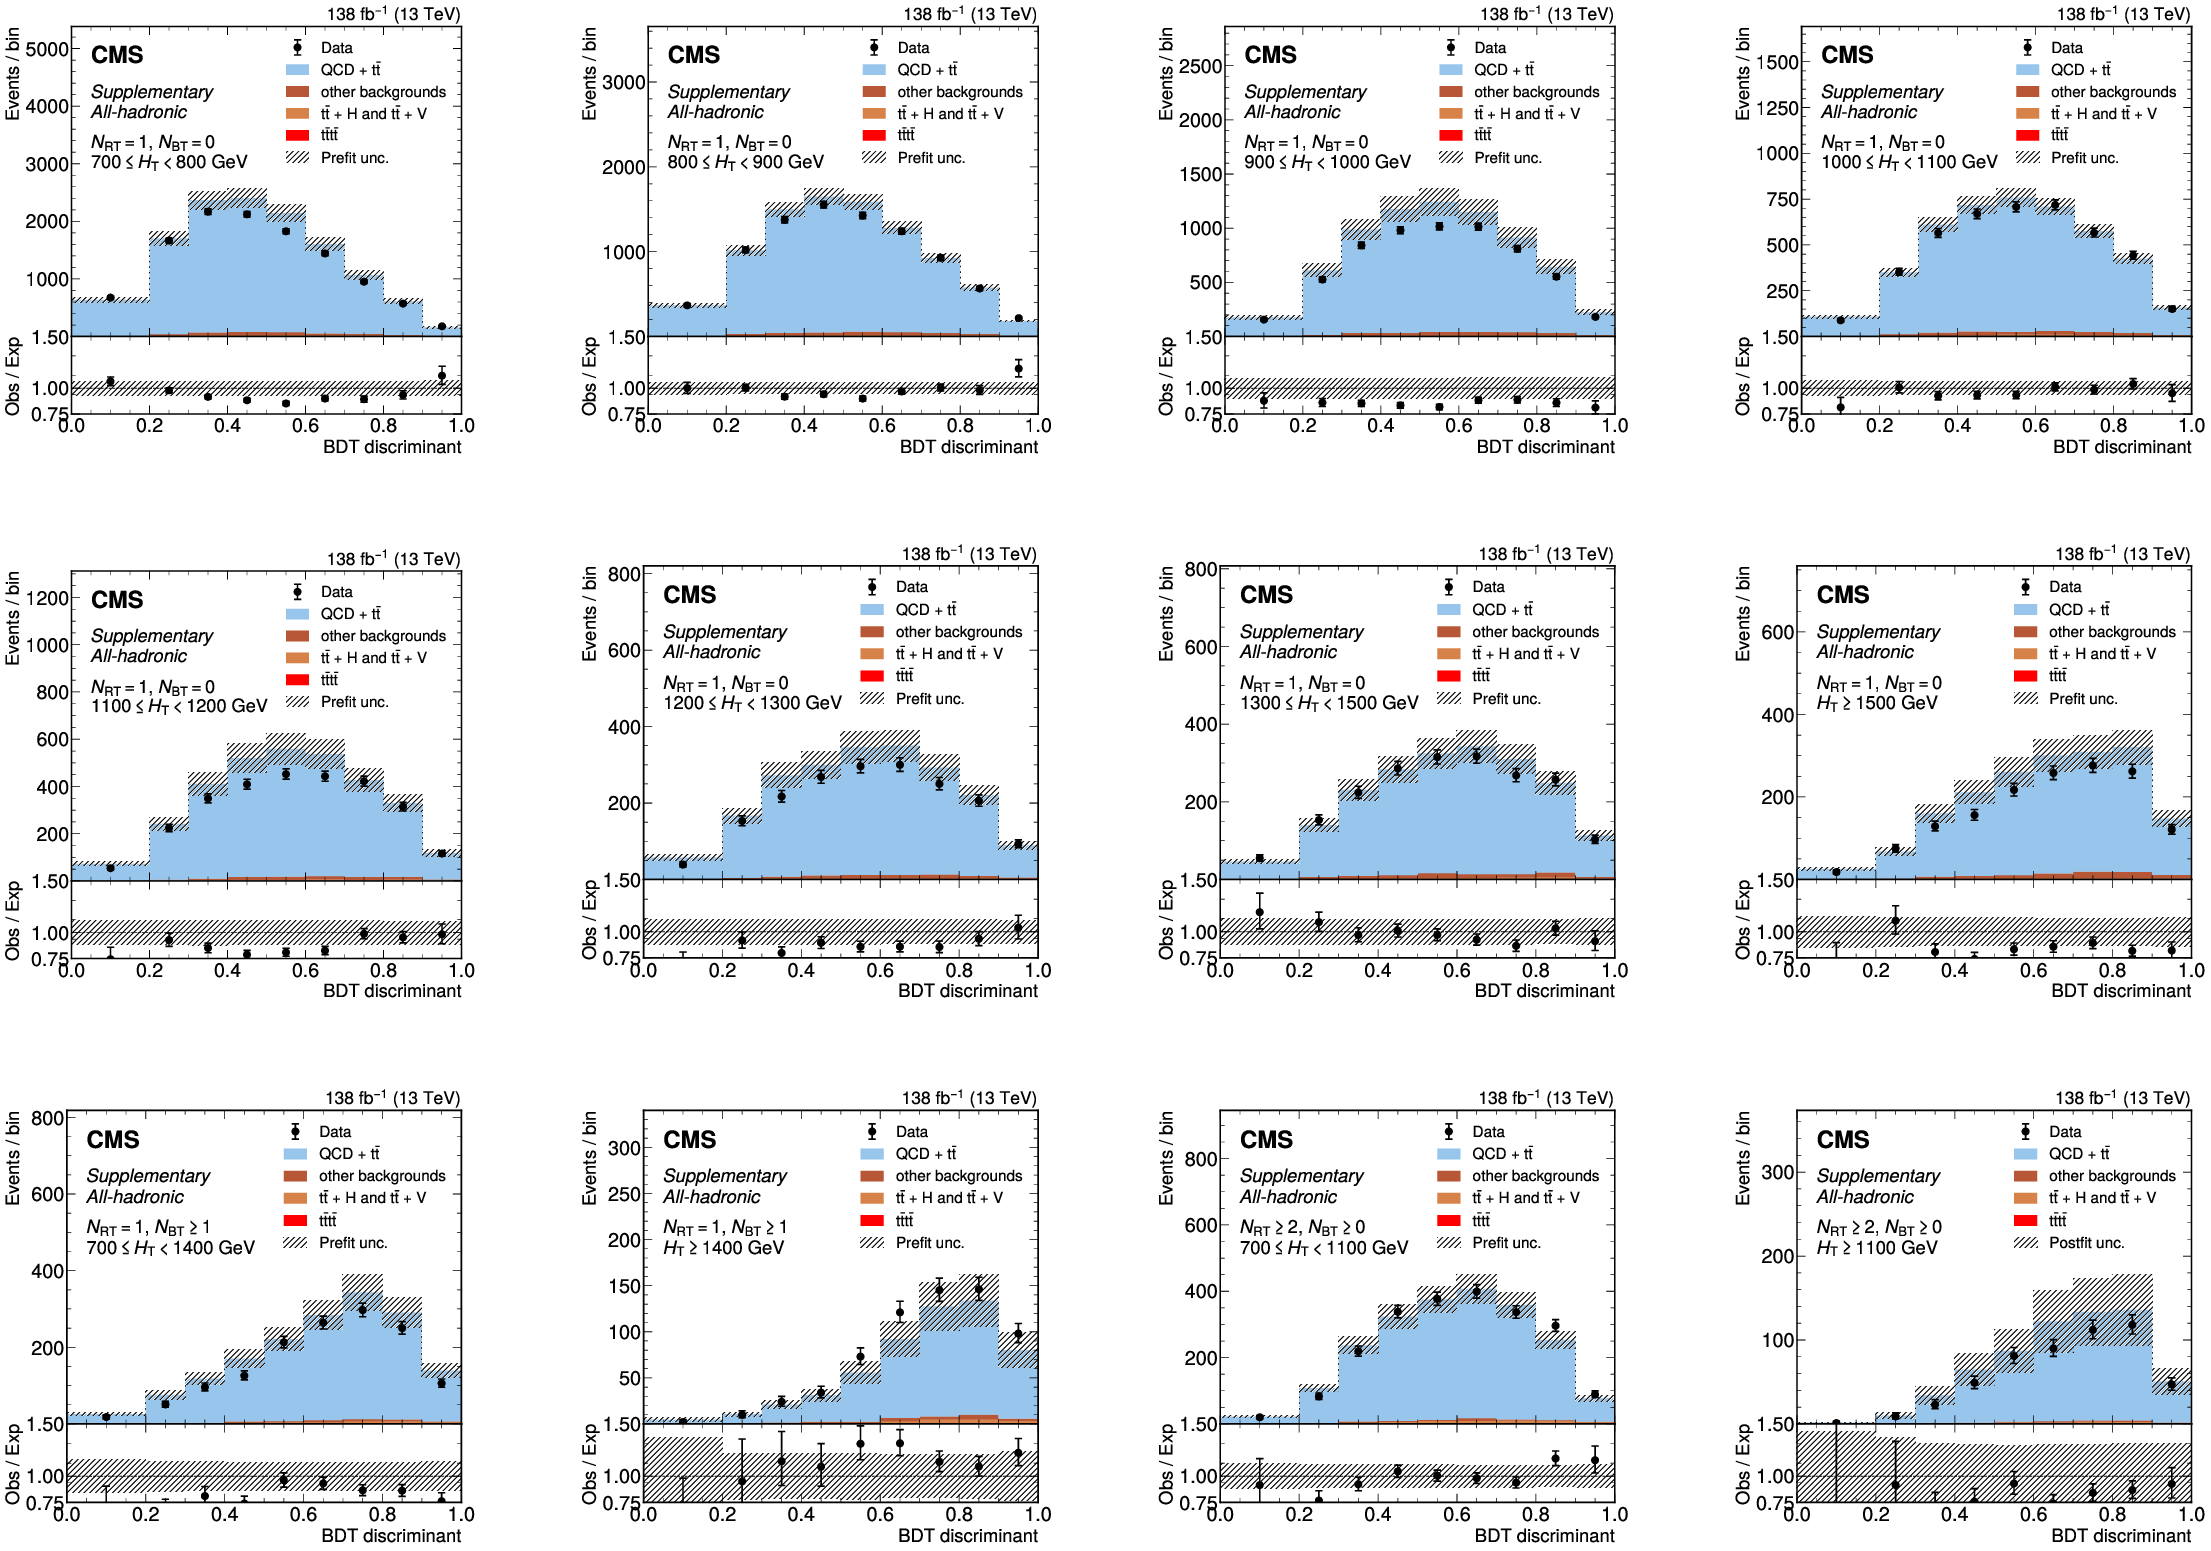
png pdf |
Additional Figure 19:
The distribution of the BDT discriminants in the 8-jet validation region for the full 2016--2018 data set in the all-hadronic channel for all $ N_\text{RT} $, $ N_\text{BT} $, and $ H_{\mathrm{T}} $ categories. ($ N_\text{RT} $ and $ N_\text{BT} $ represent number of resolved tops and b-jets respectively.) The background from QCD multijet and $ \mathrm{t} \bar{\mathrm{t}} $ production is derived from control regions in the data. Estimates for the $ \mathrm{t}\bar{\mathrm{t}}\mathrm{t}\bar{\mathrm{t}} $ signal and other backgrounds are shown using simulated samples. The hatched bands correspond to the estimated total uncertainty per validation region. |
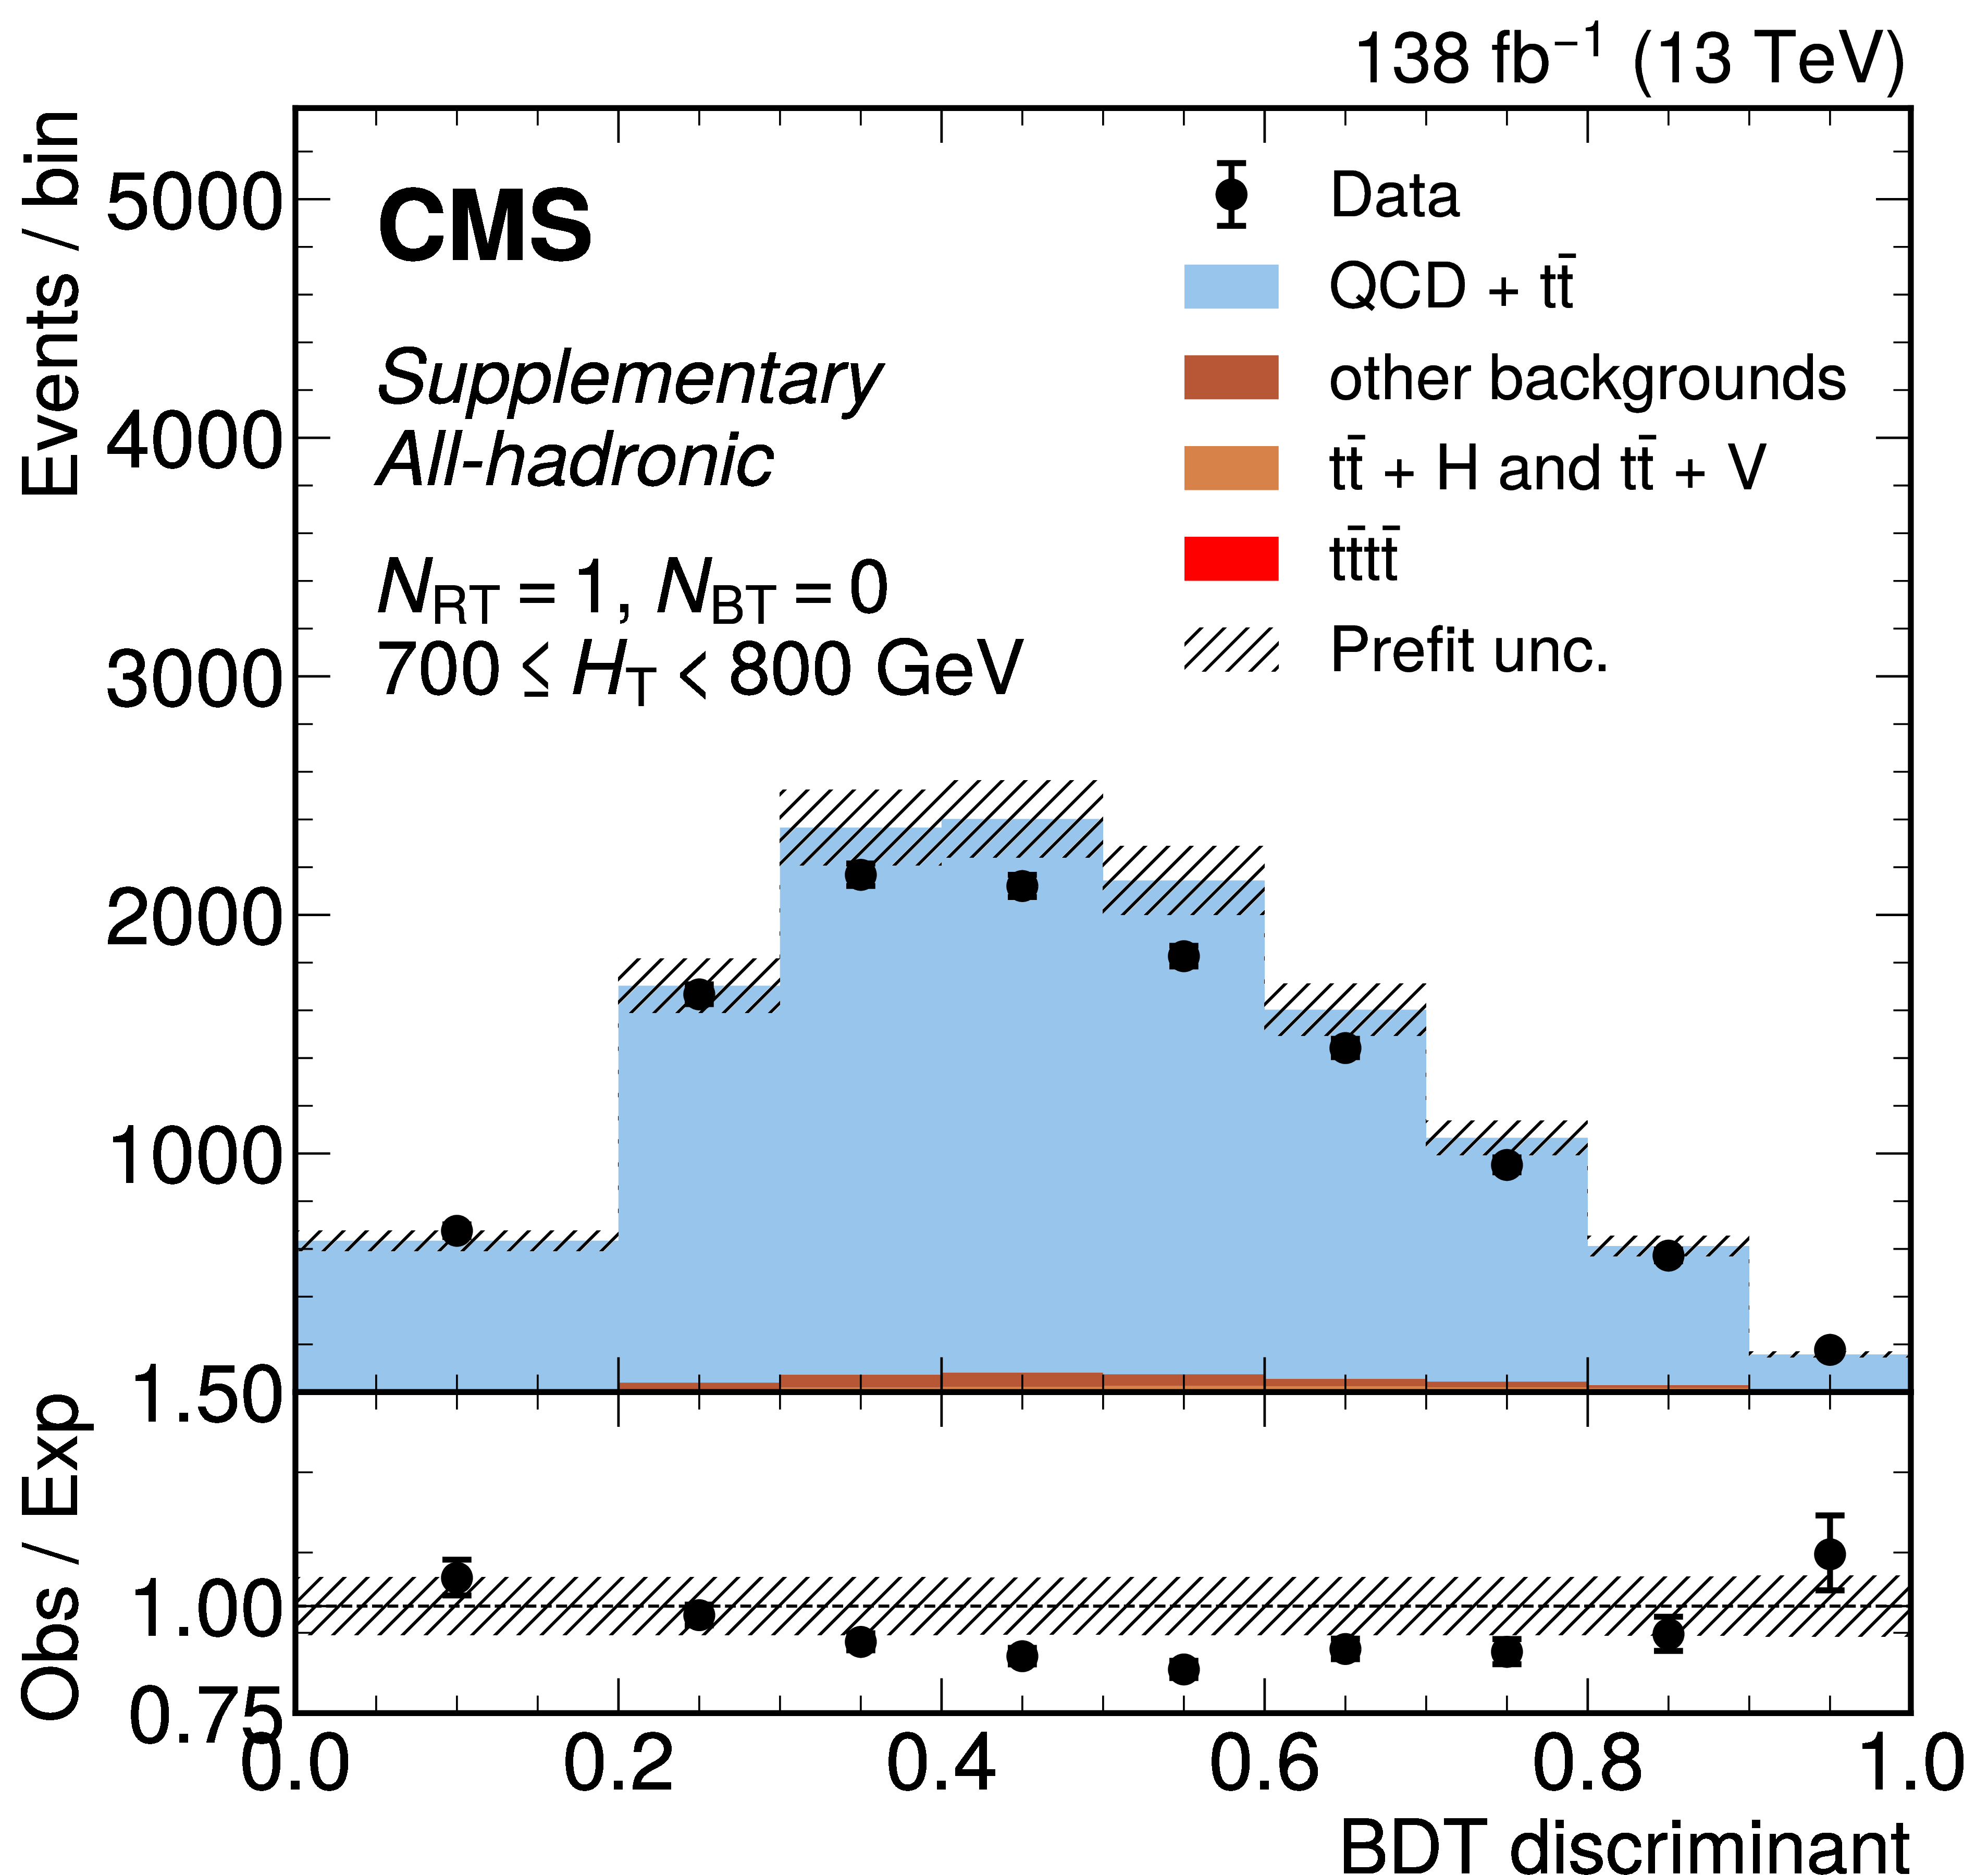
png pdf |
Additional Figure 19-a:
The distribution of the BDT discriminants in the 8-jet validation region for the full 2016--2018 data set in the all-hadronic channel for all $ N_\text{RT} $, $ N_\text{BT} $, and $ H_{\mathrm{T}} $ categories. ($ N_\text{RT} $ and $ N_\text{BT} $ represent number of resolved tops and b-jets respectively.) The background from QCD multijet and $ \mathrm{t} \bar{\mathrm{t}} $ production is derived from control regions in the data. Estimates for the $ \mathrm{t}\bar{\mathrm{t}}\mathrm{t}\bar{\mathrm{t}} $ signal and other backgrounds are shown using simulated samples. The hatched bands correspond to the estimated total uncertainty per validation region. |

png pdf |
Additional Figure 19-b:
The distribution of the BDT discriminants in the 8-jet validation region for the full 2016--2018 data set in the all-hadronic channel for all $ N_\text{RT} $, $ N_\text{BT} $, and $ H_{\mathrm{T}} $ categories. ($ N_\text{RT} $ and $ N_\text{BT} $ represent number of resolved tops and b-jets respectively.) The background from QCD multijet and $ \mathrm{t} \bar{\mathrm{t}} $ production is derived from control regions in the data. Estimates for the $ \mathrm{t}\bar{\mathrm{t}}\mathrm{t}\bar{\mathrm{t}} $ signal and other backgrounds are shown using simulated samples. The hatched bands correspond to the estimated total uncertainty per validation region. |
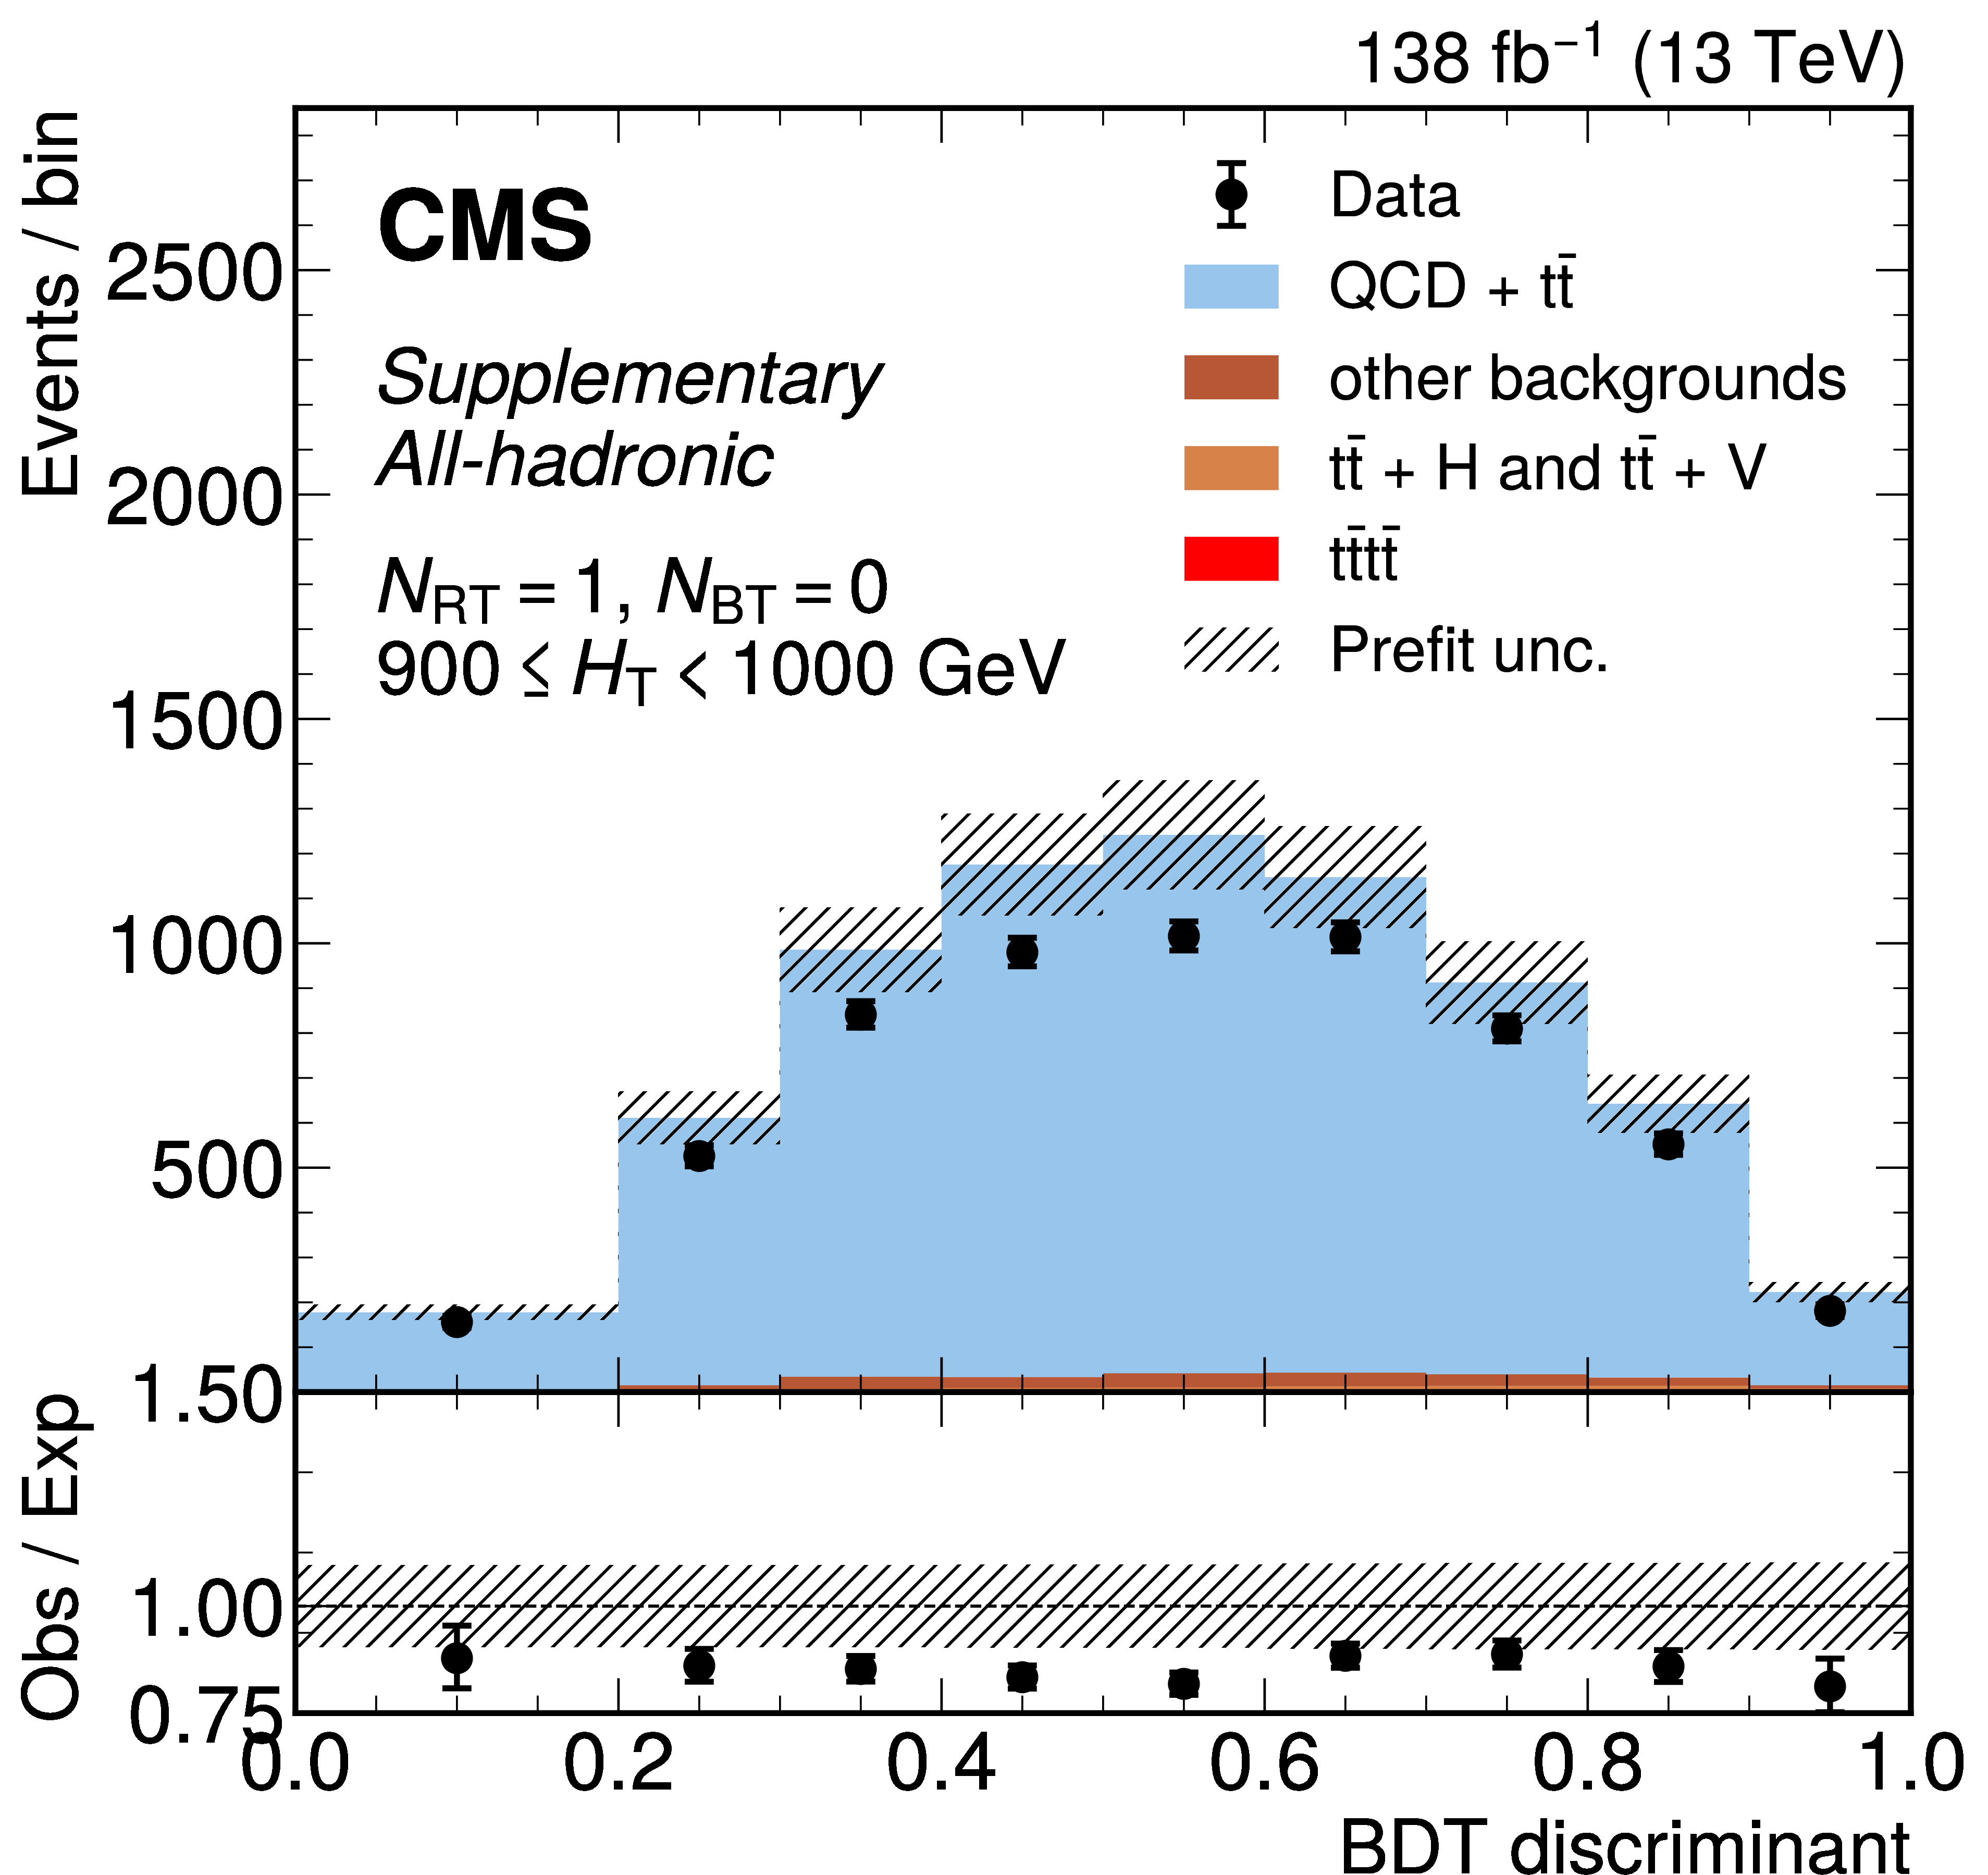
png pdf |
Additional Figure 19-c:
The distribution of the BDT discriminants in the 8-jet validation region for the full 2016--2018 data set in the all-hadronic channel for all $ N_\text{RT} $, $ N_\text{BT} $, and $ H_{\mathrm{T}} $ categories. ($ N_\text{RT} $ and $ N_\text{BT} $ represent number of resolved tops and b-jets respectively.) The background from QCD multijet and $ \mathrm{t} \bar{\mathrm{t}} $ production is derived from control regions in the data. Estimates for the $ \mathrm{t}\bar{\mathrm{t}}\mathrm{t}\bar{\mathrm{t}} $ signal and other backgrounds are shown using simulated samples. The hatched bands correspond to the estimated total uncertainty per validation region. |
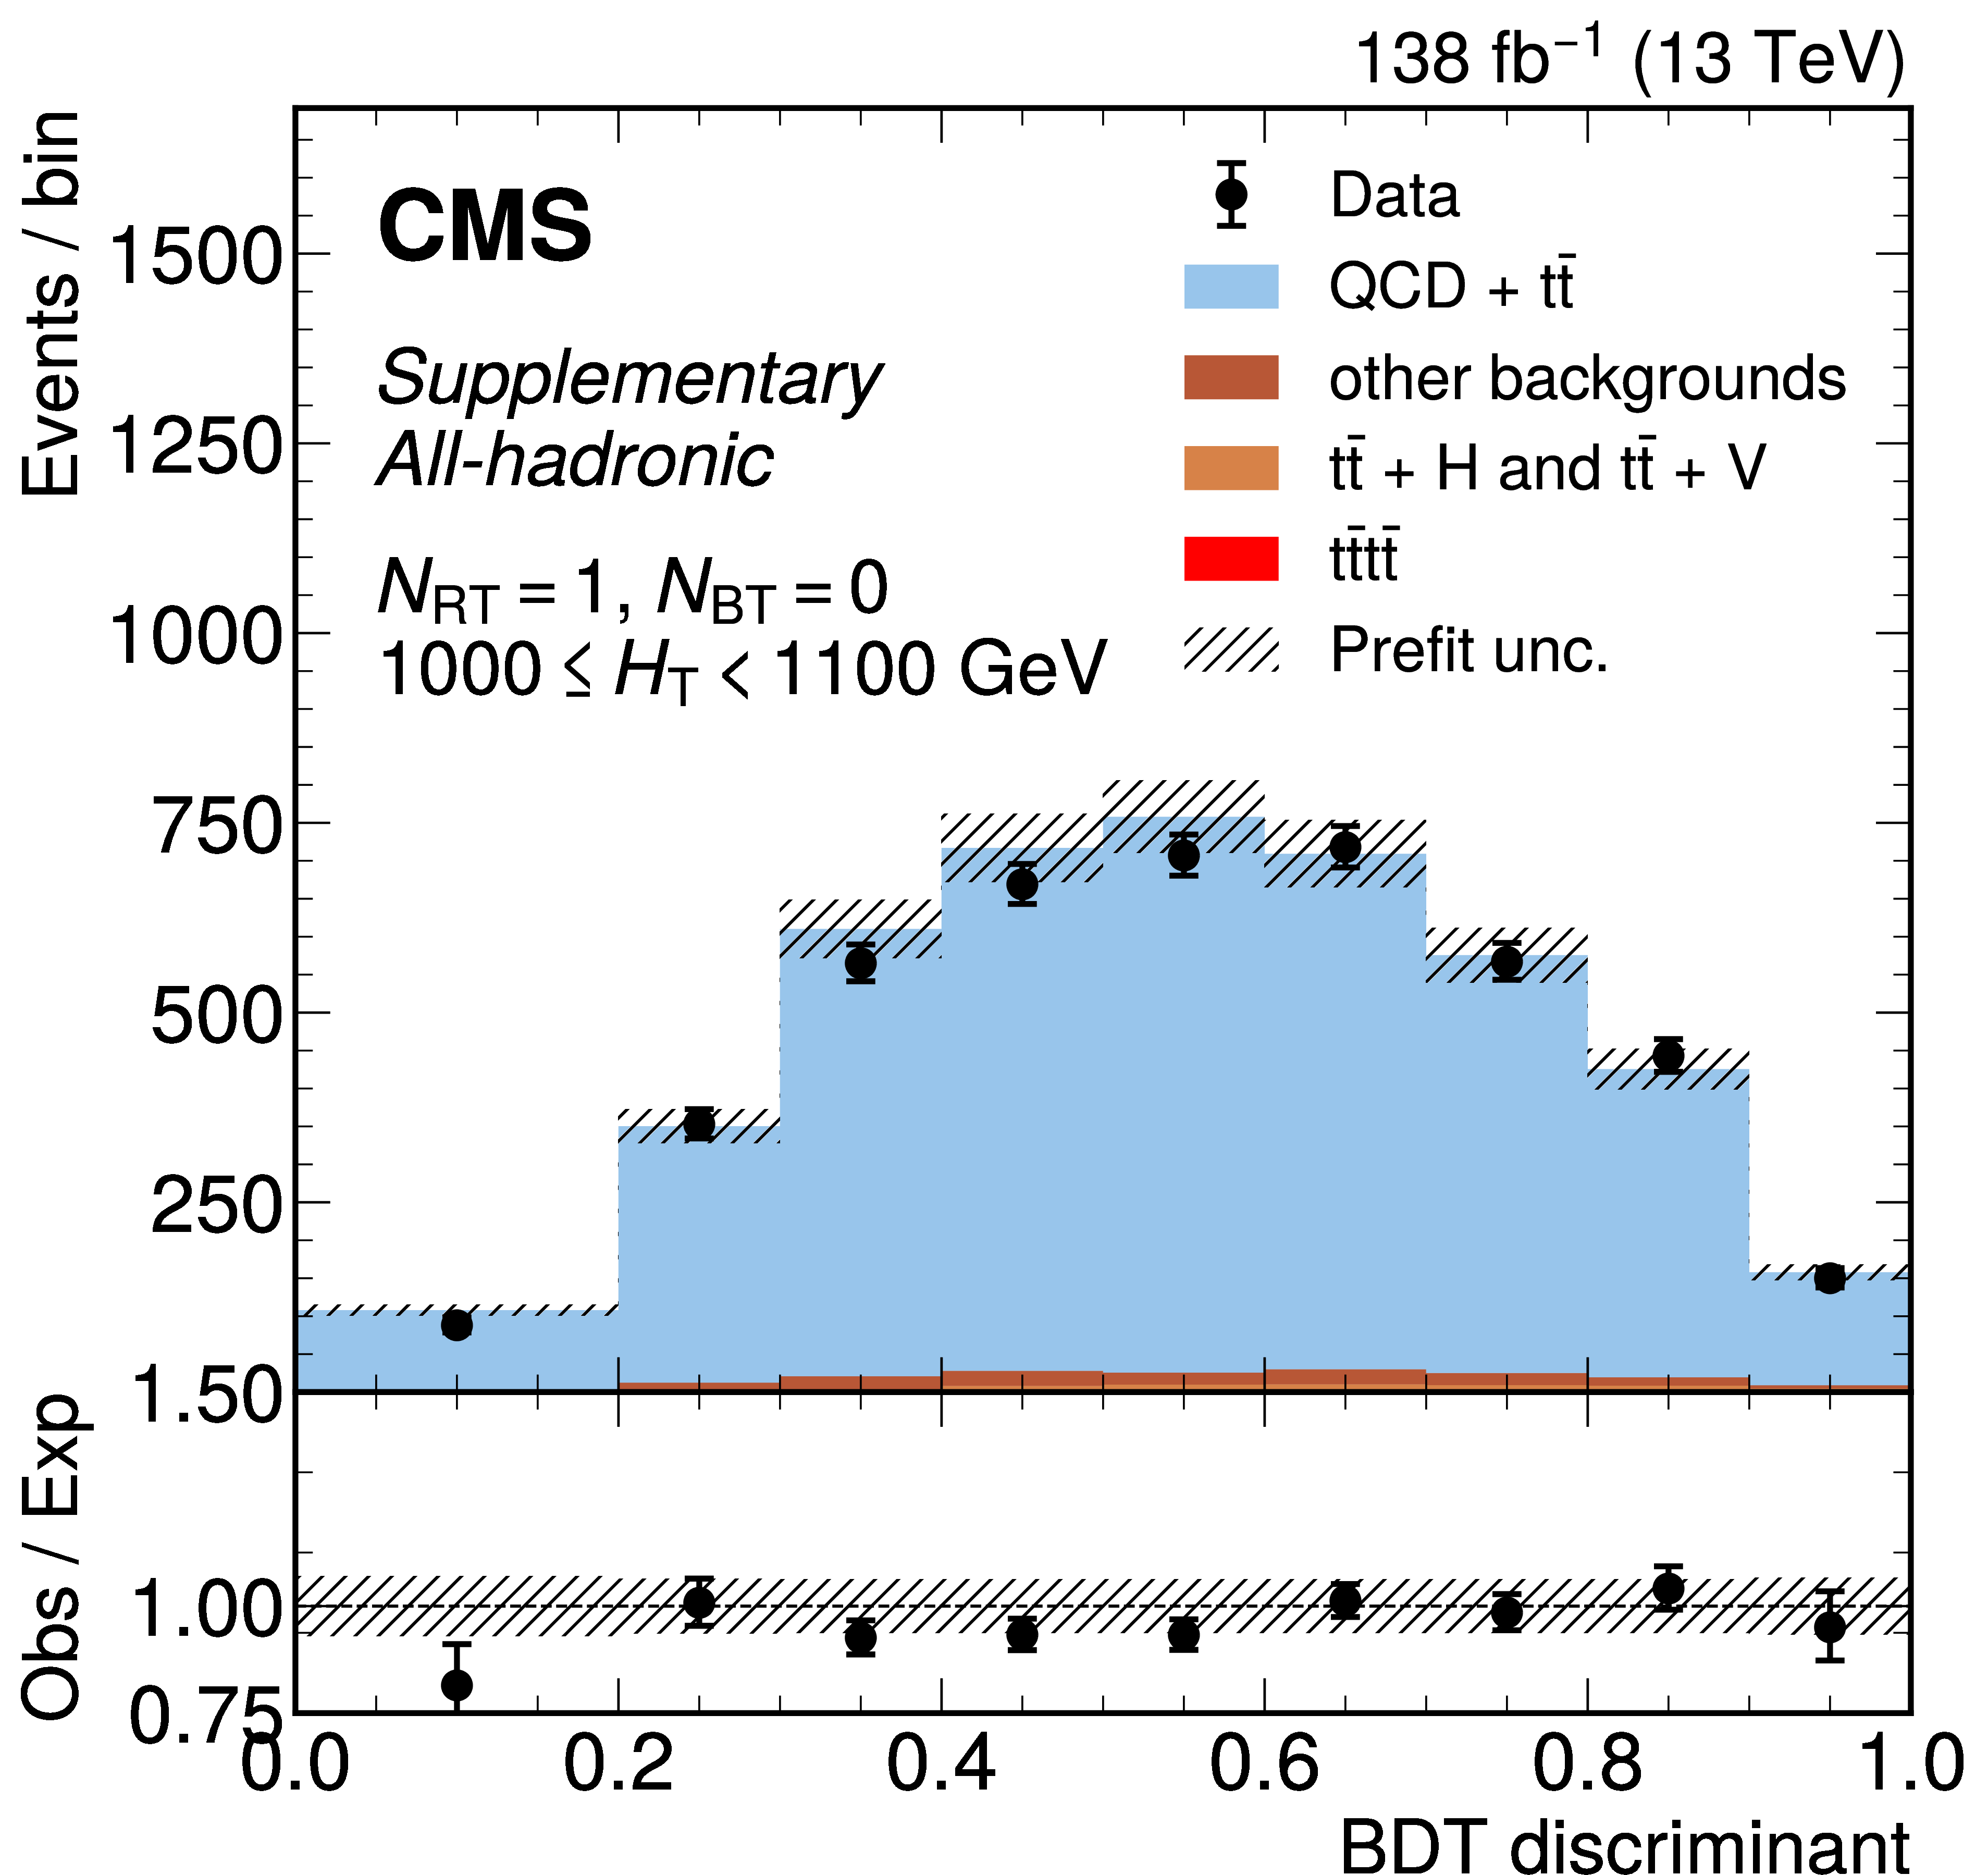
png pdf |
Additional Figure 19-d:
The distribution of the BDT discriminants in the 8-jet validation region for the full 2016--2018 data set in the all-hadronic channel for all $ N_\text{RT} $, $ N_\text{BT} $, and $ H_{\mathrm{T}} $ categories. ($ N_\text{RT} $ and $ N_\text{BT} $ represent number of resolved tops and b-jets respectively.) The background from QCD multijet and $ \mathrm{t} \bar{\mathrm{t}} $ production is derived from control regions in the data. Estimates for the $ \mathrm{t}\bar{\mathrm{t}}\mathrm{t}\bar{\mathrm{t}} $ signal and other backgrounds are shown using simulated samples. The hatched bands correspond to the estimated total uncertainty per validation region. |
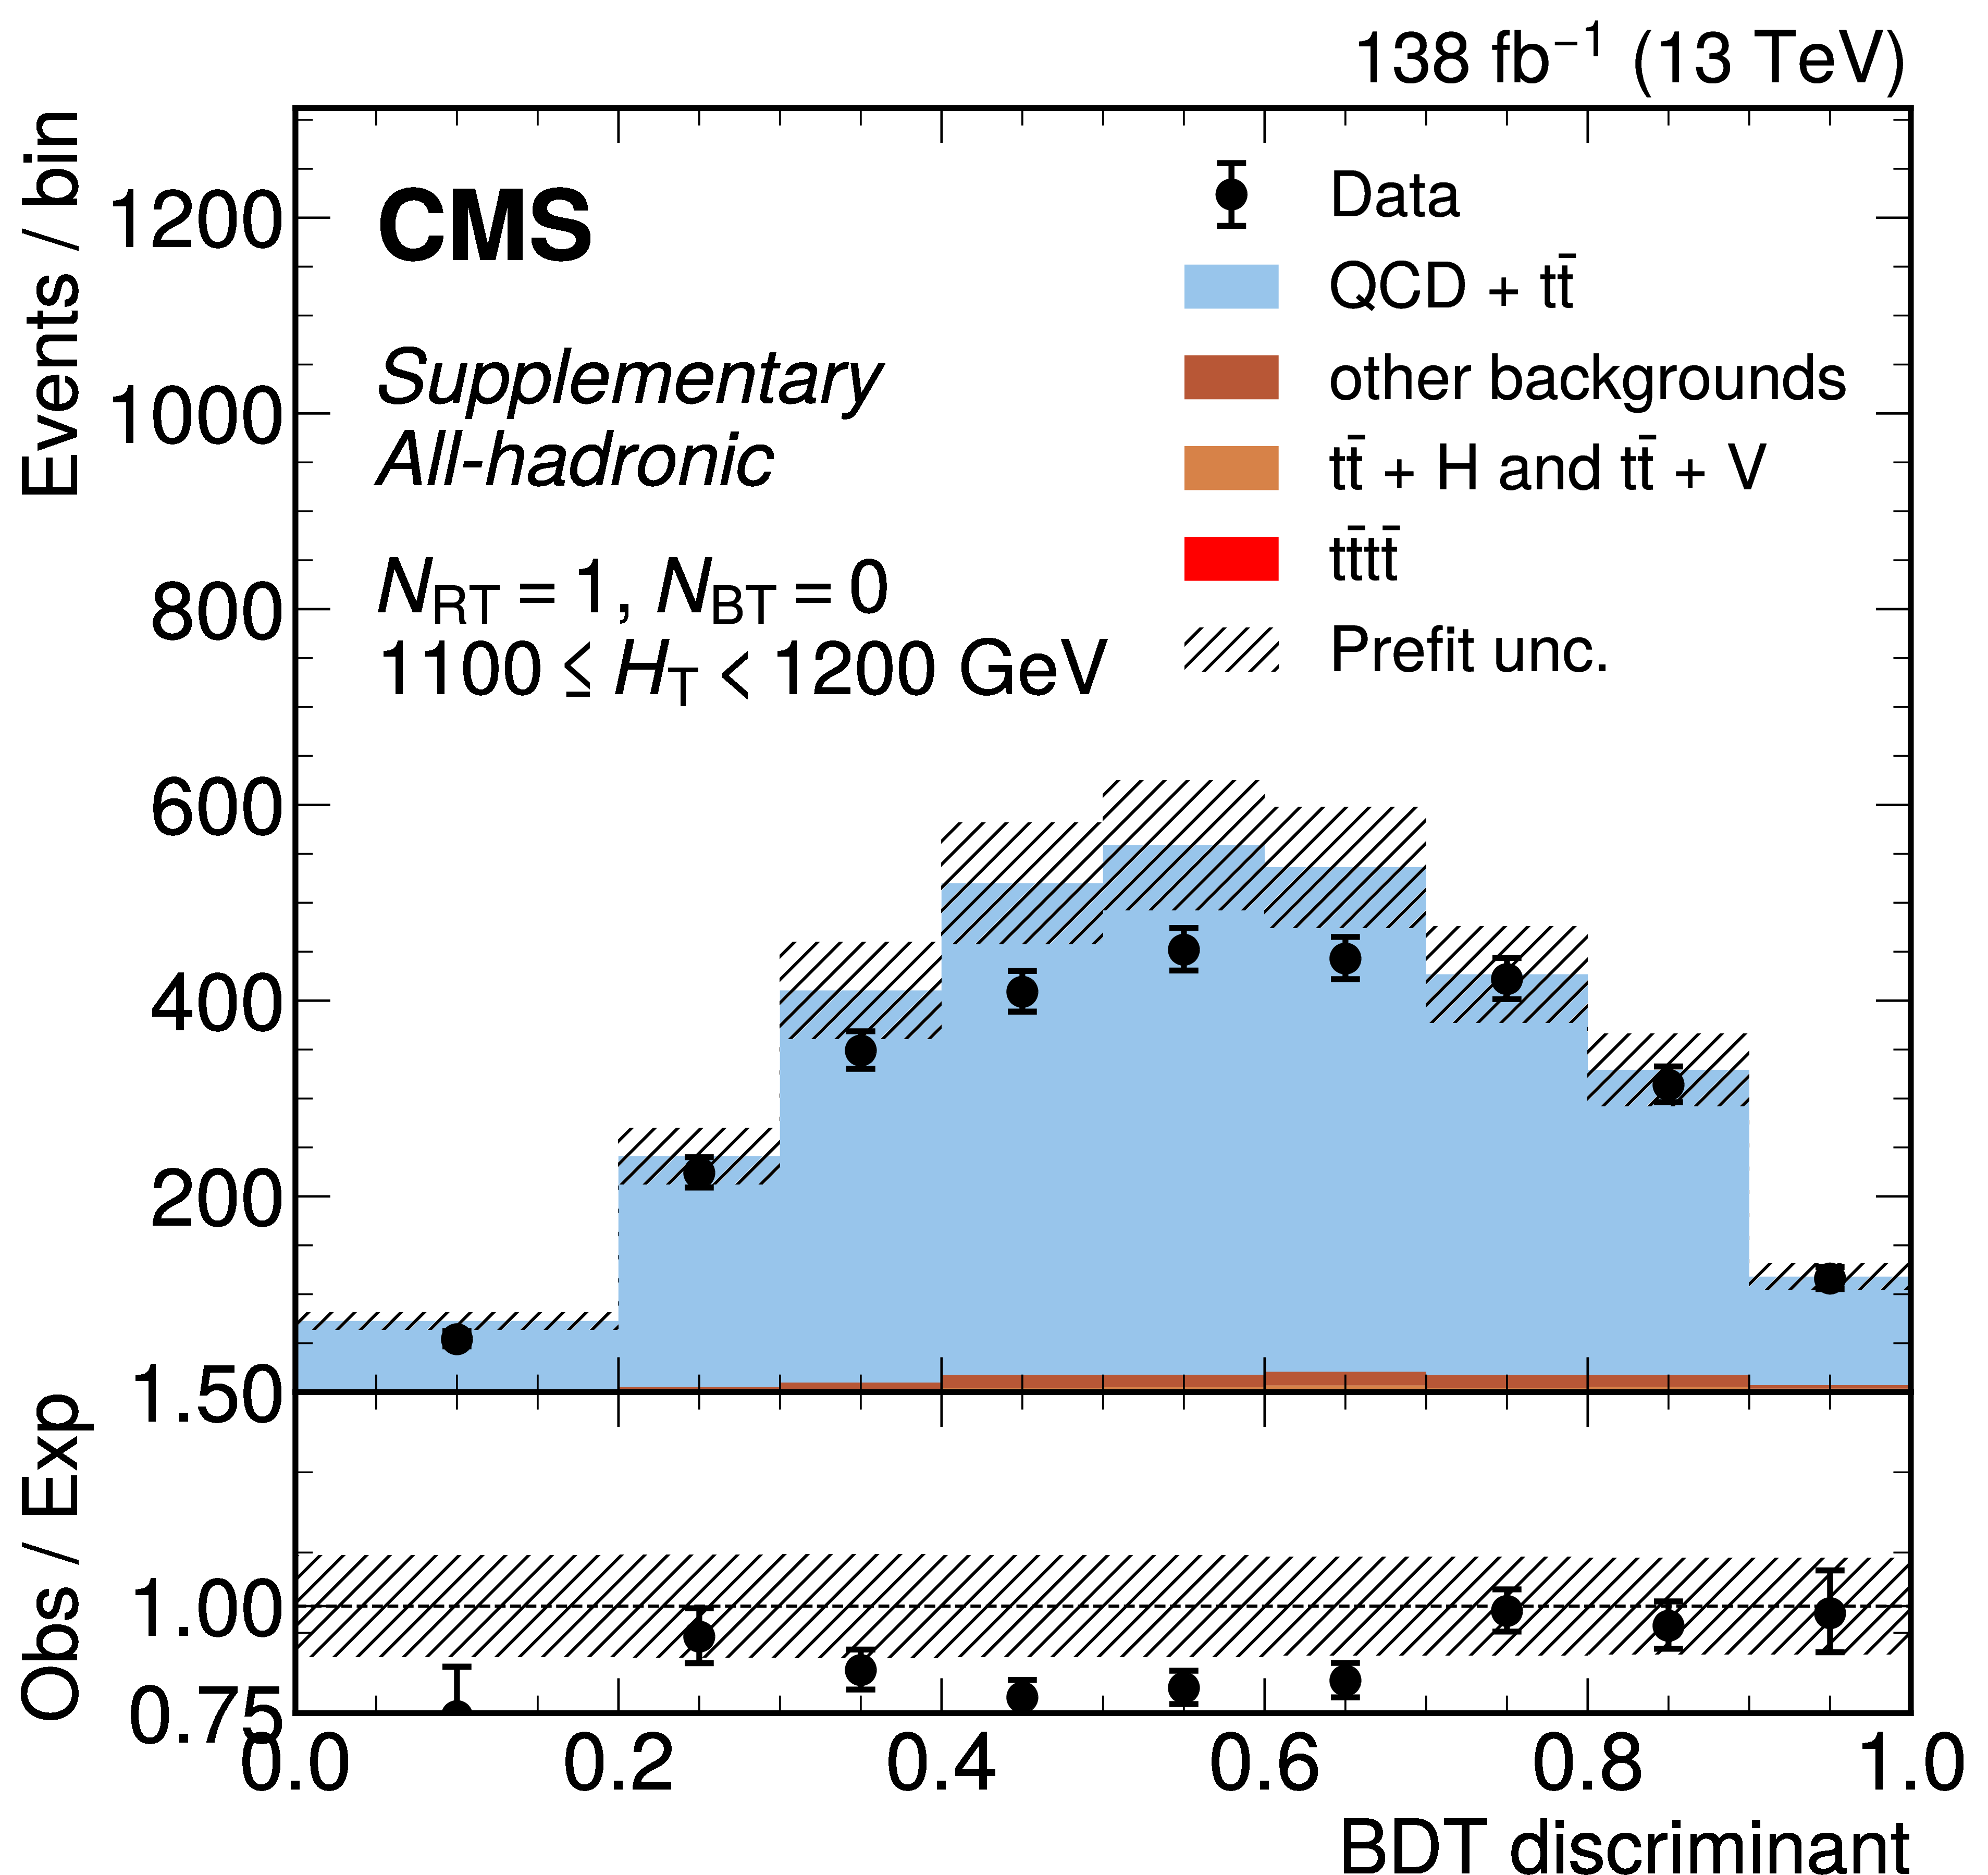
png pdf |
Additional Figure 19-e:
The distribution of the BDT discriminants in the 8-jet validation region for the full 2016--2018 data set in the all-hadronic channel for all $ N_\text{RT} $, $ N_\text{BT} $, and $ H_{\mathrm{T}} $ categories. ($ N_\text{RT} $ and $ N_\text{BT} $ represent number of resolved tops and b-jets respectively.) The background from QCD multijet and $ \mathrm{t} \bar{\mathrm{t}} $ production is derived from control regions in the data. Estimates for the $ \mathrm{t}\bar{\mathrm{t}}\mathrm{t}\bar{\mathrm{t}} $ signal and other backgrounds are shown using simulated samples. The hatched bands correspond to the estimated total uncertainty per validation region. |

png pdf |
Additional Figure 19-f:
The distribution of the BDT discriminants in the 8-jet validation region for the full 2016--2018 data set in the all-hadronic channel for all $ N_\text{RT} $, $ N_\text{BT} $, and $ H_{\mathrm{T}} $ categories. ($ N_\text{RT} $ and $ N_\text{BT} $ represent number of resolved tops and b-jets respectively.) The background from QCD multijet and $ \mathrm{t} \bar{\mathrm{t}} $ production is derived from control regions in the data. Estimates for the $ \mathrm{t}\bar{\mathrm{t}}\mathrm{t}\bar{\mathrm{t}} $ signal and other backgrounds are shown using simulated samples. The hatched bands correspond to the estimated total uncertainty per validation region. |
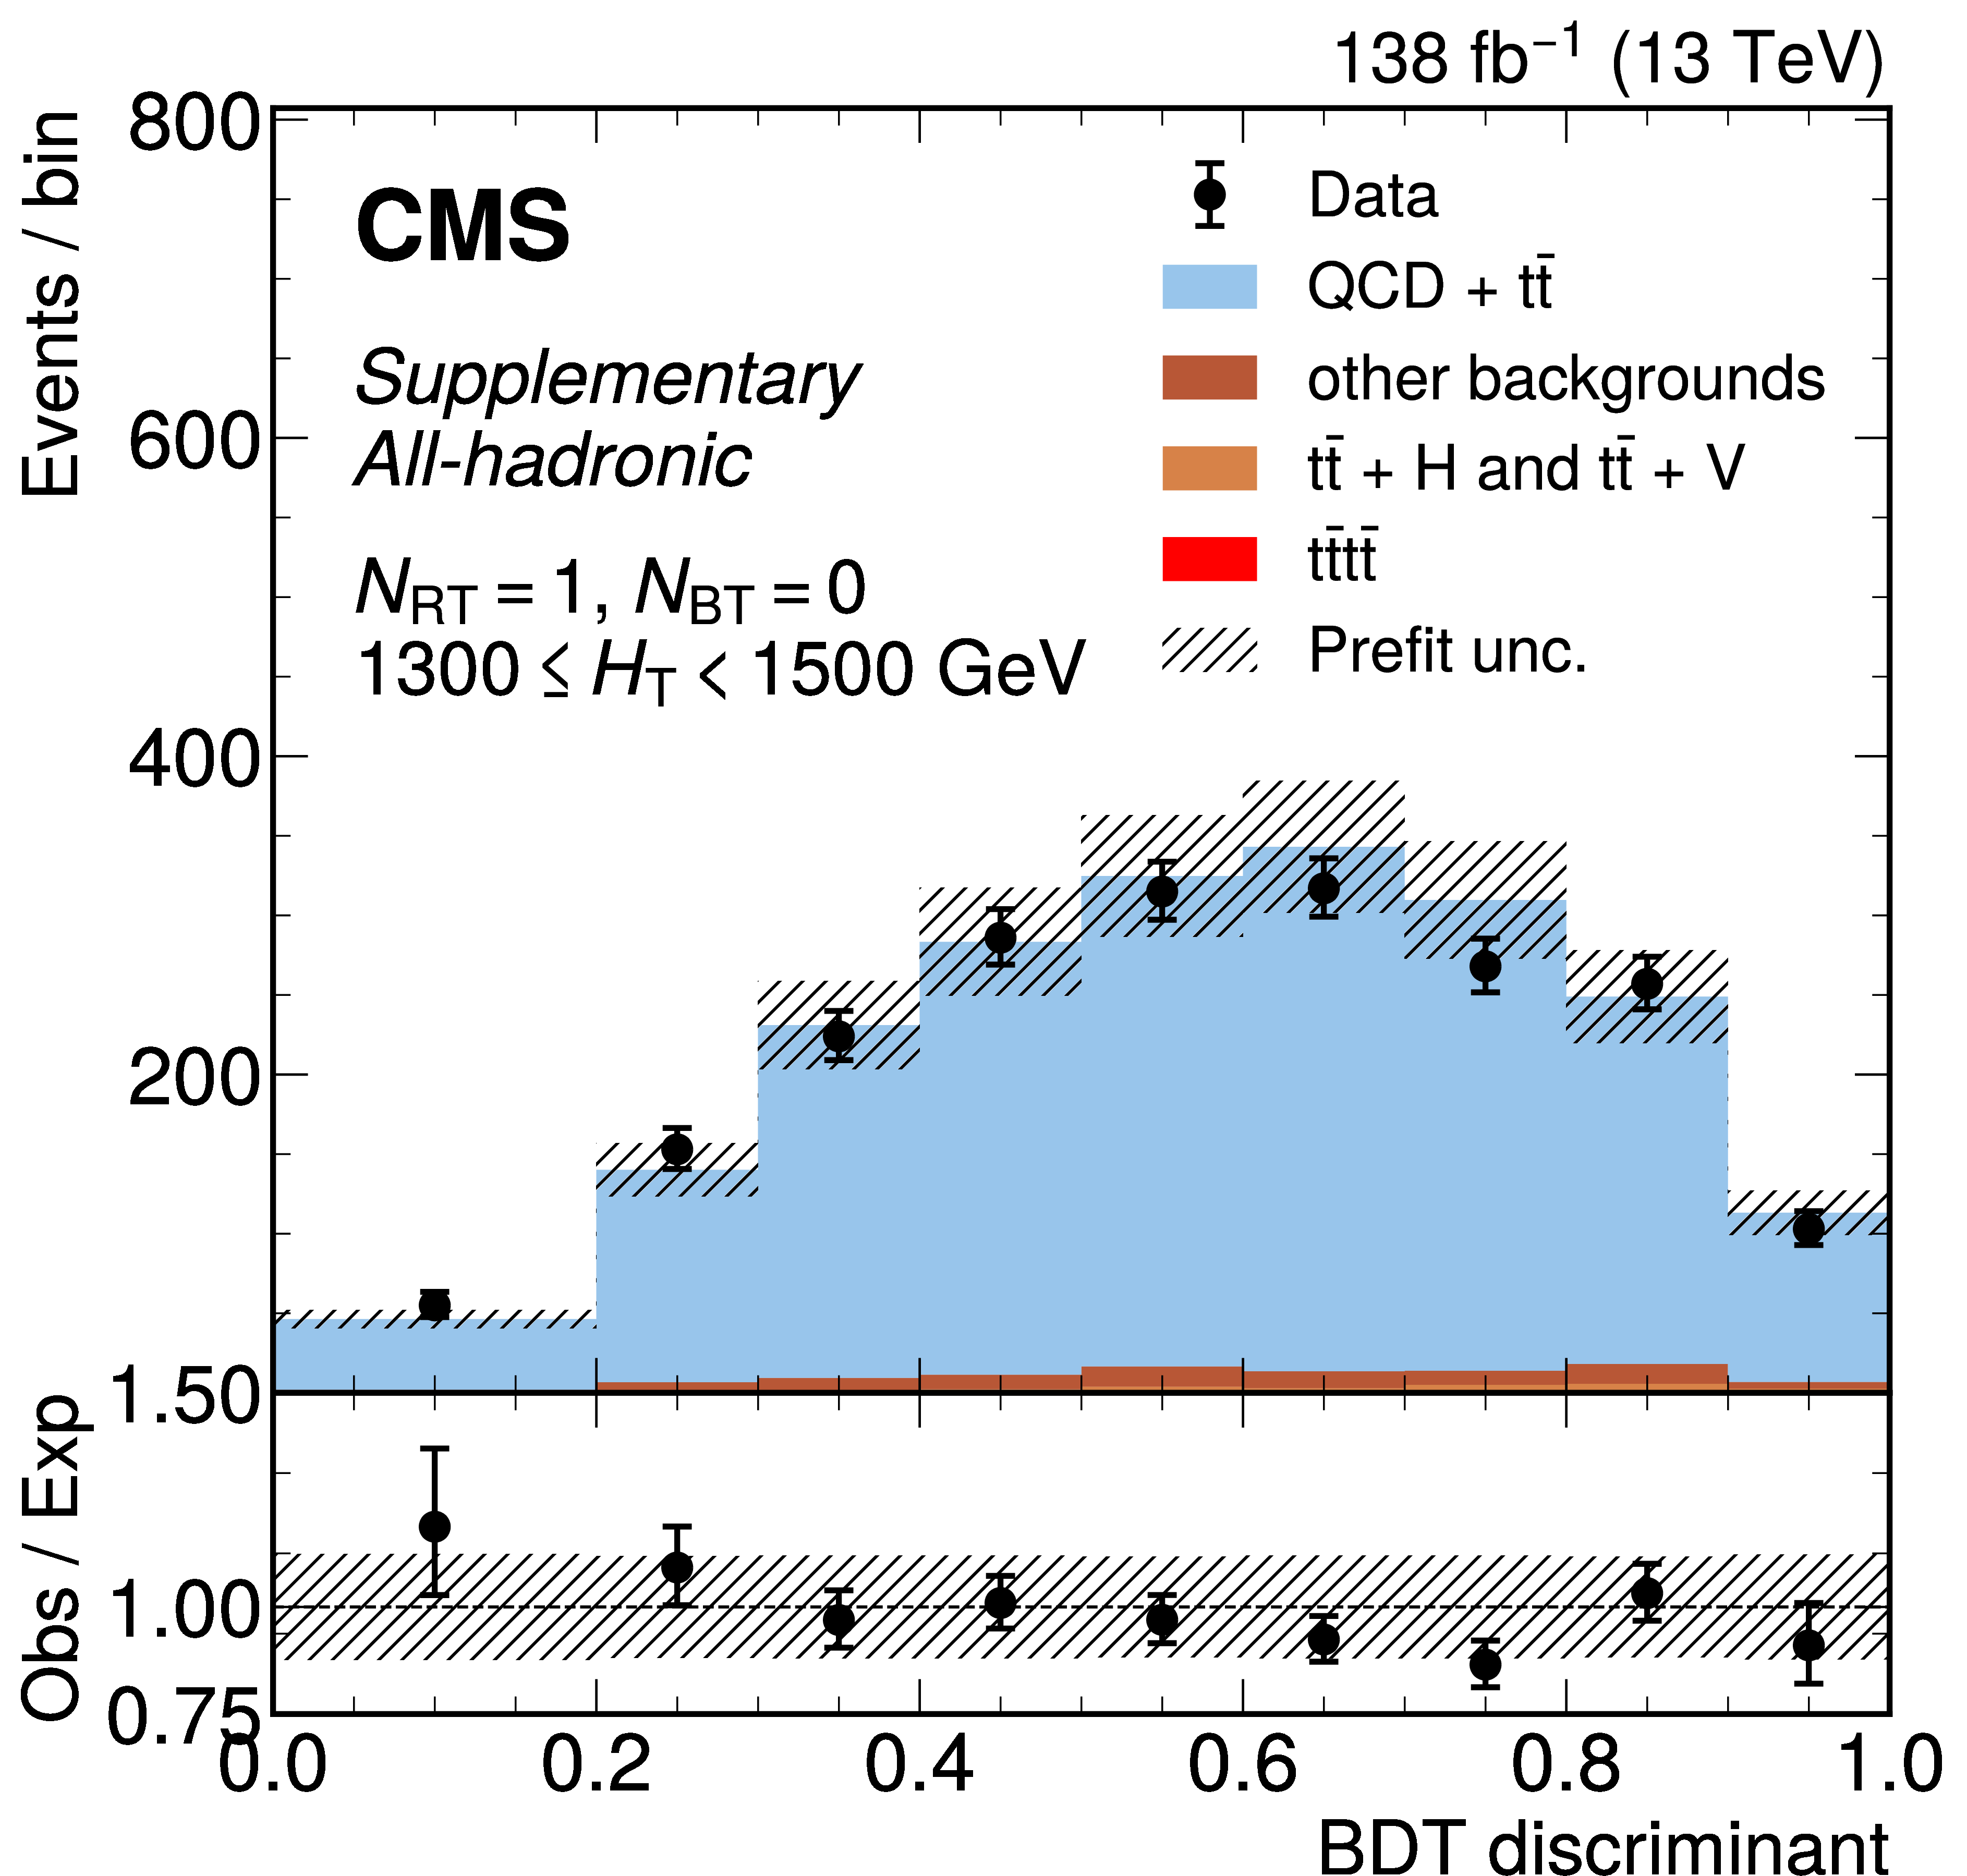
png pdf |
Additional Figure 19-g:
The distribution of the BDT discriminants in the 8-jet validation region for the full 2016--2018 data set in the all-hadronic channel for all $ N_\text{RT} $, $ N_\text{BT} $, and $ H_{\mathrm{T}} $ categories. ($ N_\text{RT} $ and $ N_\text{BT} $ represent number of resolved tops and b-jets respectively.) The background from QCD multijet and $ \mathrm{t} \bar{\mathrm{t}} $ production is derived from control regions in the data. Estimates for the $ \mathrm{t}\bar{\mathrm{t}}\mathrm{t}\bar{\mathrm{t}} $ signal and other backgrounds are shown using simulated samples. The hatched bands correspond to the estimated total uncertainty per validation region. |
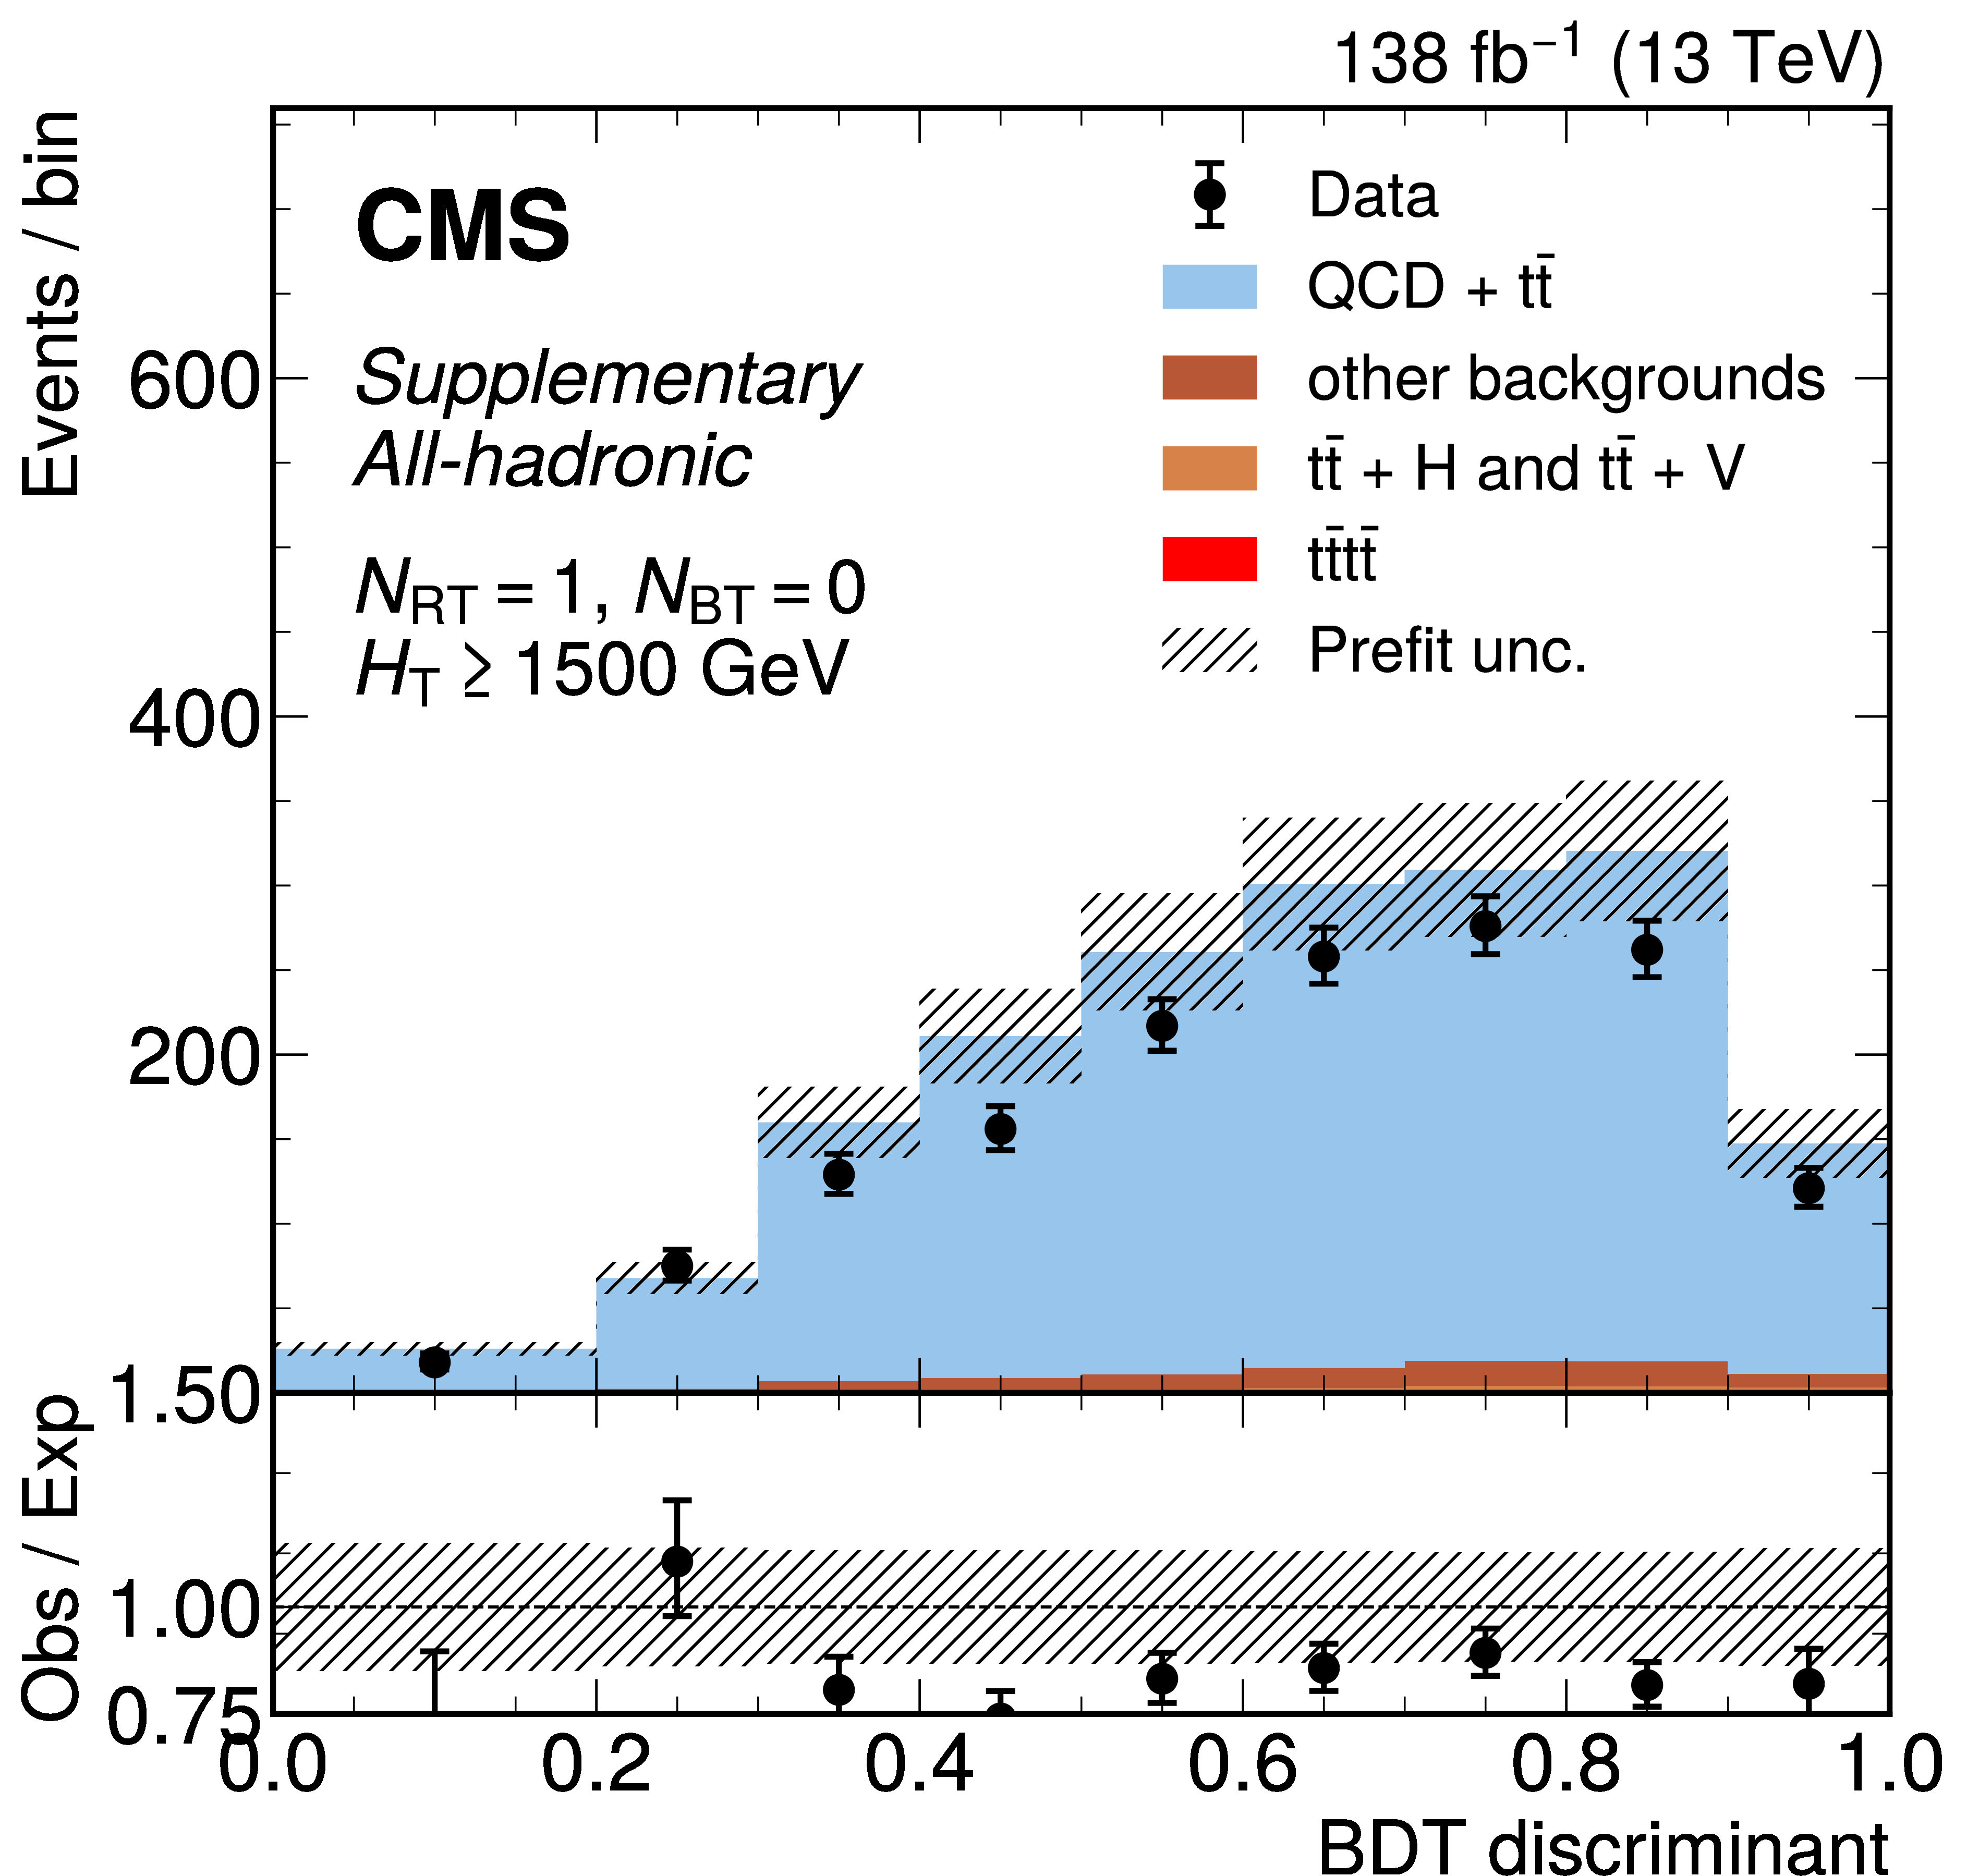
png pdf |
Additional Figure 19-h:
The distribution of the BDT discriminants in the 8-jet validation region for the full 2016--2018 data set in the all-hadronic channel for all $ N_\text{RT} $, $ N_\text{BT} $, and $ H_{\mathrm{T}} $ categories. ($ N_\text{RT} $ and $ N_\text{BT} $ represent number of resolved tops and b-jets respectively.) The background from QCD multijet and $ \mathrm{t} \bar{\mathrm{t}} $ production is derived from control regions in the data. Estimates for the $ \mathrm{t}\bar{\mathrm{t}}\mathrm{t}\bar{\mathrm{t}} $ signal and other backgrounds are shown using simulated samples. The hatched bands correspond to the estimated total uncertainty per validation region. |
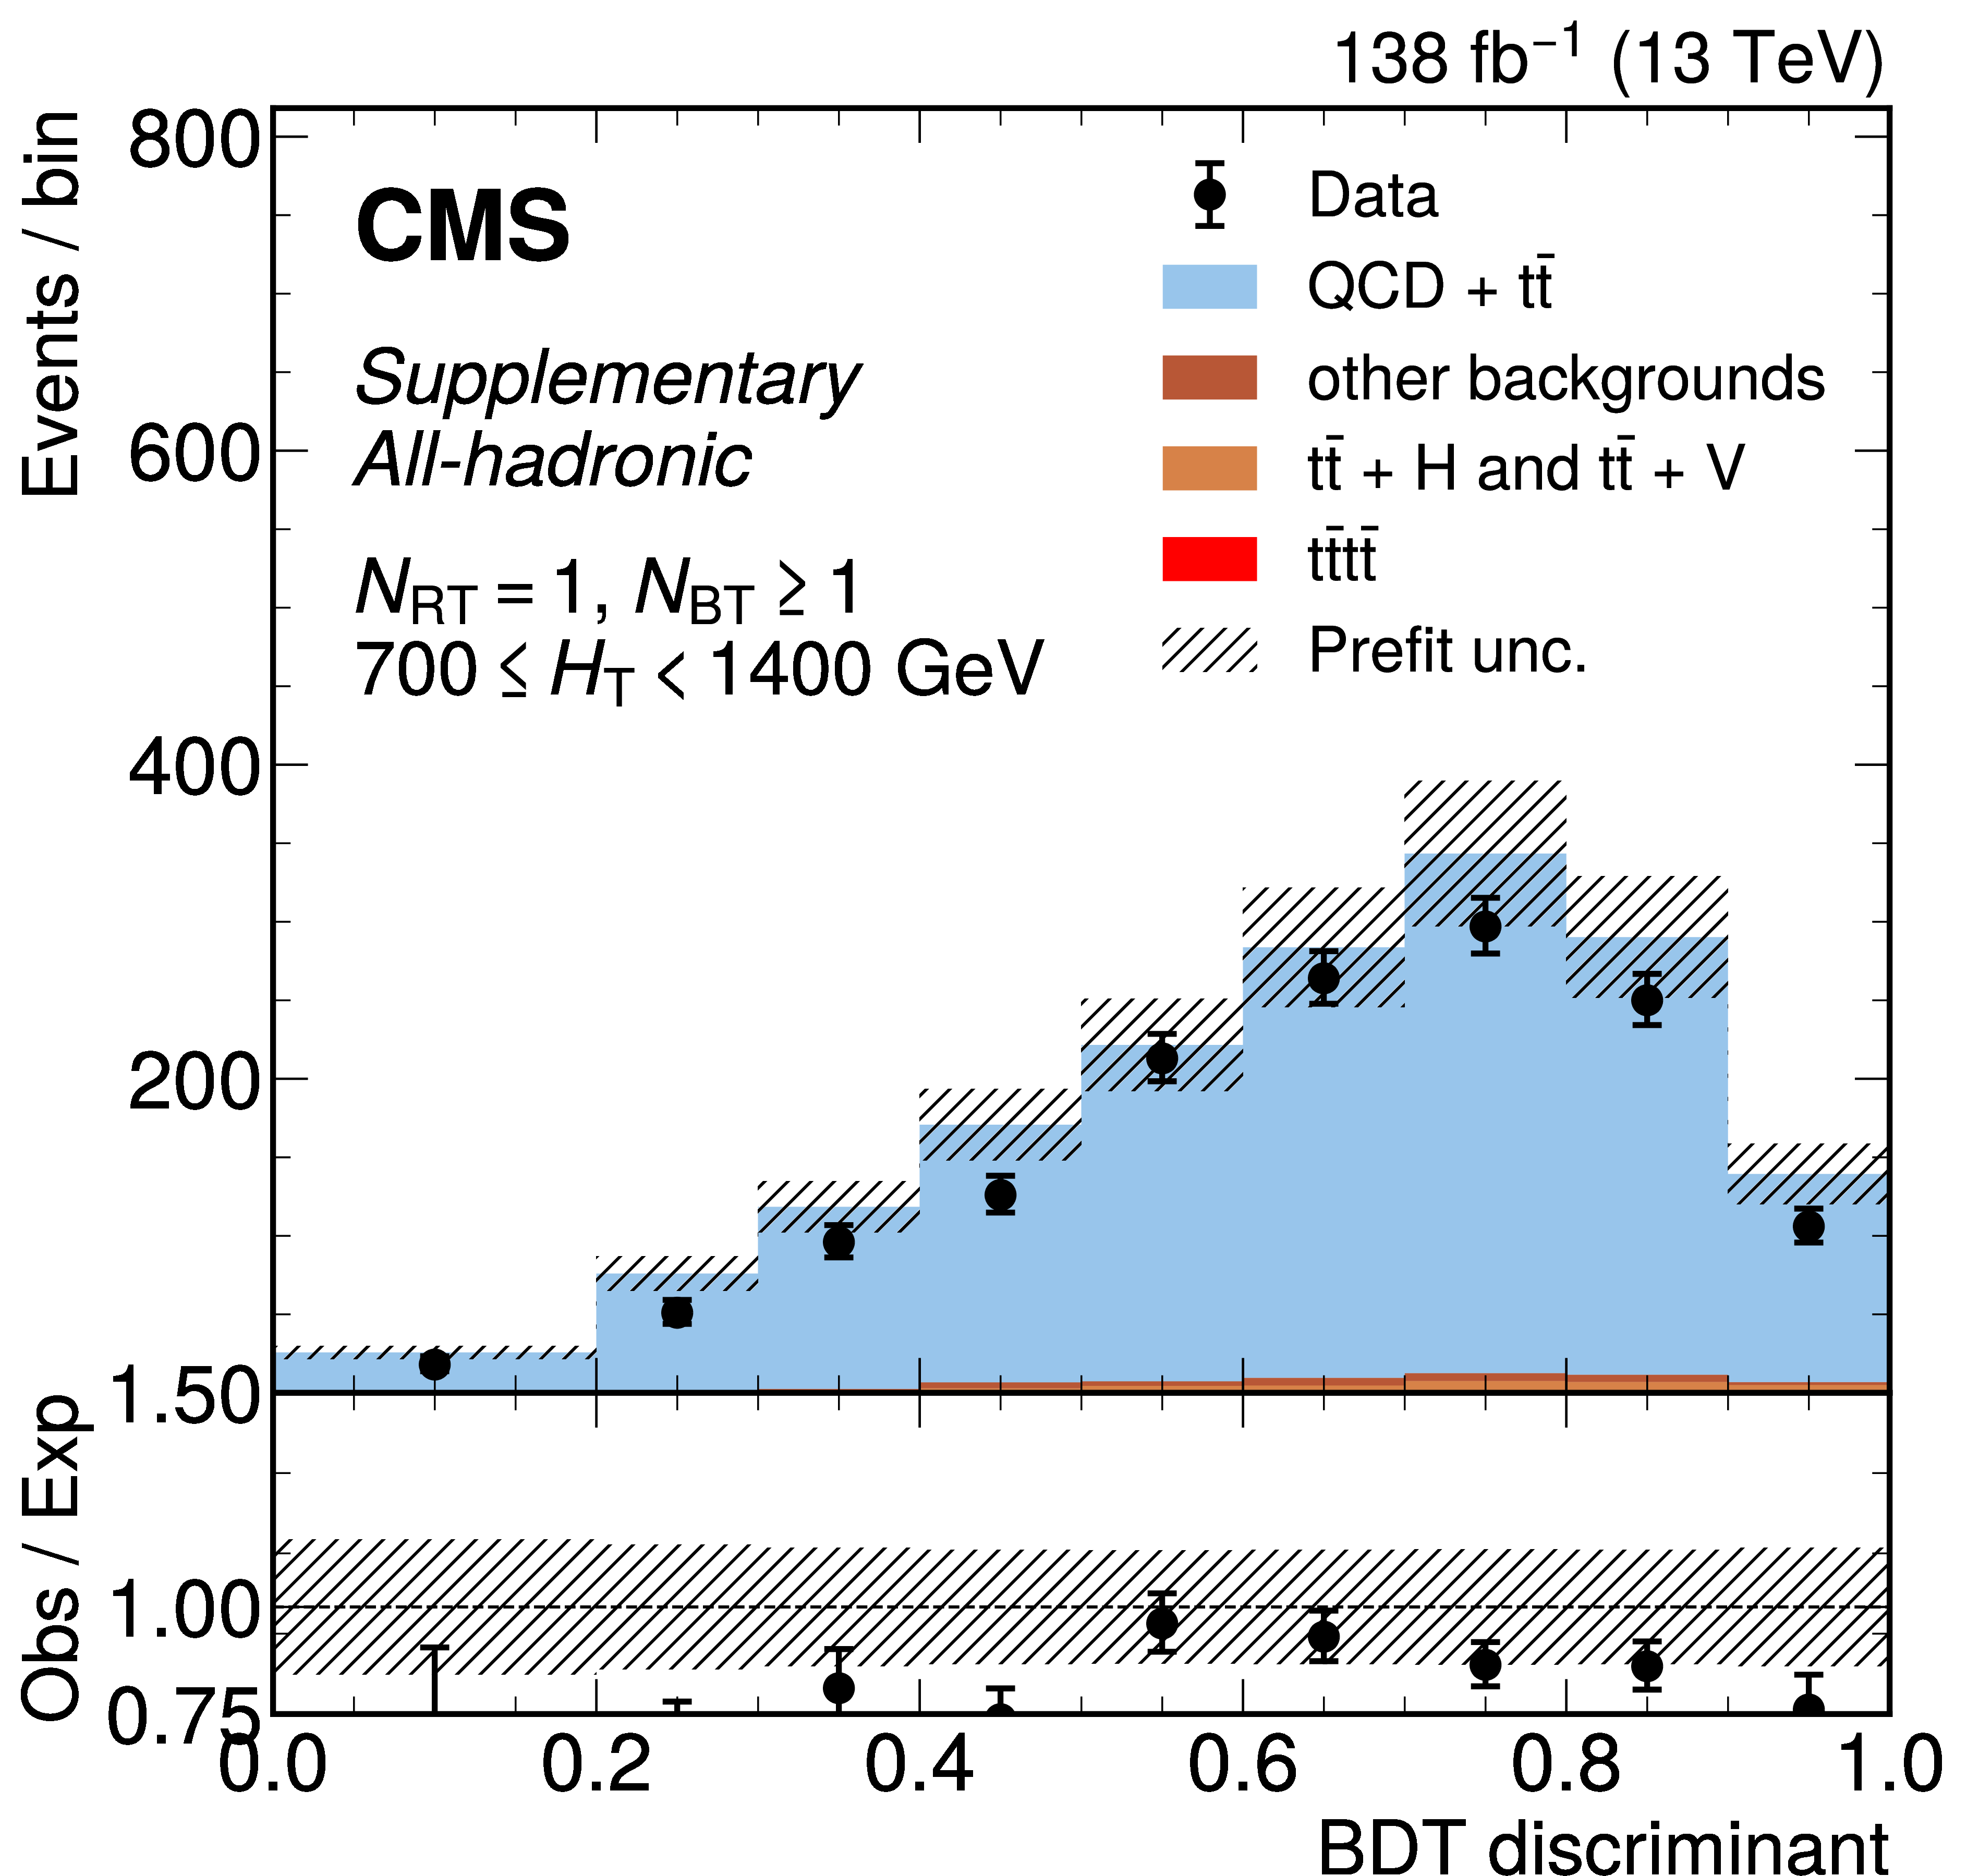
png pdf |
Additional Figure 19-i:
The distribution of the BDT discriminants in the 8-jet validation region for the full 2016--2018 data set in the all-hadronic channel for all $ N_\text{RT} $, $ N_\text{BT} $, and $ H_{\mathrm{T}} $ categories. ($ N_\text{RT} $ and $ N_\text{BT} $ represent number of resolved tops and b-jets respectively.) The background from QCD multijet and $ \mathrm{t} \bar{\mathrm{t}} $ production is derived from control regions in the data. Estimates for the $ \mathrm{t}\bar{\mathrm{t}}\mathrm{t}\bar{\mathrm{t}} $ signal and other backgrounds are shown using simulated samples. The hatched bands correspond to the estimated total uncertainty per validation region. |
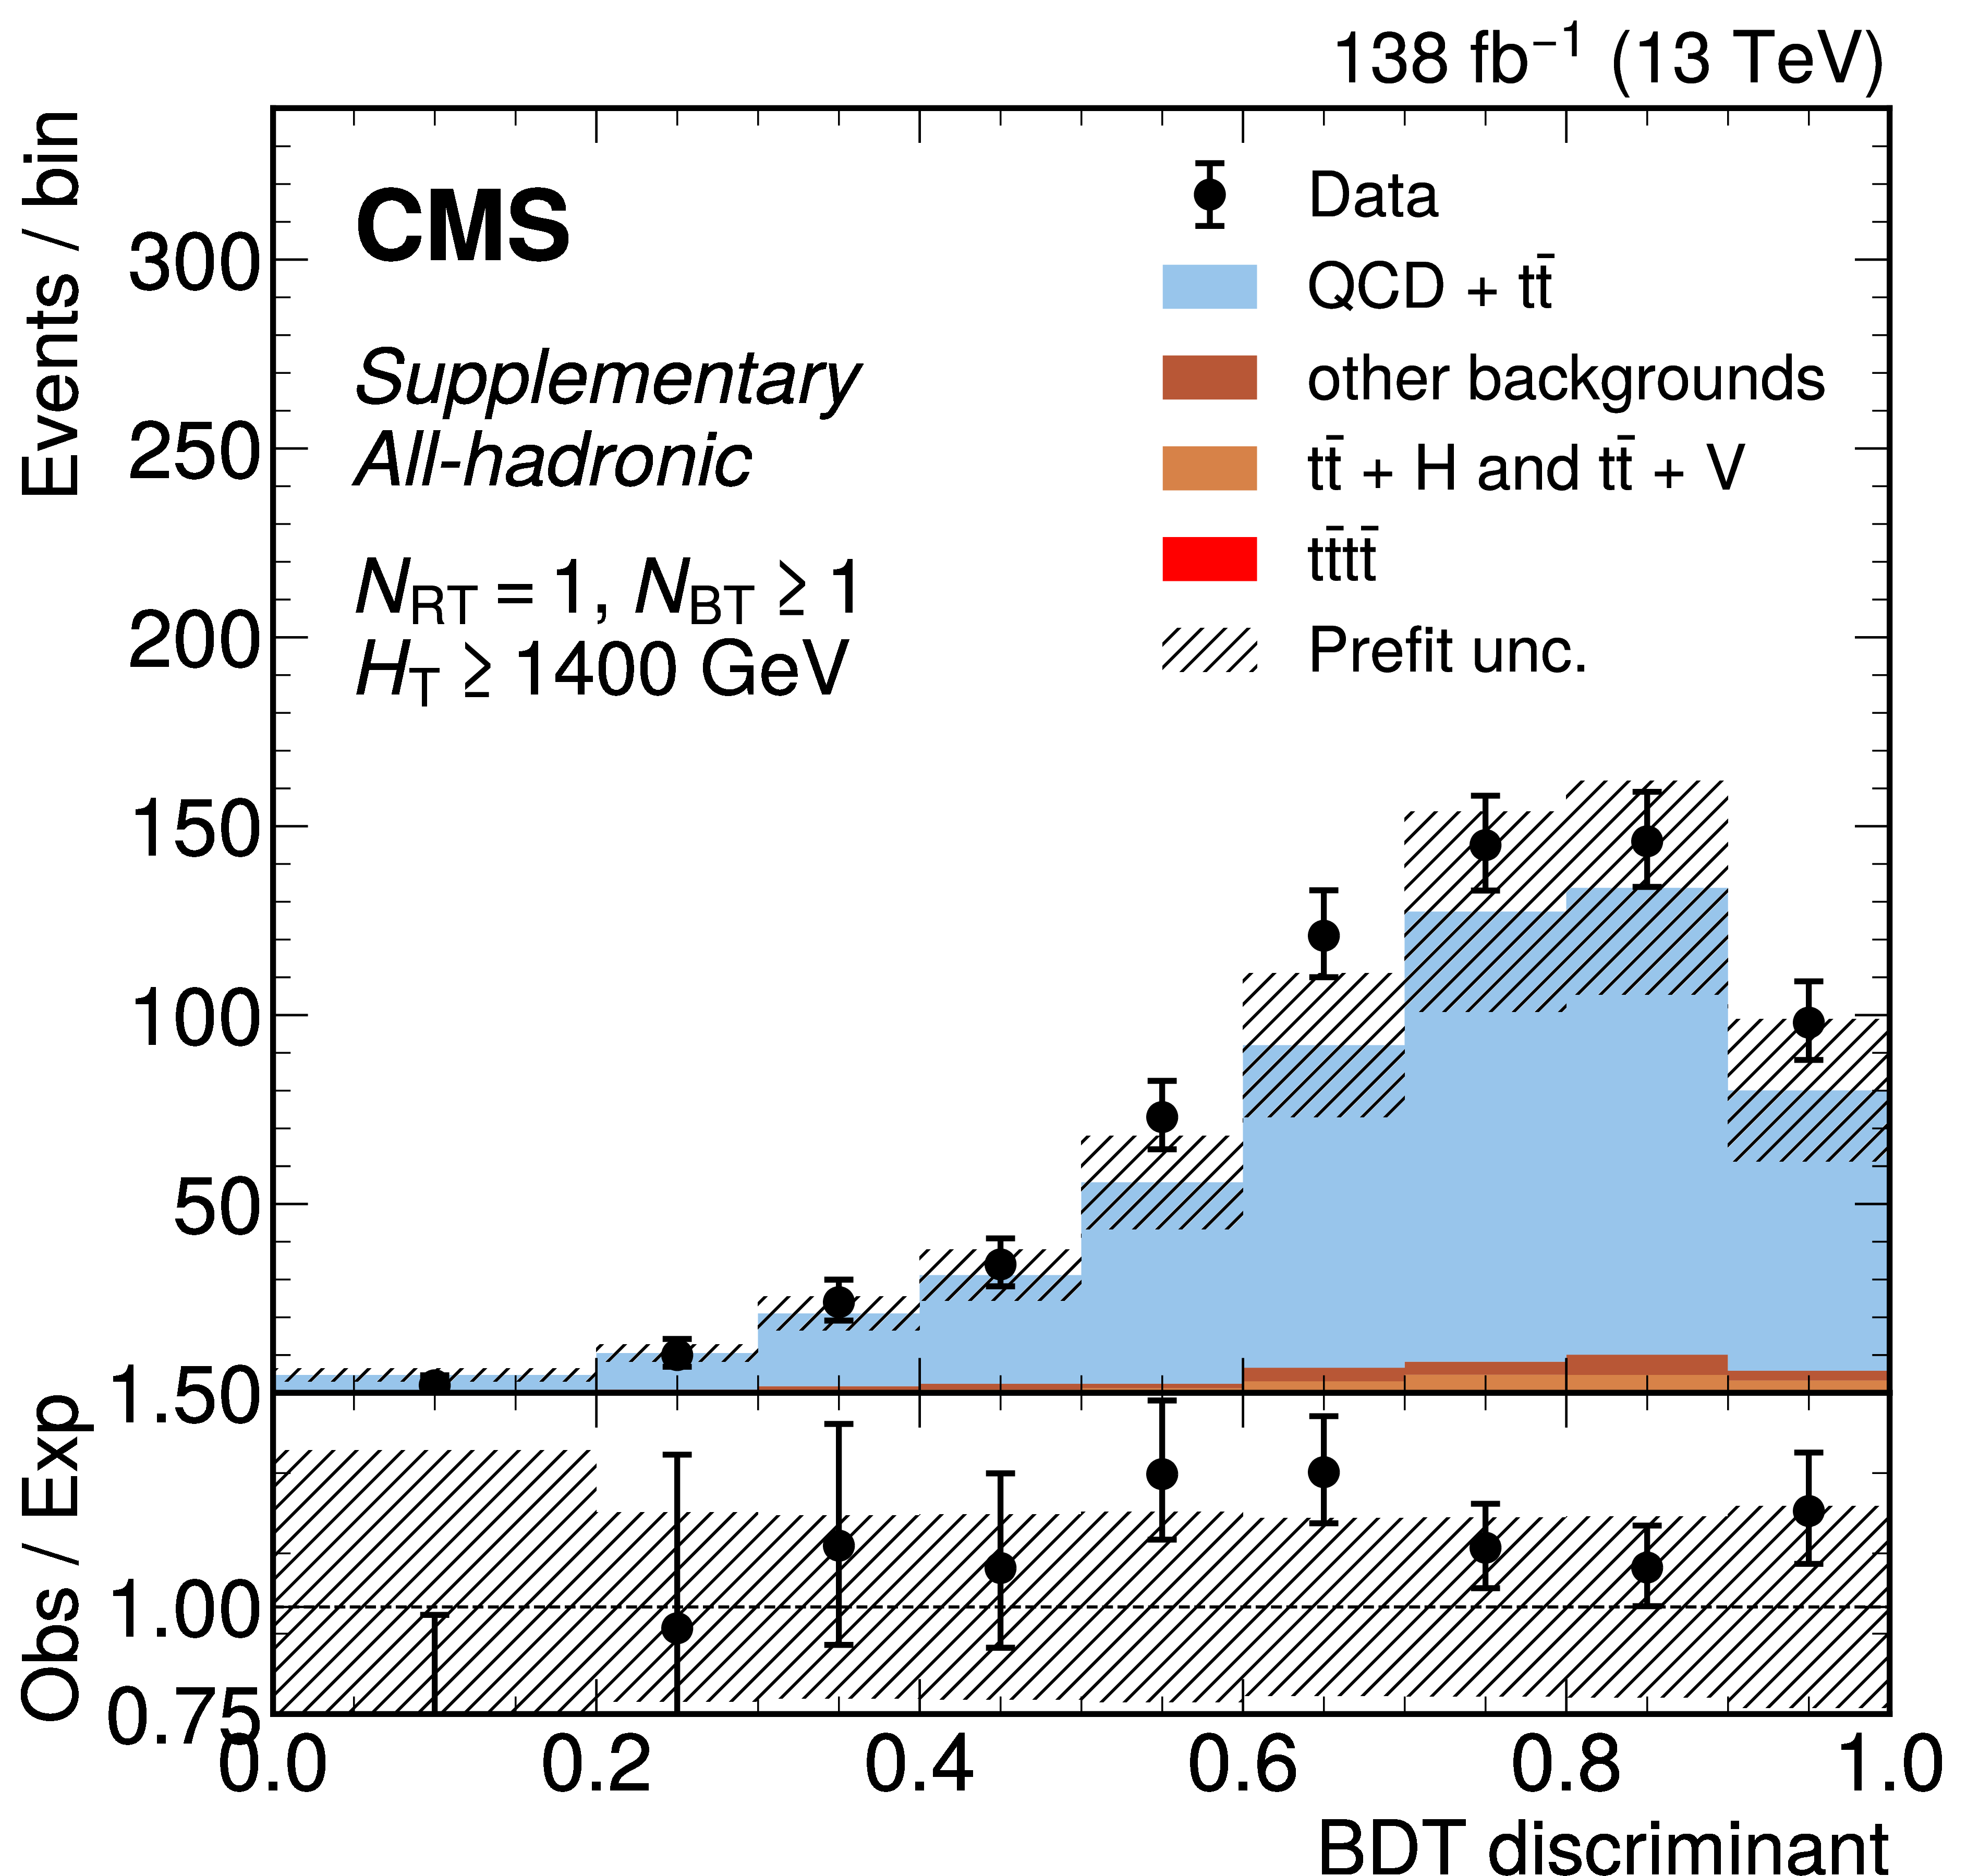
png pdf |
Additional Figure 19-j:
The distribution of the BDT discriminants in the 8-jet validation region for the full 2016--2018 data set in the all-hadronic channel for all $ N_\text{RT} $, $ N_\text{BT} $, and $ H_{\mathrm{T}} $ categories. ($ N_\text{RT} $ and $ N_\text{BT} $ represent number of resolved tops and b-jets respectively.) The background from QCD multijet and $ \mathrm{t} \bar{\mathrm{t}} $ production is derived from control regions in the data. Estimates for the $ \mathrm{t}\bar{\mathrm{t}}\mathrm{t}\bar{\mathrm{t}} $ signal and other backgrounds are shown using simulated samples. The hatched bands correspond to the estimated total uncertainty per validation region. |
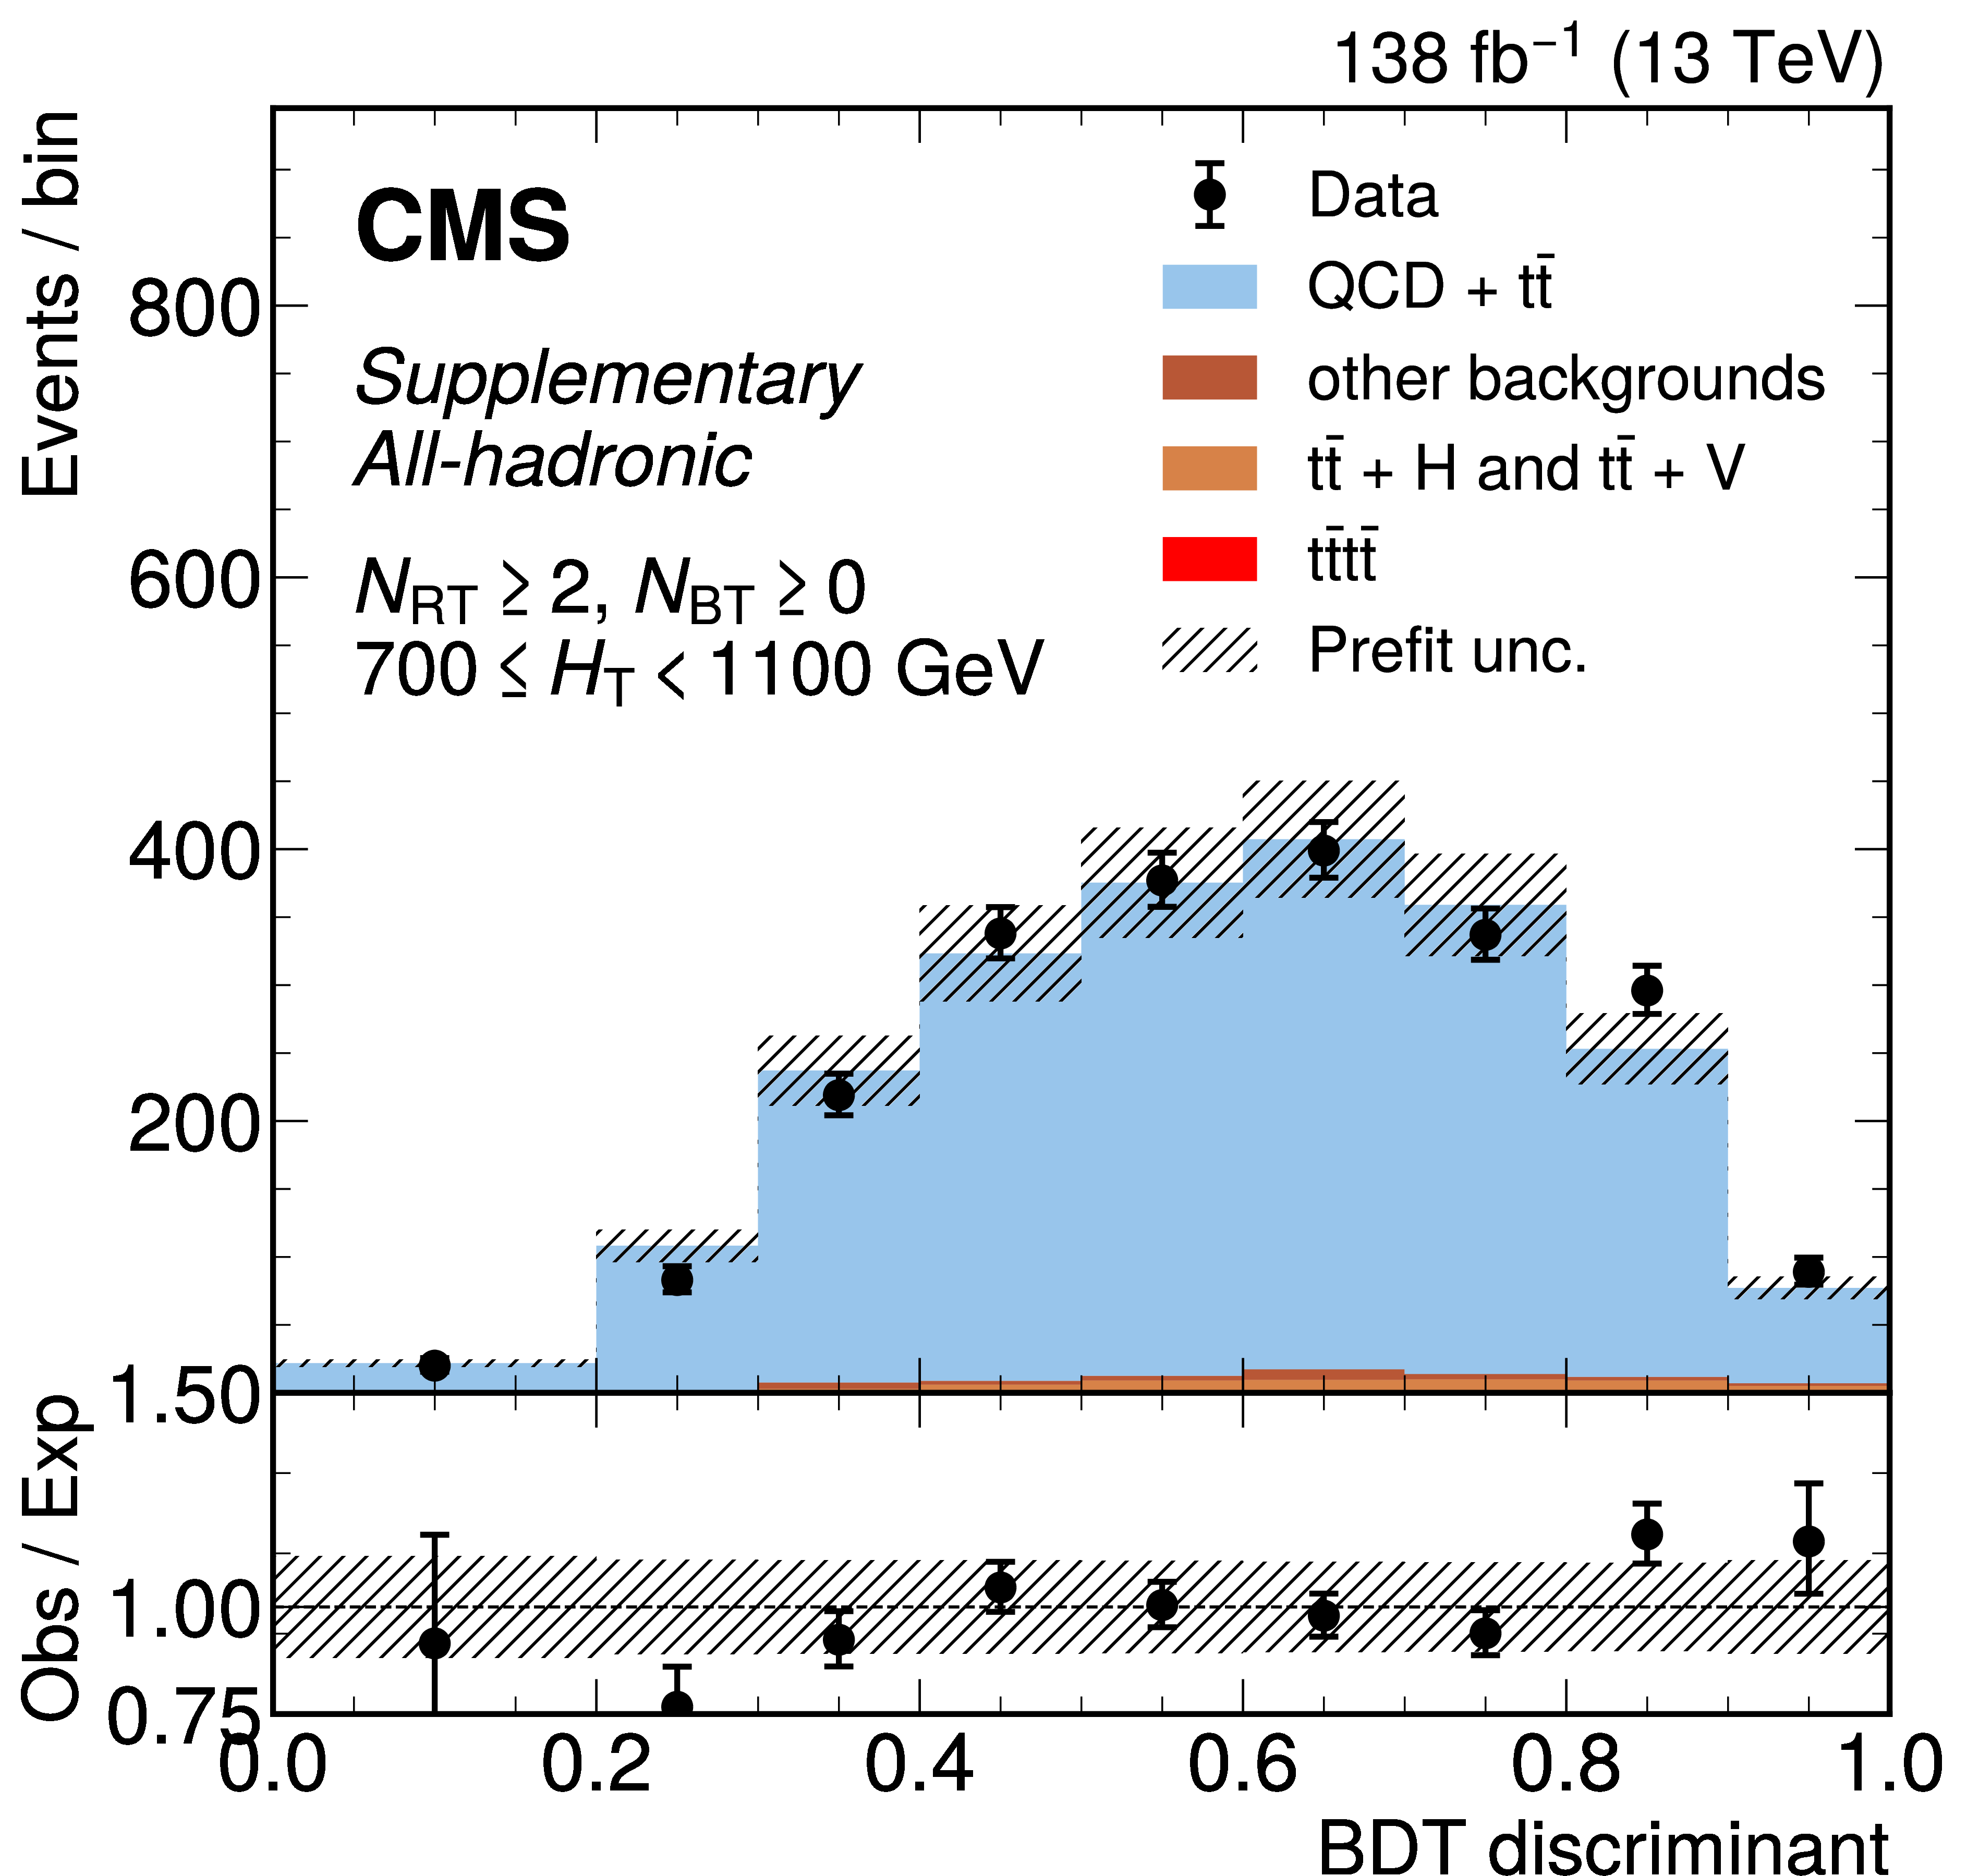
png pdf |
Additional Figure 19-k:
The distribution of the BDT discriminants in the 8-jet validation region for the full 2016--2018 data set in the all-hadronic channel for all $ N_\text{RT} $, $ N_\text{BT} $, and $ H_{\mathrm{T}} $ categories. ($ N_\text{RT} $ and $ N_\text{BT} $ represent number of resolved tops and b-jets respectively.) The background from QCD multijet and $ \mathrm{t} \bar{\mathrm{t}} $ production is derived from control regions in the data. Estimates for the $ \mathrm{t}\bar{\mathrm{t}}\mathrm{t}\bar{\mathrm{t}} $ signal and other backgrounds are shown using simulated samples. The hatched bands correspond to the estimated total uncertainty per validation region. |
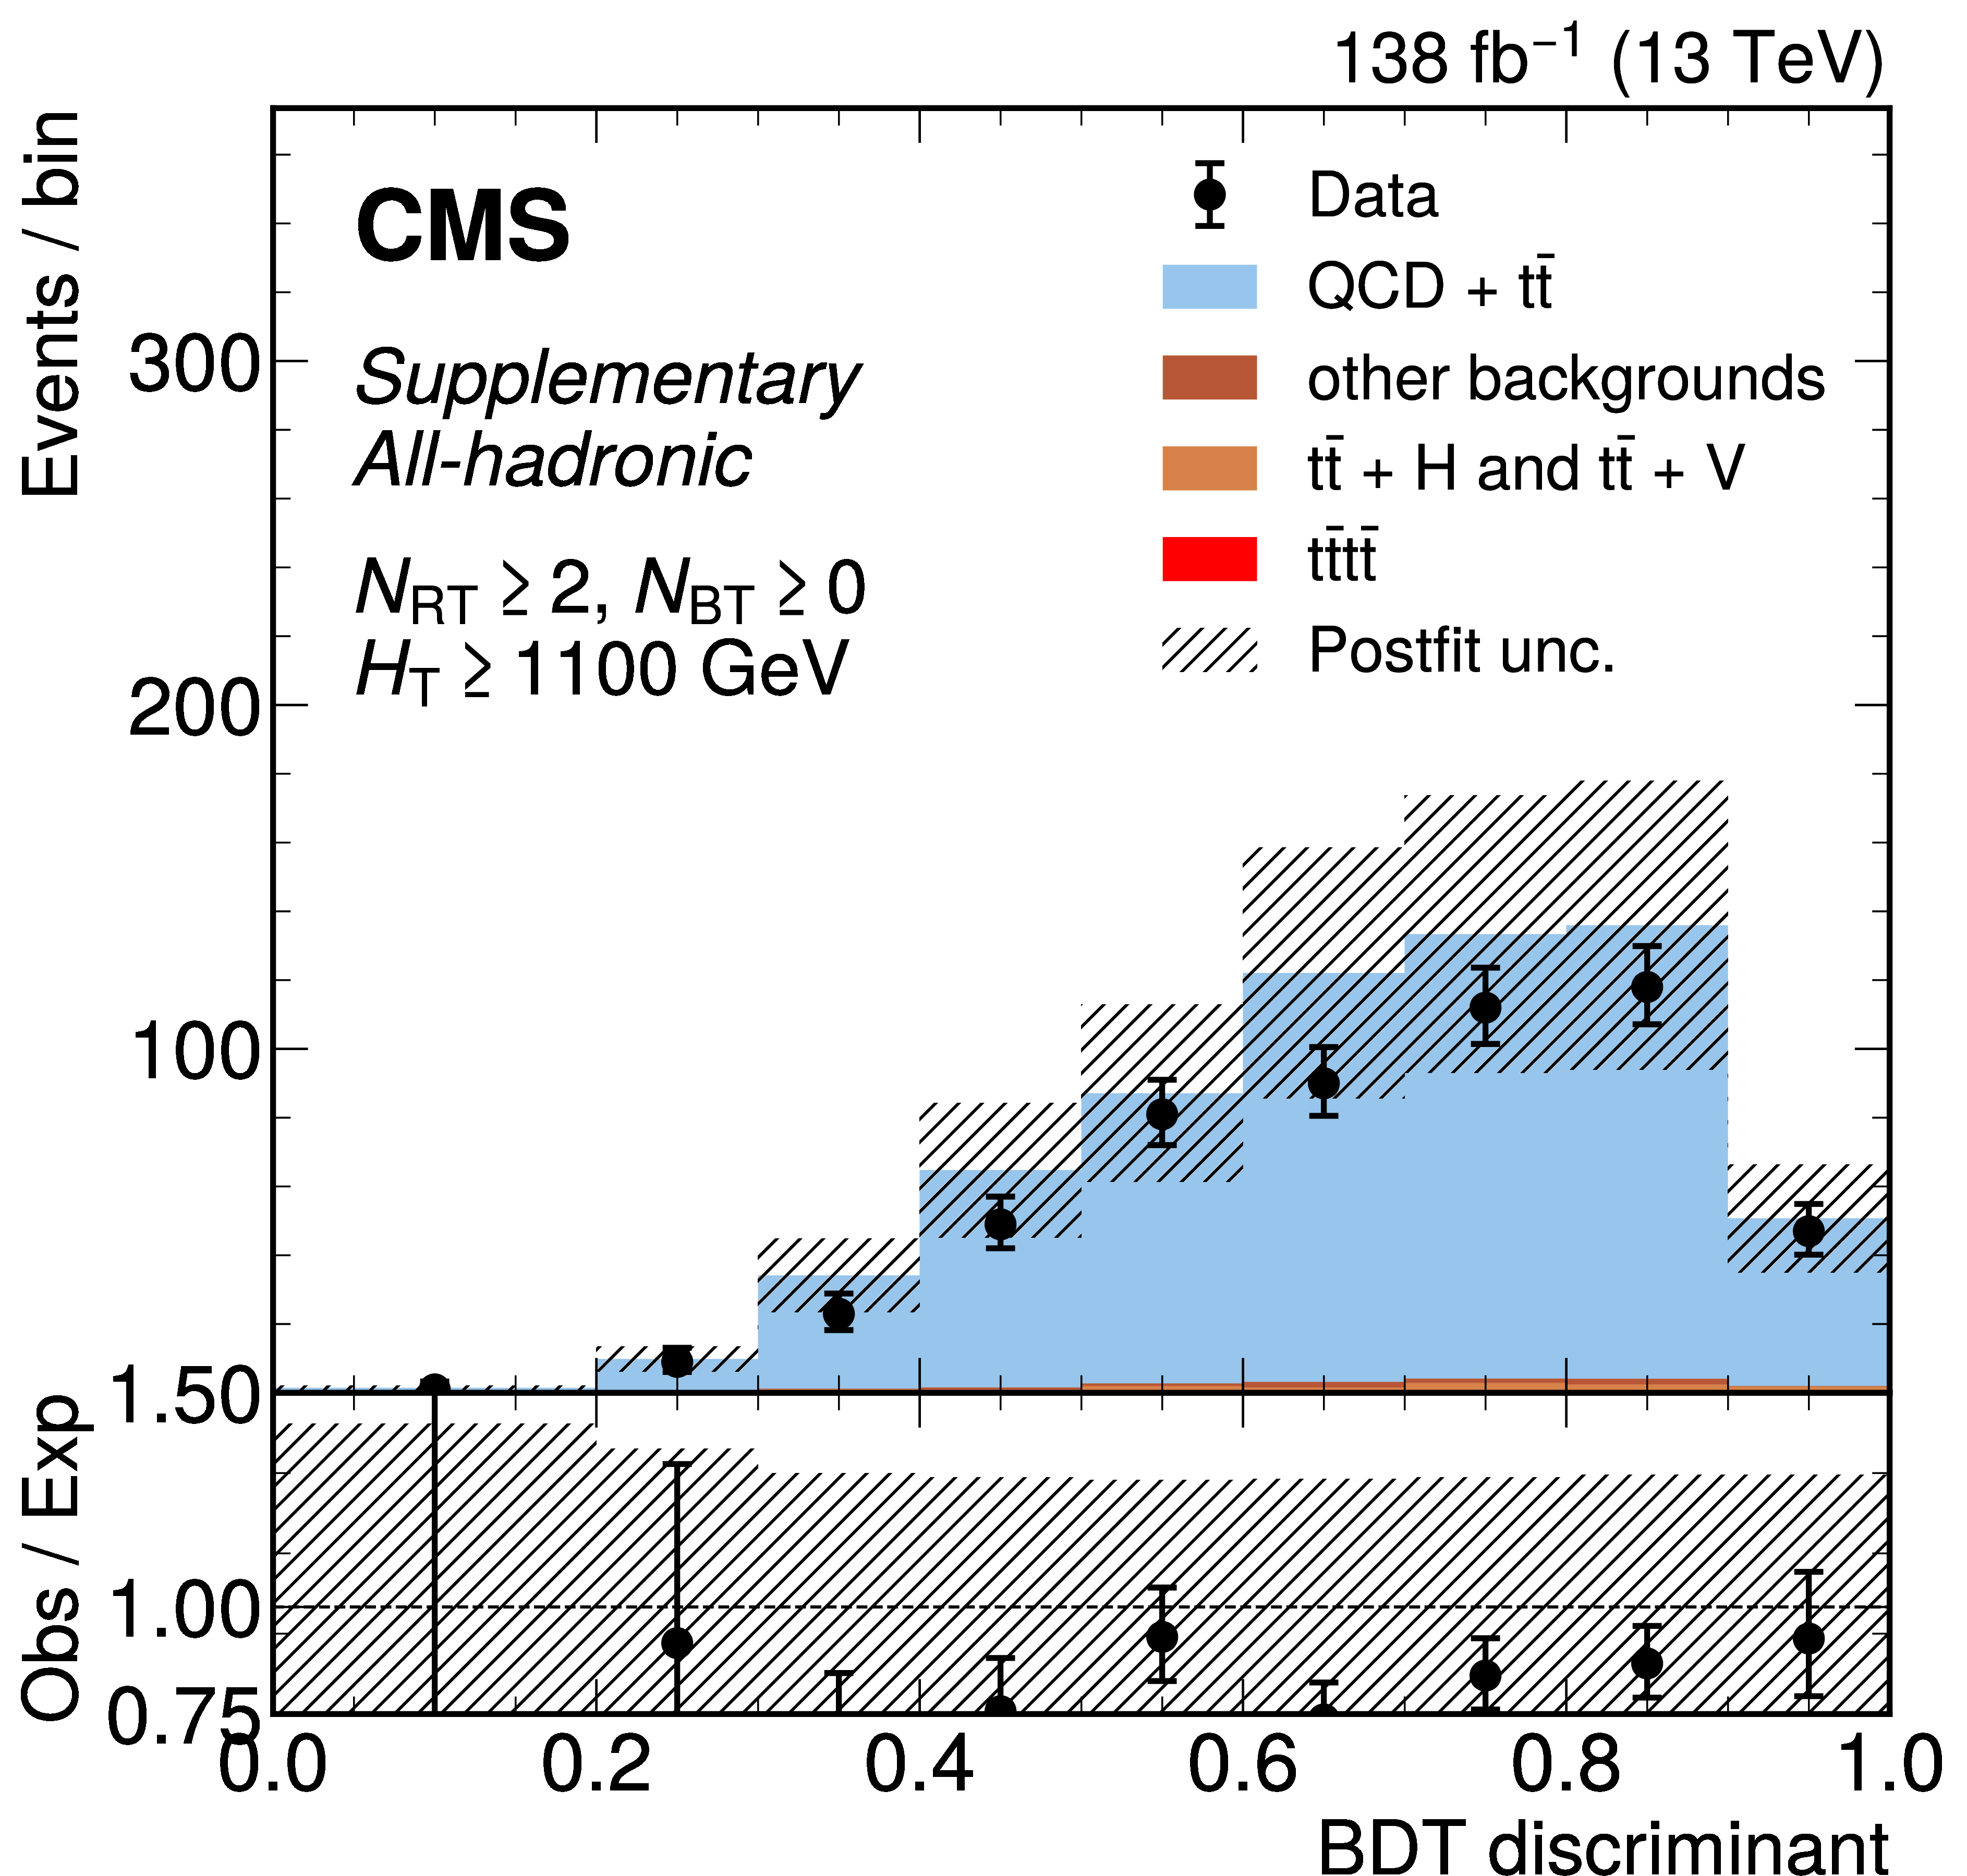
png pdf |
Additional Figure 19-l:
The distribution of the BDT discriminants in the 8-jet validation region for the full 2016--2018 data set in the all-hadronic channel for all $ N_\text{RT} $, $ N_\text{BT} $, and $ H_{\mathrm{T}} $ categories. ($ N_\text{RT} $ and $ N_\text{BT} $ represent number of resolved tops and b-jets respectively.) The background from QCD multijet and $ \mathrm{t} \bar{\mathrm{t}} $ production is derived from control regions in the data. Estimates for the $ \mathrm{t}\bar{\mathrm{t}}\mathrm{t}\bar{\mathrm{t}} $ signal and other backgrounds are shown using simulated samples. The hatched bands correspond to the estimated total uncertainty per validation region. |
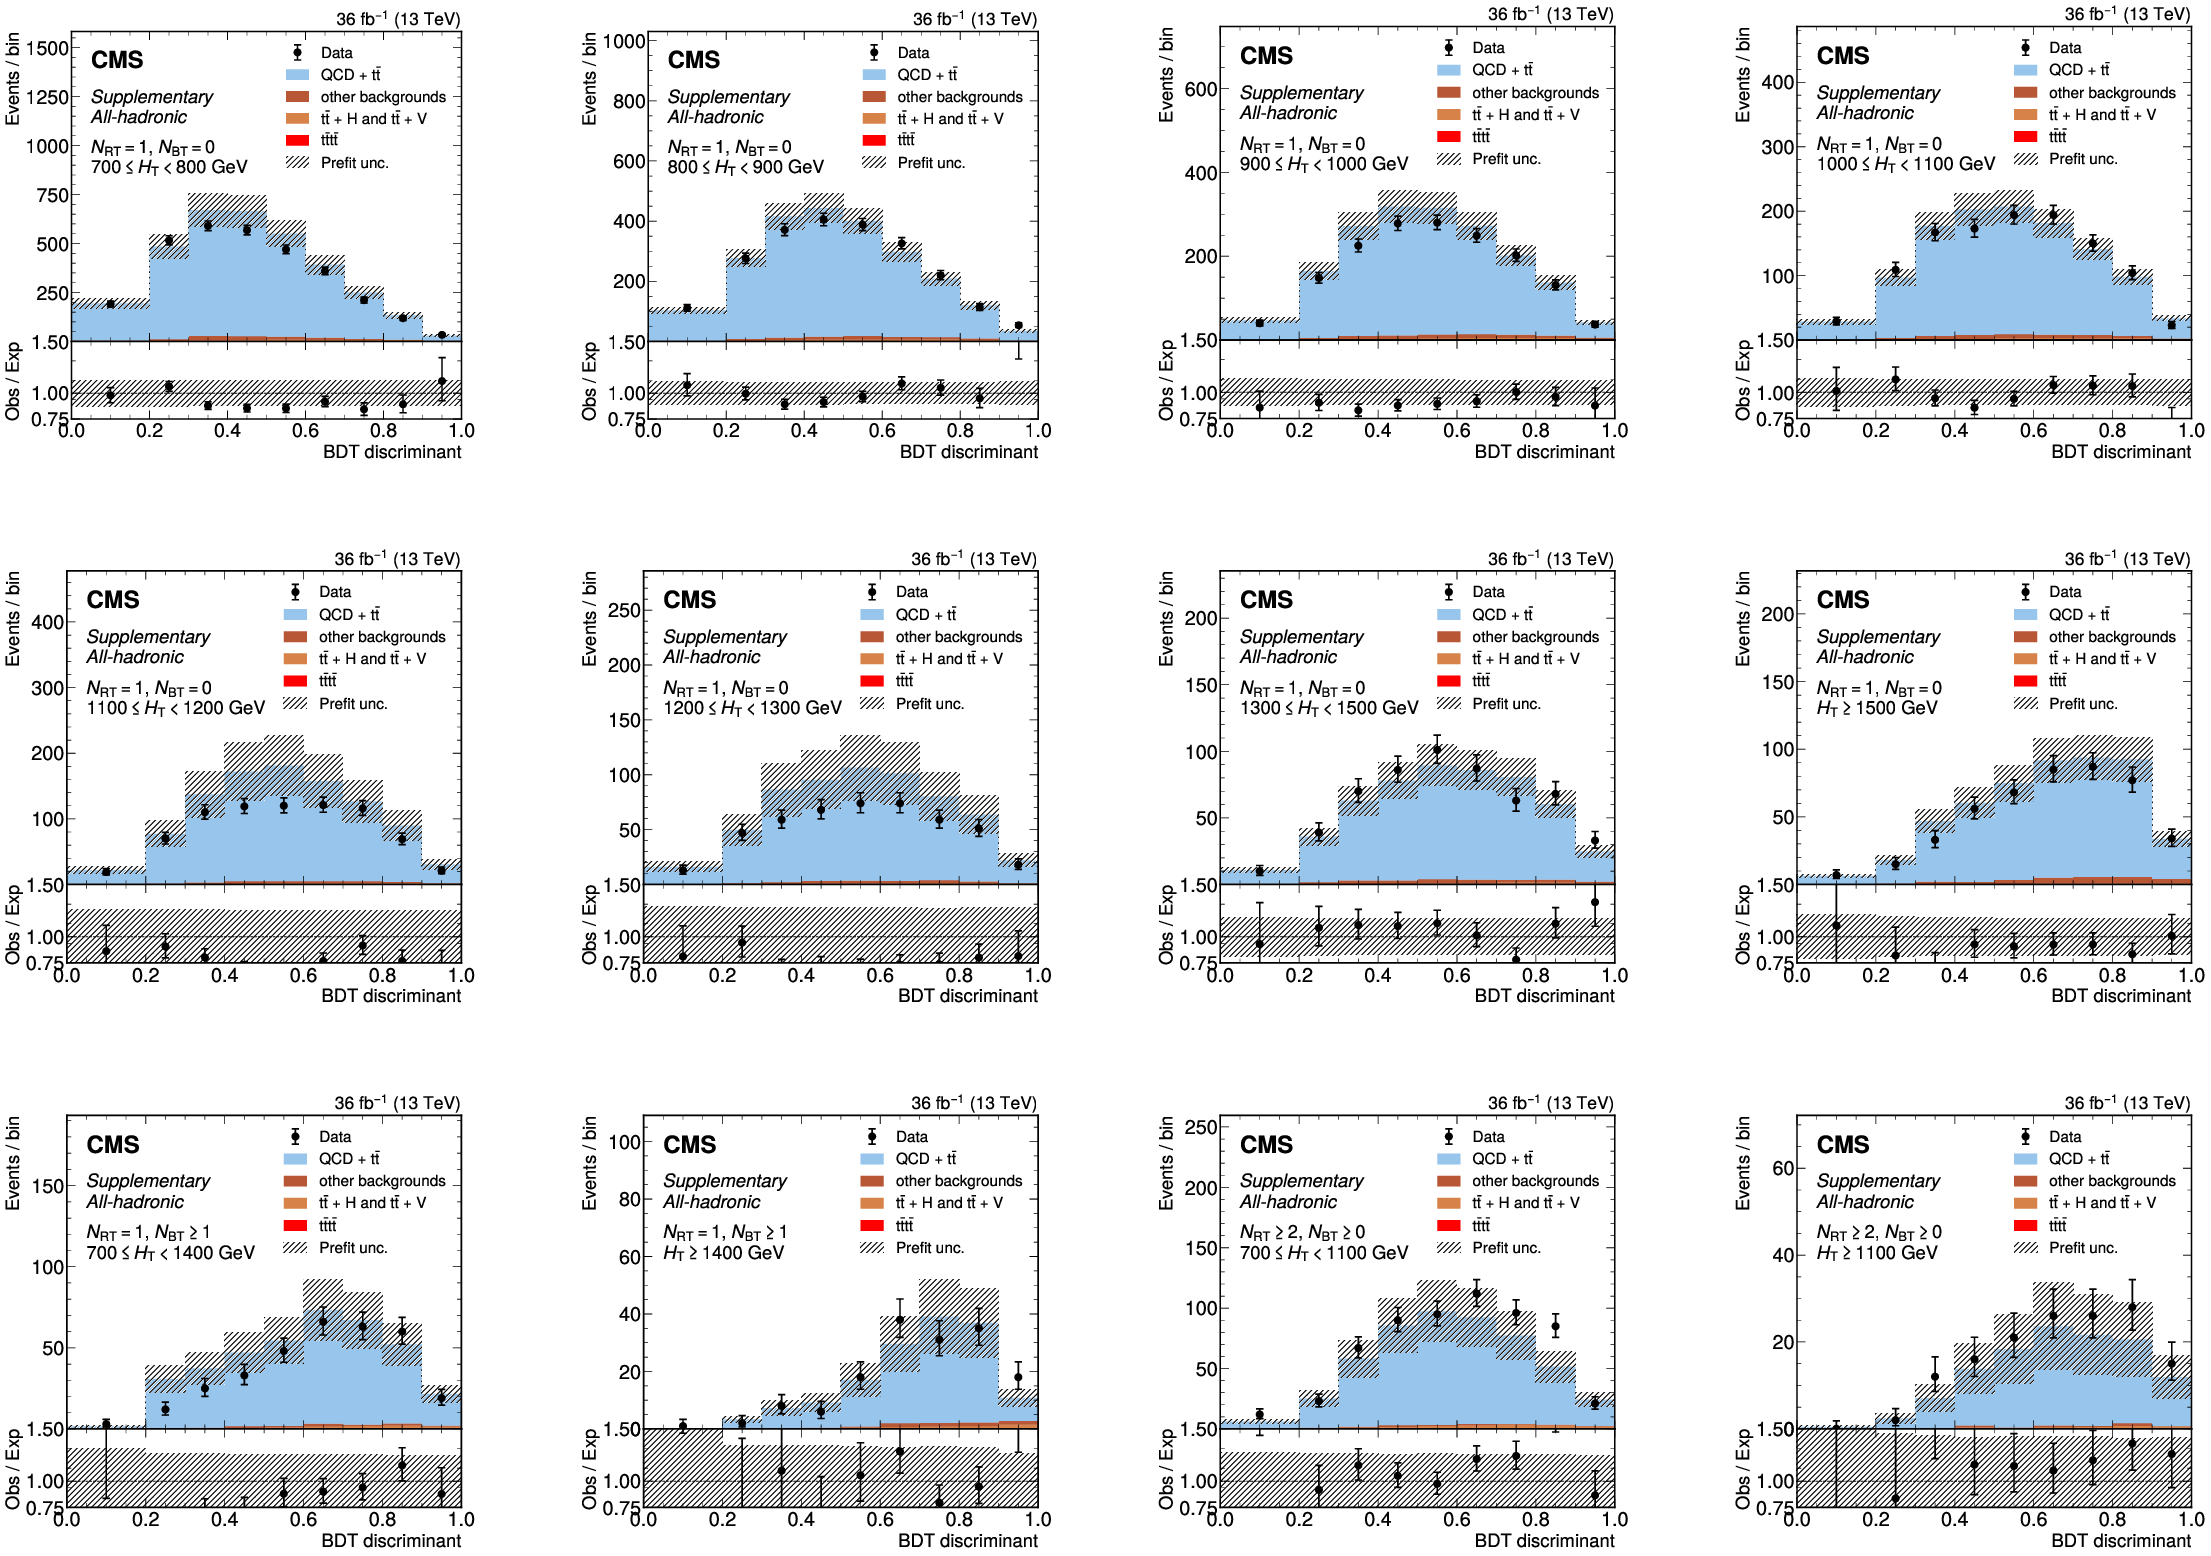
png pdf |
Additional Figure 20:
The distribution of the BDT discriminants in the 8-jet validation region (VR) for the 2016 data set in the all-hadronic channel for all $ N_\text{RT} $, $ N_\text{BT} $, and $ H_{\mathrm{T}} $ categories. ($ N_\text{RT} $ and $ N_\text{BT} $ represent number of resolved tops and b-jets respectively.) The background from QCD multijet and $ \mathrm{t} \bar{\mathrm{t}} $ production is derived from control regions in the data. Estimates for the $ \mathrm{t}\bar{\mathrm{t}}\mathrm{t}\bar{\mathrm{t}} $ signal and other backgrounds are shown using simulated samples. The hatched bands correspond to the estimated total uncertainty per validation region. VR-derived shape uncertainties to account for discrepancies between the data and the data-driven background estimate observed in the VRs are shown overlaid in red and blue for reference. |
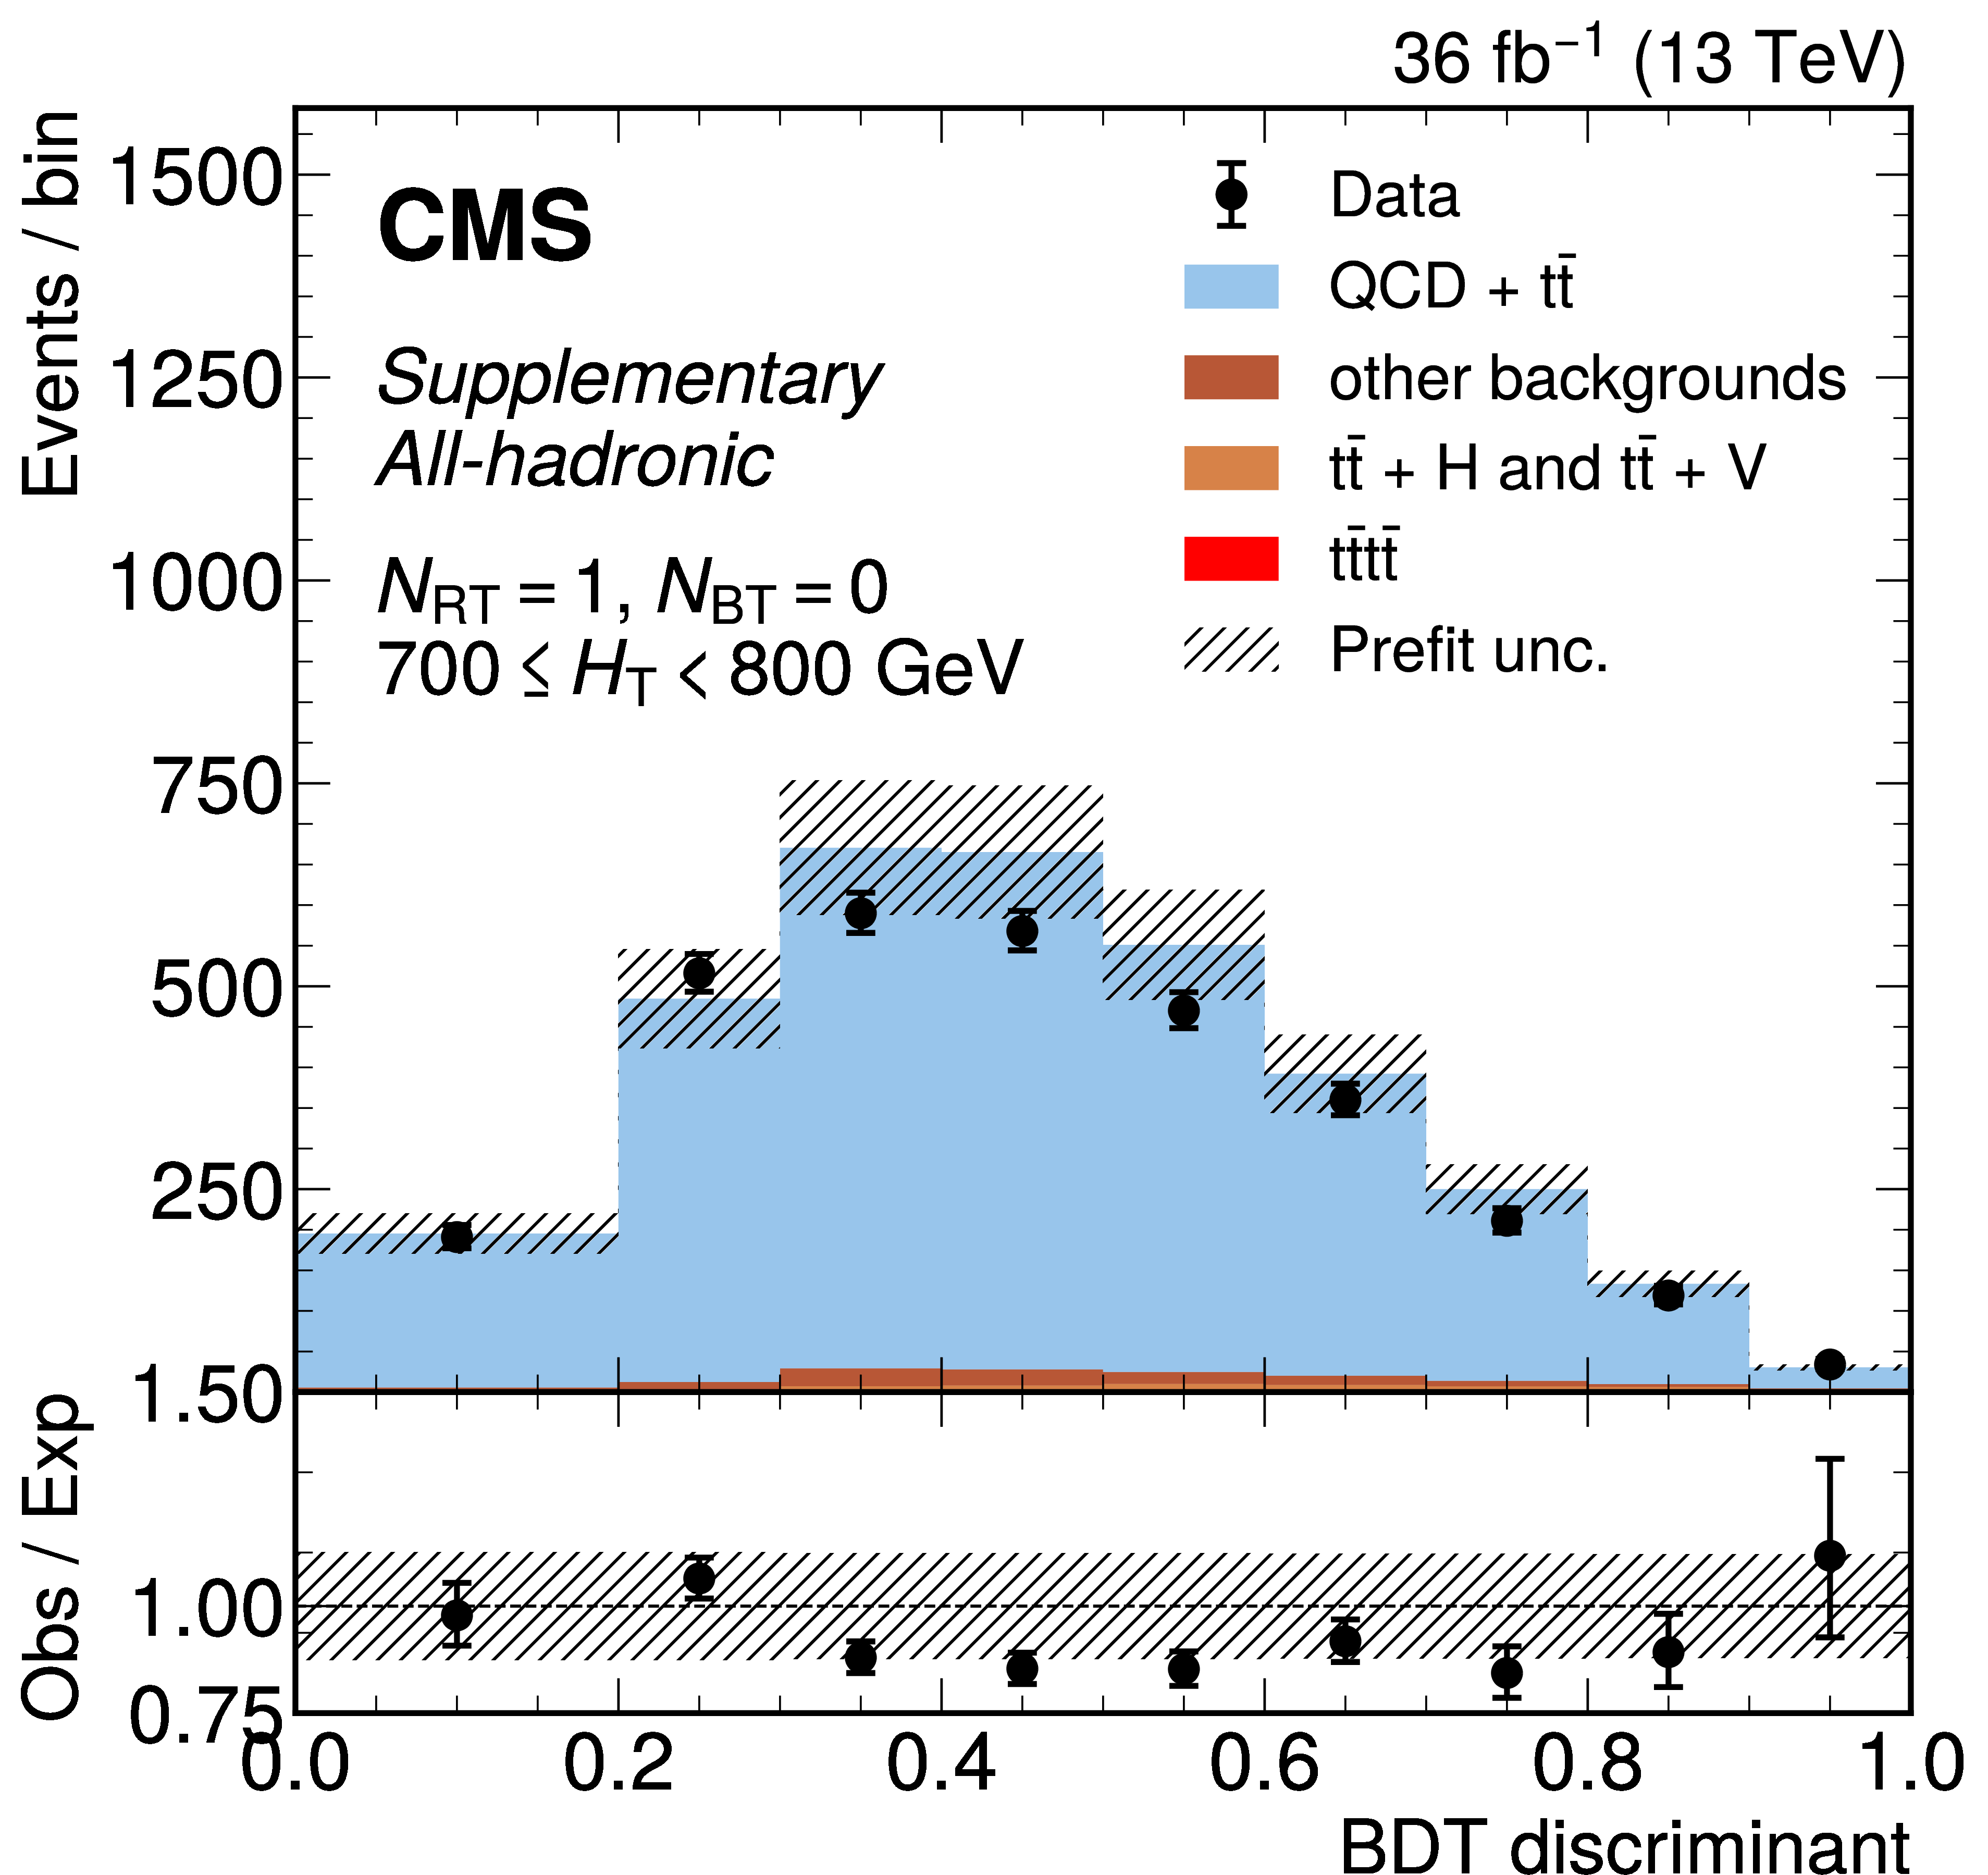
png pdf |
Additional Figure 20-a:
The distribution of the BDT discriminants in the 8-jet validation region (VR) for the 2016 data set in the all-hadronic channel for all $ N_\text{RT} $, $ N_\text{BT} $, and $ H_{\mathrm{T}} $ categories. ($ N_\text{RT} $ and $ N_\text{BT} $ represent number of resolved tops and b-jets respectively.) The background from QCD multijet and $ \mathrm{t} \bar{\mathrm{t}} $ production is derived from control regions in the data. Estimates for the $ \mathrm{t}\bar{\mathrm{t}}\mathrm{t}\bar{\mathrm{t}} $ signal and other backgrounds are shown using simulated samples. The hatched bands correspond to the estimated total uncertainty per validation region. VR-derived shape uncertainties to account for discrepancies between the data and the data-driven background estimate observed in the VRs are shown overlaid in red and blue for reference. |
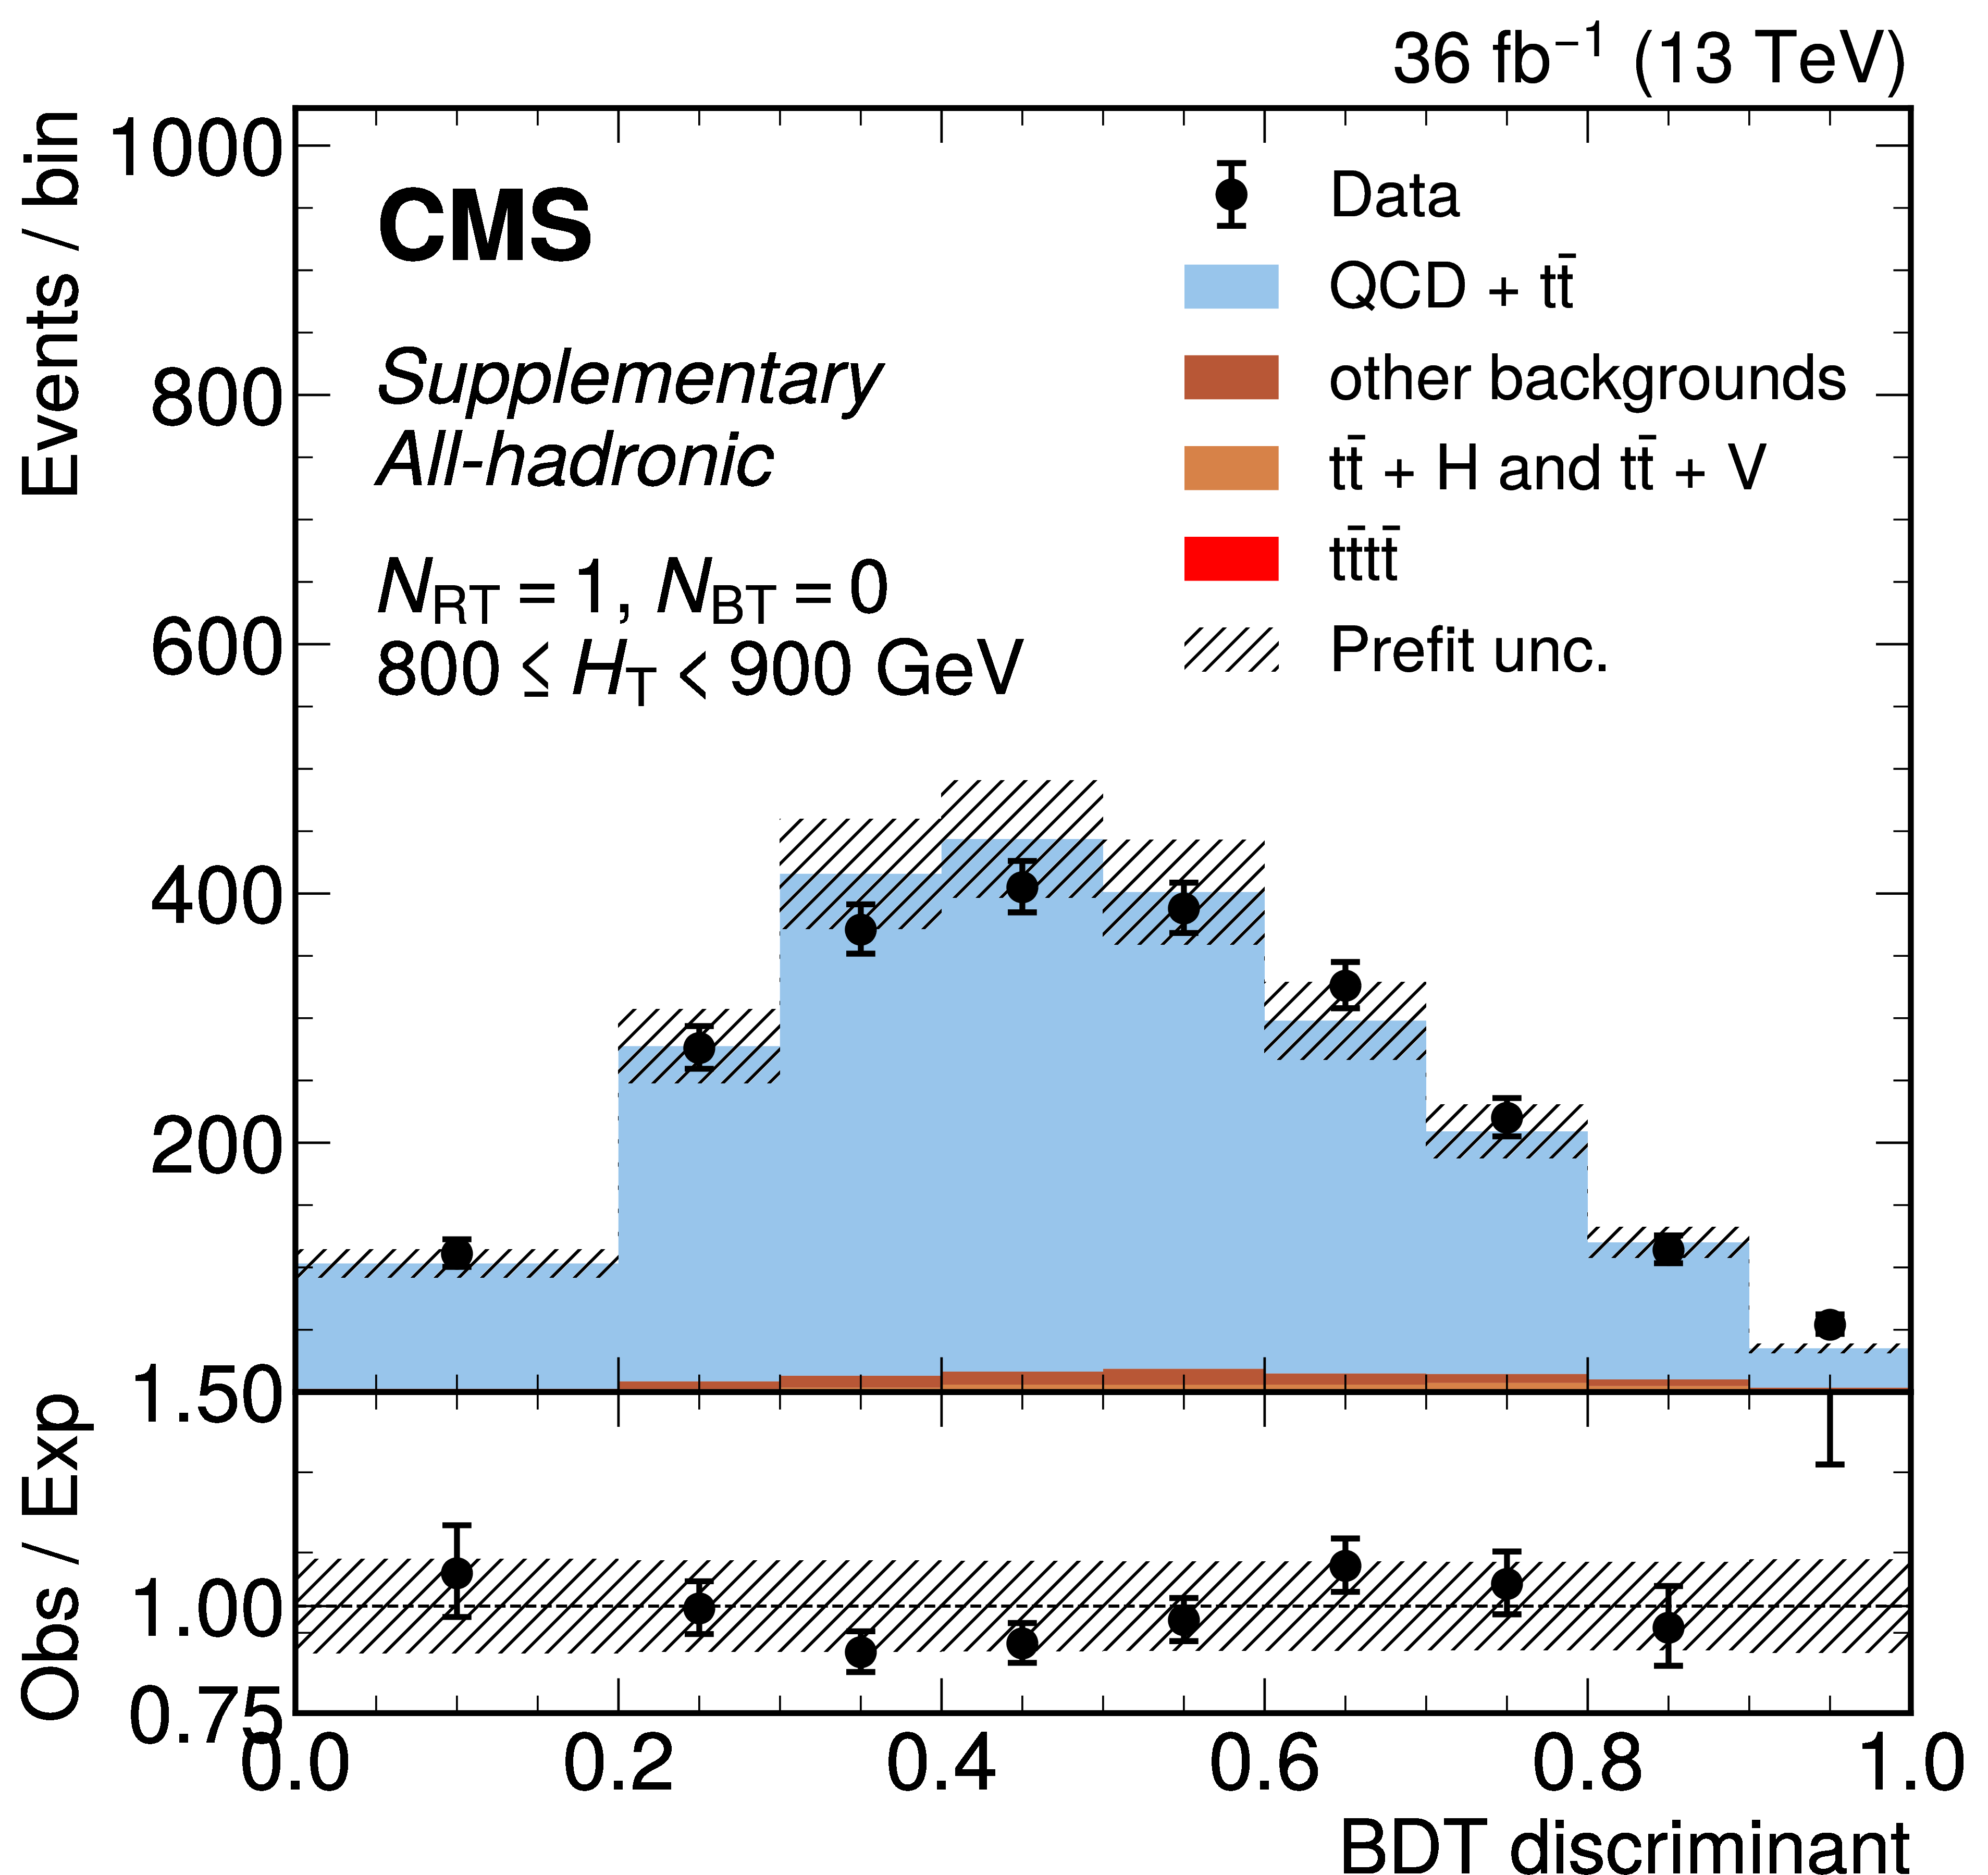
png pdf |
Additional Figure 20-b:
The distribution of the BDT discriminants in the 8-jet validation region (VR) for the 2016 data set in the all-hadronic channel for all $ N_\text{RT} $, $ N_\text{BT} $, and $ H_{\mathrm{T}} $ categories. ($ N_\text{RT} $ and $ N_\text{BT} $ represent number of resolved tops and b-jets respectively.) The background from QCD multijet and $ \mathrm{t} \bar{\mathrm{t}} $ production is derived from control regions in the data. Estimates for the $ \mathrm{t}\bar{\mathrm{t}}\mathrm{t}\bar{\mathrm{t}} $ signal and other backgrounds are shown using simulated samples. The hatched bands correspond to the estimated total uncertainty per validation region. VR-derived shape uncertainties to account for discrepancies between the data and the data-driven background estimate observed in the VRs are shown overlaid in red and blue for reference. |

png pdf |
Additional Figure 20-c:
The distribution of the BDT discriminants in the 8-jet validation region (VR) for the 2016 data set in the all-hadronic channel for all $ N_\text{RT} $, $ N_\text{BT} $, and $ H_{\mathrm{T}} $ categories. ($ N_\text{RT} $ and $ N_\text{BT} $ represent number of resolved tops and b-jets respectively.) The background from QCD multijet and $ \mathrm{t} \bar{\mathrm{t}} $ production is derived from control regions in the data. Estimates for the $ \mathrm{t}\bar{\mathrm{t}}\mathrm{t}\bar{\mathrm{t}} $ signal and other backgrounds are shown using simulated samples. The hatched bands correspond to the estimated total uncertainty per validation region. VR-derived shape uncertainties to account for discrepancies between the data and the data-driven background estimate observed in the VRs are shown overlaid in red and blue for reference. |
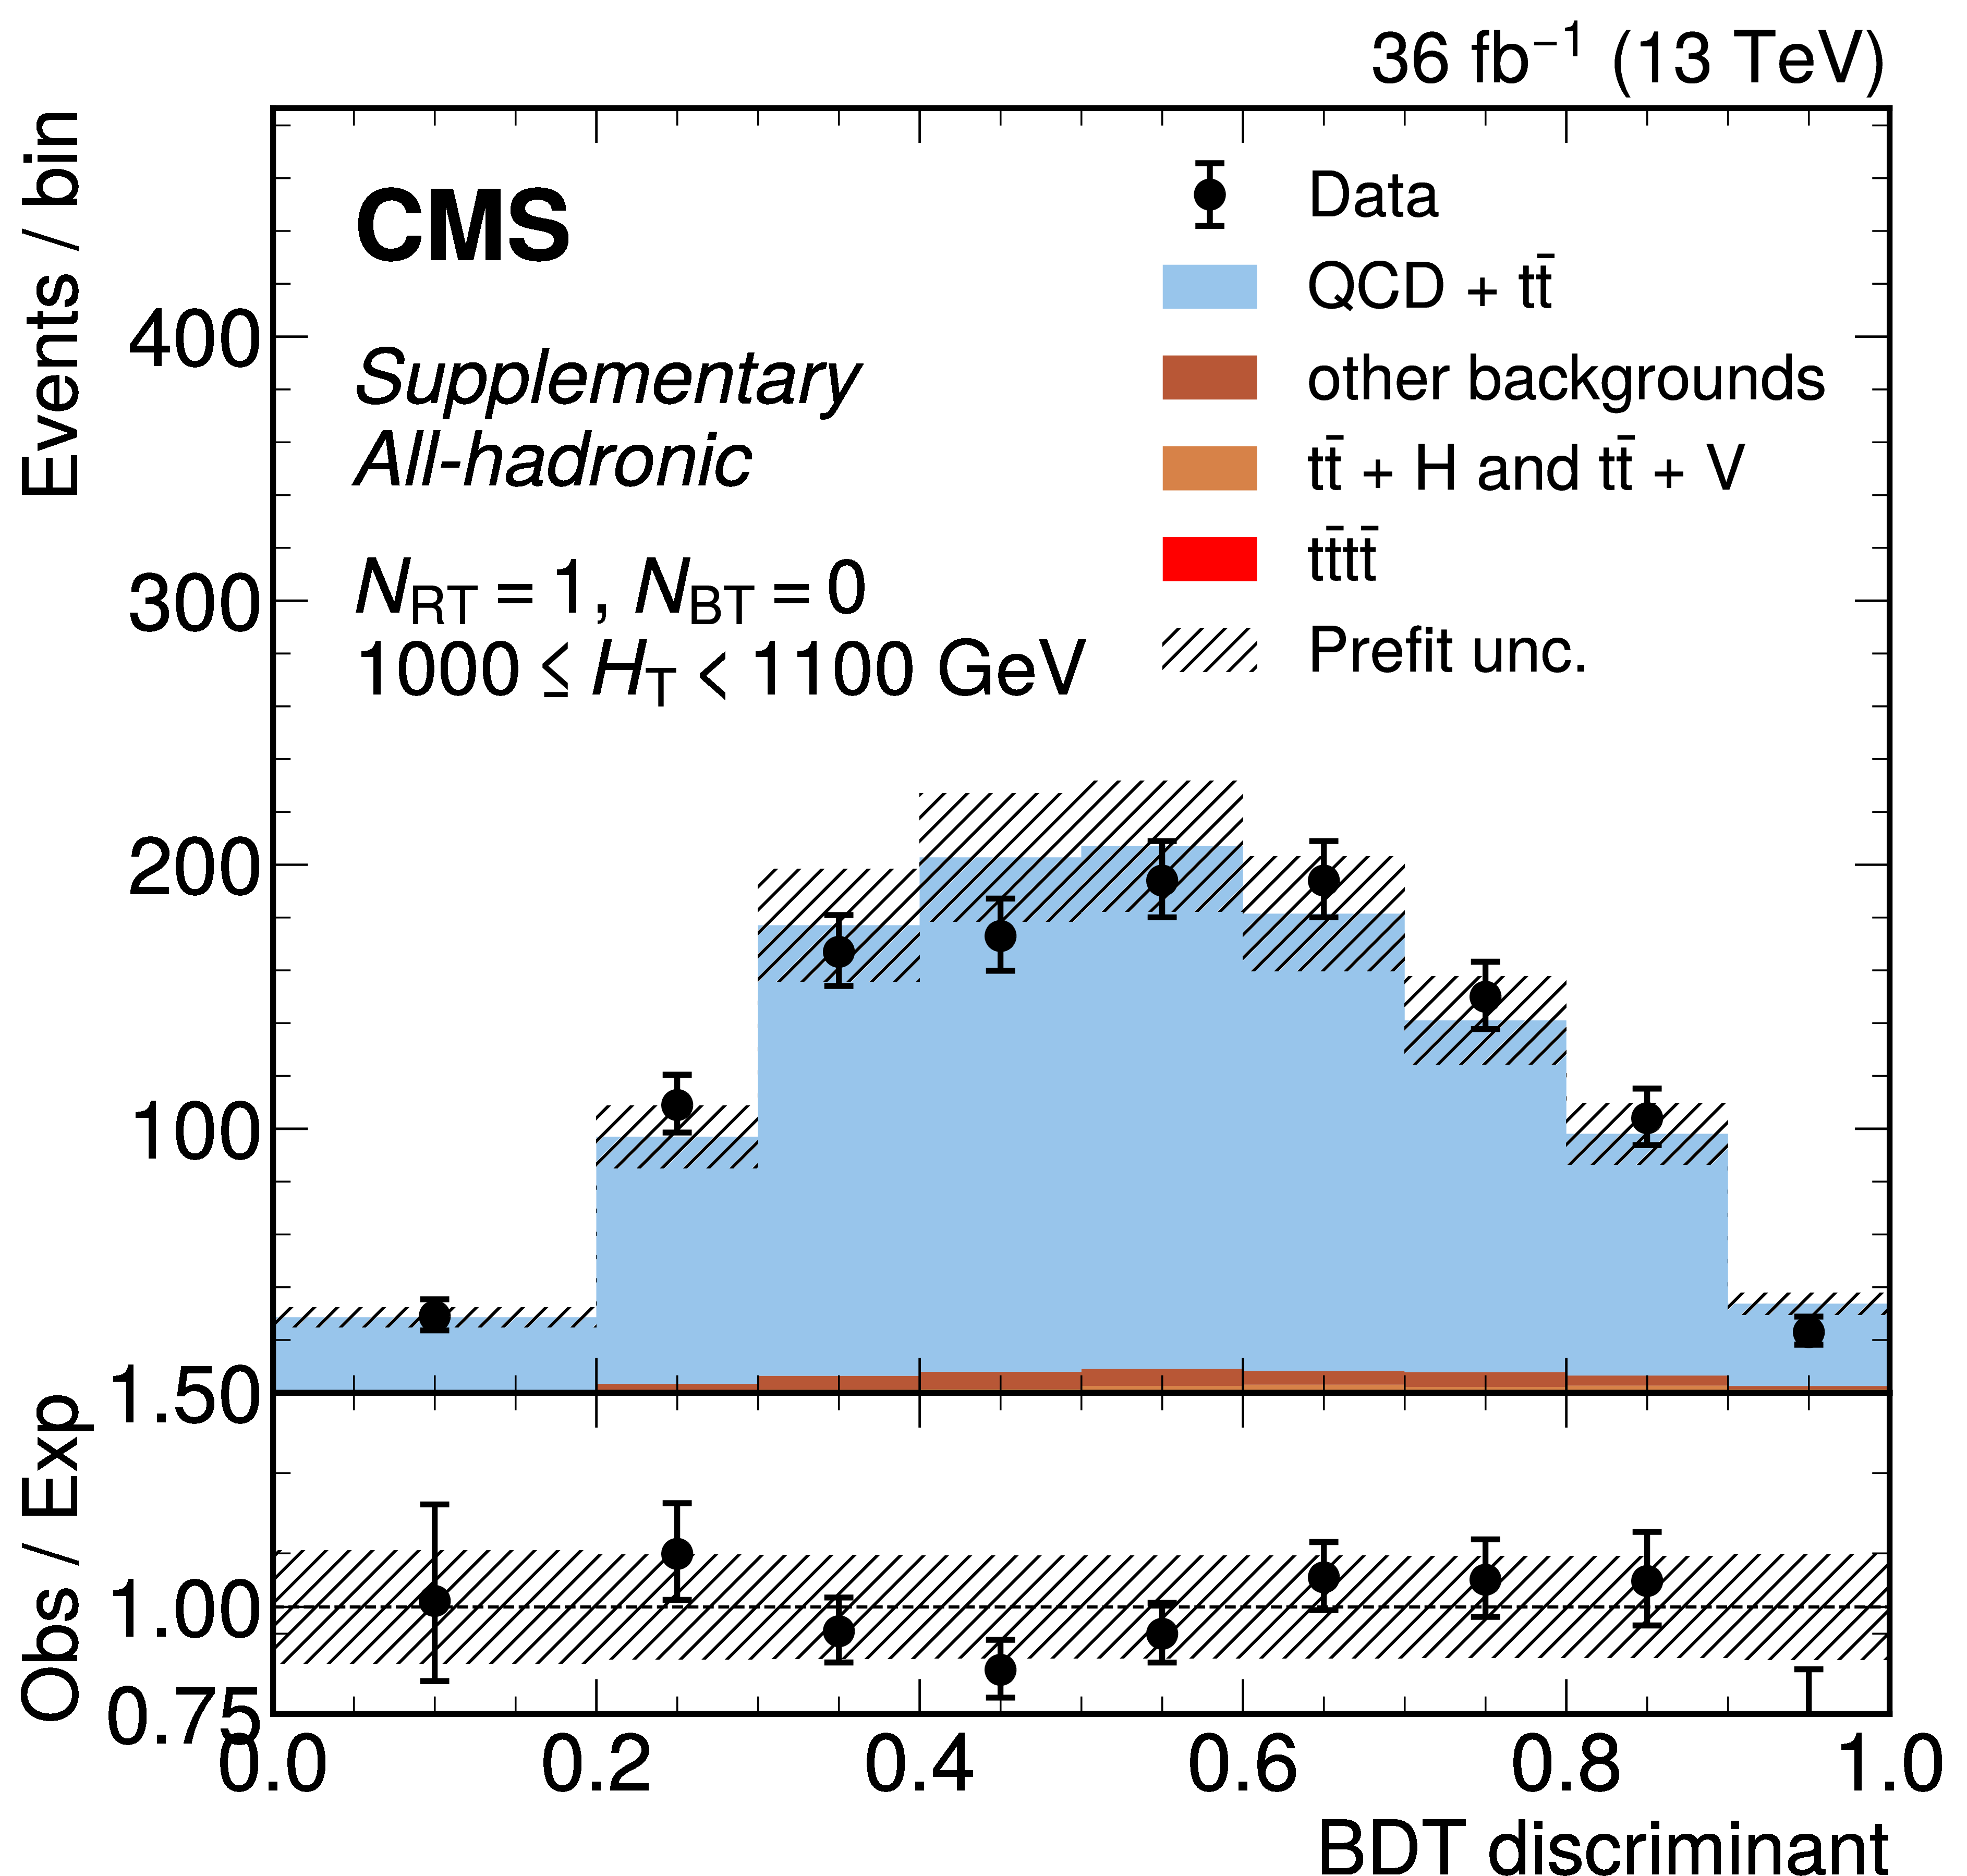
png pdf |
Additional Figure 20-d:
The distribution of the BDT discriminants in the 8-jet validation region (VR) for the 2016 data set in the all-hadronic channel for all $ N_\text{RT} $, $ N_\text{BT} $, and $ H_{\mathrm{T}} $ categories. ($ N_\text{RT} $ and $ N_\text{BT} $ represent number of resolved tops and b-jets respectively.) The background from QCD multijet and $ \mathrm{t} \bar{\mathrm{t}} $ production is derived from control regions in the data. Estimates for the $ \mathrm{t}\bar{\mathrm{t}}\mathrm{t}\bar{\mathrm{t}} $ signal and other backgrounds are shown using simulated samples. The hatched bands correspond to the estimated total uncertainty per validation region. VR-derived shape uncertainties to account for discrepancies between the data and the data-driven background estimate observed in the VRs are shown overlaid in red and blue for reference. |

png pdf |
Additional Figure 20-e:
The distribution of the BDT discriminants in the 8-jet validation region (VR) for the 2016 data set in the all-hadronic channel for all $ N_\text{RT} $, $ N_\text{BT} $, and $ H_{\mathrm{T}} $ categories. ($ N_\text{RT} $ and $ N_\text{BT} $ represent number of resolved tops and b-jets respectively.) The background from QCD multijet and $ \mathrm{t} \bar{\mathrm{t}} $ production is derived from control regions in the data. Estimates for the $ \mathrm{t}\bar{\mathrm{t}}\mathrm{t}\bar{\mathrm{t}} $ signal and other backgrounds are shown using simulated samples. The hatched bands correspond to the estimated total uncertainty per validation region. VR-derived shape uncertainties to account for discrepancies between the data and the data-driven background estimate observed in the VRs are shown overlaid in red and blue for reference. |
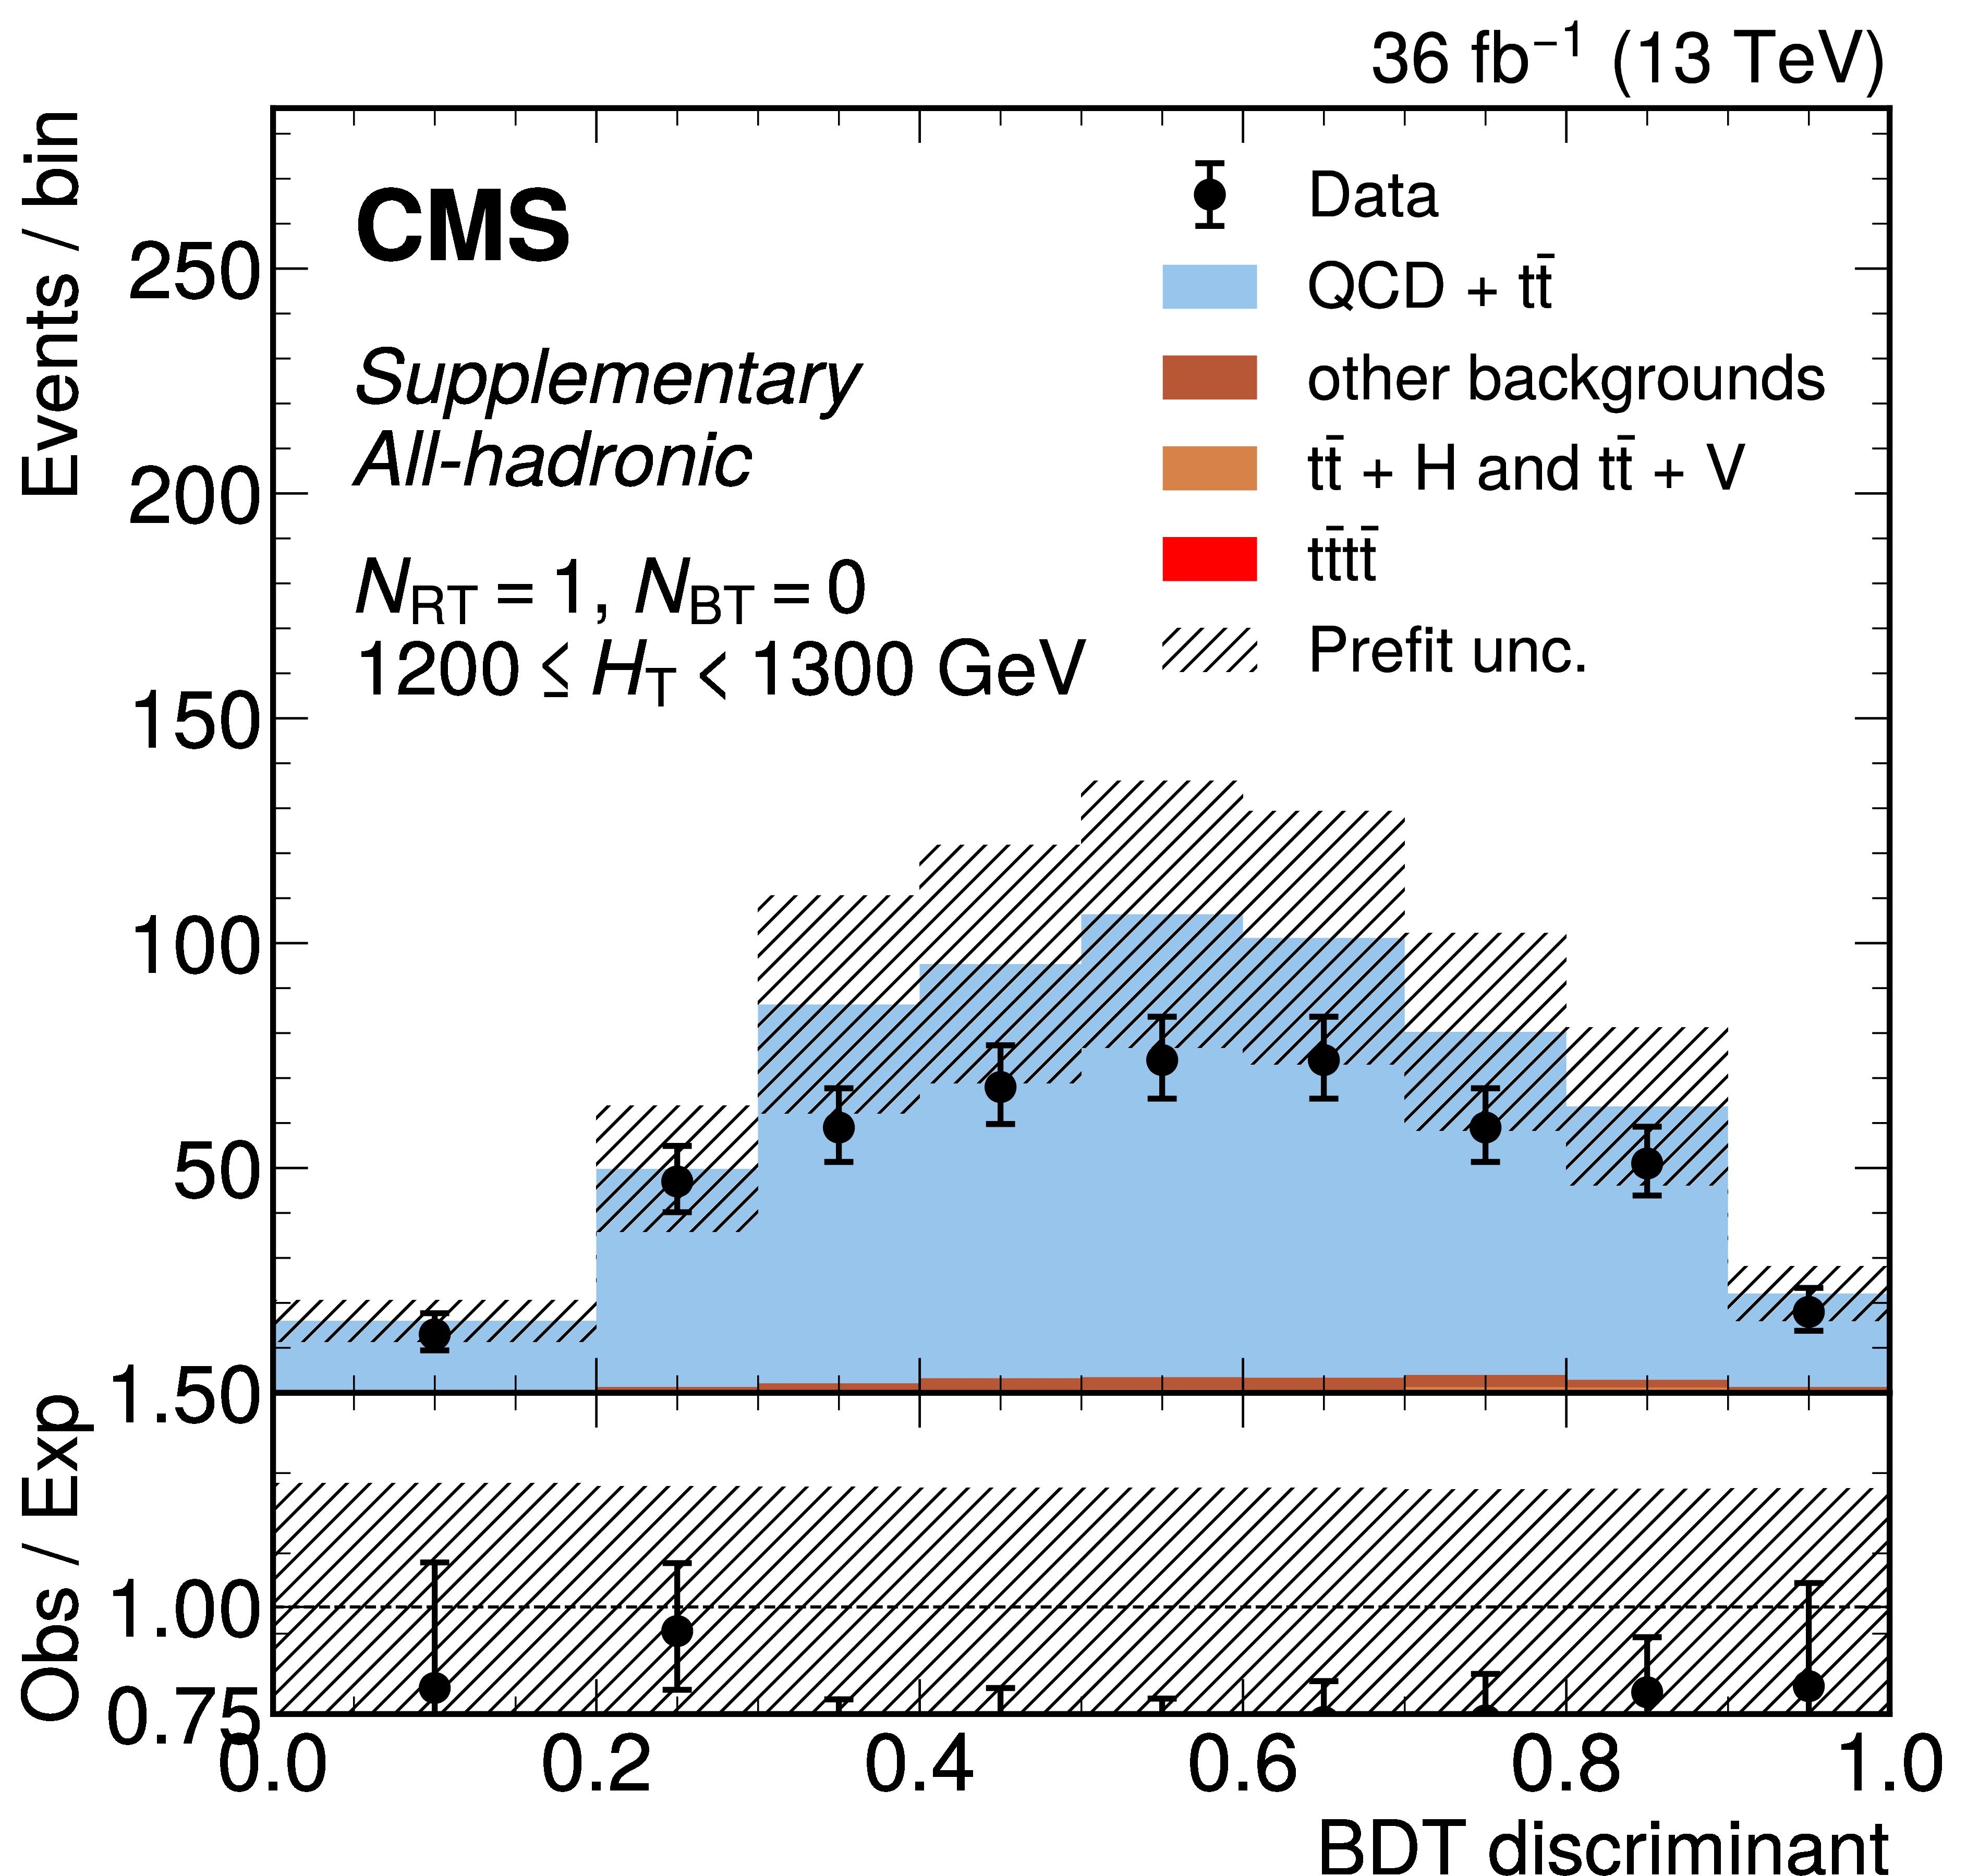
png pdf |
Additional Figure 20-f:
The distribution of the BDT discriminants in the 8-jet validation region (VR) for the 2016 data set in the all-hadronic channel for all $ N_\text{RT} $, $ N_\text{BT} $, and $ H_{\mathrm{T}} $ categories. ($ N_\text{RT} $ and $ N_\text{BT} $ represent number of resolved tops and b-jets respectively.) The background from QCD multijet and $ \mathrm{t} \bar{\mathrm{t}} $ production is derived from control regions in the data. Estimates for the $ \mathrm{t}\bar{\mathrm{t}}\mathrm{t}\bar{\mathrm{t}} $ signal and other backgrounds are shown using simulated samples. The hatched bands correspond to the estimated total uncertainty per validation region. VR-derived shape uncertainties to account for discrepancies between the data and the data-driven background estimate observed in the VRs are shown overlaid in red and blue for reference. |
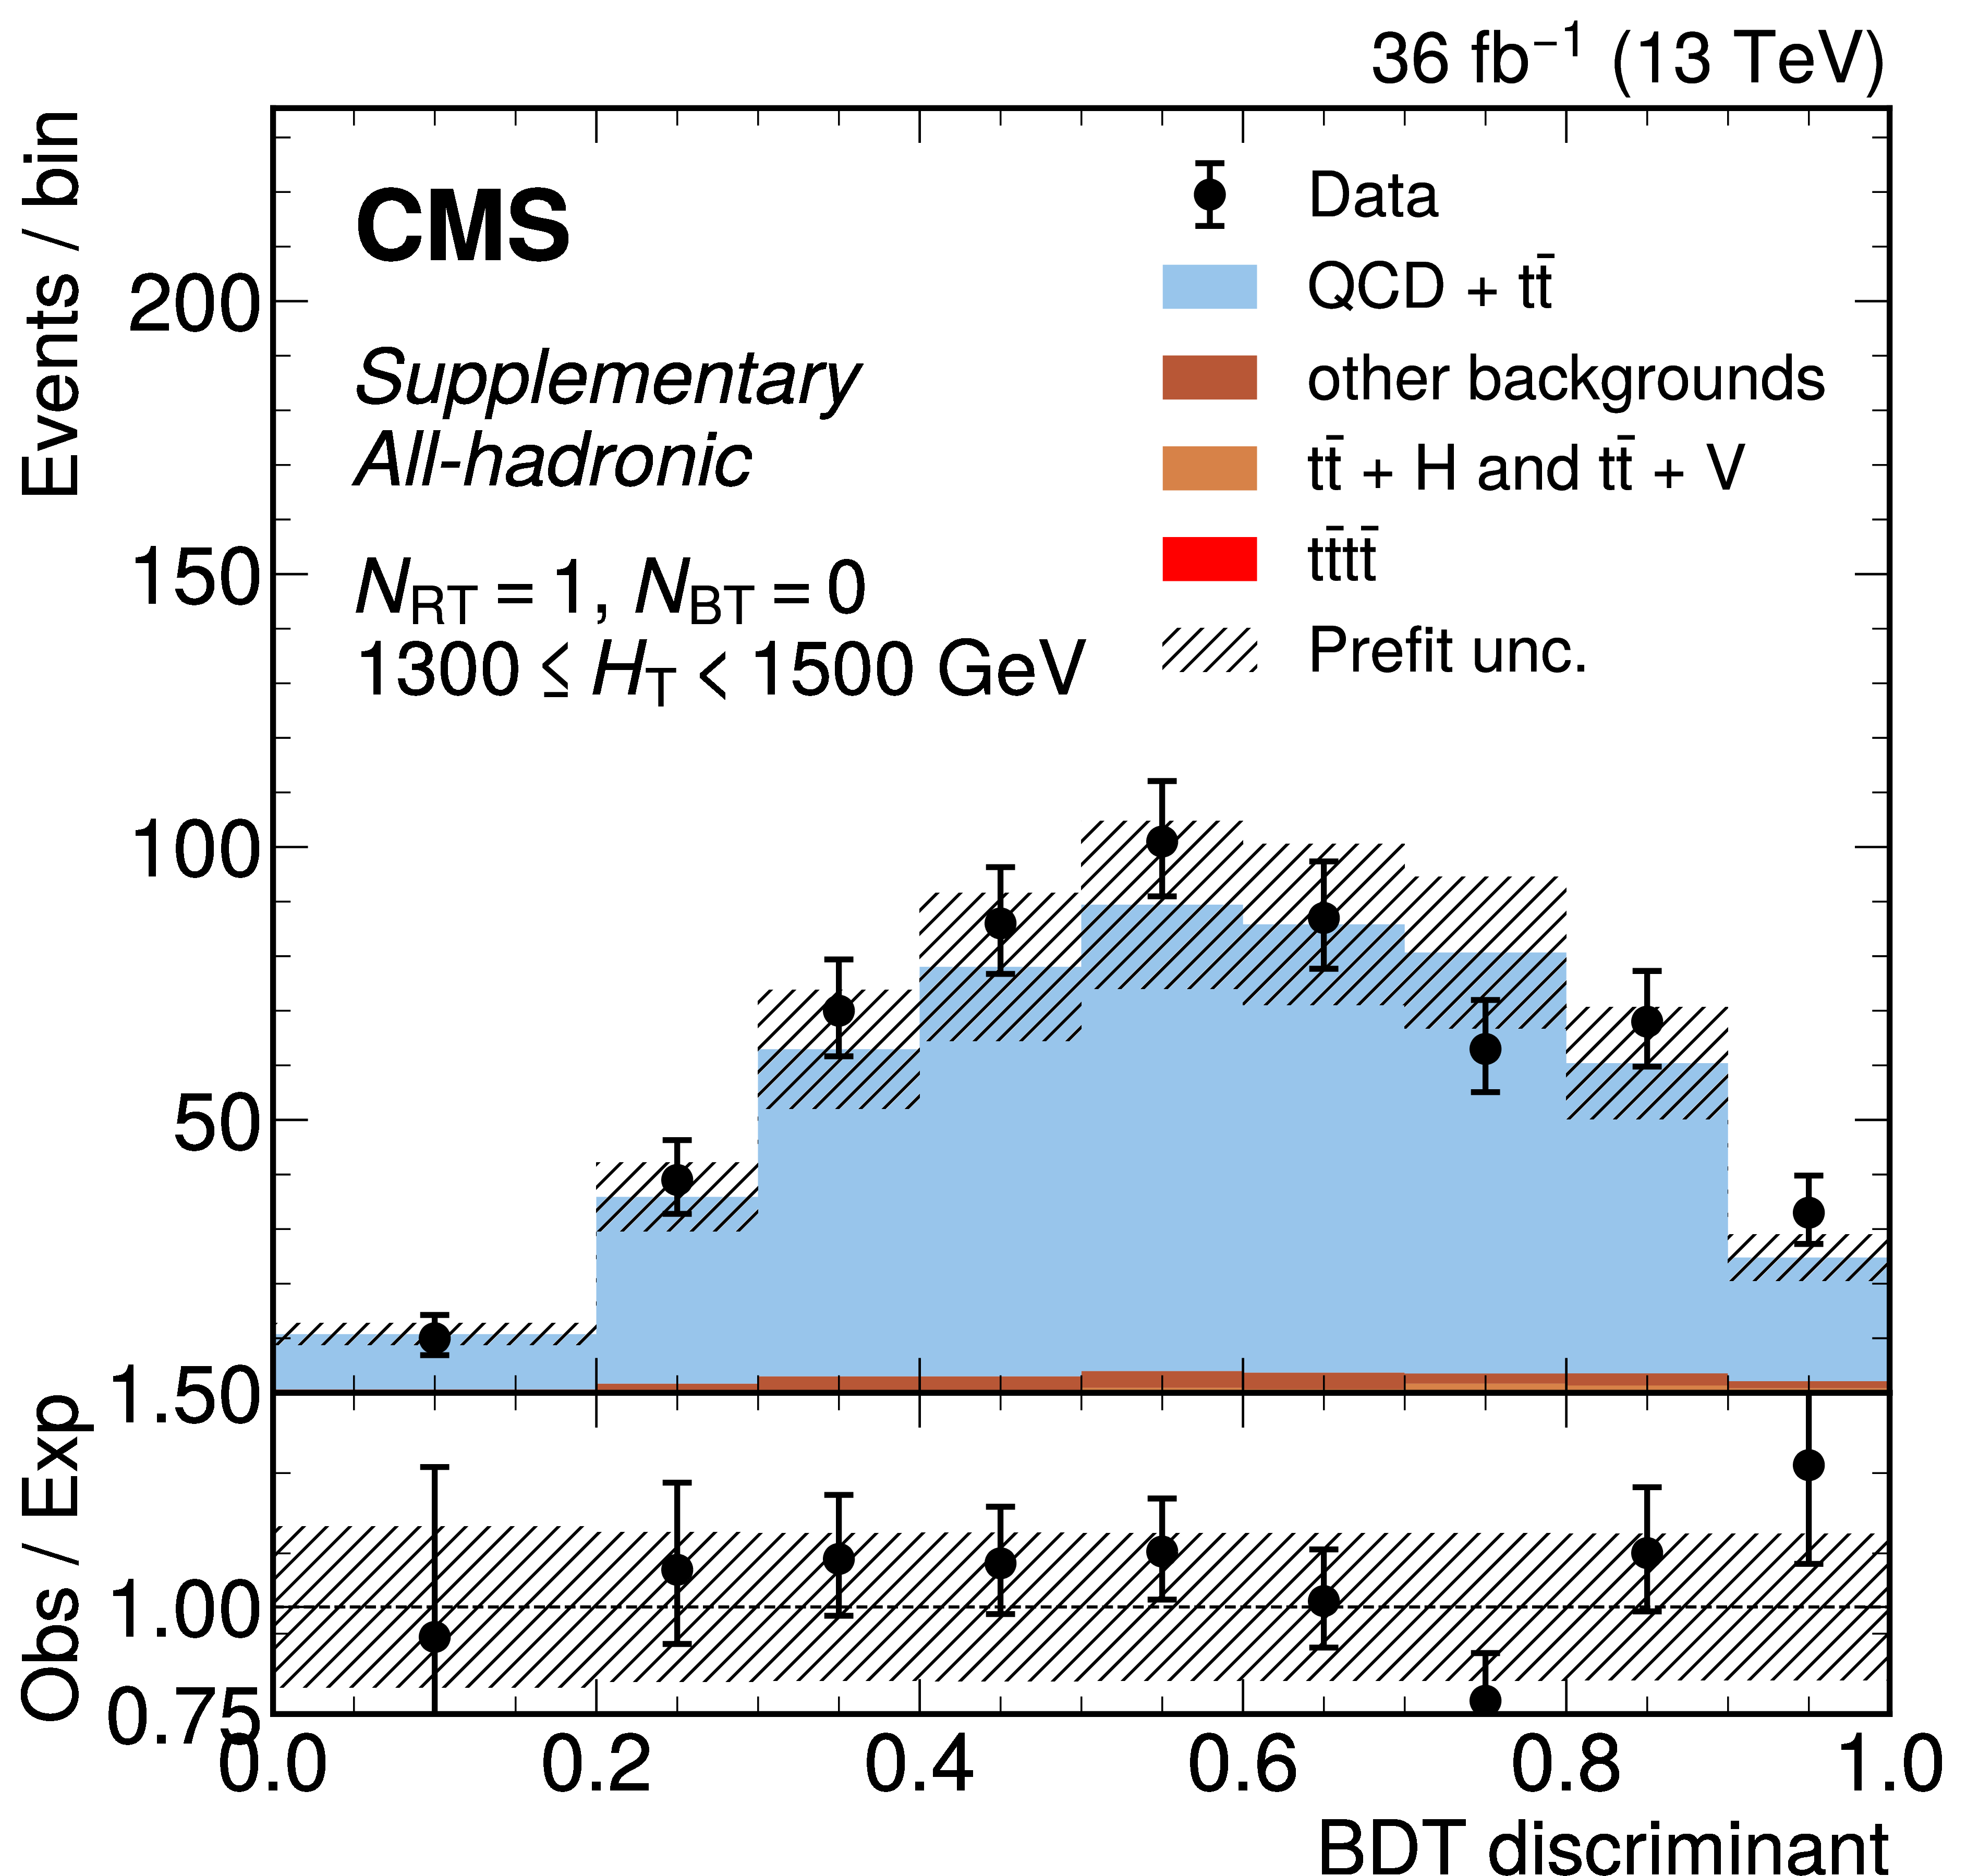
png pdf |
Additional Figure 20-g:
The distribution of the BDT discriminants in the 8-jet validation region (VR) for the 2016 data set in the all-hadronic channel for all $ N_\text{RT} $, $ N_\text{BT} $, and $ H_{\mathrm{T}} $ categories. ($ N_\text{RT} $ and $ N_\text{BT} $ represent number of resolved tops and b-jets respectively.) The background from QCD multijet and $ \mathrm{t} \bar{\mathrm{t}} $ production is derived from control regions in the data. Estimates for the $ \mathrm{t}\bar{\mathrm{t}}\mathrm{t}\bar{\mathrm{t}} $ signal and other backgrounds are shown using simulated samples. The hatched bands correspond to the estimated total uncertainty per validation region. VR-derived shape uncertainties to account for discrepancies between the data and the data-driven background estimate observed in the VRs are shown overlaid in red and blue for reference. |
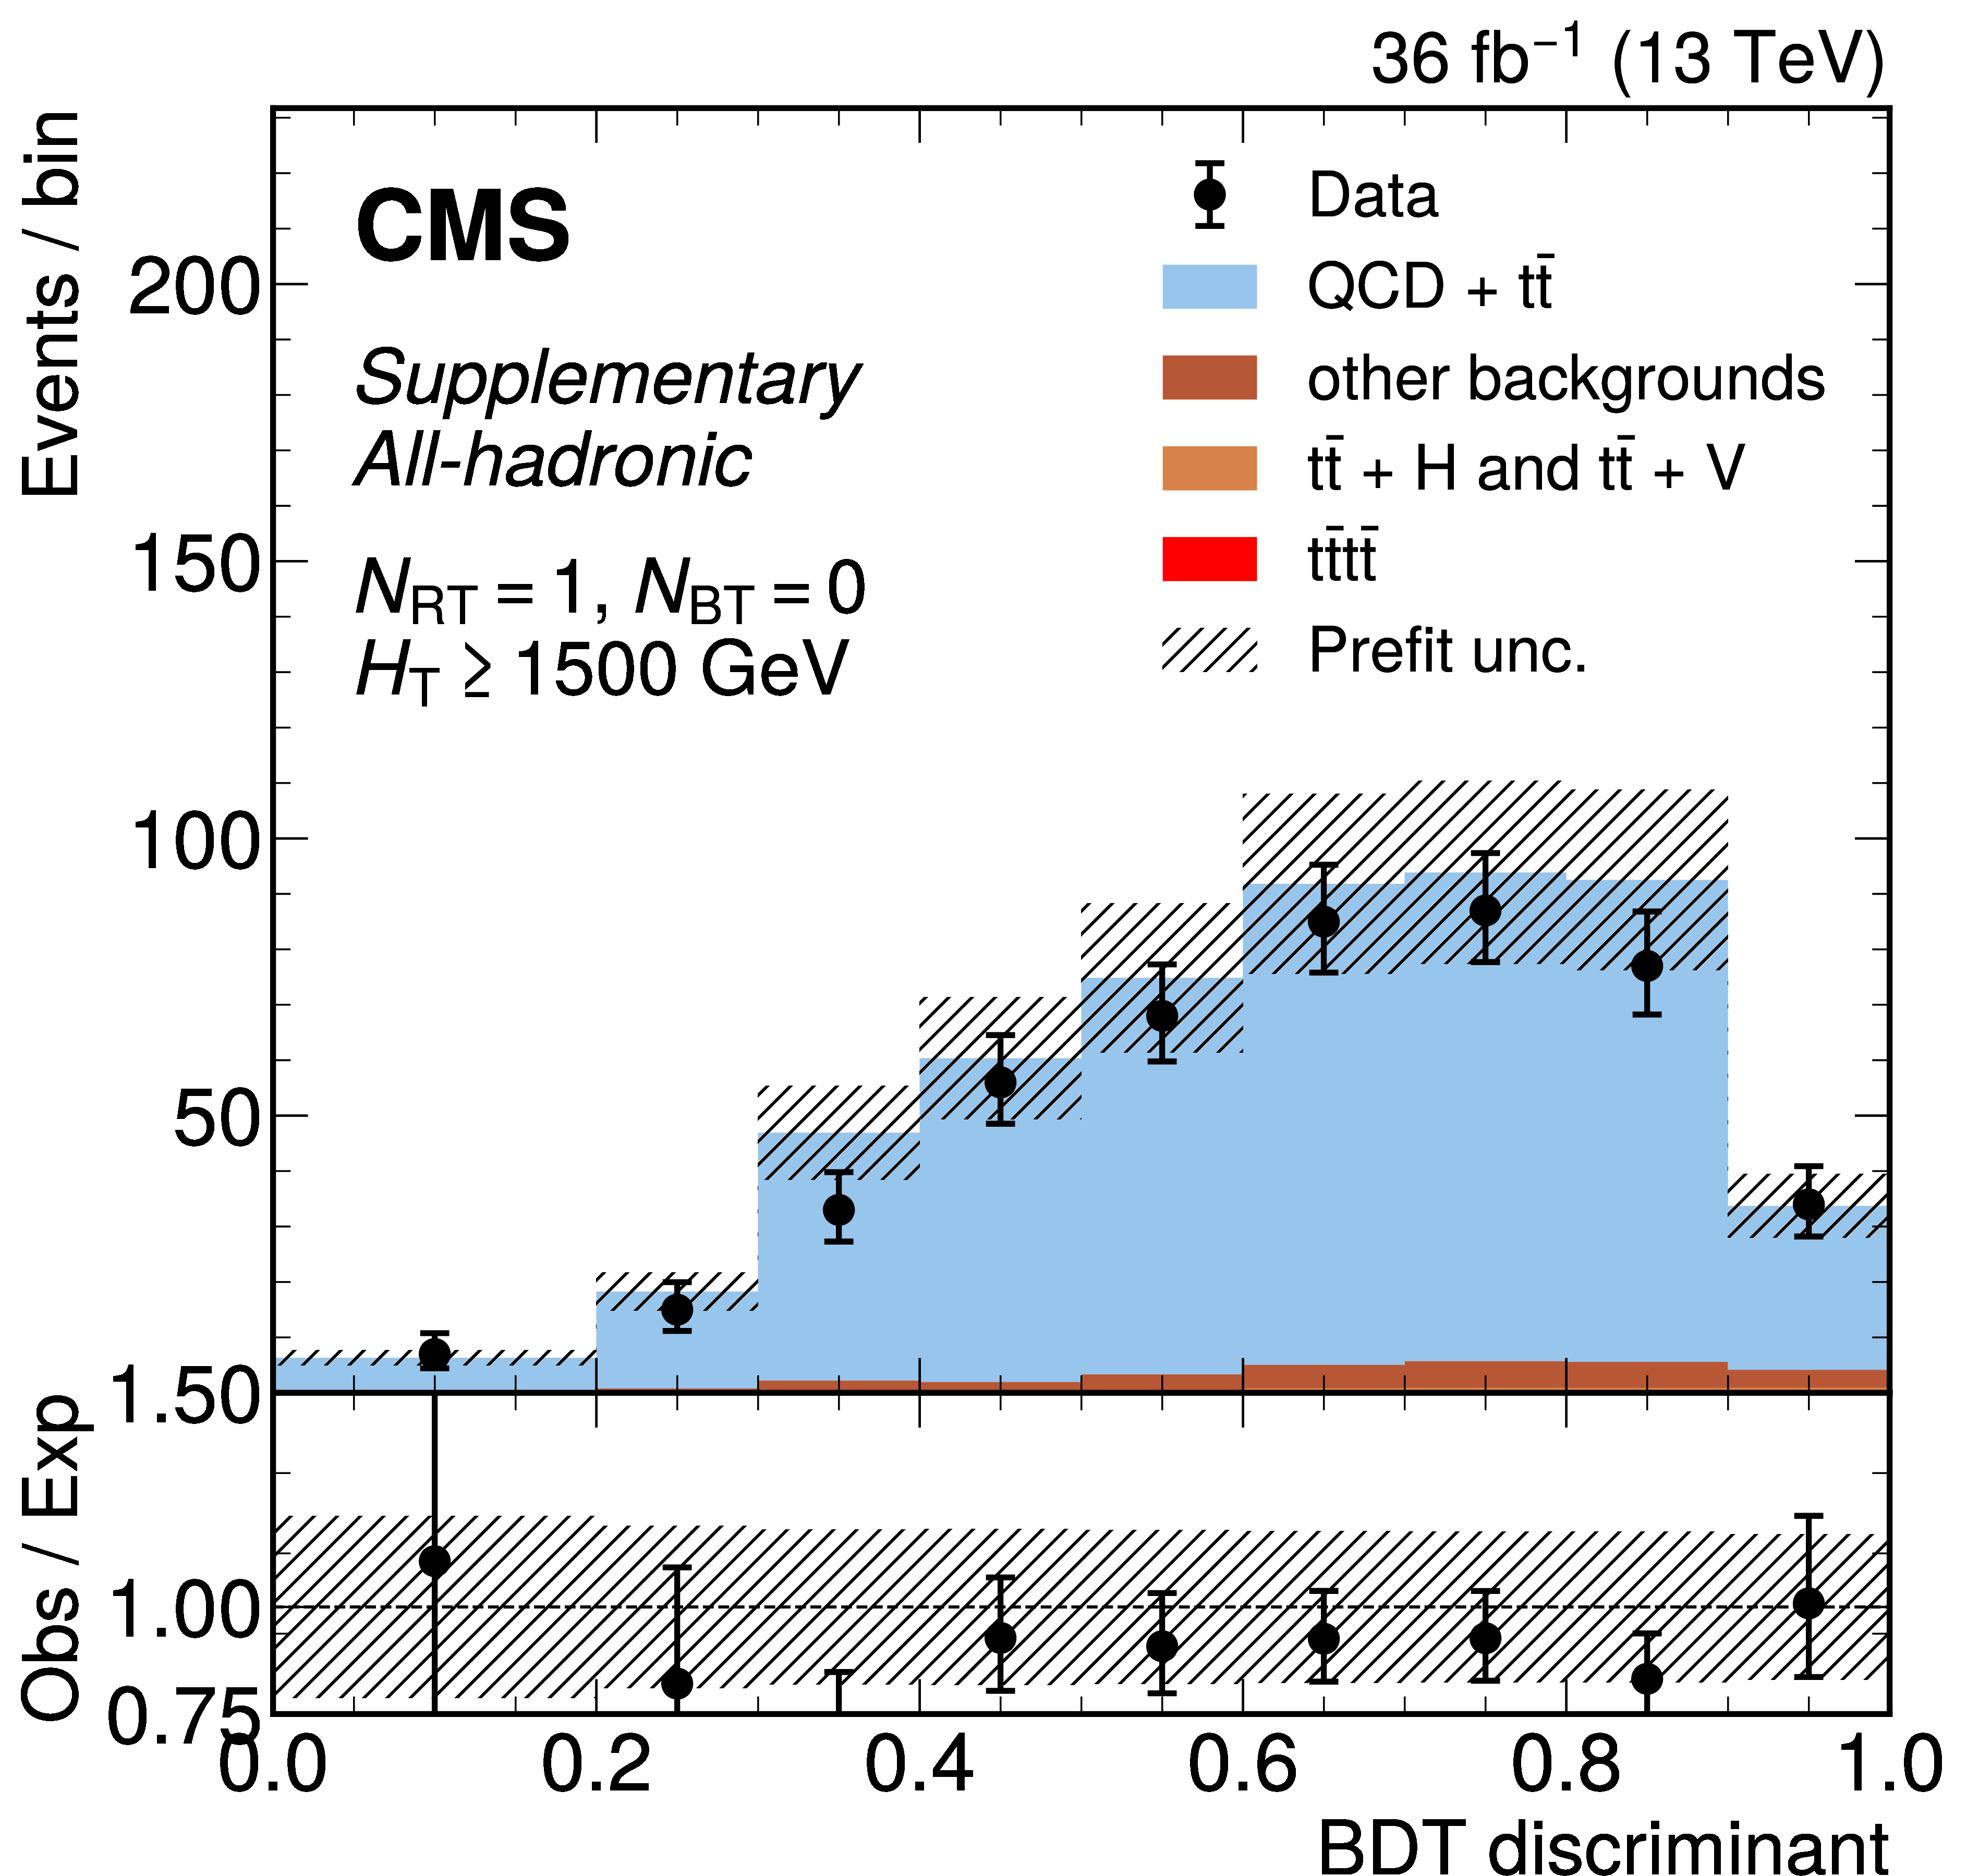
png pdf |
Additional Figure 20-h:
The distribution of the BDT discriminants in the 8-jet validation region (VR) for the 2016 data set in the all-hadronic channel for all $ N_\text{RT} $, $ N_\text{BT} $, and $ H_{\mathrm{T}} $ categories. ($ N_\text{RT} $ and $ N_\text{BT} $ represent number of resolved tops and b-jets respectively.) The background from QCD multijet and $ \mathrm{t} \bar{\mathrm{t}} $ production is derived from control regions in the data. Estimates for the $ \mathrm{t}\bar{\mathrm{t}}\mathrm{t}\bar{\mathrm{t}} $ signal and other backgrounds are shown using simulated samples. The hatched bands correspond to the estimated total uncertainty per validation region. VR-derived shape uncertainties to account for discrepancies between the data and the data-driven background estimate observed in the VRs are shown overlaid in red and blue for reference. |
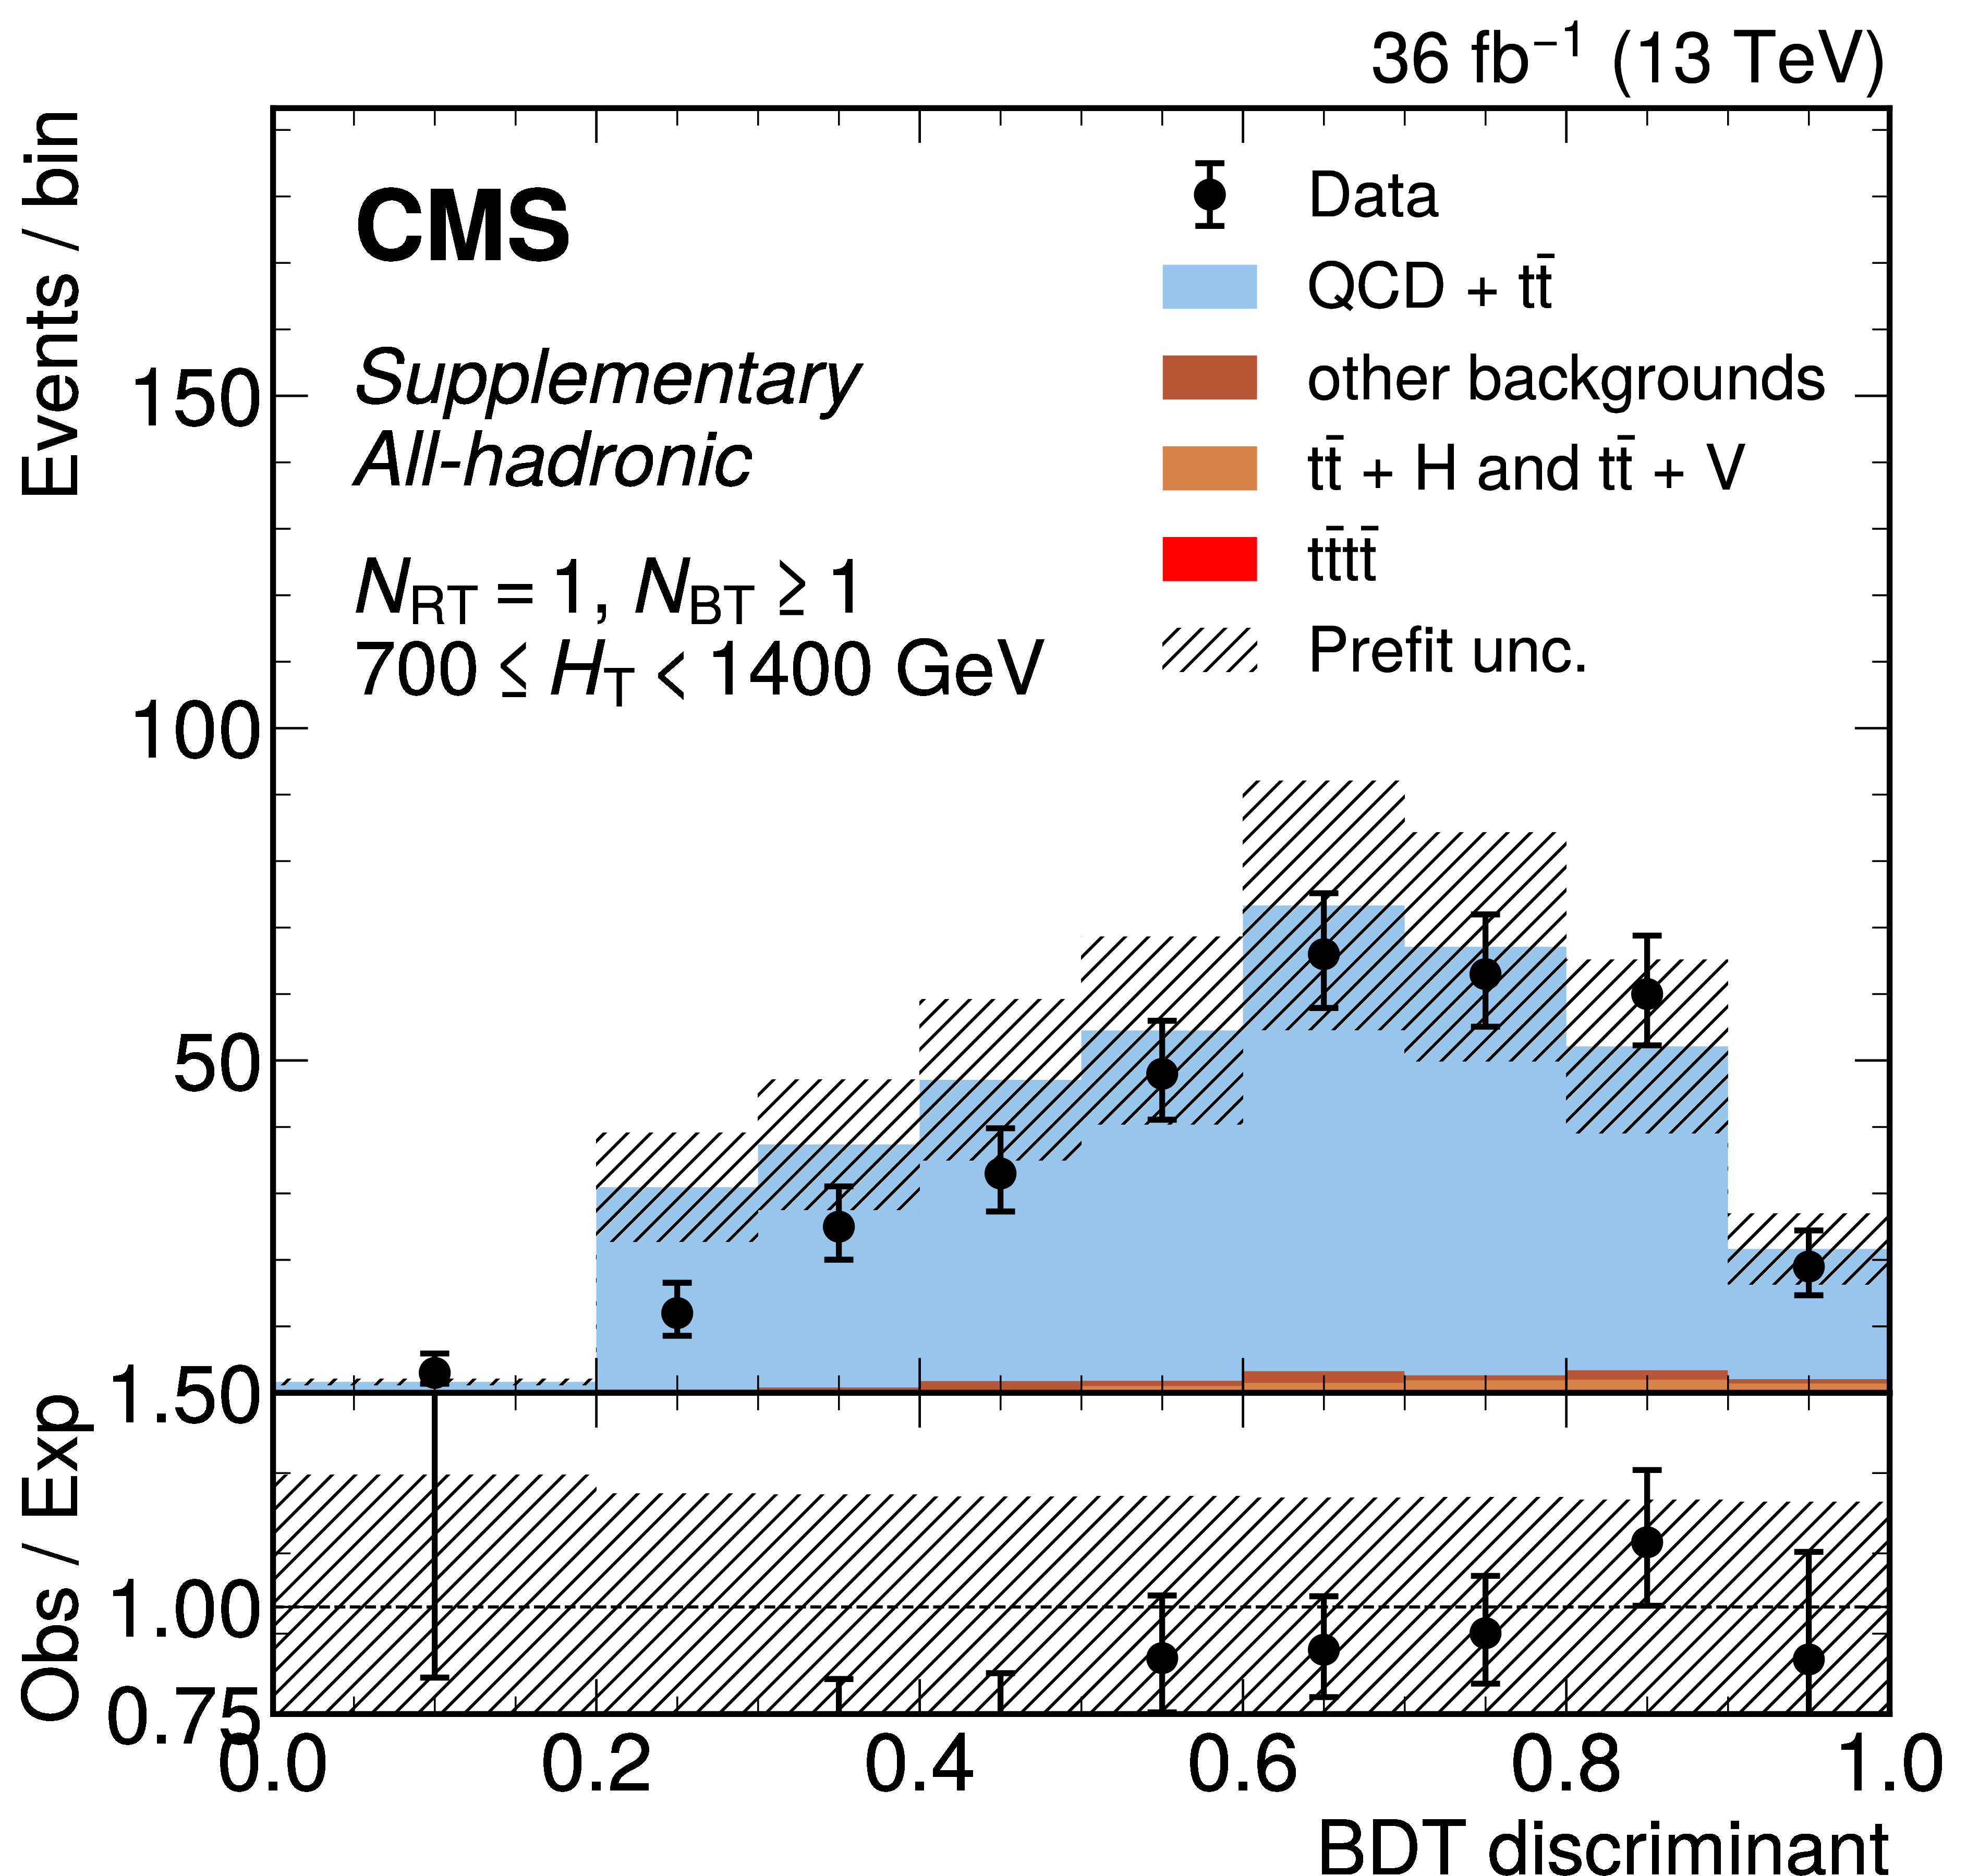
png pdf |
Additional Figure 20-i:
The distribution of the BDT discriminants in the 8-jet validation region (VR) for the 2016 data set in the all-hadronic channel for all $ N_\text{RT} $, $ N_\text{BT} $, and $ H_{\mathrm{T}} $ categories. ($ N_\text{RT} $ and $ N_\text{BT} $ represent number of resolved tops and b-jets respectively.) The background from QCD multijet and $ \mathrm{t} \bar{\mathrm{t}} $ production is derived from control regions in the data. Estimates for the $ \mathrm{t}\bar{\mathrm{t}}\mathrm{t}\bar{\mathrm{t}} $ signal and other backgrounds are shown using simulated samples. The hatched bands correspond to the estimated total uncertainty per validation region. VR-derived shape uncertainties to account for discrepancies between the data and the data-driven background estimate observed in the VRs are shown overlaid in red and blue for reference. |
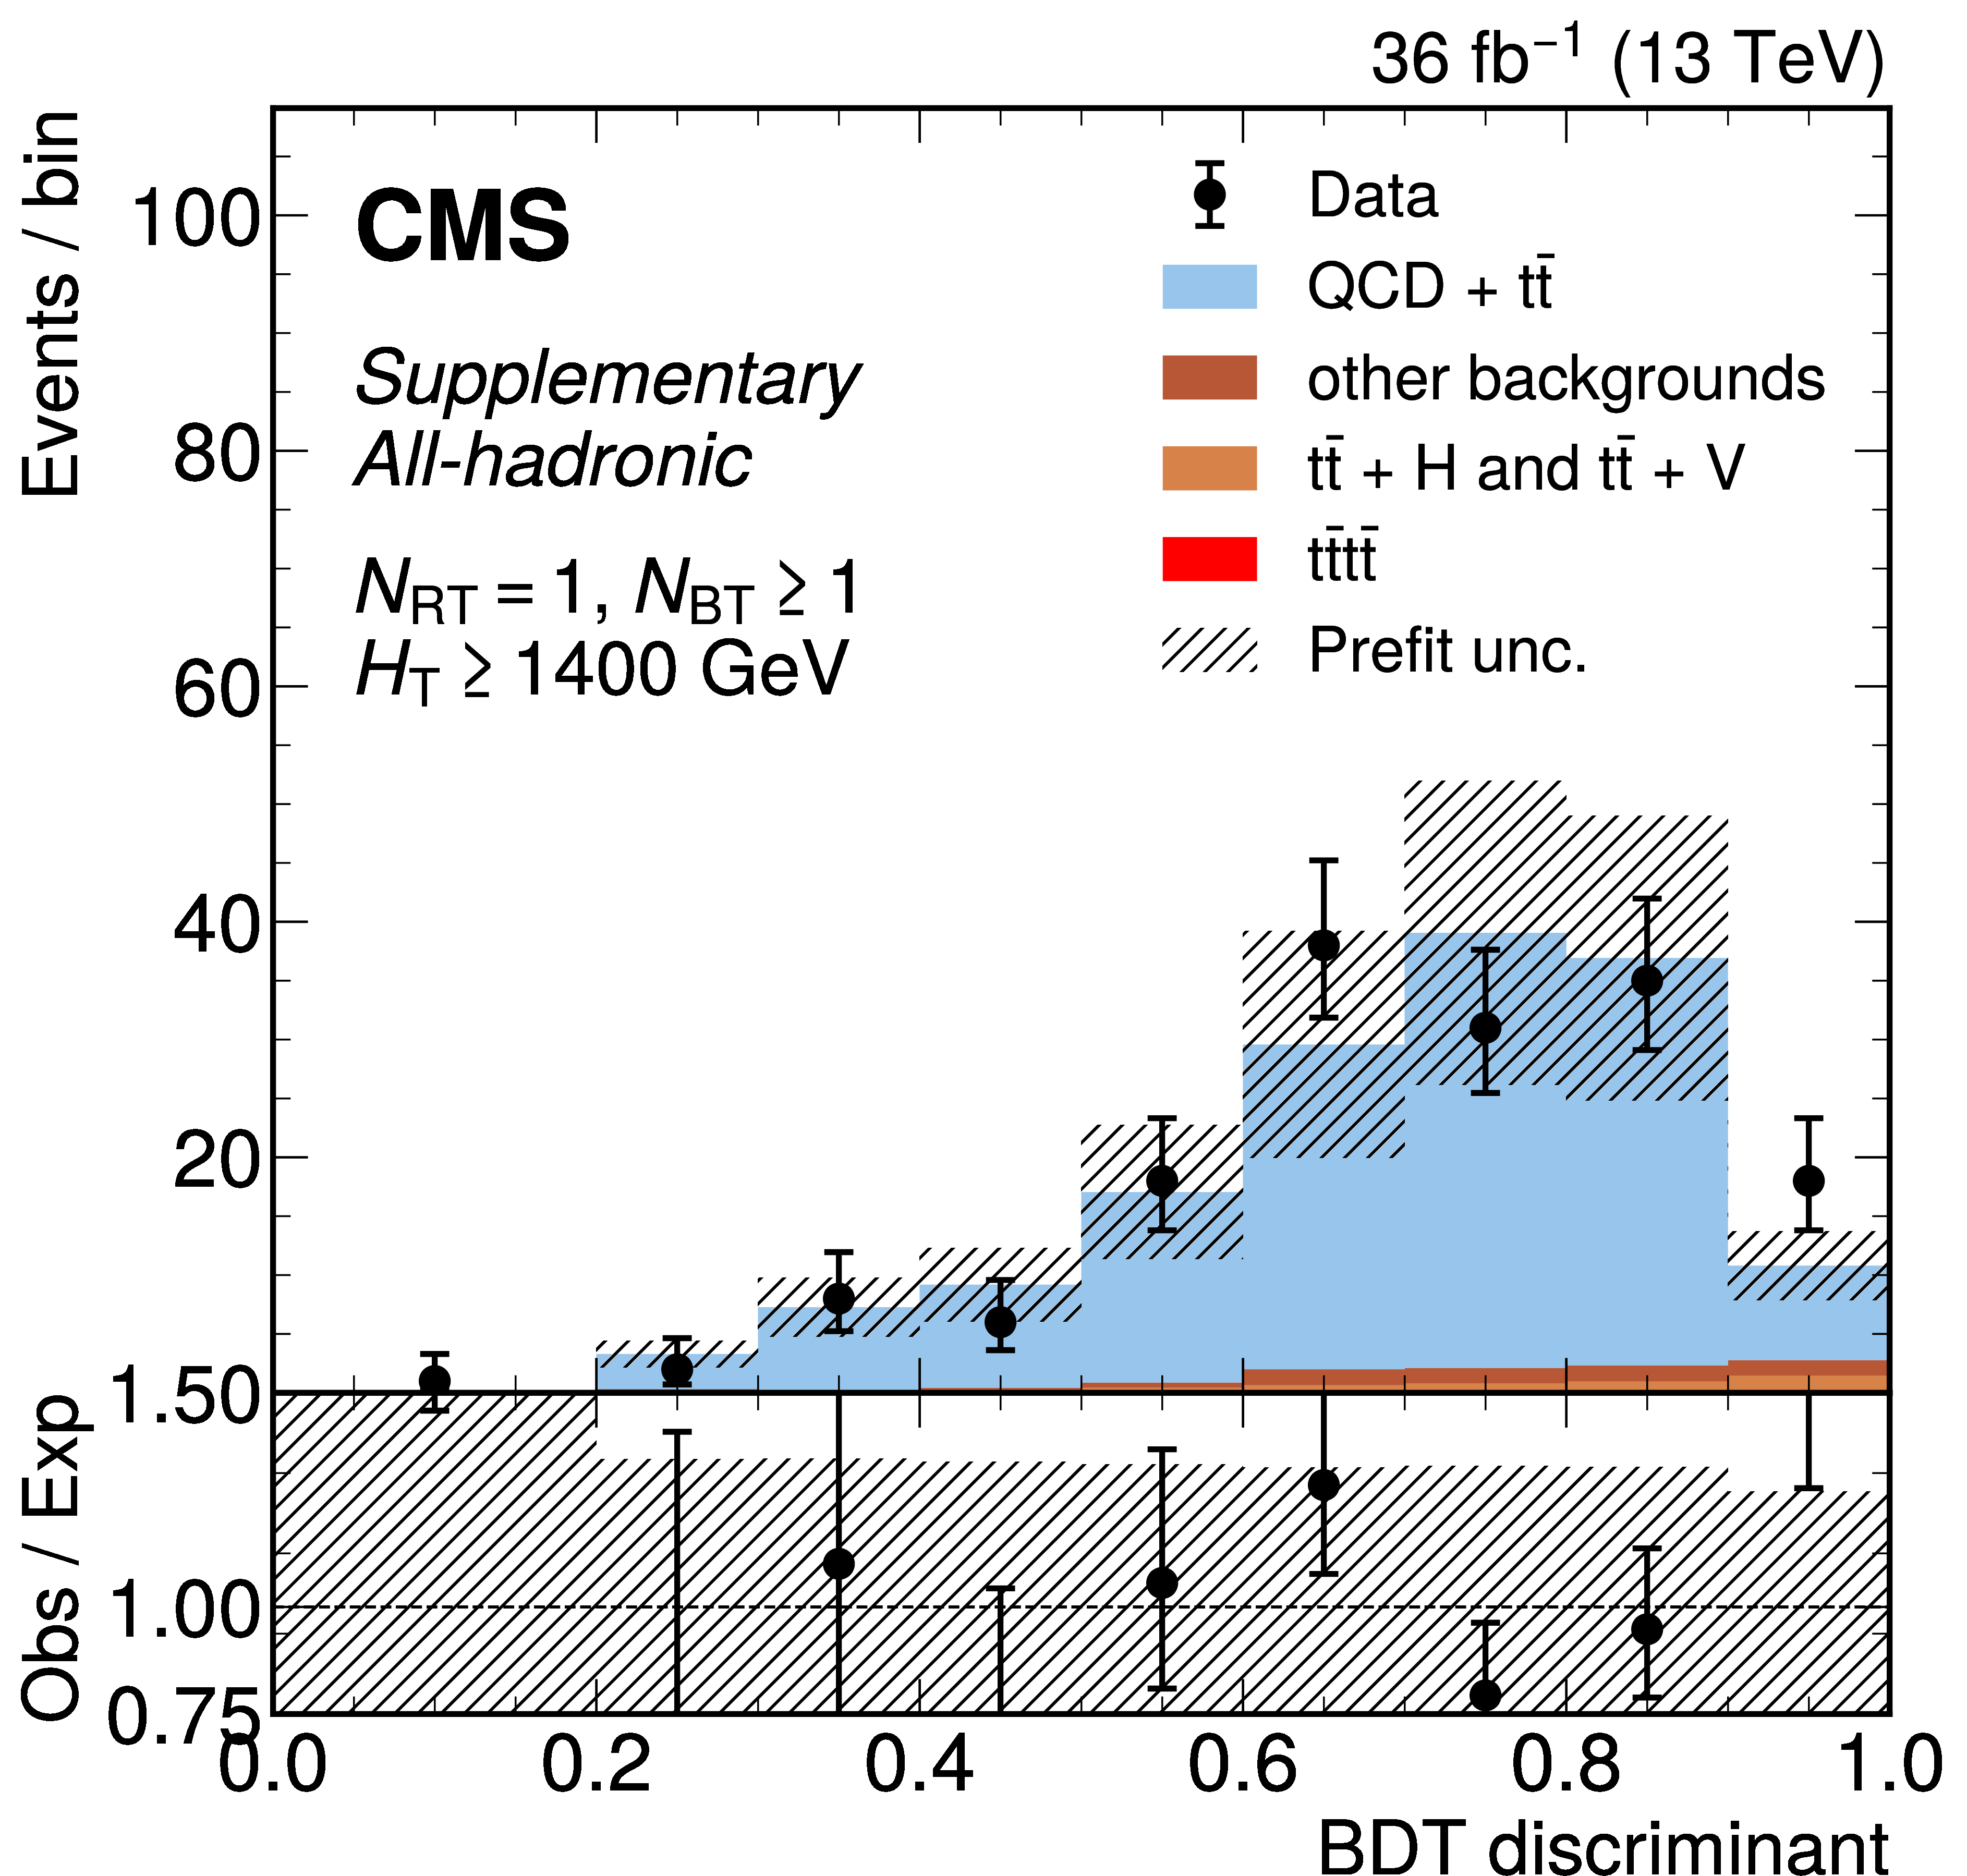
png pdf |
Additional Figure 20-j:
The distribution of the BDT discriminants in the 8-jet validation region (VR) for the 2016 data set in the all-hadronic channel for all $ N_\text{RT} $, $ N_\text{BT} $, and $ H_{\mathrm{T}} $ categories. ($ N_\text{RT} $ and $ N_\text{BT} $ represent number of resolved tops and b-jets respectively.) The background from QCD multijet and $ \mathrm{t} \bar{\mathrm{t}} $ production is derived from control regions in the data. Estimates for the $ \mathrm{t}\bar{\mathrm{t}}\mathrm{t}\bar{\mathrm{t}} $ signal and other backgrounds are shown using simulated samples. The hatched bands correspond to the estimated total uncertainty per validation region. VR-derived shape uncertainties to account for discrepancies between the data and the data-driven background estimate observed in the VRs are shown overlaid in red and blue for reference. |

png pdf |
Additional Figure 20-k:
The distribution of the BDT discriminants in the 8-jet validation region (VR) for the 2016 data set in the all-hadronic channel for all $ N_\text{RT} $, $ N_\text{BT} $, and $ H_{\mathrm{T}} $ categories. ($ N_\text{RT} $ and $ N_\text{BT} $ represent number of resolved tops and b-jets respectively.) The background from QCD multijet and $ \mathrm{t} \bar{\mathrm{t}} $ production is derived from control regions in the data. Estimates for the $ \mathrm{t}\bar{\mathrm{t}}\mathrm{t}\bar{\mathrm{t}} $ signal and other backgrounds are shown using simulated samples. The hatched bands correspond to the estimated total uncertainty per validation region. VR-derived shape uncertainties to account for discrepancies between the data and the data-driven background estimate observed in the VRs are shown overlaid in red and blue for reference. |

png pdf |
Additional Figure 20-l:
The distribution of the BDT discriminants in the 8-jet validation region (VR) for the 2016 data set in the all-hadronic channel for all $ N_\text{RT} $, $ N_\text{BT} $, and $ H_{\mathrm{T}} $ categories. ($ N_\text{RT} $ and $ N_\text{BT} $ represent number of resolved tops and b-jets respectively.) The background from QCD multijet and $ \mathrm{t} \bar{\mathrm{t}} $ production is derived from control regions in the data. Estimates for the $ \mathrm{t}\bar{\mathrm{t}}\mathrm{t}\bar{\mathrm{t}} $ signal and other backgrounds are shown using simulated samples. The hatched bands correspond to the estimated total uncertainty per validation region. VR-derived shape uncertainties to account for discrepancies between the data and the data-driven background estimate observed in the VRs are shown overlaid in red and blue for reference. |
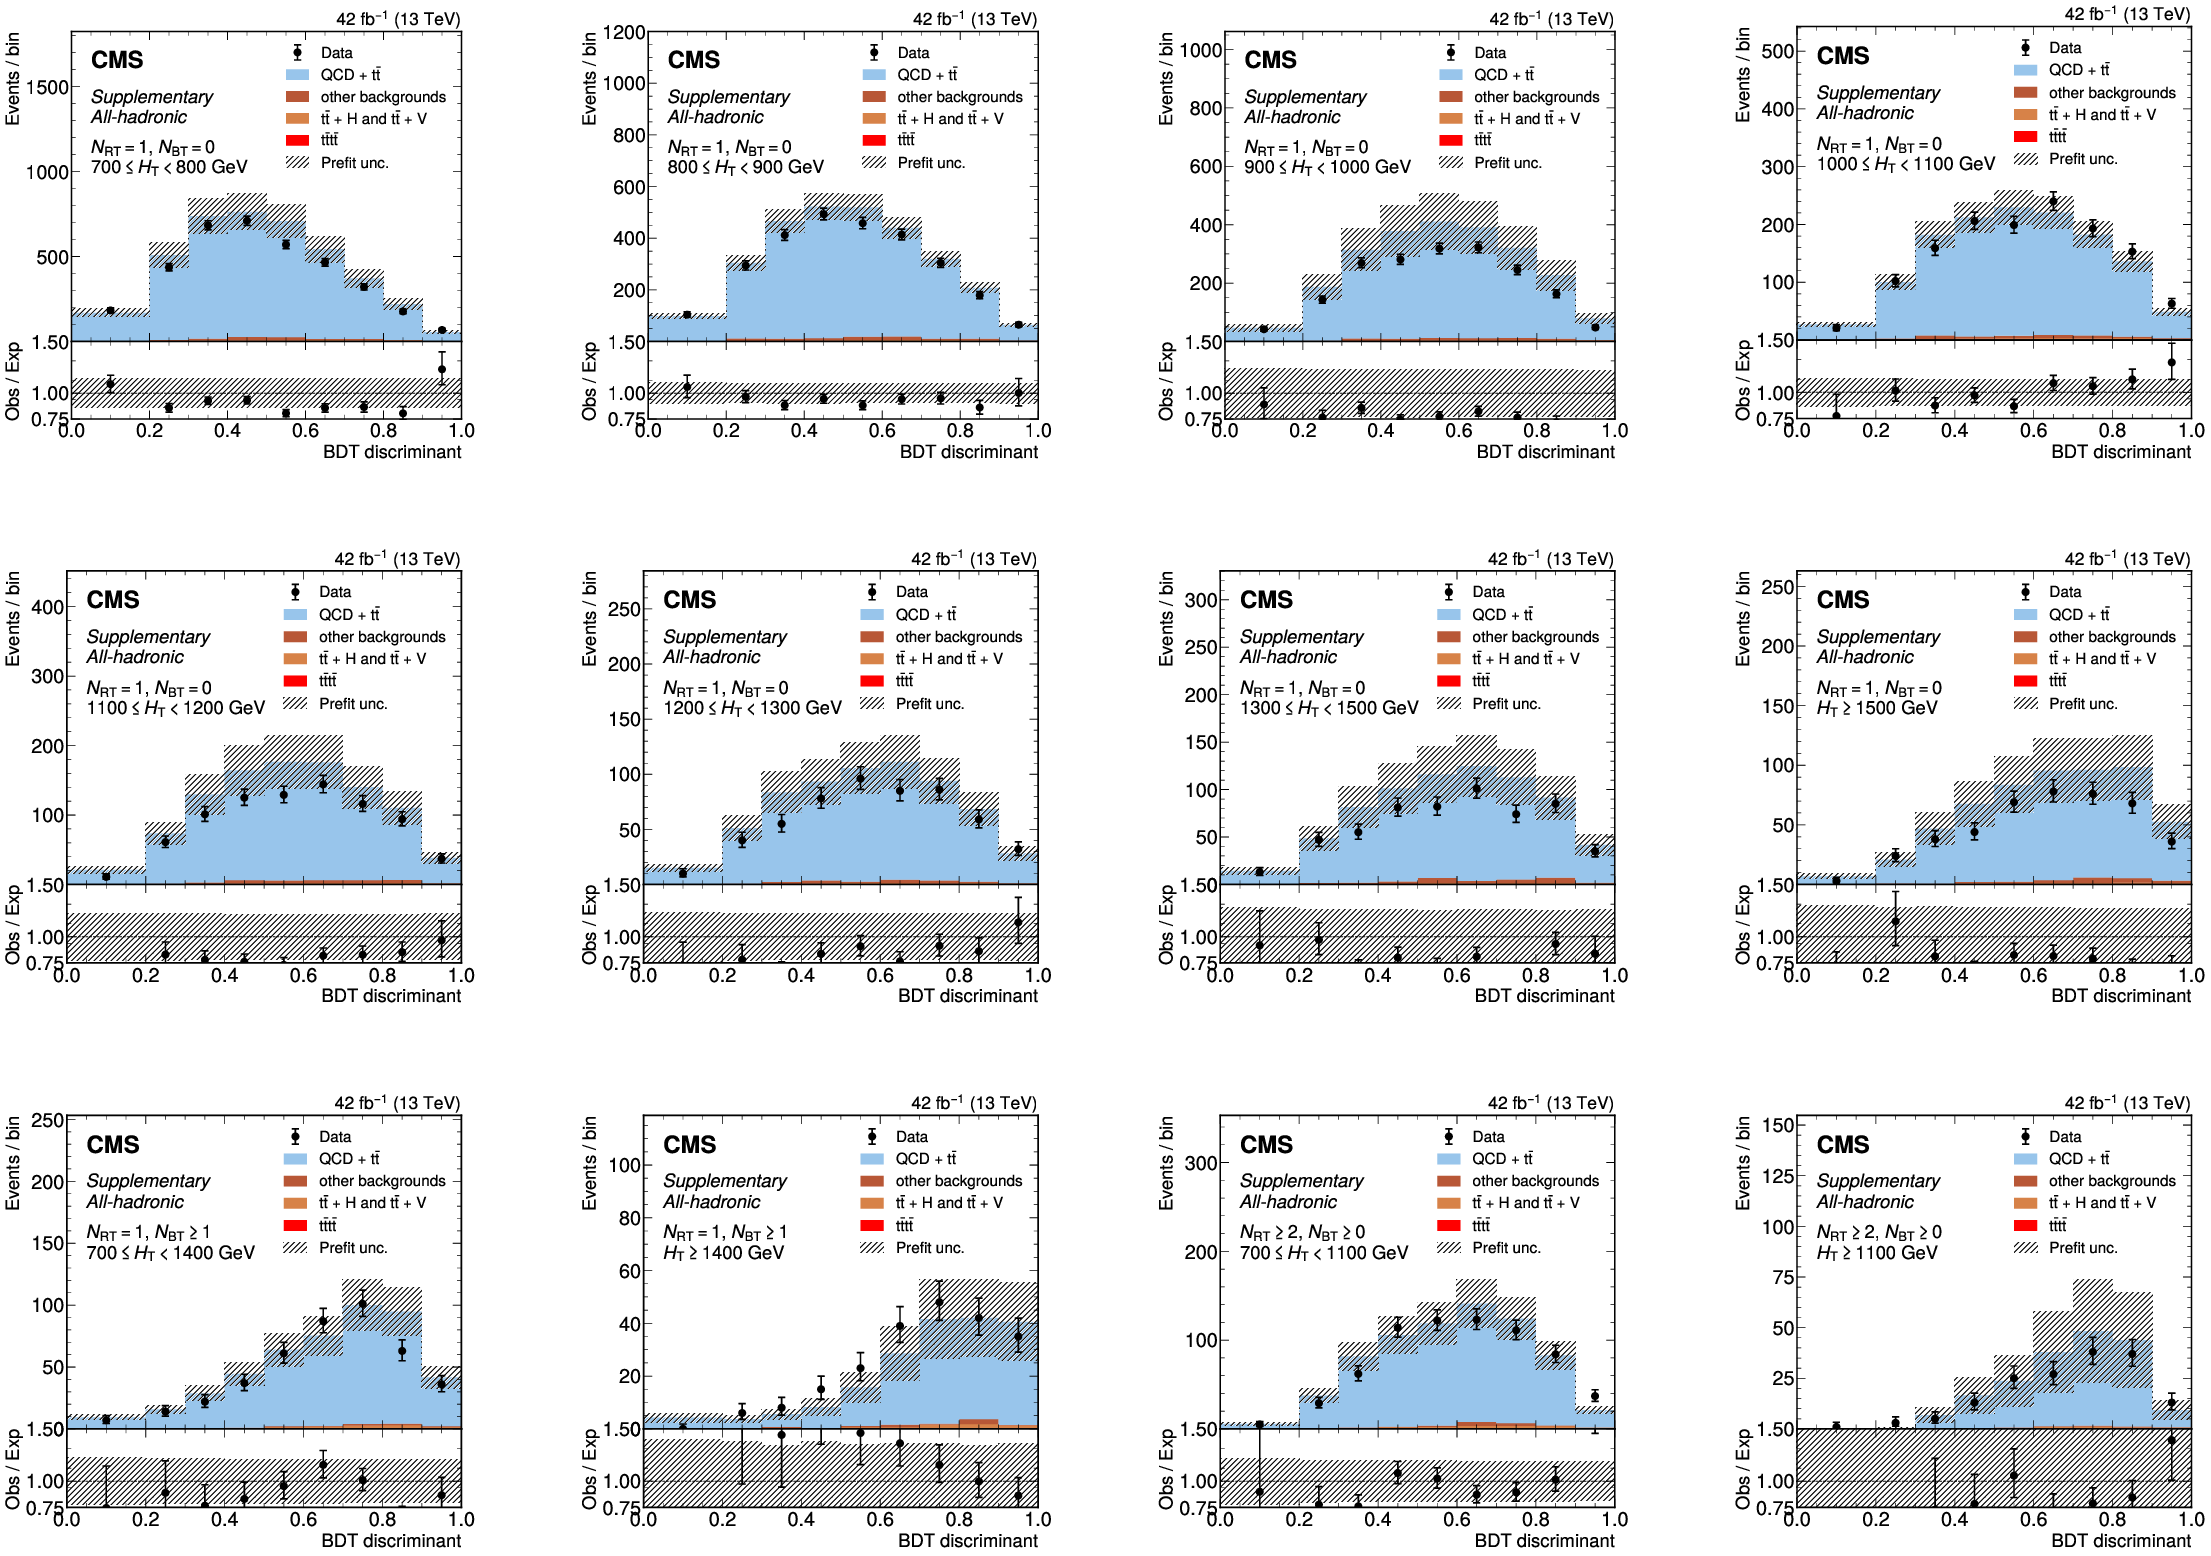
png pdf |
Additional Figure 21:
The distribution of the BDT discriminants in the 8-jet validation region (VR) for the 2017 data set in the all-hadronic channel for all $ N_\text{RT} $, $ N_\text{BT} $, and $ H_{\mathrm{T}} $ categories. ($ N_\text{RT} $ and $ N_\text{BT} $ represent number of resolved tops and b-jets respectively.) The background from QCD multijet and $ \mathrm{t} \bar{\mathrm{t}} $ production is derived from control regions in the data. Estimates for the $ \mathrm{t}\bar{\mathrm{t}}\mathrm{t}\bar{\mathrm{t}} $ signal and other backgrounds are shown using simulated samples. The hatched bands correspond to the estimated total uncertainty per validation region. VR-derived shape uncertainties to account for discrepancies between the data and the data-driven background estimate observed in the VRs are shown overlaid in red and blue for reference. |
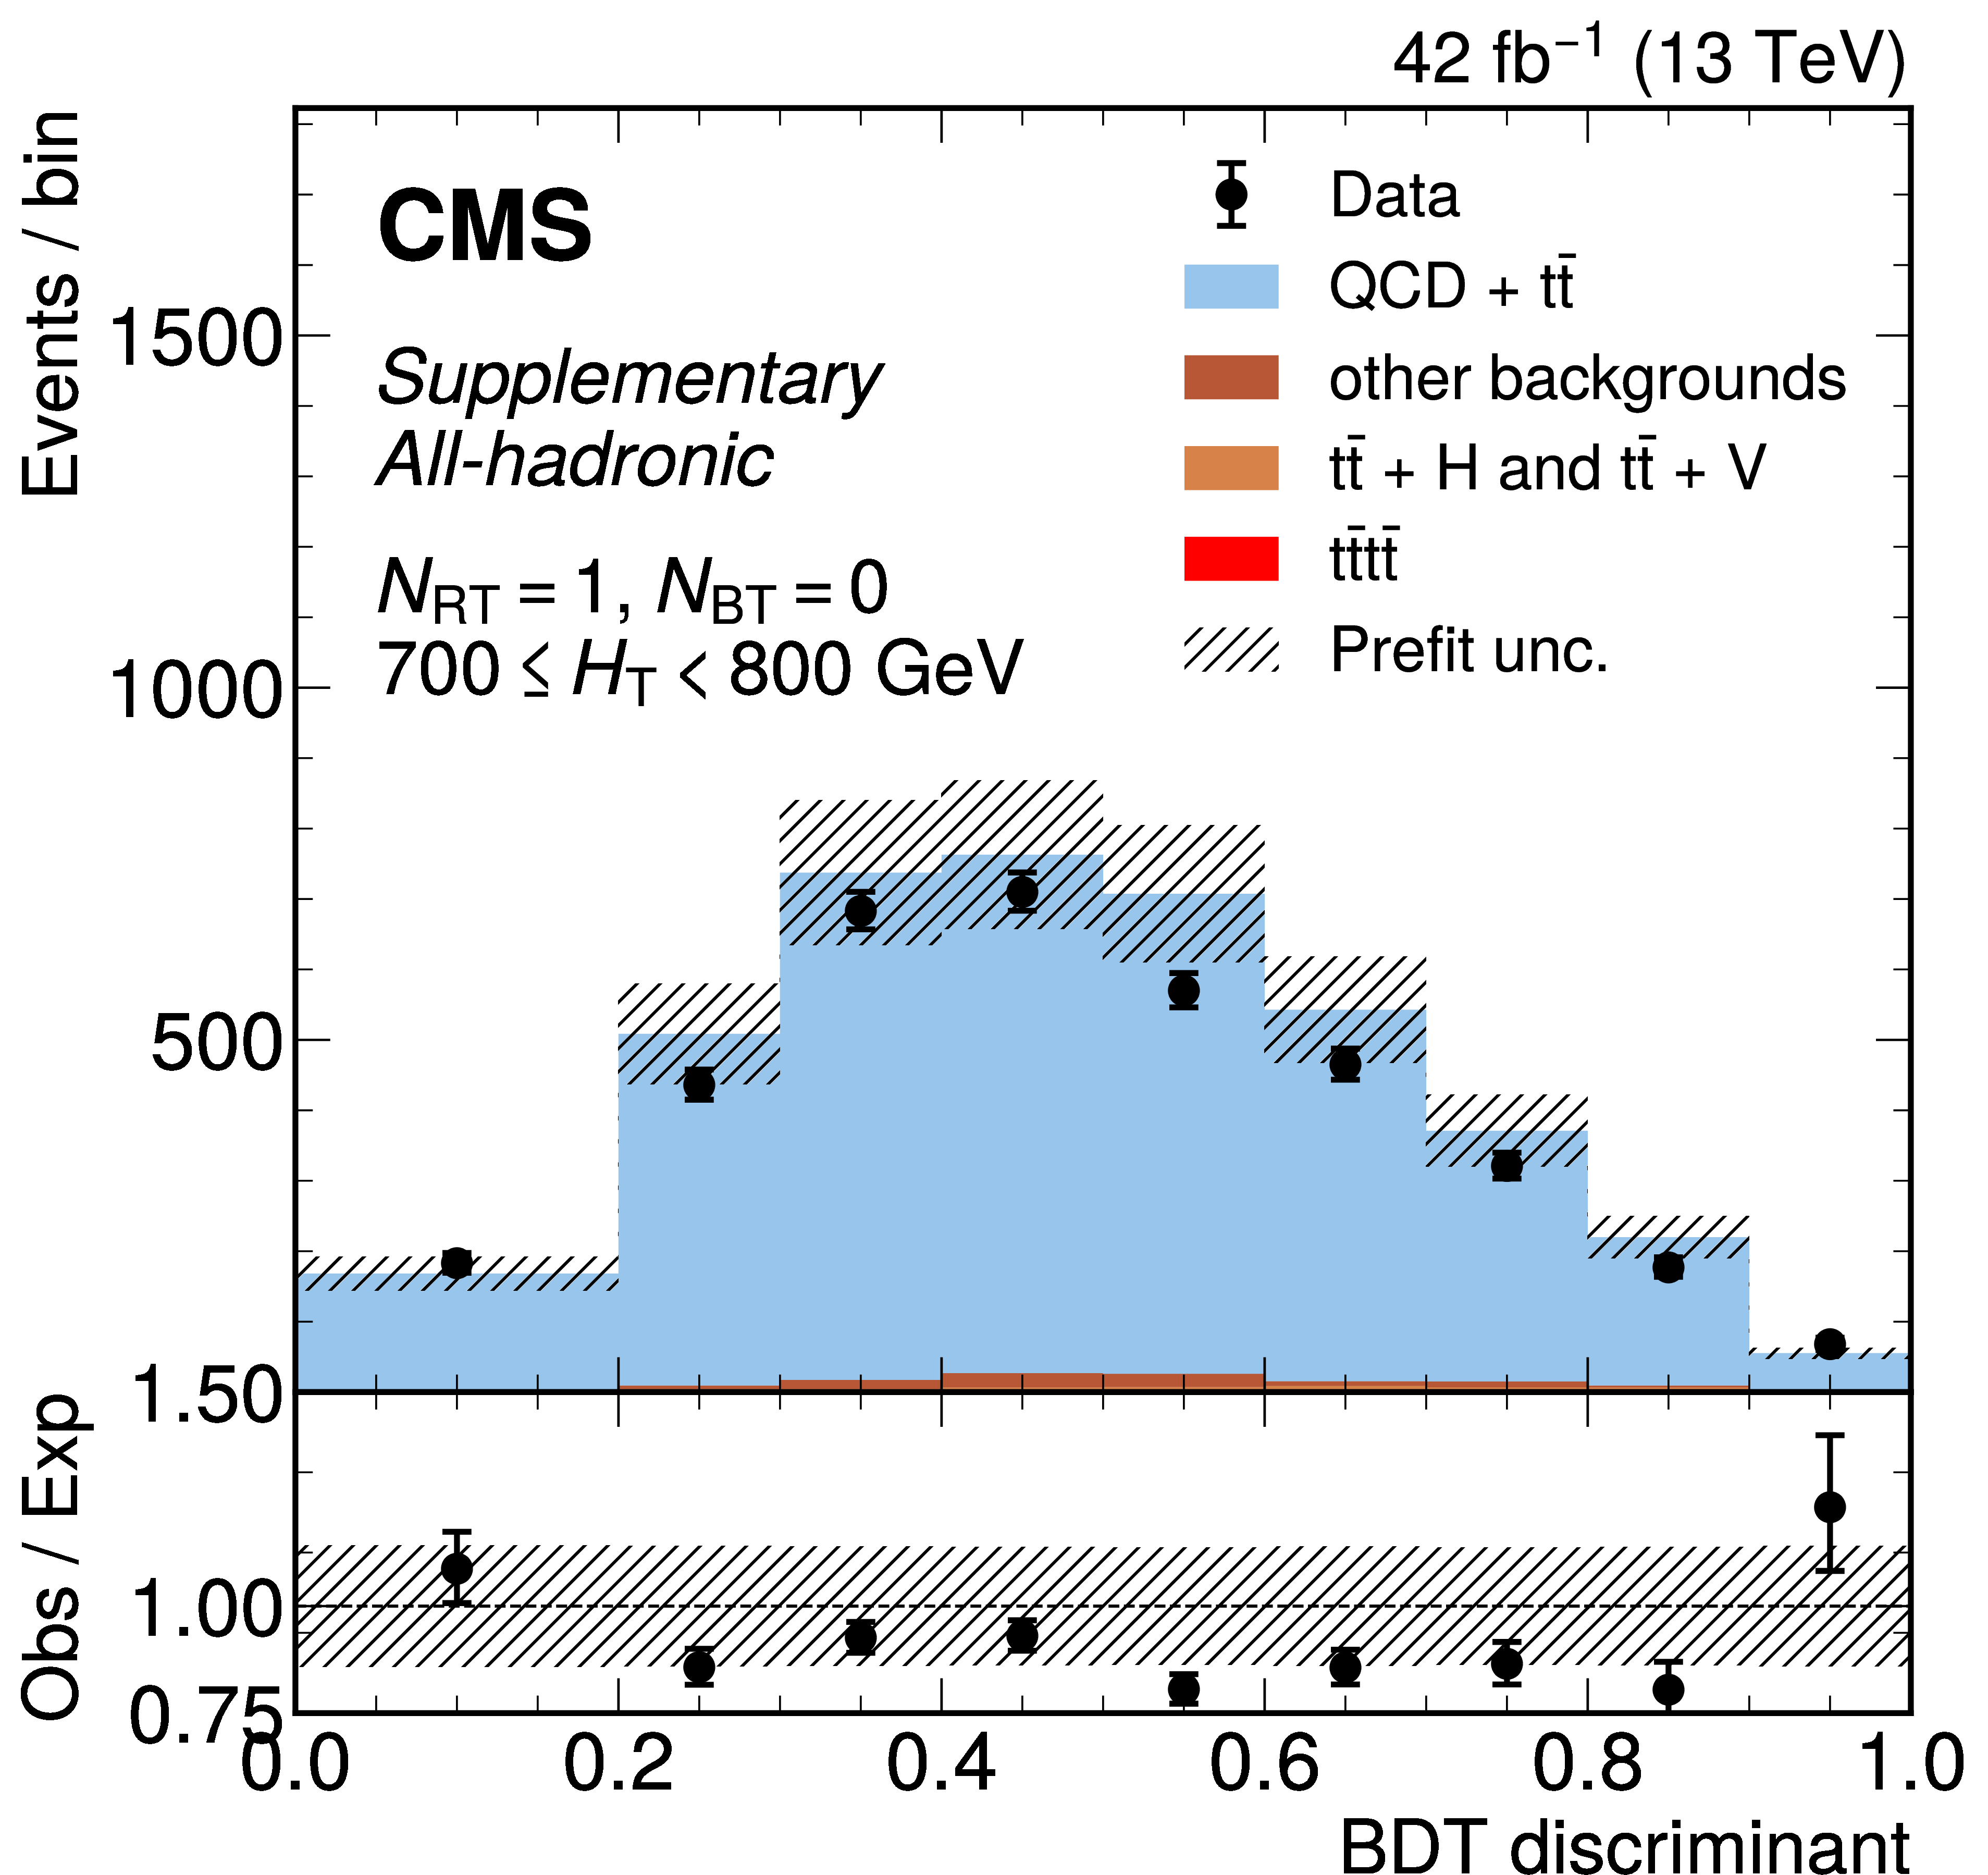
png pdf |
Additional Figure 21-a:
The distribution of the BDT discriminants in the 8-jet validation region (VR) for the 2017 data set in the all-hadronic channel for all $ N_\text{RT} $, $ N_\text{BT} $, and $ H_{\mathrm{T}} $ categories. ($ N_\text{RT} $ and $ N_\text{BT} $ represent number of resolved tops and b-jets respectively.) The background from QCD multijet and $ \mathrm{t} \bar{\mathrm{t}} $ production is derived from control regions in the data. Estimates for the $ \mathrm{t}\bar{\mathrm{t}}\mathrm{t}\bar{\mathrm{t}} $ signal and other backgrounds are shown using simulated samples. The hatched bands correspond to the estimated total uncertainty per validation region. VR-derived shape uncertainties to account for discrepancies between the data and the data-driven background estimate observed in the VRs are shown overlaid in red and blue for reference. |

png pdf |
Additional Figure 21-b:
The distribution of the BDT discriminants in the 8-jet validation region (VR) for the 2017 data set in the all-hadronic channel for all $ N_\text{RT} $, $ N_\text{BT} $, and $ H_{\mathrm{T}} $ categories. ($ N_\text{RT} $ and $ N_\text{BT} $ represent number of resolved tops and b-jets respectively.) The background from QCD multijet and $ \mathrm{t} \bar{\mathrm{t}} $ production is derived from control regions in the data. Estimates for the $ \mathrm{t}\bar{\mathrm{t}}\mathrm{t}\bar{\mathrm{t}} $ signal and other backgrounds are shown using simulated samples. The hatched bands correspond to the estimated total uncertainty per validation region. VR-derived shape uncertainties to account for discrepancies between the data and the data-driven background estimate observed in the VRs are shown overlaid in red and blue for reference. |

png pdf |
Additional Figure 21-c:
The distribution of the BDT discriminants in the 8-jet validation region (VR) for the 2017 data set in the all-hadronic channel for all $ N_\text{RT} $, $ N_\text{BT} $, and $ H_{\mathrm{T}} $ categories. ($ N_\text{RT} $ and $ N_\text{BT} $ represent number of resolved tops and b-jets respectively.) The background from QCD multijet and $ \mathrm{t} \bar{\mathrm{t}} $ production is derived from control regions in the data. Estimates for the $ \mathrm{t}\bar{\mathrm{t}}\mathrm{t}\bar{\mathrm{t}} $ signal and other backgrounds are shown using simulated samples. The hatched bands correspond to the estimated total uncertainty per validation region. VR-derived shape uncertainties to account for discrepancies between the data and the data-driven background estimate observed in the VRs are shown overlaid in red and blue for reference. |
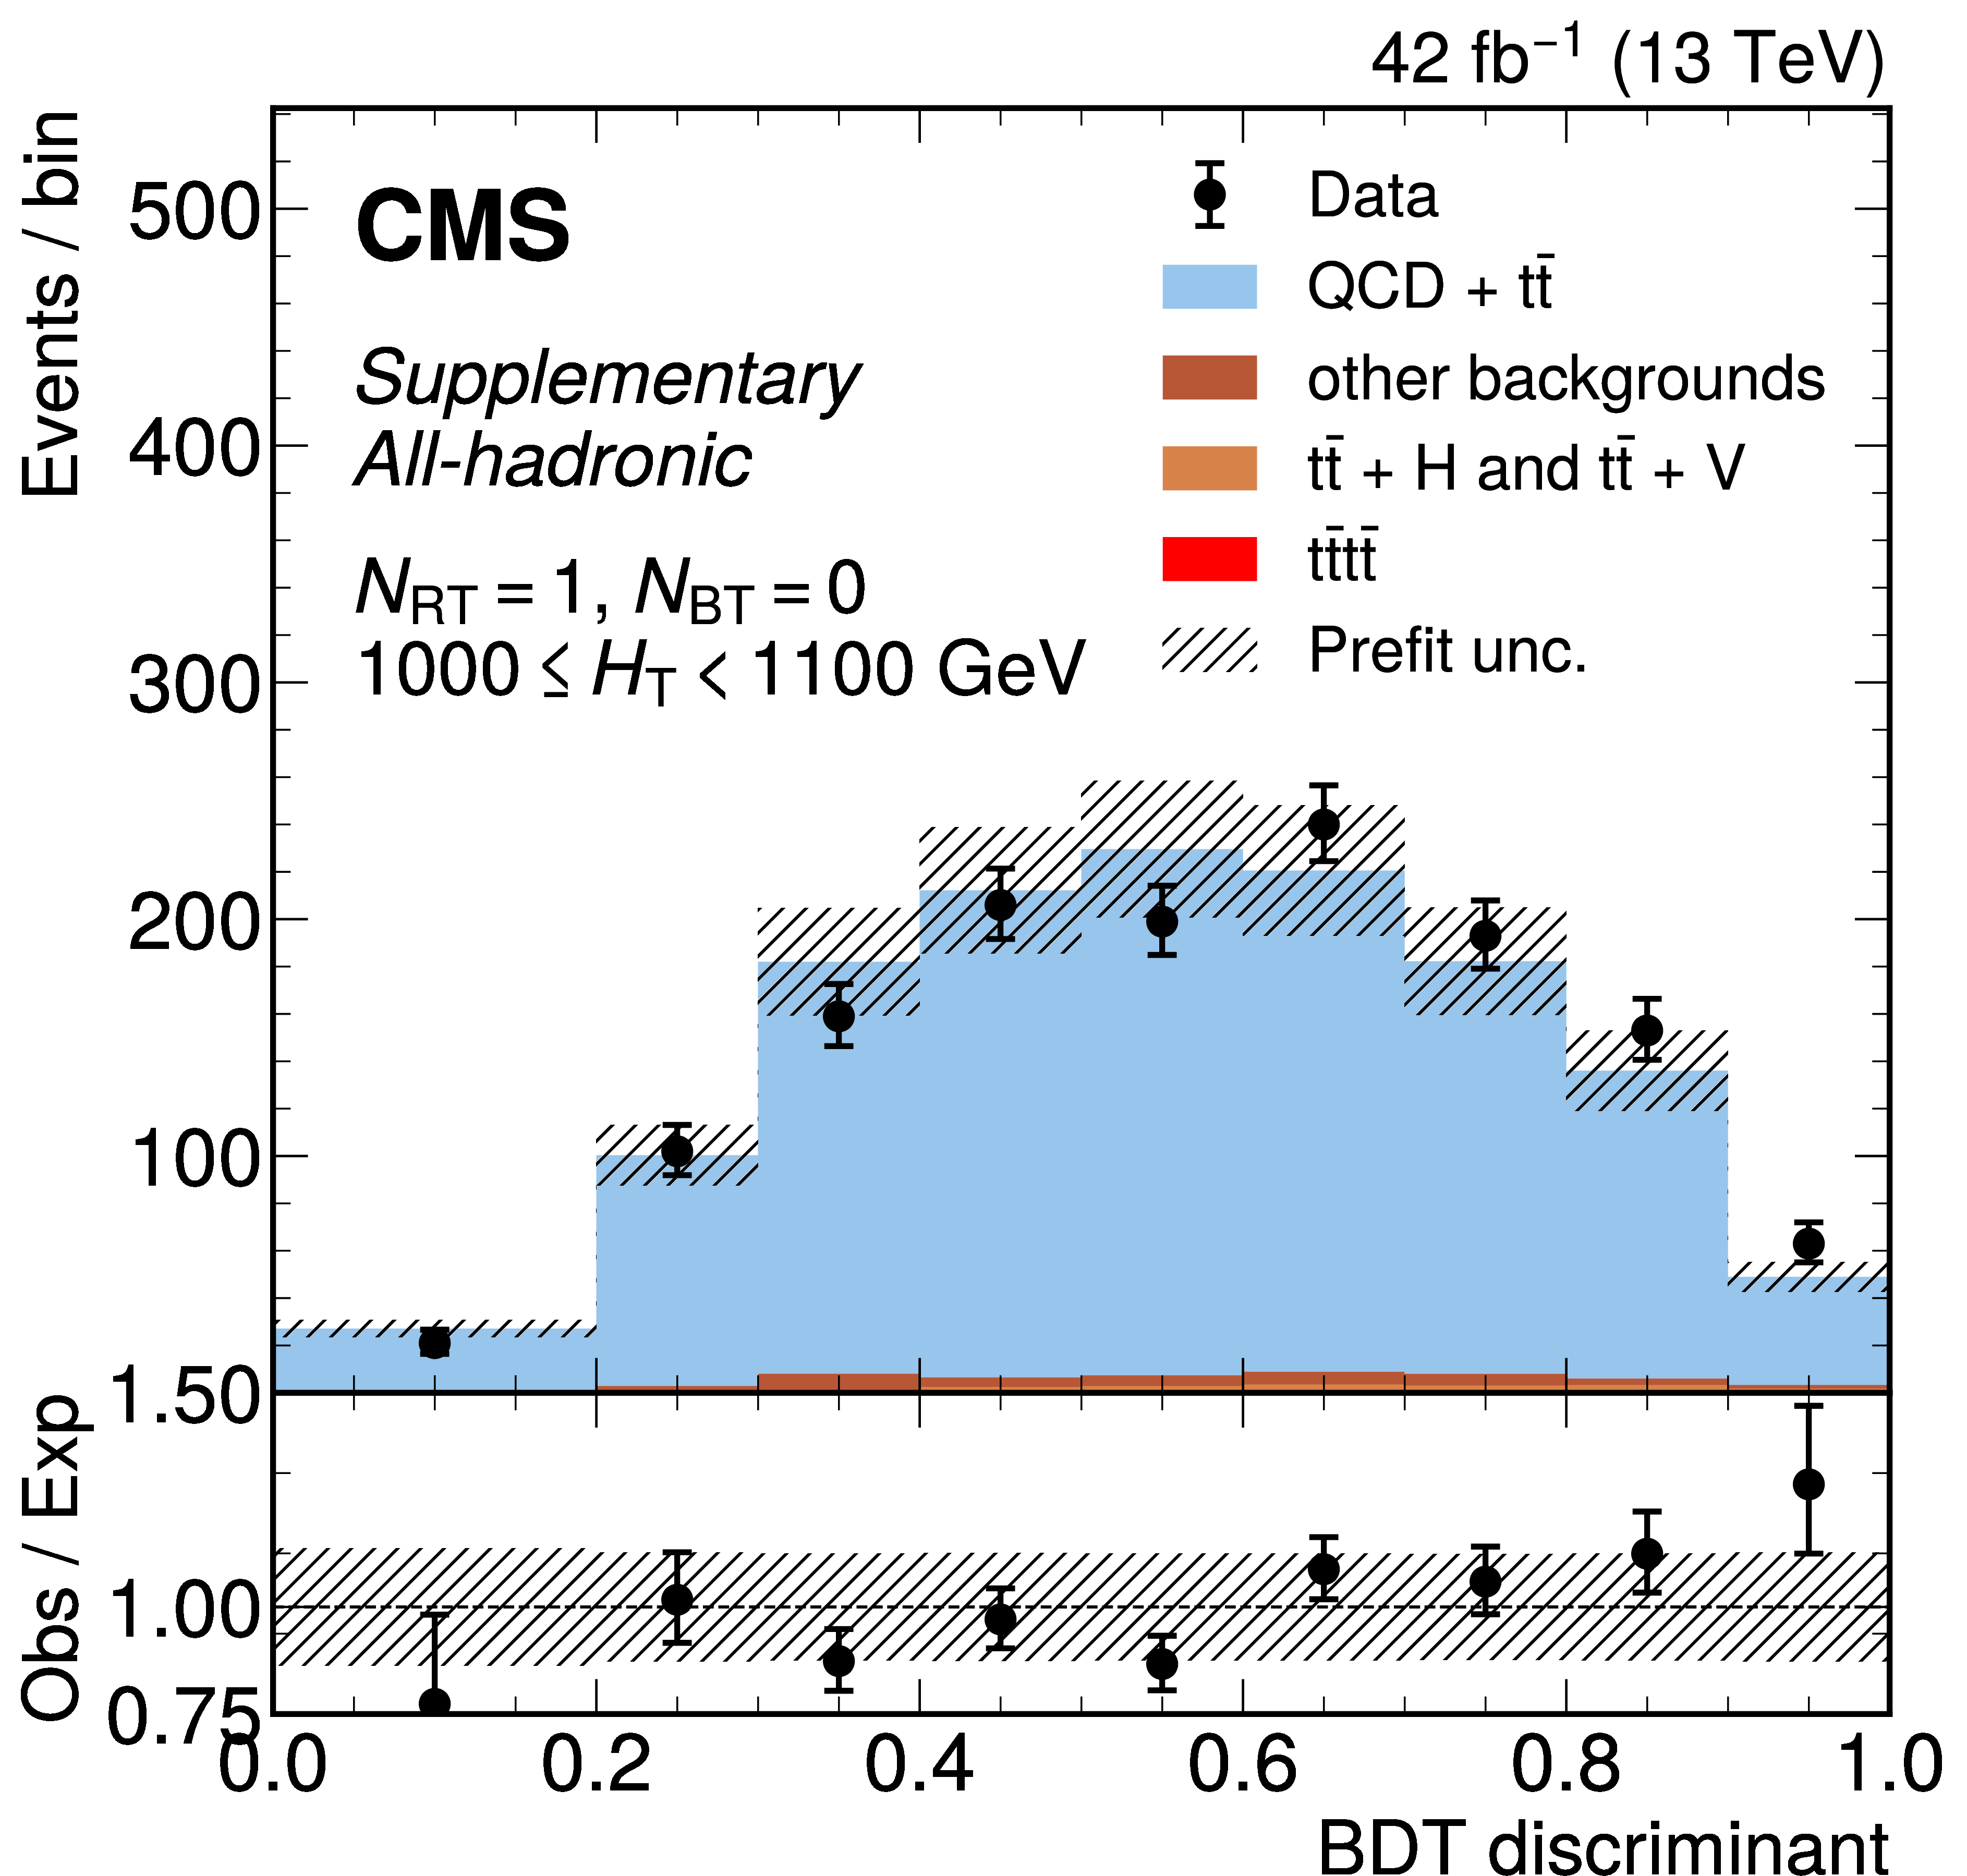
png pdf |
Additional Figure 21-d:
The distribution of the BDT discriminants in the 8-jet validation region (VR) for the 2017 data set in the all-hadronic channel for all $ N_\text{RT} $, $ N_\text{BT} $, and $ H_{\mathrm{T}} $ categories. ($ N_\text{RT} $ and $ N_\text{BT} $ represent number of resolved tops and b-jets respectively.) The background from QCD multijet and $ \mathrm{t} \bar{\mathrm{t}} $ production is derived from control regions in the data. Estimates for the $ \mathrm{t}\bar{\mathrm{t}}\mathrm{t}\bar{\mathrm{t}} $ signal and other backgrounds are shown using simulated samples. The hatched bands correspond to the estimated total uncertainty per validation region. VR-derived shape uncertainties to account for discrepancies between the data and the data-driven background estimate observed in the VRs are shown overlaid in red and blue for reference. |
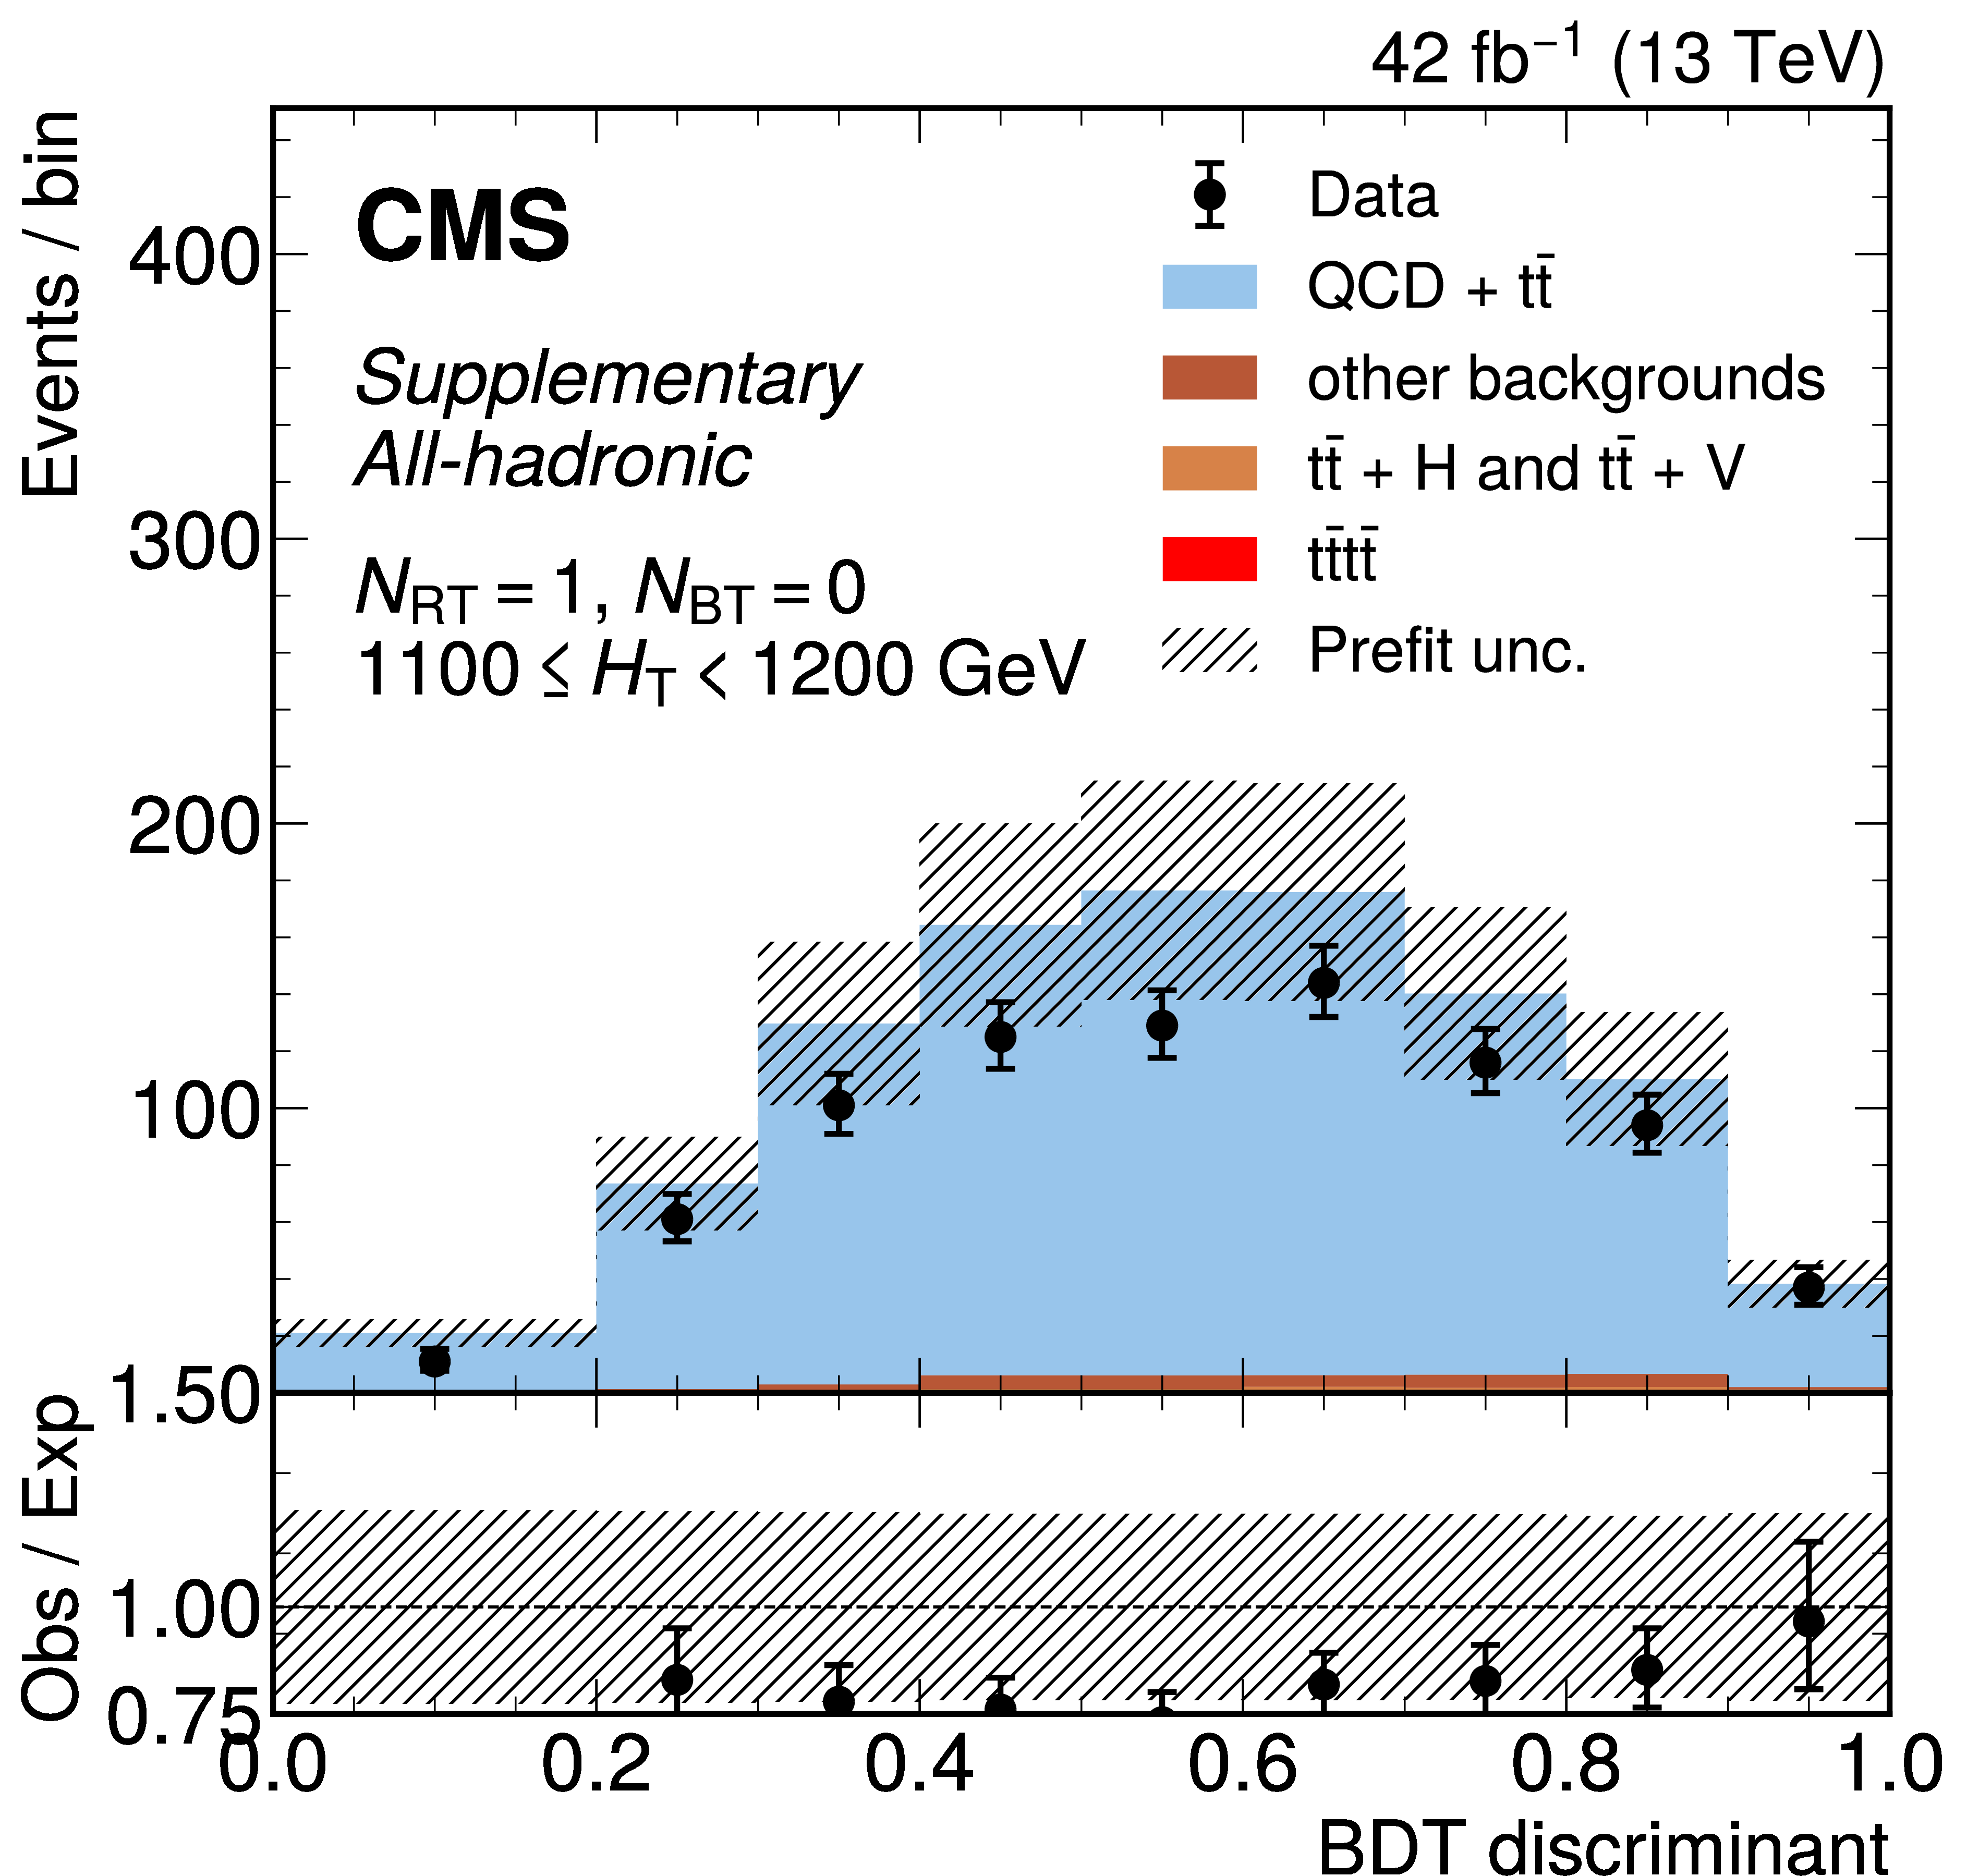
png pdf |
Additional Figure 21-e:
The distribution of the BDT discriminants in the 8-jet validation region (VR) for the 2017 data set in the all-hadronic channel for all $ N_\text{RT} $, $ N_\text{BT} $, and $ H_{\mathrm{T}} $ categories. ($ N_\text{RT} $ and $ N_\text{BT} $ represent number of resolved tops and b-jets respectively.) The background from QCD multijet and $ \mathrm{t} \bar{\mathrm{t}} $ production is derived from control regions in the data. Estimates for the $ \mathrm{t}\bar{\mathrm{t}}\mathrm{t}\bar{\mathrm{t}} $ signal and other backgrounds are shown using simulated samples. The hatched bands correspond to the estimated total uncertainty per validation region. VR-derived shape uncertainties to account for discrepancies between the data and the data-driven background estimate observed in the VRs are shown overlaid in red and blue for reference. |
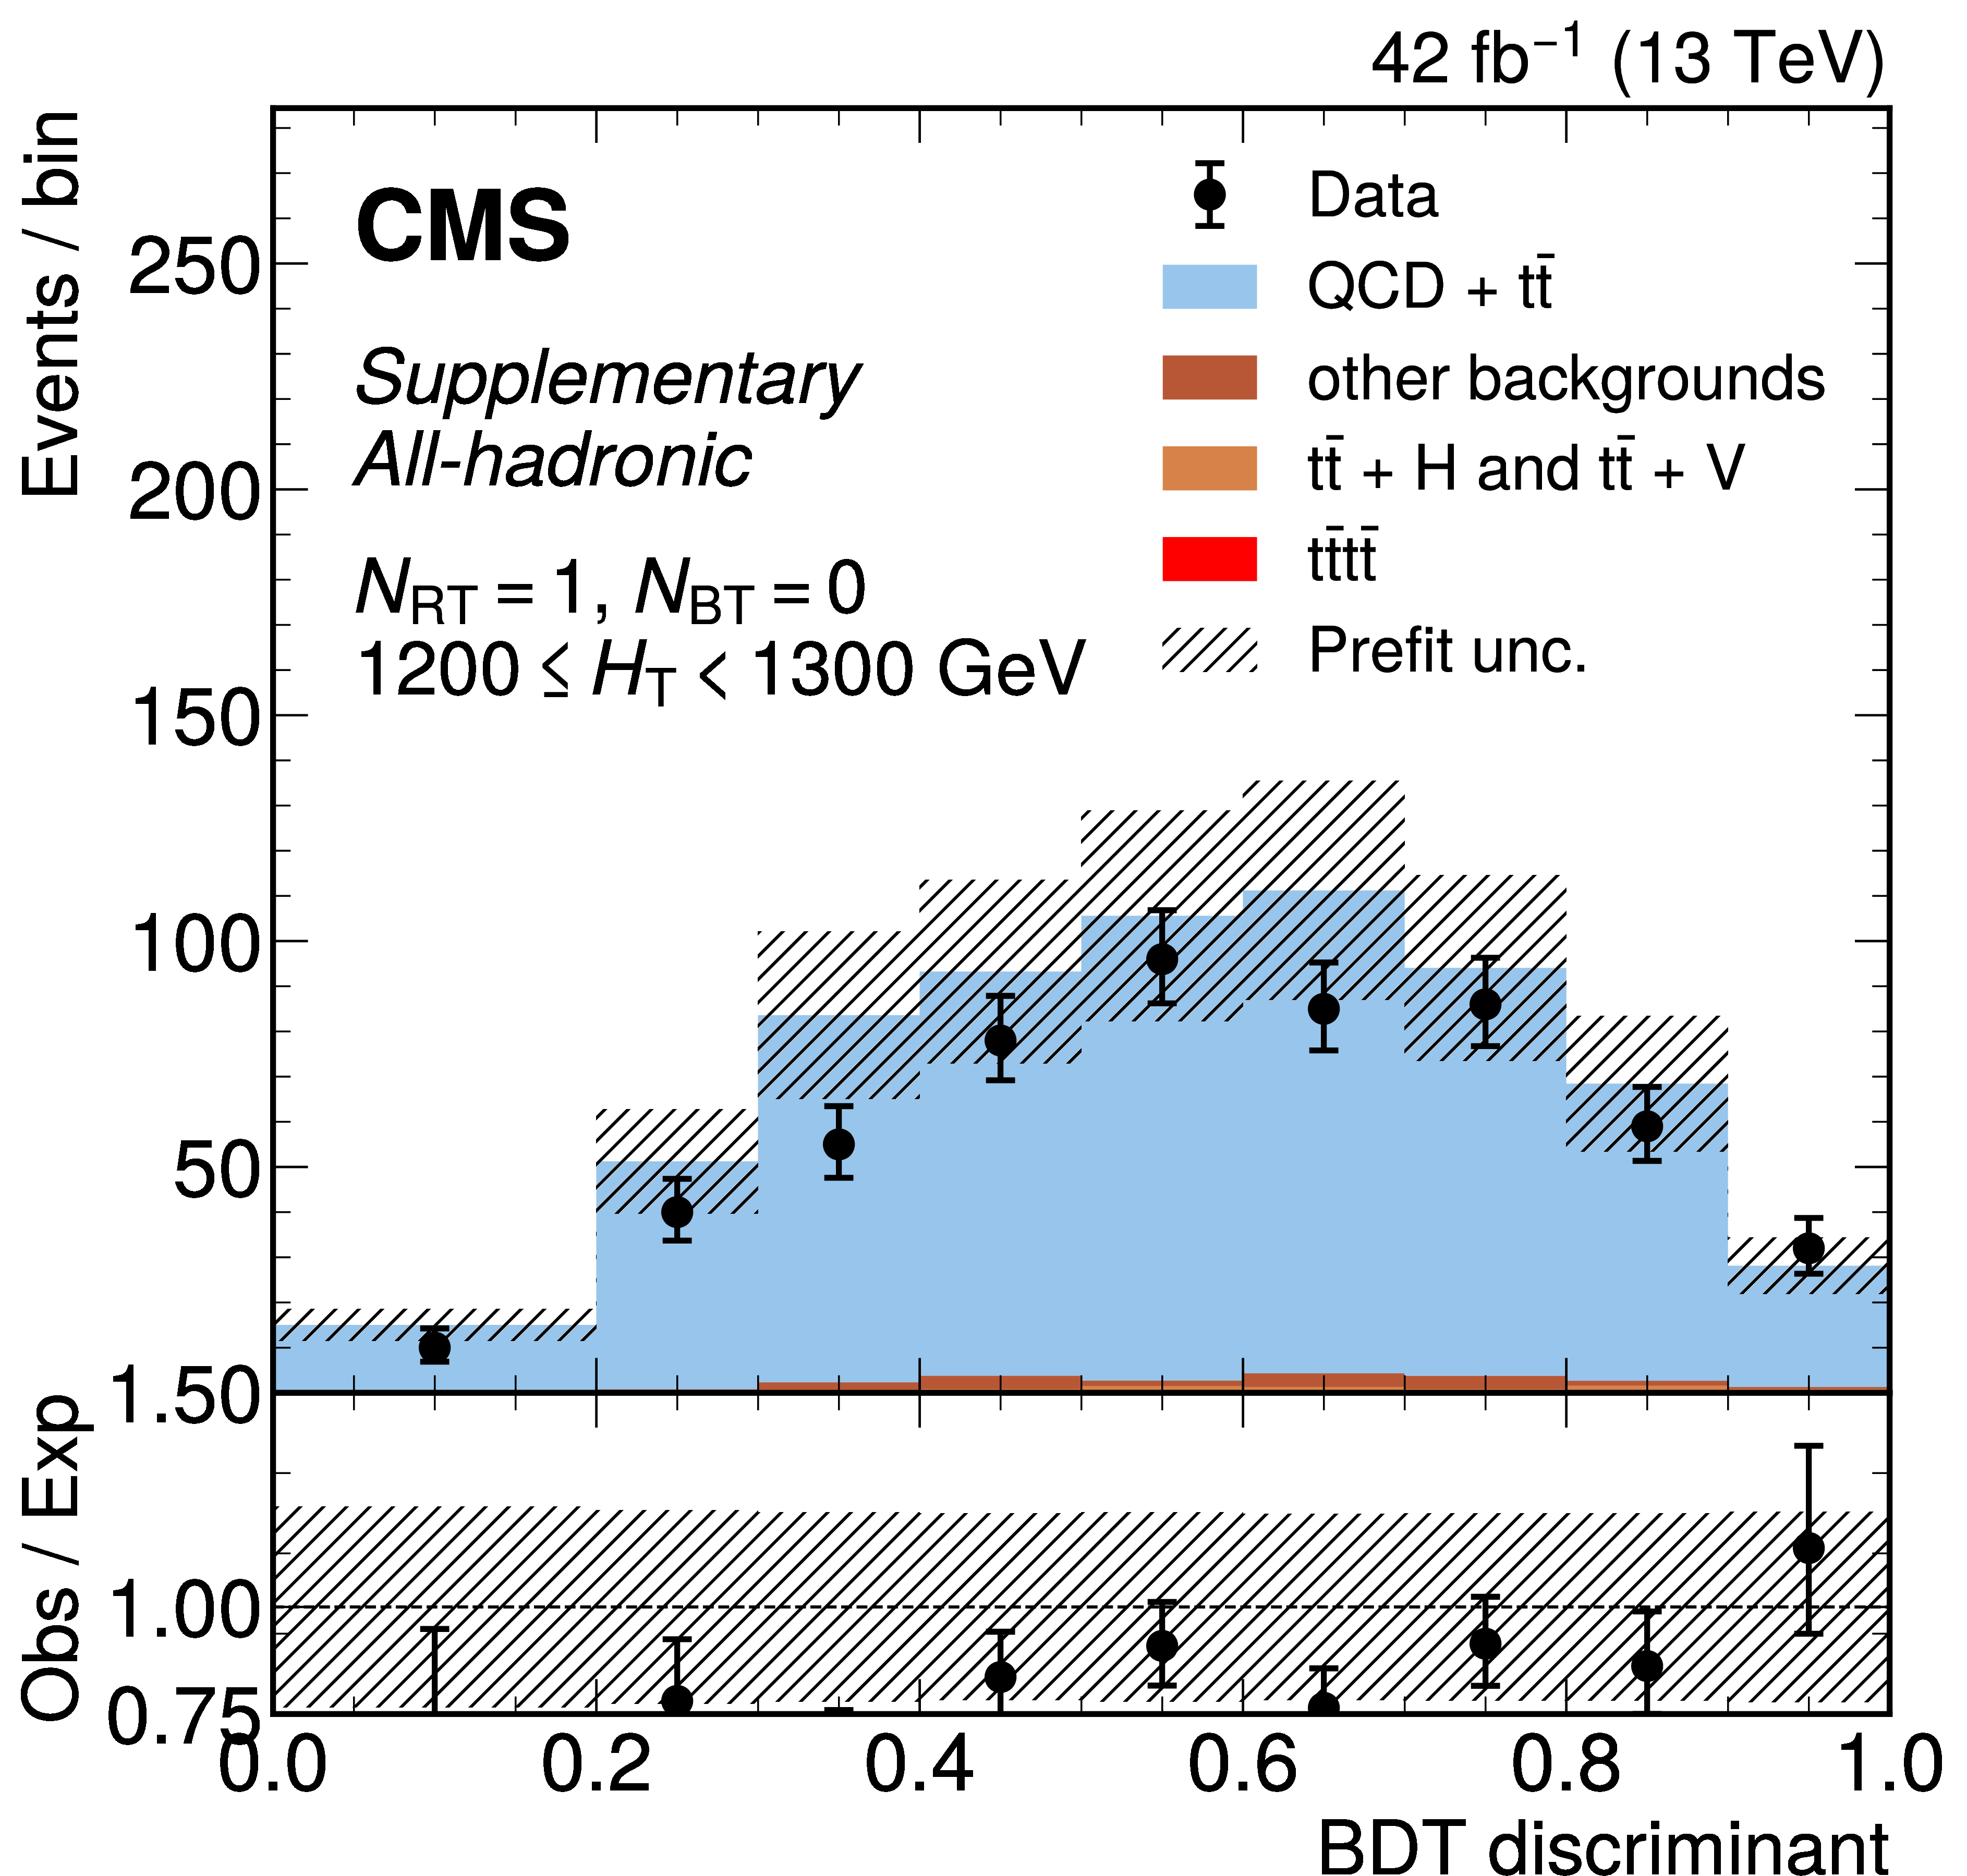
png pdf |
Additional Figure 21-f:
The distribution of the BDT discriminants in the 8-jet validation region (VR) for the 2017 data set in the all-hadronic channel for all $ N_\text{RT} $, $ N_\text{BT} $, and $ H_{\mathrm{T}} $ categories. ($ N_\text{RT} $ and $ N_\text{BT} $ represent number of resolved tops and b-jets respectively.) The background from QCD multijet and $ \mathrm{t} \bar{\mathrm{t}} $ production is derived from control regions in the data. Estimates for the $ \mathrm{t}\bar{\mathrm{t}}\mathrm{t}\bar{\mathrm{t}} $ signal and other backgrounds are shown using simulated samples. The hatched bands correspond to the estimated total uncertainty per validation region. VR-derived shape uncertainties to account for discrepancies between the data and the data-driven background estimate observed in the VRs are shown overlaid in red and blue for reference. |

png pdf |
Additional Figure 21-g:
The distribution of the BDT discriminants in the 8-jet validation region (VR) for the 2017 data set in the all-hadronic channel for all $ N_\text{RT} $, $ N_\text{BT} $, and $ H_{\mathrm{T}} $ categories. ($ N_\text{RT} $ and $ N_\text{BT} $ represent number of resolved tops and b-jets respectively.) The background from QCD multijet and $ \mathrm{t} \bar{\mathrm{t}} $ production is derived from control regions in the data. Estimates for the $ \mathrm{t}\bar{\mathrm{t}}\mathrm{t}\bar{\mathrm{t}} $ signal and other backgrounds are shown using simulated samples. The hatched bands correspond to the estimated total uncertainty per validation region. VR-derived shape uncertainties to account for discrepancies between the data and the data-driven background estimate observed in the VRs are shown overlaid in red and blue for reference. |
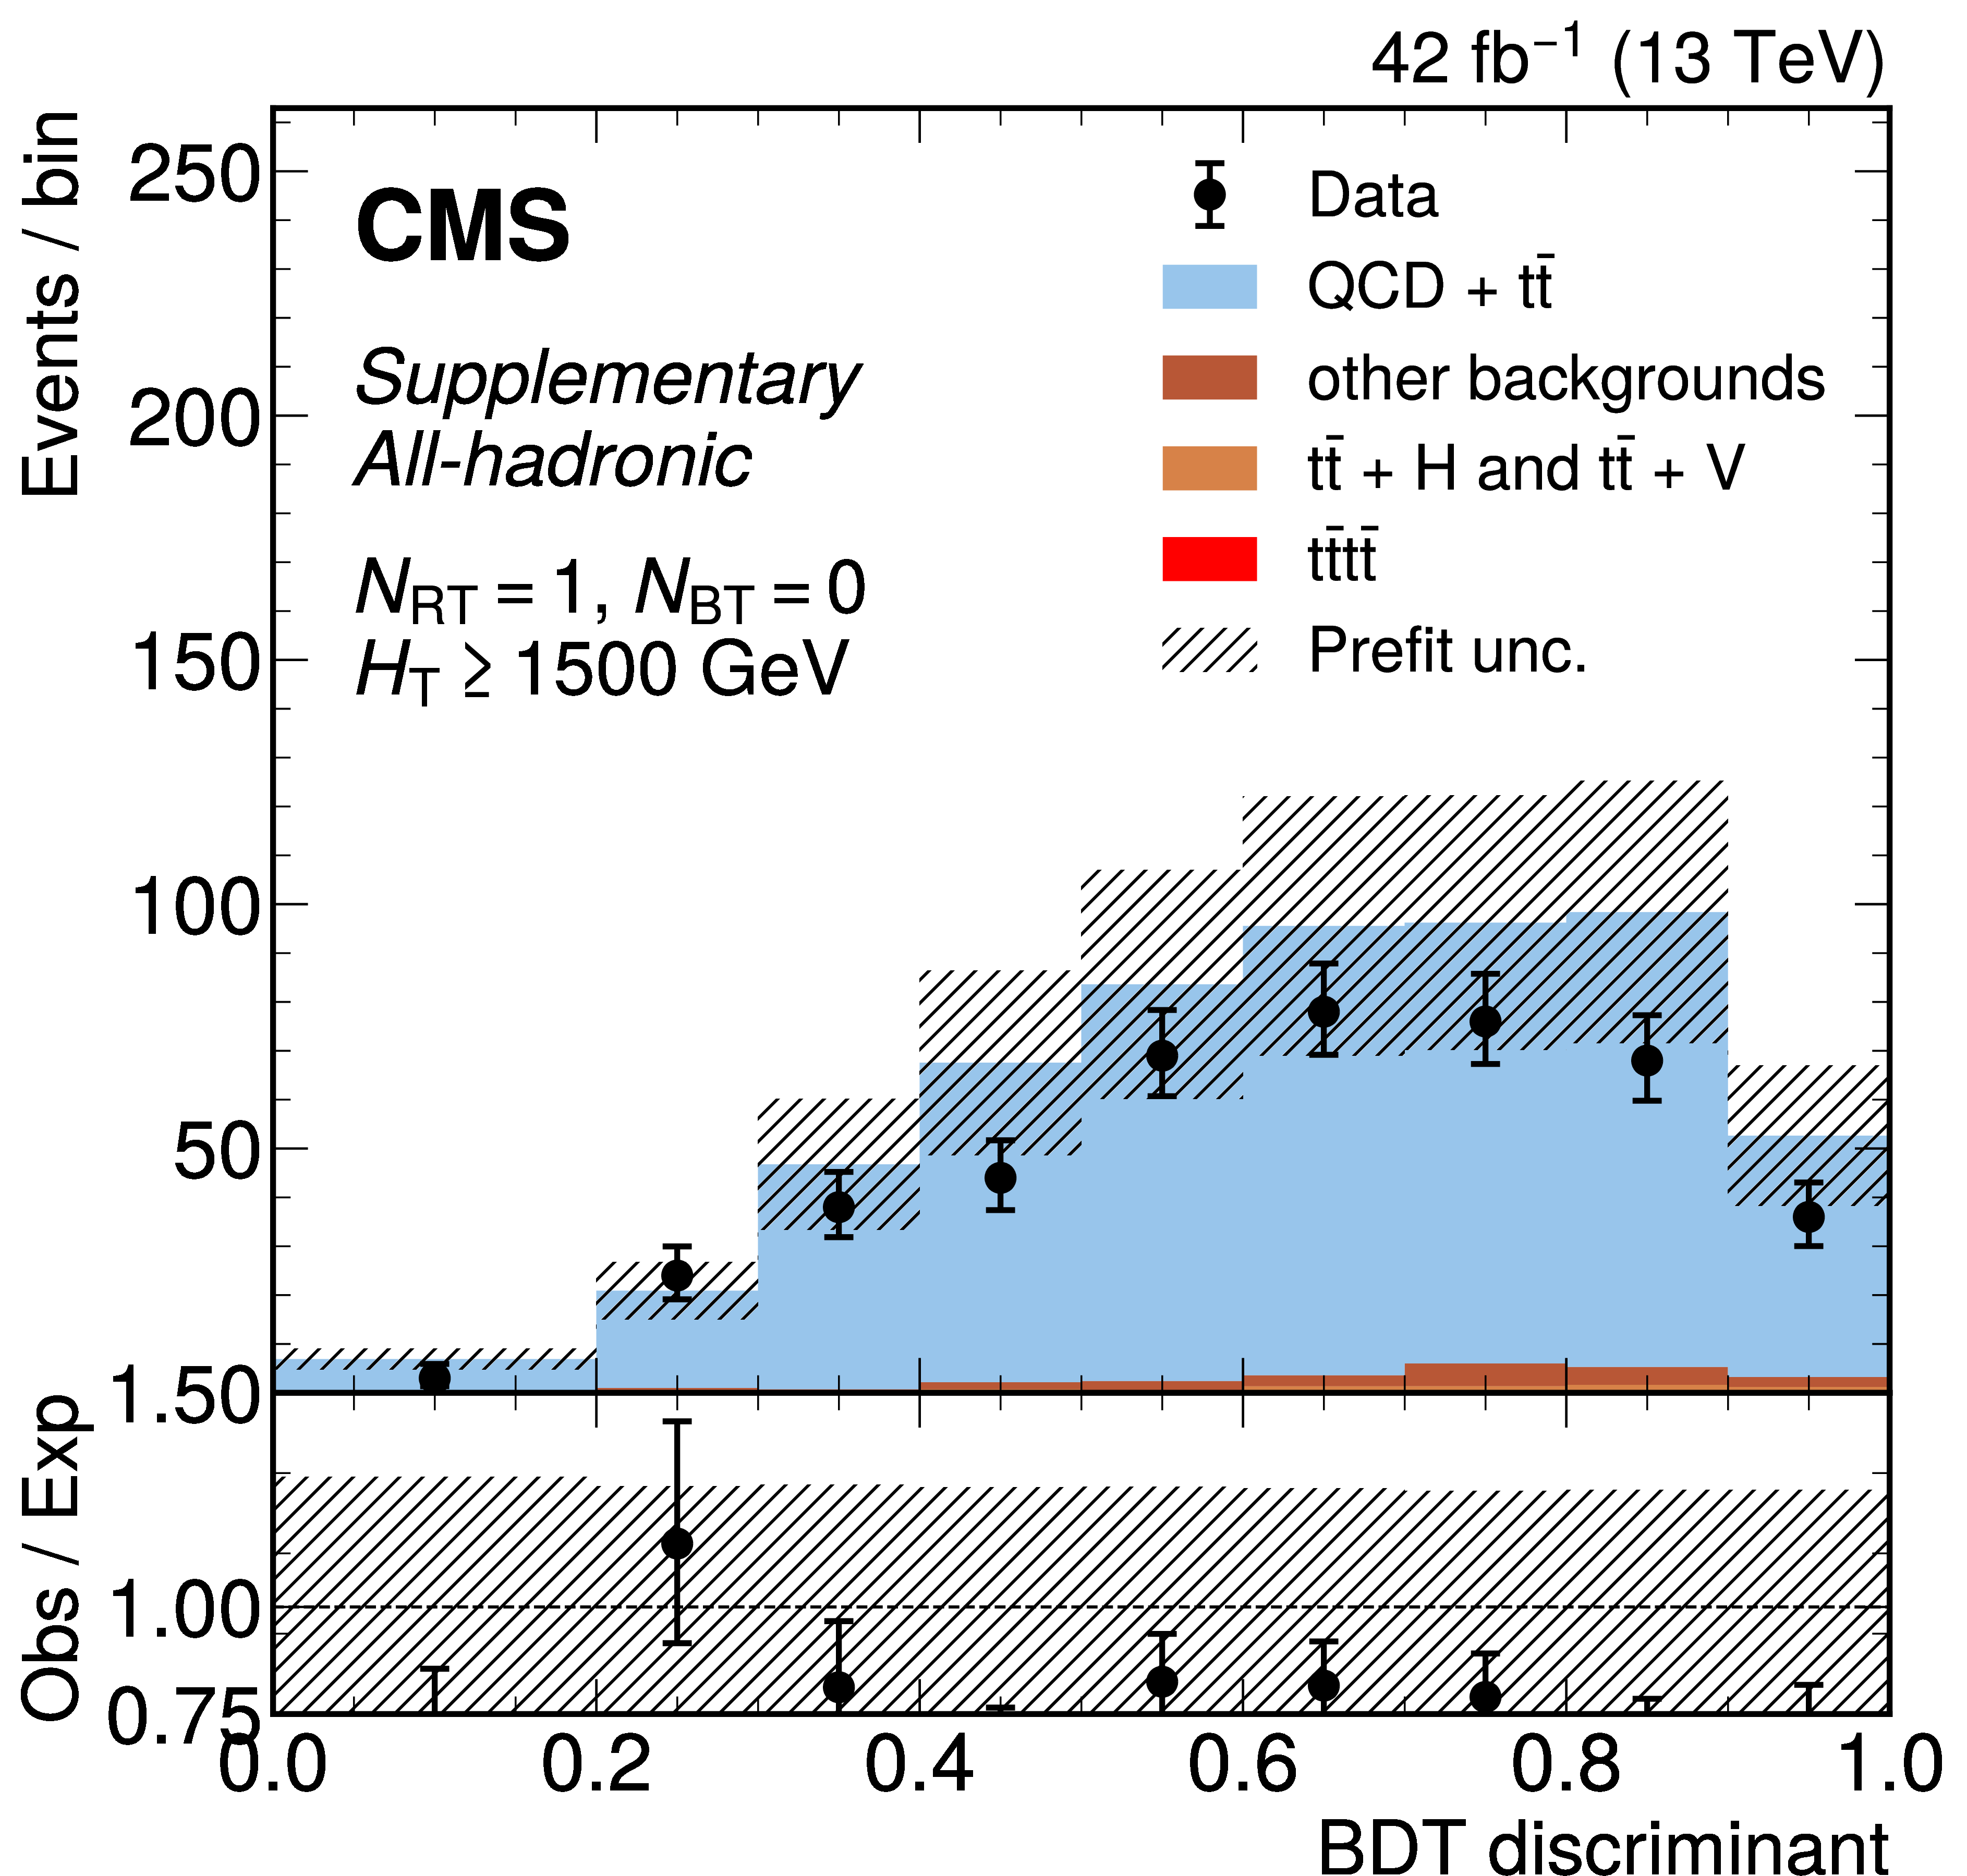
png pdf |
Additional Figure 21-h:
The distribution of the BDT discriminants in the 8-jet validation region (VR) for the 2017 data set in the all-hadronic channel for all $ N_\text{RT} $, $ N_\text{BT} $, and $ H_{\mathrm{T}} $ categories. ($ N_\text{RT} $ and $ N_\text{BT} $ represent number of resolved tops and b-jets respectively.) The background from QCD multijet and $ \mathrm{t} \bar{\mathrm{t}} $ production is derived from control regions in the data. Estimates for the $ \mathrm{t}\bar{\mathrm{t}}\mathrm{t}\bar{\mathrm{t}} $ signal and other backgrounds are shown using simulated samples. The hatched bands correspond to the estimated total uncertainty per validation region. VR-derived shape uncertainties to account for discrepancies between the data and the data-driven background estimate observed in the VRs are shown overlaid in red and blue for reference. |

png pdf |
Additional Figure 21-i:
The distribution of the BDT discriminants in the 8-jet validation region (VR) for the 2017 data set in the all-hadronic channel for all $ N_\text{RT} $, $ N_\text{BT} $, and $ H_{\mathrm{T}} $ categories. ($ N_\text{RT} $ and $ N_\text{BT} $ represent number of resolved tops and b-jets respectively.) The background from QCD multijet and $ \mathrm{t} \bar{\mathrm{t}} $ production is derived from control regions in the data. Estimates for the $ \mathrm{t}\bar{\mathrm{t}}\mathrm{t}\bar{\mathrm{t}} $ signal and other backgrounds are shown using simulated samples. The hatched bands correspond to the estimated total uncertainty per validation region. VR-derived shape uncertainties to account for discrepancies between the data and the data-driven background estimate observed in the VRs are shown overlaid in red and blue for reference. |
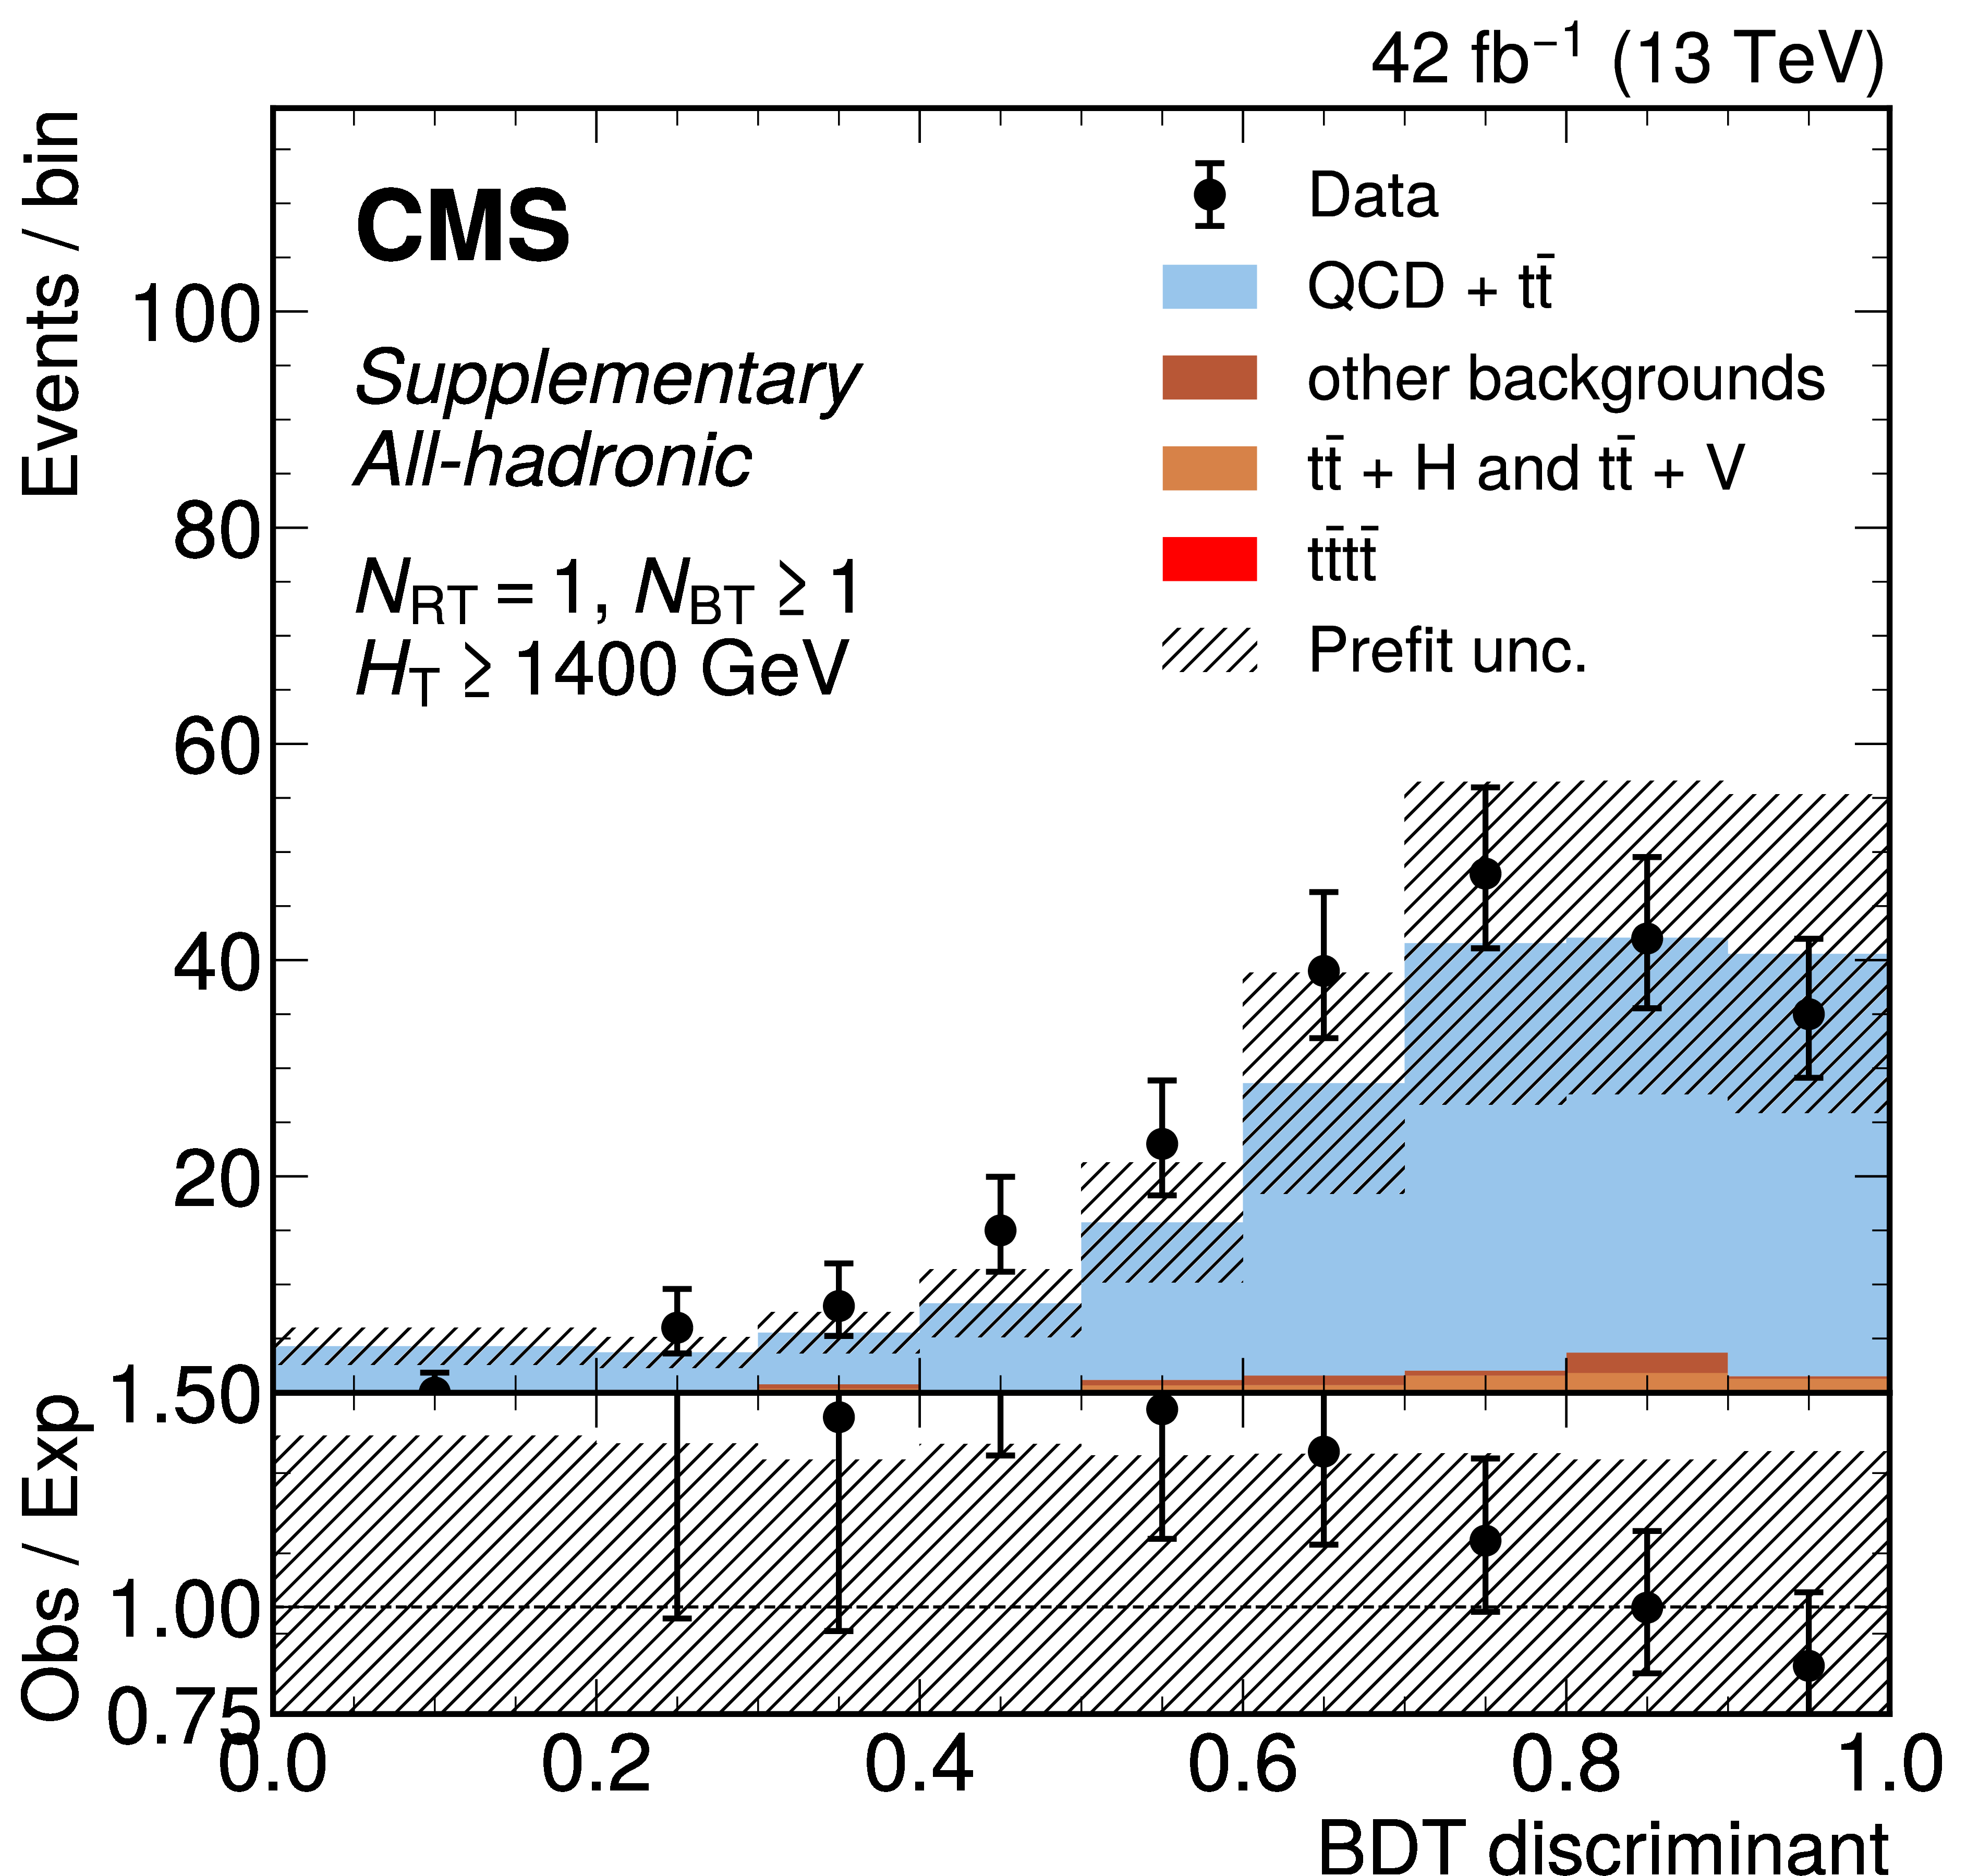
png pdf |
Additional Figure 21-j:
The distribution of the BDT discriminants in the 8-jet validation region (VR) for the 2017 data set in the all-hadronic channel for all $ N_\text{RT} $, $ N_\text{BT} $, and $ H_{\mathrm{T}} $ categories. ($ N_\text{RT} $ and $ N_\text{BT} $ represent number of resolved tops and b-jets respectively.) The background from QCD multijet and $ \mathrm{t} \bar{\mathrm{t}} $ production is derived from control regions in the data. Estimates for the $ \mathrm{t}\bar{\mathrm{t}}\mathrm{t}\bar{\mathrm{t}} $ signal and other backgrounds are shown using simulated samples. The hatched bands correspond to the estimated total uncertainty per validation region. VR-derived shape uncertainties to account for discrepancies between the data and the data-driven background estimate observed in the VRs are shown overlaid in red and blue for reference. |
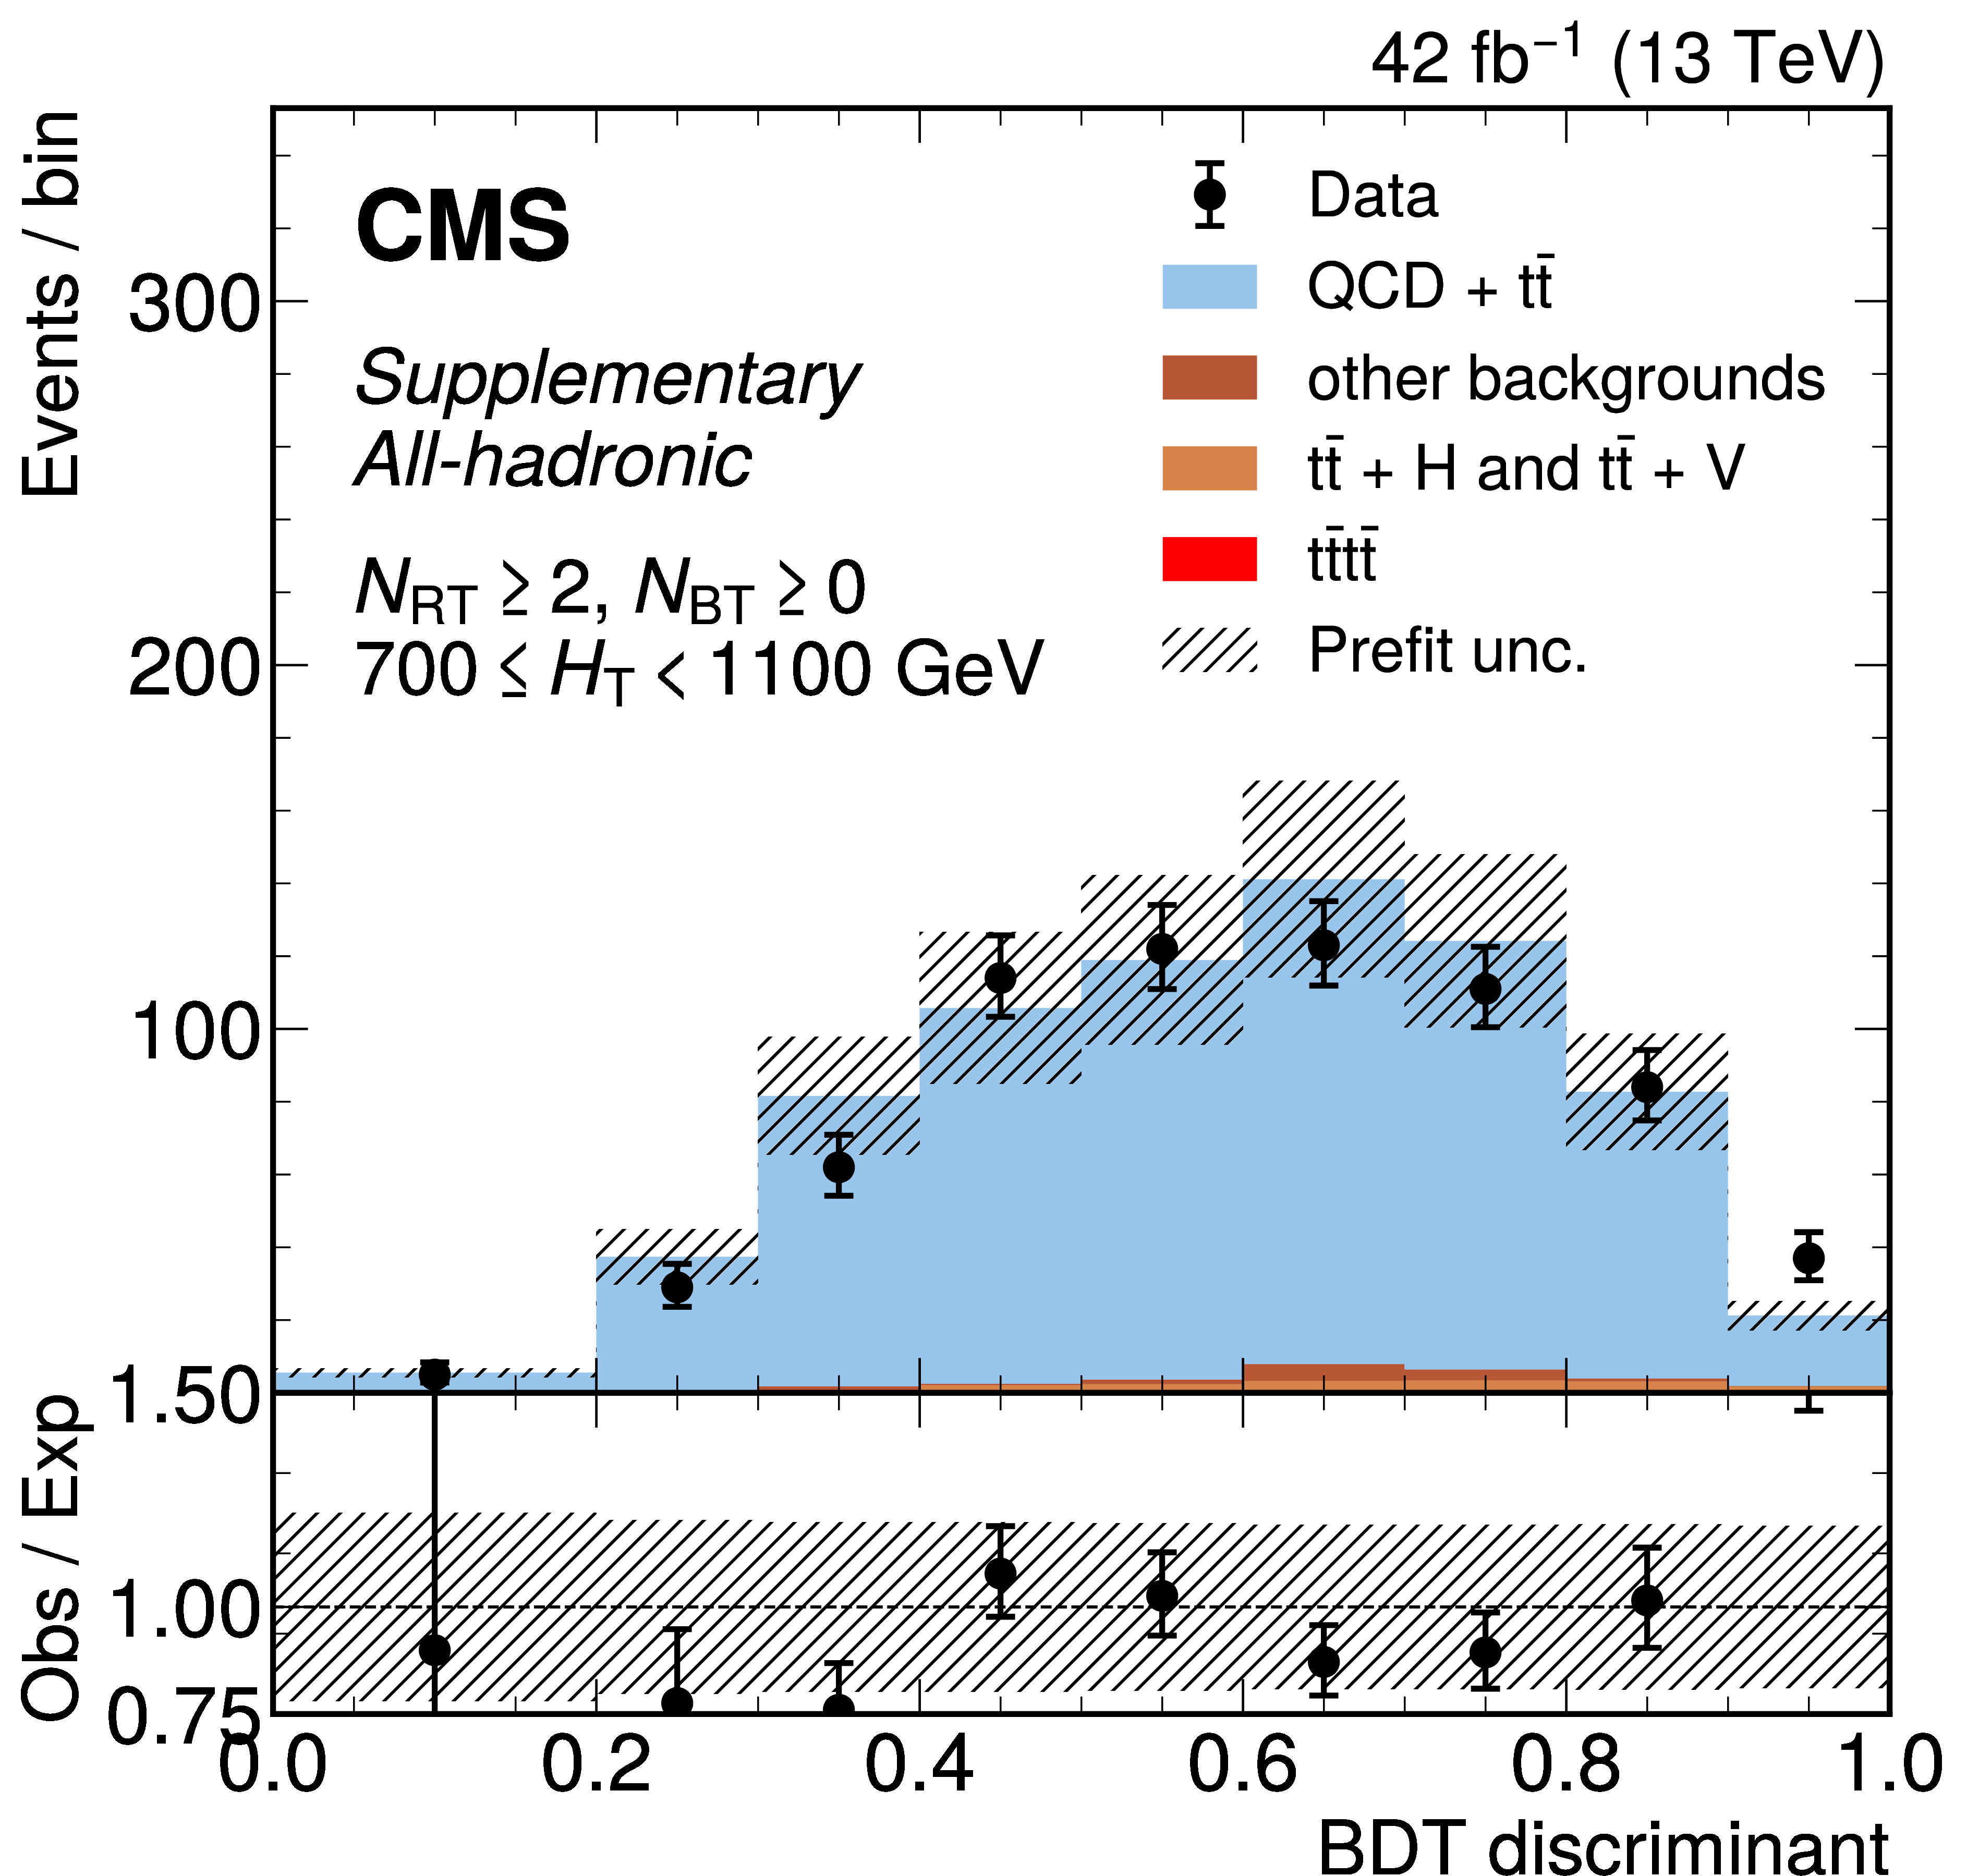
png pdf |
Additional Figure 21-k:
The distribution of the BDT discriminants in the 8-jet validation region (VR) for the 2017 data set in the all-hadronic channel for all $ N_\text{RT} $, $ N_\text{BT} $, and $ H_{\mathrm{T}} $ categories. ($ N_\text{RT} $ and $ N_\text{BT} $ represent number of resolved tops and b-jets respectively.) The background from QCD multijet and $ \mathrm{t} \bar{\mathrm{t}} $ production is derived from control regions in the data. Estimates for the $ \mathrm{t}\bar{\mathrm{t}}\mathrm{t}\bar{\mathrm{t}} $ signal and other backgrounds are shown using simulated samples. The hatched bands correspond to the estimated total uncertainty per validation region. VR-derived shape uncertainties to account for discrepancies between the data and the data-driven background estimate observed in the VRs are shown overlaid in red and blue for reference. |
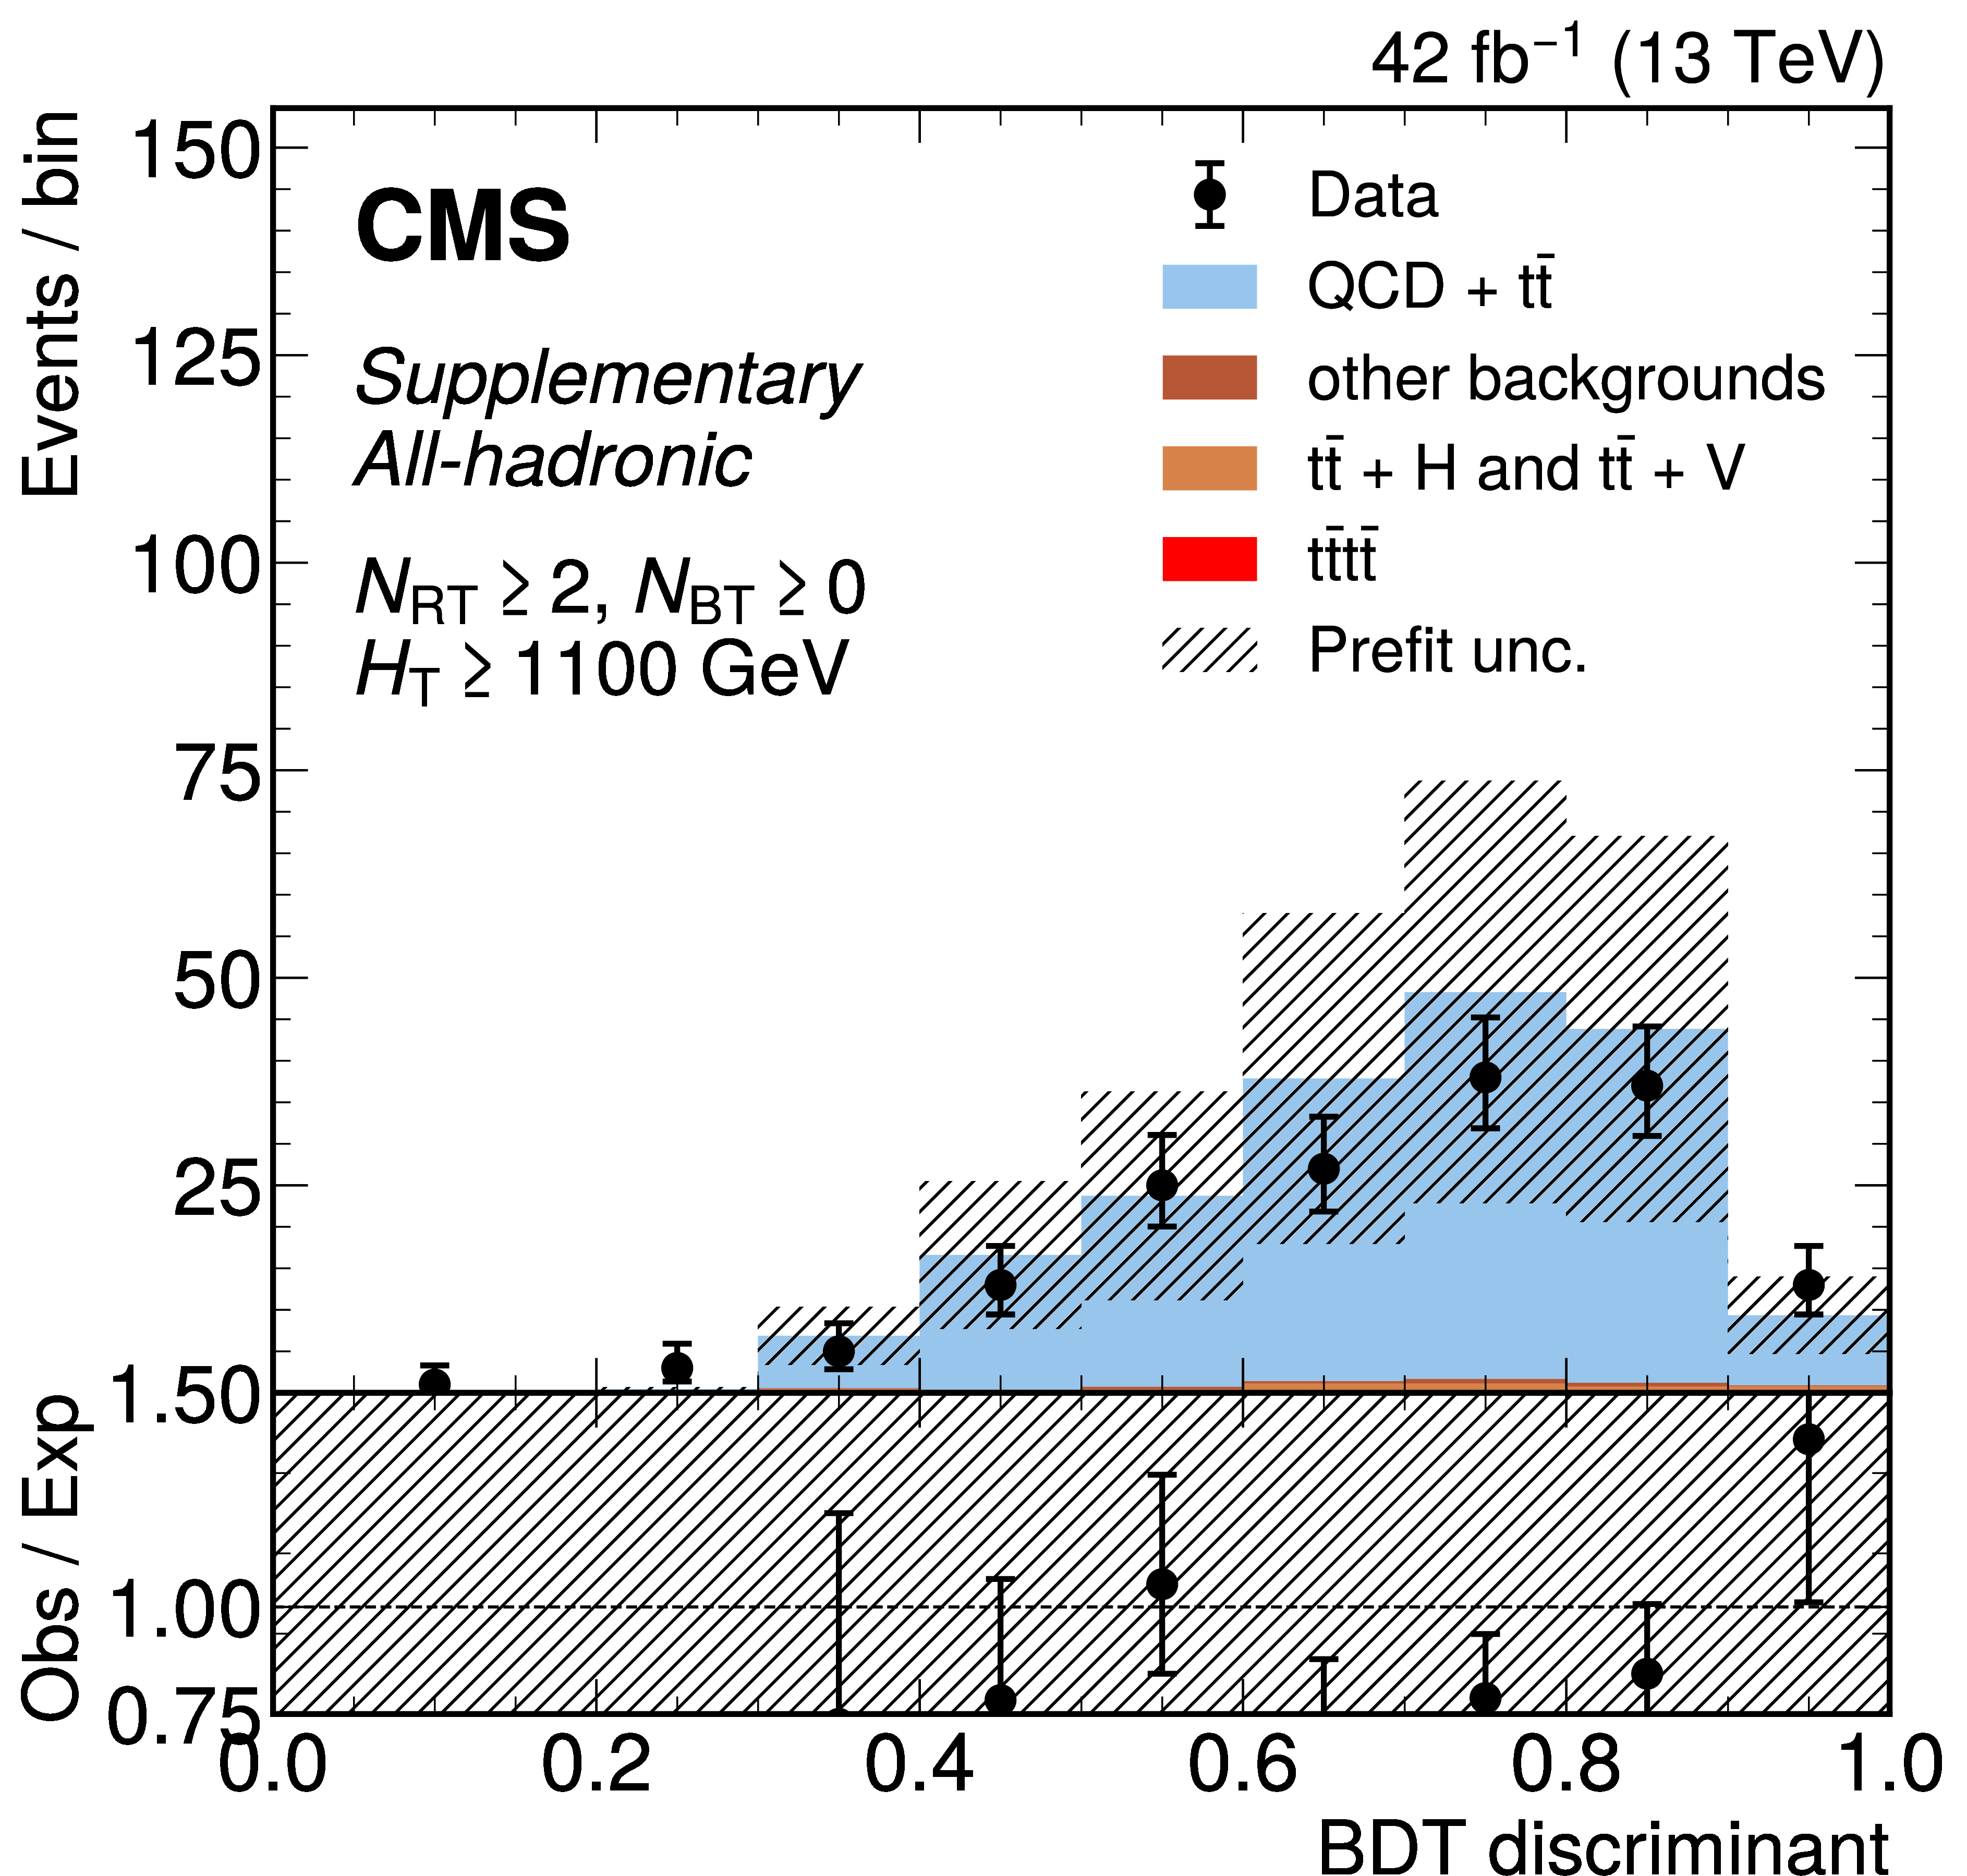
png pdf |
Additional Figure 21-l:
The distribution of the BDT discriminants in the 8-jet validation region (VR) for the 2017 data set in the all-hadronic channel for all $ N_\text{RT} $, $ N_\text{BT} $, and $ H_{\mathrm{T}} $ categories. ($ N_\text{RT} $ and $ N_\text{BT} $ represent number of resolved tops and b-jets respectively.) The background from QCD multijet and $ \mathrm{t} \bar{\mathrm{t}} $ production is derived from control regions in the data. Estimates for the $ \mathrm{t}\bar{\mathrm{t}}\mathrm{t}\bar{\mathrm{t}} $ signal and other backgrounds are shown using simulated samples. The hatched bands correspond to the estimated total uncertainty per validation region. VR-derived shape uncertainties to account for discrepancies between the data and the data-driven background estimate observed in the VRs are shown overlaid in red and blue for reference. |

png pdf |
Additional Figure 22:
The distribution of the BDT discriminants in the 8-jet validation region (VR) for the 2018 data set in the all-hadronic channel for all $ N_\text{RT} $, $ N_\text{BT} $, and $ H_{\mathrm{T}} $ categories. ($ N_\text{RT} $ and $ N_\text{BT} $ represent number of resolved tops and b-jets respectively.) The background from QCD multijet and $ \mathrm{t} \bar{\mathrm{t}} $ production is derived from control regions in the data. Estimates for the $ \mathrm{t}\bar{\mathrm{t}}\mathrm{t}\bar{\mathrm{t}} $ signal and other backgrounds are shown using simulated samples. The hatched bands correspond to the estimated total uncertainty per validation region. VR-derived shape uncertainties to account for discrepancies between the data and the data-driven background estimate observed in the VRs are shown overlaid in red and blue for reference. |
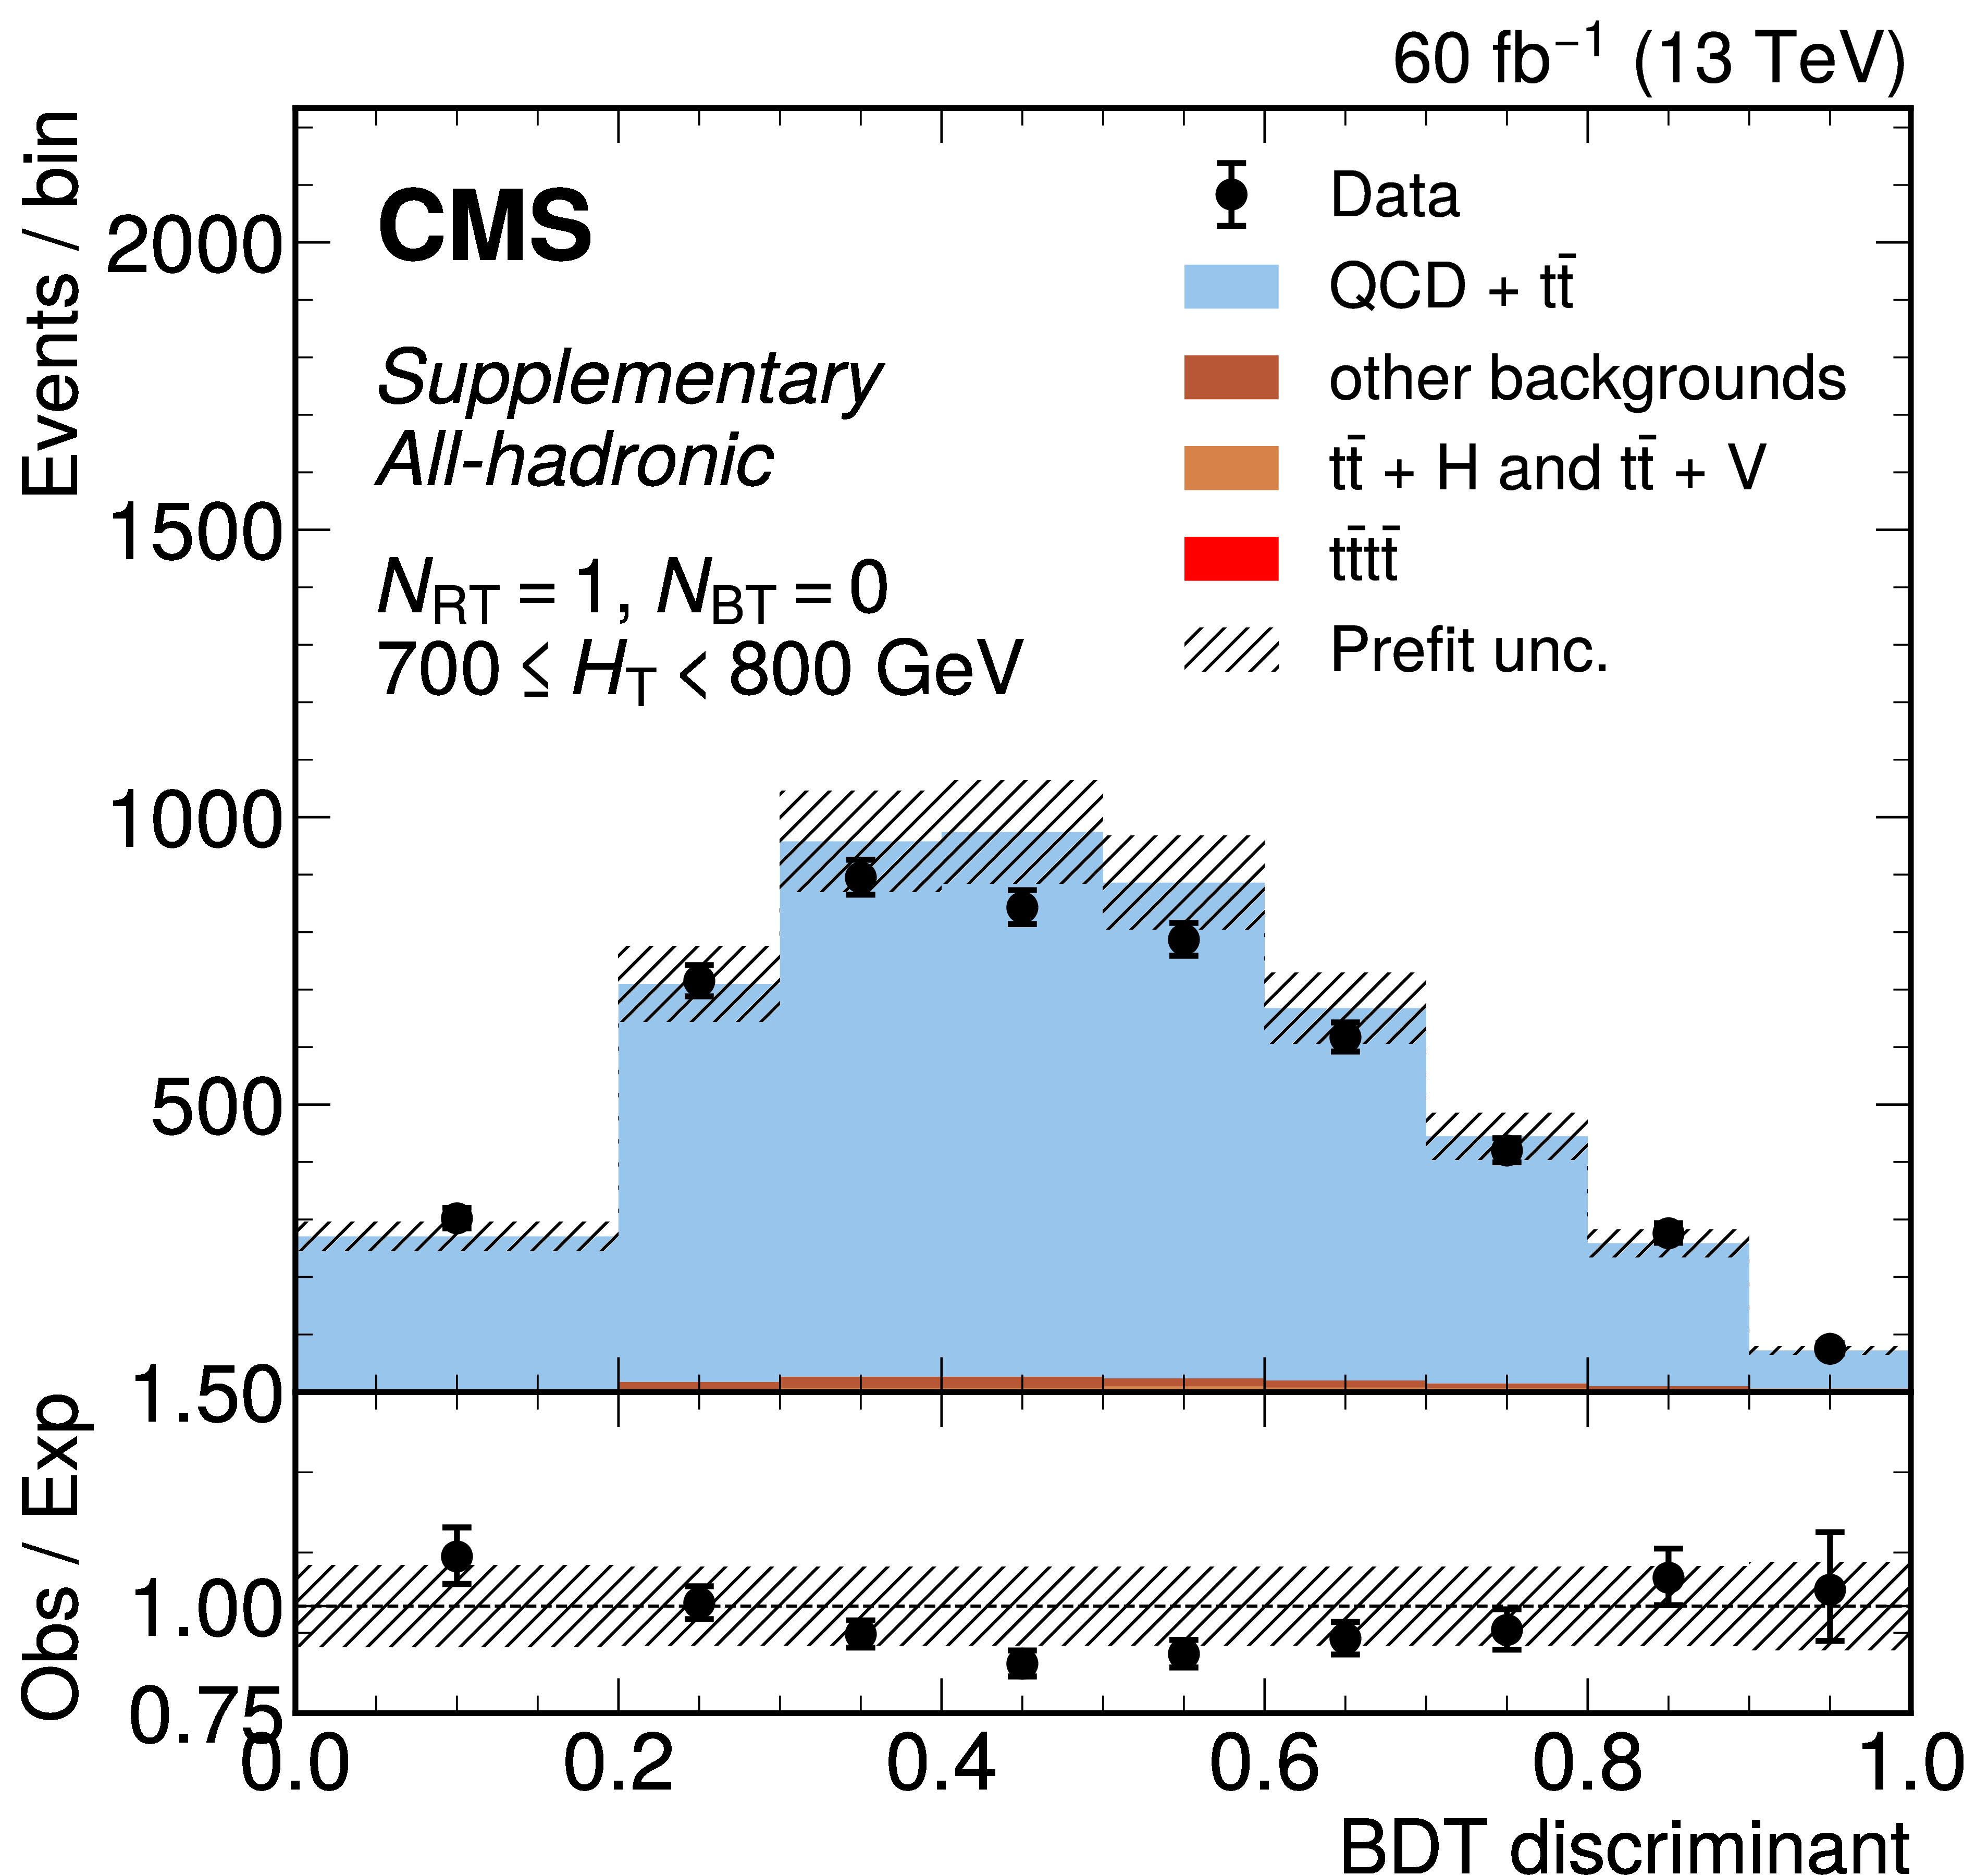
png pdf |
Additional Figure 22-a:
The distribution of the BDT discriminants in the 8-jet validation region (VR) for the 2018 data set in the all-hadronic channel for all $ N_\text{RT} $, $ N_\text{BT} $, and $ H_{\mathrm{T}} $ categories. ($ N_\text{RT} $ and $ N_\text{BT} $ represent number of resolved tops and b-jets respectively.) The background from QCD multijet and $ \mathrm{t} \bar{\mathrm{t}} $ production is derived from control regions in the data. Estimates for the $ \mathrm{t}\bar{\mathrm{t}}\mathrm{t}\bar{\mathrm{t}} $ signal and other backgrounds are shown using simulated samples. The hatched bands correspond to the estimated total uncertainty per validation region. VR-derived shape uncertainties to account for discrepancies between the data and the data-driven background estimate observed in the VRs are shown overlaid in red and blue for reference. |

png pdf |
Additional Figure 22-b:
The distribution of the BDT discriminants in the 8-jet validation region (VR) for the 2018 data set in the all-hadronic channel for all $ N_\text{RT} $, $ N_\text{BT} $, and $ H_{\mathrm{T}} $ categories. ($ N_\text{RT} $ and $ N_\text{BT} $ represent number of resolved tops and b-jets respectively.) The background from QCD multijet and $ \mathrm{t} \bar{\mathrm{t}} $ production is derived from control regions in the data. Estimates for the $ \mathrm{t}\bar{\mathrm{t}}\mathrm{t}\bar{\mathrm{t}} $ signal and other backgrounds are shown using simulated samples. The hatched bands correspond to the estimated total uncertainty per validation region. VR-derived shape uncertainties to account for discrepancies between the data and the data-driven background estimate observed in the VRs are shown overlaid in red and blue for reference. |

png pdf |
Additional Figure 22-c:
The distribution of the BDT discriminants in the 8-jet validation region (VR) for the 2018 data set in the all-hadronic channel for all $ N_\text{RT} $, $ N_\text{BT} $, and $ H_{\mathrm{T}} $ categories. ($ N_\text{RT} $ and $ N_\text{BT} $ represent number of resolved tops and b-jets respectively.) The background from QCD multijet and $ \mathrm{t} \bar{\mathrm{t}} $ production is derived from control regions in the data. Estimates for the $ \mathrm{t}\bar{\mathrm{t}}\mathrm{t}\bar{\mathrm{t}} $ signal and other backgrounds are shown using simulated samples. The hatched bands correspond to the estimated total uncertainty per validation region. VR-derived shape uncertainties to account for discrepancies between the data and the data-driven background estimate observed in the VRs are shown overlaid in red and blue for reference. |
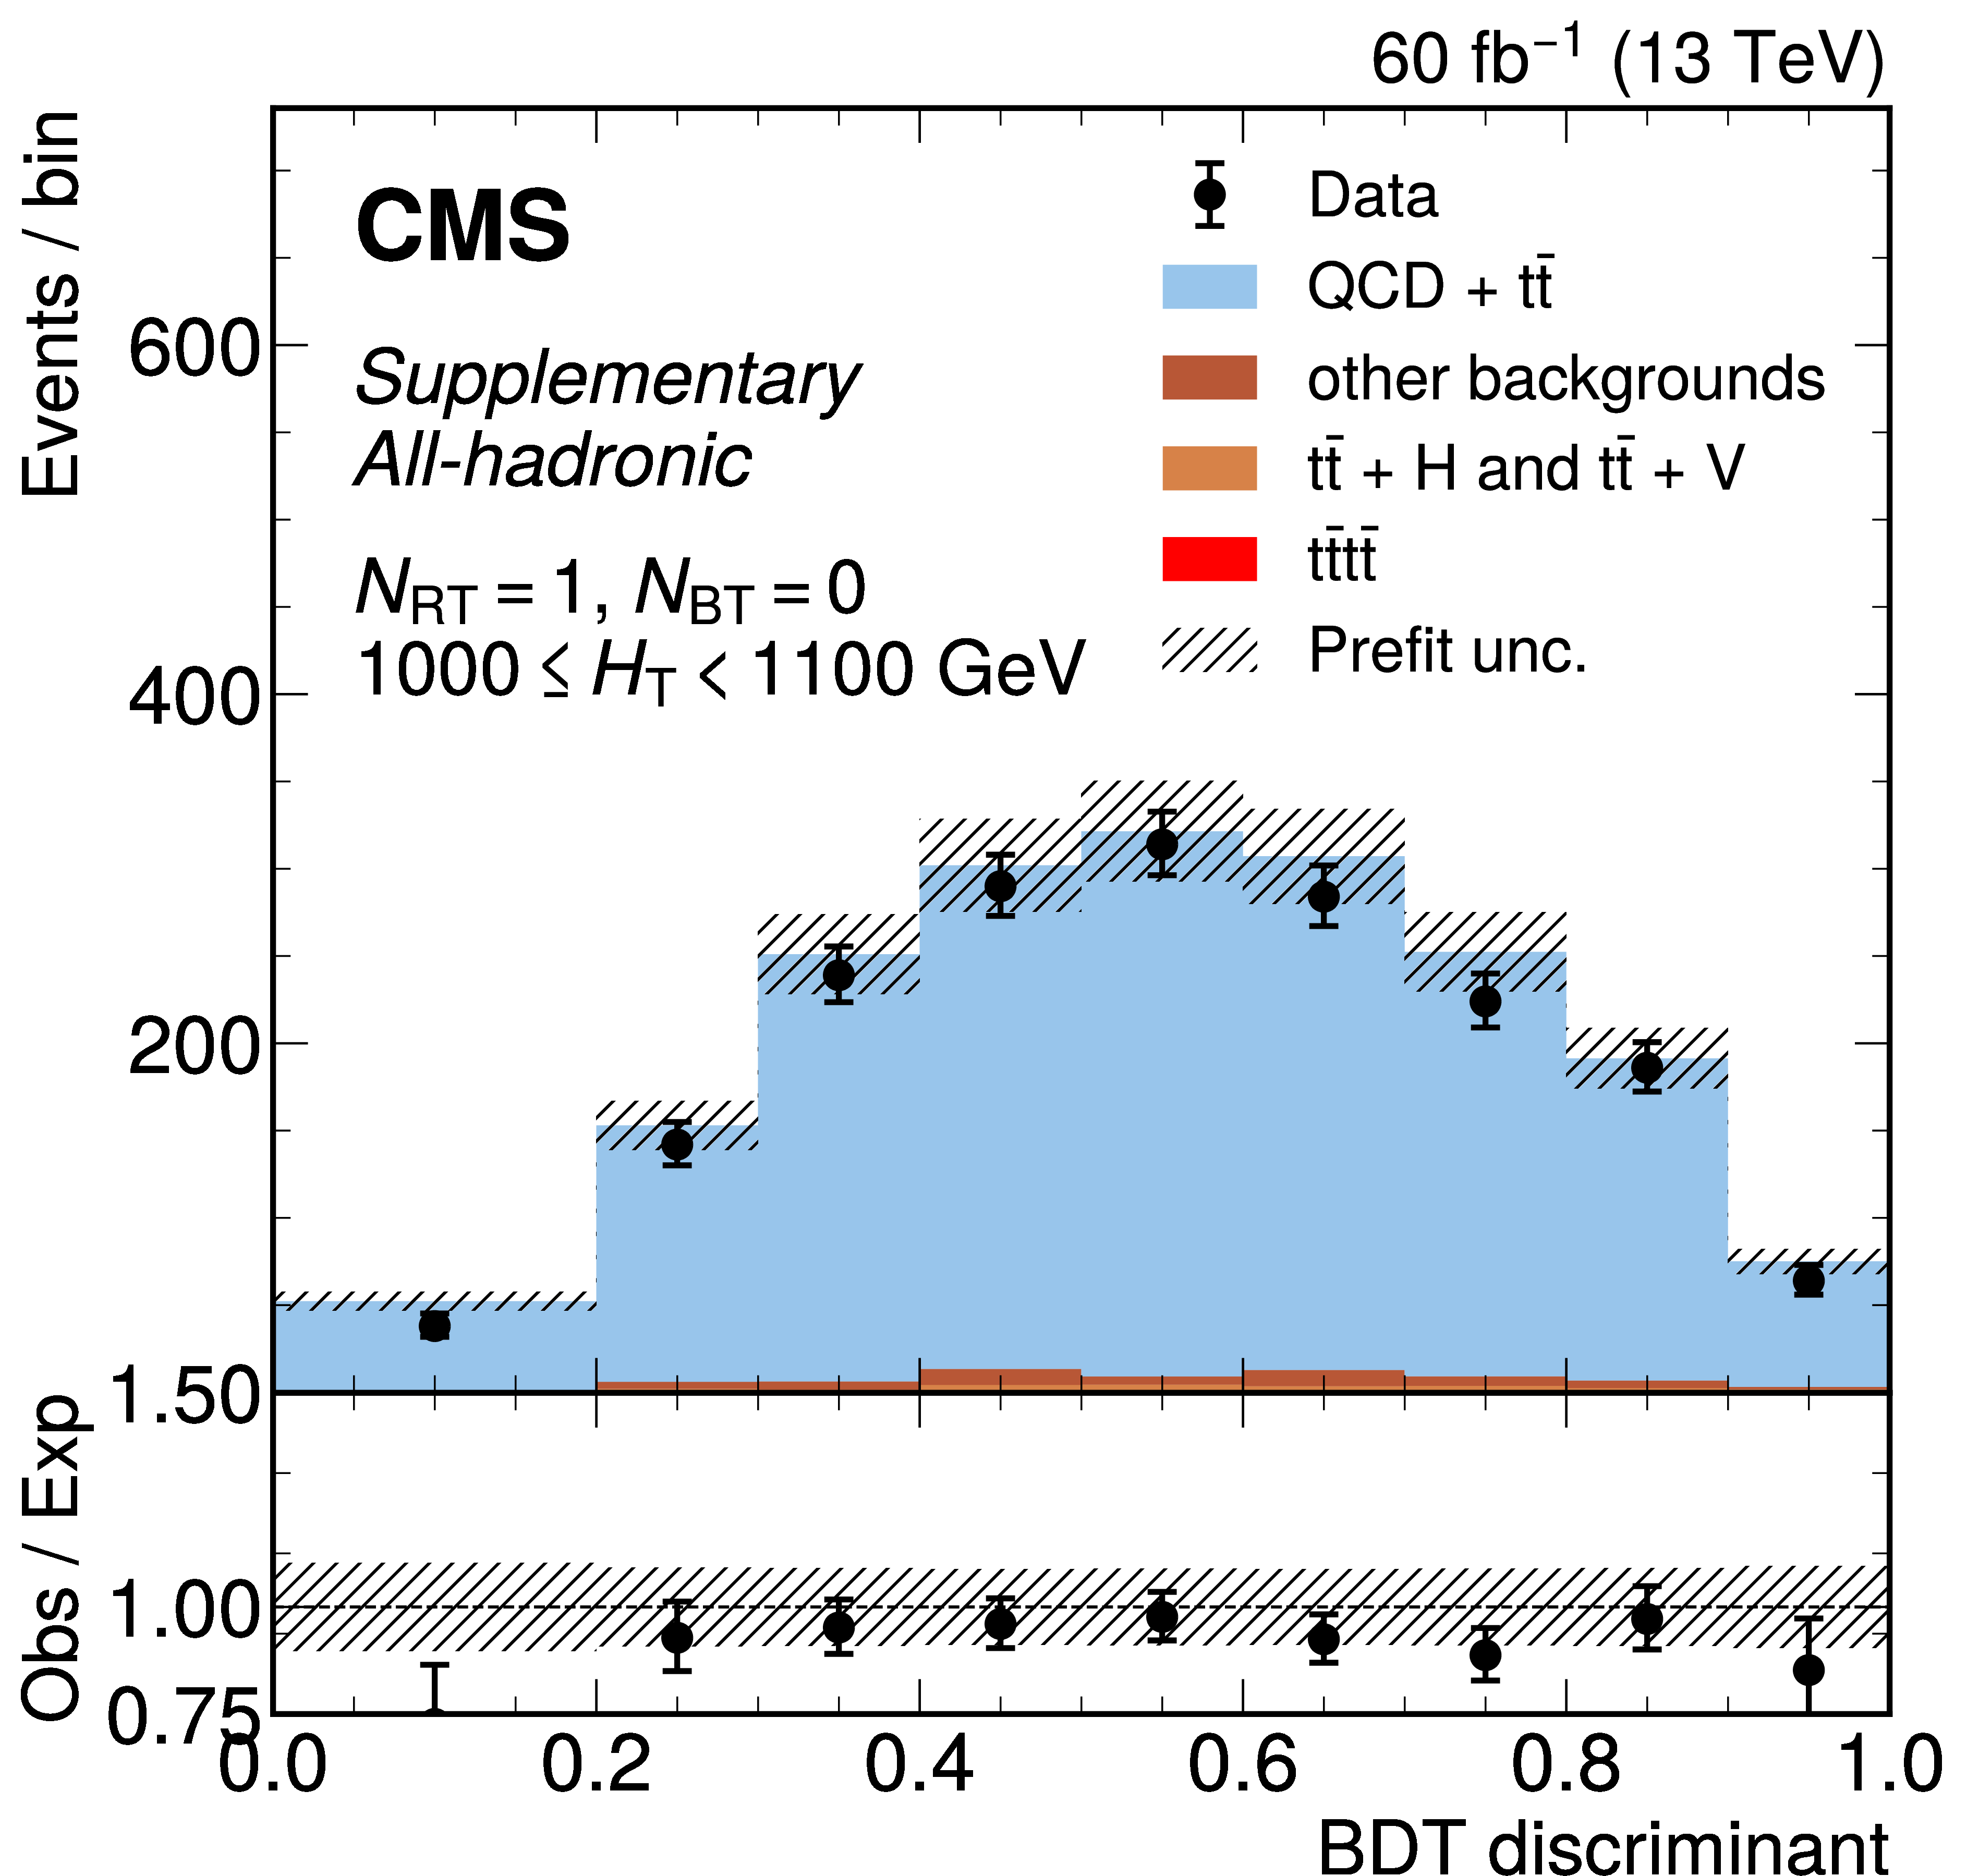
png pdf |
Additional Figure 22-d:
The distribution of the BDT discriminants in the 8-jet validation region (VR) for the 2018 data set in the all-hadronic channel for all $ N_\text{RT} $, $ N_\text{BT} $, and $ H_{\mathrm{T}} $ categories. ($ N_\text{RT} $ and $ N_\text{BT} $ represent number of resolved tops and b-jets respectively.) The background from QCD multijet and $ \mathrm{t} \bar{\mathrm{t}} $ production is derived from control regions in the data. Estimates for the $ \mathrm{t}\bar{\mathrm{t}}\mathrm{t}\bar{\mathrm{t}} $ signal and other backgrounds are shown using simulated samples. The hatched bands correspond to the estimated total uncertainty per validation region. VR-derived shape uncertainties to account for discrepancies between the data and the data-driven background estimate observed in the VRs are shown overlaid in red and blue for reference. |

png pdf |
Additional Figure 22-e:
The distribution of the BDT discriminants in the 8-jet validation region (VR) for the 2018 data set in the all-hadronic channel for all $ N_\text{RT} $, $ N_\text{BT} $, and $ H_{\mathrm{T}} $ categories. ($ N_\text{RT} $ and $ N_\text{BT} $ represent number of resolved tops and b-jets respectively.) The background from QCD multijet and $ \mathrm{t} \bar{\mathrm{t}} $ production is derived from control regions in the data. Estimates for the $ \mathrm{t}\bar{\mathrm{t}}\mathrm{t}\bar{\mathrm{t}} $ signal and other backgrounds are shown using simulated samples. The hatched bands correspond to the estimated total uncertainty per validation region. VR-derived shape uncertainties to account for discrepancies between the data and the data-driven background estimate observed in the VRs are shown overlaid in red and blue for reference. |
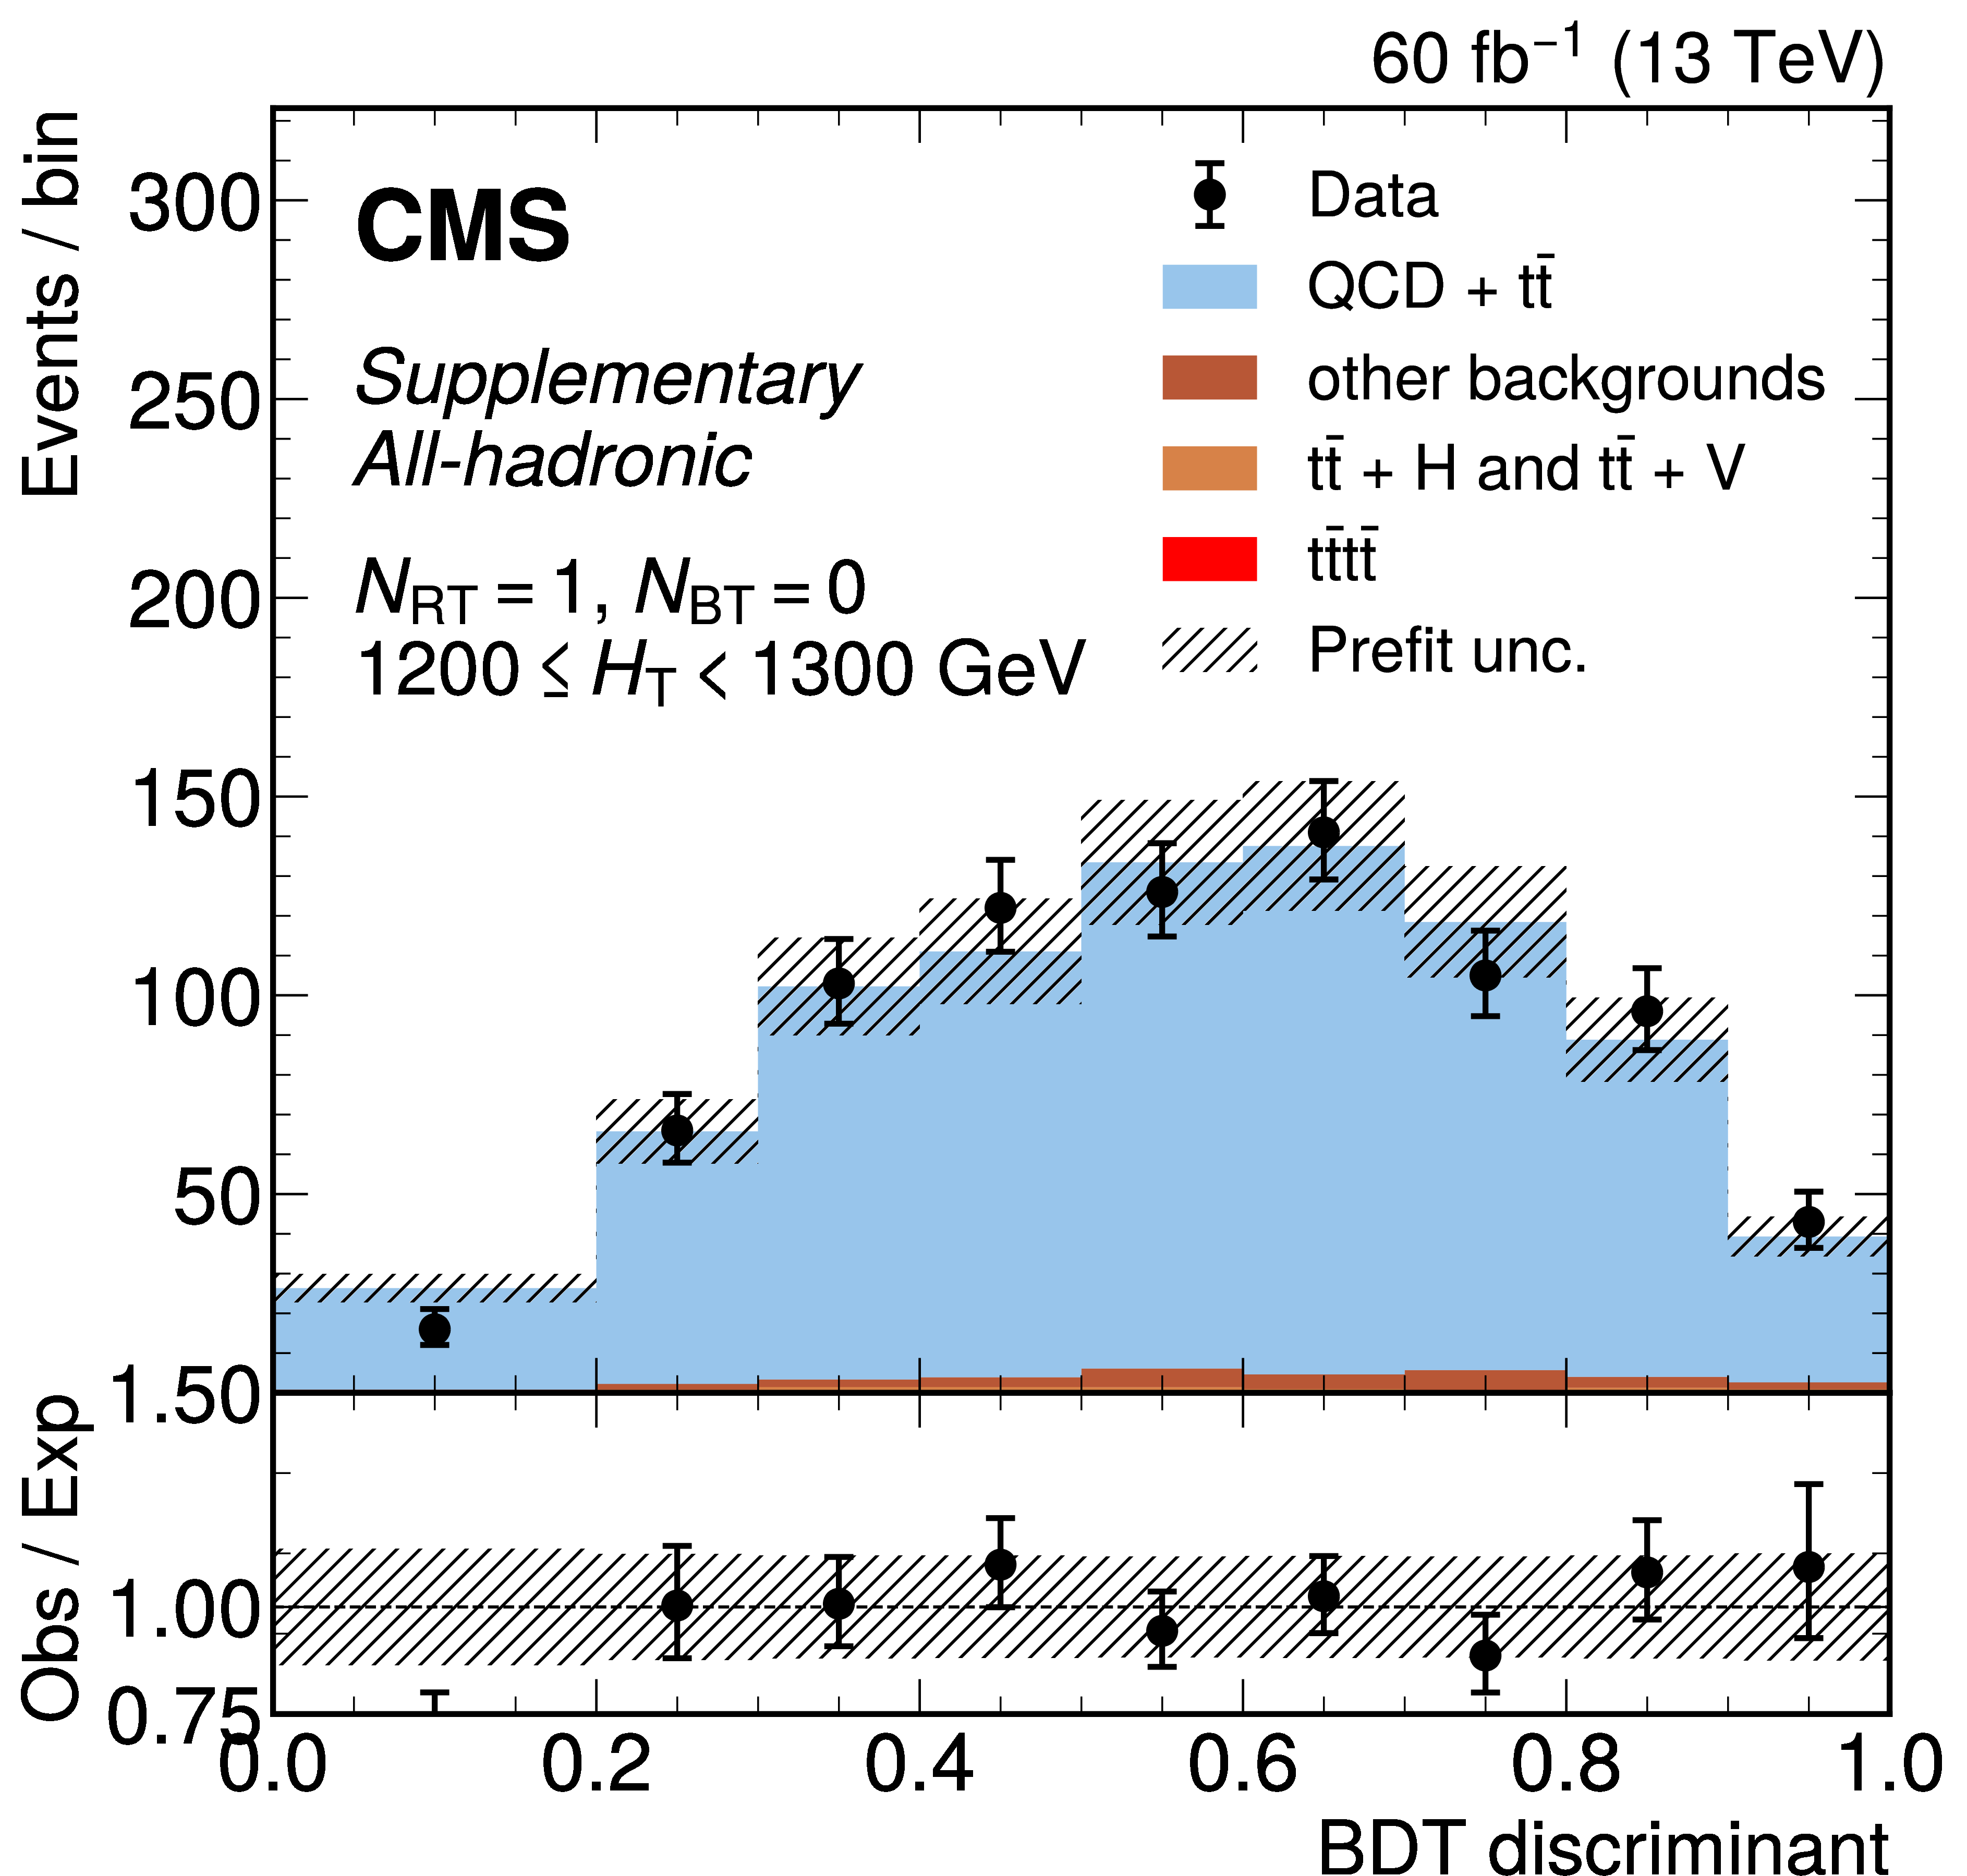
png pdf |
Additional Figure 22-f:
The distribution of the BDT discriminants in the 8-jet validation region (VR) for the 2018 data set in the all-hadronic channel for all $ N_\text{RT} $, $ N_\text{BT} $, and $ H_{\mathrm{T}} $ categories. ($ N_\text{RT} $ and $ N_\text{BT} $ represent number of resolved tops and b-jets respectively.) The background from QCD multijet and $ \mathrm{t} \bar{\mathrm{t}} $ production is derived from control regions in the data. Estimates for the $ \mathrm{t}\bar{\mathrm{t}}\mathrm{t}\bar{\mathrm{t}} $ signal and other backgrounds are shown using simulated samples. The hatched bands correspond to the estimated total uncertainty per validation region. VR-derived shape uncertainties to account for discrepancies between the data and the data-driven background estimate observed in the VRs are shown overlaid in red and blue for reference. |

png pdf |
Additional Figure 22-g:
The distribution of the BDT discriminants in the 8-jet validation region (VR) for the 2018 data set in the all-hadronic channel for all $ N_\text{RT} $, $ N_\text{BT} $, and $ H_{\mathrm{T}} $ categories. ($ N_\text{RT} $ and $ N_\text{BT} $ represent number of resolved tops and b-jets respectively.) The background from QCD multijet and $ \mathrm{t} \bar{\mathrm{t}} $ production is derived from control regions in the data. Estimates for the $ \mathrm{t}\bar{\mathrm{t}}\mathrm{t}\bar{\mathrm{t}} $ signal and other backgrounds are shown using simulated samples. The hatched bands correspond to the estimated total uncertainty per validation region. VR-derived shape uncertainties to account for discrepancies between the data and the data-driven background estimate observed in the VRs are shown overlaid in red and blue for reference. |
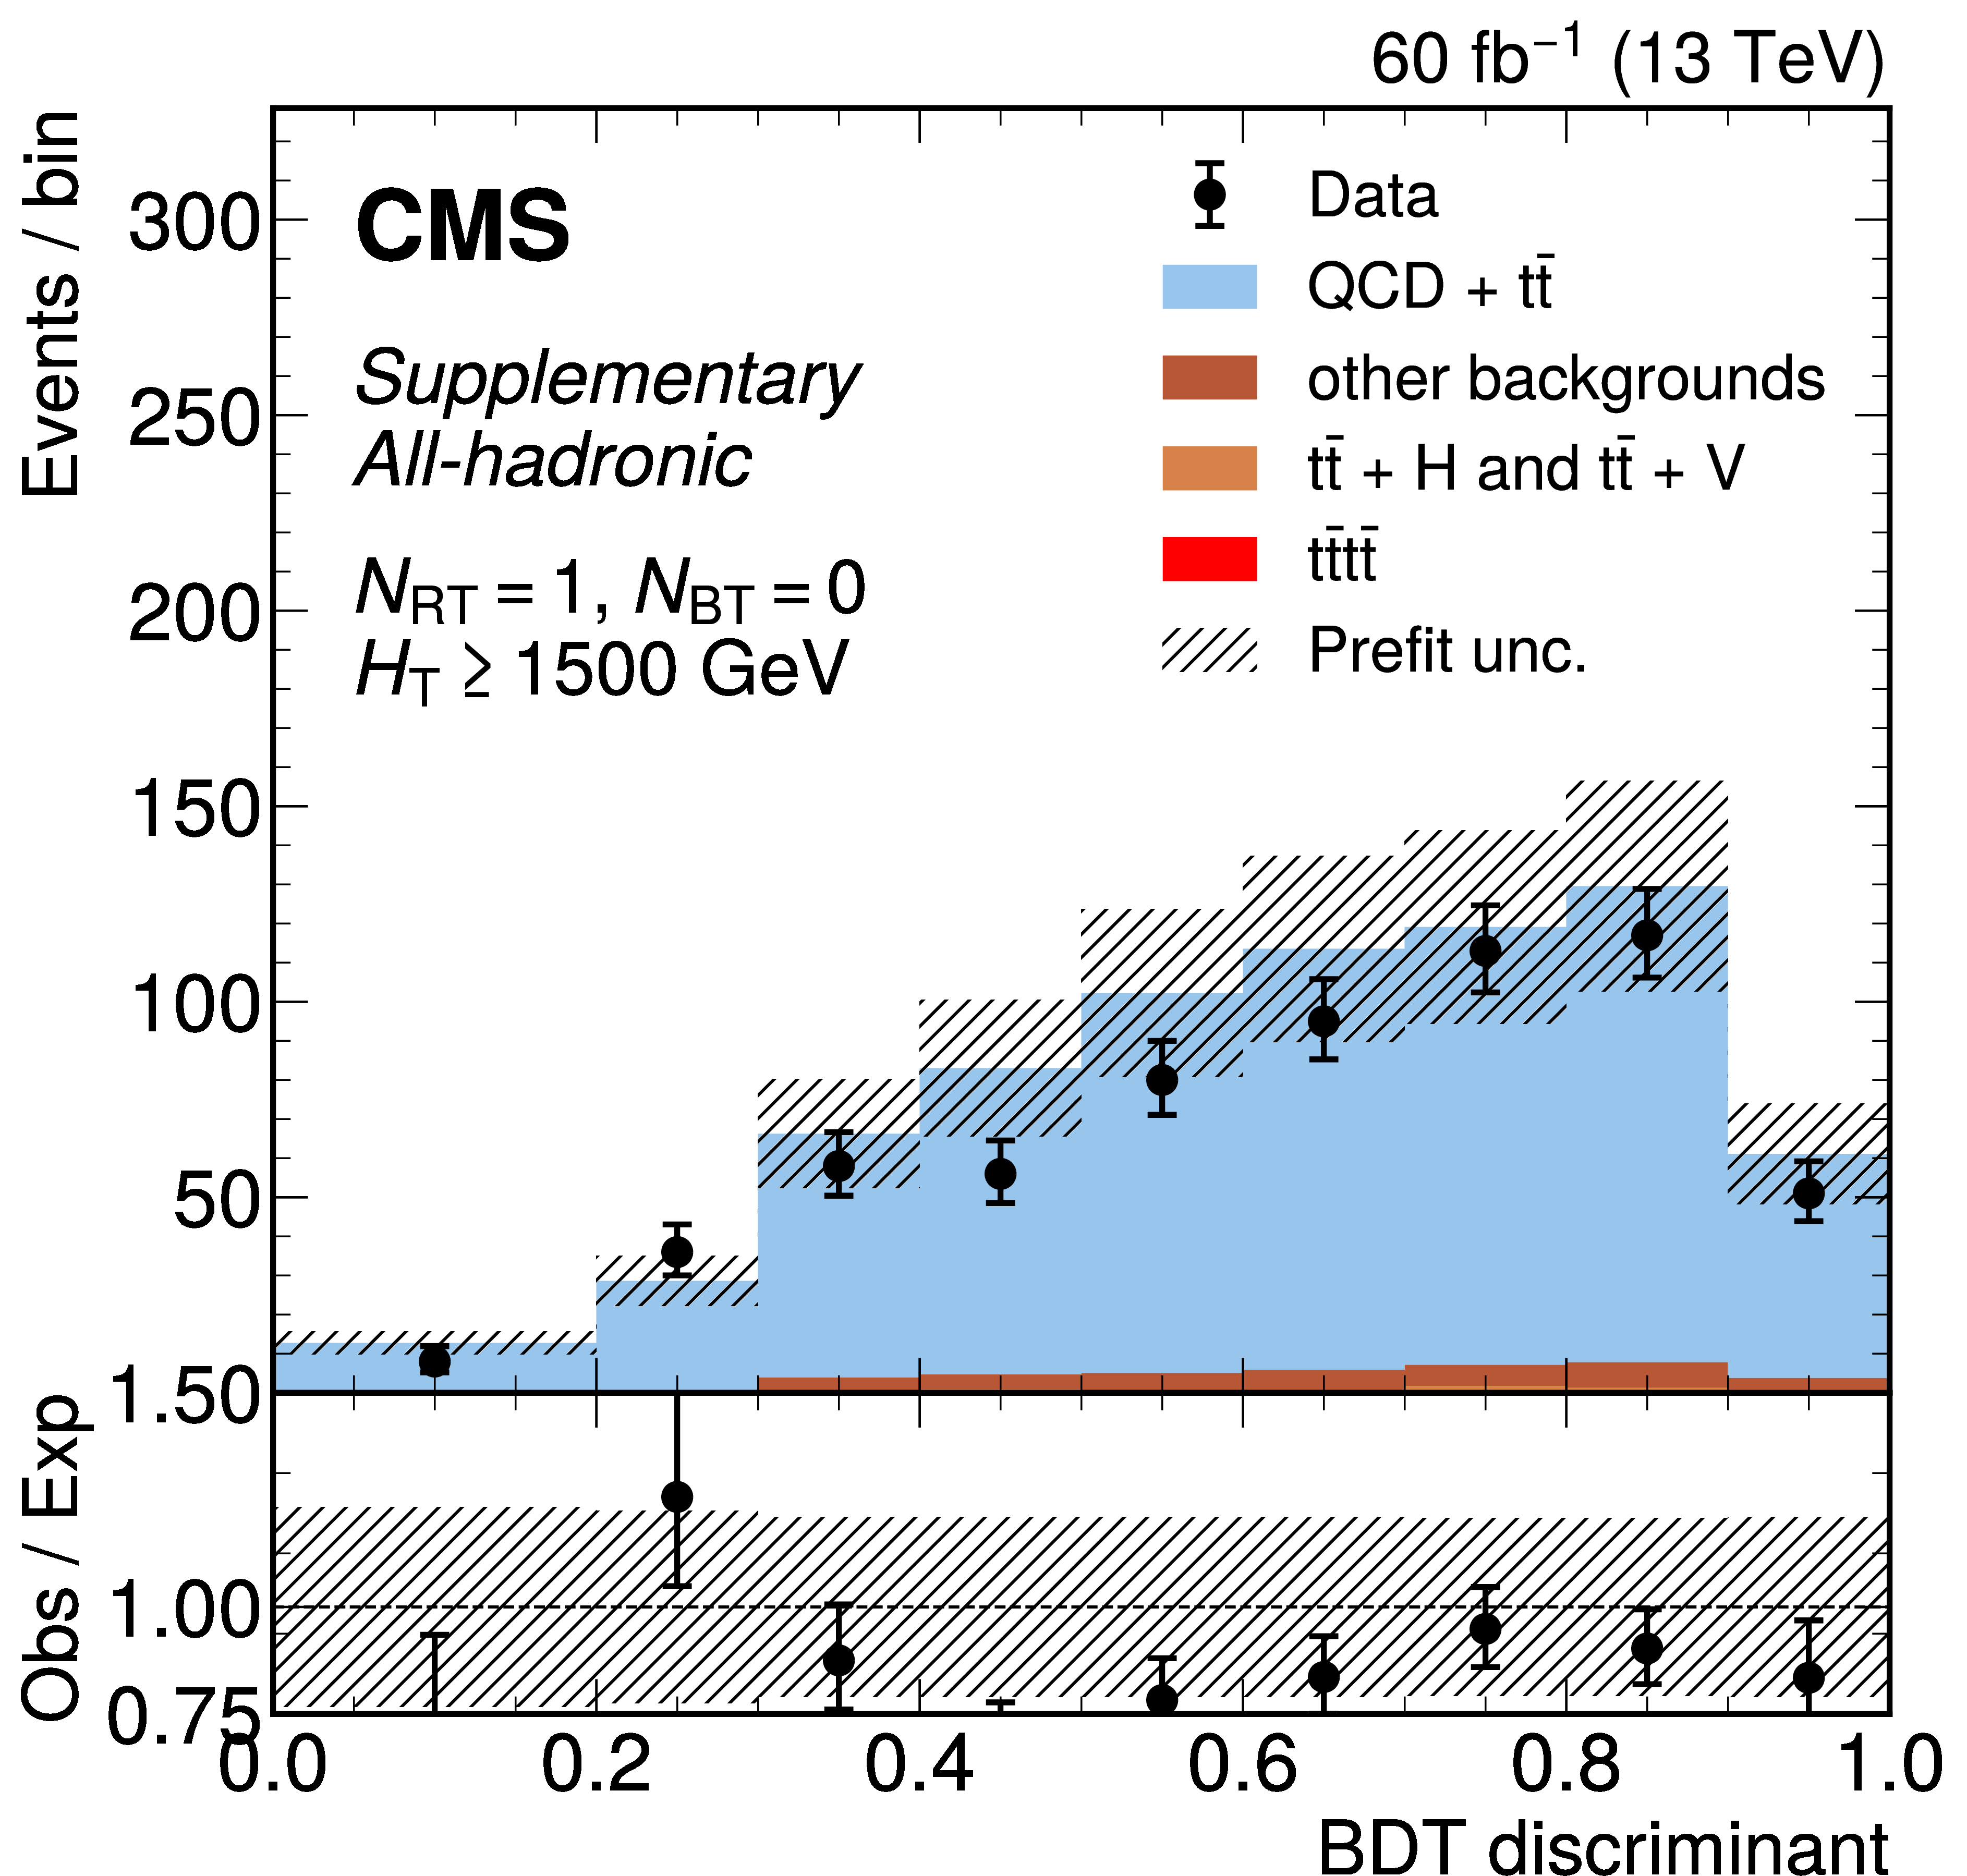
png pdf |
Additional Figure 22-h:
The distribution of the BDT discriminants in the 8-jet validation region (VR) for the 2018 data set in the all-hadronic channel for all $ N_\text{RT} $, $ N_\text{BT} $, and $ H_{\mathrm{T}} $ categories. ($ N_\text{RT} $ and $ N_\text{BT} $ represent number of resolved tops and b-jets respectively.) The background from QCD multijet and $ \mathrm{t} \bar{\mathrm{t}} $ production is derived from control regions in the data. Estimates for the $ \mathrm{t}\bar{\mathrm{t}}\mathrm{t}\bar{\mathrm{t}} $ signal and other backgrounds are shown using simulated samples. The hatched bands correspond to the estimated total uncertainty per validation region. VR-derived shape uncertainties to account for discrepancies between the data and the data-driven background estimate observed in the VRs are shown overlaid in red and blue for reference. |
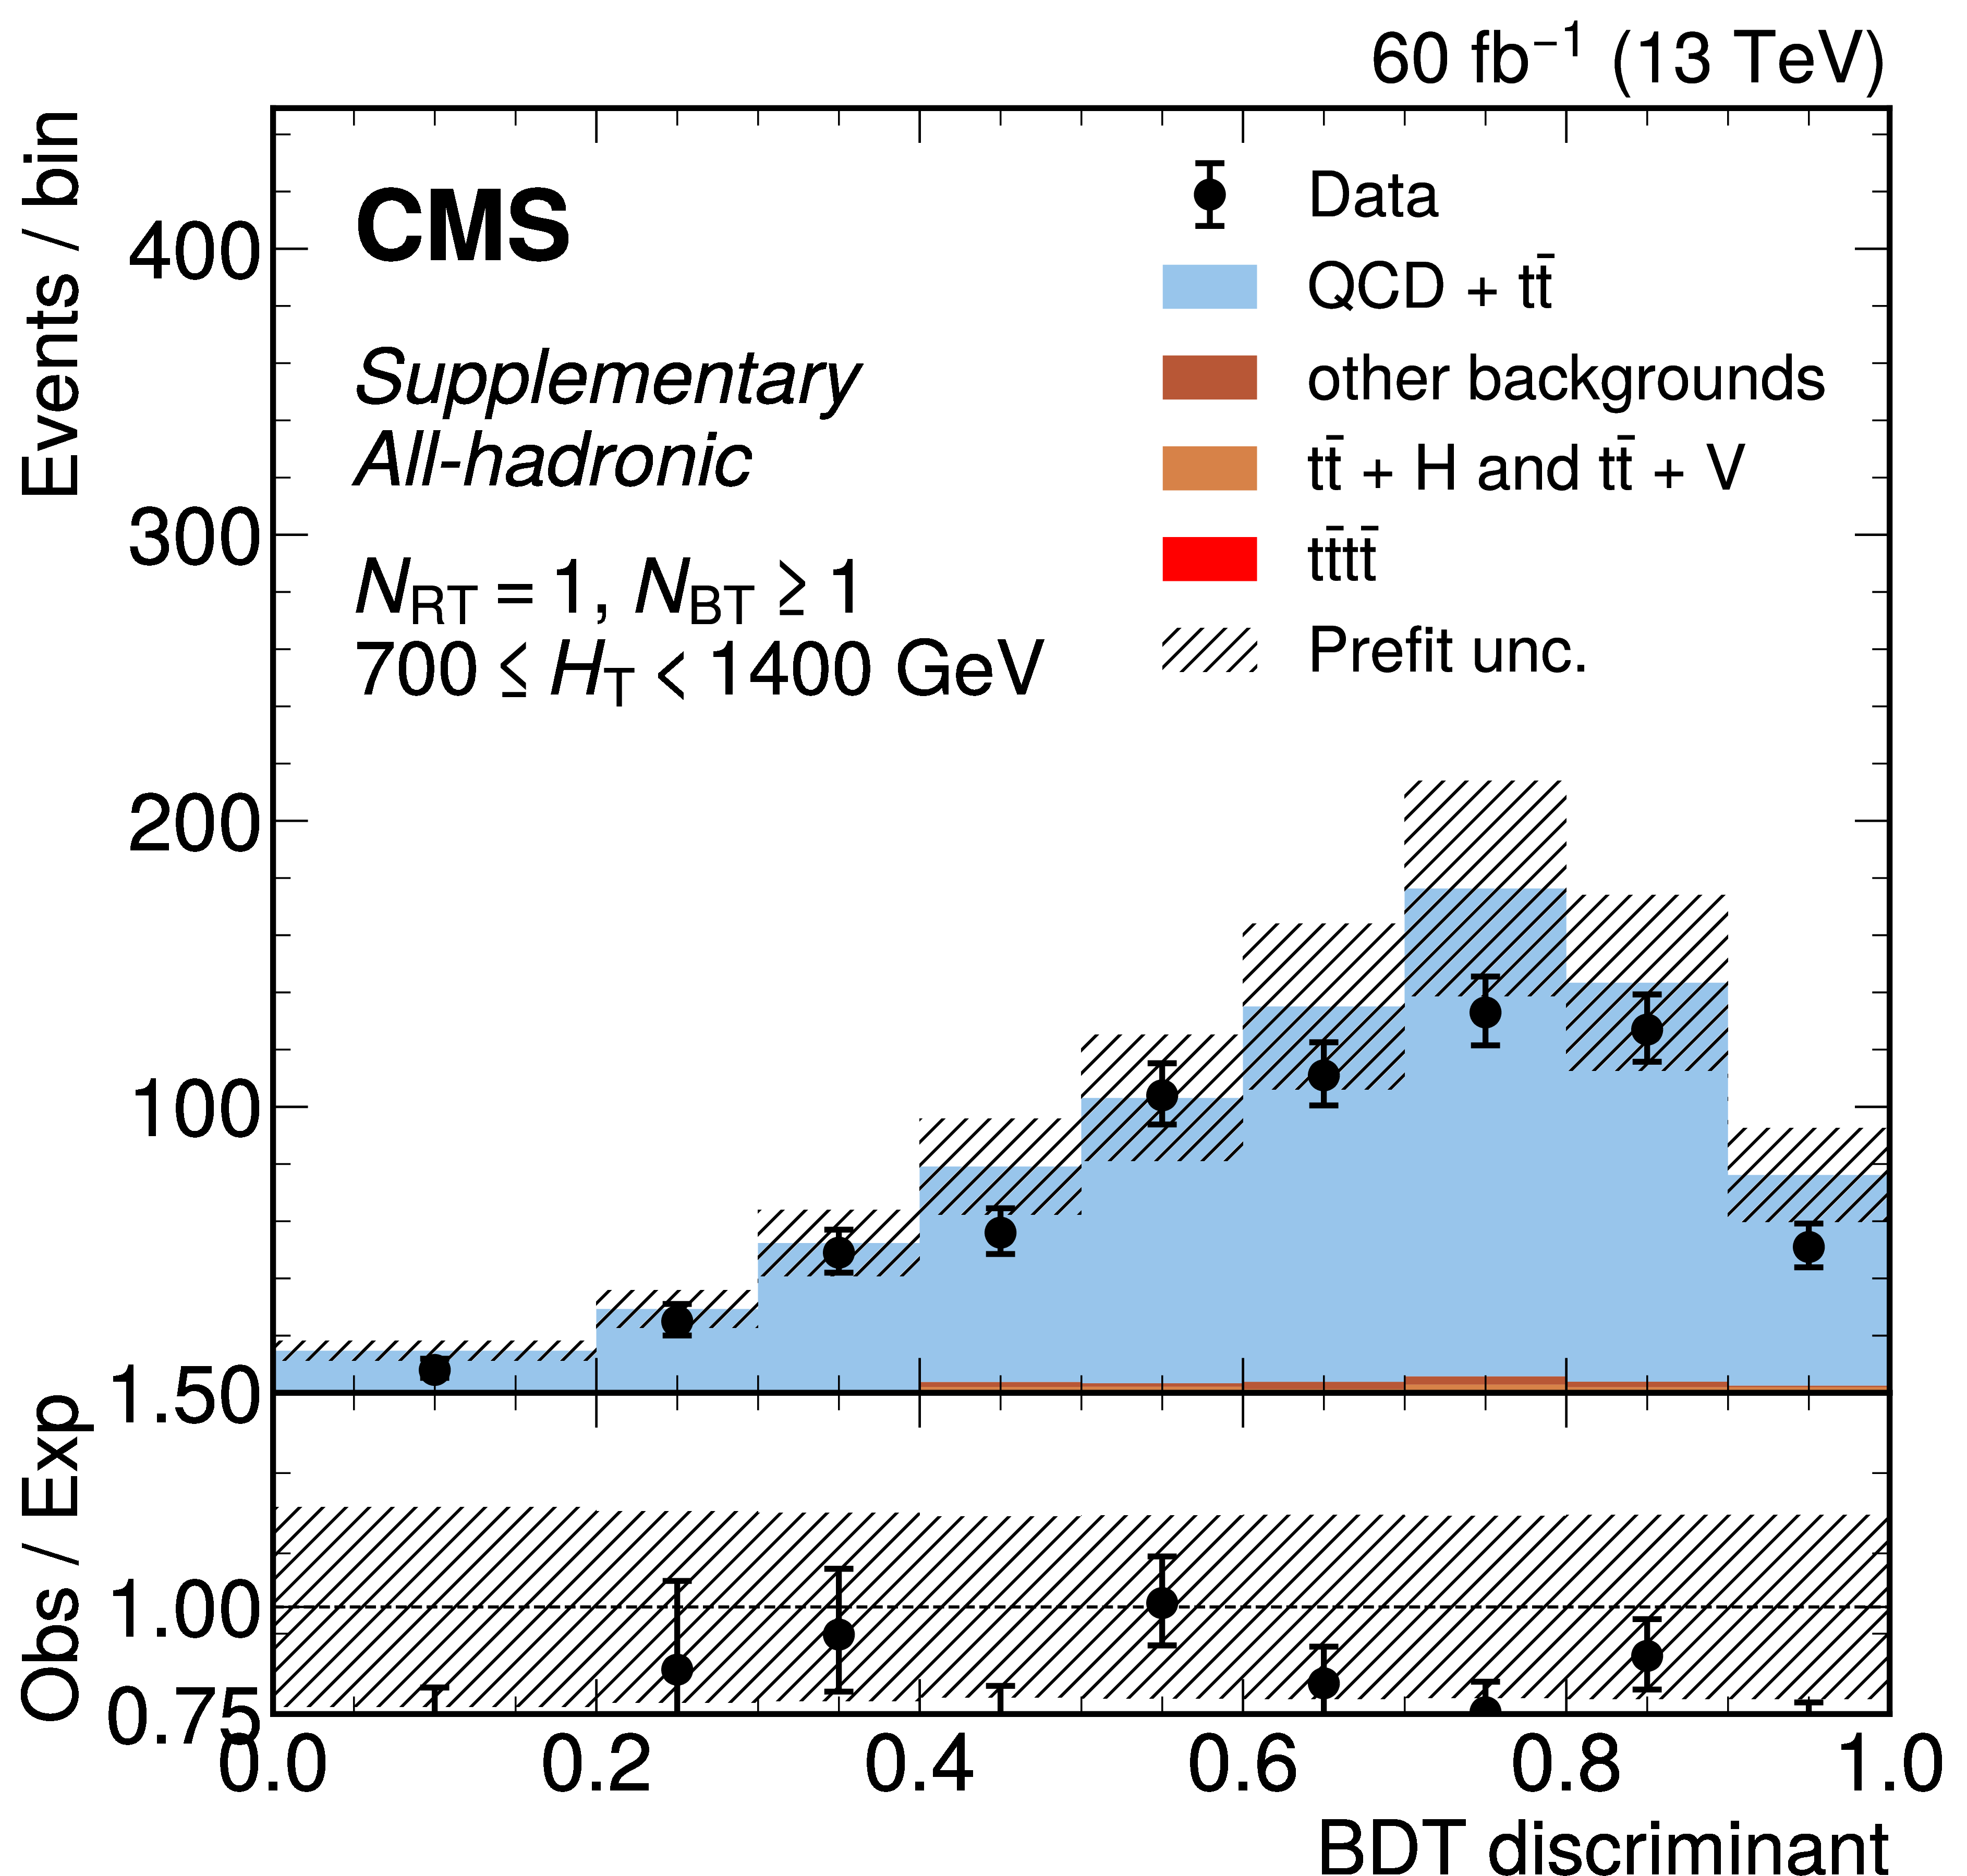
png pdf |
Additional Figure 22-i:
The distribution of the BDT discriminants in the 8-jet validation region (VR) for the 2018 data set in the all-hadronic channel for all $ N_\text{RT} $, $ N_\text{BT} $, and $ H_{\mathrm{T}} $ categories. ($ N_\text{RT} $ and $ N_\text{BT} $ represent number of resolved tops and b-jets respectively.) The background from QCD multijet and $ \mathrm{t} \bar{\mathrm{t}} $ production is derived from control regions in the data. Estimates for the $ \mathrm{t}\bar{\mathrm{t}}\mathrm{t}\bar{\mathrm{t}} $ signal and other backgrounds are shown using simulated samples. The hatched bands correspond to the estimated total uncertainty per validation region. VR-derived shape uncertainties to account for discrepancies between the data and the data-driven background estimate observed in the VRs are shown overlaid in red and blue for reference. |
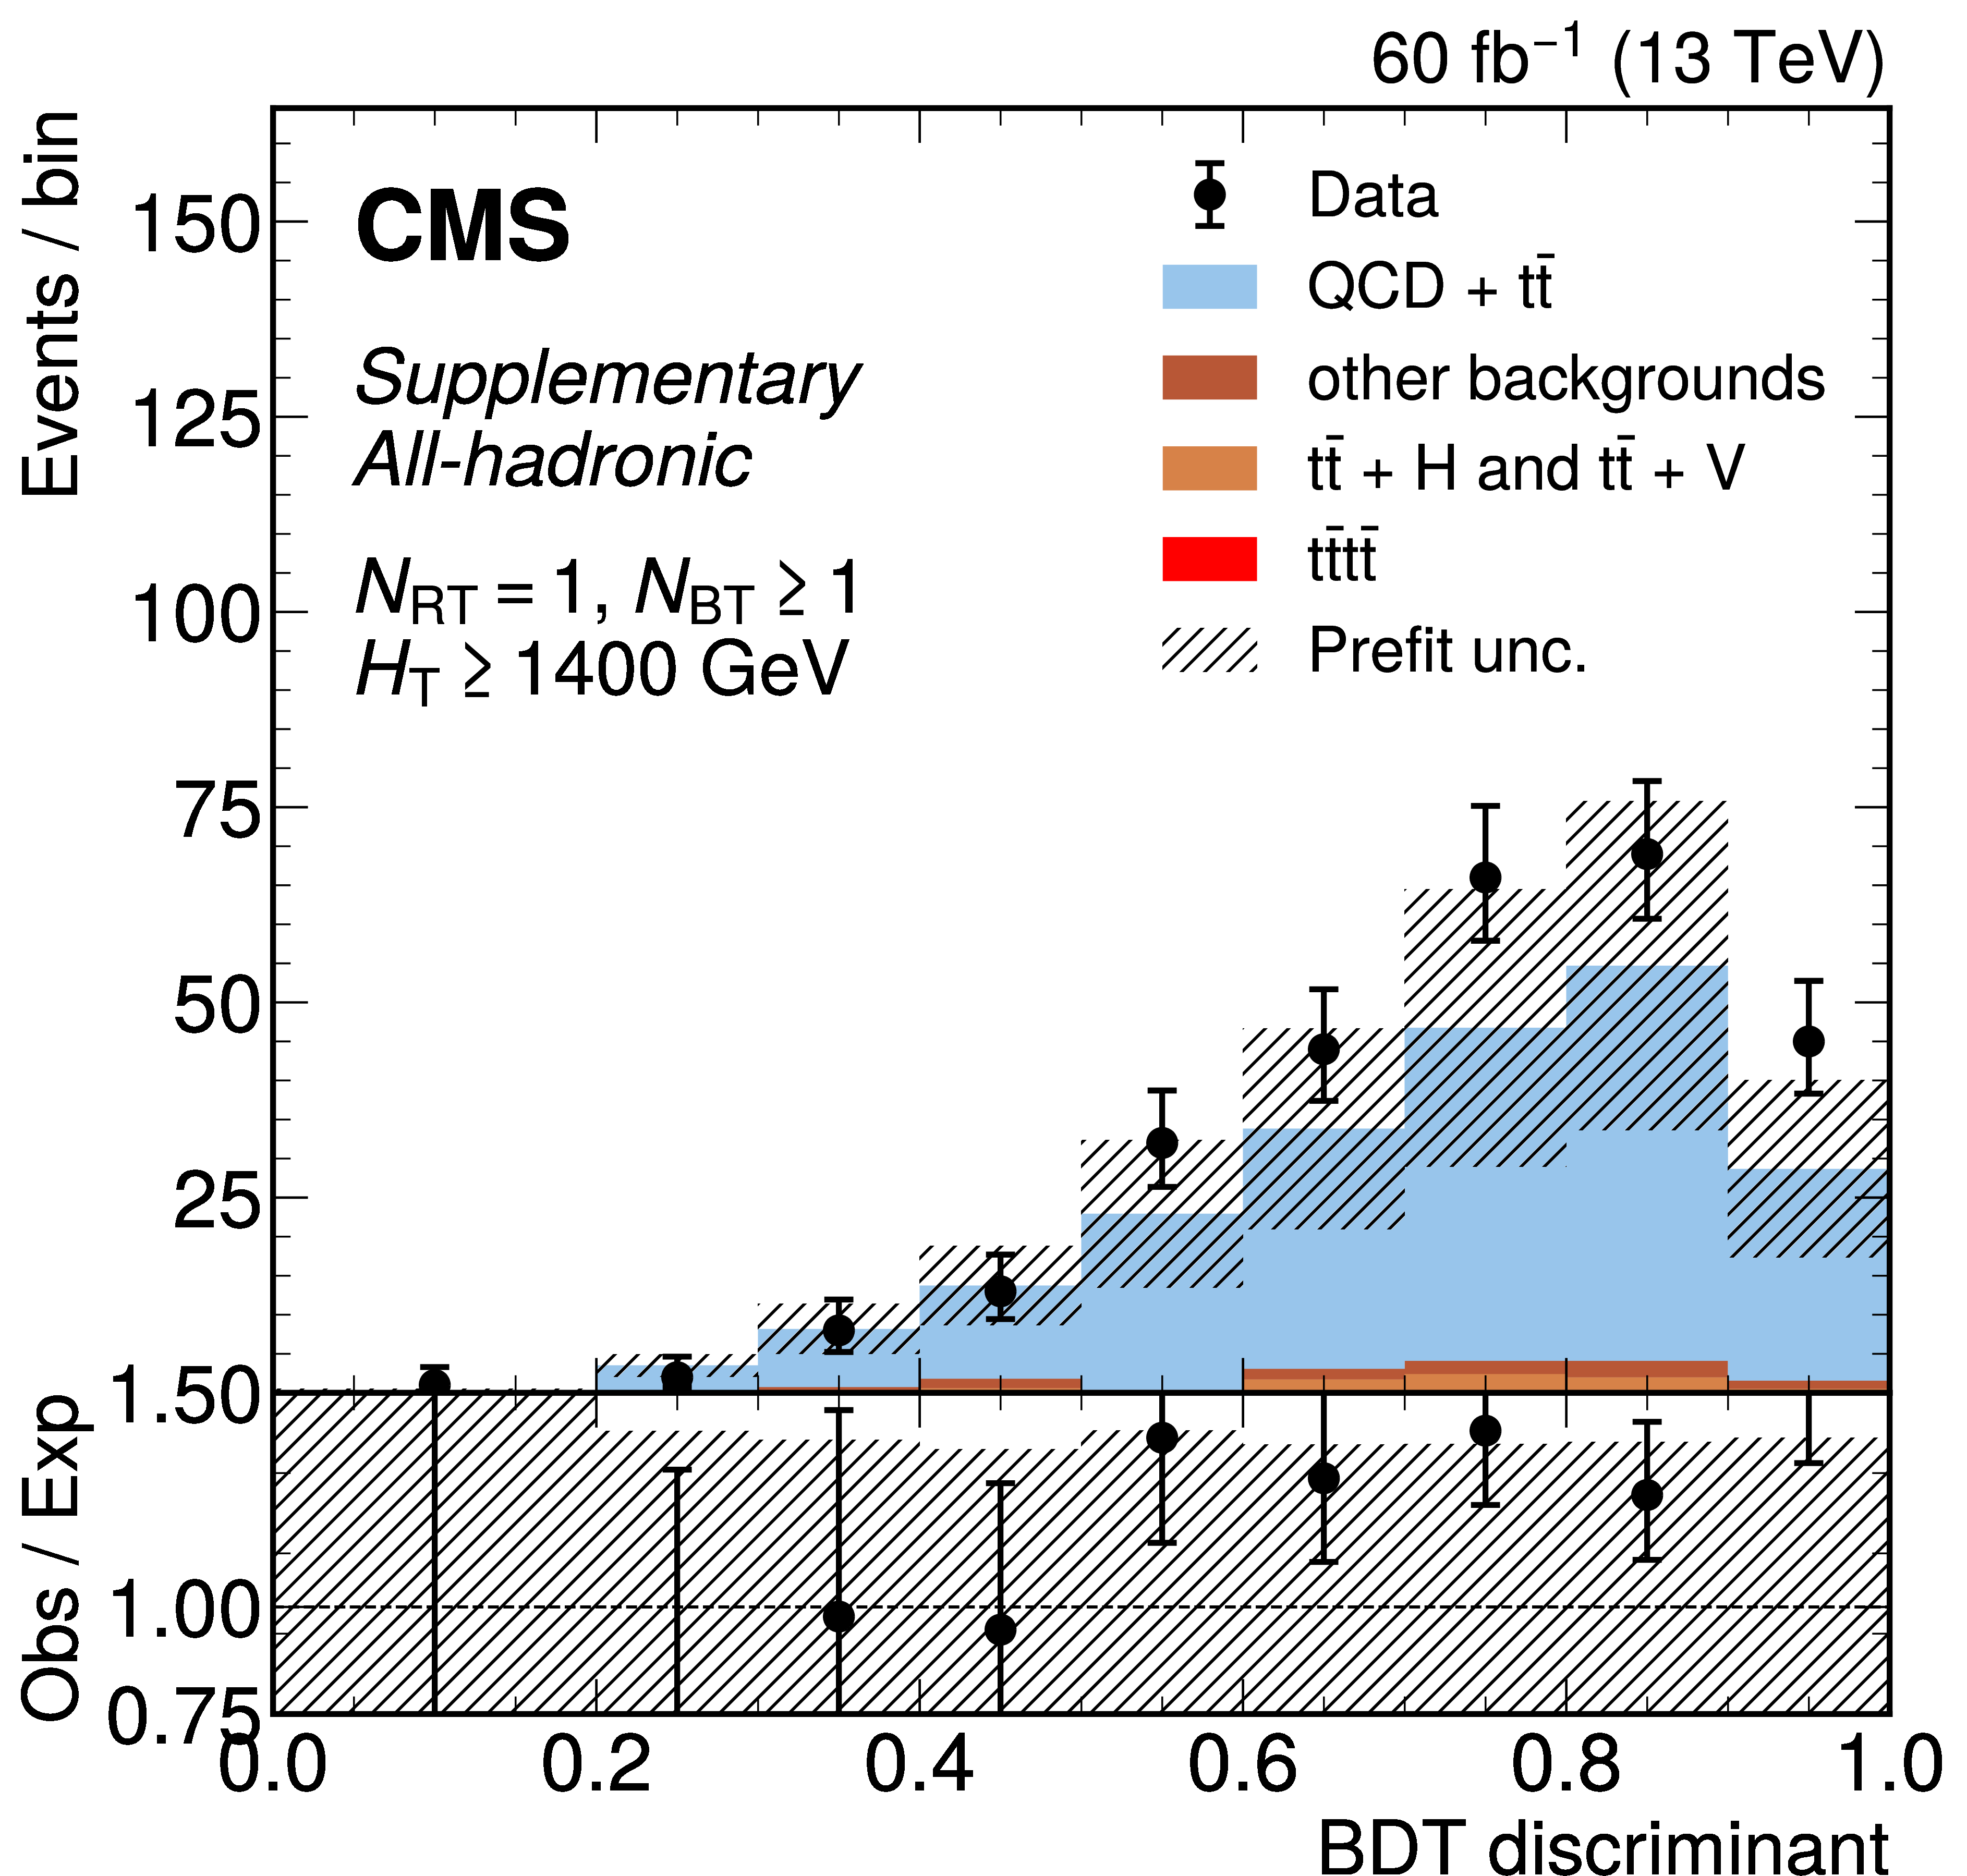
png pdf |
Additional Figure 22-j:
The distribution of the BDT discriminants in the 8-jet validation region (VR) for the 2018 data set in the all-hadronic channel for all $ N_\text{RT} $, $ N_\text{BT} $, and $ H_{\mathrm{T}} $ categories. ($ N_\text{RT} $ and $ N_\text{BT} $ represent number of resolved tops and b-jets respectively.) The background from QCD multijet and $ \mathrm{t} \bar{\mathrm{t}} $ production is derived from control regions in the data. Estimates for the $ \mathrm{t}\bar{\mathrm{t}}\mathrm{t}\bar{\mathrm{t}} $ signal and other backgrounds are shown using simulated samples. The hatched bands correspond to the estimated total uncertainty per validation region. VR-derived shape uncertainties to account for discrepancies between the data and the data-driven background estimate observed in the VRs are shown overlaid in red and blue for reference. |

png pdf |
Additional Figure 22-k:
The distribution of the BDT discriminants in the 8-jet validation region (VR) for the 2018 data set in the all-hadronic channel for all $ N_\text{RT} $, $ N_\text{BT} $, and $ H_{\mathrm{T}} $ categories. ($ N_\text{RT} $ and $ N_\text{BT} $ represent number of resolved tops and b-jets respectively.) The background from QCD multijet and $ \mathrm{t} \bar{\mathrm{t}} $ production is derived from control regions in the data. Estimates for the $ \mathrm{t}\bar{\mathrm{t}}\mathrm{t}\bar{\mathrm{t}} $ signal and other backgrounds are shown using simulated samples. The hatched bands correspond to the estimated total uncertainty per validation region. VR-derived shape uncertainties to account for discrepancies between the data and the data-driven background estimate observed in the VRs are shown overlaid in red and blue for reference. |
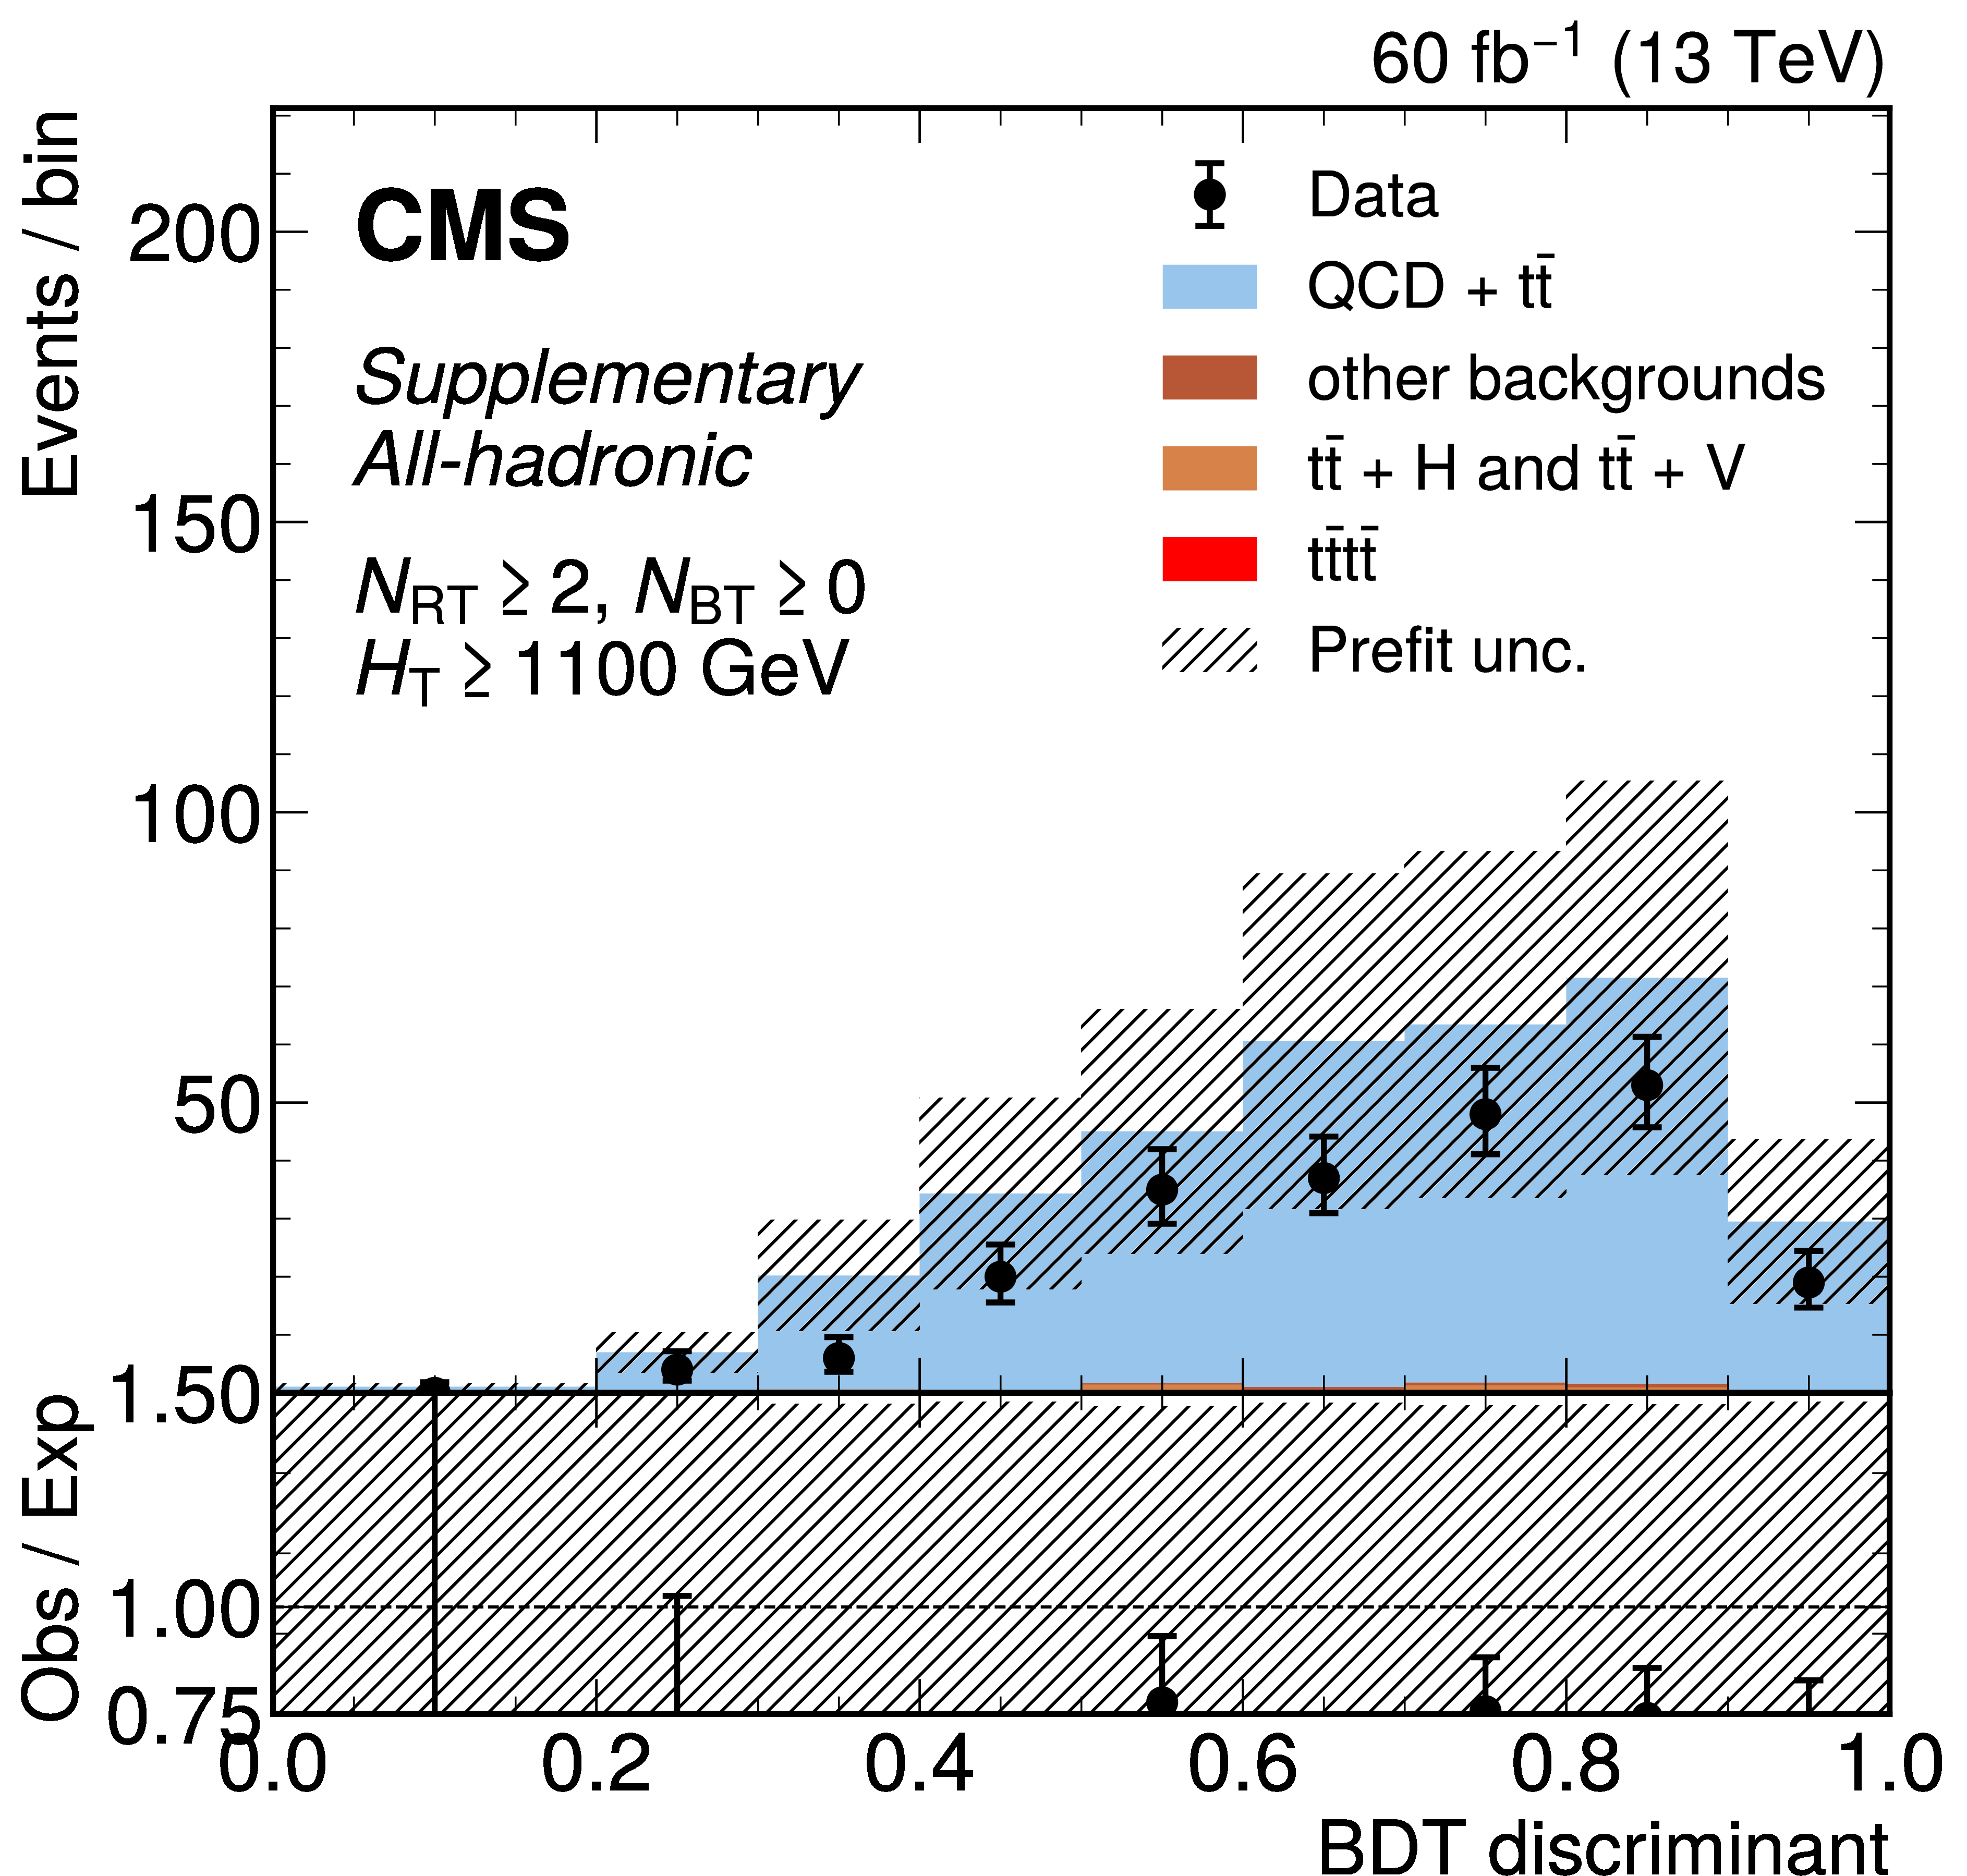
png pdf |
Additional Figure 22-l:
The distribution of the BDT discriminants in the 8-jet validation region (VR) for the 2018 data set in the all-hadronic channel for all $ N_\text{RT} $, $ N_\text{BT} $, and $ H_{\mathrm{T}} $ categories. ($ N_\text{RT} $ and $ N_\text{BT} $ represent number of resolved tops and b-jets respectively.) The background from QCD multijet and $ \mathrm{t} \bar{\mathrm{t}} $ production is derived from control regions in the data. Estimates for the $ \mathrm{t}\bar{\mathrm{t}}\mathrm{t}\bar{\mathrm{t}} $ signal and other backgrounds are shown using simulated samples. The hatched bands correspond to the estimated total uncertainty per validation region. VR-derived shape uncertainties to account for discrepancies between the data and the data-driven background estimate observed in the VRs are shown overlaid in red and blue for reference. |
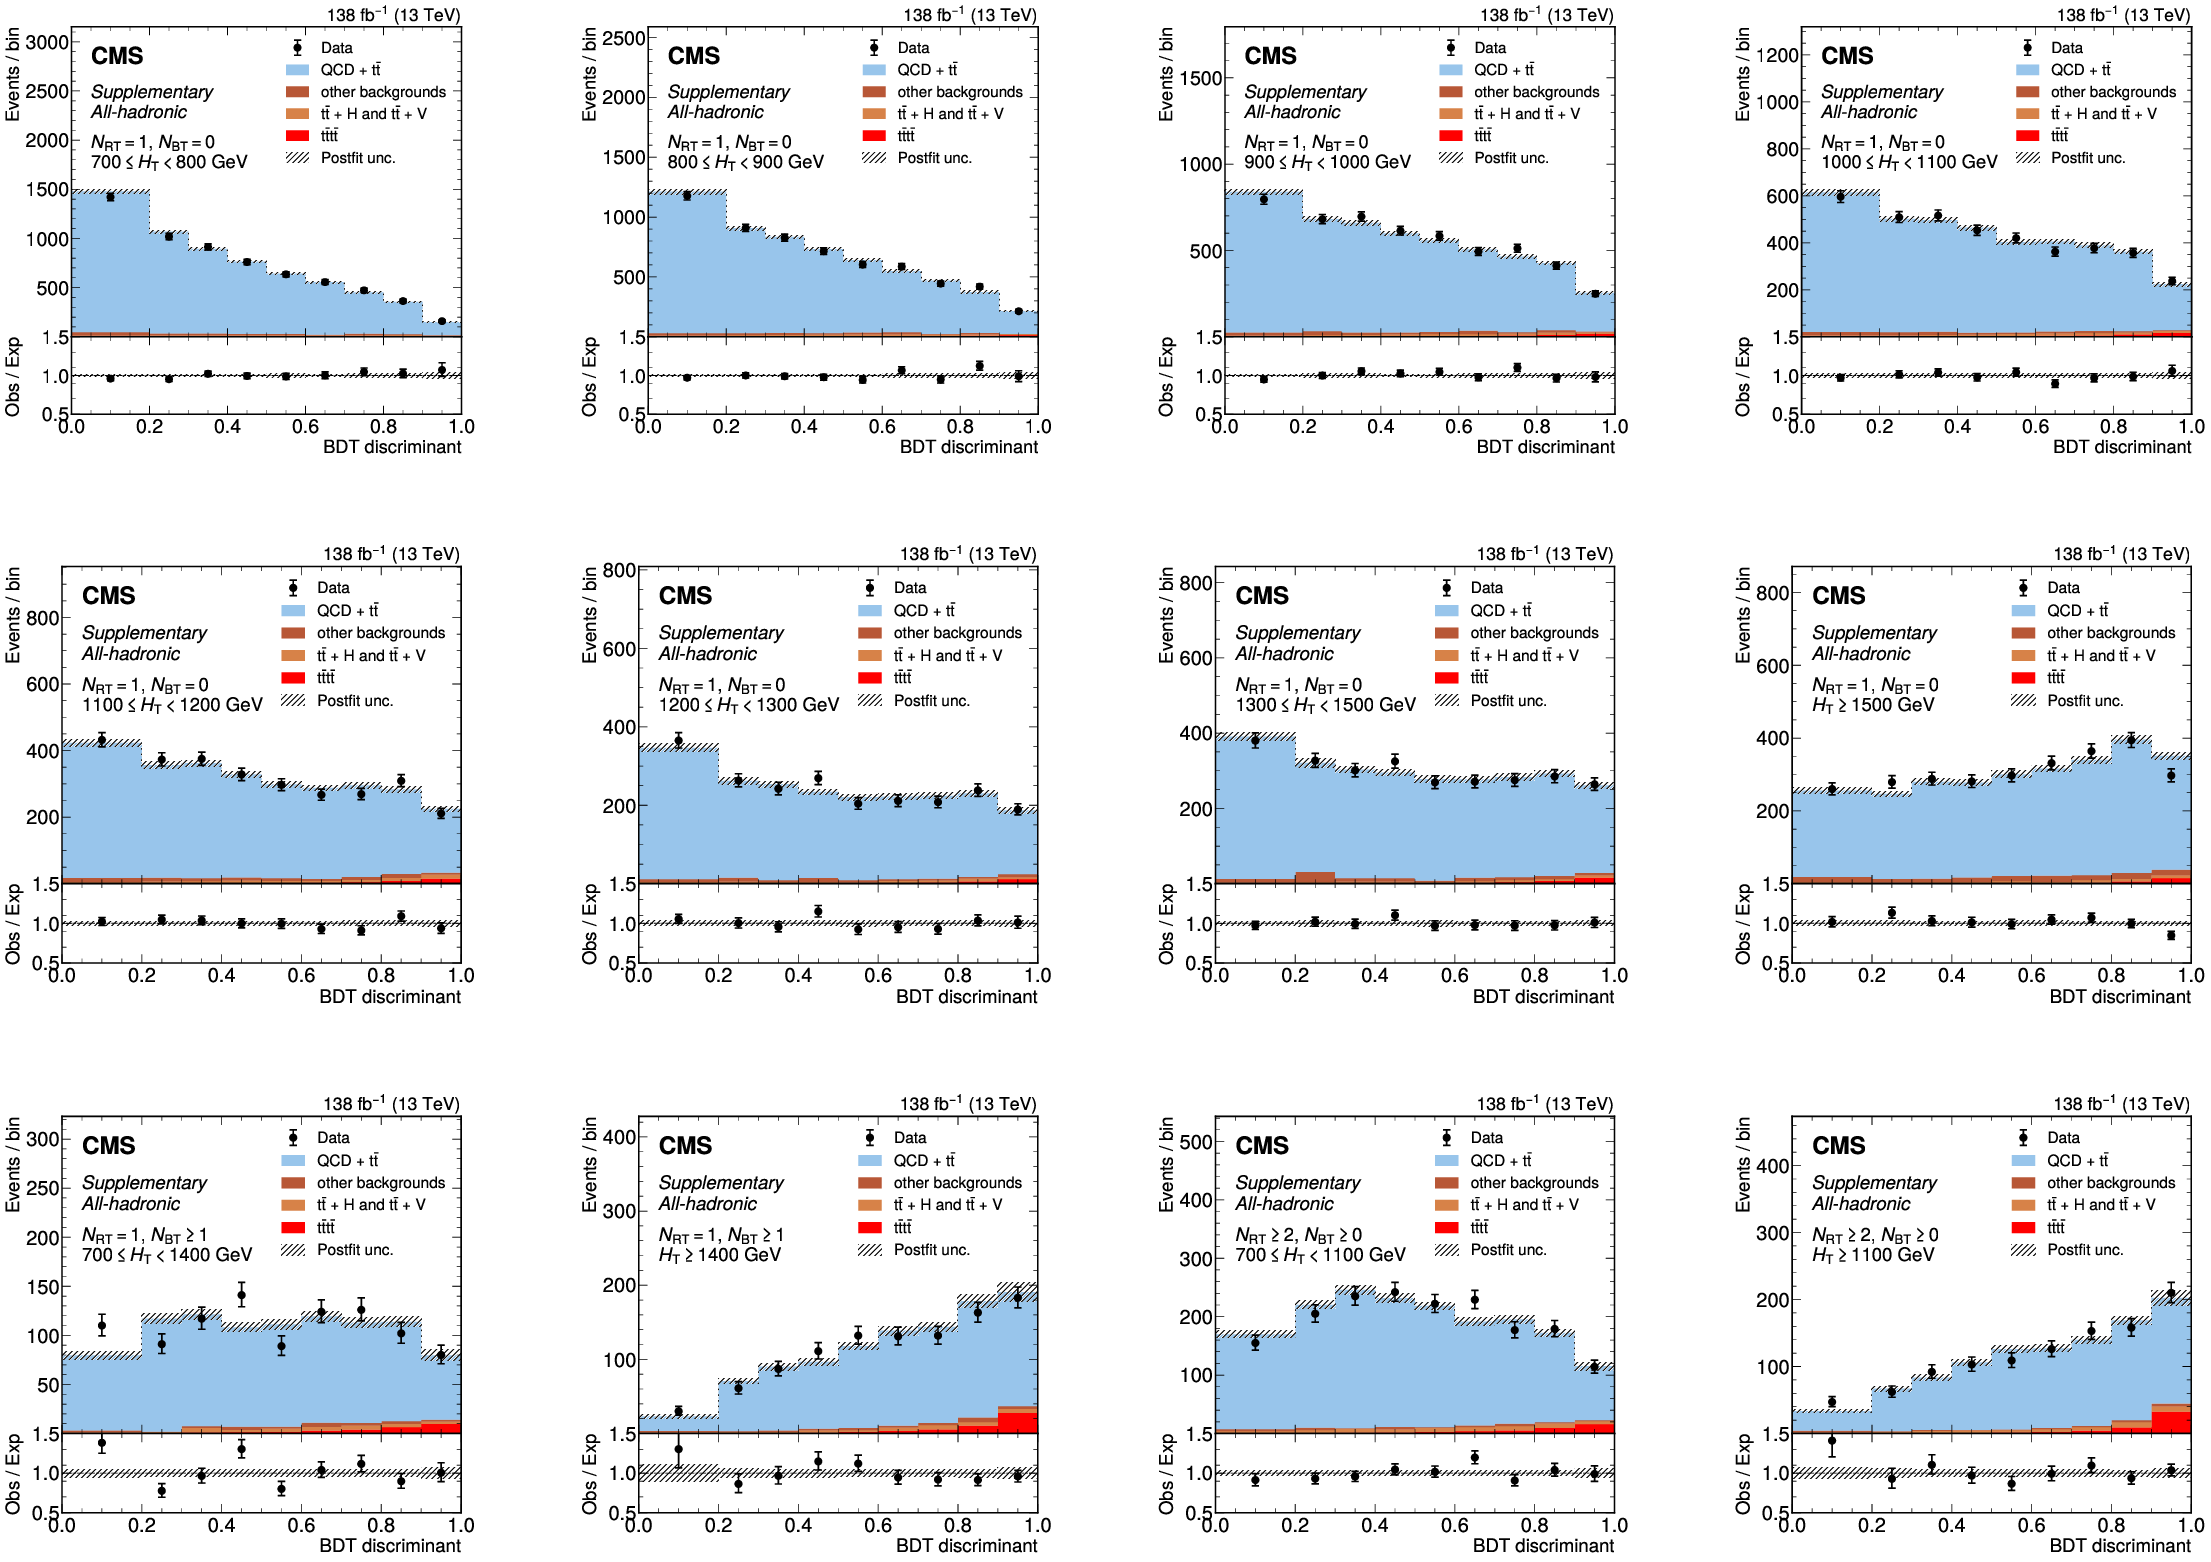
png pdf |
Additional Figure 23:
The distribution of the BDT discriminants in the signal region for the full 2016--2018 data set in the all-hadronic channel for all $ N_\text{RT} $, $ N_\text{BT} $, and $ H_{\mathrm{T}} $ categories. ($ N_\text{RT} $ and $ N_\text{BT} $ represent number of resolved tops and b-jets respectively.) The background from QCD multijet and $ \mathrm{t} \bar{\mathrm{t}} $ production is derived from control regions in the data. Estimates for the $ \mathrm{t}\bar{\mathrm{t}}\mathrm{t}\bar{\mathrm{t}} $ signal and other backgrounds are shown using simulated samples. The hatched bands correspond to the estimated total uncertainty after the fit. |
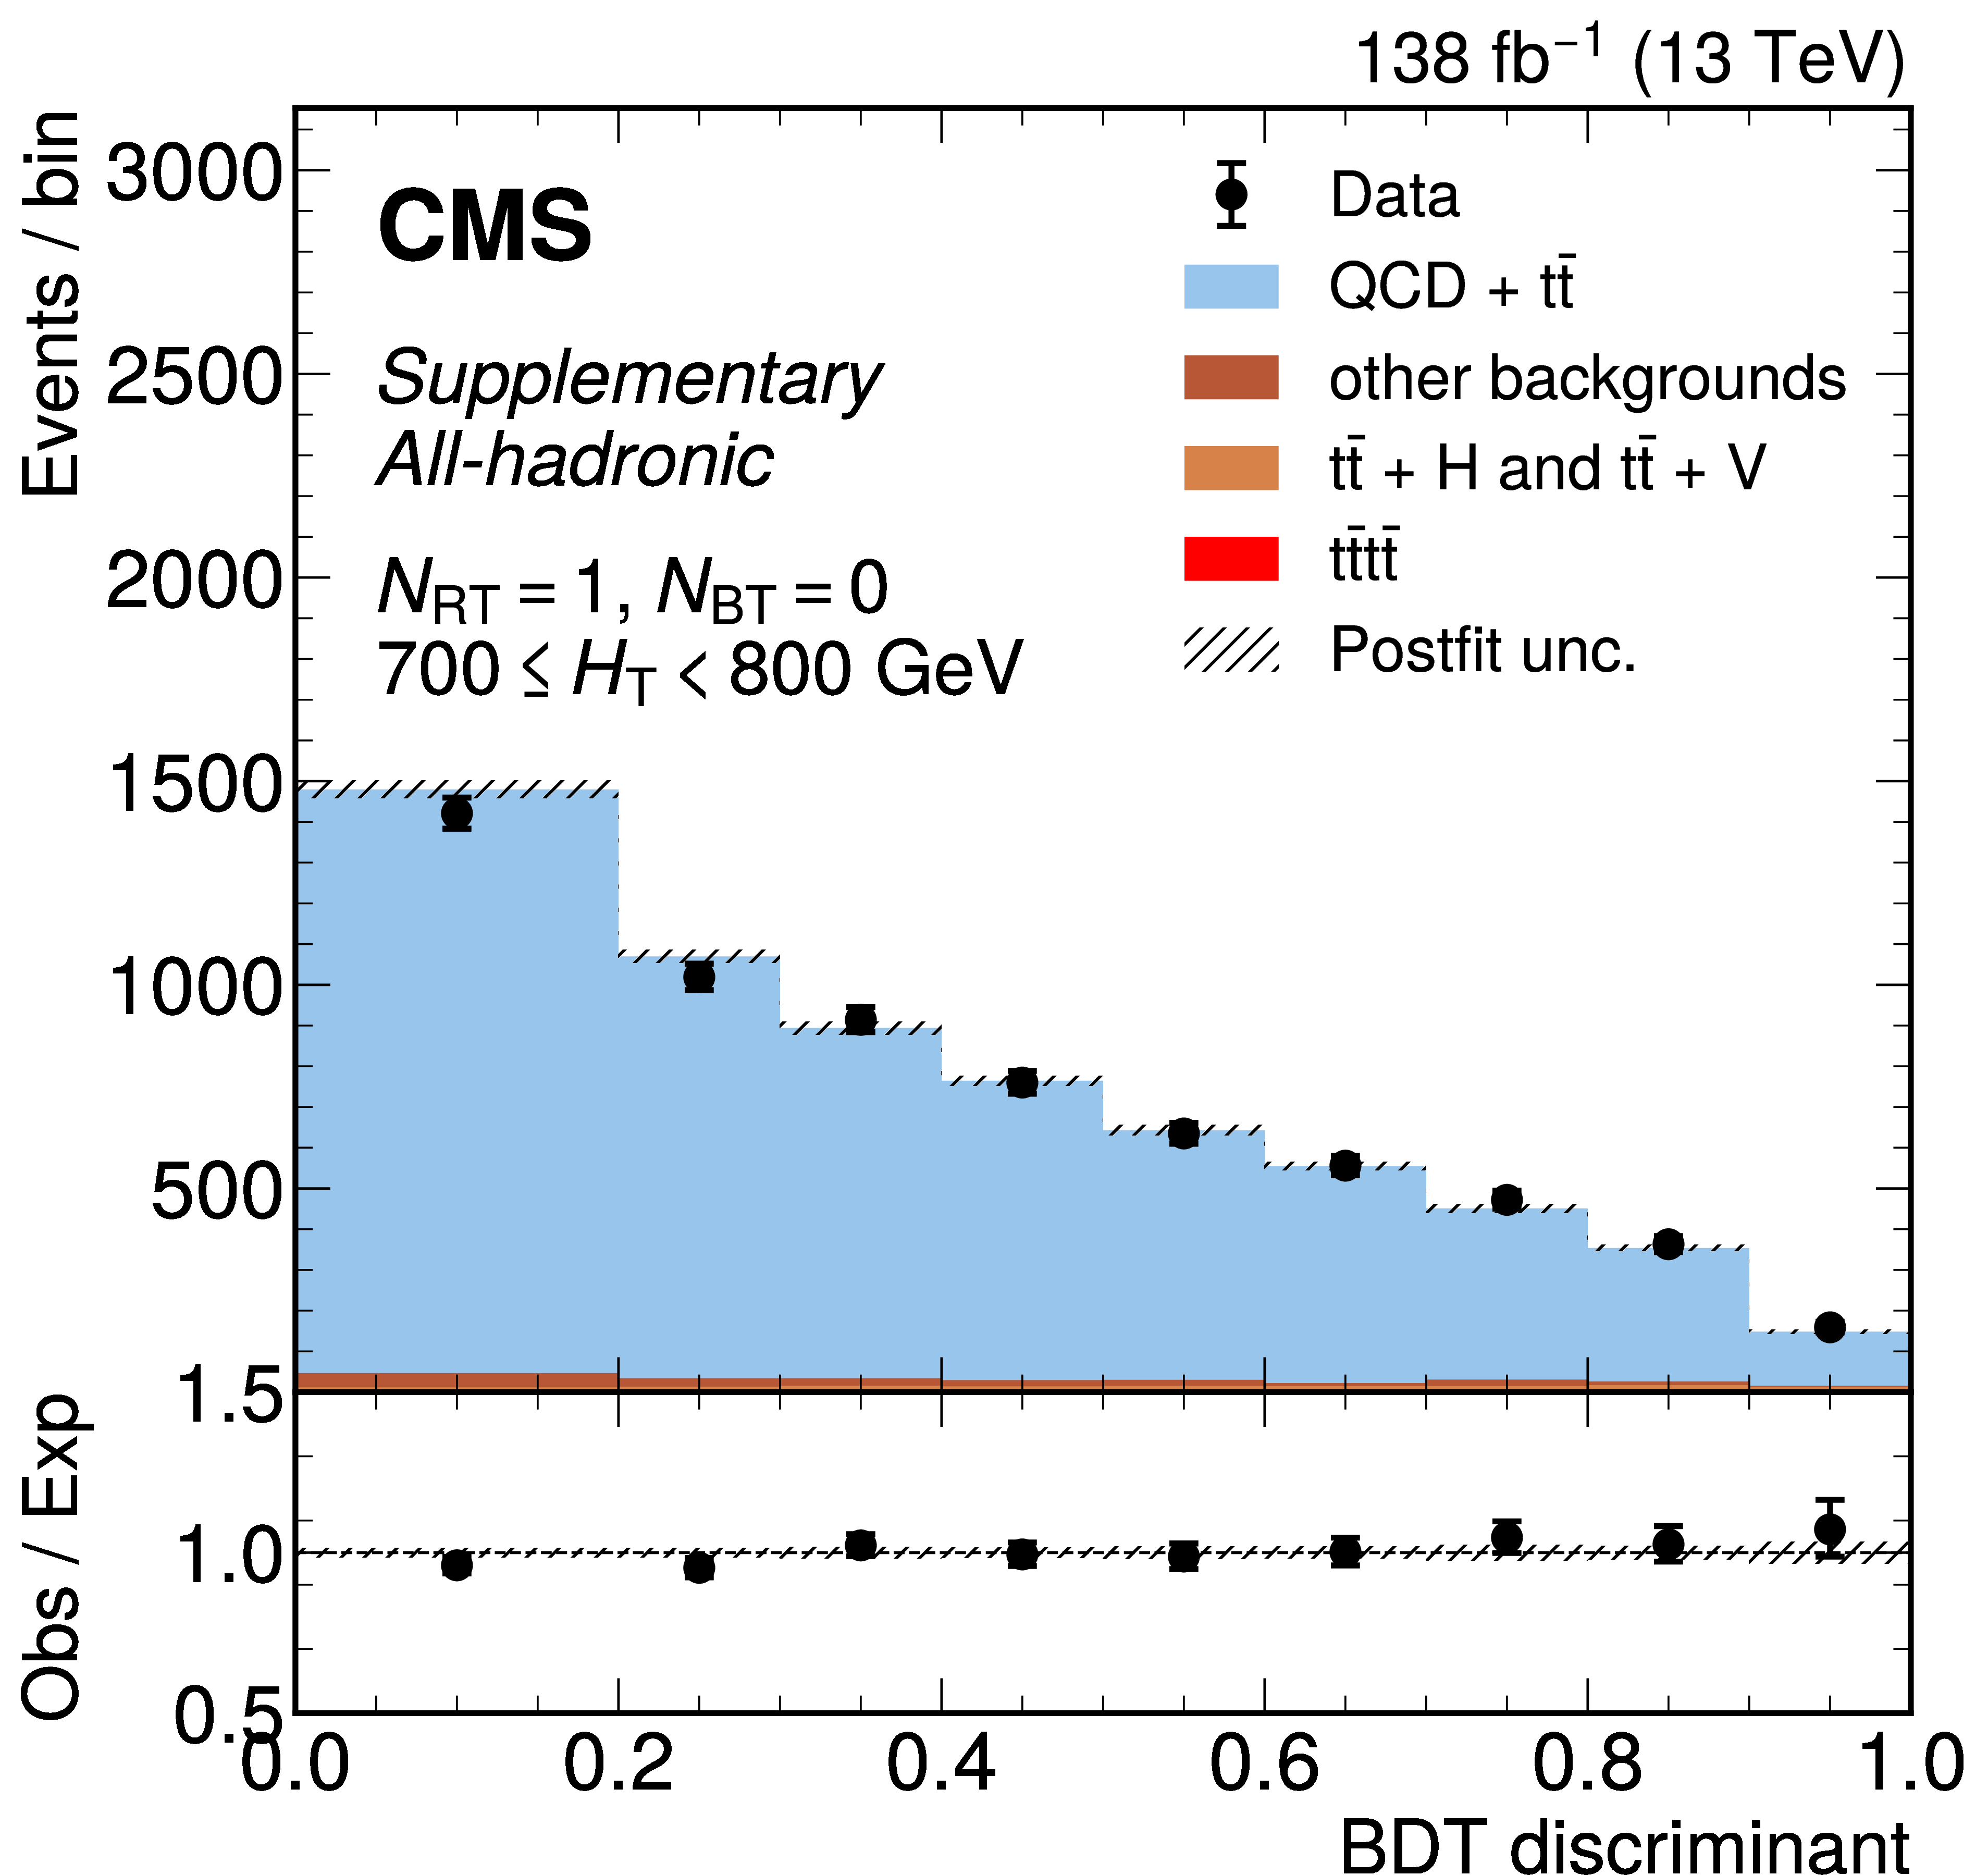
png pdf |
Additional Figure 23-a:
The distribution of the BDT discriminants in the signal region for the full 2016--2018 data set in the all-hadronic channel for all $ N_\text{RT} $, $ N_\text{BT} $, and $ H_{\mathrm{T}} $ categories. ($ N_\text{RT} $ and $ N_\text{BT} $ represent number of resolved tops and b-jets respectively.) The background from QCD multijet and $ \mathrm{t} \bar{\mathrm{t}} $ production is derived from control regions in the data. Estimates for the $ \mathrm{t}\bar{\mathrm{t}}\mathrm{t}\bar{\mathrm{t}} $ signal and other backgrounds are shown using simulated samples. The hatched bands correspond to the estimated total uncertainty after the fit. |
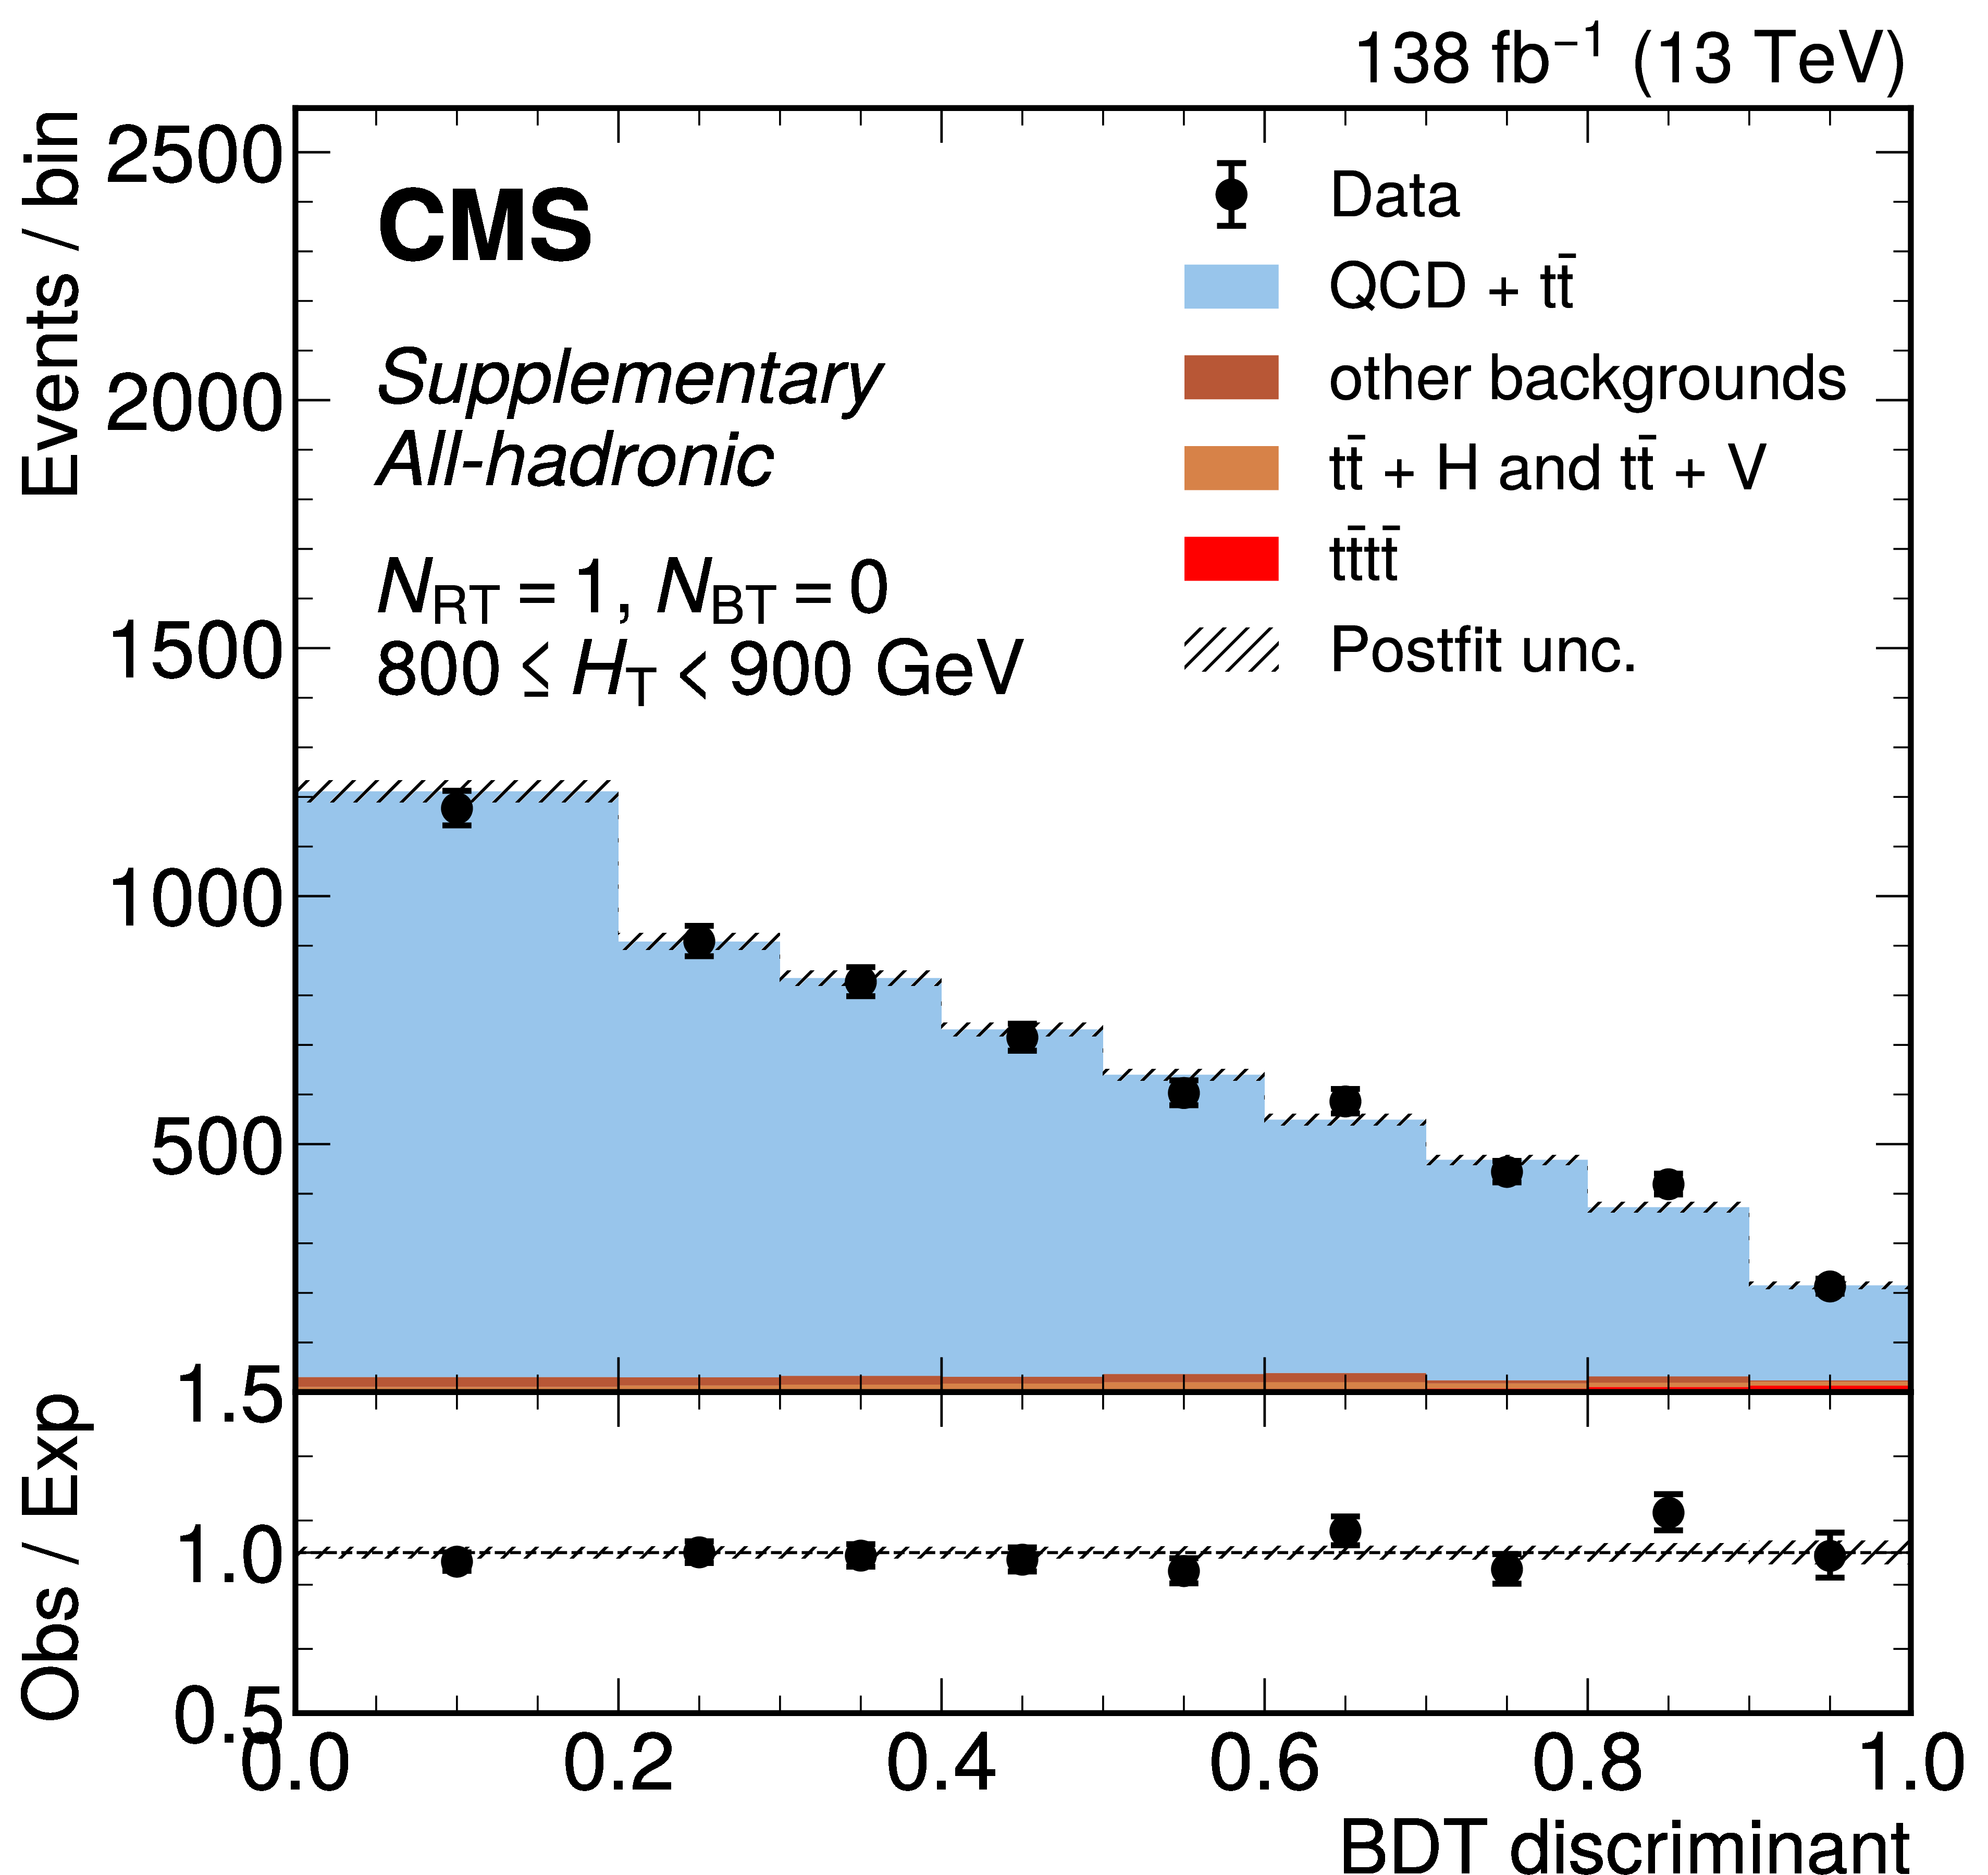
png pdf |
Additional Figure 23-b:
The distribution of the BDT discriminants in the signal region for the full 2016--2018 data set in the all-hadronic channel for all $ N_\text{RT} $, $ N_\text{BT} $, and $ H_{\mathrm{T}} $ categories. ($ N_\text{RT} $ and $ N_\text{BT} $ represent number of resolved tops and b-jets respectively.) The background from QCD multijet and $ \mathrm{t} \bar{\mathrm{t}} $ production is derived from control regions in the data. Estimates for the $ \mathrm{t}\bar{\mathrm{t}}\mathrm{t}\bar{\mathrm{t}} $ signal and other backgrounds are shown using simulated samples. The hatched bands correspond to the estimated total uncertainty after the fit. |
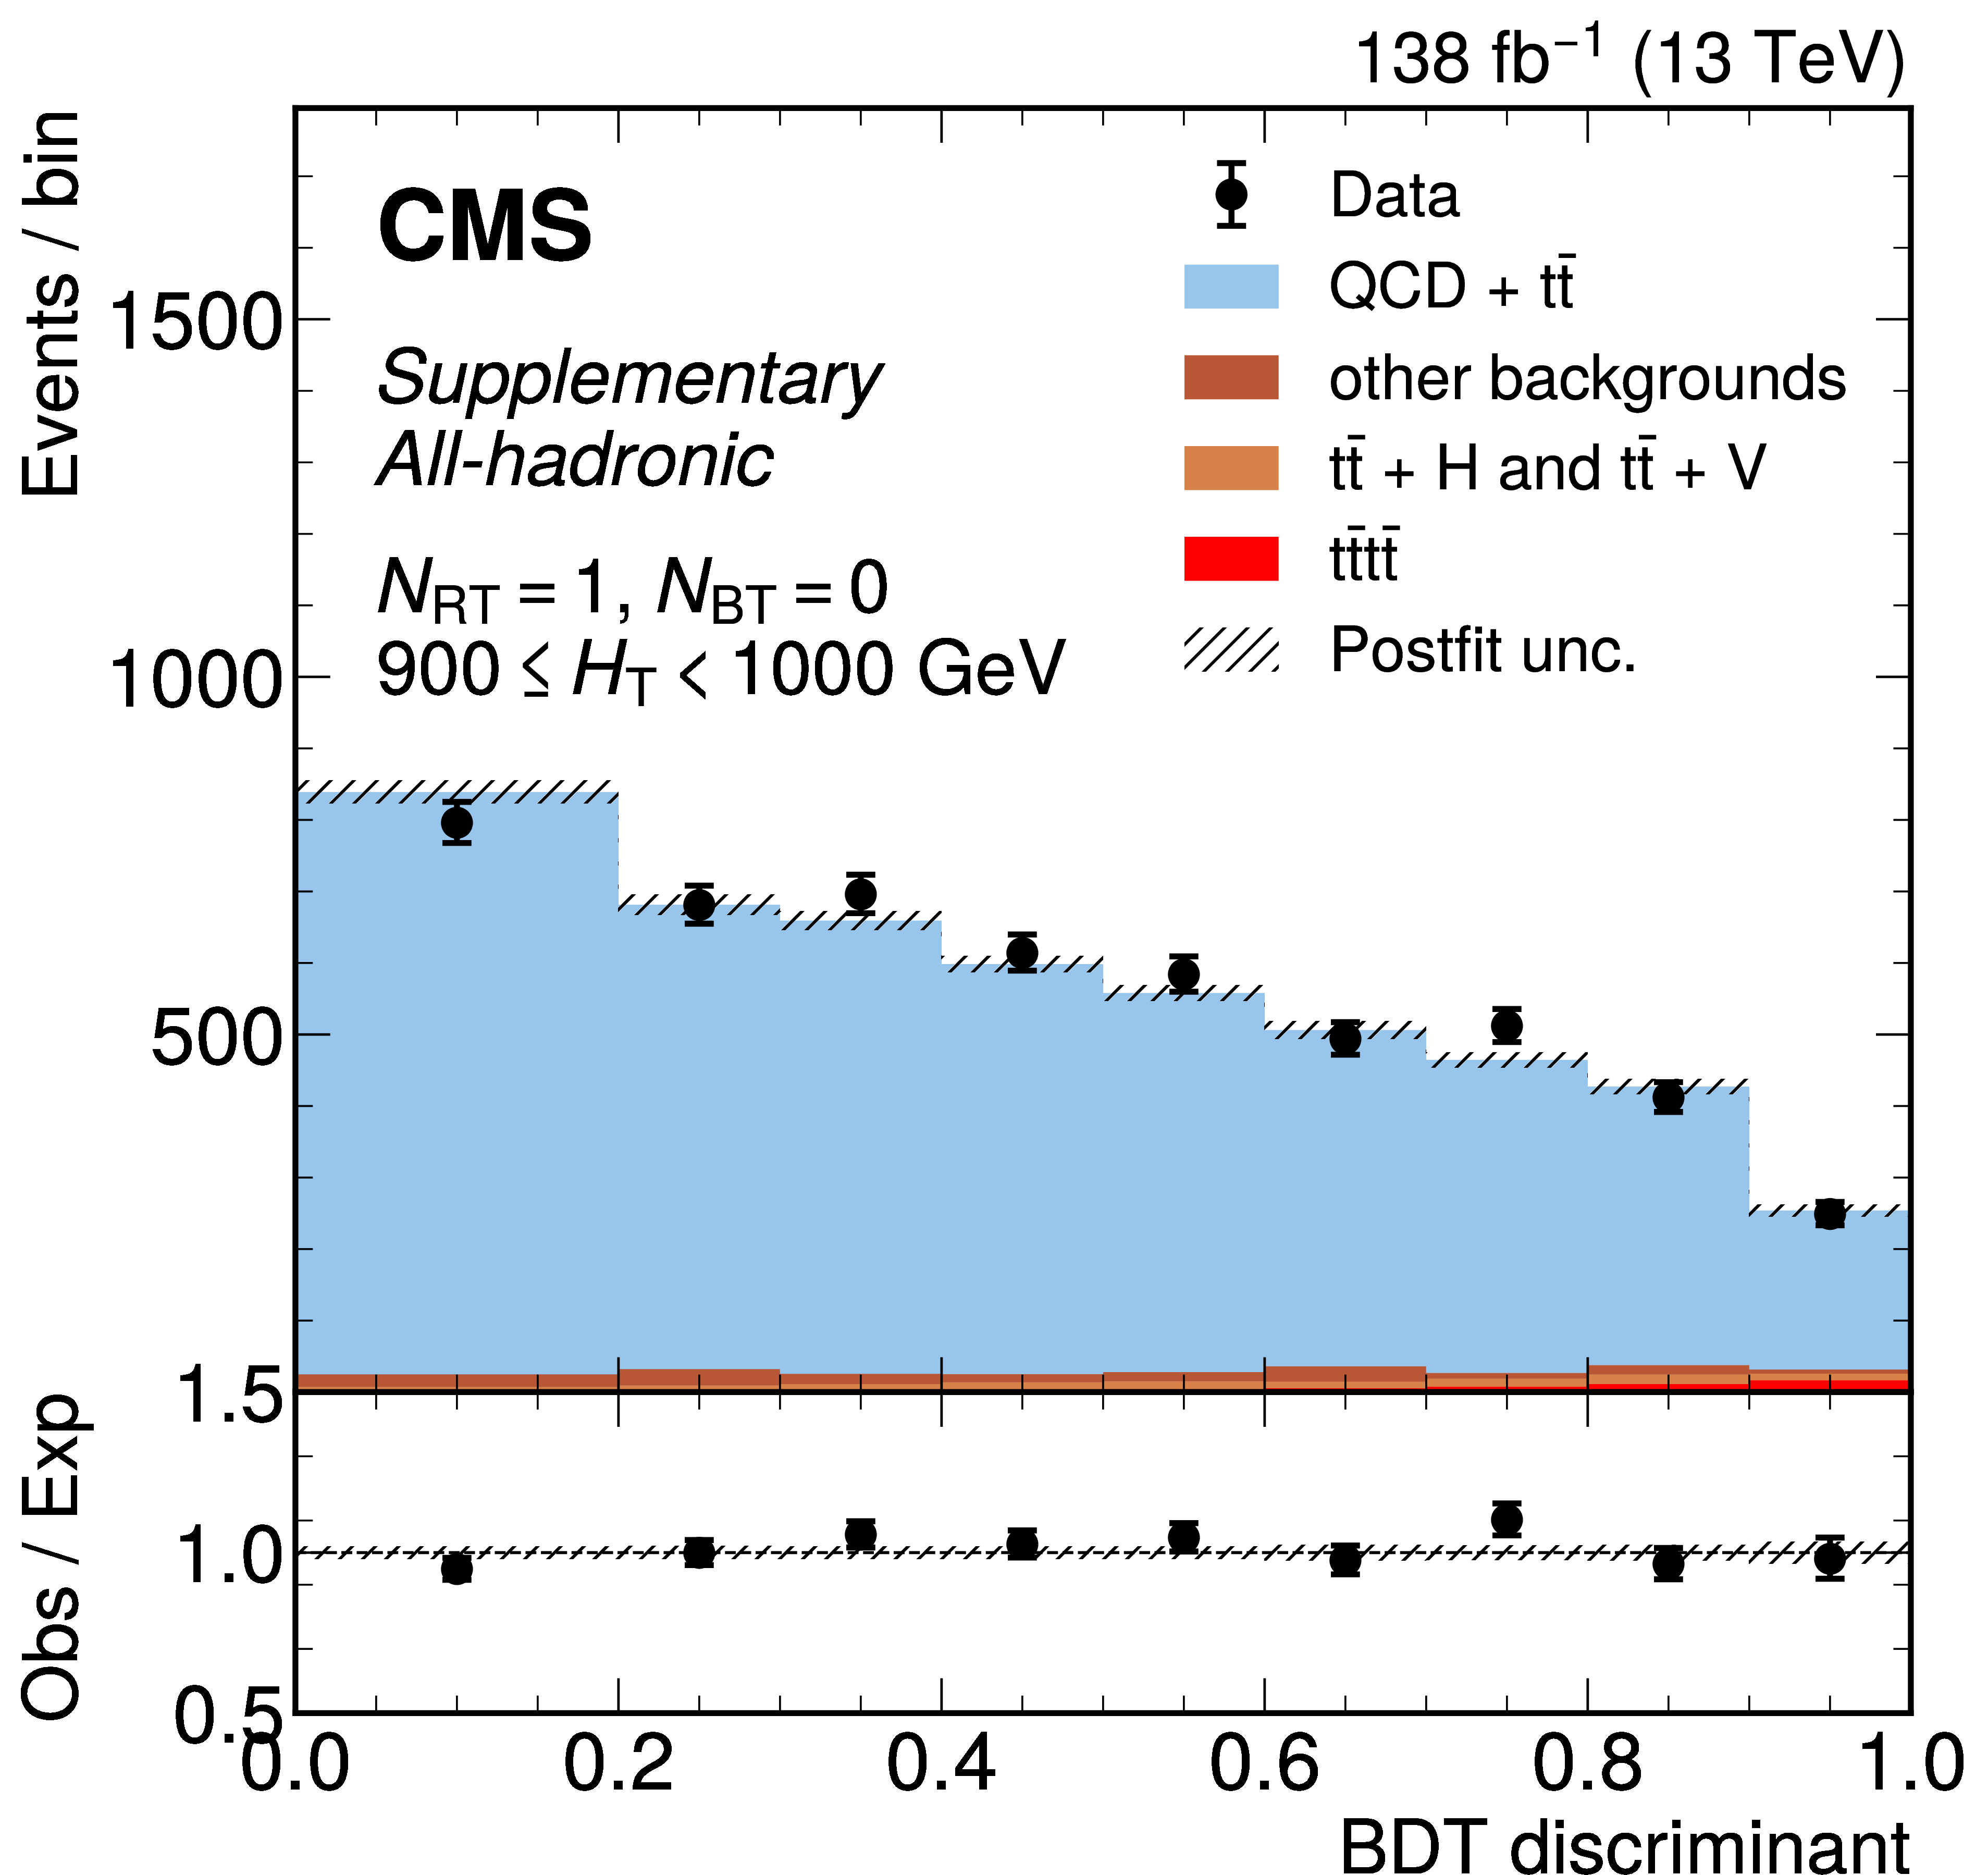
png pdf |
Additional Figure 23-c:
The distribution of the BDT discriminants in the signal region for the full 2016--2018 data set in the all-hadronic channel for all $ N_\text{RT} $, $ N_\text{BT} $, and $ H_{\mathrm{T}} $ categories. ($ N_\text{RT} $ and $ N_\text{BT} $ represent number of resolved tops and b-jets respectively.) The background from QCD multijet and $ \mathrm{t} \bar{\mathrm{t}} $ production is derived from control regions in the data. Estimates for the $ \mathrm{t}\bar{\mathrm{t}}\mathrm{t}\bar{\mathrm{t}} $ signal and other backgrounds are shown using simulated samples. The hatched bands correspond to the estimated total uncertainty after the fit. |

png pdf |
Additional Figure 23-d:
The distribution of the BDT discriminants in the signal region for the full 2016--2018 data set in the all-hadronic channel for all $ N_\text{RT} $, $ N_\text{BT} $, and $ H_{\mathrm{T}} $ categories. ($ N_\text{RT} $ and $ N_\text{BT} $ represent number of resolved tops and b-jets respectively.) The background from QCD multijet and $ \mathrm{t} \bar{\mathrm{t}} $ production is derived from control regions in the data. Estimates for the $ \mathrm{t}\bar{\mathrm{t}}\mathrm{t}\bar{\mathrm{t}} $ signal and other backgrounds are shown using simulated samples. The hatched bands correspond to the estimated total uncertainty after the fit. |
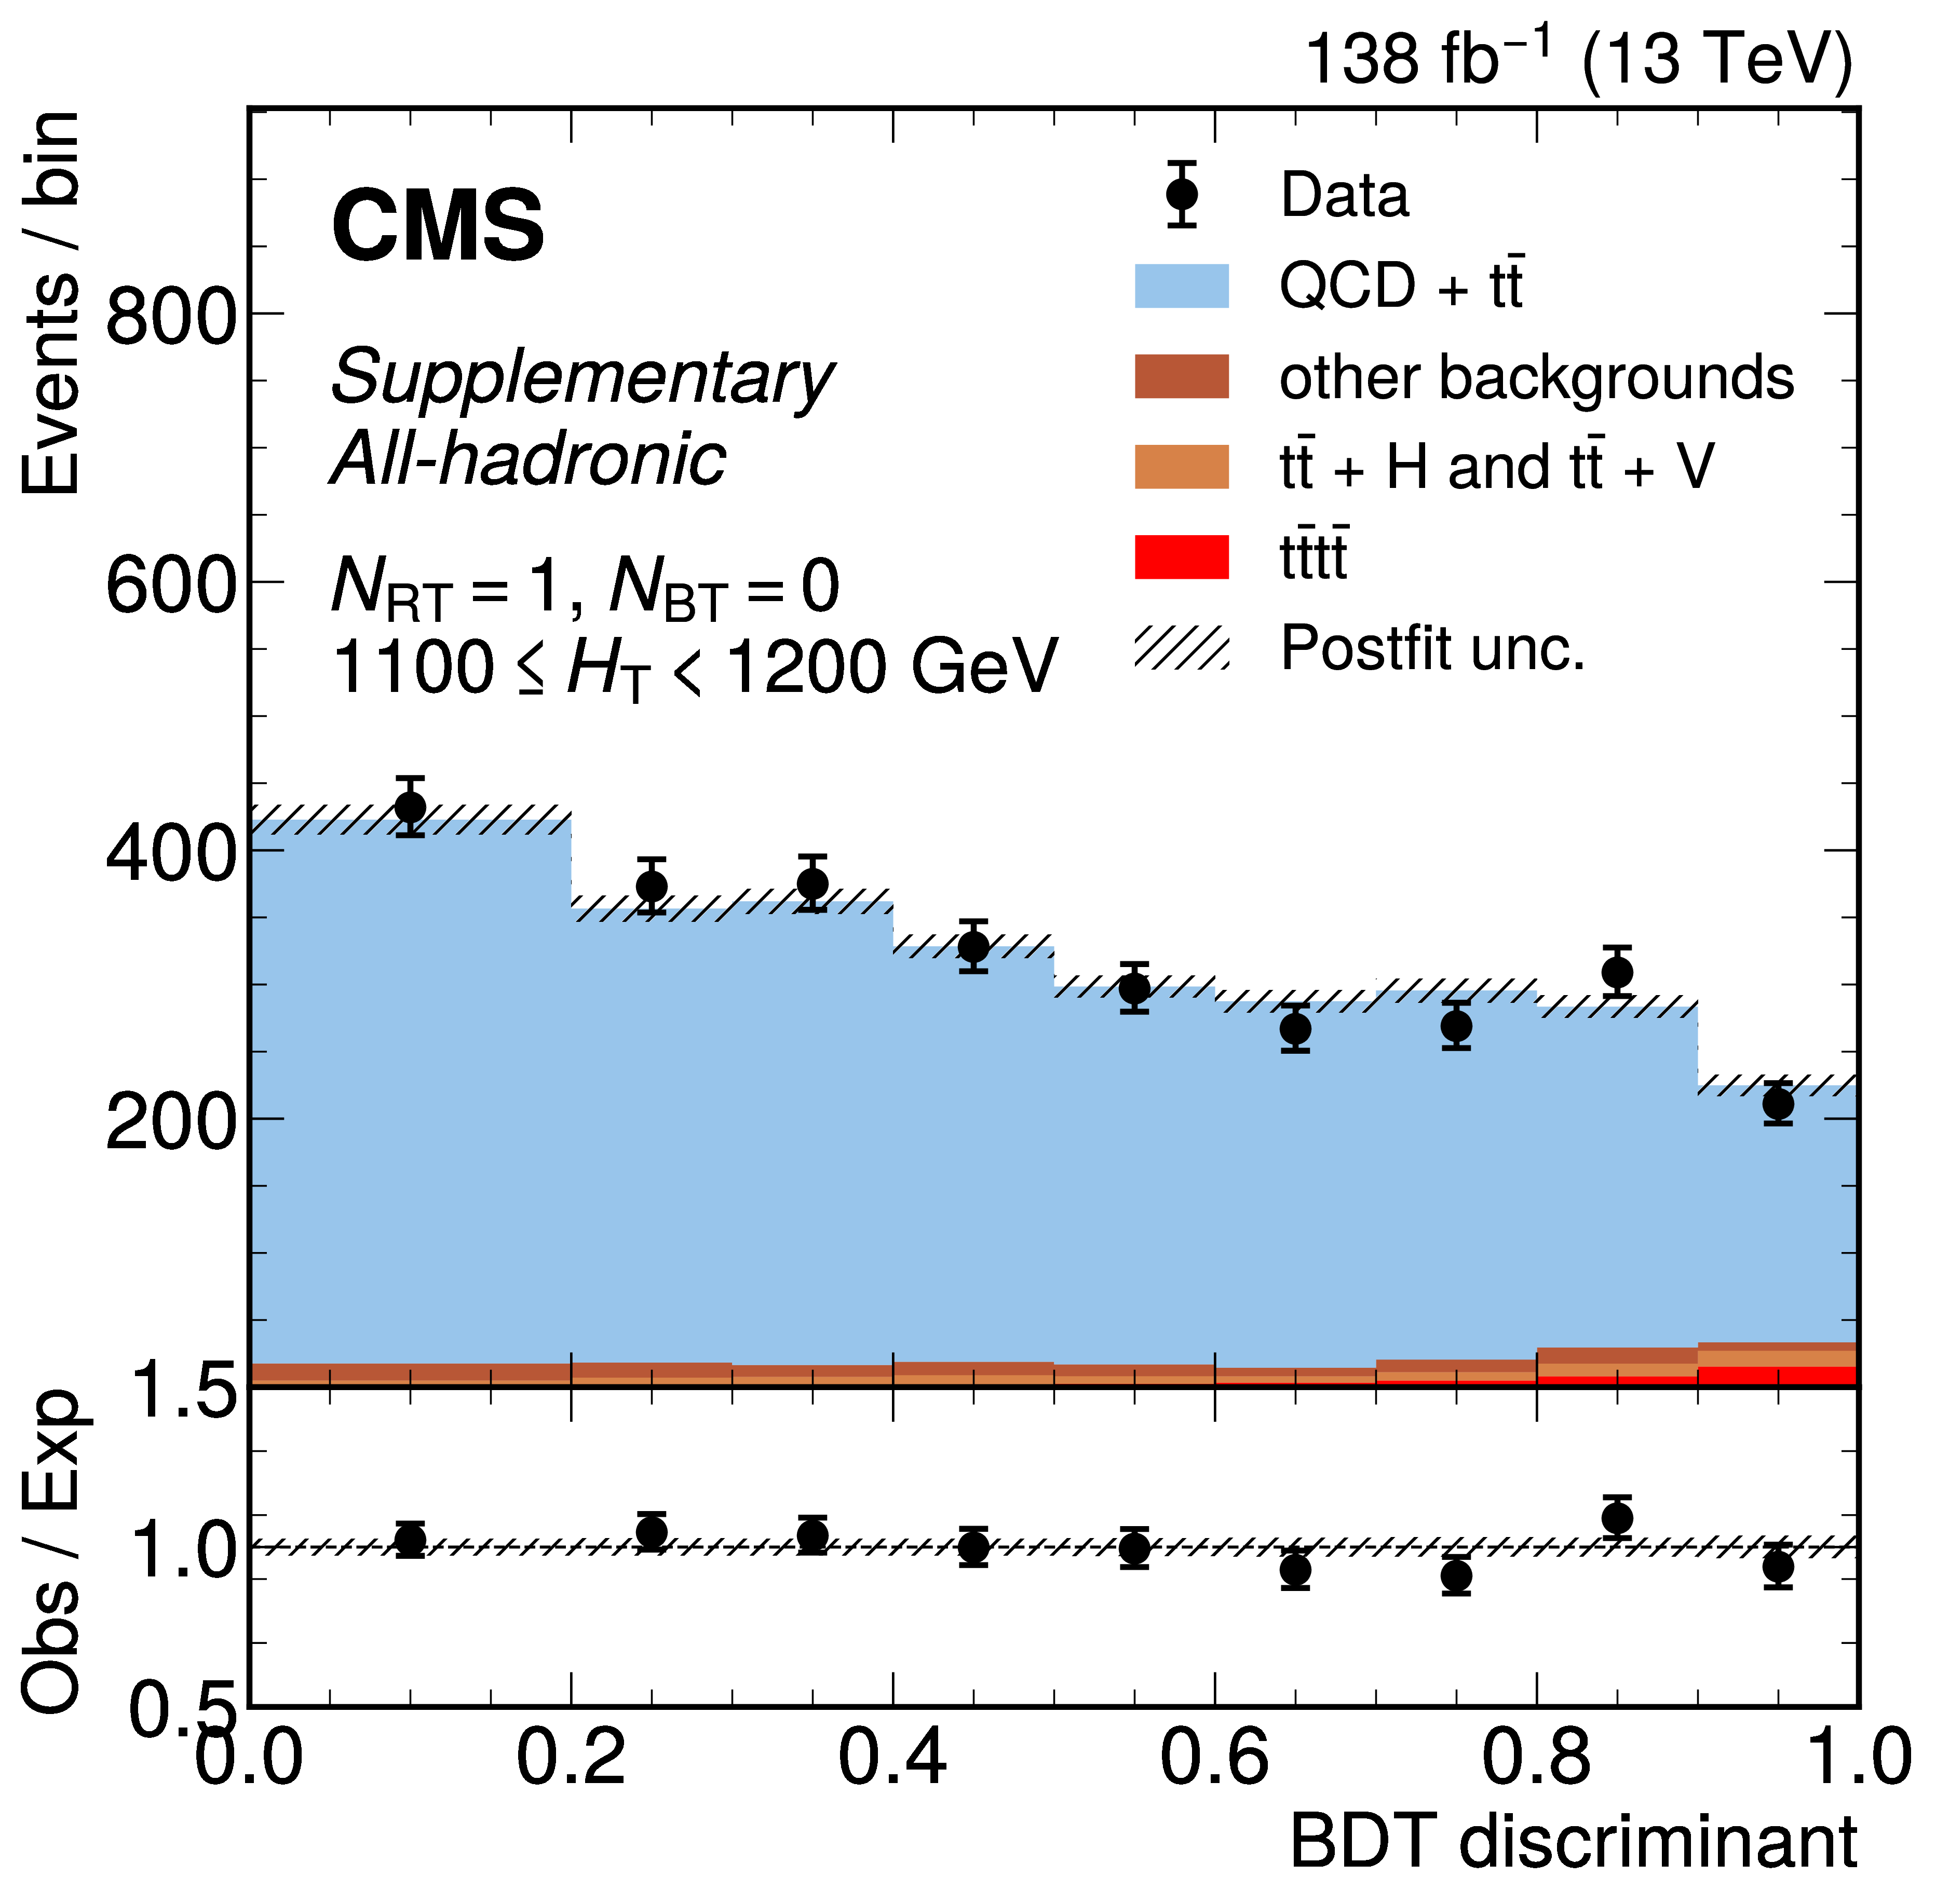
png pdf |
Additional Figure 23-e:
The distribution of the BDT discriminants in the signal region for the full 2016--2018 data set in the all-hadronic channel for all $ N_\text{RT} $, $ N_\text{BT} $, and $ H_{\mathrm{T}} $ categories. ($ N_\text{RT} $ and $ N_\text{BT} $ represent number of resolved tops and b-jets respectively.) The background from QCD multijet and $ \mathrm{t} \bar{\mathrm{t}} $ production is derived from control regions in the data. Estimates for the $ \mathrm{t}\bar{\mathrm{t}}\mathrm{t}\bar{\mathrm{t}} $ signal and other backgrounds are shown using simulated samples. The hatched bands correspond to the estimated total uncertainty after the fit. |

png pdf |
Additional Figure 23-f:
The distribution of the BDT discriminants in the signal region for the full 2016--2018 data set in the all-hadronic channel for all $ N_\text{RT} $, $ N_\text{BT} $, and $ H_{\mathrm{T}} $ categories. ($ N_\text{RT} $ and $ N_\text{BT} $ represent number of resolved tops and b-jets respectively.) The background from QCD multijet and $ \mathrm{t} \bar{\mathrm{t}} $ production is derived from control regions in the data. Estimates for the $ \mathrm{t}\bar{\mathrm{t}}\mathrm{t}\bar{\mathrm{t}} $ signal and other backgrounds are shown using simulated samples. The hatched bands correspond to the estimated total uncertainty after the fit. |
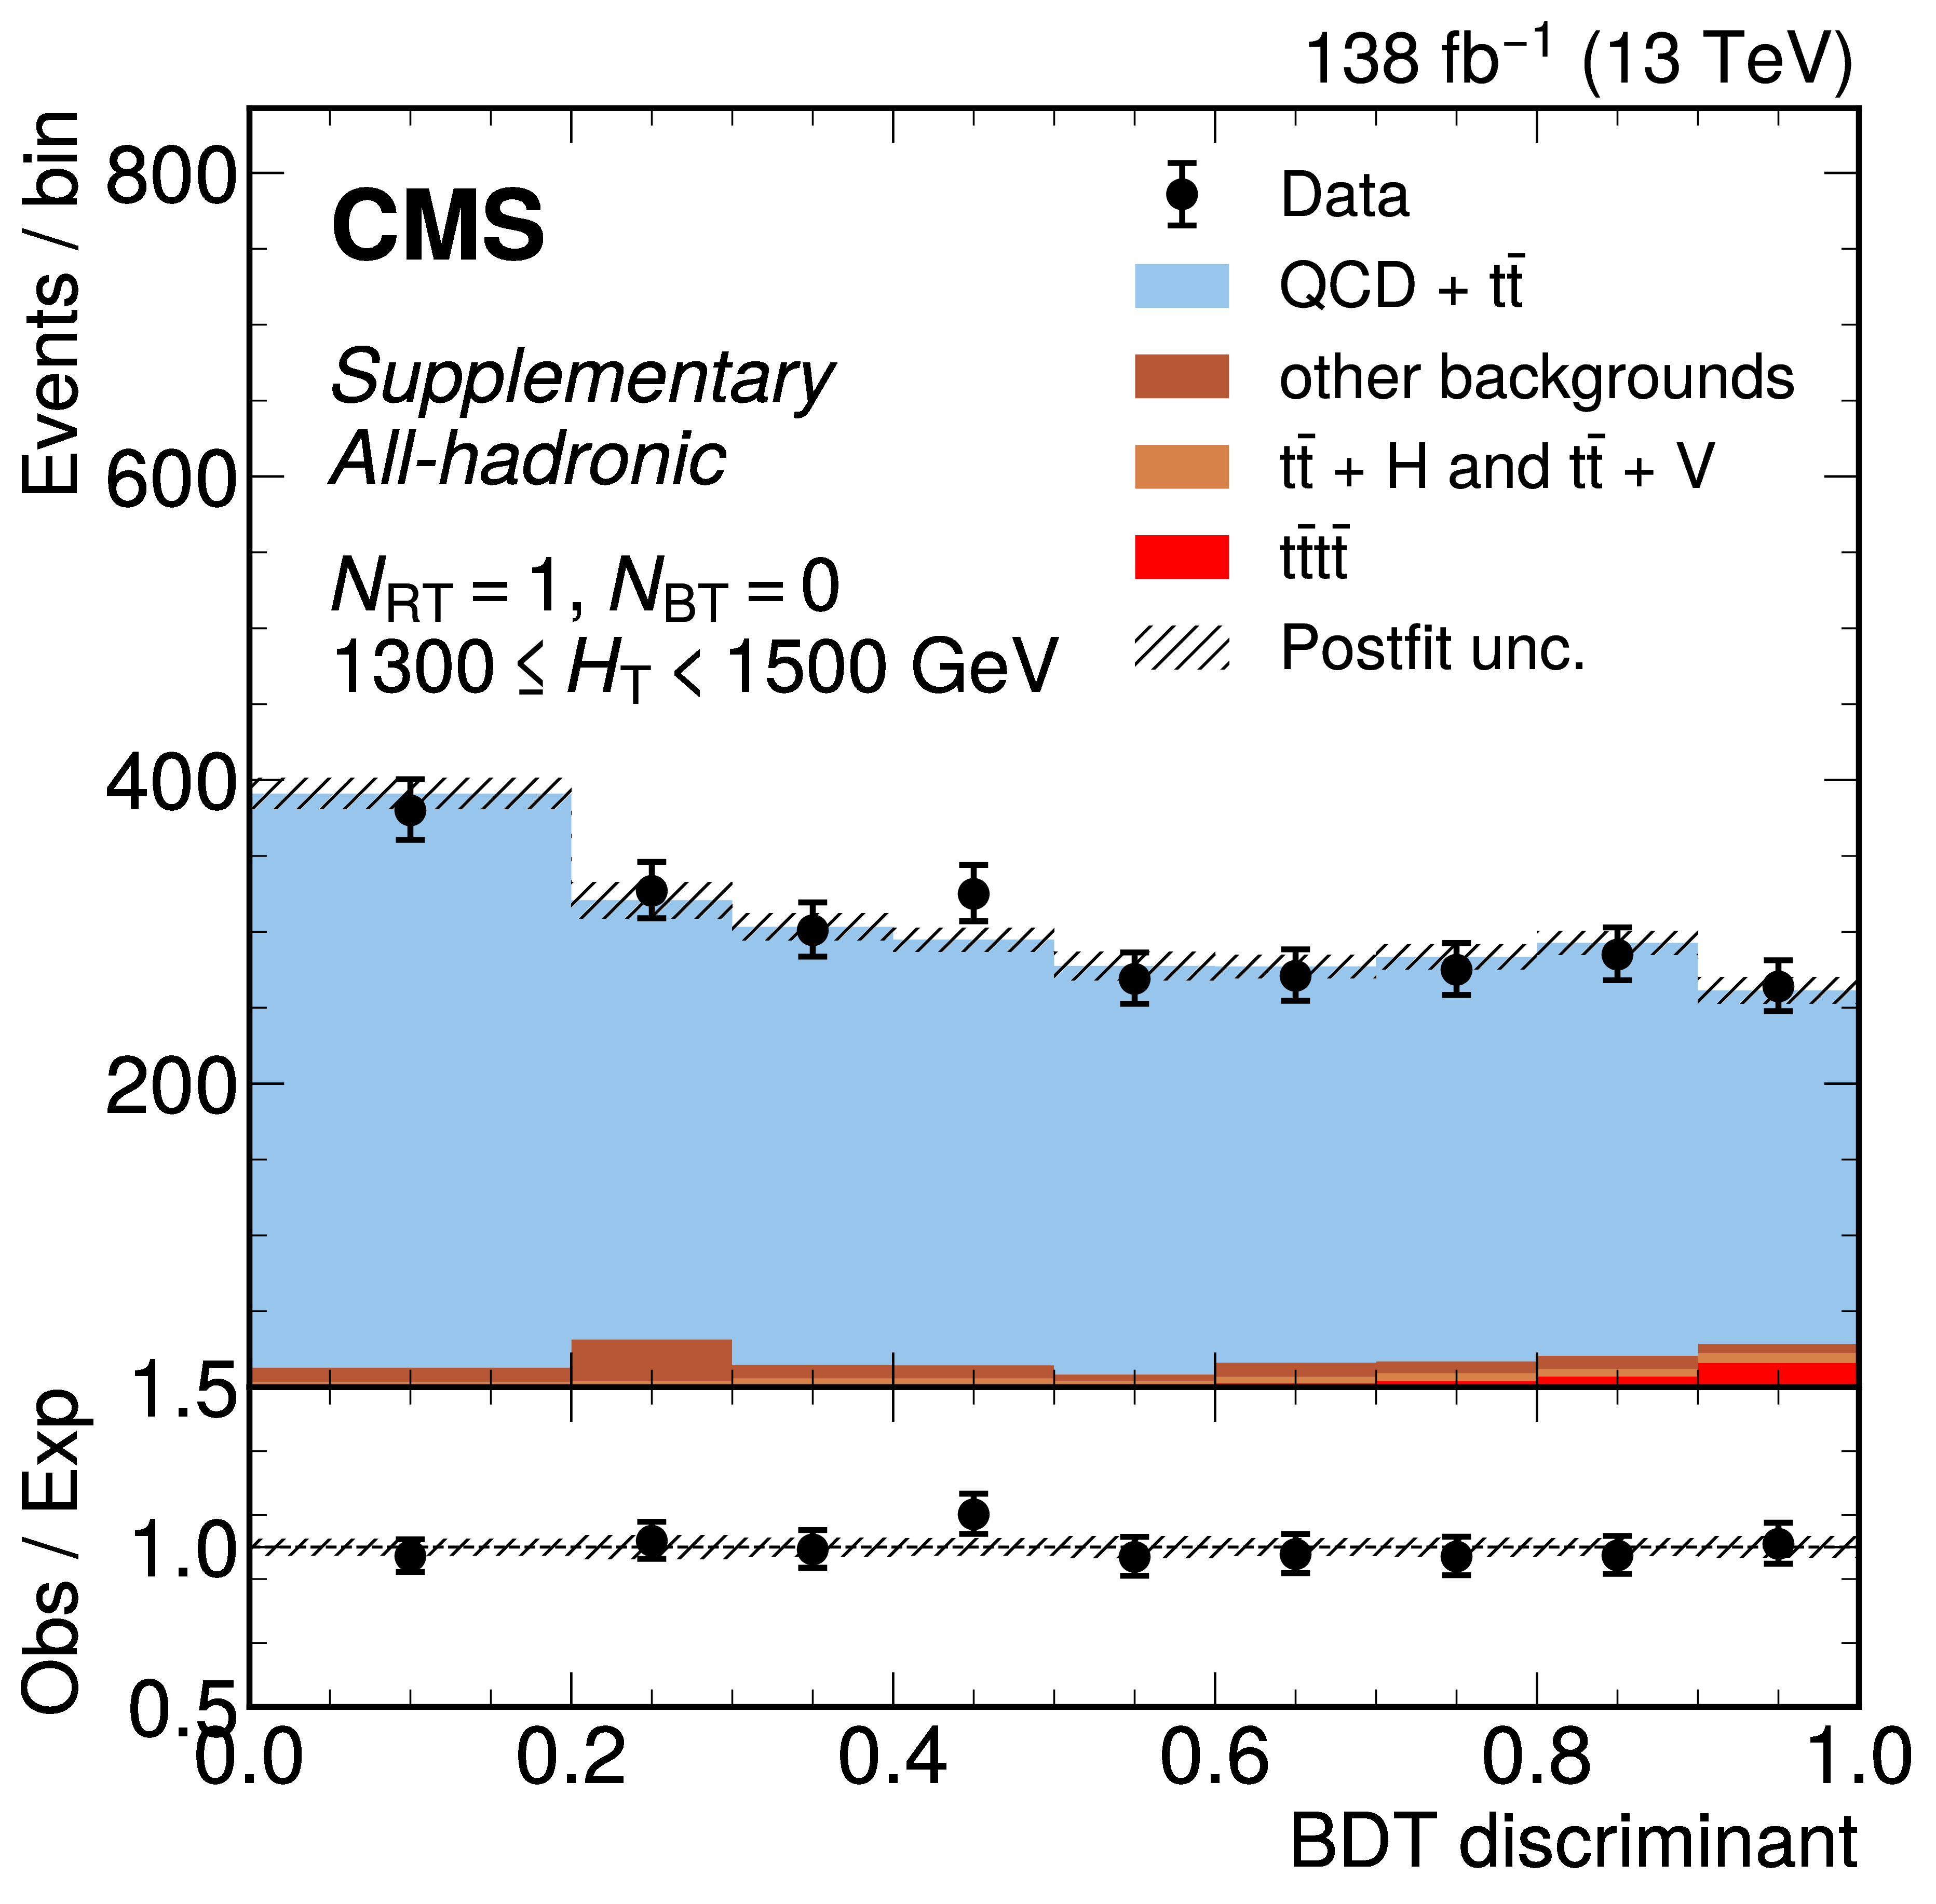
png pdf |
Additional Figure 23-g:
The distribution of the BDT discriminants in the signal region for the full 2016--2018 data set in the all-hadronic channel for all $ N_\text{RT} $, $ N_\text{BT} $, and $ H_{\mathrm{T}} $ categories. ($ N_\text{RT} $ and $ N_\text{BT} $ represent number of resolved tops and b-jets respectively.) The background from QCD multijet and $ \mathrm{t} \bar{\mathrm{t}} $ production is derived from control regions in the data. Estimates for the $ \mathrm{t}\bar{\mathrm{t}}\mathrm{t}\bar{\mathrm{t}} $ signal and other backgrounds are shown using simulated samples. The hatched bands correspond to the estimated total uncertainty after the fit. |
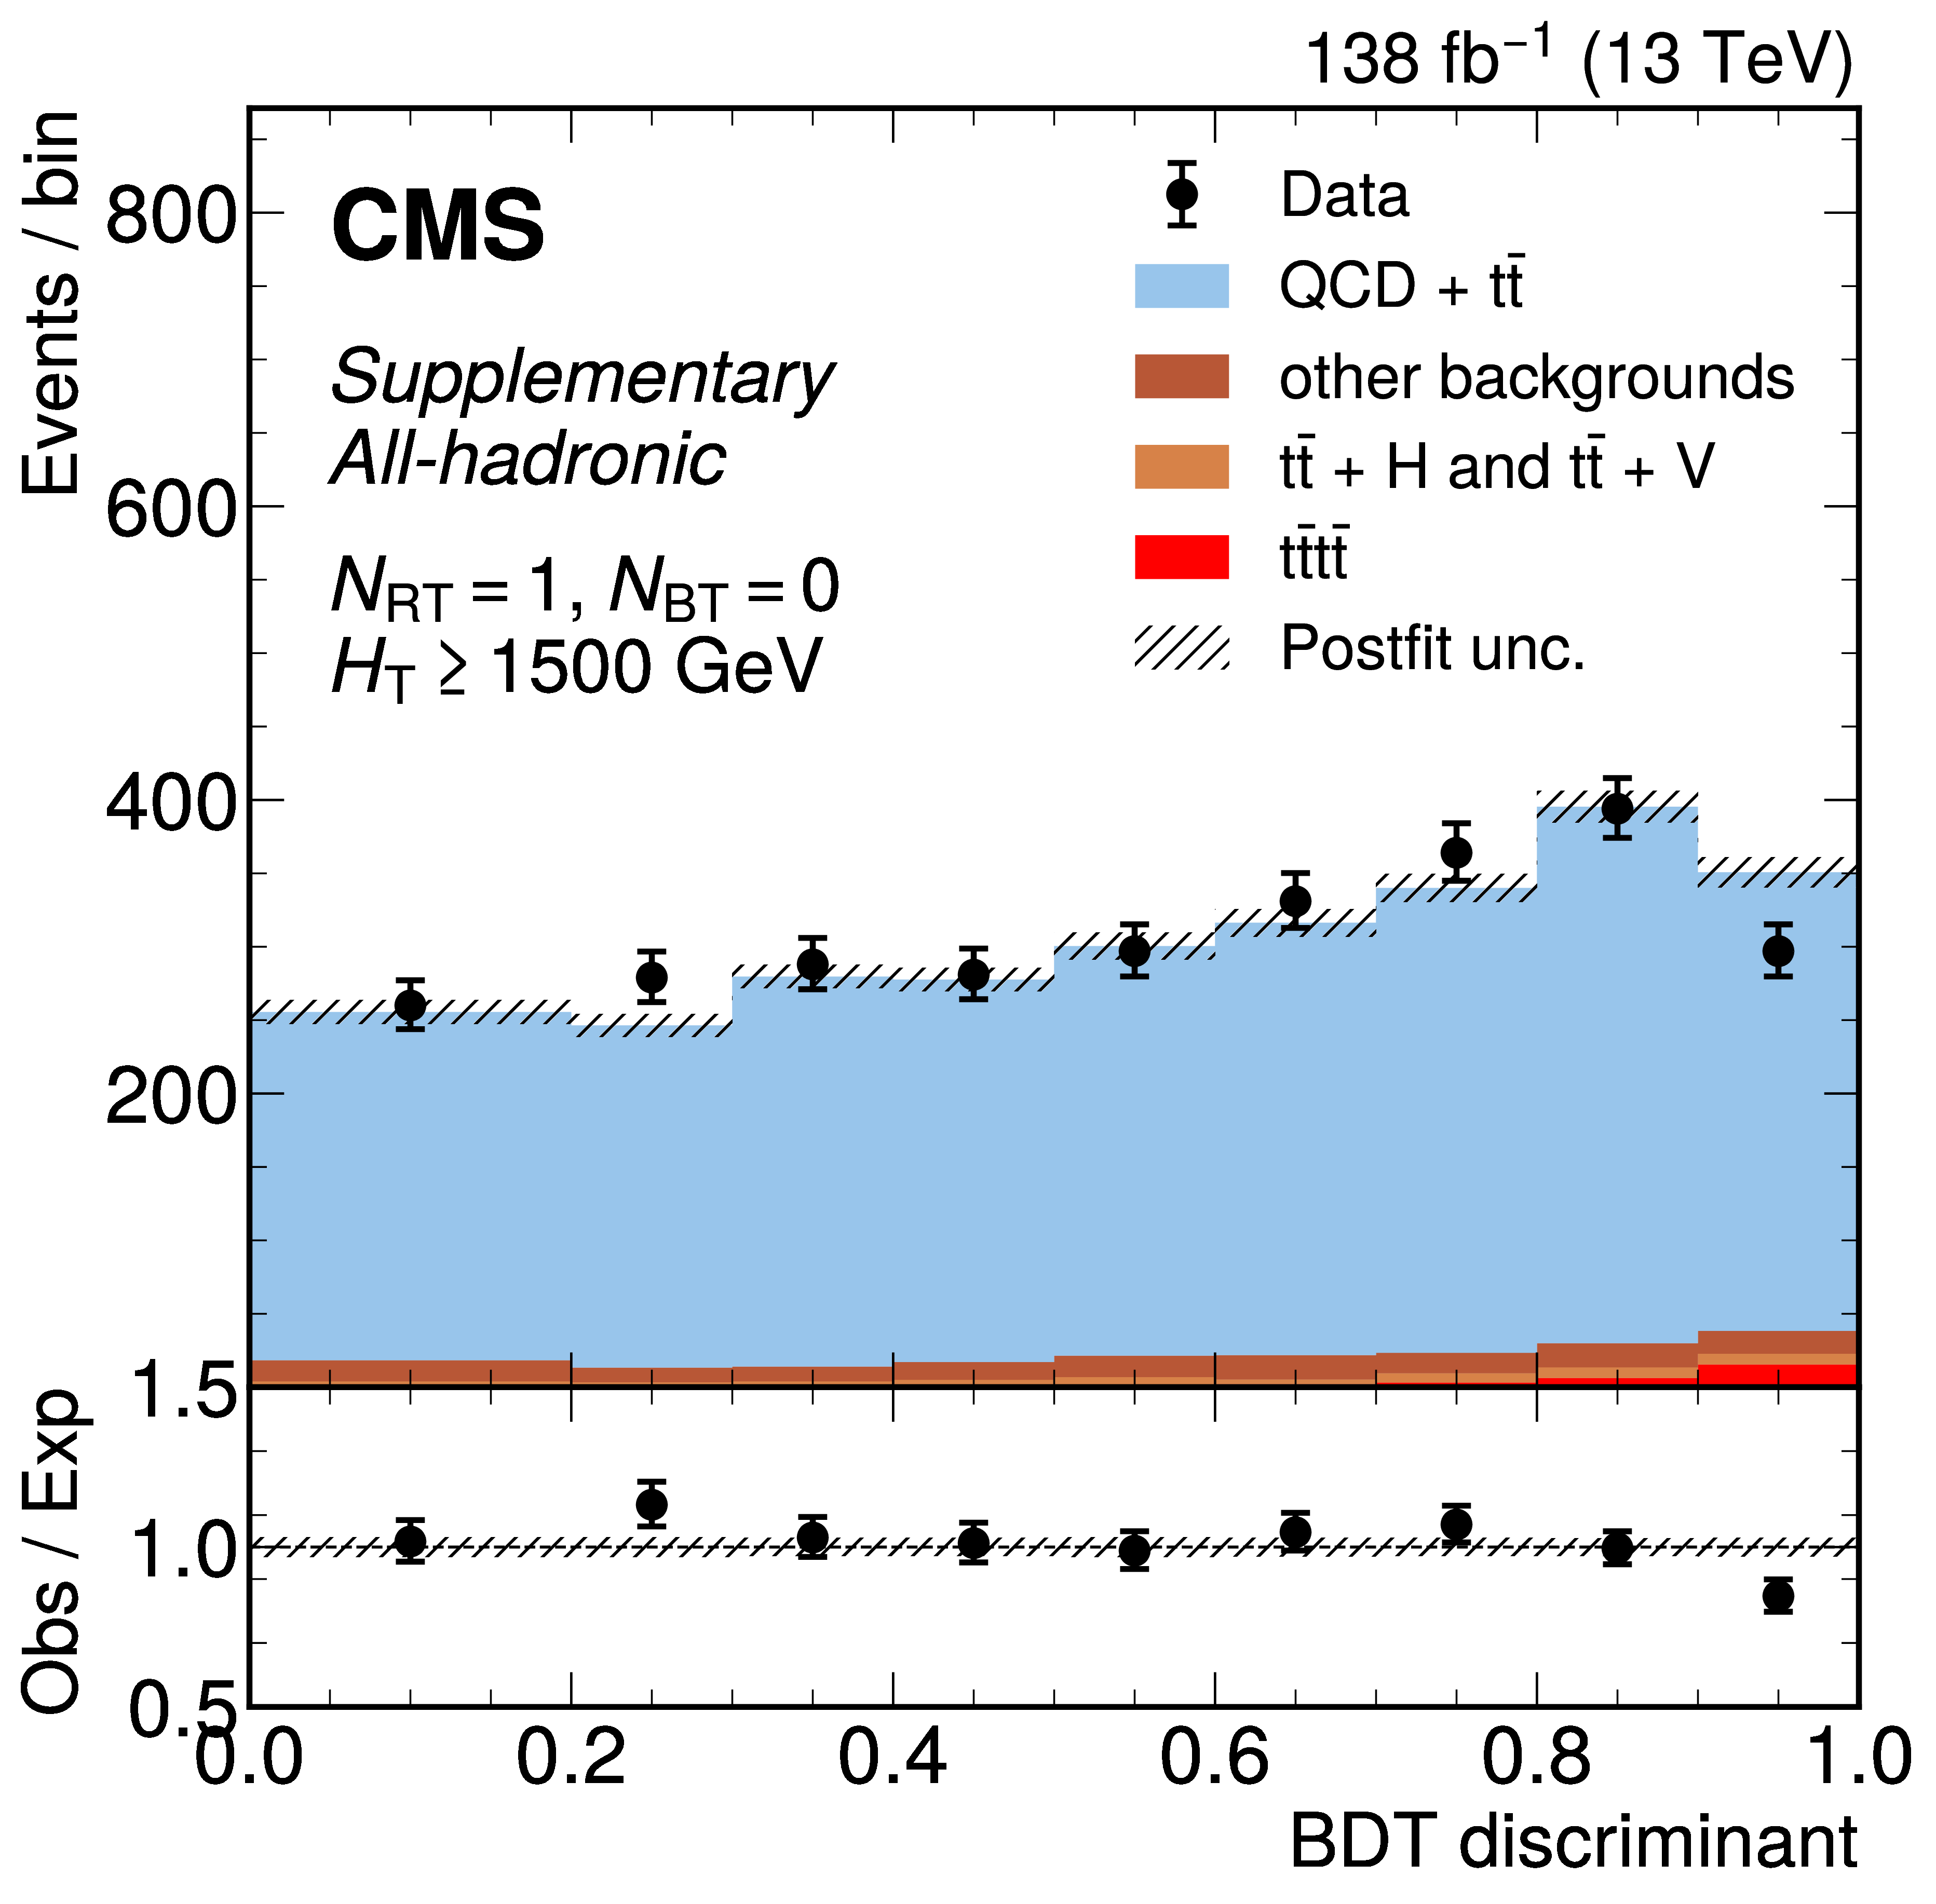
png pdf |
Additional Figure 23-h:
The distribution of the BDT discriminants in the signal region for the full 2016--2018 data set in the all-hadronic channel for all $ N_\text{RT} $, $ N_\text{BT} $, and $ H_{\mathrm{T}} $ categories. ($ N_\text{RT} $ and $ N_\text{BT} $ represent number of resolved tops and b-jets respectively.) The background from QCD multijet and $ \mathrm{t} \bar{\mathrm{t}} $ production is derived from control regions in the data. Estimates for the $ \mathrm{t}\bar{\mathrm{t}}\mathrm{t}\bar{\mathrm{t}} $ signal and other backgrounds are shown using simulated samples. The hatched bands correspond to the estimated total uncertainty after the fit. |
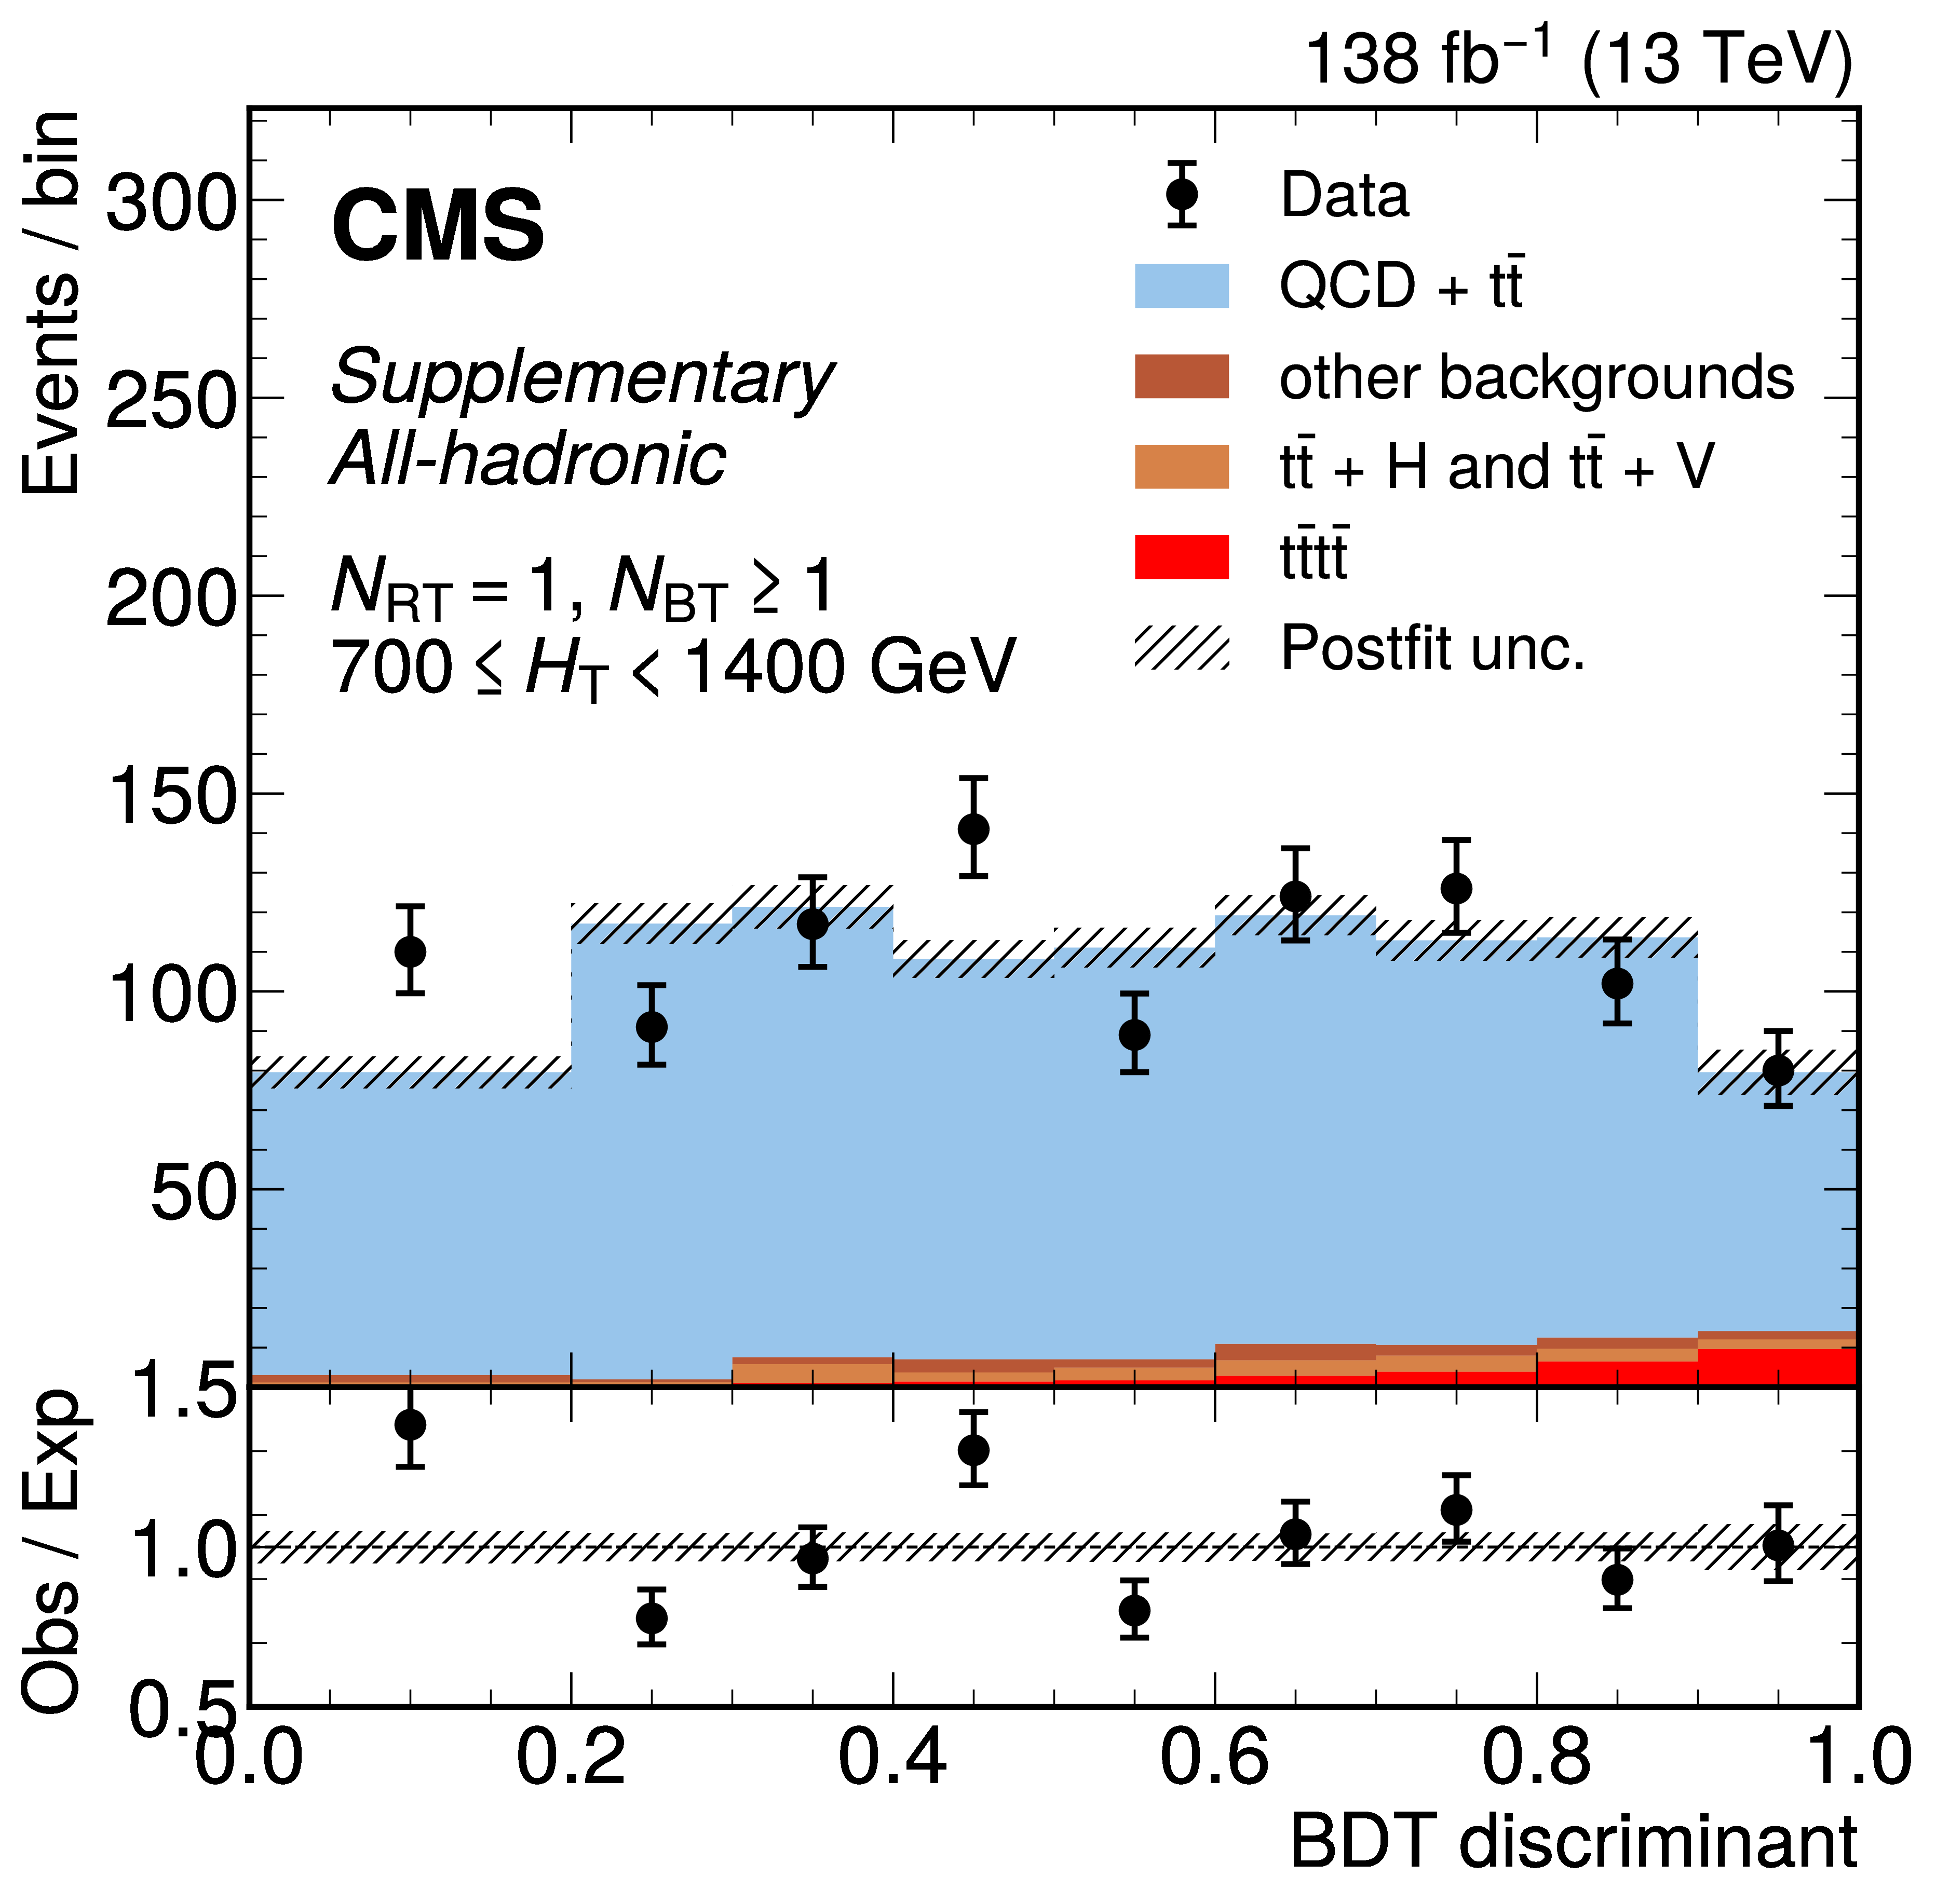
png pdf |
Additional Figure 23-i:
The distribution of the BDT discriminants in the signal region for the full 2016--2018 data set in the all-hadronic channel for all $ N_\text{RT} $, $ N_\text{BT} $, and $ H_{\mathrm{T}} $ categories. ($ N_\text{RT} $ and $ N_\text{BT} $ represent number of resolved tops and b-jets respectively.) The background from QCD multijet and $ \mathrm{t} \bar{\mathrm{t}} $ production is derived from control regions in the data. Estimates for the $ \mathrm{t}\bar{\mathrm{t}}\mathrm{t}\bar{\mathrm{t}} $ signal and other backgrounds are shown using simulated samples. The hatched bands correspond to the estimated total uncertainty after the fit. |
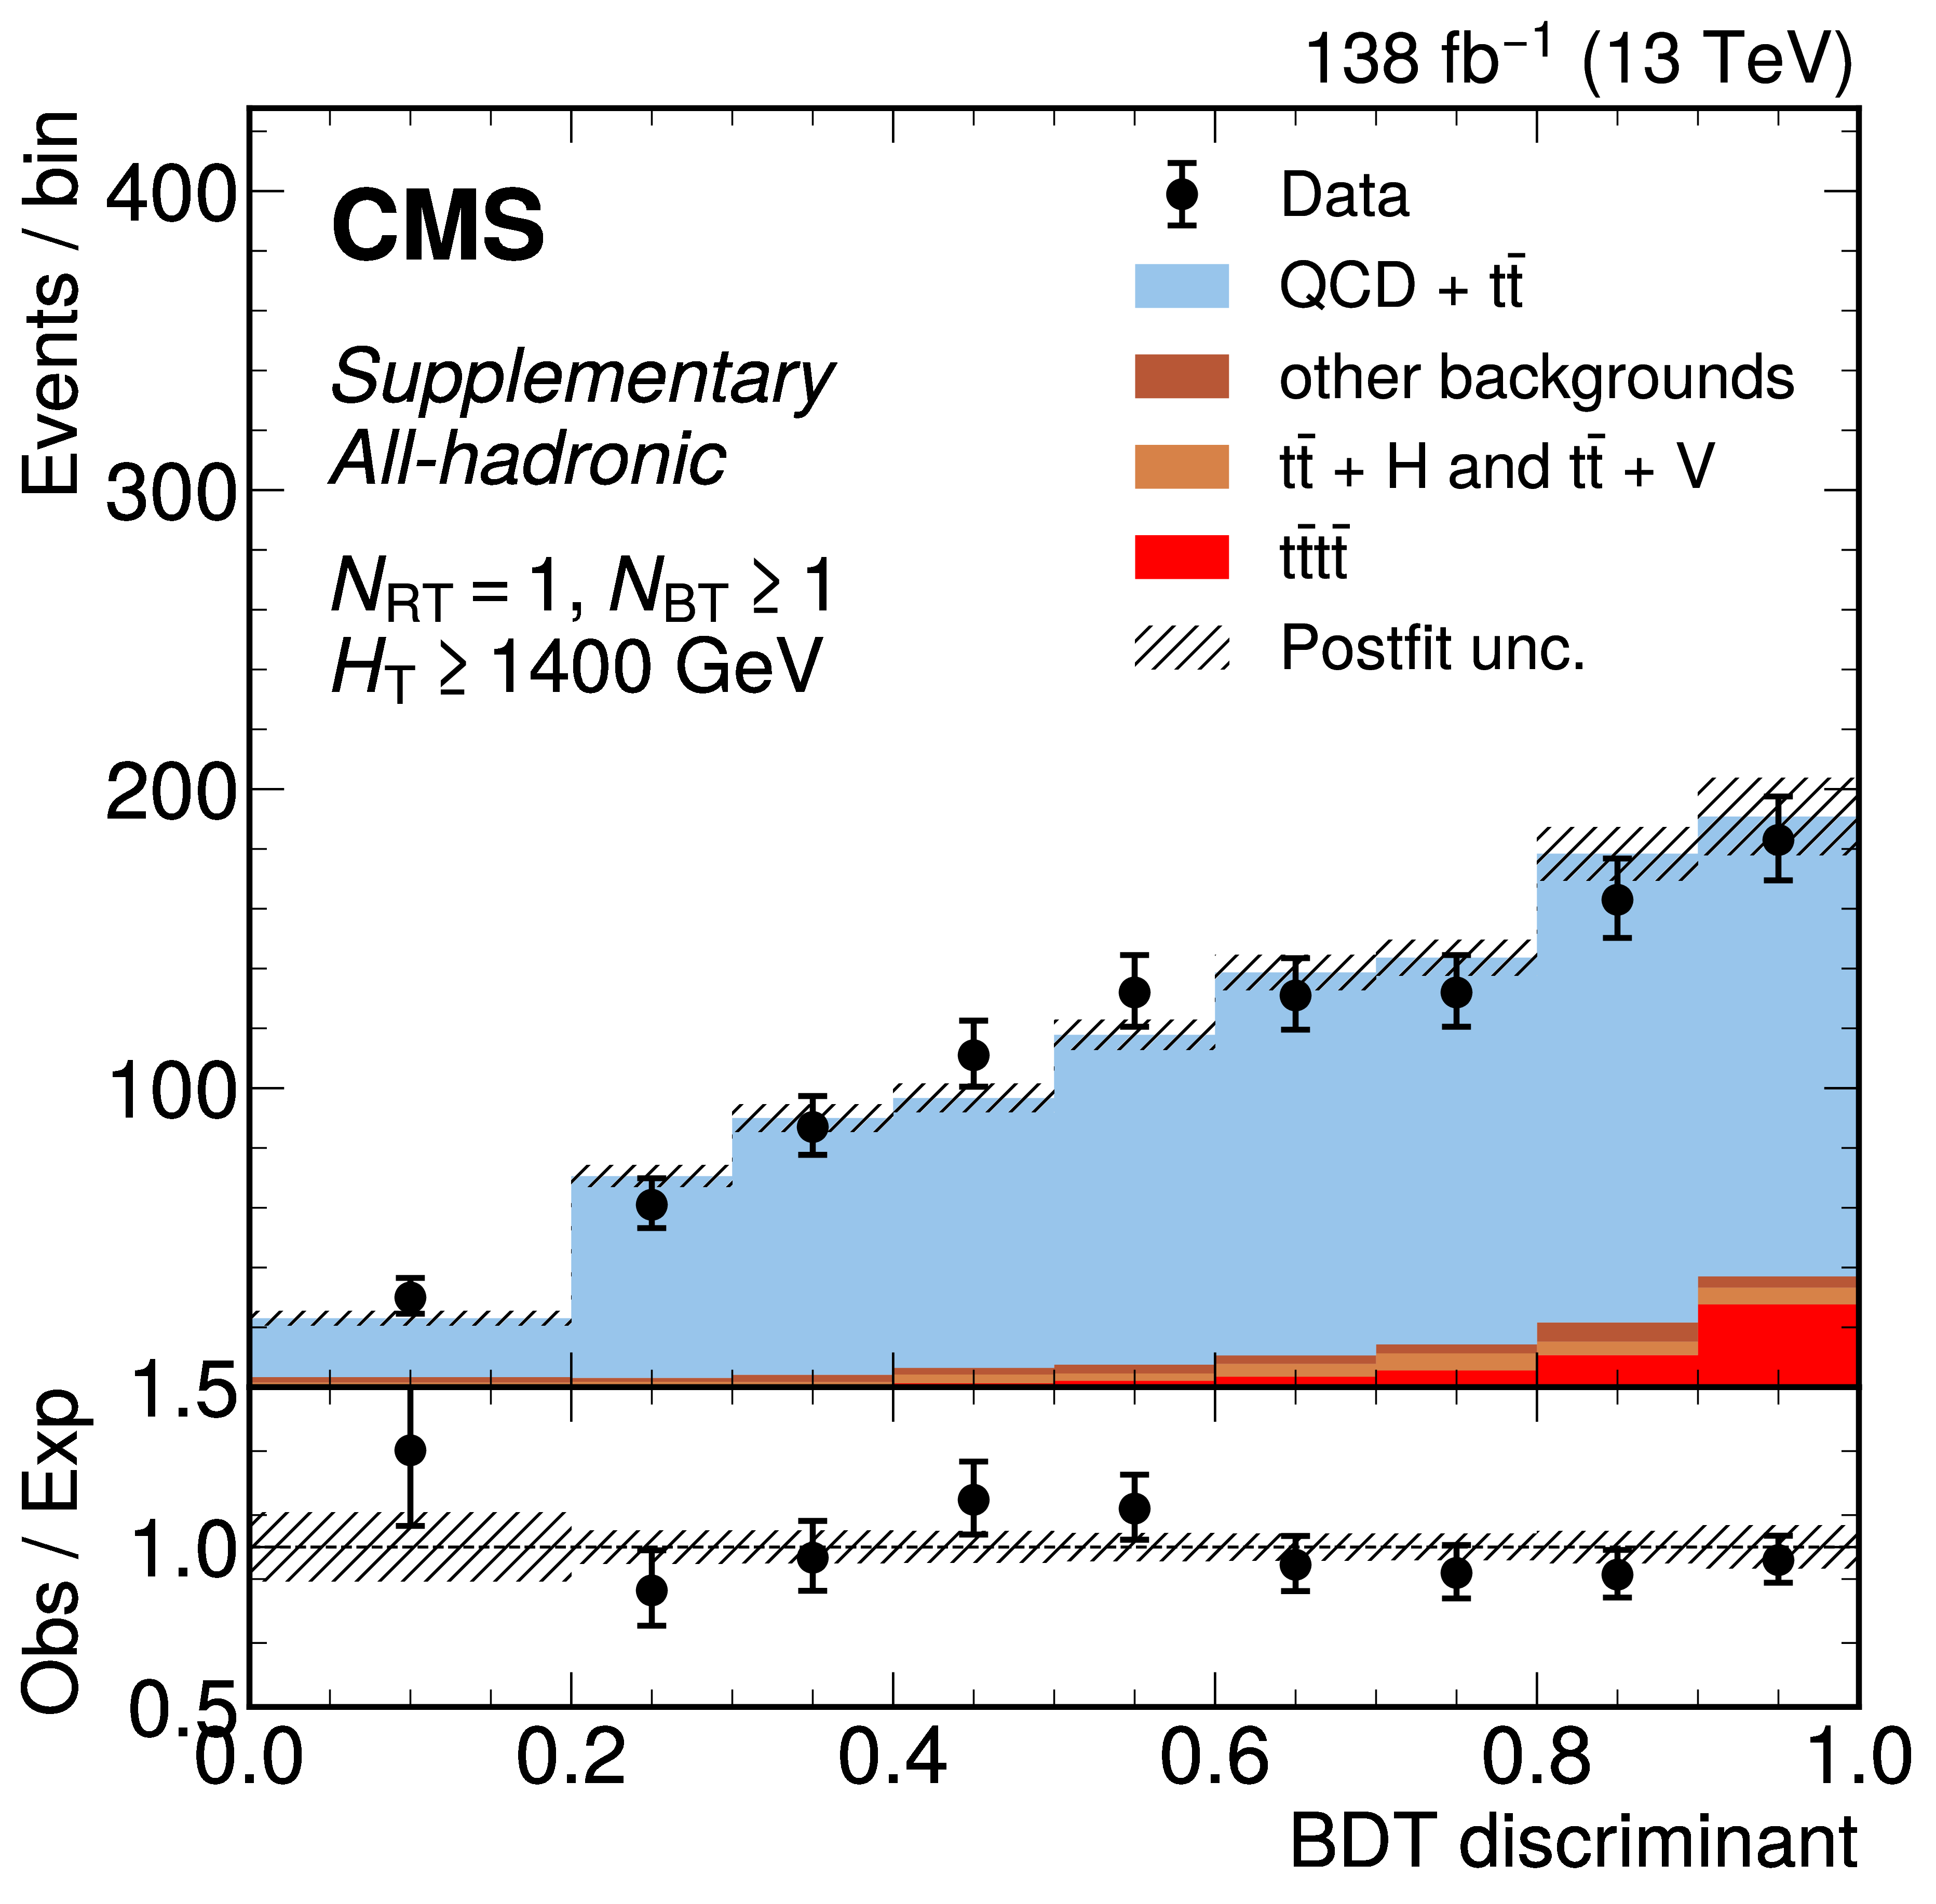
png pdf |
Additional Figure 23-j:
The distribution of the BDT discriminants in the signal region for the full 2016--2018 data set in the all-hadronic channel for all $ N_\text{RT} $, $ N_\text{BT} $, and $ H_{\mathrm{T}} $ categories. ($ N_\text{RT} $ and $ N_\text{BT} $ represent number of resolved tops and b-jets respectively.) The background from QCD multijet and $ \mathrm{t} \bar{\mathrm{t}} $ production is derived from control regions in the data. Estimates for the $ \mathrm{t}\bar{\mathrm{t}}\mathrm{t}\bar{\mathrm{t}} $ signal and other backgrounds are shown using simulated samples. The hatched bands correspond to the estimated total uncertainty after the fit. |
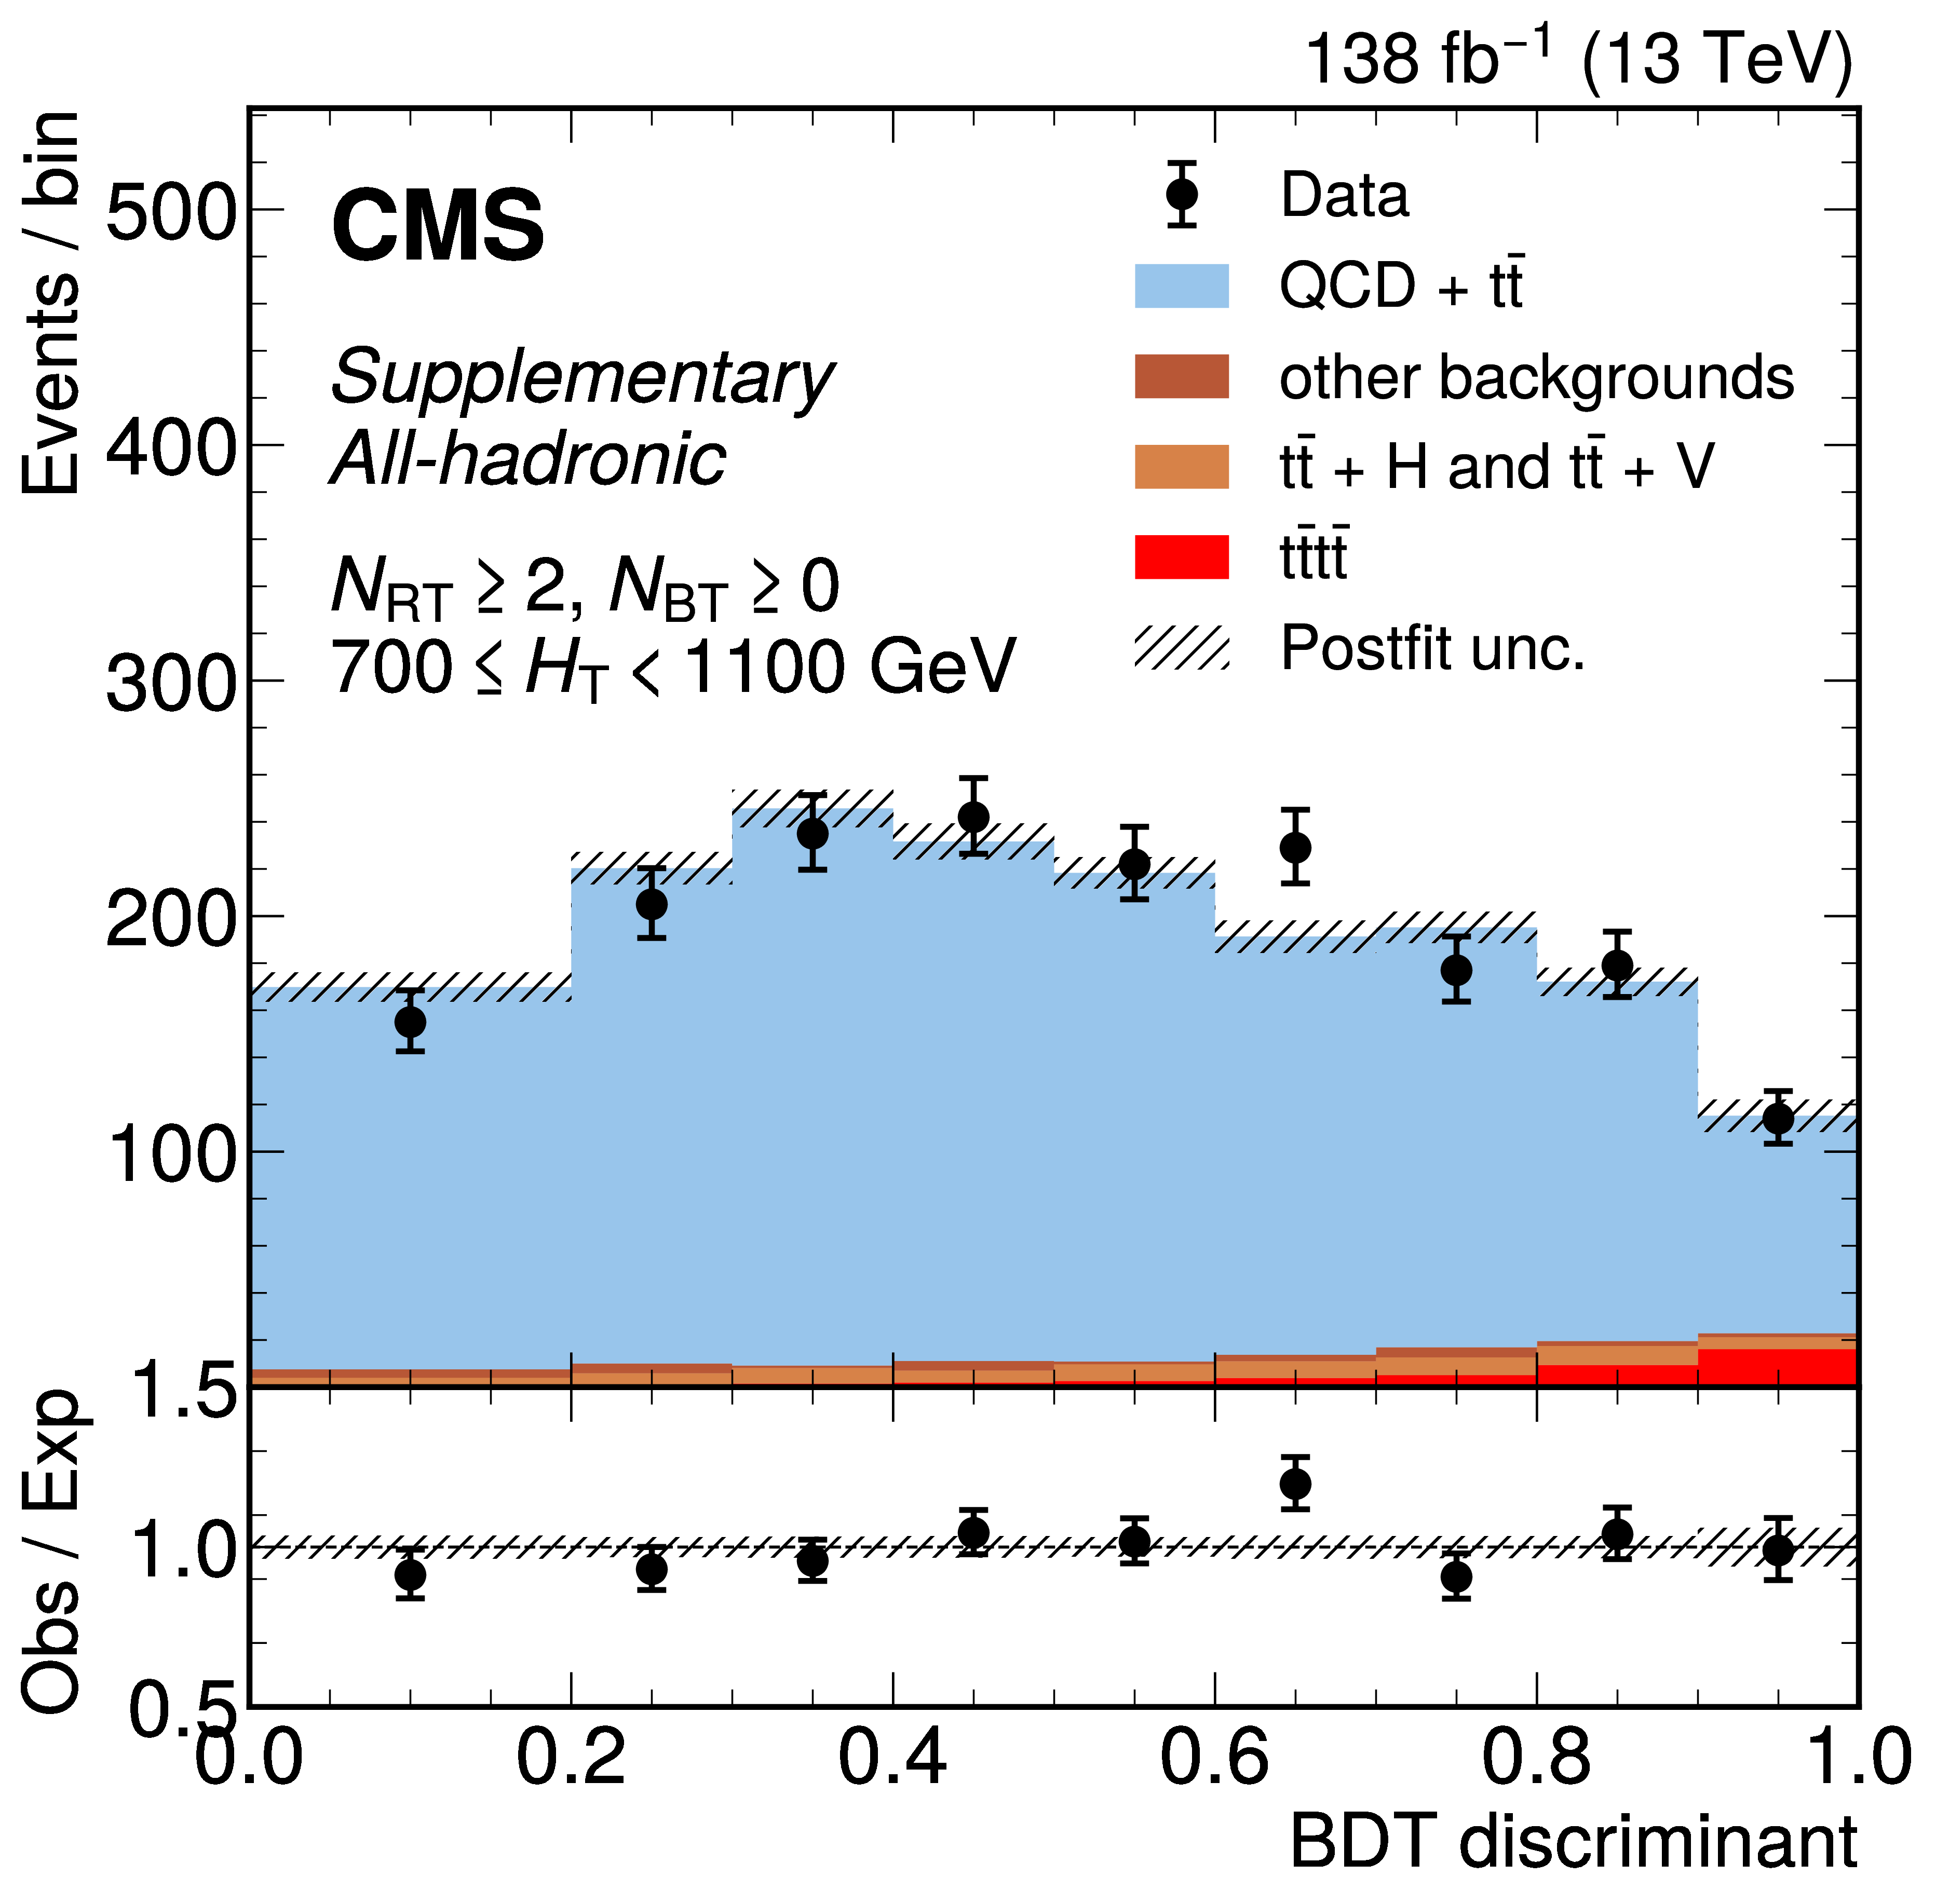
png pdf |
Additional Figure 23-k:
The distribution of the BDT discriminants in the signal region for the full 2016--2018 data set in the all-hadronic channel for all $ N_\text{RT} $, $ N_\text{BT} $, and $ H_{\mathrm{T}} $ categories. ($ N_\text{RT} $ and $ N_\text{BT} $ represent number of resolved tops and b-jets respectively.) The background from QCD multijet and $ \mathrm{t} \bar{\mathrm{t}} $ production is derived from control regions in the data. Estimates for the $ \mathrm{t}\bar{\mathrm{t}}\mathrm{t}\bar{\mathrm{t}} $ signal and other backgrounds are shown using simulated samples. The hatched bands correspond to the estimated total uncertainty after the fit. |
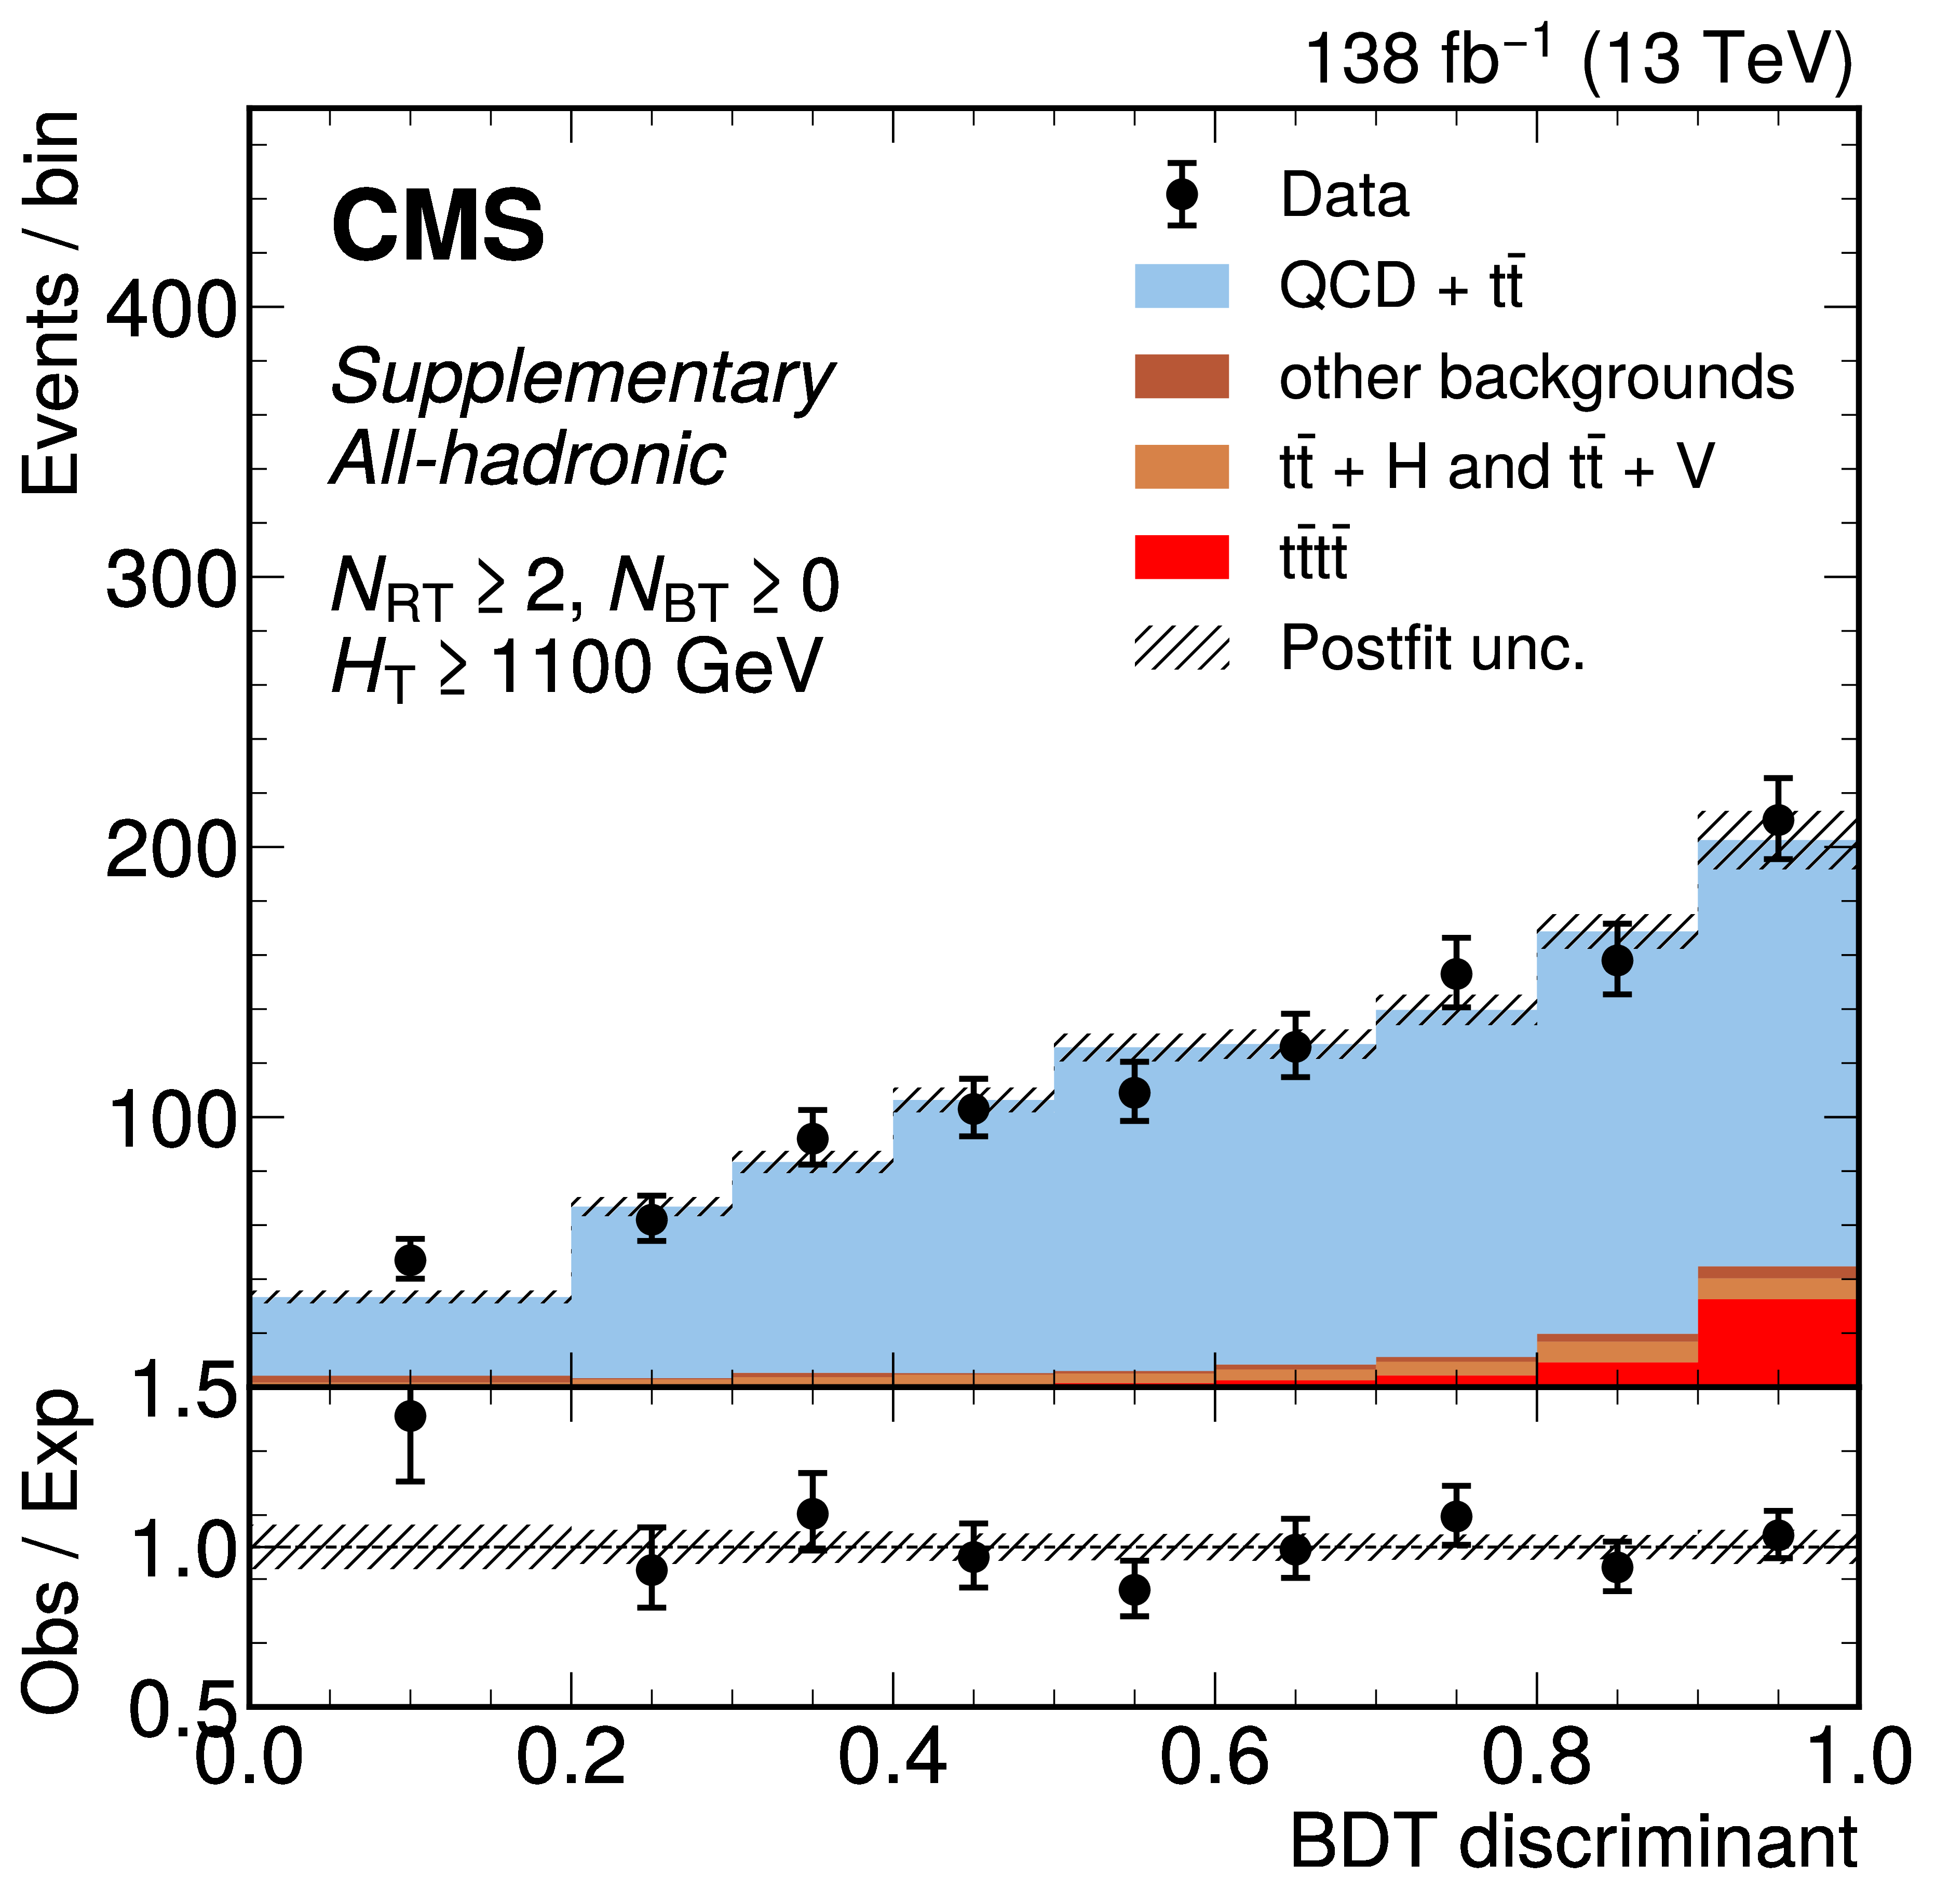
png pdf |
Additional Figure 23-l:
The distribution of the BDT discriminants in the signal region for the full 2016--2018 data set in the all-hadronic channel for all $ N_\text{RT} $, $ N_\text{BT} $, and $ H_{\mathrm{T}} $ categories. ($ N_\text{RT} $ and $ N_\text{BT} $ represent number of resolved tops and b-jets respectively.) The background from QCD multijet and $ \mathrm{t} \bar{\mathrm{t}} $ production is derived from control regions in the data. Estimates for the $ \mathrm{t}\bar{\mathrm{t}}\mathrm{t}\bar{\mathrm{t}} $ signal and other backgrounds are shown using simulated samples. The hatched bands correspond to the estimated total uncertainty after the fit. |
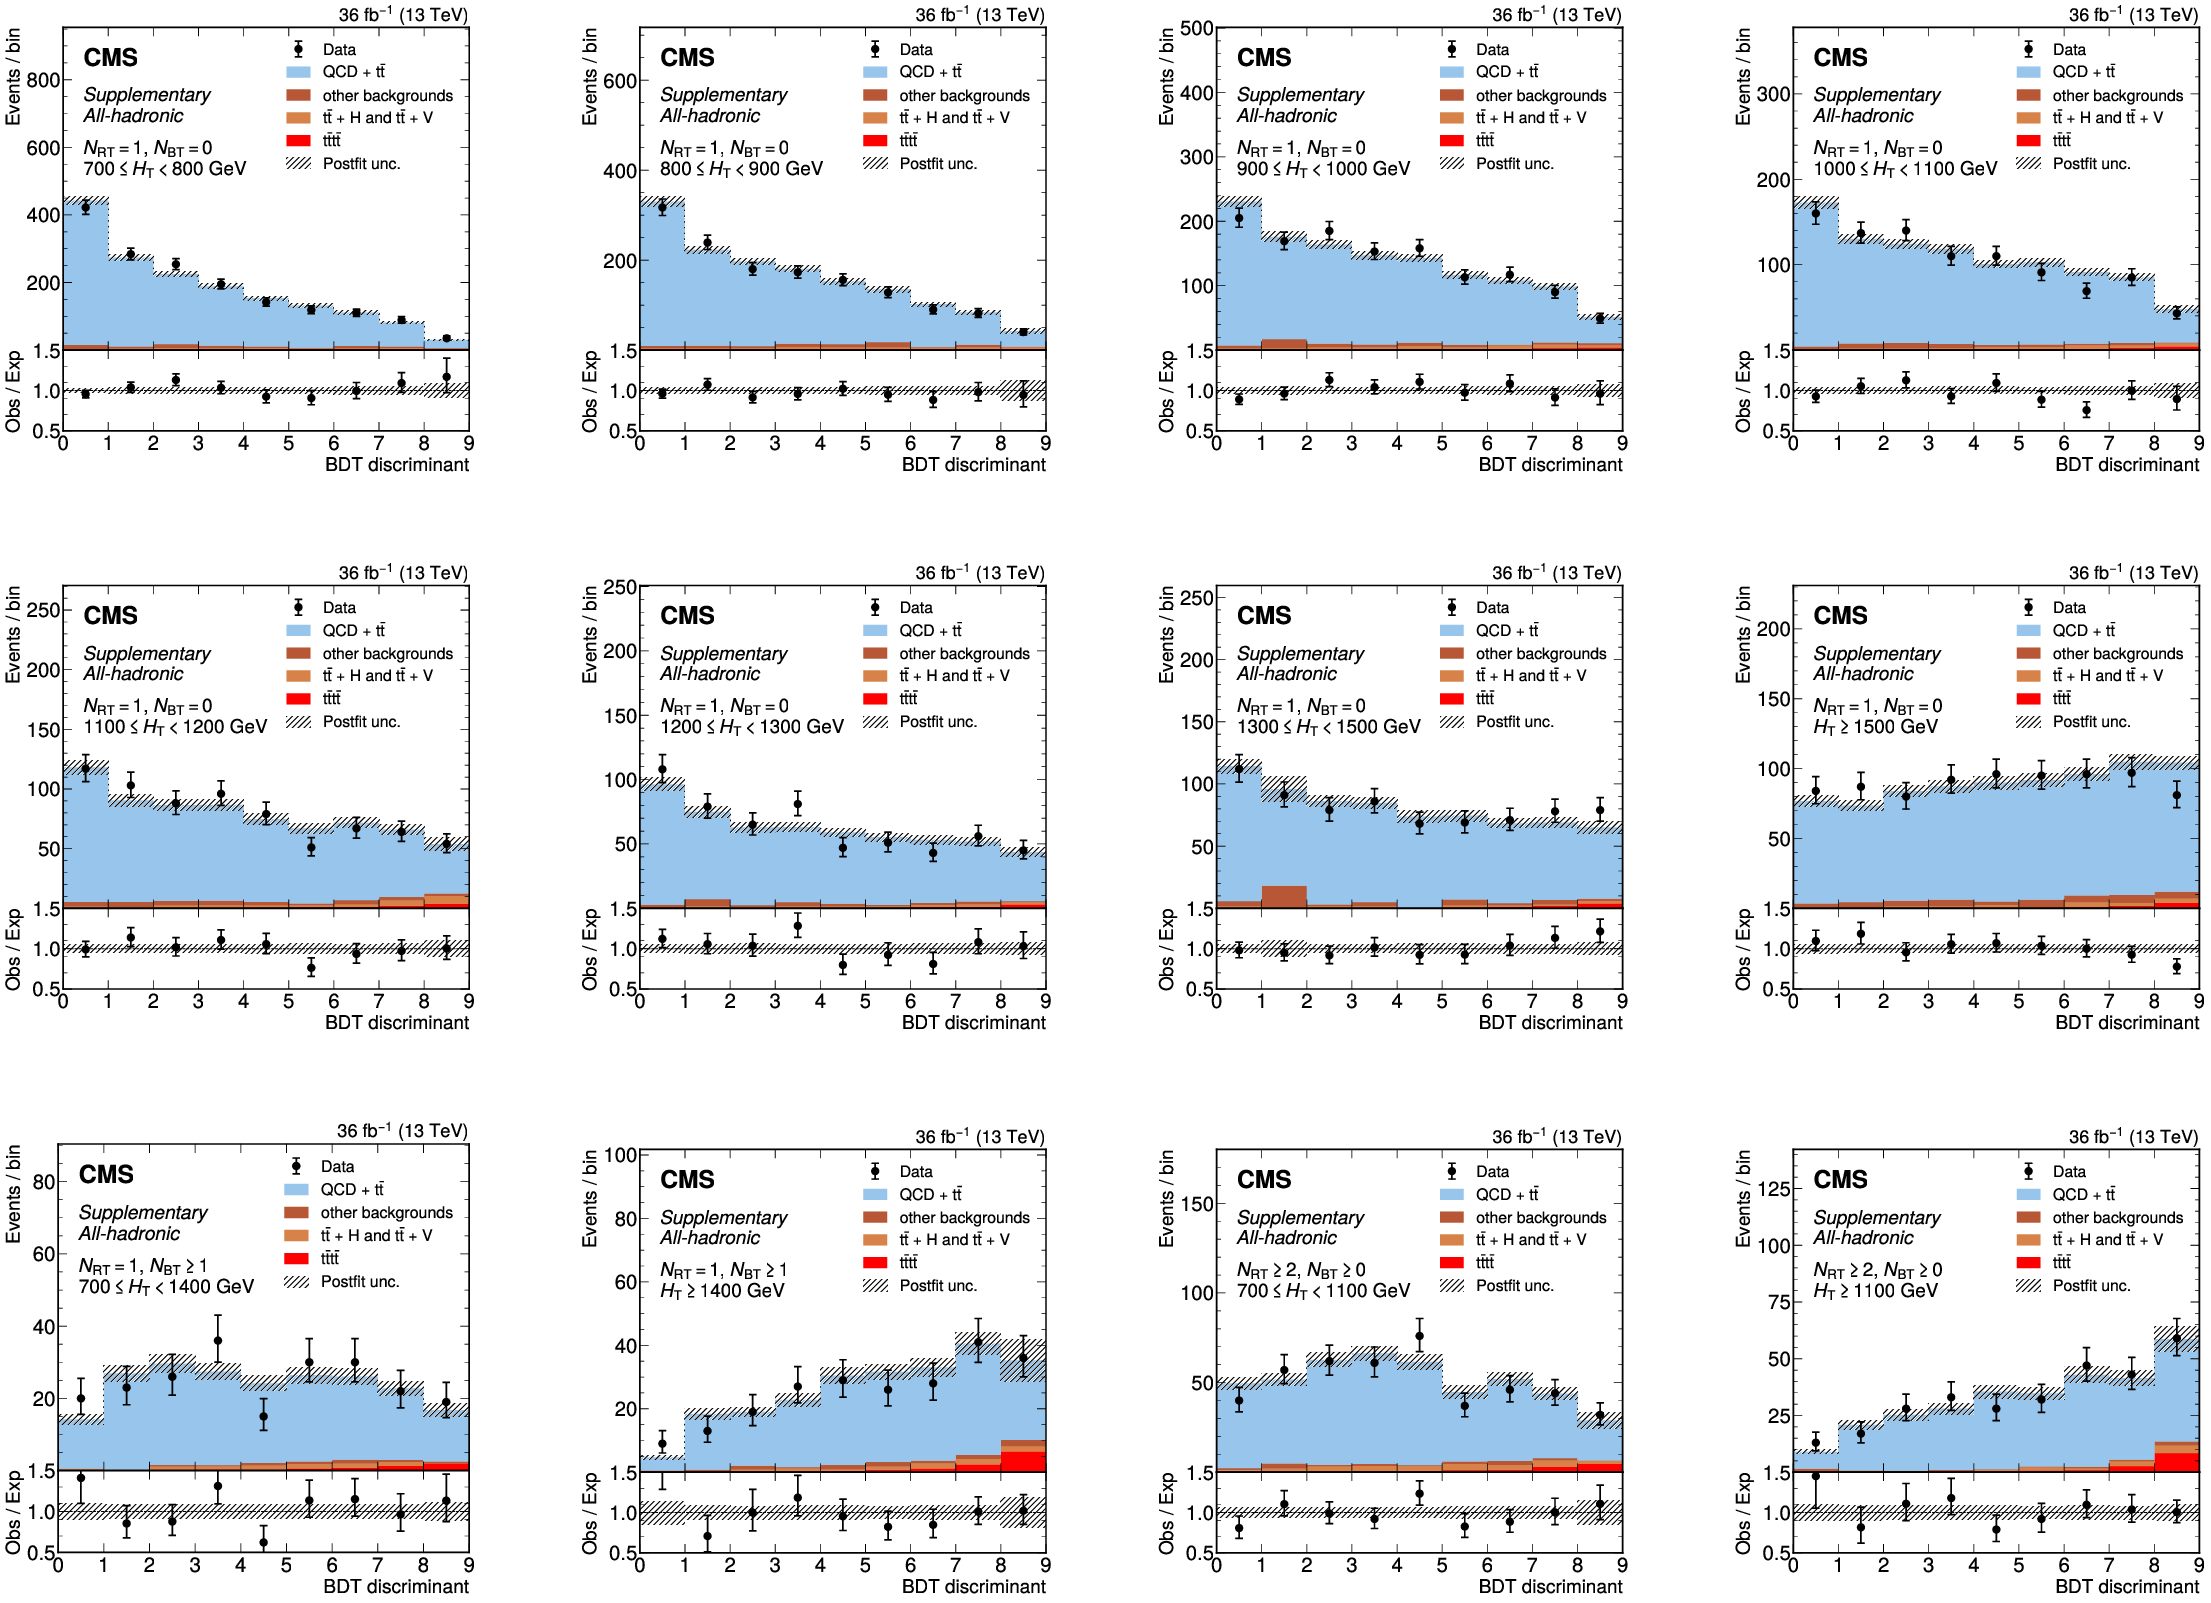
png pdf |
Additional Figure 24:
The distribution of the BDT discriminants in the signal region for the 2016 data set in the all-hadronic channel for all $ N_\text{RT} $, $ N_\text{BT} $, and $ H_{\mathrm{T}} $ categories. ($ N_\text{RT} $ and $ N_\text{BT} $ represent number of resolved tops and b-jets respectively.) The background from QCD multijet and $ \mathrm{t} \bar{\mathrm{t}} $ production is derived from control regions in the data. Estimates for the $ \mathrm{t}\bar{\mathrm{t}}\mathrm{t}\bar{\mathrm{t}} $ signal and other backgrounds are shown using simulated samples. The hatched bands correspond to the estimated total uncertainty after the fit. |
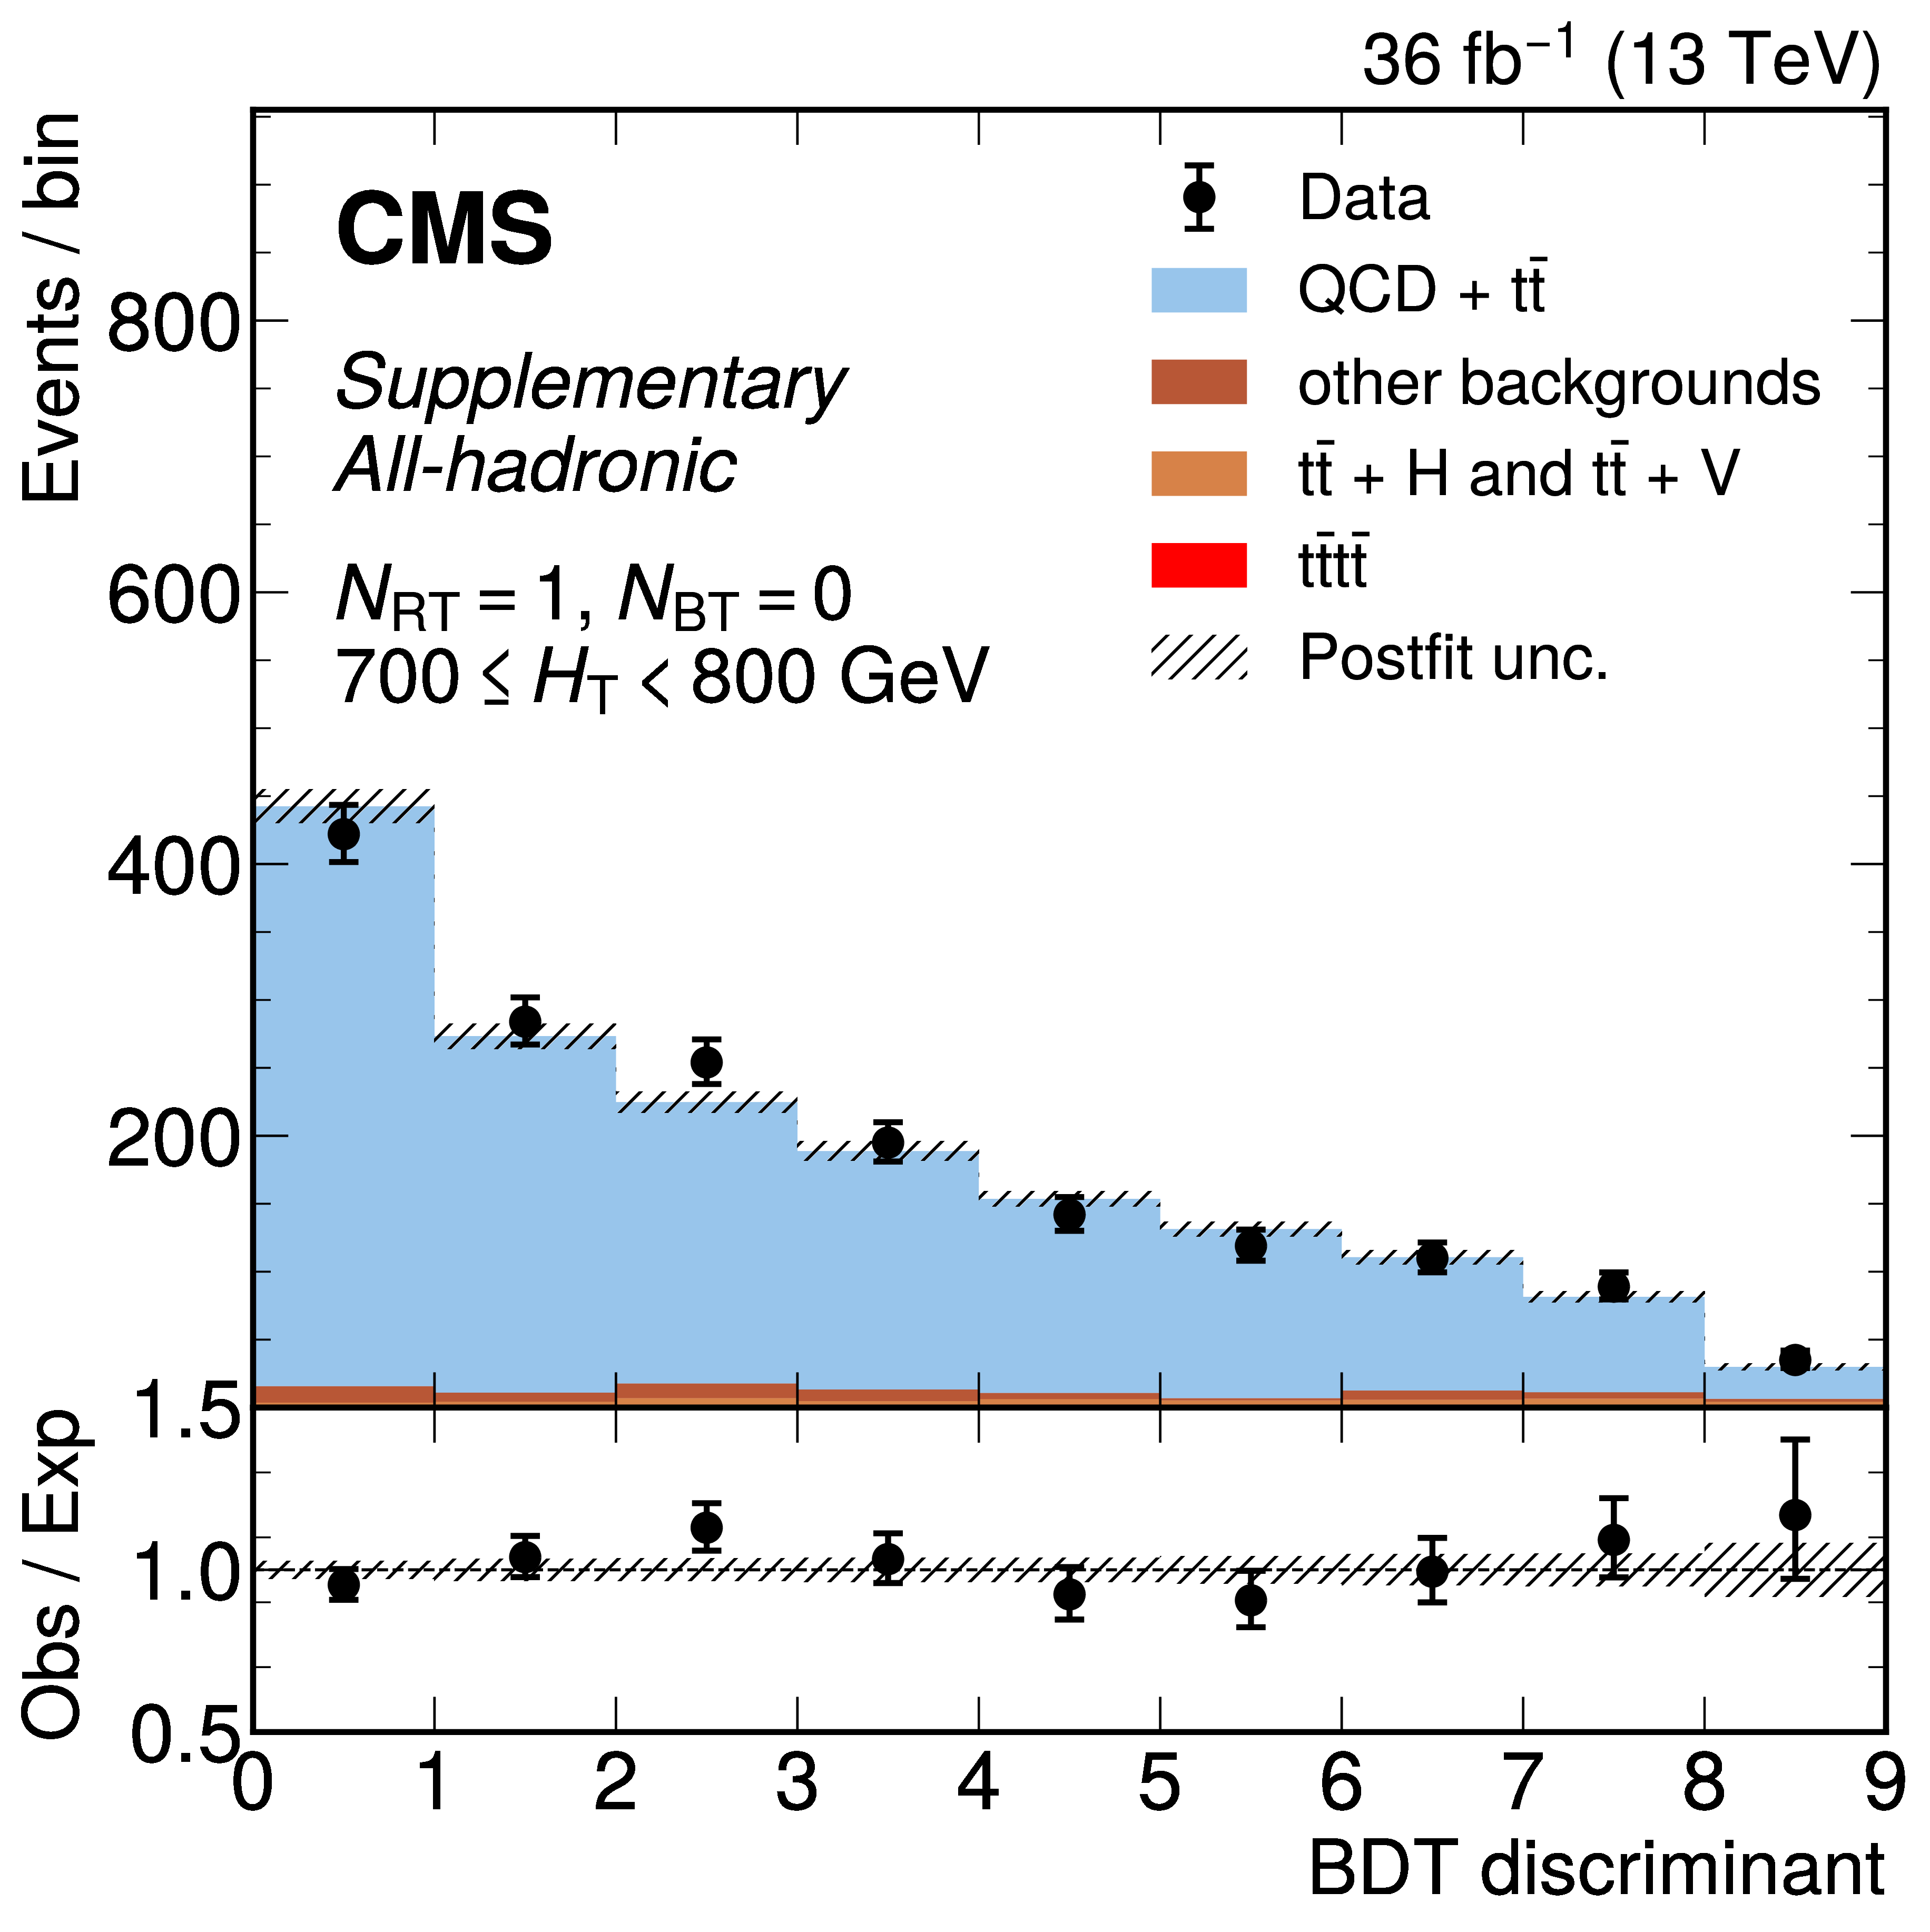
png pdf |
Additional Figure 24-a:
The distribution of the BDT discriminants in the signal region for the 2016 data set in the all-hadronic channel for all $ N_\text{RT} $, $ N_\text{BT} $, and $ H_{\mathrm{T}} $ categories. ($ N_\text{RT} $ and $ N_\text{BT} $ represent number of resolved tops and b-jets respectively.) The background from QCD multijet and $ \mathrm{t} \bar{\mathrm{t}} $ production is derived from control regions in the data. Estimates for the $ \mathrm{t}\bar{\mathrm{t}}\mathrm{t}\bar{\mathrm{t}} $ signal and other backgrounds are shown using simulated samples. The hatched bands correspond to the estimated total uncertainty after the fit. |

png pdf |
Additional Figure 24-b:
The distribution of the BDT discriminants in the signal region for the 2016 data set in the all-hadronic channel for all $ N_\text{RT} $, $ N_\text{BT} $, and $ H_{\mathrm{T}} $ categories. ($ N_\text{RT} $ and $ N_\text{BT} $ represent number of resolved tops and b-jets respectively.) The background from QCD multijet and $ \mathrm{t} \bar{\mathrm{t}} $ production is derived from control regions in the data. Estimates for the $ \mathrm{t}\bar{\mathrm{t}}\mathrm{t}\bar{\mathrm{t}} $ signal and other backgrounds are shown using simulated samples. The hatched bands correspond to the estimated total uncertainty after the fit. |
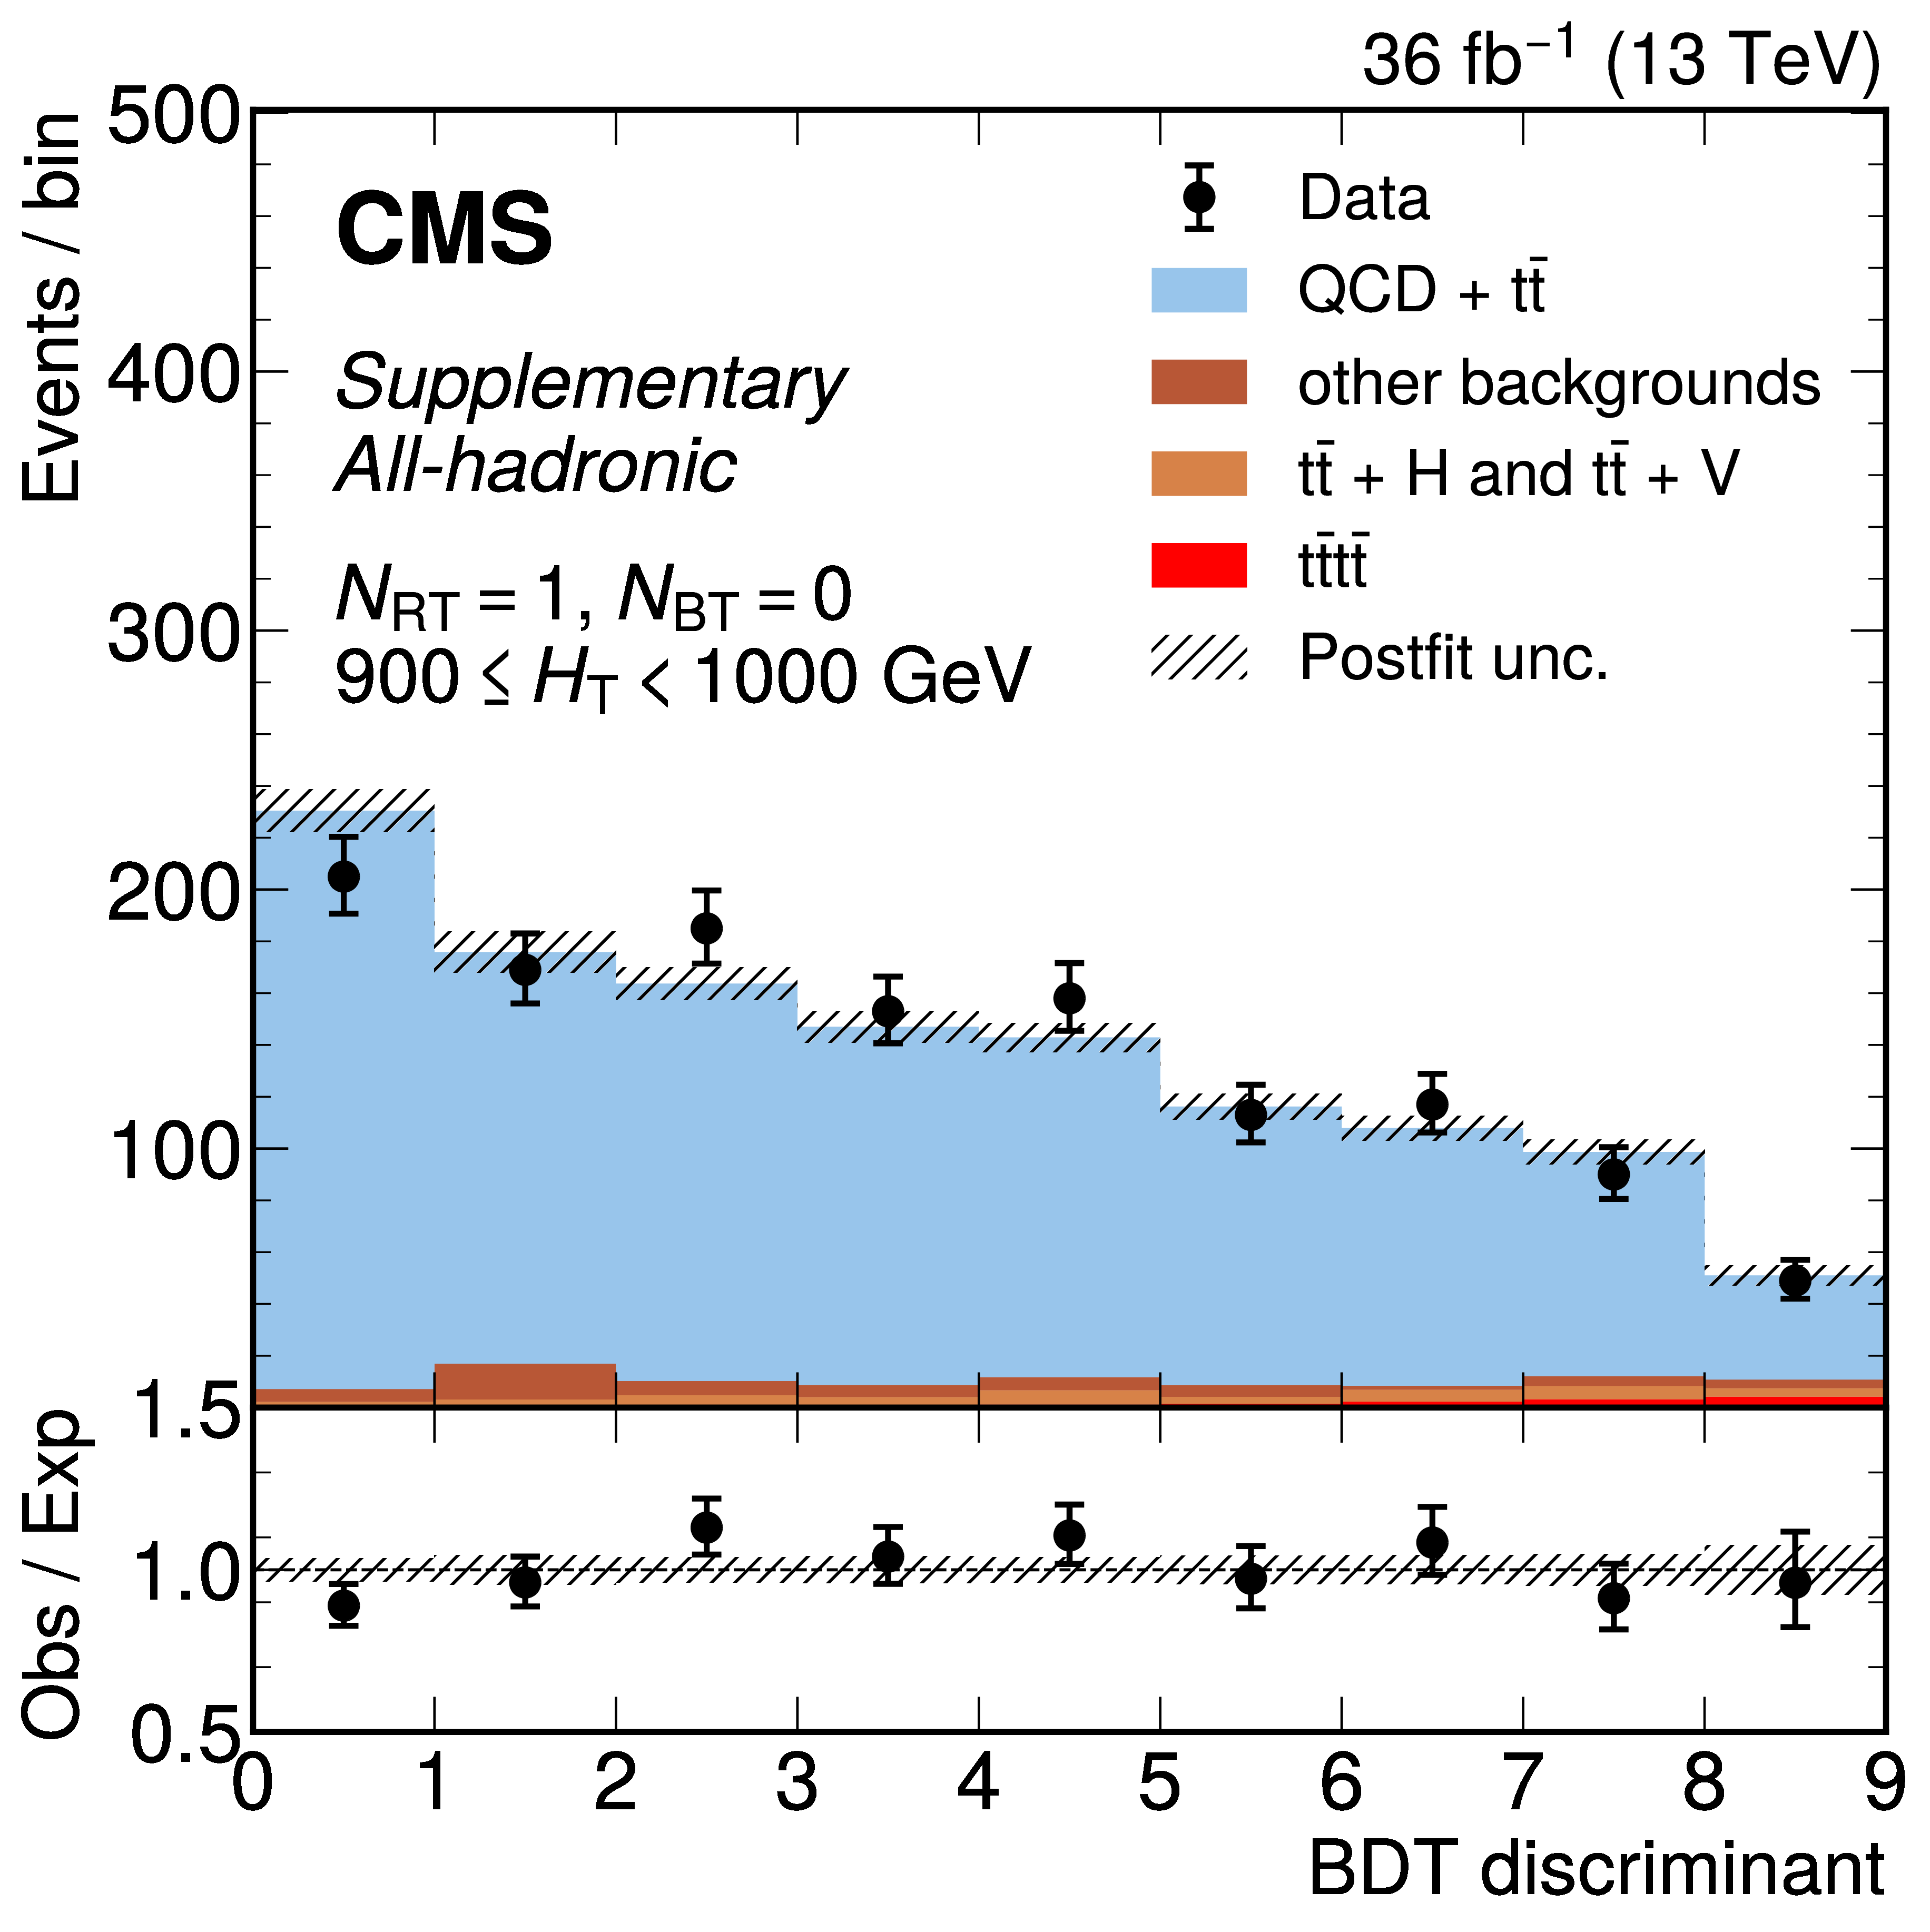
png pdf |
Additional Figure 24-c:
The distribution of the BDT discriminants in the signal region for the 2016 data set in the all-hadronic channel for all $ N_\text{RT} $, $ N_\text{BT} $, and $ H_{\mathrm{T}} $ categories. ($ N_\text{RT} $ and $ N_\text{BT} $ represent number of resolved tops and b-jets respectively.) The background from QCD multijet and $ \mathrm{t} \bar{\mathrm{t}} $ production is derived from control regions in the data. Estimates for the $ \mathrm{t}\bar{\mathrm{t}}\mathrm{t}\bar{\mathrm{t}} $ signal and other backgrounds are shown using simulated samples. The hatched bands correspond to the estimated total uncertainty after the fit. |
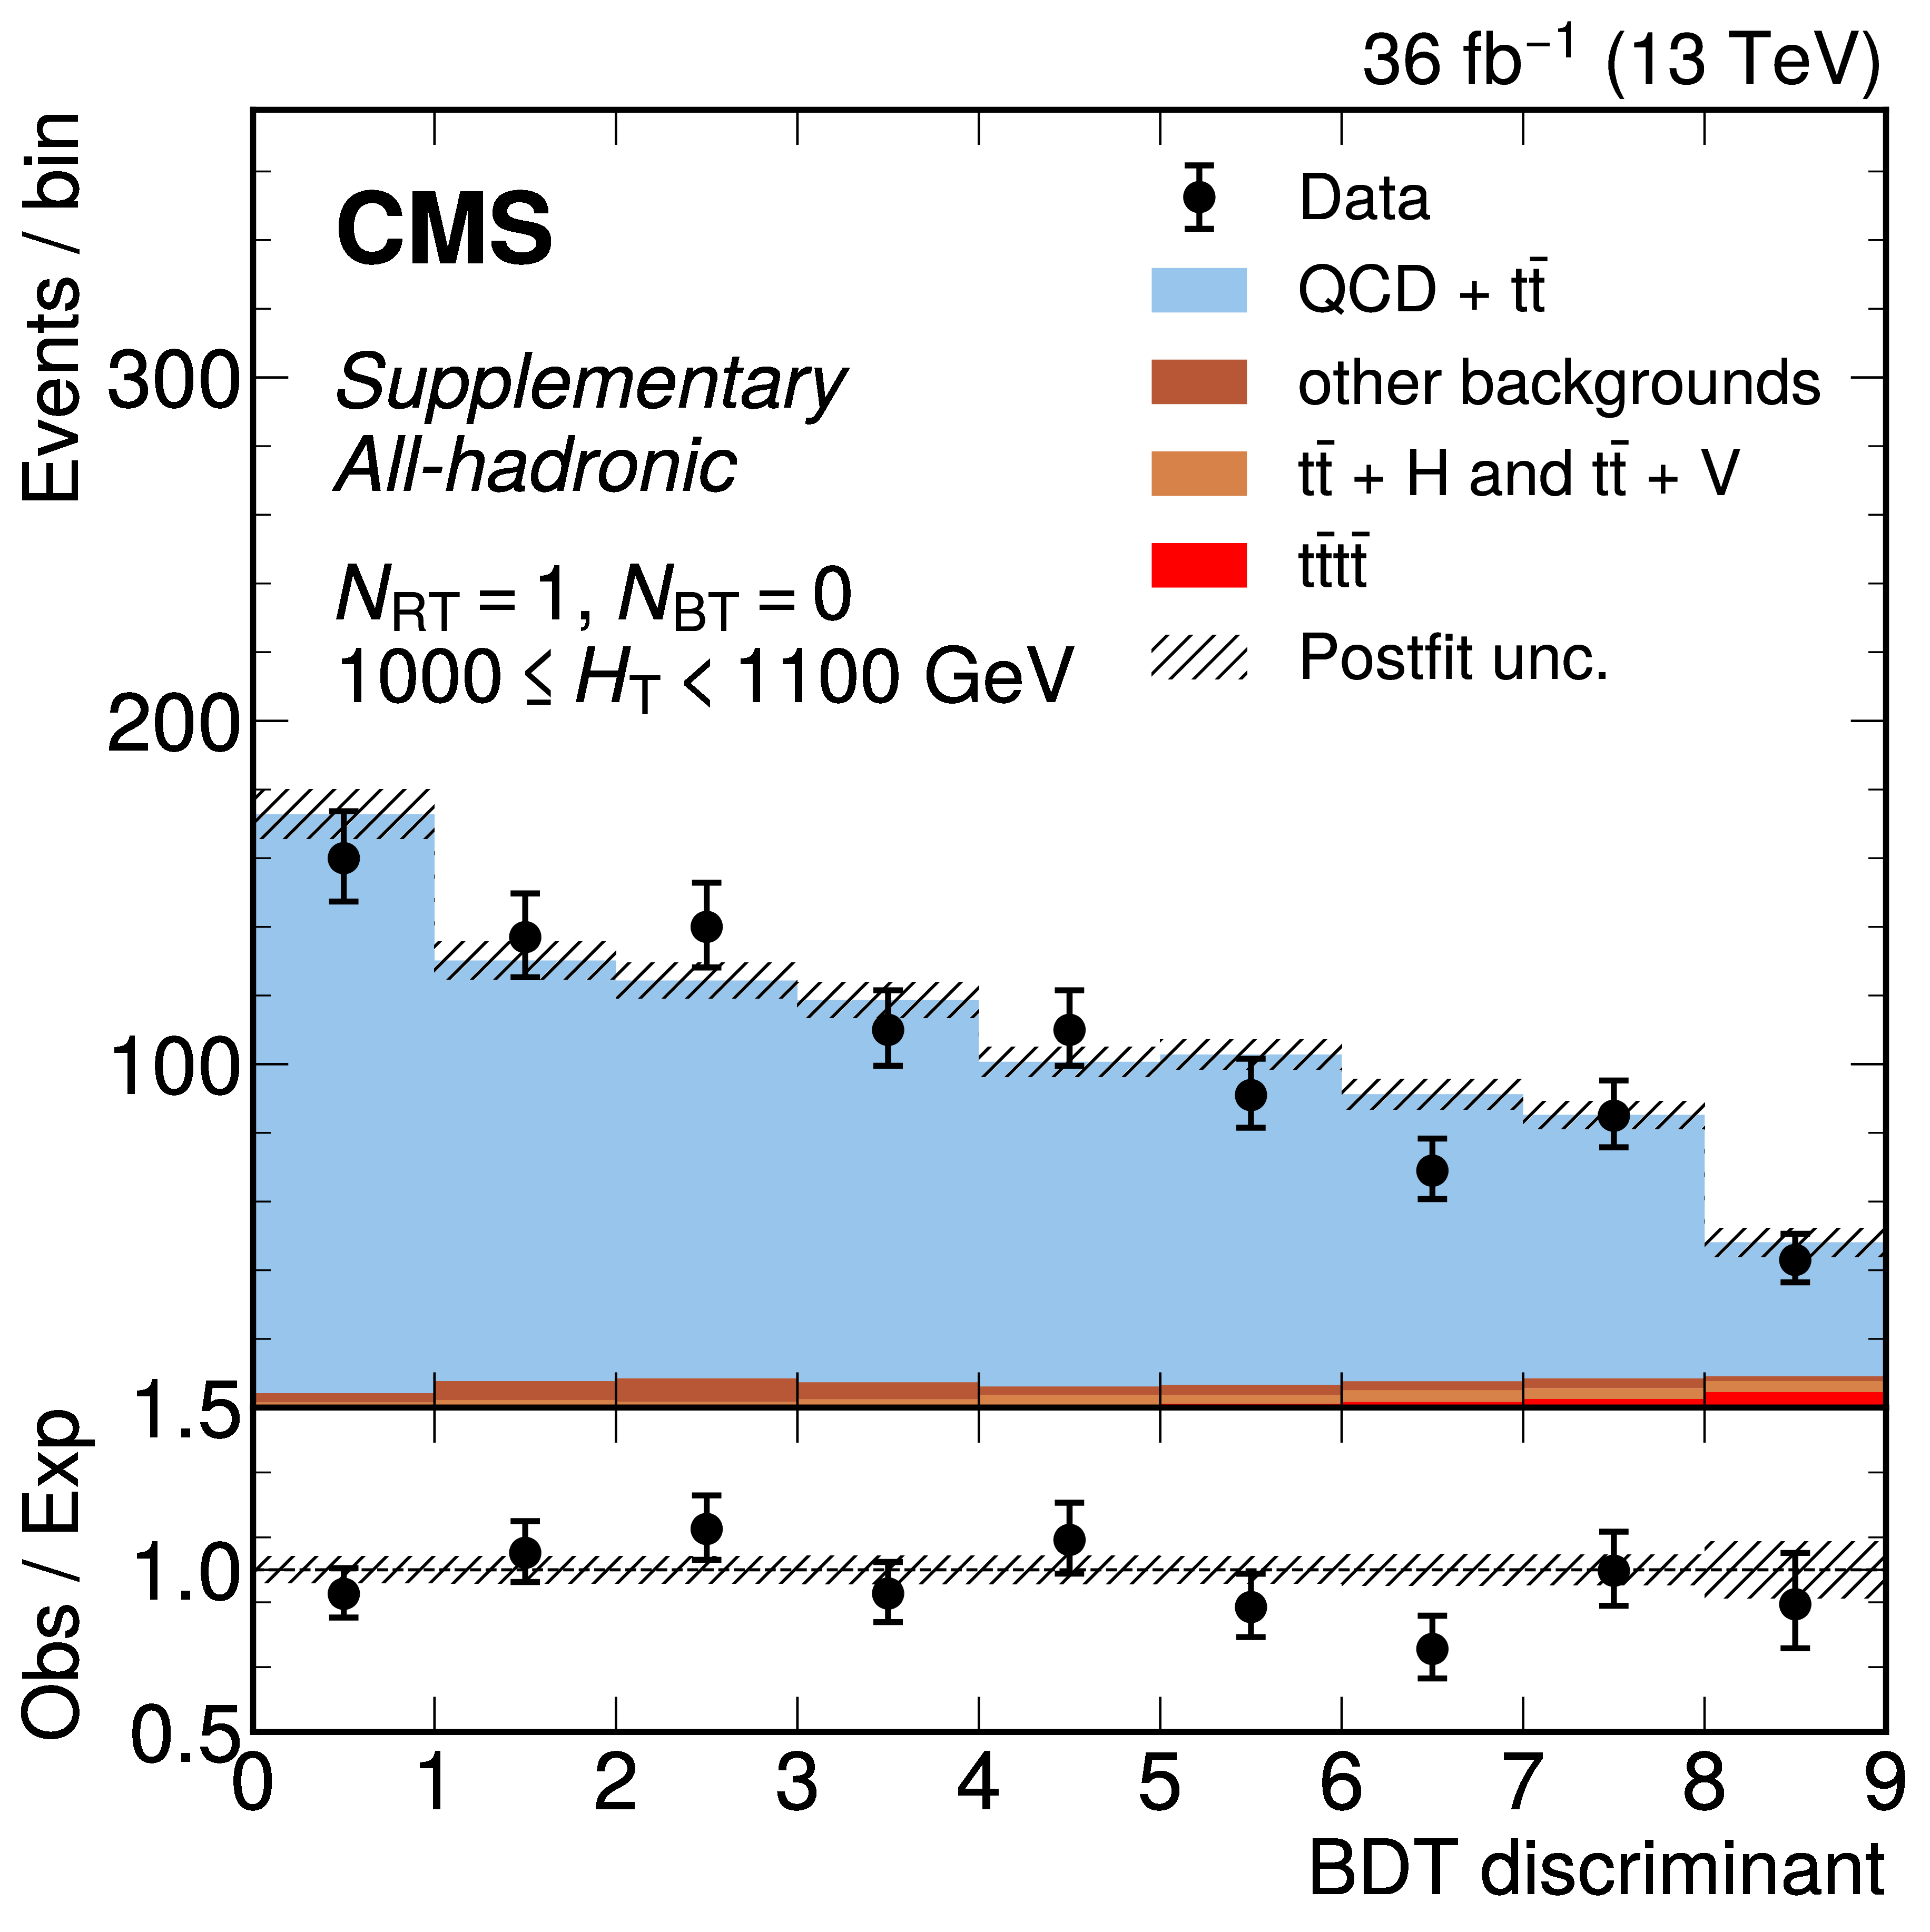
png pdf |
Additional Figure 24-d:
The distribution of the BDT discriminants in the signal region for the 2016 data set in the all-hadronic channel for all $ N_\text{RT} $, $ N_\text{BT} $, and $ H_{\mathrm{T}} $ categories. ($ N_\text{RT} $ and $ N_\text{BT} $ represent number of resolved tops and b-jets respectively.) The background from QCD multijet and $ \mathrm{t} \bar{\mathrm{t}} $ production is derived from control regions in the data. Estimates for the $ \mathrm{t}\bar{\mathrm{t}}\mathrm{t}\bar{\mathrm{t}} $ signal and other backgrounds are shown using simulated samples. The hatched bands correspond to the estimated total uncertainty after the fit. |
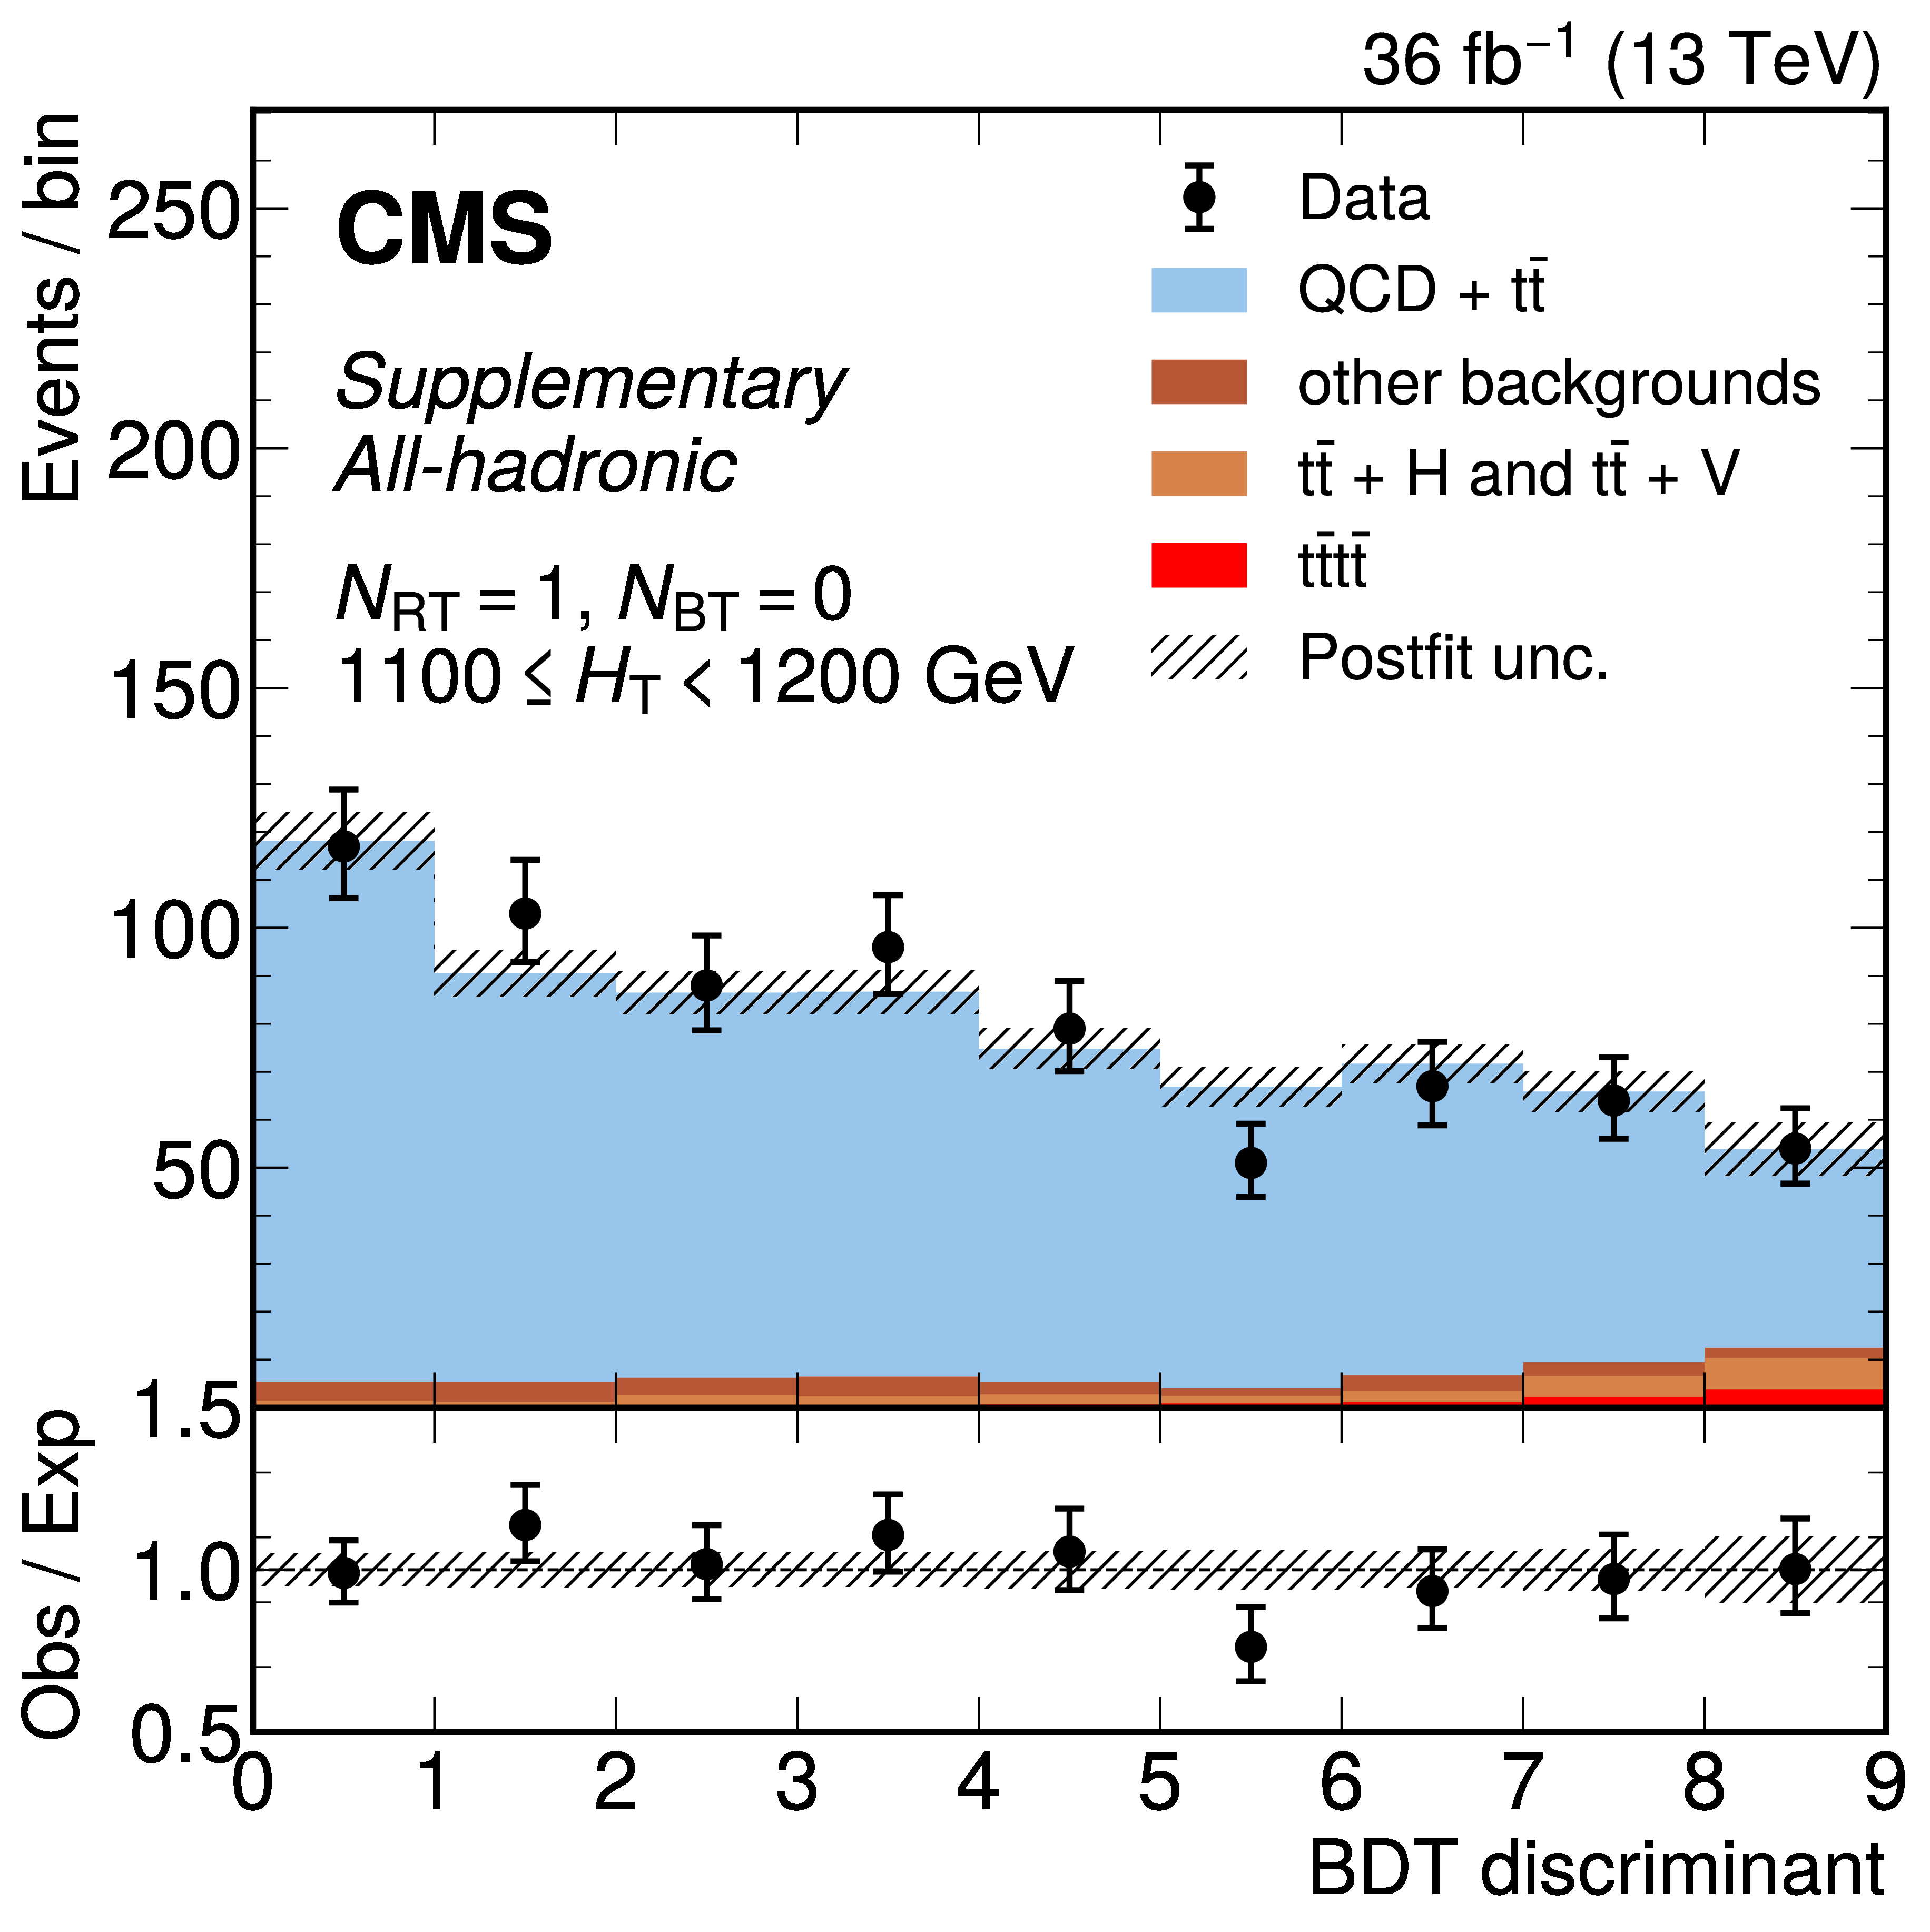
png pdf |
Additional Figure 24-e:
The distribution of the BDT discriminants in the signal region for the 2016 data set in the all-hadronic channel for all $ N_\text{RT} $, $ N_\text{BT} $, and $ H_{\mathrm{T}} $ categories. ($ N_\text{RT} $ and $ N_\text{BT} $ represent number of resolved tops and b-jets respectively.) The background from QCD multijet and $ \mathrm{t} \bar{\mathrm{t}} $ production is derived from control regions in the data. Estimates for the $ \mathrm{t}\bar{\mathrm{t}}\mathrm{t}\bar{\mathrm{t}} $ signal and other backgrounds are shown using simulated samples. The hatched bands correspond to the estimated total uncertainty after the fit. |

png pdf |
Additional Figure 24-f:
The distribution of the BDT discriminants in the signal region for the 2016 data set in the all-hadronic channel for all $ N_\text{RT} $, $ N_\text{BT} $, and $ H_{\mathrm{T}} $ categories. ($ N_\text{RT} $ and $ N_\text{BT} $ represent number of resolved tops and b-jets respectively.) The background from QCD multijet and $ \mathrm{t} \bar{\mathrm{t}} $ production is derived from control regions in the data. Estimates for the $ \mathrm{t}\bar{\mathrm{t}}\mathrm{t}\bar{\mathrm{t}} $ signal and other backgrounds are shown using simulated samples. The hatched bands correspond to the estimated total uncertainty after the fit. |
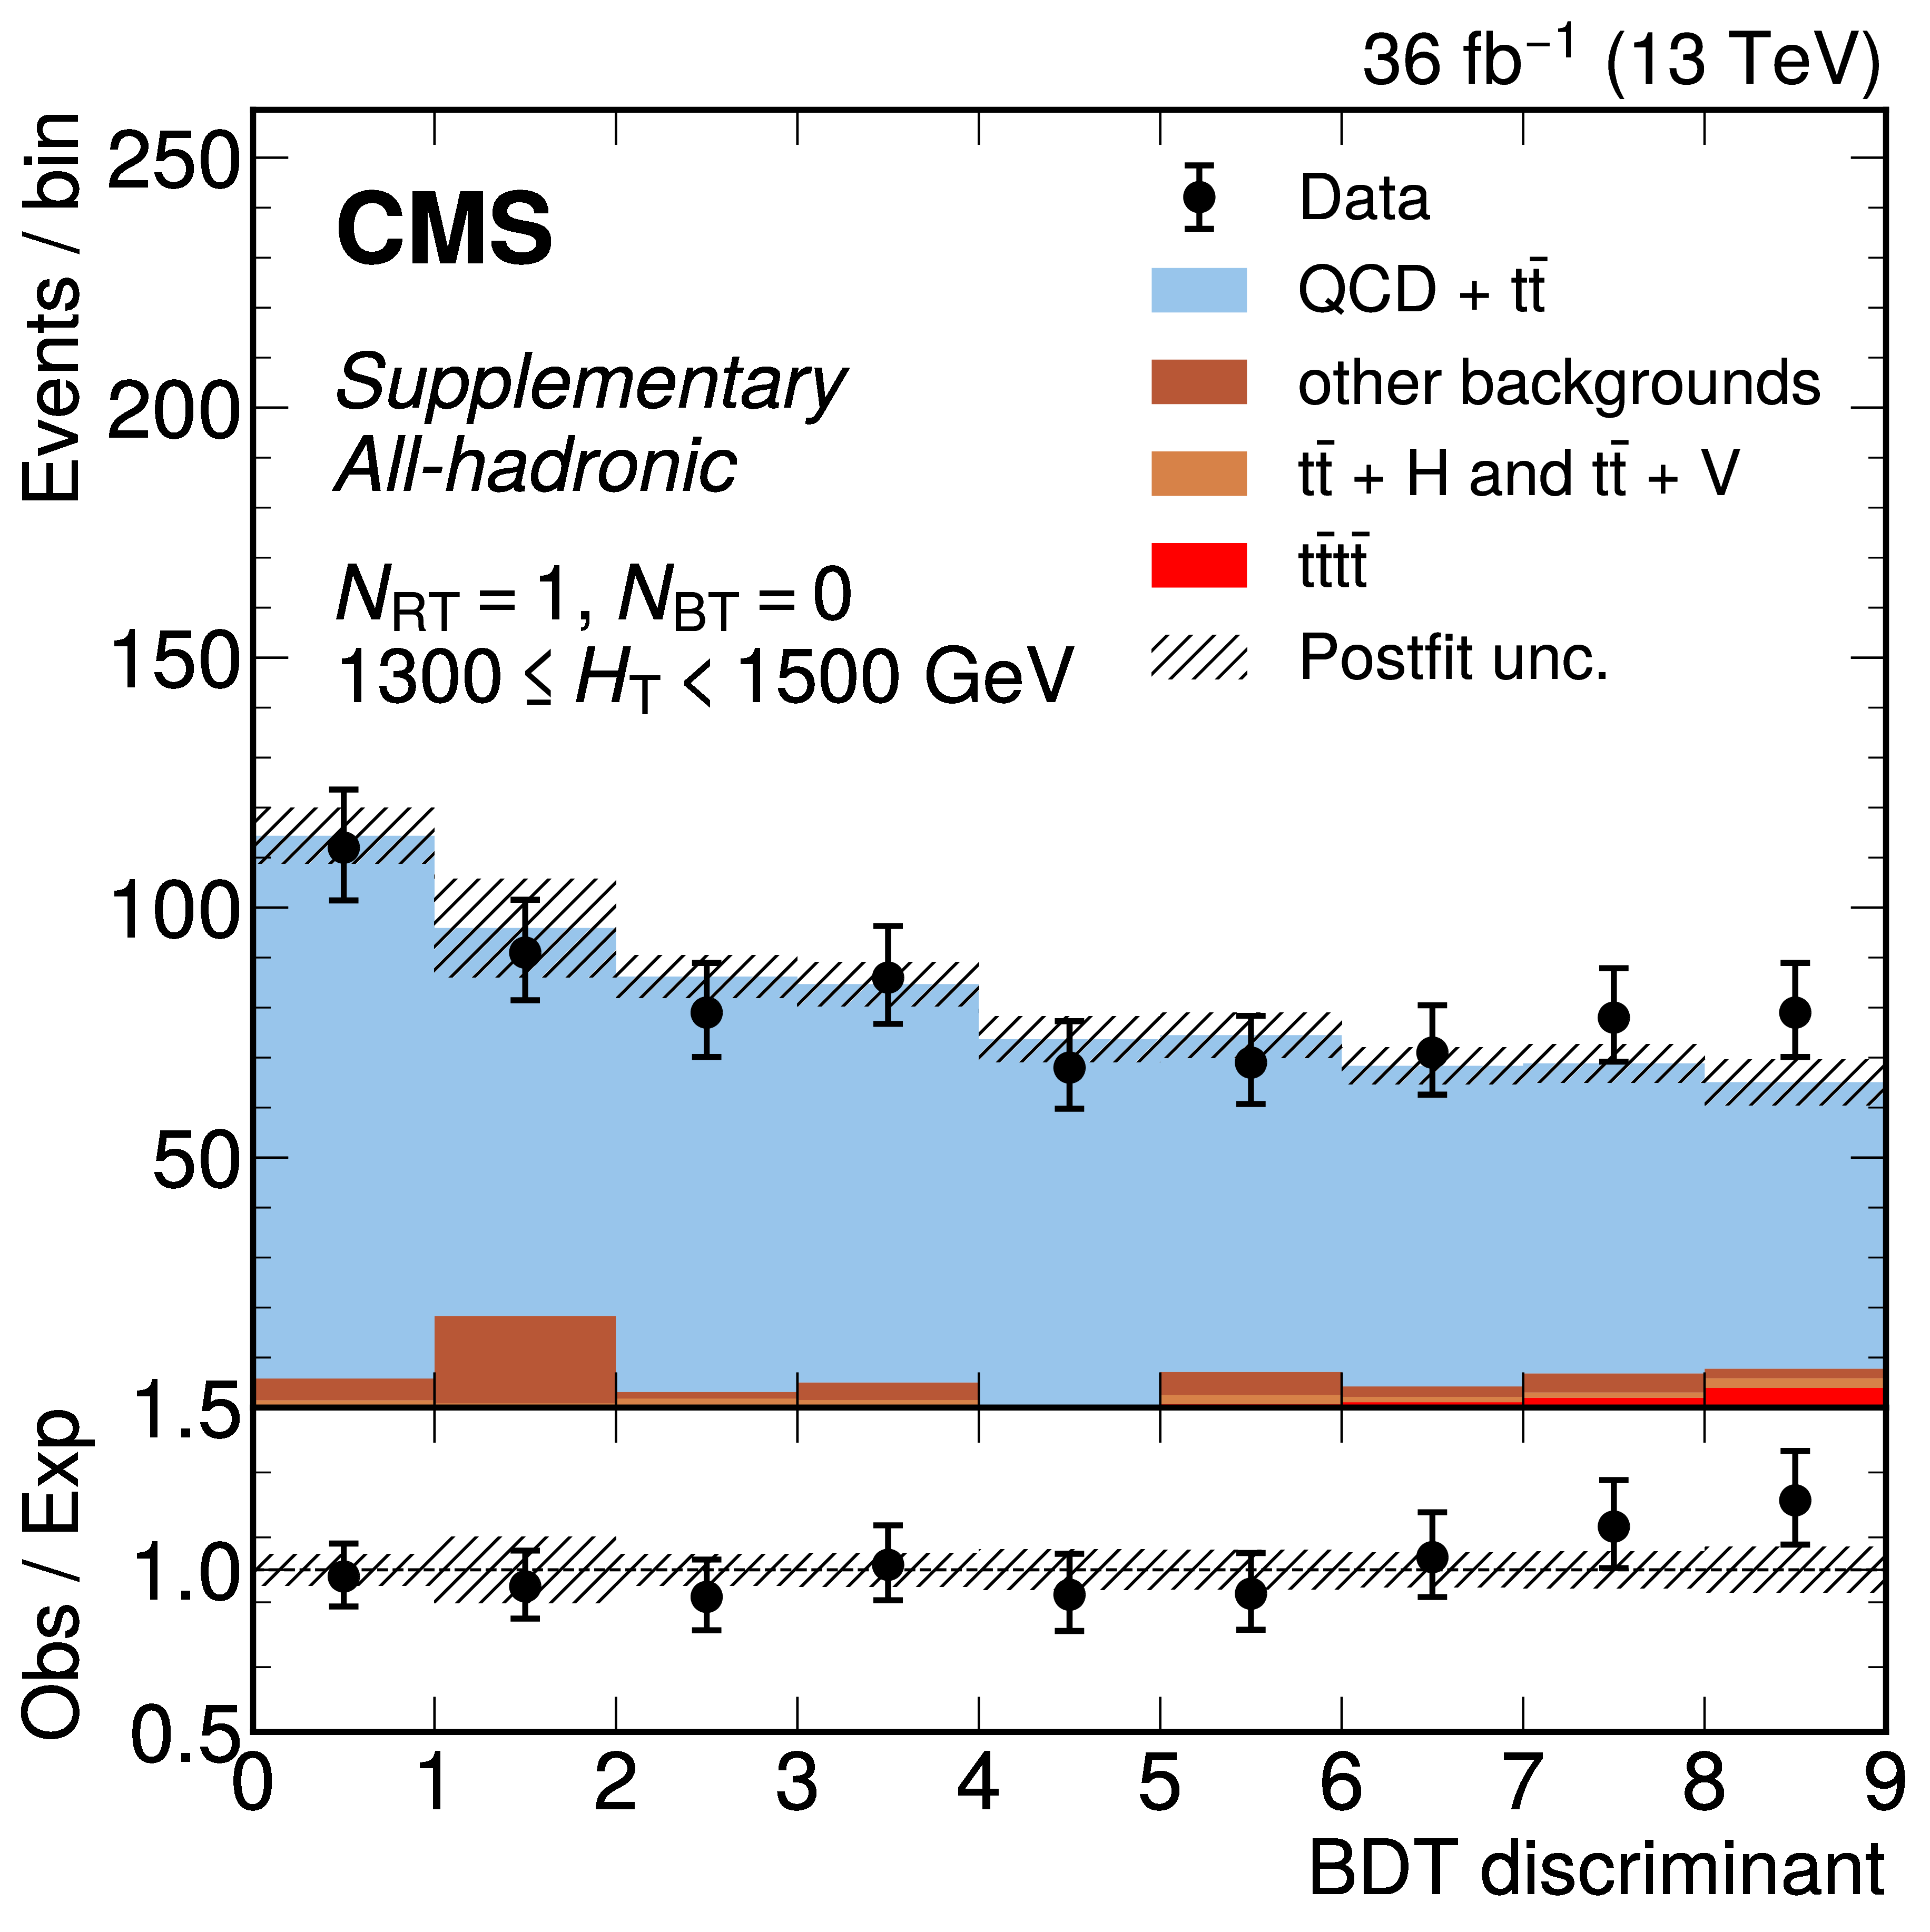
png pdf |
Additional Figure 24-g:
The distribution of the BDT discriminants in the signal region for the 2016 data set in the all-hadronic channel for all $ N_\text{RT} $, $ N_\text{BT} $, and $ H_{\mathrm{T}} $ categories. ($ N_\text{RT} $ and $ N_\text{BT} $ represent number of resolved tops and b-jets respectively.) The background from QCD multijet and $ \mathrm{t} \bar{\mathrm{t}} $ production is derived from control regions in the data. Estimates for the $ \mathrm{t}\bar{\mathrm{t}}\mathrm{t}\bar{\mathrm{t}} $ signal and other backgrounds are shown using simulated samples. The hatched bands correspond to the estimated total uncertainty after the fit. |
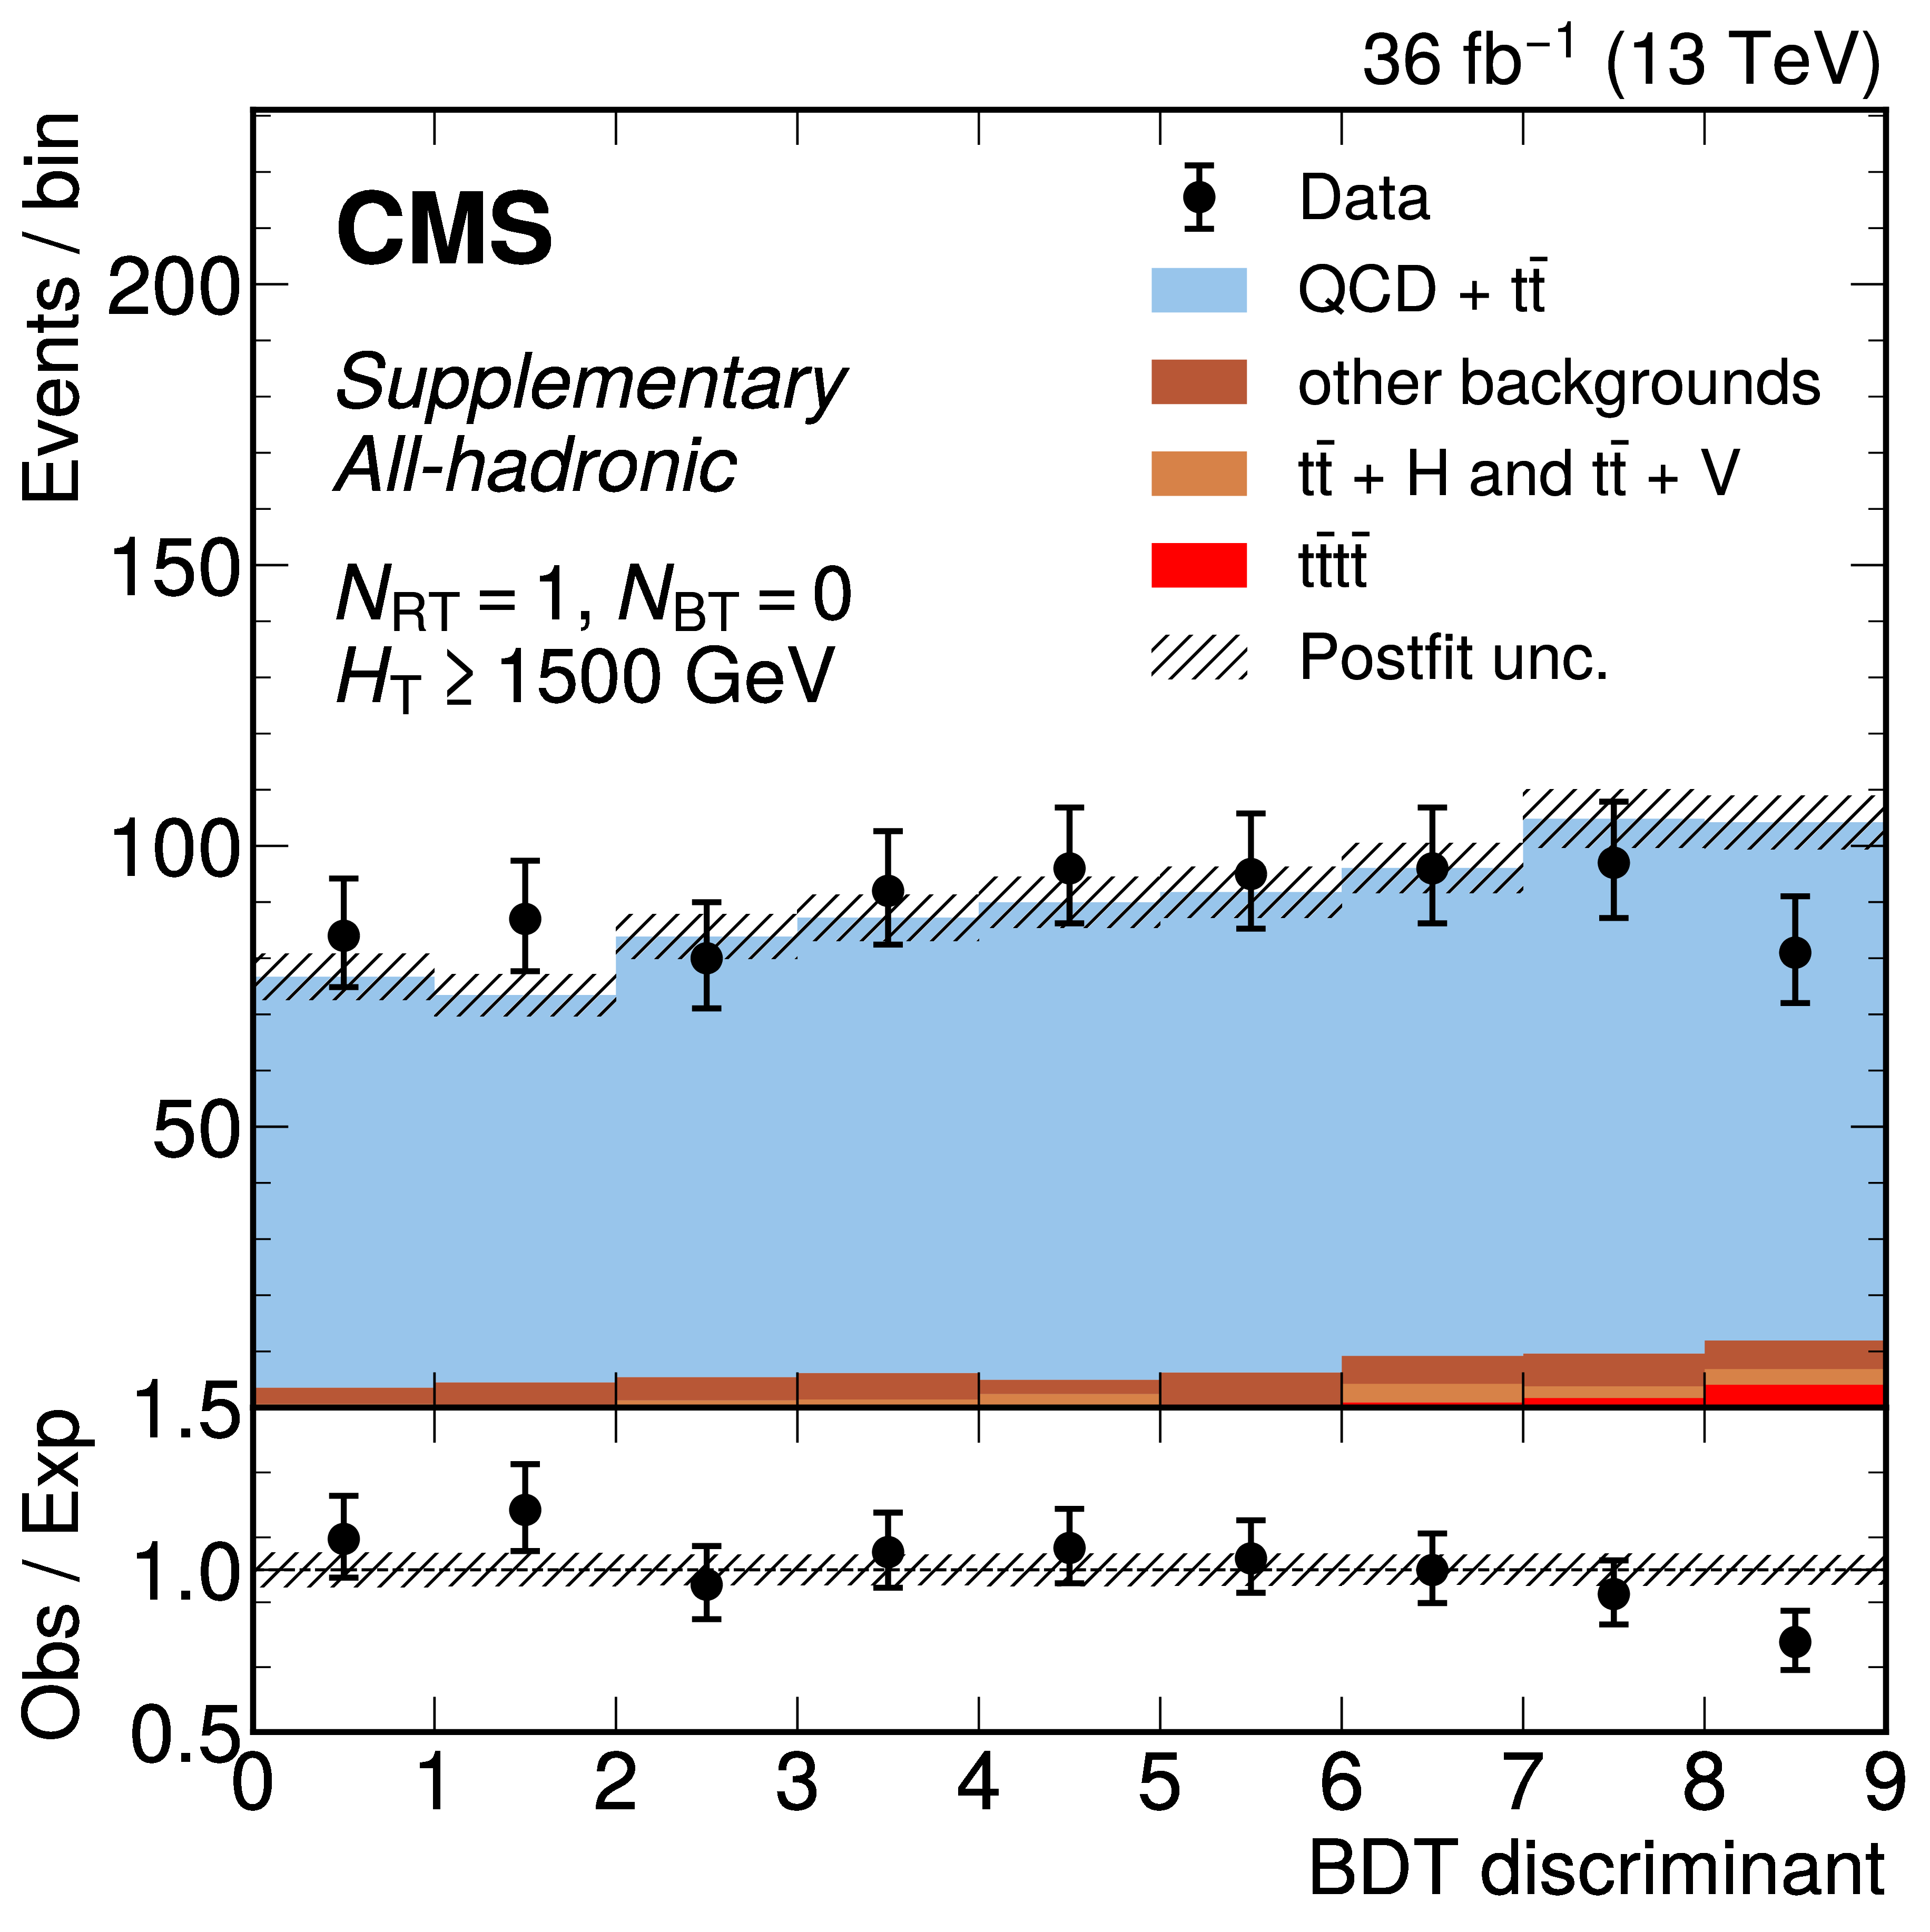
png pdf |
Additional Figure 24-h:
The distribution of the BDT discriminants in the signal region for the 2016 data set in the all-hadronic channel for all $ N_\text{RT} $, $ N_\text{BT} $, and $ H_{\mathrm{T}} $ categories. ($ N_\text{RT} $ and $ N_\text{BT} $ represent number of resolved tops and b-jets respectively.) The background from QCD multijet and $ \mathrm{t} \bar{\mathrm{t}} $ production is derived from control regions in the data. Estimates for the $ \mathrm{t}\bar{\mathrm{t}}\mathrm{t}\bar{\mathrm{t}} $ signal and other backgrounds are shown using simulated samples. The hatched bands correspond to the estimated total uncertainty after the fit. |

png pdf |
Additional Figure 24-i:
The distribution of the BDT discriminants in the signal region for the 2016 data set in the all-hadronic channel for all $ N_\text{RT} $, $ N_\text{BT} $, and $ H_{\mathrm{T}} $ categories. ($ N_\text{RT} $ and $ N_\text{BT} $ represent number of resolved tops and b-jets respectively.) The background from QCD multijet and $ \mathrm{t} \bar{\mathrm{t}} $ production is derived from control regions in the data. Estimates for the $ \mathrm{t}\bar{\mathrm{t}}\mathrm{t}\bar{\mathrm{t}} $ signal and other backgrounds are shown using simulated samples. The hatched bands correspond to the estimated total uncertainty after the fit. |
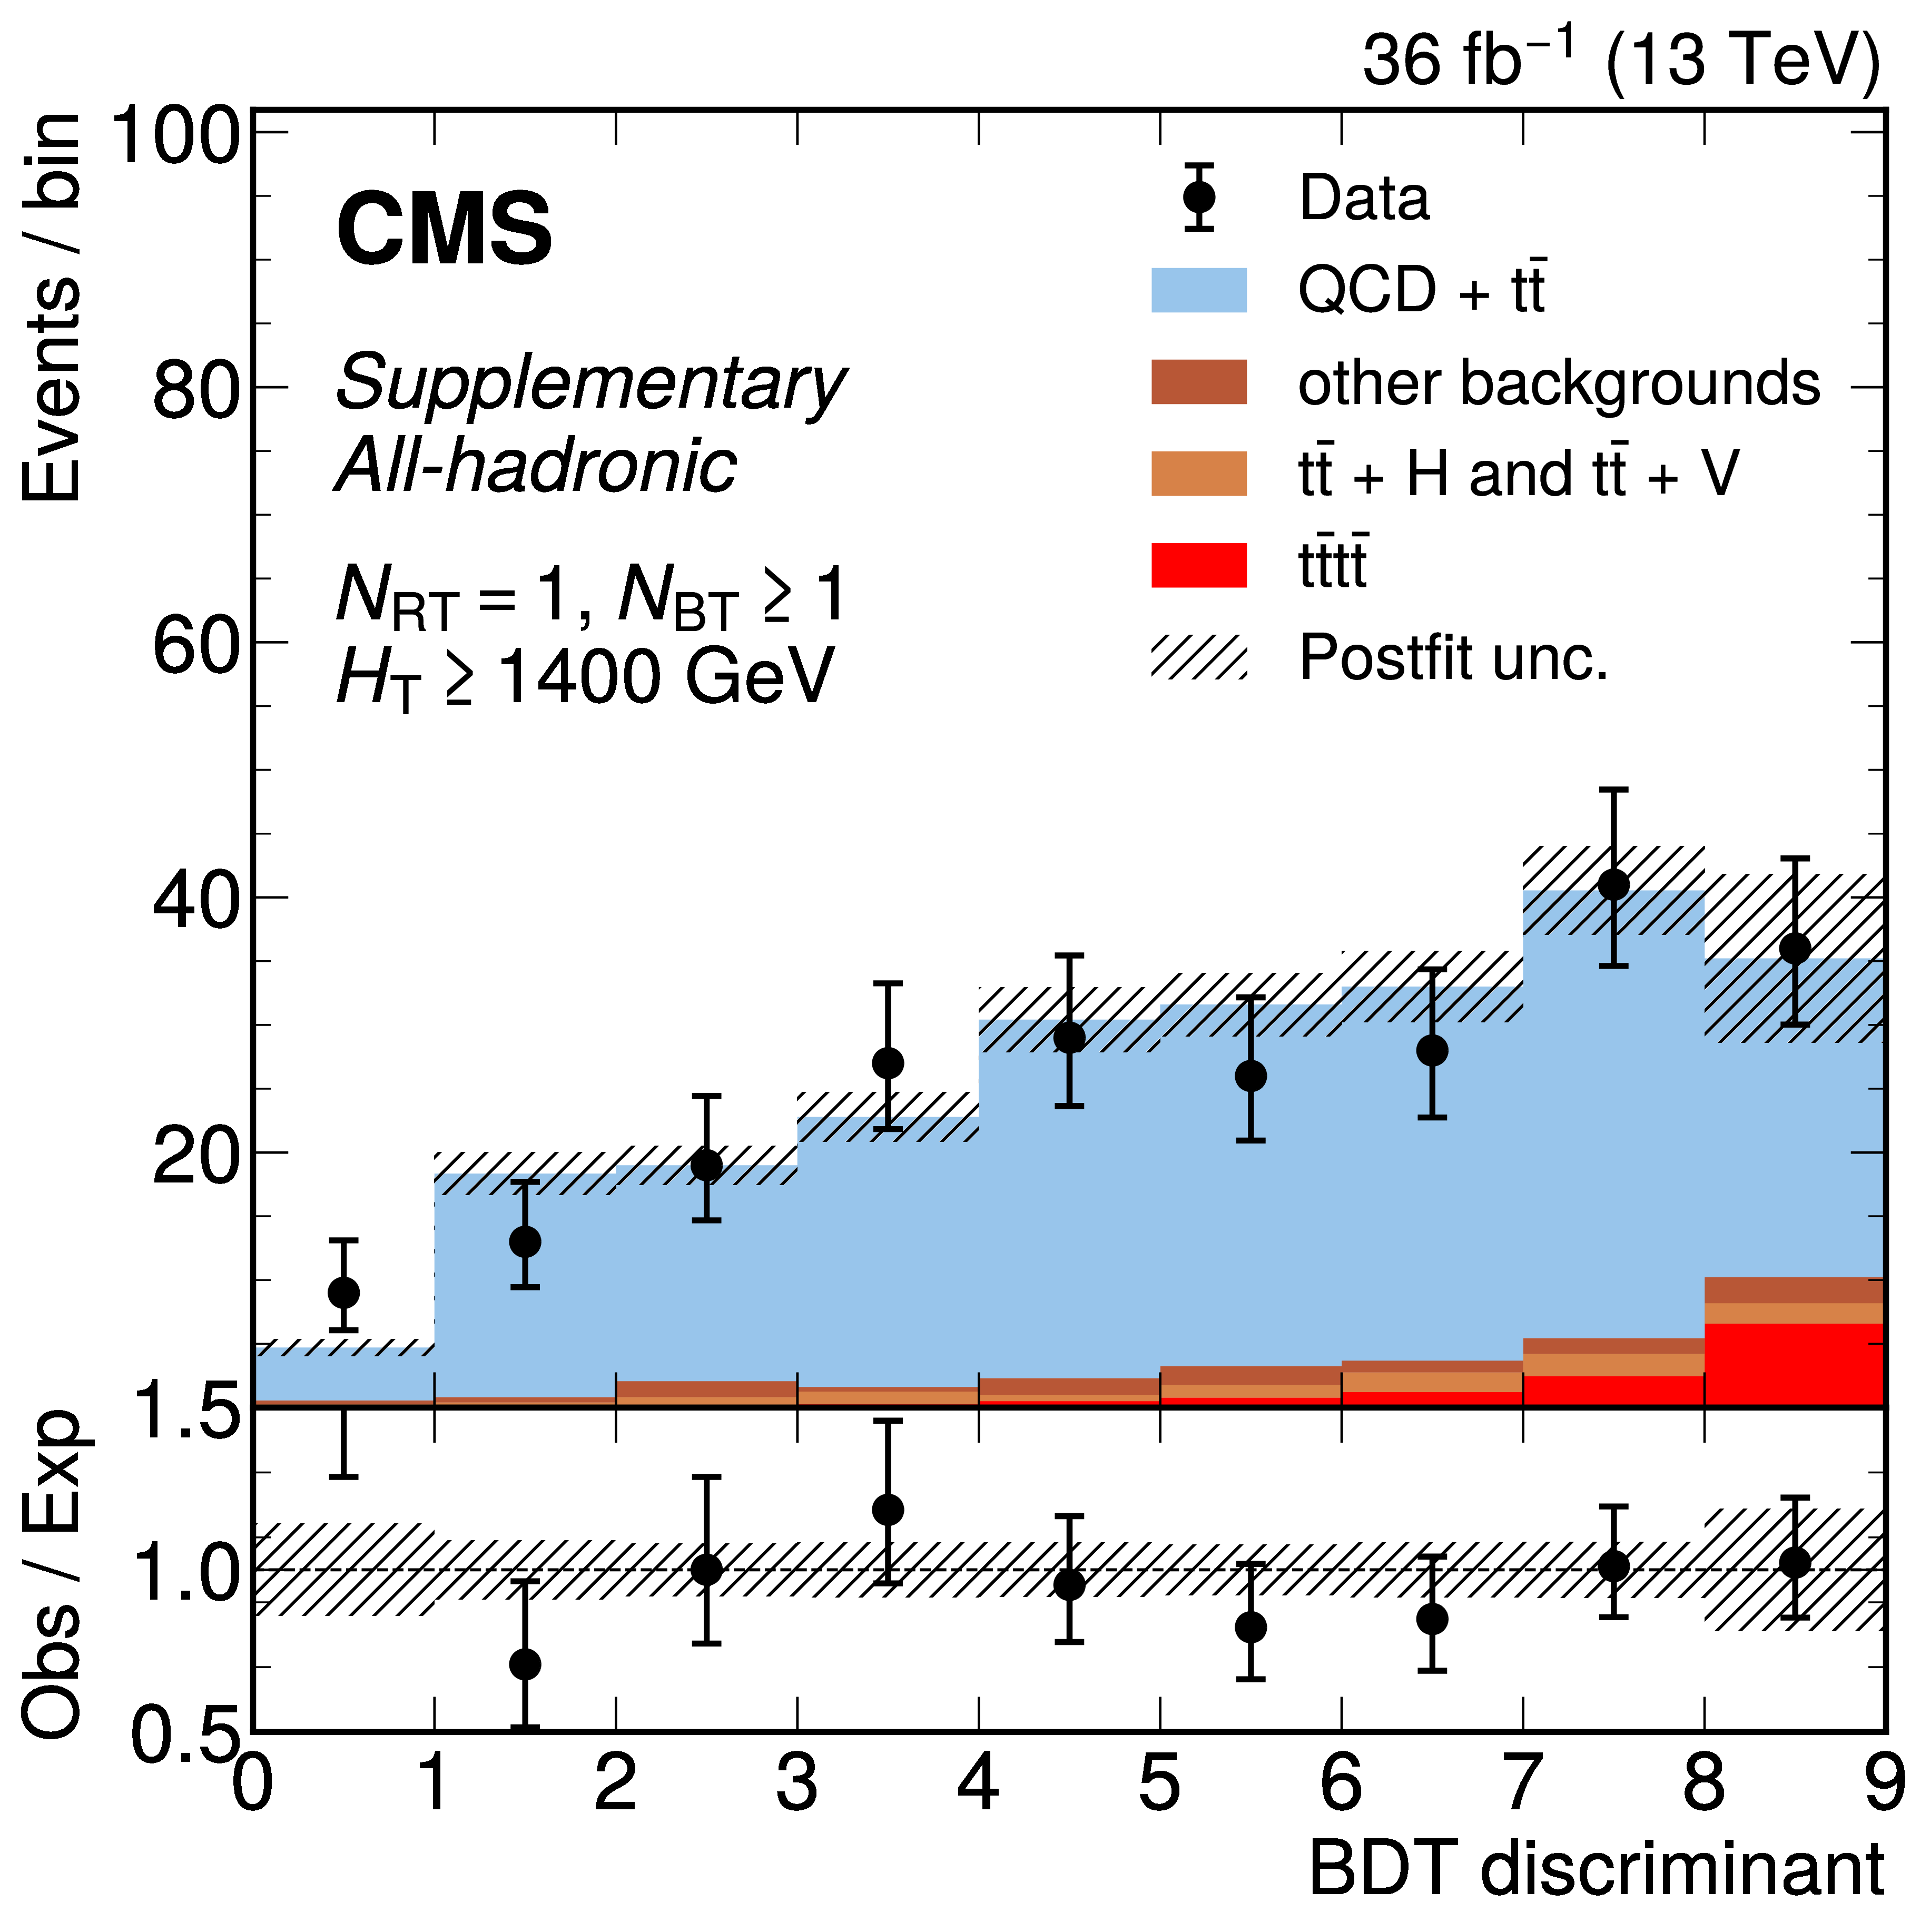
png pdf |
Additional Figure 24-j:
The distribution of the BDT discriminants in the signal region for the 2016 data set in the all-hadronic channel for all $ N_\text{RT} $, $ N_\text{BT} $, and $ H_{\mathrm{T}} $ categories. ($ N_\text{RT} $ and $ N_\text{BT} $ represent number of resolved tops and b-jets respectively.) The background from QCD multijet and $ \mathrm{t} \bar{\mathrm{t}} $ production is derived from control regions in the data. Estimates for the $ \mathrm{t}\bar{\mathrm{t}}\mathrm{t}\bar{\mathrm{t}} $ signal and other backgrounds are shown using simulated samples. The hatched bands correspond to the estimated total uncertainty after the fit. |

png pdf |
Additional Figure 24-k:
The distribution of the BDT discriminants in the signal region for the 2016 data set in the all-hadronic channel for all $ N_\text{RT} $, $ N_\text{BT} $, and $ H_{\mathrm{T}} $ categories. ($ N_\text{RT} $ and $ N_\text{BT} $ represent number of resolved tops and b-jets respectively.) The background from QCD multijet and $ \mathrm{t} \bar{\mathrm{t}} $ production is derived from control regions in the data. Estimates for the $ \mathrm{t}\bar{\mathrm{t}}\mathrm{t}\bar{\mathrm{t}} $ signal and other backgrounds are shown using simulated samples. The hatched bands correspond to the estimated total uncertainty after the fit. |
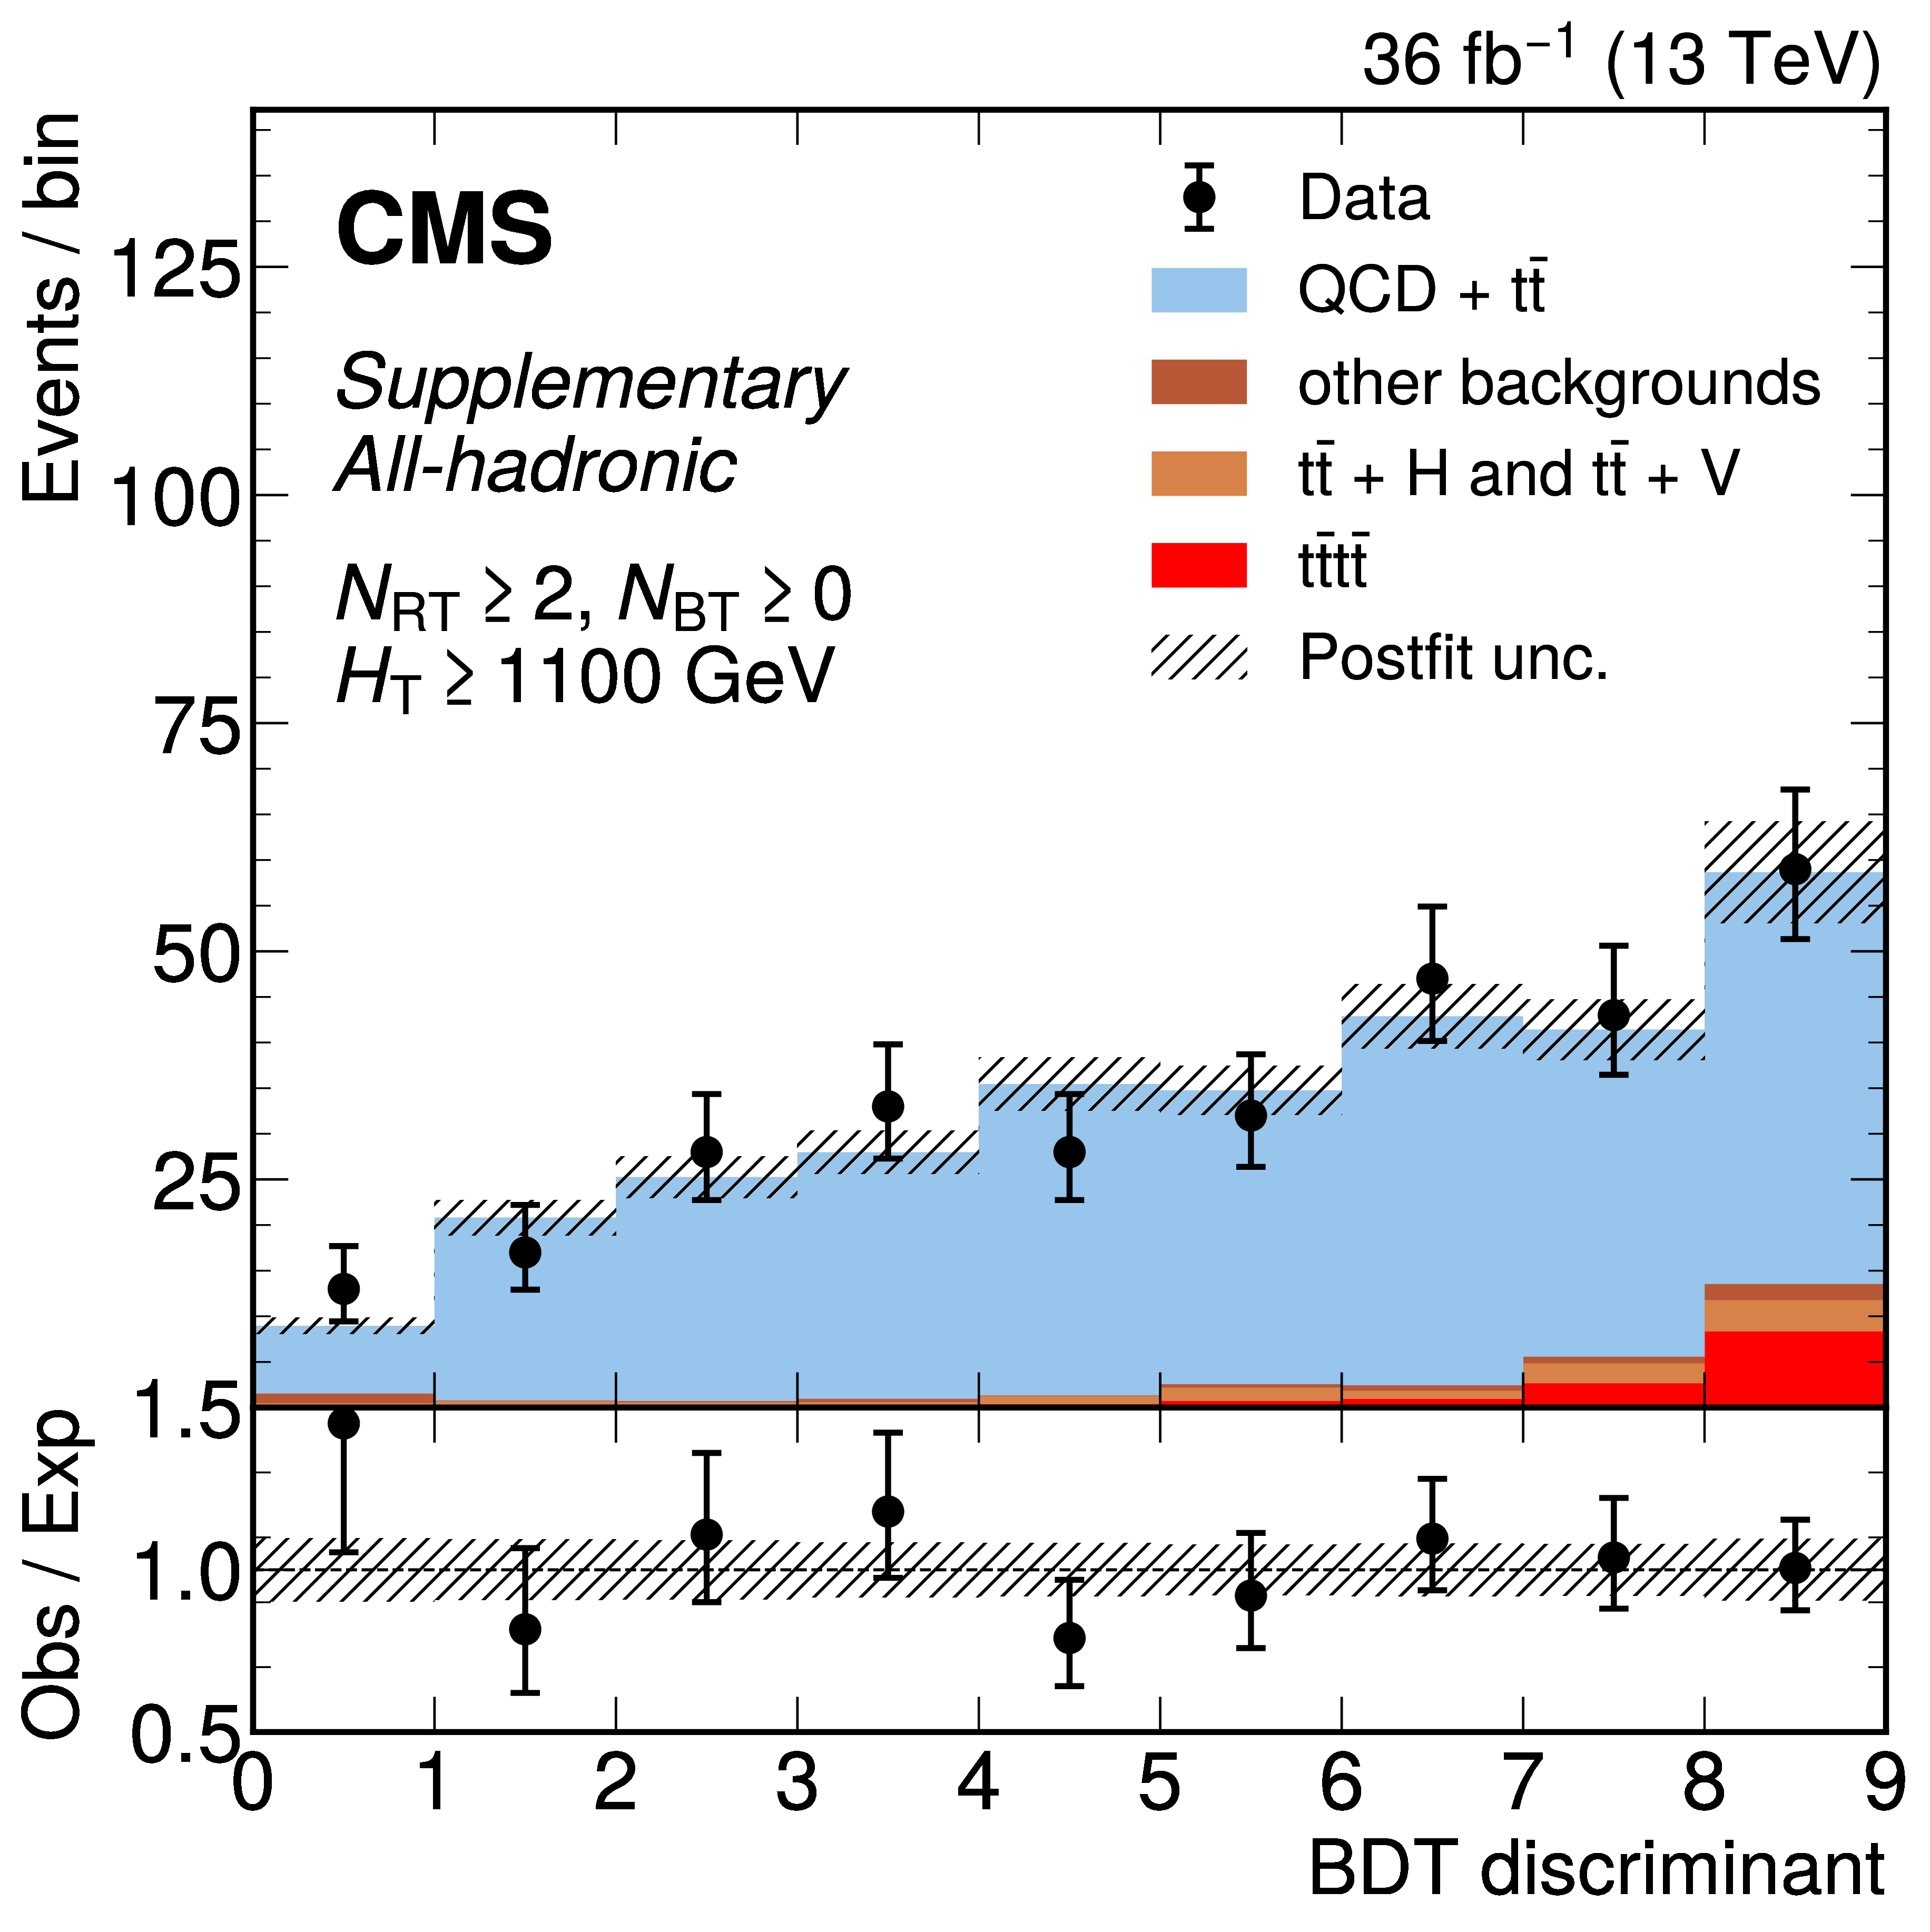
png pdf |
Additional Figure 24-l:
The distribution of the BDT discriminants in the signal region for the 2016 data set in the all-hadronic channel for all $ N_\text{RT} $, $ N_\text{BT} $, and $ H_{\mathrm{T}} $ categories. ($ N_\text{RT} $ and $ N_\text{BT} $ represent number of resolved tops and b-jets respectively.) The background from QCD multijet and $ \mathrm{t} \bar{\mathrm{t}} $ production is derived from control regions in the data. Estimates for the $ \mathrm{t}\bar{\mathrm{t}}\mathrm{t}\bar{\mathrm{t}} $ signal and other backgrounds are shown using simulated samples. The hatched bands correspond to the estimated total uncertainty after the fit. |
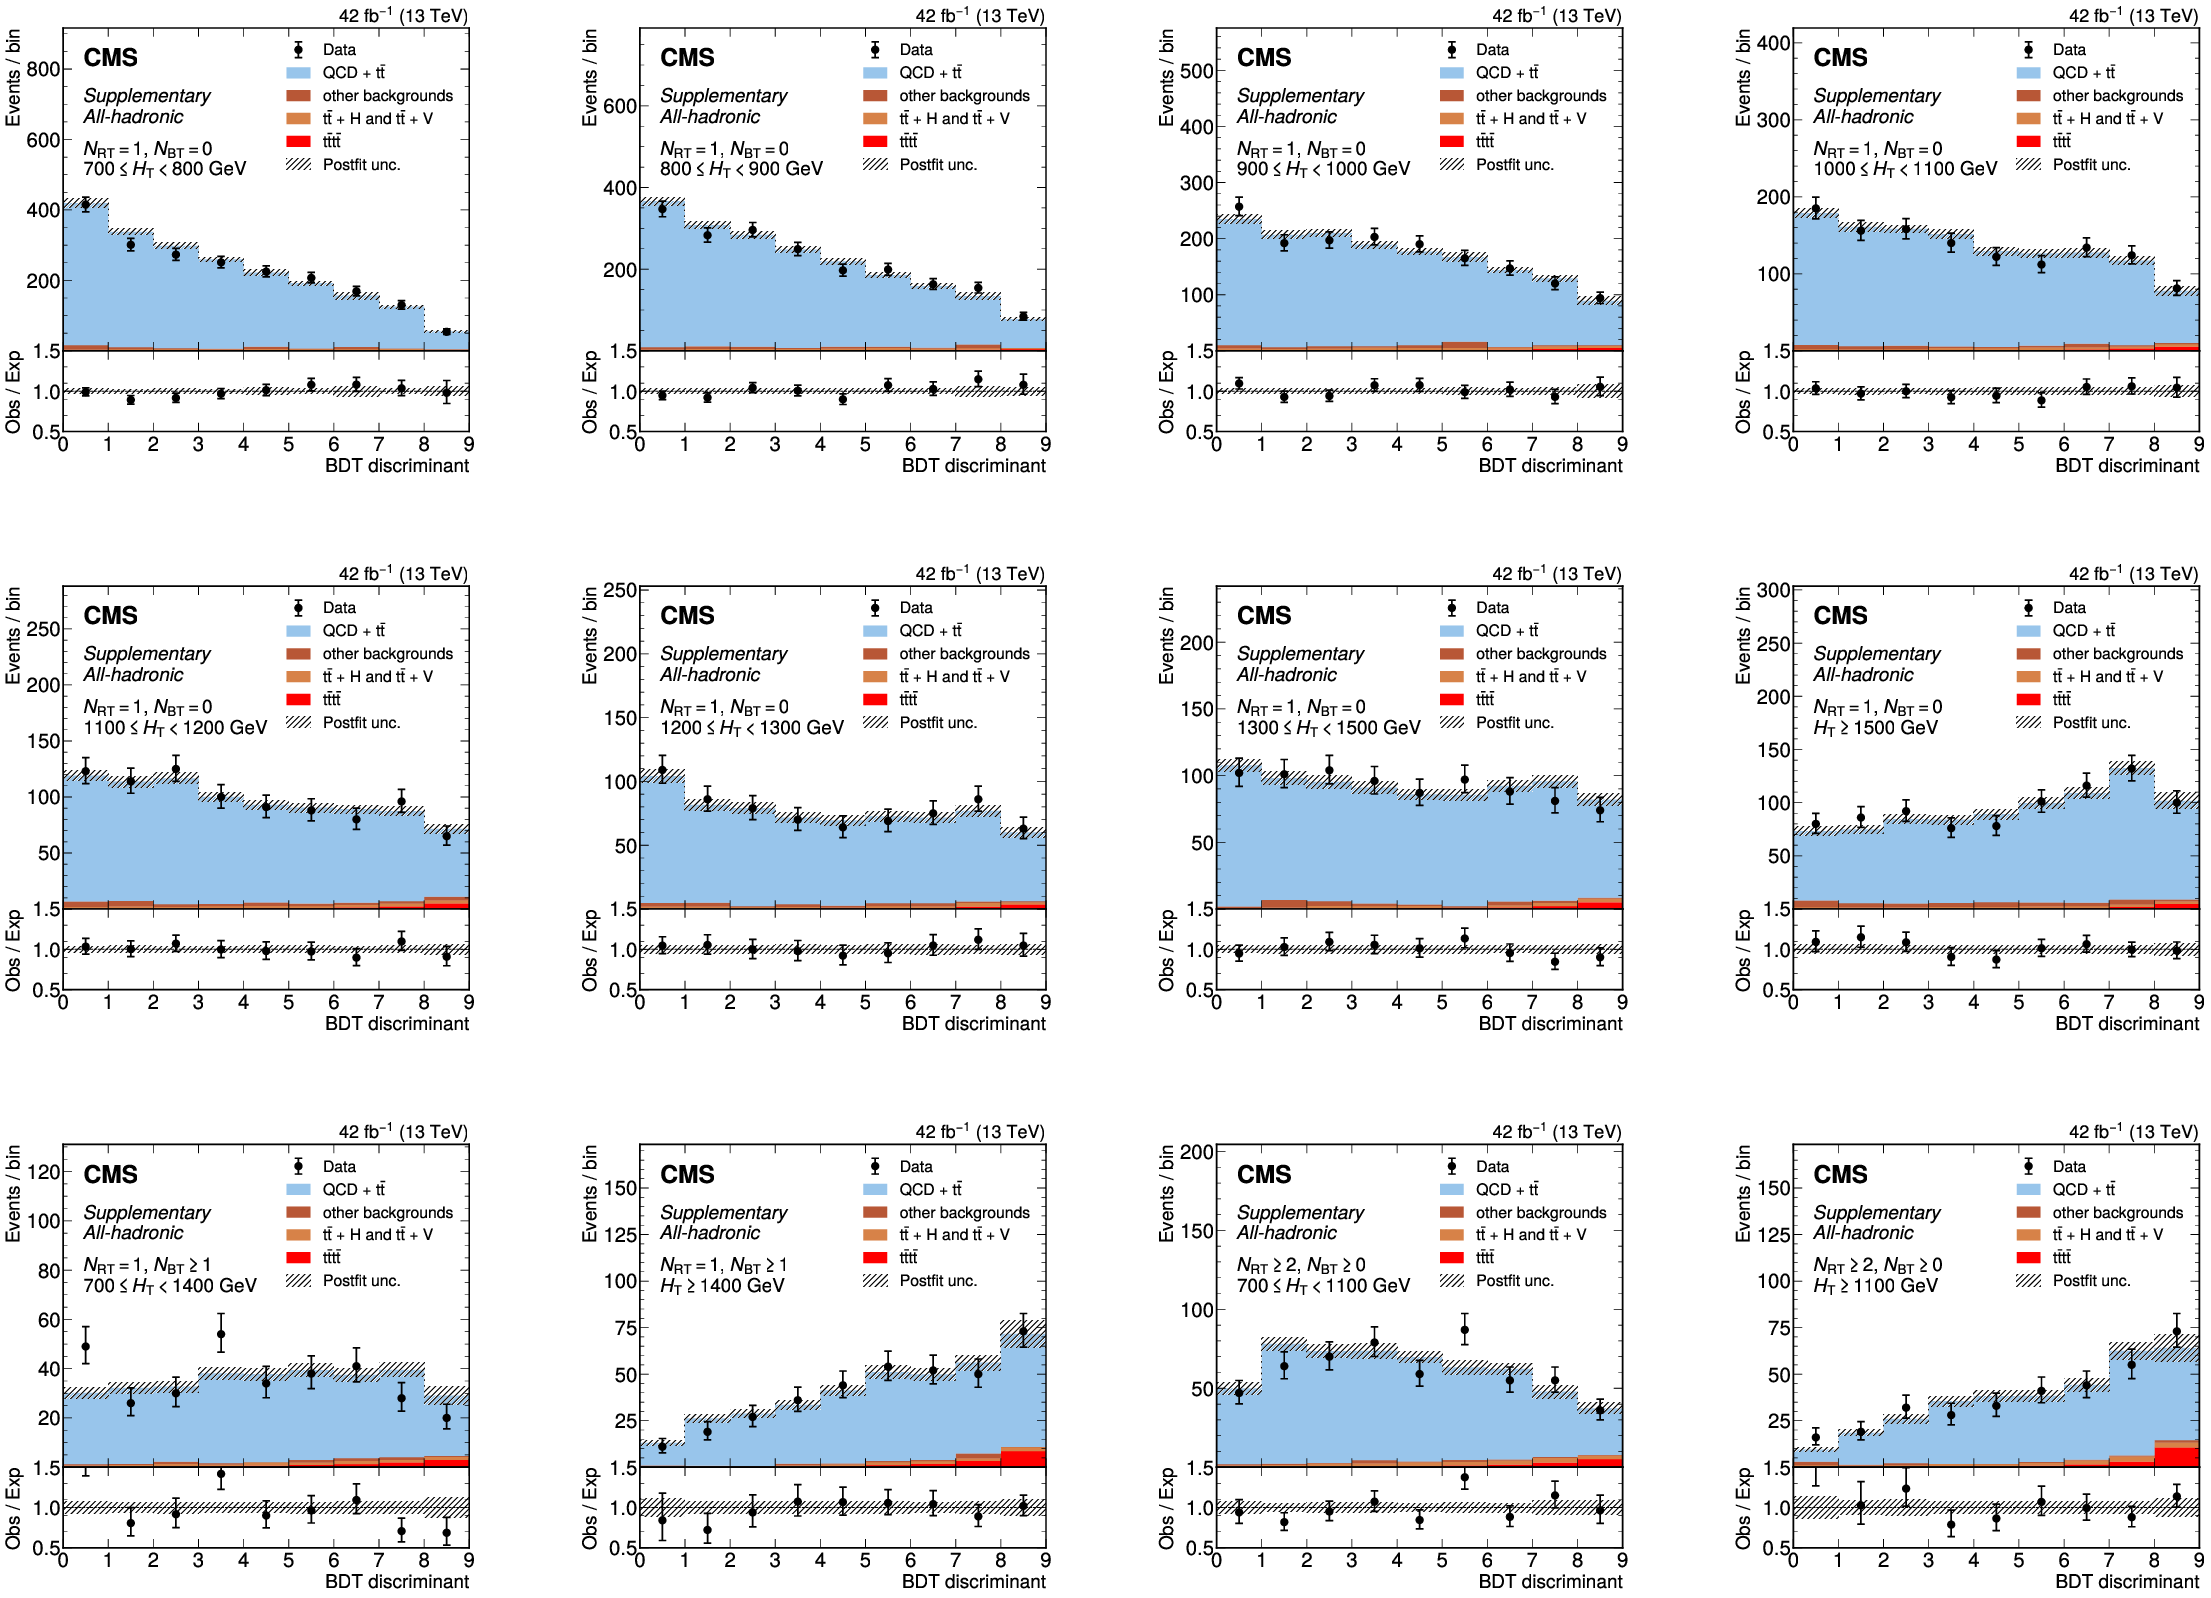
png pdf |
Additional Figure 25:
The distribution of the BDT discriminants in the signal region for the 2017 data set in the all-hadronic channel for all $ N_\text{RT} $, $ N_\text{BT} $, and $ H_{\mathrm{T}} $ categories. ($ N_\text{RT} $ and $ N_\text{BT} $ represent number of resolved tops and b-jets respectively.) The background from QCD multijet and $ \mathrm{t} \bar{\mathrm{t}} $ production is derived from control regions in the data. Estimates for the $ \mathrm{t}\bar{\mathrm{t}}\mathrm{t}\bar{\mathrm{t}} $ signal and other backgrounds are shown using simulated samples. The hatched bands correspond to the estimated total uncertainty after the fit. |
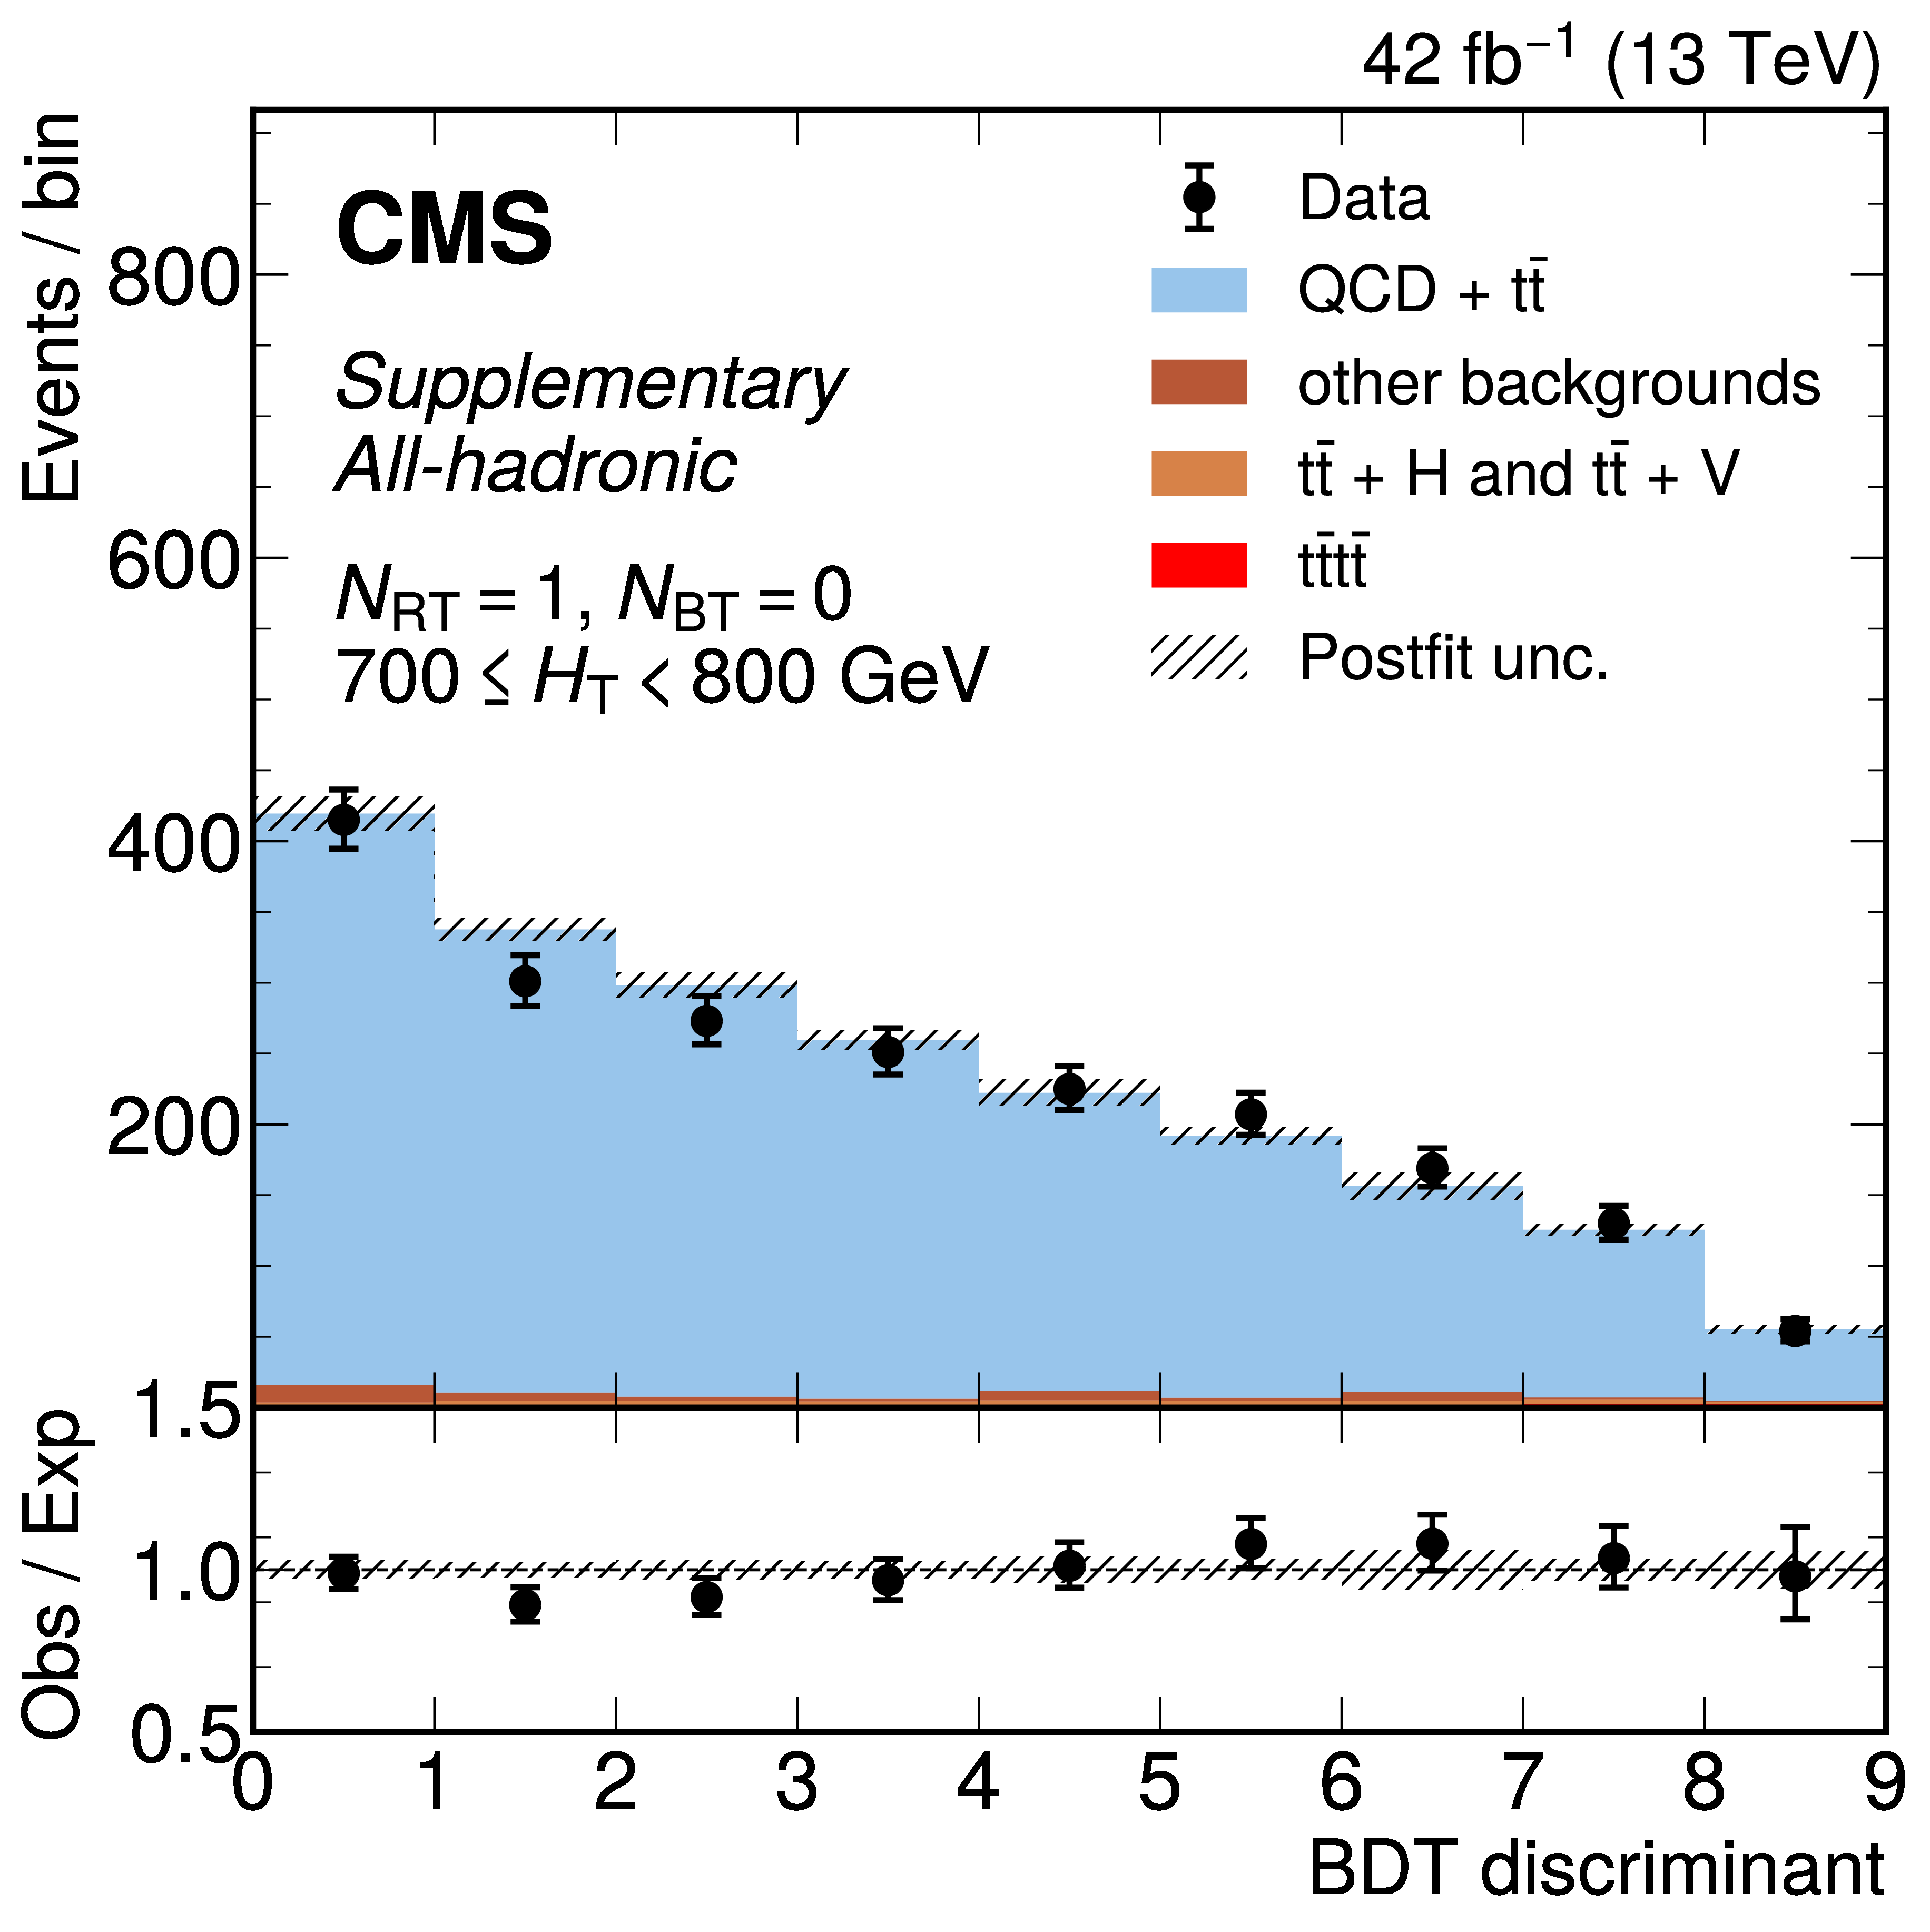
png pdf |
Additional Figure 25-a:
The distribution of the BDT discriminants in the signal region for the 2017 data set in the all-hadronic channel for all $ N_\text{RT} $, $ N_\text{BT} $, and $ H_{\mathrm{T}} $ categories. ($ N_\text{RT} $ and $ N_\text{BT} $ represent number of resolved tops and b-jets respectively.) The background from QCD multijet and $ \mathrm{t} \bar{\mathrm{t}} $ production is derived from control regions in the data. Estimates for the $ \mathrm{t}\bar{\mathrm{t}}\mathrm{t}\bar{\mathrm{t}} $ signal and other backgrounds are shown using simulated samples. The hatched bands correspond to the estimated total uncertainty after the fit. |
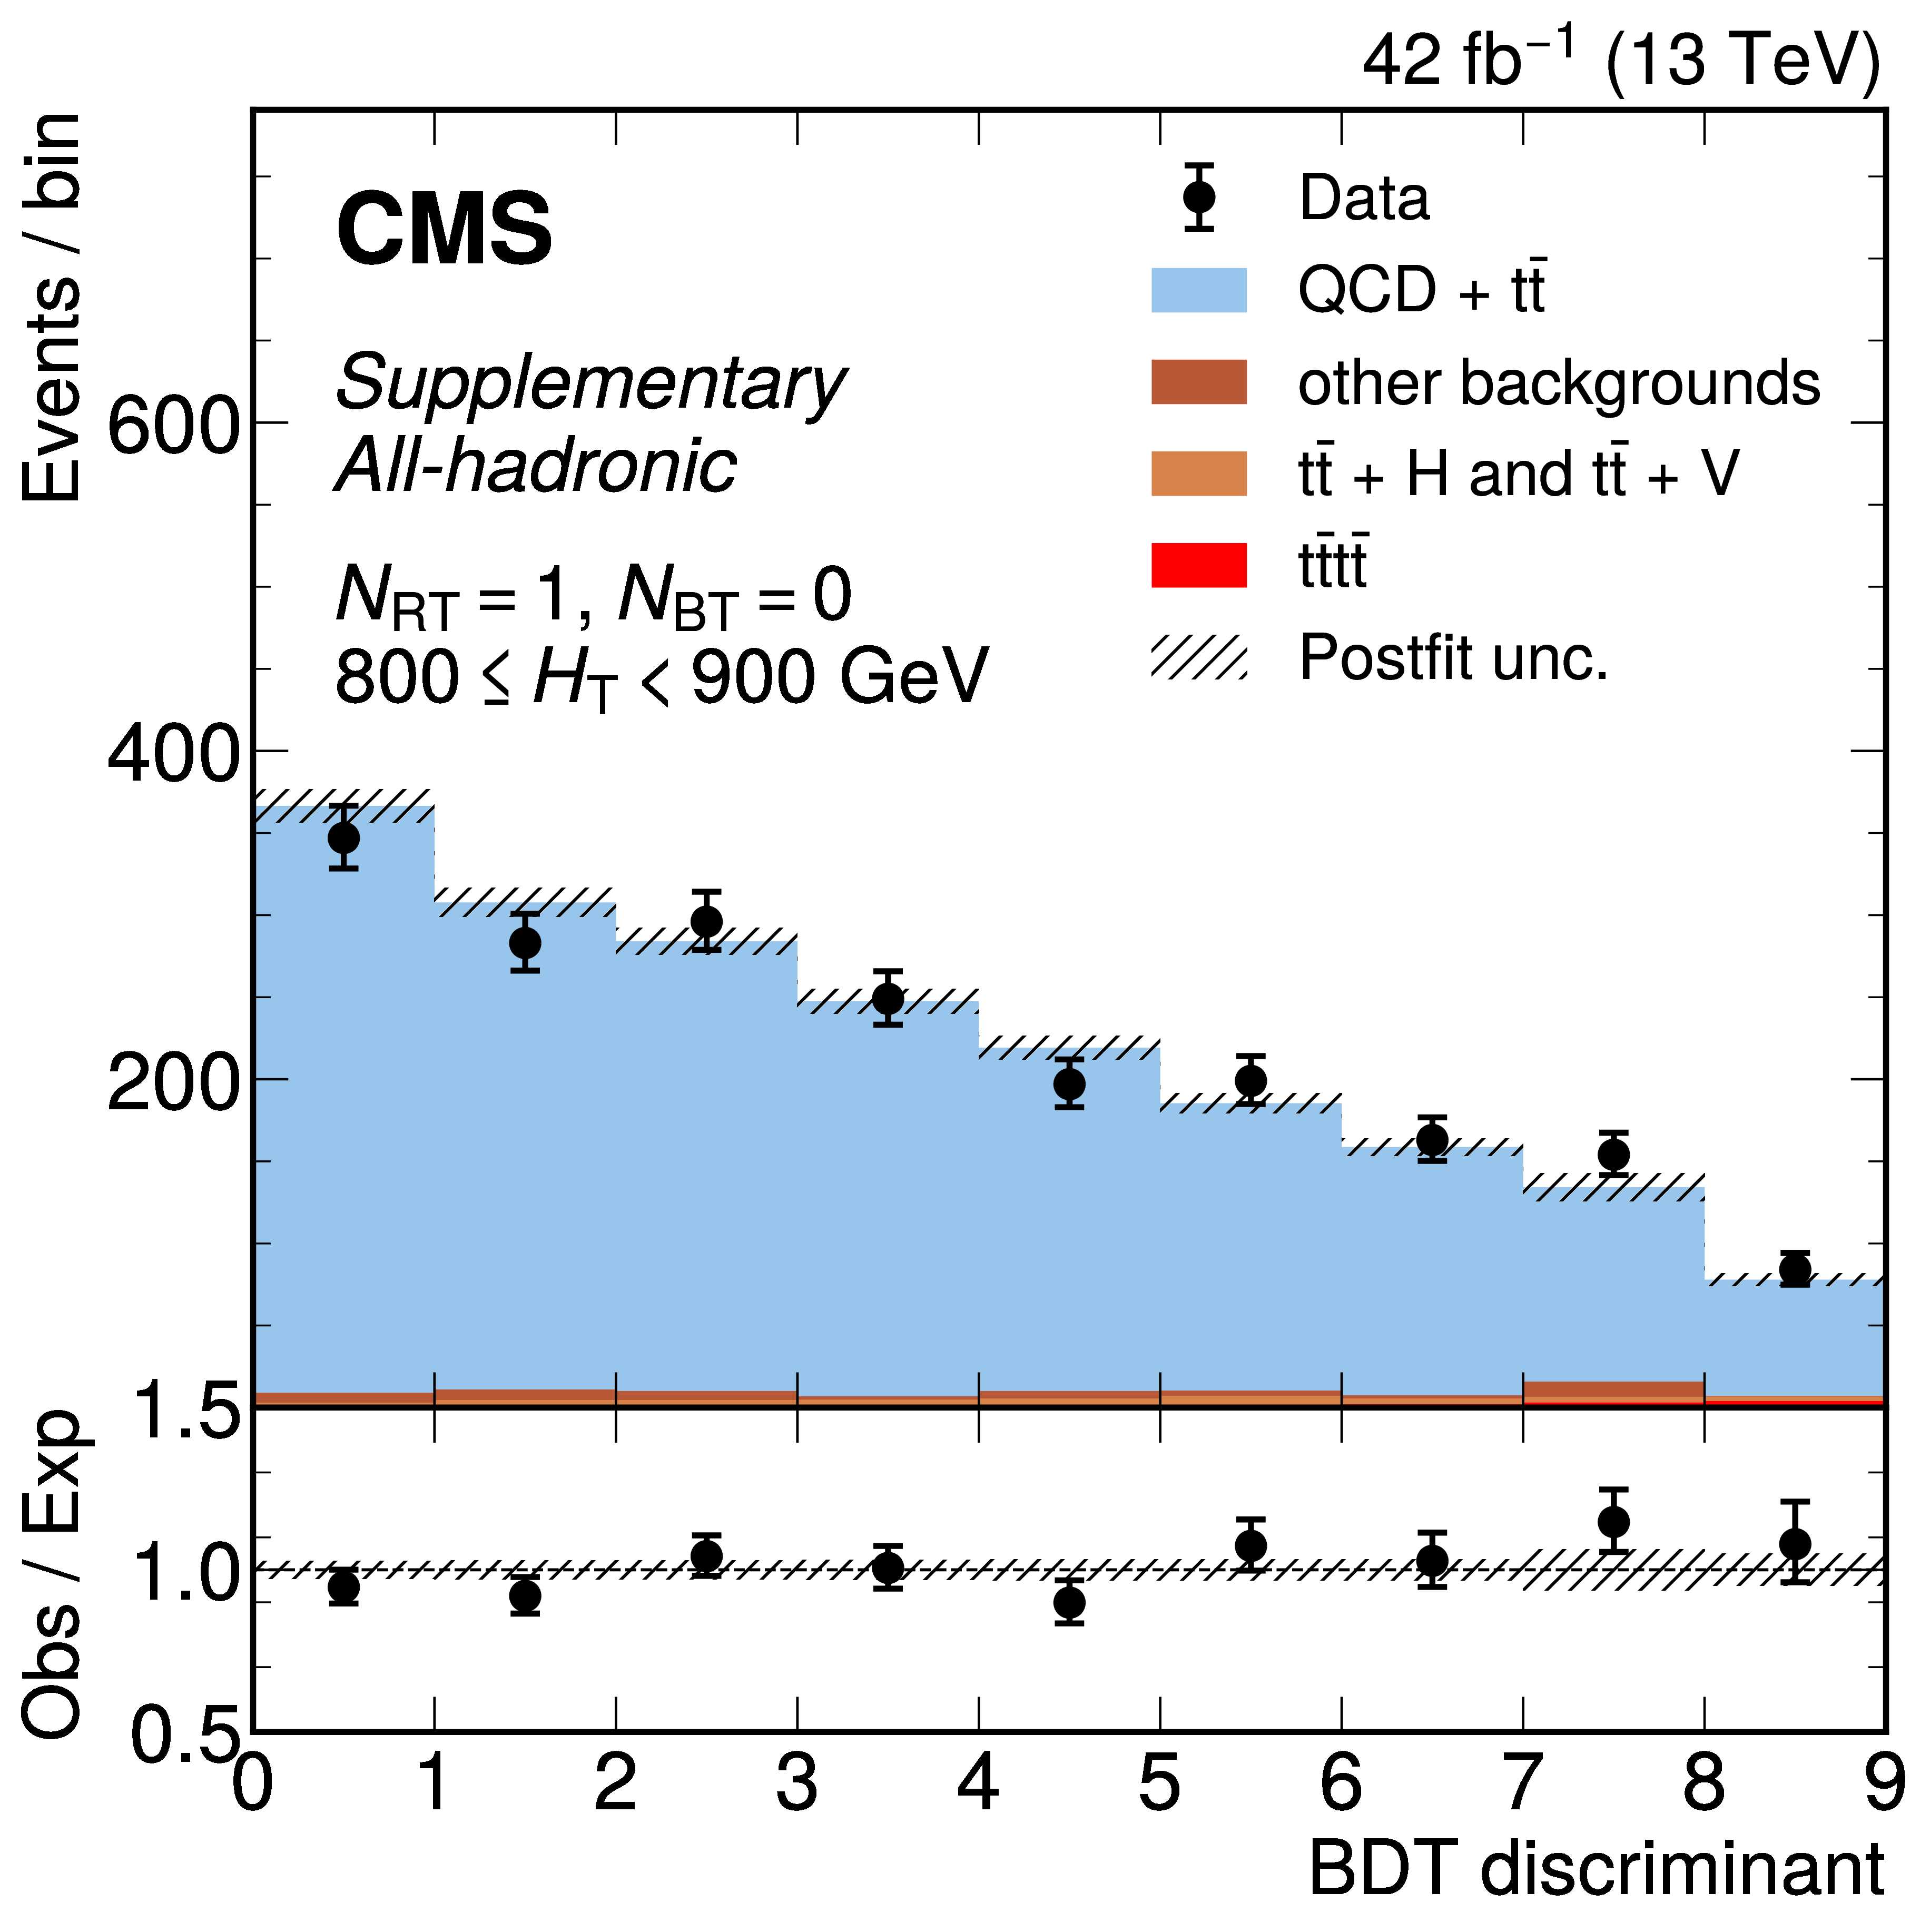
png pdf |
Additional Figure 25-b:
The distribution of the BDT discriminants in the signal region for the 2017 data set in the all-hadronic channel for all $ N_\text{RT} $, $ N_\text{BT} $, and $ H_{\mathrm{T}} $ categories. ($ N_\text{RT} $ and $ N_\text{BT} $ represent number of resolved tops and b-jets respectively.) The background from QCD multijet and $ \mathrm{t} \bar{\mathrm{t}} $ production is derived from control regions in the data. Estimates for the $ \mathrm{t}\bar{\mathrm{t}}\mathrm{t}\bar{\mathrm{t}} $ signal and other backgrounds are shown using simulated samples. The hatched bands correspond to the estimated total uncertainty after the fit. |
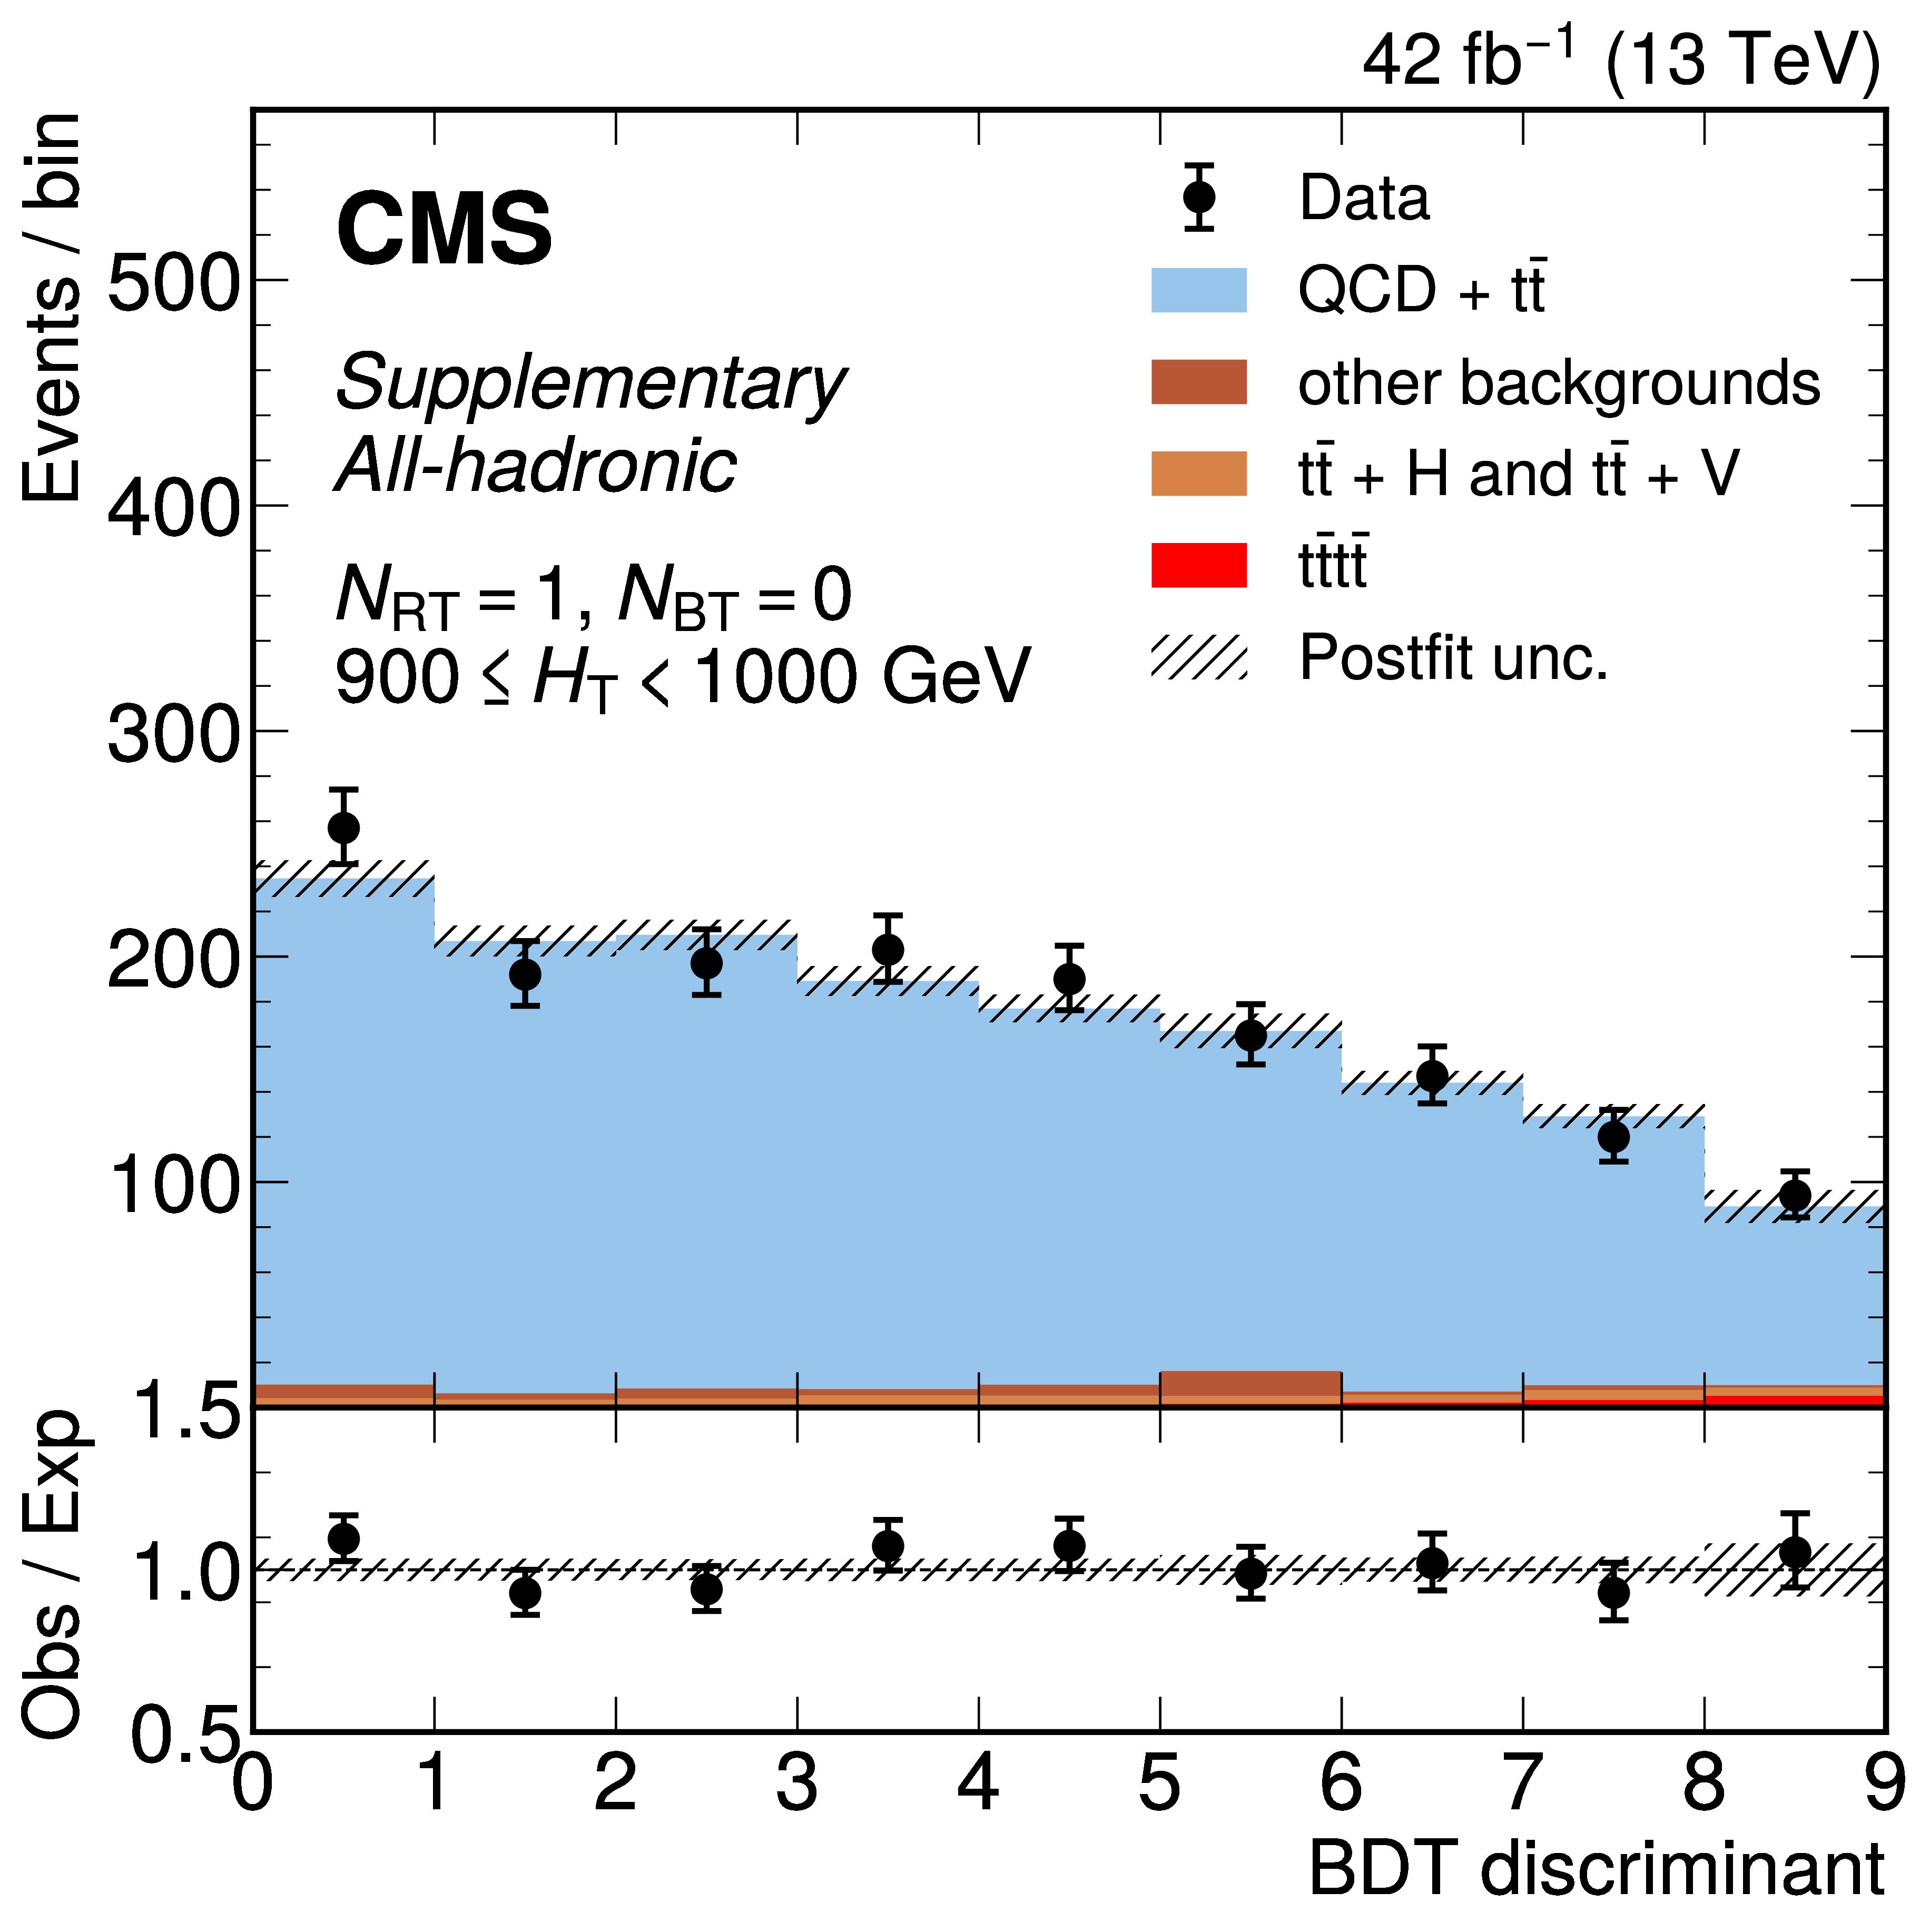
png pdf |
Additional Figure 25-c:
The distribution of the BDT discriminants in the signal region for the 2017 data set in the all-hadronic channel for all $ N_\text{RT} $, $ N_\text{BT} $, and $ H_{\mathrm{T}} $ categories. ($ N_\text{RT} $ and $ N_\text{BT} $ represent number of resolved tops and b-jets respectively.) The background from QCD multijet and $ \mathrm{t} \bar{\mathrm{t}} $ production is derived from control regions in the data. Estimates for the $ \mathrm{t}\bar{\mathrm{t}}\mathrm{t}\bar{\mathrm{t}} $ signal and other backgrounds are shown using simulated samples. The hatched bands correspond to the estimated total uncertainty after the fit. |
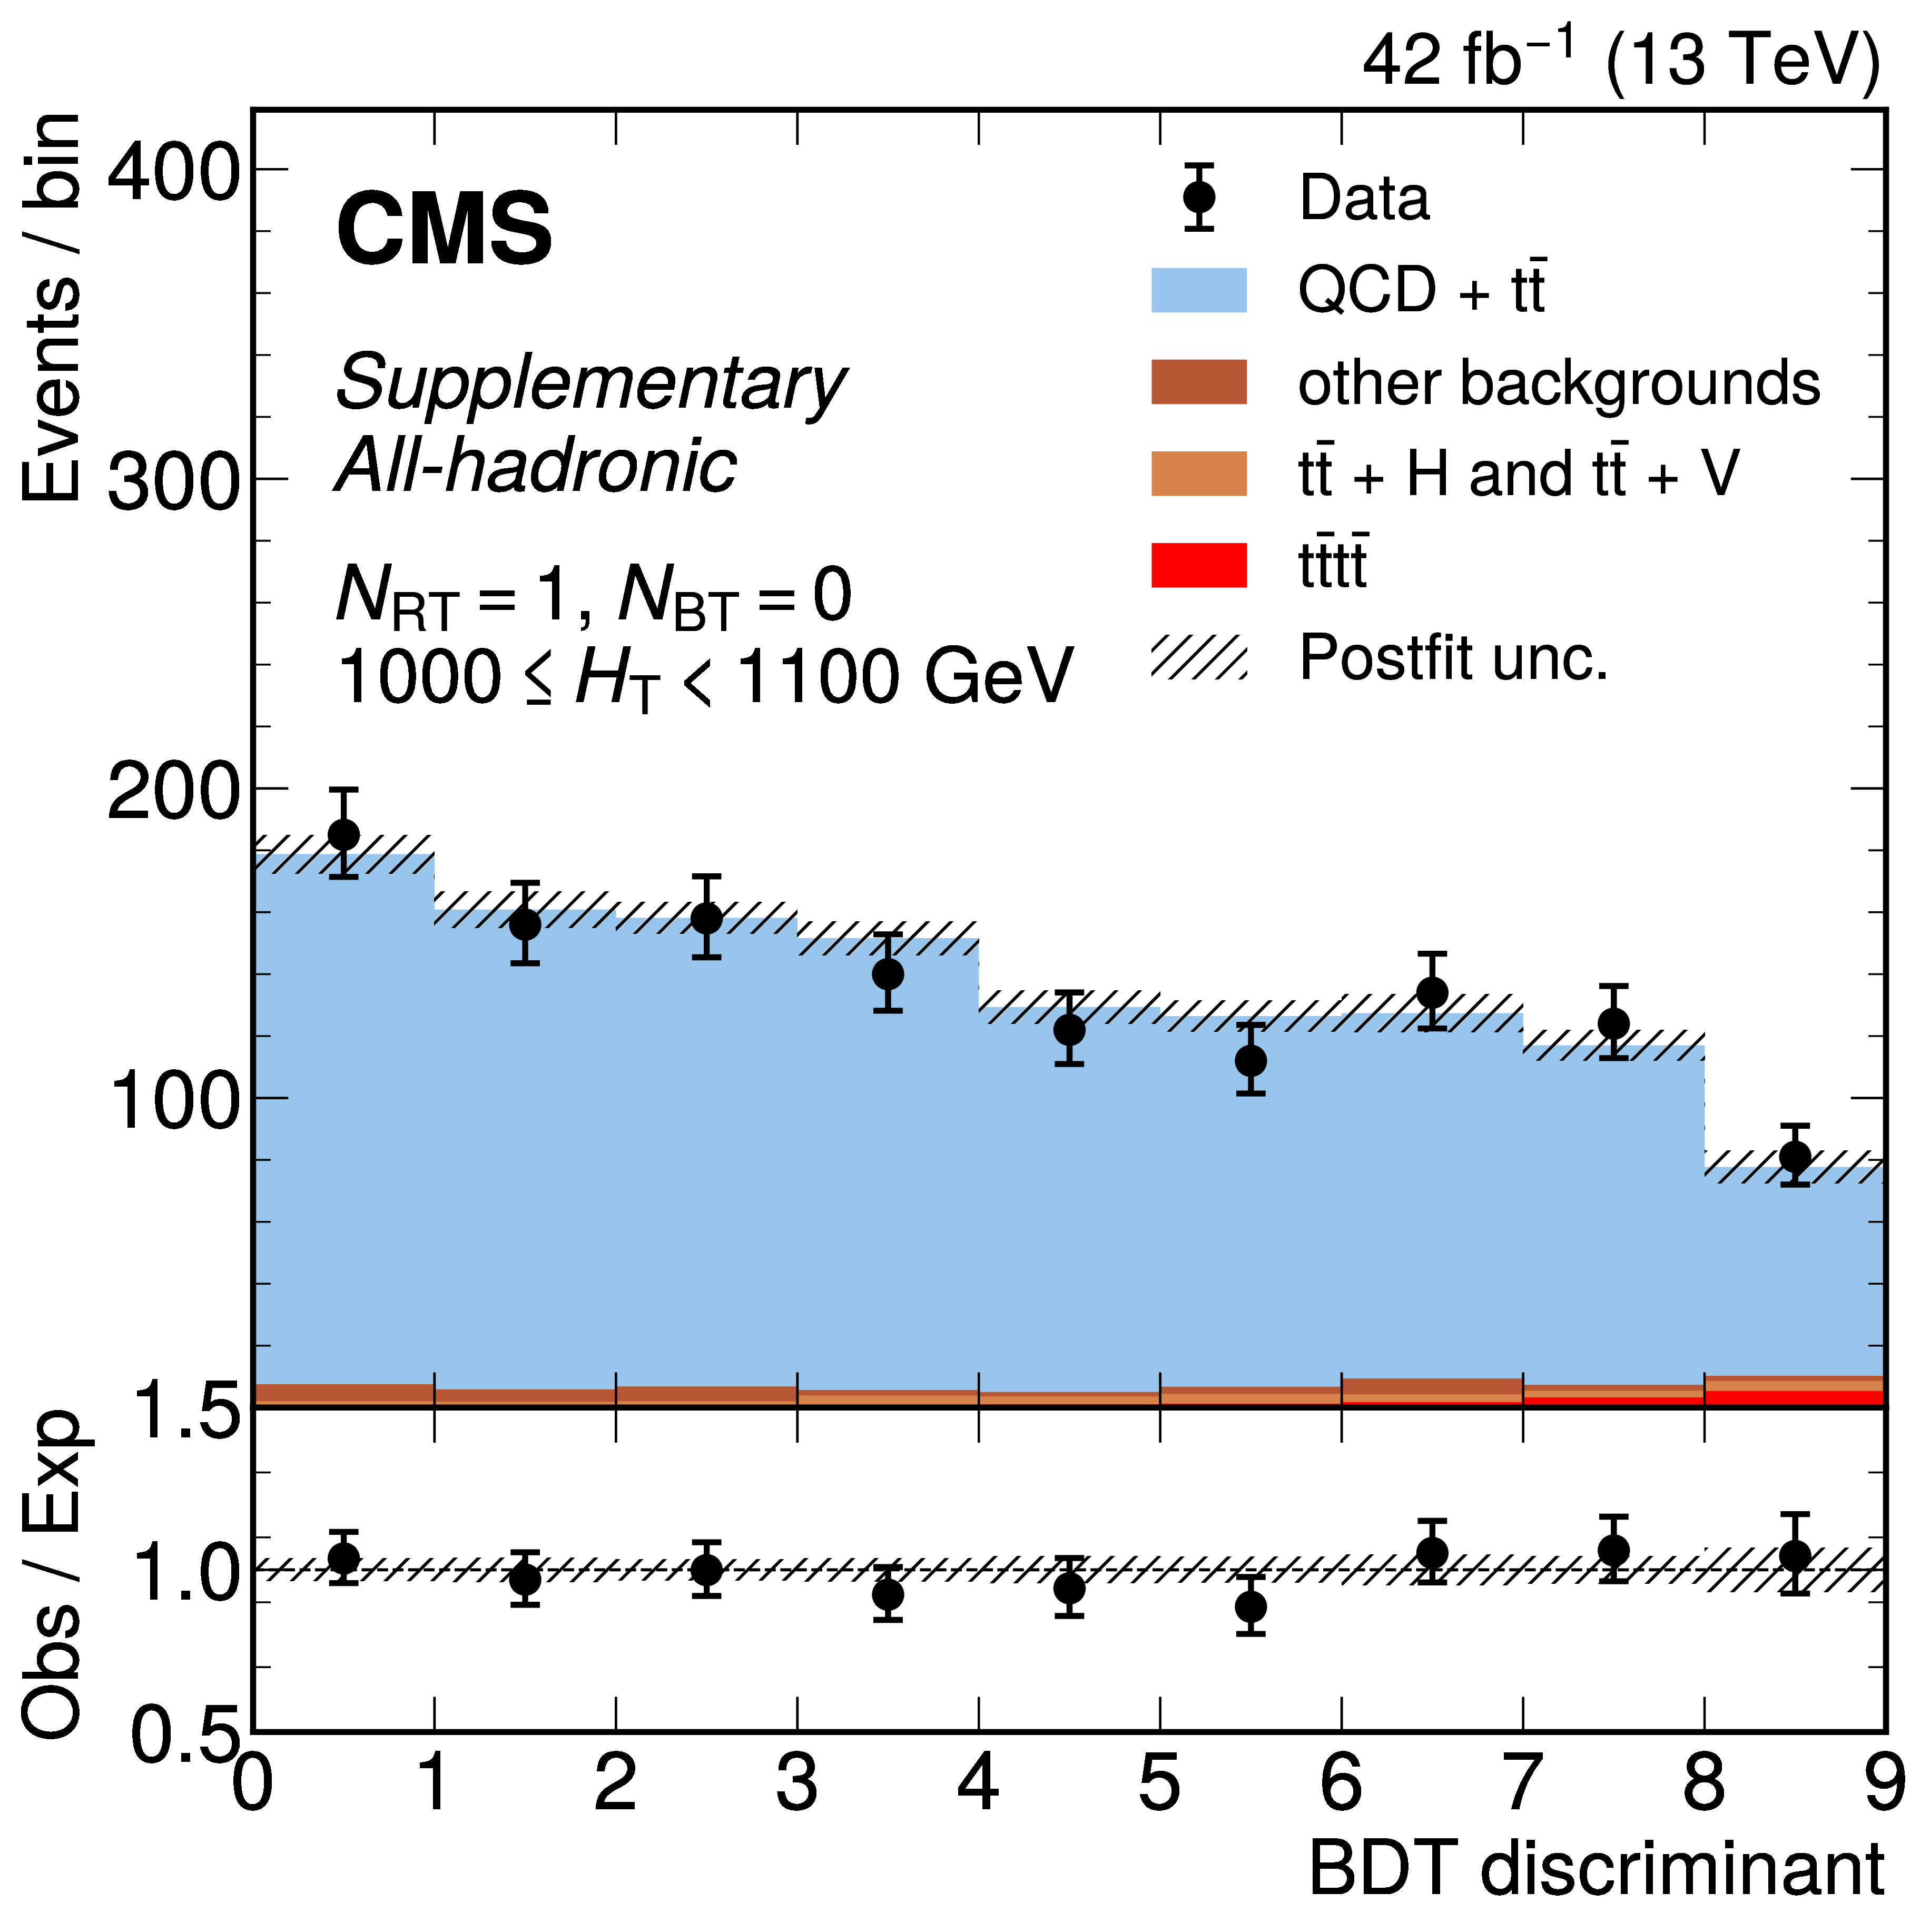
png pdf |
Additional Figure 25-d:
The distribution of the BDT discriminants in the signal region for the 2017 data set in the all-hadronic channel for all $ N_\text{RT} $, $ N_\text{BT} $, and $ H_{\mathrm{T}} $ categories. ($ N_\text{RT} $ and $ N_\text{BT} $ represent number of resolved tops and b-jets respectively.) The background from QCD multijet and $ \mathrm{t} \bar{\mathrm{t}} $ production is derived from control regions in the data. Estimates for the $ \mathrm{t}\bar{\mathrm{t}}\mathrm{t}\bar{\mathrm{t}} $ signal and other backgrounds are shown using simulated samples. The hatched bands correspond to the estimated total uncertainty after the fit. |
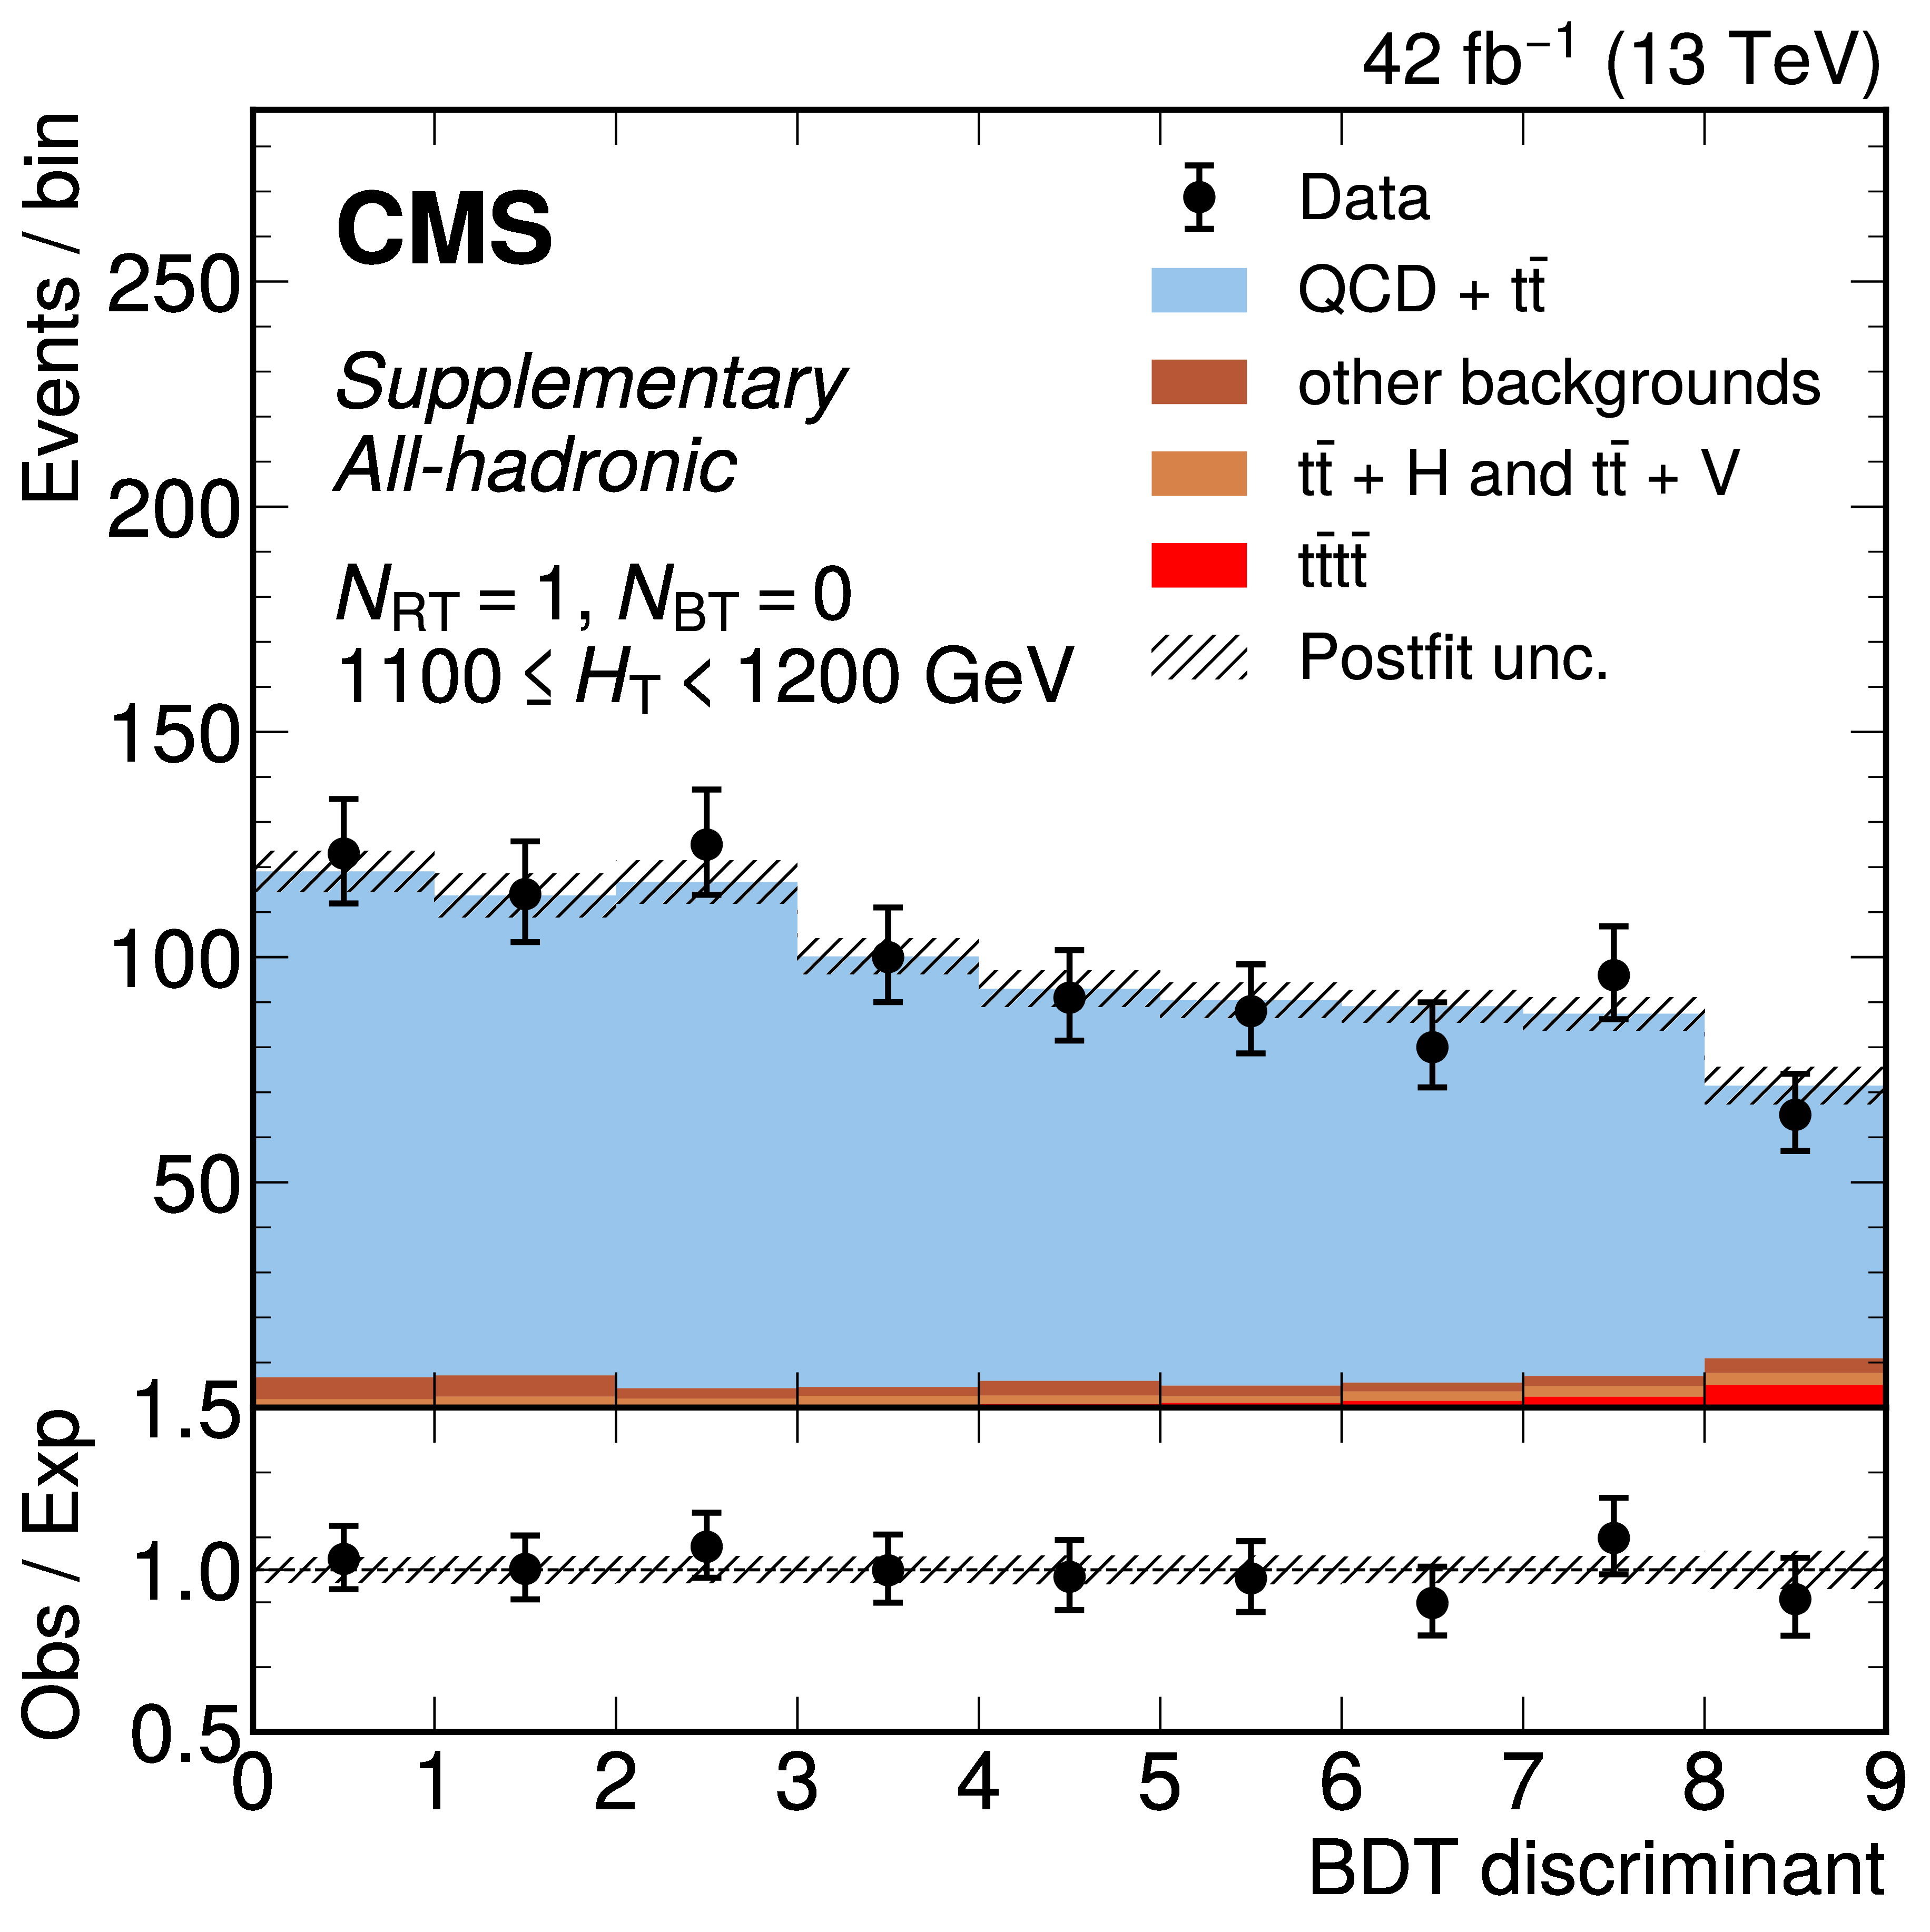
png pdf |
Additional Figure 25-e:
The distribution of the BDT discriminants in the signal region for the 2017 data set in the all-hadronic channel for all $ N_\text{RT} $, $ N_\text{BT} $, and $ H_{\mathrm{T}} $ categories. ($ N_\text{RT} $ and $ N_\text{BT} $ represent number of resolved tops and b-jets respectively.) The background from QCD multijet and $ \mathrm{t} \bar{\mathrm{t}} $ production is derived from control regions in the data. Estimates for the $ \mathrm{t}\bar{\mathrm{t}}\mathrm{t}\bar{\mathrm{t}} $ signal and other backgrounds are shown using simulated samples. The hatched bands correspond to the estimated total uncertainty after the fit. |
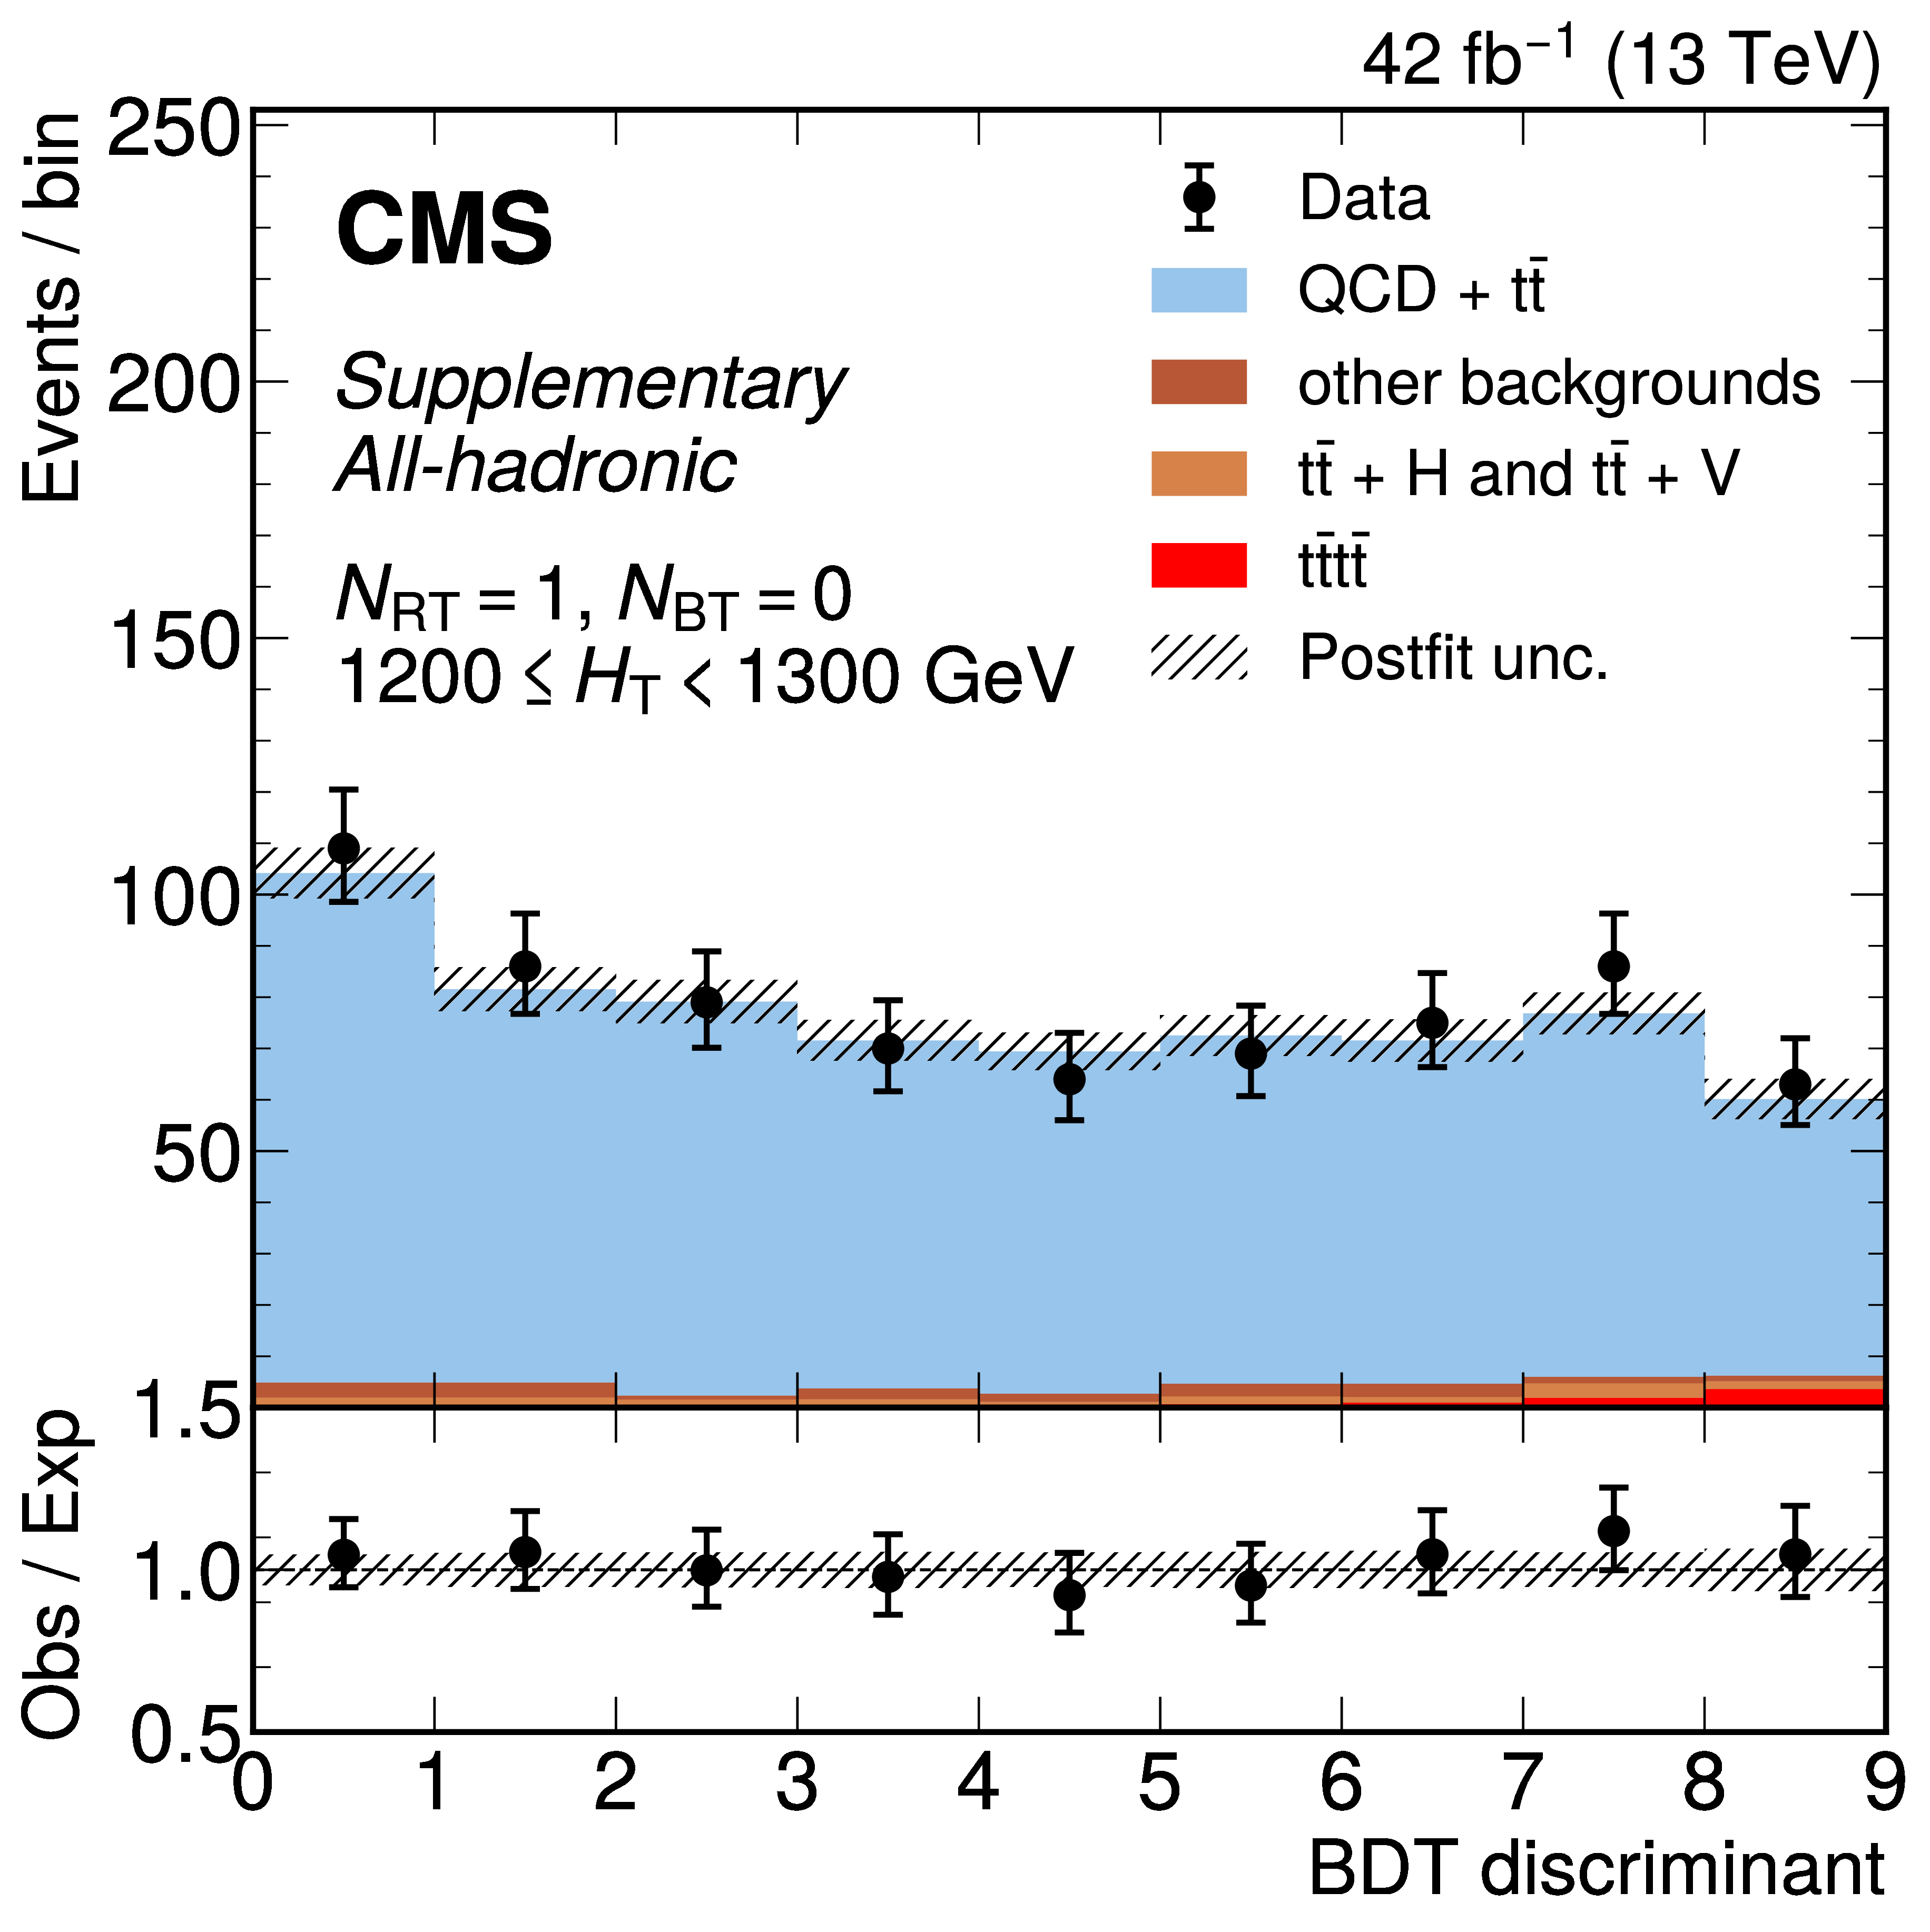
png pdf |
Additional Figure 25-f:
The distribution of the BDT discriminants in the signal region for the 2017 data set in the all-hadronic channel for all $ N_\text{RT} $, $ N_\text{BT} $, and $ H_{\mathrm{T}} $ categories. ($ N_\text{RT} $ and $ N_\text{BT} $ represent number of resolved tops and b-jets respectively.) The background from QCD multijet and $ \mathrm{t} \bar{\mathrm{t}} $ production is derived from control regions in the data. Estimates for the $ \mathrm{t}\bar{\mathrm{t}}\mathrm{t}\bar{\mathrm{t}} $ signal and other backgrounds are shown using simulated samples. The hatched bands correspond to the estimated total uncertainty after the fit. |
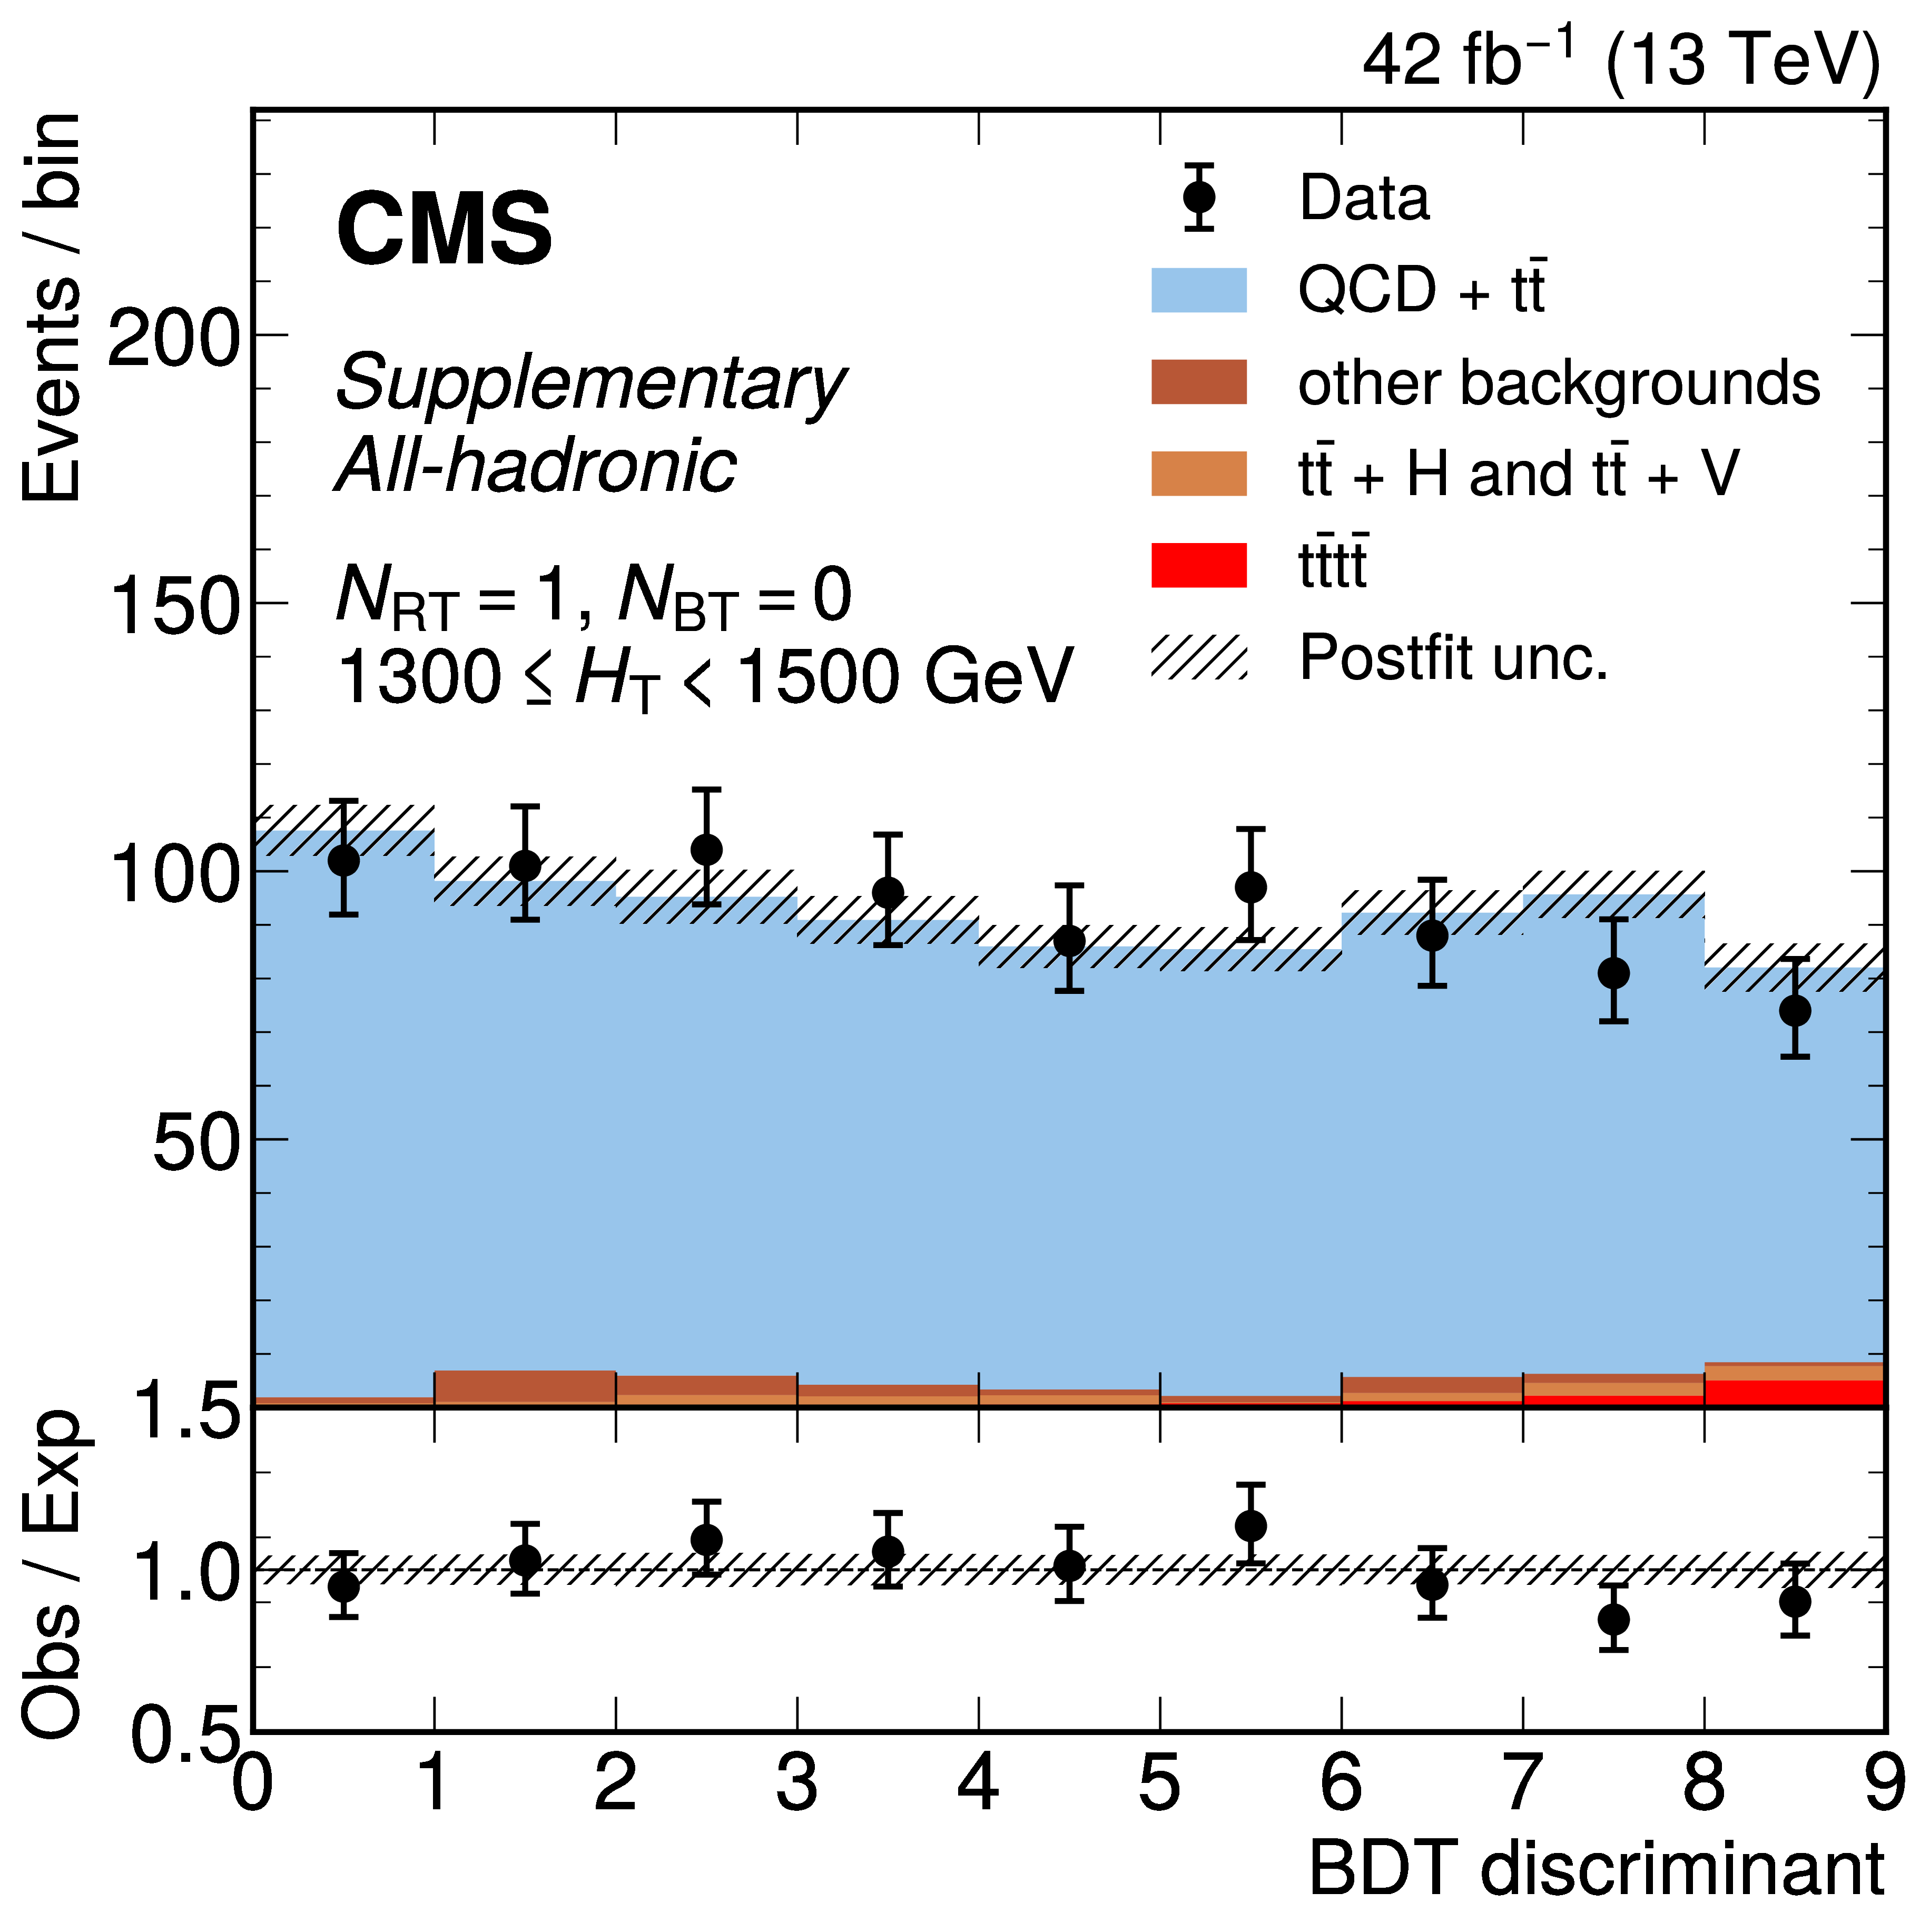
png pdf |
Additional Figure 25-g:
The distribution of the BDT discriminants in the signal region for the 2017 data set in the all-hadronic channel for all $ N_\text{RT} $, $ N_\text{BT} $, and $ H_{\mathrm{T}} $ categories. ($ N_\text{RT} $ and $ N_\text{BT} $ represent number of resolved tops and b-jets respectively.) The background from QCD multijet and $ \mathrm{t} \bar{\mathrm{t}} $ production is derived from control regions in the data. Estimates for the $ \mathrm{t}\bar{\mathrm{t}}\mathrm{t}\bar{\mathrm{t}} $ signal and other backgrounds are shown using simulated samples. The hatched bands correspond to the estimated total uncertainty after the fit. |
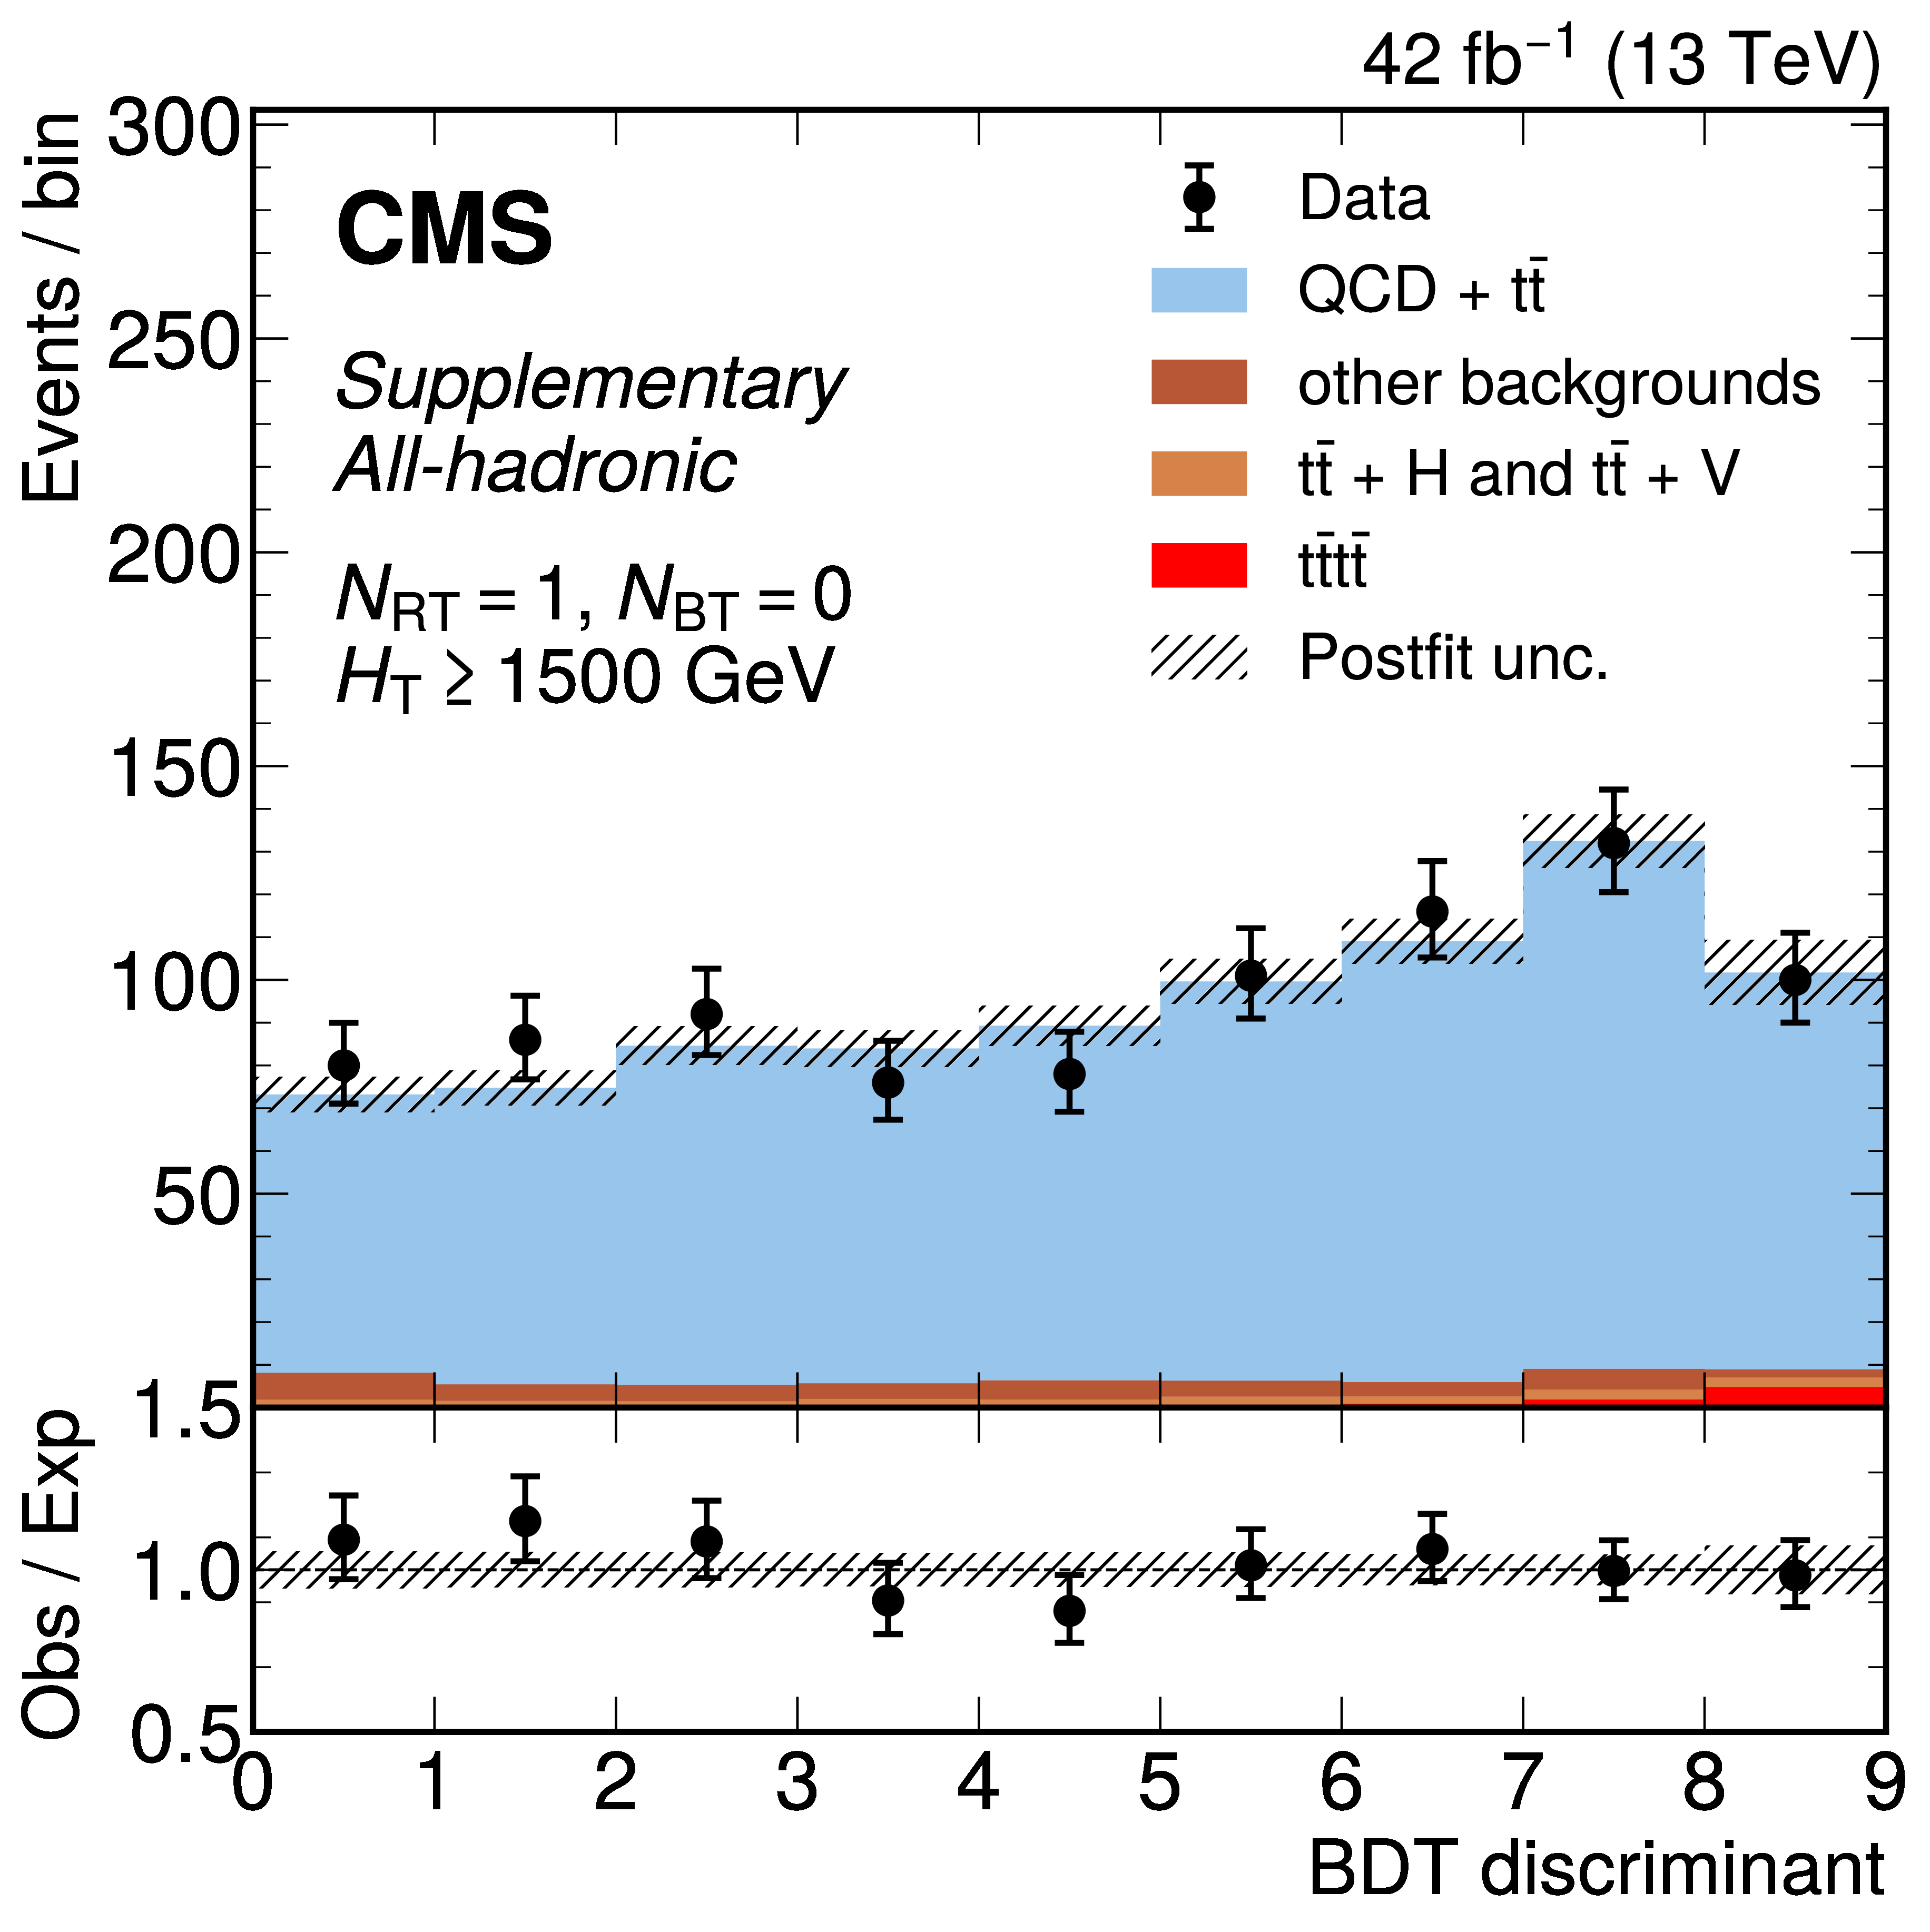
png pdf |
Additional Figure 25-h:
The distribution of the BDT discriminants in the signal region for the 2017 data set in the all-hadronic channel for all $ N_\text{RT} $, $ N_\text{BT} $, and $ H_{\mathrm{T}} $ categories. ($ N_\text{RT} $ and $ N_\text{BT} $ represent number of resolved tops and b-jets respectively.) The background from QCD multijet and $ \mathrm{t} \bar{\mathrm{t}} $ production is derived from control regions in the data. Estimates for the $ \mathrm{t}\bar{\mathrm{t}}\mathrm{t}\bar{\mathrm{t}} $ signal and other backgrounds are shown using simulated samples. The hatched bands correspond to the estimated total uncertainty after the fit. |

png pdf |
Additional Figure 25-i:
The distribution of the BDT discriminants in the signal region for the 2017 data set in the all-hadronic channel for all $ N_\text{RT} $, $ N_\text{BT} $, and $ H_{\mathrm{T}} $ categories. ($ N_\text{RT} $ and $ N_\text{BT} $ represent number of resolved tops and b-jets respectively.) The background from QCD multijet and $ \mathrm{t} \bar{\mathrm{t}} $ production is derived from control regions in the data. Estimates for the $ \mathrm{t}\bar{\mathrm{t}}\mathrm{t}\bar{\mathrm{t}} $ signal and other backgrounds are shown using simulated samples. The hatched bands correspond to the estimated total uncertainty after the fit. |
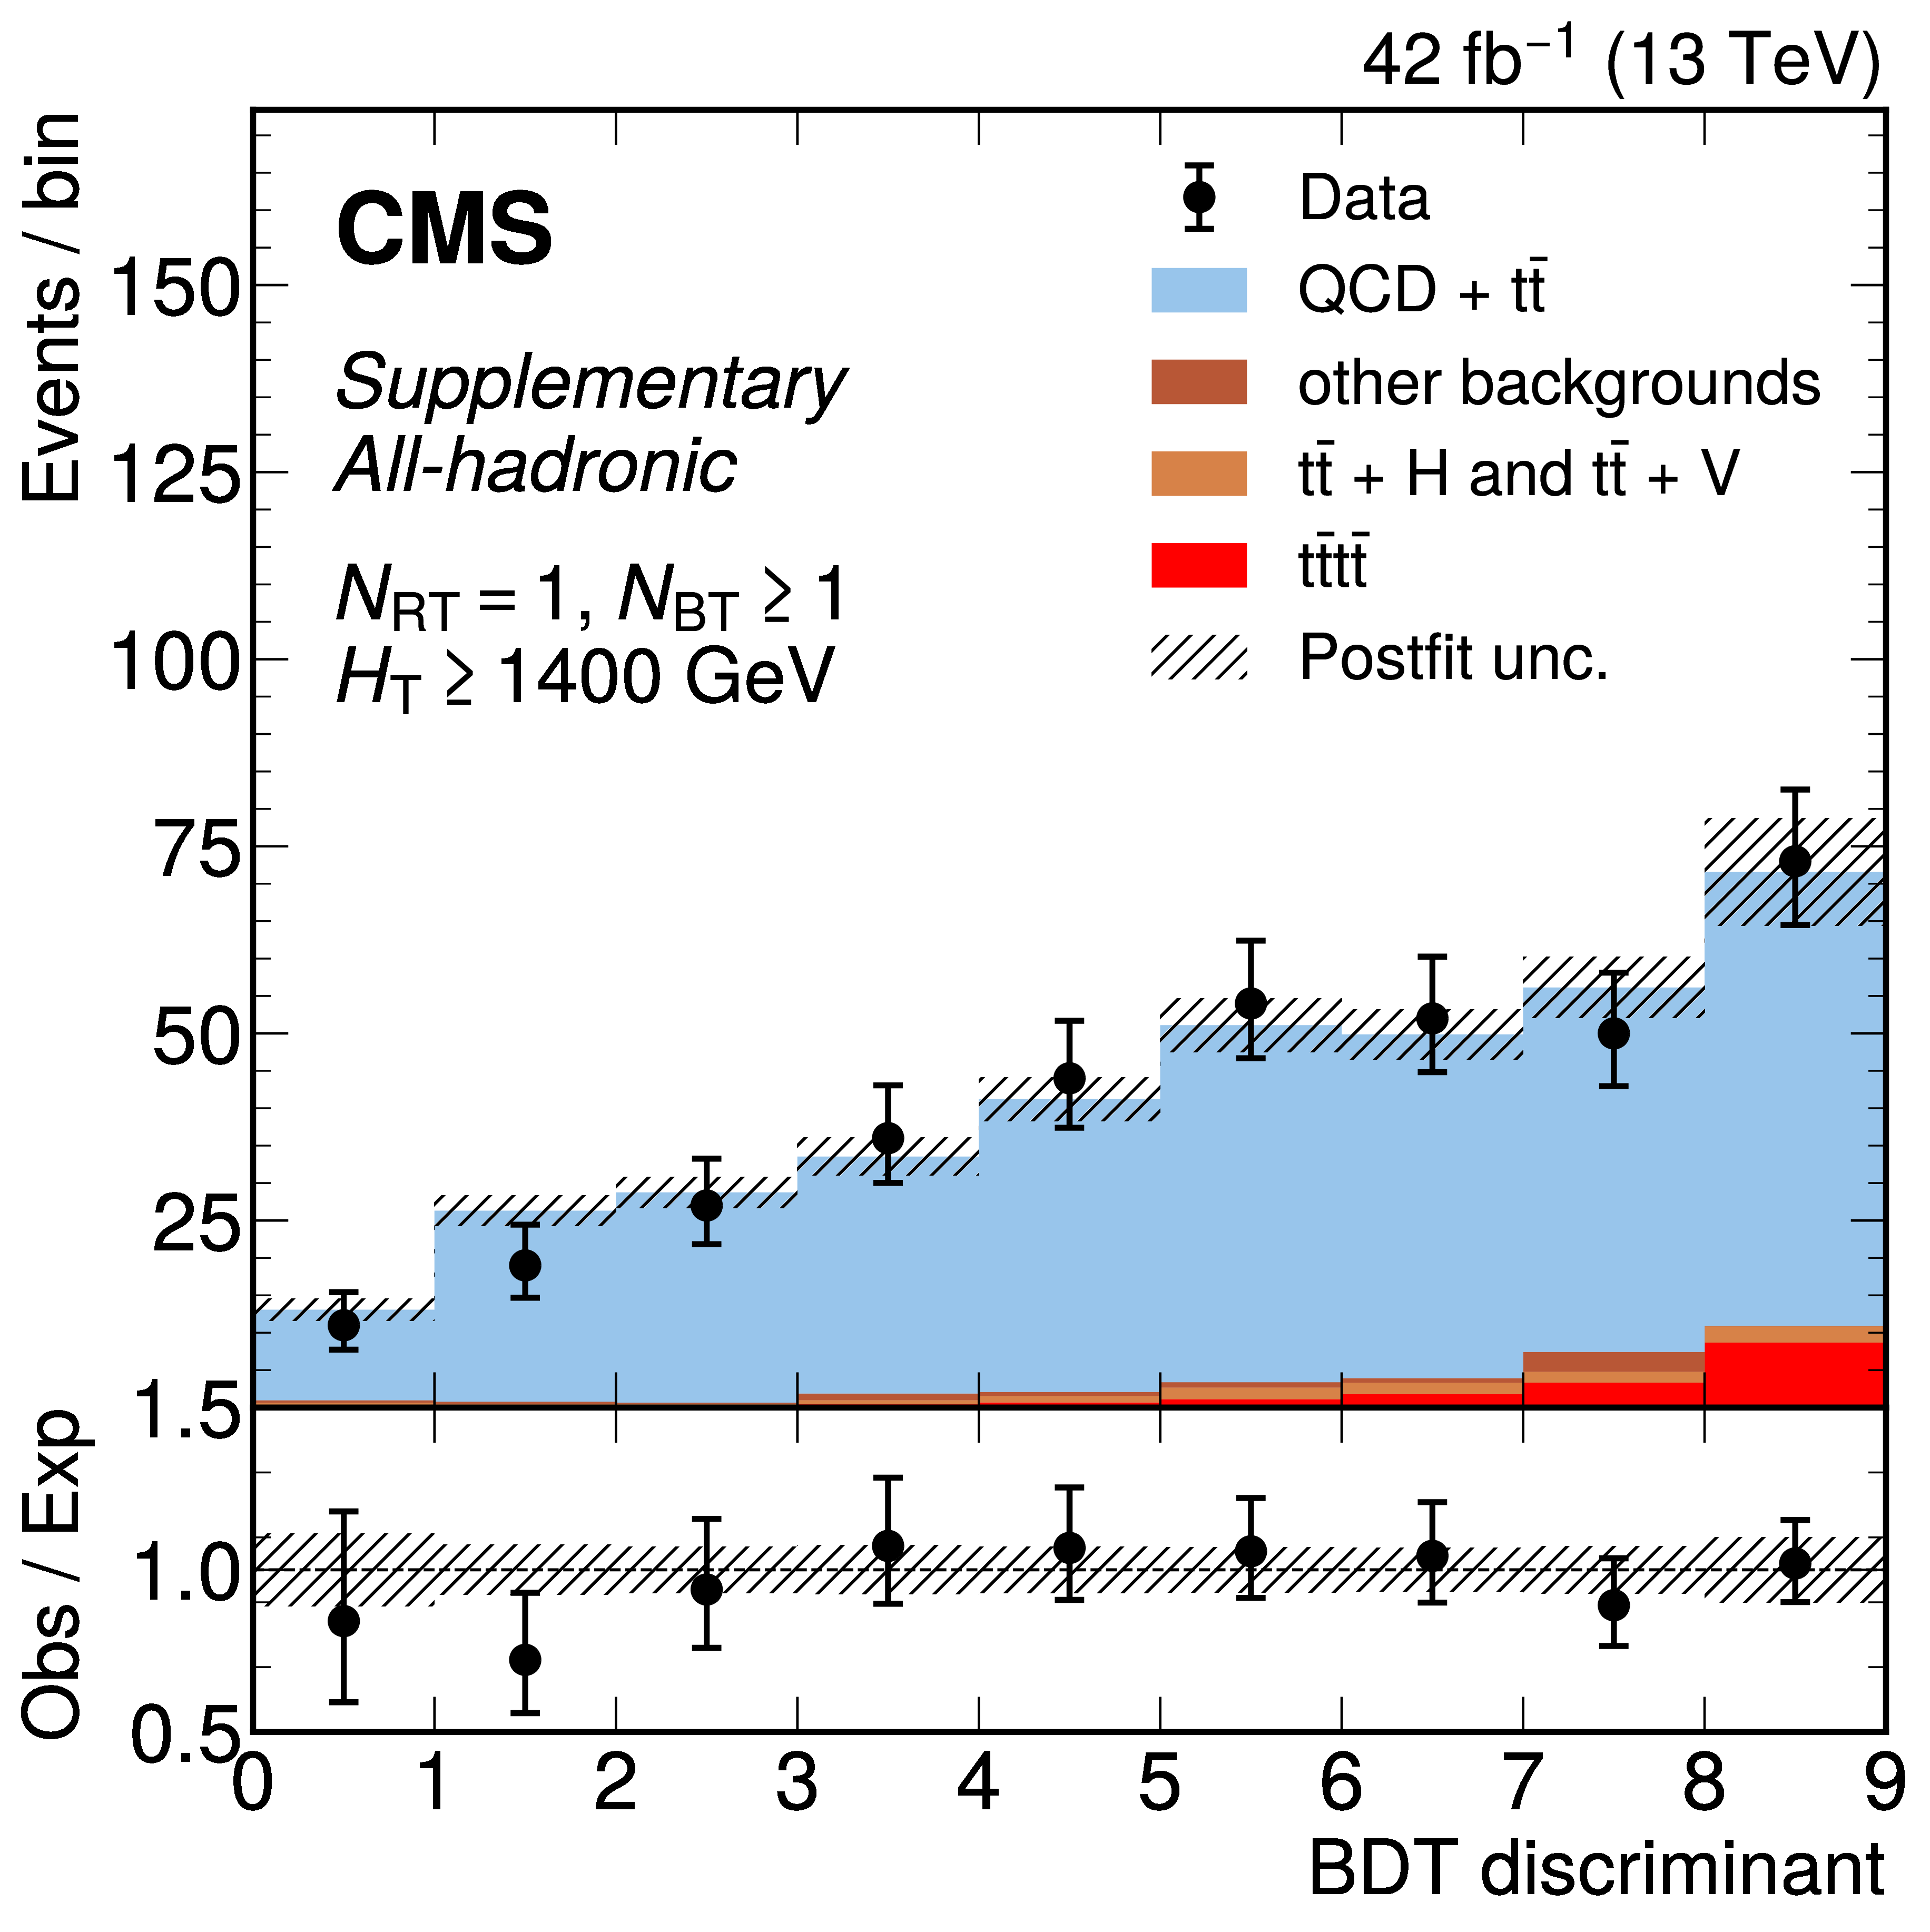
png pdf |
Additional Figure 25-j:
The distribution of the BDT discriminants in the signal region for the 2017 data set in the all-hadronic channel for all $ N_\text{RT} $, $ N_\text{BT} $, and $ H_{\mathrm{T}} $ categories. ($ N_\text{RT} $ and $ N_\text{BT} $ represent number of resolved tops and b-jets respectively.) The background from QCD multijet and $ \mathrm{t} \bar{\mathrm{t}} $ production is derived from control regions in the data. Estimates for the $ \mathrm{t}\bar{\mathrm{t}}\mathrm{t}\bar{\mathrm{t}} $ signal and other backgrounds are shown using simulated samples. The hatched bands correspond to the estimated total uncertainty after the fit. |
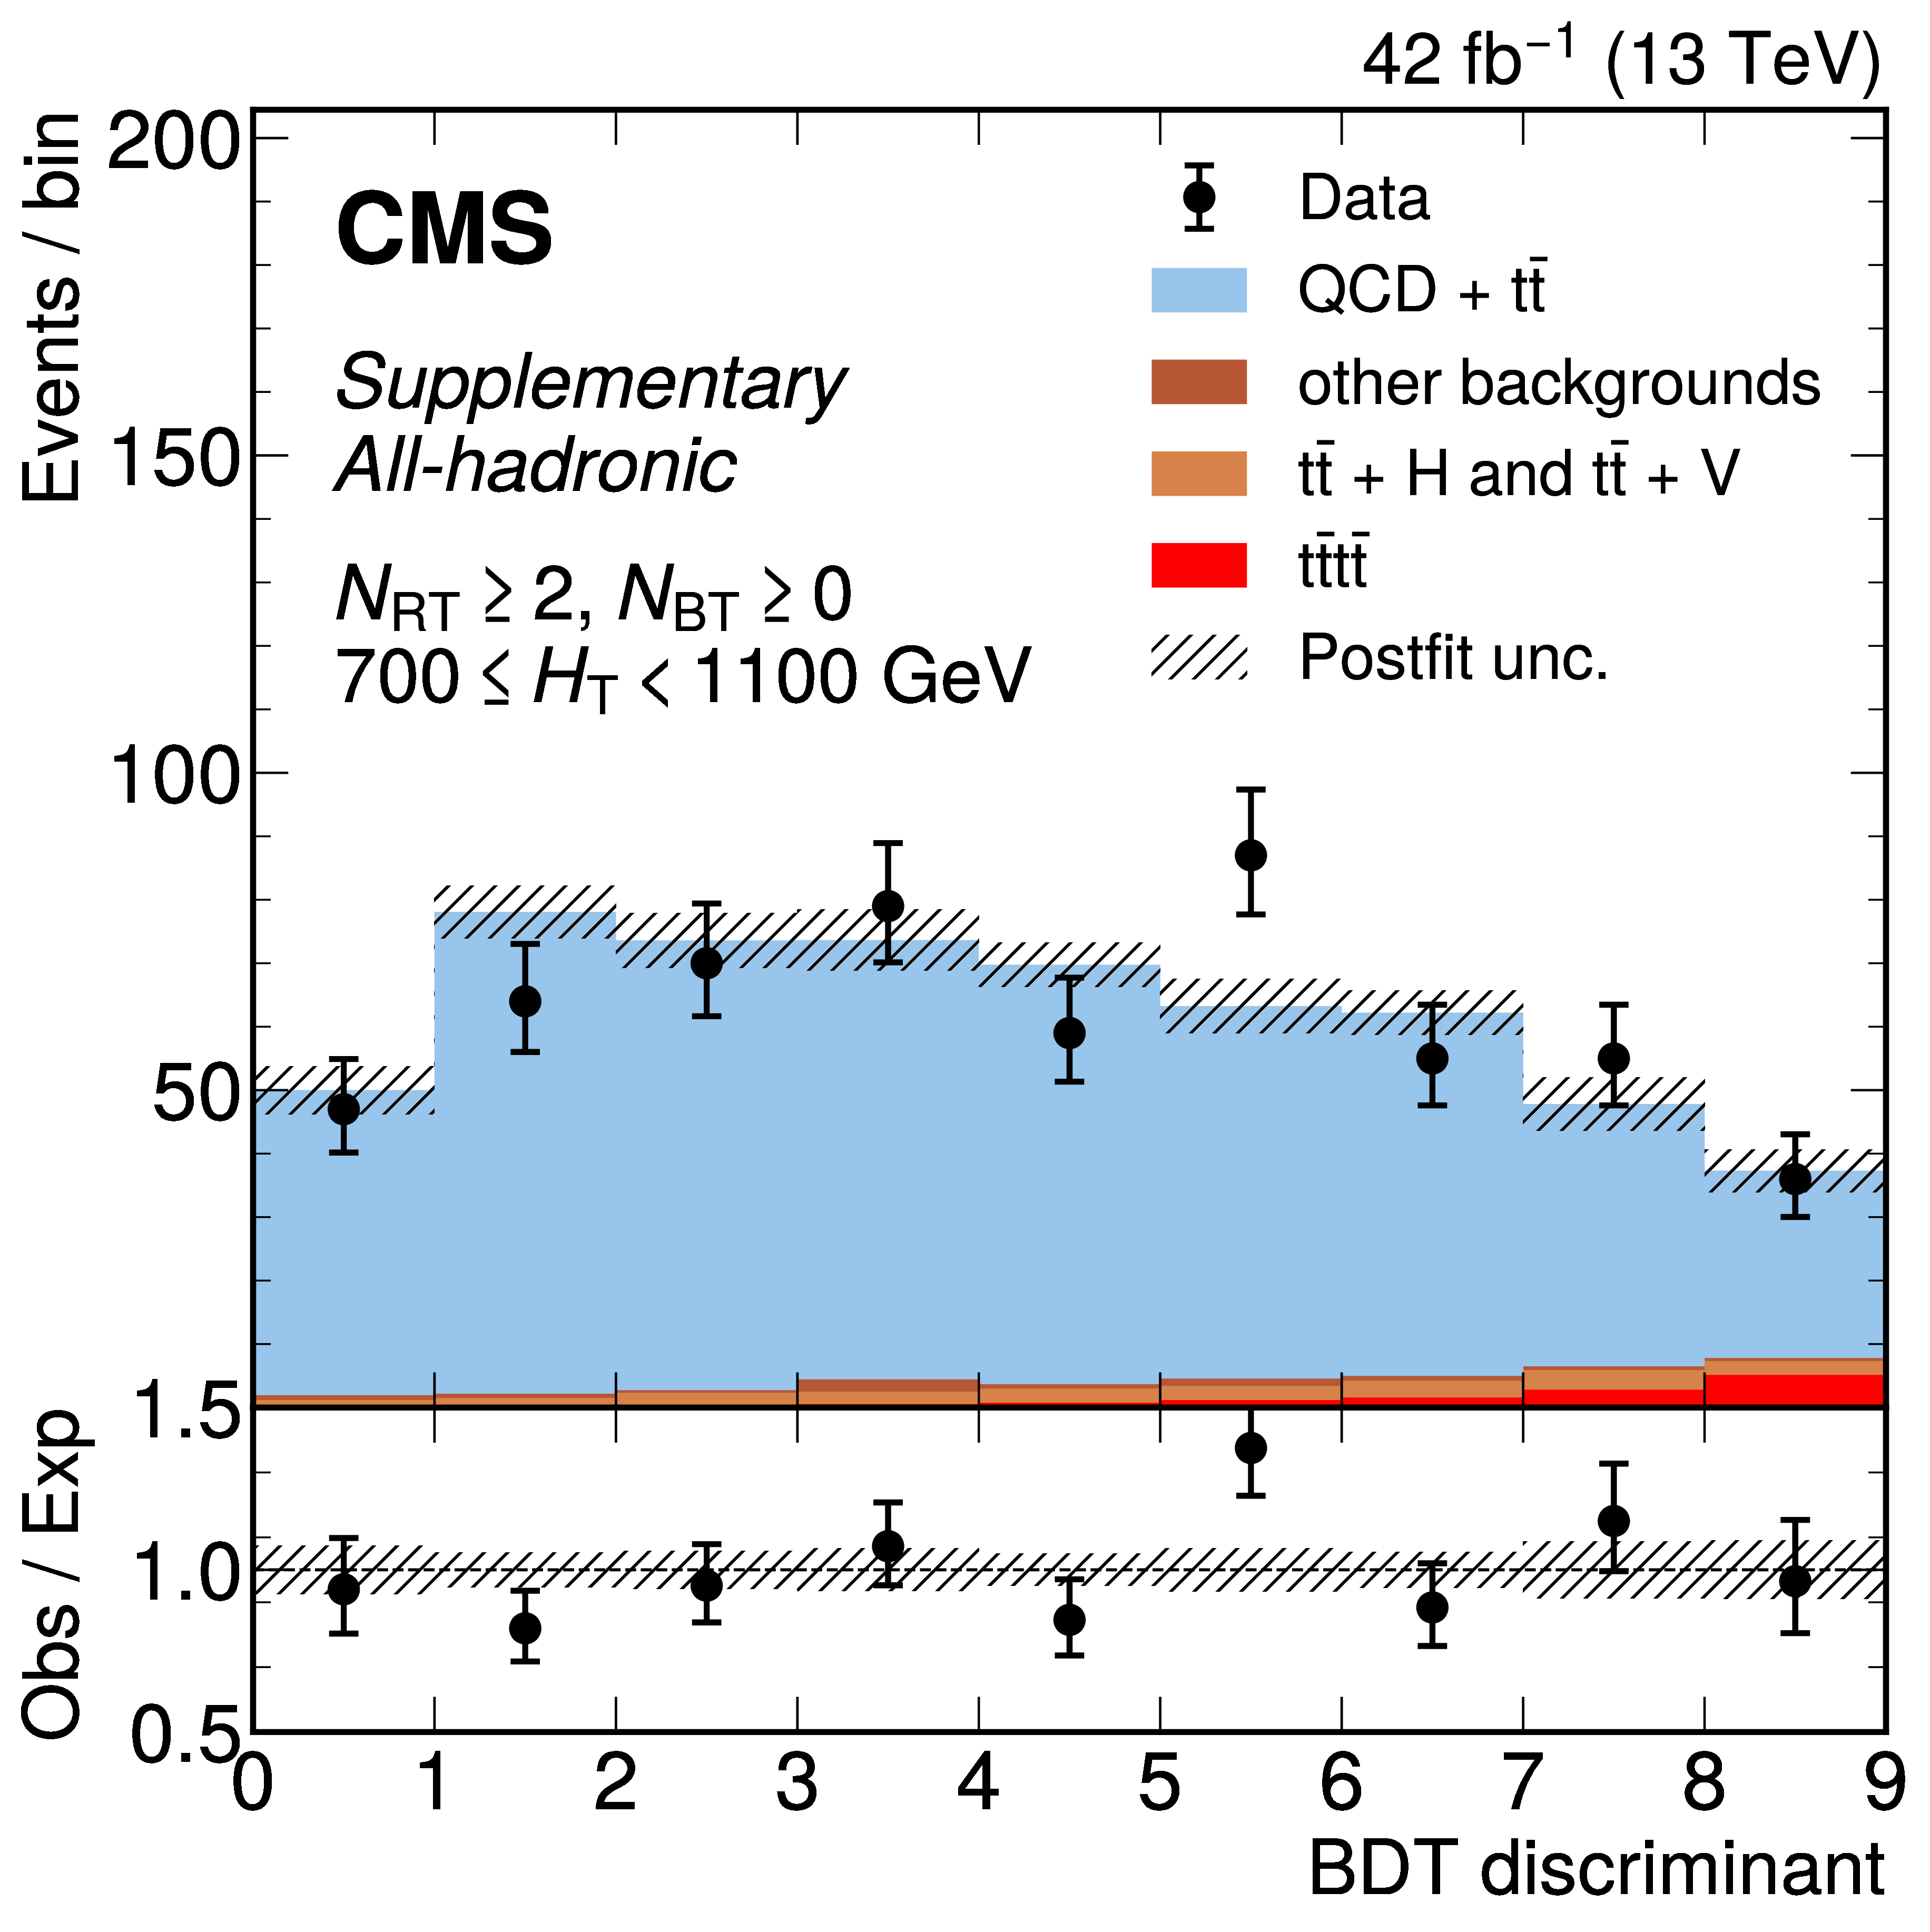
png pdf |
Additional Figure 25-k:
The distribution of the BDT discriminants in the signal region for the 2017 data set in the all-hadronic channel for all $ N_\text{RT} $, $ N_\text{BT} $, and $ H_{\mathrm{T}} $ categories. ($ N_\text{RT} $ and $ N_\text{BT} $ represent number of resolved tops and b-jets respectively.) The background from QCD multijet and $ \mathrm{t} \bar{\mathrm{t}} $ production is derived from control regions in the data. Estimates for the $ \mathrm{t}\bar{\mathrm{t}}\mathrm{t}\bar{\mathrm{t}} $ signal and other backgrounds are shown using simulated samples. The hatched bands correspond to the estimated total uncertainty after the fit. |
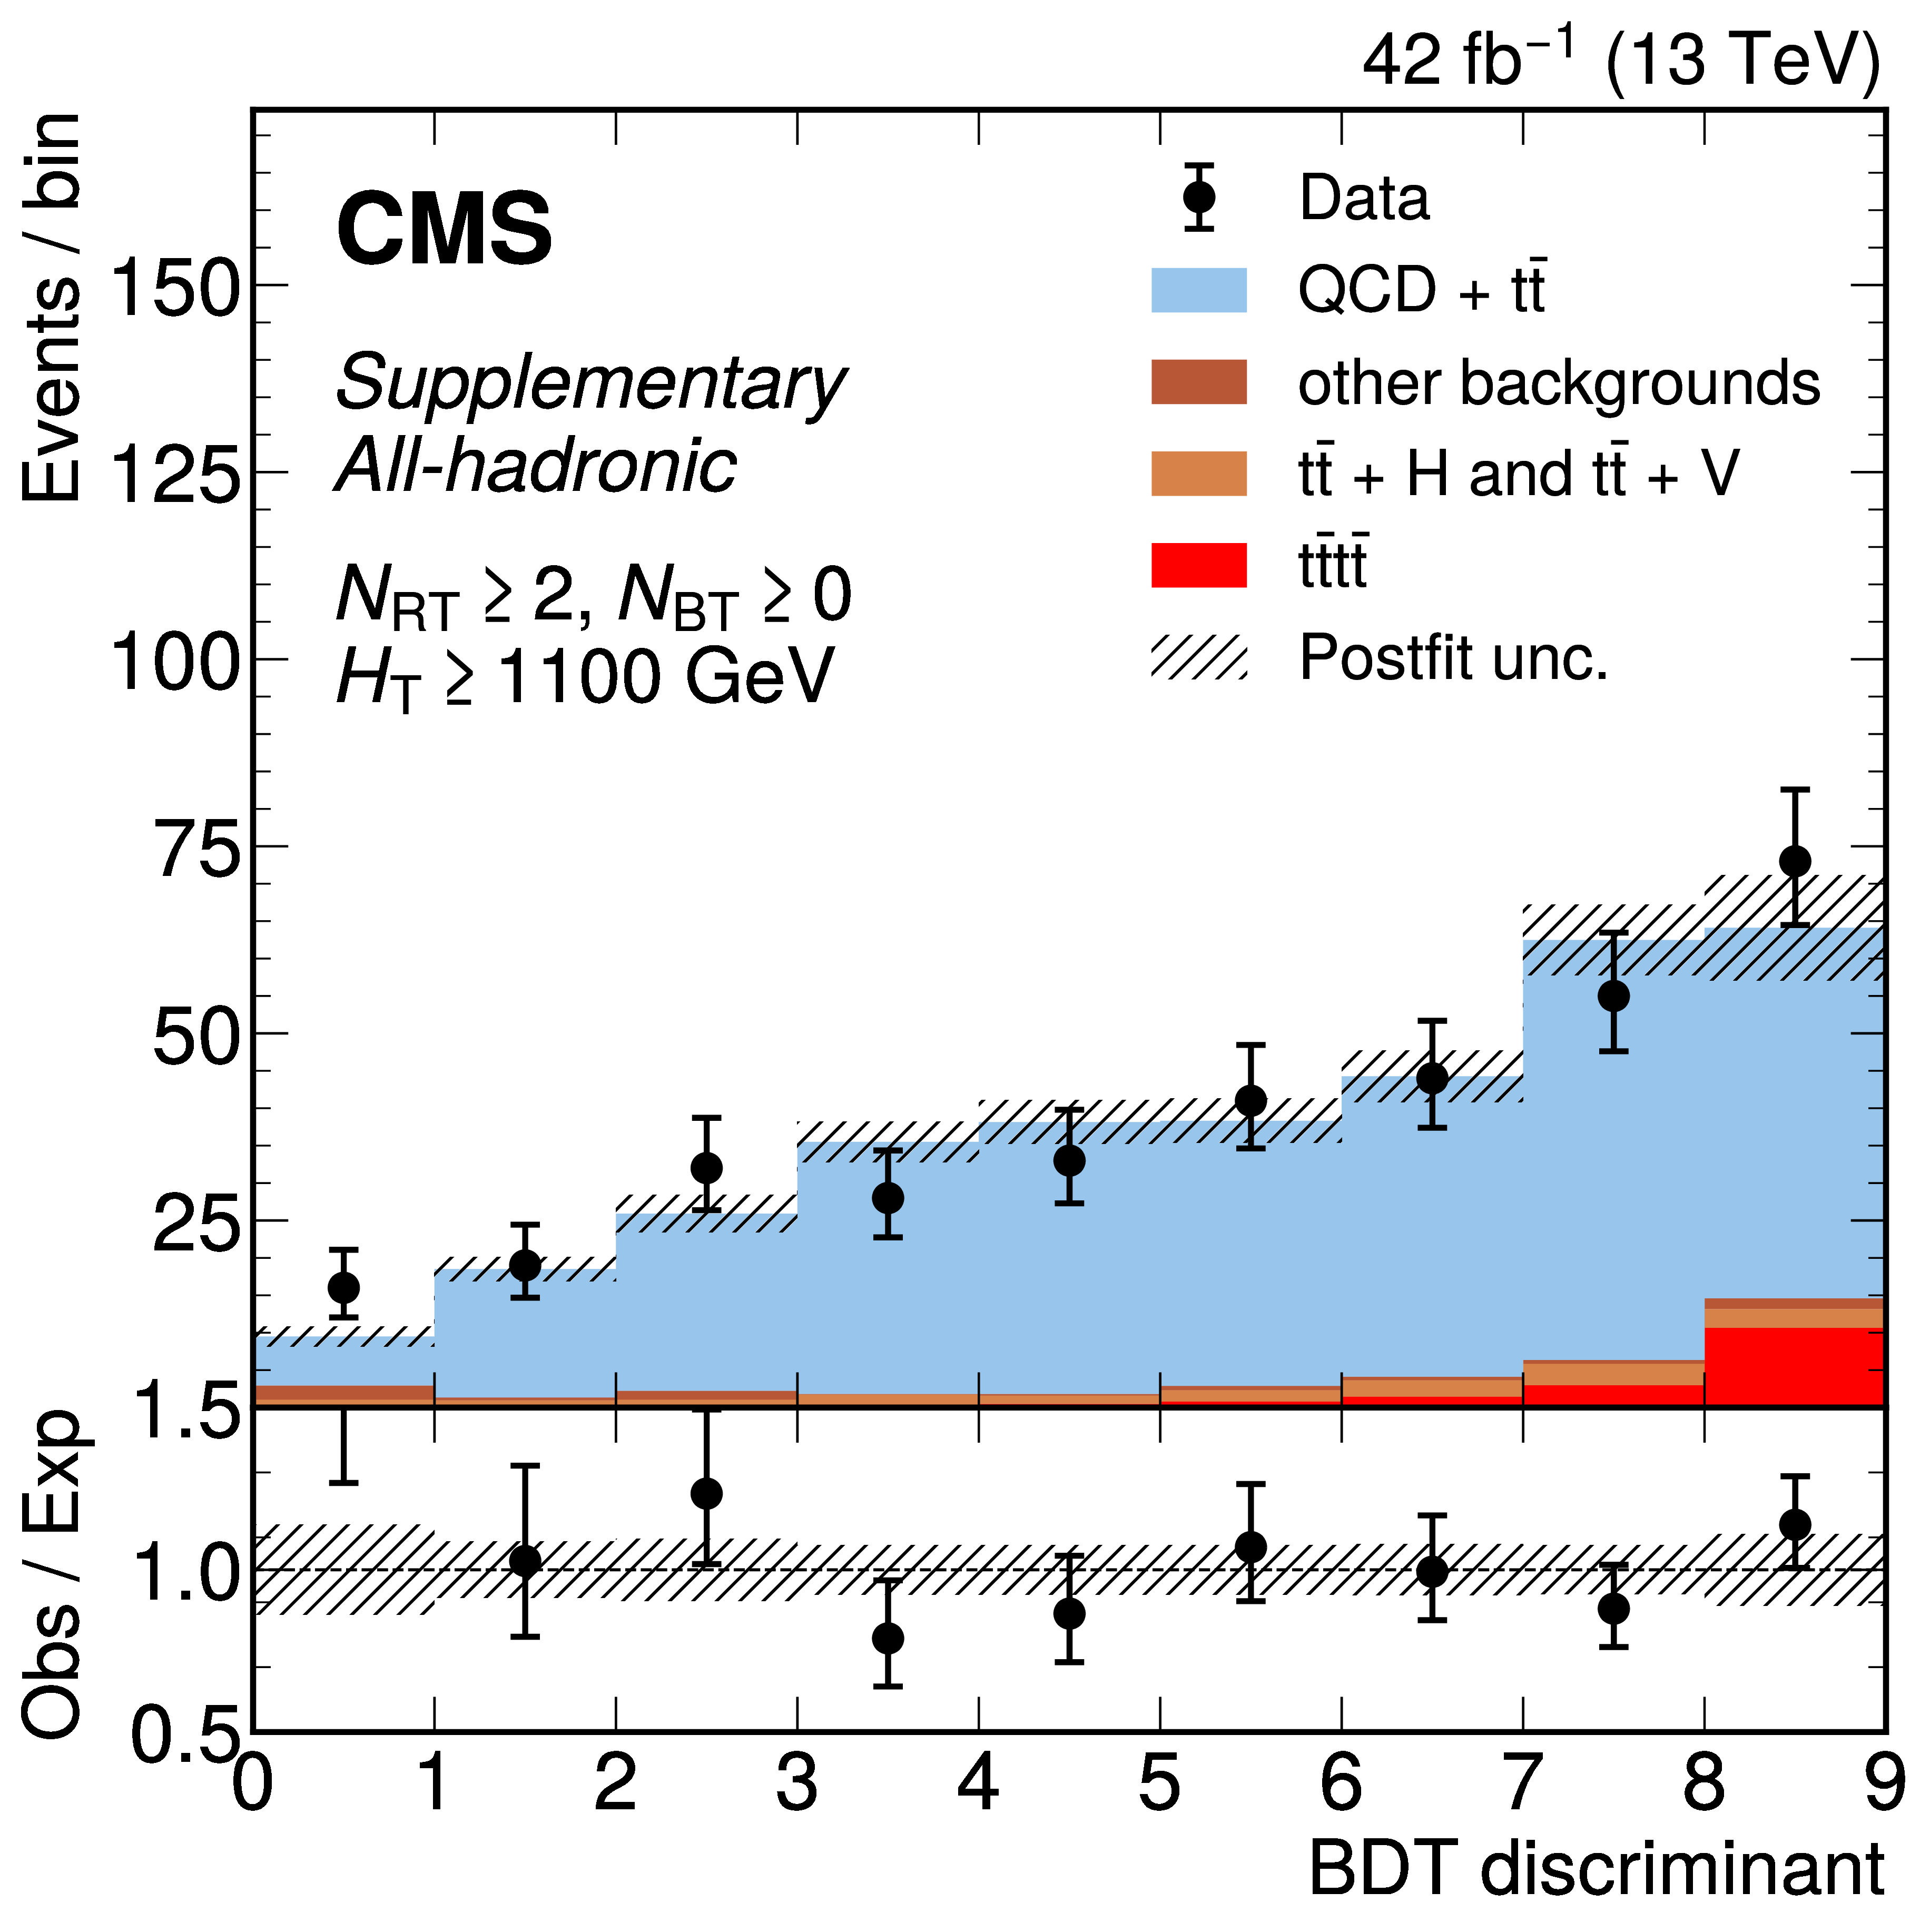
png pdf |
Additional Figure 25-l:
The distribution of the BDT discriminants in the signal region for the 2017 data set in the all-hadronic channel for all $ N_\text{RT} $, $ N_\text{BT} $, and $ H_{\mathrm{T}} $ categories. ($ N_\text{RT} $ and $ N_\text{BT} $ represent number of resolved tops and b-jets respectively.) The background from QCD multijet and $ \mathrm{t} \bar{\mathrm{t}} $ production is derived from control regions in the data. Estimates for the $ \mathrm{t}\bar{\mathrm{t}}\mathrm{t}\bar{\mathrm{t}} $ signal and other backgrounds are shown using simulated samples. The hatched bands correspond to the estimated total uncertainty after the fit. |
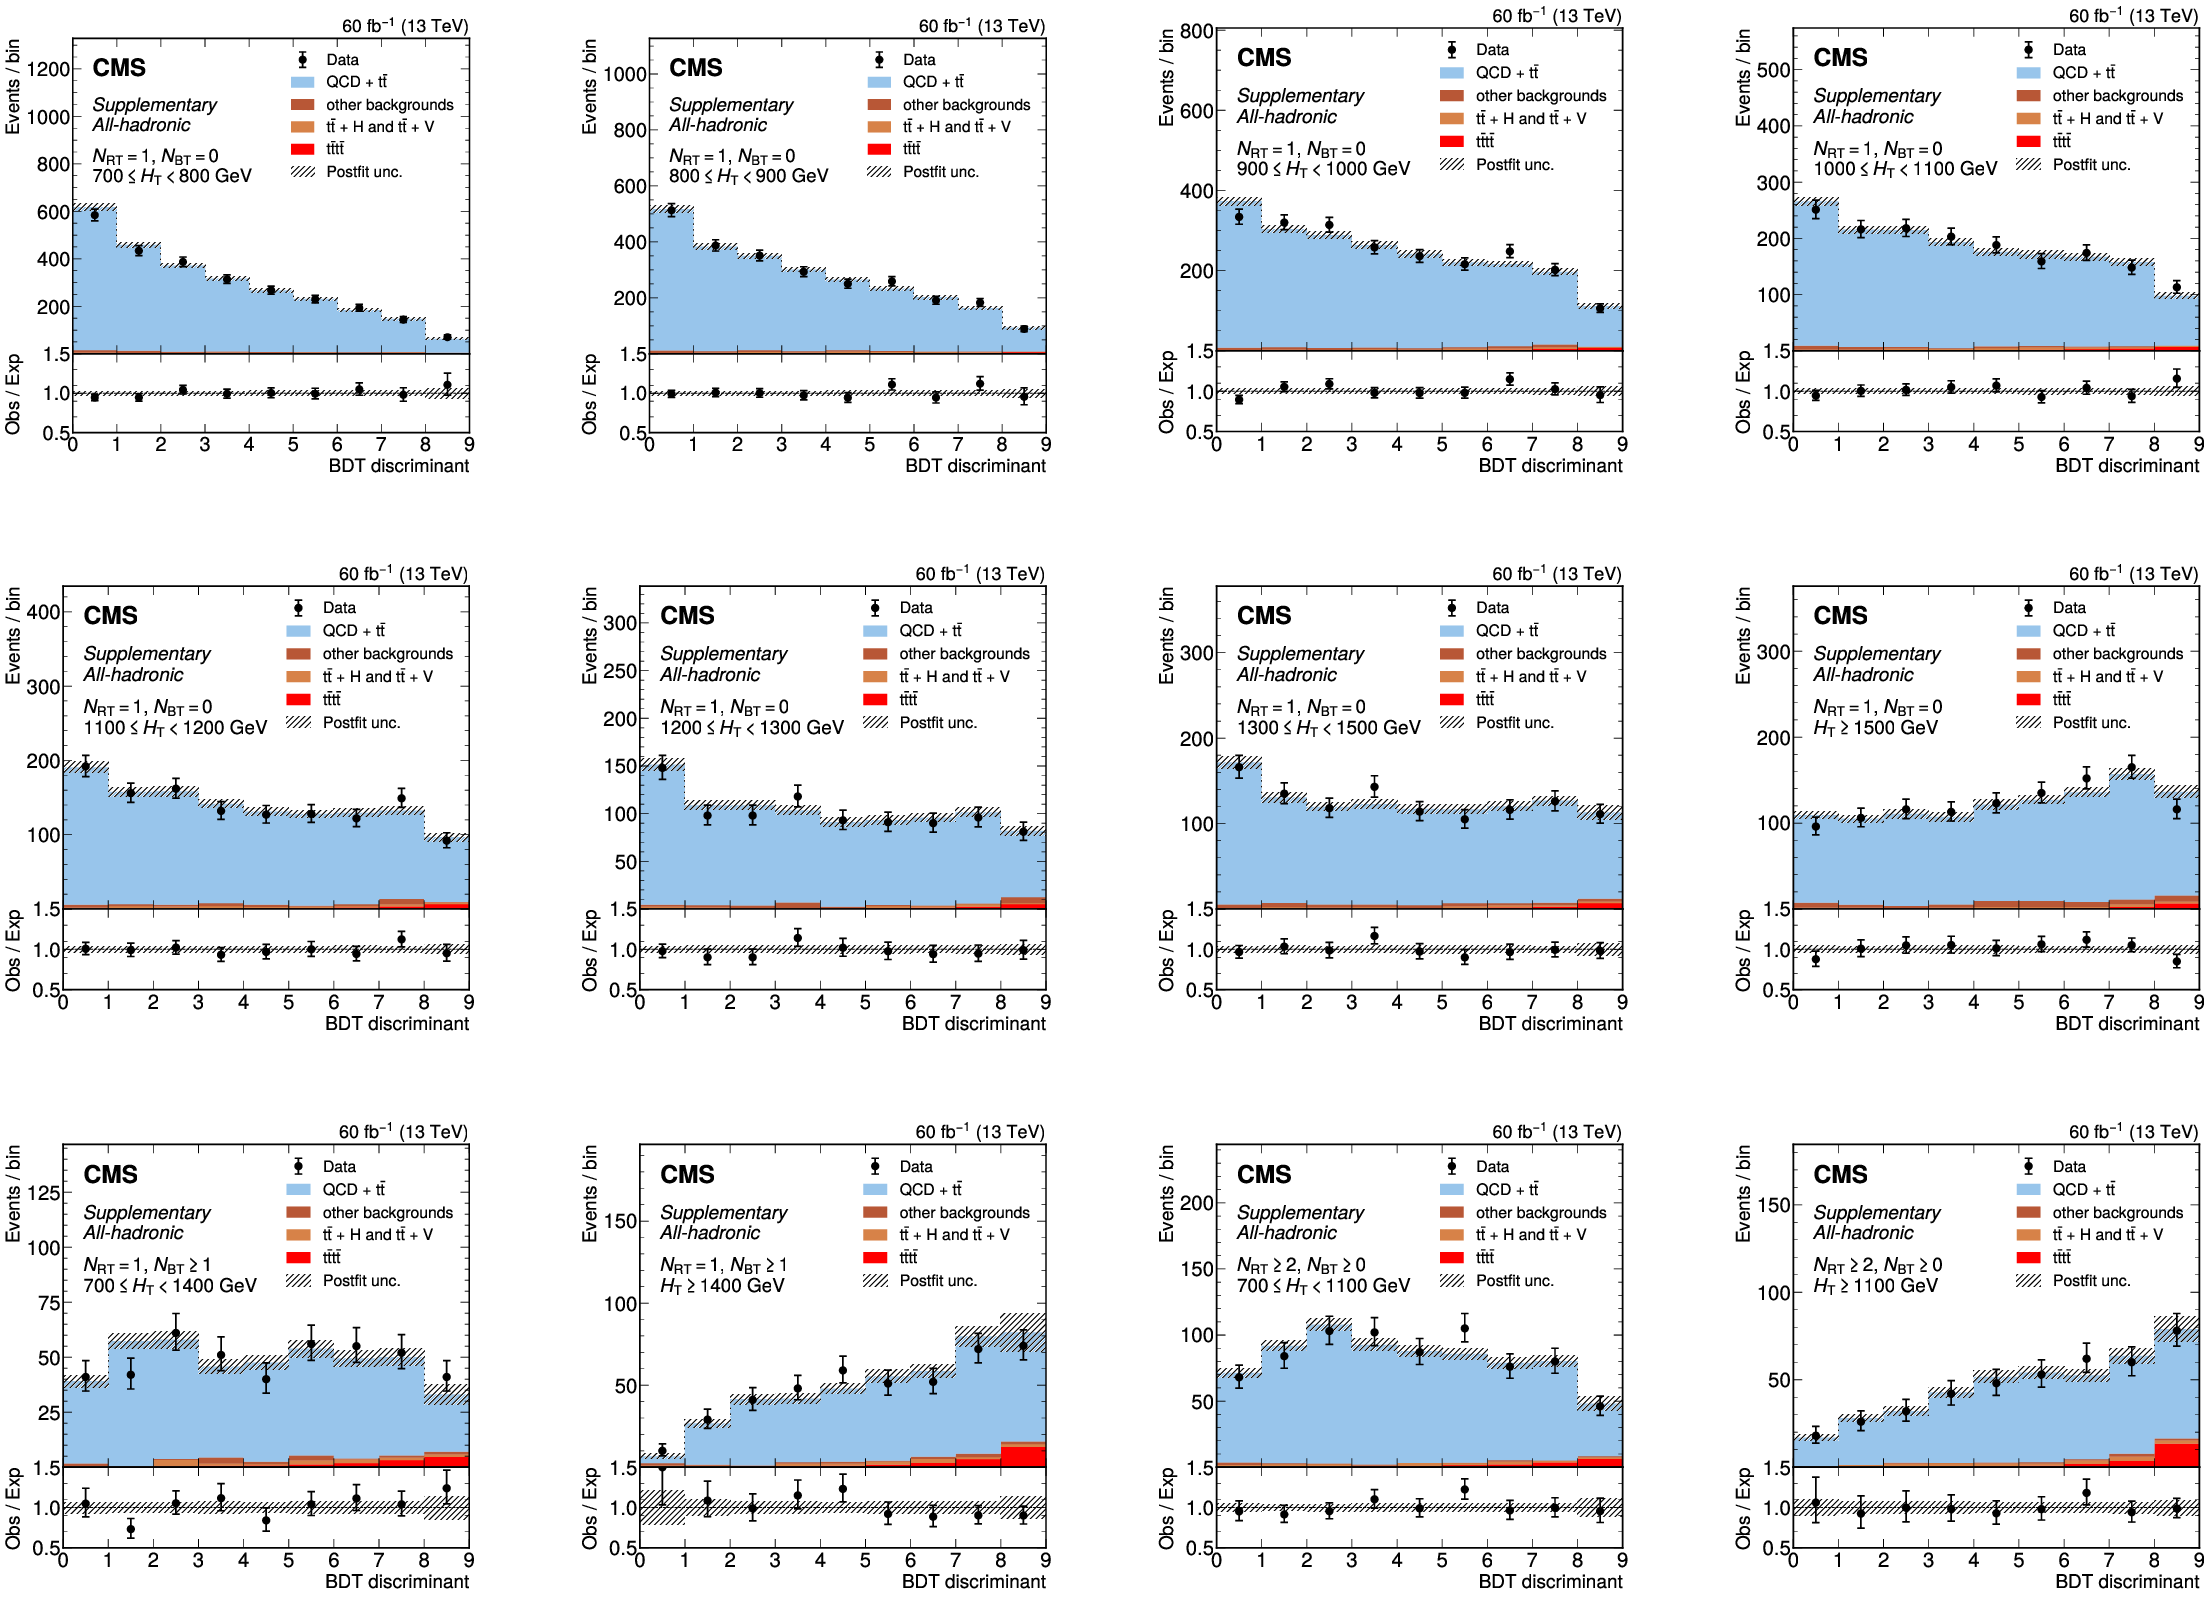
png pdf |
Additional Figure 26:
The distribution of the BDT discriminants in the signal region for the 2018 data set in the all-hadronic channel for all $ N_\text{RT} $, $ N_\text{BT} $, and $ H_{\mathrm{T}} $ categories. ($ N_\text{RT} $ and $ N_\text{BT} $ represent number of resolved tops and b-jets respectively.) The background from QCD multijet and $ \mathrm{t} \bar{\mathrm{t}} $ production is derived from control regions in the data. Estimates for the $ \mathrm{t}\bar{\mathrm{t}}\mathrm{t}\bar{\mathrm{t}} $ signal and other backgrounds are shown using simulated samples. The hatched bands correspond to the estimated total uncertainty after the fit. |
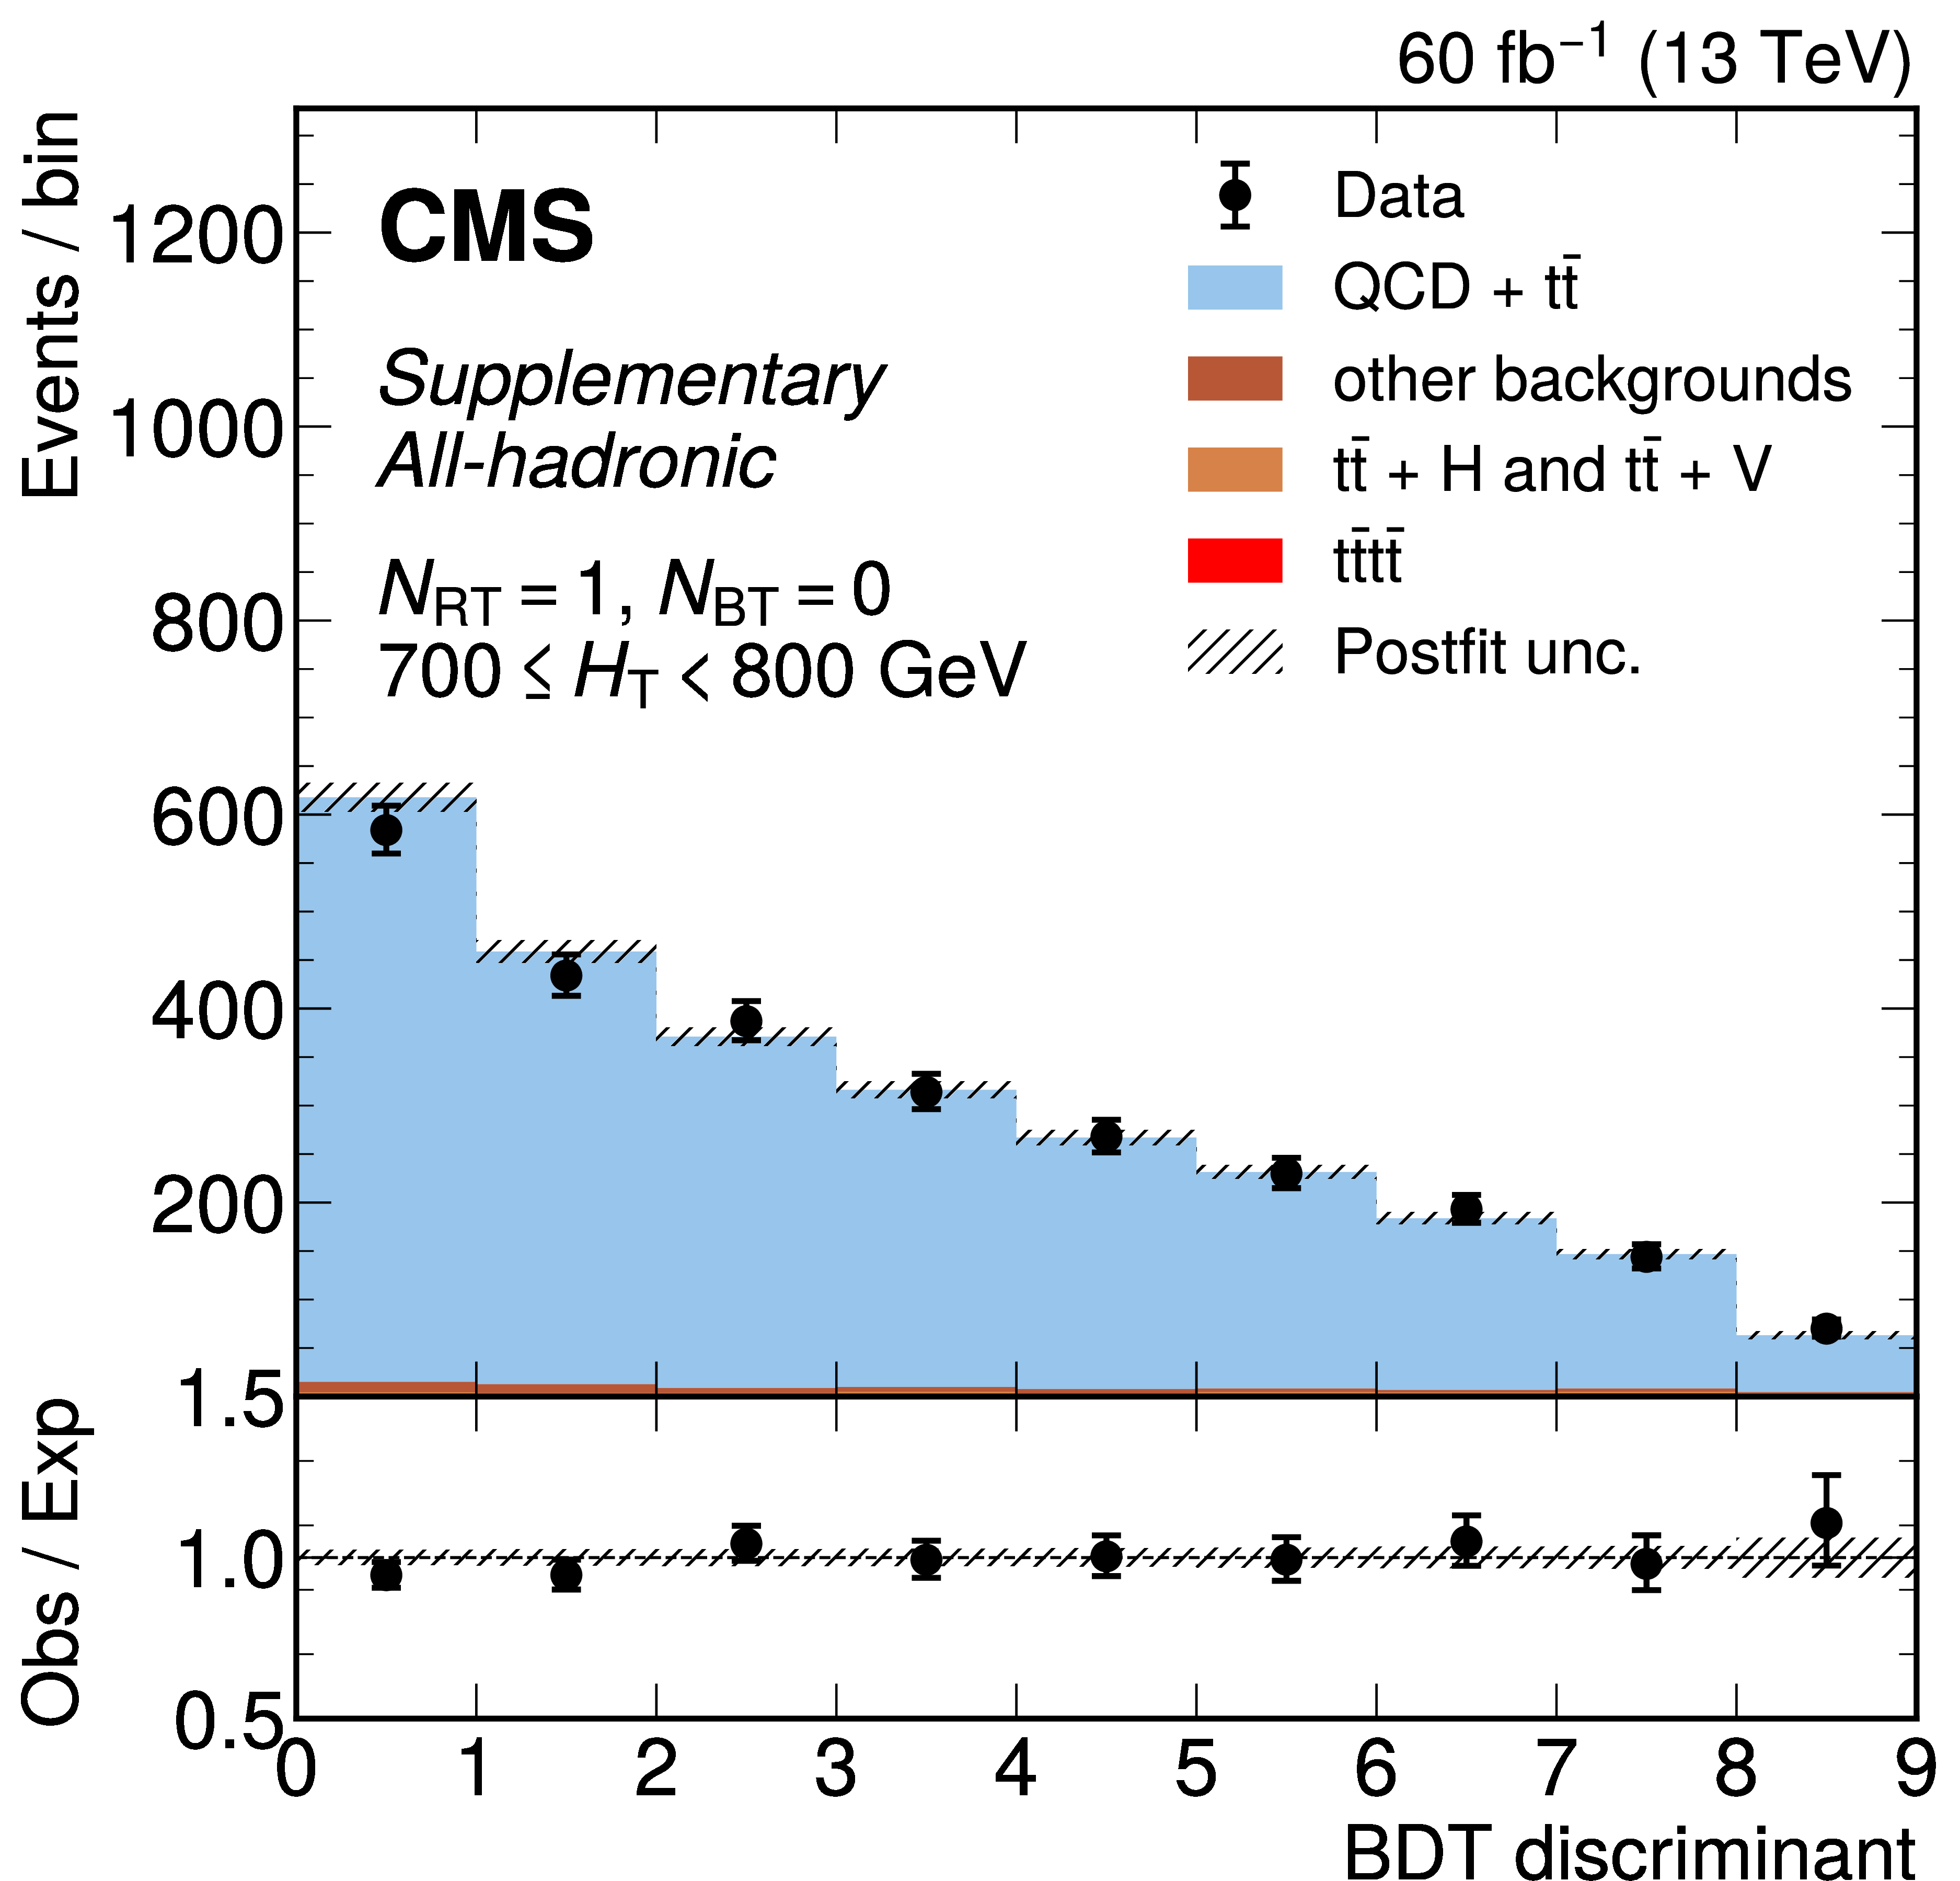
png pdf |
Additional Figure 26-a:
The distribution of the BDT discriminants in the signal region for the 2018 data set in the all-hadronic channel for all $ N_\text{RT} $, $ N_\text{BT} $, and $ H_{\mathrm{T}} $ categories. ($ N_\text{RT} $ and $ N_\text{BT} $ represent number of resolved tops and b-jets respectively.) The background from QCD multijet and $ \mathrm{t} \bar{\mathrm{t}} $ production is derived from control regions in the data. Estimates for the $ \mathrm{t}\bar{\mathrm{t}}\mathrm{t}\bar{\mathrm{t}} $ signal and other backgrounds are shown using simulated samples. The hatched bands correspond to the estimated total uncertainty after the fit. |
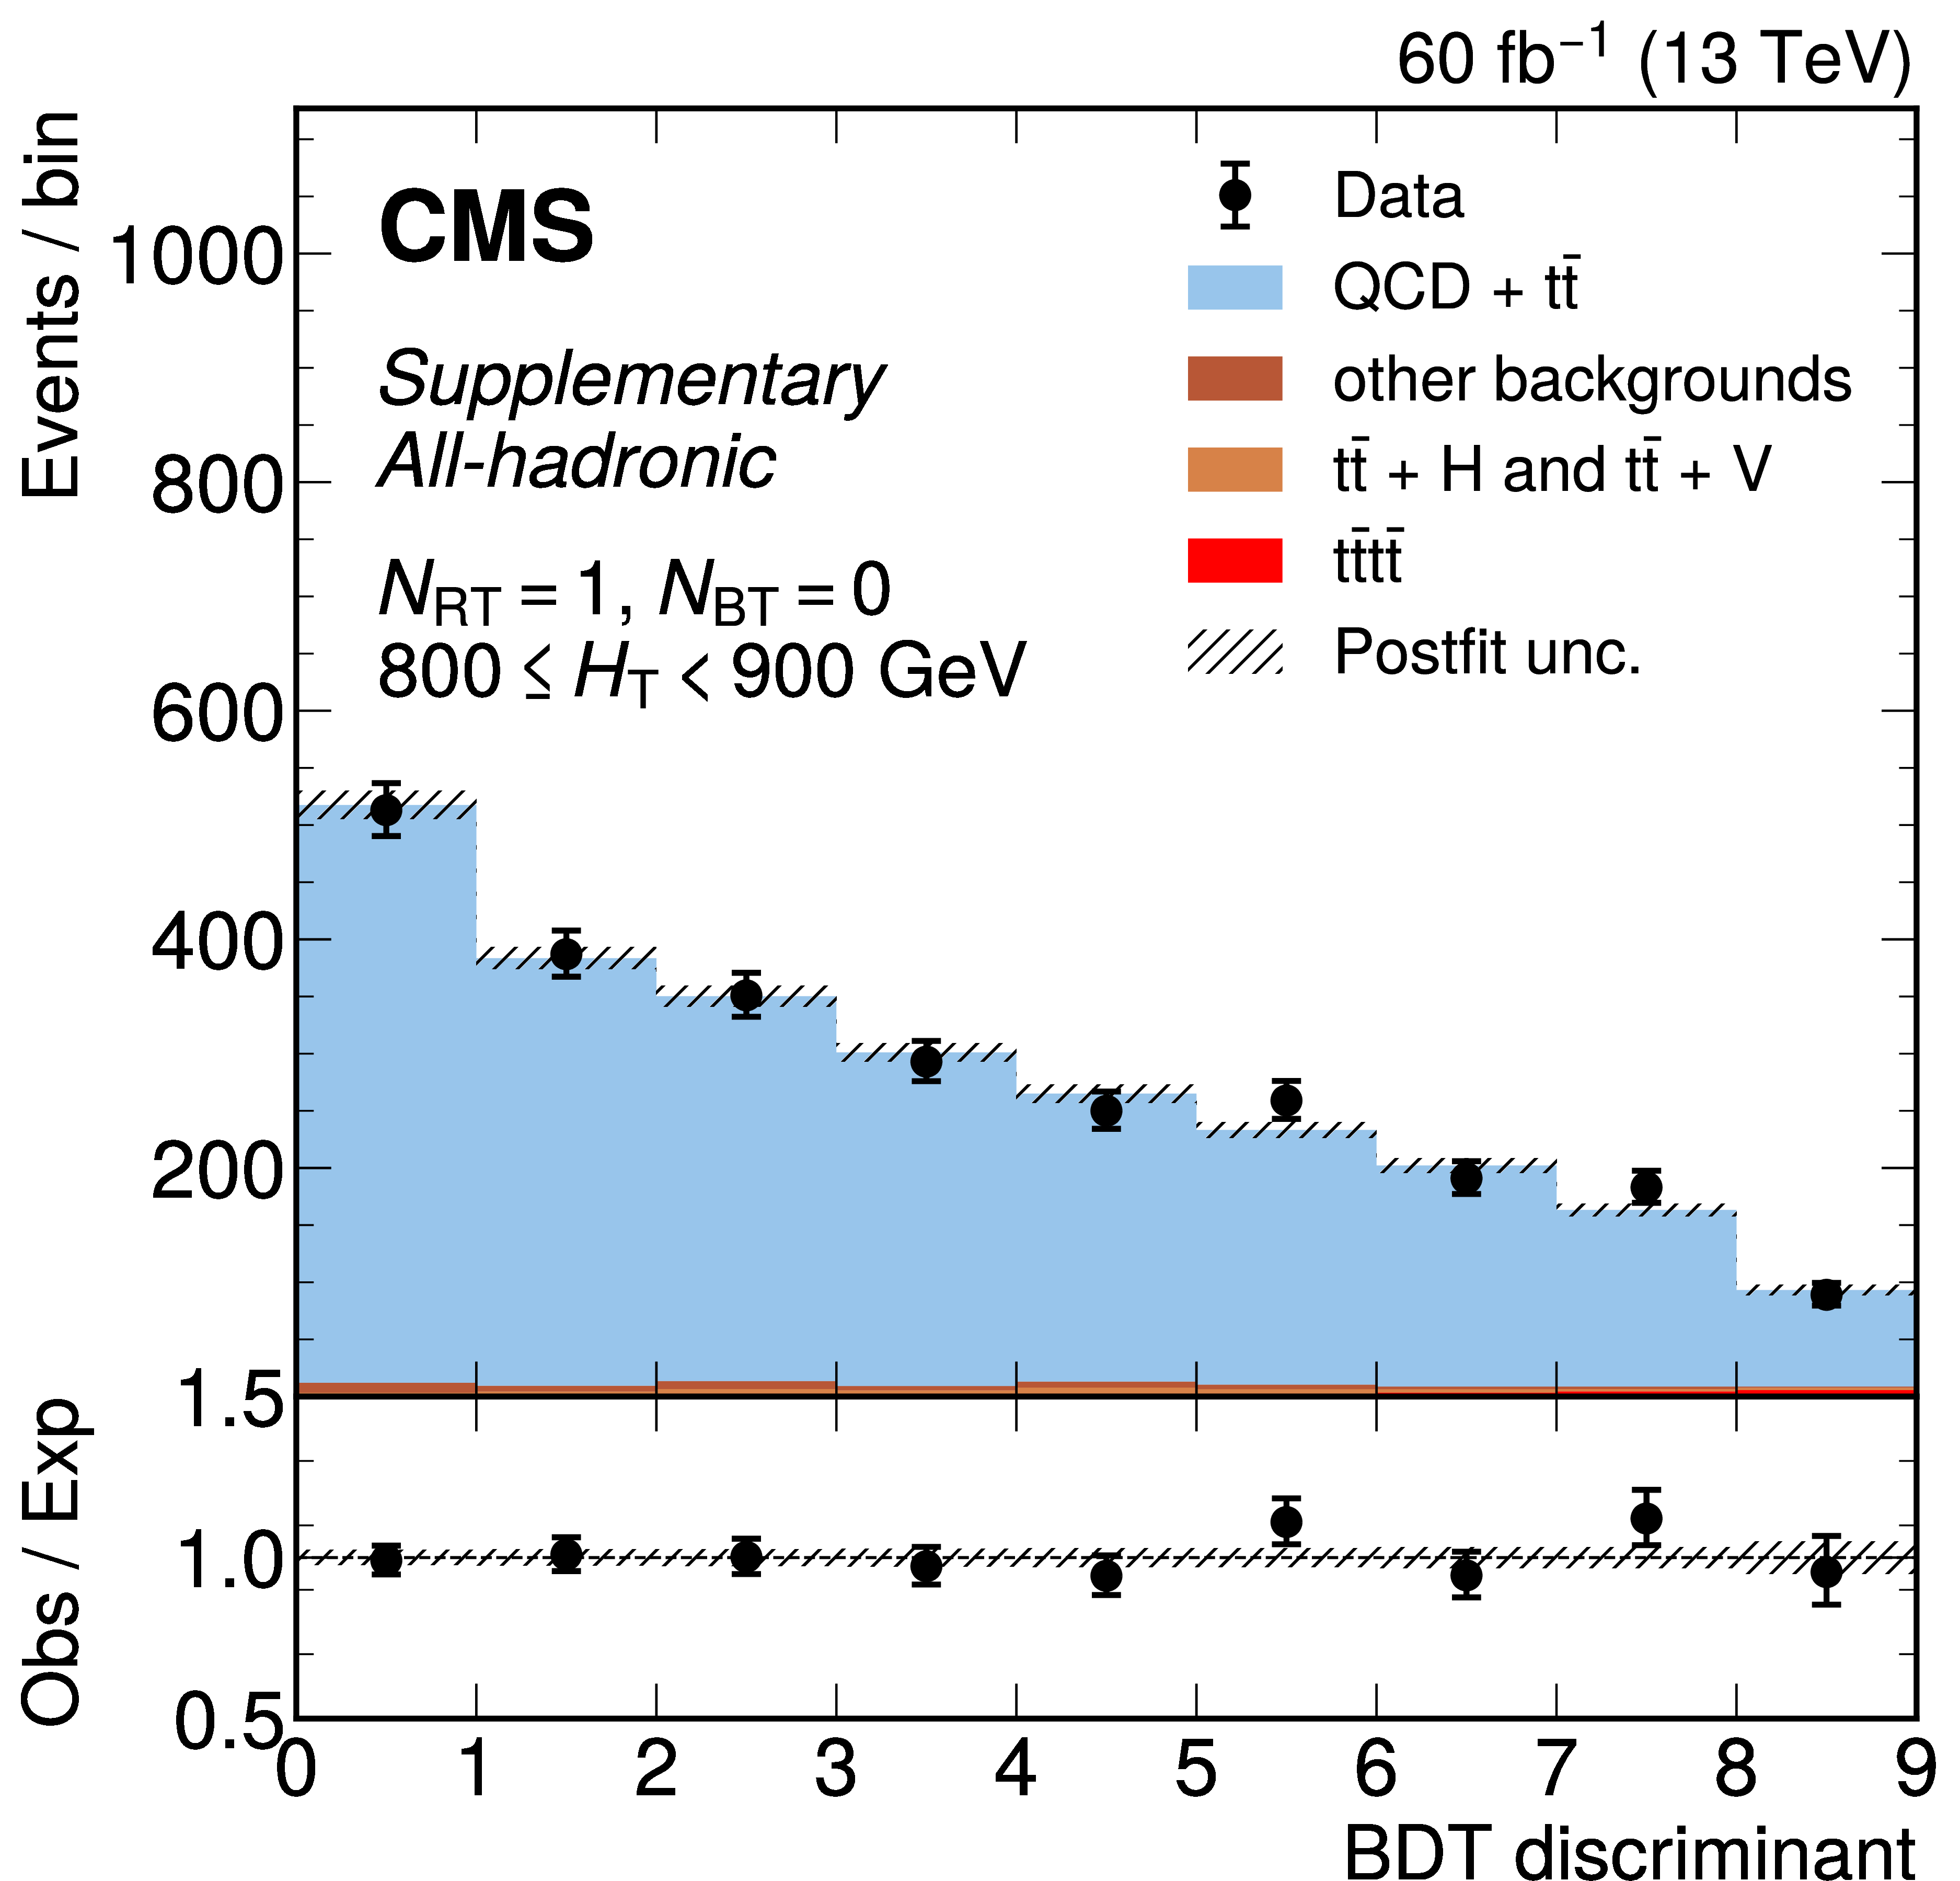
png pdf |
Additional Figure 26-b:
The distribution of the BDT discriminants in the signal region for the 2018 data set in the all-hadronic channel for all $ N_\text{RT} $, $ N_\text{BT} $, and $ H_{\mathrm{T}} $ categories. ($ N_\text{RT} $ and $ N_\text{BT} $ represent number of resolved tops and b-jets respectively.) The background from QCD multijet and $ \mathrm{t} \bar{\mathrm{t}} $ production is derived from control regions in the data. Estimates for the $ \mathrm{t}\bar{\mathrm{t}}\mathrm{t}\bar{\mathrm{t}} $ signal and other backgrounds are shown using simulated samples. The hatched bands correspond to the estimated total uncertainty after the fit. |
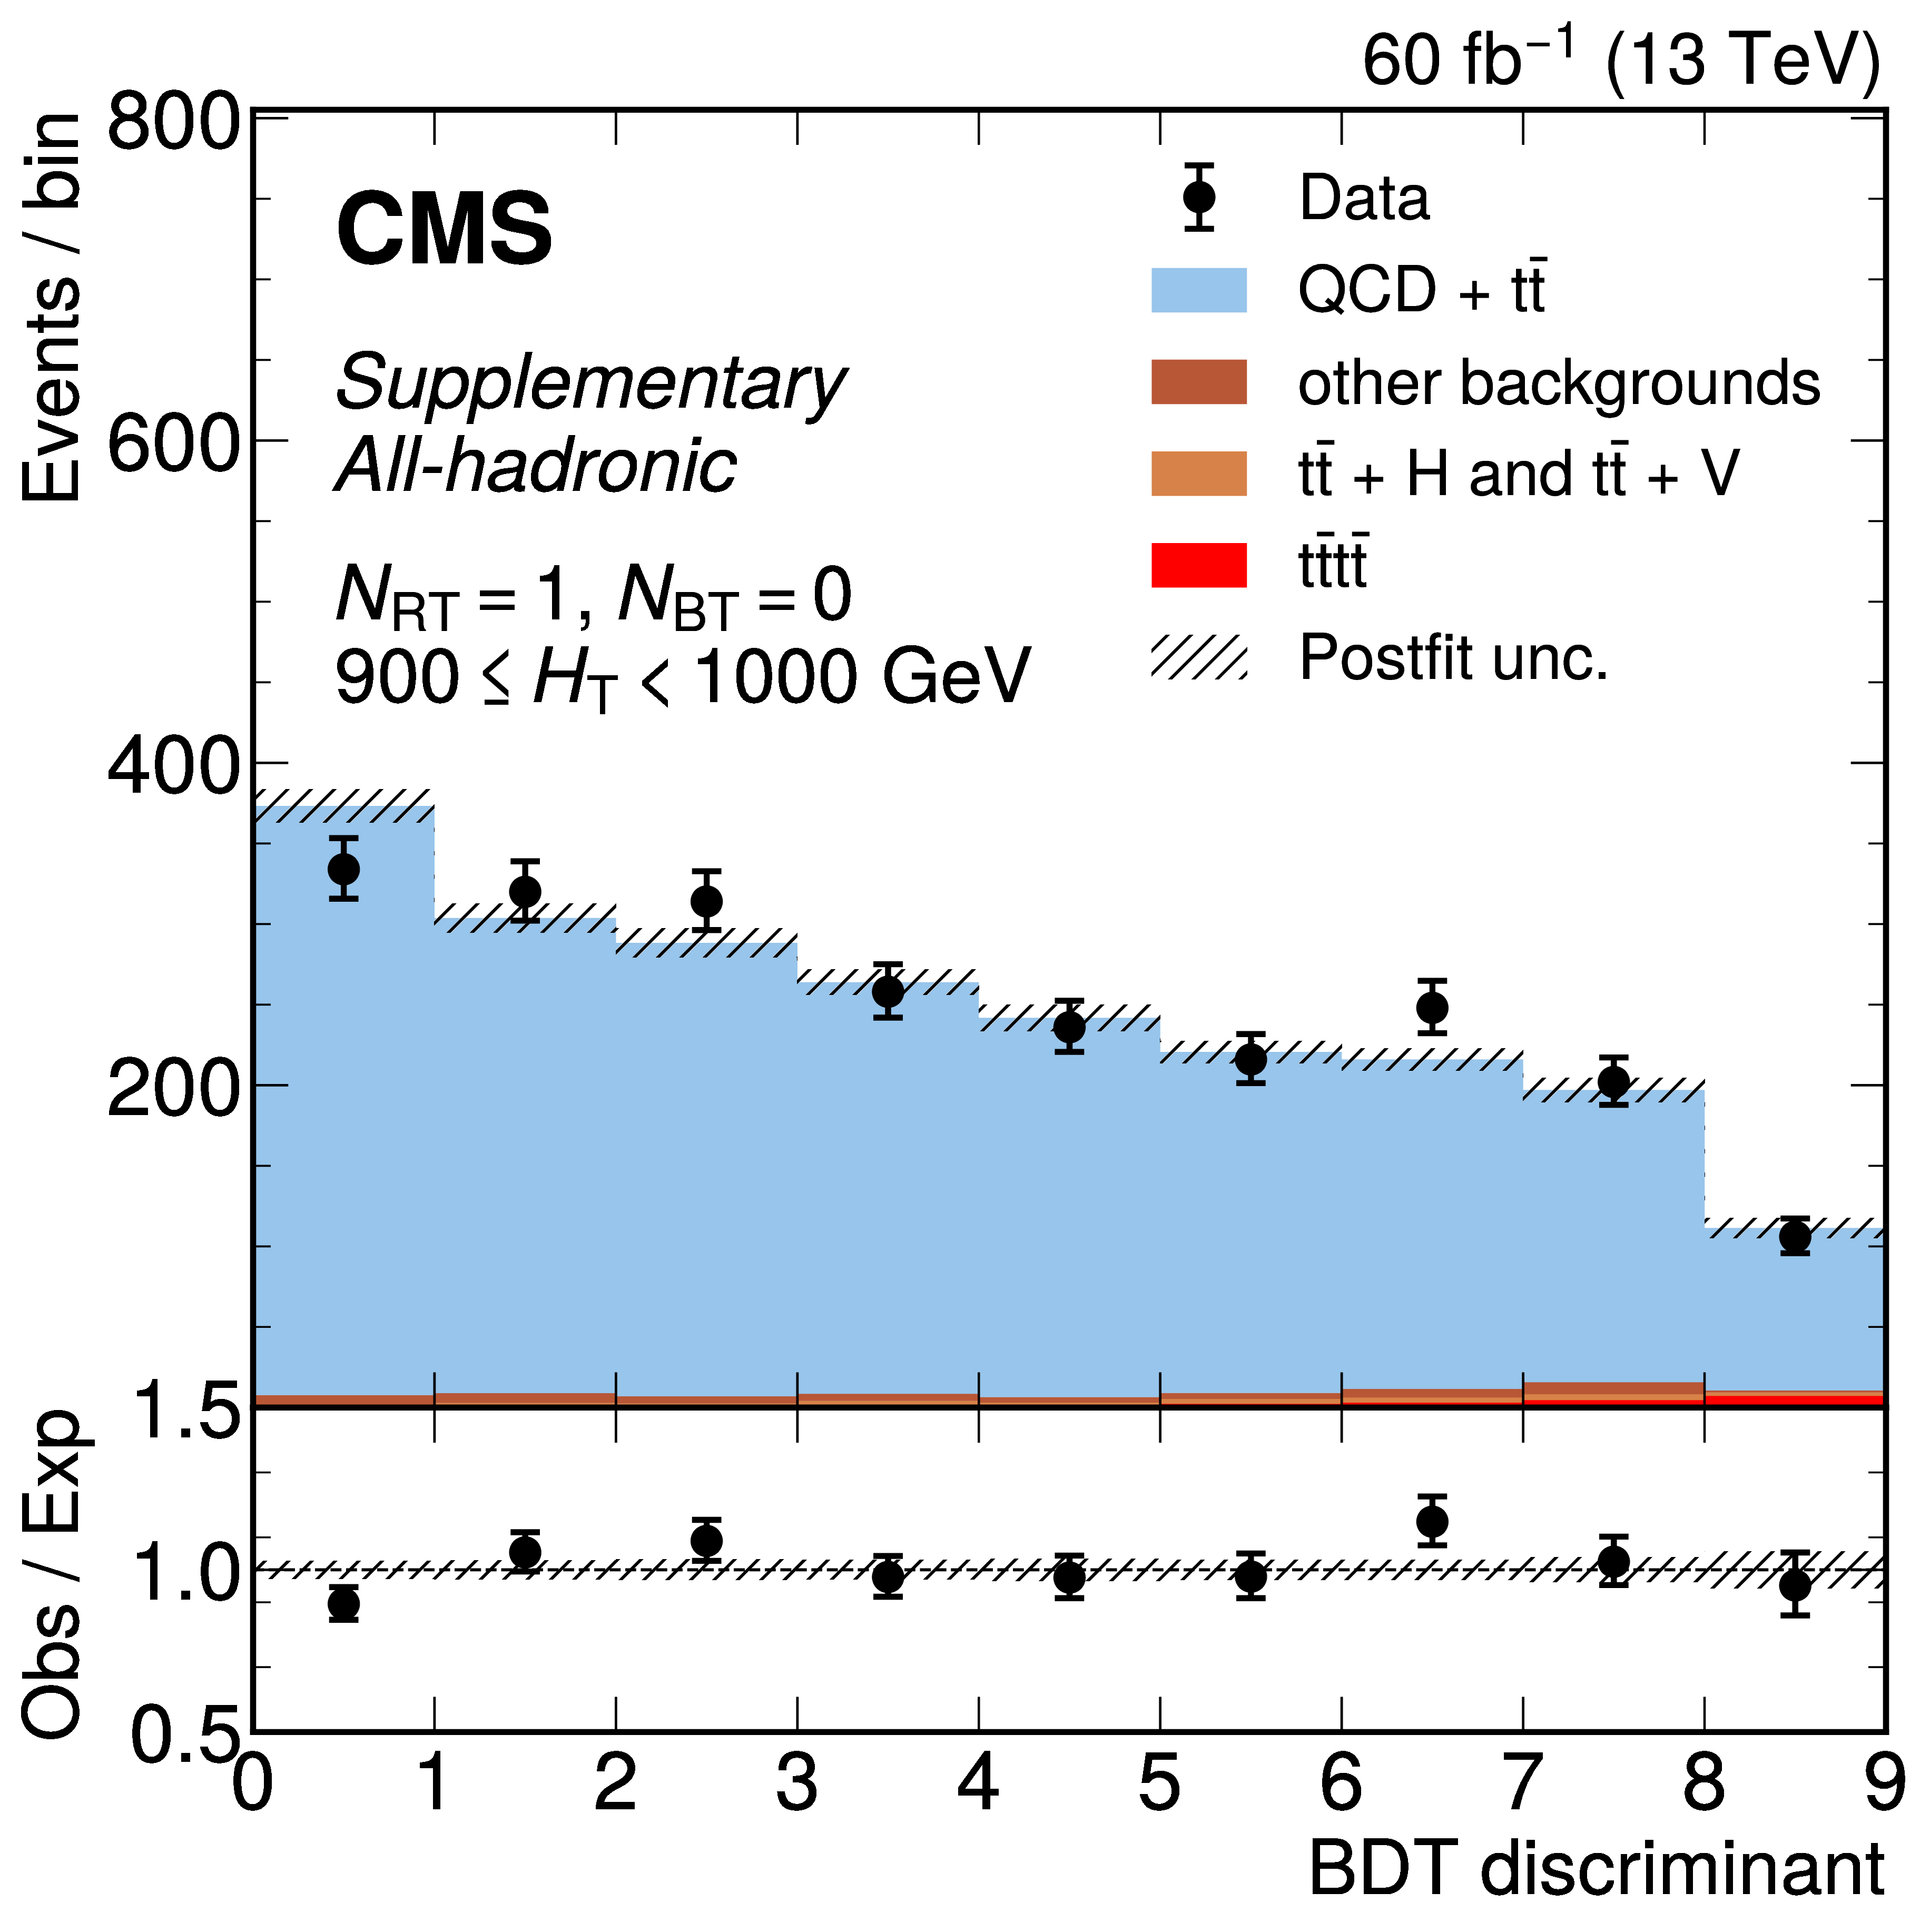
png pdf |
Additional Figure 26-c:
The distribution of the BDT discriminants in the signal region for the 2018 data set in the all-hadronic channel for all $ N_\text{RT} $, $ N_\text{BT} $, and $ H_{\mathrm{T}} $ categories. ($ N_\text{RT} $ and $ N_\text{BT} $ represent number of resolved tops and b-jets respectively.) The background from QCD multijet and $ \mathrm{t} \bar{\mathrm{t}} $ production is derived from control regions in the data. Estimates for the $ \mathrm{t}\bar{\mathrm{t}}\mathrm{t}\bar{\mathrm{t}} $ signal and other backgrounds are shown using simulated samples. The hatched bands correspond to the estimated total uncertainty after the fit. |
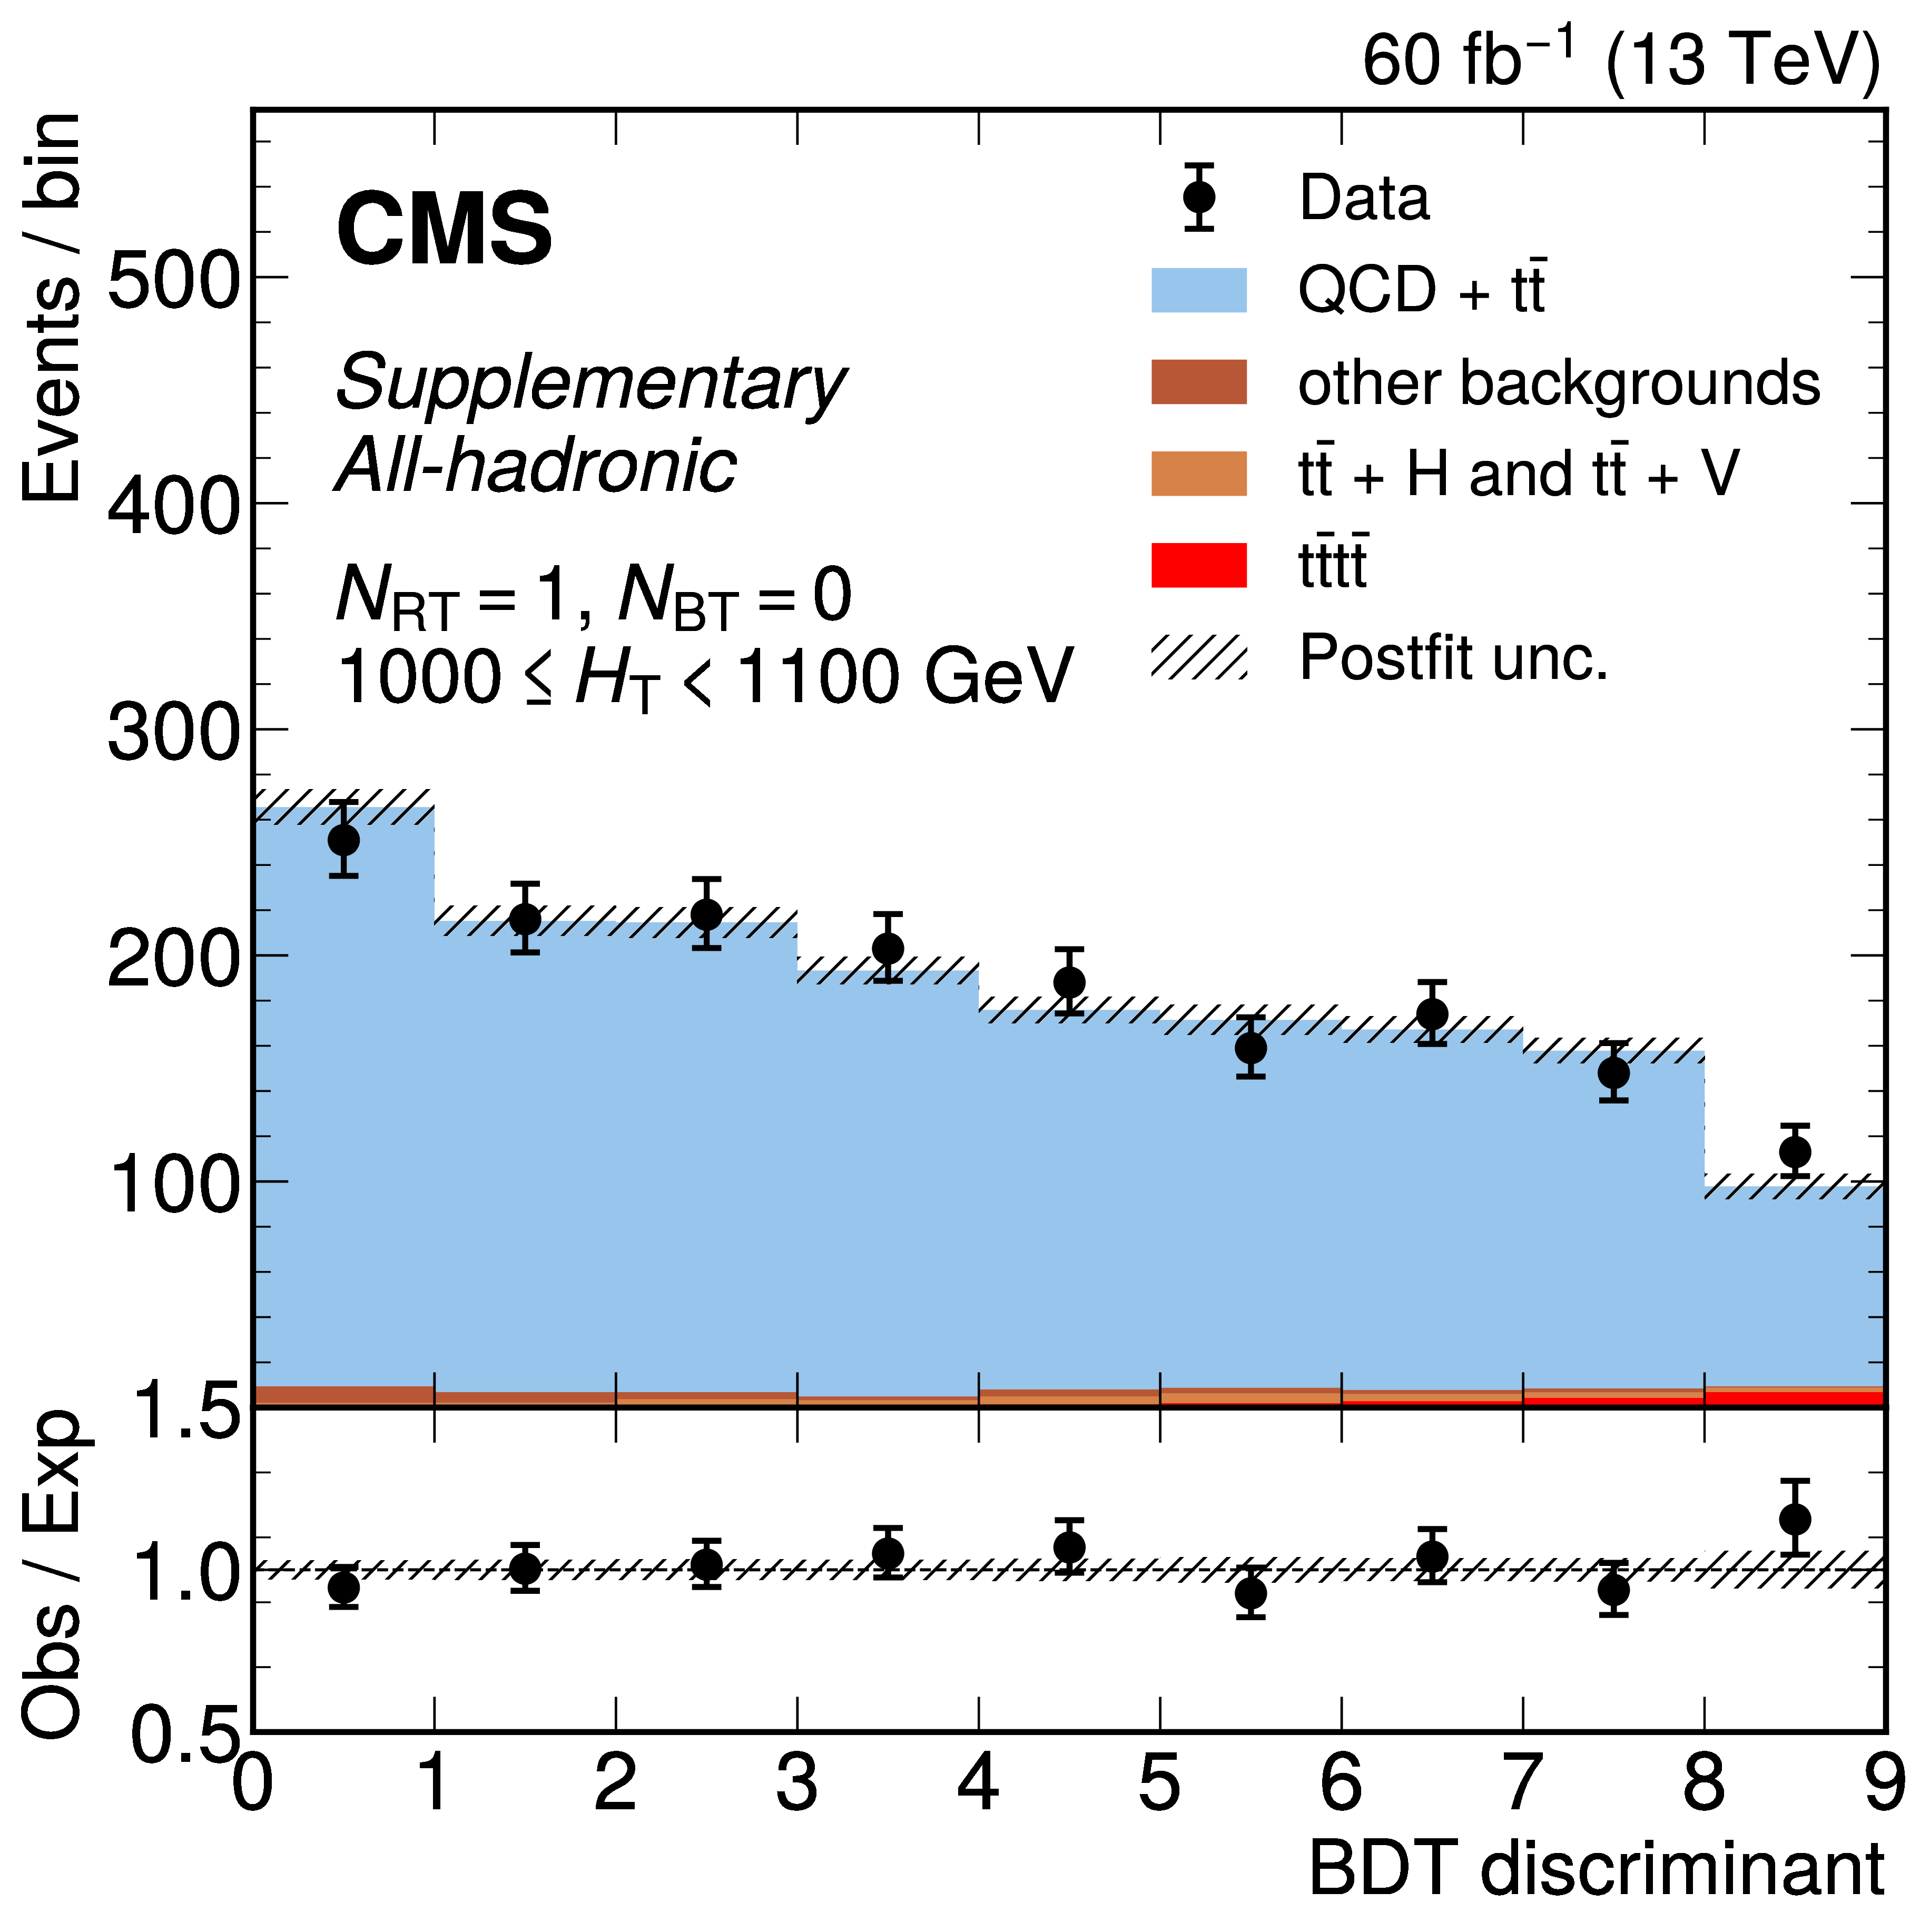
png pdf |
Additional Figure 26-d:
The distribution of the BDT discriminants in the signal region for the 2018 data set in the all-hadronic channel for all $ N_\text{RT} $, $ N_\text{BT} $, and $ H_{\mathrm{T}} $ categories. ($ N_\text{RT} $ and $ N_\text{BT} $ represent number of resolved tops and b-jets respectively.) The background from QCD multijet and $ \mathrm{t} \bar{\mathrm{t}} $ production is derived from control regions in the data. Estimates for the $ \mathrm{t}\bar{\mathrm{t}}\mathrm{t}\bar{\mathrm{t}} $ signal and other backgrounds are shown using simulated samples. The hatched bands correspond to the estimated total uncertainty after the fit. |

png pdf |
Additional Figure 26-e:
The distribution of the BDT discriminants in the signal region for the 2018 data set in the all-hadronic channel for all $ N_\text{RT} $, $ N_\text{BT} $, and $ H_{\mathrm{T}} $ categories. ($ N_\text{RT} $ and $ N_\text{BT} $ represent number of resolved tops and b-jets respectively.) The background from QCD multijet and $ \mathrm{t} \bar{\mathrm{t}} $ production is derived from control regions in the data. Estimates for the $ \mathrm{t}\bar{\mathrm{t}}\mathrm{t}\bar{\mathrm{t}} $ signal and other backgrounds are shown using simulated samples. The hatched bands correspond to the estimated total uncertainty after the fit. |

png pdf |
Additional Figure 26-f:
The distribution of the BDT discriminants in the signal region for the 2018 data set in the all-hadronic channel for all $ N_\text{RT} $, $ N_\text{BT} $, and $ H_{\mathrm{T}} $ categories. ($ N_\text{RT} $ and $ N_\text{BT} $ represent number of resolved tops and b-jets respectively.) The background from QCD multijet and $ \mathrm{t} \bar{\mathrm{t}} $ production is derived from control regions in the data. Estimates for the $ \mathrm{t}\bar{\mathrm{t}}\mathrm{t}\bar{\mathrm{t}} $ signal and other backgrounds are shown using simulated samples. The hatched bands correspond to the estimated total uncertainty after the fit. |
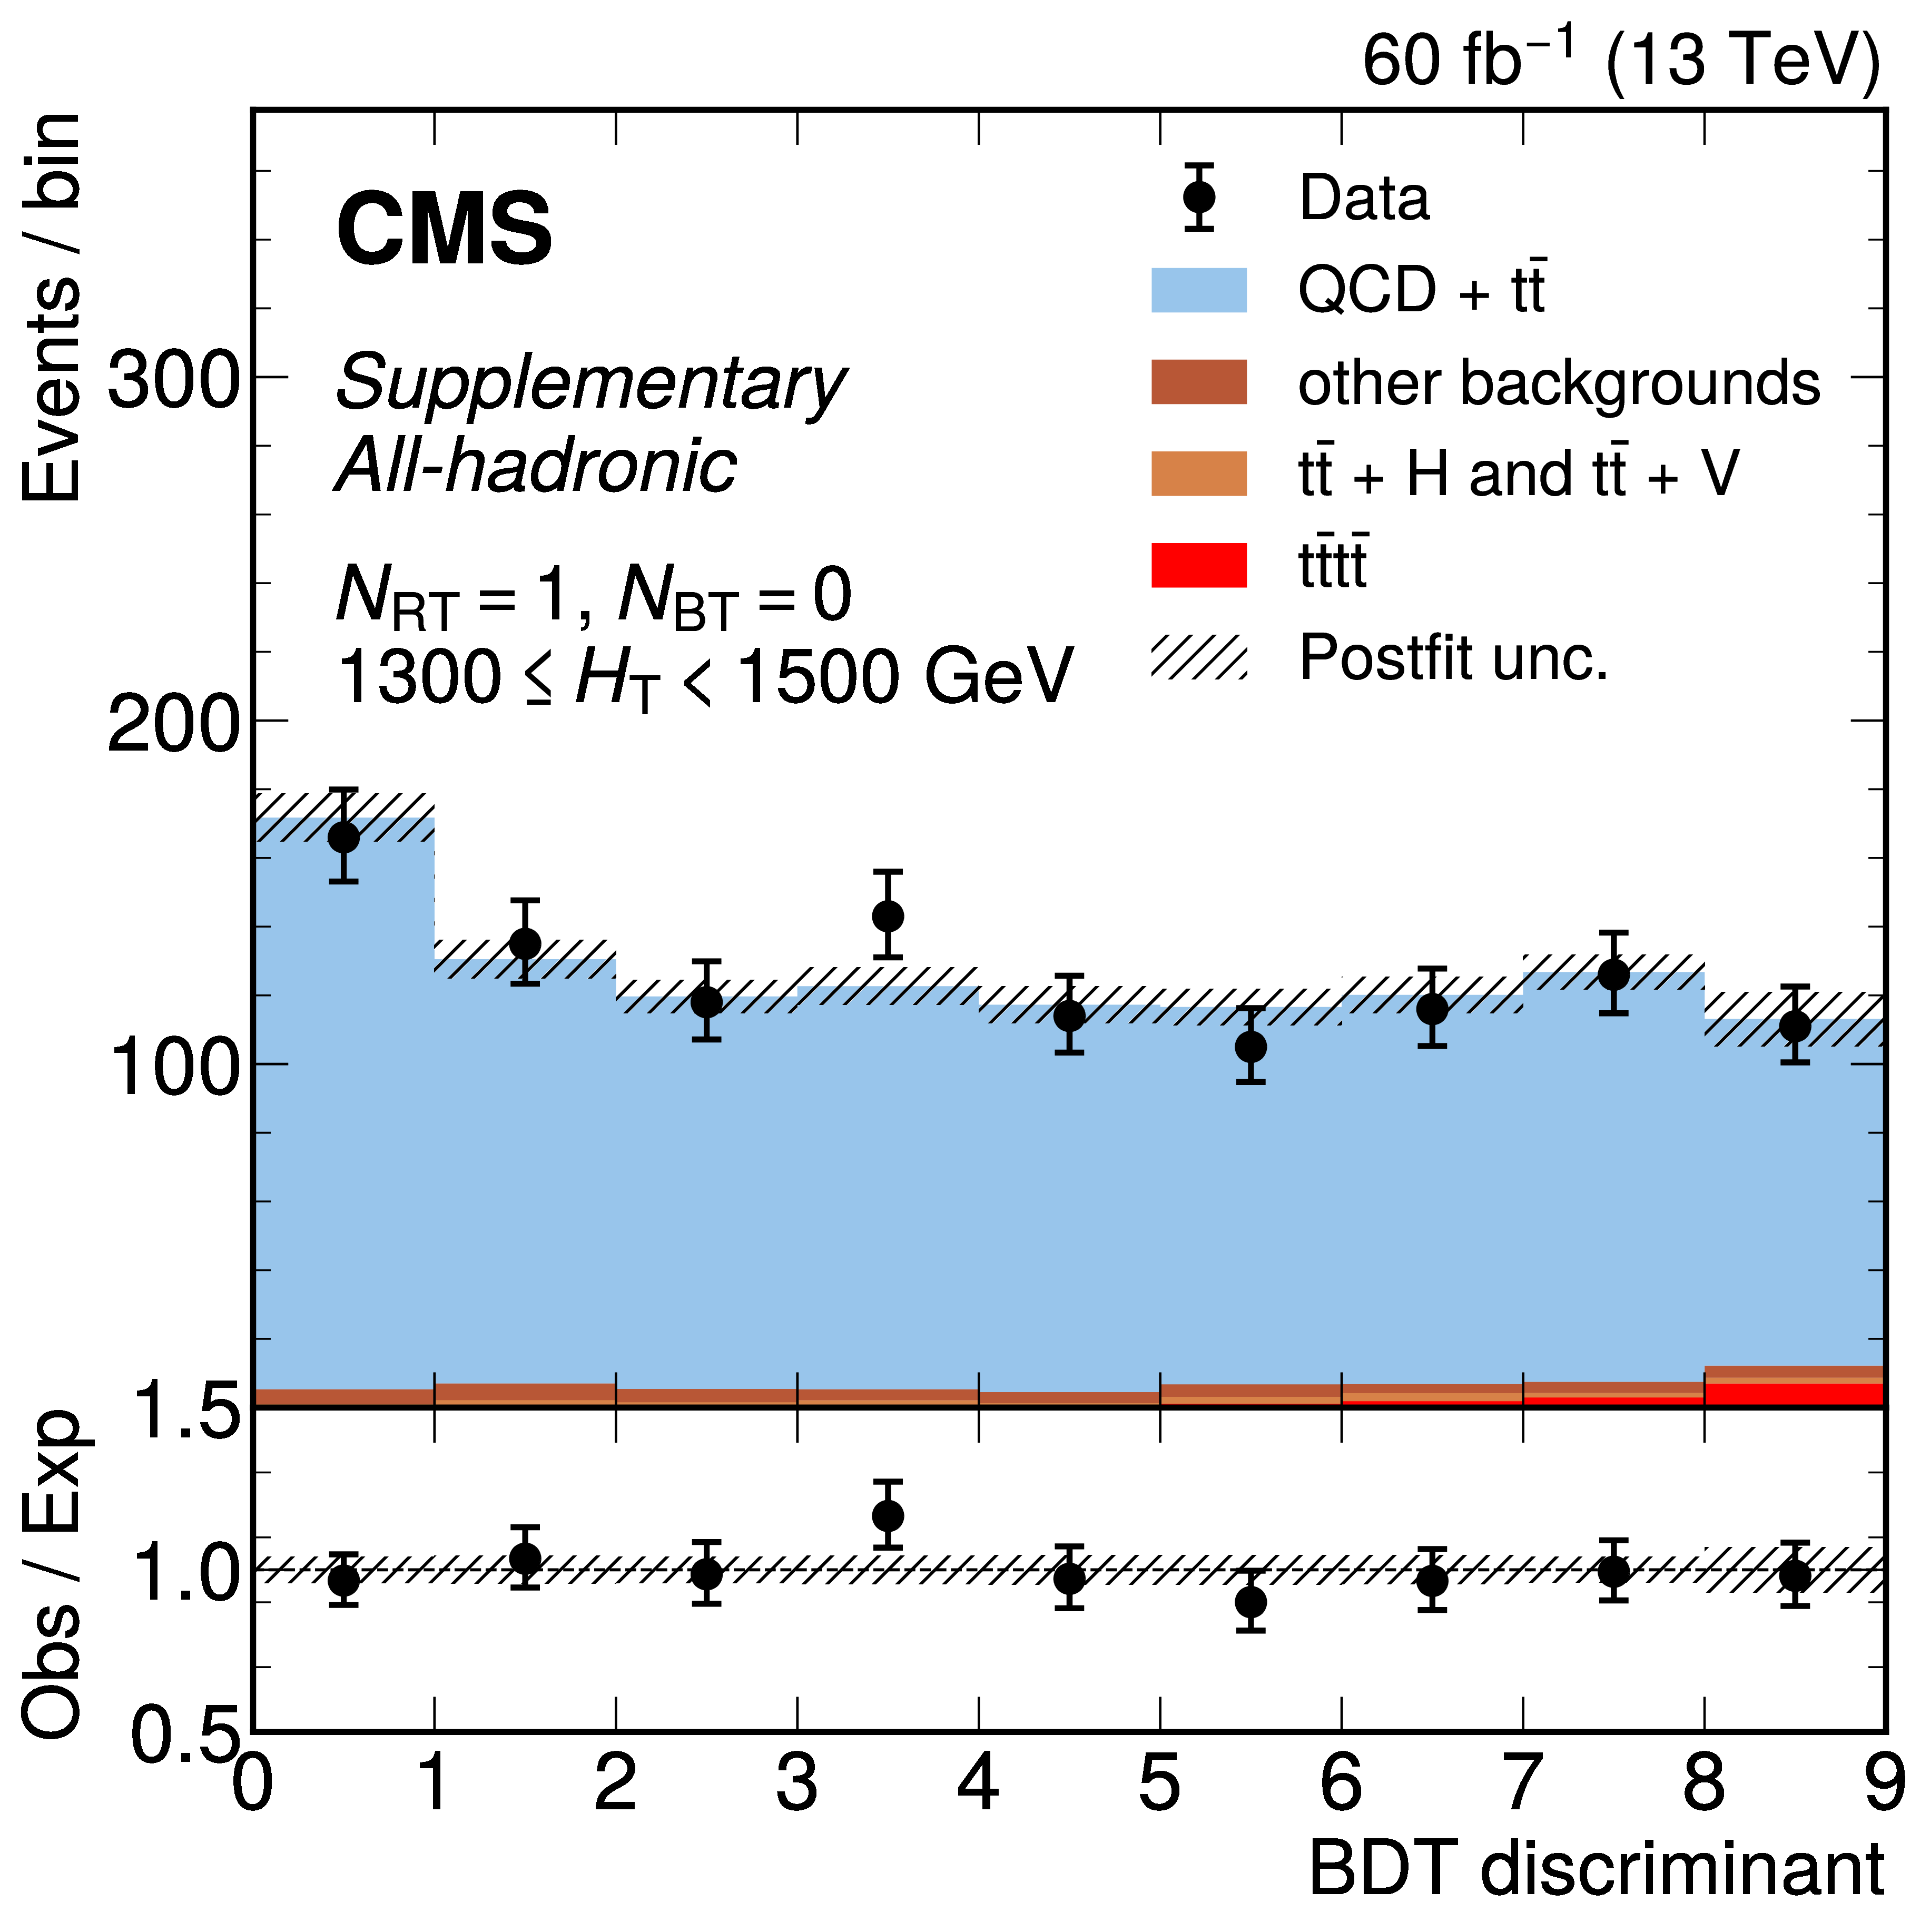
png pdf |
Additional Figure 26-g:
The distribution of the BDT discriminants in the signal region for the 2018 data set in the all-hadronic channel for all $ N_\text{RT} $, $ N_\text{BT} $, and $ H_{\mathrm{T}} $ categories. ($ N_\text{RT} $ and $ N_\text{BT} $ represent number of resolved tops and b-jets respectively.) The background from QCD multijet and $ \mathrm{t} \bar{\mathrm{t}} $ production is derived from control regions in the data. Estimates for the $ \mathrm{t}\bar{\mathrm{t}}\mathrm{t}\bar{\mathrm{t}} $ signal and other backgrounds are shown using simulated samples. The hatched bands correspond to the estimated total uncertainty after the fit. |
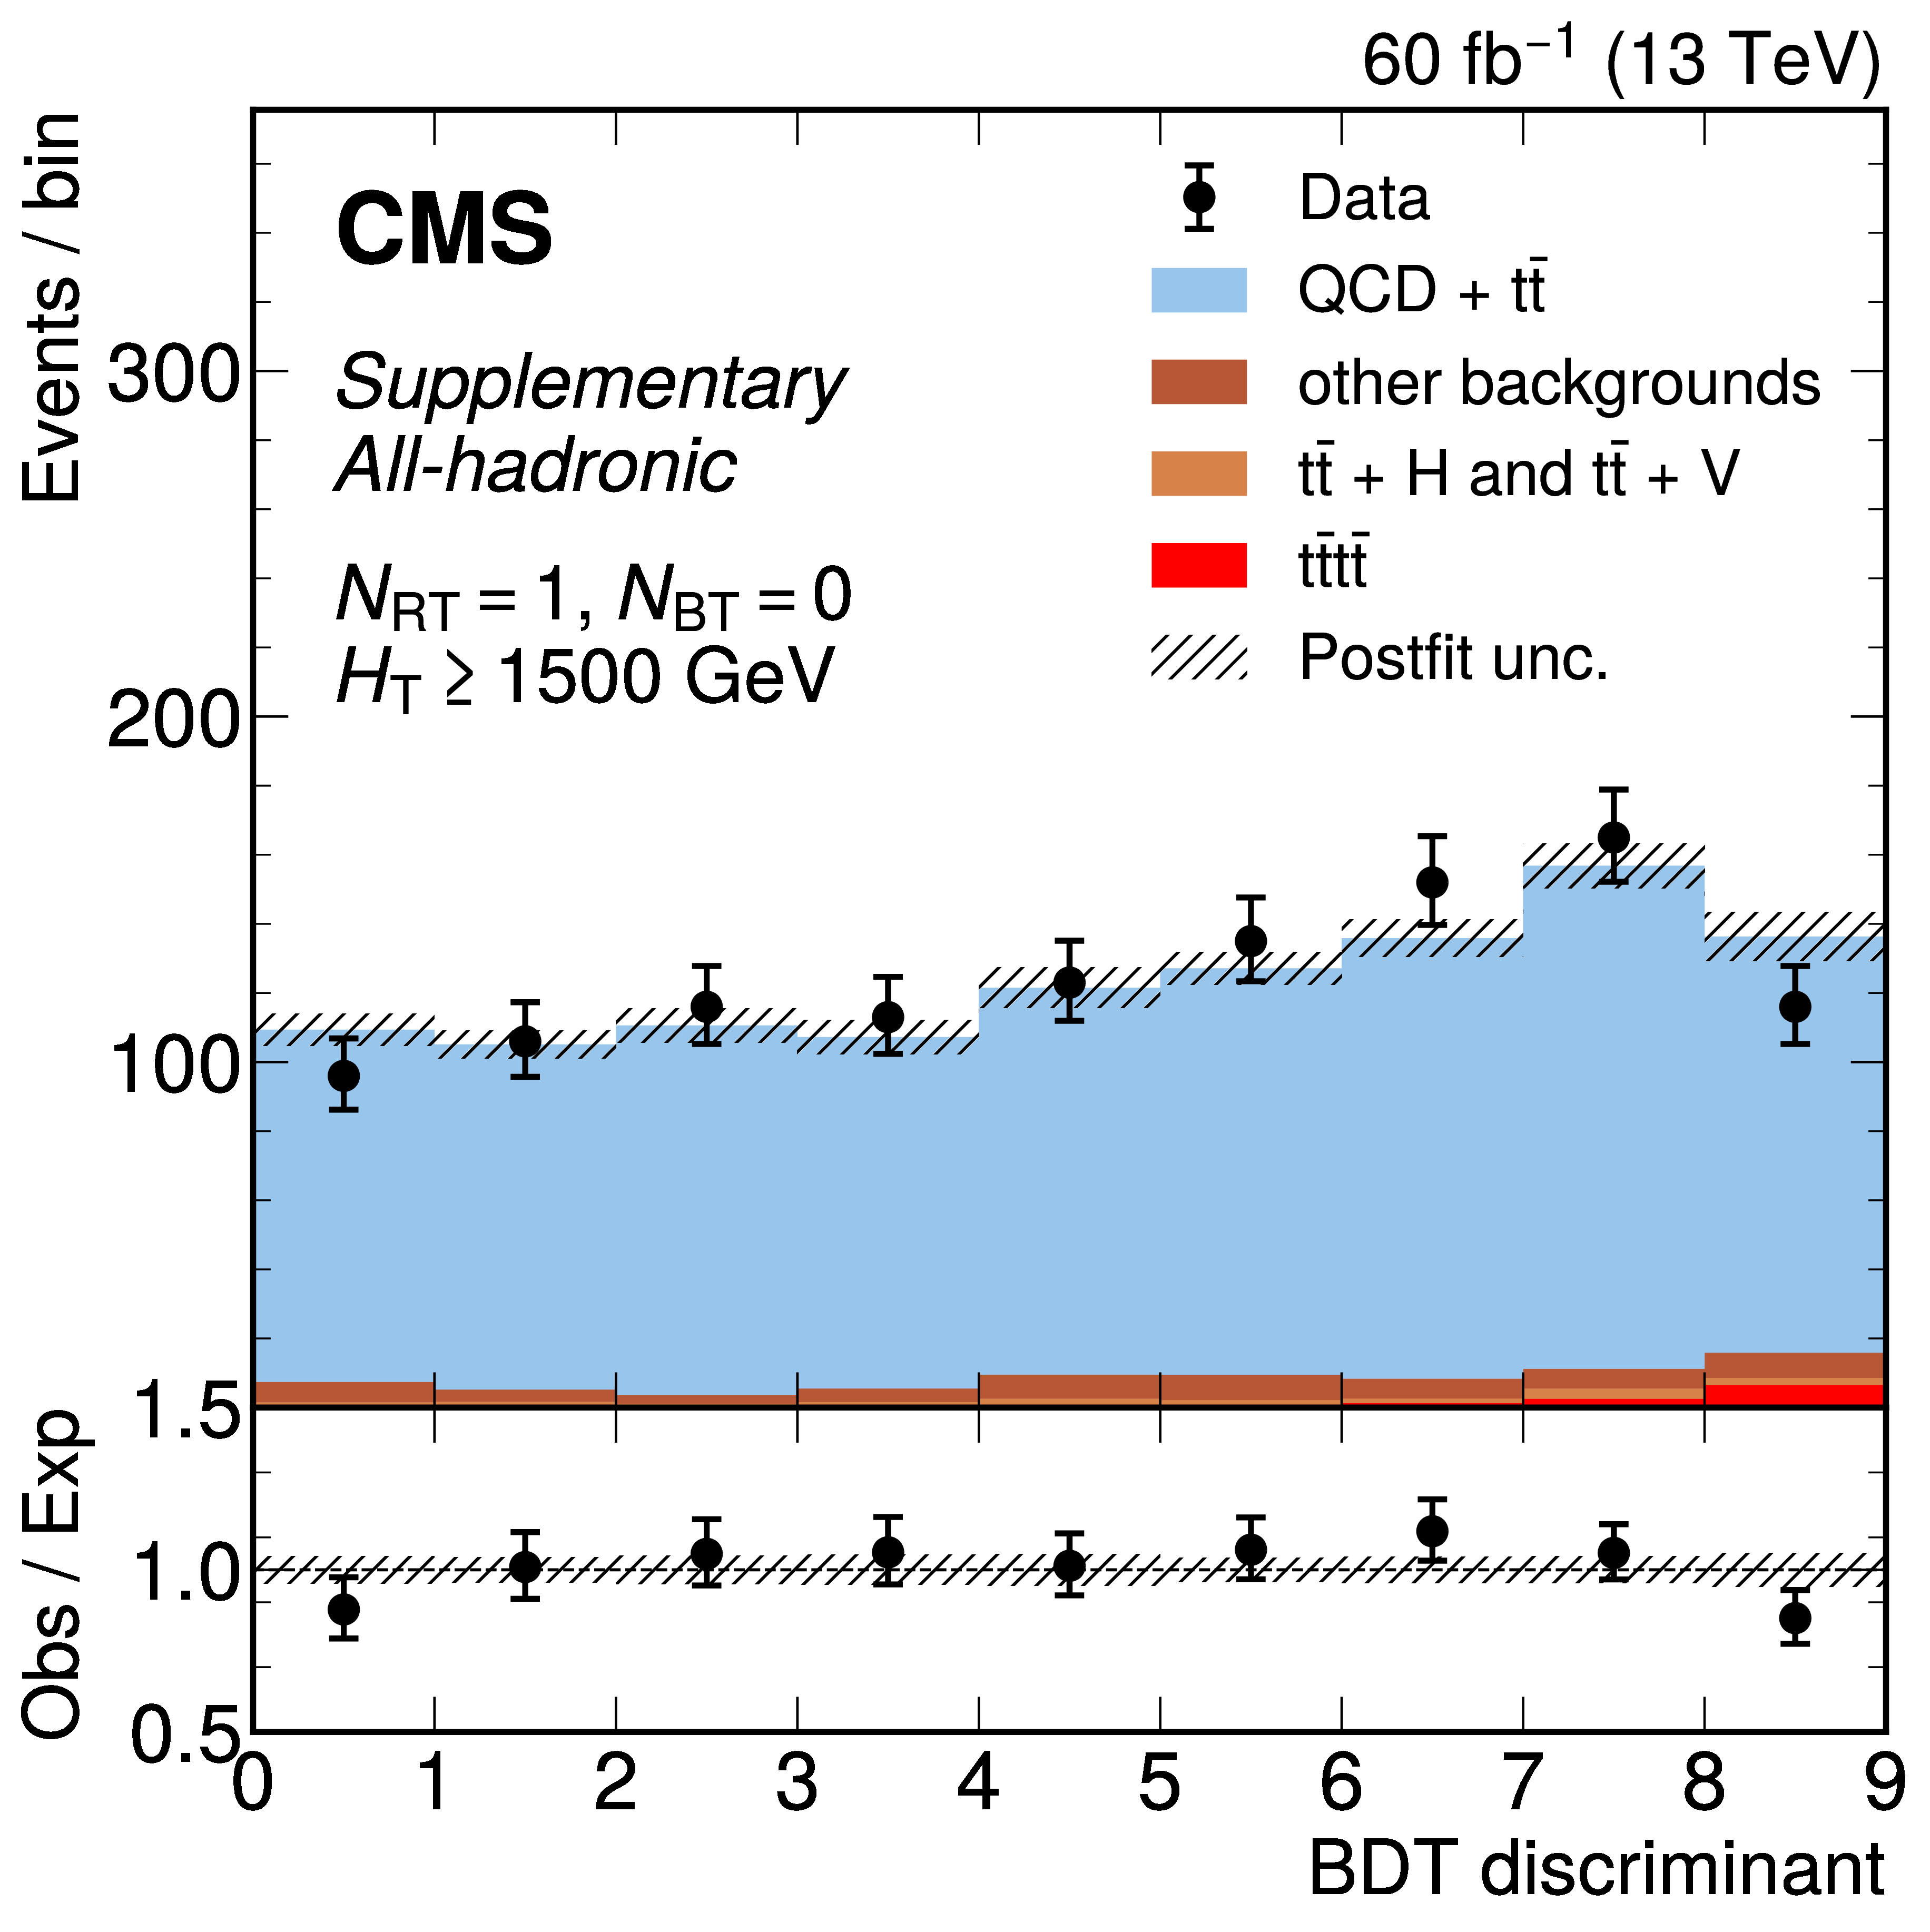
png pdf |
Additional Figure 26-h:
The distribution of the BDT discriminants in the signal region for the 2018 data set in the all-hadronic channel for all $ N_\text{RT} $, $ N_\text{BT} $, and $ H_{\mathrm{T}} $ categories. ($ N_\text{RT} $ and $ N_\text{BT} $ represent number of resolved tops and b-jets respectively.) The background from QCD multijet and $ \mathrm{t} \bar{\mathrm{t}} $ production is derived from control regions in the data. Estimates for the $ \mathrm{t}\bar{\mathrm{t}}\mathrm{t}\bar{\mathrm{t}} $ signal and other backgrounds are shown using simulated samples. The hatched bands correspond to the estimated total uncertainty after the fit. |

png pdf |
Additional Figure 26-i:
The distribution of the BDT discriminants in the signal region for the 2018 data set in the all-hadronic channel for all $ N_\text{RT} $, $ N_\text{BT} $, and $ H_{\mathrm{T}} $ categories. ($ N_\text{RT} $ and $ N_\text{BT} $ represent number of resolved tops and b-jets respectively.) The background from QCD multijet and $ \mathrm{t} \bar{\mathrm{t}} $ production is derived from control regions in the data. Estimates for the $ \mathrm{t}\bar{\mathrm{t}}\mathrm{t}\bar{\mathrm{t}} $ signal and other backgrounds are shown using simulated samples. The hatched bands correspond to the estimated total uncertainty after the fit. |
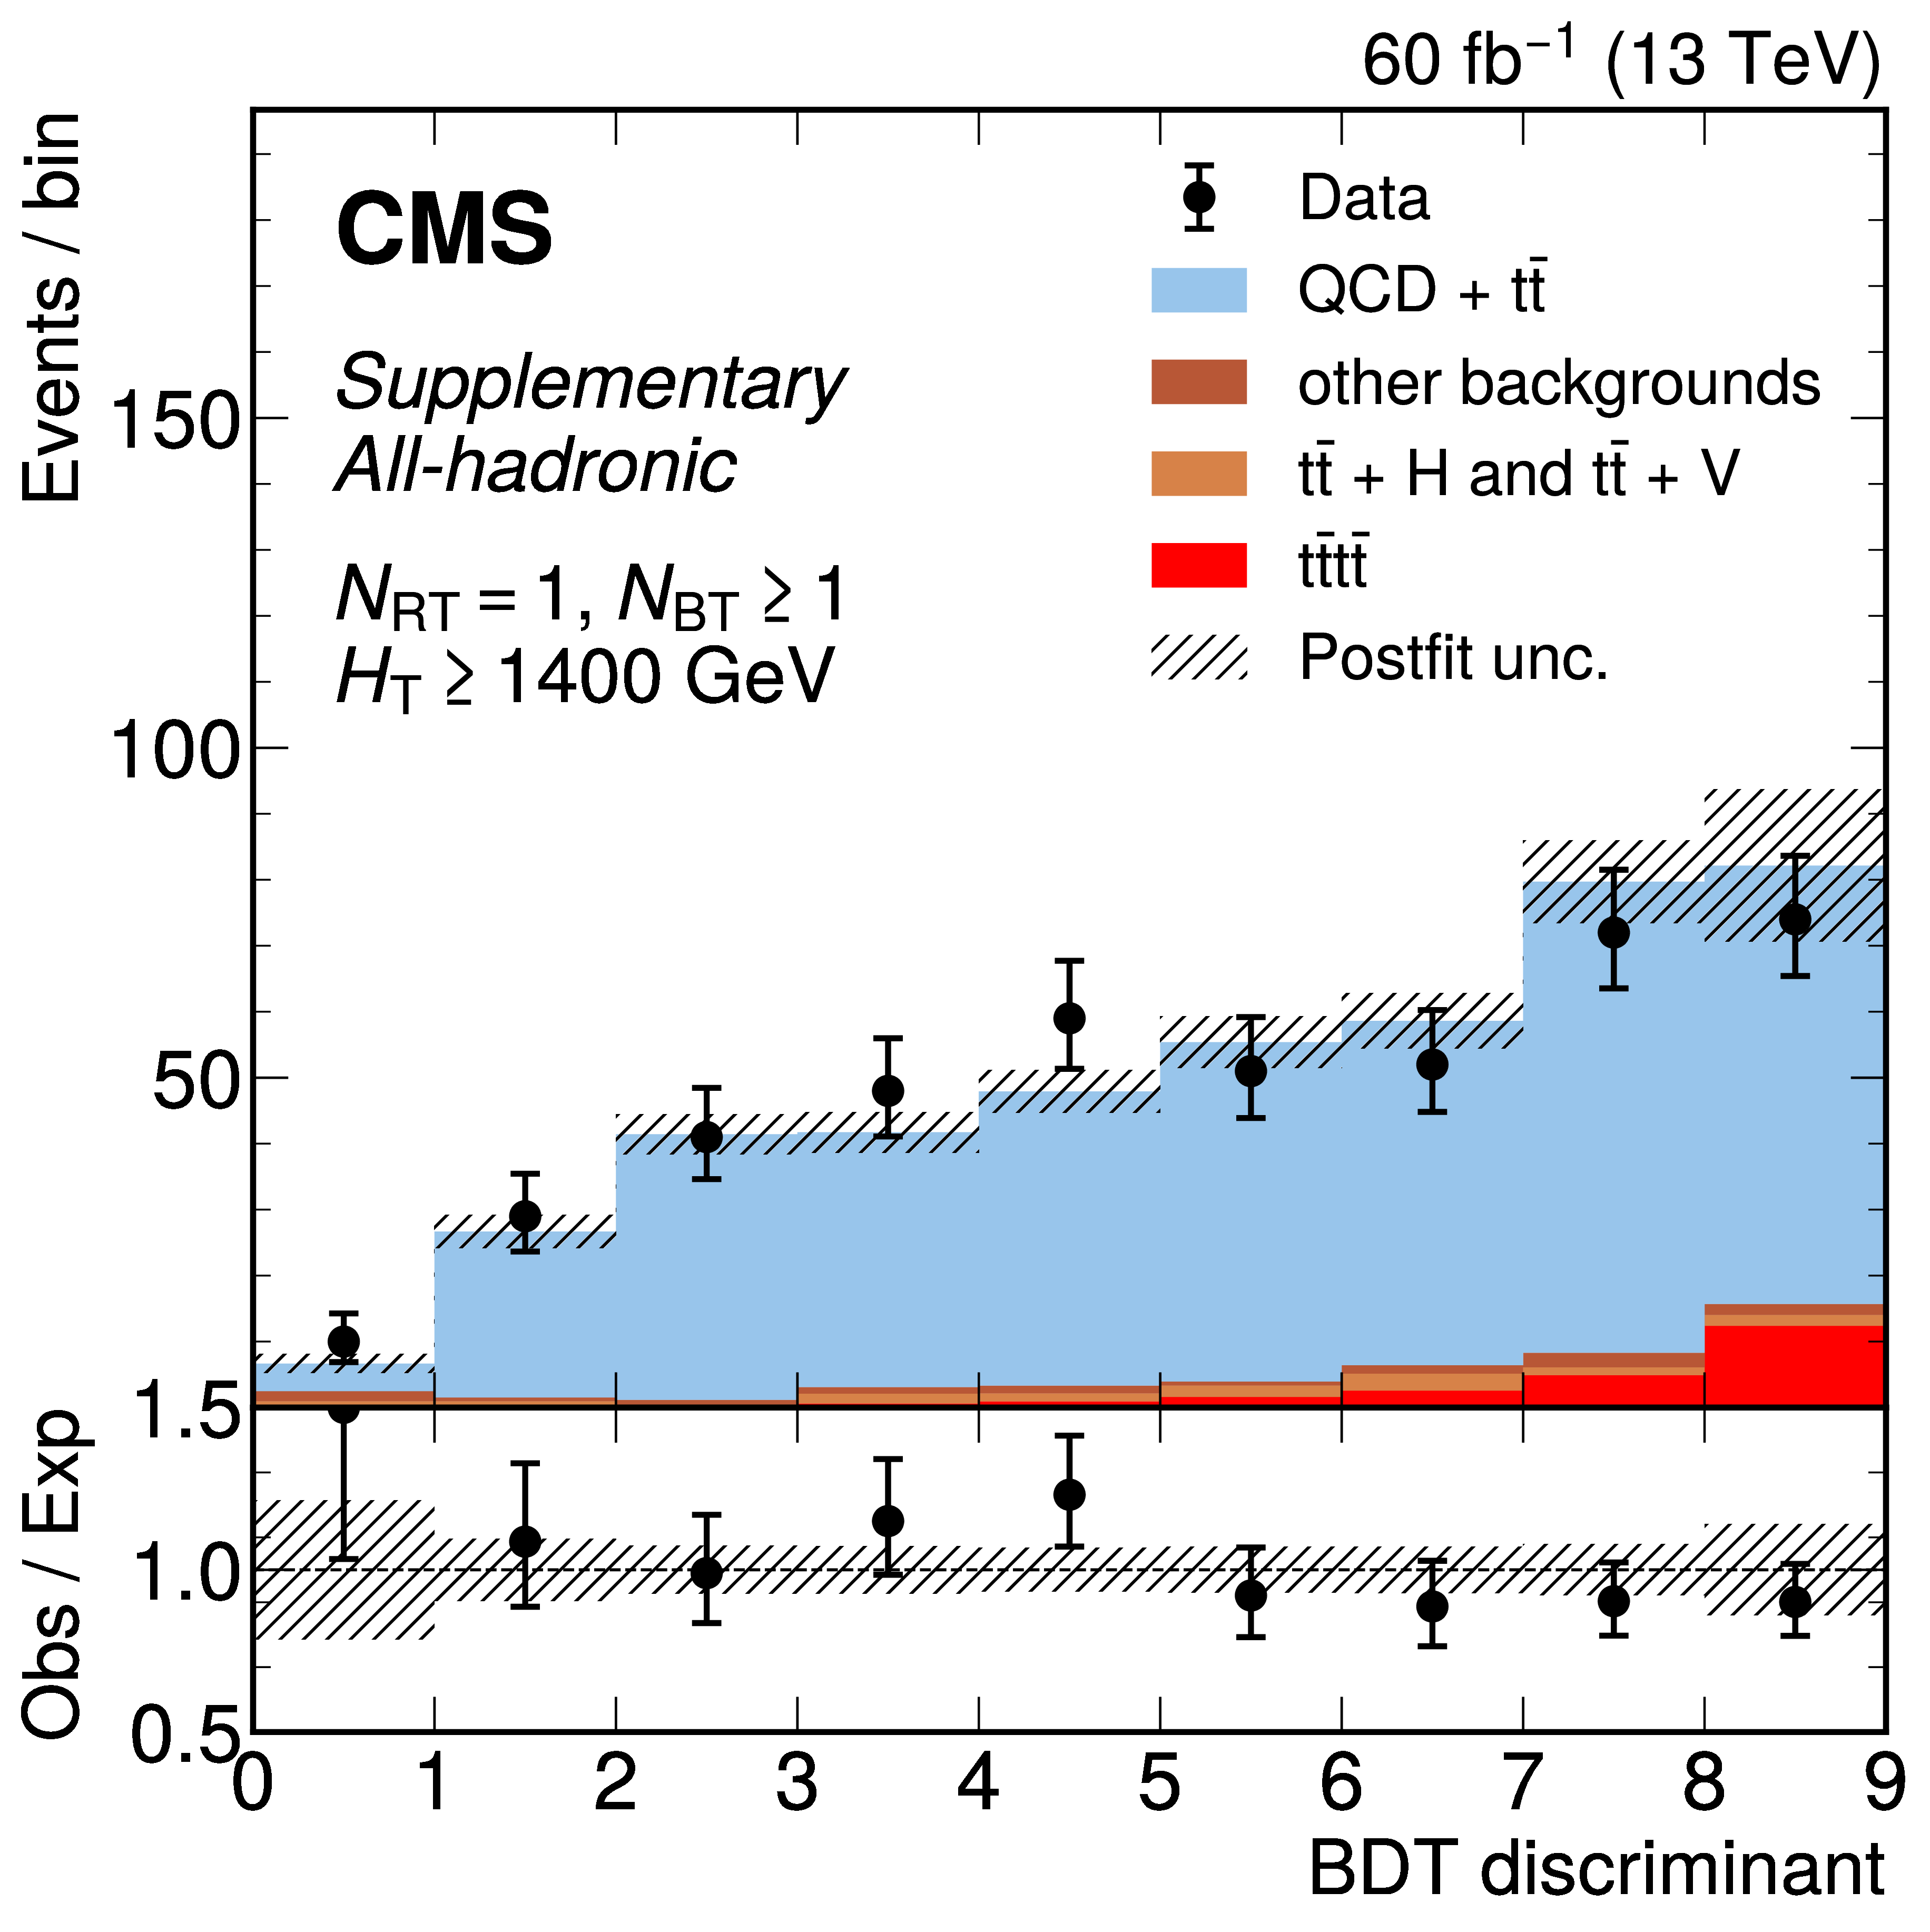
png pdf |
Additional Figure 26-j:
The distribution of the BDT discriminants in the signal region for the 2018 data set in the all-hadronic channel for all $ N_\text{RT} $, $ N_\text{BT} $, and $ H_{\mathrm{T}} $ categories. ($ N_\text{RT} $ and $ N_\text{BT} $ represent number of resolved tops and b-jets respectively.) The background from QCD multijet and $ \mathrm{t} \bar{\mathrm{t}} $ production is derived from control regions in the data. Estimates for the $ \mathrm{t}\bar{\mathrm{t}}\mathrm{t}\bar{\mathrm{t}} $ signal and other backgrounds are shown using simulated samples. The hatched bands correspond to the estimated total uncertainty after the fit. |

png pdf |
Additional Figure 26-k:
The distribution of the BDT discriminants in the signal region for the 2018 data set in the all-hadronic channel for all $ N_\text{RT} $, $ N_\text{BT} $, and $ H_{\mathrm{T}} $ categories. ($ N_\text{RT} $ and $ N_\text{BT} $ represent number of resolved tops and b-jets respectively.) The background from QCD multijet and $ \mathrm{t} \bar{\mathrm{t}} $ production is derived from control regions in the data. Estimates for the $ \mathrm{t}\bar{\mathrm{t}}\mathrm{t}\bar{\mathrm{t}} $ signal and other backgrounds are shown using simulated samples. The hatched bands correspond to the estimated total uncertainty after the fit. |
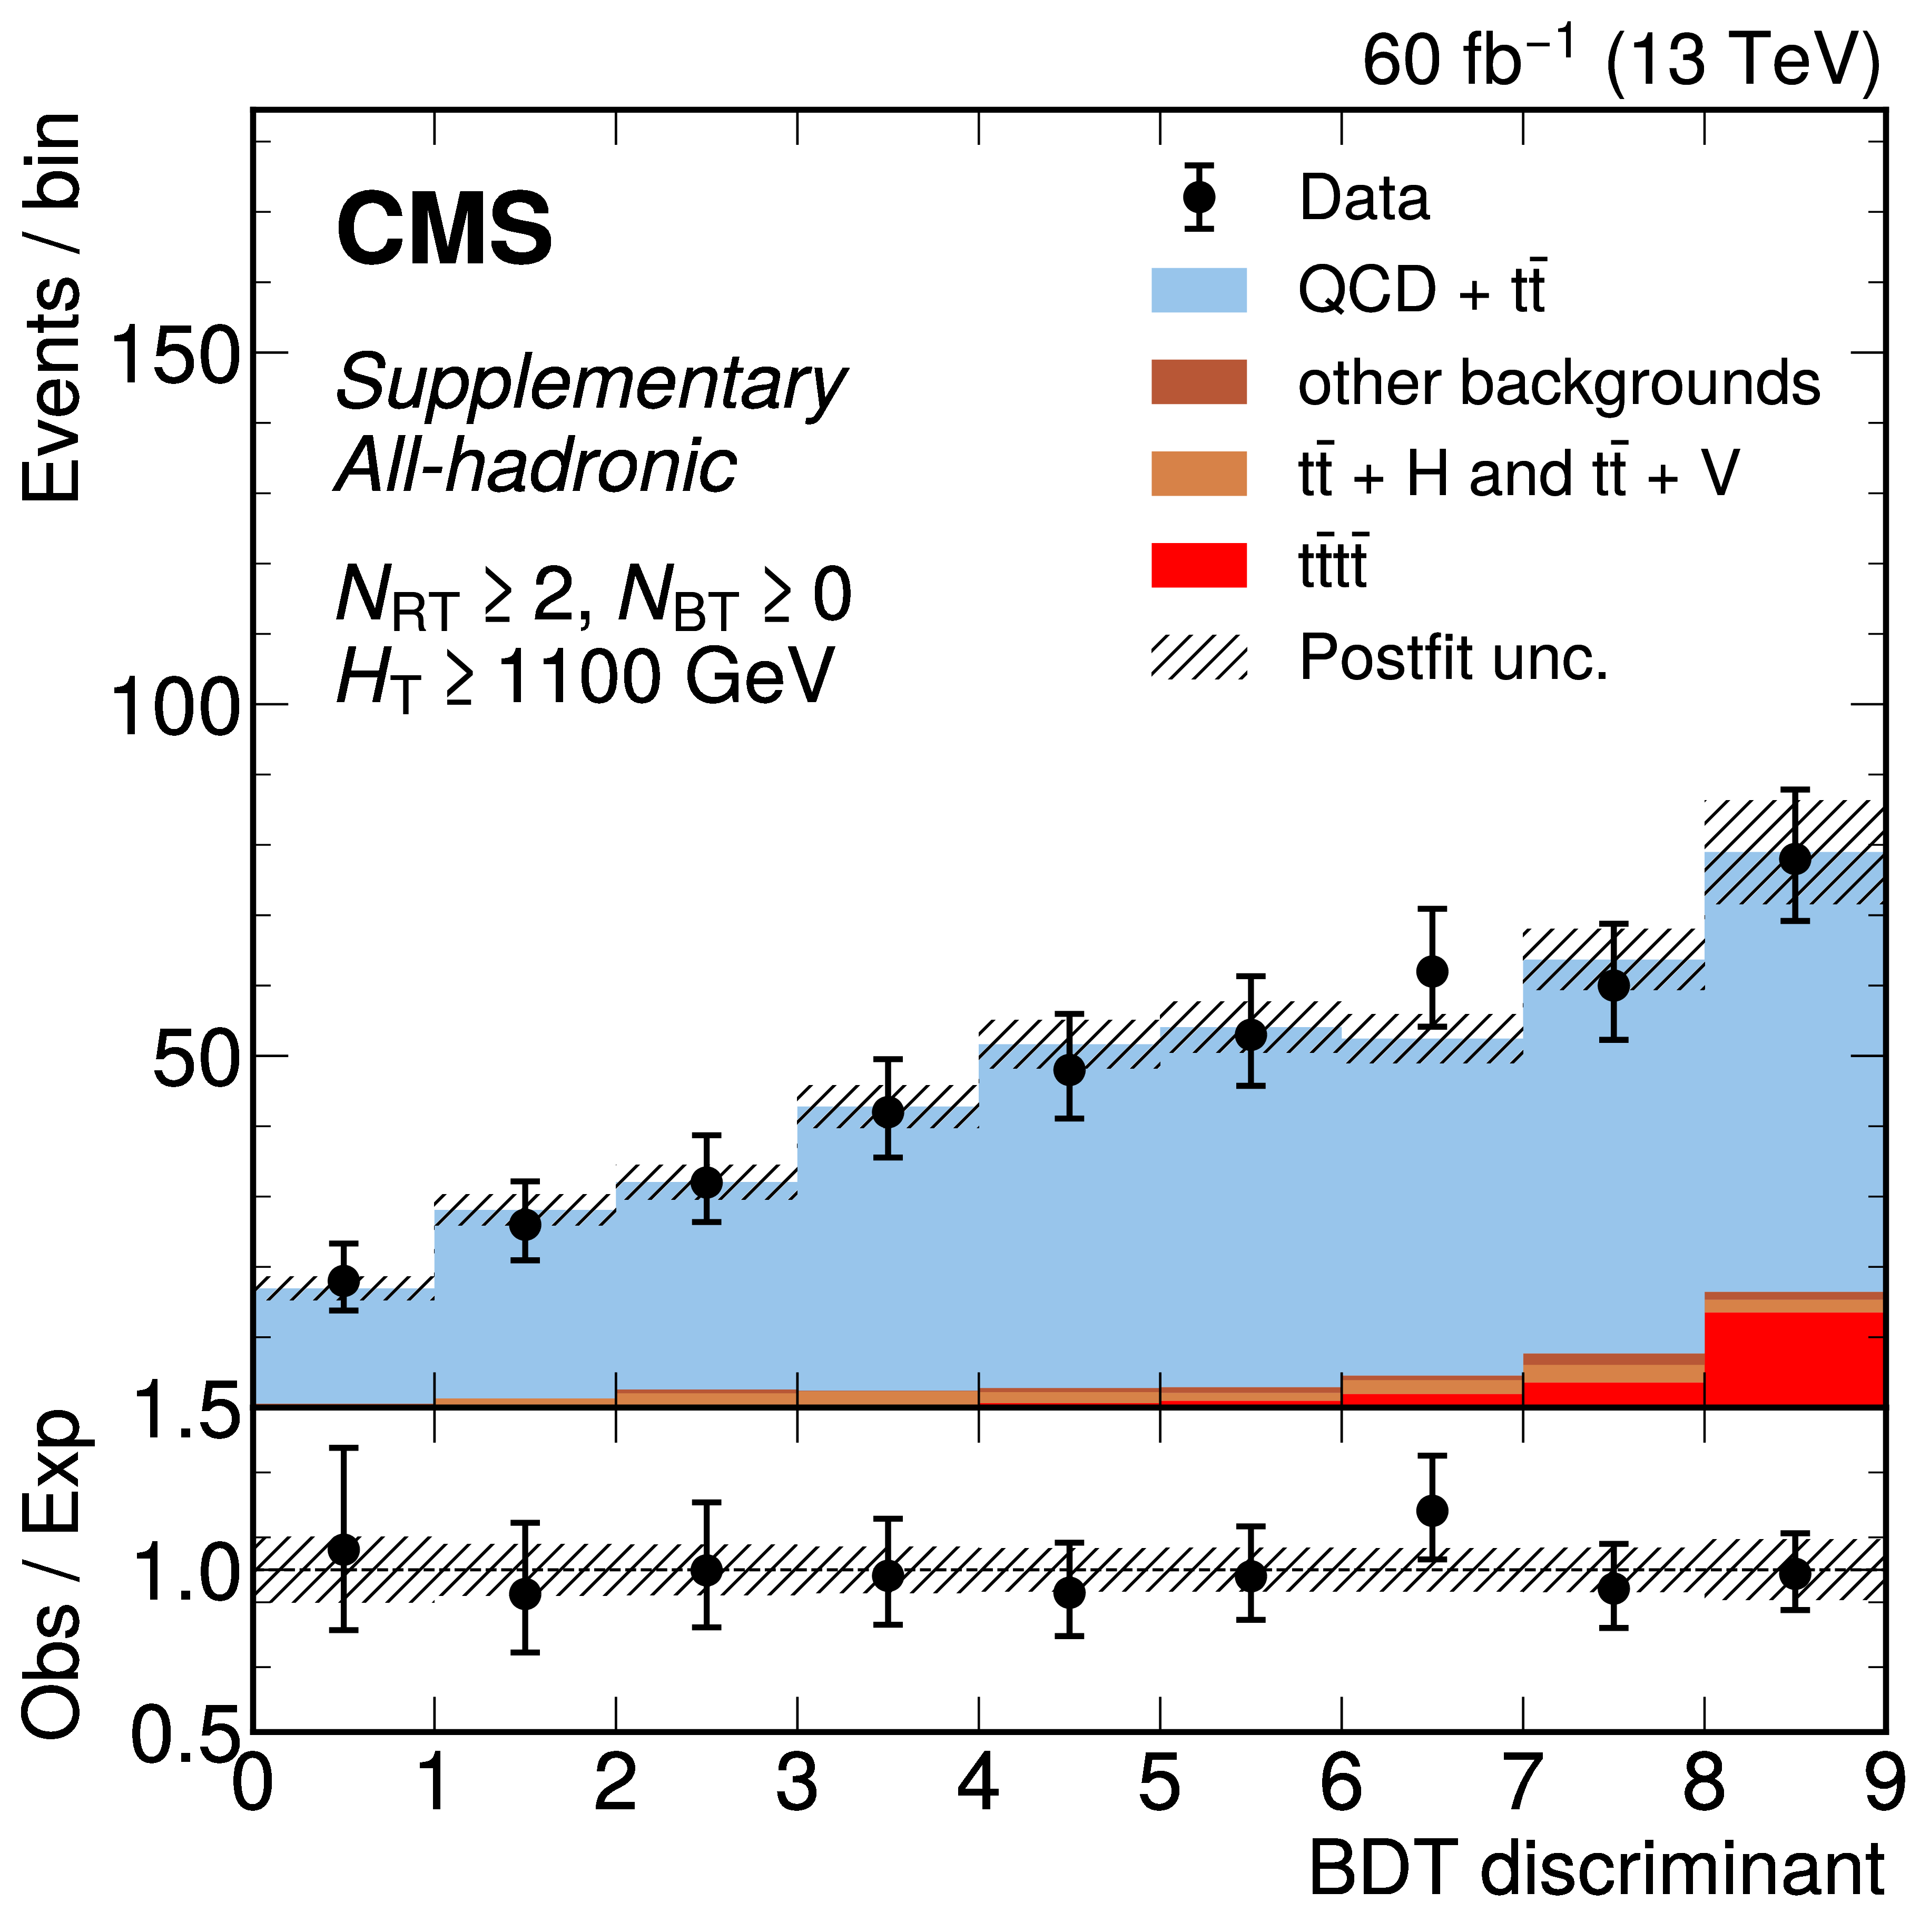
png pdf |
Additional Figure 26-l:
The distribution of the BDT discriminants in the signal region for the 2018 data set in the all-hadronic channel for all $ N_\text{RT} $, $ N_\text{BT} $, and $ H_{\mathrm{T}} $ categories. ($ N_\text{RT} $ and $ N_\text{BT} $ represent number of resolved tops and b-jets respectively.) The background from QCD multijet and $ \mathrm{t} \bar{\mathrm{t}} $ production is derived from control regions in the data. Estimates for the $ \mathrm{t}\bar{\mathrm{t}}\mathrm{t}\bar{\mathrm{t}} $ signal and other backgrounds are shown using simulated samples. The hatched bands correspond to the estimated total uncertainty after the fit. |
| Additional Tables | |
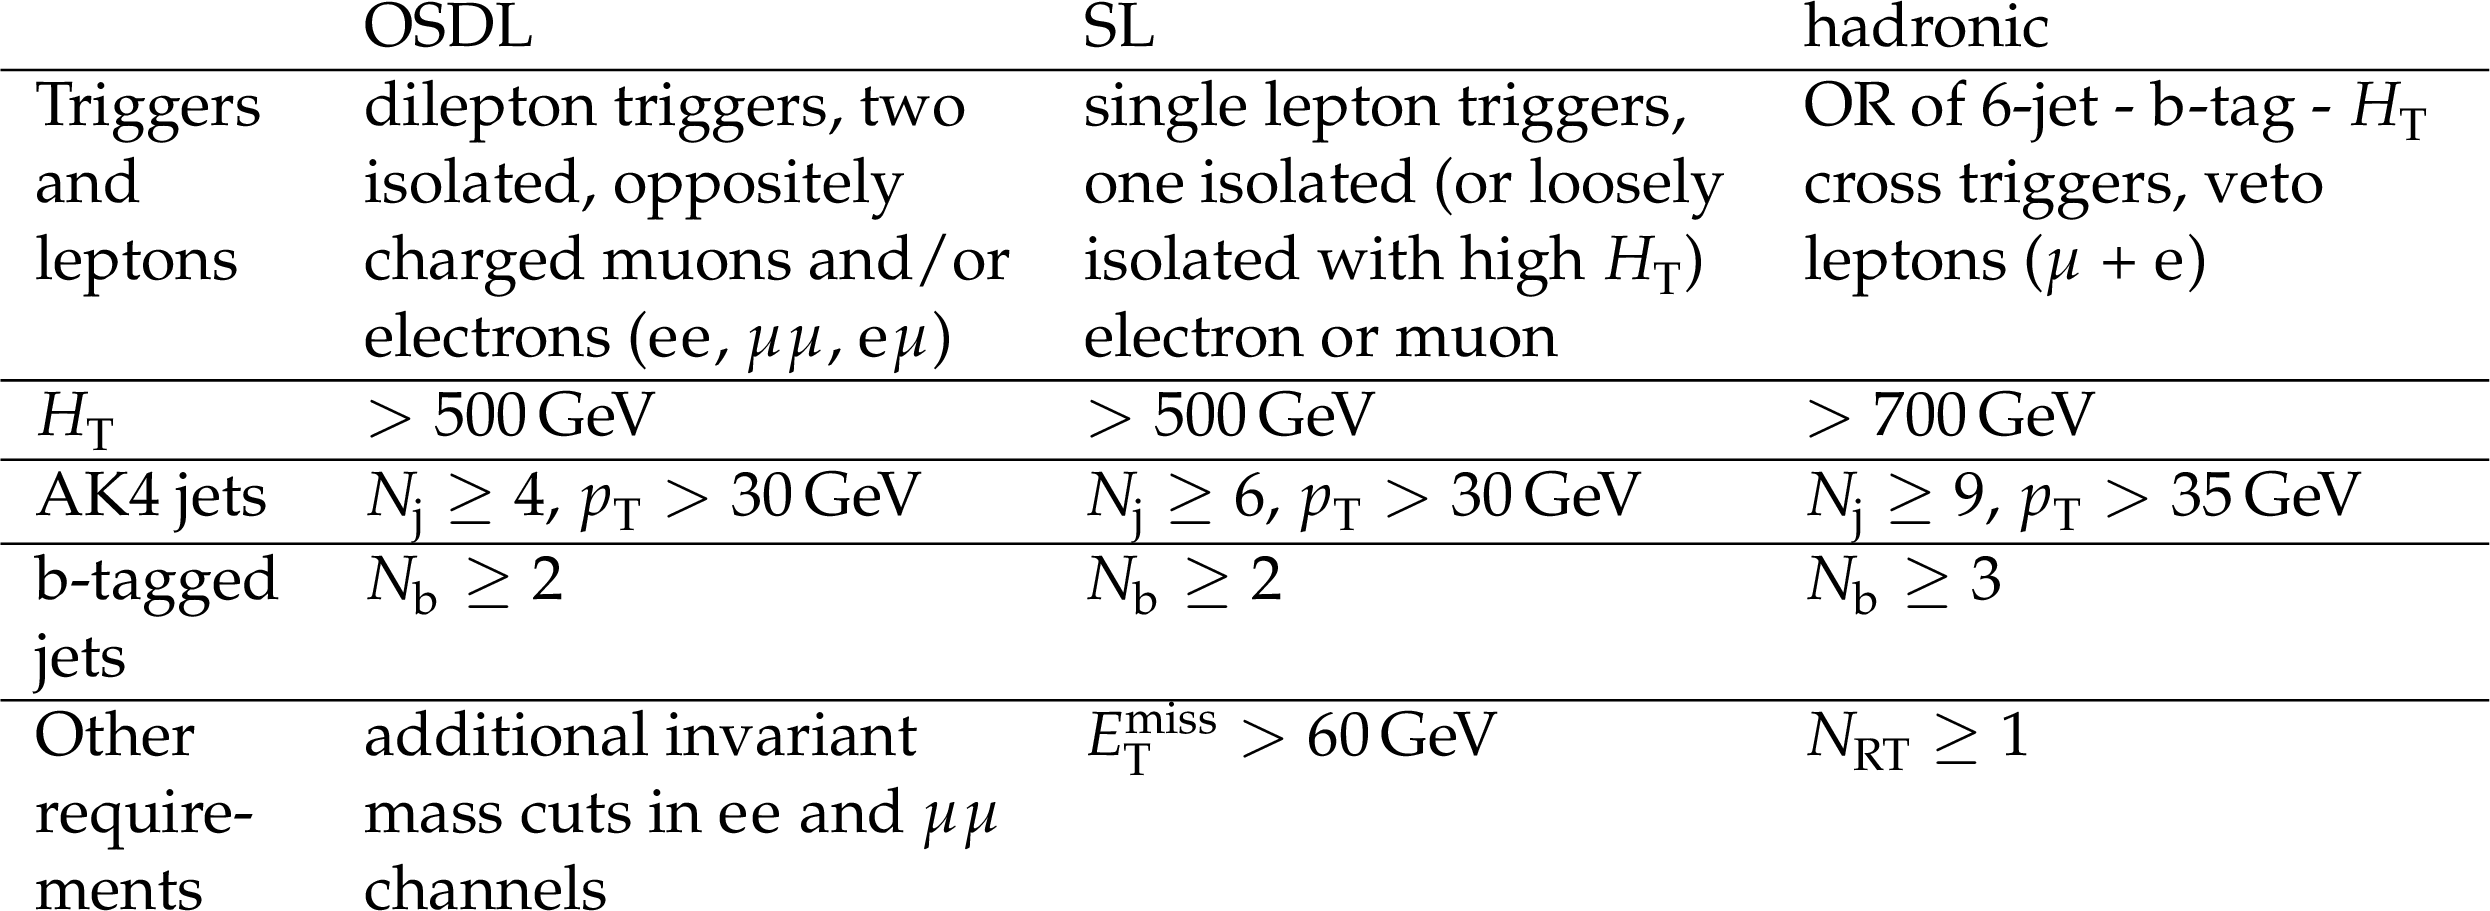
png pdf |
Additional Table 1:
Summary on event selection and triggers for each final state used in this analysis. $ N_\text{j} $, $ N_\mathrm{b} $, and $ N_\text{RT} $ refers to number of jets, number of b-tagged jets, and number of resolved tops respectively. |
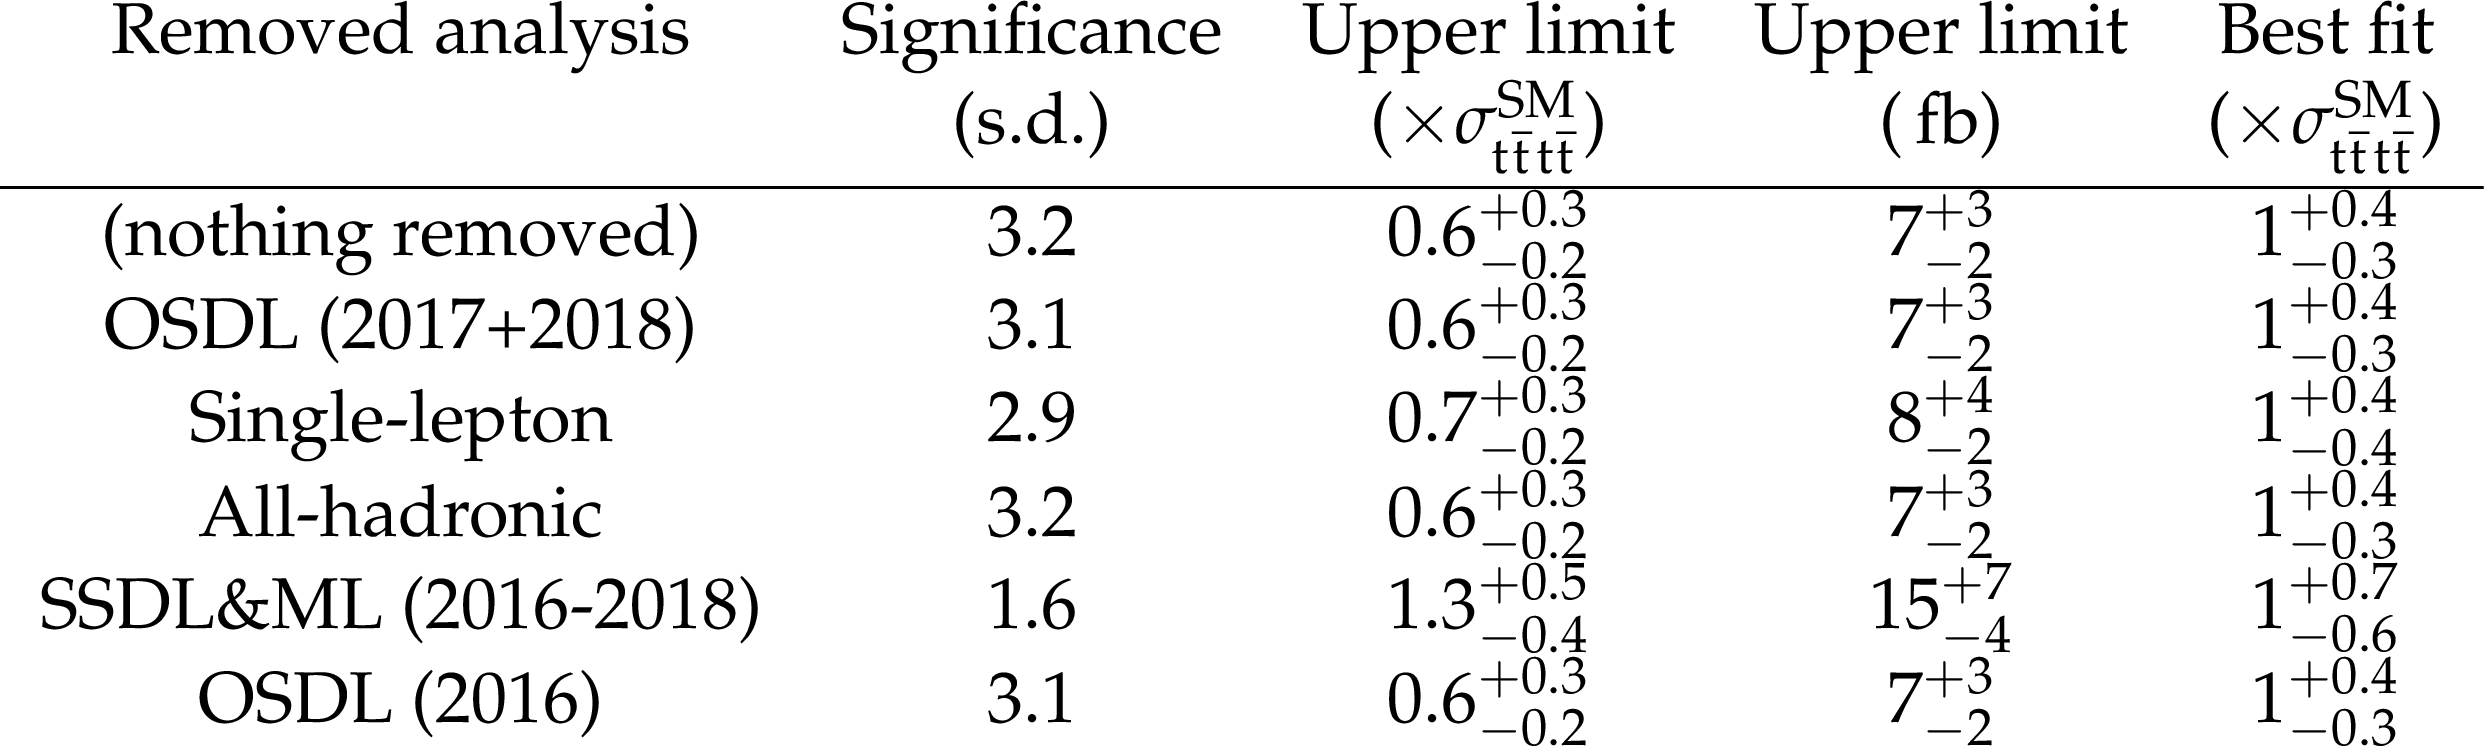
png pdf |
Additional Table 2:
Expected search significance (in terms of $ \sigma_{\mathrm{t}\bar{\mathrm{t}}\mathrm{t}\bar{\mathrm{t}}}^{\textrm{SM}} = $ 12 fb), cross section upper limits (in fb), and best signal strength fit (in terms of $ \sigma_{\mathrm{t}\bar{\mathrm{t}}\mathrm{t}\bar{\mathrm{t}}}^{\textrm{SM}} $), individually calculated from the combination, where one analysis is removed at a time. |
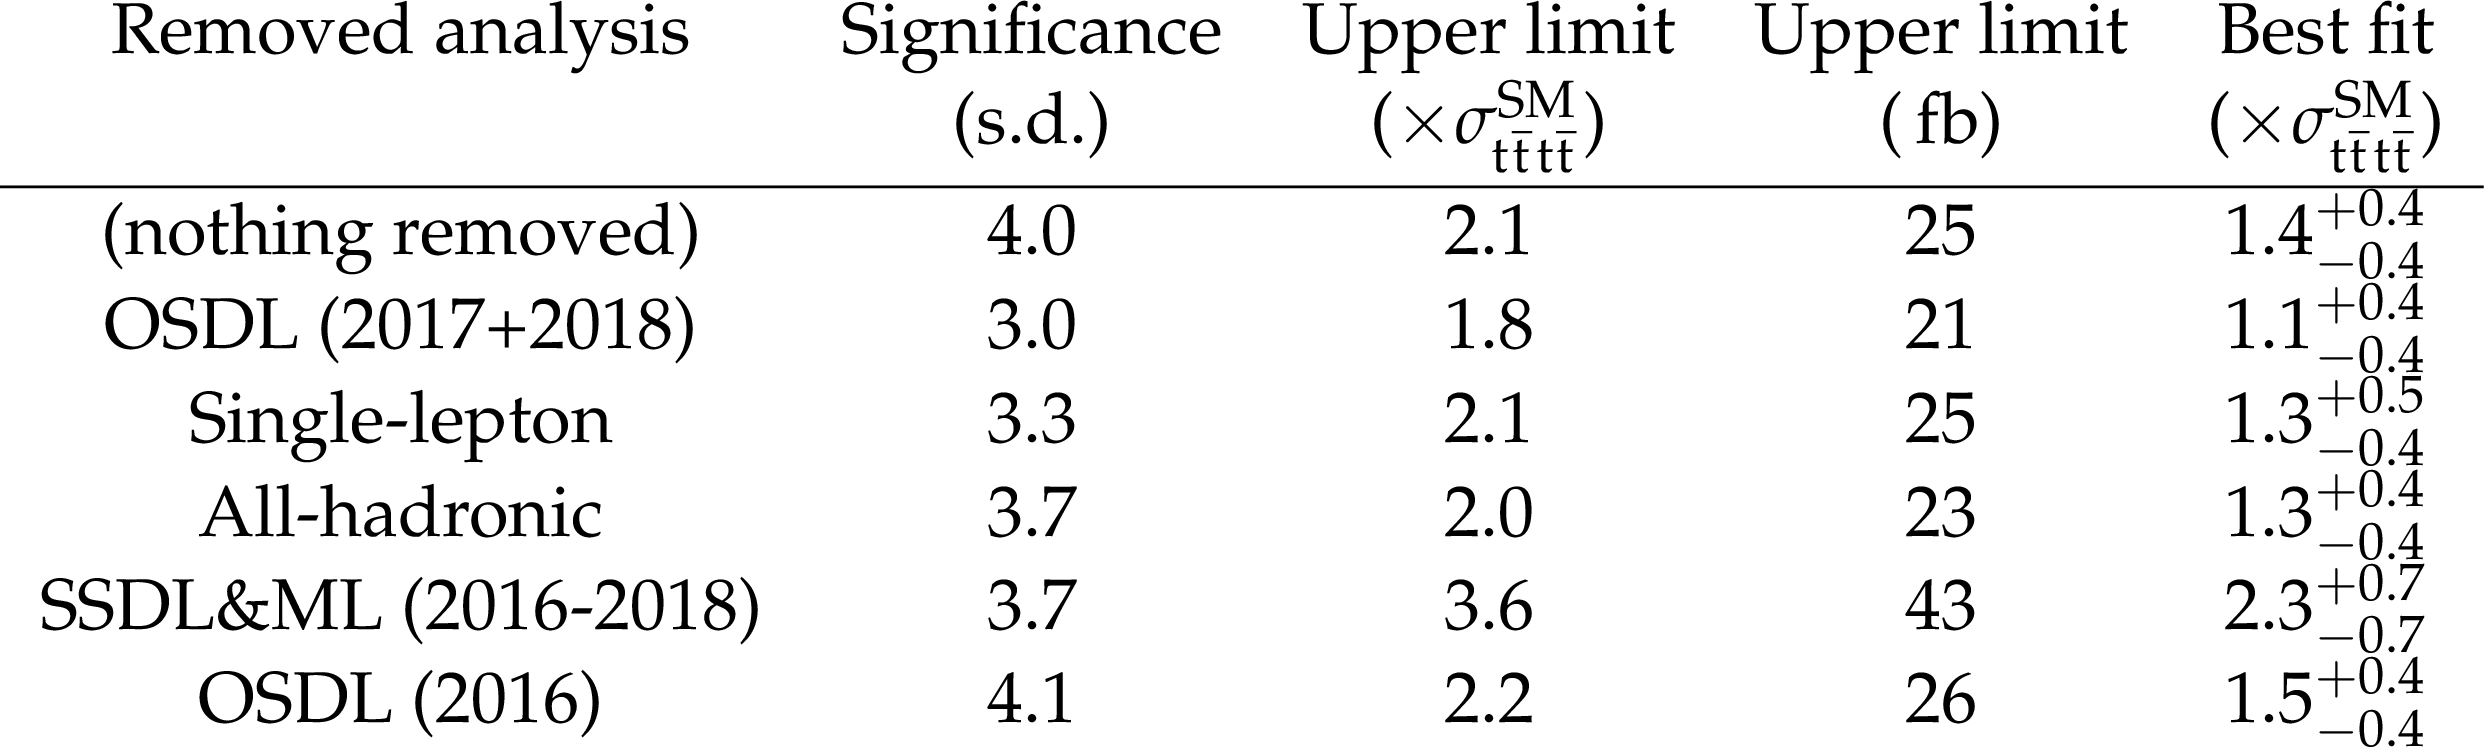
png pdf |
Additional Table 3:
Observed search significance (in terms of $ \sigma_{\mathrm{t}\bar{\mathrm{t}}\mathrm{t}\bar{\mathrm{t}}}^{\textrm{SM}} = $ 12 fb), cross section upper limits (in fb), and best signal strength fit (in terms of $ \sigma_{\mathrm{t}\bar{\mathrm{t}}\mathrm{t}\bar{\mathrm{t}}}^{\textrm{SM}} $), individually calculated from the combination, where one analysis is removed at a time. |

png pdf |
Additional Table 4:
Compatibility of individual channels with respect to each other and to the SM. |
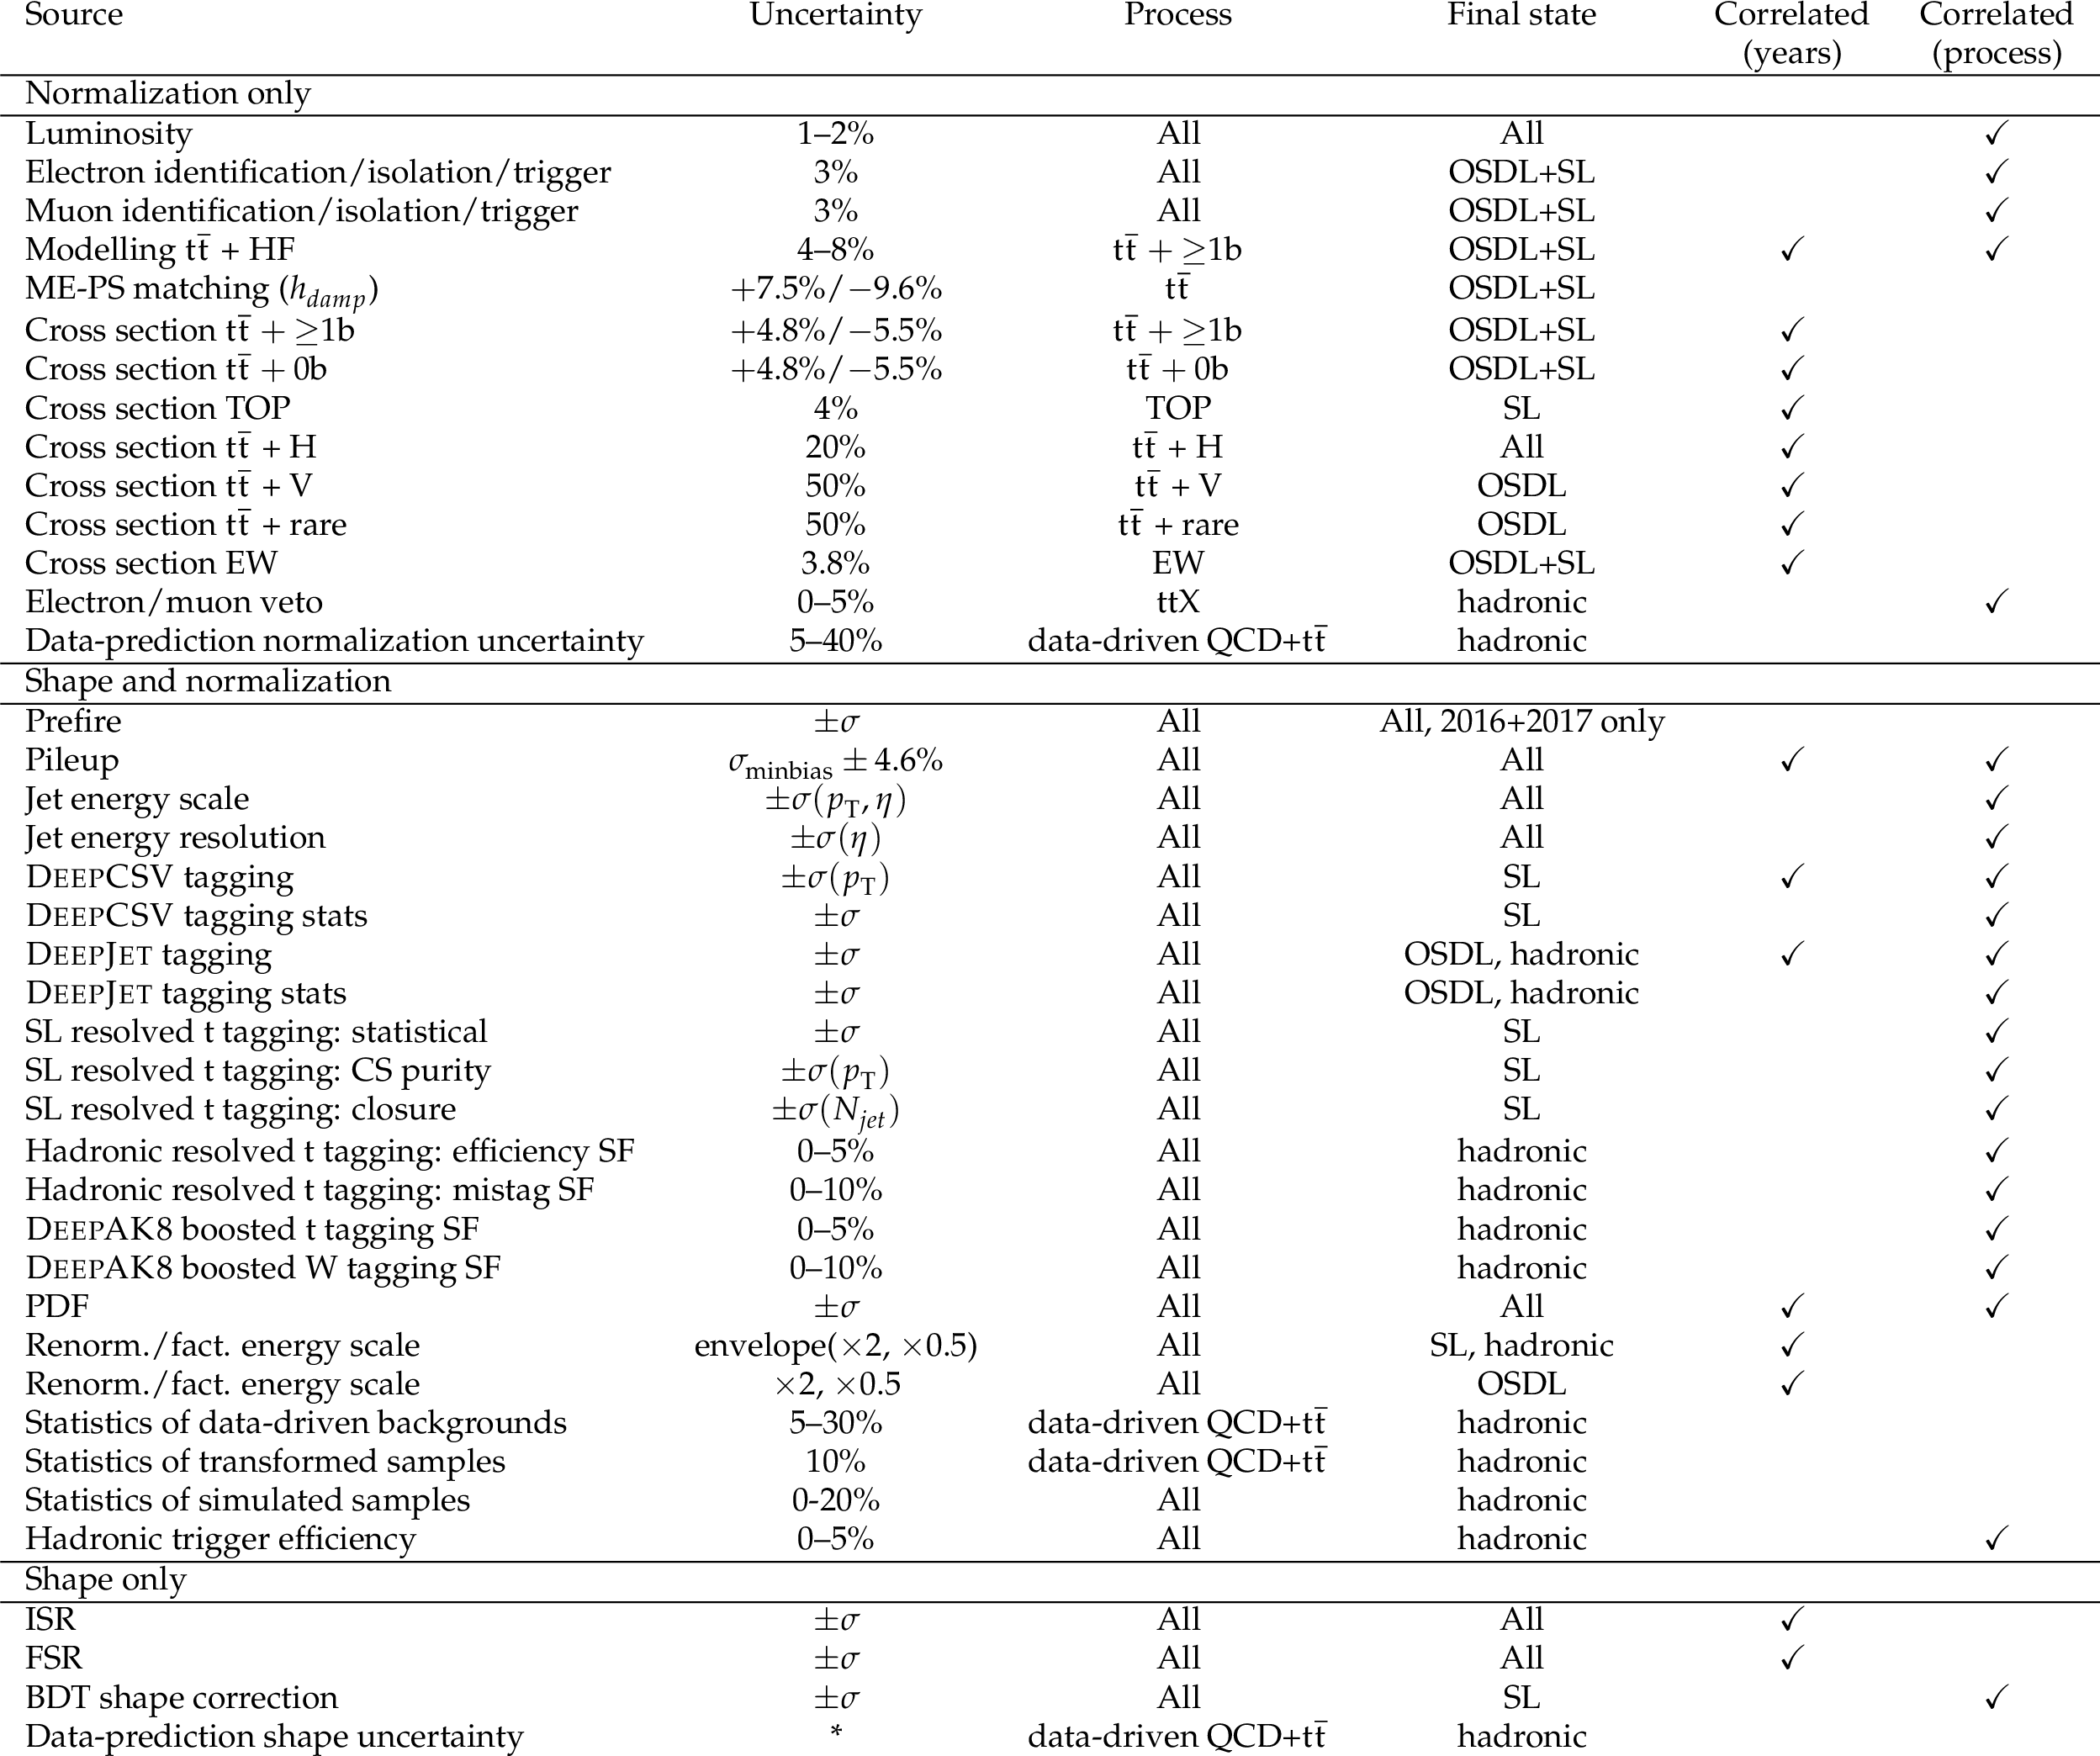
png pdf |
Additional Table 5:
Summary of systematic uncertainties used as input to the simultaneous fit. Correlations are also indicated. Note ''All'' refers to all simulated samples, not including data-driven QCD+ $ \mathrm{t} \bar{\mathrm{t}} $ backgrounds in the all-hadronic channel. ''ttX'' refers to $ \mathrm{t} \bar{\mathrm{t}} $ production in association with single bosons (H, W, Z). Data-prediction shape and normalization uncertainties apply to the data-driven QCD+ $ \mathrm{t} \bar{\mathrm{t}} $ backgrounds in the all-hadronic channel that are derived in the validation region (VR) and applied in the signal region (SR) for corresponding categories. These uncertainties are correlated between top SR categories per year that use the same NN trainings. |
| References | ||||
| 1 | J. Alwall et al. | The automated computation of tree-level and next-to-leading order differential cross sections, and their matching to parton shower simulations | JHEP 07 (2014) 079 | 1405.0301 |
| 2 | T. Ježo and M. Kraus | Hadroproduction of four top quarks in the powheg box | PRD 105 (2022) 114024 | 2110.15159 |
| 3 | R. Frederix, D. Pagani, and M. Zaro | Large NLO corrections in $ t\bar{t}W^{\pm} $ and $ t\bar{t}t\bar{t} $ hadroproduction from supposedly subleading EW contributions | JHEP 02 (2018) 031 | 1711.02116 |
| 4 | G. Bevilacqua and M. Worek | Constraining BSM physics at the LHC: four top final states with NLO accuracy in perturbative QCD | JHEP 07 (2012) 111 | 1206.3064 |
| 5 | R. Frederix et al. | The automation of next-to-leading order electroweak calculations | JHEP 07 (2018) 185 | 1804.10017 |
| 6 | H. P. Nilles | Supersymmetry, supergravity and particle physics | Phys. Rept. 110 (1984) 1 | |
| 7 | S. P. Martin | A supersymmetry primer | Adv. Ser. Direct. High Energy Phys. 18 (1998) 1 | hep-ph/9709356 |
| 8 | G. Cacciapaglia et al. | Composite scalars at the LHC: the Higgs, the sextet and the octet | JHEP 11 (2015) 201 | 1507.02283 |
| 9 | K. Kumar, T. M. P. Tait, and R. Vega-Morales | Manifestations of top compositeness at colliders | JHEP 05 (2009) 022 | 0901.3808 |
| 10 | D. Dicus, A. Stange, and S. Willenbrock | Higgs decay to top quarks at hadron colliders | PLB 333 (1994) 126 | hep-ph/9404359 |
| 11 | N. Craig et al. | The hunt for the rest of the Higgs bosons | JHEP 06 (2015) 137 | 1504.04630 |
| 12 | N. Craig et al. | Heavy Higgs bosons at low $ \tan \beta $: from the LHC to 100 TeV | JHEP 01 (2017) 018 | 1605.08744 |
| 13 | G. Cacciapaglia, A. Deandrea, and J. Llodra-Perez | A dark matter candidate from Lorentz invariance in 6D | JHEP 03 (2010) 083 | 0907.4993 |
| 14 | O. Ducu, L. Heurtier, and J. Maurer | LHC signatures of a Z' mediator between dark matter and the SU(3) sector | JHEP 03 (2016) 006 | 1509.05615 |
| 15 | C. Degrande et al. | Non-resonant new physics in top pair production at hadron colliders | JHEP 03 (2011) 125 | 1010.6304 |
| 16 | ATLAS Collaboration | Search for four-top-quark production in the single-lepton and opposite-sign dilepton final states in pp collisions at $ \sqrt{s} =$ 13 TeV with the ATLAS detector | PRD 99 (2019) 052009 | 1811.02305 |
| 17 | ATLAS Collaboration | Search for new phenomena in events with same-charge leptons and $ b $-jets in $ pp $ collisions at $ \sqrt{s}= $ 13 TeV with the ATLAS detector | JHEP 12 (2018) 039 | 1807.11883 |
| 18 | ATLAS Collaboration | Evidence for $ t\bar{t}t\bar{t} $ production in the multilepton final state in proton-proton collisions at $ \sqrt{s}= $ 13 TeV with the ATLAS detector | EPJC 80 (2020) 1085 | 2007.14858 |
| 19 | CMS Collaboration | Search for physics beyond the standard model in events with two leptons of same sign, missing transverse momentum, and jets in proton-proton collisions at $ \sqrt{s}= $ 13 TeV | EPJC 77 (2017) 578 | CMS-SUS-16-035 1704.07323 |
| 20 | CMS Collaboration | Search for standard model production of four top quarks with same-sign and multilepton final states in proton-proton collisions at $ \sqrt{s}= $ 13 TeV | EPJC 78 (2018) 140 | CMS-TOP-17-009 1710.10614 |
| 21 | CMS Collaboration | Search for production of four top quarks in final states with same-sign or multiple leptons in proton-proton collisions at $ \sqrt{s}= $ 13 TeV | EPJC 80 (2020) 75 | CMS-TOP-18-003 1908.06463 |
| 22 | CMS Collaboration | Search for the production of four top quarks in the single-lepton and opposite-sign dilepton final states in proton-proton collisions at $ \sqrt{s} =$ 13 TeV | JHEP 11 (2019) 082 | CMS-TOP-17-019 1906.02805 |
| 23 | CMS Collaboration | Precision luminosity measurement in proton-proton collisions at $ \sqrt{s} = $ 13 TeV in 2015 and 2016 at CMS | EPJC 81 (2021) 800 | CMS-LUM-17-003 2104.01927 |
| 24 | CMS Collaboration | CMS luminosity measurement for the 2017 data-taking period at $ \sqrt{s} = $ 13 TeV | CMS Physics Analysis Summary, 2018 CMS-PAS-LUM-17-004 |
CMS-PAS-LUM-17-004 |
| 25 | CMS Collaboration | CMS luminosity measurement for the 2018 data-taking period at $ \sqrt{s} = $ 13 TeV | CMS Physics Analysis Summary, 2019 CMS-PAS-LUM-18-002 |
CMS-PAS-LUM-18-002 |
| 26 | CMS Collaboration | HEPData record for this analysis | link | |
| 27 | CMS Collaboration | Performance of the CMS Level-1 trigger in proton-proton collisions at $ \sqrt{s} = $ 13 TeV | JINST 15 (2020) P10017 | CMS-TRG-17-001 2006.10165 |
| 28 | CMS Collaboration | The CMS trigger system | JINST 12 (2017) P01020 | CMS-TRG-12-001 1609.02366 |
| 29 | CMS Collaboration | The CMS experiment at the CERN LHC | JINST 3 (2008) S08004 | |
| 30 | P. Nason | A new method for combining NLO QCD with shower Monte Carlo algorithms | JHEP 11 (2004) 040 | hep-ph/0409146 |
| 31 | S. Frixione, P. Nason, and C. Oleari | Matching NLO QCD computations with parton shower simulations: the POWHEG method | JHEP 11 (2007) 070 | 0709.2092 |
| 32 | S. Alioli, P. Nason, C. Oleari, and E. Re | A general framework for implementing NLO calculations in shower Monte Carlo programs: the POWHEG BOX | JHEP 06 (2010) 043 | 1002.2581 |
| 33 | T. Sjöstrand et al. | An introduction to PYTHIA 8.2 | Comput. Phys. Commun. 191 (2015) 159 | 1410.3012 |
| 34 | J. Alwall et al. | Comparative study of various algorithms for the merging of parton showers and matrix elements in hadronic collisions | EPJC 53 (2008) 473 | 0706.2569 |
| 35 | R. Frederix and S. Frixione | Merging meets matching in MC@NLO | JHEP 12 (2012) 061 | 1209.6215 |
| 36 | CMS Collaboration | Event generator tunes obtained from underlying event and multiparton scattering measurements | EPJC 76 (2016) 155 | CMS-GEN-14-001 1512.00815 |
| 37 | CMS Collaboration | Investigations of the impact of the parton shower tuning in Pythia 8 in the modelling of $ \mathrm{t\overline{t}} $ at $ \sqrt{s}= $ 8 and 13 TeV | CMS Physics Analysis Summary, 2016 CMS-PAS-TOP-16-021 |
CMS-PAS-TOP-16-021 |
| 38 | CMS Collaboration | Extraction and validation of a new set of CMS PYTHIA8 tunes from underlying-event measurements | EPJC 80 (2020) 4 | CMS-GEN-17-001 1903.12179 |
| 39 | NNPDF Collaboration | Parton distributions for the LHC Run II | JHEP 04 (2015) 040 | 1410.8849 |
| 40 | NNPDF Collaboration | Parton distributions from high-precision collider data | EPJC 77 (2017) 663 | 1706.00428 |
| 41 | CMS Collaboration | Measurement of the cross section for $ \text{t}\bar{\text{t}} $ production with additional jets and b jets in pp collisions at $ \sqrt{s}= $ 13 TeV | JHEP 07 (2020) 125 | CMS-TOP-18-002 2003.06467 |
| 42 | CMS Collaboration | First measurement of the cross section for top quark pair production with additional charm jets using dileptonic final states in pp collisions at $ \sqrt{s}= $ 13 TeV | PLB 820 (2021) 136565 | CMS-TOP-20-003 2012.09225 |
| 43 | GEANT4 Collaboration | GEANT 4---a simulation toolkit | NIM A 506 (2003) 250 | |
| 44 | CMS Collaboration | Particle-flow reconstruction and global event description with the CMS detector | JINST 12 (2017) P10003 | CMS-PRF-14-001 1706.04965 |
| 45 | CMS Collaboration | Electron and photon reconstruction and identification with the CMS experiment at the CERN LHC | JINST 16 (2021) P05014 | CMS-EGM-17-001 2012.06888 |
| 46 | CMS Collaboration | ECAL 2016 refined calibration and Run2 summary plots | CMS Detector Performance Note CMS-DP-2020-021, 2020 CDS |
|
| 47 | CMS Collaboration | Performance of the CMS muon detector and muon reconstruction with proton-proton collisions at $ \sqrt{s}= $ 13 TeV | JINST 13 (2018) P06015 | CMS-MUO-16-001 1804.04528 |
| 48 | K. Rehermann and B. Tweedie | Efficient identification of boosted semileptonic top quarks at the LHC | JHEP 03 (2011) 059 | 1007.2221 |
| 49 | M. Cacciari, G. P. Salam, and G. Soyez | The anti-$ k_{\mathrm{T}} $ jet clustering algorithm | JHEP 04 (2008) 063 | 0802.1189 |
| 50 | M. Cacciari, G. P. Salam, and G. Soyez | FastJet user manual | EPJC 72 (2012) 1896 | 1111.6097 |
| 51 | CMS Collaboration | Jet energy scale and resolution in the CMS experiment in pp collisions at 8 TeV | JINST 12 (2017) P02014 | CMS-JME-13-004 1607.03663 |
| 52 | D. Bertolini, P. Harris, M. Low, and N. Tran | Pileup per particle identification | JHEP 10 (2014) 059 | 1407.6013 |
| 53 | CMS Collaboration | Pileup mitigation at CMS in 13 TeV data | JINST 15 (2020) P09018 | CMS-JME-18-001 2003.00503 |
| 54 | CMS Collaboration | Identification of heavy-flavour jets with the CMS detector in pp collisions at 13 TeV | JINST 13 (2018) P05011 | CMS-BTV-16-002 1712.07158 |
| 55 | E. Bols et al. | Jet flavour classification using DeepJet | JINST 15 (2020) P12012 | 2008.10519 |
| 56 | CMS Collaboration | Performance of the DeepJet b tagging algorithm using 41.9/fb of data from proton-proton collisions at 13 TeV with Phase 1 CMS detector | CMS Detector Performance Note CMS-DP-2018-058, 2018 CDS |
|
| 57 | CMS Collaboration | Search for direct top squark pair production in events with one lepton, jets, and missing transverse momentum at 13 TeV with the CMS experiment | JHEP 05 (2020) 032 | CMS-SUS-19-009 1912.08887 |
| 58 | CMS Collaboration | Search for top squark production in fully-hadronic final states in proton-proton collisions at $ \sqrt{s} = $ 13 TeV | PRD 104 (2021) 052001 | CMS-SUS-19-010 2103.01290 |
| 59 | T. Hastie, R. Tibshirani, and J. Friedman | The elements of statistical learning | Springer-Verlag, second edition, . , ISBN~978-0-387-84858-7, 2013 link |
|
| 60 | L. Breiman, J. Friedman, R. Olshen, and C. Stone | Classification and regression trees | Wadsworth, . ISBN~978-041418, 1984 | |
| 61 | CMS Collaboration | Search for direct production of supersymmetric partners of the top quark in the all-jets final state in proton-proton collisions at $ \sqrt{s}= $ 13 TeV | JHEP 10 (2017) 005 | CMS-SUS-16-049 1707.03316 |
| 62 | CMS Collaboration | Machine learning-based identification of highly Lorentz-boosted hadronically decaying particles at the CMS experiment | CMS Physics Analysis Summary, 2019 CMS-PAS-JME-18-002 |
CMS-PAS-JME-18-002 |
| 63 | H. Voss, A. H ö cker, J. Stelzer, and F. Tegenfeldt | TMVA, the toolkit for multivariate data analysis with ROOT | in XIth International Workshop on Advanced Computing and Analysis Techniques in Physics Research (ACAT), . . . [PoS(ACAT)040], 2007 link |
physics/0703039 |
| 64 | G. C. Fox and S. Wolfram | Observables for the analysis of event shapes in $ {e}^{+}{e}^{-} $ annihilation and other processes | PRL 41 (1978) 1581 | |
| 65 | L. Prokhorenkova et al. | Catboost: unbiased boosting with categorical features | 1706.09516 | |
| 66 | S. Choi and H. Oh | Improved extrapolation methods of data-driven background estimations in high energy physics | EPJC 81 (2021) 643 | 1906.10831 |
| 67 | S. Choi, J. Lim, and H. Oh | Data-driven estimation of background distribution through neural autoregressive flows | 2008.03636 | |
| 68 | A. L. Read | Presentation of search results: the $ CL_s $ technique | JPG 28 (2002) 2693 | |
| 69 | T. Junk | Confidence level computation for combining searches with small statistics | NIM A 434 (1999) 435 | hep-ex/9902006 |
| 70 | G. Cowan, K. Cranmer, E. Gross, and O. Vitells | Asymptotic formulae for likelihood-based tests of new physics | EPJC 71 (2011) 1554 | 1007.1727 |
|
|
Compact Muon Solenoid LHC, CERN |
|

|

|

|

|

|