

Compact Muon Solenoid
LHC, CERN
| CMS-B2G-22-003 ; CERN-EP-2022-090 | ||
| Search for nonresonant pair production of highly energetic Higgs bosons decaying to bottom quarks | ||
| CMS Collaboration | ||
| 13 May 2022 | ||
| Phys. Rev. Lett. 131 (2023) 041803 | ||
| Abstract: A search for nonresonant Higgs boson (H) pair production via gluon and vector boson (V) fusion is performed in the four-bottom-quark final state, using proton-proton collision data at 13 TeV corresponding to 138 fb$^{-1}$ collected by the CMS experiment at the LHC. The analysis targets Lorentz-boosted H pairs identified using a graph neural network. It constrains the strengths relative to the standard model of the H self-coupling and the quartic VVHH couplings, ${\kappa_{2\mathrm{V}}} $, excluding ${\kappa_{2\mathrm{V}}} = $ 0 for the first time, with a significance of 6.3 standard deviations when other H couplings are fixed to their standard model values. | ||
| Links: e-print arXiv:2205.06667 [hep-ex] (PDF) ; CDS record ; inSPIRE record ; HepData record ; CADI line (restricted) ; | ||
| Figures | Summary | Additional Figures & Tables | References | CMS Publications |
|---|
| Figures | |
png pdf |
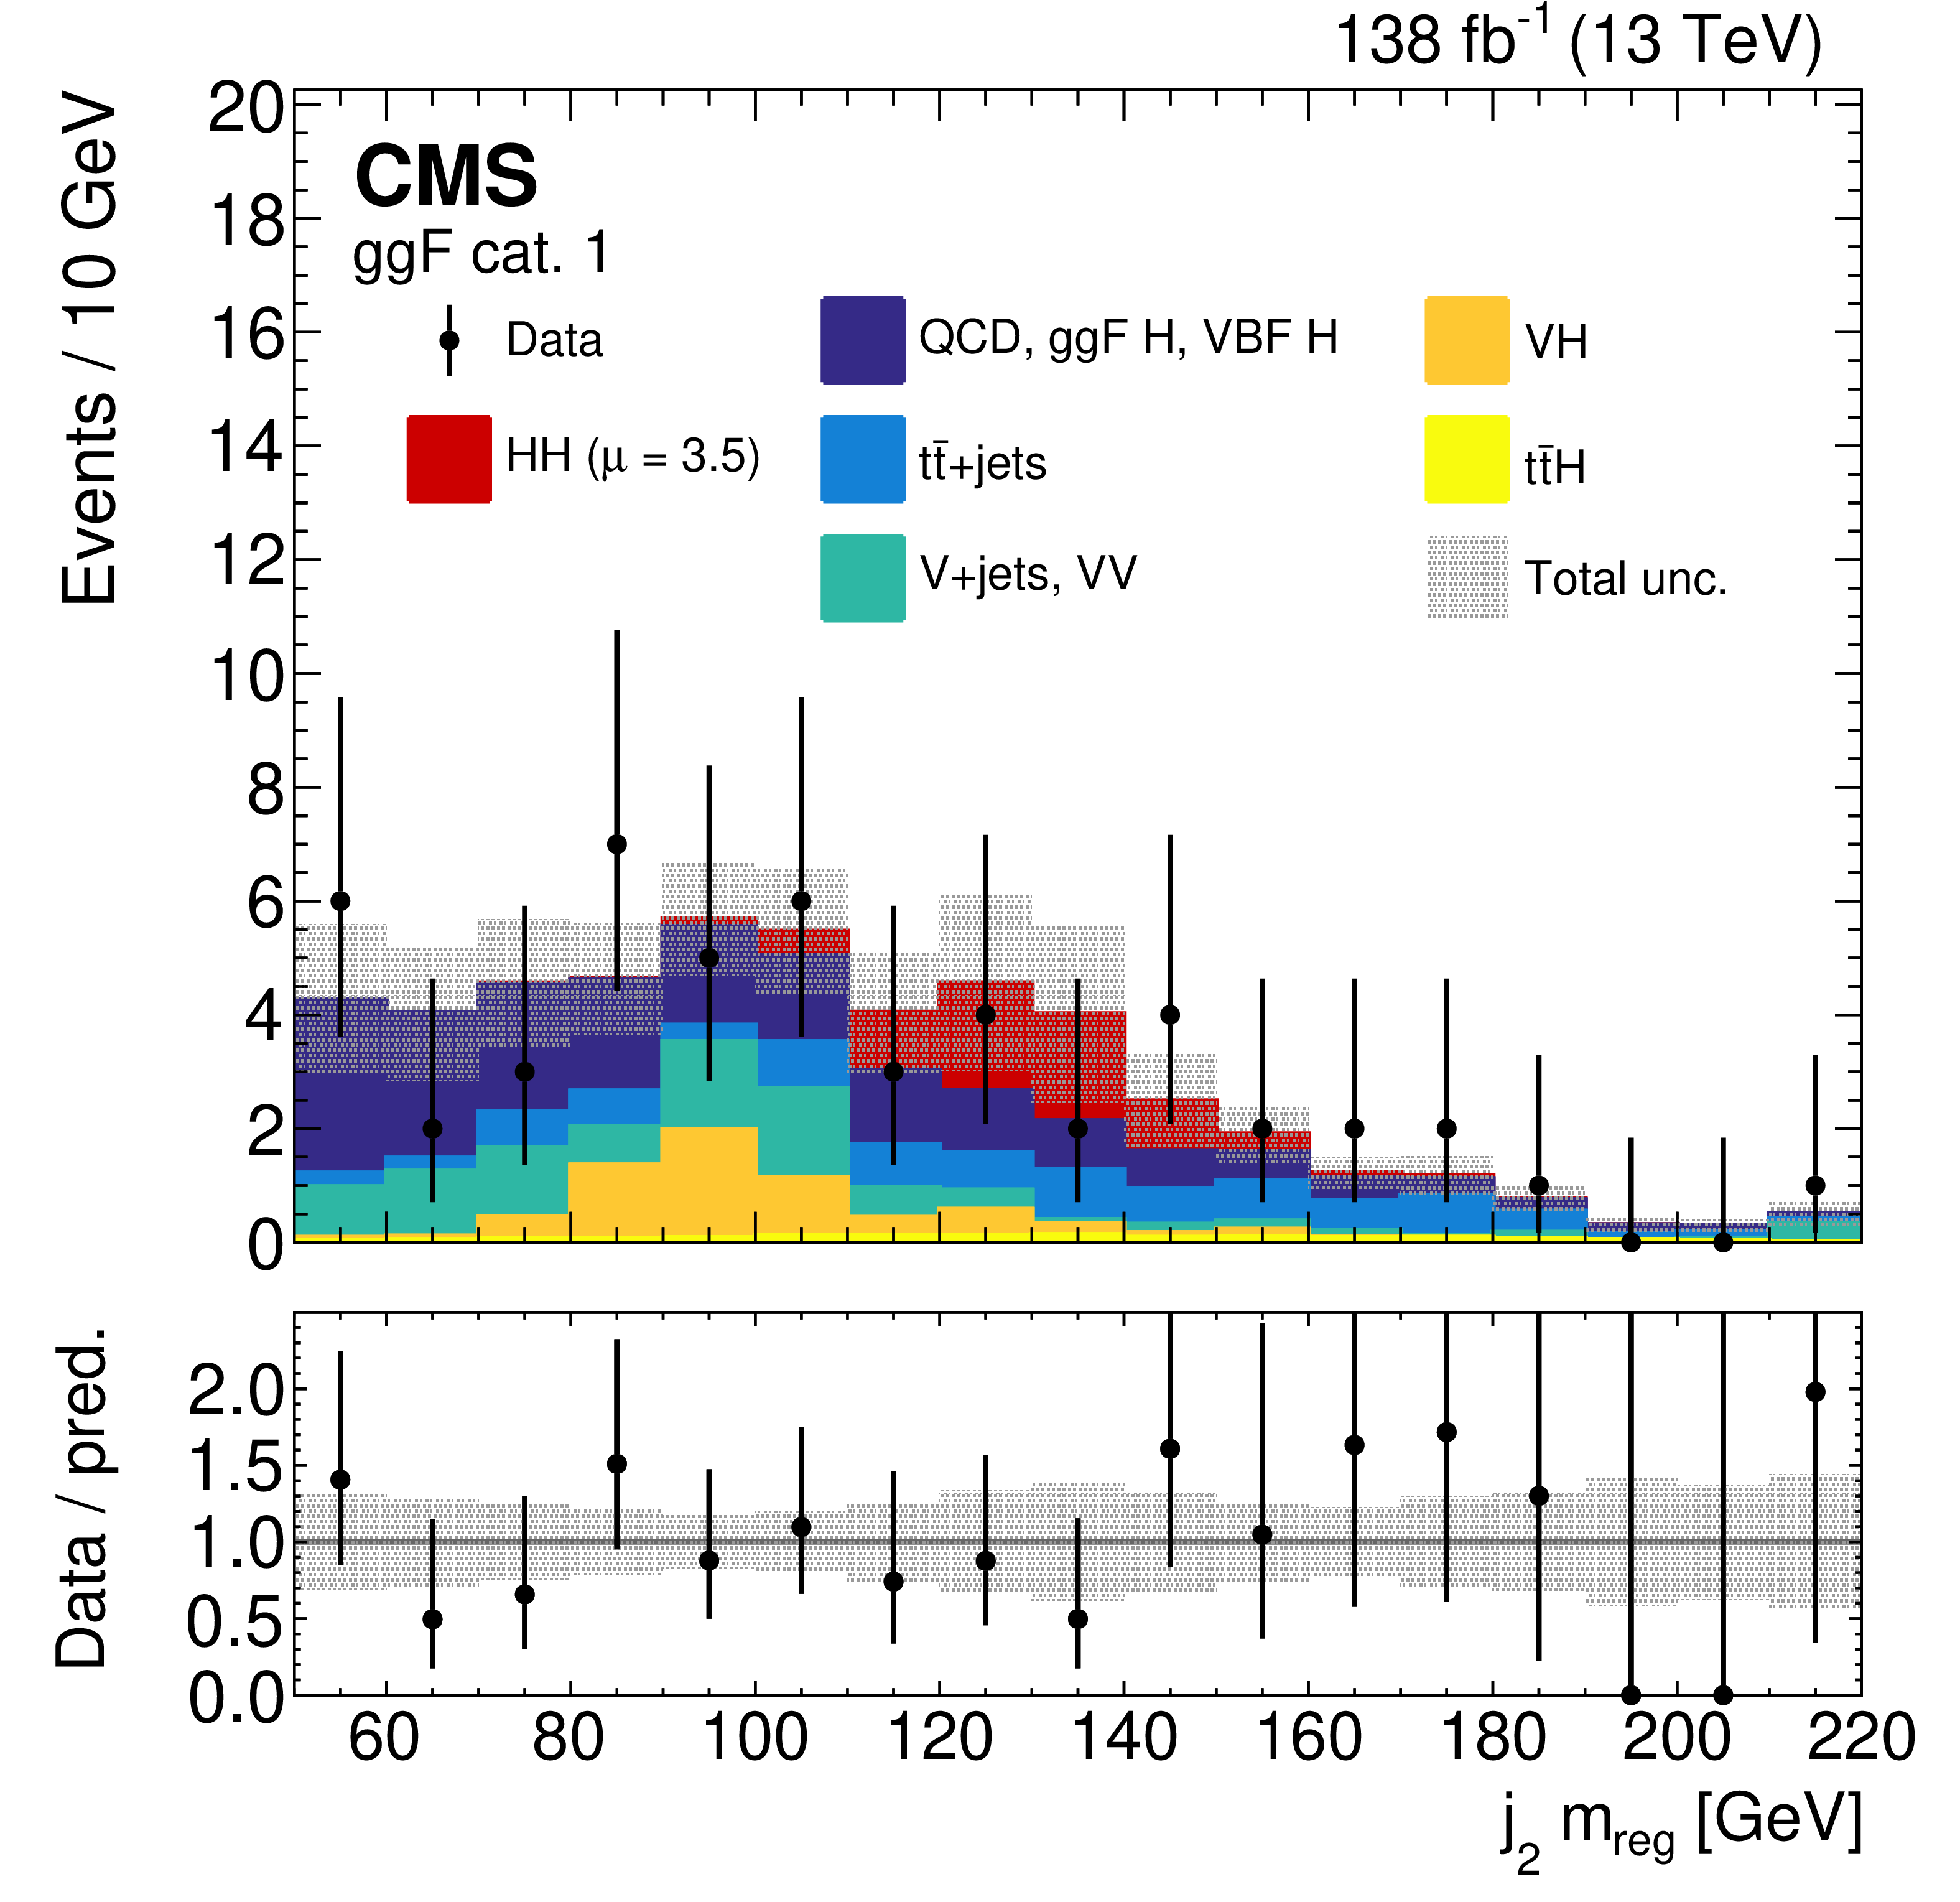
Figure 1:
The data and fitted signal and background distributions for the ${D_{\mathrm{b} \mathrm{\bar{b}}}}$-subleading jet regressed mass are shown for the ggF BDT event category 1, the category accounting for most of the sensitivity to the ggF HH signal. The SM HH ($ {\kappa _{2{\mathrm{V}}}} = {\kappa _{\mathrm{V}}} = {\kappa _\lambda} =$ 1) signal is shown scaled to the best fit signal strength $\mu =$ 3.5. The lower panel shows the ratio of the data and the total prediction, with its uncertainty represented by the shaded band. The error bars on the data points represent the statistical uncertainties. |

png pdf |
Figure 2:
The distributions of the invariant mass of the HH system after a background-only fit to the data, for the VBF low-purity (LP), medium-purity (MP), and high-purity (HP) categories. The VBF signal for $ {\kappa _{2{\mathrm{V}}}} =$ 0, $ {\kappa _{\mathrm{V}}} = {\kappa _\lambda} =$ 1, is shown in red with the vertical error bar indicating the prefit uncertainty. The lower panel shows the ratio of the data and the total background prediction, with its uncertainty represented by the shaded band. The error bars on the data points represent the statistical uncertainties. |
png pdf |
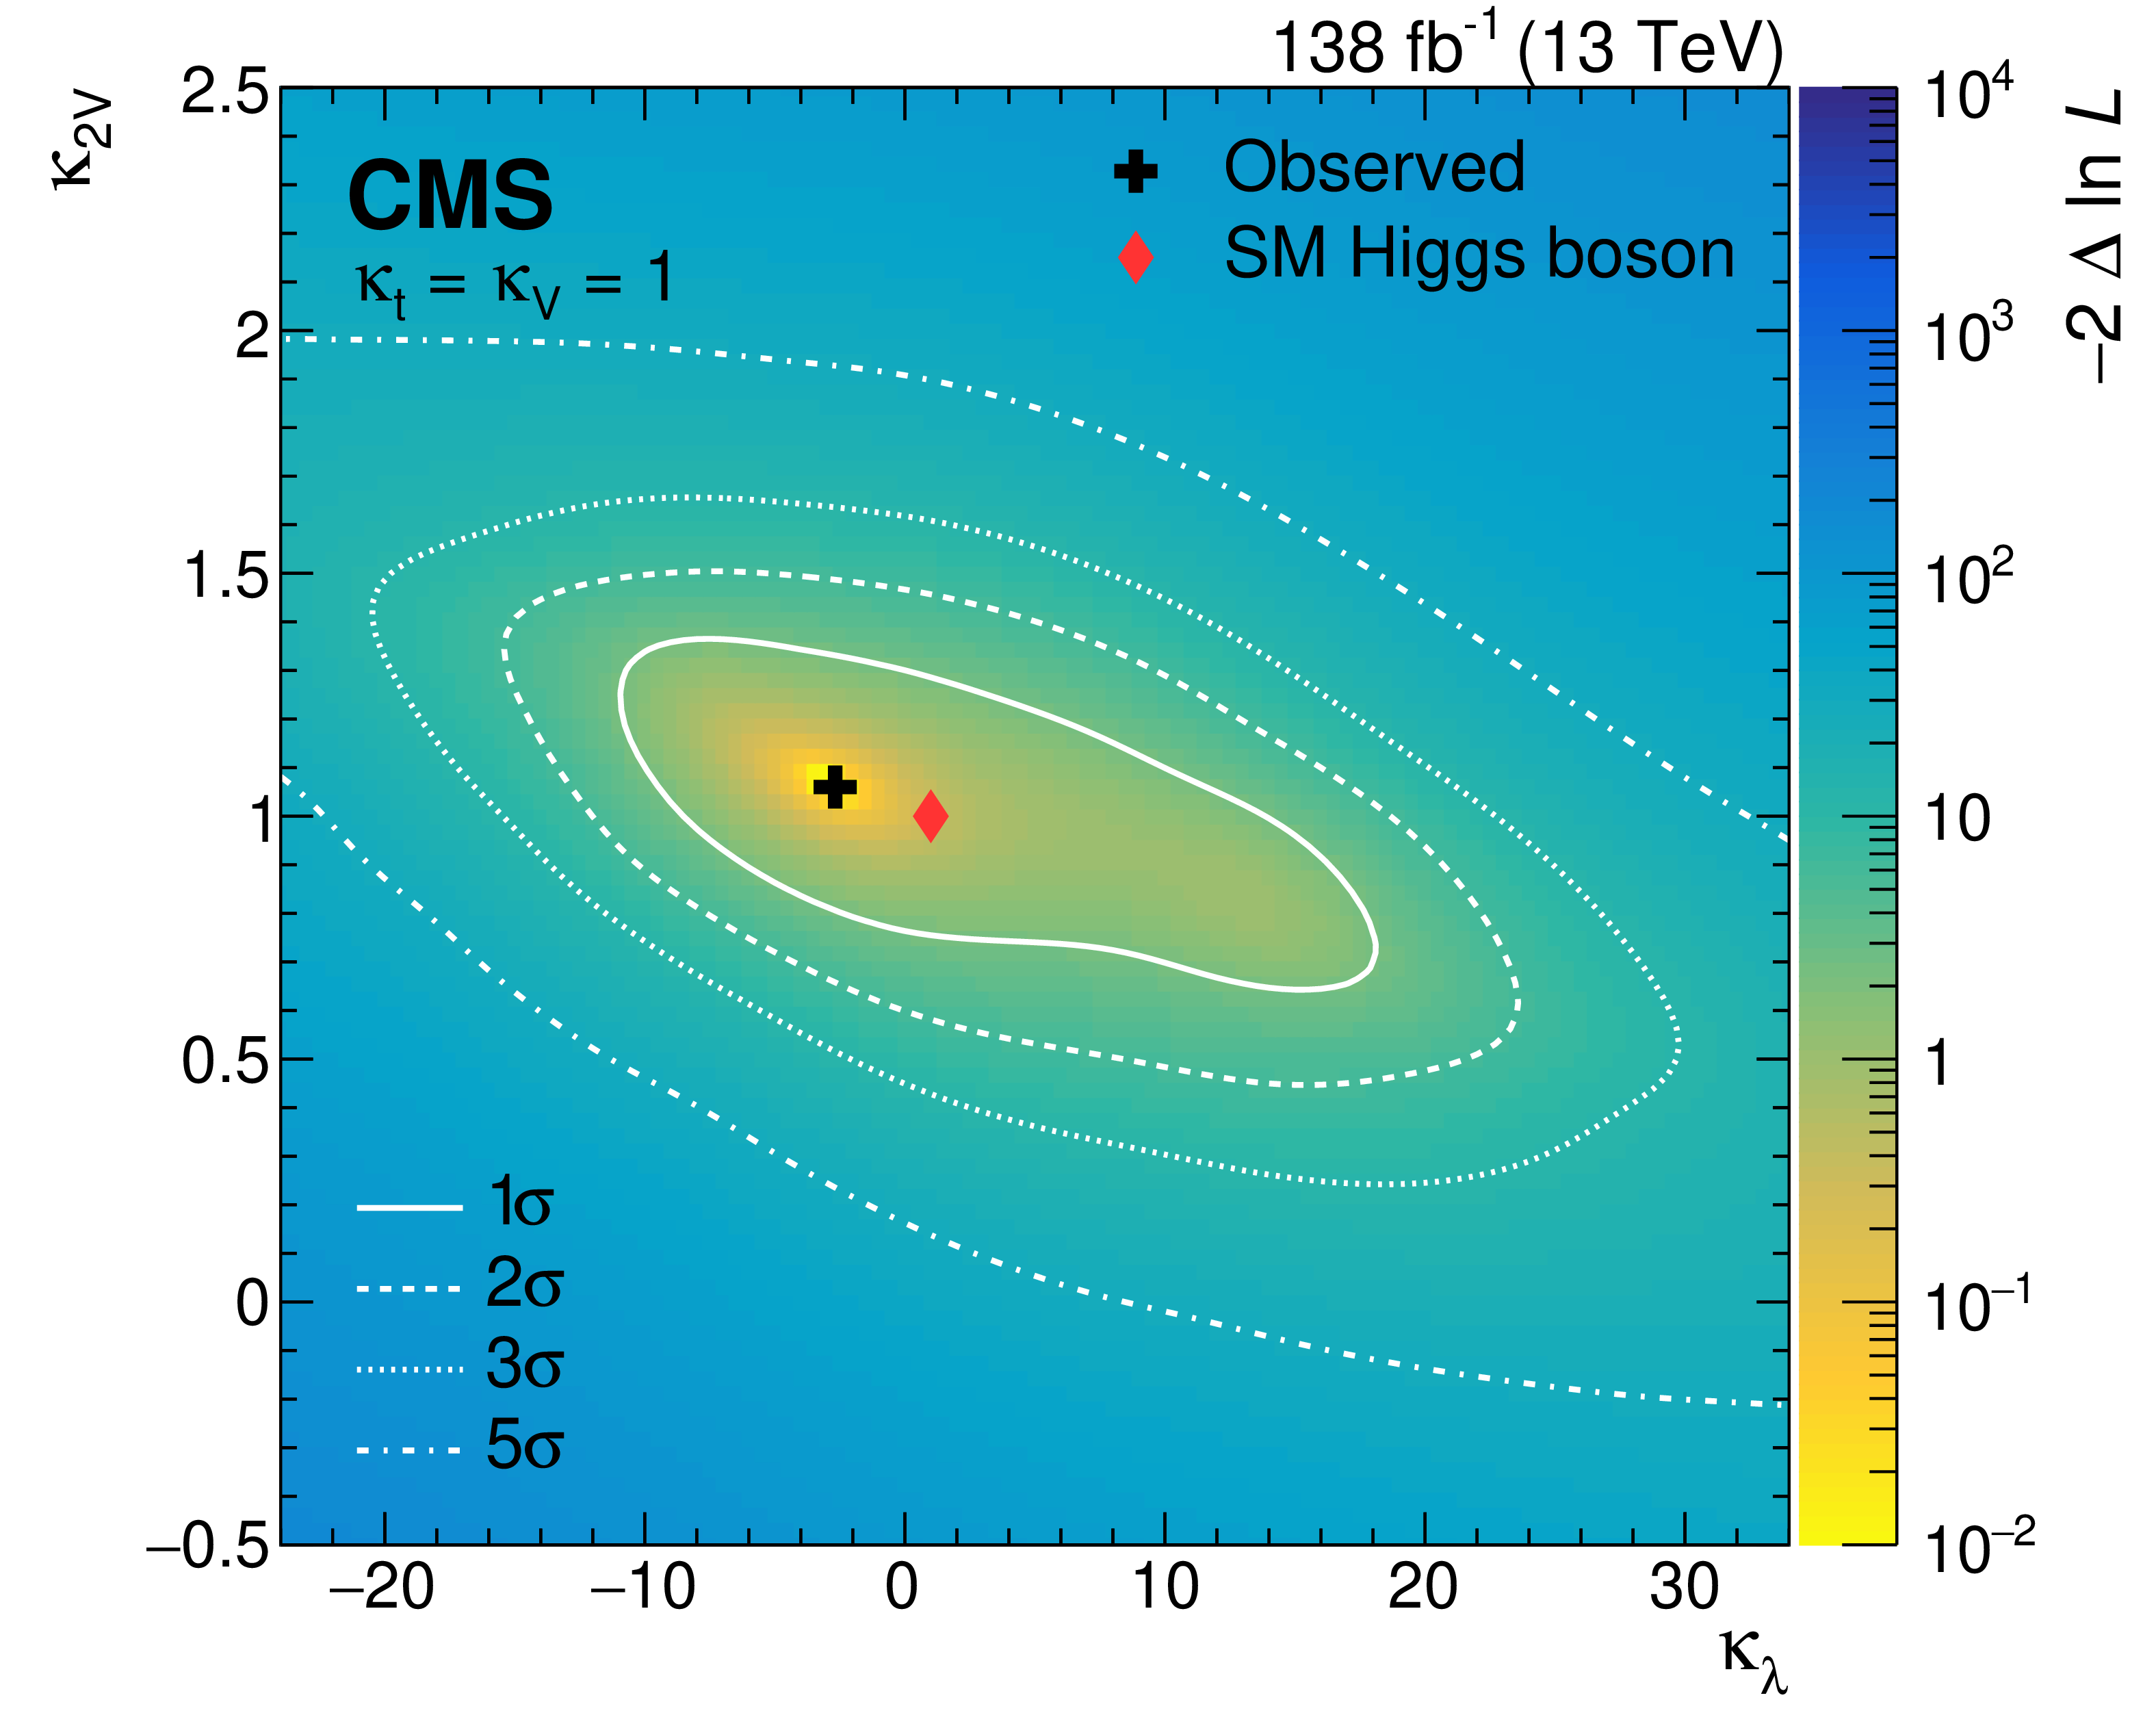
Figure 3:
Two-parameter profile likelihood test statistic ($-2\Delta \ln\mathcal {L}$) scan in data as a function of ${\kappa _\lambda}$ and ${\kappa _{2{\mathrm{V}}}}$. The black cross indicates the minimum, while the red diamond marks the SM expectation ($ {\kappa _\lambda} = {\kappa _{2{\mathrm{V}}}} = $ 1). The gray solid, dashed, dotted, and dash-dotted contours enclose the 1, 2, 3, and 5$\sigma $ CL regions, respectively. |
| Summary |
| In summary, a search for nonresonant Higgs boson pair (HH) production via gluon fusion and vector boson (V) fusion in the final state with two bottom quark-antiquark ($\mathrm{b\bar{b}}$) pairs has been presented. The search is focused on the phase space region where both Higgs bosons are highly Lorentz boosted so that each Higgs boson is reconstructed as a large-radius jet. A novel algorithm based on a graph neural network is applied to identify the jets that correspond to $\mathrm{H \to b\bar{b}}$ decays. The data are found to agree with the background-only hypothesis, and an observed (expected) upper limit at 95% confidence level is set to 9.9 (5.1) relative to the standard model cross section. This represents a factor of 30 improvement over the previous best search for a pair of boosted $\mathrm{H \to b\bar{b}}$ jets, which used only data collected in 2016 (36 fb$^{-1}$) and less advanced methods for $\mathrm{H \to b\bar{b}}$ identification and event selection [93]. Upper limits on the production cross section are set as a function of the coupling modifier parameters $\kappa_\lambda$ and $\kappa_{2\mathrm{V}}$ , which parametrize the strengths of the Higgs boson self-coupling, and the quartic VVHH couplings, respectively, relative to their standard model values. The values of $\kappa_\lambda$ and $\kappa_{2\mathrm{V}}$ are observed (expected) to be in the ranges [$-$9.9, 16.9] ([-5.1, 12.2]) and [0.62, 1.41] ([0.66, 1.37]), respectively, excluding $ \kappa_{2\mathrm{V}} = $ 0 for the first time, with a significance of 6.3 standard deviations, when all the Higgs boson couplings, except for the one being scanned, are set to their standard model values. |
| Additional Figures | |
png pdf |
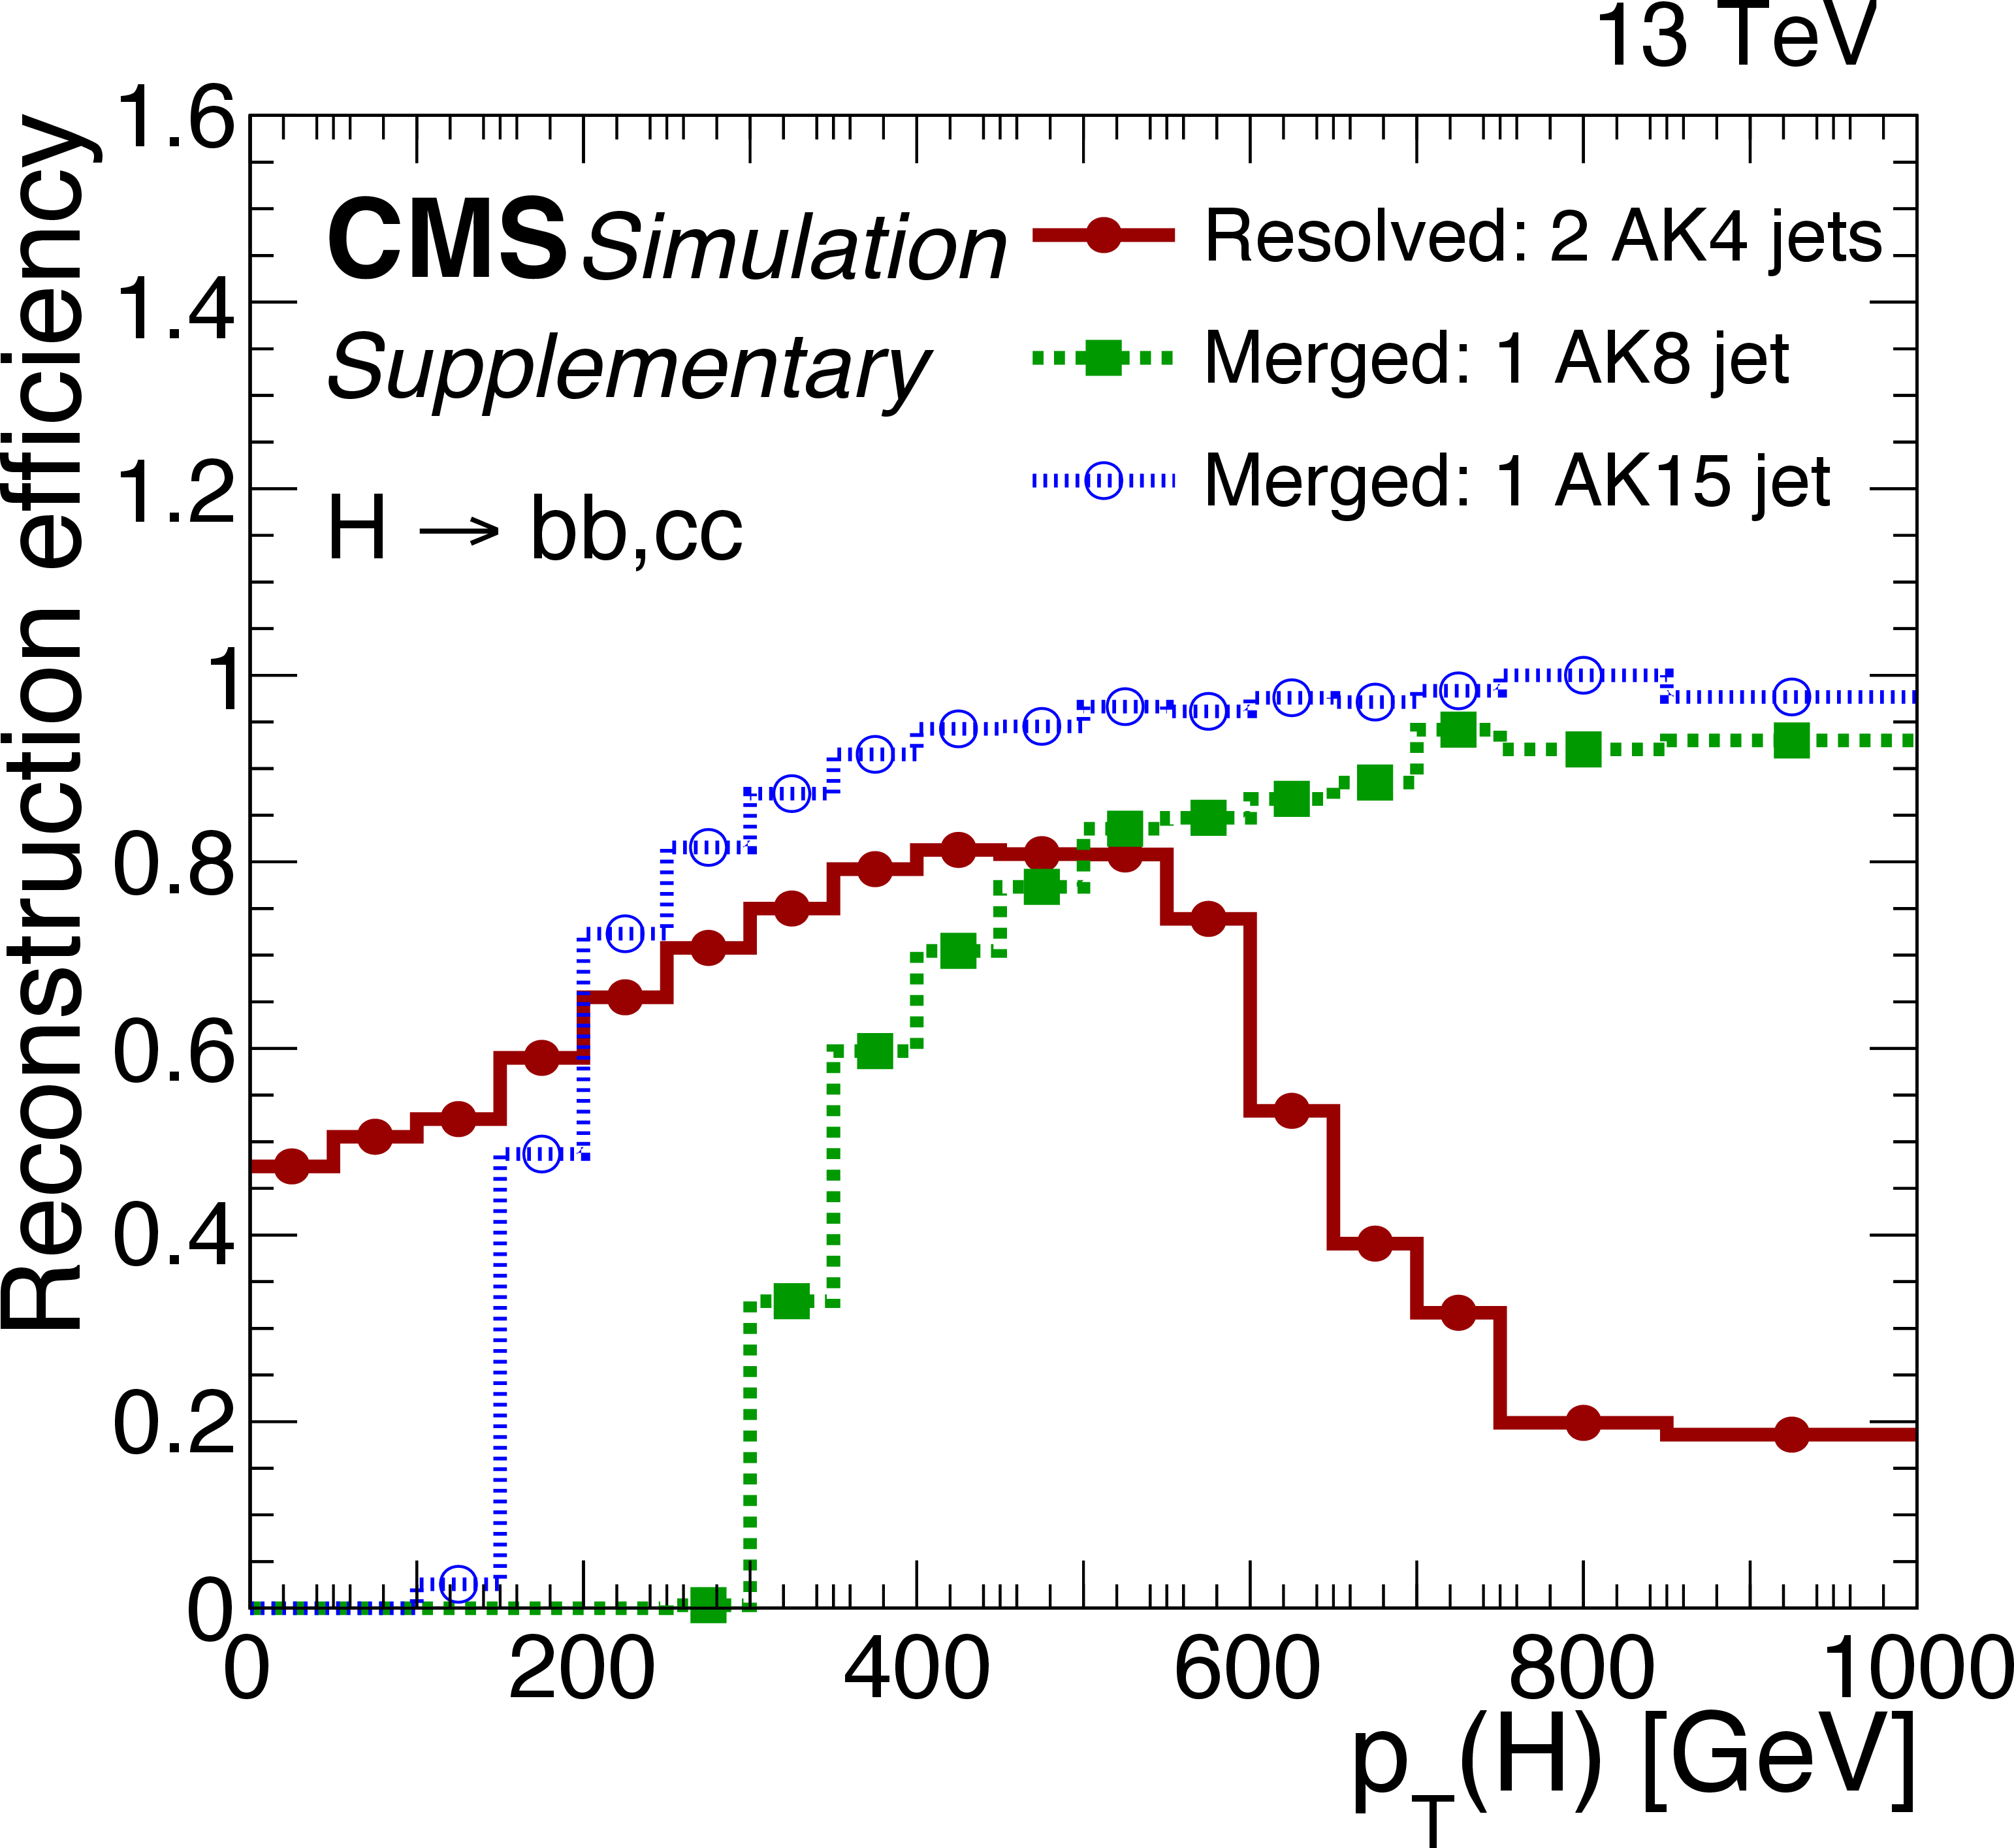
Additional Figure 1:
Comparison of reconstruction efficiency for Higgs boson decays into bottom or charm quark-antiquark pairs, reconstructed using a pair of anti-$ k_{\mathrm{T}} $ jets clustered with $ R= $ 0.4 (AK4, red), using a single anti-$ k_{\mathrm{T}} $ jet with $ R= $ 0.8 (AK8, green) or a single anti-$ k_{\mathrm{T}} $ jet with $ R= $ 1.5 (blue). Only the matching efficiency between generator-level particles and the reconstructed jets is considered. |
png pdf |
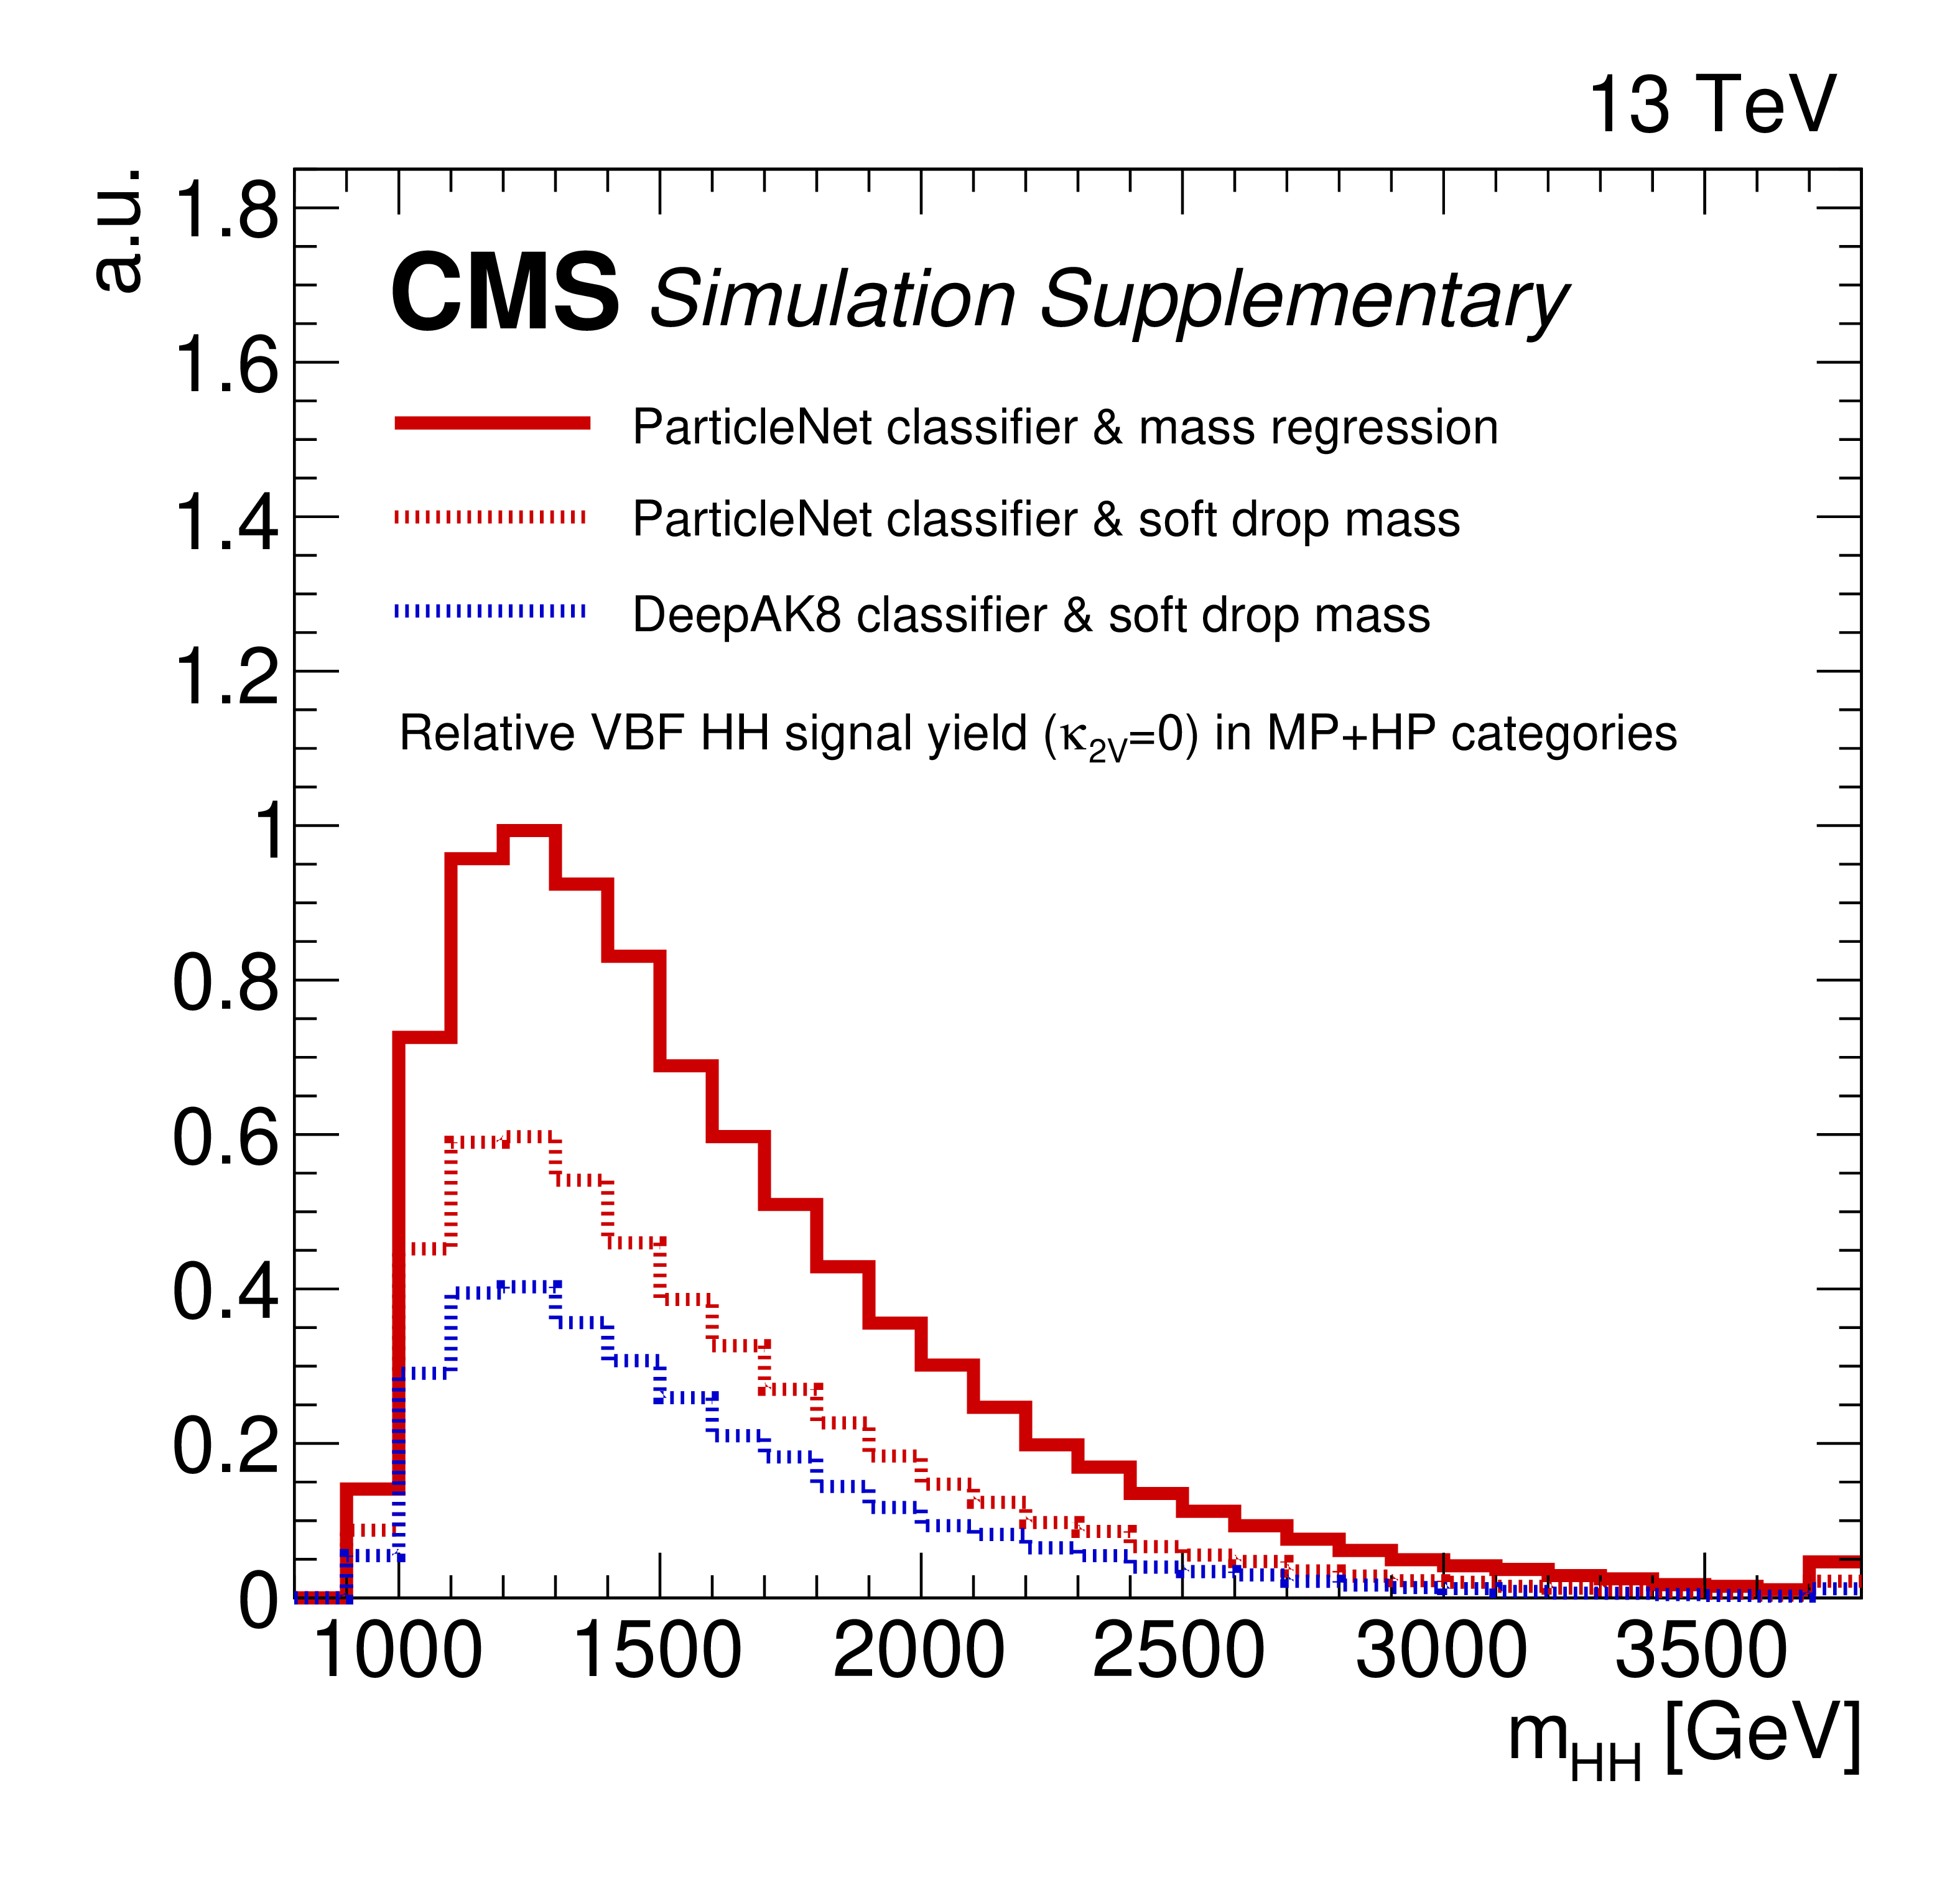
Additional Figure 2:
Comparison of the expected VBF HH signal yields, for a simulated VBF HH signal sample with $ \kappa_{2\mathrm{V}}= $ 0, entering the Medium Purity (MP) or High Purity (HP) event categories. The events are shown with an arbitrary normalization, accounting for the differences in selection efficiency between the three methods shown. The blue and red dashed lines correspond to using mass-decorrelated DeepAK8 or ParticleNet classifiers, respectively, to discriminate between signal jets and QCD multijet background. The soft-drop algorithm is used with angular exponent $ \beta= $ 0 and soft radiation fraction $ z= $ 0.1 for selections on Higgs boson candidate masses. The ParticleNet classifier is observed to improve the selection efficiency by $ \approx $50% compared to DeepAK8, at a similar background rejection rate. The solid red line corresponds to using the ParticleNet-based mass regression instead of the soft-drop algorithm, yielding another $ \approx $50% increase in selection efficiency (with the same cut values for the mass selections). More information on the training of the ParticleNet classifier and its performance can be found in CMS Detector Performance Note CMS-DP-2020-002 at CMS-DP-2020-002. Training and performance of the mass regression algorithm are detailed in CMS-DP-2021-017 in CMS-DP-2021-017. |
png pdf |
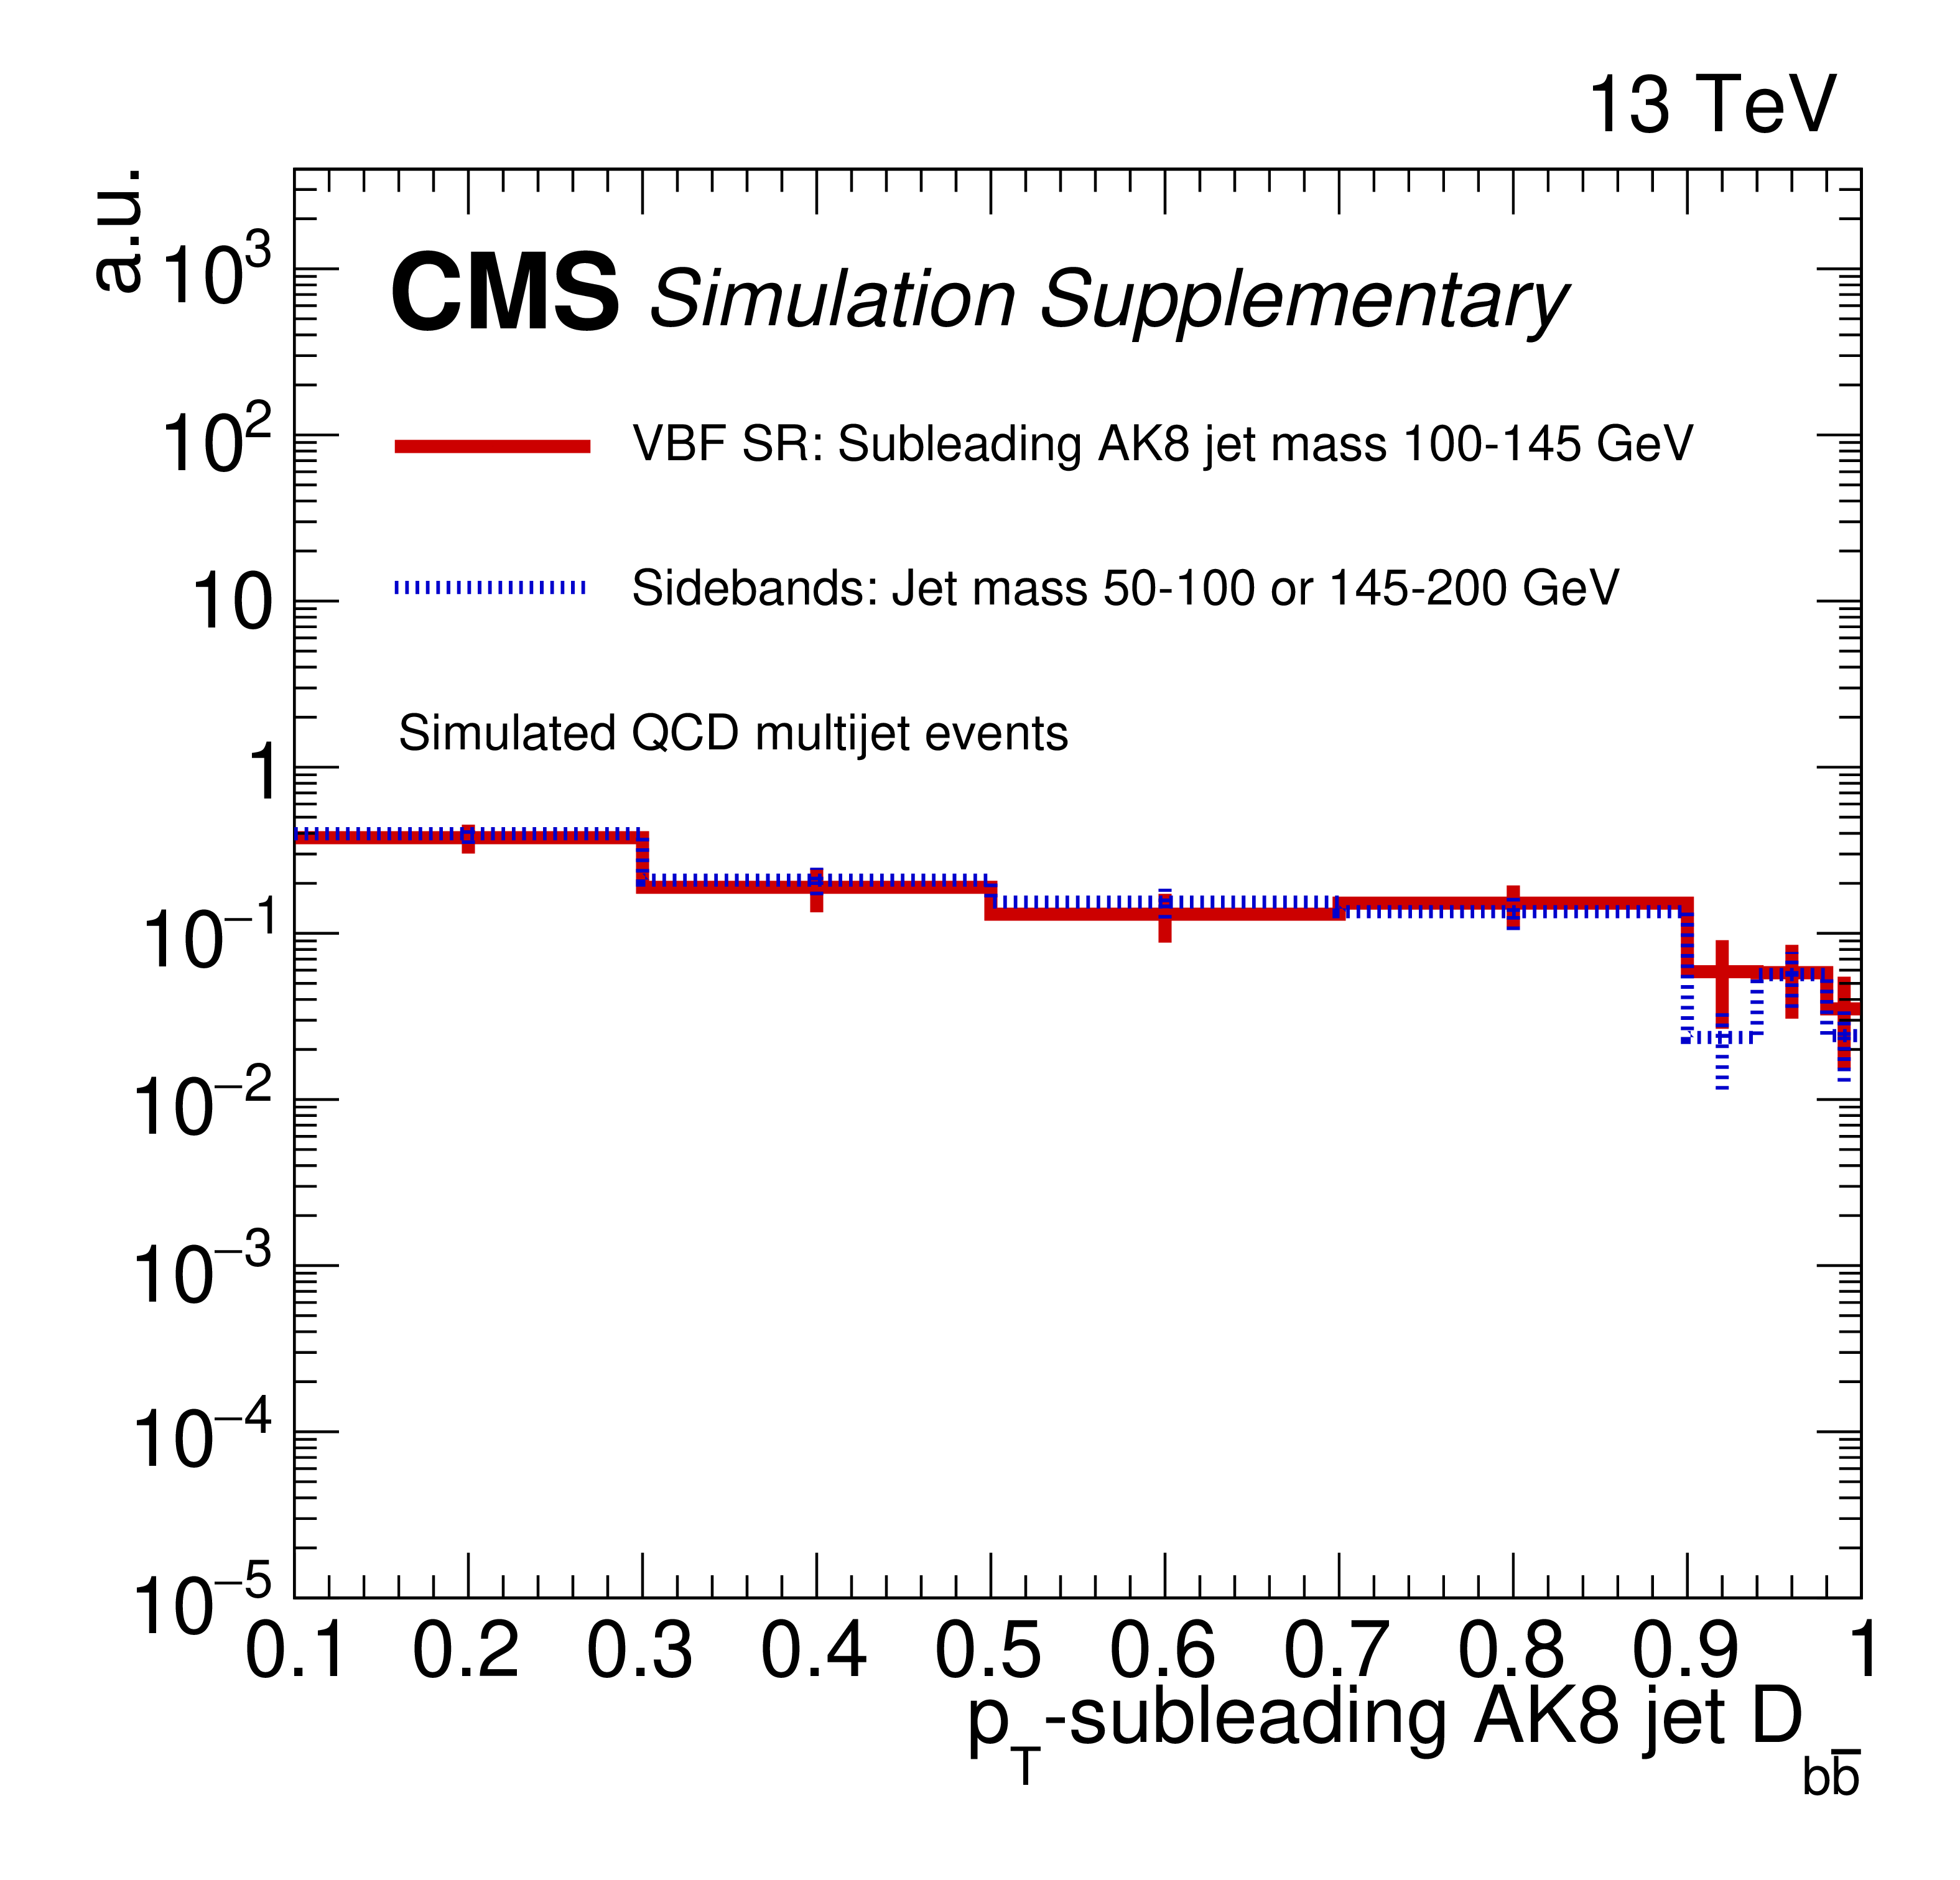
Additional Figure 3:
Comparison of the ParticleNet discriminant ($ D_{\mathrm{b}\overline{\mathrm{b}}} $) shape between the VBF search region (SR, red) and its large-radius (AK8) jet mass sidebands (blue), using simulated QCD multijet events. The sidebands are used as a control region in the QCD background estimation to obtain transfer factors that correct for the difference in selection efficiency between the QCD-enriched low-$ D_{\mathrm{b}\overline{\mathrm{b}}} $ category and the high-$ D_{\mathrm{b}\overline{\mathrm{b}}} $ search categories. The agreement of the two shapes demonstrates that the transfer factors obtained from the sidebands can be applied to obtain a correct normalization in the SR. |
png pdf |
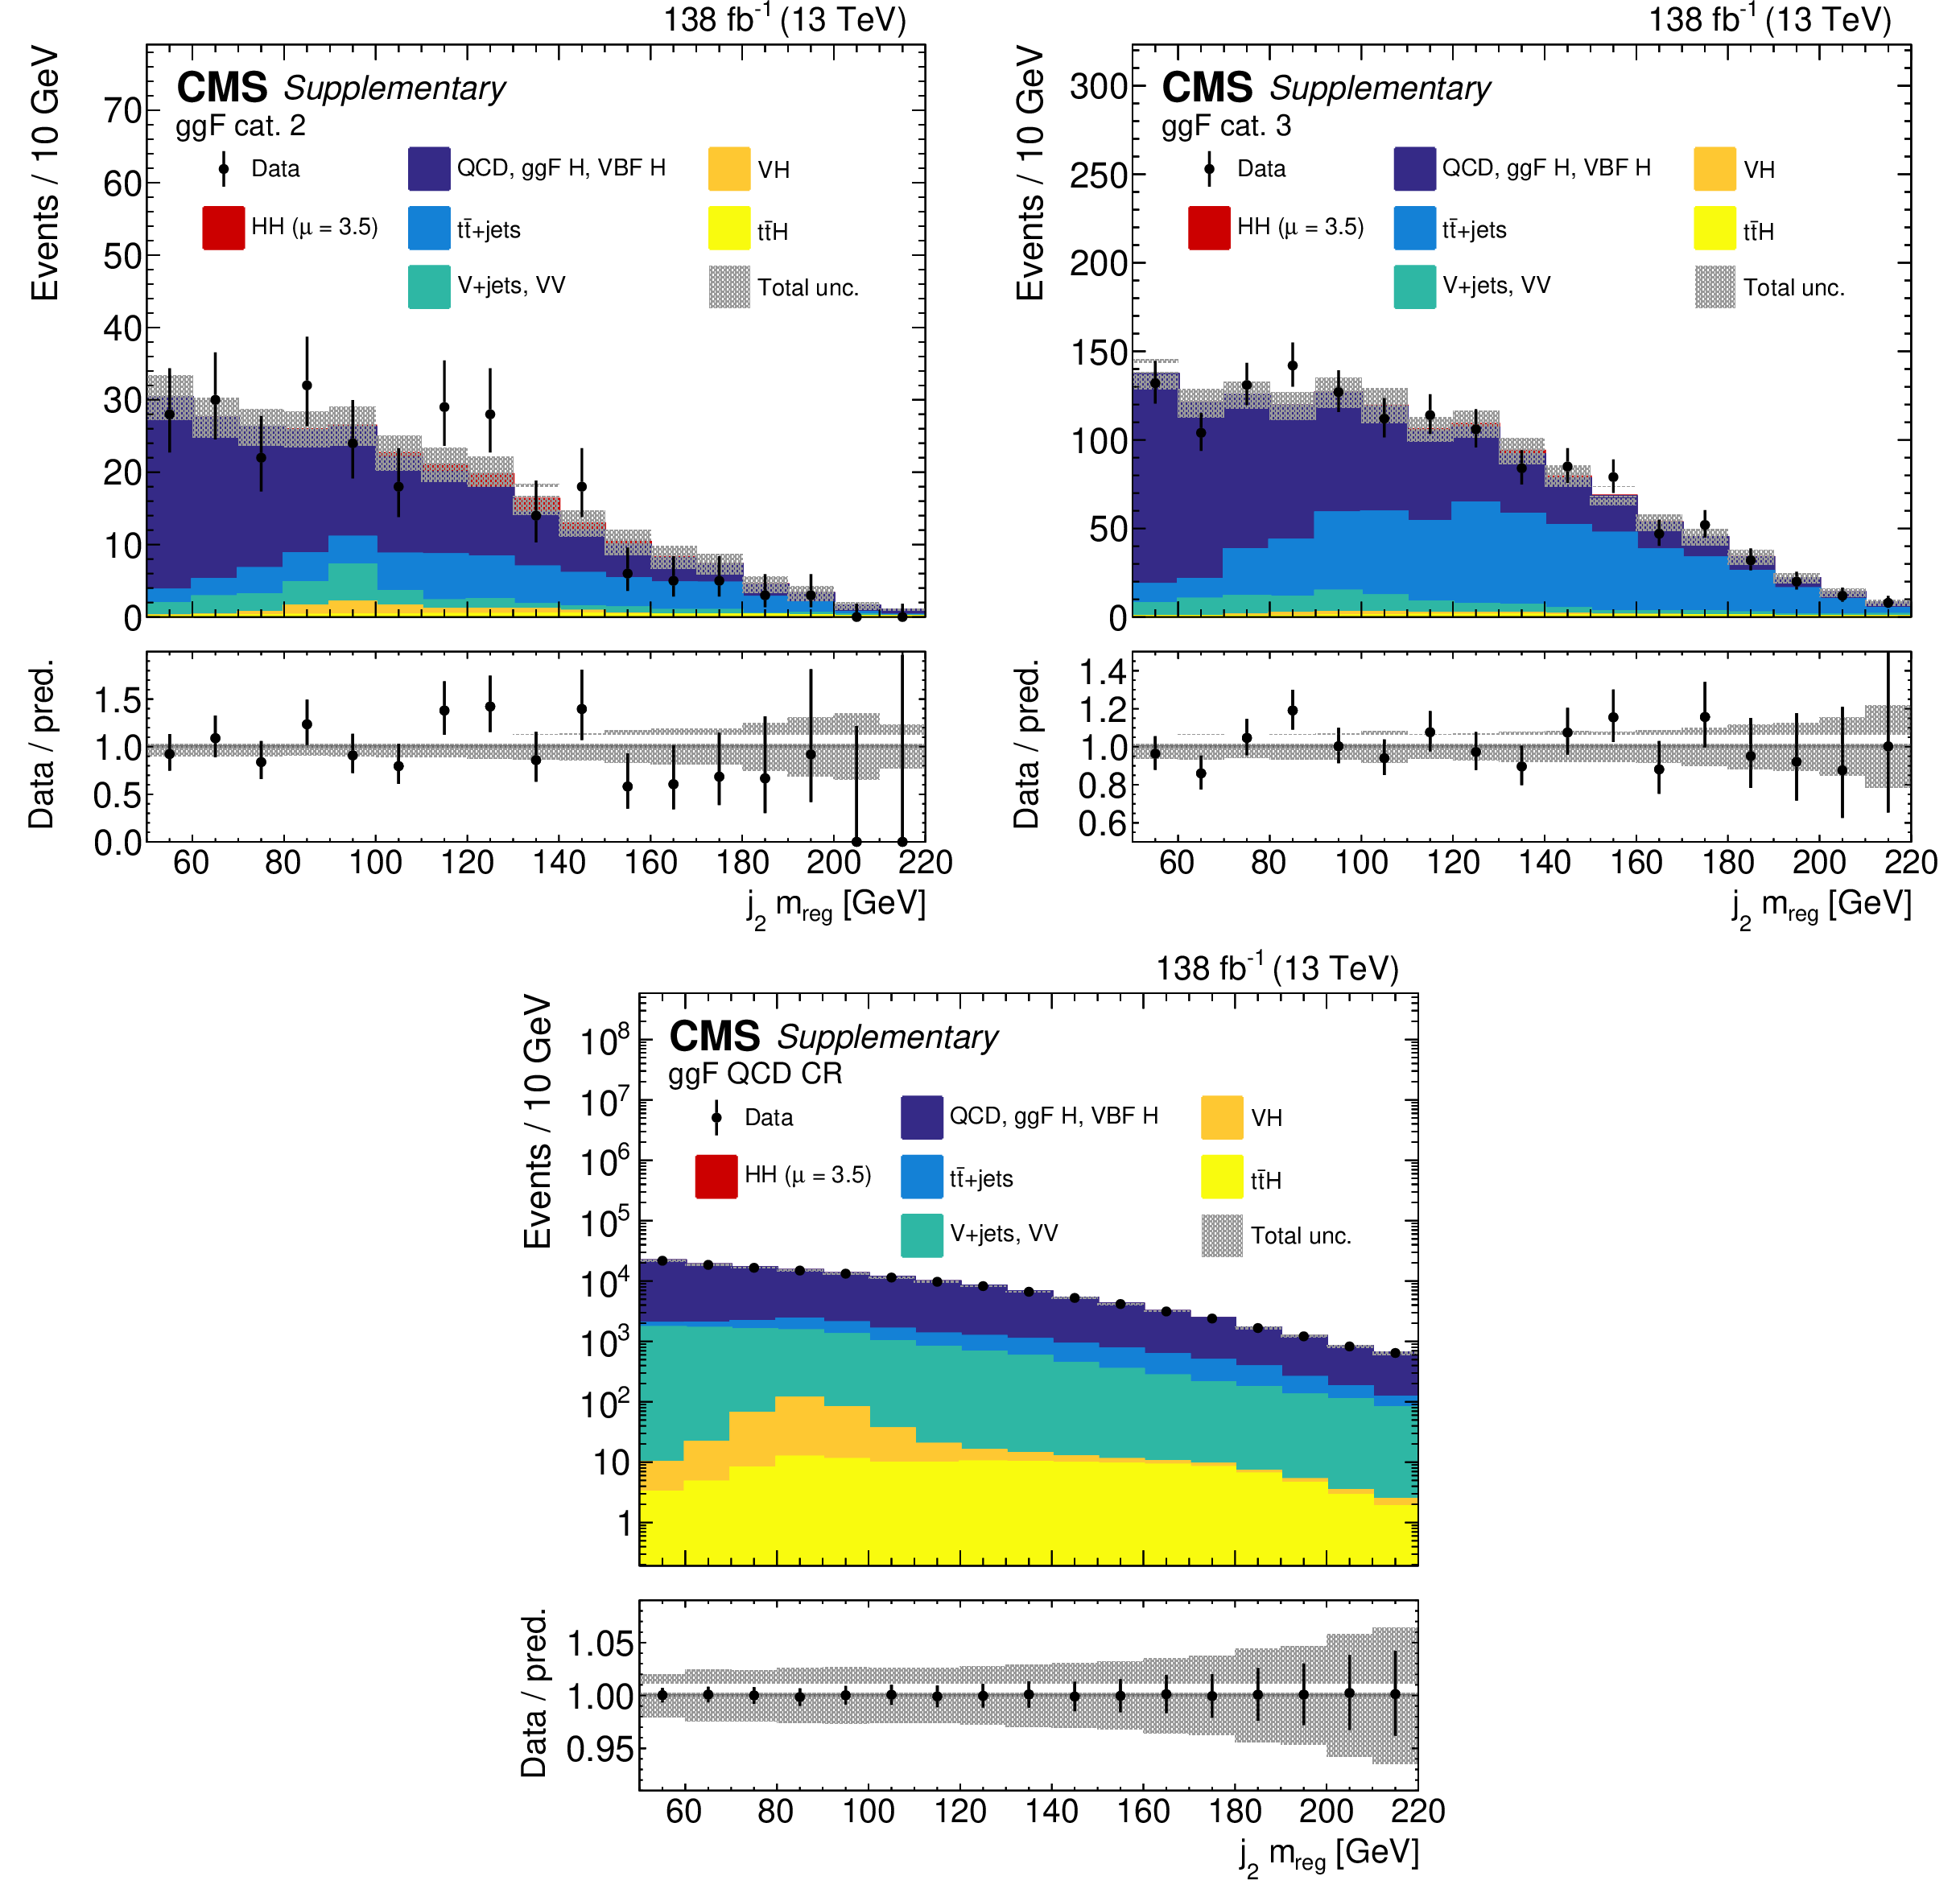
Additional Figure 4:
The data and fitted signal and background distributions for the $ D_{\mathrm{b}\overline{\mathrm{b}}} $-subleading jet regressed mass are shown for the ggF BDT event categories 2 (upper left) and 3 (upper right), and the QCD multijet background control region (lower). The SM HH ($ \kappa_{2\mathrm{V}}=\kappa_\mathrm{V}=\kappa_\lambda= $ 1) signal is shown scaled to the best fit signal strength $ \mu= $ 3.5. The lower panel shows the ratio of the data and the total prediction, with its uncertainty represented by the shaded band. The error bars on the data points represent the statistical uncertainties. |
png pdf |
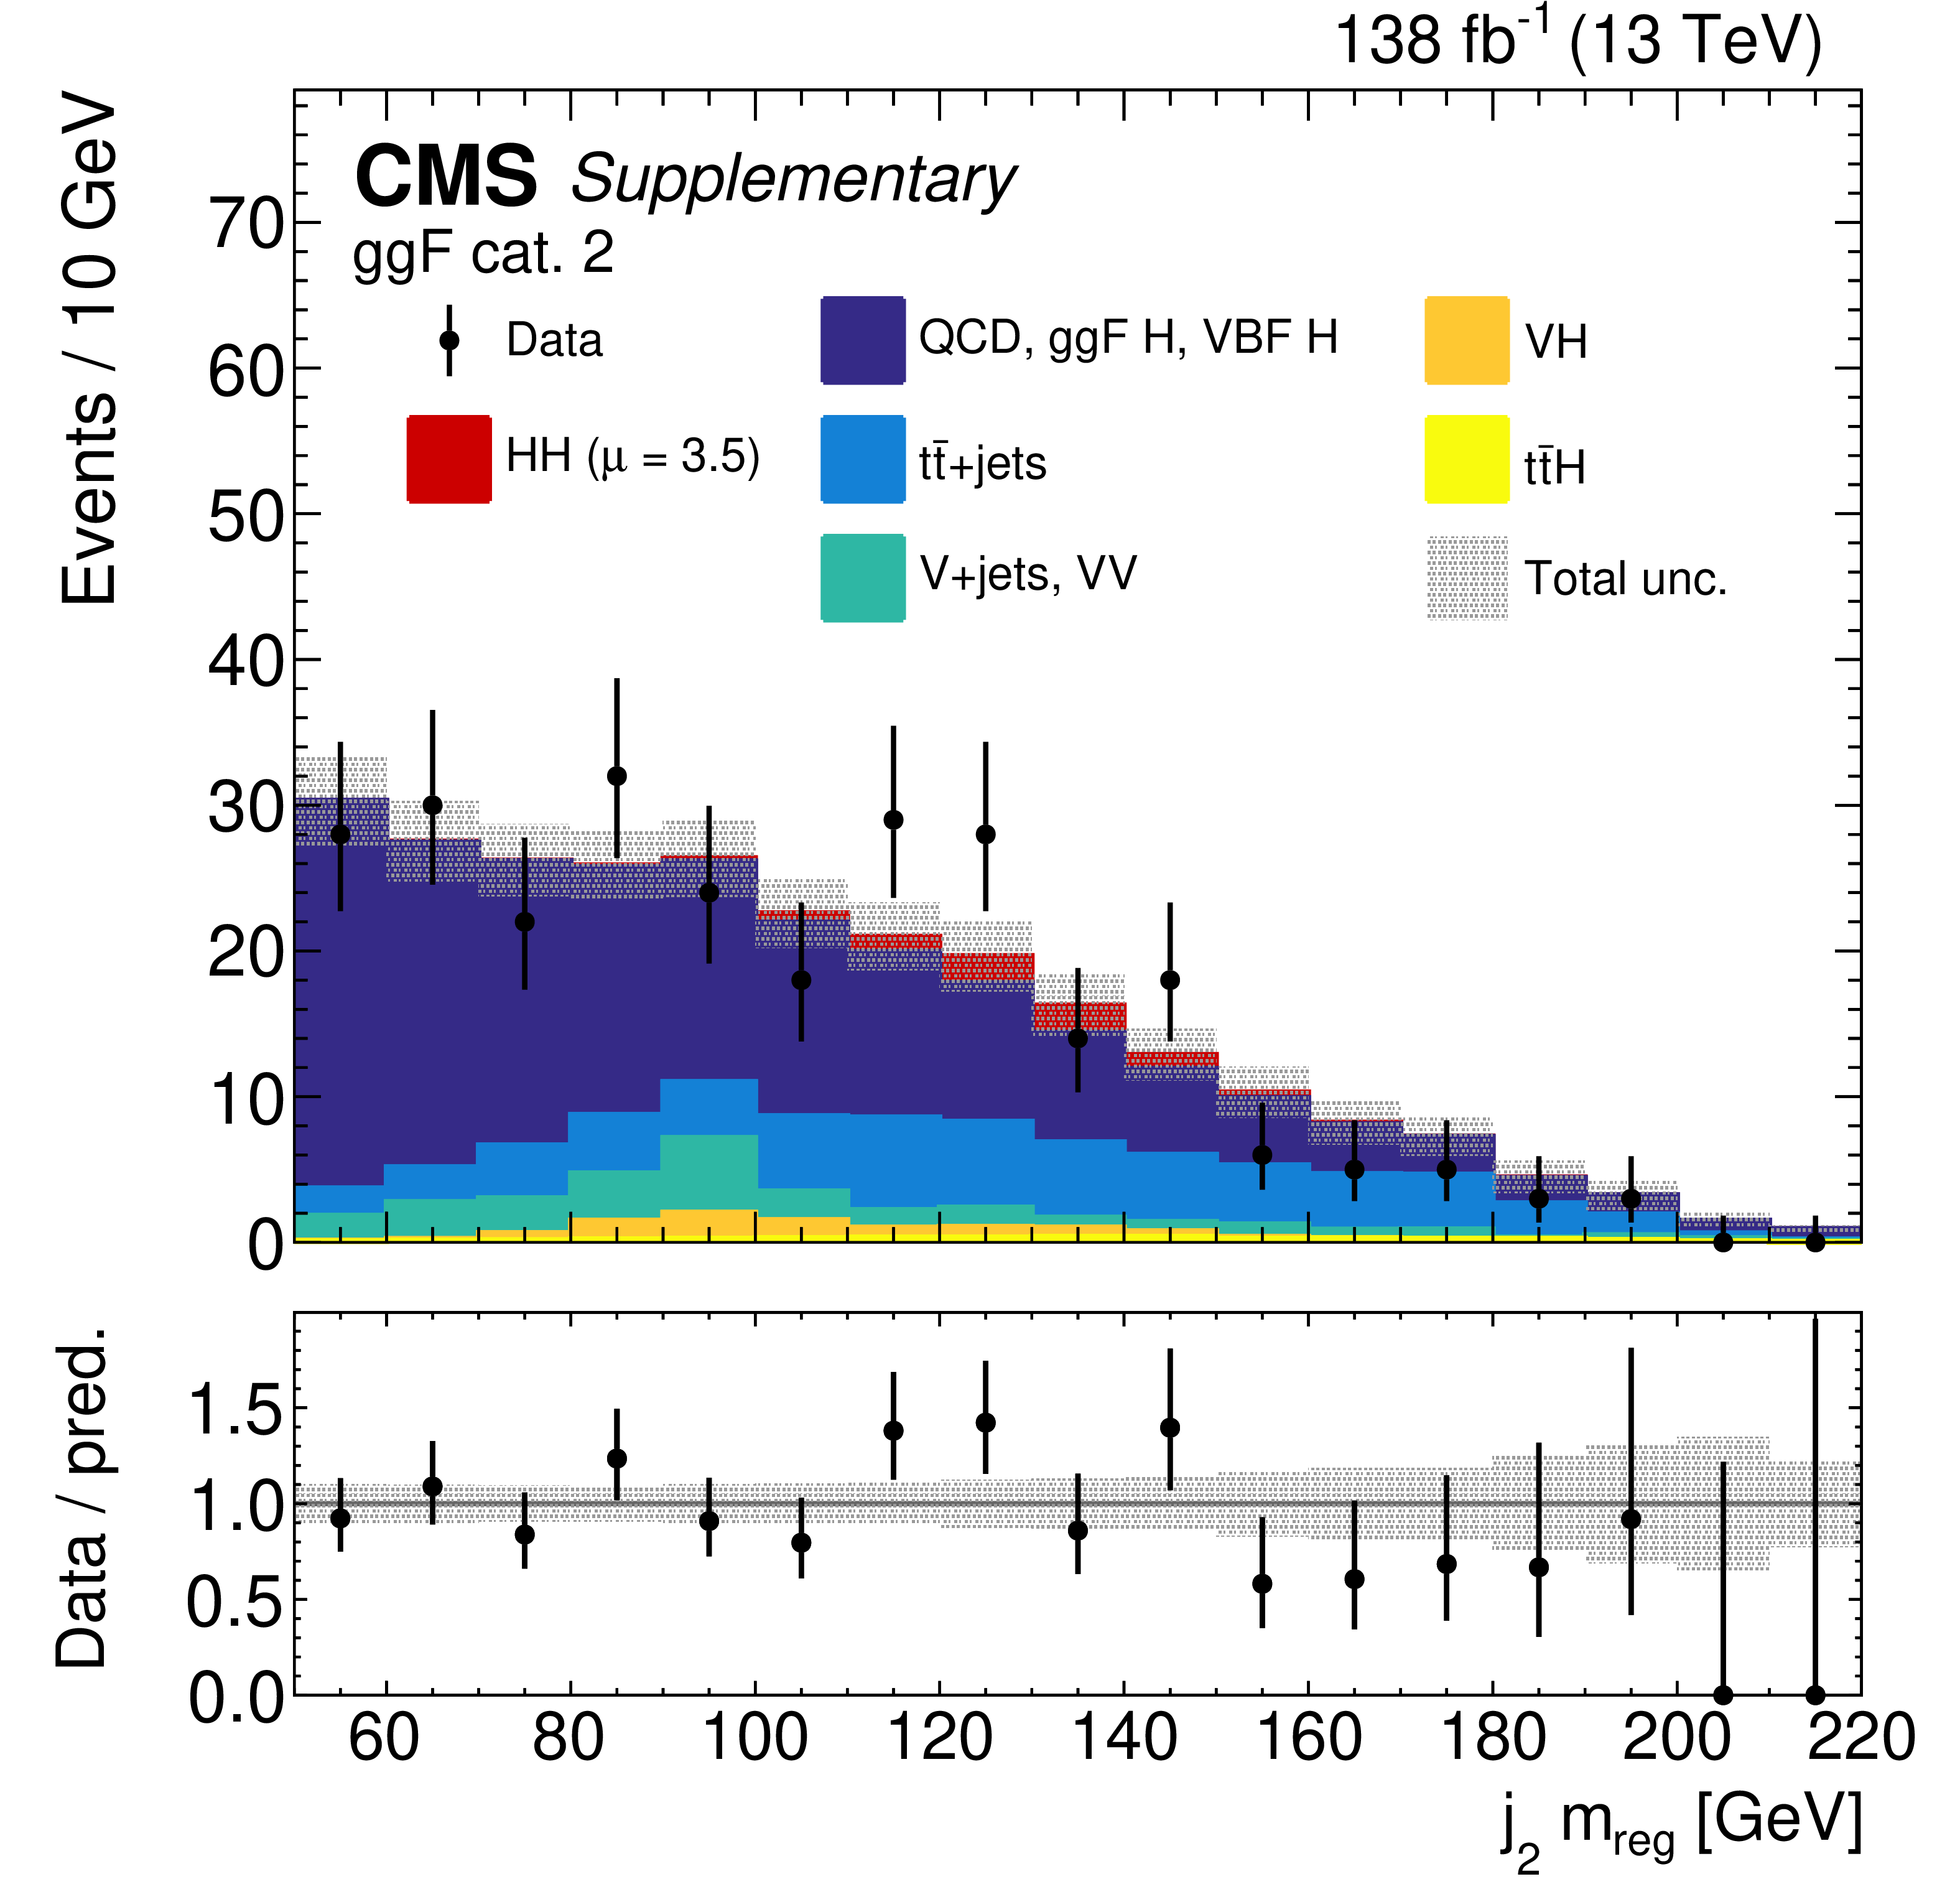
Additional Figure 4-a:
The data and fitted signal and background distributions for the $ D_{\mathrm{b}\overline{\mathrm{b}}} $-subleading jet regressed mass are shown for the ggF BDT event category 2. The SM HH ($ \kappa_{2\mathrm{V}}=\kappa_\mathrm{V}=\kappa_\lambda= $ 1) signal is shown scaled to the best fit signal strength $ \mu= $ 3.5. The lower panel shows the ratio of the data and the total prediction, with its uncertainty represented by the shaded band. The error bars on the data points represent the statistical uncertainties. |
png pdf |
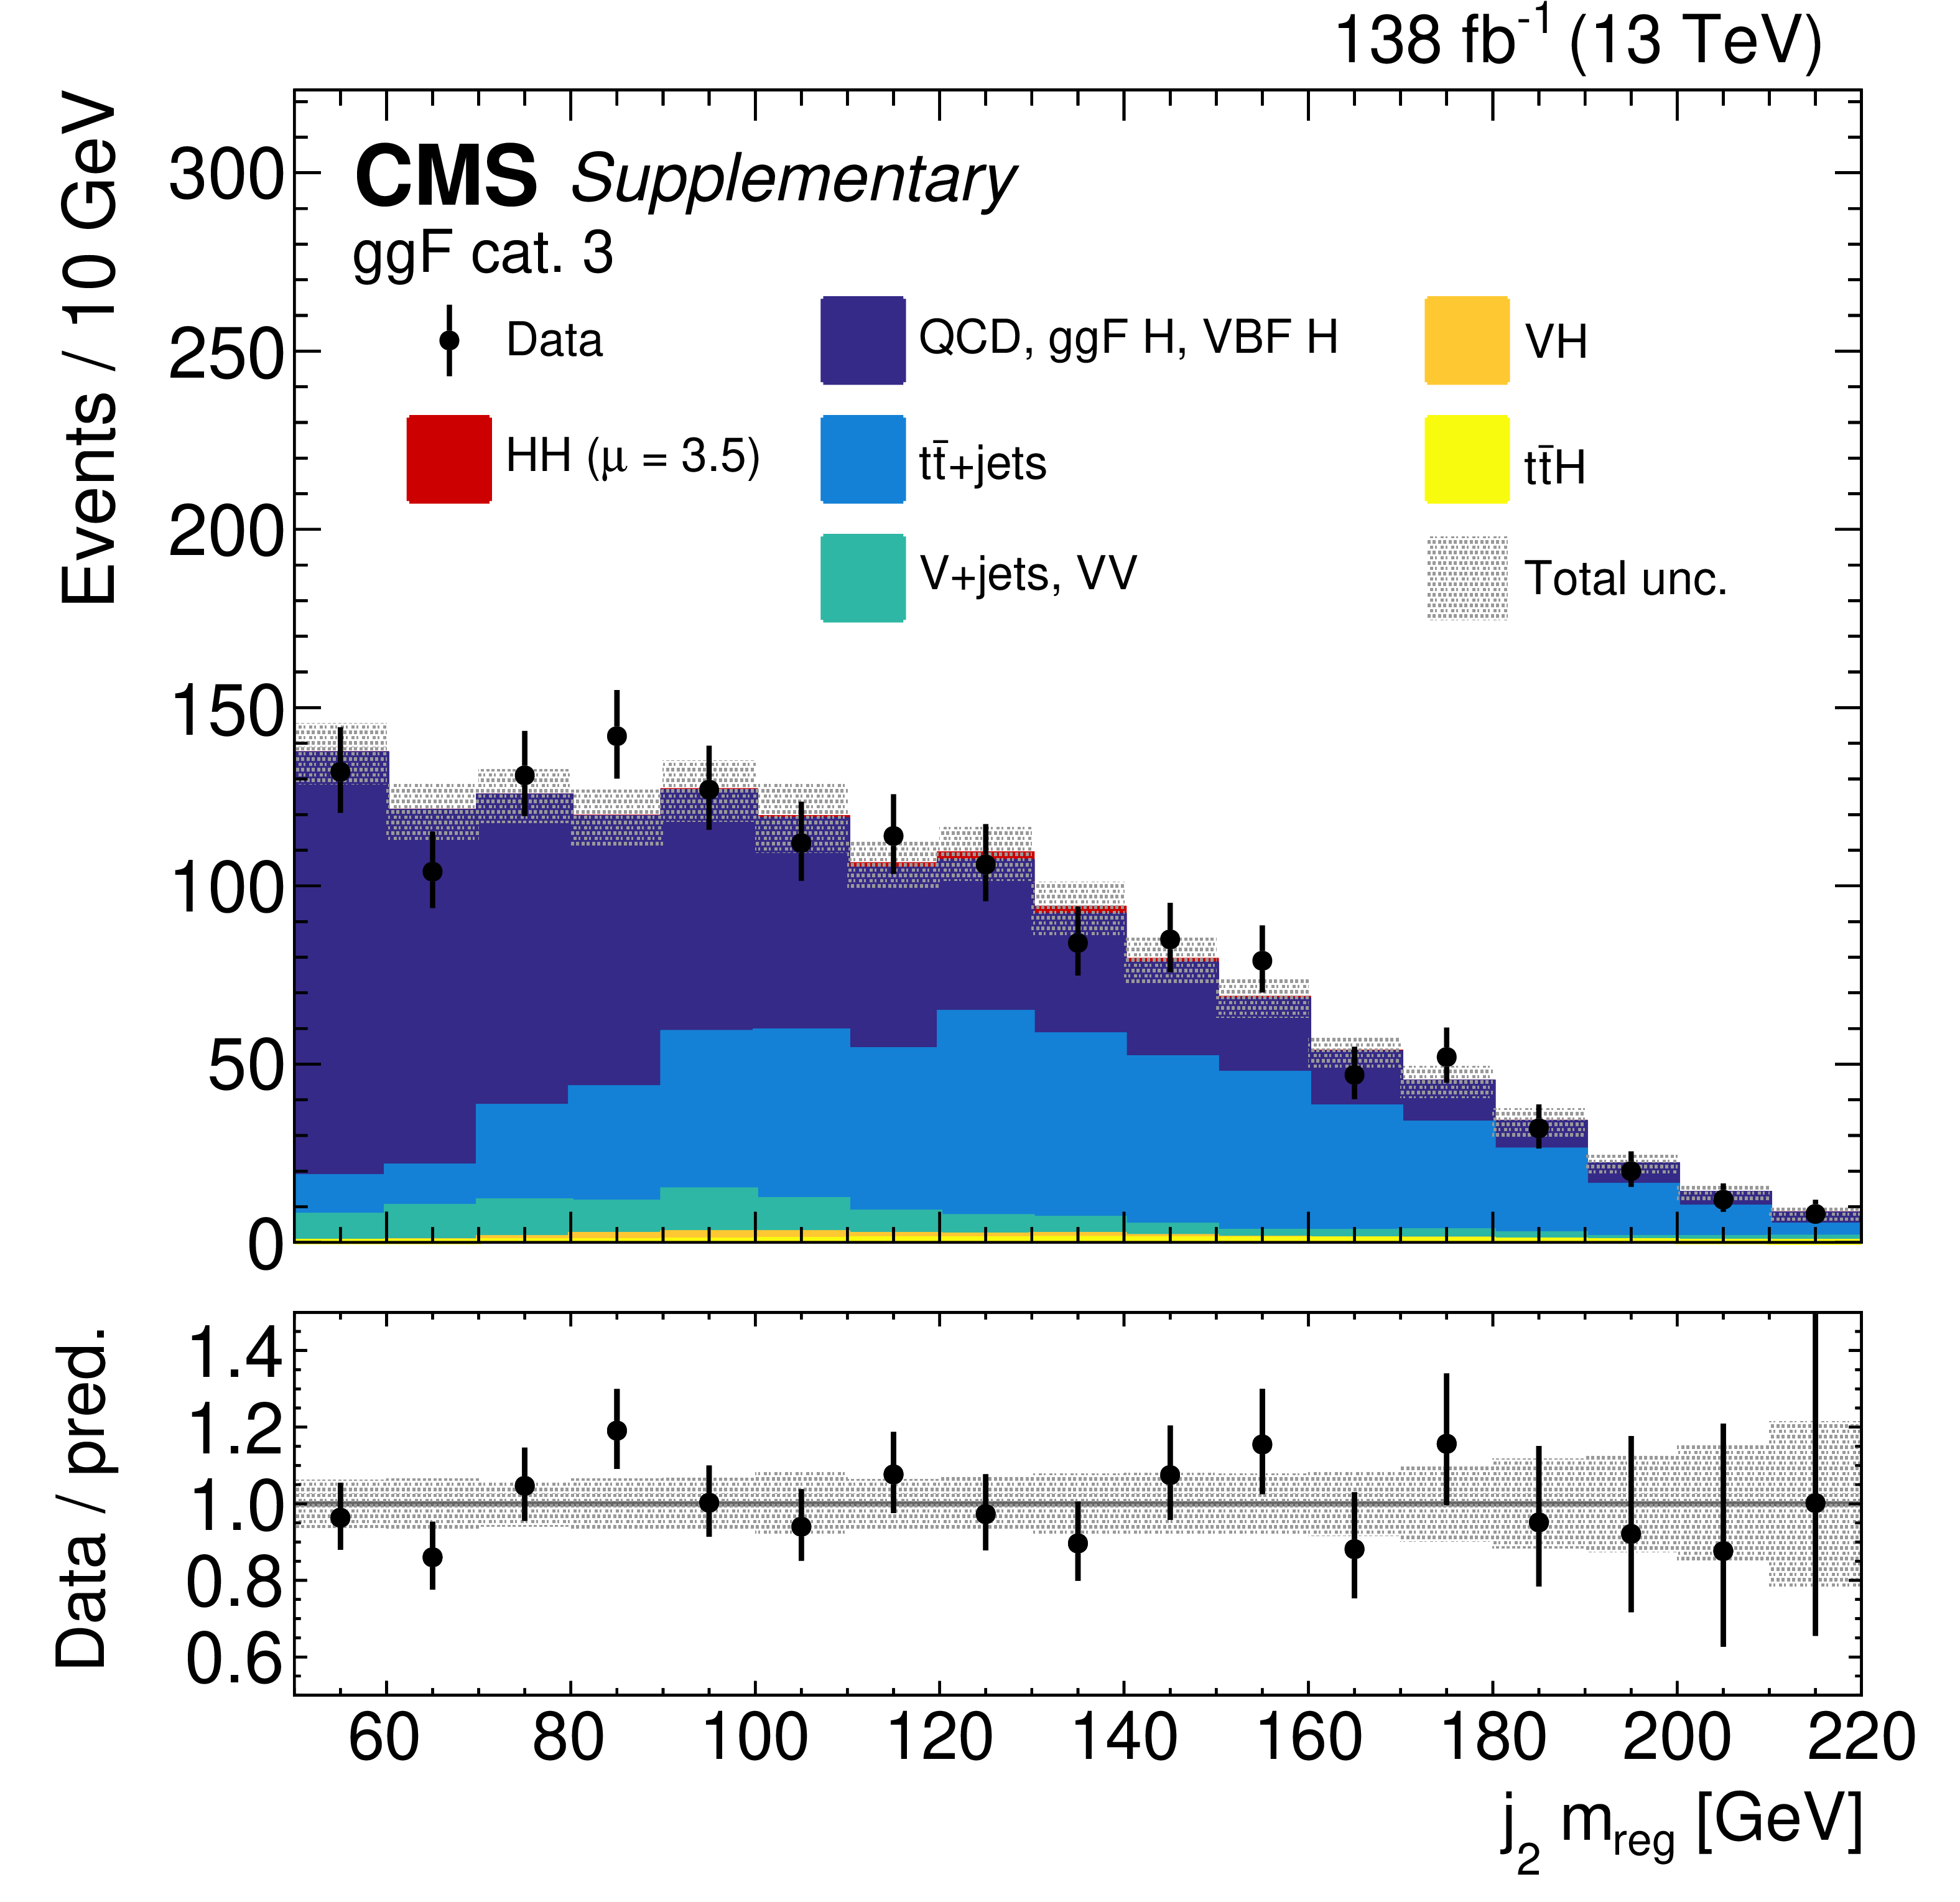
Additional Figure 4-b:
The data and fitted signal and background distributions for the $ D_{\mathrm{b}\overline{\mathrm{b}}} $-subleading jet regressed mass are shown for the ggF BDT event category 3. The SM HH ($ \kappa_{2\mathrm{V}}=\kappa_\mathrm{V}=\kappa_\lambda= $ 1) signal is shown scaled to the best fit signal strength $ \mu= $ 3.5. The lower panel shows the ratio of the data and the total prediction, with its uncertainty represented by the shaded band. The error bars on the data points represent the statistical uncertainties. |
png pdf |
Additional Figure 4-c:
The data and fitted signal and background distributions for the $ D_{\mathrm{b}\overline{\mathrm{b}}} $-subleading jet regressed mass are shown for the QCD multijet background control region. The SM HH ($ \kappa_{2\mathrm{V}}=\kappa_\mathrm{V}=\kappa_\lambda= $ 1) signal is shown scaled to the best fit signal strength $ \mu= $ 3.5. The lower panel shows the ratio of the data and the total prediction, with its uncertainty represented by the shaded band. The error bars on the data points represent the statistical uncertainties. |
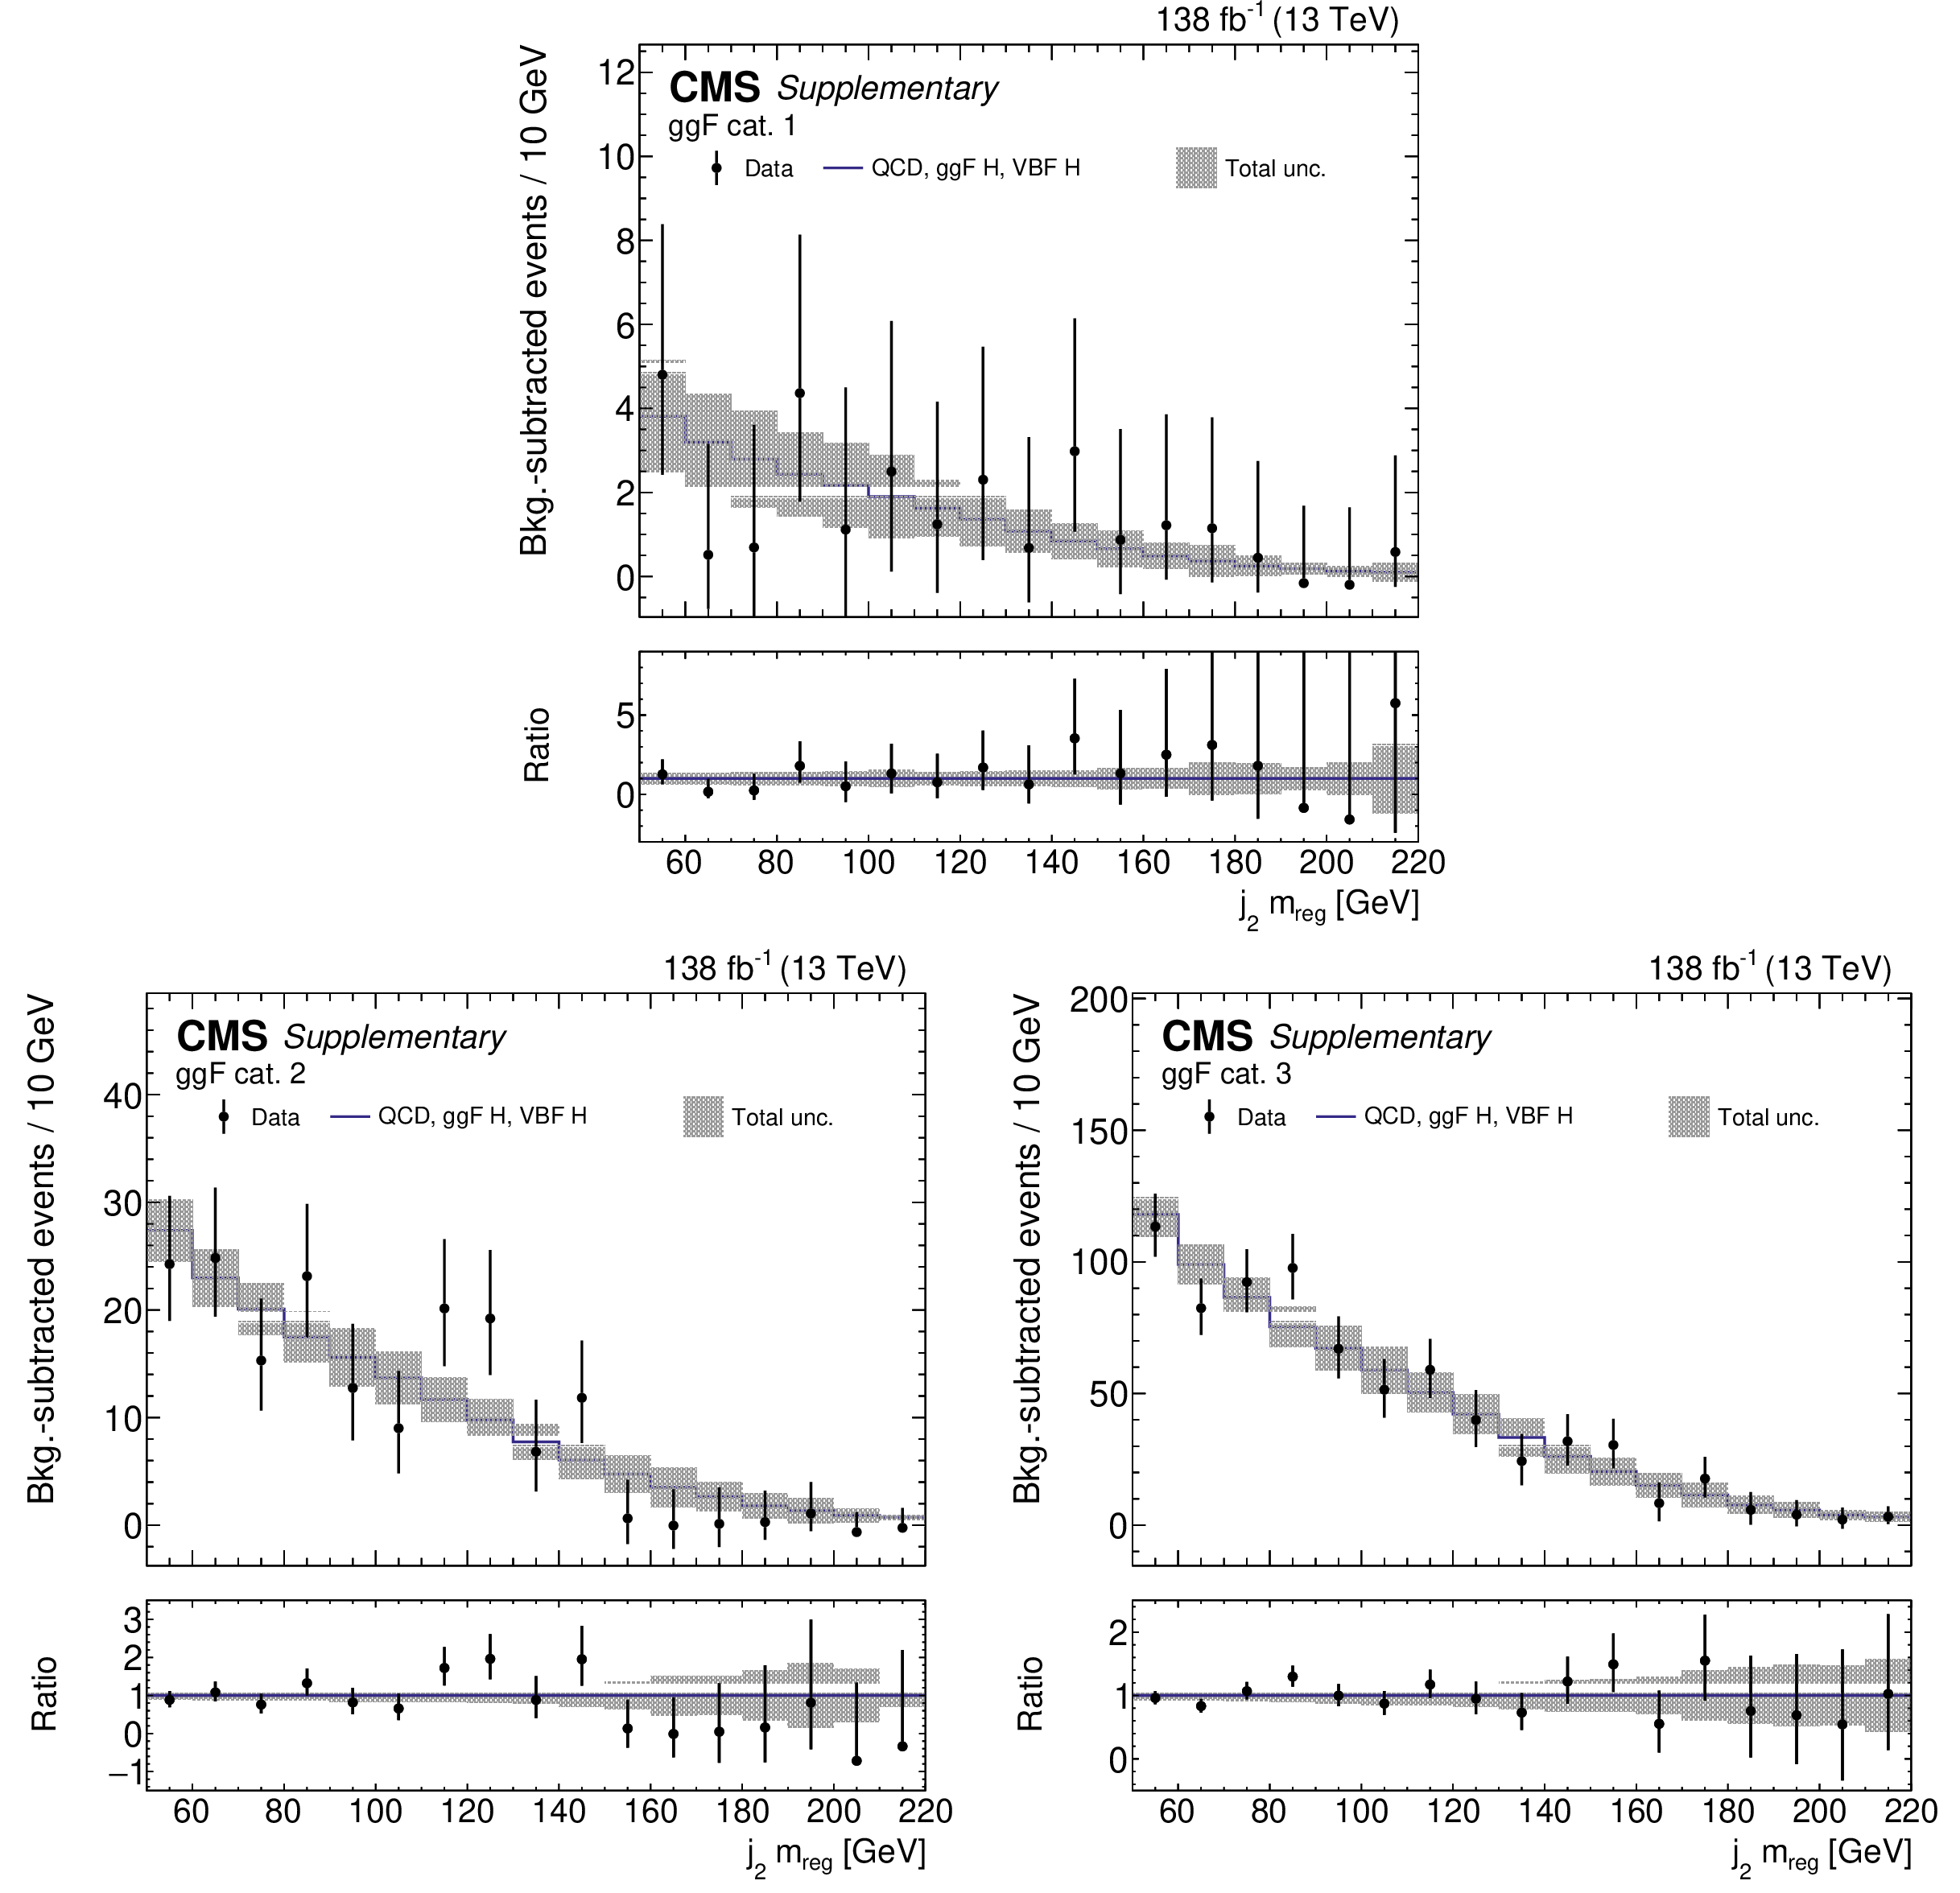
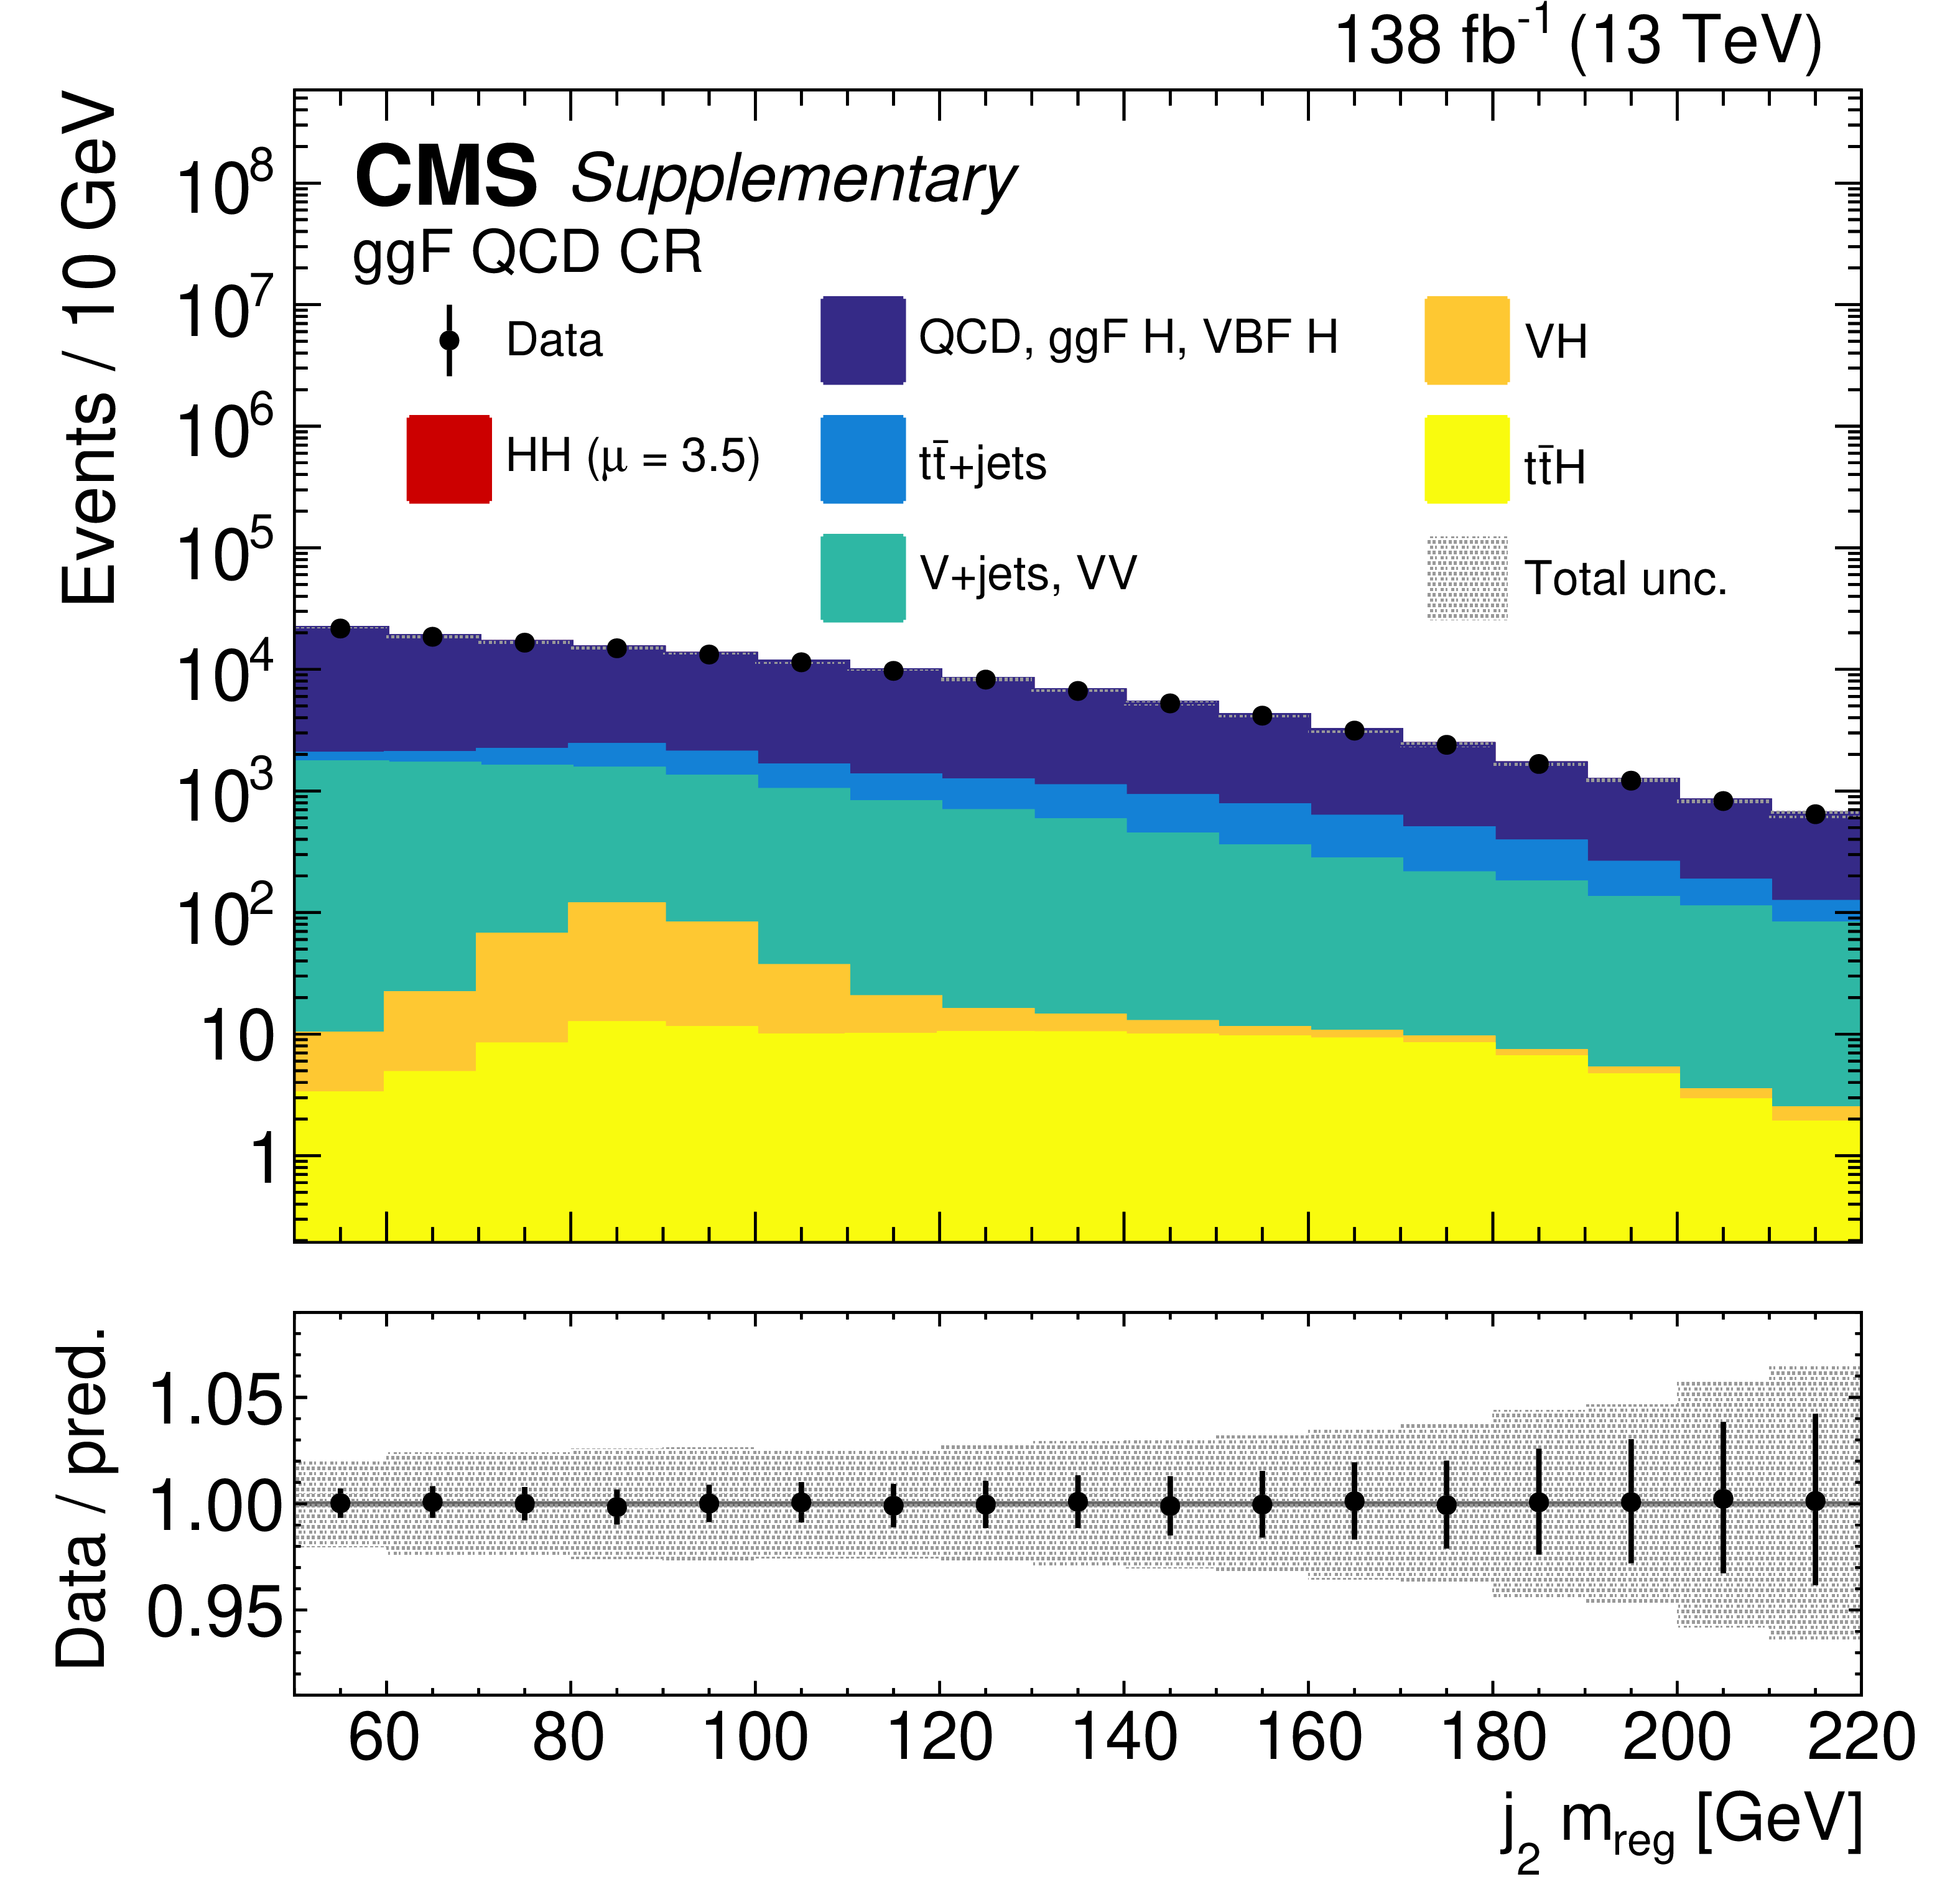
png pdf |
Additional Figure 5:
The data in the ggF BDT event categories 1 (upper), 2 (lower left), and 3 (lower right) after subtracting all background processes except the QCD multijet one compared to the QCD multijet background prediction derived from the dedicated control region. The fitted shape and uncertainty are derived from a simultaneous background-only fit of all four ggF analysis regions. |

png pdf |
Additional Figure 5-a:
The data in the ggF BDT event category 1 after subtracting all background processes except the QCD multijet one compared to the QCD multijet background prediction derived from the dedicated control region. The fitted shape and uncertainty are derived from a simultaneous background-only fit of all four ggF analysis regions. |
png pdf |
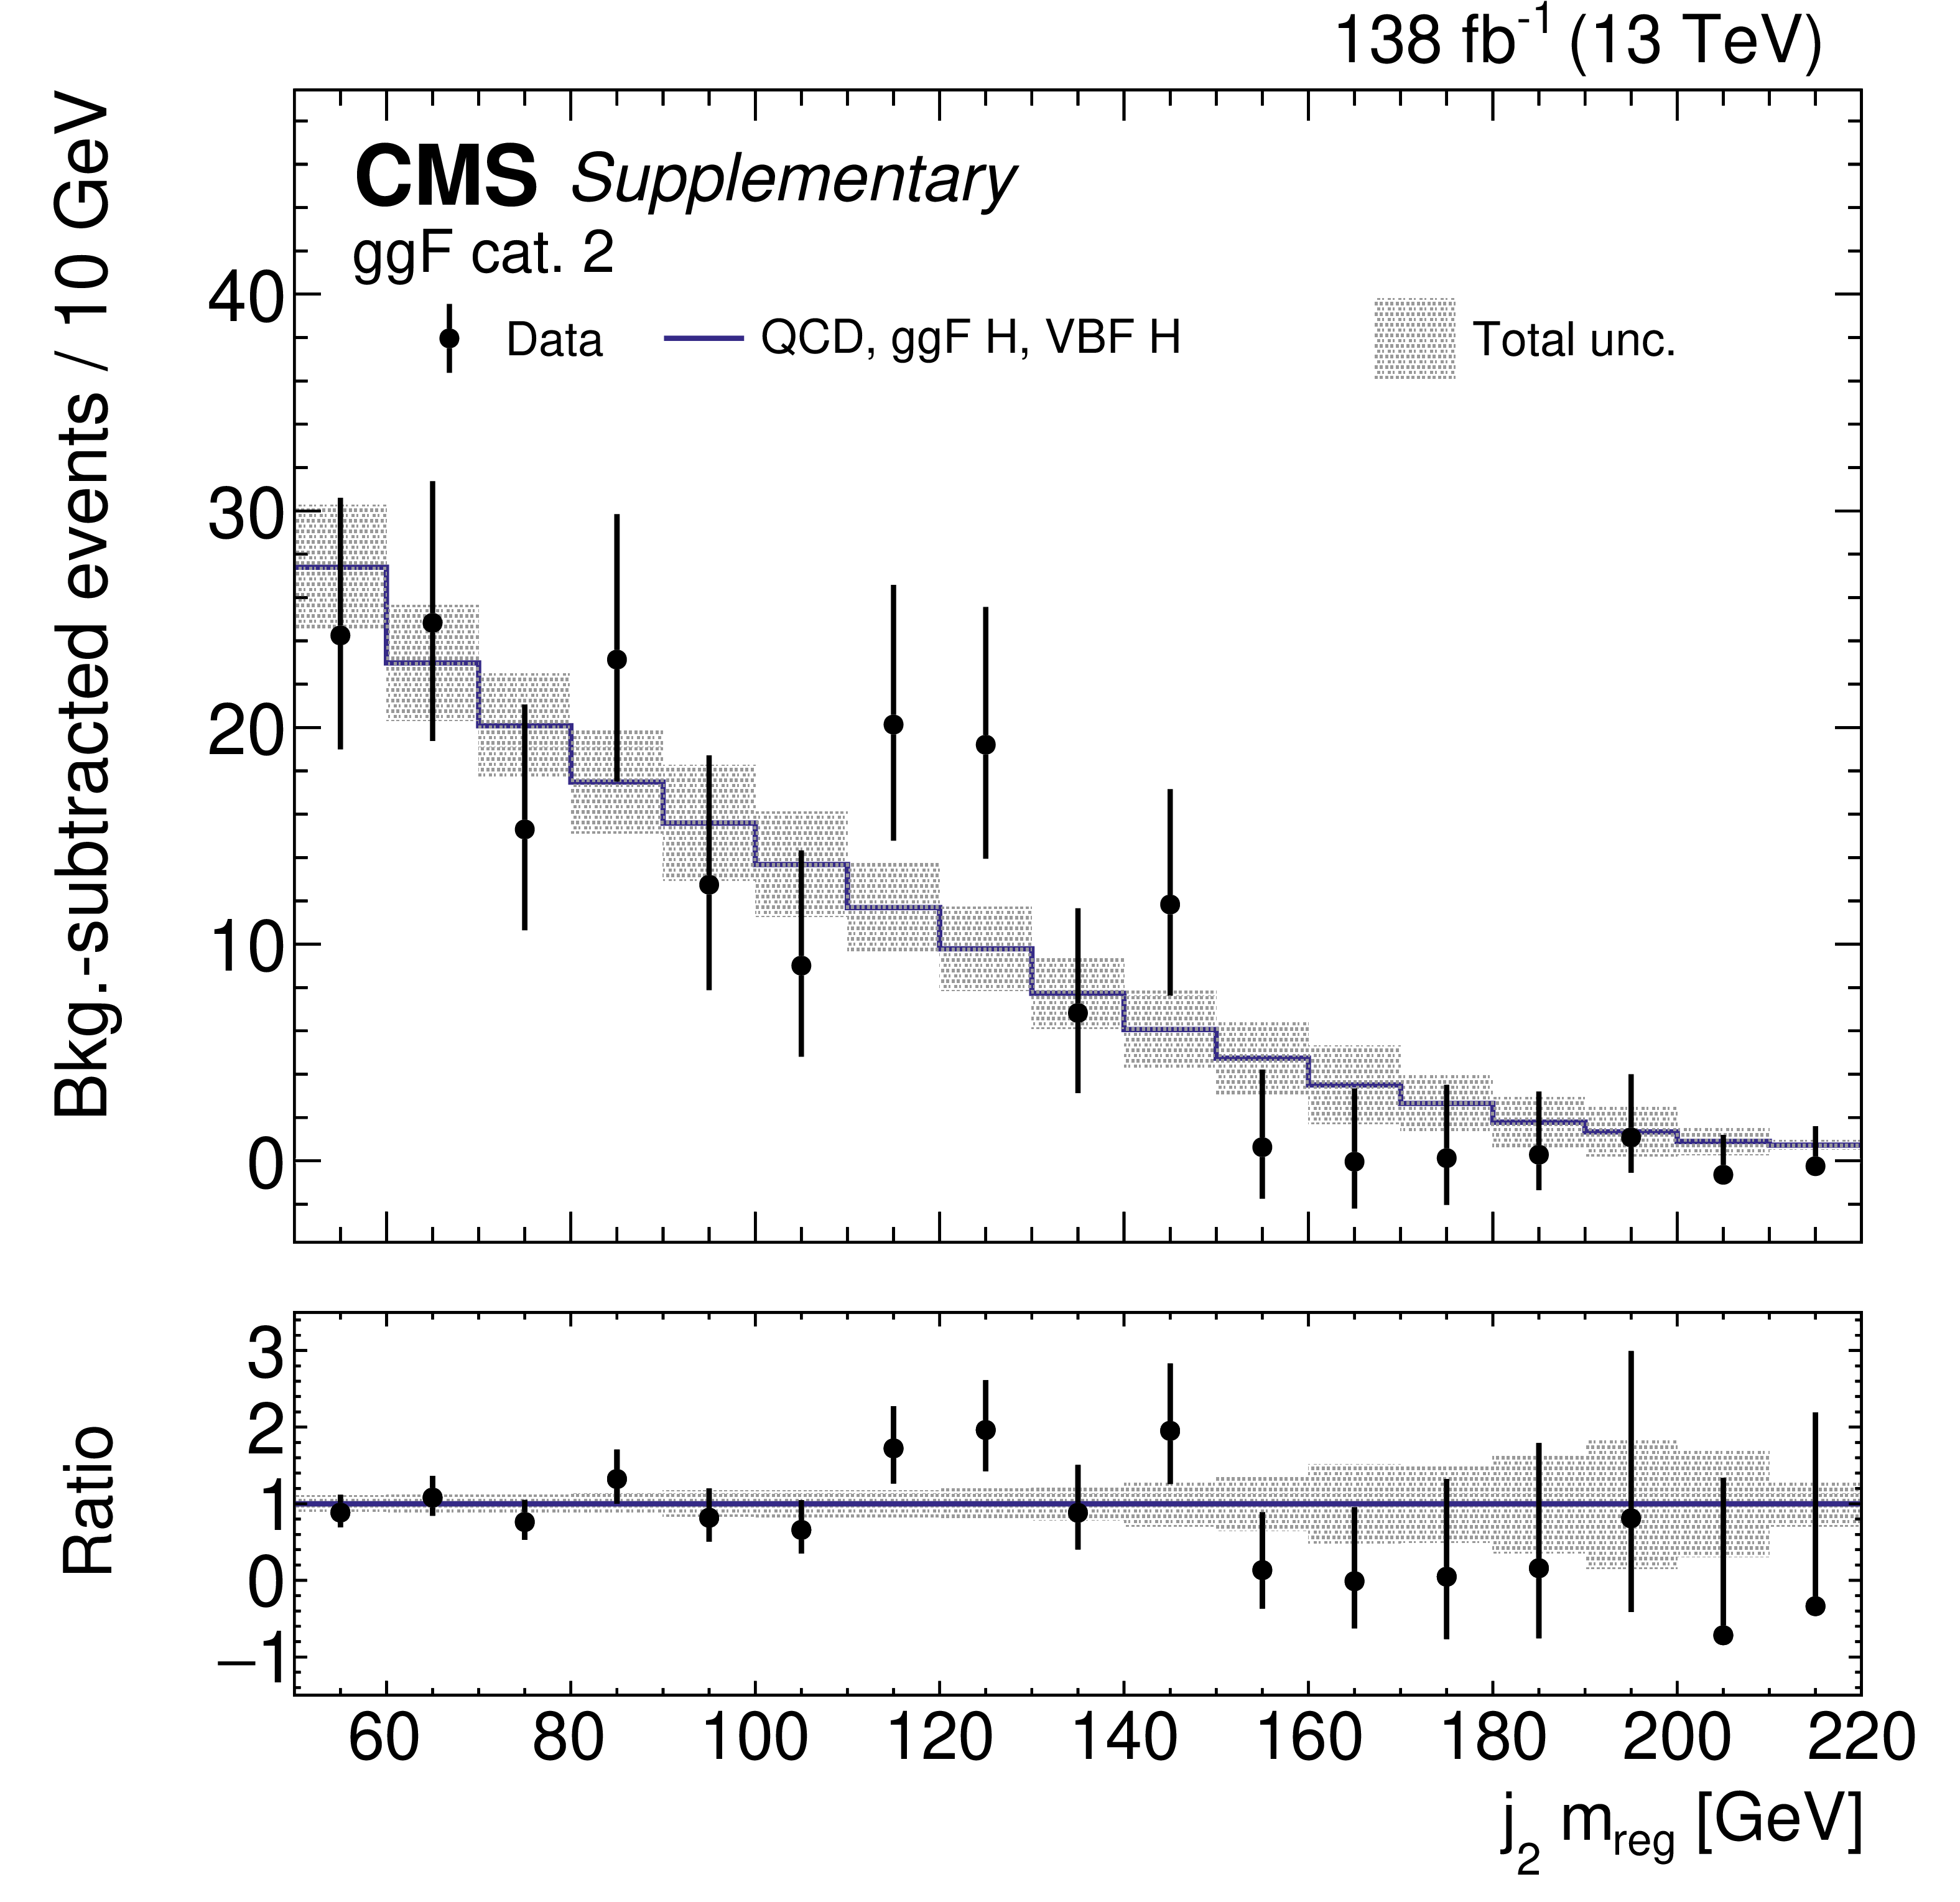
Additional Figure 5-b:
The data in the ggF BDT event category 2 after subtracting all background processes except the QCD multijet one compared to the QCD multijet background prediction derived from the dedicated control region. The fitted shape and uncertainty are derived from a simultaneous background-only fit of all four ggF analysis regions. |

png pdf |
Additional Figure 5-c:
The data in the ggF BDT event category 3 after subtracting all background processes except the QCD multijet one compared to the QCD multijet background prediction derived from the dedicated control region. The fitted shape and uncertainty are derived from a simultaneous background-only fit of all four ggF analysis regions. |

png pdf |
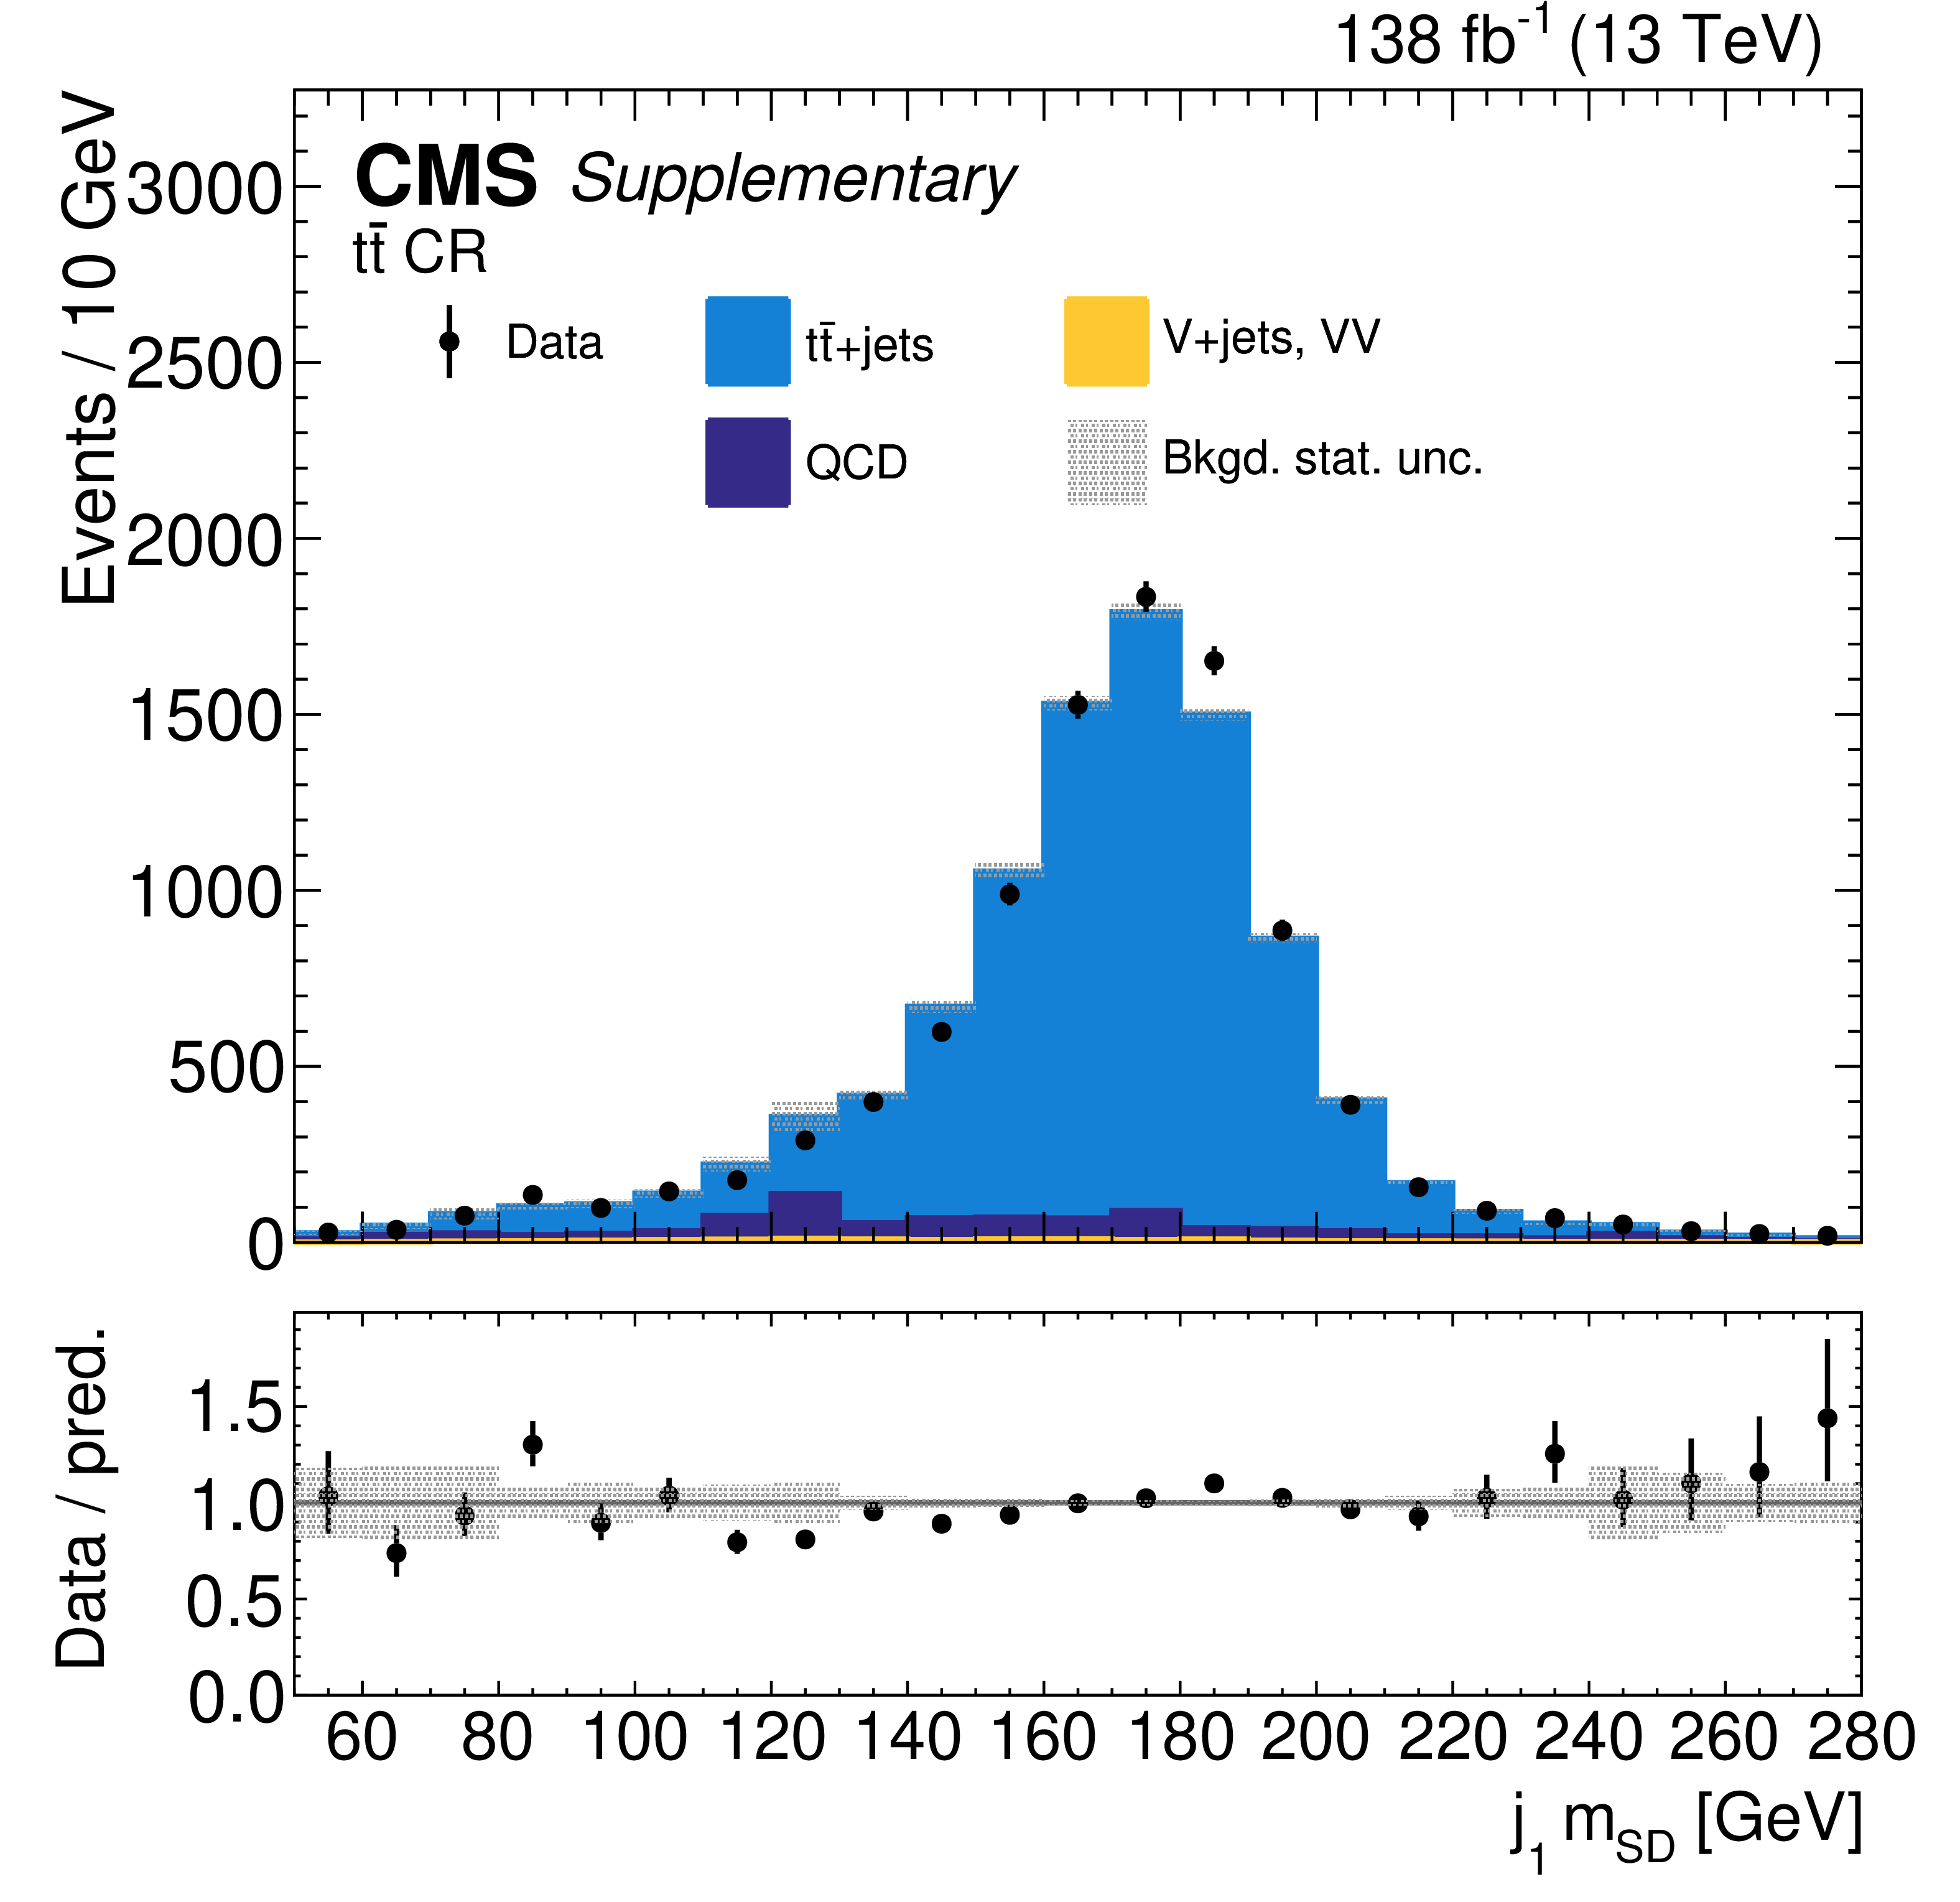
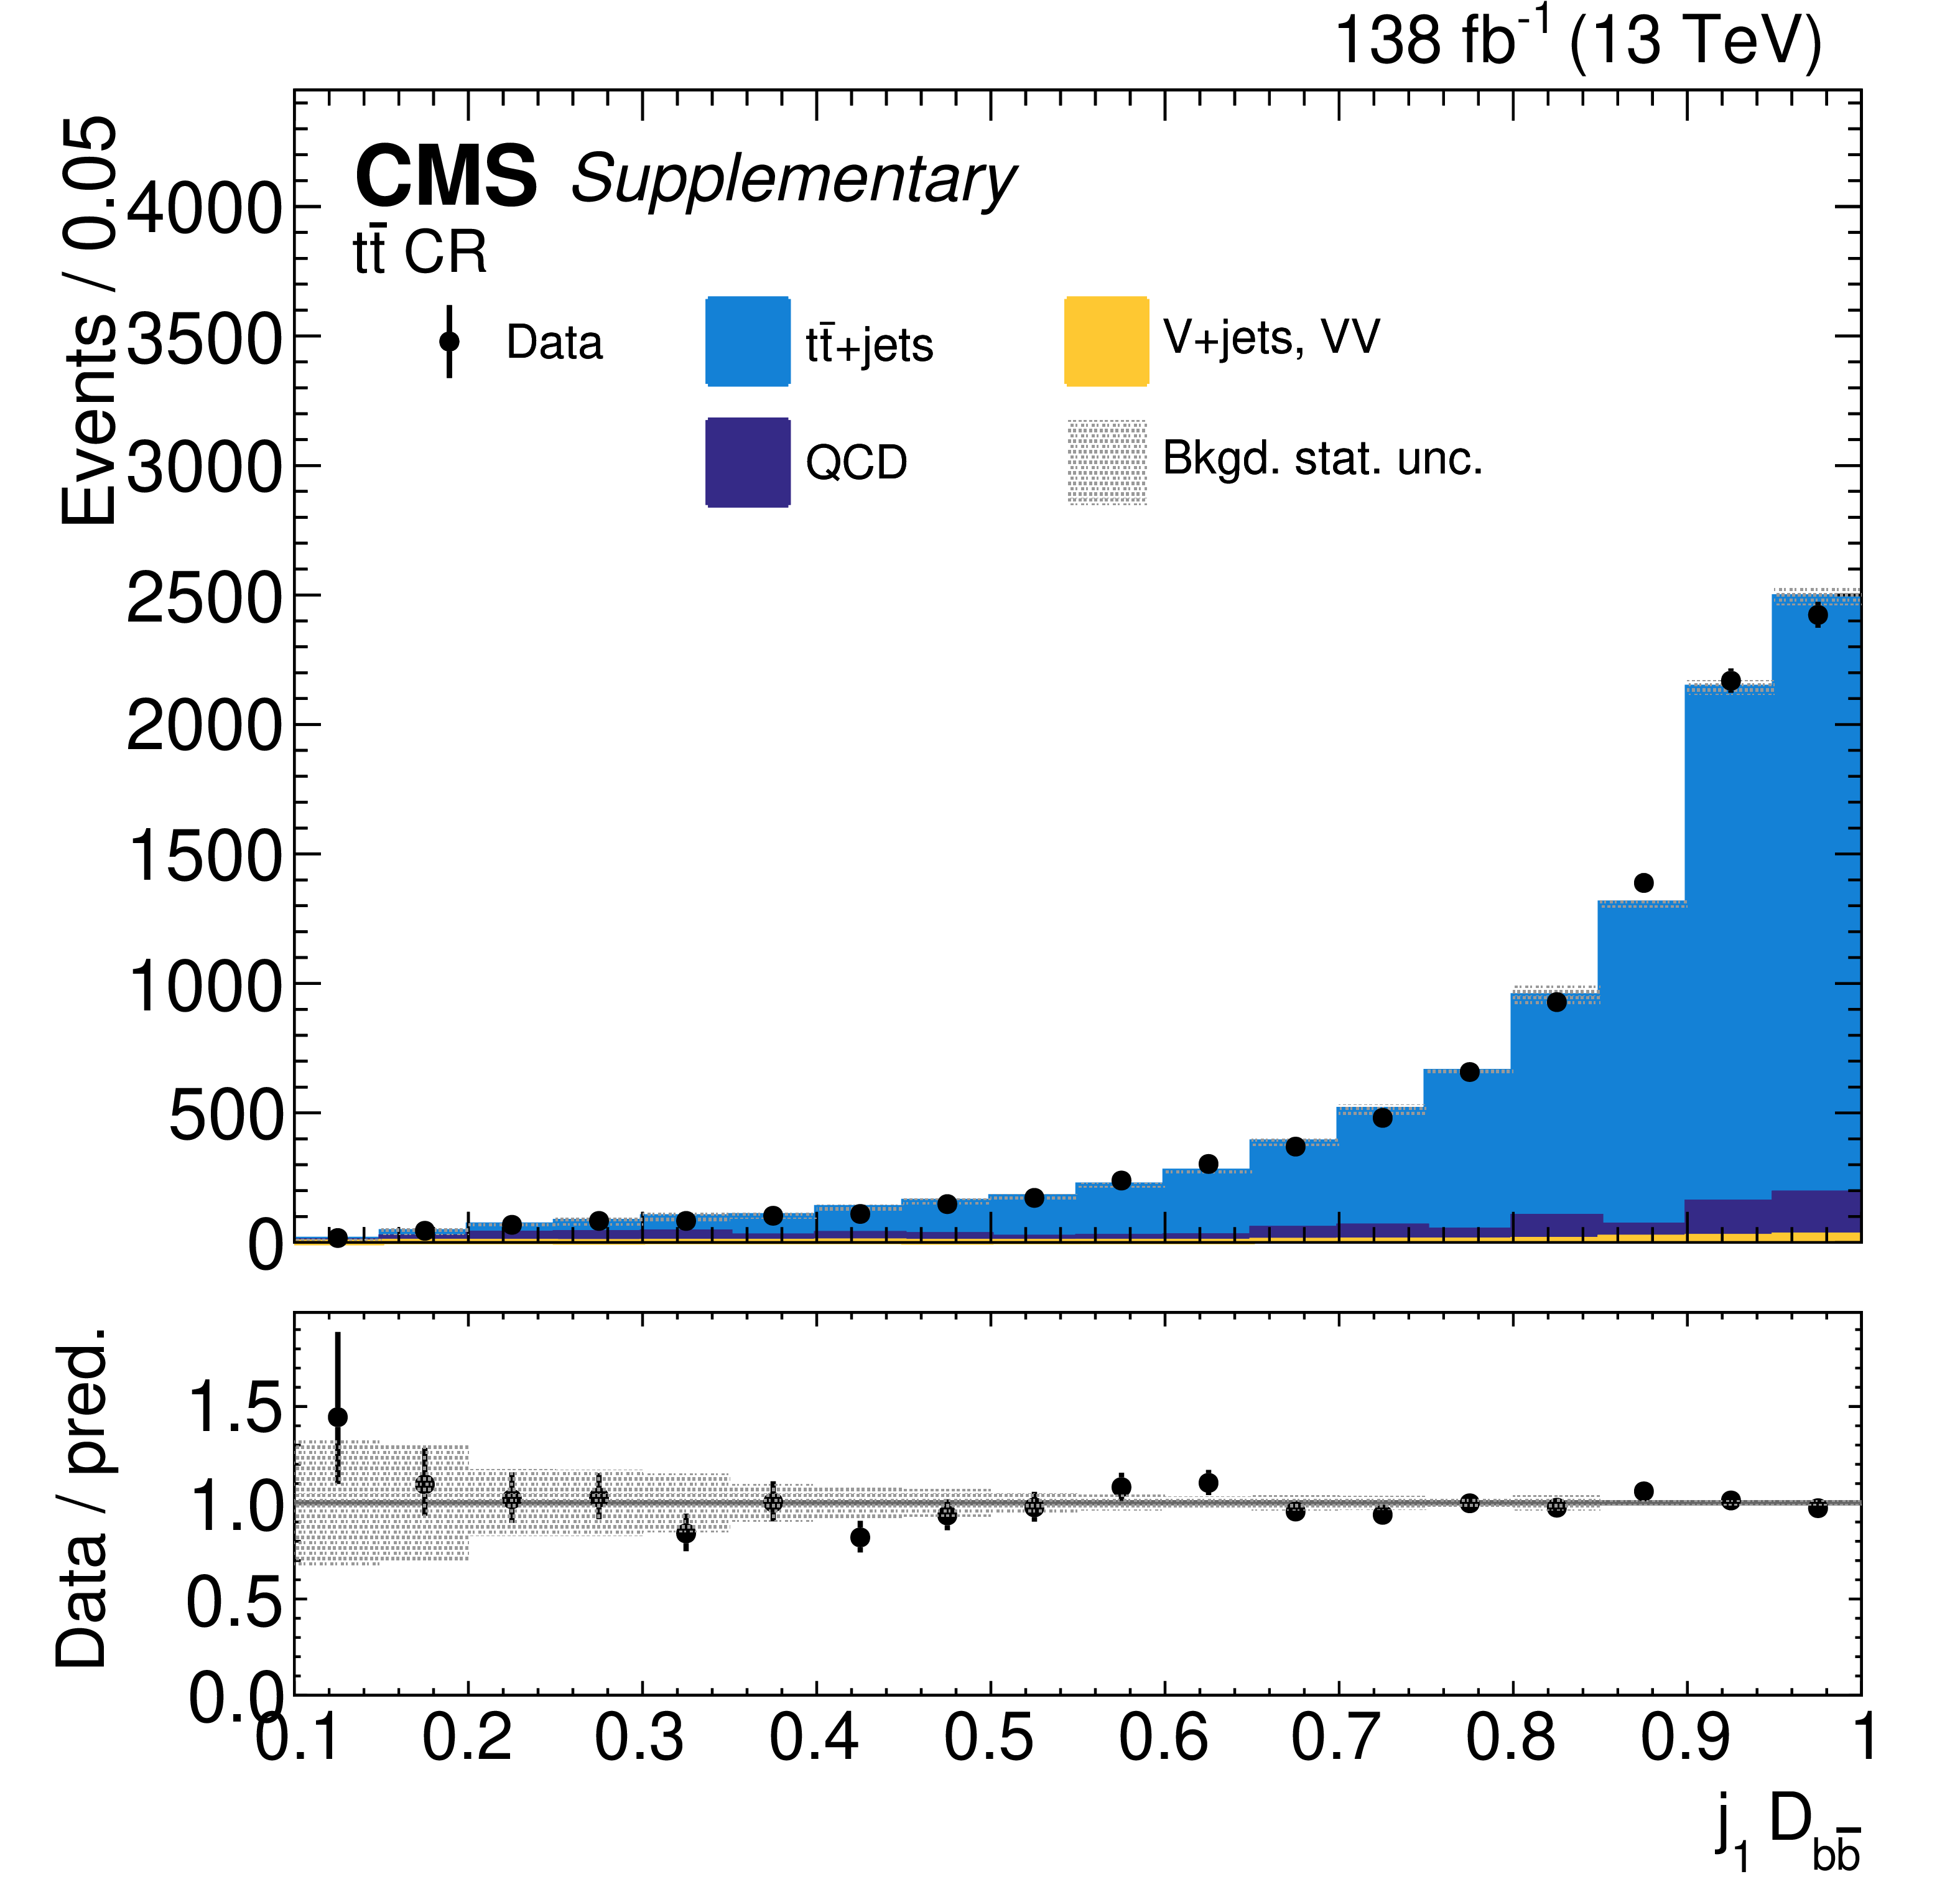
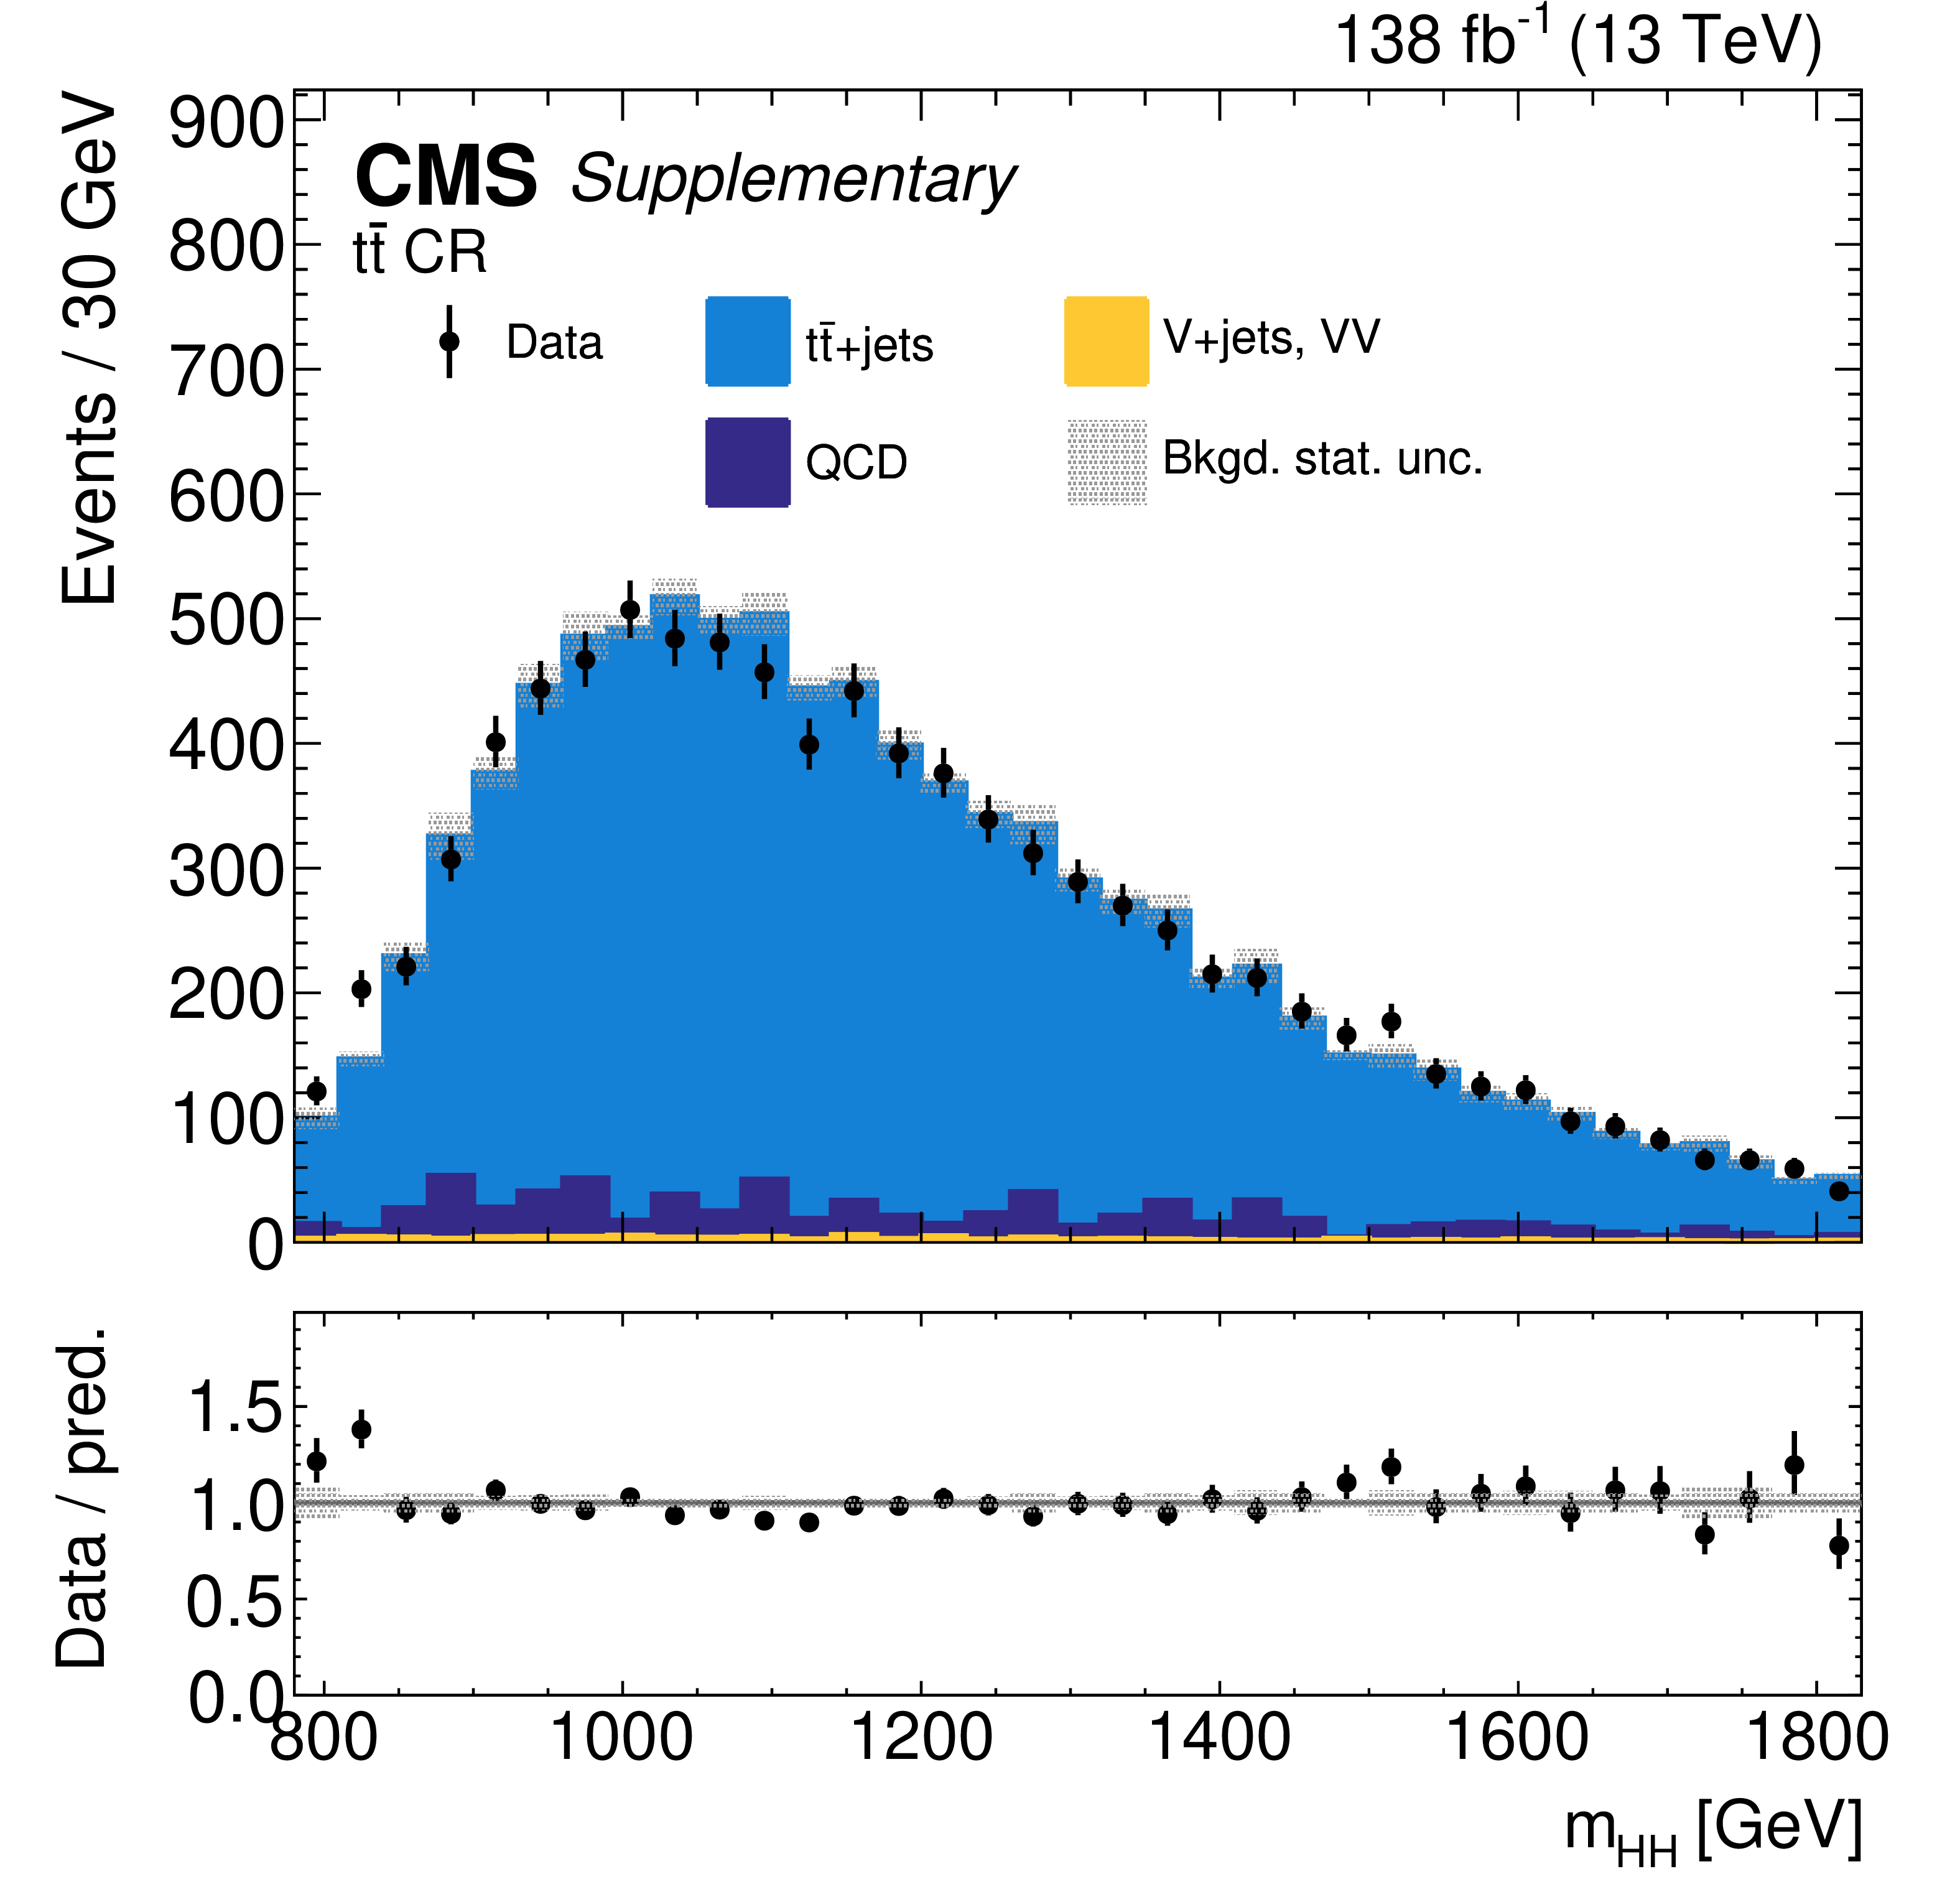
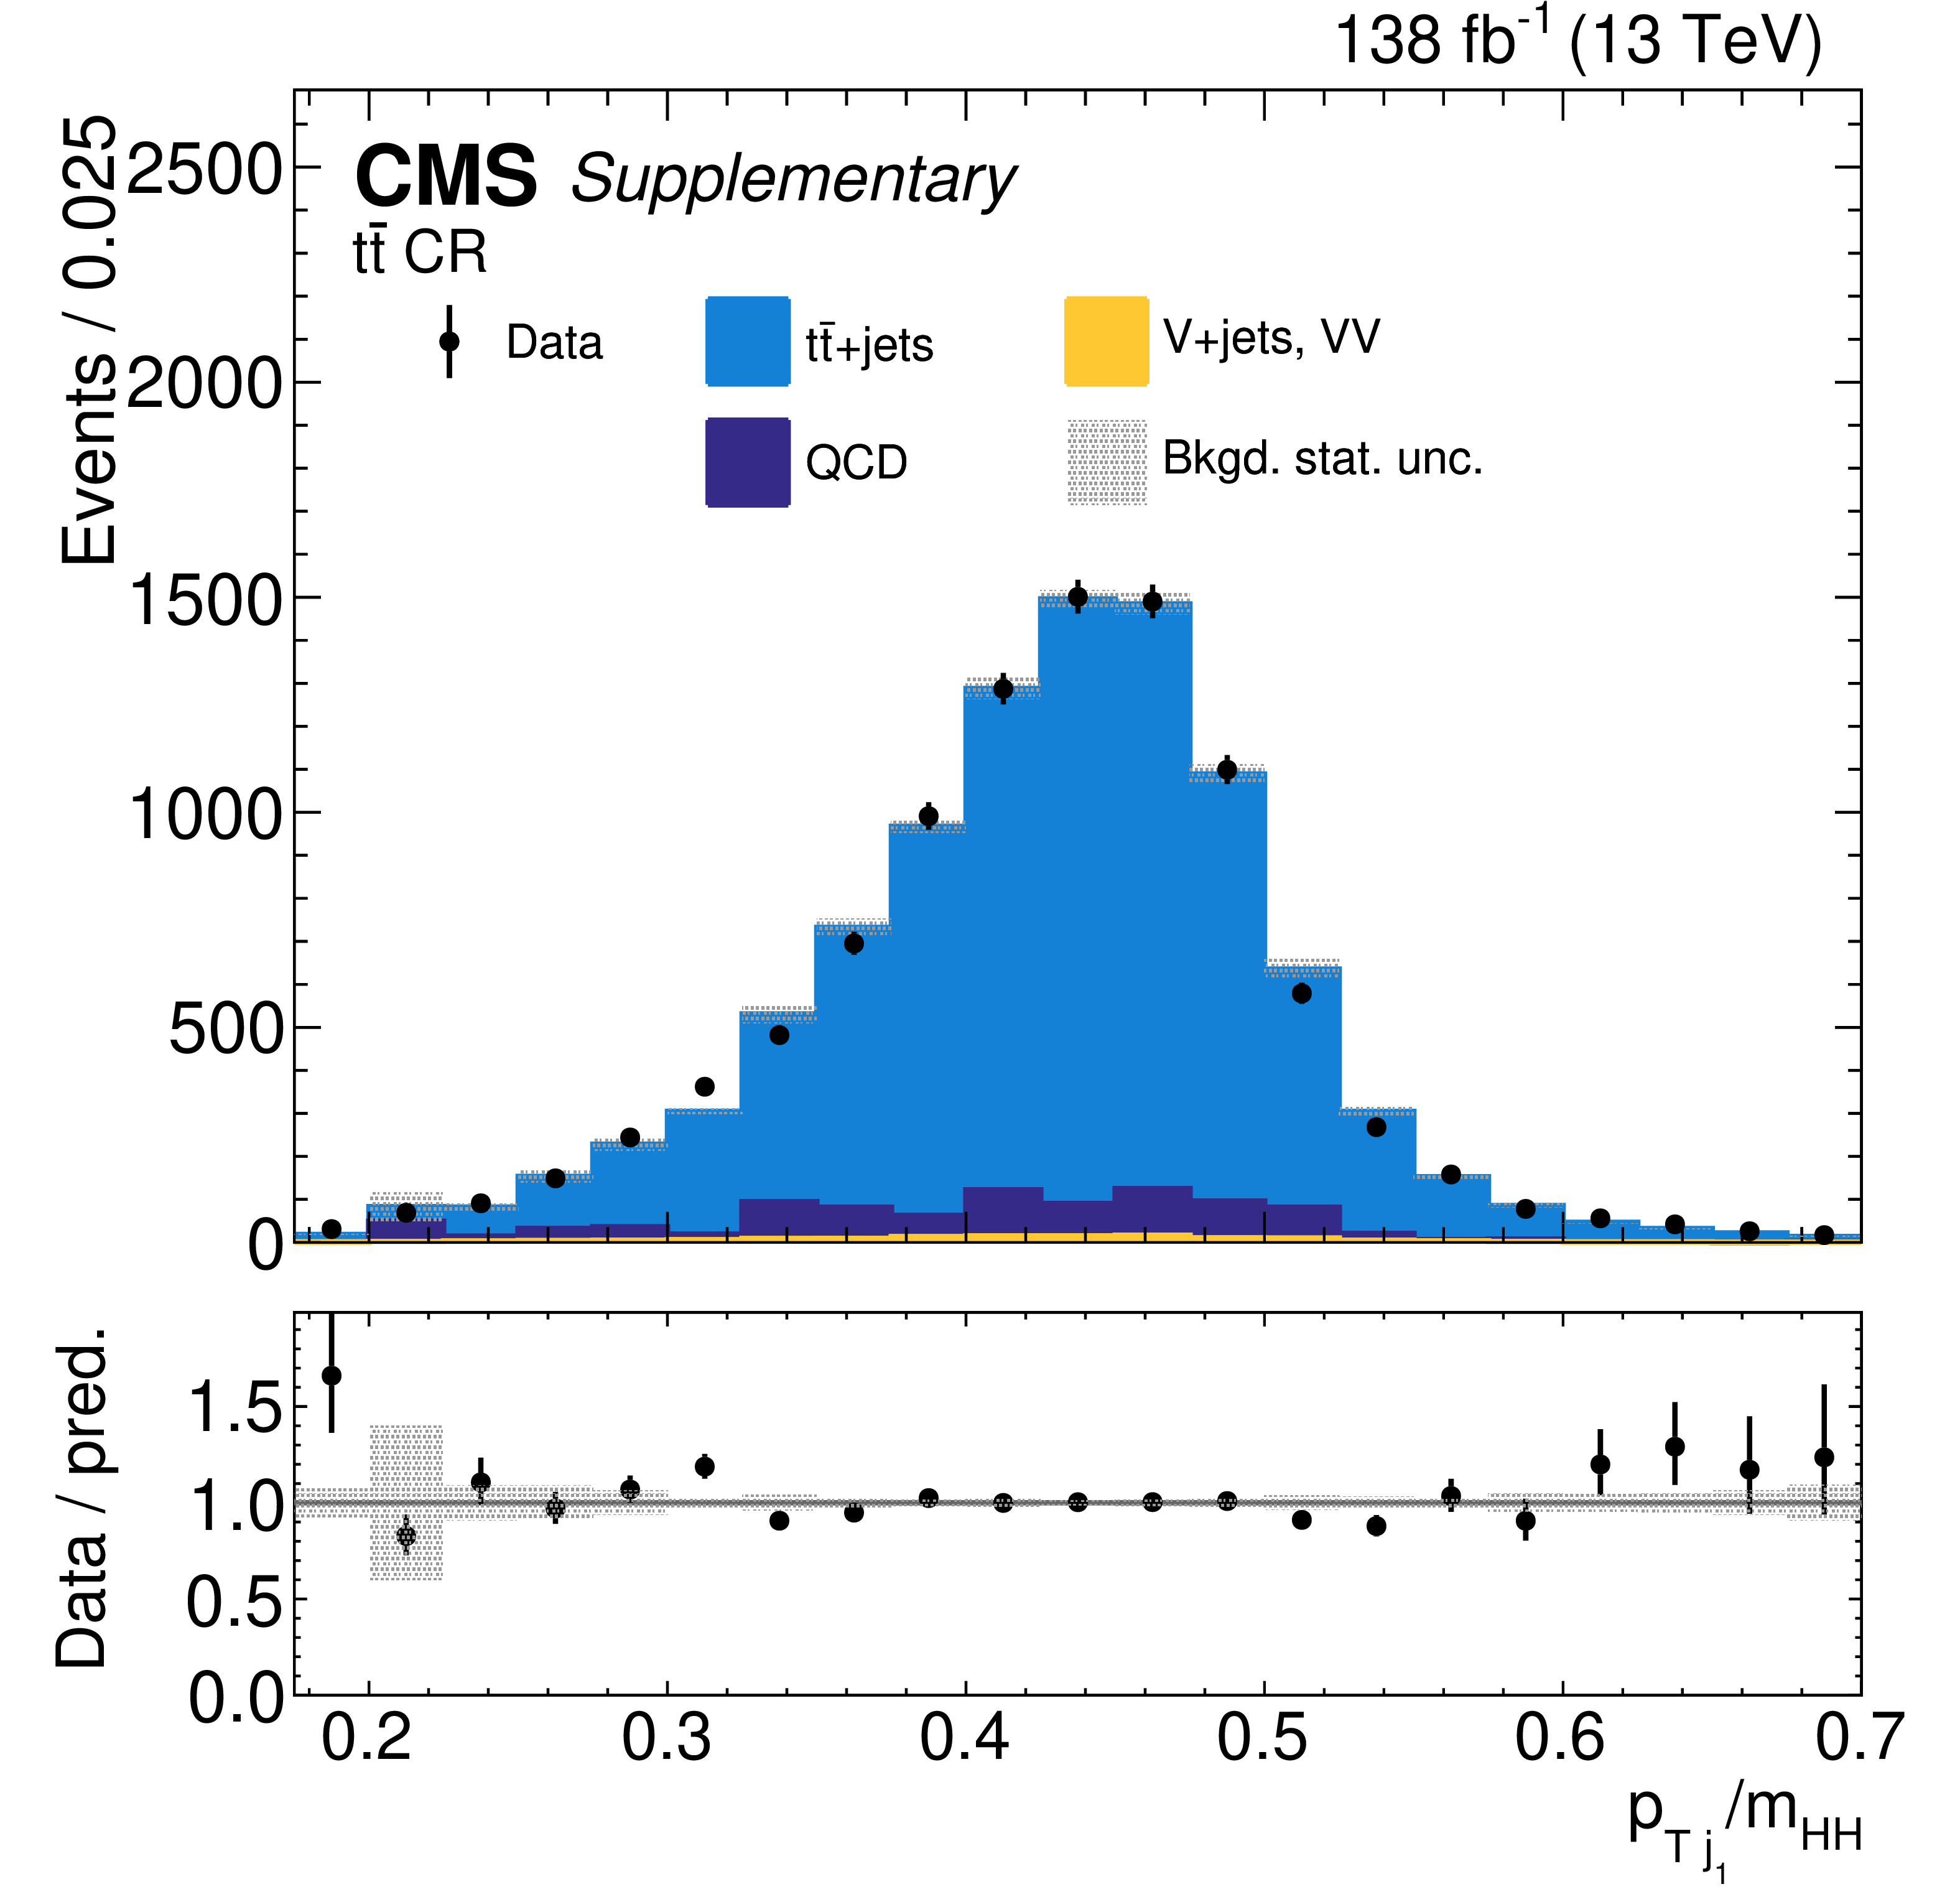
Additional Figure 6:
The data and expected background distributions from simulation in the $ {\mathrm{t}\overline{\mathrm{t}}} $ control region for some of the most discriminating BDT input variables, including the $ D_{\mathrm{b}\overline{\mathrm{b}}} $-leading jet $ m_\mathrm{SD} $ (upper left) and $ D_{\mathrm{b}\overline{\mathrm{b}}} $ (upper right), $ m_{\mathrm{H}\mathrm{H}} $ (lower left), and $ {p_{\mathrm{T}}}_{\text{j}_1}/m_{\mathrm{H}\mathrm{H}} $ (lower right). The lower panel shows the ratio of the data and the total background prediction, with its statistical uncertainty represented by the shaded band. The error bars on the data points represent the statistical uncertainties. |
png pdf |
Additional Figure 6-a:
The data and expected background distributions from simulation in the $ {\mathrm{t}\overline{\mathrm{t}}} $ control region for the leading jet $ m_\mathrm{SD} $. The lower panel shows the ratio of the data and the total background prediction, with its statistical uncertainty represented by the shaded band. The error bars on the data points represent the statistical uncertainties. |
png pdf |
Additional Figure 6-b:
The data and expected background distributions from simulation in the $ {\mathrm{t}\overline{\mathrm{t}}} $ control region for the leading jet $ D_{\mathrm{b}\overline{\mathrm{b}}} $. The lower panel shows the ratio of the data and the total background prediction, with its statistical uncertainty represented by the shaded band. The error bars on the data points represent the statistical uncertainties. |
png pdf |
Additional Figure 6-c:
The data and expected background distributions from simulation in the $ {\mathrm{t}\overline{\mathrm{t}}} $ control region for $ m_{\mathrm{H}\mathrm{H}} $. The lower panel shows the ratio of the data and the total background prediction, with its statistical uncertainty represented by the shaded band. The error bars on the data points represent the statistical uncertainties. |
png pdf |
Additional Figure 6-d:
The data and expected background distributions from simulation in the $ {\mathrm{t}\overline{\mathrm{t}}} $ control region for $ {p_{\mathrm{T}}}_{\text{j}_1}/m_{\mathrm{H}\mathrm{H}} $. The lower panel shows the ratio of the data and the total background prediction, with its statistical uncertainty represented by the shaded band. The error bars on the data points represent the statistical uncertainties. |
png pdf |
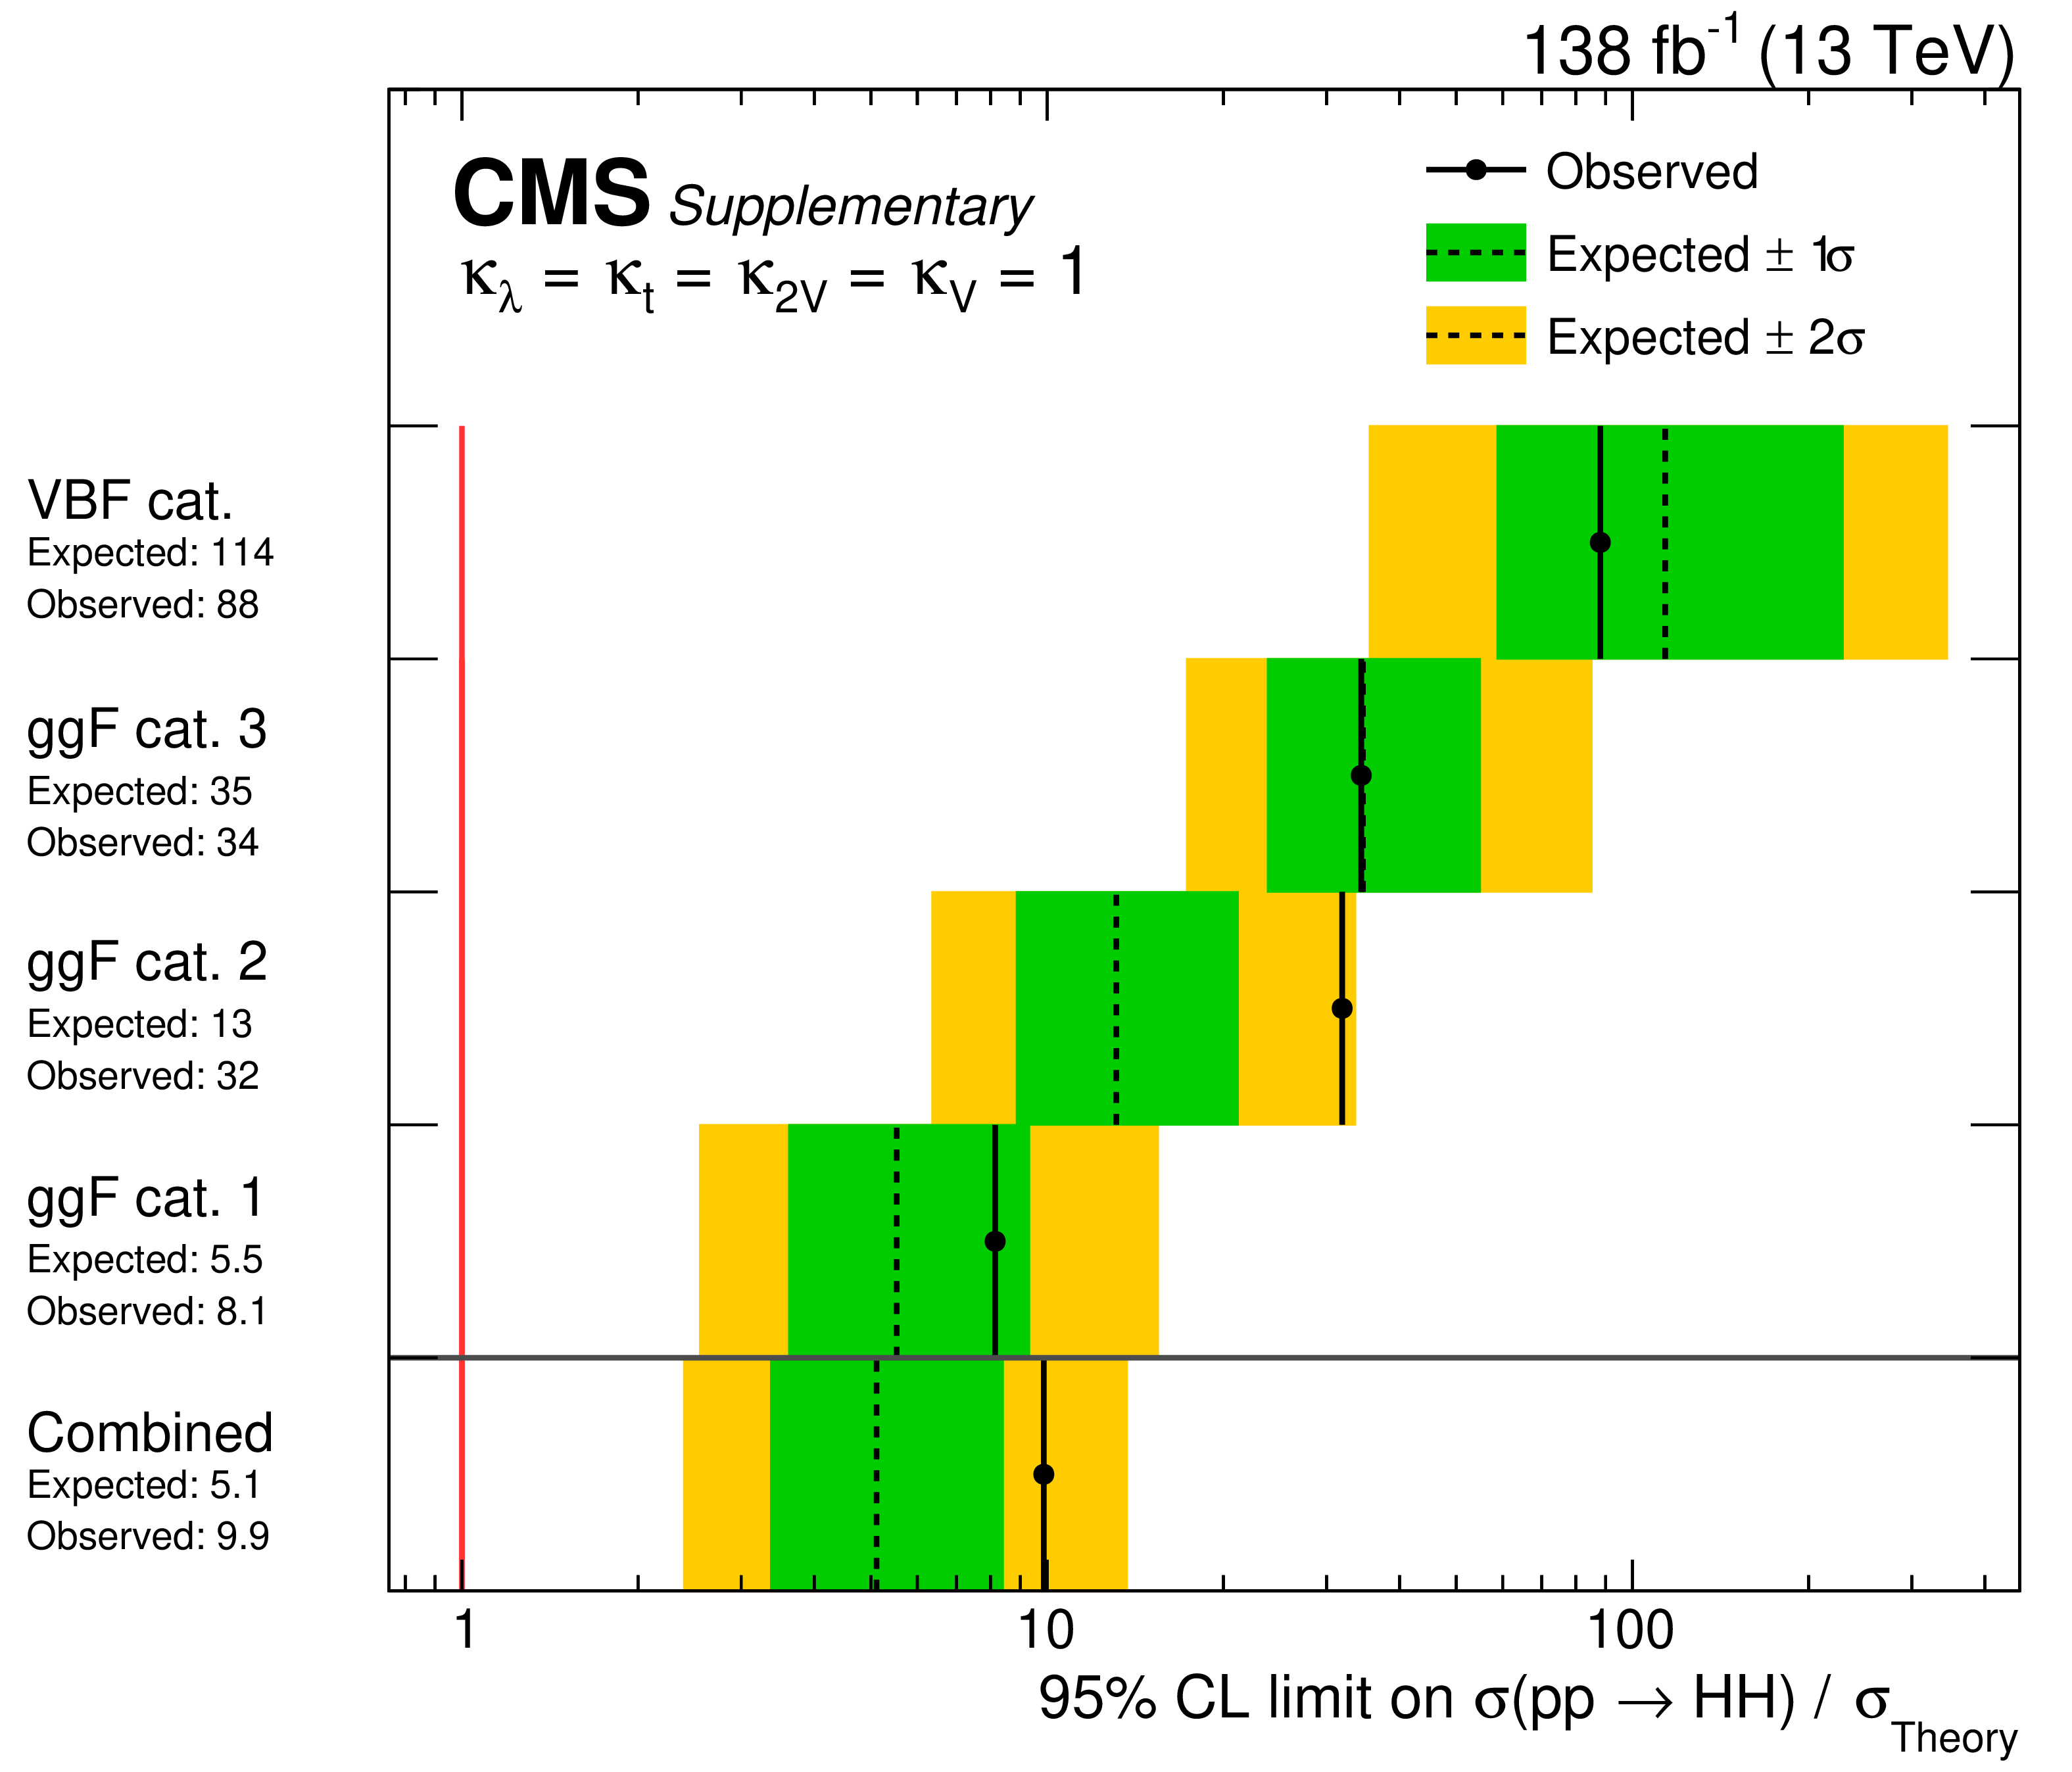
Additional Figure 7:
Expected and observed 95% CL upper limits on HH production with respect to the SM expectation ($ \kappa_\lambda=\kappa_{\mathrm{t}}=\kappa_\mathrm{V}=\kappa_{2\mathrm{V}}= $ 1) in the individual ggF and VBF search categories and their combination. |
png pdf |
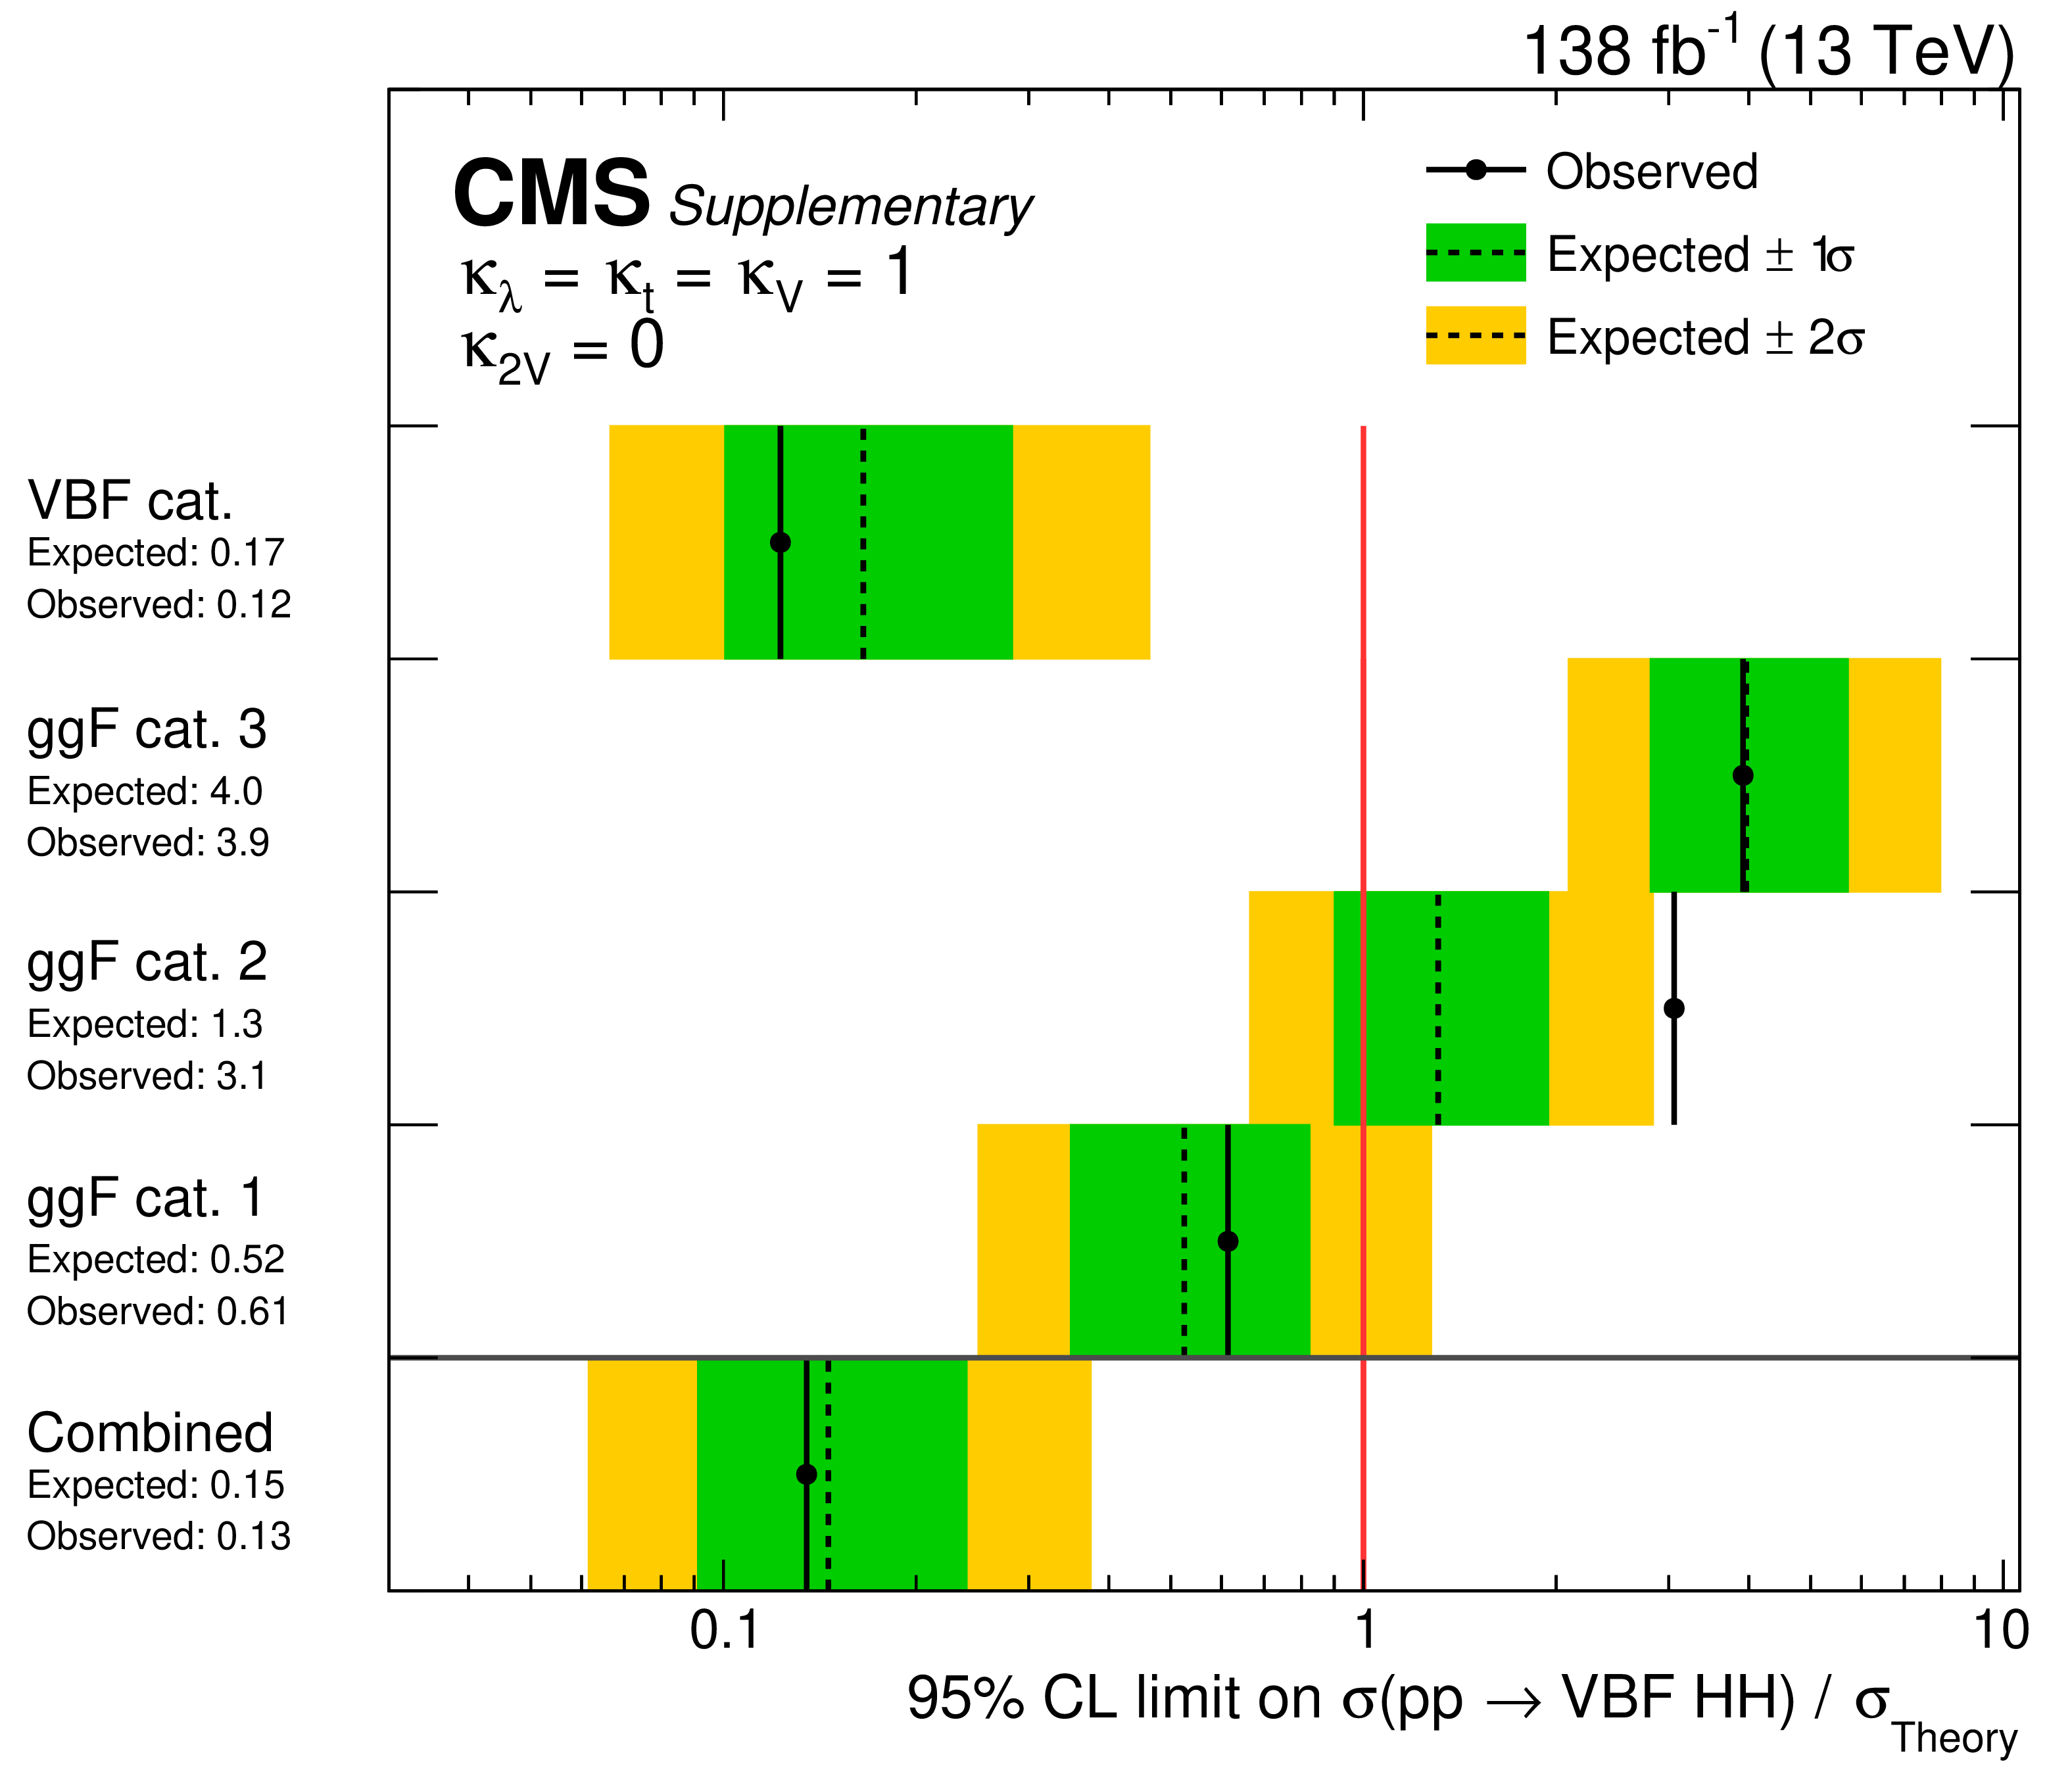
Additional Figure 8:
Expected and observed 95% CL upper limits on HH production with respect to the expectation for $ \kappa_\lambda=\kappa_{\mathrm{t}}=\kappa_\mathrm{V}= $ 1, $ \kappa_{2\mathrm{V}}= $ 0 in the individual ggF and VBF search categories and their combination. |

png pdf |
Additional Figure 9:
Observed (solid line) and expected (dashed line) 95% CL exclusion limit on the product of the inclusive HH production cross section and the branching fraction into $ \mathrm{b}\overline{\mathrm{b}}\mathrm{b}\overline{\mathrm{b}} $ as a function of $ \kappa_\lambda $ (upper), $ \kappa_{2\mathrm{V}} $ (lower left), and $ \kappa_\mathrm{V} $ (lower right) is shown with other couplings fixed to the SM values. The green and yellow bands correspond to one and two standard deviations, respectively, around the expected median. The red solid line depicts the theoretical prediction for the HH production cross section and the red band shows its uncertainty [60,109,61,110,5,111,112,113,114,8].The crossings of observed limit and the theoretical cross section indicate the ranges of the coupling values excluded at 95% CL. |

png pdf |
Additional Figure 9-a:
Observed (solid line) and expected (dashed line) 95% CL exclusion limit on the product of the inclusive HH production cross section and the branching fraction into $ \mathrm{b}\overline{\mathrm{b}}\mathrm{b}\overline{\mathrm{b}} $ as a function of $ \kappa_\lambda $ is shown with other couplings fixed to the SM values. The green and yellow bands correspond to one and two standard deviations, respectively, around the expected median. The red solid line depicts the theoretical prediction for the HH production cross section and the red band shows its uncertainty [60,109,61,110,5,111,112,113,114,8].The crossings of observed limit and the theoretical cross section indicate the ranges of the coupling values excluded at 95% CL. |
png pdf |
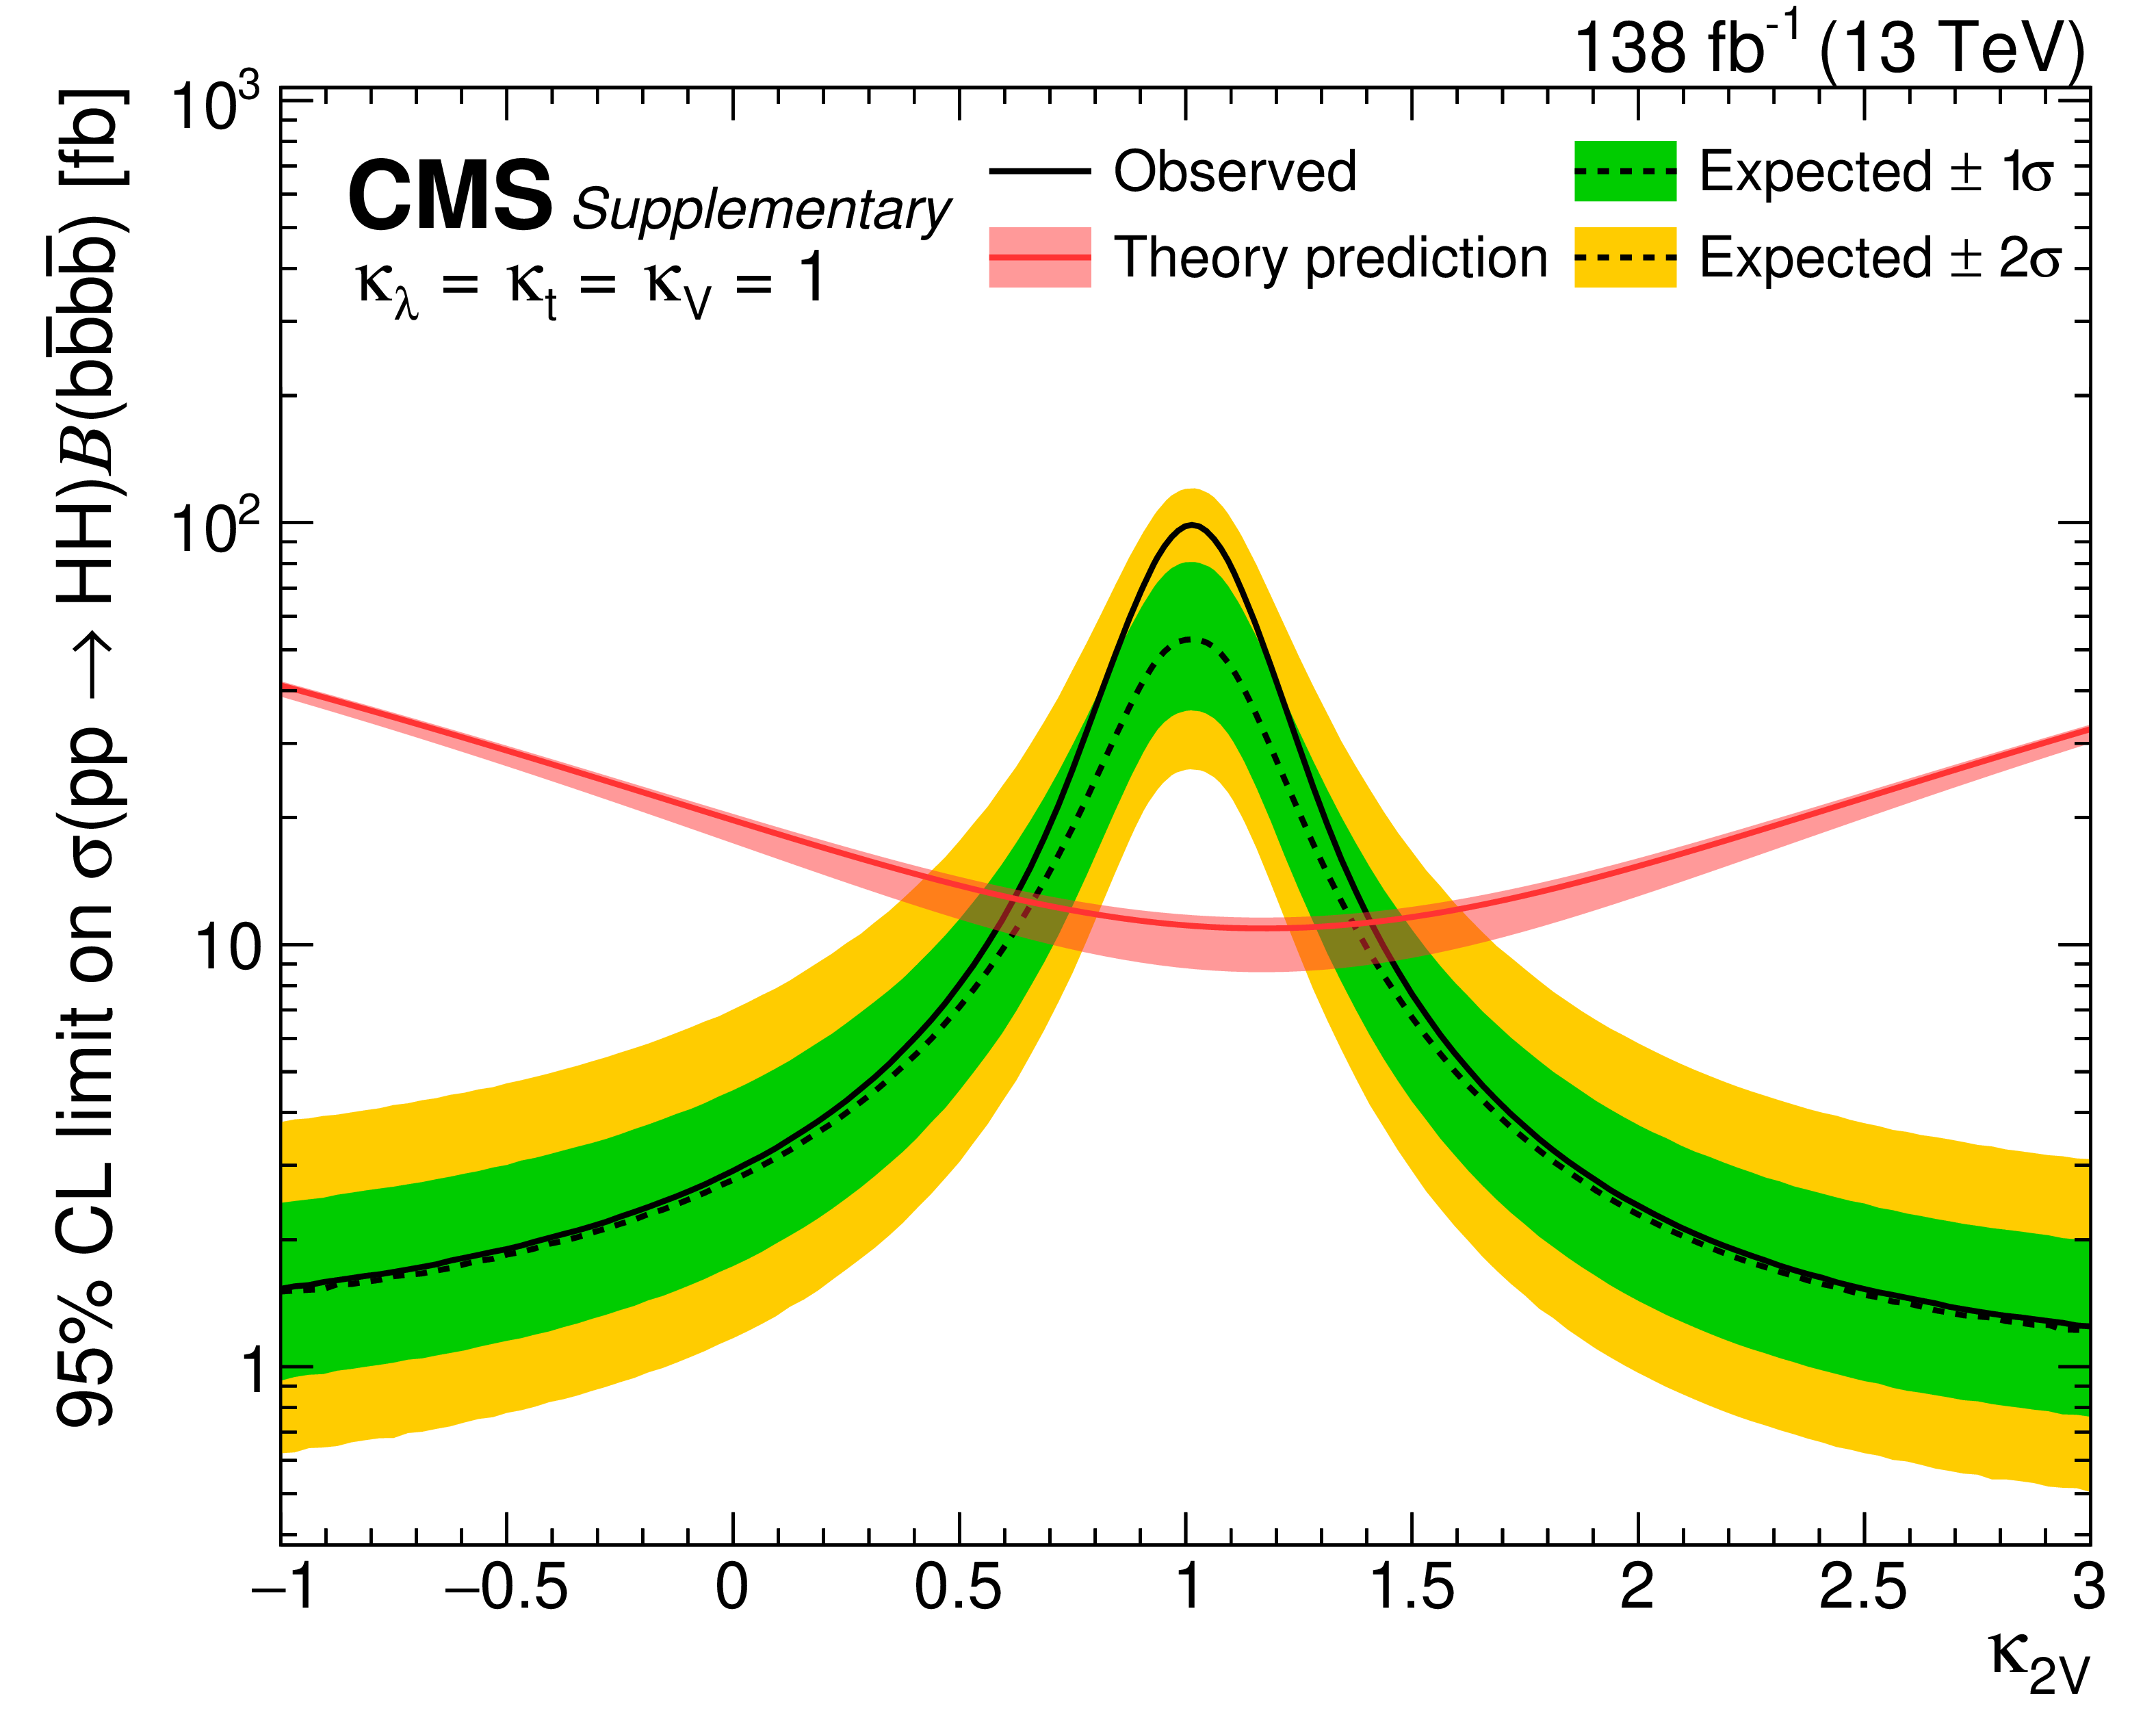
Additional Figure 9-b:
Observed (solid line) and expected (dashed line) 95% CL exclusion limit on the product of the inclusive HH production cross section and the branching fraction into $ \mathrm{b}\overline{\mathrm{b}}\mathrm{b}\overline{\mathrm{b}} $ as a function of $ \kappa_{2\mathrm{V}} $ is shown with other couplings fixed to the SM values. The green and yellow bands correspond to one and two standard deviations, respectively, around the expected median. The red solid line depicts the theoretical prediction for the HH production cross section and the red band shows its uncertainty [60,109,61,110,5,111,112,113,114,8].The crossings of observed limit and the theoretical cross section indicate the ranges of the coupling values excluded at 95% CL. |

png pdf |
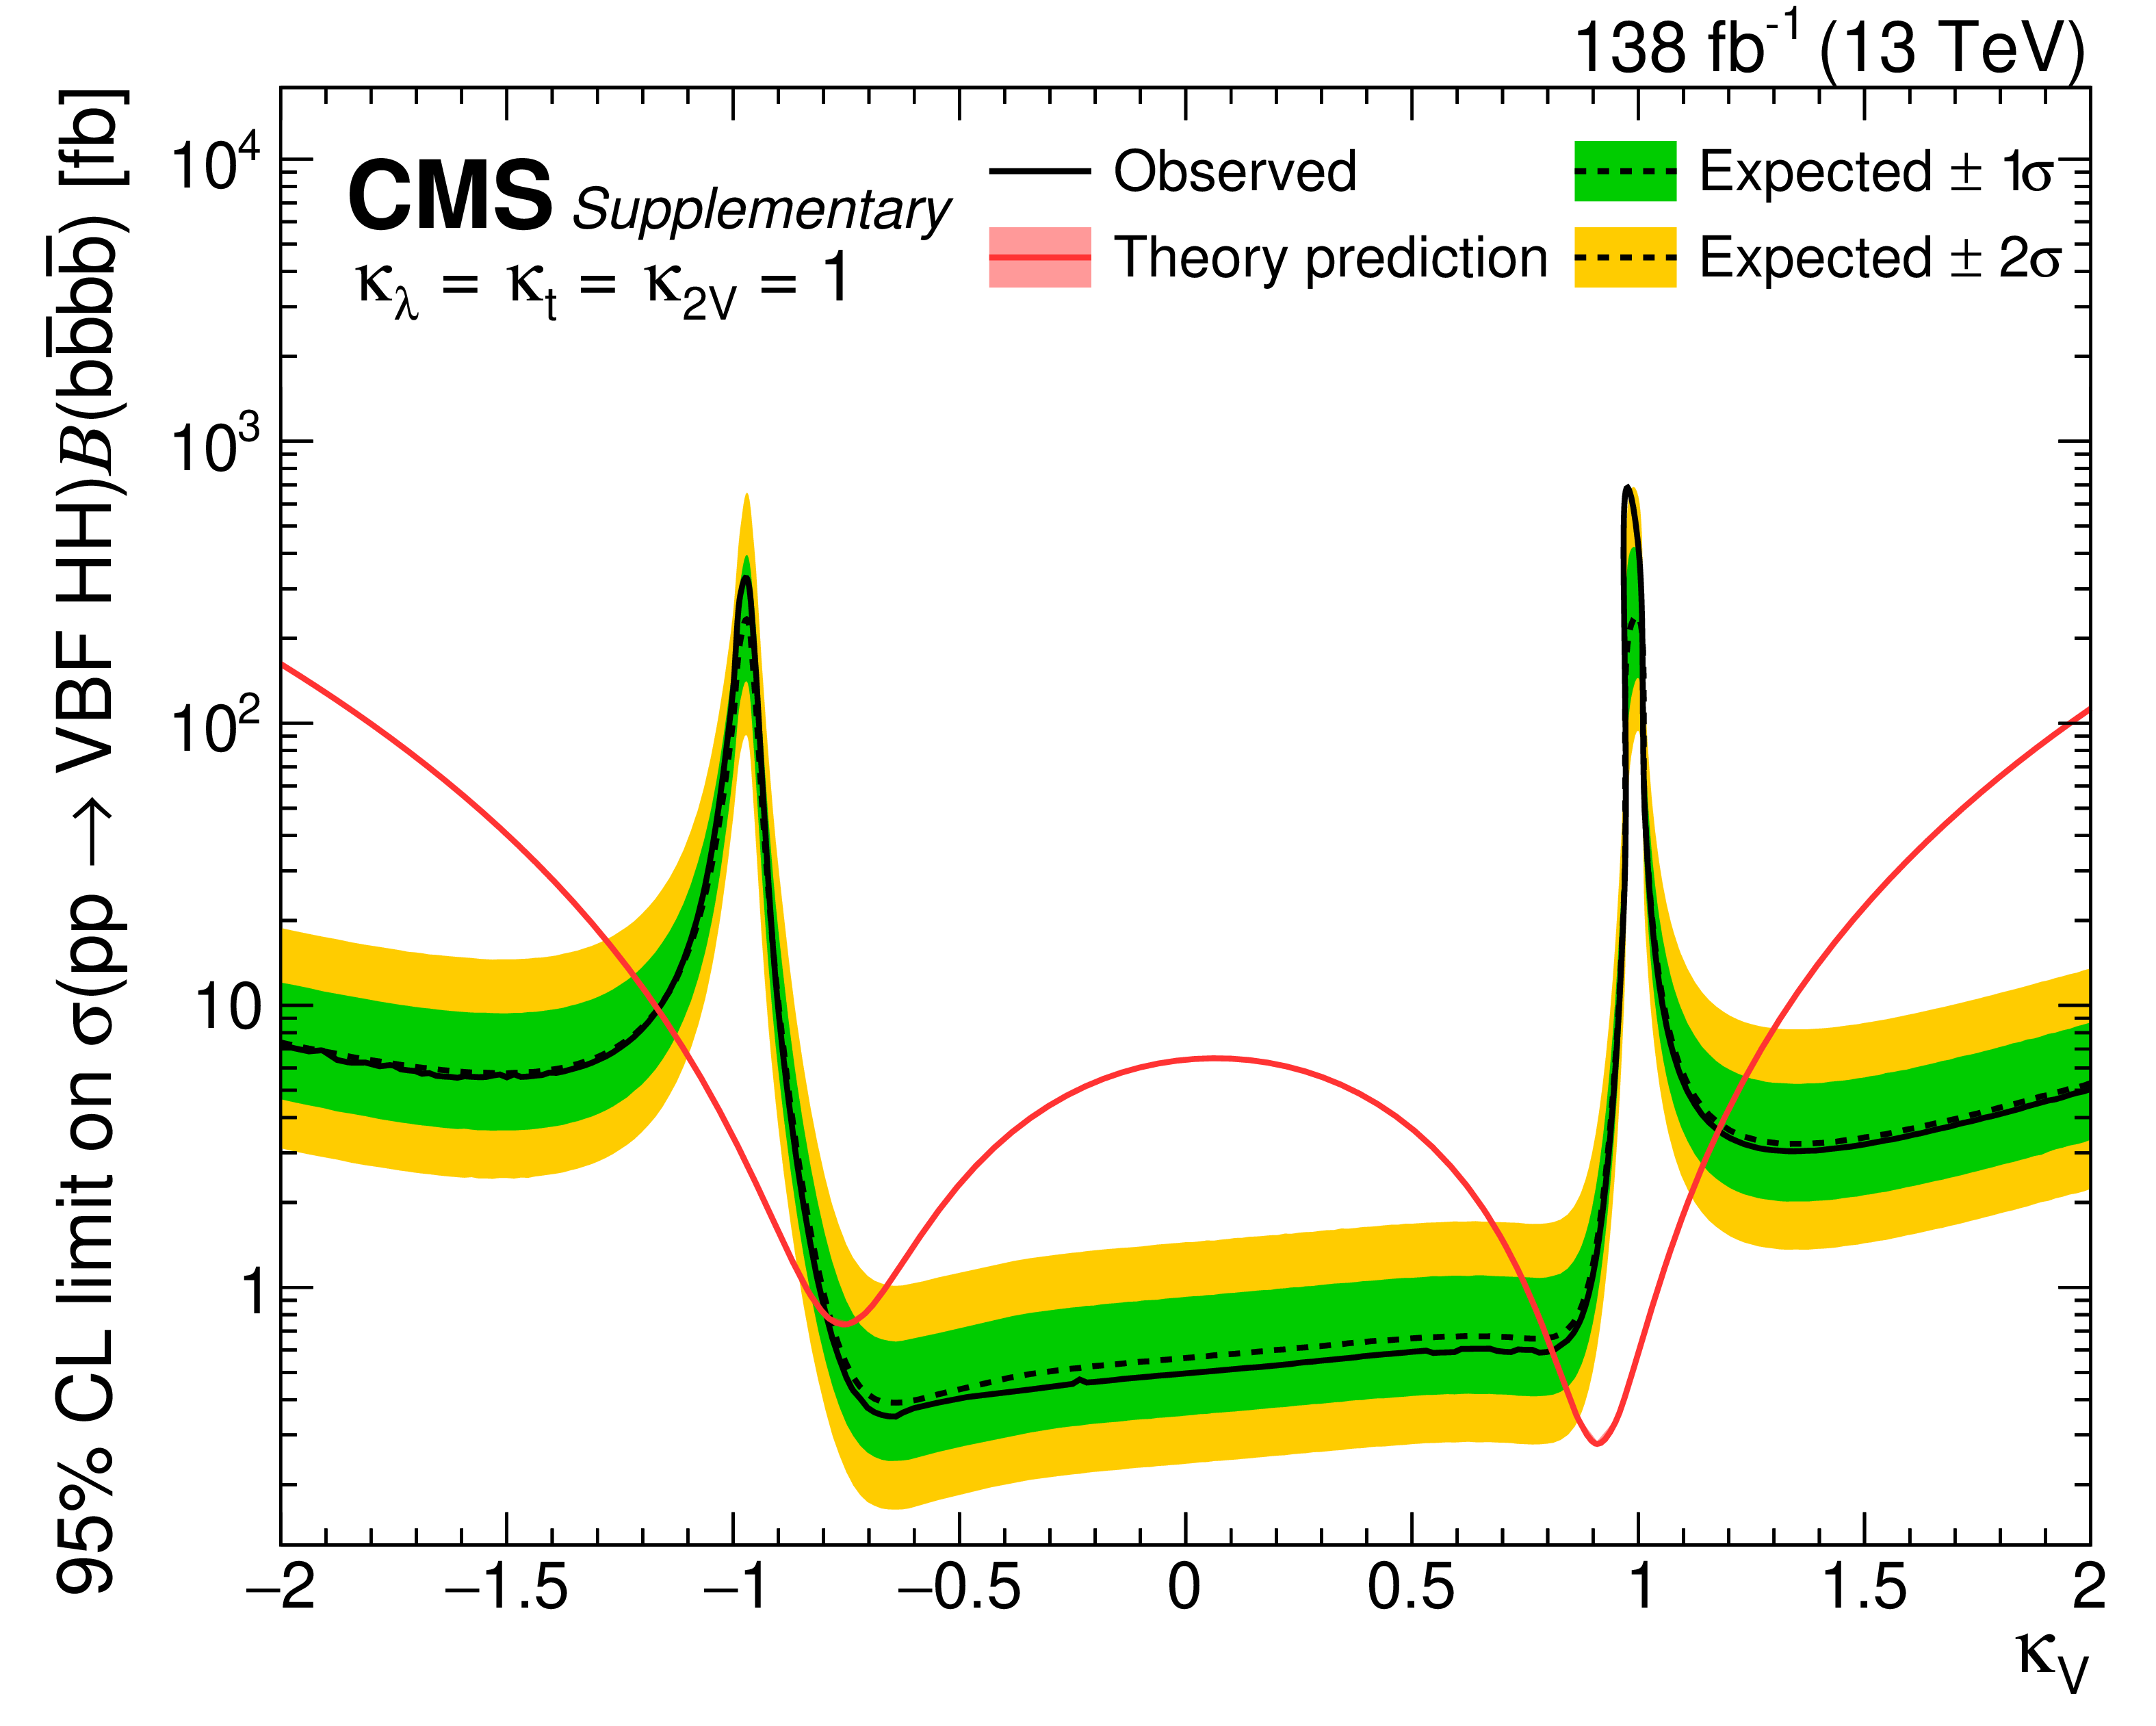
Additional Figure 9-c:
Observed (solid line) and expected (dashed line) 95% CL exclusion limit on the product of the inclusive HH production cross section and the branching fraction into $ \mathrm{b}\overline{\mathrm{b}}\mathrm{b}\overline{\mathrm{b}} $ as a function of $ \kappa_\mathrm{V} $ is shown with other couplings fixed to the SM values. The green and yellow bands correspond to one and two standard deviations, respectively, around the expected median. The red solid line depicts the theoretical prediction for the HH production cross section and the red band shows its uncertainty [60,109,61,110,5,111,112,113,114,8].The crossings of observed limit and the theoretical cross section indicate the ranges of the coupling values excluded at 95% CL. |
png pdf |
Additional Figure 10:
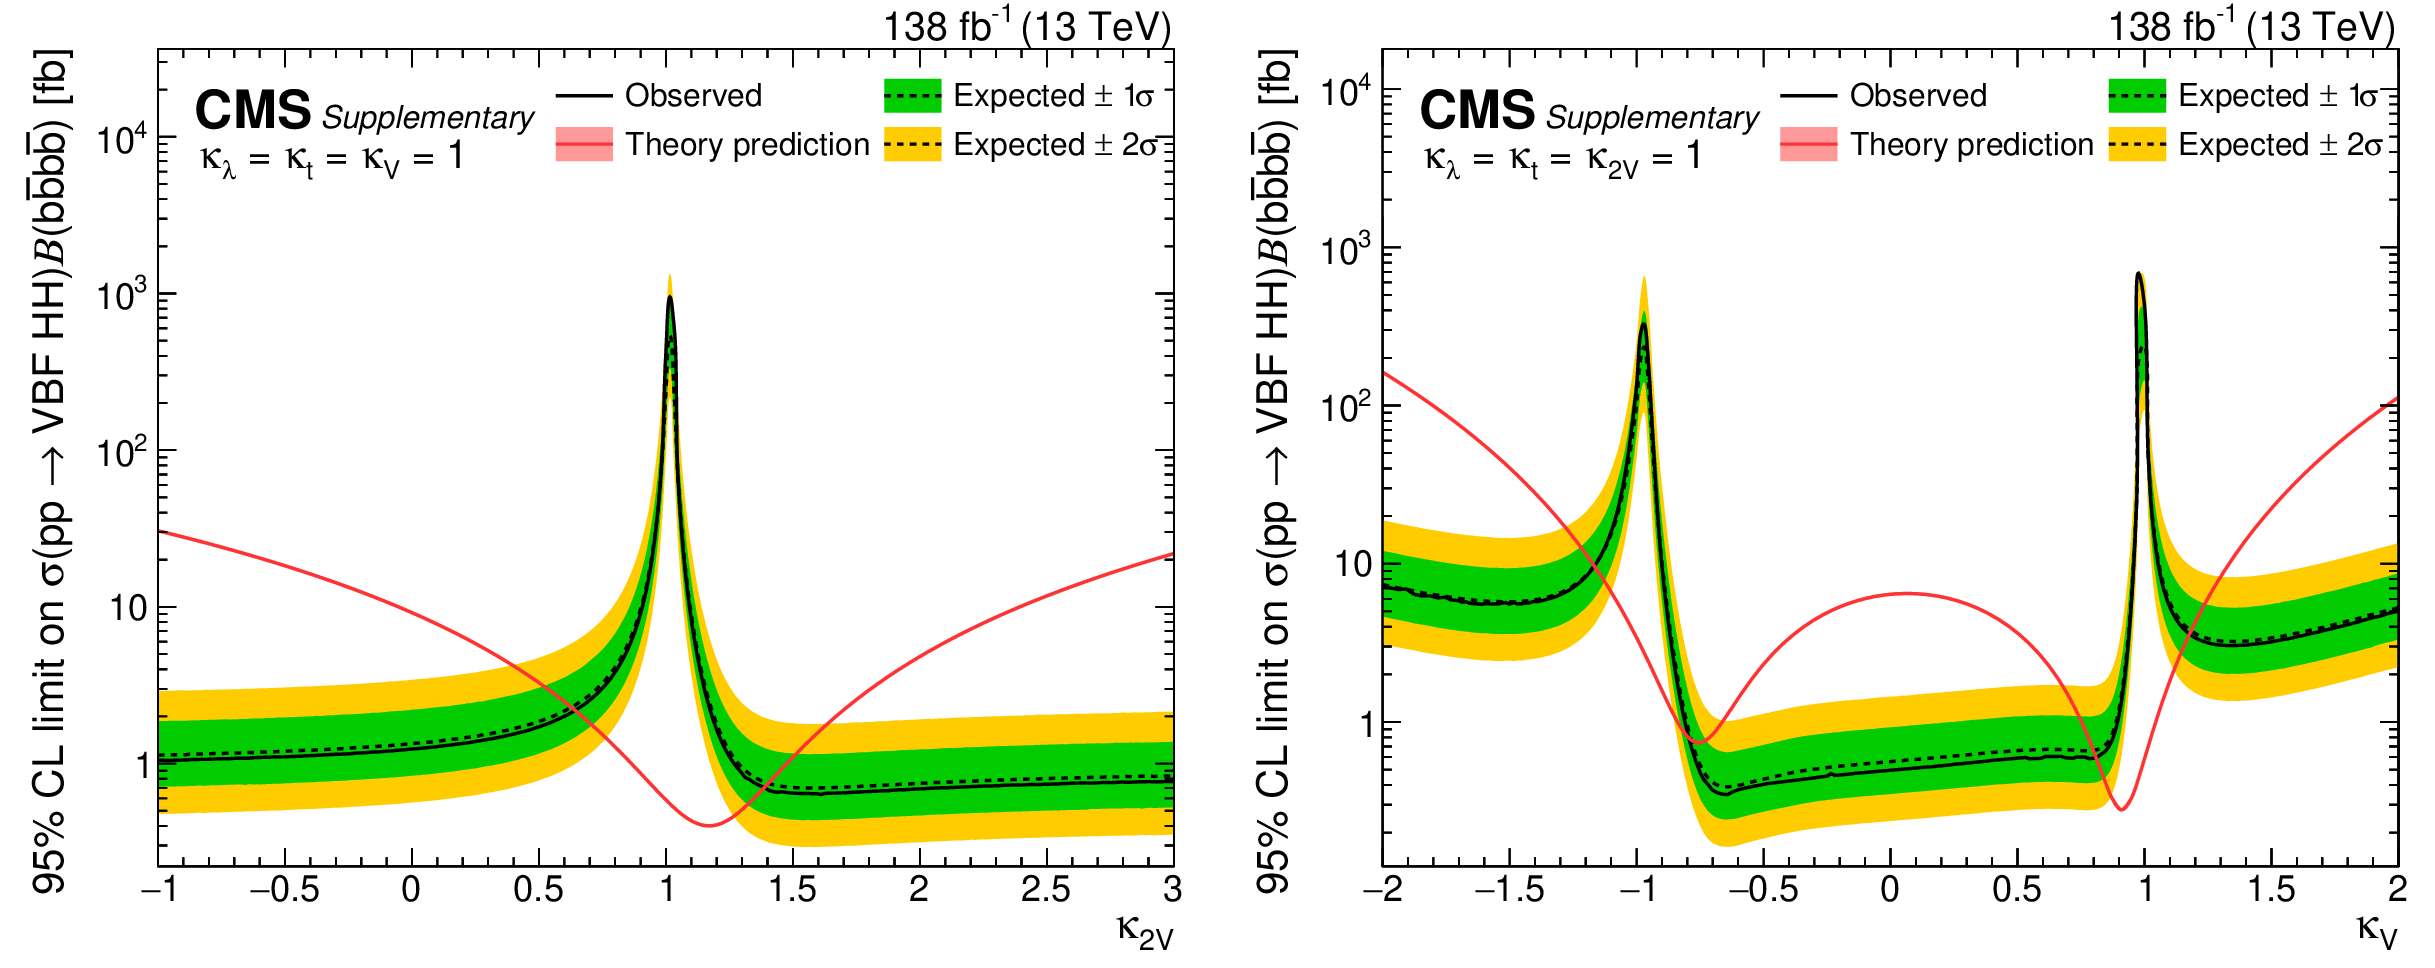
Observed (solid line) and expected (dashed line) 95% CL exclusion limit on the product of the VBF HH production cross section and the branching fraction into $ \mathrm{b}\overline{\mathrm{b}}\mathrm{b}\overline{\mathrm{b}} $ as a function of $ \kappa_{2\mathrm{V}} $ (left) and $ \kappa_\mathrm{V} $ (right) is shown with other couplings fixed to the SM values. The green and yellow bands correspond to one and two standard deviations, respectively, around the expected median. The red solid line depicts the theoretical prediction for the VBF HH production cross section and the red band shows its uncertainty [113,114,8]. The crossings of observed limit and the theoretical cross section indicate the ranges of the coupling values excluded at 95% CL. |
png pdf |
Additional Figure 10-a:
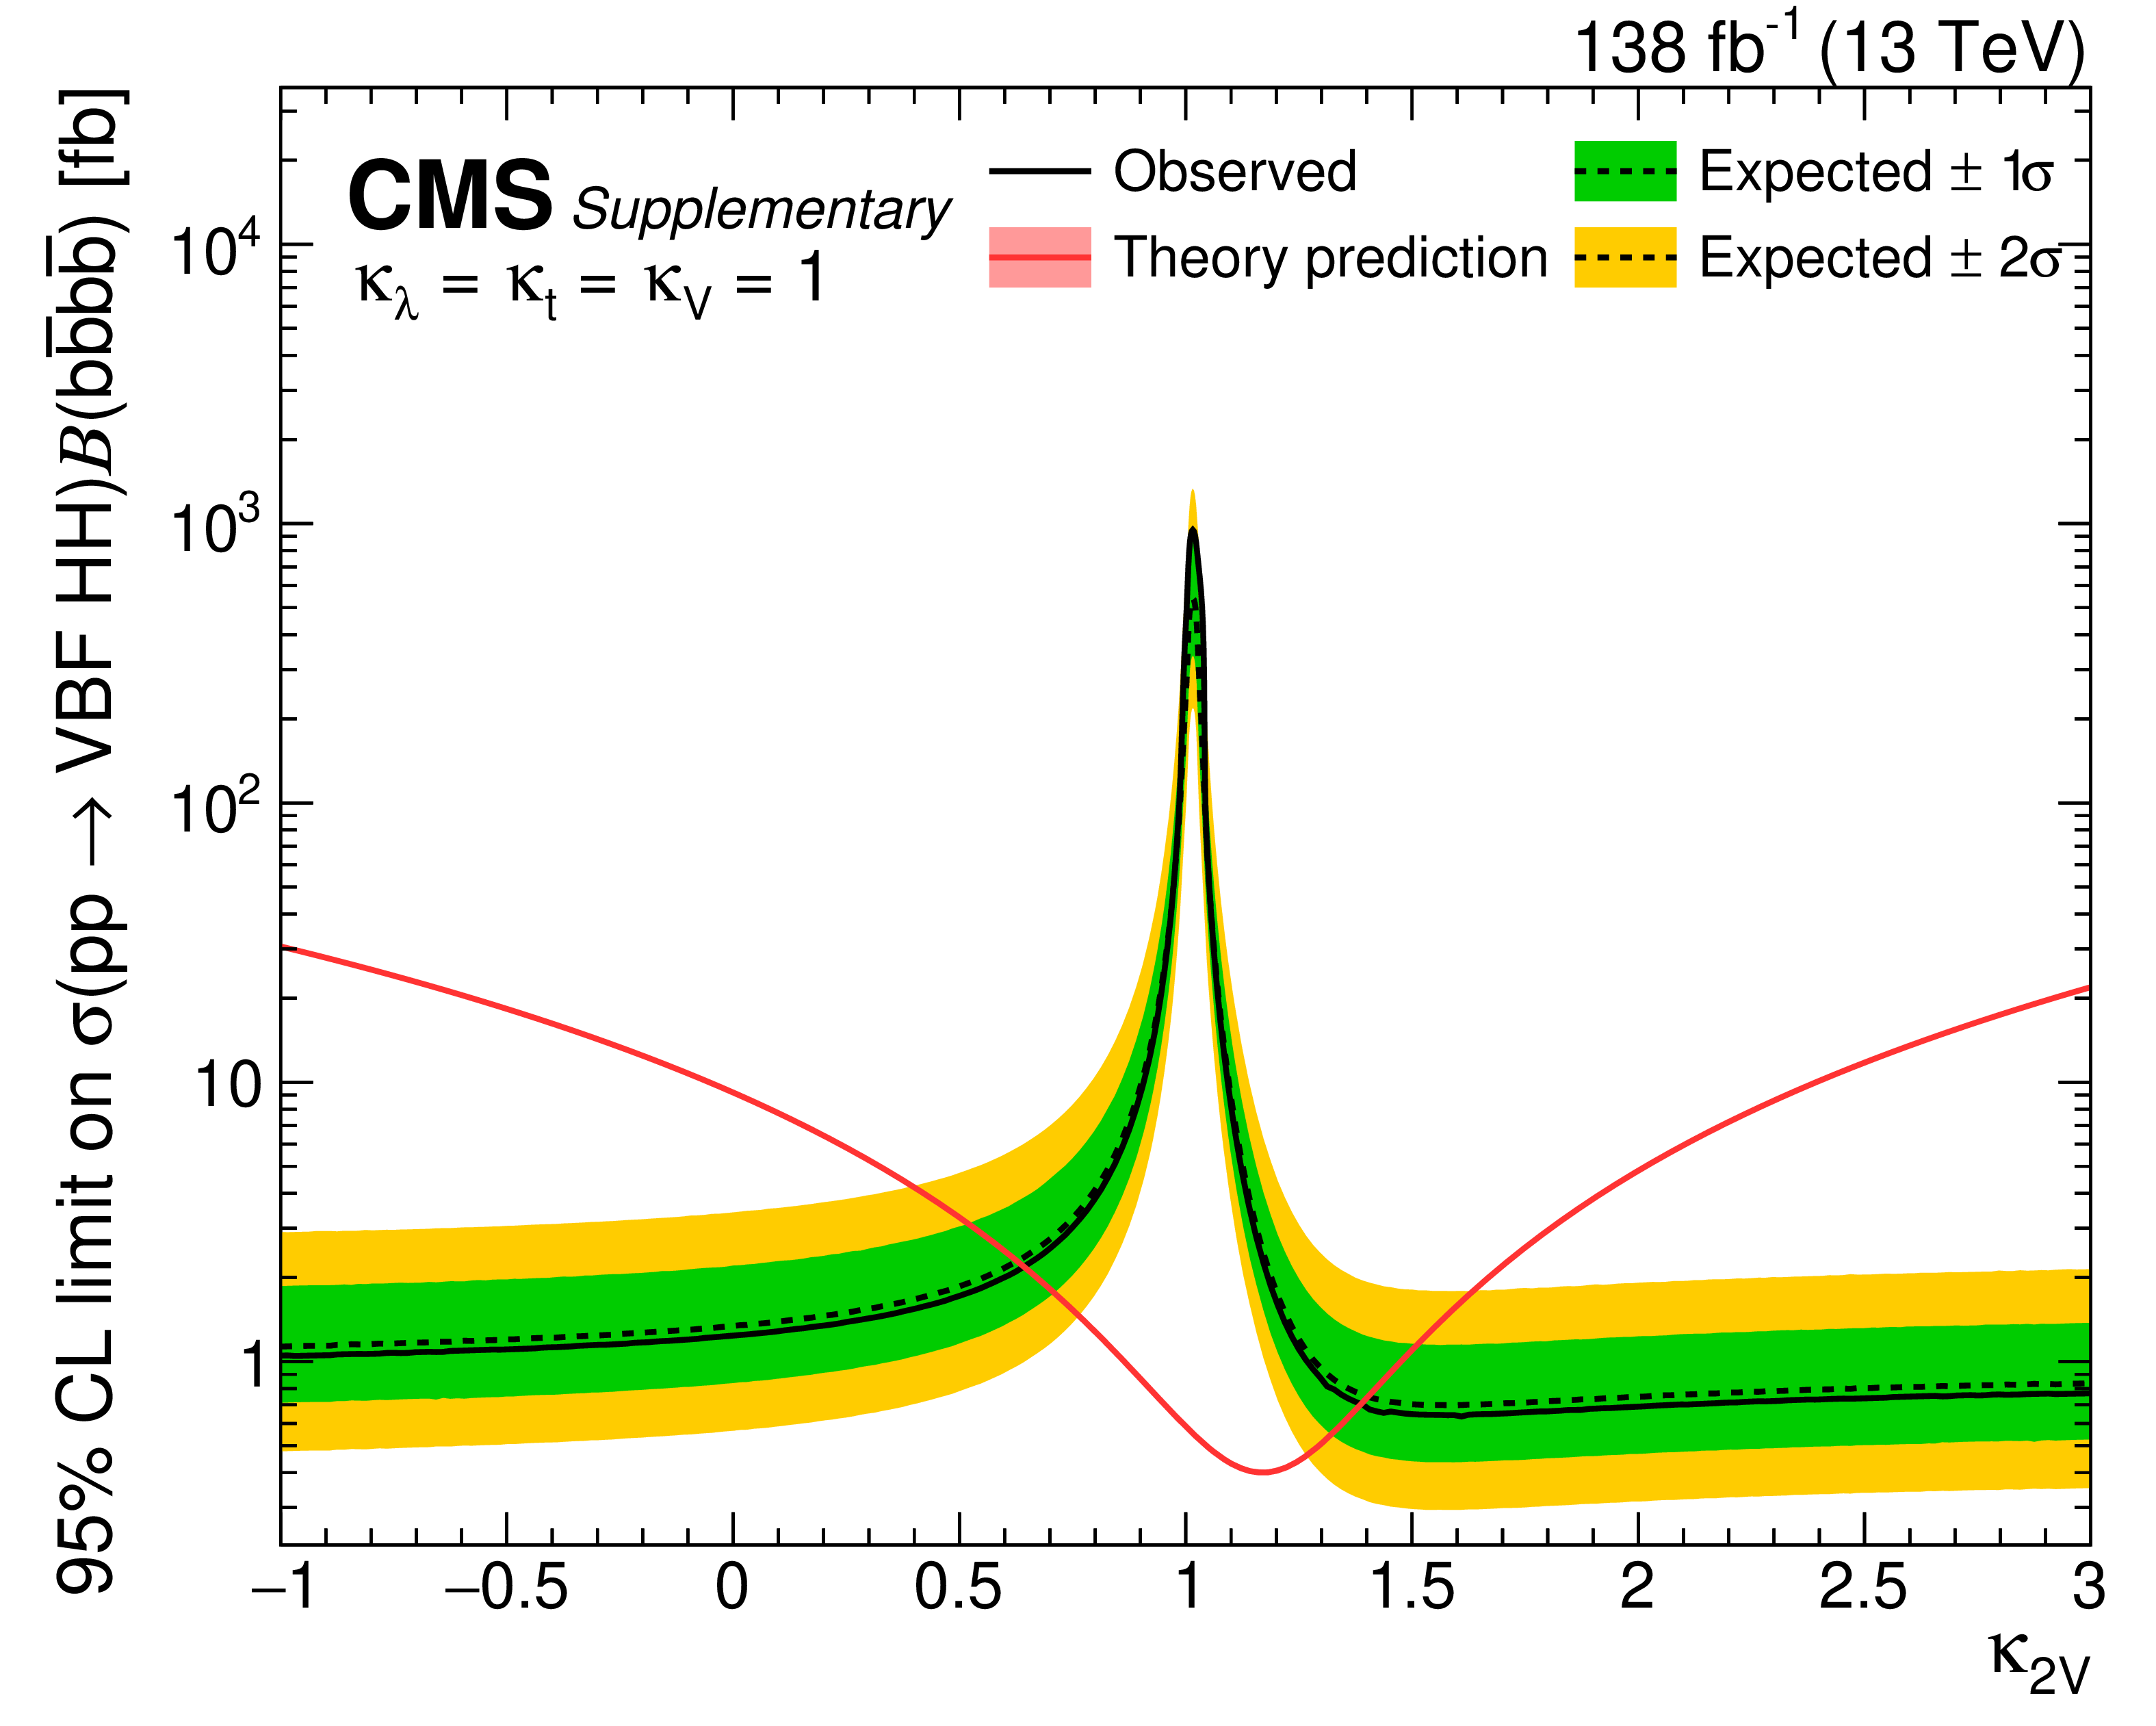
Observed (solid line) and expected (dashed line) 95% CL exclusion limit on the product of the VBF HH production cross section and the branching fraction into $ \mathrm{b}\overline{\mathrm{b}}\mathrm{b}\overline{\mathrm{b}} $ as a function of $ \kappa_{2\mathrm{V}} $ is shown with other couplings fixed to the SM values. The green and yellow bands correspond to one and two standard deviations, respectively, around the expected median. The red solid line depicts the theoretical prediction for the VBF HH production cross section and the red band shows its uncertainty [113,114,8]. The crossings of observed limit and the theoretical cross section indicate the ranges of the coupling values excluded at 95% CL. |
png pdf |
Additional Figure 10-b:
Observed (solid line) and expected (dashed line) 95% CL exclusion limit on the product of the VBF HH production cross section and the branching fraction into $ \mathrm{b}\overline{\mathrm{b}}\mathrm{b}\overline{\mathrm{b}} $ as a function of $ \kappa_\mathrm{V} $ is shown with other couplings fixed to the SM values. The green and yellow bands correspond to one and two standard deviations, respectively, around the expected median. The red solid line depicts the theoretical prediction for the VBF HH production cross section and the red band shows its uncertainty [113,114,8]. The crossings of observed limit and the theoretical cross section indicate the ranges of the coupling values excluded at 95% CL. |
png pdf |
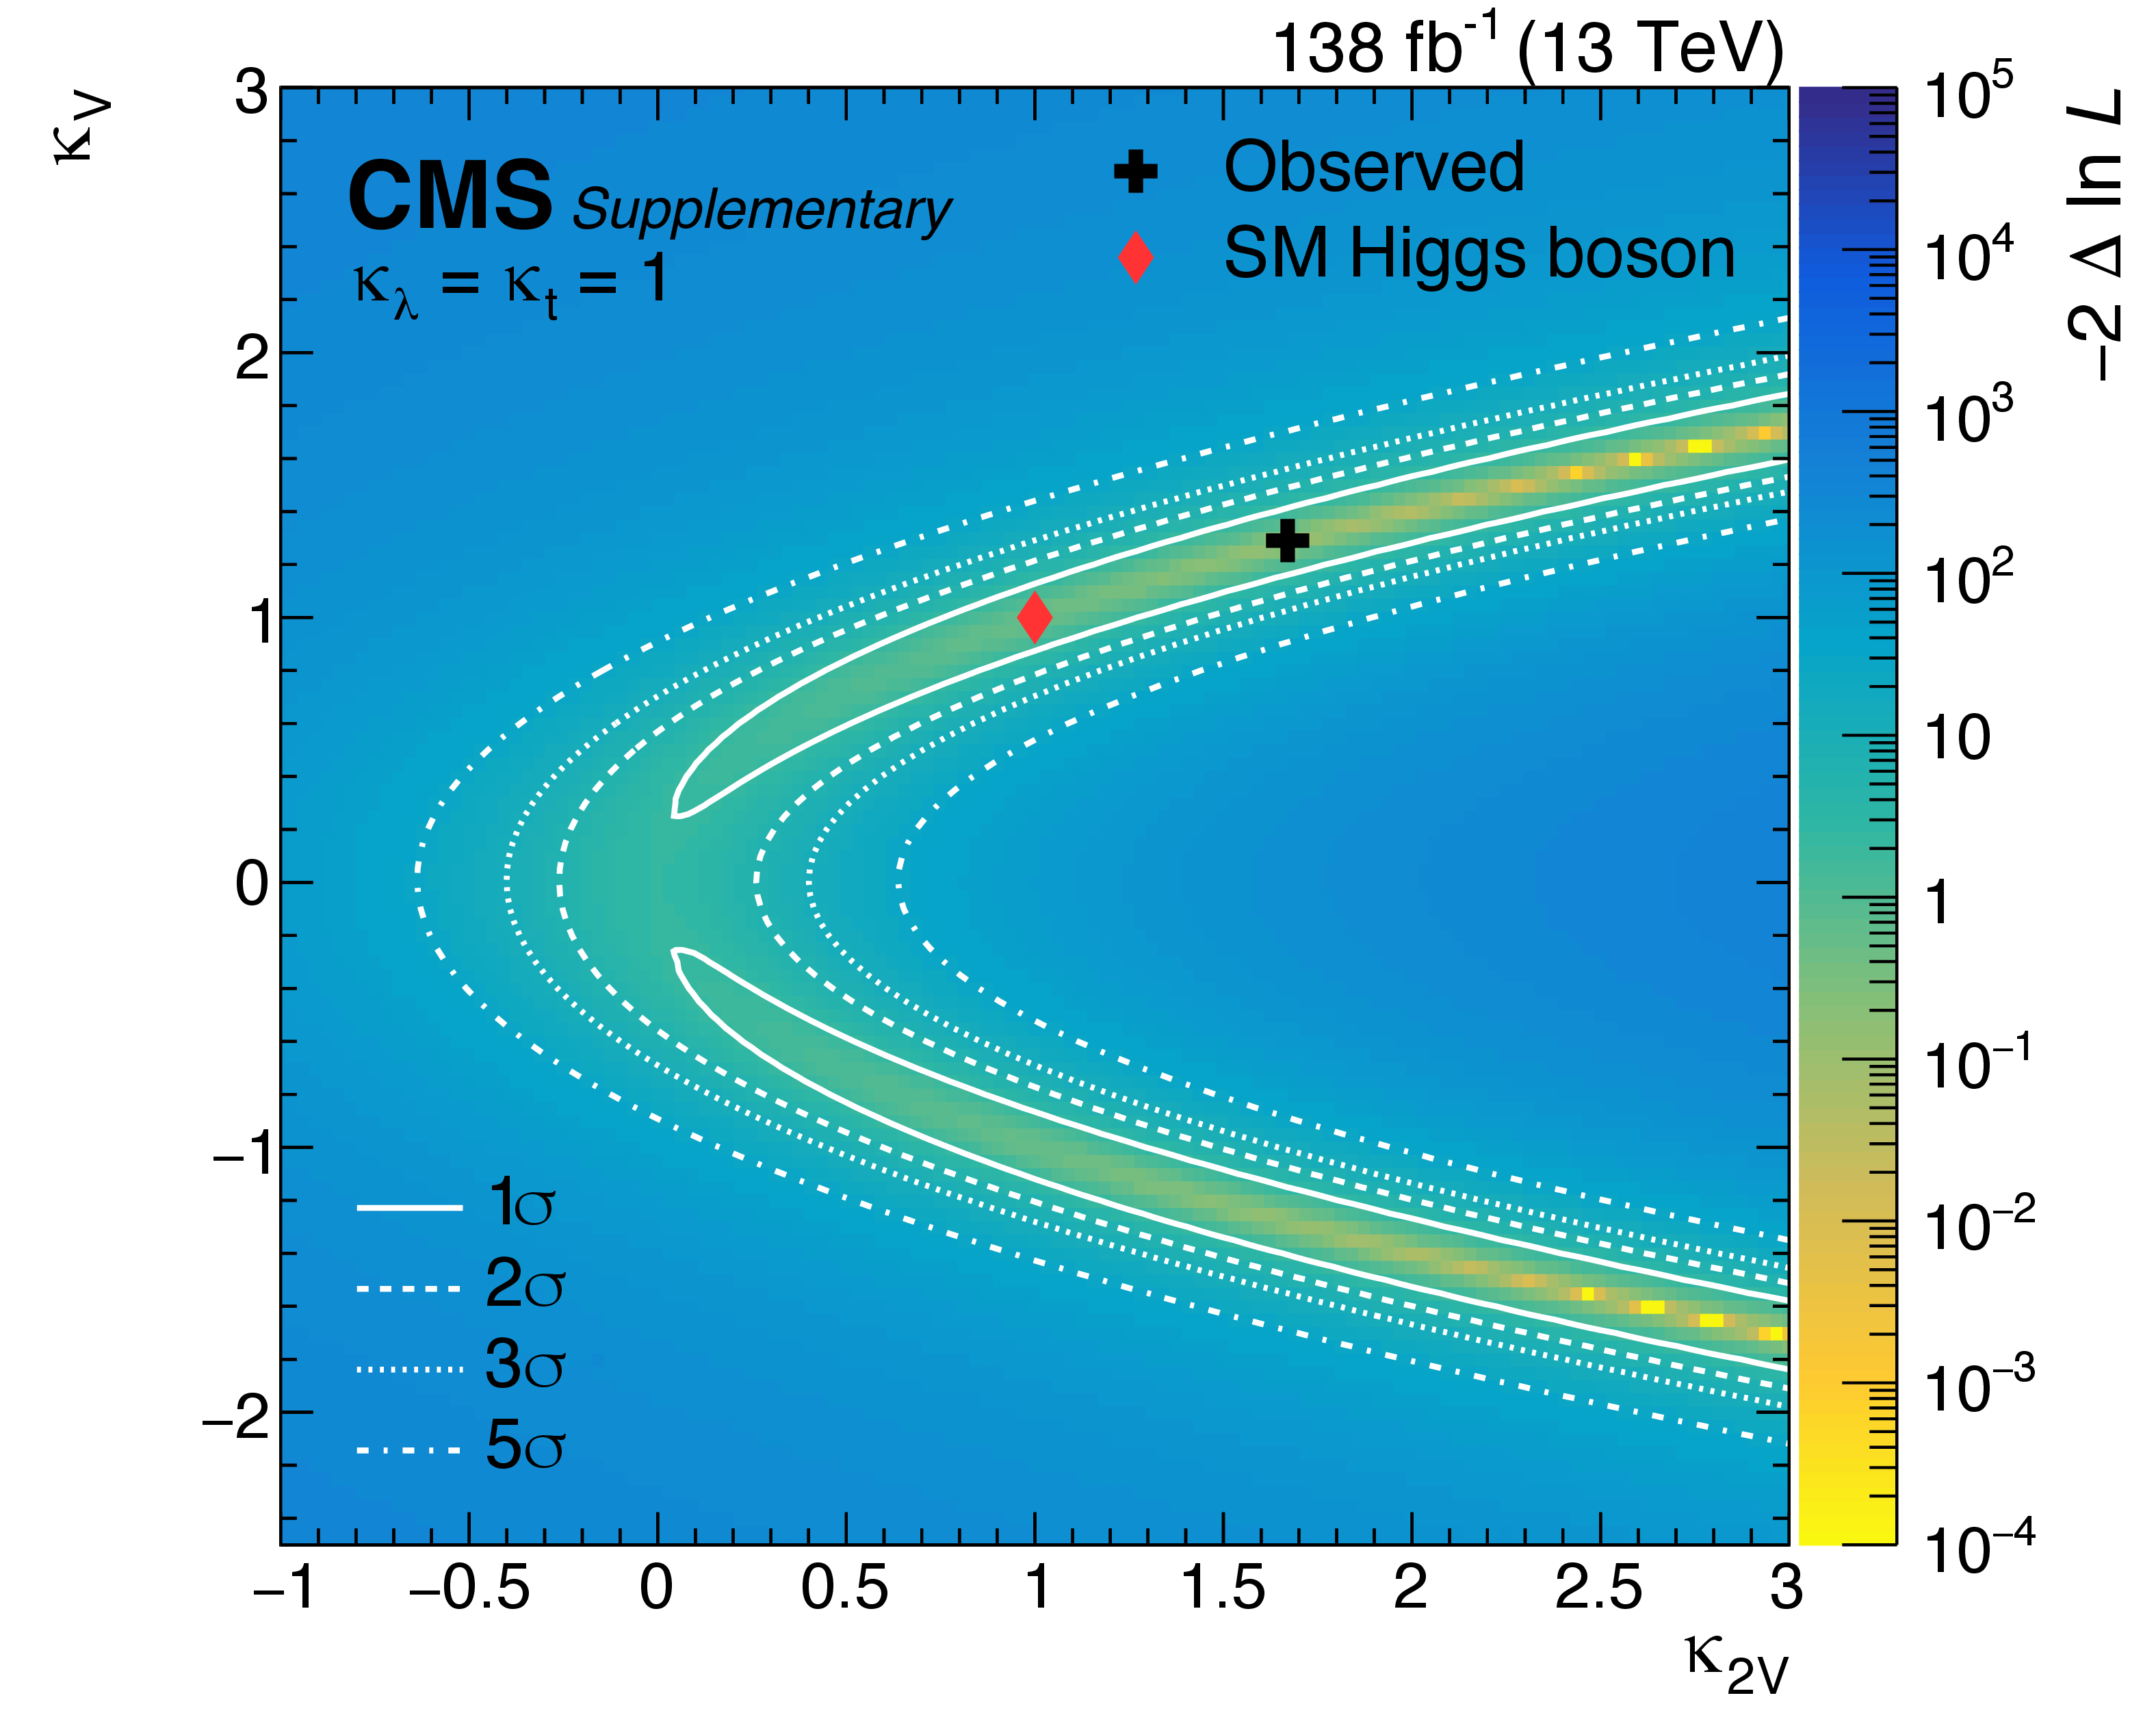
Additional Figure 11:
Two-parameter profile likelihood test statistic ($ -2\Delta\ln\mathcal{L} $) scan in data as a function of $ \kappa_{2\mathrm{V}} $ and $ \kappa_\mathrm{V} $. The black cross indicates the minimum, while the red diamond marks the SM expectation ($ \kappa_\lambda = \kappa_{2\mathrm{V}} = $ 1). The gray solid, dashed, dotted, and dash-dotted contours enclose the 1, 2, 3, and 5 $ \,\sigma \text{CL} $ regions, respectively. |

png pdf |
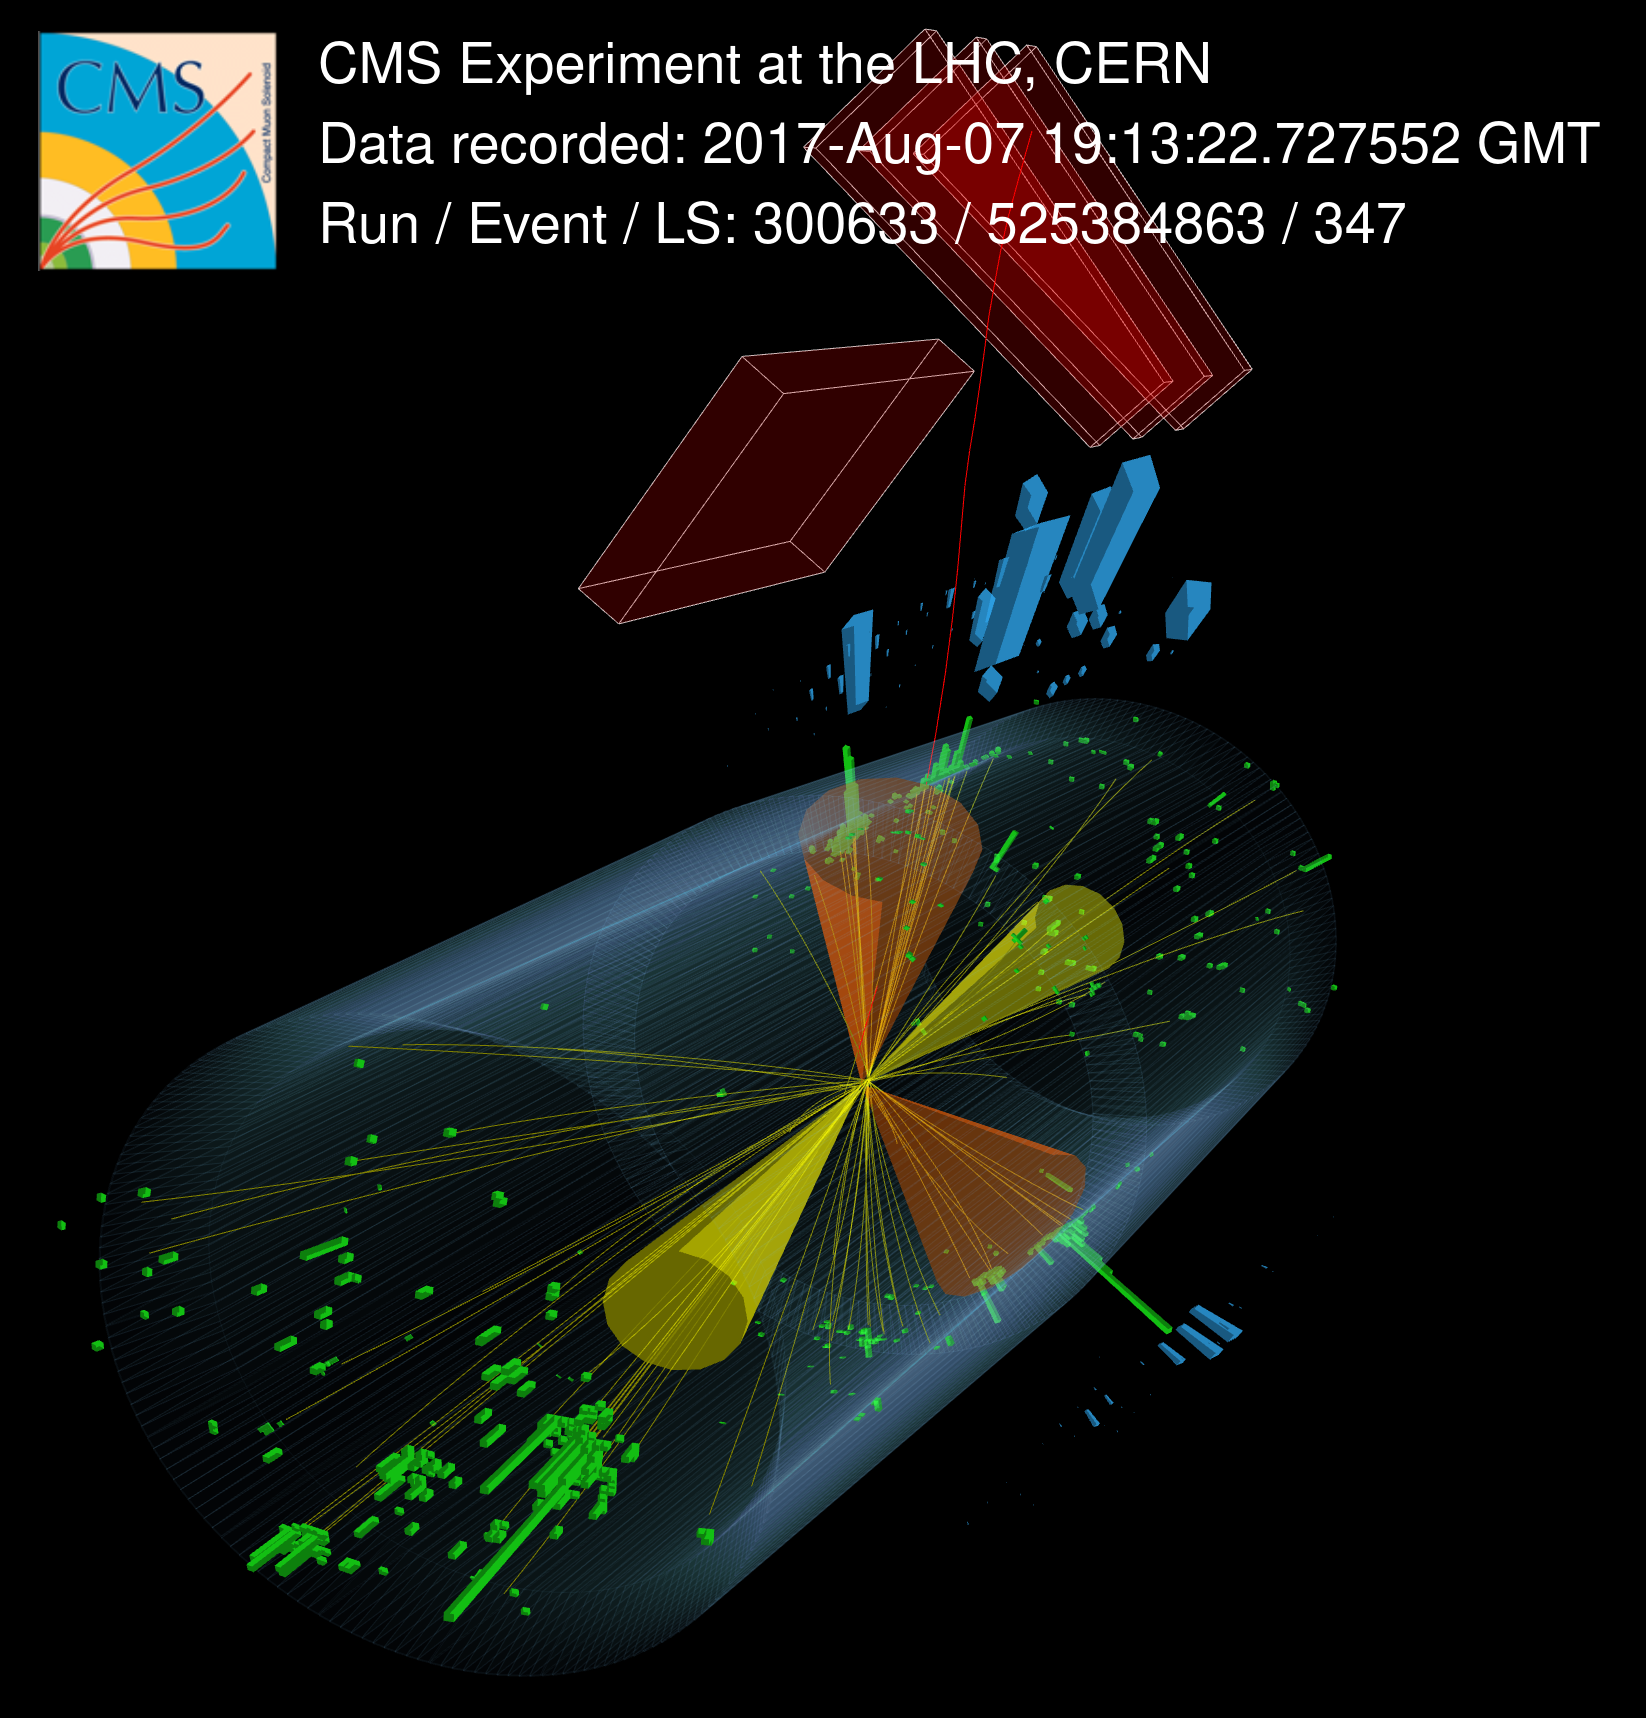
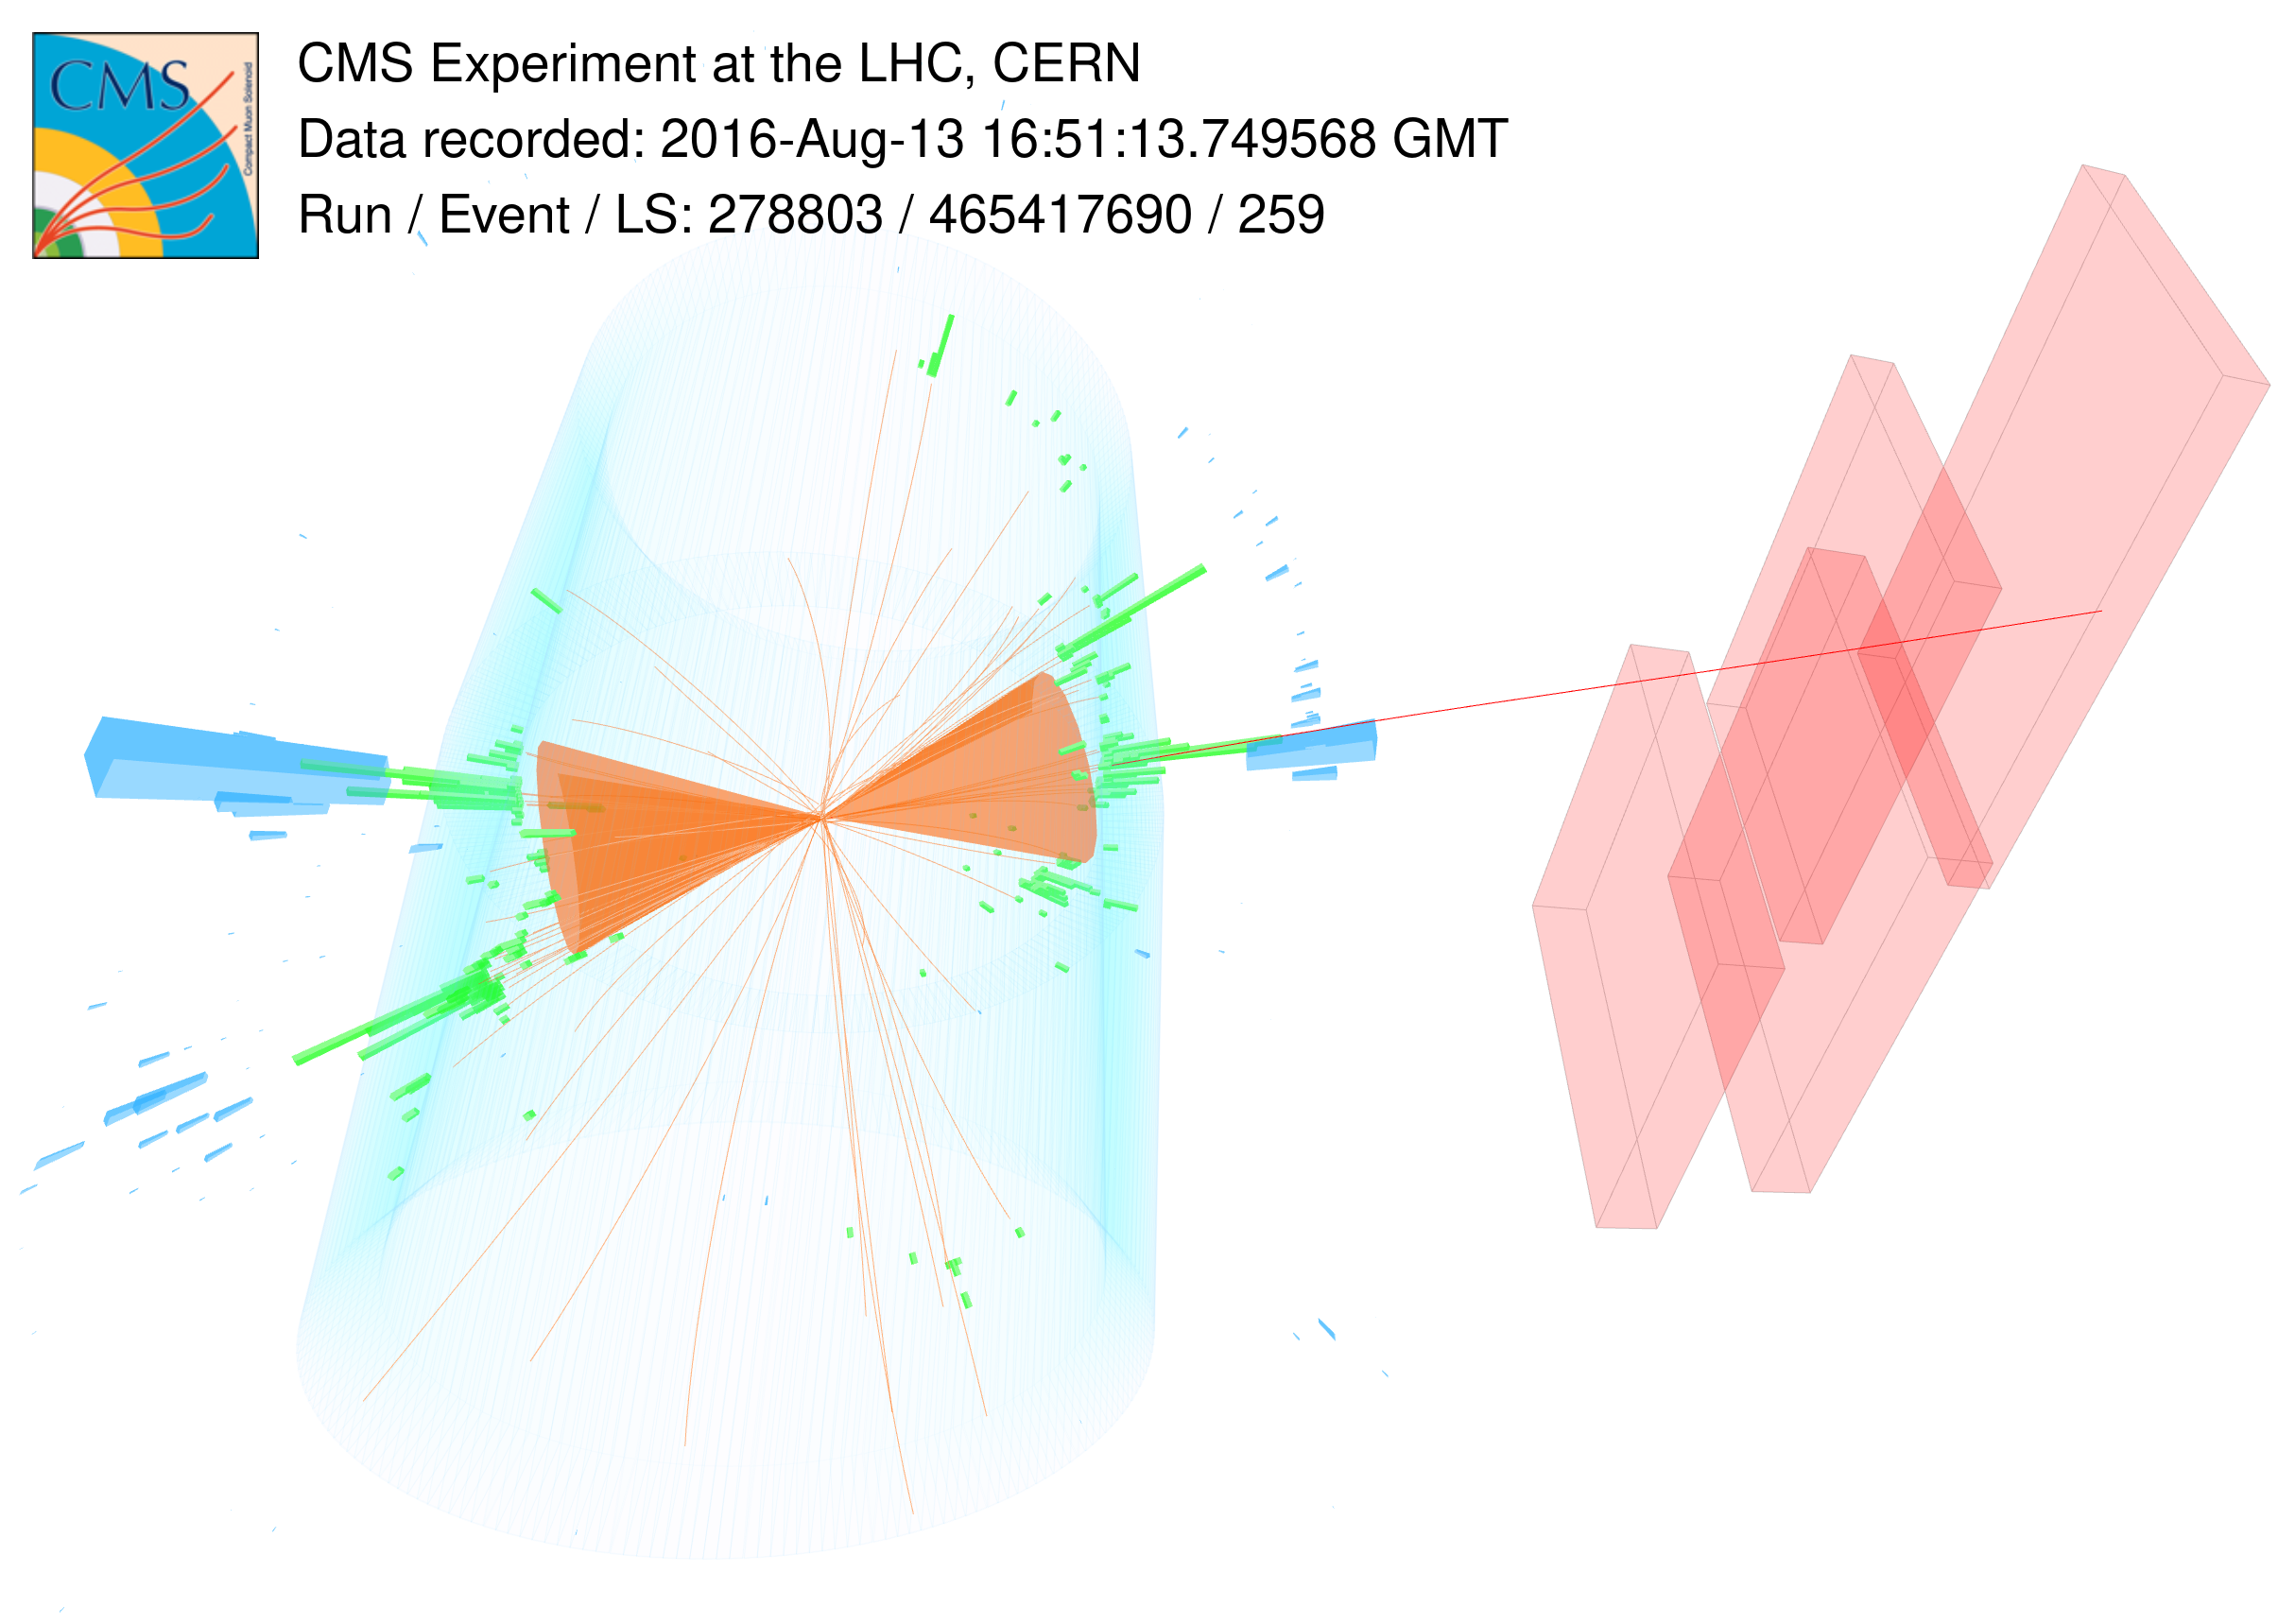
Additional Figure 12:
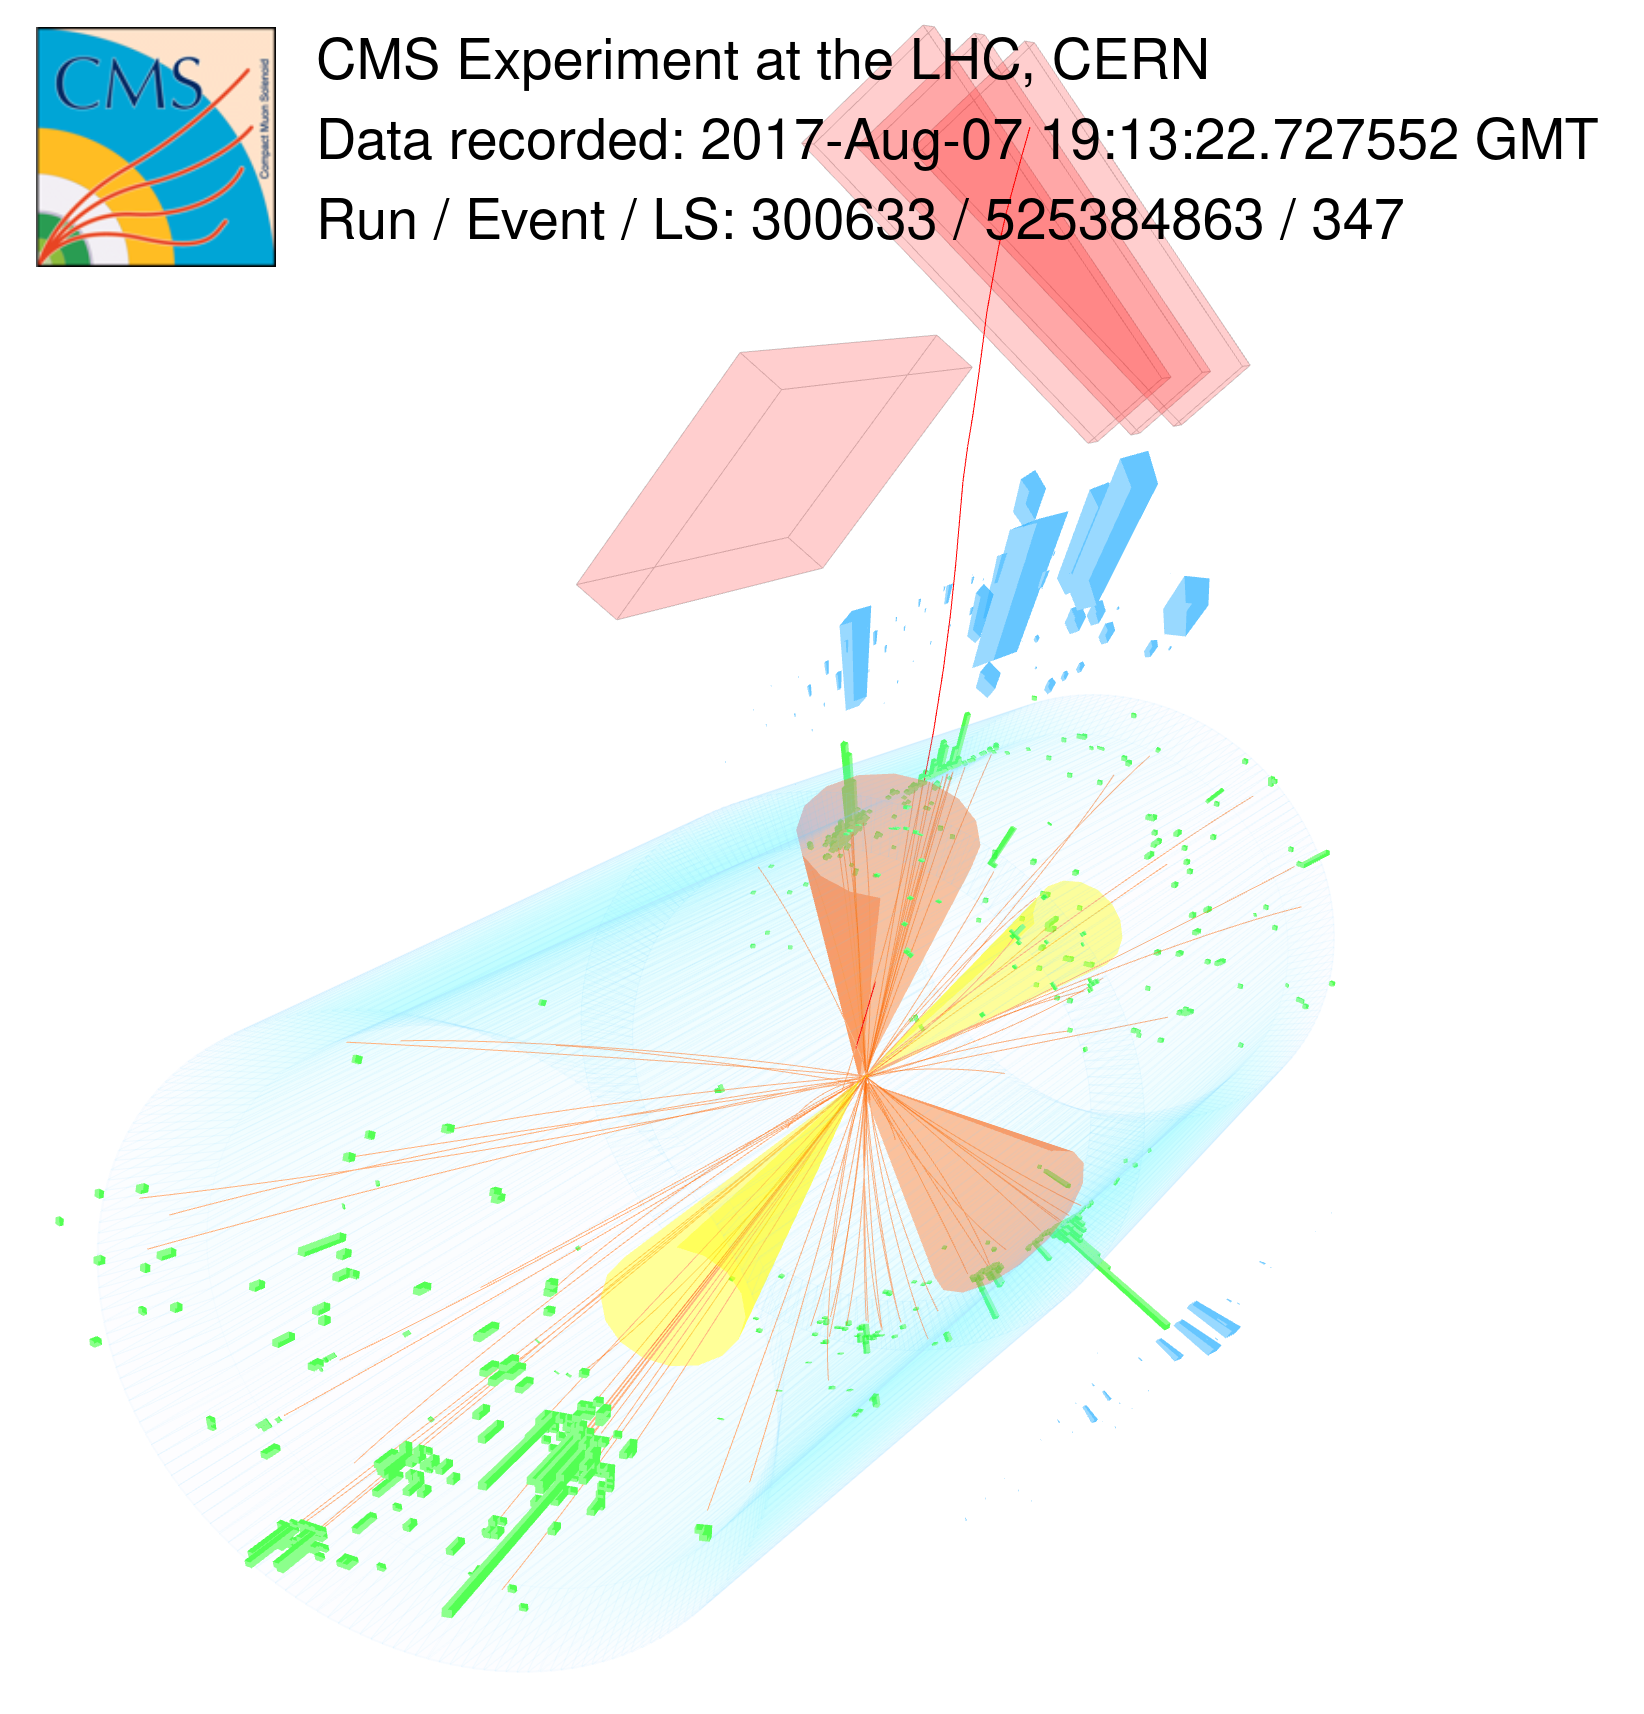
Two candidate events in which two Higgs bosons produced at large transverse momentum decay into collimated bottom quark-antiquark pairs, where both pairs are reconstructed as large-radius jets, represented by the orange cones. Two additional small-radius jets, represented by the yellow cones, are also measured in the forward segments of the detector in the event on the right. The energy deposits in the electromagnetic and hadron calorimeters are represented by green and blue boxes, respectively. In this visualization, only the former ones are displayed for the detector endcap regions. A muon (red line), potentially arising from a bottom hadron decay in one of the Higgs boson candidate jets, is measured in dedicated detectors (red boxes). The event signatures are consistent with gluon fusion (left) or vector boson fusion (right) production of a Higgs boson pair. |

png |
Additional Figure 12-a:
Candidate event in which two Higgs bosons produced at large transverse momentum decay into collimated bottom quark-antiquark pairs, where both pairs are reconstructed as large-radius jets, represented by the orange cones. The energy deposits in the electromagnetic and hadron calorimeters are represented by green and blue boxes, respectively. In this visualization, only the former ones are displayed for the detector endcap regions. A muon (red line), potentially arising from a bottom hadron decay in one of the Higgs boson candidate jets, is measured in dedicated detectors (red boxes). The event signature is consistent with vector boson fusion production of a Higgs boson pair. |
png |
Additional Figure 12-b:
Candidate event in which two Higgs bosons produced at large transverse momentum decay into collimated bottom quark-antiquark pairs, where both pairs are reconstructed as large-radius jets, represented by the orange cones. Two additional small-radius jets, represented by the yellow cones, are also measured in the forward segments of the detector. The energy deposits in the electromagnetic and hadron calorimeters are represented by green and blue boxes, respectively. In this visualization, only the former ones are displayed for the detector endcap regions. A muon (red line), potentially arising from a bottom hadron decay in one of the Higgs boson candidate jets, is measured in dedicated detectors (red boxes). The event signature is consistent with gluon fusion production of a Higgs boson pair. |
png |
Additional Figure 12-c:
Candidate event in which two Higgs bosons produced at large transverse momentum decay into collimated bottom quark-antiquark pairs, where both pairs are reconstructed as large-radius jets, represented by the orange cones. The energy deposits in the electromagnetic and hadron calorimeters are represented by green and blue boxes, respectively. In this visualization, only the former ones are displayed for the detector endcap regions. A muon (red line), potentially arising from a bottom hadron decay in one of the Higgs boson candidate jets, is measured in dedicated detectors (red boxes). The event signature is consistent with vector boson fusion production of a Higgs boson pair. |
png |
Additional Figure 12-d:
Candidate event in which two Higgs bosons produced at large transverse momentum decay into collimated bottom quark-antiquark pairs, where both pairs are reconstructed as large-radius jets, represented by the orange cones. Two additional small-radius jets, represented by the yellow cones, are also measured in the forward segments of the detector. The energy deposits in the electromagnetic and hadron calorimeters are represented by green and blue boxes, respectively. In this visualization, only the former ones are displayed for the detector endcap regions. A muon (red line), potentially arising from a bottom hadron decay in one of the Higgs boson candidate jets, is measured in dedicated detectors (red boxes). The event signature is consistent with gluon fusion production of a Higgs boson pair. |
png pdf |
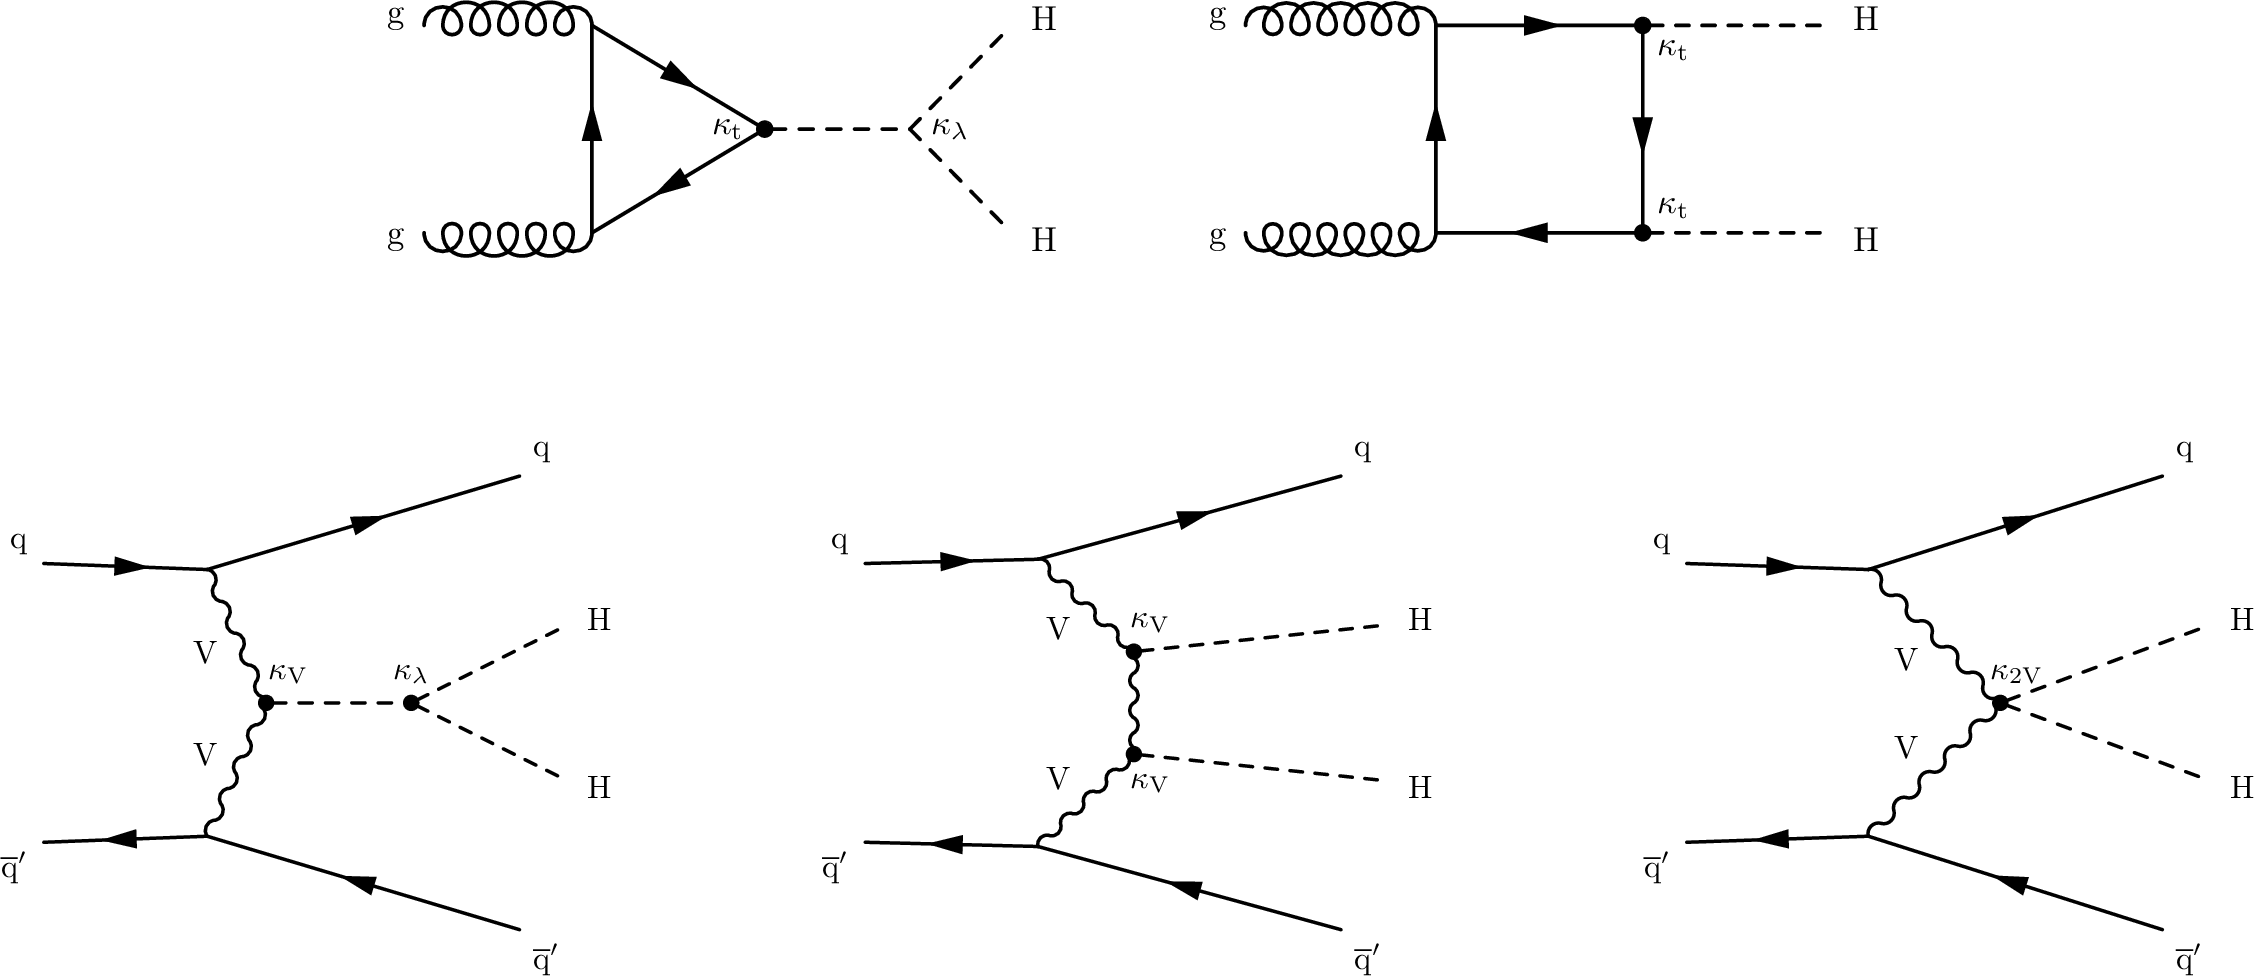
Additional Figure 13:
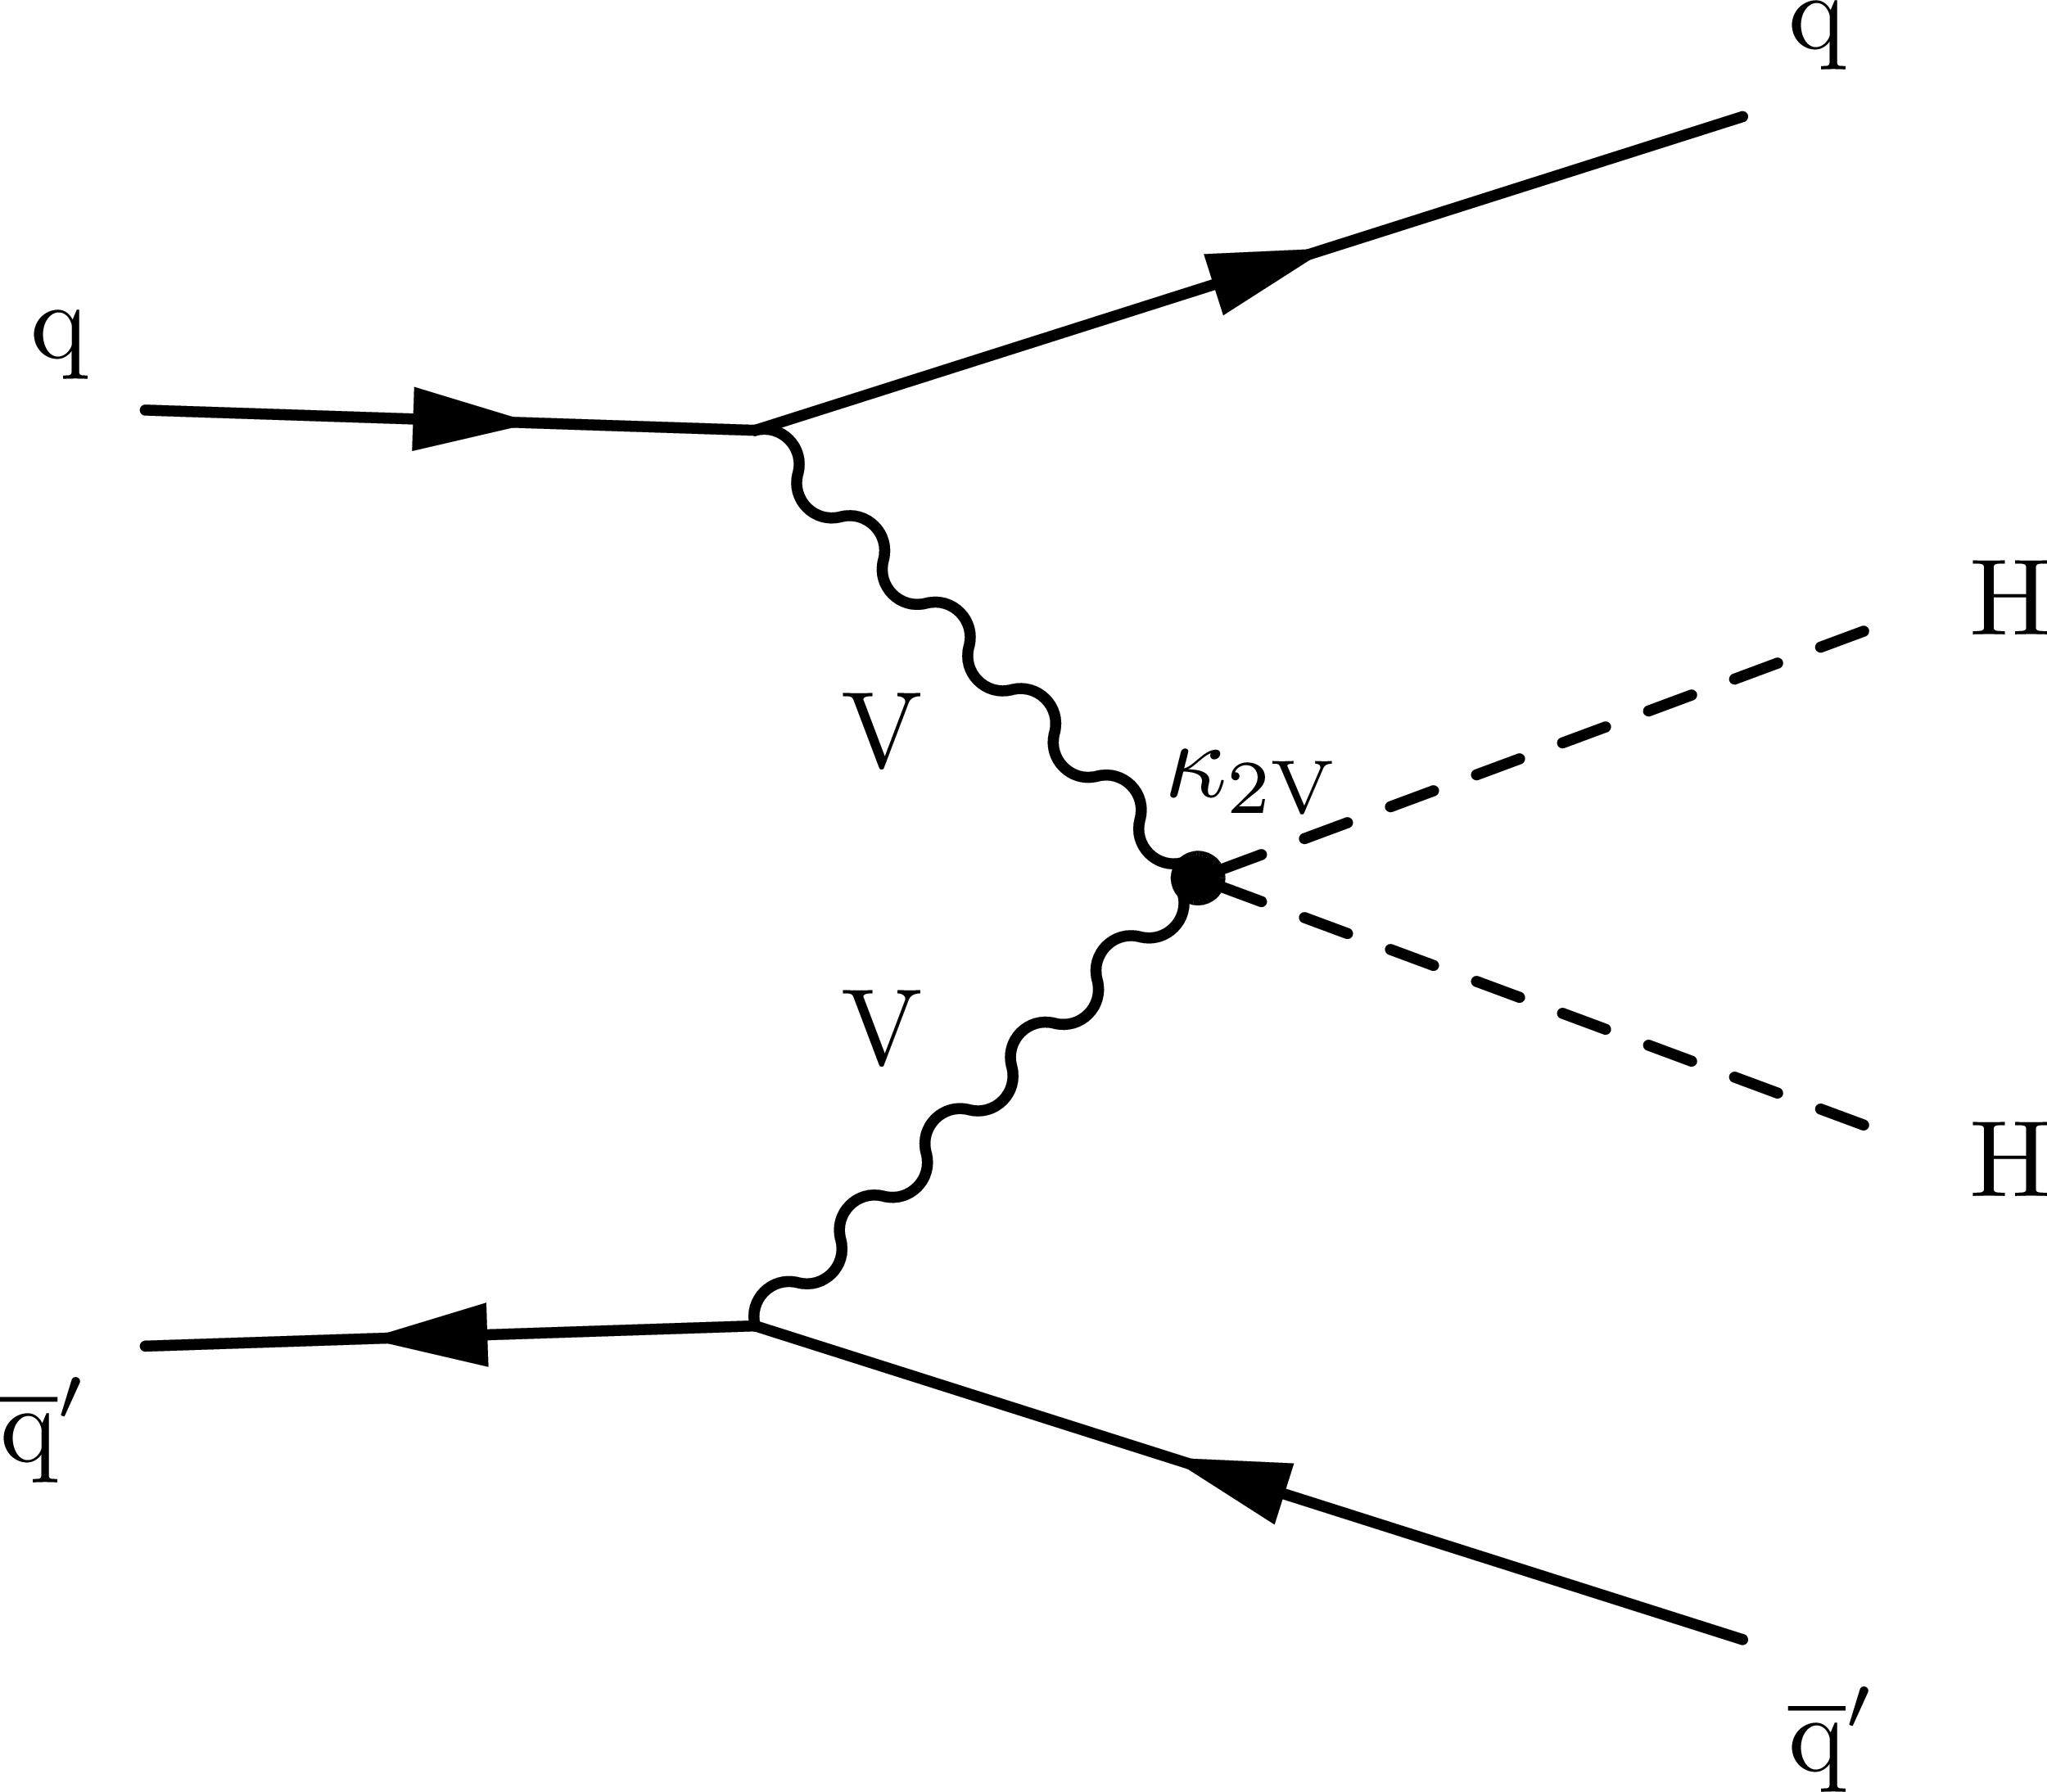
Leading-order Feynman diagrams for nonresonant HH production via gluon fusion (upper) and vector boson fusion (lower). |
png pdf |
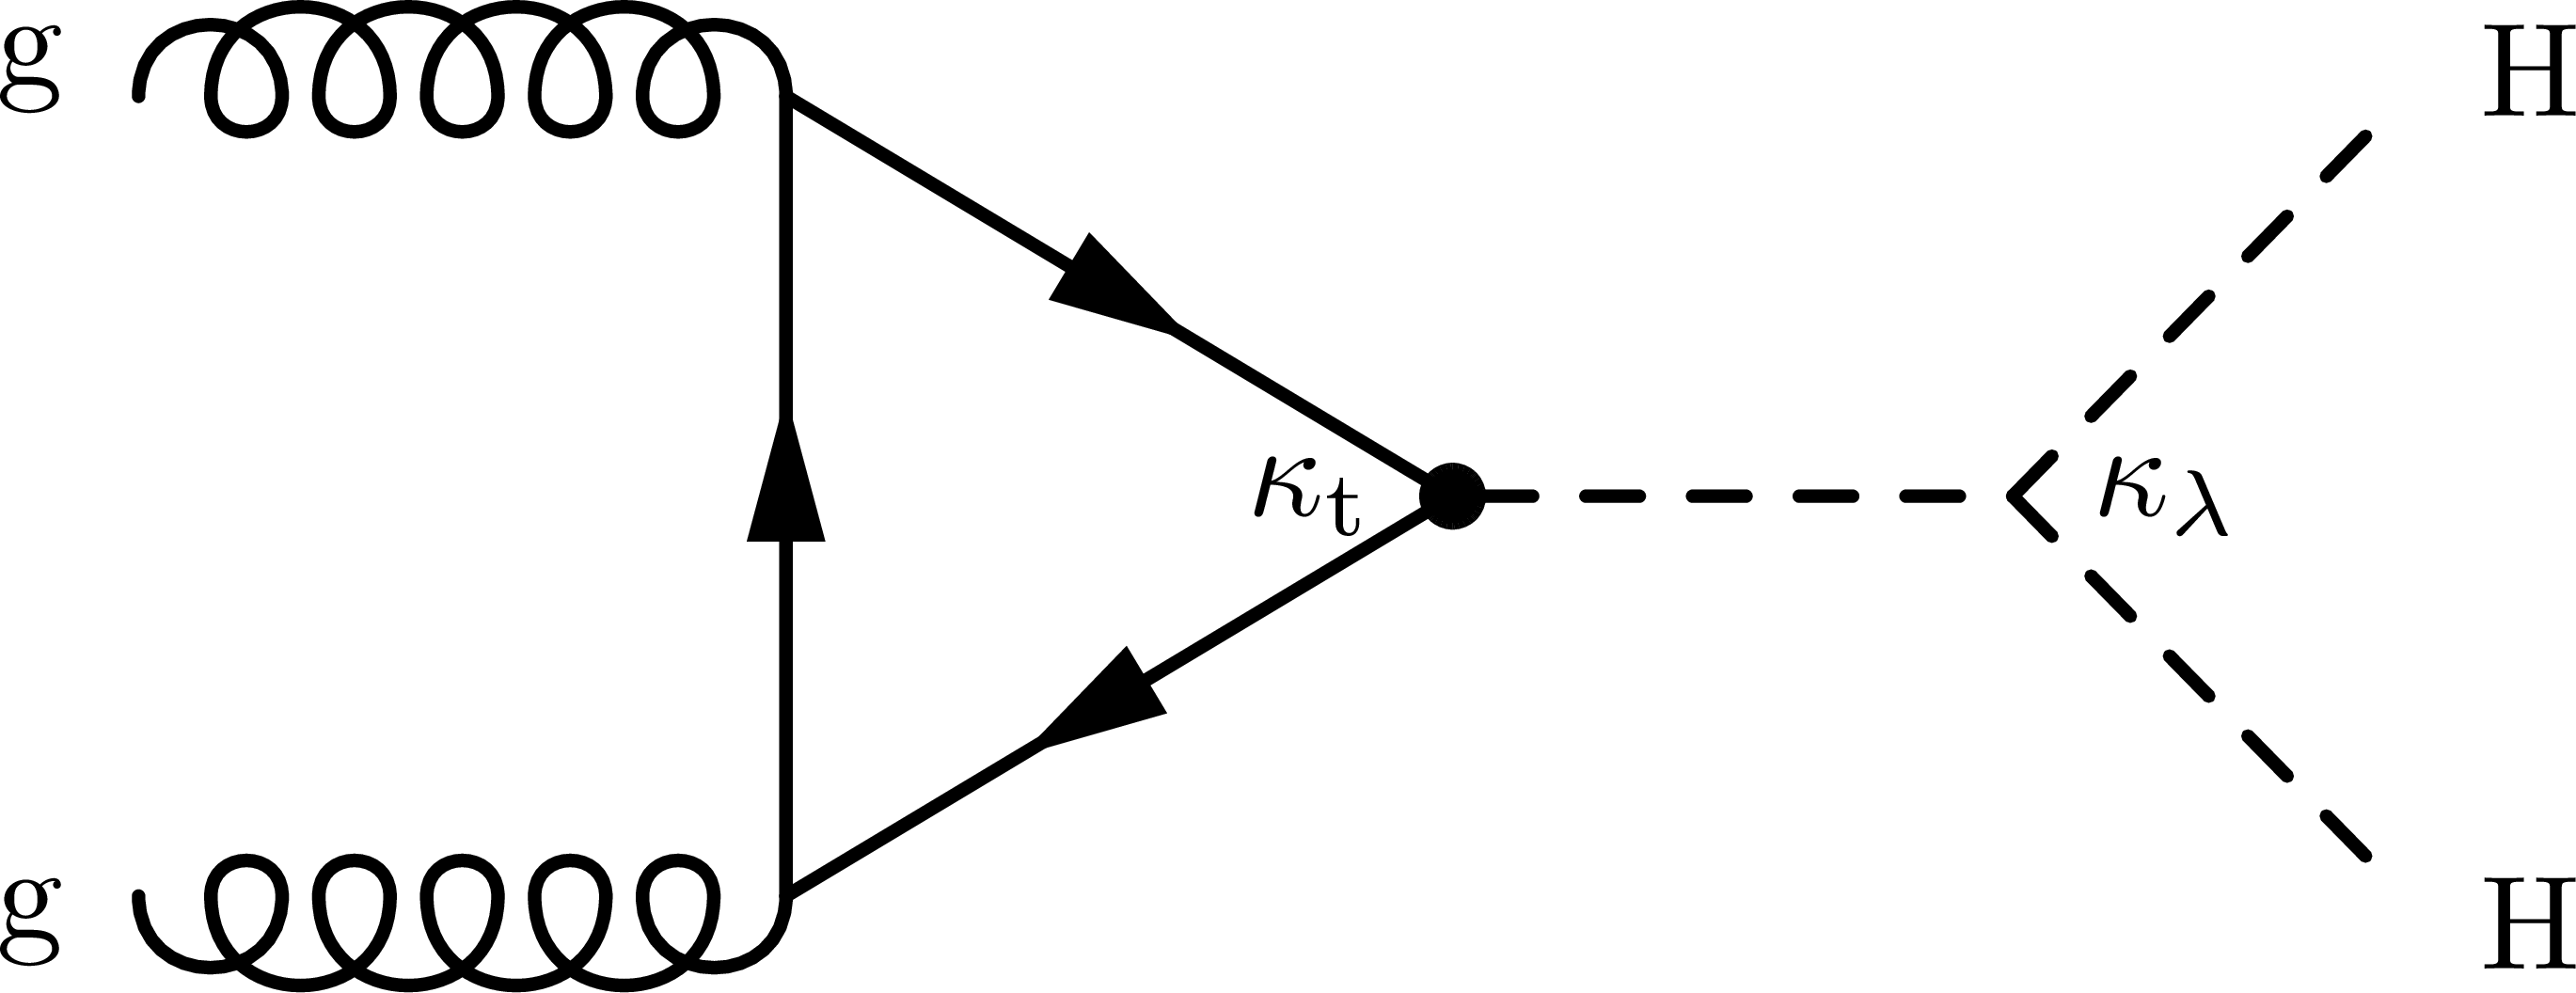
Additional Figure 13-a:
Leading-order Feynman diagram for nonresonant HH production via gluon fusion. |

png pdf |
Additional Figure 13-b:
Leading-order Feynman diagram for nonresonant HH production via gluon fusion. |

png pdf |
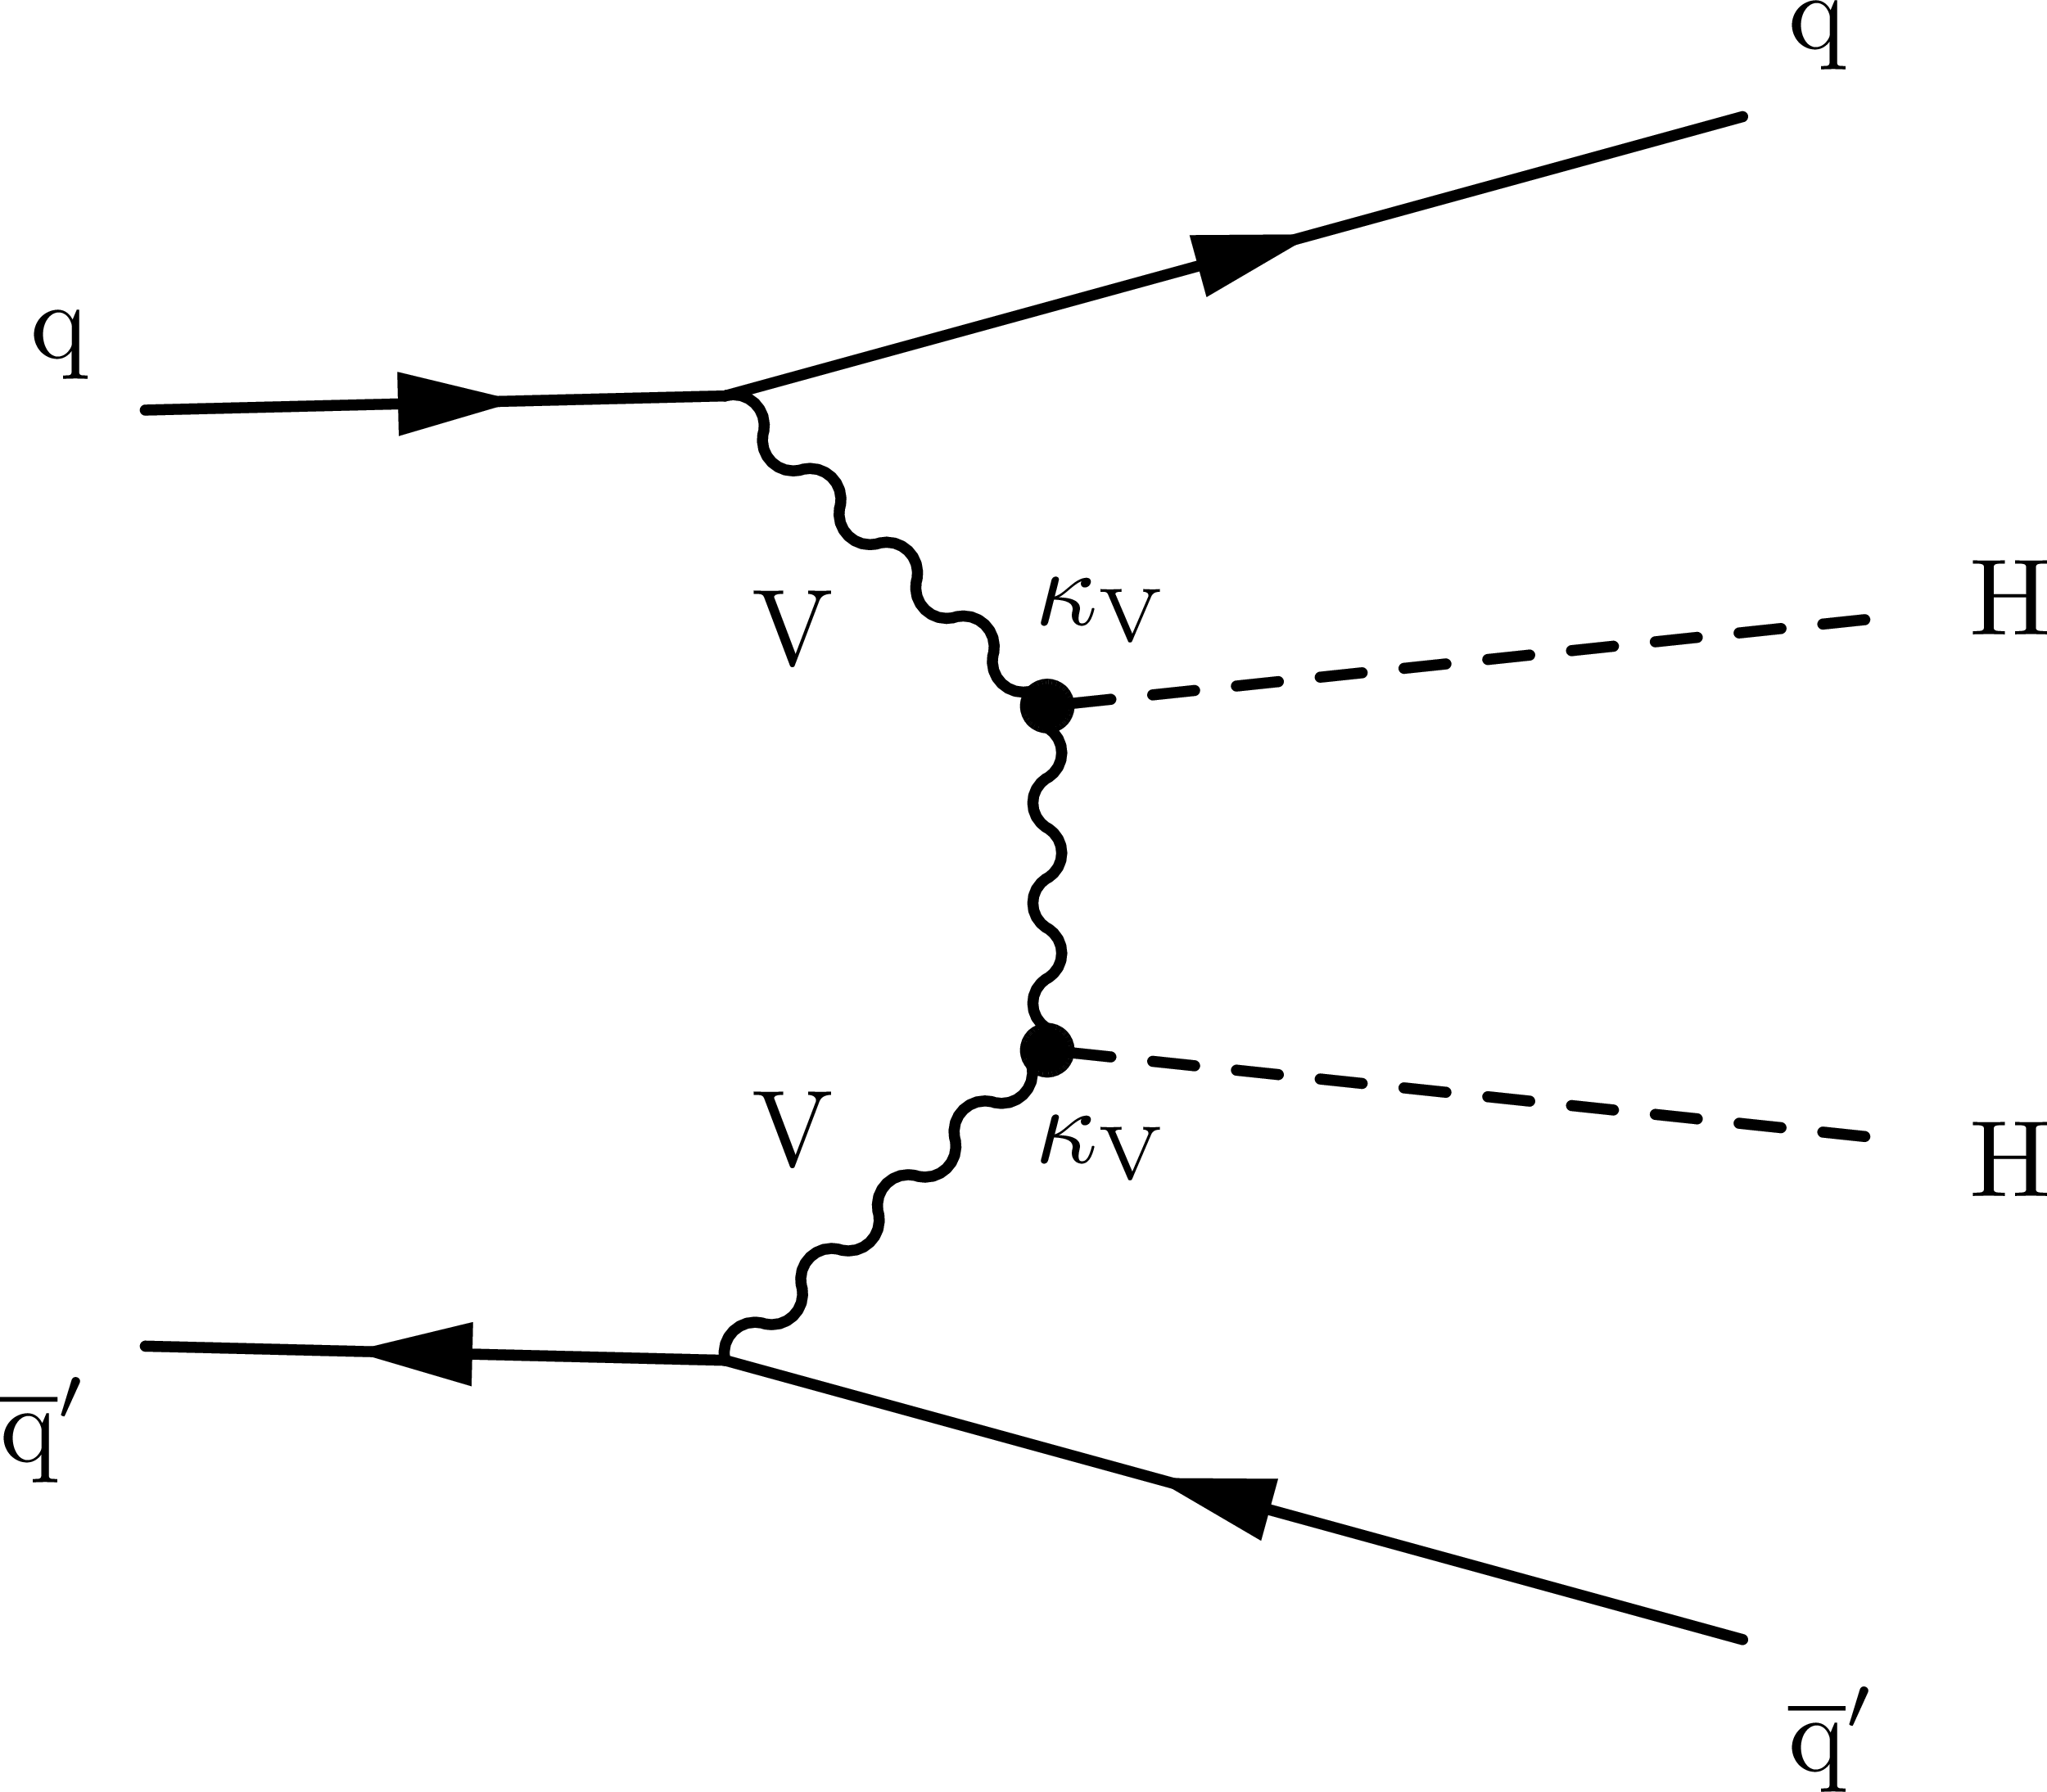
Additional Figure 13-c:
Leading-order Feynman diagram for nonresonant HH production via vector boson fusion. |
png pdf |
Additional Figure 13-d:
Leading-order Feynman diagram for nonresonant HH production via vector boson fusion. |
png pdf |
Additional Figure 13-e:
Leading-order Feynman diagram for nonresonant HH production via vector boson fusion. |
| Additional Tables | |
png pdf |
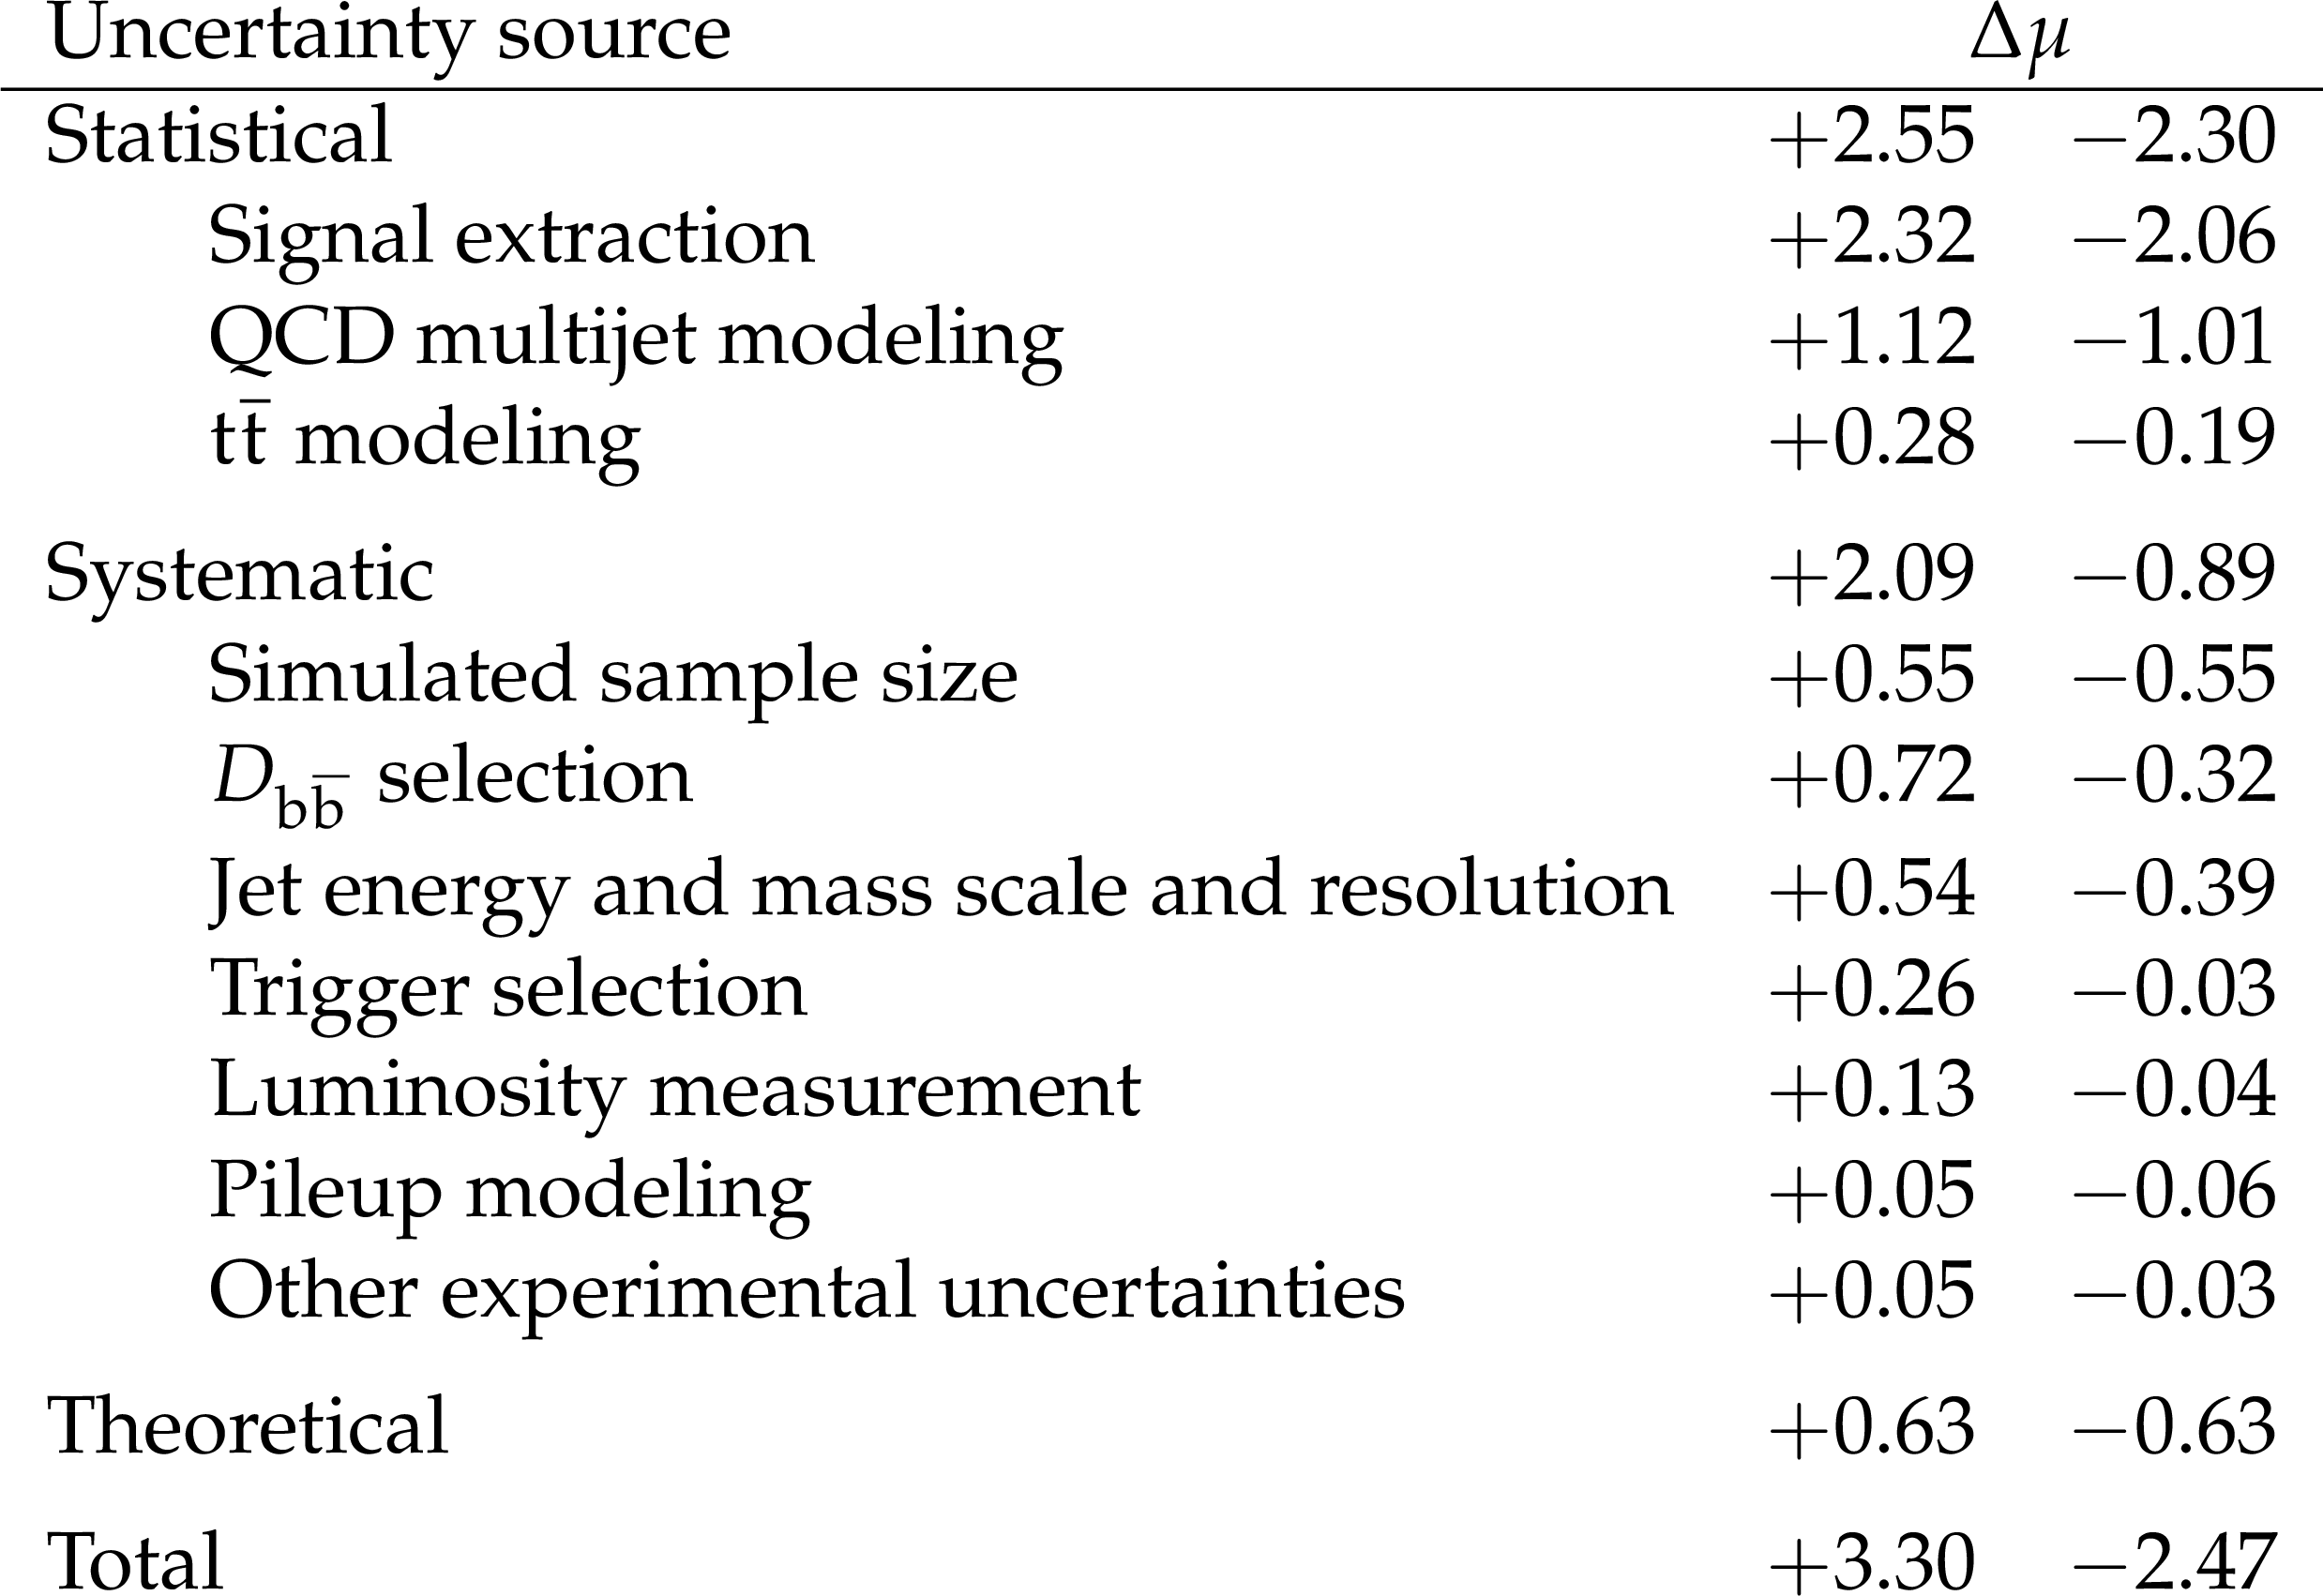
Additional Table 1:
Major sources of uncertainty in the measurement of the signal strength modifier $ \mu $, and their observed impact ($ \Delta\mu $) from a fit to the combined data set. Decompositions of the statistical, systematic, and theoretical components of the total uncertainty are specified. The impact of each uncertainty is evaluated by computing the uncertainty excluding that source and subtracting it in quadrature from the total uncertainty. The sum in quadrature for each source does not in general equal the total uncertainty of each component because of correlations in the combined fit between nuisance parameters corresponding to different sources. |
| References | ||||
| 1 | ATLAS Collaboration | Observation of a new particle in the search for the standard model Higgs boson with the ATLAS detector at the LHC | PLB 716 (2012) 1 | 1207.7214 |
| 2 | CMS Collaboration | Observation of a new boson at a mass of 125 GeV with the CMS experiment at the LHC | PLB 716 (2012) 30 | CMS-HIG-12-028 1207.7235 |
| 3 | CMS Collaboration | Observation of a new boson with mass near 125 GeV in pp collisions at $ \sqrt{s} = $ 7 and 8 TeV | JHEP 06 (2013) 081 | CMS-HIG-12-036 1303.4571 |
| 4 | M. Grazzini et al. | Higgs boson pair production at NNLO with top quark mass effects | JHEP 05 (2018) 059 | 1803.02463 |
| 5 | J. Baglio et al. | $ \mathrm{g}\mathrm{g}\to \mathrm{H}\mathrm{H} $: Combined uncertainties | PRD 103 (2021) 056002 | 2008.11626 |
| 6 | CMS Collaboration | Combined measurements of Higgs boson couplings in proton-proton collisions at $ \sqrt{s} = $ 13 TeV | EPJC 79 (2019) 421 | CMS-HIG-17-031 1809.10733 |
| 7 | ATLAS Collaboration | Combined measurements of Higgs boson production and decay using up to 80 fb$^{-1} of proton-proton collision data at $ \sqrt{s} = $ 13 TeV collected with the ATLAS experiment | PRD 101 (2020) 012002 | 1909.02845 |
| 8 | F. A. Dreyer and A. Karlberg | Vector-boson fusion Higgs pair production at N$ ^3 $LO | PRD 98 (2018) 114016 | 1811.07906 |
| 9 | ATLAS Collaboration | Search for Higgs boson pair production in the $ \gamma\gamma\mathrm{b\bar{b}} $ final state using pp collision data at $ \sqrt{s} = $ 8 TeV from the ATLAS detector | PRL 114 (2015) 081802 | 1406.5053 |
| 10 | CMS Collaboration | Search for Higgs boson pair production in the $ \gamma\gamma\mathrm{b\bar{b}} $ final state in pp collisions at $ \sqrt{s} = $ 13 TeV | PLB 788 (2019) 7 | CMS-HIG-17-008 1806.00408 |
| 11 | CMS Collaboration | Search for nonresonant Higgs boson pair production in final states with two bottom quarks and two photons in proton-proton collisions at $ \sqrt{s} = $ 13 TeV | JHEP 03 (2021) 257 | CMS-HIG-19-018 2011.12373 |
| 12 | ATLAS Collaboration | Search for Higgs boson pair production in the two bottom quarks plus two photons final state in pp collisions at $ \sqrt{s} = $ 13 TeV with the ATLAS detector | 2021. Submitted to PRD | 2112.11876 |
| 13 | CMS Collaboration | Search for Higgs boson pair production in the $ \mathrm{b}\mathrm{b}\tau\tau $ final state in proton-proton collisions at $ \sqrt{s} = $ 8 TeV | PRD 96 (2017) 072004 | CMS-HIG-15-013 1707.00350 |
| 14 | ATLAS Collaboration | Search for resonant and non-resonant Higgs boson pair production in the $ \mathrm{b\bar{b}}\tau^+\tau^- $ decay channel in pp collisions at $ \sqrt{s} = $ 13 TeV with the ATLAS detector | PRL 121 (2018) 191801 | 1808.00336 |
| 15 | ATLAS Collaboration | Search for Higgs boson pair production in the $ \mathrm{b\bar{b}}\mathrm{b\bar{b}} $ final state from pp collisions at $ \sqrt{s} = $ 8 TeV with the ATLAS detector | EPJC 75 (2015) 412 | 1506.00285 |
| 16 | ATLAS Collaboration | Search for pair production of Higgs bosons in the $ \mathrm{b\bar{b}}\mathrm{b\bar{b}} $ final state using proton-proton collisions at $ \sqrt{s} = $ 13 TeV with the ATLAS detector | PRD 94 (2016) 052002 | 1606.04782 |
| 17 | ATLAS Collaboration | Search for pair production of Higgs bosons in the $ \mathrm{b\bar{b}}\mathrm{b\bar{b}} $ final state using proton-proton collisions at $ \sqrt{s} = $ 13 TeV with the ATLAS detector | JHEP 01 (2019) 030 | 1804.06174 |
| 18 | CMS Collaboration | Search for nonresonant Higgs boson pair production in the $ \mathrm{ b\bar{b} b\bar{b} } $ final state at $ \sqrt{s} = $ 13 TeV | JHEP 04 (2019) 112 | CMS-HIG-17-017 1810.11854 |
| 19 | ATLAS Collaboration | Search for the $ \mathrm{ HH }\to\mathrm{ b\bar{b} b\bar{b} } $ process via vector-boson fusion production using proton-proton collisions at $ \sqrt{s} = $ 13 TeV with the ATLAS detector | JHEP 07 (2020) 108 | 2001.05178 |
| 20 | CMS Collaboration | Search for Higgs boson pair production in the four b quark final state in proton-proton collisions at $ \sqrt{s} = $ 13 TeV | 2022. Submitted to \emphPRLett | CMS-HIG-20-005 2202.09617 |
| 21 | CMS Collaboration | Search for resonant and nonresonant Higgs boson pair production in the $ \mathrm{b\bar{b}}\ell\nu\ell\nu $ final state in proton-proton collisions at $ \sqrt{s} = $ 13 TeV | JHEP 01 (2018) 054 | CMS-HIG-17-006 1708.04188 |
| 22 | ATLAS Collaboration | Search for Higgs boson pair production in the $ \mathrm{b\bar{b}}\mathrm{W}\mathrm{W}^{\ast} $ decay mode at $ \sqrt{s} = $ 13 TeV with the ATLAS detector | JHEP 04 (2019) 092 | 1811.04671 |
| 23 | ATLAS Collaboration | Search for non-resonant Higgs boson pair production in the $ \mathrm{b}\mathrm{b}\ell\nu\ell\nu $ final state with the ATLAS detector in pp collisions at $ \sqrt{s} = $ 13 TeV | PLB 801 (2020) 135145 | 1908.06765 |
| 24 | CMS Collaboration | Search for resonant pair production of Higgs bosons in the $ \mathrm{b}\mathrm{b}\mathrm{Z}\mathrm{Z} $ channel in proton-proton collisions at $ \sqrt{s} = $ 13 TeV | PRD 102 (2020) 032003 | CMS-HIG-18-013 2006.06391 |
| 25 | ATLAS Collaboration | Searches for Higgs boson pair production in the $ \mathrm{H}\mathrm{H}\to \mathrm{b}\mathrm{b}\tau\tau, \gamma\gamma \mathrm{W}\mathrm{W}^{\ast}, \gamma\gamma\mathrm{b}\mathrm{b}, \mathrm{b}\mathrm{b}\mathrm{b}\mathrm{b} $ channels with the ATLAS detector | PRD 92 (2015) 092004 | 1509.04670 |
| 26 | CMS Collaboration | Combination of searches for Higgs boson pair production in proton-proton collisions at $ \sqrt{s} = $ 13 TeV | PRL 122 (2019) 121803 | CMS-HIG-17-030 1811.09689 |
| 27 | ATLAS Collaboration | Combination of searches for Higgs boson pairs in pp collisions at $ \sqrt{s} = $ 13 TeV with the ATLAS detector | PLB 800 (2020) 135103 | 1906.02025 |
| 28 | M. J. Dolan, C. Englert, N. Greiner, and M. Spannowsky | Production of $ \mathrm{H}\mathrm{H} jj $ at the LHC | PRL 112 (2014) 101802 | 1310.1084 |
| 29 | M. J. Dolan et al. | $ \mathrm{H}\mathrm{H} jj $ production at the LHC | EPJC 75 (2015) 387 | 1506.08008 |
| 30 | F. Bishara, R. Contino, and J. Rojo | Higgs pair production in vector-boson fusion at the LHC and beyond | EPJC 77 (2017) 481 | 1611.03860 |
| 31 | E. Arganda, C. Garcia-Garcia, and M. J. Herrero | Probing the Higgs self-coupling through double Higgs production in vector boson scattering at the LHC | NPB 945 (2019) 114687 | 1807.09736 |
| 32 | G. F. Giudice, C. Grojean, A. Pomarol, and R. Rattazzi | The strongly-interacting light Higgs | JHEP 06 (2007) 045 | hep-ph/0703164 |
| 33 | H. Qu and L. Gouskos | Jet tagging via particle clouds | PRD 101 (2020) 056019 | 1902.08570 |
| 34 | CMS Collaboration | The CMS experiment at the CERN LHC | JINST 3 (2008) S08004 | CMS-00-001 |
| 35 | CMS Collaboration | The CMS trigger system | JINST 12 (2017) P01020 | CMS-TRG-12-001 1609.02366 |
| 36 | CMS Collaboration | Performance of the CMS Level-1 trigger in proton-proton collisions at $ \sqrt{s} = $ 13 TeV | JINST 15 (2020) P10017 | CMS-TRG-17-001 2006.10165 |
| 37 | CMS Collaboration | Electron and photon reconstruction and identification with the CMS experiment at the CERN LHC | JINST 16 (2021) P05014 | CMS-EGM-17-001 2012.06888 |
| 38 | CMS Collaboration | Performance of the CMS muon detector and muon reconstruction with proton-proton collisions at $ \sqrt{s} = $ 13 TeV | JINST 13 (2018) P06015 | CMS-MUO-16-001 1804.04528 |
| 39 | CMS Collaboration | Description and performance of track and primary-vertex reconstruction with the CMS tracker | JINST 9 (2014) P10009 | CMS-TRK-11-001 1405.6569 |
| 40 | CMS Collaboration | Particle-flow reconstruction and global event description with the CMS detector | JINST 12 (2017) P10003 | CMS-PRF-14-001 1706.04965 |
| 41 | CMS Collaboration | Performance of reconstruction and identification of $ \tau $ leptons decaying to hadrons and $ \nu_\tau $ in pp collisions at $ \sqrt{s} = $ 13 TeV | JINST 13 (2018) P10005 | CMS-TAU-16-003 1809.02816 |
| 42 | CMS Collaboration | Jet energy scale and resolution in the CMS experiment in pp collisions at 8 TeV | JINST 12 (2017) P02014 | CMS-JME-13-004 1607.03663 |
| 43 | CMS Collaboration | Performance of missing transverse momentum reconstruction in proton-proton collisions at $ \sqrt{s} = $ 13 TeV using the CMS detector | JINST 14 (2019) P07004 | CMS-JME-17-001 1903.06078 |
| 44 | CMS Collaboration | Technical proposal for the Phase-II upgrade of the Compact Muon Solenoid | CMS-PAS-TDR-15-002 | CMS-PAS-TDR-15-002 |
| 45 | P. Nason | A new method for combining NLO QCD with shower Monte Carlo algorithms | JHEP 11 (2004) 040 | hep-ph/0409146 |
| 46 | S. Frixione, P. Nason, and C. Oleari | Matching NLO QCD computations with parton shower simulations: the POWHEG method | JHEP 11 (2007) 070 | 0709.2092 |
| 47 | S. Alioli, P. Nason, C. Oleari, and E. Re | A general framework for implementing NLO calculations in shower Monte Carlo programs: the POWHEG BOX | JHEP 06 (2010) 043 | 1002.2581 |
| 48 | E. Bagnaschi, G. Degrassi, P. Slavich, and A. Vicini | Higgs production via gluon fusion in the POWHEG approach in the SM and in the MSSM | JHEP 02 (2012) 088 | 1111.2854 |
| 49 | G. Heinrich et al. | NLO predictions for Higgs boson pair production with full top quark mass dependence matched to parton showers | JHEP 08 (2017) 088 | 1703.09252 |
| 50 | S. Jones and S. Kuttimalai | Parton shower and NLO-matching uncertainties in Higgs boson pair production | JHEP 02 (2018) 176 | 1711.03319 |
| 51 | G. Buchalla et al. | Higgs boson pair production in non-linear effective field theory with full $ m_\mathrm{t} $-dependence at NLO QCD | JHEP 09 (2018) 057 | 1806.05162 |
| 52 | G. Heinrich et al. | Probing the trilinear Higgs boson coupling in di-Higgs production at NLO QCD including parton shower effects | JHEP 06 (2019) 066 | 1903.08137 |
| 53 | G. Heinrich, S. P. Jones, M. Kerner, and L. Scyboz | A non-linear EFT description of $ \mathrm{g}\mathrm{g}\to\mathrm{ HH } $ at NLO interfaced to POWHEG | JHEP 10 (2020) 021 | 2006.16877 |
| 54 | J. Davies et al. | Double Higgs boson production at NLO: Combining the exact numerical result and high-energy expansion | JHEP 11 (2019) 024 | 1907.06408 |
| 55 | J. Alwall et al. | The automated computation of tree-level and next-to-leading order differential cross sections, and their matching to parton shower simulations | JHEP 07 (2014) 079 | 1405.0301 |
| 56 | S. Dawson, S. Dittmaier, and M. Spira | Neutral Higgs boson pair production at hadron colliders: QCD corrections | PRD 58 (1998) 115012 | hep-ph/9805244 |
| 57 | D. Y. Shao, C. S. Li, H. T. Li, and J. Wang | Threshold resummation effects in Higgs boson pair production at the LHC | JHEP 07 (2013) 169 | 1301.1245 |
| 58 | D. de Florian and J. Mazzitelli | Higgs boson pair production at next-to-next-to-leading order in QCD | PRL 111 (2013) 201801 | 1309.6594 |
| 59 | D. de Florian and J. Mazzitelli | Higgs pair production at next-to-next-to-leading logarithmic accuracy at the LHC | JHEP 09 (2015) 053 | 1505.07122 |
| 60 | S. Borowka et al. | Higgs boson pair production in gluon fusion at next-to-leading order with full top-quark mass dependence | PRL 117 (2016) 012001 | 1604.06447 |
| 61 | J. Baglio et al. | Gluon fusion into Higgs pairs at NLO QCD and the top mass scheme | EPJC 79 (2019) 459 | 1811.05692 |
| 62 | S. Frixione, P. Nason, and G. Ridolfi | A positive-weight next-to-leading-order Monte Carlo for heavy flavour hadroproduction | JHEP 09 (2007) 126 | 0707.3088 |
| 63 | T. Je\vzo et al. | An NLO+PS generator for $ \mathrm{t\bar{t}} $ and Wt production and decay including non-resonant and interference effects | EPJC 76 (2016) 691 | 1607.04538 |
| 64 | R. Frederix and S. Frixione | Merging meets matching in MC@NLO | JHEP 12 (2012) 061 | 1209.6215 |
| 65 | M. Czakon and A. Mitov | Top++: A program for the calculation of the top-pair cross-section at hadron colliders | CPC 185 (2014) 2930 | 1112.5675 |
| 66 | M. Czakon et al. | Top-pair production at the LHC through NNLO QCD and NLO EW | JHEP 10 (2017) 186 | 1705.04105 |
| 67 | T. Sjostrand et al. | An introduction to $ PYTHIA8.2 $ | CPC 191 (2015) 159 | 1410.3012 |
| 68 | CMS Collaboration | Event generator tunes obtained from underlying event and multiparton scattering measurements | EPJC 76 (2016) 155 | CMS-GEN-14-001 1512.00815 |
| 69 | CMS Collaboration | Extraction and validation of a new set of CMS PYTHIA-8 tunes from underlying-event measurements | EPJC 80 (2020) 4 | CMS-GEN-17-001 1903.12179 |
| 70 | NNPDF Collaboration | Parton distributions for the LHC Run II | JHEP 04 (2015) 040 | 1410.8849 |
| 71 | NNPDF Collaboration | Parton distributions from high-precision collider data | EPJC 77 (2017) 663 | 1706.00428 |
| 72 | GEANT4 Collaboration | GEANT4--a simulation toolkit | NIMA 506 (2003) 250 | |
| 73 | M. Cacciari, G. P. Salam, and G. Soyez | The anti-$ {k_{\mathrm{T}}} $ jet clustering algorithm | JHEP 04 (2008) 063 | 0802.1189 |
| 74 | M. Cacciari, G. P. Salam, and G. Soyez | FastJet user manual | EPJC 72 (2012) 1896 | 1111.6097 |
| 75 | D. Bertolini, P. Harris, M. Low, and N. Tran | Pileup per particle identification | JHEP 10 (2014) 059 | 1407.6013 |
| 76 | CMS Collaboration | Pileup mitigation at CMS in 13 TeV data | JINST 15 (2020) P09018 | CMS-JME-18-001 2003.00503 |
| 77 | CMS Collaboration | Performance of electron reconstruction and selection with the CMS detector in proton-proton collisions at $ \sqrt{s} = $ 8 TeV | JINST 10 (2015) P06005 | CMS-EGM-13-001 1502.02701 |
| 78 | CMS Collaboration | Search for supersymmetry in pp collisions at $ \sqrt{s} = $ 13 TeV in the single-lepton final state using the sum of masses of large-radius jets | JHEP 08 (2016) 122 | CMS-SUS-15-007 1605.04608 |
| 79 | D. Krohn, J. Thaler, and L. Wang | Jet trimming | JHEP 02 (2010) 084 | 0912.1342 |
| 80 | I. Henrion et al. | Neural message passing for jet physics | in Deep Learning for Physical Sciences Workshop at 31st Conf. on Neural Information Processing Systems Long Beach, CA | |
| 81 | E. A. Moreno et al. | JEDI-net: a jet identification algorithm based on interaction networks | EPJC 80 (2020) 58 | 1908.05318 |
| 82 | E. A. Moreno et al. | Interaction networks for the identification of boosted $ \mathrm{H}\to\mathrm{b\bar{b}} $ decays | PRD 102 (2020) 012010 | 1909.12285 |
| 83 | A. Butter et al. | The machine learning landscape of top taggers | SciPost Phys. 7 (2019) 014 | 1902.09914 |
| 84 | CMS Collaboration | Identification of heavy-flavour jets with the CMS detector in pp collisions at 13 TeV | JINST 13 (2018) P05011 | CMS-BTV-16-002 1712.07158 |
| 85 | CMS Collaboration | Identification of b-quark jets with the CMS experiment | JINST 8 (2013) P04013 | CMS-BTV-12-001 1211.4462 |
| 86 | CMS Collaboration | Identification of heavy, energetic, hadronically decaying particles using machine-learning techniques | JINST 15 (2020) P06005 | CMS-JME-18-002 2004.08262 |
| 87 | CMS Collaboration | Identification of highly Lorentz-boosted heavy particles using graph neural networks and new mass decorrelation techniques | CDS | |
| 88 | CMS Collaboration | Calibration of the mass-decorrelated ParticleNet tagger for boosted $ \mathrm{b\bar{b}} $ and $ \mathrm{c\bar{c}} $ jets using LHC Run 2 data | CDS | |
| 89 | A. J. Larkoski, S. Marzani, G. Soyez, and J. Thaler | Soft drop | JHEP 05 (2014) 146 | 1402.2657 |
| 90 | M. Dasgupta, A. Fregoso, S. Marzani, and G. P. Salam | Towards an understanding of jet substructure | JHEP 09 (2013) 029 | 1307.0007 |
| 91 | CMS Collaboration | Mass regression of highly-boosted jets using graph neural networks | CDS | |
| 92 | J. Thaler and K. Van Tilburg | Identifying boosted objects with $ N $-subjettiness | JHEP 03 (2011) 015 | 1011.2268 |
| 93 | CMS Collaboration | Search for a massive resonance decaying to a pair of Higgs bosons in the four b quark final state in proton-proton collisions at $ \sqrt{s} = $ 13 TeV | PLB 781 (2018) 244 | 1710.04960 |
| 94 | CMS Collaboration | Search for production of Higgs boson pairs in the four b quark final state using large-area jets in proton-proton collisions at $ \sqrt{s} = $ 13 TeV | JHEP 01 (2019) 040 | CMS-B2G-17-019 1808.01473 |
| 95 | CMS Collaboration | Inclusive search for highly boosted Higgs bosons decaying to bottom quark-antiquark pairs in proton-proton collisions at $ \sqrt{s} = $ 13 TeV | JHEP 12 (2020) 85 | CMS-HIG-19-003 2006.13251 |
| 96 | R. A. Fisher | On the interpretation of $ \chi^{2} $ from contingency tables, and the calculation of P | J. R. Stat. Soc. 85 (1922) 87 | |
| 97 | F. J. Massey Jr. | The Kolmogorov-Smirnov test for goodness of fit | J. Am. Stat. Assoc. 46 (1951) 68 | |
| 98 | S. Baker and R. D. Cousins | Clarification of the use of chi square and likelihood functions in fits to histograms | NIM221 (1984) 437 | |
| 99 | J. K. Lindsey | Parametric Statistical Inference | Oxford Science Publications. Clarendon Press, 1996 ISBN 9780198523598 | |
| 100 | CMS Collaboration | Precision luminosity measurement in proton-proton collisions at $ \sqrt{s} = $ 13 TeV in 2015 and 2016 at CMS | EPJC 81 (2021) 800 | CMS-LUM-17-003 2104.01927 |
| 101 | CMS Collaboration | CMS luminosity measurement for the 2017 data-taking period at $ \sqrt{s} = $ 13 TeV | CMS-PAS-LUM-17-004 | CMS-PAS-LUM-17-004 |
| 102 | CMS Collaboration | CMS luminosity measurement for the 2018 data-taking period at $ \sqrt{s} = $ 13 TeV | CMS-PAS-LUM-18-002 | CMS-PAS-LUM-18-002 |
| 103 | ATLAS and CMS Collaborations, and LHC Higgs Combination Group | Procedure for the LHC Higgs boson search combination in Summer 2011 | CMS-NOTE-2011-005 | |
| 104 | CMS Collaboration | Precise determination of the mass of the Higgs boson and tests of compatibility of its couplings with the standard model predictions using proton collisions at 7 and 8 TeV | EPJC 75 (2015) 212 | CMS-HIG-14-009 1412.8662 |
| 105 | T. Junk | Confidence level computation for combining searches with small statistics | NIMA 434 (1999) 435 | hep-ex/9902006 |
| 106 | A. L. Read | Presentation of search results: the CLs technique | JPG 28 (2002) 2693 | |
| 107 | G. Cowan, K. Cranmer, E. Gross, and O. Vitells | Asymptotic formulae for likelihood-based tests of new physics | EPJC 71 (2011) 1554 | 1007.1727 |
| 108 | CMS Collaboration | HEPData record for this analysis | link | |
|
|
Compact Muon Solenoid LHC, CERN |
|

|

|

|

|

|