

Compact Muon Solenoid
LHC, CERN
| CMS-TOP-22-009 ; CERN-EP-2023-201 | ||
| Inclusive and differential cross section measurements of $ {\mathrm{t}\bar{\mathrm{t}}} \mathrm{b}\bar{\mathrm{b}} $ production in the lepton+jets channel at $ \sqrt{s}= $ 13 TeV | ||
| CMS Collaboration | ||
| 25 September 2023 | ||
| Accepted for publication in J. High Energy Phys. | ||
| Abstract: Measurements of inclusive and normalized differential cross sections of the associated production of top quark-antiquark and bottom quark-antiquark pairs, $ {\mathrm{t}\bar{\mathrm{t}}} \mathrm{b}\bar{\mathrm{b}} $, are presented. The results are based on data from proton-proton collisions collected by the CMS detector at a centre-of-mass energy of 13 TeV, corresponding to an integrated luminosity of 138 fb$ ^{-1} $. The cross sections are measured in the lepton+jets decay channel of the top quark pair, using events containing exactly one isolated electron or muon and at least five jets. Measurements are made in four fiducial phase space regions, targeting different aspects of the $ {\mathrm{t}\bar{\mathrm{t}}} \mathrm{b}\bar{\mathrm{b}} $ process. Distributions are unfolded to the particle level through maximum likelihood fits, and compared with predictions from several event generators. The inclusive cross section measurements of this process in the fiducial phase space regions are the most precise to date. In most cases, the measured inclusive cross sections exceed the predictions with the chosen generator settings. The only exception is when using a particular choice of dynamic renormalization scale, $ {\mu_{\mathrm{R}}=\frac12 \prod_{i=\mathrm{t},\bar{\mathrm{t}},\mathrm{b},\bar{\mathrm{b}}} m_{\mathrm{T},i}^{1/4}} $, where $ {m_{\mathrm{T},i}^2=m_i^2+p_{\mathrm{T},i}^2} $ are the transverse masses of top and bottom quarks. The differential cross sections show varying degrees of compatibility with the theoretical predictions, and none of the tested generators with the chosen settings simultaneously describe all the measured distributions. | ||
| Links: e-print arXiv:2309.14442 [hep-ex] (PDF) ; CDS record ; inSPIRE record ; HepData record ; CADI line (restricted) ; | ||
| Figures | |
png pdf |
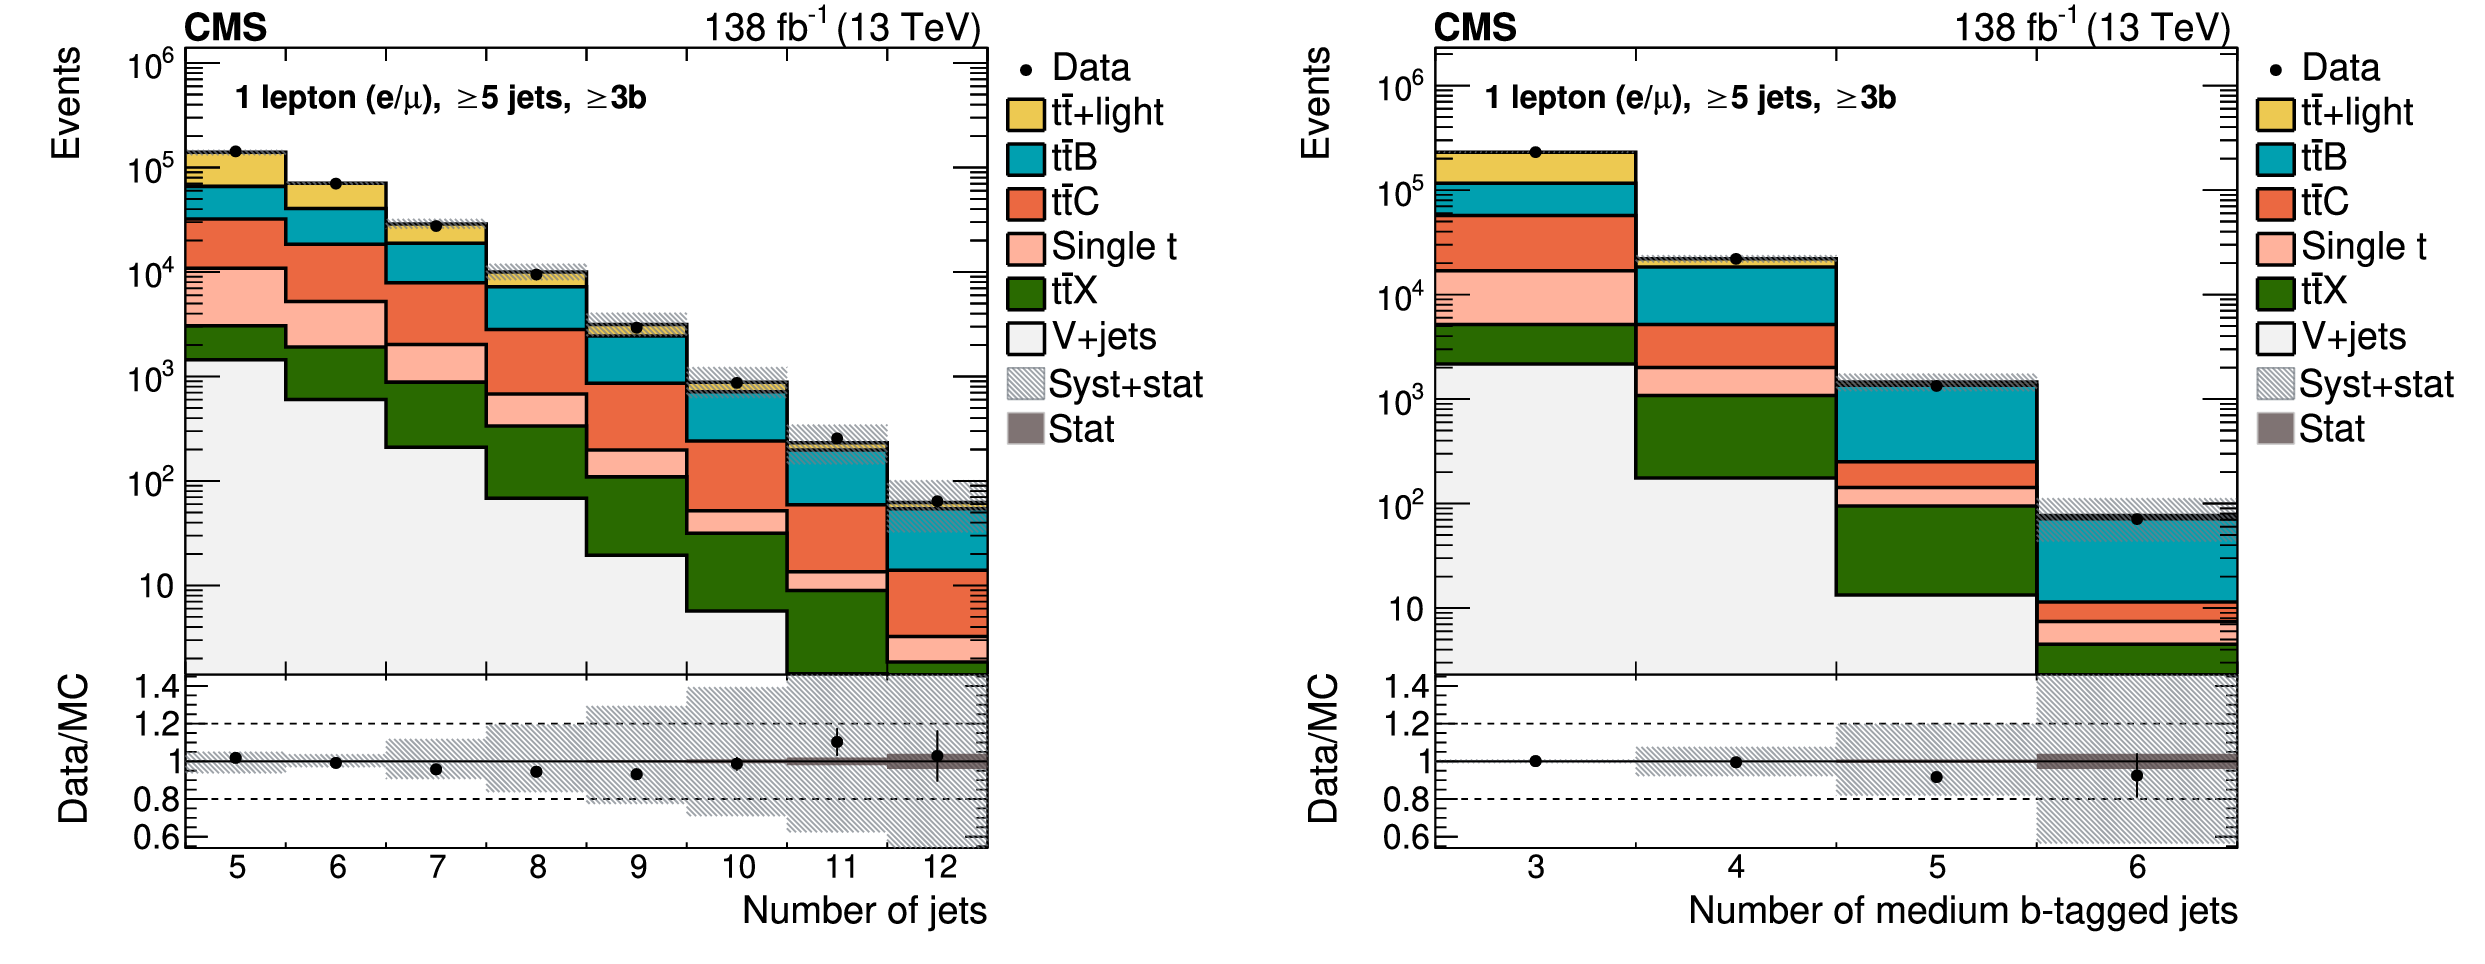
Figure 1:
Jet (left) and b-tagged jet (right) multiplicity with the $ \geq $5 jets: $ \geq $3b selection prior to any fit, shown for both lepton channels and all data periods combined. For the purpose of visualisation, the contributions from simulation have been scaled by a common factor to match the yield in data. The $ {\mathrm{t}\bar{\mathrm{t}}} \mathrm{X} $ contribution includes the $ {\mathrm{t}\bar{\mathrm{t}}} \mathrm{H} $, $ {\mathrm{t}\bar{\mathrm{t}}} \mathrm{W} $, and $ {\mathrm{t}\bar{\mathrm{t}}} \mathrm{Z} $ processes. The shaded bands include all a priori uncertainties described in Section 7, including the $ {\mathrm{t}\bar{\mathrm{t}}} {\mathrm{B}} $ cross section uncertainty estimated from the nominal $ {\mathrm{t}\bar{\mathrm{t}}} \mathrm{b}\bar{\mathrm{b}} $ simulation. Only effects on the shape of the distributions are considered. The last bins also contain the overflow. |
png pdf |
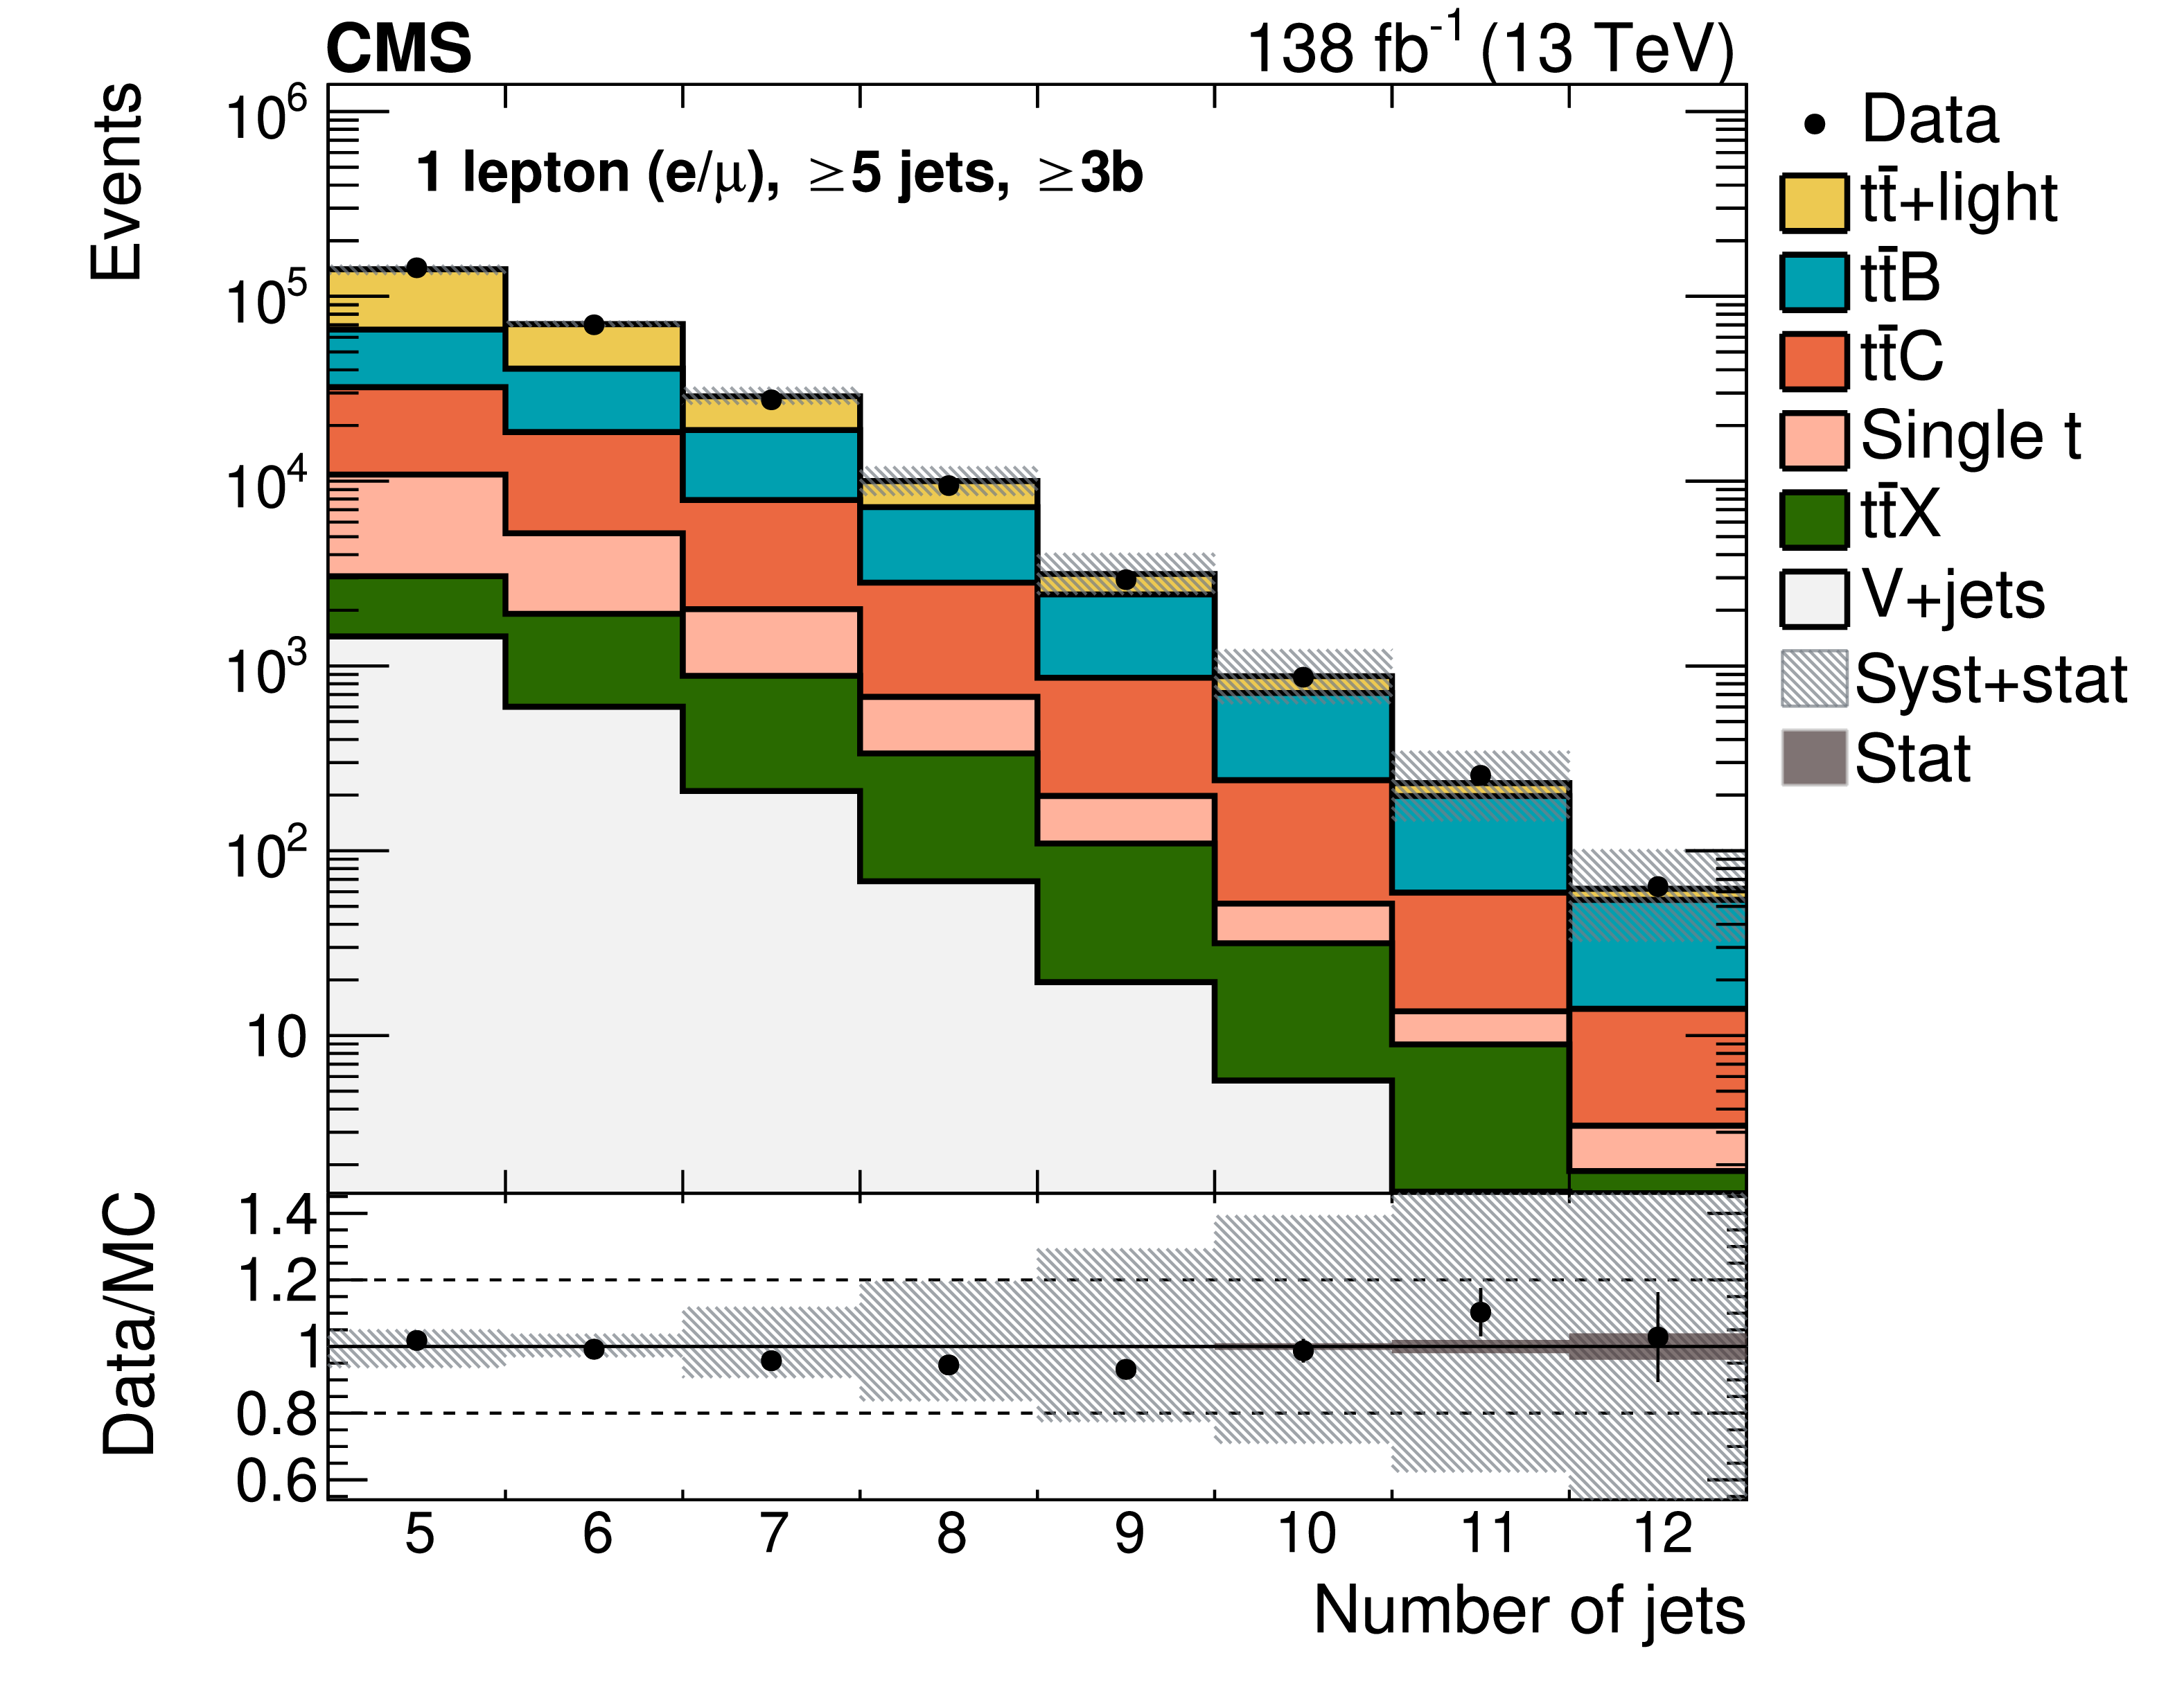
Figure 1-a:
Jet (left) and b-tagged jet (right) multiplicity with the $ \geq $5 jets: $ \geq $3b selection prior to any fit, shown for both lepton channels and all data periods combined. For the purpose of visualisation, the contributions from simulation have been scaled by a common factor to match the yield in data. The $ {\mathrm{t}\bar{\mathrm{t}}} \mathrm{X} $ contribution includes the $ {\mathrm{t}\bar{\mathrm{t}}} \mathrm{H} $, $ {\mathrm{t}\bar{\mathrm{t}}} \mathrm{W} $, and $ {\mathrm{t}\bar{\mathrm{t}}} \mathrm{Z} $ processes. The shaded bands include all a priori uncertainties described in Section 7, including the $ {\mathrm{t}\bar{\mathrm{t}}} {\mathrm{B}} $ cross section uncertainty estimated from the nominal $ {\mathrm{t}\bar{\mathrm{t}}} \mathrm{b}\bar{\mathrm{b}} $ simulation. Only effects on the shape of the distributions are considered. The last bins also contain the overflow. |

png pdf |
Figure 1-b:
Jet (left) and b-tagged jet (right) multiplicity with the $ \geq $5 jets: $ \geq $3b selection prior to any fit, shown for both lepton channels and all data periods combined. For the purpose of visualisation, the contributions from simulation have been scaled by a common factor to match the yield in data. The $ {\mathrm{t}\bar{\mathrm{t}}} \mathrm{X} $ contribution includes the $ {\mathrm{t}\bar{\mathrm{t}}} \mathrm{H} $, $ {\mathrm{t}\bar{\mathrm{t}}} \mathrm{W} $, and $ {\mathrm{t}\bar{\mathrm{t}}} \mathrm{Z} $ processes. The shaded bands include all a priori uncertainties described in Section 7, including the $ {\mathrm{t}\bar{\mathrm{t}}} {\mathrm{B}} $ cross section uncertainty estimated from the nominal $ {\mathrm{t}\bar{\mathrm{t}}} \mathrm{b}\bar{\mathrm{b}} $ simulation. Only effects on the shape of the distributions are considered. The last bins also contain the overflow. |
png pdf |
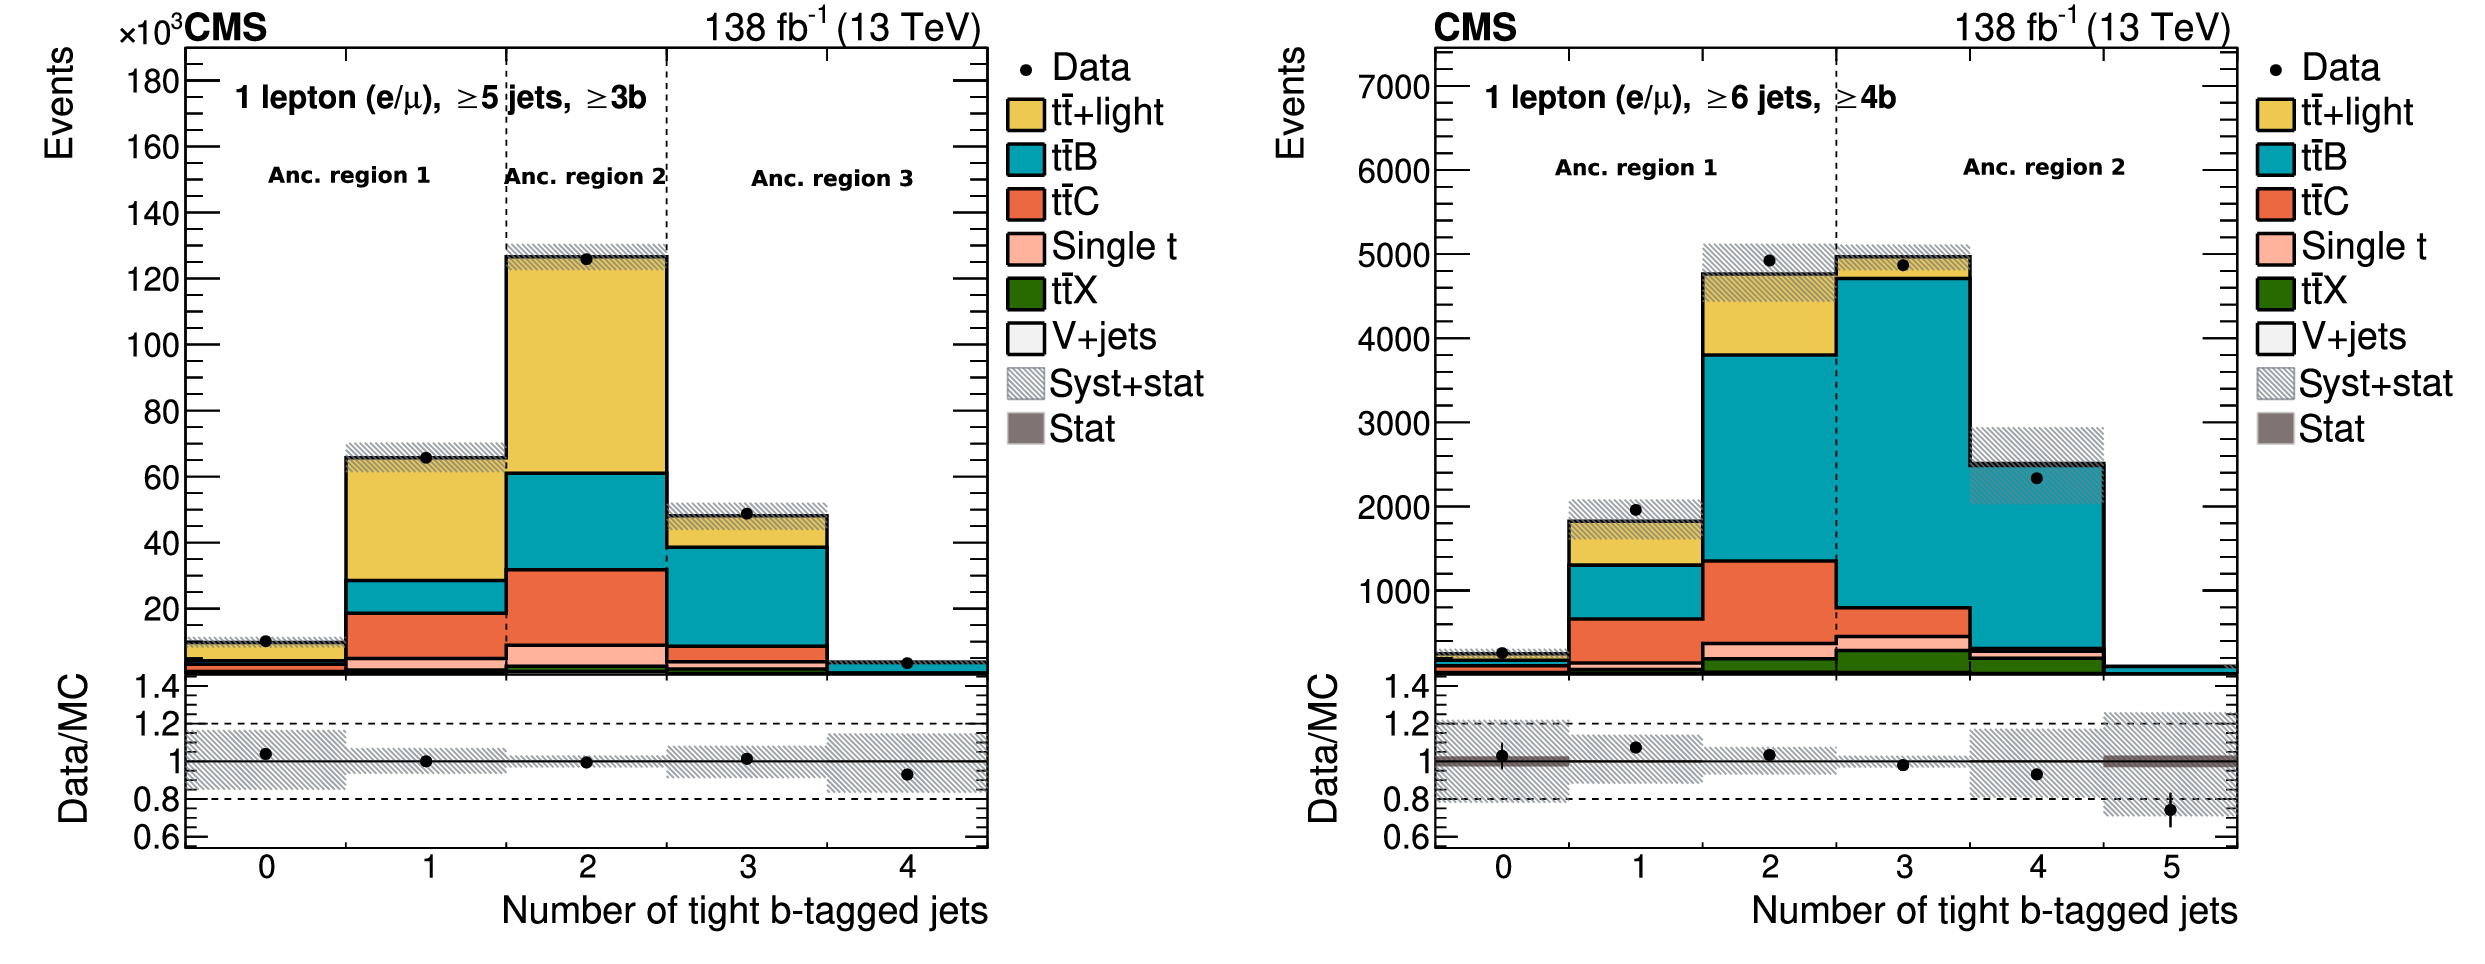
Figure 2:
Number of jets b tagged at the tight working point with the $ \geq $5 jets: $ \geq $3b (left) and $ \geq $6 jets: $ \geq $4b selections (right) prior to any fit, shown for all lepton channels and years combined. For the purpose of visualisation, the contributions from simulation have been scaled by a common factor to match the yield in data. The shaded bands include all uncertainties described in Section 7, including the $ {\mathrm{t}\bar{\mathrm{t}}} {\mathrm{B}} $ cross section uncertainty estimated from the nominal $ {\mathrm{t}\bar{\mathrm{t}}} \mathrm{b}\bar{\mathrm{b}} $ simulation. Only effects on the shape of the distributions are considered. The last bins also contain the overflow. The vertical dashed lines indicate the ancillary regions. |

png pdf |
Figure 2-a:
Number of jets b tagged at the tight working point with the $ \geq $5 jets: $ \geq $3b (left) and $ \geq $6 jets: $ \geq $4b selections (right) prior to any fit, shown for all lepton channels and years combined. For the purpose of visualisation, the contributions from simulation have been scaled by a common factor to match the yield in data. The shaded bands include all uncertainties described in Section 7, including the $ {\mathrm{t}\bar{\mathrm{t}}} {\mathrm{B}} $ cross section uncertainty estimated from the nominal $ {\mathrm{t}\bar{\mathrm{t}}} \mathrm{b}\bar{\mathrm{b}} $ simulation. Only effects on the shape of the distributions are considered. The last bins also contain the overflow. The vertical dashed lines indicate the ancillary regions. |

png pdf |
Figure 2-b:
Number of jets b tagged at the tight working point with the $ \geq $5 jets: $ \geq $3b (left) and $ \geq $6 jets: $ \geq $4b selections (right) prior to any fit, shown for all lepton channels and years combined. For the purpose of visualisation, the contributions from simulation have been scaled by a common factor to match the yield in data. The shaded bands include all uncertainties described in Section 7, including the $ {\mathrm{t}\bar{\mathrm{t}}} {\mathrm{B}} $ cross section uncertainty estimated from the nominal $ {\mathrm{t}\bar{\mathrm{t}}} \mathrm{b}\bar{\mathrm{b}} $ simulation. Only effects on the shape of the distributions are considered. The last bins also contain the overflow. The vertical dashed lines indicate the ancillary regions. |
png pdf |
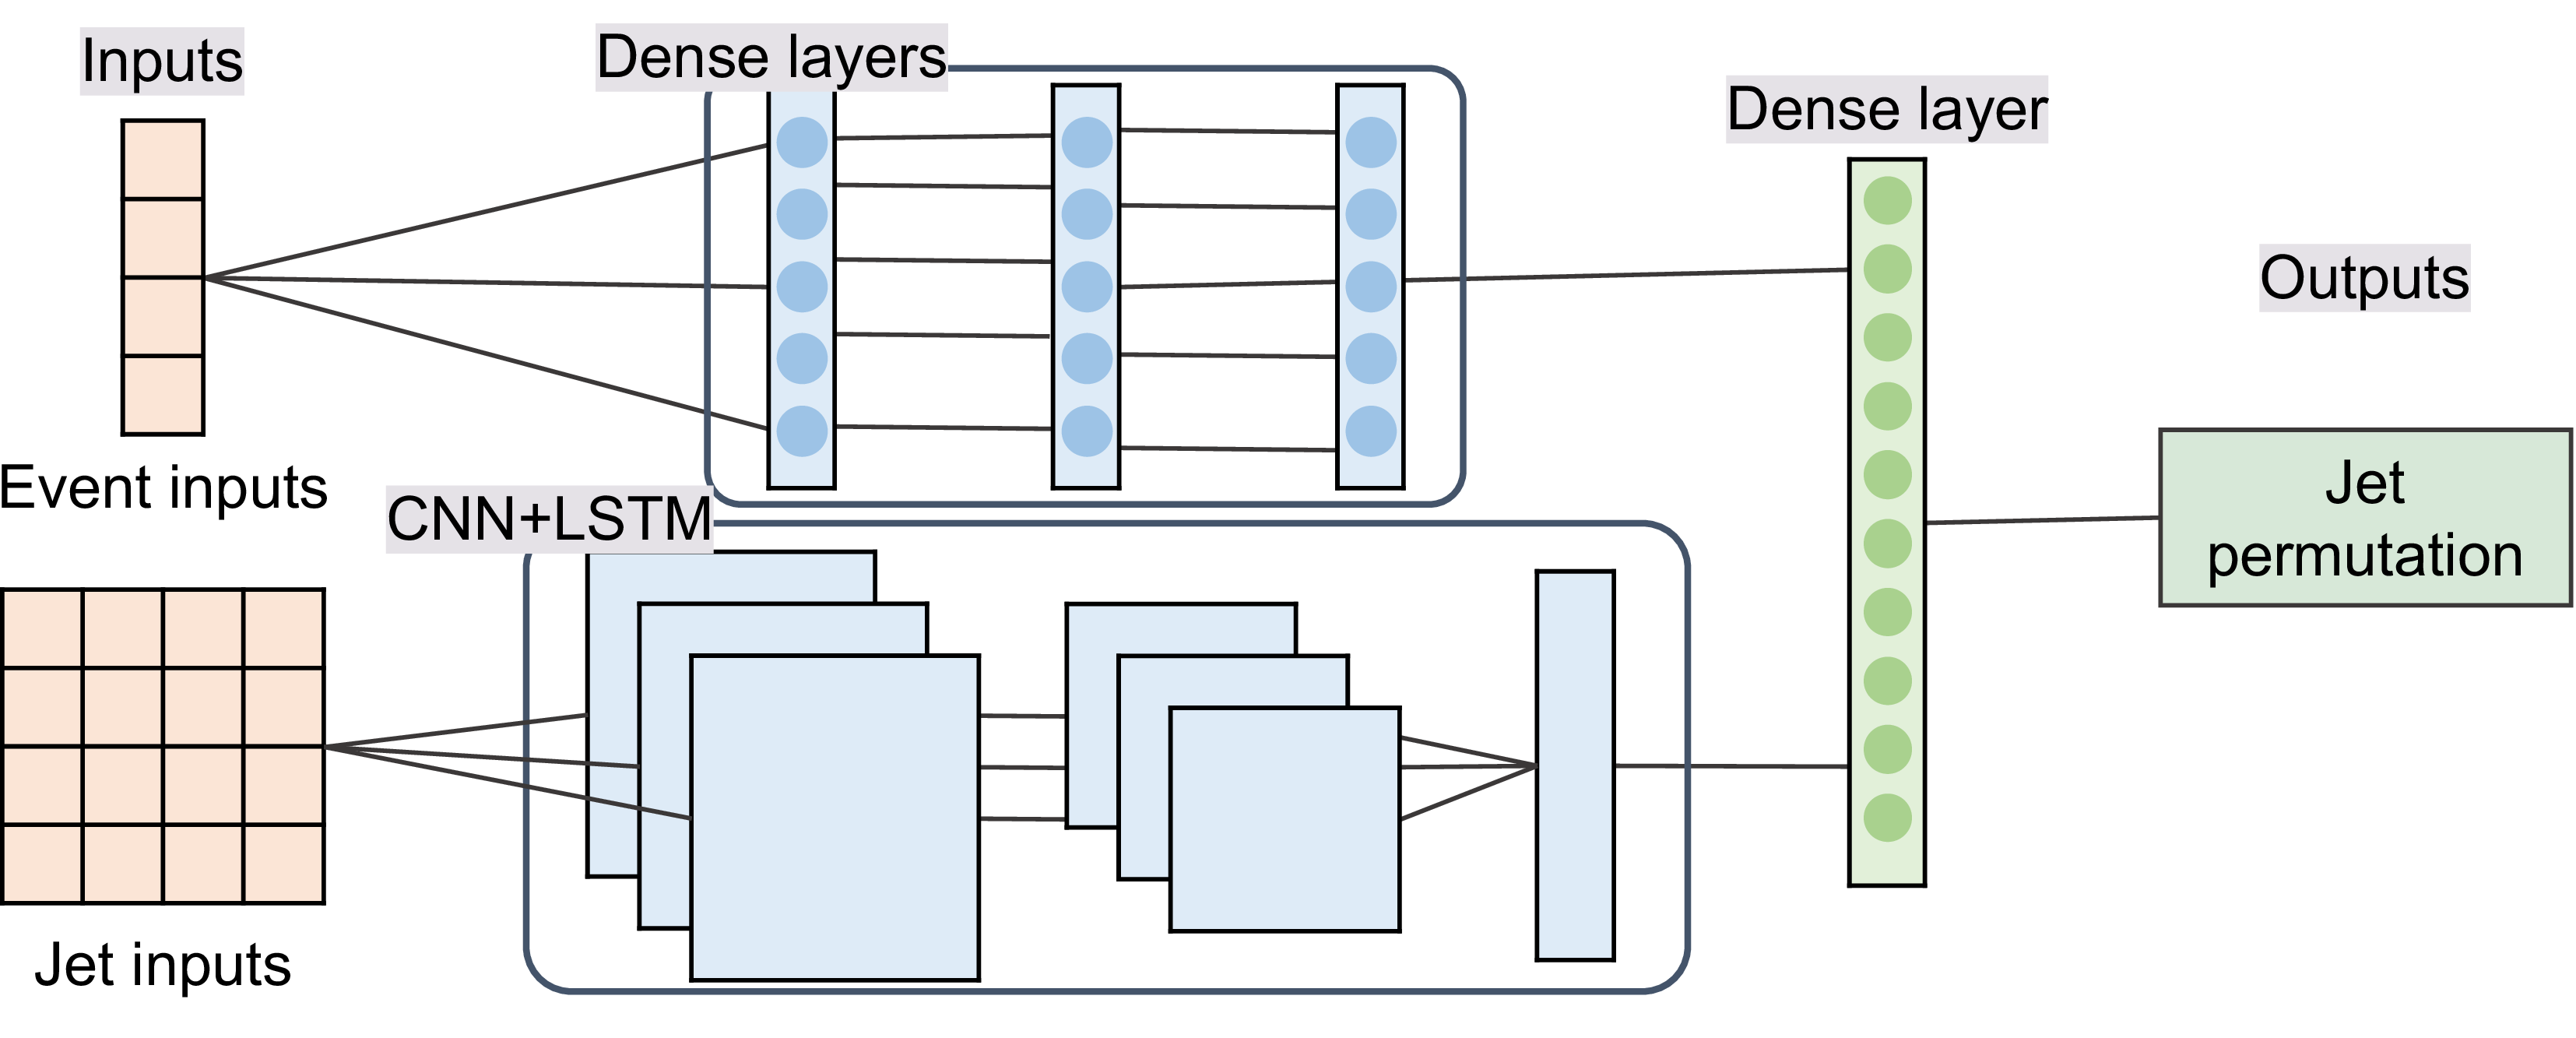
Figure 3:
Structural representation of the neural network used for the assignment of the additional b-jet pair. The neural network uses two sets of input variables:\ global event information is connected to three dense network layers, and jet-specific information is connected via convolutional network layers (CNN) and a long short-term memory (LSTM) cell. The input sequences are concatenated into one dense layer. The output layer consists of six nodes, each representing one of the six possible candidate jet combinations. |
png pdf |
Figure 4:
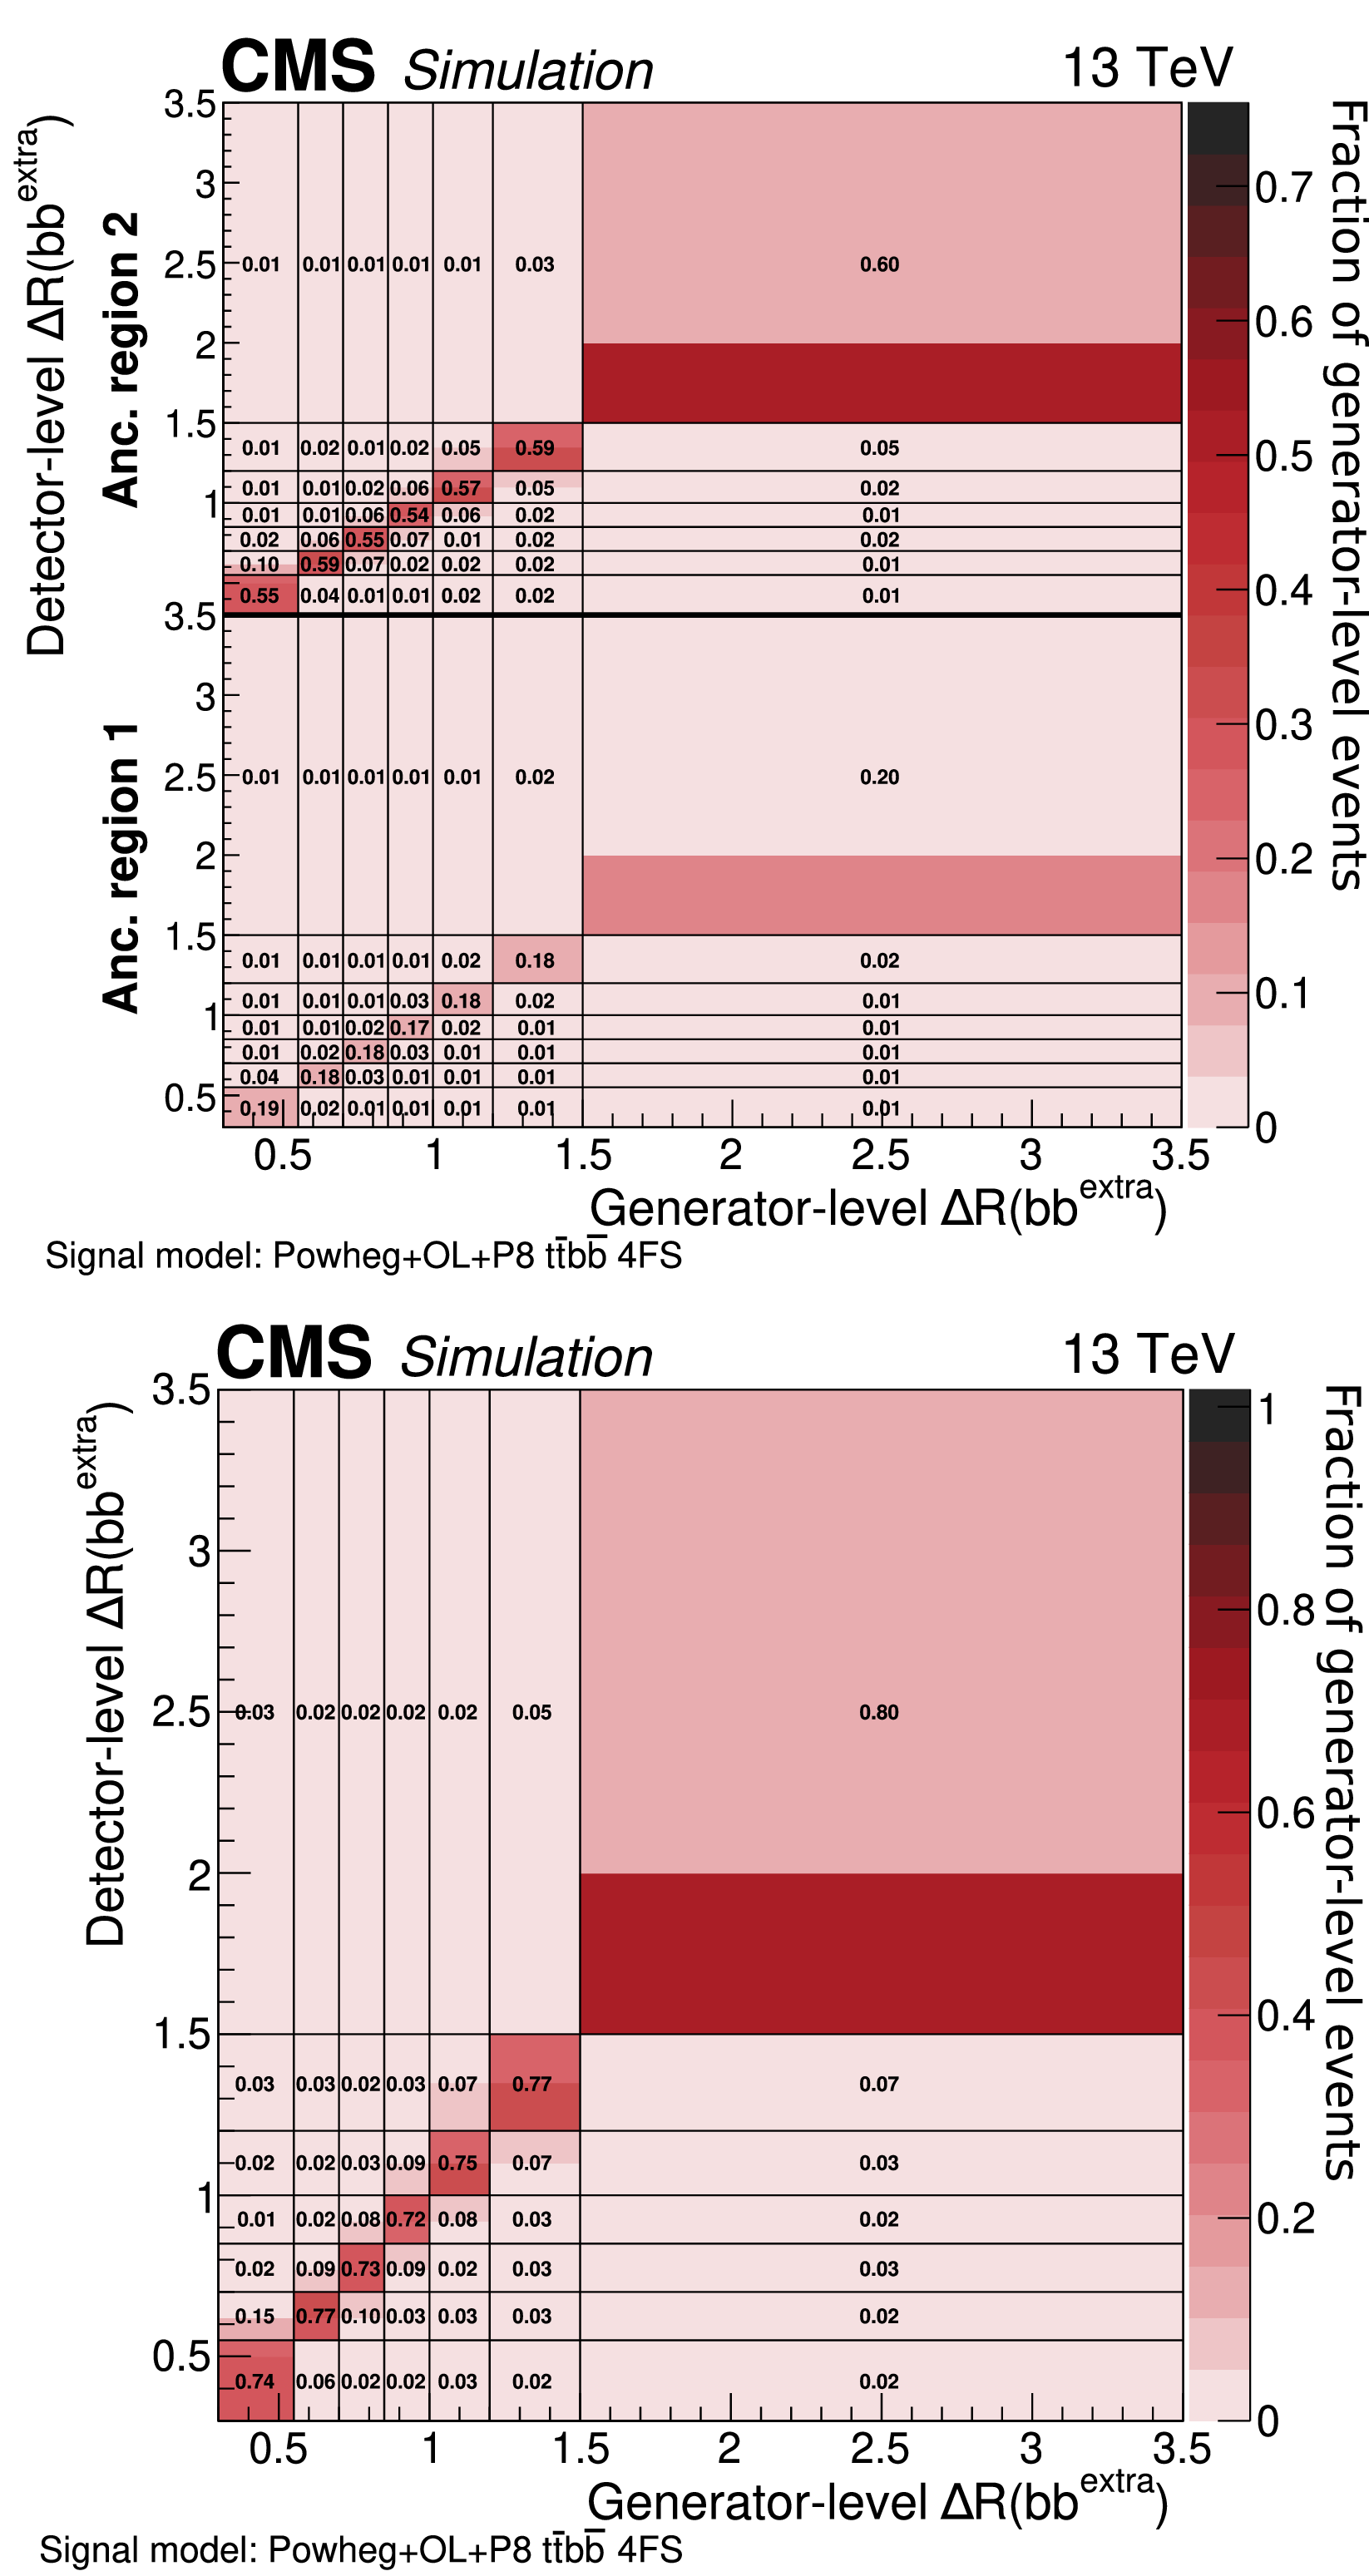
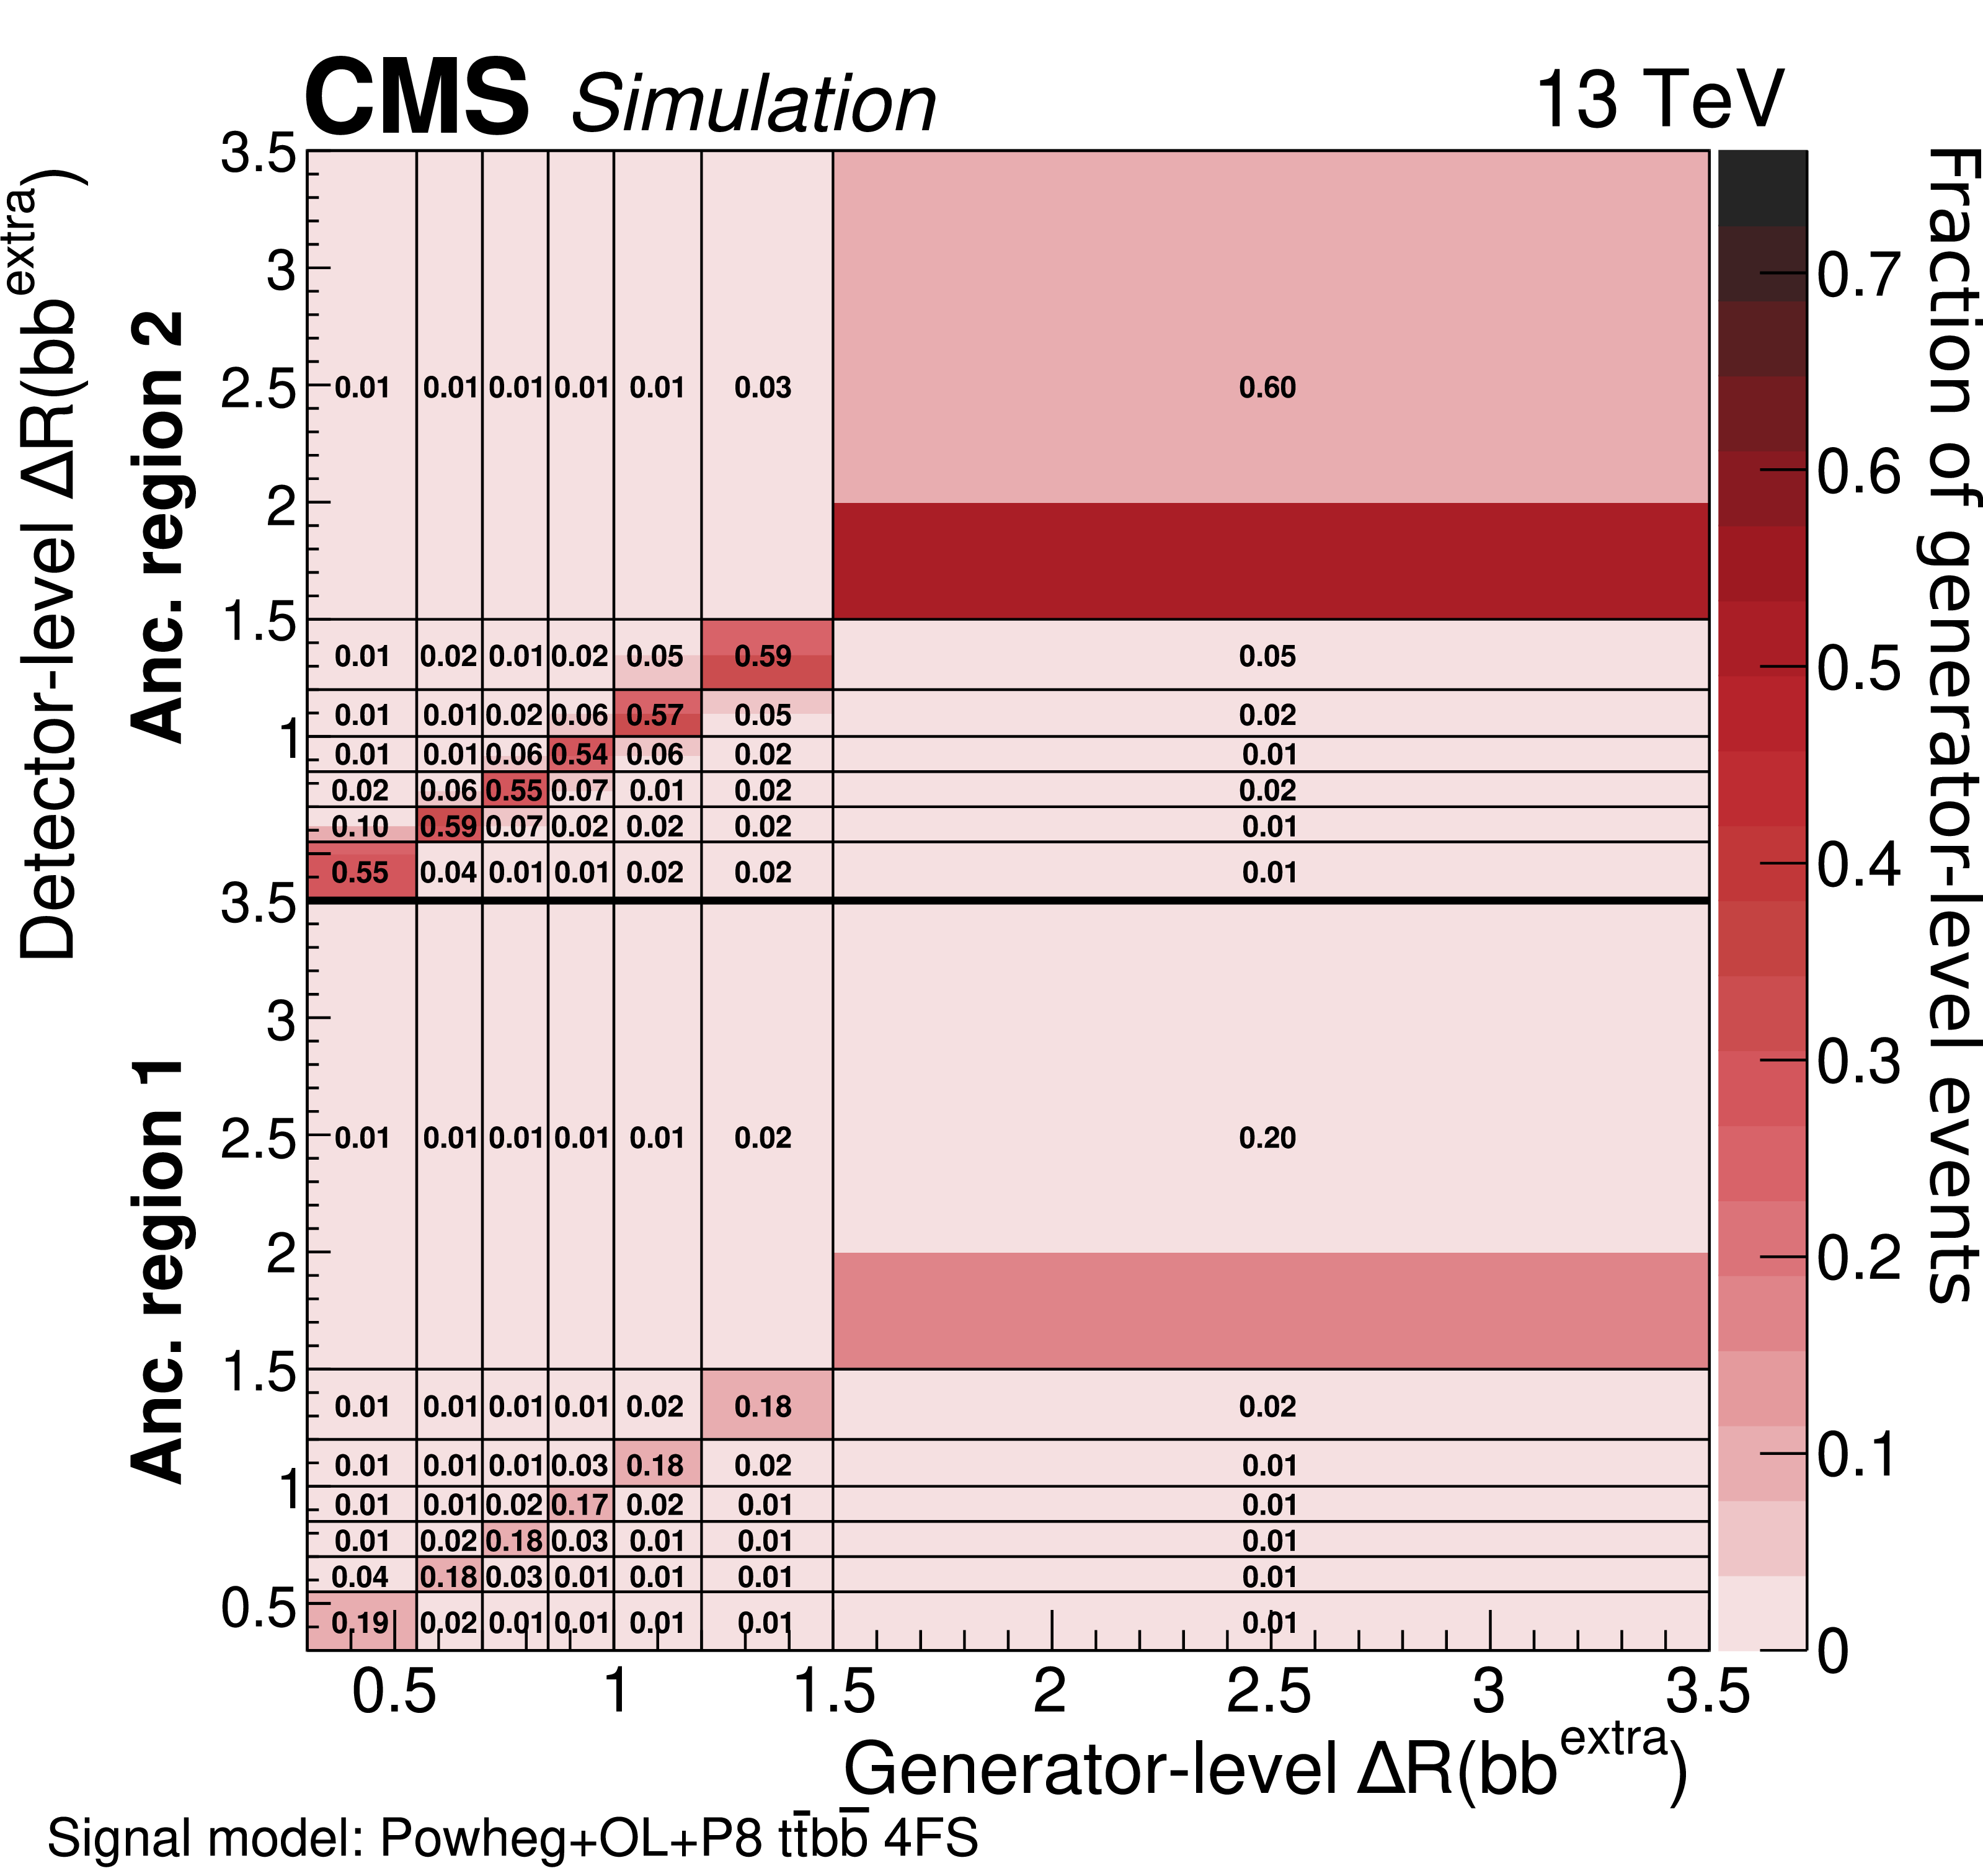
Response matrix for $ \Delta R(\smash[t]{\mathrm{b}\mathrm{b}^{\text{extra}}} ) $ in the $ \geq $6 jets: $ \geq $4b phase space. The $ x $ ($ y $) axes show the generator- (detector-)level observables. The upper figure includes the ancillary variable, unrolled on the same axis as the detector-level observable, so that the binning of the detector-level observable, stacked vertically, is repeated twice. For the lower figure, the ancillary variables are projected out to more easily visualize the correspondence between true and reconstructed values. The coloured bins show the finer binning used at reconstructed level (bins split in two), while the numbers show the values one would obtain when using the same binning at the generator and detector level. |
png pdf |
Figure 4-a:
Response matrix for $ \Delta R(\smash[t]{\mathrm{b}\mathrm{b}^{\text{extra}}} ) $ in the $ \geq $6 jets: $ \geq $4b phase space. The $ x $ ($ y $) axes show the generator- (detector-)level observables. The upper figure includes the ancillary variable, unrolled on the same axis as the detector-level observable, so that the binning of the detector-level observable, stacked vertically, is repeated twice. For the lower figure, the ancillary variables are projected out to more easily visualize the correspondence between true and reconstructed values. The coloured bins show the finer binning used at reconstructed level (bins split in two), while the numbers show the values one would obtain when using the same binning at the generator and detector level. |

png pdf |
Figure 4-b:
Response matrix for $ \Delta R(\smash[t]{\mathrm{b}\mathrm{b}^{\text{extra}}} ) $ in the $ \geq $6 jets: $ \geq $4b phase space. The $ x $ ($ y $) axes show the generator- (detector-)level observables. The upper figure includes the ancillary variable, unrolled on the same axis as the detector-level observable, so that the binning of the detector-level observable, stacked vertically, is repeated twice. For the lower figure, the ancillary variables are projected out to more easily visualize the correspondence between true and reconstructed values. The coloured bins show the finer binning used at reconstructed level (bins split in two), while the numbers show the values one would obtain when using the same binning at the generator and detector level. |
png pdf |
Figure 5:
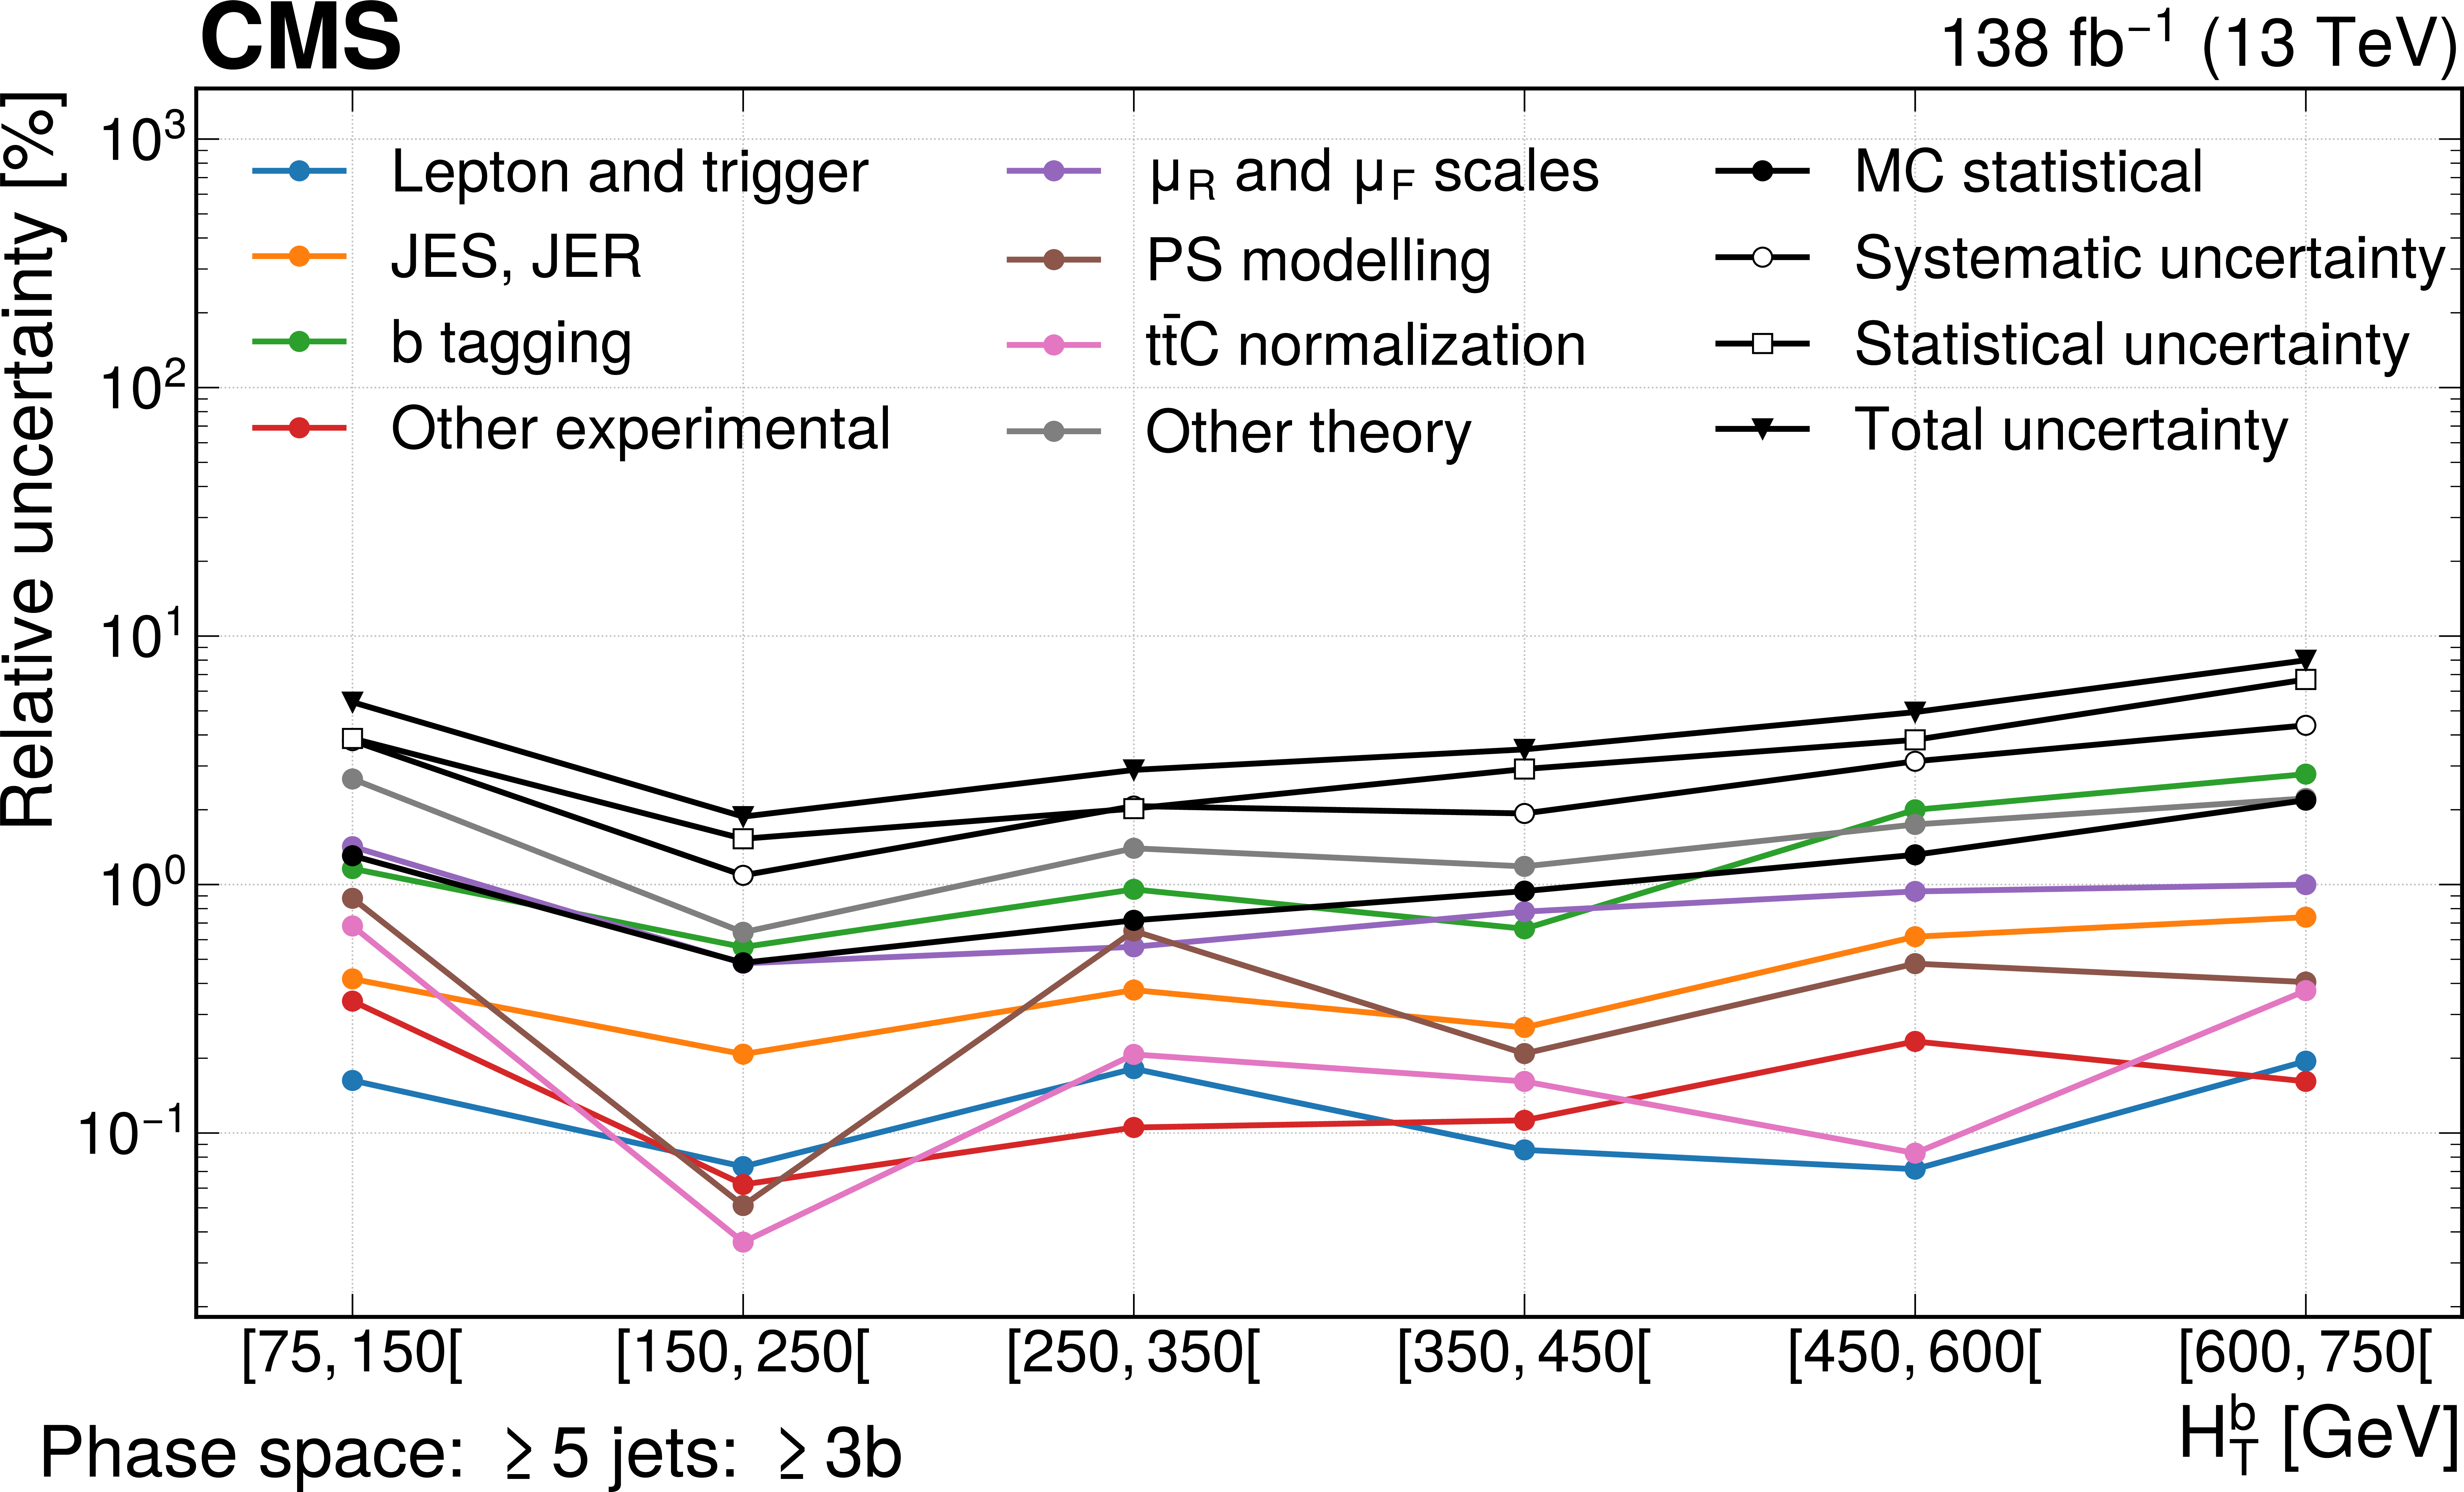
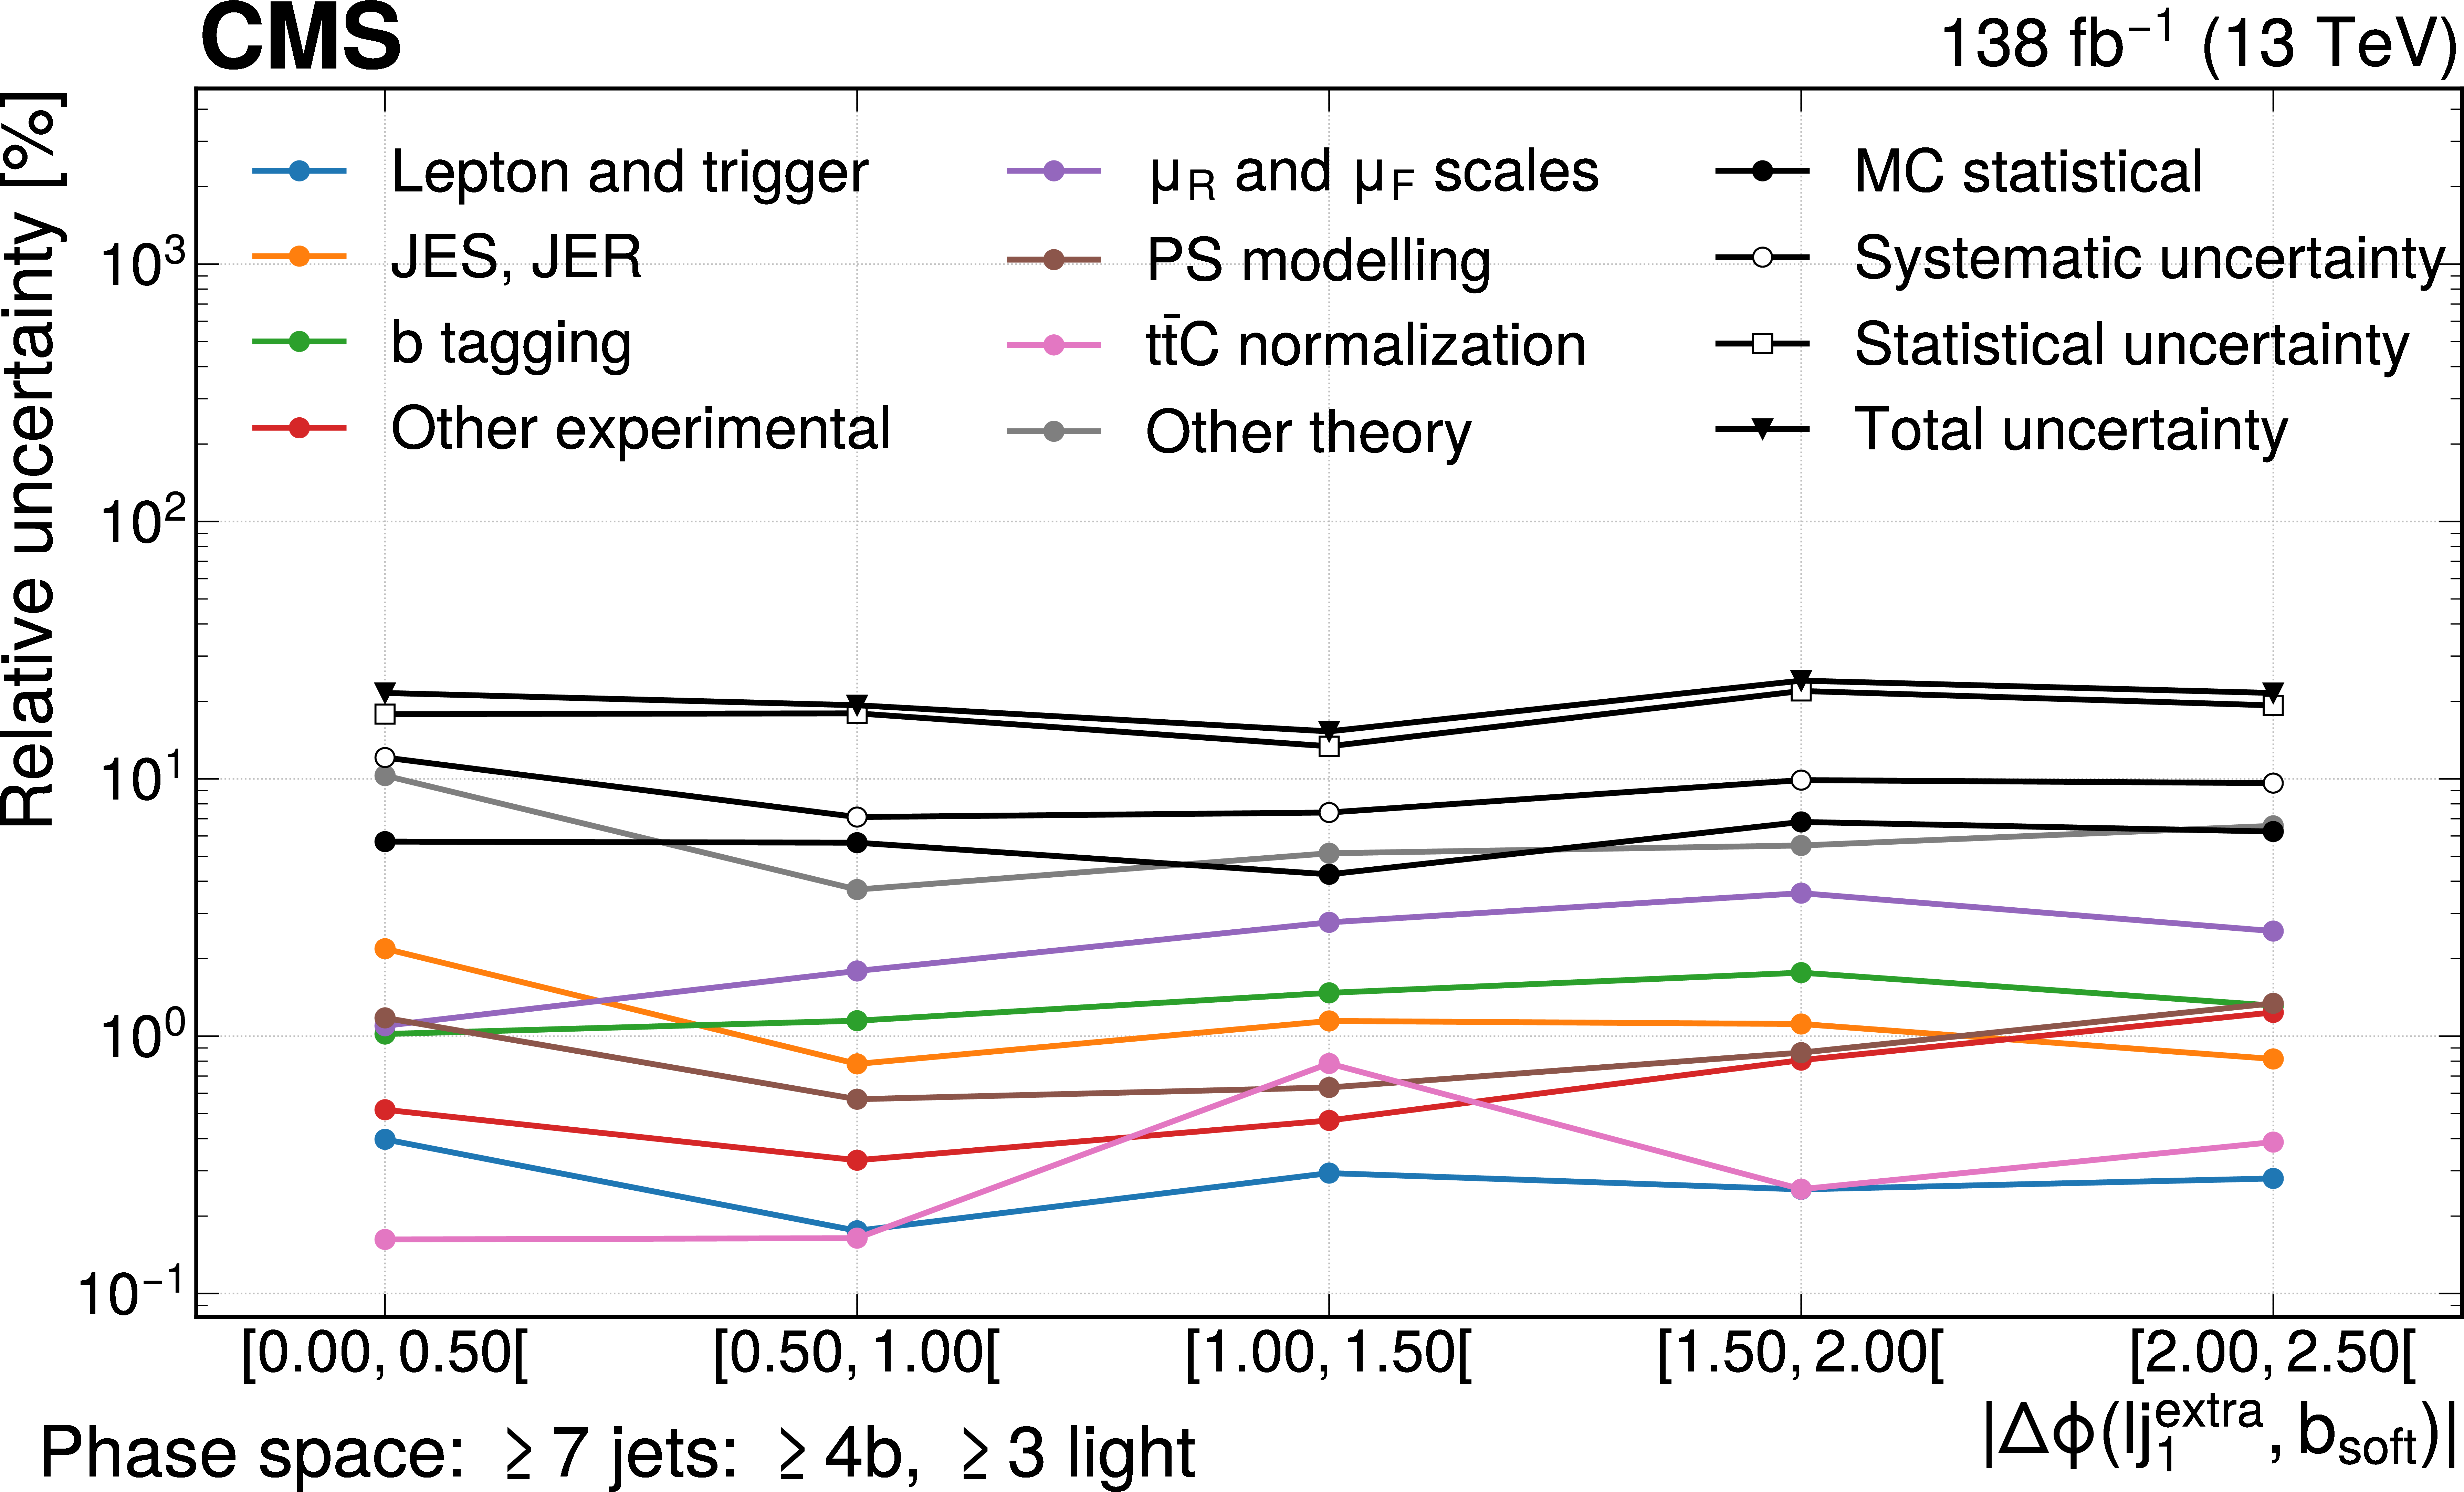
Effect of the considered sources of uncertainties on the measurement of the normalized differential cross section of the $ H_{\mathrm{T}} $ of b jets in the $ \geq $5 jets: $ \geq $3b phase space, obtained by combining the impacts of associated nuisance parameters according to Eq. (2). The ordering of the various sources is similar for other observables and in the other phase space regions. The last bin of the distribution is not shown, since it has no associated parameter of interest but is constrained by the other bins as described in Section 6.3. The category ``other theory'' includes b quark fragmentation, top quark $ p_{\mathrm{T}} $ modelling, PDF, $ h_{\mathrm{damp}} $, colour reconnection, and underlying event uncertainties. The category ``other experimental'' includes pileup and the integrated luminosity uncertainties. |
png pdf |
Figure 6:
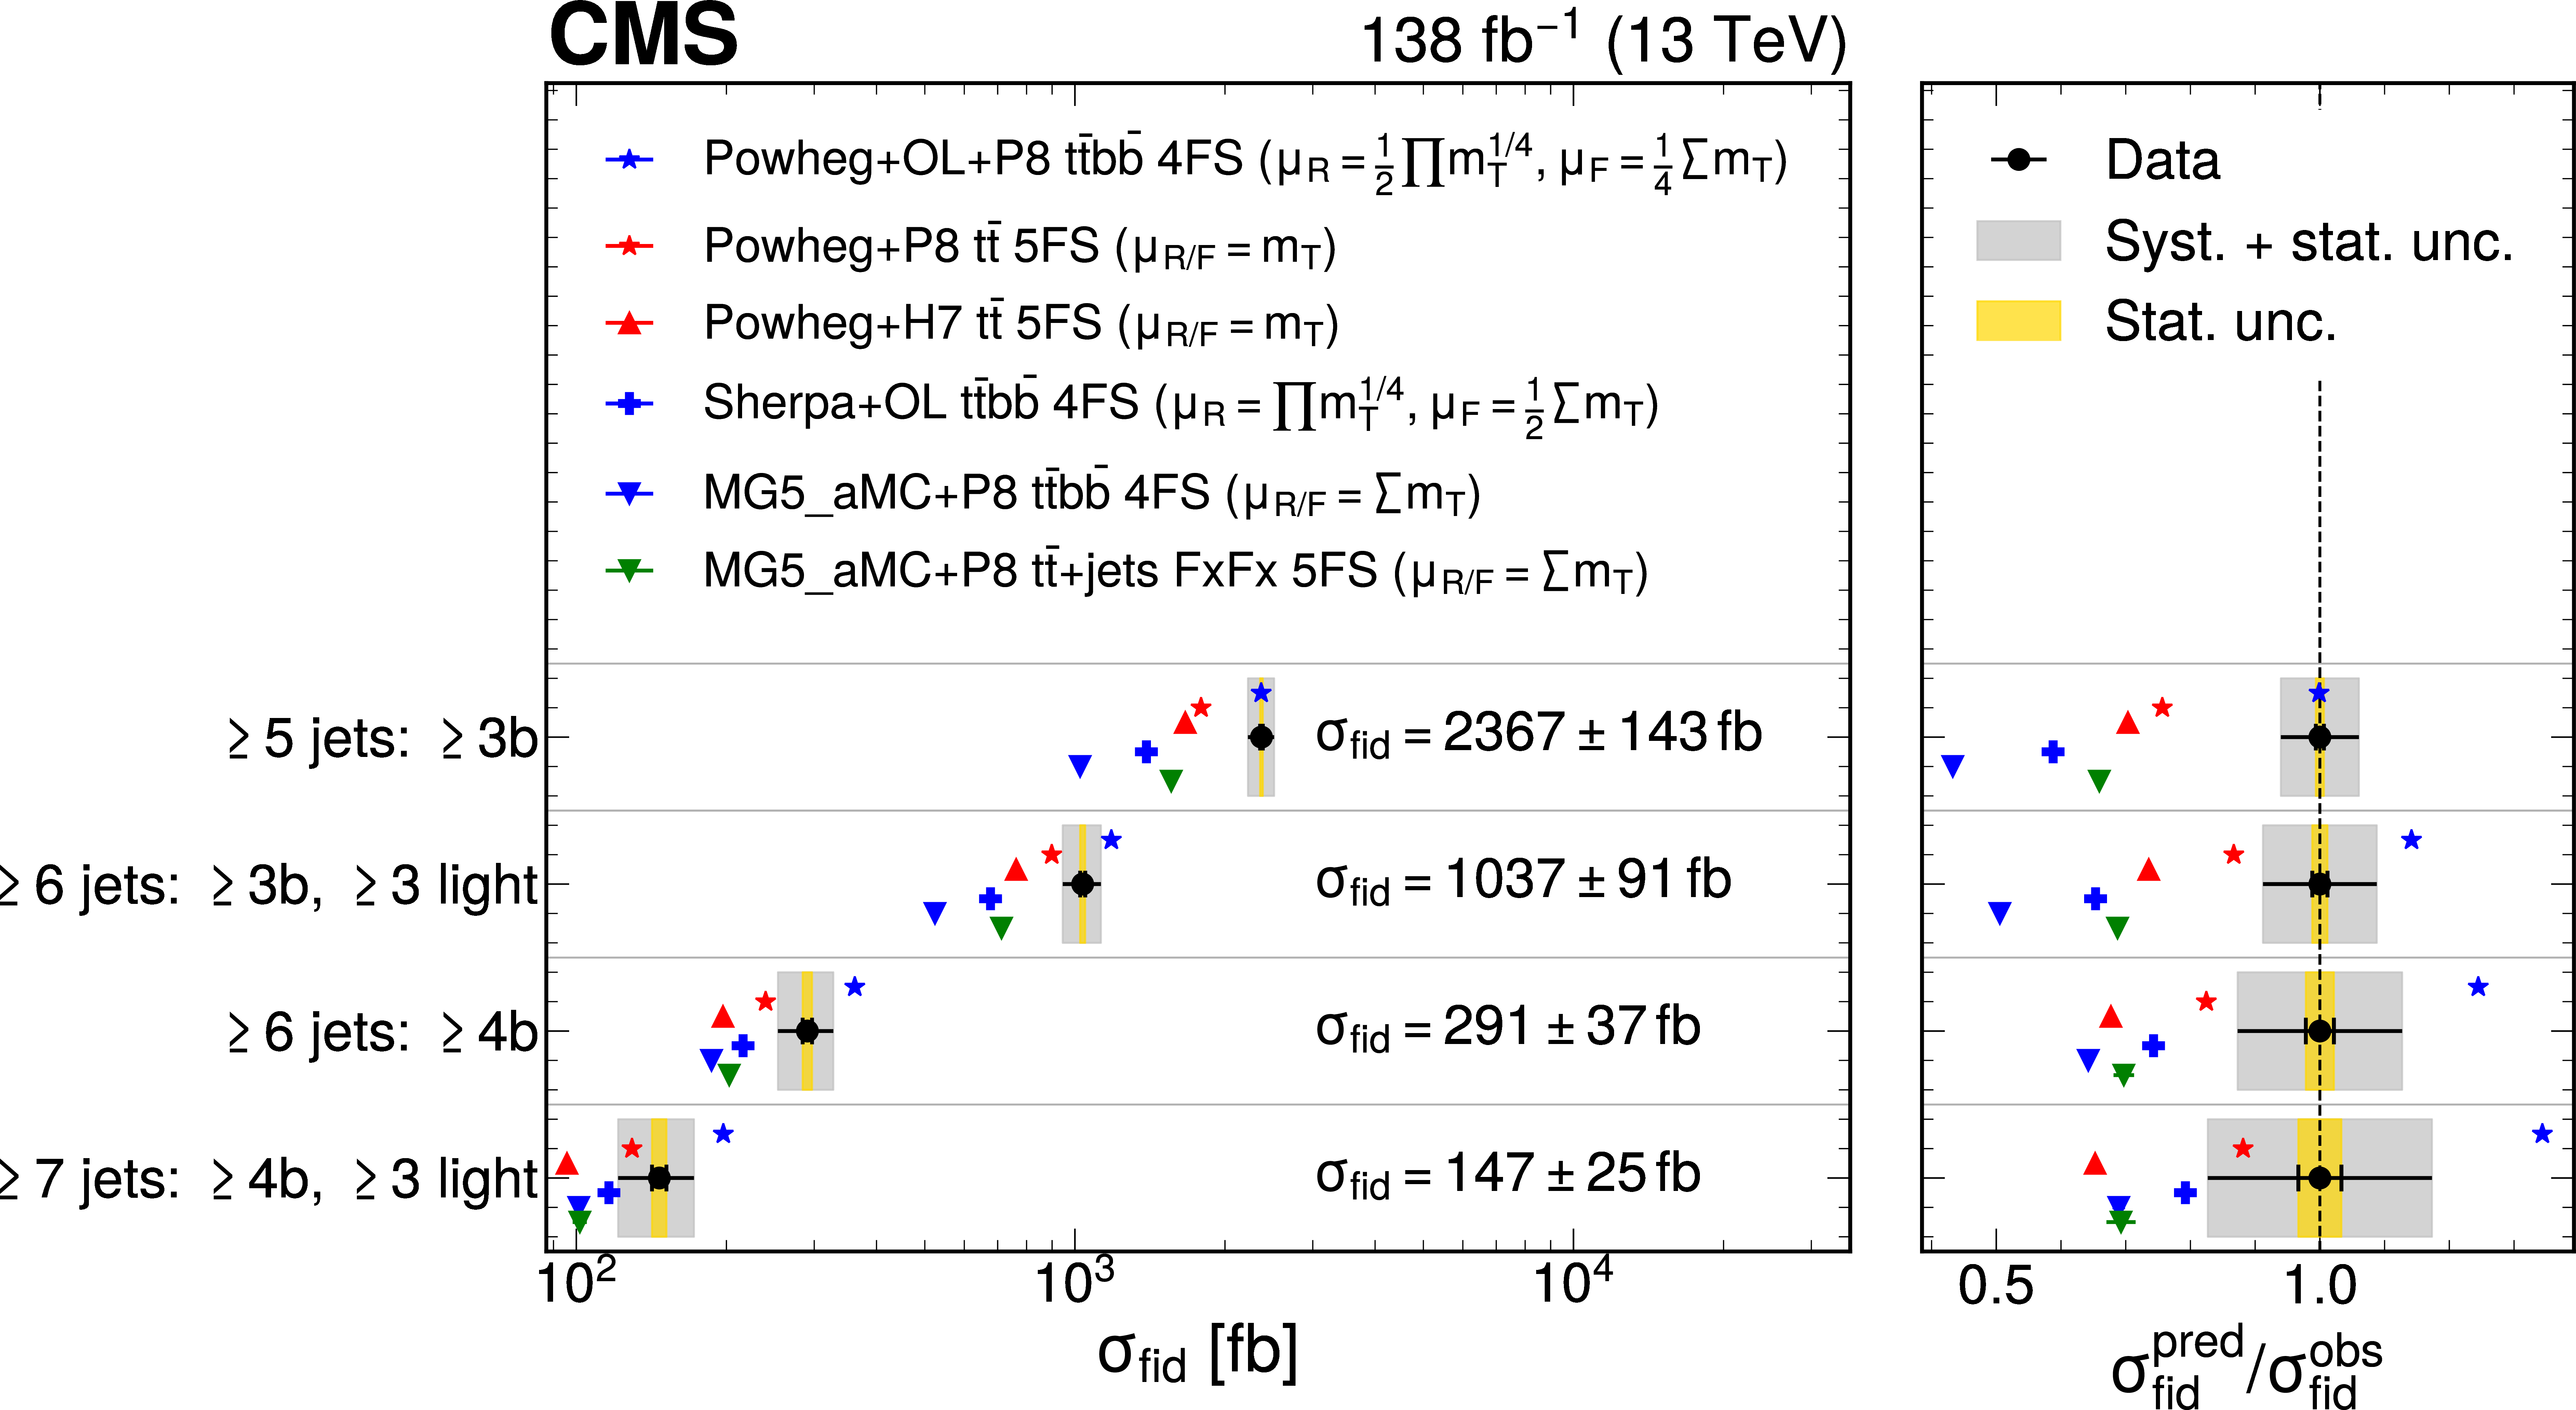
Measured inclusive cross sections for each considered phase space, compared to predictions from different $ {\mathrm{t}\bar{\mathrm{t}}} \mathrm{b}\bar{\mathrm{b}} $ simulation approaches shown as coloured symbols. The predictions include uncertainties (horizontal bars) due to the limited number of simulated events. The blue colour is reserved for models using massive b quarks and NLO QCD $ {\mathrm{t}\bar{\mathrm{t}}} \mathrm{b}\bar{\mathrm{b}} $ MEs, while red is used for the inclusive $ \mathrm{t} \bar{\mathrm{t}} $ generators at NLO in QCD with massless b quarks. The right panel shows the ratios between the predicted and measured cross sections, with the black bars showing the relative uncertainties in the measurements. |
png pdf |
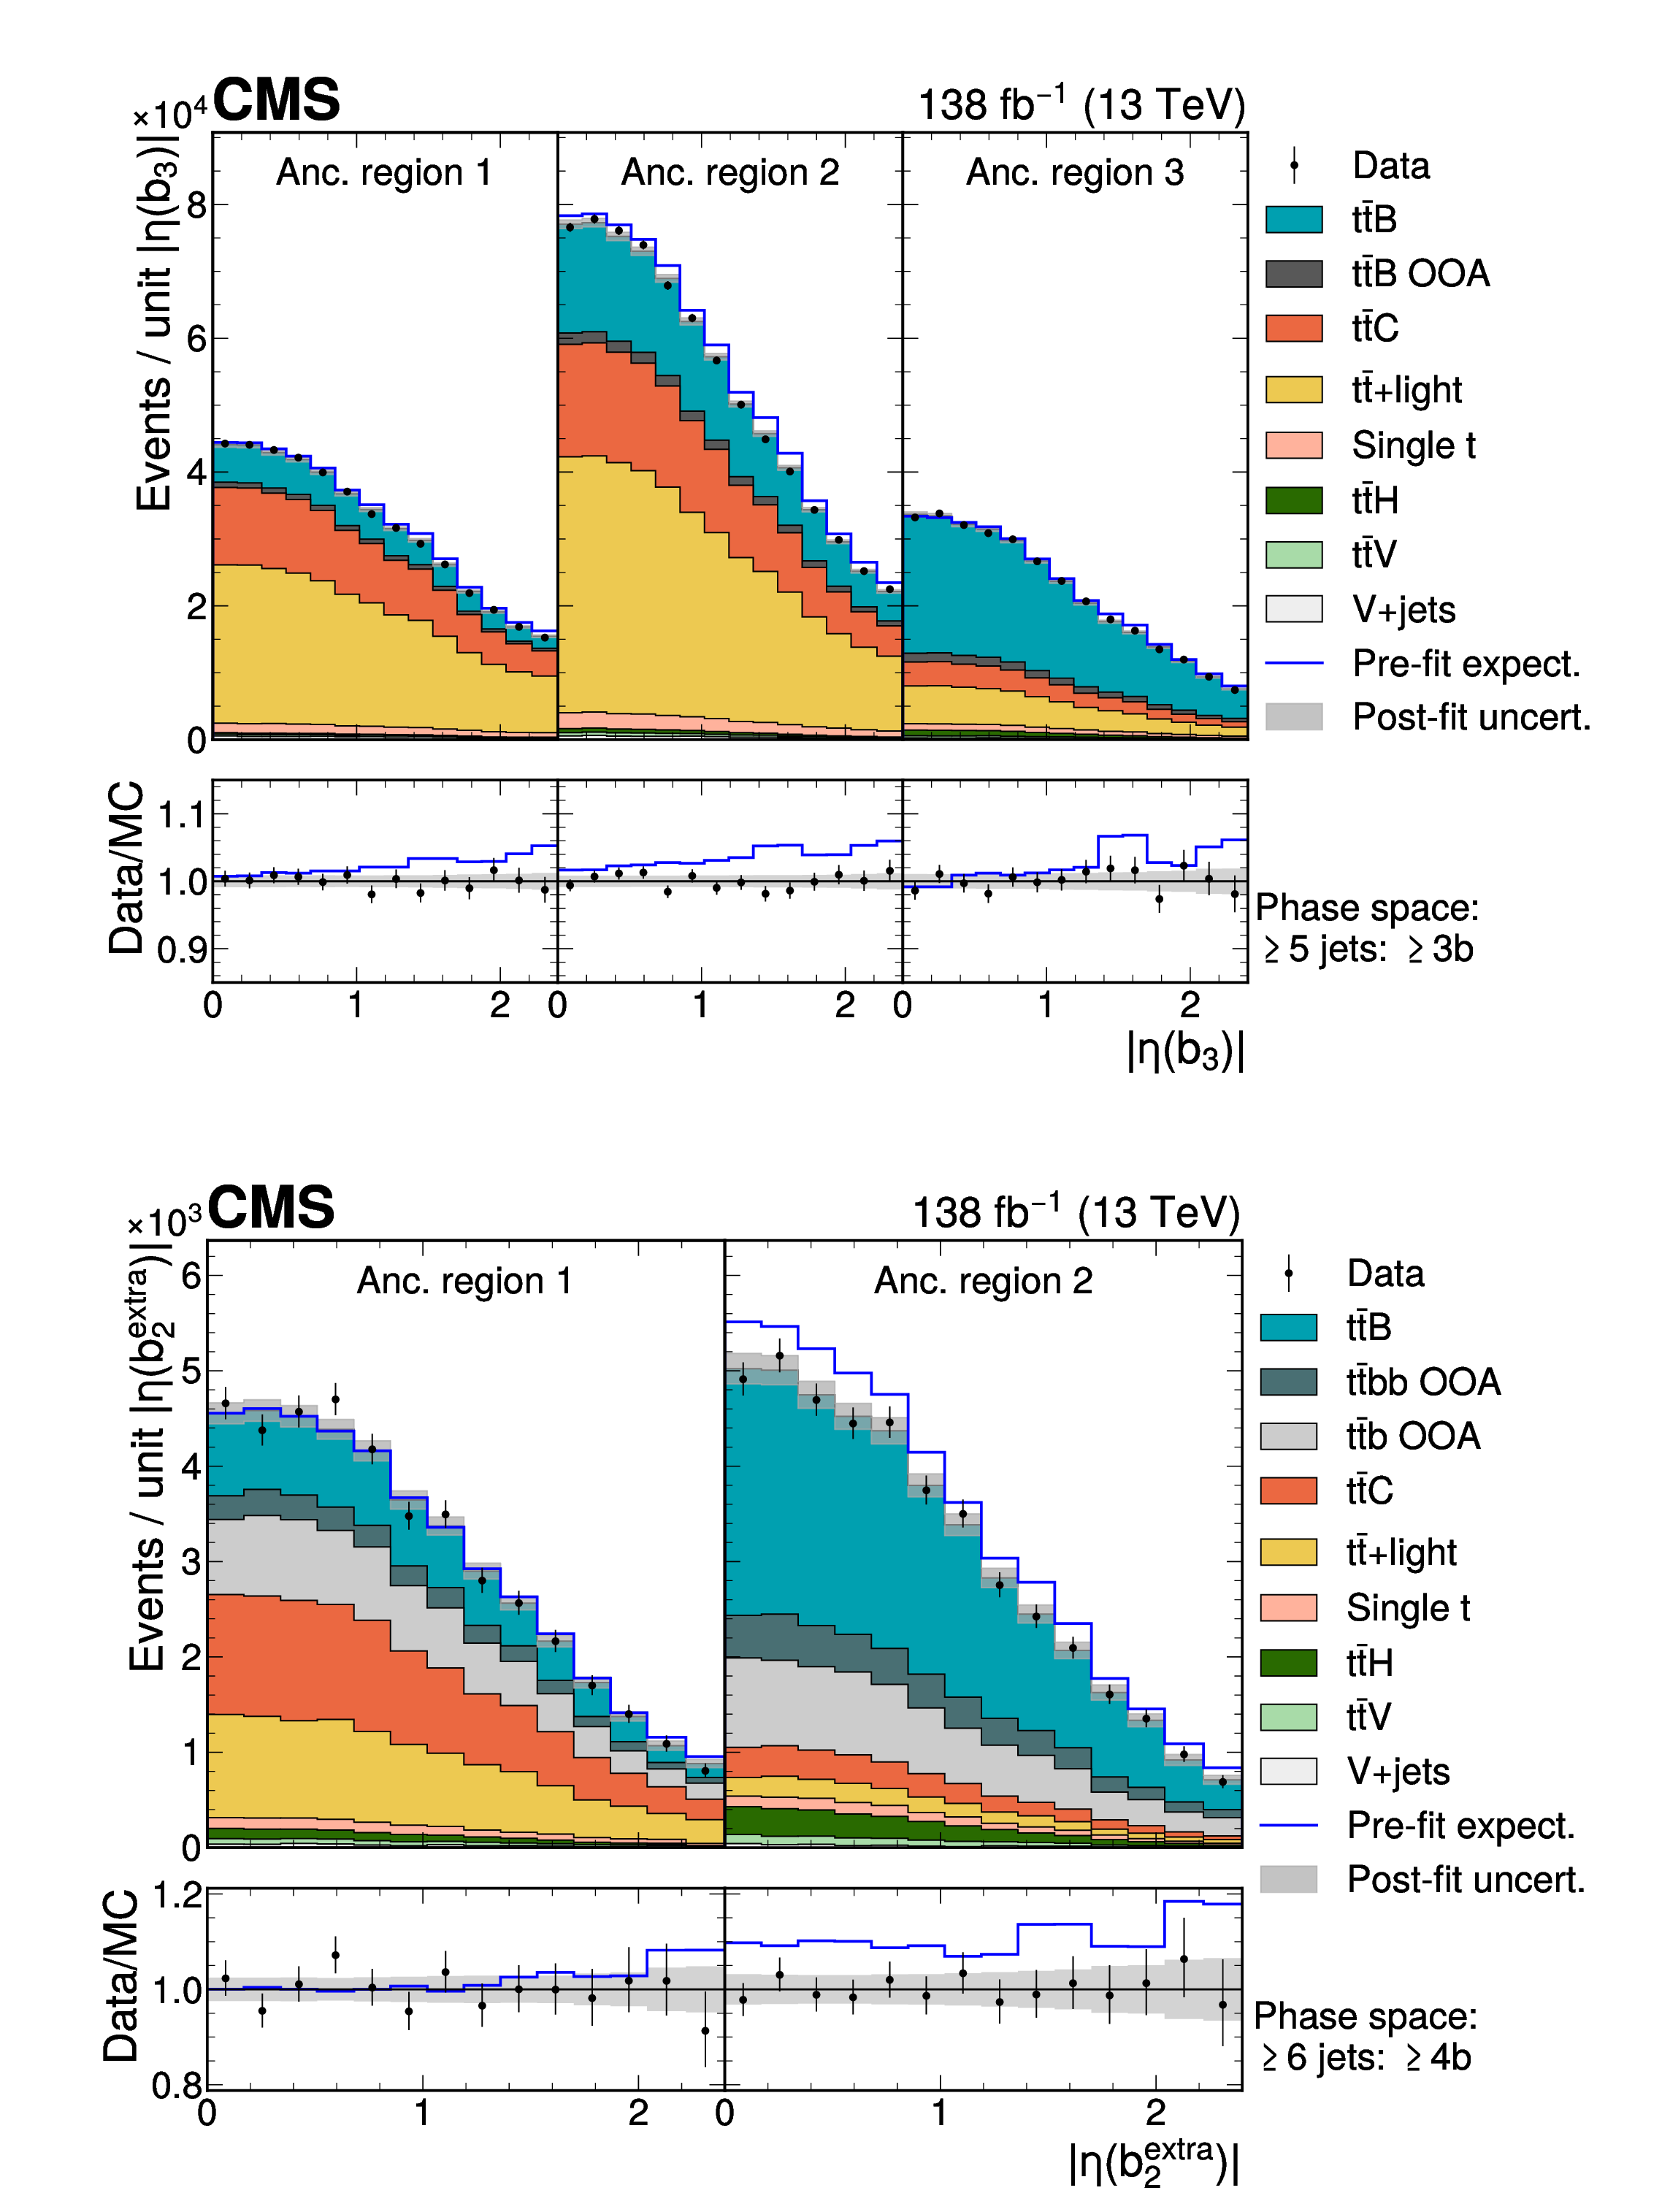
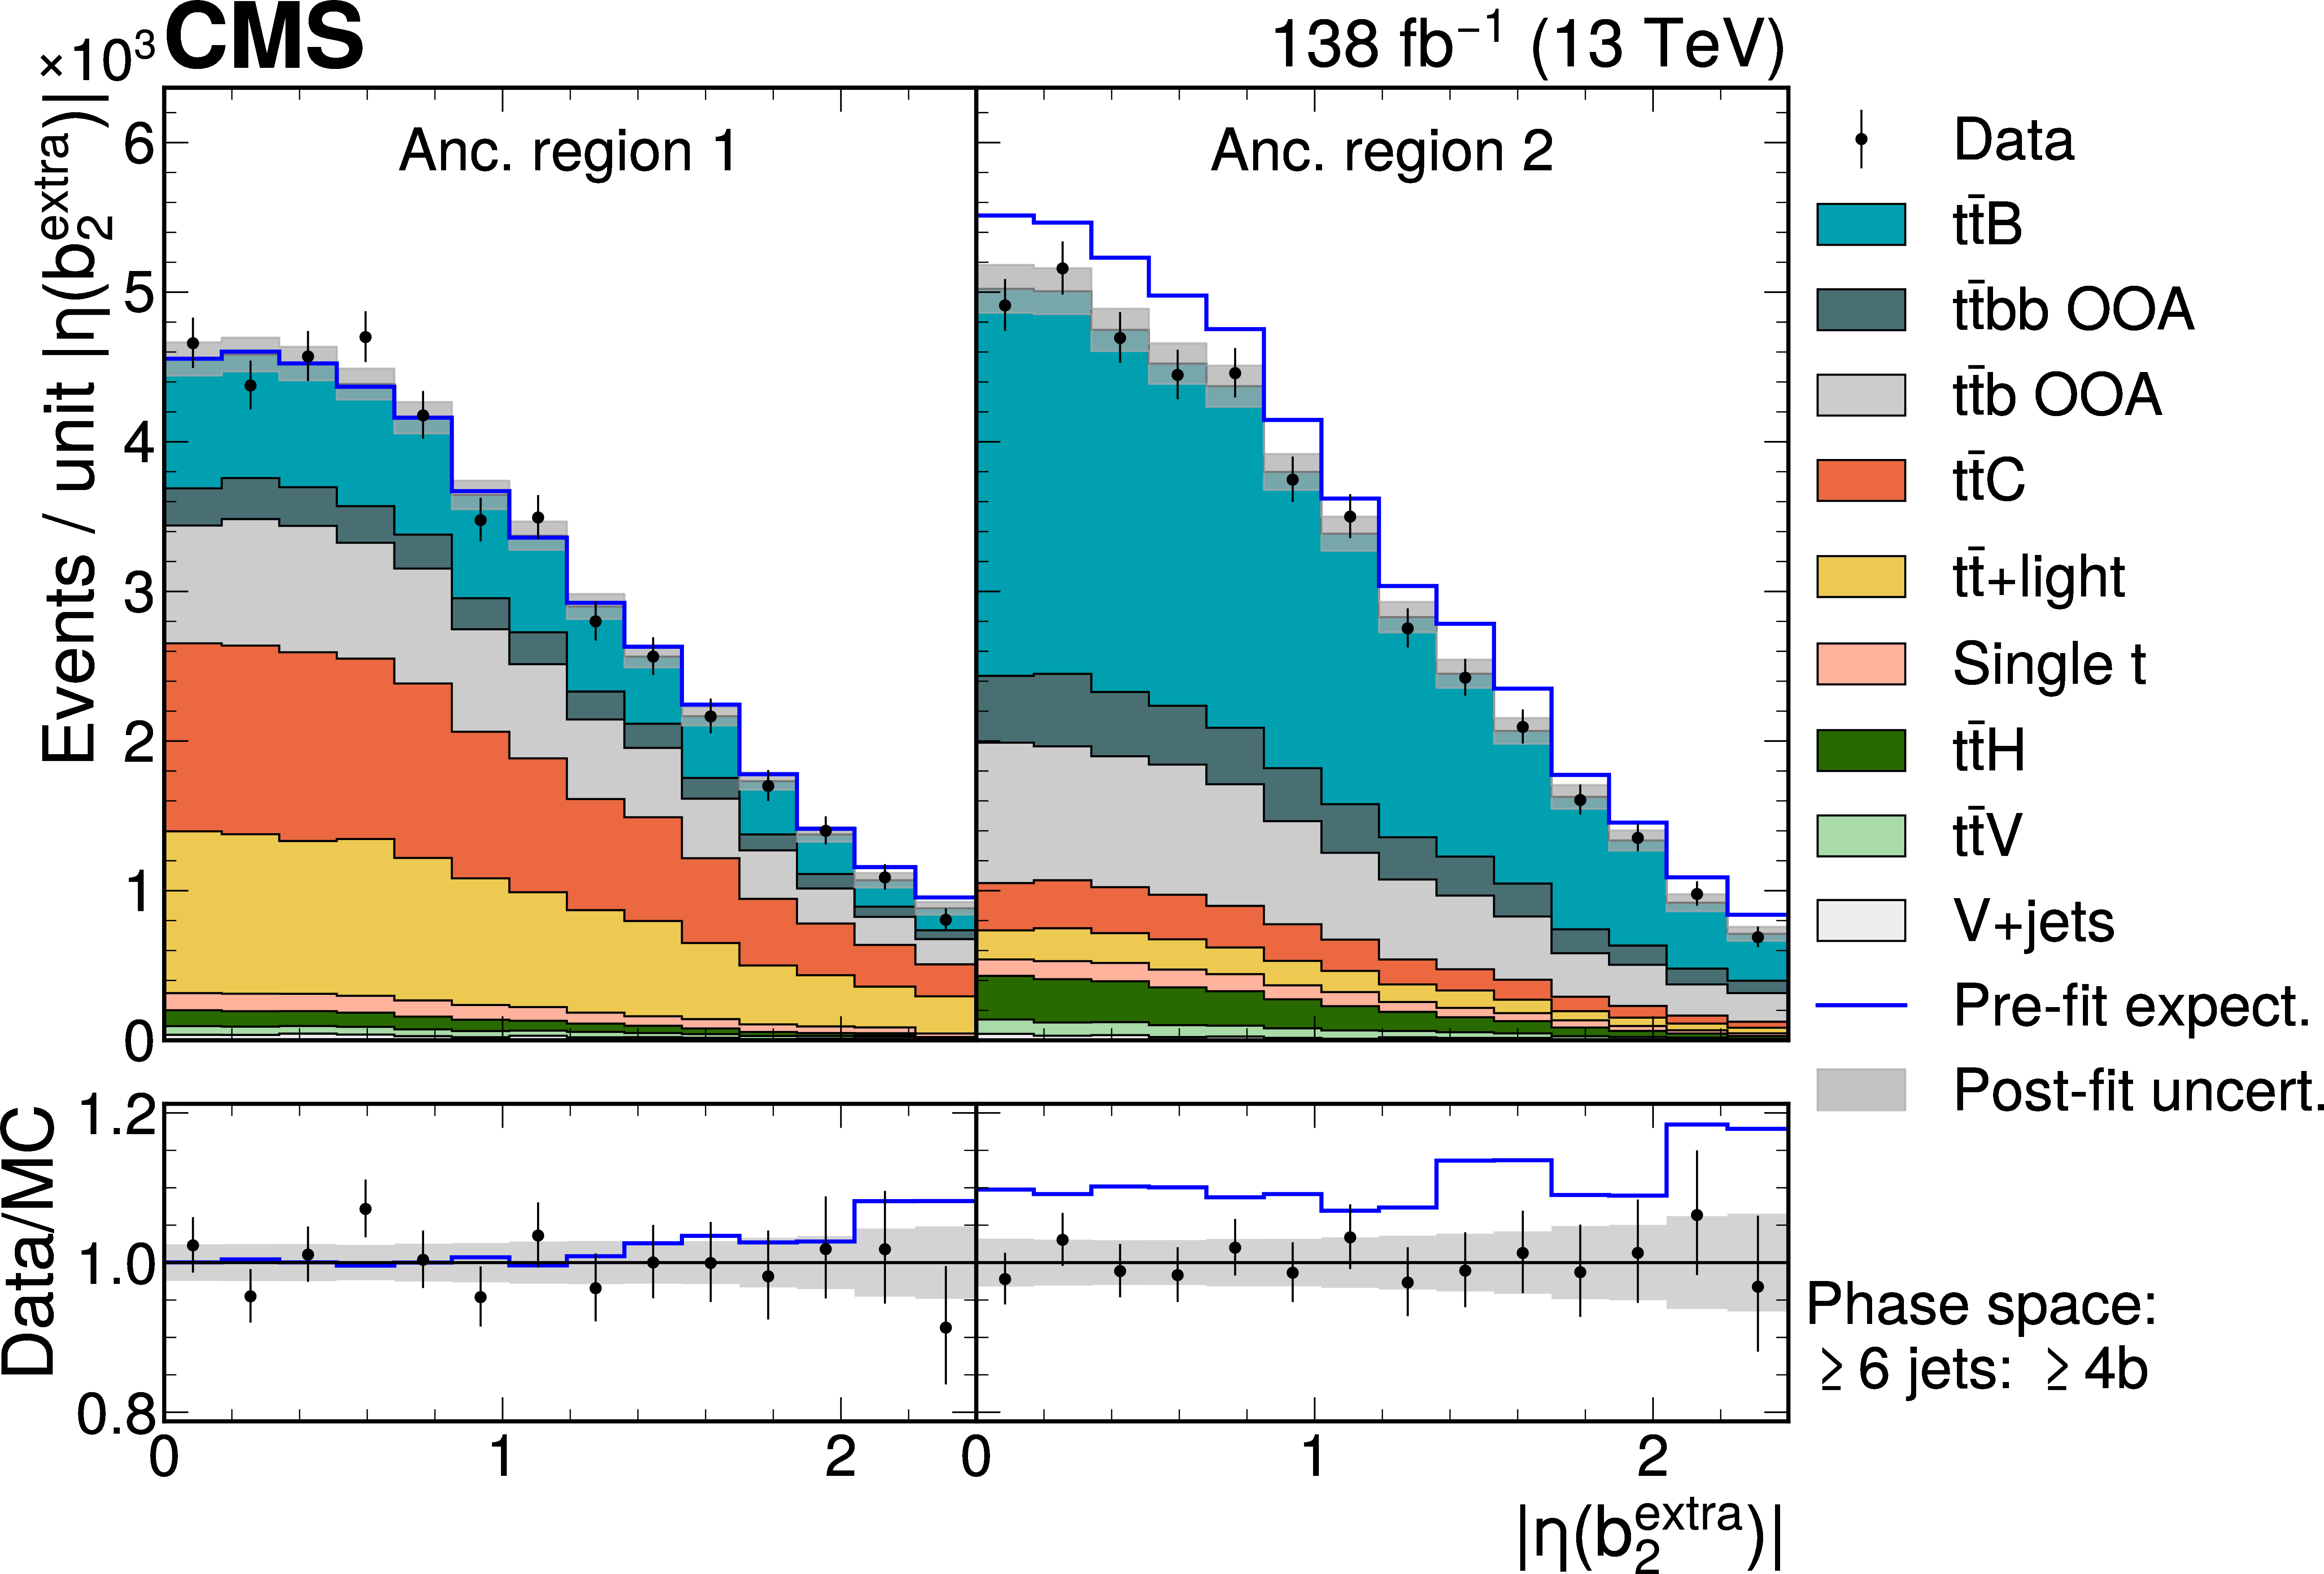
Figure 7:
The $ |\eta| $ of the third-hardest b jet in $ p_{\mathrm{T}} $ ($ |\eta(b_{3})| $) in the $ \geq $5 jets: $ \geq $3b phase space (upper) and the $ |\eta| $ of the subleading additional b jet ($ |\eta(b_{2}^{\text{extra}})| $) in the $ \geq $6 jets: $ \geq $4b phase space (lower) after the fit to data, shown for both lepton channels and all data periods combined. The distributions are shown separately for each ancillary region, as defined in Section 6.1. In the $ \geq $5 jets: $ \geq $3b ($ \geq $6 jets: $ \geq $4b) phase space the ancillary regions are defined as $ \leq $2, 2, and $ \geq $3 ($ \leq $3 and $ \geq $3) tight b-tagged jets. The shaded bands include all uncertainties described in Section 7 after profiling the nuisance parameters in the fit, estimated by sampling the predicted yields from the fit covariance matrix. The blue line shows the sum of the predicted yields for all processes before the fit to data, using the nominal $ {\mathrm{t}\bar{\mathrm{t}}} \mathrm{b}\bar{\mathrm{b}} $ samples and its corresponding cross section for the signal. In the ratio panel the expected yields before the fit to data are shown relative to the predicted yields after the fit to data. The last bins contain the overflow. |

png pdf |
Figure 7-a:
The $ |\eta| $ of the third-hardest b jet in $ p_{\mathrm{T}} $ ($ |\eta(b_{3})| $) in the $ \geq $5 jets: $ \geq $3b phase space (upper) and the $ |\eta| $ of the subleading additional b jet ($ |\eta(b_{2}^{\text{extra}})| $) in the $ \geq $6 jets: $ \geq $4b phase space (lower) after the fit to data, shown for both lepton channels and all data periods combined. The distributions are shown separately for each ancillary region, as defined in Section 6.1. In the $ \geq $5 jets: $ \geq $3b ($ \geq $6 jets: $ \geq $4b) phase space the ancillary regions are defined as $ \leq $2, 2, and $ \geq $3 ($ \leq $3 and $ \geq $3) tight b-tagged jets. The shaded bands include all uncertainties described in Section 7 after profiling the nuisance parameters in the fit, estimated by sampling the predicted yields from the fit covariance matrix. The blue line shows the sum of the predicted yields for all processes before the fit to data, using the nominal $ {\mathrm{t}\bar{\mathrm{t}}} \mathrm{b}\bar{\mathrm{b}} $ samples and its corresponding cross section for the signal. In the ratio panel the expected yields before the fit to data are shown relative to the predicted yields after the fit to data. The last bins contain the overflow. |
png pdf |
Figure 7-b:
The $ |\eta| $ of the third-hardest b jet in $ p_{\mathrm{T}} $ ($ |\eta(b_{3})| $) in the $ \geq $5 jets: $ \geq $3b phase space (upper) and the $ |\eta| $ of the subleading additional b jet ($ |\eta(b_{2}^{\text{extra}})| $) in the $ \geq $6 jets: $ \geq $4b phase space (lower) after the fit to data, shown for both lepton channels and all data periods combined. The distributions are shown separately for each ancillary region, as defined in Section 6.1. In the $ \geq $5 jets: $ \geq $3b ($ \geq $6 jets: $ \geq $4b) phase space the ancillary regions are defined as $ \leq $2, 2, and $ \geq $3 ($ \leq $3 and $ \geq $3) tight b-tagged jets. The shaded bands include all uncertainties described in Section 7 after profiling the nuisance parameters in the fit, estimated by sampling the predicted yields from the fit covariance matrix. The blue line shows the sum of the predicted yields for all processes before the fit to data, using the nominal $ {\mathrm{t}\bar{\mathrm{t}}} \mathrm{b}\bar{\mathrm{b}} $ samples and its corresponding cross section for the signal. In the ratio panel the expected yields before the fit to data are shown relative to the predicted yields after the fit to data. The last bins contain the overflow. |
png pdf |
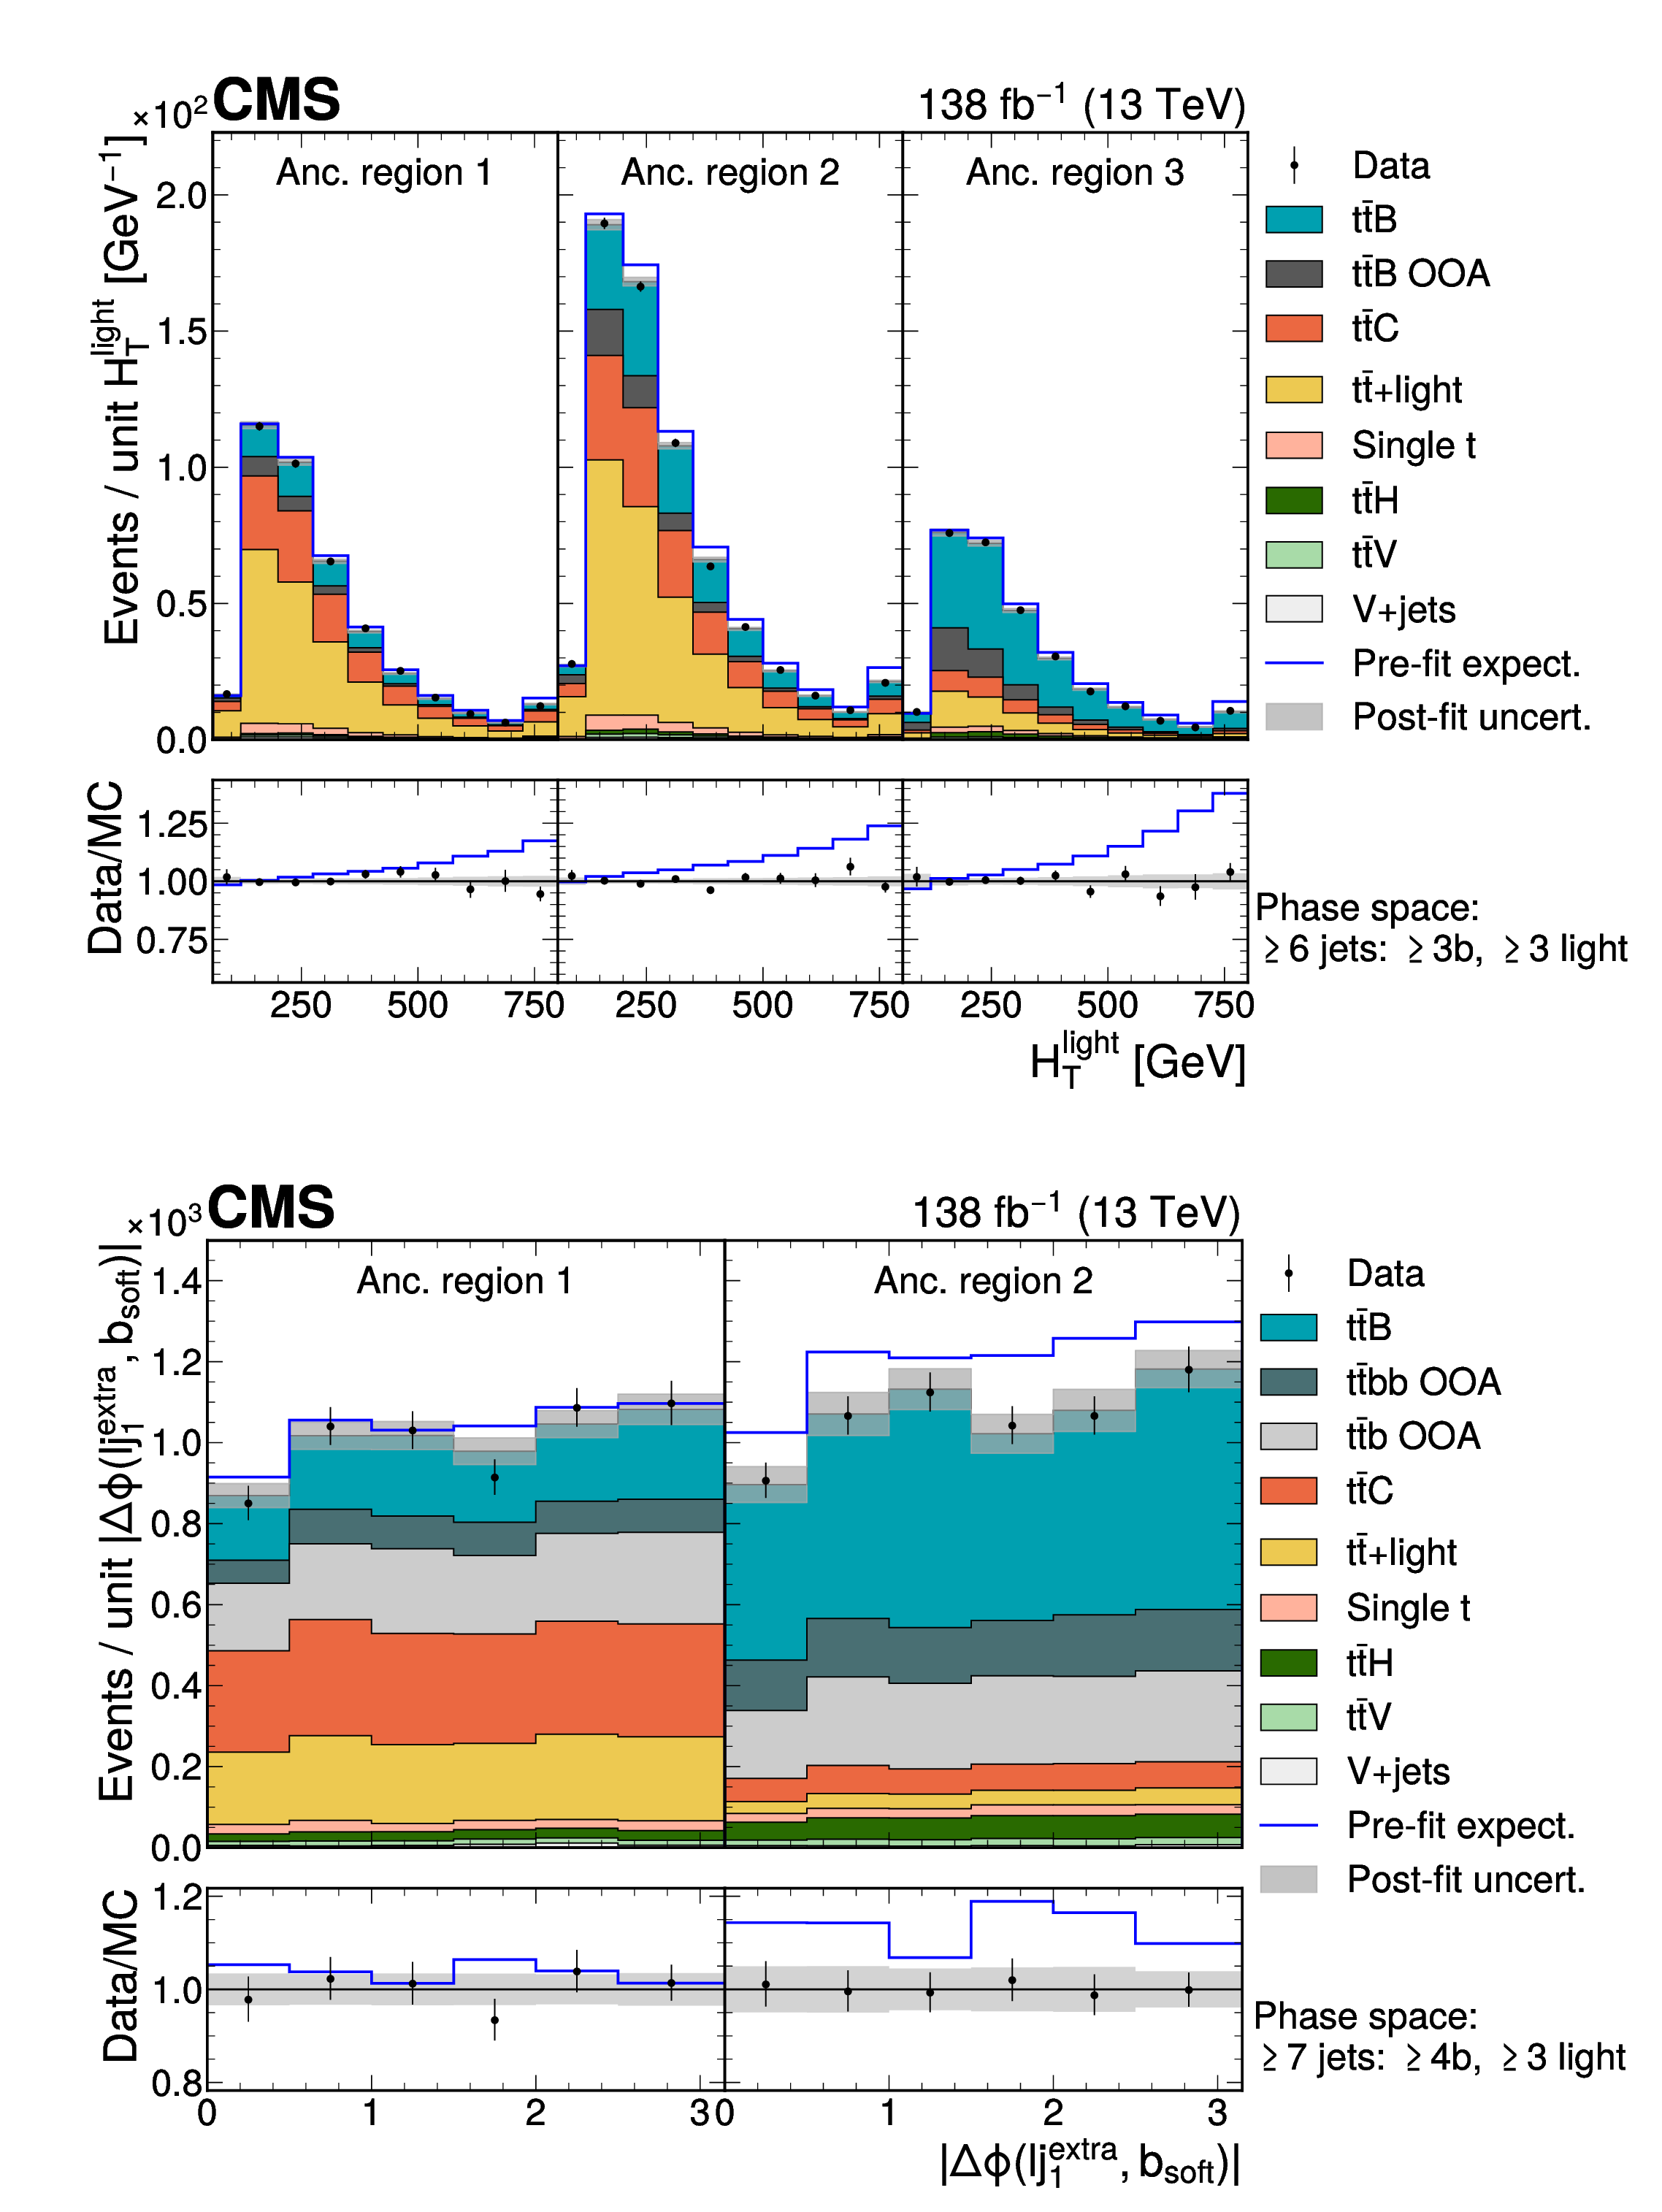
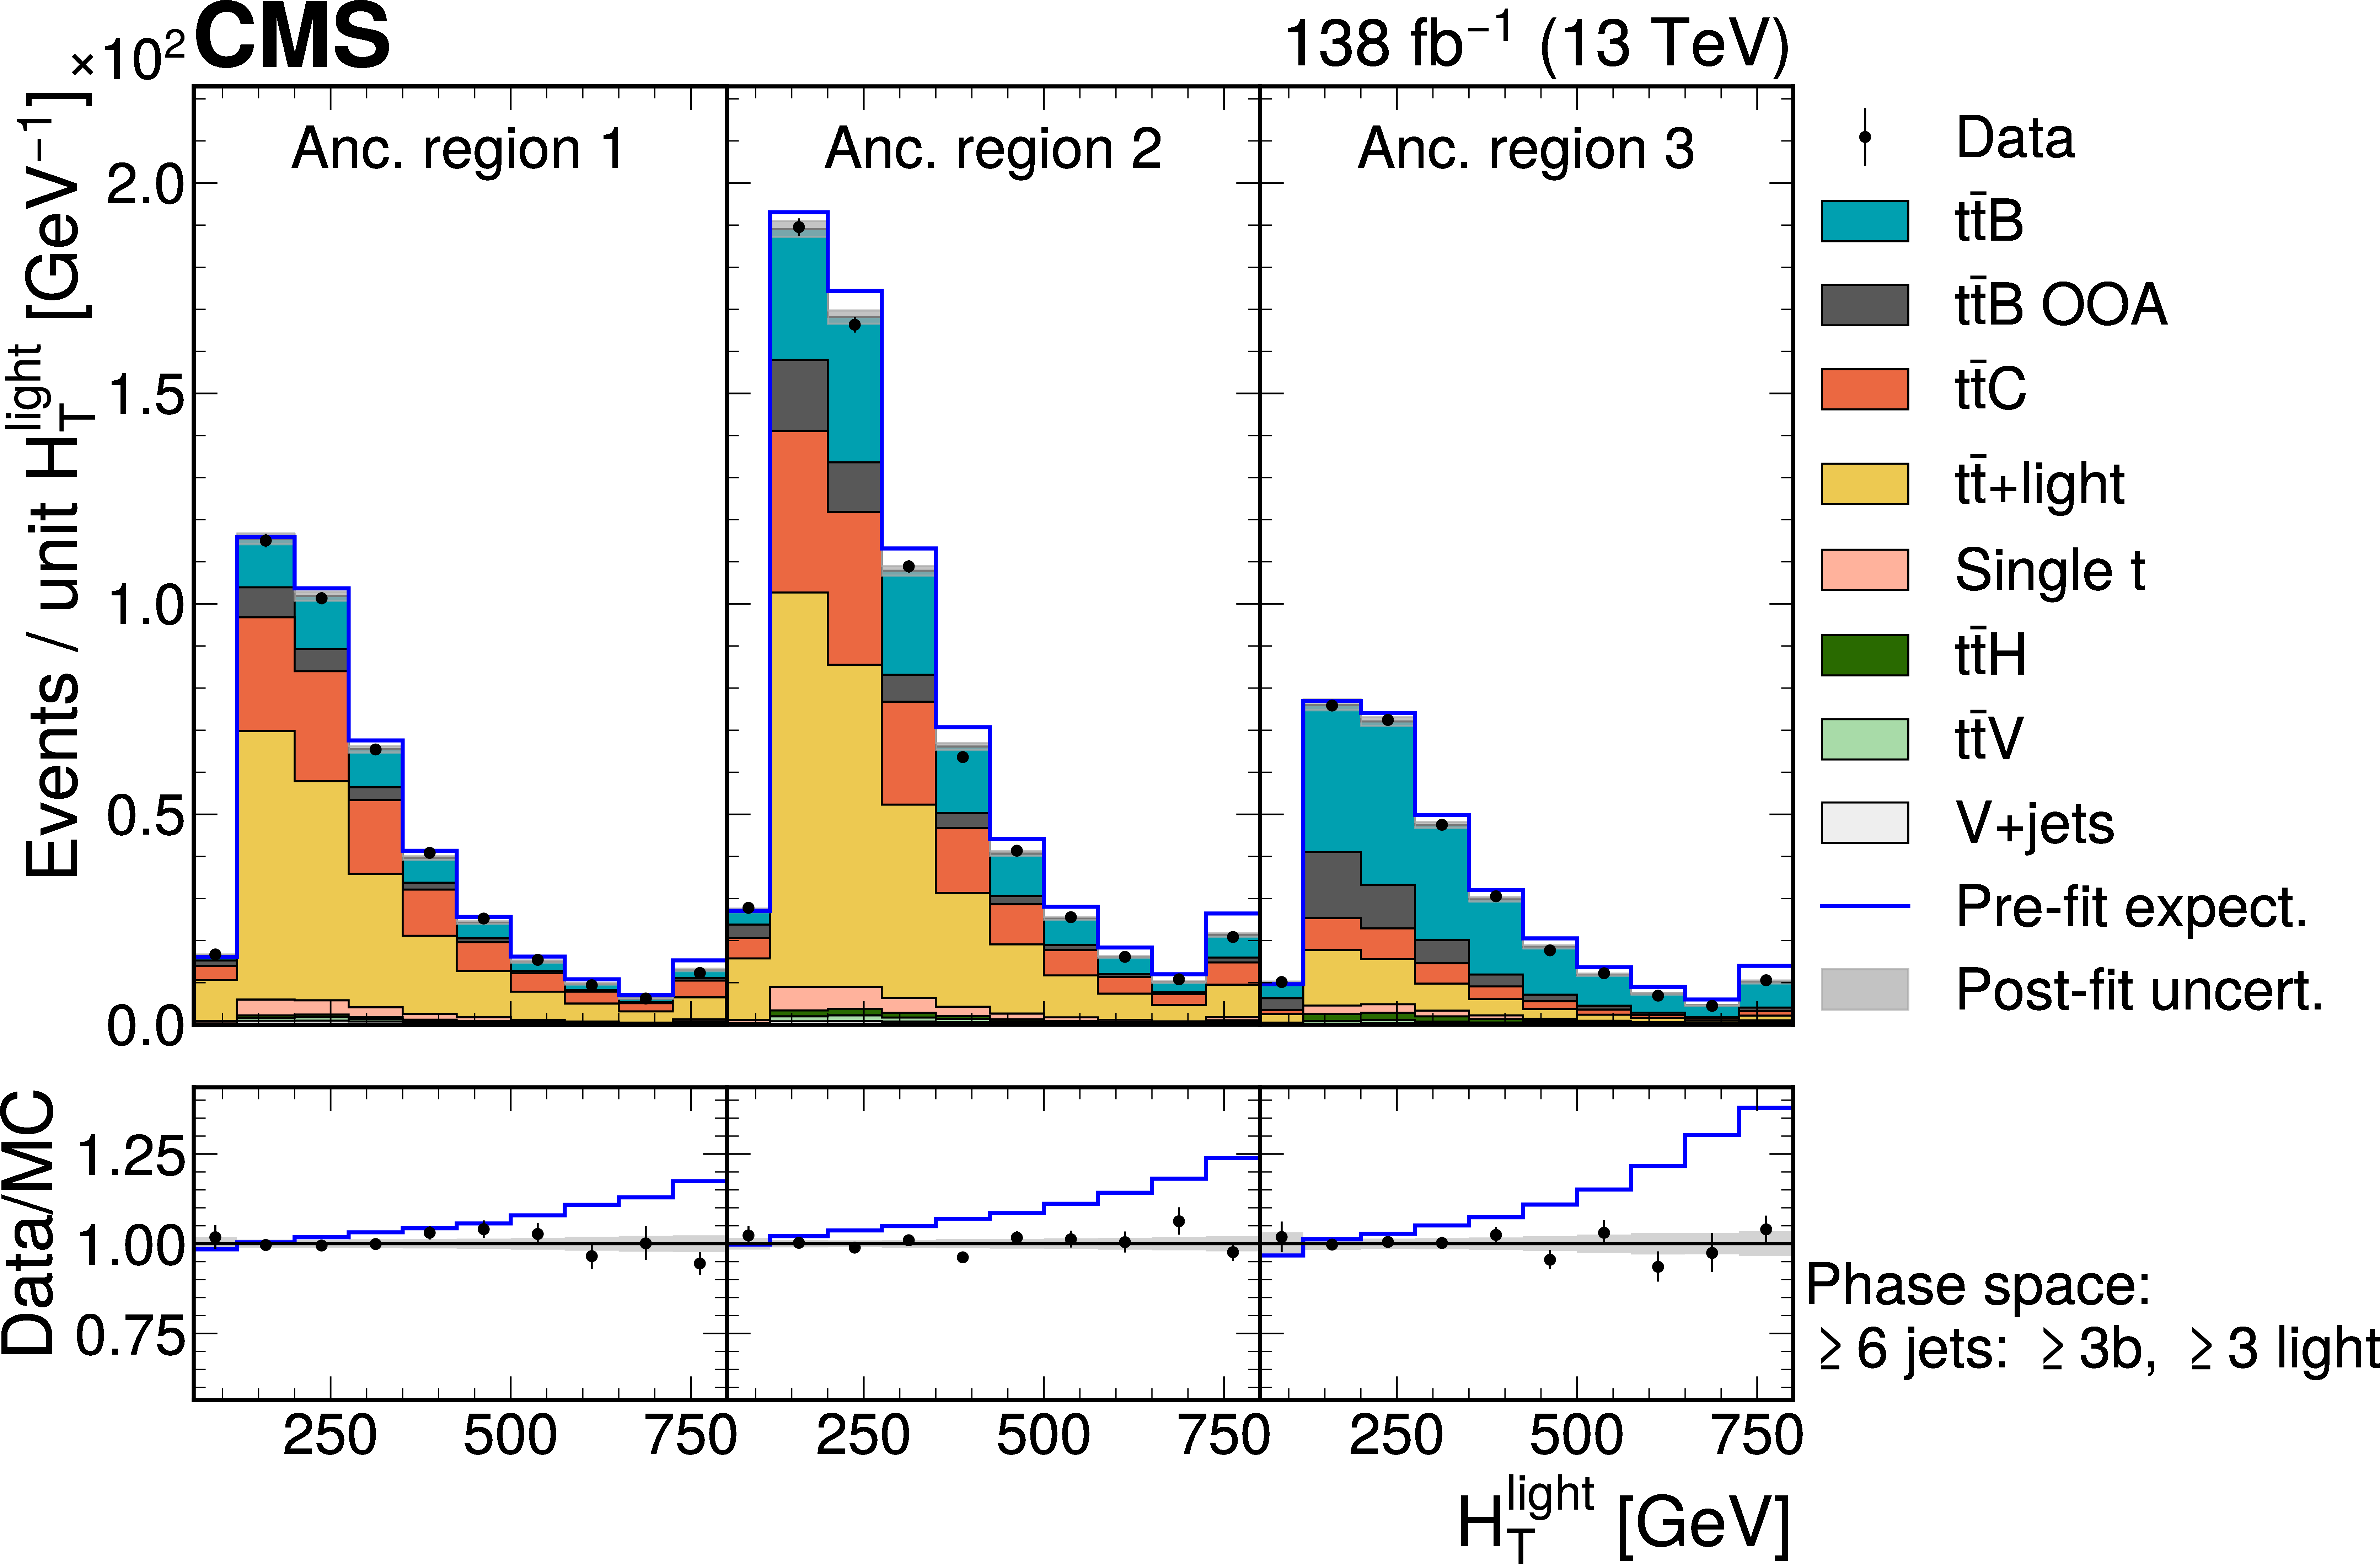
Figure 8:
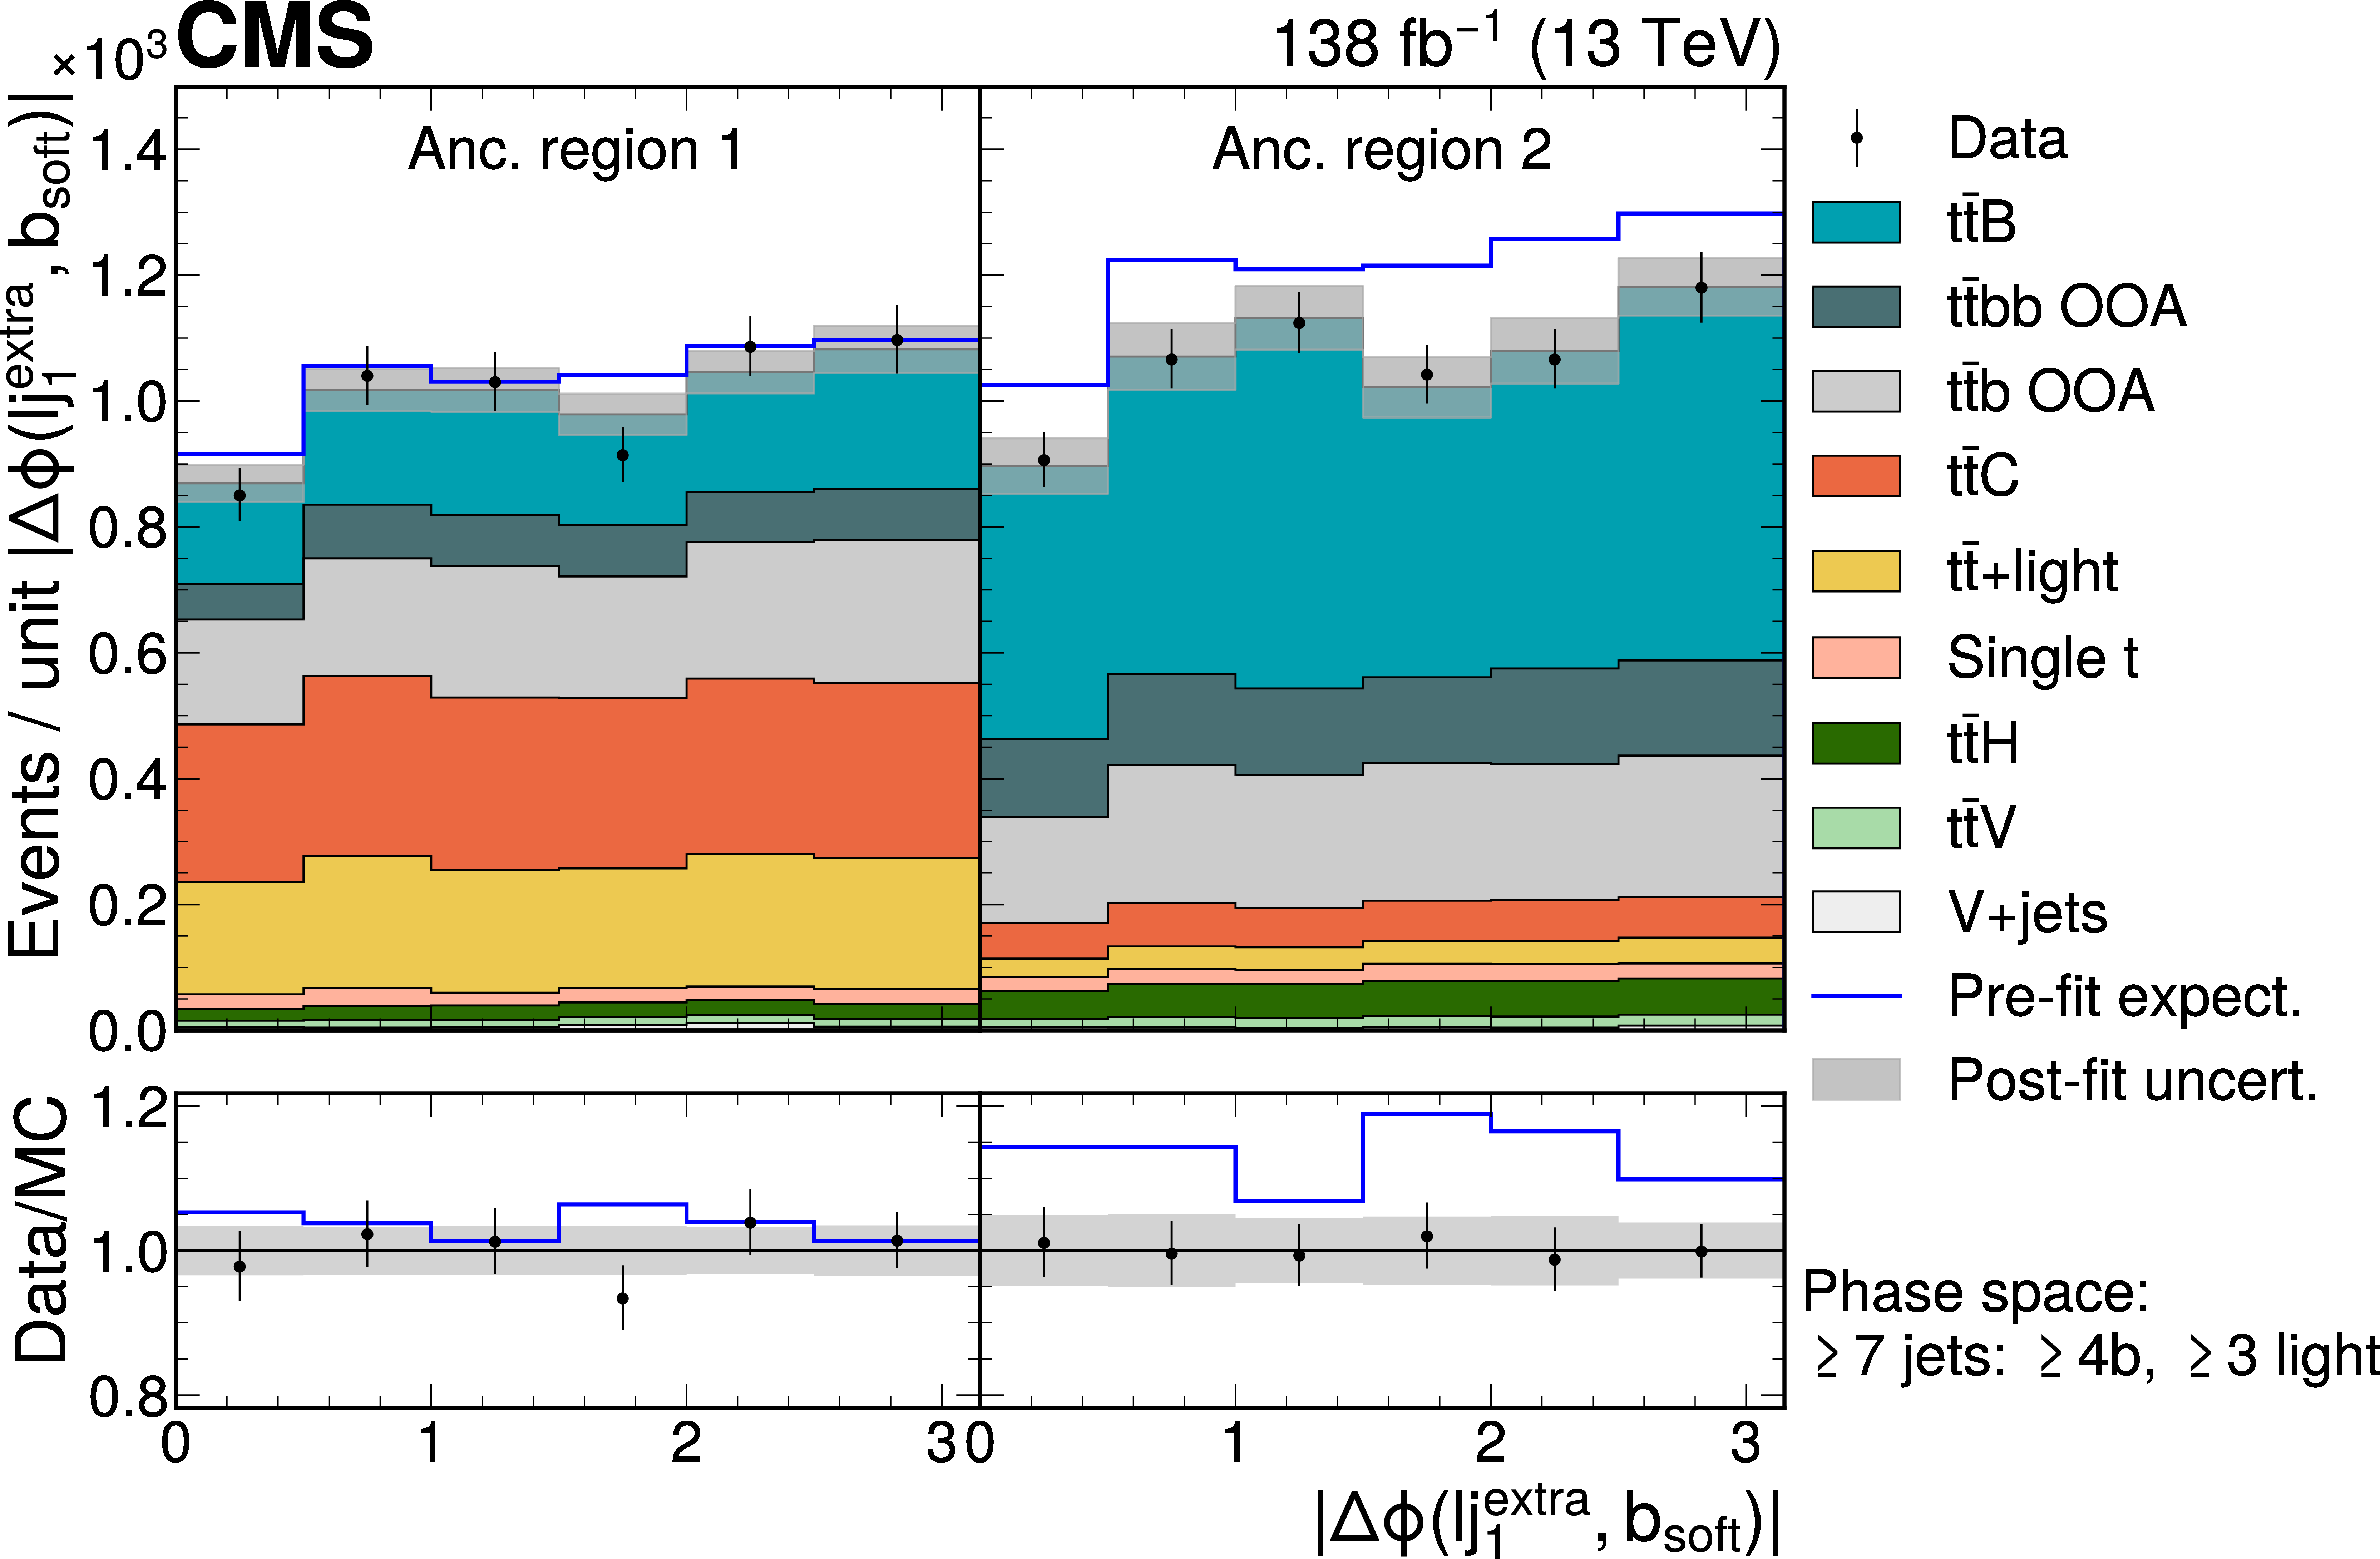
The $ H_{\mathrm{T}} $ of all light jets in the $ \geq $6 jets: $ \geq $3b, $ \geq $3 light phase space (upper) and the azimuthal angle between the hardest remaining light jet and the softest b jet ($ |\Delta\phi(\mathrm{lj}_{1}^{\text{extra}},\mathrm{b}_{\text{soft}})| $) in the $ \geq $7 jets: $ \geq $4b, $ \geq $3 light phase space (lower) after the fit to data, shown for both lepton channels and all data periods combined. The distributions are shown separately for each ancillary region, as defined in Section 6.1. In the $ \geq $6 jets: $ \geq $3b, $ \geq $3 light ($ \geq $7 jets: $ \geq $4b, $ \geq $3 light ) phase space the ancillary regions are defined as $ \leq $2, 2, and $ \geq $3 ($ \leq $3 and $ \geq $3) tight b-tagged jets. The shaded bands include all uncertainties described in Section 7 after profiling the nuisance parameters in the fit, estimated by sampling the predicted yields from the fit covariance matrix. The blue line shows the sum of the predicted yields for all processes before the fit to data, using the nominal $ {\mathrm{t}\bar{\mathrm{t}}} \mathrm{b}\bar{\mathrm{b}} $ samples and its corresponding cross section for the signal. In the ratio panel the expected yields before the fit to data are shown relative to the predicted yields after the fit to data. The last bins contain the overflow. |
png pdf |
Figure 8-a:
The $ H_{\mathrm{T}} $ of all light jets in the $ \geq $6 jets: $ \geq $3b, $ \geq $3 light phase space (upper) and the azimuthal angle between the hardest remaining light jet and the softest b jet ($ |\Delta\phi(\mathrm{lj}_{1}^{\text{extra}},\mathrm{b}_{\text{soft}})| $) in the $ \geq $7 jets: $ \geq $4b, $ \geq $3 light phase space (lower) after the fit to data, shown for both lepton channels and all data periods combined. The distributions are shown separately for each ancillary region, as defined in Section 6.1. In the $ \geq $6 jets: $ \geq $3b, $ \geq $3 light ($ \geq $7 jets: $ \geq $4b, $ \geq $3 light ) phase space the ancillary regions are defined as $ \leq $2, 2, and $ \geq $3 ($ \leq $3 and $ \geq $3) tight b-tagged jets. The shaded bands include all uncertainties described in Section 7 after profiling the nuisance parameters in the fit, estimated by sampling the predicted yields from the fit covariance matrix. The blue line shows the sum of the predicted yields for all processes before the fit to data, using the nominal $ {\mathrm{t}\bar{\mathrm{t}}} \mathrm{b}\bar{\mathrm{b}} $ samples and its corresponding cross section for the signal. In the ratio panel the expected yields before the fit to data are shown relative to the predicted yields after the fit to data. The last bins contain the overflow. |
png pdf |
Figure 8-b:
The $ H_{\mathrm{T}} $ of all light jets in the $ \geq $6 jets: $ \geq $3b, $ \geq $3 light phase space (upper) and the azimuthal angle between the hardest remaining light jet and the softest b jet ($ |\Delta\phi(\mathrm{lj}_{1}^{\text{extra}},\mathrm{b}_{\text{soft}})| $) in the $ \geq $7 jets: $ \geq $4b, $ \geq $3 light phase space (lower) after the fit to data, shown for both lepton channels and all data periods combined. The distributions are shown separately for each ancillary region, as defined in Section 6.1. In the $ \geq $6 jets: $ \geq $3b, $ \geq $3 light ($ \geq $7 jets: $ \geq $4b, $ \geq $3 light ) phase space the ancillary regions are defined as $ \leq $2, 2, and $ \geq $3 ($ \leq $3 and $ \geq $3) tight b-tagged jets. The shaded bands include all uncertainties described in Section 7 after profiling the nuisance parameters in the fit, estimated by sampling the predicted yields from the fit covariance matrix. The blue line shows the sum of the predicted yields for all processes before the fit to data, using the nominal $ {\mathrm{t}\bar{\mathrm{t}}} \mathrm{b}\bar{\mathrm{b}} $ samples and its corresponding cross section for the signal. In the ratio panel the expected yields before the fit to data are shown relative to the predicted yields after the fit to data. The last bins contain the overflow. |
png pdf |
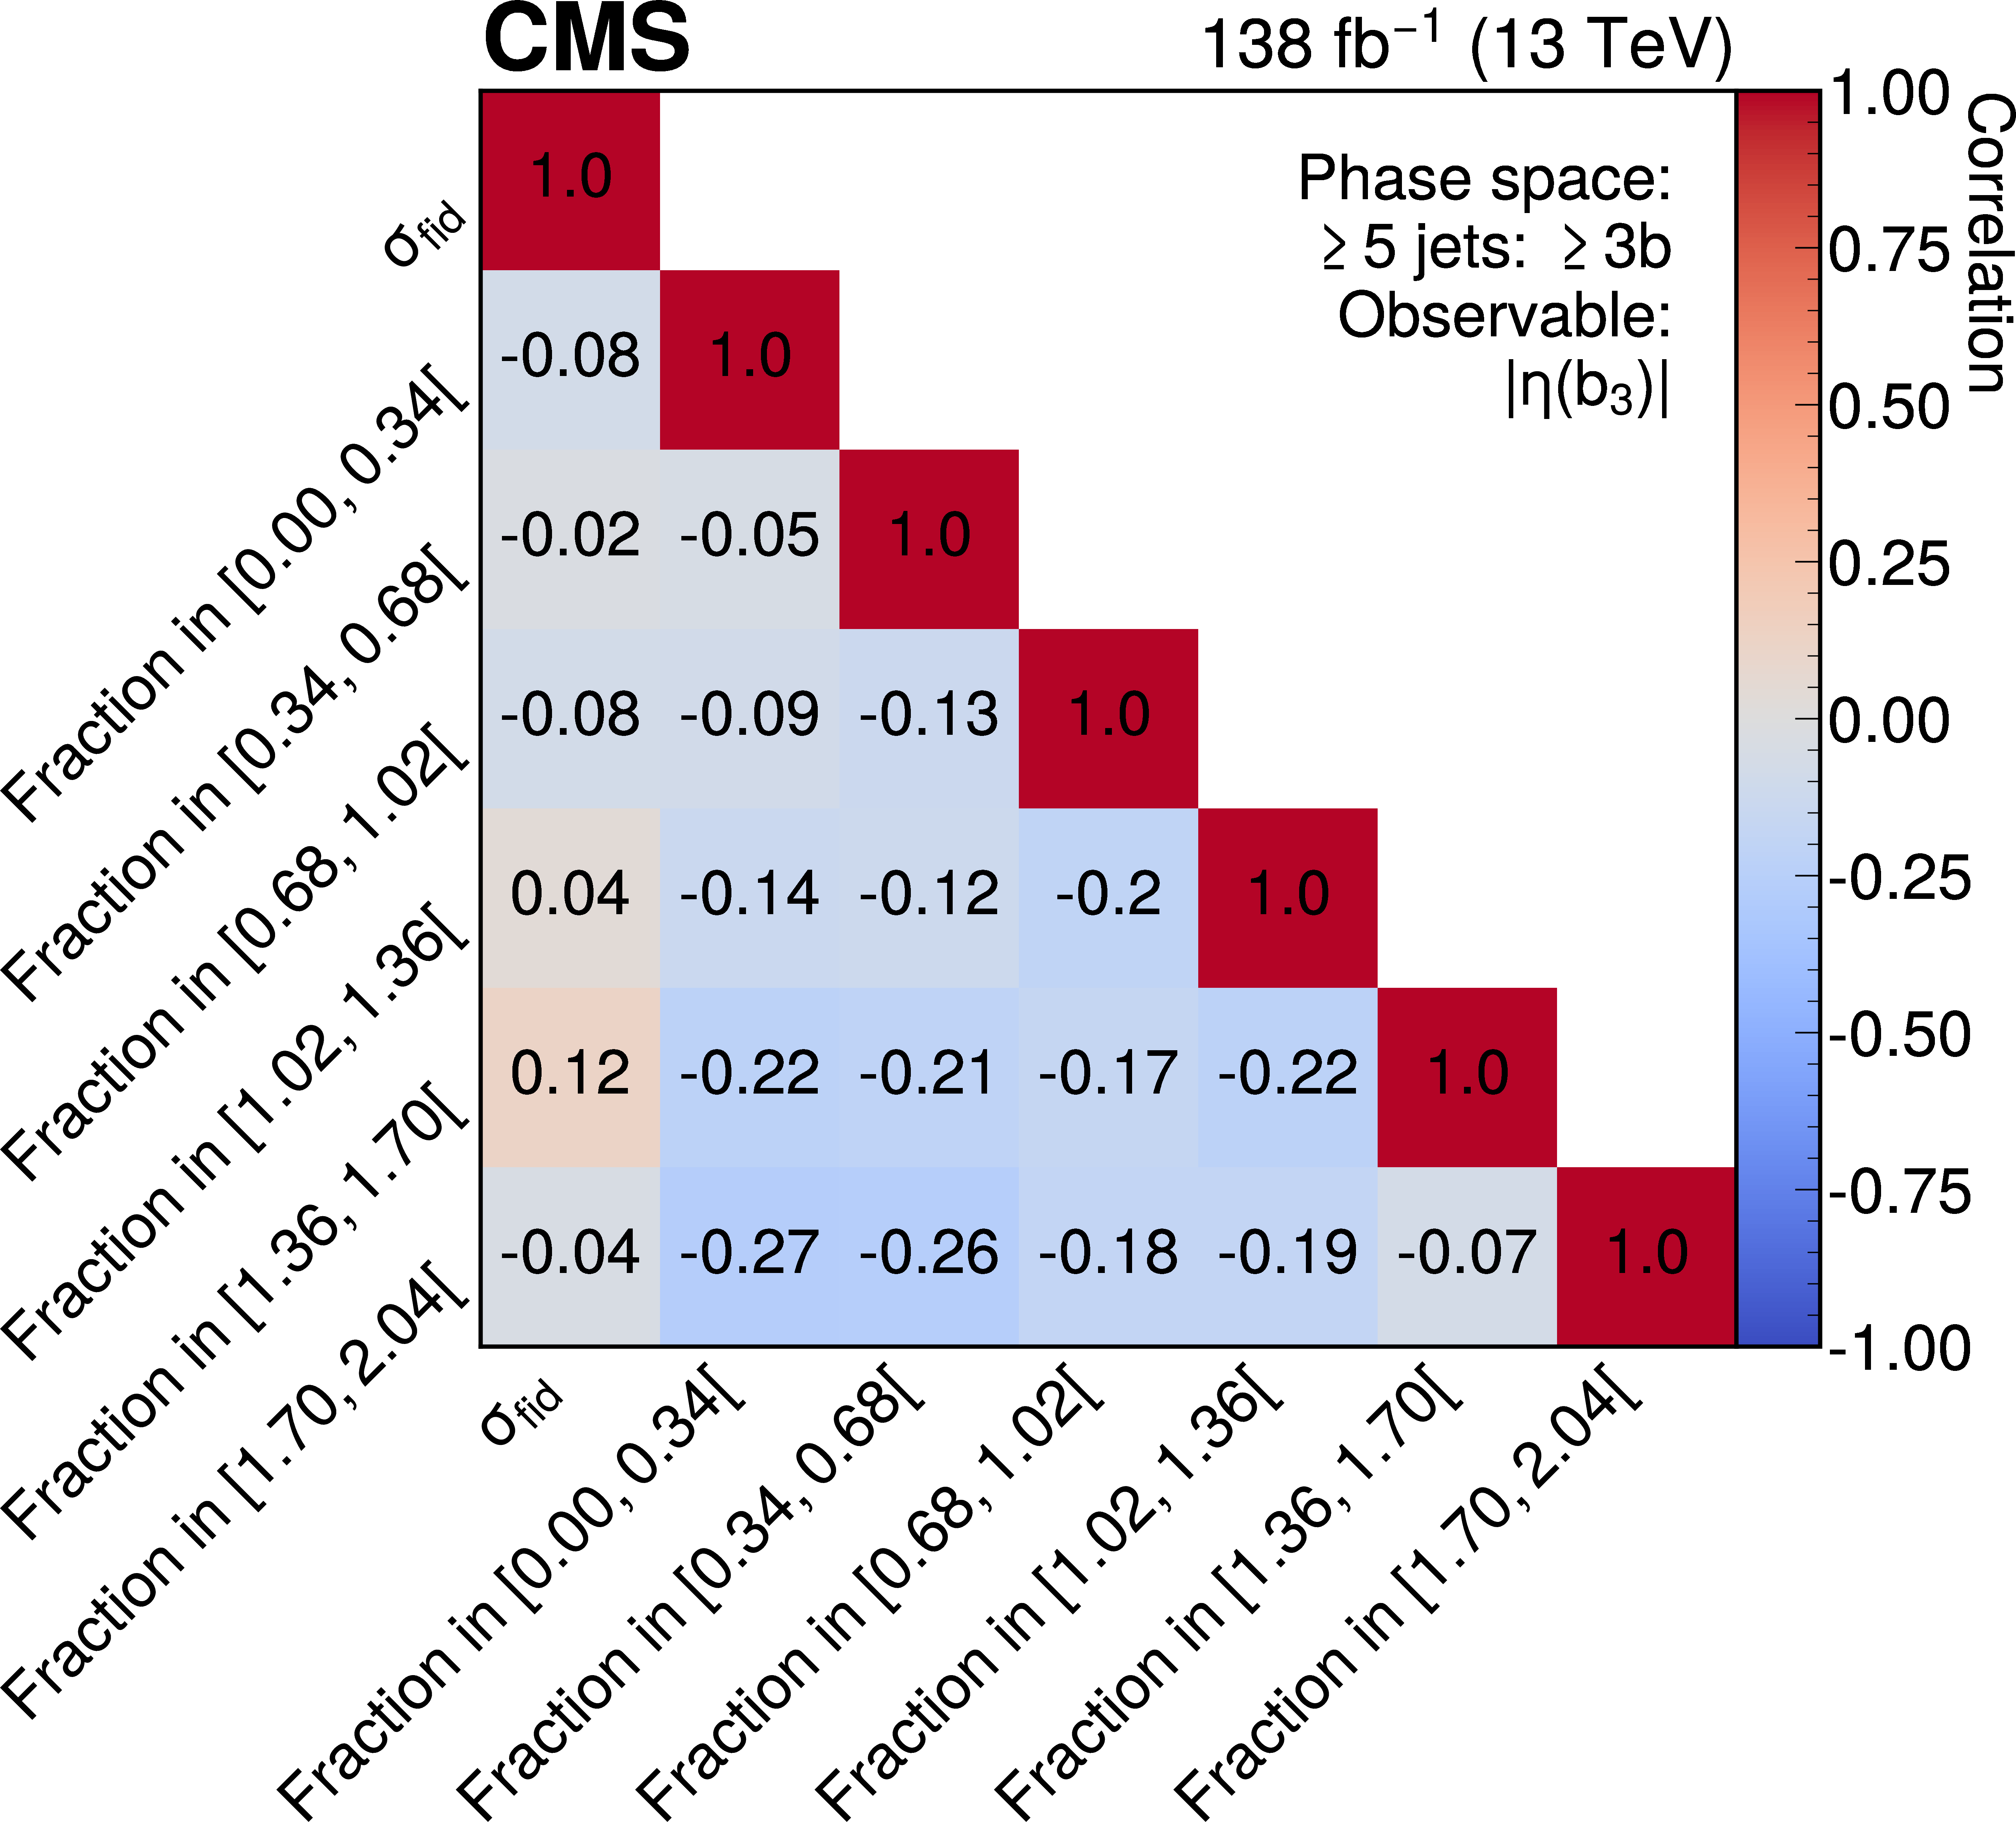
Figure 9:
Correlations between the parameters of interest $ \vec{\mu} $ in the fit for $ |\eta(b_{3})| $ in the $ \geq $5 jets: $ \geq $3b phase space. |
png pdf |
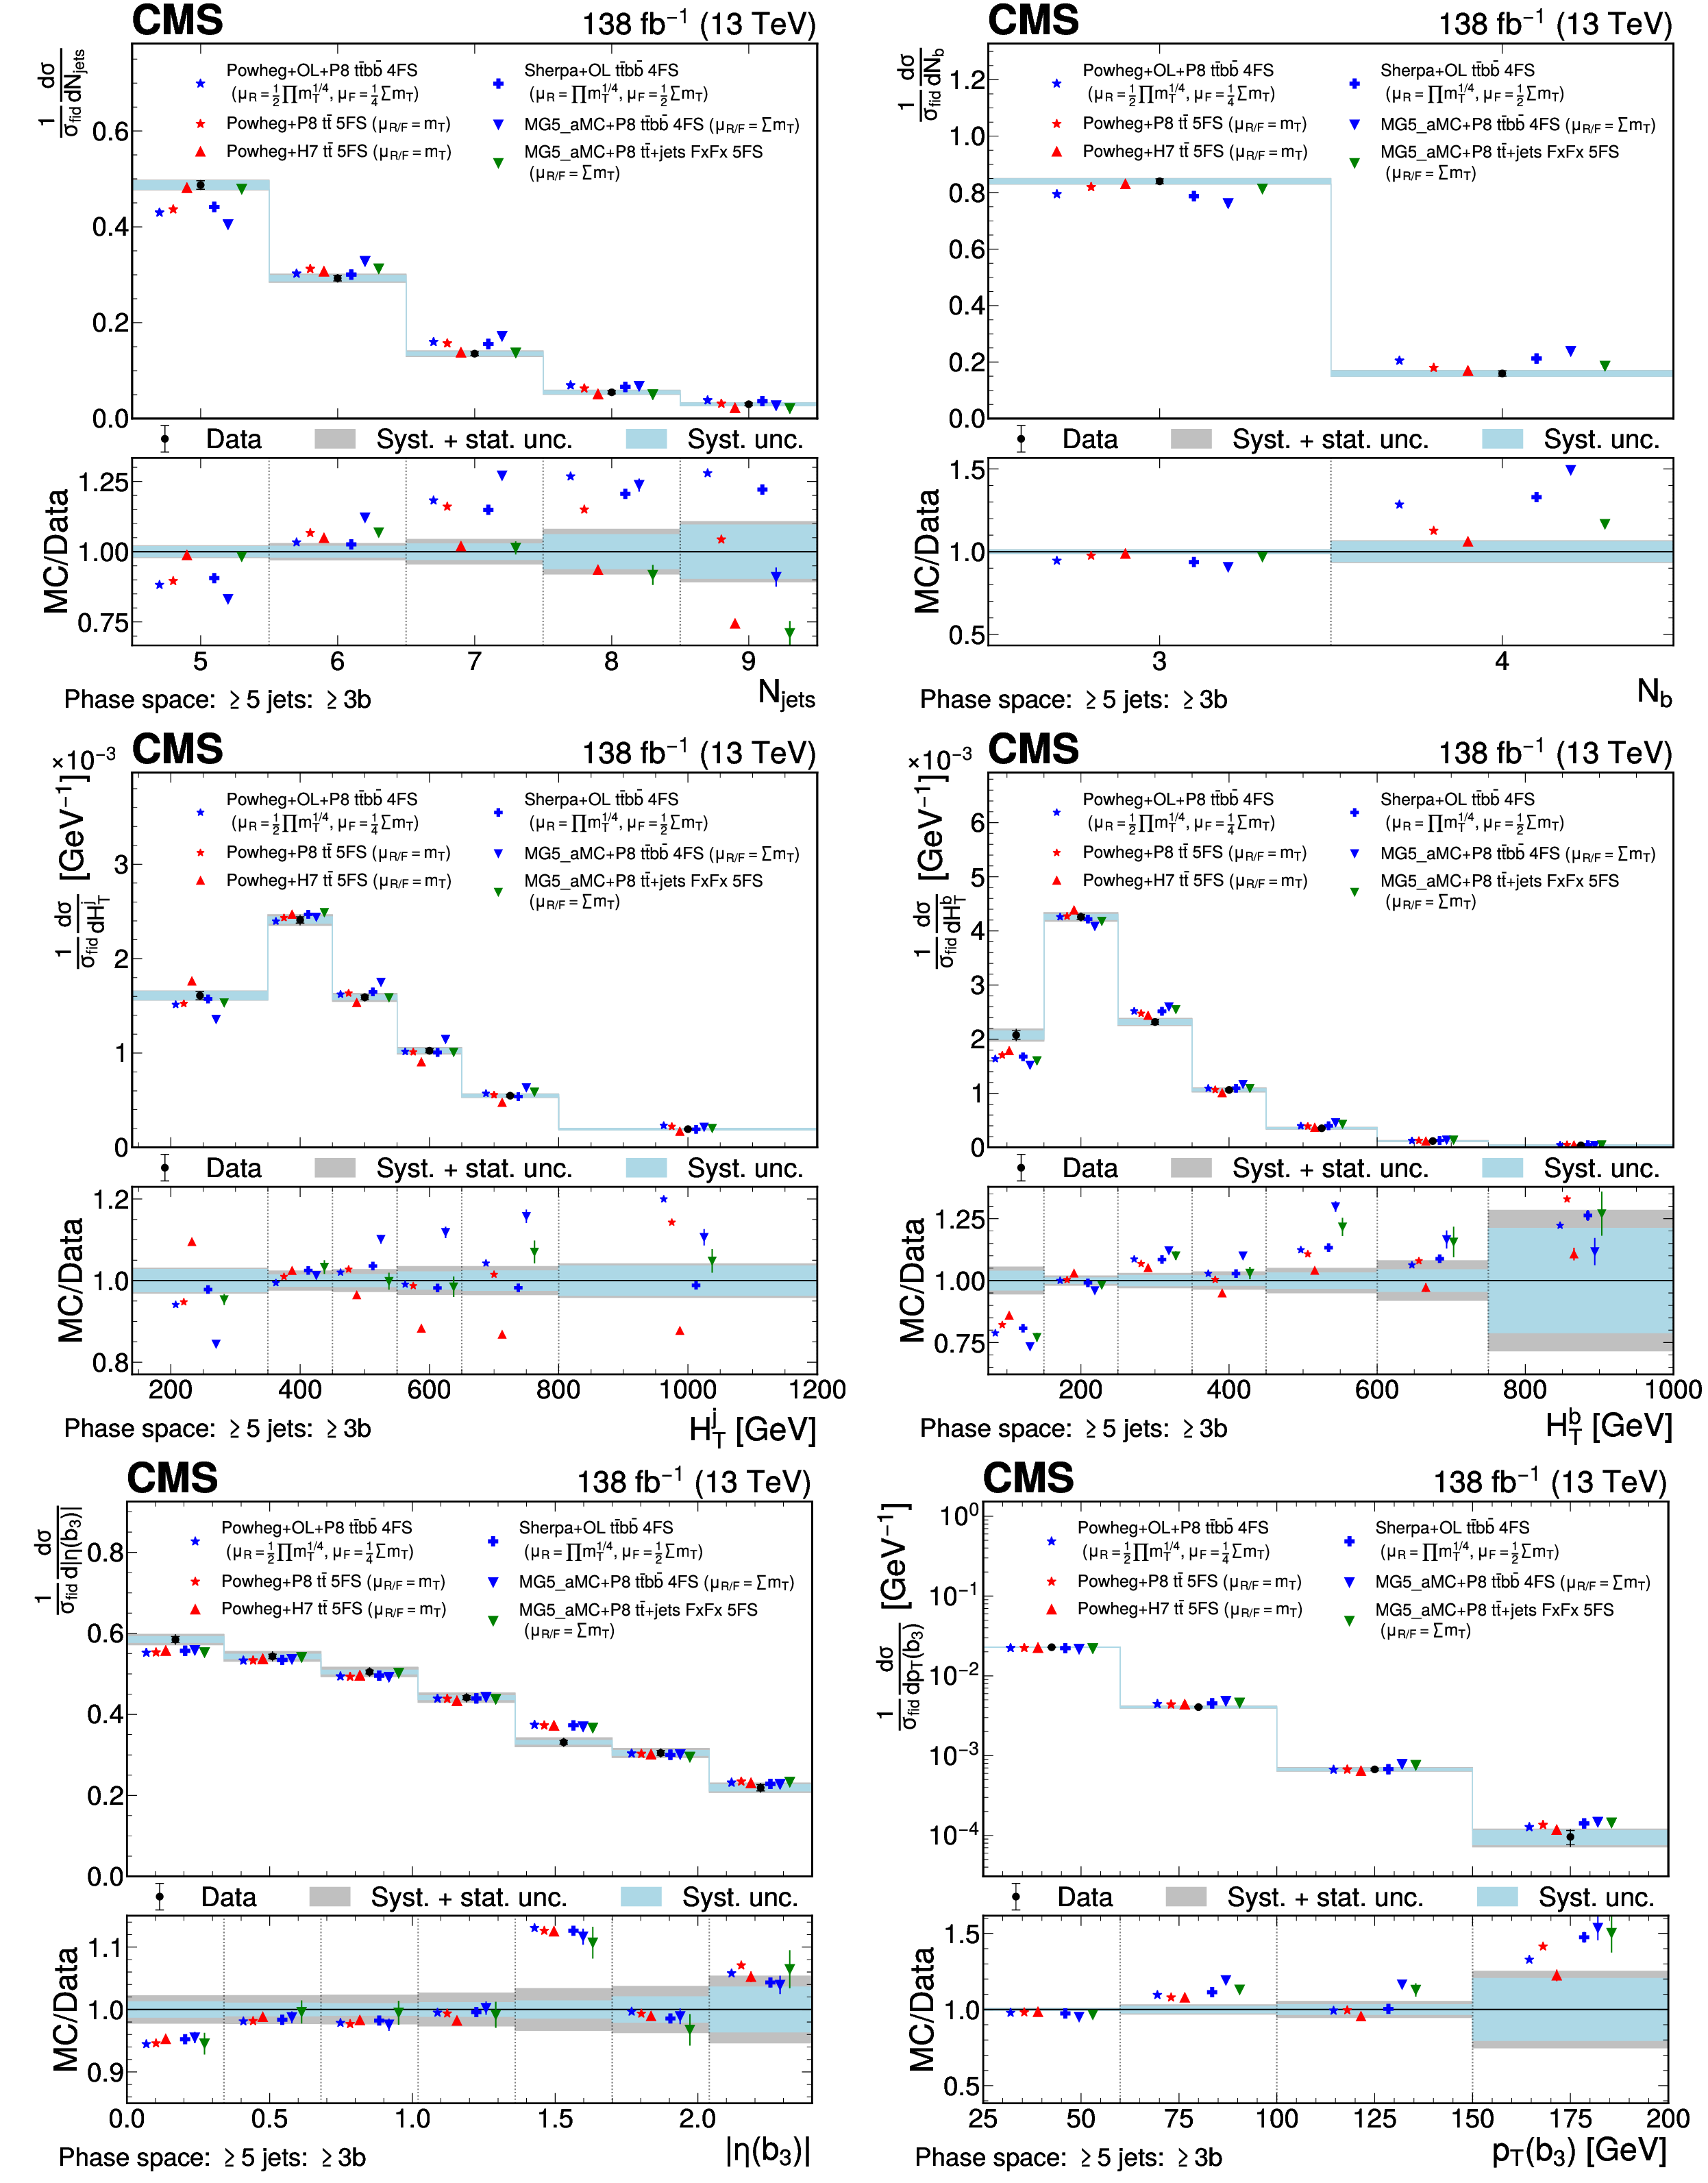
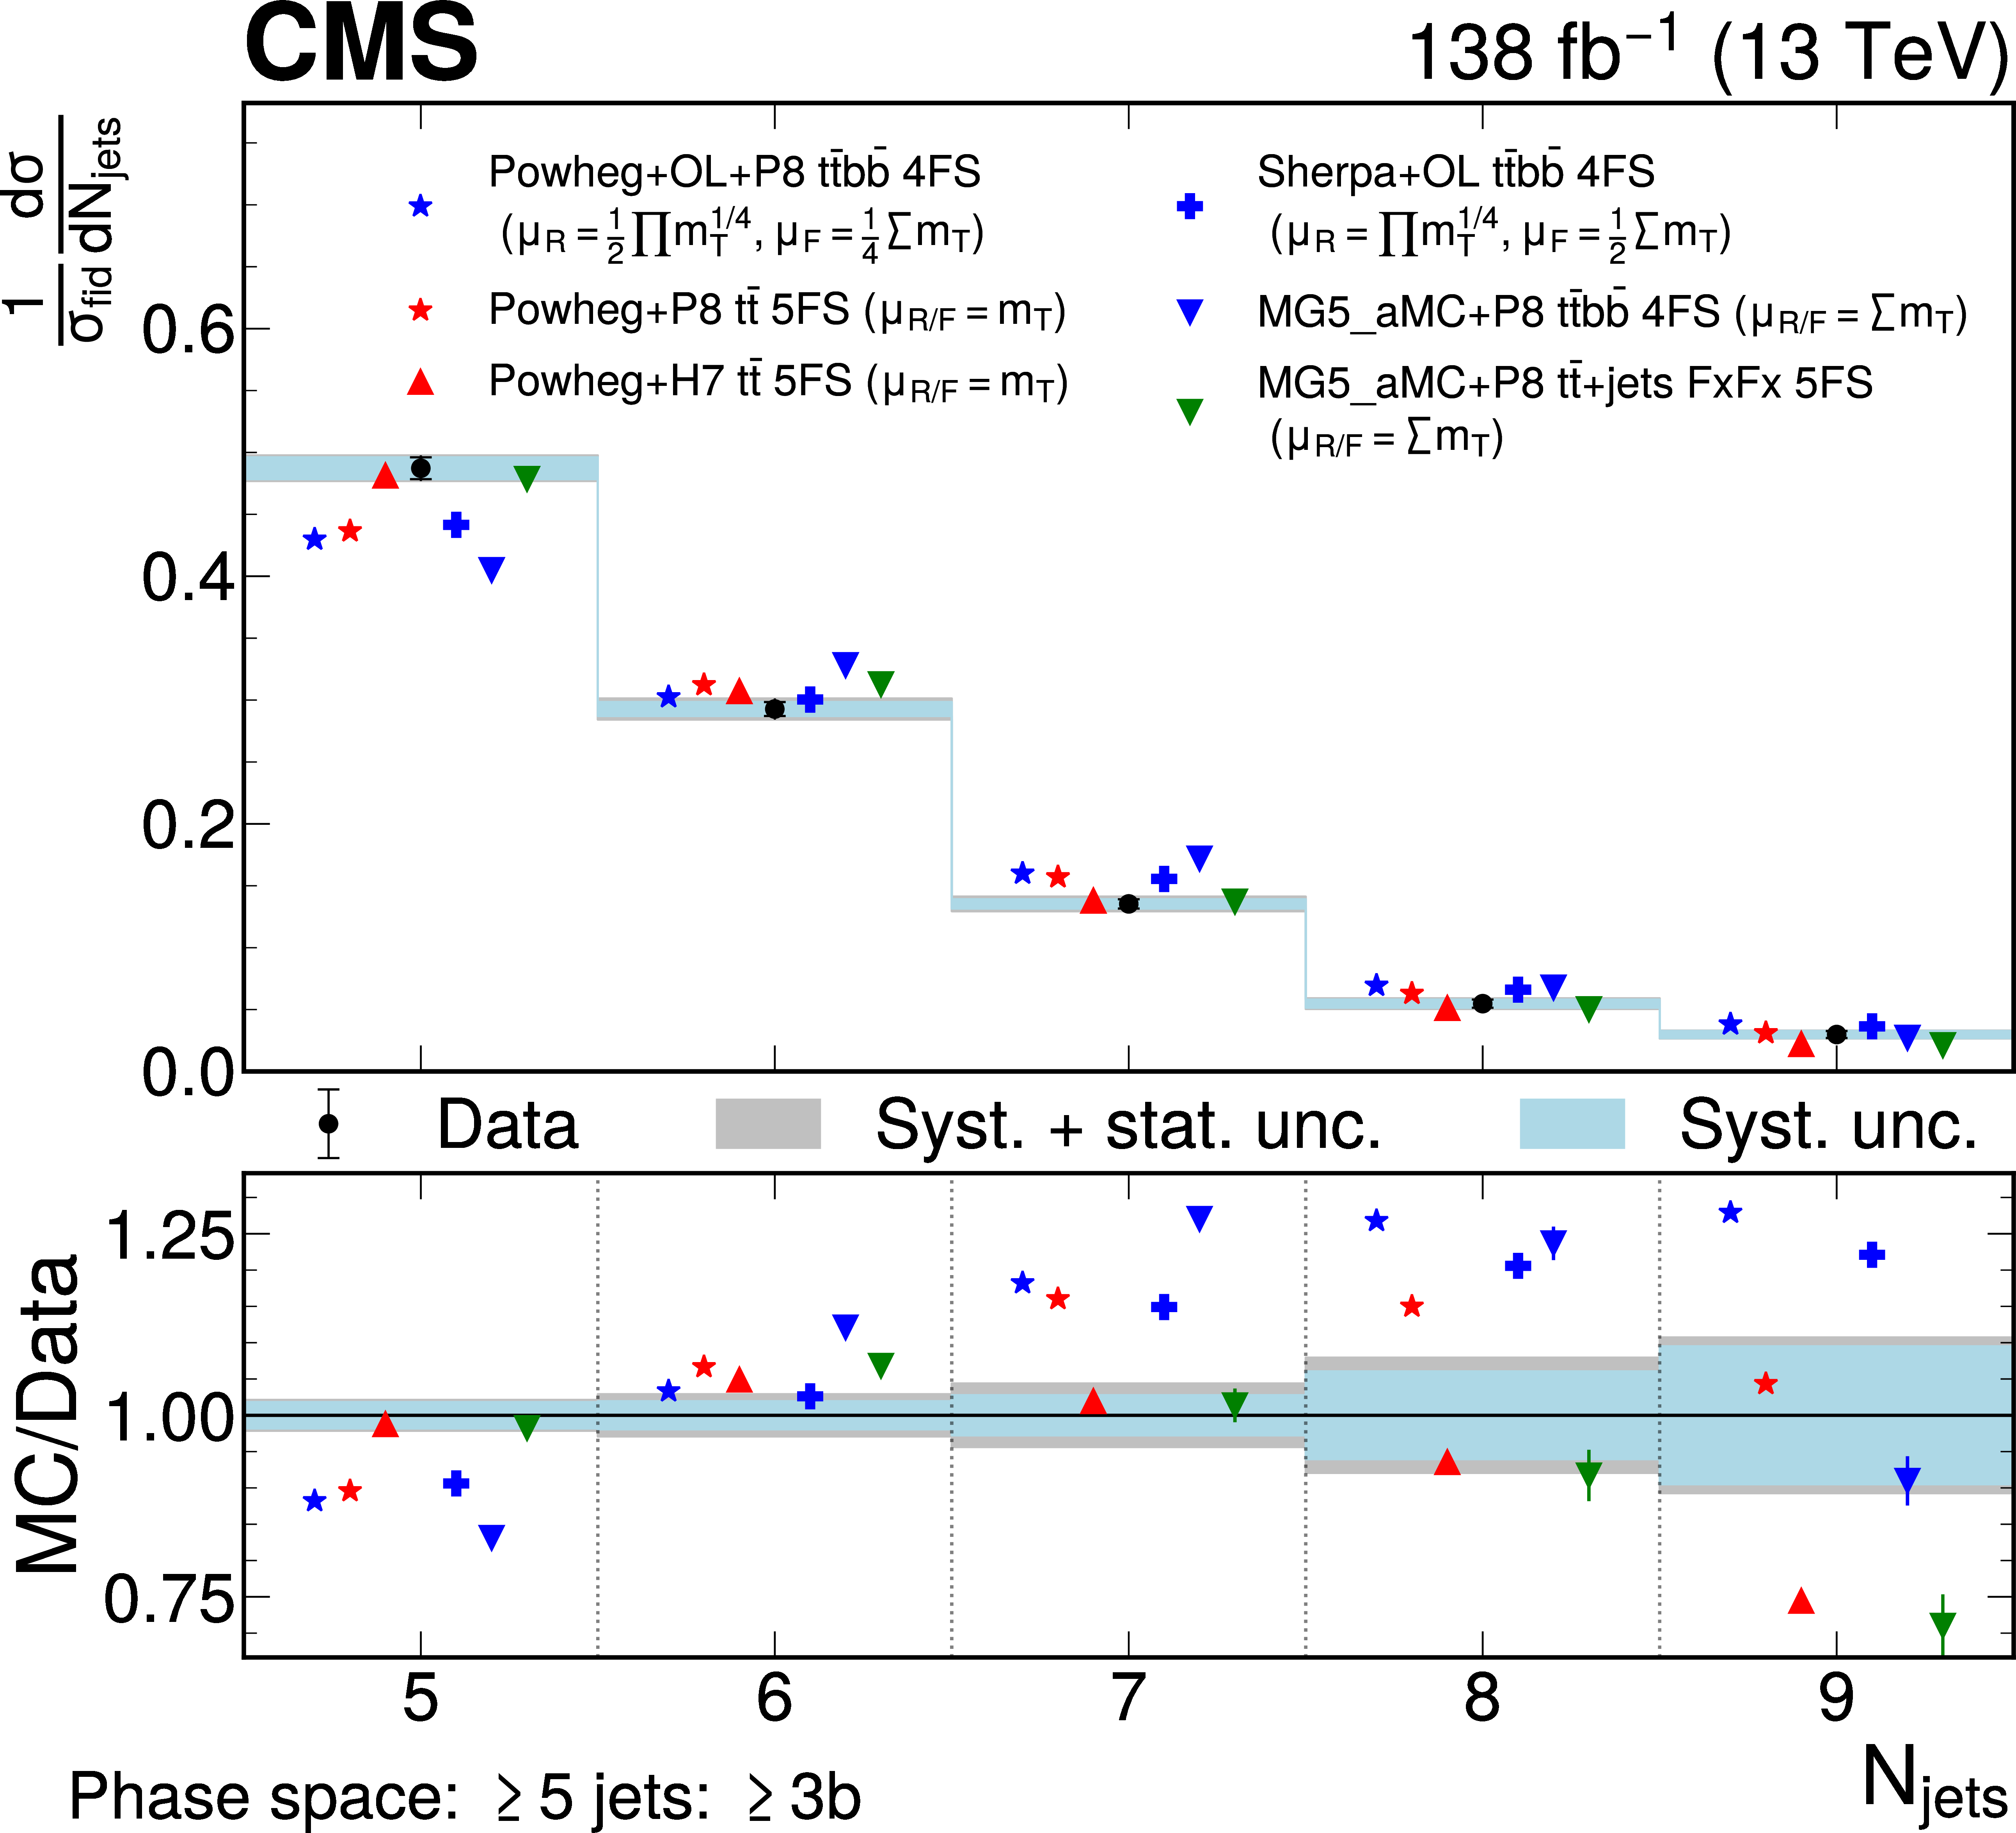
Figure 10:
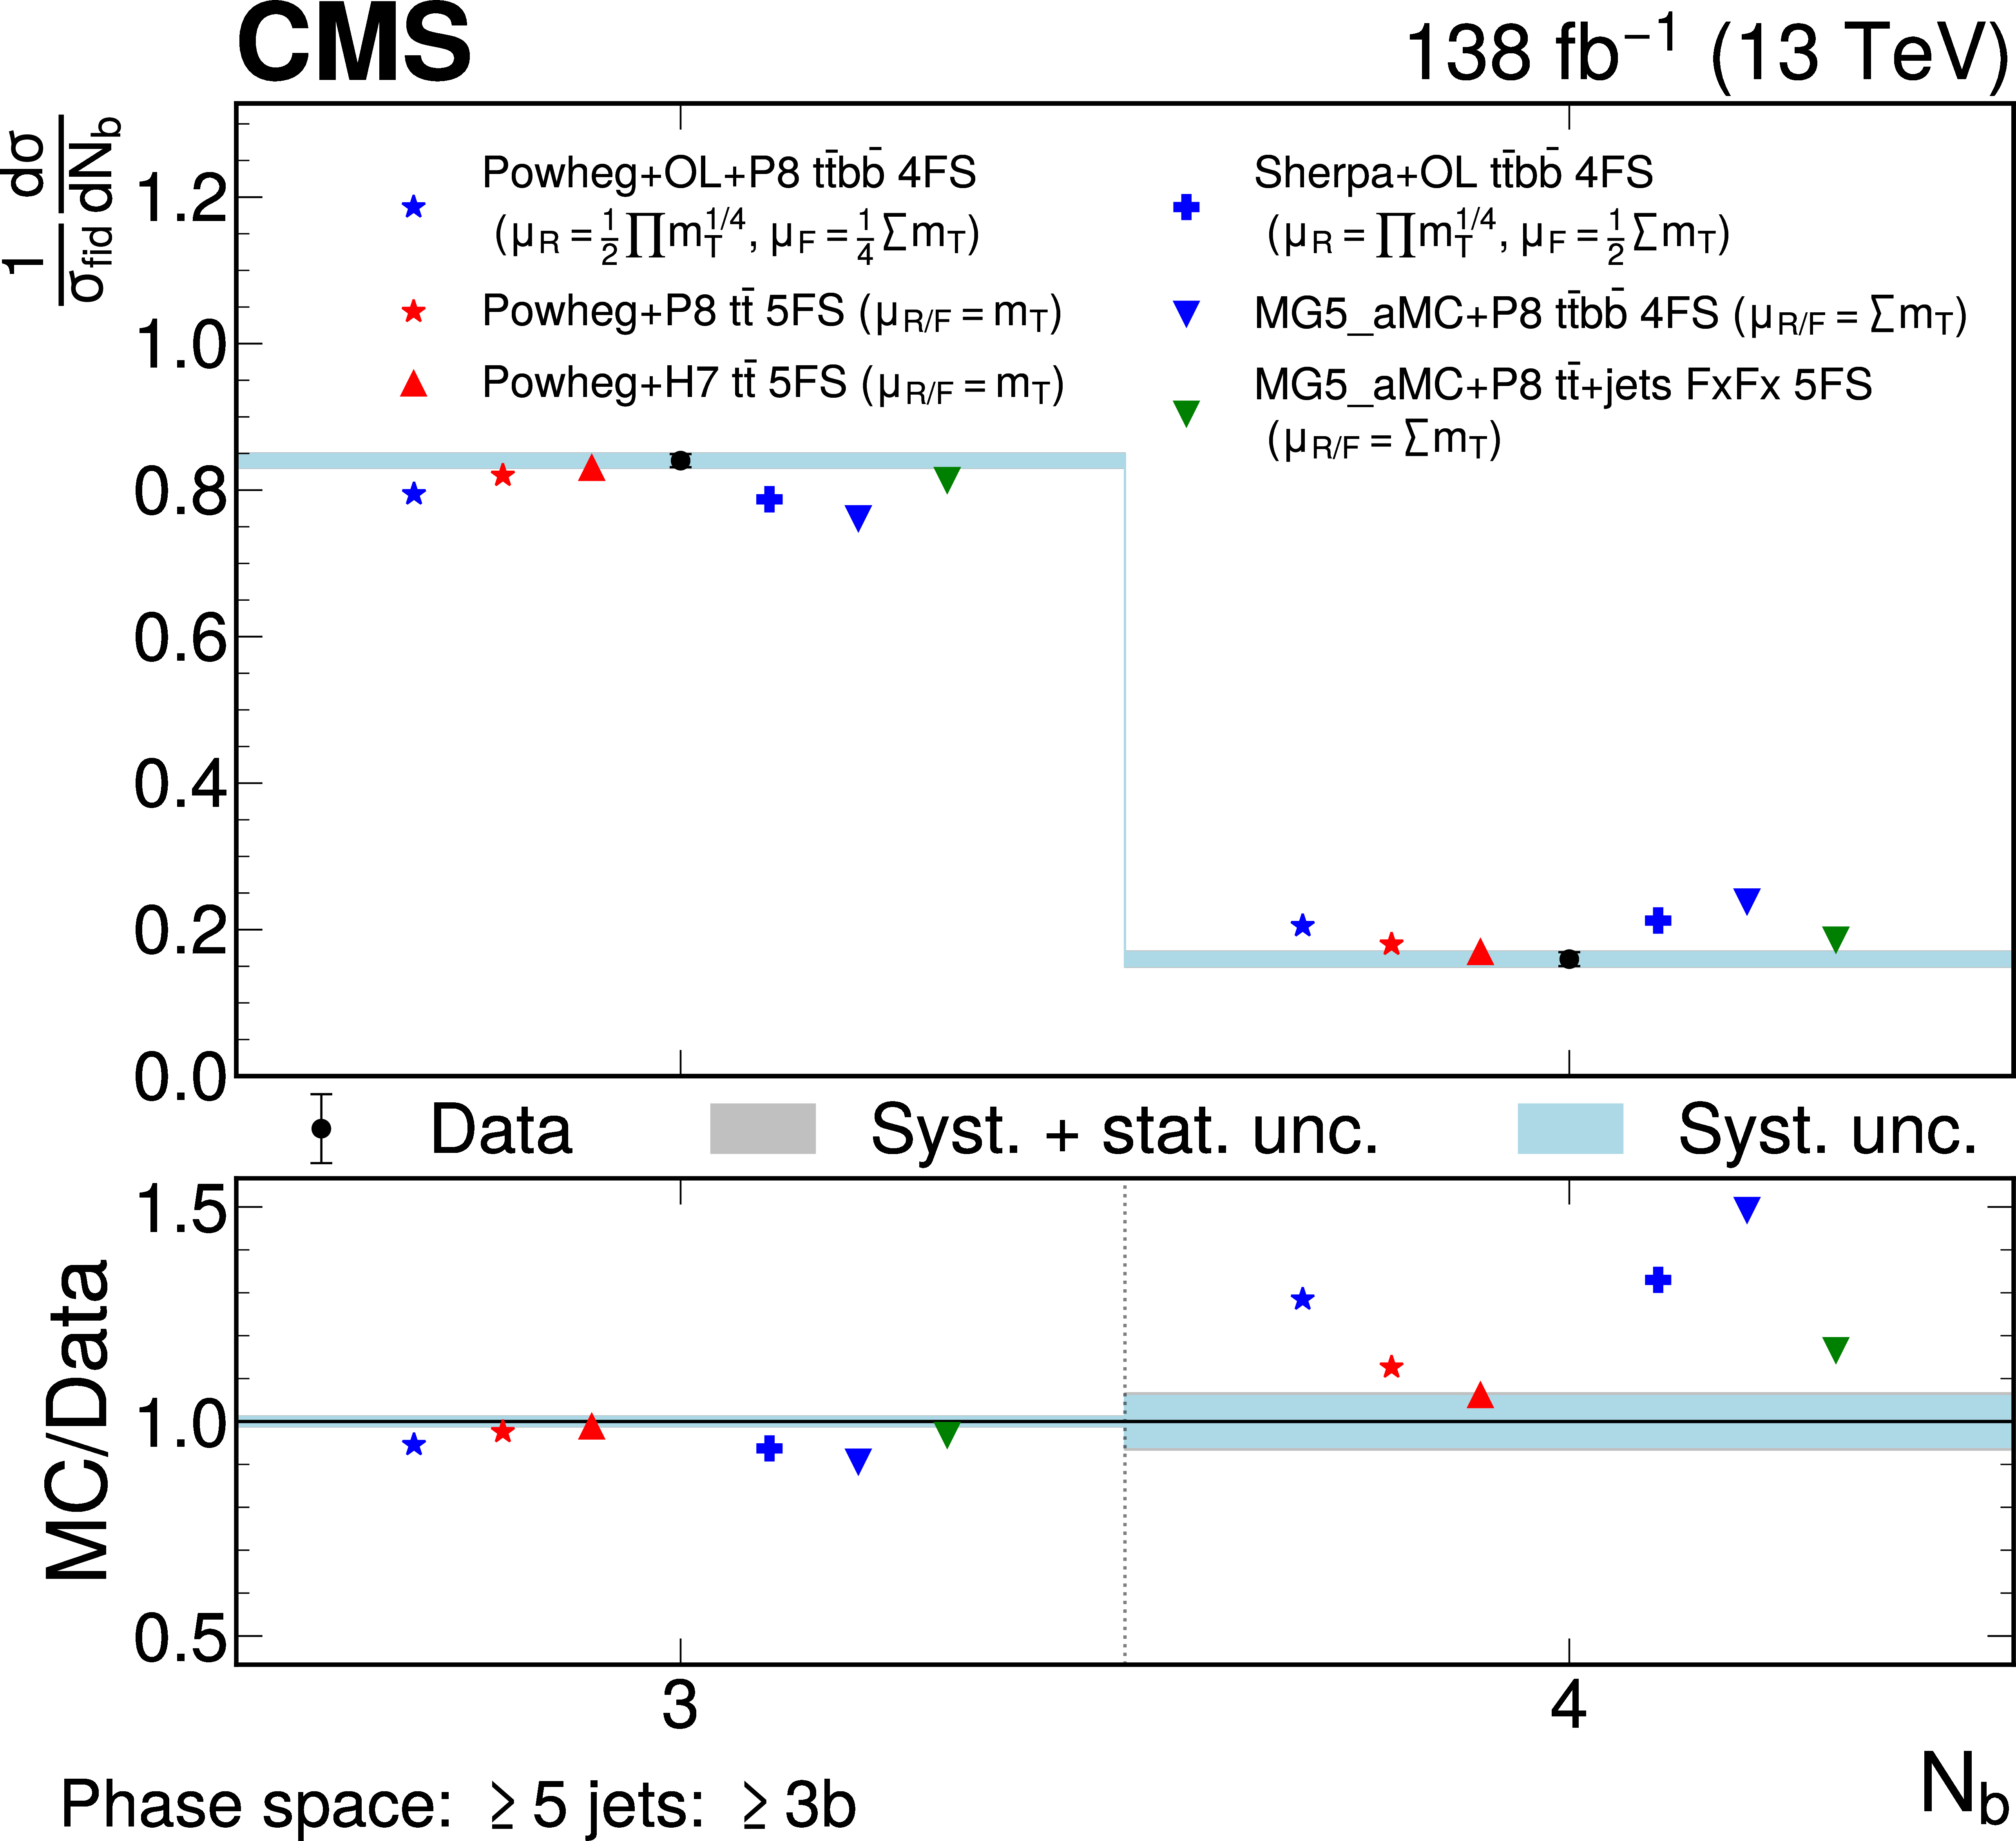
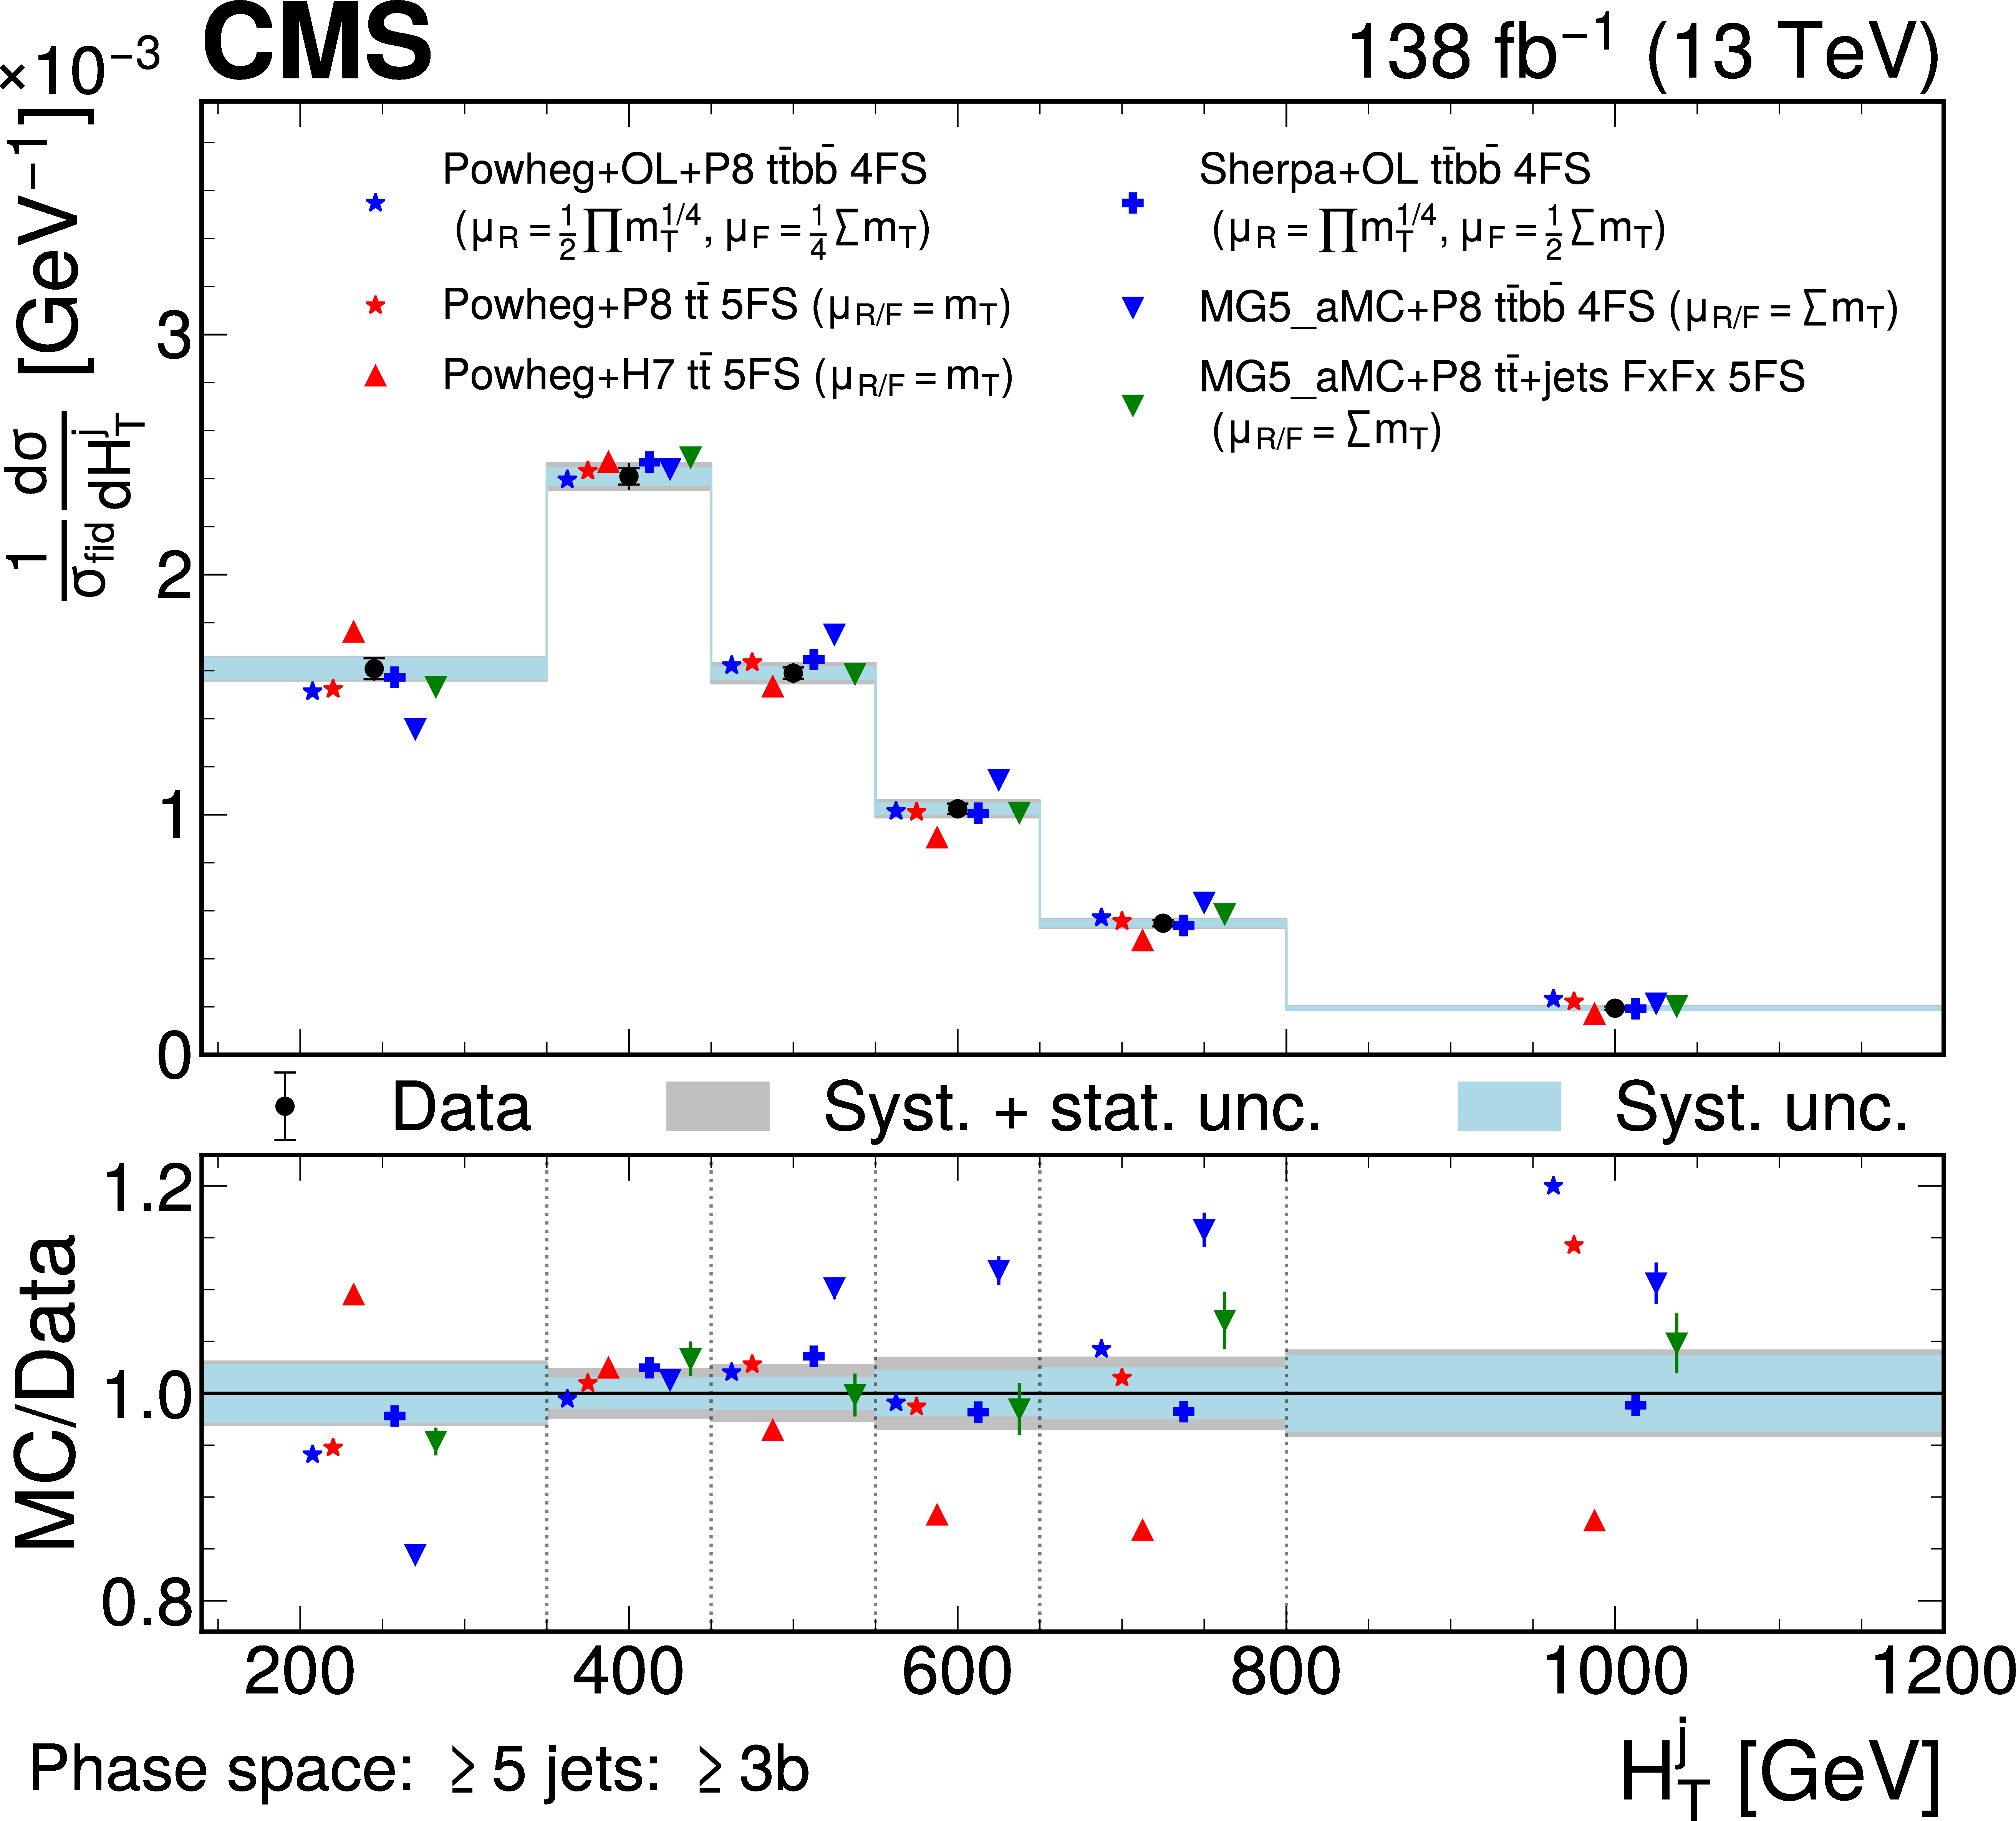
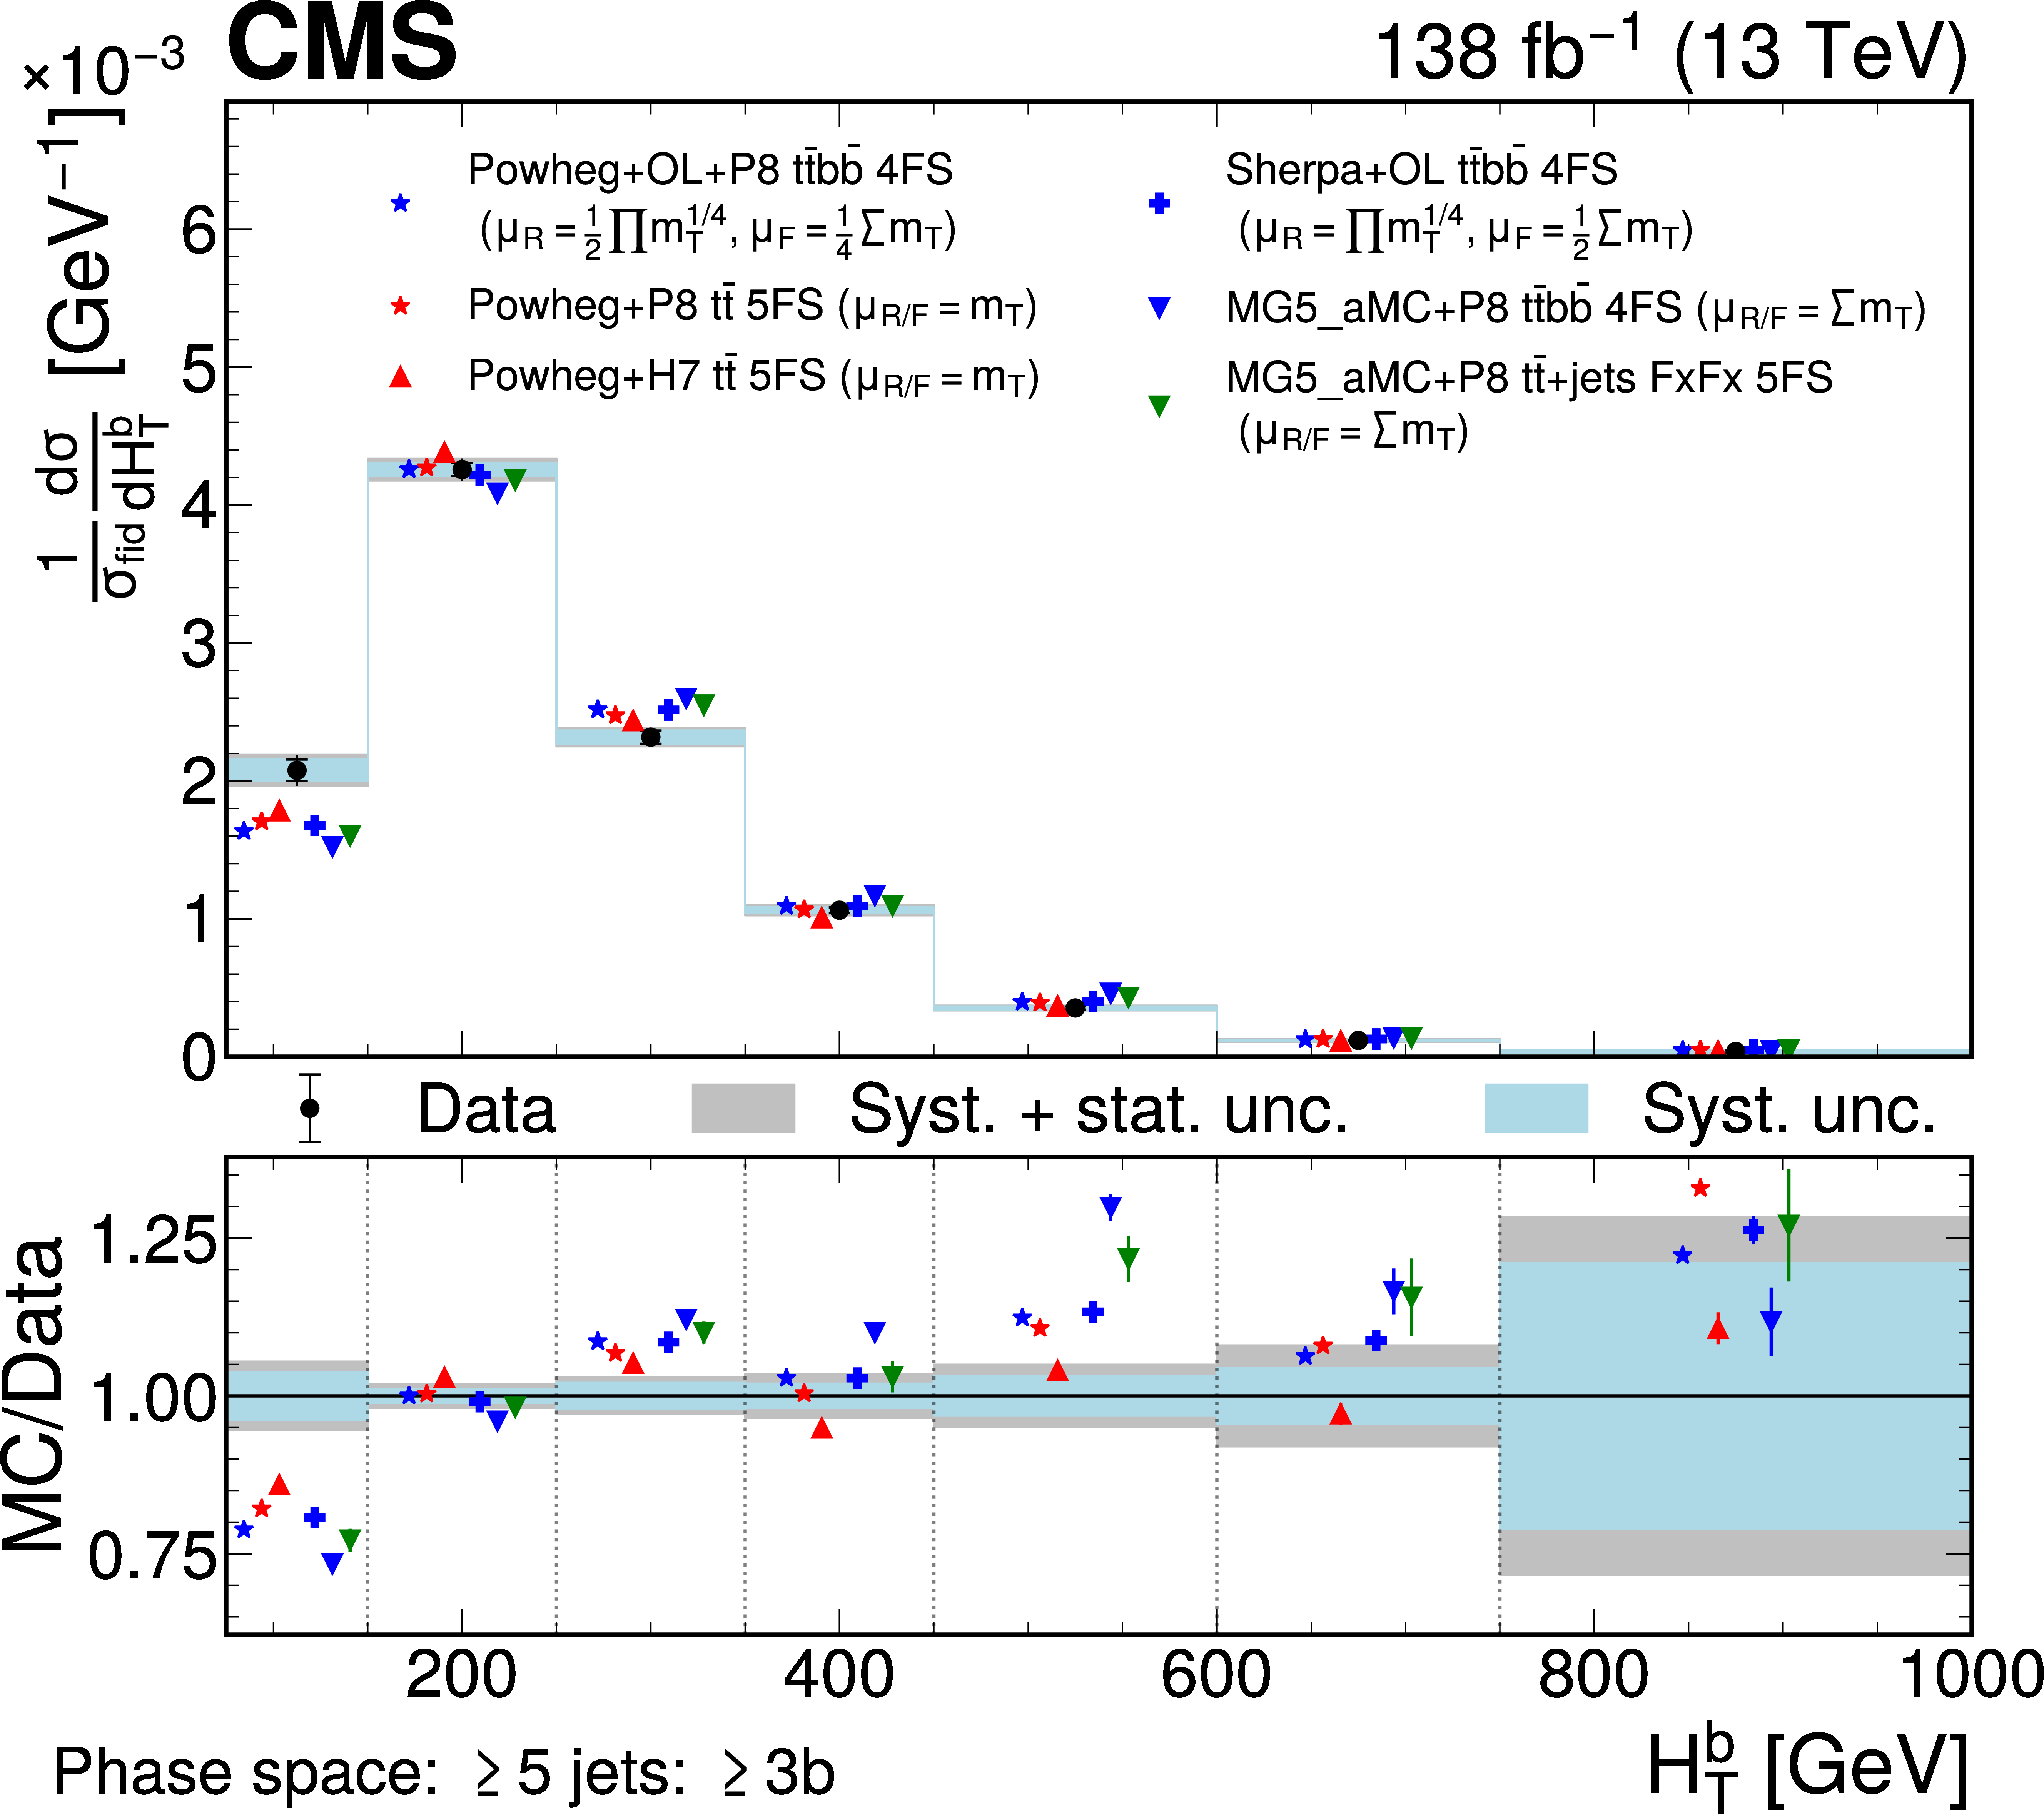
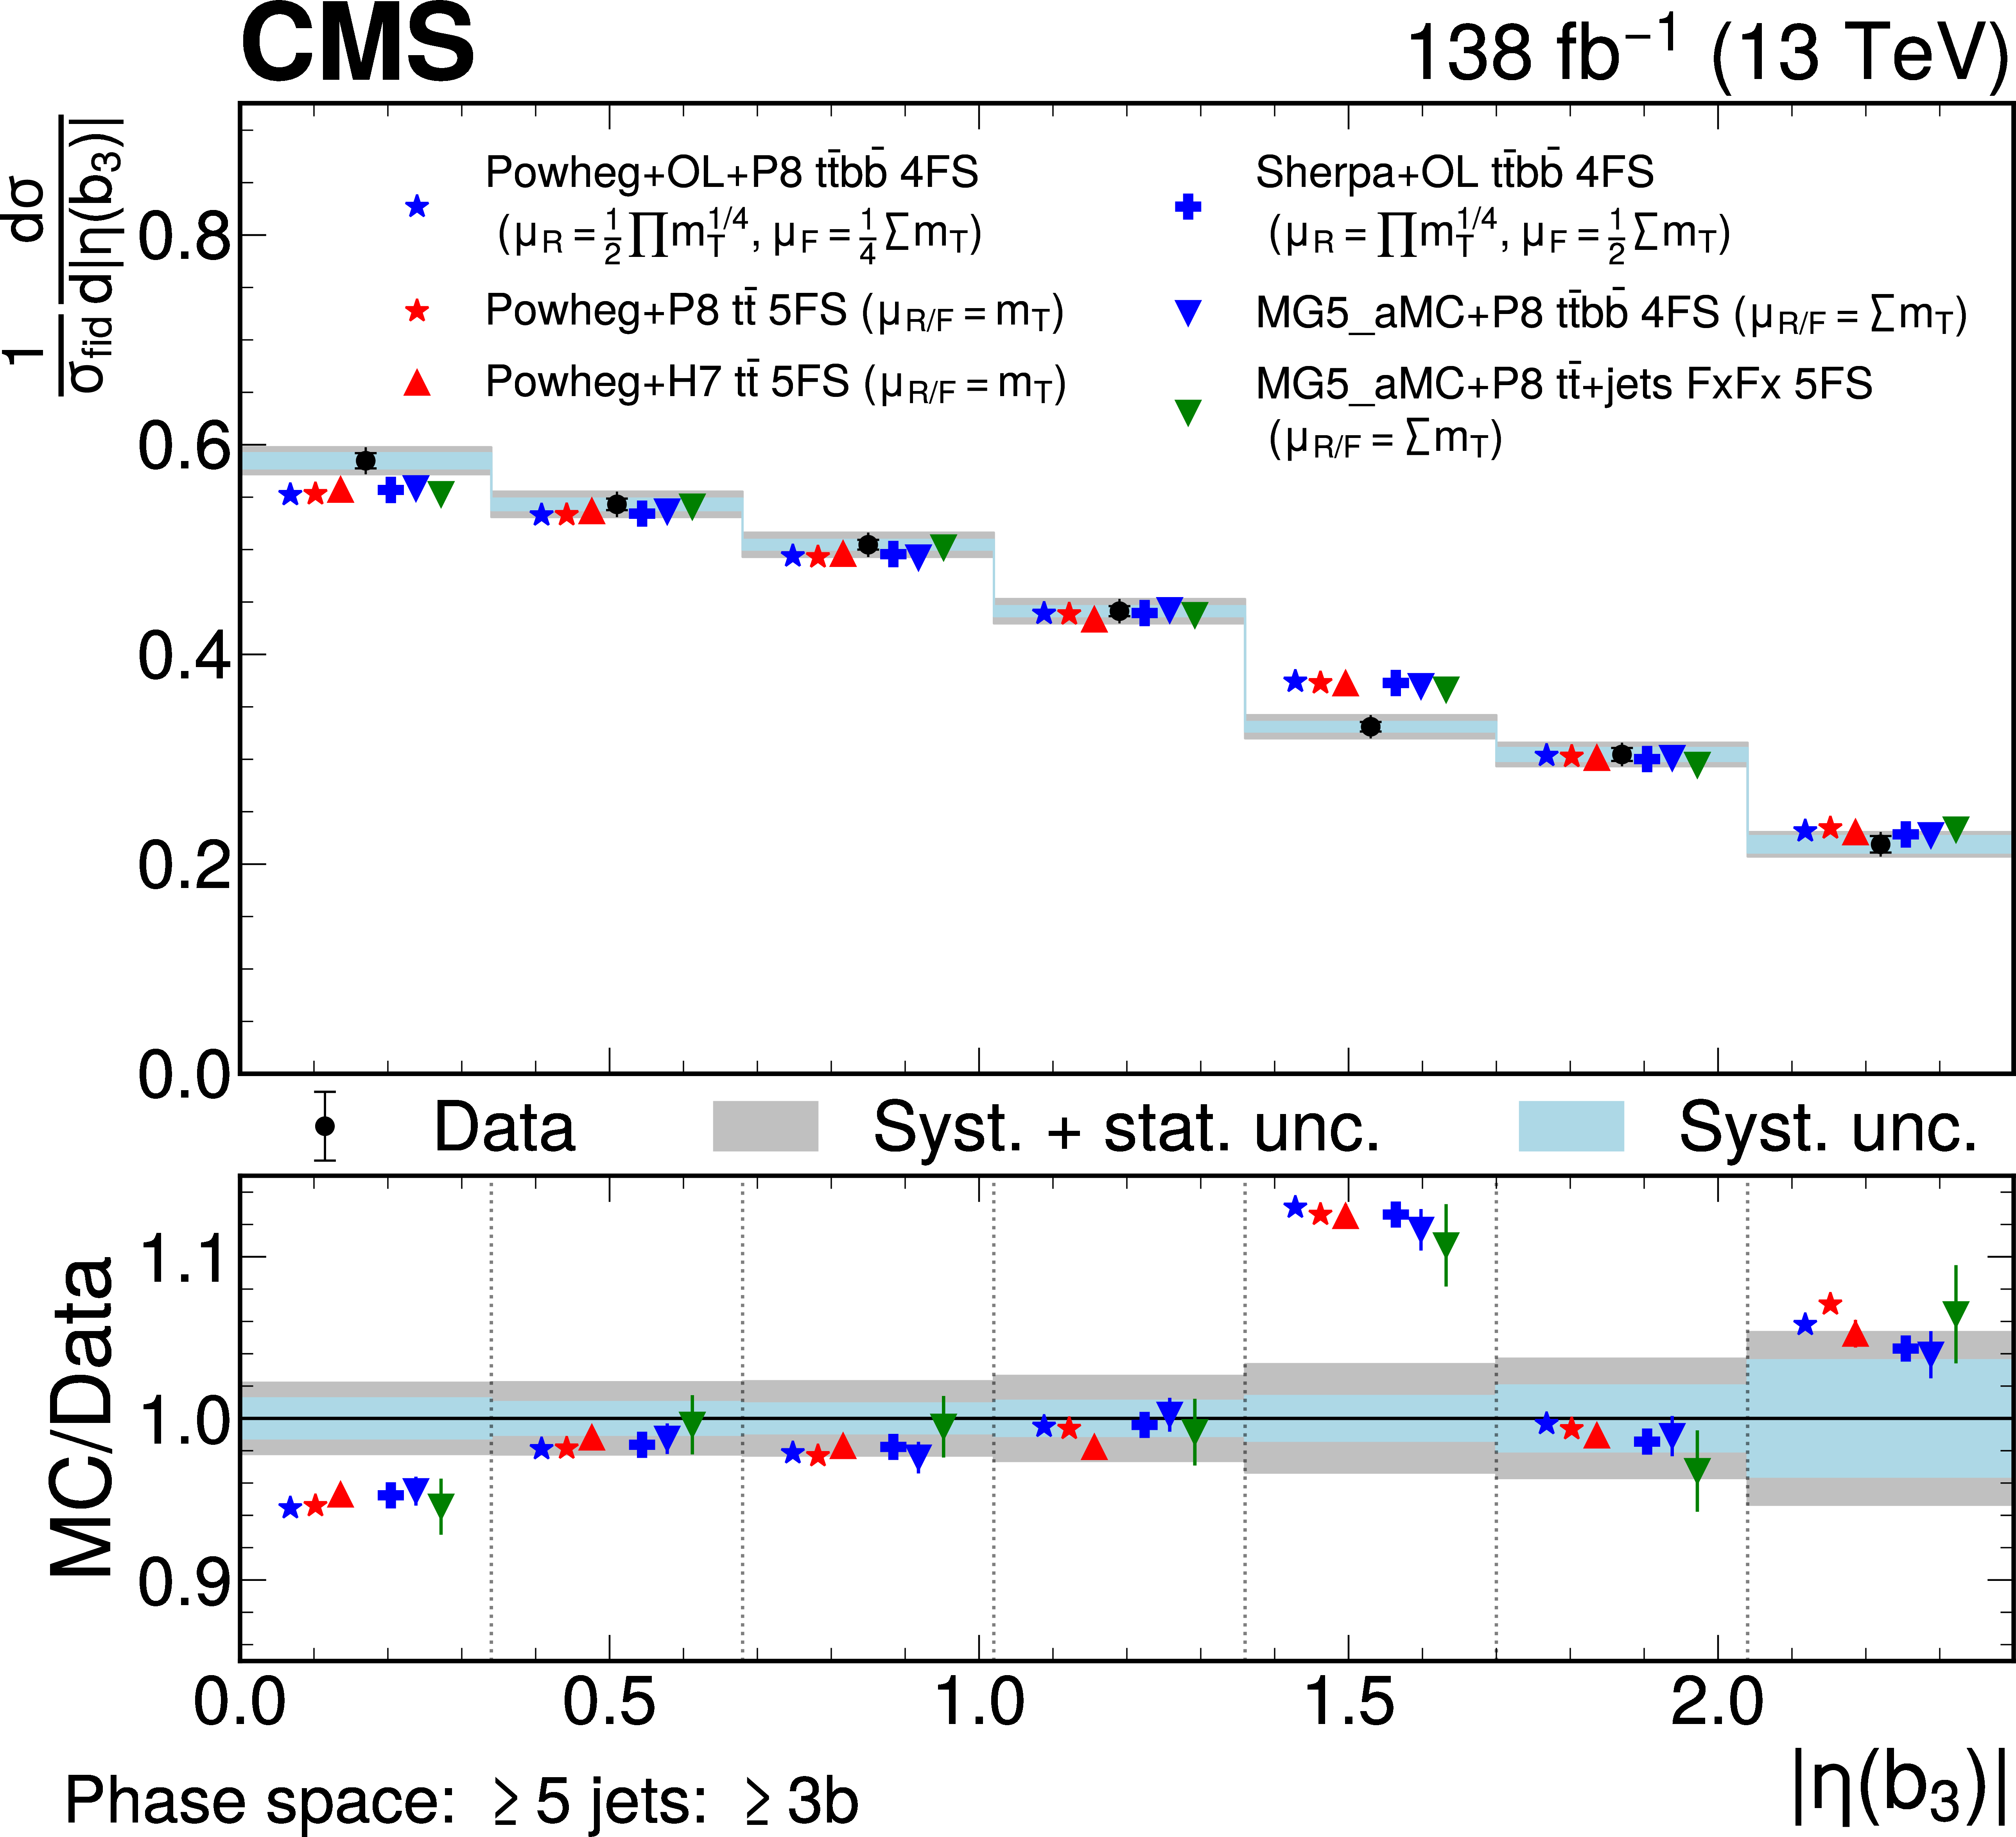
Predicted and observed normalized differential cross sections in the $ \geq $5 jets: $ \geq $3b fiducial phase space, for the inclusive jet multiplicity (upper left), the b jet multiplicity (upper right), the inclusive jet $ H_{\mathrm{T}} $ (middle left, \smash $ H_{\mathrm{T}}^{{\mathrm{j}} } $), the $ H_{\mathrm{T}} $ of b jets (middle right, \smash $ H_{\mathrm{T}}^{\mathrm{b}} $), the $ |\eta| $ of the third b jet (lower left), and the $ p_{\mathrm{T}} $ of the third b jet (lower right). The data are represented by points, with inner (outer) vertical bars indicating the systematic (total) uncertainties, also represented as blue (grey) bands. Cross section prediction obtained at the particle level from different simulation approaches are shown, including their statistical uncertainties, as coloured symbols with different shapes. For $ N_{\text{jets}} $, $ N_{\mathrm{b}} $, \smash $ H_{\mathrm{T}}^{{\mathrm{j}} } $, \smash $ H_{\mathrm{T}}^{\mathrm{b}} $, and $p_{\mathrm{T}}(\mathrm{b}_{3}) $, the last bins contain the overflow. |
png pdf |
Figure 10-a:
Predicted and observed normalized differential cross sections in the $ \geq $5 jets: $ \geq $3b fiducial phase space, for the inclusive jet multiplicity (upper left), the b jet multiplicity (upper right), the inclusive jet $ H_{\mathrm{T}} $ (middle left, \smash $ H_{\mathrm{T}}^{{\mathrm{j}} } $), the $ H_{\mathrm{T}} $ of b jets (middle right, \smash $ H_{\mathrm{T}}^{\mathrm{b}} $), the $ |\eta| $ of the third b jet (lower left), and the $ p_{\mathrm{T}} $ of the third b jet (lower right). The data are represented by points, with inner (outer) vertical bars indicating the systematic (total) uncertainties, also represented as blue (grey) bands. Cross section prediction obtained at the particle level from different simulation approaches are shown, including their statistical uncertainties, as coloured symbols with different shapes. For $ N_{\text{jets}} $, $ N_{\mathrm{b}} $, \smash $ H_{\mathrm{T}}^{{\mathrm{j}} } $, \smash $ H_{\mathrm{T}}^{\mathrm{b}} $, and $p_{\mathrm{T}}(\mathrm{b}_{3}) $, the last bins contain the overflow. |
png pdf |
Figure 10-b:
Predicted and observed normalized differential cross sections in the $ \geq $5 jets: $ \geq $3b fiducial phase space, for the inclusive jet multiplicity (upper left), the b jet multiplicity (upper right), the inclusive jet $ H_{\mathrm{T}} $ (middle left, \smash $ H_{\mathrm{T}}^{{\mathrm{j}} } $), the $ H_{\mathrm{T}} $ of b jets (middle right, \smash $ H_{\mathrm{T}}^{\mathrm{b}} $), the $ |\eta| $ of the third b jet (lower left), and the $ p_{\mathrm{T}} $ of the third b jet (lower right). The data are represented by points, with inner (outer) vertical bars indicating the systematic (total) uncertainties, also represented as blue (grey) bands. Cross section prediction obtained at the particle level from different simulation approaches are shown, including their statistical uncertainties, as coloured symbols with different shapes. For $ N_{\text{jets}} $, $ N_{\mathrm{b}} $, \smash $ H_{\mathrm{T}}^{{\mathrm{j}} } $, \smash $ H_{\mathrm{T}}^{\mathrm{b}} $, and $p_{\mathrm{T}}(\mathrm{b}_{3}) $, the last bins contain the overflow. |
png pdf |
Figure 10-c:
Predicted and observed normalized differential cross sections in the $ \geq $5 jets: $ \geq $3b fiducial phase space, for the inclusive jet multiplicity (upper left), the b jet multiplicity (upper right), the inclusive jet $ H_{\mathrm{T}} $ (middle left, \smash $ H_{\mathrm{T}}^{{\mathrm{j}} } $), the $ H_{\mathrm{T}} $ of b jets (middle right, \smash $ H_{\mathrm{T}}^{\mathrm{b}} $), the $ |\eta| $ of the third b jet (lower left), and the $ p_{\mathrm{T}} $ of the third b jet (lower right). The data are represented by points, with inner (outer) vertical bars indicating the systematic (total) uncertainties, also represented as blue (grey) bands. Cross section prediction obtained at the particle level from different simulation approaches are shown, including their statistical uncertainties, as coloured symbols with different shapes. For $ N_{\text{jets}} $, $ N_{\mathrm{b}} $, \smash $ H_{\mathrm{T}}^{{\mathrm{j}} } $, \smash $ H_{\mathrm{T}}^{\mathrm{b}} $, and $p_{\mathrm{T}}(\mathrm{b}_{3}) $, the last bins contain the overflow. |
png pdf |
Figure 10-d:
Predicted and observed normalized differential cross sections in the $ \geq $5 jets: $ \geq $3b fiducial phase space, for the inclusive jet multiplicity (upper left), the b jet multiplicity (upper right), the inclusive jet $ H_{\mathrm{T}} $ (middle left, \smash $ H_{\mathrm{T}}^{{\mathrm{j}} } $), the $ H_{\mathrm{T}} $ of b jets (middle right, \smash $ H_{\mathrm{T}}^{\mathrm{b}} $), the $ |\eta| $ of the third b jet (lower left), and the $ p_{\mathrm{T}} $ of the third b jet (lower right). The data are represented by points, with inner (outer) vertical bars indicating the systematic (total) uncertainties, also represented as blue (grey) bands. Cross section prediction obtained at the particle level from different simulation approaches are shown, including their statistical uncertainties, as coloured symbols with different shapes. For $ N_{\text{jets}} $, $ N_{\mathrm{b}} $, \smash $ H_{\mathrm{T}}^{{\mathrm{j}} } $, \smash $ H_{\mathrm{T}}^{\mathrm{b}} $, and $p_{\mathrm{T}}(\mathrm{b}_{3}) $, the last bins contain the overflow. |
png pdf |
Figure 10-e:
Predicted and observed normalized differential cross sections in the $ \geq $5 jets: $ \geq $3b fiducial phase space, for the inclusive jet multiplicity (upper left), the b jet multiplicity (upper right), the inclusive jet $ H_{\mathrm{T}} $ (middle left, \smash $ H_{\mathrm{T}}^{{\mathrm{j}} } $), the $ H_{\mathrm{T}} $ of b jets (middle right, \smash $ H_{\mathrm{T}}^{\mathrm{b}} $), the $ |\eta| $ of the third b jet (lower left), and the $ p_{\mathrm{T}} $ of the third b jet (lower right). The data are represented by points, with inner (outer) vertical bars indicating the systematic (total) uncertainties, also represented as blue (grey) bands. Cross section prediction obtained at the particle level from different simulation approaches are shown, including their statistical uncertainties, as coloured symbols with different shapes. For $ N_{\text{jets}} $, $ N_{\mathrm{b}} $, \smash $ H_{\mathrm{T}}^{{\mathrm{j}} } $, \smash $ H_{\mathrm{T}}^{\mathrm{b}} $, and $p_{\mathrm{T}}(\mathrm{b}_{3}) $, the last bins contain the overflow. |

png pdf |
Figure 10-f:
Predicted and observed normalized differential cross sections in the $ \geq $5 jets: $ \geq $3b fiducial phase space, for the inclusive jet multiplicity (upper left), the b jet multiplicity (upper right), the inclusive jet $ H_{\mathrm{T}} $ (middle left, \smash $ H_{\mathrm{T}}^{{\mathrm{j}} } $), the $ H_{\mathrm{T}} $ of b jets (middle right, \smash $ H_{\mathrm{T}}^{\mathrm{b}} $), the $ |\eta| $ of the third b jet (lower left), and the $ p_{\mathrm{T}} $ of the third b jet (lower right). The data are represented by points, with inner (outer) vertical bars indicating the systematic (total) uncertainties, also represented as blue (grey) bands. Cross section prediction obtained at the particle level from different simulation approaches are shown, including their statistical uncertainties, as coloured symbols with different shapes. For $ N_{\text{jets}} $, $ N_{\mathrm{b}} $, \smash $ H_{\mathrm{T}}^{{\mathrm{j}} } $, \smash $ H_{\mathrm{T}}^{\mathrm{b}} $, and $p_{\mathrm{T}}(\mathrm{b}_{3}) $, the last bins contain the overflow. |
png pdf |
Figure 11:
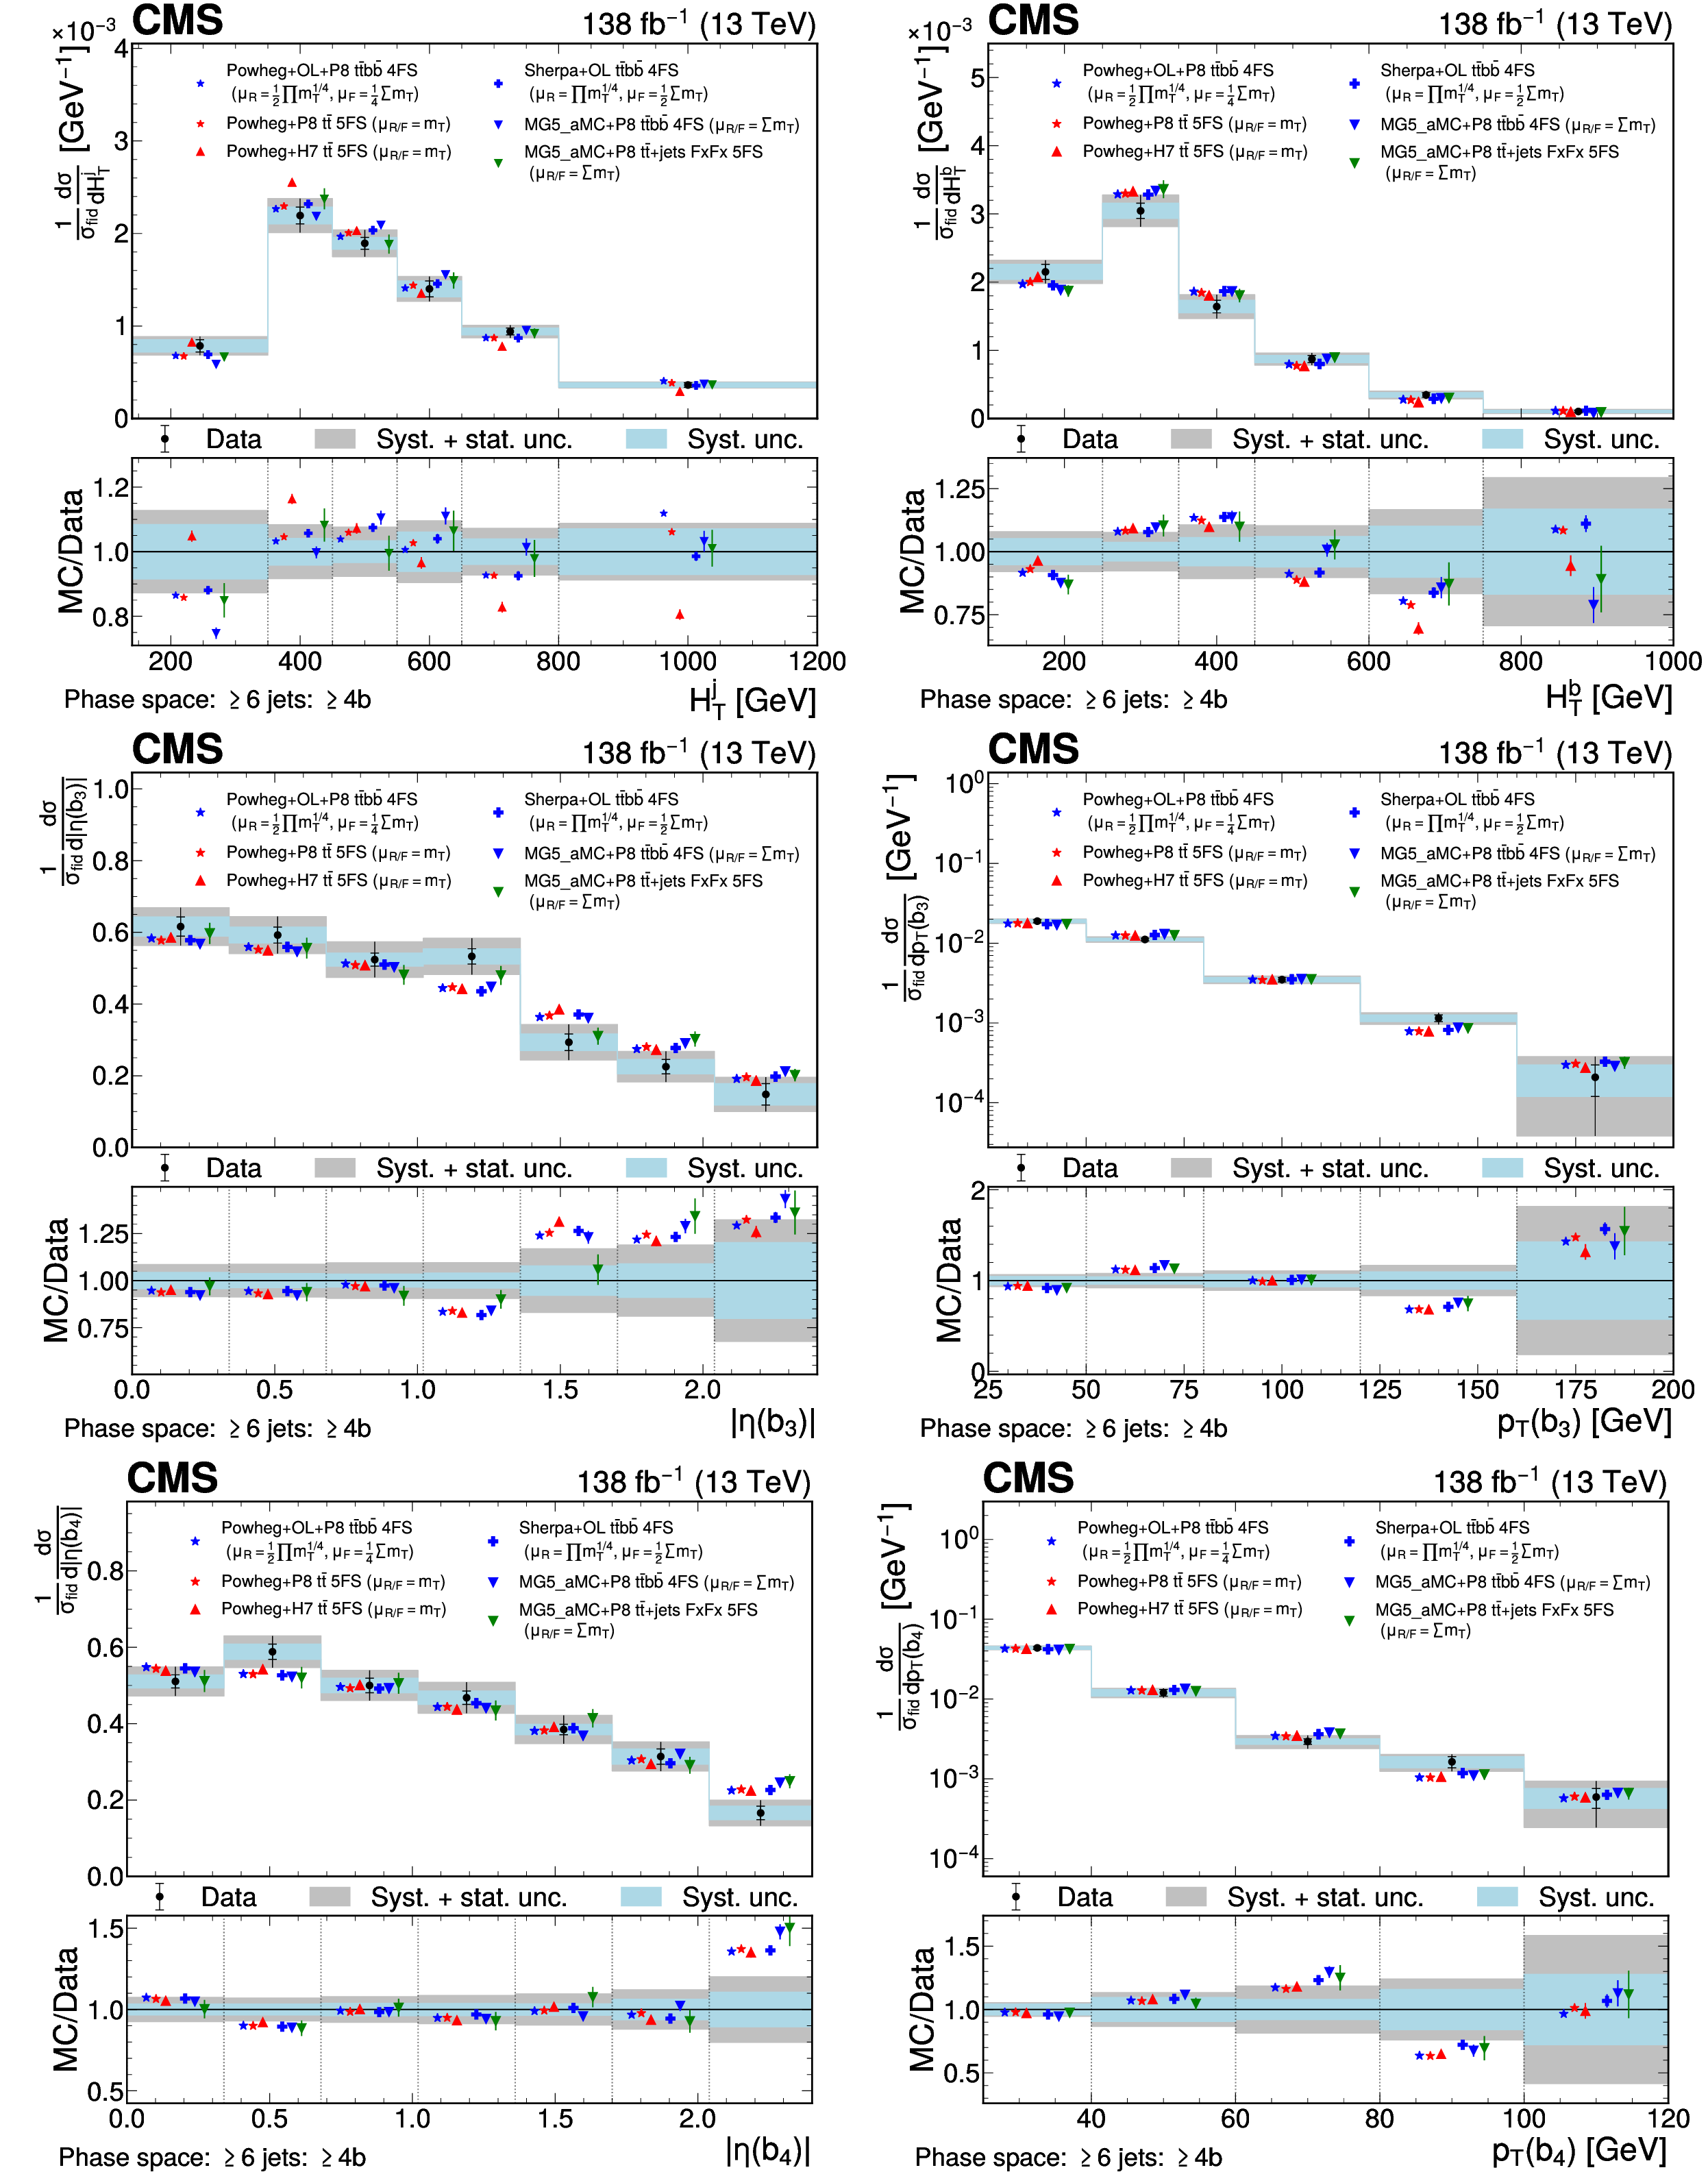
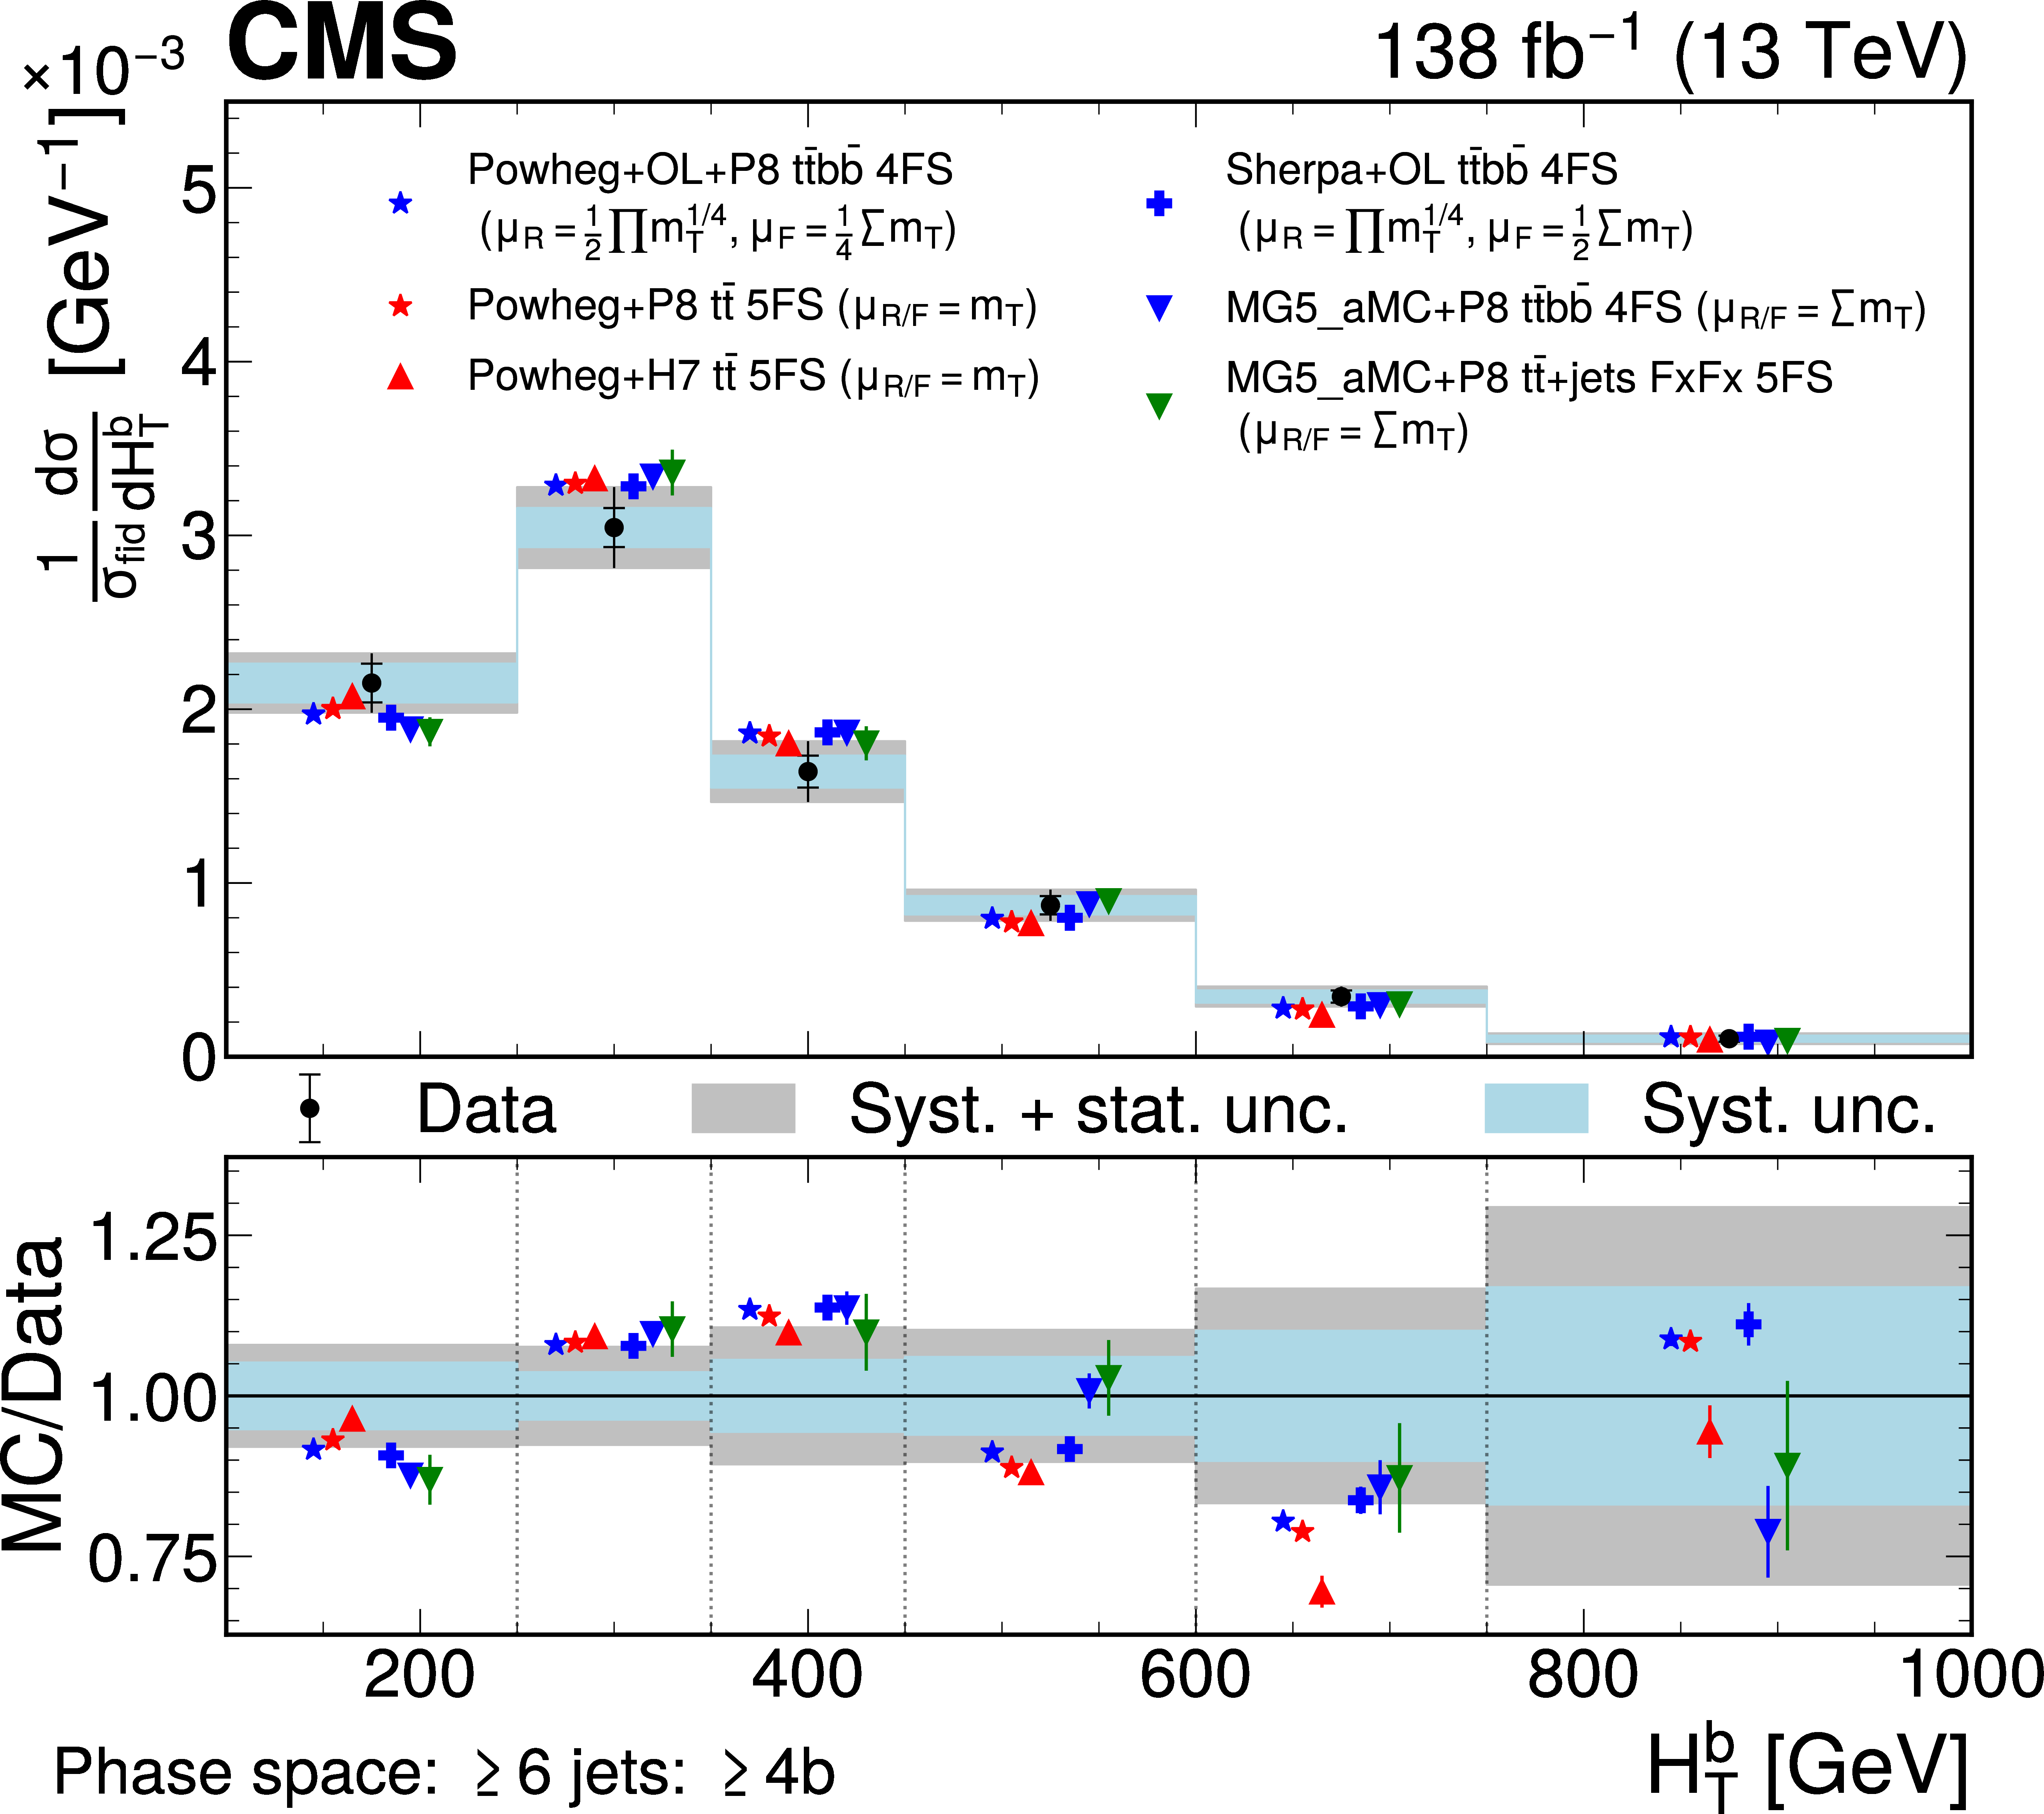
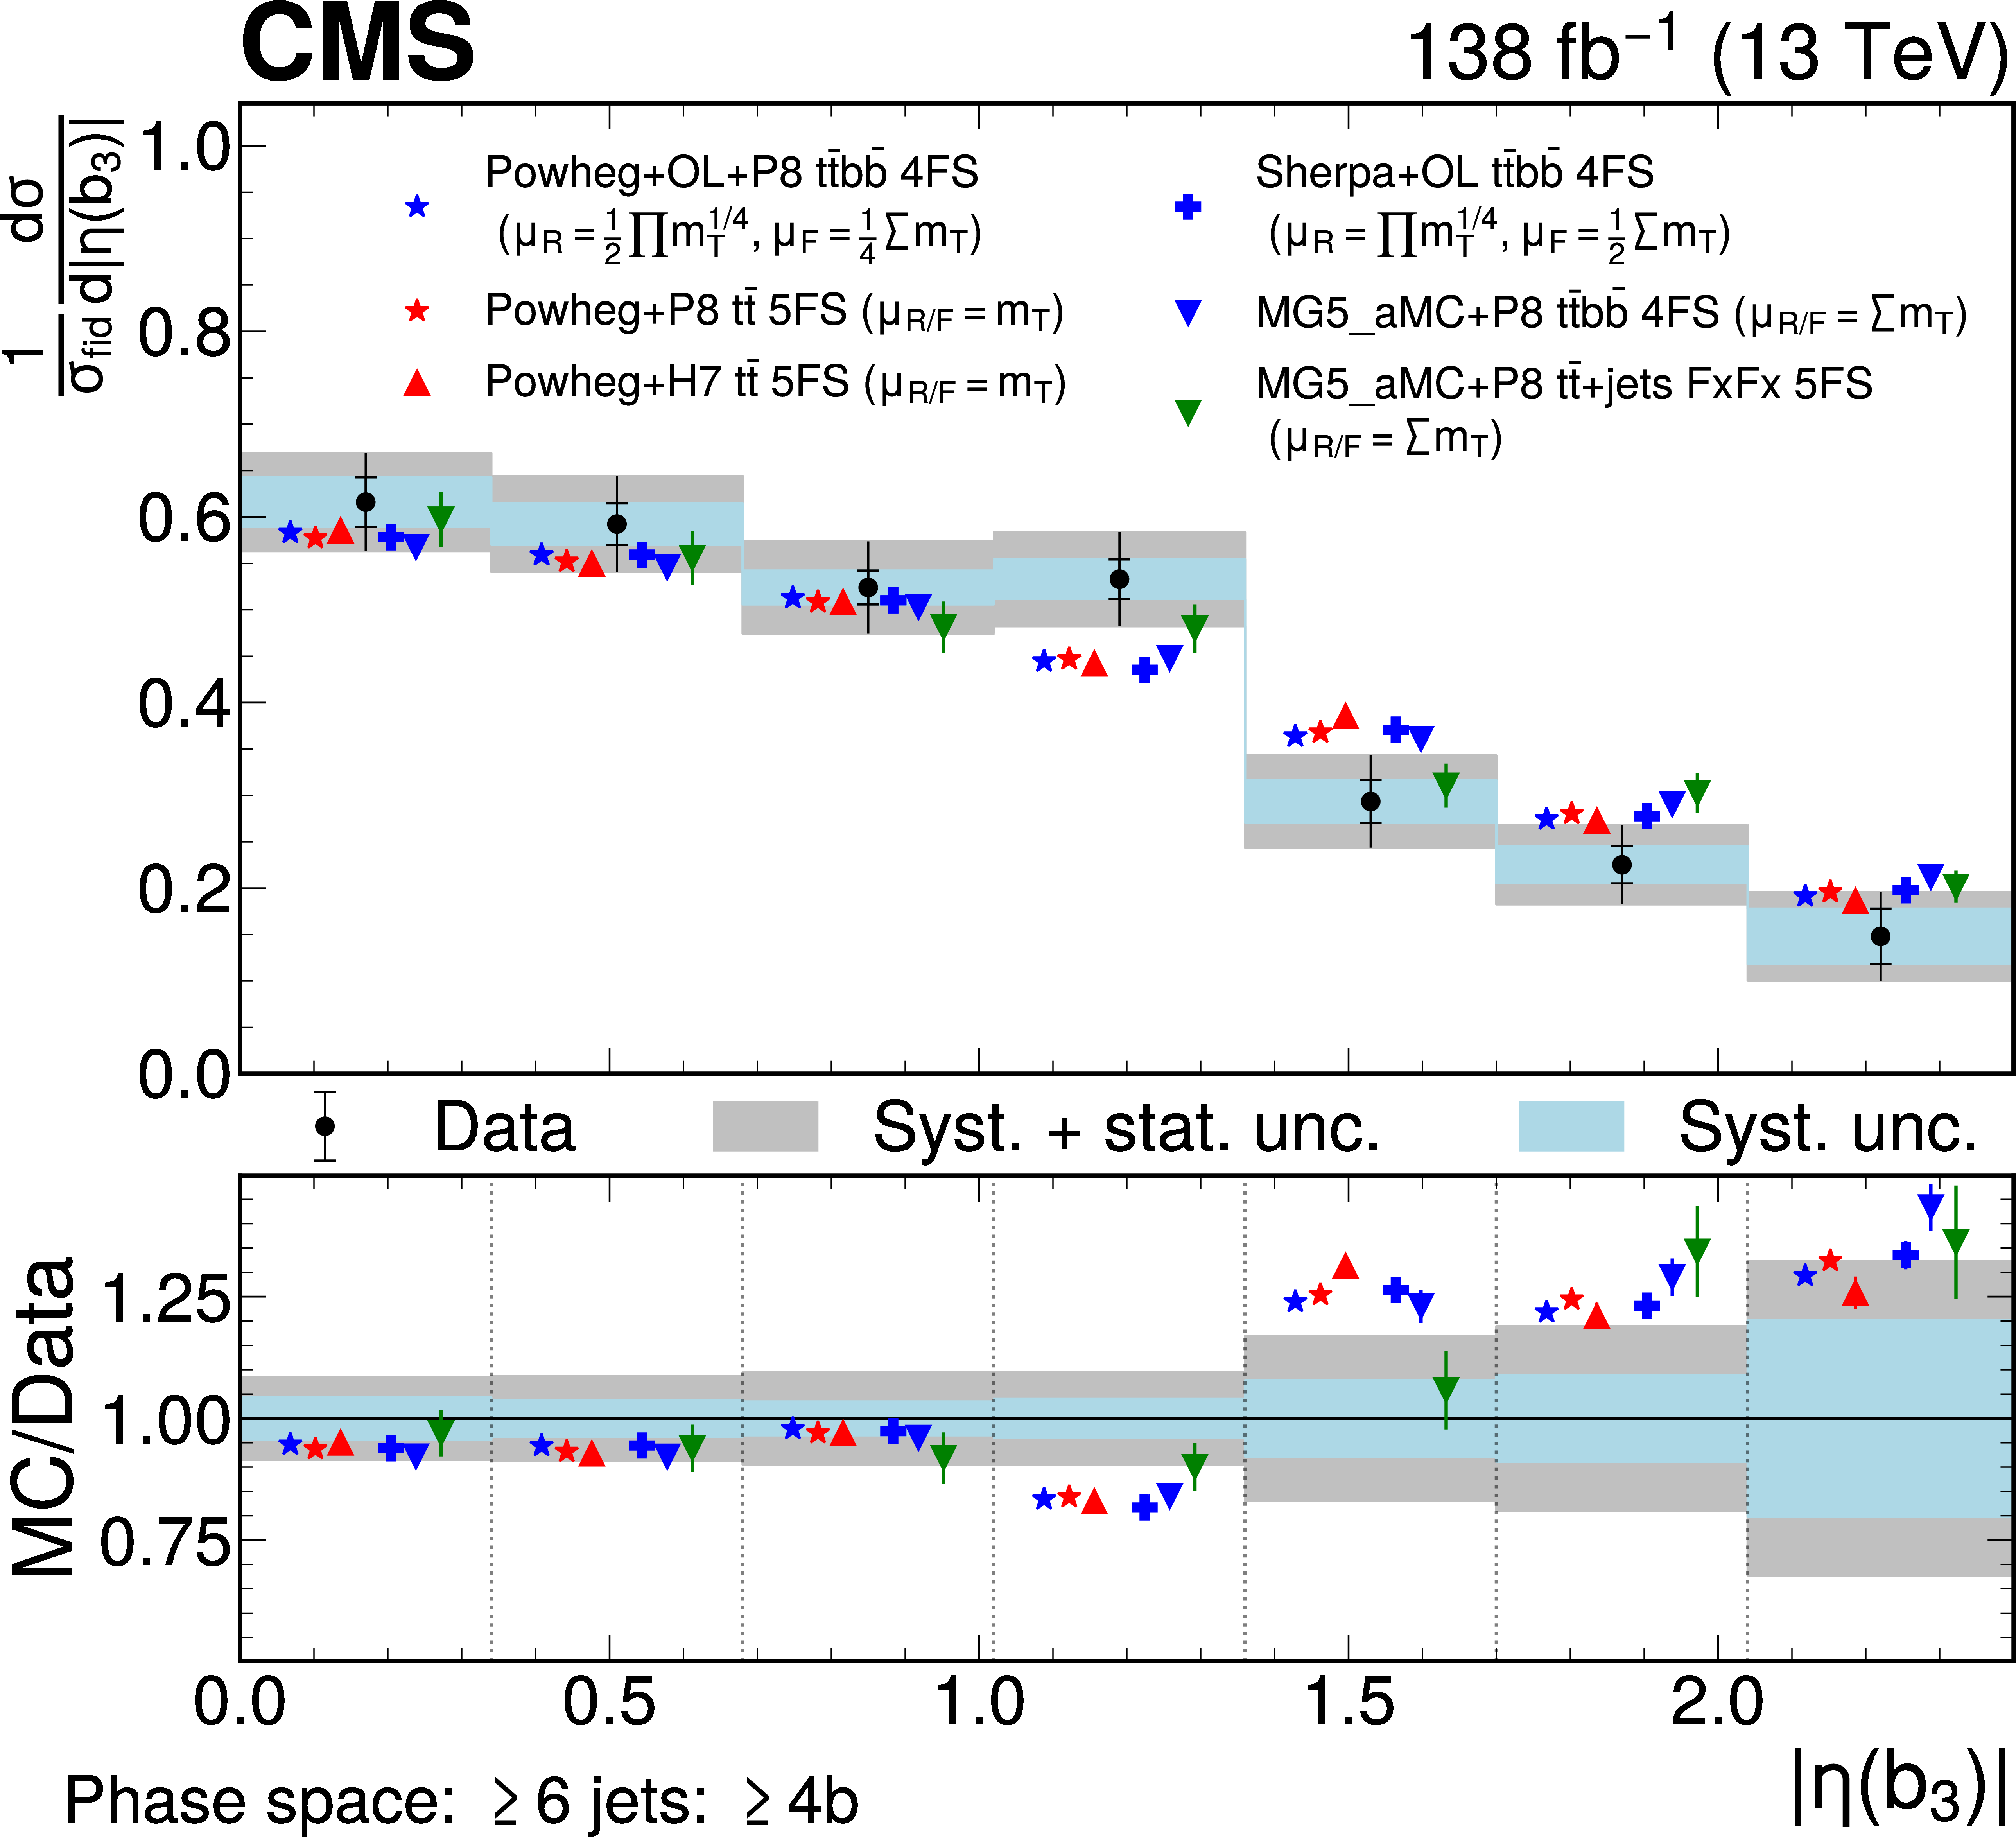
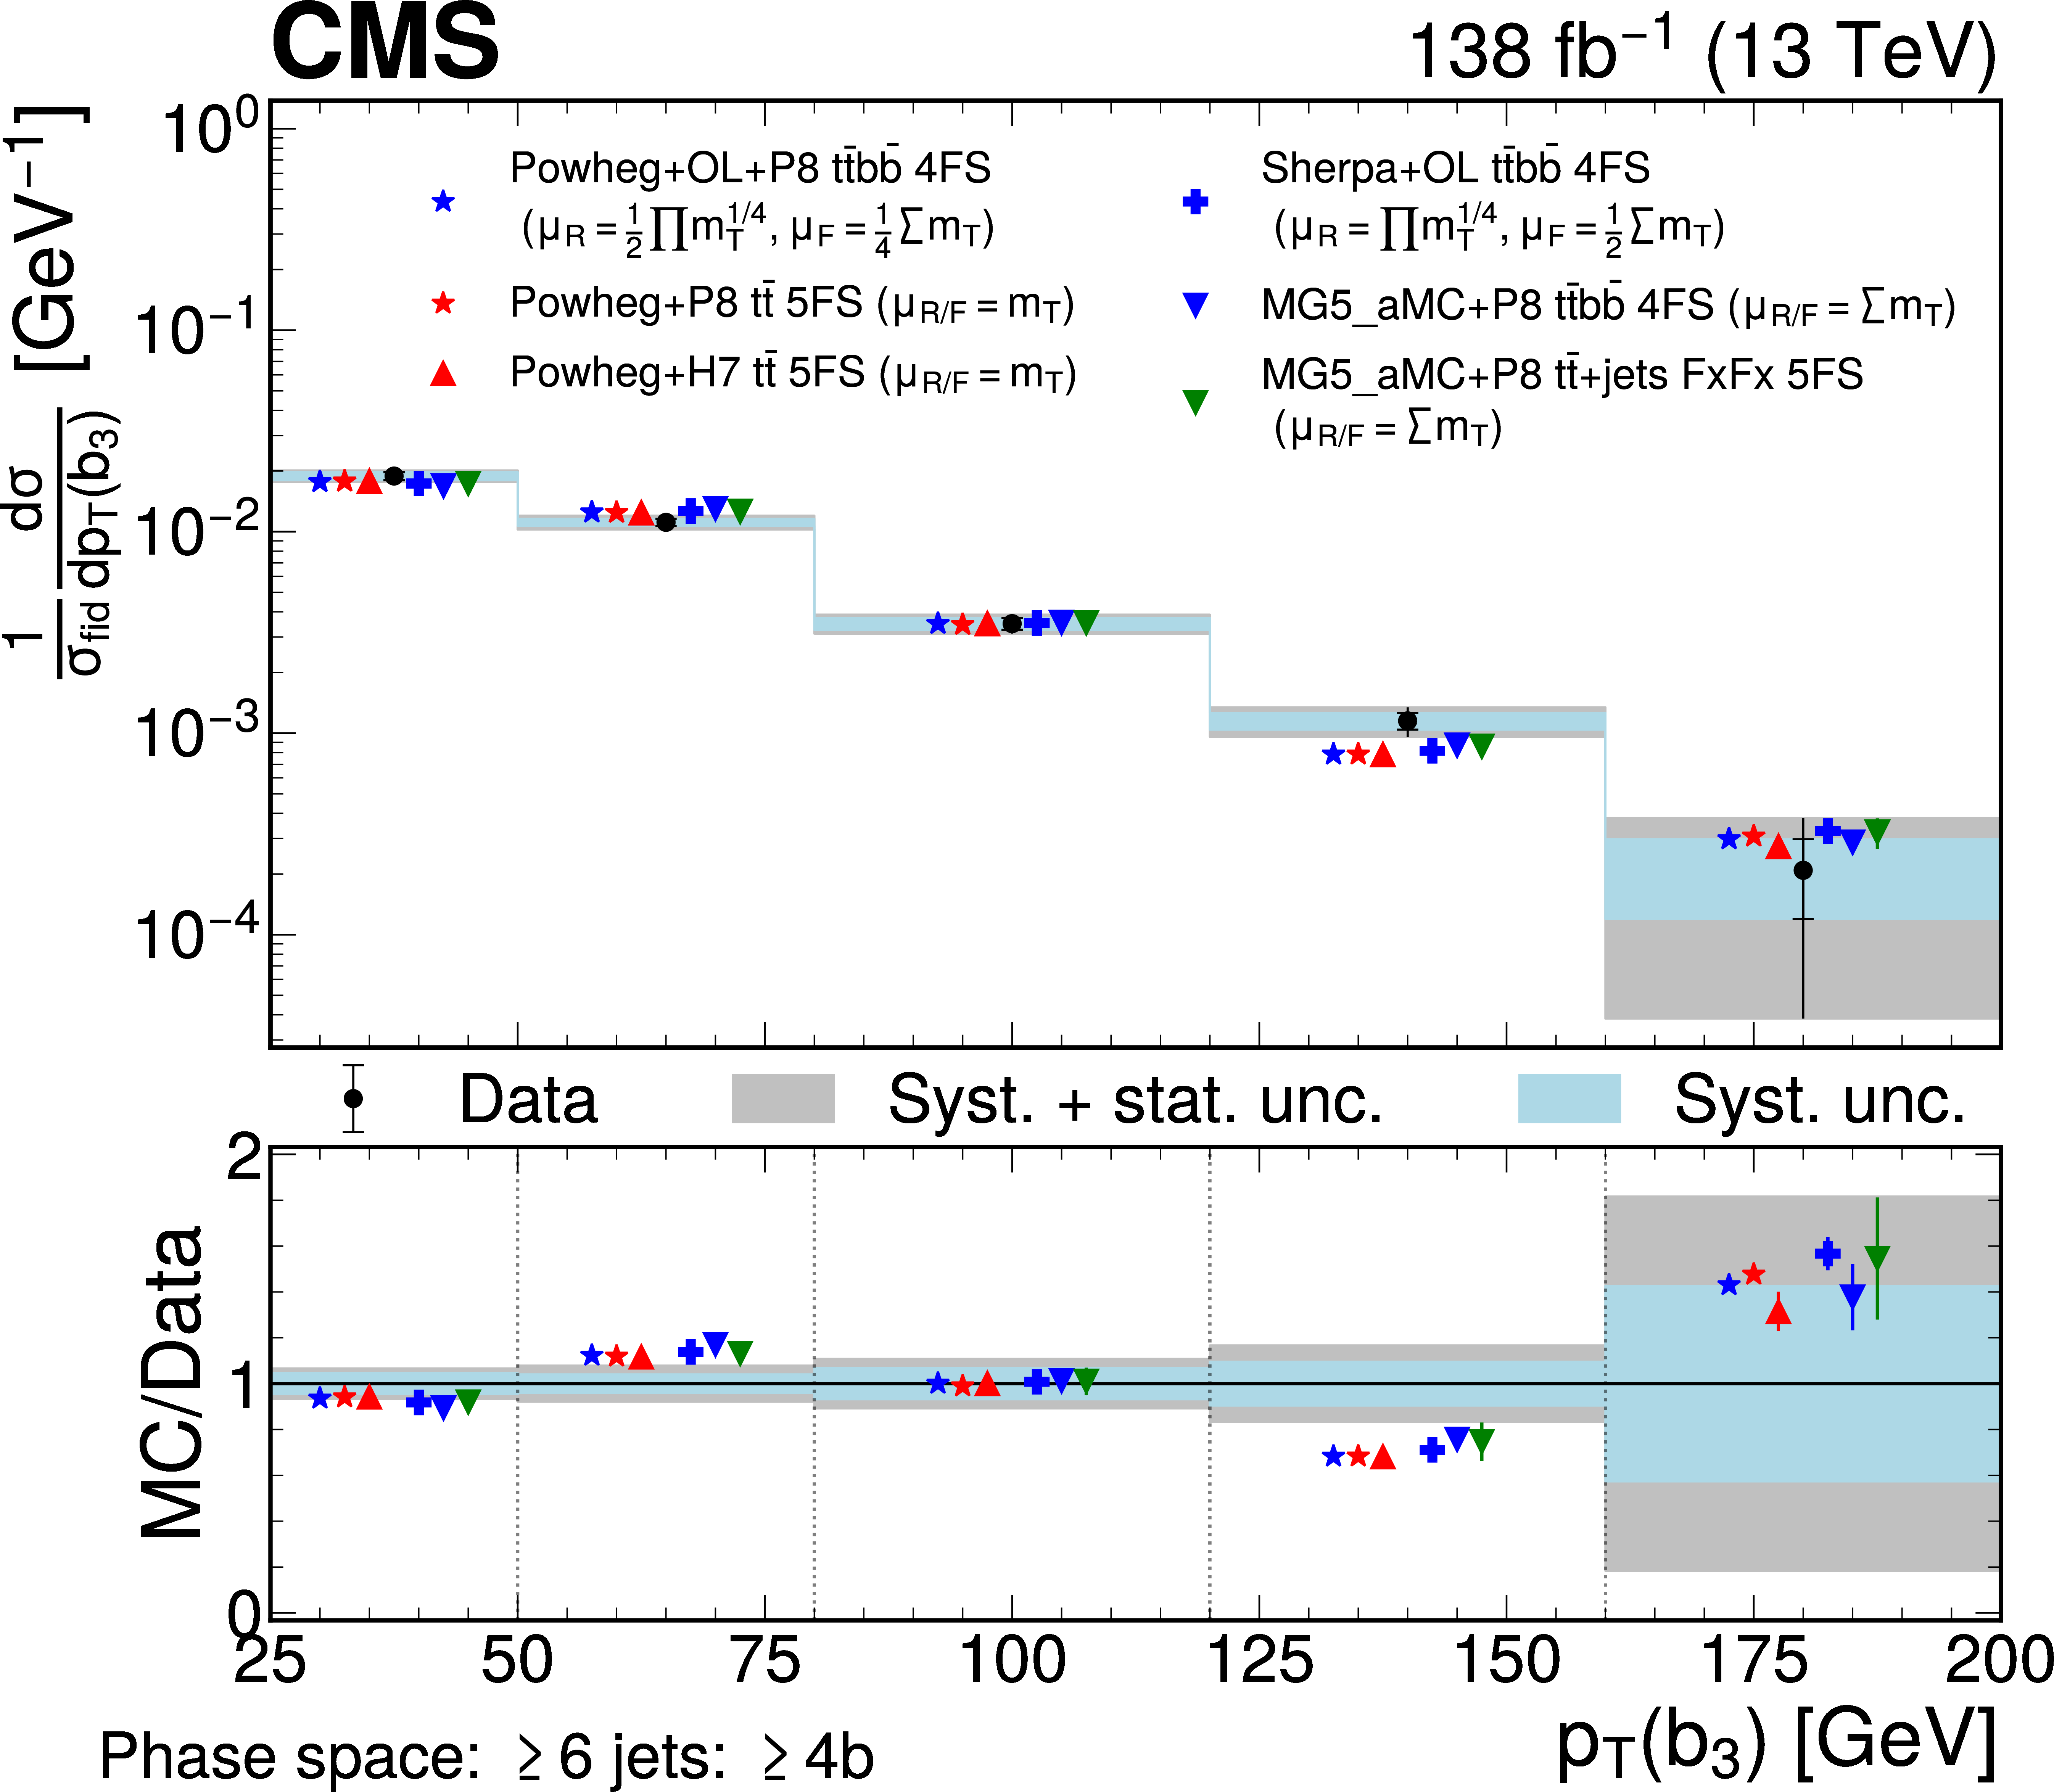
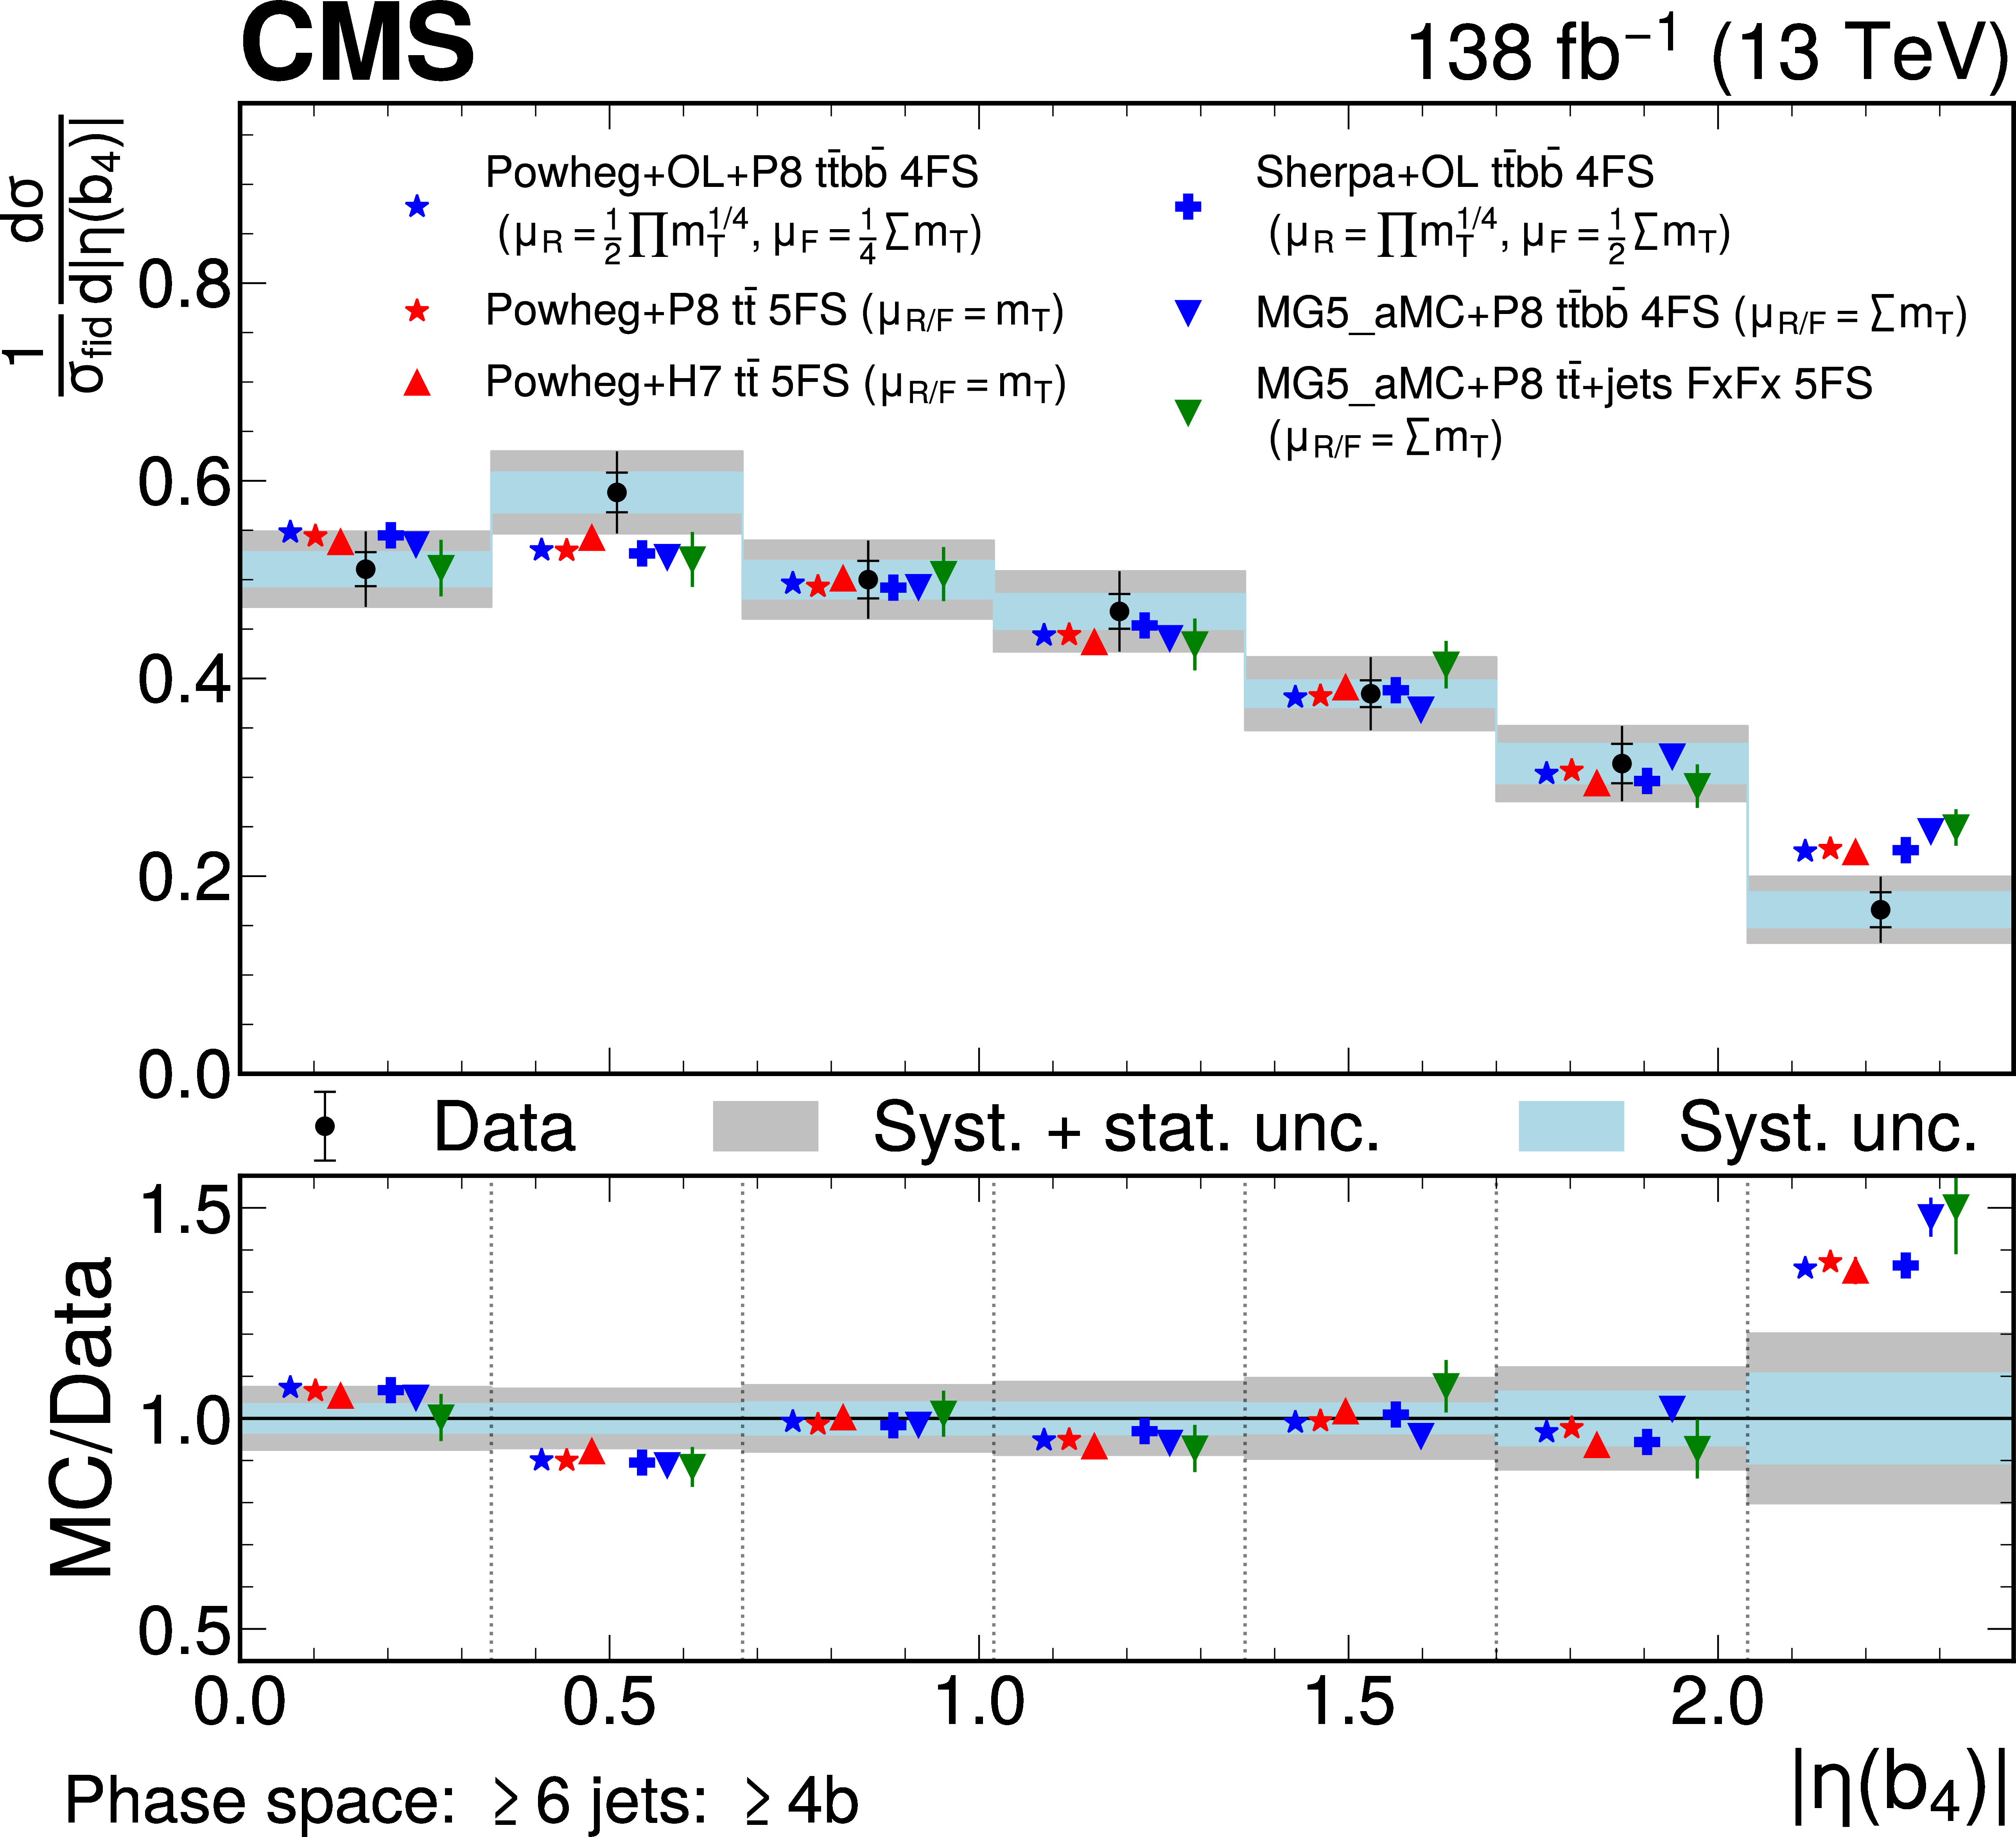
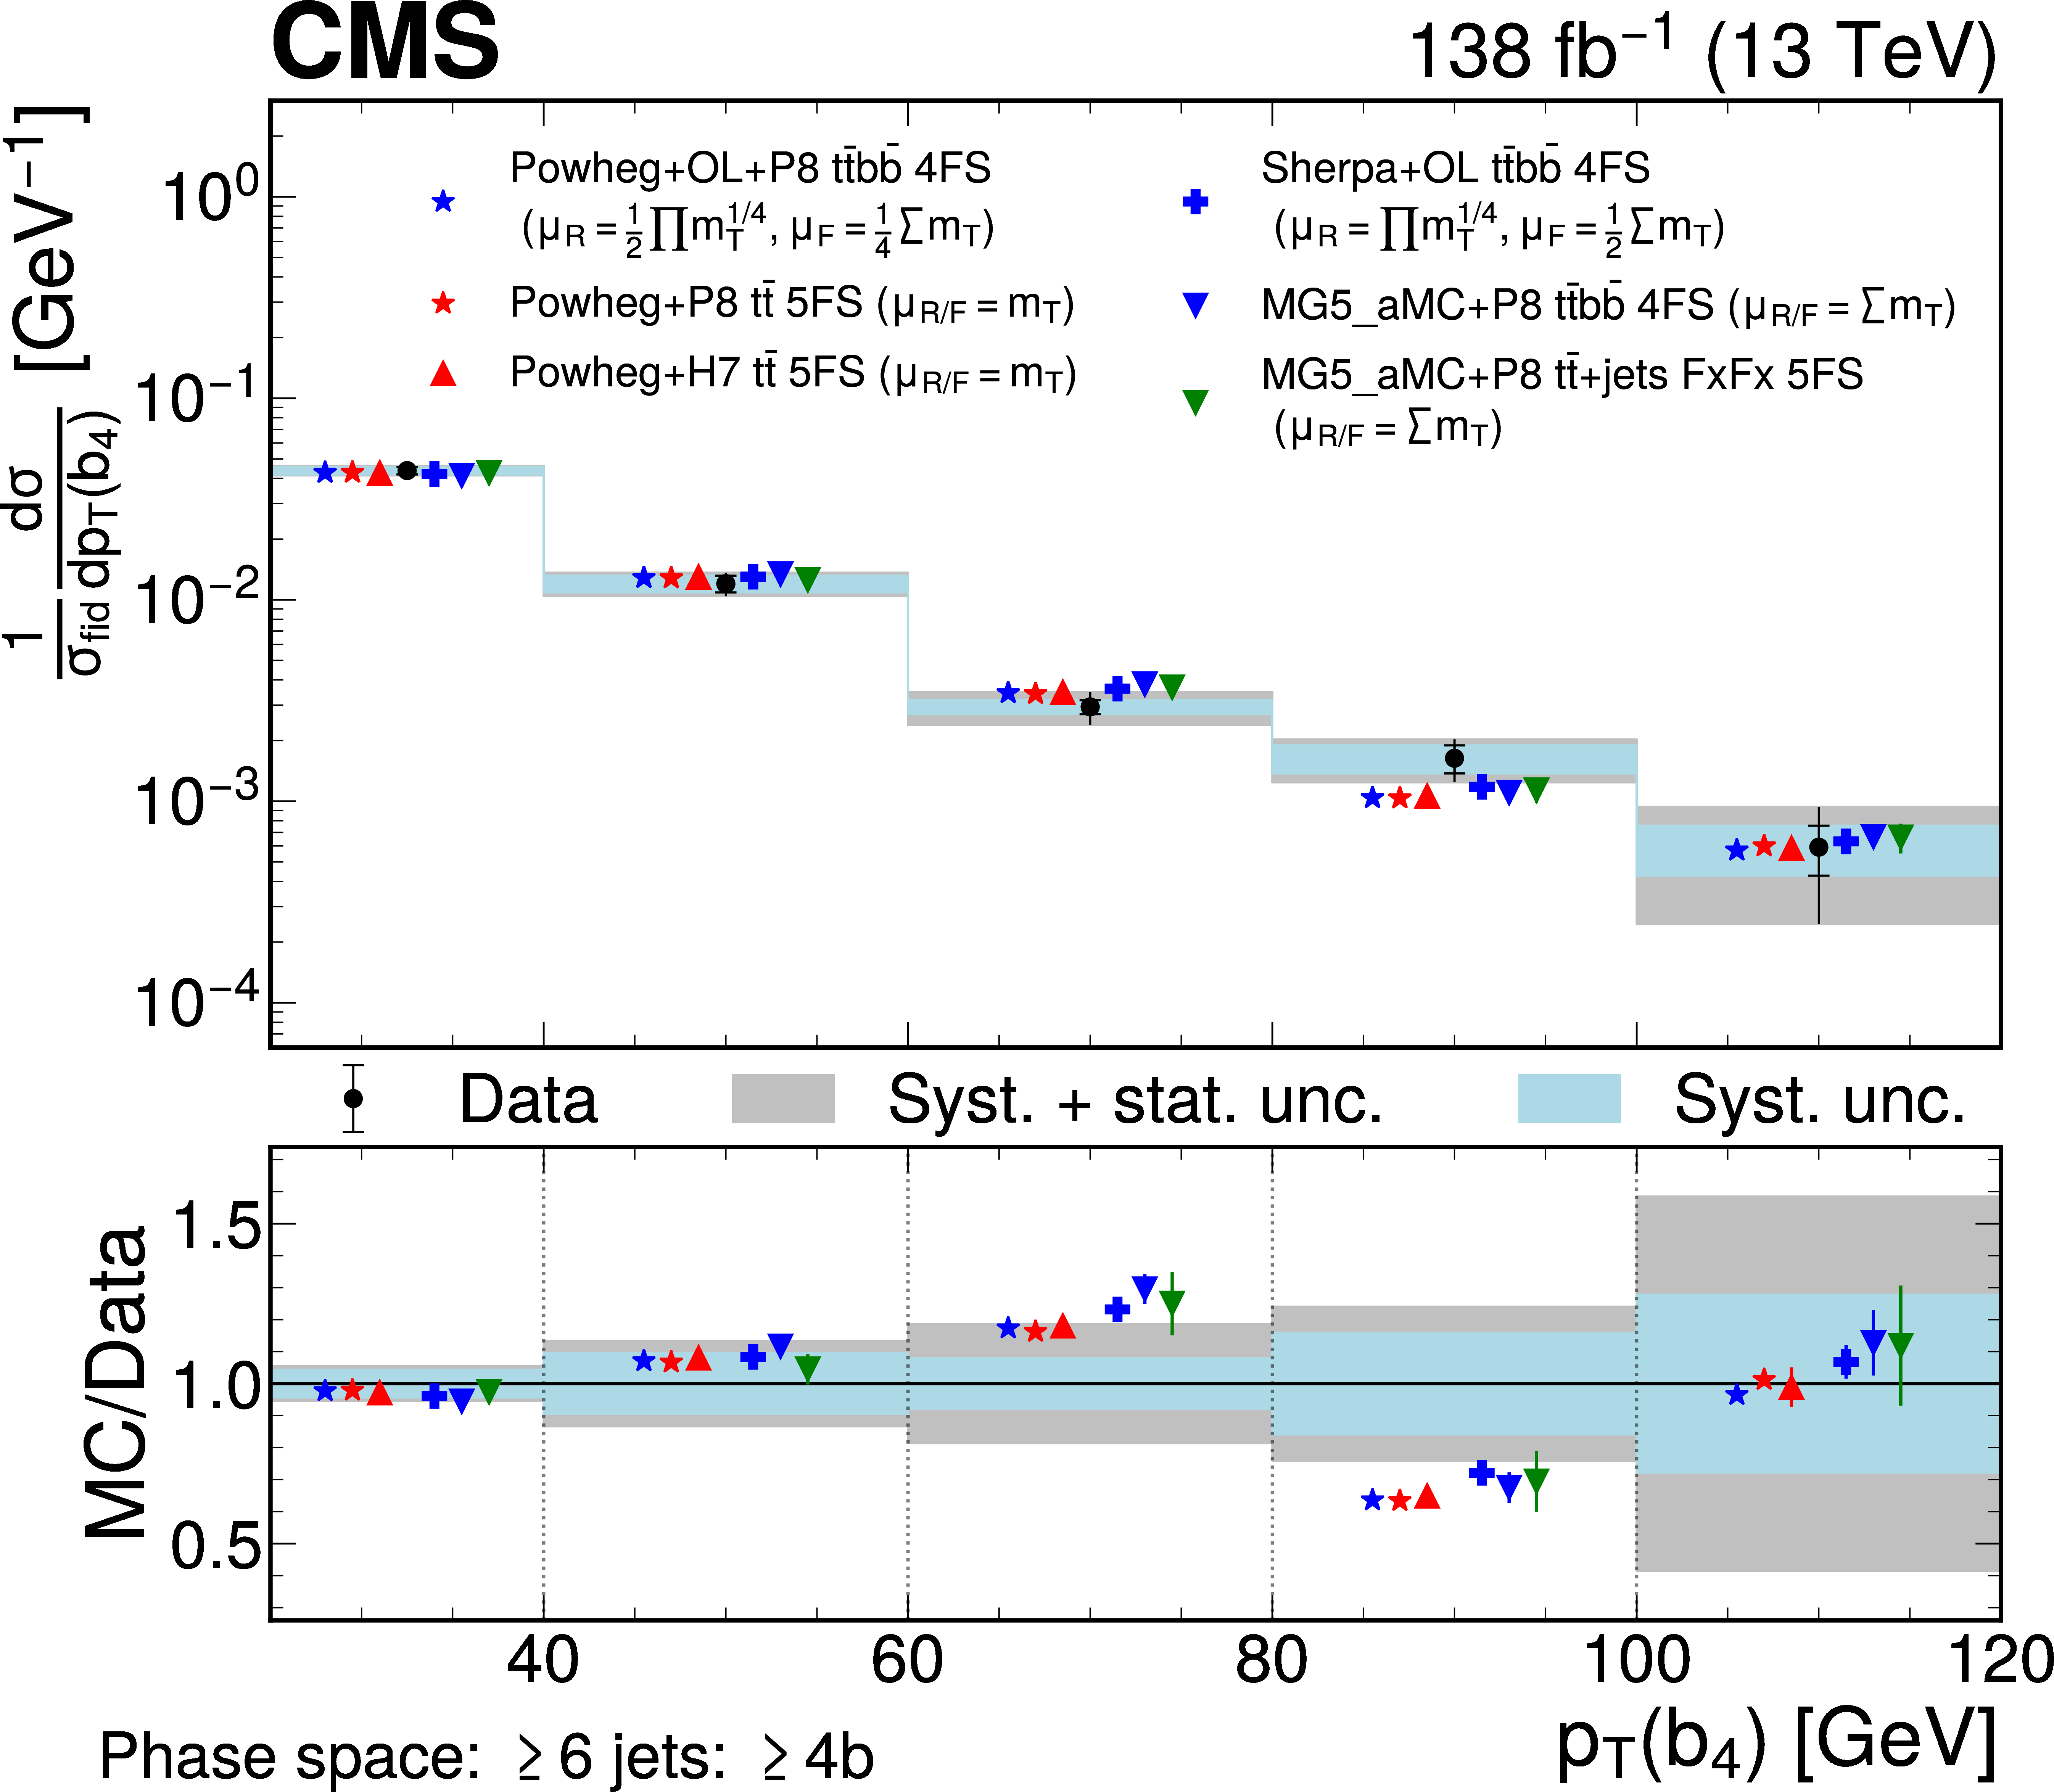
Predicted and observed normalized differential cross sections in the $ \geq $6 jets: $ \geq $4b fiducial phase space, for the inclusive jet $ H_{\mathrm{T}} $ (upper left), the $ H_{\mathrm{T}} $ of b jets (upper right), the $ |\eta| $ of the third b jet (middle left), the $ p_{\mathrm{T}} $ of the third b jet (middle right), the $ |\eta| $ of the fourth b jet (lower left), and the $ p_{\mathrm{T}} $ of the fourth b jet (lower right). The data are represented by points, with inner (outer) vertical bars indicating the systematic (total) uncertainties, also represented as blue (grey) bands. Cross section predictions obtained at the particle level from different simulation approaches are shown, including their statistical uncertainties, as coloured symbols with different shapes. For $ H_{\mathrm{T}} $ and $ p_{\mathrm{T}} $, the last bins contain the overflow. |
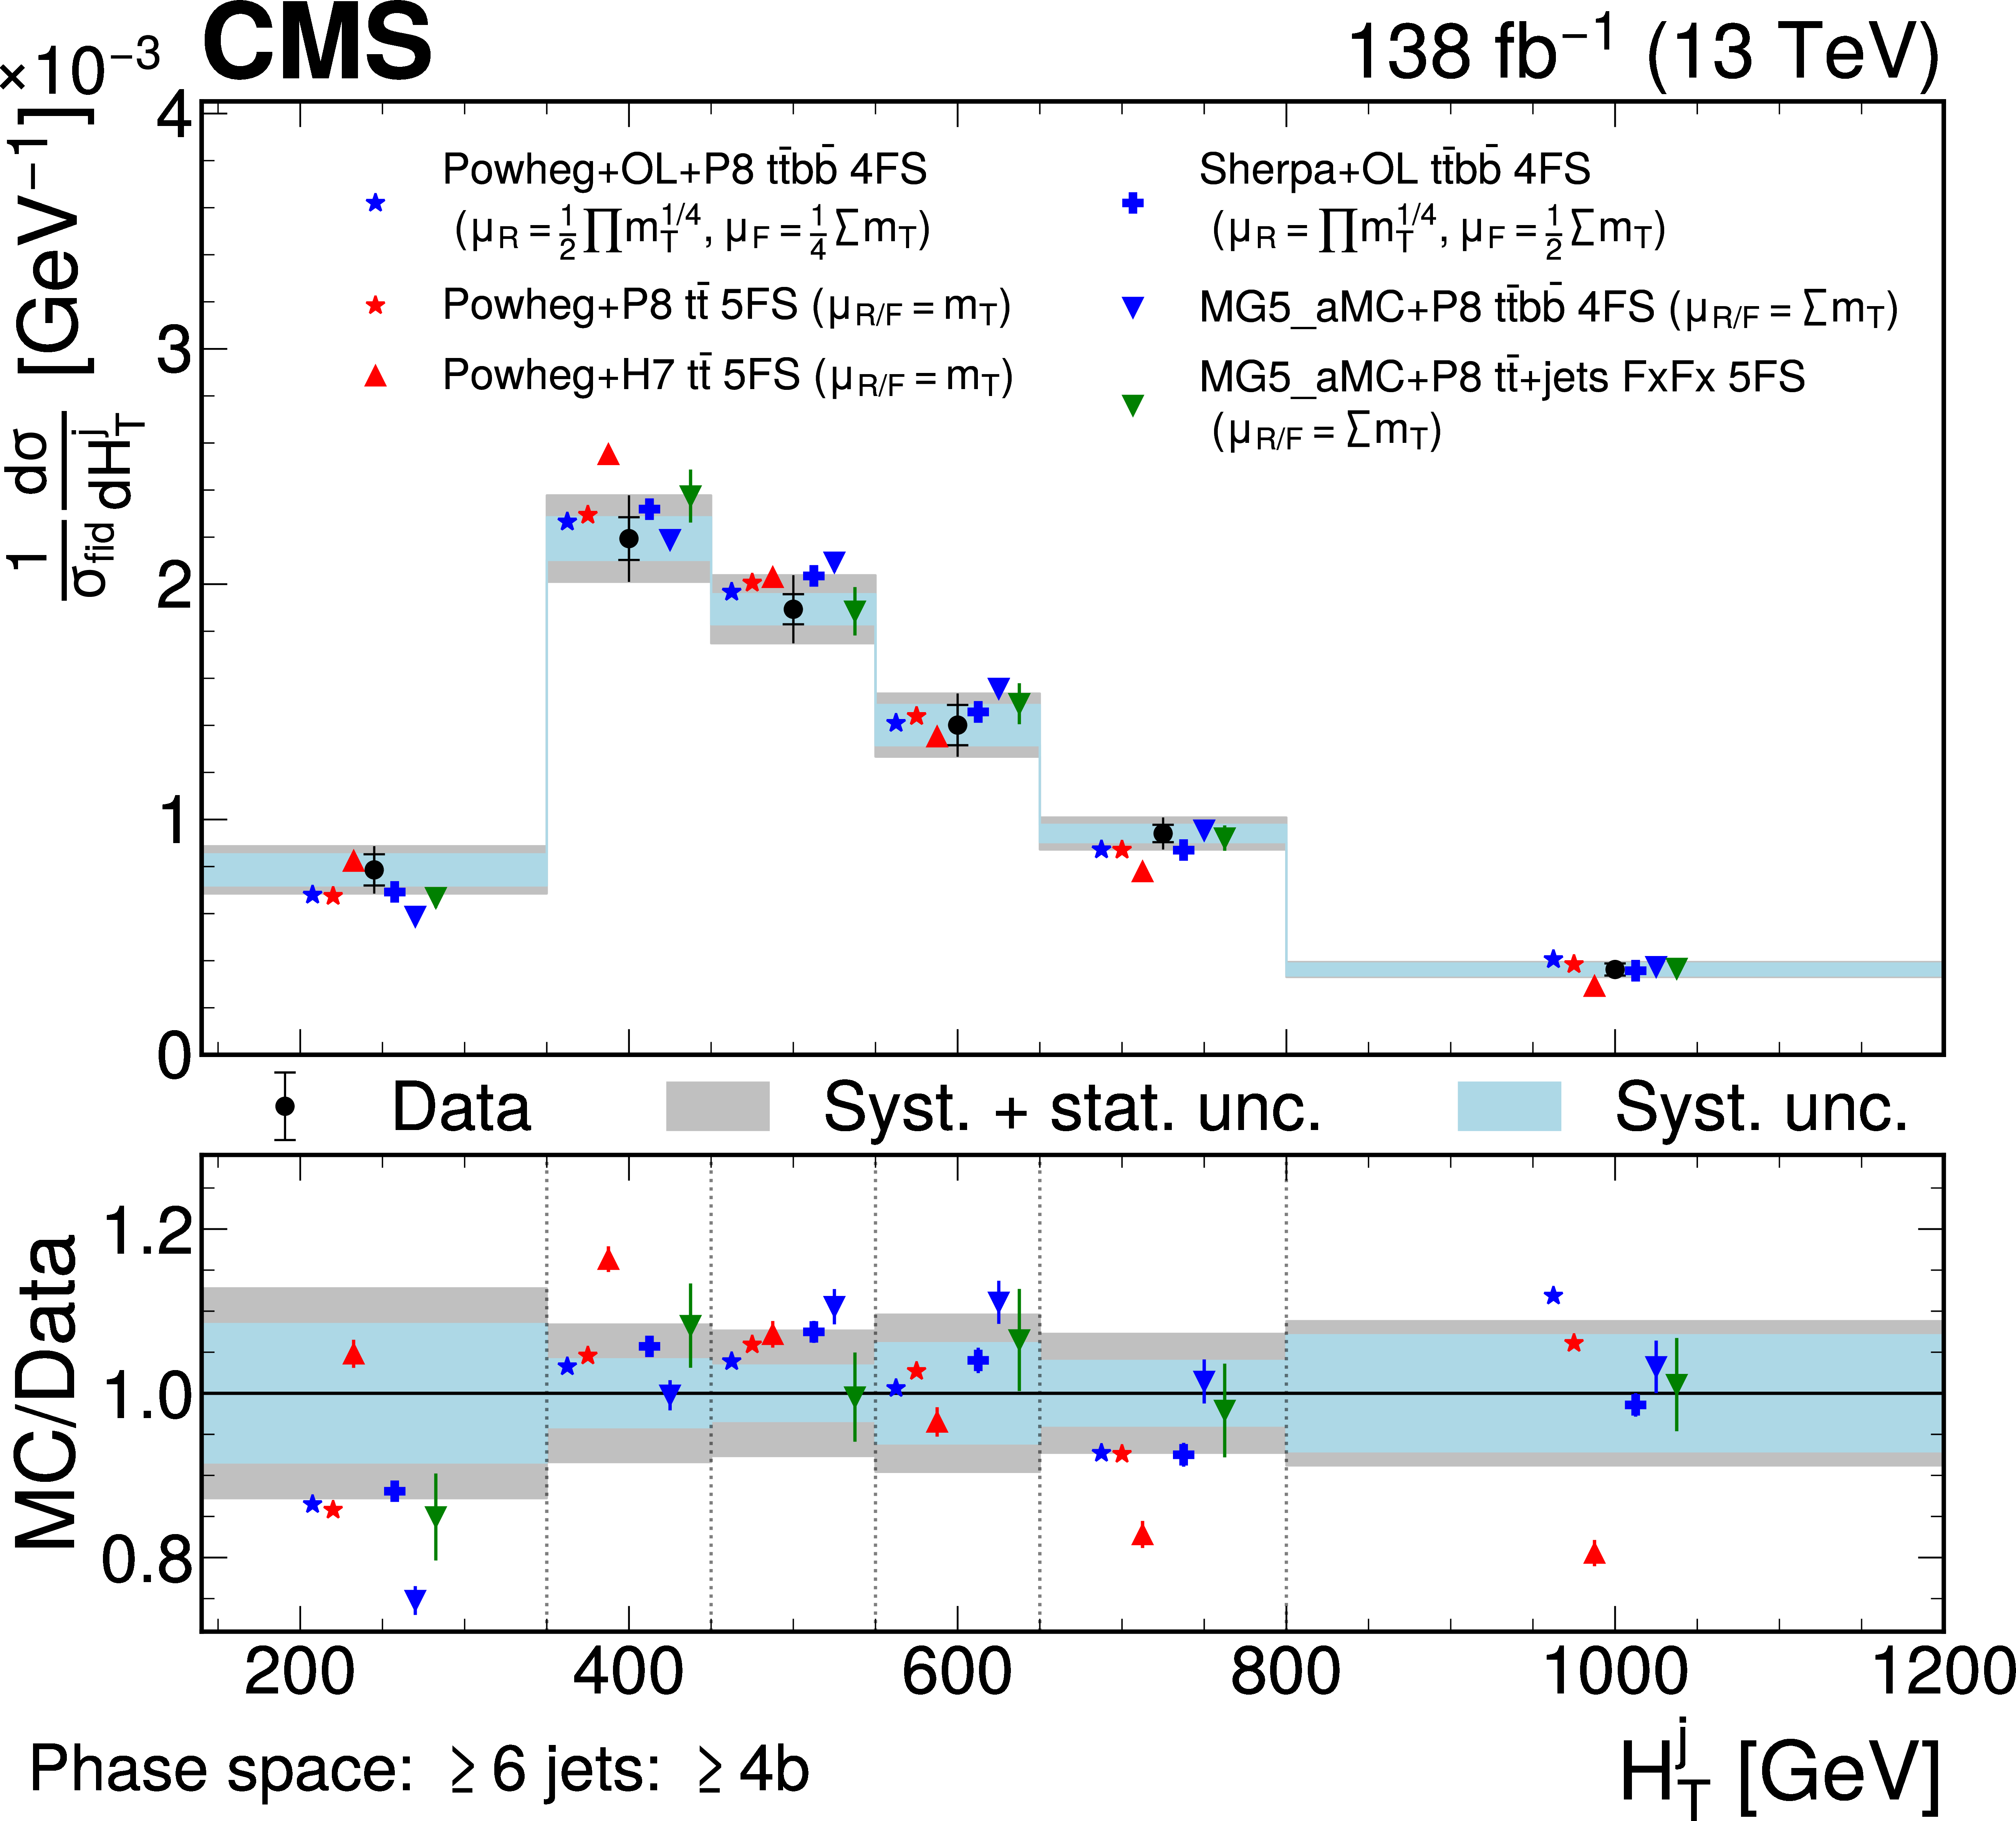
png pdf |
Figure 11-a:
Predicted and observed normalized differential cross sections in the $ \geq $6 jets: $ \geq $4b fiducial phase space, for the inclusive jet $ H_{\mathrm{T}} $ (upper left), the $ H_{\mathrm{T}} $ of b jets (upper right), the $ |\eta| $ of the third b jet (middle left), the $ p_{\mathrm{T}} $ of the third b jet (middle right), the $ |\eta| $ of the fourth b jet (lower left), and the $ p_{\mathrm{T}} $ of the fourth b jet (lower right). The data are represented by points, with inner (outer) vertical bars indicating the systematic (total) uncertainties, also represented as blue (grey) bands. Cross section predictions obtained at the particle level from different simulation approaches are shown, including their statistical uncertainties, as coloured symbols with different shapes. For $ H_{\mathrm{T}} $ and $ p_{\mathrm{T}} $, the last bins contain the overflow. |
png pdf |
Figure 11-b:
Predicted and observed normalized differential cross sections in the $ \geq $6 jets: $ \geq $4b fiducial phase space, for the inclusive jet $ H_{\mathrm{T}} $ (upper left), the $ H_{\mathrm{T}} $ of b jets (upper right), the $ |\eta| $ of the third b jet (middle left), the $ p_{\mathrm{T}} $ of the third b jet (middle right), the $ |\eta| $ of the fourth b jet (lower left), and the $ p_{\mathrm{T}} $ of the fourth b jet (lower right). The data are represented by points, with inner (outer) vertical bars indicating the systematic (total) uncertainties, also represented as blue (grey) bands. Cross section predictions obtained at the particle level from different simulation approaches are shown, including their statistical uncertainties, as coloured symbols with different shapes. For $ H_{\mathrm{T}} $ and $ p_{\mathrm{T}} $, the last bins contain the overflow. |
png pdf |
Figure 11-c:
Predicted and observed normalized differential cross sections in the $ \geq $6 jets: $ \geq $4b fiducial phase space, for the inclusive jet $ H_{\mathrm{T}} $ (upper left), the $ H_{\mathrm{T}} $ of b jets (upper right), the $ |\eta| $ of the third b jet (middle left), the $ p_{\mathrm{T}} $ of the third b jet (middle right), the $ |\eta| $ of the fourth b jet (lower left), and the $ p_{\mathrm{T}} $ of the fourth b jet (lower right). The data are represented by points, with inner (outer) vertical bars indicating the systematic (total) uncertainties, also represented as blue (grey) bands. Cross section predictions obtained at the particle level from different simulation approaches are shown, including their statistical uncertainties, as coloured symbols with different shapes. For $ H_{\mathrm{T}} $ and $ p_{\mathrm{T}} $, the last bins contain the overflow. |
png pdf |
Figure 11-d:
Predicted and observed normalized differential cross sections in the $ \geq $6 jets: $ \geq $4b fiducial phase space, for the inclusive jet $ H_{\mathrm{T}} $ (upper left), the $ H_{\mathrm{T}} $ of b jets (upper right), the $ |\eta| $ of the third b jet (middle left), the $ p_{\mathrm{T}} $ of the third b jet (middle right), the $ |\eta| $ of the fourth b jet (lower left), and the $ p_{\mathrm{T}} $ of the fourth b jet (lower right). The data are represented by points, with inner (outer) vertical bars indicating the systematic (total) uncertainties, also represented as blue (grey) bands. Cross section predictions obtained at the particle level from different simulation approaches are shown, including their statistical uncertainties, as coloured symbols with different shapes. For $ H_{\mathrm{T}} $ and $ p_{\mathrm{T}} $, the last bins contain the overflow. |
png pdf |
Figure 11-e:
Predicted and observed normalized differential cross sections in the $ \geq $6 jets: $ \geq $4b fiducial phase space, for the inclusive jet $ H_{\mathrm{T}} $ (upper left), the $ H_{\mathrm{T}} $ of b jets (upper right), the $ |\eta| $ of the third b jet (middle left), the $ p_{\mathrm{T}} $ of the third b jet (middle right), the $ |\eta| $ of the fourth b jet (lower left), and the $ p_{\mathrm{T}} $ of the fourth b jet (lower right). The data are represented by points, with inner (outer) vertical bars indicating the systematic (total) uncertainties, also represented as blue (grey) bands. Cross section predictions obtained at the particle level from different simulation approaches are shown, including their statistical uncertainties, as coloured symbols with different shapes. For $ H_{\mathrm{T}} $ and $ p_{\mathrm{T}} $, the last bins contain the overflow. |
png pdf |
Figure 11-f:
Predicted and observed normalized differential cross sections in the $ \geq $6 jets: $ \geq $4b fiducial phase space, for the inclusive jet $ H_{\mathrm{T}} $ (upper left), the $ H_{\mathrm{T}} $ of b jets (upper right), the $ |\eta| $ of the third b jet (middle left), the $ p_{\mathrm{T}} $ of the third b jet (middle right), the $ |\eta| $ of the fourth b jet (lower left), and the $ p_{\mathrm{T}} $ of the fourth b jet (lower right). The data are represented by points, with inner (outer) vertical bars indicating the systematic (total) uncertainties, also represented as blue (grey) bands. Cross section predictions obtained at the particle level from different simulation approaches are shown, including their statistical uncertainties, as coloured symbols with different shapes. For $ H_{\mathrm{T}} $ and $ p_{\mathrm{T}} $, the last bins contain the overflow. |
png pdf |
Figure 12:
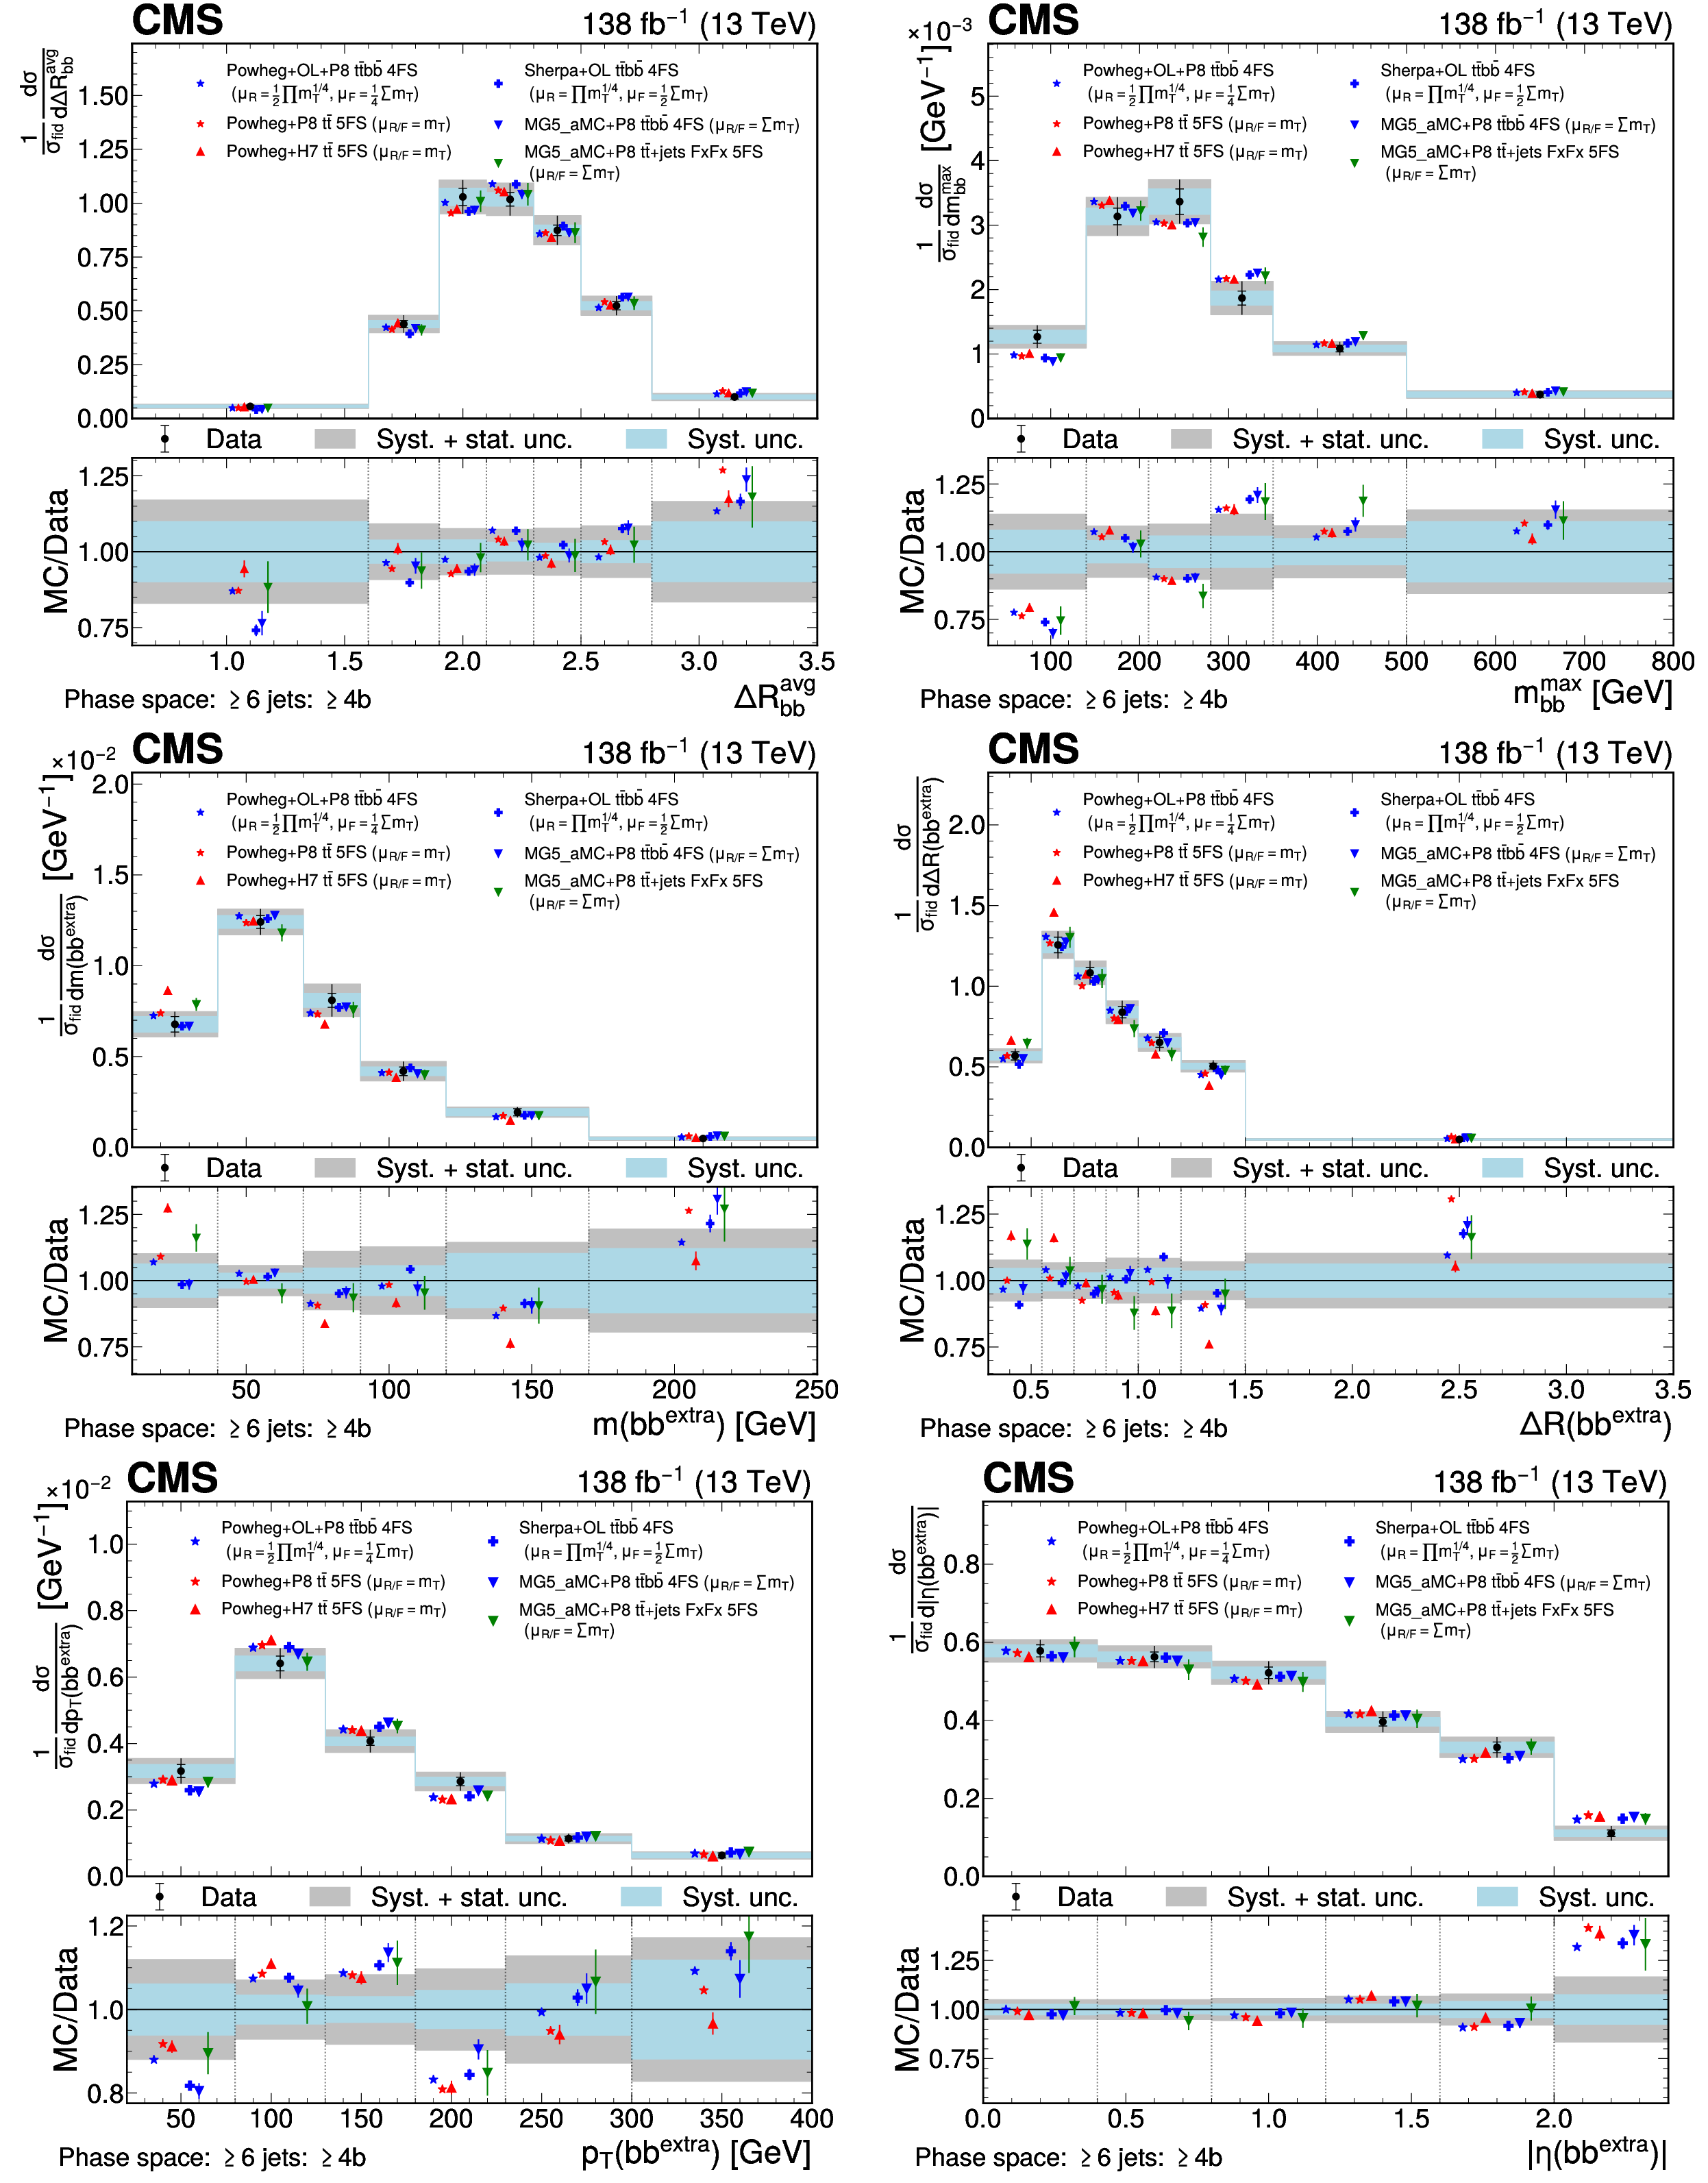
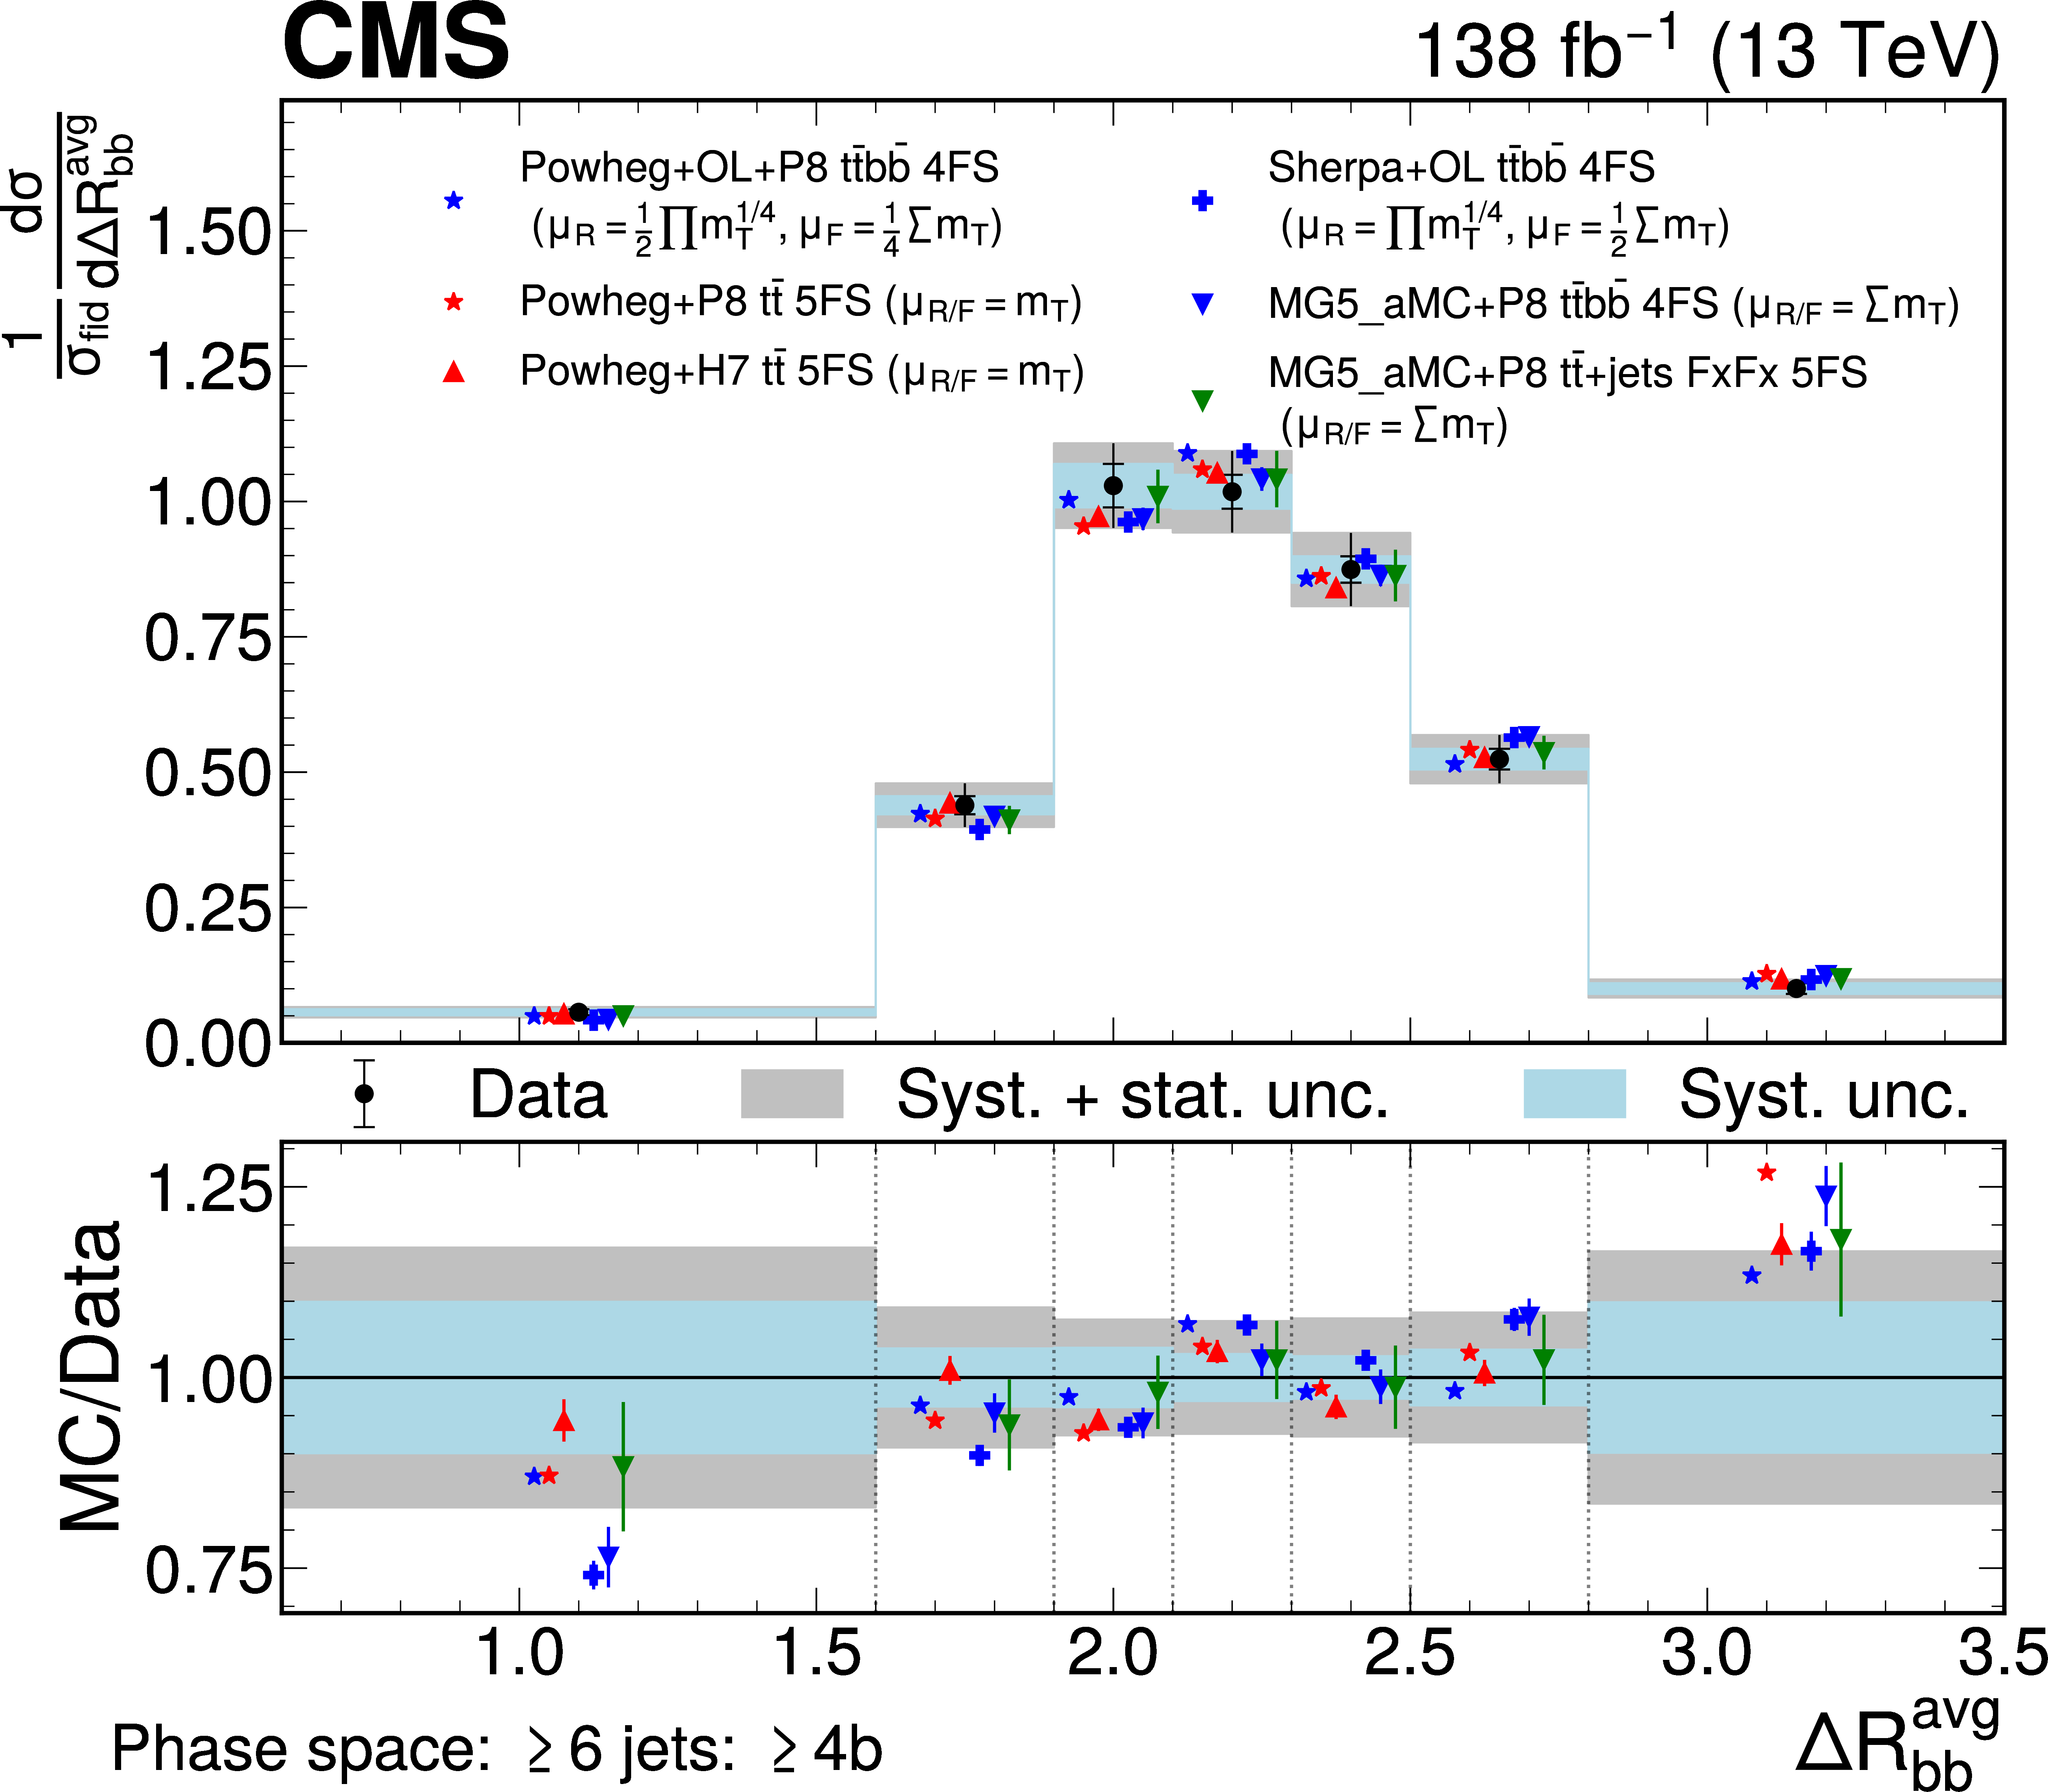
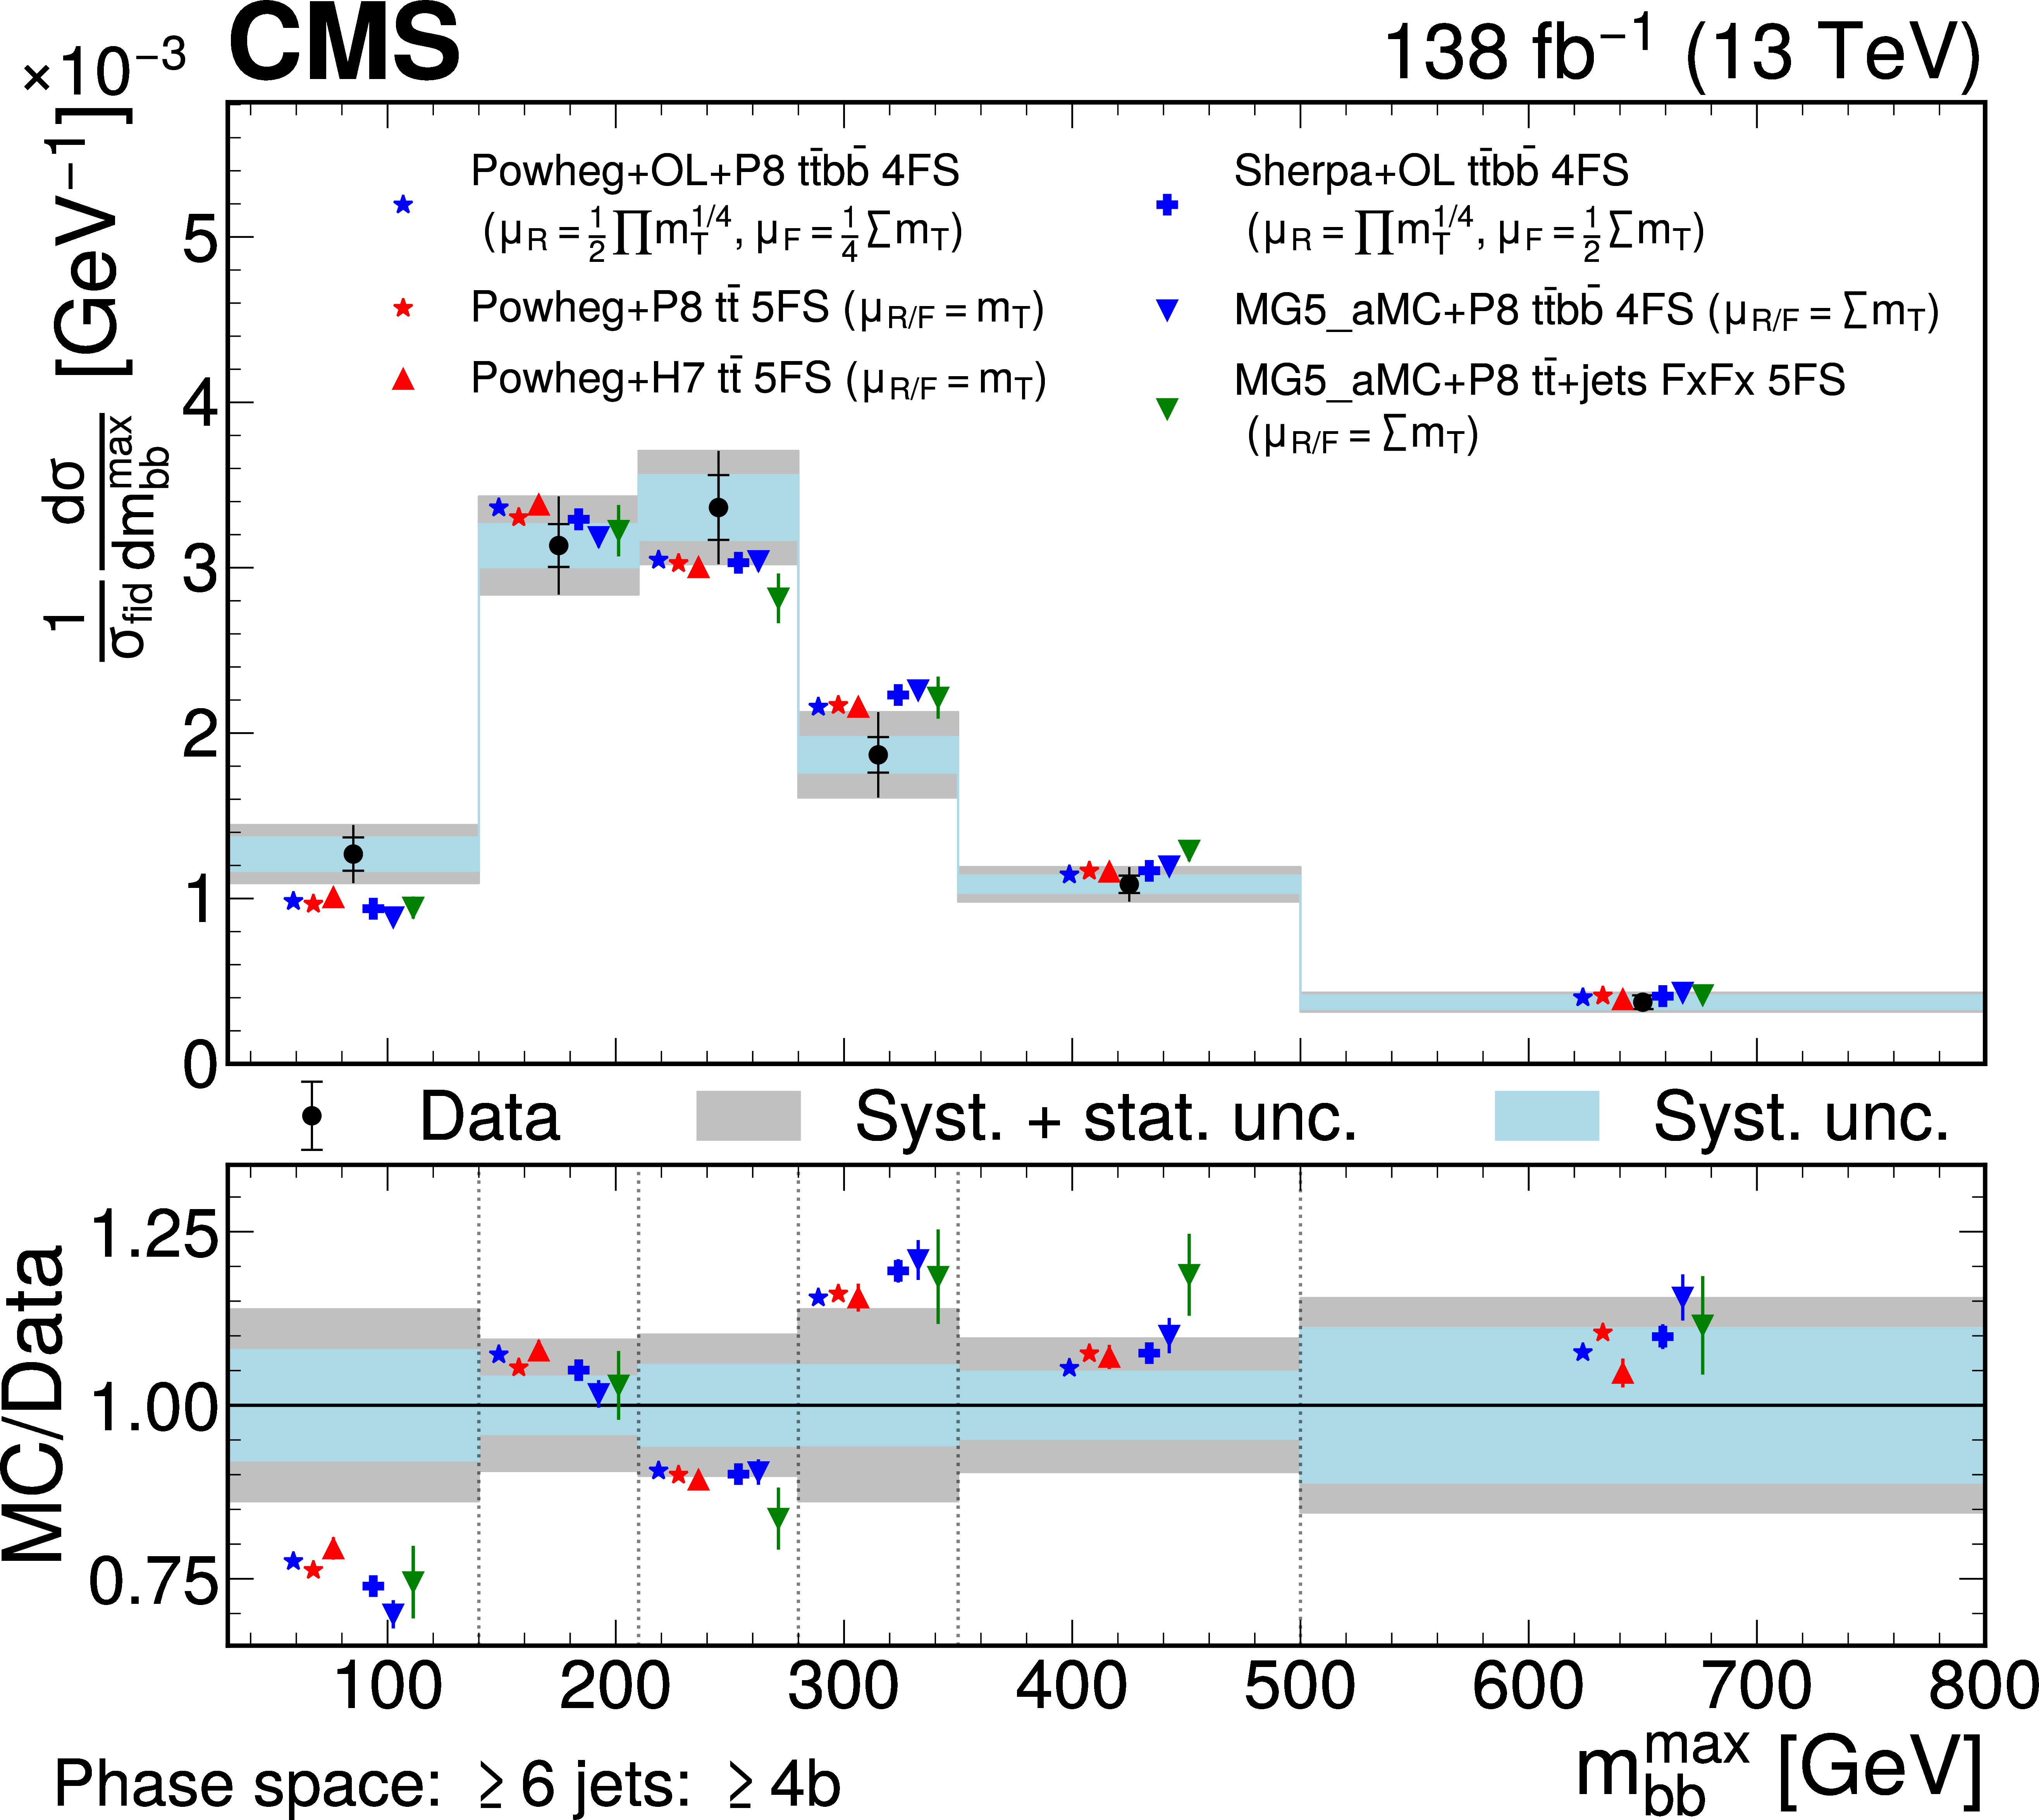
Predicted and observed normalized differential cross sections in the $ \geq $6 jets: $ \geq $4b fiducial phase space, for the average $ \Delta R $ of all possible $ \mathrm{b}\mathrm{b} $ pairs (upper left), the largest invariant mass of any $ \mathrm{b}\mathrm{b} $ pair (upper right), the invariant mass (middle left), $ \Delta R $ (middle right), $ p_{\mathrm{T}} $ (lower left), and $ |\eta| $ (lower right) of the extra b-jet pair. The data are represented by points, with inner (outer) vertical bars indicating the systematic (total) uncertainties, also represented as blue (grey) bands. Cross section predictions obtained at the particle level from different simulation approaches are shown, including their statistical uncertainties, as coloured symbols. For $ m_{\mathrm{b}\mathrm{b}} $ and $ p_{\mathrm{T}} $, the last bins contain the overflow. |
png pdf |
Figure 12-a:
Predicted and observed normalized differential cross sections in the $ \geq $6 jets: $ \geq $4b fiducial phase space, for the average $ \Delta R $ of all possible $ \mathrm{b}\mathrm{b} $ pairs (upper left), the largest invariant mass of any $ \mathrm{b}\mathrm{b} $ pair (upper right), the invariant mass (middle left), $ \Delta R $ (middle right), $ p_{\mathrm{T}} $ (lower left), and $ |\eta| $ (lower right) of the extra b-jet pair. The data are represented by points, with inner (outer) vertical bars indicating the systematic (total) uncertainties, also represented as blue (grey) bands. Cross section predictions obtained at the particle level from different simulation approaches are shown, including their statistical uncertainties, as coloured symbols. For $ m_{\mathrm{b}\mathrm{b}} $ and $ p_{\mathrm{T}} $, the last bins contain the overflow. |
png pdf |
Figure 12-b:
Predicted and observed normalized differential cross sections in the $ \geq $6 jets: $ \geq $4b fiducial phase space, for the average $ \Delta R $ of all possible $ \mathrm{b}\mathrm{b} $ pairs (upper left), the largest invariant mass of any $ \mathrm{b}\mathrm{b} $ pair (upper right), the invariant mass (middle left), $ \Delta R $ (middle right), $ p_{\mathrm{T}} $ (lower left), and $ |\eta| $ (lower right) of the extra b-jet pair. The data are represented by points, with inner (outer) vertical bars indicating the systematic (total) uncertainties, also represented as blue (grey) bands. Cross section predictions obtained at the particle level from different simulation approaches are shown, including their statistical uncertainties, as coloured symbols. For $ m_{\mathrm{b}\mathrm{b}} $ and $ p_{\mathrm{T}} $, the last bins contain the overflow. |
png pdf |
Figure 12-c:
Predicted and observed normalized differential cross sections in the $ \geq $6 jets: $ \geq $4b fiducial phase space, for the average $ \Delta R $ of all possible $ \mathrm{b}\mathrm{b} $ pairs (upper left), the largest invariant mass of any $ \mathrm{b}\mathrm{b} $ pair (upper right), the invariant mass (middle left), $ \Delta R $ (middle right), $ p_{\mathrm{T}} $ (lower left), and $ |\eta| $ (lower right) of the extra b-jet pair. The data are represented by points, with inner (outer) vertical bars indicating the systematic (total) uncertainties, also represented as blue (grey) bands. Cross section predictions obtained at the particle level from different simulation approaches are shown, including their statistical uncertainties, as coloured symbols. For $ m_{\mathrm{b}\mathrm{b}} $ and $ p_{\mathrm{T}} $, the last bins contain the overflow. |
png pdf |
Figure 12-d:
Predicted and observed normalized differential cross sections in the $ \geq $6 jets: $ \geq $4b fiducial phase space, for the average $ \Delta R $ of all possible $ \mathrm{b}\mathrm{b} $ pairs (upper left), the largest invariant mass of any $ \mathrm{b}\mathrm{b} $ pair (upper right), the invariant mass (middle left), $ \Delta R $ (middle right), $ p_{\mathrm{T}} $ (lower left), and $ |\eta| $ (lower right) of the extra b-jet pair. The data are represented by points, with inner (outer) vertical bars indicating the systematic (total) uncertainties, also represented as blue (grey) bands. Cross section predictions obtained at the particle level from different simulation approaches are shown, including their statistical uncertainties, as coloured symbols. For $ m_{\mathrm{b}\mathrm{b}} $ and $ p_{\mathrm{T}} $, the last bins contain the overflow. |
png pdf |
Figure 12-e:
Predicted and observed normalized differential cross sections in the $ \geq $6 jets: $ \geq $4b fiducial phase space, for the average $ \Delta R $ of all possible $ \mathrm{b}\mathrm{b} $ pairs (upper left), the largest invariant mass of any $ \mathrm{b}\mathrm{b} $ pair (upper right), the invariant mass (middle left), $ \Delta R $ (middle right), $ p_{\mathrm{T}} $ (lower left), and $ |\eta| $ (lower right) of the extra b-jet pair. The data are represented by points, with inner (outer) vertical bars indicating the systematic (total) uncertainties, also represented as blue (grey) bands. Cross section predictions obtained at the particle level from different simulation approaches are shown, including their statistical uncertainties, as coloured symbols. For $ m_{\mathrm{b}\mathrm{b}} $ and $ p_{\mathrm{T}} $, the last bins contain the overflow. |
png pdf |
Figure 12-f:
Predicted and observed normalized differential cross sections in the $ \geq $6 jets: $ \geq $4b fiducial phase space, for the average $ \Delta R $ of all possible $ \mathrm{b}\mathrm{b} $ pairs (upper left), the largest invariant mass of any $ \mathrm{b}\mathrm{b} $ pair (upper right), the invariant mass (middle left), $ \Delta R $ (middle right), $ p_{\mathrm{T}} $ (lower left), and $ |\eta| $ (lower right) of the extra b-jet pair. The data are represented by points, with inner (outer) vertical bars indicating the systematic (total) uncertainties, also represented as blue (grey) bands. Cross section predictions obtained at the particle level from different simulation approaches are shown, including their statistical uncertainties, as coloured symbols. For $ m_{\mathrm{b}\mathrm{b}} $ and $ p_{\mathrm{T}} $, the last bins contain the overflow. |
png pdf |
Figure 13:
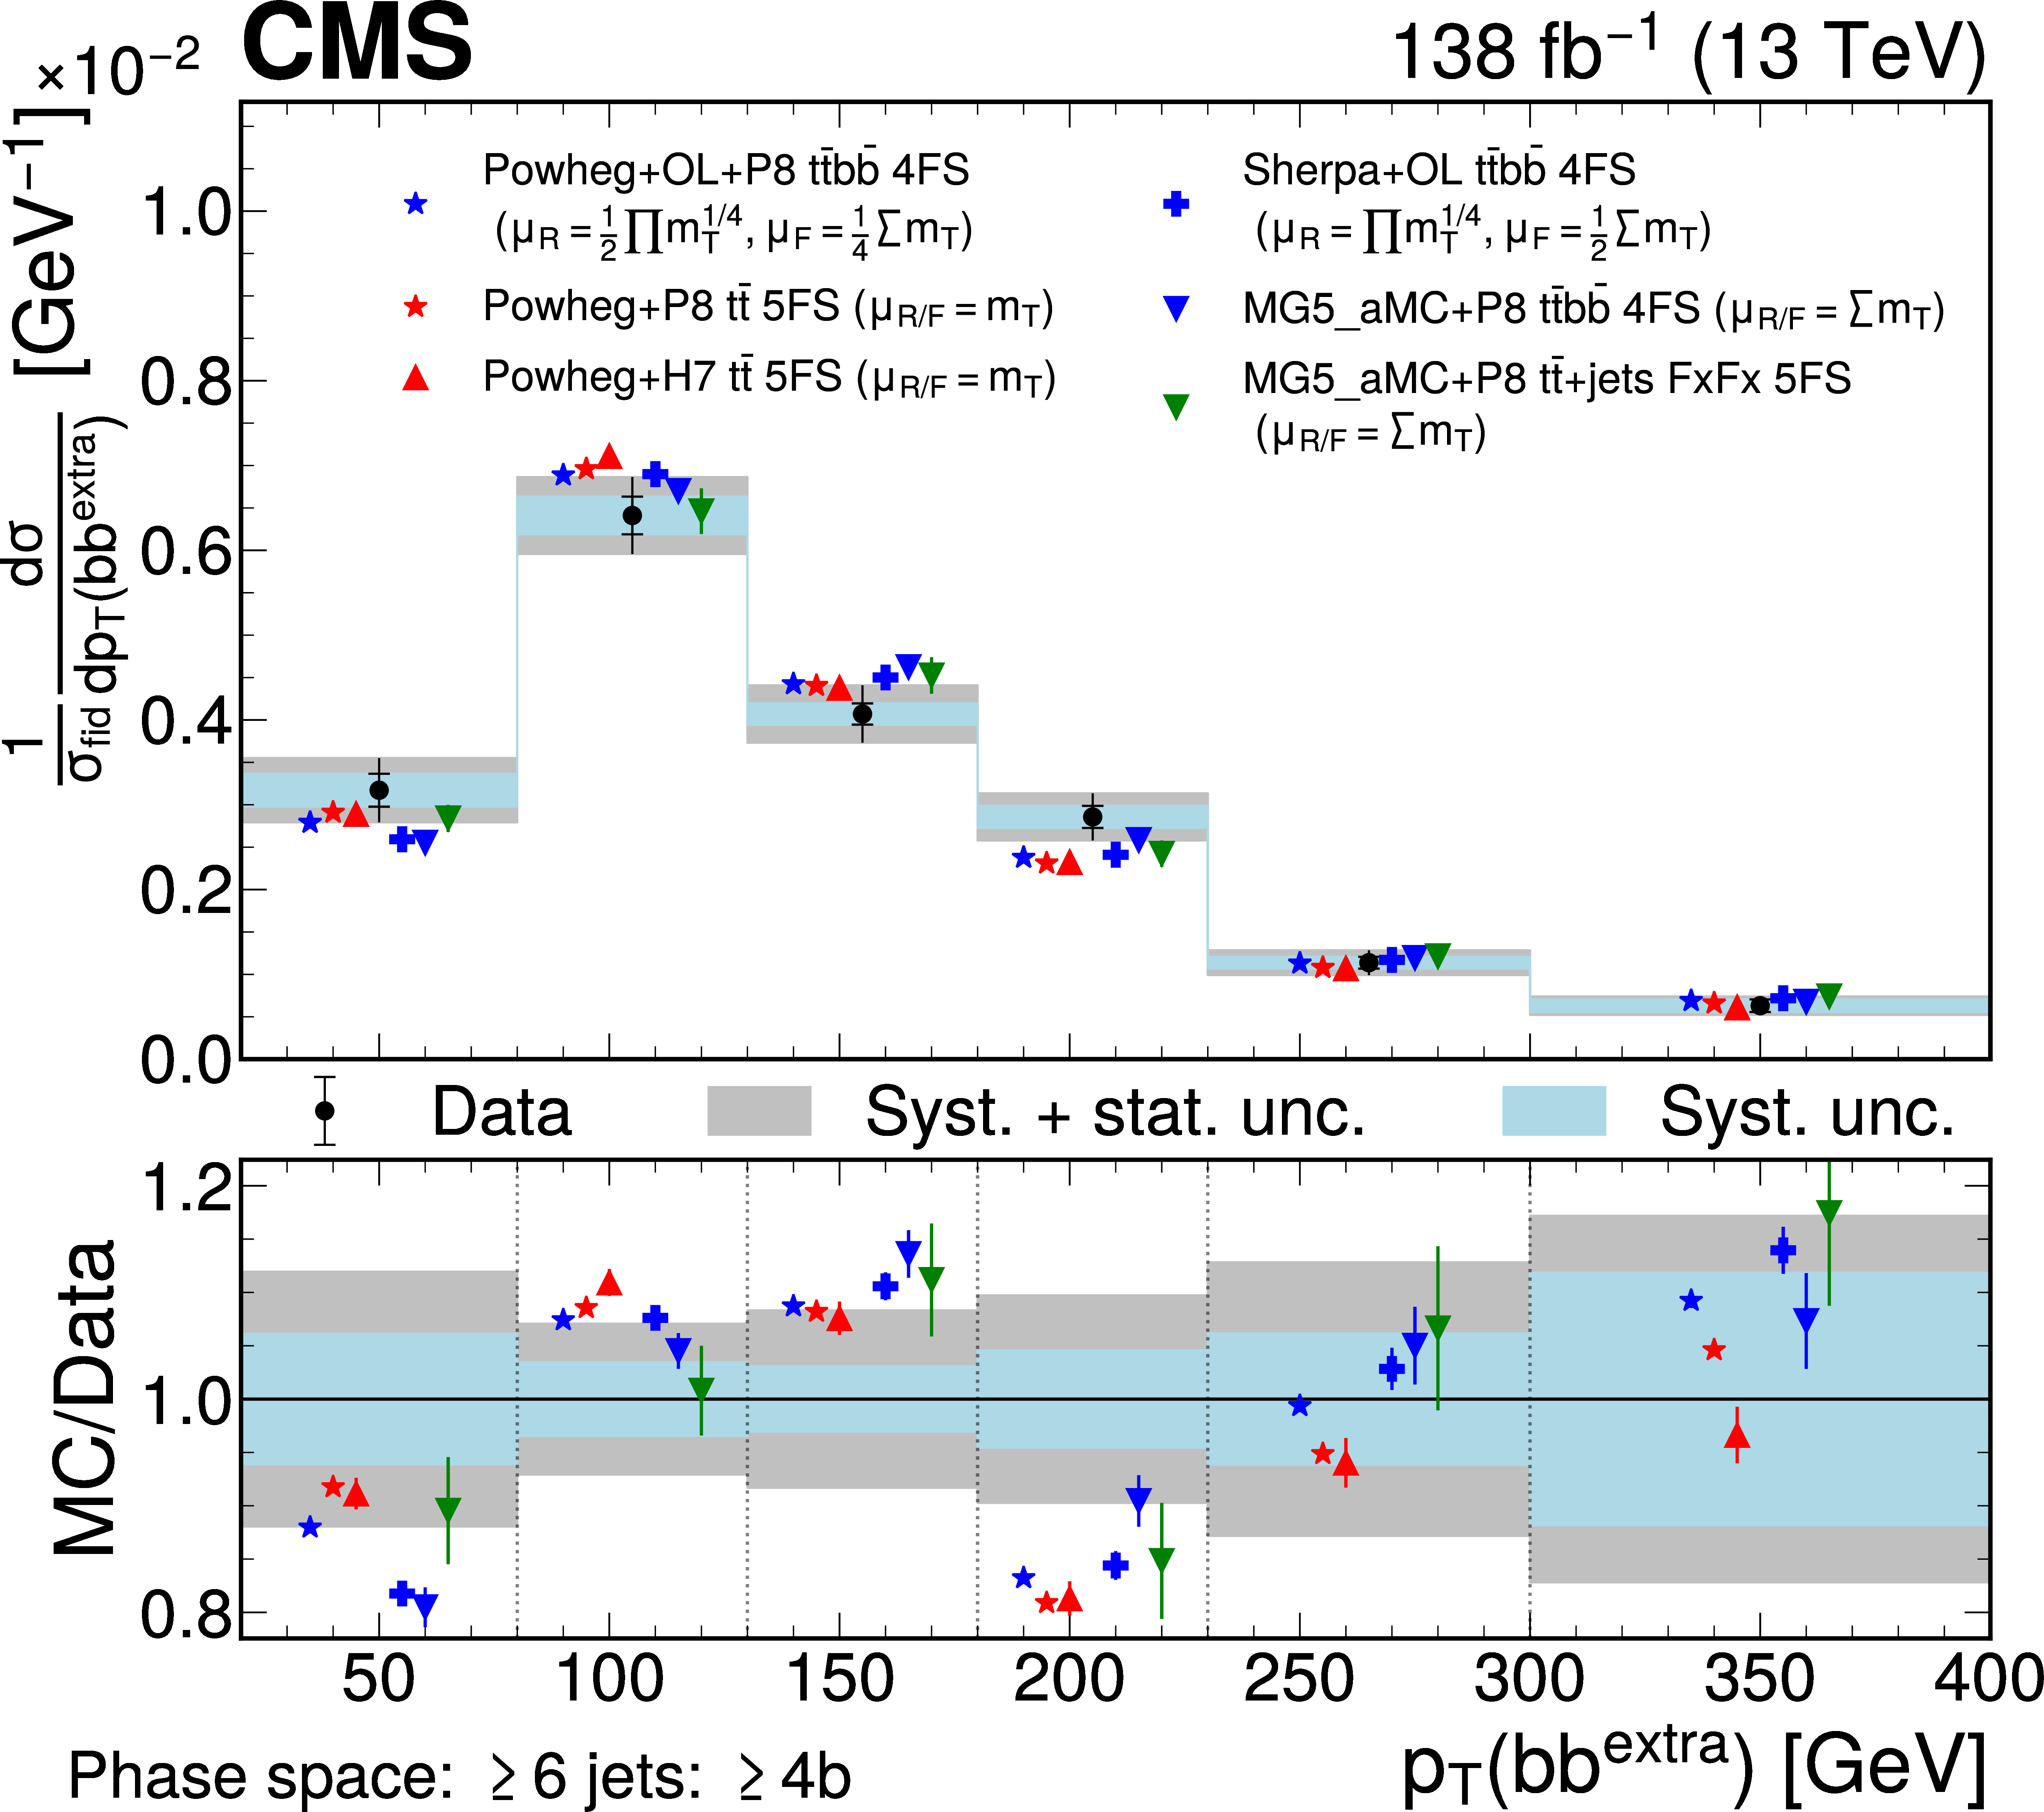
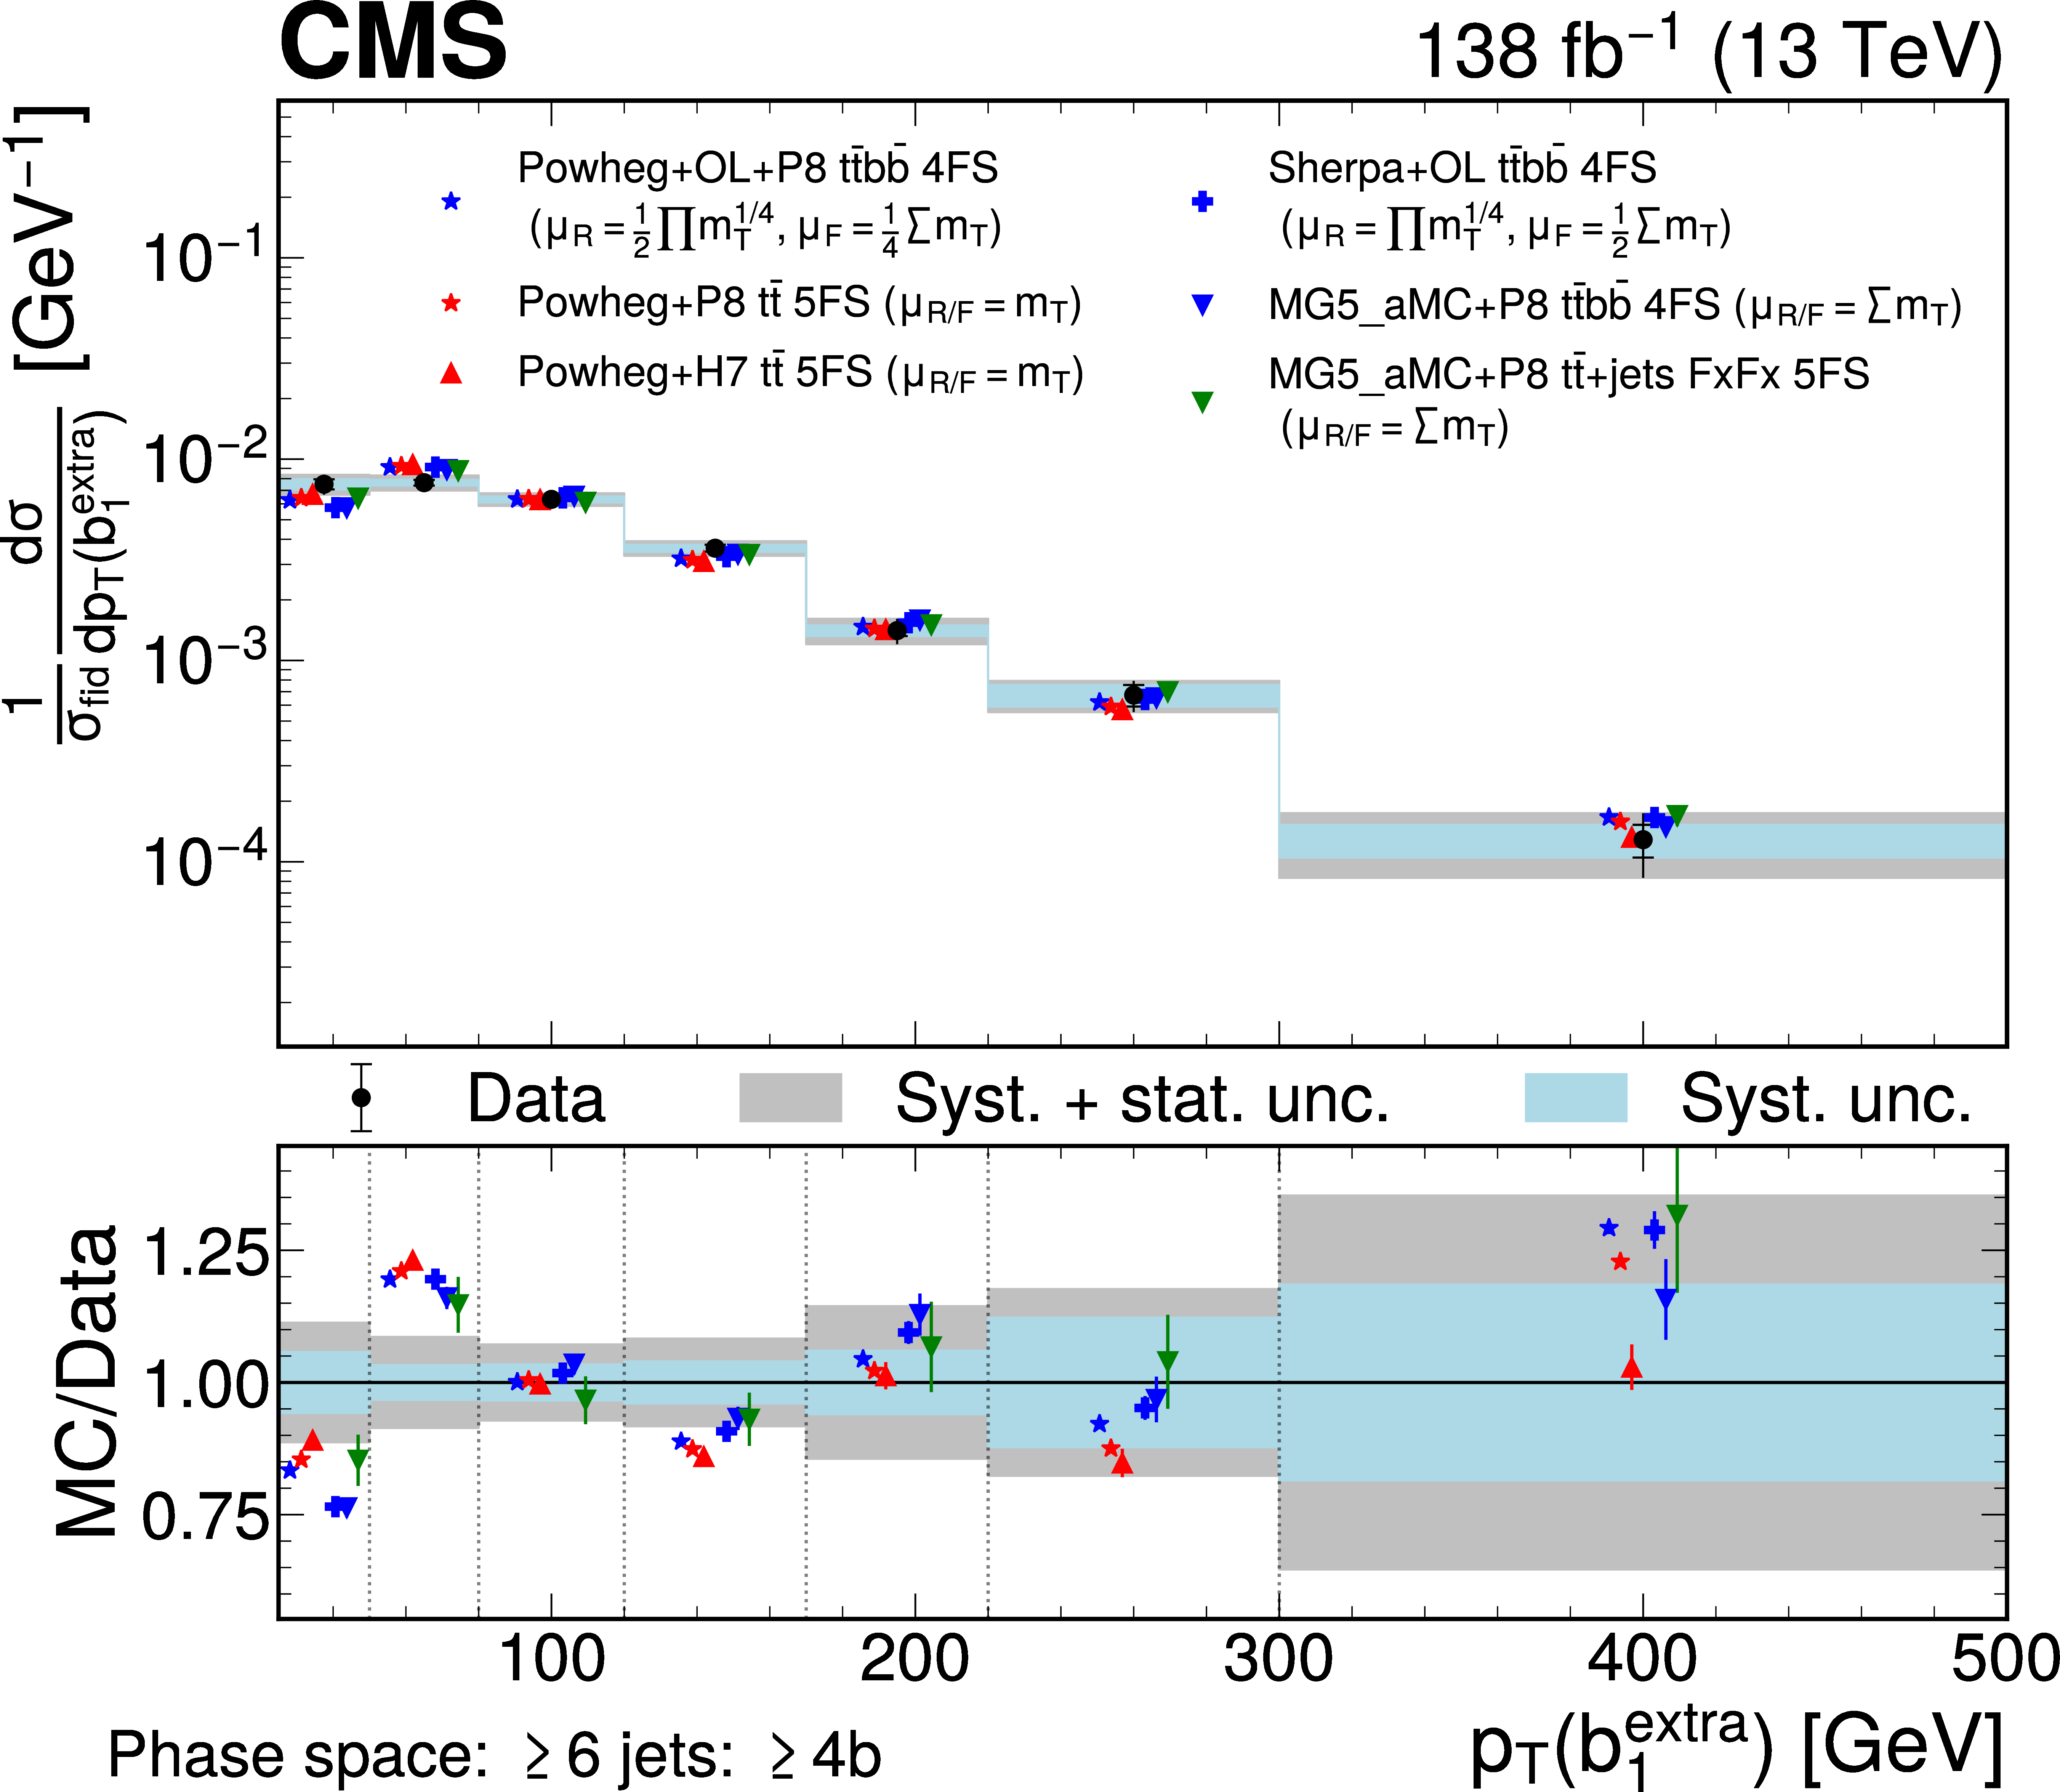
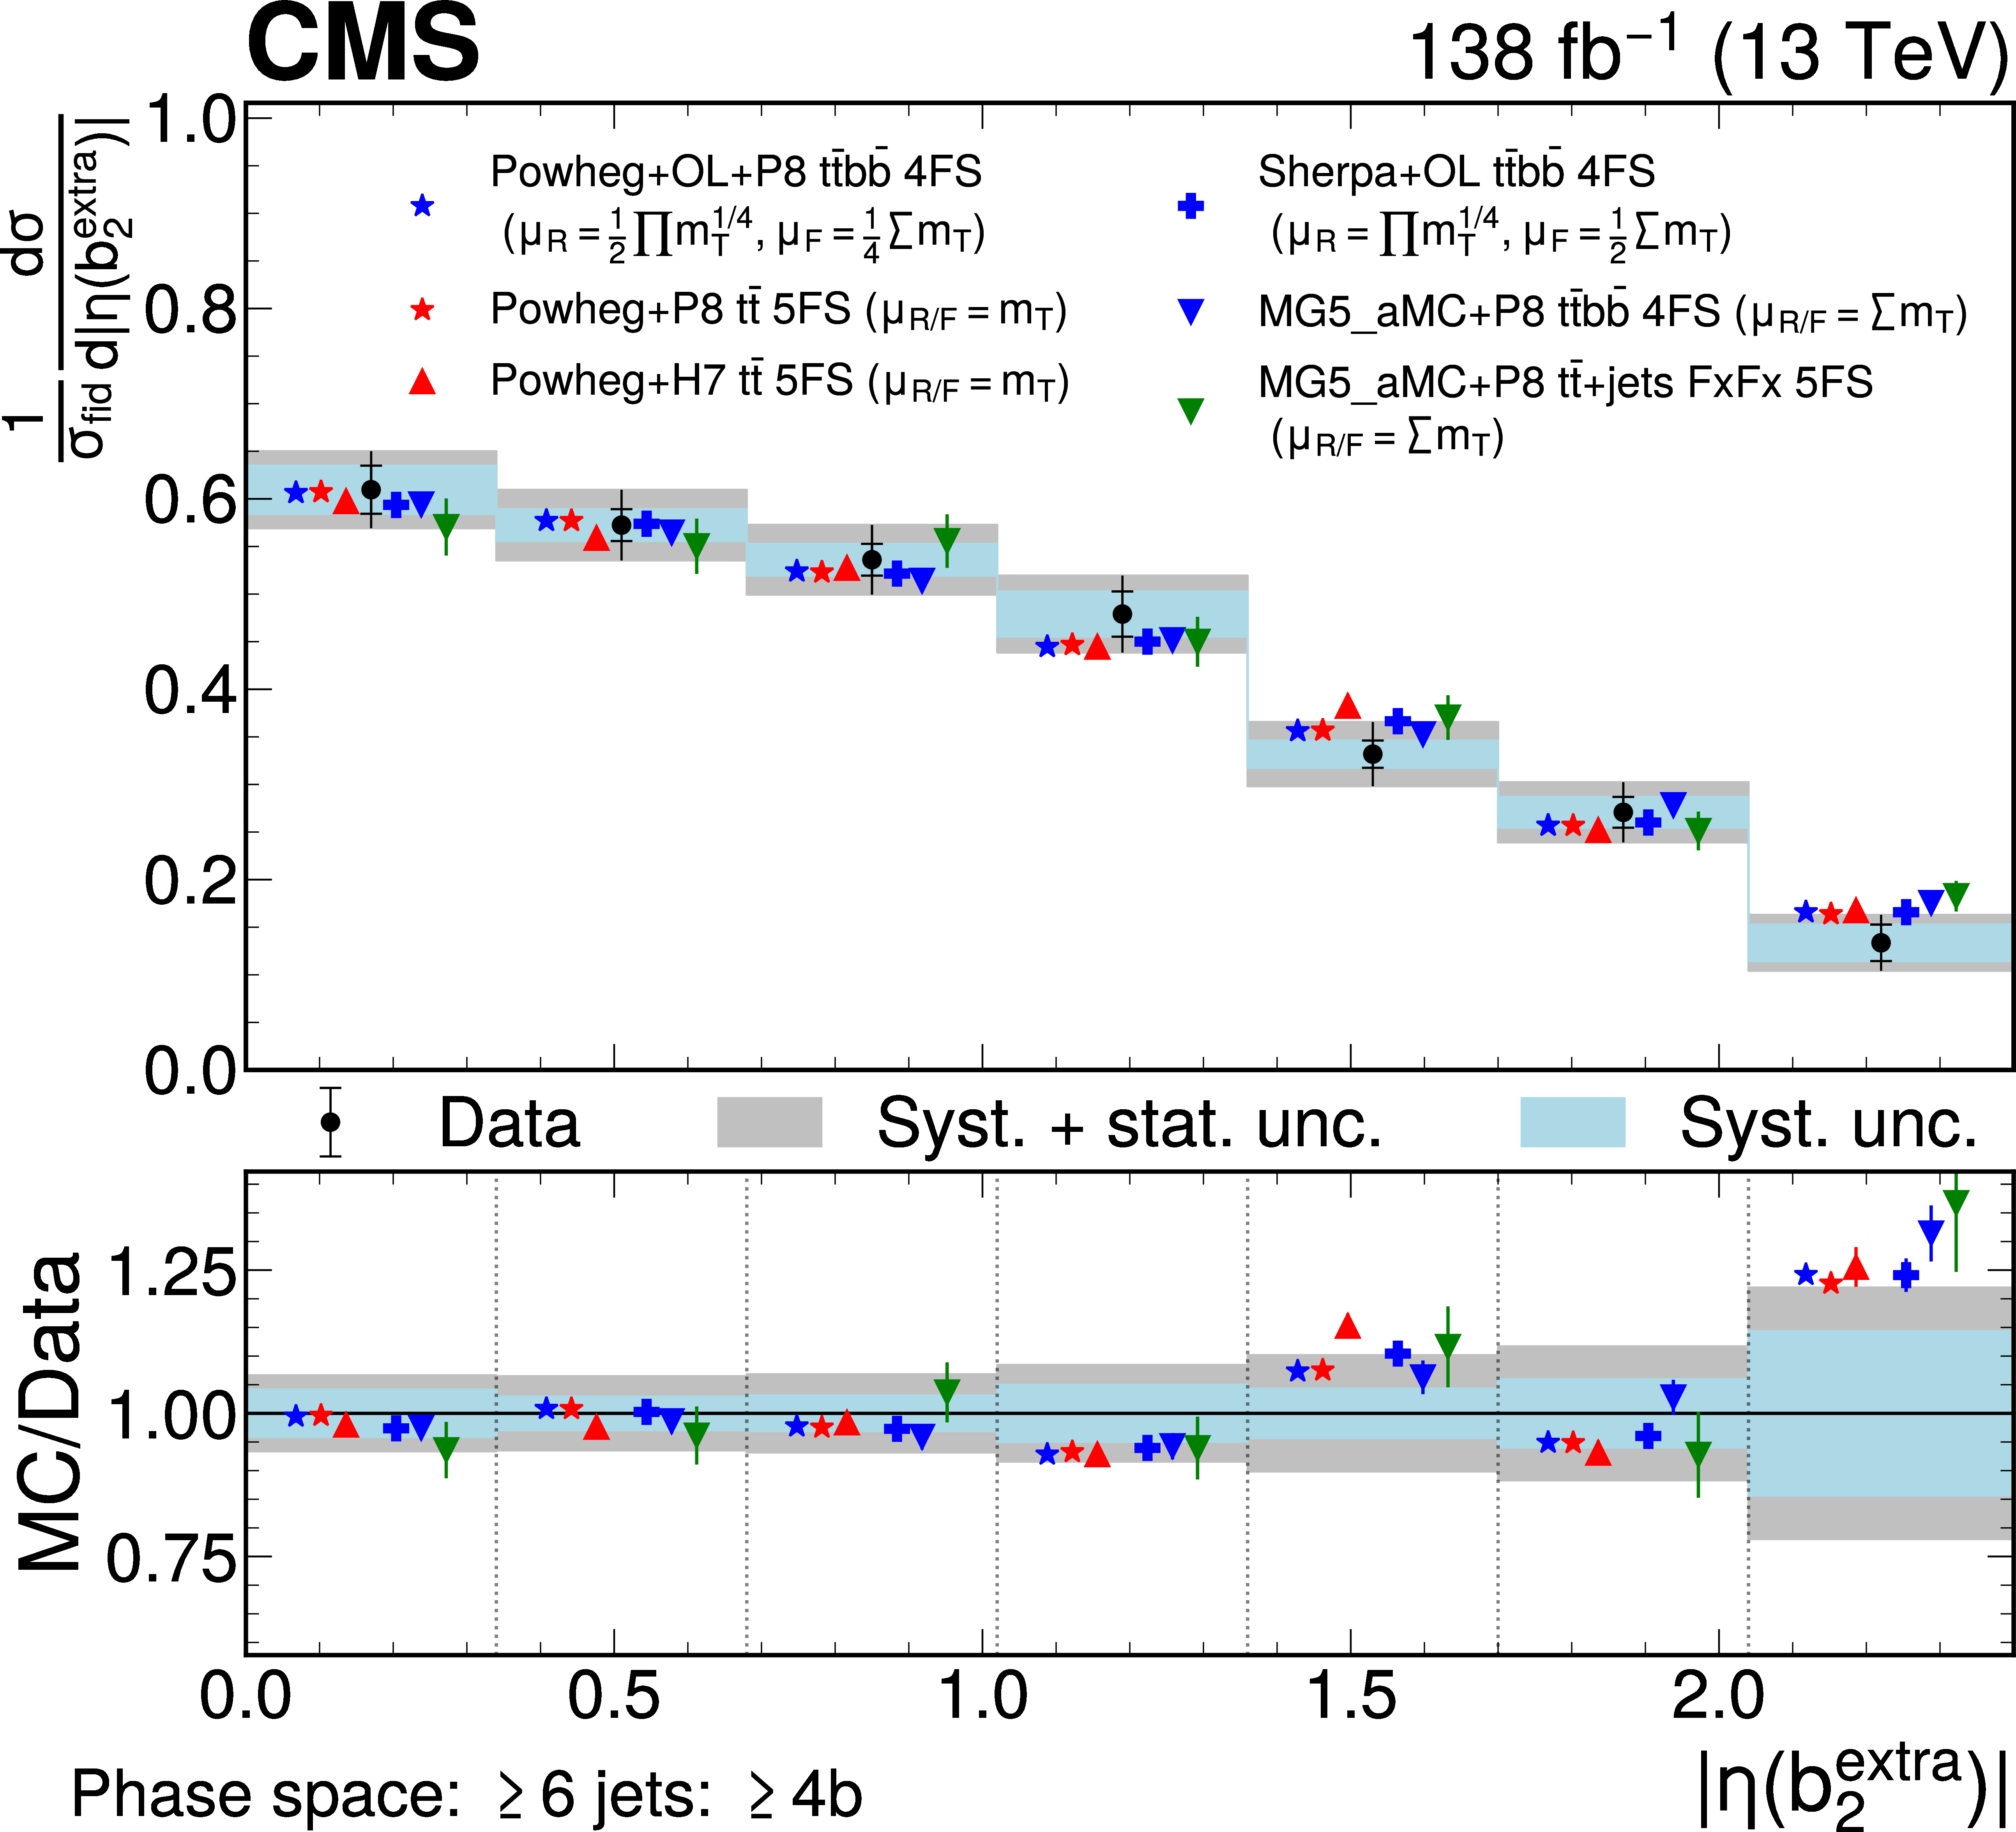
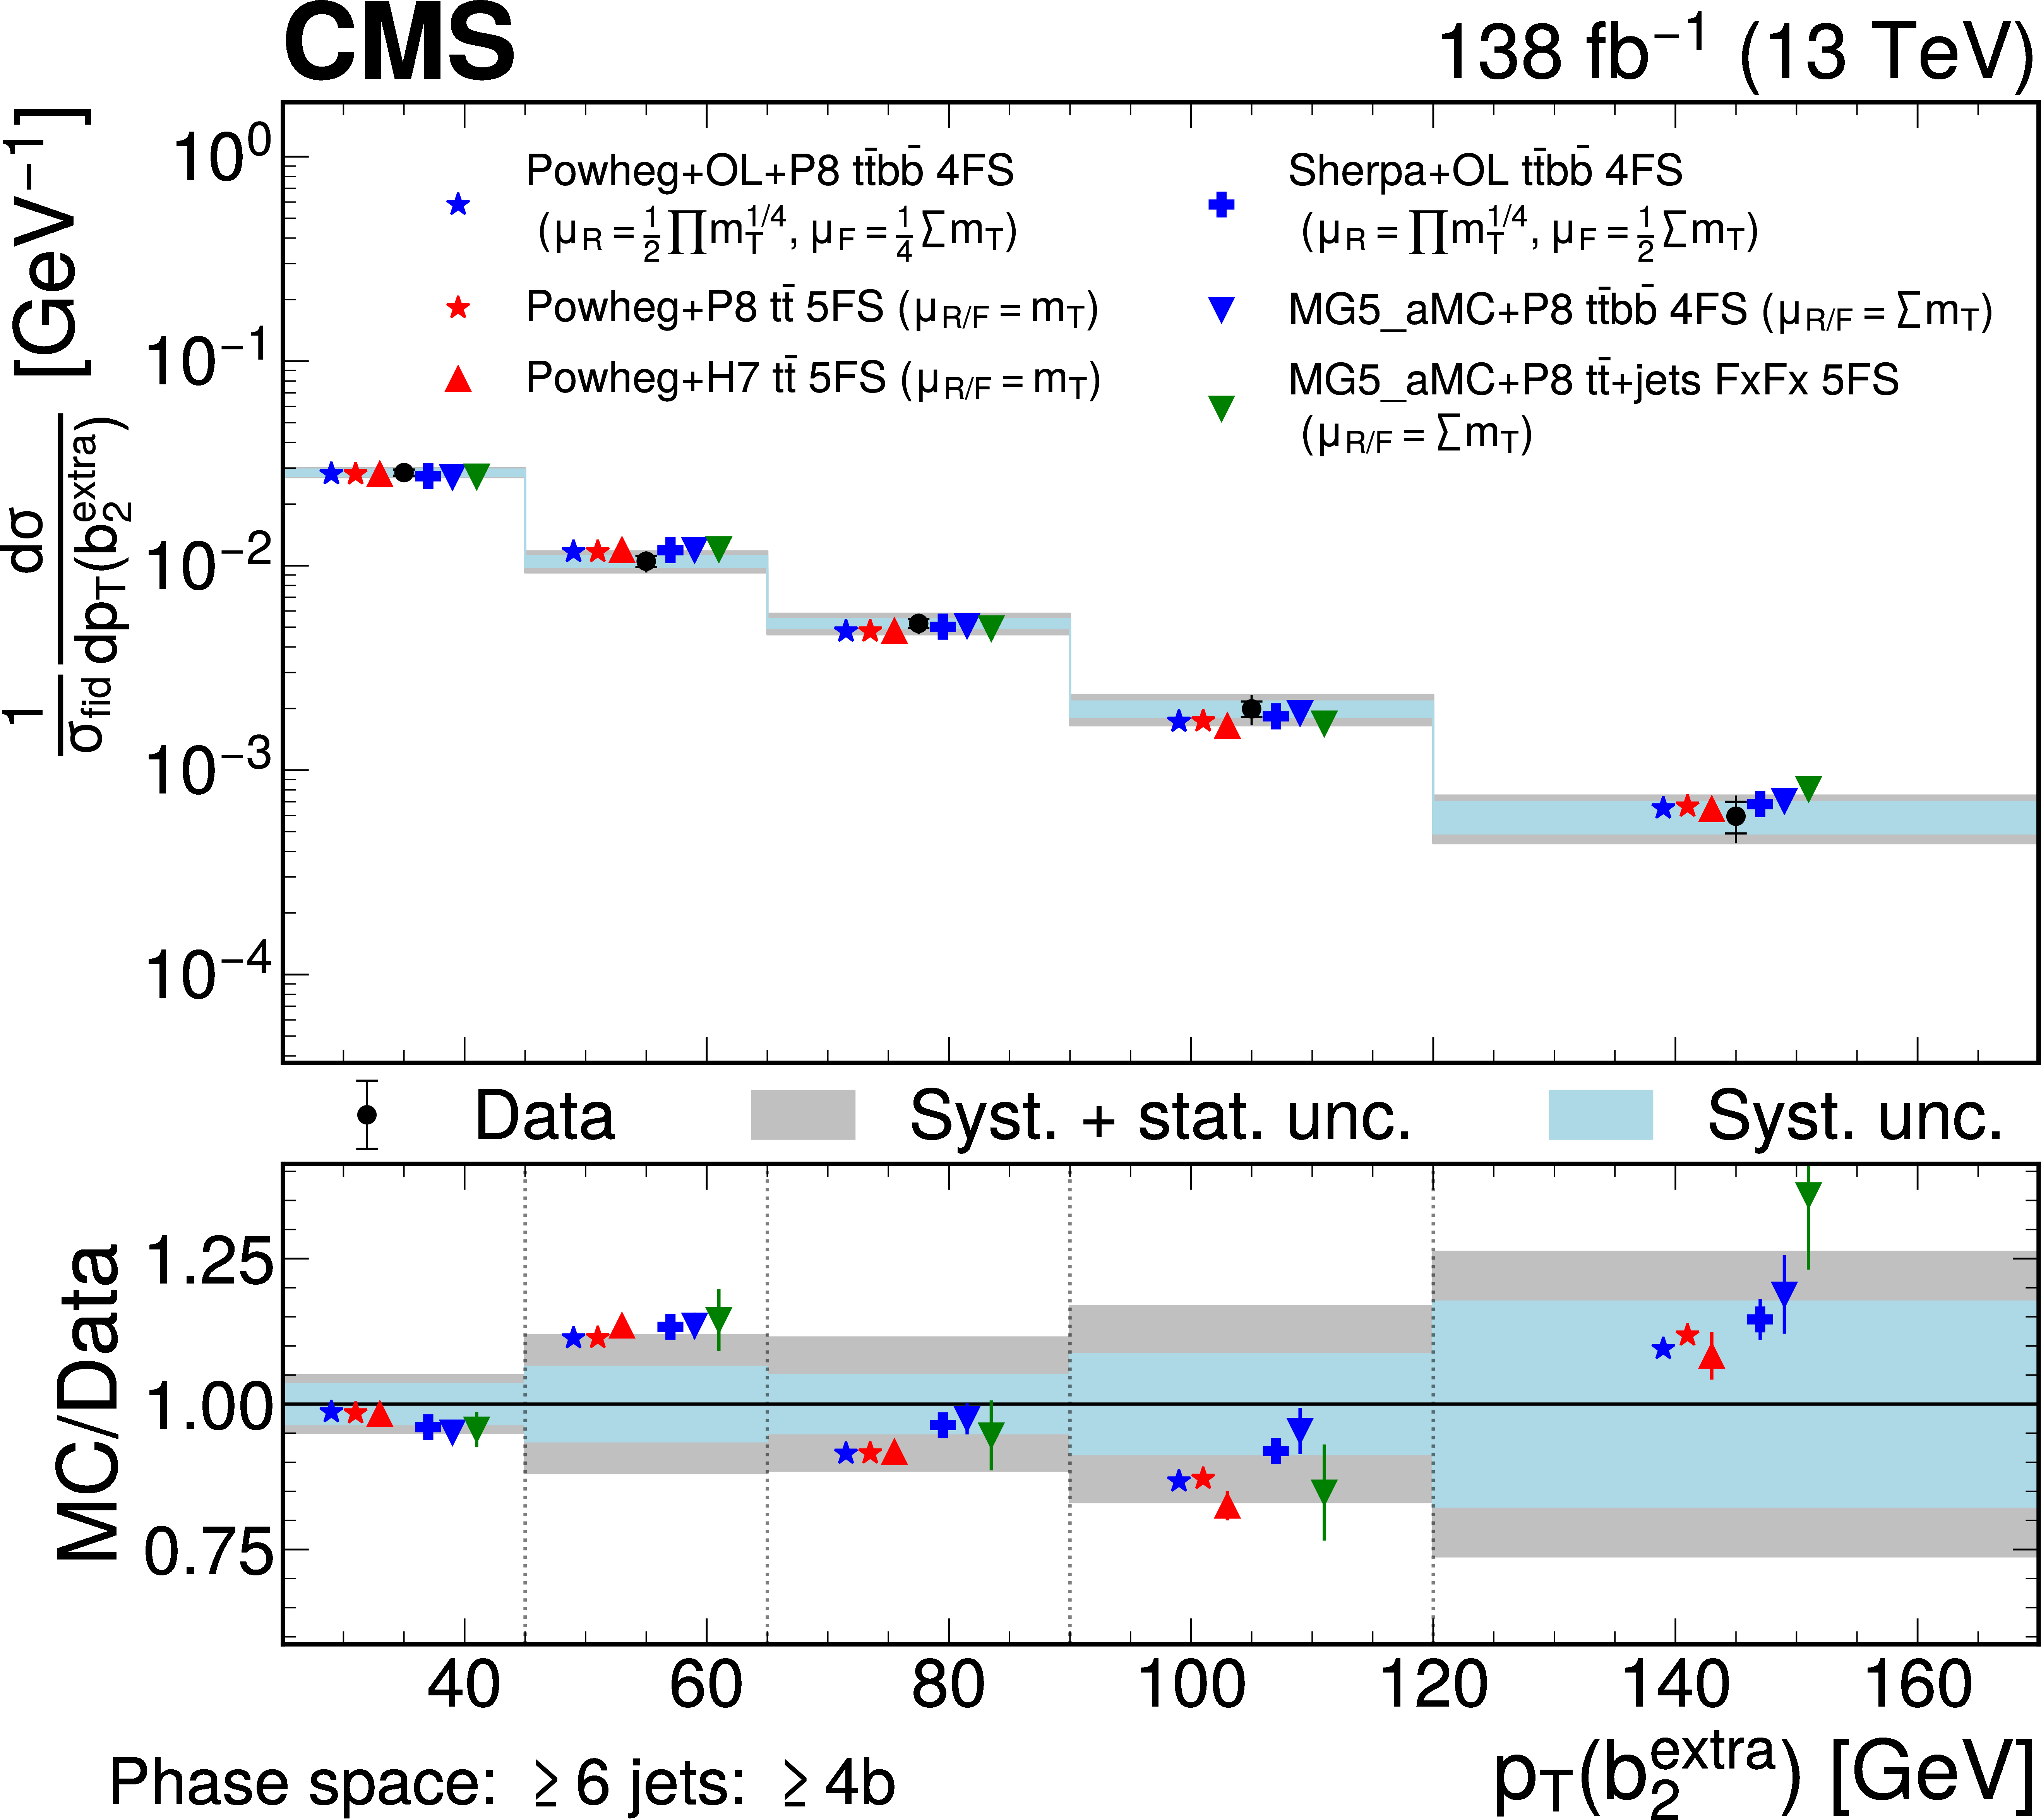
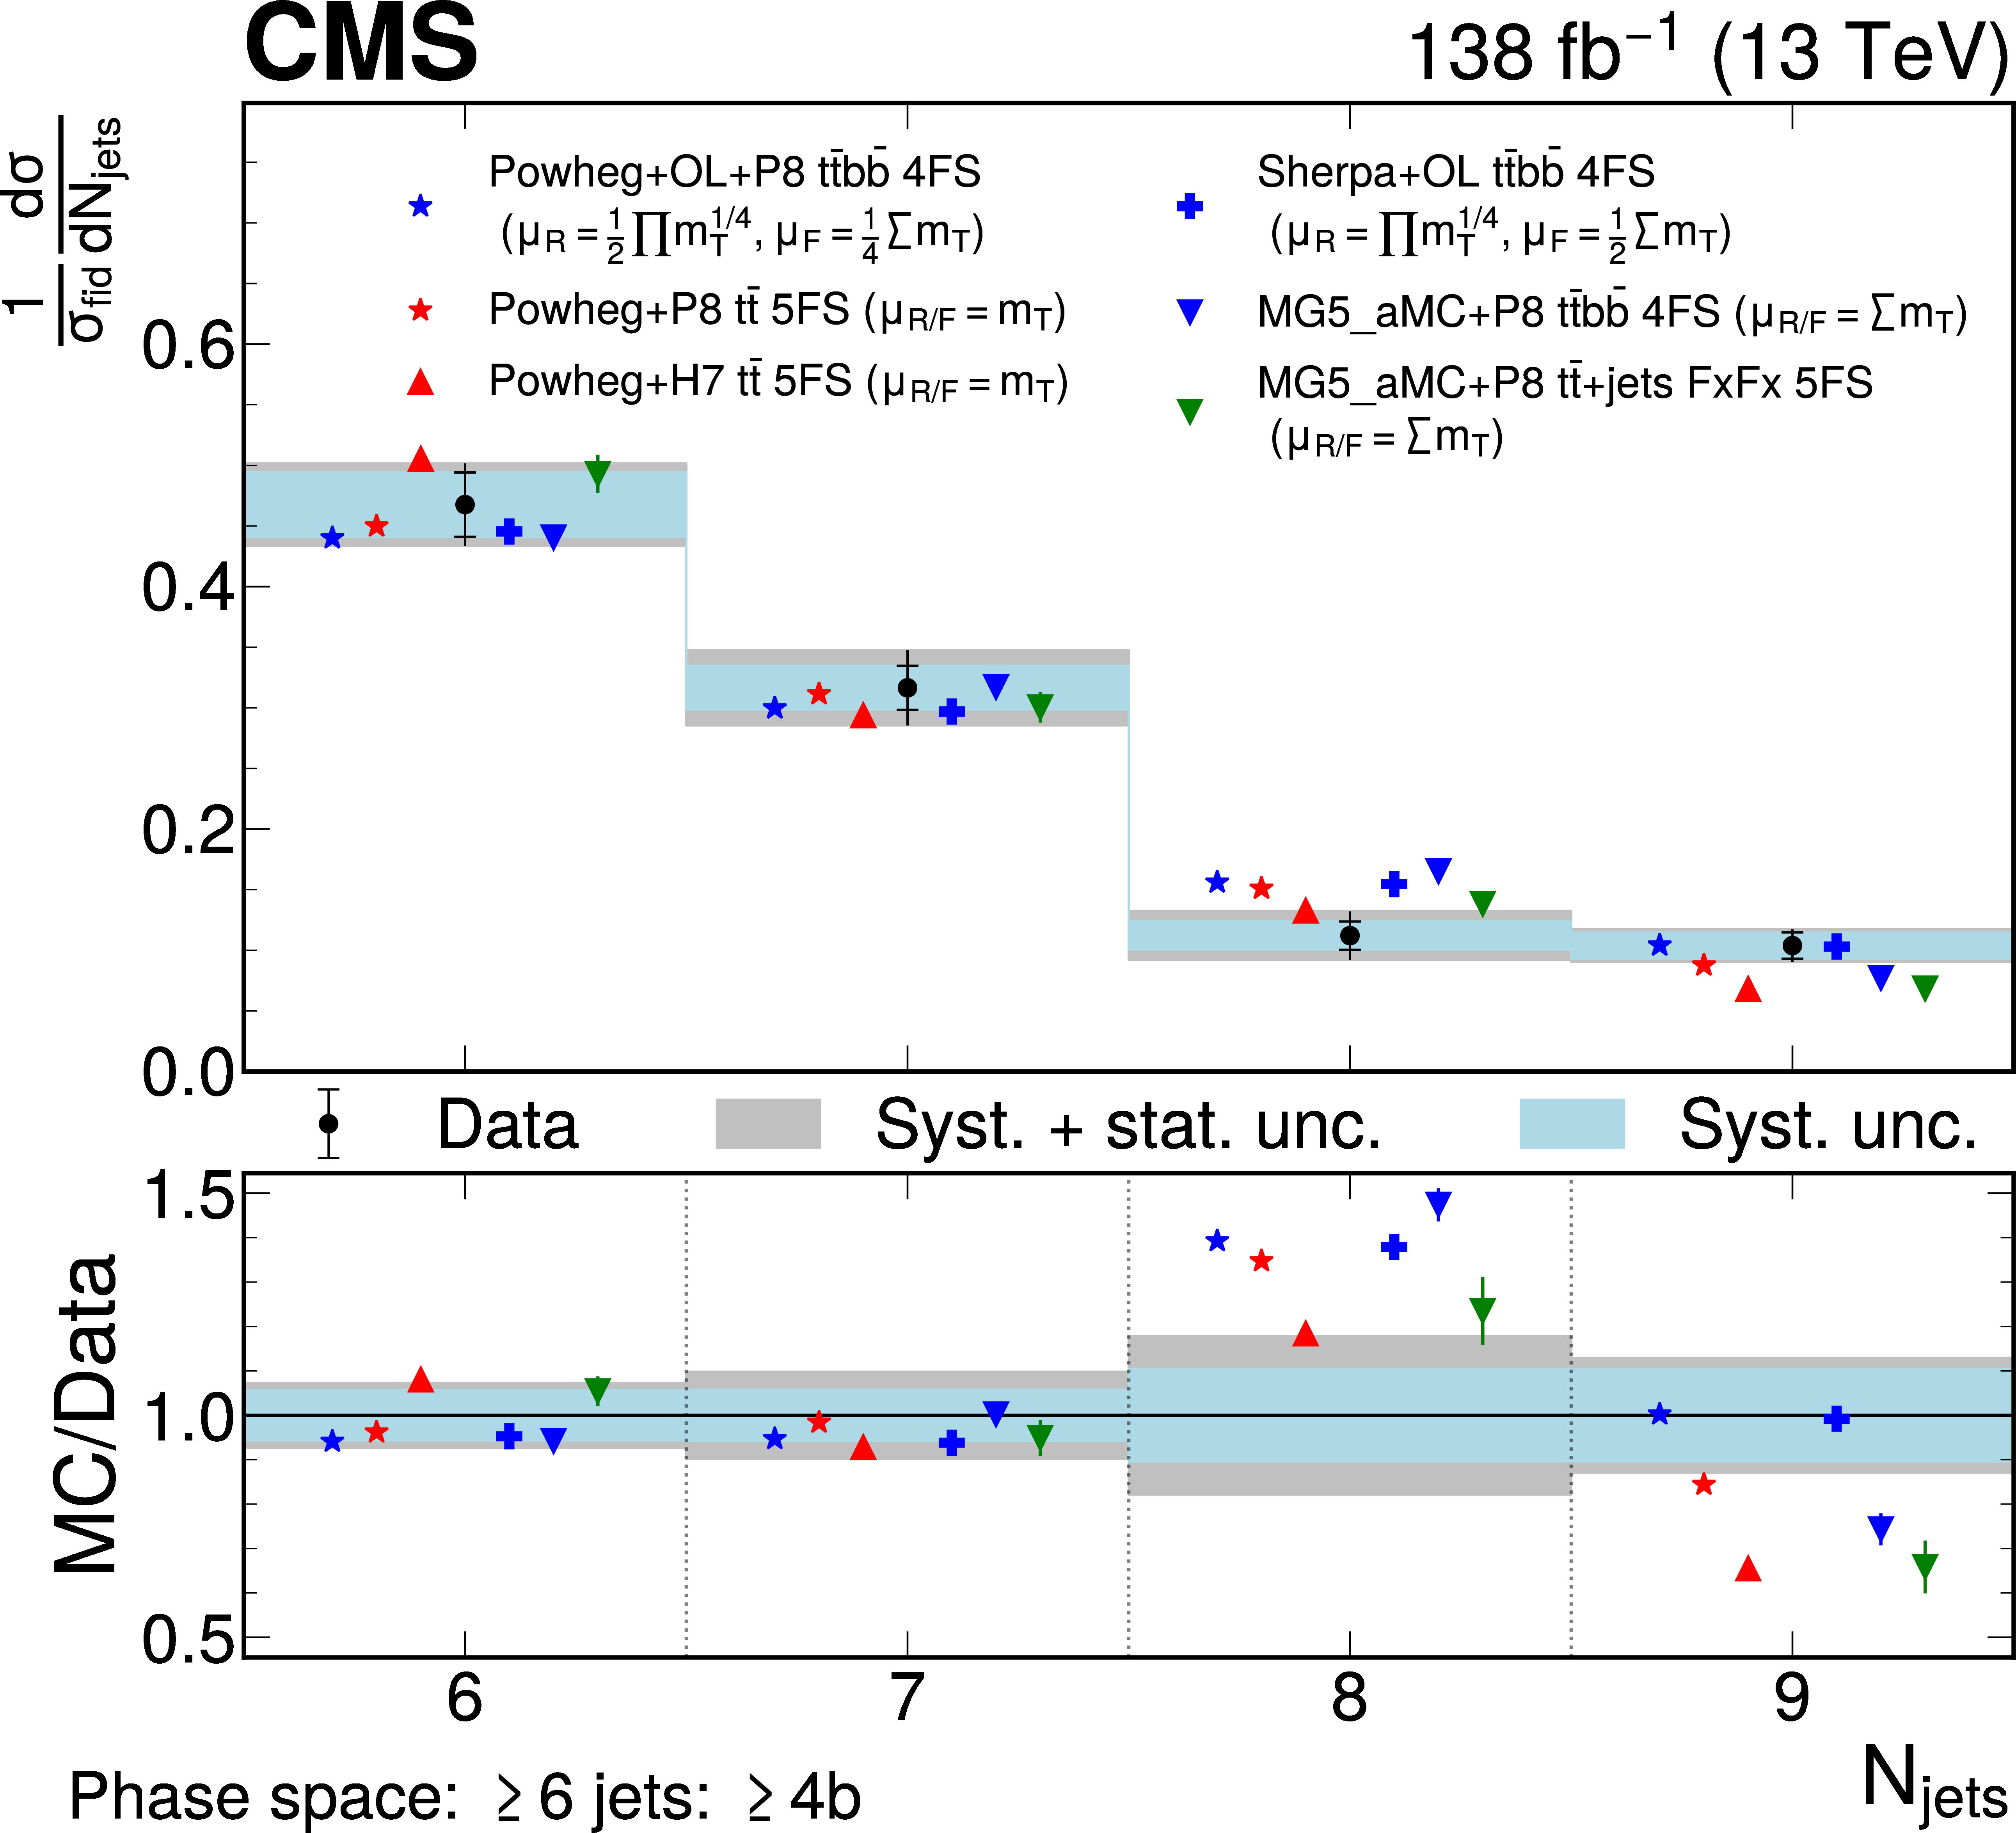
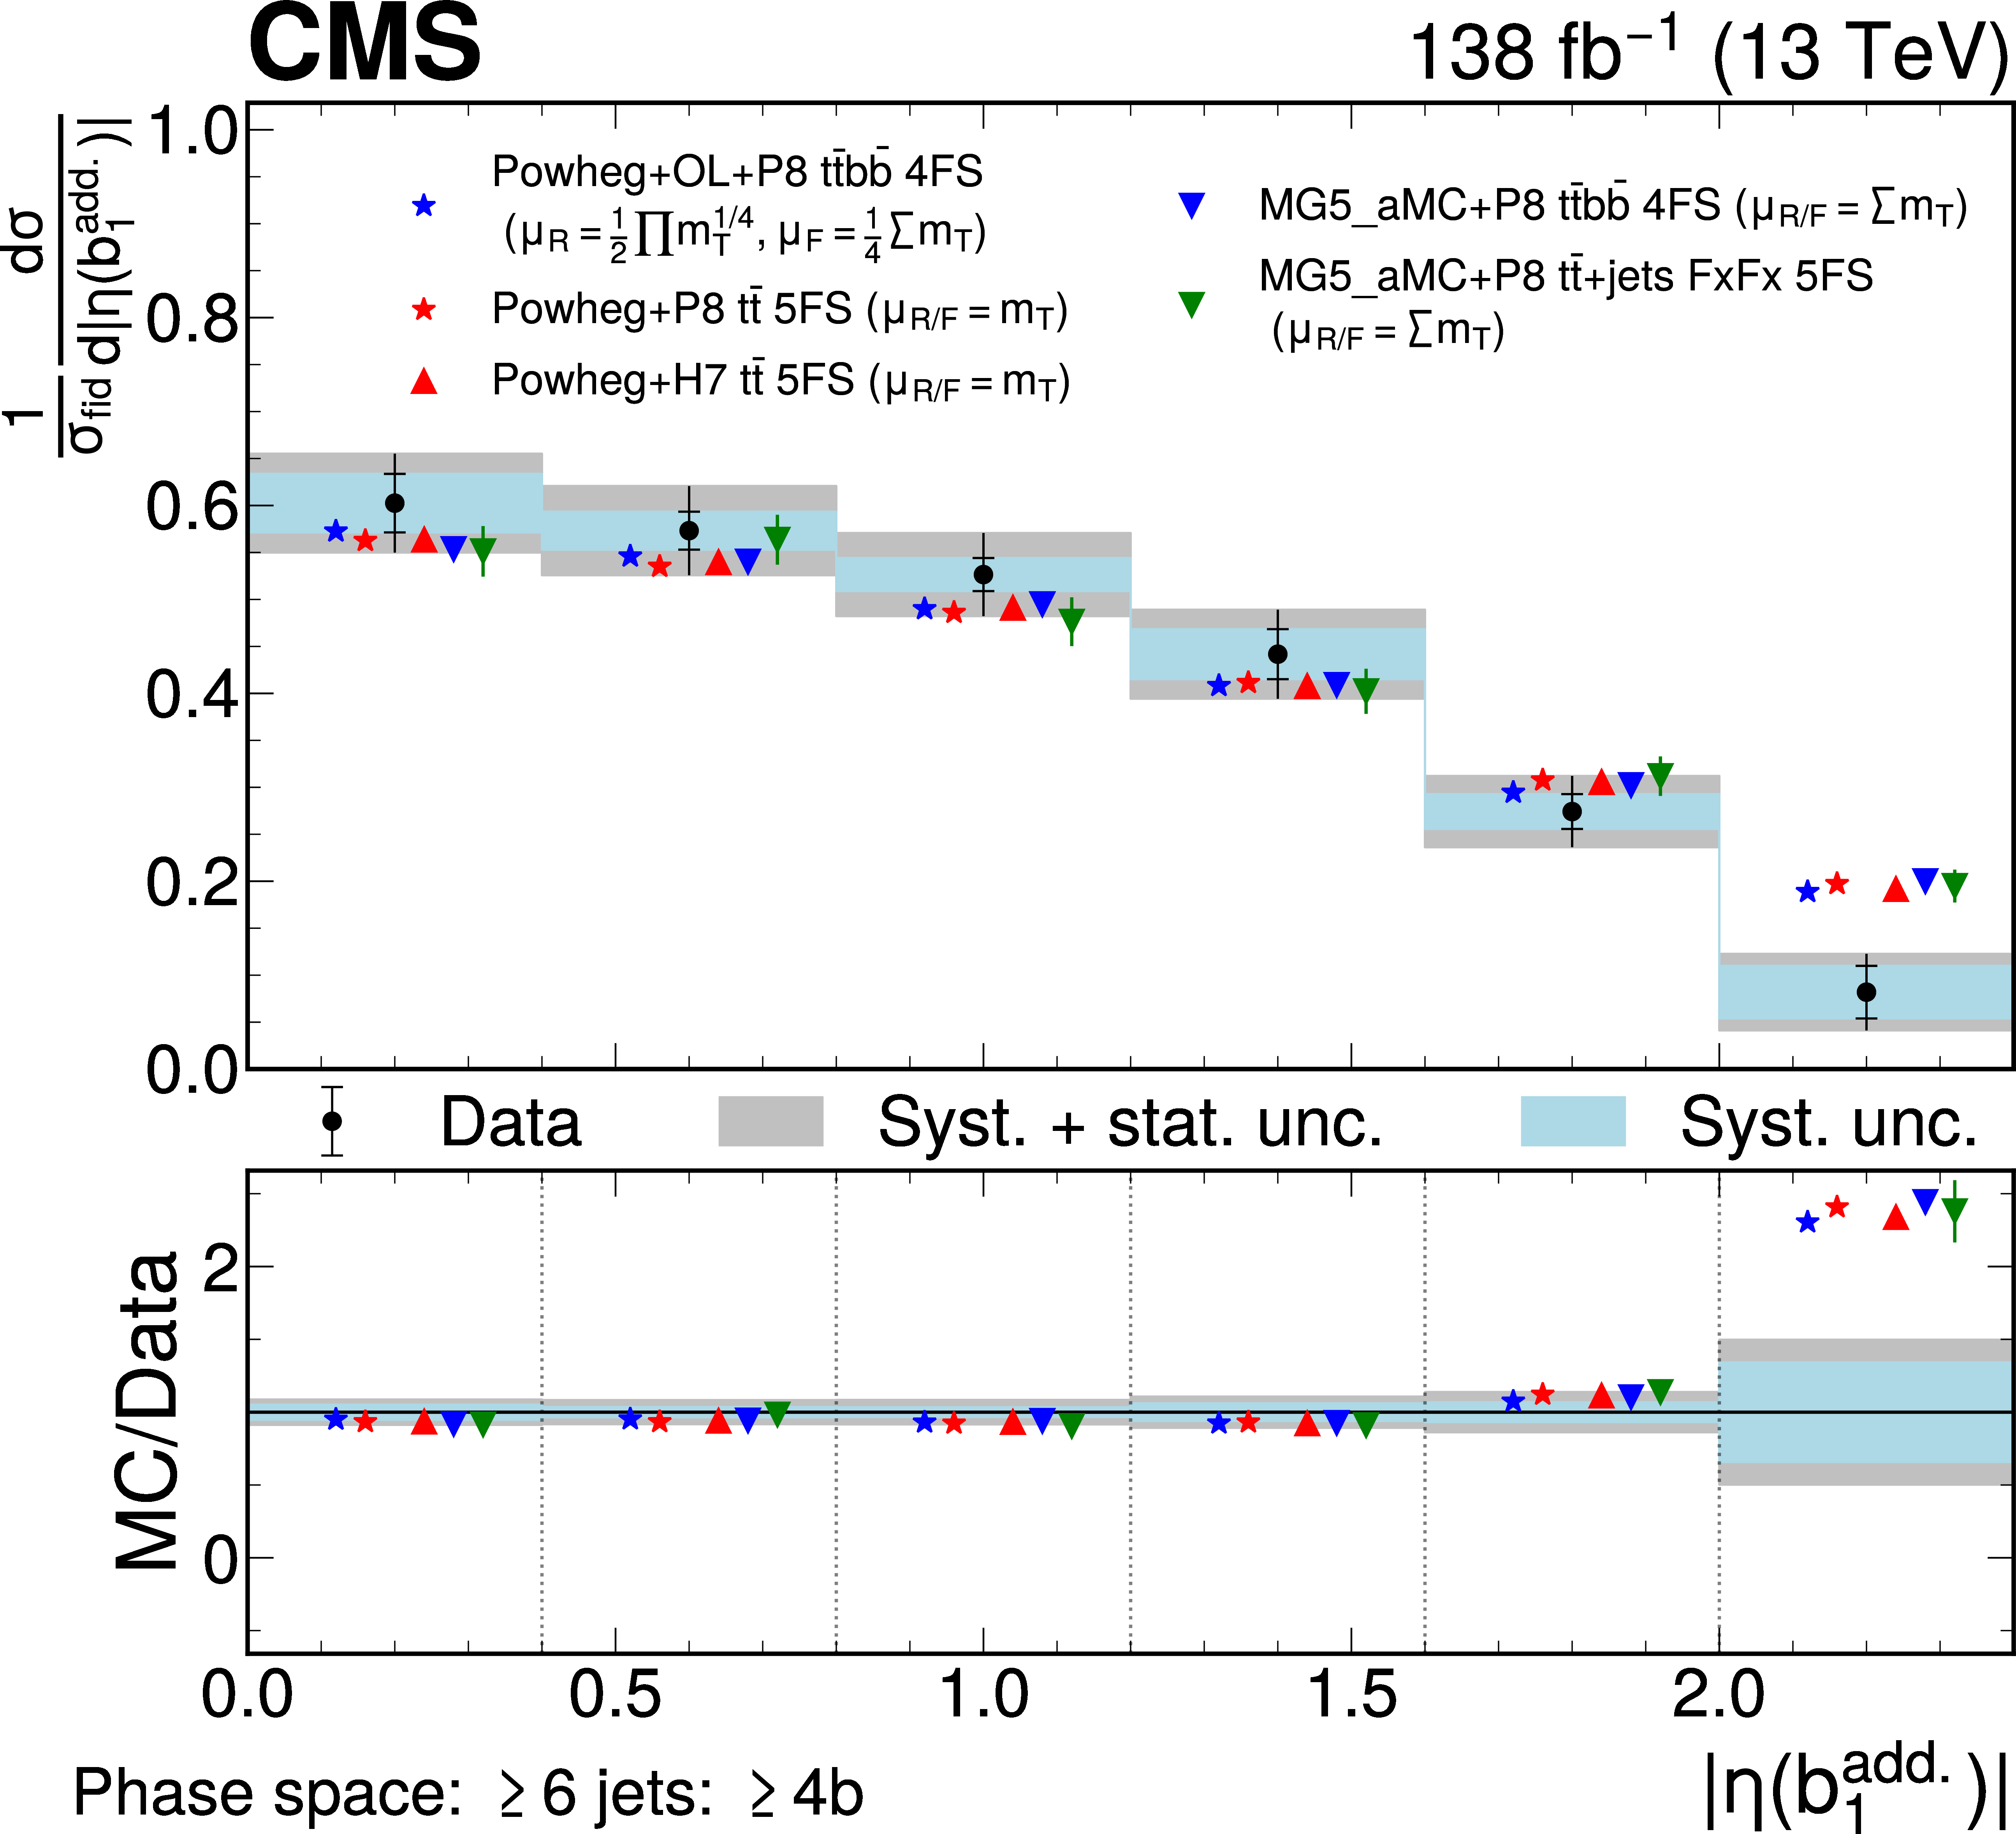
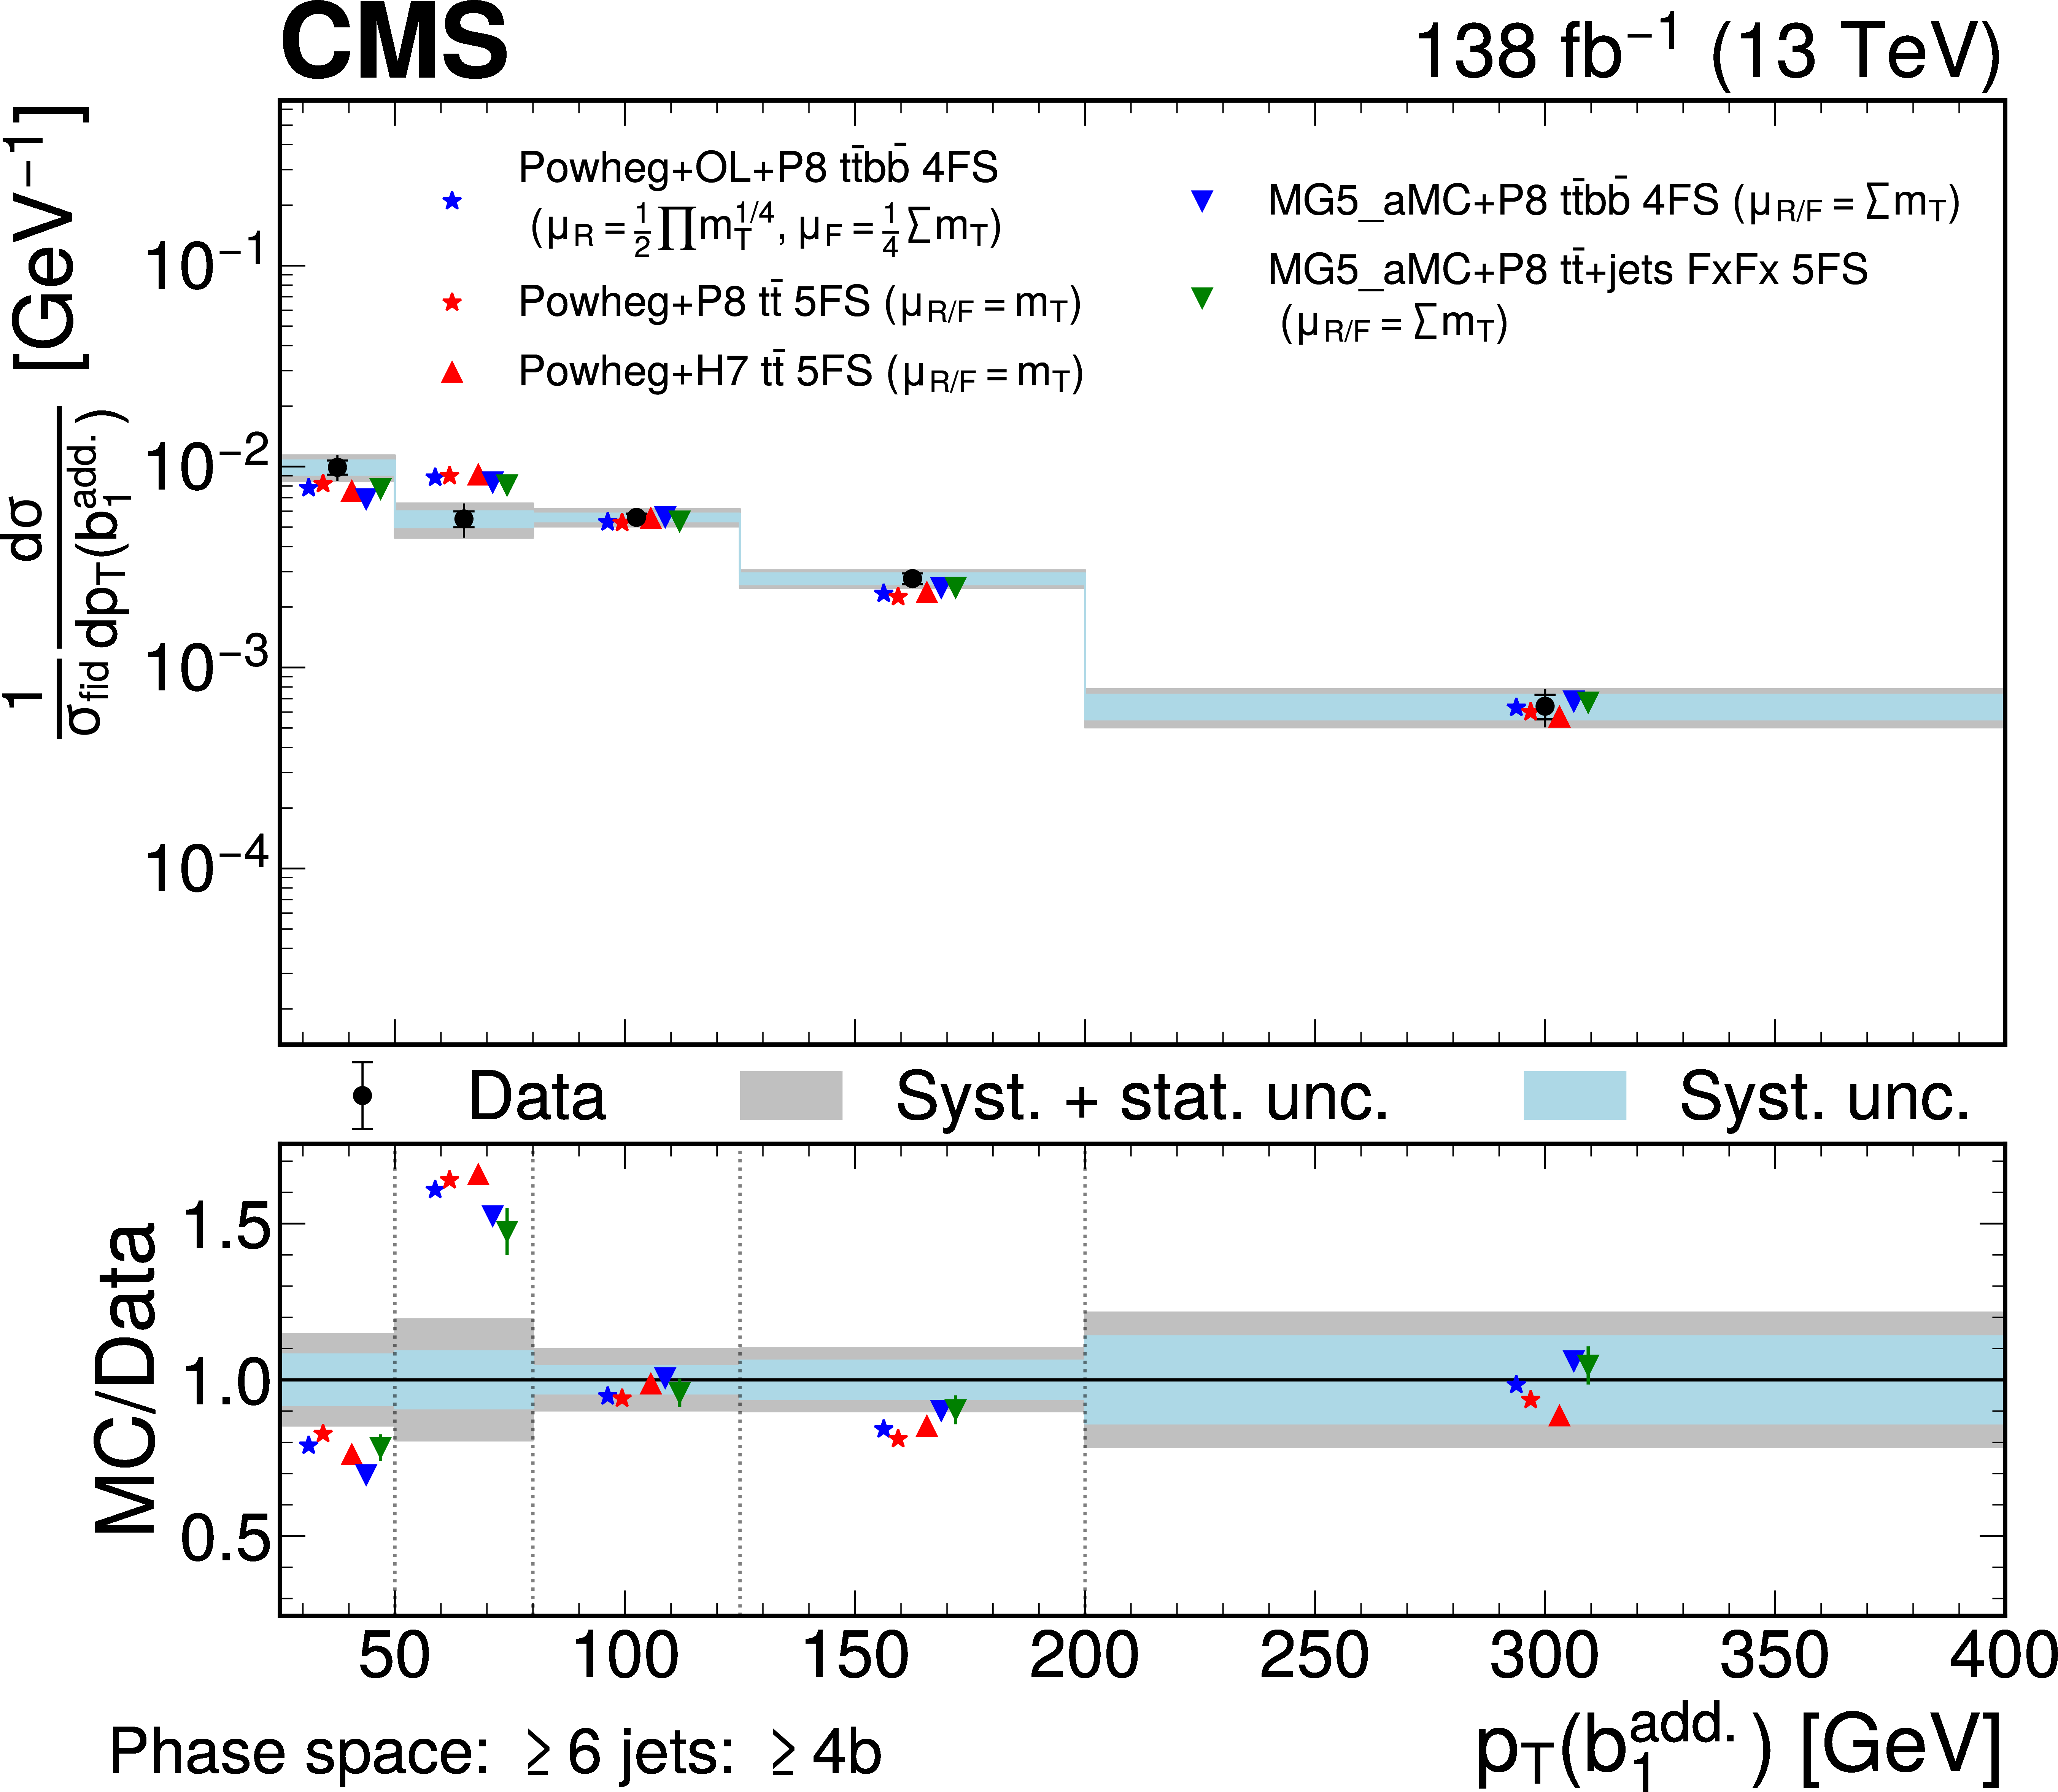
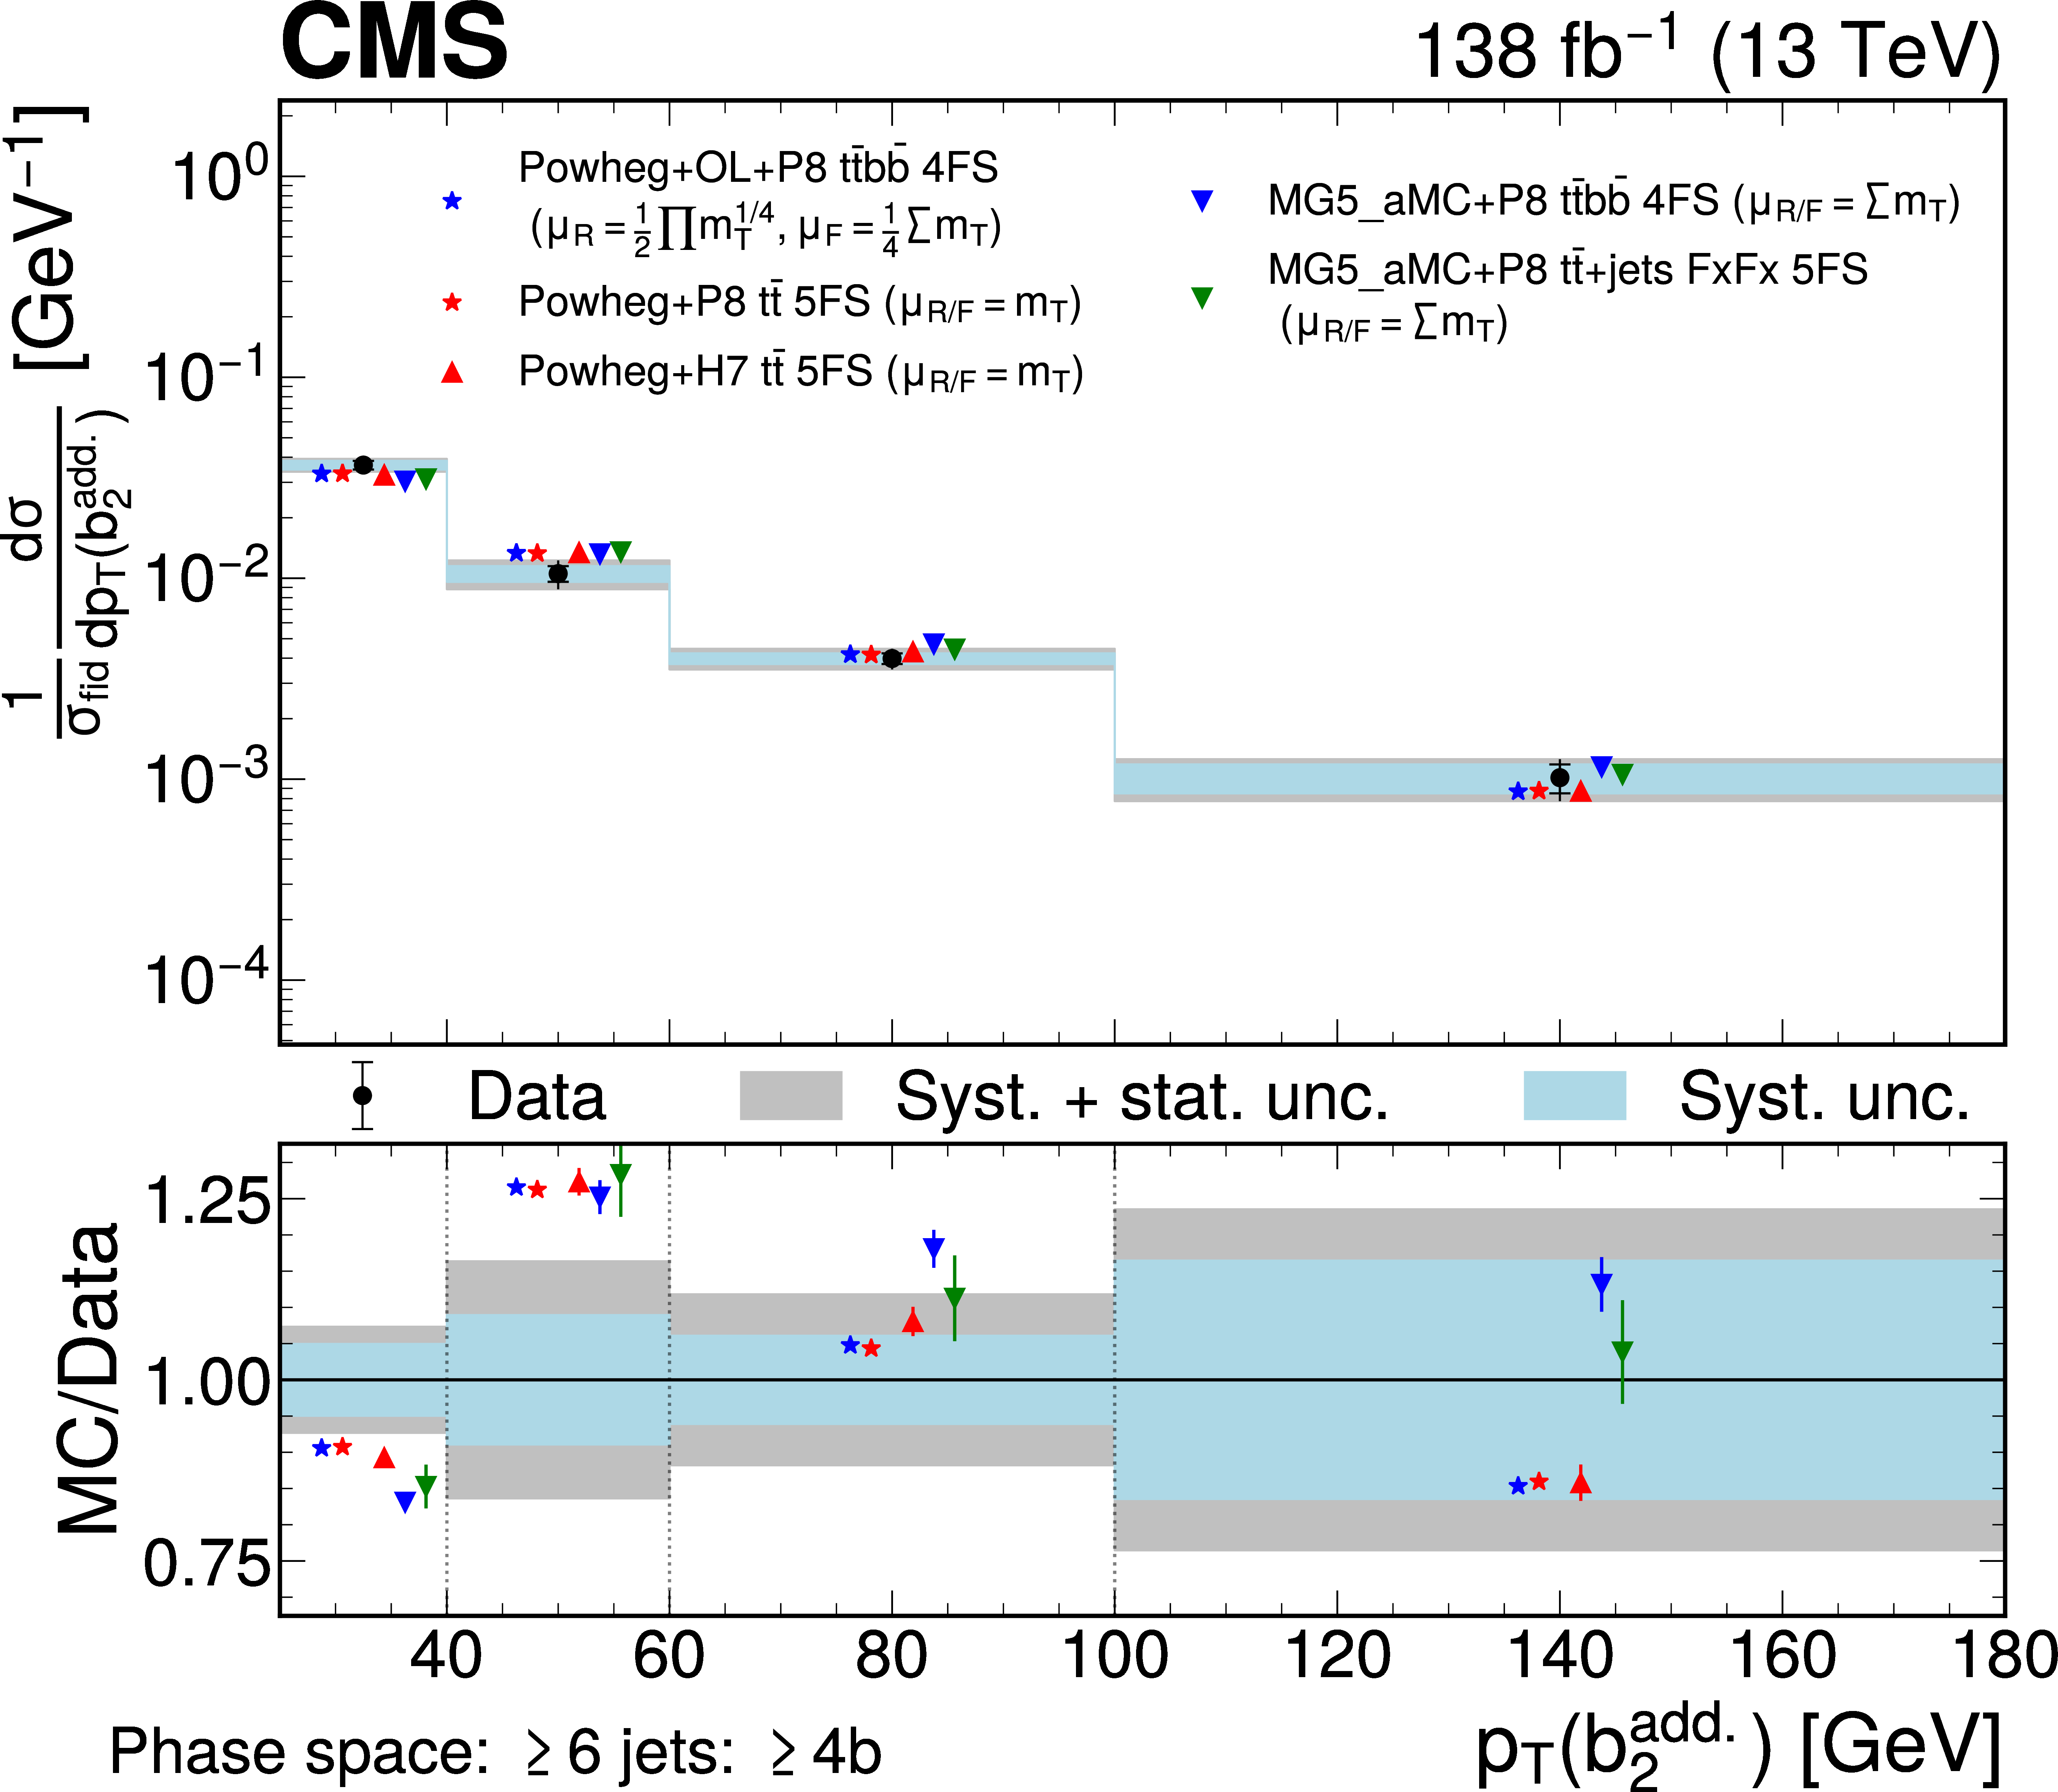
Predicted and observed normalized differential cross sections in the $ \geq $6 jets: $ \geq $4b fiducial phase space, for the $ |\eta| $ (upper left) and $ p_{\mathrm{T}} $ (upper right) of the first extra b jet, the $ |\eta| $ (middle left) and $ p_{\mathrm{T}} $ (middle right) of the second extra b jet, and the inclusive jet multiplicity (lower left). The data are represented by points, with inner (outer) vertical bars indicating the systematic (total) uncertainties, also represented as blue (grey) bands. Cross section predictions obtained at the particle level from different simulation approaches are shown, including their statistical uncertainties, as coloured symbols. For $ N_{\text{jets}} $ and $ p_{\mathrm{T}} $, the last bins contain the overflow. |
png pdf |
Figure 13-a:
Predicted and observed normalized differential cross sections in the $ \geq $6 jets: $ \geq $4b fiducial phase space, for the $ |\eta| $ (upper left) and $ p_{\mathrm{T}} $ (upper right) of the first extra b jet, the $ |\eta| $ (middle left) and $ p_{\mathrm{T}} $ (middle right) of the second extra b jet, and the inclusive jet multiplicity (lower left). The data are represented by points, with inner (outer) vertical bars indicating the systematic (total) uncertainties, also represented as blue (grey) bands. Cross section predictions obtained at the particle level from different simulation approaches are shown, including their statistical uncertainties, as coloured symbols. For $ N_{\text{jets}} $ and $ p_{\mathrm{T}} $, the last bins contain the overflow. |
png pdf |
Figure 13-b:
Predicted and observed normalized differential cross sections in the $ \geq $6 jets: $ \geq $4b fiducial phase space, for the $ |\eta| $ (upper left) and $ p_{\mathrm{T}} $ (upper right) of the first extra b jet, the $ |\eta| $ (middle left) and $ p_{\mathrm{T}} $ (middle right) of the second extra b jet, and the inclusive jet multiplicity (lower left). The data are represented by points, with inner (outer) vertical bars indicating the systematic (total) uncertainties, also represented as blue (grey) bands. Cross section predictions obtained at the particle level from different simulation approaches are shown, including their statistical uncertainties, as coloured symbols. For $ N_{\text{jets}} $ and $ p_{\mathrm{T}} $, the last bins contain the overflow. |
png pdf |
Figure 13-c:
Predicted and observed normalized differential cross sections in the $ \geq $6 jets: $ \geq $4b fiducial phase space, for the $ |\eta| $ (upper left) and $ p_{\mathrm{T}} $ (upper right) of the first extra b jet, the $ |\eta| $ (middle left) and $ p_{\mathrm{T}} $ (middle right) of the second extra b jet, and the inclusive jet multiplicity (lower left). The data are represented by points, with inner (outer) vertical bars indicating the systematic (total) uncertainties, also represented as blue (grey) bands. Cross section predictions obtained at the particle level from different simulation approaches are shown, including their statistical uncertainties, as coloured symbols. For $ N_{\text{jets}} $ and $ p_{\mathrm{T}} $, the last bins contain the overflow. |
png pdf |
Figure 13-d:
Predicted and observed normalized differential cross sections in the $ \geq $6 jets: $ \geq $4b fiducial phase space, for the $ |\eta| $ (upper left) and $ p_{\mathrm{T}} $ (upper right) of the first extra b jet, the $ |\eta| $ (middle left) and $ p_{\mathrm{T}} $ (middle right) of the second extra b jet, and the inclusive jet multiplicity (lower left). The data are represented by points, with inner (outer) vertical bars indicating the systematic (total) uncertainties, also represented as blue (grey) bands. Cross section predictions obtained at the particle level from different simulation approaches are shown, including their statistical uncertainties, as coloured symbols. For $ N_{\text{jets}} $ and $ p_{\mathrm{T}} $, the last bins contain the overflow. |
png pdf |
Figure 13-e:
Predicted and observed normalized differential cross sections in the $ \geq $6 jets: $ \geq $4b fiducial phase space, for the $ |\eta| $ (upper left) and $ p_{\mathrm{T}} $ (upper right) of the first extra b jet, the $ |\eta| $ (middle left) and $ p_{\mathrm{T}} $ (middle right) of the second extra b jet, and the inclusive jet multiplicity (lower left). The data are represented by points, with inner (outer) vertical bars indicating the systematic (total) uncertainties, also represented as blue (grey) bands. Cross section predictions obtained at the particle level from different simulation approaches are shown, including their statistical uncertainties, as coloured symbols. For $ N_{\text{jets}} $ and $ p_{\mathrm{T}} $, the last bins contain the overflow. |
png pdf |
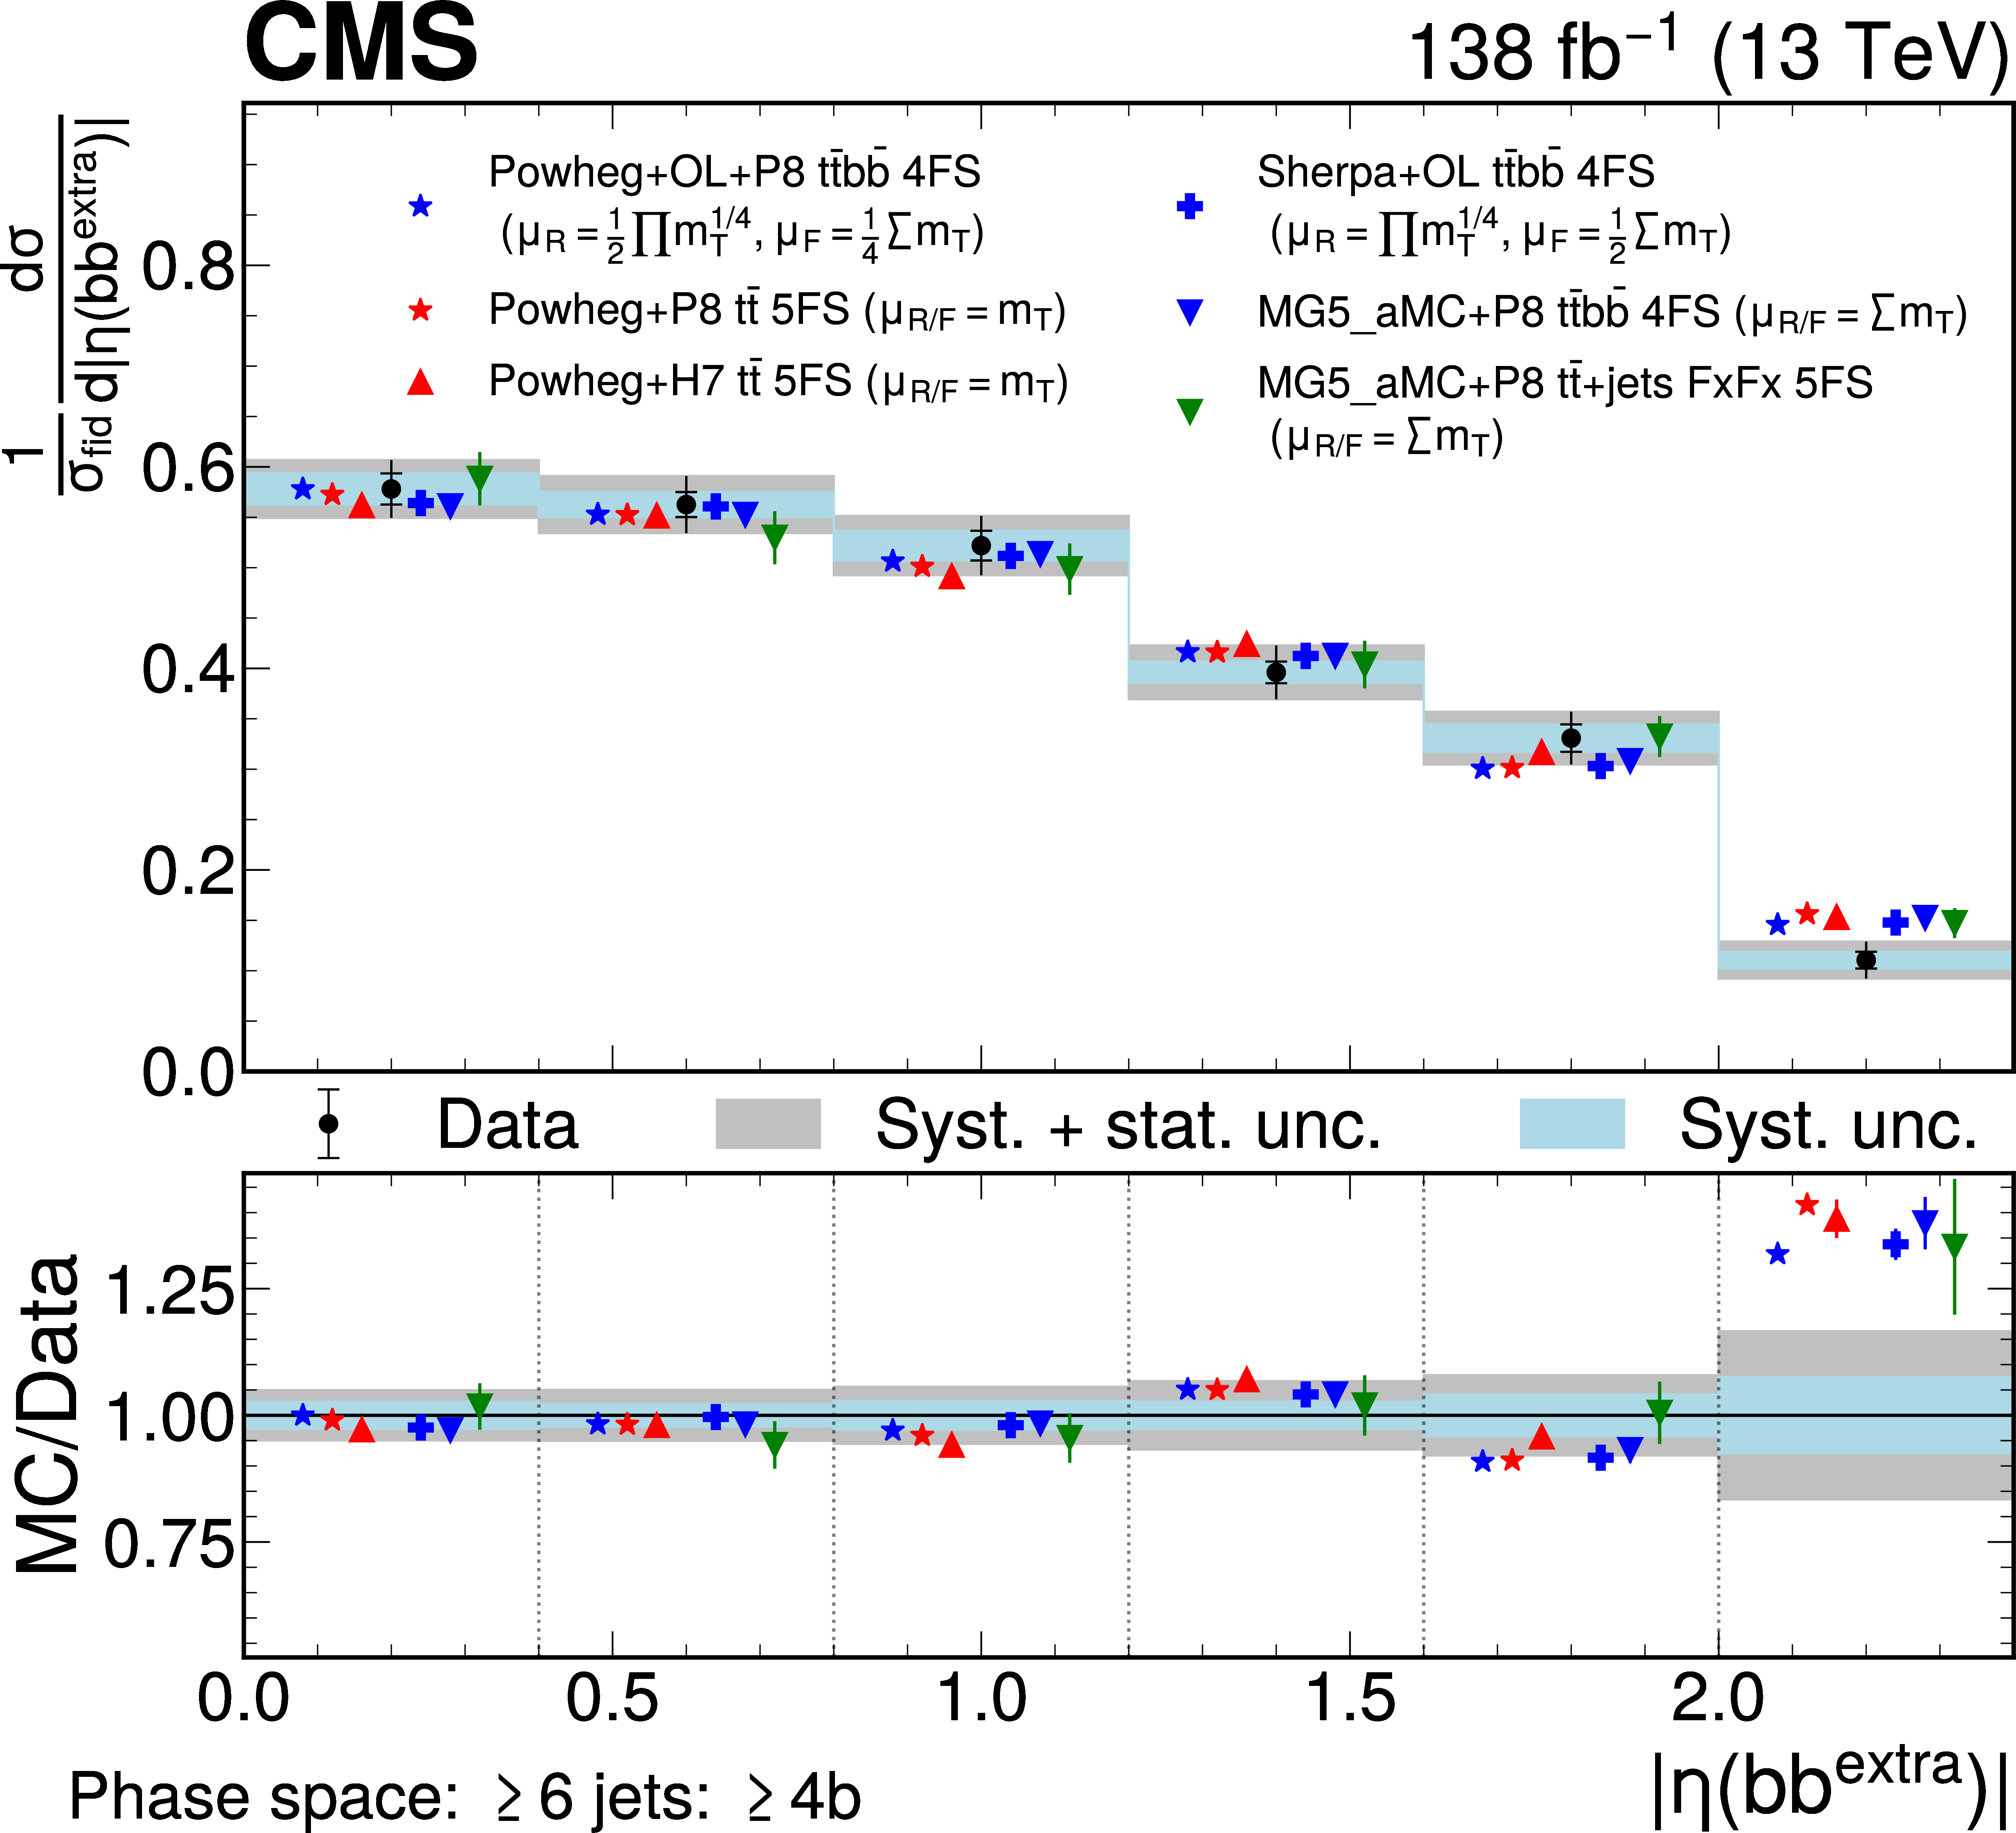
Figure 14:
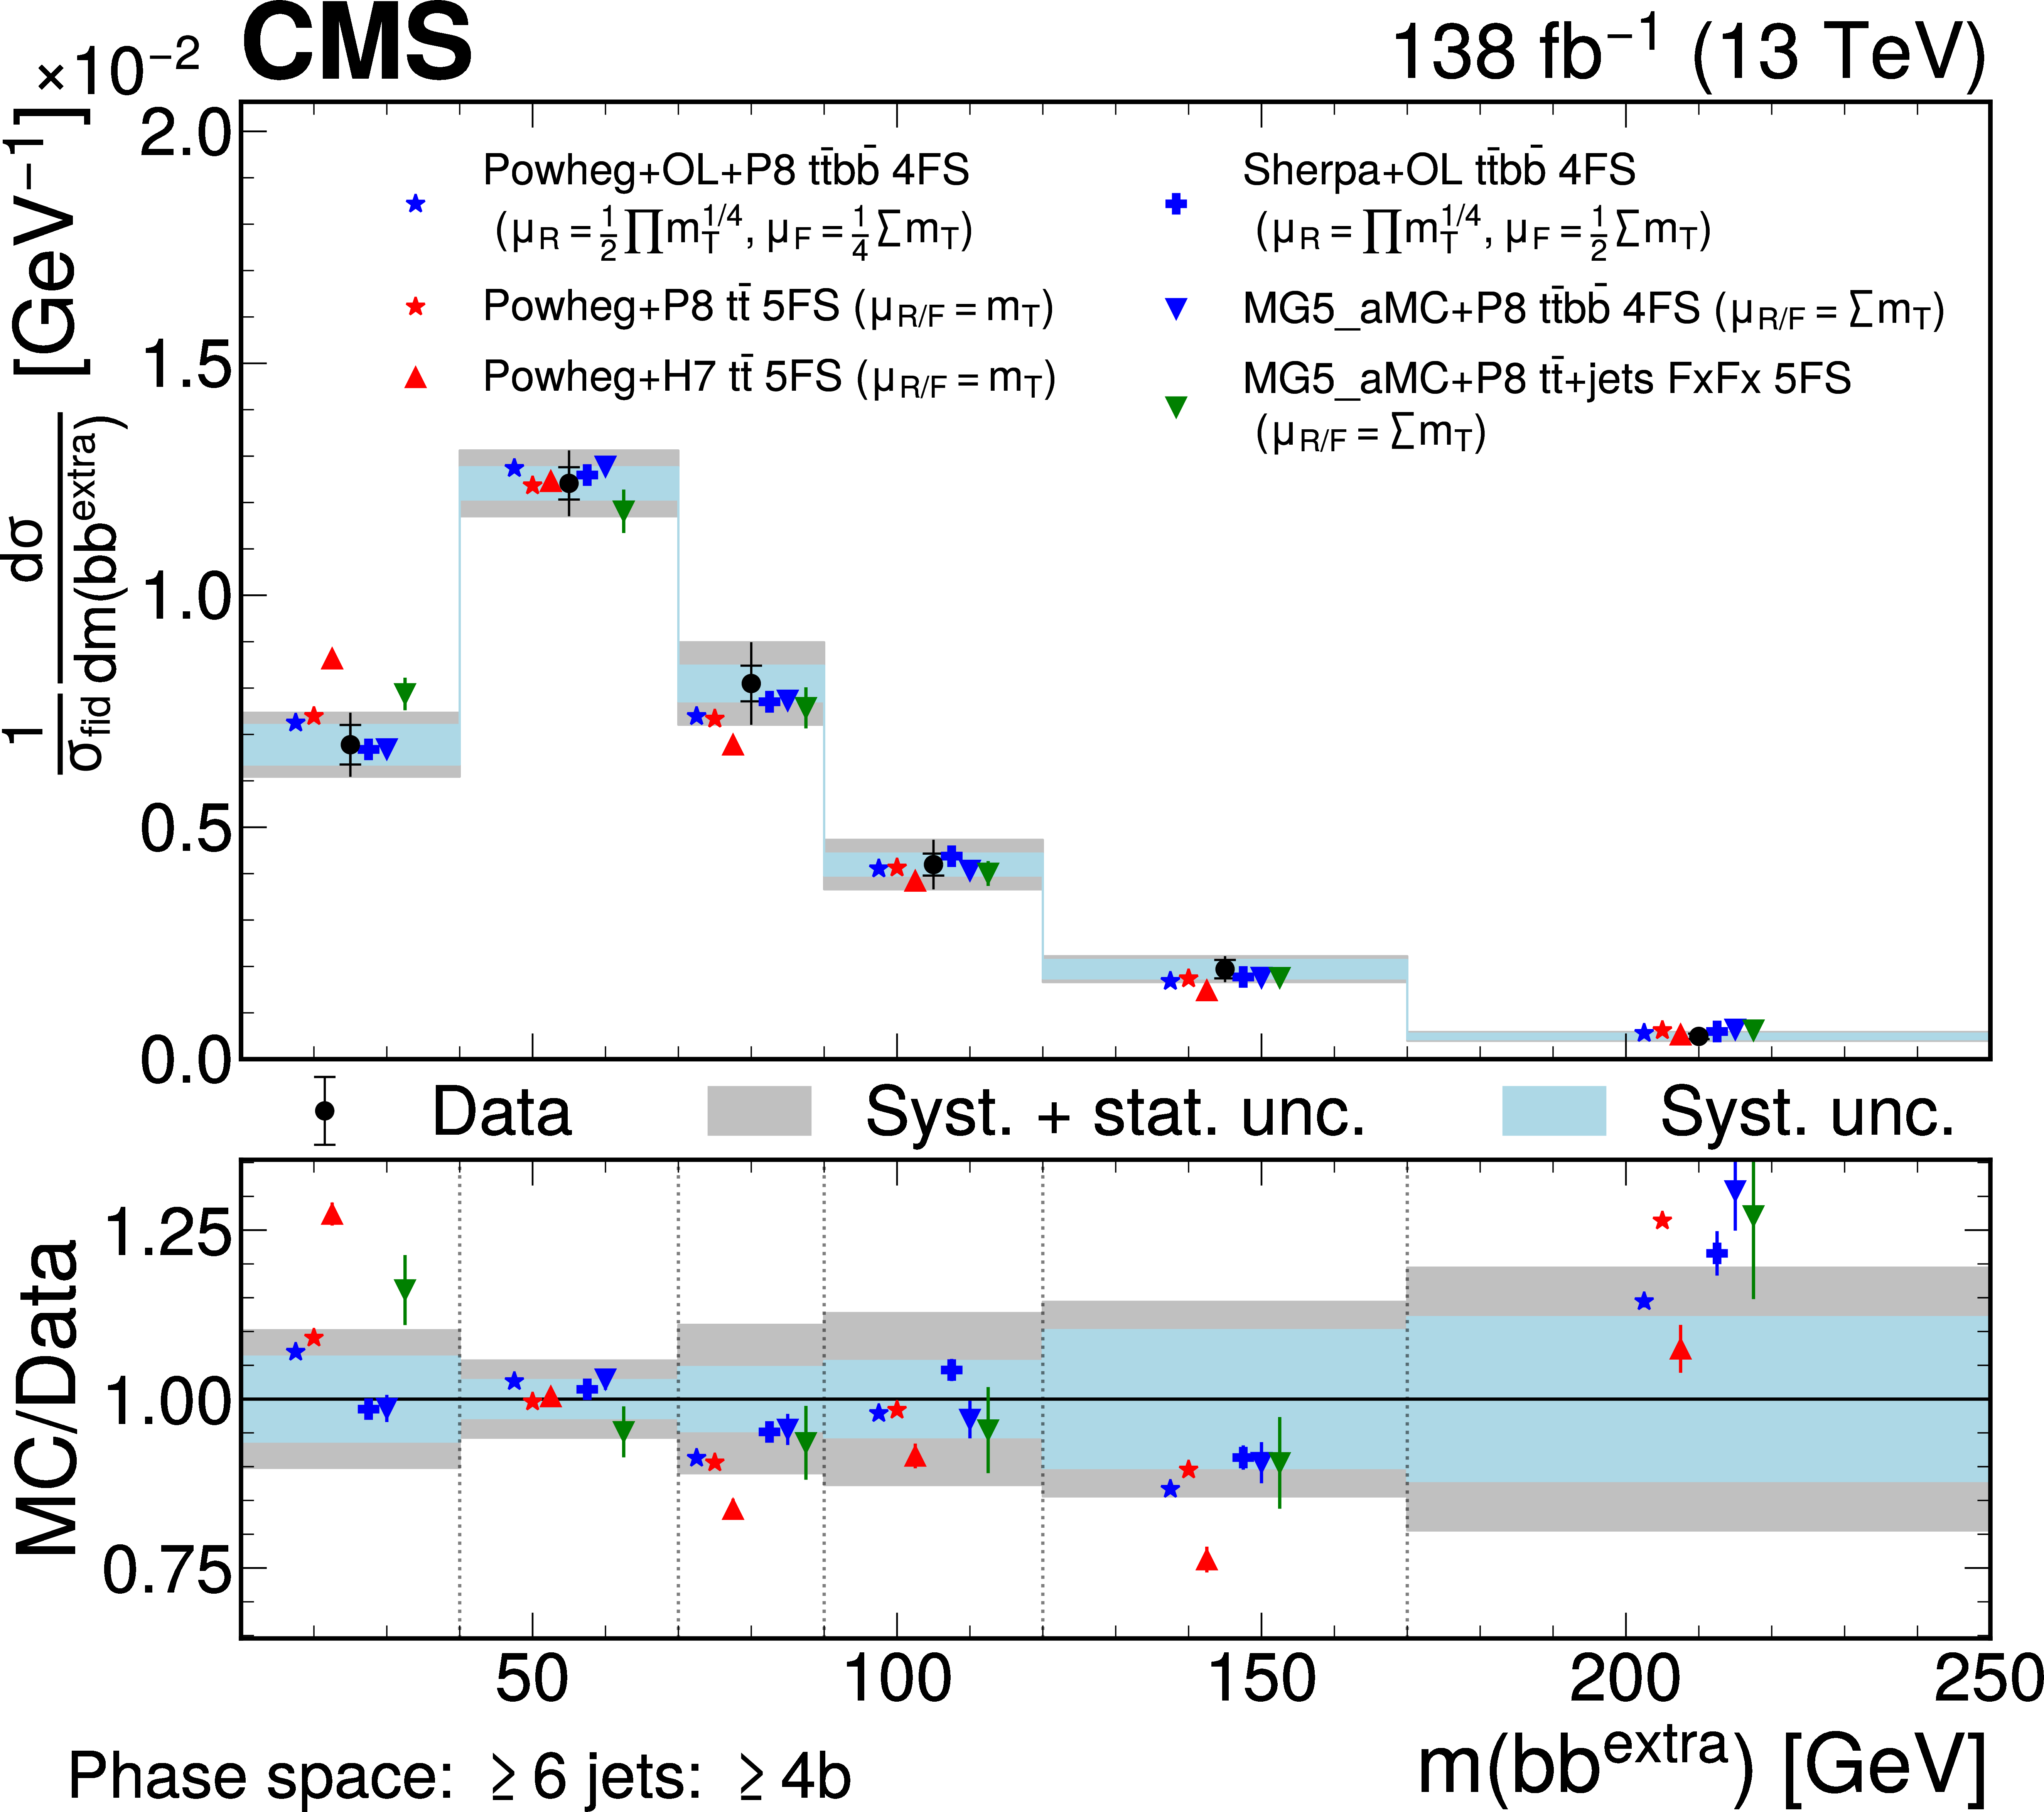
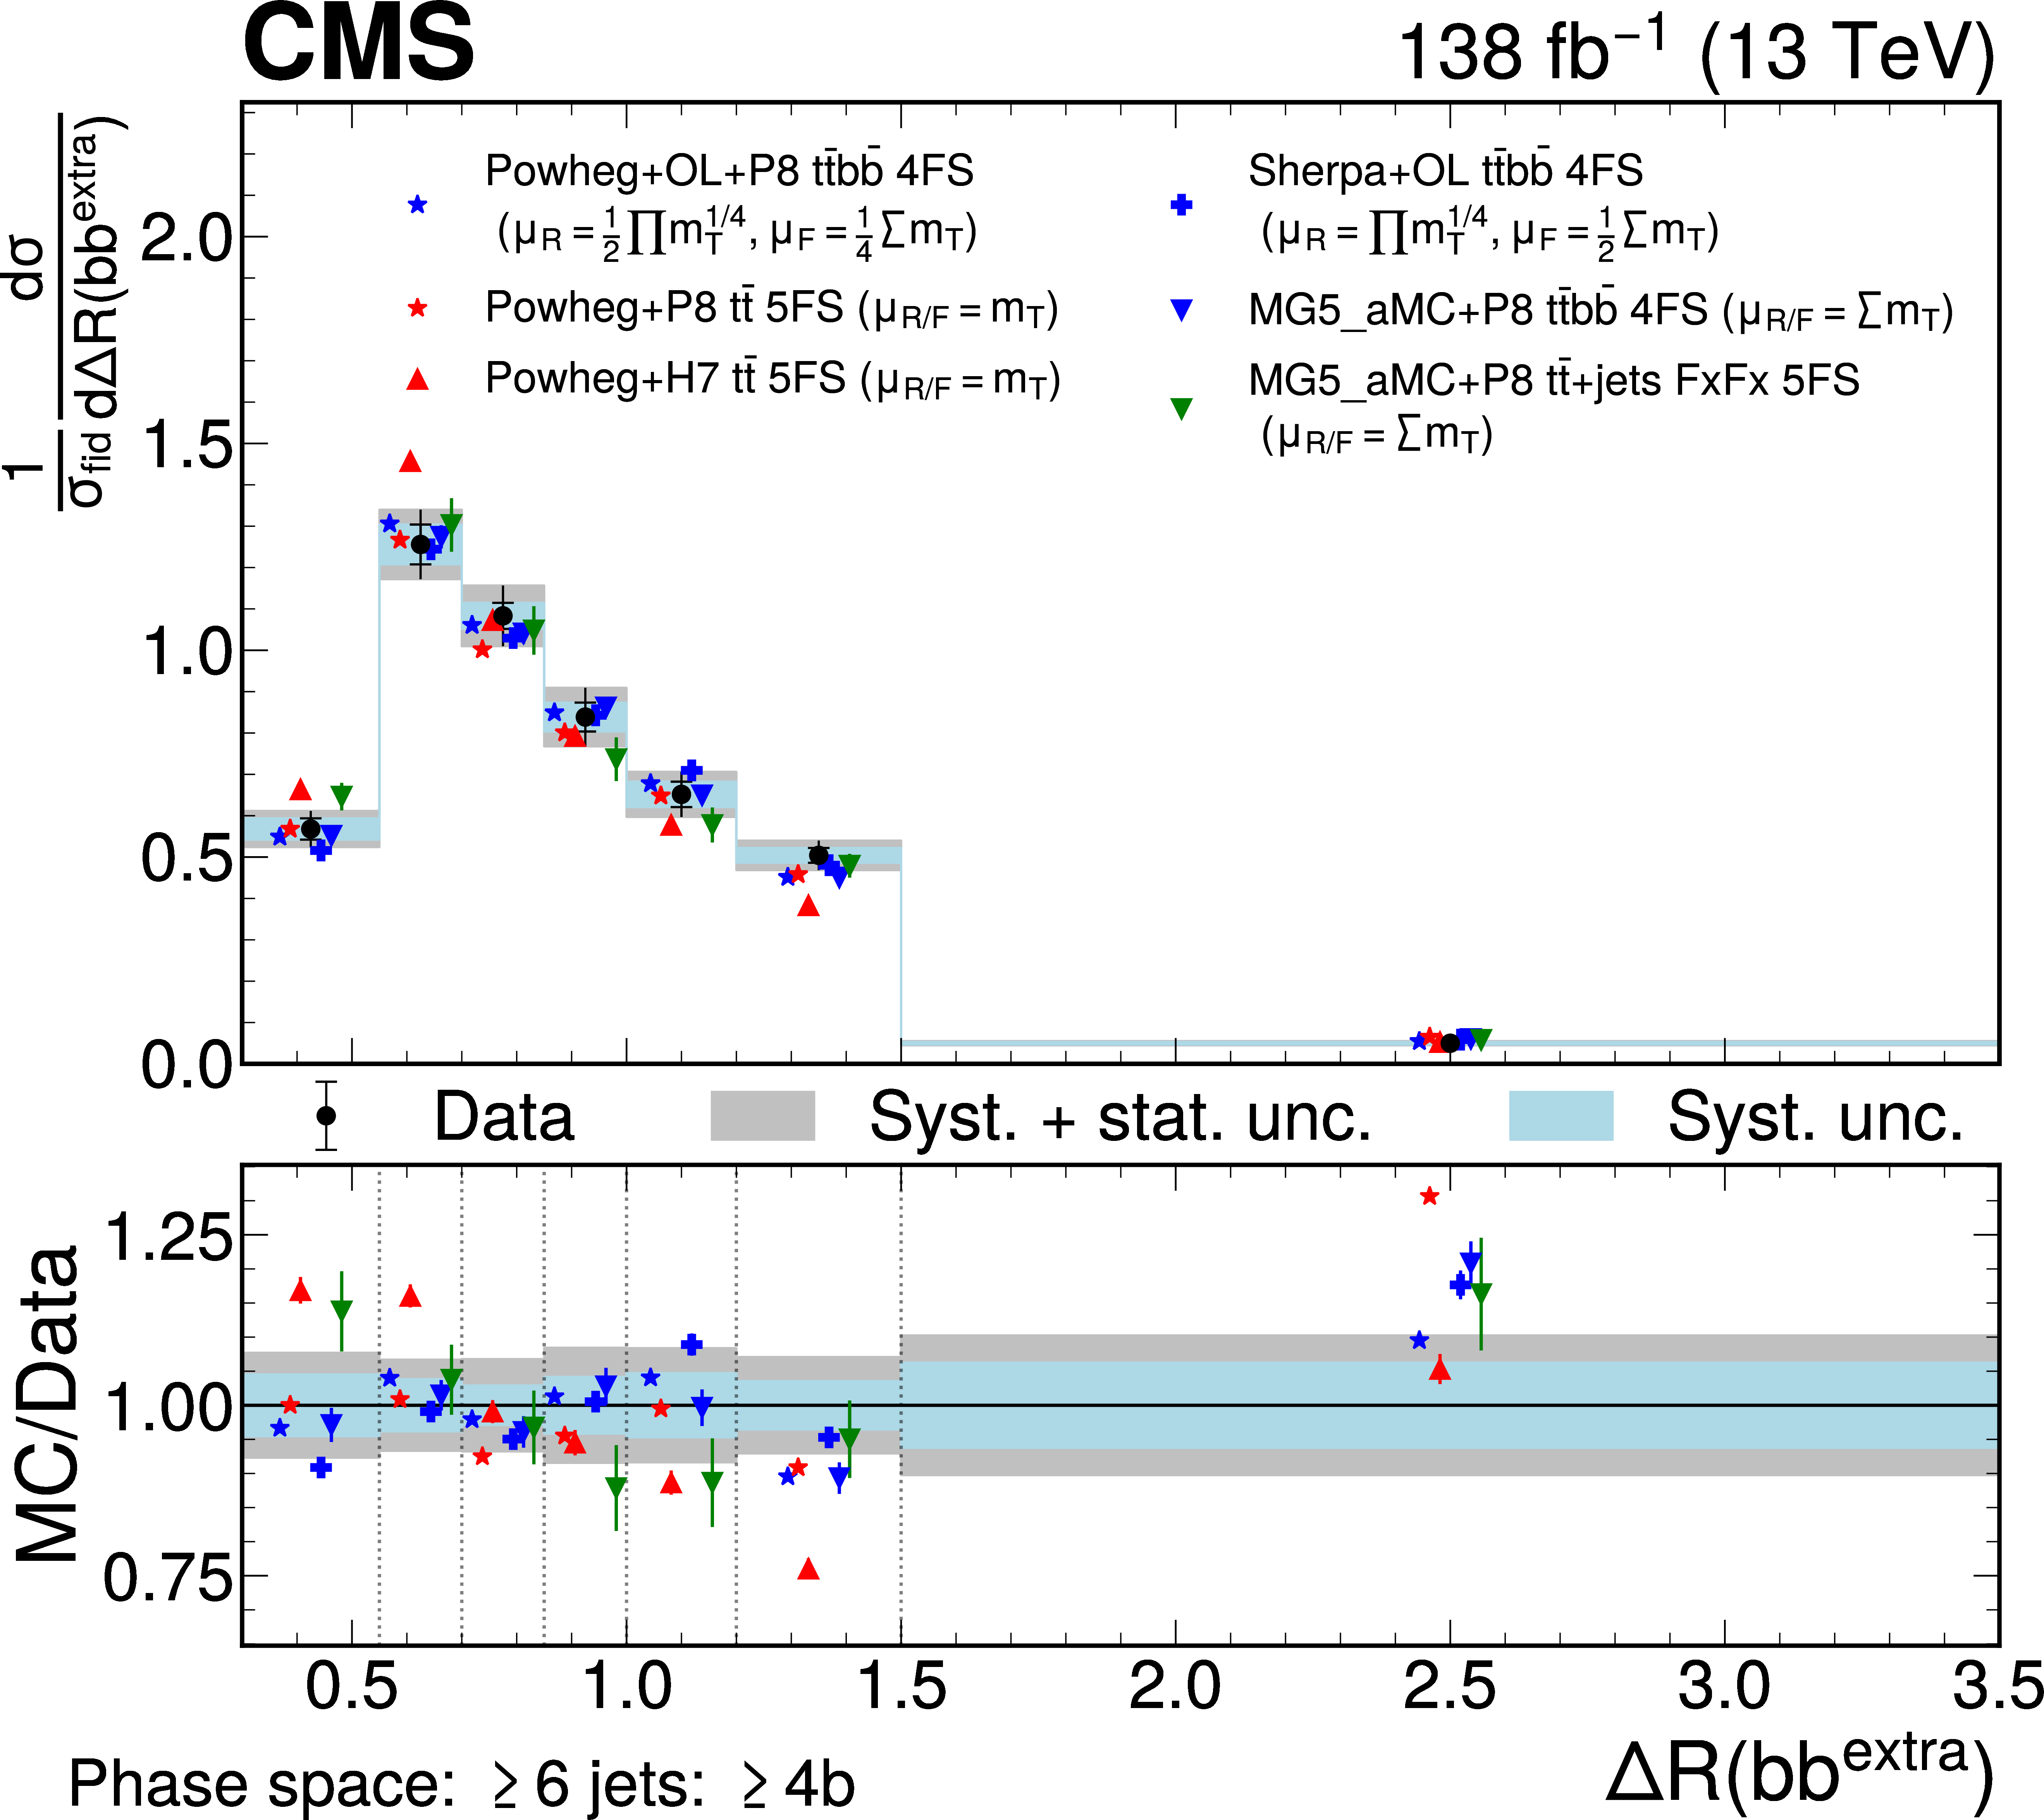
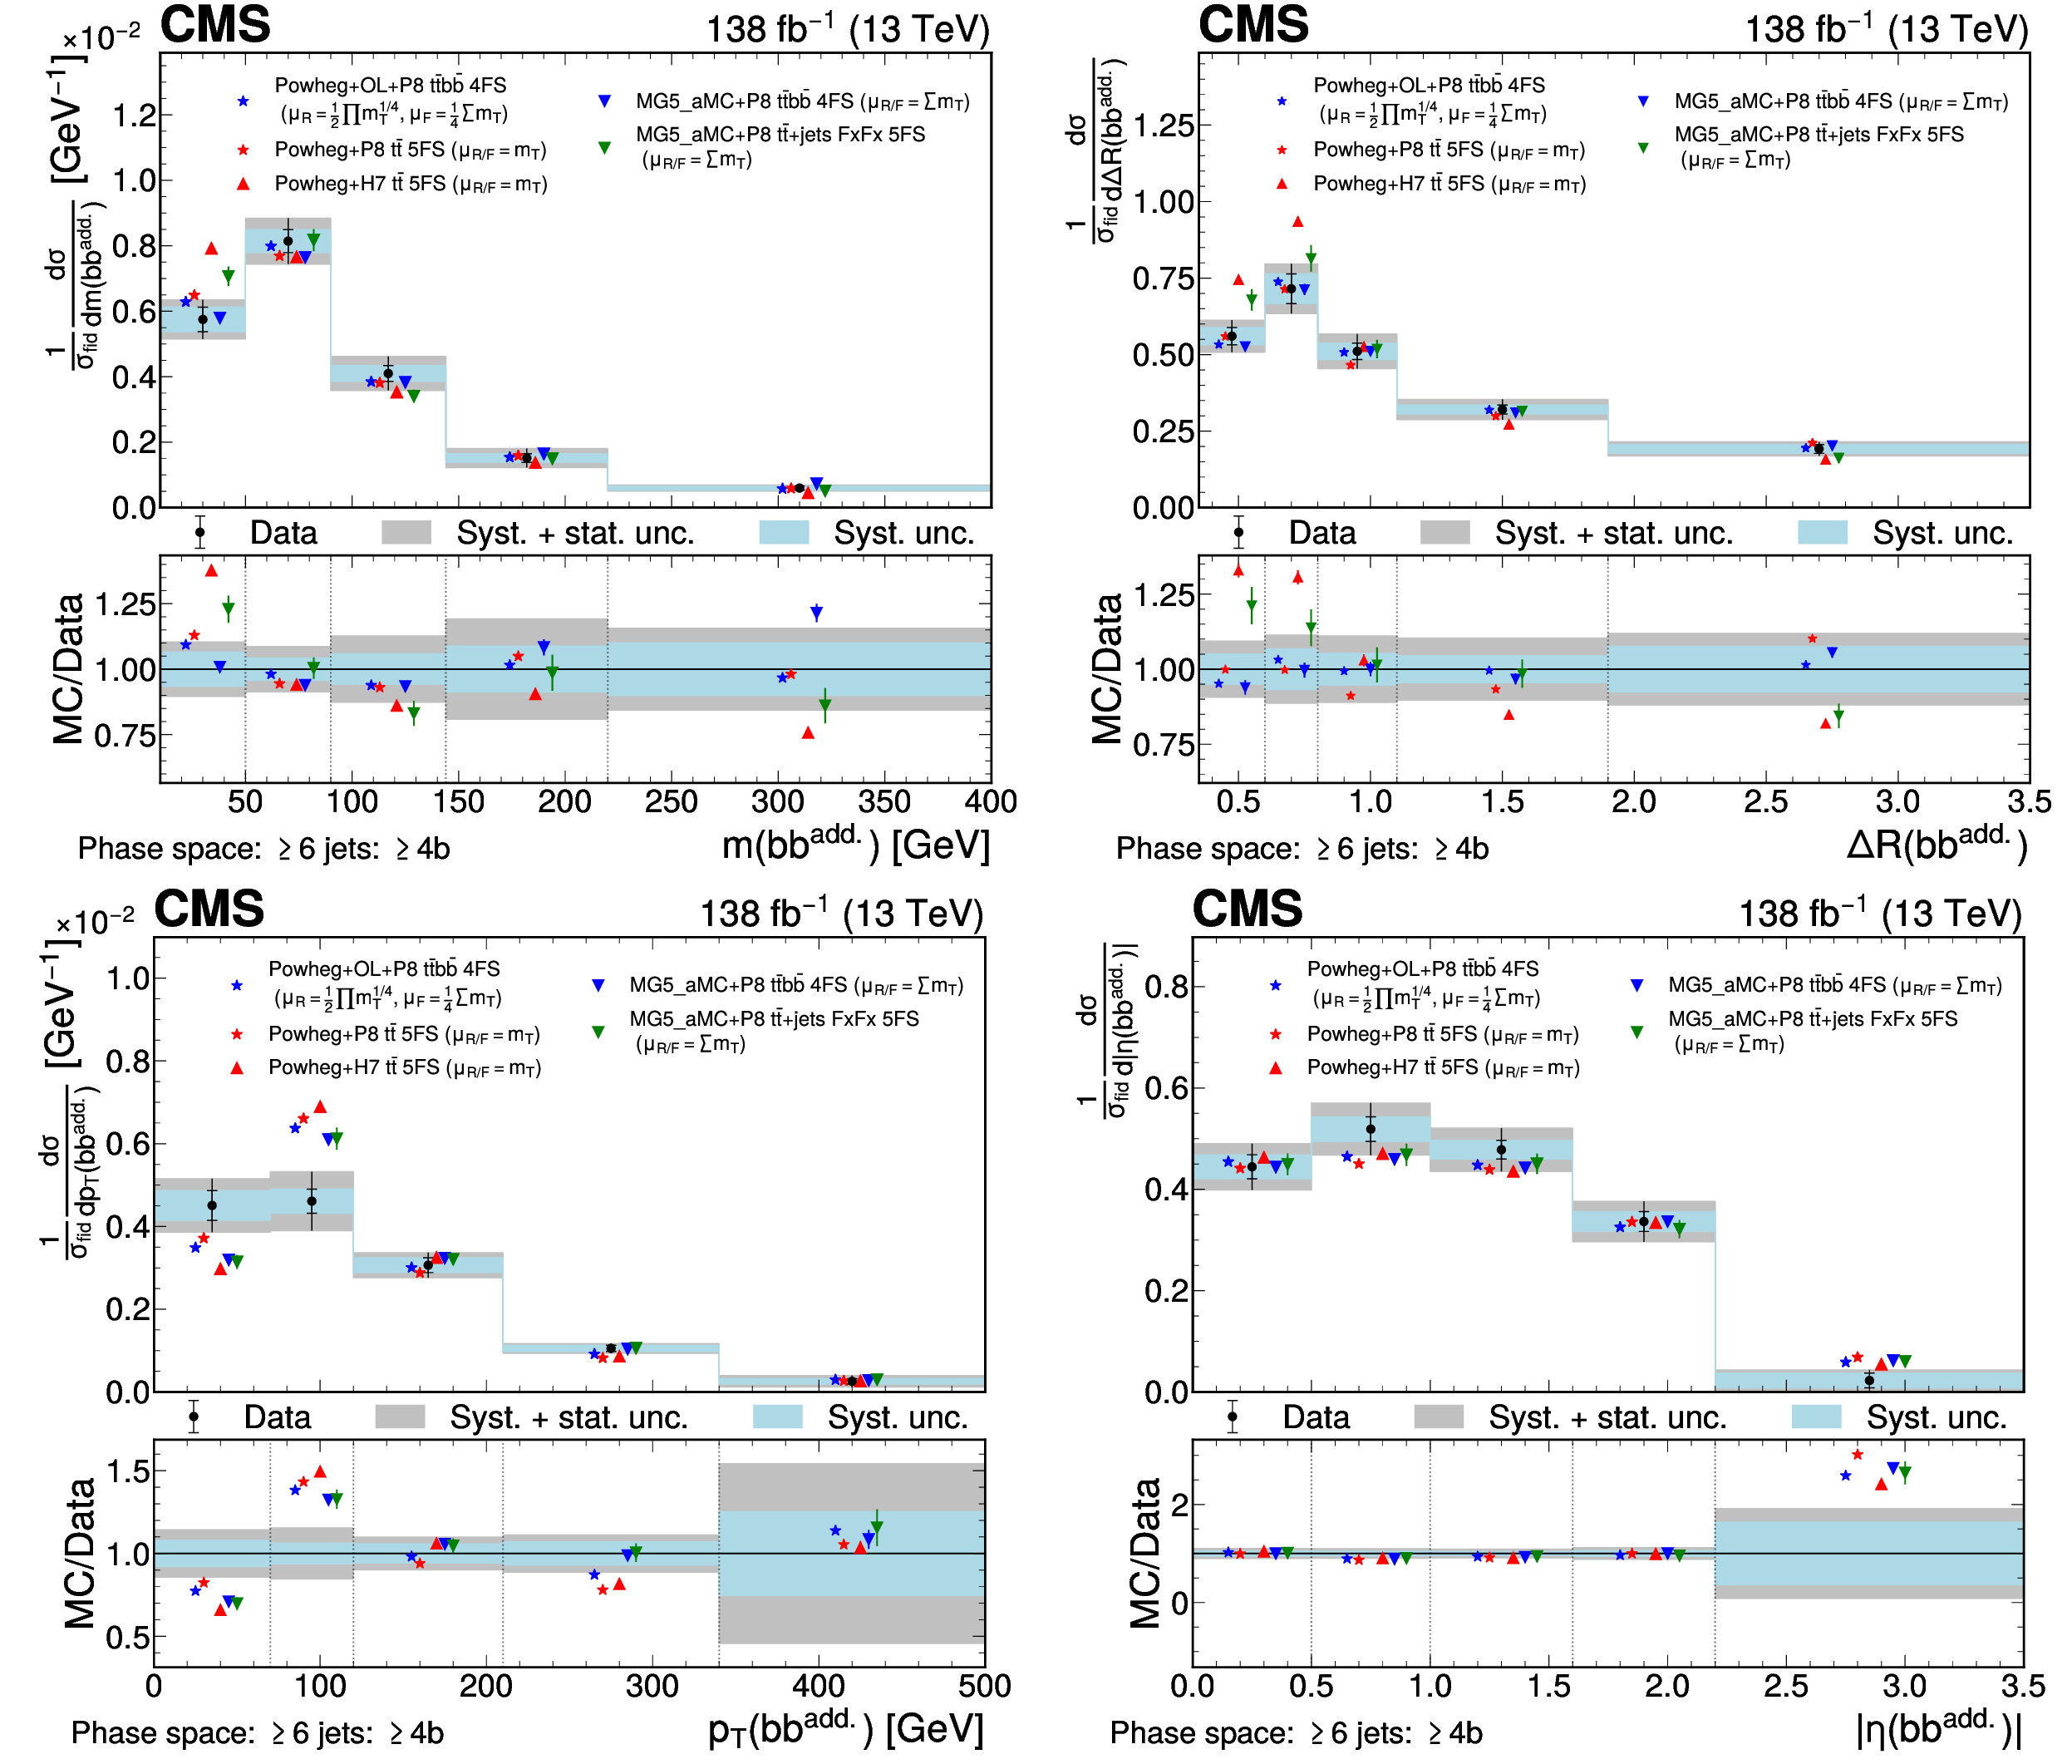
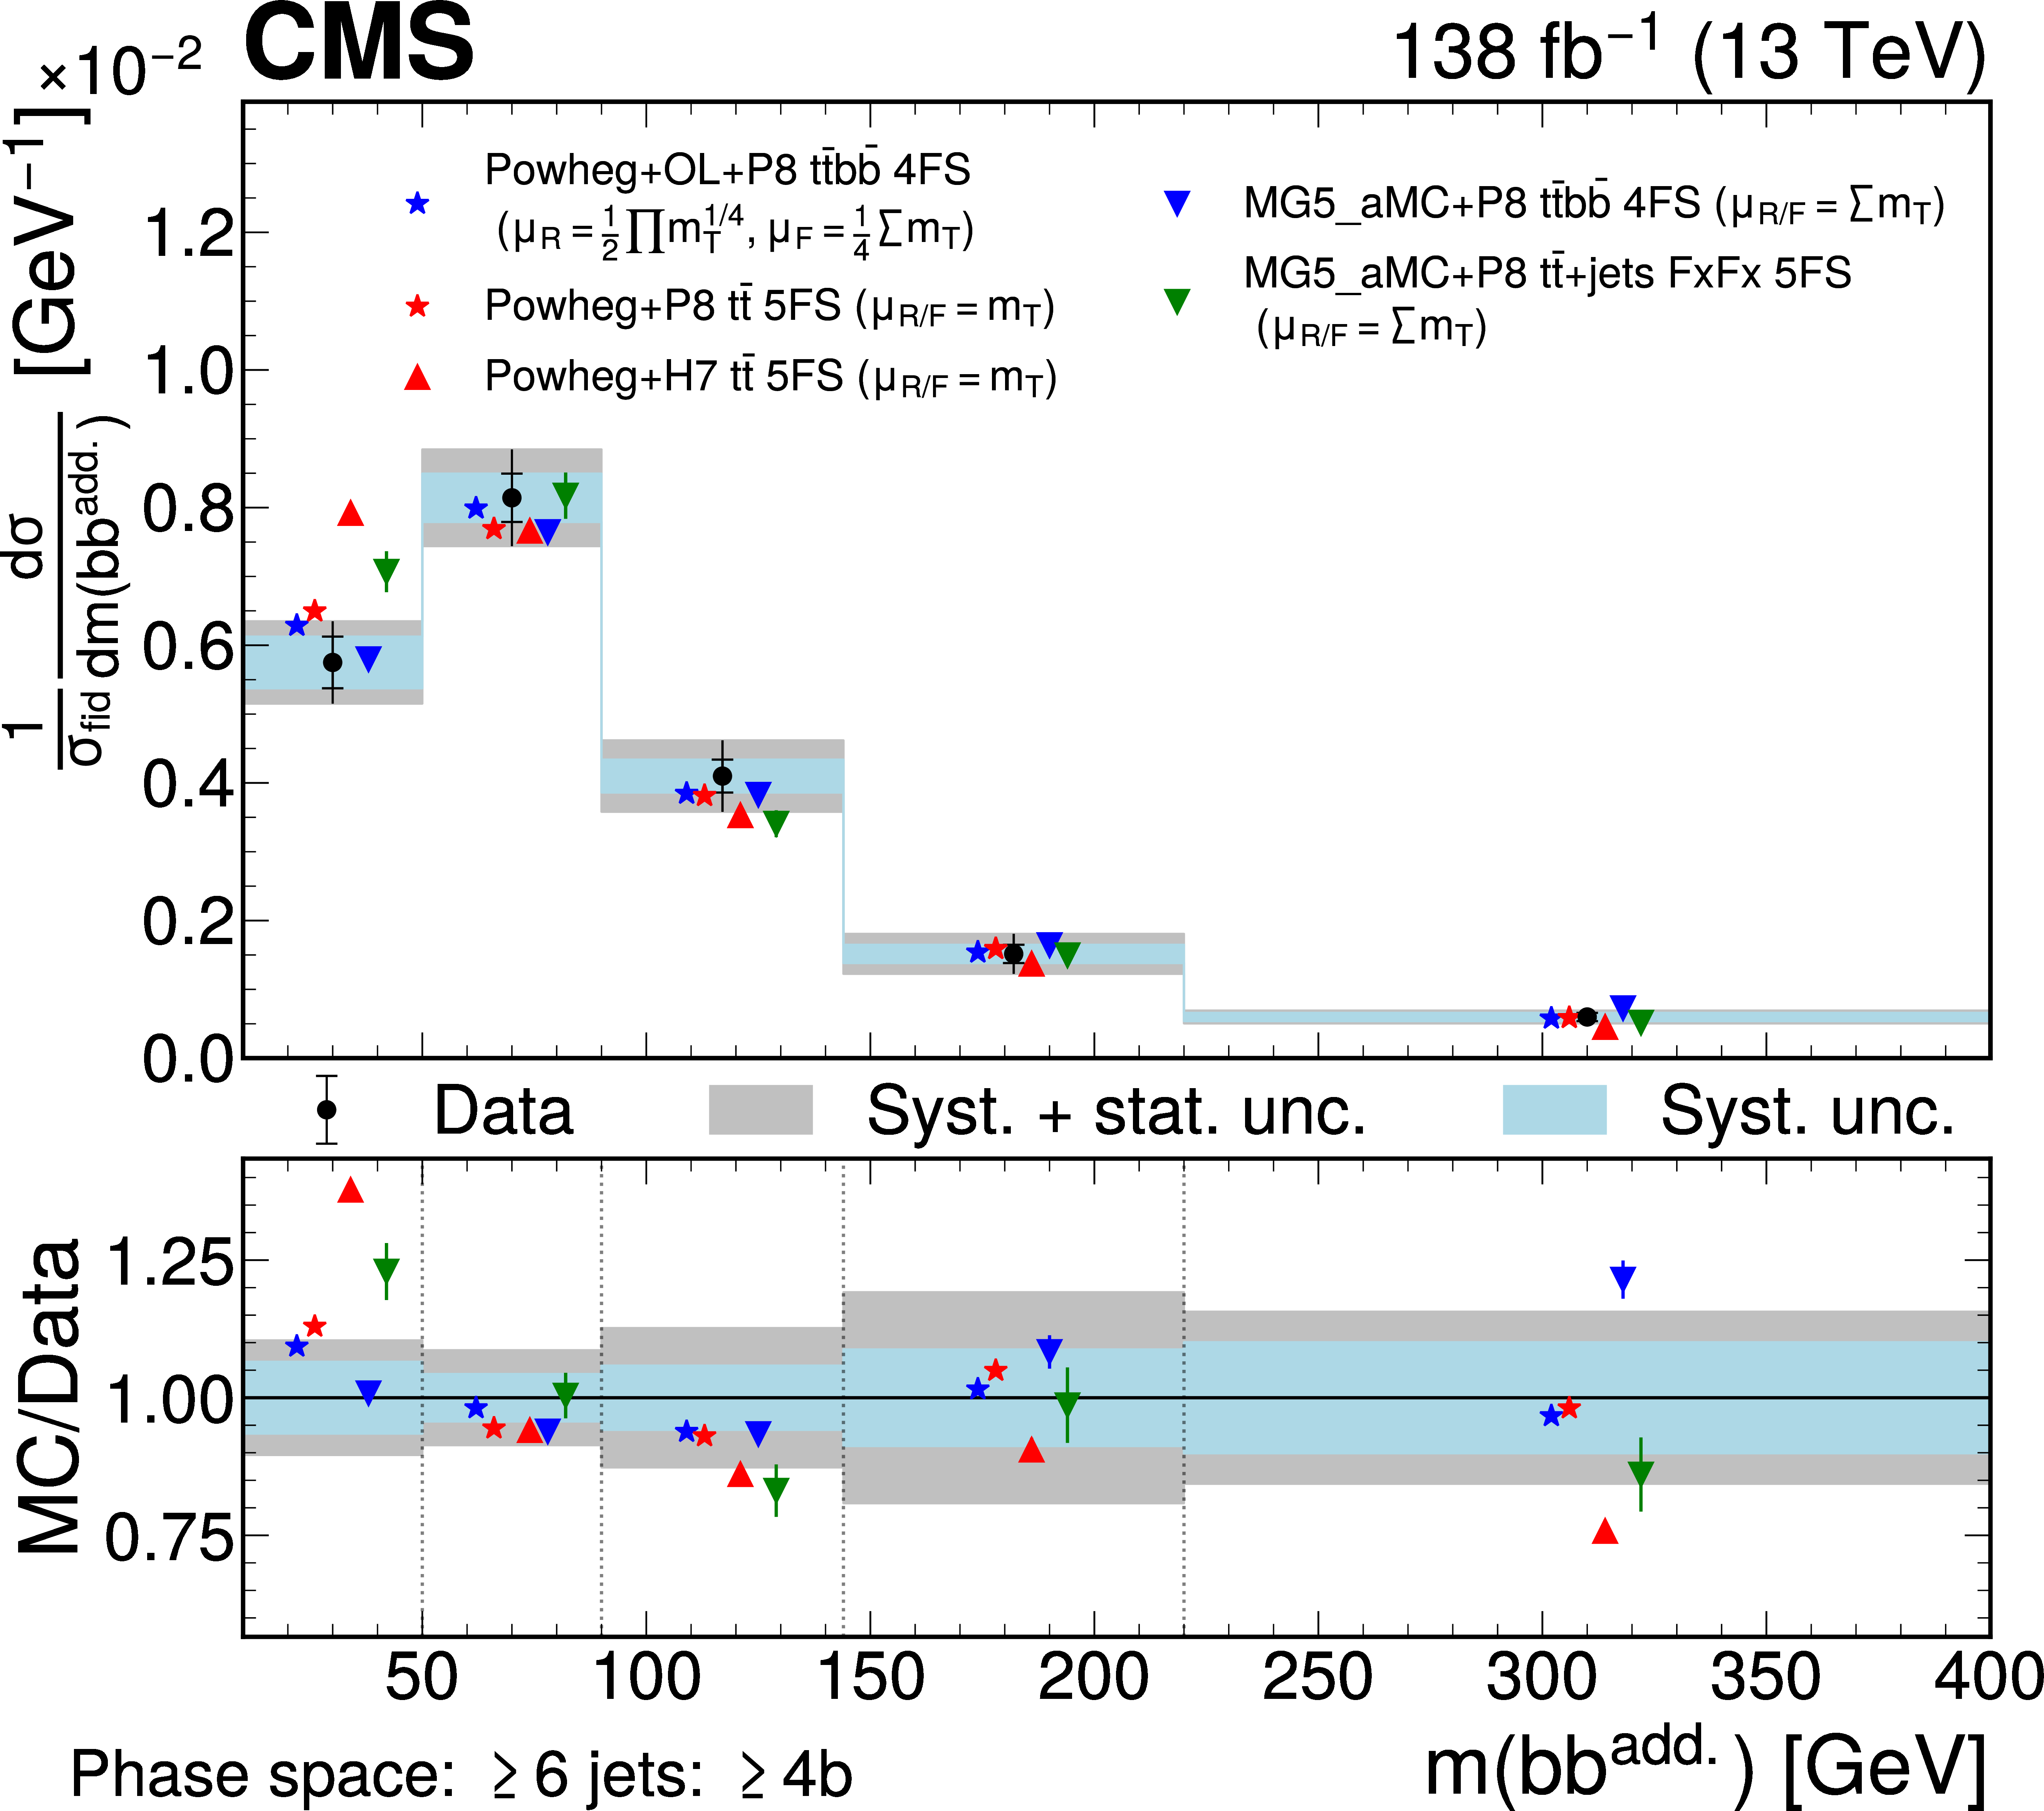
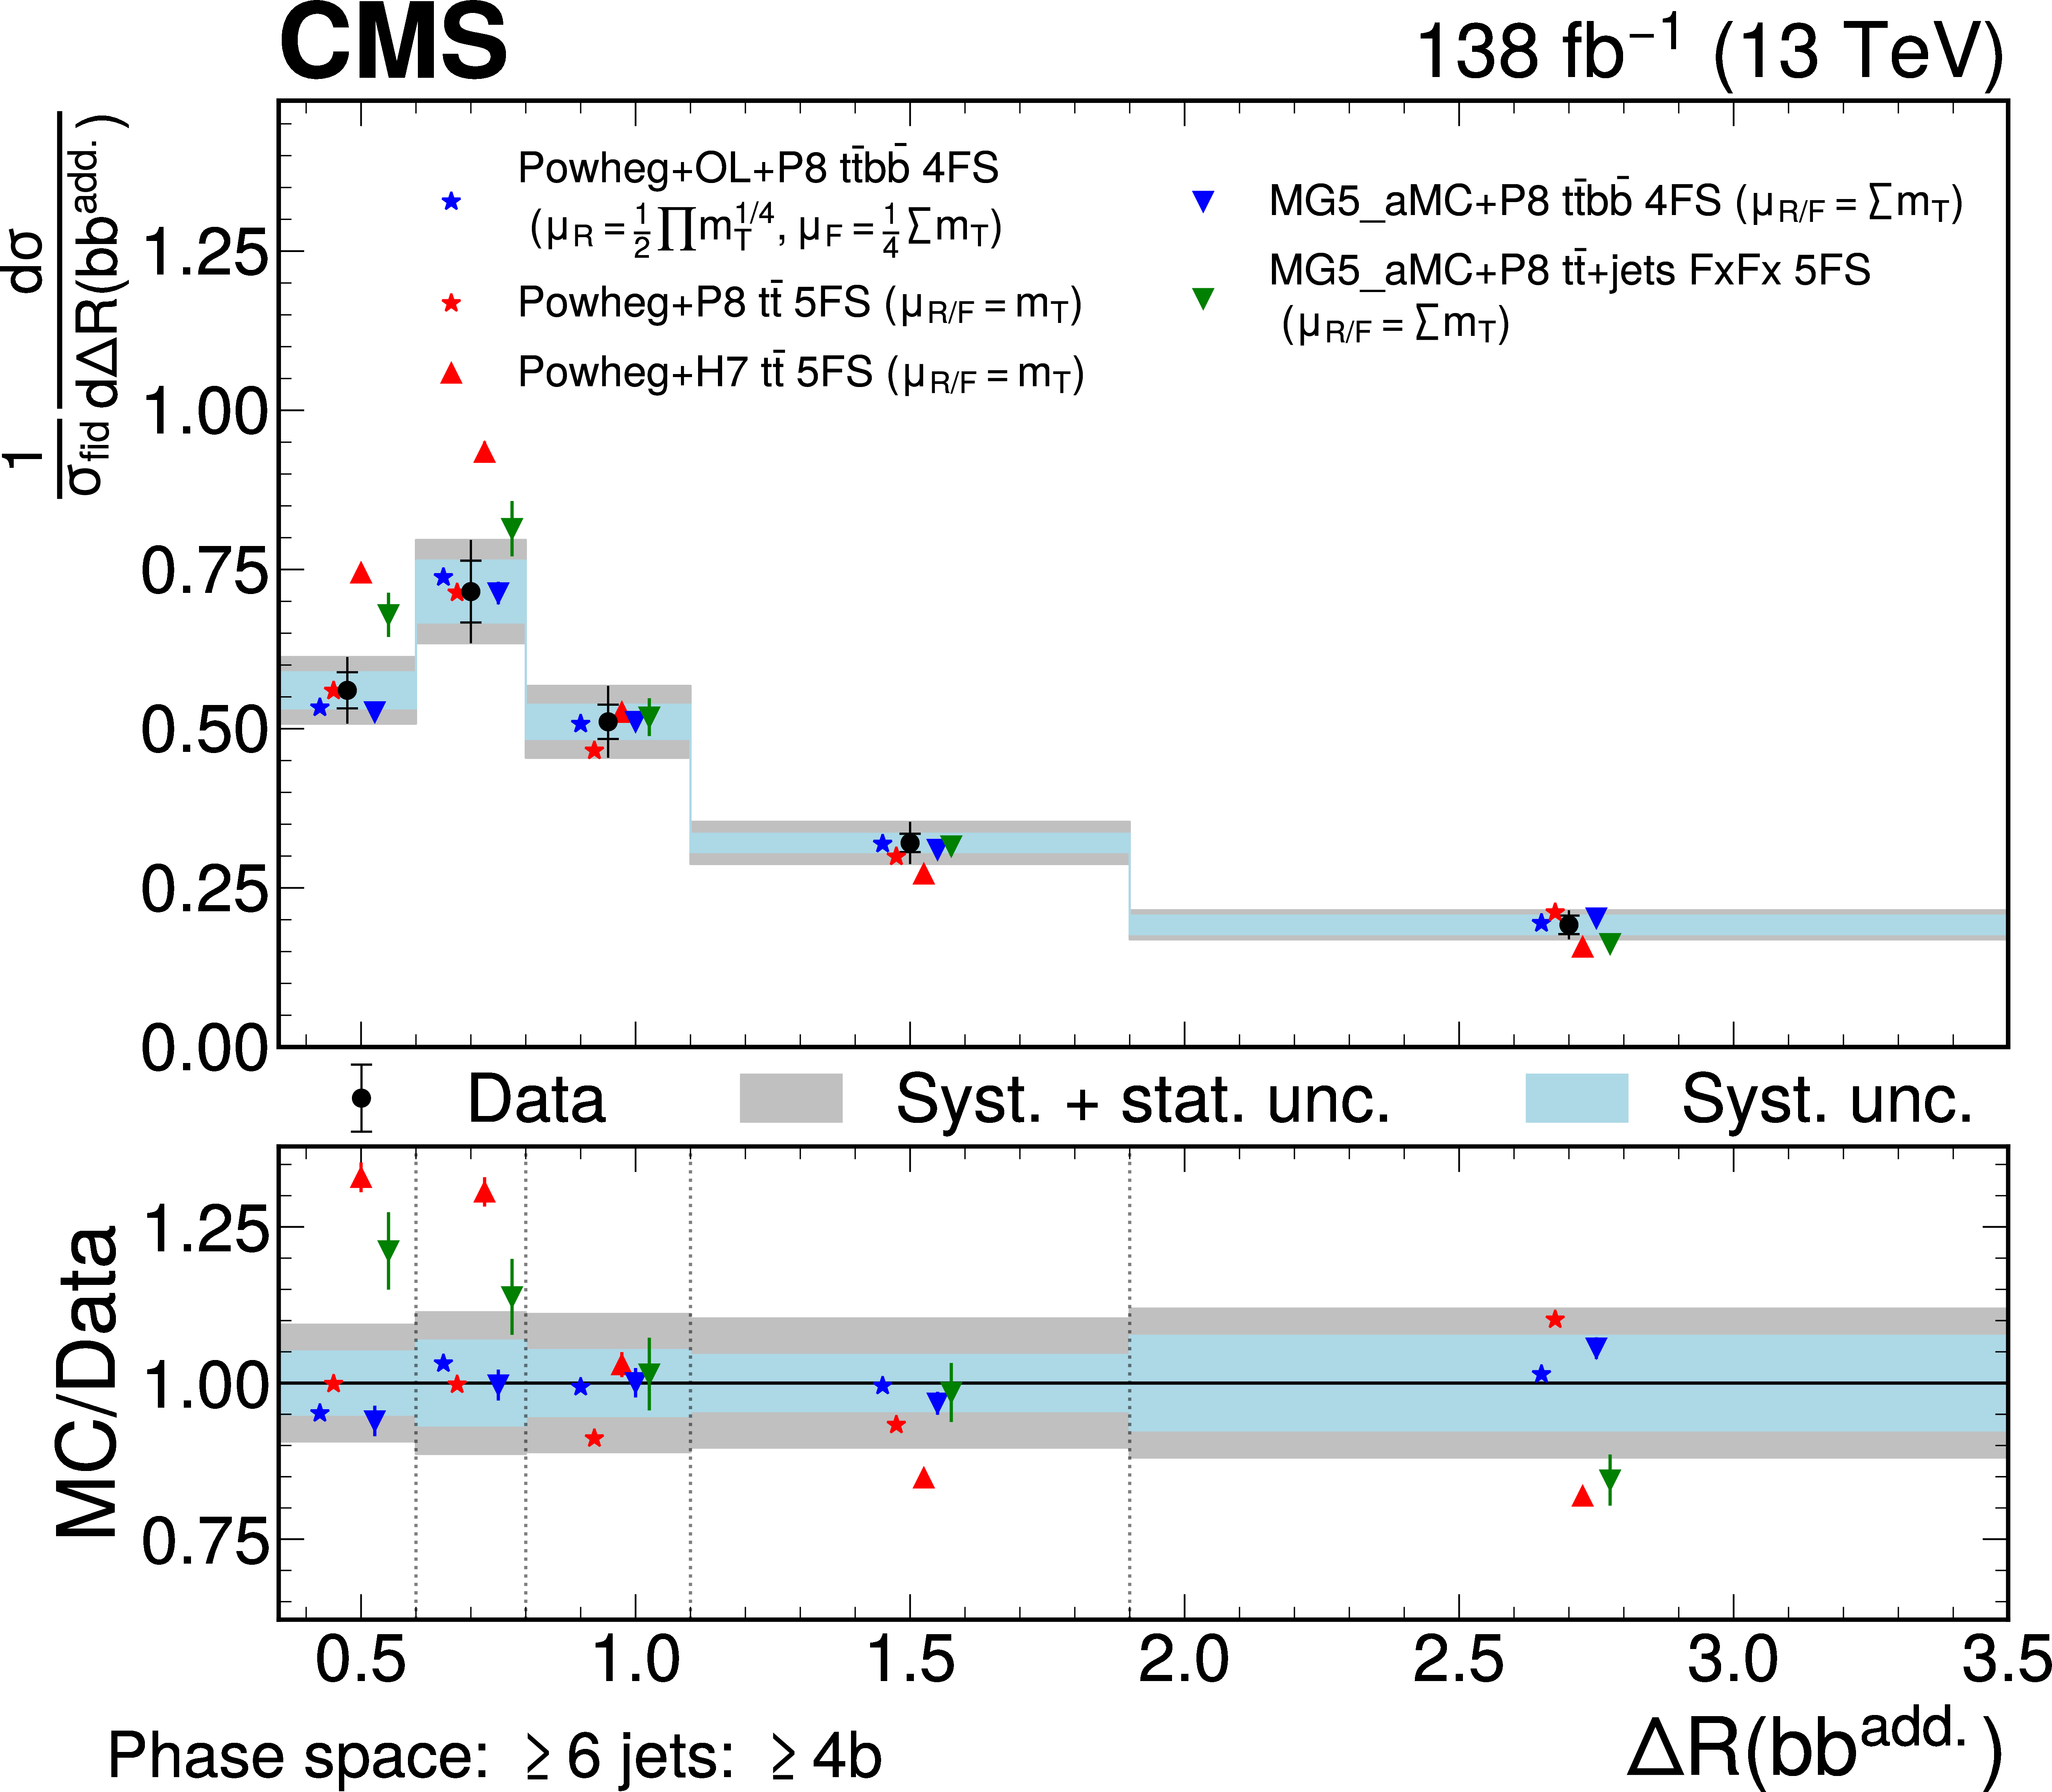
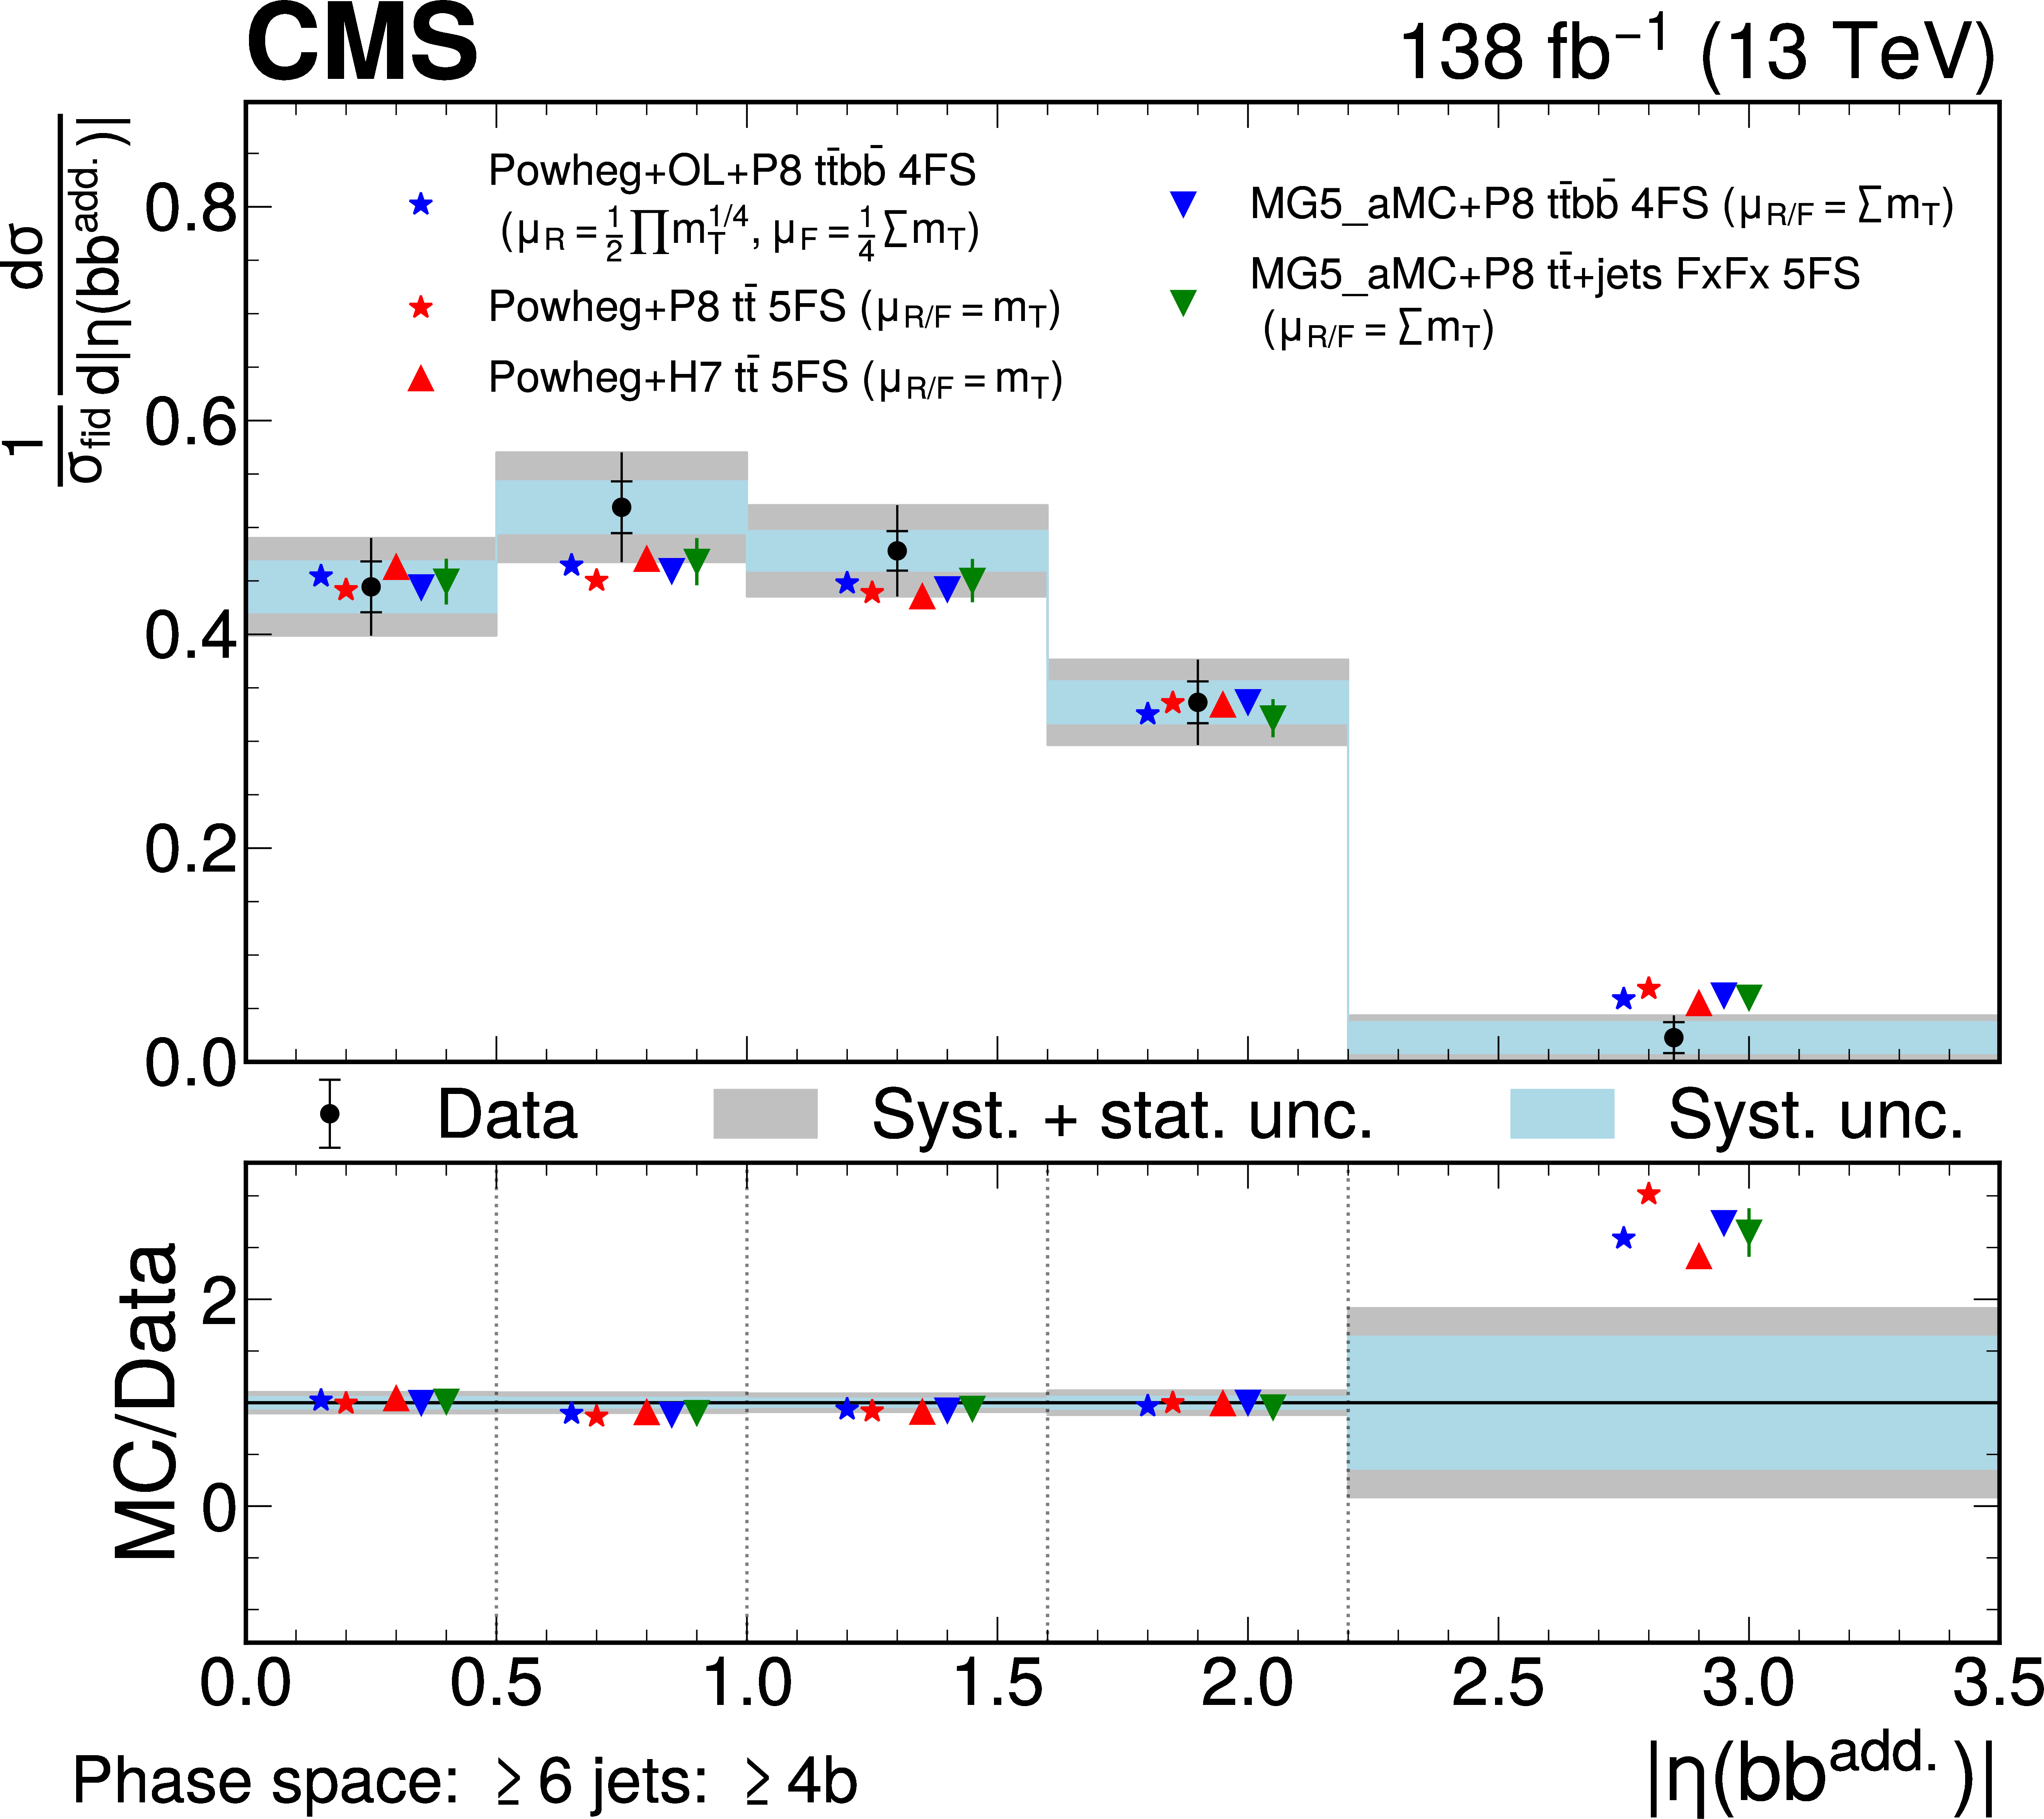
Predicted and observed normalized differential cross sections in the $ \geq $6 jets: $ \geq $4b fiducial phase space, for the invariant mass (upper left), $ \Delta R $ (upper right), $ p_{\mathrm{T}} $ (lower left), and $ |\eta| $ (lower right) of the additional b-jet pair not originating from decaying top quarks. The data are represented by points, with inner (outer) vertical bars indicating the systematic (total) uncertainties, also represented as blue (grey) bands. Cross section predictions obtained at the particle level from different simulation approaches are shown, including their statistical uncertainties, as coloured symbols. For $ m_{\mathrm{b}\mathrm{b}} $ and $ p_{\mathrm{T}} $, the last bins contain the overflow. |
png pdf |
Figure 14-a:
Predicted and observed normalized differential cross sections in the $ \geq $6 jets: $ \geq $4b fiducial phase space, for the invariant mass (upper left), $ \Delta R $ (upper right), $ p_{\mathrm{T}} $ (lower left), and $ |\eta| $ (lower right) of the additional b-jet pair not originating from decaying top quarks. The data are represented by points, with inner (outer) vertical bars indicating the systematic (total) uncertainties, also represented as blue (grey) bands. Cross section predictions obtained at the particle level from different simulation approaches are shown, including their statistical uncertainties, as coloured symbols. For $ m_{\mathrm{b}\mathrm{b}} $ and $ p_{\mathrm{T}} $, the last bins contain the overflow. |
png pdf |
Figure 14-b:
Predicted and observed normalized differential cross sections in the $ \geq $6 jets: $ \geq $4b fiducial phase space, for the invariant mass (upper left), $ \Delta R $ (upper right), $ p_{\mathrm{T}} $ (lower left), and $ |\eta| $ (lower right) of the additional b-jet pair not originating from decaying top quarks. The data are represented by points, with inner (outer) vertical bars indicating the systematic (total) uncertainties, also represented as blue (grey) bands. Cross section predictions obtained at the particle level from different simulation approaches are shown, including their statistical uncertainties, as coloured symbols. For $ m_{\mathrm{b}\mathrm{b}} $ and $ p_{\mathrm{T}} $, the last bins contain the overflow. |

png pdf |
Figure 14-c:
Predicted and observed normalized differential cross sections in the $ \geq $6 jets: $ \geq $4b fiducial phase space, for the invariant mass (upper left), $ \Delta R $ (upper right), $ p_{\mathrm{T}} $ (lower left), and $ |\eta| $ (lower right) of the additional b-jet pair not originating from decaying top quarks. The data are represented by points, with inner (outer) vertical bars indicating the systematic (total) uncertainties, also represented as blue (grey) bands. Cross section predictions obtained at the particle level from different simulation approaches are shown, including their statistical uncertainties, as coloured symbols. For $ m_{\mathrm{b}\mathrm{b}} $ and $ p_{\mathrm{T}} $, the last bins contain the overflow. |
png pdf |
Figure 14-d:
Predicted and observed normalized differential cross sections in the $ \geq $6 jets: $ \geq $4b fiducial phase space, for the invariant mass (upper left), $ \Delta R $ (upper right), $ p_{\mathrm{T}} $ (lower left), and $ |\eta| $ (lower right) of the additional b-jet pair not originating from decaying top quarks. The data are represented by points, with inner (outer) vertical bars indicating the systematic (total) uncertainties, also represented as blue (grey) bands. Cross section predictions obtained at the particle level from different simulation approaches are shown, including their statistical uncertainties, as coloured symbols. For $ m_{\mathrm{b}\mathrm{b}} $ and $ p_{\mathrm{T}} $, the last bins contain the overflow. |

png pdf |
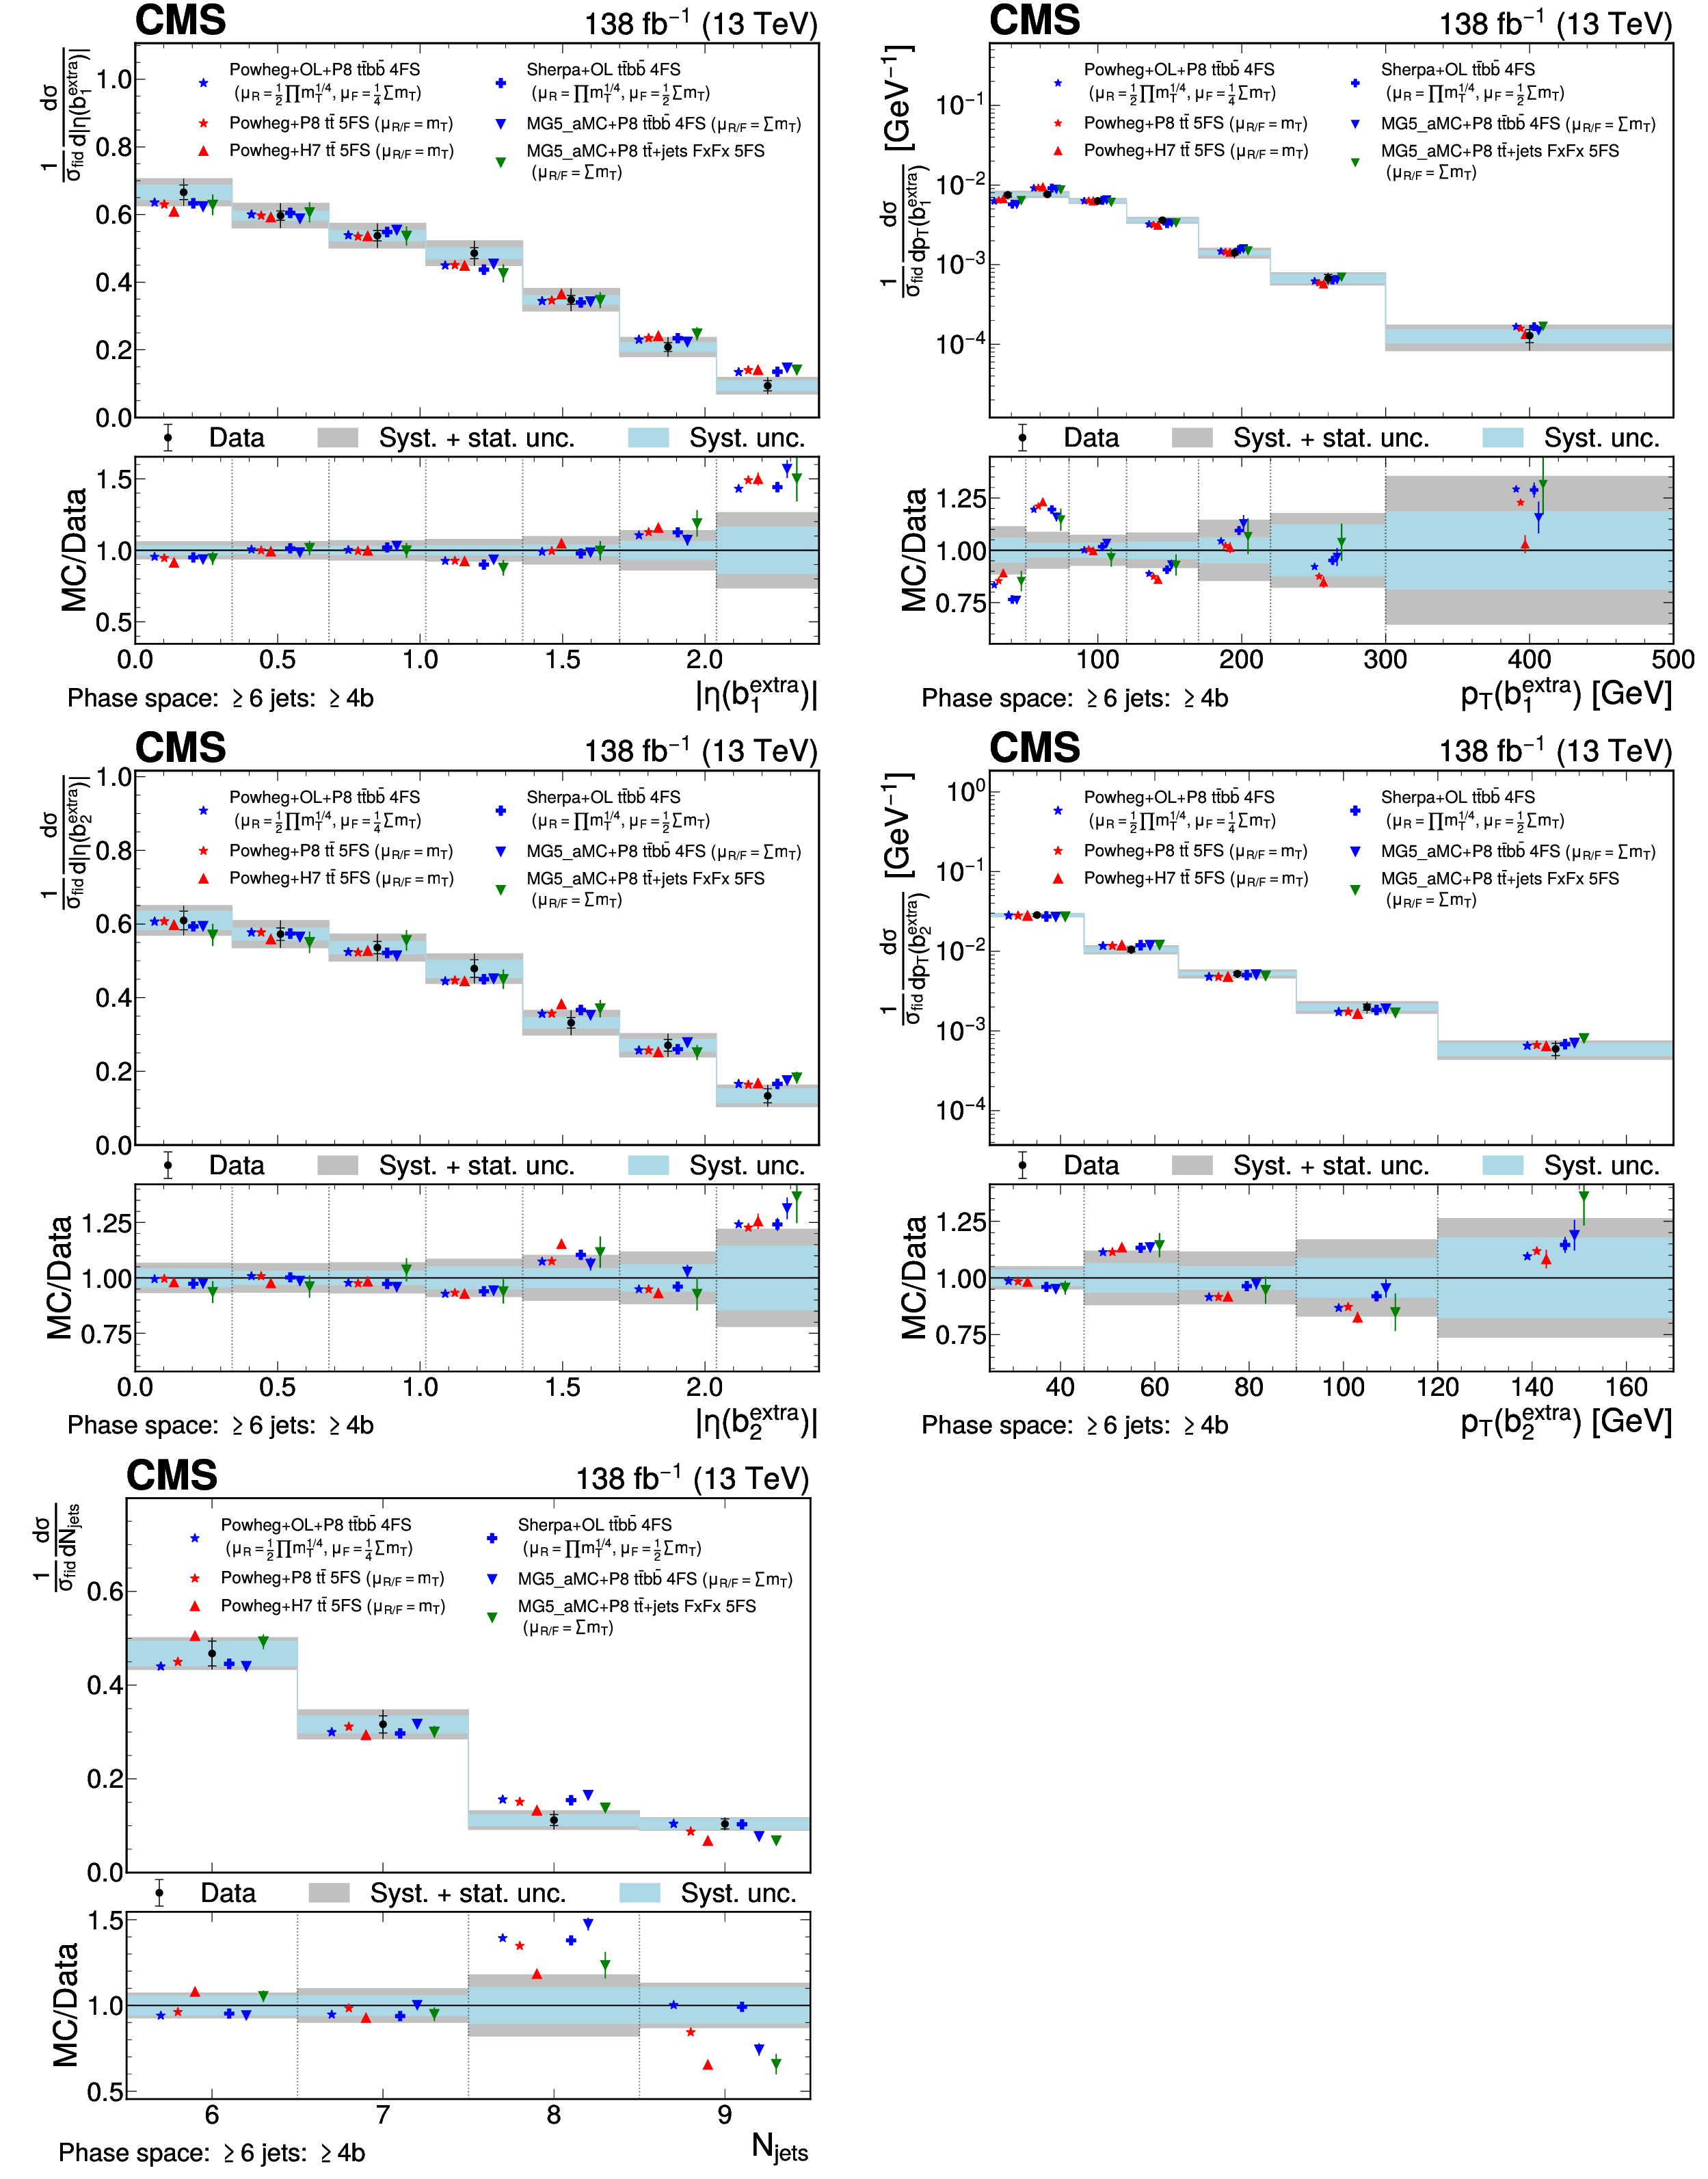
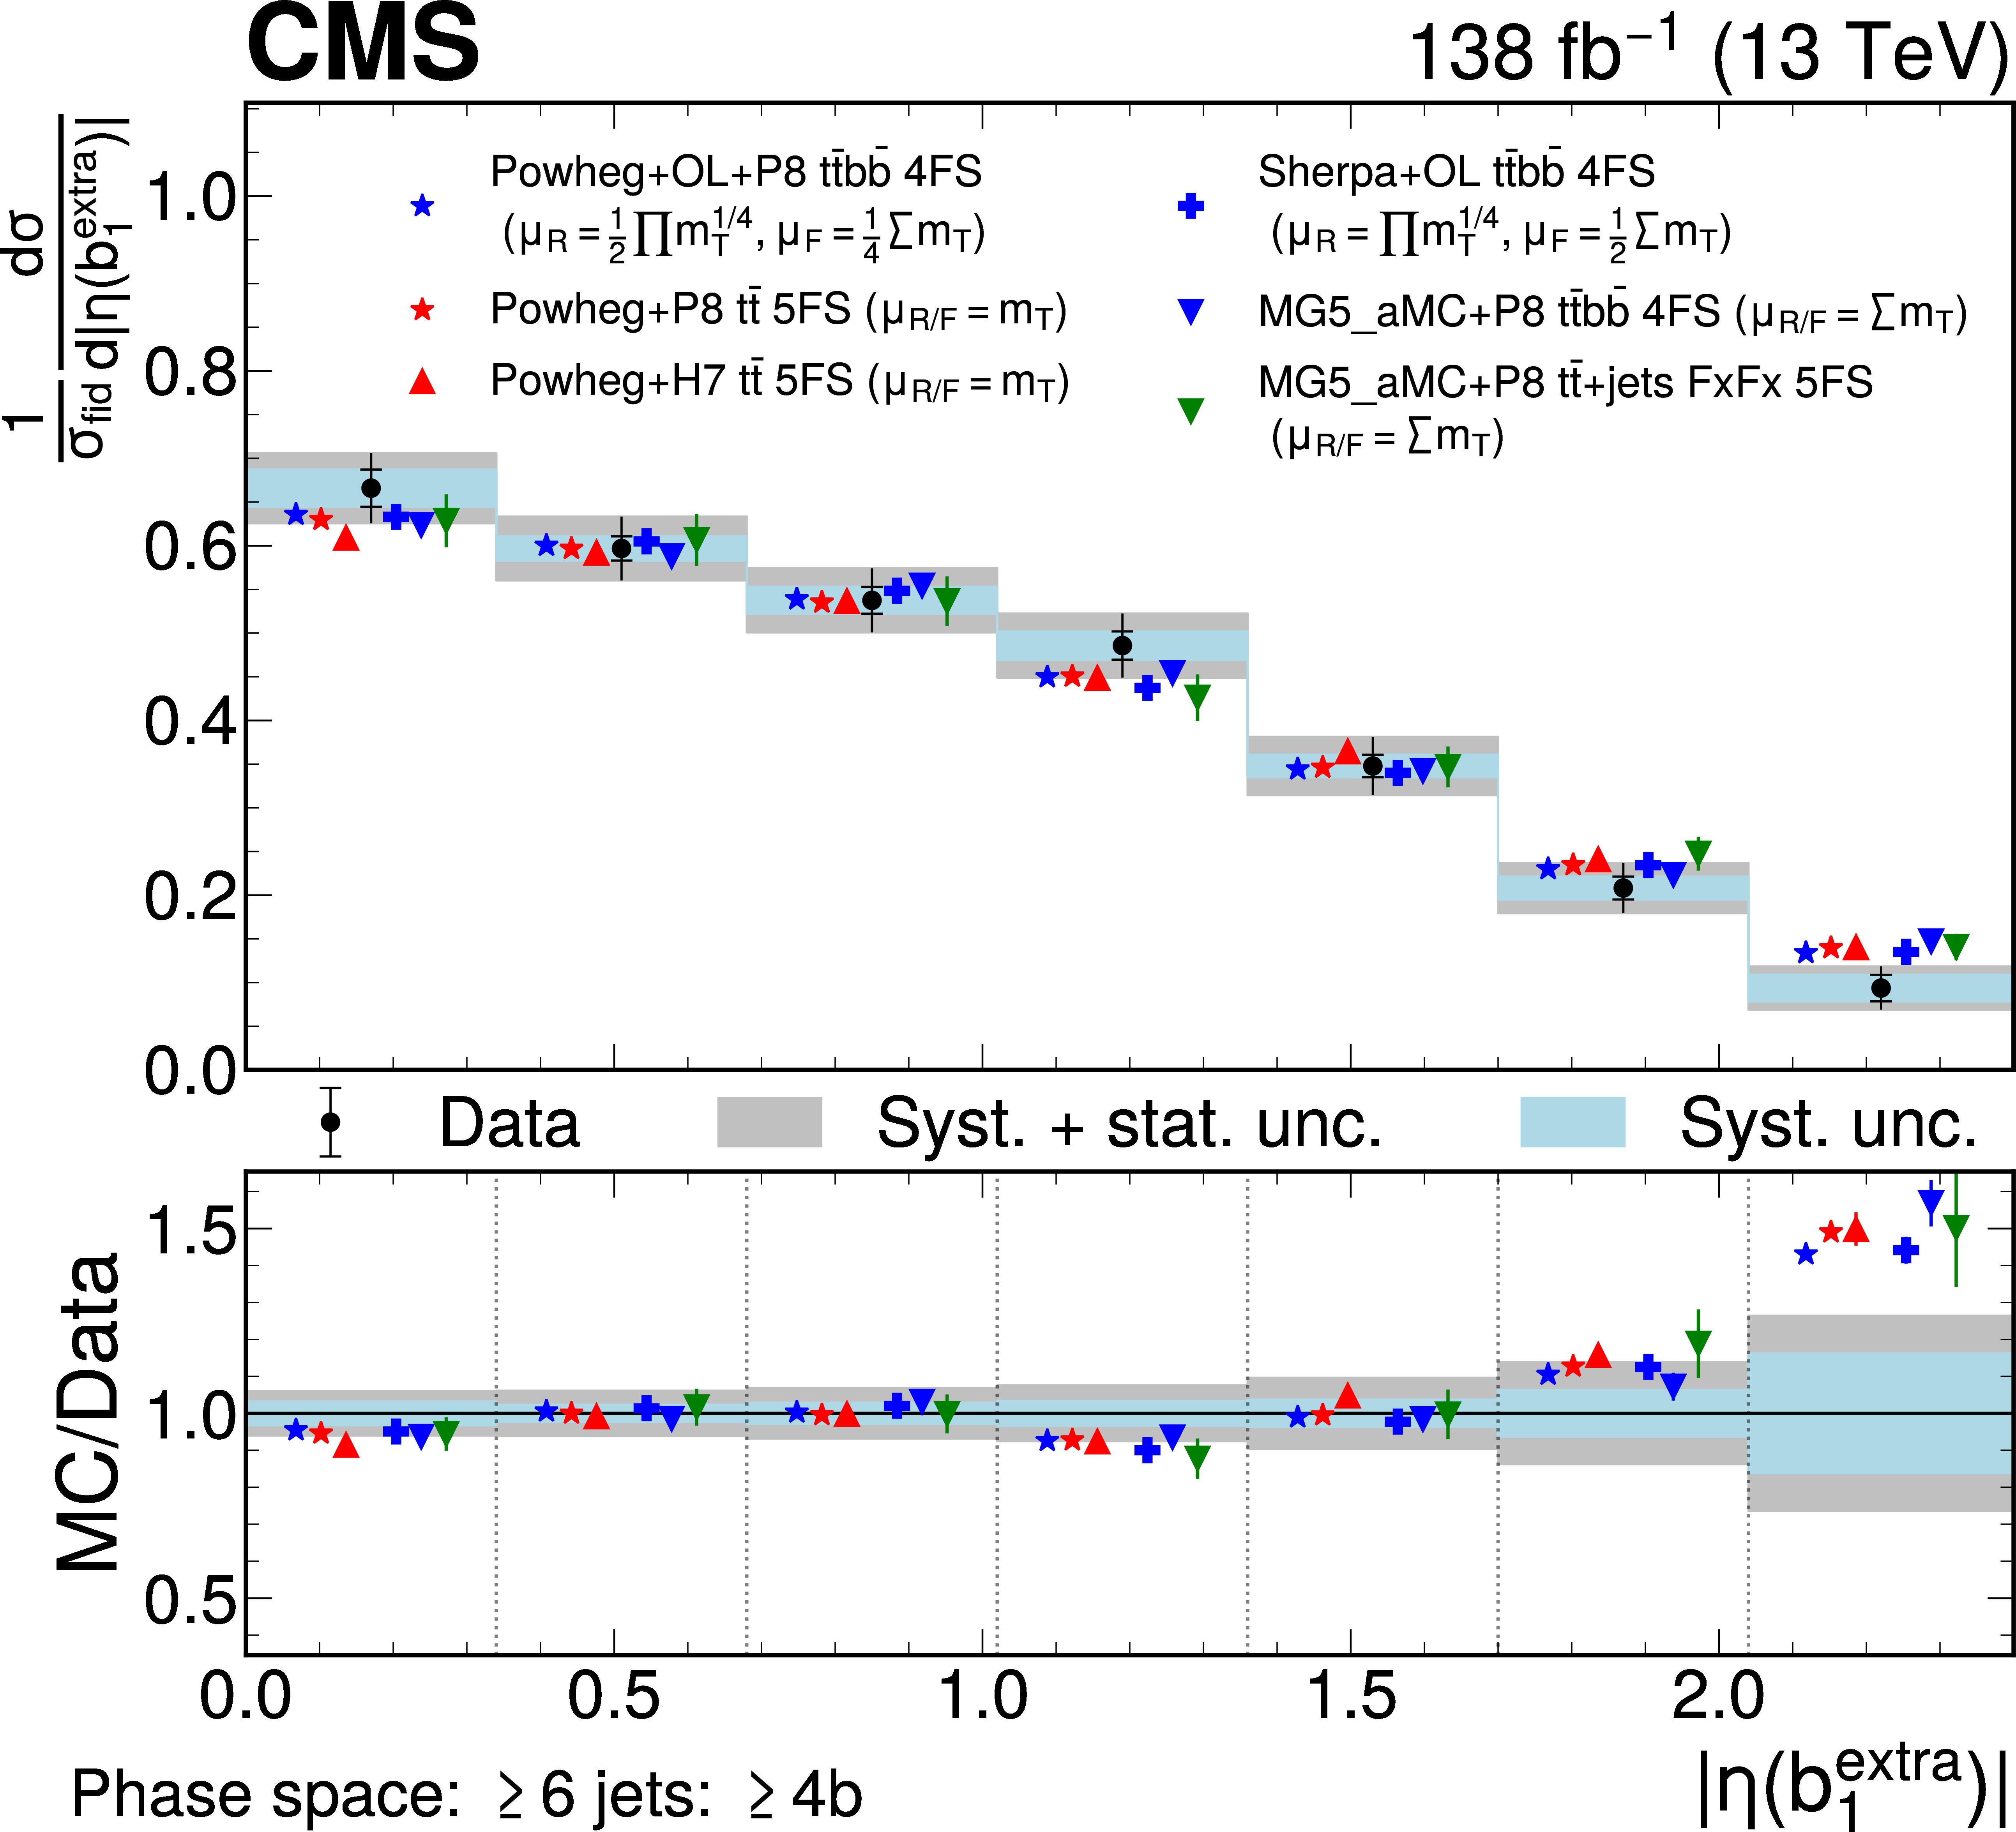
Figure 15:
Predicted and observed normalized differential cross sections in the $ \geq $6 jets: $ \geq $4b fiducial phase space, for the $ |\eta| $ (left) and $ p_{\mathrm{T}} $ (right) of the first (upper row) and second (lower row) additional b of the b-jet pair not originating from decaying top quarks. The data are represented by points, with inner (outer) vertical bars indicating the systematic (total) uncertainties, also represented as blue (grey) bands. Cross section predictions obtained at the particle level from different simulation approaches are shown, including their statistical uncertainties, as coloured symbols. For $ p_{\mathrm{T}} $, the last bins contain the overflow. |
png pdf |
Figure 15-a:
Predicted and observed normalized differential cross sections in the $ \geq $6 jets: $ \geq $4b fiducial phase space, for the $ |\eta| $ (left) and $ p_{\mathrm{T}} $ (right) of the first (upper row) and second (lower row) additional b of the b-jet pair not originating from decaying top quarks. The data are represented by points, with inner (outer) vertical bars indicating the systematic (total) uncertainties, also represented as blue (grey) bands. Cross section predictions obtained at the particle level from different simulation approaches are shown, including their statistical uncertainties, as coloured symbols. For $ p_{\mathrm{T}} $, the last bins contain the overflow. |
png pdf |
Figure 15-b:
Predicted and observed normalized differential cross sections in the $ \geq $6 jets: $ \geq $4b fiducial phase space, for the $ |\eta| $ (left) and $ p_{\mathrm{T}} $ (right) of the first (upper row) and second (lower row) additional b of the b-jet pair not originating from decaying top quarks. The data are represented by points, with inner (outer) vertical bars indicating the systematic (total) uncertainties, also represented as blue (grey) bands. Cross section predictions obtained at the particle level from different simulation approaches are shown, including their statistical uncertainties, as coloured symbols. For $ p_{\mathrm{T}} $, the last bins contain the overflow. |

png pdf |
Figure 15-c:
Predicted and observed normalized differential cross sections in the $ \geq $6 jets: $ \geq $4b fiducial phase space, for the $ |\eta| $ (left) and $ p_{\mathrm{T}} $ (right) of the first (upper row) and second (lower row) additional b of the b-jet pair not originating from decaying top quarks. The data are represented by points, with inner (outer) vertical bars indicating the systematic (total) uncertainties, also represented as blue (grey) bands. Cross section predictions obtained at the particle level from different simulation approaches are shown, including their statistical uncertainties, as coloured symbols. For $ p_{\mathrm{T}} $, the last bins contain the overflow. |
png pdf |
Figure 15-d:
Predicted and observed normalized differential cross sections in the $ \geq $6 jets: $ \geq $4b fiducial phase space, for the $ |\eta| $ (left) and $ p_{\mathrm{T}} $ (right) of the first (upper row) and second (lower row) additional b of the b-jet pair not originating from decaying top quarks. The data are represented by points, with inner (outer) vertical bars indicating the systematic (total) uncertainties, also represented as blue (grey) bands. Cross section predictions obtained at the particle level from different simulation approaches are shown, including their statistical uncertainties, as coloured symbols. For $ p_{\mathrm{T}} $, the last bins contain the overflow. |
png pdf |
Figure 16:
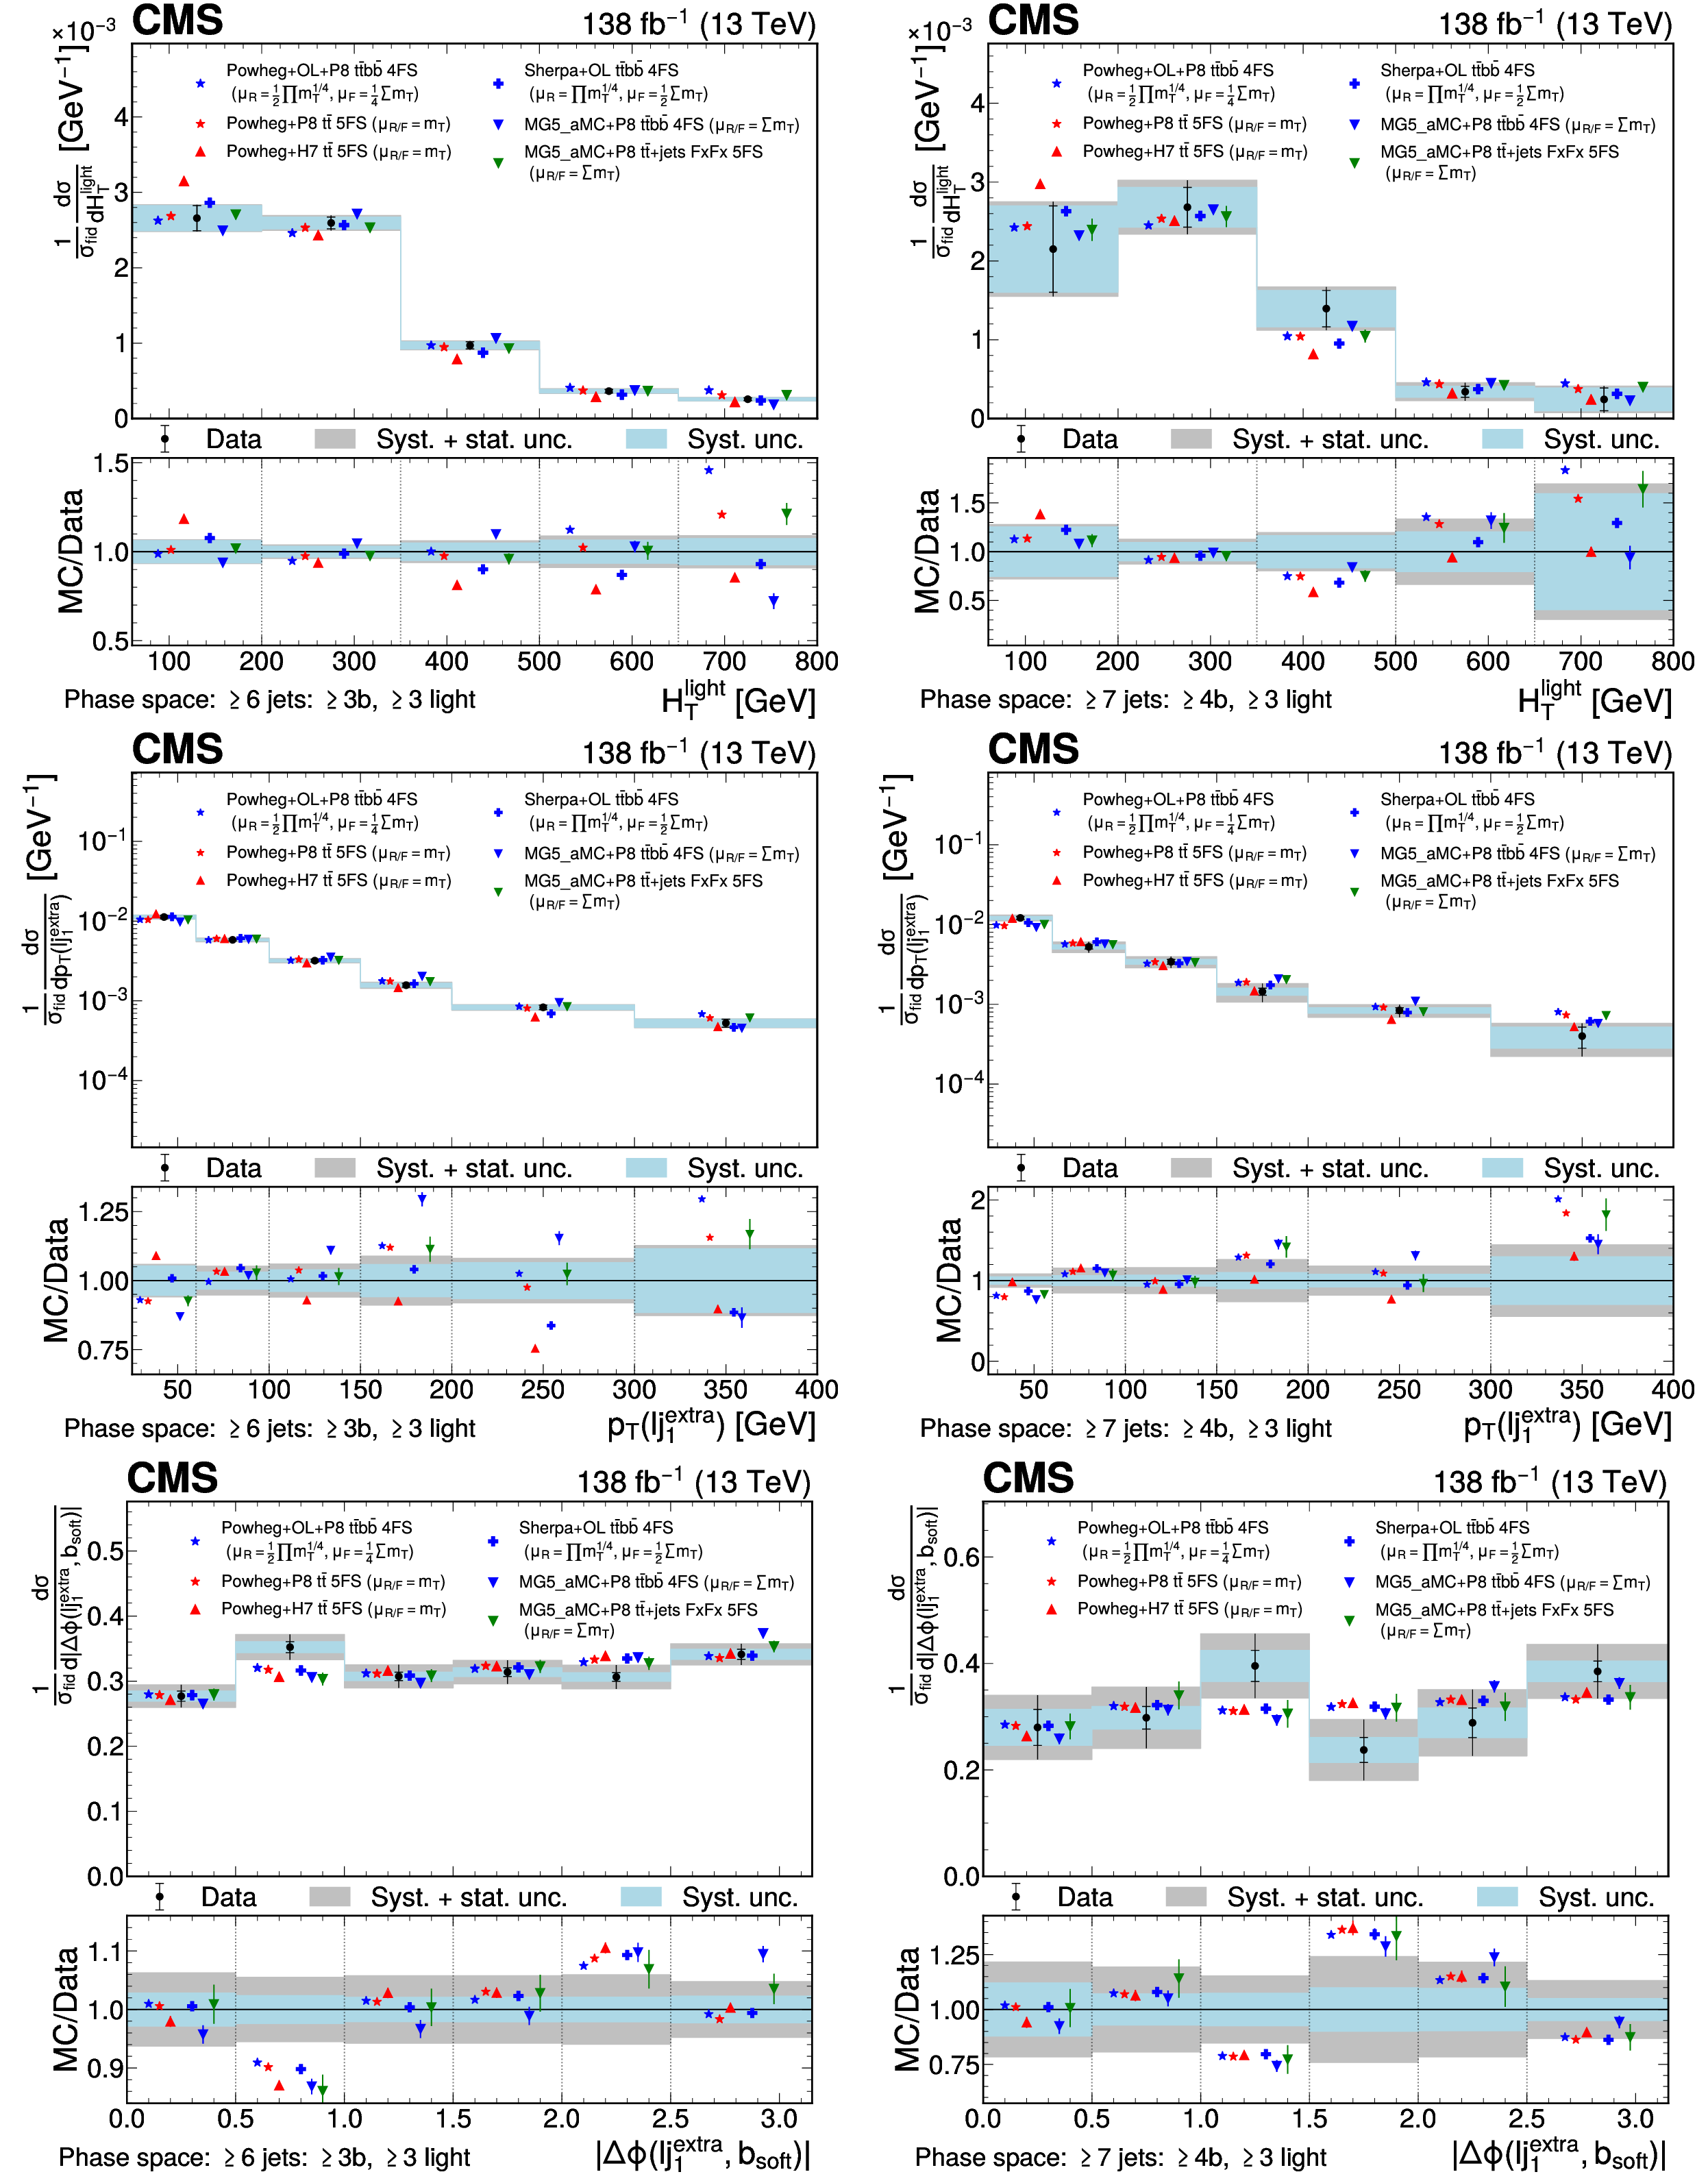
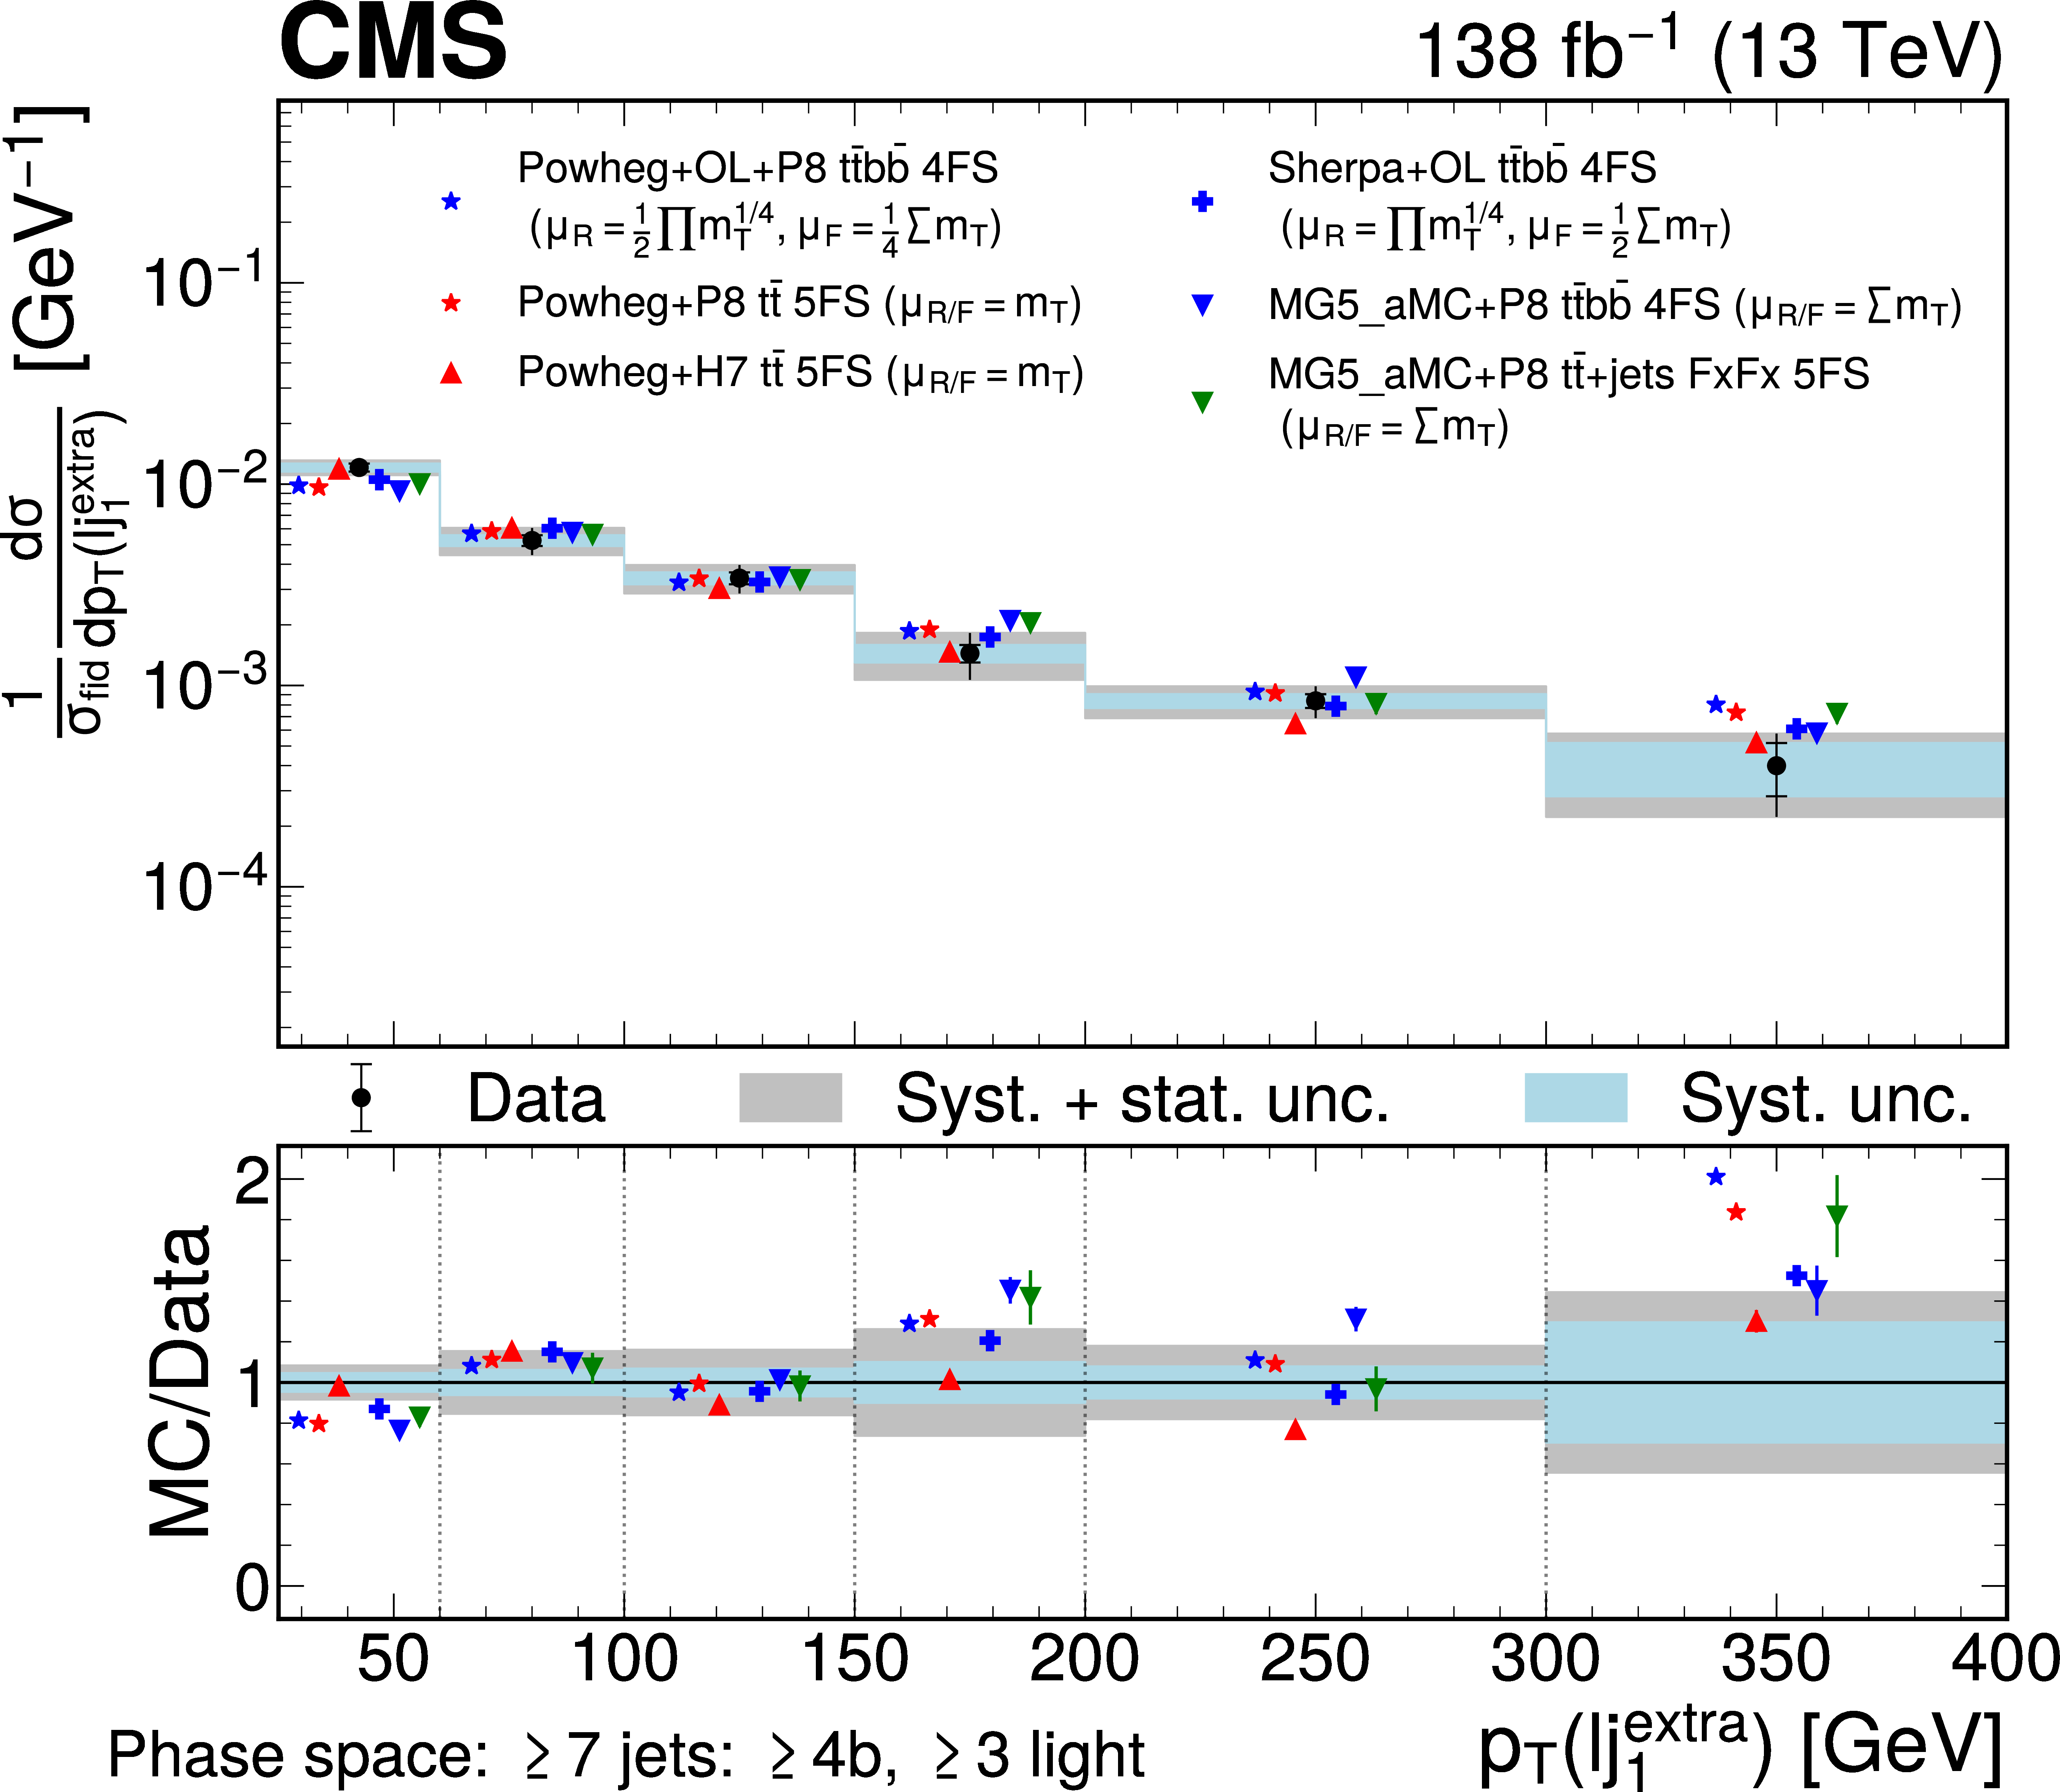
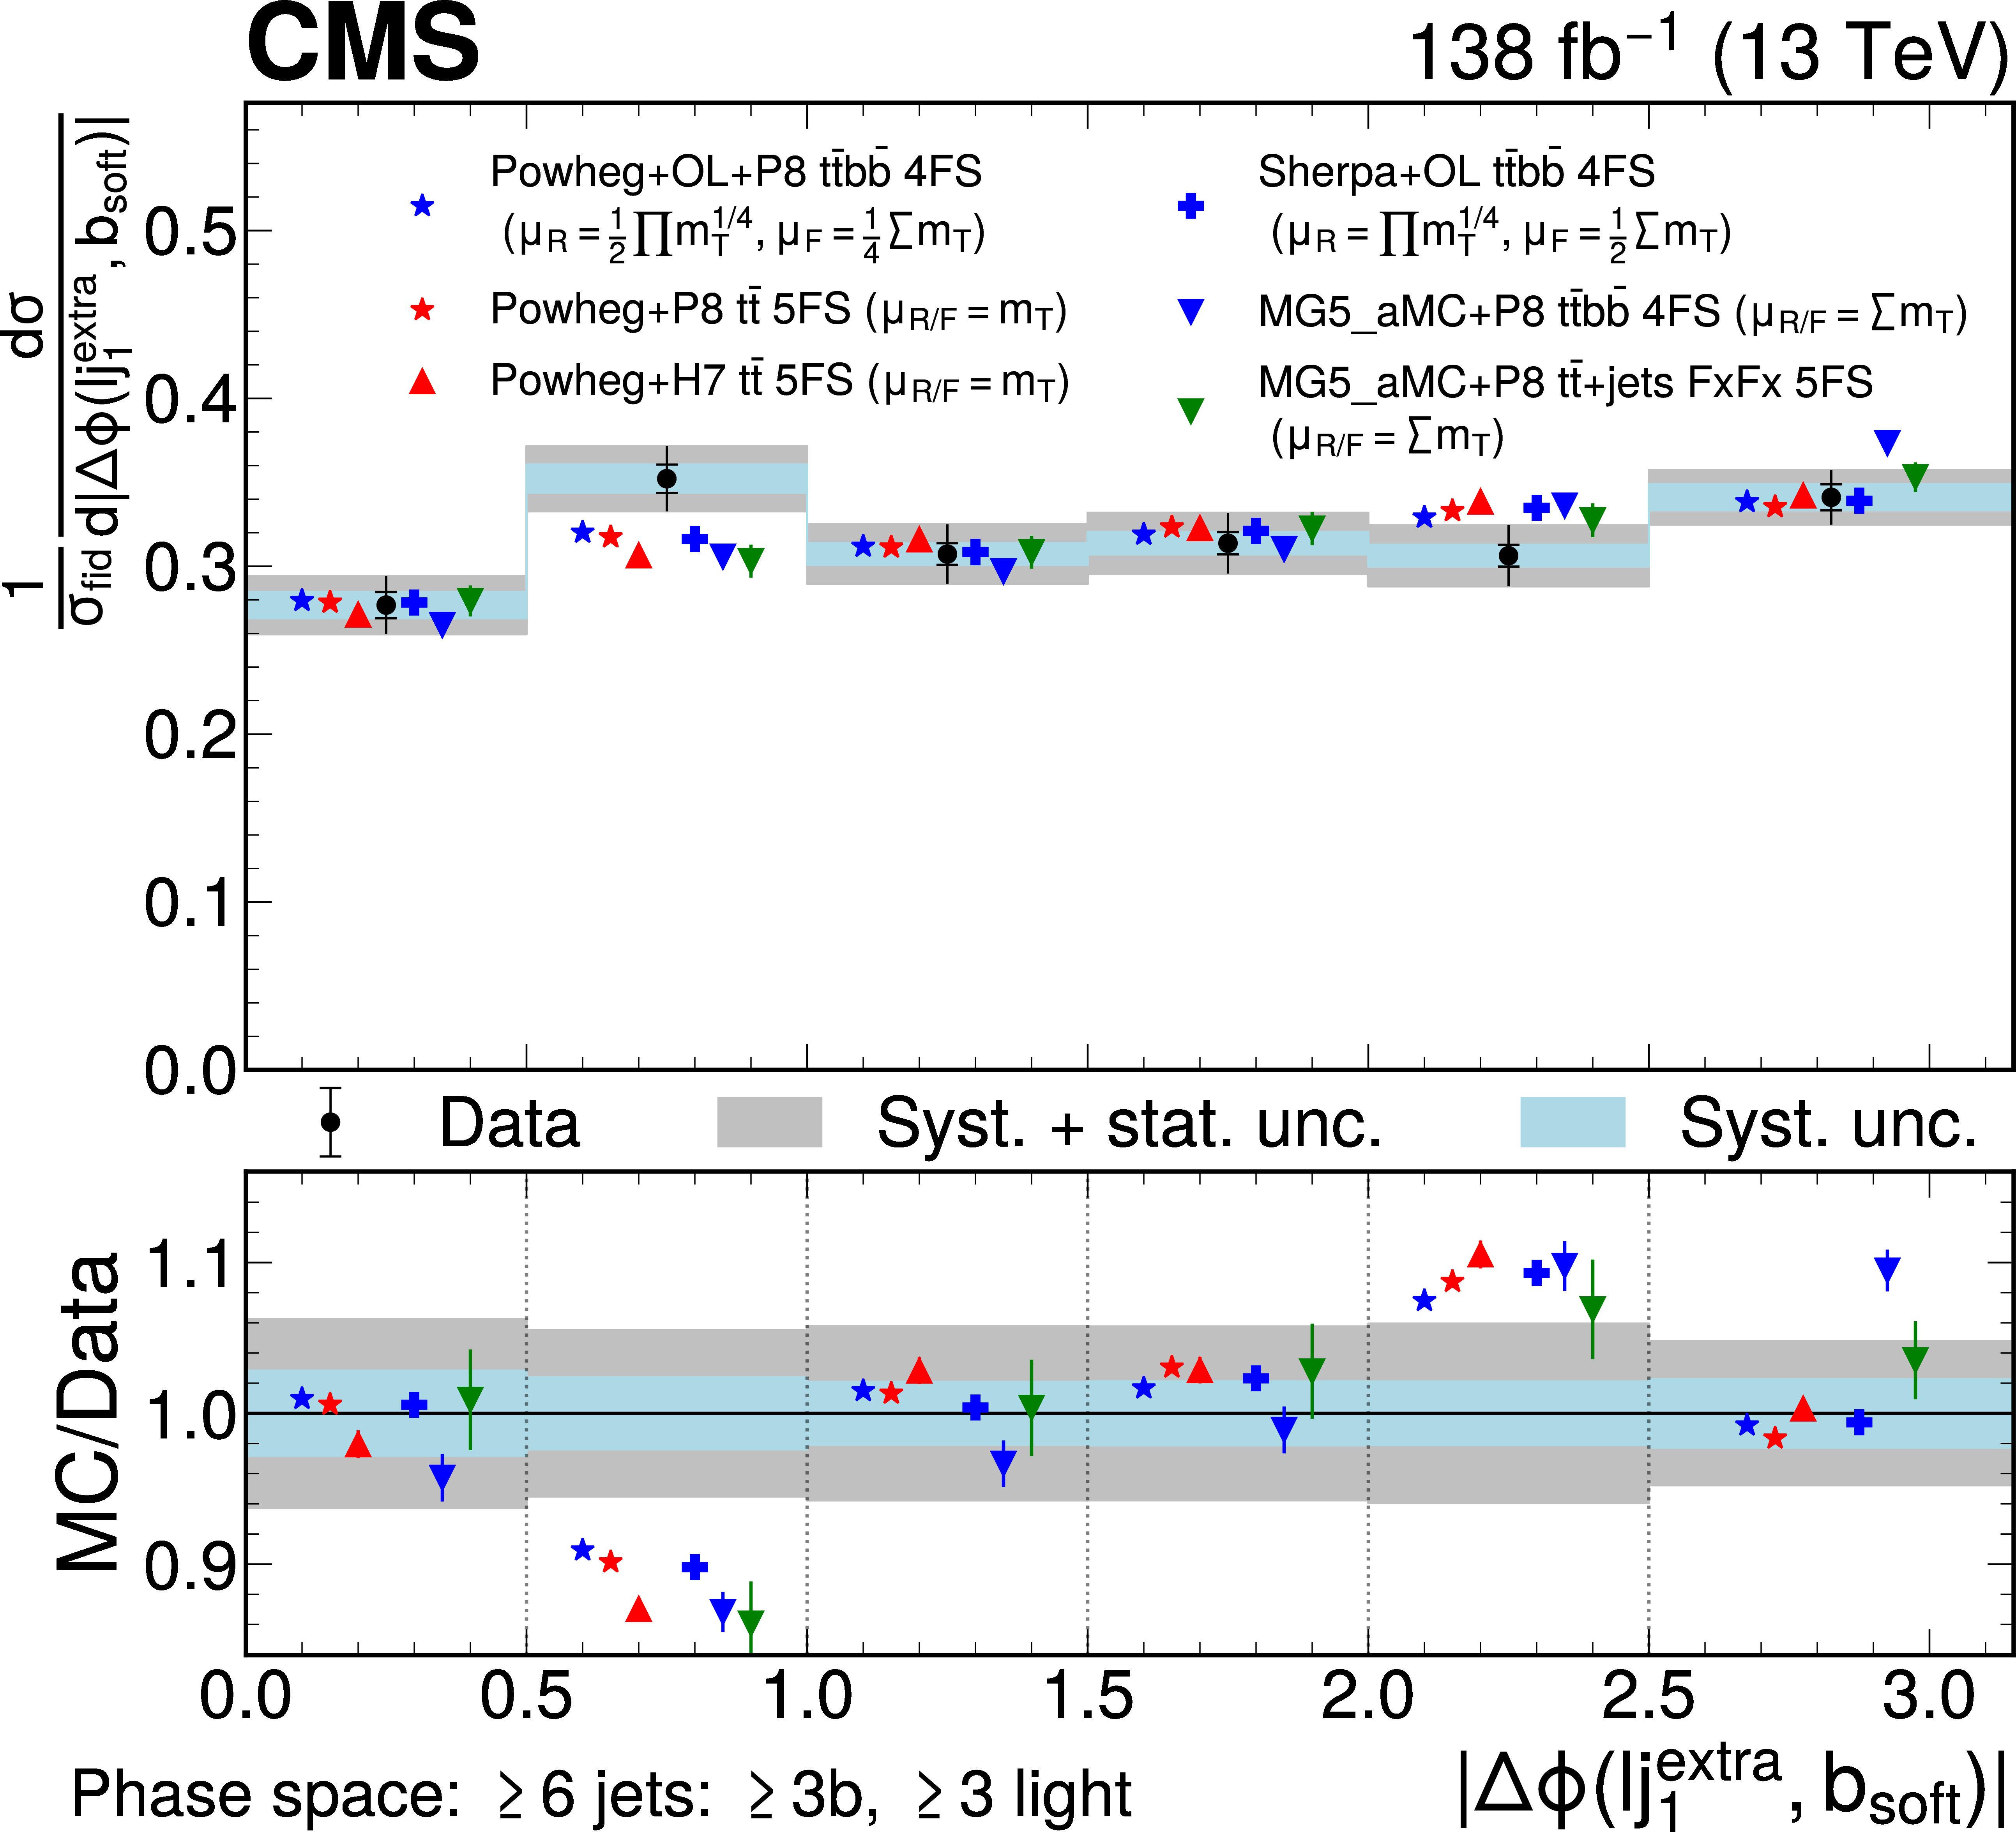
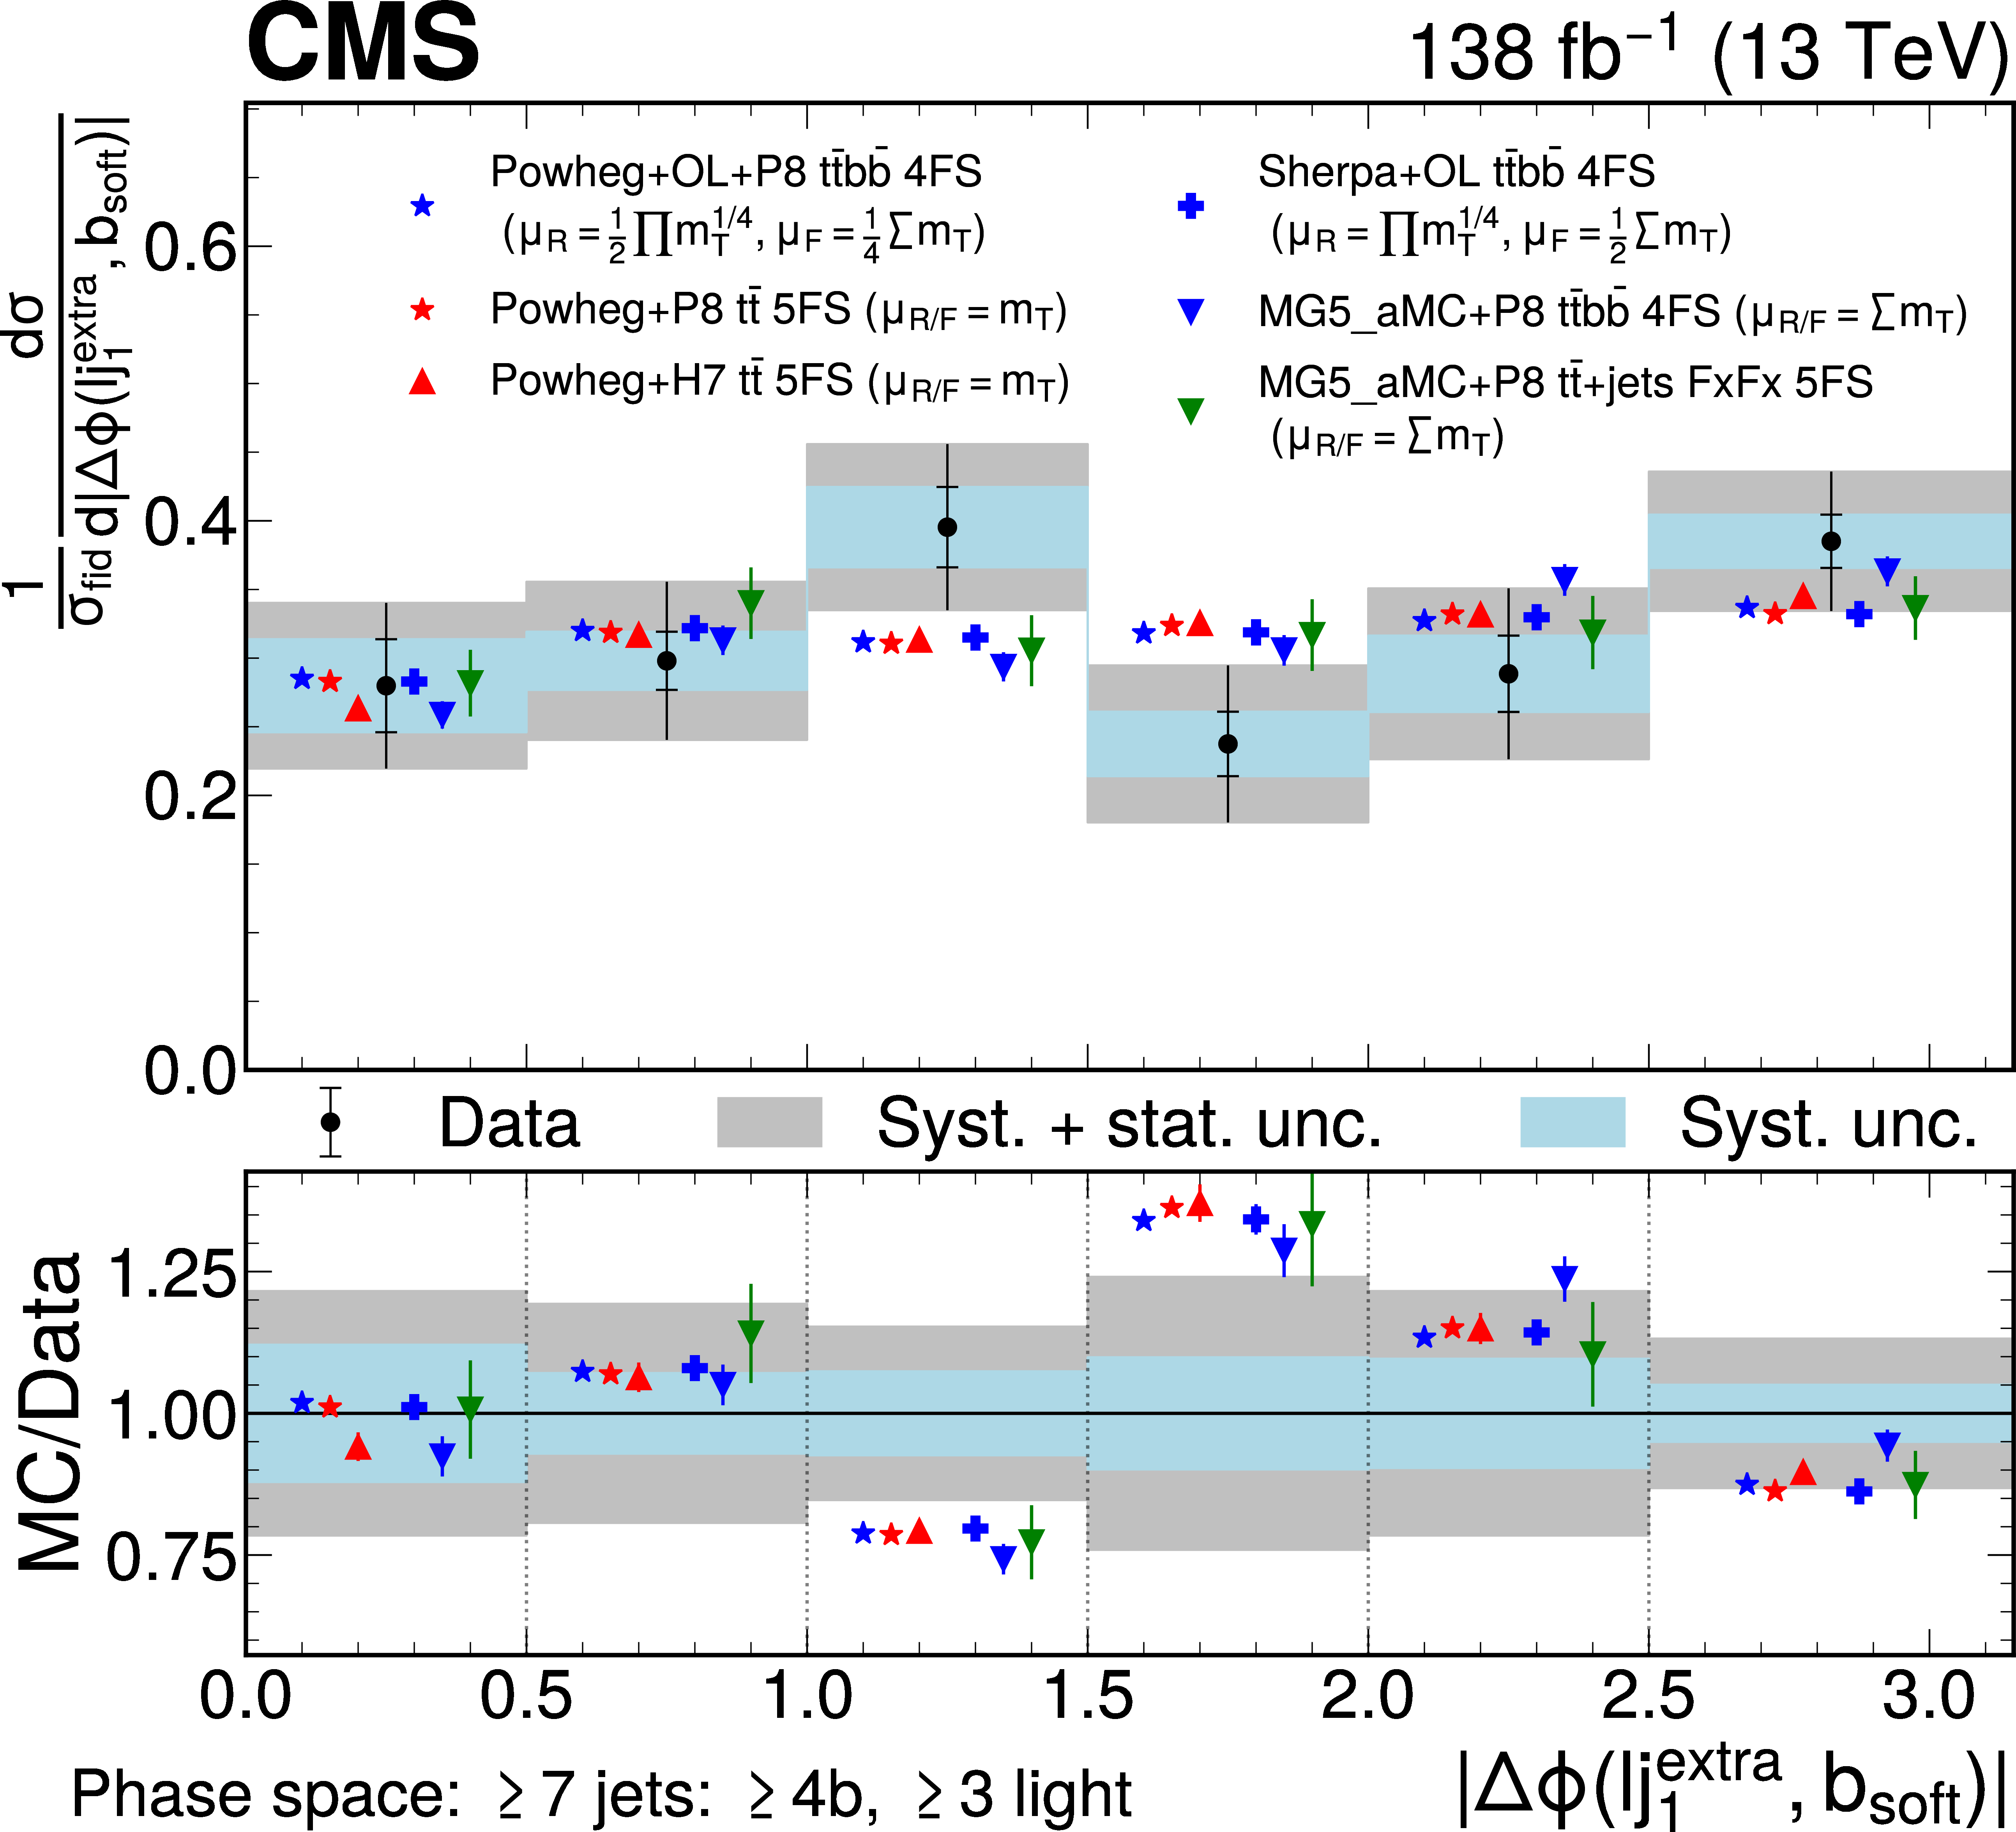
Predicted and observed normalized differential cross sections in the $ \geq $6 jets: $ \geq $3b, $ \geq $3 light (left) and $ \geq $7 jets: $ \geq $4b, $ \geq $3 light (right) fiducial phase space regions, for the $ H_{\mathrm{T}} $ of light jets (upper row), the $ p_{\mathrm{T}} $ of the extra light jet (middle row), and the $ \Delta\phi $ between the extra light jet and the softest b jet (lower row). The data are represented by points, with inner (outer) vertical bars indicating the systematic (total) uncertainties, also represented as blue (grey) bands. Cross section predictions obtained at the particle level from different simulation approaches are shown, including their statistical uncertainties, as coloured symbols with different shapes. For $ H_{\mathrm{T}} $ and $ p_{\mathrm{T}} $, the last bins contain the overflow. |

png pdf |
Figure 16-a:
Predicted and observed normalized differential cross sections in the $ \geq $6 jets: $ \geq $3b, $ \geq $3 light (left) and $ \geq $7 jets: $ \geq $4b, $ \geq $3 light (right) fiducial phase space regions, for the $ H_{\mathrm{T}} $ of light jets (upper row), the $ p_{\mathrm{T}} $ of the extra light jet (middle row), and the $ \Delta\phi $ between the extra light jet and the softest b jet (lower row). The data are represented by points, with inner (outer) vertical bars indicating the systematic (total) uncertainties, also represented as blue (grey) bands. Cross section predictions obtained at the particle level from different simulation approaches are shown, including their statistical uncertainties, as coloured symbols with different shapes. For $ H_{\mathrm{T}} $ and $ p_{\mathrm{T}} $, the last bins contain the overflow. |

png pdf |
Figure 16-b:
Predicted and observed normalized differential cross sections in the $ \geq $6 jets: $ \geq $3b, $ \geq $3 light (left) and $ \geq $7 jets: $ \geq $4b, $ \geq $3 light (right) fiducial phase space regions, for the $ H_{\mathrm{T}} $ of light jets (upper row), the $ p_{\mathrm{T}} $ of the extra light jet (middle row), and the $ \Delta\phi $ between the extra light jet and the softest b jet (lower row). The data are represented by points, with inner (outer) vertical bars indicating the systematic (total) uncertainties, also represented as blue (grey) bands. Cross section predictions obtained at the particle level from different simulation approaches are shown, including their statistical uncertainties, as coloured symbols with different shapes. For $ H_{\mathrm{T}} $ and $ p_{\mathrm{T}} $, the last bins contain the overflow. |

png pdf |
Figure 16-c:
Predicted and observed normalized differential cross sections in the $ \geq $6 jets: $ \geq $3b, $ \geq $3 light (left) and $ \geq $7 jets: $ \geq $4b, $ \geq $3 light (right) fiducial phase space regions, for the $ H_{\mathrm{T}} $ of light jets (upper row), the $ p_{\mathrm{T}} $ of the extra light jet (middle row), and the $ \Delta\phi $ between the extra light jet and the softest b jet (lower row). The data are represented by points, with inner (outer) vertical bars indicating the systematic (total) uncertainties, also represented as blue (grey) bands. Cross section predictions obtained at the particle level from different simulation approaches are shown, including their statistical uncertainties, as coloured symbols with different shapes. For $ H_{\mathrm{T}} $ and $ p_{\mathrm{T}} $, the last bins contain the overflow. |
png pdf |
Figure 16-d:
Predicted and observed normalized differential cross sections in the $ \geq $6 jets: $ \geq $3b, $ \geq $3 light (left) and $ \geq $7 jets: $ \geq $4b, $ \geq $3 light (right) fiducial phase space regions, for the $ H_{\mathrm{T}} $ of light jets (upper row), the $ p_{\mathrm{T}} $ of the extra light jet (middle row), and the $ \Delta\phi $ between the extra light jet and the softest b jet (lower row). The data are represented by points, with inner (outer) vertical bars indicating the systematic (total) uncertainties, also represented as blue (grey) bands. Cross section predictions obtained at the particle level from different simulation approaches are shown, including their statistical uncertainties, as coloured symbols with different shapes. For $ H_{\mathrm{T}} $ and $ p_{\mathrm{T}} $, the last bins contain the overflow. |
png pdf |
Figure 16-e:
Predicted and observed normalized differential cross sections in the $ \geq $6 jets: $ \geq $3b, $ \geq $3 light (left) and $ \geq $7 jets: $ \geq $4b, $ \geq $3 light (right) fiducial phase space regions, for the $ H_{\mathrm{T}} $ of light jets (upper row), the $ p_{\mathrm{T}} $ of the extra light jet (middle row), and the $ \Delta\phi $ between the extra light jet and the softest b jet (lower row). The data are represented by points, with inner (outer) vertical bars indicating the systematic (total) uncertainties, also represented as blue (grey) bands. Cross section predictions obtained at the particle level from different simulation approaches are shown, including their statistical uncertainties, as coloured symbols with different shapes. For $ H_{\mathrm{T}} $ and $ p_{\mathrm{T}} $, the last bins contain the overflow. |
png pdf |
Figure 16-f:
Predicted and observed normalized differential cross sections in the $ \geq $6 jets: $ \geq $3b, $ \geq $3 light (left) and $ \geq $7 jets: $ \geq $4b, $ \geq $3 light (right) fiducial phase space regions, for the $ H_{\mathrm{T}} $ of light jets (upper row), the $ p_{\mathrm{T}} $ of the extra light jet (middle row), and the $ \Delta\phi $ between the extra light jet and the softest b jet (lower row). The data are represented by points, with inner (outer) vertical bars indicating the systematic (total) uncertainties, also represented as blue (grey) bands. Cross section predictions obtained at the particle level from different simulation approaches are shown, including their statistical uncertainties, as coloured symbols with different shapes. For $ H_{\mathrm{T}} $ and $ p_{\mathrm{T}} $, the last bins contain the overflow. |

png pdf |
Figure 17:
Observed $ z $ score for each of the theoretical predictions, given the unfolded normalized differential cross sections and their covariances. A lower value indicates a better agreement between prediction and measurement. The dashed line at $ z= $ 2 indicates a $ p $-value of 5%. Predictions for which the $ z $ score exceeds the visible range of the figure are marked with arrows ($ \to $). |
png pdf |
Figure A1:
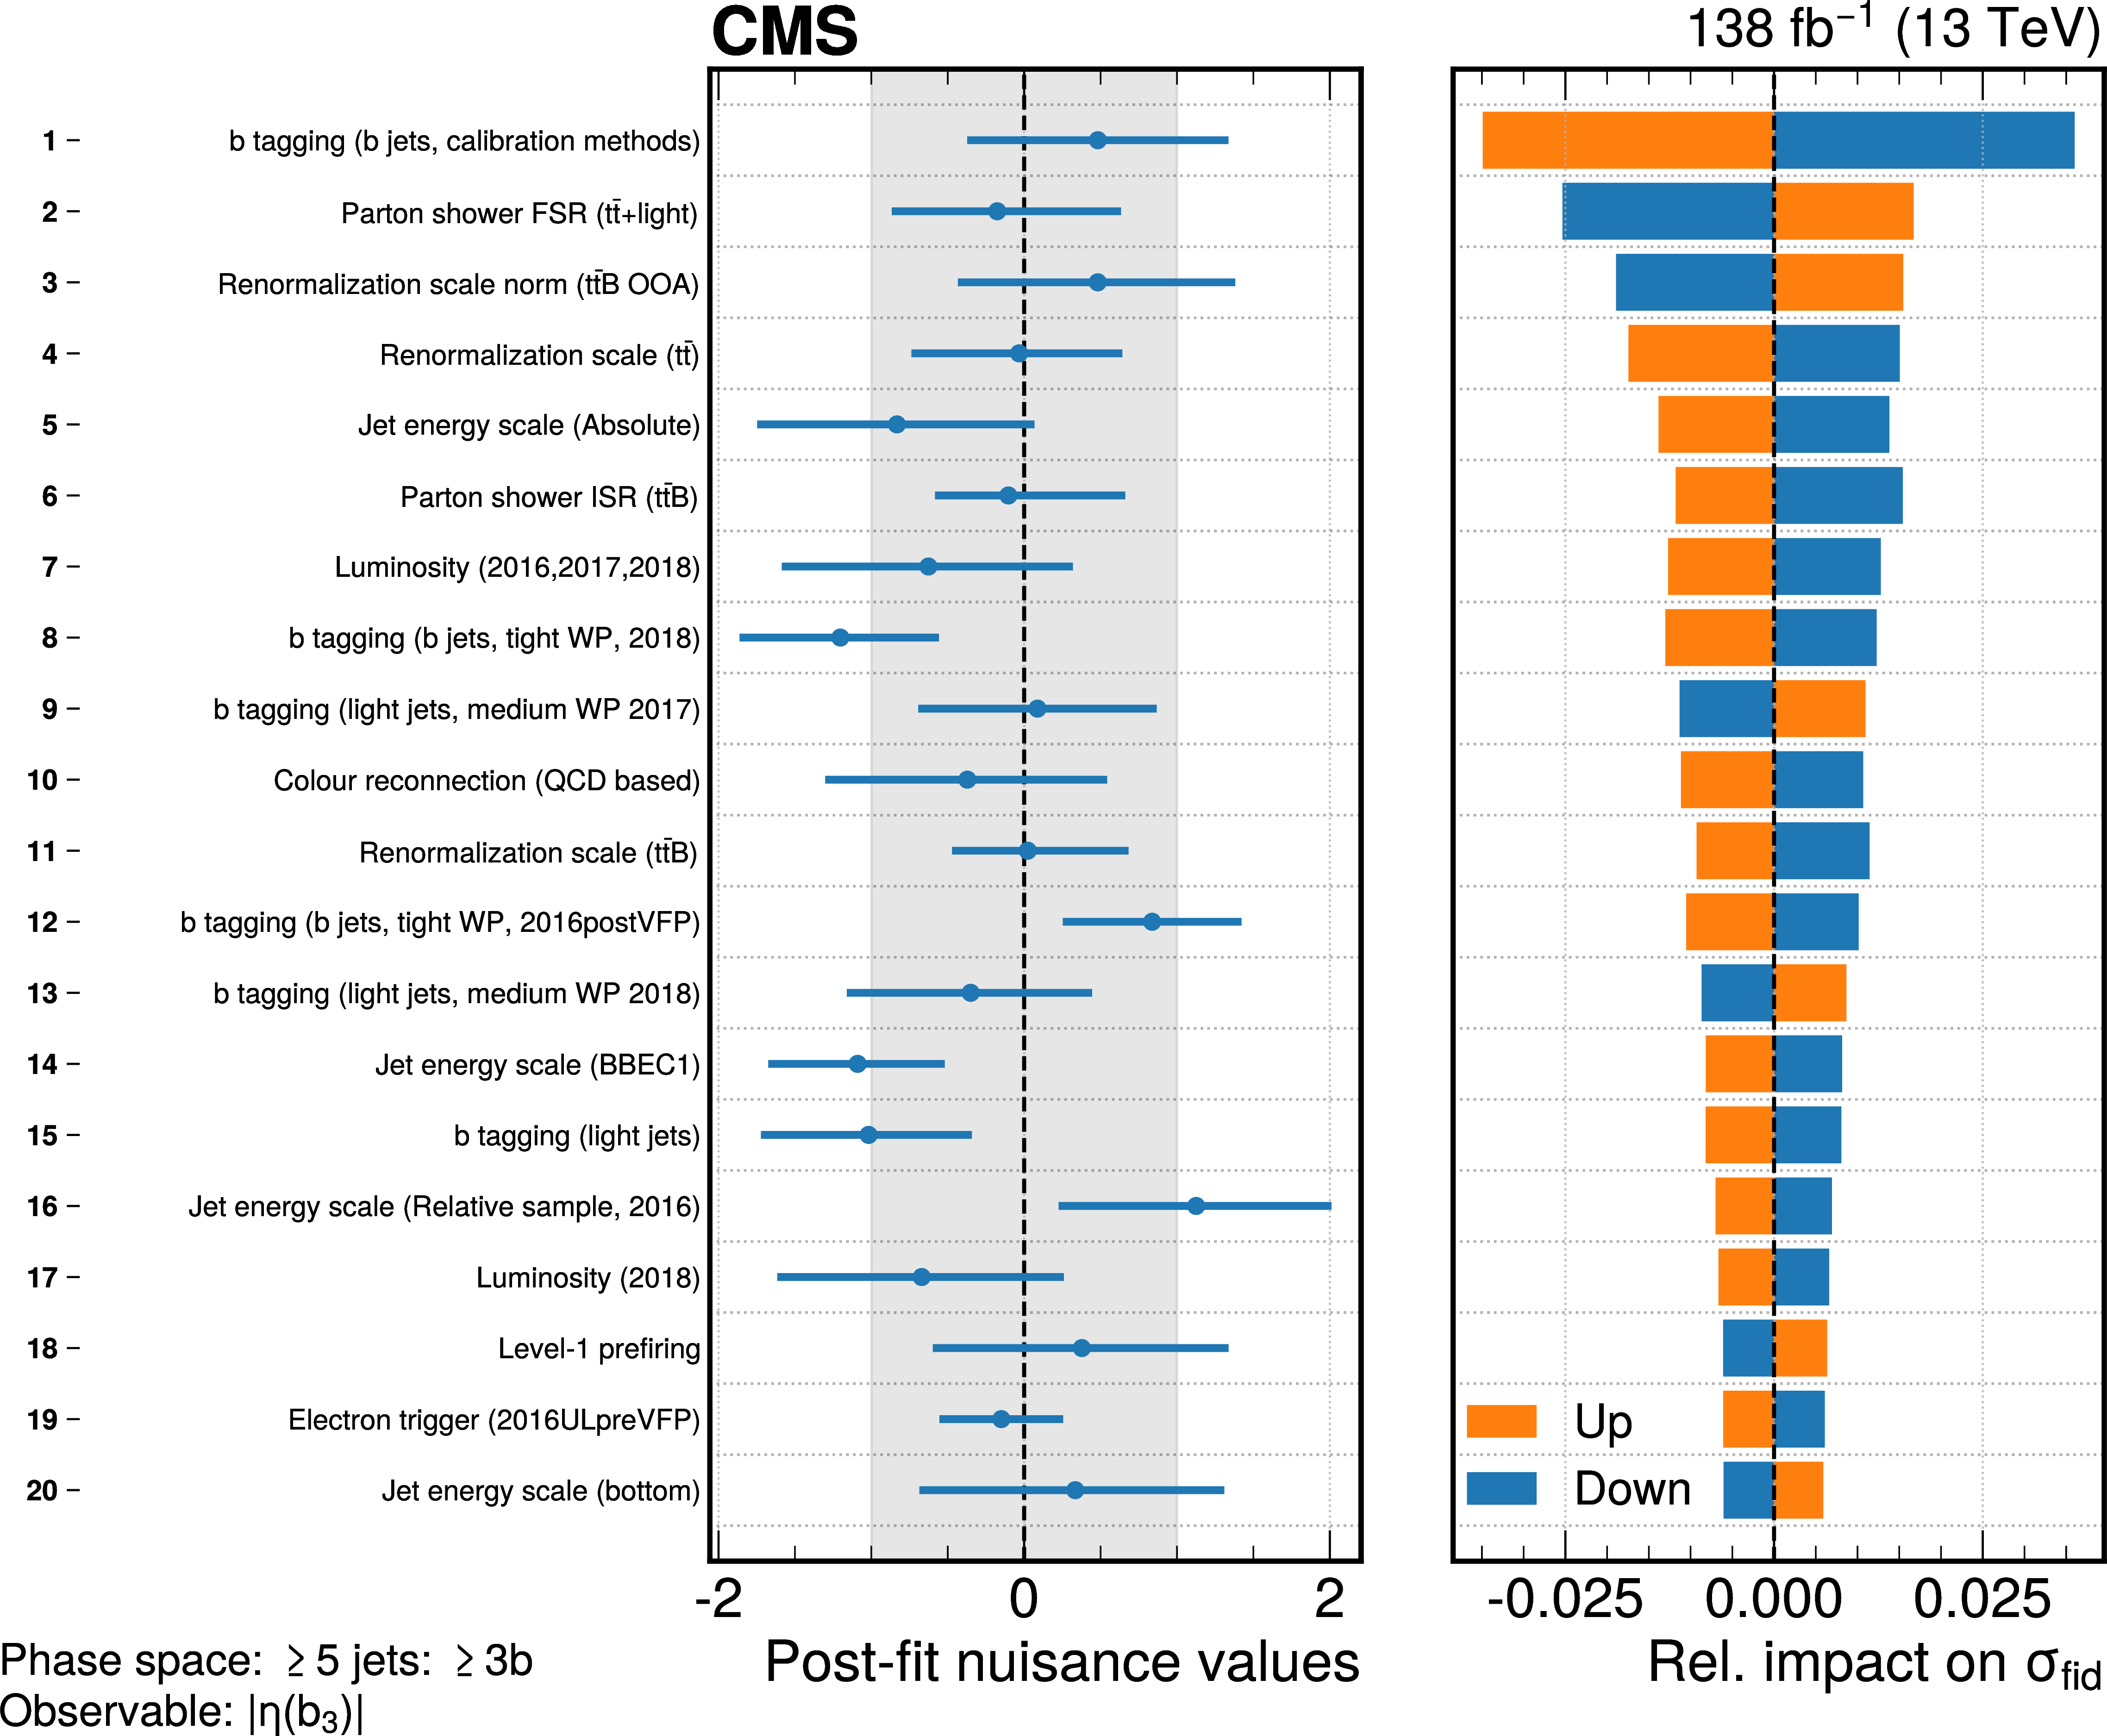
Post-fit nuisance parameter values and relative impacts on the fiducial cross section, for the fit of $ |\eta| $ of the b jet with third-highest $ p_{\mathrm{T}} $ in the $ \geq $5 jets: $ \geq $3b phase space. The nuisance parameters are defined such that the prefit value is zero with unity uncertainty. |
png pdf |
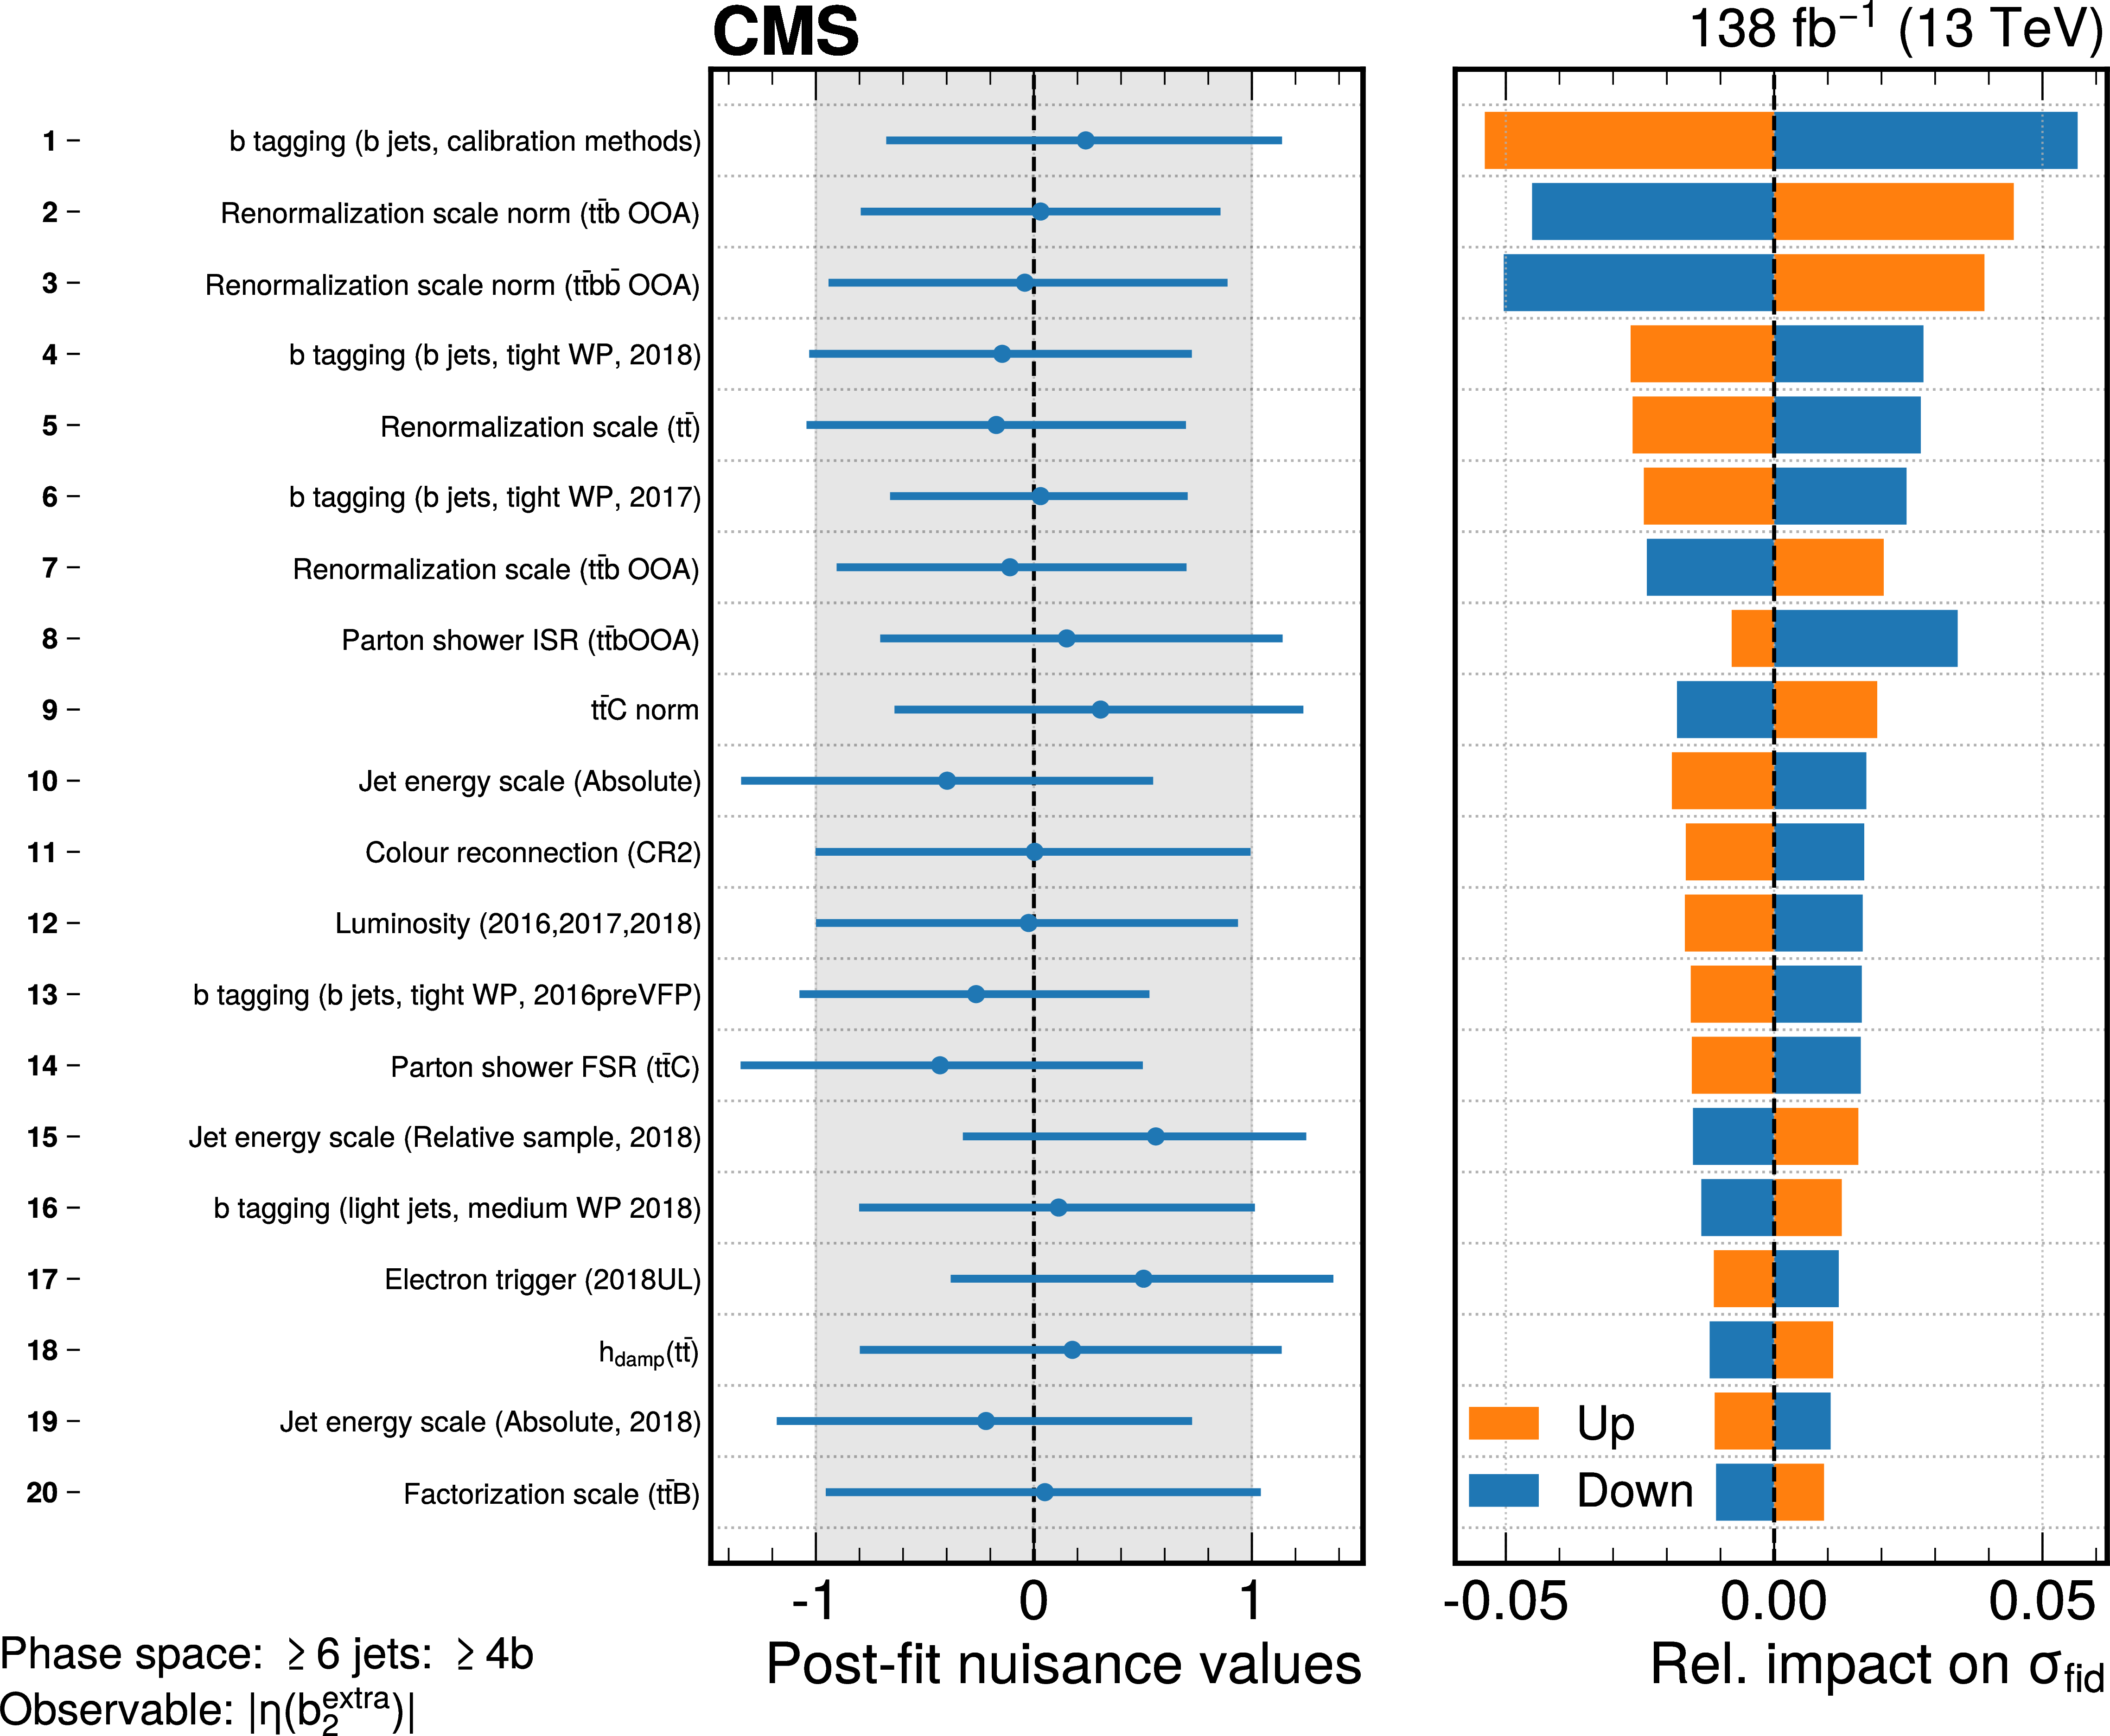
Figure A2:
Post-fit nuisance parameter values and relative impacts on the fiducial cross section, for the fit of $ |\eta| $ of the subleading extra b jet in the $ \geq $6 jets: $ \geq $4b phase space. The nuisance parameters are defined such that the prefit value is zero with unity uncertainty. |
png pdf |
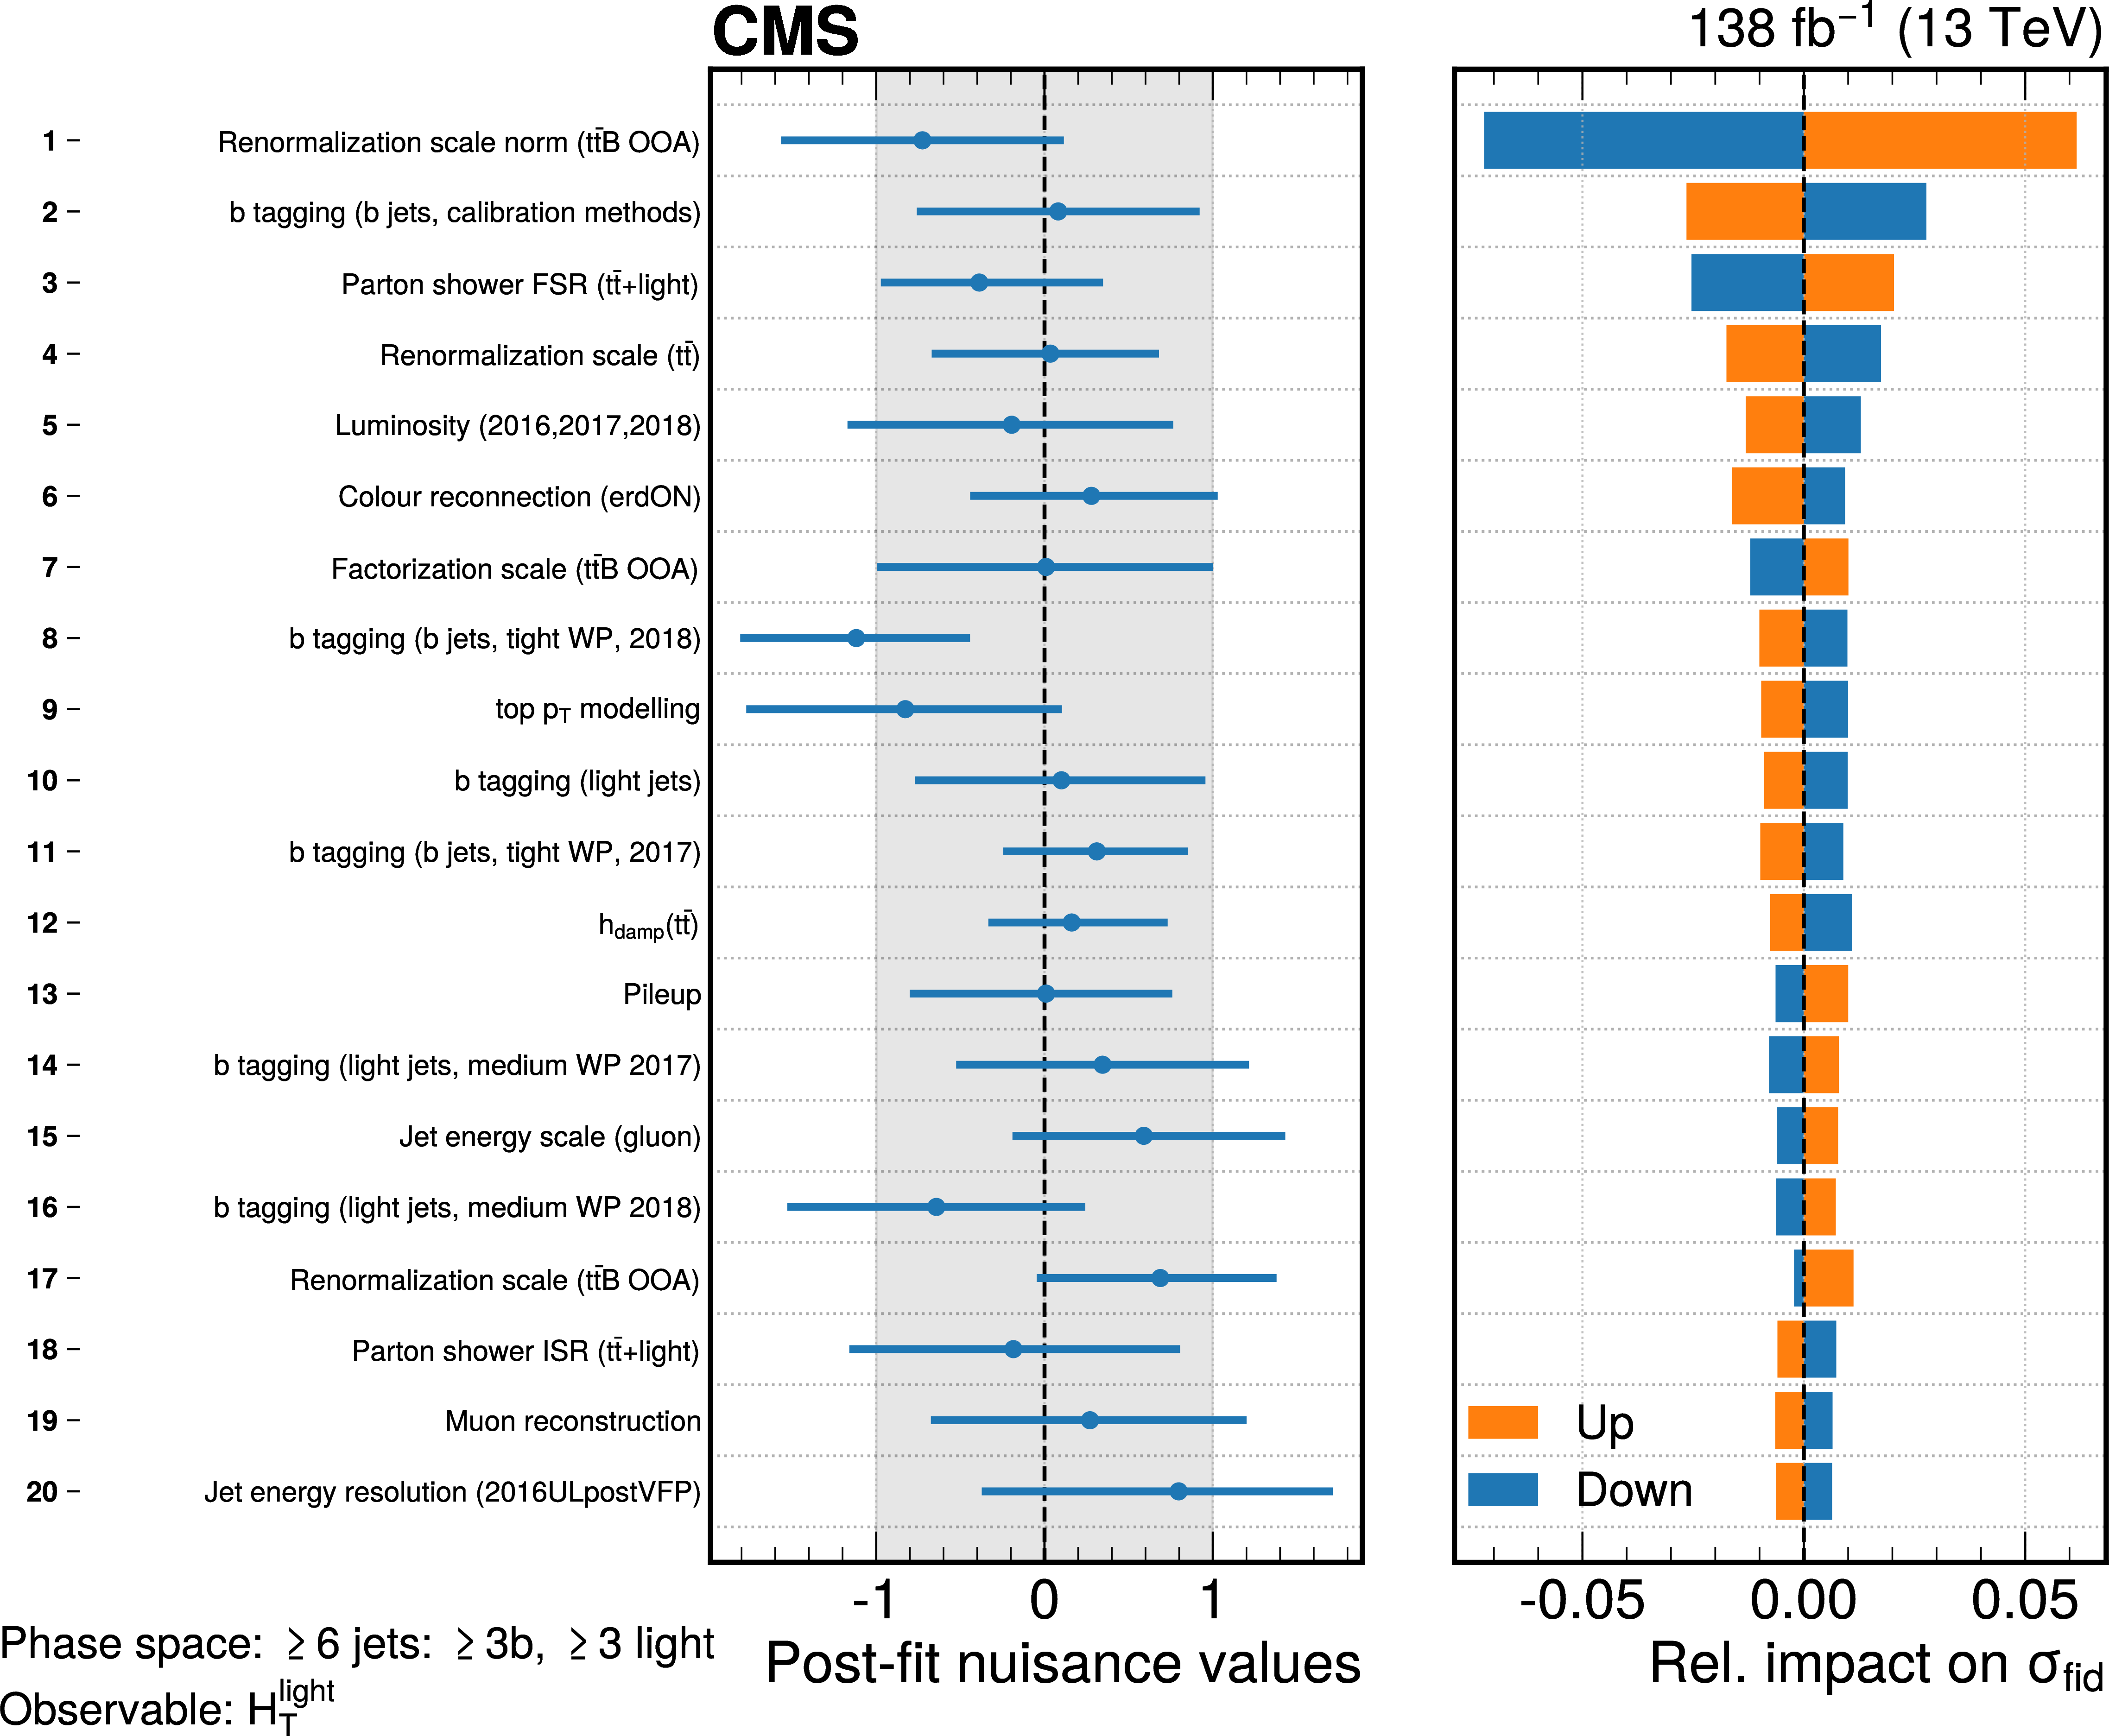
Figure A3:
Post-fit nuisance parameter values and relative impacts on the fiducial cross section, for the fit of $ H_{\mathrm{T}} $ of light jets in the $ \geq $6 jets: $ \geq $3b, $ \geq $3 light phase space. The nuisance parameters are defined such that the prefit value is zero with unity uncertainty. |

png pdf |
Figure A4:
Post-fit nuisance parameter values and relative impacts on the fiducial cross section, for the fit of $ \Delta\phi $ between leading light jet and softest b jet in the $ \geq $7 jets: $ \geq $4b, $ \geq $3 light phase space. The nuisance parameters are defined such that the prefit value is zero with unity uncertainty. |

png pdf |
Figure B1:
Effect of the considered sources of uncertainties on the measurement of the normalized differential cross section of the $ |\eta| $ of the b jet with third-highest $ p_{\mathrm{T}} $ in the $ \geq $5 jets: $ \geq $3b phase space, obtained by combining the impacts of associated nuisance parameters. The last bin of the distribution is not shown, since it has no associated parameter of interest but is constrained by the other bins. The category ``other theory'' includes b quark fragmentation, top quark $ p_{\mathrm{T}} $ modelling, PDF, $ h_{\mathrm{damp}} $, colour reconnection, and underlying event uncertainties. The category ``other experimental'' includes pileup and the integrated luminosity uncertainties. |
png pdf |
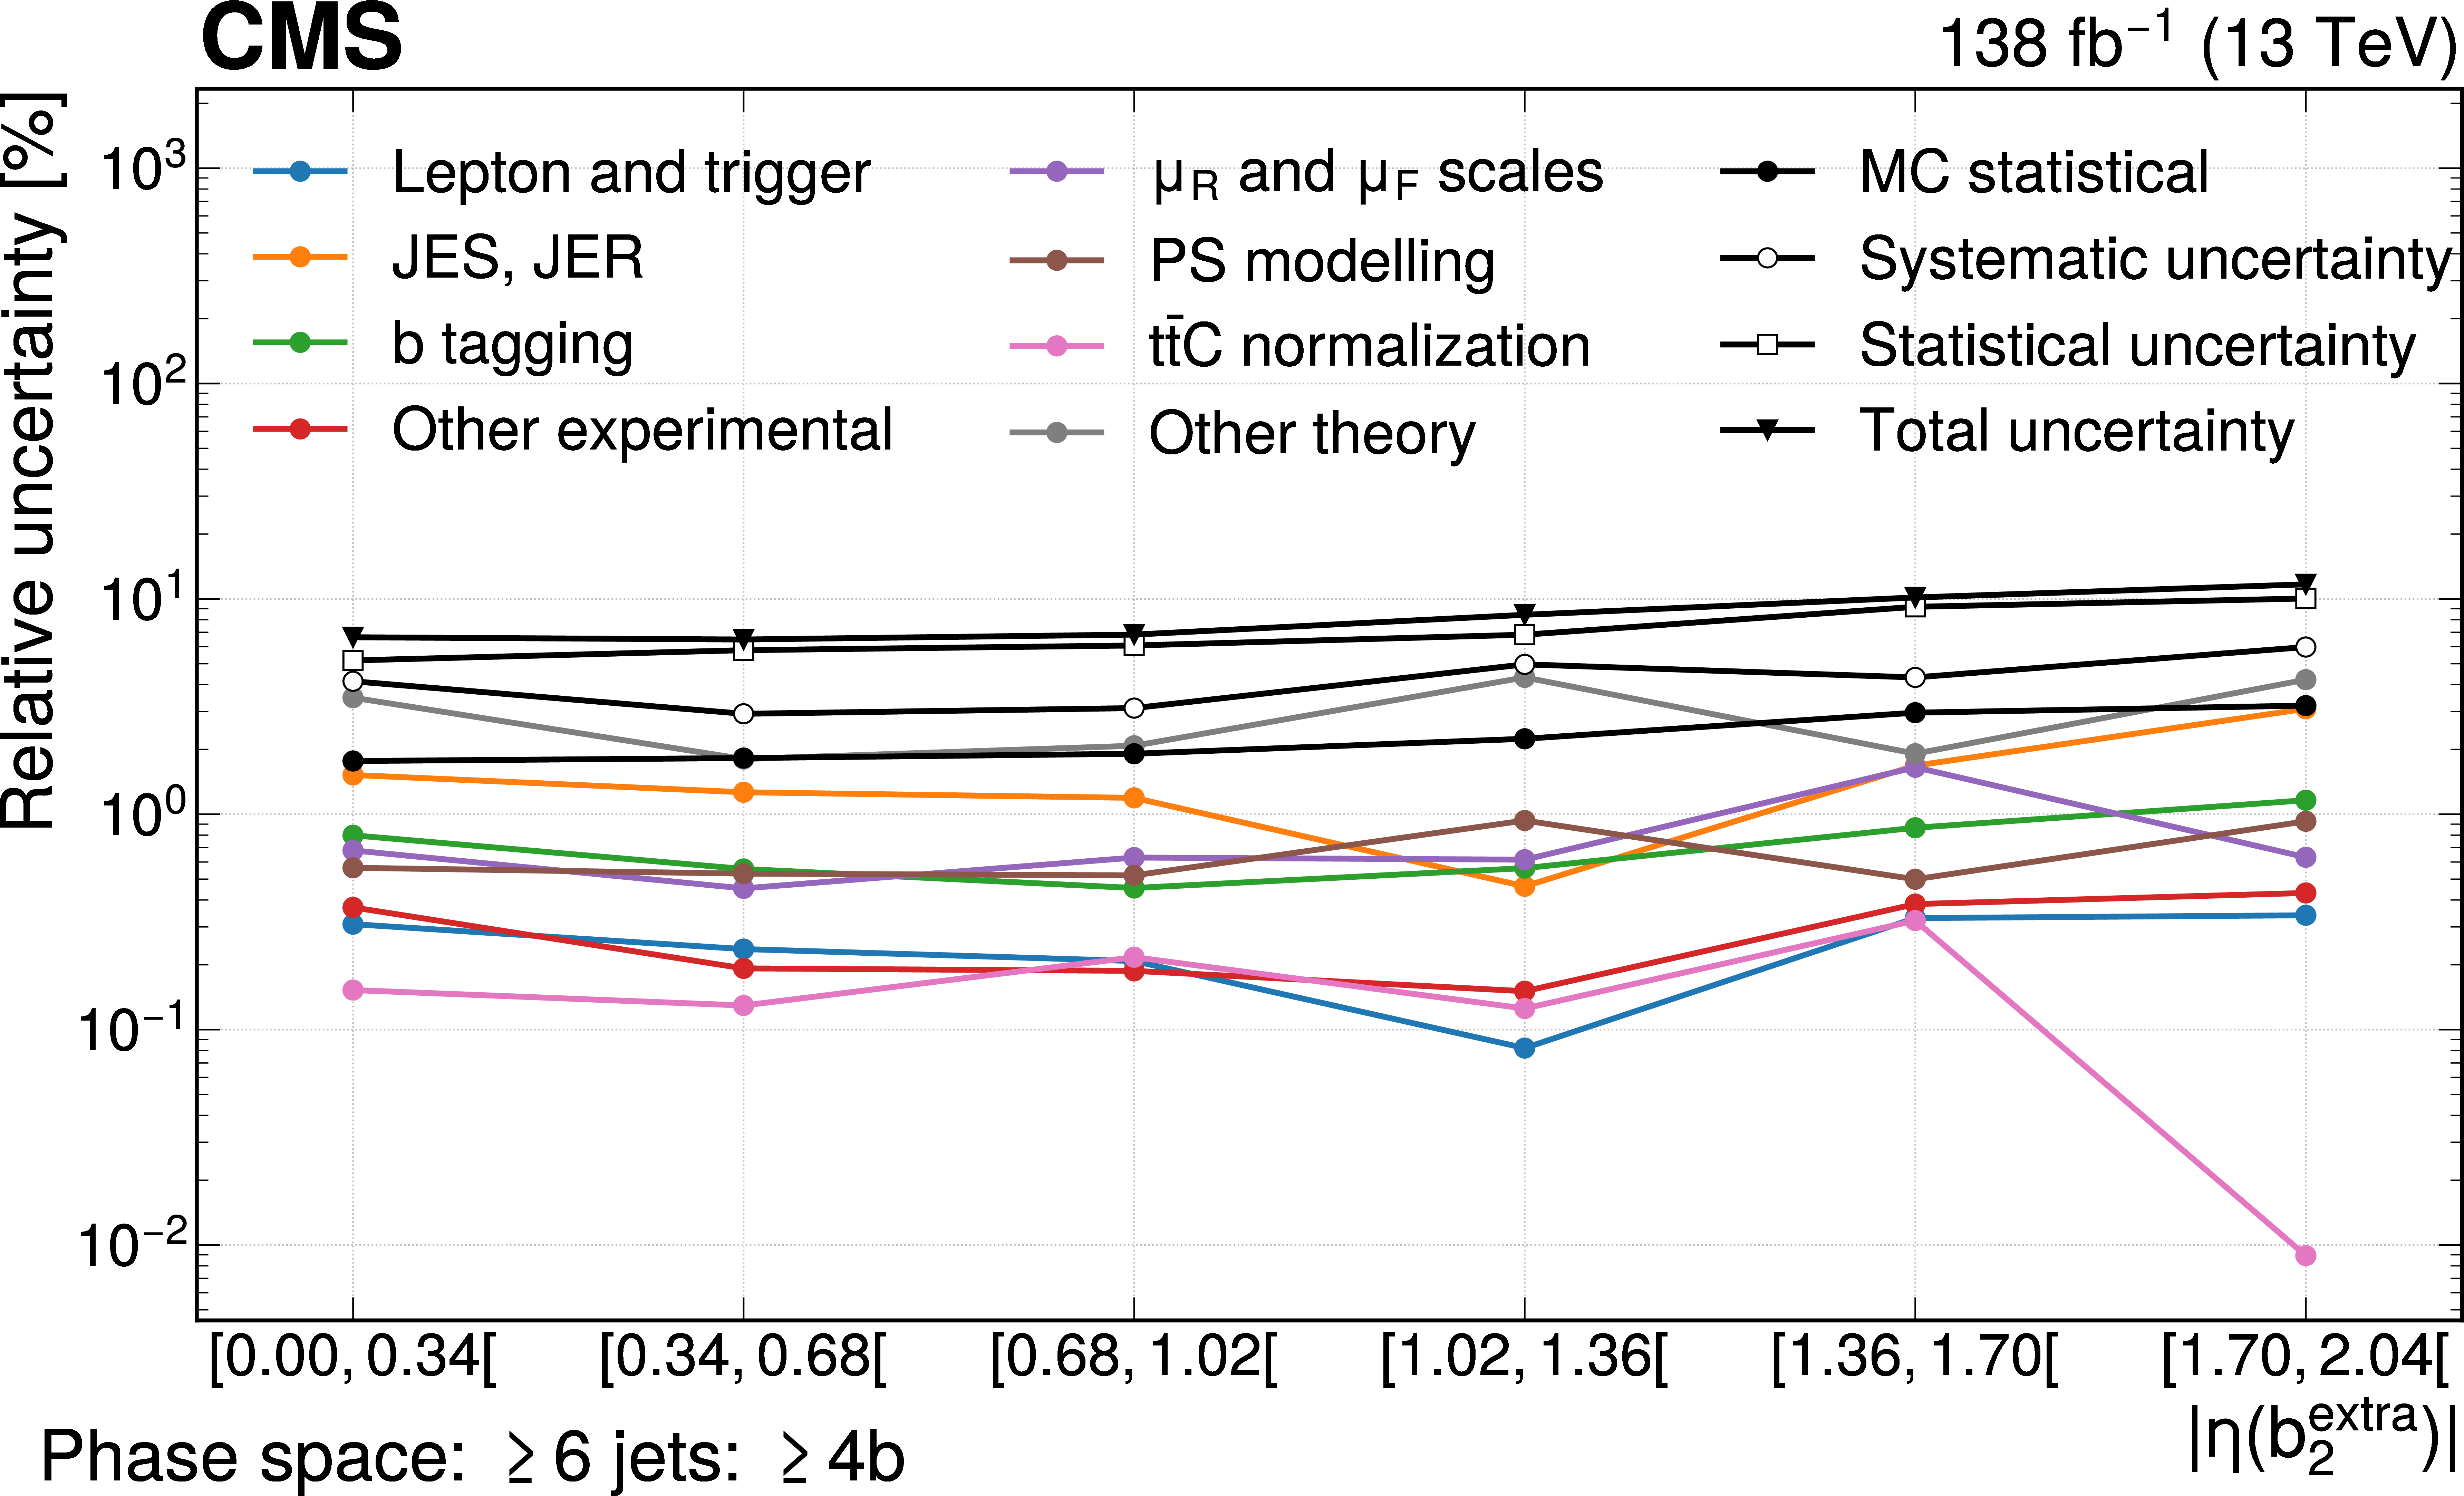
Figure B2:
Effect of the considered sources of uncertainties on the measurement of the normalized differential cross section of the $ |\eta| $ of the subleading extra b jet in the $ \geq $6 jets: $ \geq $4b phase space, obtained by combining the impacts of associated nuisance parameters. The last bin of the distribution is not shown, since it has no associated parameter of interest but is constrained by the other bins. The category ``other theory'' includes b quark fragmentation, top quark $ p_{\mathrm{T}} $ modelling, PDF, $ h_{\mathrm{damp}} $, colour reconnection, and underlying event uncertainties. The category ``other experimental'' includes pileup and the integrated luminosity uncertainties. |
png pdf |
Figure B3:
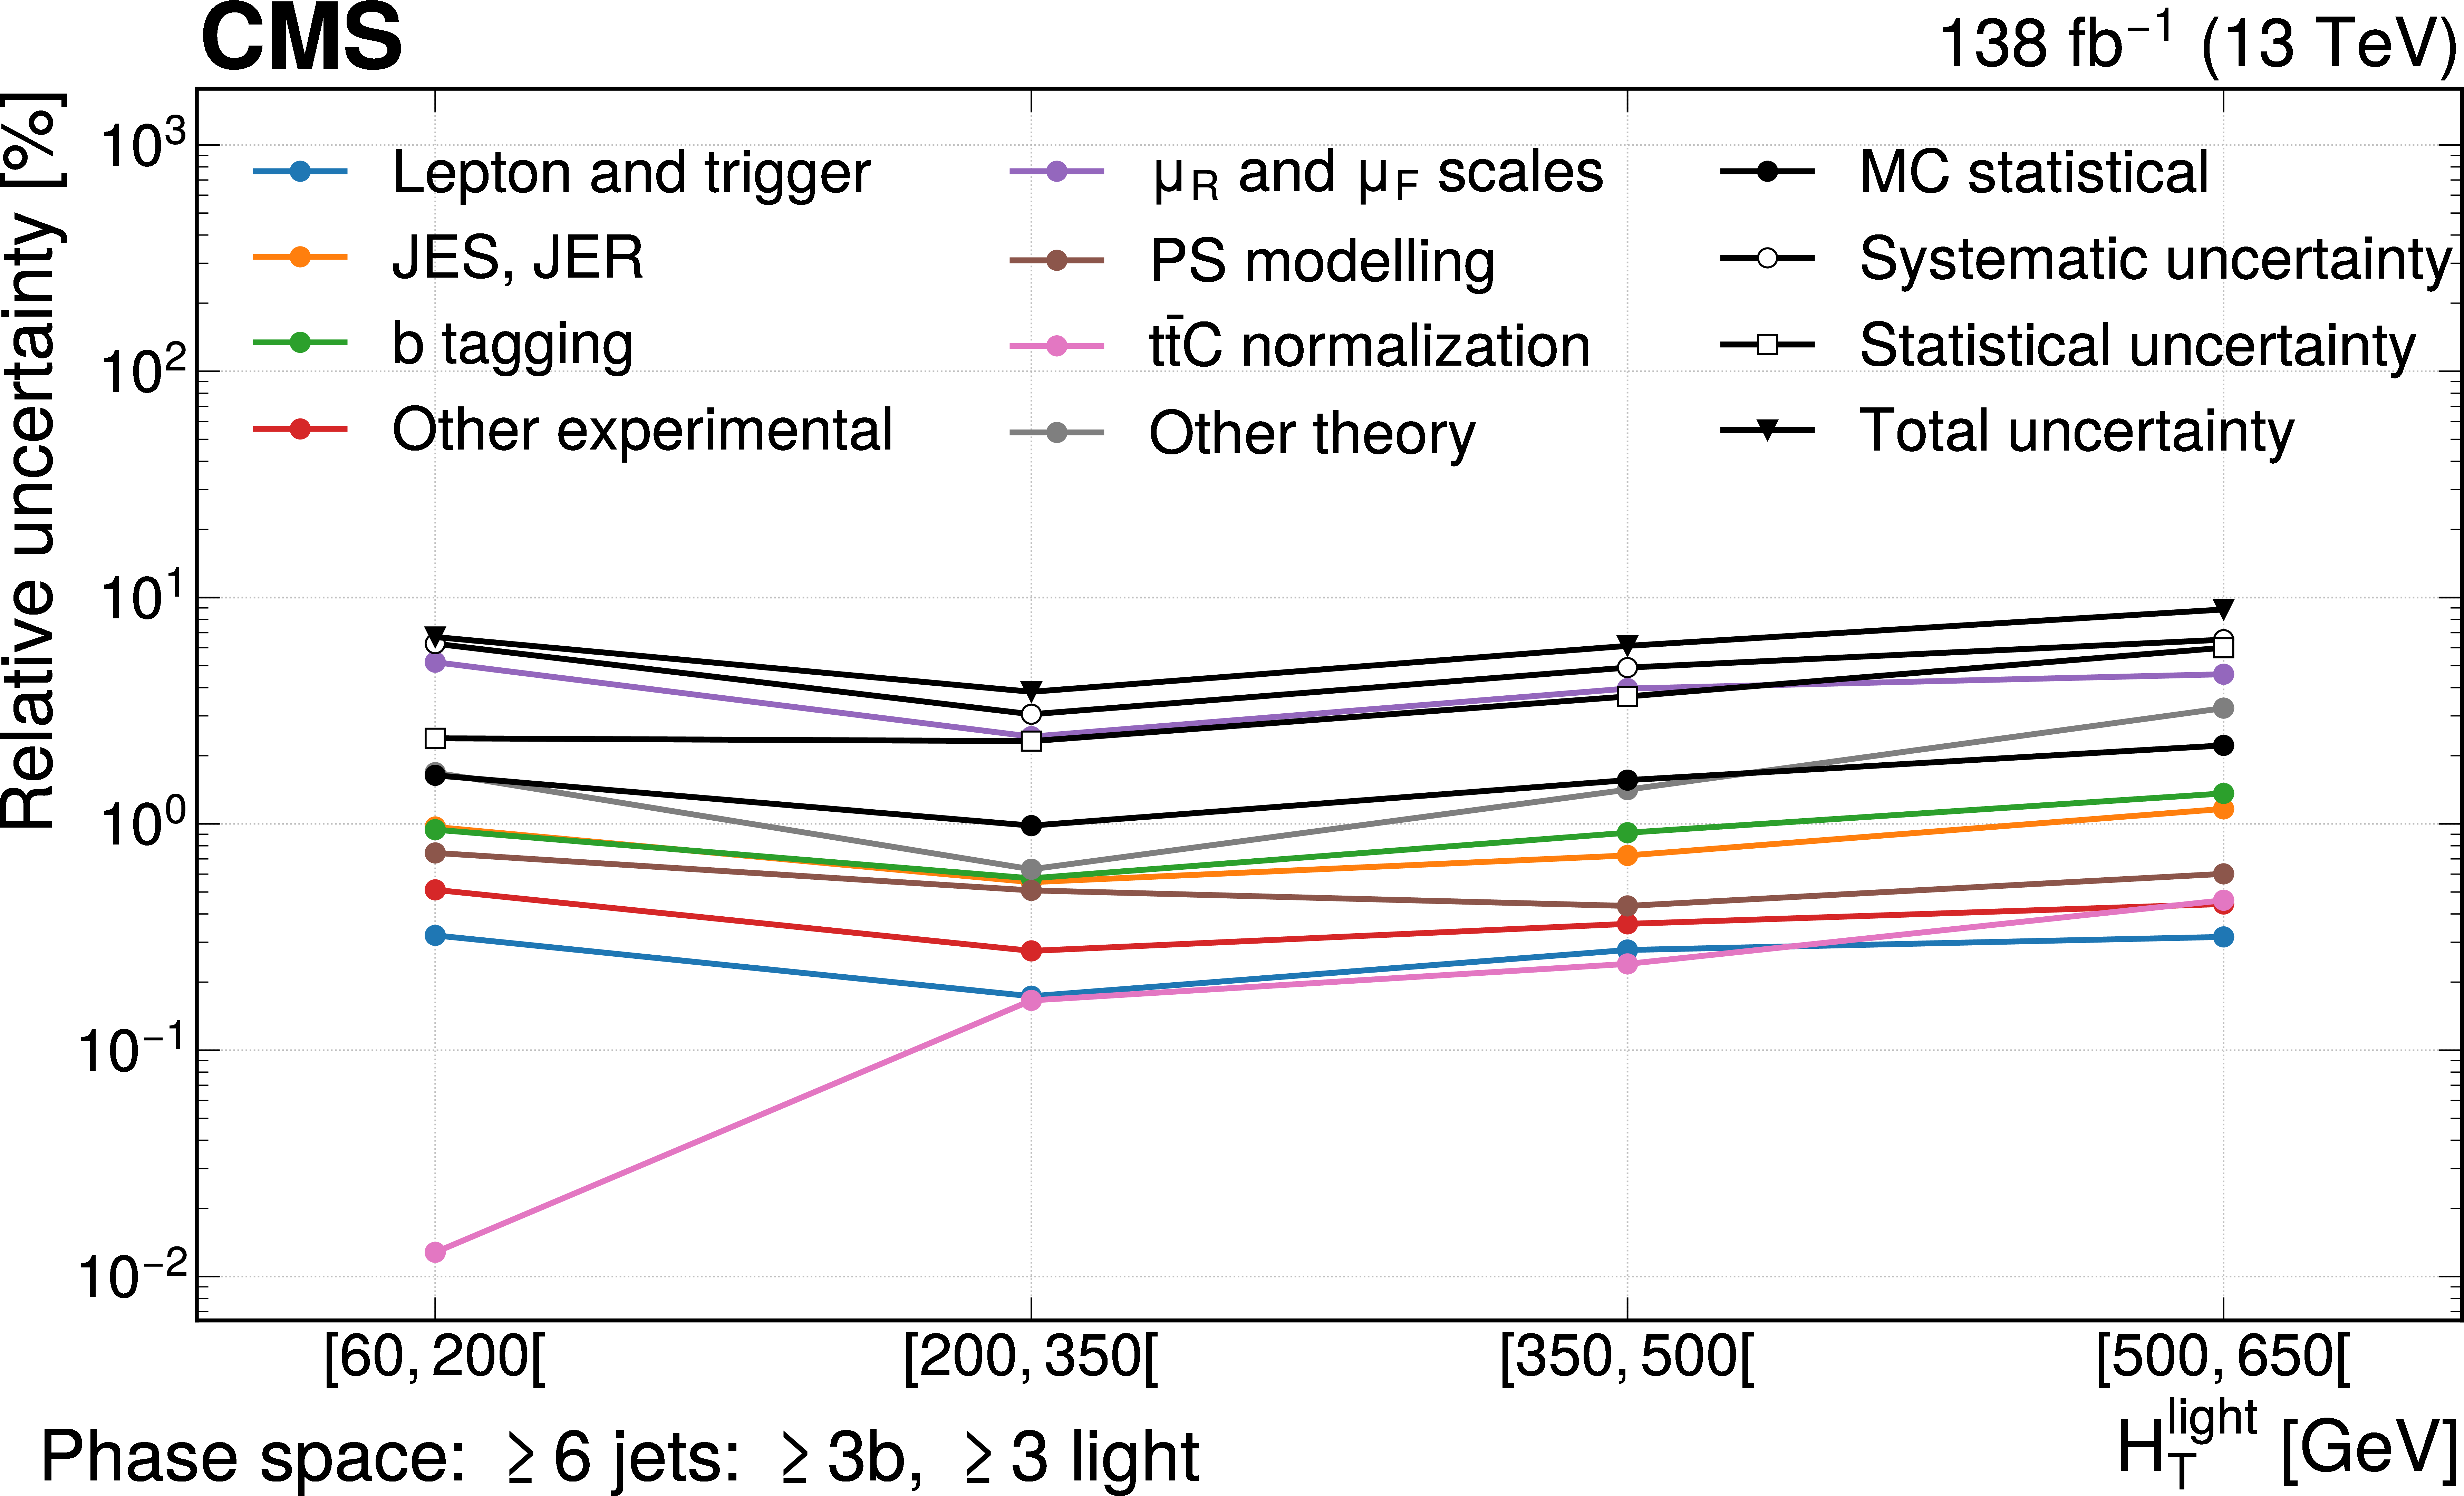
Effect of the considered sources of uncertainties on the measurement of the normalized differential cross section of the $ H_{\mathrm{T}} $ of light jets in the $ \geq $6 jets: $ \geq $3b, $ \geq $3 light phase space, obtained by combining the impacts of associated nuisance parameters. The last bin of the distribution is not shown, since it has no associated parameter of interest but is constrained by the other bins. The category ``other theory'' includes b quark fragmentation, top quark $ p_{\mathrm{T}} $ modelling, PDF, $ h_{\mathrm{damp}} $, colour reconnection, and underlying event uncertainties. The category ``other experimental'' includes pileup and the integrated luminosity uncertainties. |
png pdf |
Figure B4:
Effect of the considered sources of uncertainties on the measurement of the normalized differential cross section of the $ \Delta\phi $ between leading light jet and softest b jet in the $ \geq $7 jets: $ \geq $4b, $ \geq $3 light phase space, obtained by combining the impacts of associated nuisance parameters. The last bin of the distribution is not shown, since it has no associated parameter of interest but is constrained by the other bins. The category ``other theory'' includes b quark fragmentation, top quark $ p_{\mathrm{T}} $ modelling, PDF, $ h_{\mathrm{damp}} $, colour reconnection, and underlying event uncertainties. The category ``other experimental'' includes pileup and the integrated luminosity uncertainties. |

png pdf |
Figure C1:
Correlations between the parameters of interest $ \vec{\mu} $ in the fit of the $ |\eta| $ of the subleading extra b jet in the $ \geq $6 jets: $ \geq $4b phase space. |
png pdf |
Figure C2:
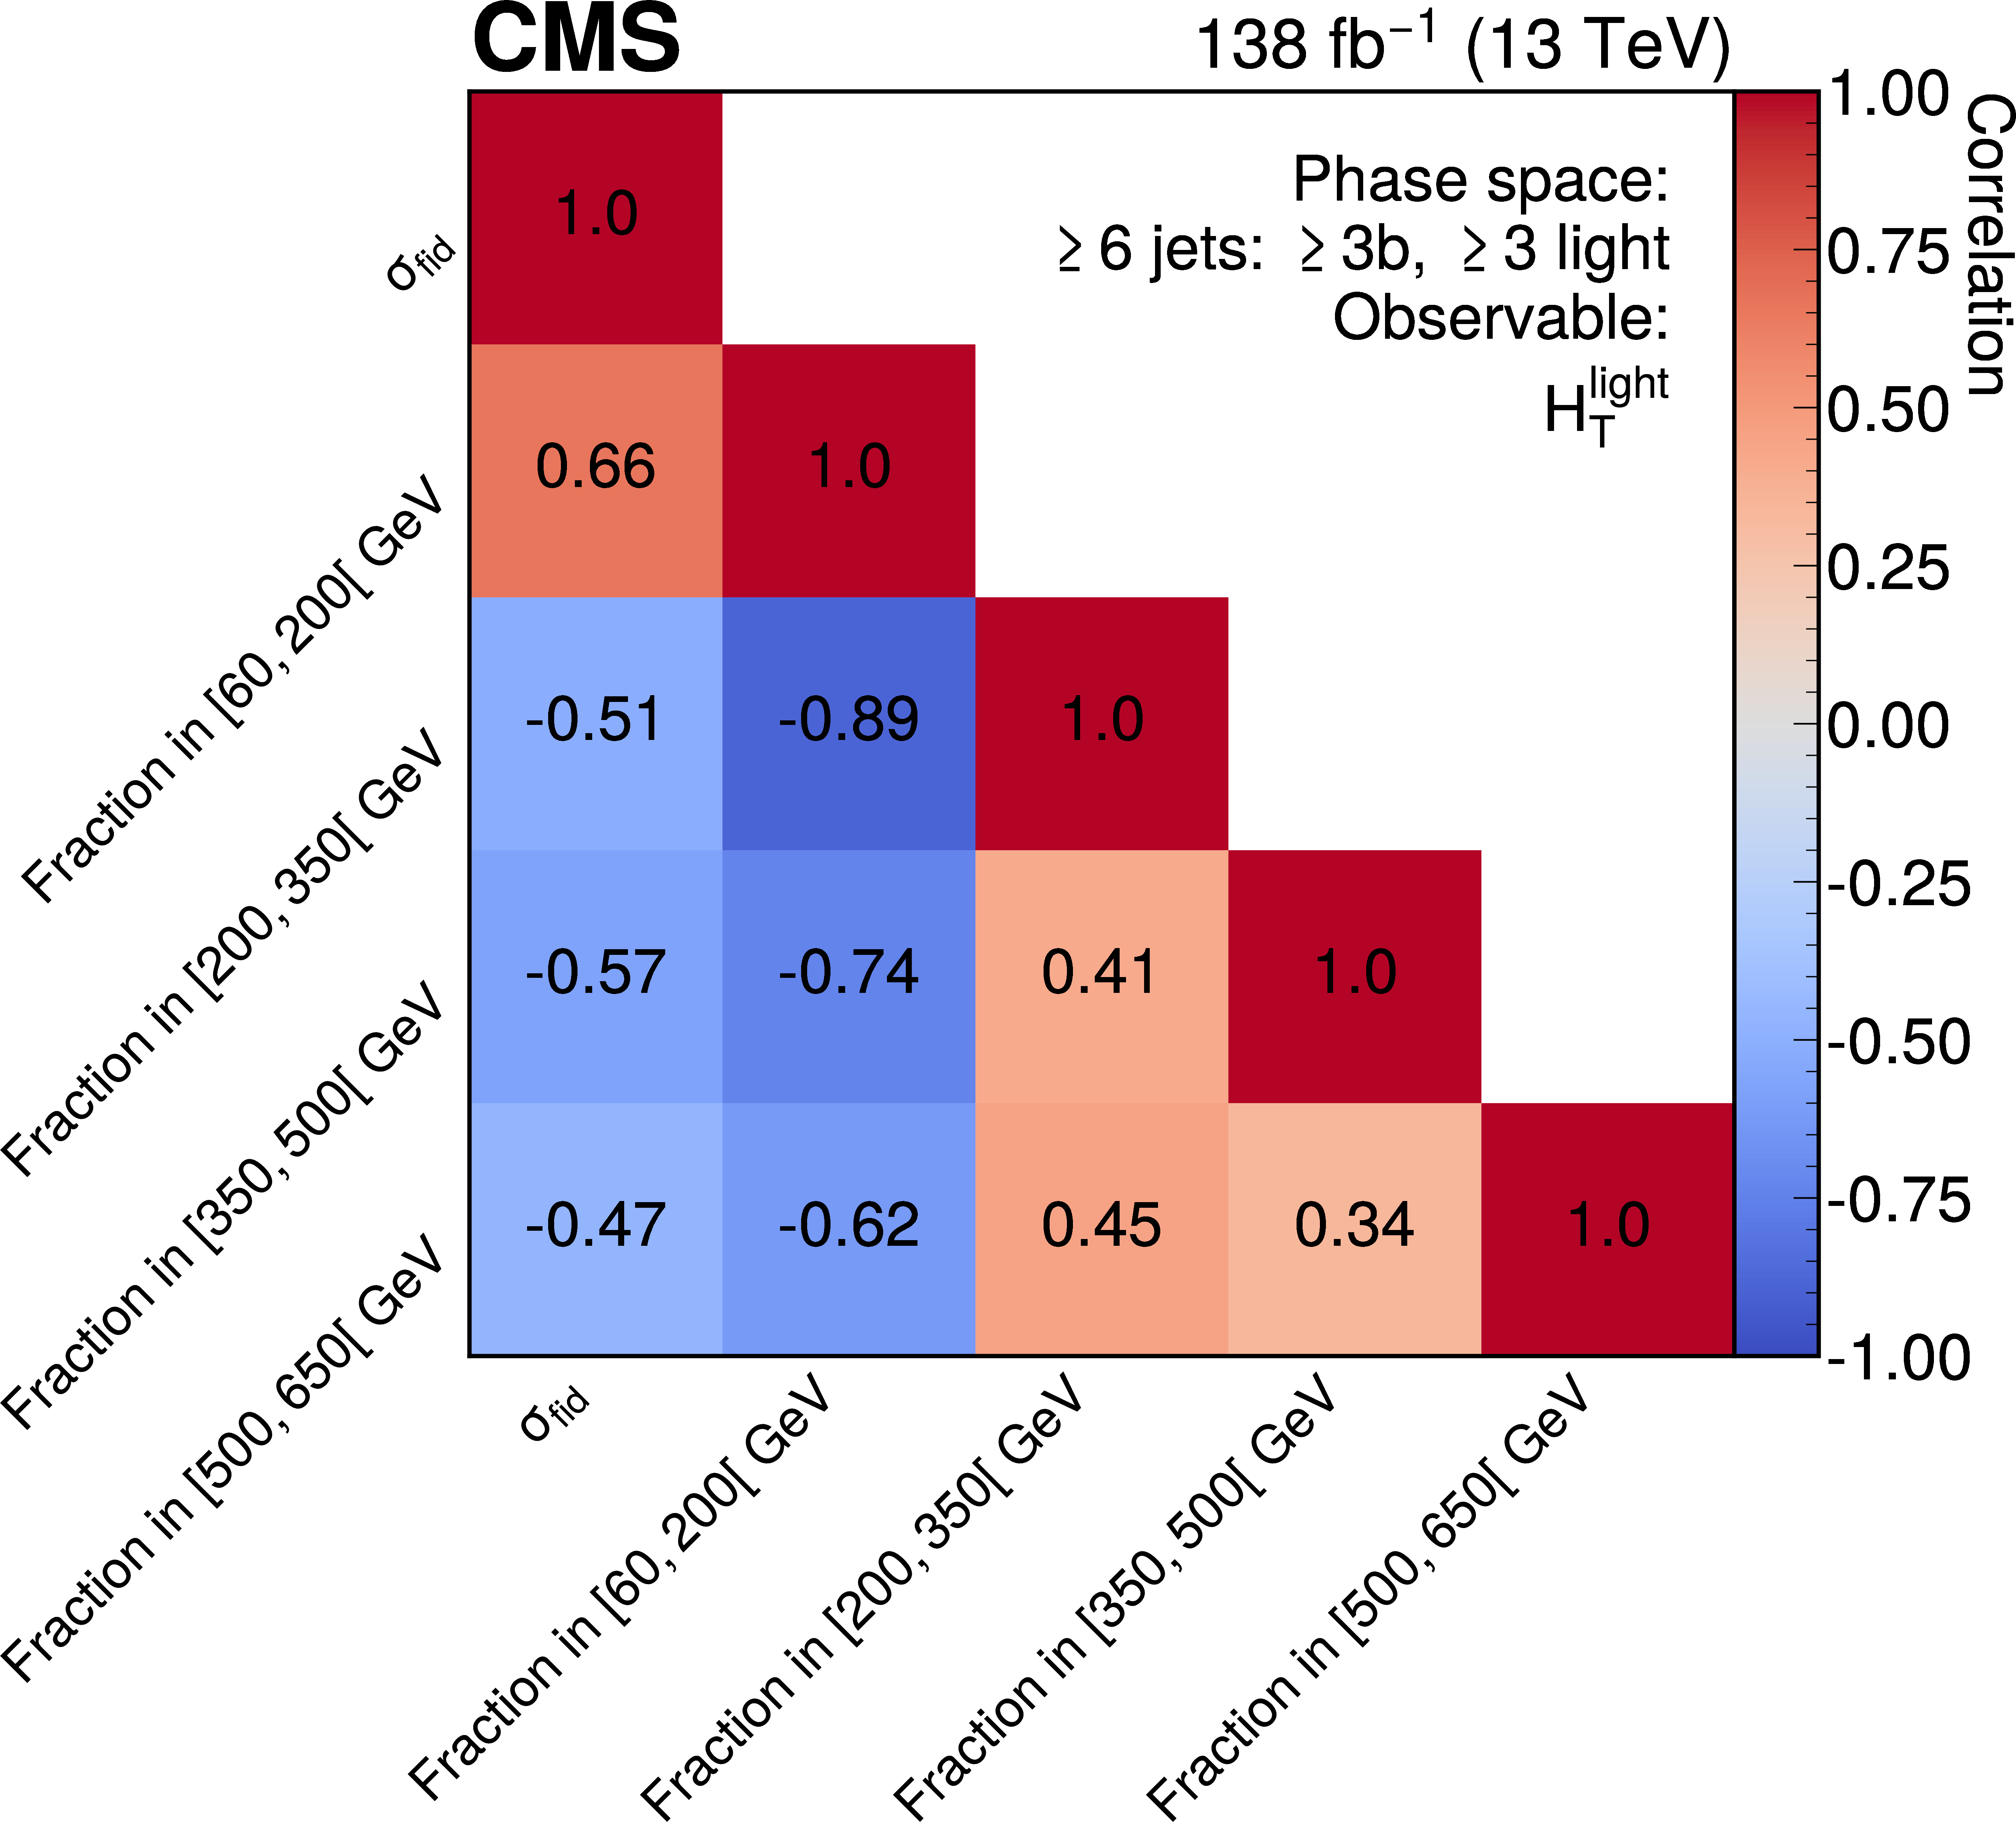
Correlations between the parameters of interest $ \vec{\mu} $ in the fit of the $ H_{\mathrm{T}} $ of light jets in the $ \geq $6 jets: $ \geq $3b, $ \geq $3 light phase space. |
png pdf |
Figure C3:
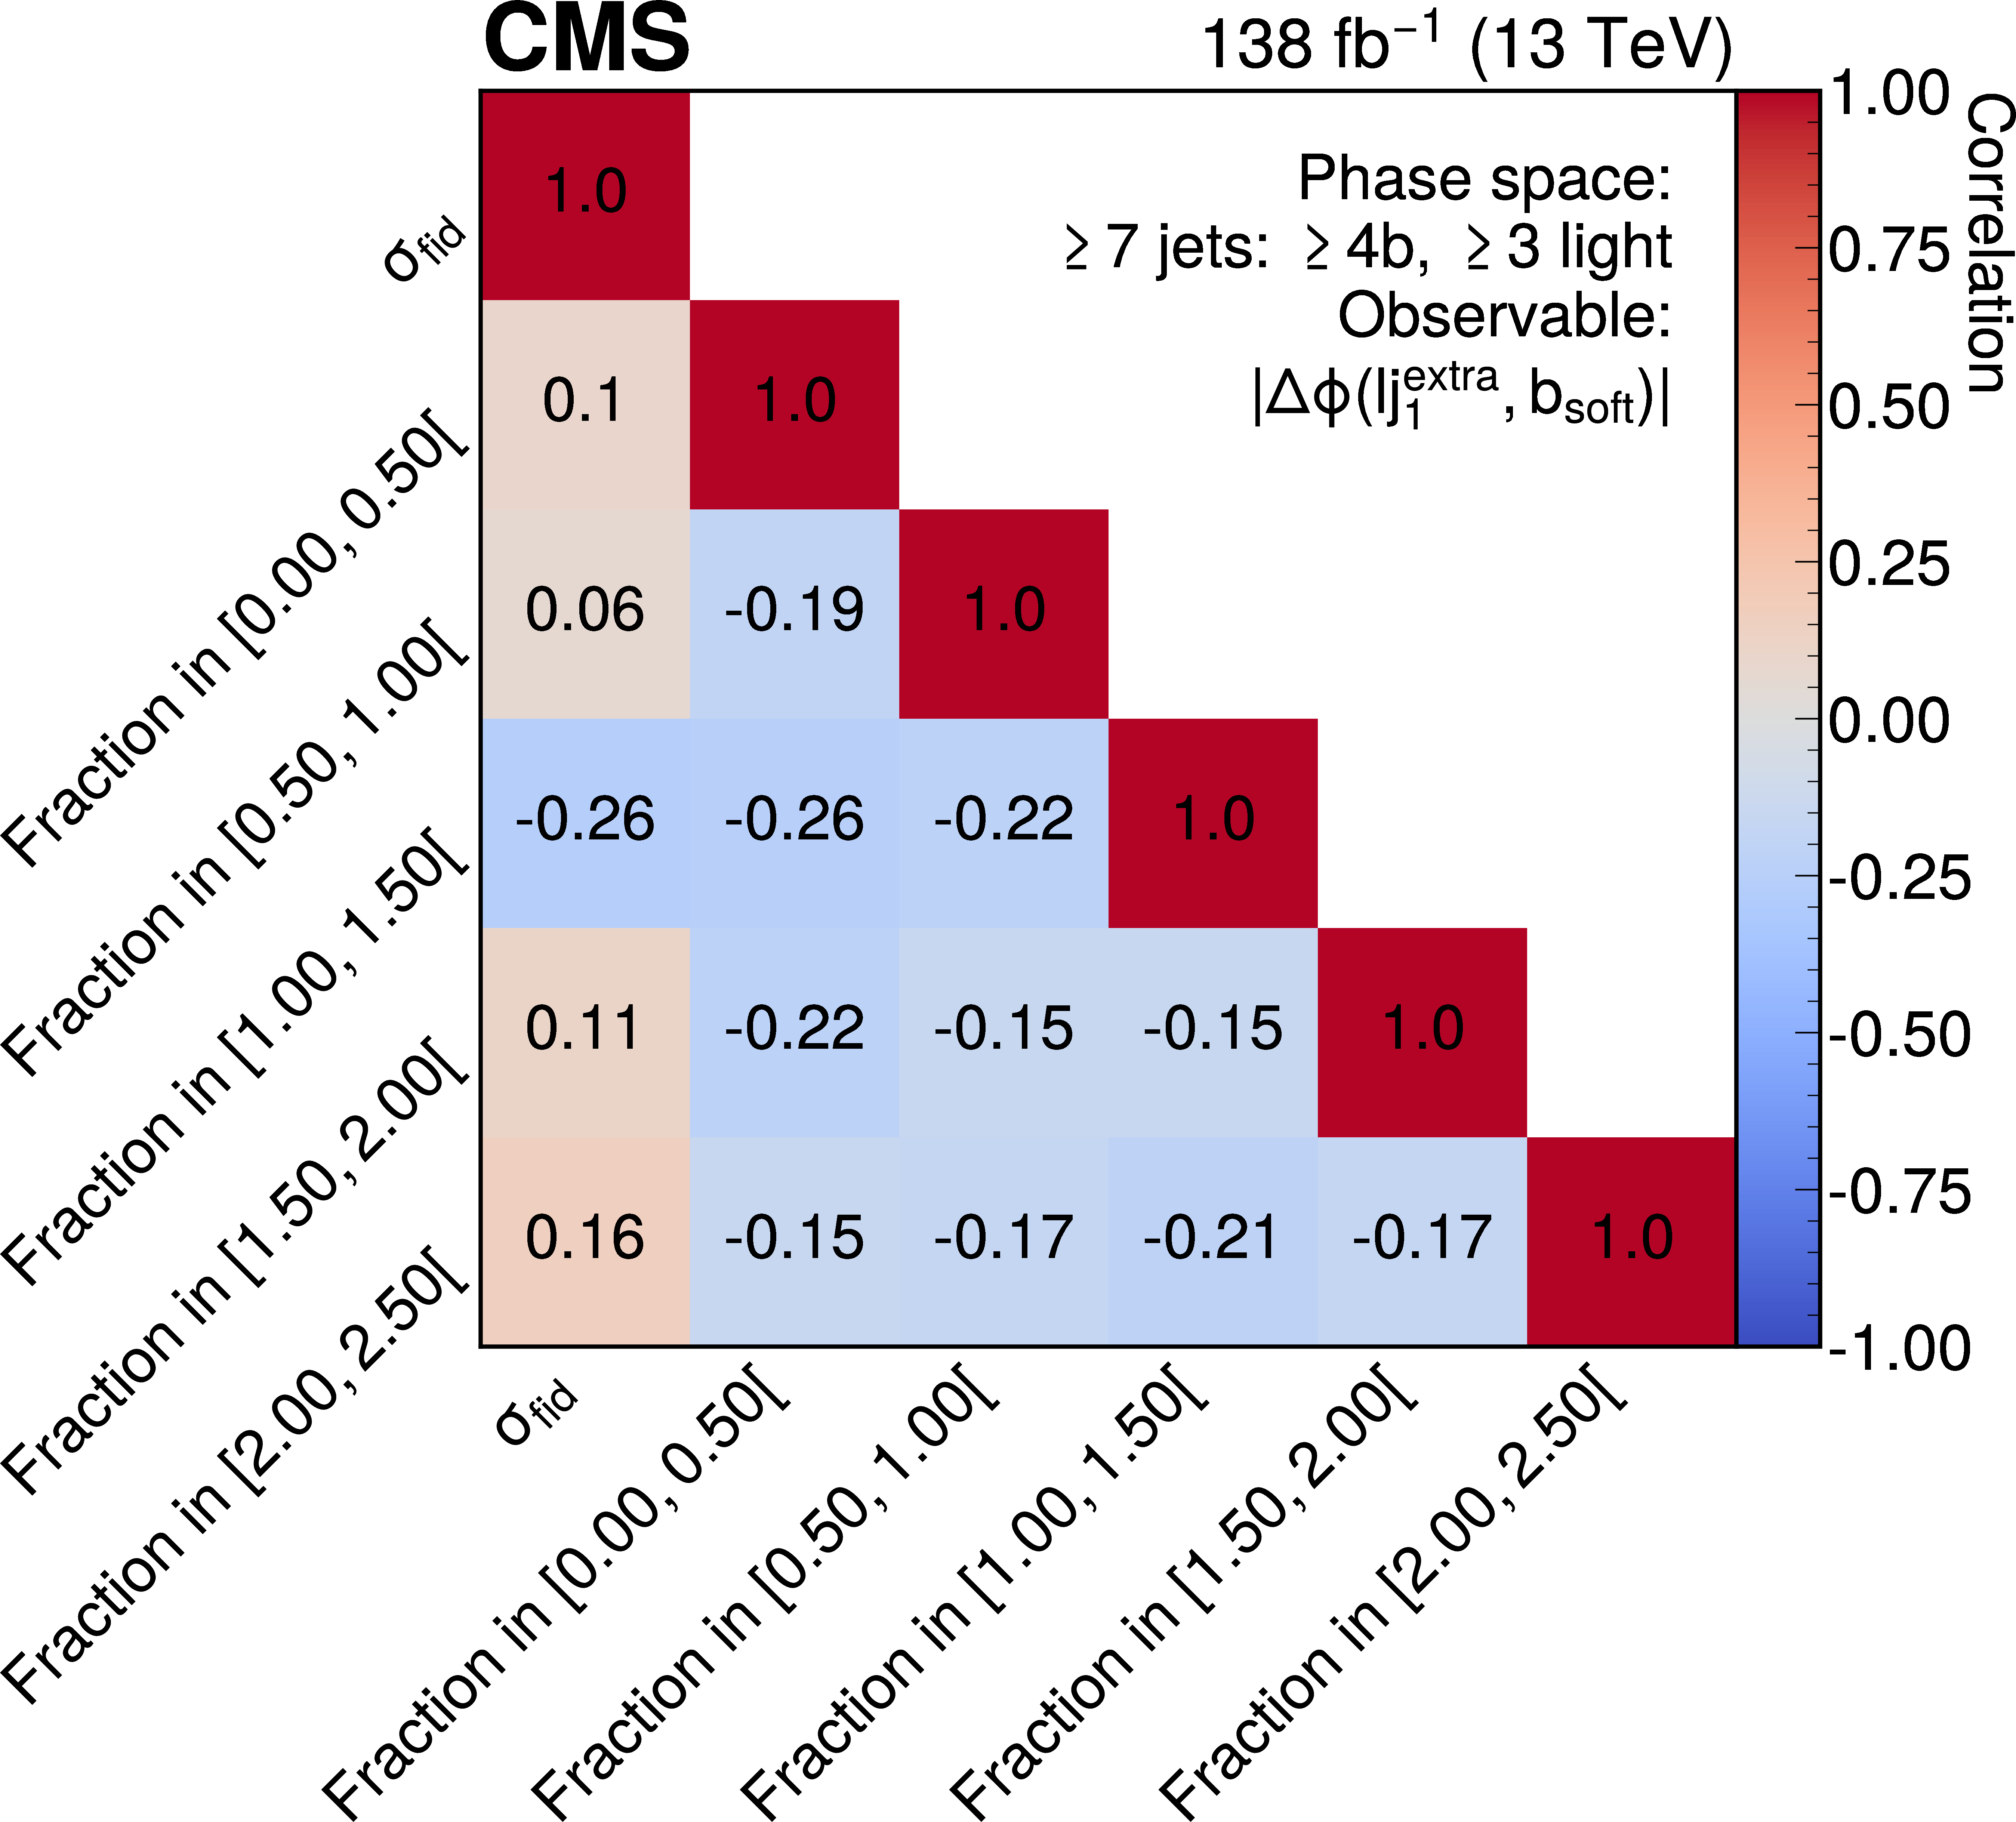
Correlations between the parameters of interest $ \vec{\mu} $ in the fit of the $ \Delta\phi $ between leading light jet and softest b jet in the $ \geq $7 jets: $ \geq $4b, $ \geq $3 light phase space. |
png pdf |
Figure D1:
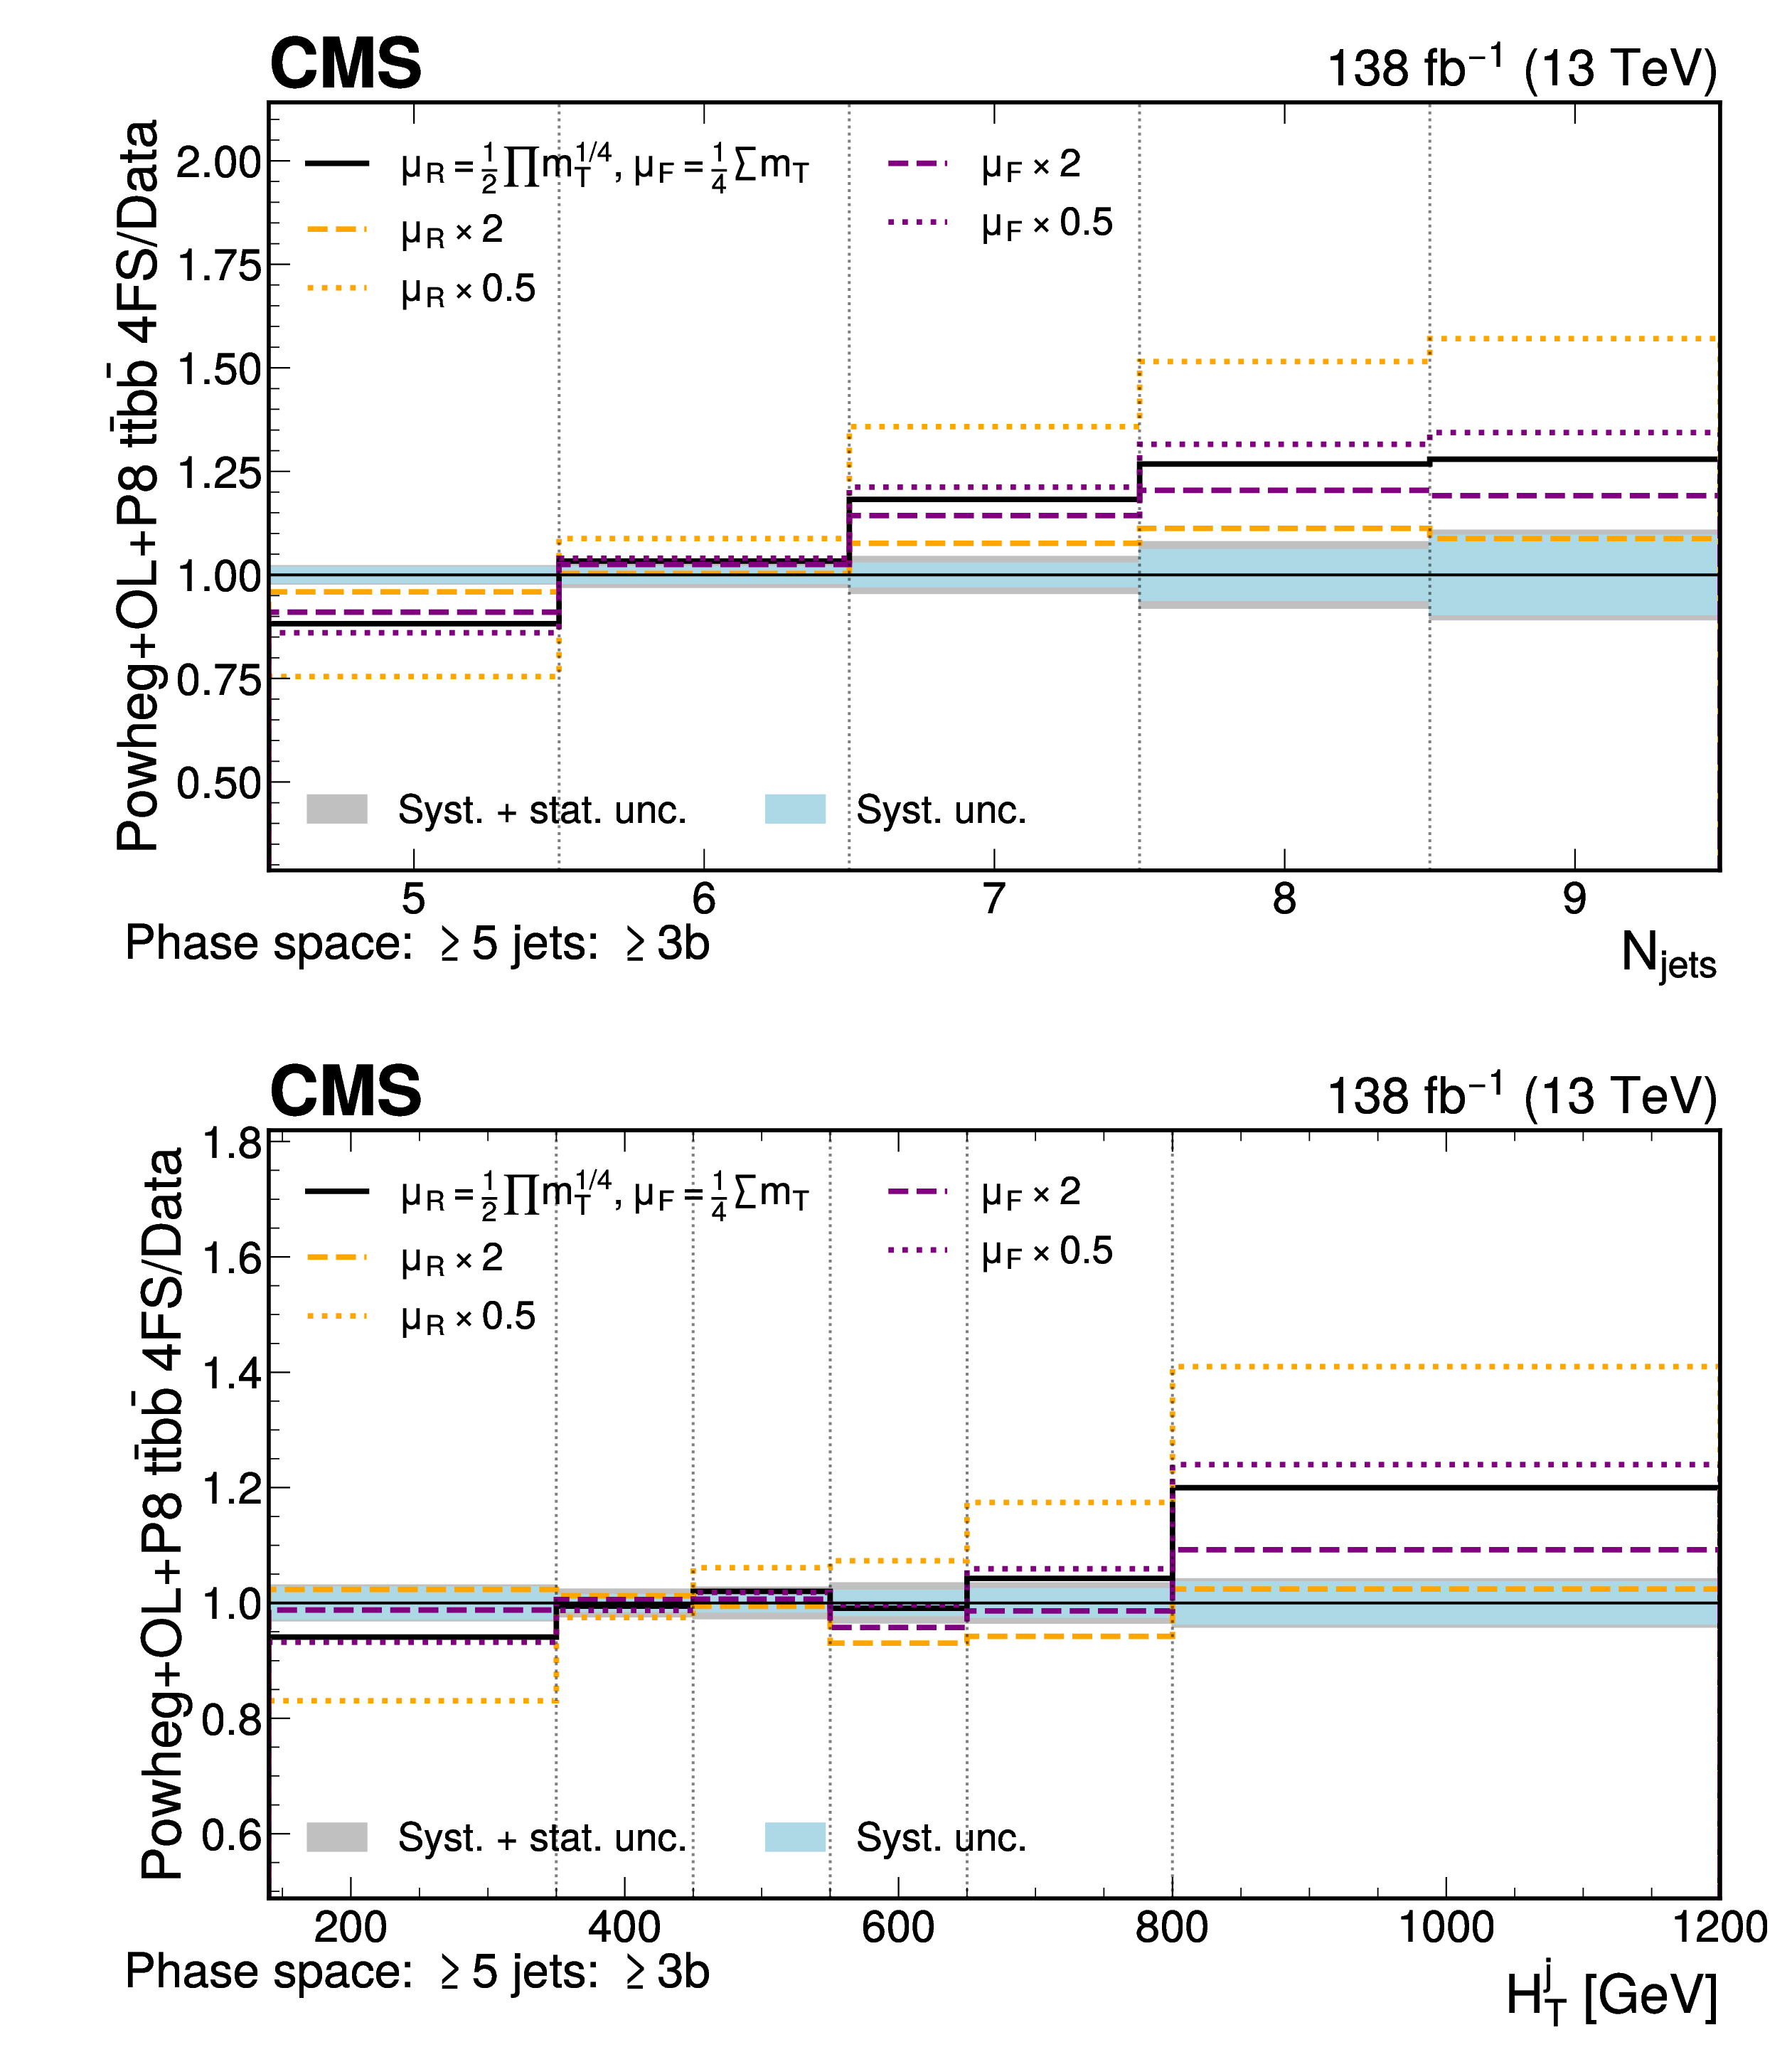
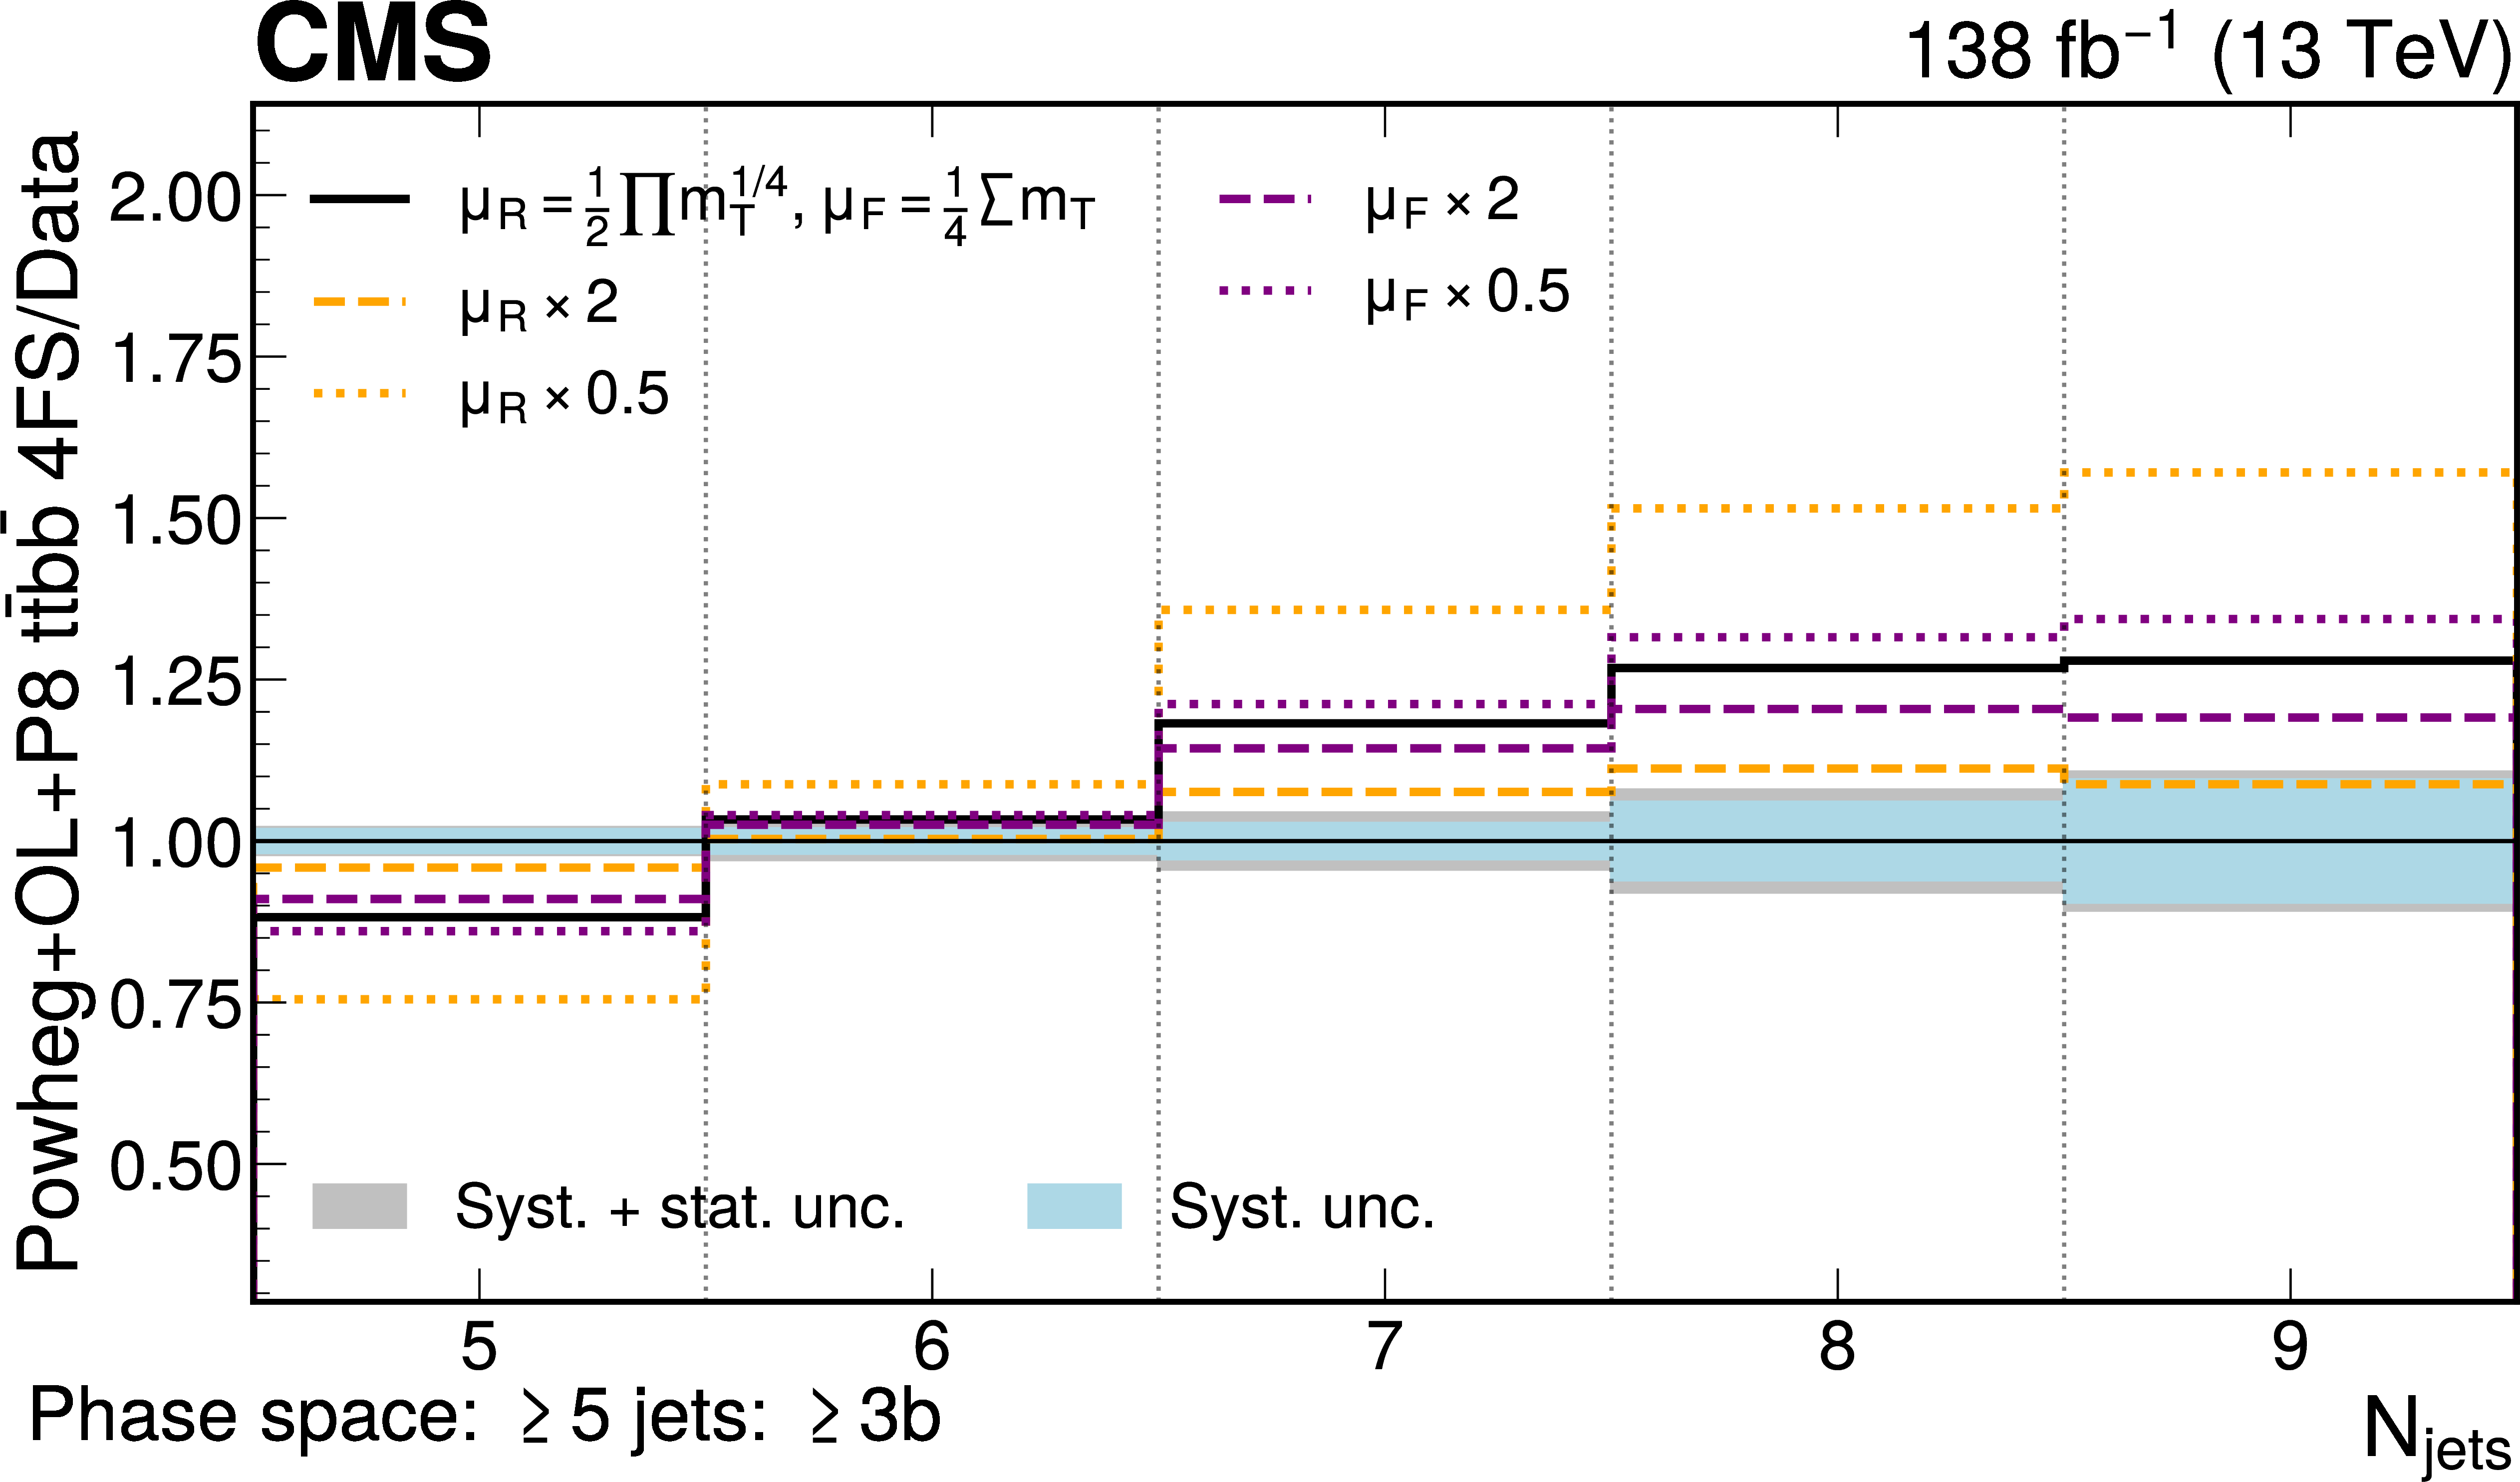
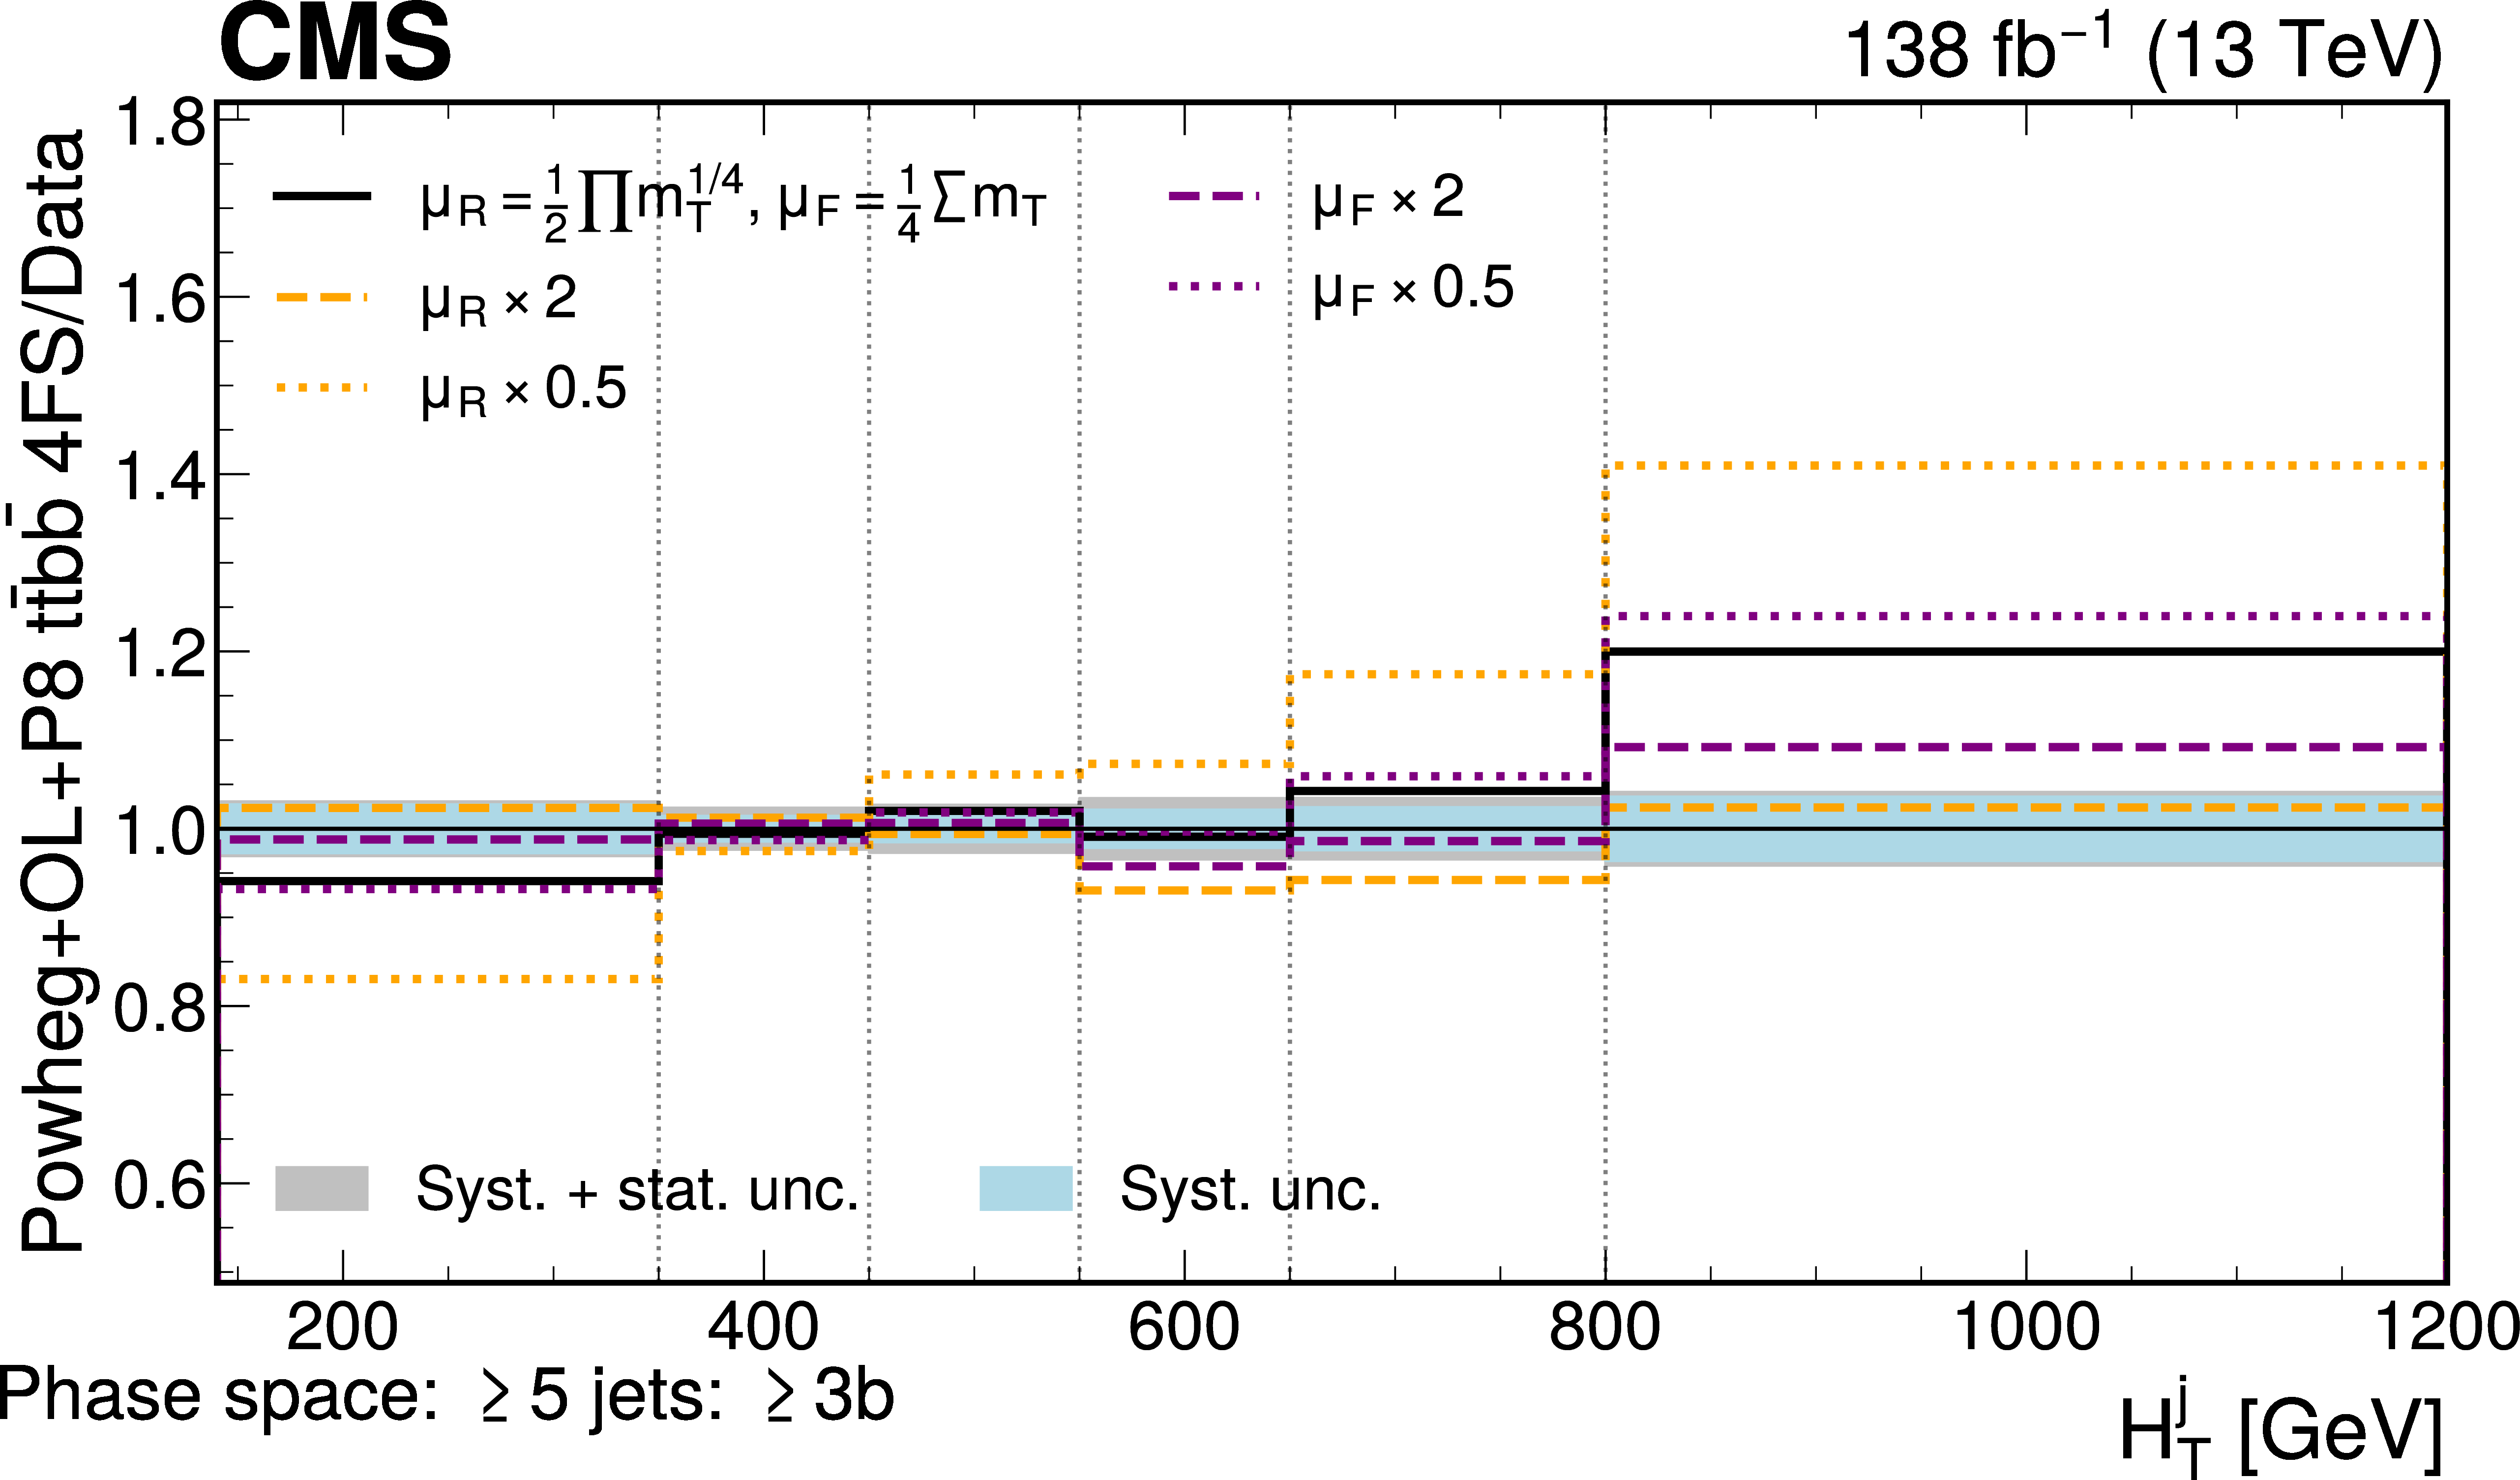
Ratio of normalized differential cross section predictions of the POWHEG+OL+P8 $\mathrm{t\bar{t}b\bar{b}}$ 4FS modeling approach with different $ \mu_{\mathrm{R}} $ and $ \mu_{\mathrm{F}} $ scale settings relative to the measured normalized differential cross sections for the number of jets (upper) and $ H_{\mathrm{T}} $ of jets (lower) in the $ \geq $5 jets: $ \geq $3b phase space. The systematic (total) uncertainties of the measurement are represented as grey (blue) bands. Variations of the $ \mu_{\mathrm{R}} $ ($ \mu_{\mathrm{F}} $) scale relative to the nominal scale setting are shown in orange (purple). The last bin in the distributions contains the overflow. |
png pdf |
Figure D1-a:
Ratio of normalized differential cross section predictions of the POWHEG+OL+P8 $\mathrm{t\bar{t}b\bar{b}}$ 4FS modeling approach with different $ \mu_{\mathrm{R}} $ and $ \mu_{\mathrm{F}} $ scale settings relative to the measured normalized differential cross sections for the number of jets (upper) and $ H_{\mathrm{T}} $ of jets (lower) in the $ \geq $5 jets: $ \geq $3b phase space. The systematic (total) uncertainties of the measurement are represented as grey (blue) bands. Variations of the $ \mu_{\mathrm{R}} $ ($ \mu_{\mathrm{F}} $) scale relative to the nominal scale setting are shown in orange (purple). The last bin in the distributions contains the overflow. |
png pdf |
Figure D1-b:
Ratio of normalized differential cross section predictions of the POWHEG+OL+P8 $\mathrm{t\bar{t}b\bar{b}}$ 4FS modeling approach with different $ \mu_{\mathrm{R}} $ and $ \mu_{\mathrm{F}} $ scale settings relative to the measured normalized differential cross sections for the number of jets (upper) and $ H_{\mathrm{T}} $ of jets (lower) in the $ \geq $5 jets: $ \geq $3b phase space. The systematic (total) uncertainties of the measurement are represented as grey (blue) bands. Variations of the $ \mu_{\mathrm{R}} $ ($ \mu_{\mathrm{F}} $) scale relative to the nominal scale setting are shown in orange (purple). The last bin in the distributions contains the overflow. |

png pdf |
Figure D2:
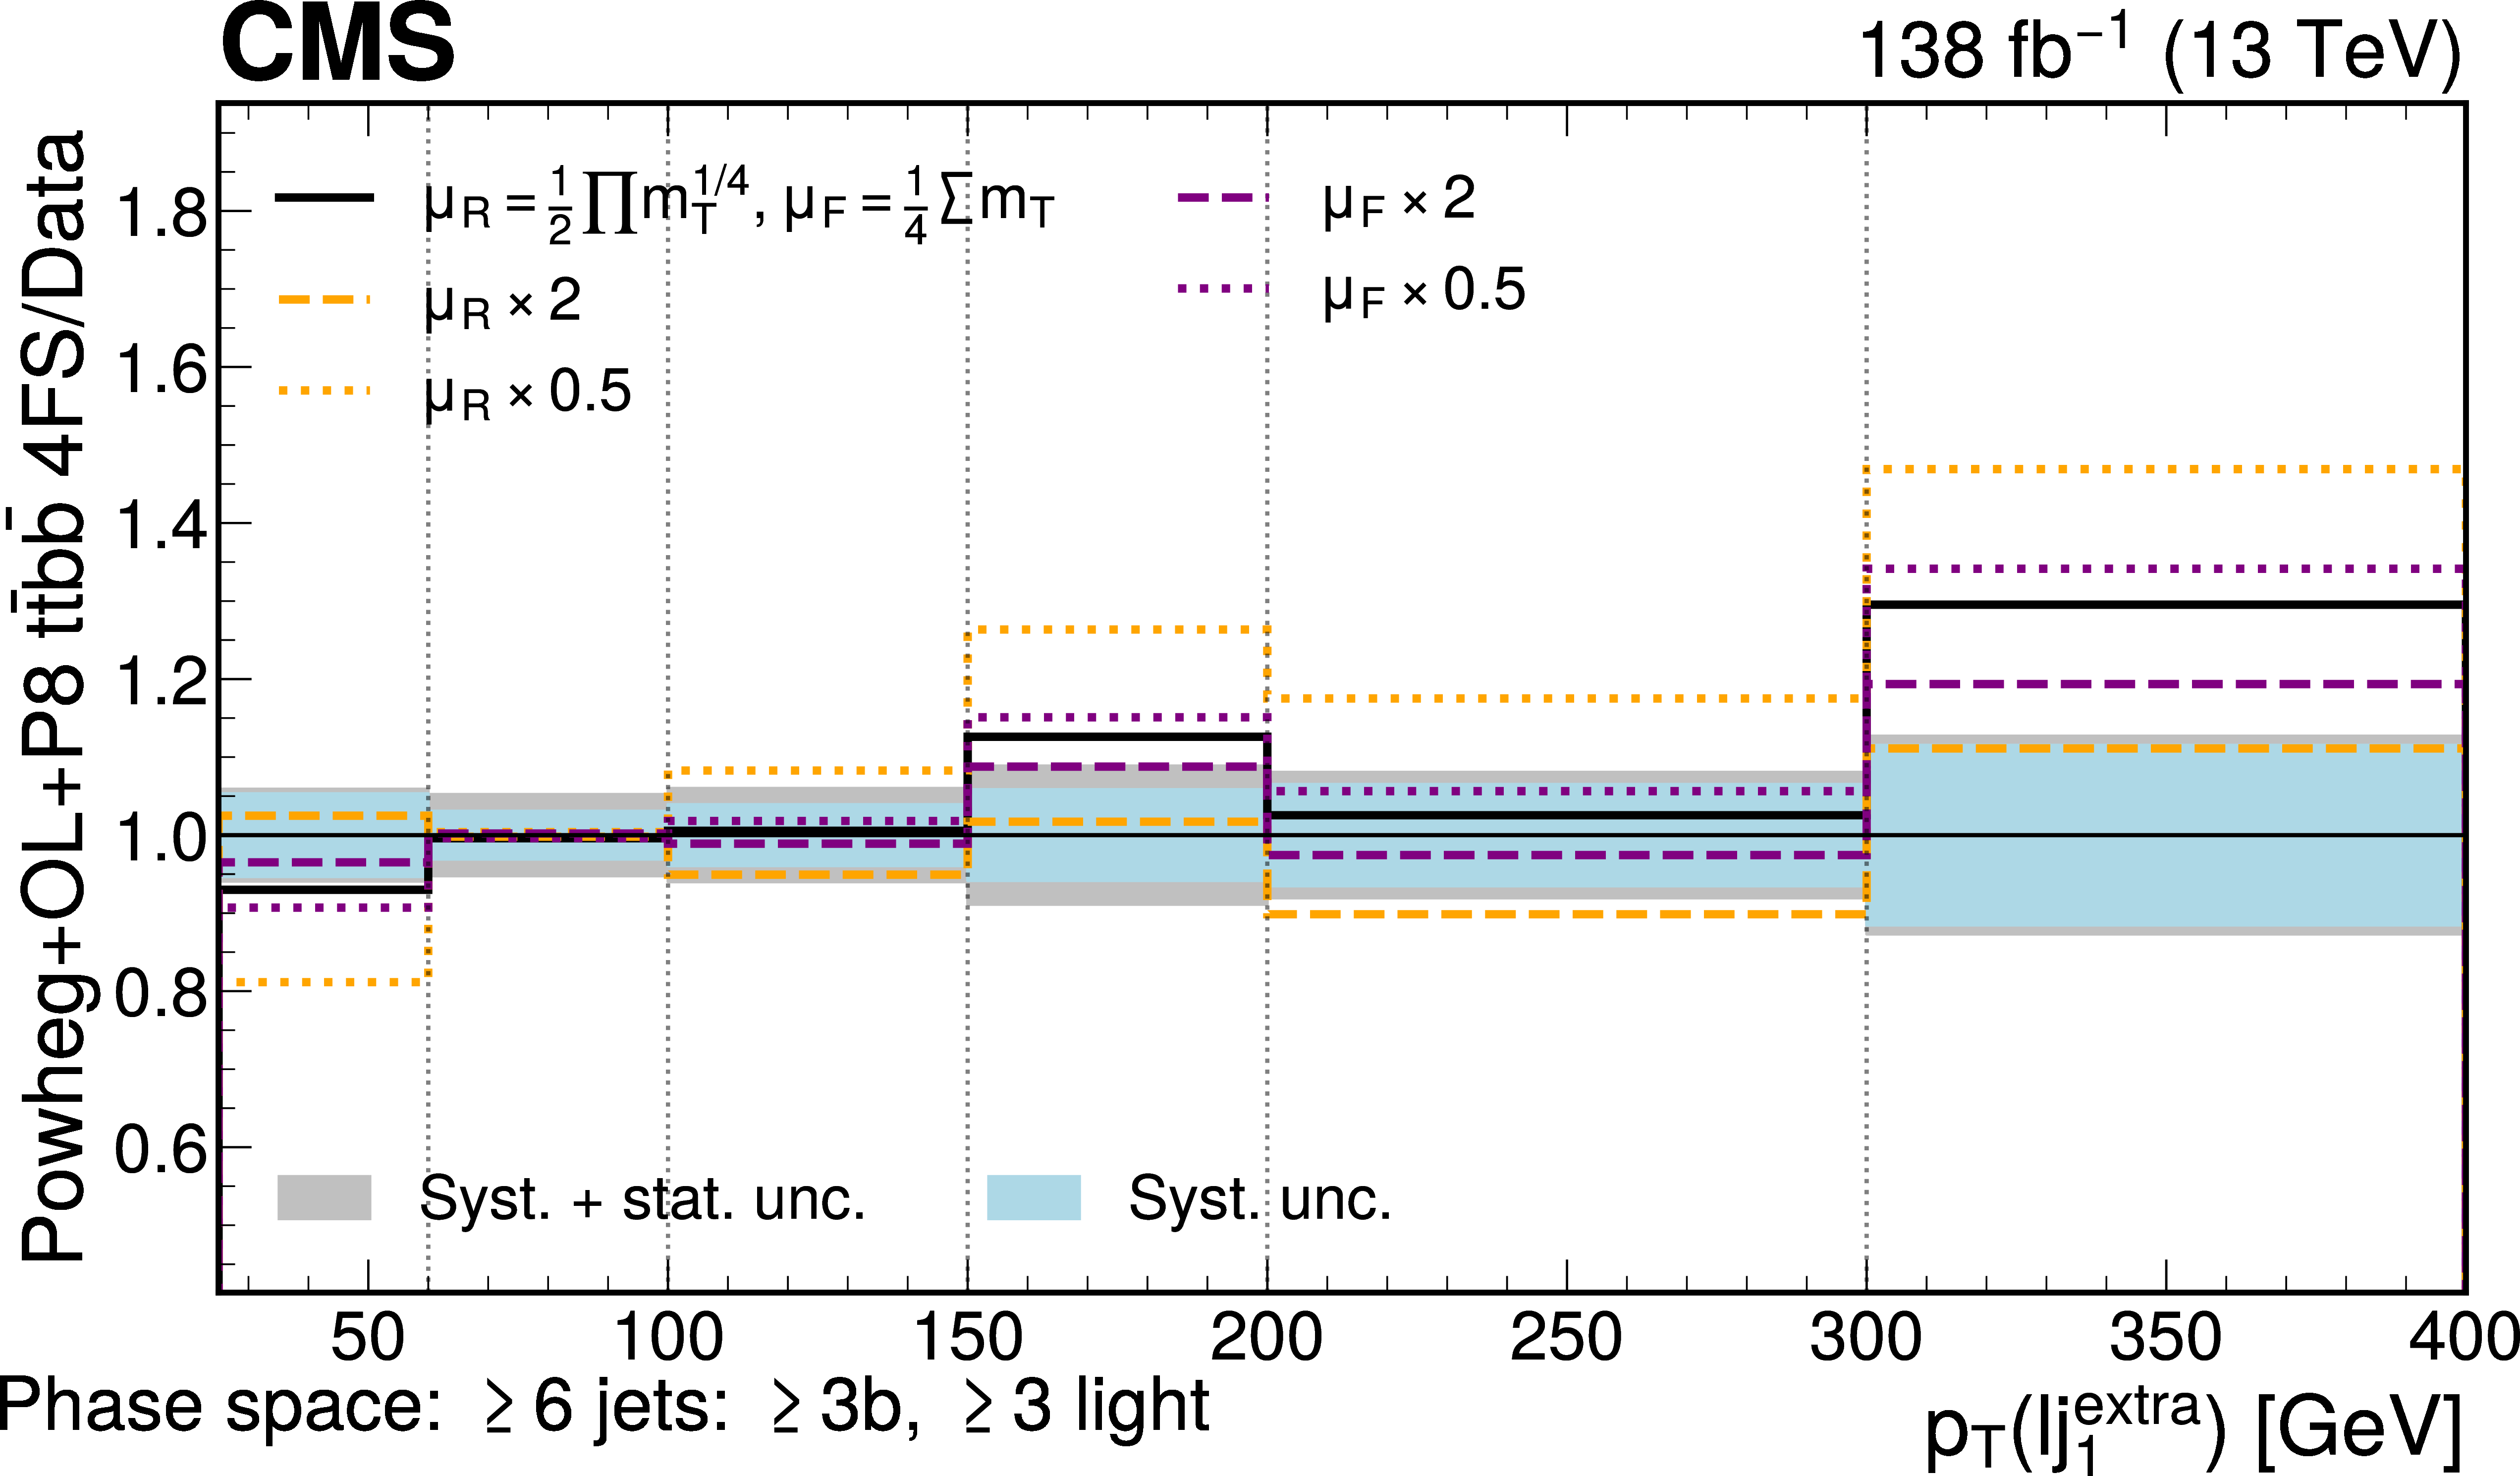
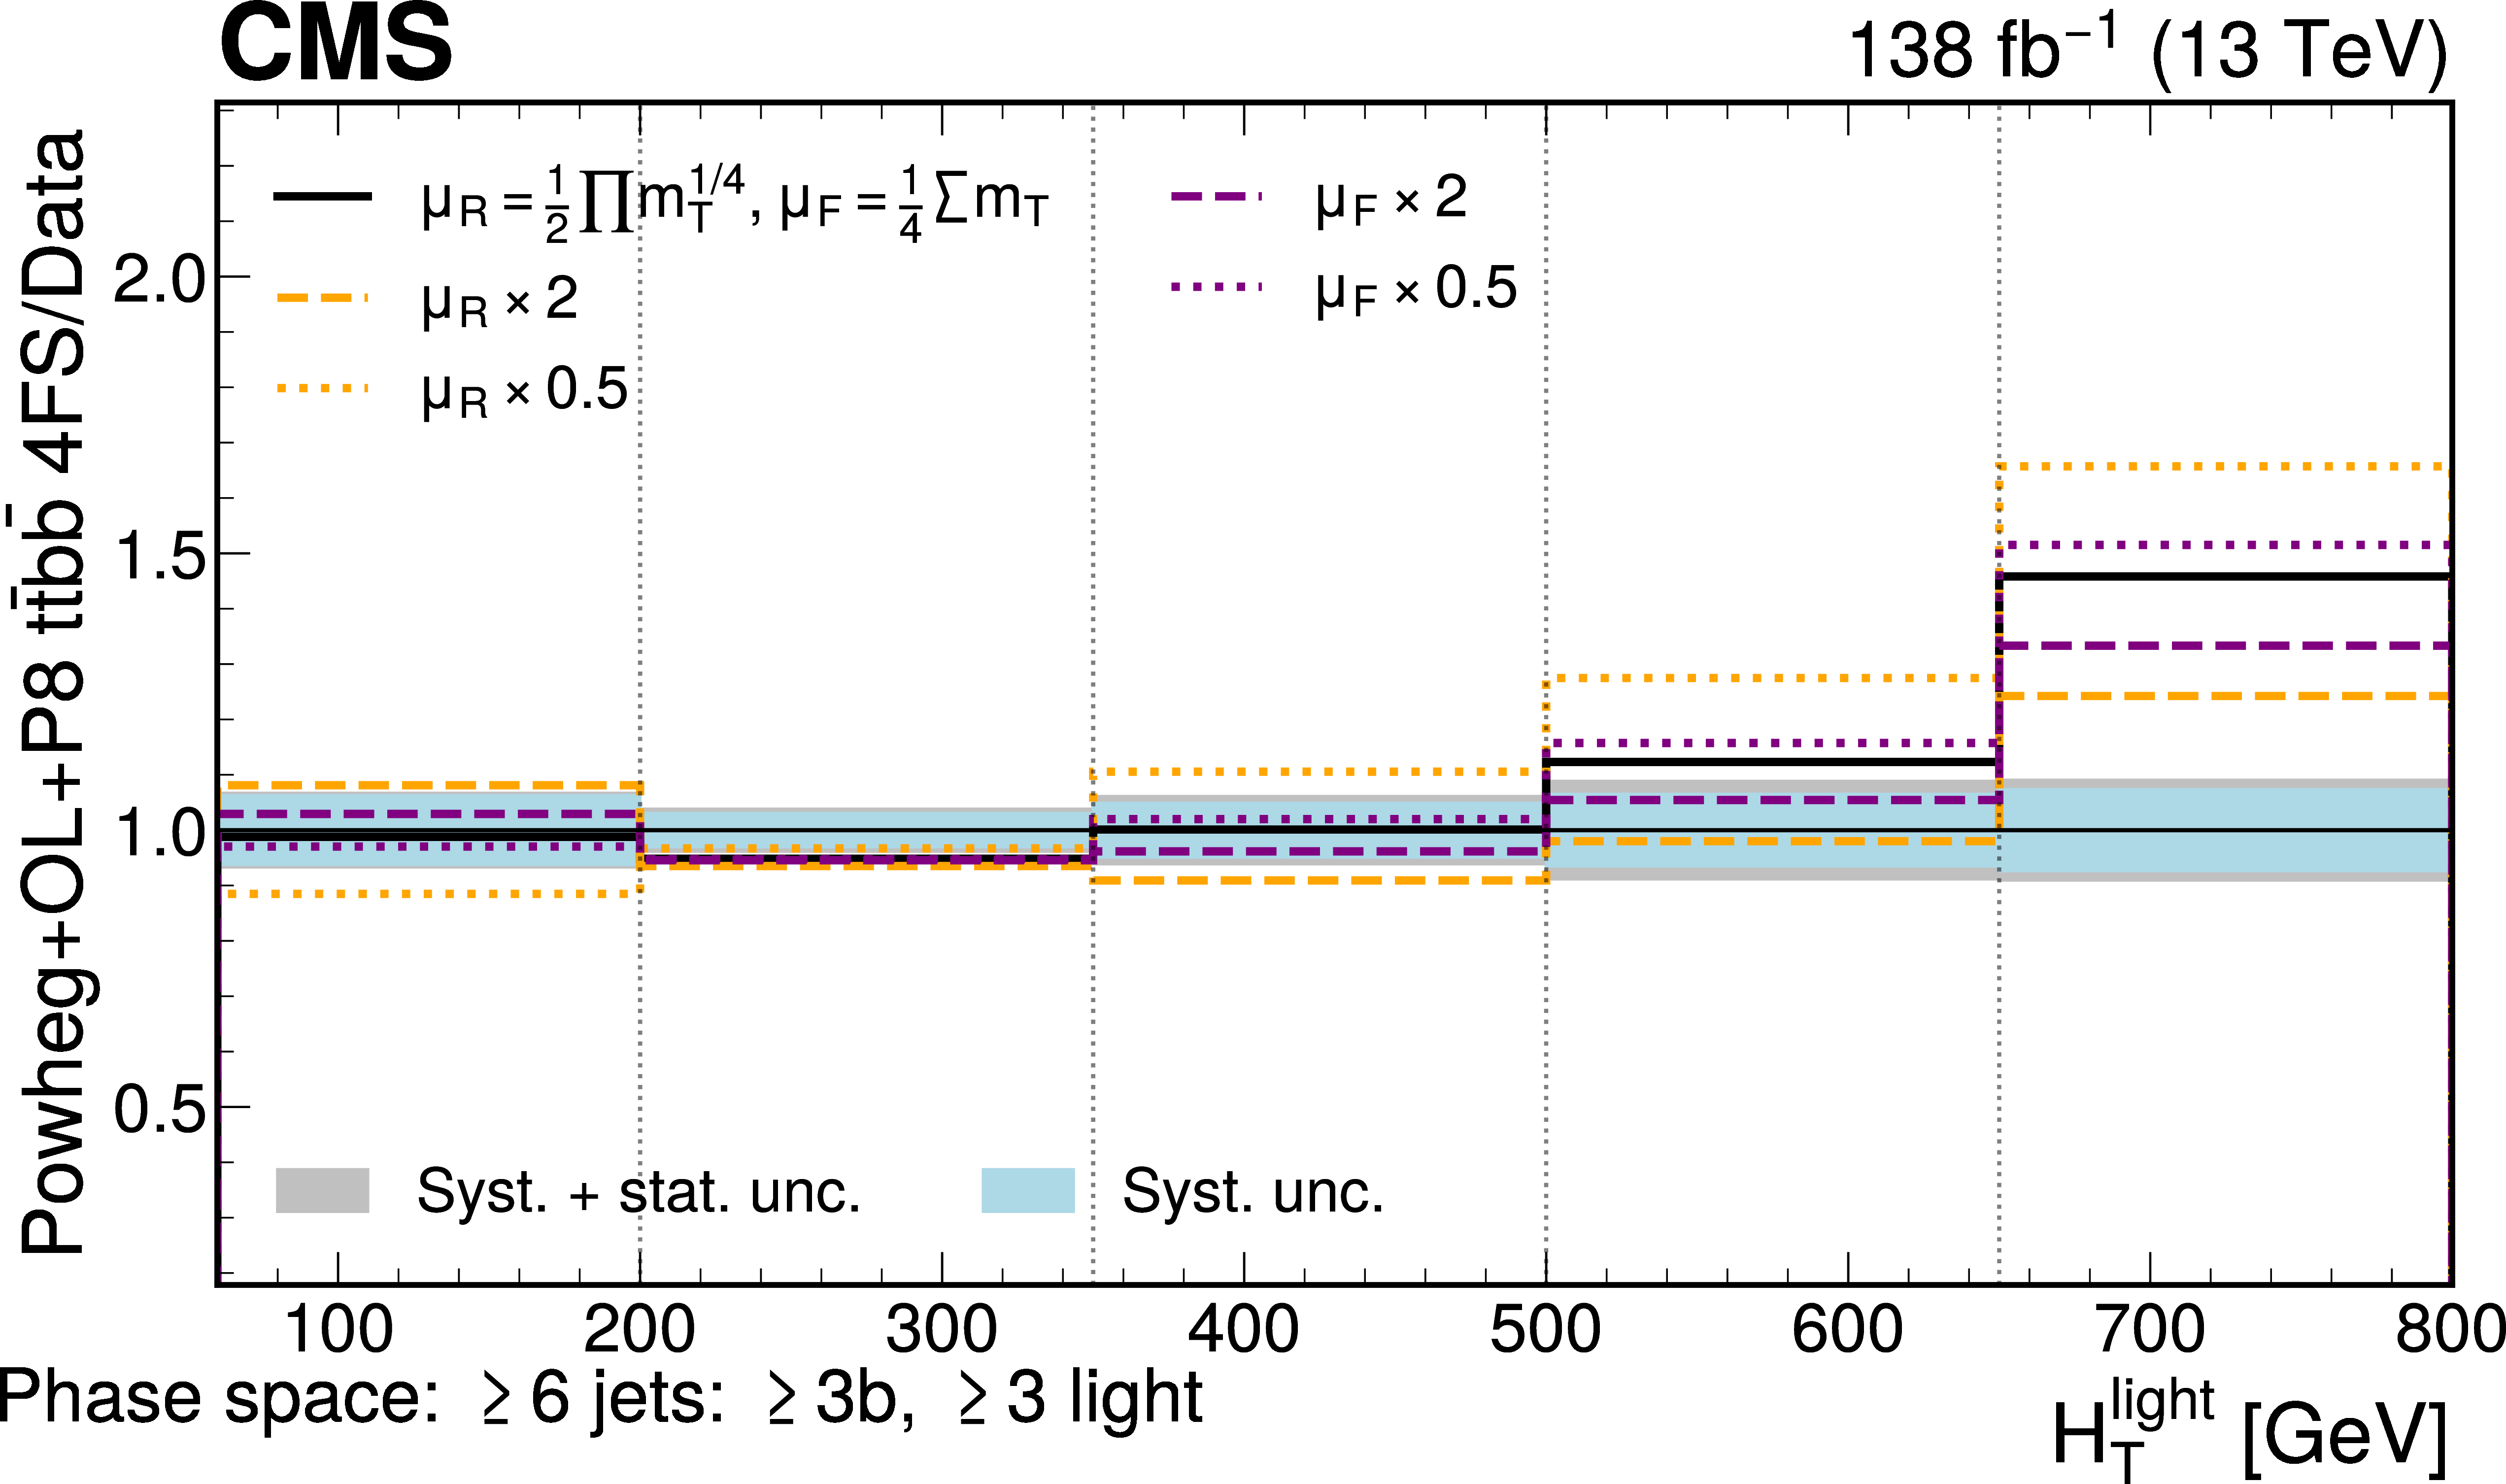
Ratio of normalized differential cross section predictions of the POWHEG+OL+P8} $\mathrm{t\bar{t}b\bar{b}}$ 4FS modeling approach with different $ \mu_{\mathrm{R}} $ and $ \mu_{\mathrm{F}} $ scale settings relative to the measured normalized differential cross sections for the extra light jet (upper) and $ H_{\mathrm{T}} $ of light jets (lower) in the $ \geq $6 jets: $ \geq $3b, $ \geq $3 light phase space. The systematic (total) uncertainties of the measurement are represented as grey (blue) bands. The systematic (total) uncertainties of the measurement are represented as grey (blue) bands. Variations of the $ \mu_{\mathrm{R}} $ ($ \mu_{\mathrm{F}} $) scale relative to the nominal scale setting are shown in orange (purple). The last bin in the distributions contains the overflow. |
png pdf |
Figure D2-a:
Ratio of normalized differential cross section predictions of the POWHEG+OL+P8} $\mathrm{t\bar{t}b\bar{b}}$ 4FS modeling approach with different $ \mu_{\mathrm{R}} $ and $ \mu_{\mathrm{F}} $ scale settings relative to the measured normalized differential cross sections for the extra light jet (upper) and $ H_{\mathrm{T}} $ of light jets (lower) in the $ \geq $6 jets: $ \geq $3b, $ \geq $3 light phase space. The systematic (total) uncertainties of the measurement are represented as grey (blue) bands. The systematic (total) uncertainties of the measurement are represented as grey (blue) bands. Variations of the $ \mu_{\mathrm{R}} $ ($ \mu_{\mathrm{F}} $) scale relative to the nominal scale setting are shown in orange (purple). The last bin in the distributions contains the overflow. |
png pdf |
Figure D2-b:
Ratio of normalized differential cross section predictions of the POWHEG+OL+P8} $\mathrm{t\bar{t}b\bar{b}}$ 4FS modeling approach with different $ \mu_{\mathrm{R}} $ and $ \mu_{\mathrm{F}} $ scale settings relative to the measured normalized differential cross sections for the extra light jet (upper) and $ H_{\mathrm{T}} $ of light jets (lower) in the $ \geq $6 jets: $ \geq $3b, $ \geq $3 light phase space. The systematic (total) uncertainties of the measurement are represented as grey (blue) bands. The systematic (total) uncertainties of the measurement are represented as grey (blue) bands. Variations of the $ \mu_{\mathrm{R}} $ ($ \mu_{\mathrm{F}} $) scale relative to the nominal scale setting are shown in orange (purple). The last bin in the distributions contains the overflow. |
| Tables | |
png pdf |
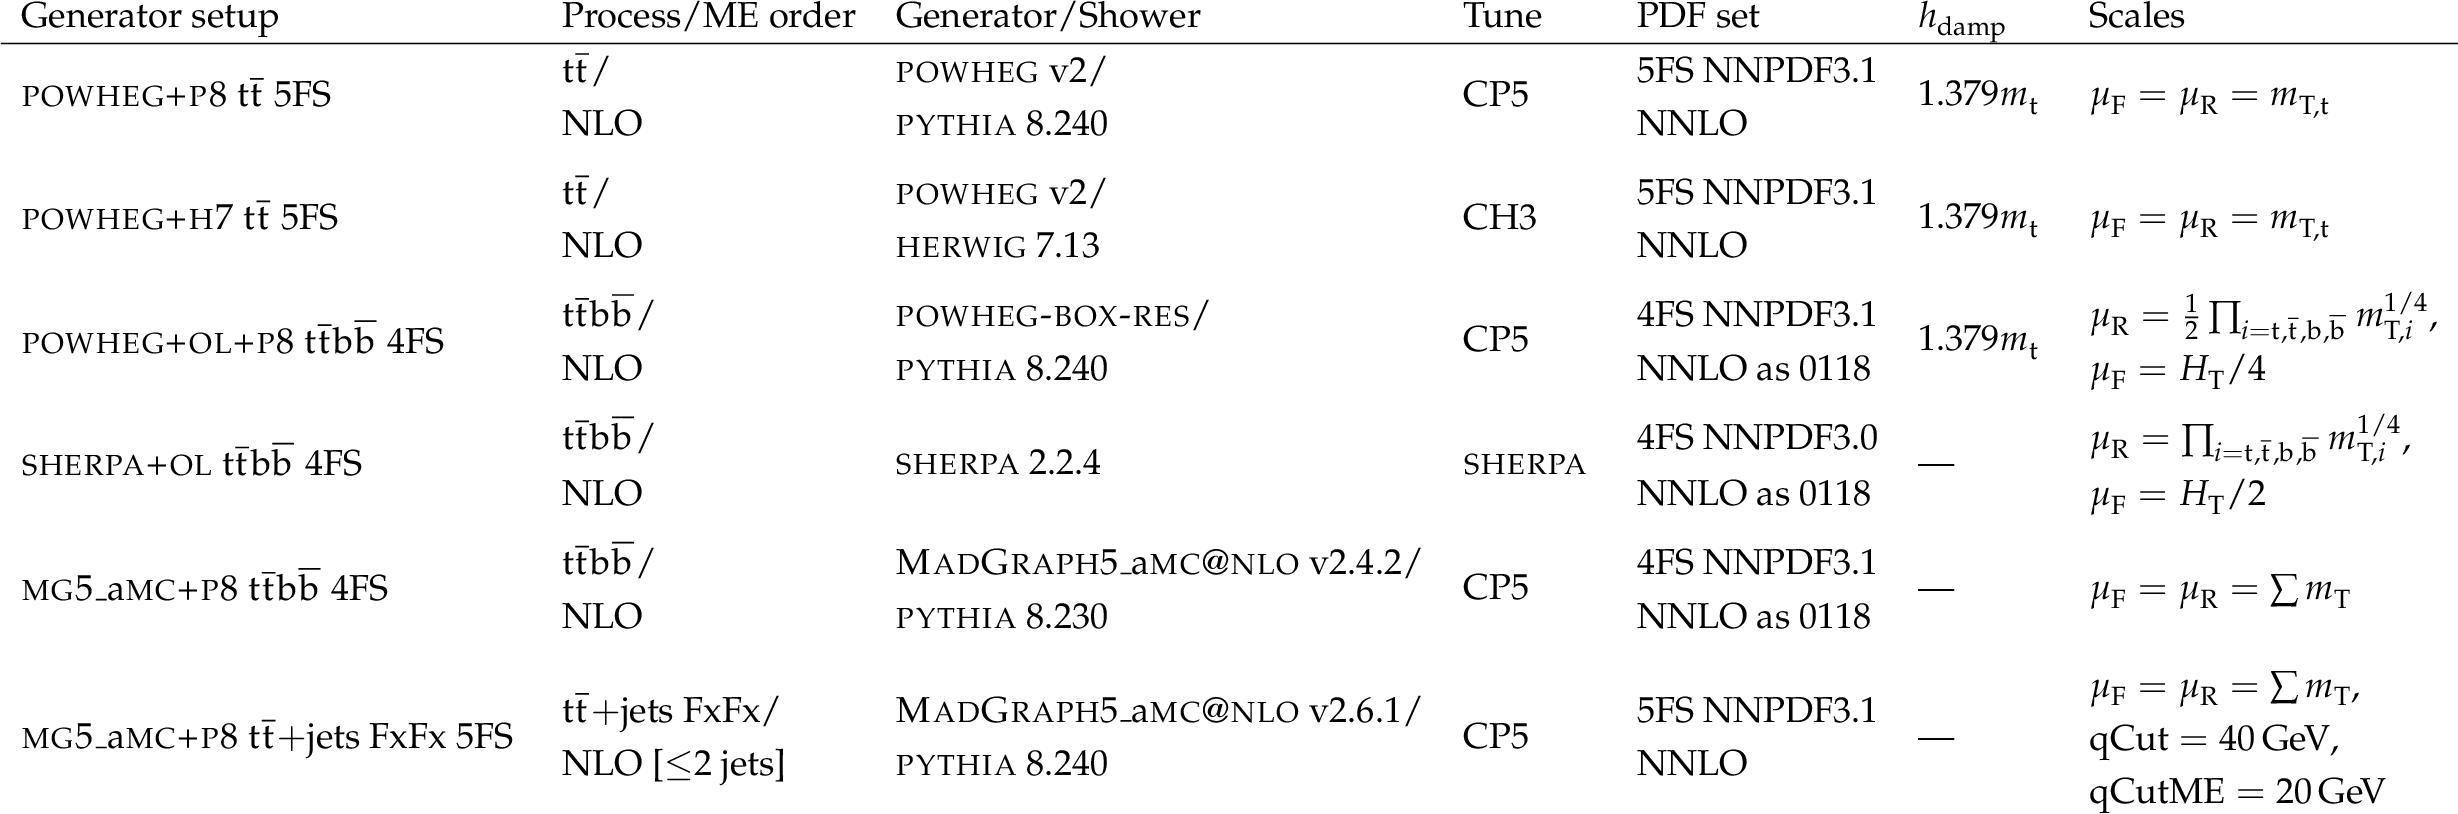
Table 1:
Generator settings for different modeling approaches of $ {\mathrm{t}\bar{\mathrm{t}}} \mathrm{b}\bar{\mathrm{b}} $ production. The top quark mass value is set to $ m_{\mathrm{t}} = $ 172.5 GeV for all generator setups, and for the generator setups using massive b quarks, the b quark mass value is set to $ m_{\mathrm{b}} = $ 4.75 GeV. In the scale settings, $ H_{\mathrm{T}} $ corresponds to the scalar $ m_{\mathrm{T}} $ sum, $ H_{\mathrm{T}} = \sum_{i=\mathrm{t},\bar{\mathrm{t}},\mathrm{b},\bar{\mathrm{b}},\mathrm{g}} m_{\mathrm{T},i} $, and \smash$ m_{\mathrm{T},i}=\sqrt{\smash[b]{m_i^2+p_{\mathrm{T},i}^2}} $ is the transverse mass. For generators setups using POWHEG the $ h_{\mathrm{damp}} $ value is specified. Other generator setups do not use this parameter and are marked with ($ \text{--} $). |

png pdf |
Table 2:
Generator settings for various minor background samples simulated with POWHEG [34-61-66] or MadGraph-5\_aMC@NLO [32]. The ``Group'' column refers to the grouping of processes in the maximum likelihood fits. |
png pdf |
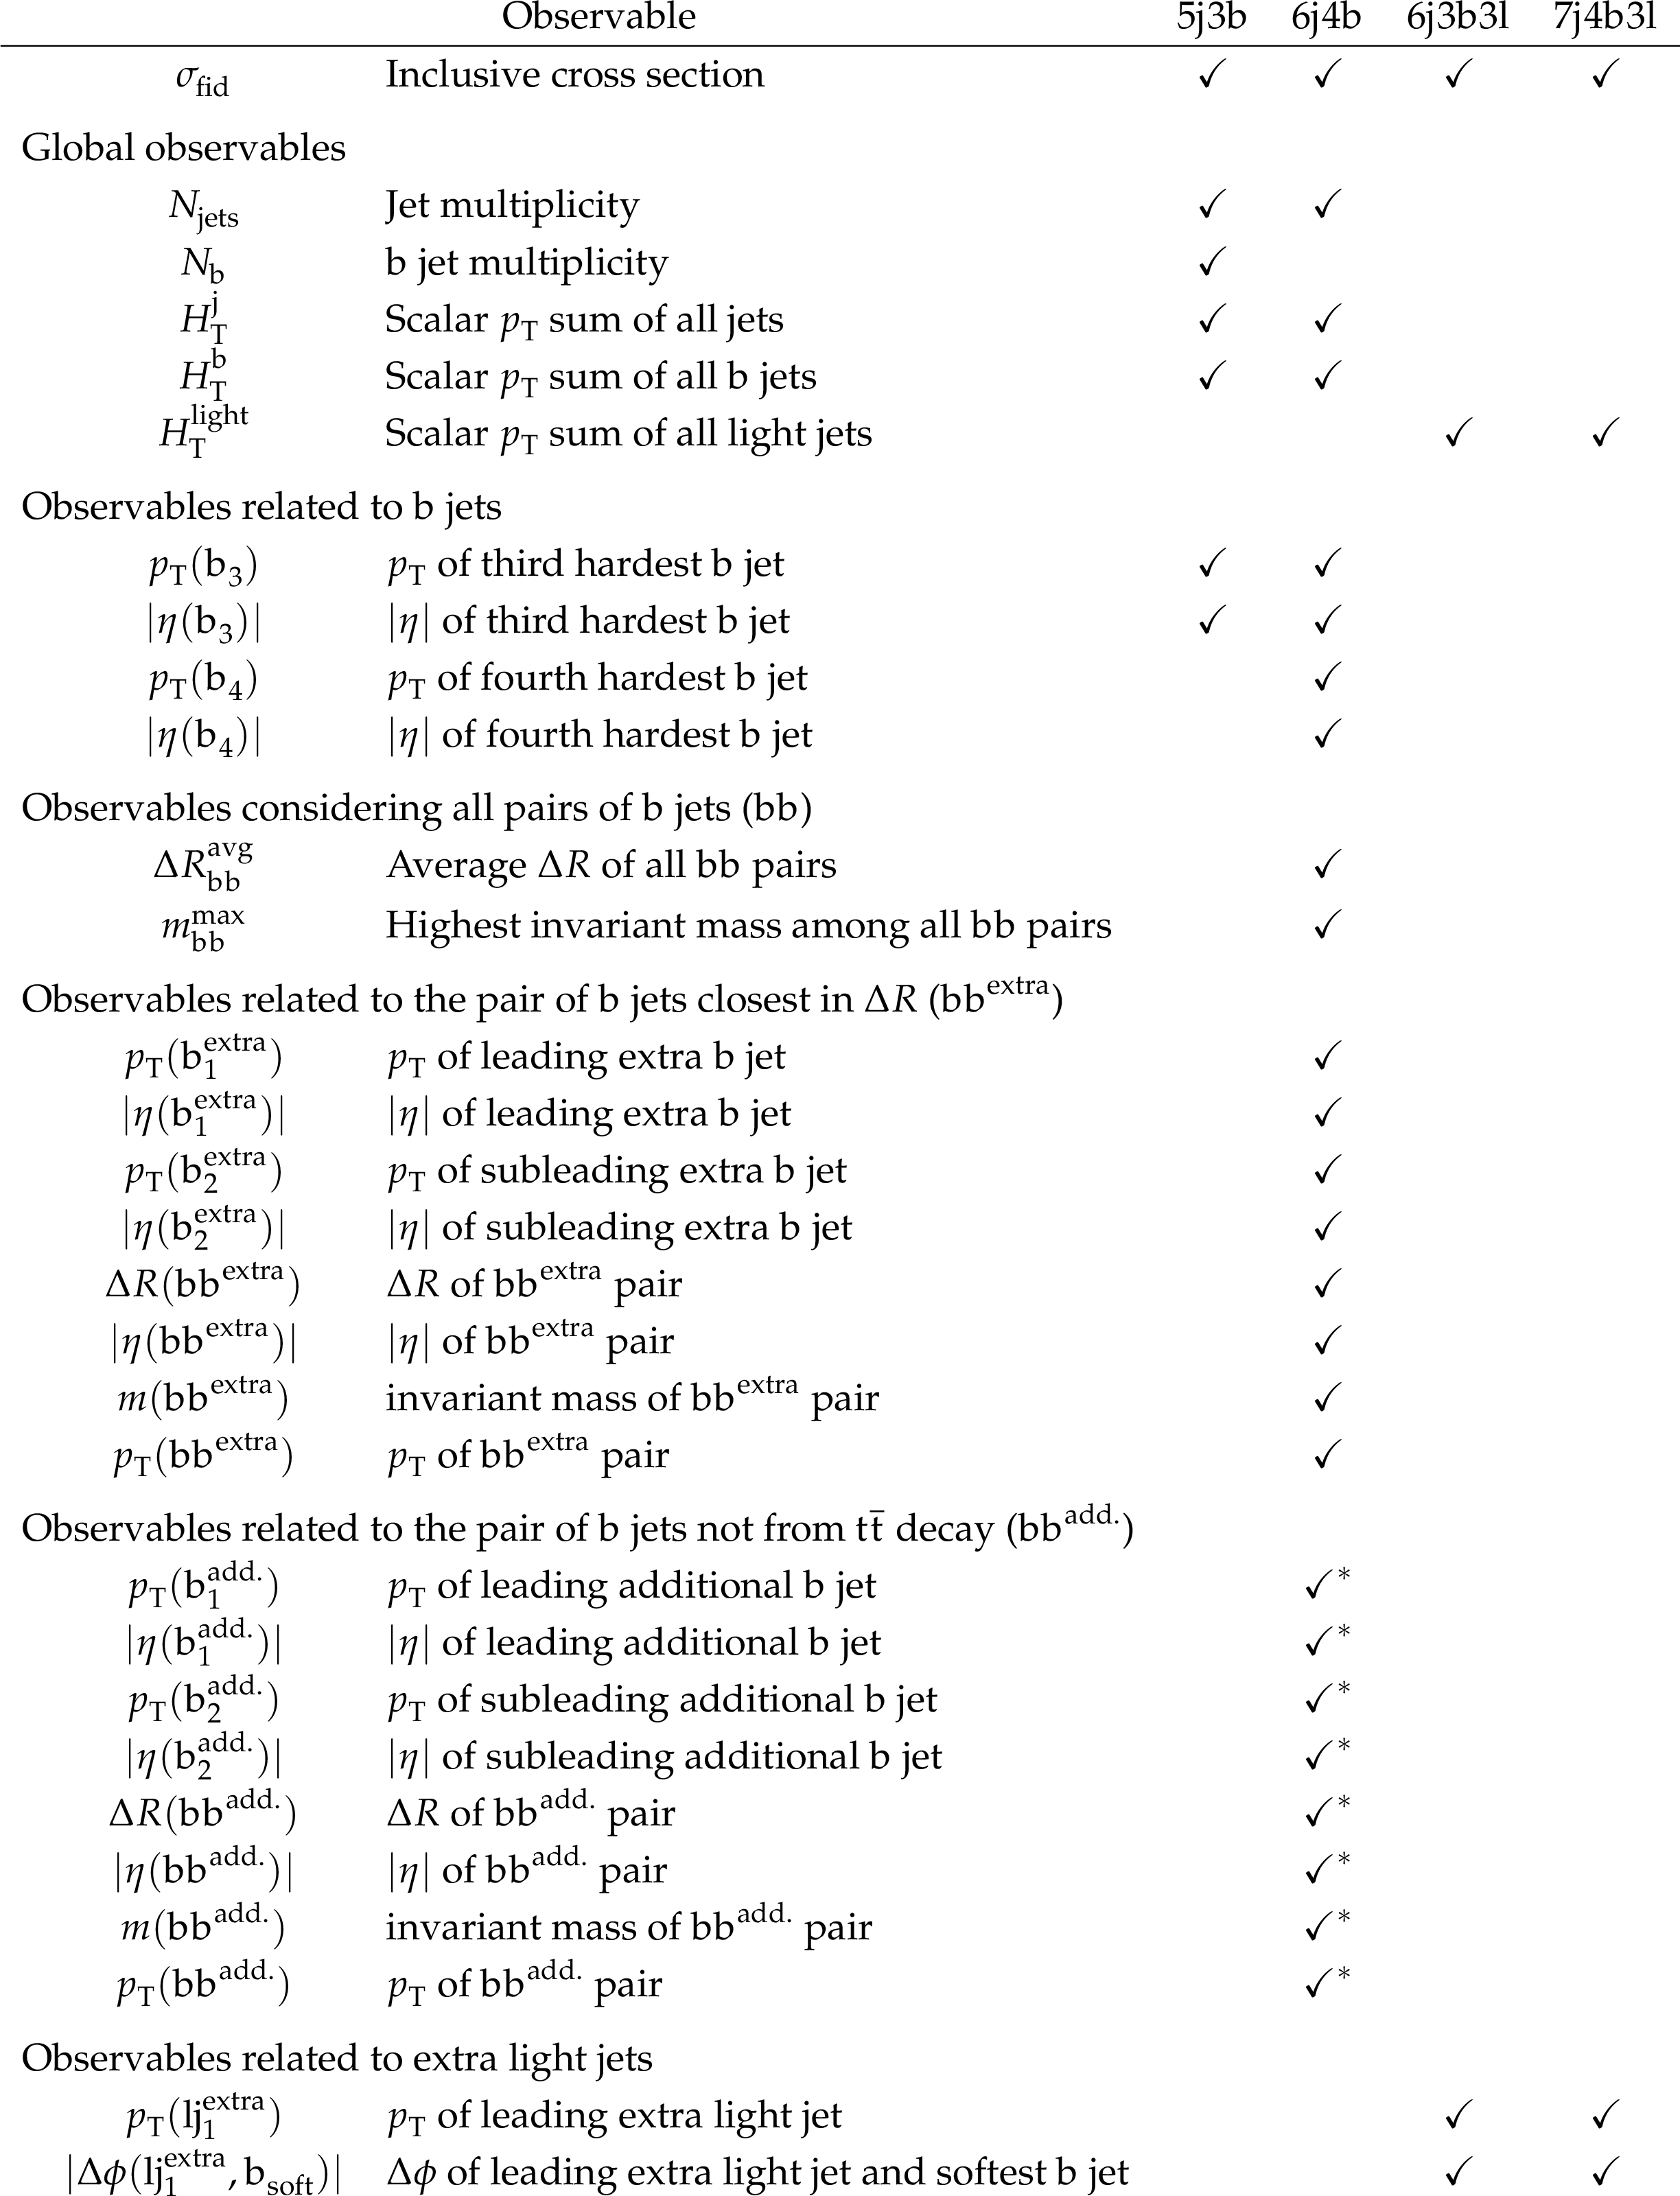
Table 3:
Description of all measured observables for each of the four fiducial phase space regions. Observables marked as ($ \checkmark^\ast $) rely on the definition of additional b jets, and do not fully correspond to the 6j4b fiducial phase space defined at the particle level, but also require the presence of b jets without top (anti)quarks in their simulated history. |
png pdf |
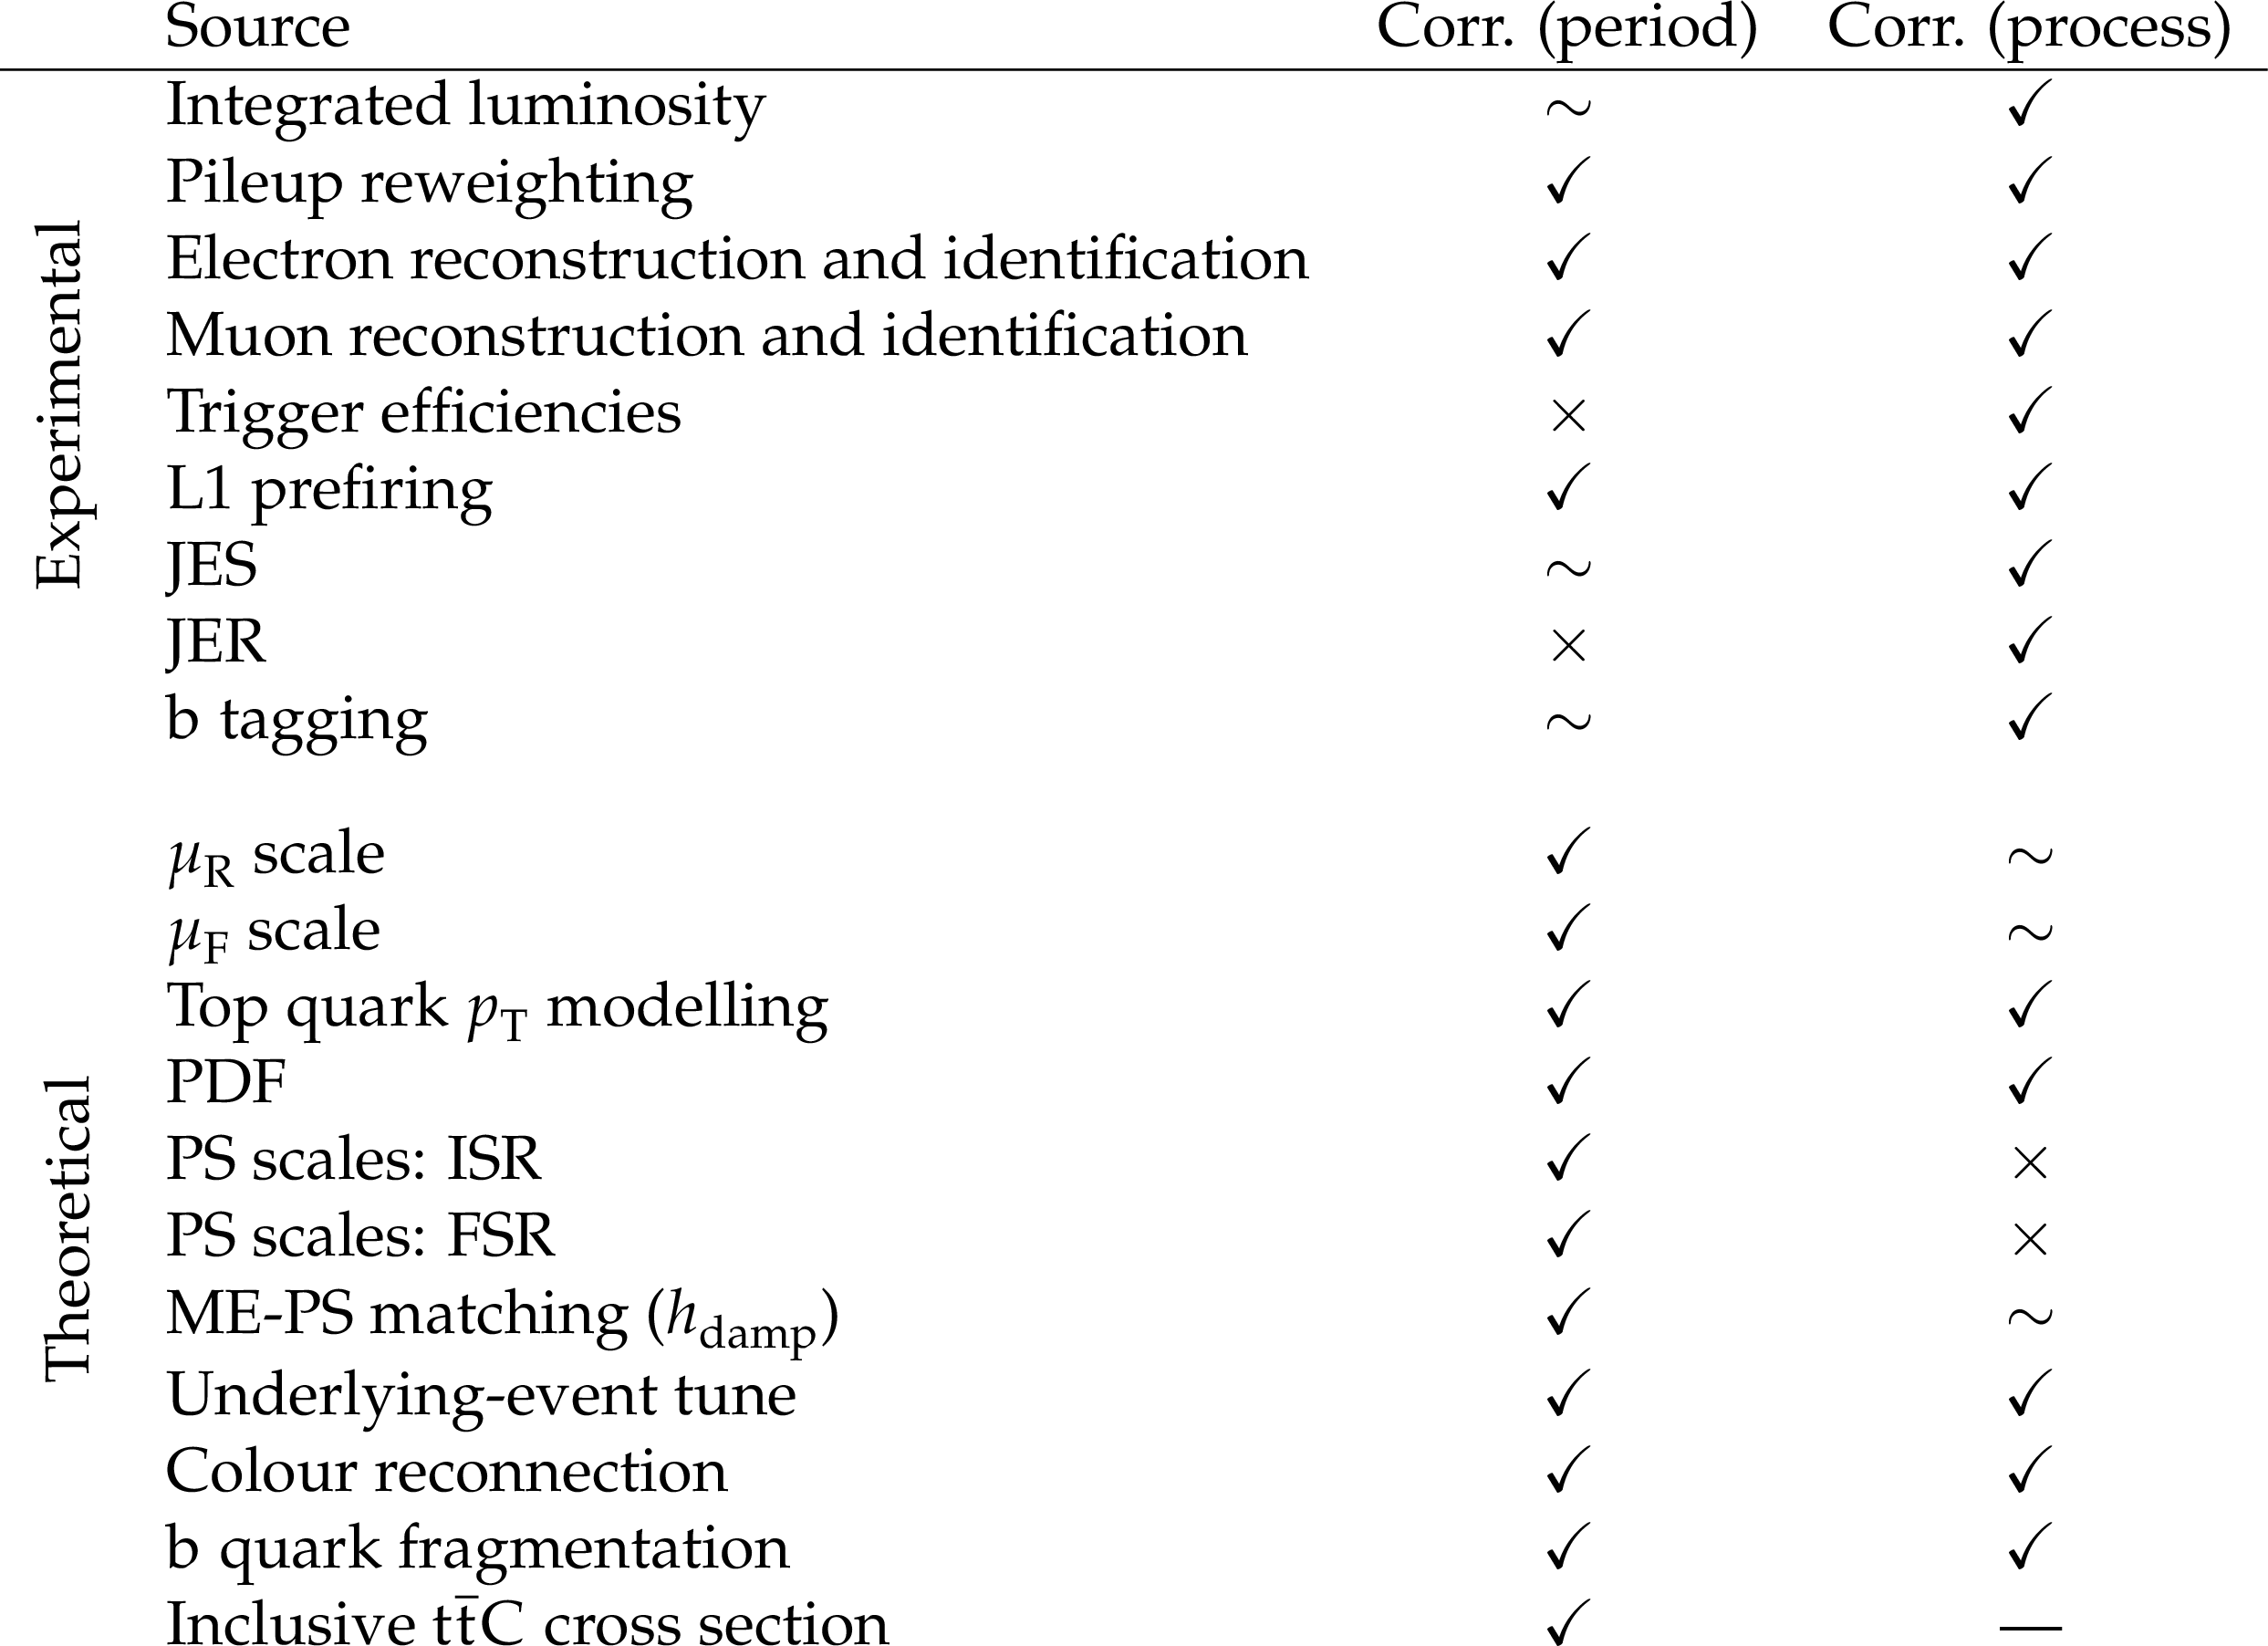
Table 4:
Summary of the systematic uncertainty sources in the inclusive and differential $ {\mathrm{t}\bar{\mathrm{t}}} \mathrm{b}\bar{\mathrm{b}} $ cross section measurements. The first column lists the source of the uncertainty. The second (third) column indicates the treatment of correlations of the uncertainties between different data-taking periods (processes), where $ \checkmark $ means fully correlated, $ \sim $ means partially correlated (i.e., contains sub-sources that are either fully correlated or uncorrelated), $ \times $ means uncorrelated, and $ \text{--} $ means not applicable. |
png pdf |
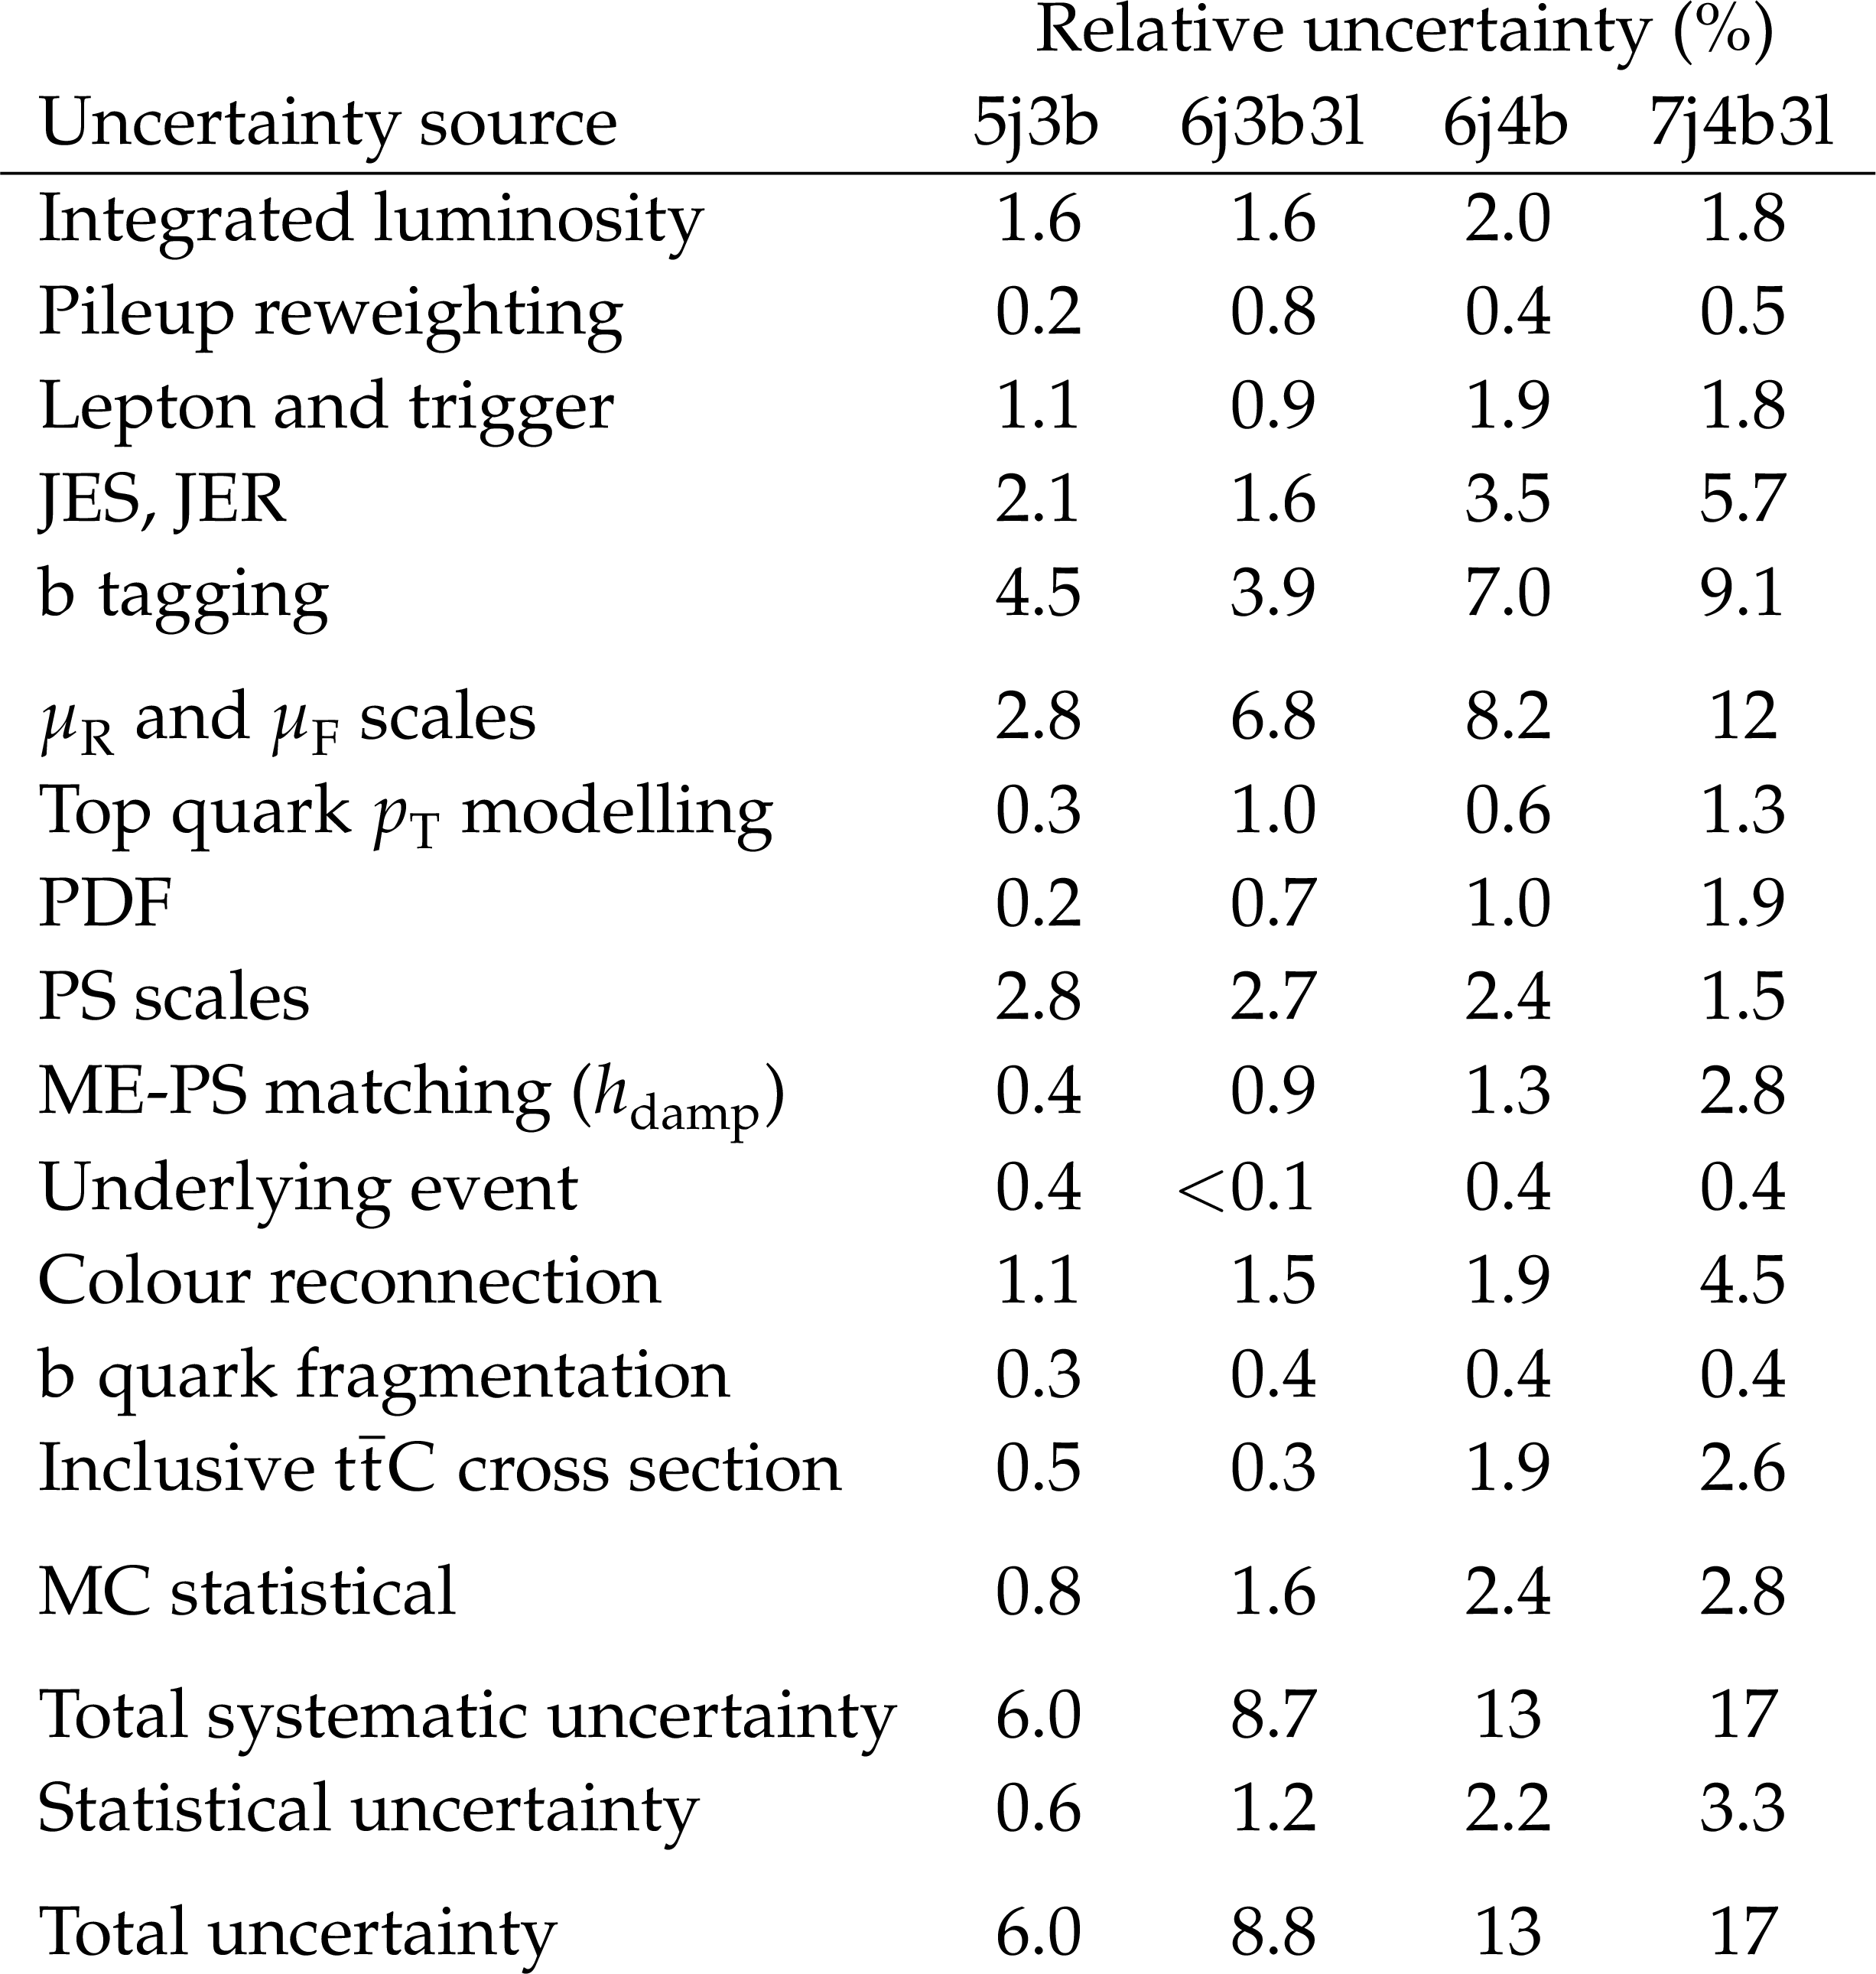
Table 5:
Contributions of the considered sources of uncertainty to the total uncertainty in the inclusive cross sections. For each group of uncertainty sources, the impacts of the corresponding nuisance parameters on the total cross section are combined, taking into account their correlation in the fit. The numbers show relative uncertainties (in %). The statistical uncertainty is obtained as the difference, in quadrature, between the total uncertainty and the sum of all systematic uncertainties. |
png pdf |
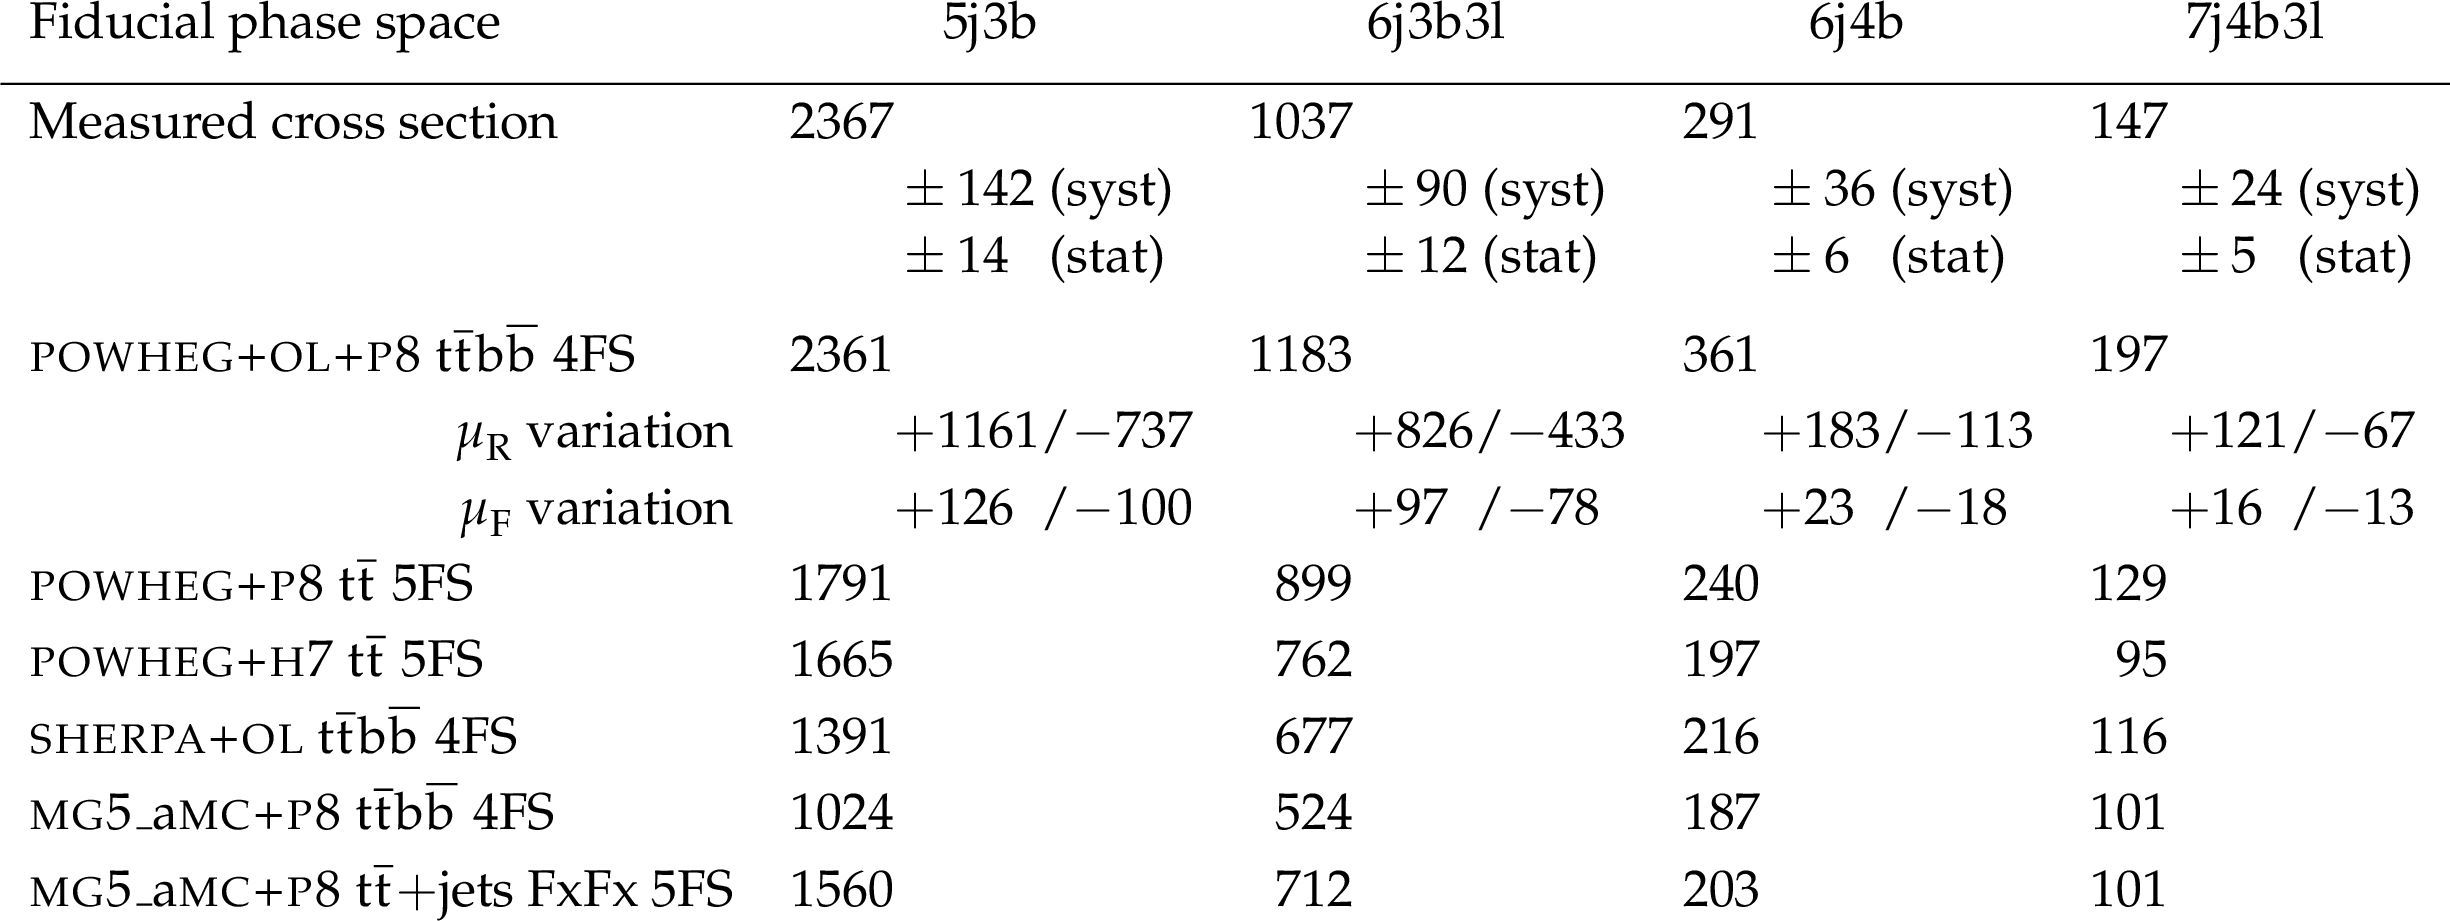
Table 6:
Measured and predicted inclusive cross sections in the four considered phase space regions (in fb). |
png pdf |
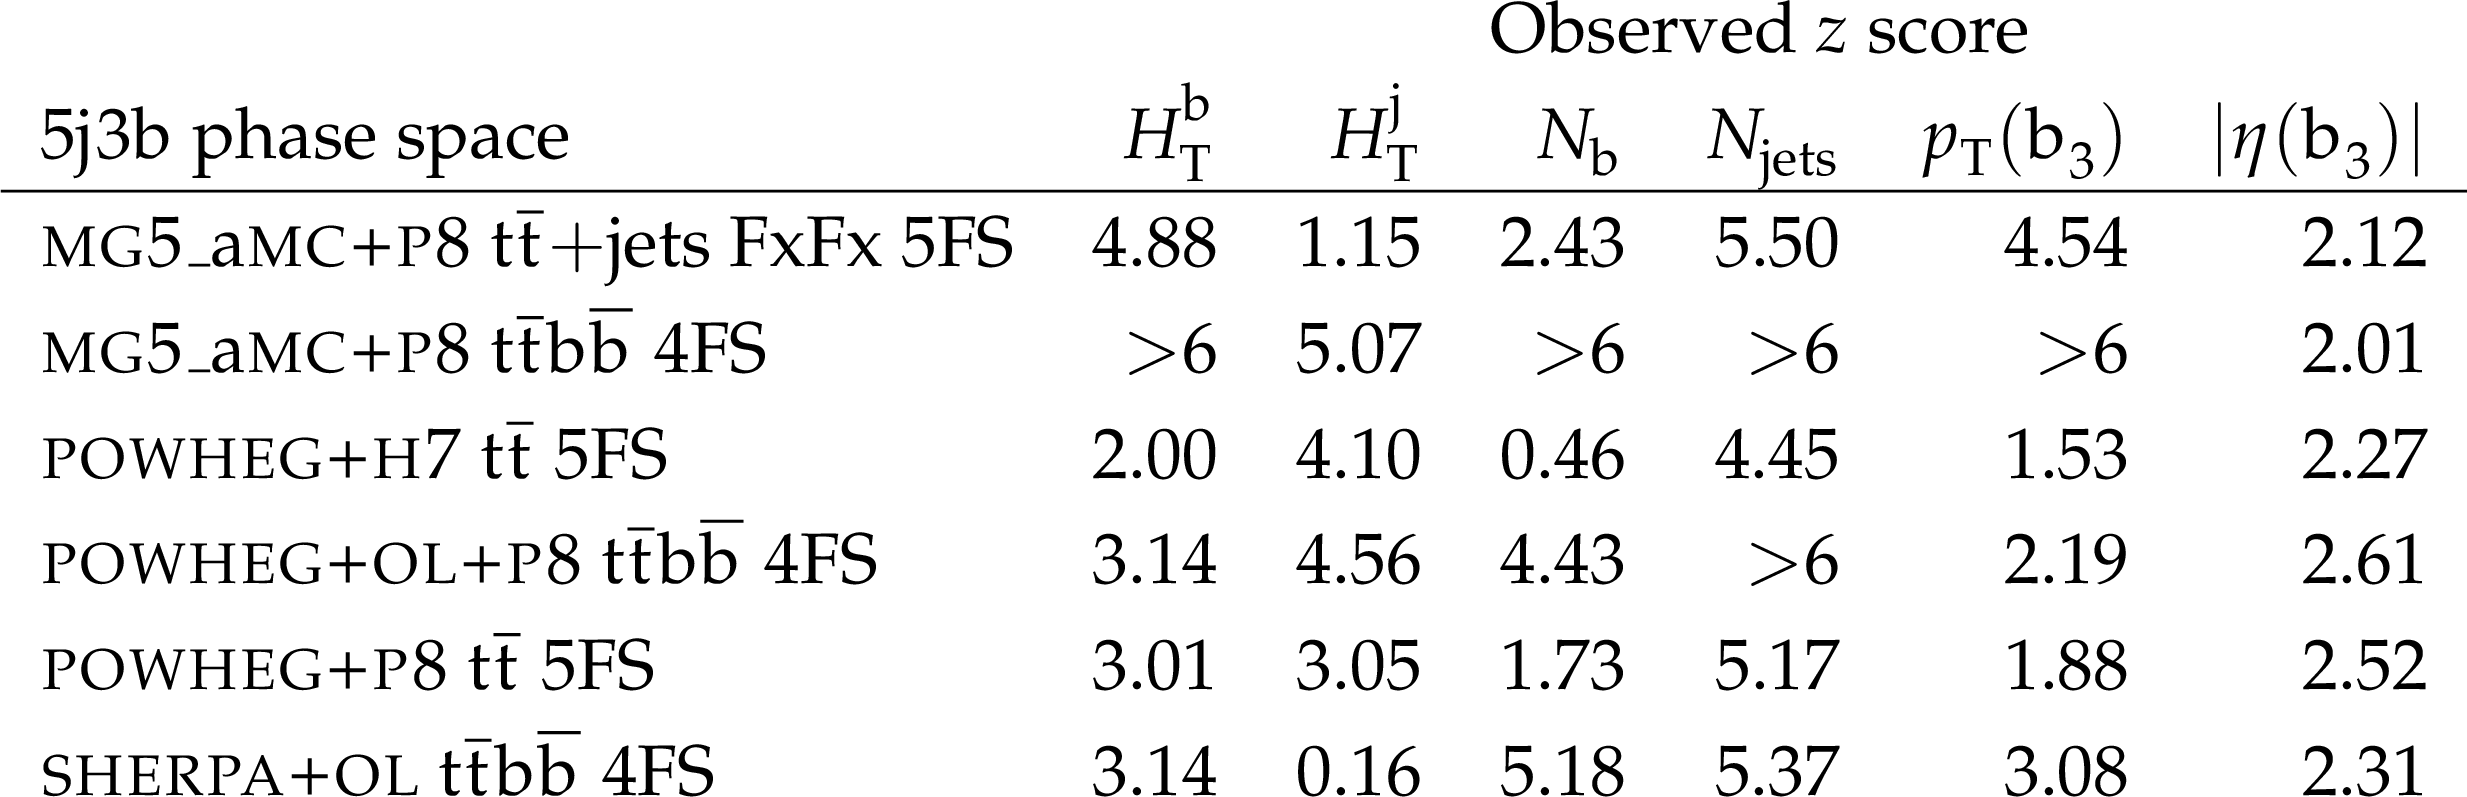
Table E1:
Observed $ z $ score for each of the theoretical predictions in the 5j3b phase space, given the unfolded data and covariance matrix. For the determination of the $ z $ score, only the measurement uncertainties are considered. |
png pdf |
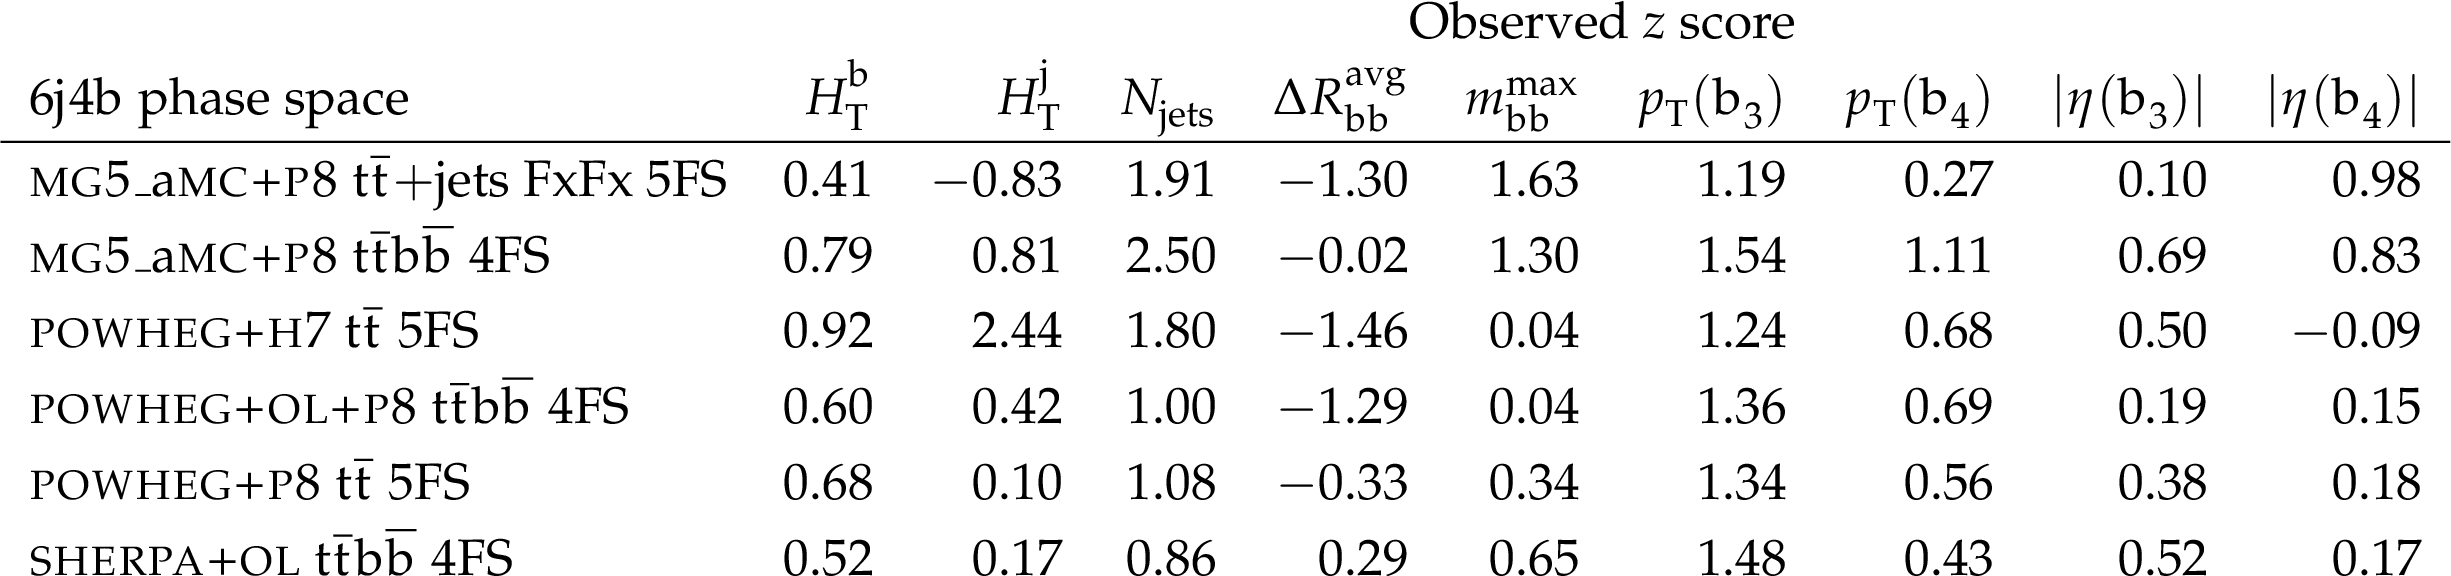
Table E2:
Observed $ z $ score for each of the theoretical predictions in the 6j4b phase space, given the unfolded data and covariance matrix. For the determination of the $ z $ score, only the measurement uncertainties are considered. |
png pdf |
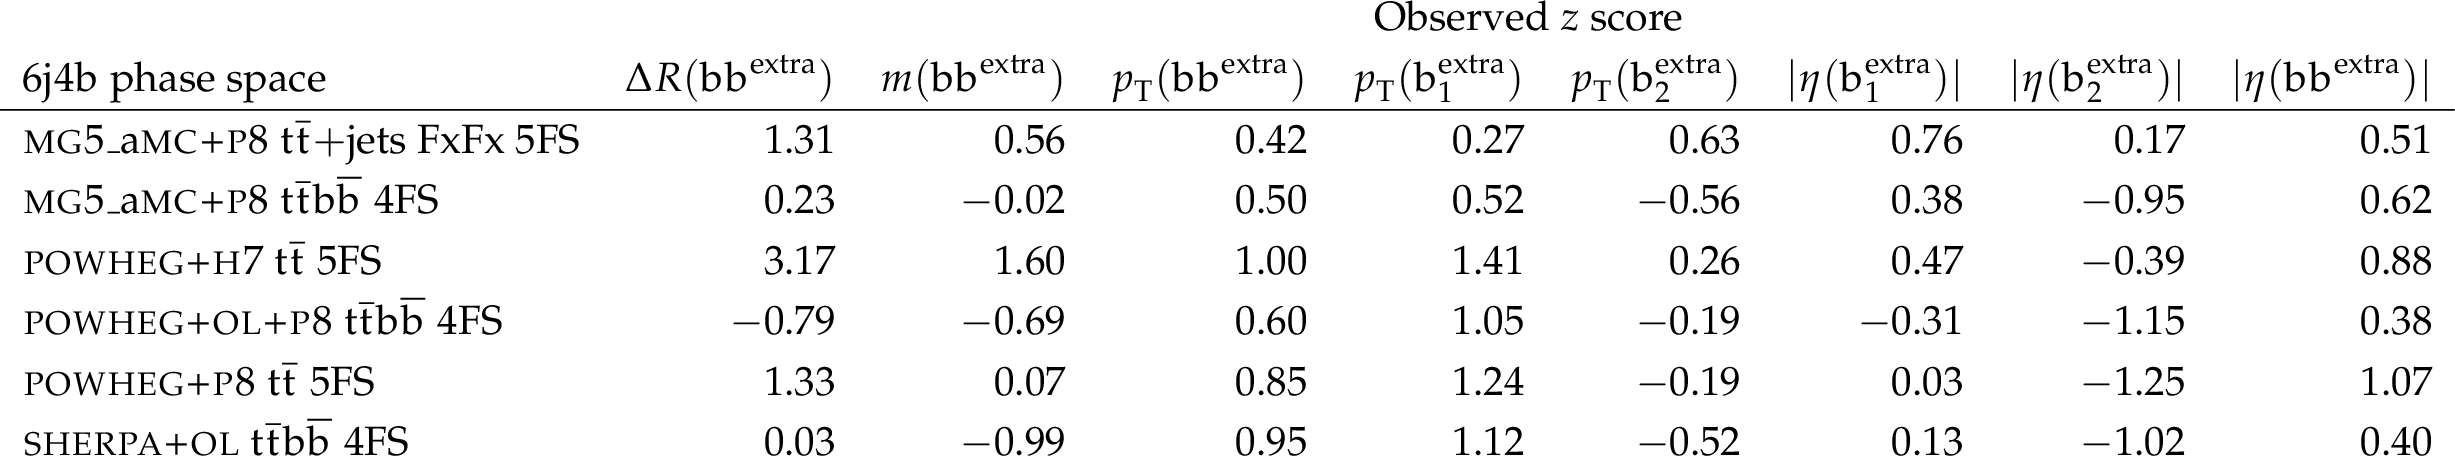
Table E3:
Observed $ z $ score for each of the theoretical predictions in the 6j4b phase space of the observables related to the $ \mathrm{b}\mathrm{b}^{\text{extra}} $ pair, given the unfolded data and covariance matrix. For the determination of the $ z $ score, only the measurement uncertainties are considered. |
png pdf |
Table E4:
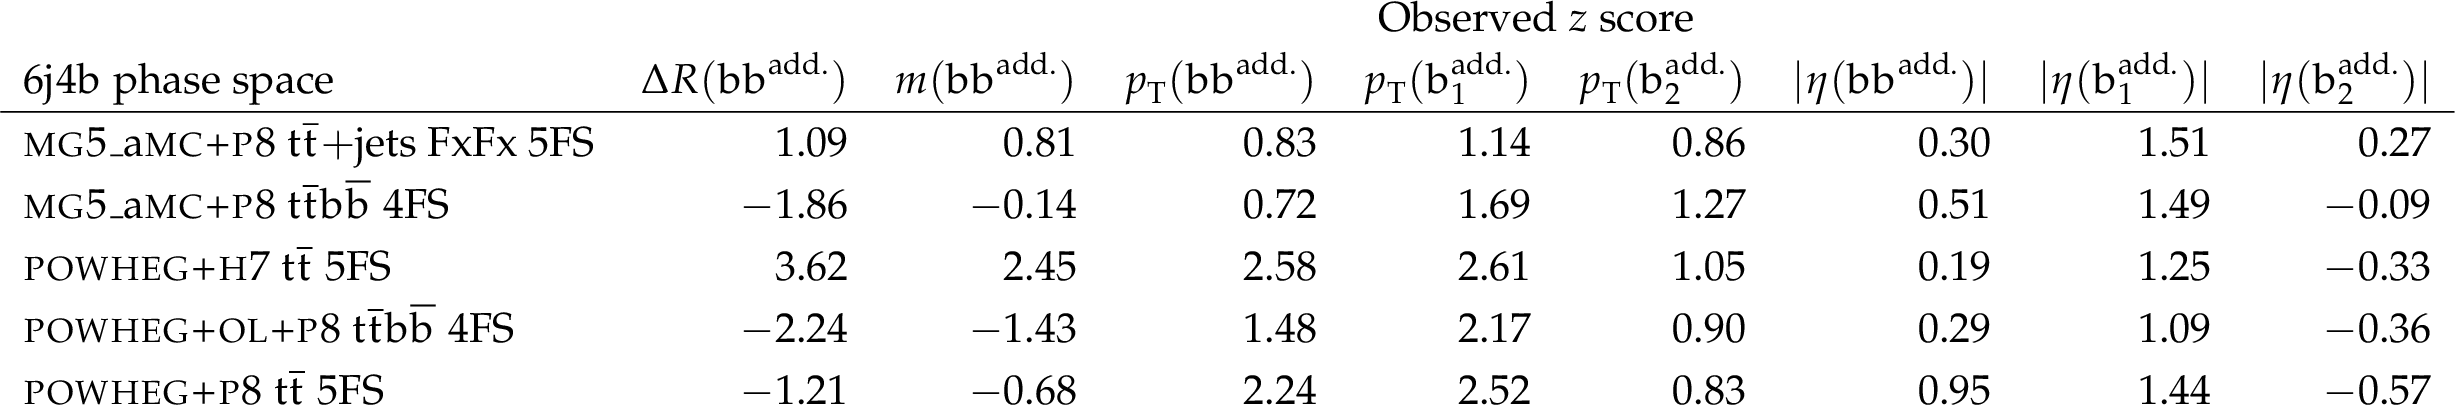
Observed $ z $ score for each of the theoretical predictions in the 6j4b phase space of the observables related to the $ \mathrm{b}\mathrm{b}^{\text{add.}} $ pair, given the unfolded data and covariance matrix. For the determination of the $ z $ score, only the measurement uncertainties are considered. |
png pdf |
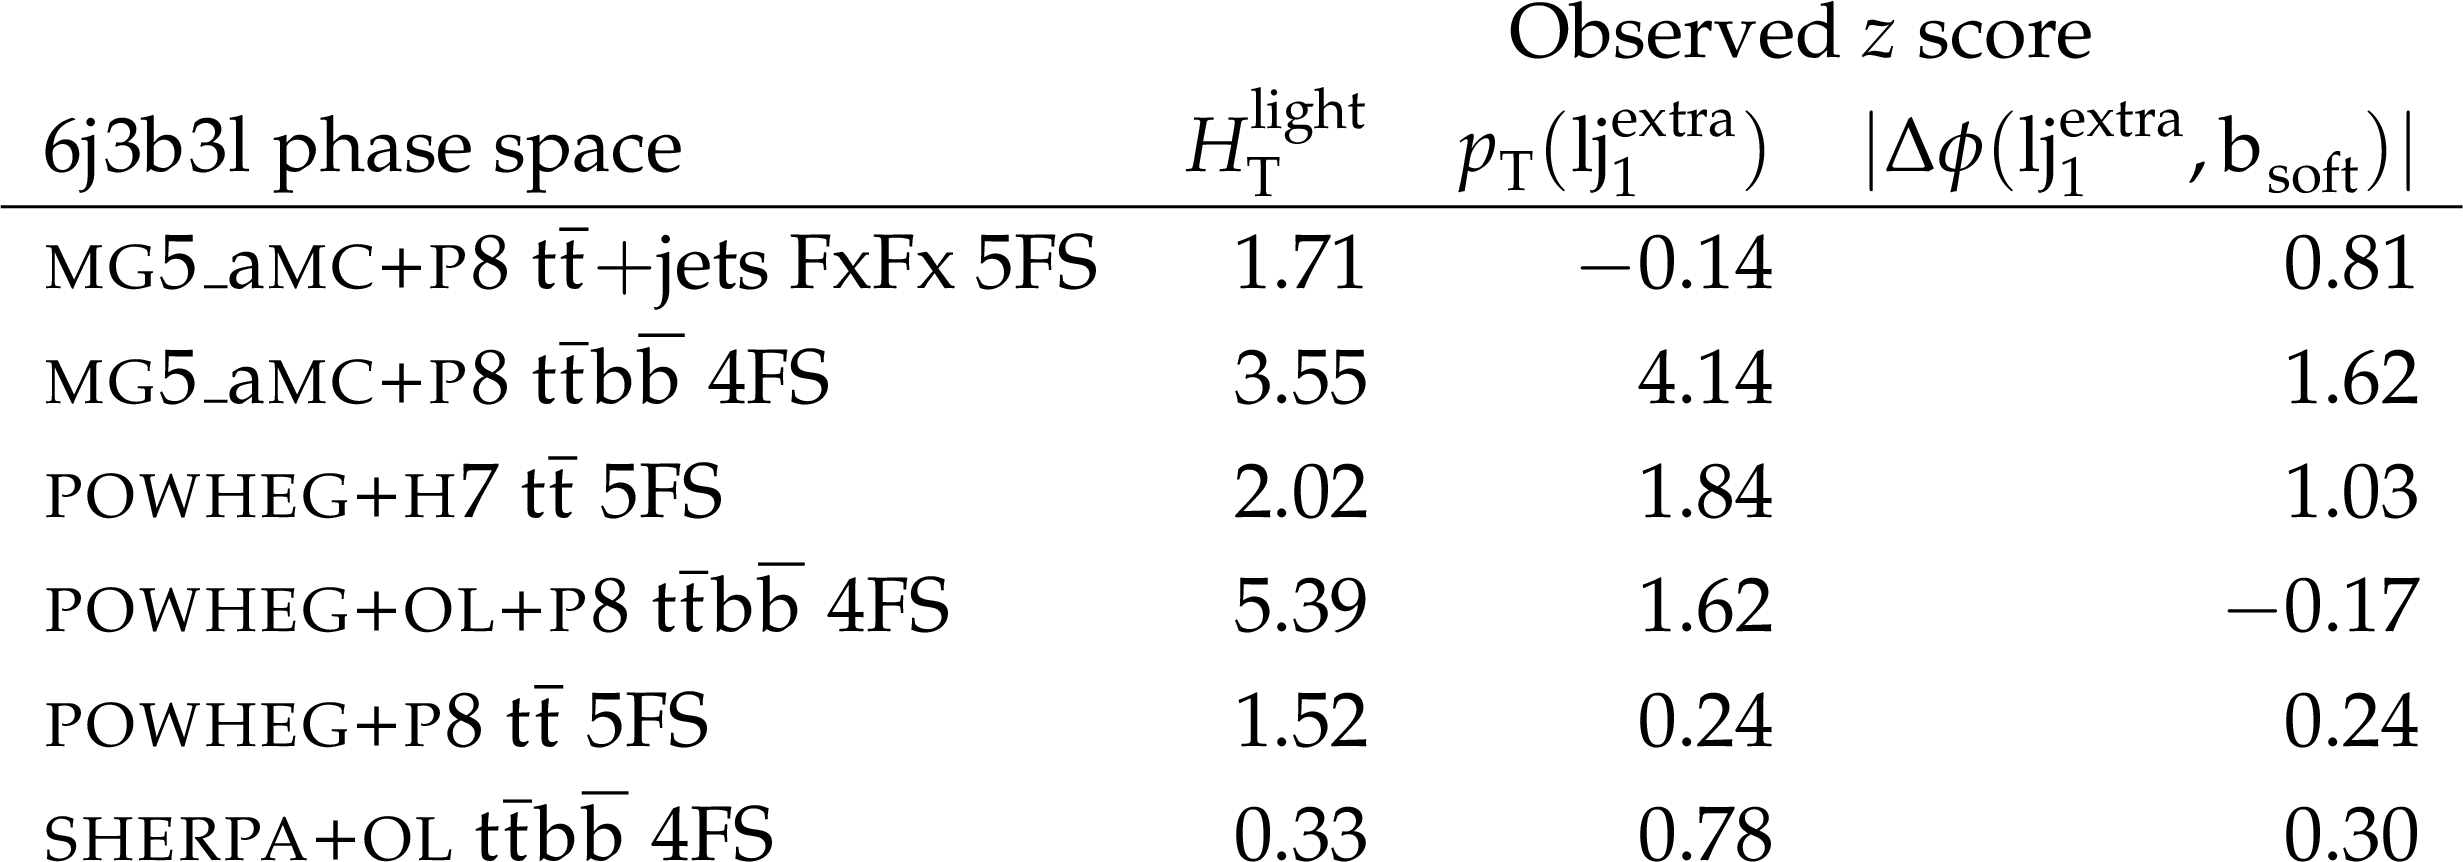
Table E5:
Observed $ z $ score for each of the theoretical predictions in the 6j3b3l phase space, given the unfolded data and covariance matrix. For the determination of the $ z $ score, only the measurement uncertainties are considered. |

png pdf |
Table E6:
Observed $ z $ score for each of the theoretical predictions in the 7j4b3l phase space, given the unfolded data and covariance matrix. For the determination of the $ z $ score, only the measurement uncertainties are considered. |
| Summary |
| Measurements of inclusive and normalized differential cross sections of the associated production of top quark-antiquark and bottom quark-antiquark pairs, $ {\mathrm{t}\bar{\mathrm{t}}} \mathrm{b}\bar{\mathrm{b}} $, for events containing an electron or a muon, have been presented. These measurements use proton-proton collision data recorded by the CMS detector at $ \sqrt{s} = $ 13 TeV and correspond to an integrated luminosity of 138 fb$ ^{-1} $. The inclusive cross sections are measured in four fiducial phase space regions requiring different jet, b jet, and light jet multiplicities. With total uncertainties of 6-17%, depending on the phase space, these are the most precise measurements of the $ {\mathrm{t}\bar{\mathrm{t}}} \mathrm{b}\bar{\mathrm{b}} $ cross section to date. The uncertainties are dominated by systematic sources, with the leading uncertainties originating from the calibration of the b tagging and of the jet energy scale, and from the choice of renormalization scale in the signal $ {\mathrm{t}\bar{\mathrm{t}}} \mathrm{b}\bar{\mathrm{b}} $ and background $ \mathrm{t} \bar{\mathrm{t}} $ processes. In most cases, the measured inclusive cross sections exceed the predictions with the chosen generator settings. The only exception is when using a particular choice of dynamic renormalization scale, $ \smash[b]{\mu_{\mathrm{R}}=\frac12 \prod_{i=\mathrm{t},\bar{\mathrm{t}},\mathrm{b},\bar{\mathrm{b}}} m_{\mathrm{T},i}^{1/4}} $, where $ \smash{m_{\mathrm{T},i}^2=m_i^2+p_{\mathrm{T},i}^2} $ are the transverse masses of top and bottom quarks. Differential cross section measurements are performed as a function of several observables in the aforementioned phase space regions. These observables mainly target b jets as well as additional light jets produced in association with the top quark pairs. In the phase space containing events with at least six jets, of which at least four are b tagged, the additional b-jet radiation is probed with two different approaches. The first approach uses observables defined purely at the particle level, without any reference to the top quark decay chains, by selecting the two b jets with the smallest angular separation. The second approach uses explicitly the b jets at the generator level that do not originate from top quark decays and identifies those jets at the detector level with a neural network discriminant. The differential measurements have relative uncertainties in the range of 2-50%, depending on the phase space and the observable. The results are compared to the predictions of several event generator setups, and it is found that none of them simultaneously describe all measured distributions in the various phase space regions. In the more inclusive phase space with five jets and three b jets, the agreement between data and predictions is generally poor, while in the phase space with six jets and four b jets, corresponding to the case in which the two additional b jets in $ {\mathrm{t}\bar{\mathrm{t}}} \mathrm{b}\bar{\mathrm{b}} $ production are resolved, most predictions are compatible with the data within the larger experimental uncertainties. These measurements will help to further tune and refine the theoretical predictions and better assess the validity of the theoretical uncertainties estimated from the various $ {\mathrm{t}\bar{\mathrm{t}}} \mathrm{b}\bar{\mathrm{b}} $ event generators. |
| References | ||||
| 1 | F. Buccioni, S. Kallweit, S. Pozzorini, and M. F. Zoller | NLO QCD predictions for $ {\mathrm{t}\overline{\mathrm{t}}} \mathrm{b}\overline{\mathrm{b}} $ production in association with a light jet at the LHC | JHEP 12 (2019) 015 | 1907.13624 |
| 2 | T. Ježo, J. M. Lindert, N. Moretti, and S. Pozzorini | New NLOPS predictions for $ {\mathrm{t}\overline{\mathrm{t}}}$ + $\mathrm{b} $-jet production at the LHC | EPJC 78 (2018) 502 | 1802.00426 |
| 3 | ATLAS Collaboration | Search for the standard model Higgs boson decaying into $ \mathrm{b} \overline{\mathrm{b}} $ produced in association with top quarks decaying hadronically in pp collisions at $ \sqrt{s}= $ 8 TeV with the ATLAS detector | JHEP 05 (2016) 160 | 1604.03812 |
| 4 | ATLAS Collaboration | Search for the standard model Higgs boson produced in association with top quarks and decaying into a $ \mathrm{b} \overline{\mathrm{b}} $ pair in pp collisions at $ \sqrt{s}= $ 13 TeV with the ATLAS detector | PRD 97 (2018) 072016 | 1712.08895 |
| 5 | ATLAS Collaboration | Observation of Higgs boson production in association with a top quark pair at the LHC with the ATLAS detector | PLB 784 (2018) 173 | 1806.00425 |
| 6 | CMS Collaboration | Search for $ {\mathrm{t}\overline{\mathrm{t}}} \mathrm{H} $ production in the all-jet final state in proton-proton collisions at $ \sqrt{s}= $ 13 TeV | JHEP 06 (2018) 101 | CMS-HIG-17-022 1803.06986 |
| 7 | CMS Collaboration | Observation of $ {\mathrm{t}\overline{\mathrm{t}}} \mathrm{H} $ production | PRL 120 (2018) 231801 | CMS-HIG-17-035 1804.02610 |
| 8 | CMS Collaboration | Search for $ {\mathrm{t}\overline{\mathrm{t}}} \mathrm{H} $ production in the $ \mathrm{H}\to\mathrm{b}\overline{\mathrm{b}} $ decay channel with leptonic $ \mathrm{t} \overline{\mathrm{t}} $ decays in proton-proton collisions at $ \sqrt{s}= $ 13 TeV | JHEP 03 (2019) 026 | CMS-HIG-17-026 1804.03682 |
| 9 | ATLAS Collaboration | Search for four-top-quark production in the single-lepton and opposite-sign dilepton final states in pp collisions at $ \sqrt{s}= $ 13 TeV with the ATLAS detector | PRD 99 (2019) 052009 | 1811.02305 |
| 10 | ATLAS Collaboration | Evidence for $ {\mathrm{t}\overline{\mathrm{t}}} {\mathrm{t}\overline{\mathrm{t}}} $ production in the multilepton final state in proton-proton collisions at $ \sqrt{s}= $ 13 TeV with the ATLAS detector | EPJC 80 (2020) 1085 | 2007.14858 |
| 11 | ATLAS Collaboration | Measurement of the $ {\mathrm{t}\overline{\mathrm{t}}} {\mathrm{t}\overline{\mathrm{t}}} $ production cross section in pp collisions at $ \sqrt{s}= $ 13 TeV with the ATLAS detector | JHEP 11 (2021) 118 | 2106.11683 |
| 12 | CMS Collaboration | Search for standard model production of four top quarks in the lepton+jets channel in pp collisions at $ \sqrt{s}= $ 8 TeV | JHEP 11 (2014) 154 | CMS-TOP-13-012 1409.7339 |
| 13 | CMS Collaboration | Search for standard model production of four top quarks with same-sign and multilepton final states in proton-proton collisions at $ \sqrt{s}= $ 13 TeV | EPJC 78 (2018) 140 | CMS-TOP-17-009 1710.10614 |
| 14 | CMS Collaboration | Search for standard model production of four top quarks in proton-proton collisions at $ \sqrt{s}= $ 13 TeV | PLB 772 (2017) 336 | CMS-TOP-16-016 1702.06164 |
| 15 | CMS Collaboration | Search for the production of four top quarks in the single-lepton and opposite-sign dilepton final states in proton-proton collisions at $ \sqrt{s}= $ 13 TeV | JHEP 11 (2019) 082 | CMS-TOP-17-019 1906.02805 |
| 16 | CMS Collaboration | Search for production of four top quarks in final states with same-sign or multiple leptons in proton-proton collisions at $ \sqrt{s}= $ 13 TeV | EPJC 80 (2020) 75 | CMS-TOP-18-003 1908.06463 |
| 17 | CMS Collaboration | Evidence for four-top quark production in proton-proton collisions at $ \sqrt{s}= $ 13 TeV | PLB 844 (2023) 138076 | CMS-TOP-21-005 2303.03864 |
| 18 | ATLAS Collaboration | Observation of four-top-quark production in the multilepton final state with the ATLAS detector | EPJC 83 (2023) 496 | 2303.15061 |
| 19 | CMS Collaboration | Observation of four top quark production in proton-proton collisions at $ \sqrt{s}= $ 13 TeV | Submitted to PLB, 2023 | CMS-TOP-22-013 2305.13439 |
| 20 | Q.-H. Cao, S.-L. Chen, and Y. Liu | Probing Higgs width and top quark Yukawa coupling from $ {\mathrm{t}\overline{\mathrm{t}}} \mathrm{H} $ and $ {\mathrm{t}\overline{\mathrm{t}}} {\mathrm{t}\overline{\mathrm{t}}} $ productions | PRD 95 (2017) 053004 | 1602.01934 |
| 21 | Q.-H. Cao et al. | Limiting top quark-Higgs boson interaction and Higgs-boson width from multitop productions | PRD 99 (2019) 113003 | 1901.04567 |
| 22 | M. Worek | Next-to-leading order QCD corrections to $ {\mathrm{t}\overline{\mathrm{t}}} \mathrm{b}\overline{\mathrm{b}} $ production at the LHC | in Proc. 33rd Int. Conf. of Theoretical Physics on Matter to the Deepest: Ustroń, Poland, 2009 Acta Phys. Pol. B 40 (2009) 2937 |
0910.4080 |
| 23 | G. Bevilacqua et al. | Assault on the NLO wishlist: $ \mathrm{p}\mathrm{p}\to{\mathrm{t}\overline{\mathrm{t}}} \mathrm{b}\overline{\mathrm{b}} $ | JHEP 09 (2009) 109 | 0907.4723 |
| 24 | A. Bredenstein, A. Denner, S. Dittmaier, and S. Pozzorini | NLO QCD corrections to $ \mathrm{p}\mathrm{p}\to{\mathrm{t}\overline{\mathrm{t}}} \mathrm{b}\overline{\mathrm{b}}+\mathrm{X} $ at the LHC | PRL 103 (2009) 012002 | 0905.0110 |
| 25 | A. Bredenstein, A. Denner, S. Dittmaier, and S. Pozzorini | NLO QCD corrections to $ {\mathrm{t}\overline{\mathrm{t}}} \mathrm{b}\overline{\mathrm{b}} $ production at the LHC: 2. Full hadronic results | JHEP 03 (2010) 021 | 1001.4006 |
| 26 | M. Worek | On the next-to-leading order QCD $ K $-factor for $ {\mathrm{t}\overline{\mathrm{t}}} \mathrm{b}\overline{\mathrm{b}} $ production at the Tevatron | JHEP 02 (2012) 043 | 1112.4325 |
| 27 | A. Denner, J.-N. Lang, and M. Pellen | Full NLO QCD corrections to off-shell $ {\mathrm{t}\overline{\mathrm{t}}} \mathrm{b}\overline{\mathrm{b}} $ production | PRD 104 (2021) 056018 | 2008.00918 |
| 28 | G. Bevilacqua et al. | $ {\mathrm{t}\overline{\mathrm{t}}} \mathrm{b}\overline{\mathrm{b}} $ at the LHC: on the size of corrections and b-jet definitions | JHEP 08 (2021) 008 | 2105.08404 |
| 29 | S. Höche et al. | Next-to-leading order QCD predictions for top-quark pair production with up to two jets merged with a parton shower | PLB 748 (2015) 74 | 1402.6293 |
| 30 | M. V. Garzelli, A. Kardos, and Z. Trócsányi | Hadroproduction of $ {\mathrm{t}\overline{\mathrm{t}}} \mathrm{b}\overline{\mathrm{b}} $ final states at LHC: predictions at NLO accuracy matched with parton shower | JHEP 03 (2015) 083 | 1408.0266 |
| 31 | S. Höche et al. | Next-to-leading order QCD predictions for top-quark pair production with up to three jets | EPJC 77 (2017) 145 | 1607.06934 |
| 32 | J. Alwall et al. | The automated computation of tree-level and next-to-leading order differential cross sections, and their matching to parton shower simulations | JHEP 07 (2014) 079 | 1405.0301 |
| 33 | R. Frederix and S. Frixione | Merging meets matching in MC@NLO | JHEP 12 (2012) 061 | 1209.6215 |
| 34 | S. Frixione, P. Nason, and G. Ridolfi | A positive-weight next-to-leading-order Monte Carlo for heavy flavour hadroproduction | JHEP 09 (2007) 126 | 0707.3088 |
| 35 | F. Cascioli et al. | NLO matching for $ {\mathrm{t}\overline{\mathrm{t}}} \mathrm{b}\overline{\mathrm{b}} $ production with massive b-quarks | PLB 734 (2014) 210 | 1309.5912 |
| 36 | G. Bevilacqua, M. V. Garzelli, and A. Kardos | $ {\mathrm{t}\overline{\mathrm{t}}} \mathrm{b}\overline{\mathrm{b}} $ hadroproduction with massive bottom quarks with \textscPowHel | 1709.06915 | |
| 37 | ATLAS Collaboration | Study of heavy-flavor quarks produced in association with top-quark pairs at $ \sqrt{s}= $ 7 TeV using the ATLAS detector | PRD 89 (2014) 072012 | 1304.6386 |
| 38 | ATLAS Collaboration | Measurements of fiducial cross-sections for $ \mathrm{t} \overline{\mathrm{t}} $ production with one or two additional b-jets in pp collisions at $ \sqrt{s}= $ 8 TeV using the ATLAS detector | EPJC 76 (2016) 11 | 1508.06868 |
| 39 | ATLAS Collaboration | Measurements of inclusive and differential fiducial cross-sections of $ \mathrm{t} \overline{\mathrm{t}} $ production with additional heavy-flavour jets in proton-proton collisions at $ \sqrt{s}= $ 13 TeV with the ATLAS detector | JHEP 04 (2019) 046 | 1811.12113 |
| 40 | CMS Collaboration | Measurement of $ \mathrm{t} \overline{\mathrm{t}} $ production with additional jet activity, including b quark jets, in the dilepton decay channel using pp collisions at $ \sqrt{s}= $ 8 TeV | EPJC 76 (2016) 379 | CMS-TOP-12-041 1510.03072 |
| 41 | CMS Collaboration | Measurement of the cross section ratio $ \sigma_{{\mathrm{t}\overline{\mathrm{t}}} \mathrm{b}\overline{\mathrm{b}}}/\sigma_{{\mathrm{t}\overline{\mathrm{t}}} \mathrm{jj}} $ in pp collisions at $ \sqrt{s}= $ 8 TeV | PLB 746 (2015) 132 | CMS-TOP-13-010 1411.5621 |
| 42 | CMS Collaboration | Measurements of $ \mathrm{t} \overline{\mathrm{t}} $ cross sections in association with b jets and inclusive jets and their ratio using dilepton final states in pp collisions at $ \sqrt{s}= $ 13 TeV | PLB 776 (2018) 355 | CMS-TOP-16-010 1705.10141 |
| 43 | CMS Collaboration | Measurement of the $ {\mathrm{t}\overline{\mathrm{t}}} \mathrm{b}\overline{\mathrm{b}} $ production cross section in the all-jet final state in $ {\mathrm{p}\mathrm{p}} $ collisions at $ \sqrt{s}= $ 13 TeV | PLB 803 (2020) 135285 | CMS-TOP-18-011 1909.05306 |
| 44 | CMS Collaboration | Measurement of the cross section for $ \mathrm{t} \overline{\mathrm{t}} $ production with additional jets and b jets in $ {\mathrm{p}\mathrm{p}} $ collisions at $ \sqrt{s}= $ 13 TeV | JHEP 07 (2020) 125 | CMS-TOP-18-002 2003.06467 |
| 45 | CMS Collaboration | First measurement of the cross section for top quark pair production with additional charm jets using dileptonic final states in $ {\mathrm{p}\mathrm{p}} $ collisions at $ \sqrt{s}= $ 13 TeV | PLB 820 (2021) 136565 | CMS-TOP-20-003 2012.09225 |
| 46 | CMS Collaboration | HEPData record for this analysis | link | |
| 47 | CMS Collaboration | The CMS experiment at the CERN LHC | JINST 3 (2008) S08004 | |
| 48 | CMS Tracker Group | The CMS Phase-1 pixel detector upgrade | JINST 16 (2021) P02027 | 2012.14304 |
| 49 | CMS Collaboration | Performance of the CMS Level-1 trigger in proton-proton collisions at $ \sqrt{s}= $ 13 TeV | JINST 15 (2020) P10017 | CMS-TRG-17-001 2006.10165 |
| 50 | CMS Collaboration | The CMS trigger system | JINST 12 (2017) P01020 | CMS-TRG-12-001 1609.02366 |
| 51 | T. Sjöstrand et al. | An introduction to PYTHIA8.2 | Comput. Phys. Commun. 191 (2015) 159 | 1410.3012 |
| 52 | GEANT 4 Collaboration | GEANT 4---a simulation toolkit | NIM A 506 (2003) 250 | |
| 53 | T. Ježo and P. Nason | On the treatment of resonances in next-to-leading order calculations matched to a parton shower | JHEP 12 (2015) 065 | 1509.09071 |
| 54 | F. Buccioni et al. | OpenLoops 2 | EPJC 79 (2019) 866 | 1907.13071 |
| 55 | M. Bähr et al. | HERWIG++ physics and manual | EPJC 58 (2008) 639 | 0803.0883 |
| 56 | J. Bellm et al. | HERWIG 7.0/ HERWIG++ 3.0 release note | EPJC 76 (2016) 196 | 1512.01178 |
| 57 | CMS Collaboration | Development and validation of HERWIG 7 tunes from CMS underlying-event measurements | EPJC 81 (2021) 312 | CMS-GEN-19-001 2011.03422 |
| 58 | T. Gleisberg et al. | Event generation with SHERPA 1.1 | JHEP 02 (2009) 007 | 0811.4622 |
| 59 | M. Czakon and A. Mitov | top++: A program for the calculation of the top-pair cross-section at hadron colliders | Comput. Phys. Commun. 185 (2014) 2930 | 1112.5675 |
| 60 | N. Kidonakis | Top quark production | in Proc. Helmholtz International Summer School on Physics of Heavy Quarks and Hadrons, Dubna, Russia, 2013 DESY-PROC-2013-03 |
1311.0283 |
| 61 | P. Nason | A new method for combining NLO QCD with shower Monte Carlo algorithms | JHEP 11 (2004) 040 | hep-ph/0409146 |
| 62 | S. Frixione, P. Nason, and C. Oleari | Matching NLO QCD computations with parton shower simulations: the POWHEG method | JHEP 11 (2007) 070 | 0709.2092 |
| 63 | S. Alioli, P. Nason, C. Oleari, and E. Re | A general framework for implementing NLO calculations in shower Monte Carlo programs: the POWHEG box | JHEP 06 (2010) 043 | 1002.2581 |
| 64 | S. Alioli, P. Nason, C. Oleari, and E. Re | NLO single-top production matched with shower in POWHEG: $ s $- and $ t $-channel contributions | JHEP 09 (2009) 111 | 0907.4076 |
| 65 | E. Re | Single-top $ \mathrm{W}\mathrm{t} $-channel production matched with parton showers using the POWHEG method | EPJC 71 (2011) 1547 | 1009.2450 |
| 66 | H. B. Hartanto, B. Jäger, L. Reina, and D. Wackeroth | Higgs boson production in association with top quarks in the POWHEG box | PRD 91 (2015) 094003 | 1501.04498 |
| 67 | P. Artoisenet, R. Frederix, O. Mattelaer, and R. Rietkerk | Automatic spin-entangled decays of heavy resonances in Monte Carlo simulations | JHEP 03 (2013) 015 | 1212.3460 |
| 68 | J. Alwall et al. | Comparative study of various algorithms for the merging of parton showers and matrix elements in hadronic collisions | EPJC 53 (2008) 473 | 0706.2569 |
| 69 | NNPDF Collaboration | Parton distributions for the LHC run II | JHEP 04 (2015) 040 | 1410.8849 |
| 70 | CMS Collaboration | Extraction and validation of a new set of CMS PYTHIA8 tunes from underlying-event measurements | EPJC 80 (2020) 4 | CMS-GEN-17-001 1903.12179 |
| 71 | Y. Li and F. Petriello | Combining QCD and electroweak corrections to dilepton production in the framework of the FEWZ simulation code | PRD 86 (2012) 094034 | 1208.5967 |
| 72 | CMS Collaboration | Particle-flow reconstruction and global event description with the CMS detector | JINST 12 (2017) P10003 | CMS-PRF-14-001 1706.04965 |
| 73 | CMS Collaboration | Technical proposal for the Phase-II upgrade of the Compact Muon Solenoid | CMS Technical Proposal CERN-LHCC-2015-010, CMS-TDR-15-02, 2015 CDS |
|
| 74 | CMS Collaboration | Electron and photon reconstruction and identification with the CMS experiment at the CERN LHC | JINST 16 (2021) P05014 | CMS-EGM-17-001 2012.06888 |
| 75 | CMS Collaboration | Performance of the CMS muon detector and muon reconstruction with proton-proton collisions at $ \sqrt{s}= $ 13 TeV | JINST 13 (2018) P06015 | CMS-MUO-16-001 1804.04528 |
| 76 | CMS Collaboration | Pileup mitigation at CMS in 13 TeV data | JINST 15 (2020) P09018 | CMS-JME-18-001 2003.00503 |
| 77 | M. Cacciari, G. P. Salam, and G. Soyez | The anti-$ k_{\mathrm{T}} $ jet clustering algorithm | JHEP 04 (2008) 063 | 0802.1189 |
| 78 | M. Cacciari, G. P. Salam, and G. Soyez | FASTJET user manual | EPJC 72 (2012) 1896 | 1111.6097 |
| 79 | CMS Collaboration | Jet energy scale and resolution in the CMS experiment in pp collisions at 8 TeV | JINST 12 (2017) P02014 | CMS-JME-13-004 1607.03663 |
| 80 | CMS Collaboration | Identification of heavy-flavour jets with the CMS detector in pp collisions at 13 TeV | JINST 13 (2018) P05011 | CMS-BTV-16-002 1712.07158 |
| 81 | E. Bols et al. | Jet flavour classification using DeepJet | JINST 15 (2020) P12012 | 2008.10519 |
| 82 | CMS Collaboration | Performance summary of AK4 jet b tagging with data from proton-proton collisions at 13 TeV with the CMS detector | CMS Detector Performance Note CMS-DP-2023-005, 2023 CDS |
|
| 83 | M. Cacciari and G. P. Salam | Pileup subtraction using jet areas | PLB 659 (2008) 119 | 0707.1378 |
| 84 | CMS Collaboration | Simulation of the silicon strip tracker pre-amplifier in early 2016 data | CMS Detector Performance Note CMS-DP-2020-045, 2020 CDS |
|
| 85 | Y. LeCun et al. | Handwritten digit recognition with a back-propagation network | in Proc. 2nd Int. Conf. on Advances in Neural Information Processing Systems (NIPS'89): Denver CO, USA, 1989 link |
|
| 86 | S. Hochreiter and J. Schmidhuber | Long short-term memory | Neural Comput. 9 (1997) 1735 | |
| 87 | F. Chollet et al. | keras: Deep learning for humans | link | |
| 88 | M. Abadi et al. | TensorFlow: large-scale machine learning on heterogeneous distributed systems | 1603.04467 | |
| 89 | D. P. Kingma and J. Ba | Adam: a method for stochastic optimization | in Proc. 3rd Int. Conf. on Learning Representations, San Diego CA, USA, 2015, [ICLR 201 (2015) 5] | 1412.6980 |
| 90 | N. Srivastava et al. | Dropout: a simple way to prevent neural networks from overfitting | J. Mach. Learn. Res. 15 (2014) 1929 | |
| 91 | S. Wertz | moofit: a package for smooth binned likelihood fits | link | |
| 92 | J. Bradbury et al. | jax: autograd and xla | link | |
| 93 | CMS Collaboration | Precision luminosity measurement in proton-proton collisions at $ \sqrt{s}= $ 13 TeV in 2015 and 2016 at CMS | EPJC 81 (2021) 800 | CMS-LUM-17-003 2104.01927 |
| 94 | CMS Collaboration | CMS luminosity measurement for the 2017 data-taking period at $ \sqrt{s}= $ 13 TeV | CMS Physics Analysis Summary, 2018 CMS-PAS-LUM-17-004 |
CMS-PAS-LUM-17-004 |
| 95 | CMS Collaboration | CMS luminosity measurement for the 2018 data-taking period at $ \sqrt{s}= $ 13 TeV | CMS Physics Analysis Summary, 2019 CMS-PAS-LUM-18-002 |
CMS-PAS-LUM-18-002 |
| 96 | M. Czakon et al. | Top-pair production at the LHC through NNLO QCD and NLO EW | JHEP 10 (2017) 186 | 1705.04105 |
| 97 | S. Argyropoulos and T. Sjöstrand | Effects of color reconnection on $ \mathrm{t} \overline{\mathrm{t}} $ final states at the LHC | JHEP 11 (2014) 043 | 1407.6653 |
| 98 | J. R. Christiansen and P. Z. Skands | String formation beyond leading colour | JHEP 08 (2015) 003 | 1505.01681 |
| 99 | ATLAS Collaboration | Measurement of b-quark fragmentation properties in jets using the decay $ {{\mathrm{B}^{\pm}}\to\mathrm{J}/\psi\mathrm{K^{\pm}}} $ in pp collisions at $ \sqrt{s}= $ 13 TeV with the ATLAS detector | JHEP 12 (2021) 131 | 2108.11650 |
| 100 | R. J. Barlow and C. Beeston | Fitting using finite Monte Carlo samples | Comput. Phys. Commun. 77 (1993) 219 | |
| 101 | J. S. Conway | Incorporating nuisance parameters in likelihoods for multisource spectra | in Workshop on Statistical Issues Related to Discovery Claims in Search Experiments and Unfolding (PHYSTAT ): Geneva, Switzerland, 2011 link |
1103.0354 |
| 102 | R. D. Cousins, J. T. Linnemann, and J. Tucker | Evaluation of three methods for calculating statistical significance when incorporating a systematic uncertainty into a test of the background-only hypothesis for a Poisson process | NIM A 595 (2008) 480 | physics/0702156 |
|
|
Compact Muon Solenoid LHC, CERN |
|

|

|

|

|

|