

Compact Muon Solenoid
LHC, CERN
| CMS-TOP-21-012 ; CERN-EP-2022-222 | ||
| Measurement of the differential $ \mathrm{t} \overline{\mathrm{t}} $ production cross section as a function of the jet mass and extraction of the top quark mass in hadronic decays of boosted top quarks | ||
| CMS Collaboration | ||
| 2 November 2022 | ||
| Eur. Phys. J. C 83 (2023) 560 | ||
| Abstract: A measurement of the jet mass distribution in hadronic decays of Lorentz-boosted top quarks is presented. The measurement is performed in the lepton+jets channel of top quark pair production ( $ \mathrm{t} \overline{\mathrm{t}} $) events, where the lepton is an electron or muon. The products of the hadronic top quark decay are reconstructed using a single large-radius jet with transverse momentum greater than 400 GeV. The data were collected with the CMS detector at the LHC in proton-proton collisions and correspond to an integrated luminosity of 138 fb$ ^{-1} $. The differential $ \mathrm{t} \overline{\mathrm{t}} $ production cross section as a function of the jet mass is unfolded to the particle level and is used to extract the top quark mass. The jet mass scale is calibrated using the hadronic W boson decay within the large-radius jet. The uncertainties in the modelling of the final state radiation are reduced by studying angular correlations in the jet substructure. These developments lead to a significant increase in precision, and a top quark mass of 173.06 $ \pm $ 0.84 GeV. | ||
| Links: e-print arXiv:2211.01456 [hep-ex] (PDF) ; CDS record ; inSPIRE record ; HepData record ; Physics Briefing ; CADI line (restricted) ; | ||
| Figures | |
png pdf |
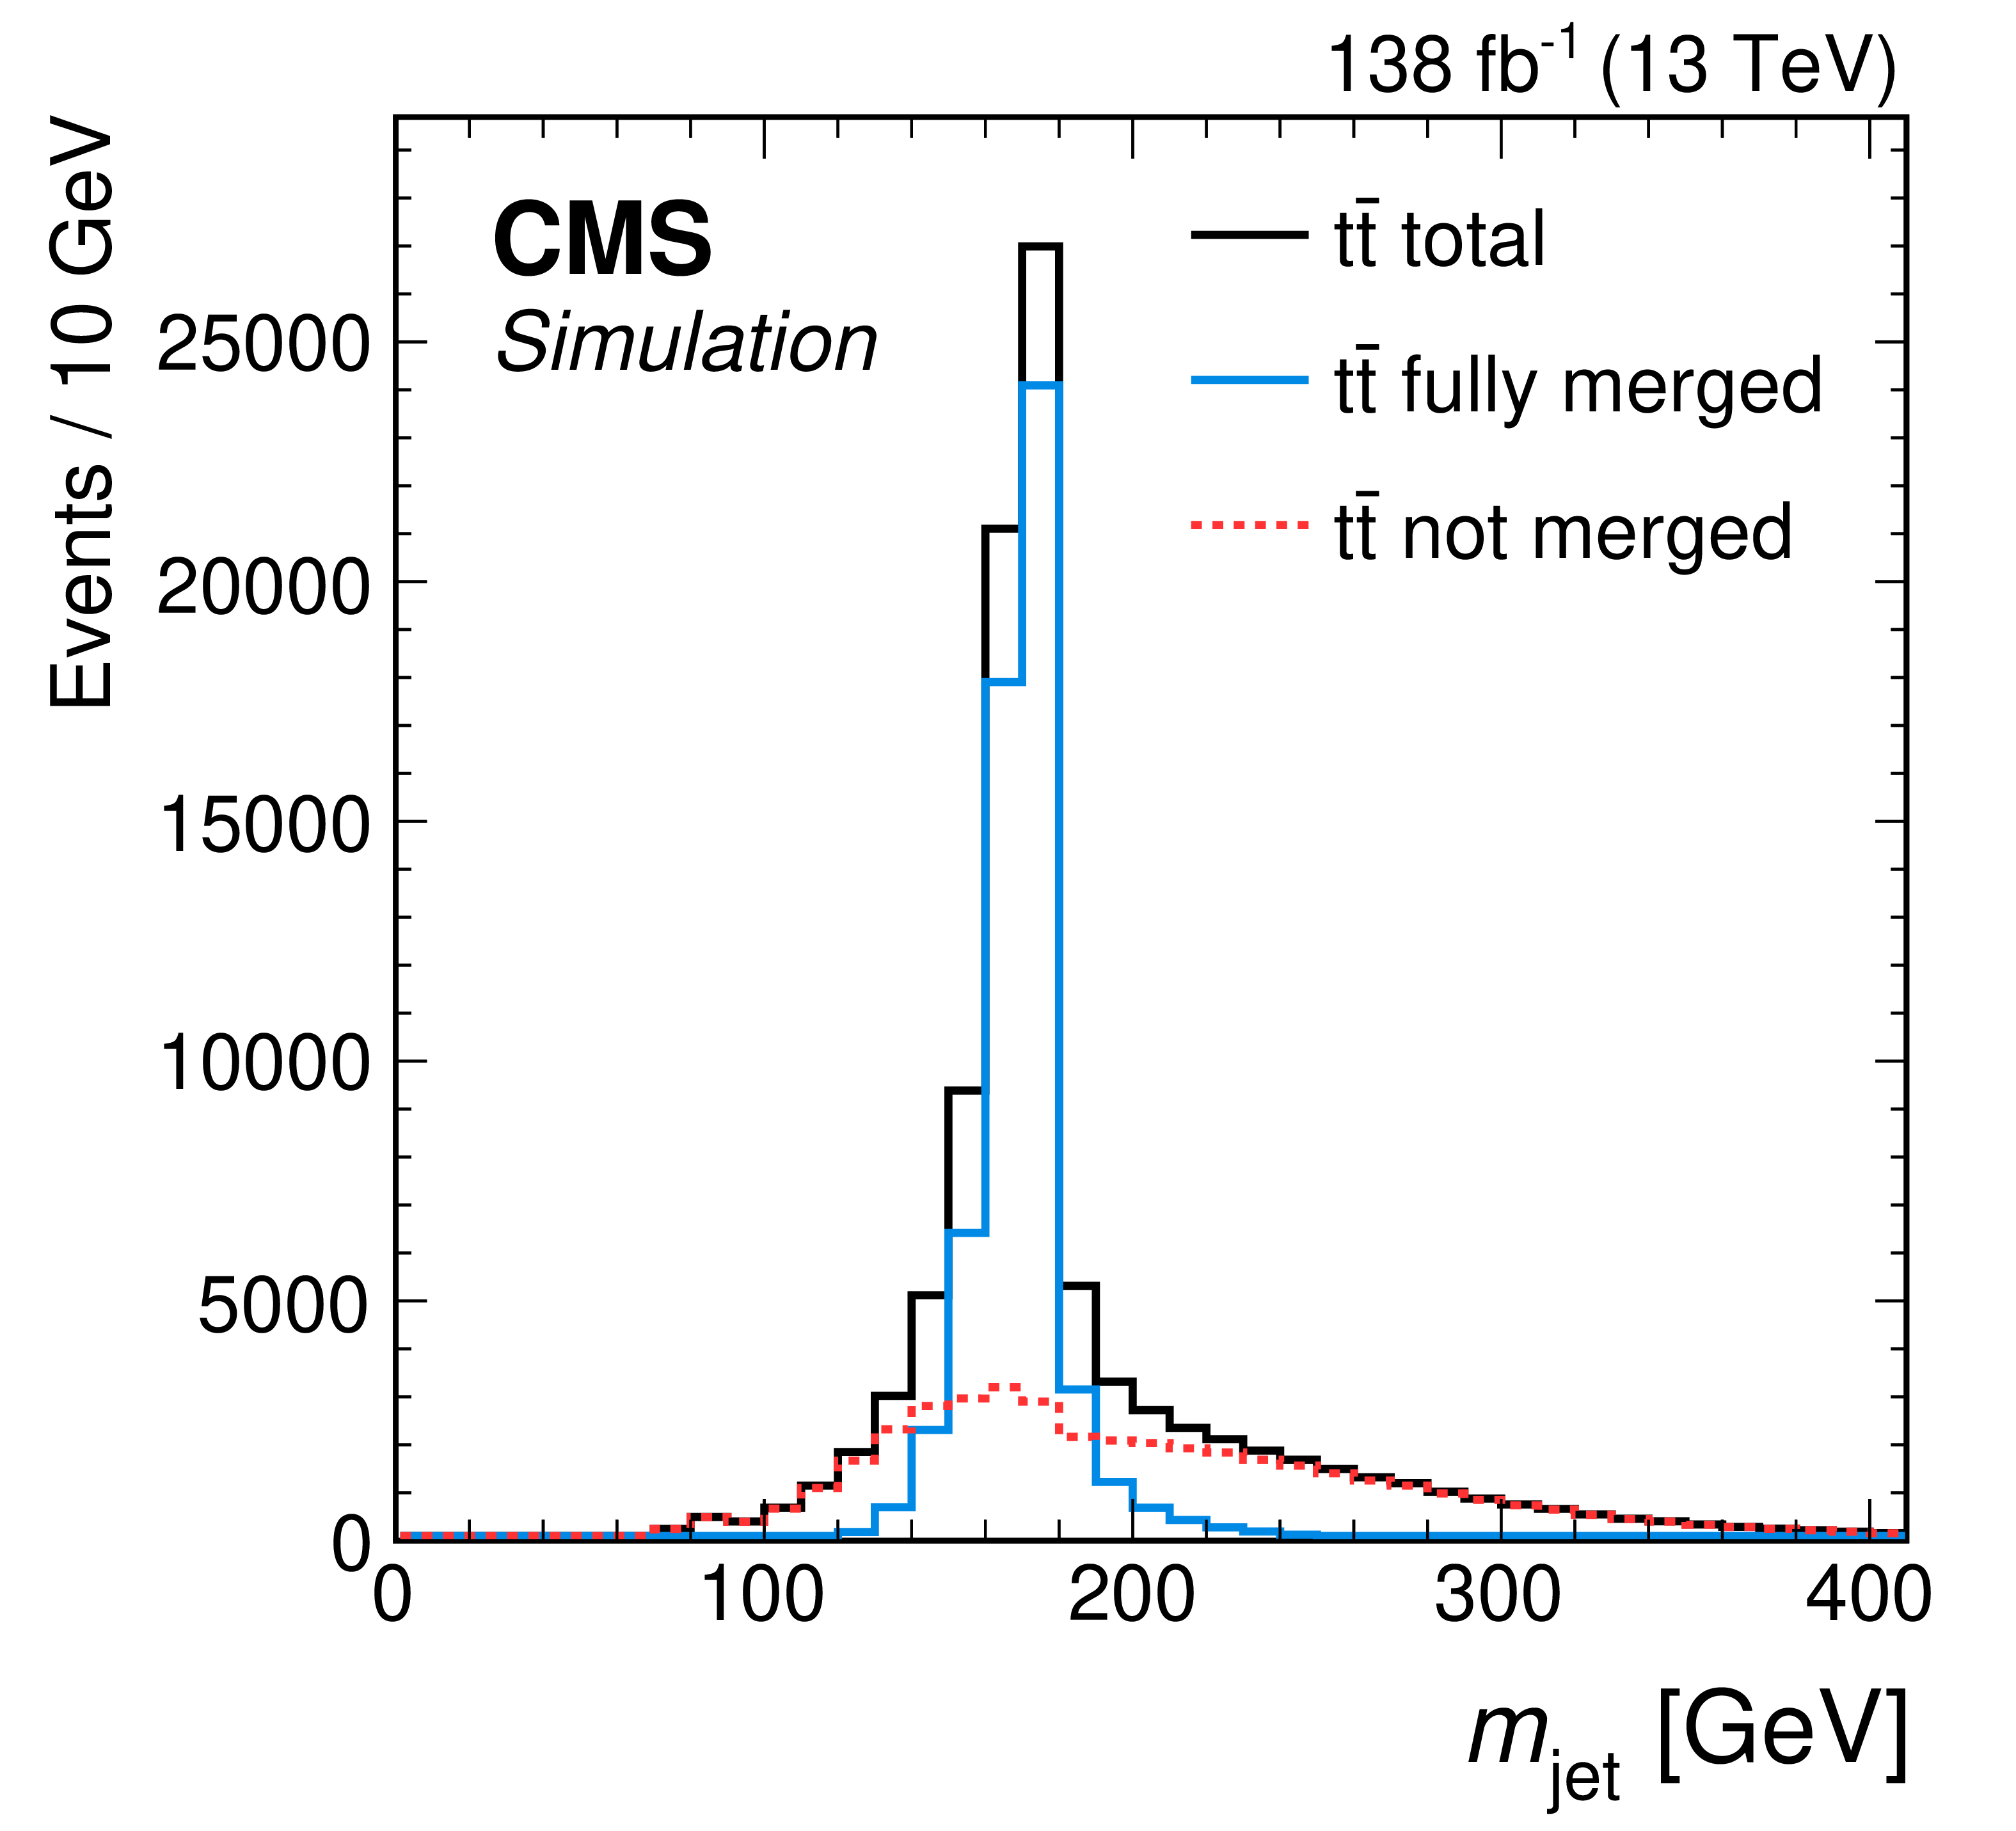
Figure 1:
Distribution in $ m_\text{jet} $ at the particle level after the selection of the fiducial region in the lepton+jets channel of $ \mathrm{t} \overline{\mathrm{t}} $, simulated with POWHEG. The contributions from fully merged events (blue solid) and not merged events (red dashed) are displayed, as well as the sum of the two (black solid). |

png pdf |
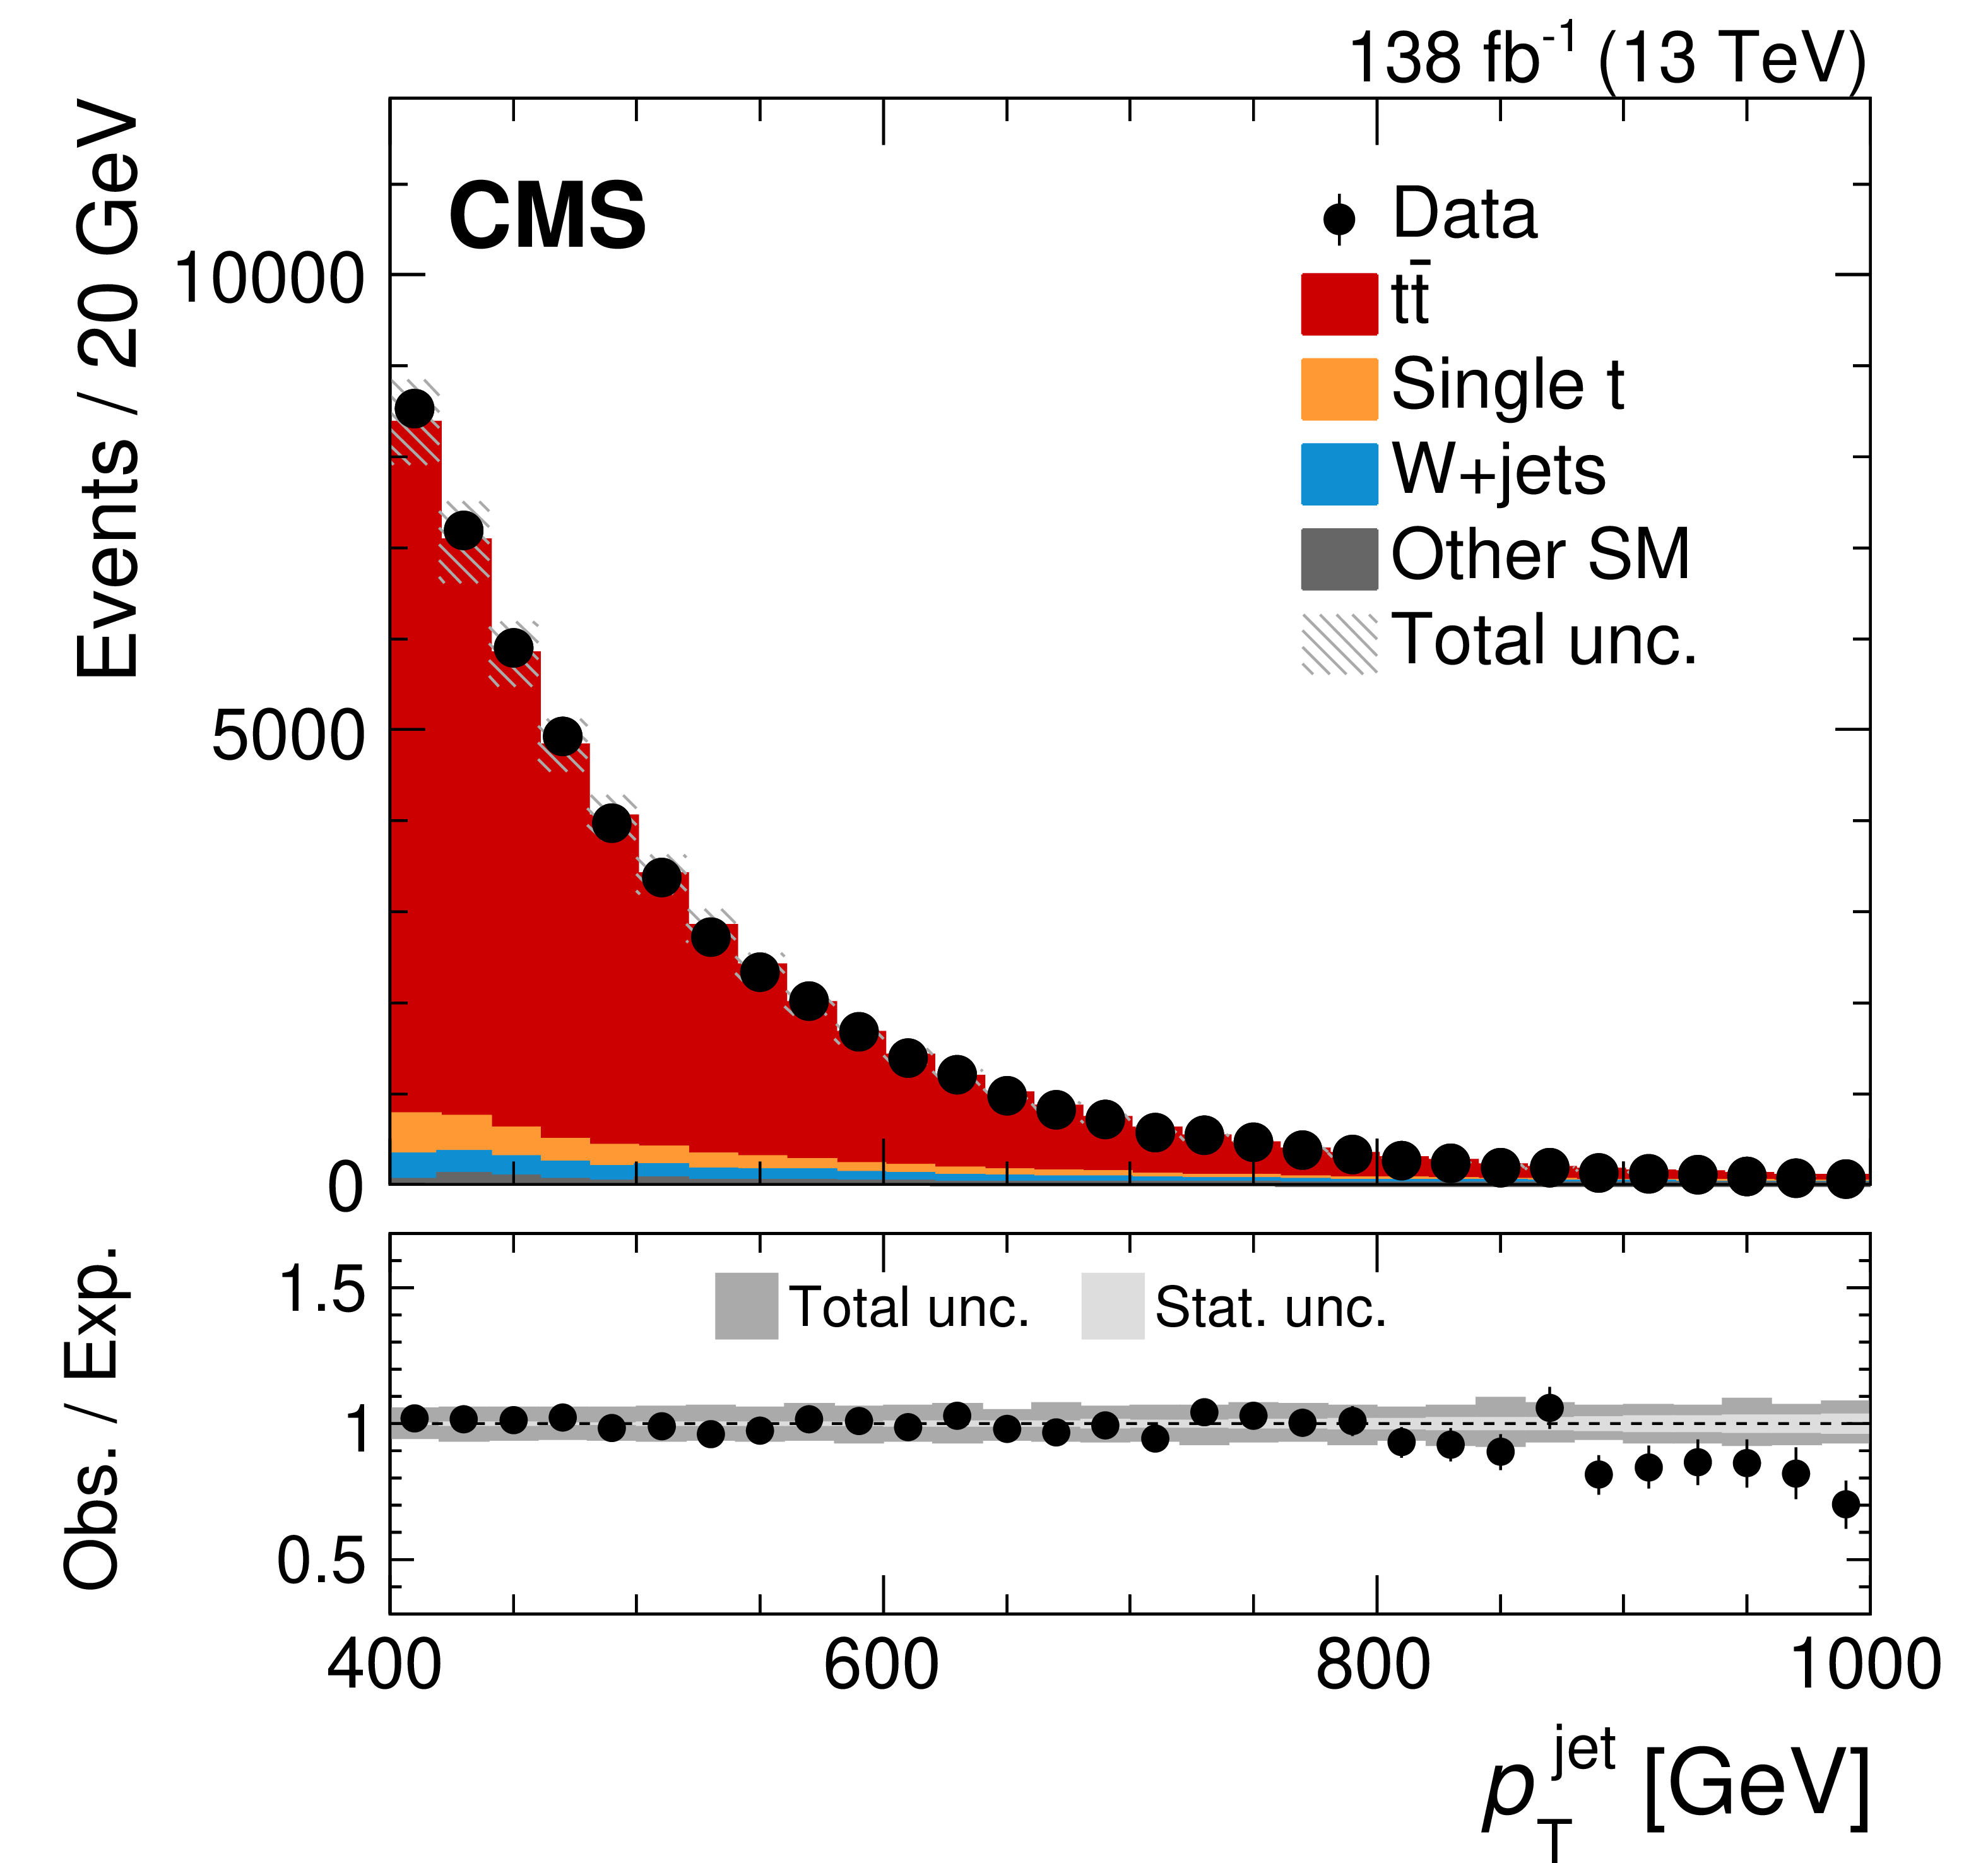
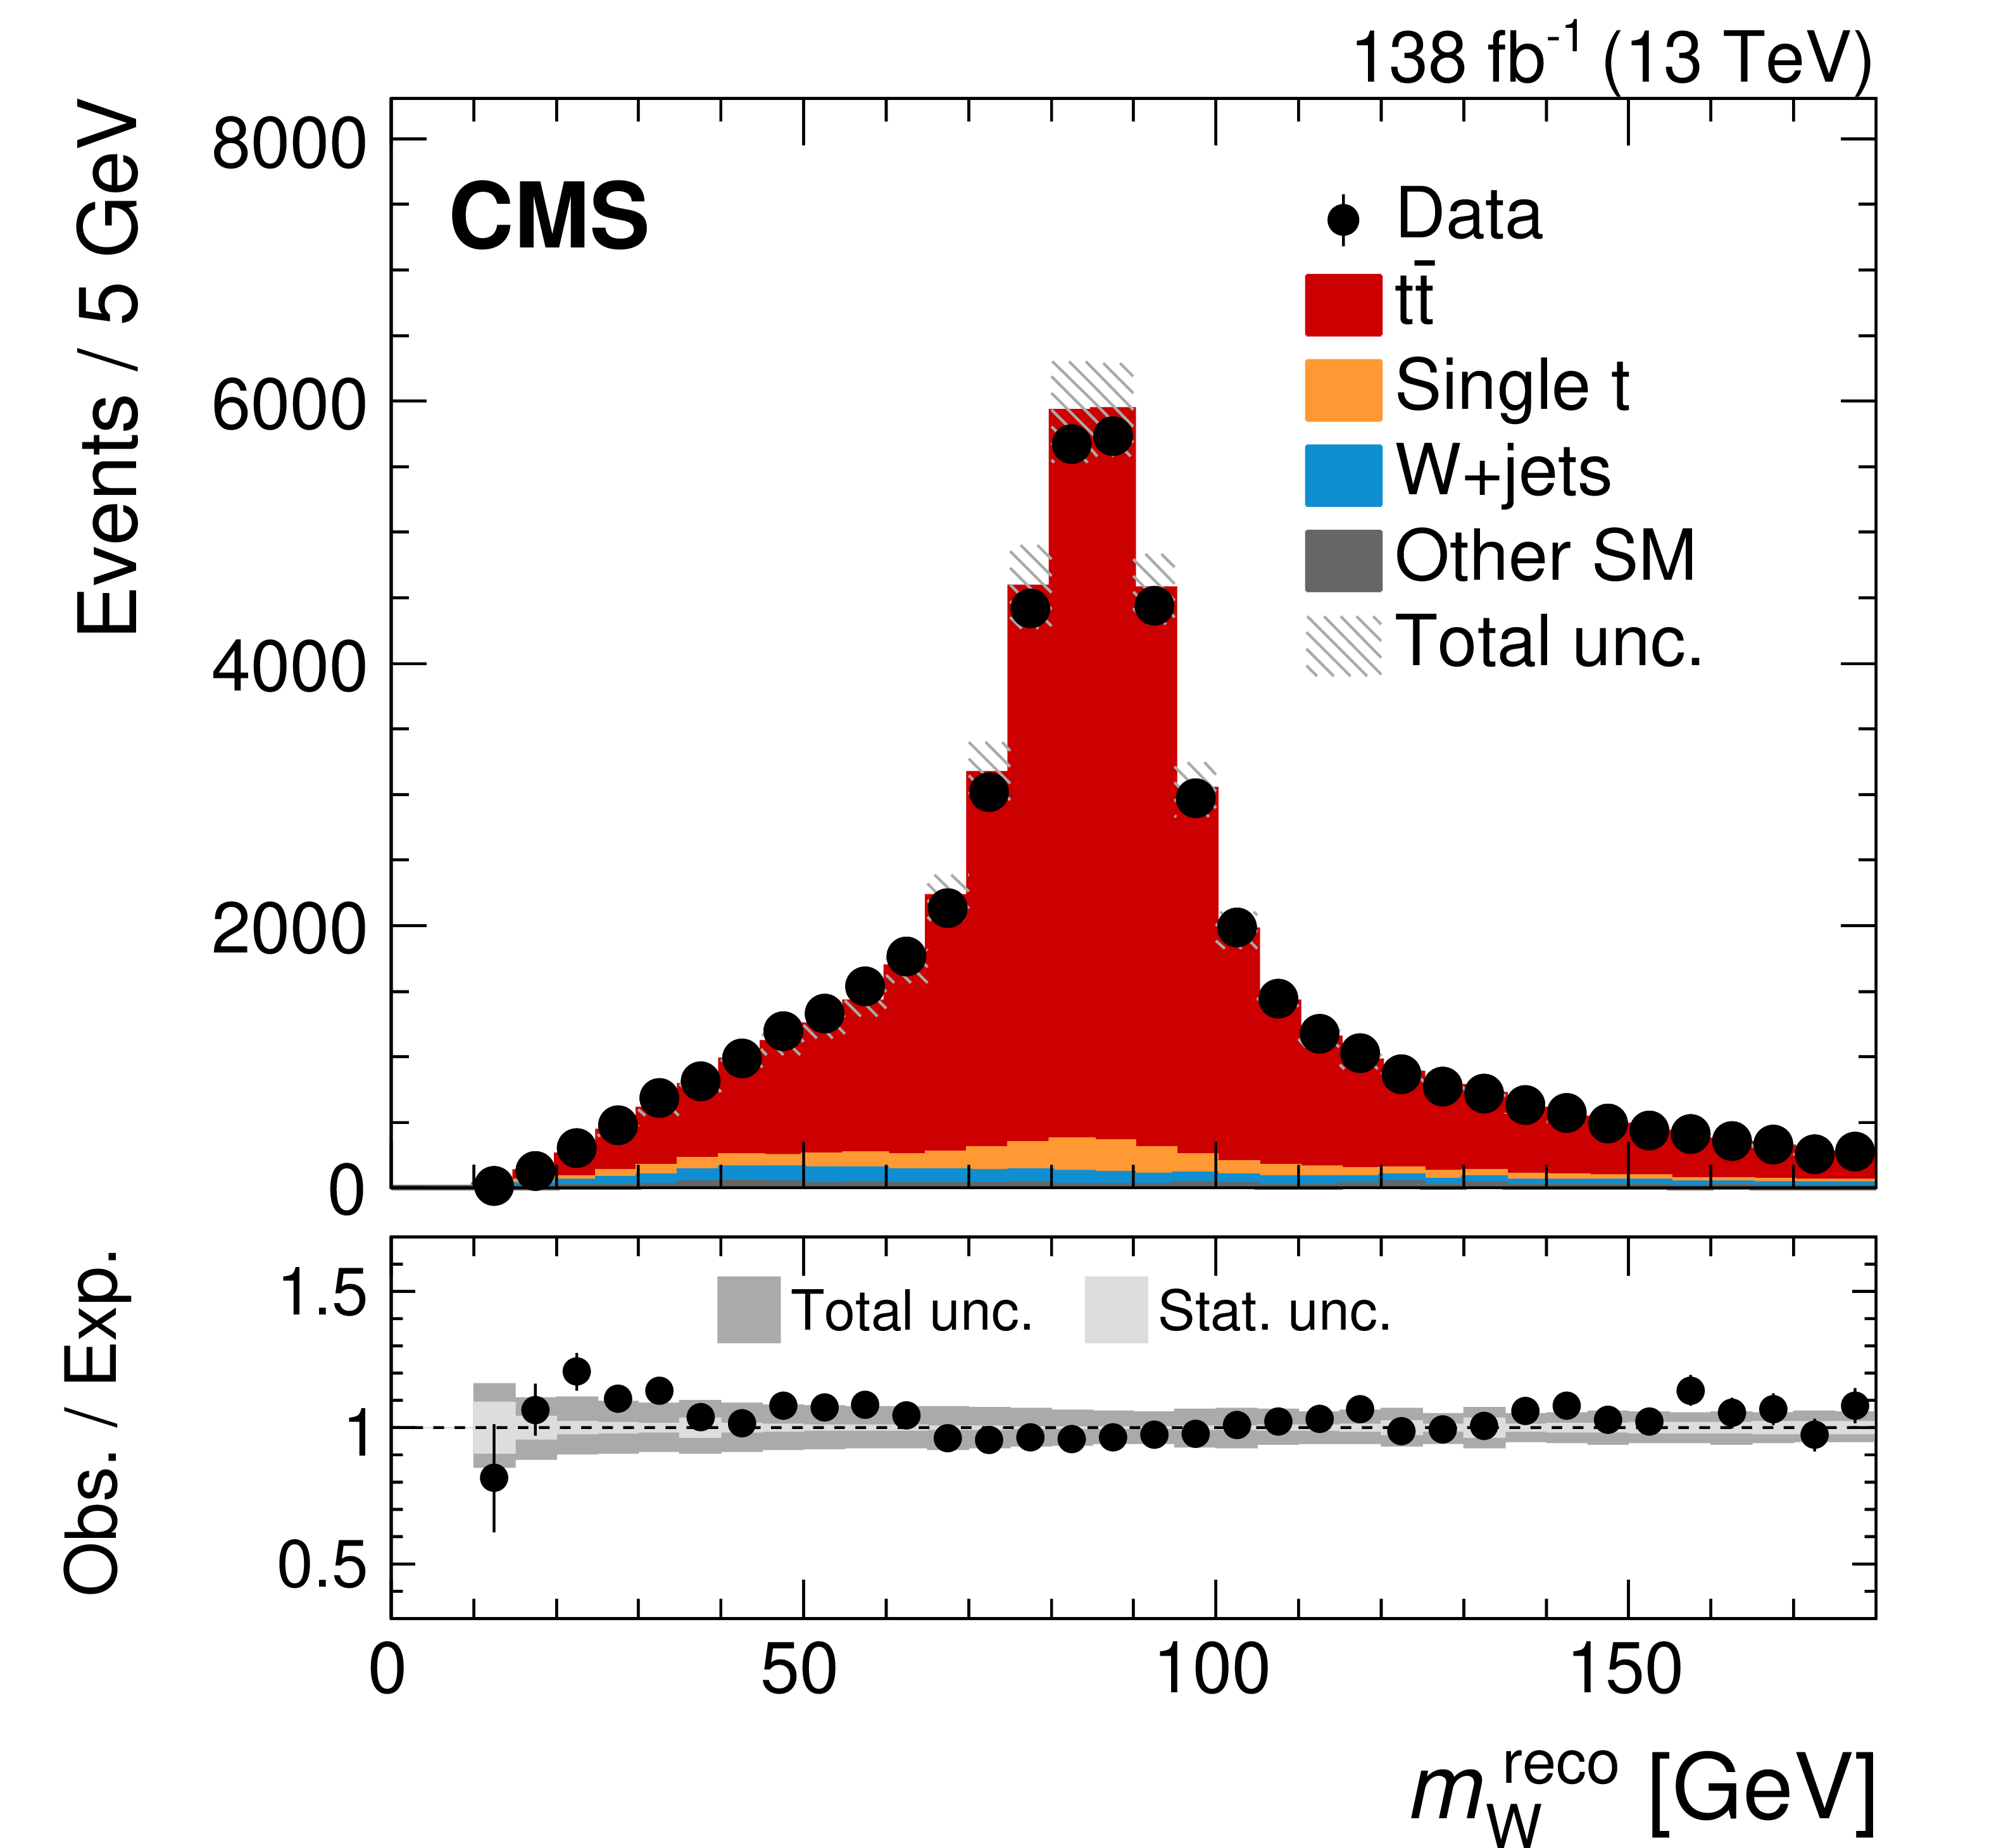
Figure 2:
Distributions in the reconstructed XCone jet $ p_{\mathrm{T}} $ (left) and $ m_\text{jet} $ (right), after the full event selection. The vertical bars on the markers show the statistical uncertainty. The hatched regions show the total uncertainty in the simulation, including the statistical and experimental systematic uncertainties. The lower panels show the ratio of the data to the simulation. The uncertainty bands include the experimental systematic uncertainties and statistical uncertainties in the simulation. In the ratios, the statistical (light grey) and total (dark grey) uncertainties are shown separately. |
png pdf |
Figure 2-a:
Distribution in the reconstructed XCone jet $ p_{\mathrm{T}} $, after the full event selection. The vertical bars on the markers show the statistical uncertainty. The hatched region shows the total uncertainty in the simulation, including the statistical and experimental systematic uncertainties. The lower panel shows the ratio of the data to the simulation. The uncertainty band includes the experimental systematic uncertainties and statistical uncertainties in the simulation. In the ratio, the statistical (light grey) and total (dark grey) uncertainties are shown separately. |

png pdf |
Figure 2-b:
Distribution in the reconstructed XCone jet $ m_\text{jet} $, after the full event selection. The vertical bars on the markers show the statistical uncertainty. The hatched region shows the total uncertainty in the simulation, including the statistical and experimental systematic uncertainties. The lower panel shows the ratio of the data to the simulation. The uncertainty band includes the experimental systematic uncertainties and statistical uncertainties in the simulation. In the ratio, the statistical (light grey) and total (dark grey) uncertainties are shown separately. |

png pdf |
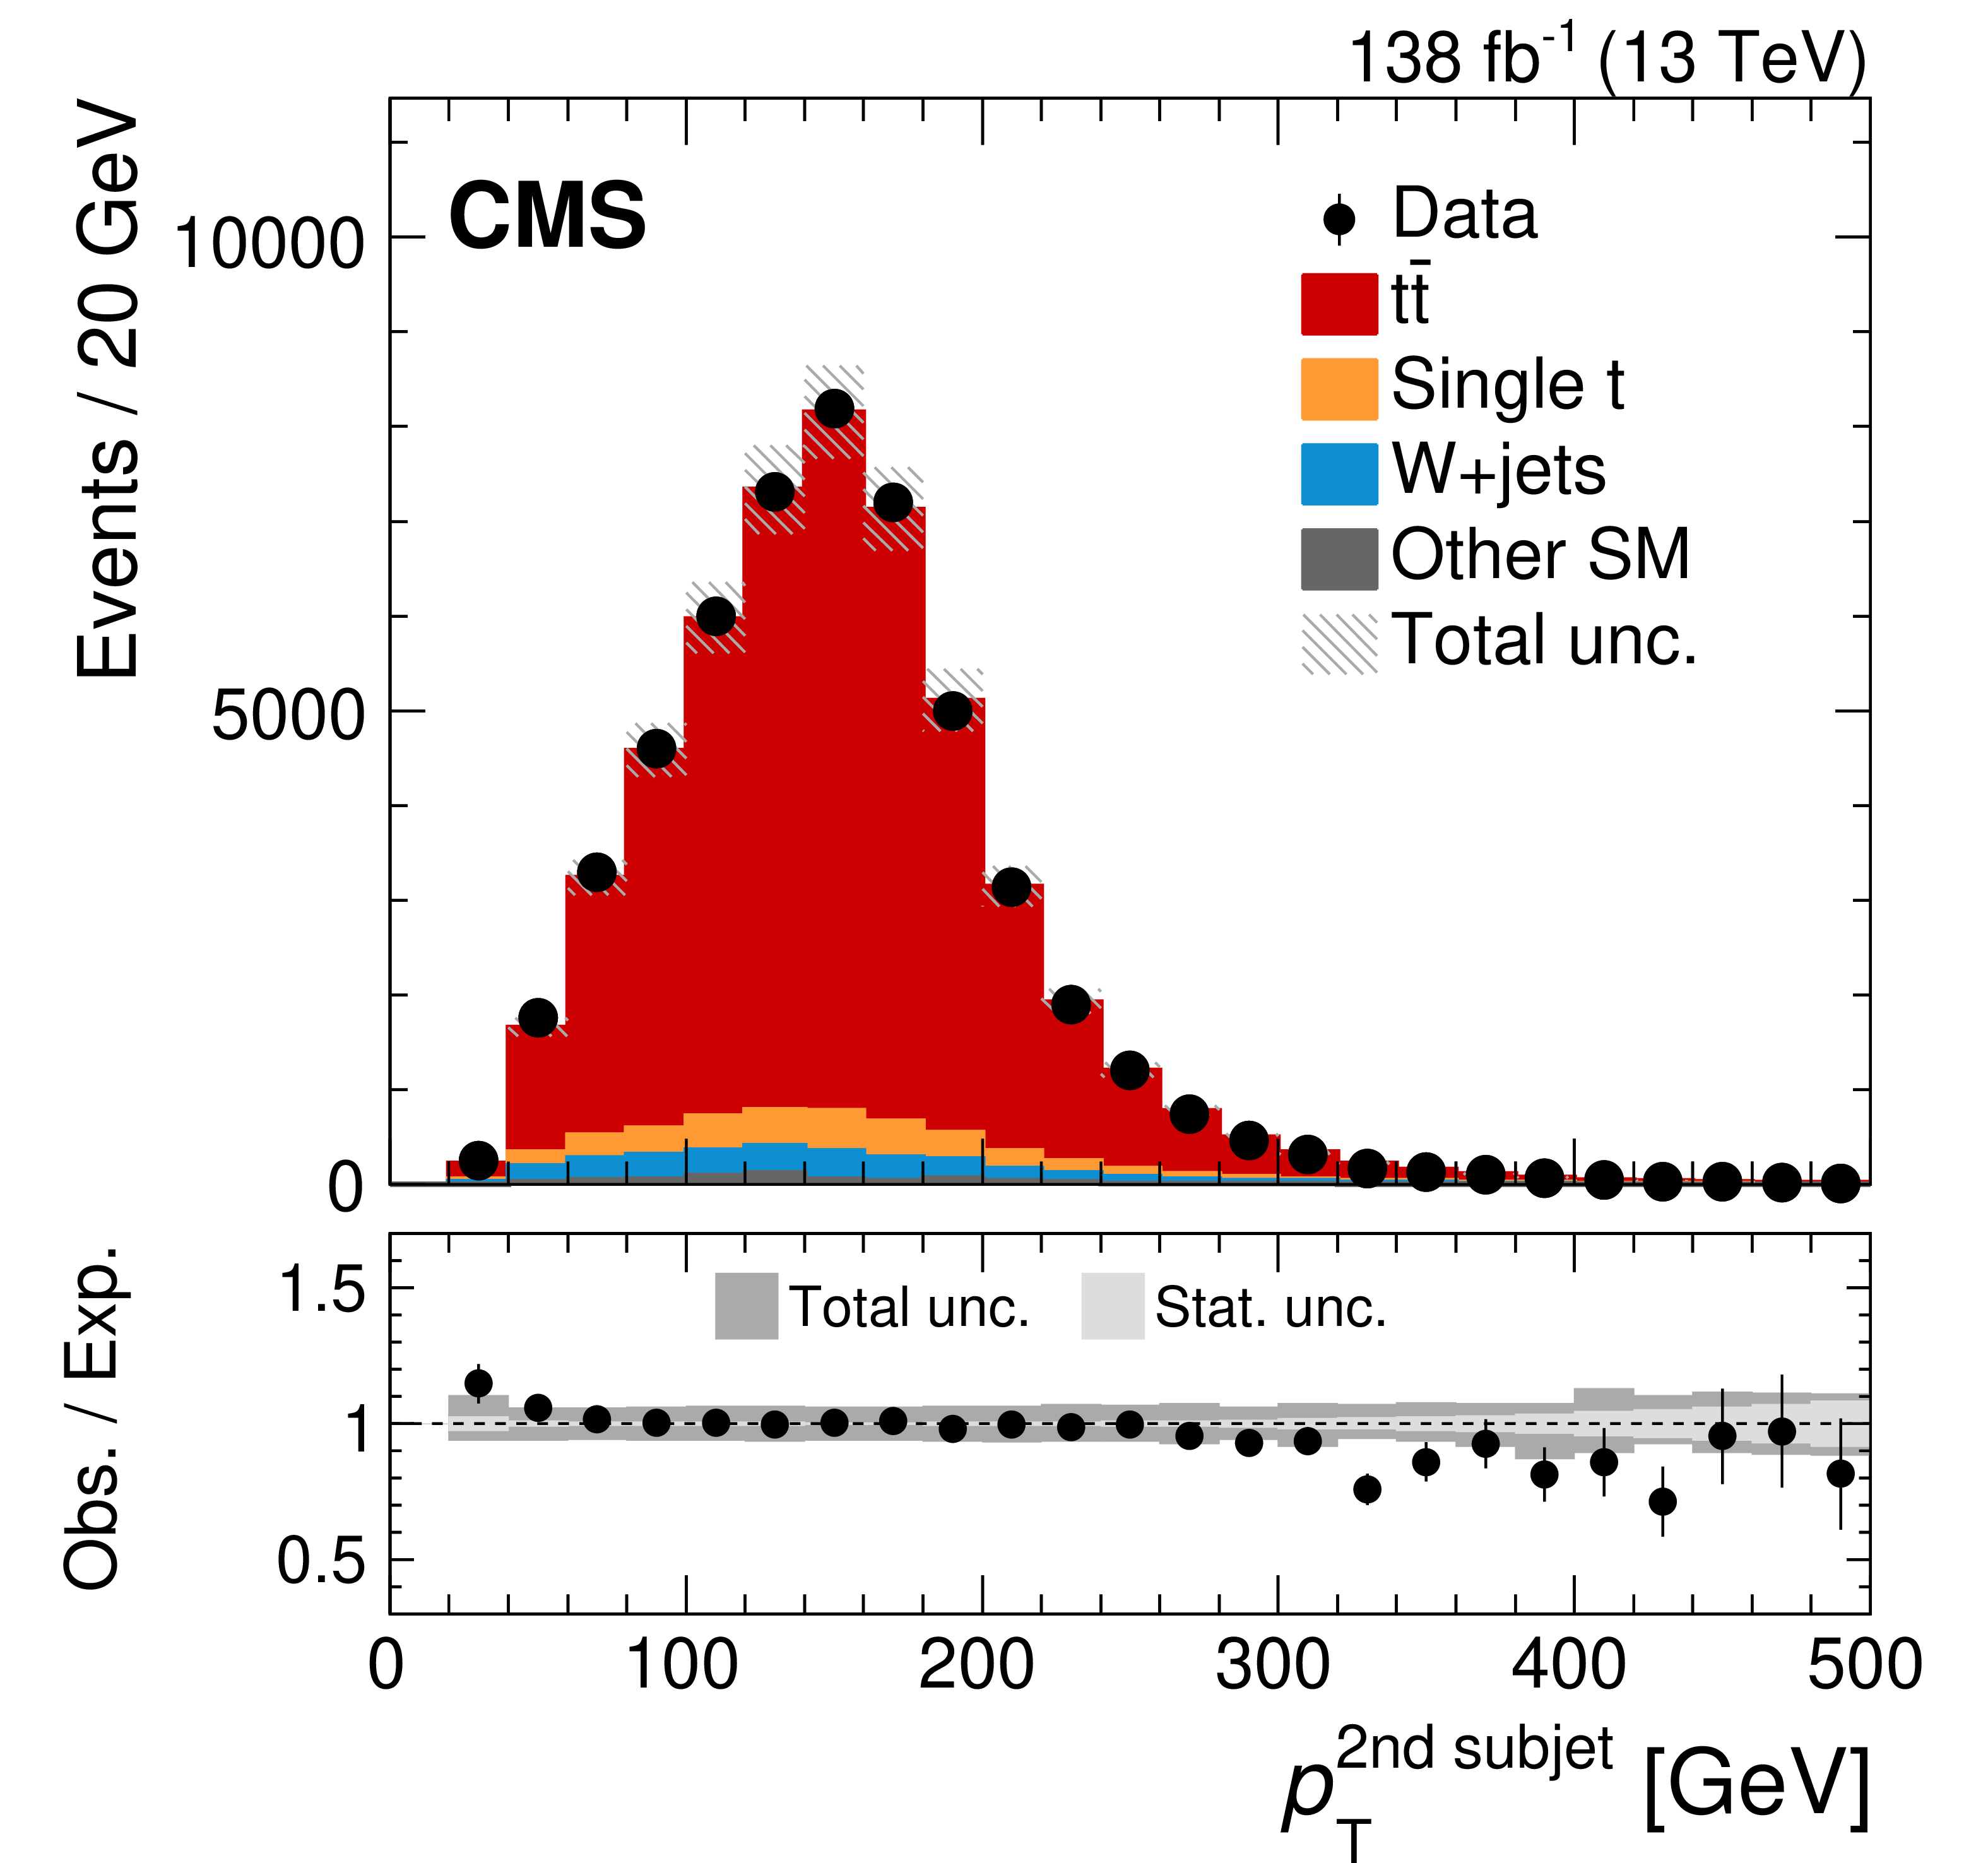
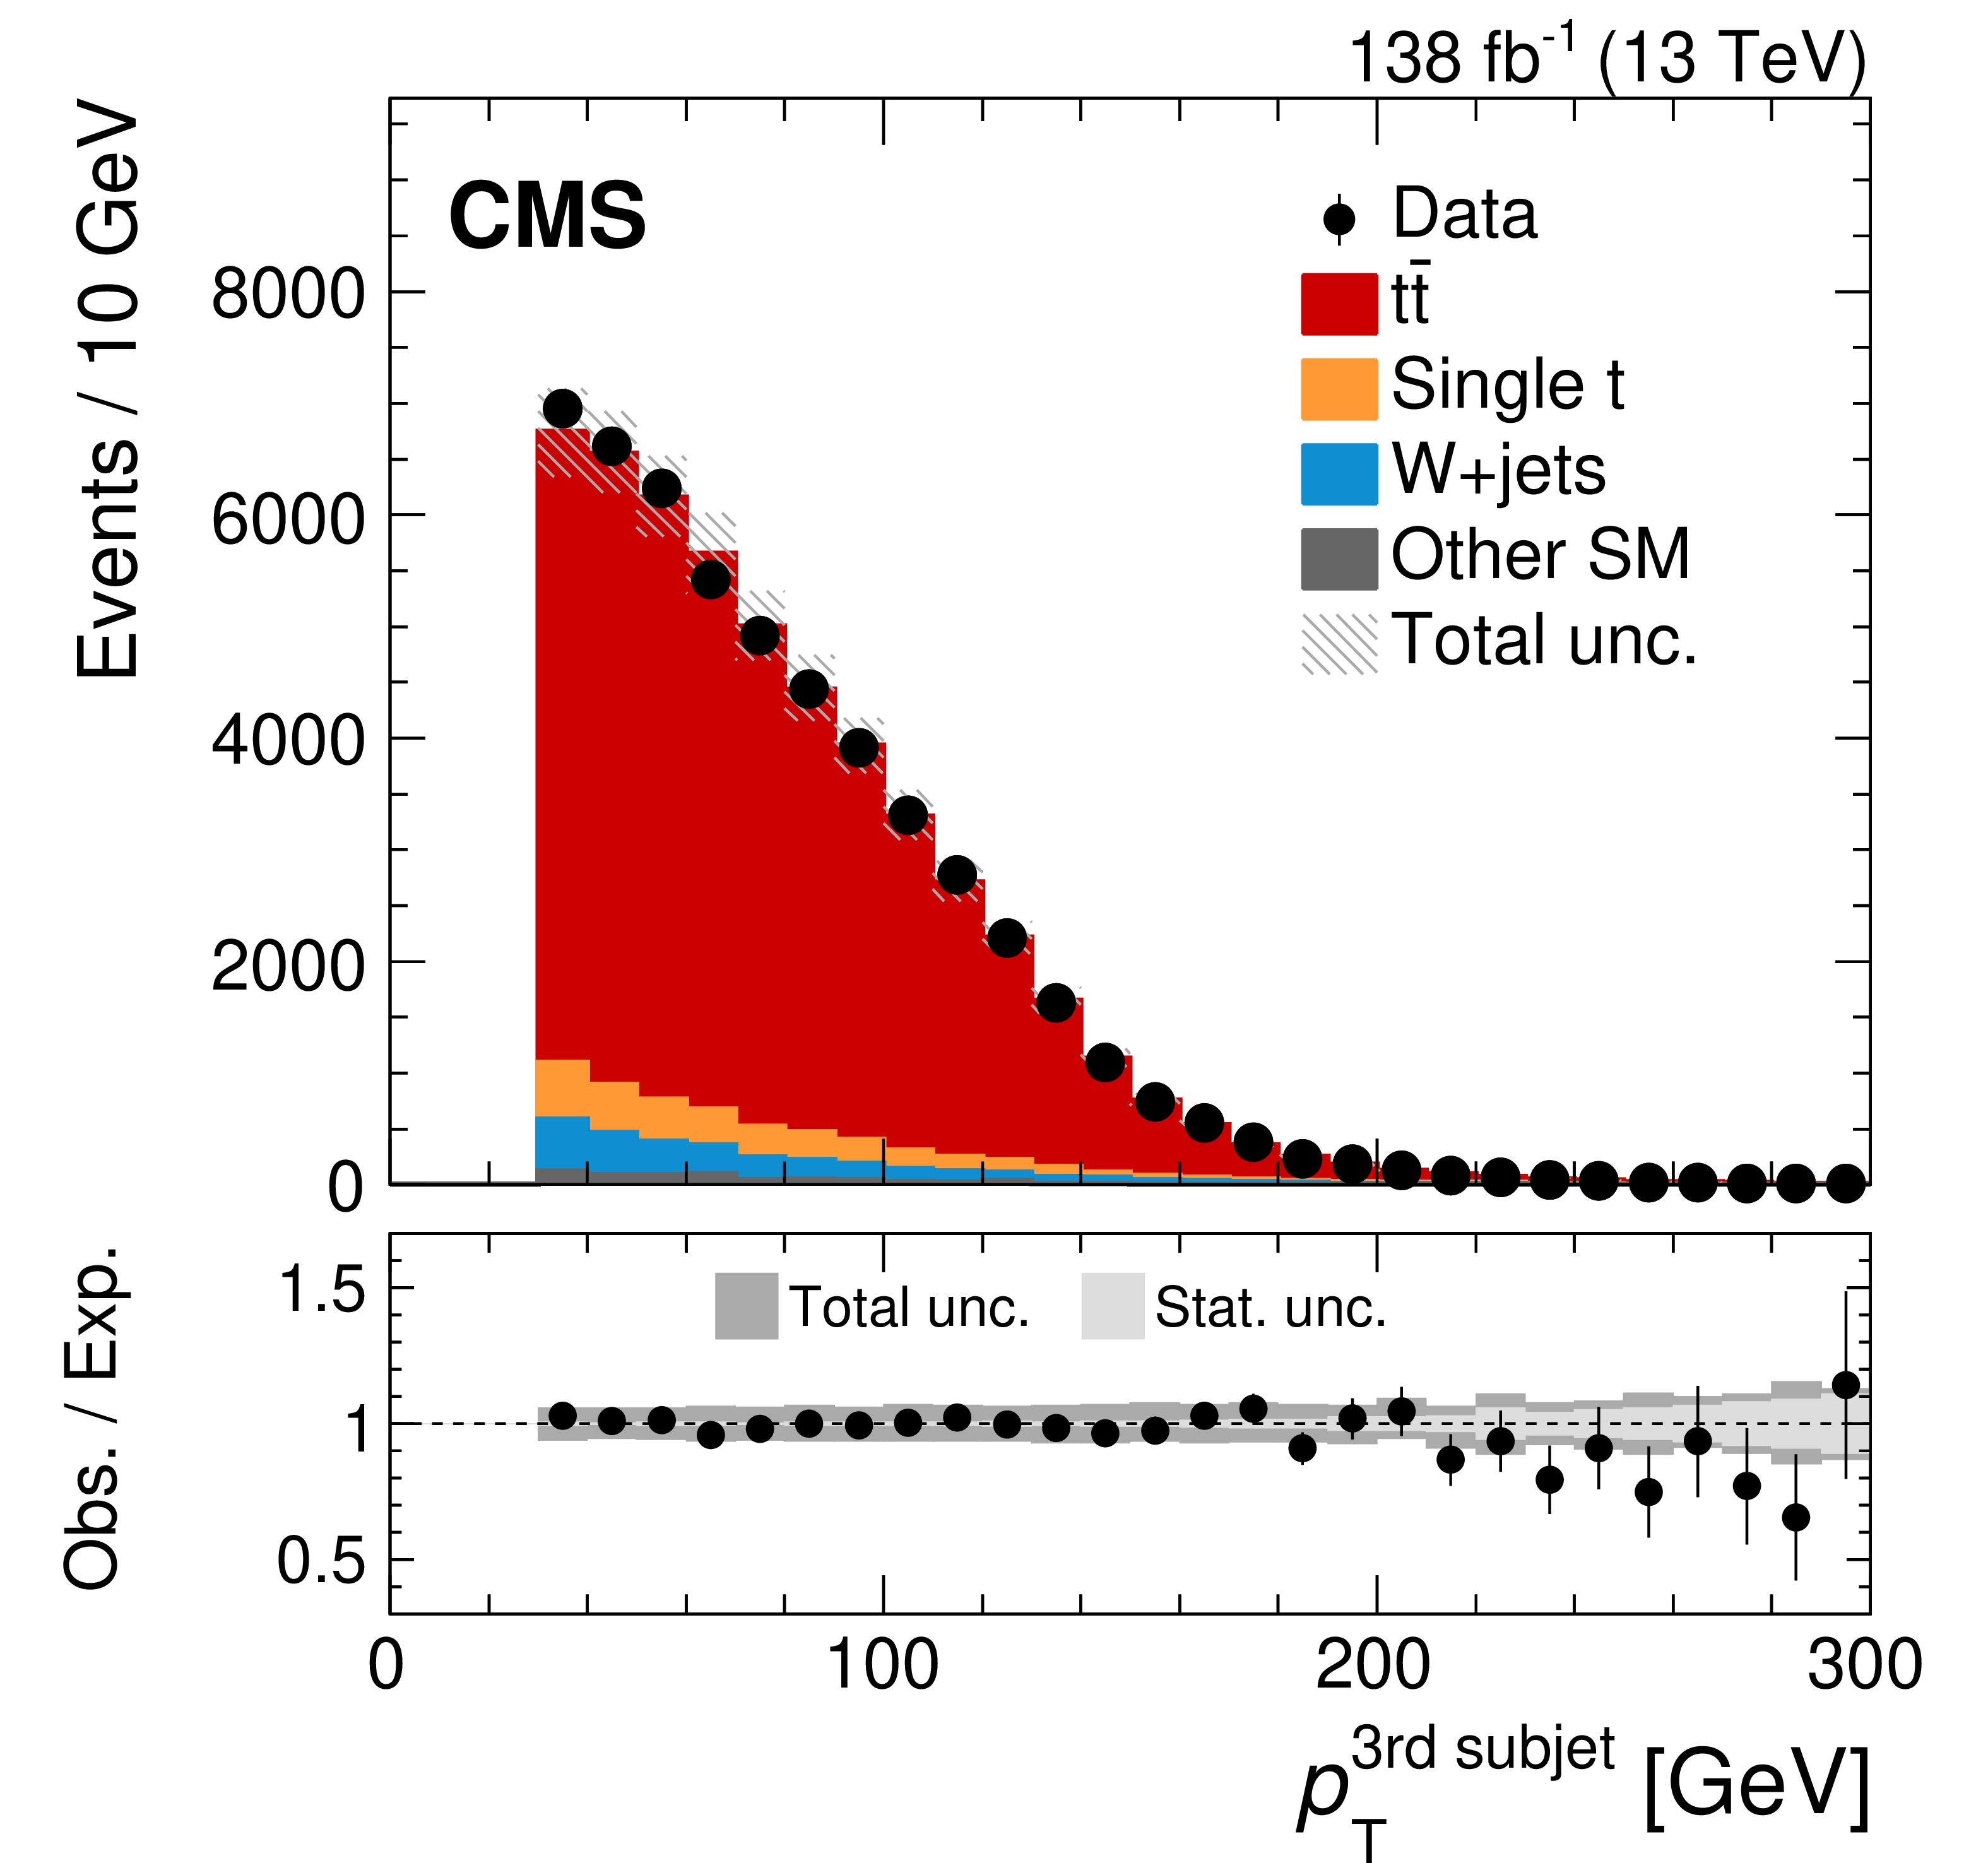
Figure 3:
Distributions in reconstructed $ p_{\mathrm{T}} $ of the $ p_{\mathrm{T}} $-leading XCone subjet (upper left), second XCone subjet (upper right) and third XCone subjet (lower). The vertical bars on the markers show the statistical uncertainty. The hatched regions show the total uncertainty in the simulation, including the statistical and experimental systematic uncertainties. The lower panels show the ratio of the data to the simulation. The uncertainty bands include the experimental systematic uncertainties and statistical uncertainties in the simulation. In the ratios, the statistical (light grey) and total (dark grey) uncertainties are shown separately. |

png pdf |
Figure 3-a:
Distribution in reconstructed $ p_{\mathrm{T}} $ of the $ p_{\mathrm{T}} $-leading XCone subjet. The vertical bars on the markers show the statistical uncertainty. The hatched region shows the total uncertainty in the simulation, including the statistical and experimental systematic uncertainties. The lower panel shows the ratio of the data to the simulation. The uncertainty band include the experimental systematic uncertainties and statistical uncertainties in the simulation. In the ratio, the statistical (light grey) and total (dark grey) uncertainties are shown separately. |
png pdf |
Figure 3-b:
Distribution in reconstructed $ p_{\mathrm{T}} $ of the $ p_{\mathrm{T}} $-second XCone subjet. The vertical bars on the markers show the statistical uncertainty. The hatched region shows the total uncertainty in the simulation, including the statistical and experimental systematic uncertainties. The lower panel shows the ratio of the data to the simulation. The uncertainty band include the experimental systematic uncertainties and statistical uncertainties in the simulation. In the ratio, the statistical (light grey) and total (dark grey) uncertainties are shown separately. |
png pdf |
Figure 3-c:
Distribution in reconstructed $ p_{\mathrm{T}} $ of the $ p_{\mathrm{T}} $-third XCone subjet. The vertical bars on the markers show the statistical uncertainty. The hatched region shows the total uncertainty in the simulation, including the statistical and experimental systematic uncertainties. The lower panel shows the ratio of the data to the simulation. The uncertainty band include the experimental systematic uncertainties and statistical uncertainties in the simulation. In the ratio, the statistical (light grey) and total (dark grey) uncertainties are shown separately. |
png pdf |
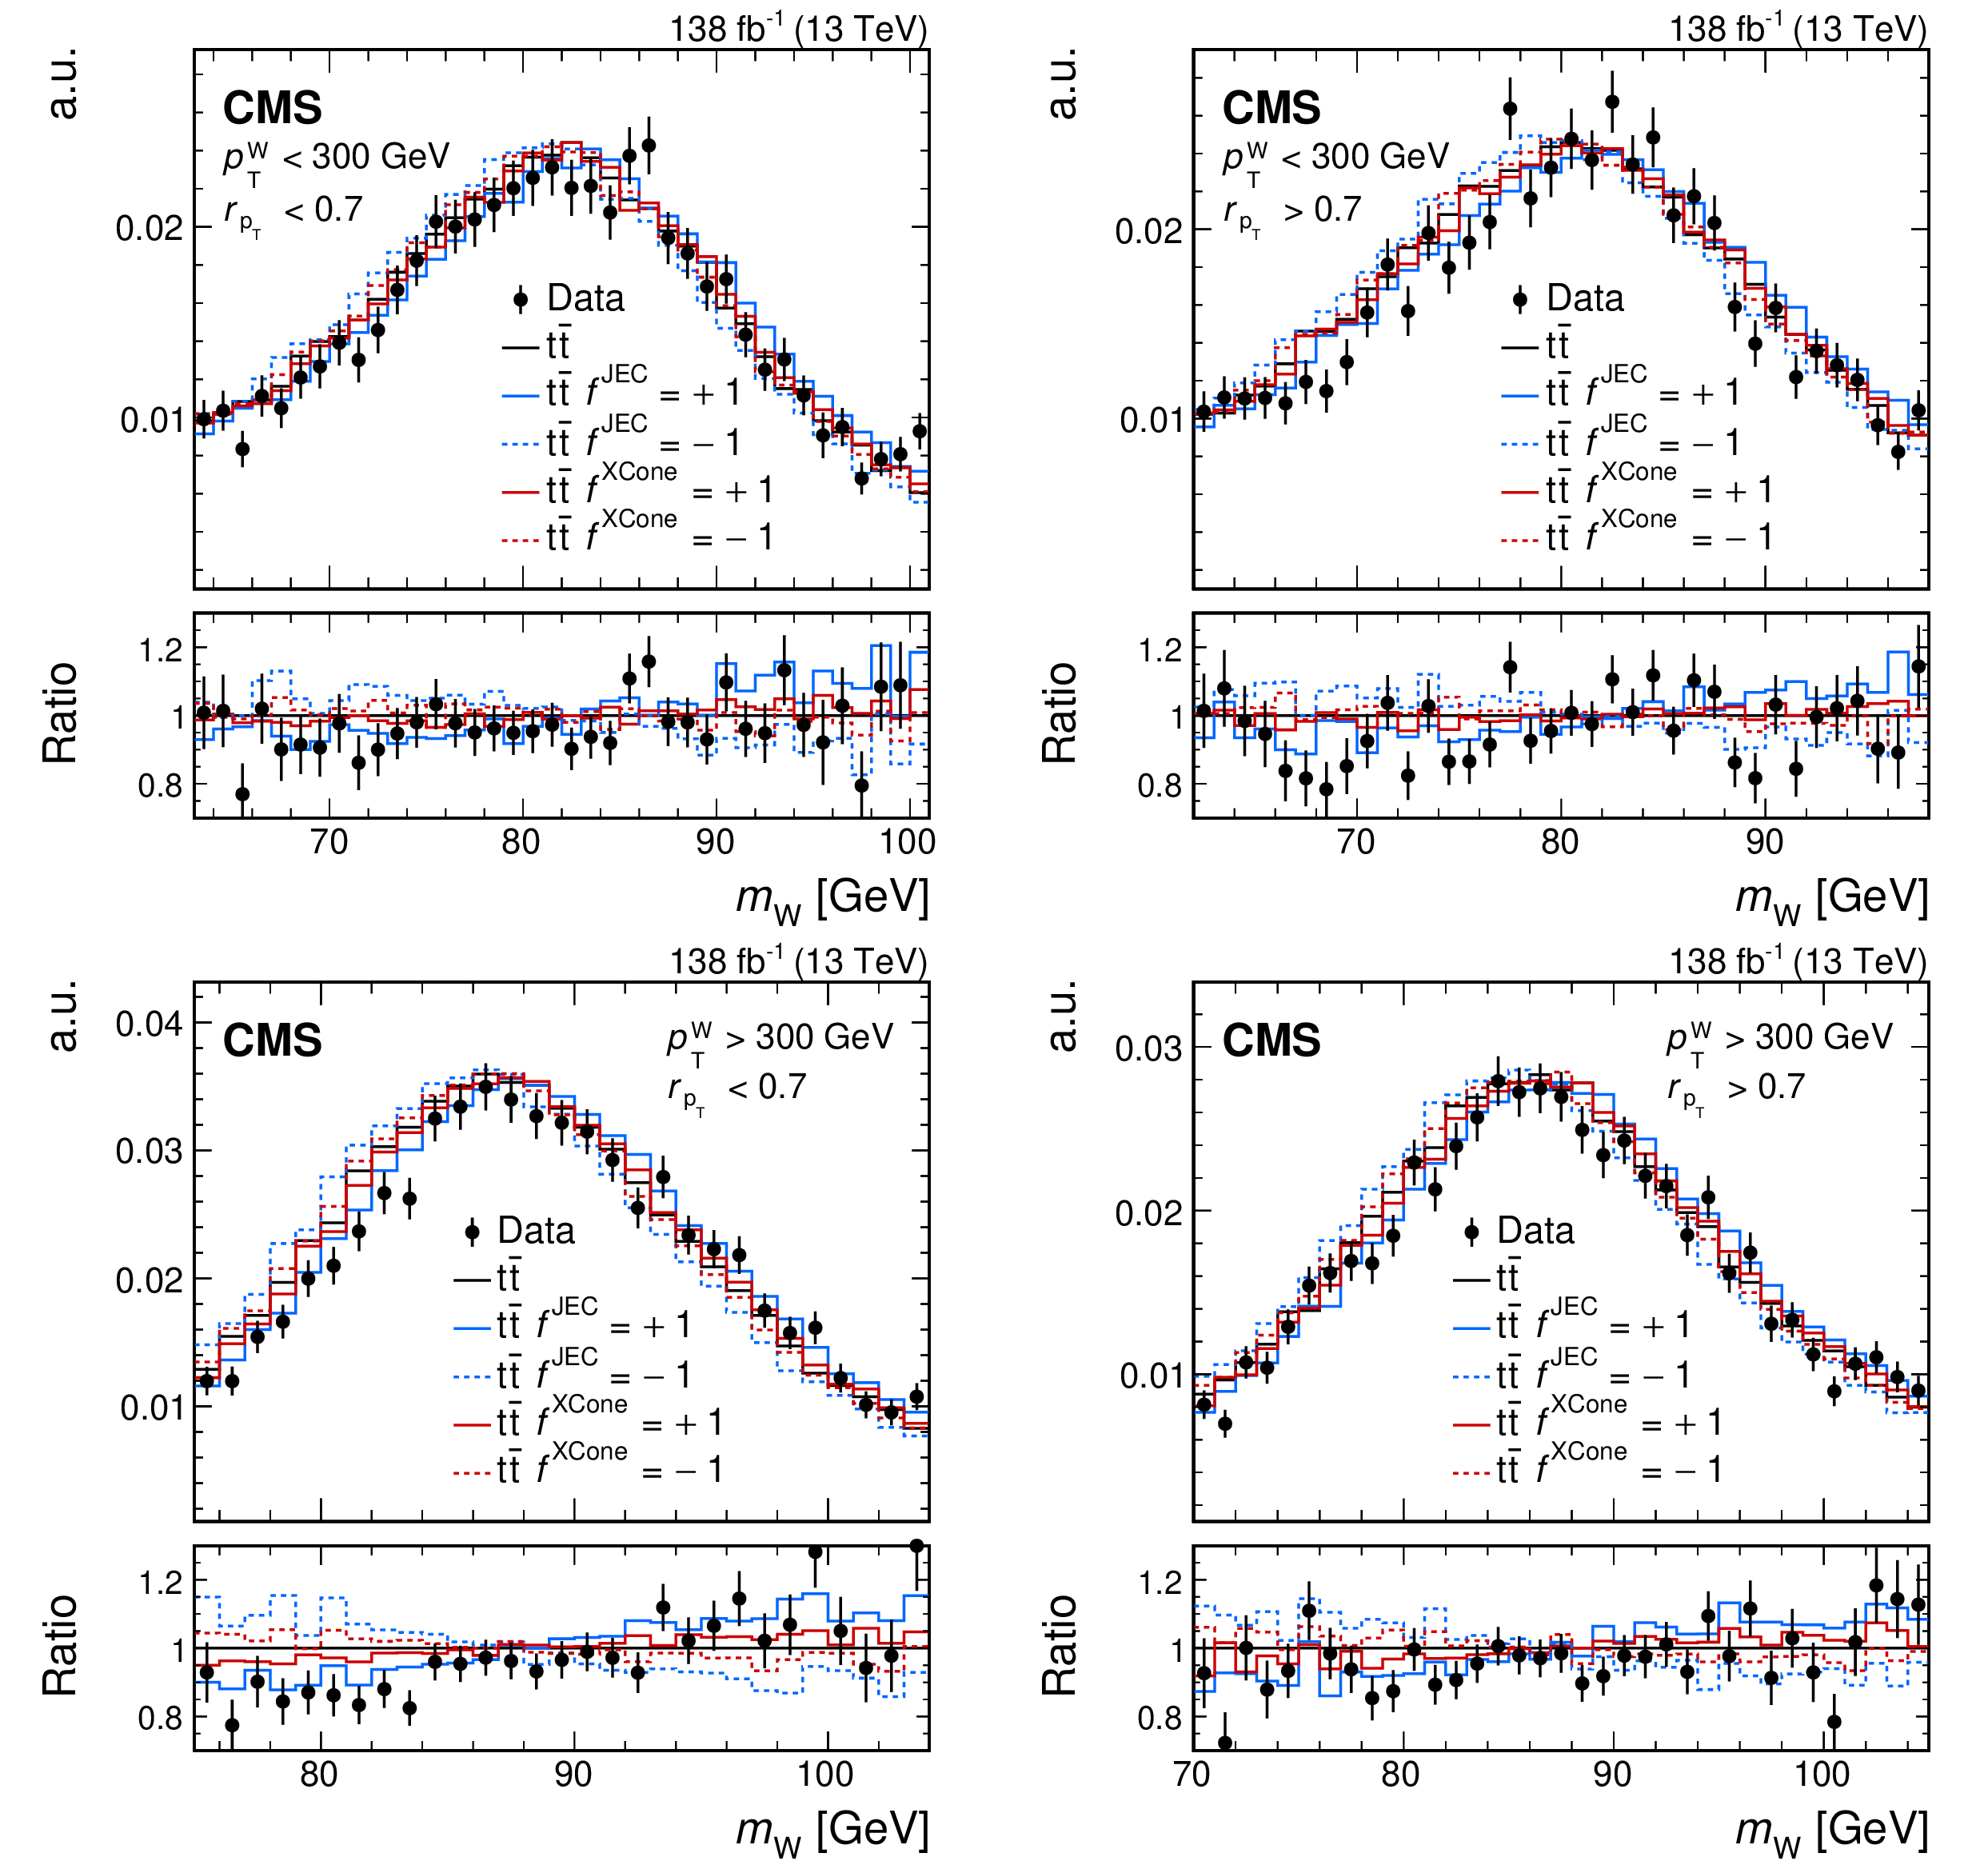
Figure 4:
Peak region of the reconstructed W boson mass in the four regions $ p_{\mathrm{T}}^\mathrm{W} < $ 300 GeV and $ r_{p_{\mathrm{T}}} < $ 0.7 (upper left), $ p_{\mathrm{T}}^\mathrm{W} < $ 300 GeV and $ r_{p_{\mathrm{T}}} > $ 0.7 (upper right), $ p_{\mathrm{T}}^\mathrm{W} > $ 300 GeV and $ r_{p_{\mathrm{T}}} < $ 0.7 (lower left), and $ p_{\mathrm{T}}^\mathrm{W} > $ 300 GeV and $ r_{p_{\mathrm{T}}} > $ 0.7 (lower right). The background-subtracted data and the $ \mathrm{t} \overline{\mathrm{t}} $ simulation are normalised to unit area. For illustration, the $ \mathrm{t} \overline{\mathrm{t}} $ simulation is also shown with the JEC and XCone correction factors varied by one standard deviation. The lower panels show the ratios to the nominal $ \mathrm{t} \overline{\mathrm{t}} $ simulation. |

png pdf |
Figure 4-a:
Peak region of the reconstructed W boson mass in the $ p_{\mathrm{T}}^\mathrm{W} < $ 300 GeV and $ r_{p_{\mathrm{T}}} < $ 0.7 region. The background-subtracted data and the $ \mathrm{t} \overline{\mathrm{t}} $ simulation are normalised to unit area. For illustration, the $ \mathrm{t} \overline{\mathrm{t}} $ simulation is also shown with the JEC and XCone correction factors varied by one standard deviation. The lower panel shows the ratios to the nominal $ \mathrm{t} \overline{\mathrm{t}} $ simulation. |
png pdf |
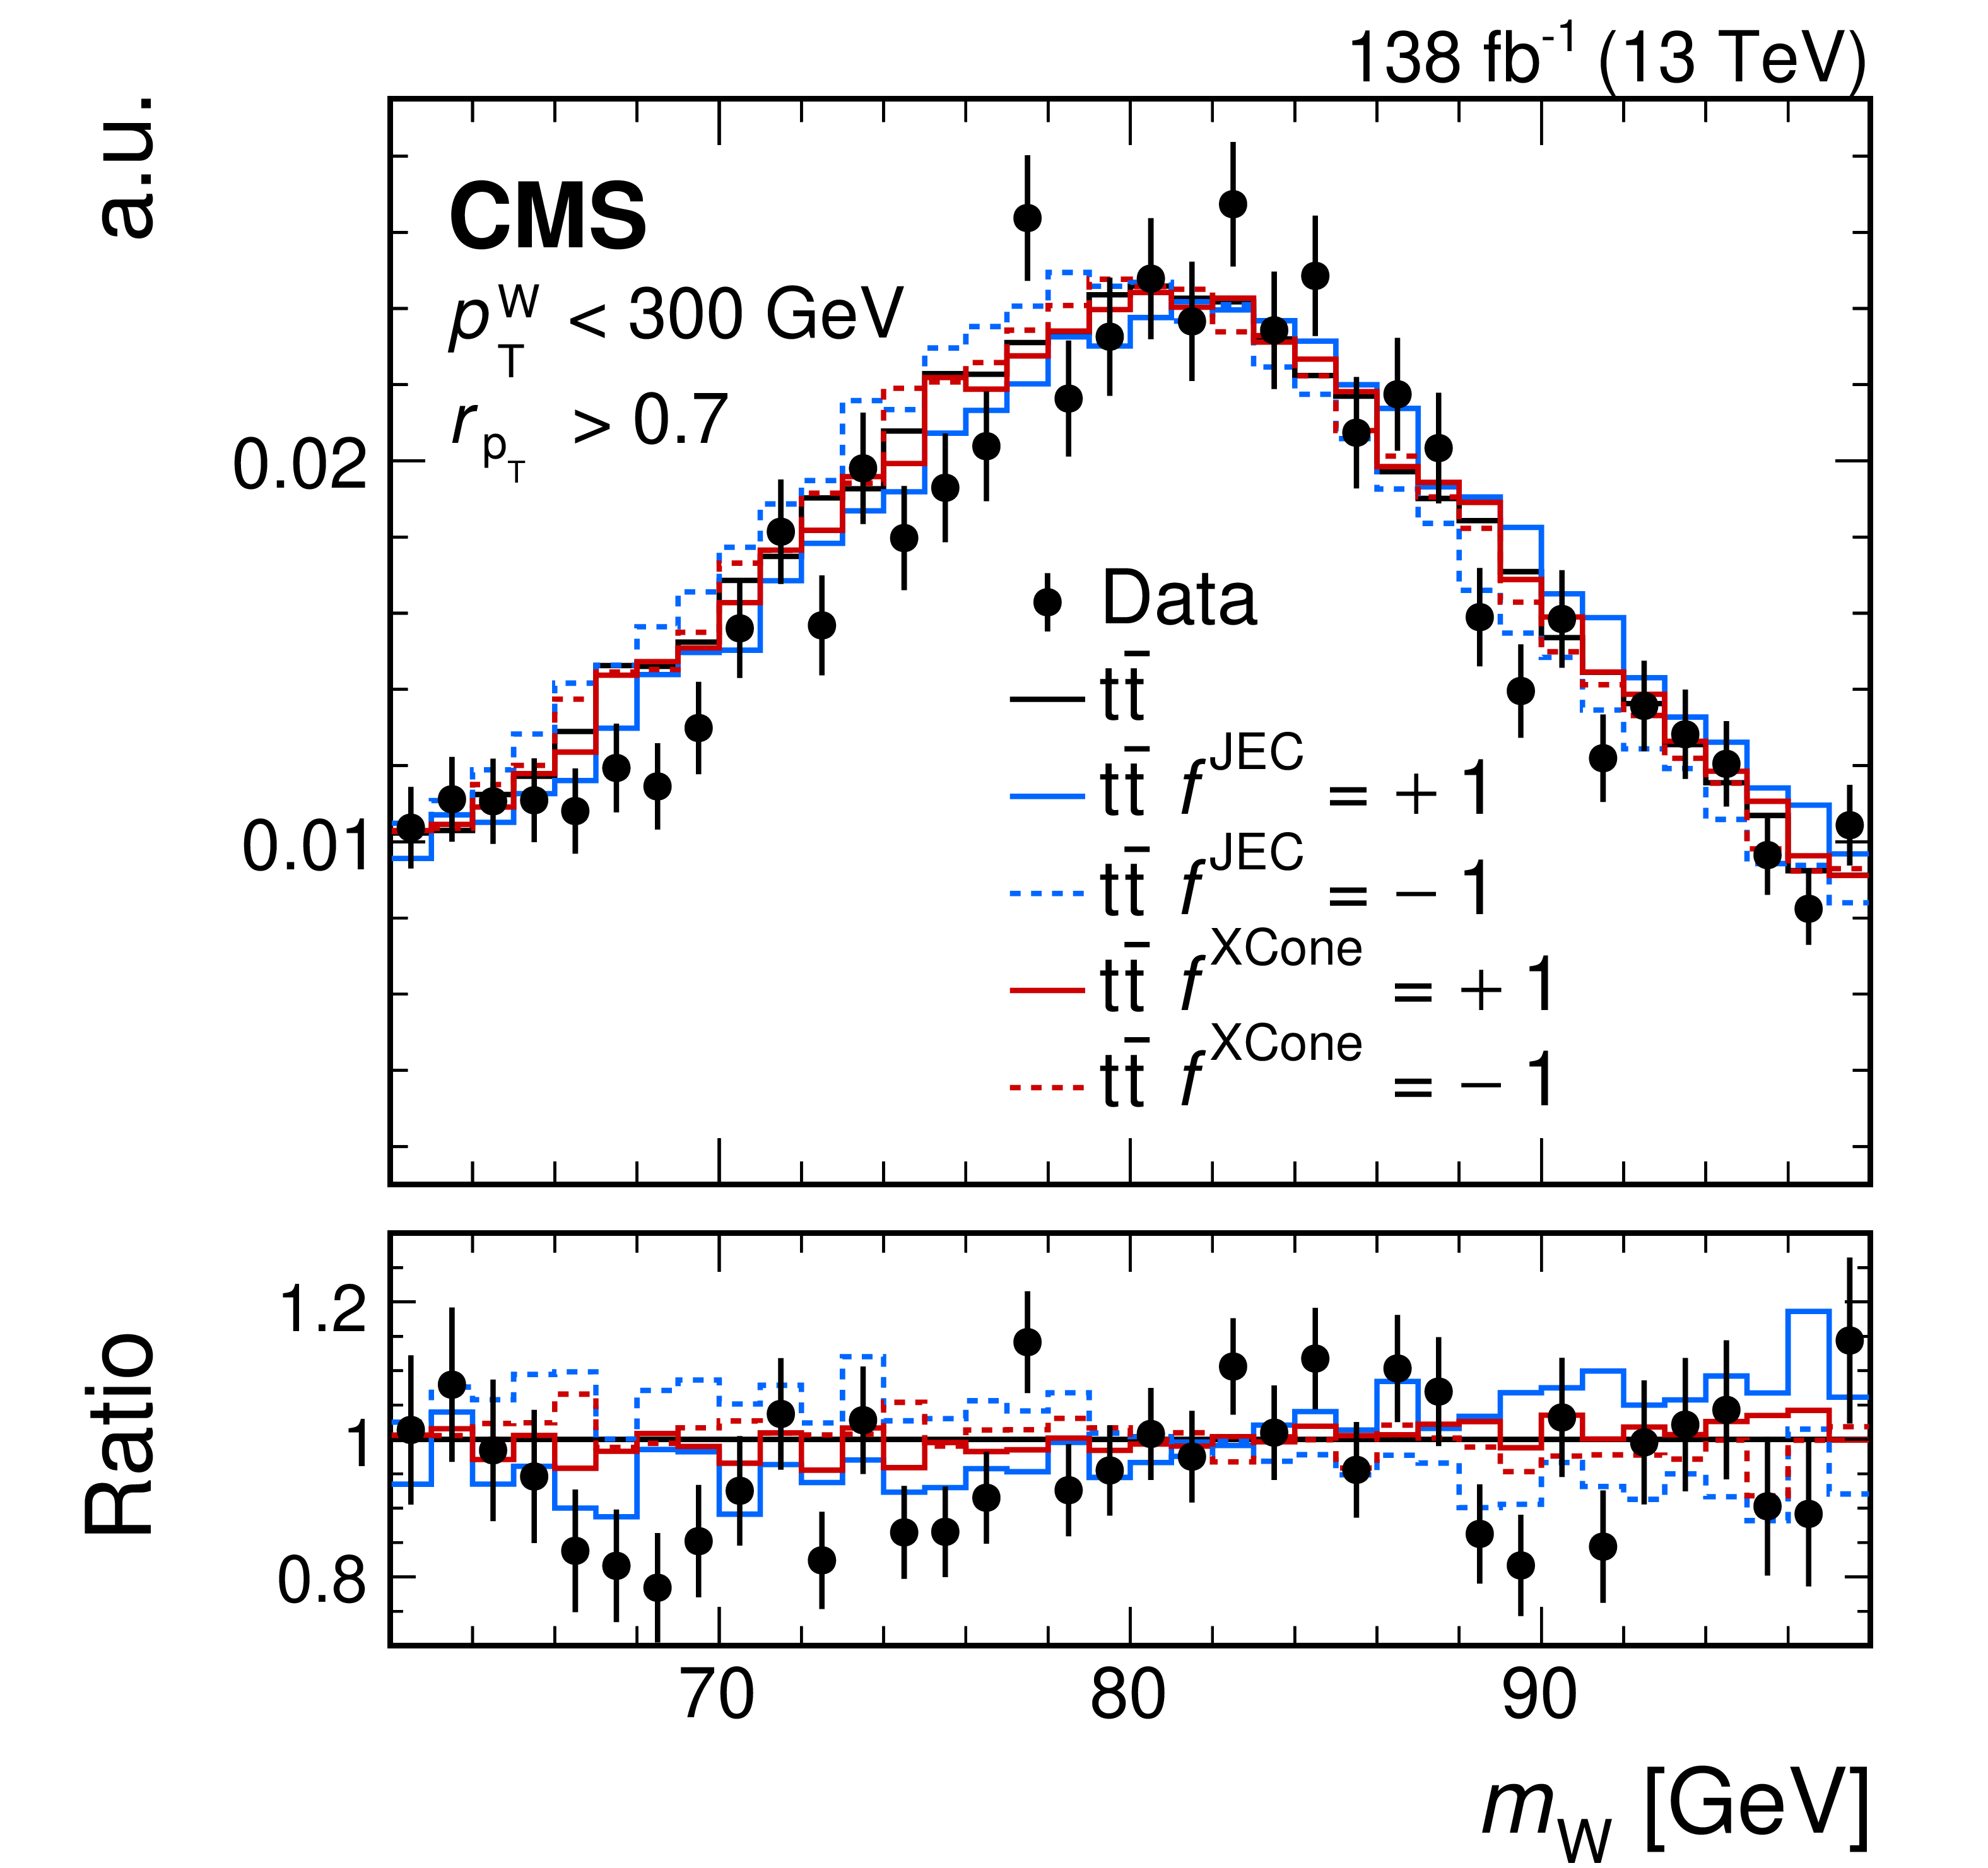
Figure 4-b:
Peak region of the reconstructed W boson mass in the $ p_{\mathrm{T}}^\mathrm{W} < $ 300 GeV and $ r_{p_{\mathrm{T}}} > $ 0.7 region. The background-subtracted data and the $ \mathrm{t} \overline{\mathrm{t}} $ simulation are normalised to unit area. For illustration, the $ \mathrm{t} \overline{\mathrm{t}} $ simulation is also shown with the JEC and XCone correction factors varied by one standard deviation. The lower panel shows the ratios to the nominal $ \mathrm{t} \overline{\mathrm{t}} $ simulation. |

png pdf |
Figure 4-c:
Peak region of the reconstructed W boson mass in the $ p_{\mathrm{T}}^\mathrm{W} > $ 300 GeV and $ r_{p_{\mathrm{T}}} < $ 0.7 region. The background-subtracted data and the $ \mathrm{t} \overline{\mathrm{t}} $ simulation are normalised to unit area. For illustration, the $ \mathrm{t} \overline{\mathrm{t}} $ simulation is also shown with the JEC and XCone correction factors varied by one standard deviation. The lower panel shows the ratios to the nominal $ \mathrm{t} \overline{\mathrm{t}} $ simulation. |
png pdf |
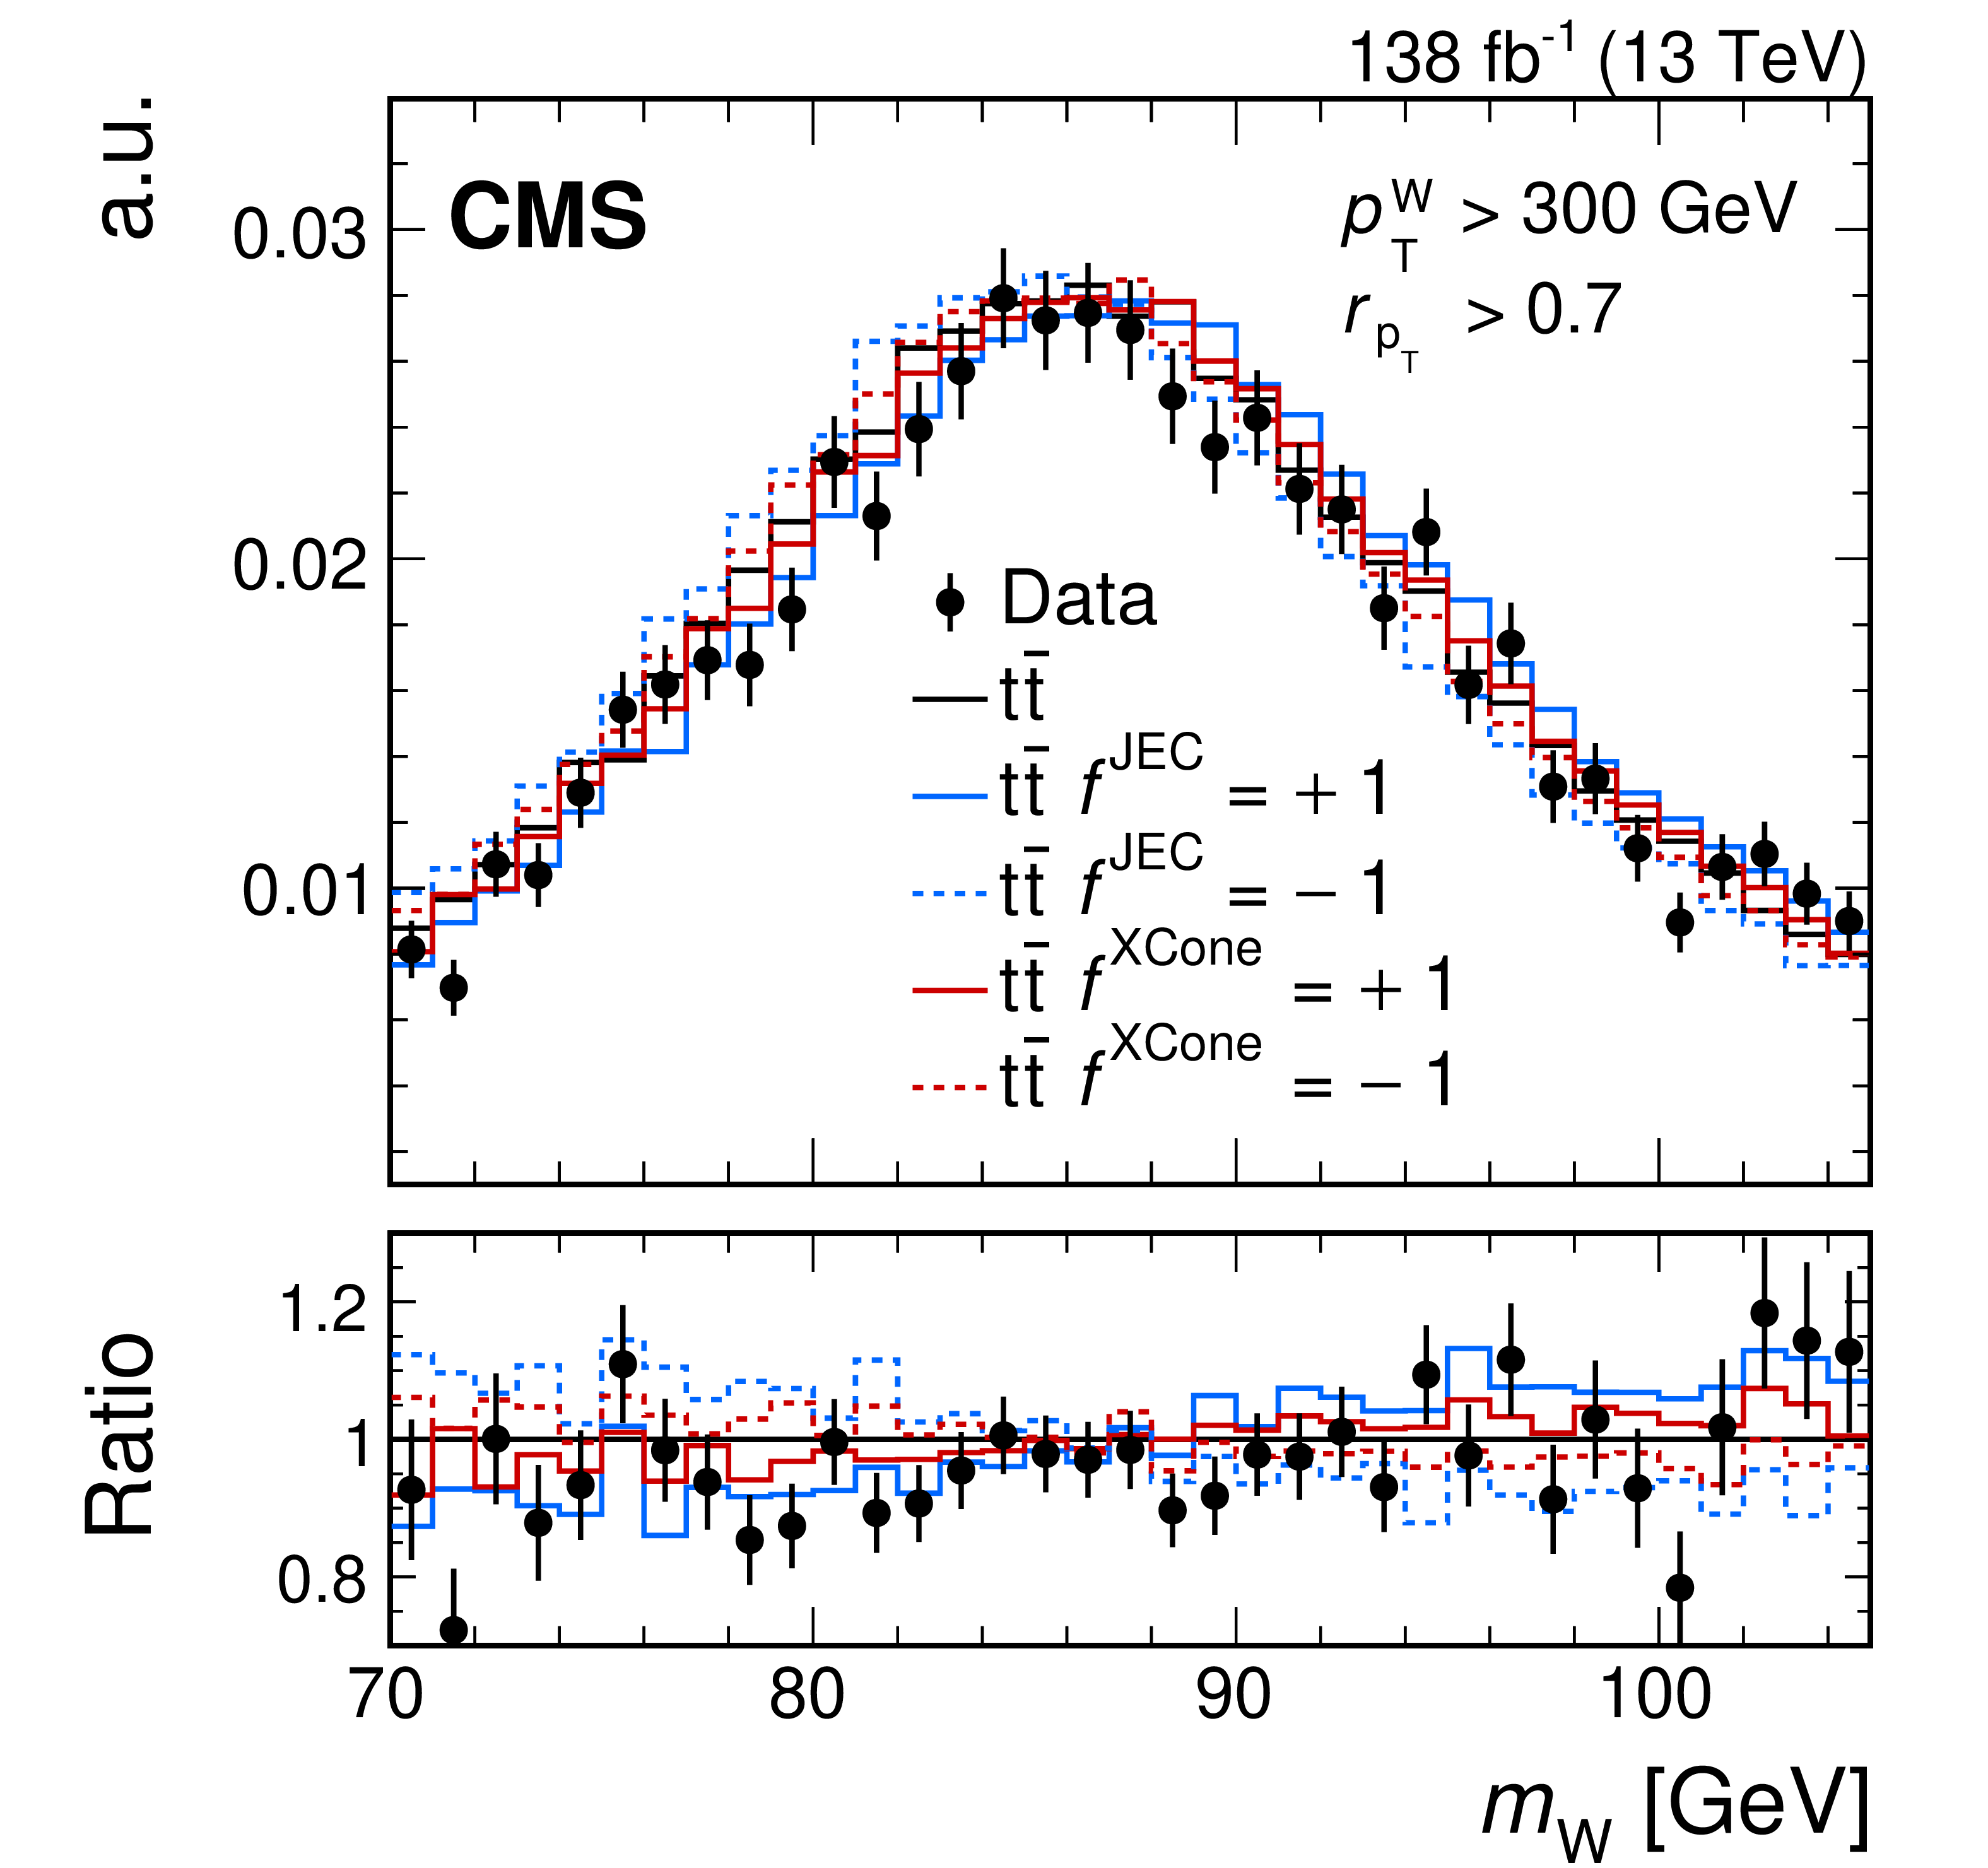
Figure 4-d:
Peak region of the reconstructed W boson mass in the $ p_{\mathrm{T}}^\mathrm{W} > $ 300 GeV and $ r_{p_{\mathrm{T}}} > $ 0.7 region. The background-subtracted data and the $ \mathrm{t} \overline{\mathrm{t}} $ simulation are normalised to unit area. For illustration, the $ \mathrm{t} \overline{\mathrm{t}} $ simulation is also shown with the JEC and XCone correction factors varied by one standard deviation. The lower panel shows the ratios to the nominal $ \mathrm{t} \overline{\mathrm{t}} $ simulation. |
png pdf |
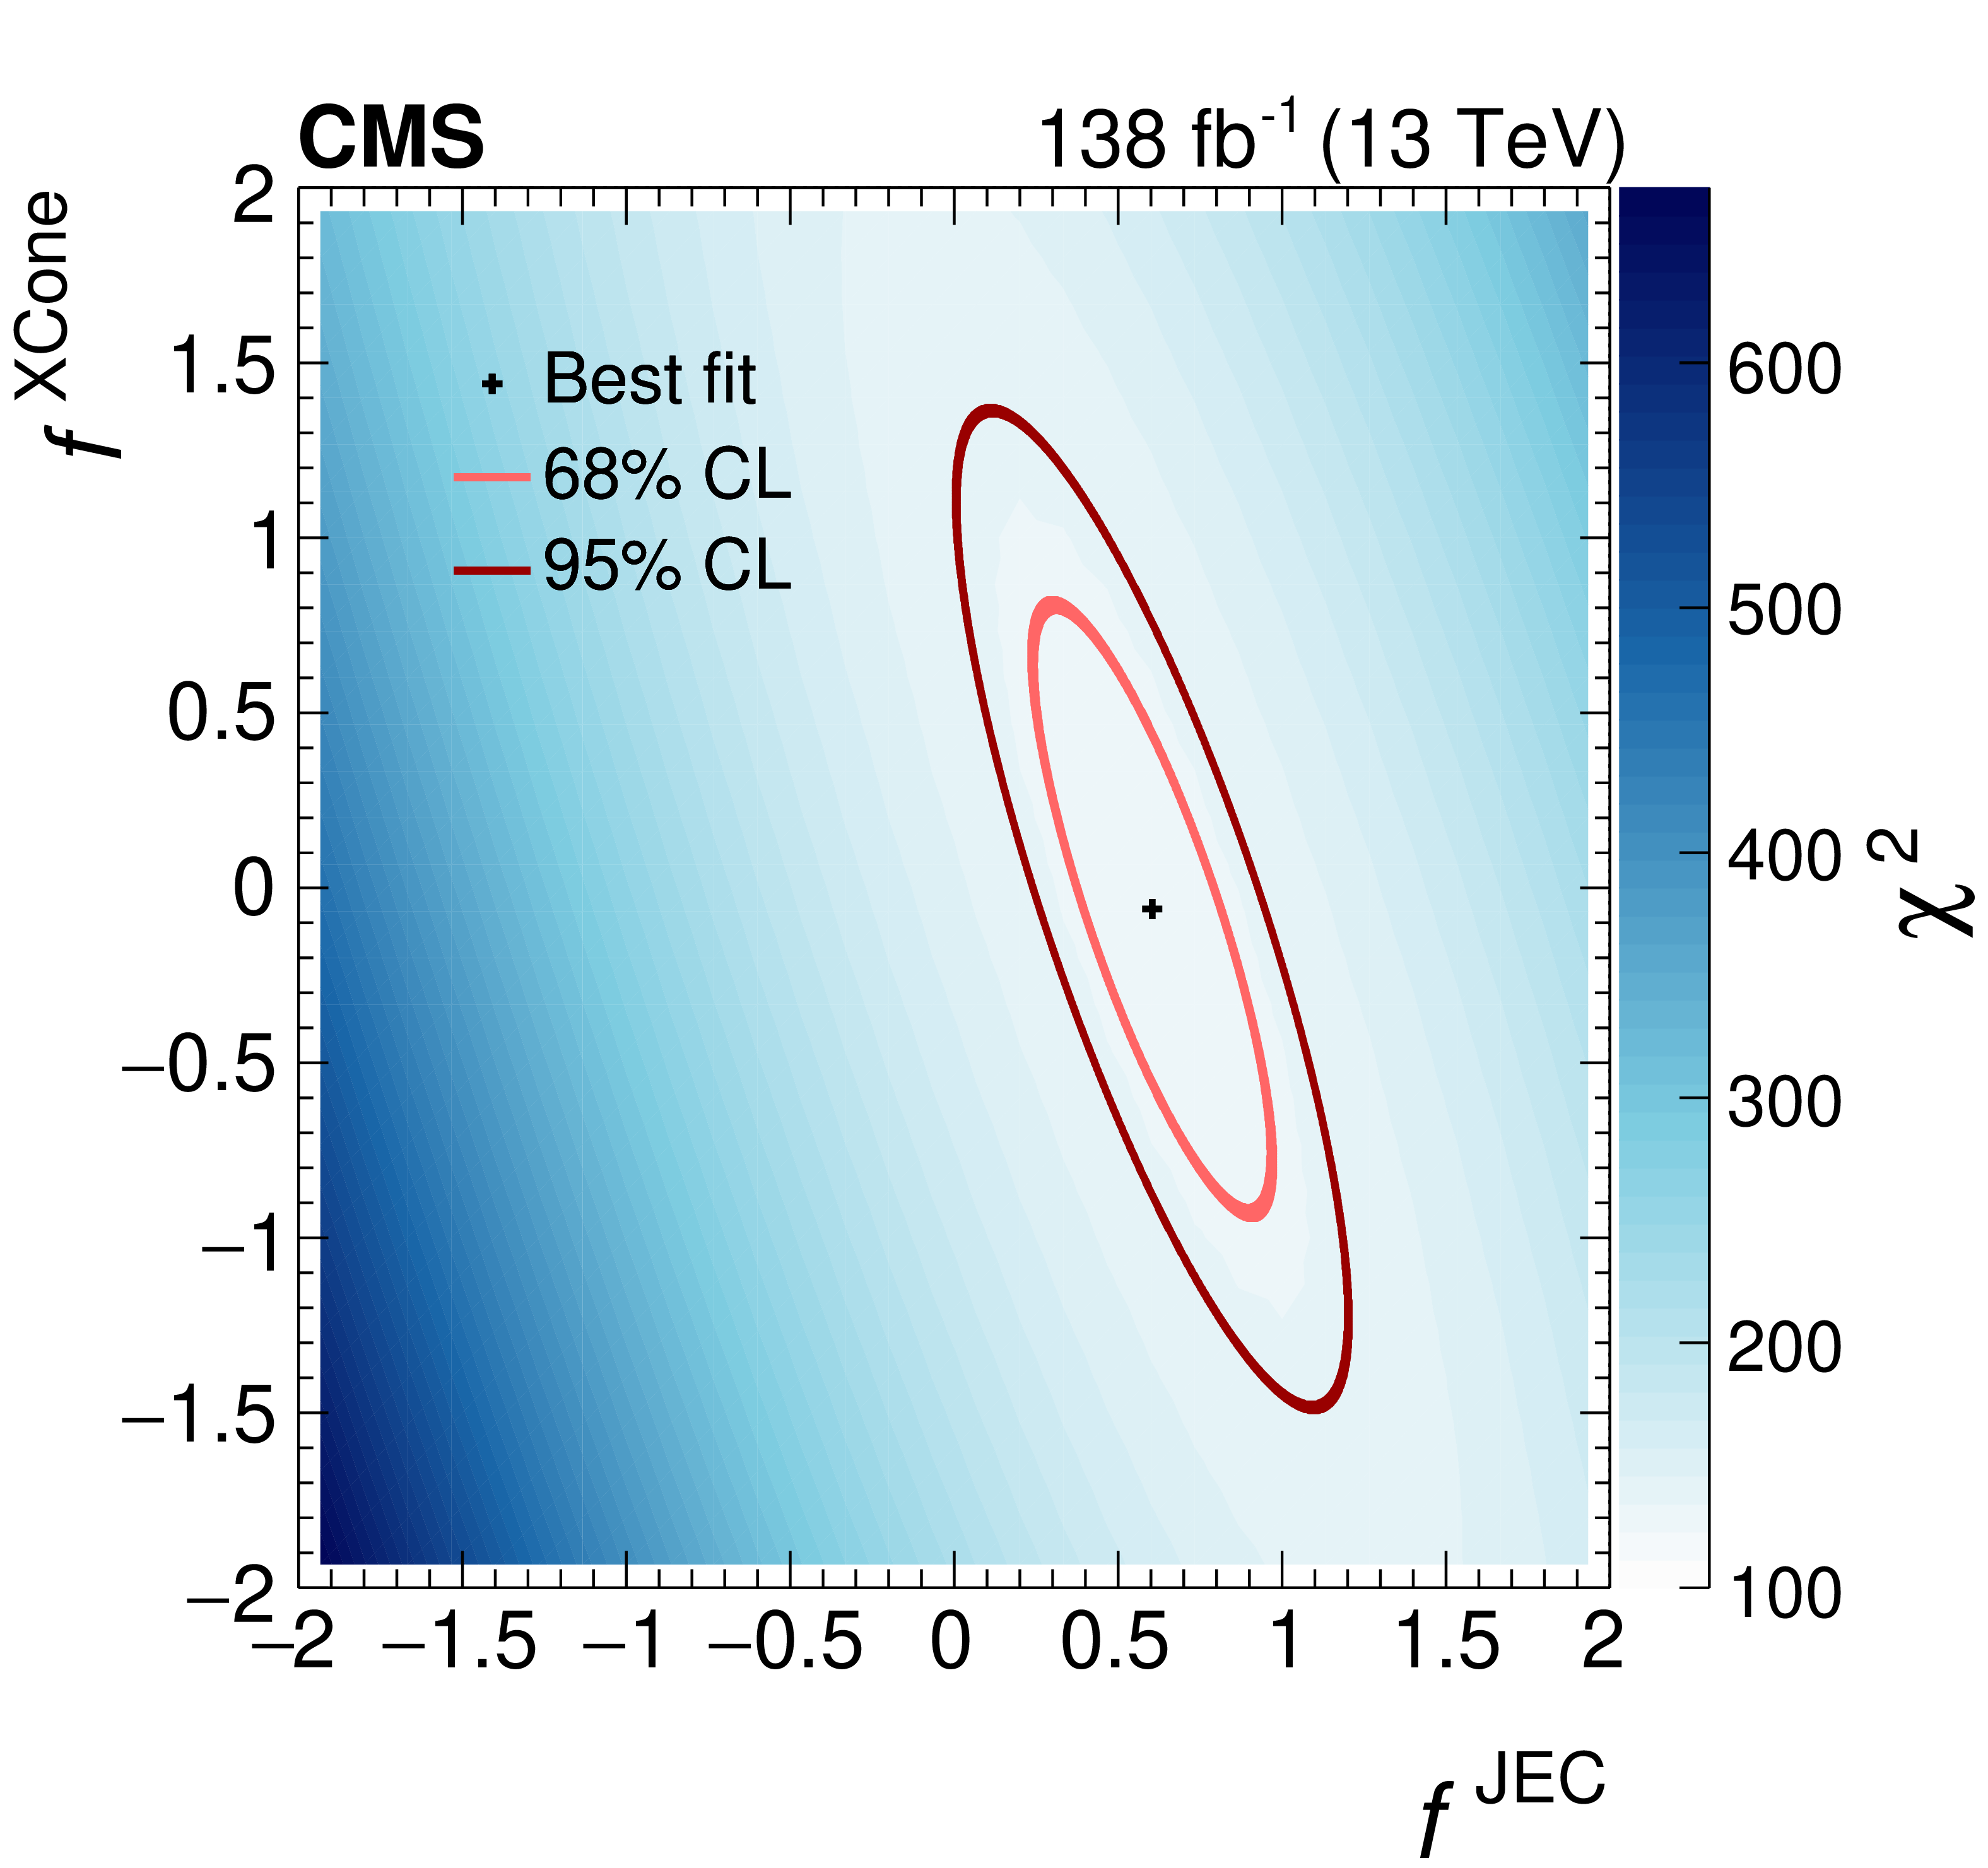
Figure 5:
The two-dimensional $ \chi^2 $ as a function of $ f^\text{JEC} $ and $ f^\text{XCone} $, obtained from a comparison of background-subtracted data with the predictions from $ \mathrm{t} \overline{\mathrm{t}} $ production in the reconstructed $ m_{\mathrm{W}} $ distributions. The minimum is indicated by a black cross, and the borders of the 68 and 95% CL intervals are shown by the light and dark red ellipses, respectively. |
png pdf |
Figure 6:
Jet mass distribution of hadronic decays of the W boson, reconstructed from two XCone subjets. The vertical bars on the markers show the statistical uncertainty. The hatched regions show the total uncertainty in the simulation, including the statistical and experimental systematic uncertainties. The lower panel shows the ratio of the data to the simulation. The uncertainty bands include the experimental systematic uncertainties and statistical uncertainties in the simulation. The statistical (light grey) and total (dark grey) uncertainties are shown separately in the ratio. |

png pdf |
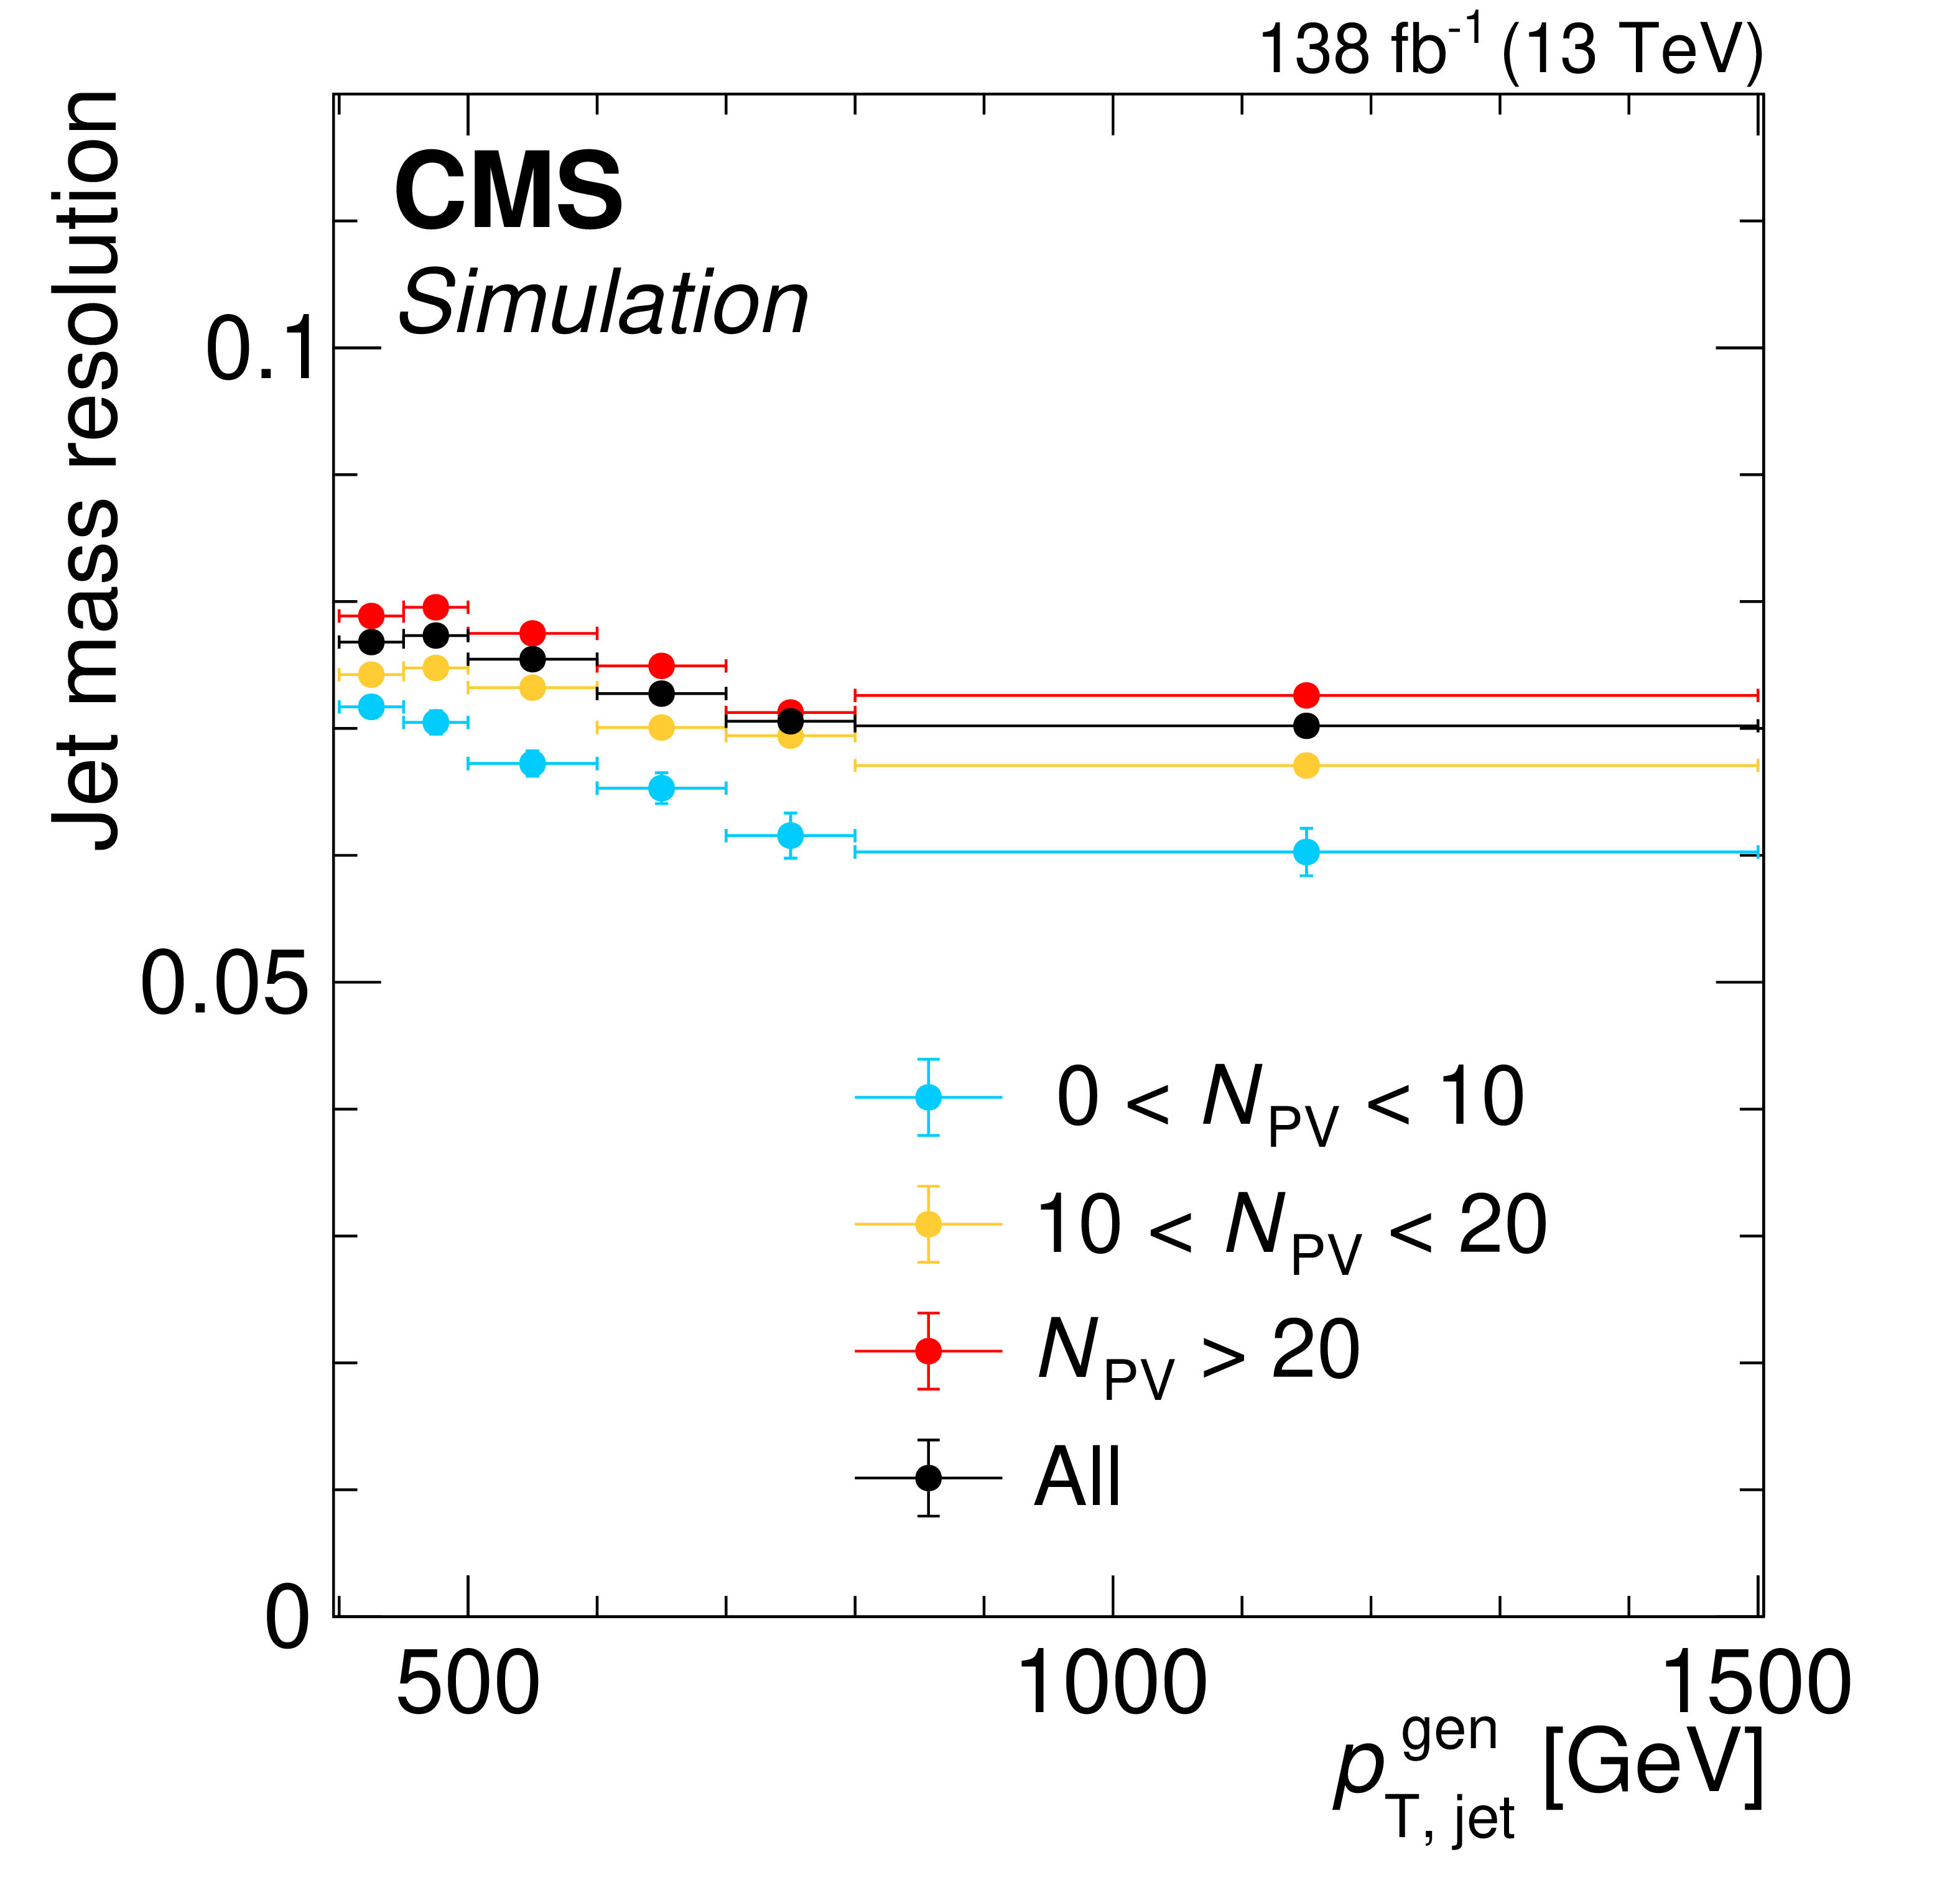
Figure 7:
Mean values of the $ m_\text{jet} $ distribution for t and W boson decays, as a function of the number of primary vertices $ N_{\text{PV}} $ (left). Data (markers) are compared with $ \mathrm{t} \overline{\mathrm{t}} $ simulation (filled areas). The vertical bars and size of the filled areas show the statistical uncertainties in the calculation of the mean values. Jet mass resolution in simulation as a function of particle-level XCone-jet $ p_{\mathrm{T}} $, given for different intervals in the number of primary vertices (right). The vertical bars indicate the statistical uncertainties and the horizontal bars indicate the bin width. |

png pdf |
Figure 7-a:
Mean values of the $ m_\text{jet} $ distribution for t and W boson decays, as a function of the number of primary vertices $ N_{\text{PV}} $. Data (markers) are compared with $ \mathrm{t} \overline{\mathrm{t}} $ simulation (filled areas). The vertical bars and size of the filled areas show the statistical uncertainties in the calculation of the mean values. |
png pdf |
Figure 7-b:
Jet mass resolution in simulation as a function of particle-level XCone-jet $ p_{\mathrm{T}} $, given for different intervals in the number of primary vertices. The vertical bars indicate the statistical uncertainties and the horizontal bars indicate the bin width. |

png pdf |
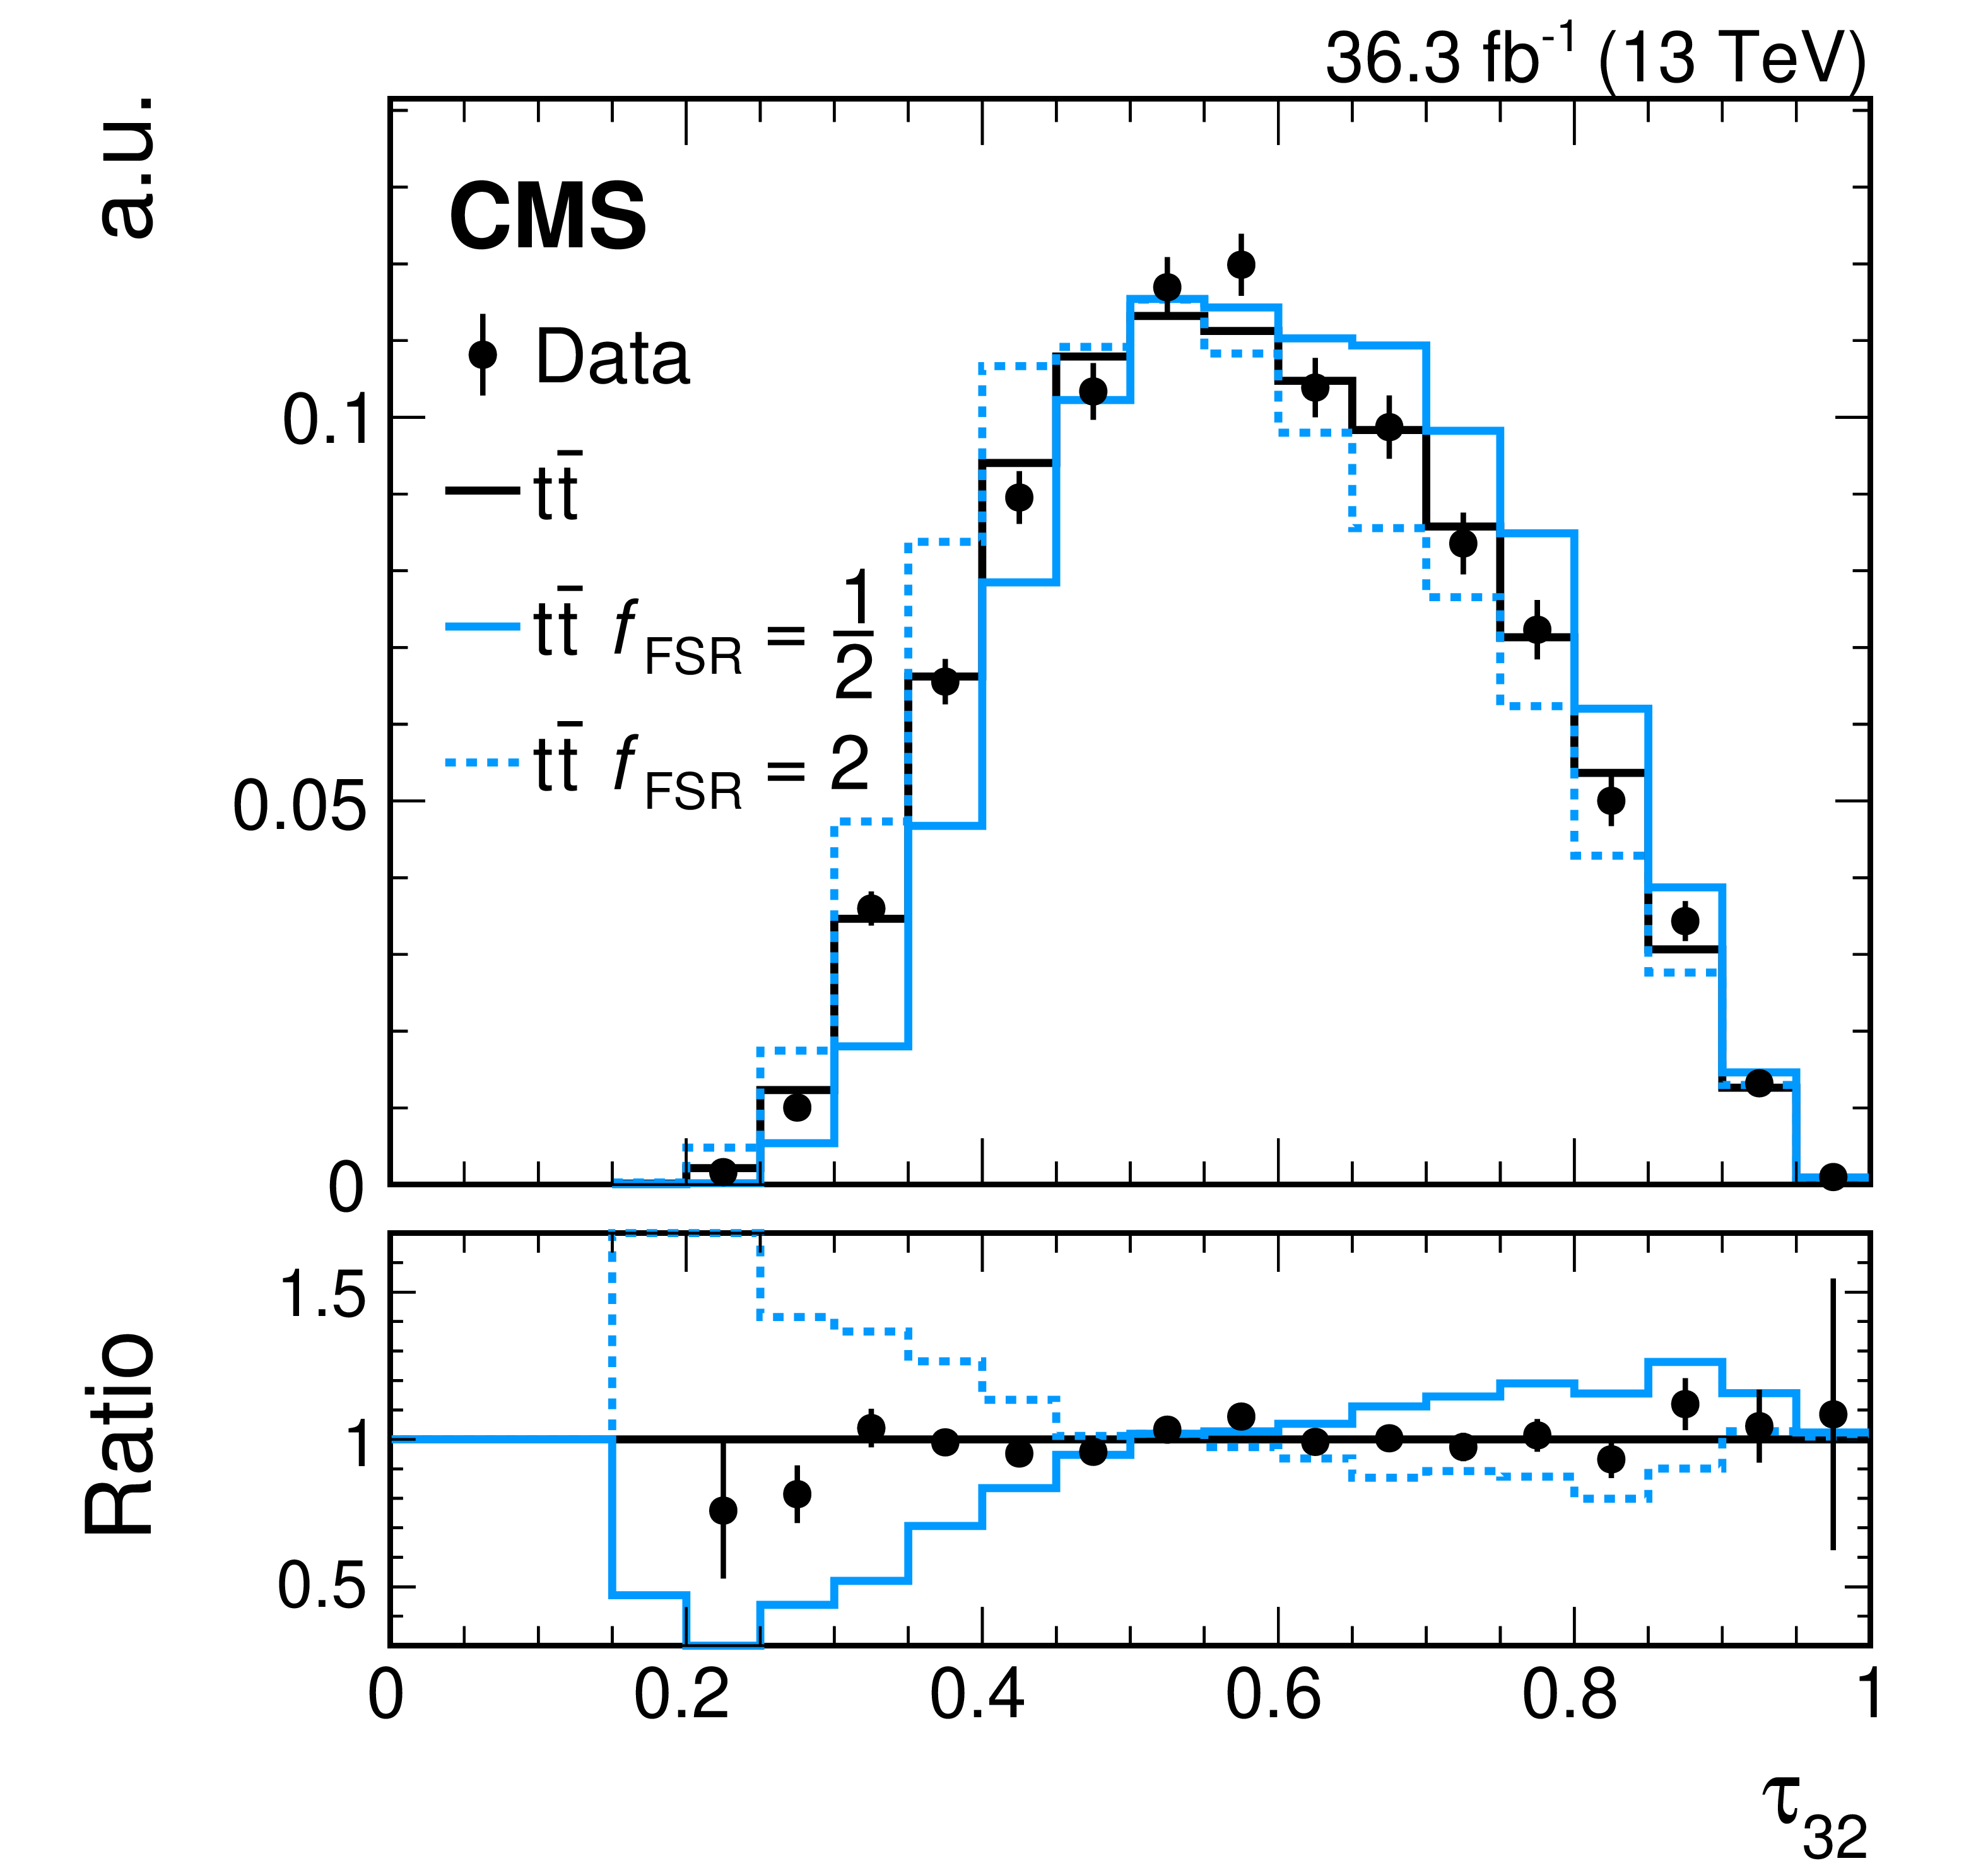
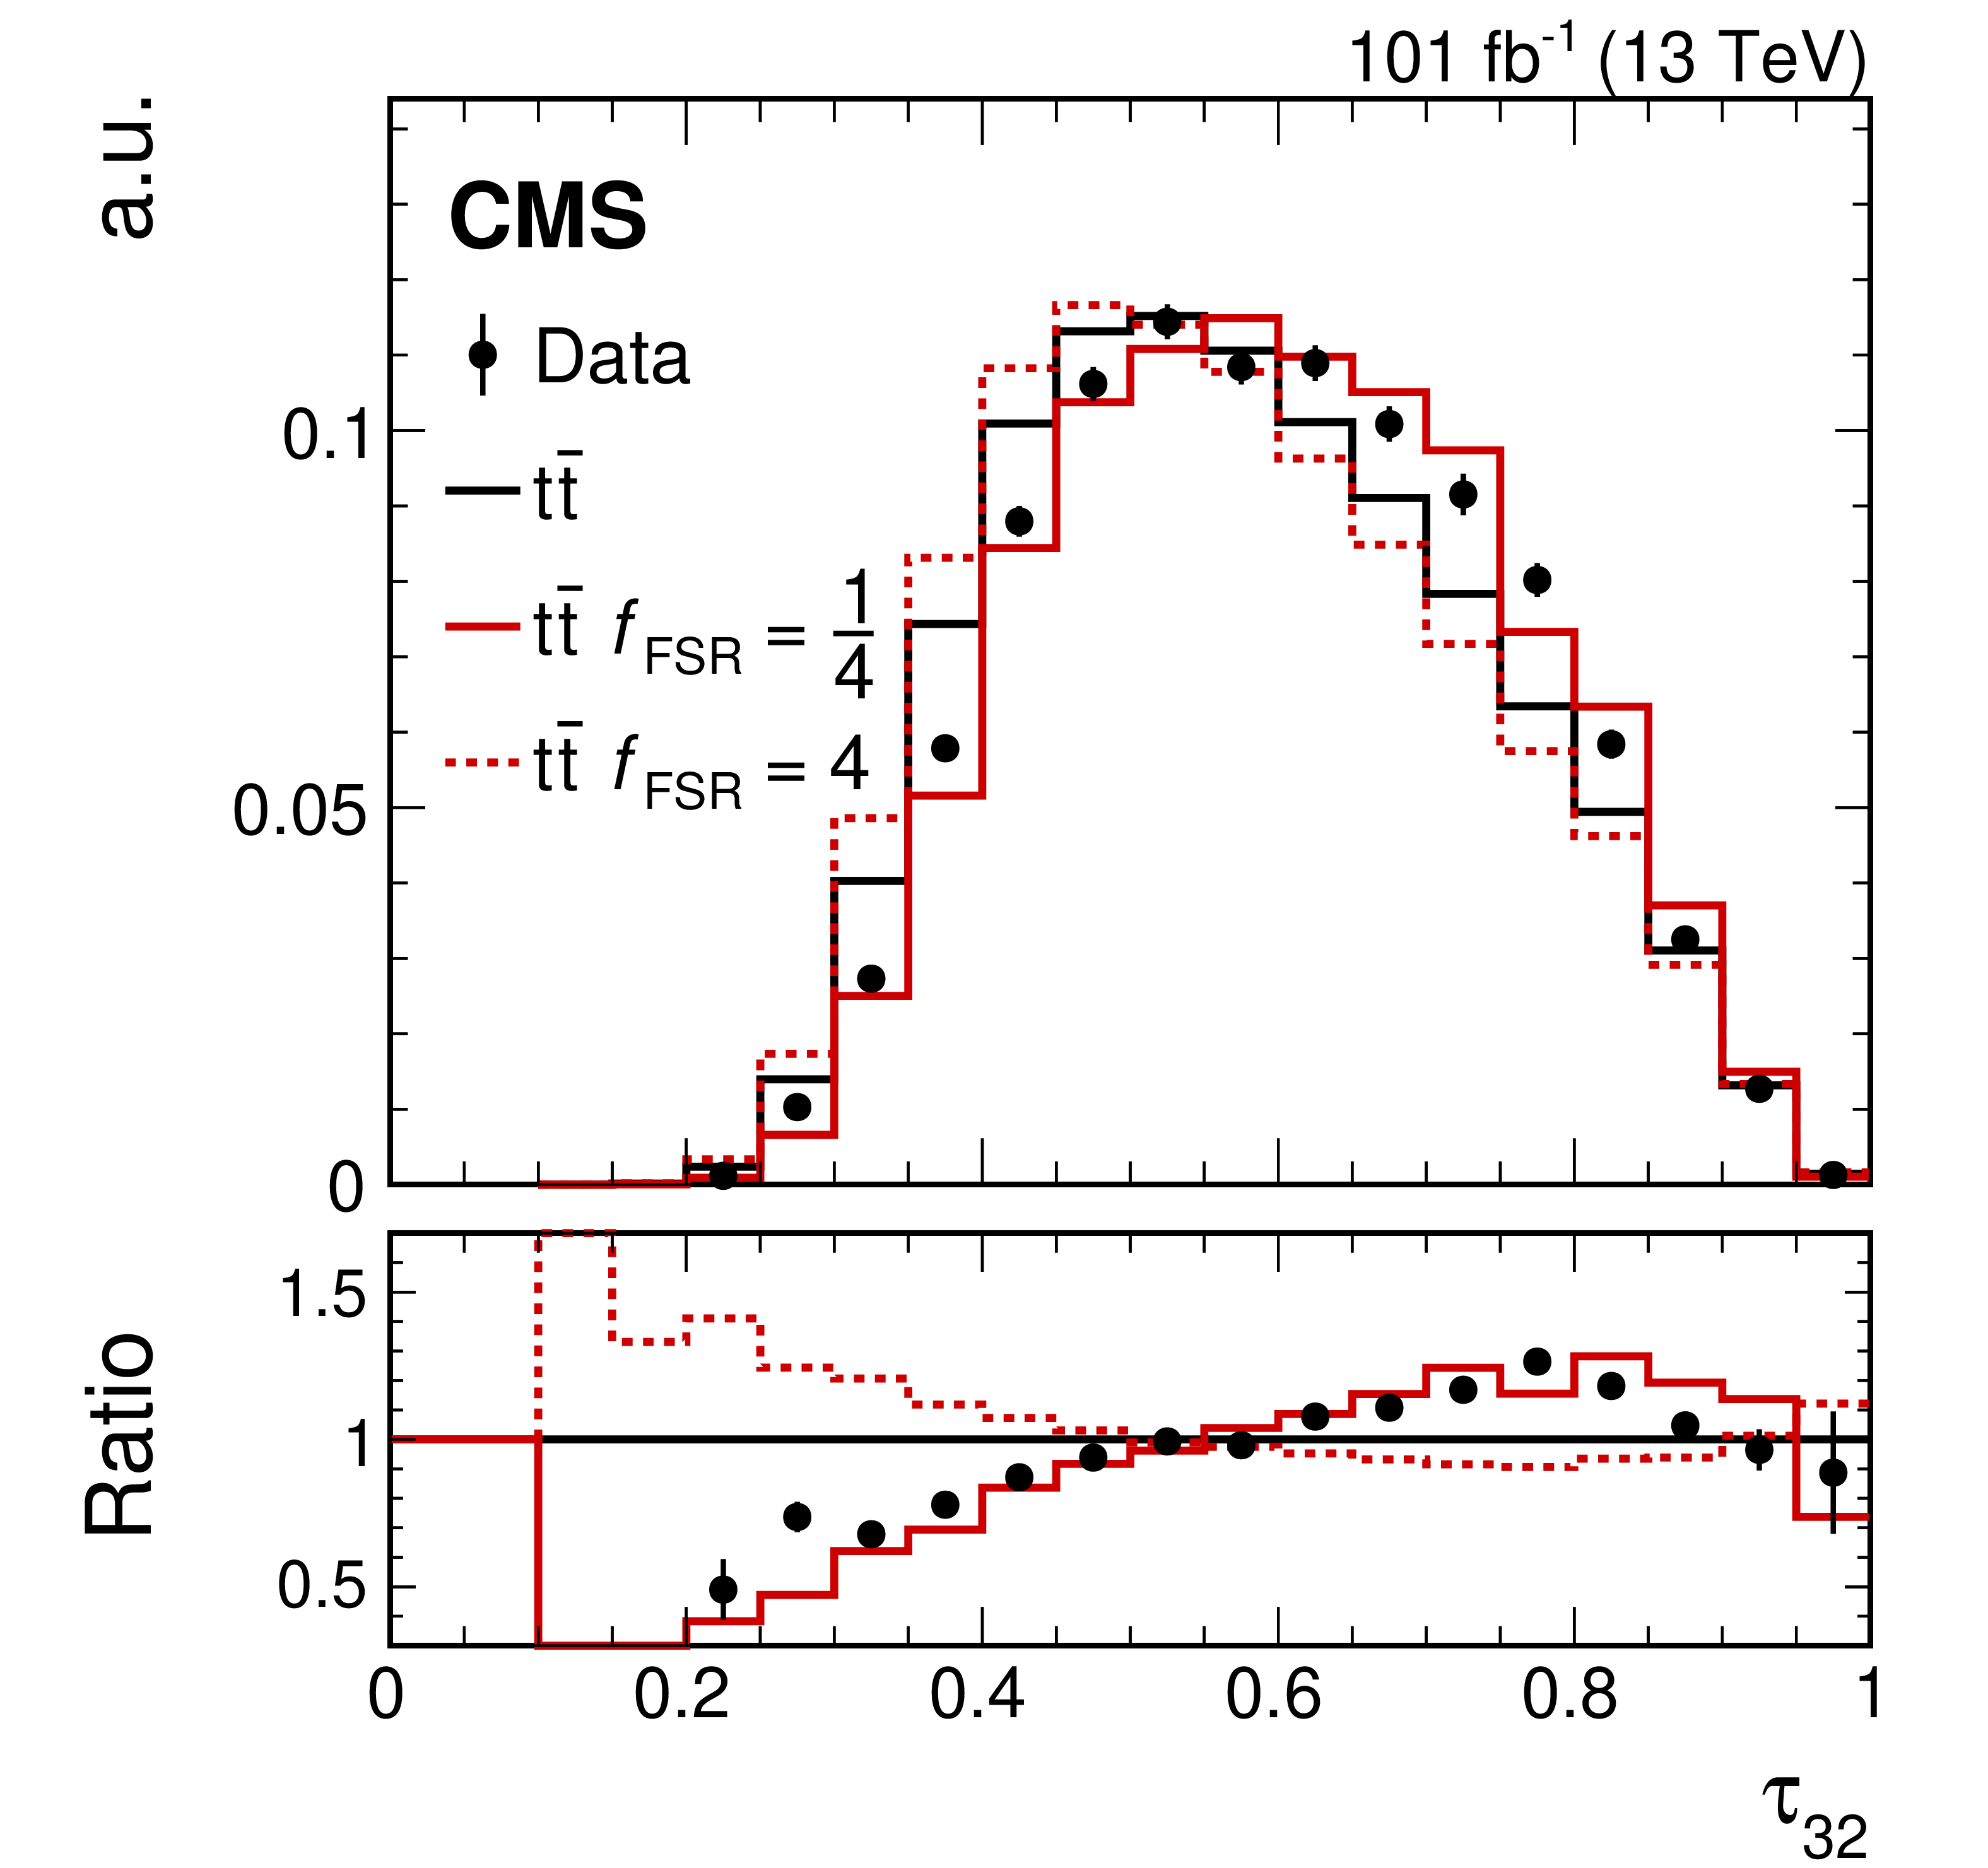
Figure 8:
The normalised distributions in $ \tau_{32} $ for AK8 jets with $ m_\text{jet} > $ 140 GeV from the hadronic decay of boosted top quarks. Shown are distributions for 2016 (left) and the combination of 2017 and 2018 (right). The background-subtracted data are compared to $ \mathrm{t} \overline{\mathrm{t}} $ simulations with the UE tunes CUETP8M2T4 for 2016 and CP5 for the combination of 2017 and 2018, and different values of $ f_\text{FSR} $ are shown as well. The lower panels show the ratio to the $ \mathrm{t} \overline{\mathrm{t}} $ simulation with $ f_\text{FSR}= $ 1. |
png pdf |
Figure 8-a:
The normalised distribution in $ \tau_{32} $ for AK8 jets with $ m_\text{jet} > $ 140 GeV from the hadronic decay of boosted top quarks for 2016. The background-subtracted data are compared to $ \mathrm{t} \overline{\mathrm{t}} $ simulations with the UE tune CUETP8M2T4 and different values of $ f_\text{FSR} $ are shown as well. The lower panel shows the ratio to the $ \mathrm{t} \overline{\mathrm{t}} $ simulation with $ f_\text{FSR}= $ 1. |
png pdf |
Figure 8-b:
The normalised distribution in $ \tau_{32} $ for AK8 jets with $ m_\text{jet} > $ 140 GeV from the hadronic decay of boosted top quarks for the combination of 2017 and 2018. The background-subtracted data are compared to $ \mathrm{t} \overline{\mathrm{t}} $ simulations with the UE tune CP5 and different values of $ f_\text{FSR} $ are shown as well. The lower panel shows the ratio to the $ \mathrm{t} \overline{\mathrm{t}} $ simulation with $ f_\text{FSR}= $ 1. |
png pdf |
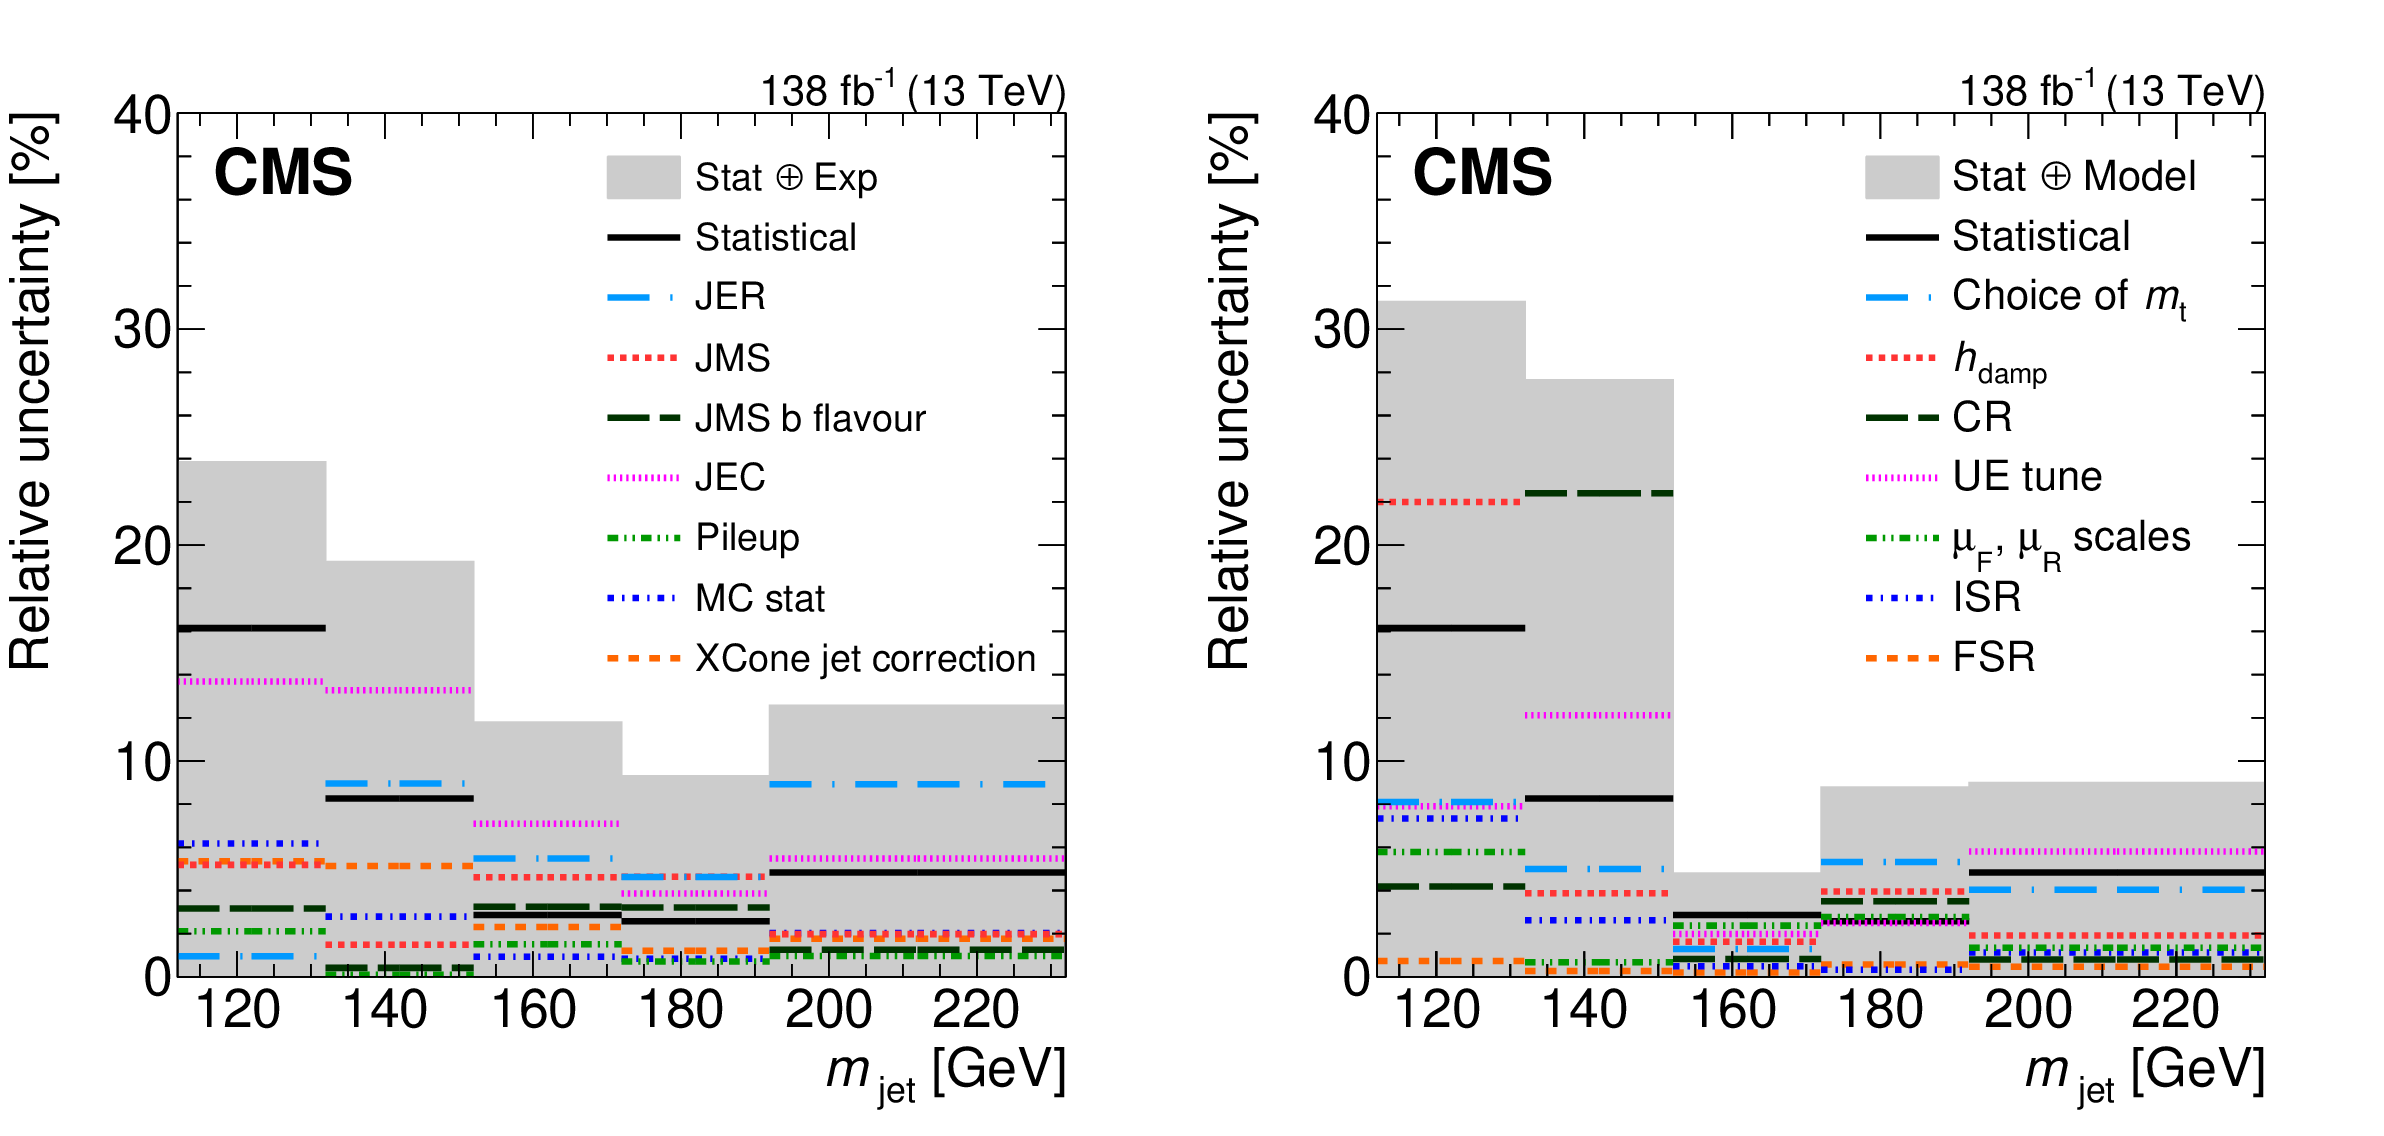
Figure 9:
Relative experimental (left) and model (right) uncertainties in the measurement of $ m_\text{jet} $. Various sources are displayed as coloured lines and compared to the total experimental or model uncertainty, respectively. The uncertainty sources are calculated as the square root of the diagonal entries from the respective covariance matrix, and do not include bin-to-bin correlations. |
png pdf |
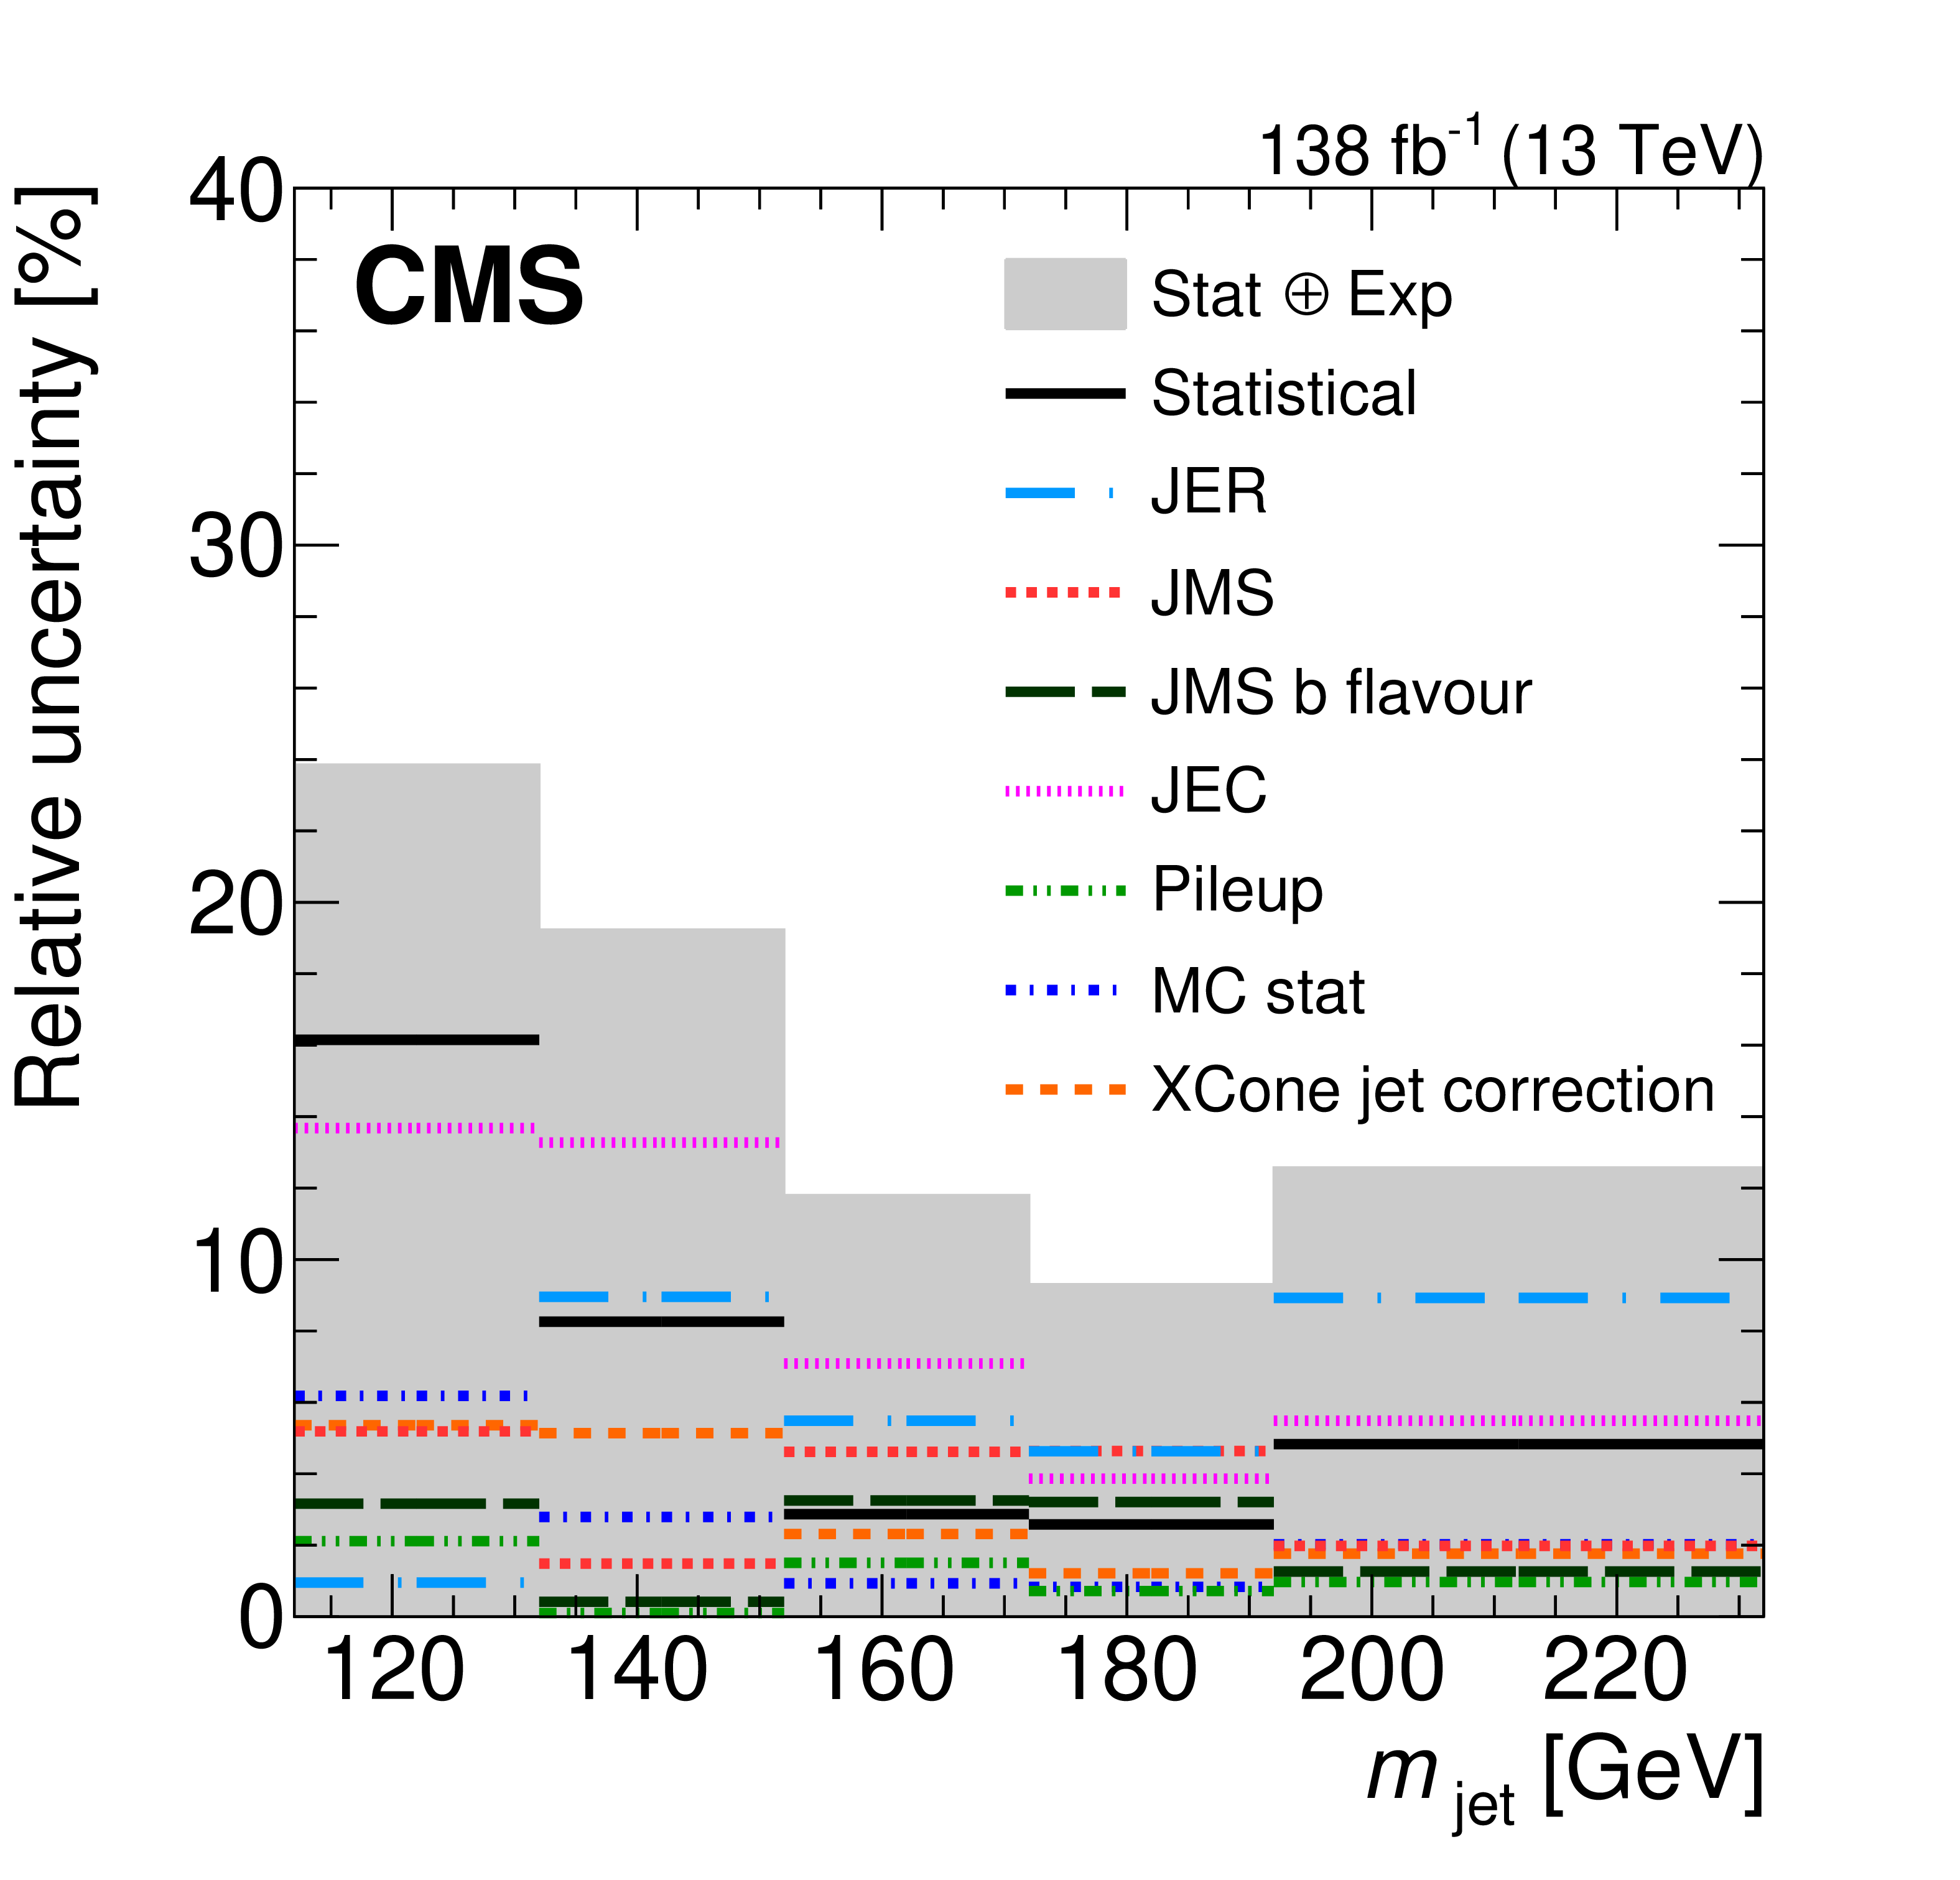
Figure 9-a:
Relative experimental uncertainties in the measurement of $ m_\text{jet} $. Various sources are displayed as coloured lines and compared to the total experimental or model uncertainty, respectively. The uncertainty sources are calculated as the square root of the diagonal entries from the respective covariance matrix, and do not include bin-to-bin correlations. |
png pdf |
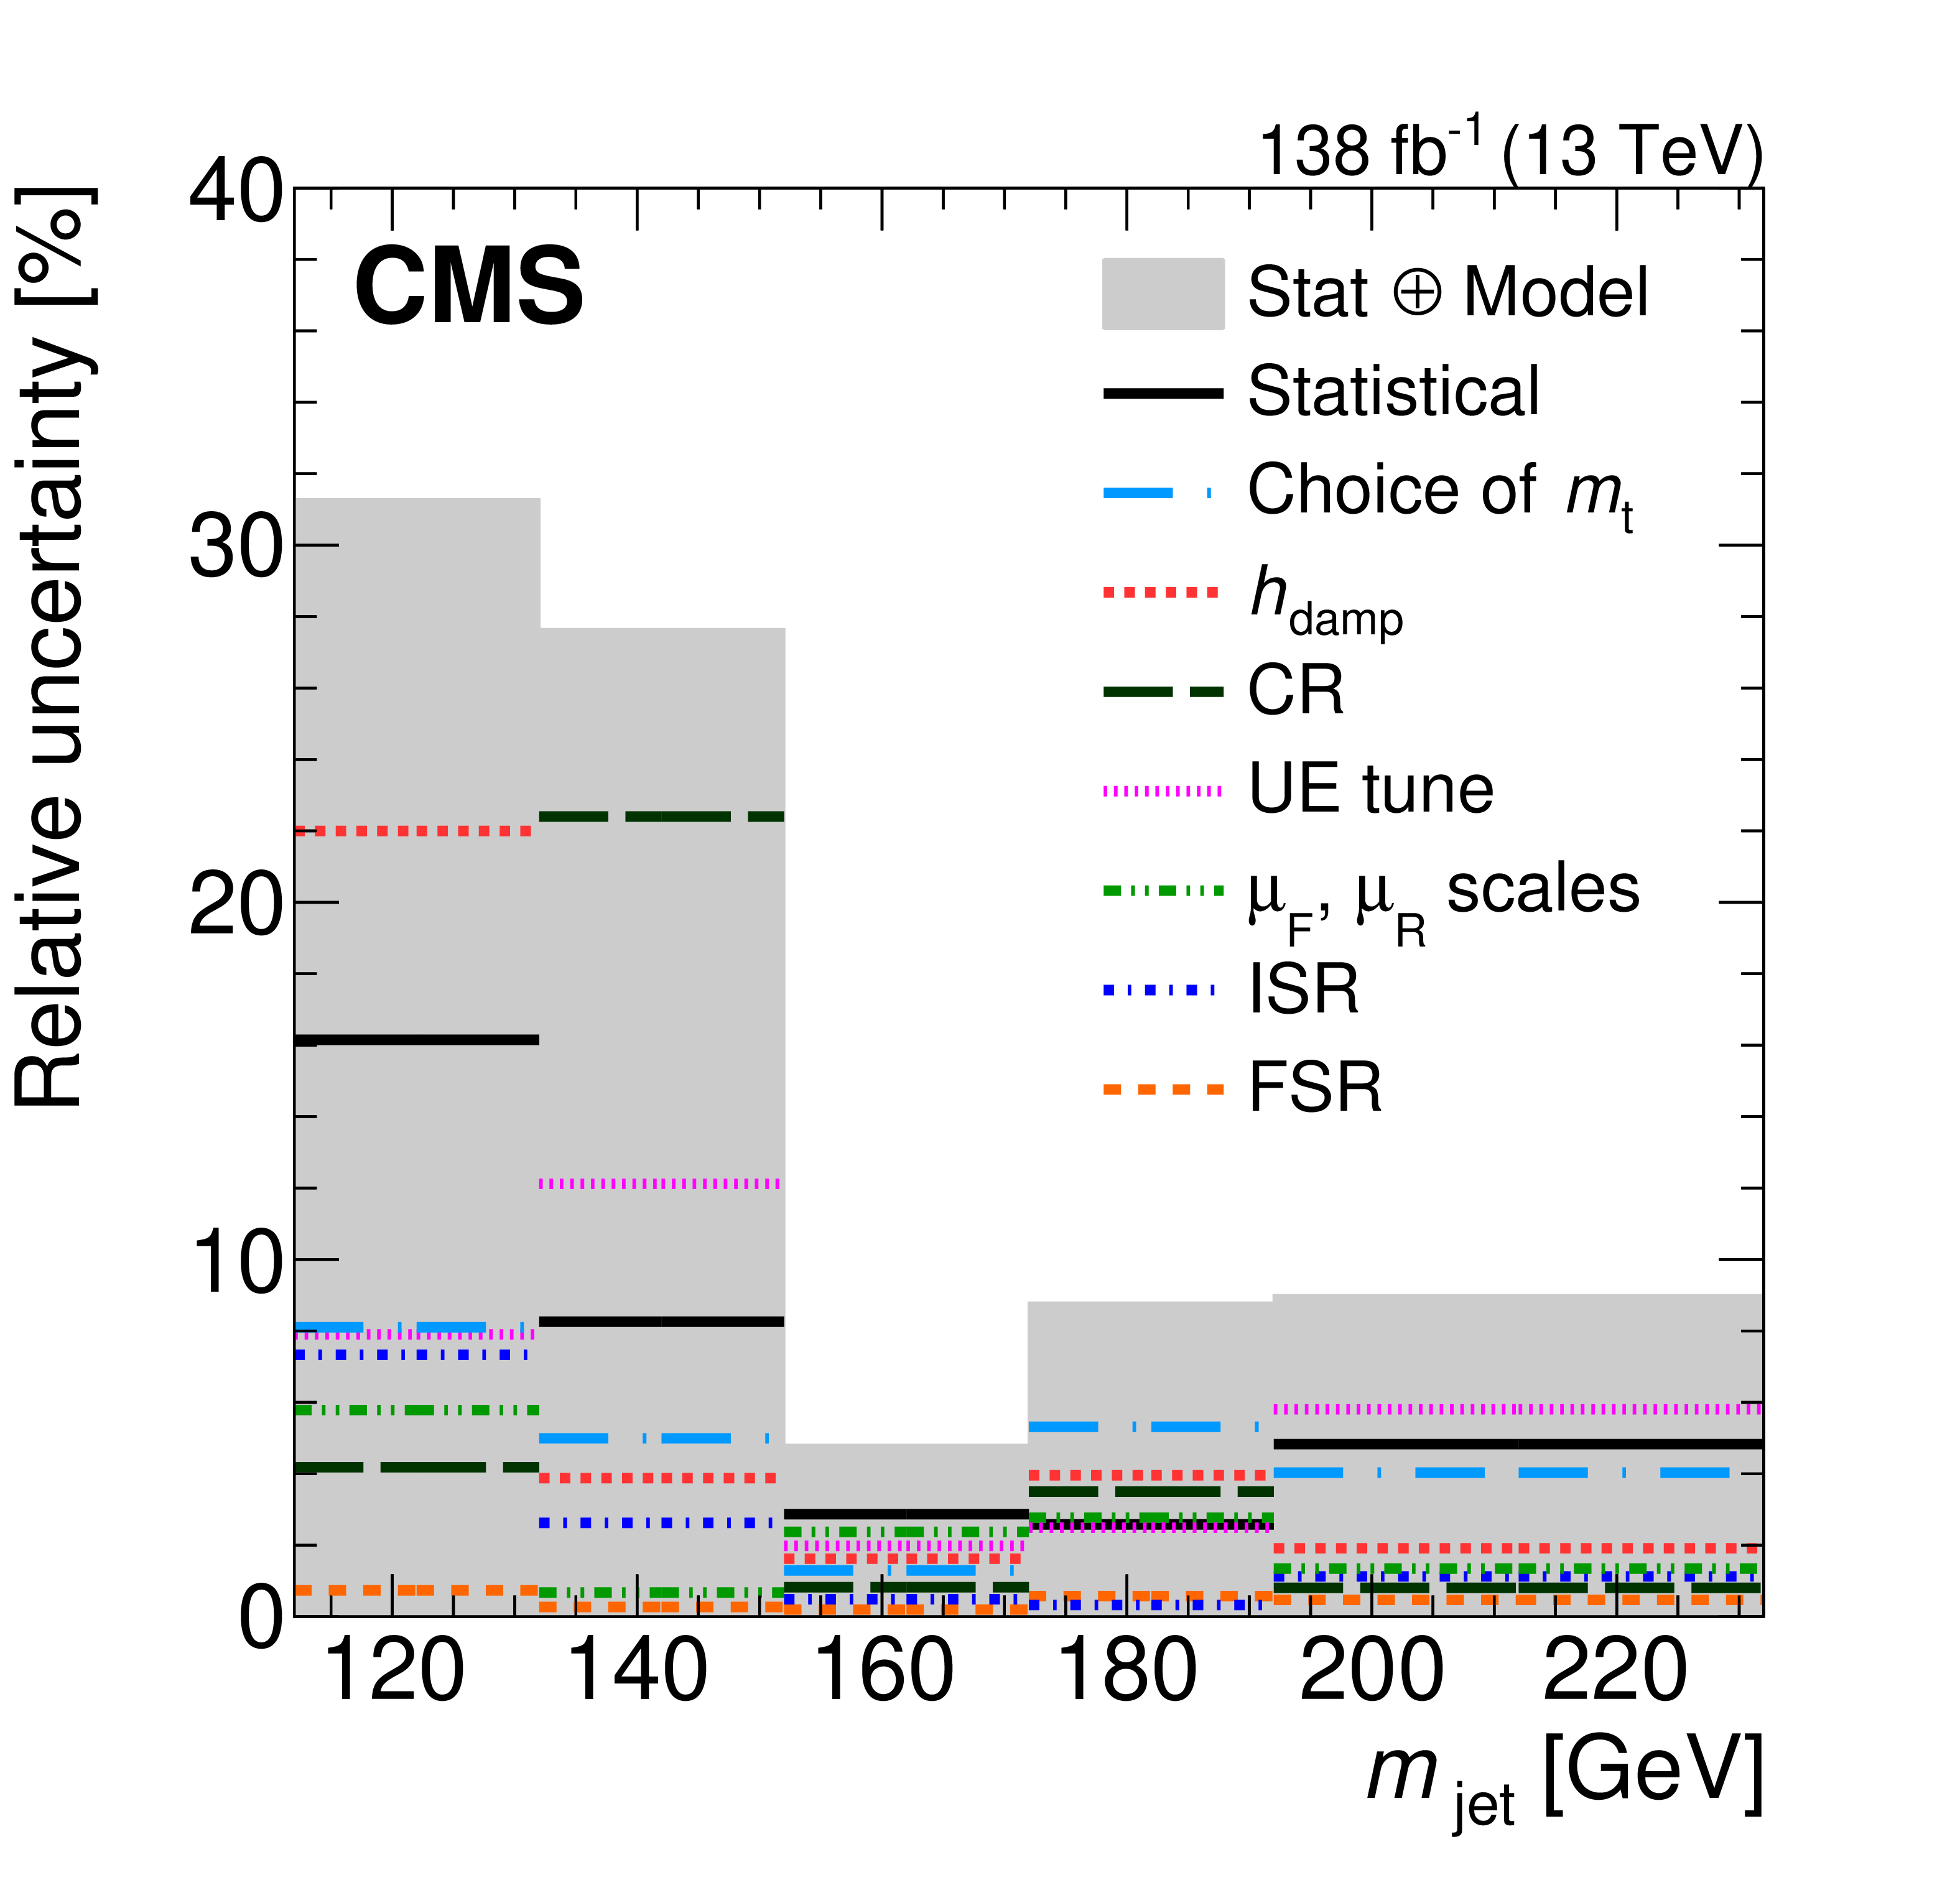
Figure 9-b:
Relative model uncertainties in the measurement of $ m_\text{jet} $. Various sources are displayed as coloured lines and compared to the total experimental or model uncertainty, respectively. The uncertainty sources are calculated as the square root of the diagonal entries from the respective covariance matrix, and do not include bin-to-bin correlations. |

png pdf |
Figure 10:
Relative experimental (left) and model (right) uncertainties after normalising the measurement to the total cross section. Various sources are displayed as coloured lines and compared to the total experimental or model uncertainty, respectively. The uncertainty sources are calculated as the square root of the diagonal entries from the respective covariance matrix, and do not include bin-to-bin correlations. |

png pdf |
Figure 10-a:
Relative experimental uncertainties after normalising the measurement to the total cross section. Various sources are displayed as coloured lines and compared to the total experimental or model uncertainty, respectively. The uncertainty sources are calculated as the square root of the diagonal entries from the respective covariance matrix, and do not include bin-to-bin correlations. |

png pdf |
Figure 10-b:
Relative model uncertainties after normalising the measurement to the total cross section. Various sources are displayed as coloured lines and compared to the total experimental or model uncertainty, respectively. The uncertainty sources are calculated as the square root of the diagonal entries from the respective covariance matrix, and do not include bin-to-bin correlations. |

png pdf |
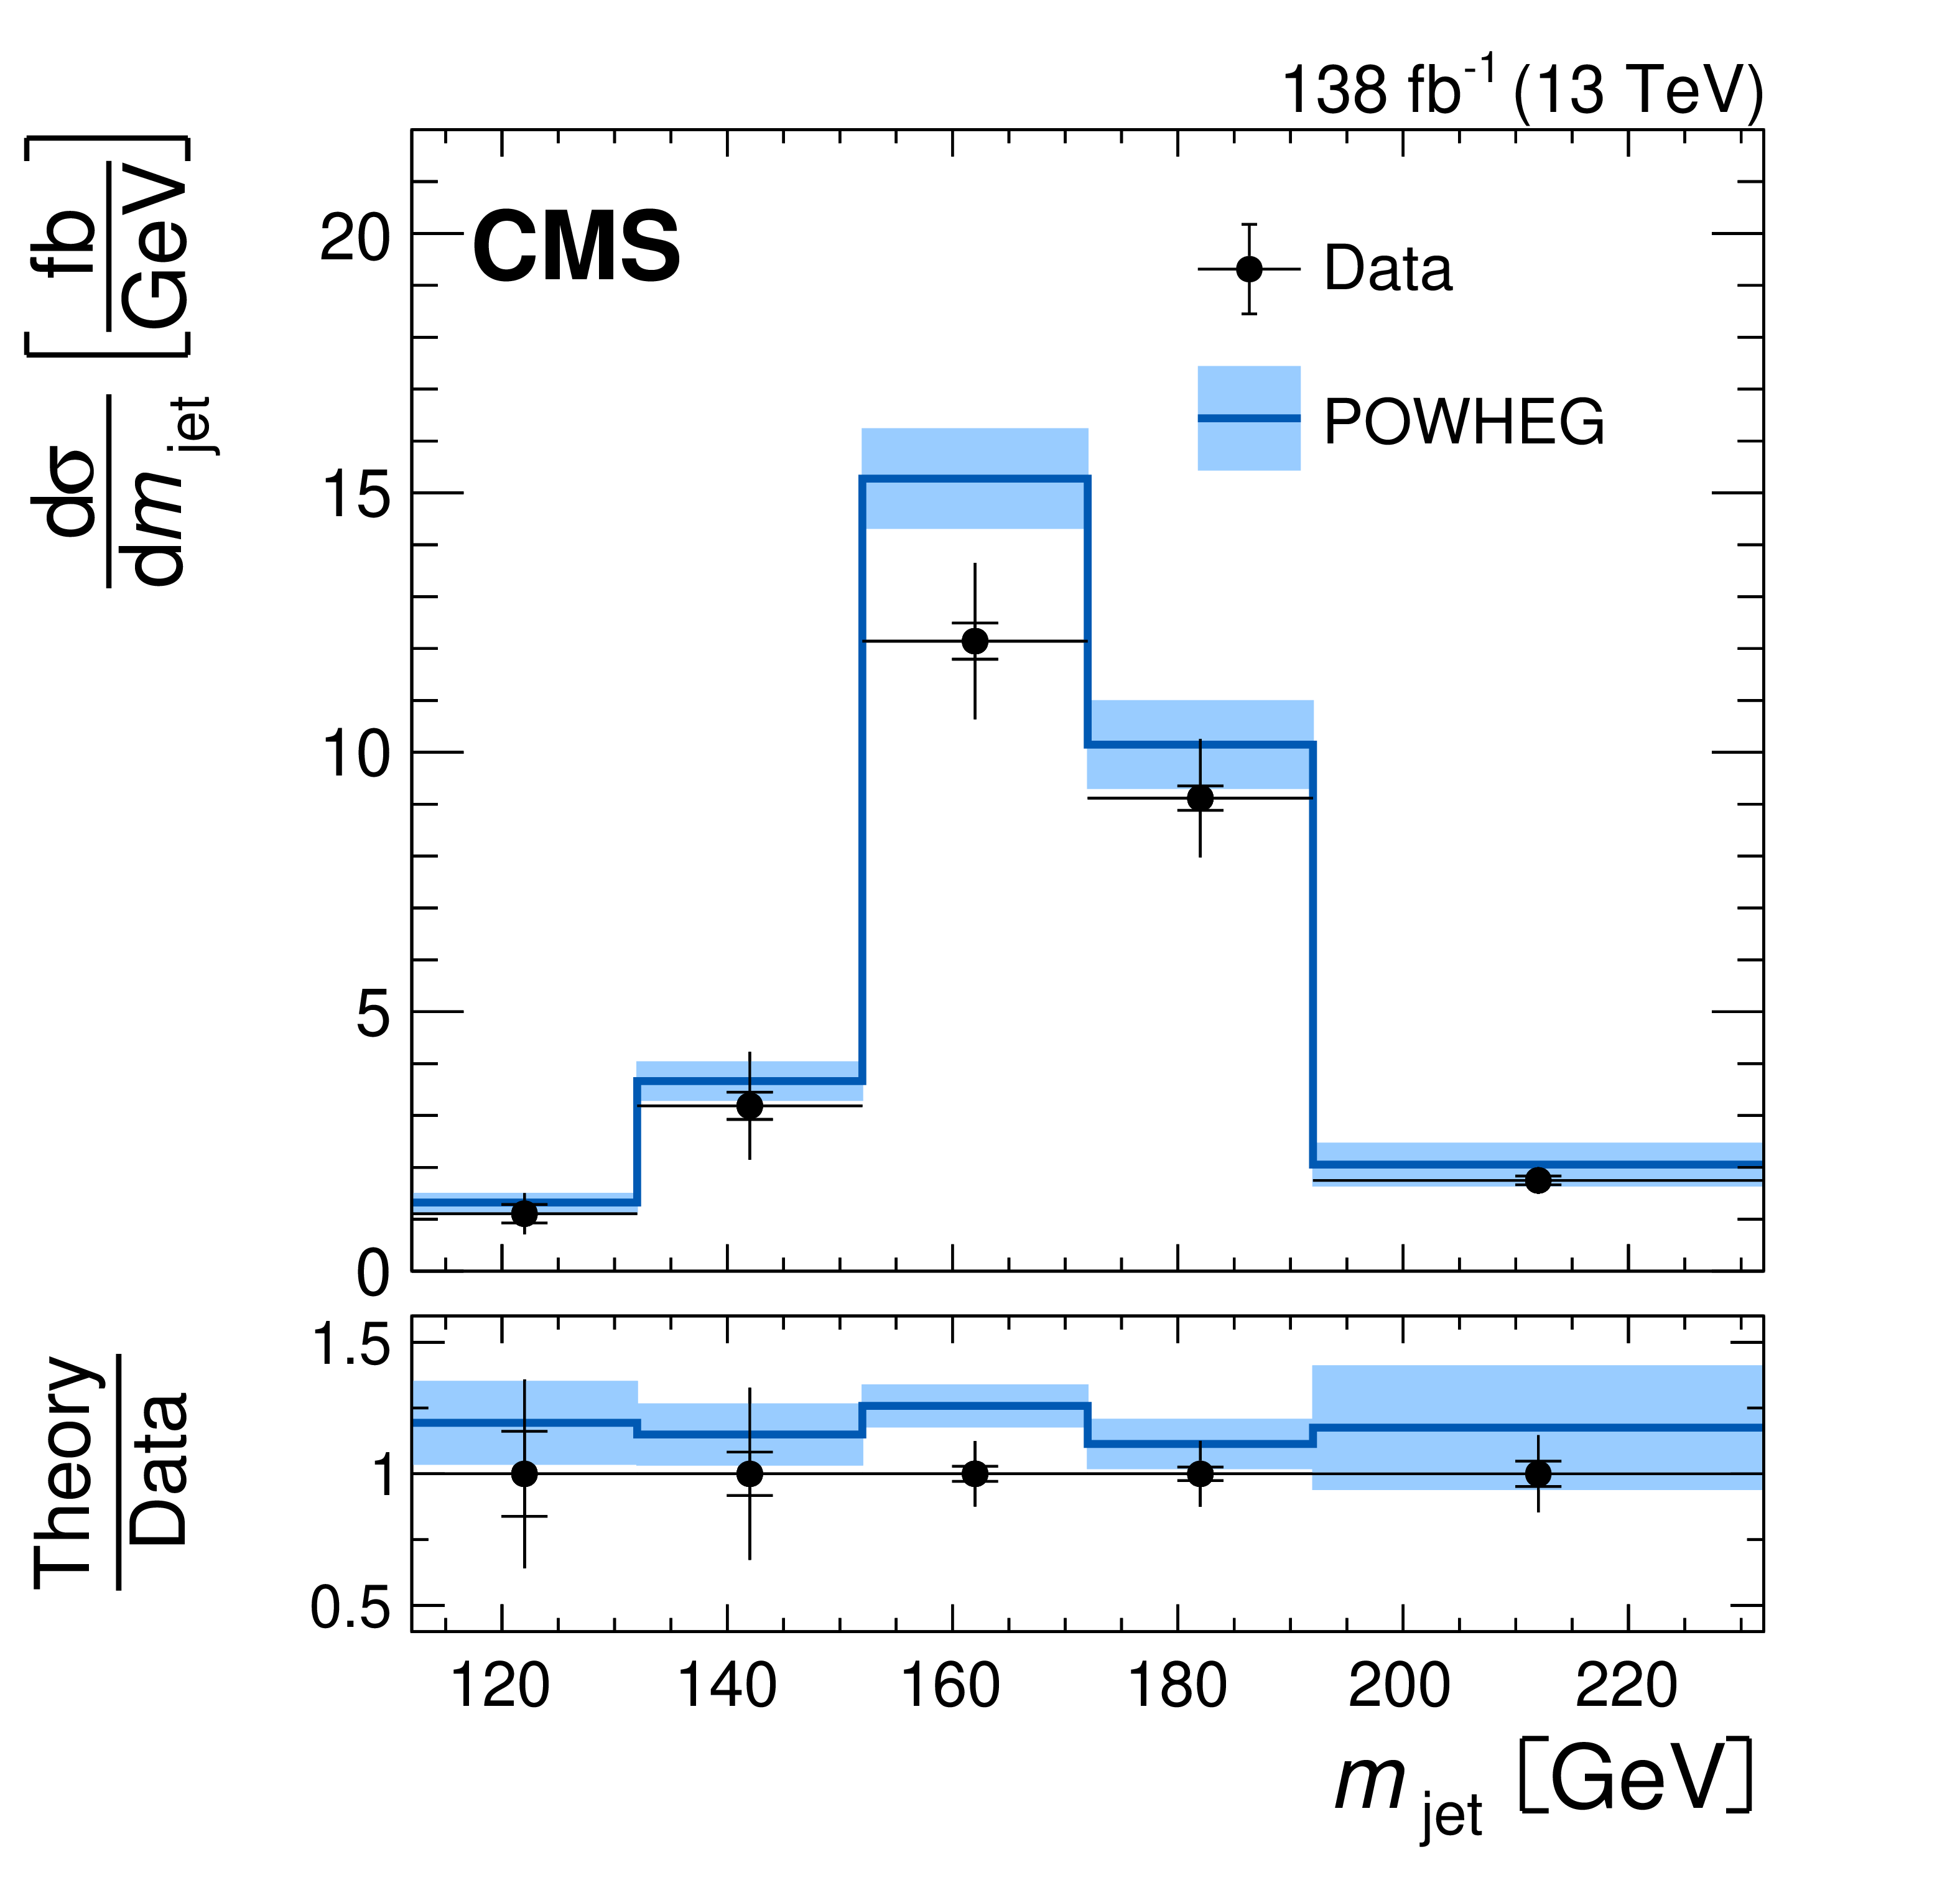
Figure 11:
Differential $ \mathrm{t} \overline{\mathrm{t}} $ production cross section as a function of $ m_\text{jet} $ compared to predictions obtained with POWHEG: absolute (left) and normalised (right). For the normalised measurement, the data are compared to predictions with different $ m_{\mathrm{t}} $. The vertical bars represent the total uncertainties, and the statistical uncertainties are shown by short horizontal bars. The long horizontal bars reflect the bin widths. Theoretical uncertainties in the prediction are indicated by the bands. The lower panels show the ratio of the theoretical prediction to data. |
png pdf |
Figure 11-a:
Absolute differential $ \mathrm{t} \overline{\mathrm{t}} $ production cross section as a function of $ m_\text{jet} $ compared to predictions obtained with POWHEG. The vertical bars represent the total uncertainties, and the statistical uncertainties are shown by short horizontal bars. The long horizontal bars reflect the bin widths. Theoretical uncertainties in the prediction are indicated by the bands. The lower panel shows the ratio of the theoretical prediction to data. |

png pdf |
Figure 11-b:
Normalised differential $ \mathrm{t} \overline{\mathrm{t}} $ production cross section as a function of $ m_\text{jet} $ compared to predictions obtained with POWHEG. The data are compared to predictions with different $ m_{\mathrm{t}} $. The vertical bars represent the total uncertainties, and the statistical uncertainties are shown by short horizontal bars. The long horizontal bars reflect the bin widths. Theoretical uncertainties in the prediction are indicated by the bands. The lower panel shows the ratio of the theoretical prediction to data. |

png pdf |
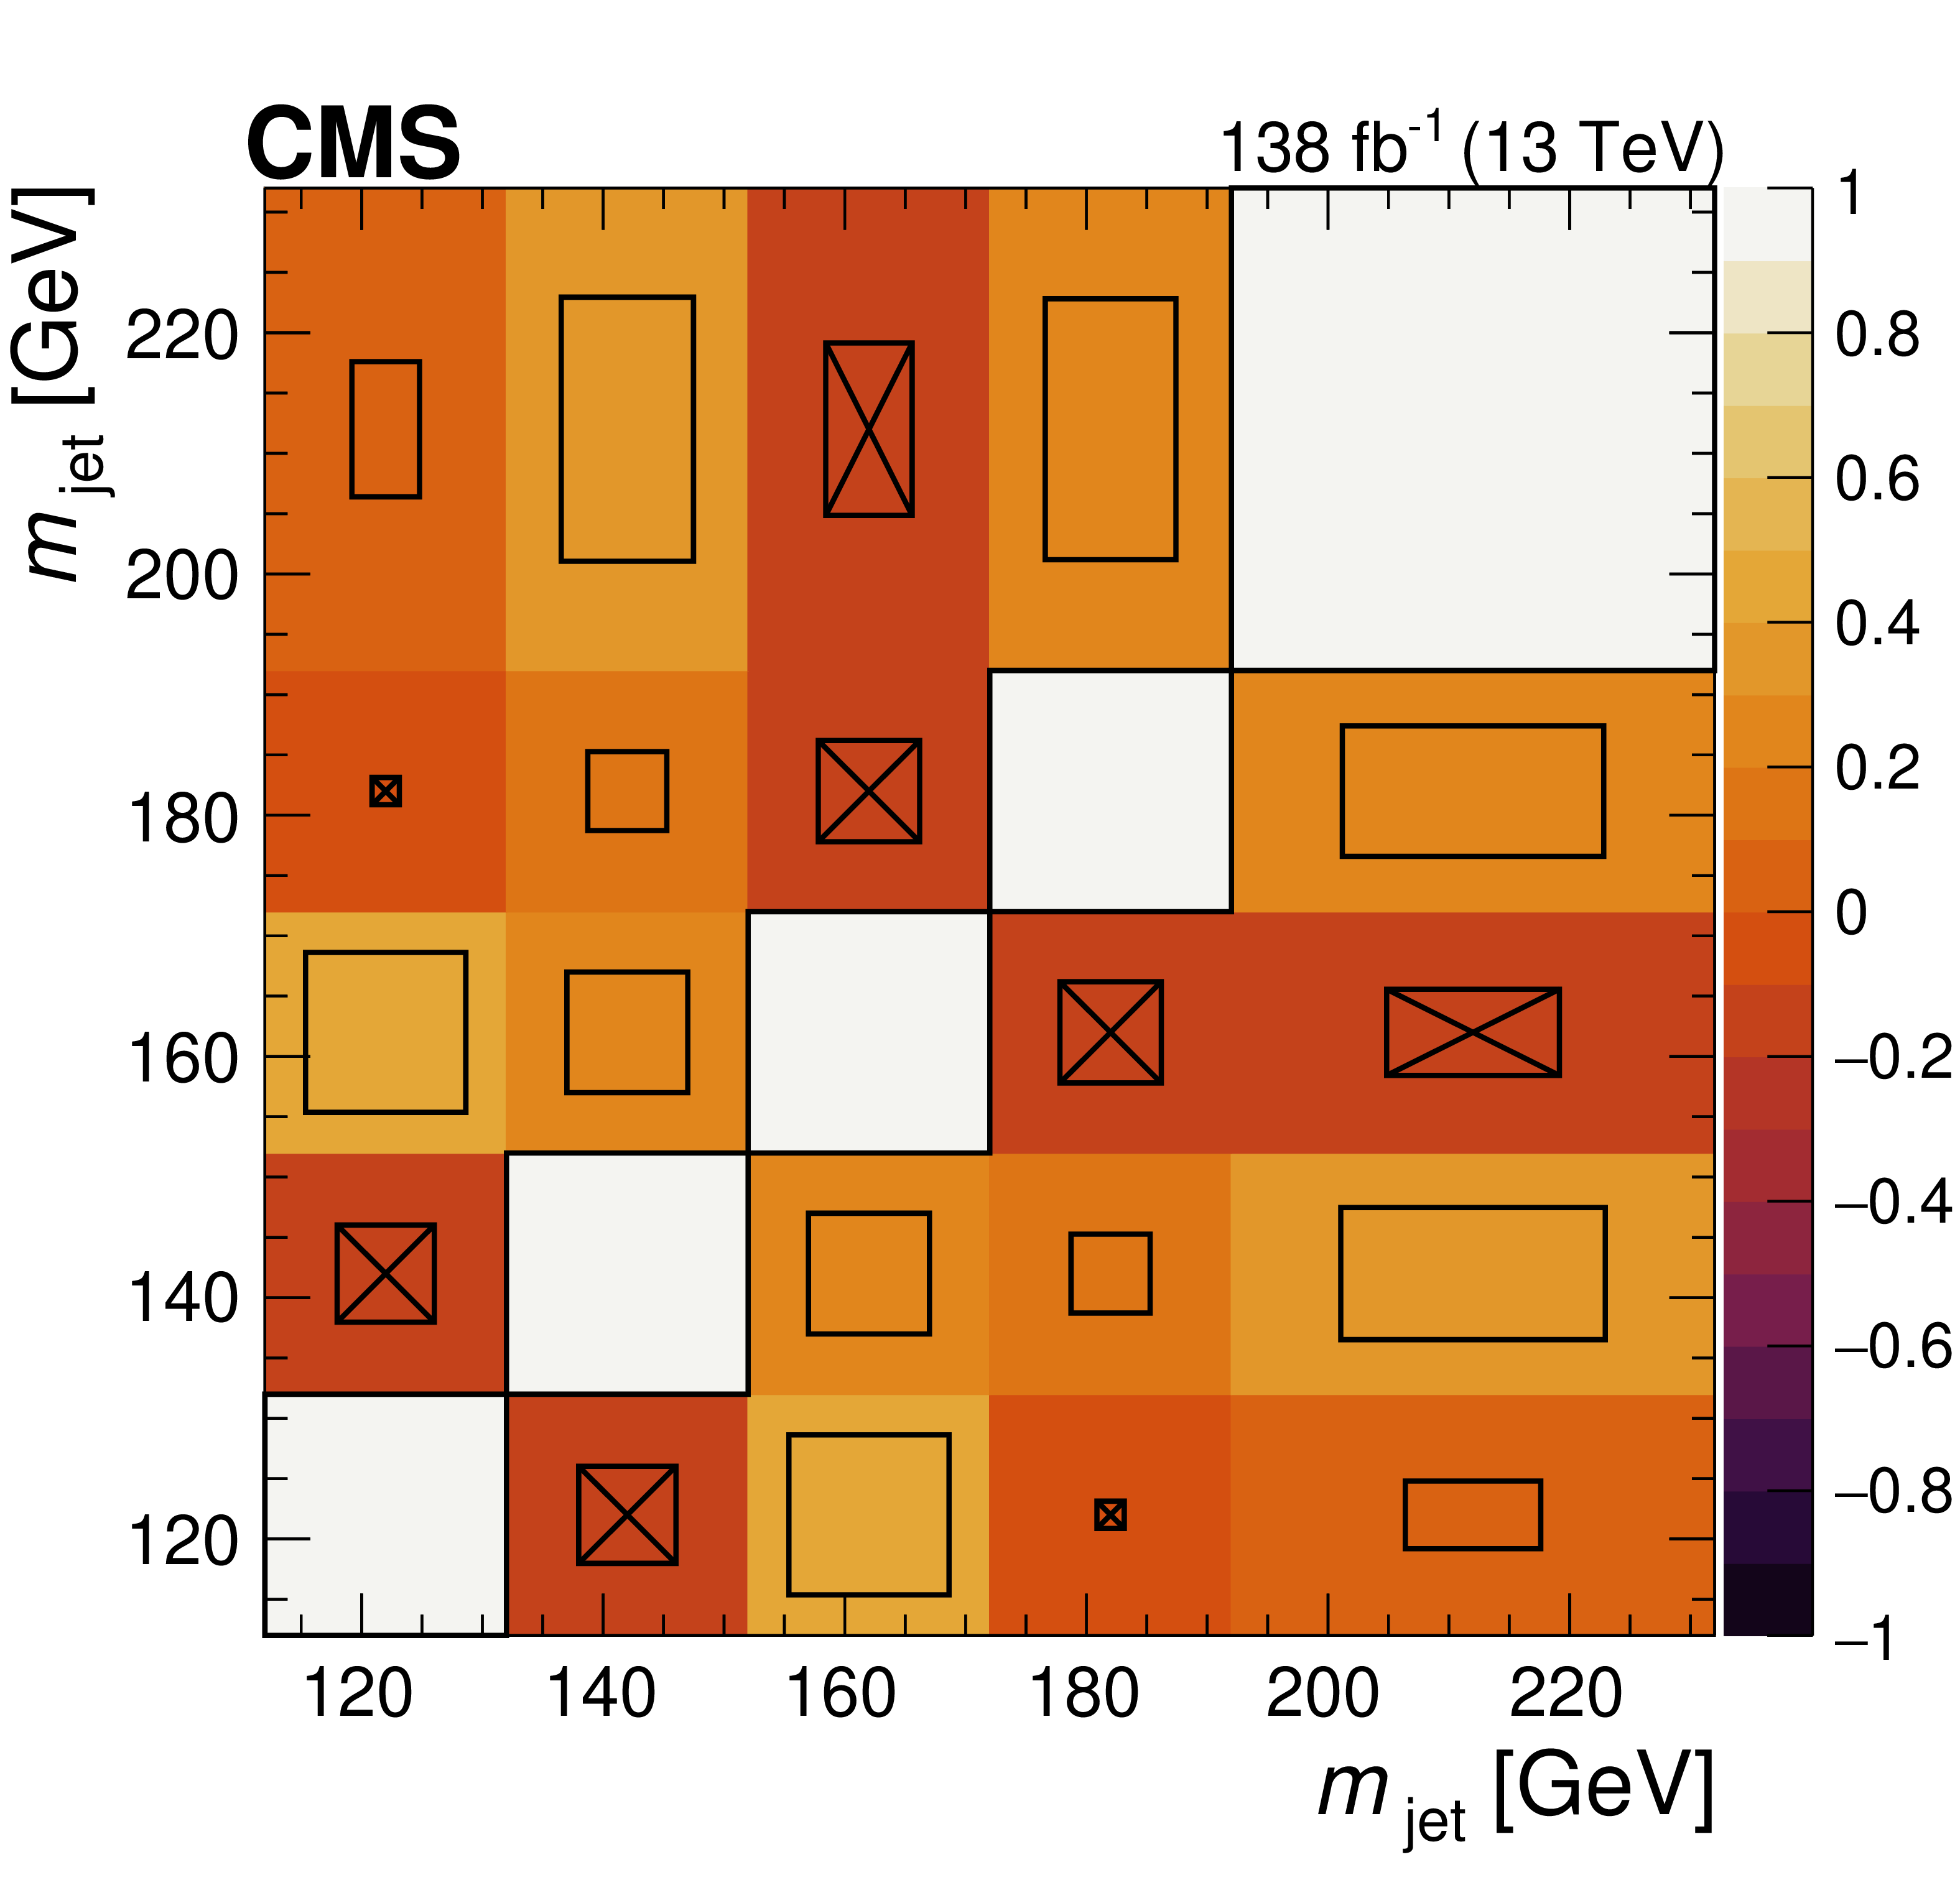
Figure 12:
Correlations between the bins in the unfolding before (left) and after (right) normalising the distribution to the total cross section. Boxes with crosses indicate negative values of the correlation coefficient. |
png pdf |
Figure 12-a:
Correlations between the bins in the unfolding before normalising the distribution to the total cross section. Boxes with crosses indicate negative values of the correlation coefficient. |

png pdf |
Figure 12-b:
Correlations between the bins in the unfolding after normalising the distribution to the total cross section. Boxes with crosses indicate negative values of the correlation coefficient. |

png pdf |
Figure 13:
Extracted top quark mass from simulation compared to the true value. The vertical error bars show the total uncertainty in the extraction of $ m_{\mathrm{t}} $. |
| Tables | |
png pdf |
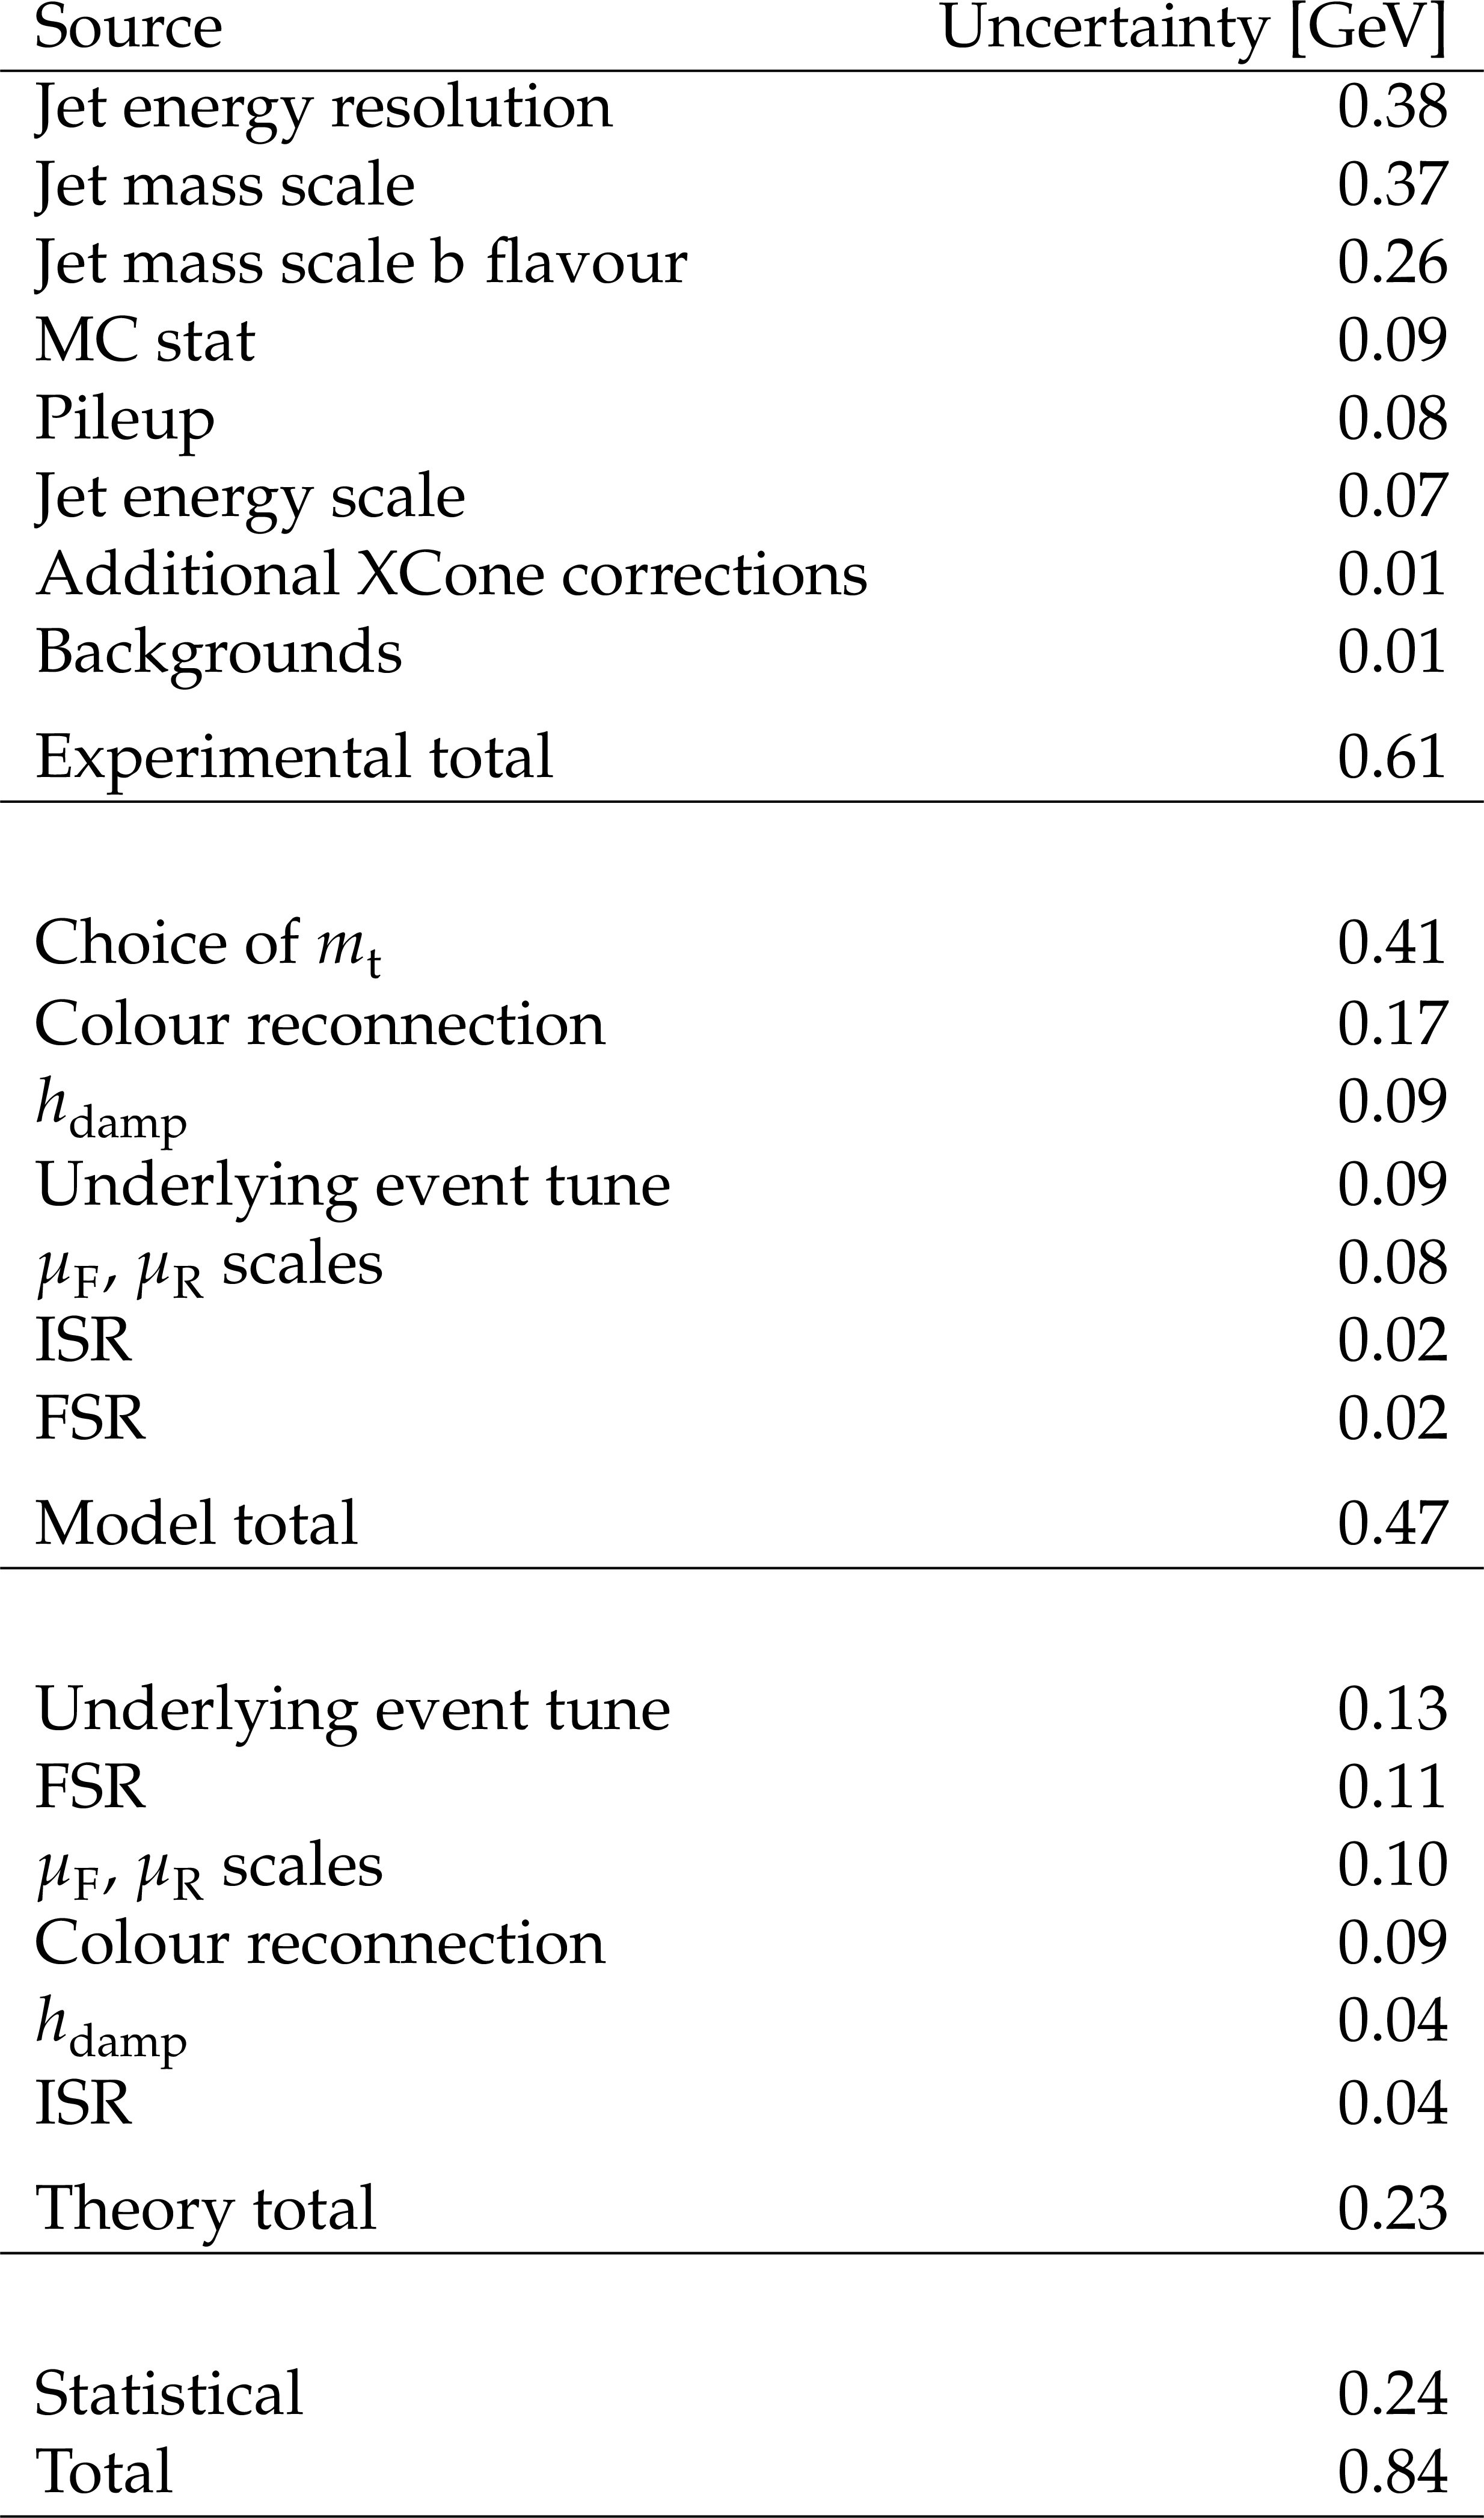
Table 1:
Total and individual uncertainties in the extraction of $ m_{\mathrm{t}} $ from the normalised differential cross section. The uncertainties are grouped into experimental, model, theory, and statistical uncertainties. Uncertainties from the choice of the PDF, b tagging, the luminosity measurement, and the lepton triggers, identification and reconstruction are smaller than 0.01 GeV and are not listed. |
| Summary |
| A measurement of the differential top quark pair ($ \mathrm{t} \overline{\mathrm{t}} $) production cross section as a function of the jet mass $ m_\text{jet} $ in hadronic decays of boosted top quarks has been presented. The normalised distribution in $ m_\text{jet} $ is sensitive to the top quark mass $ m_{\mathrm{t}} $, which is measured to be 173.06 $ \pm $ 0.84 GeV. This value is compatible with earlier precision measurements in fully resolved final states. With respect to an earlier CMS analysis, the precision is improved by a factor of more than three. This has been achieved by a dedicated calibration of the jet mass scale, a study of the effects of final state radiation inside large-radius jets, and about 4 times more data. With these improvements, the uncertainty in the extraction of $ m_{\mathrm{t}} $ at high top quark boosts becomes comparable to direct measurements close to the $ \mathrm{t} \overline{\mathrm{t}} $ production threshold. The sources of the leading systematic uncertainties are very different, highlighting the complementarity of this measurement. In addition, the study of boosted top quarks offers the possibility to directly compare the distribution in $ m_\text{jet} $ to analytic calculations. When these calculations become available, the unfolded $ m_\text{jet} $ distribution can be used to measure the top quark pole mass directly. The precisely measured differential cross section as a function of $ m_\text{jet} $ represents an important step towards understanding and resolving the ambiguities between the top quark mass extracted from a direct reconstruction of $ m_{\mathrm{t}} $, and the top quark pole mass. |
| References | ||||
| 1 | CDF Collaboration | Observation of top quark production in $ \bar{p}p $ collisions | PRL 74 (1995) 2626 | hep-ex/9503002 |
| 2 | D0 Collaboration | Observation of the top quark | PRL 74 (1995) 2632 | hep-ex/9503003 |
| 3 | ALEPH, CDF, D0, DELPHI, L3, OPAL, and SLD Collaborations, the LEP Electroweak Working Group, the Tevatron Electroweak Working Group, and the SLD Electroweak and Heavy Flavour Groups | Precision electroweak measurements and constraints on the standard model | 1012.2367 | |
| 4 | J. Haller et al. | Update of the global electroweak fit and constraints on two-Higgs-doublet models | EPJC 78 (2018) 675 | 1803.01853 |
| 5 | Particle Data Group , P. A. Zyla et al. | Review of particle physics | Prog. Theor. Exp. Phys. 2020 (2020) 083C01 | |
| 6 | G. Degrassi et al. | Higgs mass and vacuum stability in the standard model at NNLO | JHEP 08 (2012) 098 | 1205.6497 |
| 7 | F. Bezrukov, M. Y. Kalmykov, B. A. Kniehl, and M. Shaposhnikov | Higgs boson mass and new physics | JHEP 10 (2012) 140 | 1205.2893 |
| 8 | A. V. Bednyakov, B. A. Kniehl, A. F. Pikelner, and O. L. Veretin | Stability of the electroweak vacuum: Gauge independence and advanced precision | PRL 115 (2015) 201802 | 1507.08833 |
| 9 | ATLAS Collaboration | Measurement of the top quark mass in the $ {\mathrm{t}\overline{\mathrm{t}}} \rightarrow $ dilepton channel from $ \sqrt{s}= $ 8 TeV ATLAS data | PLB 761 (2016) 350 | 1606.02179 |
| 10 | ATLAS Collaboration | Top-quark mass measurement in the all-hadronic $ {\mathrm{t}\overline{\mathrm{t}}} $ decay channel at $ \sqrt{s}= $ 8 TeV with the ATLAS detector | JHEP 09 (2017) 118 | 1702.07546 |
| 11 | ATLAS Collaboration | Measurement of the top quark mass in the $ {\mathrm{t}\overline{\mathrm{t}}} \rightarrow $ lepton+jets channel from $ \sqrt{s}= $ 8 TeV ATLAS data and combination with previous results | EPJC 79 (2019) 290 | 1810.01772 |
| 12 | CMS Collaboration | Measurement of the top quark mass using proton-proton data at $ {\sqrt{s}} = $ 7 and 8 TeV | PRD 93 (2016) 072004 | CMS-TOP-14-022 1509.04044 |
| 13 | CMS Collaboration | Measurement of the top quark mass in the dileptonic $ \mathrm{t} \overline{\mathrm{t}} $ decay channel using the mass observables $ {M}_{\mathrm{b}\ell} $, $ {M}_{ {\text T}2 } $, and $ {M}_{\mathrm{b}\ell\nu} $ in pp collisions at $ \sqrt{s}= $ 8 TeV | PRD 96 (2017) 032002 | CMS-TOP-15-008 1704.06142 |
| 14 | CMS Collaboration | Measurement of the top quark mass with lepton+jets final states using pp collisions at $ \sqrt{s}= $ 13 TeV | EPJC 78 (2018) 891 | CMS-TOP-17-007 1805.01428 |
| 15 | CMS Collaboration | Measurement of the top quark mass in the all-jets final state at $ \sqrt{s} = $ 13 TeV and combination with the lepton+jets channel | EPJC 79 (2019) 313 | CMS-TOP-17-008 1812.10534 |
| 16 | A. H. Hoang et al. | The MSR mass and the $ \mathcal{O}({\Lambda}_{\mathrm{qcd}}) $ renormalon sum rule | JHEP 04 (2018) 003 | 1704.01580 |
| 17 | A. H. Hoang | What is the top quark mass? | Ann. Rev. Nucl. Part. Sci. 70 (2020) 225 | 2004.12915 |
| 18 | D0 Collaboration | Determination of the pole and $ \overline{MS} $ masses of the top quark from the $ \mathrm{t} \overline{\mathrm{t}} $ cross section | PLB 703 (2011) 422 | 1104.2887 |
| 19 | D0 Collaboration | Measurement of the inclusive $ \mathrm{t} \overline{\mathrm{t}} $ production cross section in $ \rm{p\bar{p}} $ collisions at $ \sqrt{s}= $ 1.96 TeV and determination of the top quark pole mass | PRD 94 (2016) 092004 | 1605.06168 |
| 20 | ATLAS Collaboration | Measurement of the $ \mathrm{t} \overline{\mathrm{t}} $ production cross-section using $ e\mu $ events with b-tagged jets in pp collisions at $ \sqrt{s} = $ 7 and 8 TeV with the ATLAS detector | EPJC 74 (2014) 3109 | 1406.5375 |
| 21 | ATLAS Collaboration | Measurement of lepton differential distributions and the top quark mass in $ \mathrm{t} \overline{\mathrm{t}} $ production in pp collisions at $ \sqrt{s}= $ 8 TeV with the ATLAS detector | EPJC 77 (2017) 804 | 1709.09407 |
| 22 | ATLAS Collaboration | Measurement of the $ \mathrm{t} \overline{\mathrm{t}} $ production cross-section and lepton differential distributions in $ e\mu $ dilepton events from pp collisions at $ \sqrt{s}= $ 13 TeV with the ATLAS detector | EPJC 80 (2020) 528 | 1910.08819 |
| 23 | CMS Collaboration | Determination of the top-quark pole mass and strong coupling constant from the $ \mathrm{t} \overline{\mathrm{t}} $ production cross section in pp collisions at $ \sqrt{s} $ = 7 TeV | PLB 728 (2014) 496 | CMS-TOP-12-022 1307.1907 |
| 24 | CMS Collaboration | Measurement of the $ \mathrm{t} \overline{\mathrm{t}} $ production cross section in the e$ \mu $ channel in proton-proton collisions at $ \sqrt{s} = $ 7 and 8 TeV | JHEP 08 (2016) 029 | CMS-TOP-13-004 1603.02303 |
| 25 | CMS Collaboration | Measurement of the $ \mathrm{t} \overline{\mathrm{t}} $ production cross section, the top quark mass, and the strong coupling constant using dilepton events in pp collisions at $ \sqrt{s} = $ 13 TeV | EPJC 79 (2019) 368 | CMS-TOP-17-001 1812.10505 |
| 26 | CMS Collaboration | Measurement of $ \mathrm{t} \overline{\mathrm{t}} $ normalised multi-differential cross sections in pp collisions at $ \sqrt{s}= $ 13 TeV, and simultaneous determination of the strong coupling strength, top quark pole mass, and parton distribution functions | EPJC 80 (2020) 658 | CMS-TOP-18-004 1904.05237 |
| 27 | A. J. Larkoski, I. Moult, and B. Nachman | Jet substructure at the Large Hadron Collider: A review of recent advances in theory and machine learning | Phys. Rep. 841 (2020) 1 | 1709.04464 |
| 28 | R. Kogler et al. | Jet substructure at the large hadron collider | Rev. Mod. Phys. 91 (2019) 045003 | 1803.06991 |
| 29 | R. Kogler | Advances in jet substructure at the LHC: Algorithms, measurements and searches for new physical phenomena | volume 284 of Springer Tracts Mod. Phys. Springer, 2021 link |
|
| 30 | A. H. Hoang, S. Mantry, A. Pathak, and I. W. Stewart | Extracting a short distance top mass with light grooming | PRD 100 (2019) 074021 | 1708.02586 |
| 31 | CMS Collaboration | Measurement of the top quark pole mass using $ \mathrm{t} \overline{\mathrm{t}} $ +jet events in the dilepton final state in proton-proton collisions at $ \sqrt{s} $ = 13 TeV | Submitted to JHEP, 2022 | CMS-TOP-21-008 2207.02270 |
| 32 | CMS Collaboration | Measurement of the jet mass in highly boosted $ \mathrm{t} \overline{\mathrm{t}} $ events from pp collisions at $ \sqrt{s}= $ 8 TeV | EPJC 77 (2017) 467 | CMS-TOP-15-015 1703.06330 |
| 33 | CMS Collaboration | Measurement of the jet mass distribution and top quark mass in hadronic decays of boosted top quarks in pp collisions at $ \sqrt{s} = $ 13 TeV | PRL 124 (2020) 202001 | CMS-TOP-19-005 1911.03800 |
| 34 | CMS Collaboration | Determination of jet energy calibration and transverse momentum resolution in CMS | JINST 6 (2011) P11002 | CMS-JME-10-011 1107.4277 |
| 35 | CMS Collaboration | Jet energy scale and resolution in the CMS experiment in pp collisions at 8 TeV | JINST 12 (2017) P02014 | CMS-JME-13-004 1607.03663 |
| 36 | J. Thaler and K. Van Tilburg | Identifying boosted objects with $ {N} $-subjettiness | JHEP 03 (2011) 015 | 1011.2268 |
| 37 | J. Thaler and K. Van Tilburg | Maximizing boosted top identification by minimizing $ {N} $-subjettiness | JHEP 02 (2012) 093 | 1108.2701 |
| 38 | P. Skands, S. Carrazza, and J. Rojo | Tuning PYTHIA 8.1: The Monash 2013 Tune | EPJC 74 (2014) 3024 | 1404.5630 |
| 39 | CMS Collaboration | Measurement of jet substructure observables in $ \mathrm{t} \overline{\mathrm{t}} $ events from proton-proton collisions at $ \sqrt{s}= $ 13 TeV | PRD 98 (2018) 092014 | CMS-TOP-17-013 1808.07340 |
| 40 | CMS Collaboration | HEPData record for this analysis | link | |
| 41 | CMS Collaboration | The CMS experiment at the CERN LHC | JINST 3 (2008) S08004 | |
| 42 | Tracker Group of the CMS Collaboration | The CMS Phase-1 pixel detector upgrade | JINST 16 (2021) P02027 | 2012.14304 |
| 43 | CMS Collaboration | Performance of the CMS Level-1 trigger in proton-proton collisions at $ \sqrt{s} = $ 13 TeV | JINST 15 (2020) P10017 | CMS-TRG-17-001 2006.10165 |
| 44 | CMS Collaboration | The CMS trigger system | JINST 12 (2017) P01020 | CMS-TRG-12-001 1609.02366 |
| 45 | CMS Collaboration | Precision luminosity measurement in proton-proton collisions at $ \sqrt{s} = $ 13 TeV in 2015 and 2016 at CMS | EPJC 81 (2021) 800 | CMS-LUM-17-003 2104.01927 |
| 46 | CMS Collaboration | CMS luminosity measurement for the 2017 data-taking period at $ \sqrt{s} = $ 13 TeV | CMS Physics Analysis Summary, 2018 CMS-PAS-LUM-17-004 |
CMS-PAS-LUM-17-004 |
| 47 | CMS Collaboration | CMS luminosity measurement for the 2018 data-taking period at $ \sqrt{s} = $ 13 TeV | CMS Physics Analysis Summary, 2019 CMS-PAS-LUM-18-002 |
CMS-PAS-LUM-18-002 |
| 48 | P. Nason | A new method for combining NLO QCD with shower Monte Carlo algorithms | JHEP 11 (2004) 040 | hep-ph/0409146 |
| 49 | S. Frixione, P. Nason, and C. Oleari | Matching NLO QCD computations with parton shower simulations: the POWHEG method | JHEP 11 (2007) 070 | 0709.2092 |
| 50 | S. Alioli, P. Nason, C. Oleari, and E. Re | A general framework for implementing NLO calculations in shower Monte Carlo programs: the POWHEG BOX | JHEP 06 (2010) 043 | 1002.2581 |
| 51 | S. Frixione, P. Nason, and G. Ridolfi | A positive-weight next-to-leading-order Monte Carlo for heavy flavour hadroproduction | JHEP 09 (2007) 126 | 0707.3088 |
| 52 | S. Alioli, P. Nason, C. Oleari, and E. Re | NLO single-top production matched with shower in POWHEG: $ s $- and $ t $-channel contributions | JHEP 09 (2009) 111 | 0907.4076 |
| 53 | E. Re | Single-top Wt-channel production matched with parton showers using the POWHEG method | EPJC 71 (2011) 1547 | 1009.2450 |
| 54 | M. Czakon and A. Mitov | Top++: A program for the calculation of the top-pair cross-section at hadron colliders | Comput. Phys. Commun. 185 (2014) 2930 | 1112.5675 |
| 55 | J. Alwall et al. | The automated computation of tree-level and next-to-leading order differential cross sections, and their matching to parton shower simulations | JHEP 07 (2014) 079 | 1405.0301 |
| 56 | S. Frixione and B. R. Webber | Matching NLO QCD computations and parton shower simulations | JHEP 06 (2002) 029 | hep-ph/0204244 |
| 57 | N. Kidonakis | Two-loop soft anomalous dimensions for single top quark associated production with a $ {\mathrm{W^-}} $ or $ {\mathrm{H}}^- $ | PRD 82 (2010) 054018 | 1005.4451 |
| 58 | N. Kidonakis | Top quark production | in Helmholtz International Summer School on Physics of Heavy Quarks and Hadrons, 2013 link |
1311.0283 |
| 59 | M. Aliev et al. | HATHOR --- HAdronic Top and Heavy quarks crOss section calculatoR | Comput. Phys. Commun. 182 (2011) 1034 | 1007.1327 |
| 60 | Y. Li and F. Petriello | Combining QCD and electroweak corrections to dilepton production in FEWZ | PRD 86 (2012) 094034 | 1208.5967 |
| 61 | T. Sjöstrand et al. | An introduction to PYTHIA 8.2 | Comput. Phys. Commun. 191 (2015) 159 | 1410.3012 |
| 62 | NNPDF Collaboration | Parton distributions for the LHC Run II | JHEP 04 (2015) 040 | 1410.8849 |
| 63 | NNPDF Collaboration | Parton distributions from high-precision collider data | EPJC 77 (2017) 663 | 1706.00428 |
| 64 | R. Frederix and S. Frixione | Merging meets matching in MC@NLO | JHEP 12 (2012) 061 | 1209.6215 |
| 65 | J. Alwall et al. | Comparative study of various algorithms for the merging of parton showers and matrix elements in hadronic collisions | EPJC 53 (2008) 473 | 0706.2569 |
| 66 | CMS Collaboration | Extraction and validation of a new set of CMS PYTHIA8 tunes from underlying-event measurements | EPJC 80 (2020) 4 | CMS-GEN-17-001 1903.12179 |
| 67 | CMS Collaboration | Event generator tunes obtained from underlying event and multiparton scattering measurements | EPJC 76 (2016) 155 | CMS-GEN-14-001 1512.00815 |
| 68 | GEANT4 Collaboration | GEANT 4 --- A simulation toolkit | NIM A 506 (2003) 250 | |
| 69 | J. Allison et al. | GEANT 4 developments and applications | IEEE Trans. Nucl. Sci. 53 (2006) 270 | |
| 70 | CMS Collaboration | Measurement of the inelastic proton-proton cross section at $ \sqrt{s}= $ 13 TeV | JHEP 07 (2018) 161 | CMS-FSQ-15-005 1802.02613 |
| 71 | CMS Collaboration | Particle-flow reconstruction and global event description with the CMS detector | JINST 12 (2017) P10003 | CMS-PRF-14-001 1706.04965 |
| 72 | M. Cacciari, G. P. Salam, and G. Soyez | The anti-$ k_{\mathrm{T}} $ jet clustering algorithm | JHEP 04 (2008) 063 | 0802.1189 |
| 73 | M. Cacciari, G. P. Salam, and G. Soyez | Fastjet user manual | EPJC 72 (2012) 1896 | 1111.6097 |
| 74 | CMS Collaboration | Technical proposal for the Phase-II upgrade of the Compact Muon Solenoid | CMS Technical Proposal CERN-LHCC-2015-010, CMS-TDR-15-02, 2015 CDS |
|
| 75 | CMS Collaboration | Performance of the CMS muon detector and muon reconstruction with proton-proton collisions at $ \sqrt{s}= $ 13 TeV | JINST 13 (2018) P06015 | CMS-MUO-16-001 1804.04528 |
| 76 | CMS Collaboration | Electron and photon reconstruction and identification with the CMS experiment at the CERN LHC | JINST 16 (2021) P05014 | CMS-EGM-17-001 2012.06888 |
| 77 | I. W. Stewart et al. | XCone: $ {N} $-jettiness as an exclusive cone jet algorithm | JHEP 11 (2015) 072 | 1508.01516 |
| 78 | J. Thaler and T. F. Wilkason | Resolving boosted jets with XCone | JHEP 12 (2015) 051 | 1508.01518 |
| 79 | D. Krohn, J. Thaler, and L.-T. Wang | Jet trimming | JHEP 02 (2010) 084 | 0912.1342 |
| 80 | Y. L. Dokshitzer, G. D. Leder, S. Moretti, and B. R. Webber | Better jet clustering algorithms | JHEP 08 (1997) 001 | hep-ph/9707323 |
| 81 | M. Wobisch and T. Wengler | Hadronization corrections to jet cross sections in deep-inelastic scattering | in Workshop on Monte Carlo generators for HERA physics. DESY, Hamburg, Germany, 1998 link |
hep-ph/9907280 |
| 82 | CMS Collaboration | Search for resonant $ \mathrm{t} \overline{\mathrm{t}} $ production in proton-proton collisions at $ \sqrt{s}= $ 13 TeV | JHEP 04 (2019) 031 | 1810.05905 |
| 83 | CMS Collaboration | Search for a heavy resonance decaying to a top quark and a vector-like top quark in the lepton+jets final state in pp collisions at $ \sqrt{s} = $ 13 TeV | EPJC 79 (2019) 208 | 1812.06489 |
| 84 | CMS Collaboration | Performance of b tagging algorithms in proton-proton collisions at 13 TeV with Phase 1 CMS detector | CMS Detector Performance Note CMS-DP-2018-033, 2018 CDS |
|
| 85 | E. Bols et al. | Jet flavour classification using DeepJet | JINST 15 (2020) P12012 | 2008.10519 |
| 86 | CMS Collaboration | Performance of missing transverse momentum reconstruction in proton-proton collisions at $ \sqrt{s} = $ 13 TeV using the CMS detector | JINST 14 (2019) P07004 | CMS-JME-17-001 1903.06078 |
| 87 | CMS Collaboration | Measurement of differential $ {\mathrm{t}\overline{\mathrm{t}}} $ production cross sections in the full kinematic range using lepton+jets events from proton-proton collisions at $ \sqrt {s} $ = 13 TeV | PRD 104 (2021) 092013 | CMS-TOP-20-001 2108.02803 |
| 88 | ATLAS Collaboration | Measurements of differential cross-sections in top-quark pair events with a high transverse momentum top quark and limits on beyond the standard model contributions to top-quark pair production with the ATLAS detector at $ \sqrt{s} = $ 13 TeV | JHEP 06 (2022) 063 | 2202.12134 |
| 89 | ATLAS Collaboration | Differential $ {\mathrm{t}\overline{\mathrm{t}}} $ cross-section measurements using boosted top quarks in the all-hadronic final state with 139 fb$ ^{-1} $ of ATLAS data | 2205.02817 | |
| 90 | F. Herren and M. Steinhauser | Version 3 of RunDec and CRunDec | Comput. Phys. Commun. 224 (2018) 333 | 1703.03751 |
| 91 | S. Schmitt | TUnfold: An algorithm for correcting migration effects in high energy physics | JINST 7 (2012) T10003 | 1205.6201 |
| 92 | S. Schmitt | Data unfolding methods in high energy physics | in 12th Conference on Quark Confinement and the Hadron Spectrum. Confinement XII, Thessaloniki, Greece, 2016 link |
1611.01927 |
| 93 | CMS Collaboration | Identification of heavy-flavour jets with the CMS detector in pp collisions at 13 TeV | JINST 13 (2018) P05011 | CMS-BTV-16-002 1712.07158 |
| 94 | CMS Collaboration | Measurement of the $ \mathrm{t} \overline{\mathrm{t}} $ production cross section using events in the $ \mathrm{e} \mu $ final state in pp collisions at $ \sqrt{s} = $ 13 TeV | EPJC 77 (2017) 172 | CMS-TOP-16-005 1611.04040 |
| 95 | CMS Collaboration | Measurement of inclusive W and Z boson production cross sections in pp collisions at $ \sqrt{s} = $ 8 TeV | PRL 112 (2014) 191802 | CMS-SMP-12-011 1402.0923 |
| 96 | CMS Collaboration | Cross section measurement of $ t $-channel single top quark production in pp collisions at $ \sqrt{s} = $ 13 TeV | PLB 772 (2017) 752 | CMS-TOP-16-003 1610.00678 |
| 97 | N. Kidonakis | NNLL threshold resummation for top-pair and single-top production | Phys. Part. Nucl. 45 (2014) 714 | 1210.7813 |
| 98 | T. Gehrmann et al. | W$^{+}$W$^{-}$ production at hadron colliders in next-to-next-to-leading order QCD | PRL 113 (2014) 212001 | 1408.5243 |
| 99 | CMS Collaboration | Measurement of the WZ production cross section in pp collisions at $ \sqrt{s} = $ 13 TeV | PLB 766 (2017) 268 | CMS-SMP-16-002 1607.06943 |
| 100 | T. Sjöstrand and M. van Zijl | A multiple interaction model for the event structure in hadron collisions | PRD 36 (1987) 2019 | |
| 101 | S. Argyropoulos and T. Sjöstrand | Effects of color reconnection on $ {\mathrm{t}\overline{\mathrm{t}}} $ final states at the LHC | JHEP 11 (2014) 043 | 1407.6653 |
| 102 | J. R. Christiansen and P. Z. Skands | String formation beyond leading colour | JHEP 08 (2015) 003 | 1505.01681 |
| 103 | J. Butterworth et al. | PDF4LHC recommendations for LHC Run II | JPG 43 (2016) 023001 | 1510.03865 |
| 104 | D. Britzger | The linear template fit | EPJC 82 (2022) 731 | 2112.01548 |
| 105 | CMS Collaboration | Identification of heavy, energetic, hadronically decaying particles using machine-learning techniques | JINST 15 (2020) P06005 | CMS-JME-18-002 2004.08262 |
|
|
Compact Muon Solenoid LHC, CERN |
|

|

|

|

|

|