

Compact Muon Solenoid
LHC, CERN
| CMS-TOP-21-011 ; CERN-EP-2022-168 | ||
| Measurement of the cross section of top quark-antiquark pair production in association with a W boson in proton-proton collisions at $\sqrt{s} =$ 13 TeV | ||
| CMS Collaboration | ||
| 12 August 2022 | ||
| JHEP 07 (2023) 219 | ||
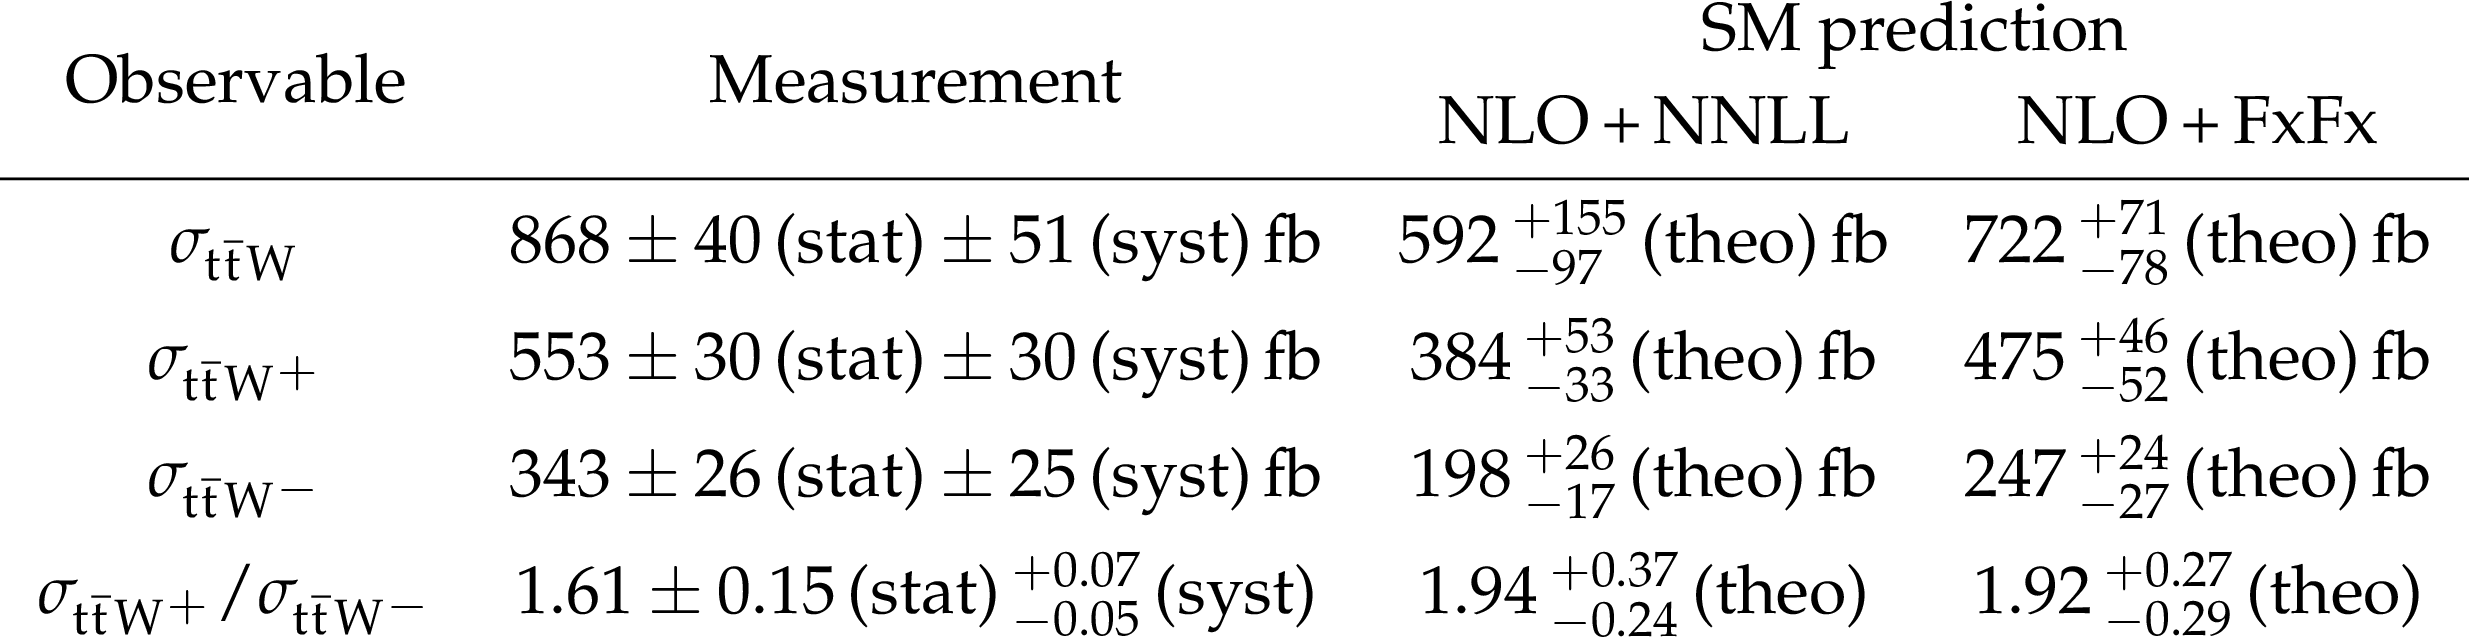
| Abstract: The production of a top quark-antiquark pair in association with a W boson ($\mathrm{t\bar{t}}$W) is measured in proton-proton collisions at a center-of-mass energy of 13 TeV. The analyzed data was recorded by the CMS experiment at the CERN LHC and corresponds to an integrated luminosity of 138 fb$^{-1}$. Events with two or three leptons (electrons and muons) and additional jets are selected. In events with two leptons, a multiclass neural network is used to distinguish between the signal and background processes. Events with three leptons are categorized based on the number of jets and of jets originating from b quark hadronization, and the lepton charges. The inclusive $\mathrm{t\bar{t}}$W production cross section in the full phase space is measured to be 868 $\pm$ 40 (stat) $\pm$ 51(syst) fb. The $\mathrm{t\bar{t}}$W$^{+}$ and $\mathrm{t\bar{t}}$W$^{-}$ cross sections are also measured as 553 $\pm$ 30 (stat) $\pm$ 30 (syst) fb NU and {343 $\pm$ 26 (stat) $\pm$ 25 (syst) fb, respectively, and the corresponding ratio of the two cross sections is found to be 1.61 $\pm$ 0.15 (stat) $^{+0.07}_{-0.05}$ (syst). The results are consistent with the standard model predictions within two standard deviations, and represent the most precise measurement of these cross sections to date. | ||
| Links: e-print arXiv:2208.06485 [hep-ex] (PDF) ; CDS record ; inSPIRE record ; HepData record ; CADI line (restricted) ; | ||
| Figures & Tables | Summary | Additional Figures | References | CMS Publications |
|---|
| Figures | |

png pdf |
Figure 1:
Representative Feynman diagrams of ${\mathrm{t} {}\mathrm{\bar{t}}}$W production at LO (upper row) and NLO (lower row). |

png pdf |
Figure 1-a:
Representative Feynman diagram of ${\mathrm{t} {}\mathrm{\bar{t}}}$W production at LO. |

png pdf |
Figure 1-b:
Representative Feynman diagram of ${\mathrm{t} {}\mathrm{\bar{t}}}$W production at LO. |

png pdf |
Figure 1-c:
Representative Feynman diagram of ${\mathrm{t} {}\mathrm{\bar{t}}}$W production at NLO. |

png pdf |
Figure 1-d:
Representative Feynman diagram of ${\mathrm{t} {}\mathrm{\bar{t}}}$W production at NLO. |
png pdf |
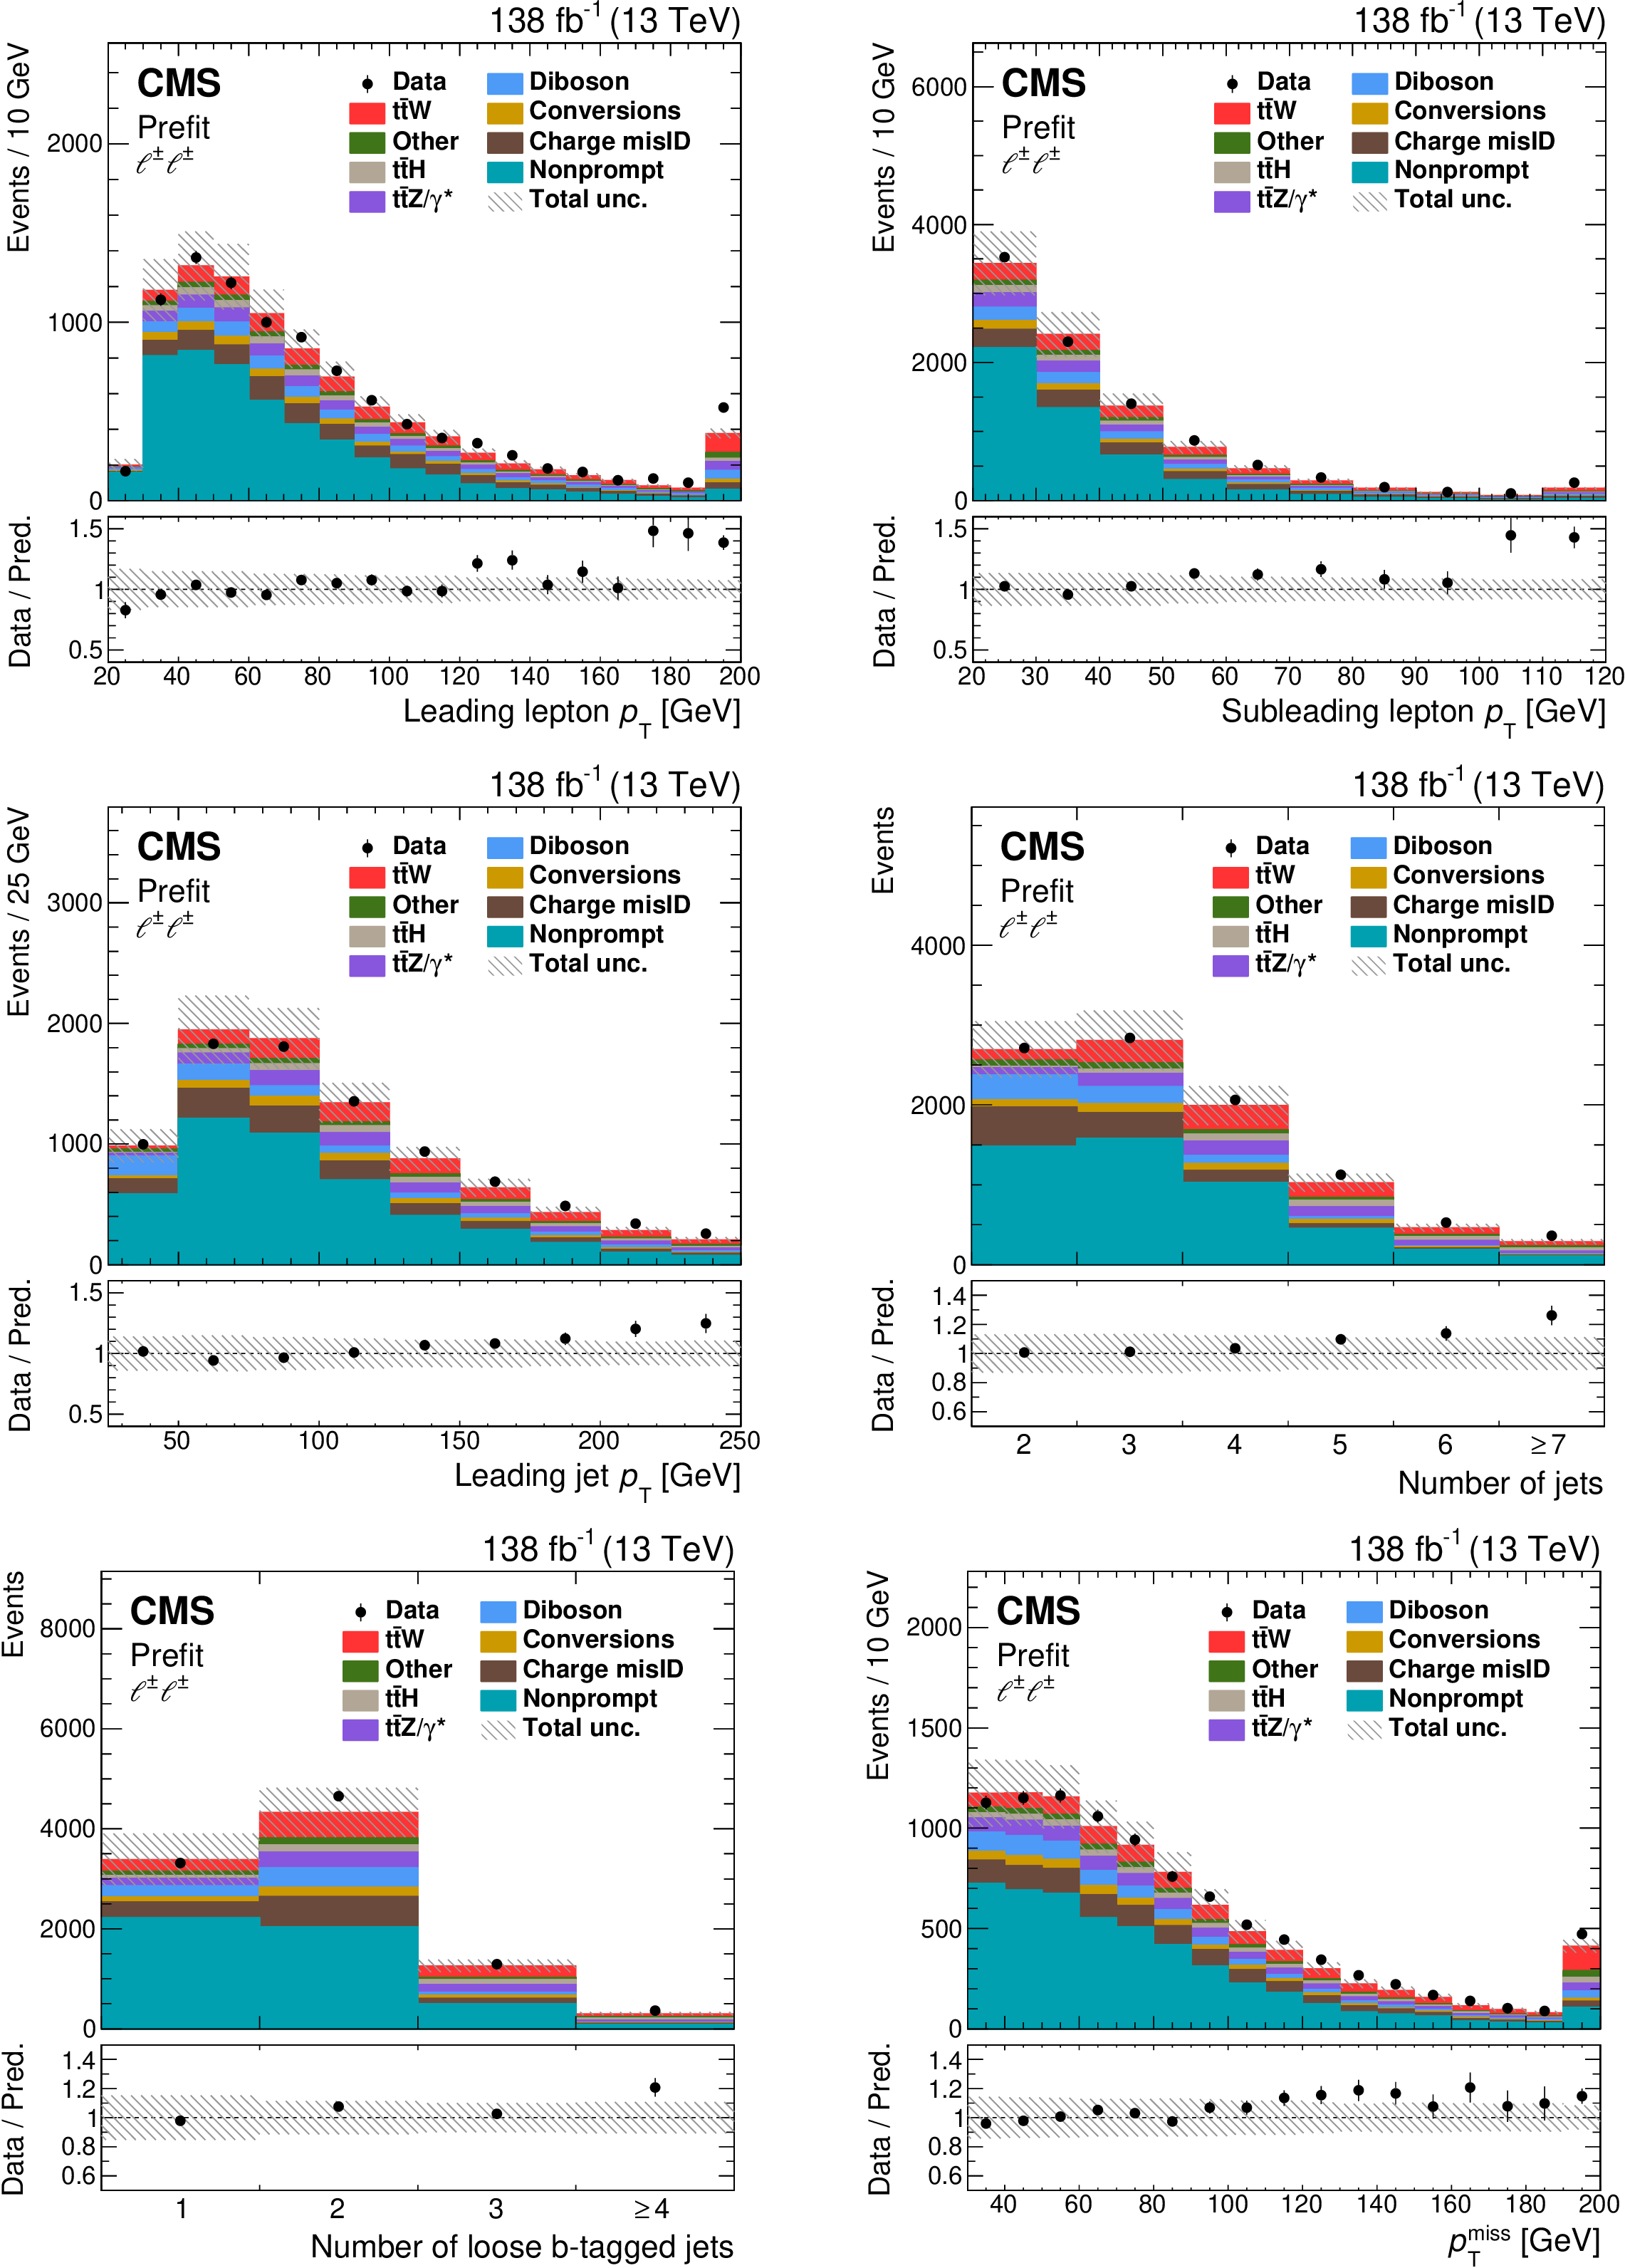
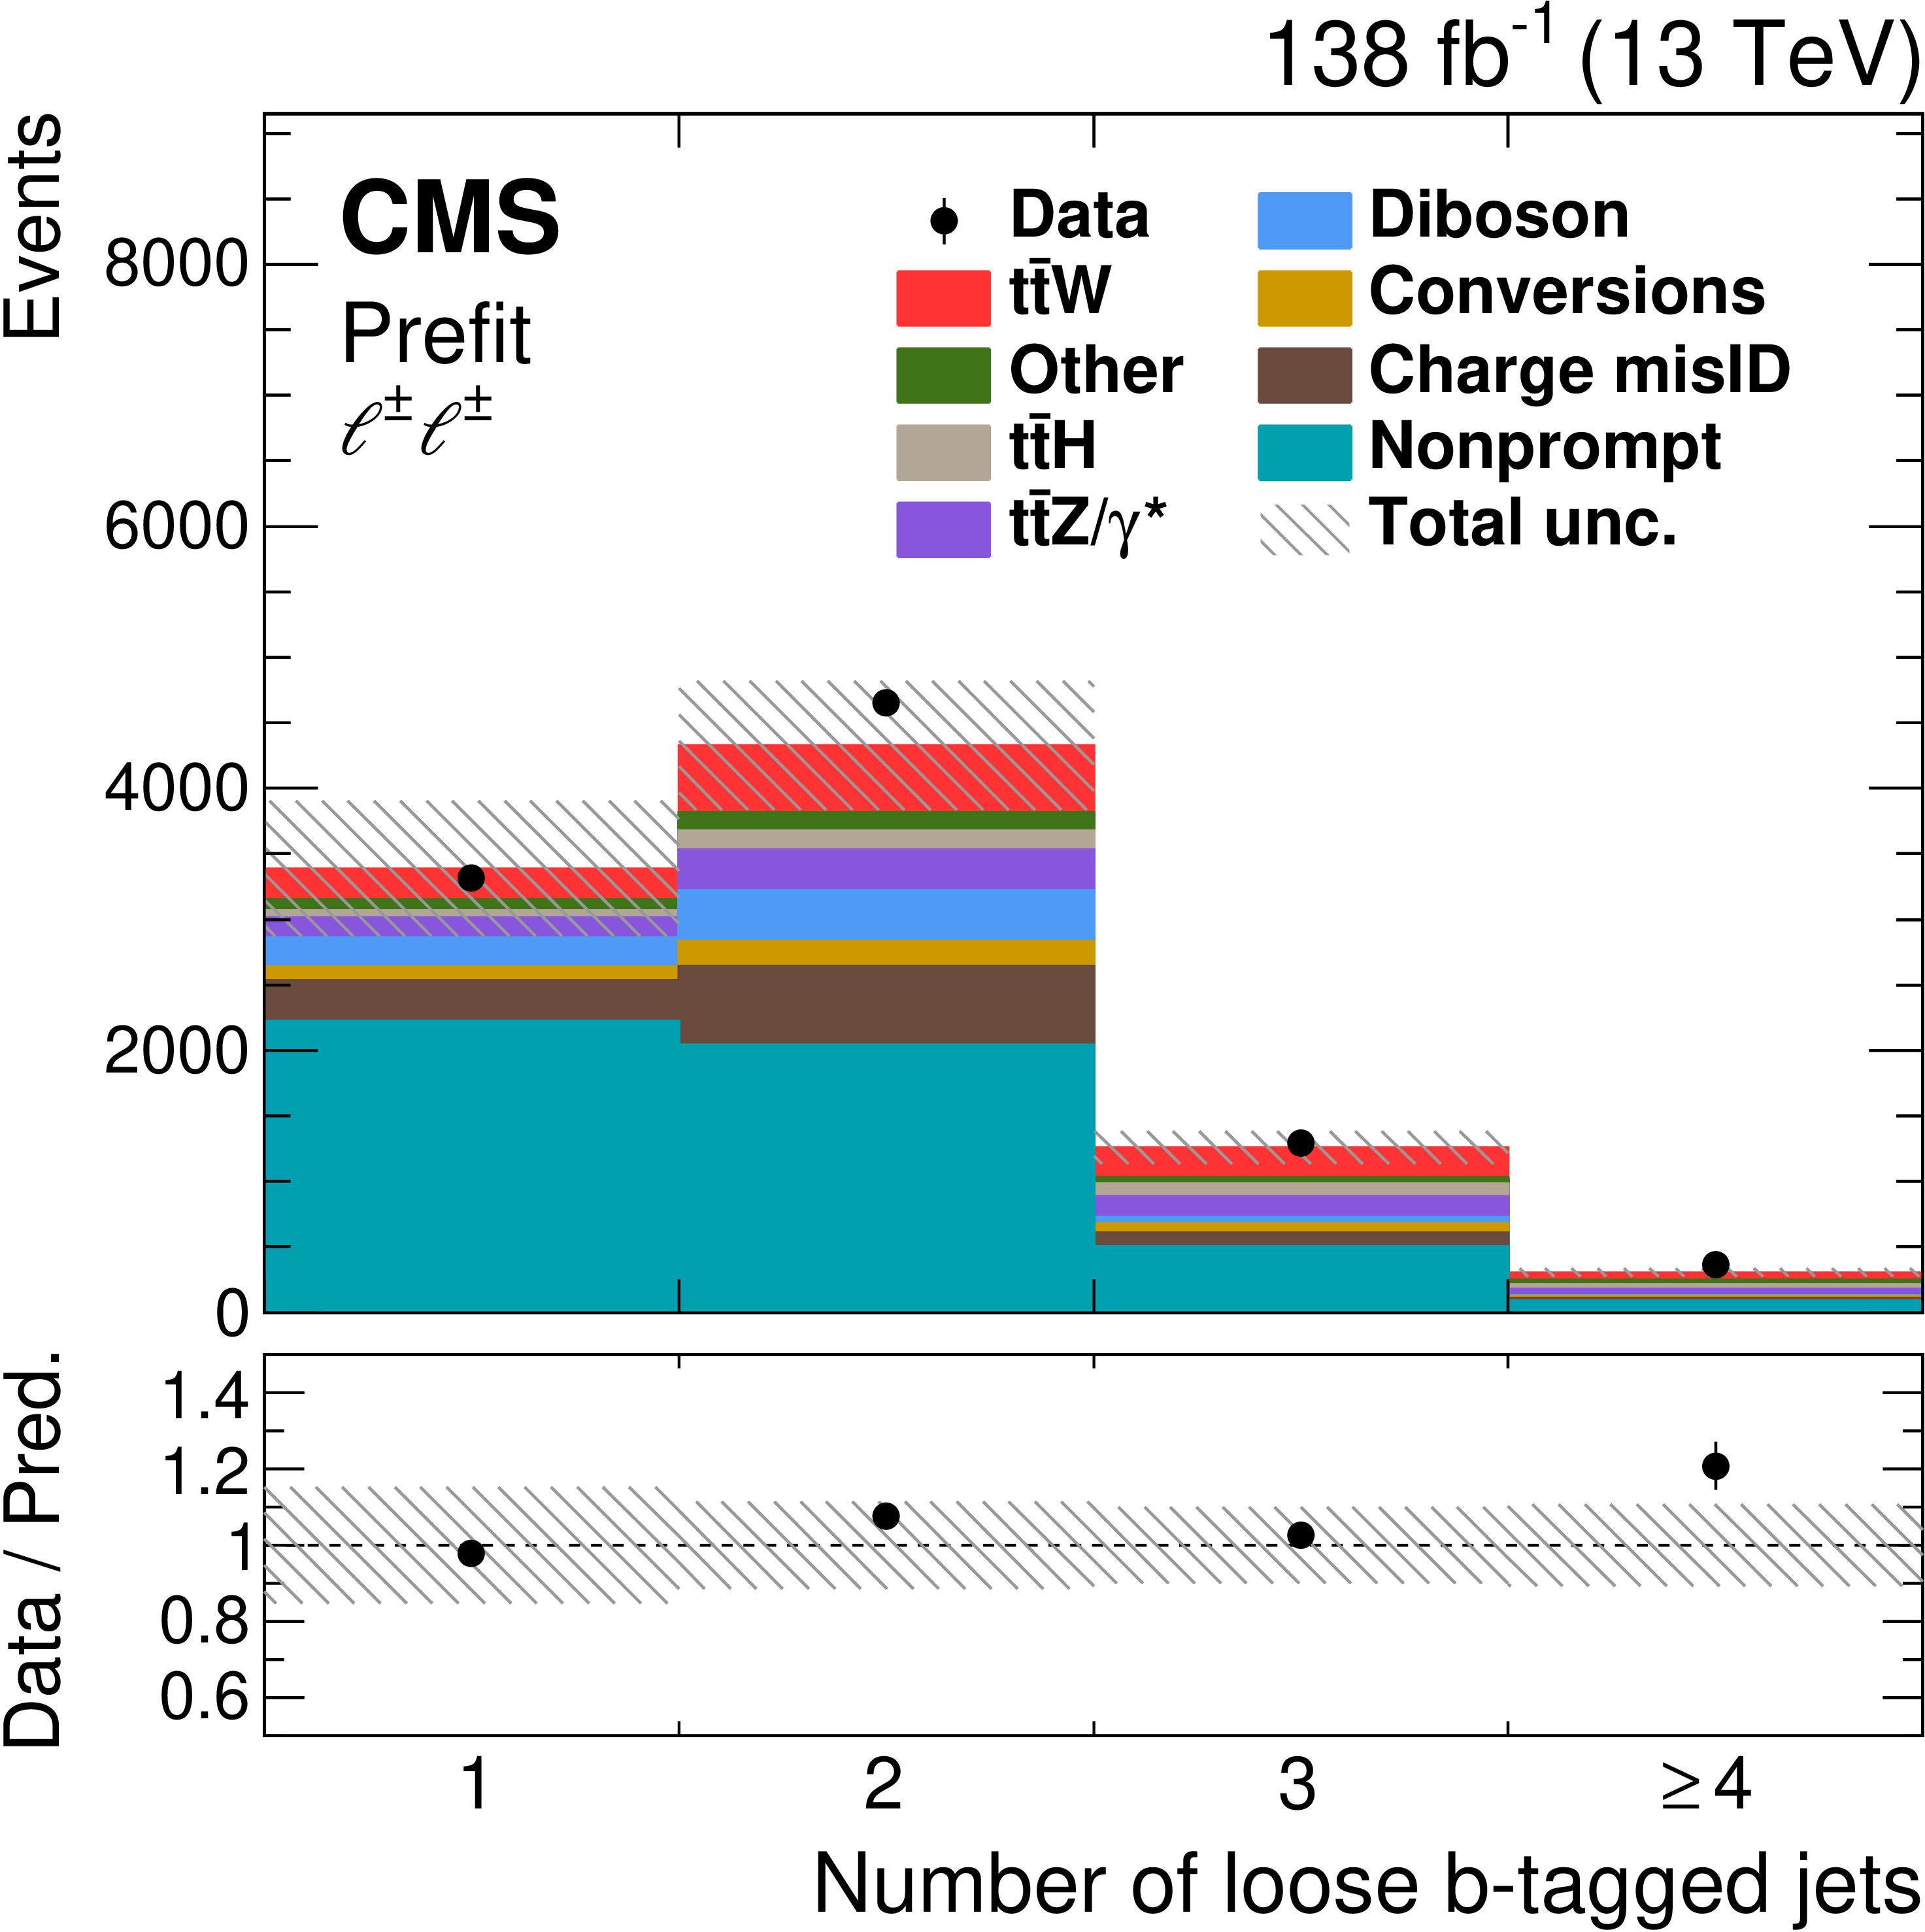
Figure 2:
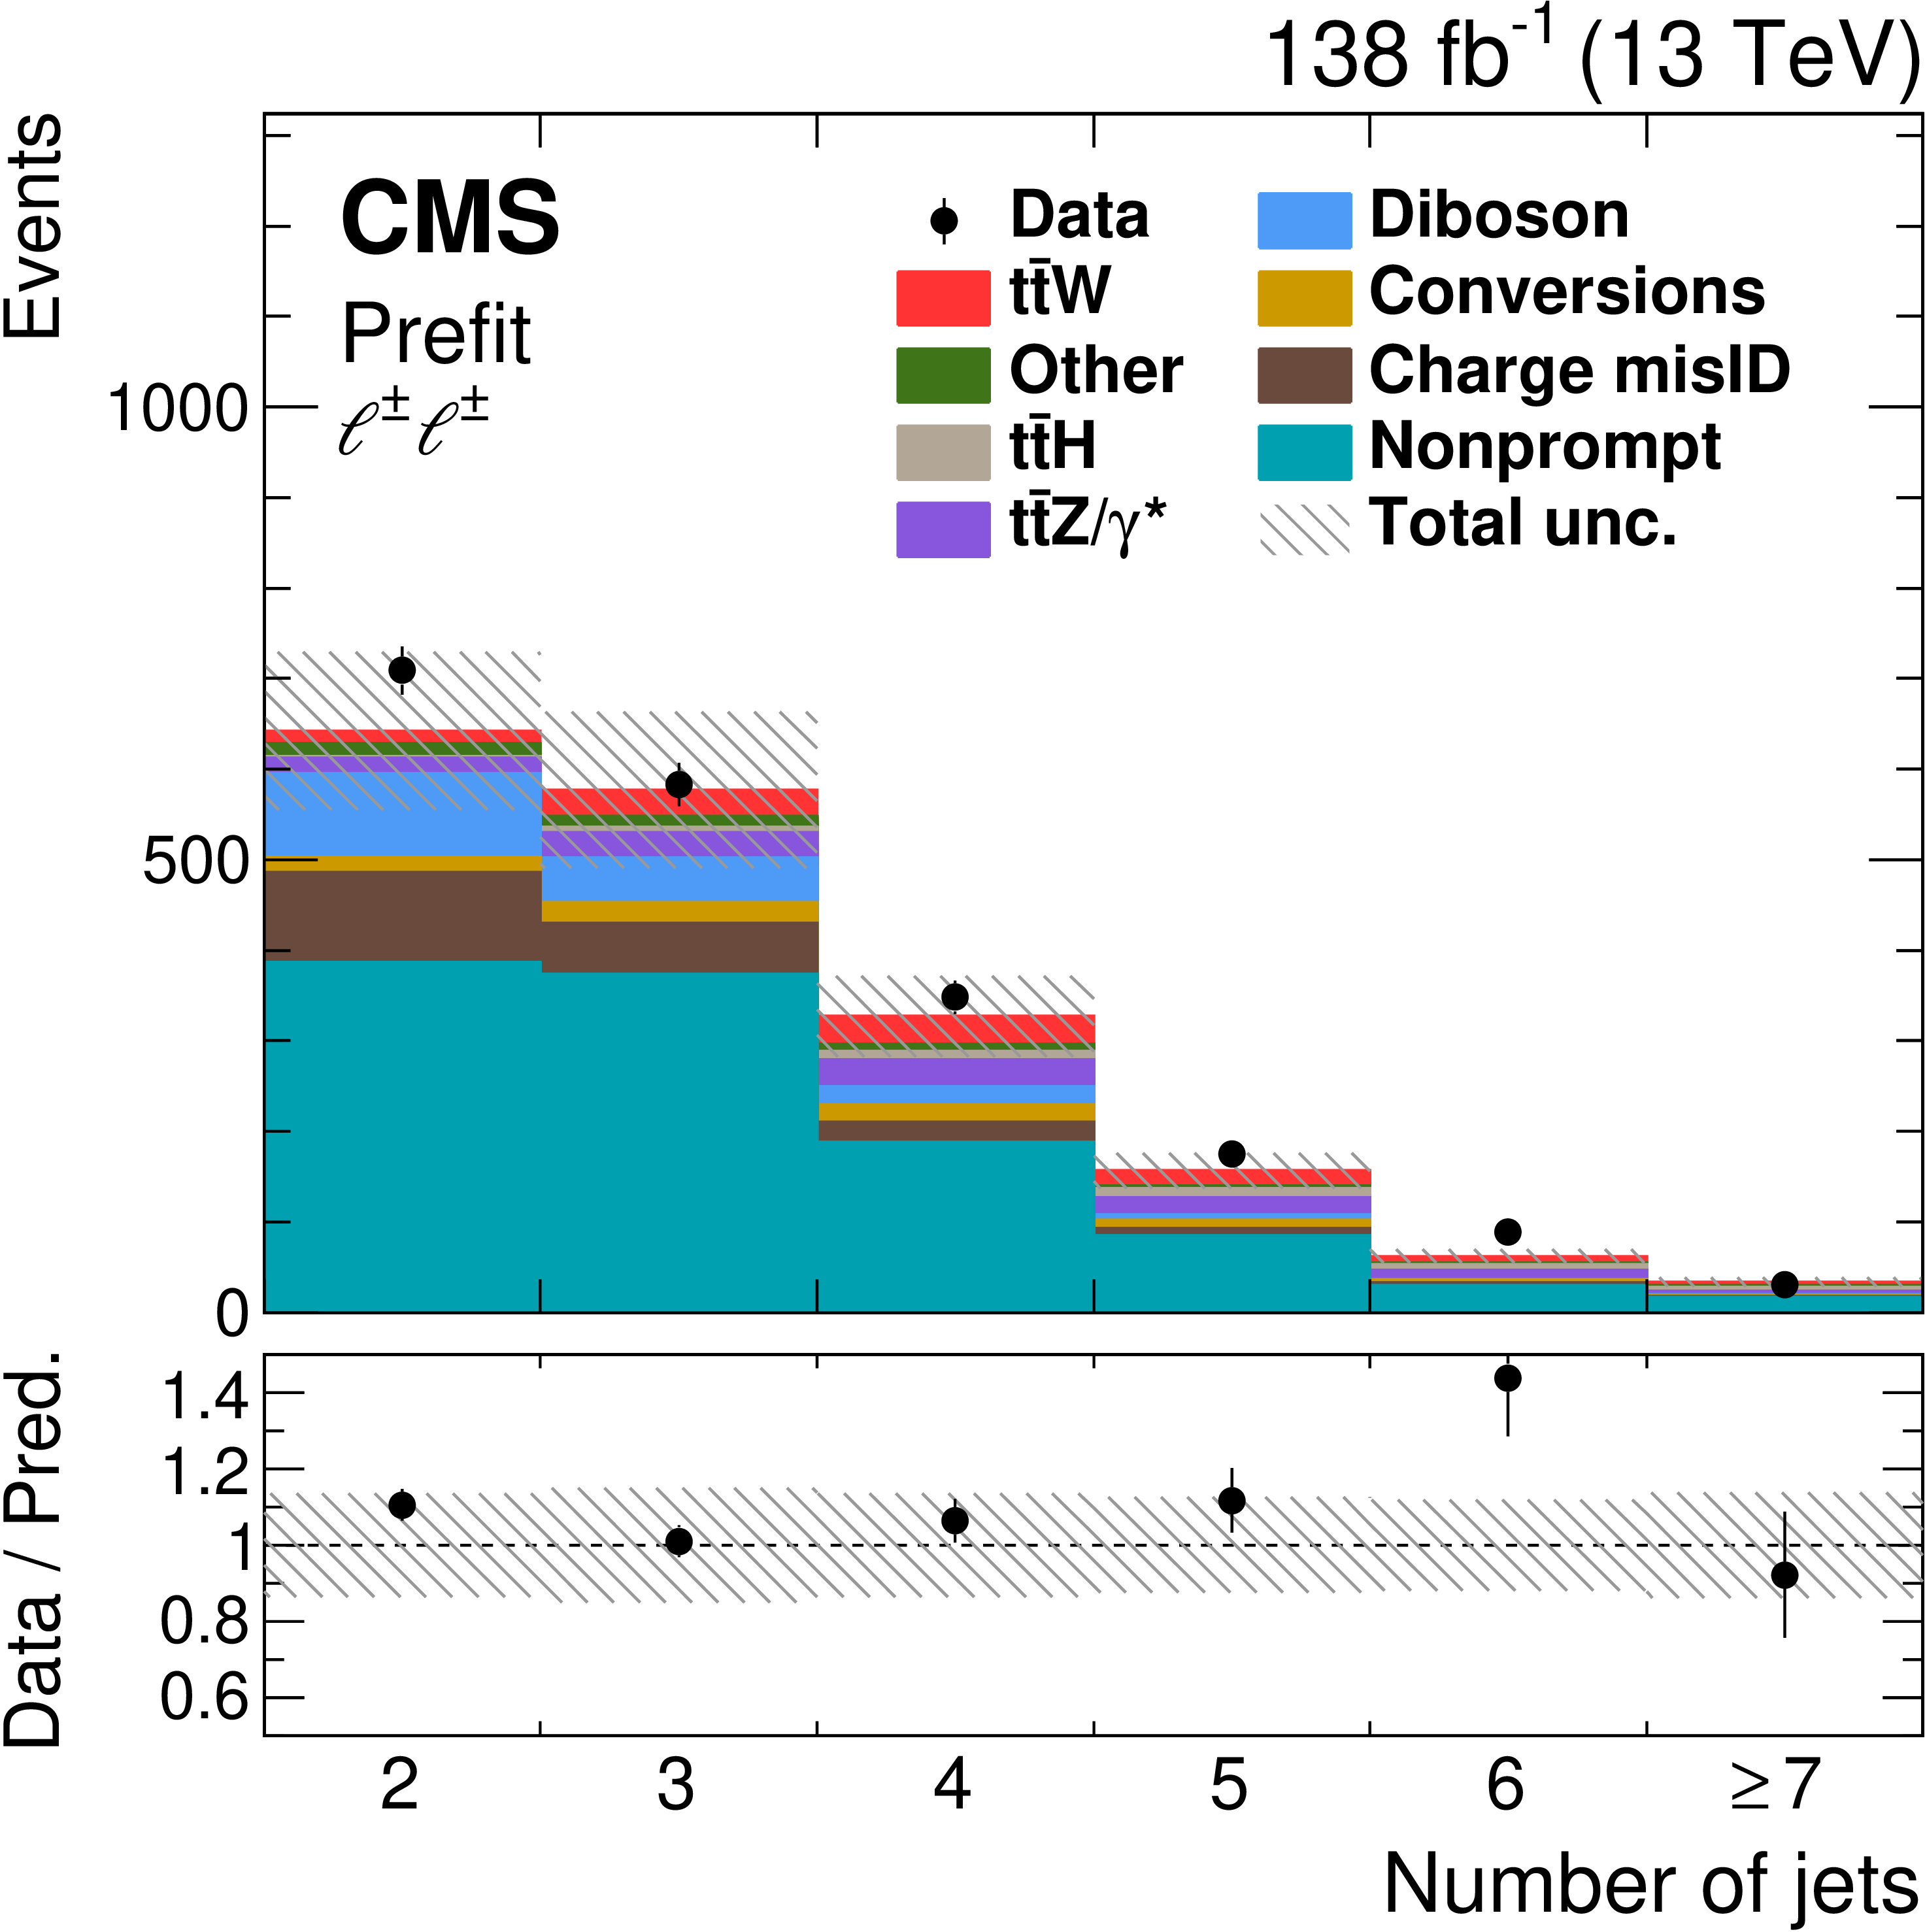
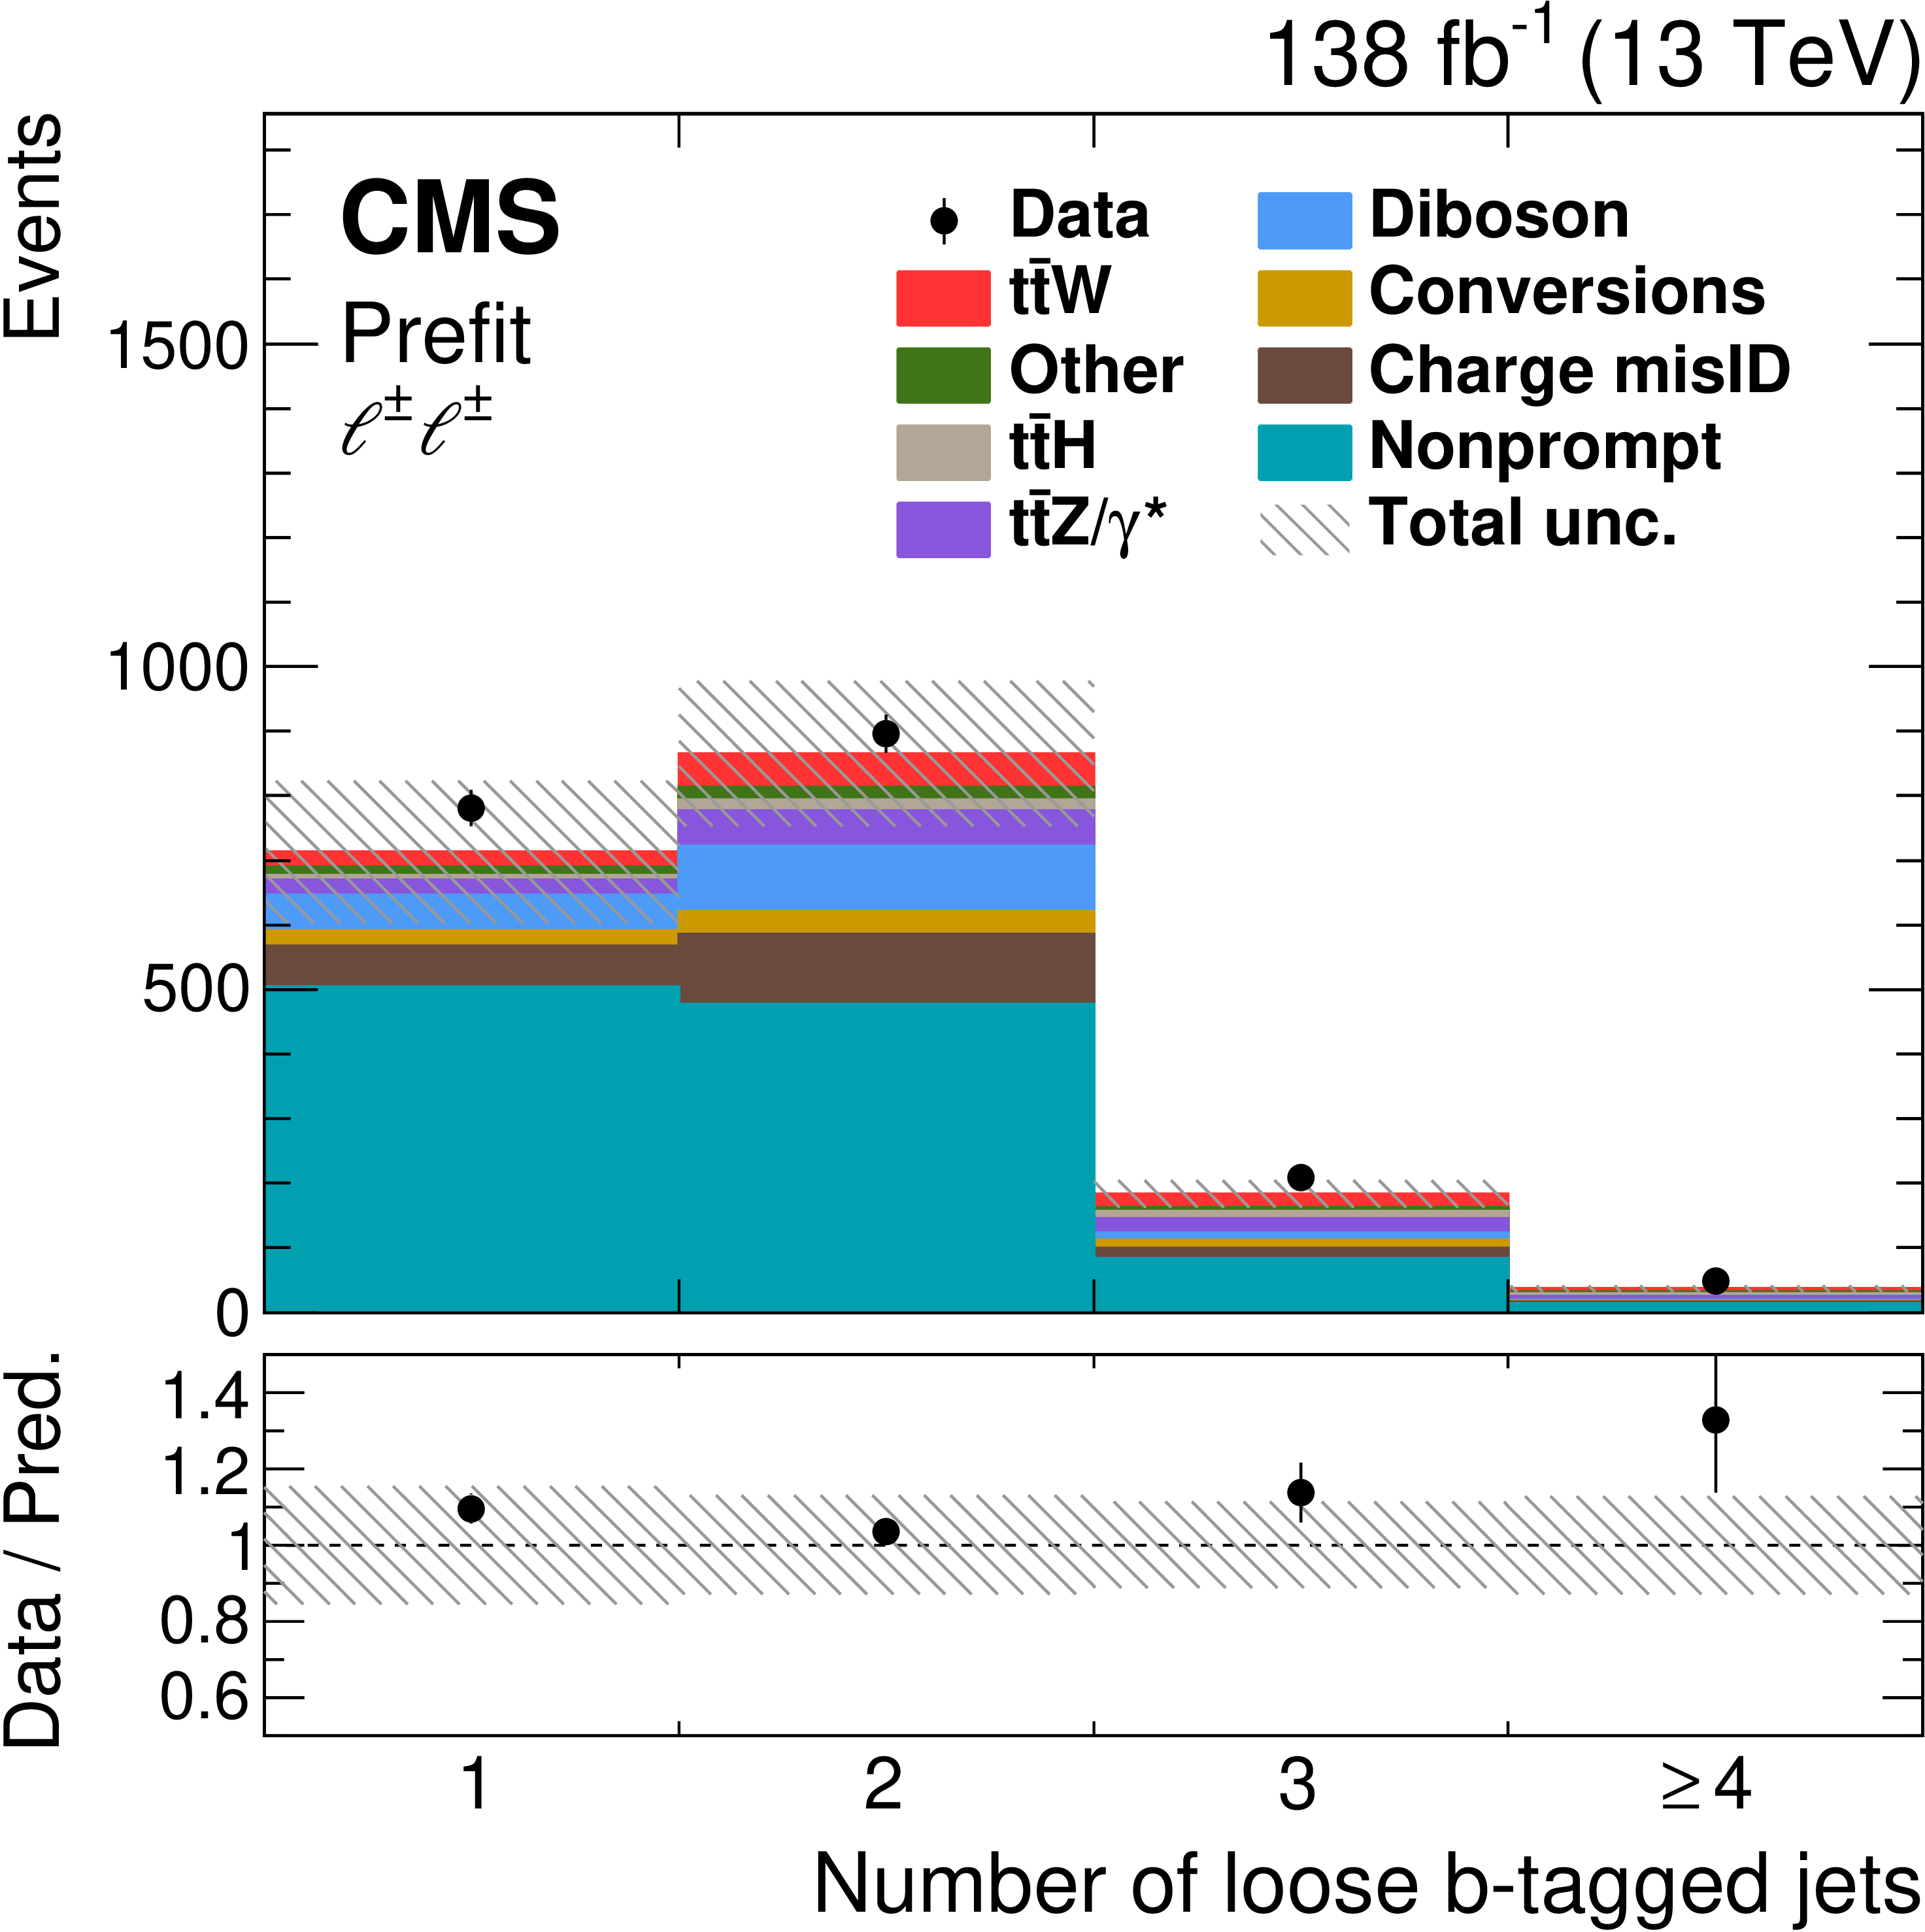
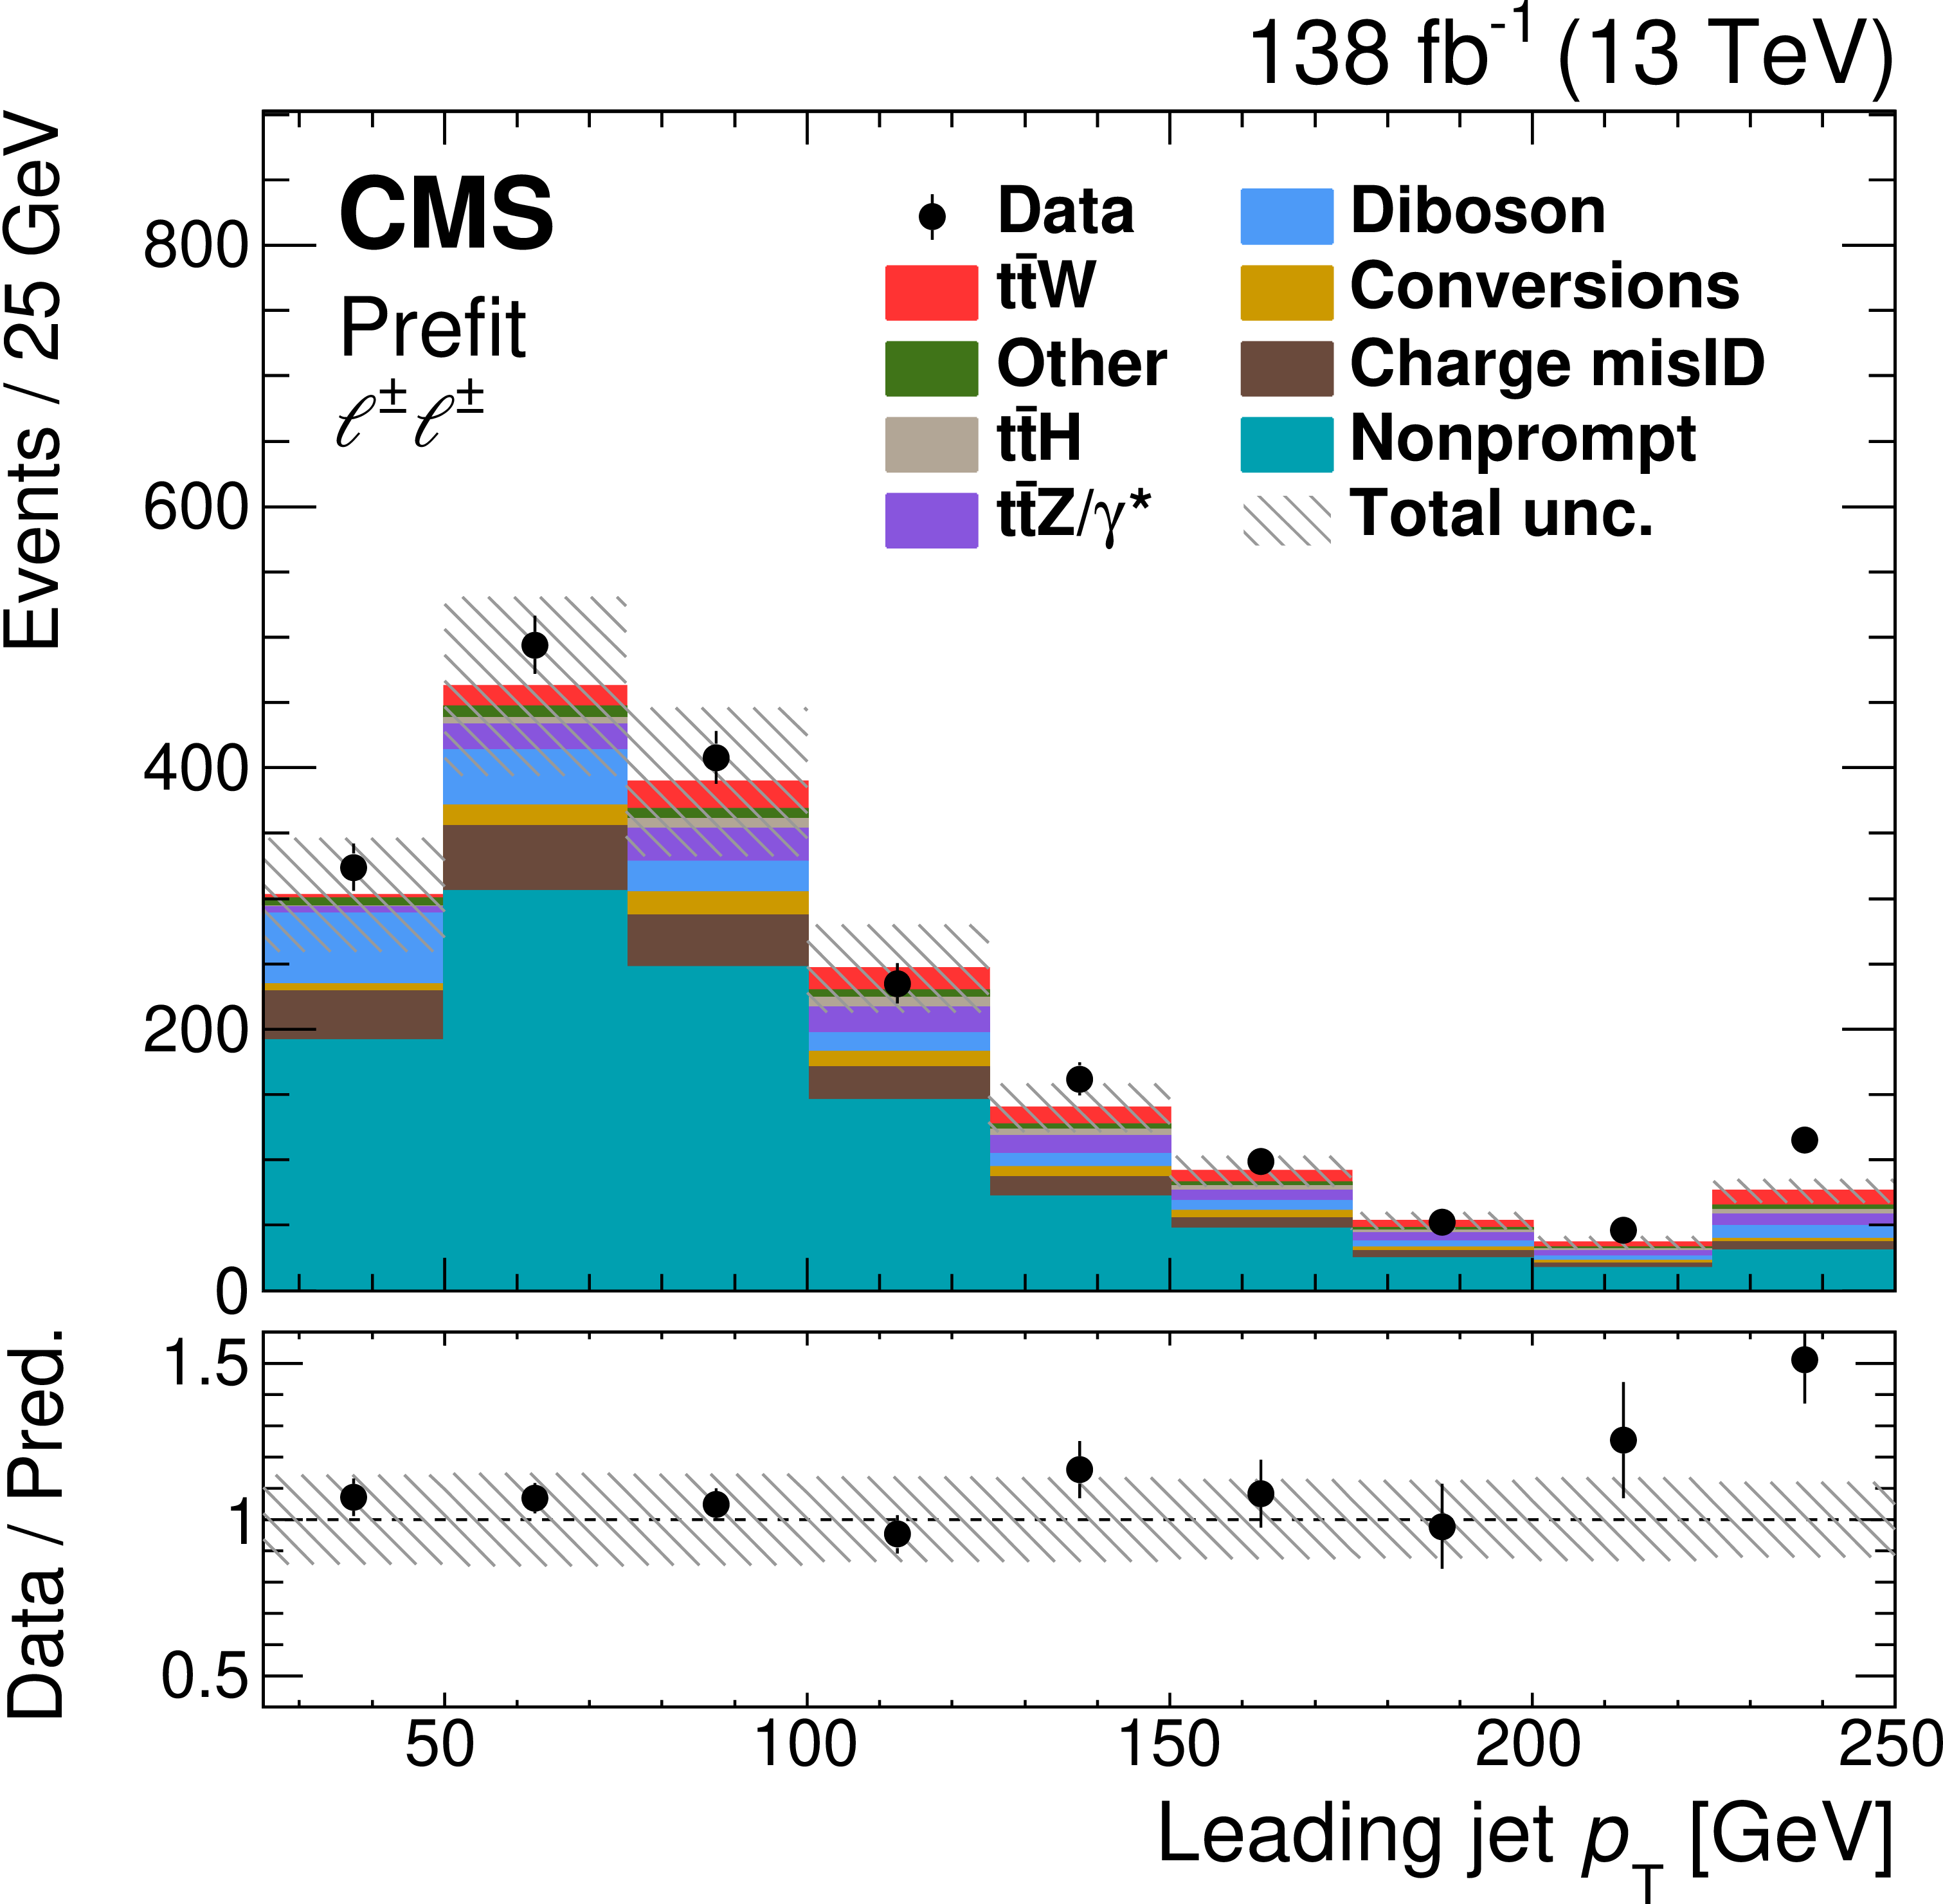
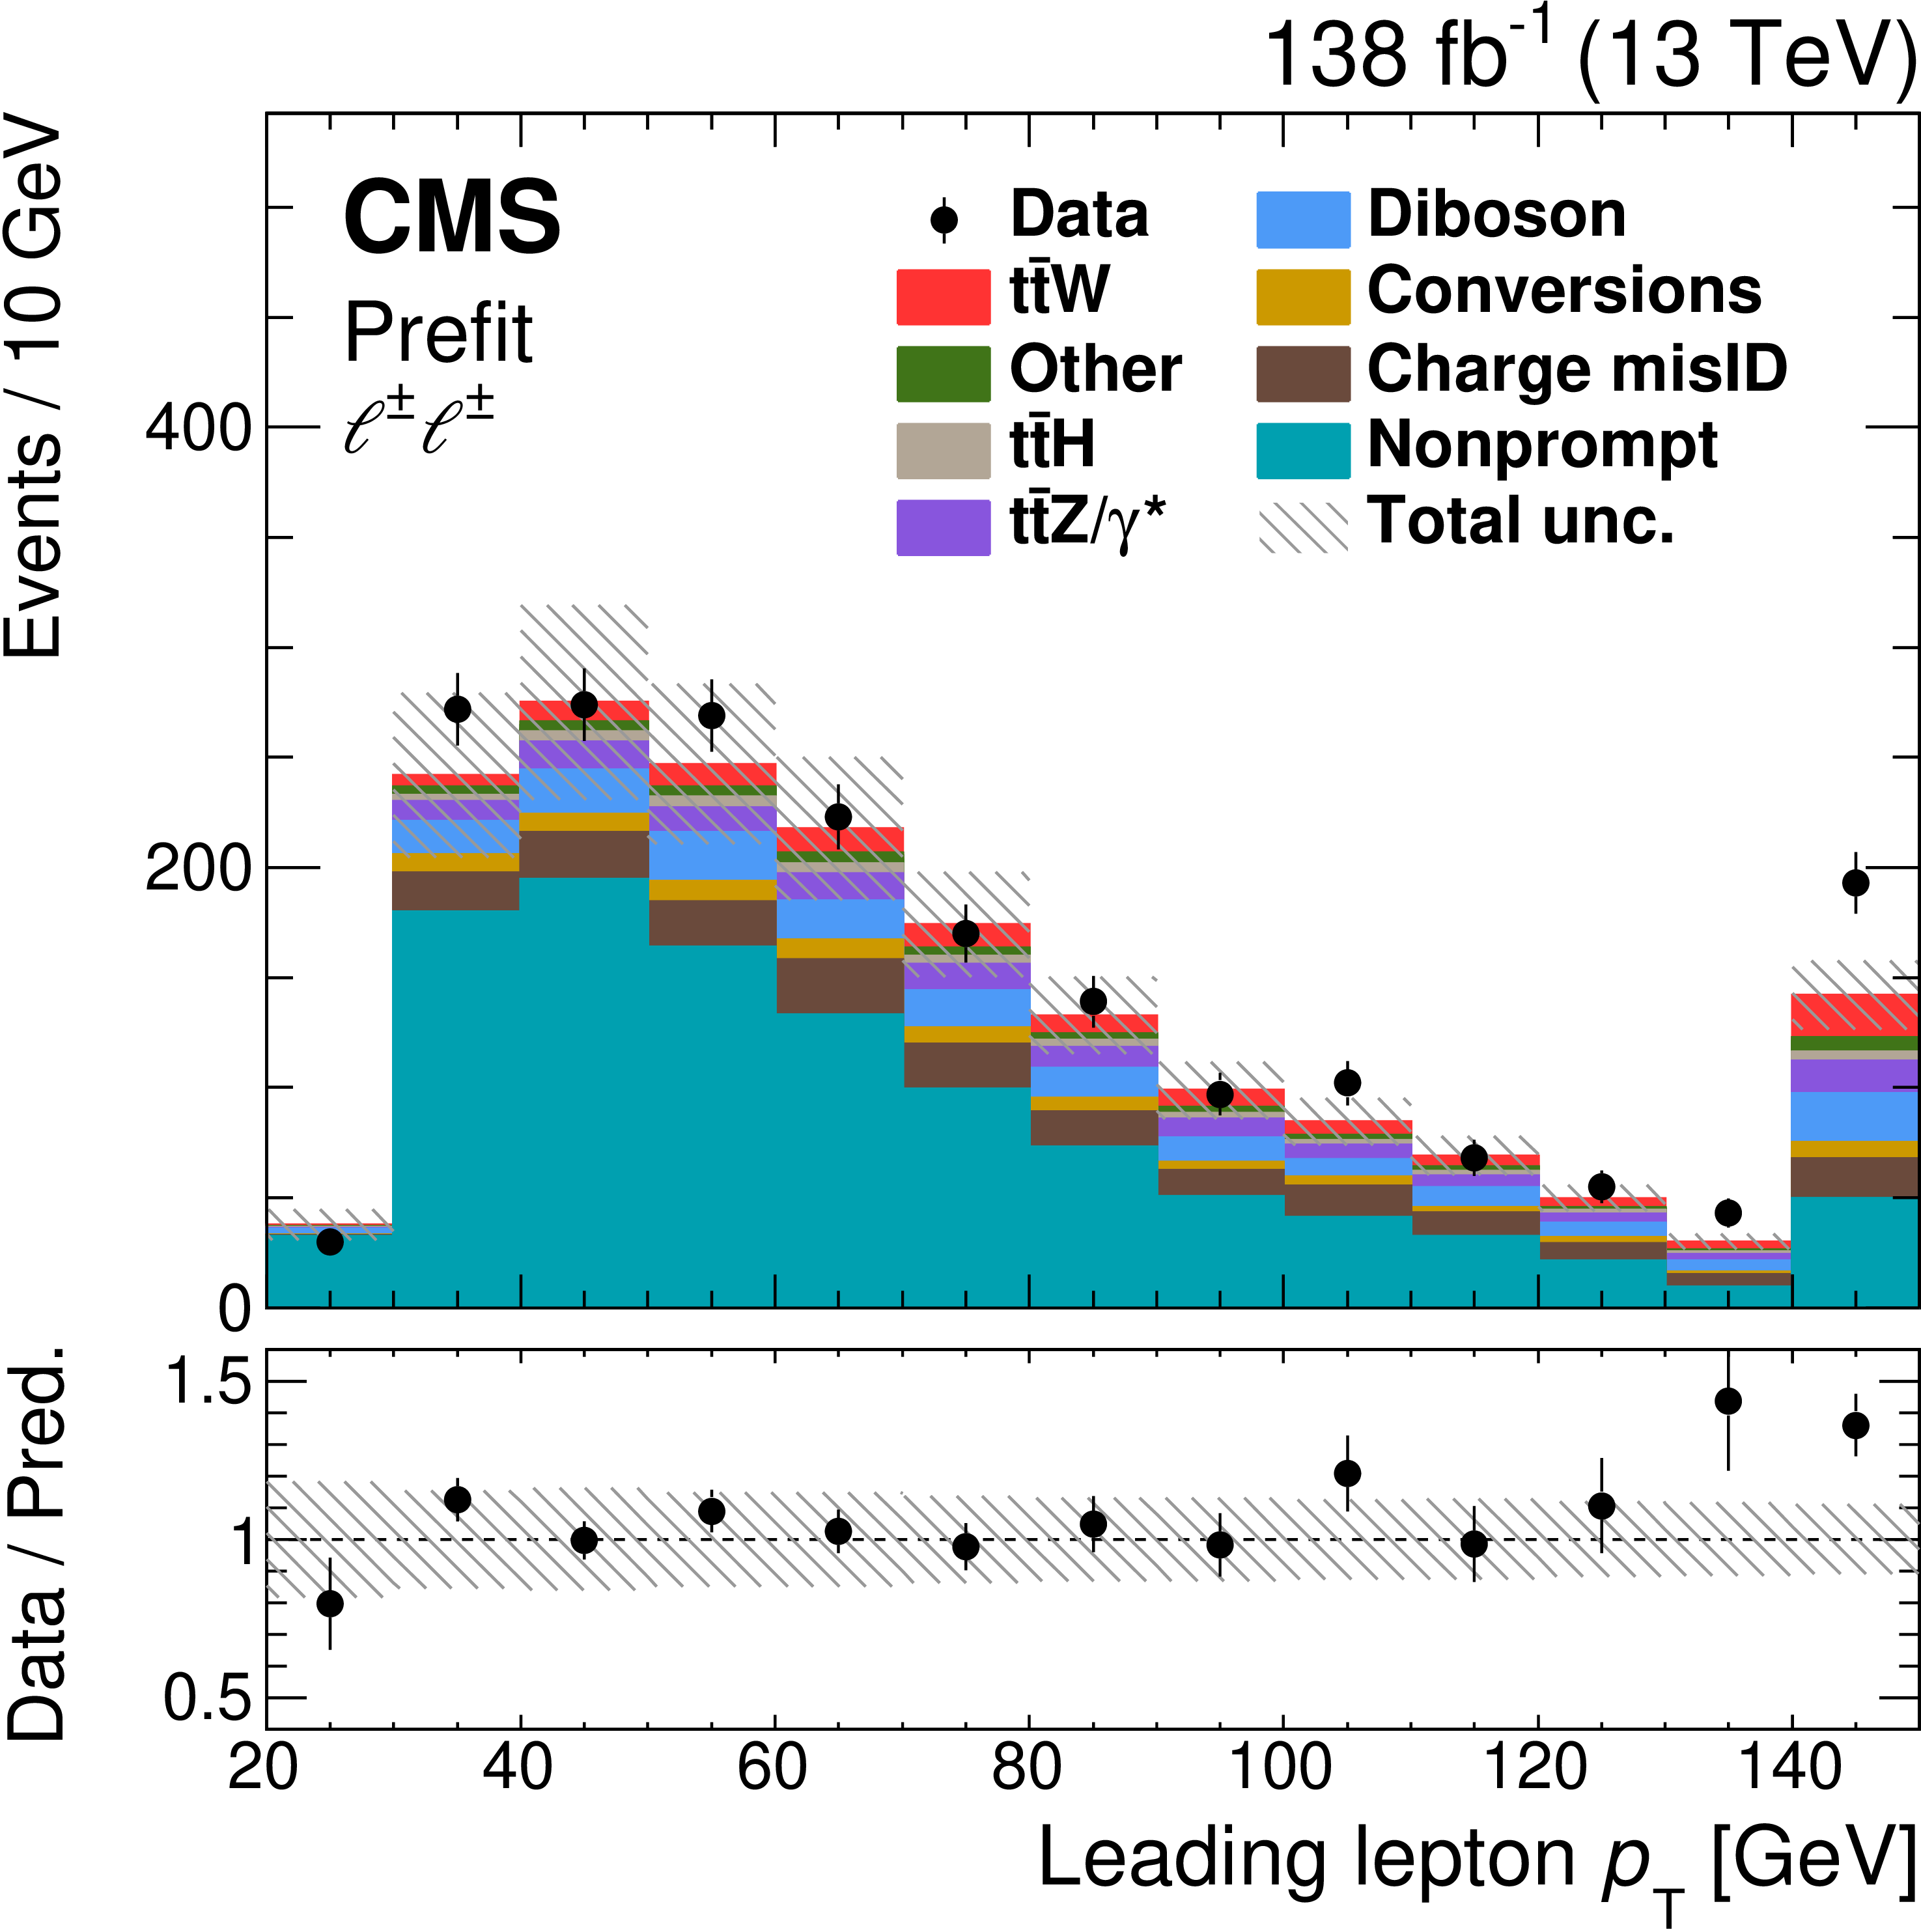
Comparison of the number of observed (points) and predicted (colored histograms) events in the same-sign dilepton signal region. The distributions of the leading (upper left) and subleading (upper right) lepton ${p_{\mathrm {T}}}$, the leading jet ${p_{\mathrm {T}}}$ (middle left), the number of jets (middle right), the number of loose b-tagged jets (lower left), and ${{p_{\mathrm {T}}} ^\text {miss}}$ (lower right) are displayed. The predictions are shown before the fit to data ("Prefit''). The vertical bars on the points represent the statistical uncertainties in the data, and the hatched bands the systematic uncertainty in the predictions. The last bins include the overflow contributions. In the lower panels, the ratio of the event yields in data to the overall sum of the predictions is presented. |
png pdf |
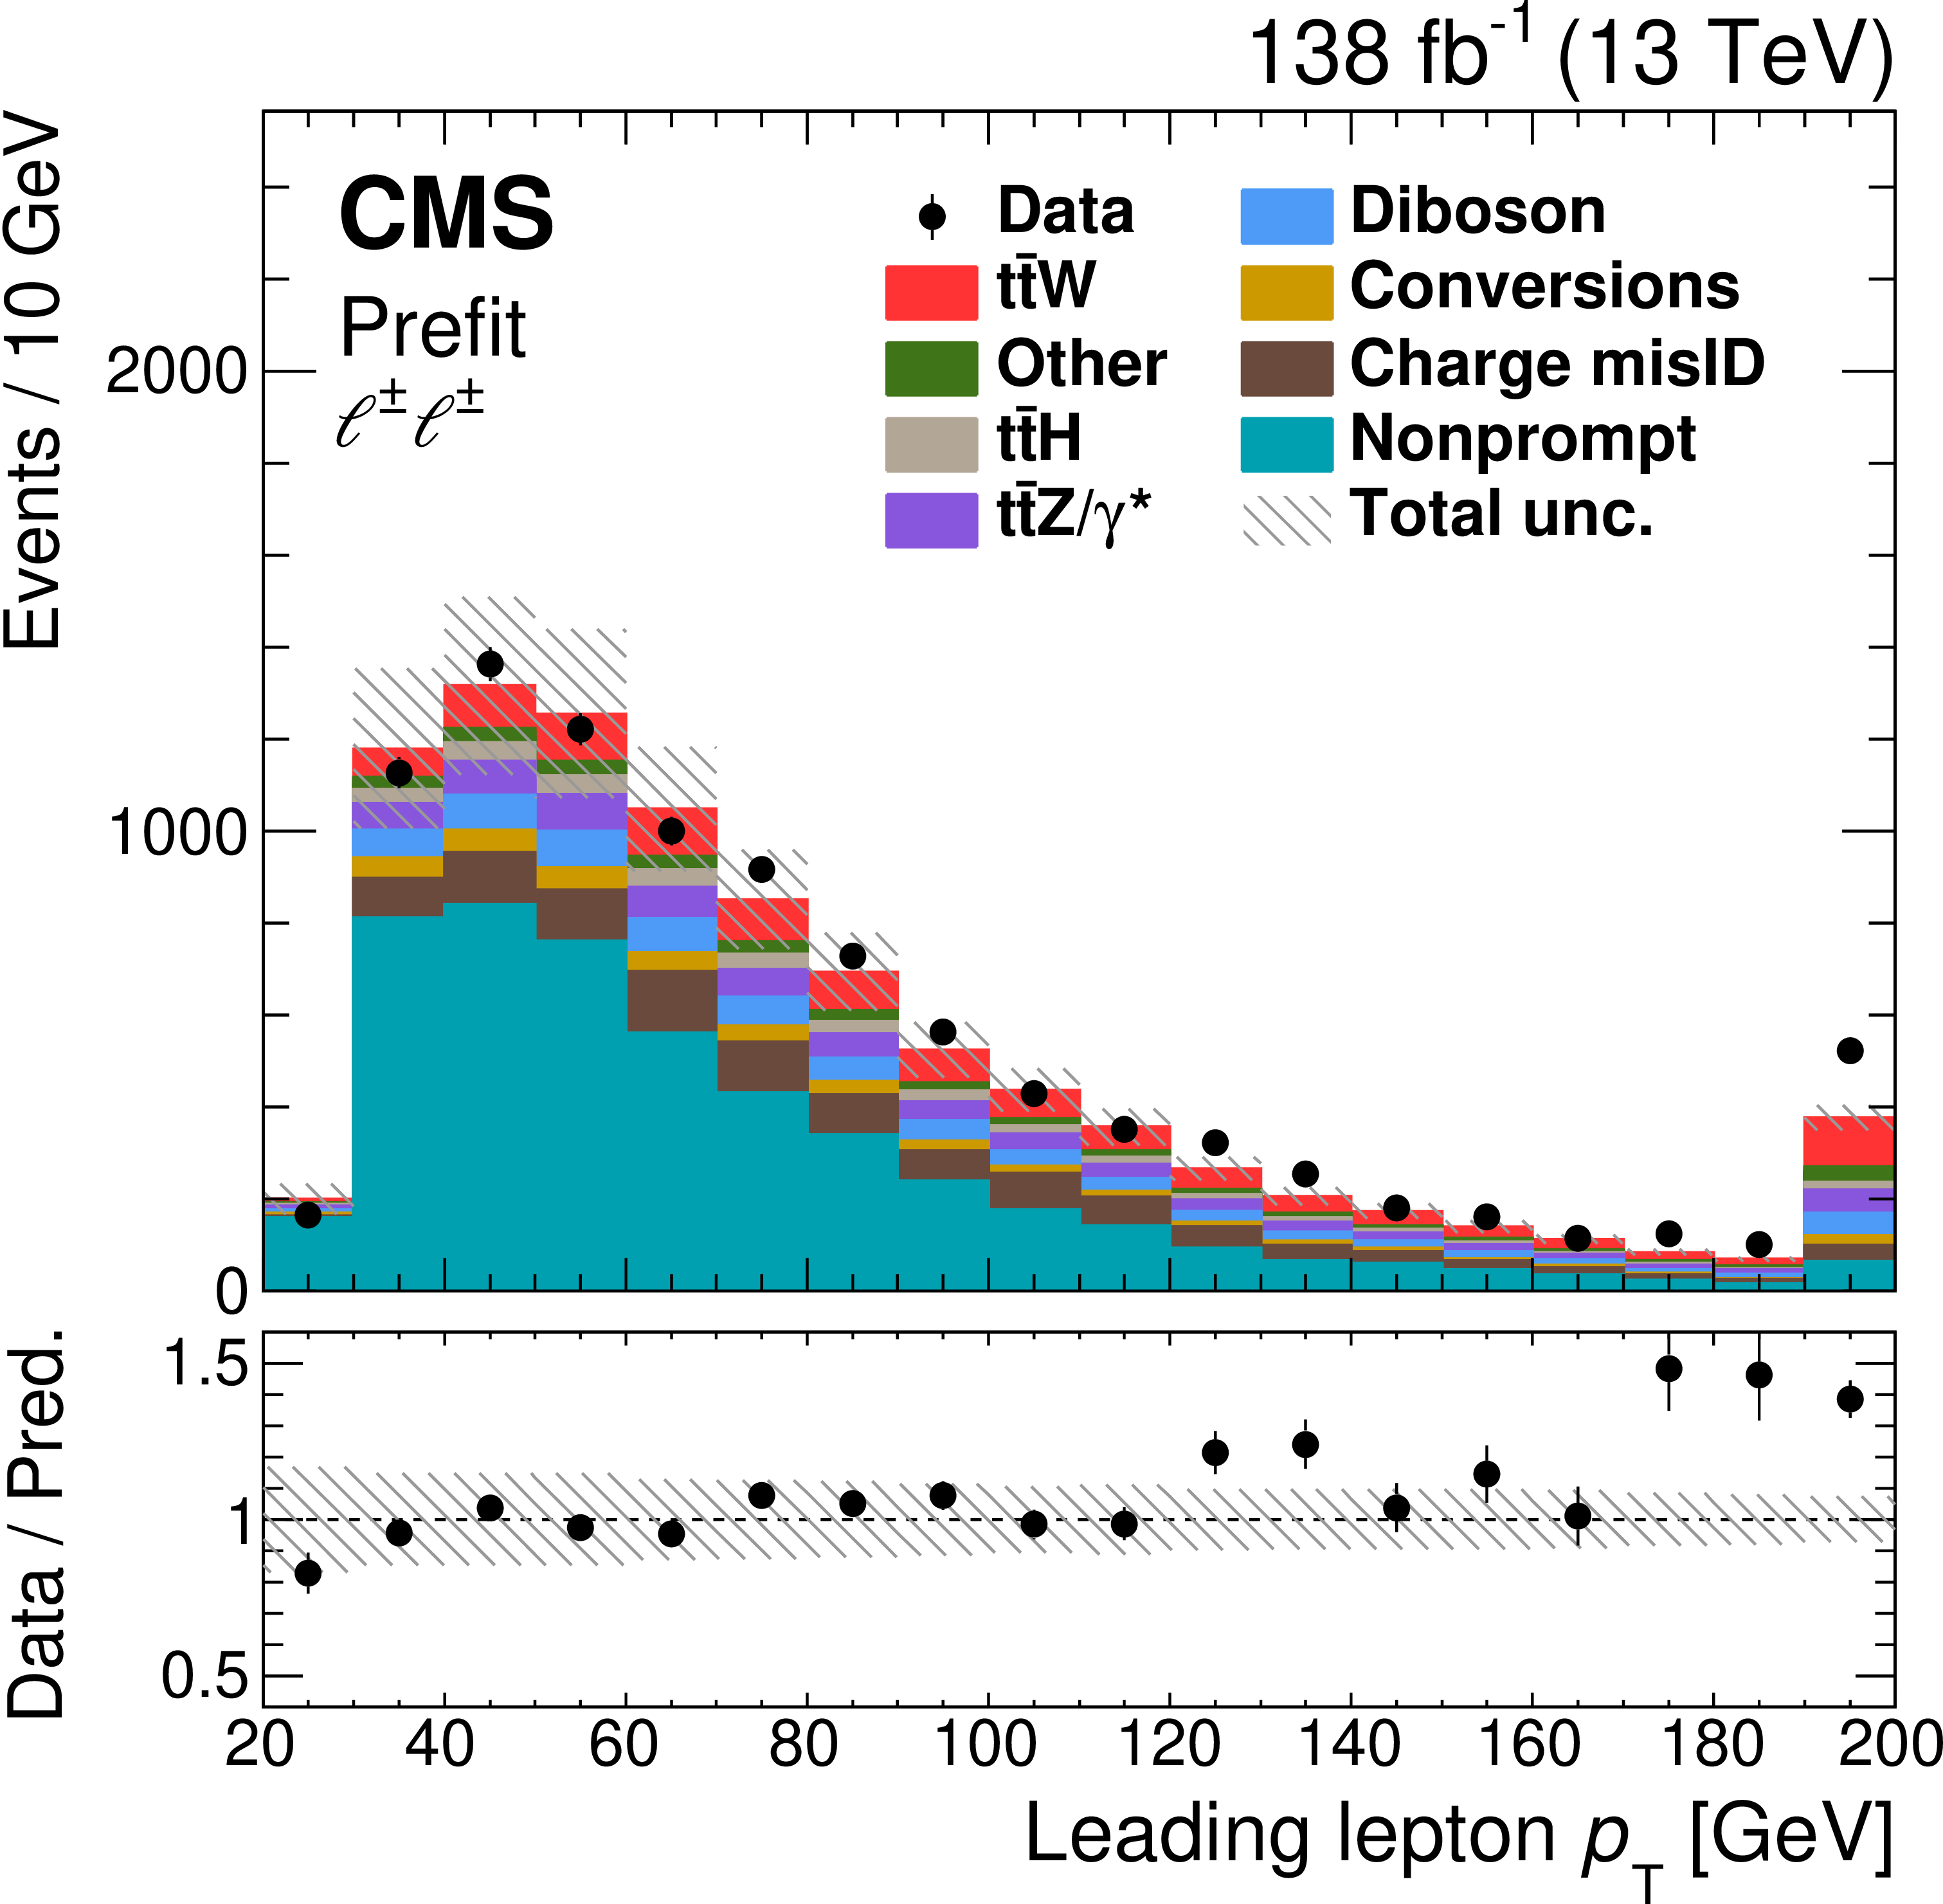
Figure 2-a:
Distribution of the leading lepton ${p_{\mathrm {T}}}$: comparison of the number of observed (points) and predicted (colored histograms) events in the same-sign dilepton signal region. The predictions are shown before the fit to data ("Prefit''). The vertical bars on the points represent the statistical uncertainties in the data, and the hatched bands the systematic uncertainty in the predictions. The last bins include the overflow contributions. In the lower panel, the ratio of the event yields in data to the overall sum of the predictions is presented. |

png pdf |
Figure 2-b:
Distribution of the subleading lepton ${p_{\mathrm {T}}}$: comparison of the number of observed (points) and predicted (colored histograms) events in the same-sign dilepton signal region. The predictions are shown before the fit to data ("Prefit''). The vertical bars on the points represent the statistical uncertainties in the data, and the hatched bands the systematic uncertainty in the predictions. The last bins include the overflow contributions. In the lower panel, the ratio of the event yields in data to the overall sum of the predictions is presented. |
png pdf |
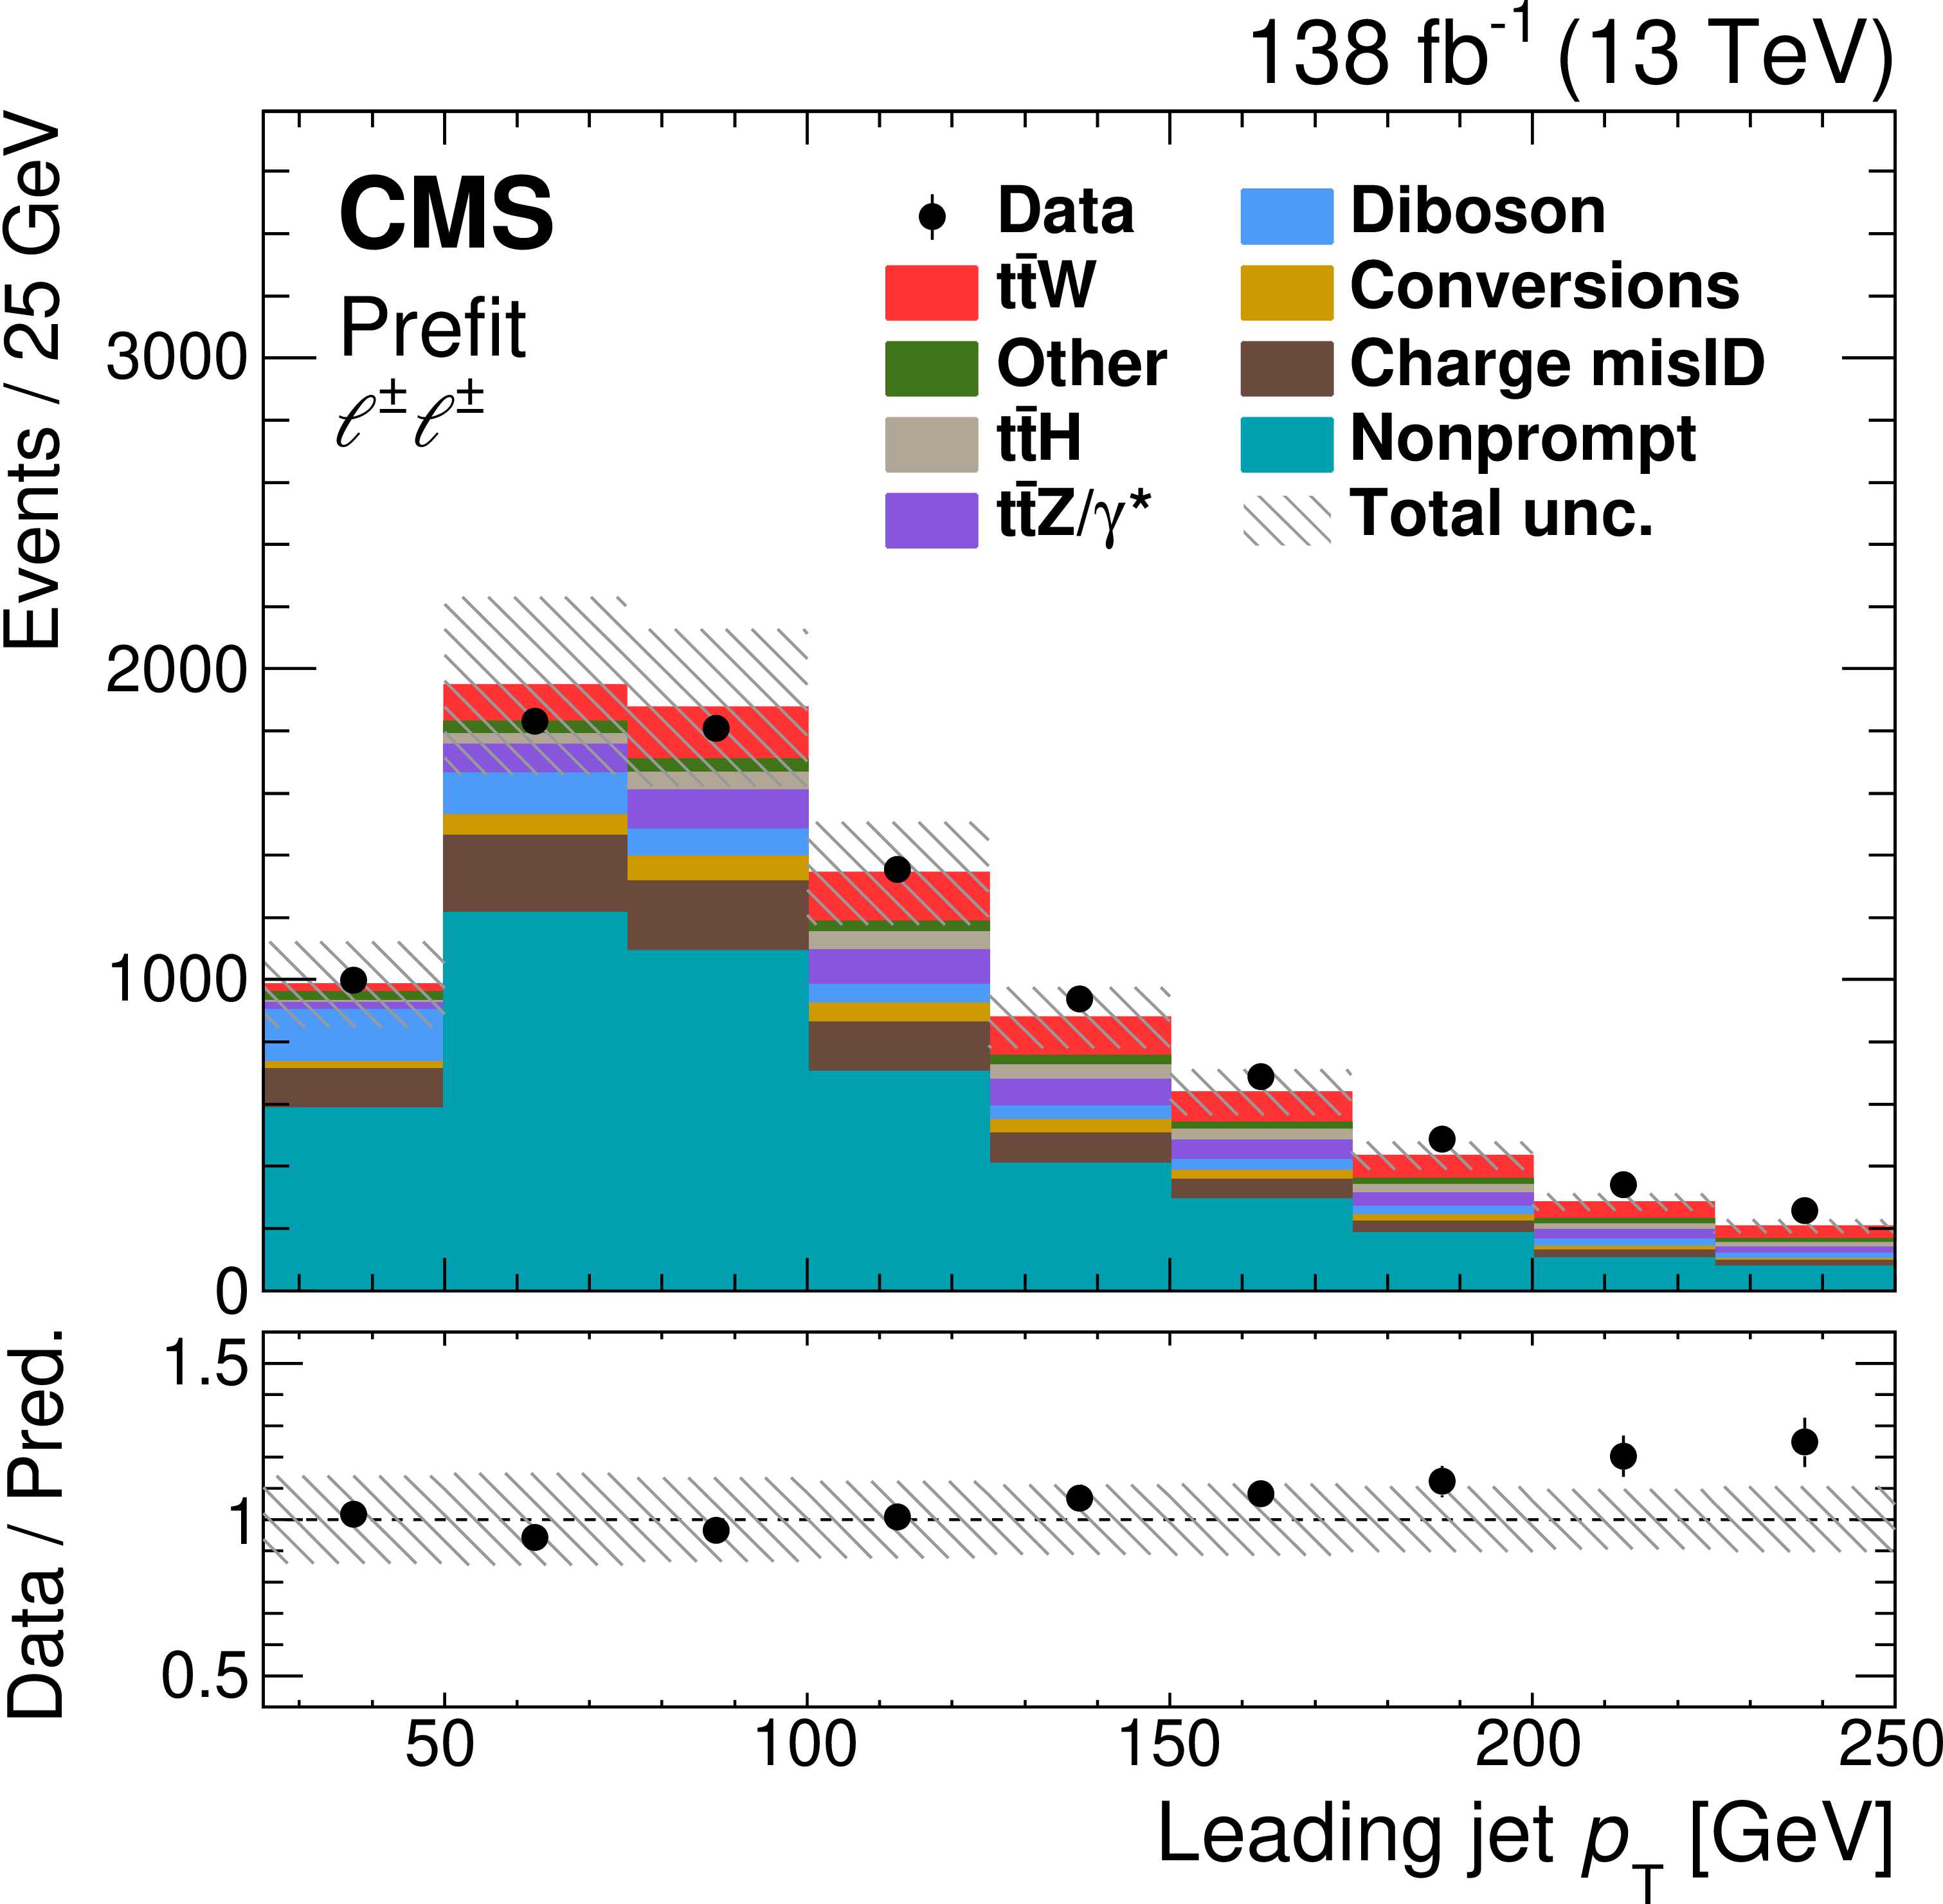
Figure 2-c:
Distribution of the leading jet ${p_{\mathrm {T}}}$: comparison of the number of observed (points) and predicted (colored histograms) events in the same-sign dilepton signal region. The predictions are shown before the fit to data ("Prefit''). The vertical bars on the points represent the statistical uncertainties in the data, and the hatched bands the systematic uncertainty in the predictions. The last bins include the overflow contributions. In the lower panel, the ratio of the event yields in data to the overall sum of the predictions is presented. |
png pdf |
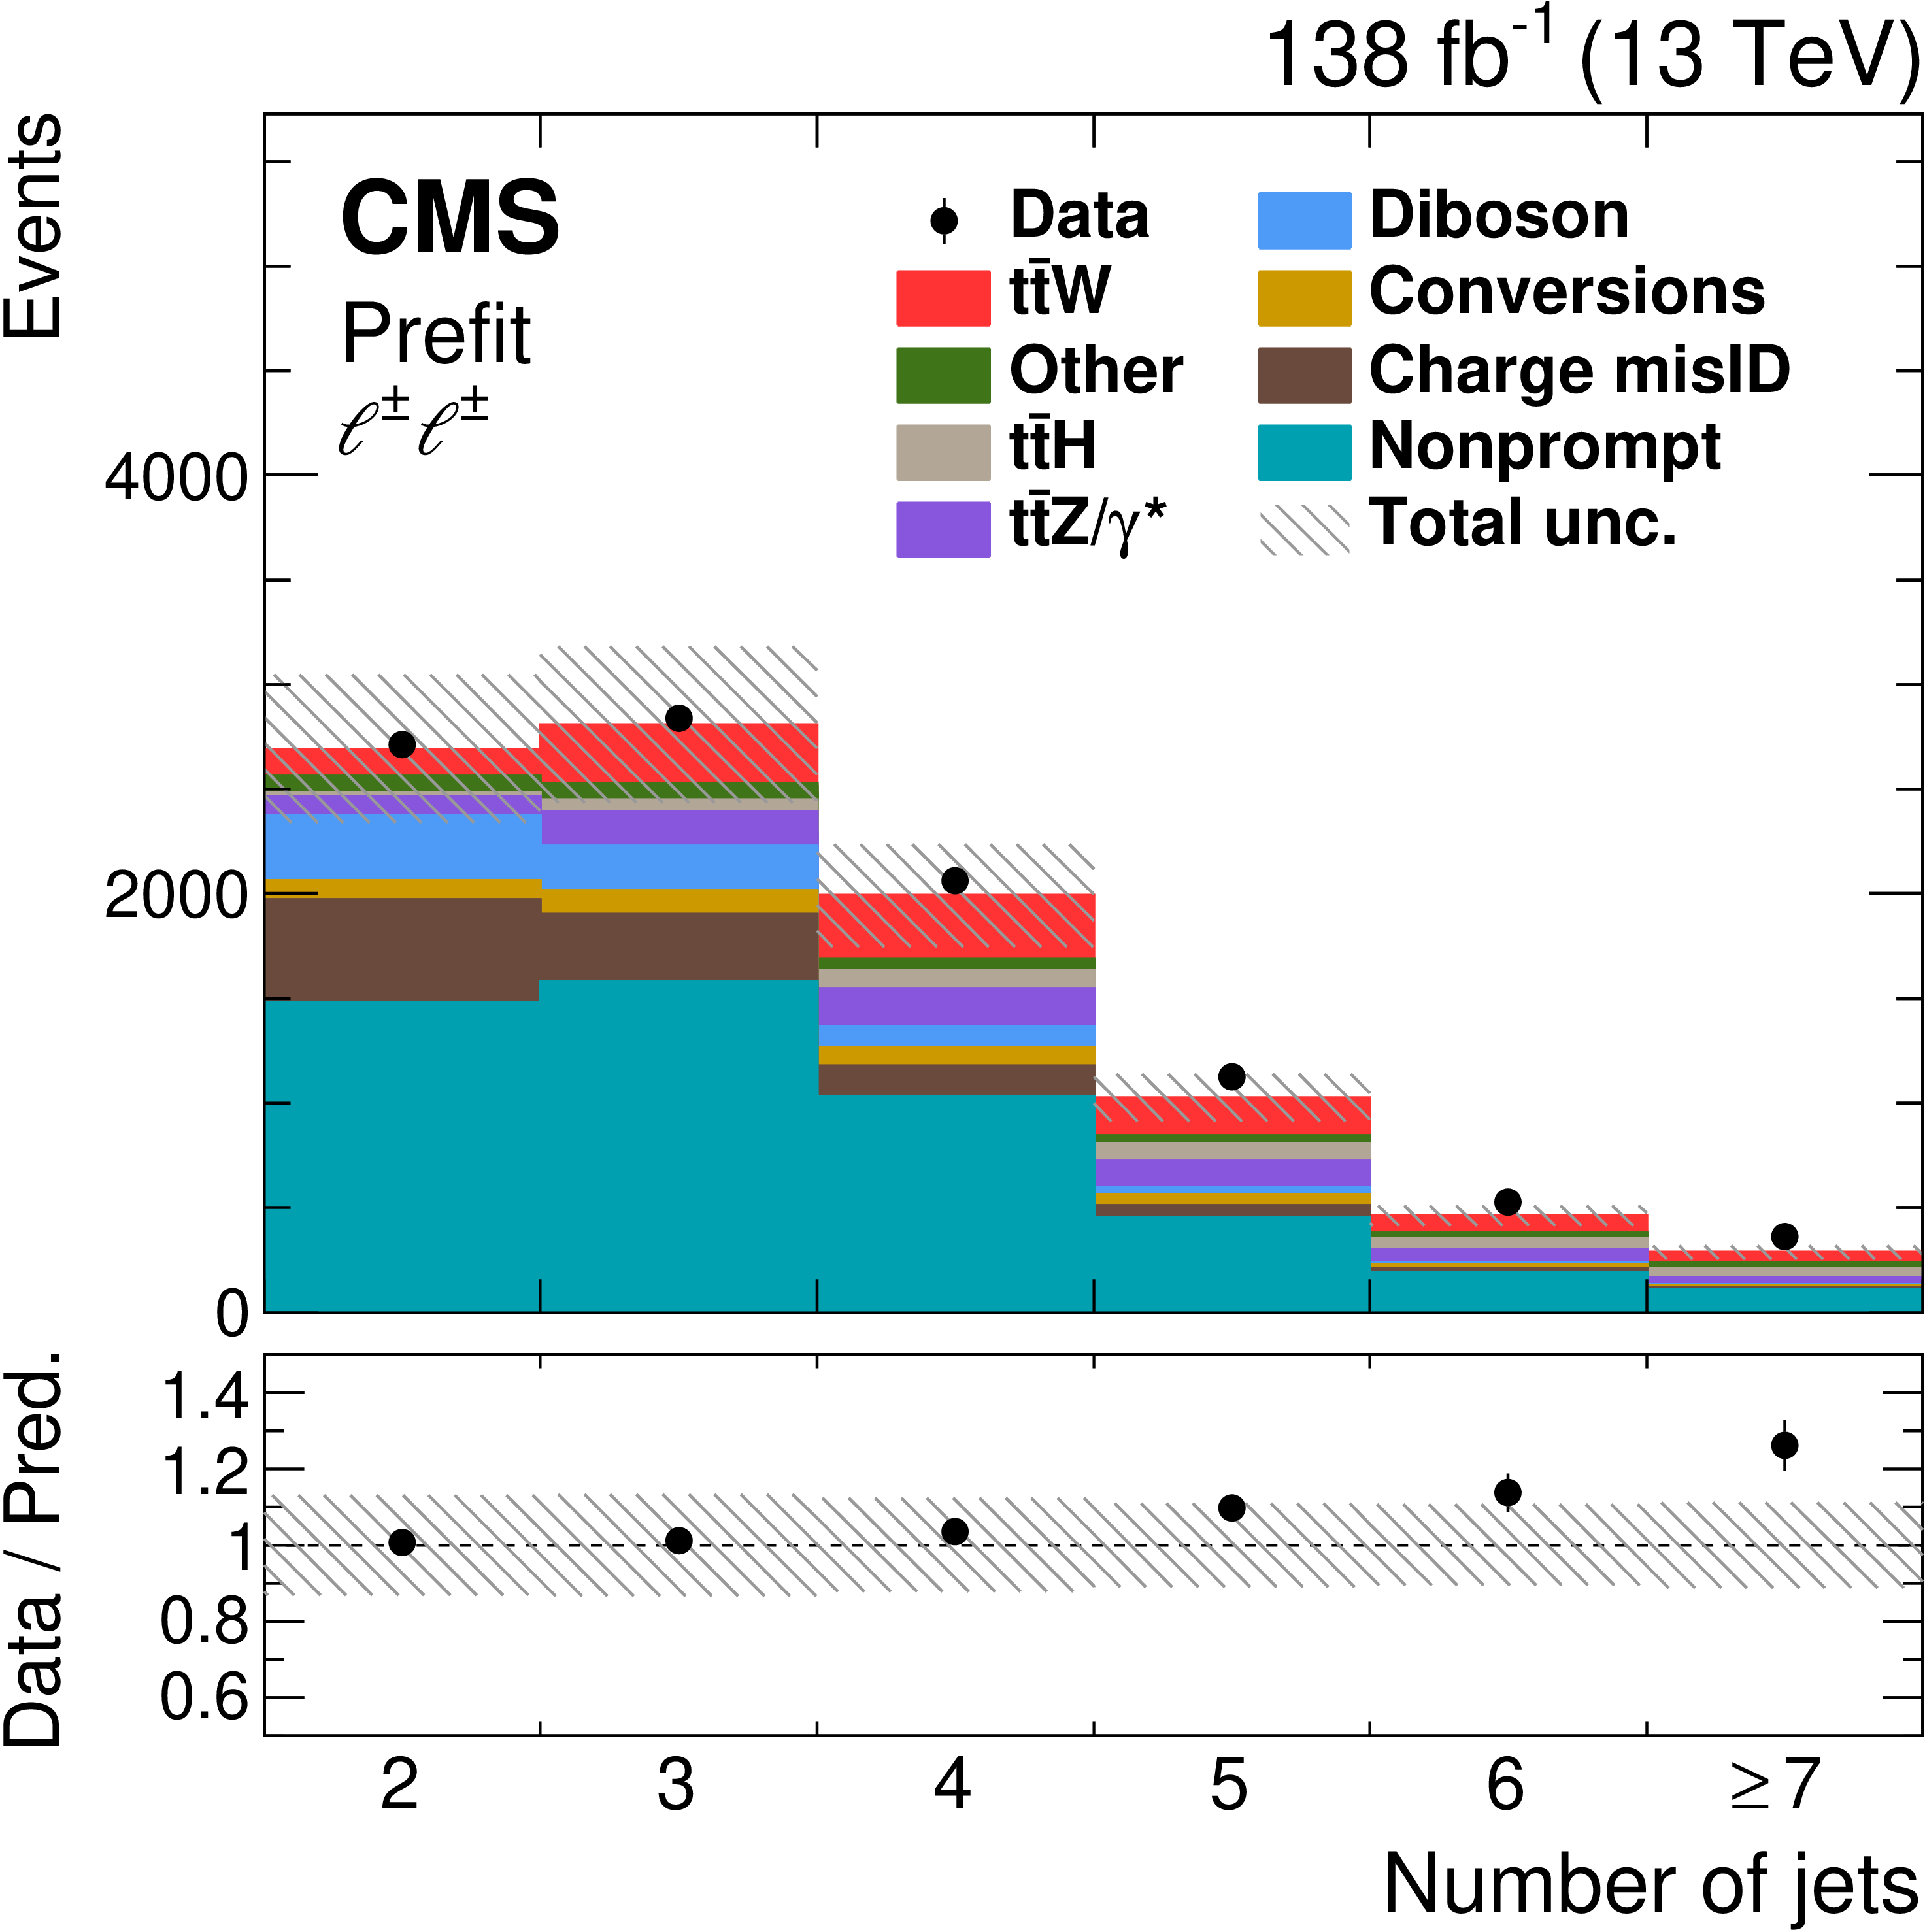
Figure 2-d:
Distribution of the number of jets: comparison of the number of observed (points) and predicted (colored histograms) events in the same-sign dilepton signal region. The predictions are shown before the fit to data ("Prefit''). The vertical bars on the points represent the statistical uncertainties in the data, and the hatched bands the systematic uncertainty in the predictions. The last bins include the overflow contributions. In the lower panel, the ratio of the event yields in data to the overall sum of the predictions is presented. |
png pdf |
Figure 2-e:
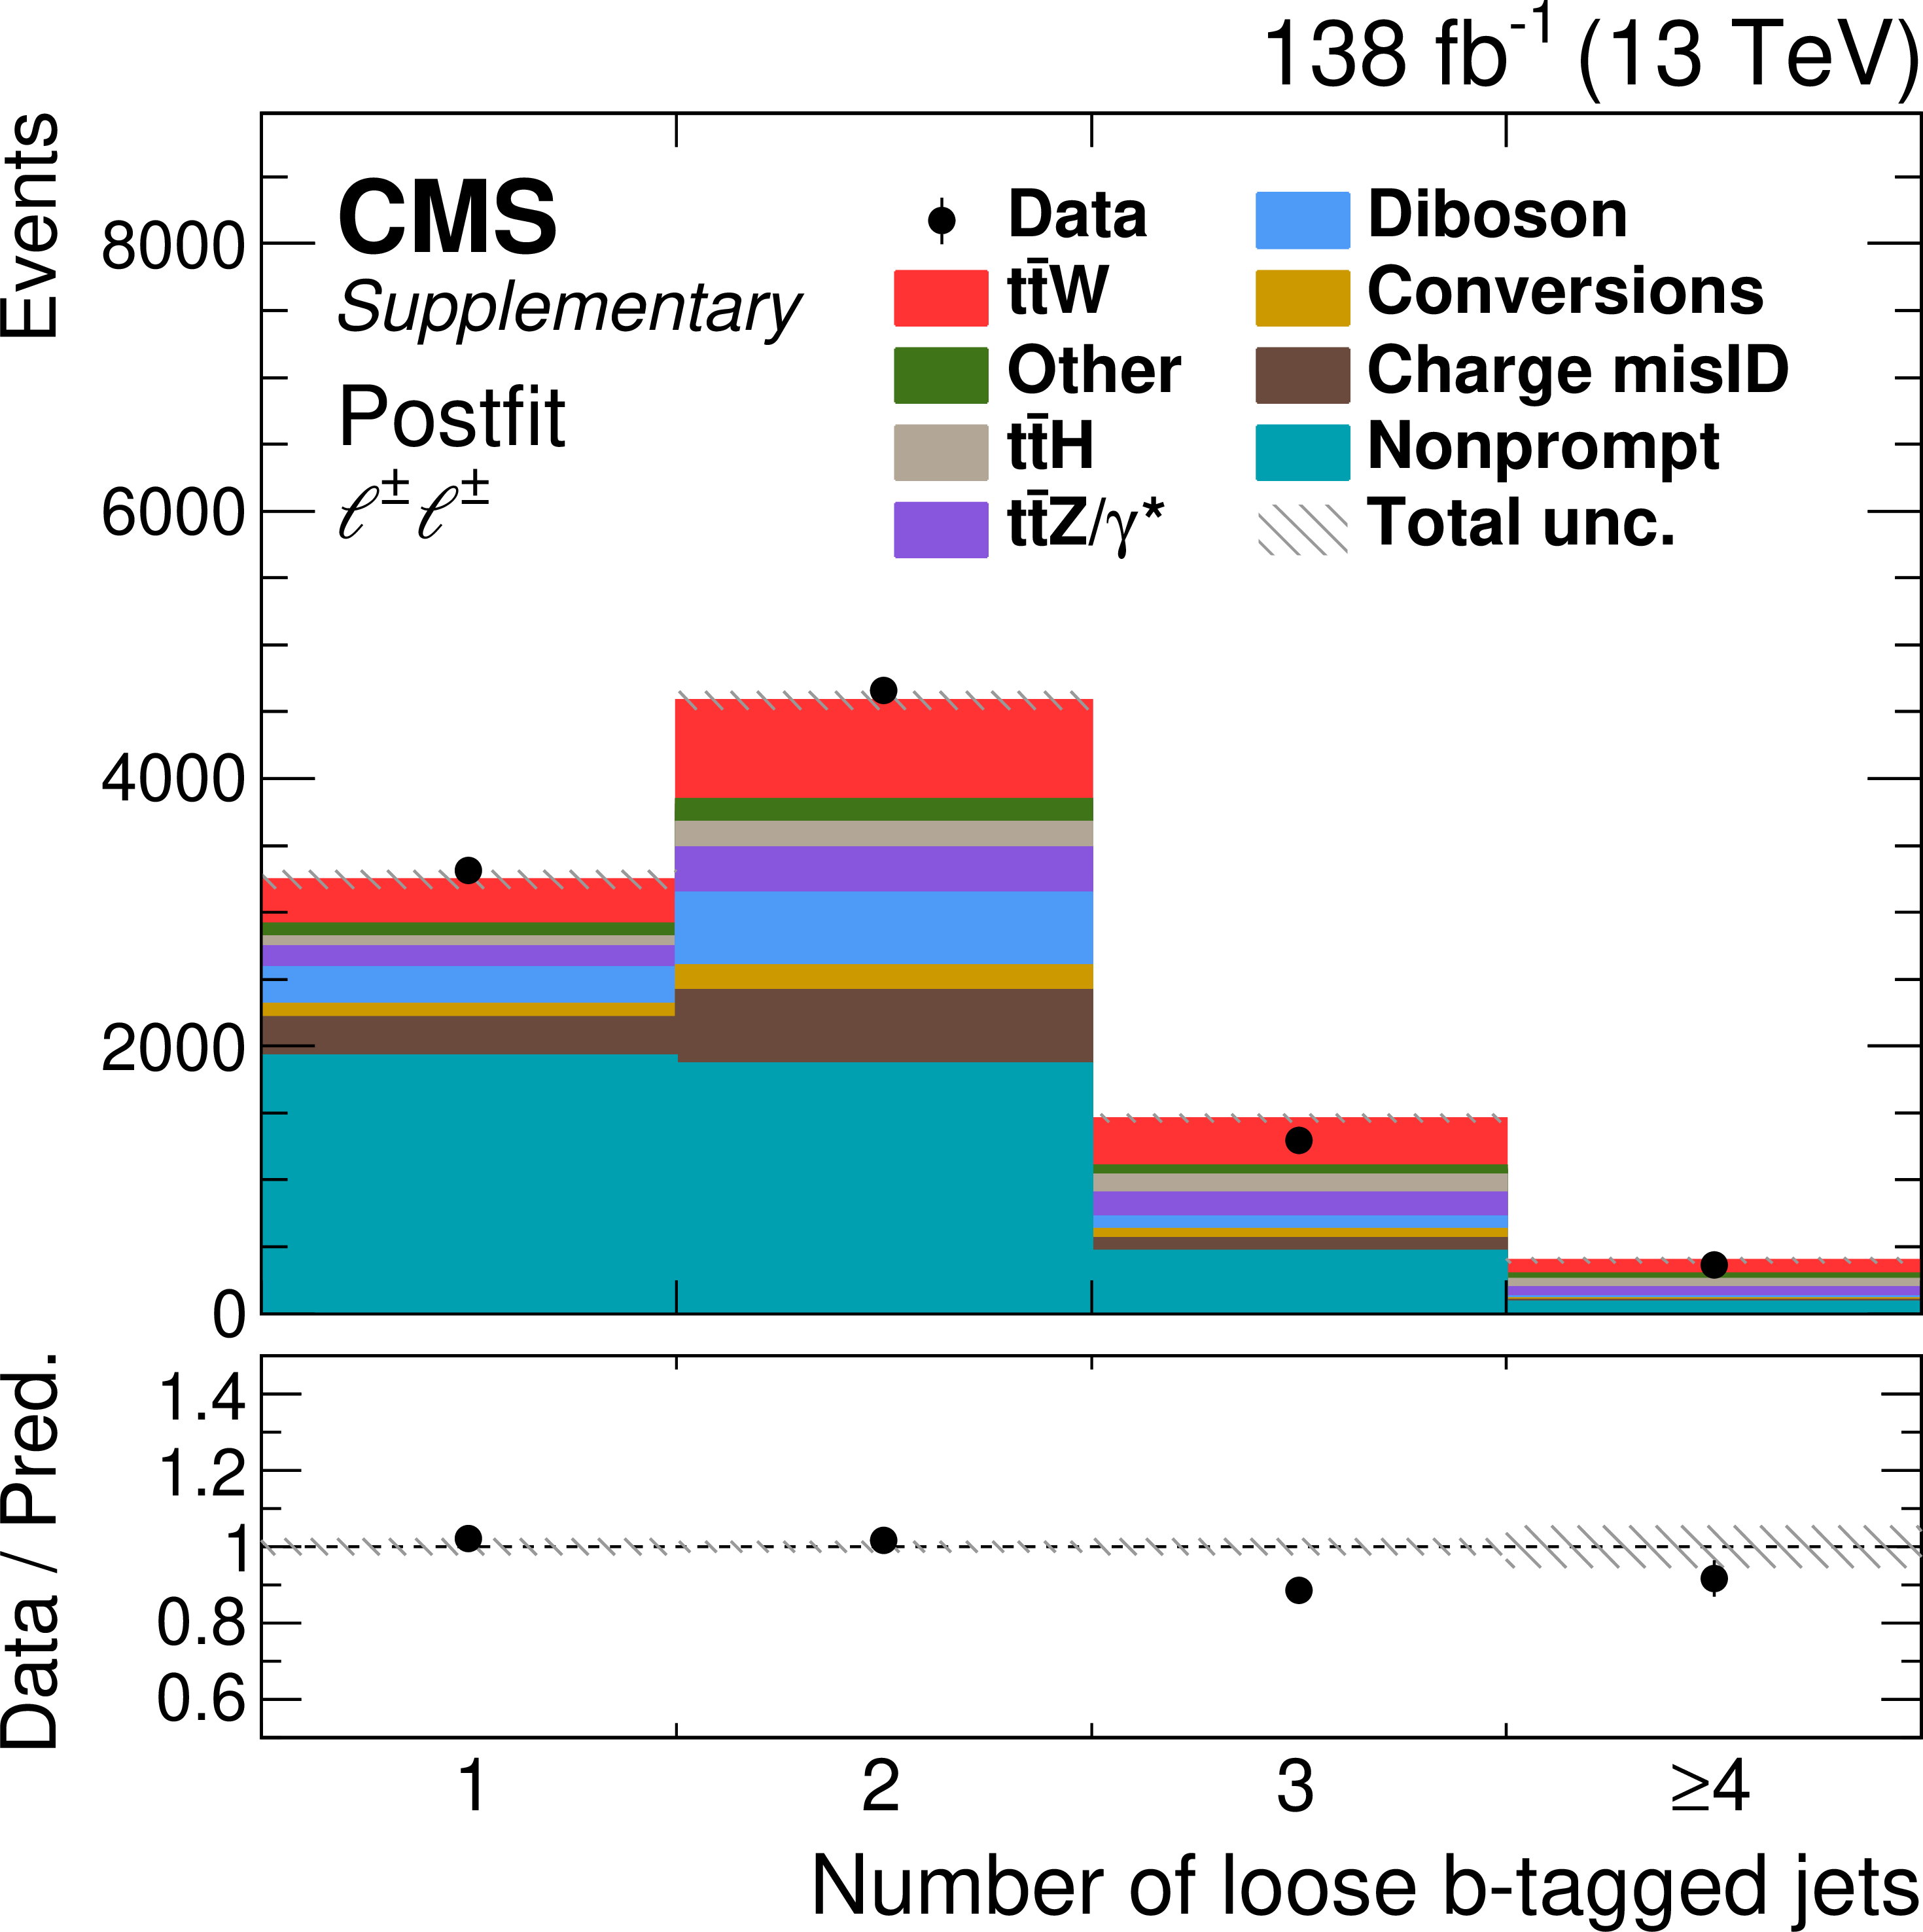
Distribution of the number of loose b-tagged jets: comparison of the number of observed (points) and predicted (colored histograms) events in the same-sign dilepton signal region. The predictions are shown before the fit to data ("Prefit''). The vertical bars on the points represent the statistical uncertainties in the data, and the hatched bands the systematic uncertainty in the predictions. The last bins include the overflow contributions. In the lower panel, the ratio of the event yields in data to the overall sum of the predictions is presented. |
png pdf |
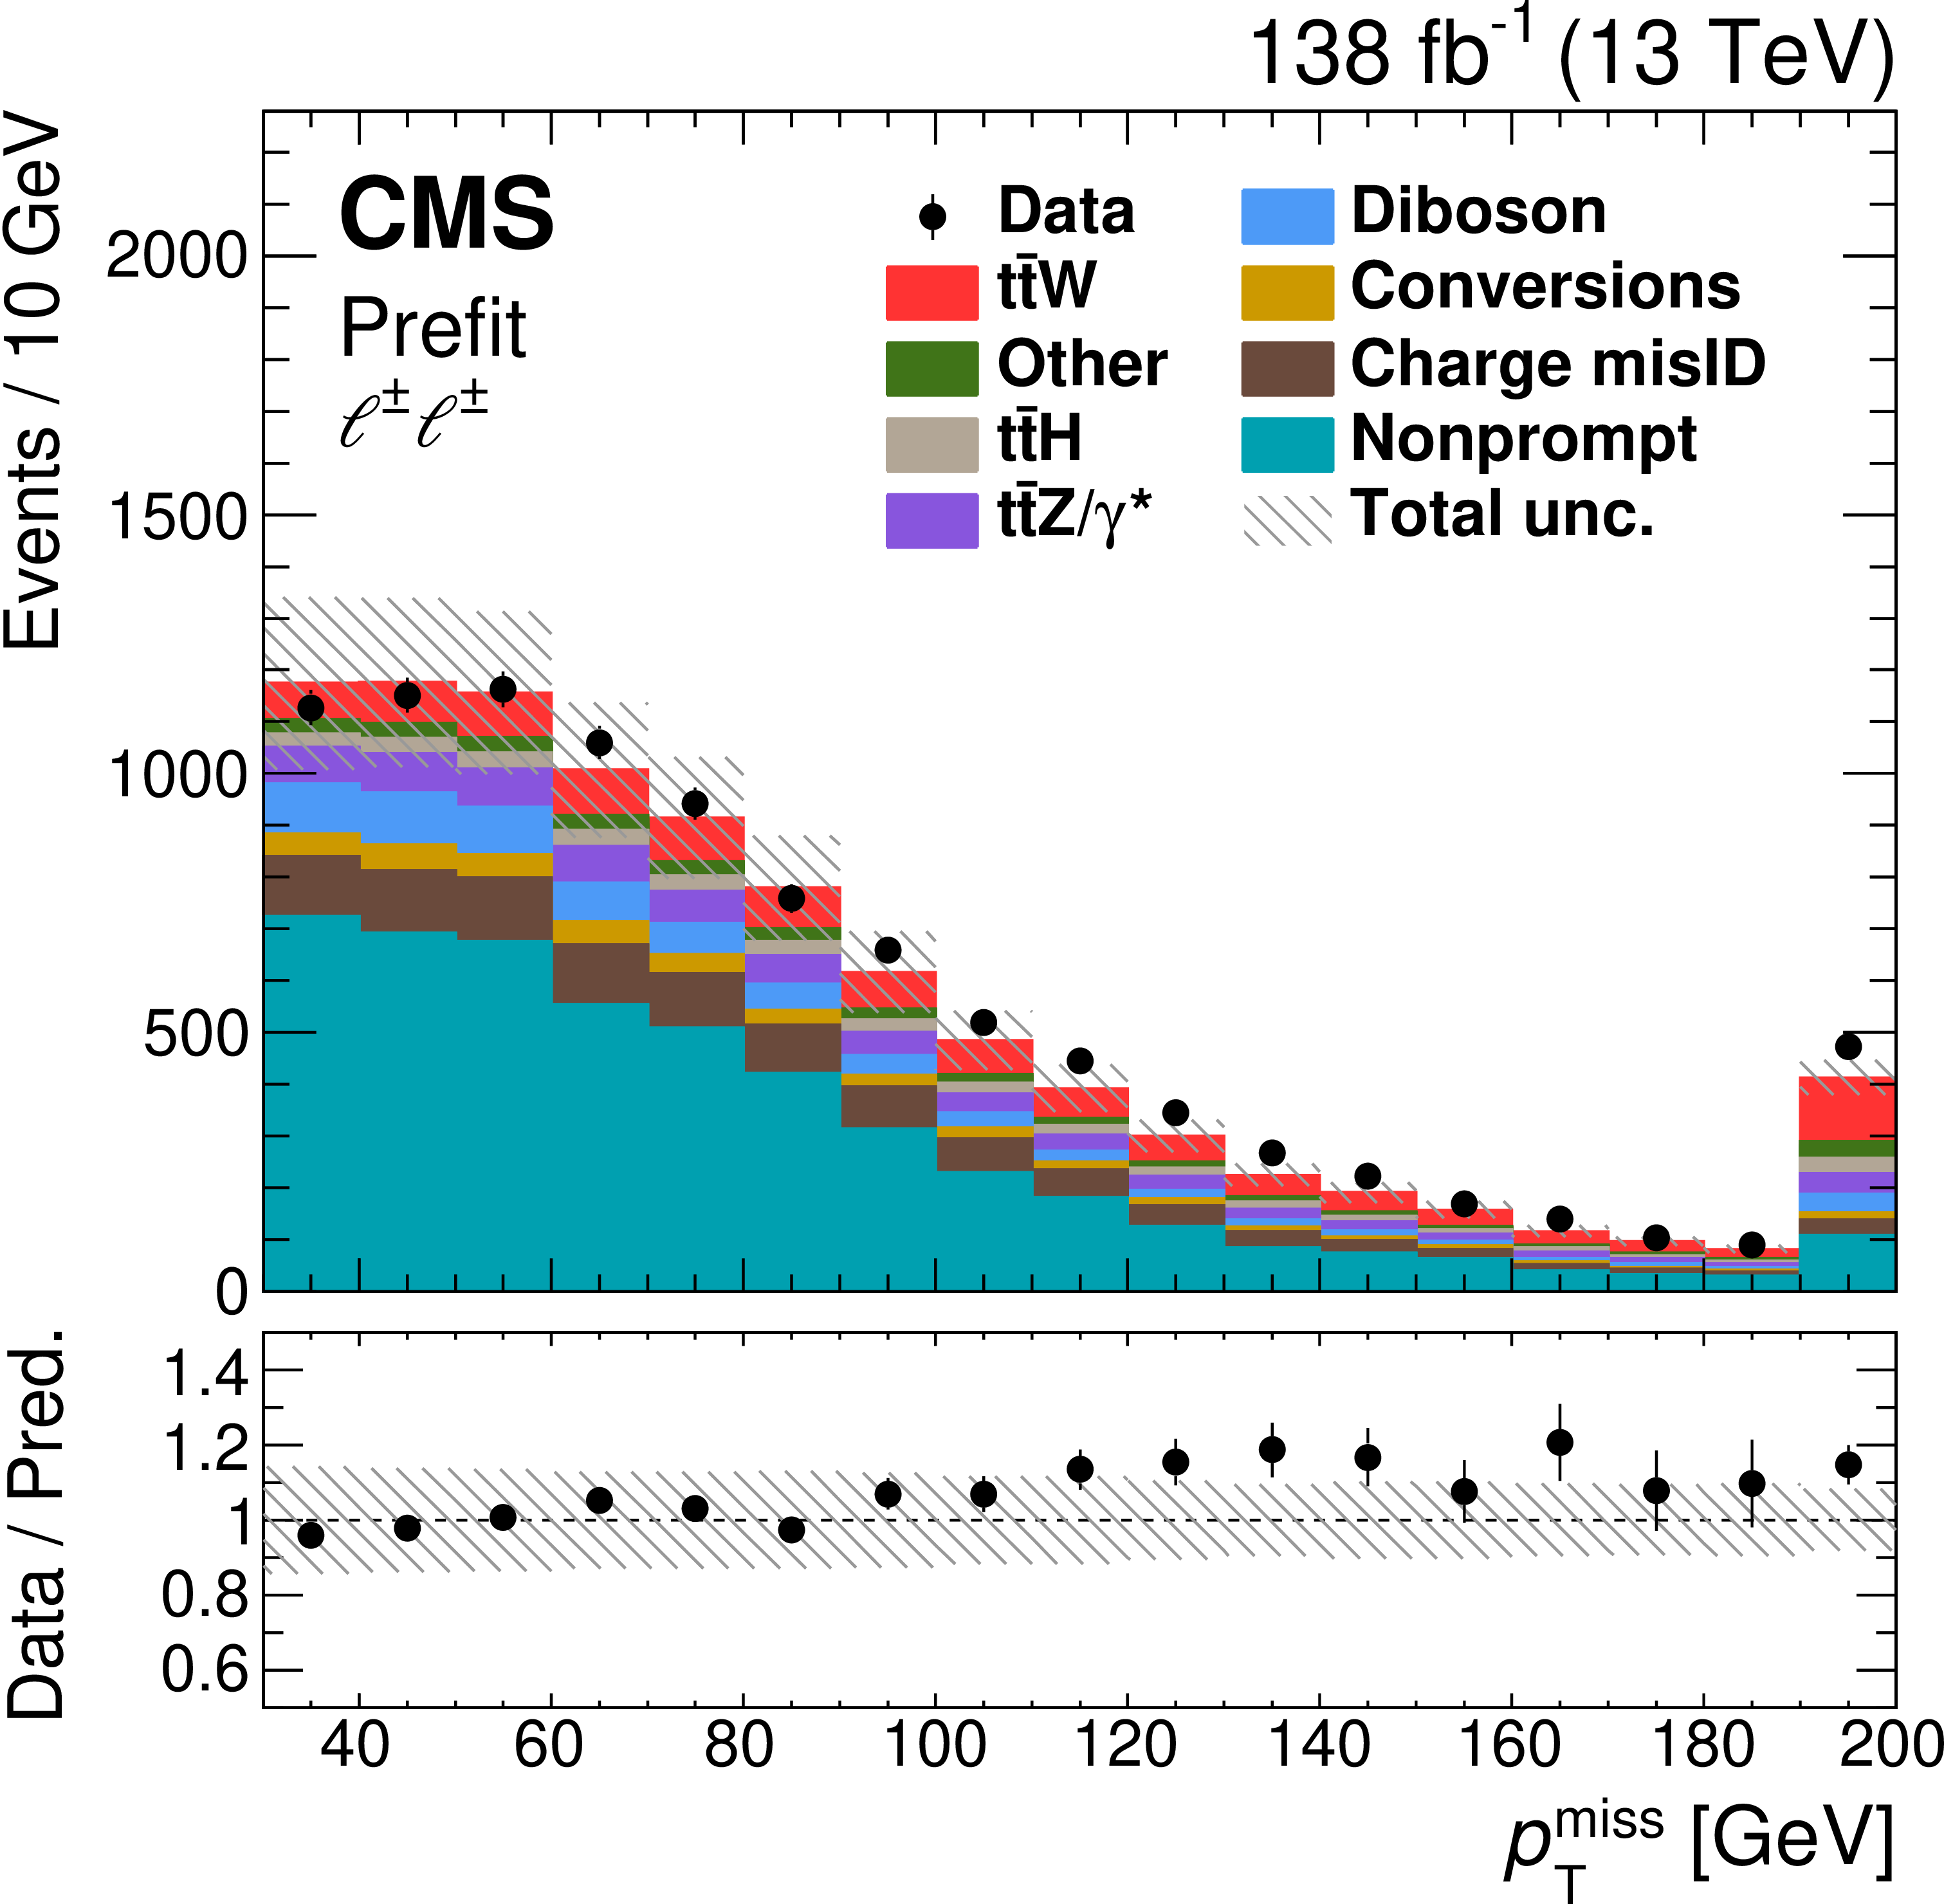
Figure 2-f:
Distribution of ${{p_{\mathrm {T}}} ^\text {miss}}$: comparison of the number of observed (points) and predicted (colored histograms) events in the same-sign dilepton signal region. The predictions are shown before the fit to data ("Prefit''). The vertical bars on the points represent the statistical uncertainties in the data, and the hatched bands the systematic uncertainty in the predictions. The last bins include the overflow contributions. In the lower panel, the ratio of the event yields in data to the overall sum of the predictions is presented. |
png pdf |
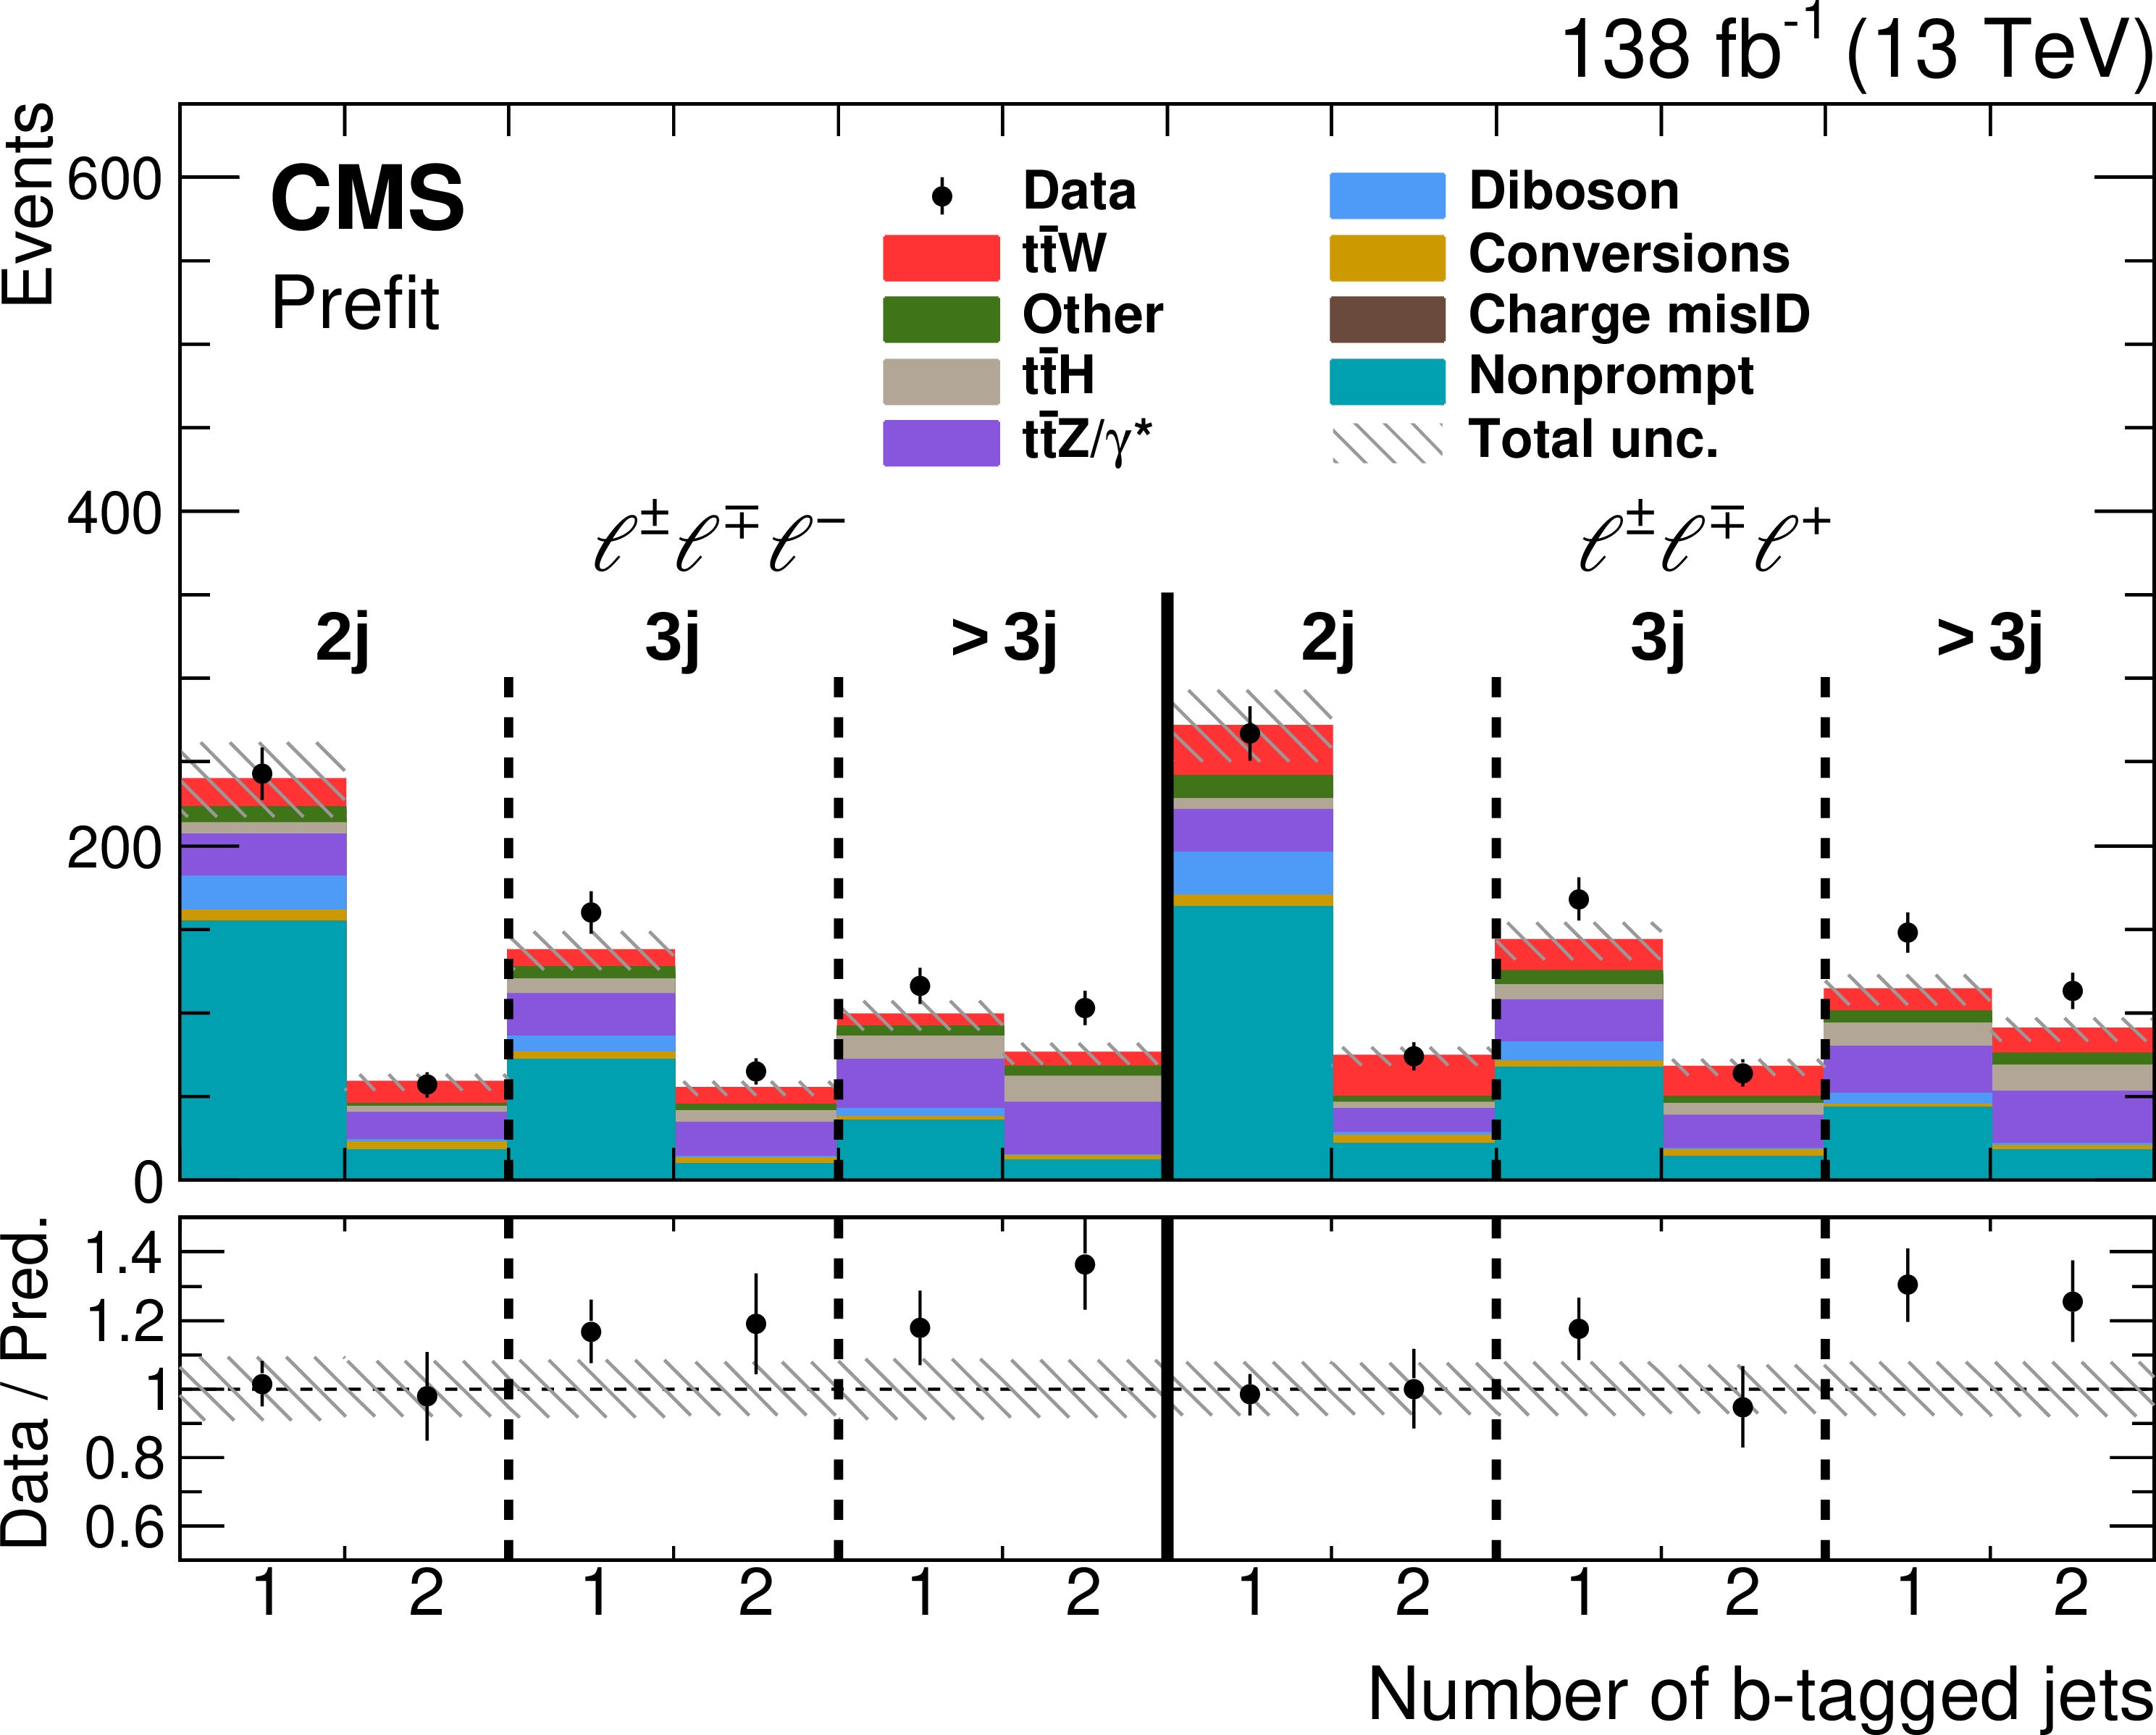
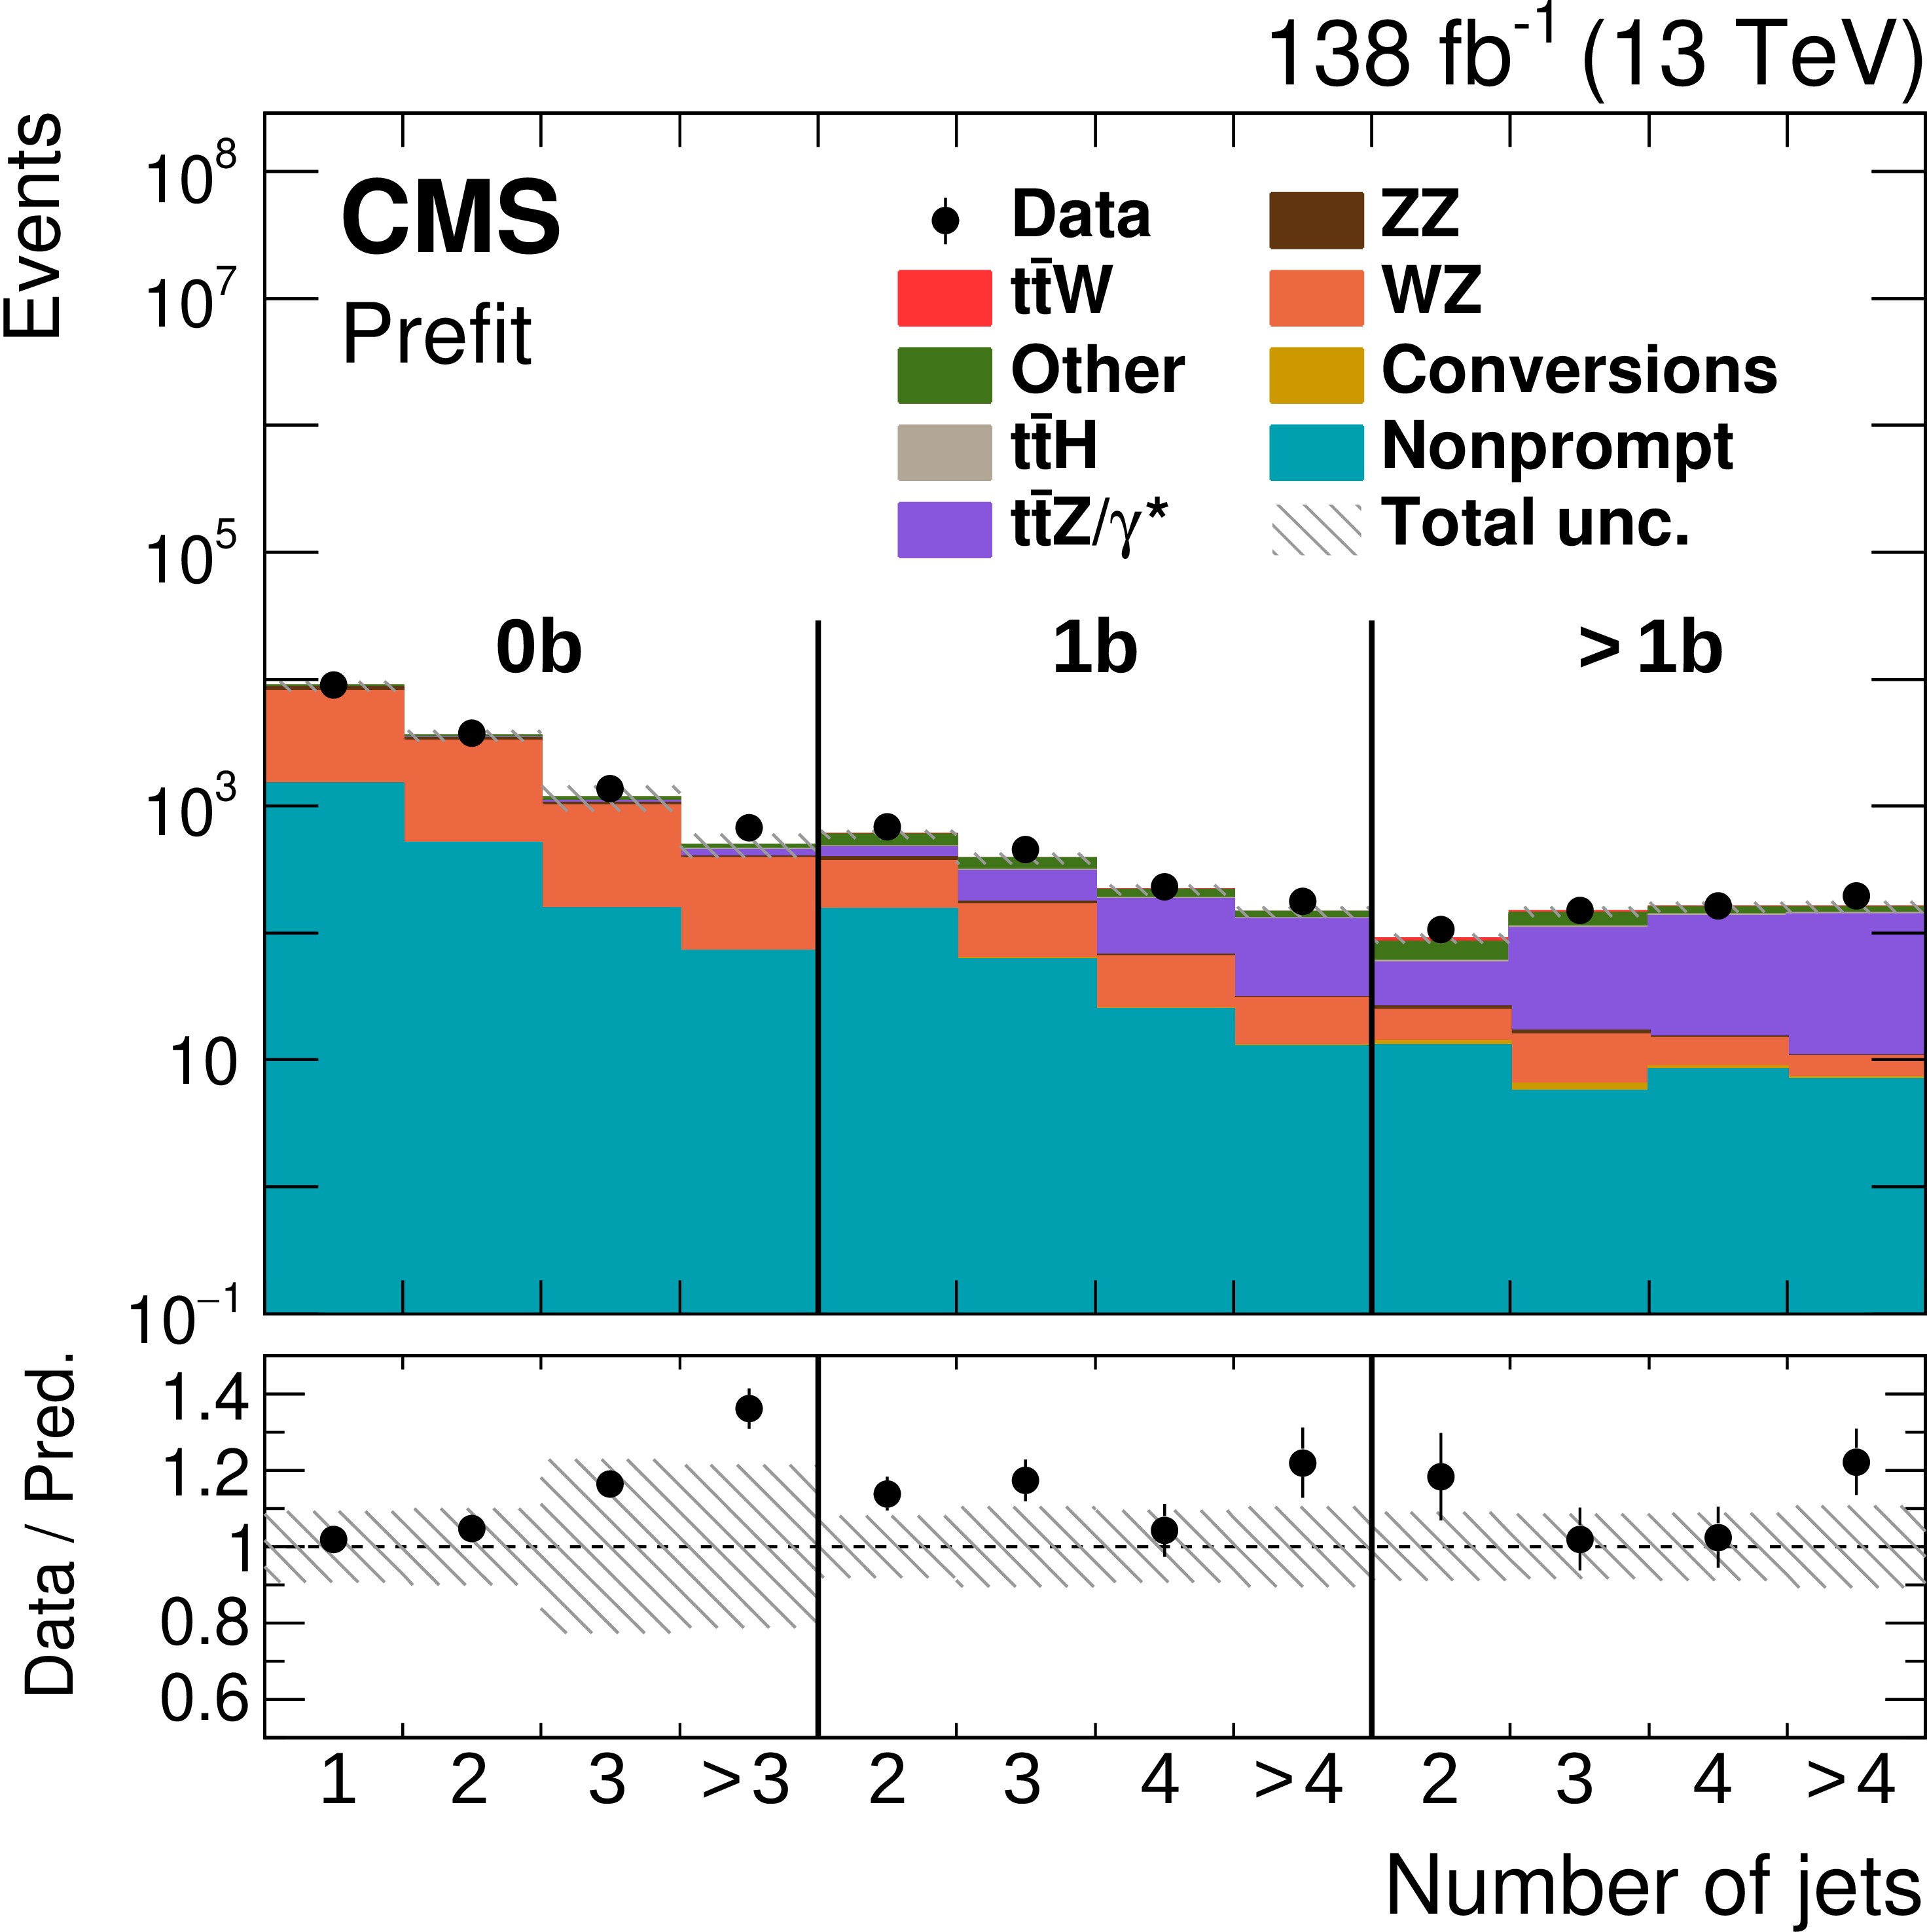
Figure 3:
Distribution of the number of medium b-tagged jets per event from data (points) and prediction (colored histograms) for events in the trilepton signal region with different numbers of jets (j). Events with total trilepton charge $-$1 and $+$1 are shown in the left and right halves of the plot, respectively. The predictions are shown before the fit to data ("Prefit''). The vertical bars on the points represent the statistical uncertainties in the data, and the hatched bands the systematic uncertainty in the predictions. The lower panel shows the ratio of the event yields in data to the overall sum of the predictions. |
png pdf |
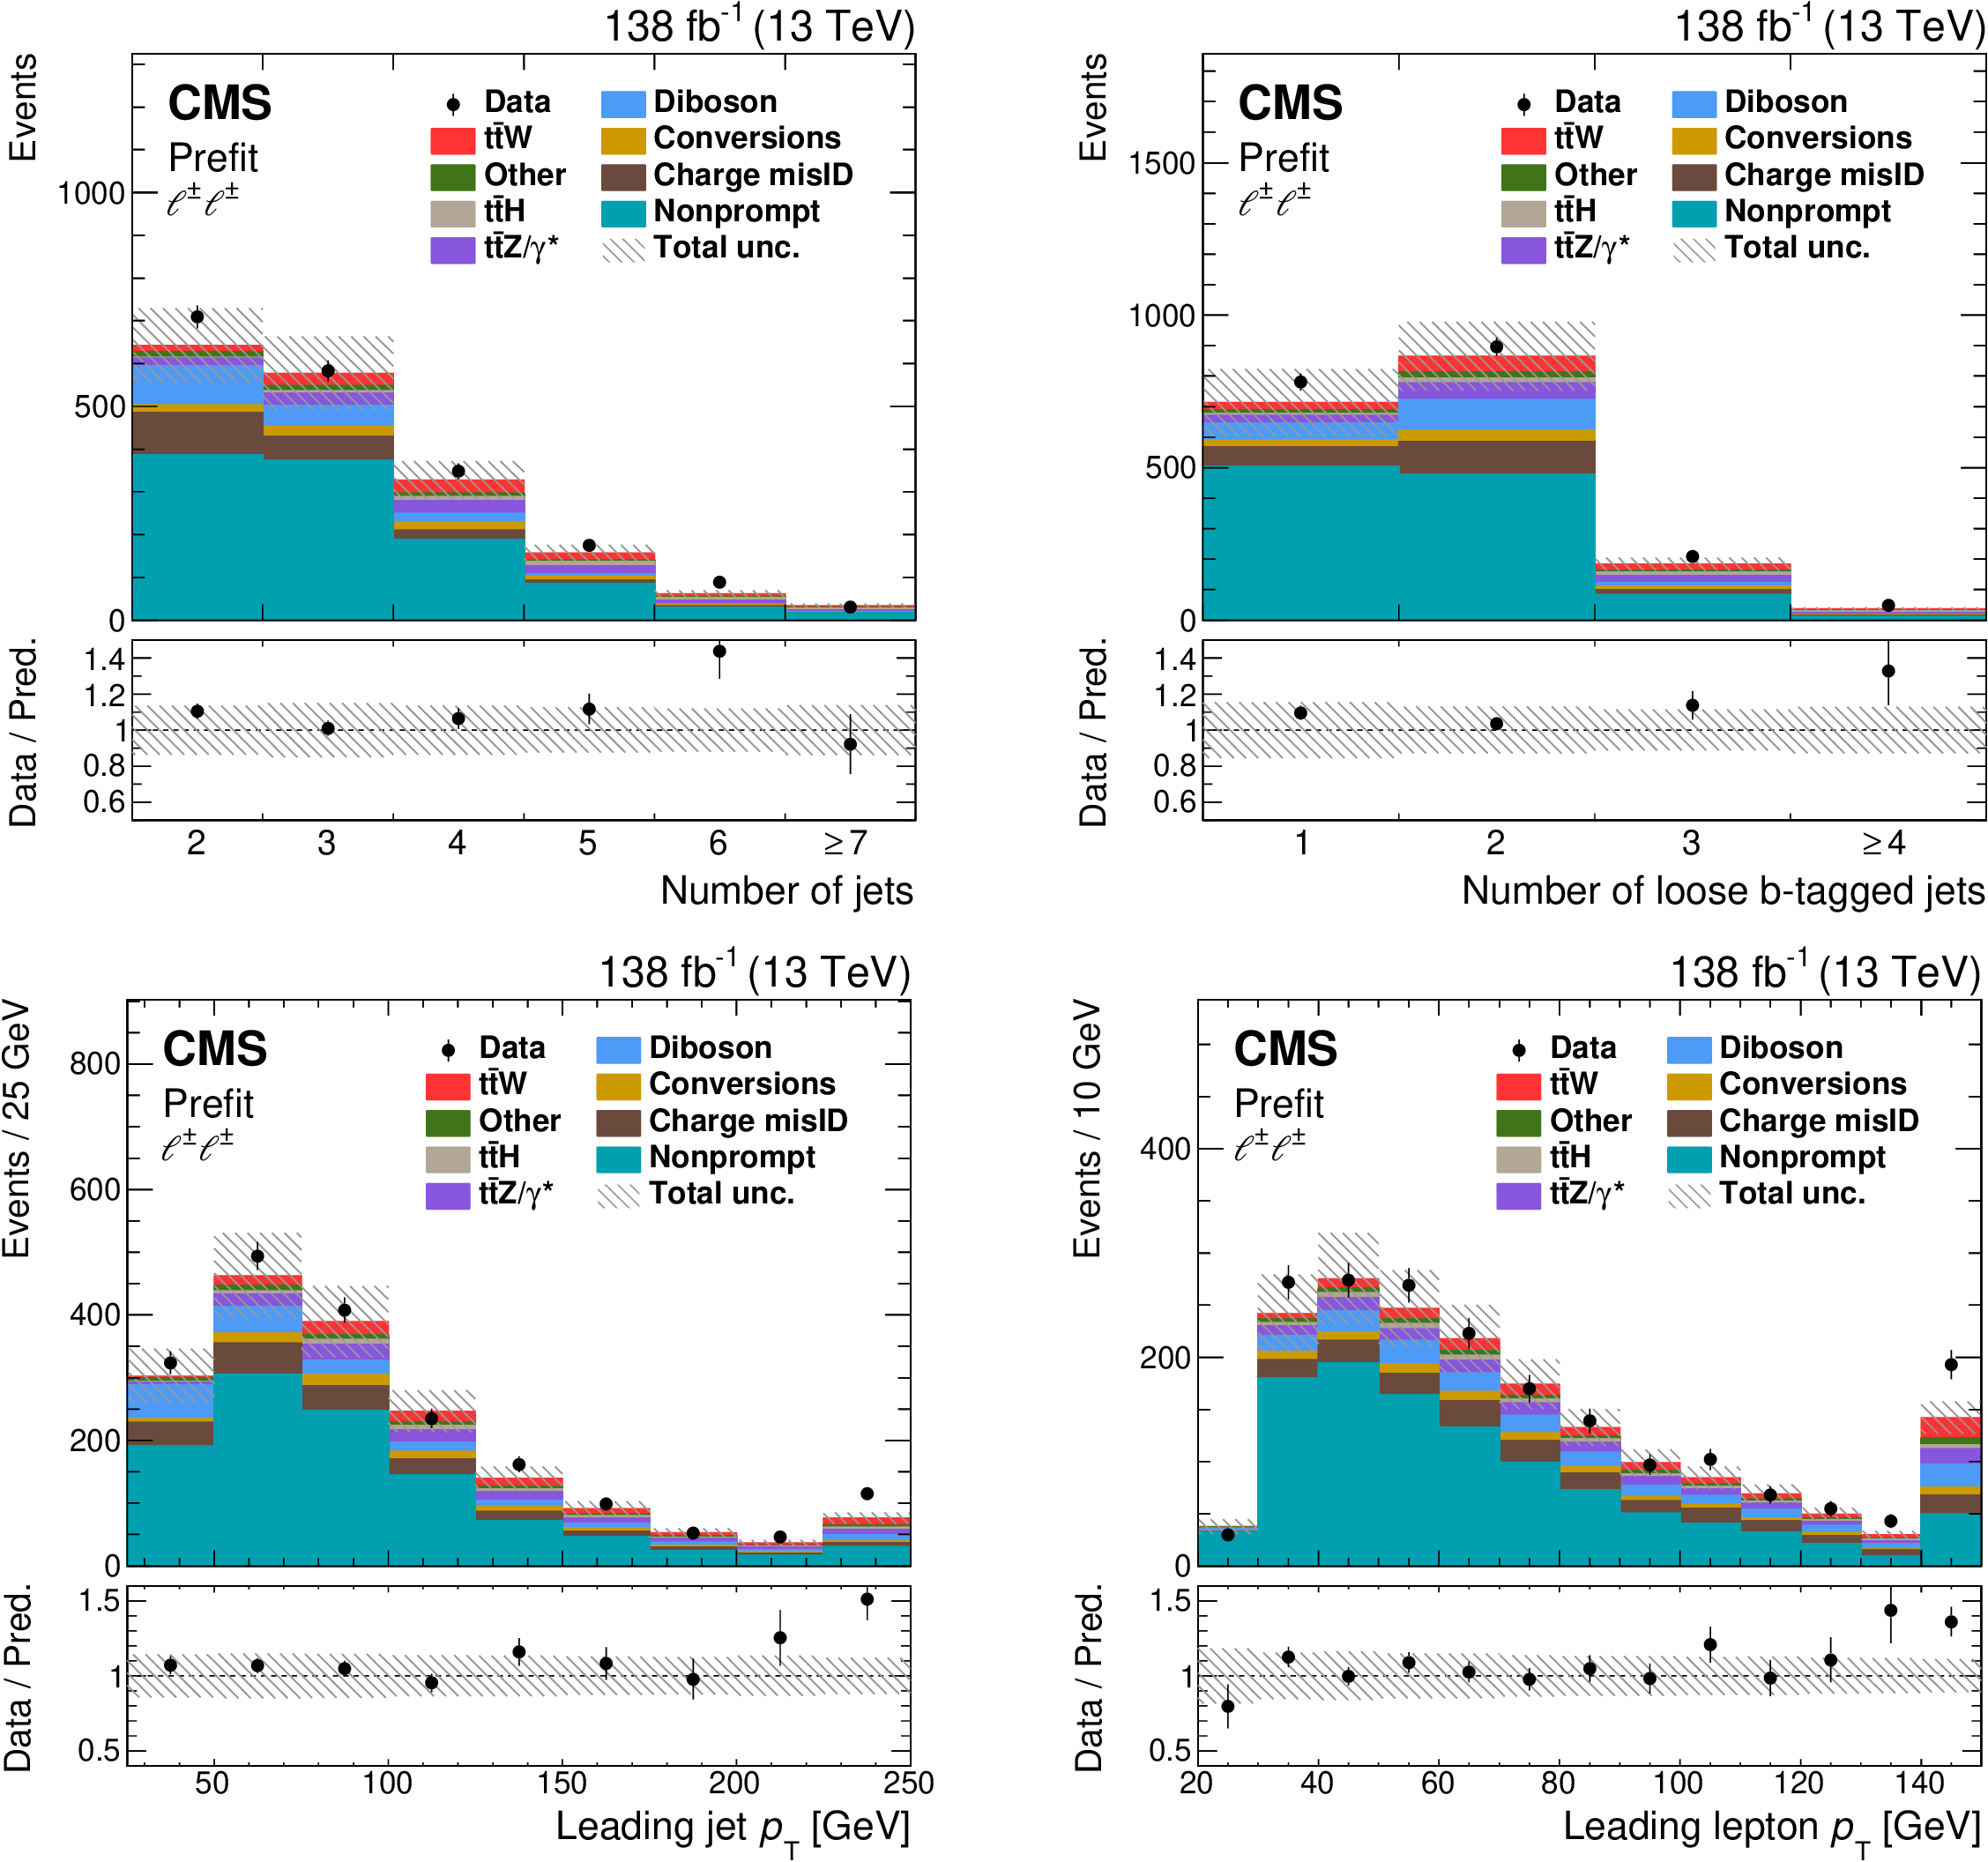
Figure 4:
Comparison of the number of observed (points) and predicted (colored histograms) events in the validation region for nonprompt leptons. The distributions of the number of jets (upper left) and loose b-tagged jets (upper right), and of the ${p_{\mathrm {T}}}$ of the leading jet (lower left) and of the leading lepton (lower right) are displayed. The predictions are shown before the fit to data ("Prefit''). The vertical bars on the points represent the statistical uncertainties in the data, and the hatched bands the systematic uncertainty in the predictions. The last bins include the overflow contributions. In the lower panels, the ratio of the event yields in data to the overall sum of the predictions is presented. |
png pdf |
Figure 4-a:
Distribution of the number of jets: comparison of the number of observed (points) and predicted (colored histograms) events in the validation region for nonprompt leptons. The predictions are shown before the fit to data ("Prefit''). The vertical bars on the points represent the statistical uncertainties in the data, and the hatched bands the systematic uncertainty in the predictions. The last bins include the overflow contributions. In the lower panel, the ratio of the event yields in data to the overall sum of the predictions is presented. |
png pdf |
Figure 4-b:
Distribution of the number of loose b-tagged jets: comparison of the number of observed (points) and predicted (colored histograms) events in the validation region for nonprompt leptons. The predictions are shown before the fit to data ("Prefit''). The vertical bars on the points represent the statistical uncertainties in the data, and the hatched bands the systematic uncertainty in the predictions. The last bins include the overflow contributions. In the lower panel, the ratio of the event yields in data to the overall sum of the predictions is presented. |
png pdf |
Figure 4-c:
Distribution of the ${p_{\mathrm {T}}}$ of the leading jet: comparison of the number of observed (points) and predicted (colored histograms) events in the validation region for nonprompt leptons. The predictions are shown before the fit to data ("Prefit''). The vertical bars on the points represent the statistical uncertainties in the data, and the hatched bands the systematic uncertainty in the predictions. The last bins include the overflow contributions. In the lower panel, the ratio of the event yields in data to the overall sum of the predictions is presented. |
png pdf |
Figure 4-d:
Distribution of the ${p_{\mathrm {T}}}$ of the leading lepton: comparison of the number of observed (points) and predicted (colored histograms) events in the validation region for nonprompt leptons. The predictions are shown before the fit to data ("Prefit''). The vertical bars on the points represent the statistical uncertainties in the data, and the hatched bands the systematic uncertainty in the predictions. The last bins include the overflow contributions. In the lower panel, the ratio of the event yields in data to the overall sum of the predictions is presented. |
png pdf |
Figure 5:
The distributions of the number of jets in events from the control region enriched in WZ and ${\mathrm{t} {}\mathrm{\bar{t}}}$Z production from data (points) and prediction (colored histograms). The events are divided into three groups depending on the number of medium b-tagged jets b in the event. The predictions are shown before the fit to data ("Prefit''). The vertical bars on the points represent the statistical uncertainties in the data, and the hatched bands the systematic uncertainty in the predictions. In the lower panels, the ratio of the event yields in data to the overall sum of the predictions is presented. |

png pdf |
Figure 6:
Distribution of the number of jets j and medium b-tagged jets b in events from the control region enriched in ZZ and ${\mathrm{t} {}\mathrm{\bar{t}}}$Z events for data (points) and prediction (colored histograms). Events in the first bin have two Z boson candidates (2Z ) and events in the other bins have exactly one Z boson candidate (1Z). The predictions are shown before the fit to data ("Prefit''). The small contribution from background processes with nonprompt leptons is estimated from simulated event samples. The vertical bars on the points represent the statistical uncertainties in the data, and the hatched bands the systematic uncertainty in the predictions. In the lower panels, the ratio of the event yields in data to the overall sum of the predictions is presented. |
png pdf |
Figure 7:
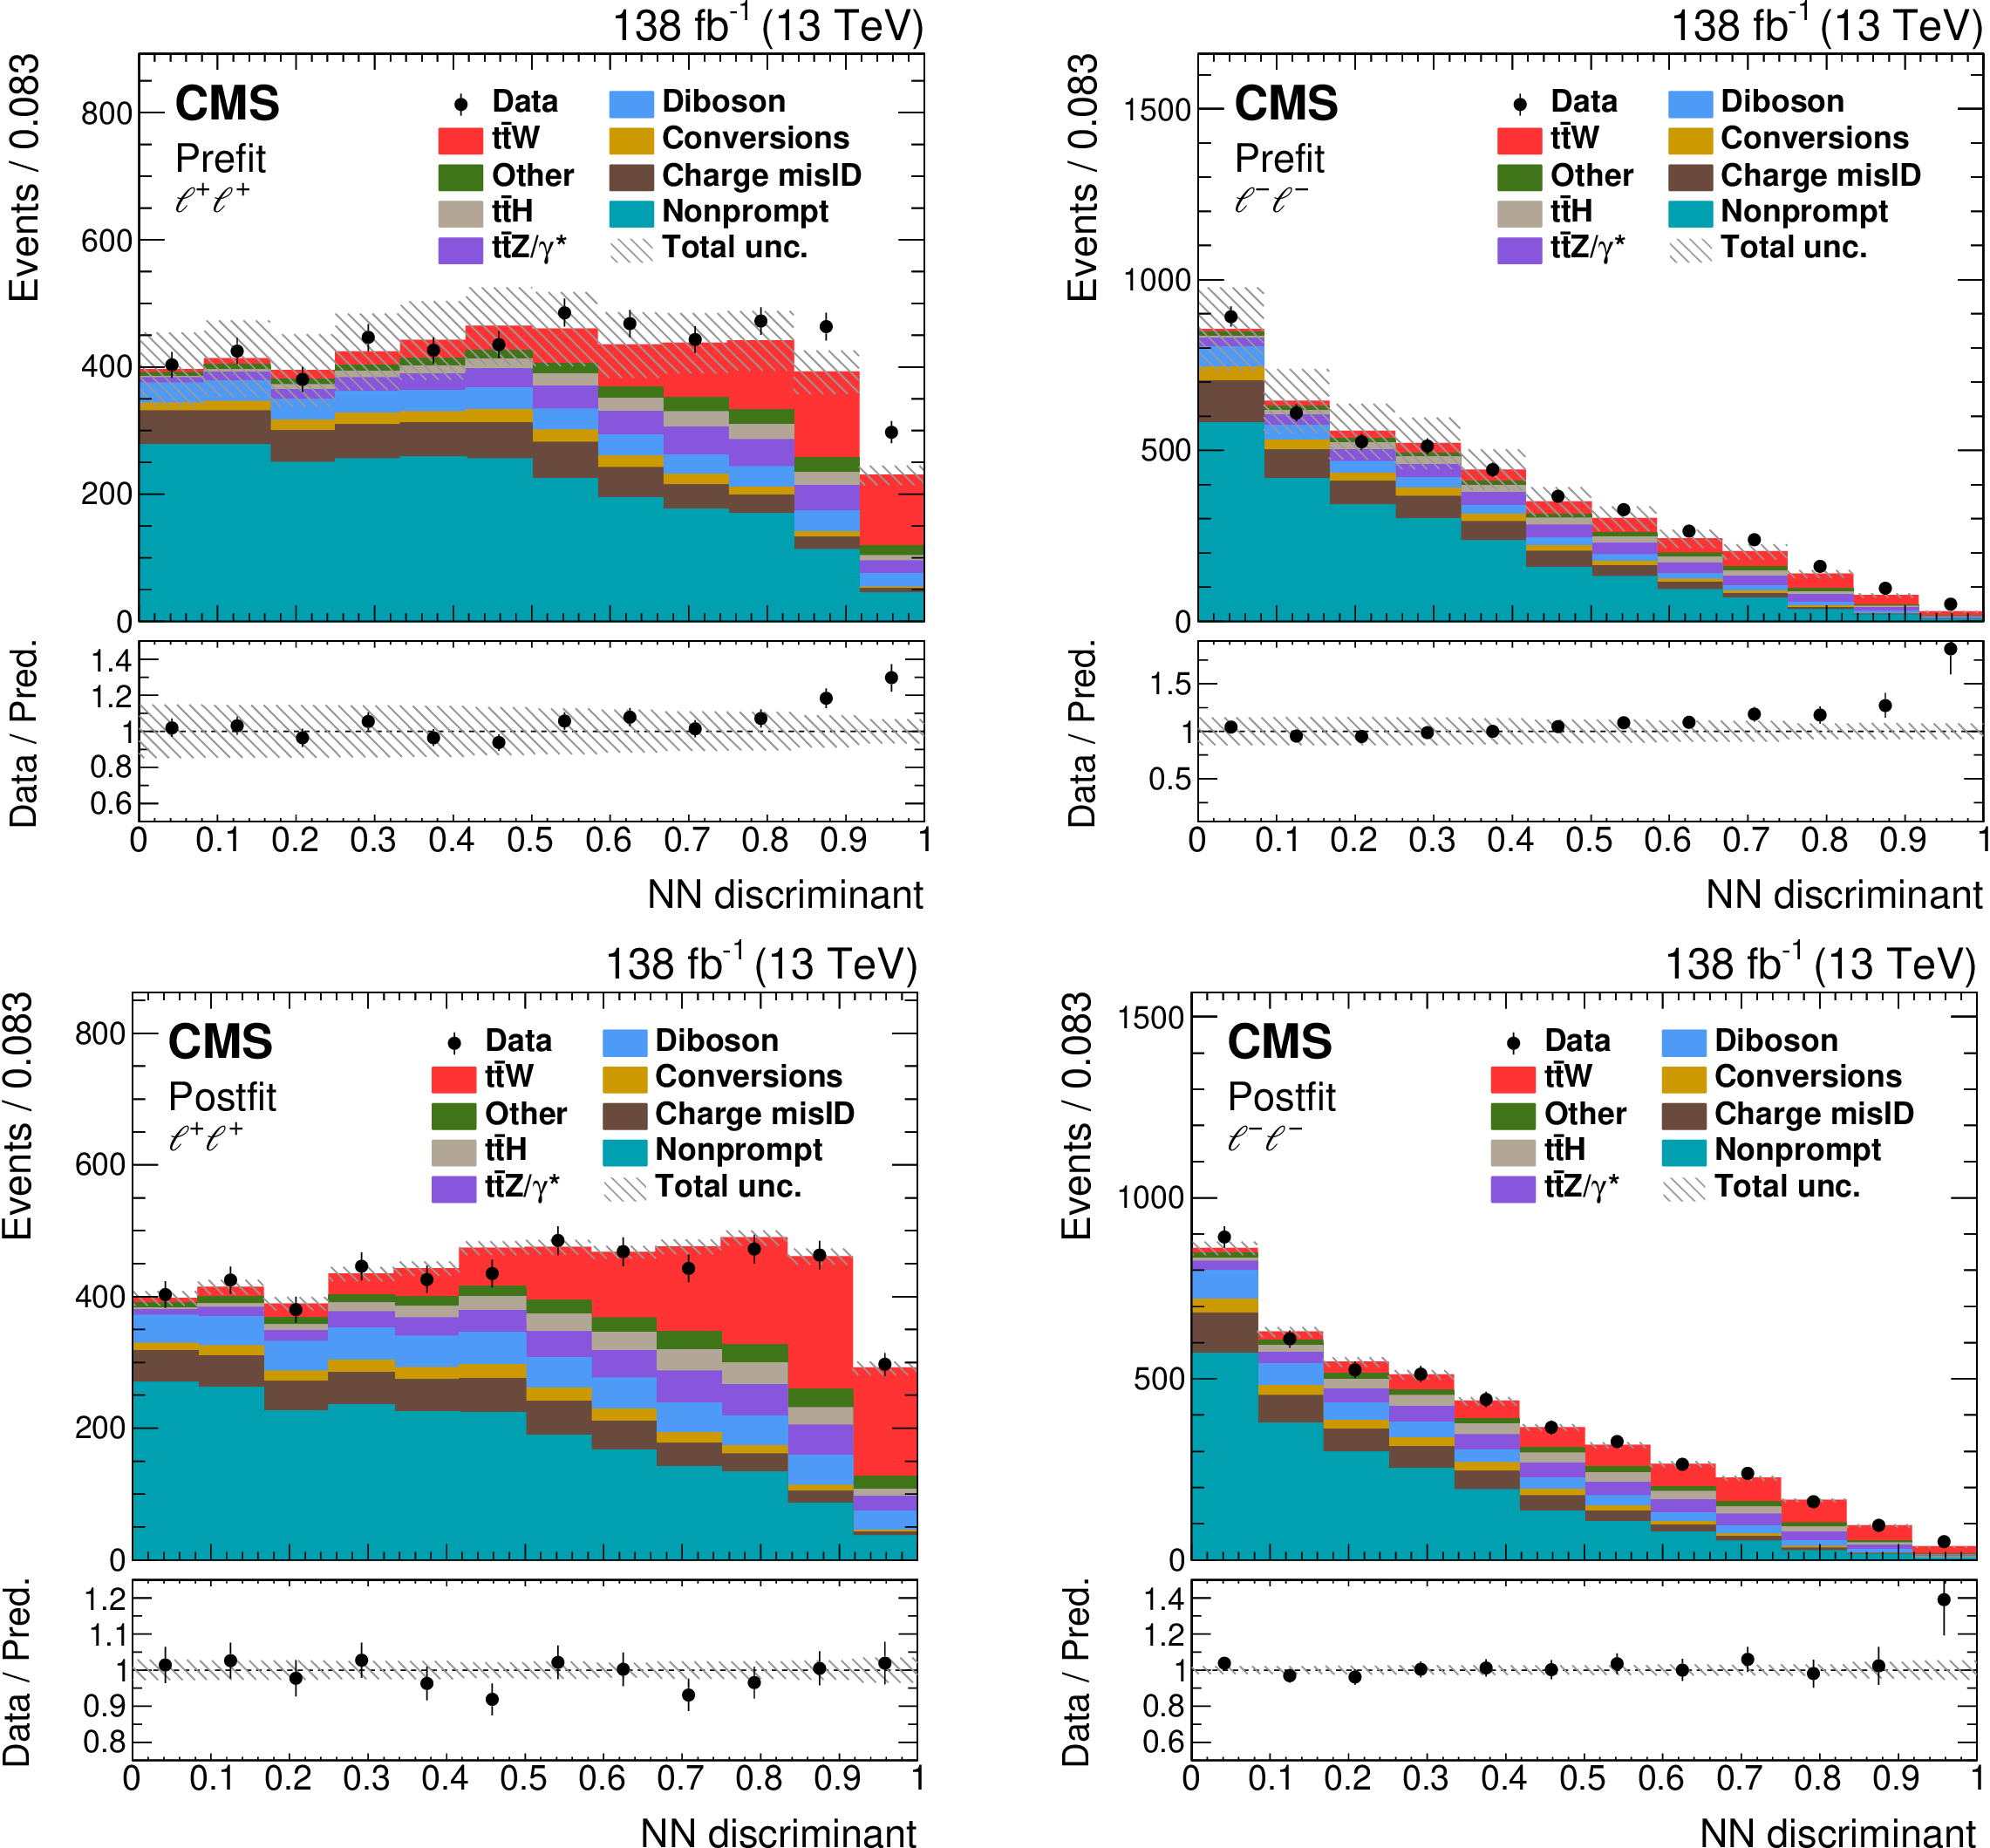
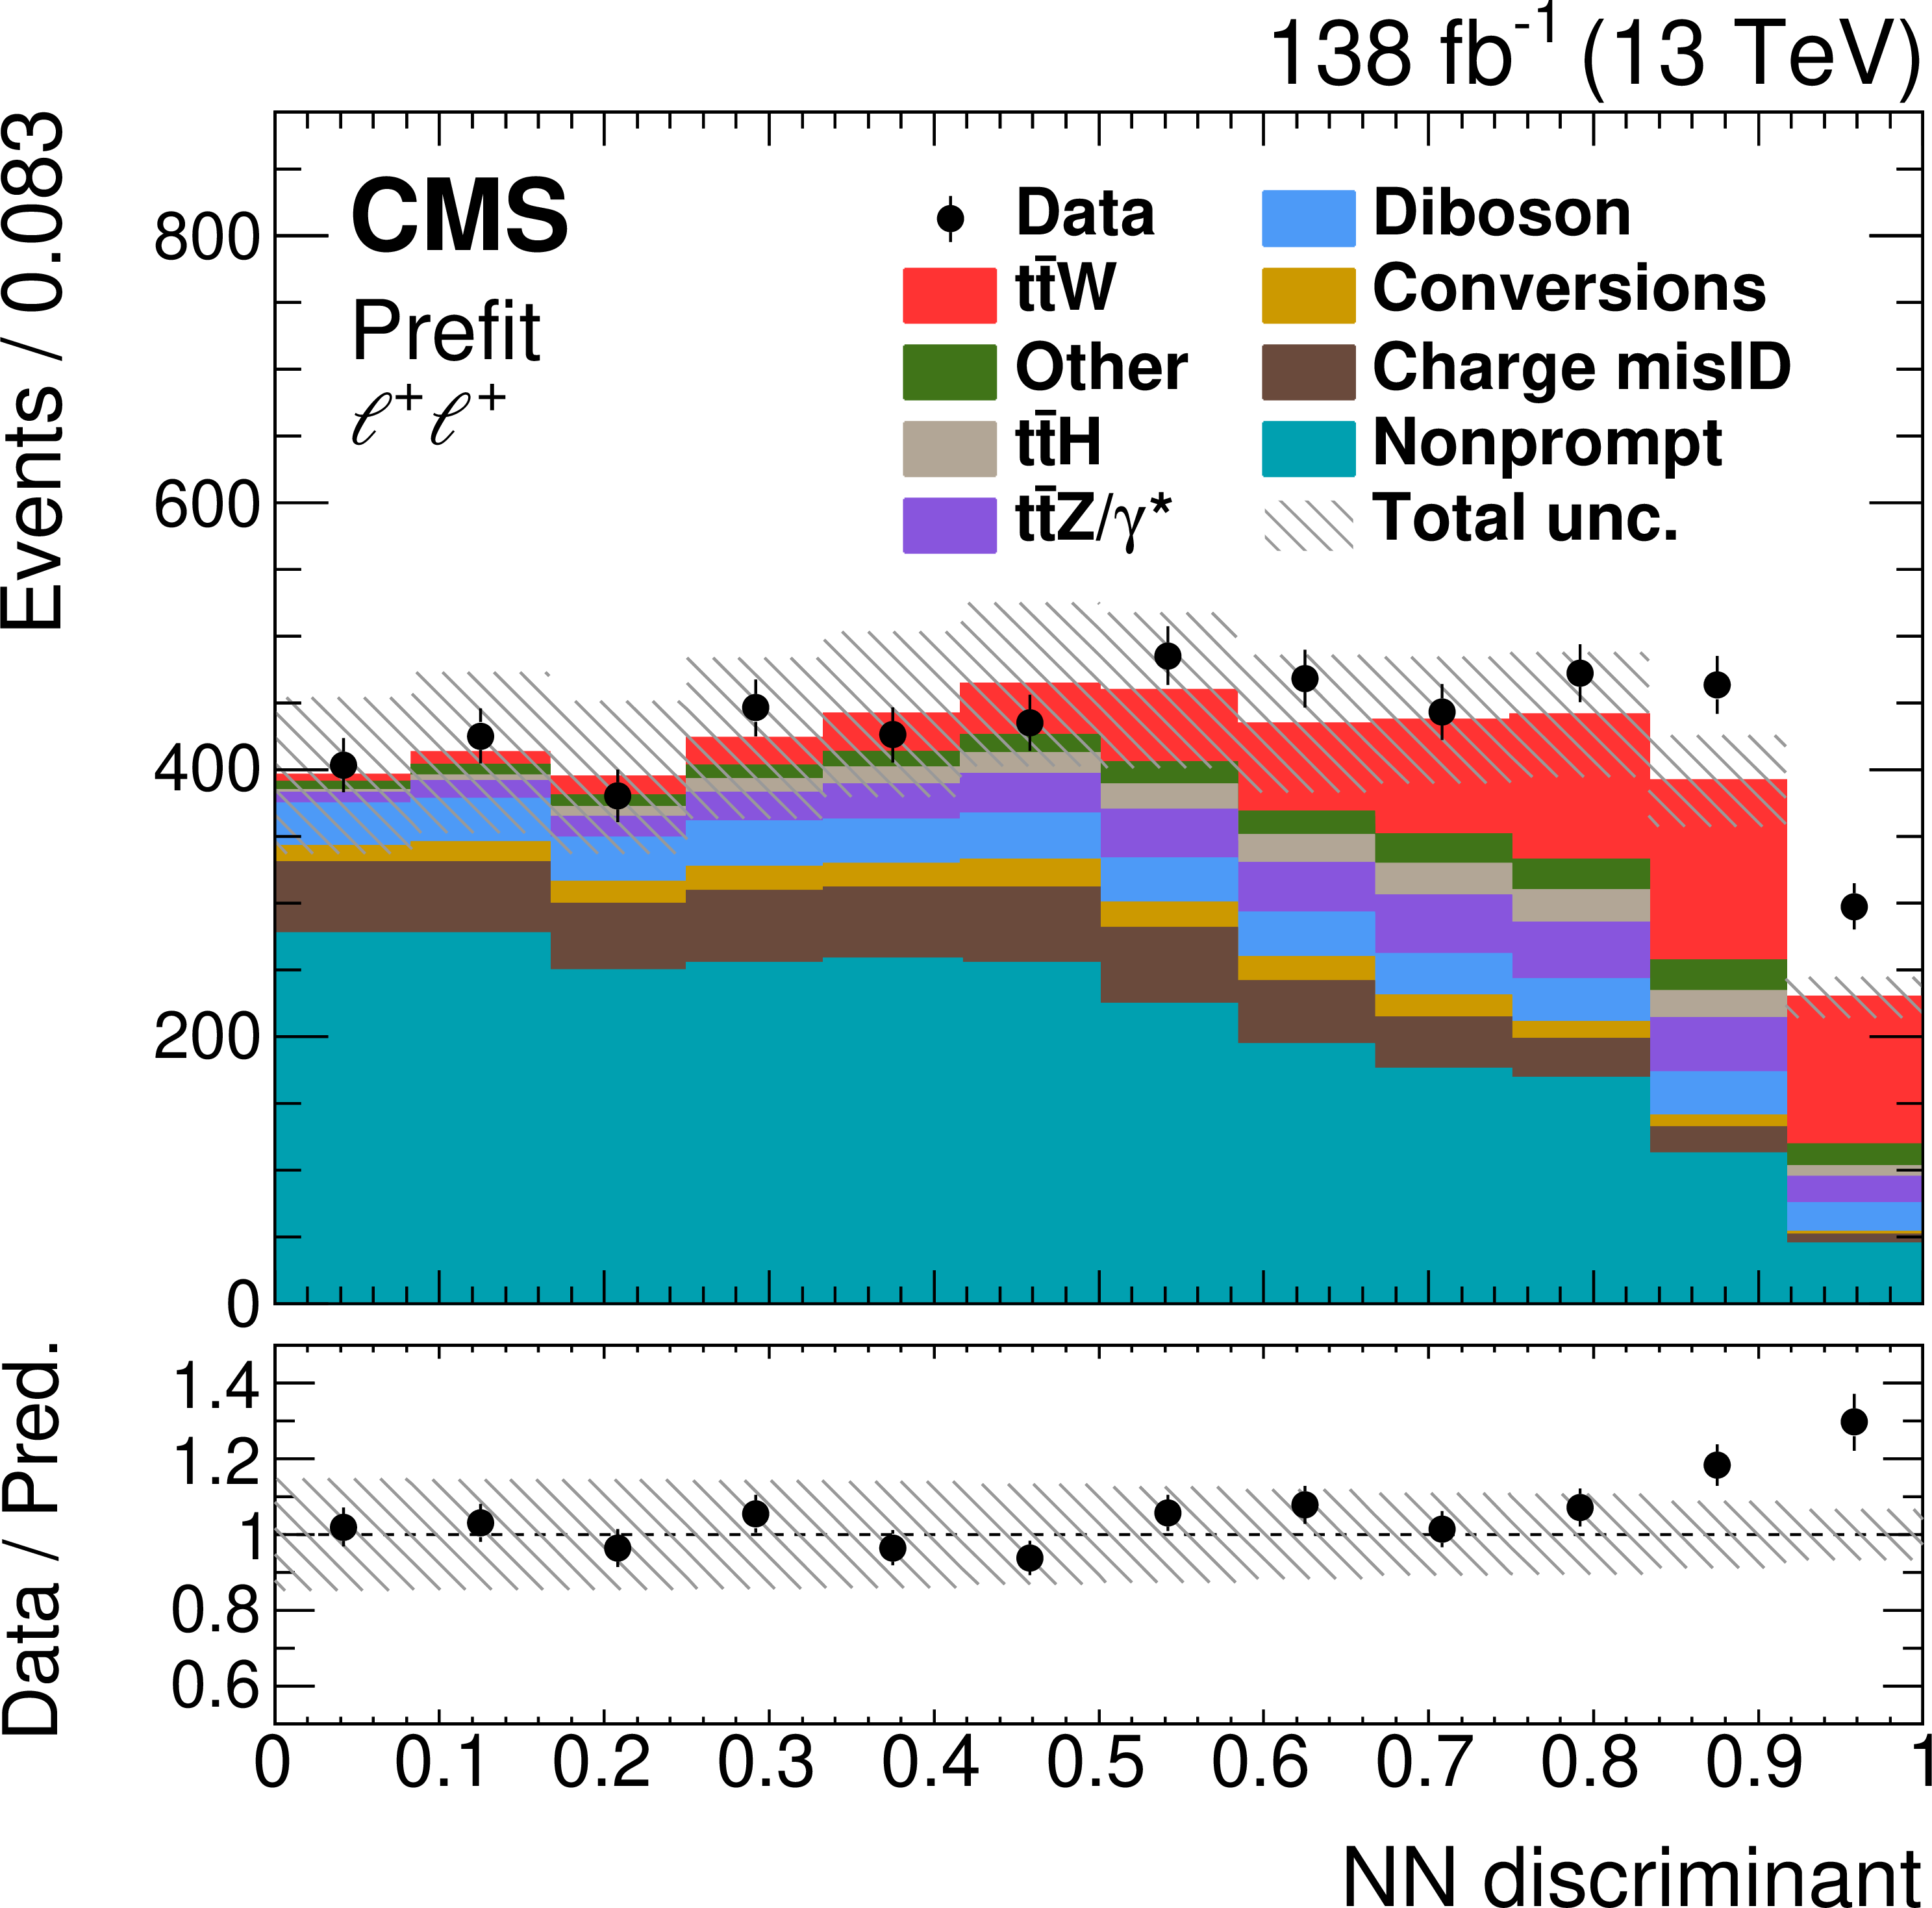
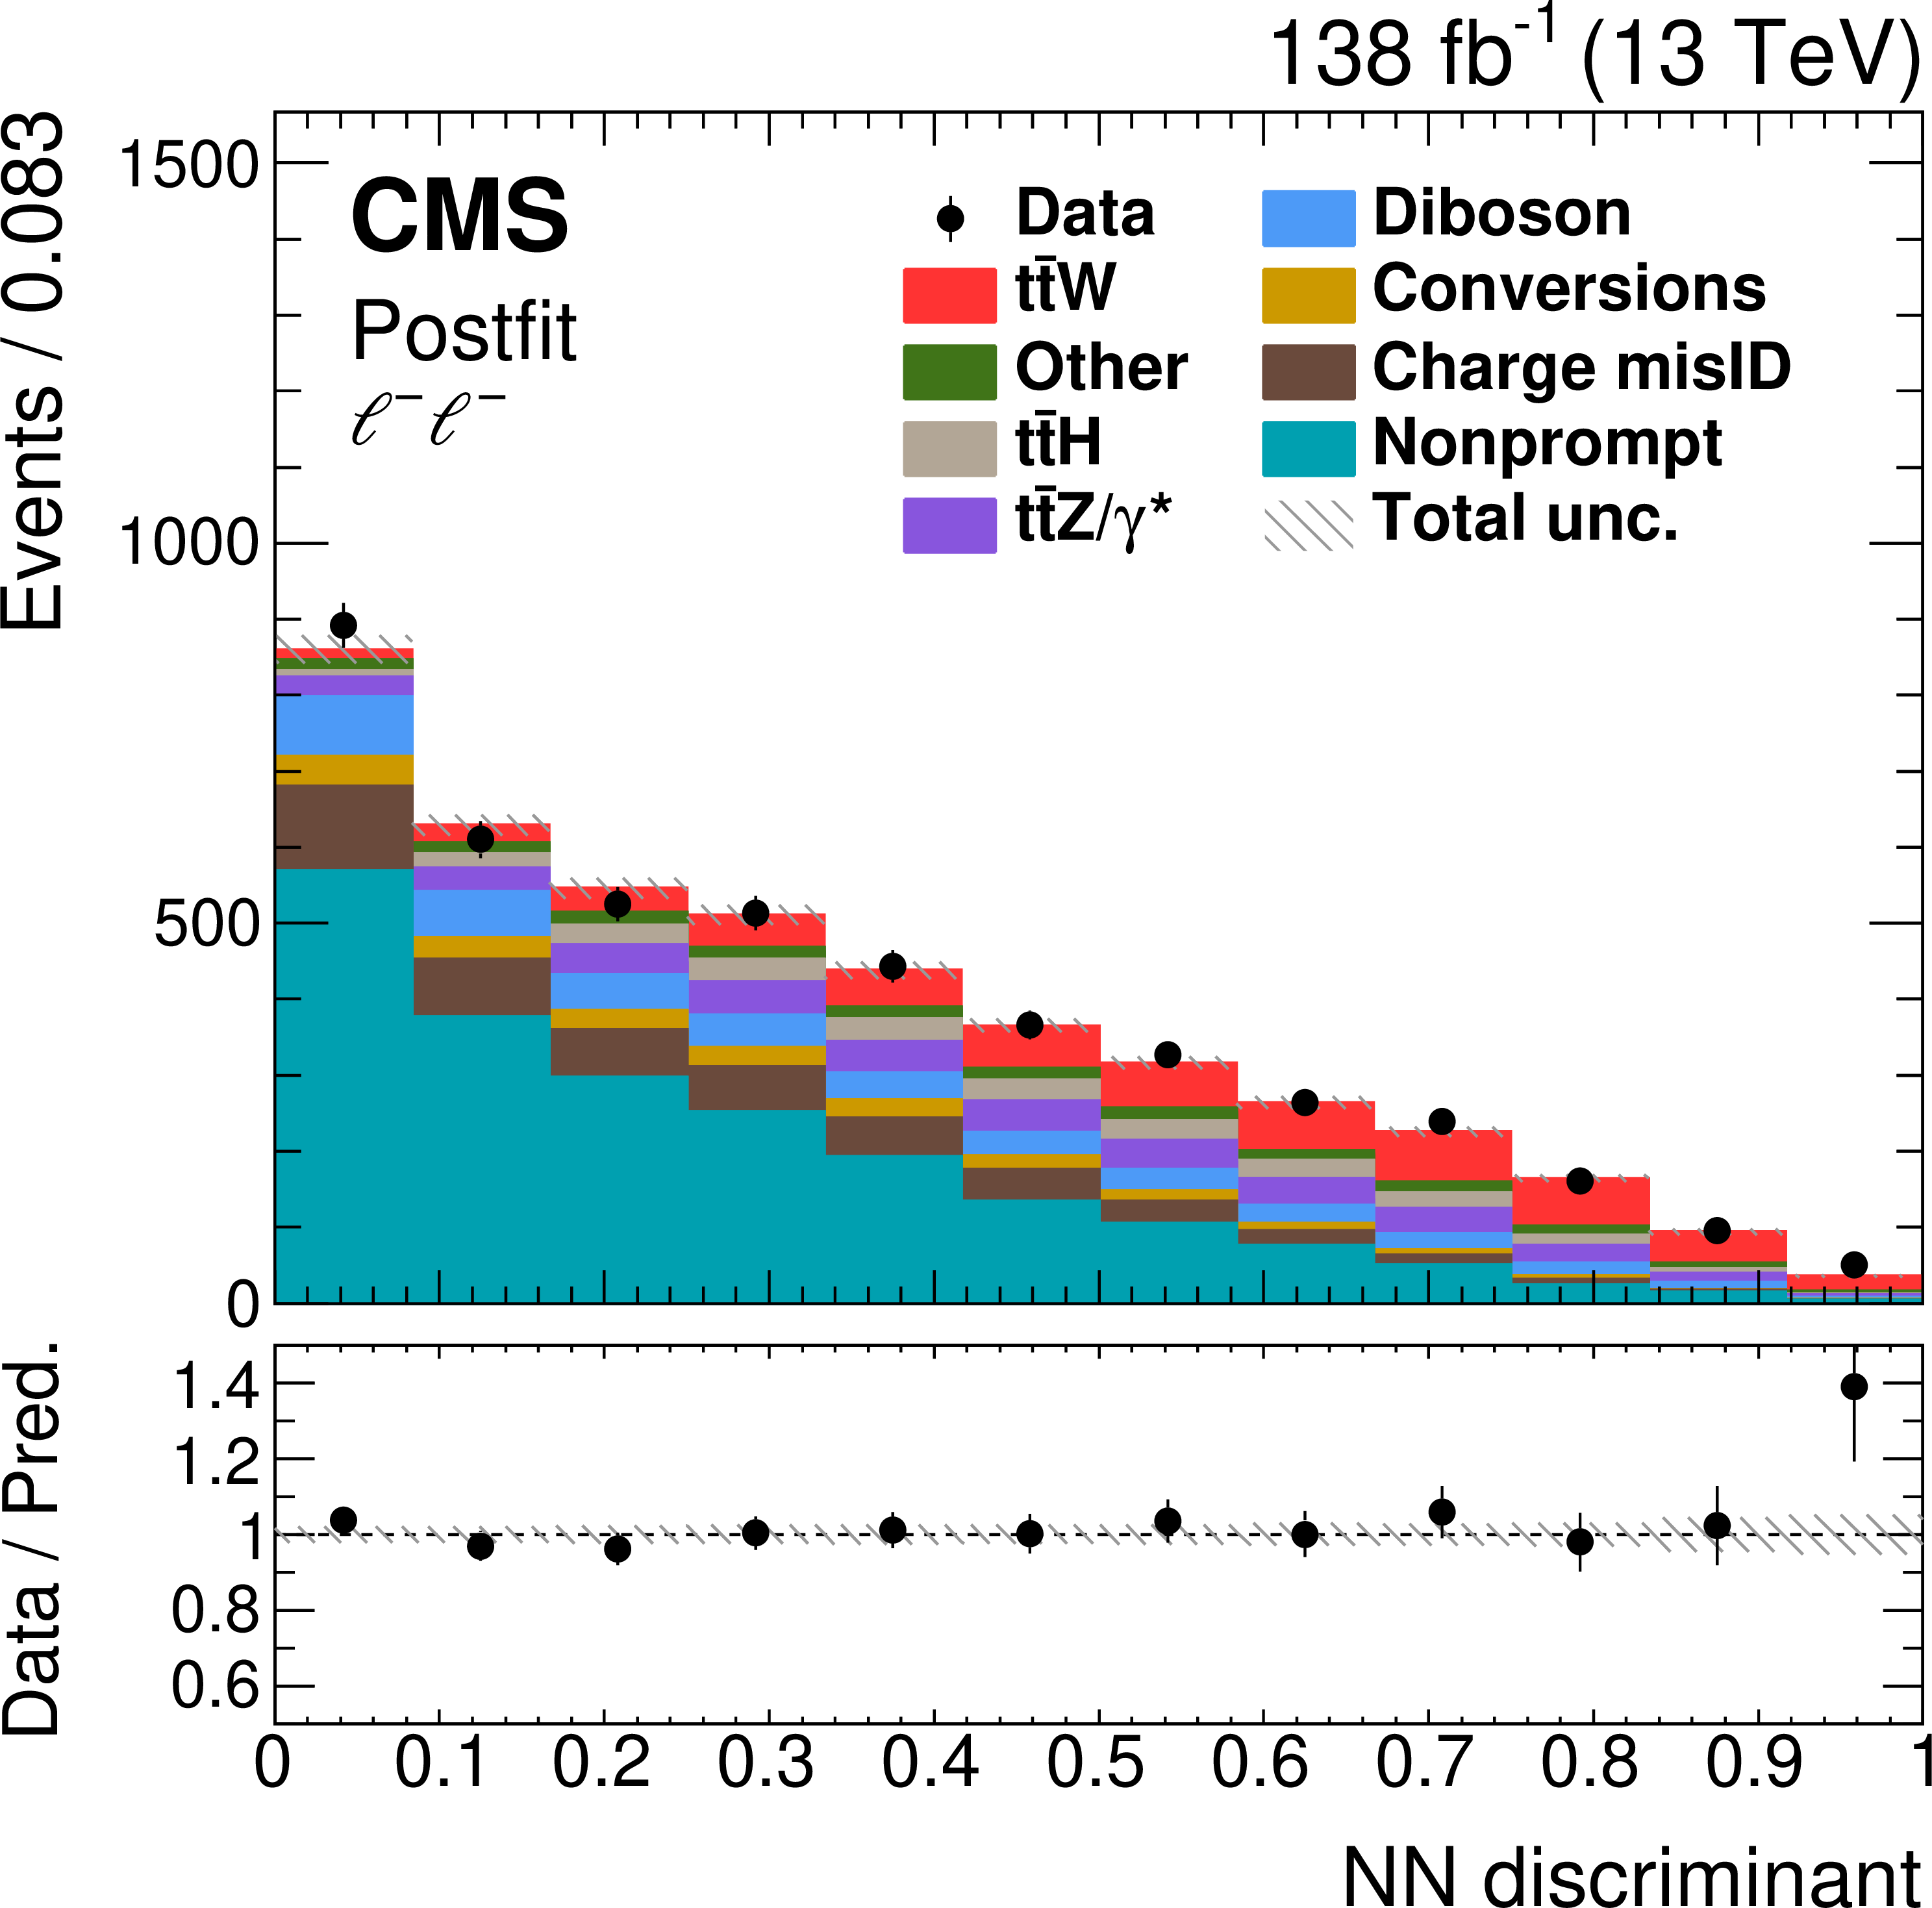
Comparison of the number of observed (points) and predicted (colored histograms) events in the same-sign dilepton signal region. The distributions of the NN output score are displayed in final states with two leptons of positive (left) and negative (right) charges. The predictions are shown "prefit'' as in Fig.2 (upper row), and with the values of the normalizations and nuisance parameters obtained in the fit to the data applied ("postfit'', lower row). The vertical bars on the points represent the statistical uncertainties in the data, and the hatched bands the systematic uncertainty in the predictions. In the lower panels, the ratio of the event yields in data to the overall sum of the predictions is presented. |
png pdf |
Figure 7-a:
Distribution of the NN output score in final states with two leptons of positive charges. Comparison of the number of observed (points) and predicted (colored histograms) events in the same-sign dilepton signal region. The predictions are shown "prefit'' as in Fig.2. The vertical bars on the points represent the statistical uncertainties in the data, and the hatched bands the systematic uncertainty in the predictions. In the lower panel, the ratio of the event yields in data to the overall sum of the predictions is presented. |
png pdf |
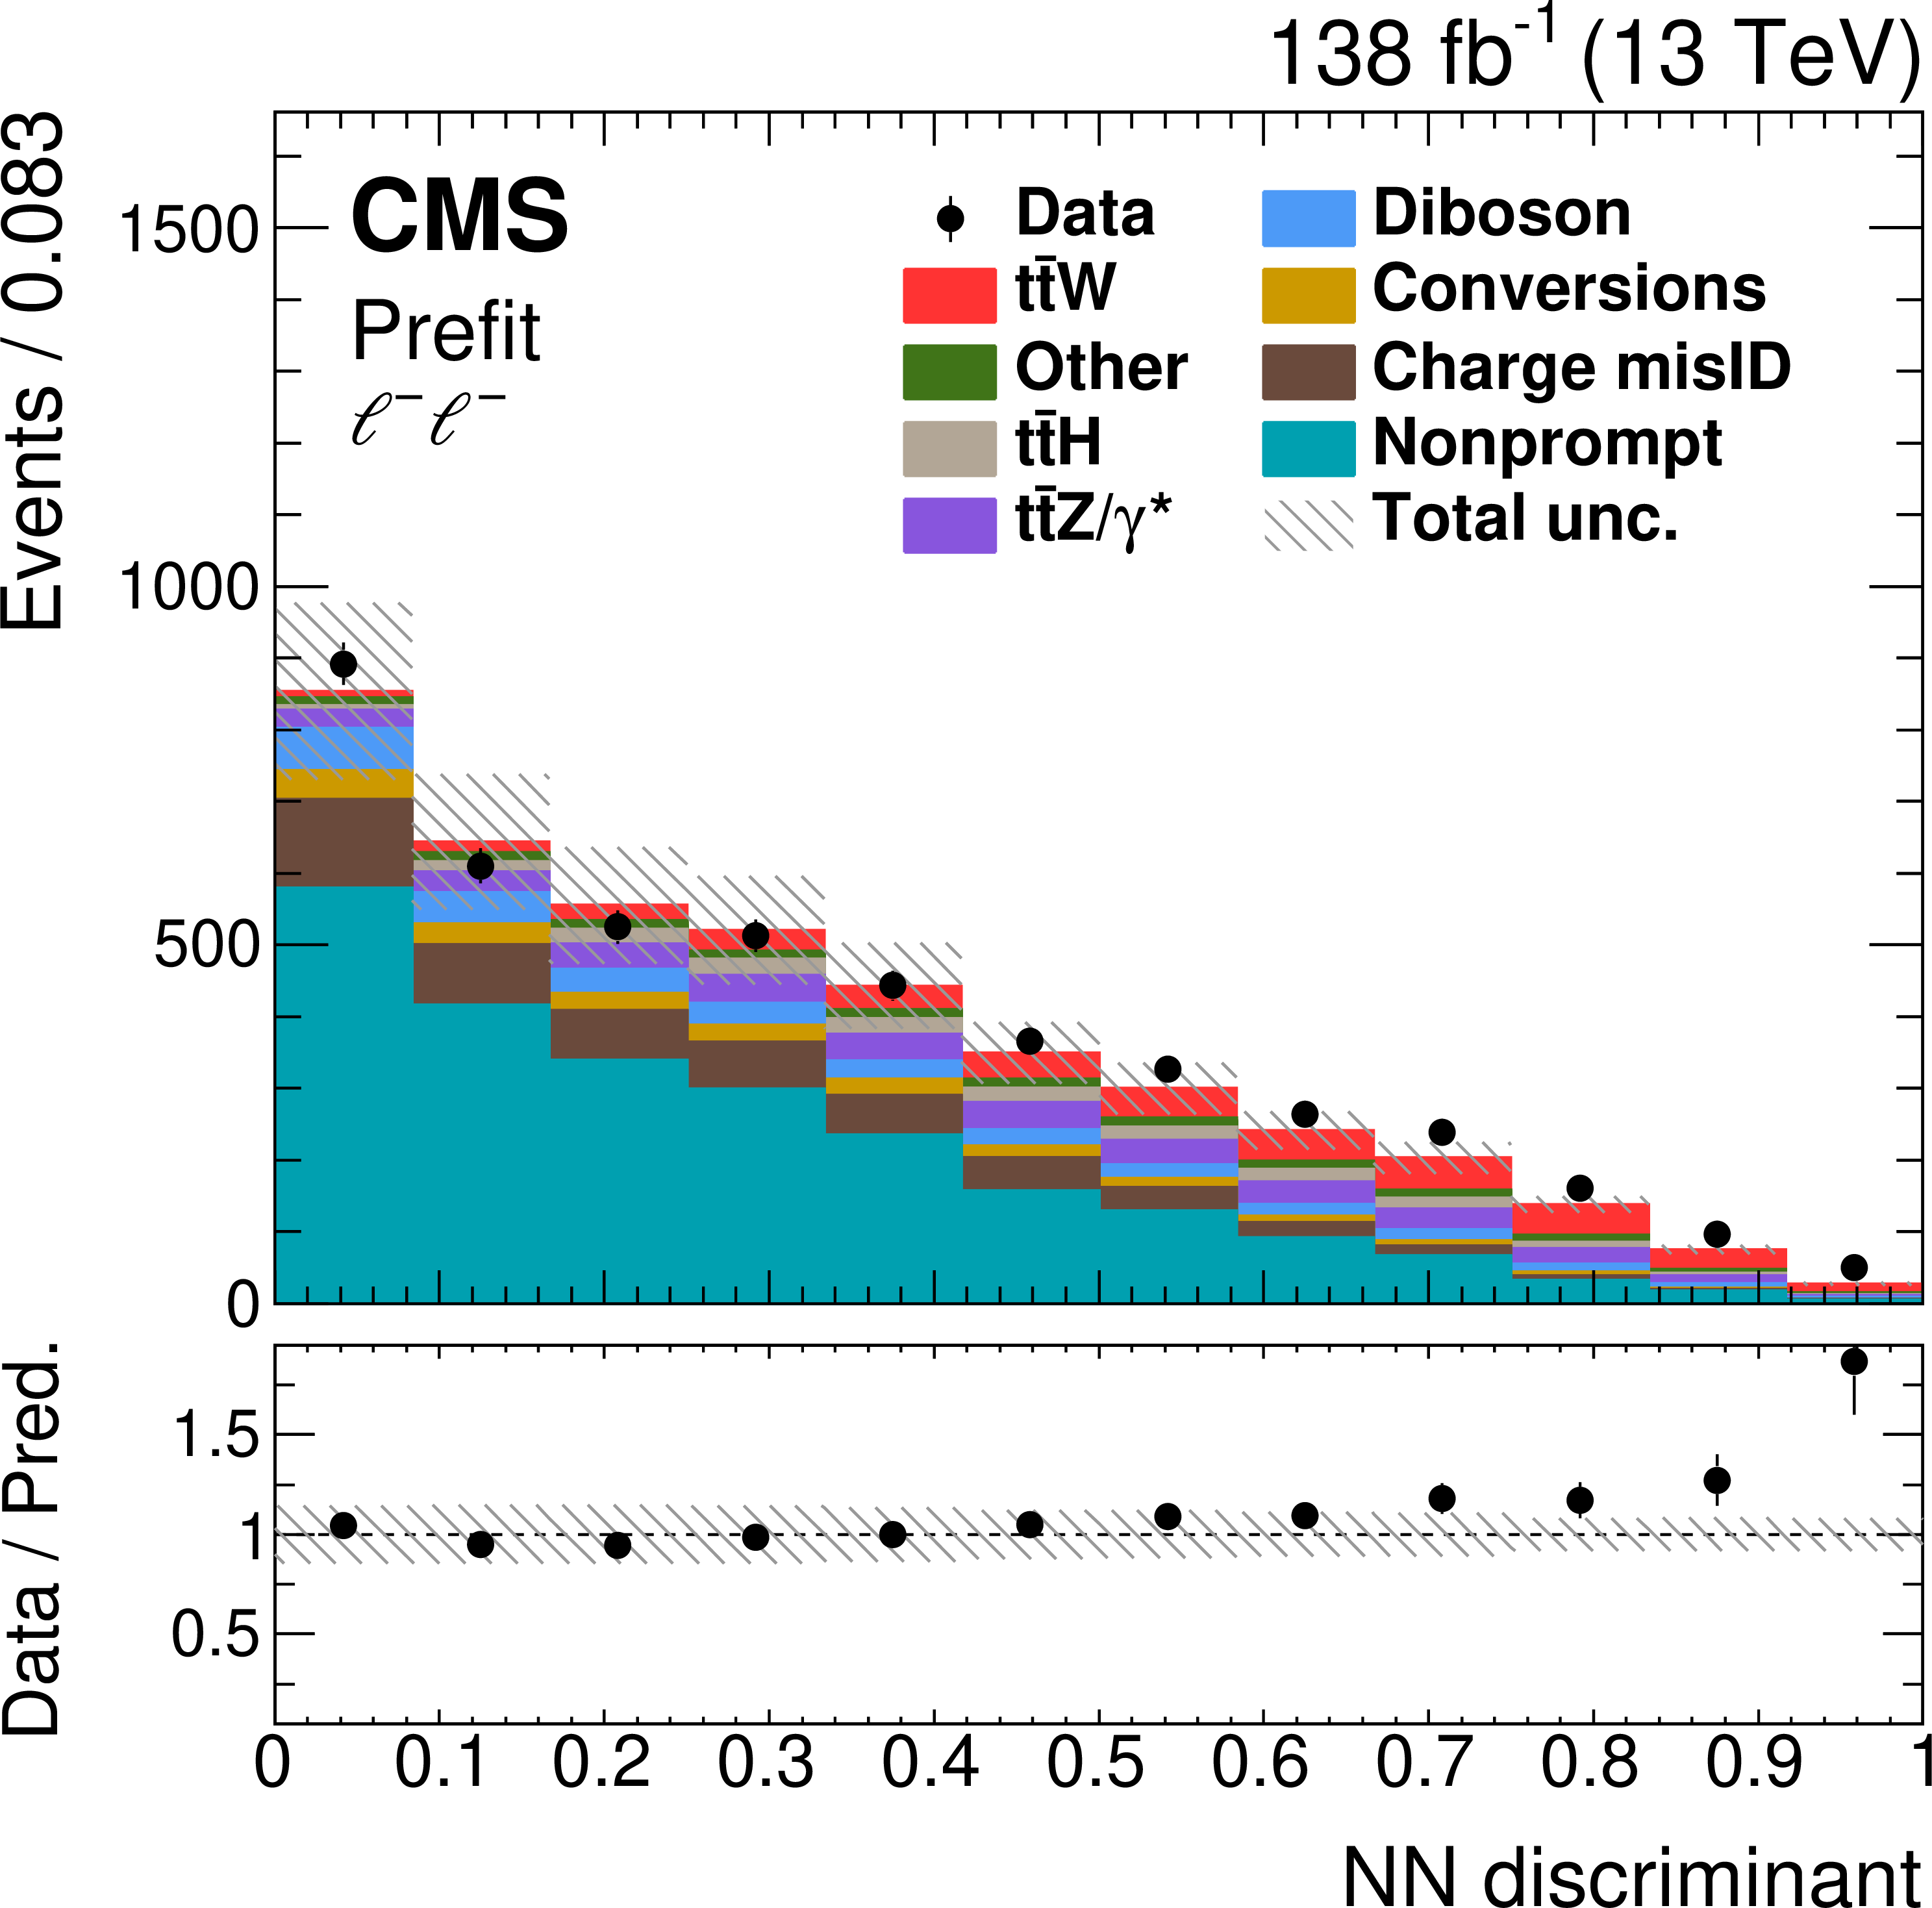
Figure 7-b:
Distribution of the NN output score in final states with two leptons of negative charges. Comparison of the number of observed (points) and predicted (colored histograms) events in the same-sign dilepton signal region. The predictions are shown "prefit'' as in Fig.2. The vertical bars on the points represent the statistical uncertainties in the data, and the hatched bands the systematic uncertainty in the predictions. In the lower panel, the ratio of the event yields in data to the overall sum of the predictions is presented. |

png pdf |
Figure 7-c:
Distribution of the NN output score in final states with two leptons of positive charges. Comparison of the number of observed (points) and predicted (colored histograms) events in the same-sign dilepton signal region. The predictions are shown with the values of the normalizations and nuisance parameters obtained in the fit to the data applied ("postfit''). The vertical bars on the points represent the statistical uncertainties in the data, and the hatched bands the systematic uncertainty in the predictions. In the lower panel, the ratio of the event yields in data to the overall sum of the predictions is presented. |
png pdf |
Figure 7-d:
Distribution of the NN output score in final states with two leptons of negative charges. Comparison of the number of observed (points) and predicted (colored histograms) events in the same-sign dilepton signal region. The predictions are shown with the values of the normalizations and nuisance parameters obtained in the fit to the data applied ("postfit''). The vertical bars on the points represent the statistical uncertainties in the data, and the hatched bands the systematic uncertainty in the predictions. In the lower panel, the ratio of the event yields in data to the overall sum of the predictions is presented. |
png pdf |
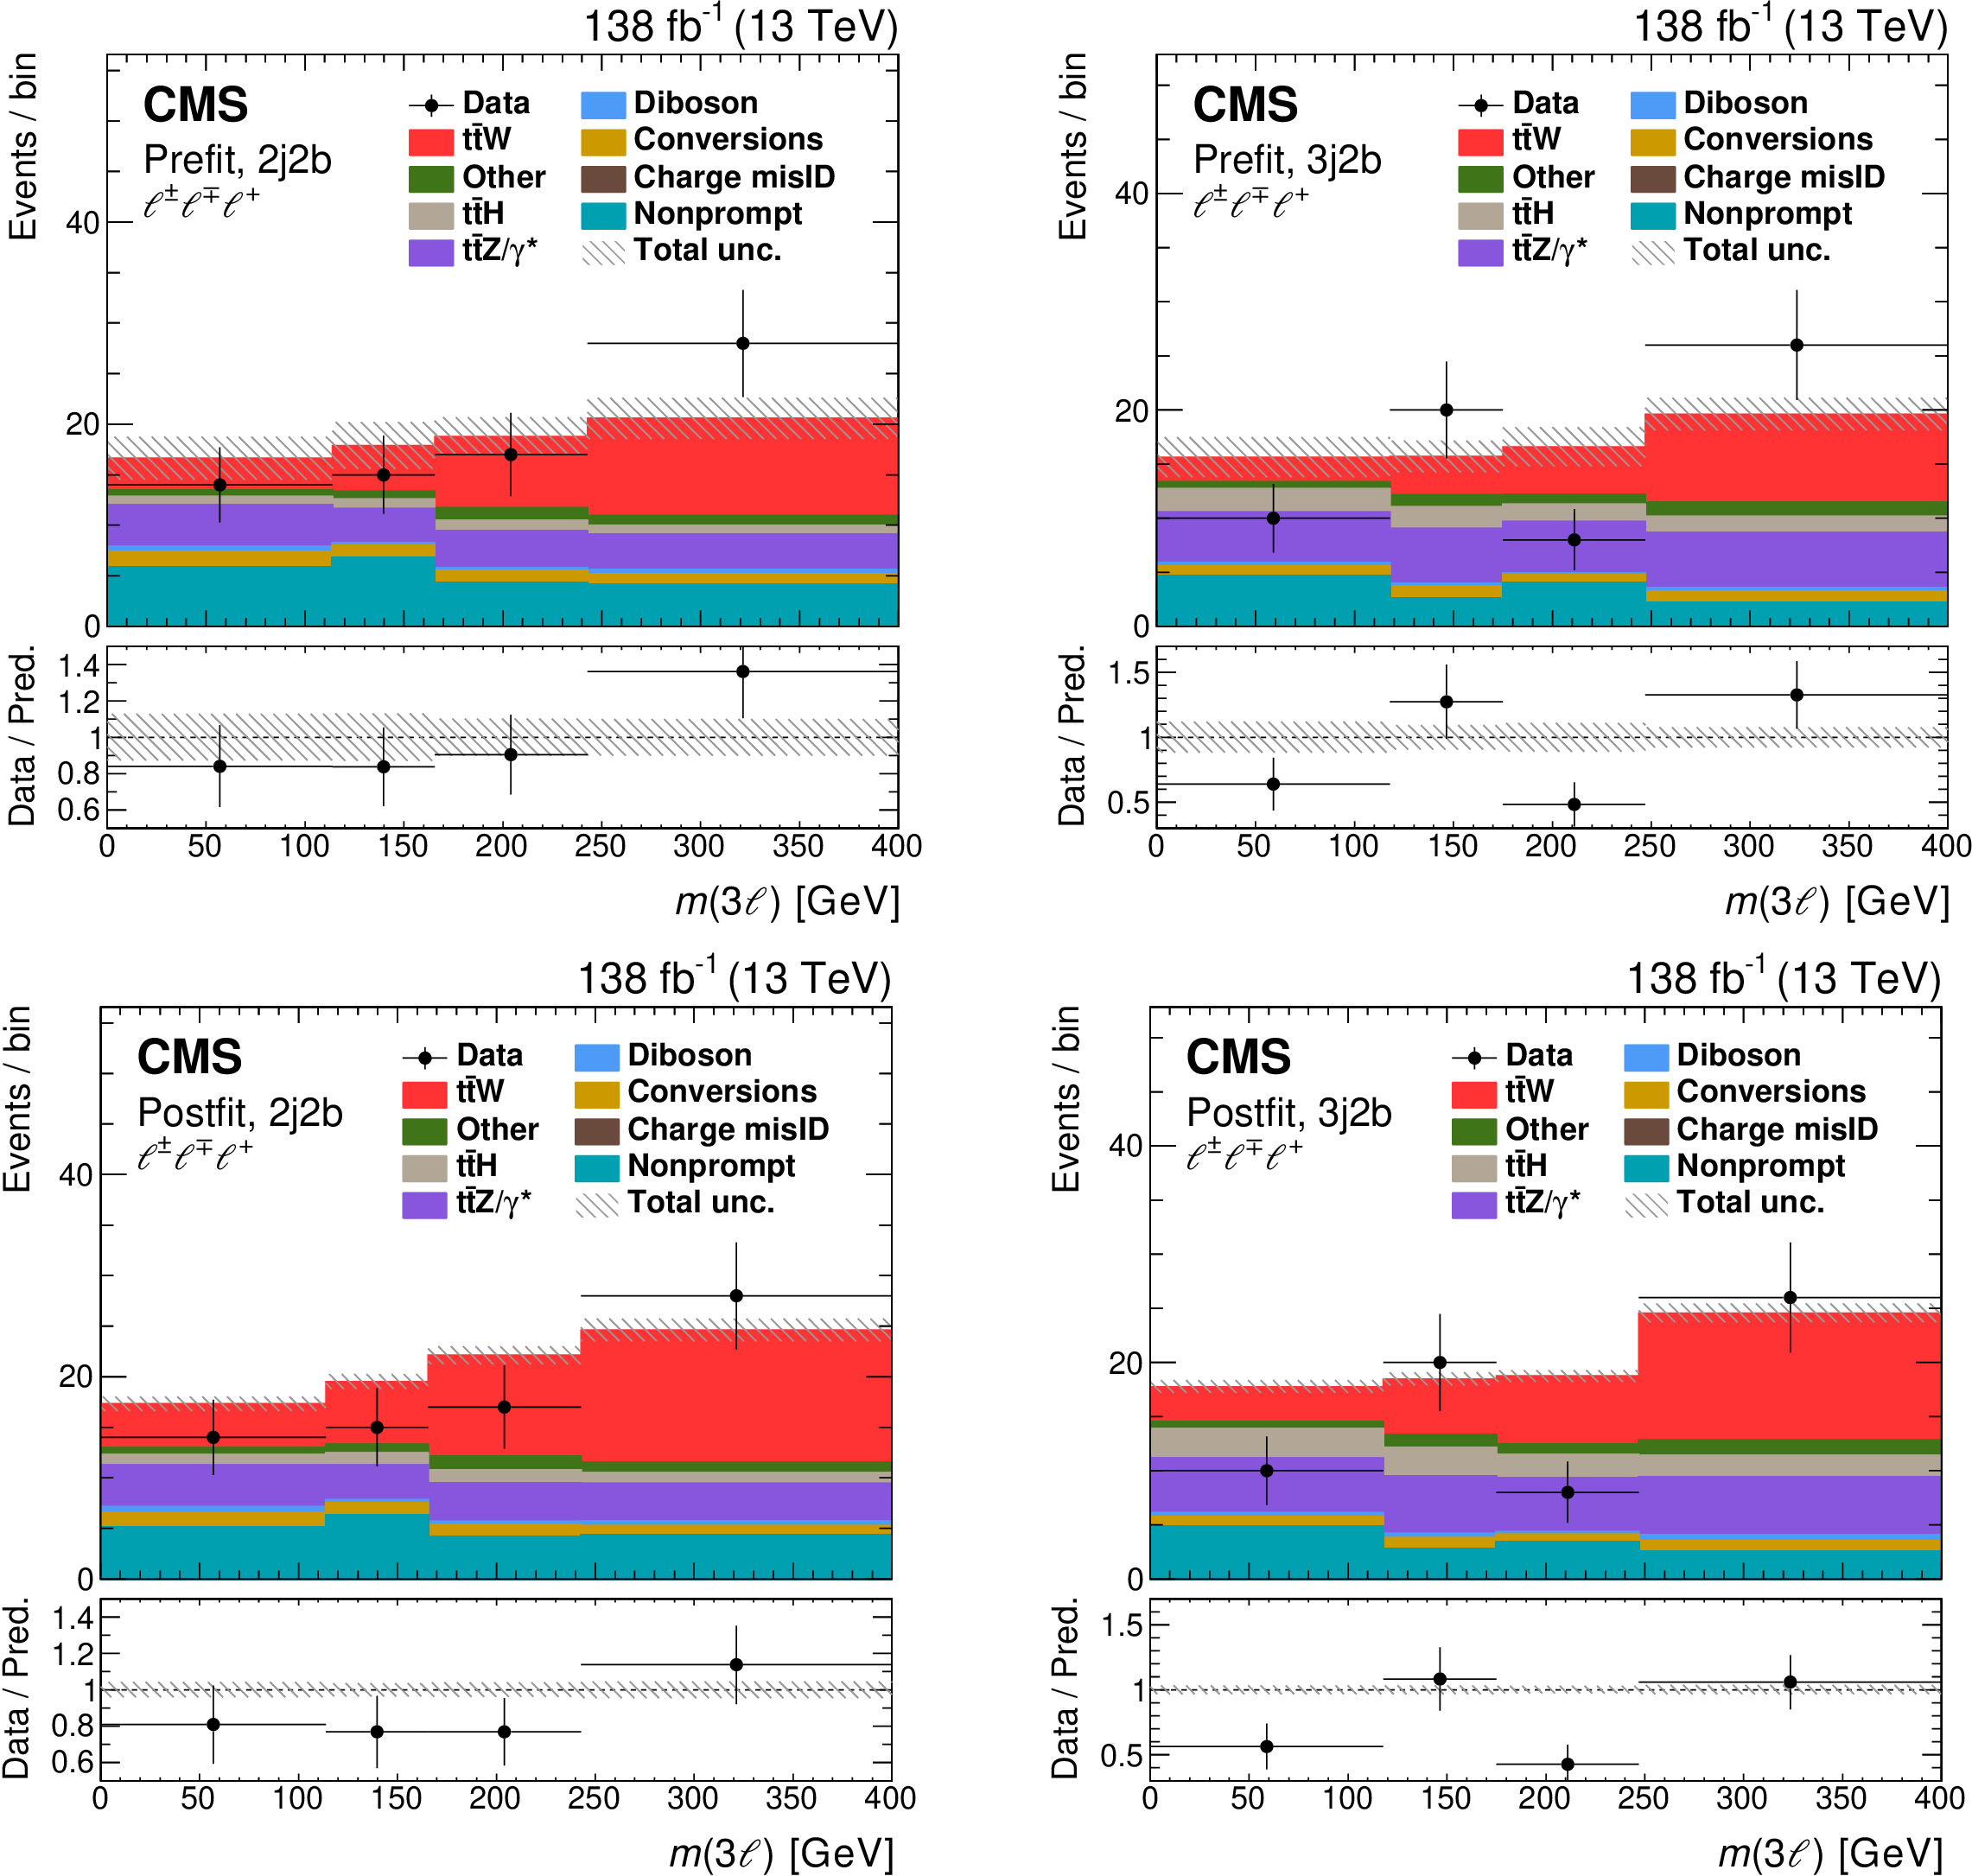
Figure 8:
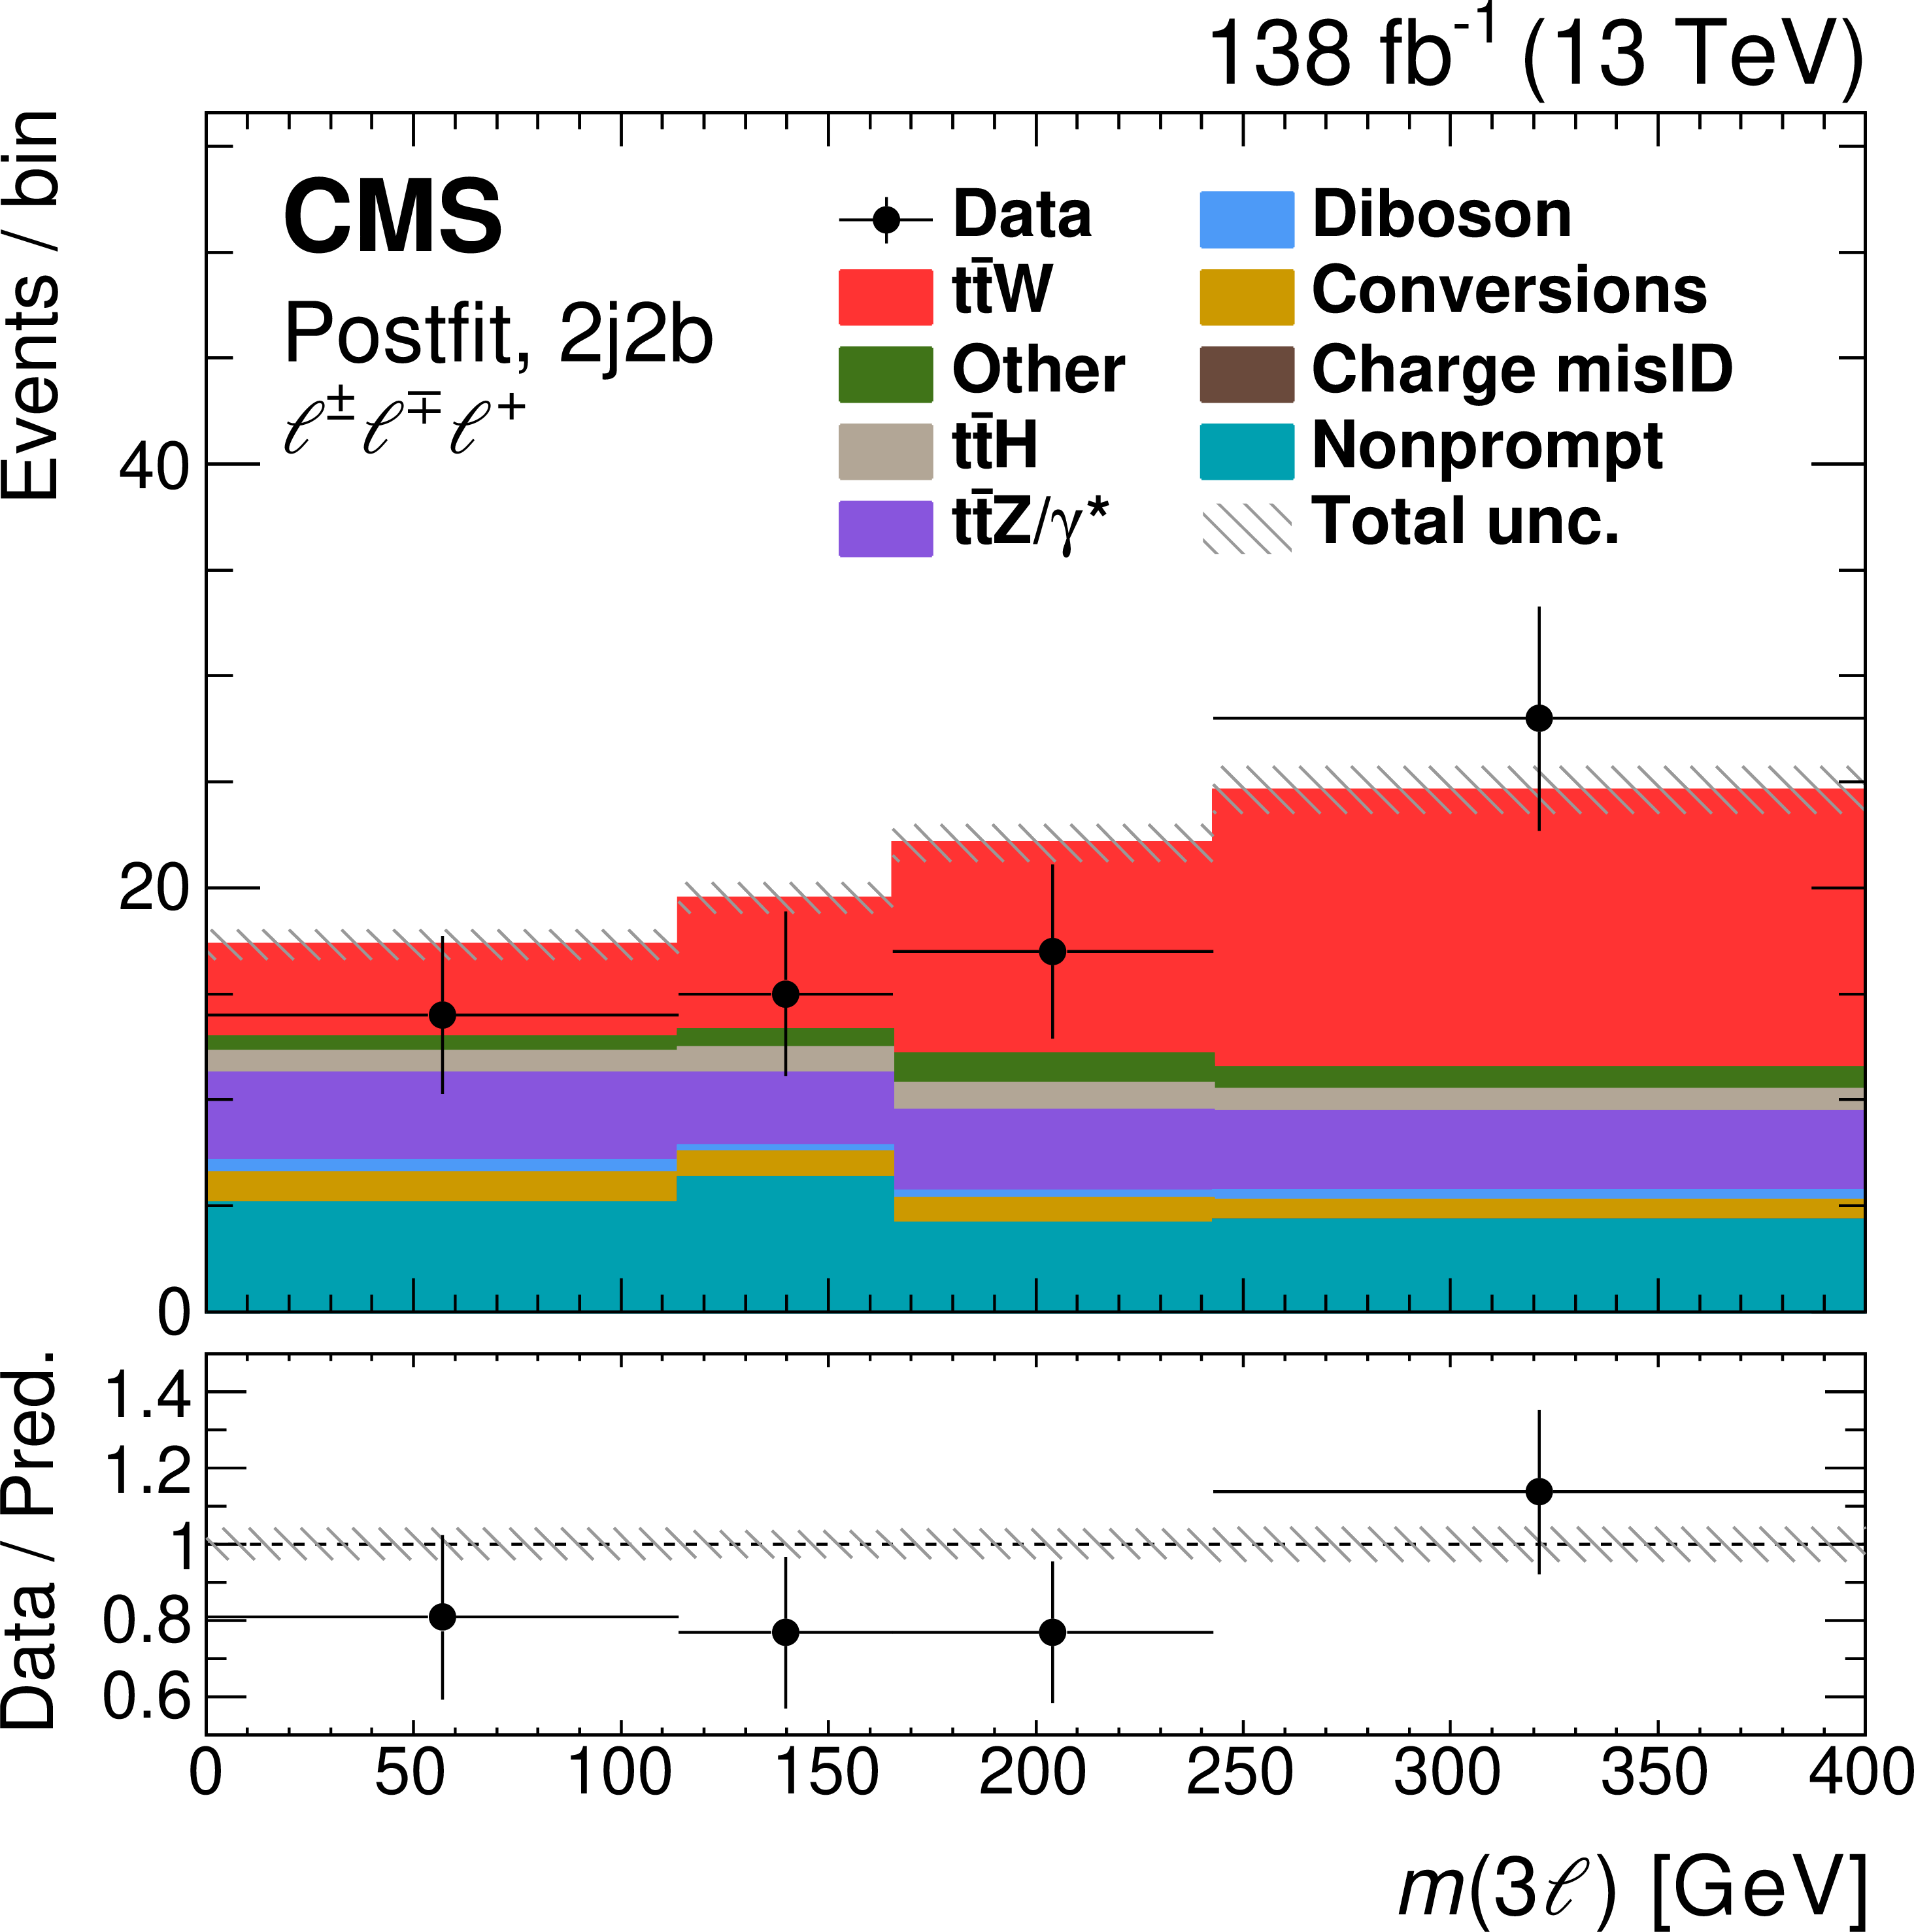
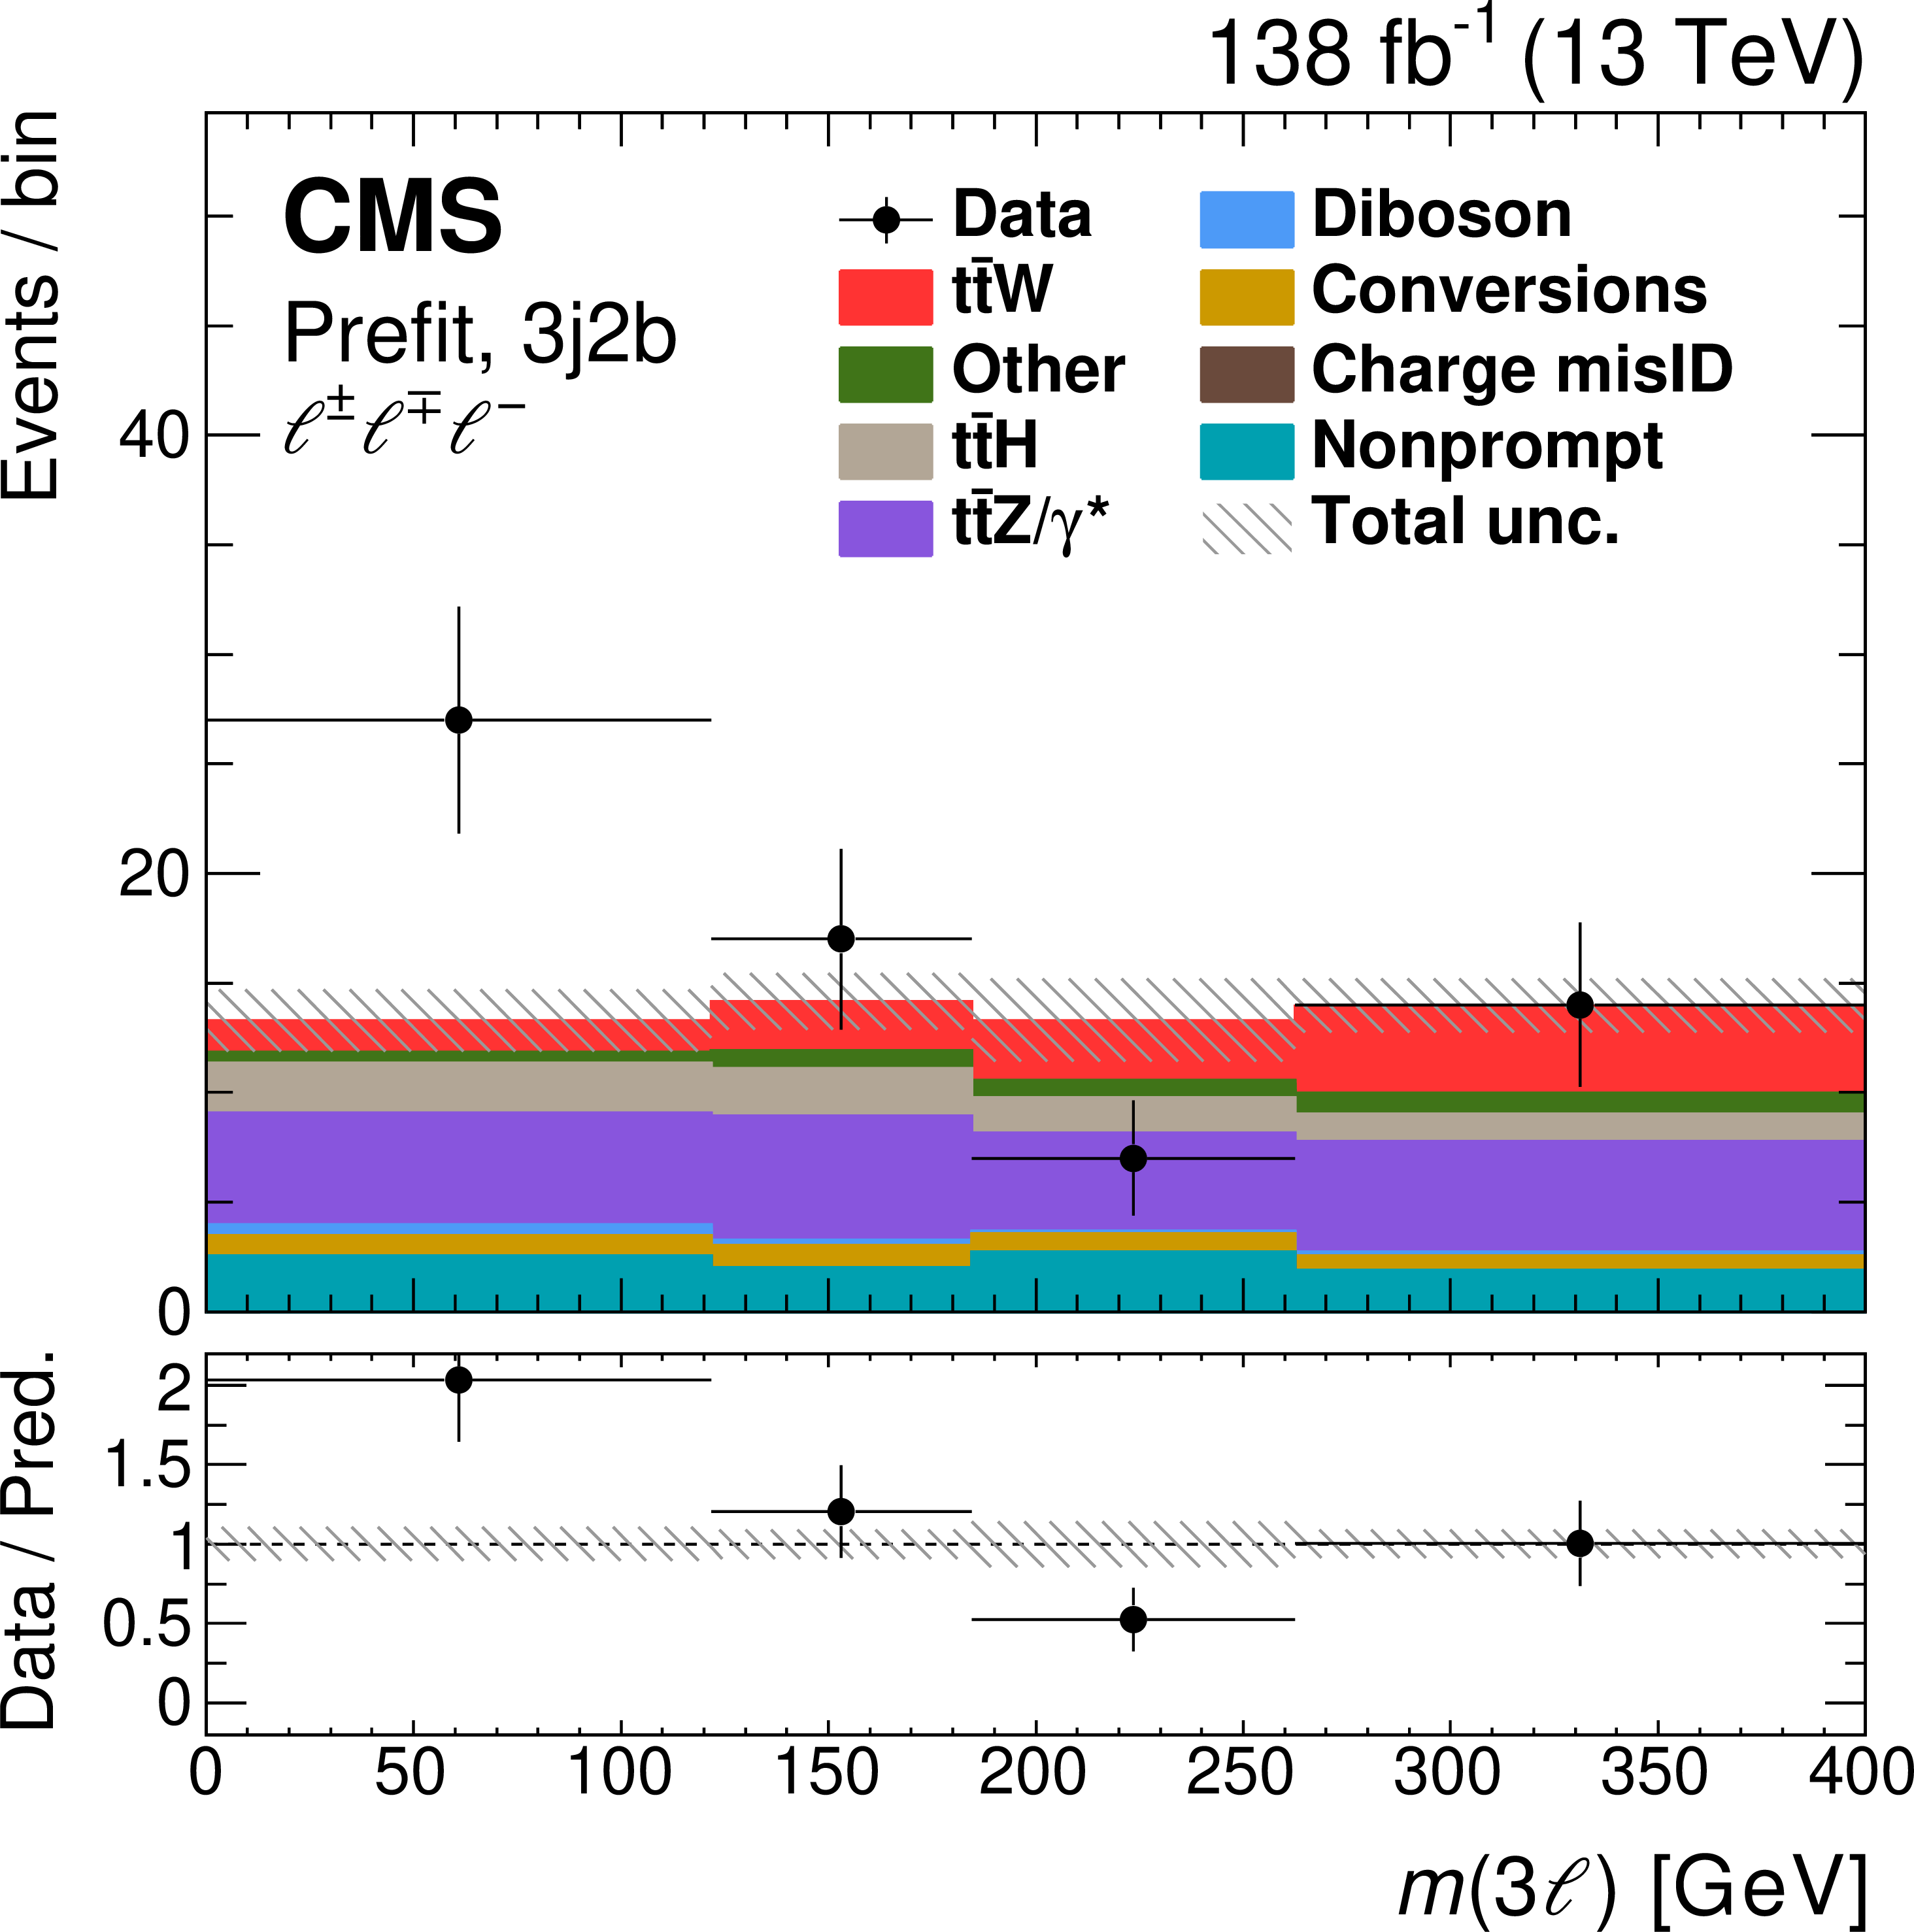
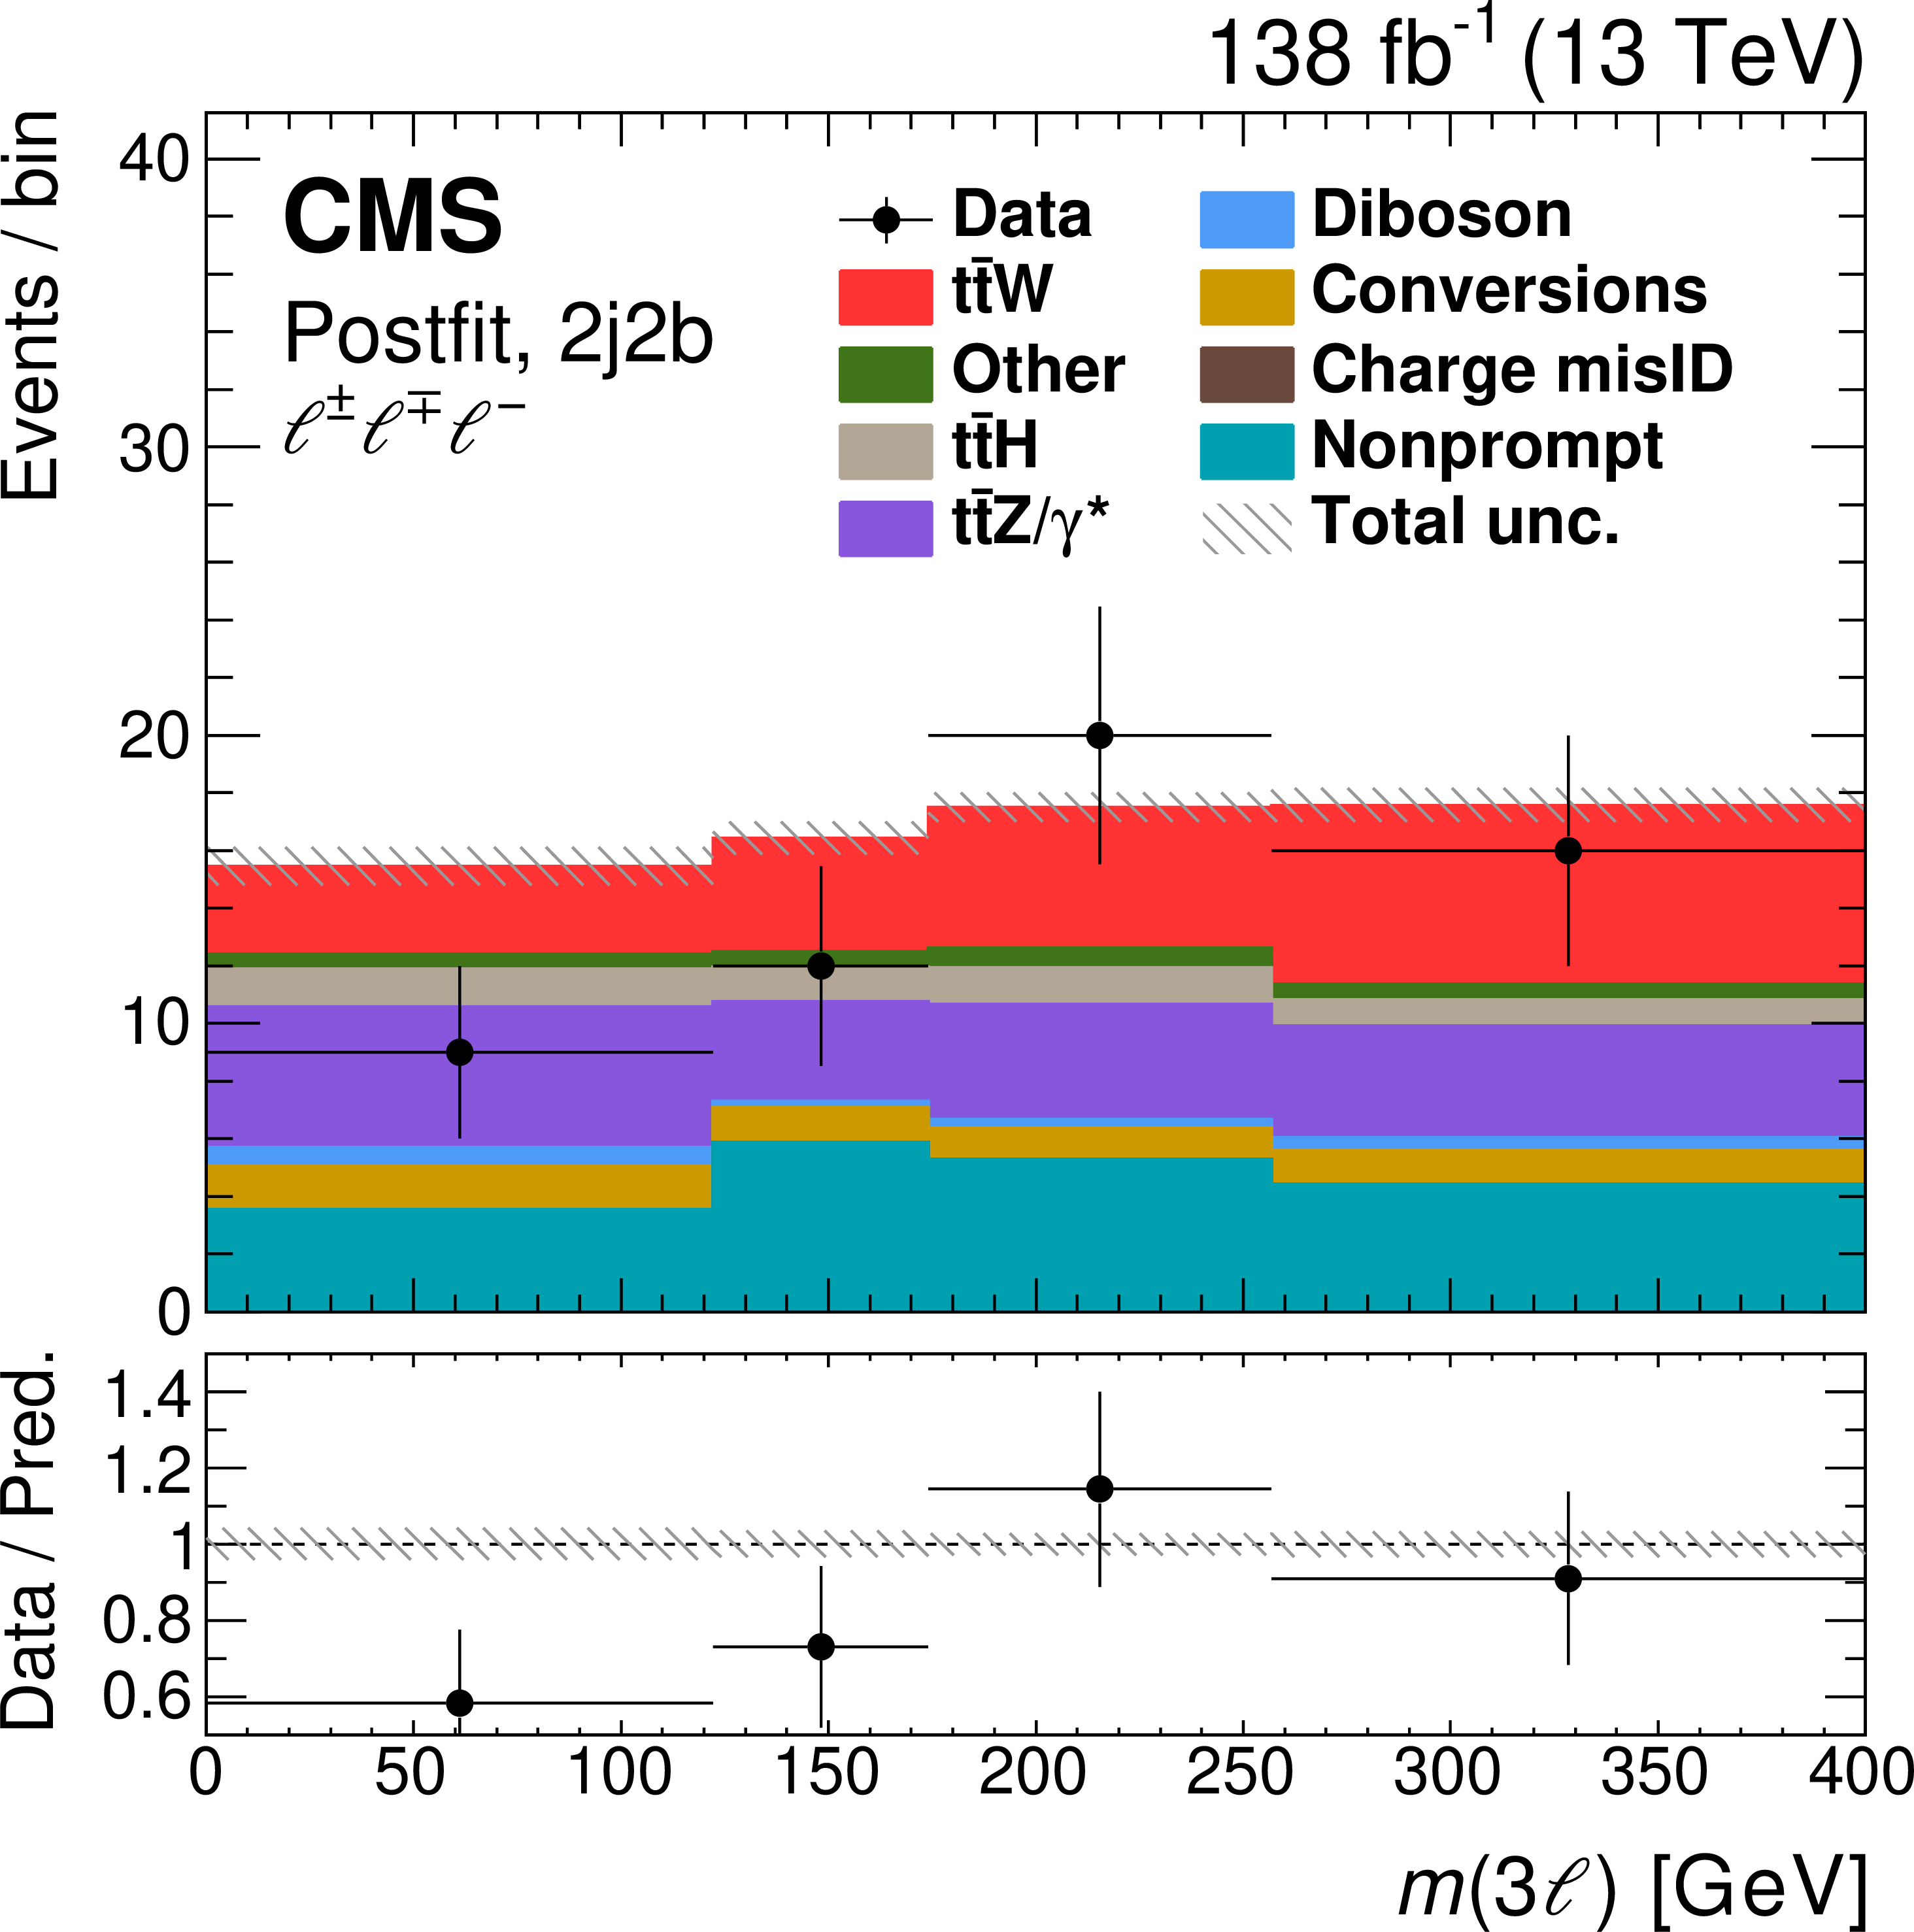
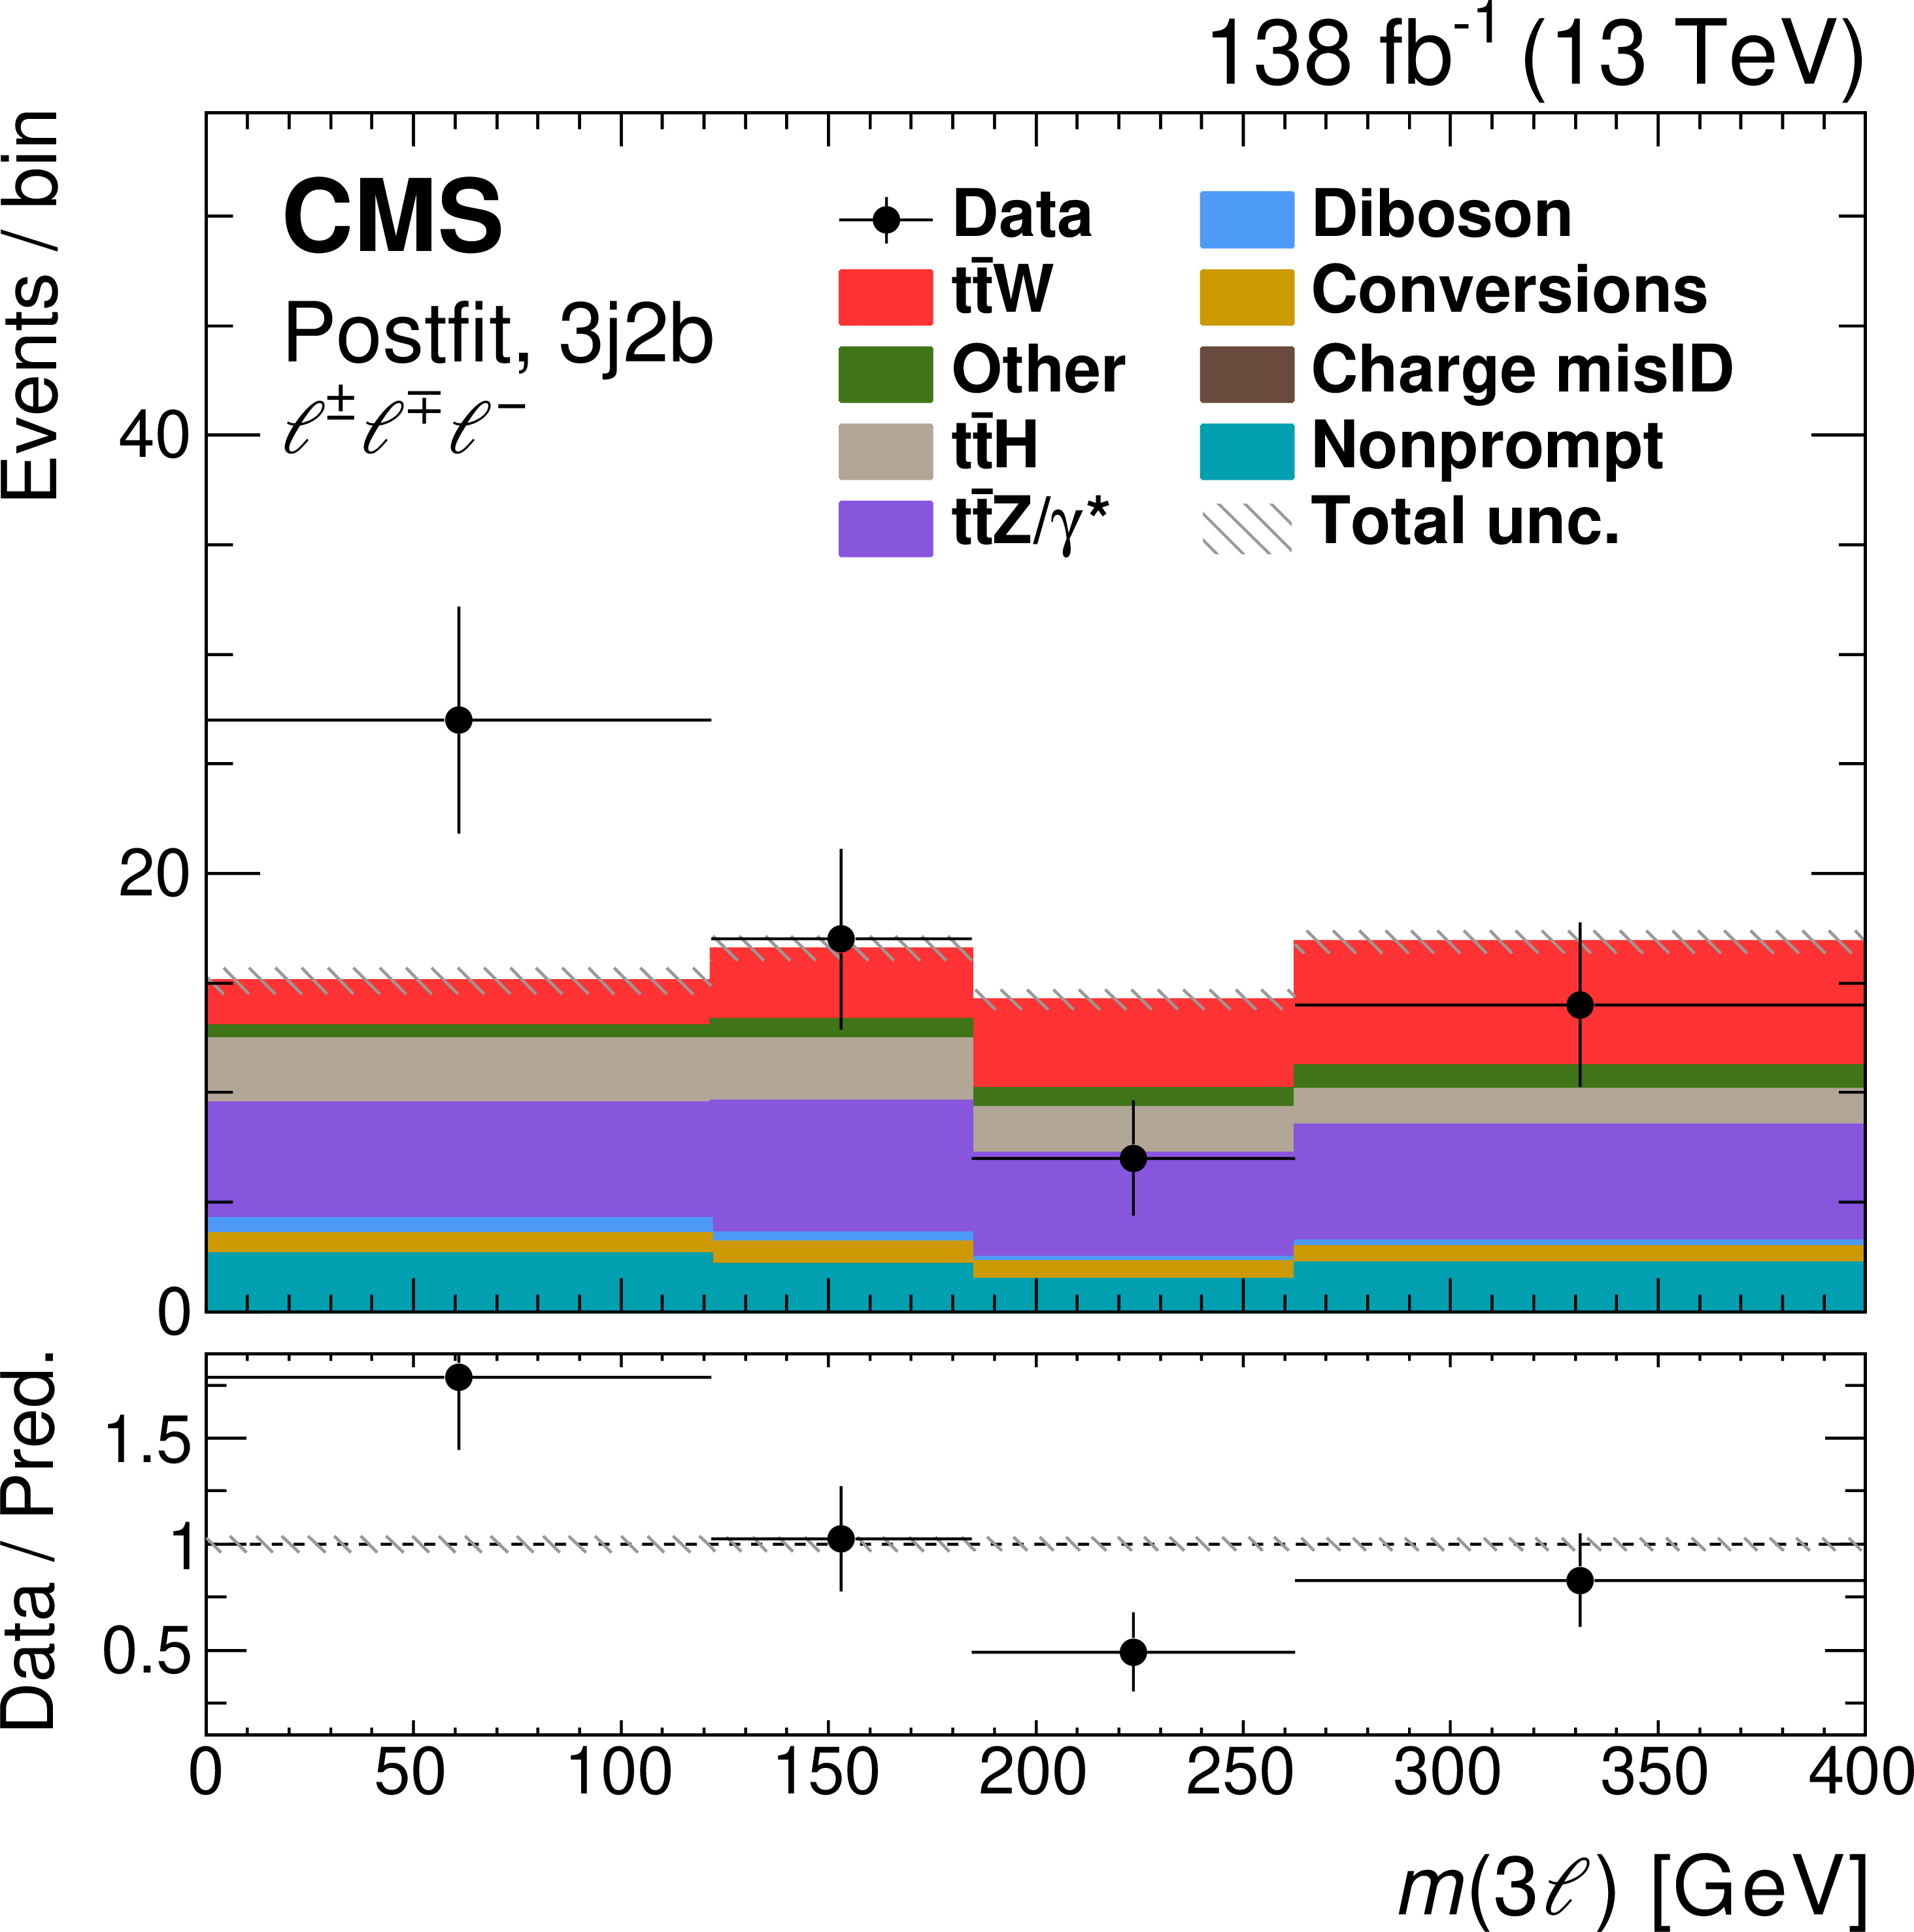
Comparison of the number of observed (points) and predicted (colored histograms) events in the trilepton signal region with positive sum of lepton charges. The distributions of the three-lepton invariant mass are displayed in final states with two (left) and three (right) jets, of which exactly two pass the medium b tagging requirements. The predictions are shown "prefit'' as in Fig. 3 (upper row), and with the values of the normalizations and nuisance parameters obtained in the fit to the data applied ("postfit'', lower row). The vertical bars on the points represent the statistical uncertainties in the data, the horizontal bars the bin widths, and the hatched bands the systematic uncertainty in the predictions. The last bins include the overflow contributions. In the lower panels, the ratio of the event yields in data to the overall sum of the predictions is presented. |
png pdf |
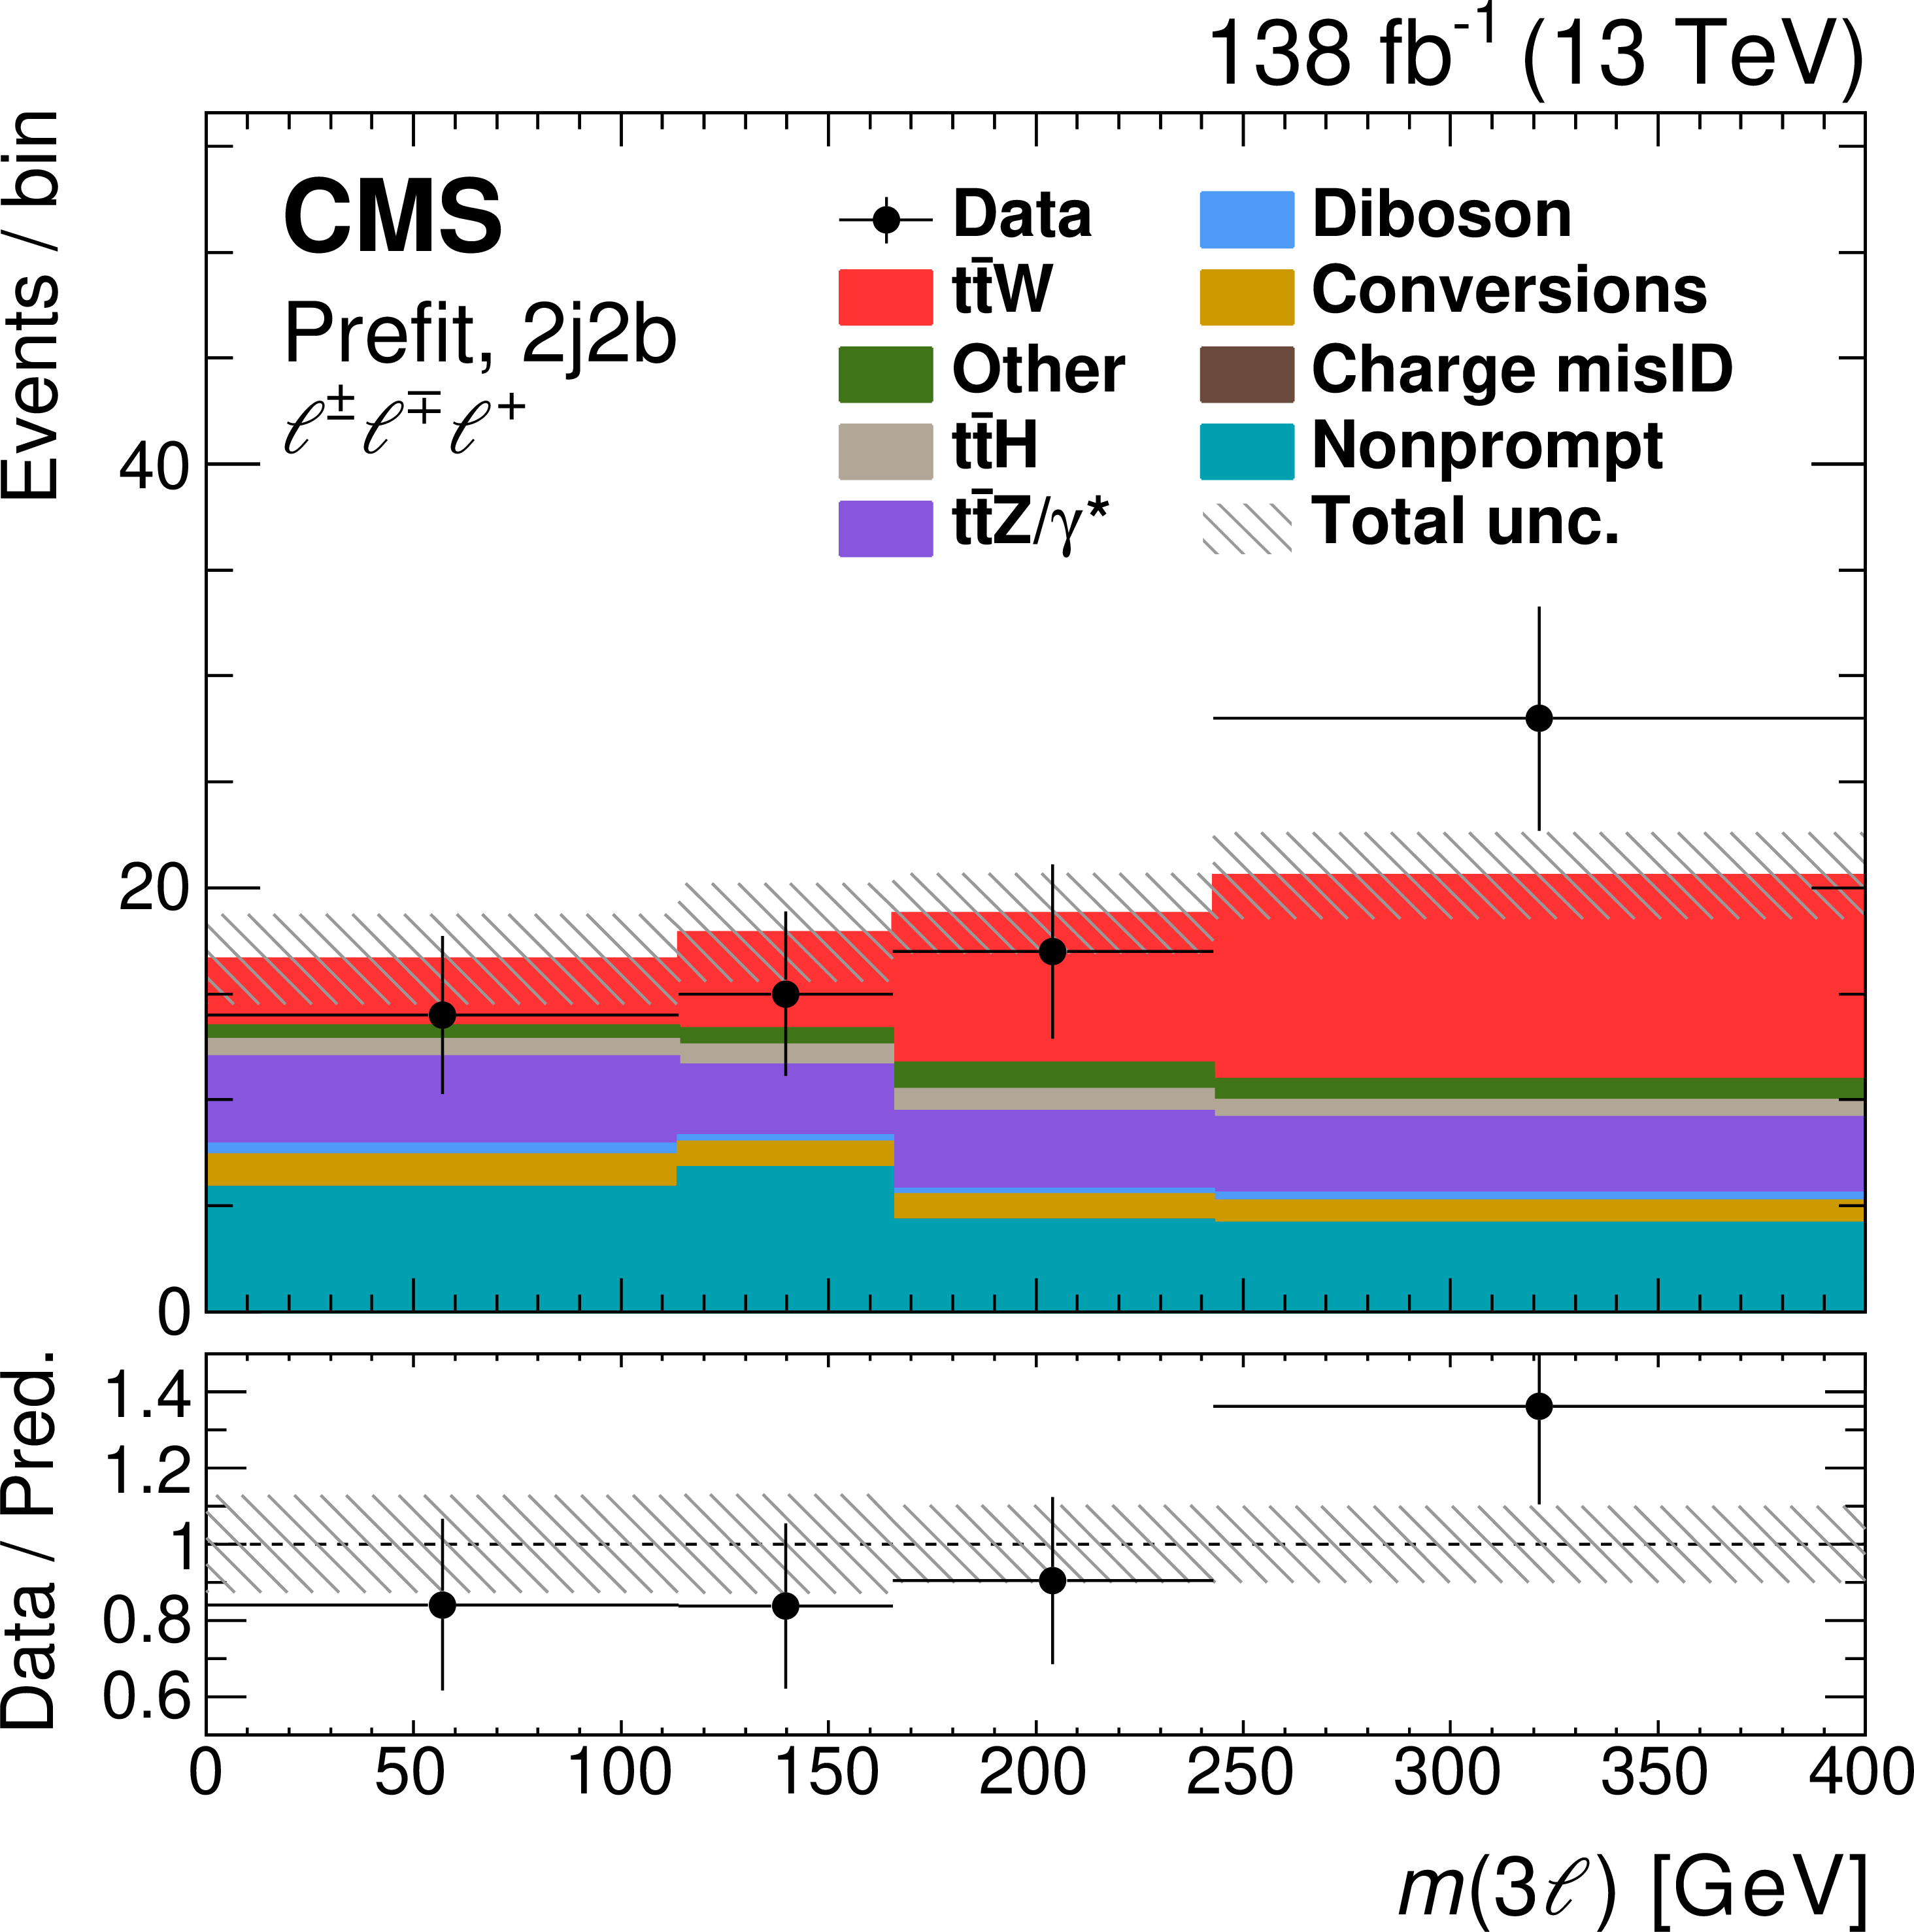
Figure 8-a:
Distribution of the three-lepton invariant mass in final states with two jets, which exactly pass the medium b tagging requirements: comparison of the number of observed (points) and predicted (colored histograms) events in the trilepton signal region with positive sum of lepton charges. The predictions are shown "prefit'' as in Fig. 3. The vertical bars on the points represent the statistical uncertainties in the data, the horizontal bars the bin widths, and the hatched bands the systematic uncertainty in the predictions. The last bins include the overflow contributions. In the lower panel, the ratio of the event yields in data to the overall sum of the predictions is presented. |
png pdf |
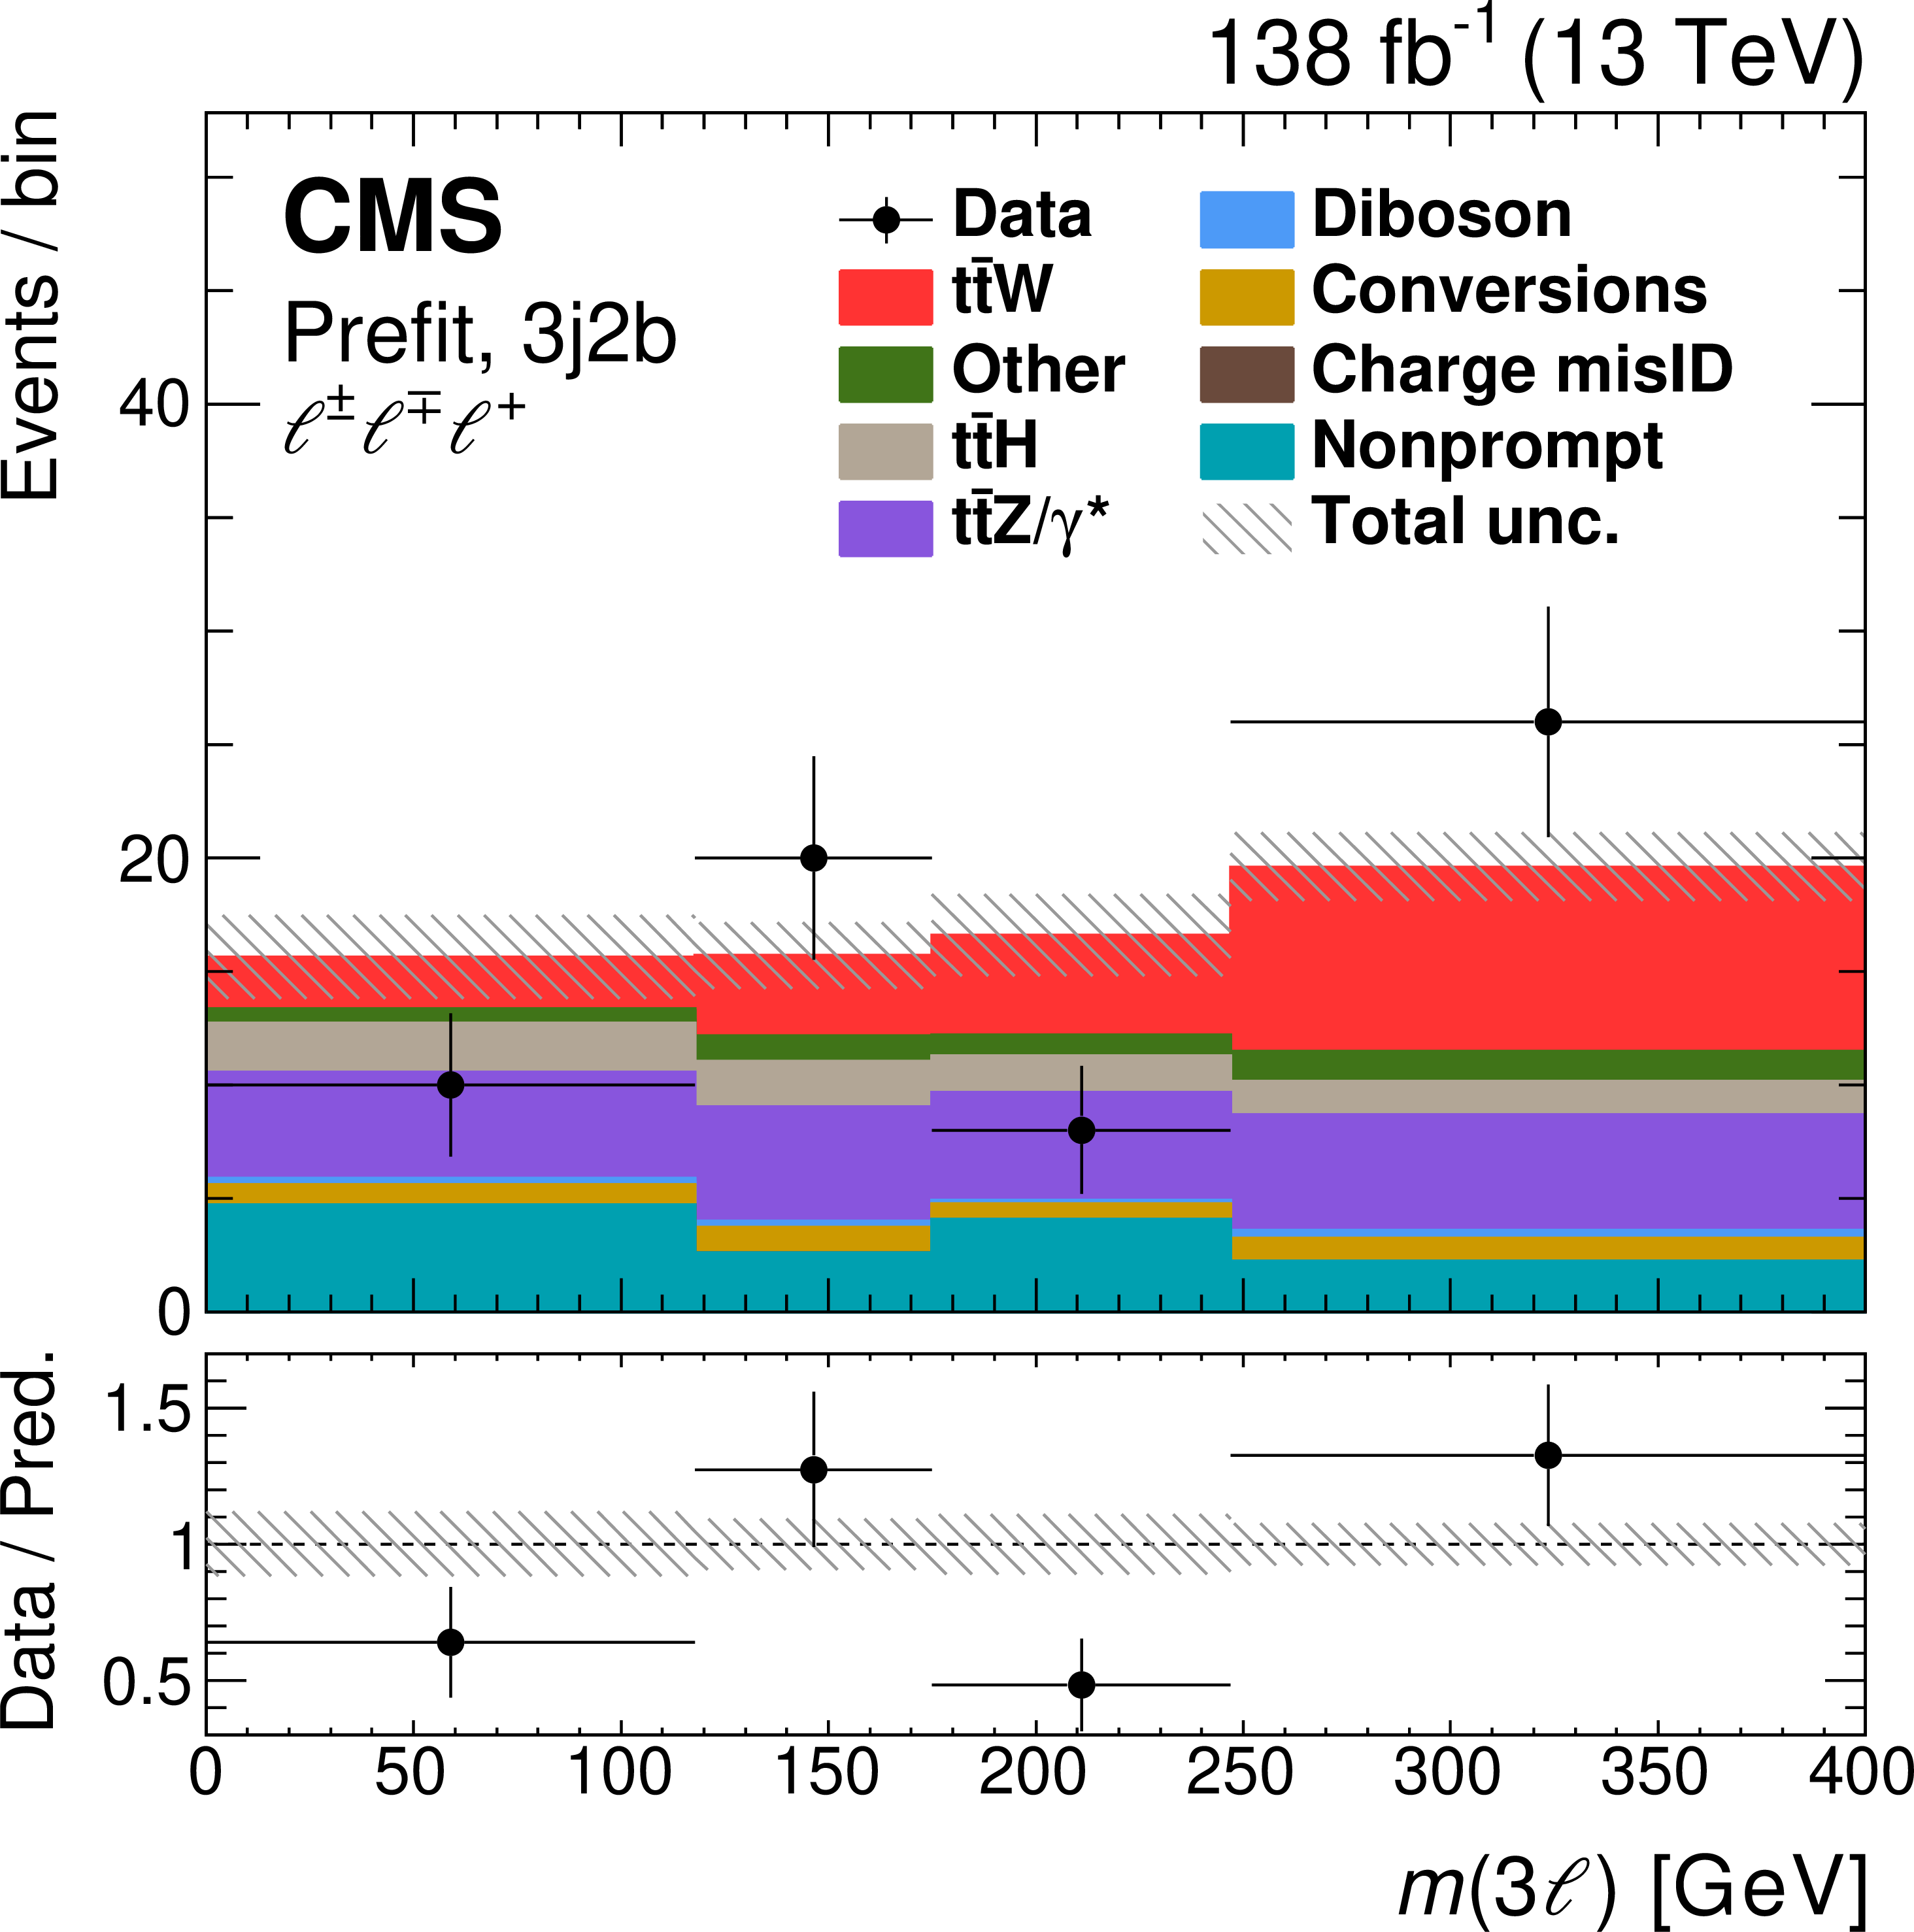
Figure 8-b:
Distribution of the three-lepton invariant mass in final states with three jets, of which exactly two pass the medium b tagging requirements: comparison of the number of observed (points) and predicted (colored histograms) events in the trilepton signal region with positive sum of lepton charges. The predictions are shown "prefit'' as in Fig. 3. The vertical bars on the points represent the statistical uncertainties in the data, the horizontal bars the bin widths, and the hatched bands the systematic uncertainty in the predictions. The last bins include the overflow contributions. In the lower panel, the ratio of the event yields in data to the overall sum of the predictions is presented. |
png pdf |
Figure 8-c:
Distribution of the three-lepton invariant mass in final states with two jets, which exactly pass the medium b tagging requirements: comparison of the number of observed (points) and predicted (colored histograms) events in the trilepton signal region with positive sum of lepton charges. The predictions are shown with the values of the normalizations and nuisance parameters obtained in the fit to the data applied ("postfit''). The vertical bars on the points represent the statistical uncertainties in the data, the horizontal bars the bin widths, and the hatched bands the systematic uncertainty in the predictions. The last bins include the overflow contributions. In the lower panel, the ratio of the event yields in data to the overall sum of the predictions is presented. |
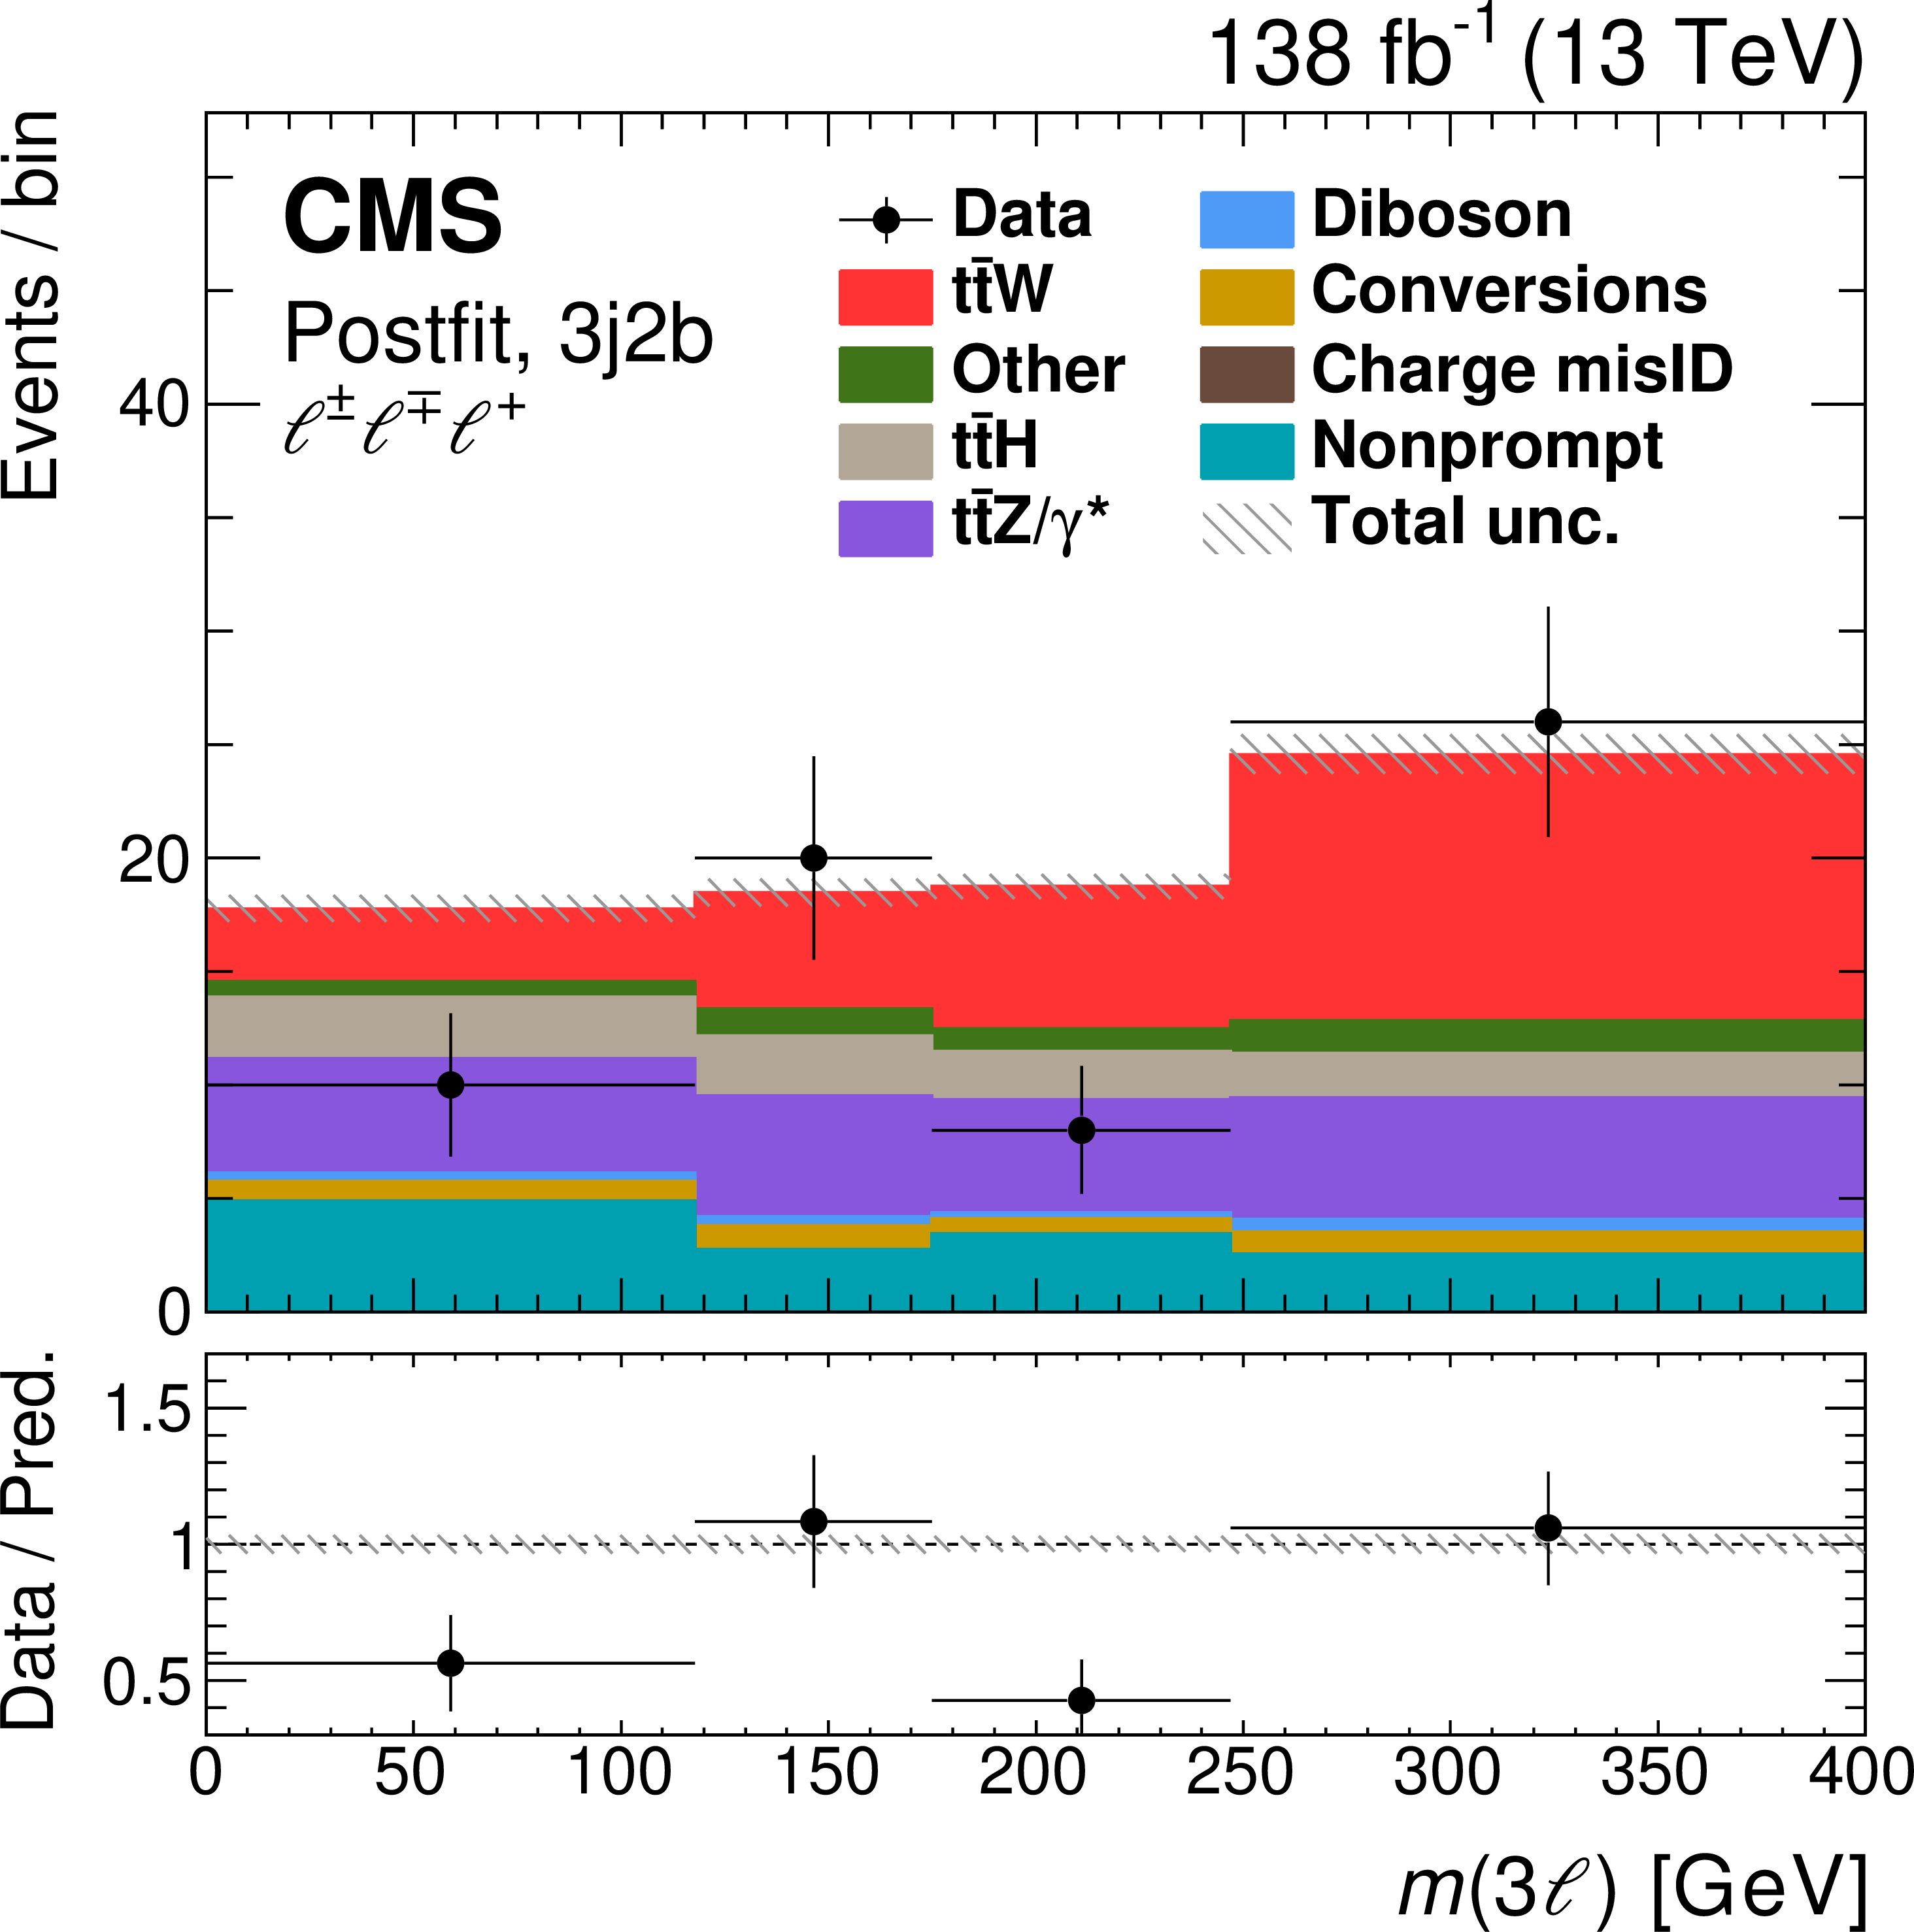
png pdf |
Figure 8-d:
Distribution of the three-lepton invariant mass in final states with three jets, of which exactly two pass the medium b tagging requirements: comparison of the number of observed (points) and predicted (colored histograms) events in the trilepton signal region with positive sum of lepton charges. The predictions are shown with the values of the normalizations and nuisance parameters obtained in the fit to the data applied ("postfit''). The vertical bars on the points represent the statistical uncertainties in the data, the horizontal bars the bin widths, and the hatched bands the systematic uncertainty in the predictions. The last bins include the overflow contributions. In the lower panel, the ratio of the event yields in data to the overall sum of the predictions is presented. |
png pdf |
Figure 9:
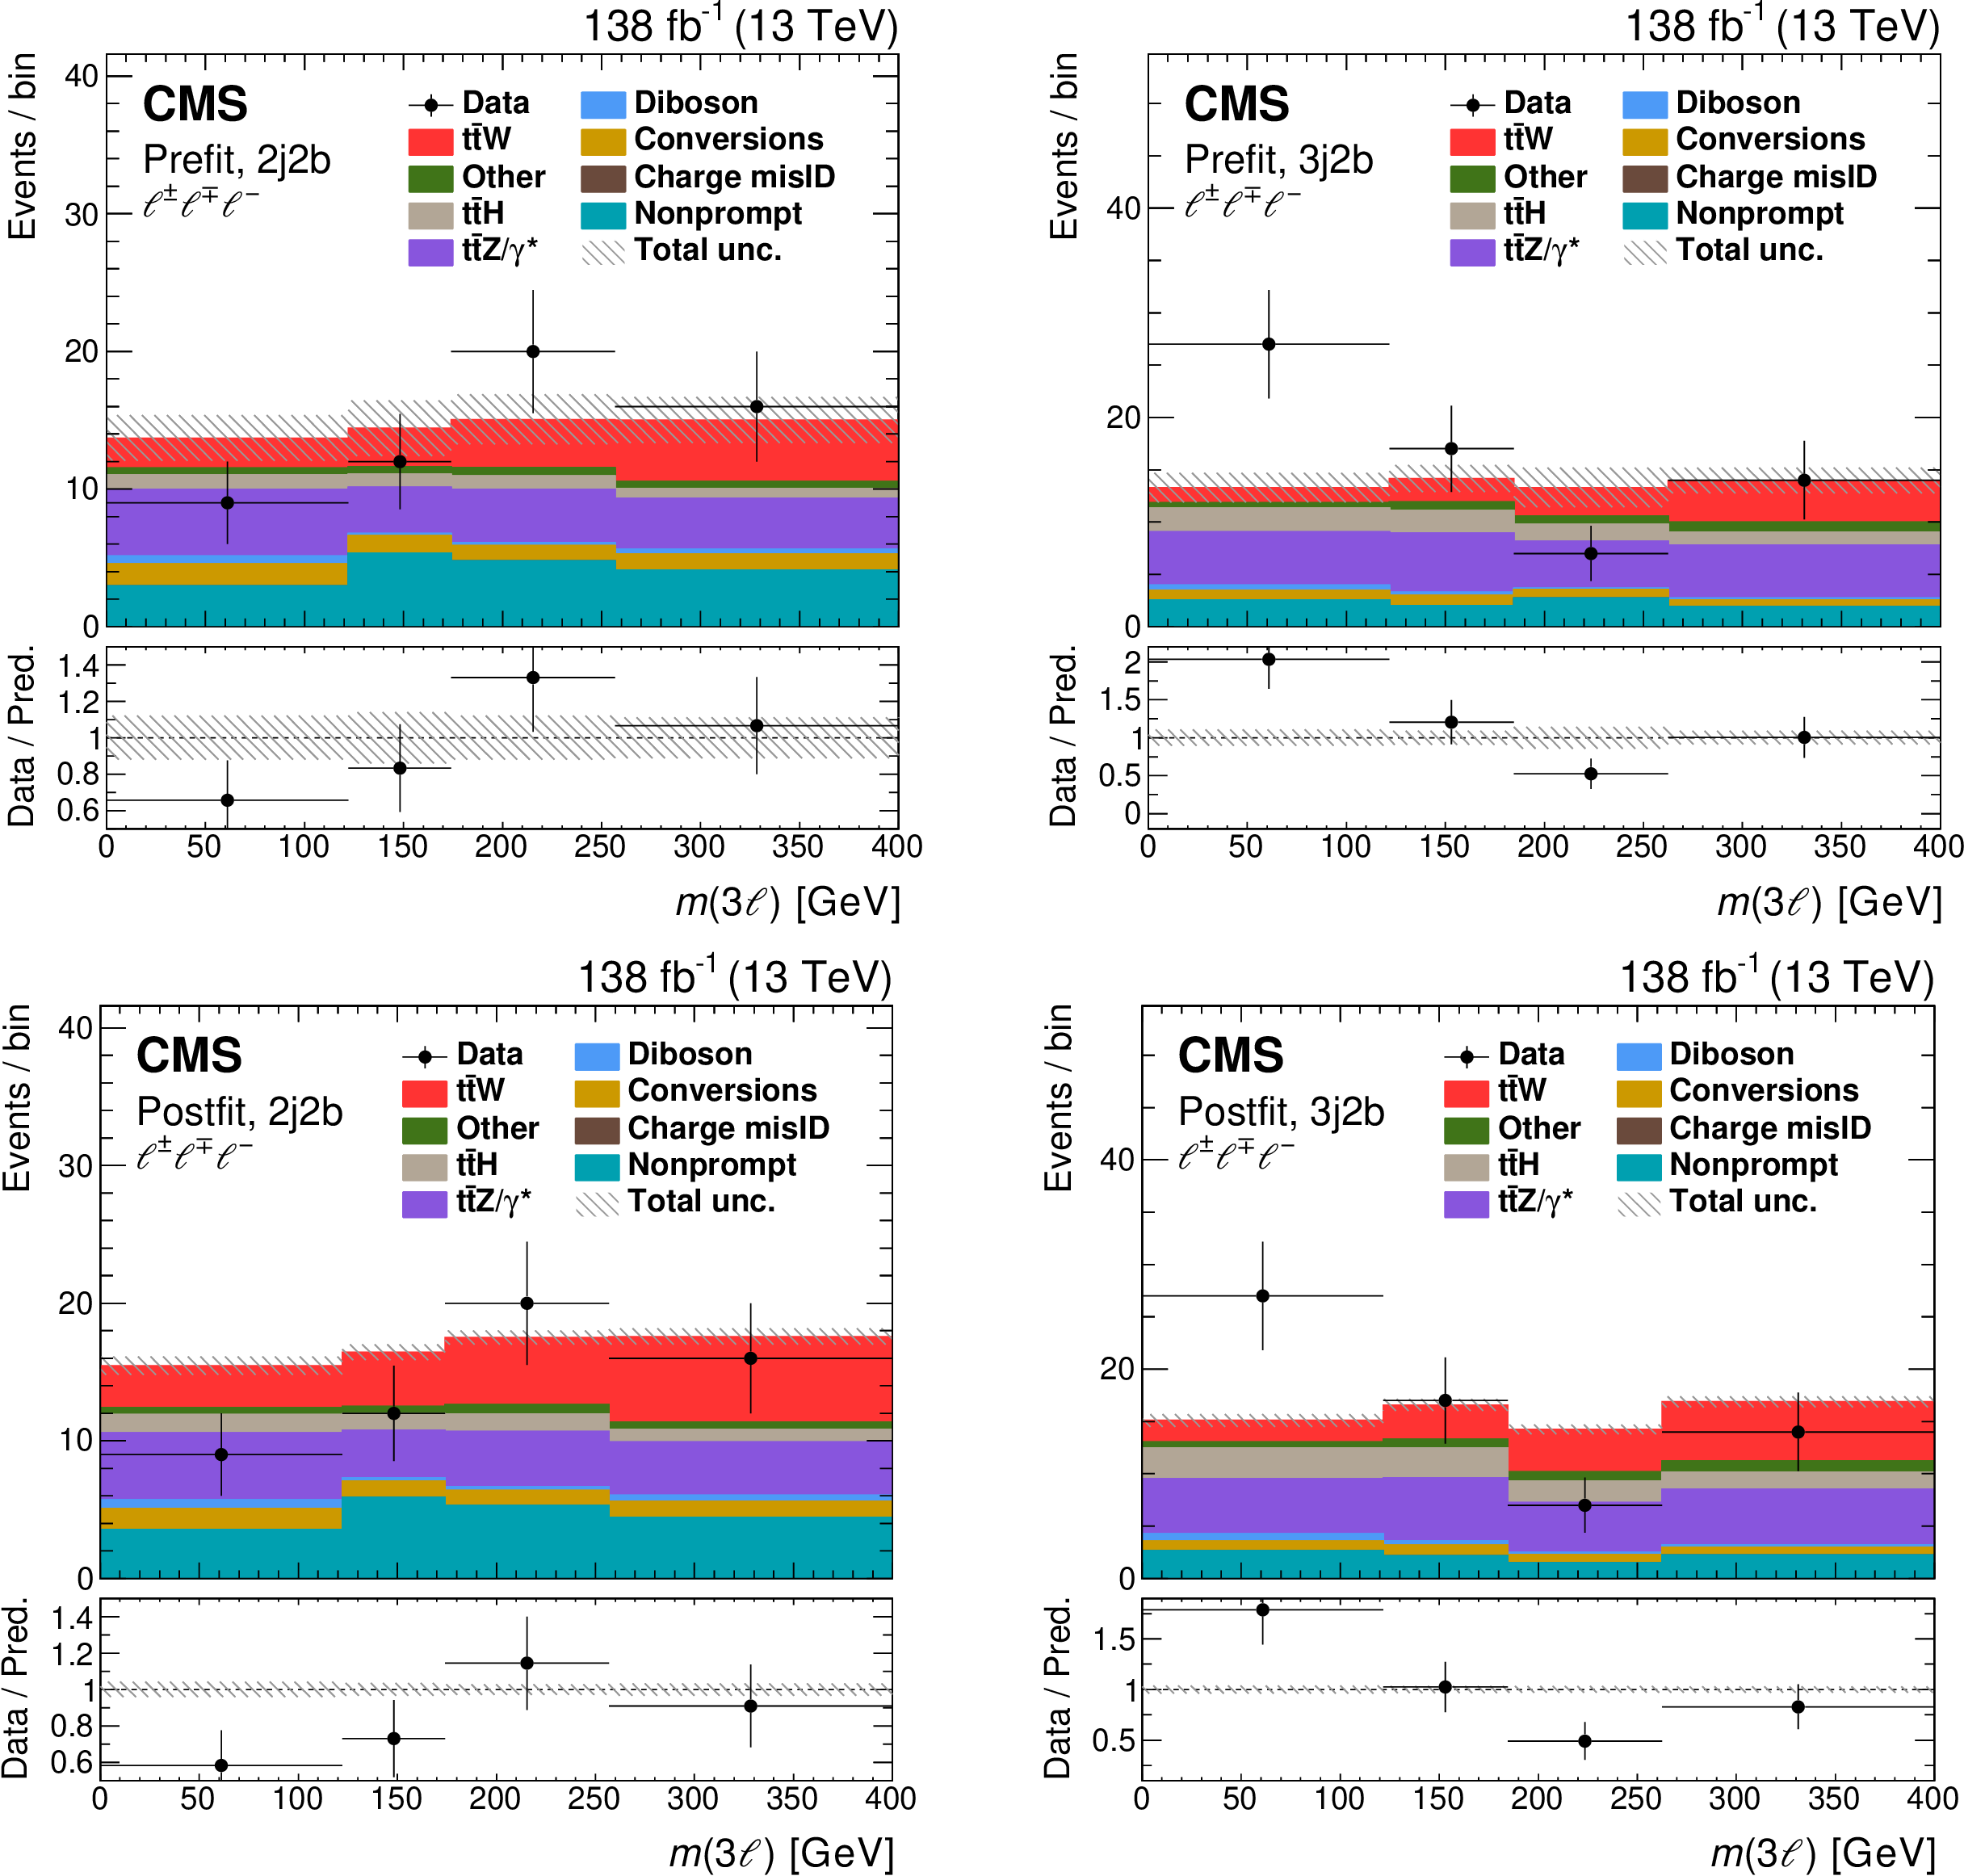
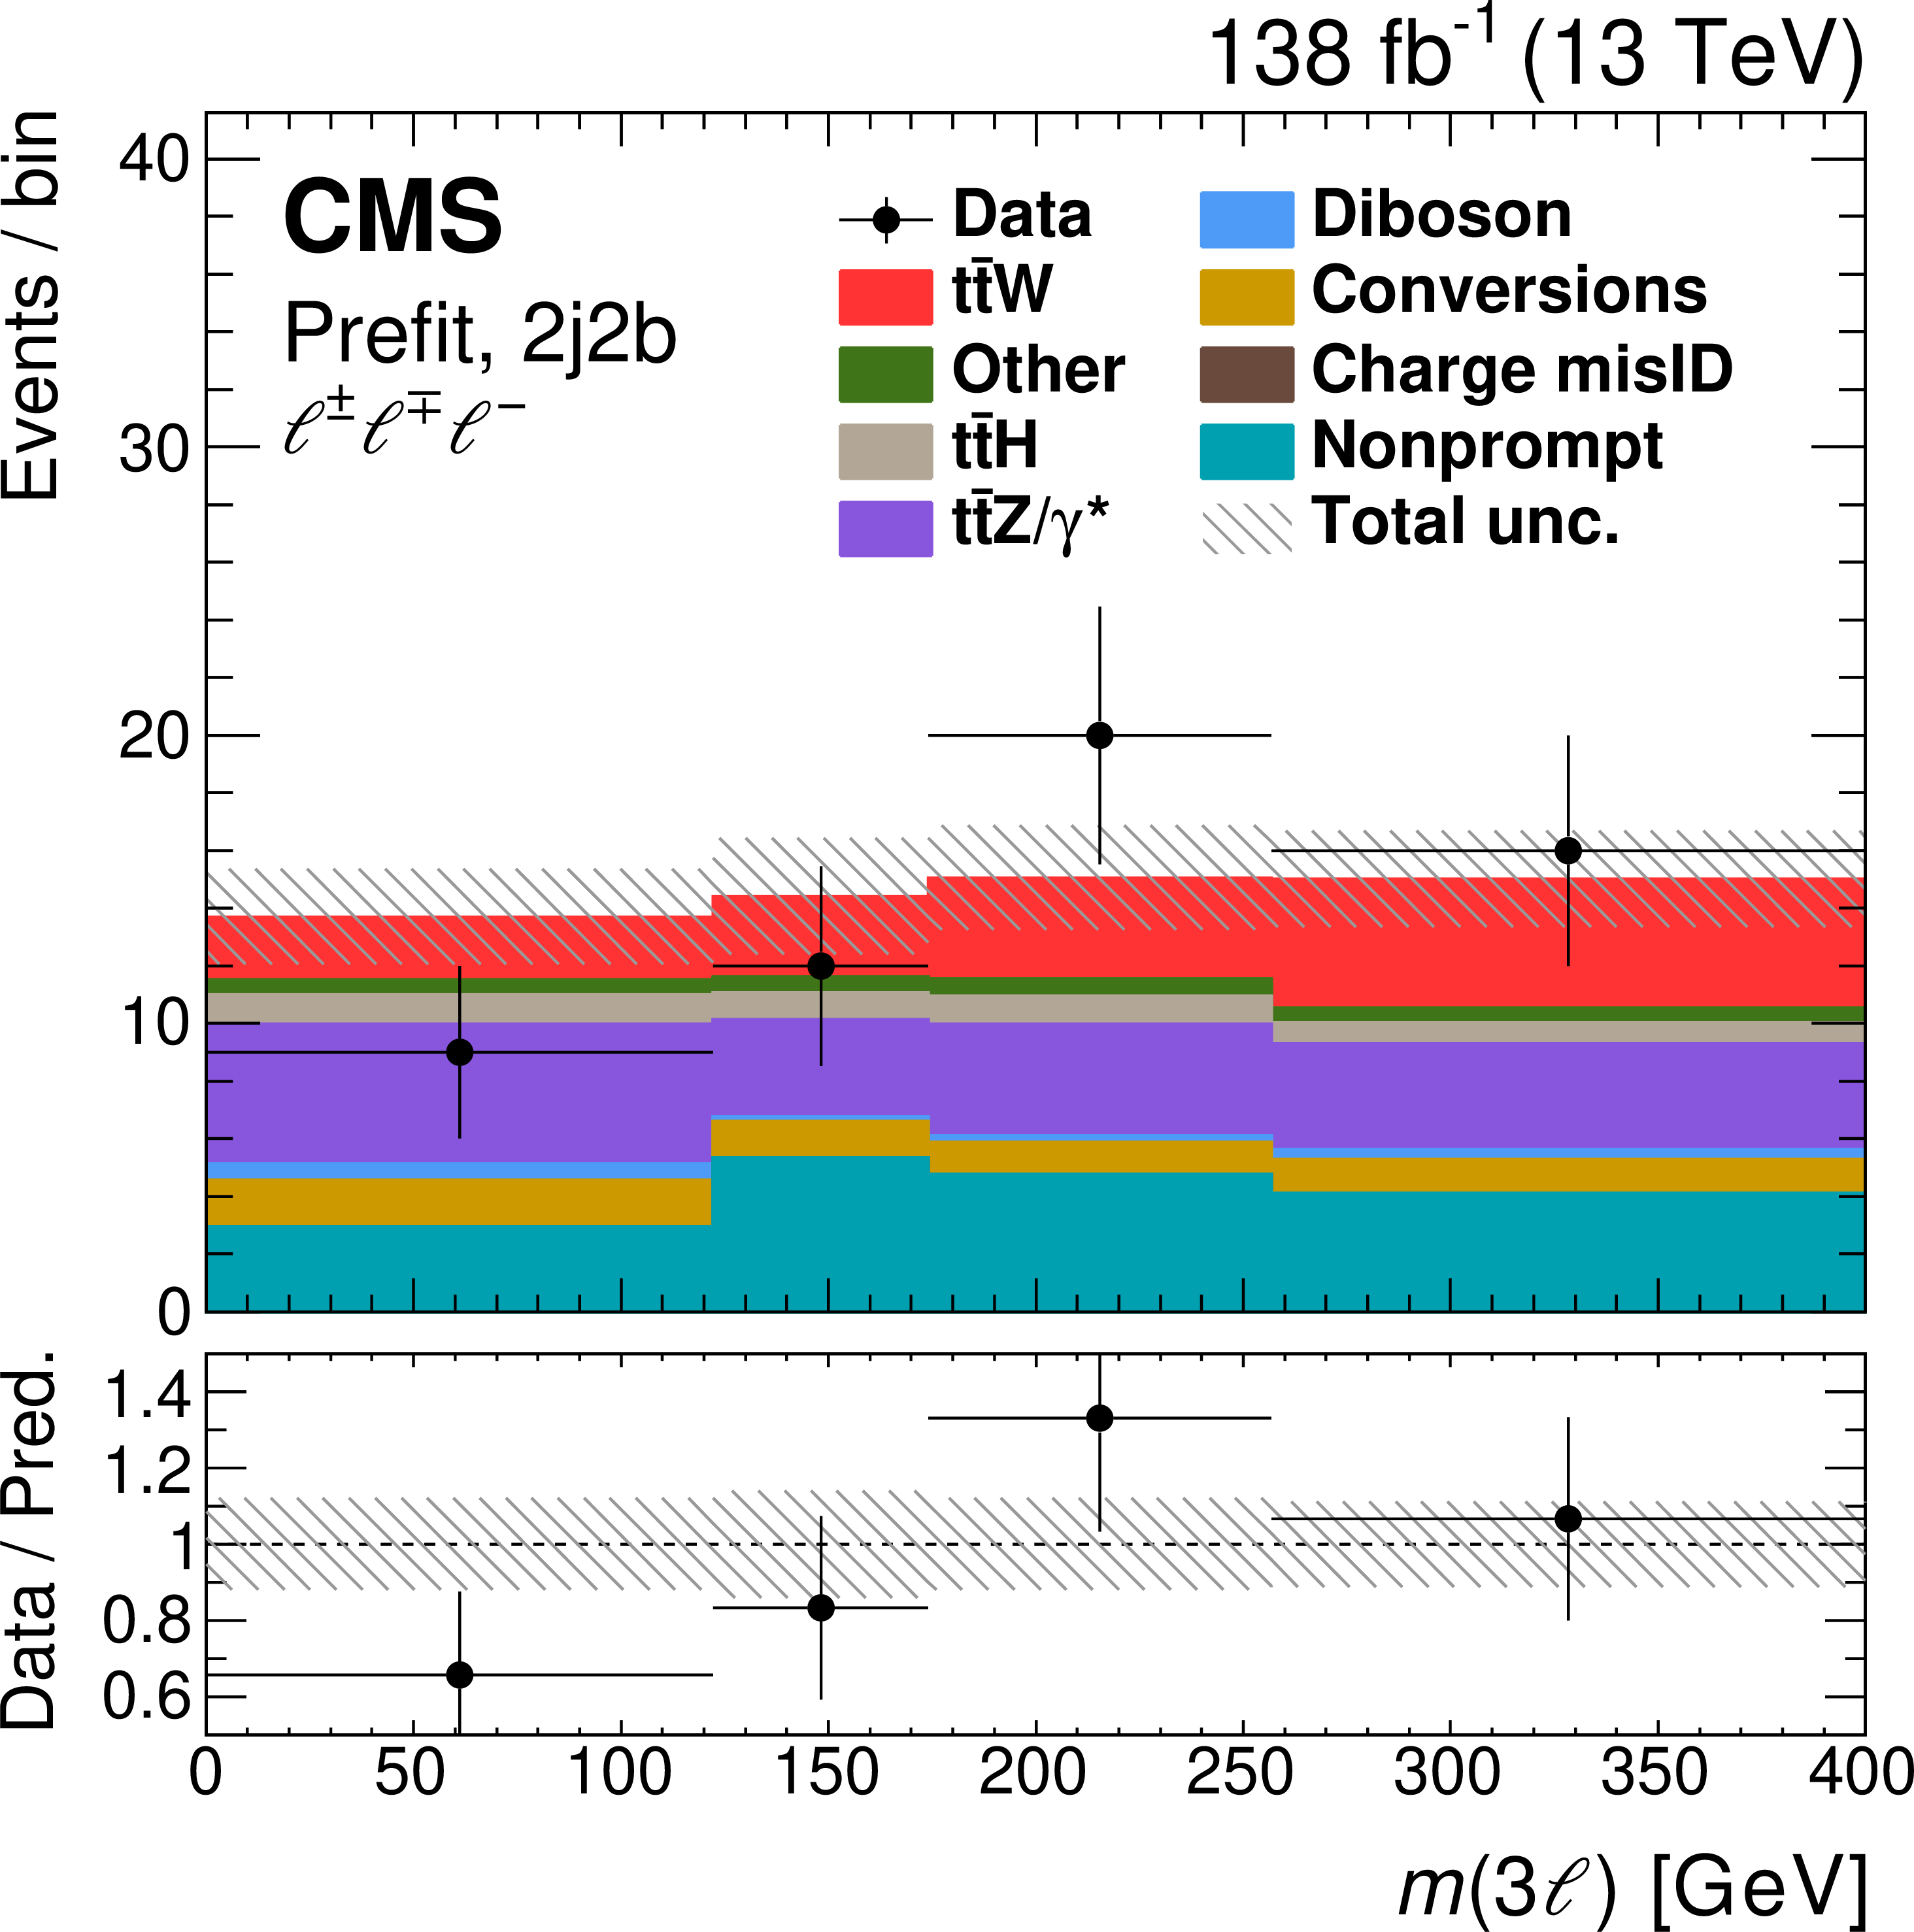
Comparison of the number of observed (points) and predicted (colored histograms) events in the trilepton signal region with negative sum of lepton charges. The distributions of the three-lepton invariant mass are displayed in final states with two (left) and three (right) jets, of which exactly two pass the medium b tagging requirements. The predictions are shown "prefit'' as in Fig. 3 (upper row), and with the values of the normalizations and nuisance parameters obtained in the fit to the data applied ("postfit'', lower row). The vertical bars on the points represent the statistical uncertainties in the data, the horizontal bars the bin widths, and the hatched bands the systematic uncertainty in the predictions. The last bins include the overflow contributions. In the lower panels, the ratio of the event yields in data to the overall sum of the predictions is presented. |
png pdf |
Figure 9-a:
Distribution of the three-lepton invariant mass in final states with two jets, which exactly pass the medium b tagging requirements. Comparison of the number of observed (points) and predicted (colored histograms) events in the trilepton signal region with negative sum of lepton charges. The predictions are shown "prefit'' as in Fig. 3. The vertical bars on the points represent the statistical uncertainties in the data, the horizontal bars the bin widths, and the hatched bands the systematic uncertainty in the predictions. The last bins include the overflow contributions. In the lower panel, the ratio of the event yields in data to the overall sum of the predictions is presented. |
png pdf |
Figure 9-b:
Distribution of the three-lepton invariant mass in final states with three jets, of which exactly two pass the medium b tagging requirements. Comparison of the number of observed (points) and predicted (colored histograms) events in the trilepton signal region with negative sum of lepton charges. The predictions are shown "prefit'' as in Fig. 3. The vertical bars on the points represent the statistical uncertainties in the data, the horizontal bars the bin widths, and the hatched bands the systematic uncertainty in the predictions. The last bins include the overflow contributions. In the lower panel, the ratio of the event yields in data to the overall sum of the predictions is presented. |
png pdf |
Figure 9-c:
Distribution of the three-lepton invariant mass in final states with two jets, which exactly pass the medium b tagging requirements. Comparison of the number of observed (points) and predicted (colored histograms) events in the trilepton signal region with negative sum of lepton charges. The predictions are shown with the values of the normalizations and nuisance parameters obtained in the fit to the data applied ("postfit''). The vertical bars on the points represent the statistical uncertainties in the data, the horizontal bars the bin widths, and the hatched bands the systematic uncertainty in the predictions. The last bins include the overflow contributions. In the lower panel, the ratio of the event yields in data to the overall sum of the predictions is presented. |
png pdf |
Figure 9-d:
Distribution of the three-lepton invariant mass in final states with three jets, of which exactly two pass the medium b tagging requirements. Comparison of the number of observed (points) and predicted (colored histograms) events in the trilepton signal region with negative sum of lepton charges. The predictions are shown with the values of the normalizations and nuisance parameters obtained in the fit to the data applied ("postfit''). The vertical bars on the points represent the statistical uncertainties in the data, the horizontal bars the bin widths, and the hatched bands the systematic uncertainty in the predictions. The last bins include the overflow contributions. In the lower panel, the ratio of the event yields in data to the overall sum of the predictions is presented. |
png pdf |
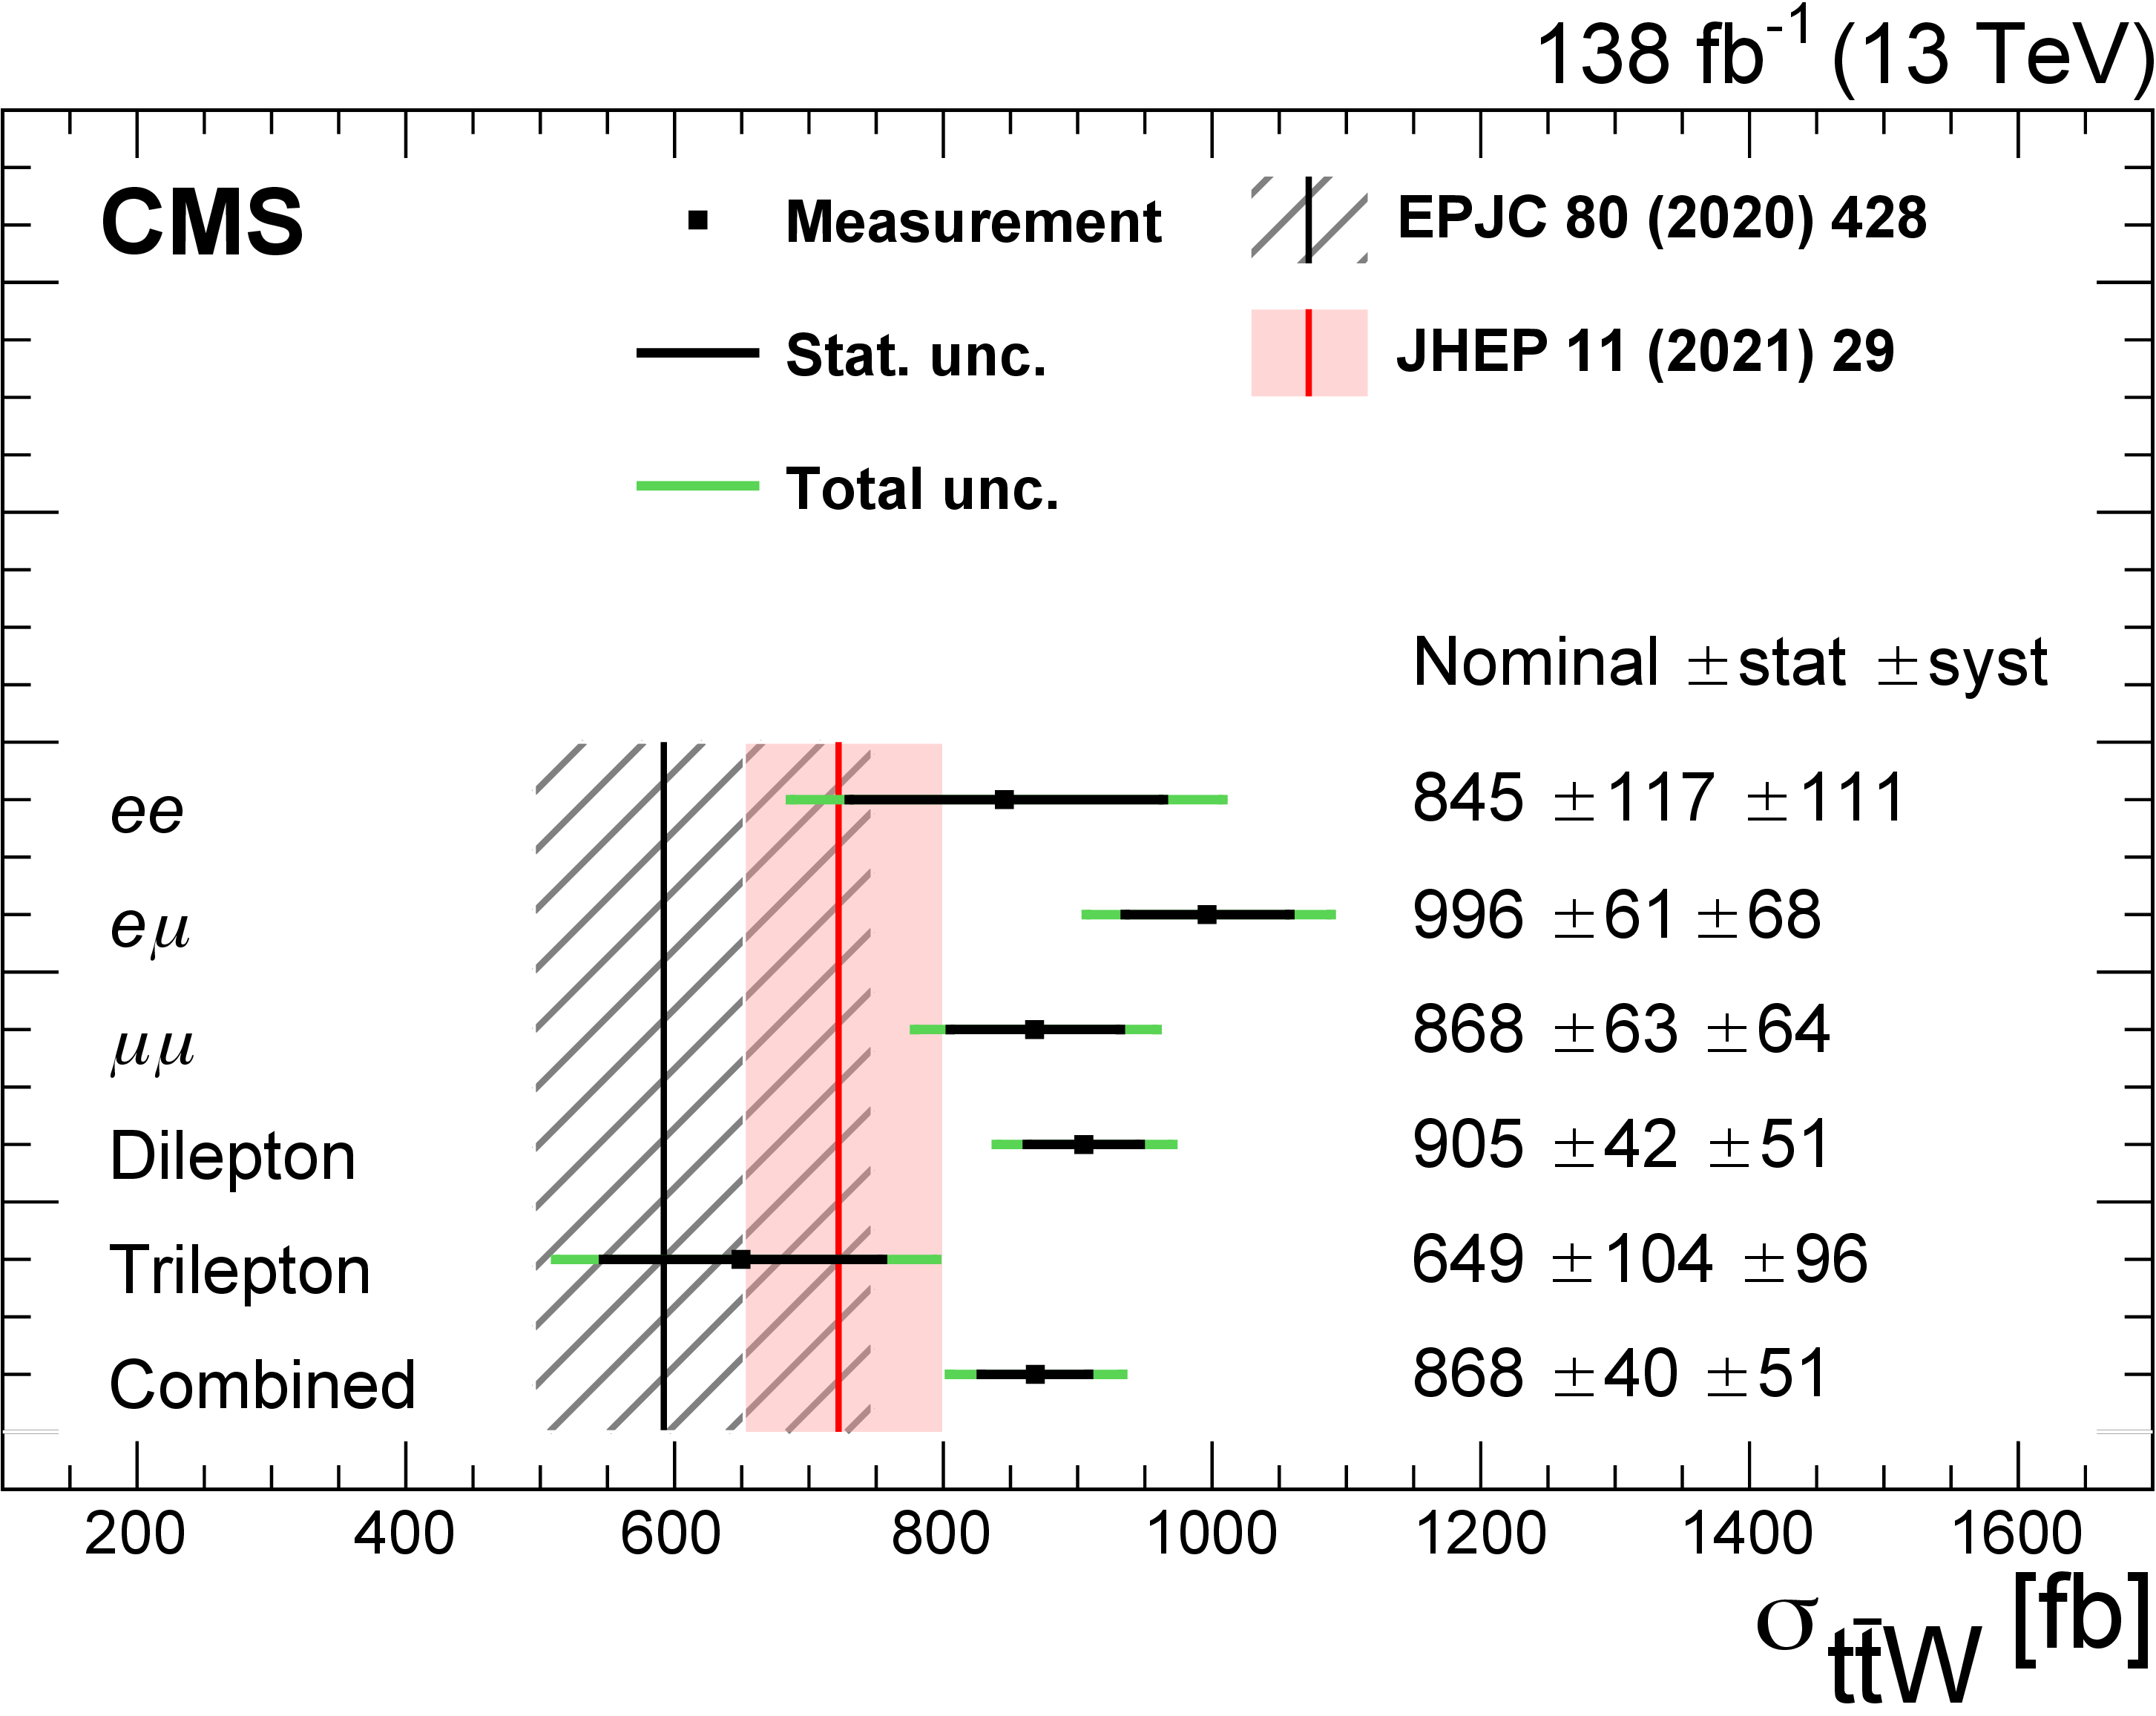
Figure 10:
The measured ${\mathrm{t} {}\mathrm{\bar{t}}}$W production cross section for the individual dilepton (ee, e$\mu $, $\mu \mu $, and combined) channels and the trilepton channel, as well as their combination. The inner black bars show the statistical uncertainty, and the outer green bars give the total uncertainty. The predictions from two SM calculations from Refs. [16,21] are shown by the black and red vertical lines, with the associated bands corresponding to the total uncertainty. |
png pdf |
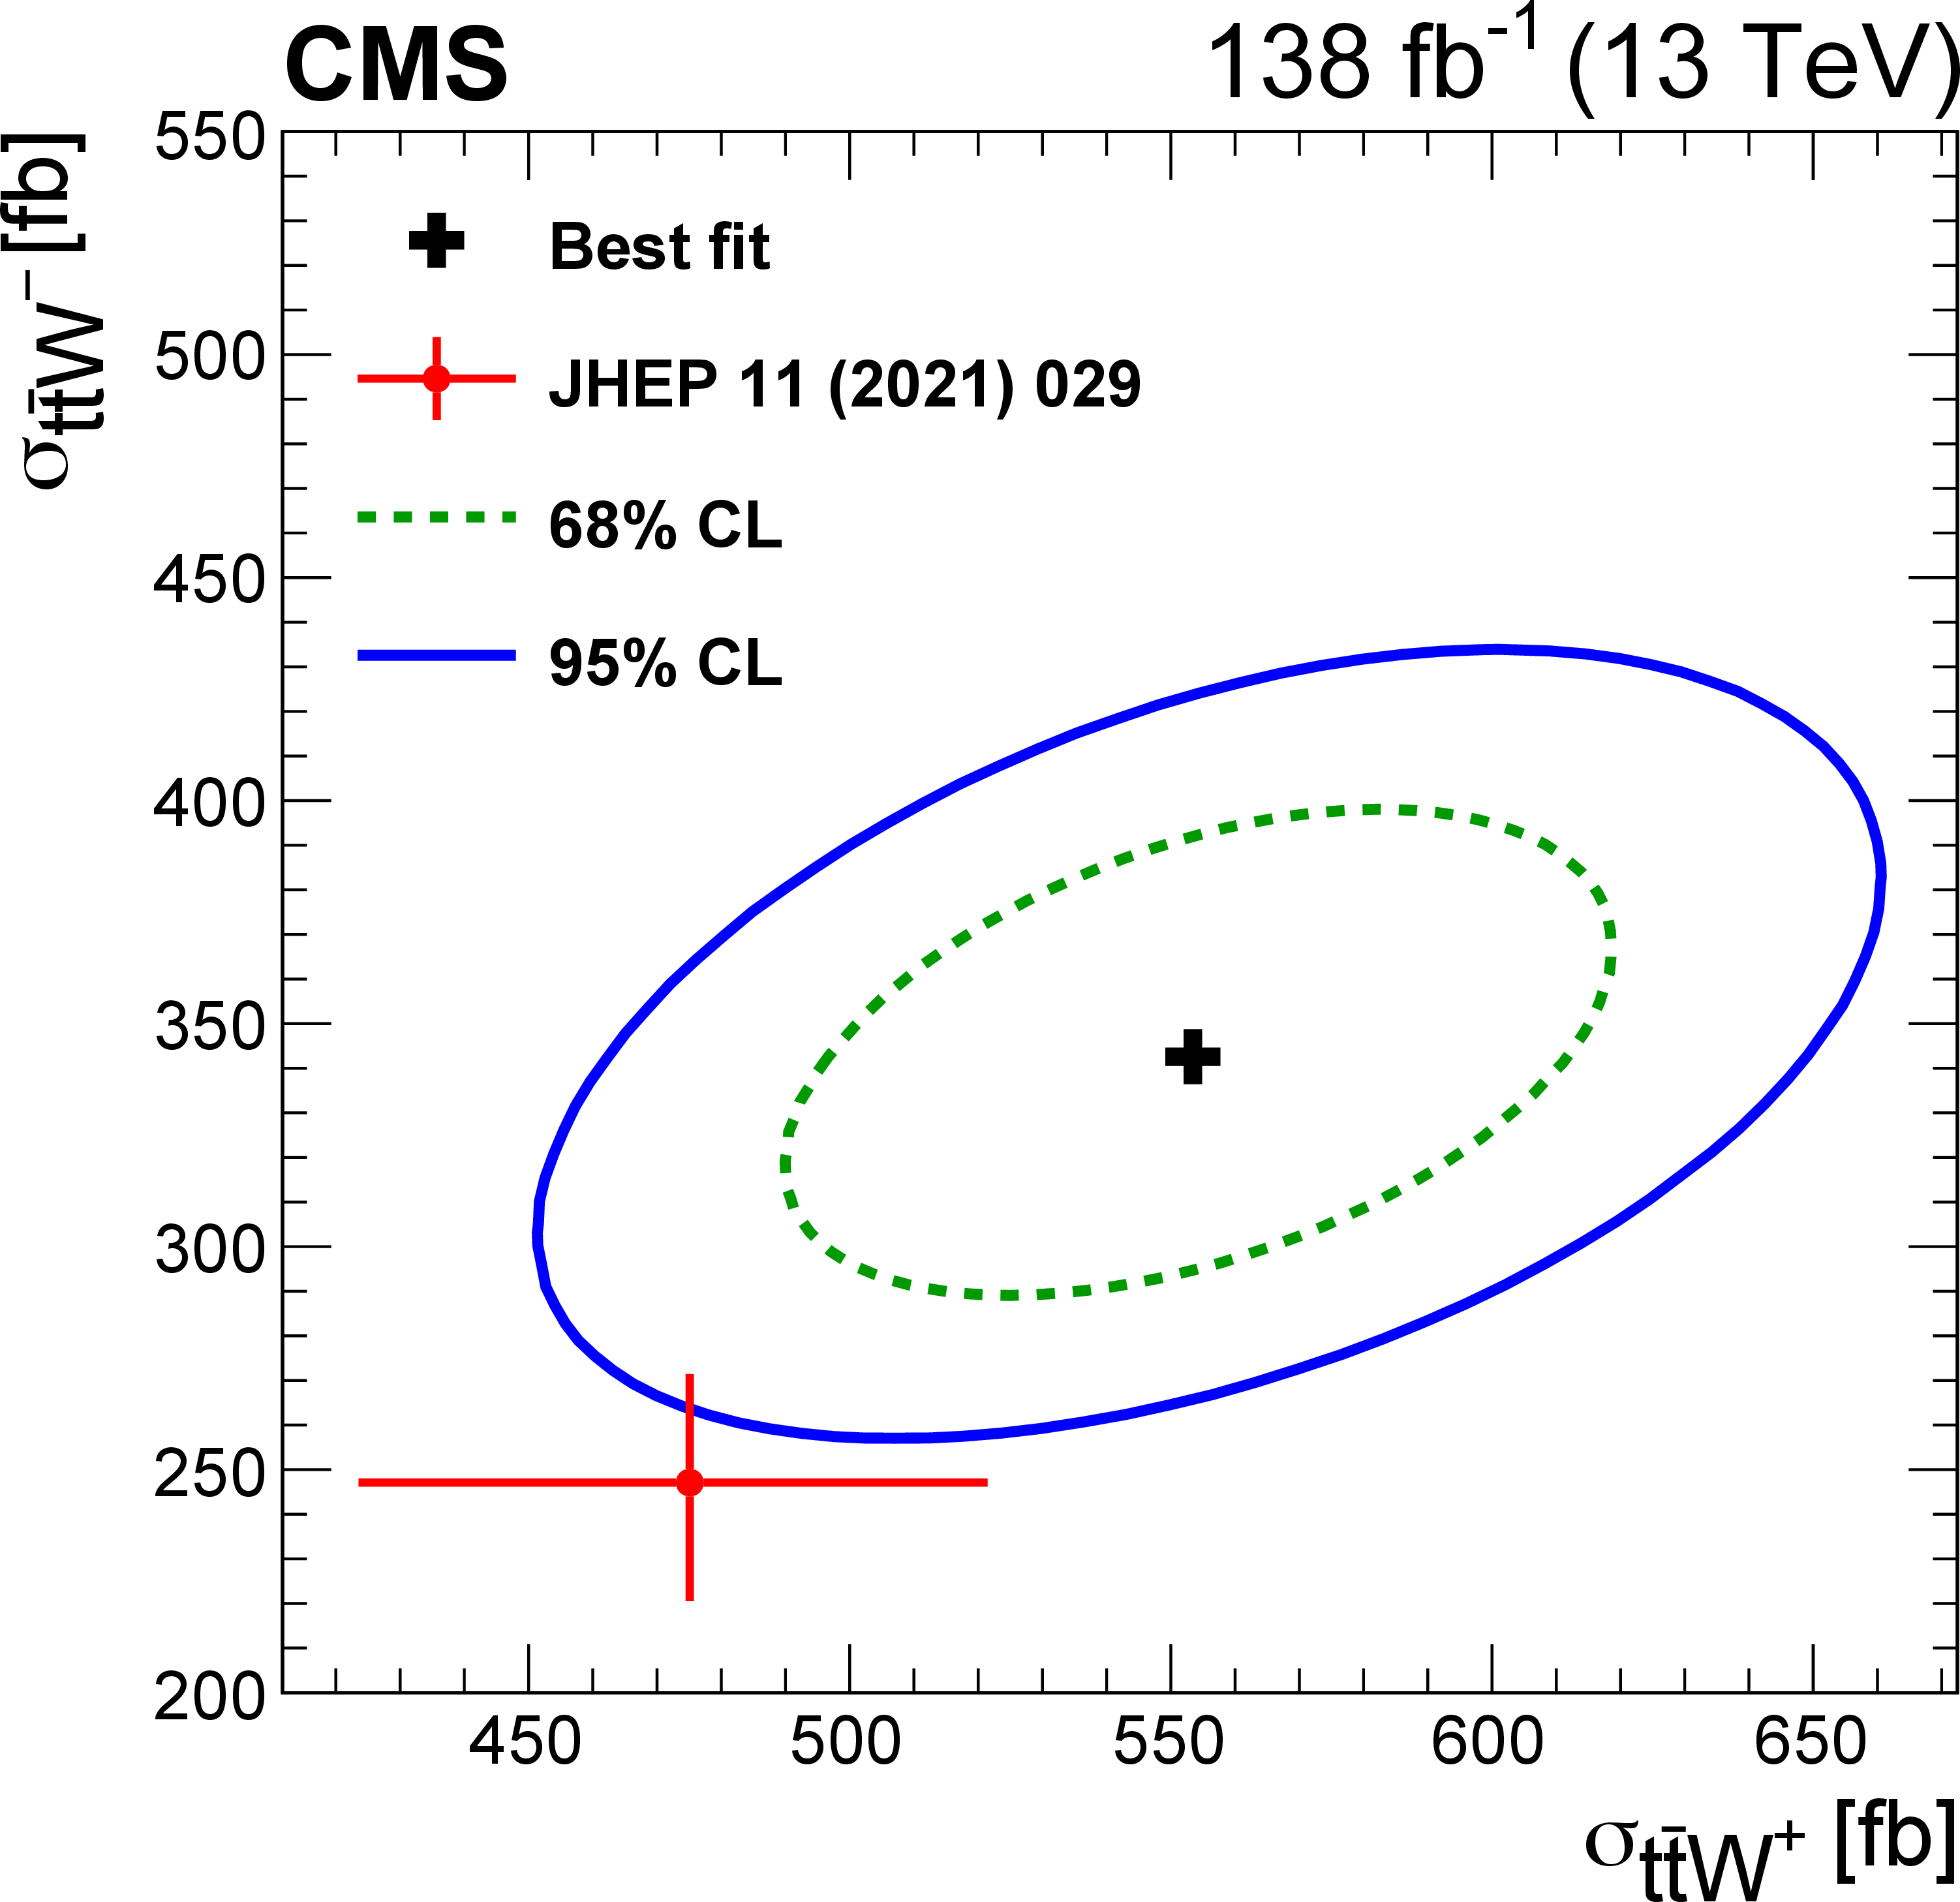
Figure 11:
The measurement of the ${\mathrm{t} {}\mathrm{\bar{t}}}$W$^{+}$ vs. ${\mathrm{t} {}\mathrm{\bar{t}}}$W$^{-}$ cross sections (black cross), along with the 68 (green dashed) and 95% (blue solid) CL intervals. The SM prediction provided by the authors of Ref. [21] is shown by the red dot, with the horizontal and vertical bars corresponding to the total uncertainties. |
png pdf |
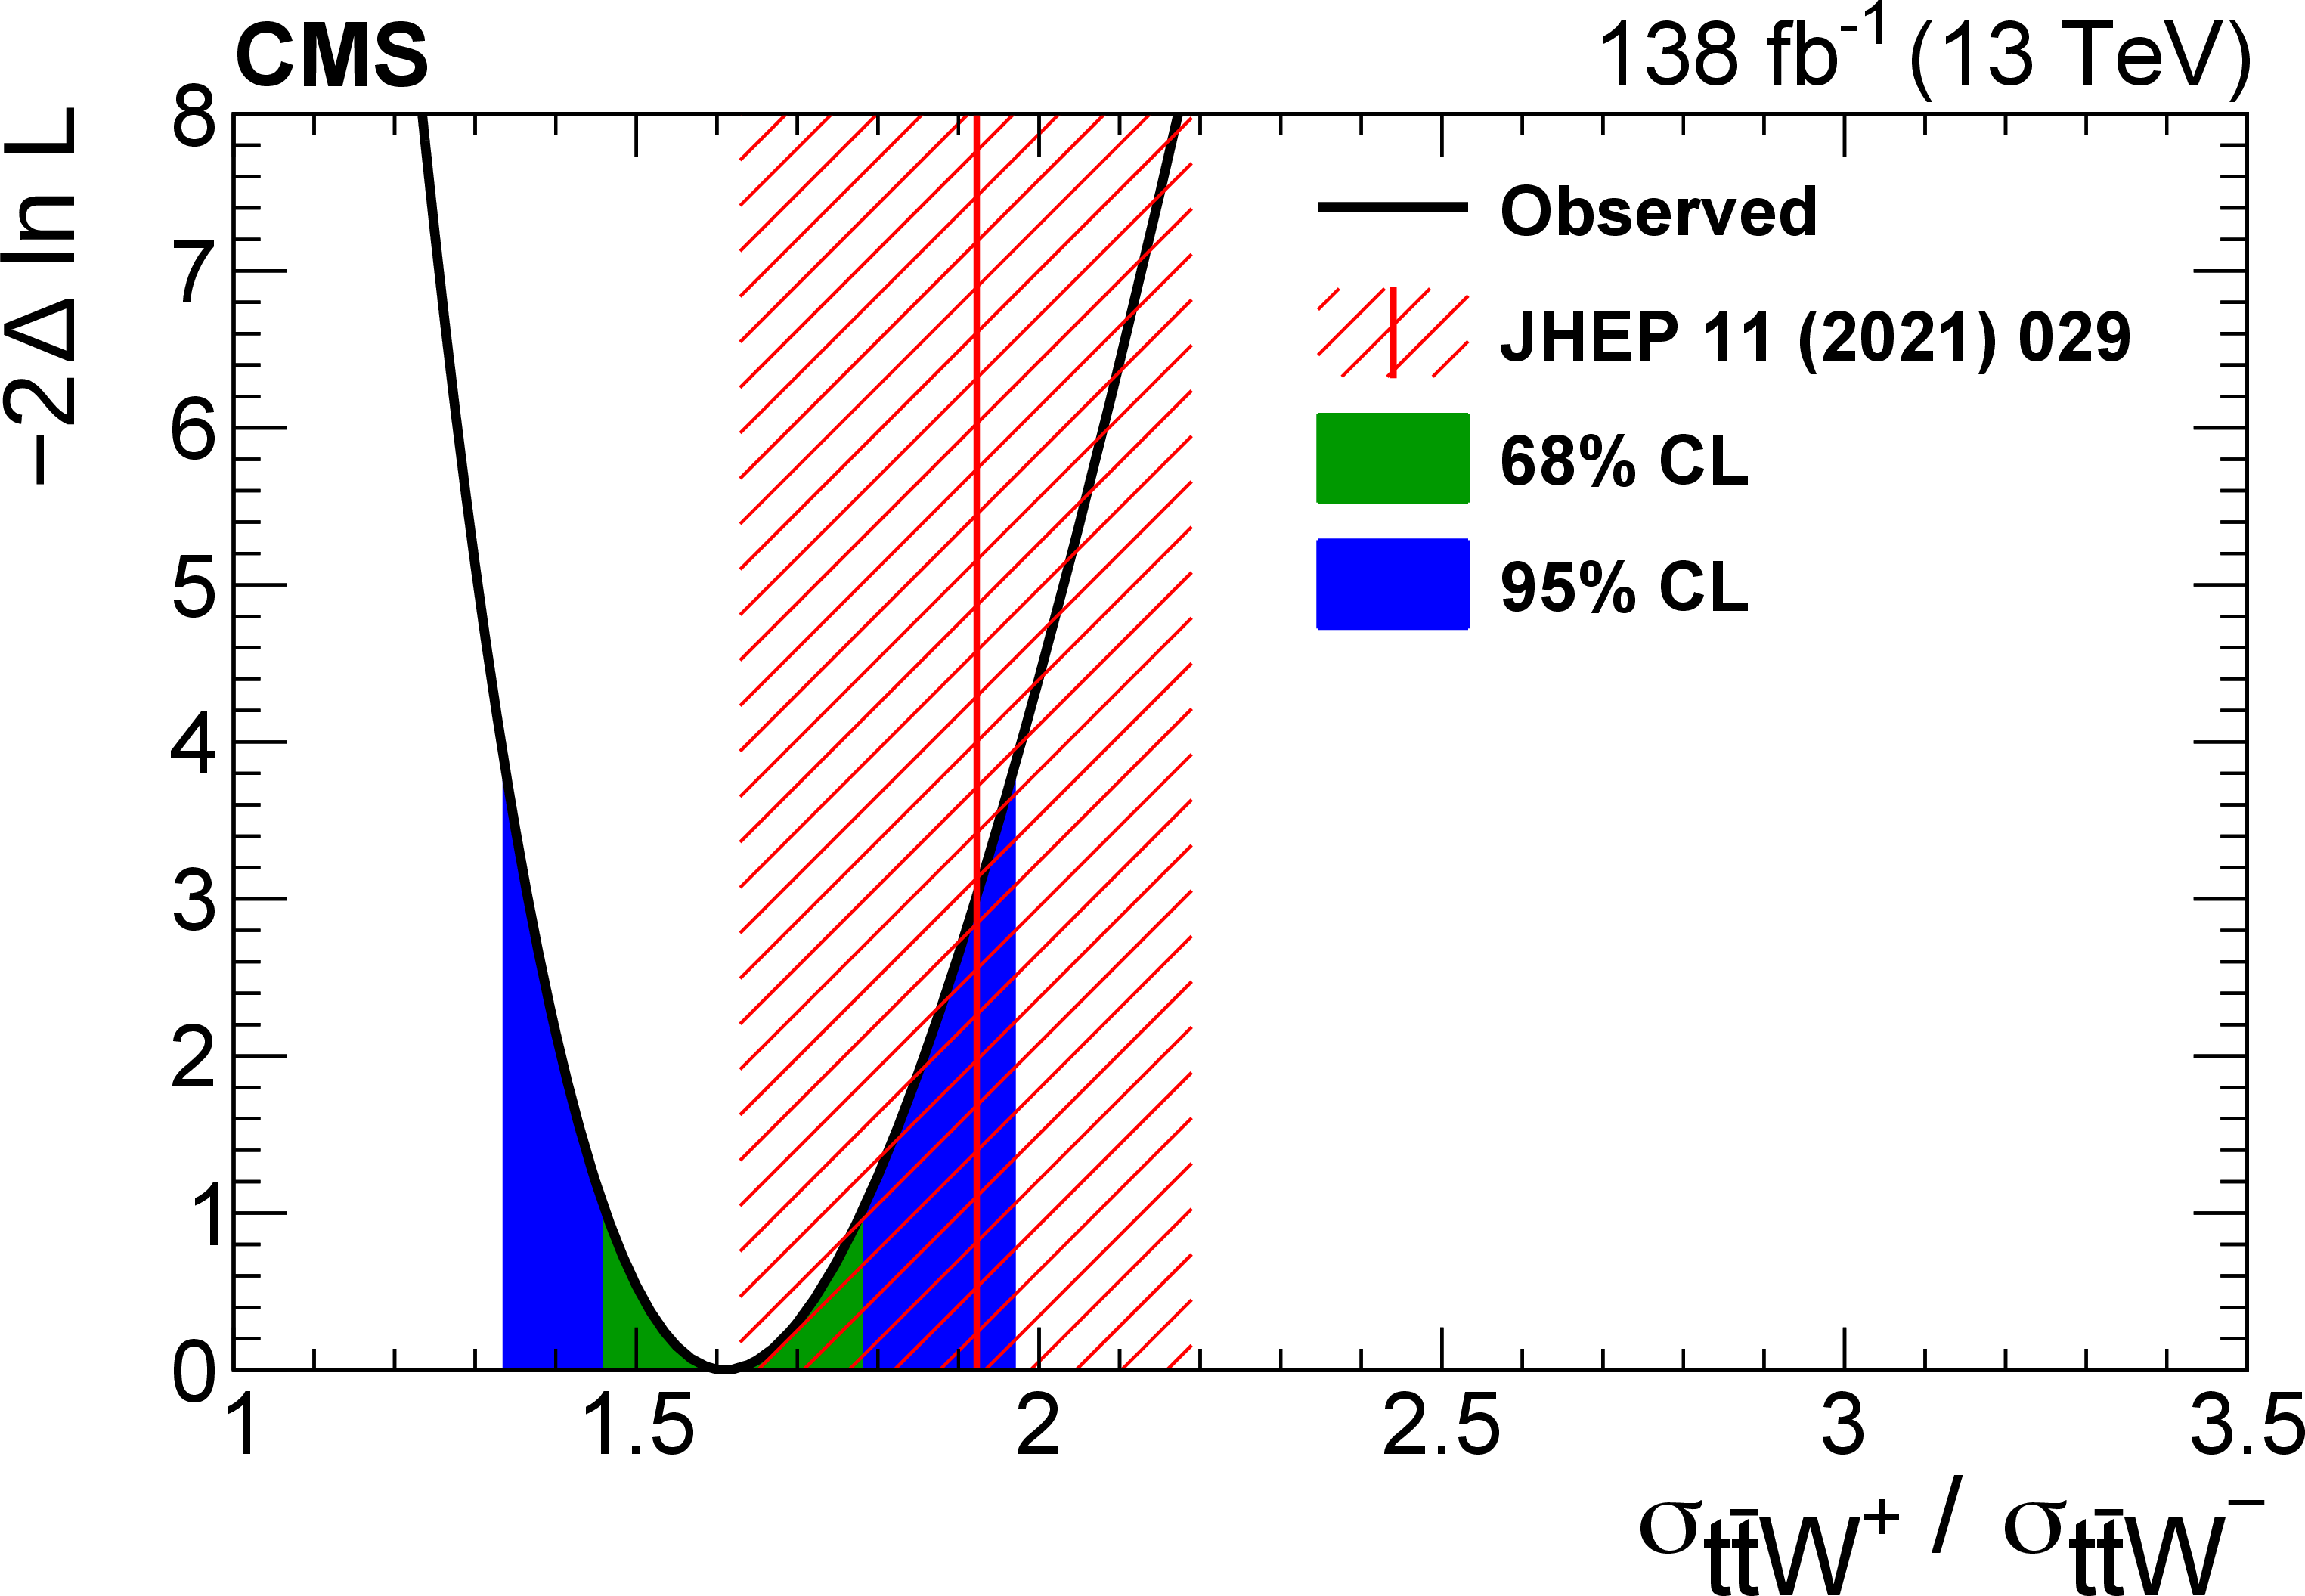
Figure 12:
The scan of the negative log-likelihood used in the measurement of the cross section ratio ${\sigma _{{{\mathrm{t} {}\mathrm{\bar{t}}} \mathrm{W^{+}}}}/\sigma _{{{\mathrm{t} {}\mathrm{\bar{t}}} \mathrm{W^{-}}}}}$. The best fit value is indicated, with the inner green and outer red bands displaying the 68 and 95% CL intervals, respectively. An SM prediction and its uncertainty, found from the cross section values provided by the authors of Ref. [21], are shown by the vertical blue line and hatched blue band. |
| Tables | |
png pdf |
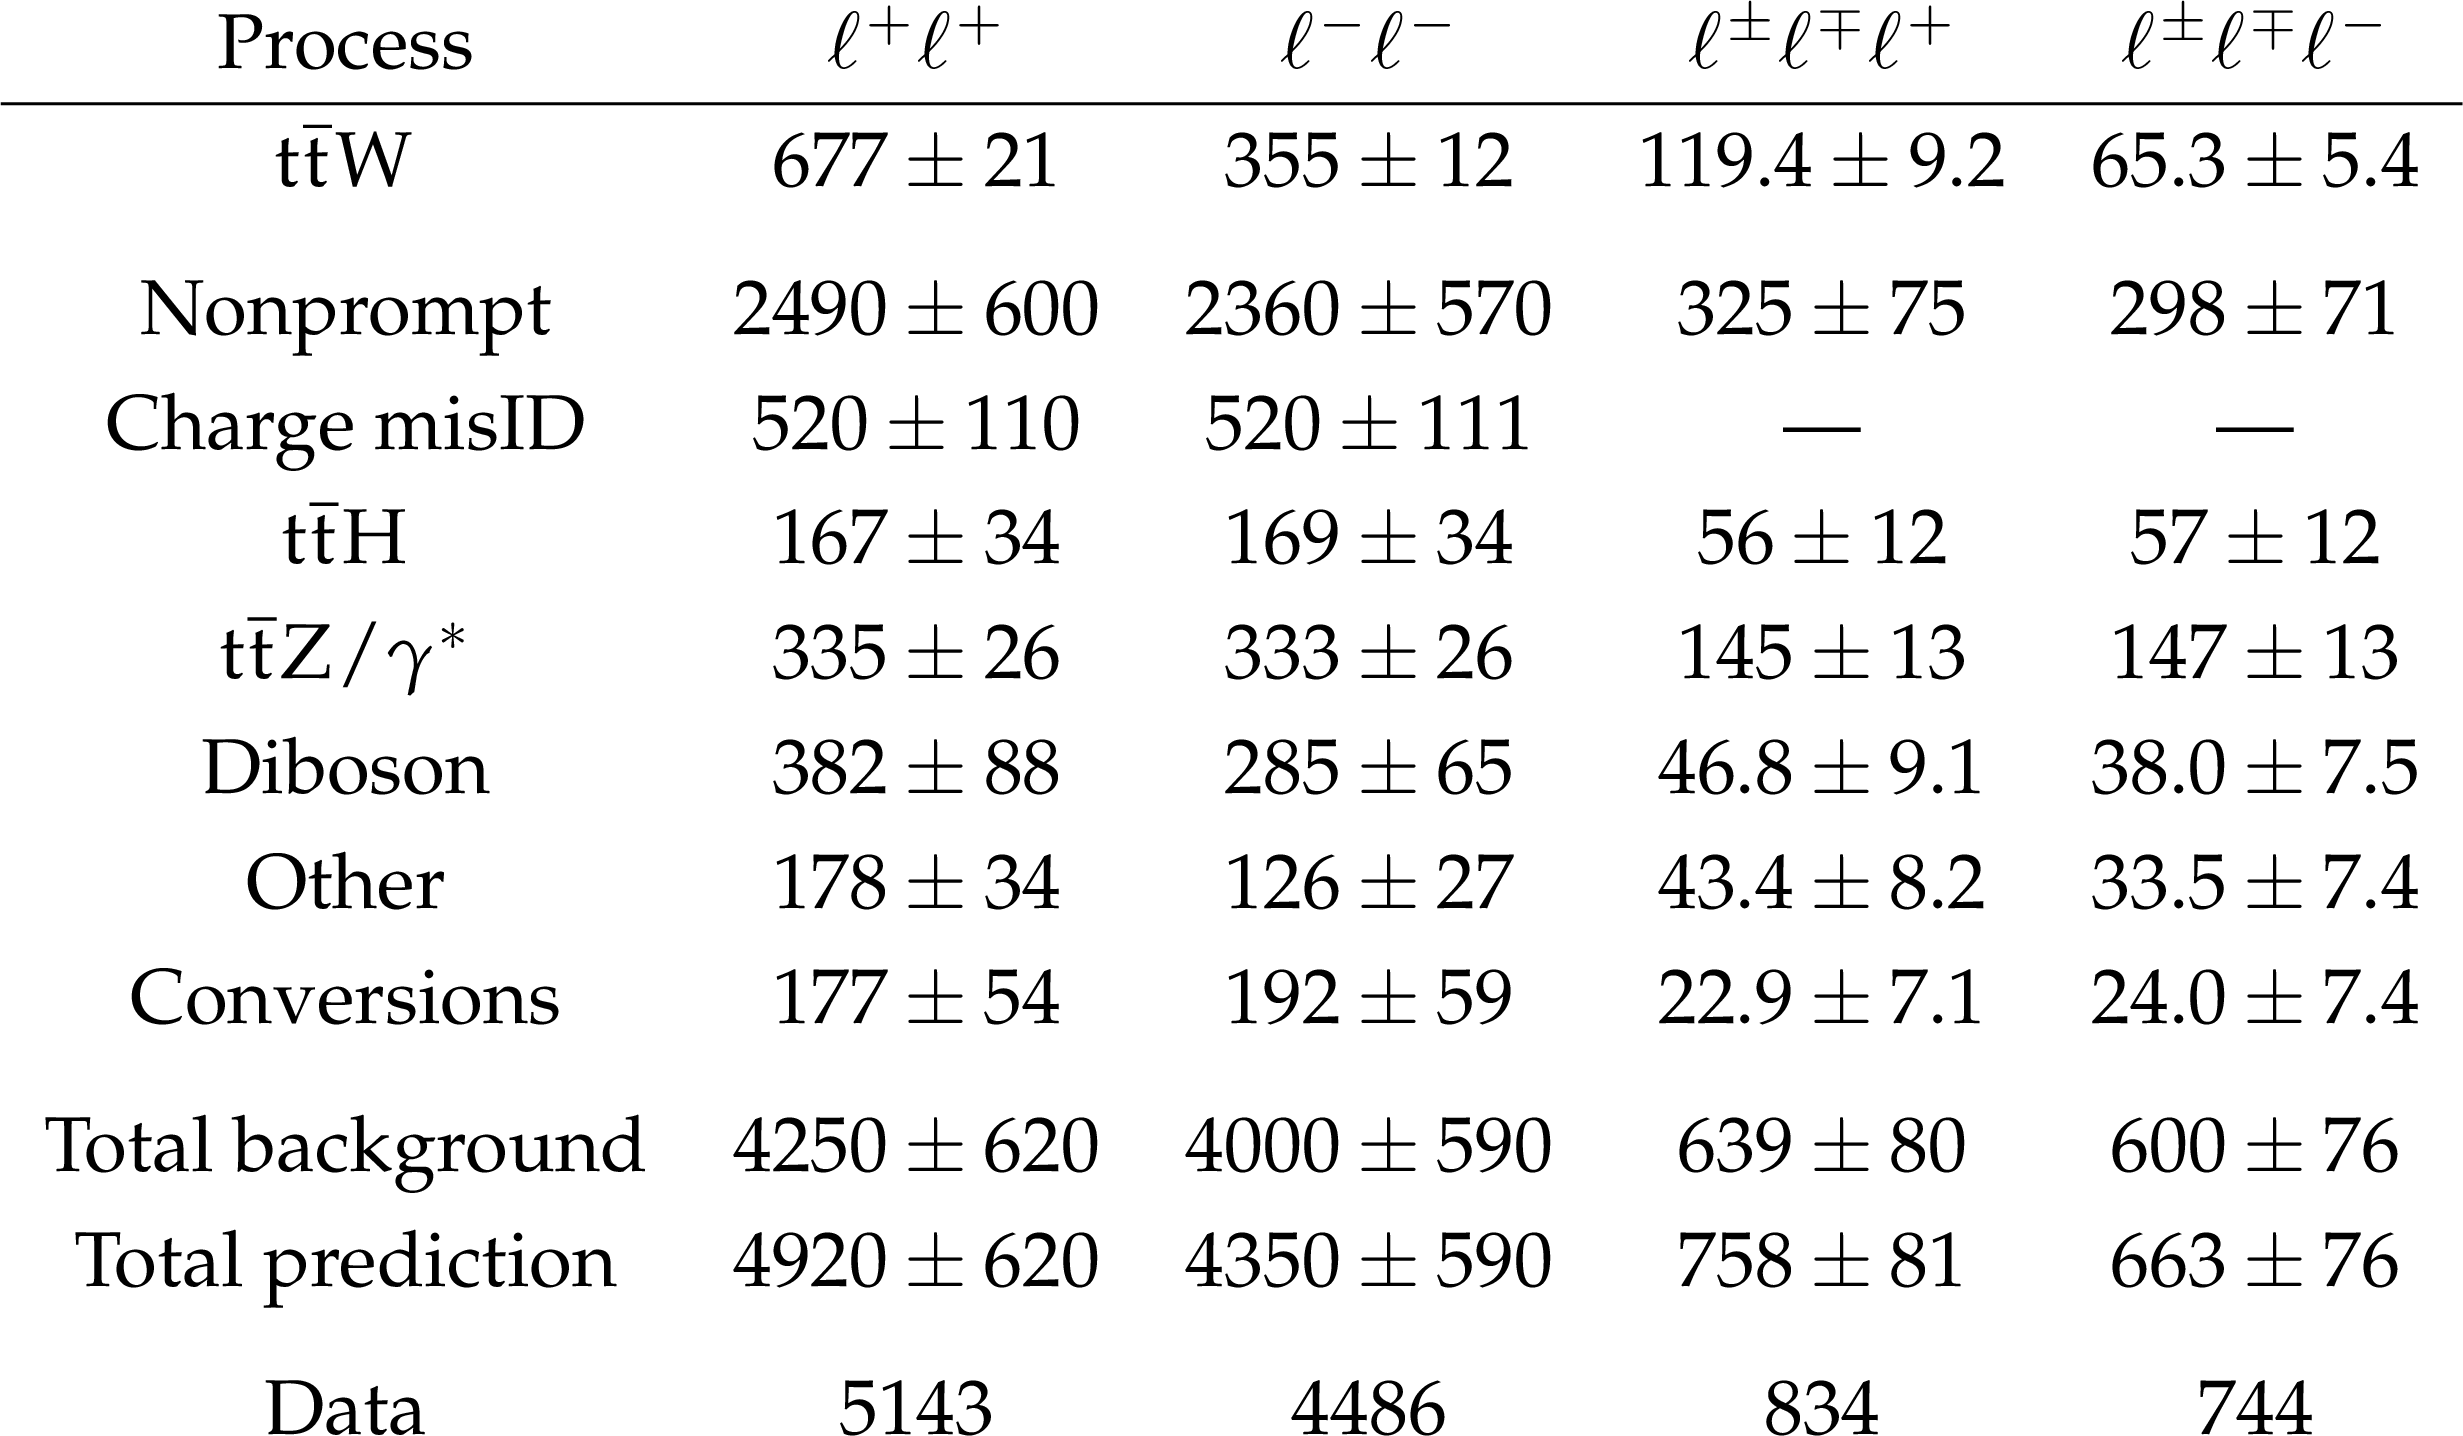
Table 1:
Number of predicted and observed events in the dilepton and trilepton signal regions before the fit to the data. The uncertainties in the predicted number of events include both the statistical and systematic components. The uncertainties in the total number of predicted background and background plus signal events in each channel are also given. The symbol "--'' indicates that the corresponding background does not apply. |
png pdf |
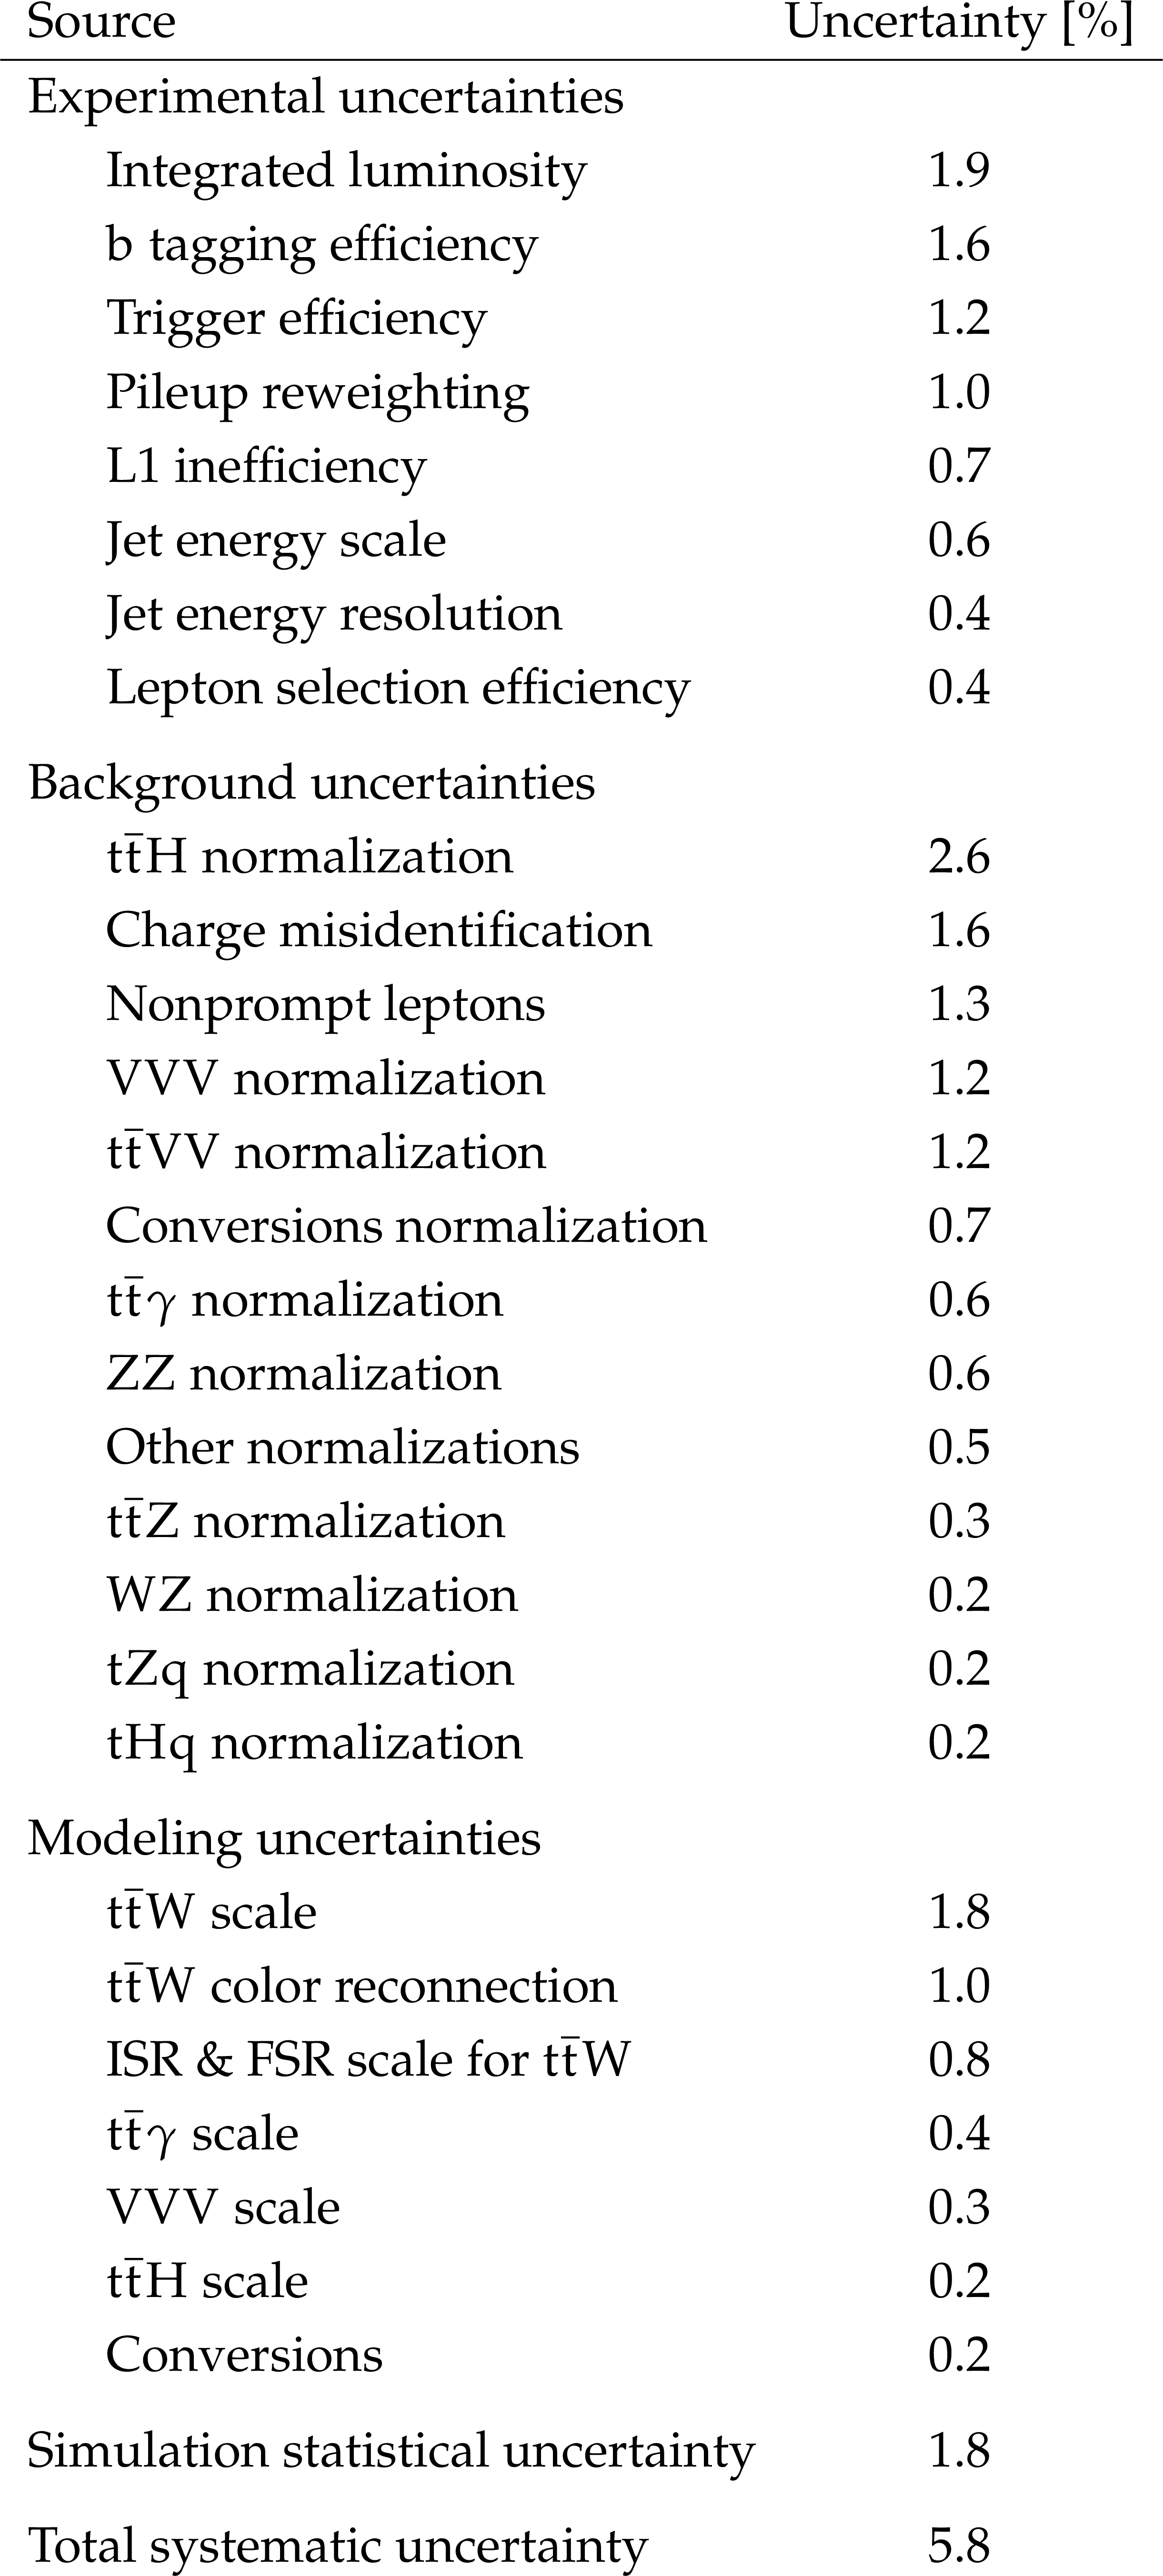
Table 2:
Sources of systematic uncertainty in the predicted signal and background event yields with their impact on the measured ${\mathrm{t} {}\mathrm{\bar{t}}}$W production cross section, estimated after the fit to the data. Only systematic uncertainty sources with values greater than 0.1% are included in the table. The production cross sections of the ${\mathrm{t} {}\mathrm{\bar{t}}}$W, WZ, ZZ, and ${\mathrm{t} {}\mathrm{\bar{t}}}$Z processes are simultaneously constrained in the fit. The second-to-last row refers to the statistical uncertainty in the simulated event samples. |
png pdf |
Table 3:
Summary of measured and predicted production cross sections of ${\mathrm{t} {}\mathrm{\bar{t}}} $W, ${\mathrm{t} {}\mathrm{\bar{t}}} $W$^{+}$, and ${\mathrm{t} {}\mathrm{\bar{t}}} $W$^{-}$ production, as well as of the ${\sigma _{{{\mathrm{t} {}\mathrm{\bar{t}}} \mathrm{W^{+}}}}/\sigma _{{{\mathrm{t} {}\mathrm{\bar{t}}} \mathrm{W^{-}}}}}$ ratio. The SM predictions quoted at NLO+NNLL accuracy are taken from Refs. [16,15]. The SM predictions quoted at NLO accuracy and including corrections from an improved FxFx merging procedure (NLO+FxFx) have been provided by the authors of Ref. [21]. The theoretical uncertainties include scale variations and PDF uncertainties. |
| Summary |
|
The cross section of the associated production of a W boson with a top quark-antiquark pair ($\mathrm{t\bar{t}}$W) in proton-proton collisions at $\sqrt{s} =$ 13 TeV is measured using data collected with the CMS detector in 2016-2018, corresponding to an integrated luminosity of 138 fb$^{-1}$. The measurement is performed in events with two same-sign or three charged leptons (electrons and muons) and additional jets. Events are categorized according to the charges and flavors of the leptons, and the number of jets and jets from the hadronization of b quarks. In the dilepton channel, a multiclass neural network is used to improve the separation of signal from background processes. In the trilepton channel, the invariant mass of the three leptons is used as the discriminating variable. Background contributions with leptons originating from hadron decays, jets or hadrons misidentified as leptons, and with misreconstructed charge are estimated from control samples in data. All other background processes are estimated from simulated event samples, and control samples in data are used to constrain the dominant contributions. The inclusive $\mathrm{t\bar{t}}$W production cross section in the full phase space is measured to be 868 $\pm$ 40 (stat) $\pm$ 51(syst) fb. The $\mathrm{t\bar{t}}$W$^{+}$ and $\mathrm{t\bar{t}}$W$^{-}$ cross sections are also determined as 553 $\pm$ 30 (stat) $\pm$ 30 (syst) fb NU and 343 $\pm$ 26 (stat) $\pm$ 25 (syst) fb, respectively. The measured ratio between these production cross sections is 1.61 $\pm$ 0.15 (stat) $^{+0.07}_{-0.05}$ (syst). The measured cross sections are larger than but consistent with standard model predictions, while the ${\sigma_{\mathrm{t\bar{t}}\mathrm{W}^{+}}/\sigma_{\mathrm{t\bar{t}}\mathrm{W}^{-}}}$ ratio is smaller than but consistent with the predicted value. These results are all consistent with earlier measurements and are the most precise determinations published to date. |
| Additional Figures | |
png pdf |
Additional Figure 1:
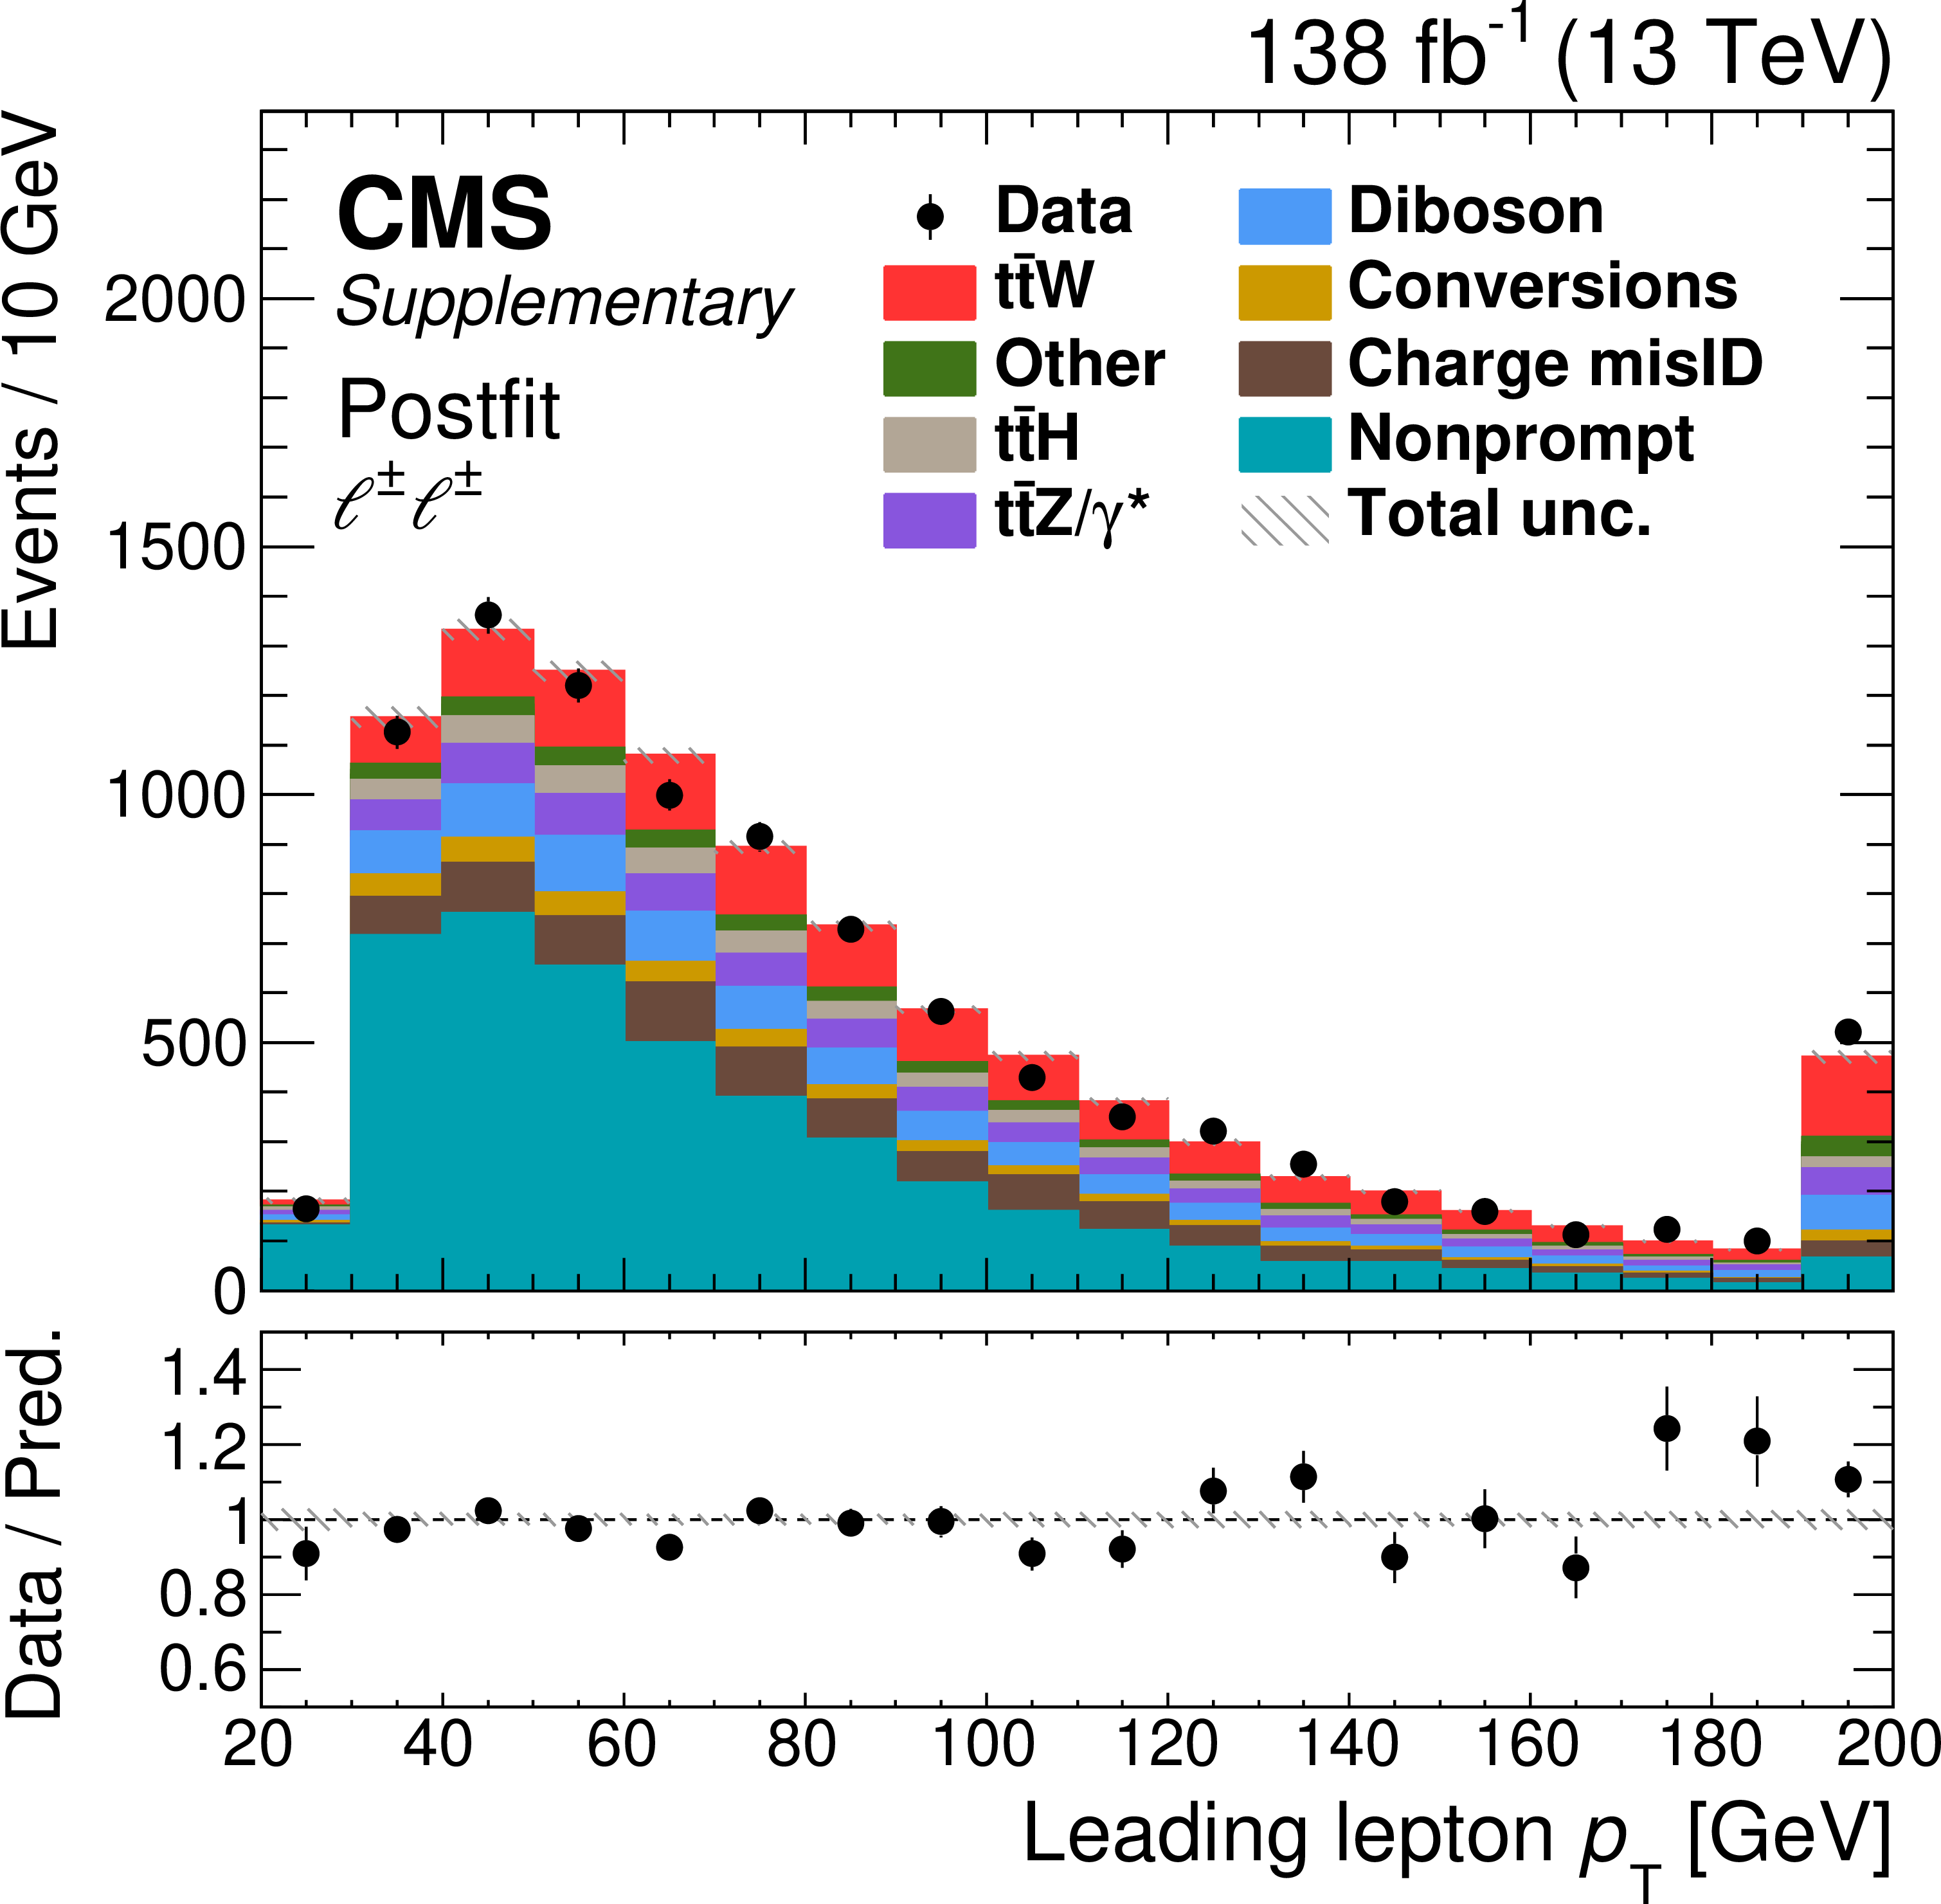
Comparison of the number of observed (points) and predicted (colored histograms) events in the same-sign dilepton signal region. The distribution of the leading lepton $ p_{\mathrm{T}} $ is displayed. The predictions are shown with the values of the normalizations and nuisance parameters obtained in the fit to the data applied (``Postfit''). The vertical bars on the points represent the statistical uncertainties in the data, and the hatched bands the systematic uncertainty in the predictions. The last bin includes the overflow contributions. In the lower panel, the ratio of the event yields in data to the overall sum of the predictions is presented. |

png pdf |
Additional Figure 2:
Comparison of the number of observed (points) and predicted (colored histograms) events in the same-sign dilepton signal region. The distribution of the subleading lepton $ p_{\mathrm{T}} $ is displayed. The predictions are shown with the values of the normalizations and nuisance parameters obtained in the fit to the data applied (``Postfit''). The vertical bars on the points represent the statistical uncertainties in the data, and the hatched bands the systematic uncertainty in the predictions. The last bin includes the overflow contributions. In the lower panel, the ratio of the event yields in data to the overall sum of the predictions is presented. |
png pdf |
Additional Figure 3:
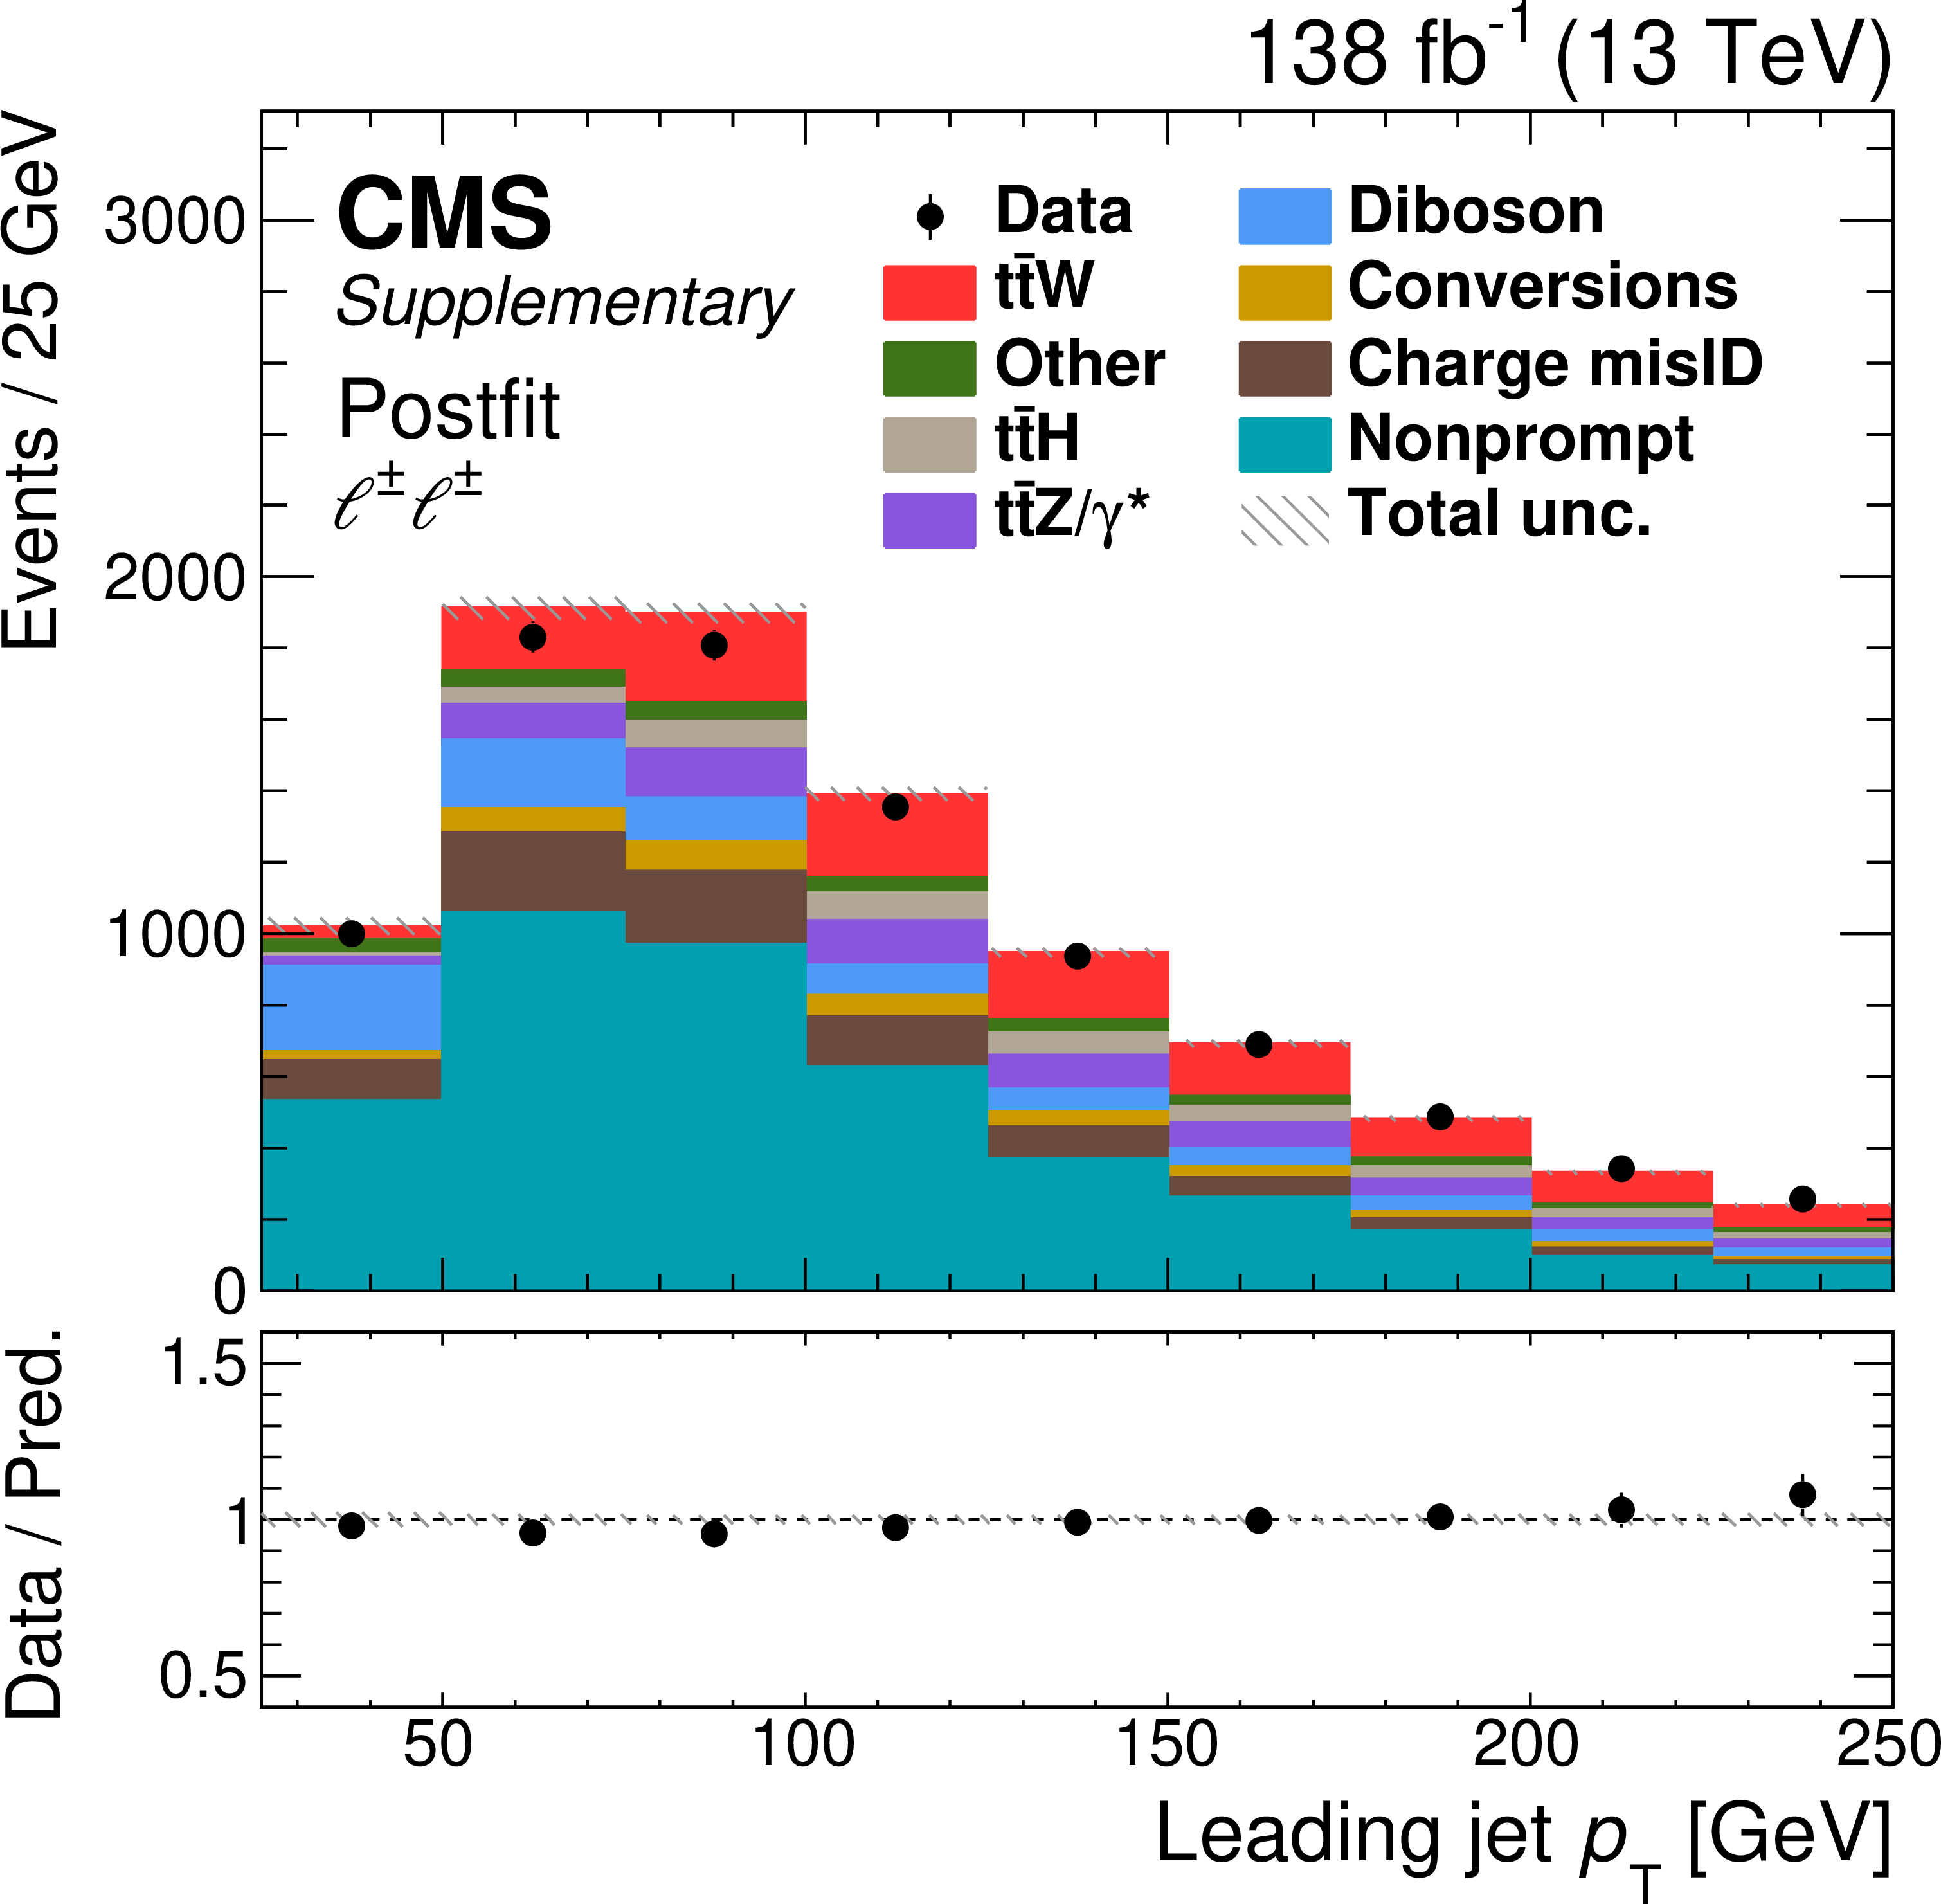
Comparison of the number of observed (points) and predicted (colored histograms) events in the same-sign dilepton signal region. The distribution of the leading jet $ p_{\mathrm{T}} $ is displayed. The predictions are shown with the values of the normalizations and nuisance parameters obtained in the fit to the data applied (``Postfit''). The vertical bars on the points represent the statistical uncertainties in the data, and the hatched bands the systematic uncertainty in the predictions. The last bin includes the overflow contributions. In the lower panel, the ratio of the event yields in data to the overall sum of the predictions is presented. |
png pdf |
Additional Figure 4:
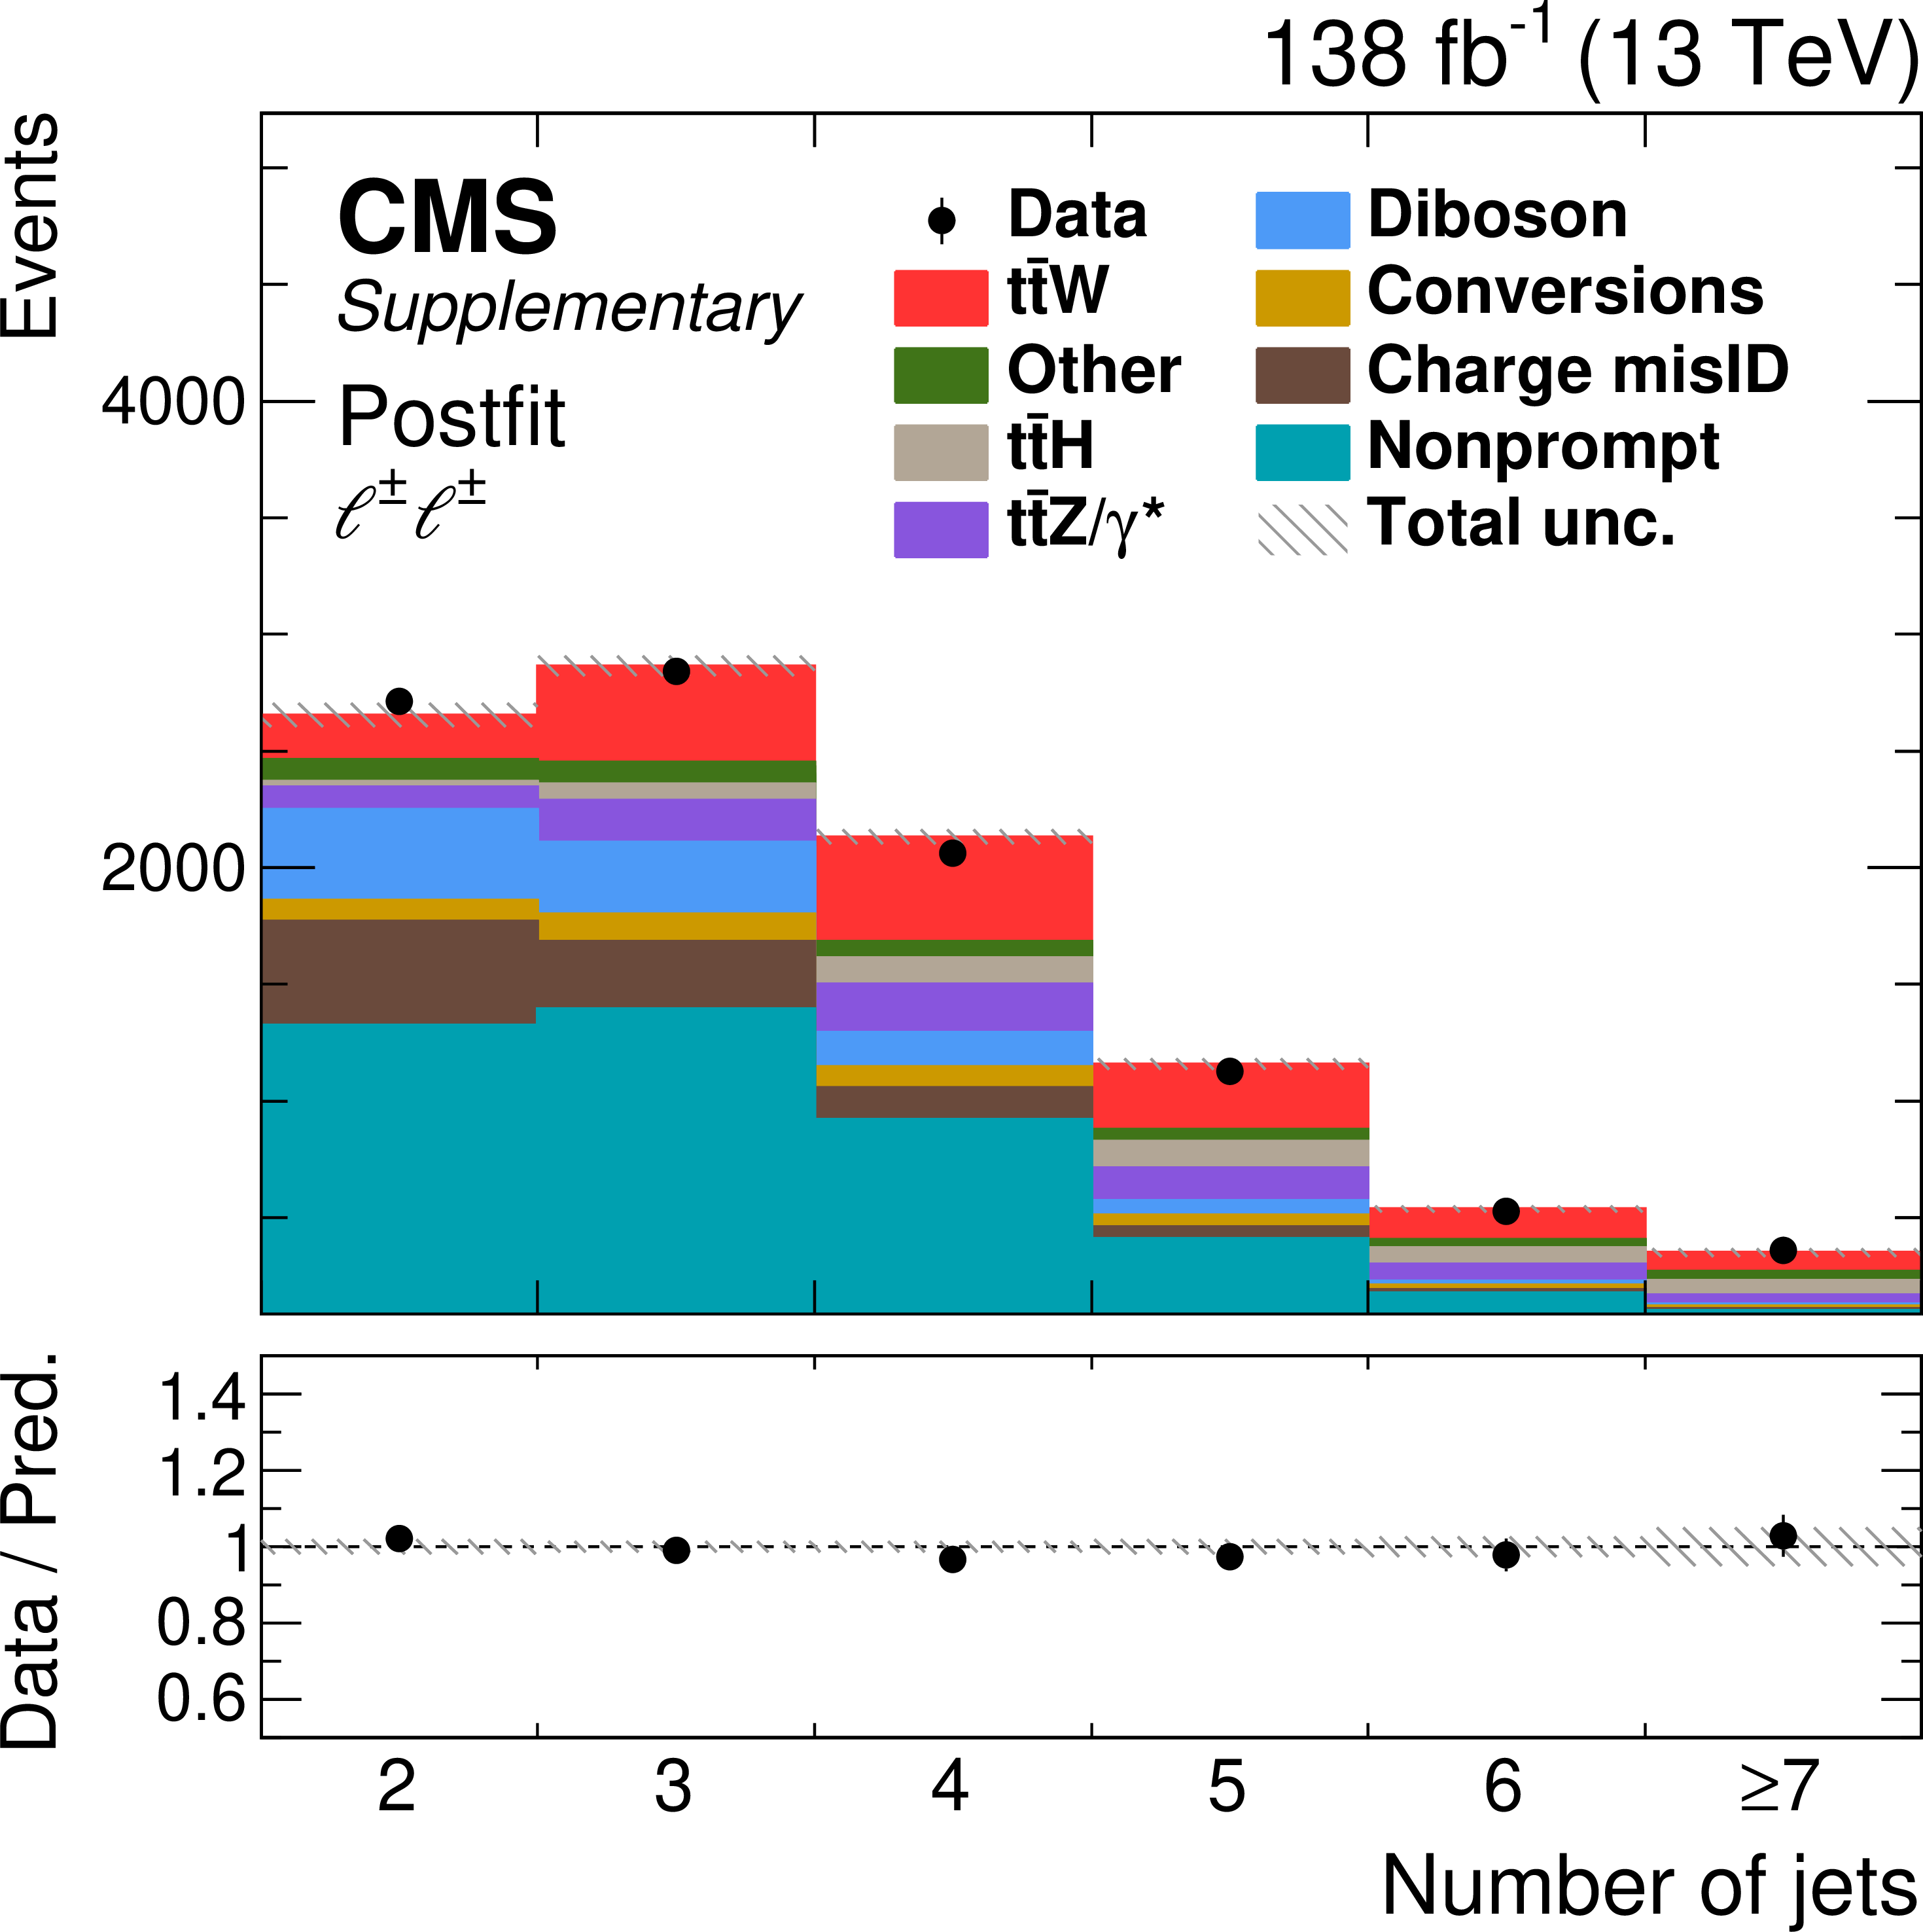
Comparison of the number of observed (points) and predicted (colored histograms) events in the same-sign dilepton signal region. The distribution of the number of jets is displayed. The predictions are shown with the values of the normalizations and nuisance parameters obtained in the fit to the data applied (``Postfit''). The vertical bars on the points represent the statistical uncertainties in the data, and the hatched bands the systematic uncertainty in the predictions. The last bin includes the overflow contributions. In the lower panel, the ratio of the event yields in data to the overall sum of the predictions is presented. |
png pdf |
Additional Figure 5:
Comparison of the number of observed (points) and predicted (colored histograms) events in the same-sign dilepton signal region. The distribution of the number of loose b-tagged jets is displayed. The predictions are shown with the values of the normalizations and nuisance parameters obtained in the fit to the data applied (``Postfit''). The vertical bars on the points represent the statistical uncertainties in the data, and the hatched bands the systematic uncertainty in the predictions. The last bin includes the overflow contributions. In the lower panel, the ratio of the event yields in data to the overall sum of the predictions is presented. |
png pdf |
Additional Figure 6:
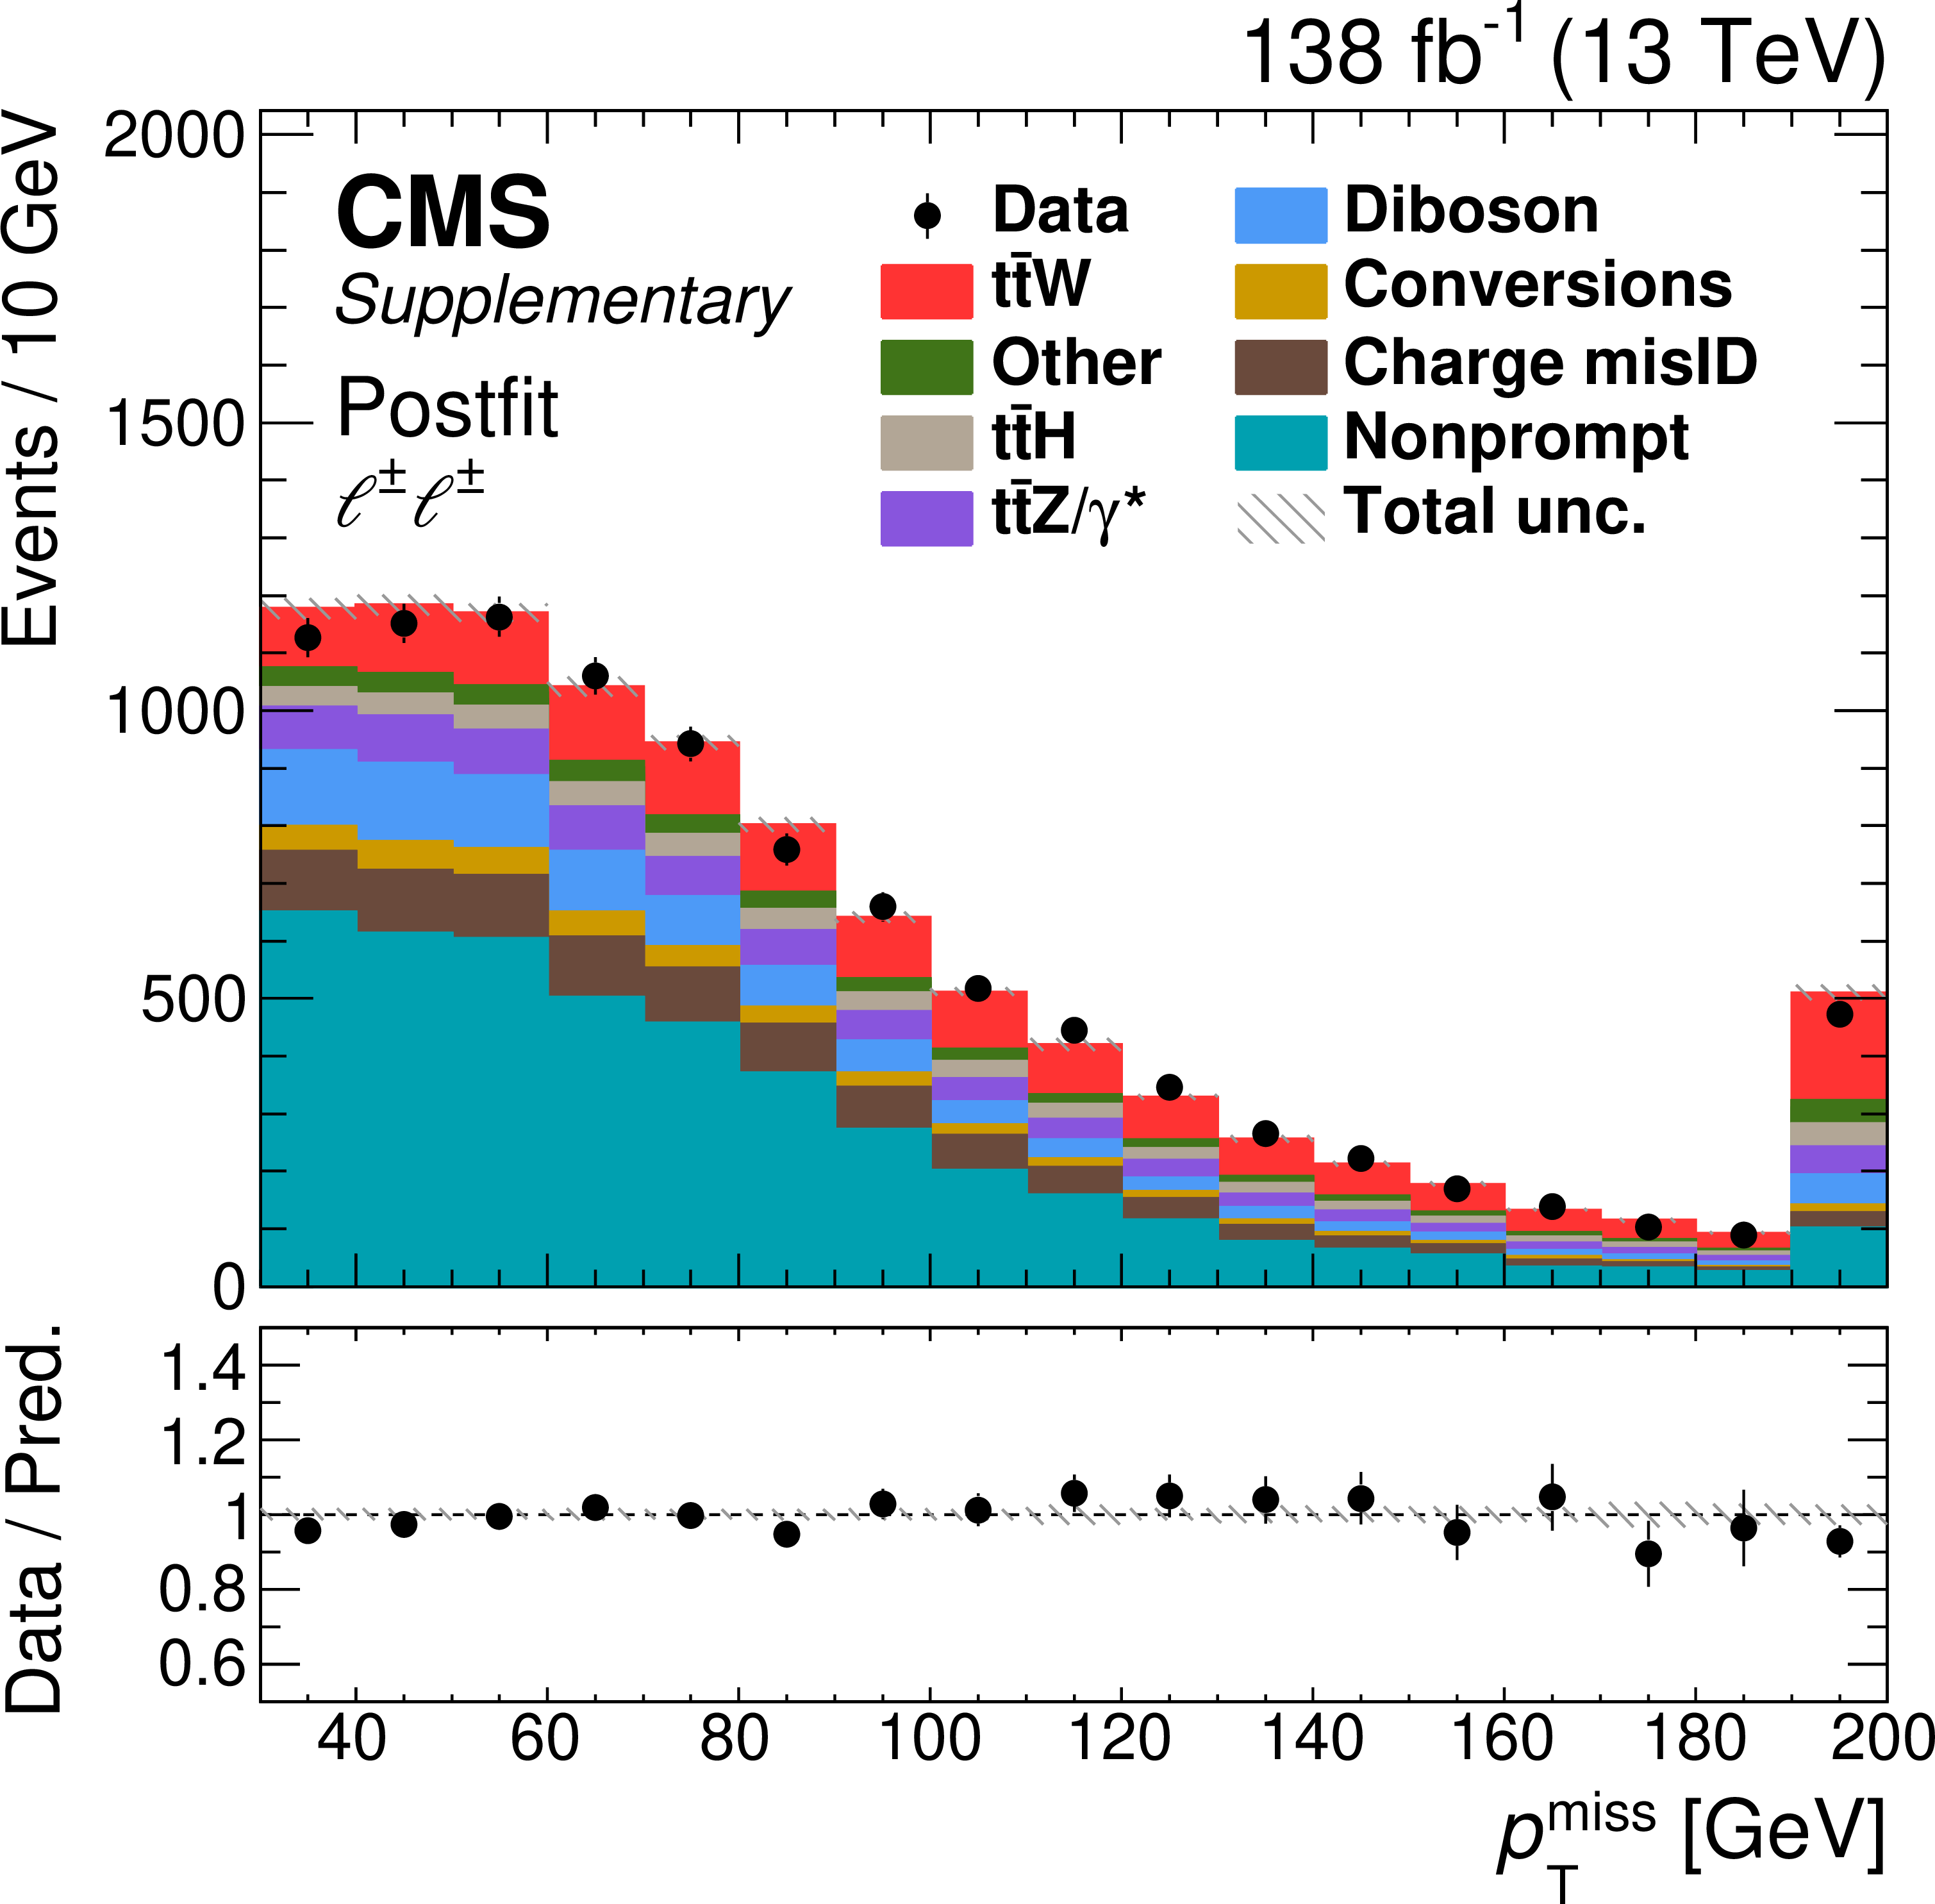
Comparison of the number of observed (points) and predicted (colored histograms) events in the same-sign dilepton signal region. The distribution of $ p_{\mathrm{T}}^\text{miss} $ is displayed. The predictions are shown with the values of the normalizations and nuisance parameters obtained in the fit to the data applied (``Postfit''). The vertical bars on the points represent the statistical uncertainties in the data, and the hatched bands the systematic uncertainty in the predictions. The last bin includes the overflow contributions. In the lower panel, the ratio of the event yields in data to the overall sum of the predictions is presented. |

png pdf |
Additional Figure 7:
Comparison of the number of observed (points) and predicted (colored histograms) events in the trilepton signal region. The distribution of the number of medium b-tagged jets is displayed. Events with total trilepton charge $-$1 and $ + $1 are shown in the left and right halves of the plot, respectively. The predictions are shown with the values of the normalizations and nuisance parameters obtained in the fit to the data applied (``Postfit''). The vertical bars on the points represent the statistical uncertainties in the data, and the hatched bands the systematic uncertainty in the predictions. In the lower panel, the ratio of the event yields in data to the overall sum of the predictions is presented. |
png pdf |
Additional Figure 8:
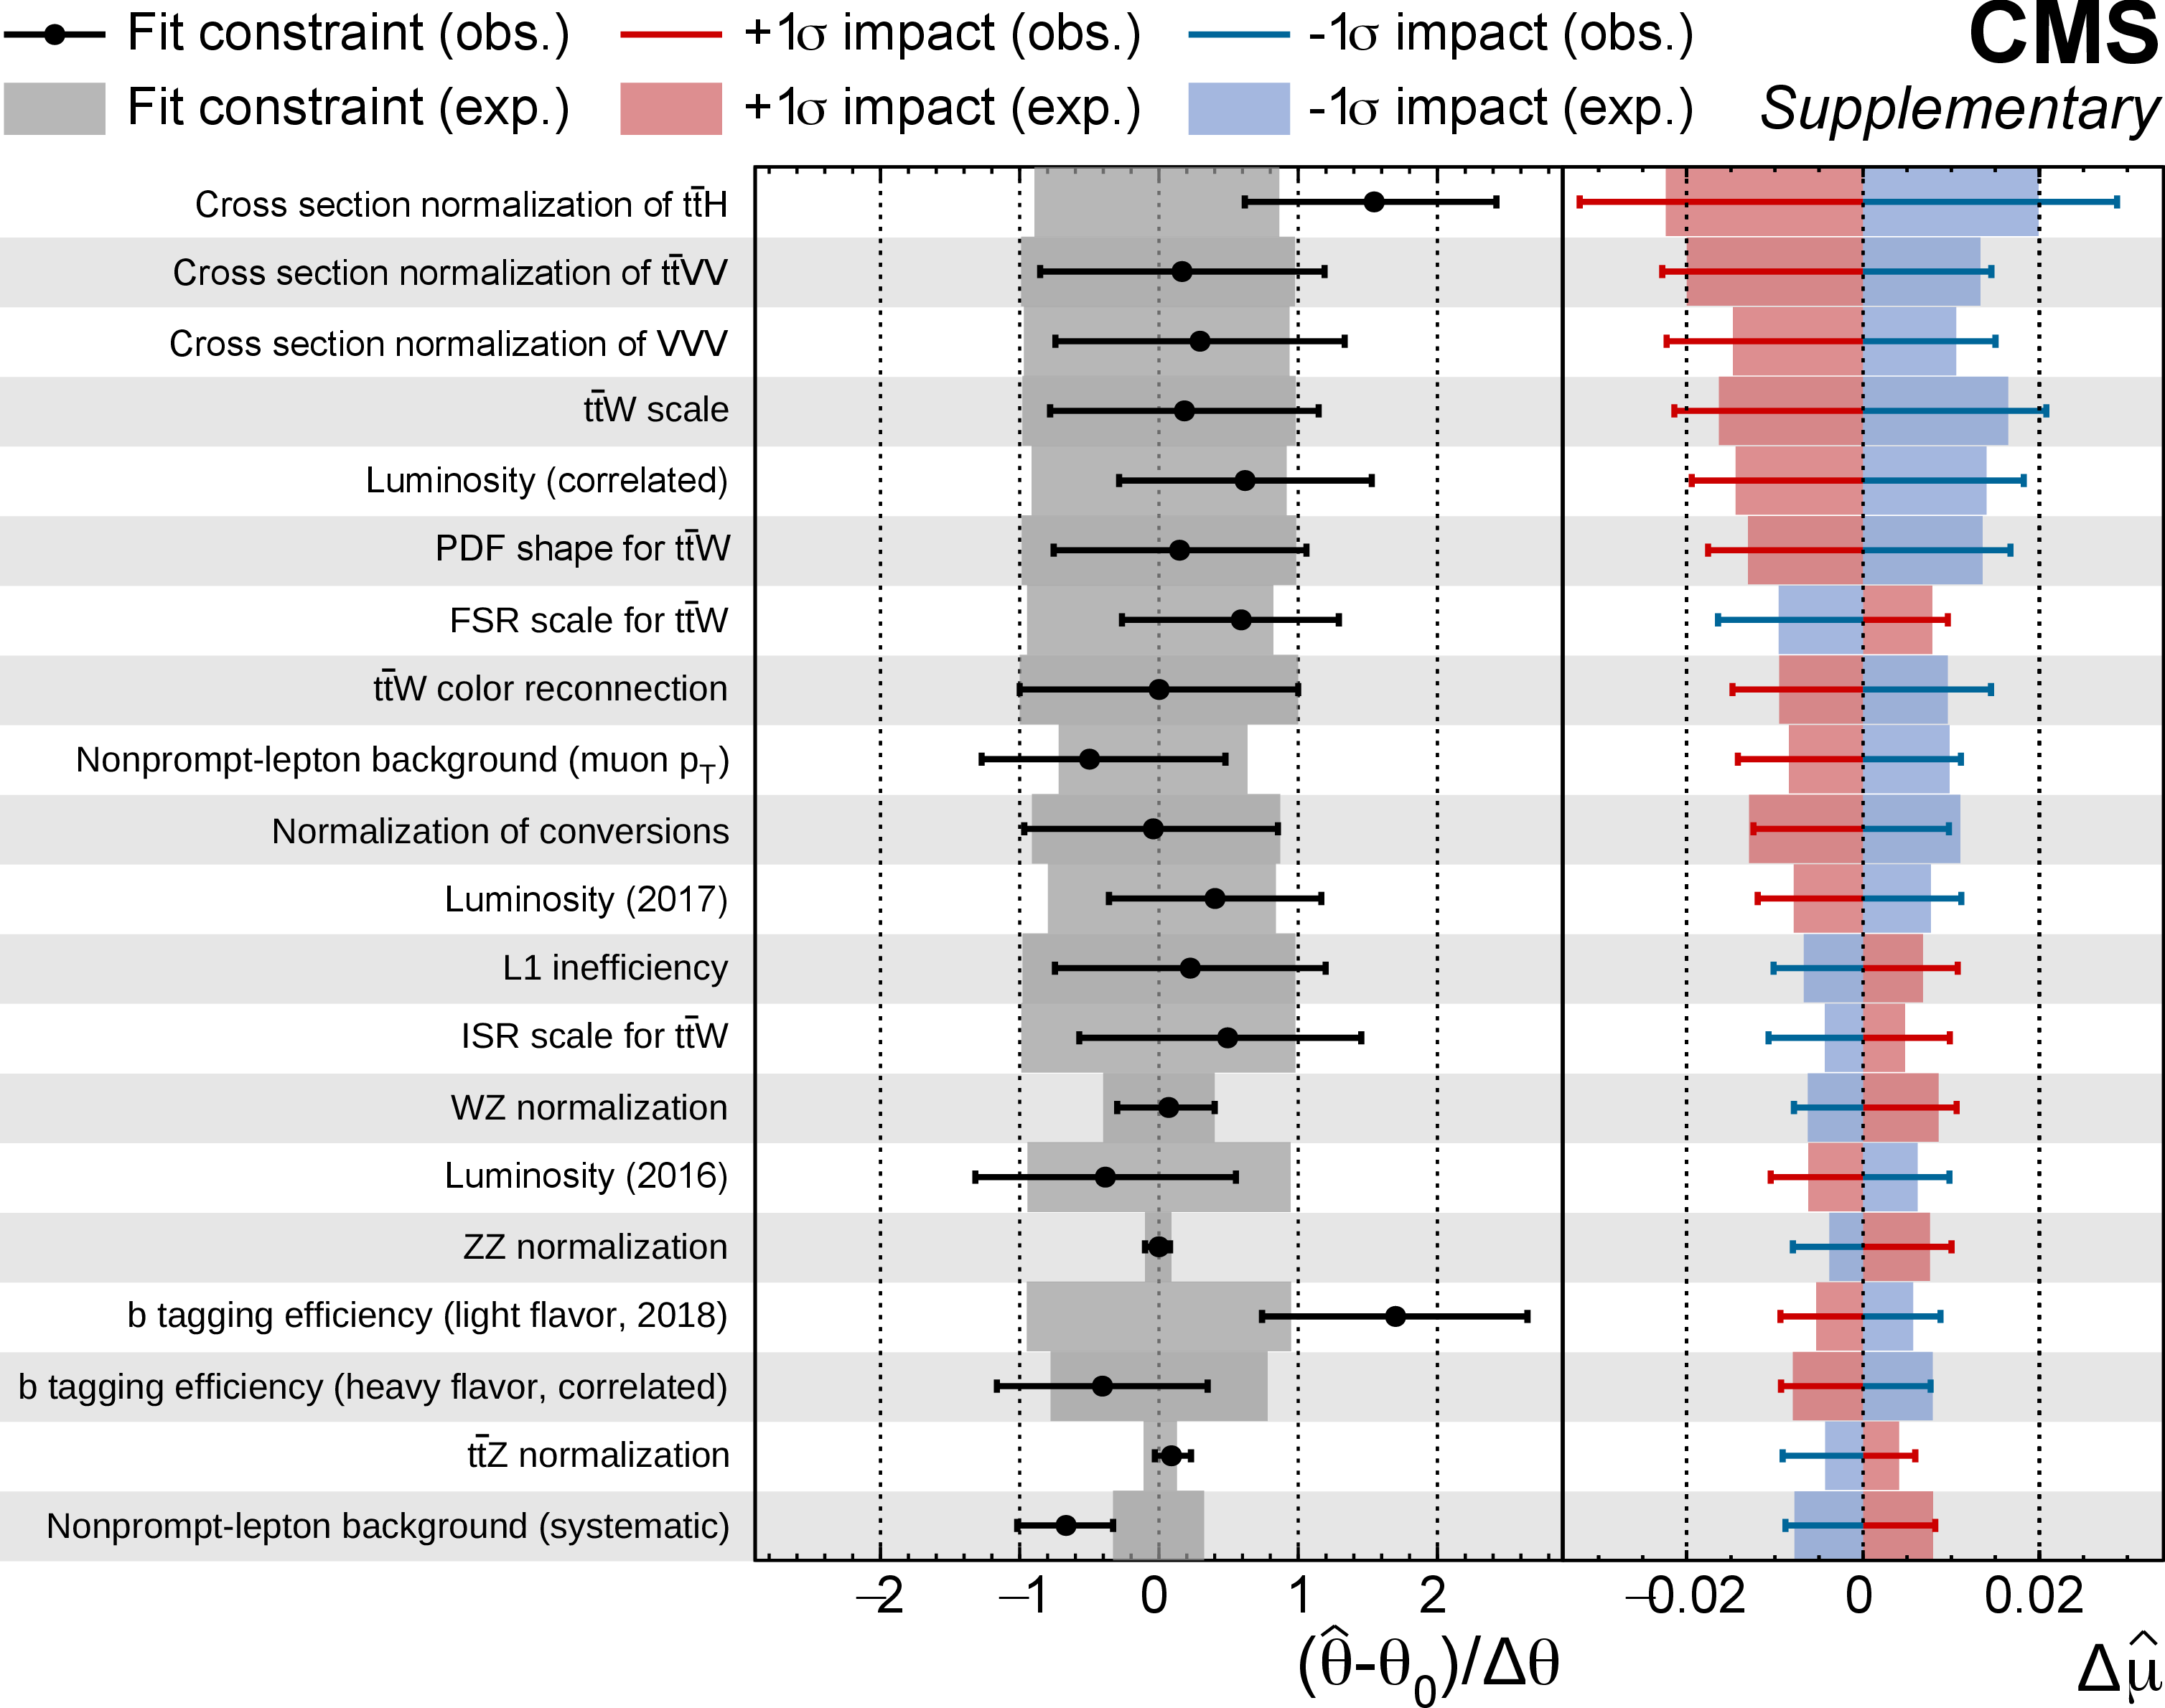
For the nuisance parameters listed in the left column, the pulls $ (\hat{\theta}-\theta_0)/\Delta\theta $ (middle column) and impacts $ \Delta\hat{\mu} $ (right column) are displayed. The 20 nuisance parameters with the largest impacts in the fit used to determine the $ {\mathrm{t}\overline{\mathrm{t}}} \mathrm{W} $ cross section are shown. The impact $ \Delta\hat{\mu} $ is defined as the shift induced in the signal strength $ \mu $ when the nuisance parameter $ \theta $ is varied by $ \pm $1 standard deviation ($ \sigma $). The pull $ (\hat\theta-\theta_0)/\Delta\theta $ is calculated from the values $ \hat{\theta} $ and $ \theta_0 $ after and before the fit of $ \theta $ and from its uncertainty $ \Delta\theta $ before the fit. The label ``correlated'' and the per-year labels indicate nuisance parameters associated with the correlated and uncorrelated parts of a systematic uncertainty. |
| References | ||||
| 1 | O. Bessidskaia Bylund et al. | Probing top quark neutral couplings in the standard model effective field theory at NLO in QCD | JHEP 05 (2016) 052 | 1601.08193 |
| 2 | J. Dror, M. Farina, E. Salvioni, and J. Serra | Strong tW scattering at the LHC | JHEP 01 (2016) 071 | 1511.03674 |
| 3 | A. Buckley et al. | Constraining top quark effective theory in the LHC Run II era | JHEP 04 (2016) 015 | 1512.03360 |
| 4 | F. Maltoni, M. Mangano, I. Tsinikos, and M. Zaro | Top-quark charge asymmetry and polarization in $ {\mathrm{t\bar{t}}\mathrm{W^{\pm}}} $ production at the LHC | PLB 736 (2014) 252 | 1406.3262 |
| 5 | R. Frederix, D. Pagani, and M. Zaro | Large NLO corrections in $ {\mathrm{t\bar{t}}\mathrm{W^{\pm}}} $ and $\mathrm{t\bar{t}t\bar{t}}$ hadroproduction from supposedly subleading EW contributions | JHEP 02 (2018) 031 | 1711.02116 |
| 6 | CMS Collaboration | Measurement of associated production of vector bosons and $ \mathrm{t\bar{t}} $ at $ \sqrt{s}=$ 7 TeV | PRL 110 (2013) 172002 | CMS-TOP-12-014 1303.3239 |
| 7 | ATLAS Collaboration | Measurement of the $\mathrm{t\bar{t}}$W and $\mathrm{t\bar{t}}$Z production cross sections in pp collisions at $ \sqrt{s} = $ 8 TeV with the ATLAS detector | JHEP 11 (2015) 172 | 1509.05276 |
| 8 | CMS Collaboration | Observation of top quark pairs produced in association with a vector boson in pp collisions at $ \sqrt{s}=$ 8 TeV | JHEP 01 (2016) 096 | CMS-TOP-14-021 1510.01131 |
| 9 | ATLAS Collaboration | Measurement of the $\mathrm{t\bar{t}}$Z and $\mathrm{t\bar{t}}$W production cross sections in multilepton final states using 3.2 fb$^{-1}$ of pp collisions at $ \sqrt{s} = $ 13 TeV with the ATLAS detector | EPJC 77 (2017) 40 | 1609.01599 |
| 10 | CMS Collaboration | Measurement of the cross section for top quark pair production in association with a $ \mathrm{W} $ or Z boson in proton-proton collisions at $ \sqrt{s}=$ 13 TeV | JHEP 08 (2018) 011 | CMS-TOP-17-005 1711.02547 |
| 11 | ATLAS Collaboration | Measurement of the $\mathrm{t\bar{t}}$Z and $\mathrm{t\bar{t}}$W cross sections in proton-proton collisions at $ \sqrt{s} = $ 13 TeV with the ATLAS detector | PRD 99 (2019) 072009 | 1901.03584 |
| 12 | CMS Collaboration | Measurement of the Higgs boson production rate in association with top quarks in final states with electrons, muons, and hadronically decaying tau leptons at $ \sqrt{s}=$ 13 TeV | EPJC 81 (2021) 378 | CMS-HIG-19-008 2011.03652 |
| 13 | CMS Collaboration | Search for production of four top quarks in final states with same-sign or multiple leptons in proton-proton collisions at $ \sqrt{s}=$ 13 TeV | EPJC 80 (2020) 75 | CMS-TOP-18-003 1908.06463 |
| 14 | ATLAS Collaboration | Evidence for $\mathrm{t\bar{t}t\bar{t}}$ production in the multilepton final state in proton-proton collisions at $ \sqrt{s} = $ 13 TeV with the ATLAS detector | EPJC 80 (2020) 1085 | 2007.14858 |
| 15 | A. Broggio et al. | Top-quark pair hadroproduction in association with a heavy boson at NLO+NNLL including EW corrections | JHEP 08 (2019) 039 | 1907.04343 |
| 16 | A. Kulesza et al. | Associated top quark pair production with a heavy boson: differential cross sections at NLO+NNLL accuracy | EPJC 80 (2020) 428 | 2001.03031 |
| 17 | G. Bevilacqua et al. | NLO QCD corrections to off-shell $ {\mathrm{t\bar{t}}\mathrm{W^{\pm}}} $ production at the LHC: correlations and asymmetries | EPJC 81 (2021) 675 | 2012.01363 |
| 18 | S. von Buddenbrock, R. Ruiz, and B. Mellado | Anatomy of inclusive $\mathrm{t\bar{t}}$W production at hadron colliders | PLB 811 (2020) 135964 | 2009.00032 |
| 19 | R. Frederix and I. Tsinikos | Subleading EW corrections and spin-correlation effects in $\mathrm{t\bar{t}}$W multi-lepton signatures | EPJC 80 (2020) 803 | 2004.09552 |
| 20 | F. Febres Cordero, M. Kraus, and L. Reina | Top-quark pair production in association with a $ \mathrm{W^{\pm}} $ gauge boson in the POWHEG-box | PRD 103 (2021) 094014 | 2101.11808 |
| 21 | R. Frederix and I. Tsinikos | On improving NLO merging for $\mathrm{t\bar{t}}$W production | JHEP 11 (2021) 29 | 2108.07826 |
| 22 | G. Bevilacqua et al. | Modeling uncertainties of $ {\mathrm{t\bar{t}}\mathrm{W^{\pm}}} $ multilepton signatures | PRD 105 (2022) 014018 | 2109.15181 |
| 23 | CMS Collaboration | HEPData record for this analysis | link | |
| 24 | CMS Collaboration | The CMS experiment at the CERN LHC | JINST 3 (2008) S08004 | CMS-00-001 |
| 25 | CMS Collaboration | Performance of the CMS Level 1 trigger in proton-proton collisions at $ \sqrt{s}=$ 13 TeV | JINST 15 (2020) P10017 | CMS-TRG-17-001 2006.10165 |
| 26 | CMS Collaboration | The CMS trigger system | JINST 12 (2017) P01020 | CMS-TRG-12-001 1609.02366 |
| 27 | G. Bevilacqua et al. | The simplest of them all: $ {\mathrm{t\bar{t}}\mathrm{W^{\pm}}} $ at NLO accuracy in QCD | JHEP 08 (2020) 043 | 2005.09427 |
| 28 | J. Alwall et al. | The automated computation of tree-level and next-to-leading order differential cross sections, and their matching to parton shower simulations | JHEP 07 (2014) 079 | 1405.0301 |
| 29 | P. Nason | A new method for combining NLO QCD with shower Monte Carlo algorithms | JHEP 11 (2004) 040 | hep-ph/0409146 |
| 30 | S. Frixione, P. Nason, and C. Oleari | Matching NLO QCD computations with parton shower simulations: the POWHEG method | JHEP 11 (2007) 070 | 0709.2092 |
| 31 | S. Alioli, P. Nason, C. Oleari, and E. Re | A general framework for implementing NLO calculations in shower Monte Carlo programs: the POWHEG box | JHEP 06 (2010) 043 | 1002.2581 |
| 32 | T. Sjostrand et al. | An introduction to PYTHIA8.2 | CPC 191 (2015) 159 | 1410.3012 |
| 33 | R. Frederix and S. Frixione | Merging meets matching in MCatNLO | JHEP 12 (2012) 061 | 1209.6215 |
| 34 | J. Alwall et al. | Comparative study of various algorithms for the merging of parton showers and matrix elements in hadronic collisions | EPJC 53 (2008) 473 | 0706.2569 |
| 35 | S. Agostinelli et al. | GEANT4--a simulation toolkit | NIMA 506 (2003) 250 | |
| 36 | CMS Collaboration | Measurement of the inclusive production cross sections for forward jets and for dijet events with one forward and one central jet in pp collisions at $ \sqrt{s}=$ 7 TeV | JHEP 06 (2012) 036 | CMS-FWD-11-002 1202.0704 |
| 37 | CMS Collaboration | Measurement of the inelastic proton-proton cross section at $ \sqrt{s}=$ 7 TeV | PLB 722 (2013) 5 | CMS-FWD-11-001 1210.6718 |
| 38 | NNPDF Collaboration | Parton distributions from high-precision collider data | EPJC 77 (2017) 663 | 1706.00428 |
| 39 | P. Skands, S. Carrazza, and J. Rojo | Tuning PYTHIA8.1: the Monash 2013 tune | EPJC 74 (2014) 3024 | 1404.5630 |
| 40 | CMS Collaboration | Extraction and validation of a new set of CMS PYTHIA-8 tunes from underlying-event measurements | EPJC 80 (2020) 4 | CMS-GEN-17-001 1903.12179 |
| 41 | NNPDF Collaboration | Parton distributions for the LHC run II | JHEP 04 (2015) 040 | 1410.8849 |
| 42 | CMS Collaboration | Event generator tunes obtained from underlying event and multiparton scattering measurements | EPJC 76 (2016) 155 | CMS-GEN-14-001 1512.00815 |
| 43 | CMS Collaboration | Investigations of the impact of the parton shower tuning in PYTHIA-8 in the modelling of $ \mathrm{t\bar{t}} $ at $ \sqrt{s}= $ 8 and 13 TeV | CMS-PAS-TOP-16-021 | CMS-PAS-TOP-16-021 |
| 44 | CMS Collaboration | Particle-flow reconstruction and global event description with the CMS detector | JINST 12 (2017) P10003 | CMS-PRF-14-001 1706.04965 |
| 45 | CMS Collaboration | Technical proposal for the Phase-II upgrade of the Compact Muon Solenoid | CMS-PAS-TDR-15-002 | CMS-PAS-TDR-15-002 |
| 46 | CMS Collaboration | Electron and photon reconstruction and identification with the CMS experiment at the CERN LHC | JINST 16 (2021) P05014 | CMS-EGM-17-001 2012.06888 |
| 47 | CMS Collaboration | Performance of the CMS muon detector and muon reconstruction with proton-proton collisions at $ \sqrt{s}=$ 13 TeV | JINST 13 (2018) P06015 | CMS-MUO-16-001 1804.04528 |
| 48 | CMS Collaboration | Inclusive and differential cross section measurements of single top quark production in association with a Z boson in proton-proton collisions at $ \sqrt{s}=$ 13 TeV | JHEP 02 (2022) 107 | CMS-TOP-20-010 2111.02860 |
| 49 | CMS Collaboration | Measurement of the inclusive and differential $ {\mathrm{t\bar{t}}\gamma} $ cross sections in the dilepton channel and effective field theory interpretation in proton-proton collisions at $ \sqrt{s}=$ 13 TeV | JHEP 05 (2022) 091 | CMS-TOP-21-004 2201.07301 |
| 50 | CMS Collaboration | Search for new physics in same-sign dilepton events in proton-proton collisions at $ \sqrt{s}=$ 13 TeV | EPJC 76 (2016) 439 | CMS-SUS-15-008 1605.03171 |
| 51 | CMS Collaboration | Observation of single top quark production in association with a Z boson in proton-proton collisions at $ \sqrt{s}=$ 13 TeV | PRL 122 (2019) 132003 | CMS-TOP-18-008 1812.05900 |
| 52 | CMS Collaboration | Performance of electron reconstruction and selection with the CMS detector in proton-proton collisions at $ \sqrt{s}=$ 8 TeV | JINST 10 (2015) P06005 | CMS-EGM-13-001 1502.02701 |
| 53 | M. Cacciari, G. P. Salam, and G. Soyez | The anti-$ {k_{\mathrm{T}}} $ jet clustering algorithm | JHEP 04 (2008) 063 | 0802.1189 |
| 54 | M. Cacciari, G. P. Salam, and G. Soyez | $ FastJet $ user manual | EPJC 72 (2012) 1896 | 1111.6097 |
| 55 | CMS Collaboration | Pileup mitigation at CMS in 13 TeV data | JINST 15 (2020) P09018 | CMS-JME-18-001 2003.00503 |
| 56 | CMS Collaboration | Jet energy scale and resolution in the CMS experiment in pp collisions at 8 TeV | JINST 12 (2017) P02014 | CMS-JME-13-004 1607.03663 |
| 57 | CMS Collaboration | Identification of heavy-flavour jets with the CMS detector in pp collisions at 13 TeV | JINST 13 (2018) P05011 | CMS-BTV-16-002 1712.07158 |
| 58 | E. Bols et al. | Jet flavour classification using DeepJet | JINST 15 (2020) P12012 | 2008.10519 |
| 59 | CMS Collaboration | Performance of the DeepJet b tagging algorithm using 41.9 fb$^{-1}$ of data from proton-proton collisions at 13 TeV with Phase 1 CMS detector | CDS | |
| 60 | CMS Collaboration | Performance of missing transverse momentum reconstruction in proton-proton collisions at $ \sqrt{s}=$ 13 TeV using the CMS detector | JINST 14 (2019) P07004 | CMS-JME-17-001 1903.06078 |
| 61 | Particle Data Group, P. A. Zyla et al. | Review of particle physics | Prog. Theor. Exp. Phys. 2020 (2020) 083C01 | |
| 62 | X. Glorot, A. Bordes, and Y. Bengio | Deep sparse rectifier neural networks | in Proc. 14th Int. Conf. on Artifical Intelligence and Statistics (AISTATS 2011): Fort Lauderdale, 2011 | |
| 63 | M. Abadi et al. | TensorFlow: large-scale machine learning on heterogeneous distributed systems | 2016 | 1603.04467 |
| 64 | F. Chollet et al. | Keras | link | |
| 65 | D. P. Kingma and J. Ba | Adam: a method for stochastic optimization | in Proc. 3rd Int. Conf. on Learning Representations (ICLR 2015): San Diego 2015 | 1412.6980 |
| 66 | I. Goodfellow, Y. Bengio, and A. Courville | Deep learning | MIT Press, Cambridge, MA, USA | |
| 67 | N. Srivastava et al. | Dropout: a simple way to prevent neural networks from overfitting | J. Mach. Learn. Res. 15 (2014) 1929 | |
| 68 | CMS Collaboration | Evidence for associated production of a Higgs boson with a top quark pair in final states with electrons, muons, and hadronically decaying $ \tau $ leptons at $ \sqrt{s}=$ 13 TeV | JHEP 08 (2018) 066 | CMS-HIG-17-018 1803.05485 |
| 69 | CMS Collaboration | Precision luminosity measurement in proton-proton collisions at $ \sqrt{s}=$ 13 TeV in 2015 and 2016 at CMS | EPJC 81 (2021) 800 | CMS-LUM-17-003 2104.01927 |
| 70 | CMS Collaboration | CMS luminosity measurement for the 2017 data-taking period at $ \sqrt{s}=$ 13 TeV | CMS-PAS-LUM-17-004 | CMS-PAS-LUM-17-004 |
| 71 | CMS Collaboration | CMS luminosity measurement for the 2018 data-taking period at $ \sqrt{s}=$ 13 TeV | CMS-PAS-LUM-18-002 | CMS-PAS-LUM-18-002 |
| 72 | CMS Collaboration | Search for the associated production of the Higgs boson with a top-quark pair | JHEP 09 (2014) 087 | CMS-HIG-13-029 1408.1682 |
| 73 | CMS Collaboration | Measurement of the inclusive and differential $ {\mathrm{t\bar{t}}\gamma} $ cross sections in the single-lepton channel and EFT interpretation at $ \sqrt{s}=$ 13 TeV | JHEP 12 (2021) 180 | CMS-TOP-18-010 2107.01508 |
| 74 | CMS Collaboration | Search for electroweak production of charginos and neutralinos in multilepton final states in proton-proton collisions at $ \sqrt{s}=$ 13 TeV | JHEP 03 (2018) 166 | CMS-SUS-16-039 1709.05406 |
| 75 | CMS Collaboration | A portrait of the Higgs boson by the CMS experiment ten years after the discovery | Nature 607 (2022) 60 | CMS-HIG-22-001 2207.00043 |
| 76 | CMS Collaboration | Search for standard model production of four top quarks with same-sign and multilepton final states in proton-proton collisions at $ \sqrt{s}=$ 13 TeV | EPJC 78 (2018) 140 | CMS-TOP-17-009 1710.10614 |
| 77 | CMS Collaboration | Observation of the production of three massive gauge bosons at $ \sqrt{s}=$ 13 TeV | PRL 125 (2020) 151802 | CMS-SMP-19-014 2006.11191 |
| 78 | CMS Collaboration | CMS PYTHIA-8 colour reconnection tunes based on underlying-event data | 2022. Submitted to EPJC | CMS-GEN-17-002 2205.02905 |
| 79 | L. Ferencz et al. | Study of $ {\mathrm{t}\overline{\mathrm{t}}} \mathrm{b}\overline{\mathrm{b}} $ and $ {{\mathrm{t}\overline{\mathrm{t}}} \mathrm{W}} $ background modelling for $ {{\mathrm{t}\overline{\mathrm{t}}} \mathrm{H}} $ analyses | LHC Higgs Working Group Public Note LHCHWG-2022-003, 2023 | 2301.11670 |
| 80 | J. Butterworth et al. | PDF4LHC recommendations for LHC Run II | JPG 43 (2016) 023001 | 1510.03865 |
| 81 | ATLAS and CMS Collaborations, and LHC Higgs Combination Group | Procedure for the LHC Higgs boson search combination in Summer 2011 | CMS-NOTE-2011-005 | |
| 82 | G. Cowan, K. Cranmer, E. Gross, and O. Vitells | Asymptotic formulae for likelihood-based tests of new physics | EPJC 71 (2011) 1554 | 1007.1727 |
| 83 | R. Barlow and C. Beeston | Fitting using finite Monte Carlo samples | CPC 77 (1993) 219 | |
| 84 | J. S. Conway | Incorporating nuisance parameters in likelihoods for multisource spectra | in Proc. 2011 Workshop on Statistical Issues Related to Discovery Claims in Search Experiments and Unfolding (PHYSTAT 2011): Geneva 2011 | 1103.0354 |
|
|
Compact Muon Solenoid LHC, CERN |
|

|

|

|

|

|